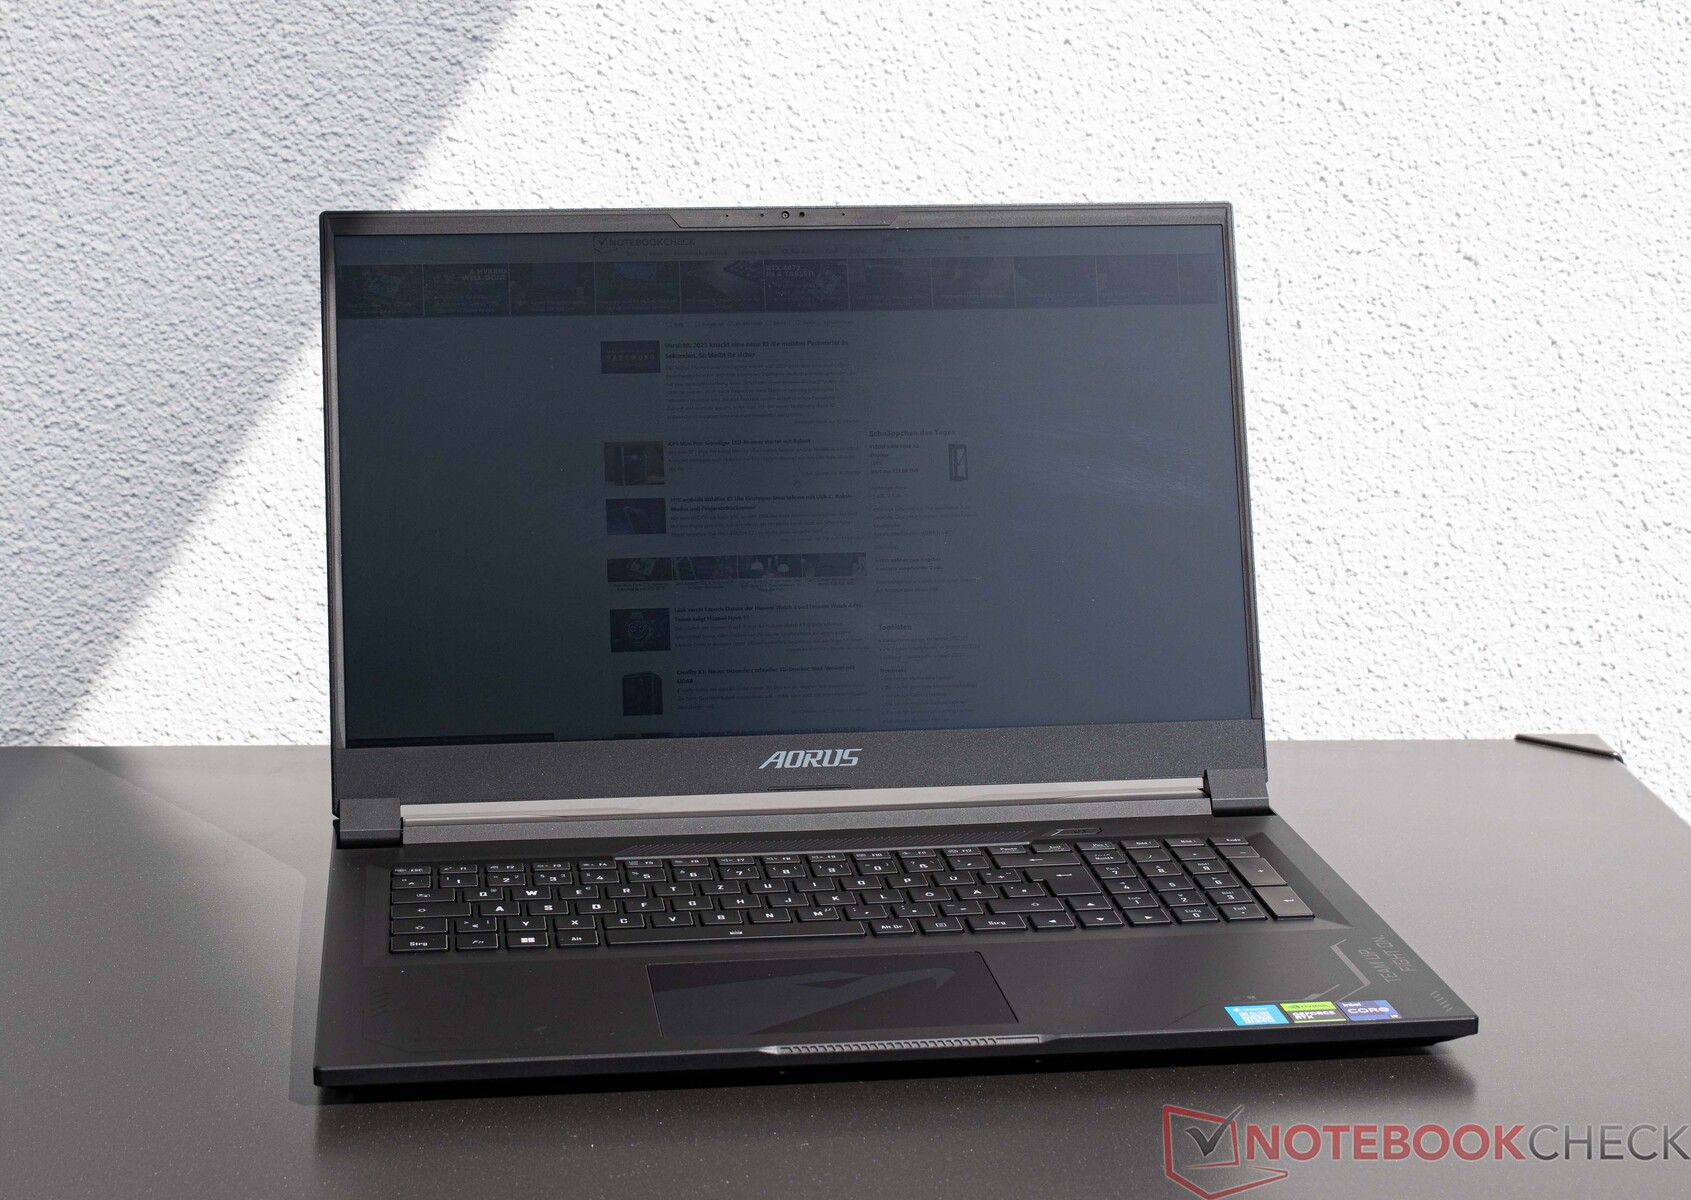
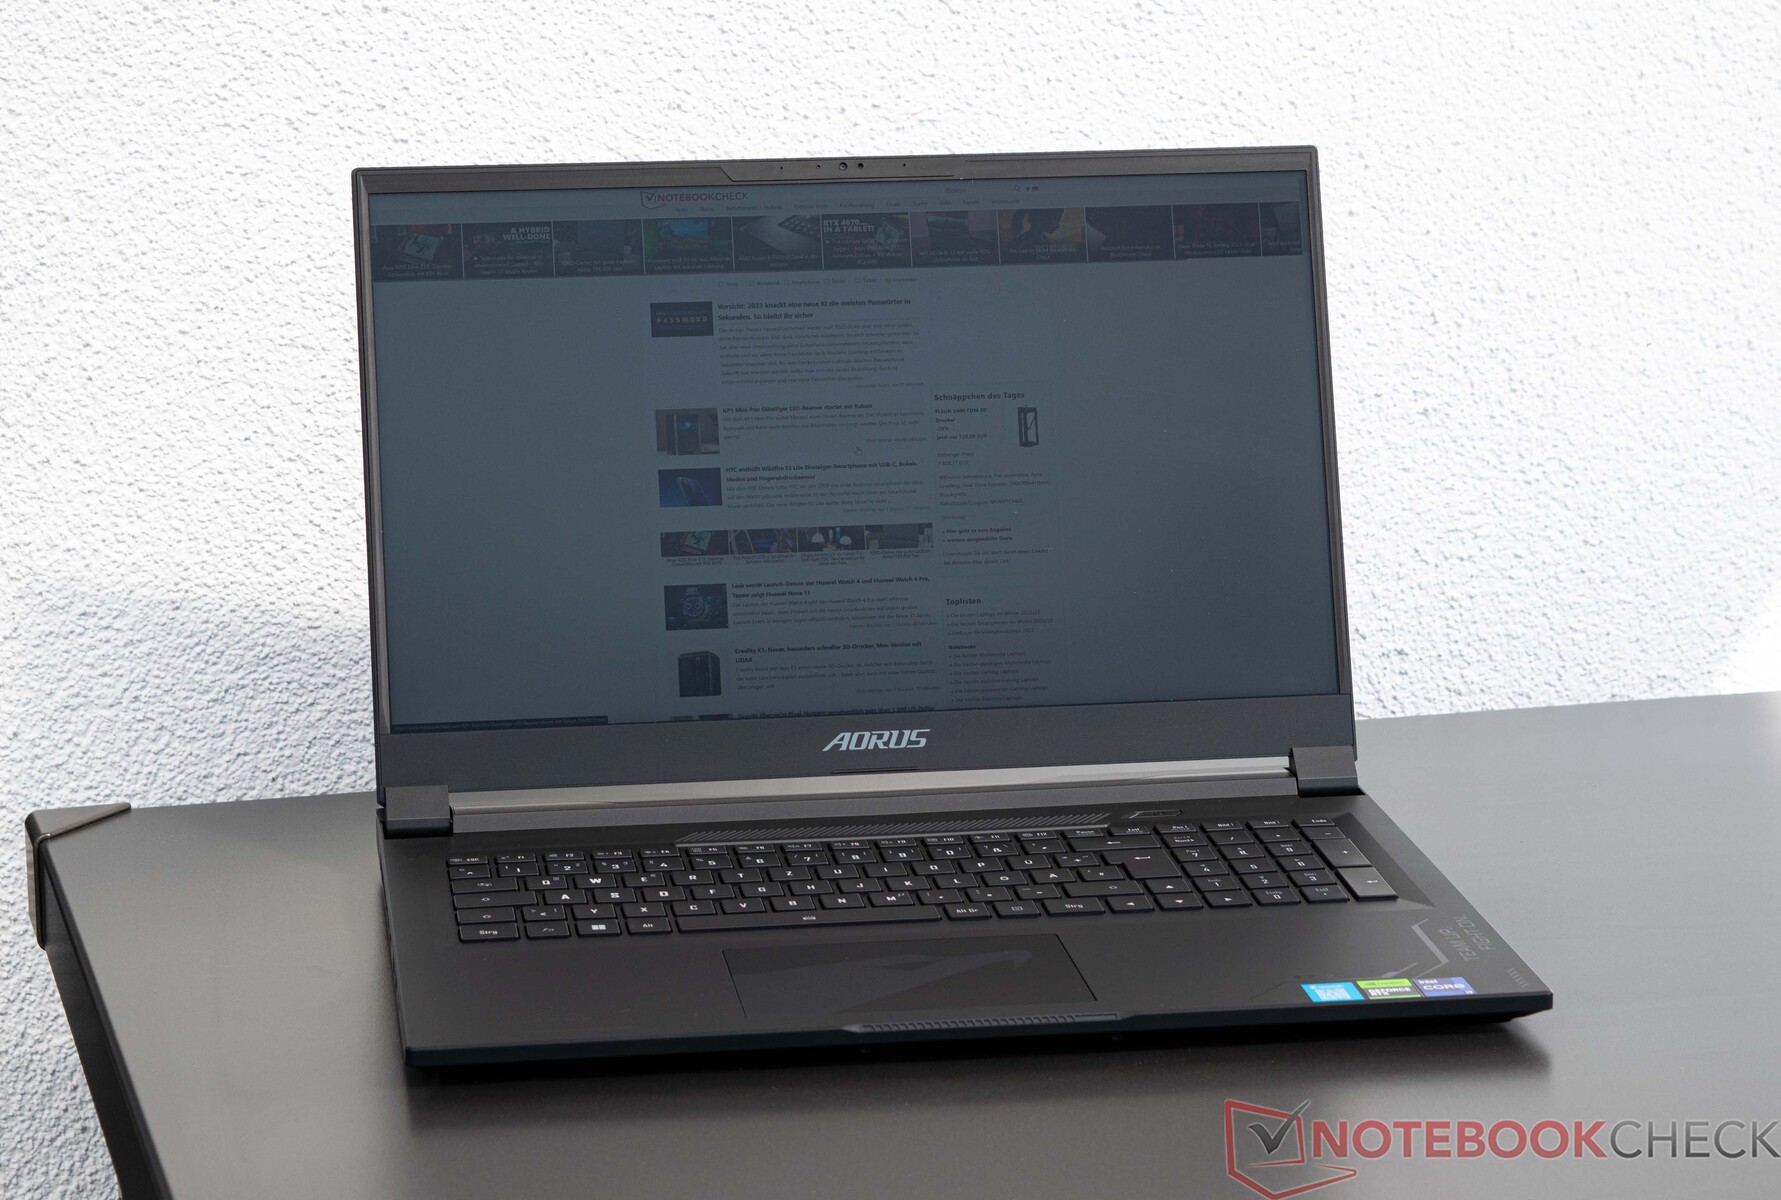
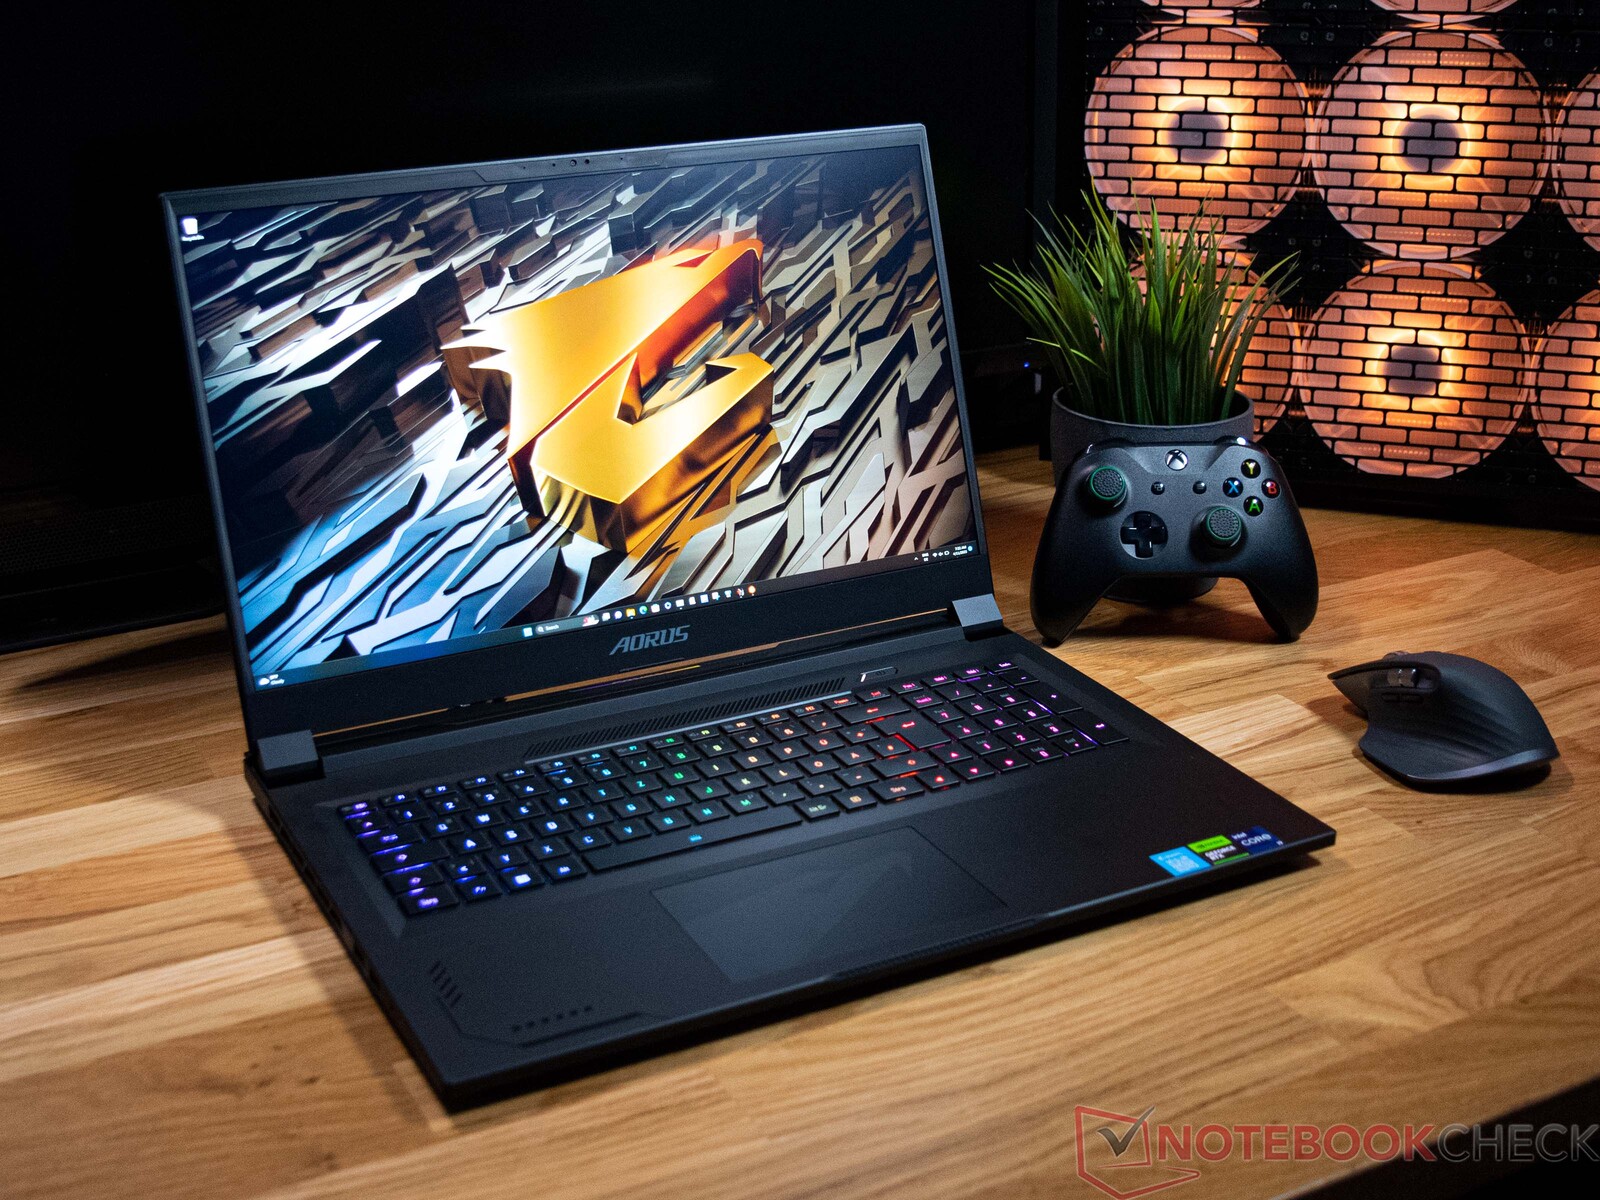
Recenzja Aorus 17X AZF: Wysokiej klasy laptop do gier z i9-13900HX i RTX 4090 w smukłej obudowie
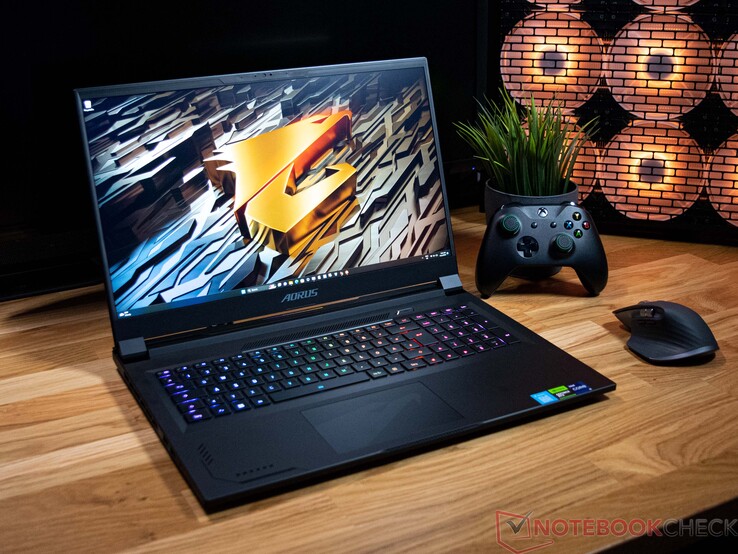
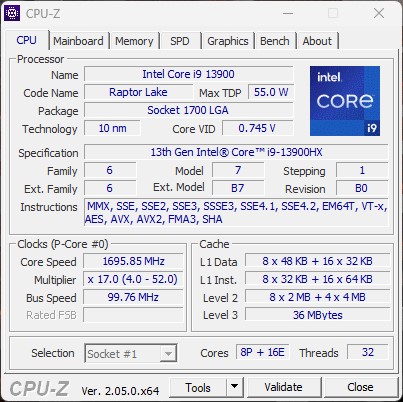
Nowy Aorus 17X AZF został zbudowany w oparciu o procesor Intel Raptor Lake H oraz najnowszy mobilny flagowiec GPU od Nvidii. A Intel Core i9 13900HX współpracuje z Nvidia GeForce RTX 4090 laptop GPU pod maską. Już same te dwa komponenty dają pojęcie o przeznaczeniu laptopa. Ale jak dobrze spisuje się sprzęt w smukłej obudowie? Przyjrzeliśmy się temu i w dalszej części artykułu omówimy to bardziej szczegółowo. Sam procesor i GPU nie czynią jednak dobrego laptopa do gier - w Aorusie 17X AZF towarzyszy im 17-calowy ekran o częstotliwości odświeżania 240 Hz, a także pamięć masowa SSD o łącznej pojemności 2 TB, która bez problemu pomieści sporą liczbę gier i innych programów. Taka konfiguracja opiewa na kwotę 3 499,00 USD.
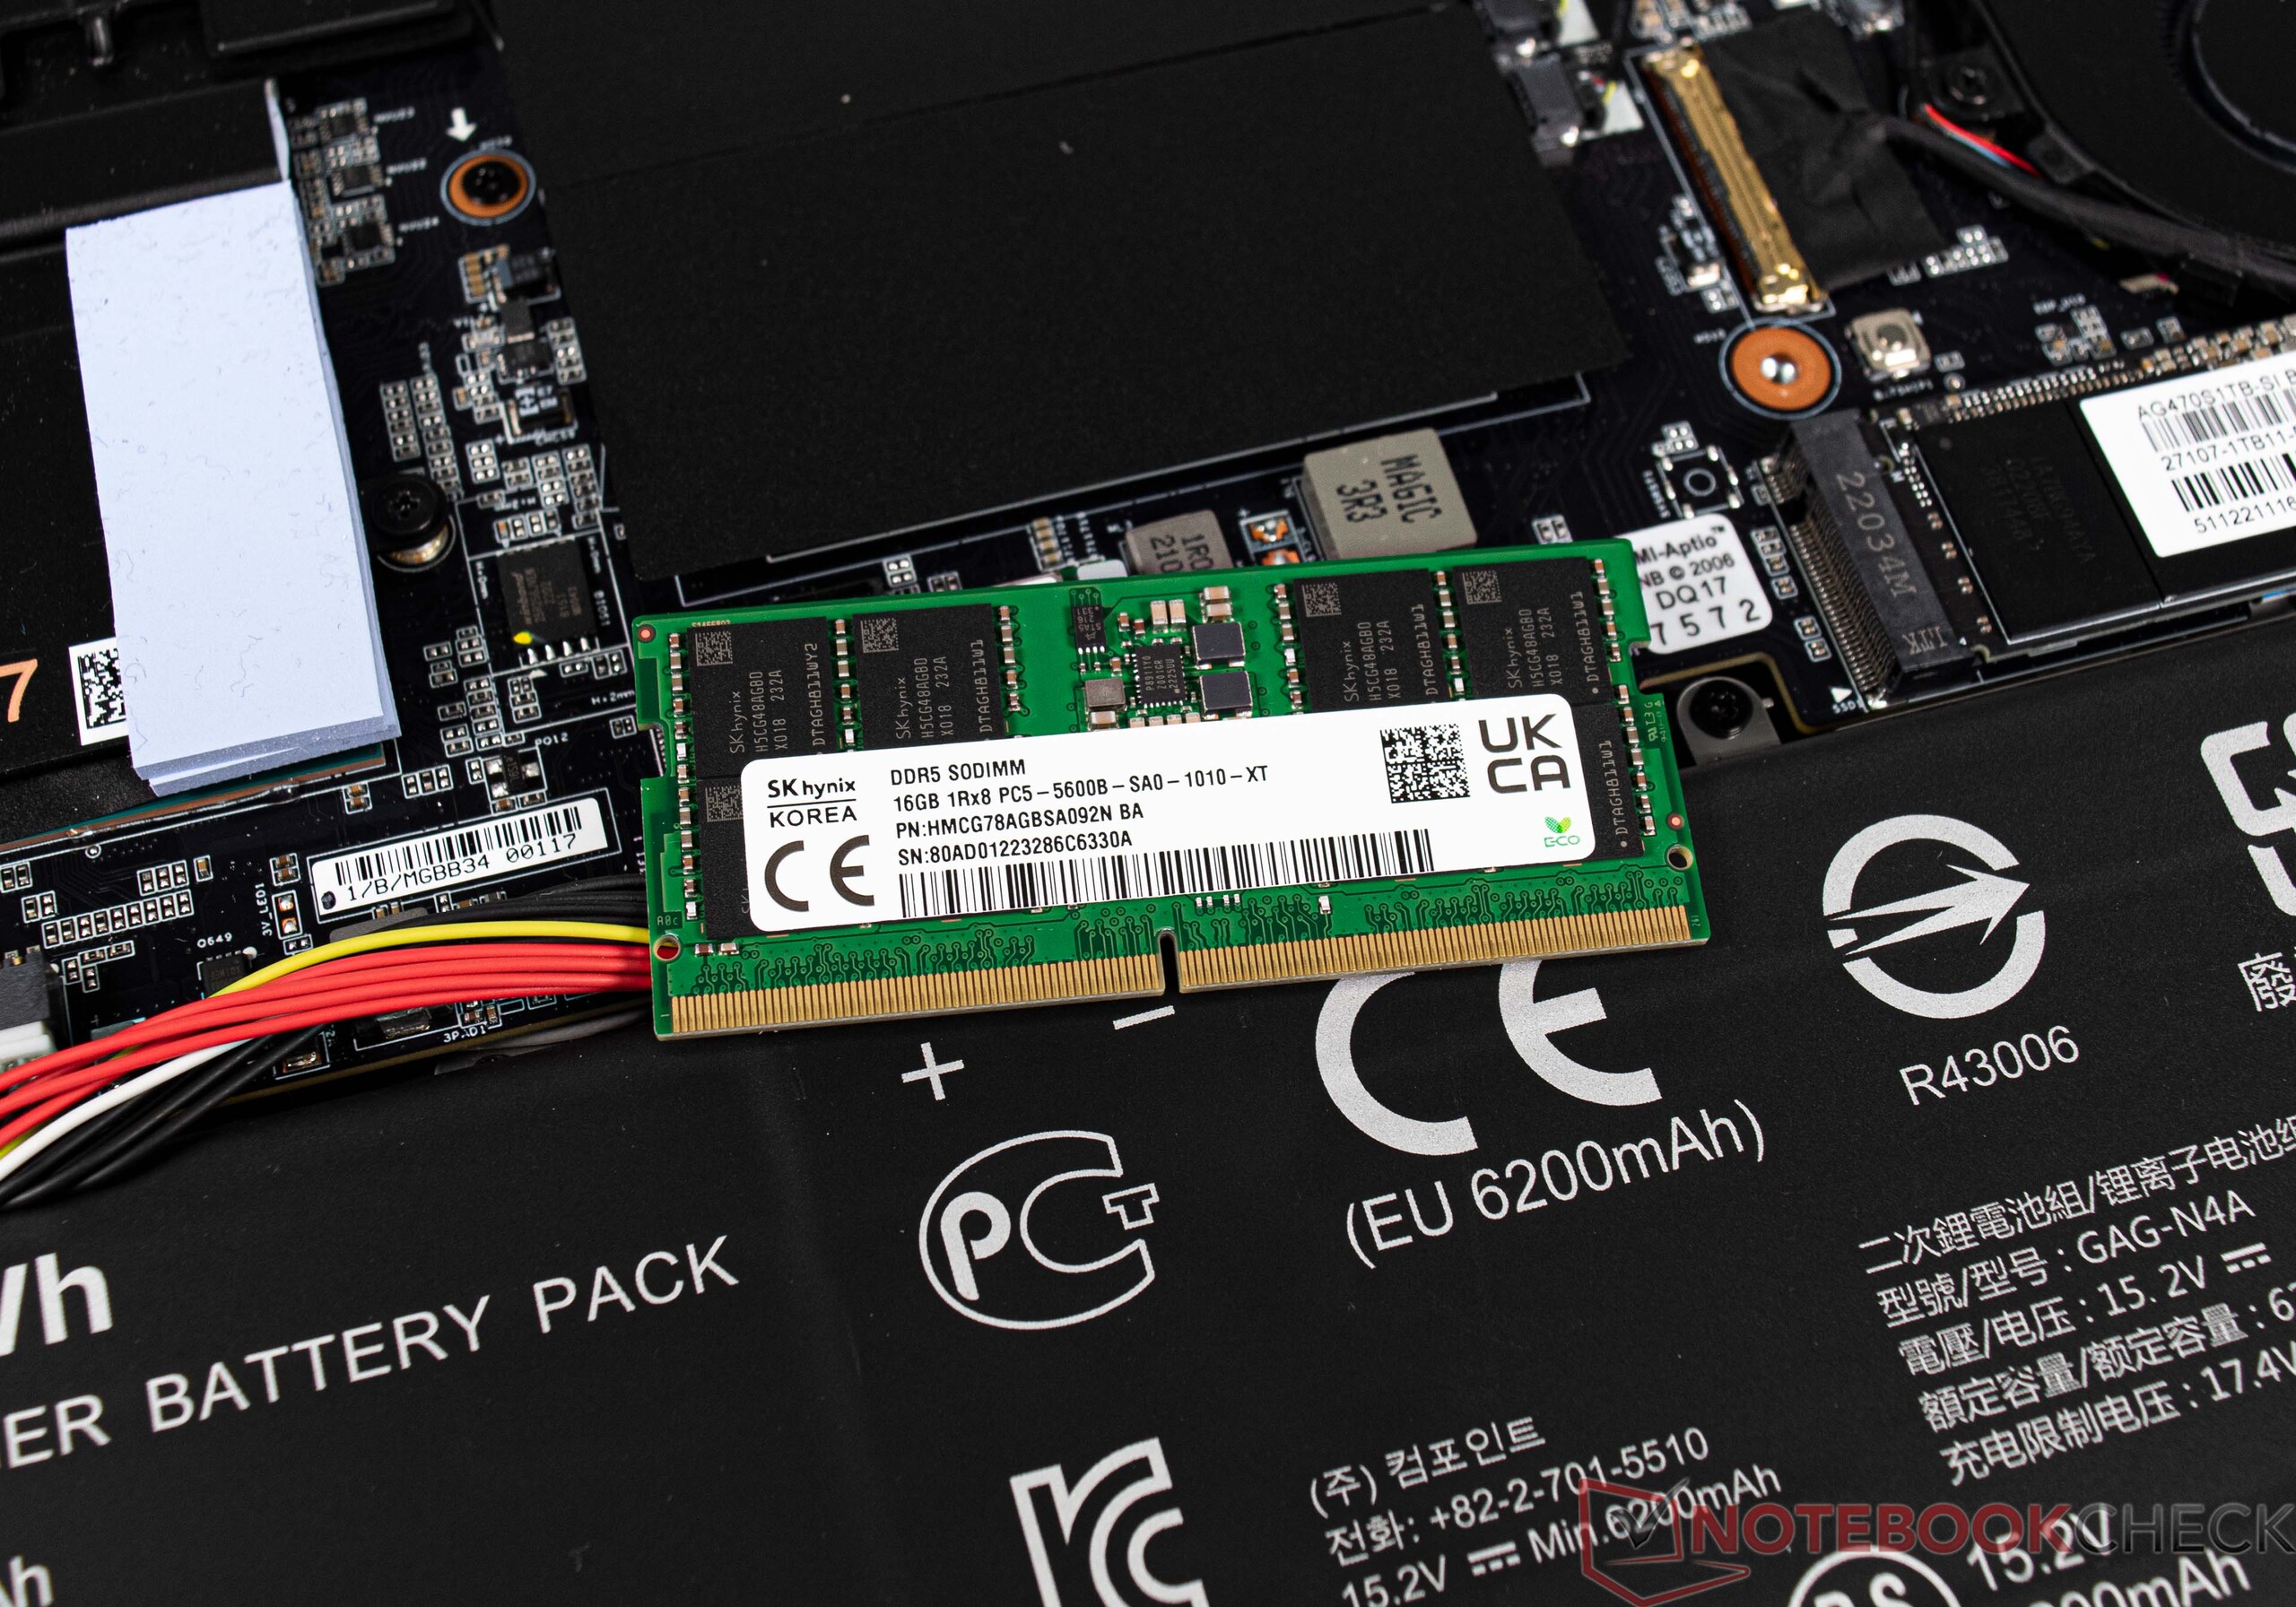
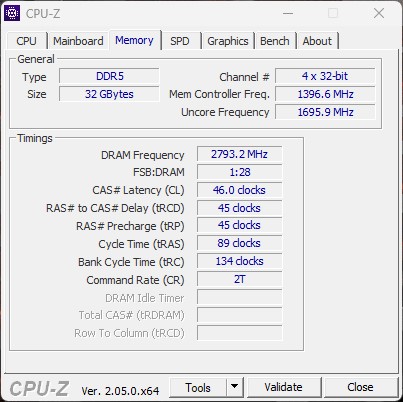
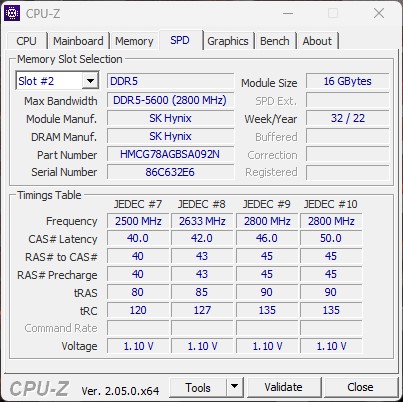
Alternatywnie Aorus 17X dostępny jest z procesorem Intel Core i7 13700HX. O ile w kwestii karty graficznej nie ma innych możliwości wyboru, o tyle prędkość pamięci RAM DDR5 może być różna. Core i7 jest technicznie ograniczony do maksymalnie 4800 MT/s, natomiast model Core i9 ma do dyspozycji maksymalnie 5600 MT/s.
Konkurencyjne laptopy tej klasy również oferują podobny poziom wydajności, gdy spojrzymy na specyfikację techniczną, gdyż również zostały wyposażone w procesory Intel Raptor-Lake H oraz mobilne układy graficzne Ada-Lovelace. Szczegółowe zestawienie porównywanych urządzeń znajdziecie w poniższej tabeli.
Potencjalni konkurenci w porównaniu
Ocena | Data | Model | Waga | Wysokość | Rozmiar | Rezolucja | Cena |
|---|---|---|---|---|---|---|---|
| 86 % v7 (old) | 04/2023 | Aorus 17X AZF i9-13900HX, GeForce RTX 4090 Laptop GPU | 2.9 kg | 21.8 mm | 17.30" | 2560x1440 | |
| 88.4 % v7 (old) | 03/2023 | Medion Erazer Beast X40 i9-13900HX, GeForce RTX 4090 Laptop GPU | 2.9 kg | 33 mm | 17.00" | 2560x1600 | |
| 88.3 % v7 (old) | 03/2023 | MSI GE78HX 13VH-070US i9-13950HX, GeForce RTX 4080 Laptop GPU | 3 kg | 23 mm | 17.00" | 2560x1600 | |
| 85.4 % v7 (old) | 03/2023 | HP Omen 17-ck2097ng i9-13900HX, GeForce RTX 4080 Laptop GPU | 2.8 kg | 27 mm | 17.30" | 2560x1440 | |
| 90.7 % v7 (old) | 04/2023 | Alienware m18 R1 i9-13980HX, GeForce RTX 4090 Laptop GPU | 3.9 kg | 26.7 mm | 18.00" | 1920x1200 | |
| 89 % v7 (old) | 02/2023 | MSI Titan GT77 HX 13VI i9-13950HX, GeForce RTX 4090 Laptop GPU | 3.5 kg | 23 mm | 17.30" | 3840x2160 |
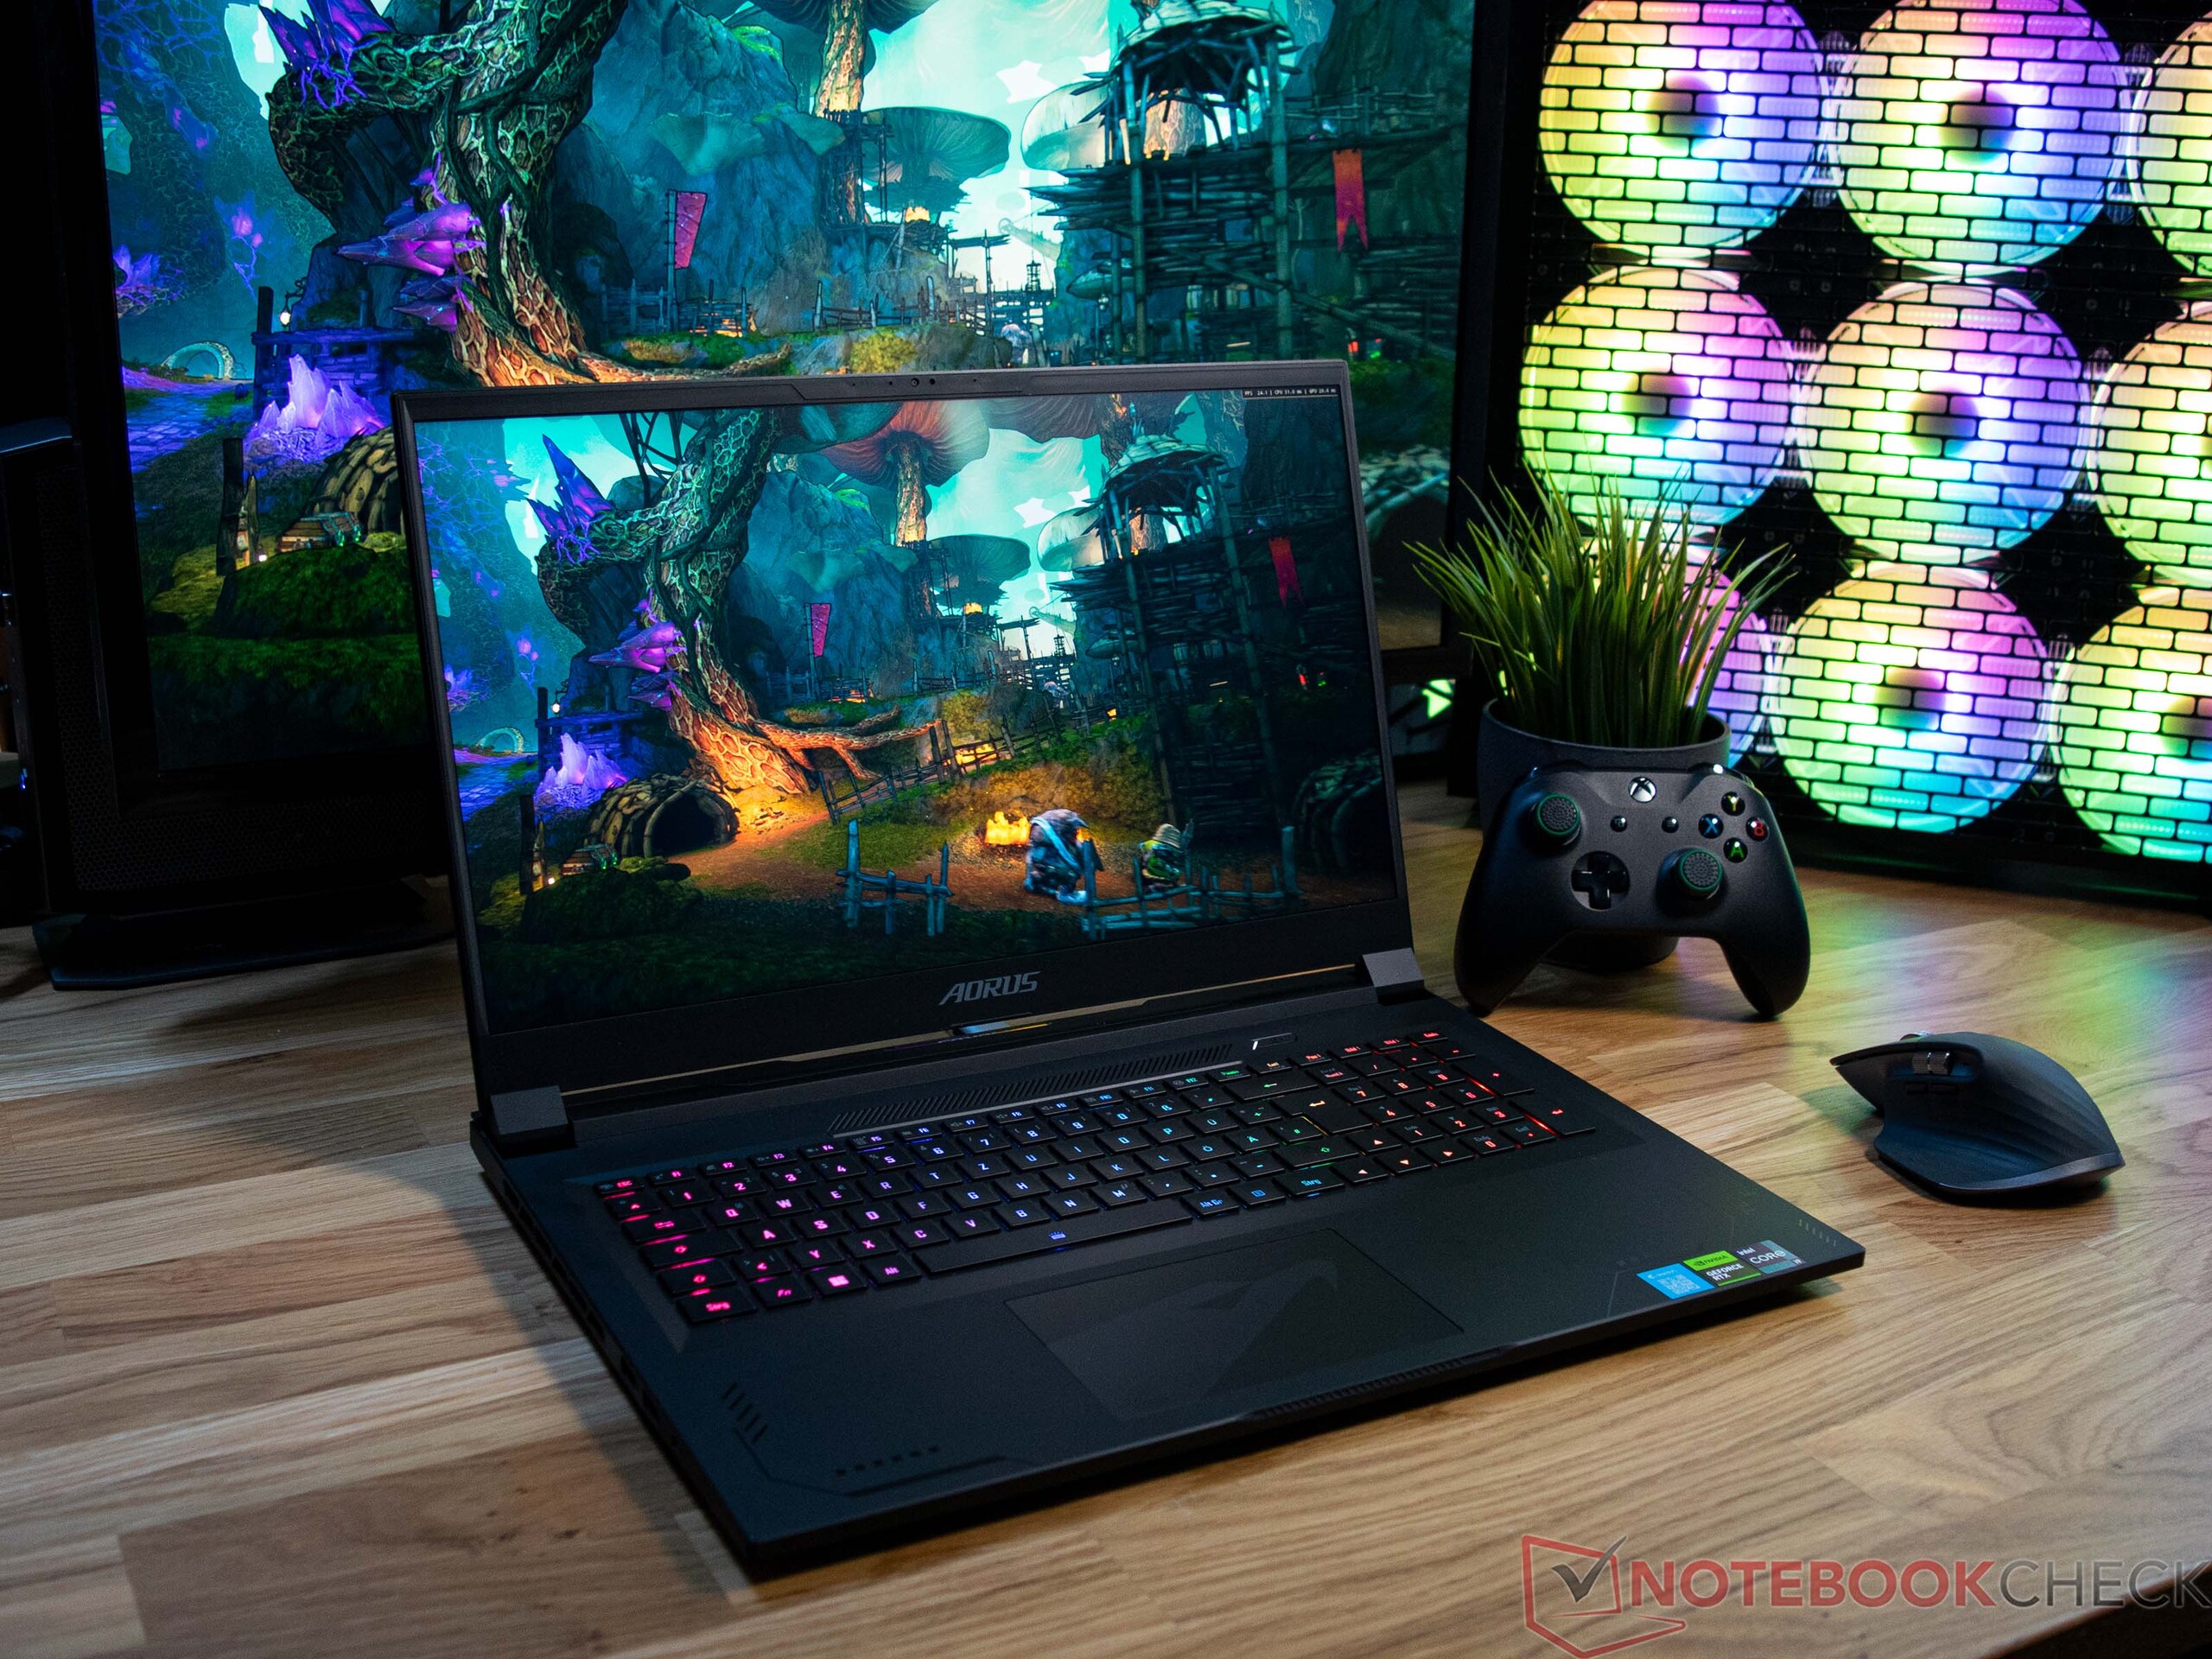
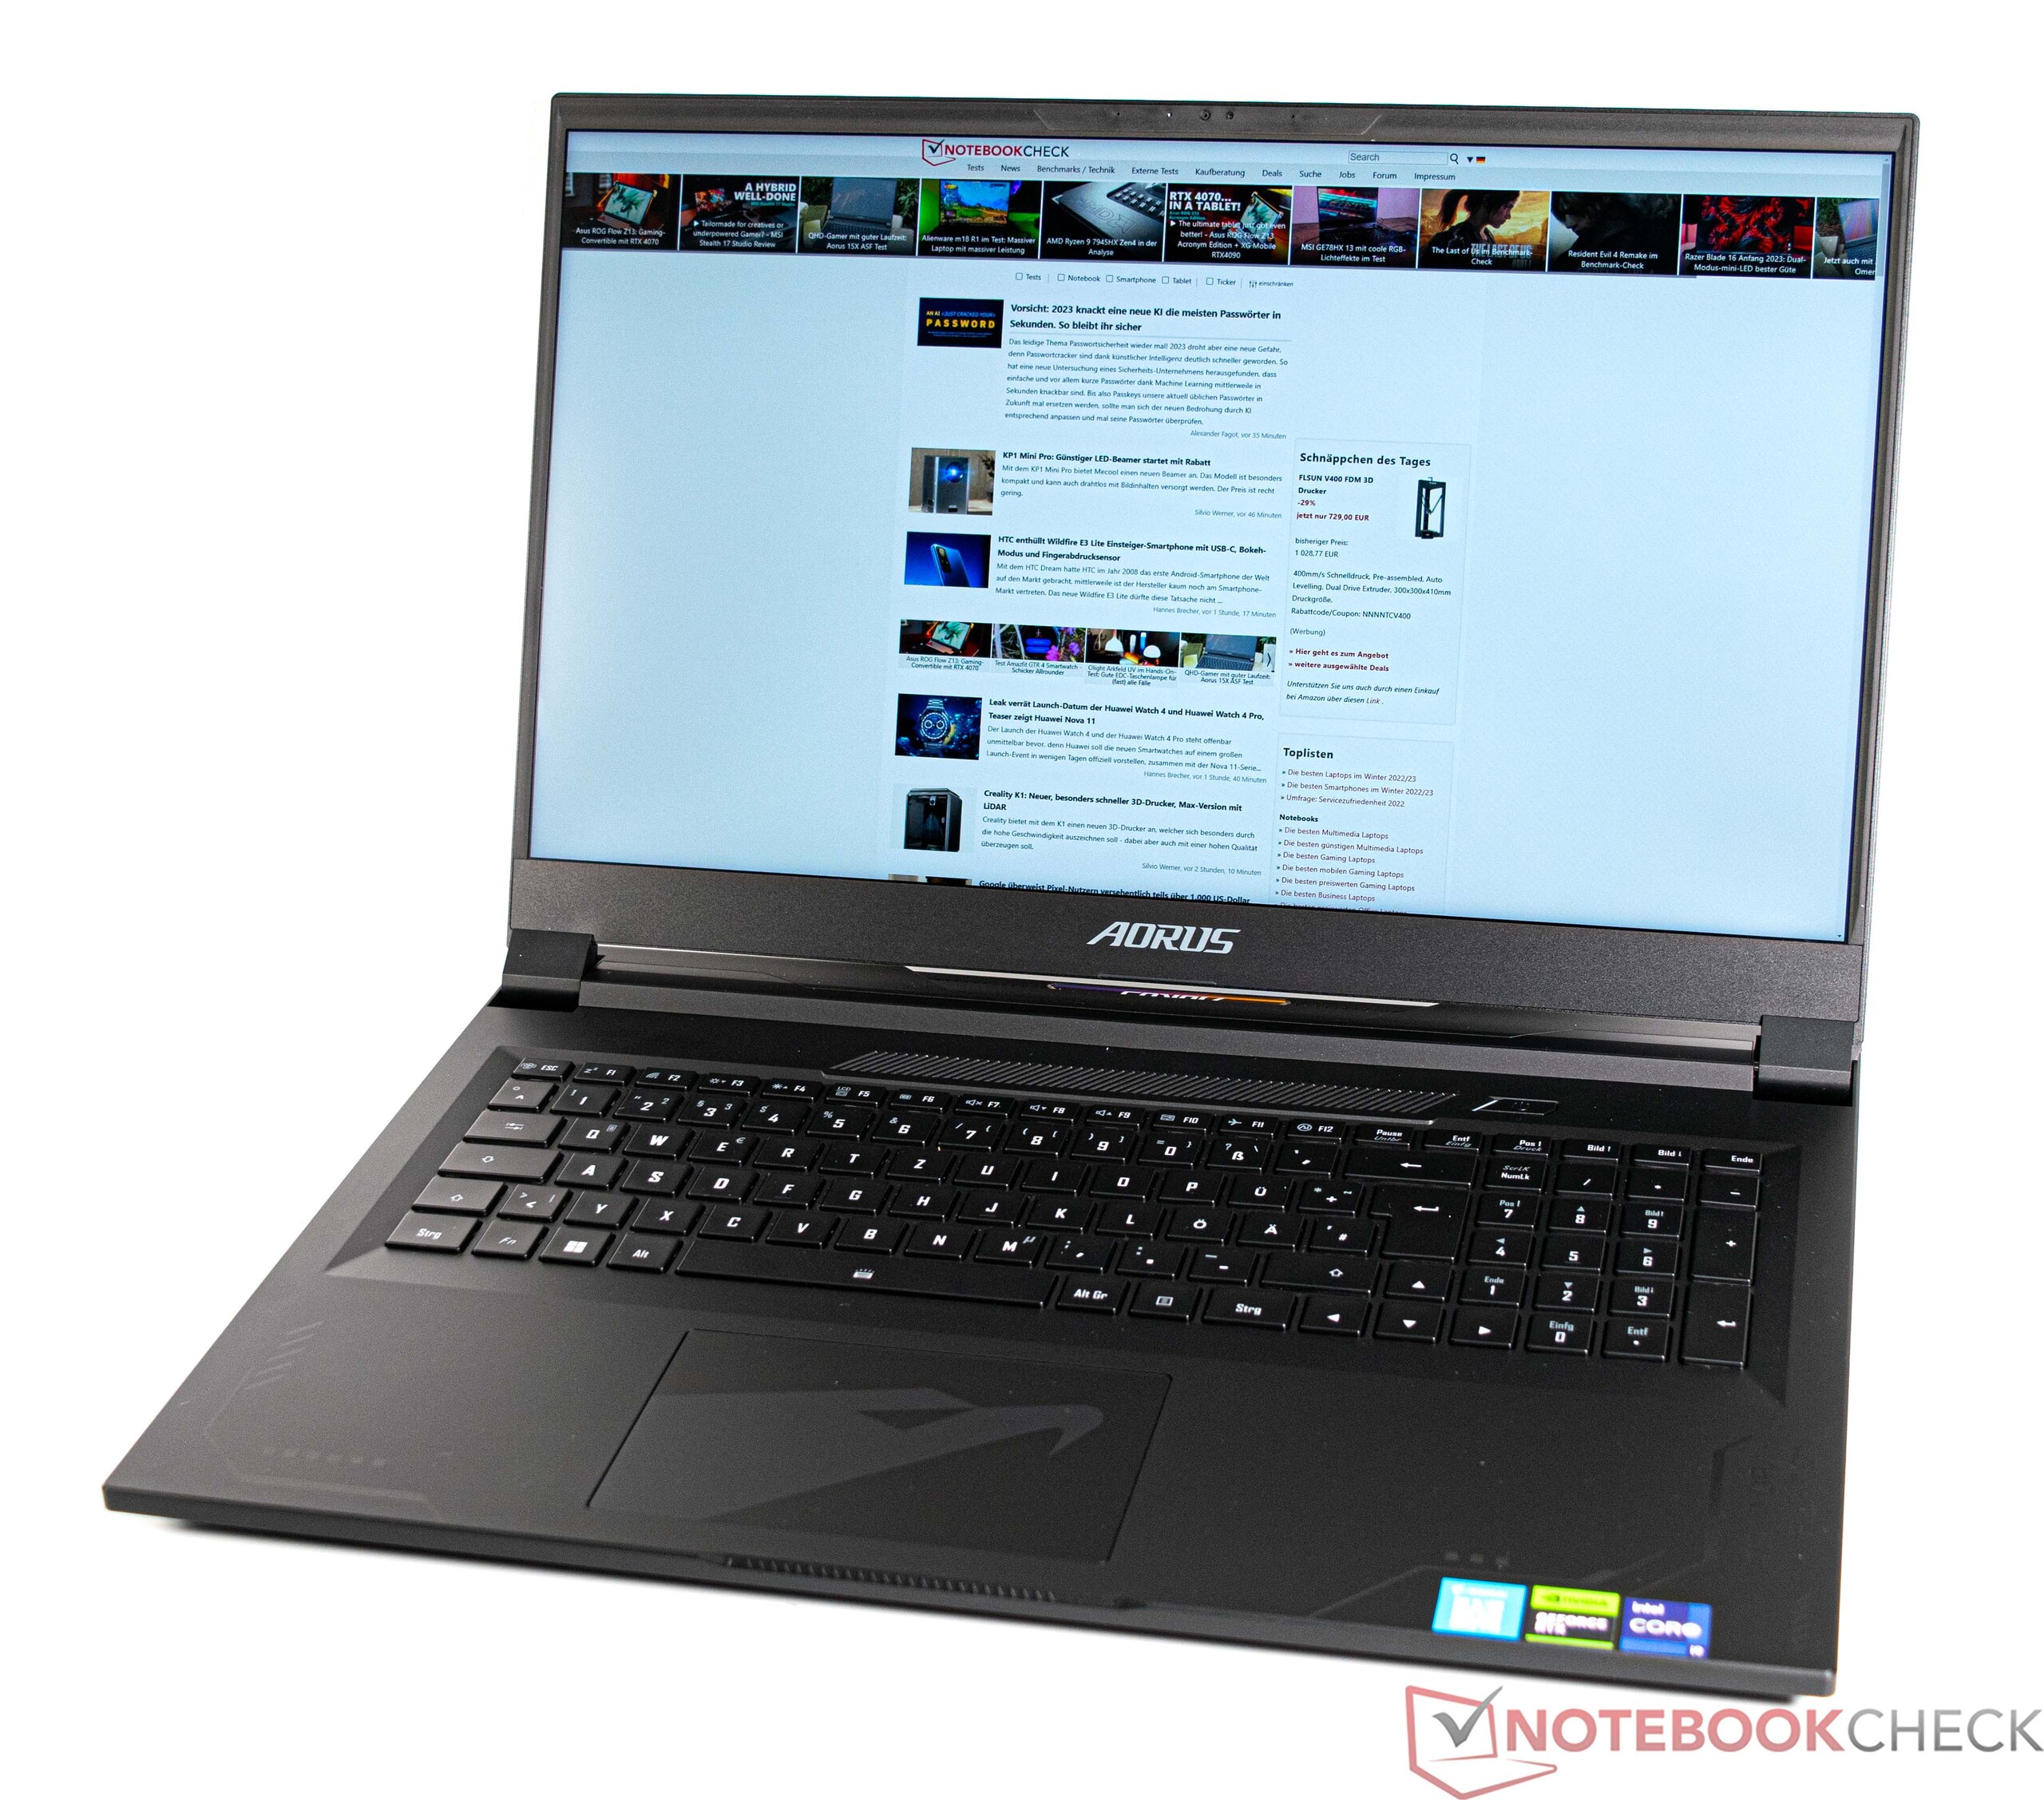
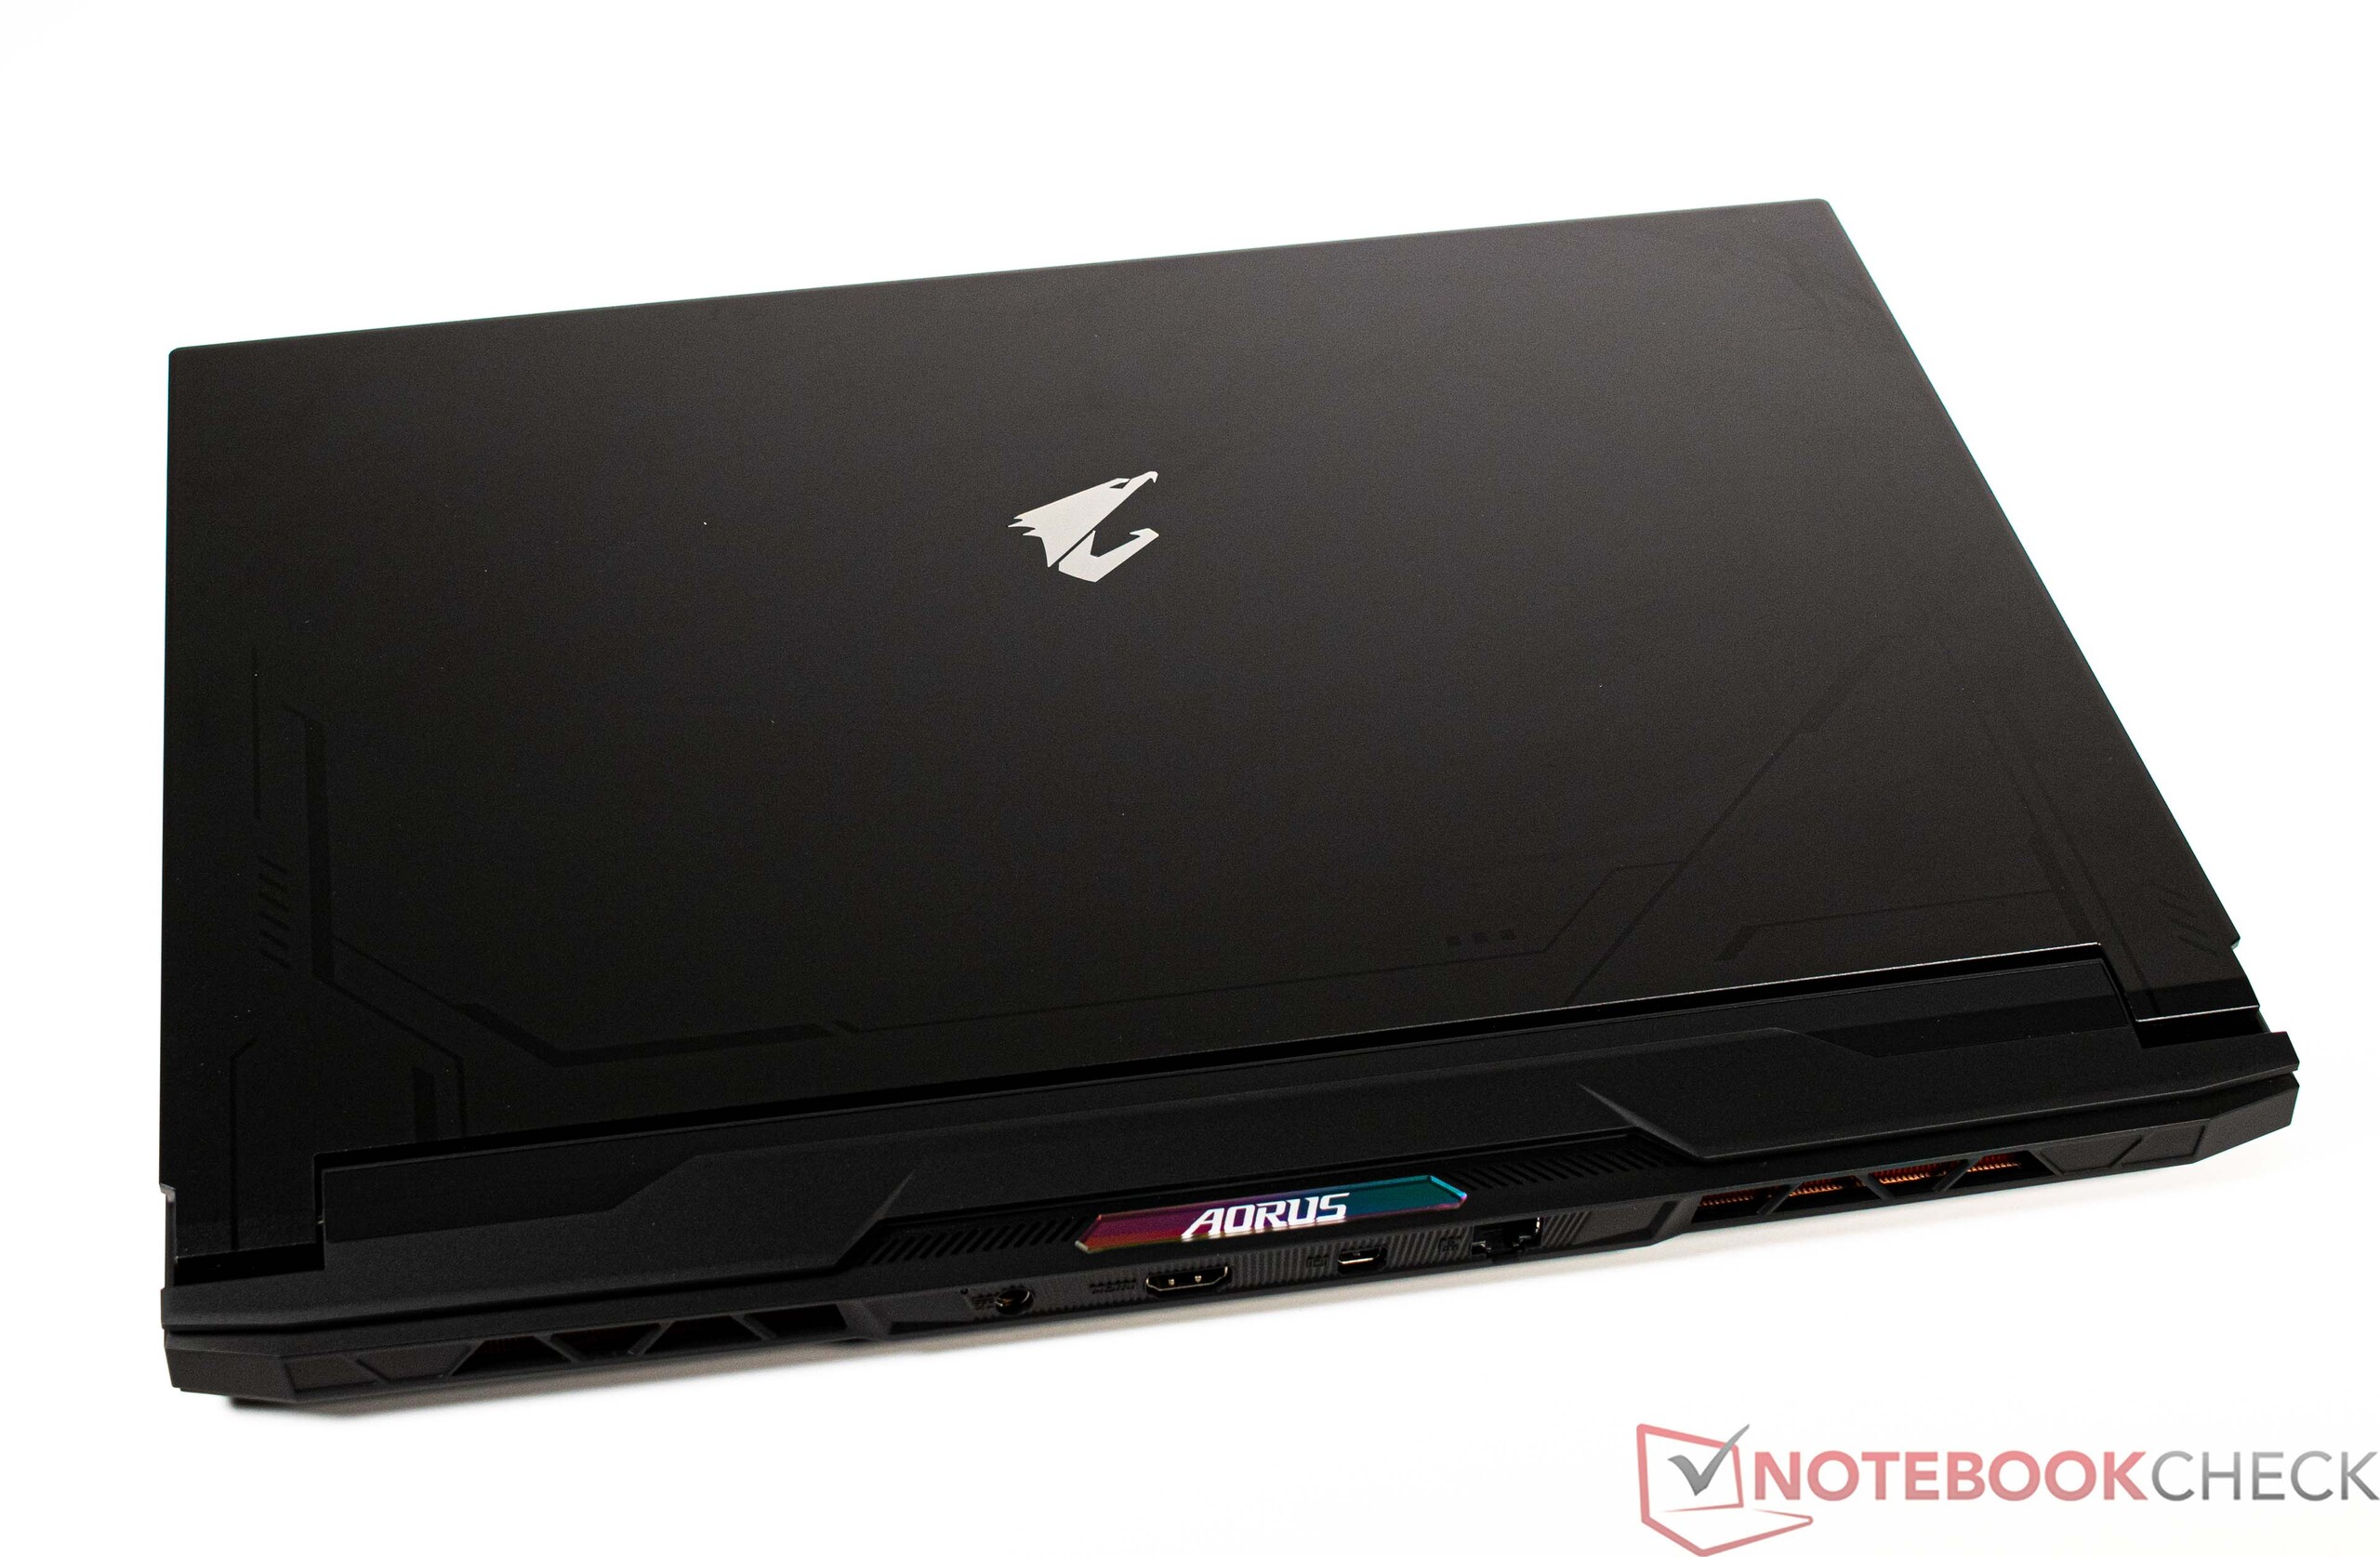
Obudowa - aluminium i plastik na Aorusie 17X
Aorus 17X został wykonany w większości z aluminium i plastiku. Ma to swoją zaletę w postaci niskiej wagi, bo przy niecałych 3 kilogramach urządzenie jest jednym z lżejszych przedstawicieli tutaj w porównaniu. Jedynie HP Omen 17 jest nieco lżejszy.
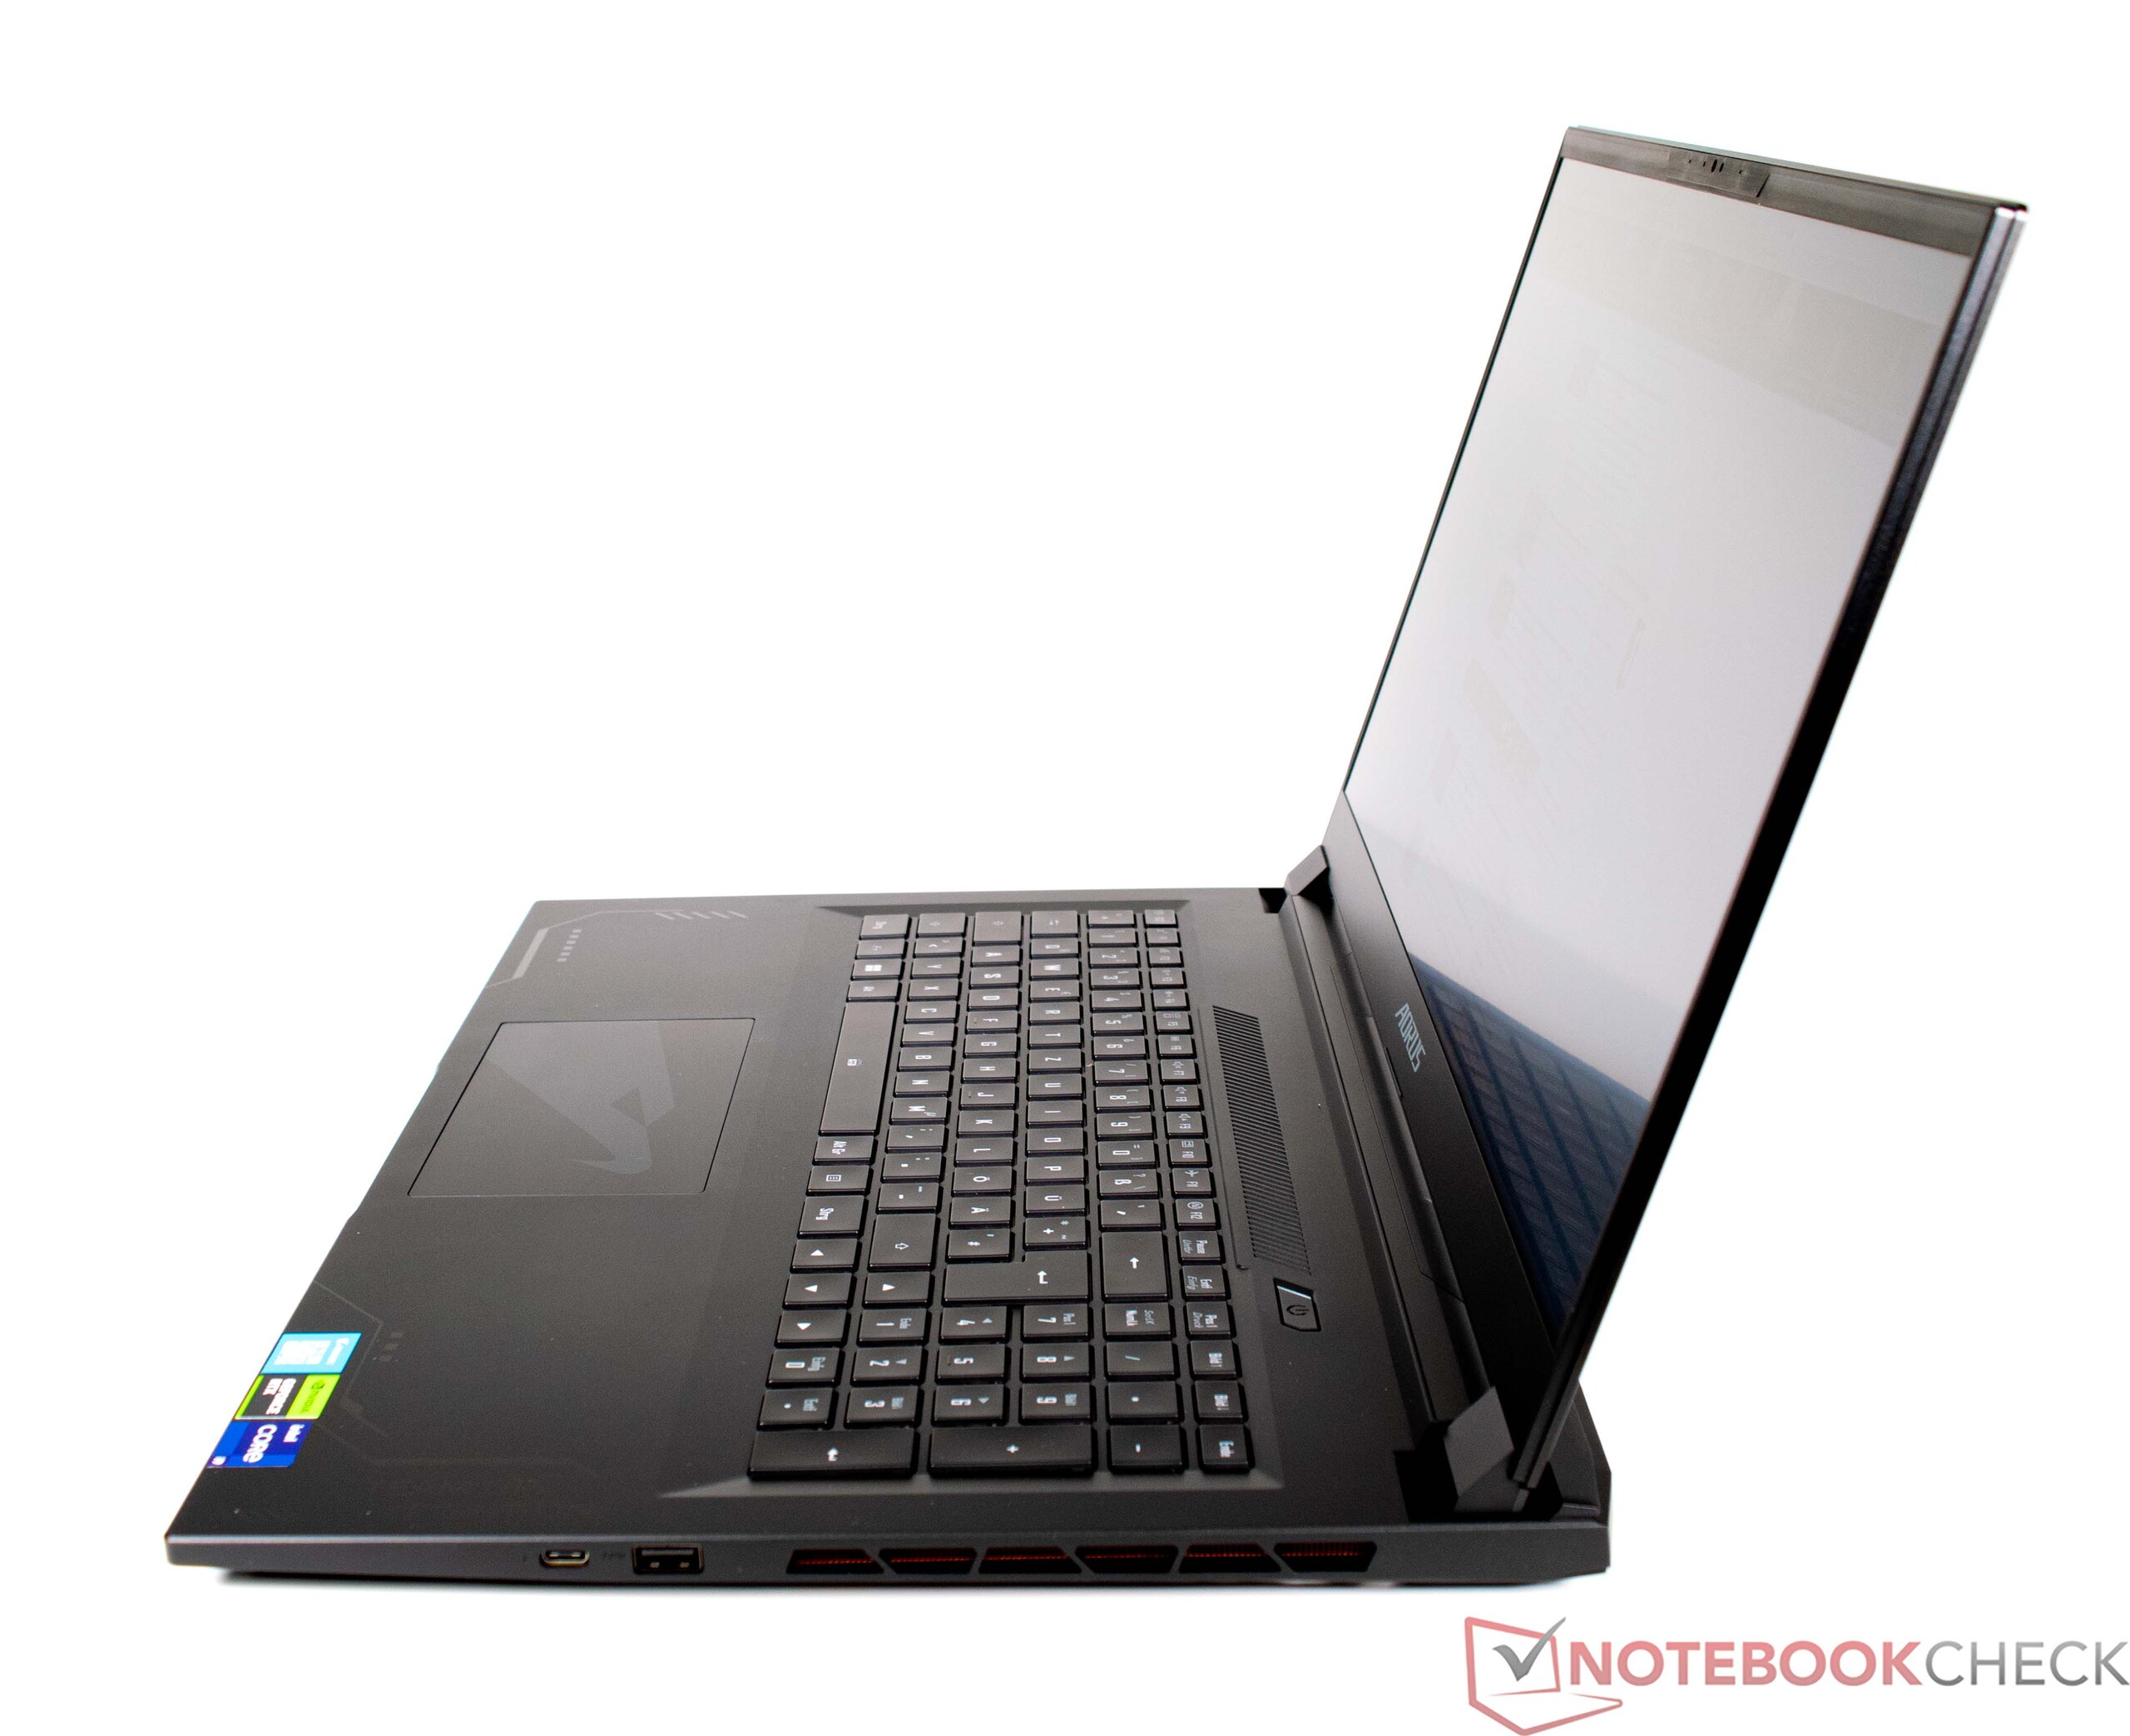
Pod względem stabilności wybór materiałów okazuje się nieco niekorzystny, ale i tak w naszym teście ciśnieniowym okazał się solidny. Producenci zawsze muszą zarządzać balansem między stabilnością a mobilnością w dużych 17-calowych laptopach, co naszym zdaniem udało się w Aorusie 17X AZF. Pokrywa wyświetlacza, wykonana w górnej części z aluminium, jest stosunkowo stabilna, choć przy odrobinie wysiłku można ją jeszcze wykręcić. Stabilne są również zawiasy, które sprawiają wrażenie solidnych i ograniczają teetering do minimum. Co więcej, możliwe jest otwarcie wyświetlacza jedną ręką.
Jedyne kolorowe elementy znajdują się na plecach w postaci podświetlanych napisów Aorus. Na pokrywie wyświetlacza znajduje się również srebrne logo Aorus, które przełamuje monotonię skądinąd całkowicie czarnego urządzenia.
Sprzęt
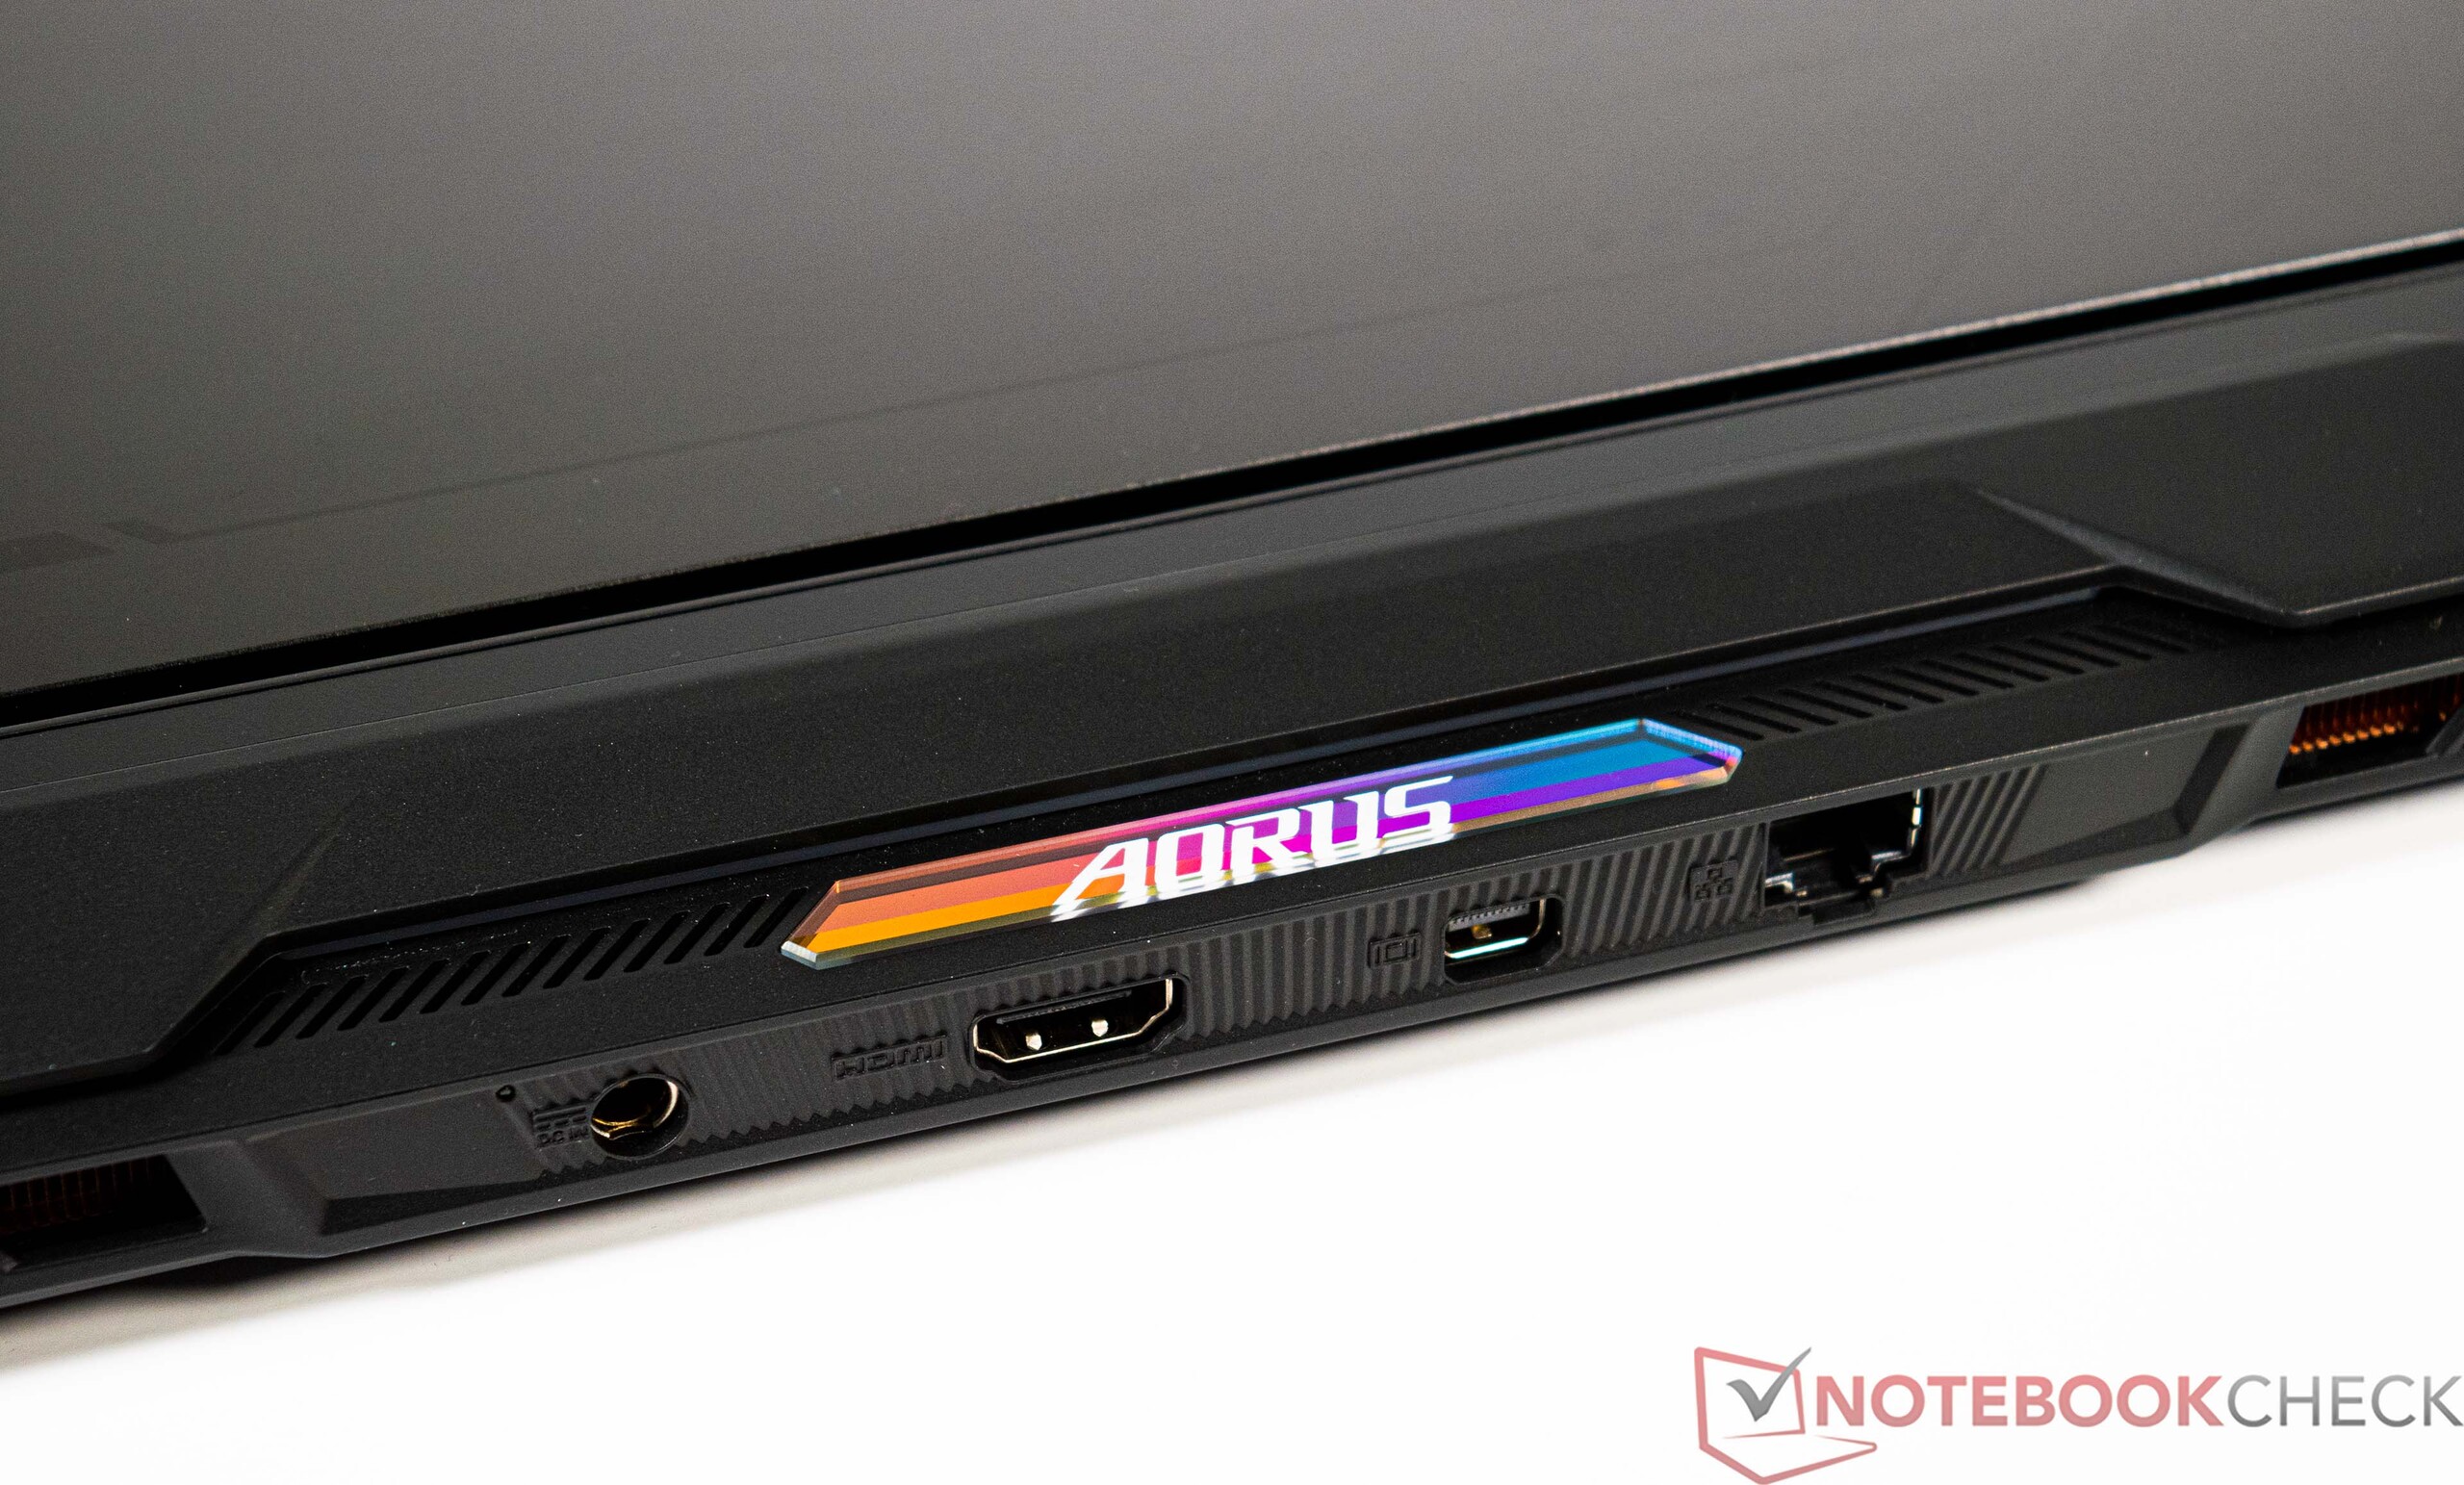
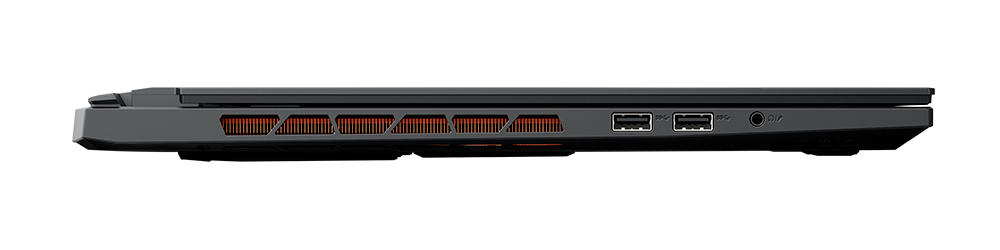
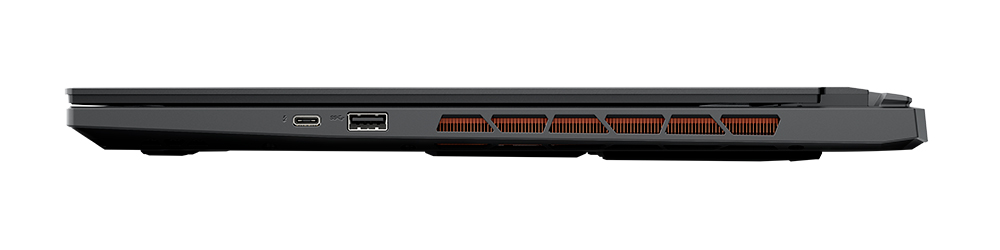
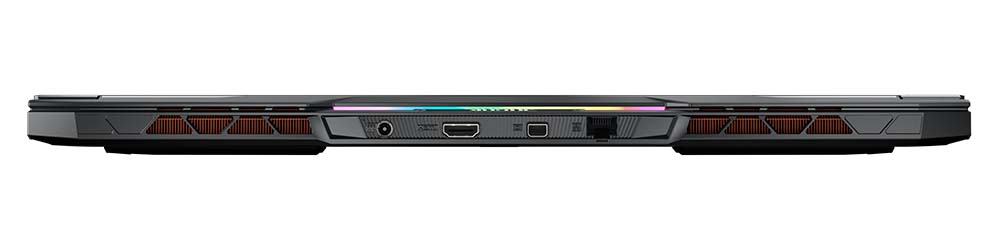
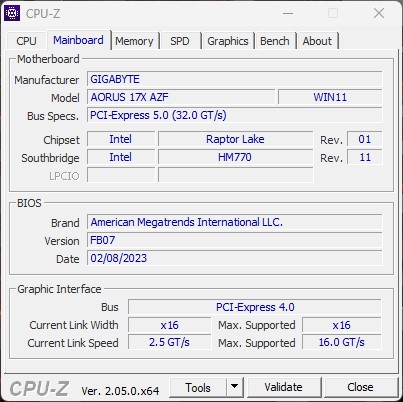
Aorus 17X AZF nie oferuje niestety tak dużego wyboru portów, ale dostępne interfejsy powinny mimo wszystko zadowolić większość użytkowników. Jest przecież nowoczesny port Thunderbolt 4 z funkcją Power Delivery (PD) oraz trzy konwencjonalne porty USB. Tymczasem zewnętrzne wyświetlacze można podłączyć przez HDMI lub DisplayPort. Rozmieszczenie interfejsów jest przyzwoite, choć producent nie miał zbyt wielu możliwości ze względu na ekspansywną konstrukcję rurek cieplnych w środku.
Komunikacja
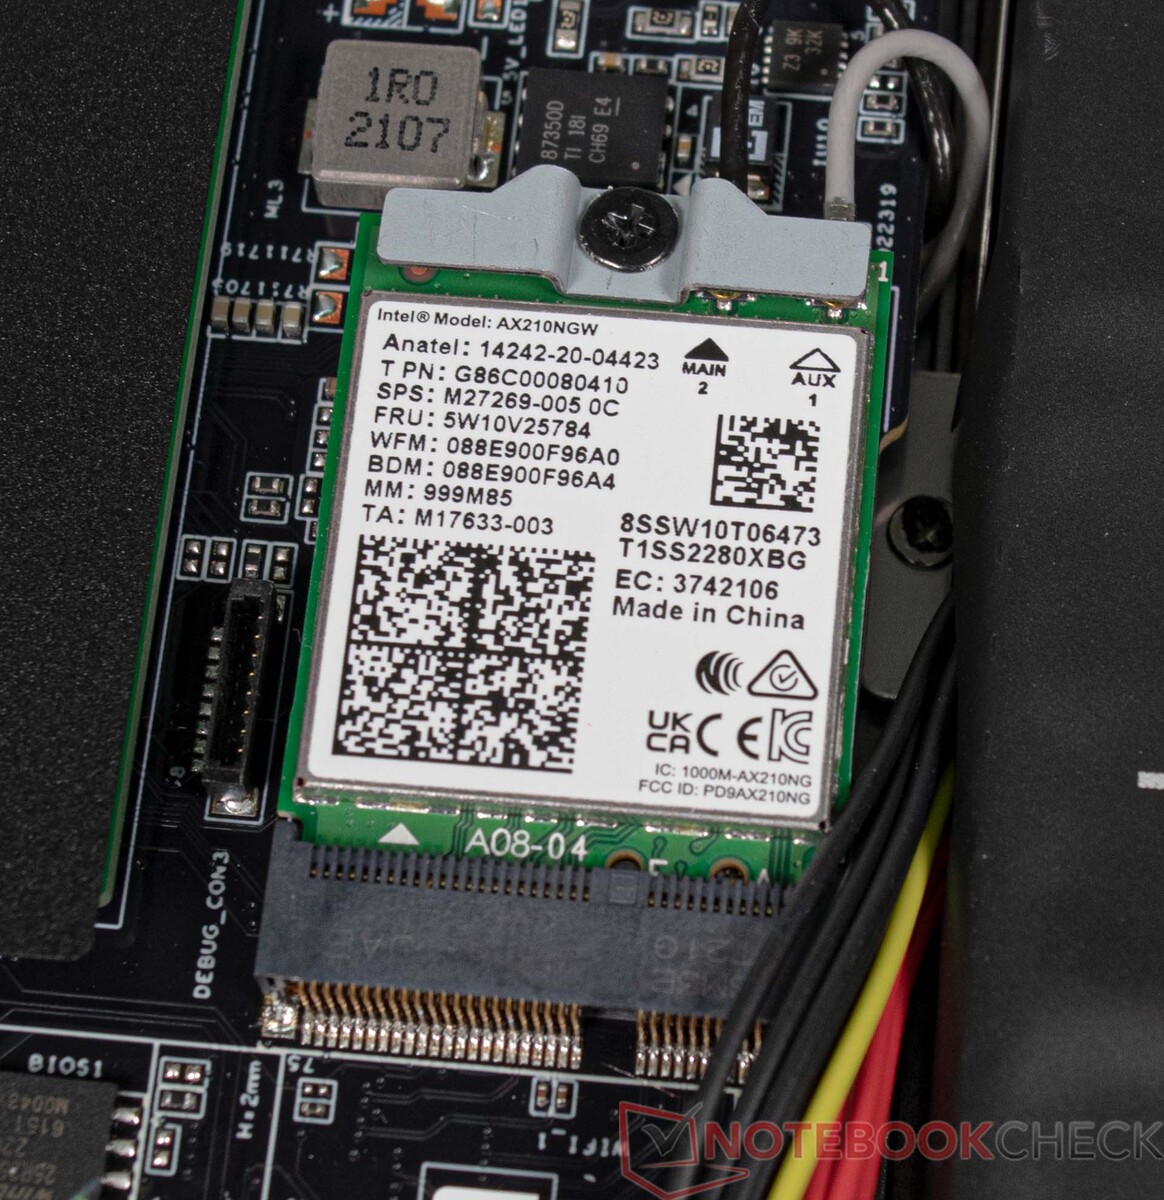
Zainstalowany moduł WLAN zapewnia dobrą wydajność, więc Aorus 17X AZF nie musi tutaj odstawać od konkurencji. Jako router testowy posłużył nam Asus ROG Rapture GT-AXE11000. Alternatywnie Aorus 17X AZF oferuje także port Ethernet, który zapewnia szybkość do 2,5 GBit/s.
Kamera internetowa
Kamera internetowa w Aorusie 17X AZF jest zdolna do pracy w rozdzielczości FHD, dzięki czemu nadaje się do prostej wideotelefonii. Kilka punktów zostało odjętych ze względu na brak wierności odwzorowania kolorów. Z kolei dwutarczowy mikrofon spisuje się dobrze, gdyż nagrania z różnych kierunków są odtwarzane z podobną głośnością.


Konserwacja
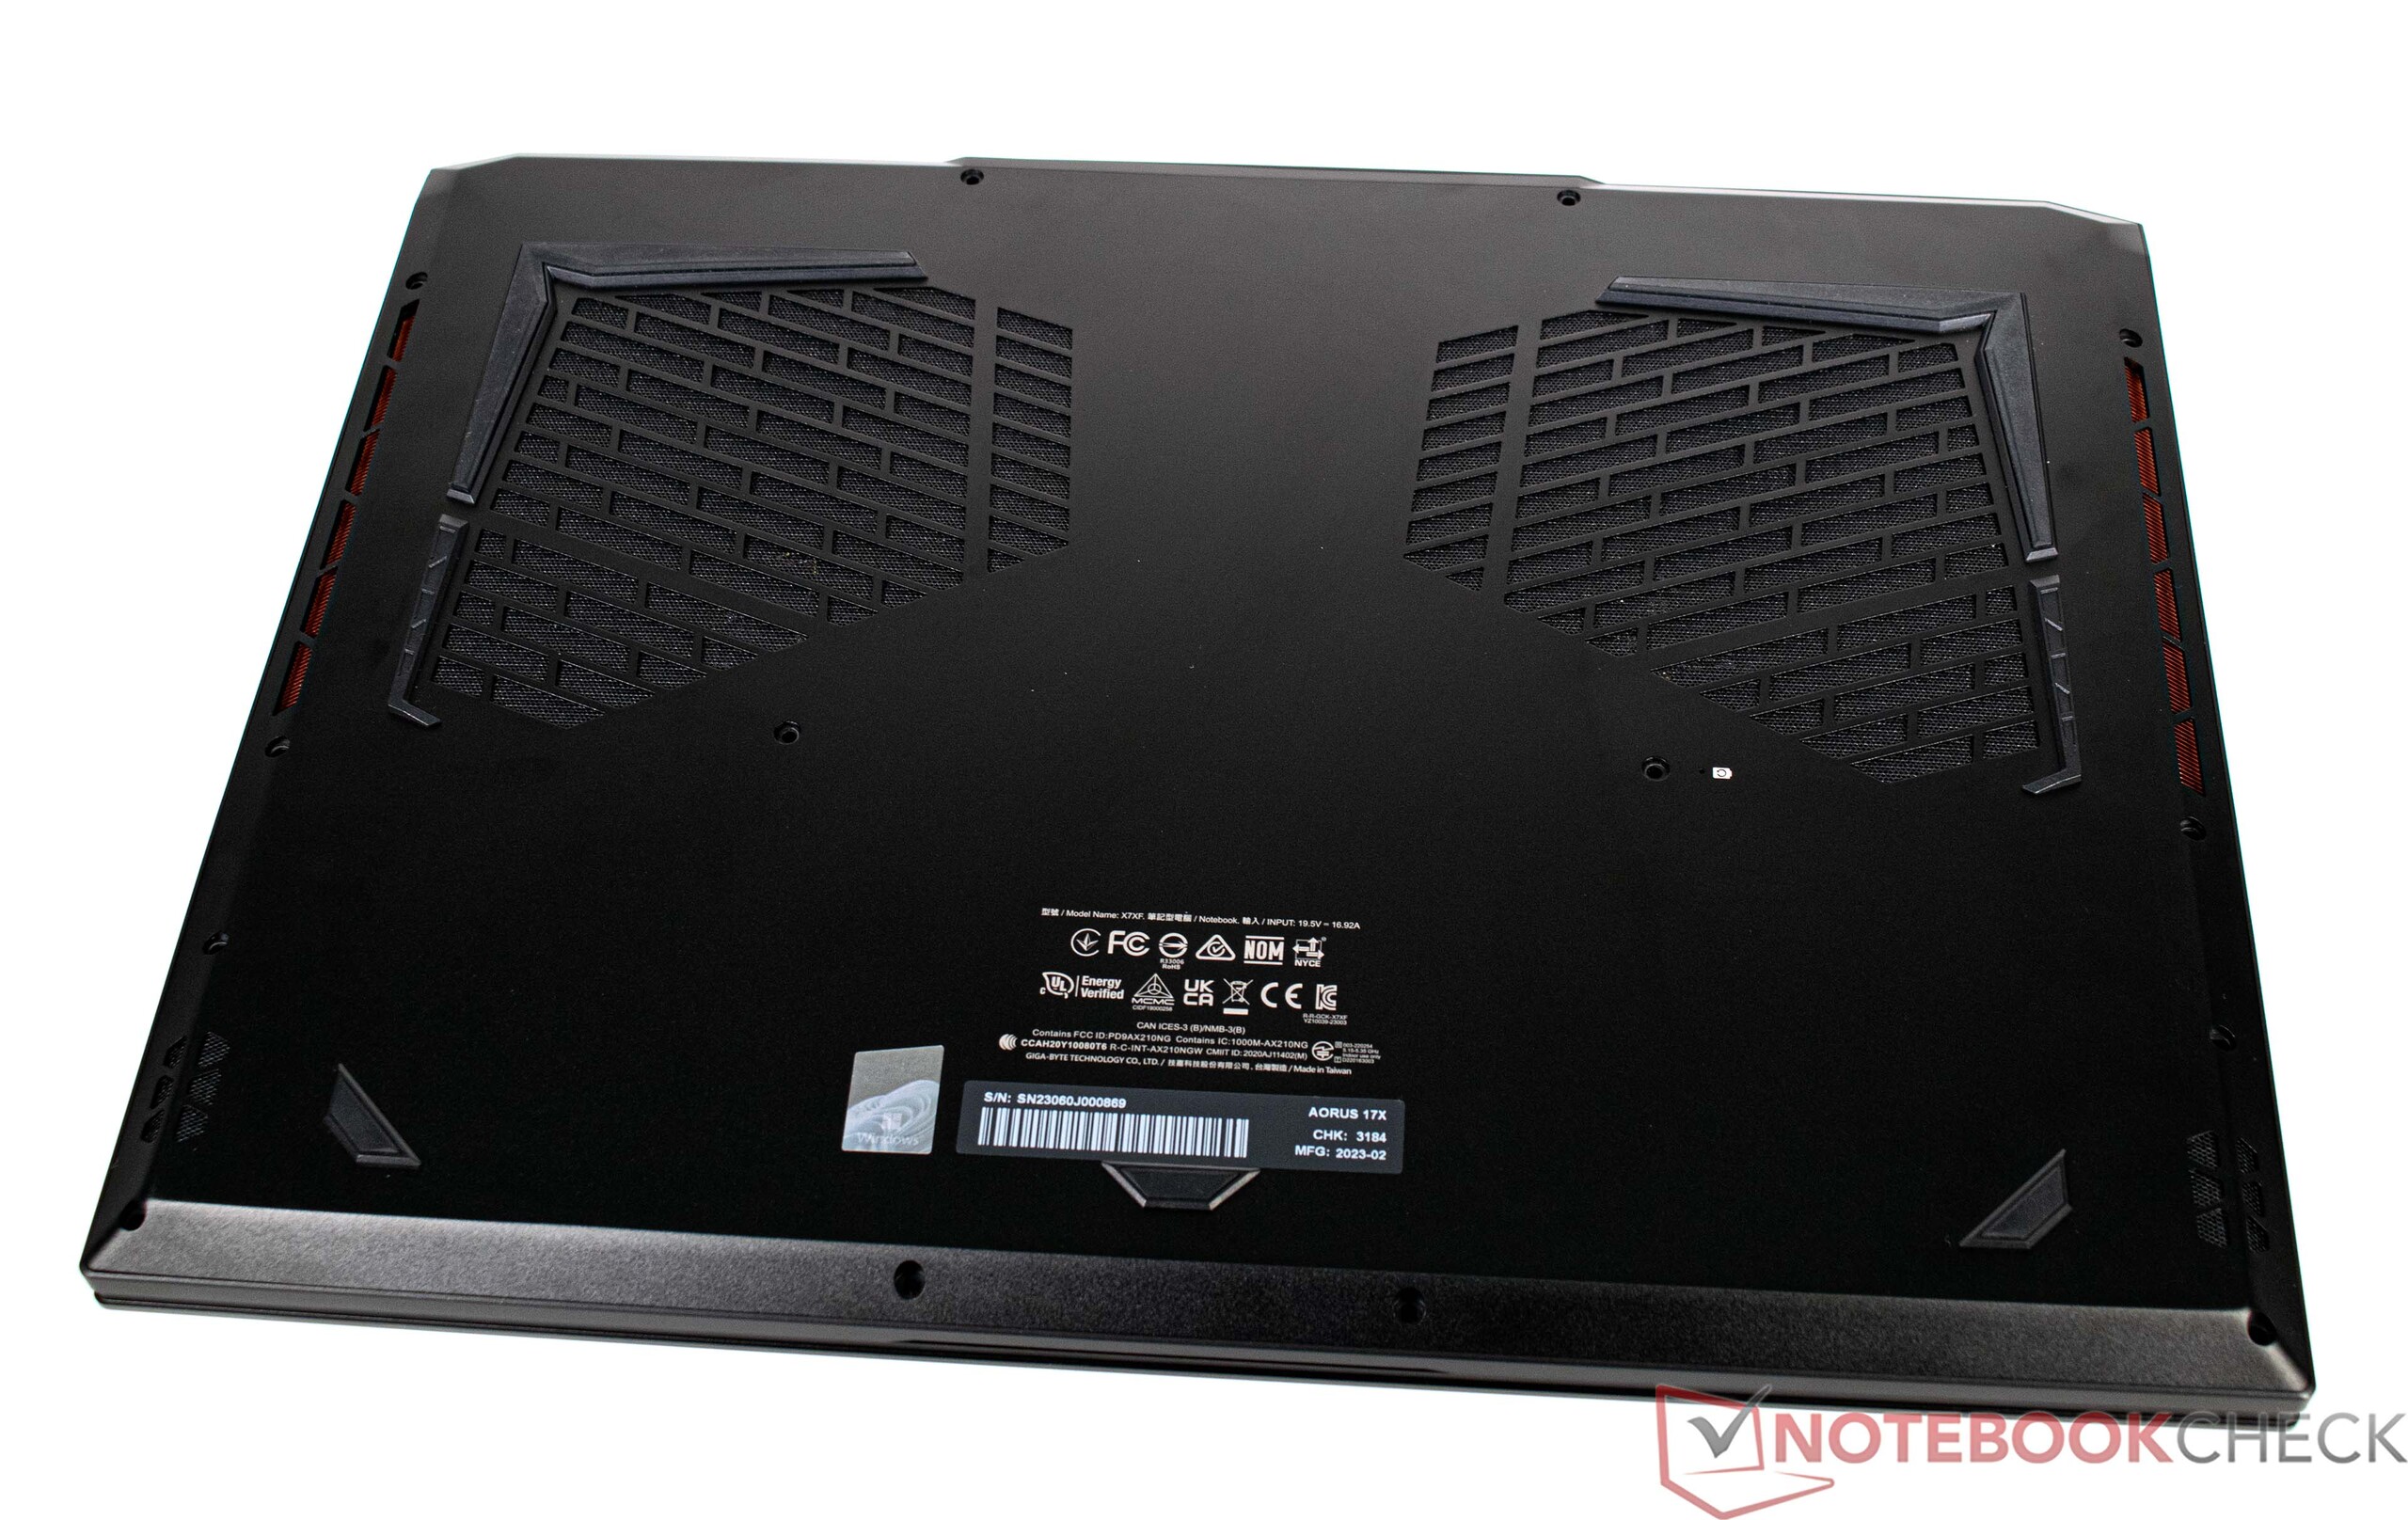
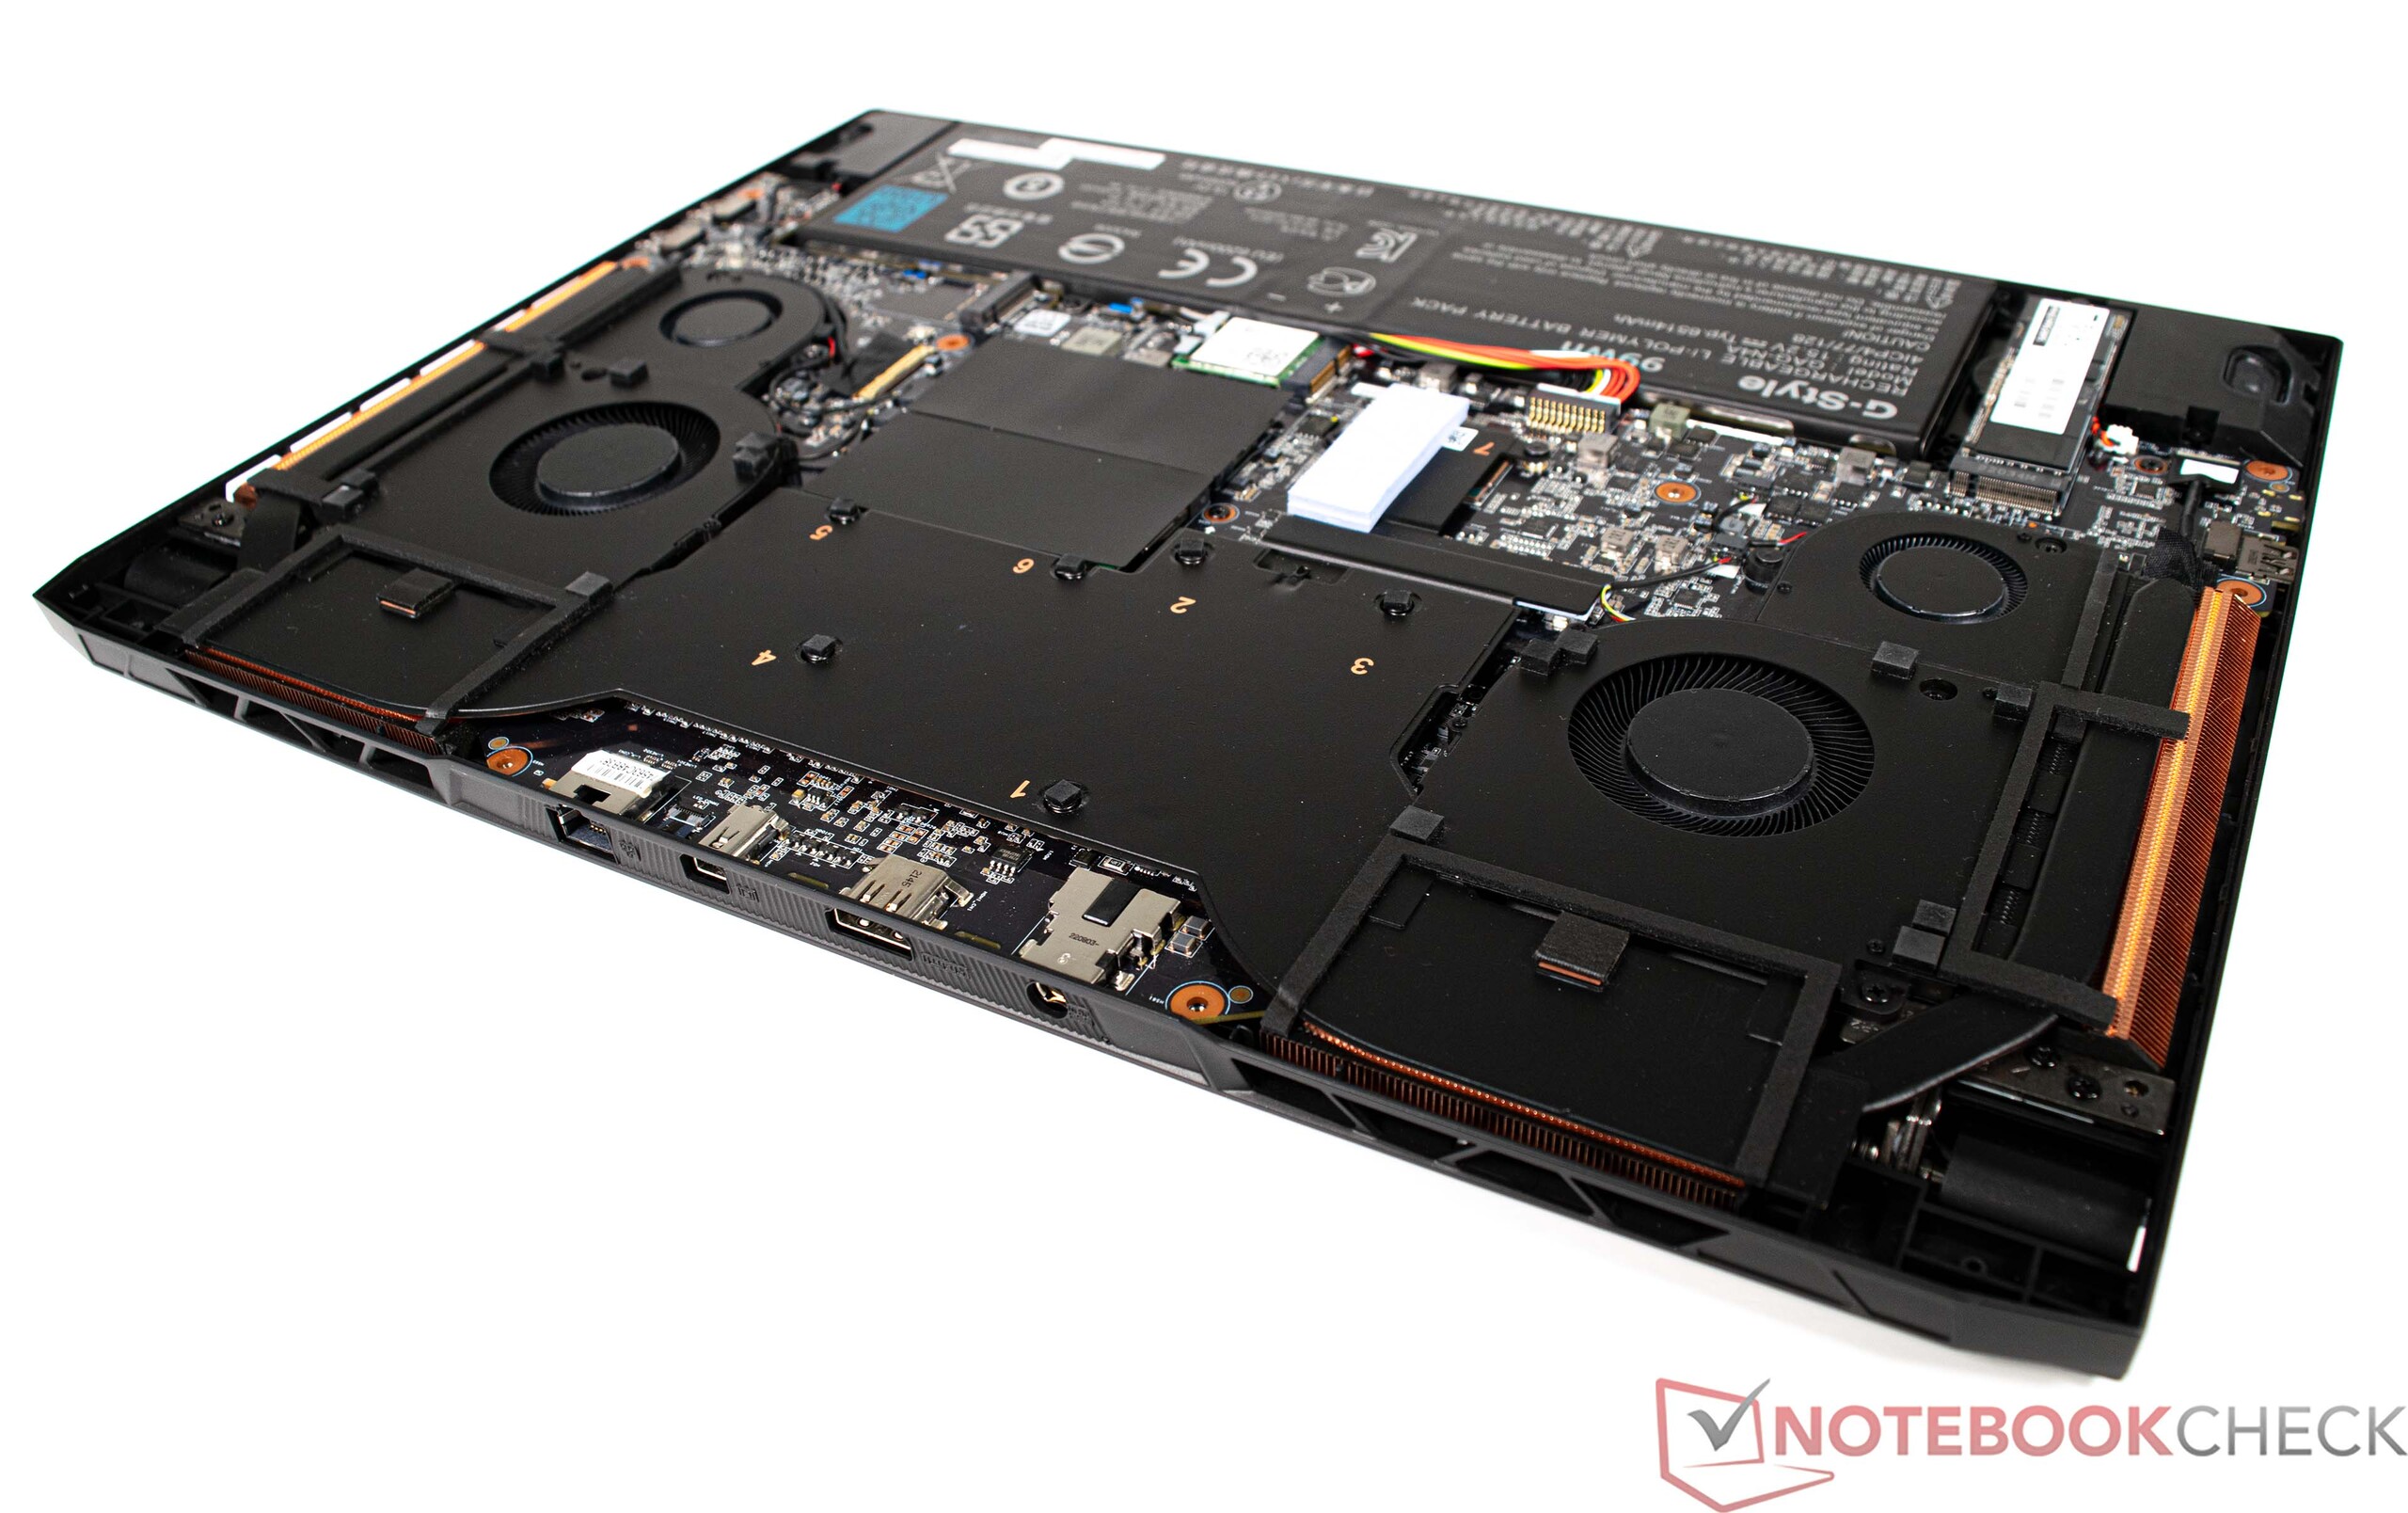
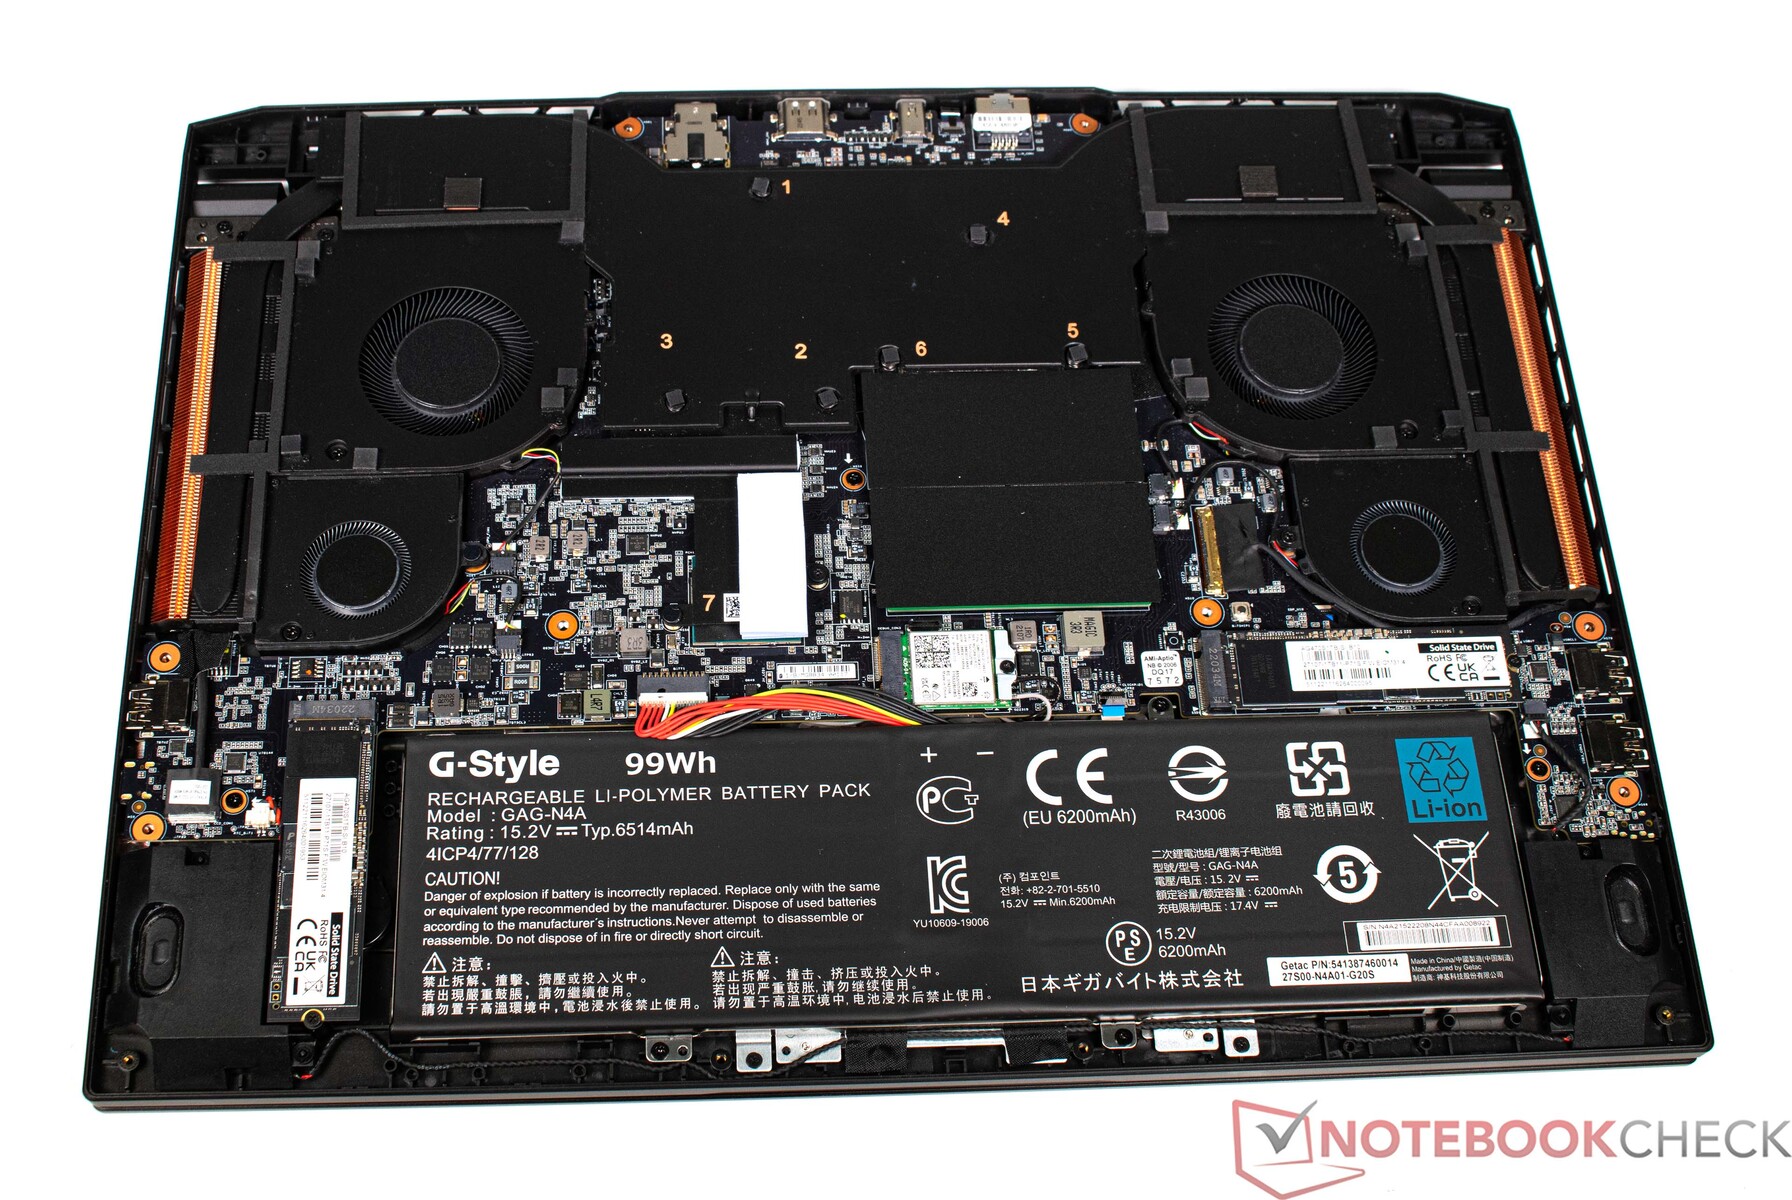
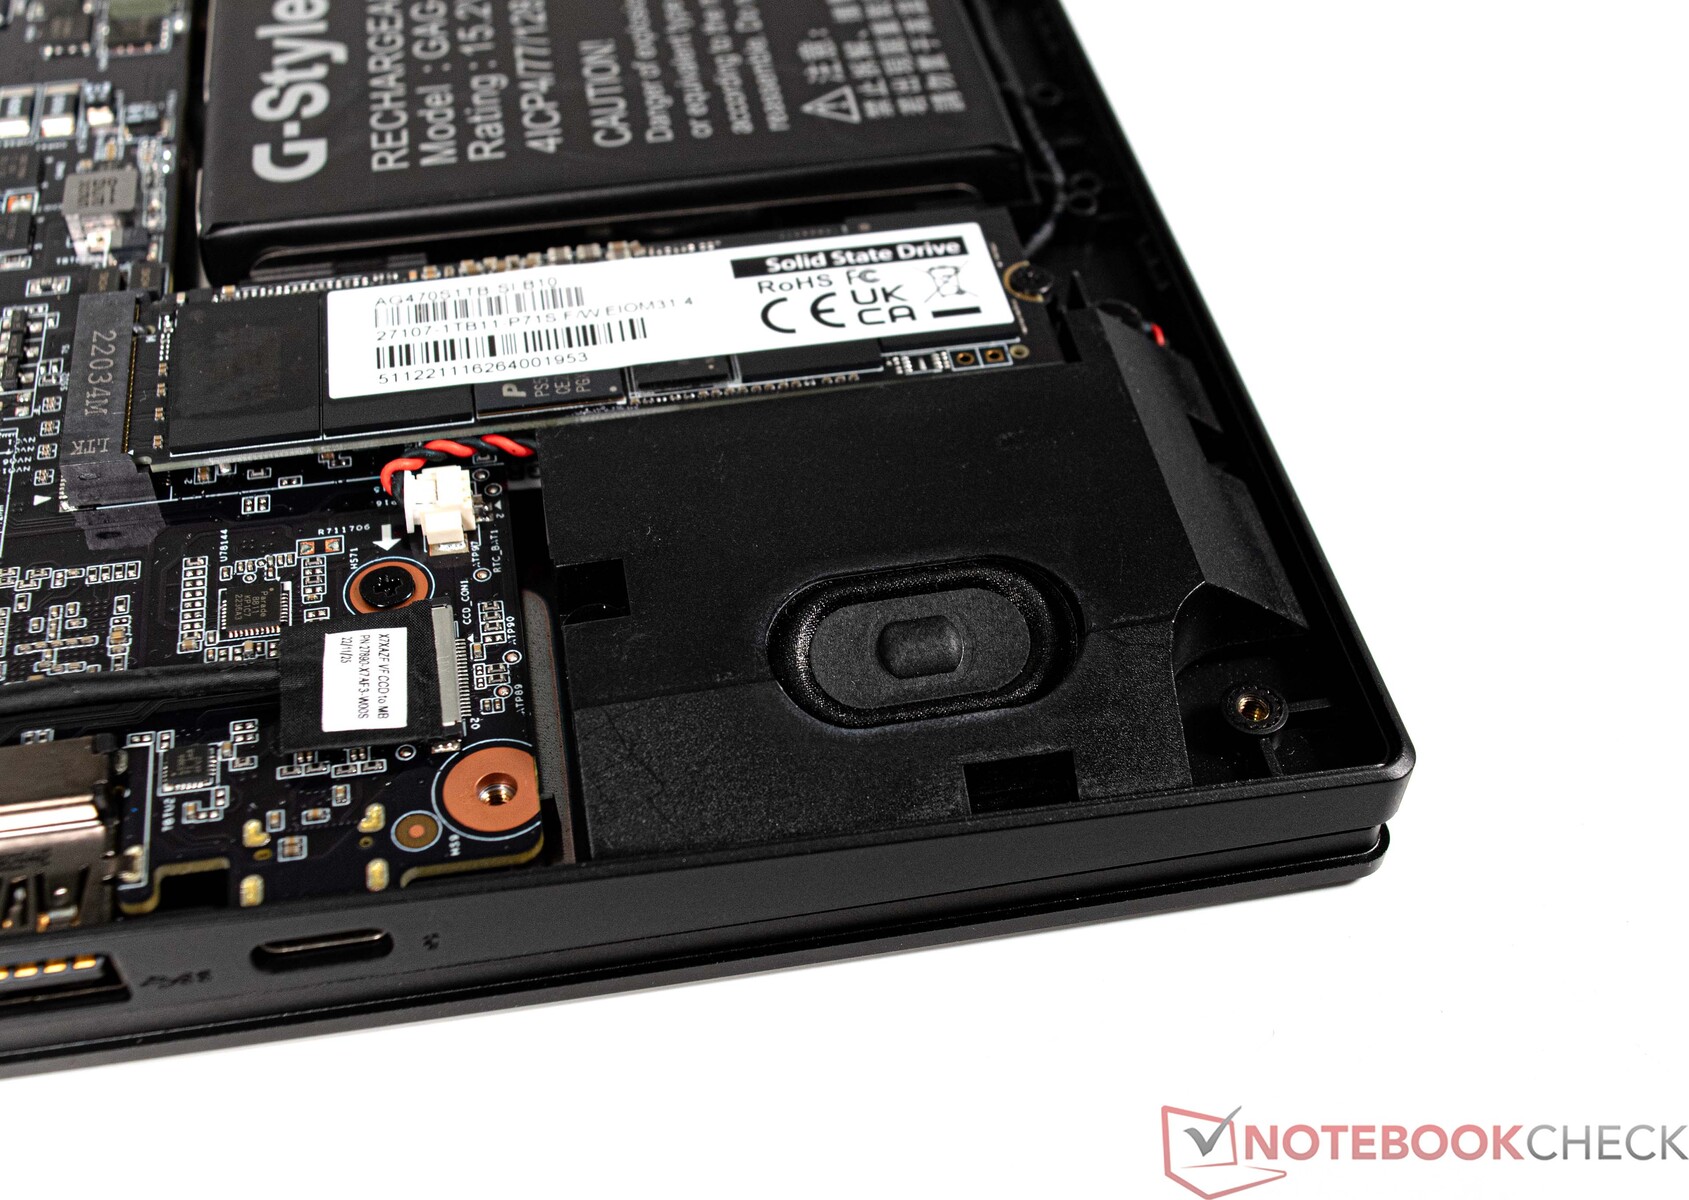
Prace konserwacyjne są w Aorusie 17X AZF zasadniczo możliwe. W tym celu trzeba jednak zdjąć baseplate, który jest przymocowany licznymi śrubkami. Wszystko co ważne leży pod płytą podstawową, jak cztery wentylatory, pamięć masowa i RAM. W naszym przypadku laptop jest w pełni wyposażony i nie ma wolnych slotów na RAM czy SSD.
Gwarancja
W Niemczech Aorus 17X AZF jest objęty 24-miesięczną gwarancją z usługą odbioru i zwrotu. To, oczywiście, może się różnić w zależności od kraju, więc kupujący powinni dwukrotnie sprawdzić przed zakupem.
Oprogramowanie
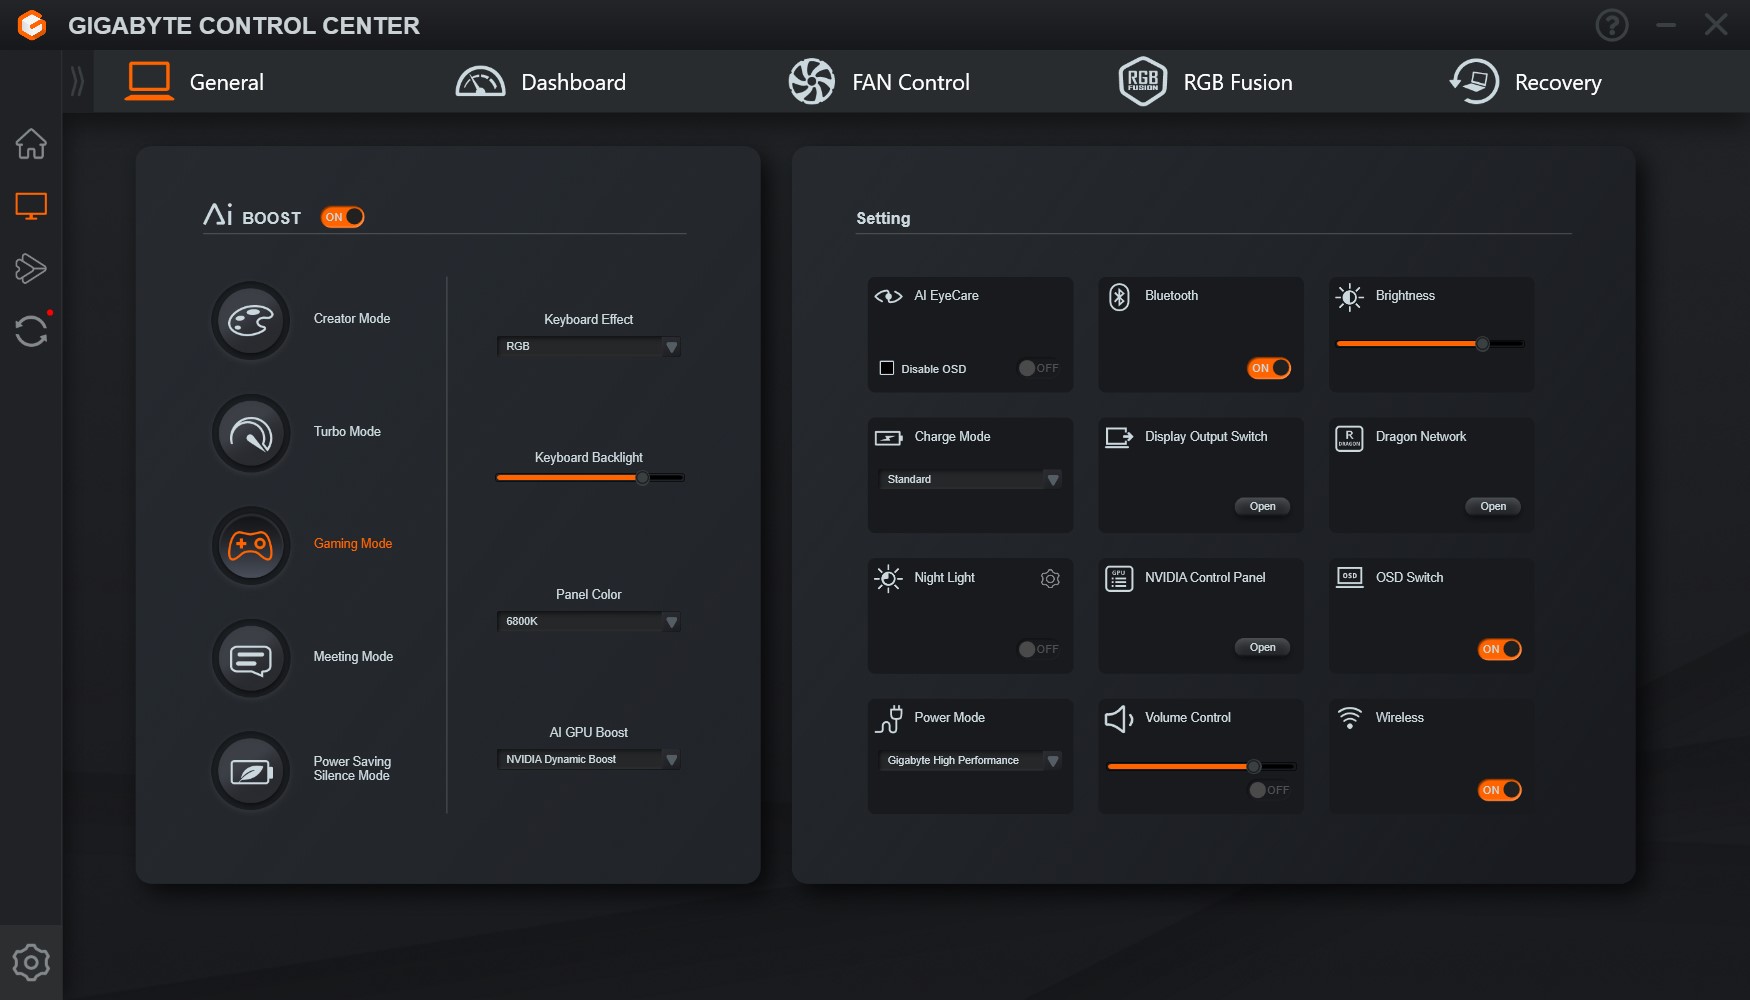
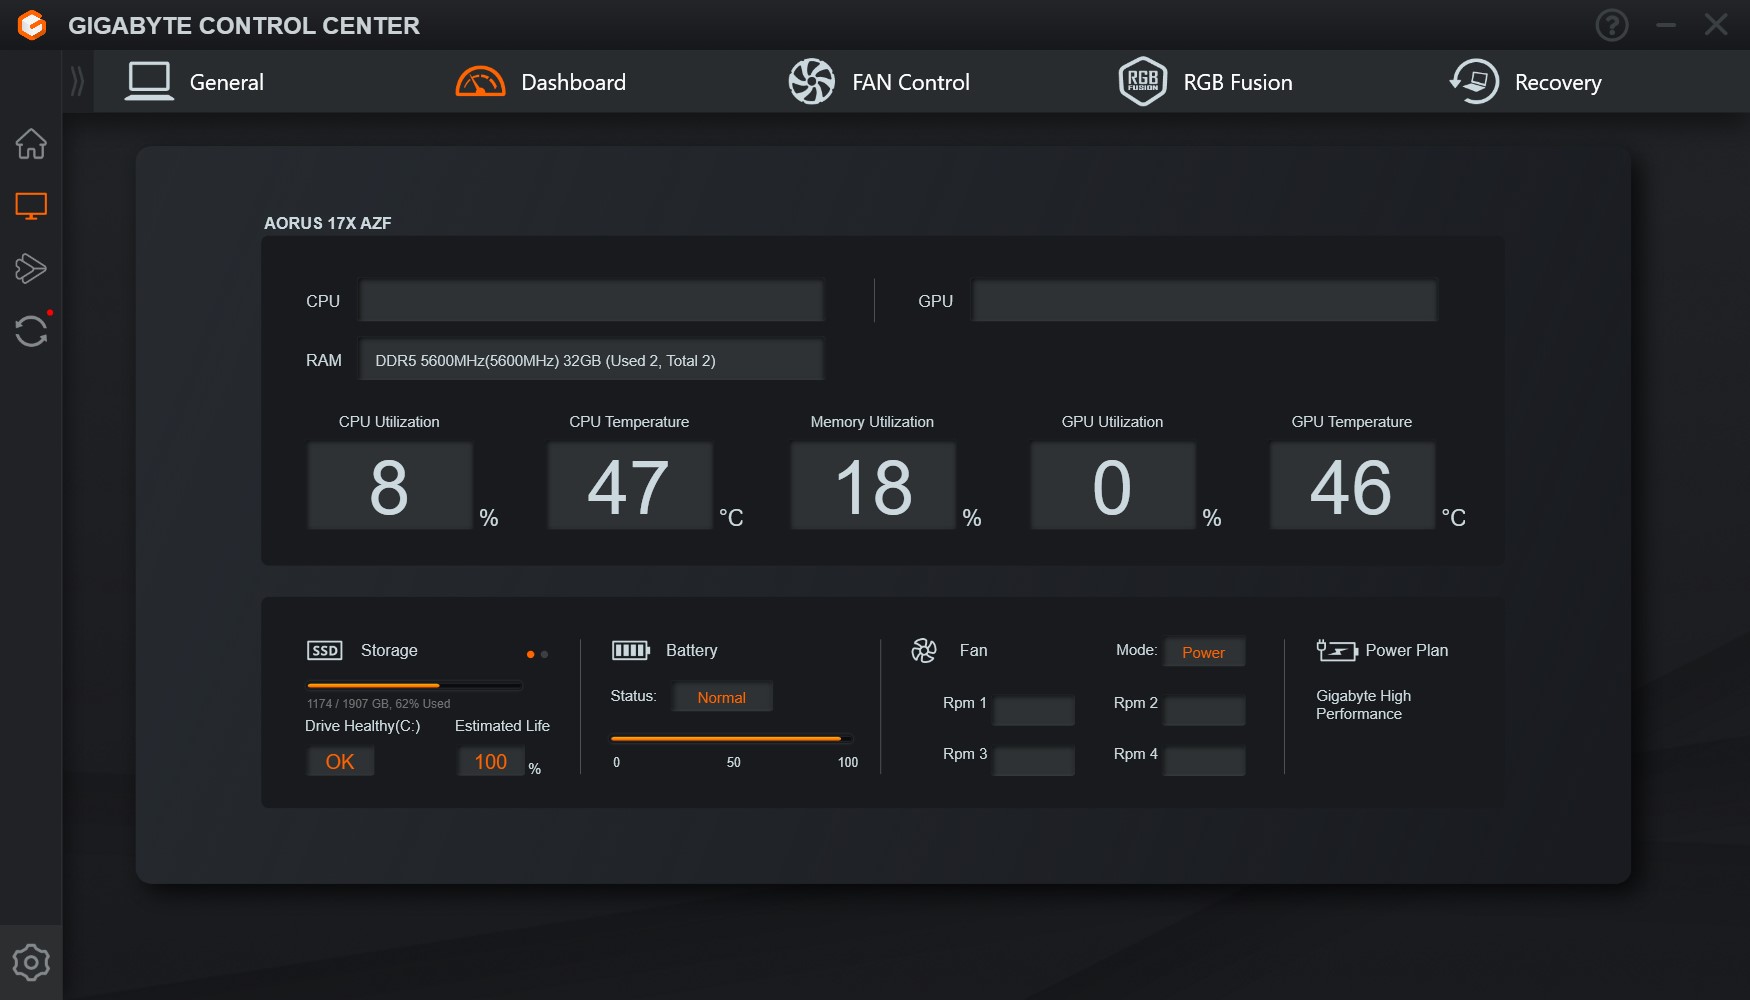
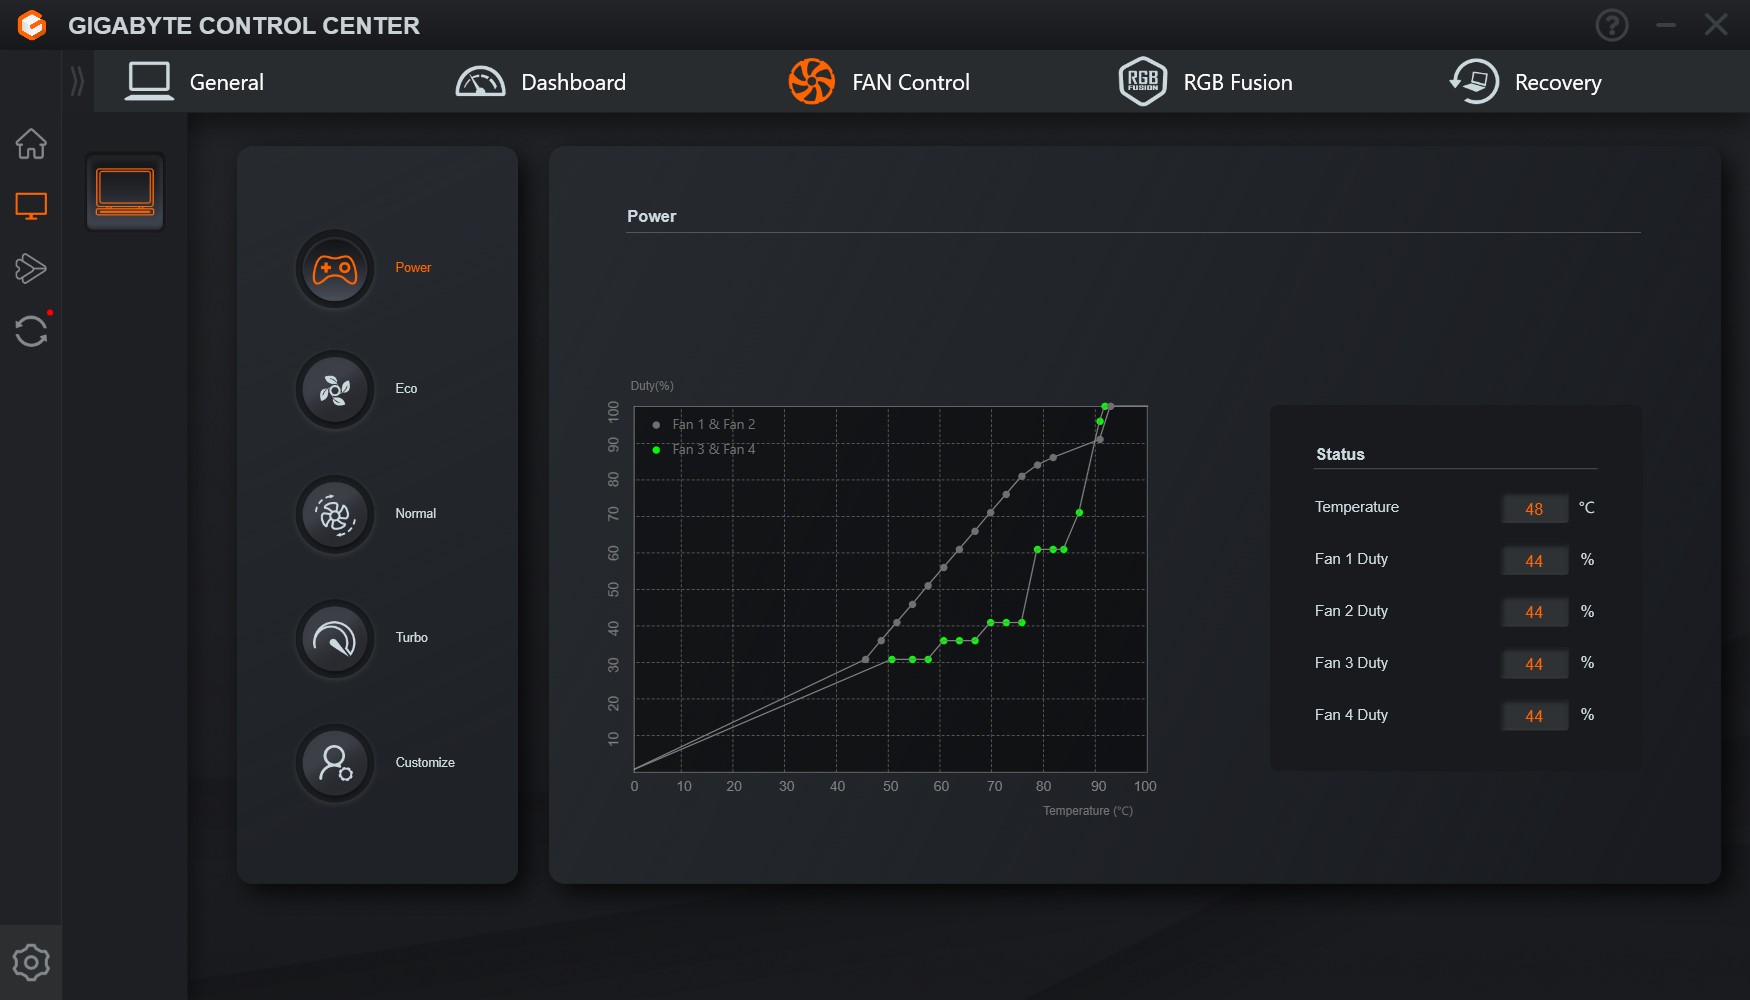
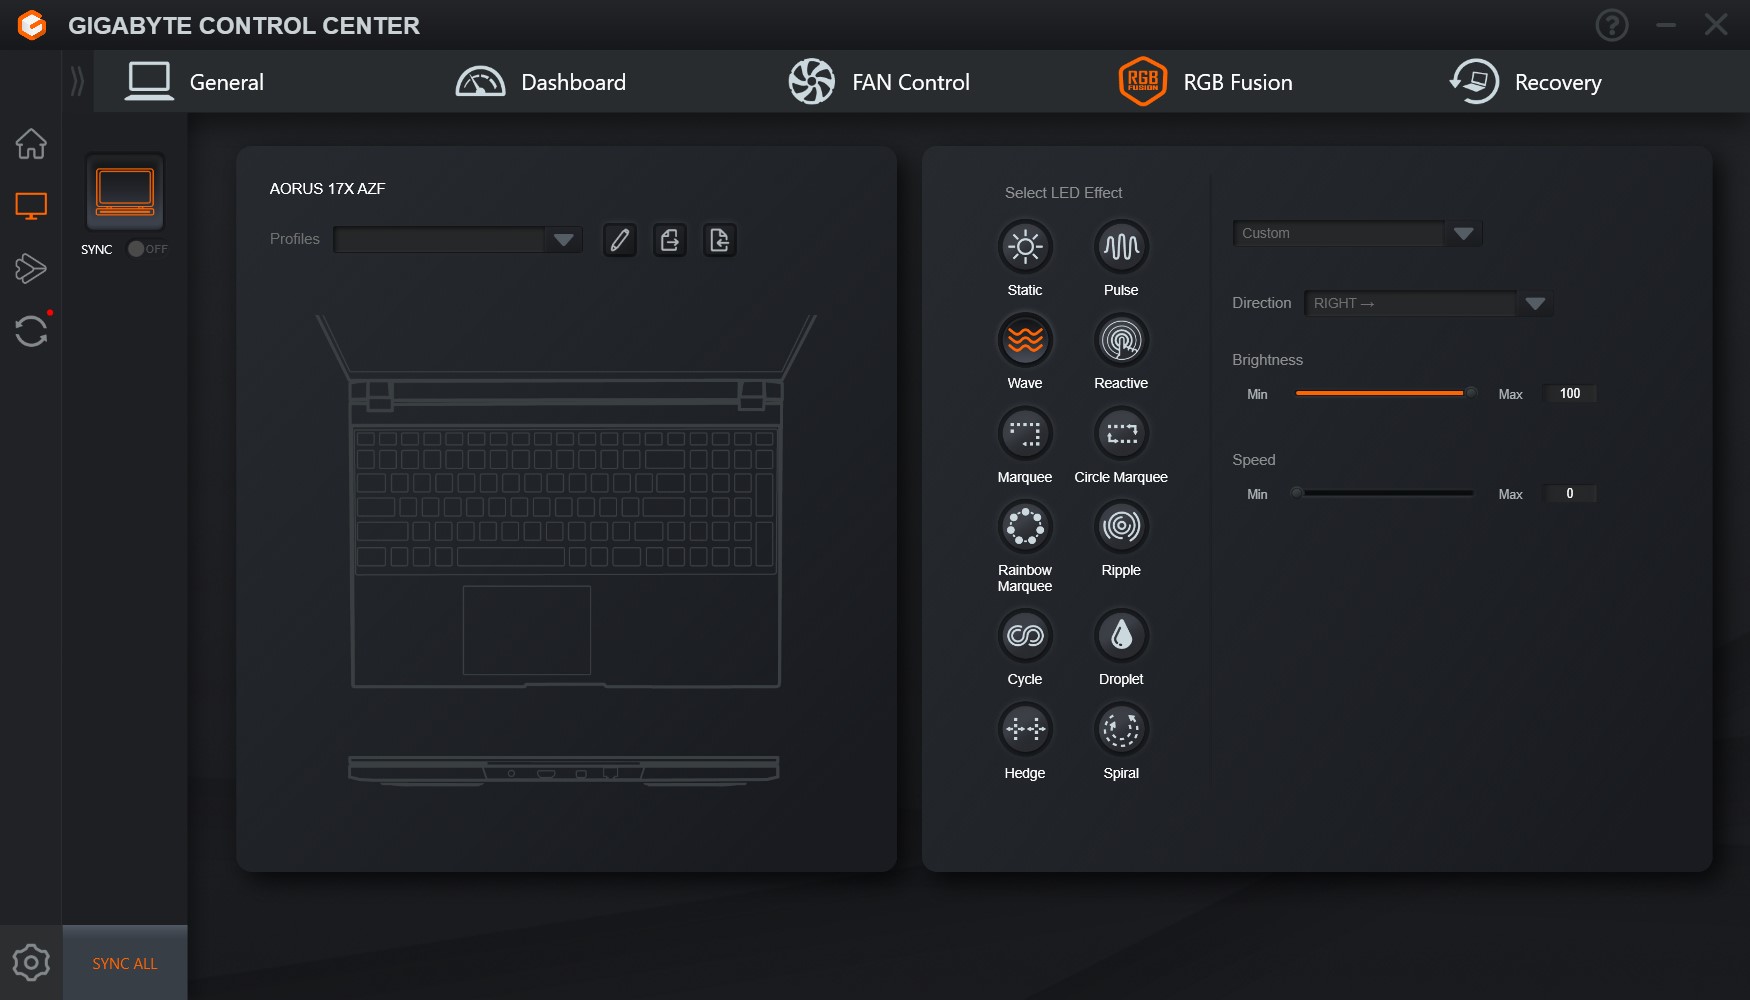
Do sterowania i monitorowania podzespołów Aorusa 17X AZF służy program Gigabyte Control Center (GCC). W naszych testach nie wystąpiły żadne problemy z GCC, za pomocą którego można regulować wydajność laptopa i tym samym wpływać na hałas w tle. Krzywą wentylatora można nieco dostosować poprzez zakładkę FAN Control. Ponadto można wybrać dużą liczbę efektów podświetlenia klawiatury.
Urządzenia wejściowe
Klawiatura
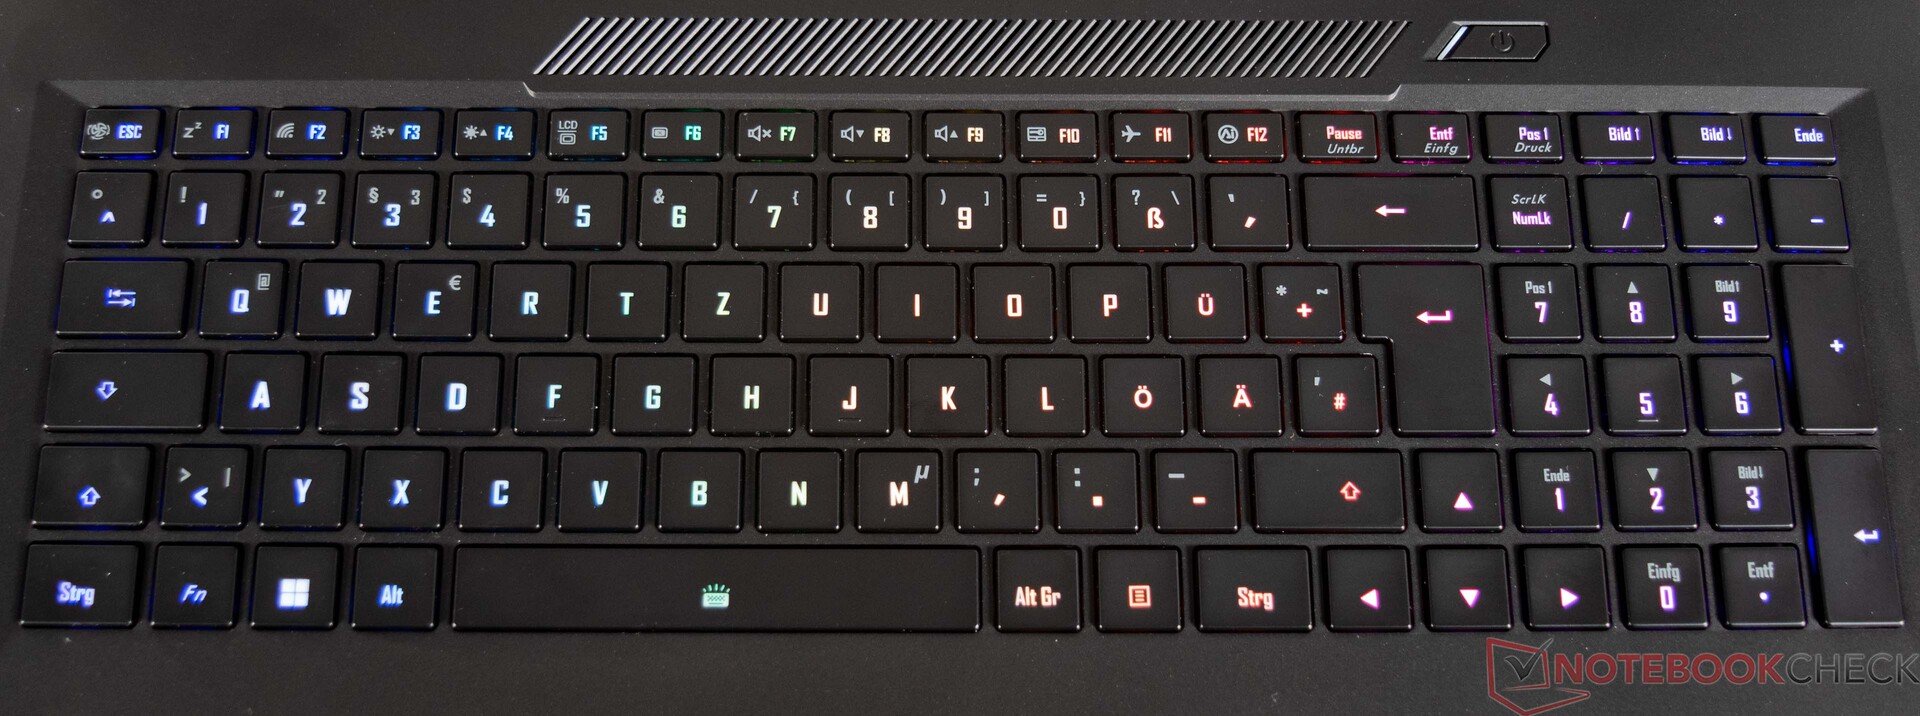
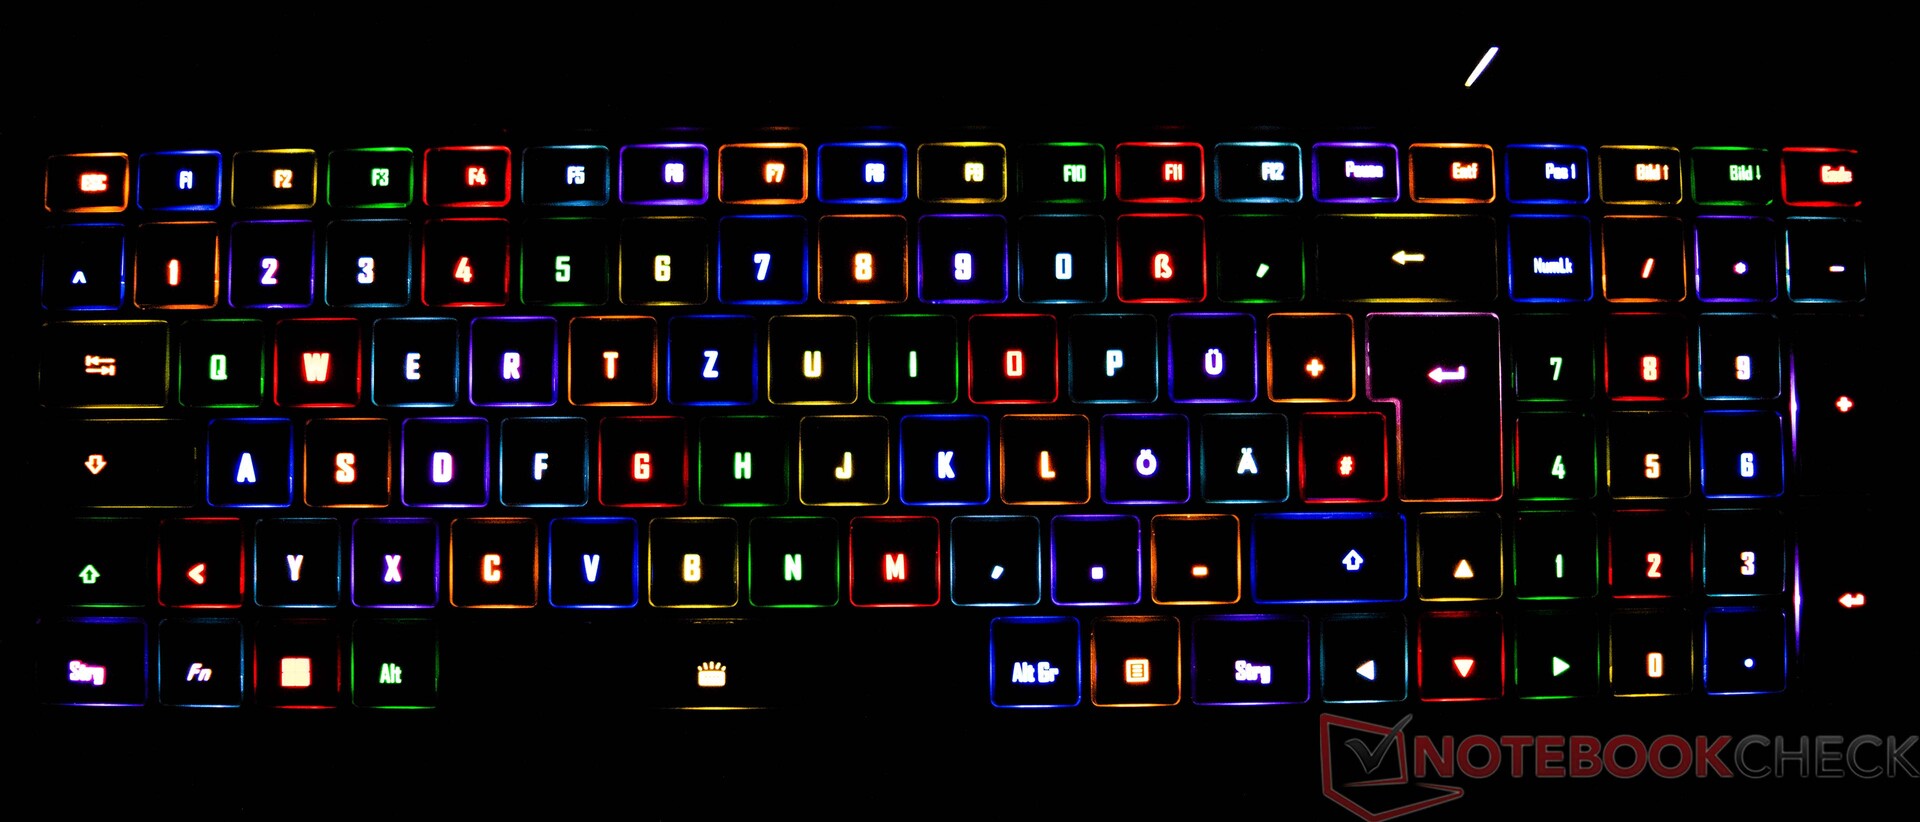
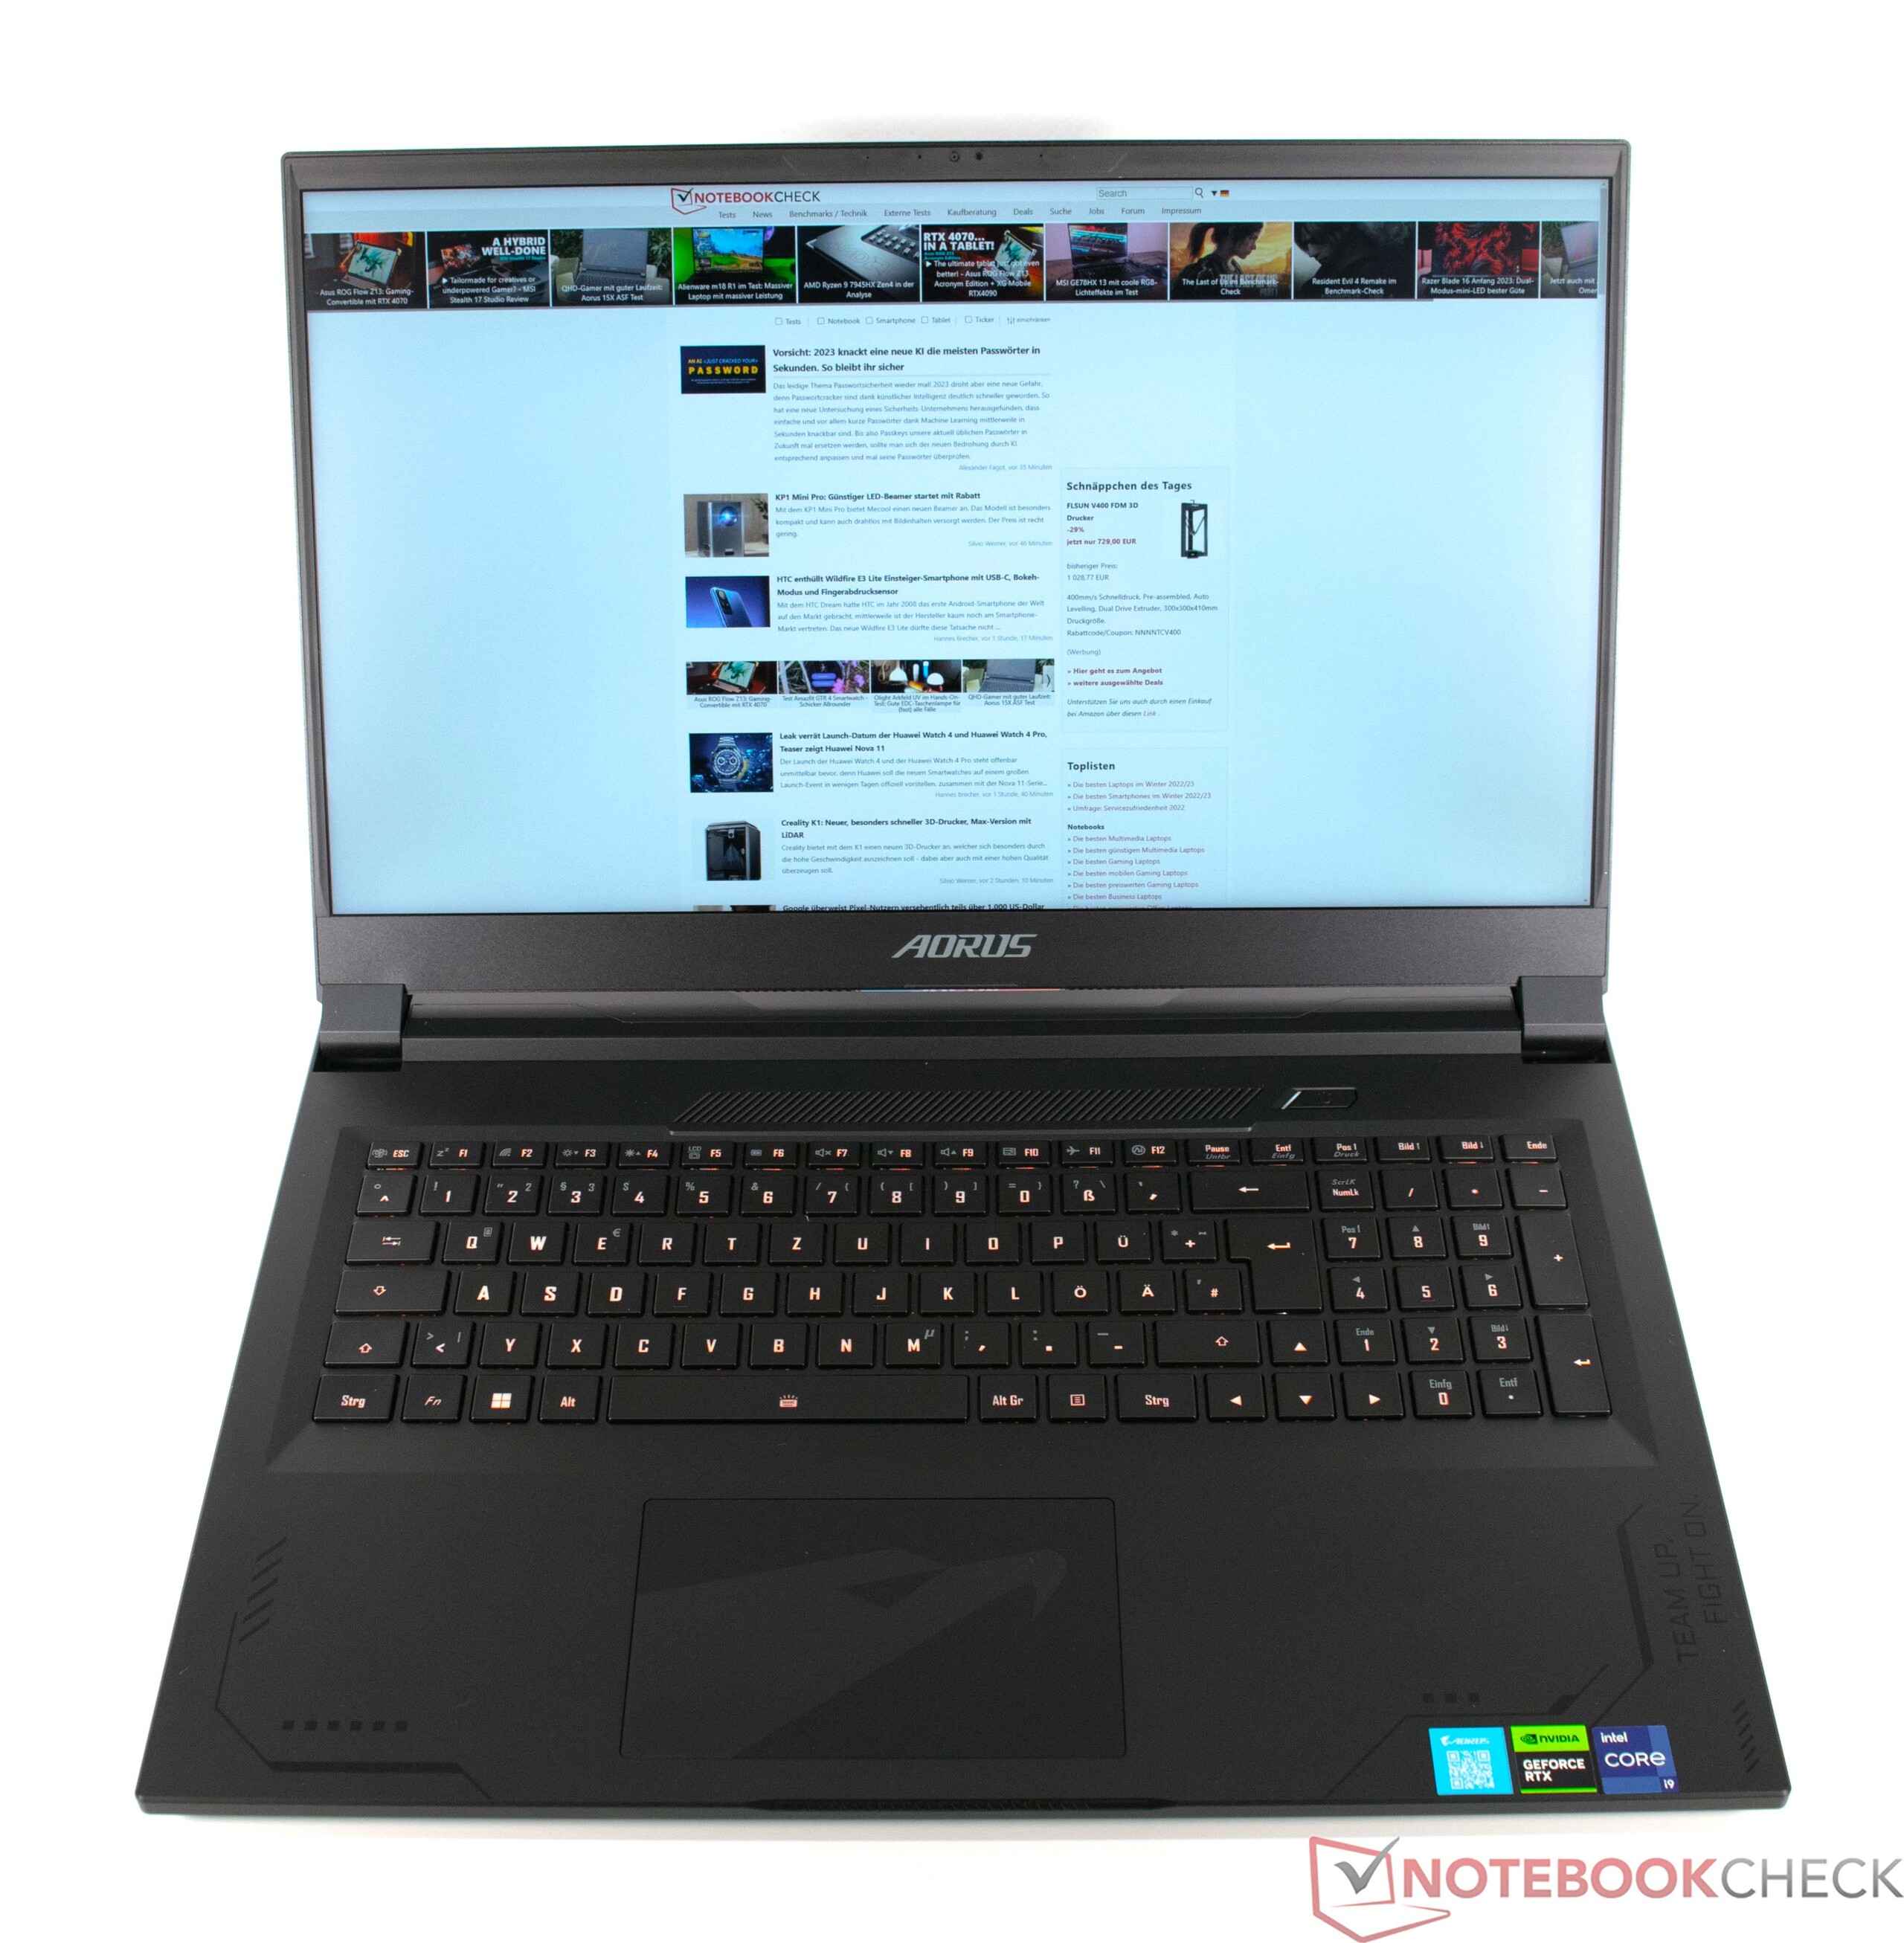
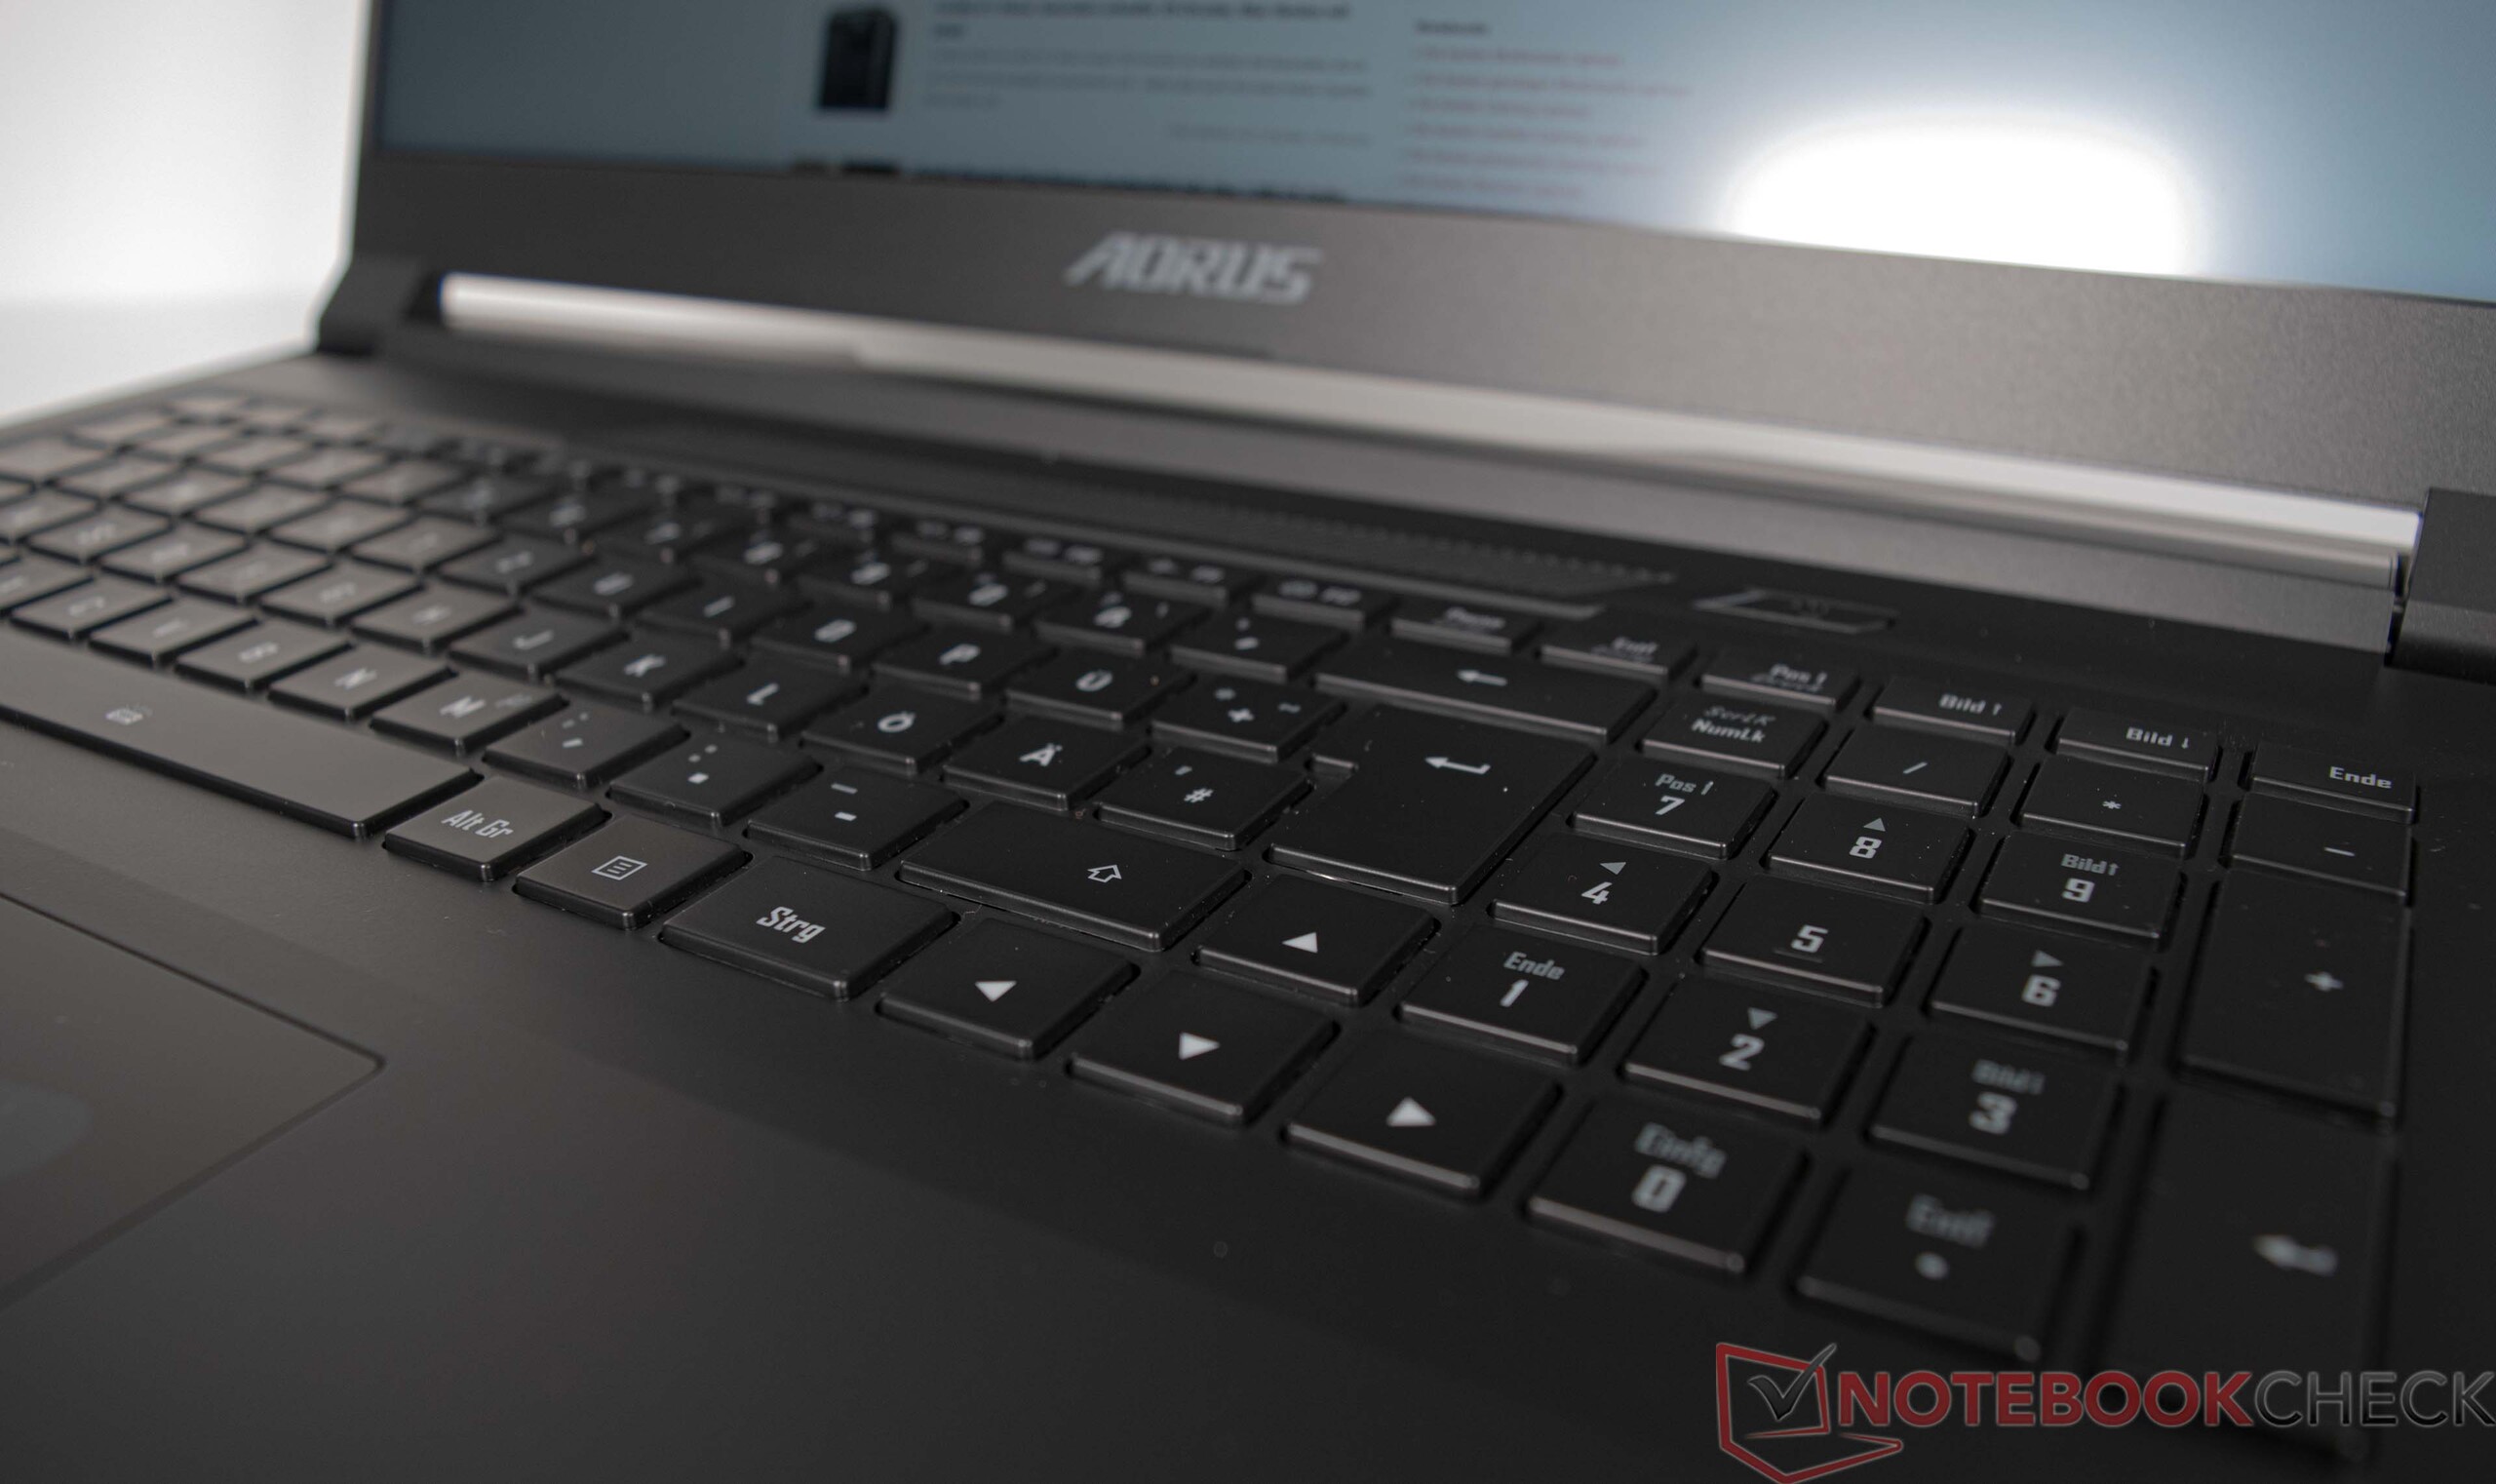
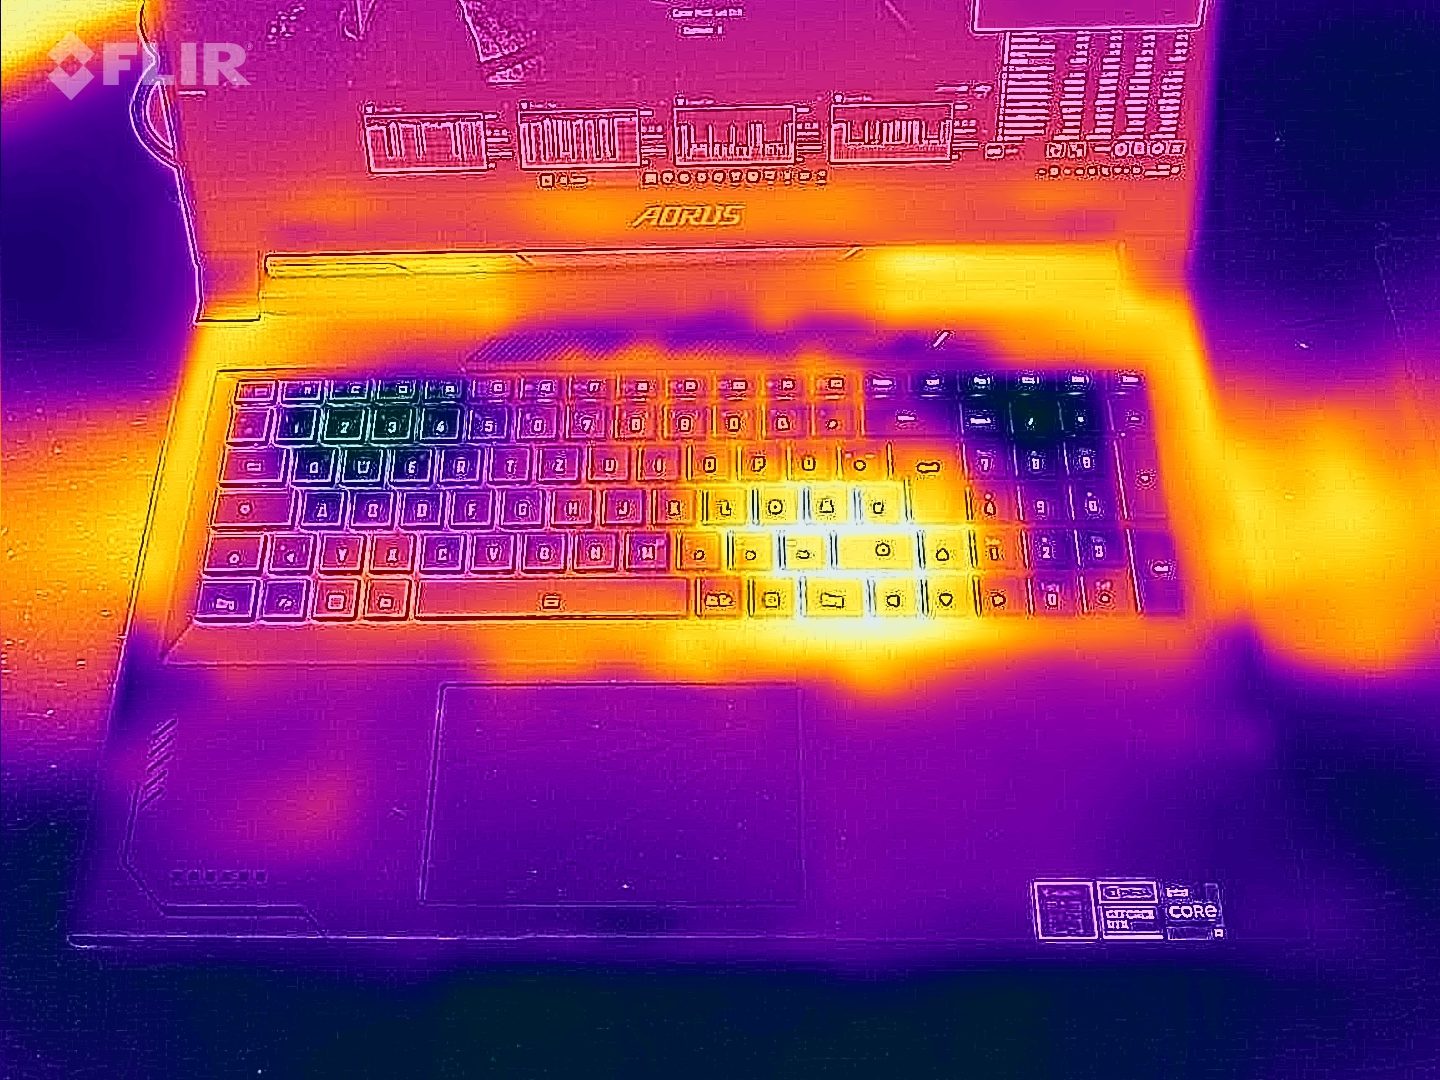
Aorus 17X AZF jest wyposażony w podświetlaną, 6-rzędową klawiaturę typu chiclet, w tym numpad. Gładkie klawisze mają średni skok i wyraźny punkt nacisku. Klawiatura lekko ugina się podczas pisania, ale nie jest to zbyt wyraźne. Podświetlenie można regulować na trzech poziomach jasności za pomocą kombinacji klawiszy, a za pomocą GCC (Gigabyte Control Center) można wybrać wiele innych opcji efektów świetlnych.
Touchpad
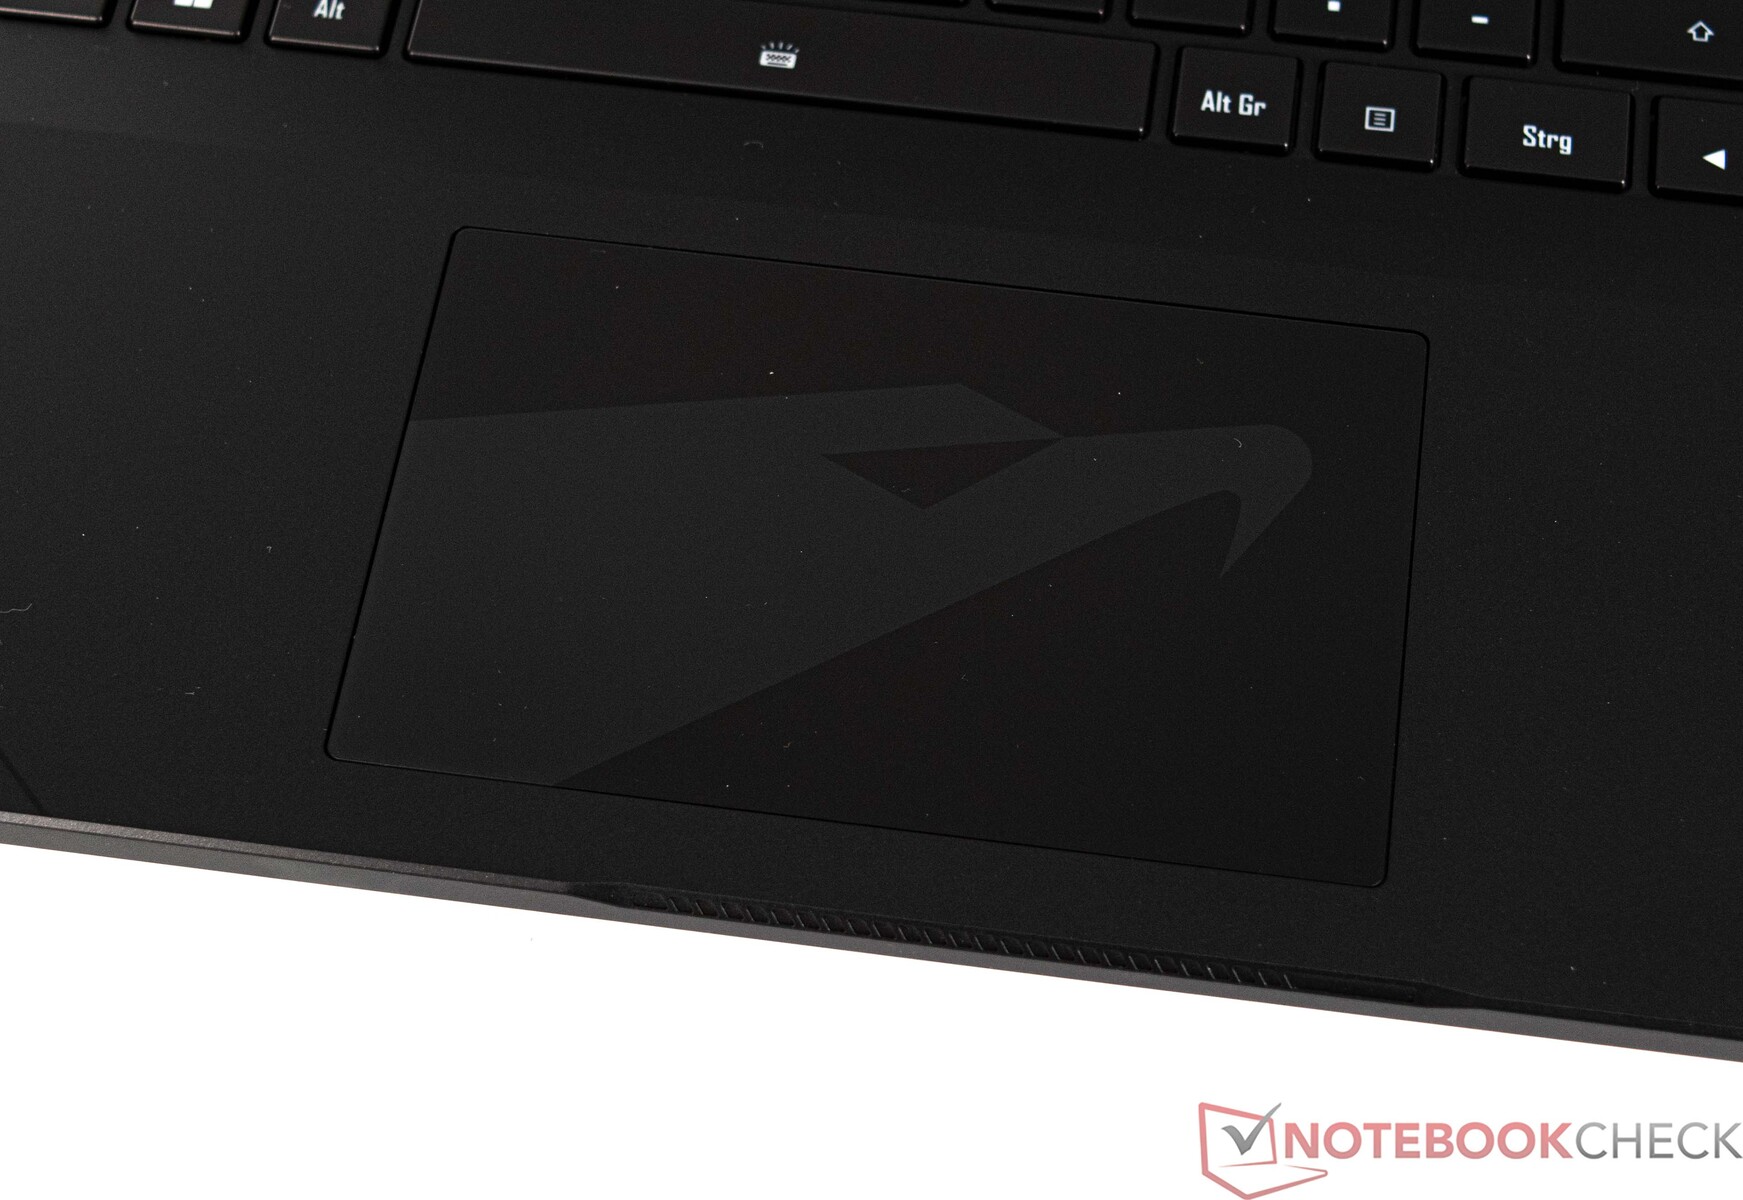
Zamiennik myszy w postaci wielodotykowego ClickPada (ok. 12,1 x 7,6 cm) oferuje przyjemne dla oka rozmiary. Aorus nałożył również na touchpada własne logo, co jest wizualnie przyjemne dla oka. ClickPad oferuje gładką powierzchnię, która pozwala na płynny ślizg palca. Powierzchnia wejściowa może być używana w całości, a także dobrze reaguje w narożnikach. Pad oferuje krótki skok przy wprowadzaniu danych i zapewnia wyraźną informację zwrotną dzięki wyraźnemu punktowi nacisku.
Wyświetl

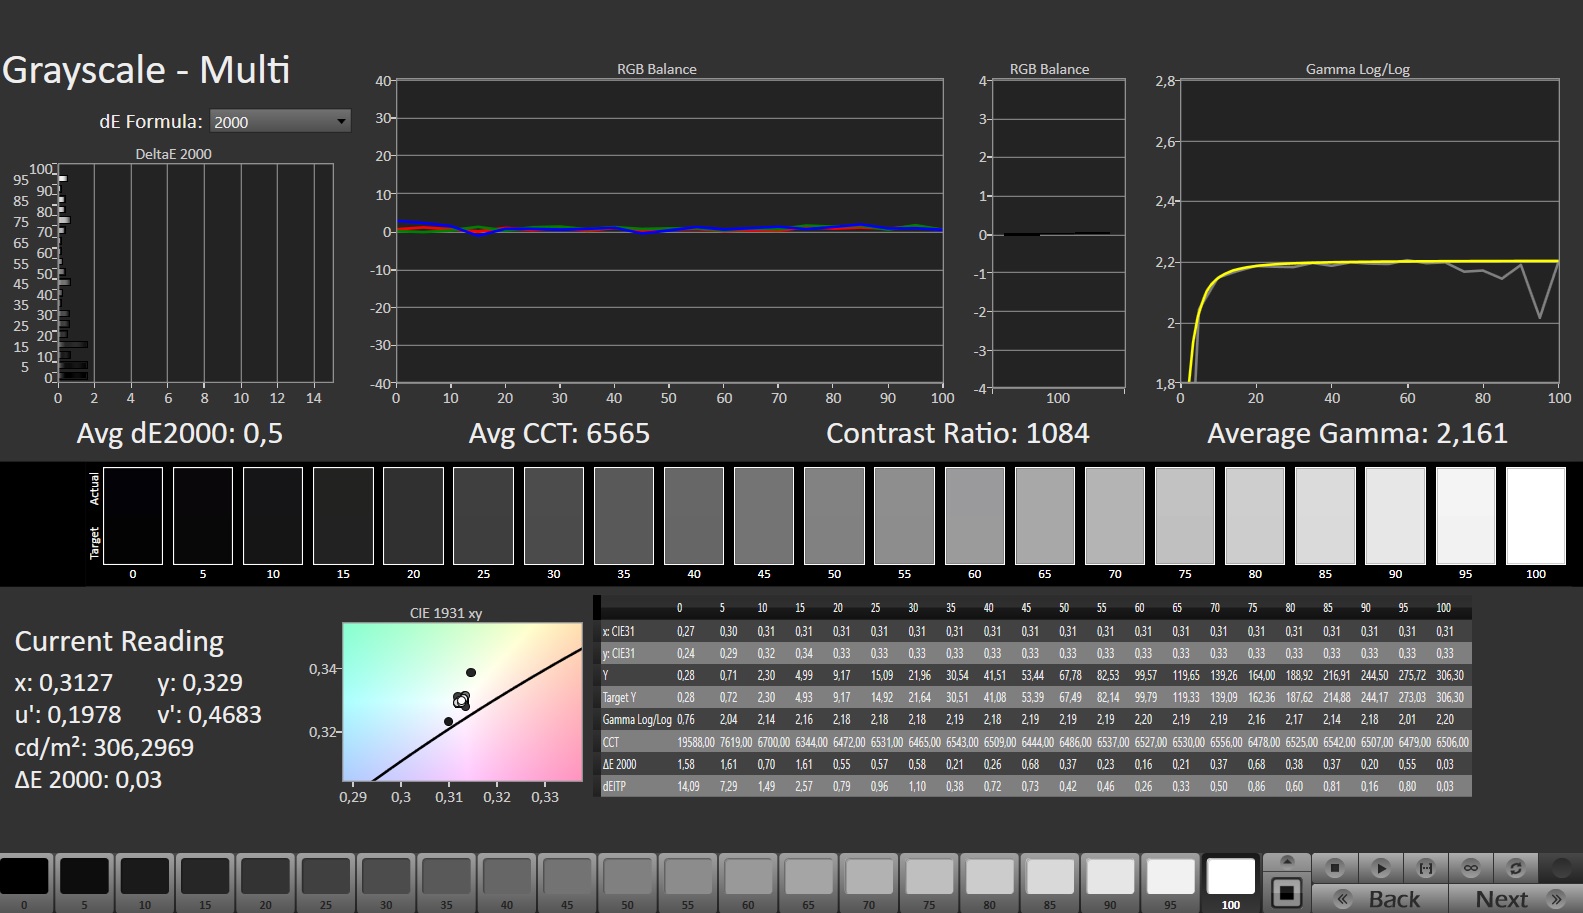
Aorus 17X AZF został wyposażony w dobry panel QHD, który powinien zaspokoić potrzeby większości graczy dzięki częstotliwości odświeżania na poziomie 240 Hz. Średnia jasność naszego testowego egzemplarza jest jednak wyraźnie słabsza na tle konkurencji. Średnia wynosząca zaledwie 276 cd/m² jest zbyt niska i wystarcza tylko na ostatnie miejsce. Aorus 17X AZF traci też ważne punkty w punktacji wyświetlaczy z lekkimi halo. Nie wykryto PWM
Alternatywne opcje wyświetlania, takie jak panel 4K, nie są przewidziane dla Aorusa 17X AZF.
| |||||||||||||||||||||||||
rozświetlenie: 90 %
na akumulatorze: 294 cd/m²
kontrast: 1050:1 (czerń: 0.28 cd/m²)
ΔE ColorChecker Calman: 2.81 | ∀{0.5-29.43 Ø4.71}
calibrated: 0.86
ΔE Greyscale Calman: 3.4 | ∀{0.09-98 Ø4.96}
84.5% AdobeRGB 1998 (Argyll 3D)
99.9% sRGB (Argyll 3D)
96.7% Display P3 (Argyll 3D)
Gamma: 2.301
CCT: 7389 K
| Aorus 17X AZF BOE09F9, IPS, 2560x1440, 17.3" | Medion Erazer Beast X40 BOE NE170QDM-NZ1, IPS, 2560x1600, 17" | MSI GE78HX 13VH-070US AU Optronics B170QAN01.2, IPS, 2560x1600, 17" | HP Omen 17-ck2097ng BOE BOE09BF, IPS, 2560x1440, 17.3" | MSI Titan GT77 HX 13VI B173ZAN06.C, Mini-LED, 3840x2160, 17.3" | Alienware m18 R1 Chi Mei 180JME, IPS, 1920x1200, 18" | |
|---|---|---|---|---|---|---|
| Display | -16% | 1% | -17% | 2% | 2% | |
| Display P3 Coverage (%) | 96.7 | 68.6 -29% | 97.6 1% | 67.4 -30% | 94.9 -2% | 97.7 1% |
| sRGB Coverage (%) | 99.9 | 99.8 0% | 99.9 0% | 97.6 -2% | 99.9 0% | 100 0% |
| AdobeRGB 1998 Coverage (%) | 84.5 | 69.4 -18% | 86.5 2% | 69.6 -18% | 92.4 9% | 89.8 6% |
| Response Times | 23% | 54% | 1% | -169% | 41% | |
| Response Time Grey 50% / Grey 80% * (ms) | 14 ? | 11.3 ? 19% | 4.2 ? 70% | 15.6 ? -11% | 38.4 ? -174% | 3 ? 79% |
| Response Time Black / White * (ms) | 10.1 ? | 7.5 ? 26% | 6.4 ? 37% | 8.9 ? 12% | 26.6 ? -163% | 9.9 ? 2% |
| PWM Frequency (Hz) | 2380 ? | |||||
| Screen | 11% | -24% | 14% | 64117% | 26% | |
| Brightness middle (cd/m²) | 294 | 384 31% | 398.6 36% | 371 26% | 606 106% | 372.8 27% |
| Brightness (cd/m²) | 276 | 377 37% | 384 39% | 350 27% | 602 118% | 367 33% |
| Brightness Distribution (%) | 90 | 90 0% | 89 -1% | 90 0% | 93 3% | 97 8% |
| Black Level * (cd/m²) | 0.28 | 0.45 -61% | 0.46 -64% | 0.32 -14% | 0.0001 100% | 0.32 -14% |
| Contrast (:1) | 1050 | 853 -19% | 867 -17% | 1159 10% | 6060000 577043% | 1165 11% |
| Colorchecker dE 2000 * | 2.81 | 2.05 27% | 4.05 -44% | 1.74 38% | 4.8 -71% | 1.92 32% |
| Colorchecker dE 2000 max. * | 5.7 | 3.64 36% | 8.68 -52% | 3.59 37% | 8.2 -44% | 3.65 36% |
| Colorchecker dE 2000 calibrated * | 0.86 | 0.74 14% | 1.02 -19% | 1.01 -17% | 1.8 -109% | 0.51 41% |
| Greyscale dE 2000 * | 3.4 | 2.3 32% | 6.5 -91% | 2.8 18% | 6.5 -91% | 1.5 56% |
| Gamma | 2.301 96% | 2.017 109% | 2.11 104% | 2.19 100% | 2.63 84% | 2.34 94% |
| CCT | 7389 88% | 6546 99% | 7518 86% | 6474 100% | 6596 99% | 6607 98% |
| Całkowita średnia (program / ustawienia) | 6% /
7% | 10% /
-7% | -1% /
5% | 21317% /
41195% | 23% /
23% |
* ... im mniej tym lepiej
Subiektywnie, jakość wyświetlania ekranu jest nienaganna i nie ma widocznego ziarna pomimo matowej powierzchni. Podsumowując, zmierzone wartości DeltaE-2000 są stosunkowo bliskie docelowej wartości 3 w stanie dostawy. Inne laptopy tej klasy pokazują jednak, że można to zrobić lepiej. Udało nam się znacznie poprawić wartości poprzez ręczną kalibrację. Ponadto udało nam się też nieco zmniejszyć niebieską obsadę. Stąd zalecamy korzystanie z podlinkowanego powyżej profilu ICC, jeśli chcemy używać urządzenia do edycji obrazu.
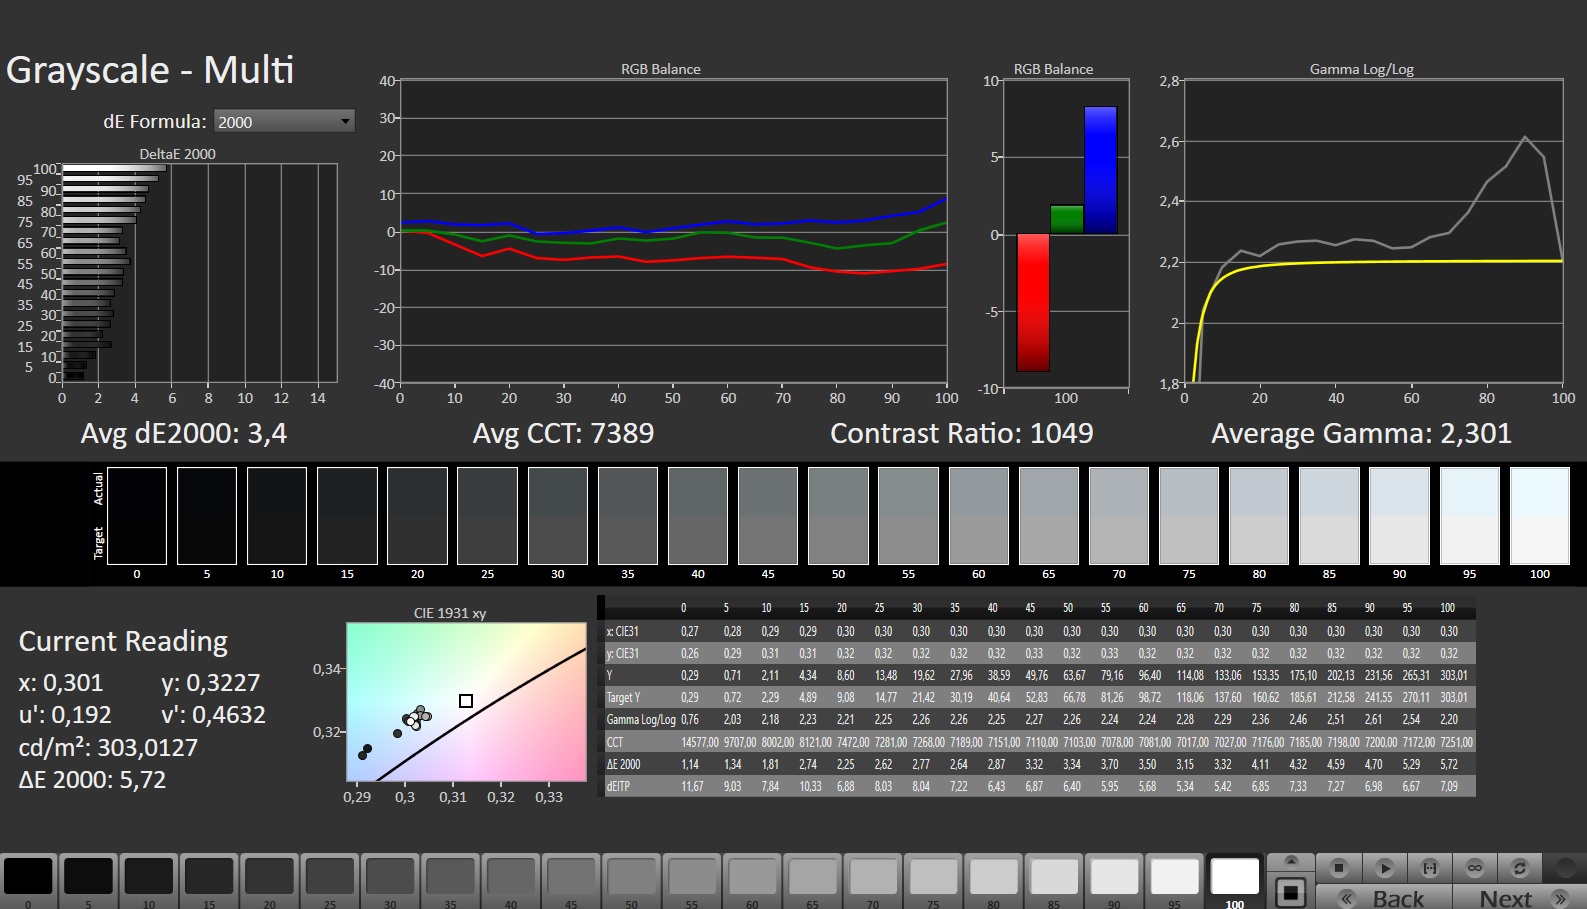
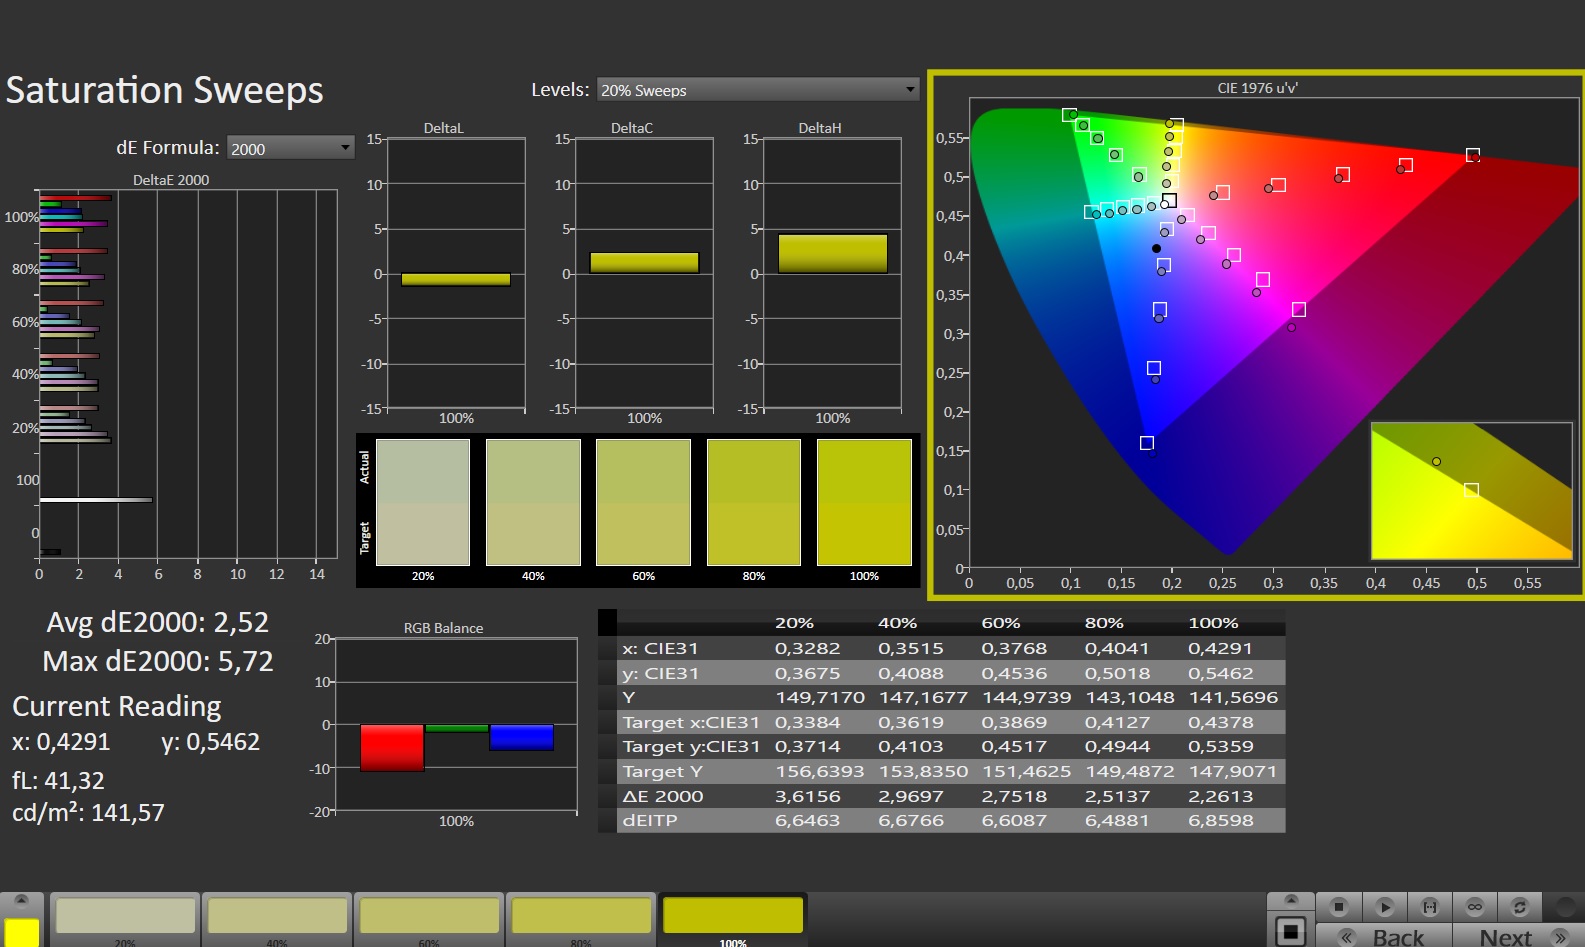
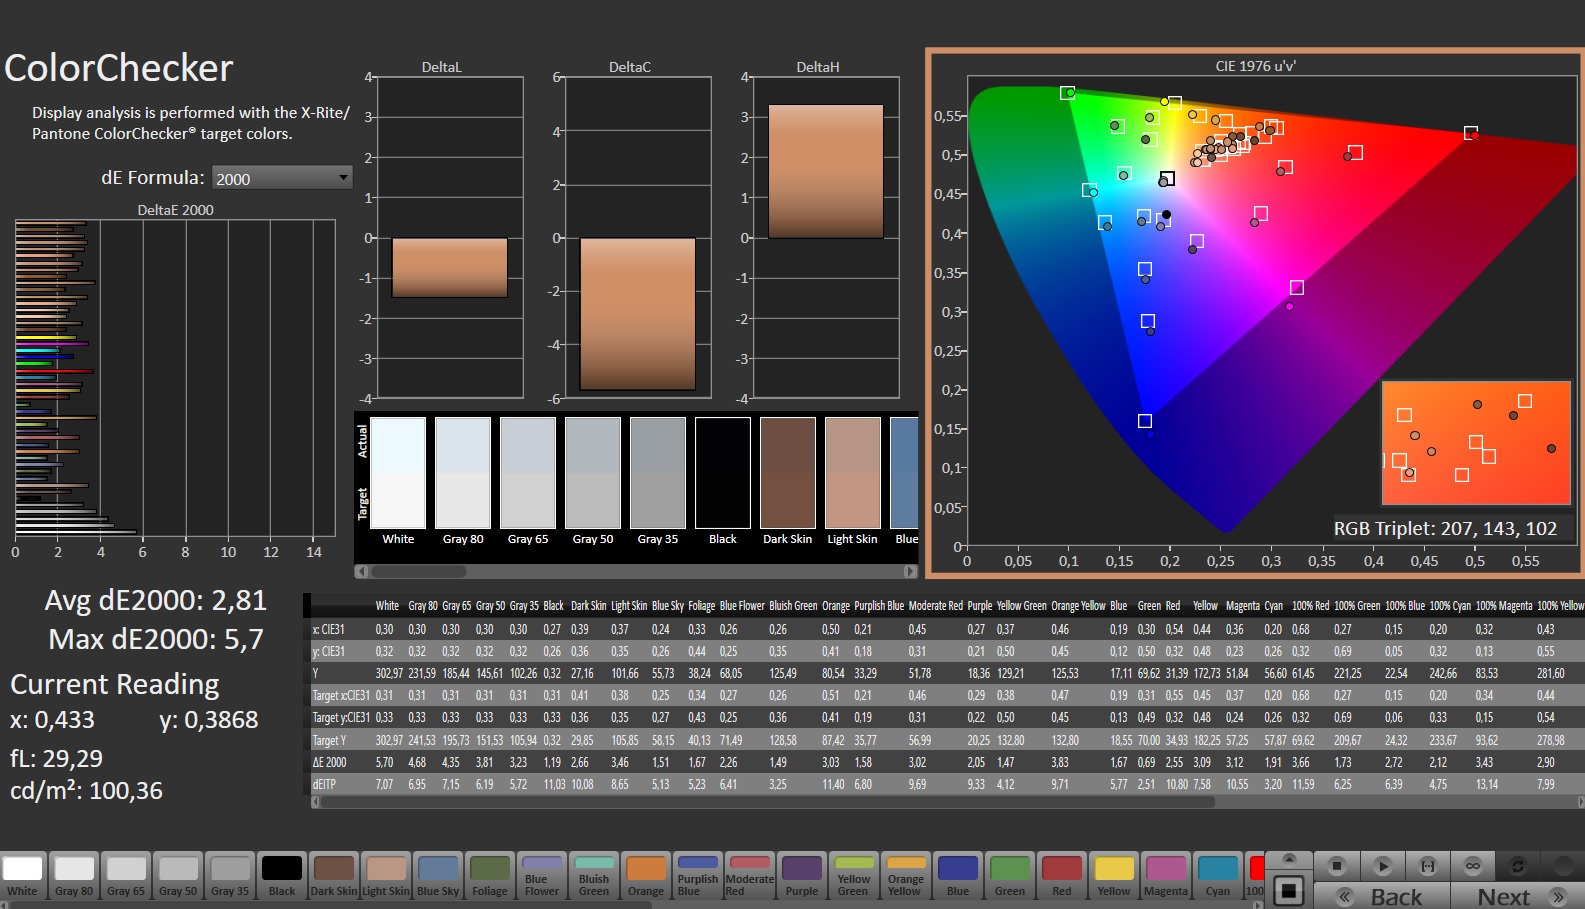
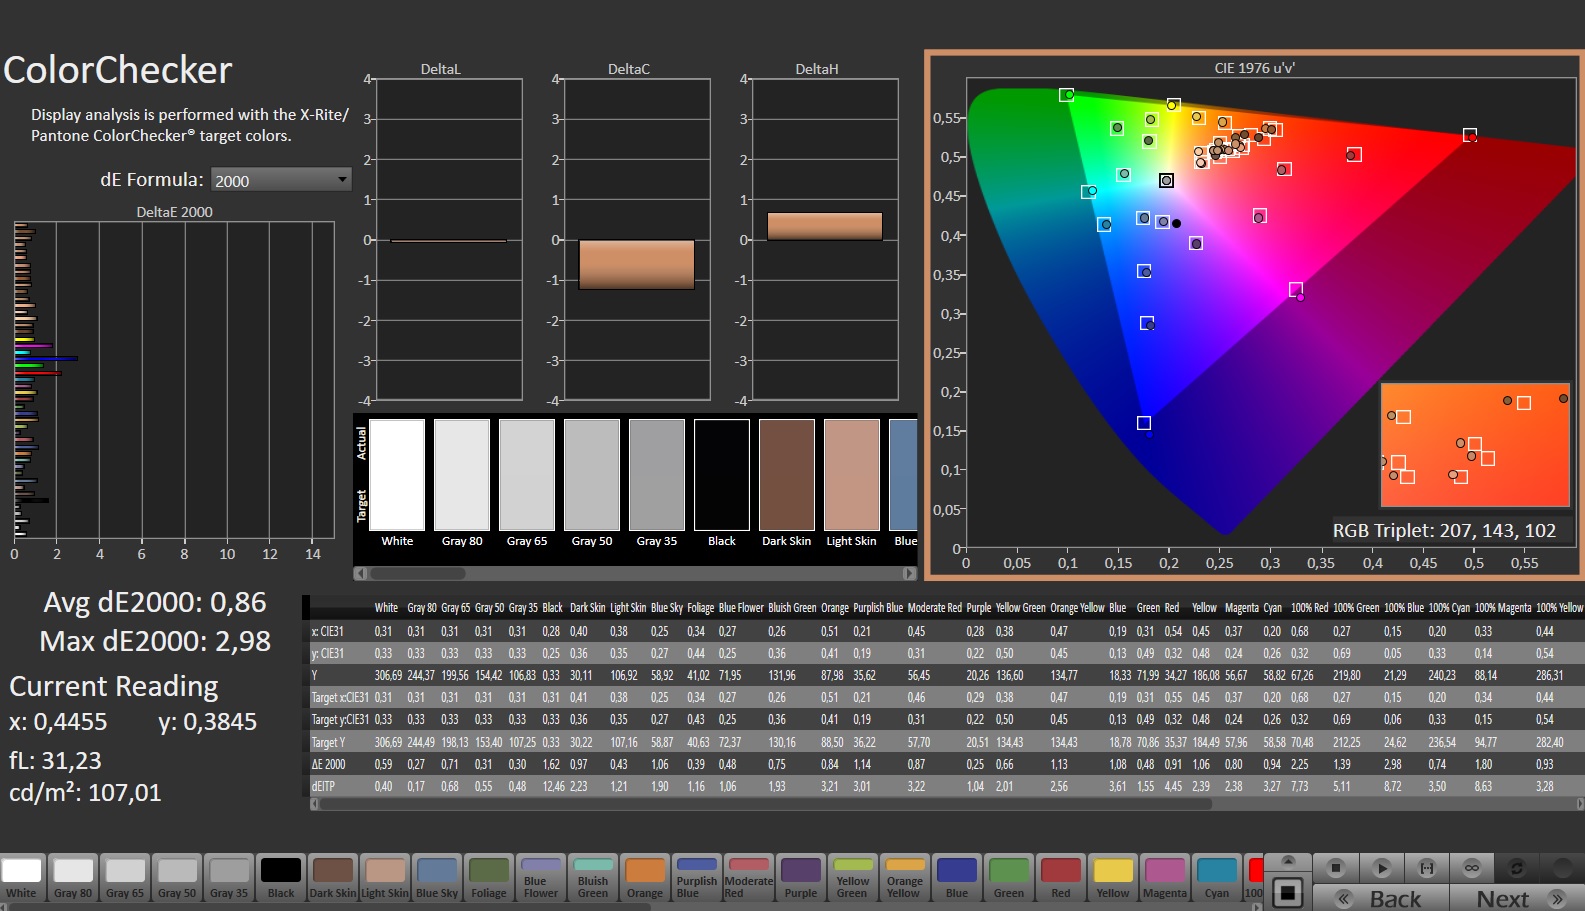
Zmierzone pokrycie przestrzeni kolorów jest dobre, a przestrzeń kolorów sRGB jest w pełni pokryta w 100%. Rozszerzona przestrzeń kolorów AdobeRGB jest wystarczająco pokryta w 84,5 procentach, a przestrzeń kolorów P3 w 96,7 procentach.

Wyświetl czasy reakcji
| ↔ Czas reakcji od czerni do bieli | ||
|---|---|---|
| 10.1 ms ... wzrost ↗ i spadek ↘ łącznie | ↗ 5.3 ms wzrost | 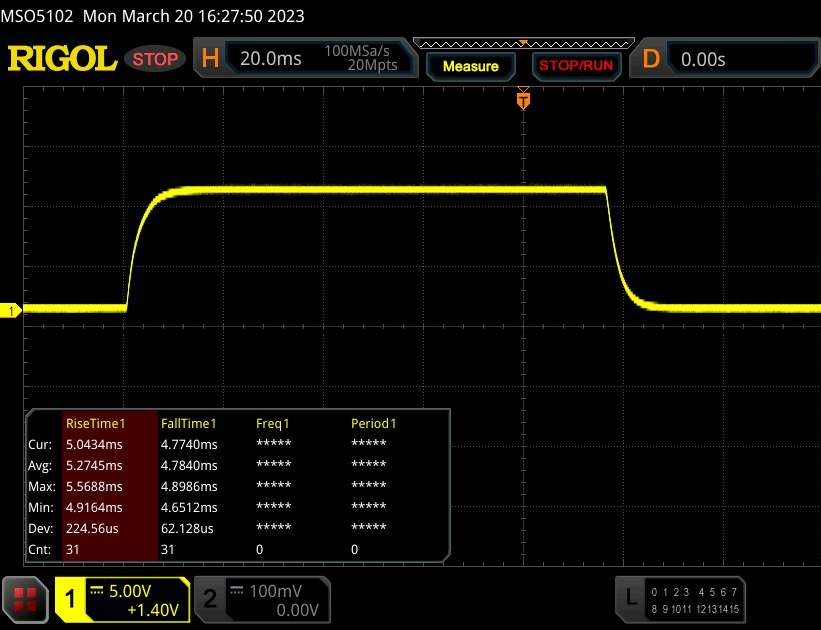 |
| ↘ 4.8 ms upadek | ||
| W naszych testach ekran wykazuje dobry współczynnik reakcji, ale może być zbyt wolny dla graczy rywalizujących ze sobą. Dla porównania, wszystkie testowane urządzenia wahają się od 0.1 (minimum) do 240 (maksimum) ms. » 28 % wszystkich urządzeń jest lepszych. Oznacza to, że zmierzony czas reakcji jest lepszy od średniej wszystkich testowanych urządzeń (19.8 ms). | ||
| ↔ Czas reakcji 50% szarości do 80% szarości | ||
| 14 ms ... wzrost ↗ i spadek ↘ łącznie | ↗ 6.9 ms wzrost | 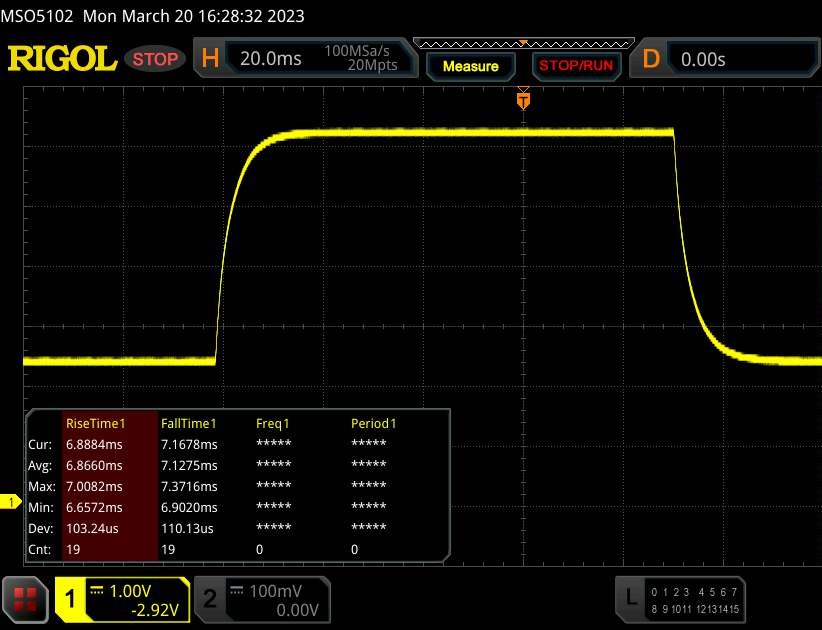 |
| ↘ 7.1 ms upadek | ||
| W naszych testach ekran wykazuje dobry współczynnik reakcji, ale może być zbyt wolny dla graczy rywalizujących ze sobą. Dla porównania, wszystkie testowane urządzenia wahają się od 0.165 (minimum) do 636 (maksimum) ms. » 28 % wszystkich urządzeń jest lepszych. Oznacza to, że zmierzony czas reakcji jest lepszy od średniej wszystkich testowanych urządzeń (31 ms). | ||
Migotanie ekranu / PWM (modulacja szerokości impulsu)
| Migotanie ekranu/nie wykryto PWM | 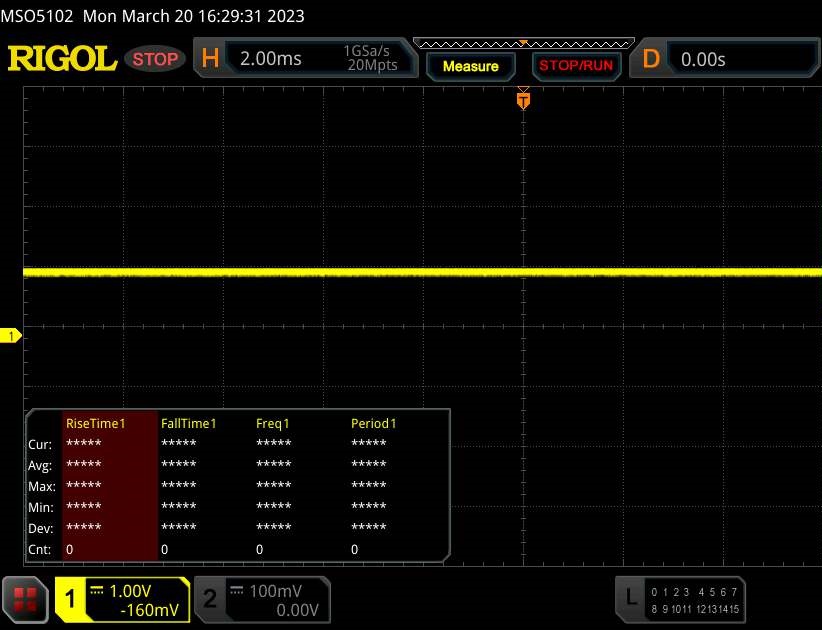 | ||
Dla porównania: 52 % wszystkich testowanych urządzeń nie używa PWM do przyciemniania wyświetlacza. Jeśli wykryto PWM, zmierzono średnio 7754 (minimum: 5 - maksimum: 343500) Hz. | |||
Stosunkowo niska jasność wyświetlacza nie sprzyja pracy na zewnątrz. Niemniej jednak praca na zewnątrz przy pełnej jasności jest możliwa, choć z pewnymi ograniczeniami. Należy unikać bezpośredniego światła słonecznego.
Zainstalowany panel IPS oferuje doskonałą jakość obrazu w normalnym użytkowaniu. Trudności w postaci lekkiego zamglenia występują tylko na obrazach w czterech narożnikach.

Performance - Raptor Lake połączony z Adą Lovelace
Aorus 17X AZF jest obecnie jednym z najmocniejszych notebooków dla graczy i oferuje doskonałą wydajność, napędzaną przez procesory Raptor Lake i Adę Lovelace. Konfiguracja testowanego egzemplarza jest dostępna w cenie 3499,99 USD.
Warunki badania
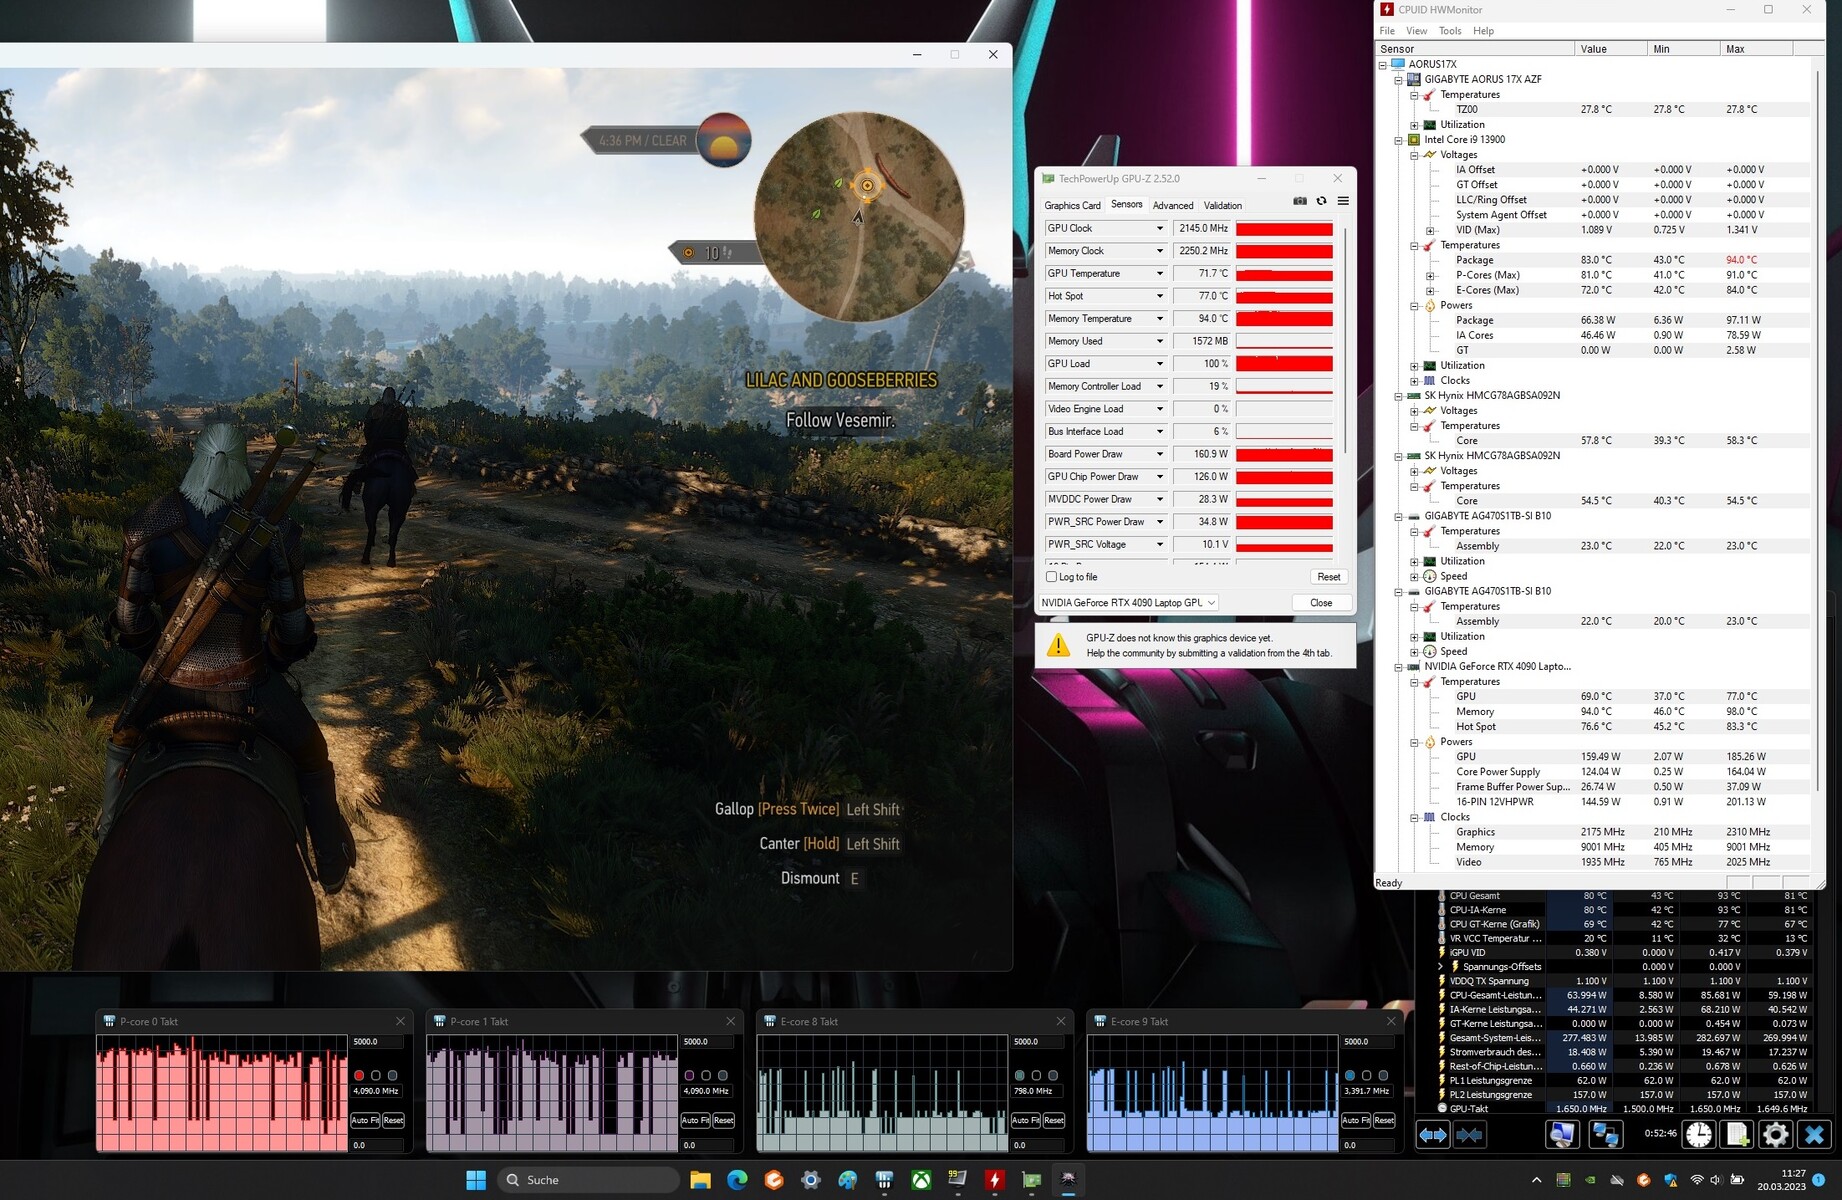
Oprócz typowych trybów wydajności (patrz tabela), centrum sterowania Aorus 17X AZF (Gigabyte Control Center) udostępnia funkcję AI Boost wyższego poziomu, z której skorzystaliśmy. Centrum sterowania wybierało następnie odpowiedni profil - tryb Gaming i tryb Creator dla benchmarków, energooszczędny tryb uśpienia dla testów baterii
Tryb Turbo odpala się w poszczególnych przypadkach dla niewielkiego wzrostu wydajności, ale ma to swoją cenę: Wentylatory stale pracują z pełną mocą. W trybie Meeting urządzenie pracuje bardzo cicho, niemal do granicy ciszy. W efekcie wydajność spada zauważalnie, choć wydajność wielowątkowa jest dotknięta bardziej niż jednowątkowa.
| Creator Modus | Turbo Modus | Gaming Modus | Meeting Modus | Energiespar Ruhemodus | |
|---|---|---|---|---|---|
| Limit mocy 1 | 86 Watt | 86 Watt | 86 Watt | 15 Watt | 15 Watt |
| Power Limit 2 | 157 Watt | 157 Watt | 157 Watt | 30 Watt | 30 Watt |
Procesor
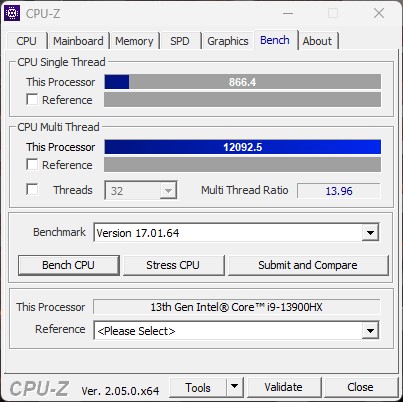
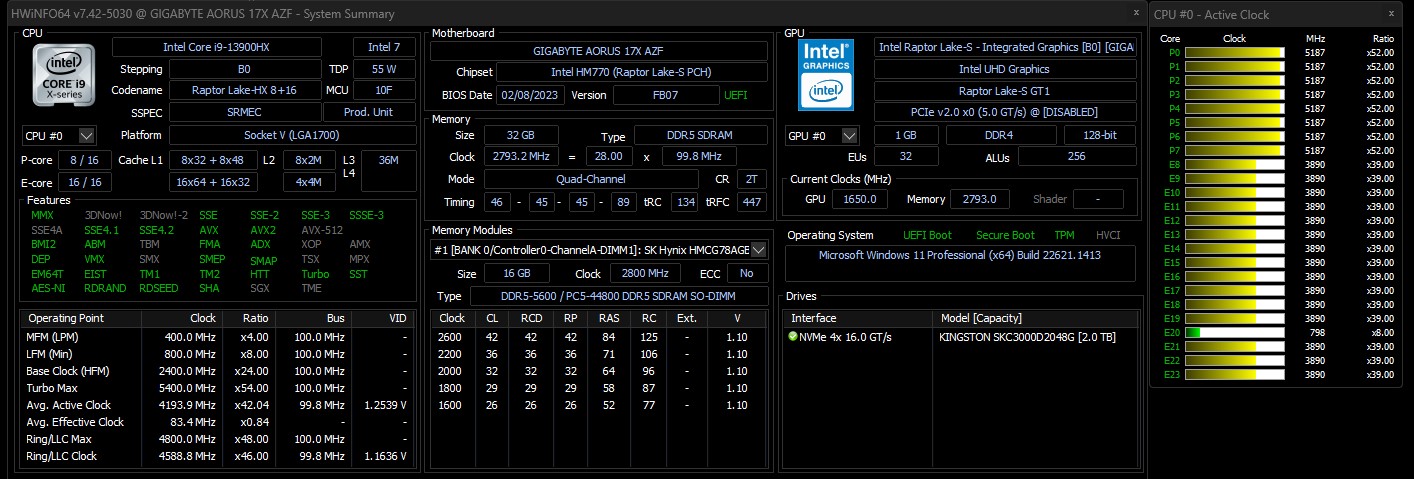
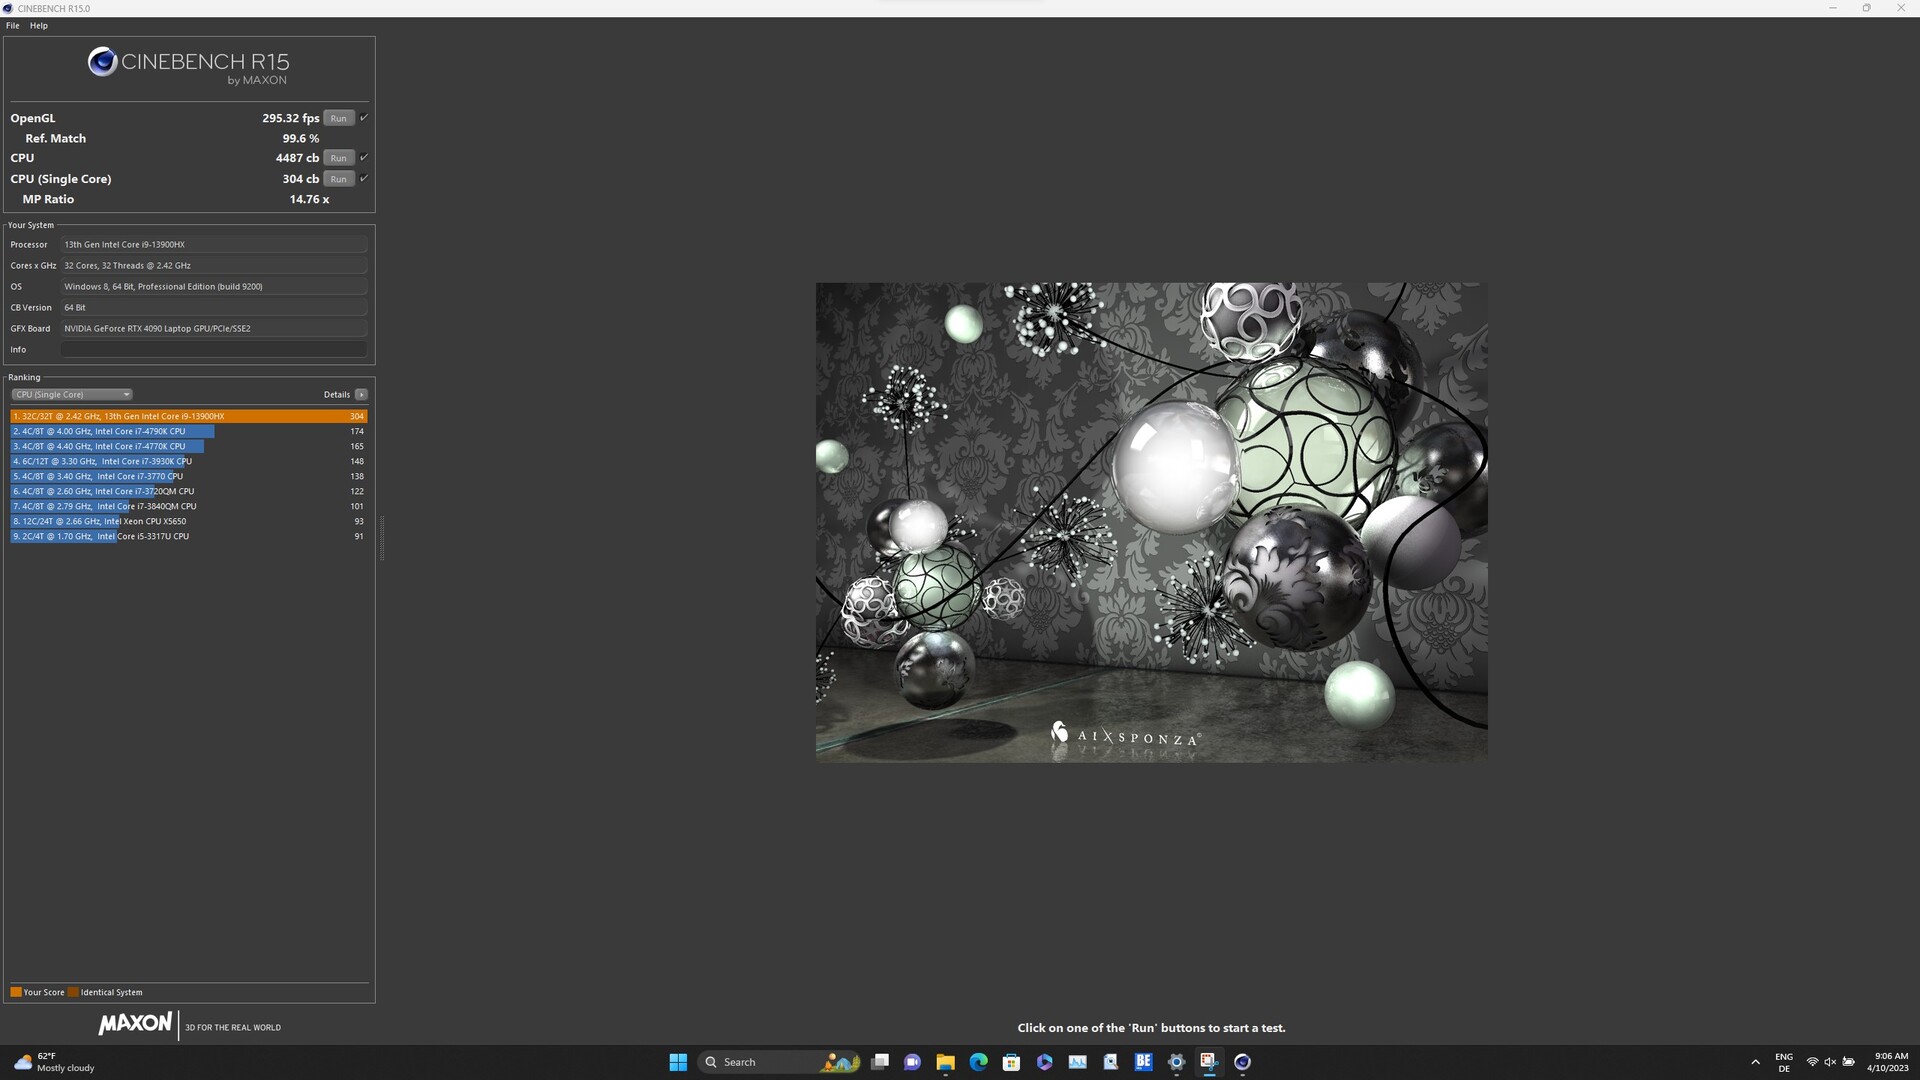
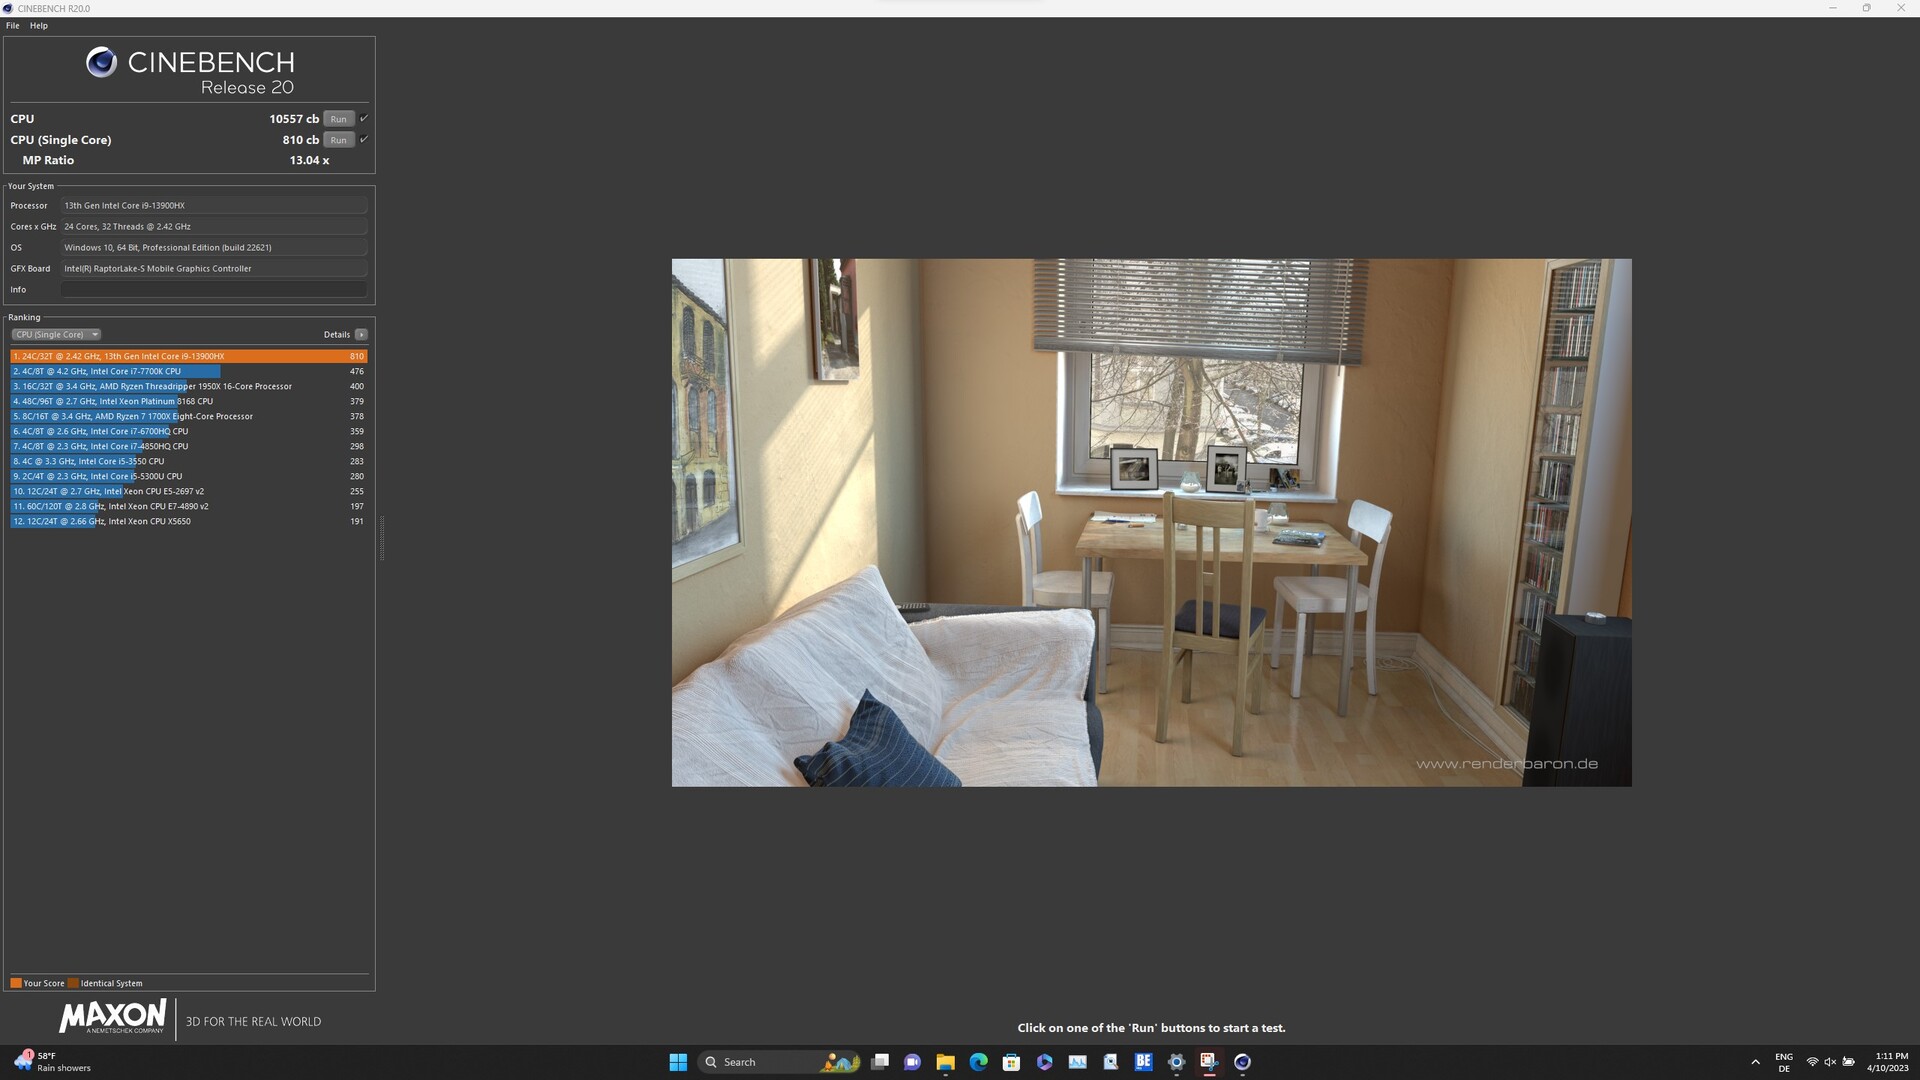
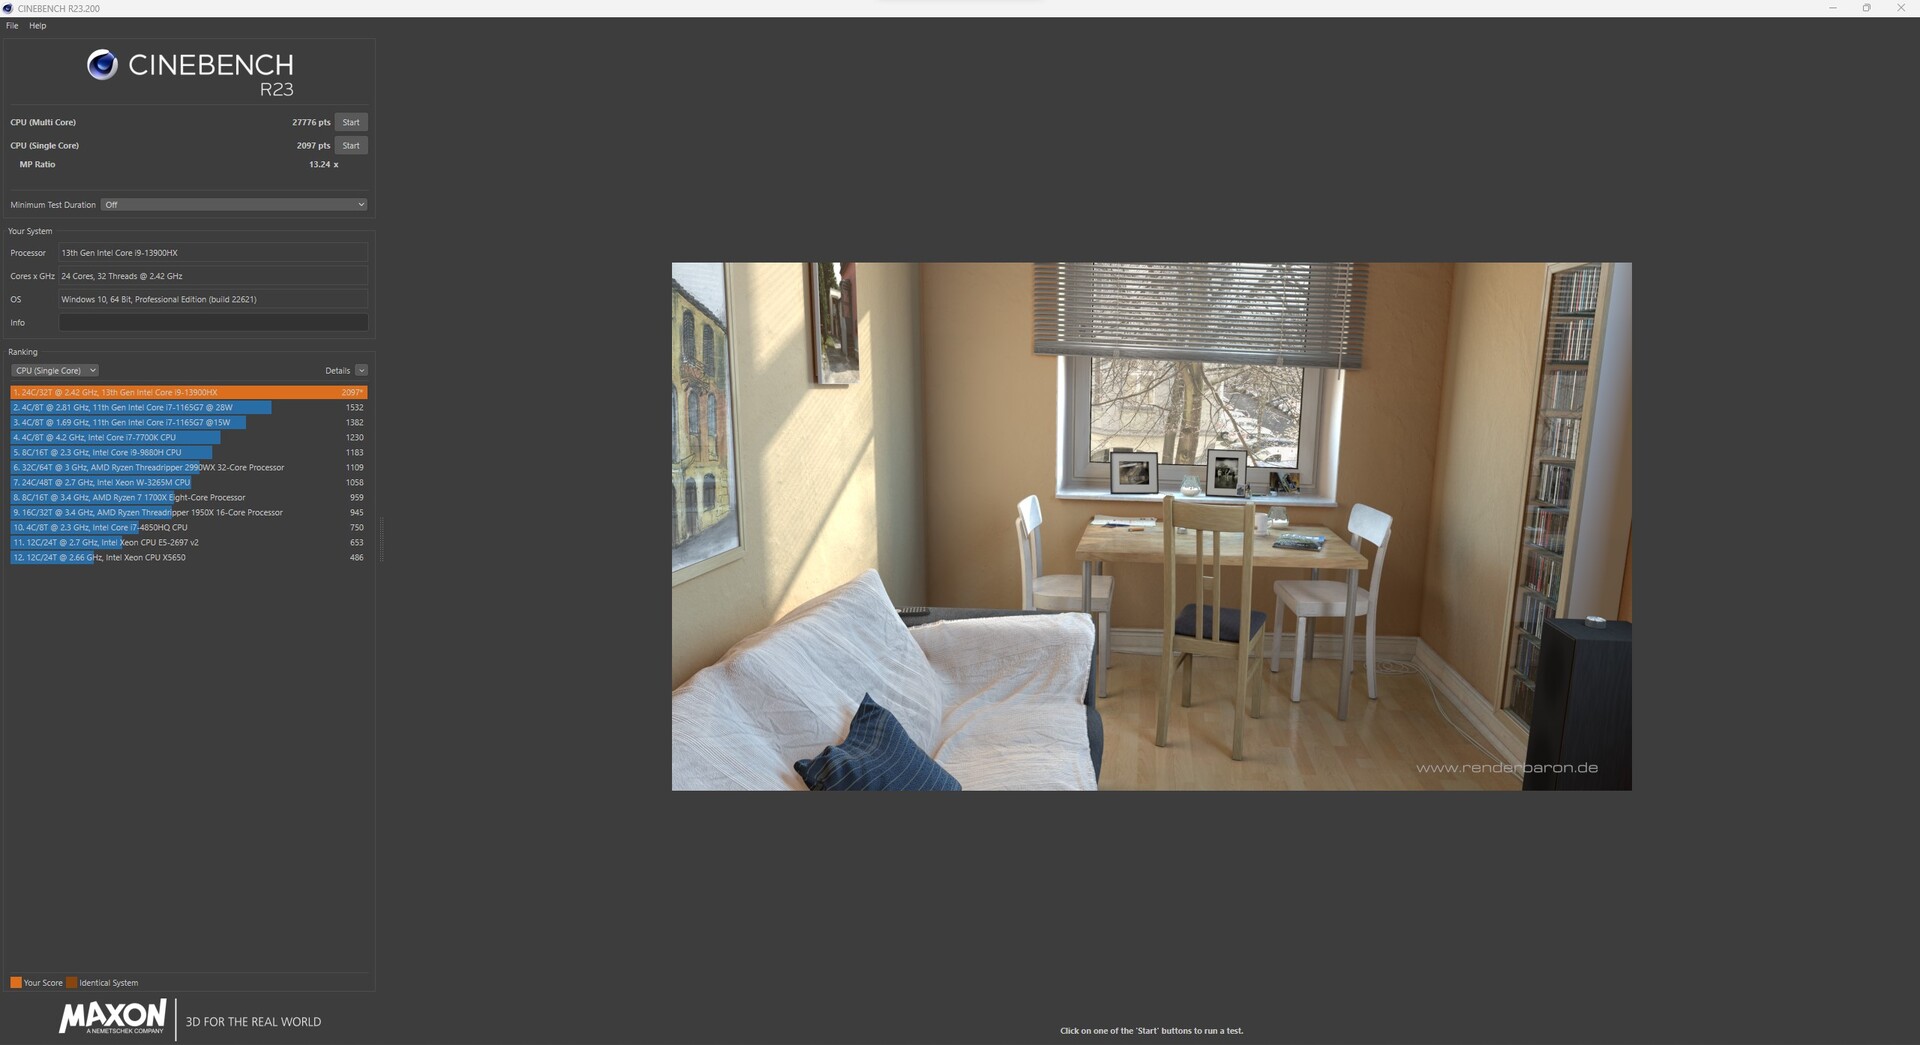
Na stronie Intel Core-i7-13900HX-Prozessor (Raptor Lake) składa się z 16 wydajnych rdzeni (bez hyperthreadingu, od 1,6 do 3,9 GHz) i 8 rdzeni wydajnościowych (hyperthreading, od 2,2 do 5,4 GHz). Łącznie są 32 logiczne rdzenie CPU, czemu w naszych testach towarzyszyła ogromna wydajność wielowątkowa. W benchmarkach wszyscy pretendenci toczą zacięty wyścig łeb w łeb. Jednak w rankingu wydajności procesora, który stanowi średnią wartość z przedstawionych benchmarków, nasz testowany egzemplarz zajął drugie, ostatnie miejsce. Tylko HP Omen 17, wykorzystujący ten sam SoC, może zostać tutaj pokonany, natomiast Medion Erazer Beastzapewnia nieco lepszą wydajność. Pozostali konkurenci wypadają lepiej ze względu na nieco szybsze SoC. Niemniej jednak przepaść do MSI GE78HX jest do pokonania i wynosi tylko 12%.
Test pętli CB15 pokazuje, że boost procesora jest wykorzystywany tylko na początku. Symulowane stałe obciążenie wielowątkowe powoduje, że po pierwszym przebiegu zegar nieco spada, choć od trzeciego przebiegu wydajność pozostaje stabilna.
Cinebench R15 Multi Sustained Load
Cinebench R23: Multi Core | Single Core
Cinebench R20: CPU (Multi Core) | CPU (Single Core)
Cinebench R15: CPU Multi 64Bit | CPU Single 64Bit
Blender: v2.79 BMW27 CPU
7-Zip 18.03: 7z b 4 | 7z b 4 -mmt1
Geekbench 5.5: Multi-Core | Single-Core
HWBOT x265 Benchmark v2.2: 4k Preset
LibreOffice : 20 Documents To PDF
R Benchmark 2.5: Overall mean
| CPU Performance rating | |
| MSI GE78HX 13VH-070US | |
| Alienware m18 R1 | |
| MSI Titan GT77 HX 13VI | |
| Medion Erazer Beast X40 | |
| Przeciętny Intel Core i9-13900HX | |
| Aorus 17X AZF | |
| HP Omen 17-ck2097ng | |
| Średnia w klasie Gaming | |
| Cinebench R23 / Multi Core | |
| MSI Titan GT77 HX 13VI | |
| MSI GE78HX 13VH-070US | |
| Alienware m18 R1 | |
| Medion Erazer Beast X40 | |
| Przeciętny Intel Core i9-13900HX (24270 - 32623, n=23) | |
| Aorus 17X AZF | |
| HP Omen 17-ck2097ng | |
| Średnia w klasie Gaming (10488 - 42661, n=107, ostatnie 2 lata) | |
| Cinebench R23 / Single Core | |
| MSI GE78HX 13VH-070US | |
| Alienware m18 R1 | |
| MSI Titan GT77 HX 13VI | |
| Aorus 17X AZF | |
| HP Omen 17-ck2097ng | |
| Przeciętny Intel Core i9-13900HX (1867 - 2105, n=20) | |
| Medion Erazer Beast X40 | |
| Średnia w klasie Gaming (1166 - 2415, n=107, ostatnie 2 lata) | |
| Cinebench R20 / CPU (Multi Core) | |
| MSI Titan GT77 HX 13VI | |
| MSI GE78HX 13VH-070US | |
| Alienware m18 R1 | |
| Medion Erazer Beast X40 | |
| Przeciętny Intel Core i9-13900HX (9152 - 12541, n=21) | |
| Aorus 17X AZF | |
| Średnia w klasie Gaming (4029 - 16433, n=106, ostatnie 2 lata) | |
| HP Omen 17-ck2097ng | |
| Cinebench R20 / CPU (Single Core) | |
| Aorus 17X AZF | |
| Alienware m18 R1 | |
| HP Omen 17-ck2097ng | |
| MSI Titan GT77 HX 13VI | |
| MSI GE78HX 13VH-070US | |
| Przeciętny Intel Core i9-13900HX (722 - 810, n=21) | |
| Medion Erazer Beast X40 | |
| Średnia w klasie Gaming (442 - 913, n=106, ostatnie 2 lata) | |
| Cinebench R15 / CPU Multi 64Bit | |
| MSI Titan GT77 HX 13VI | |
| MSI GE78HX 13VH-070US | |
| Alienware m18 R1 | |
| Medion Erazer Beast X40 | |
| Przeciętny Intel Core i9-13900HX (3913 - 4970, n=22) | |
| Aorus 17X AZF | |
| HP Omen 17-ck2097ng | |
| Średnia w klasie Gaming (1578 - 6330, n=105, ostatnie 2 lata) | |
| Cinebench R15 / CPU Single 64Bit | |
| Aorus 17X AZF | |
| MSI GE78HX 13VH-070US | |
| Alienware m18 R1 | |
| HP Omen 17-ck2097ng | |
| MSI Titan GT77 HX 13VI | |
| Medion Erazer Beast X40 | |
| Średnia w klasie Gaming (188.8 - 350, n=106, ostatnie 2 lata) | |
| Przeciętny Intel Core i9-13900HX (247 - 304, n=22) | |
| Blender / v2.79 BMW27 CPU | |
| HP Omen 17-ck2097ng | |
| Średnia w klasie Gaming (79 - 330, n=104, ostatnie 2 lata) | |
| Aorus 17X AZF | |
| Przeciętny Intel Core i9-13900HX (101 - 153, n=22) | |
| Medion Erazer Beast X40 | |
| MSI GE78HX 13VH-070US | |
| MSI Titan GT77 HX 13VI | |
| Alienware m18 R1 | |
| 7-Zip 18.03 / 7z b 4 | |
| Alienware m18 R1 | |
| MSI Titan GT77 HX 13VI | |
| MSI GE78HX 13VH-070US | |
| Medion Erazer Beast X40 | |
| Przeciętny Intel Core i9-13900HX (90675 - 127283, n=21) | |
| HP Omen 17-ck2097ng | |
| Aorus 17X AZF | |
| Średnia w klasie Gaming (33491 - 148086, n=105, ostatnie 2 lata) | |
| 7-Zip 18.03 / 7z b 4 -mmt1 | |
| Aorus 17X AZF | |
| MSI GE78HX 13VH-070US | |
| HP Omen 17-ck2097ng | |
| MSI Titan GT77 HX 13VI | |
| Medion Erazer Beast X40 | |
| Alienware m18 R1 | |
| Przeciętny Intel Core i9-13900HX (6340 - 7177, n=21) | |
| Średnia w klasie Gaming (4199 - 7436, n=105, ostatnie 2 lata) | |
| Geekbench 5.5 / Multi-Core | |
| Alienware m18 R1 | |
| MSI GE78HX 13VH-070US | |
| MSI Titan GT77 HX 13VI | |
| HP Omen 17-ck2097ng | |
| Medion Erazer Beast X40 | |
| Przeciętny Intel Core i9-13900HX (17614 - 21075, n=22) | |
| Aorus 17X AZF | |
| Średnia w klasie Gaming (6460 - 28263, n=105, ostatnie 2 lata) | |
| Geekbench 5.5 / Single-Core | |
| MSI GE78HX 13VH-070US | |
| HP Omen 17-ck2097ng | |
| Aorus 17X AZF | |
| Alienware m18 R1 | |
| Średnia w klasie Gaming (986 - 2474, n=105, ostatnie 2 lata) | |
| MSI Titan GT77 HX 13VI | |
| Medion Erazer Beast X40 | |
| Przeciętny Intel Core i9-13900HX (1345 - 2093, n=22) | |
| HWBOT x265 Benchmark v2.2 / 4k Preset | |
| MSI GE78HX 13VH-070US | |
| Alienware m18 R1 | |
| MSI Titan GT77 HX 13VI | |
| Medion Erazer Beast X40 | |
| Przeciętny Intel Core i9-13900HX (23.5 - 34.4, n=22) | |
| Średnia w klasie Gaming (11.5 - 44.4, n=105, ostatnie 2 lata) | |
| HP Omen 17-ck2097ng | |
| Aorus 17X AZF | |
| LibreOffice / 20 Documents To PDF | |
| Średnia w klasie Gaming (33.2 - 88.8, n=105, ostatnie 2 lata) | |
| MSI GE78HX 13VH-070US | |
| Alienware m18 R1 | |
| MSI Titan GT77 HX 13VI | |
| Aorus 17X AZF | |
| HP Omen 17-ck2097ng | |
| Medion Erazer Beast X40 | |
| Przeciętny Intel Core i9-13900HX (32.8 - 51.1, n=21) | |
| R Benchmark 2.5 / Overall mean | |
| Średnia w klasie Gaming (0.3439 - 0.759, n=106, ostatnie 2 lata) | |
| MSI Titan GT77 HX 13VI | |
| Przeciętny Intel Core i9-13900HX (0.375 - 0.4564, n=22) | |
| Medion Erazer Beast X40 | |
| Aorus 17X AZF | |
| Alienware m18 R1 | |
| HP Omen 17-ck2097ng | |
| MSI GE78HX 13VH-070US | |
* ... im mniej tym lepiej
AIDA64: FP32 Ray-Trace | FPU Julia | CPU SHA3 | CPU Queen | FPU SinJulia | FPU Mandel | CPU AES | CPU ZLib | FP64 Ray-Trace | CPU PhotoWorxx
| Performance rating | |
| Alienware m18 R1 | |
| MSI GE78HX 13VH-070US | |
| MSI Titan GT77 HX 13VI | |
| Medion Erazer Beast X40 | |
| Średnia w klasie Gaming | |
| Przeciętny Intel Core i9-13900HX | |
| Aorus 17X AZF | |
| HP Omen 17-ck2097ng | |
| AIDA64 / FP32 Ray-Trace | |
| Średnia w klasie Gaming (10227 - 85542, n=105, ostatnie 2 lata) | |
| Alienware m18 R1 | |
| MSI Titan GT77 HX 13VI | |
| MSI GE78HX 13VH-070US | |
| Medion Erazer Beast X40 | |
| Przeciętny Intel Core i9-13900HX (17589 - 27615, n=22) | |
| Aorus 17X AZF | |
| HP Omen 17-ck2097ng | |
| AIDA64 / FPU Julia | |
| Alienware m18 R1 | |
| MSI Titan GT77 HX 13VI | |
| MSI GE78HX 13VH-070US | |
| Średnia w klasie Gaming (51376 - 238426, n=105, ostatnie 2 lata) | |
| Medion Erazer Beast X40 | |
| Przeciętny Intel Core i9-13900HX (88686 - 137015, n=22) | |
| Aorus 17X AZF | |
| HP Omen 17-ck2097ng | |
| AIDA64 / CPU SHA3 | |
| Alienware m18 R1 | |
| MSI Titan GT77 HX 13VI | |
| MSI GE78HX 13VH-070US | |
| Medion Erazer Beast X40 | |
| Średnia w klasie Gaming (2180 - 10115, n=105, ostatnie 2 lata) | |
| Przeciętny Intel Core i9-13900HX (4362 - 7029, n=22) | |
| Aorus 17X AZF | |
| HP Omen 17-ck2097ng | |
| AIDA64 / CPU Queen | |
| Alienware m18 R1 | |
| MSI GE78HX 13VH-070US | |
| MSI Titan GT77 HX 13VI | |
| HP Omen 17-ck2097ng | |
| Przeciętny Intel Core i9-13900HX (125644 - 141385, n=22) | |
| Medion Erazer Beast X40 | |
| Aorus 17X AZF | |
| Średnia w klasie Gaming (49785 - 173351, n=90, ostatnie 2 lata) | |
| AIDA64 / FPU SinJulia | |
| MSI Titan GT77 HX 13VI | |
| MSI GE78HX 13VH-070US | |
| Alienware m18 R1 | |
| Medion Erazer Beast X40 | |
| Przeciętny Intel Core i9-13900HX (12334 - 17179, n=22) | |
| Średnia w klasie Gaming (4424 - 33636, n=105, ostatnie 2 lata) | |
| Aorus 17X AZF | |
| HP Omen 17-ck2097ng | |
| AIDA64 / FPU Mandel | |
| Alienware m18 R1 | |
| Średnia w klasie Gaming (25115 - 128721, n=105, ostatnie 2 lata) | |
| MSI Titan GT77 HX 13VI | |
| MSI GE78HX 13VH-070US | |
| Medion Erazer Beast X40 | |
| Przeciętny Intel Core i9-13900HX (43850 - 69202, n=22) | |
| Aorus 17X AZF | |
| HP Omen 17-ck2097ng | |
| AIDA64 / CPU AES | |
| Aorus 17X AZF | |
| Przeciętny Intel Core i9-13900HX (89413 - 237881, n=22) | |
| MSI Titan GT77 HX 13VI | |
| Alienware m18 R1 | |
| MSI GE78HX 13VH-070US | |
| Medion Erazer Beast X40 | |
| Średnia w klasie Gaming (39258 - 247074, n=105, ostatnie 2 lata) | |
| HP Omen 17-ck2097ng | |
| AIDA64 / CPU ZLib | |
| MSI GE78HX 13VH-070US | |
| MSI Titan GT77 HX 13VI | |
| Alienware m18 R1 | |
| Medion Erazer Beast X40 | |
| Przeciętny Intel Core i9-13900HX (1284 - 1958, n=22) | |
| Średnia w klasie Gaming (574 - 2531, n=105, ostatnie 2 lata) | |
| Aorus 17X AZF | |
| HP Omen 17-ck2097ng | |
| AIDA64 / FP64 Ray-Trace | |
| Średnia w klasie Gaming (5509 - 45446, n=105, ostatnie 2 lata) | |
| Alienware m18 R1 | |
| MSI Titan GT77 HX 13VI | |
| MSI GE78HX 13VH-070US | |
| Medion Erazer Beast X40 | |
| Przeciętny Intel Core i9-13900HX (9481 - 15279, n=22) | |
| Aorus 17X AZF | |
| HP Omen 17-ck2097ng | |
| AIDA64 / CPU PhotoWorxx | |
| Alienware m18 R1 | |
| HP Omen 17-ck2097ng | |
| Aorus 17X AZF | |
| MSI GE78HX 13VH-070US | |
| Przeciętny Intel Core i9-13900HX (42994 - 51994, n=22) | |
| Średnia w klasie Gaming (12271 - 89891, n=105, ostatnie 2 lata) | |
| Medion Erazer Beast X40 | |
| MSI Titan GT77 HX 13VI | |
Wydajność systemu
W benchmarkach wydajności systemowej Aorus 17X AZF plasuje się podobnie jak w testach procesora. Niemniej jednak wydajność systemu jest znakomita i znacznie przewyższa średnią klasową dla laptopów do gier z ostatnich dwóch lat. W benchmarkach AIDA64 Aorus 17X AZF uzyskuje bezbłędne wyniki dzięki szybkiej pamięci RAM DDR5, co plasuje nasz egzemplarz recenzencki na drugim miejscu zaAlienware m18 R1.
CrossMark: Overall | Productivity | Creativity | Responsiveness
| PCMark 10 / Score | |
| MSI Titan GT77 HX 13VI | |
| MSI GE78HX 13VH-070US | |
| Alienware m18 R1 | |
| Przeciętny Intel Core i9-13900HX, NVIDIA GeForce RTX 4090 Laptop GPU (7690 - 9331, n=8) | |
| Średnia w klasie Gaming (5828 - 12414, n=93, ostatnie 2 lata) | |
| Medion Erazer Beast X40 | |
| Aorus 17X AZF | |
| HP Omen 17-ck2097ng | |
| PCMark 10 / Essentials | |
| HP Omen 17-ck2097ng | |
| MSI Titan GT77 HX 13VI | |
| MSI GE78HX 13VH-070US | |
| Przeciętny Intel Core i9-13900HX, NVIDIA GeForce RTX 4090 Laptop GPU (10972 - 11983, n=8) | |
| Medion Erazer Beast X40 | |
| Alienware m18 R1 | |
| Aorus 17X AZF | |
| Średnia w klasie Gaming (8810 - 11935, n=97, ostatnie 2 lata) | |
| PCMark 10 / Productivity | |
| Medion Erazer Beast X40 | |
| Średnia w klasie Gaming (6845 - 25323, n=95, ostatnie 2 lata) | |
| MSI GE78HX 13VH-070US | |
| Przeciętny Intel Core i9-13900HX, NVIDIA GeForce RTX 4090 Laptop GPU (9038 - 11680, n=8) | |
| Aorus 17X AZF | |
| Alienware m18 R1 | |
| HP Omen 17-ck2097ng | |
| MSI Titan GT77 HX 13VI | |
| PCMark 10 / Digital Content Creation | |
| MSI Titan GT77 HX 13VI | |
| Alienware m18 R1 | |
| MSI GE78HX 13VH-070US | |
| Średnia w klasie Gaming (7602 - 19954, n=95, ostatnie 2 lata) | |
| Przeciętny Intel Core i9-13900HX, NVIDIA GeForce RTX 4090 Laptop GPU (10605 - 16395, n=8) | |
| Medion Erazer Beast X40 | |
| Aorus 17X AZF | |
| HP Omen 17-ck2097ng | |
| CrossMark / Overall | |
| Alienware m18 R1 | |
| Aorus 17X AZF | |
| MSI Titan GT77 HX 13VI | |
| Medion Erazer Beast X40 | |
| Przeciętny Intel Core i9-13900HX, NVIDIA GeForce RTX 4090 Laptop GPU (1825 - 2295, n=8) | |
| HP Omen 17-ck2097ng | |
| Średnia w klasie Gaming (1366 - 2409, n=94, ostatnie 2 lata) | |
| MSI GE78HX 13VH-070US | |
| CrossMark / Productivity | |
| Aorus 17X AZF | |
| Alienware m18 R1 | |
| Medion Erazer Beast X40 | |
| MSI Titan GT77 HX 13VI | |
| Przeciętny Intel Core i9-13900HX, NVIDIA GeForce RTX 4090 Laptop GPU (1666 - 2166, n=8) | |
| Średnia w klasie Gaming (1386 - 2254, n=94, ostatnie 2 lata) | |
| MSI GE78HX 13VH-070US | |
| HP Omen 17-ck2097ng | |
| CrossMark / Creativity | |
| Alienware m18 R1 | |
| MSI Titan GT77 HX 13VI | |
| Medion Erazer Beast X40 | |
| Przeciętny Intel Core i9-13900HX, NVIDIA GeForce RTX 4090 Laptop GPU (2162 - 2514, n=8) | |
| Aorus 17X AZF | |
| Średnia w klasie Gaming (1343 - 2786, n=94, ostatnie 2 lata) | |
| HP Omen 17-ck2097ng | |
| MSI GE78HX 13VH-070US | |
| CrossMark / Responsiveness | |
| Aorus 17X AZF | |
| Alienware m18 R1 | |
| MSI Titan GT77 HX 13VI | |
| Medion Erazer Beast X40 | |
| Przeciętny Intel Core i9-13900HX, NVIDIA GeForce RTX 4090 Laptop GPU (1441 - 2275, n=8) | |
| HP Omen 17-ck2097ng | |
| Średnia w klasie Gaming (1226 - 2334, n=94, ostatnie 2 lata) | |
| MSI GE78HX 13VH-070US | |
| PCMark 10 Score | 7690 pkt. | |
Pomoc | ||
| AIDA64 / Memory Copy | |
| Alienware m18 R1 | |
| Aorus 17X AZF | |
| HP Omen 17-ck2097ng | |
| MSI GE78HX 13VH-070US | |
| Przeciętny Intel Core i9-13900HX (67716 - 79193, n=22) | |
| Średnia w klasie Gaming (21750 - 129946, n=105, ostatnie 2 lata) | |
| Medion Erazer Beast X40 | |
| MSI Titan GT77 HX 13VI | |
| AIDA64 / Memory Read | |
| Alienware m18 R1 | |
| Aorus 17X AZF | |
| HP Omen 17-ck2097ng | |
| MSI GE78HX 13VH-070US | |
| Przeciętny Intel Core i9-13900HX (73998 - 88462, n=22) | |
| Medion Erazer Beast X40 | |
| Średnia w klasie Gaming (22956 - 118858, n=105, ostatnie 2 lata) | |
| MSI Titan GT77 HX 13VI | |
| AIDA64 / Memory Write | |
| Alienware m18 R1 | |
| HP Omen 17-ck2097ng | |
| Aorus 17X AZF | |
| MSI GE78HX 13VH-070US | |
| Średnia w klasie Gaming (22297 - 135096, n=105, ostatnie 2 lata) | |
| Przeciętny Intel Core i9-13900HX (65472 - 77045, n=22) | |
| Medion Erazer Beast X40 | |
| MSI Titan GT77 HX 13VI | |
| AIDA64 / Memory Latency | |
| Średnia w klasie Gaming (75.3 - 259, n=105, ostatnie 2 lata) | |
| MSI Titan GT77 HX 13VI | |
| Medion Erazer Beast X40 | |
| Przeciętny Intel Core i9-13900HX (75.3 - 91.1, n=22) | |
| HP Omen 17-ck2097ng | |
| MSI GE78HX 13VH-070US | |
| Aorus 17X AZF | |
| Alienware m18 R1 | |
* ... im mniej tym lepiej
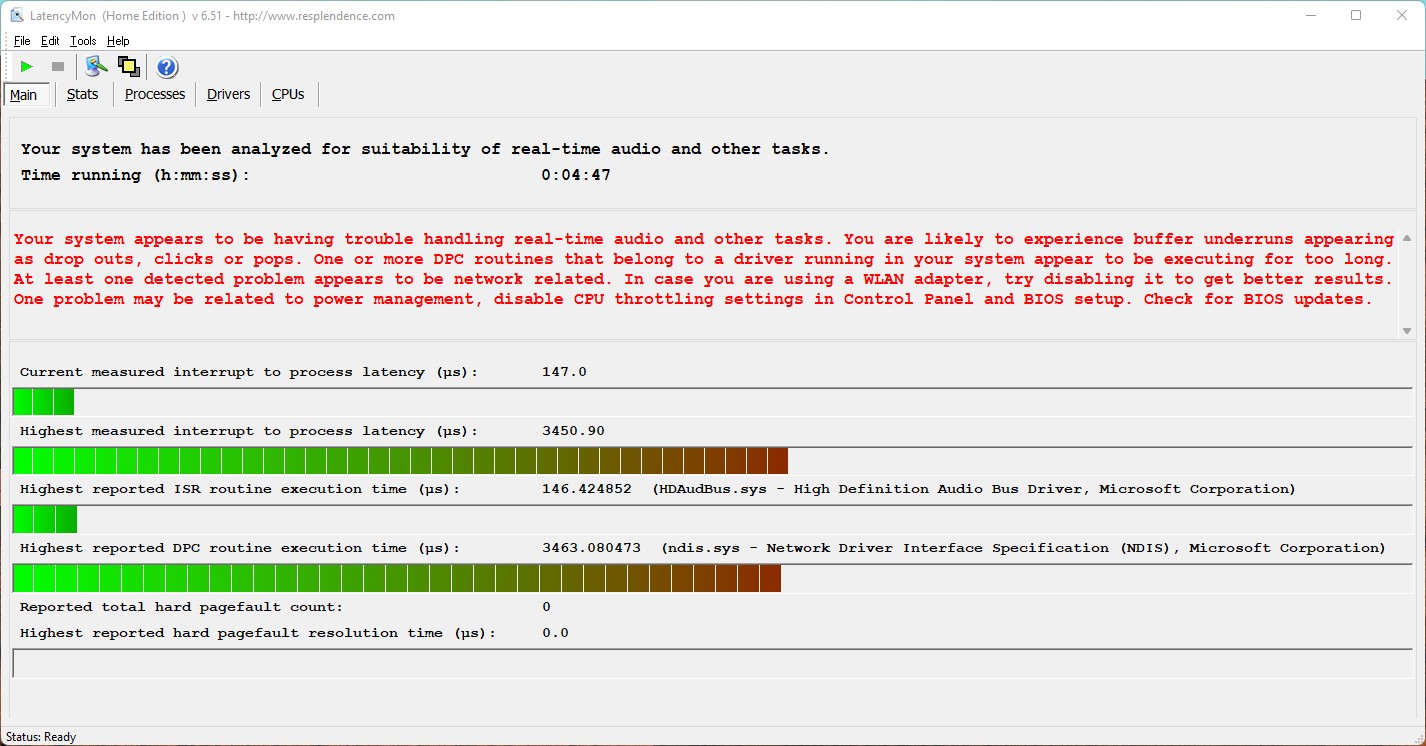
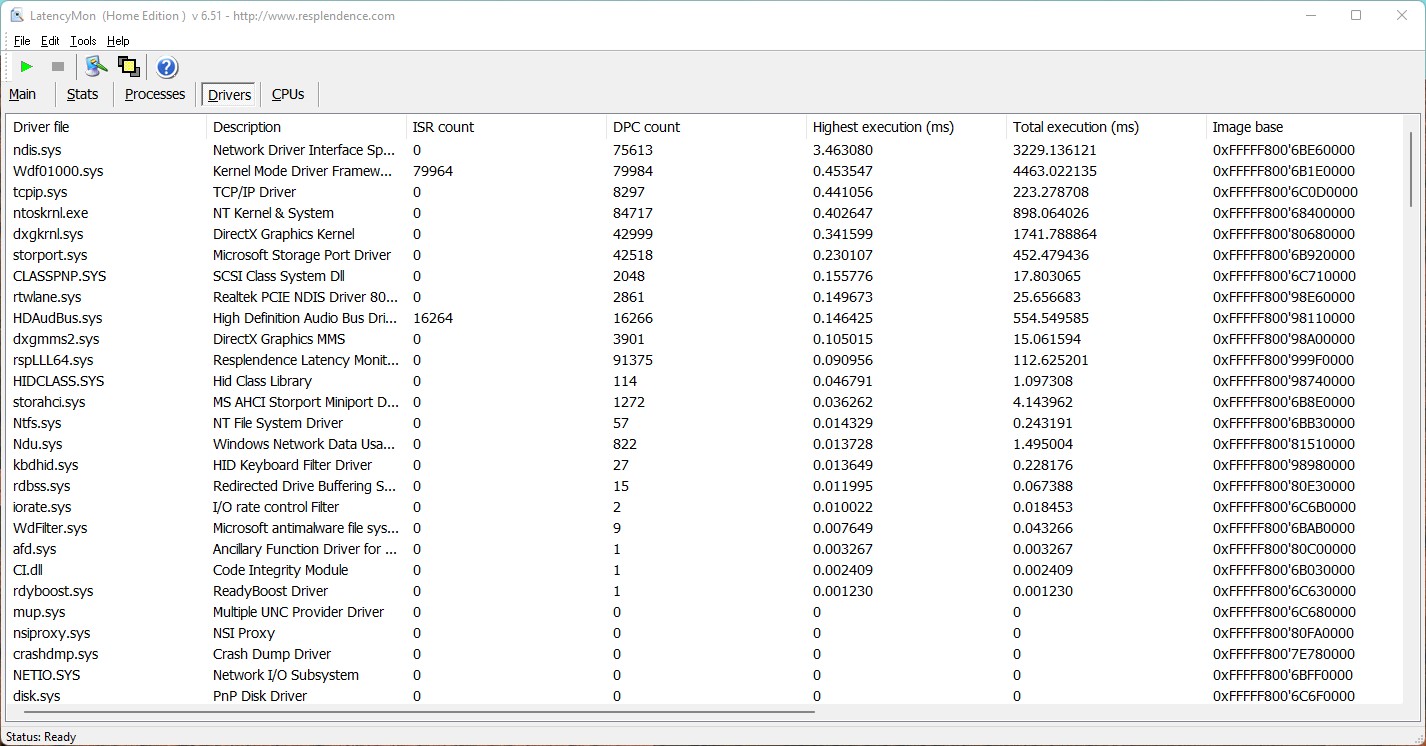
Opóźnienia DPC
Nasz standardowy test monitora latencji (surfowanie po sieci, odtwarzanie wideo 4k, Prime95 high load) ujawnia ekstremalne wartości w Aorus 17X AZF. Przyszłe aktualizacje oprogramowania powinny to poprawić, aby system nadawał się do edycji wideo i audio w czasie rzeczywistym bez ograniczeń.
| DPC Latencies / LatencyMon - interrupt to process latency (max), Web, Youtube, Prime95 | |
| Aorus 17X AZF | |
| MSI Titan GT77 HX 13VI | |
| MSI GE78HX 13VH-070US | |
| Alienware m18 R1 | |
| Medion Erazer Beast X40 | |
| HP Omen 17-ck2097ng | |
* ... im mniej tym lepiej
Urządzenia do przechowywania danych
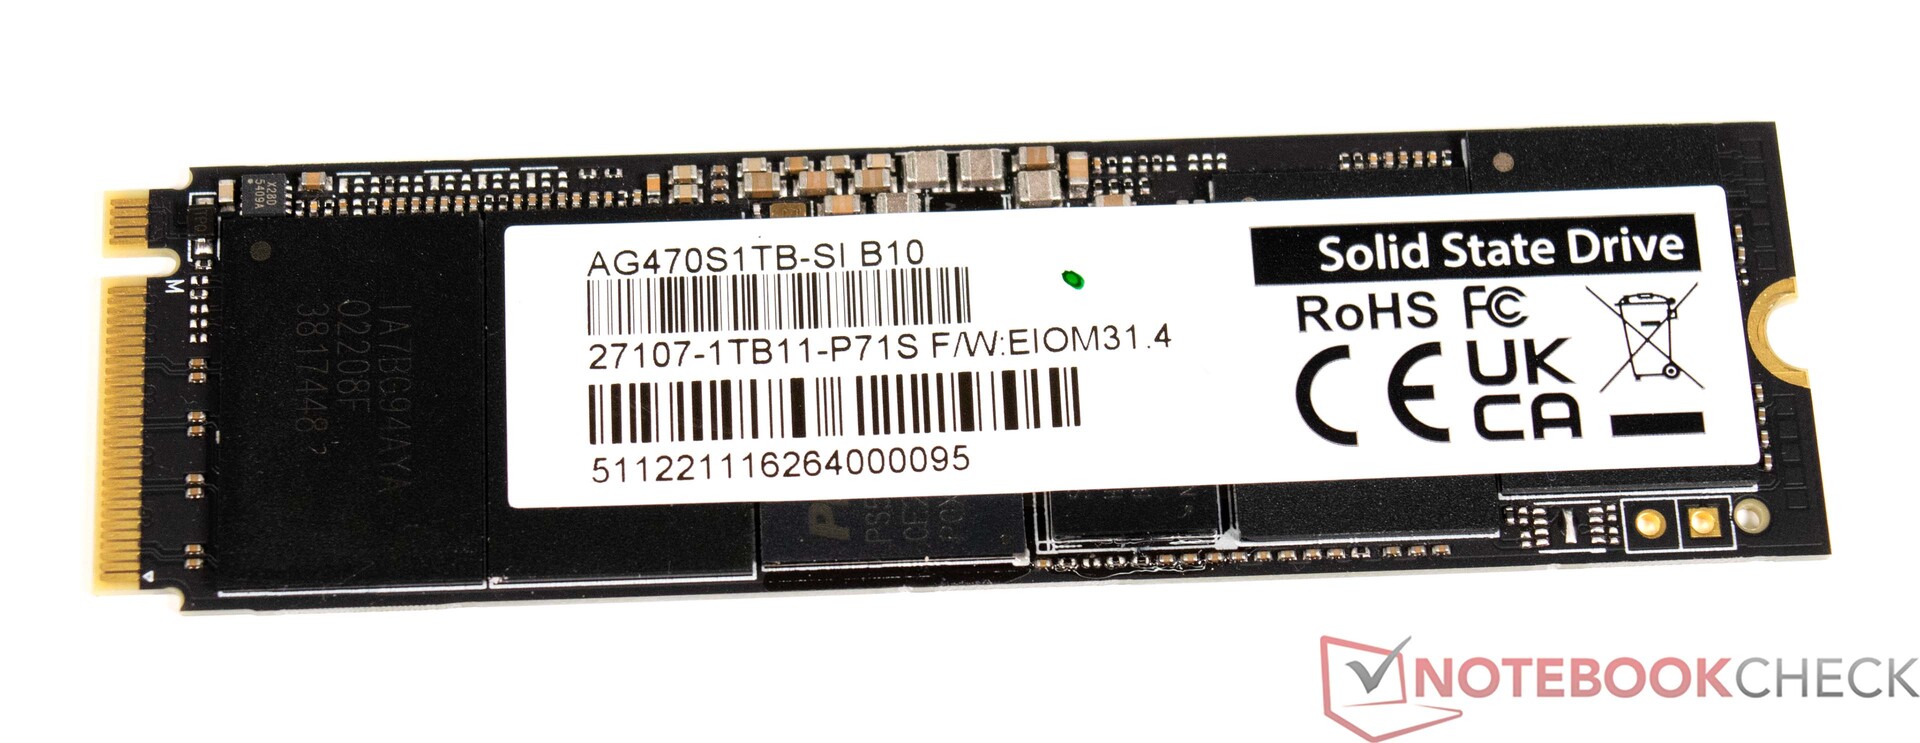
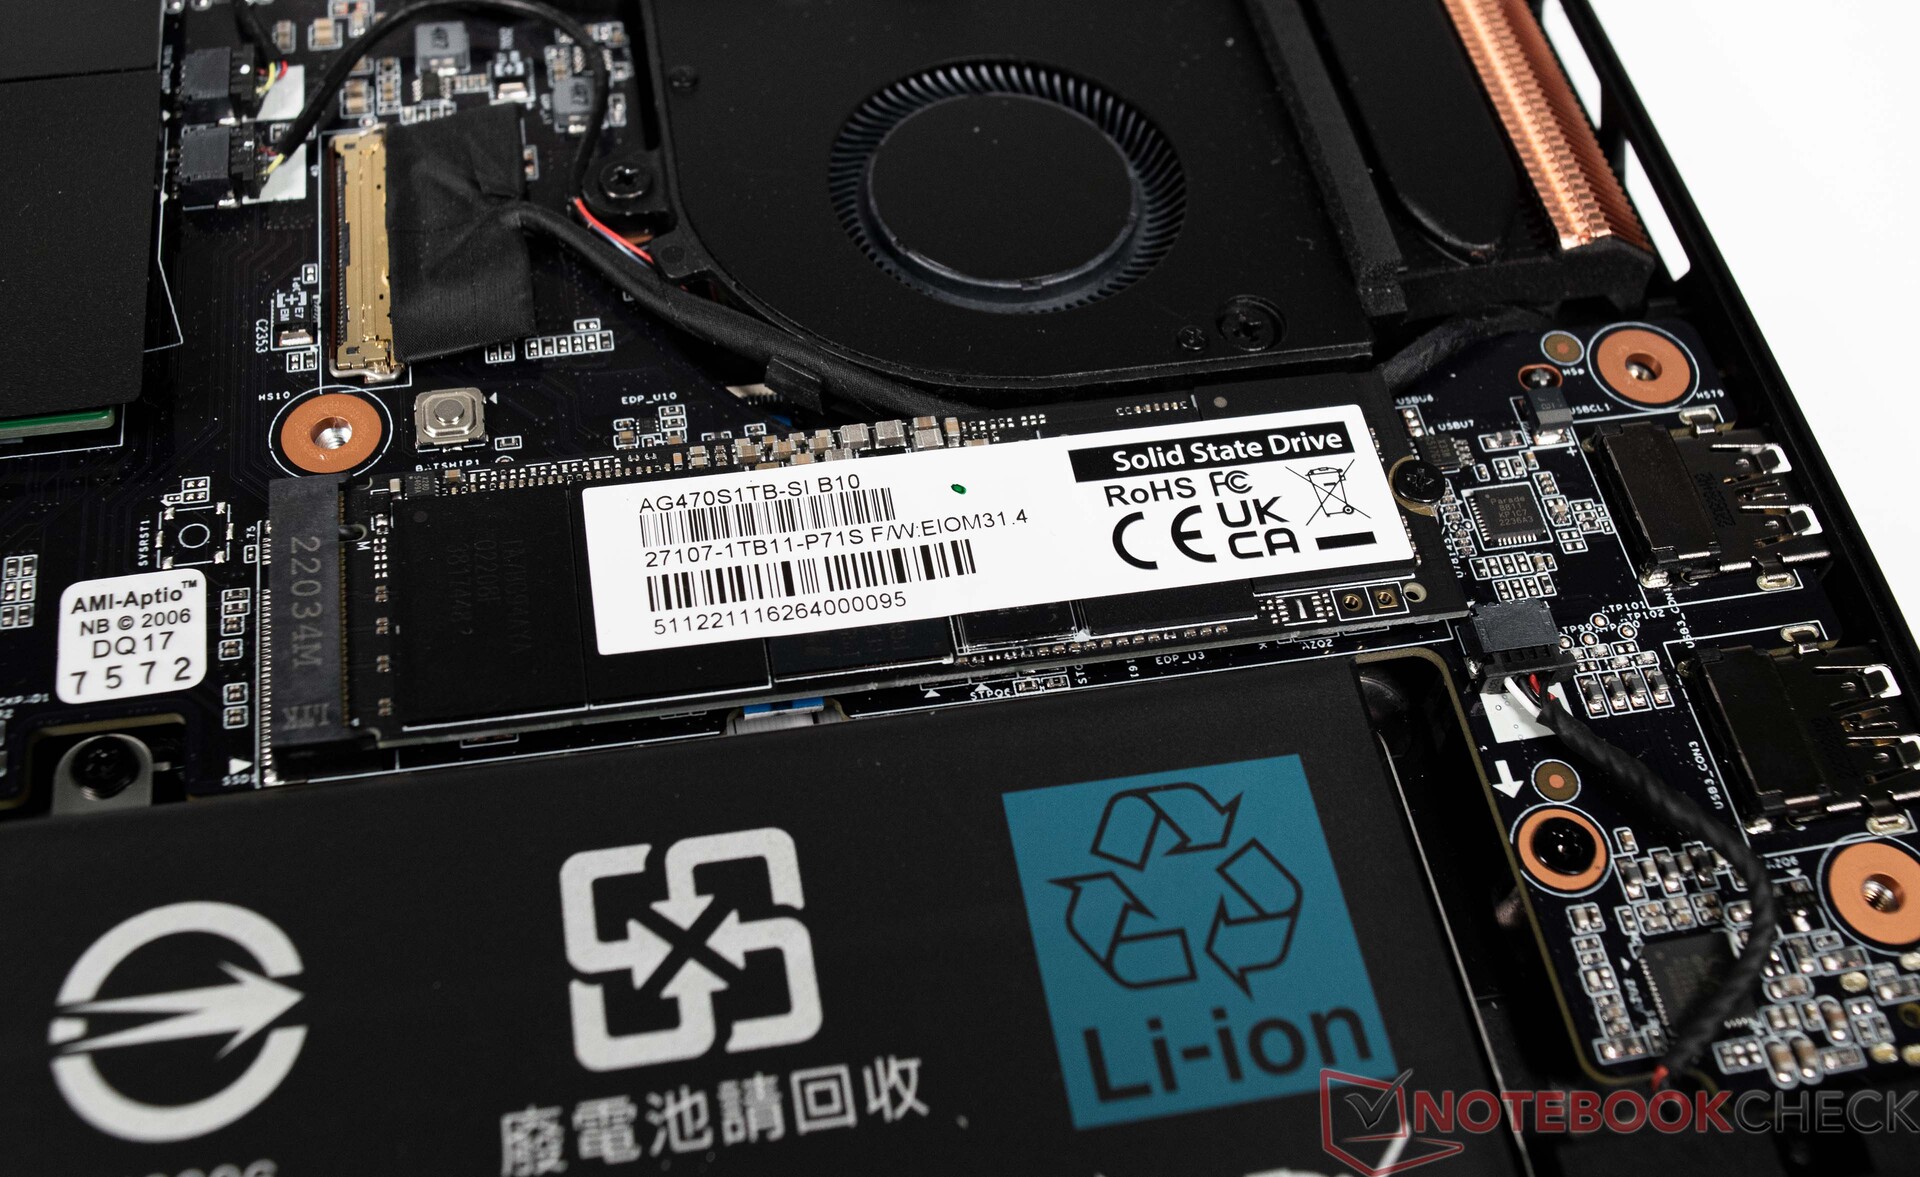
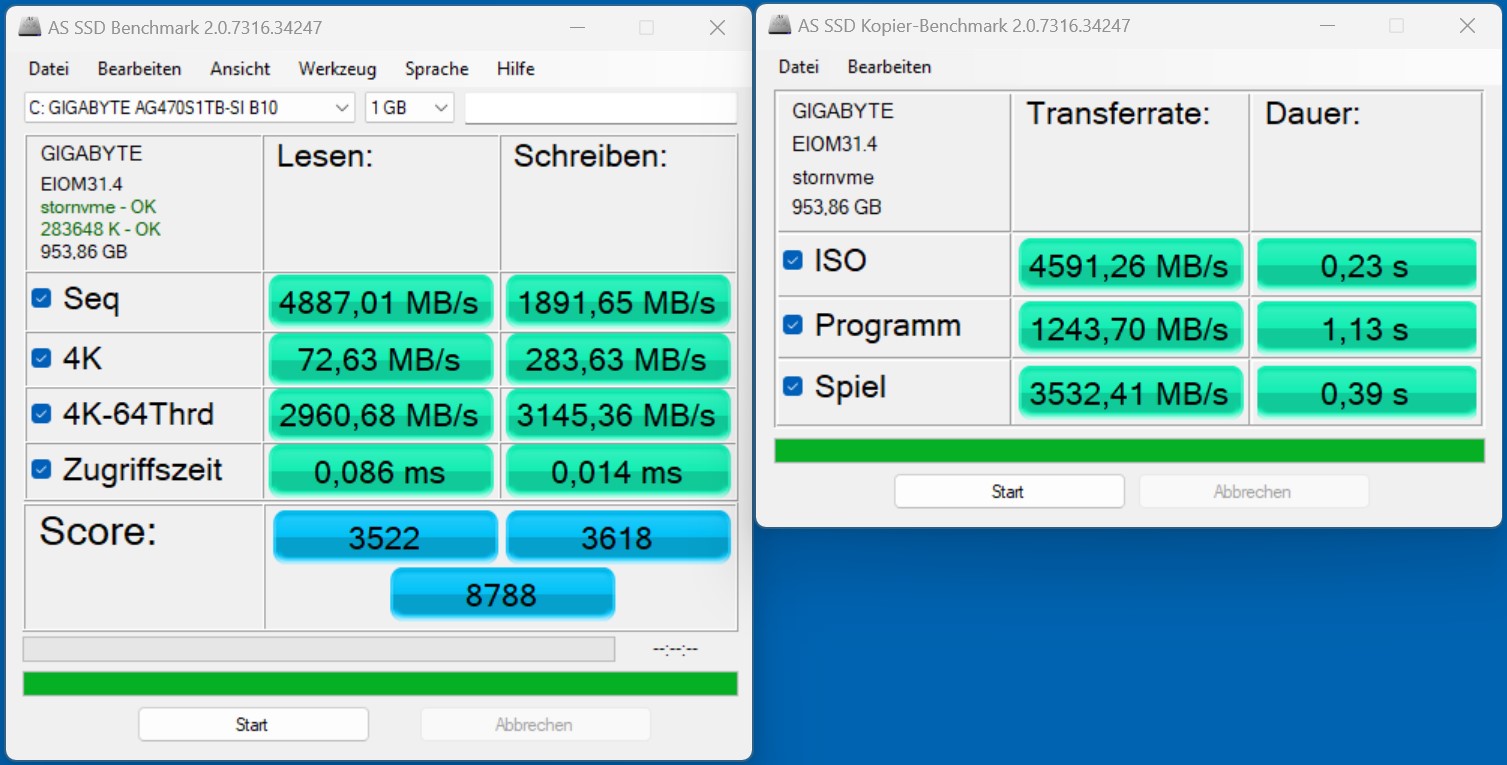
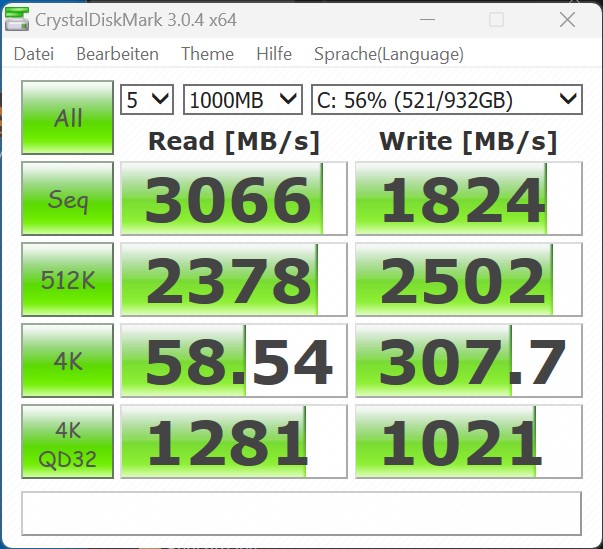
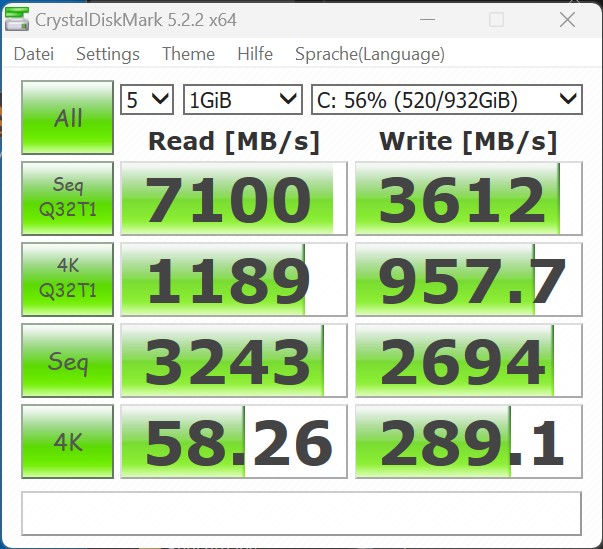
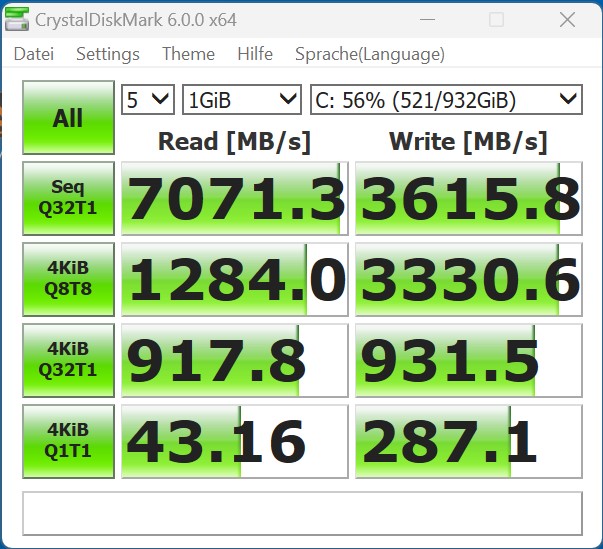
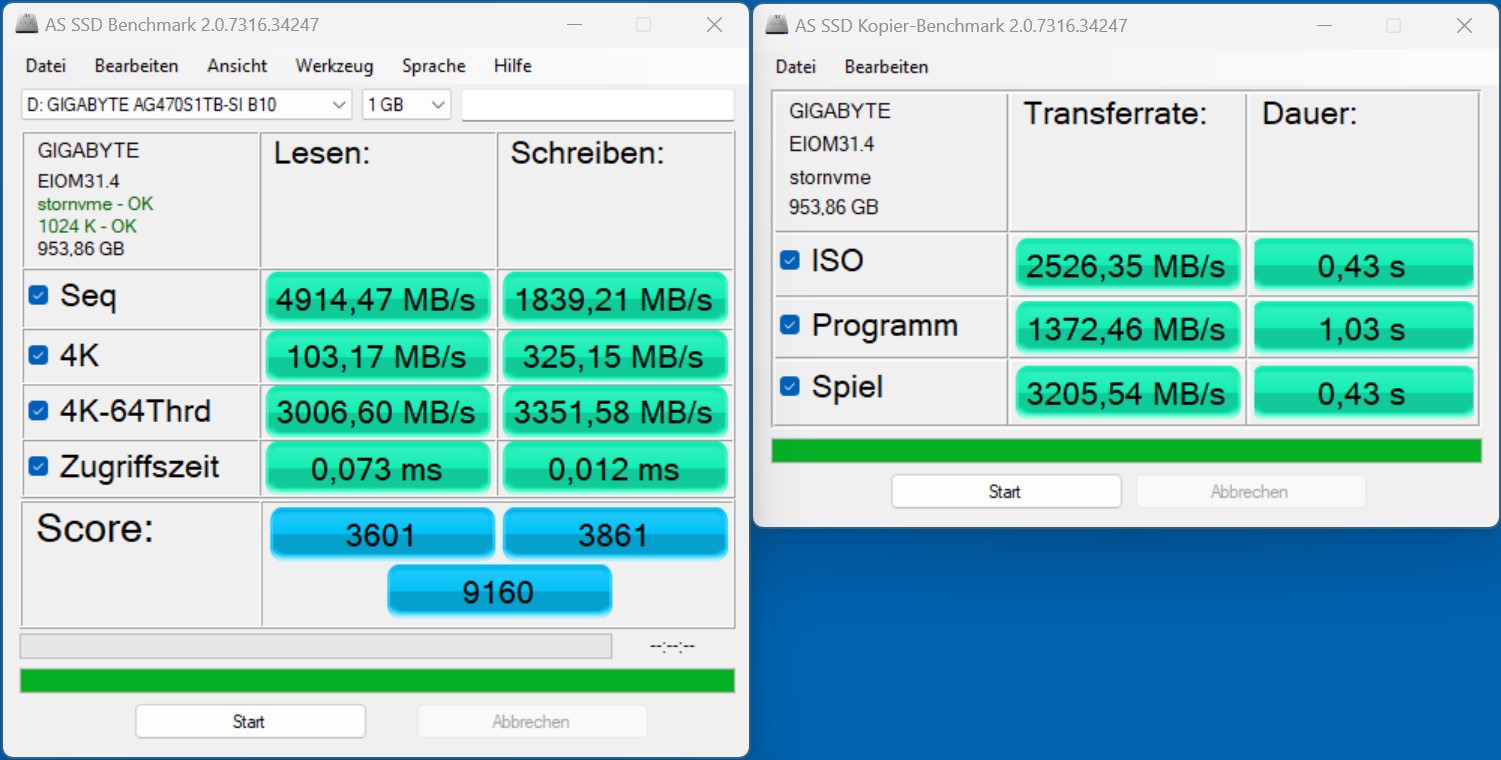
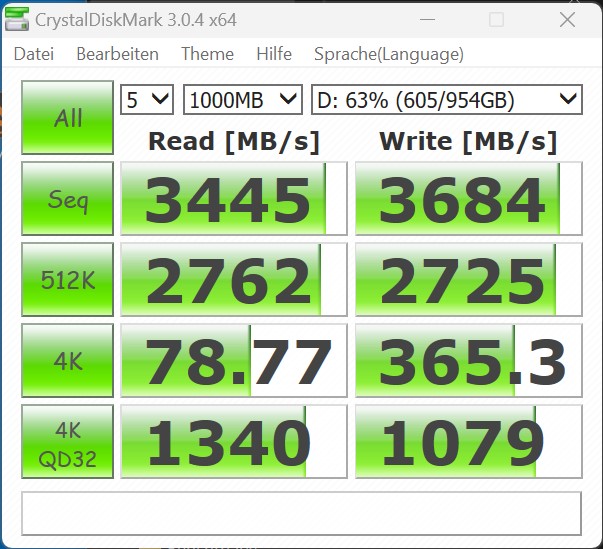
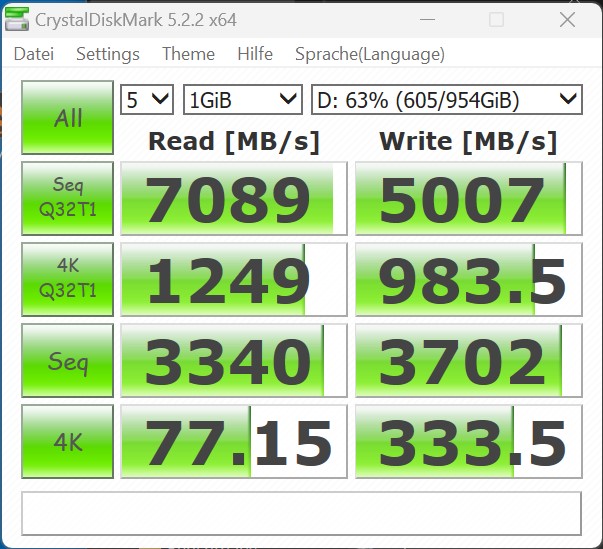
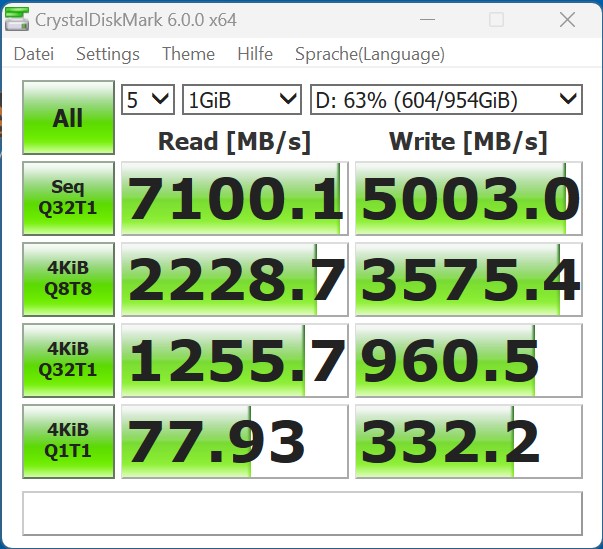
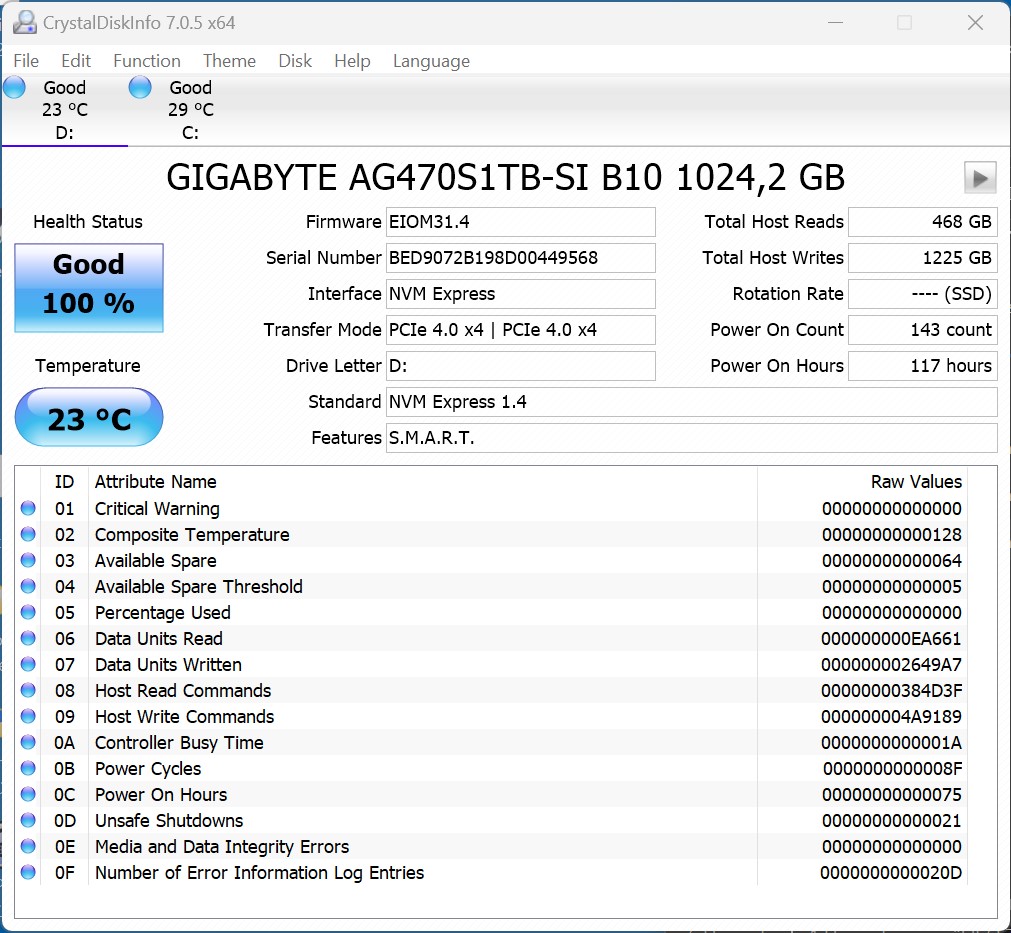
Aorus 17X AZF korzysta z autorskiego dysku SSD. Mówiąc dokładniej, nasz testowy egzemplarz oferuje dwa dyski SSD NVMe, każdy o pojemności 1 TB, co jest odpowiednie do jego przeznaczenia. Na dwóch pamięciach masowych można więc przechowywać mnóstwo danych. Oba dyski obsługują PCIe 4.0, a ponadto są połączone przez pełną przepustowość za pomocą czterech pasów. Wydajność jest solidna, nawet jeśli kilka urządzeń porównawczych wykazuje w niektórych przypadkach lepszą wydajność. Aorus 17X AZF jest już jednak w pełni wyposażony w dwa dyski SSD. Alternatywnie można oczywiście zainstalować w urządzeniu także modele 2 TB. Tymczasem spód obudowy jest wykorzystywany do efektywnego chłodzenia, więc urządzenie przeszło nasz test obciążeniowy z wynikiem pozytywnym.
Po więcej porównań i benchmarków odsyłamy do naszejtabela porównawcza tutaj.
SSD 1

SSD 2

* ... im mniej tym lepiej
Sustained Read Performance: DiskSpd Read Loop, Queue Depth 8
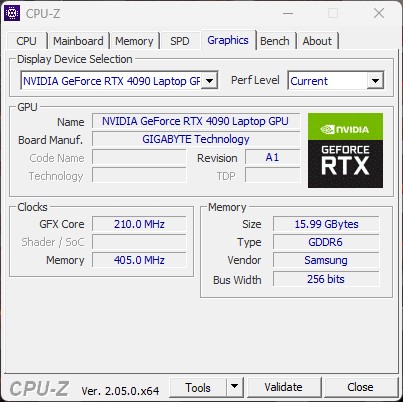
Karta graficzna
Aorus 17X AZF wykorzystuje.Nvidia GeForce RTX 4090 Laptop GPU, którego maksymalne możliwe TGP wynosi do 175 W (150 W + 25 W Dynamic Boost). Wydajność 3D jest odpowiednio dobra, choć konkurencyjne laptopy z tą samą kartą grafiki są w stanie przeważyć o nieco większej wydajności. Przepaść do Nvidia GeForce RTX 4080 laptop GPU jest znacznie większa i wynosi odpowiednio 9 i 18 procent. W porównaniu z Medion Erazer Beast, praktycznie widzimy tę samą wydajność w naszym Aorusie 17X AZF.
Więcej benchmarków dla GPU Nvidia GeForce RTX 4090 do laptopów można znaleźć tutaj.
| 3DMark 05 Standard | 61850 pkt. | |
| 3DMark 06 Standard Score | 61681 pkt. | |
| 3DMark 11 Performance | 43896 pkt. | |
| 3DMark Ice Storm Standard Score | 247981 pkt. | |
| 3DMark Cloud Gate Standard Score | 58934 pkt. | |
| 3DMark Fire Strike Score | 35428 pkt. | |
| 3DMark Fire Strike Extreme Score | 24235 pkt. | |
| 3DMark Time Spy Score | 20085 pkt. | |
Pomoc | ||
* ... im mniej tym lepiej
Wydajność w grach
Notebook został wyposażony w wyświetlacz o rozdzielczości QHD, co oznacza, że bez problemu można grać we wszystkie aktualne tytuły na maksymalnych detalach. Czasami zdarza się, że wydajność np.GPU Nvidia GeForce RTX 4090 w laptopiemoże bez problemu zasilić zewnętrzne wyświetlacze 4K w natywnej rozdzielczości. 16 GB VRAM jest dobre, przyszłościowe i nie stanowi wąskiego gardła, nawet w QHD. W naszych testach gier Aorus 17X AZF ląduje na solidnym trzecim miejscu. Wszyscy przedstawiciele, którzy wykorzystują m.in Nvidia GeForce RTX 4090 laptop GPUoferują podobny poziom wydajności.
| Performance rating - Percent | |
| Alienware m18 R1 | |
| MSI Titan GT77 HX 13VI | |
| Aorus 17X AZF | |
| Medion Erazer Beast X40 | |
| MSI GE78HX 13VH-070US | |
| HP Omen 17-ck2097ng | |
| Średnia w klasie Gaming | |
| The Witcher 3 - 1920x1080 Ultra Graphics & Postprocessing (HBAO+) | |
| Alienware m18 R1 | |
| Aorus 17X AZF | |
| MSI Titan GT77 HX 13VI | |
| Średnia w klasie Gaming (104.7 - 240, n=7, ostatnie 2 lata) | |
| Medion Erazer Beast X40 | |
| MSI GE78HX 13VH-070US | |
| HP Omen 17-ck2097ng | |
| GTA V - 1920x1080 Highest AA:4xMSAA + FX AF:16x | |
| Medion Erazer Beast X40 | |
| Alienware m18 R1 | |
| MSI Titan GT77 HX 13VI | |
| Aorus 17X AZF | |
| Średnia w klasie Gaming (48.3 - 186.9, n=94, ostatnie 2 lata) | |
| HP Omen 17-ck2097ng | |
| MSI GE78HX 13VH-070US | |
| Final Fantasy XV Benchmark - 1920x1080 High Quality | |
| Alienware m18 R1 | |
| MSI Titan GT77 HX 13VI | |
| Aorus 17X AZF | |
| Medion Erazer Beast X40 | |
| Średnia w klasie Gaming (41 - 215, n=95, ostatnie 2 lata) | |
| MSI GE78HX 13VH-070US | |
| HP Omen 17-ck2097ng | |
| Strange Brigade - 1920x1080 ultra AA:ultra AF:16 | |
| Aorus 17X AZF | |
| MSI Titan GT77 HX 13VI | |
| Alienware m18 R1 | |
| Medion Erazer Beast X40 | |
| Średnia w klasie Gaming (76.3 - 458, n=87, ostatnie 2 lata) | |
| HP Omen 17-ck2097ng | |
| MSI GE78HX 13VH-070US | |
| Dota 2 Reborn - 1920x1080 ultra (3/3) best looking | |
| Alienware m18 R1 | |
| MSI Titan GT77 HX 13VI | |
| Aorus 17X AZF | |
| Medion Erazer Beast X40 | |
| HP Omen 17-ck2097ng | |
| Średnia w klasie Gaming (84.8 - 248, n=107, ostatnie 2 lata) | |
| MSI GE78HX 13VH-070US | |
| F1 22 - 1920x1080 Ultra High Preset AA:T AF:16x | |
| Alienware m18 R1 | |
| MSI Titan GT77 HX 13VI | |
| Aorus 17X AZF | |
| Medion Erazer Beast X40 | |
| MSI GE78HX 13VH-070US | |
| HP Omen 17-ck2097ng | |
| Średnia w klasie Gaming (40.1 - 121.2, n=4, ostatnie 2 lata) | |
| The Callisto Protocol - 1920x1080 Ultra Preset (without FSR Upscaling) | |
| MSI Titan GT77 HX 13VI | |
| Aorus 17X AZF | |
| Przeciętny NVIDIA GeForce RTX 4090 Laptop GPU (102.6 - 150.7, n=6) | |
| Przeciętny NVIDIA GeForce RTX 4080 Laptop GPU (111.5 - 120.4, n=2) | |
| HP Omen 17-ck2097ng | |
| Atomic Heart - 1920x1080 Atomic Preset | |
| Przeciętny NVIDIA GeForce RTX 4090 Laptop GPU (128.6 - 166, n=3) | |
| Aorus 17X AZF | |
| Medion Erazer Beast X40 | |
| HP Omen 17-ck2097ng | |
| Przeciętny NVIDIA GeForce RTX 4080 Laptop GPU (n=1) | |
| Company of Heroes 3 - 1920x1080 Maximum Settings | |
| Aorus 17X AZF | |
| Przeciętny NVIDIA GeForce RTX 4090 Laptop GPU (215 - 235, n=2) | |
| Medion Erazer Beast X40 | |
| HP Omen 17-ck2097ng | |
| Przeciętny NVIDIA GeForce RTX 4080 Laptop GPU (n=1) | |
| Dead Space Remake - 1920x1080 Ultra Preset AA:T | |
| Aorus 17X AZF | |
| Przeciętny NVIDIA GeForce RTX 4090 Laptop GPU (129 - 140.8, n=2) | |
| MSI Titan GT77 HX 13VI | |
| Przeciętny NVIDIA GeForce RTX 4080 Laptop GPU (n=1) | |
| Średnia w klasie Gaming (n=1ostatnie 2 lata) | |
| Tiny Tina's Wonderlands - 1920x1080 Badass Preset (DX12) | |
| Alienware m18 R1 | |
| MSI Titan GT77 HX 13VI | |
| Przeciętny NVIDIA GeForce RTX 4090 Laptop GPU (141.1 - 189.4, n=14) | |
| Aorus 17X AZF | |
| Przeciętny NVIDIA GeForce RTX 4080 Laptop GPU (112.9 - 167.1, n=9) | |
| Średnia w klasie Gaming (55 - 159.4, n=4, ostatnie 2 lata) | |
| High On Life - 1920x1080 Very High Preset | |
| Aorus 17X AZF | |
| Przeciętny NVIDIA GeForce RTX 4090 Laptop GPU (180.3 - 185.2, n=2) | |
| Przeciętny NVIDIA GeForce RTX 4080 Laptop GPU (n=1) | |
| The Witcher 3 / High Graphics & Postprocessing (Nvidia HairWorks Off) | |
| Alienware m18 R1 | |
| MSI Titan GT77 HX 13VI | |
| Aorus 17X AZF | |
| MSI GE78HX 13VH-070US | |
| Przeciętny NVIDIA GeForce RTX 4090 Laptop GPU (290 - 449, n=23) | |
| Średnia w klasie Gaming (341 - 404, n=2, ostatnie 2 lata) | |
| Medion Erazer Beast X40 | |
| HP Omen 17-ck2097ng | |
| The Witcher 3 / Ultra Graphics & Postprocessing (HBAO+) | |
| Alienware m18 R1 | |
| Aorus 17X AZF | |
| MSI Titan GT77 HX 13VI | |
| Przeciętny NVIDIA GeForce RTX 4090 Laptop GPU (139.2 - 216, n=35) | |
| Średnia w klasie Gaming (104.7 - 240, n=7, ostatnie 2 lata) | |
| Medion Erazer Beast X40 | |
| MSI GE78HX 13VH-070US | |
| HP Omen 17-ck2097ng | |
Aby sprawdzić, czy liczba klatek na sekundę pozostaje stabilna i stała przez dłuższy czas, uruchomiliśmy "The Witcher 3" przez 60 minut w rozdzielczości Full HD i na maksymalnych detalach. Postać w grze nie była poruszana. Częstotliwość odświeżania jest stała, co ujawnia wykres.
Witcher 3 FPS chart
| low | med. | high | ultra | QHD | 4K | |
|---|---|---|---|---|---|---|
| GTA V (2015) | 187 | 186.1 | 182.2 | 135.3 | 132.9 | 174.3 |
| The Witcher 3 (2015) | 554.3 | 506.7 | 395.8 | 200 | 145.9 | |
| Dota 2 Reborn (2015) | 235.6 | 199.8 | 191.6 | 176.1 | 175.75 | |
| Final Fantasy XV Benchmark (2018) | 222 | 205 | 177.6 | 152.4 | 89.9 | |
| X-Plane 11.11 (2018) | 195.9 | 173.5 | 138.5 | 118.5 | ||
| Far Cry 5 (2018) | 186 | 170 | 161 | 162 | 152 | 98 |
| Strange Brigade (2018) | 527 | 441 | 414 | 386 | 300 | 154.6 |
| Shadow of the Tomb Raider (2018) | 247 | 219 | 210 | 198.6 | 162.5 | 95.2 |
| Far Cry New Dawn (2019) | 170 | 148 | 145 | 131 | 128 | 102 |
| Metro Exodus (2019) | 187.7 | 160.6 | 134.5 | 112.9 | 98 | 68.6 |
| Borderlands 3 (2019) | 208 | 182.1 | 163.6 | 146.5 | 115.8 | 67.9 |
| F1 2020 (2020) | 413 | 354 | 344 | 305 | 253 | 148.7 |
| F1 2021 (2021) | 466 | 421 | 356 | 204 | 182.7 | 107.8 |
| Far Cry 6 (2021) | 175.7 | 154.3 | 136.3 | 128.9 | 115.1 | 73.1 |
| God of War (2022) | 176.8 | 176.7 | 166.8 | 123.6 | 101.5 | 72.7 |
| GRID Legends (2022) | 227 | 209 | 190.1 | 183.2 | 178.9 | 128.6 |
| Tiny Tina's Wonderlands (2022) | 320 | 263 | 194 | 158.3 | 112.5 | 65.7 |
| F1 22 (2022) | 315 | 299 | 283 | 128.9 | 83.5 | 43 |
| The Callisto Protocol (2022) | 193.3 | 168.2 | 166.4 | 131.1 | 101.3 | 61.6 |
| High On Life (2023) | 277 | 246 | 211 | 185.2 | 126.1 | 56.9 |
| Dead Space Remake (2023) | 153.4 | 150.7 | 142.3 | 140.8 | 105.6 | 56.2 |
| Hogwarts Legacy (2023) | 116 | 100.7 | 93.7 | 89.7 | 80.9 | 50.5 |
| Returnal (2023) | 195 | 191 | 176 | 155 | 119 | 70 |
| Atomic Heart (2023) | 217 | 187.1 | 166.6 | 138.5 | 107.8 | 62.7 |
| Company of Heroes 3 (2023) | 308.5 | 280.4 | 239.6 | 235.2 | 194.8 | 117.4 |
| Resident Evil 4 Remake (2023) | 232 | 189.7 | 187.3 | 136.3 | 109.2 | 63.4 |
| The Last of Us (2023) | 113.7 | 110.8 | 109 | 105 | 81.8 | 43.8 |
Emisje - Aorus 17X AZF też może być cichy
Hałas
Podczas bezczynności i codziennego użytkowania (biuro i internet) cztery wentylatory często kręcą się z niewielką prędkością. Przy poziomie do 34 dB(A) Aorus 17X AZF jest bardzo znośny. Pod obciążeniem potrafi momentami zrobić się bardzo głośny, przy czym w naszym teście obciążeniowym odnotowaliśmy maksymalne wartości 54 dB(A). Dodatkowo wentylatory wytwarzają dźwięk o wysokiej częstotliwości, co subiektywnie sprawia, że głośność jest jeszcze większa.
W zasadzie Aorus 17X AZF pozwala również na niemal bezgłośną pracę. Wymaga to zastosowania profili Meeting mode lub Energy-saving sleep mode, które można wybrać za pośrednictwem GCC (Gigabyte Control Center). Uzyskana w ten sposób redukcja poboru mocy procesora jest nadal wystarczająca do codziennego użytkowania.
GCC może być również wykorzystane do ręcznego sterowania wentylatorem. Oprócz predefiniowanych profili, można użyć własnych krzywych wentylatora.
Hałas
| luz |
| 28 / 29 / 34 dB |
| obciążenie |
| 51 / 54 dB |
 | ||
30 dB cichy 40 dB(A) słyszalny 50 dB(A) irytujący |
||
min: | ||
| Aorus 17X AZF i9-13900HX, GeForce RTX 4090 Laptop GPU | Medion Erazer Beast X40 i9-13900HX, GeForce RTX 4090 Laptop GPU | MSI GE78HX 13VH-070US i9-13950HX, GeForce RTX 4080 Laptop GPU | HP Omen 17-ck2097ng i9-13900HX, GeForce RTX 4080 Laptop GPU | MSI Titan GT77 HX 13VI i9-13950HX, GeForce RTX 4090 Laptop GPU | Alienware m18 R1 i9-13980HX, GeForce RTX 4090 Laptop GPU | |
|---|---|---|---|---|---|---|
| Noise | 4% | 7% | 4% | 1% | 16% | |
| wyłączone / środowisko * (dB) | 25 | 24 4% | 23.4 6% | 24 4% | 24.6 2% | 22.8 9% |
| Idle Minimum * (dB) | 28 | 25 11% | 24.2 14% | 31 -11% | 29.2 -4% | 23 18% |
| Idle Average * (dB) | 29 | 29 -0% | 25.6 12% | 32 -10% | 29.2 -1% | 23 21% |
| Idle Maximum * (dB) | 34 | 35 -3% | 31 9% | 33 3% | 29.2 14% | 23 32% |
| Load Average * (dB) | 51 | 51 -0% | 43.3 15% | 45 12% | 50.7 1% | 35.6 30% |
| Witcher 3 ultra * (dB) | 57 | 51 11% | 56.3 1% | 45 21% | 53.3 6% | 51.3 10% |
| Load Maximum * (dB) | 54 | 53 2% | 59.1 -9% | 50 7% | 61 -13% | 56.7 -5% |
* ... im mniej tym lepiej
Temperatura
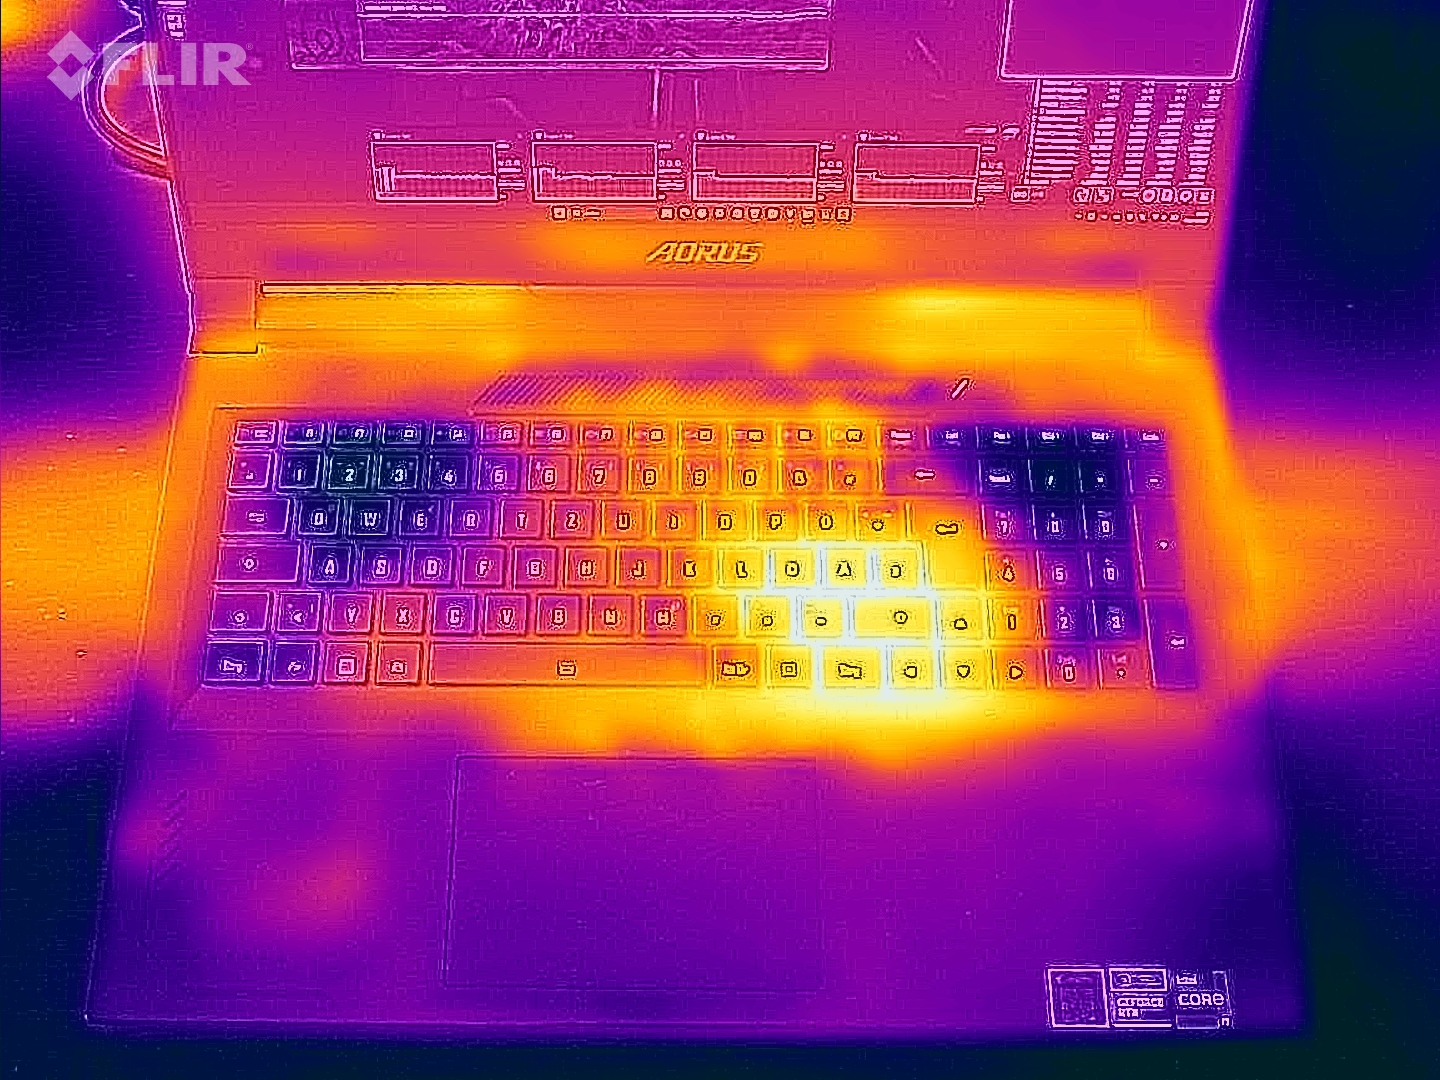
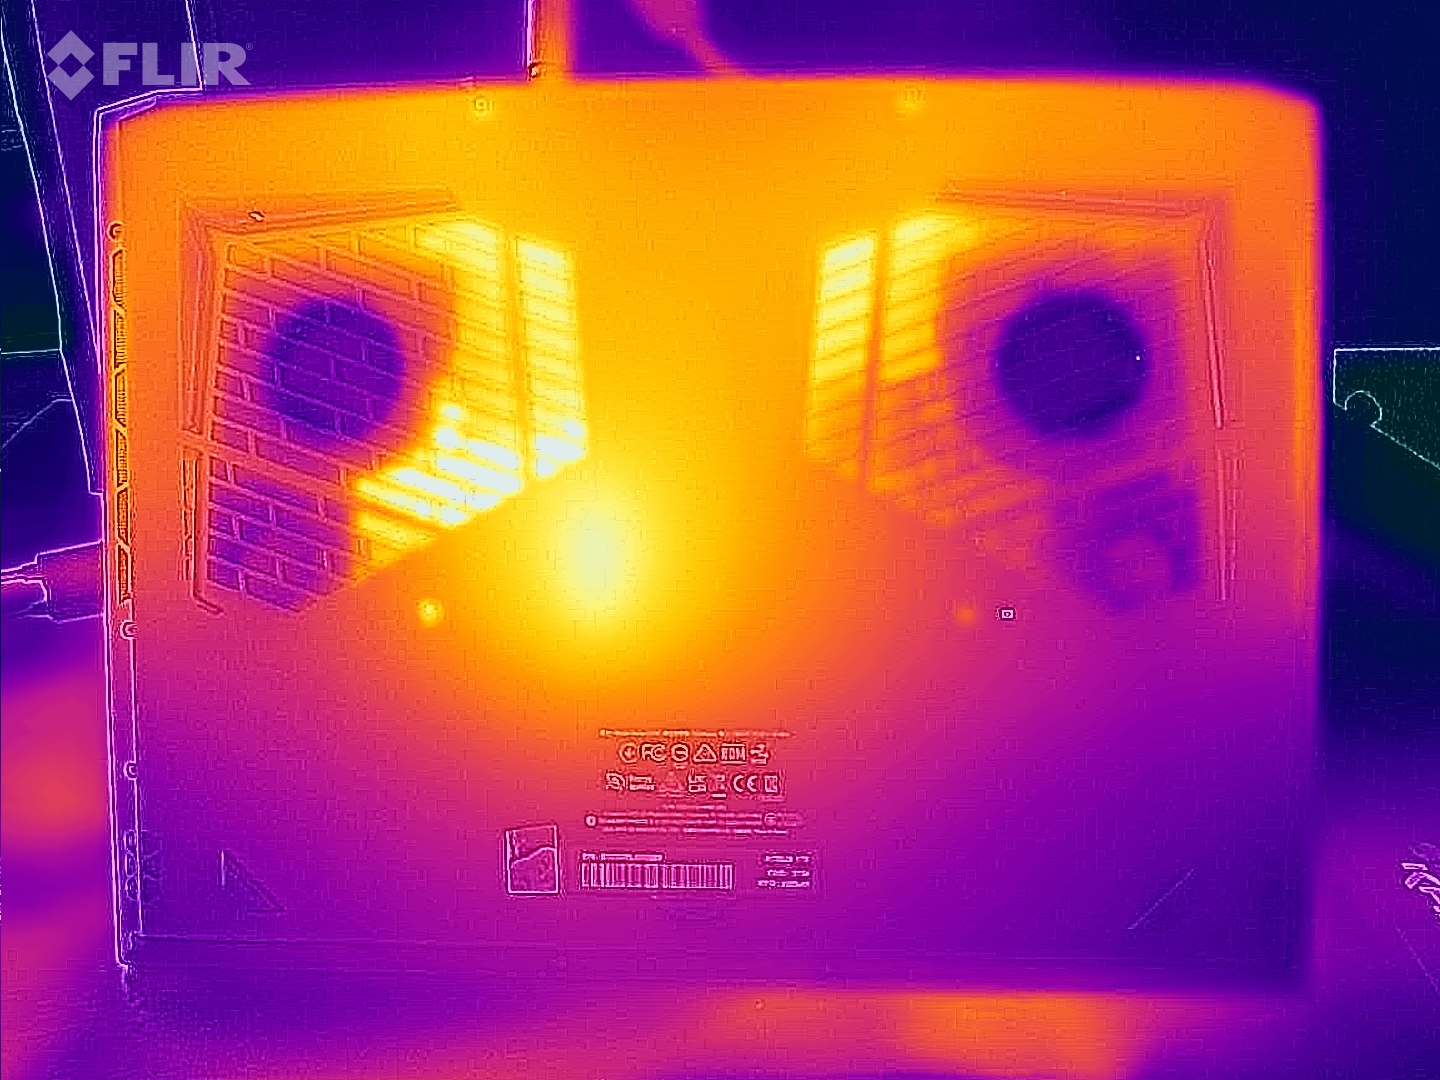
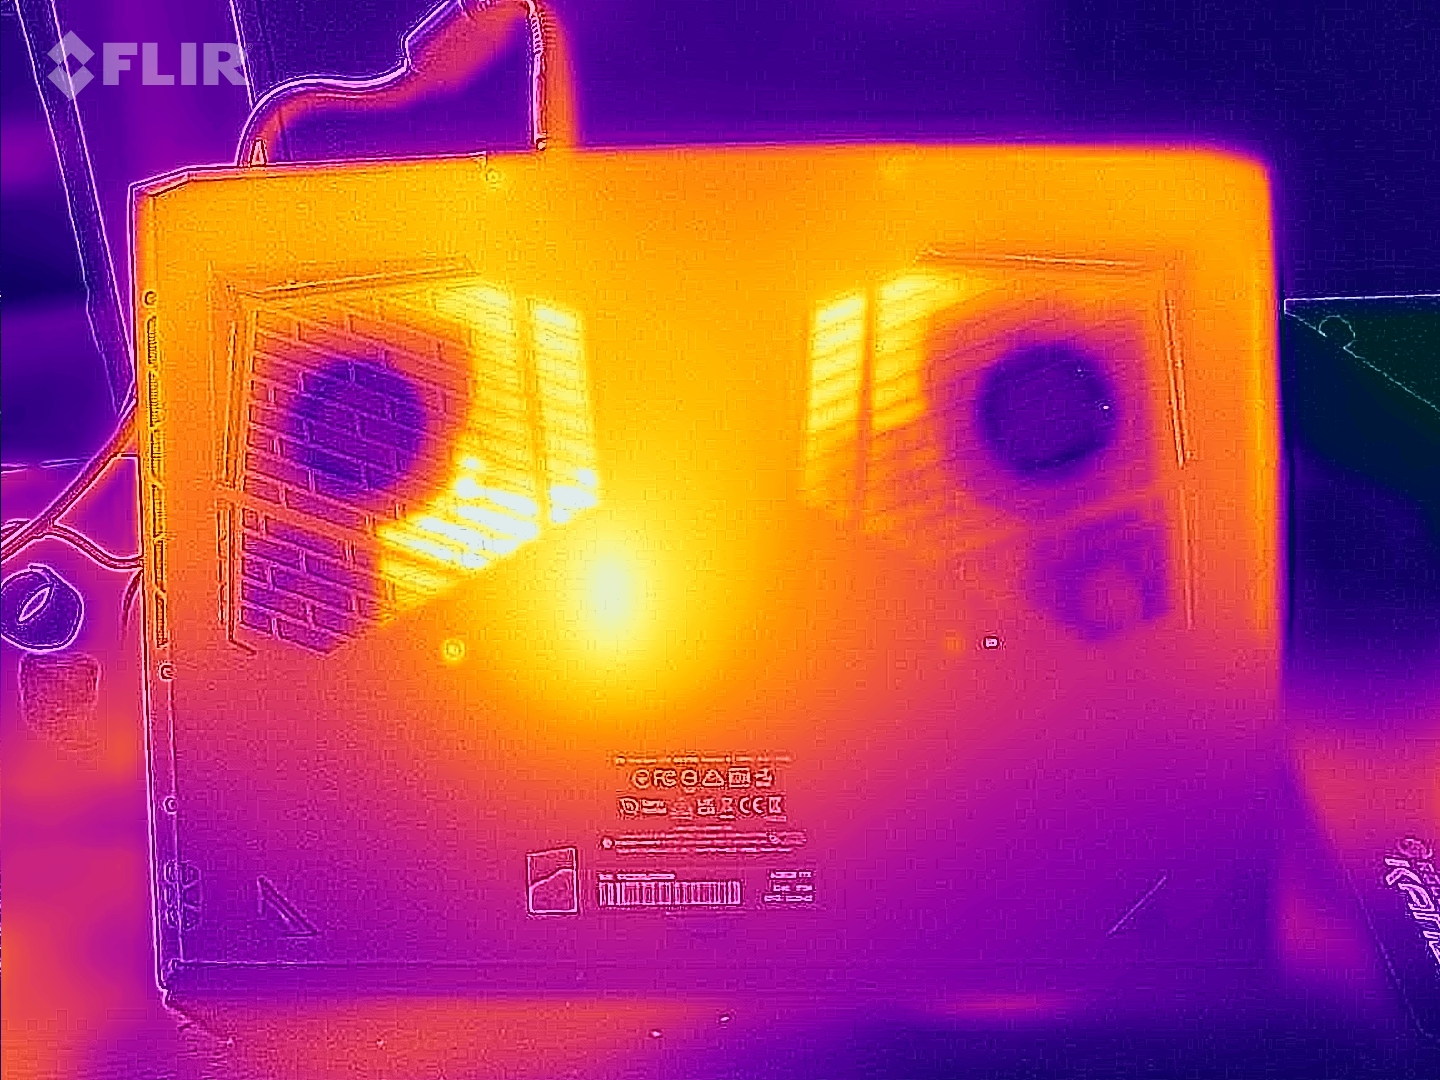
Wysokie temperatury obudowy nie zostały zaobserwowane podczas zwykłego, codziennego użytkowania w biurze i przy korzystaniu z internetu. Dopiero pod obciążeniem, np. podczas stress testów lub gier, notebook nagrzewa się znacząco. Najwyższe wskaźniki zarejestrowaliśmy na spodzie i w okolicach wylotów wentylatorów.
(-) Maksymalna temperatura w górnej części wynosi 47 °C / 117 F, w porównaniu do średniej 40.4 °C / 105 F , począwszy od 21.2 do 68.8 °C dla klasy Gaming.
(-) Dno nagrzewa się maksymalnie do 51 °C / 124 F, w porównaniu do średniej 43.2 °C / 110 F
(+) W stanie bezczynności średnia temperatura górnej części wynosi 28.1 °C / 83 F, w porównaniu ze średnią temperaturą urządzenia wynoszącą 33.9 °C / ### class_avg_f### F.
(±) Podczas gry w Wiedźmina 3 średnia temperatura górnej części wynosi 38 °C / 100 F, w porównaniu do średniej temperatury urządzenia wynoszącej 33.9 °C / ## #class_avg_f### F.
(+) Podparcia dłoni i touchpad osiągają maksymalną temperaturę skóry (34 °C / 93.2 F) i dlatego nie są gorące.
(-) Średnia temperatura obszaru podparcia dłoni w podobnych urządzeniach wynosiła 28.8 °C / 83.8 F (-5.2 °C / -9.4 F).
| Aorus 17X AZF Intel Core i9-13900HX, NVIDIA GeForce RTX 4090 Laptop GPU | Medion Erazer Beast X40 Intel Core i9-13900HX, NVIDIA GeForce RTX 4090 Laptop GPU | MSI GE78HX 13VH-070US Intel Core i9-13950HX, NVIDIA GeForce RTX 4080 Laptop GPU | HP Omen 17-ck2097ng Intel Core i9-13900HX, NVIDIA GeForce RTX 4080 Laptop GPU | MSI Titan GT77 HX 13VI Intel Core i9-13950HX, NVIDIA GeForce RTX 4090 Laptop GPU | Alienware m18 R1 Intel Core i9-13980HX, NVIDIA GeForce RTX 4090 Laptop GPU | |
|---|---|---|---|---|---|---|
| Heat | -1% | 7% | 13% | 12% | 15% | |
| Maximum Upper Side * (°C) | 47 | 48 -2% | 37.4 20% | 41 13% | 40.6 14% | 39 17% |
| Maximum Bottom * (°C) | 51 | 52 -2% | 45 12% | 51 -0% | 41.1 19% | 36.4 29% |
| Idle Upper Side * (°C) | 30 | 30 -0% | 29.8 1% | 24 20% | 26.2 13% | 29.2 3% |
| Idle Bottom * (°C) | 31 | 31 -0% | 32.4 -5% | 25 19% | 30.3 2% | 27.8 10% |
* ... im mniej tym lepiej
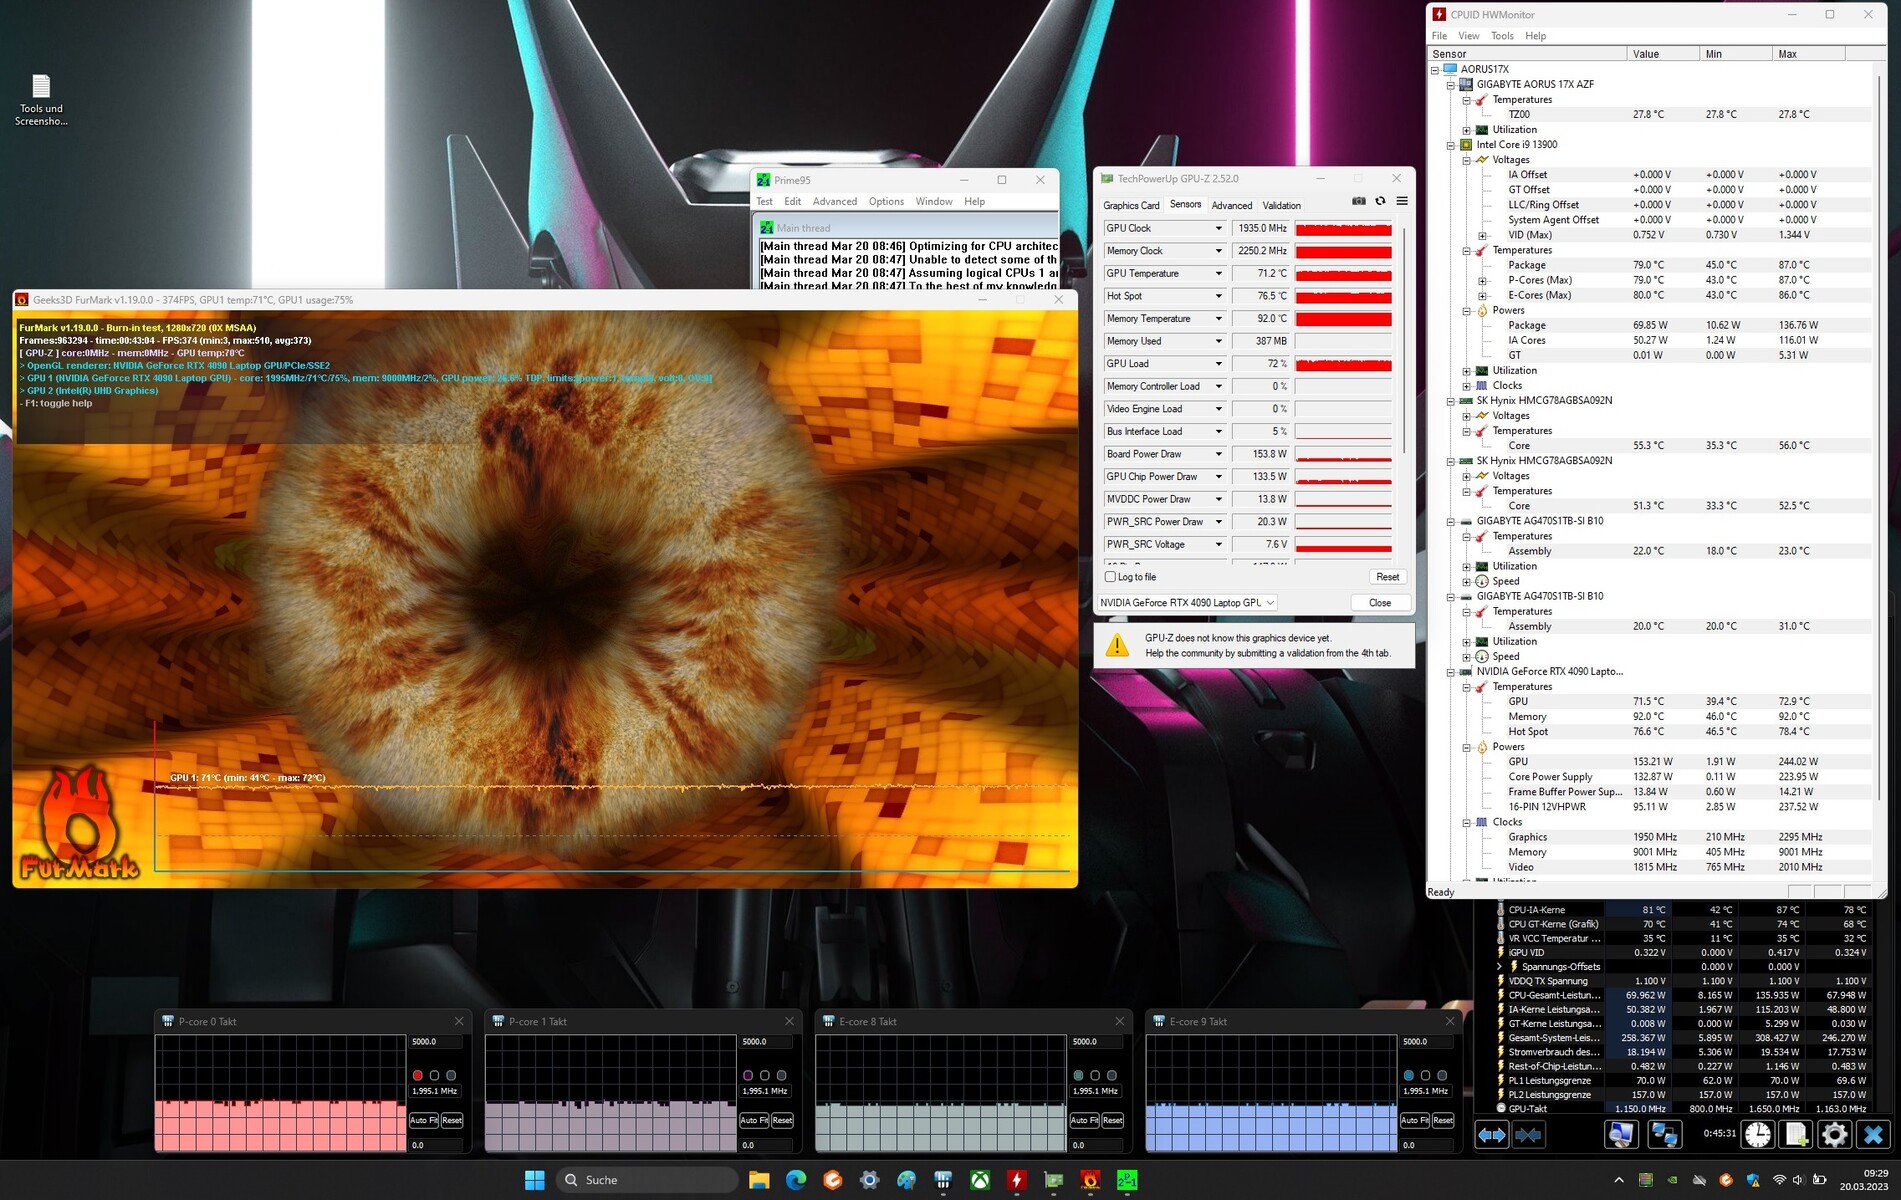
Stress Test
Test stresu, który symulujemy za pomocą Prime95 i Furmark w trybie ciągłym, reprezentuje ekstremalny scenariusz sprawdzania stabilności systemu pod pełnym obciążeniem. Procesor startuje z wysokim taktowaniem, które po krótkim czasie zostaje zdławione, ponieważ PL2 nie może być utrzymane na stałe. Rdzenie P i E w Intel Core i7 13900HX pracują konsekwentnie z częstotliwością nieco poniżej 2 GHz przez długi czas.
Mówcy
Głośniki stereo wytwarzają solidny dźwięk, ale basy są mniej imponujące ze względu na brak głośności. Dla lepszych wrażeń dźwiękowych zalecane są słuchawki lub zewnętrzny system głośników.
Aorus 17X AZF analiza dźwięku
(+) | głośniki mogą odtwarzać stosunkowo głośno (83 dB)
Bas 100 - 315 Hz
(-) | prawie brak basu - średnio 27.1% niższa od mediany
(±) | liniowość basu jest średnia (13% delta do poprzedniej częstotliwości)
Średnie 400 - 2000 Hz
(+) | zbalansowane środki średnie - tylko 4.5% od mediany
(+) | średnie są liniowe (5% delta do poprzedniej częstotliwości)
Wysokie 2–16 kHz
(+) | zrównoważone maksima - tylko 1.4% od mediany
(+) | wzloty są liniowe (4.3% delta do poprzedniej częstotliwości)
Ogólnie 100 - 16.000 Hz
(±) | liniowość ogólnego dźwięku jest średnia (17.9% różnicy w stosunku do mediany)
W porównaniu do tej samej klasy
» 55% wszystkich testowanych urządzeń w tej klasie było lepszych, 9% podobnych, 37% gorszych
» Najlepszy miał deltę 6%, średnia wynosiła ###średnia###%, najgorsza wynosiła 132%
W porównaniu do wszystkich testowanych urządzeń
» 37% wszystkich testowanych urządzeń było lepszych, 8% podobnych, 55% gorszych
» Najlepszy miał deltę 4%, średnia wynosiła ###średnia###%, najgorsza wynosiła 134%
Medion Erazer Beast X40 analiza dźwięku
(+) | głośniki mogą odtwarzać stosunkowo głośno (88 dB)
Bas 100 - 315 Hz
(-) | prawie brak basu - średnio 20.2% niższa od mediany
(±) | liniowość basu jest średnia (8.4% delta do poprzedniej częstotliwości)
Średnie 400 - 2000 Hz
(±) | wyższe średnie - średnio 5.5% wyższe niż mediana
(+) | średnie są liniowe (6.5% delta do poprzedniej częstotliwości)
Wysokie 2–16 kHz
(+) | zrównoważone maksima - tylko 3.1% od mediany
(+) | wzloty są liniowe (5.8% delta do poprzedniej częstotliwości)
Ogólnie 100 - 16.000 Hz
(±) | liniowość ogólnego dźwięku jest średnia (16.1% różnicy w stosunku do mediany)
W porównaniu do tej samej klasy
» 39% wszystkich testowanych urządzeń w tej klasie było lepszych, 7% podobnych, 54% gorszych
» Najlepszy miał deltę 6%, średnia wynosiła ###średnia###%, najgorsza wynosiła 132%
W porównaniu do wszystkich testowanych urządzeń
» 26% wszystkich testowanych urządzeń było lepszych, 5% podobnych, 69% gorszych
» Najlepszy miał deltę 4%, średnia wynosiła ###średnia###%, najgorsza wynosiła 134%
Zarządzanie energią
Pobór mocy
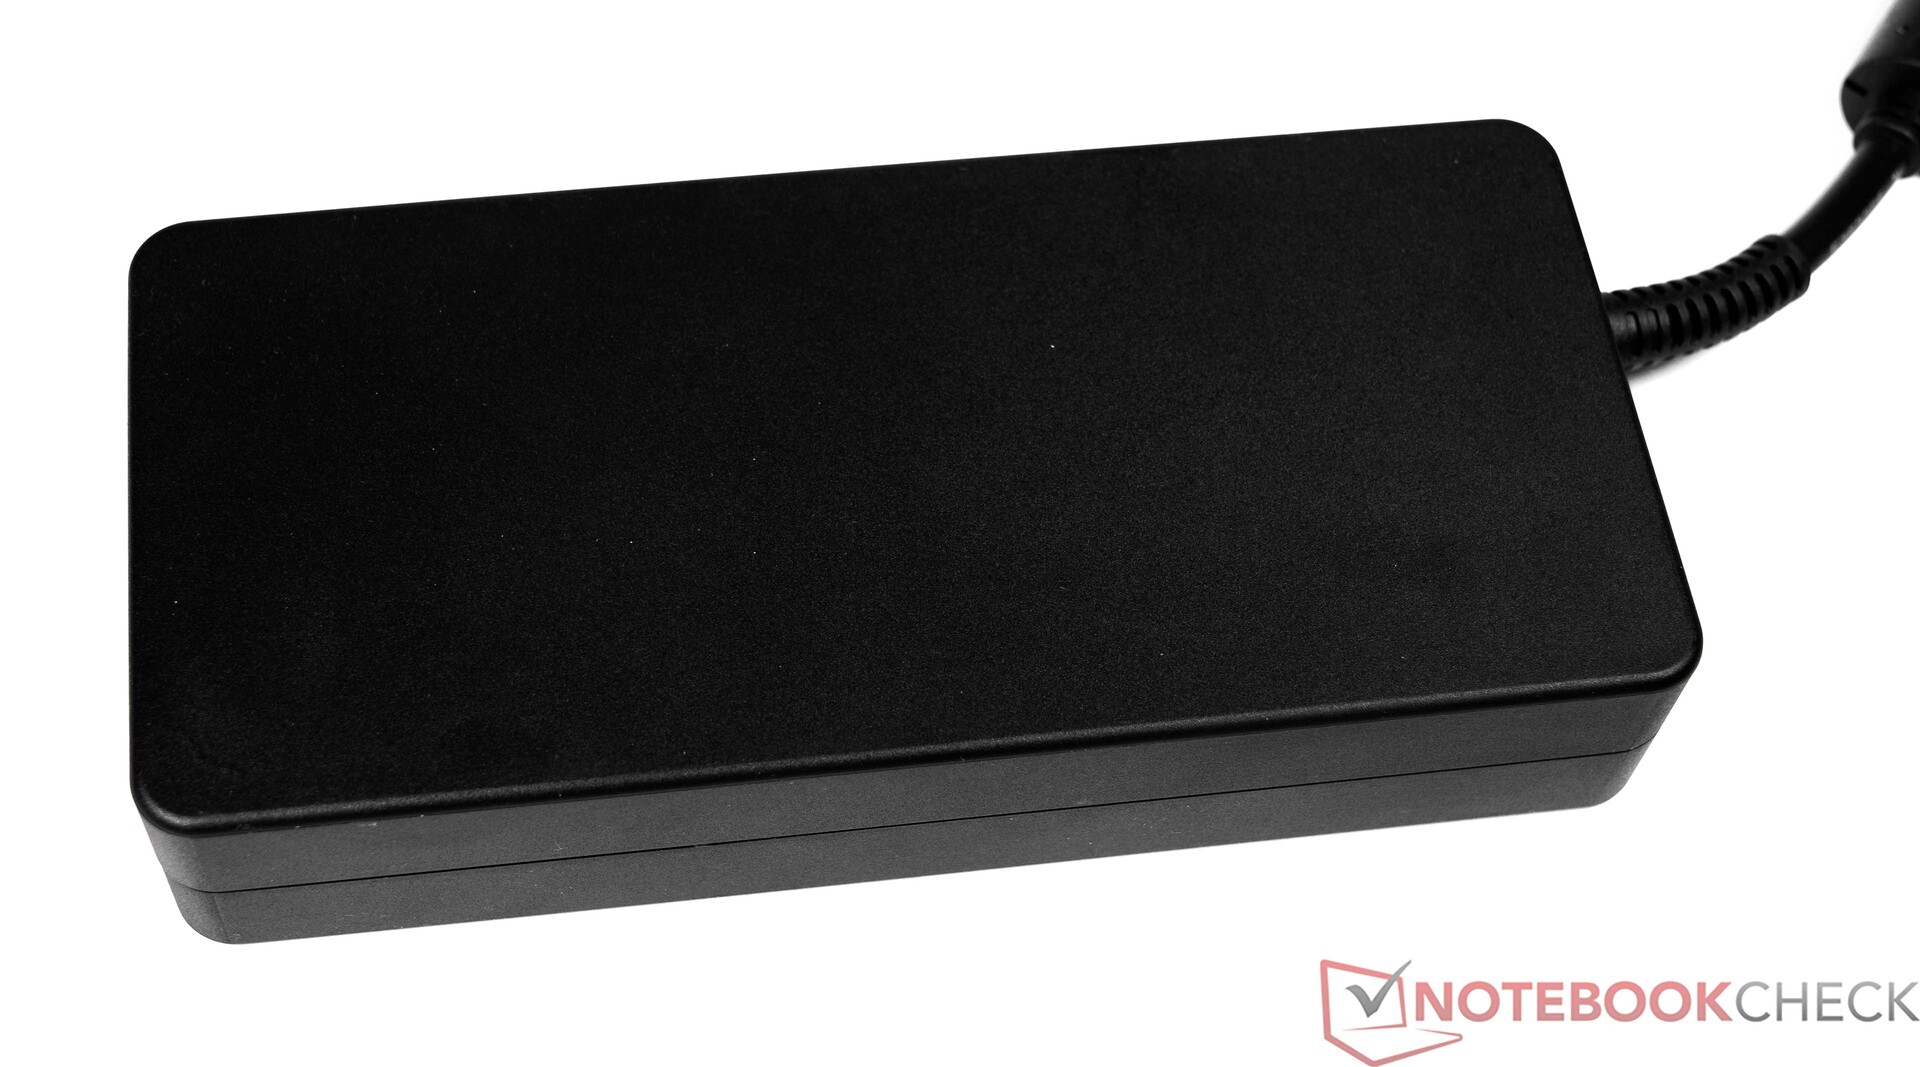
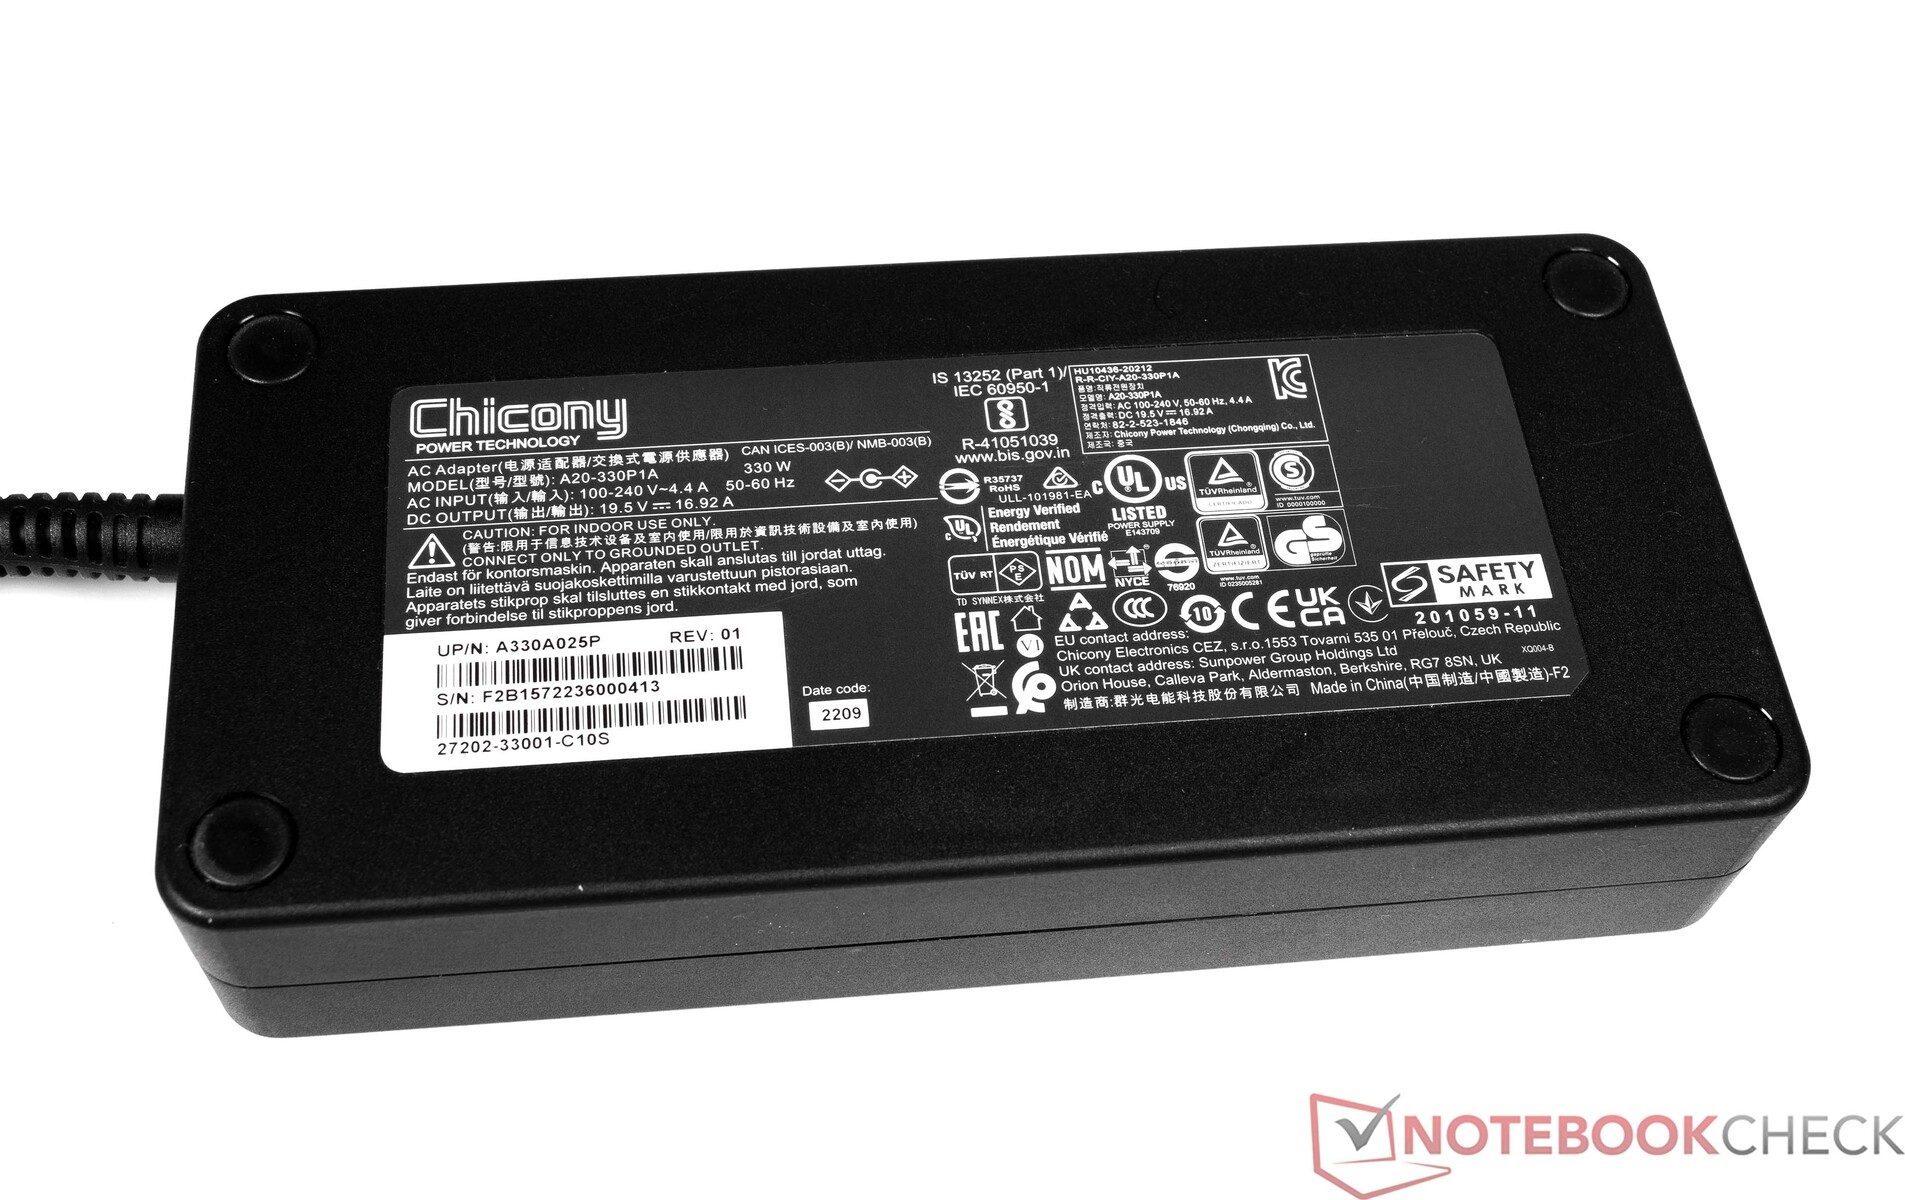
Aorus 17X AZF nie wykazuje żadnych nieprawidłowości pod względem zużycia energii. Stwierdzone wartości w idle wydają się całkiem dobre i w niektórych przypadkach są znacznie lepsze od konkurencji. Pod obciążeniem widzimy normalne wskaźniki. Zasilacz jest wystarczająco duży przy 330 W, nawet jeśli 334 W jest potrzebne do krótkich wybuchów.
| wyłączony / stan wstrzymania | |
| luz | |
| obciążenie |
|
Legenda:
min: | |
| Aorus 17X AZF i9-13900HX, GeForce RTX 4090 Laptop GPU | Medion Erazer Beast X40 i9-13900HX, GeForce RTX 4090 Laptop GPU | MSI GE78HX 13VH-070US i9-13950HX, GeForce RTX 4080 Laptop GPU | HP Omen 17-ck2097ng i9-13900HX, GeForce RTX 4080 Laptop GPU | MSI Titan GT77 HX 13VI i9-13950HX, GeForce RTX 4090 Laptop GPU | Alienware m18 R1 i9-13980HX, GeForce RTX 4090 Laptop GPU | Przeciętny NVIDIA GeForce RTX 4090 Laptop GPU | Średnia w klasie Gaming | |
|---|---|---|---|---|---|---|---|---|
| Power Consumption | -3% | -14% | -4% | -9% | -46% | -19% | 5% | |
| Idle Minimum * (Watt) | 11 | 11 -0% | 16.1 -46% | 16 -45% | 14 -27% | 21.6 -96% | 16.2 ? -47% | 13 ? -18% |
| Idle Average * (Watt) | 17 | 18 -6% | 24 -41% | 20 -18% | 21.6 -27% | 25.2 -48% | 23.1 ? -36% | 19 ? -12% |
| Idle Maximum * (Watt) | 29 | 30 -3% | 34 -17% | 26 10% | 24.8 14% | 56.7 -96% | 34.2 ? -18% | 24.6 ? 15% |
| Load Average * (Watt) | 134 | 136 -1% | 123.6 8% | 135 -1% | 122.5 9% | 164.1 -22% | 130.5 ? 3% | 110.7 ? 17% |
| Witcher 3 ultra * (Watt) | 278 | 280 -1% | 286 -3% | 215 23% | 265 5% | 311 -12% | ||
| Load Maximum * (Watt) | 334 | 363 -9% | 285.7 14% | 299 10% | 418 -25% | 338.9 -1% | 324 ? 3% | 259 ? 22% |
* ... im mniej tym lepiej
Power consumption Witcher 3 / Stress test
Power consumption with an external monitor
Czas pracy na baterii
Aorus 17X AZF osiągnął w naszym teście WLAN (wywoływanie stron internetowych przez skrypt) i teście wideo (krótki film Big Buck Bunny, kodowanie H.264, FHD, w pętli) odpowiednio 6:29 h i 6:43 h. Są to akceptowalne tempa i odzwierciedlają średnią dla klasy laptopów do gier. Podczas obu testów funkcje energooszczędne laptopa były wyłączone a jasność wyświetlacza ustawiona na około 150 cd/m². W naszym przypadku oznaczało to zmniejszenie jasności o 50 procent.
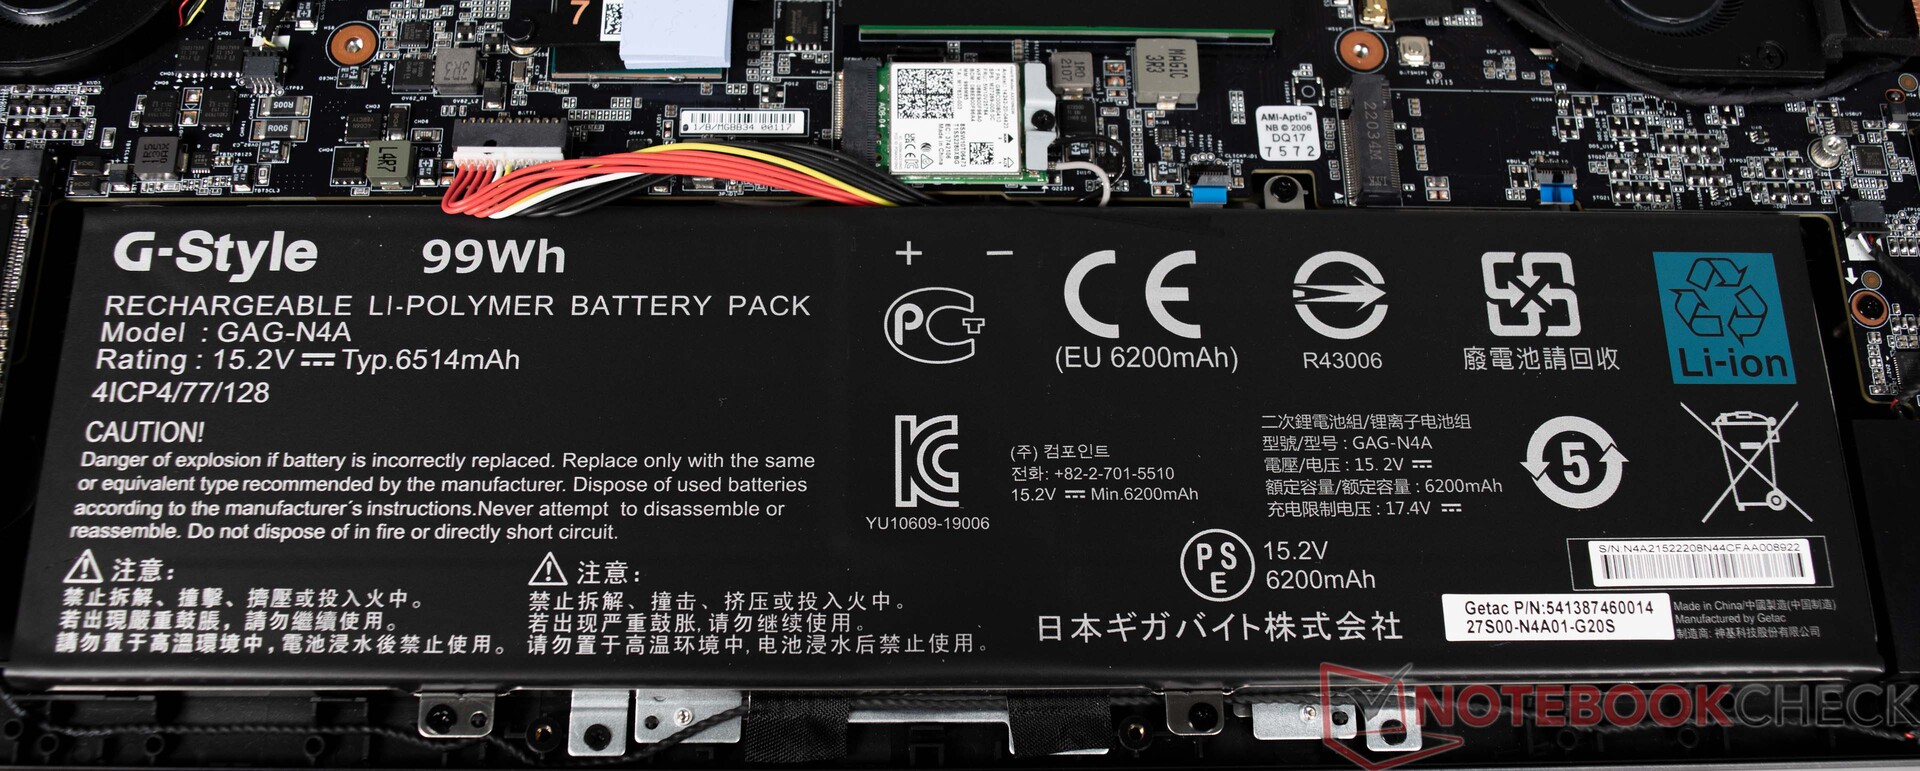
Aorus 17X AZF jest wyposażony w duży akumulator o pojemności 99 Wh, co również jest maksimum w laptopie. Prawie wszystkie urządzenia porównawcze oferują akumulator o takiej samej pojemności. Jedynie HP Omen 17 musi zadowolić się mniejszym akumulatorem o pojemności 83 Wh i dlatego pozostaje zauważalnie w tyle.
| Aorus 17X AZF i9-13900HX, GeForce RTX 4090 Laptop GPU, 99 Wh | Medion Erazer Beast X40 i9-13900HX, GeForce RTX 4090 Laptop GPU, 99.8 Wh | MSI GE78HX 13VH-070US i9-13950HX, GeForce RTX 4080 Laptop GPU, 99 Wh | HP Omen 17-ck2097ng i9-13900HX, GeForce RTX 4080 Laptop GPU, 83 Wh | MSI Titan GT77 HX 13VI i9-13950HX, GeForce RTX 4090 Laptop GPU, 99.9 Wh | Alienware m18 R1 i9-13980HX, GeForce RTX 4090 Laptop GPU, 97 Wh | Średnia w klasie Gaming | |
|---|---|---|---|---|---|---|---|
| Czasy pracy | -1% | -18% | -44% | -20% | -46% | -1% | |
| Reader / Idle (h) | 9 | 9.4 4% | 7.3 -19% | 4.2 -53% | 5.6 -38% | 8.27 ? -8% | |
| H.264 (h) | 6.7 | 6.9 3% | 3.7 -45% | 6 -10% | 8.32 ? 24% | ||
| WiFi v1.3 (h) | 6.5 | 6.4 -2% | 6.1 -6% | 3.6 -45% | 5.3 -18% | 4.3 -34% | 7.11 ? 9% |
| Load (h) | 2.1 | 1.9 -10% | 1.5 -29% | 1.4 -33% | 1.4 -33% | 0.7 -67% | 1.502 ? -28% |
Za
Przeciw
Werdykt - Mobilna potęga dla gier bez kompromisów
Aorus 17X AZF to gamingowy notebook przeznaczony do ekstremalnych wymagań. 17-calowiec był w stanie bez problemu uruchomić wszystkie testowane gry w natywnej rozdzielczości wyświetlacza i bez strat w jakości. Jest się jednak ograniczonym do gier w rozdzielczości 1440p, co jest w porządku. Dostępne są rezerwy wydajności, które można uzyskać dzięki zewnętrznym wyświetlaczom 4K. Na stronieKarta graficzna Nvidia GeForce RTX 4090 do laptopów oferuje ogromną wydajność i jest w stanie utrzymać ją na stałe. Jest on flankowany przez wydajny Intel Core-i7-13900HX. W bezpośrednim porównaniu z porównywalnymi urządzeniami, procesor w Aorusie 17X AZF nie zawsze jest jednak w stanie zaznaczyć swoją obecność. Niemniej jednak przepaść nie jest aż tak duża i raczej nie da się tego zauważyć w codziennym użytkowaniu.
Pozostały sprzęt bardzo nam się podoba: 32 GB pamięci RAM DDR5 i 2 TB pamięci masowej SSD to w sumie doskonały system, dzięki któremu przez jakiś czas nie trzeba będzie go modernizować. Wyświetlacz o rozdzielczości QHD również dobrze pasuje do laptopa i nadaje się do edycji zdjęć i wideo
Z drugiej strony istnieją ograniczenia w głośności, których nie można zignorować podczas obciążenia. Następnie ponownie, problem ten jest również powszechny w innych laptopach do gier i nie jest wyjątkowy dla Aorus 17X AZF. Łączność również wymaga poprawy i mogłaby być bardziej rozbudowana jak na 17-calowe urządzenie. Przynajmniej laptop posiada nowoczesne złącze Thunderbolt
Pod względem mobilności Aorus 17X AZF jest dobrze pozycjonowany, gdyż odnotowane czasy pracy na akumulatorze odzwierciedlają dobrą średnią klasową. Urządzenie można nawet obsługiwać niemal bezgłośnie za pośrednictwem Gigabyte Control Center, które oferuje liczne opcje regulacji
Osoby szukające tańszej alternatywy powinny przyjrzeć się HP Omen 17, który również zapewnia doskonałą wydajność w 1440p dzięki.Nvidia GeForce RTX 4080 GPU do laptopów.
Cena i dostępność
Zainteresowani nabywcy powinni sprawdzić bezpośrednio poprzez odpowiednią stronę produktu w sklepie internetowym Gigabyte, gdzie można znaleźć listę oficjalnych resellerów/dystrybutorów. W Stanach Zjednoczonych, na przykład, Aorus 17X AZF jest wymieniony zarówno na Amazon oraz Newegg w cenie 3 499,00 dolarów (ale obecnie wyprzedany na obu platformach).
Ceny są aktualne na dzień 17.04.2023 i mogą ulec zmianie.
Aorus 17X AZF
- 14/04/2023 v7 (old)
Sebastian Bade
Przezroczystość
Wyboru urządzeń do recenzji dokonuje nasza redakcja. Próbka testowa została udostępniona autorowi jako pożyczka od producenta lub sprzedawcy detalicznego na potrzeby tej recenzji. Pożyczkodawca nie miał wpływu na tę recenzję, producent nie otrzymał też kopii tej recenzji przed publikacją. Nie było obowiązku publikowania tej recenzji. Jako niezależna firma medialna, Notebookcheck nie podlega władzy producentów, sprzedawców detalicznych ani wydawców.
Tak testuje Notebookcheck
Każdego roku Notebookcheck niezależnie sprawdza setki laptopów i smartfonów, stosując standardowe procedury, aby zapewnić porównywalność wszystkich wyników. Od około 20 lat stale rozwijamy nasze metody badawcze, ustanawiając przy tym standardy branżowe. W naszych laboratoriach testowych doświadczeni technicy i redaktorzy korzystają z wysokiej jakości sprzętu pomiarowego. Testy te obejmują wieloetapowy proces walidacji. Nasz kompleksowy system ocen opiera się na setkach uzasadnionych pomiarów i benchmarków, co pozwala zachować obiektywizm.Price comparison

