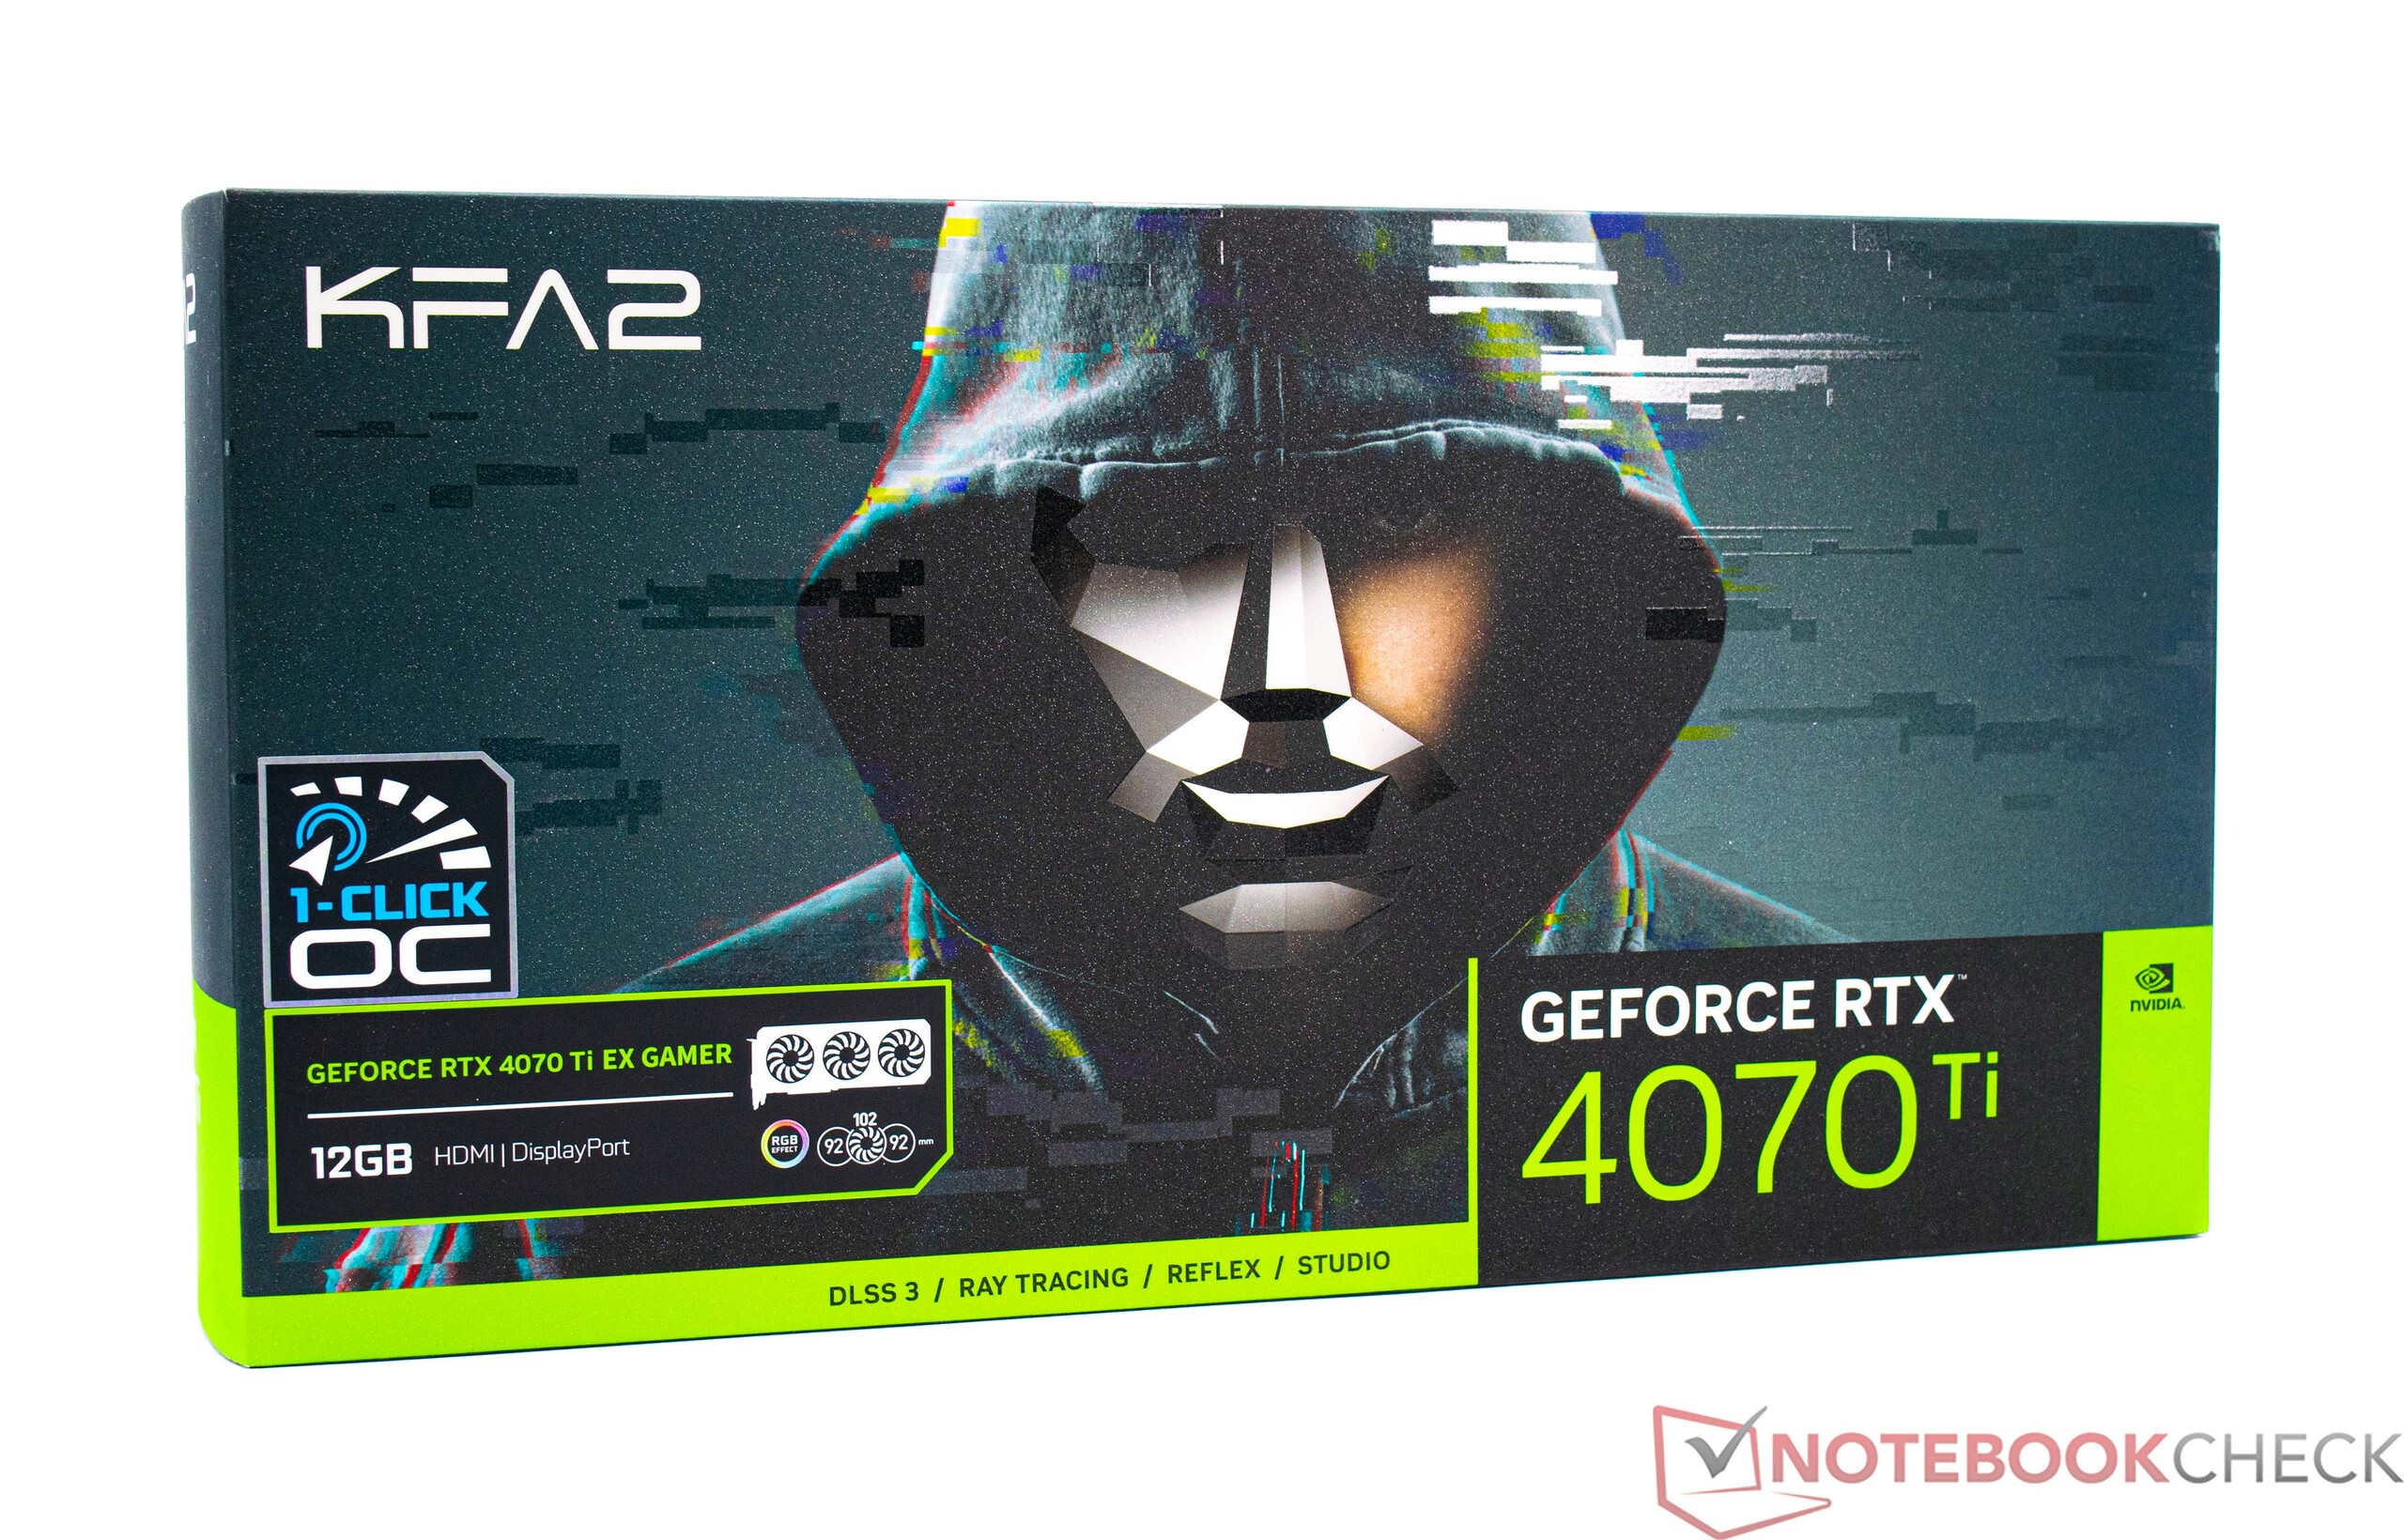
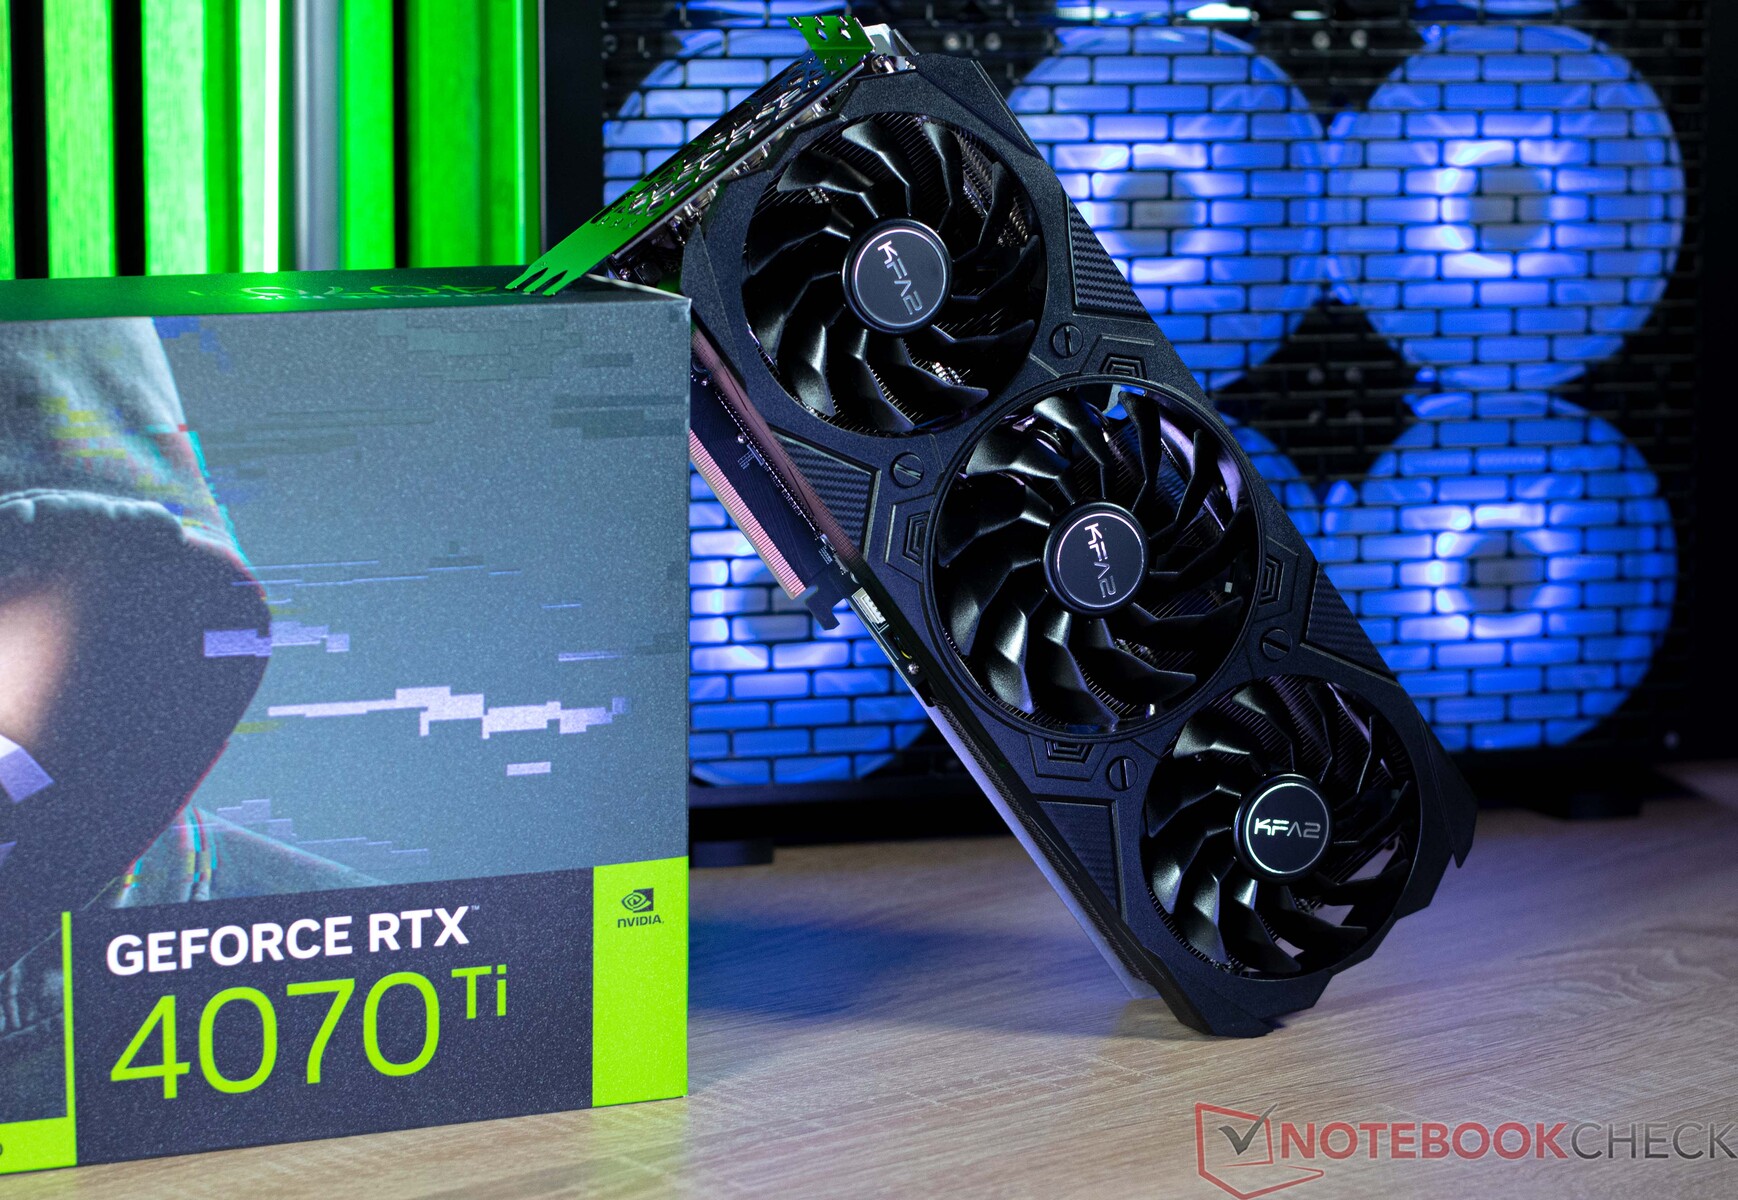
Recenzja desktopowej karty graficznej KFA2 GeForce RTX 4070 Ti EX Gamer: Niedrogie GPU do gier WQHD bez dużej ilości RGB
KFA2 GeForce RTX 4070 Ti EX Gamer to przede wszystkim potężna karta graficzna, która pod względem wydajności powinna plasować się w wysokim średnim przedziale. Karta graficzna od KFA2 jest w stanie dokładnie to potwierdzić w naszym teście - tyle możemy ujawnić już teraz. Dystans do KFA2 GeForce RTX 4070 EX Gamer jest jednak znaczny. Znajduje to odzwierciedlenie w cenie, ponieważ model bez Ti można obecnie kupić za około 630 euro (w Niemczech ~ 697 USD), podczas gdy za KFA2 GeForce RTX 4070 Ti EX Gamer trzeba zapłacić około 870 euro (~ 962 USD). Choć zdecydowanie nie jest to tania karta, to przynajmniej nadal jest nieco bardziej przystępna cenowo niż szeroko rozpowszechnione modele Asusa, MSI i innych firm. Ale w przypadku poważnej edycji gamingowejGeForce RTX 4070 TikFA2 ma również droższą wersję z układem RTX 4070 Ti w bloku startowym. Chociaż obejmuje to znacznie więcej RGB, oba modele oferują ostatecznie taką samą prędkość.
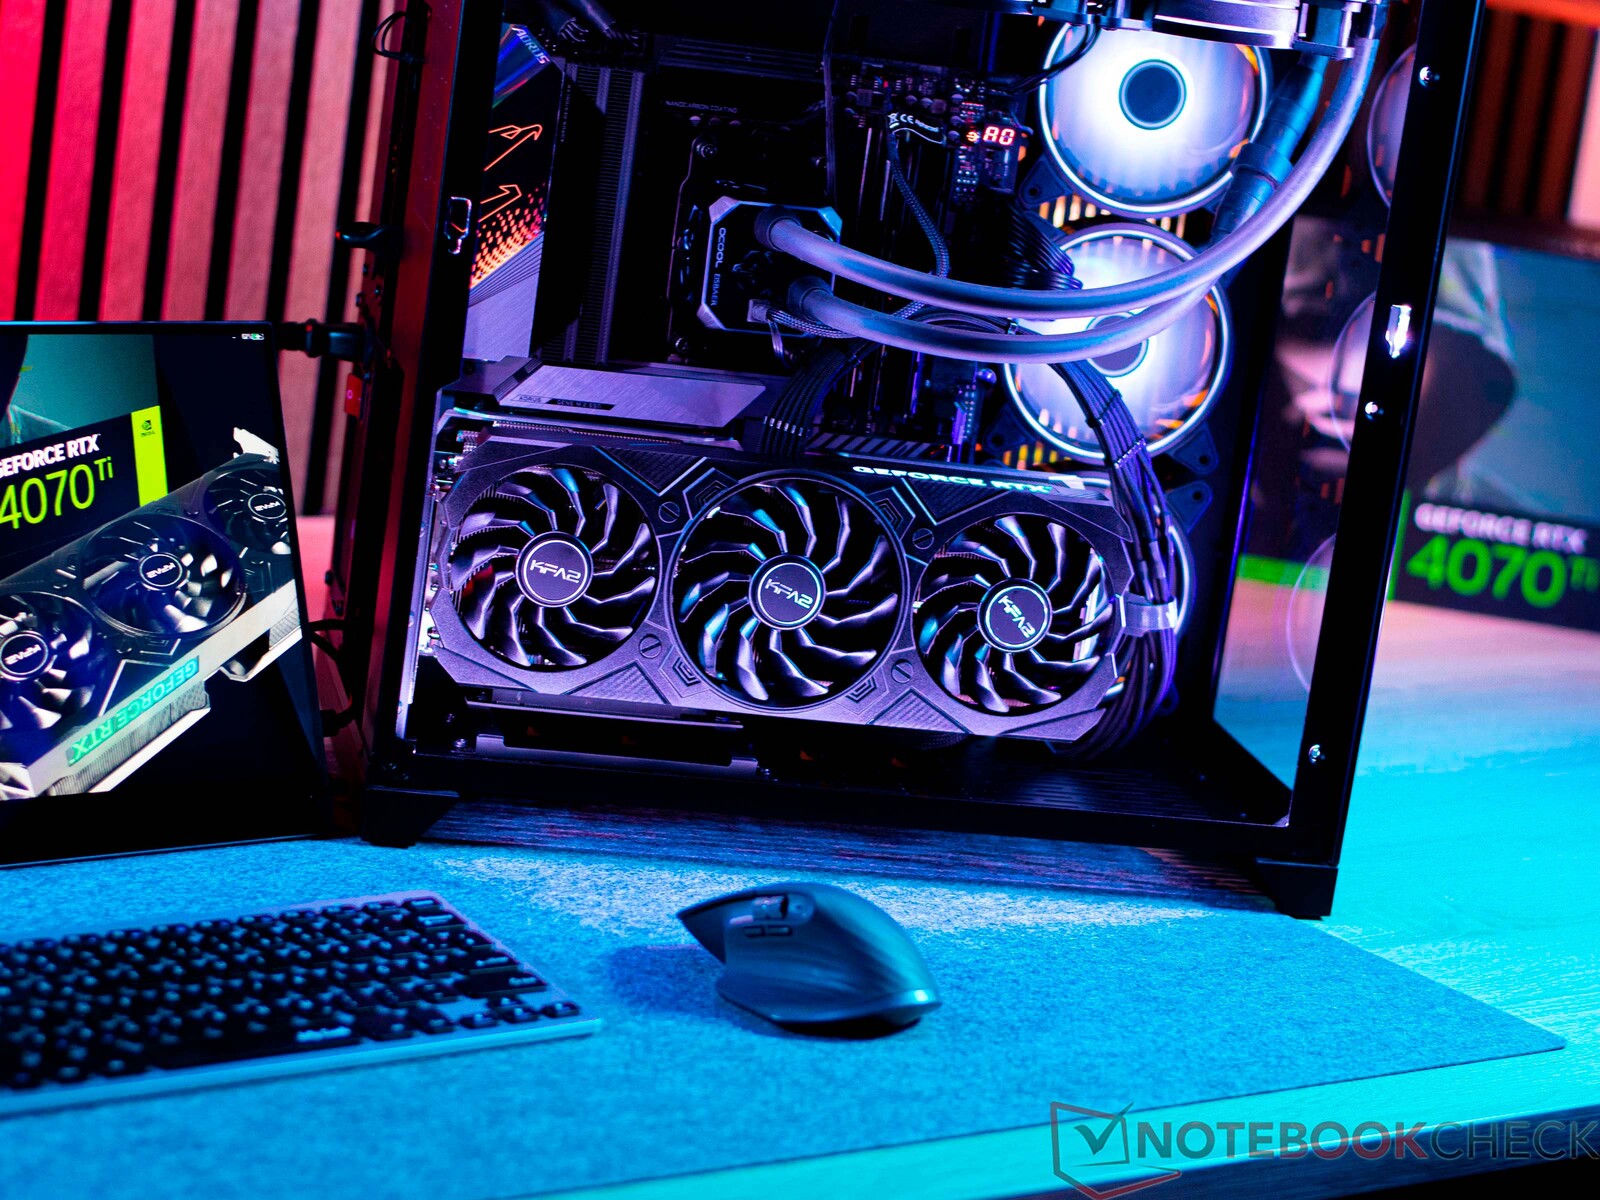
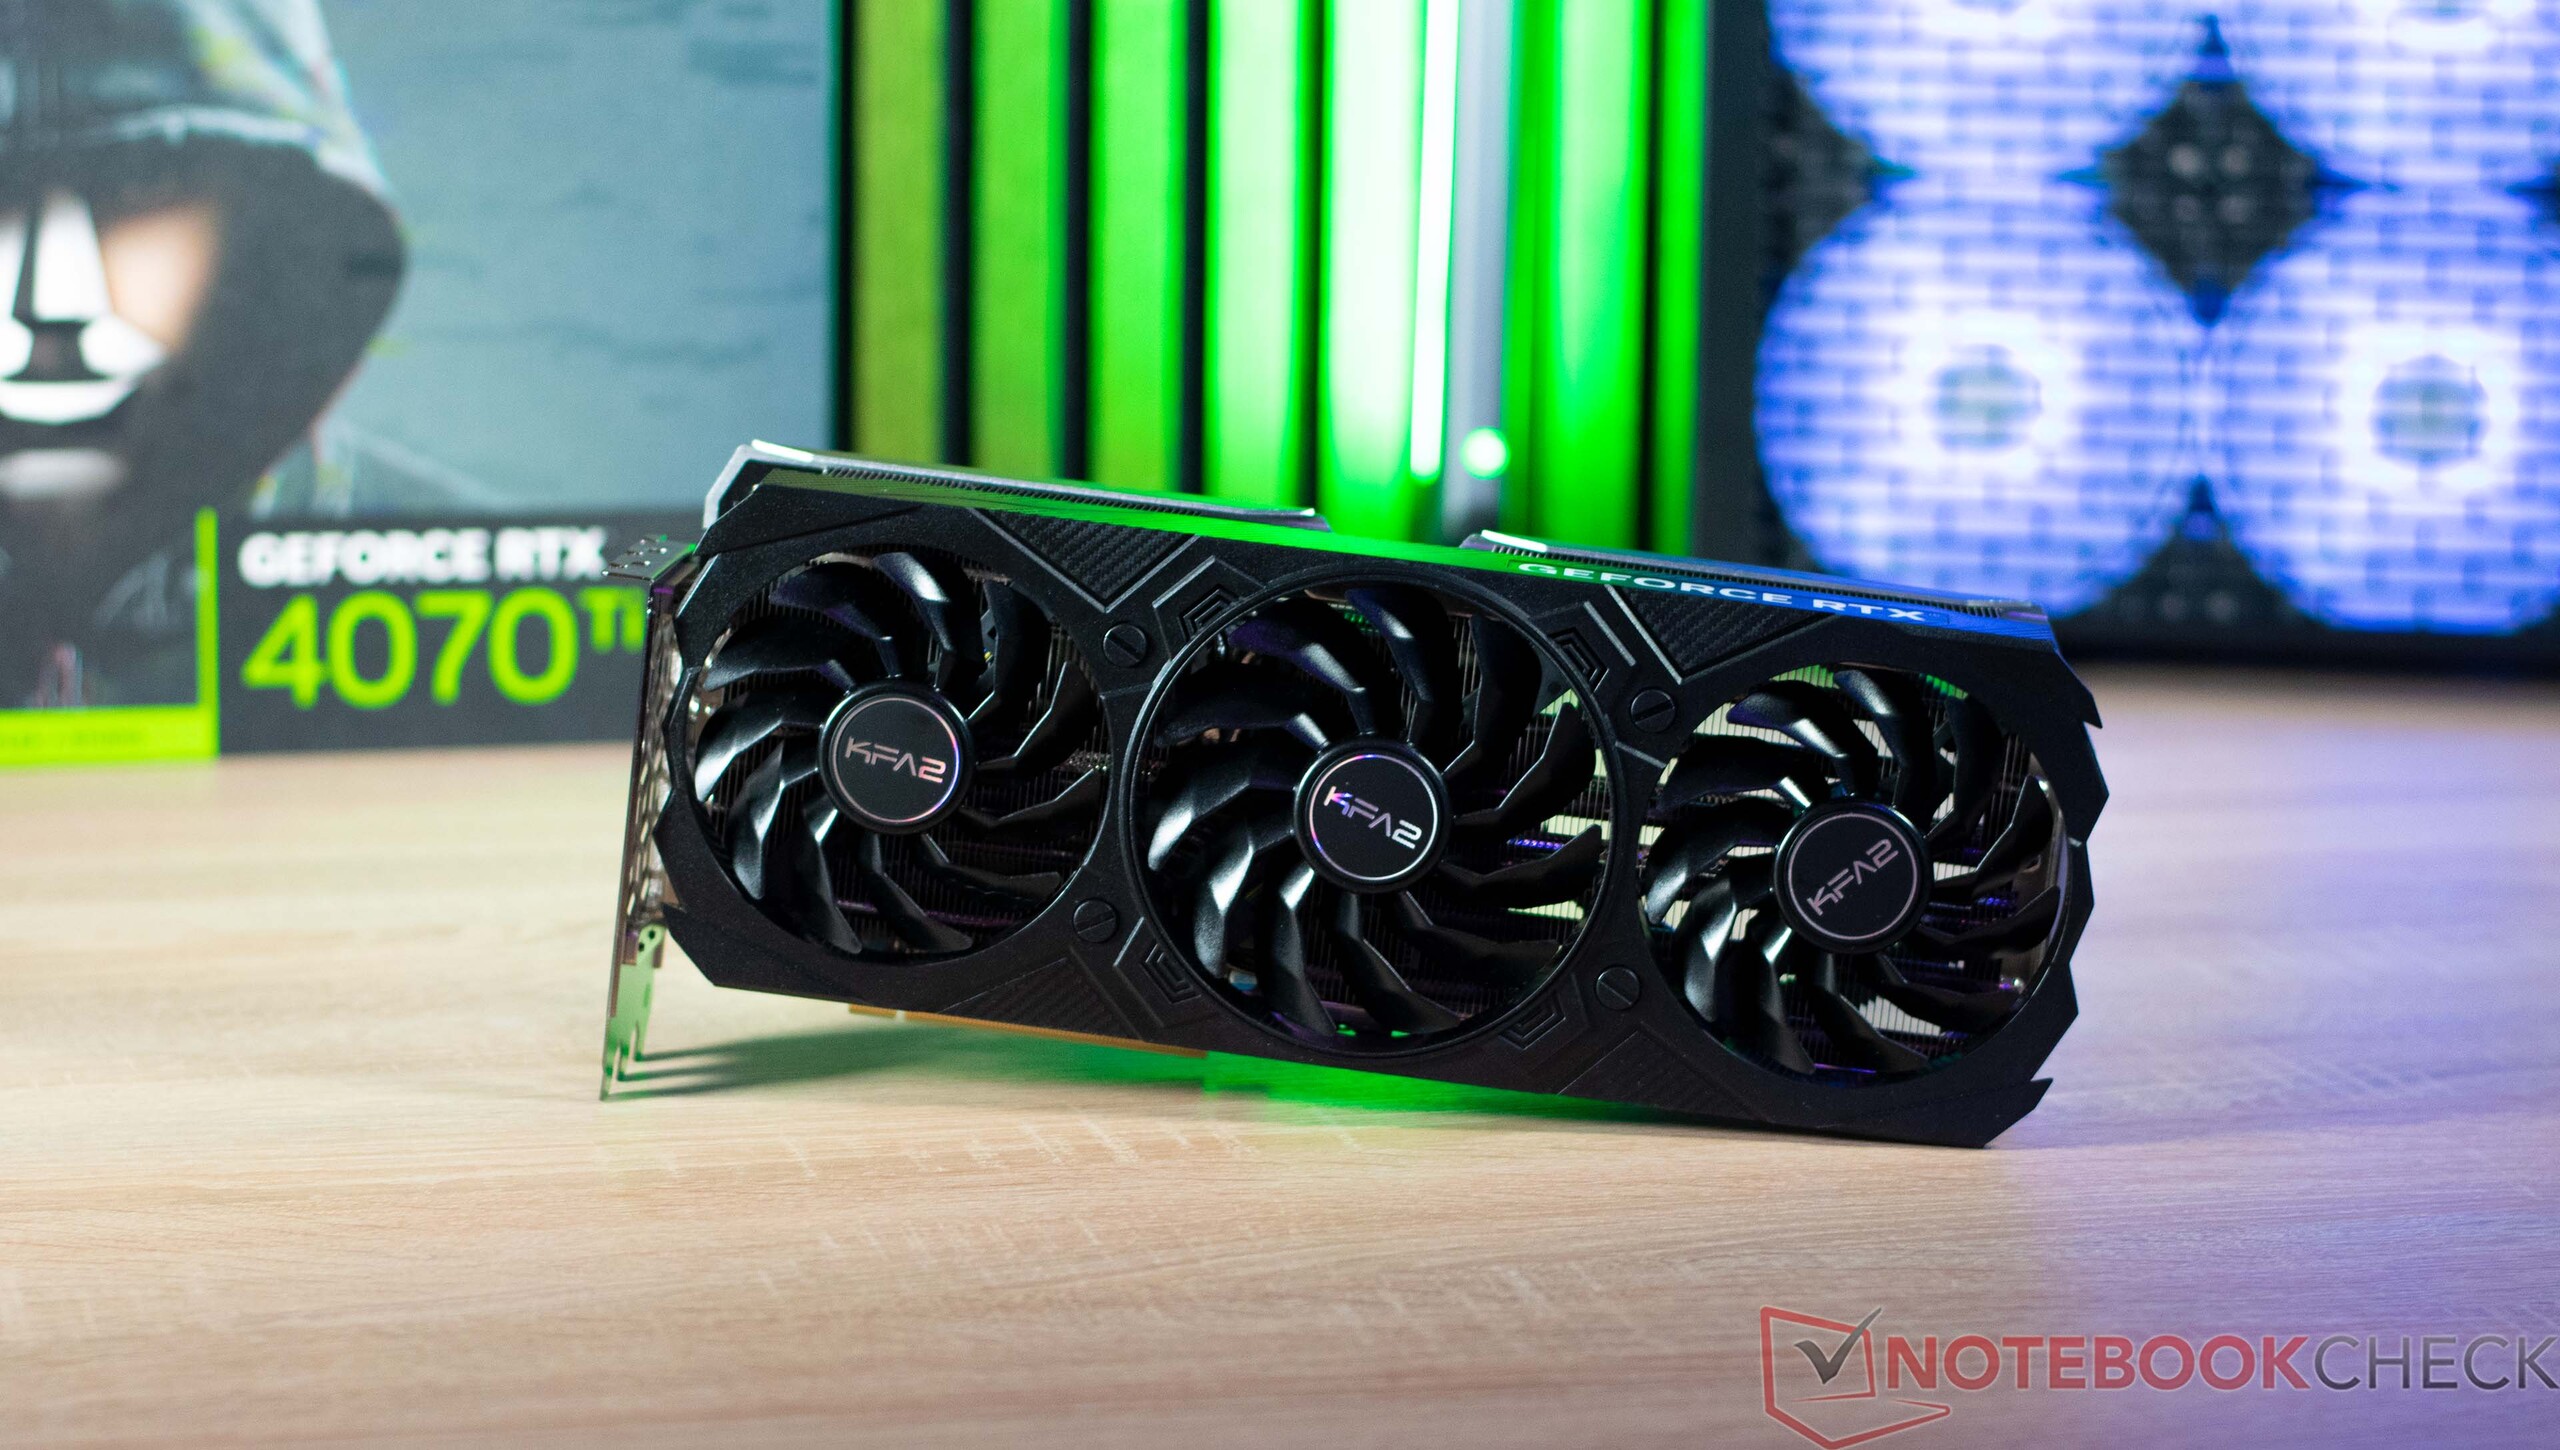
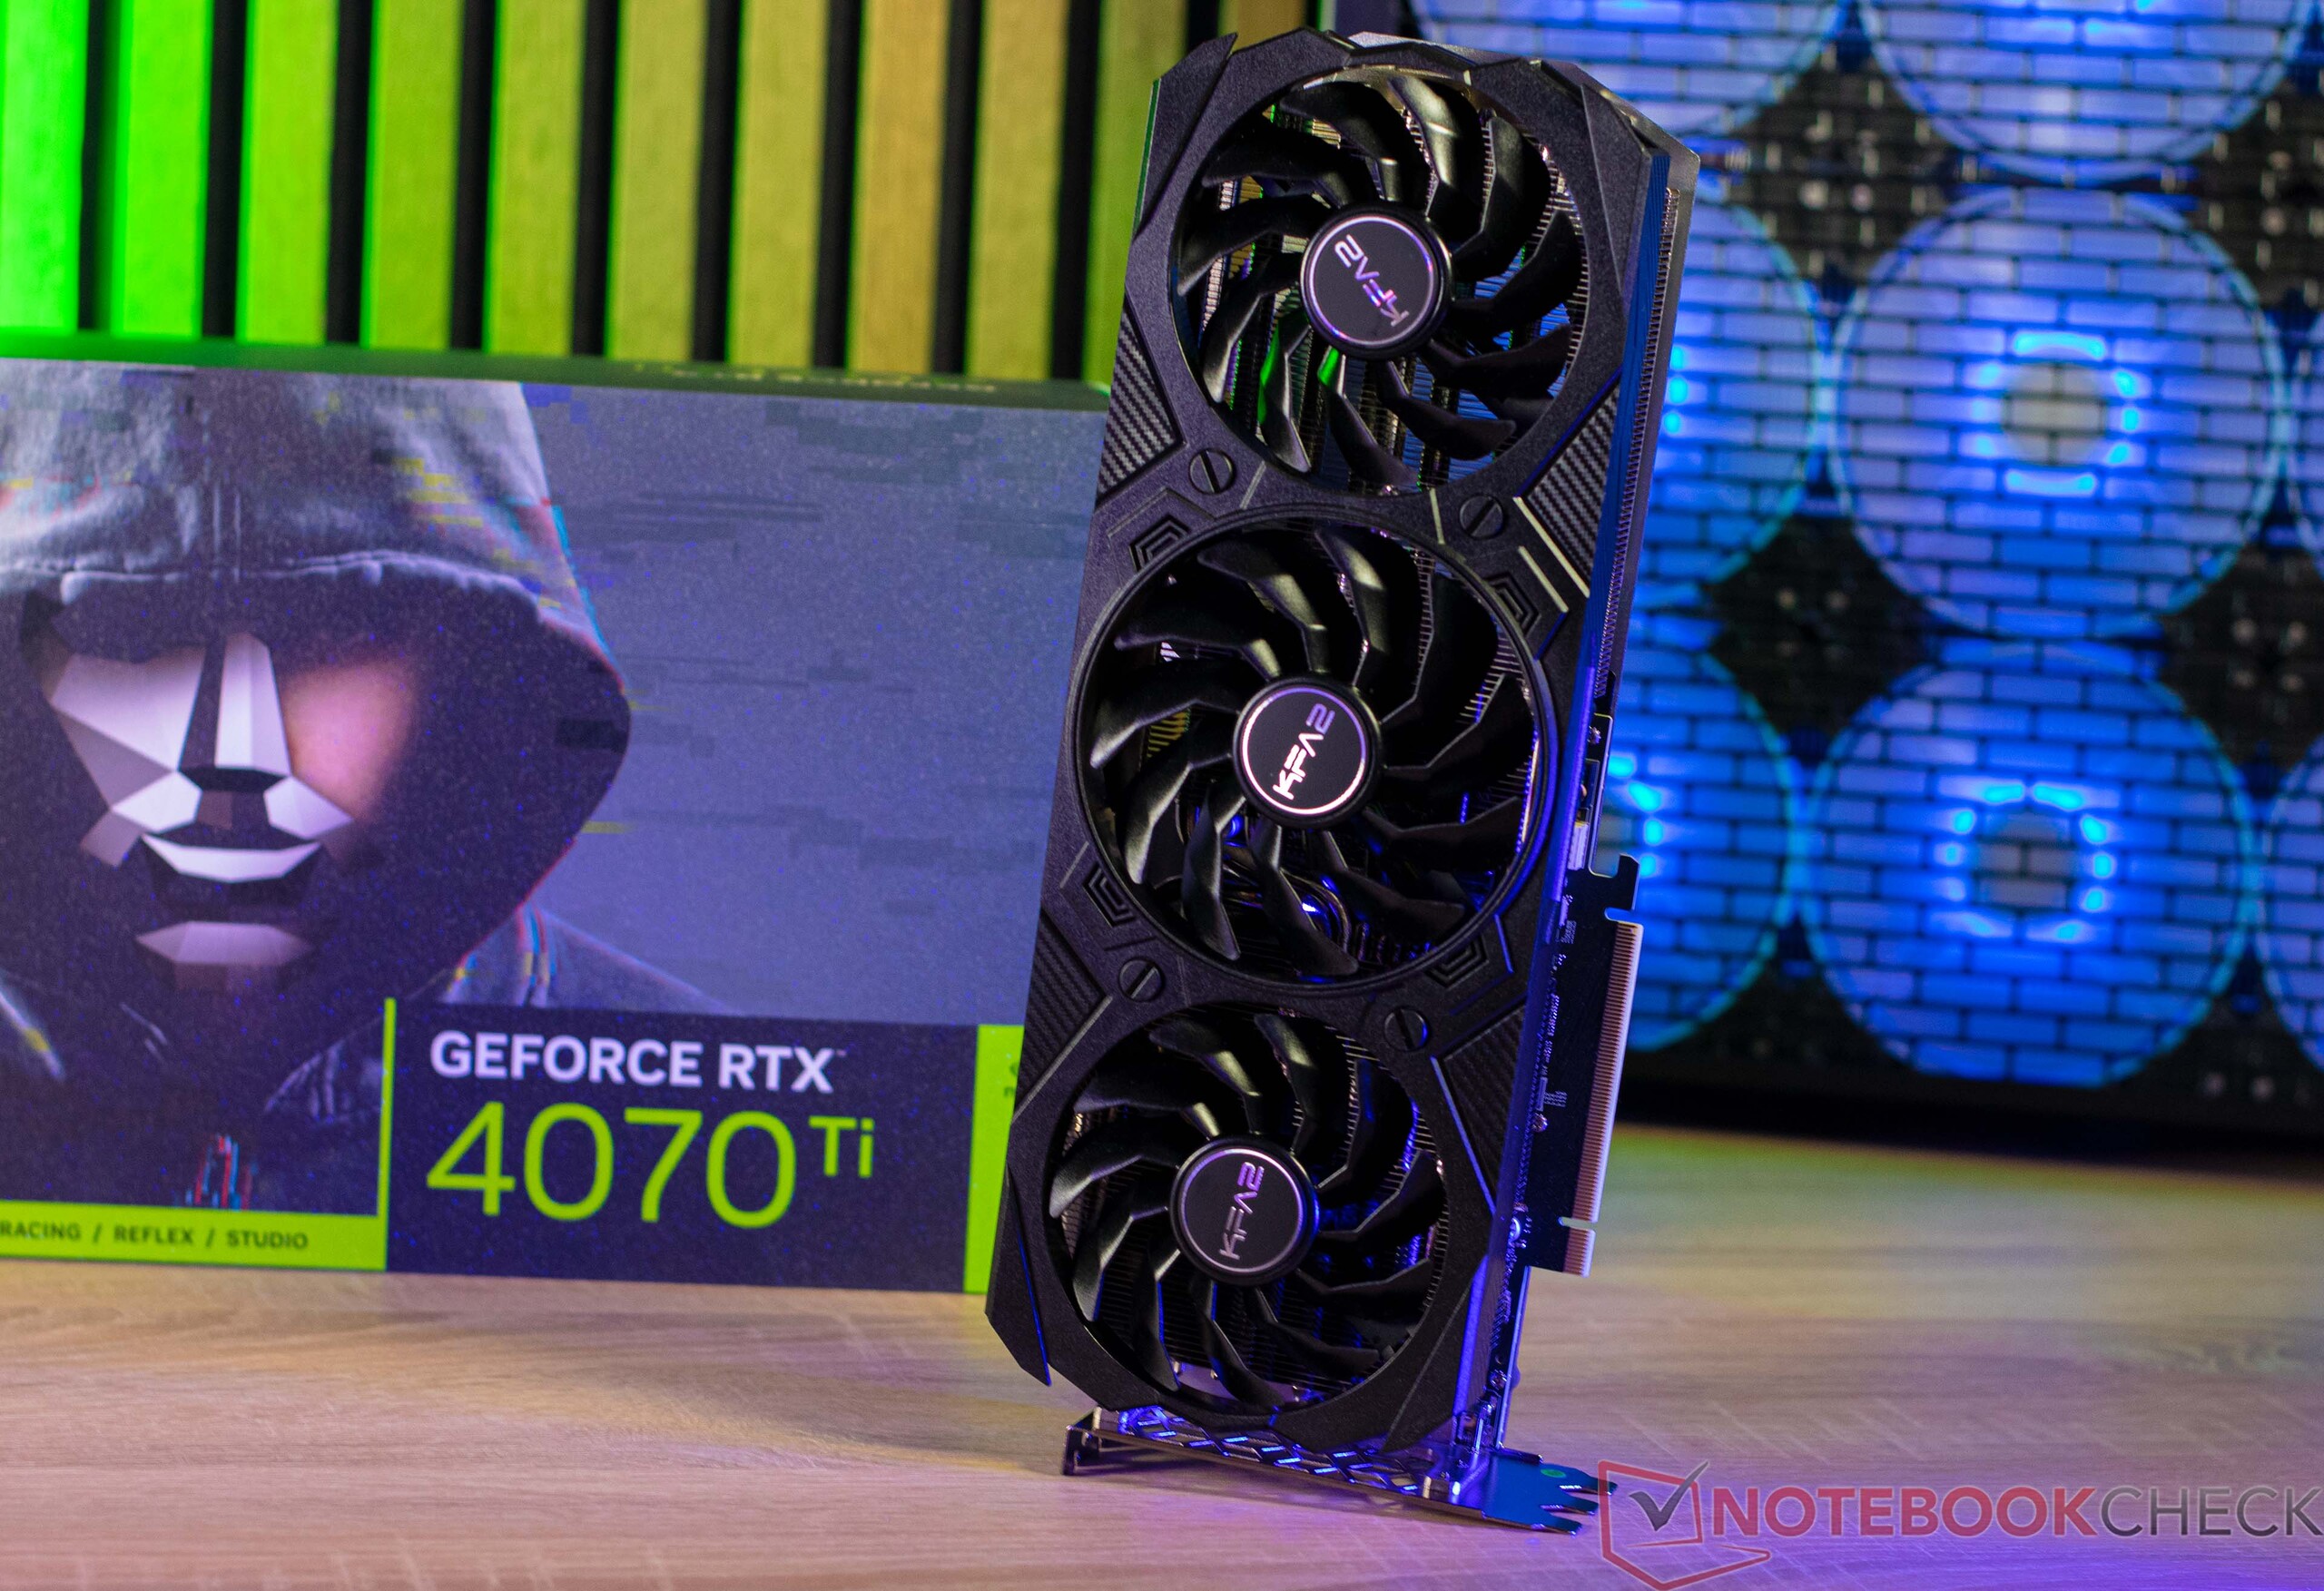
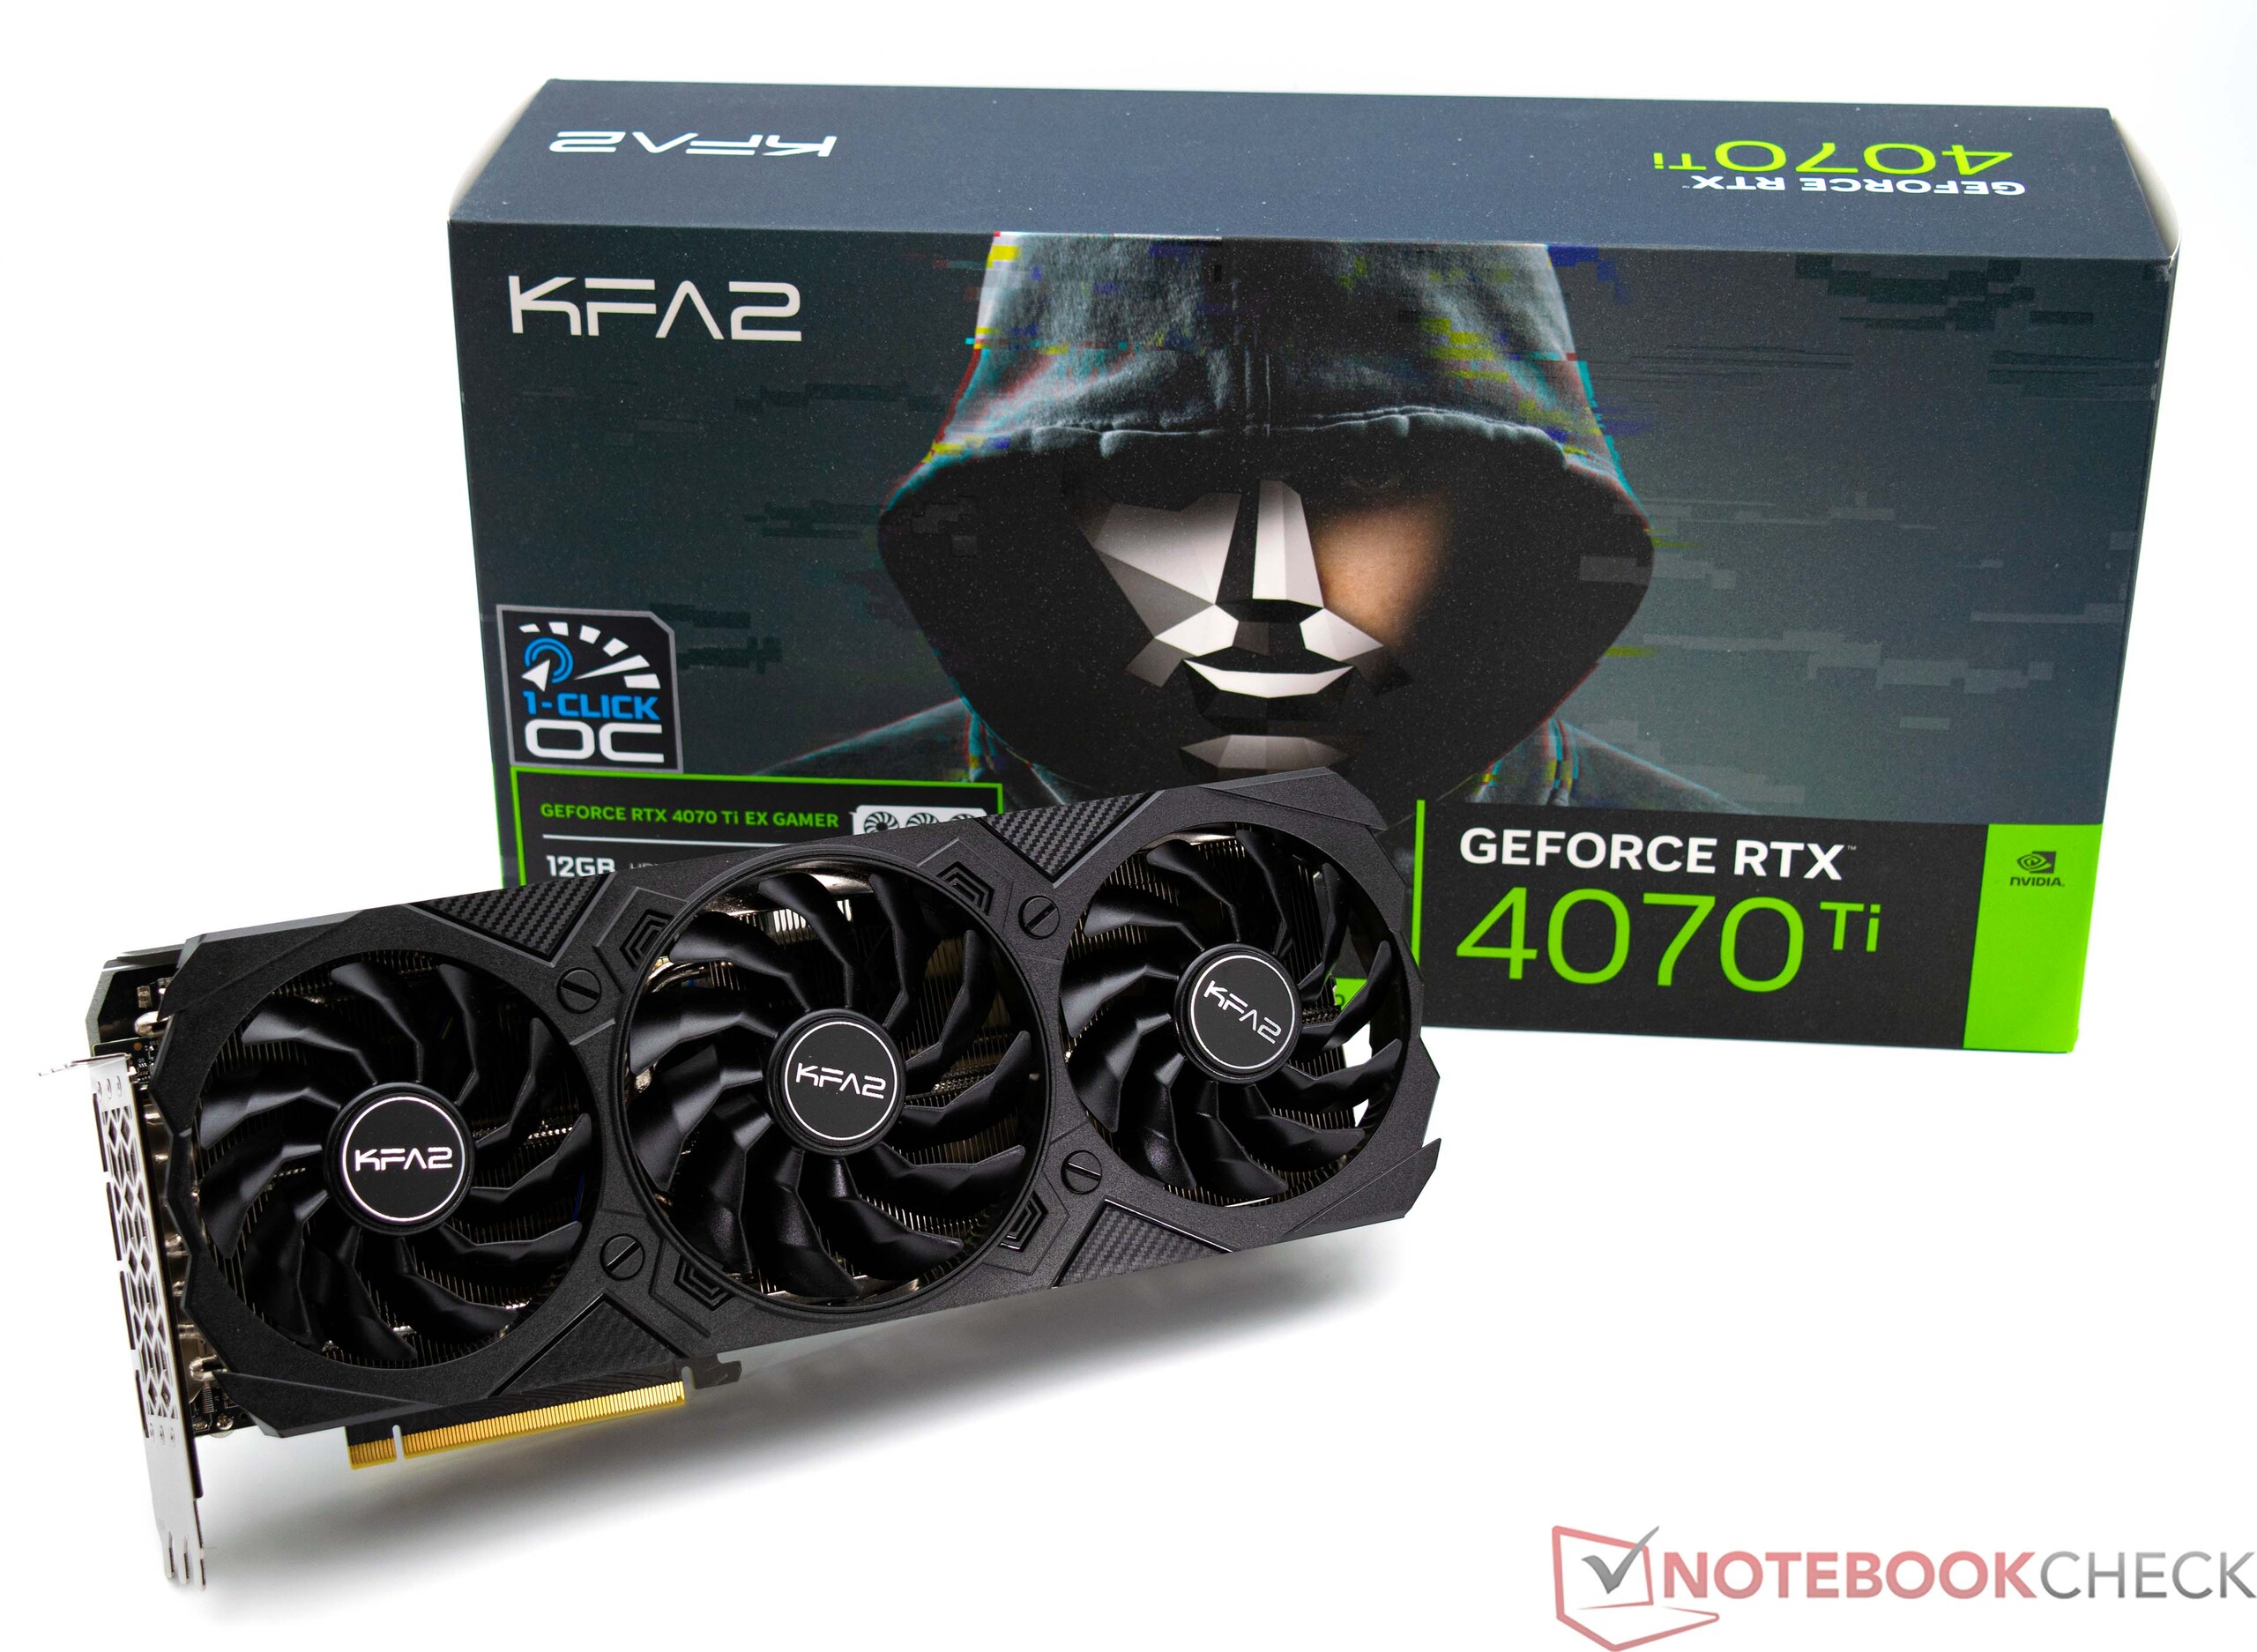
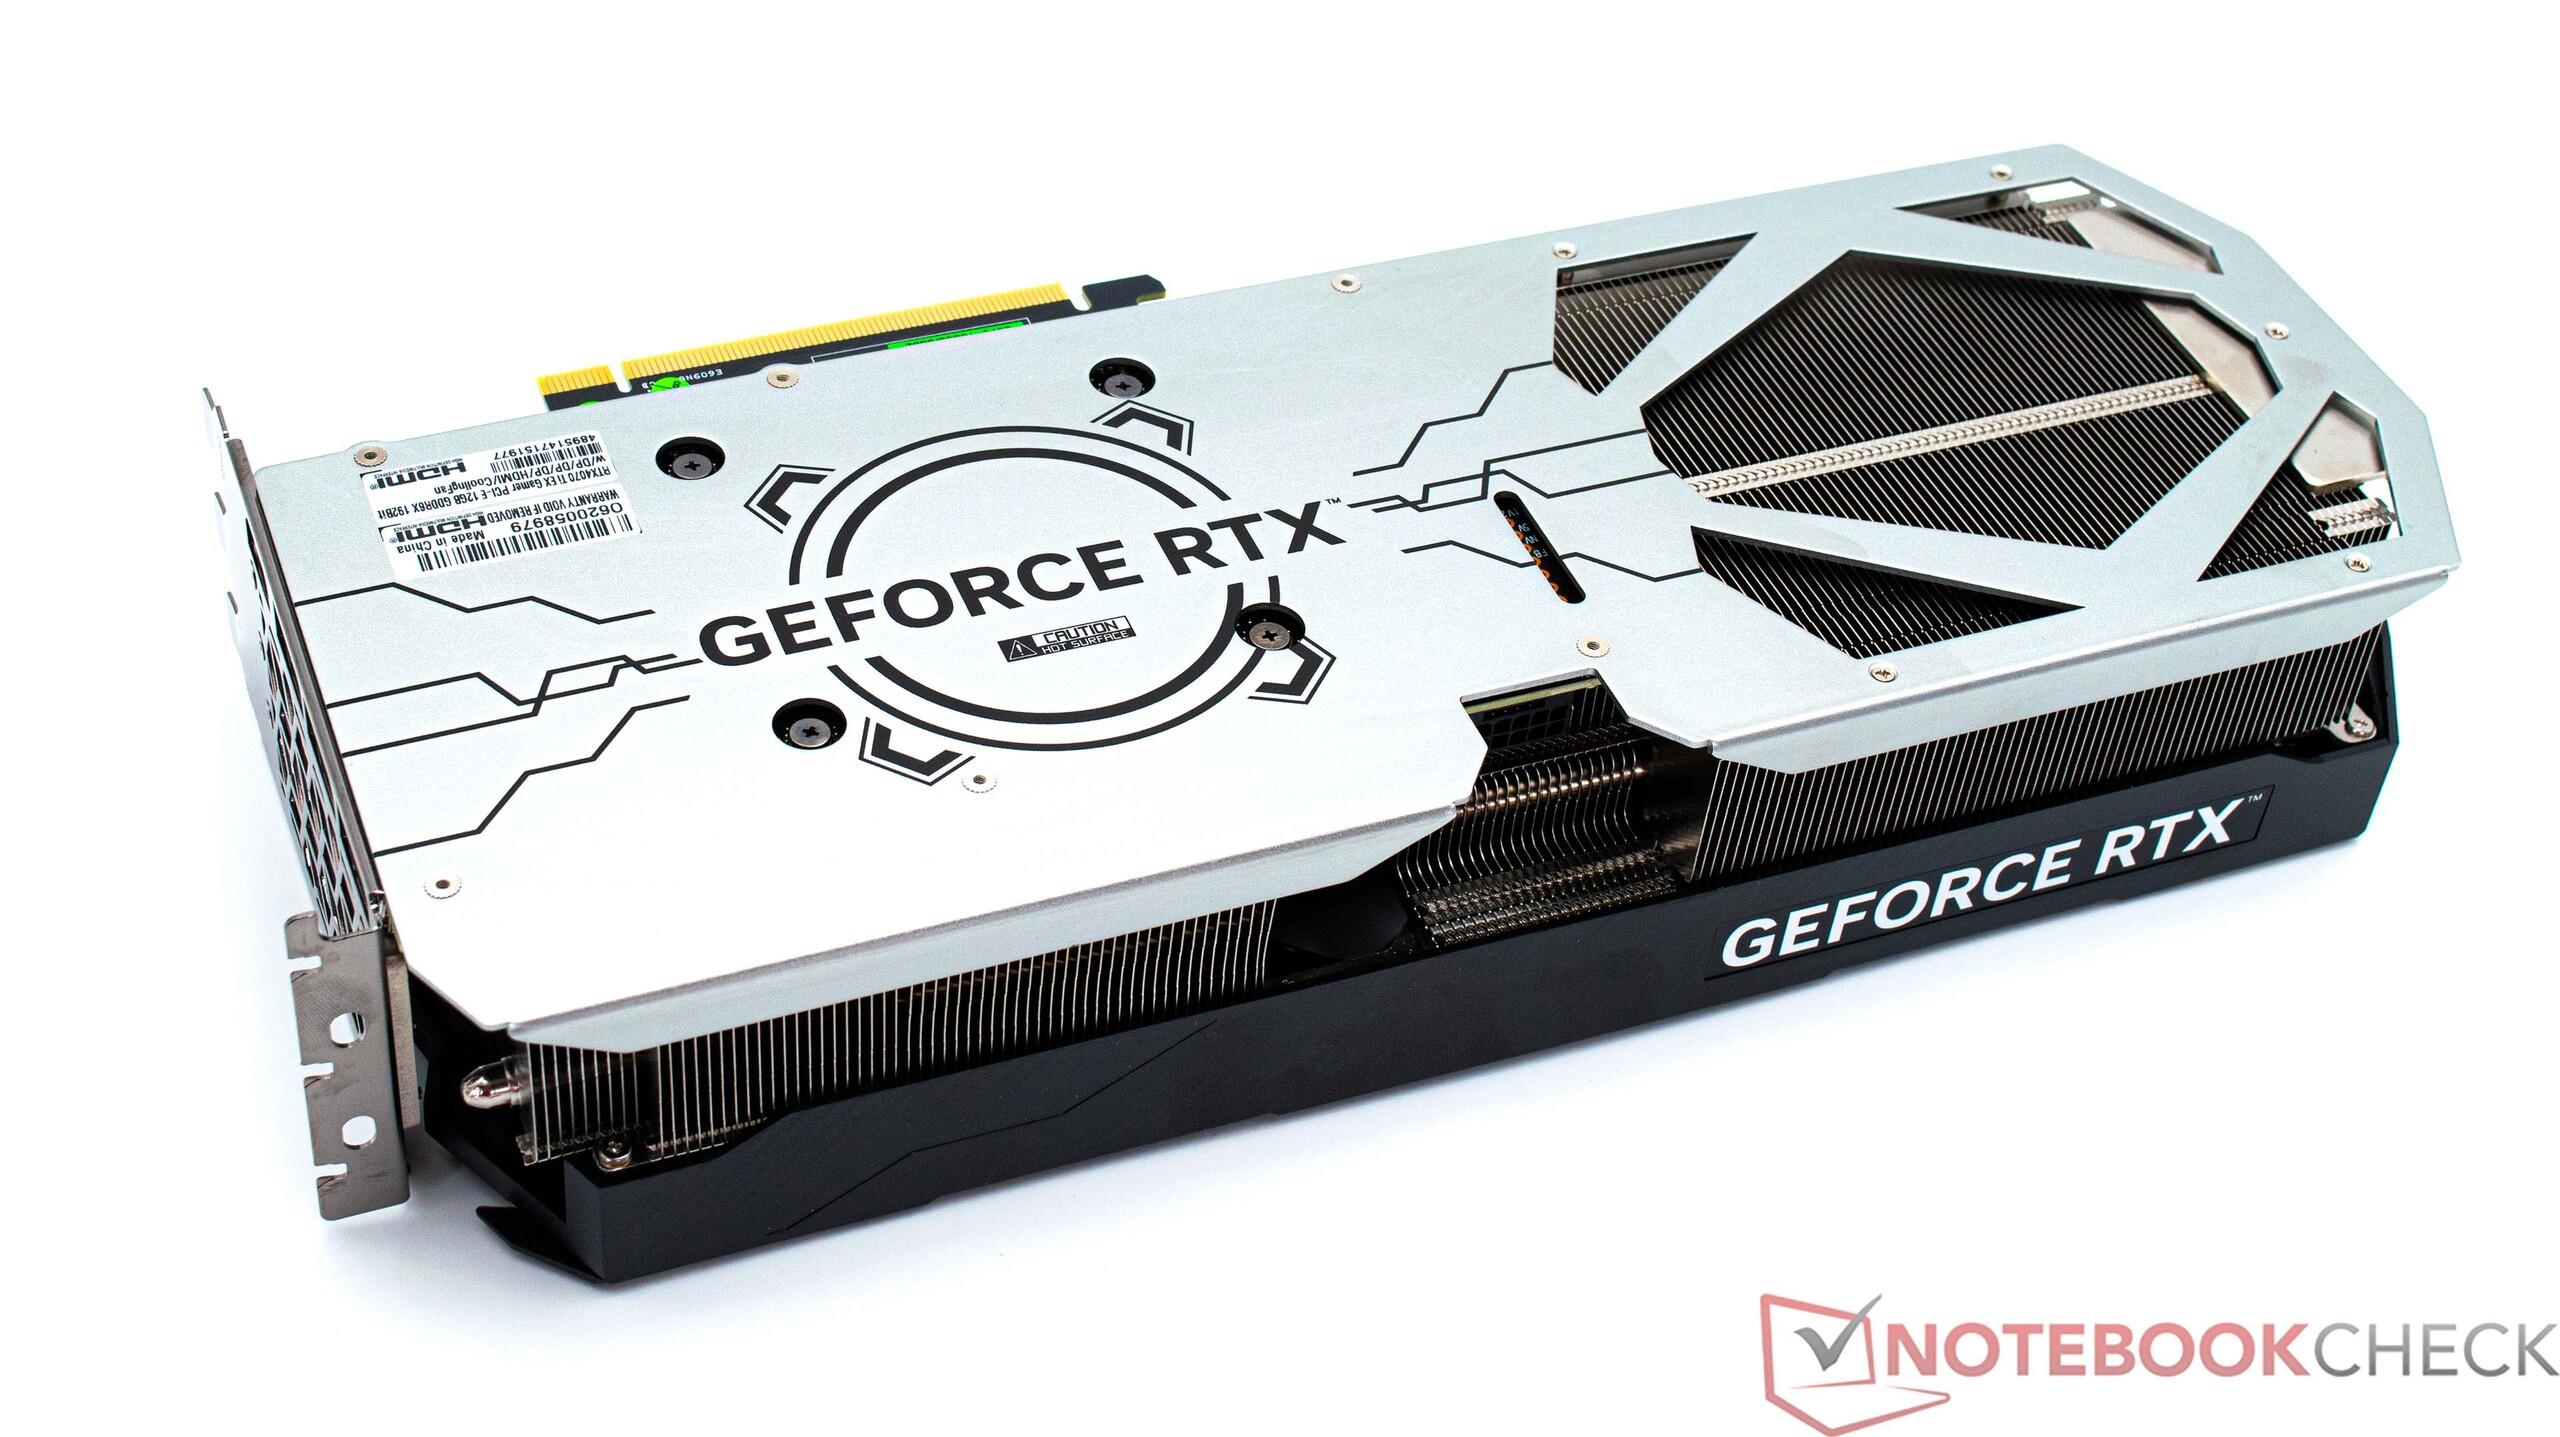
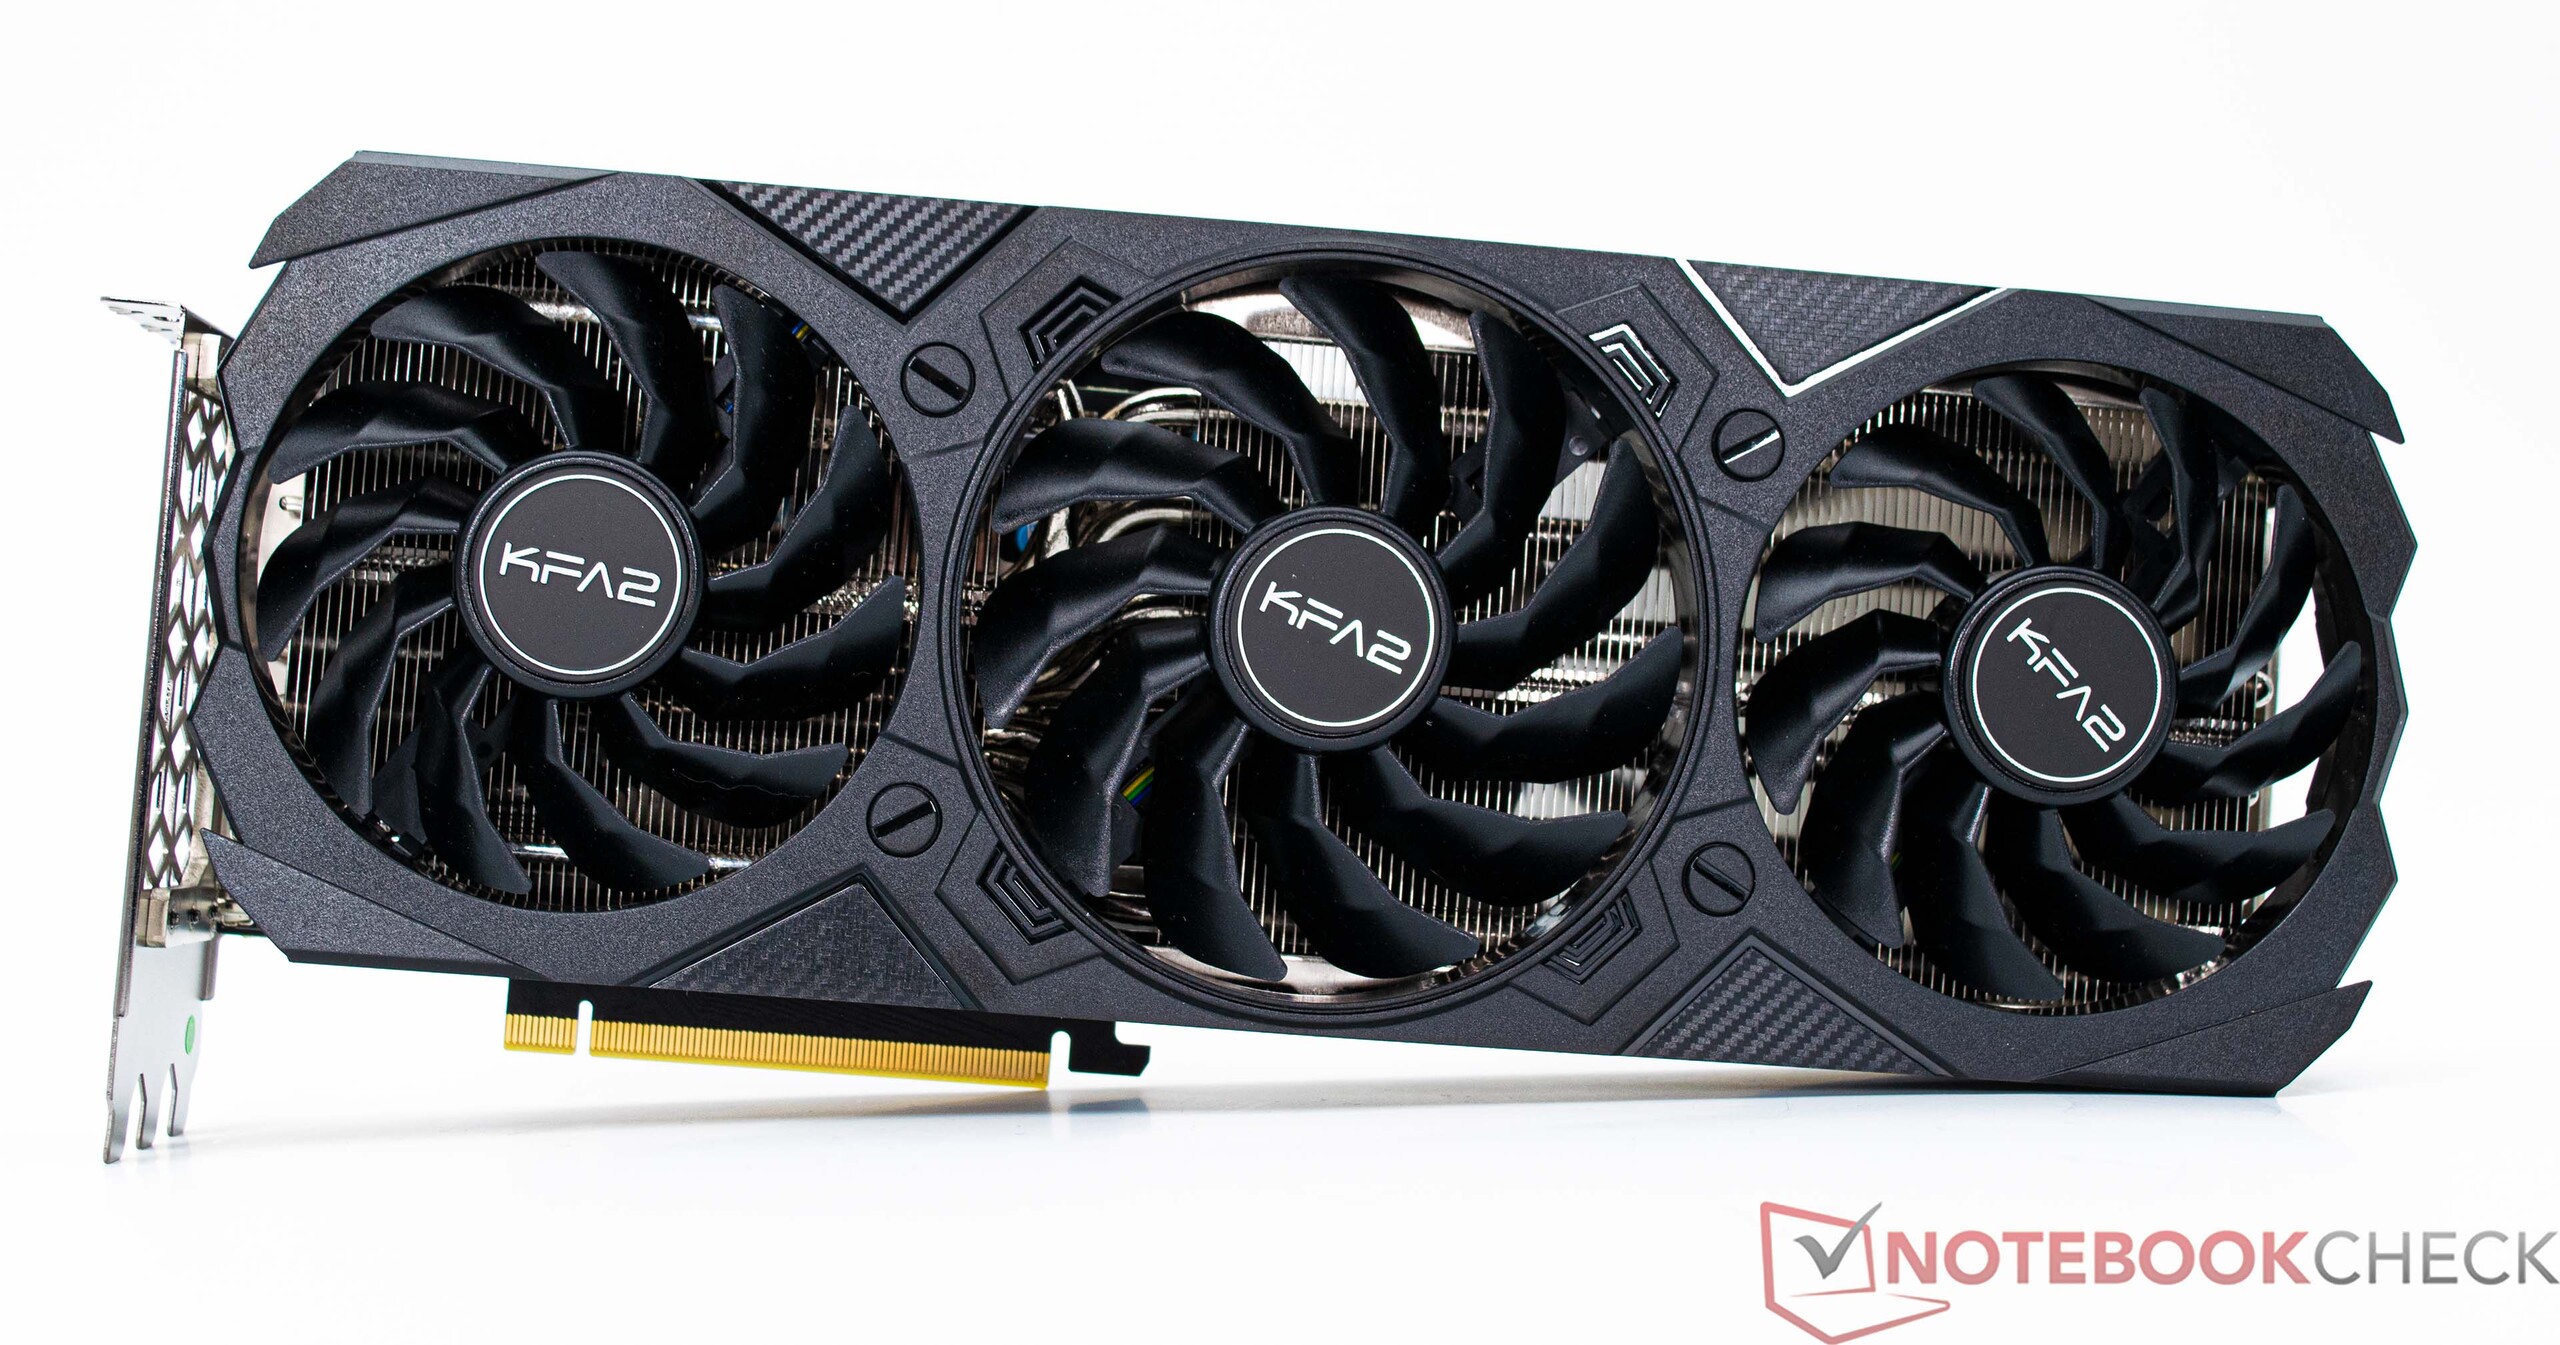
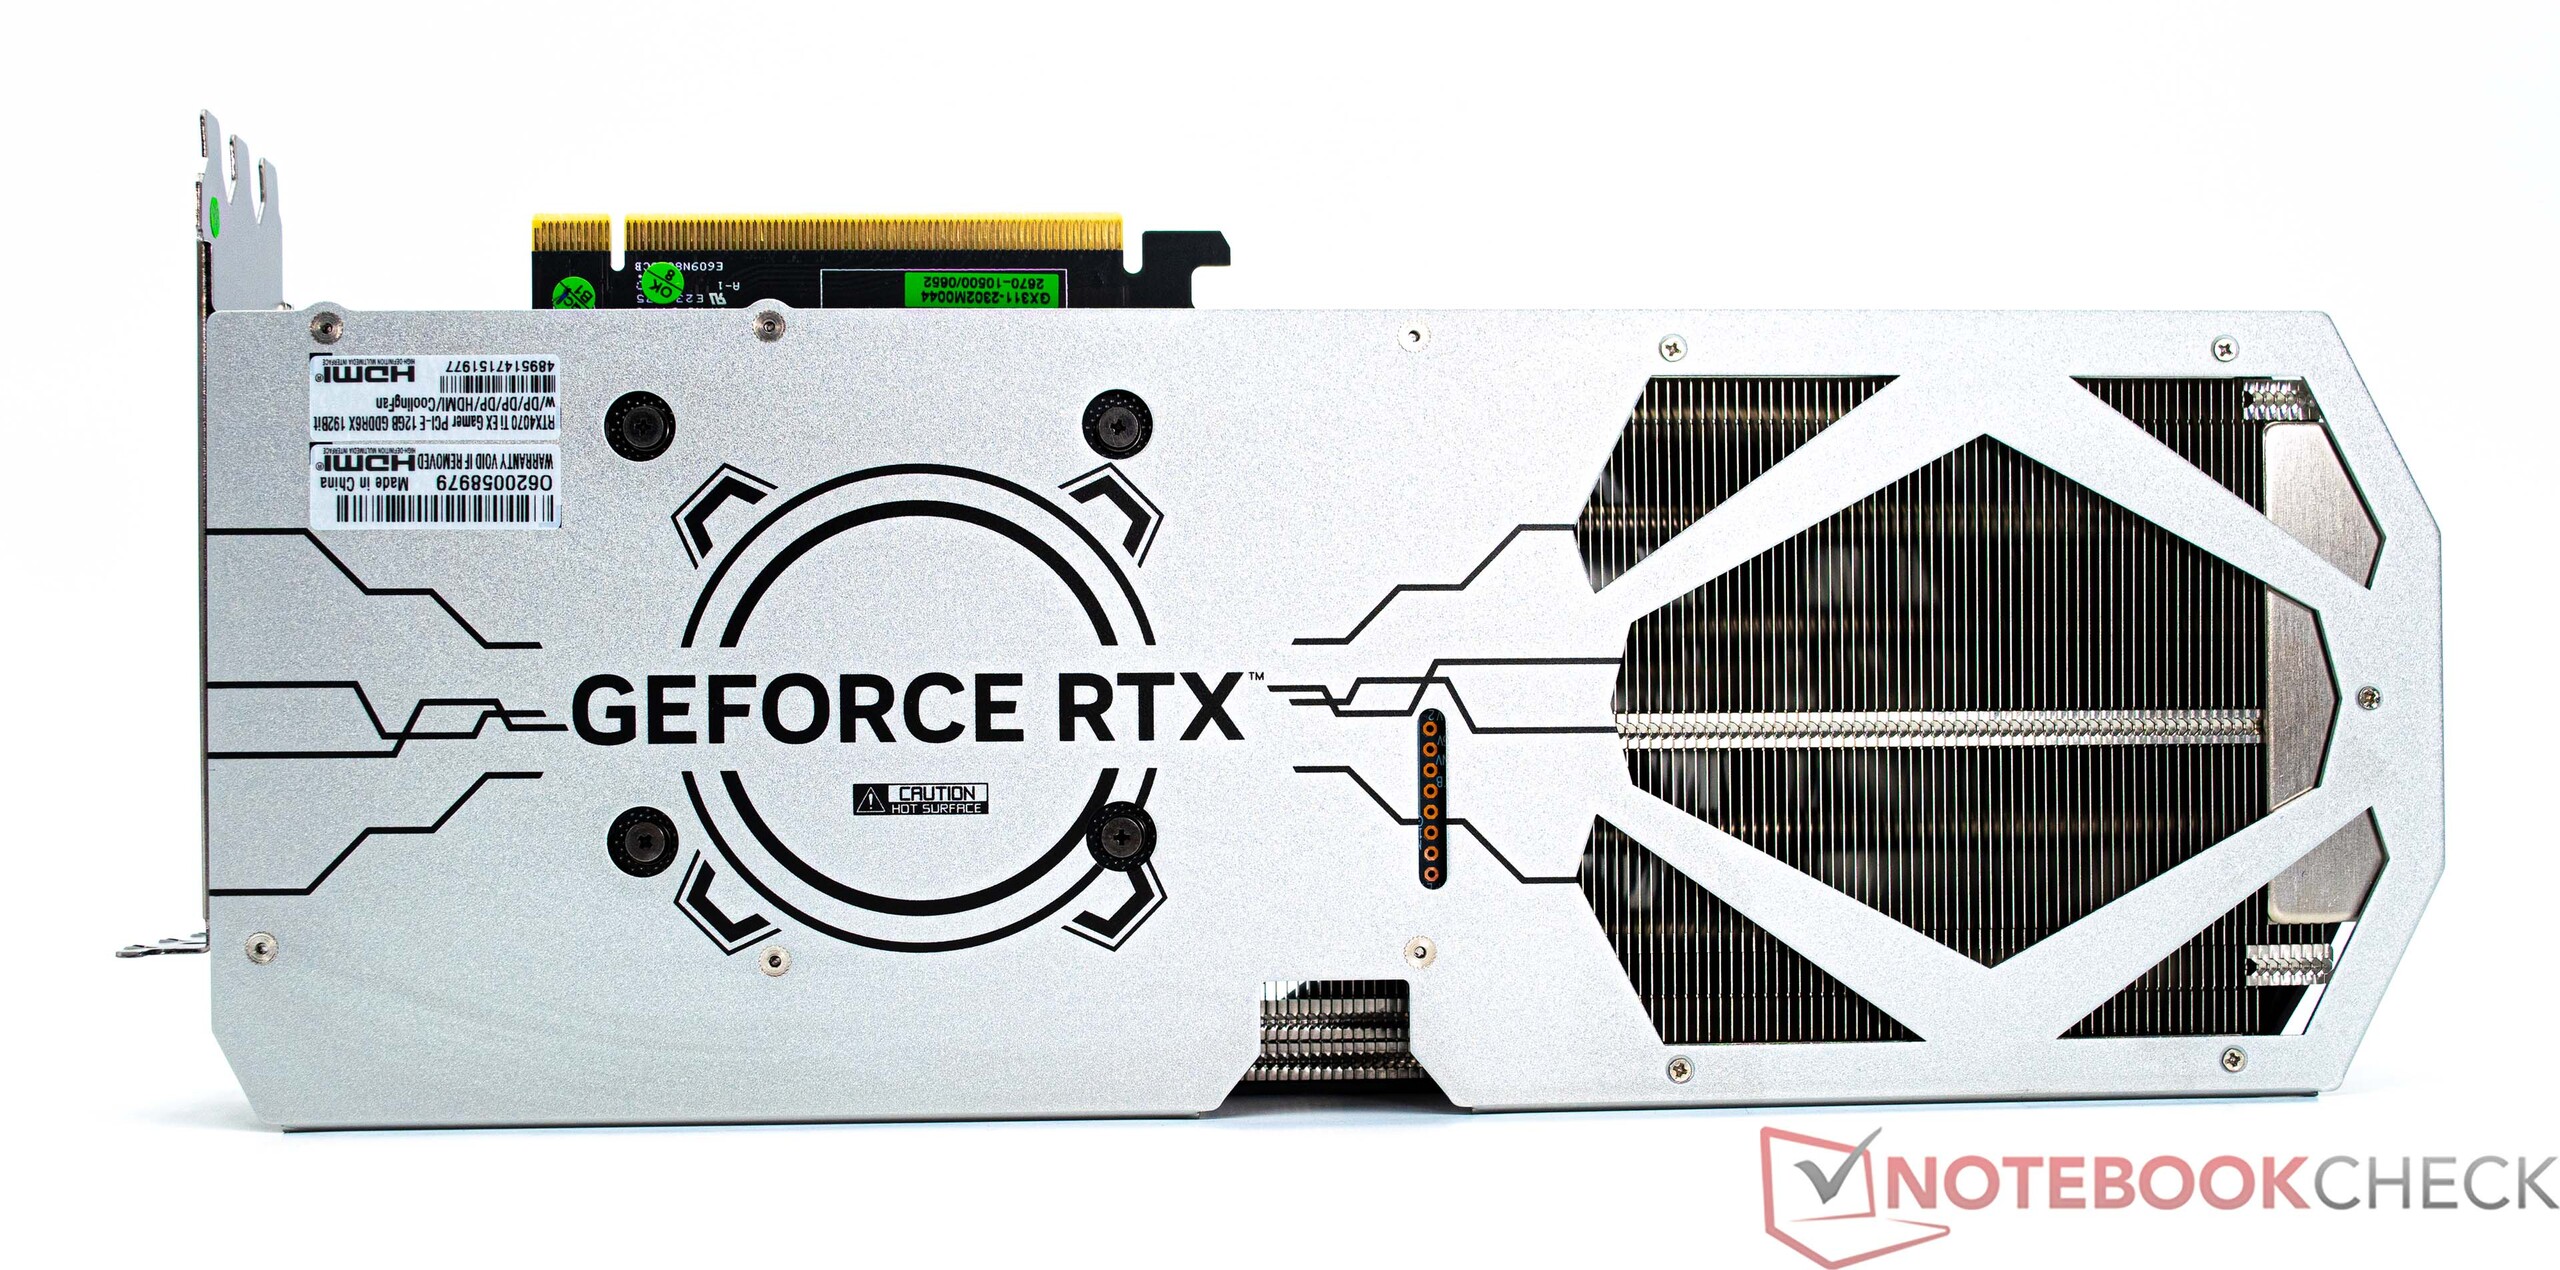
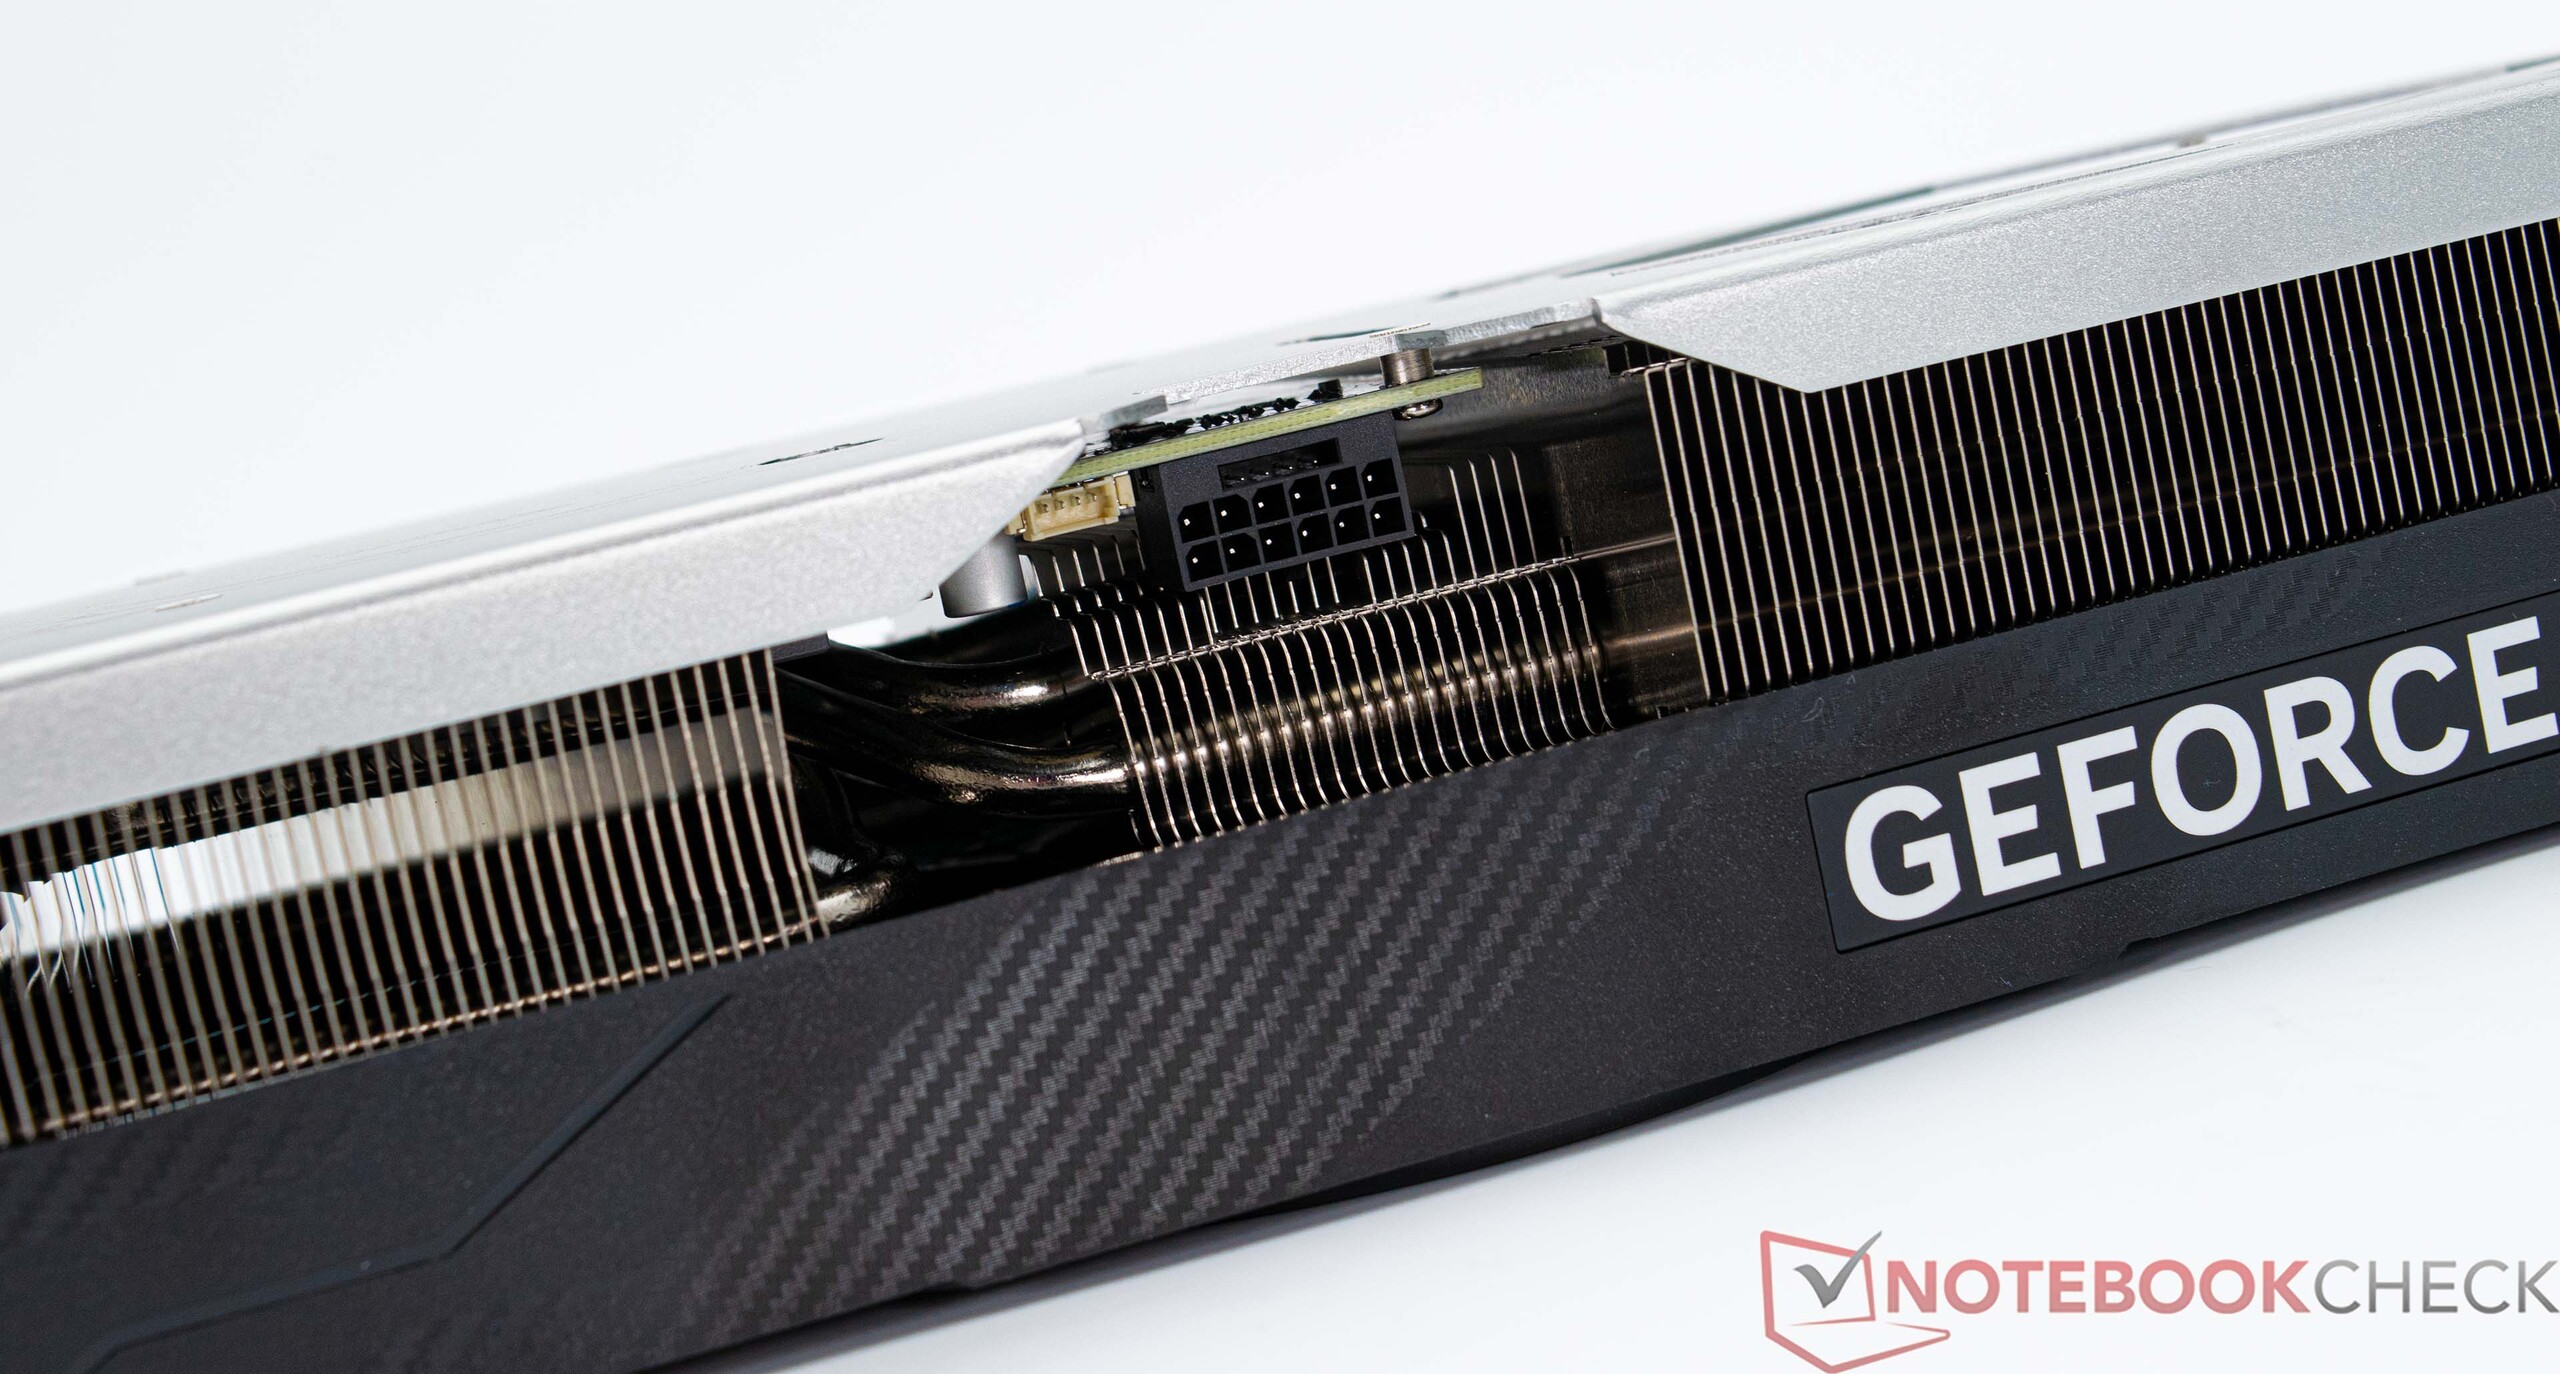
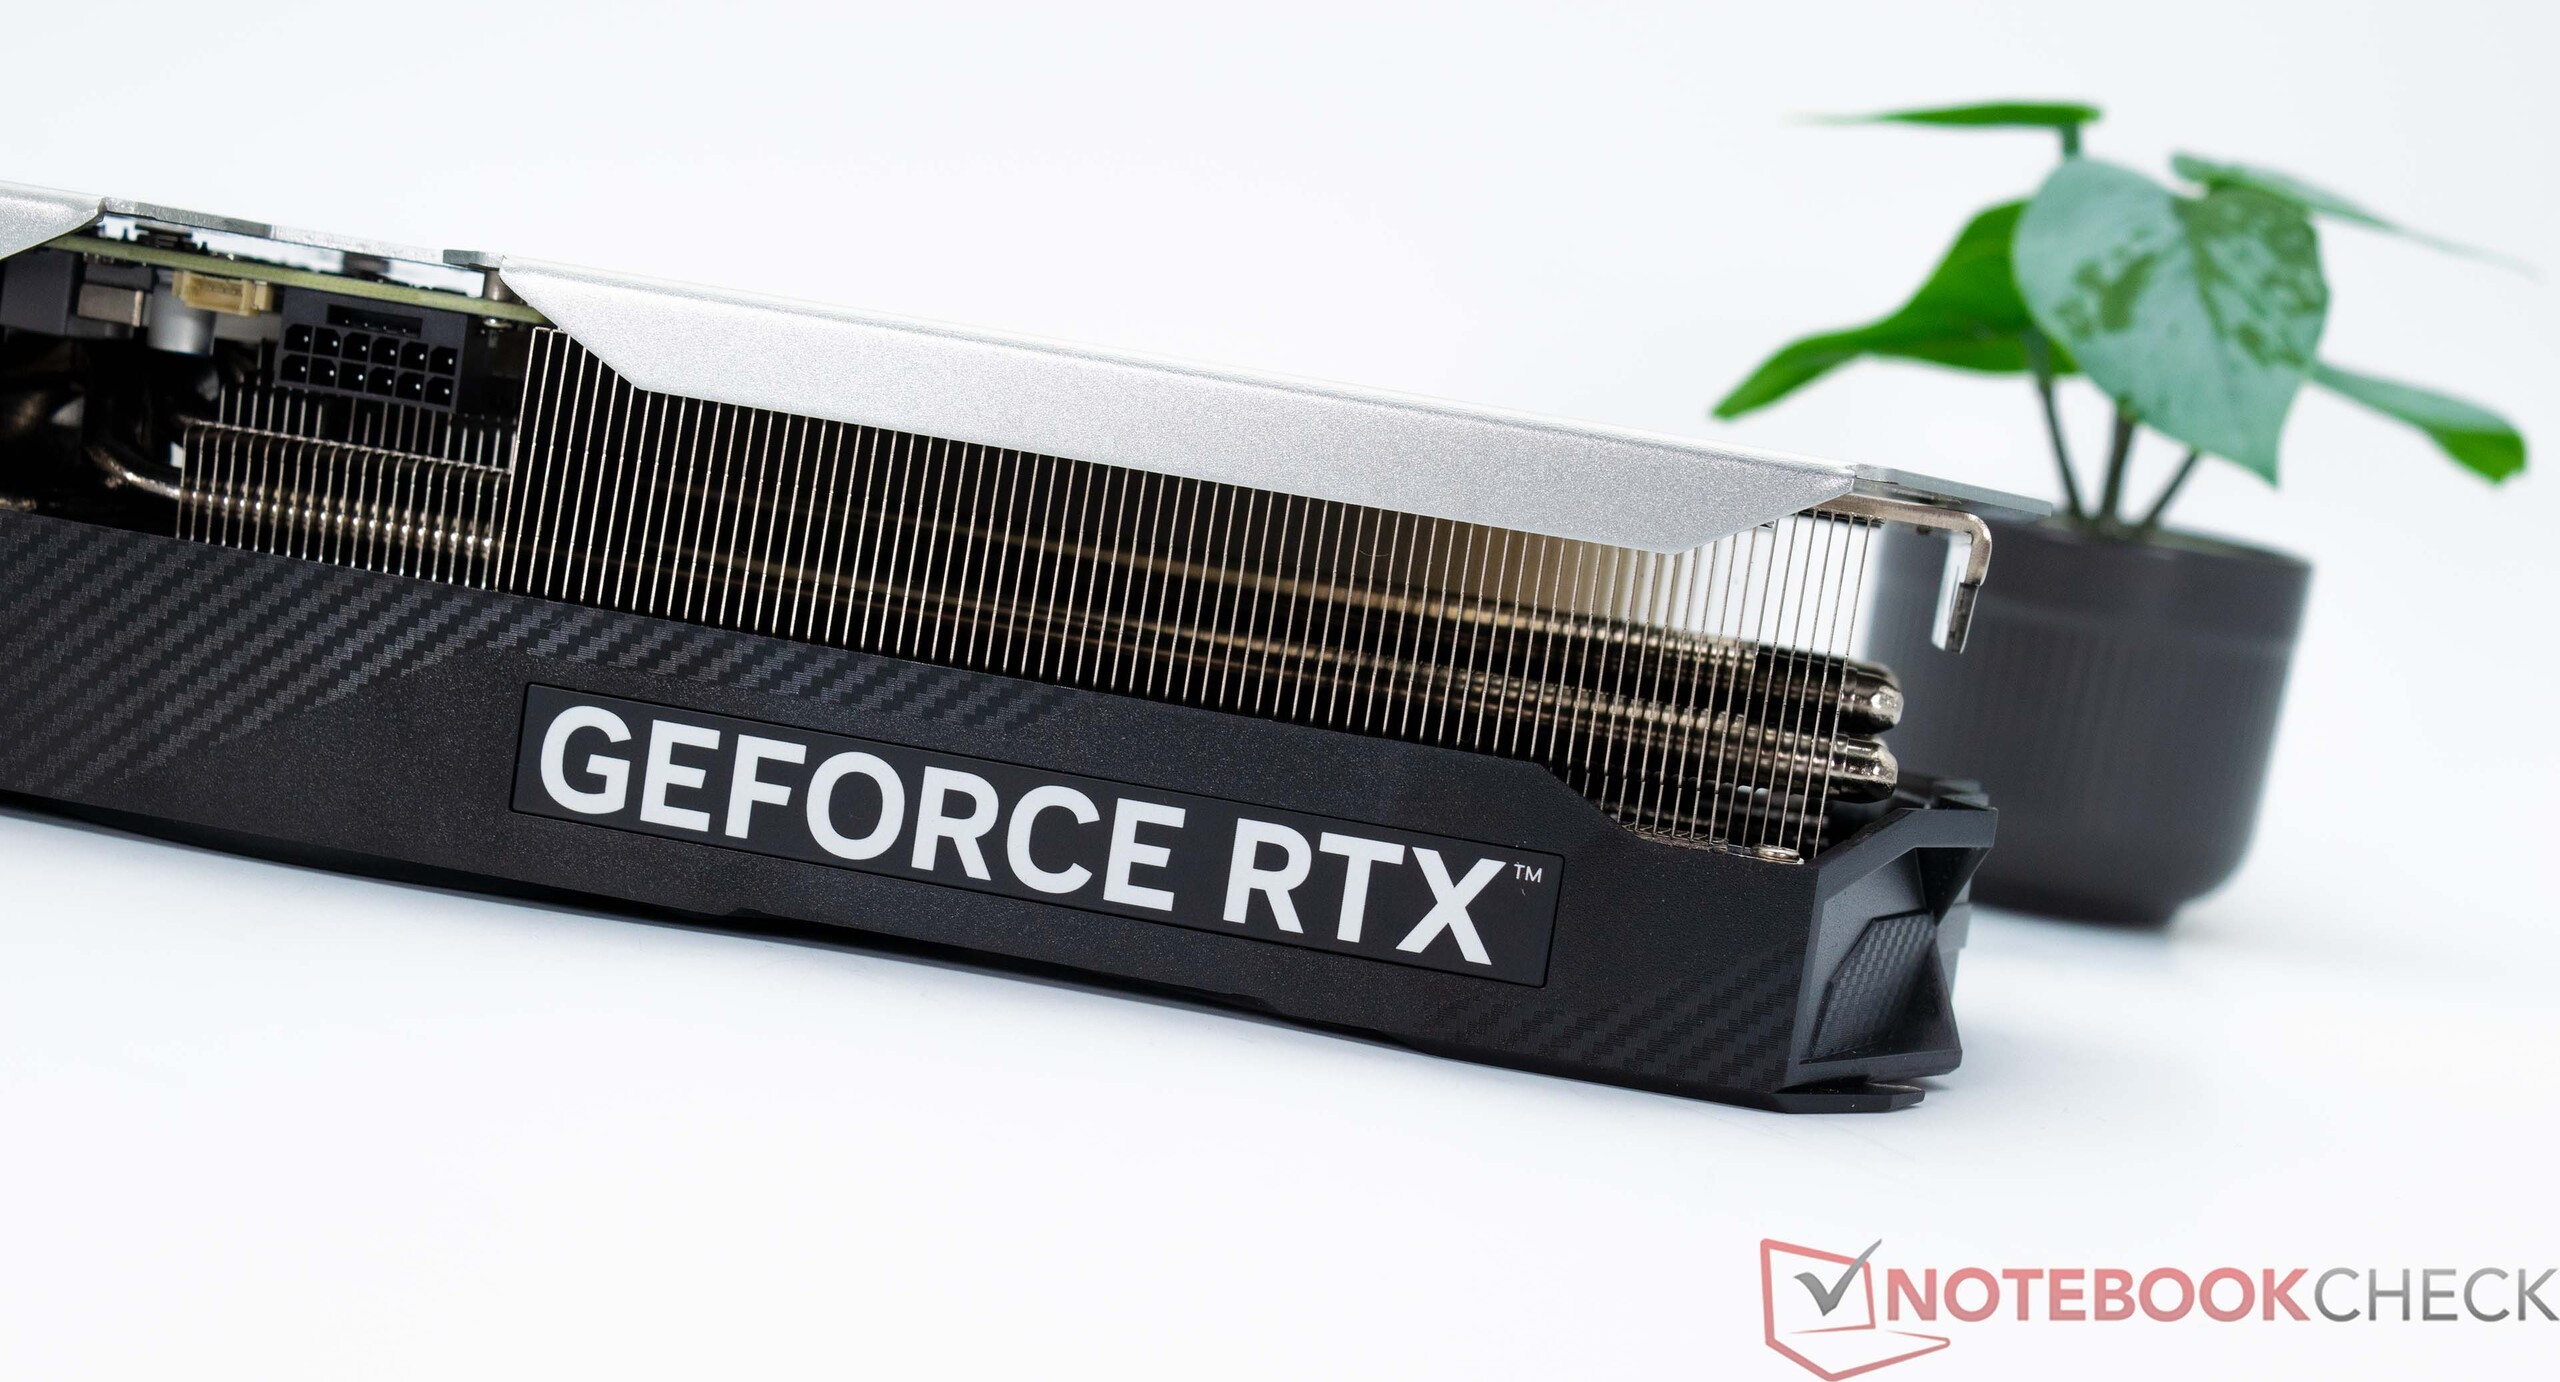
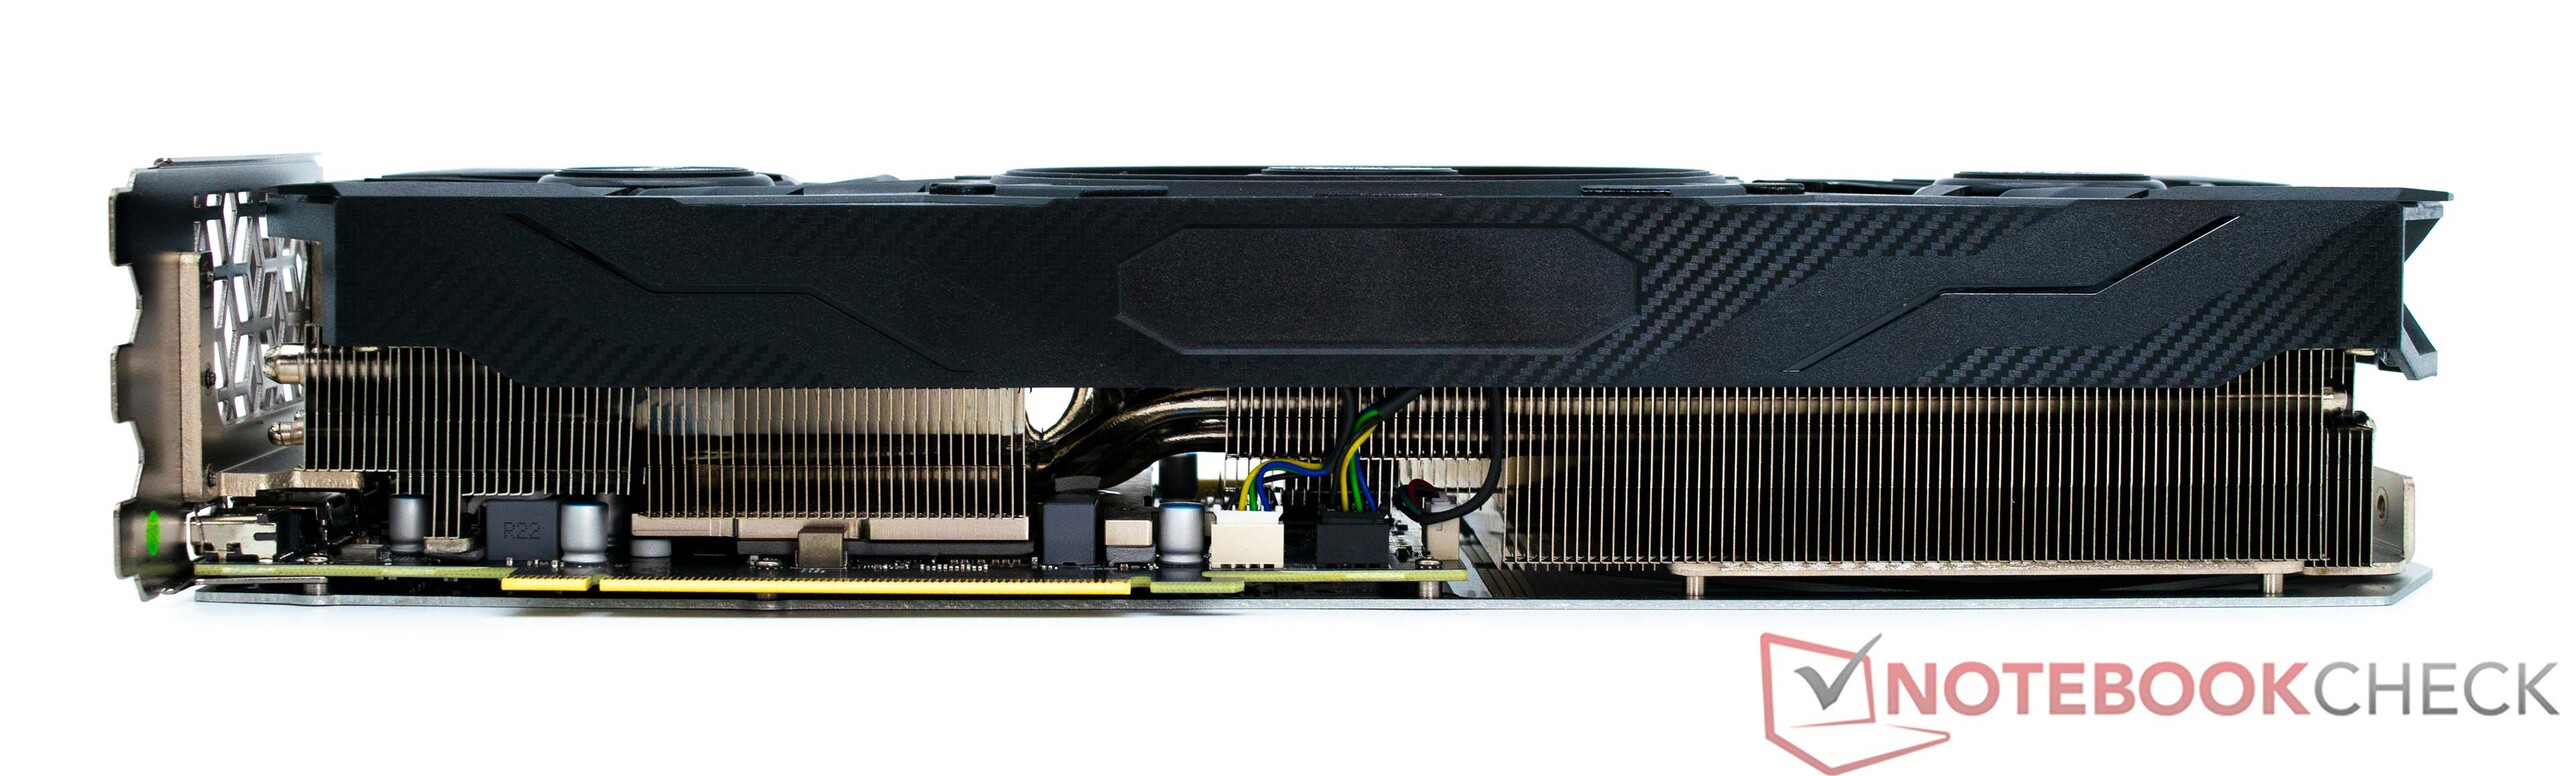
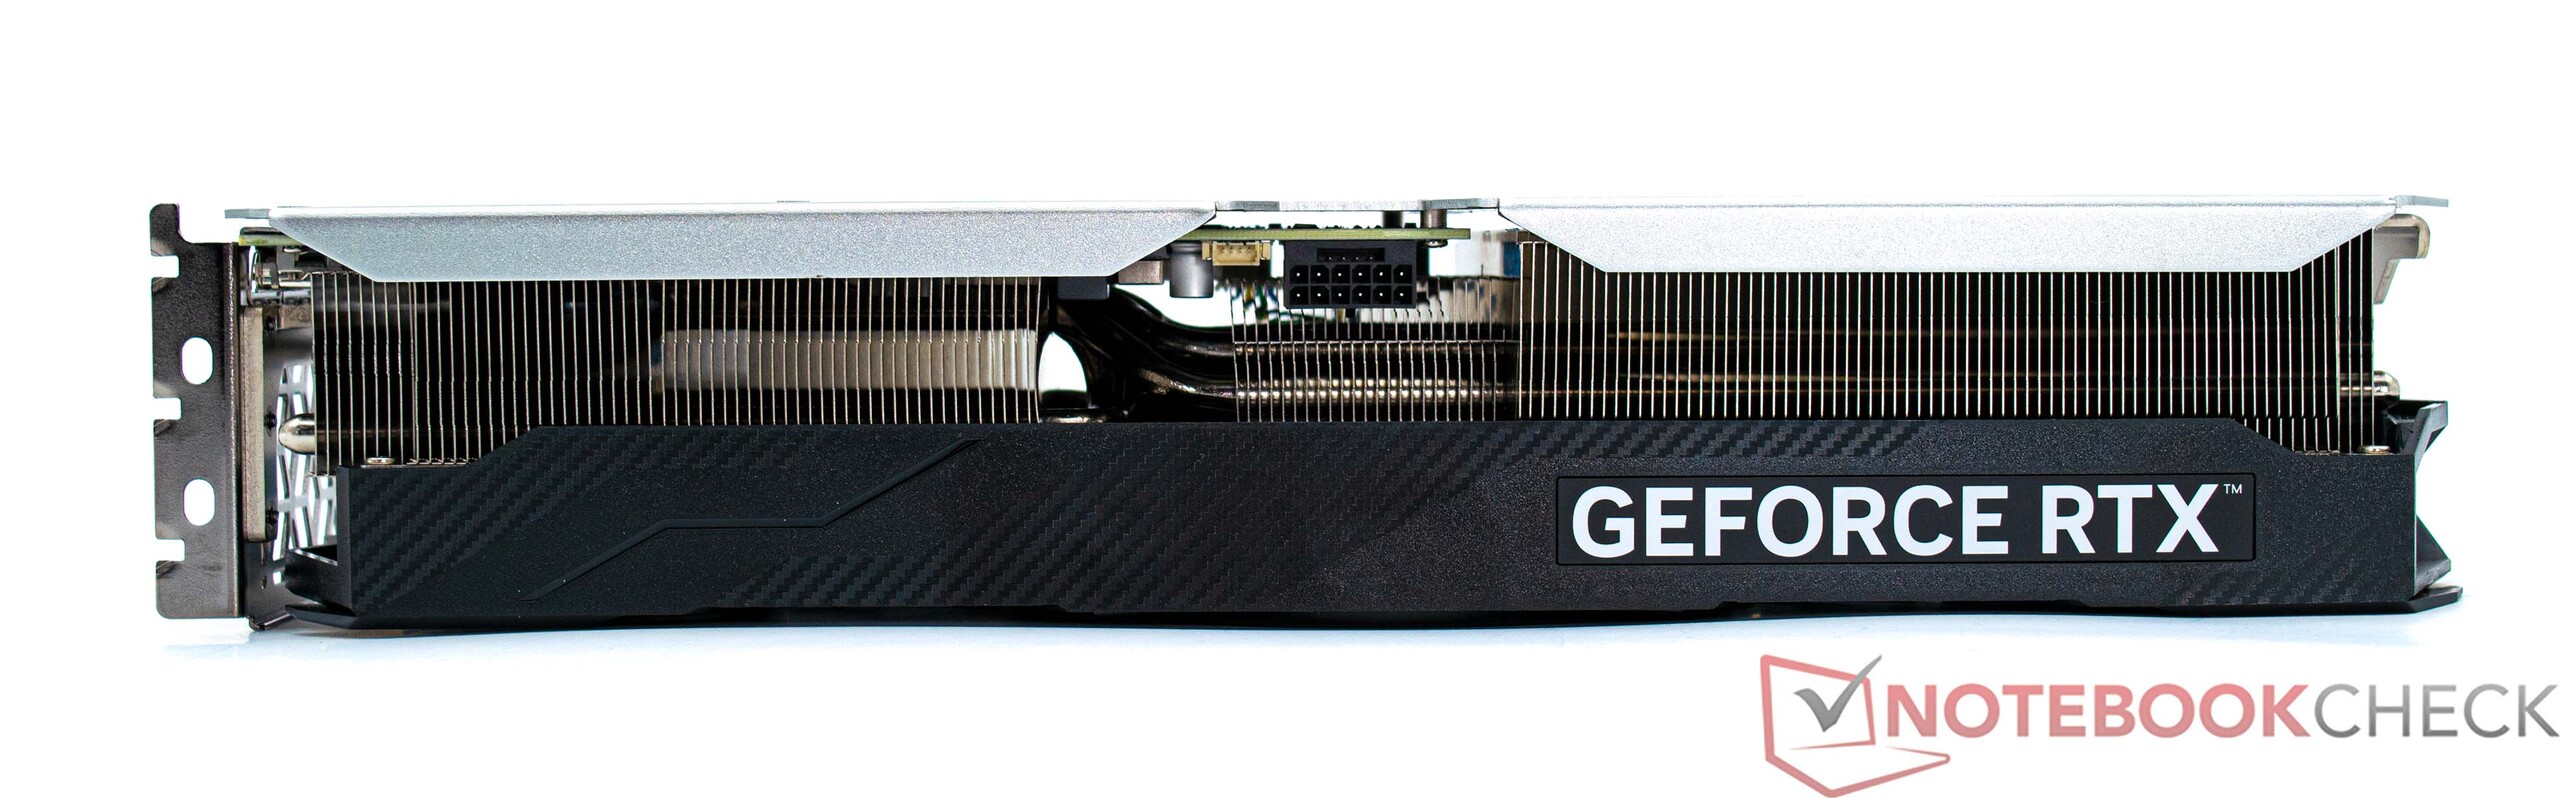
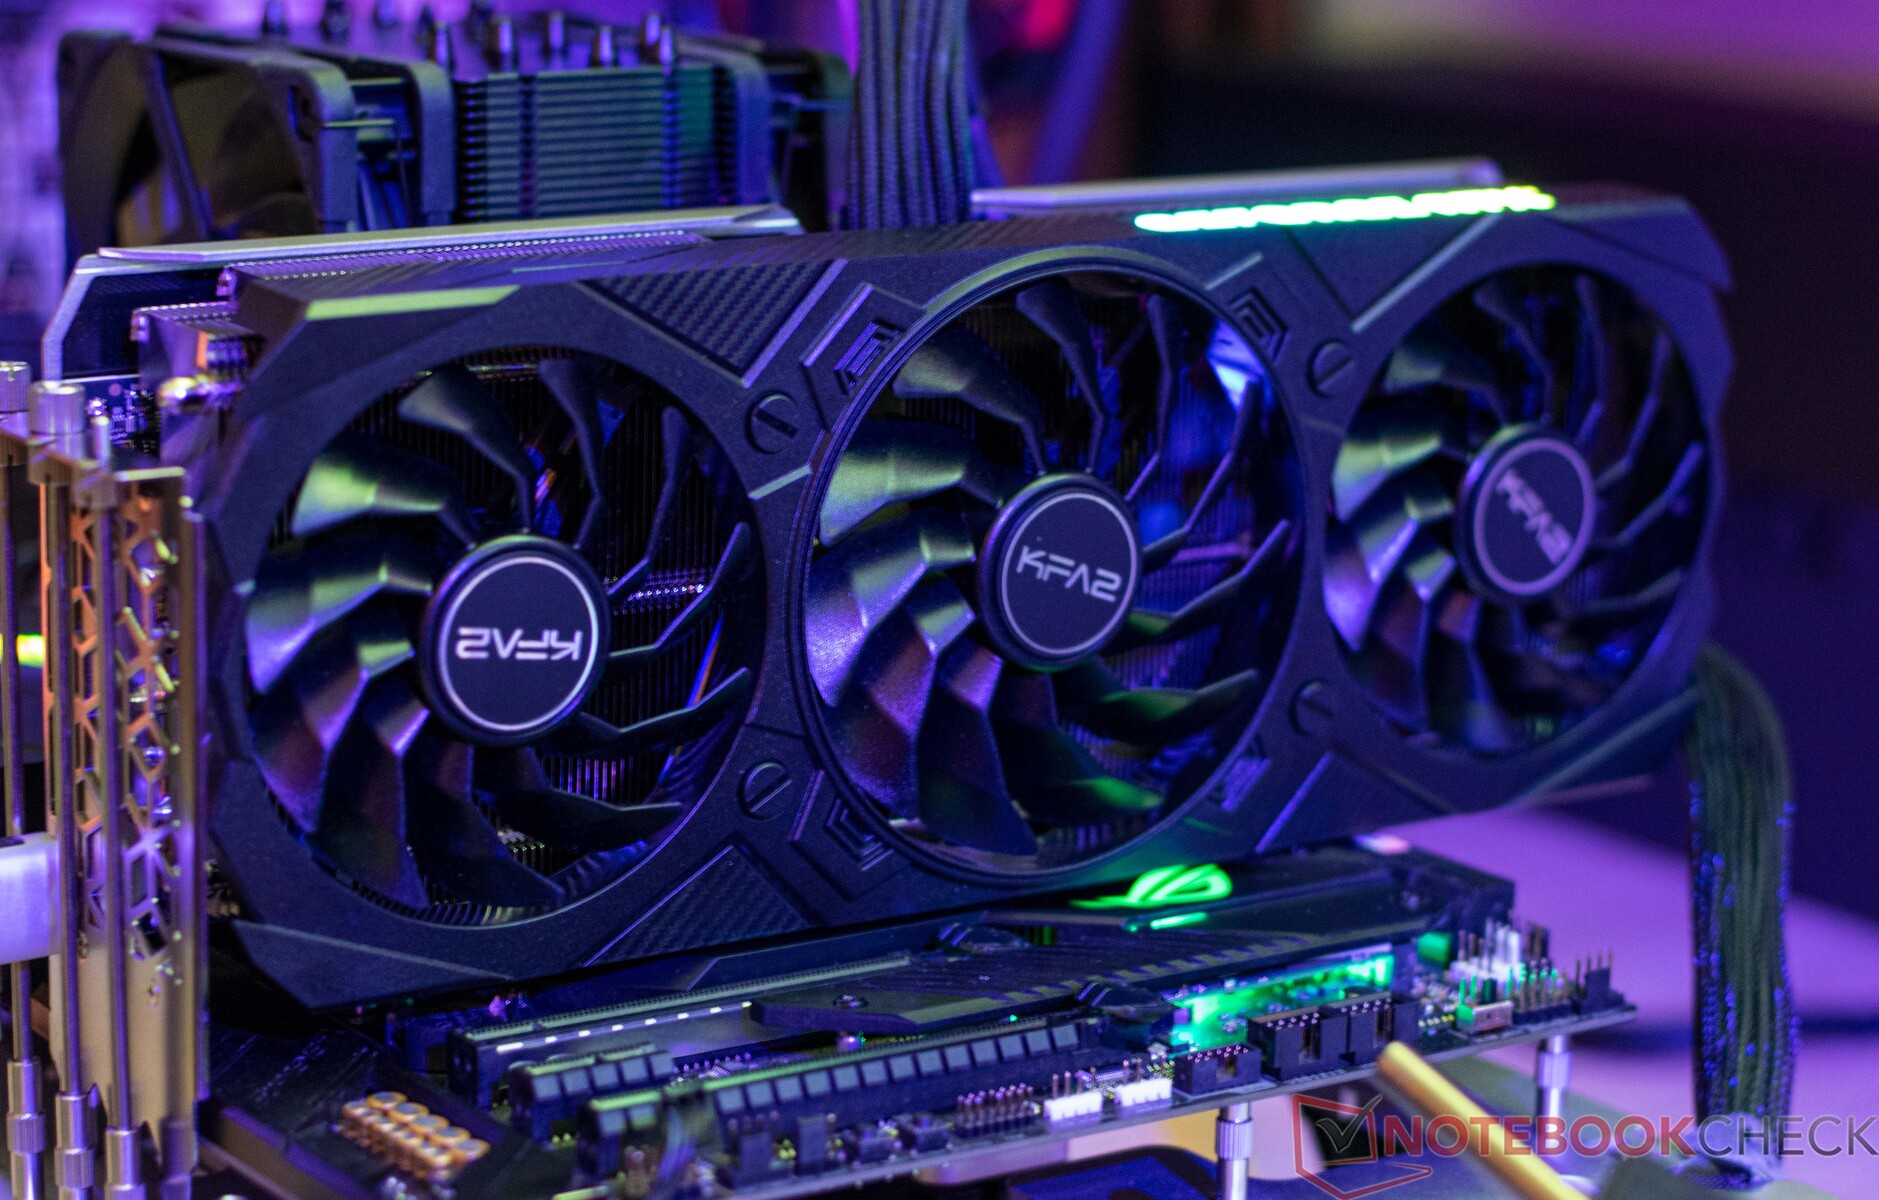
Wizualnie, KFA2 GeForce RTX 4070 Ti EX Gamer wydaje się bardzo duży, w tym potężny trójslotowy cooler, podobnie jak KFA2 GeForce RTX 4070 Ti SG. W pewnym sensie jest to dobre, ponieważ pozwala karcie graficznej pracować cicho i chłodno, chociaż duży rozmiar karty graficznej może nieco ograniczyć kompatybilność obudowy w niektórych sytuacjach. TDP karty graficznej wynosi 285 W, a zasilanie zapewnia złącze 12VHPWR. W pudełku znajduje się odpowiedni adapter 2x 6+2-pin PCIe-12VHPWR, na wypadek gdybyś nie miał jeszcze zasilacza ATX 3.0. W zestawie znajduje się również wspornik GPU.
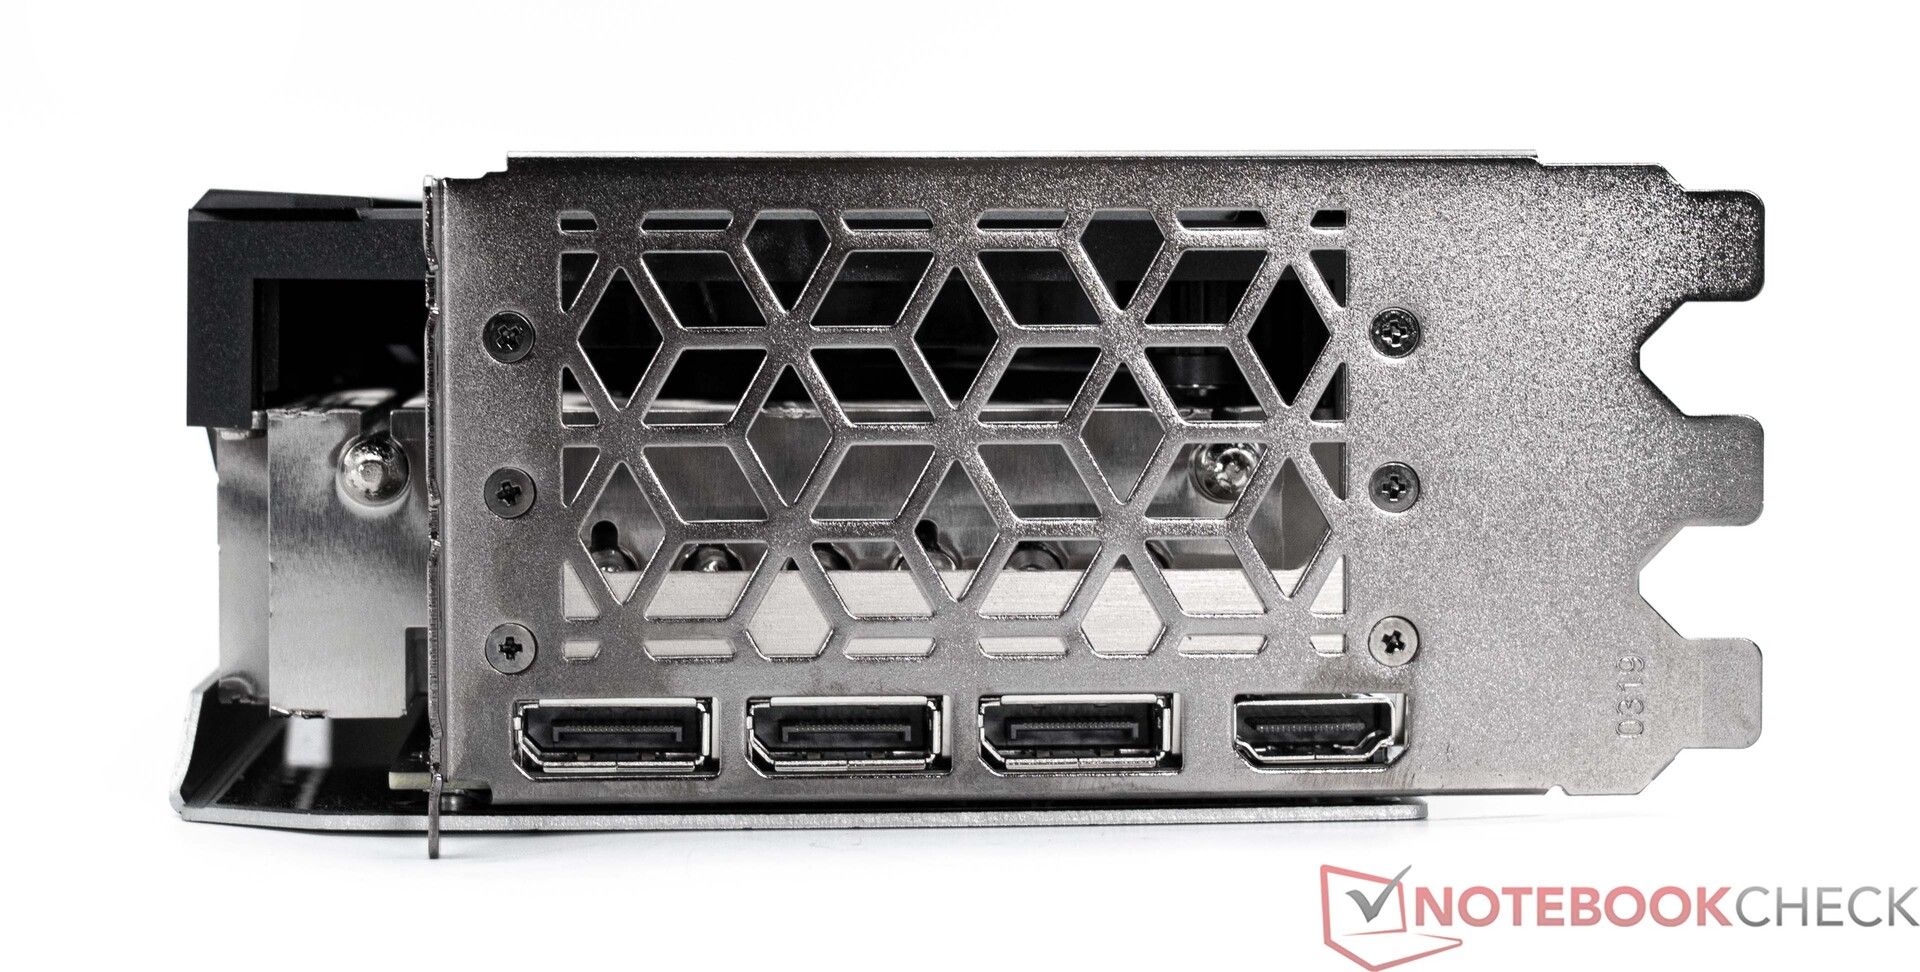
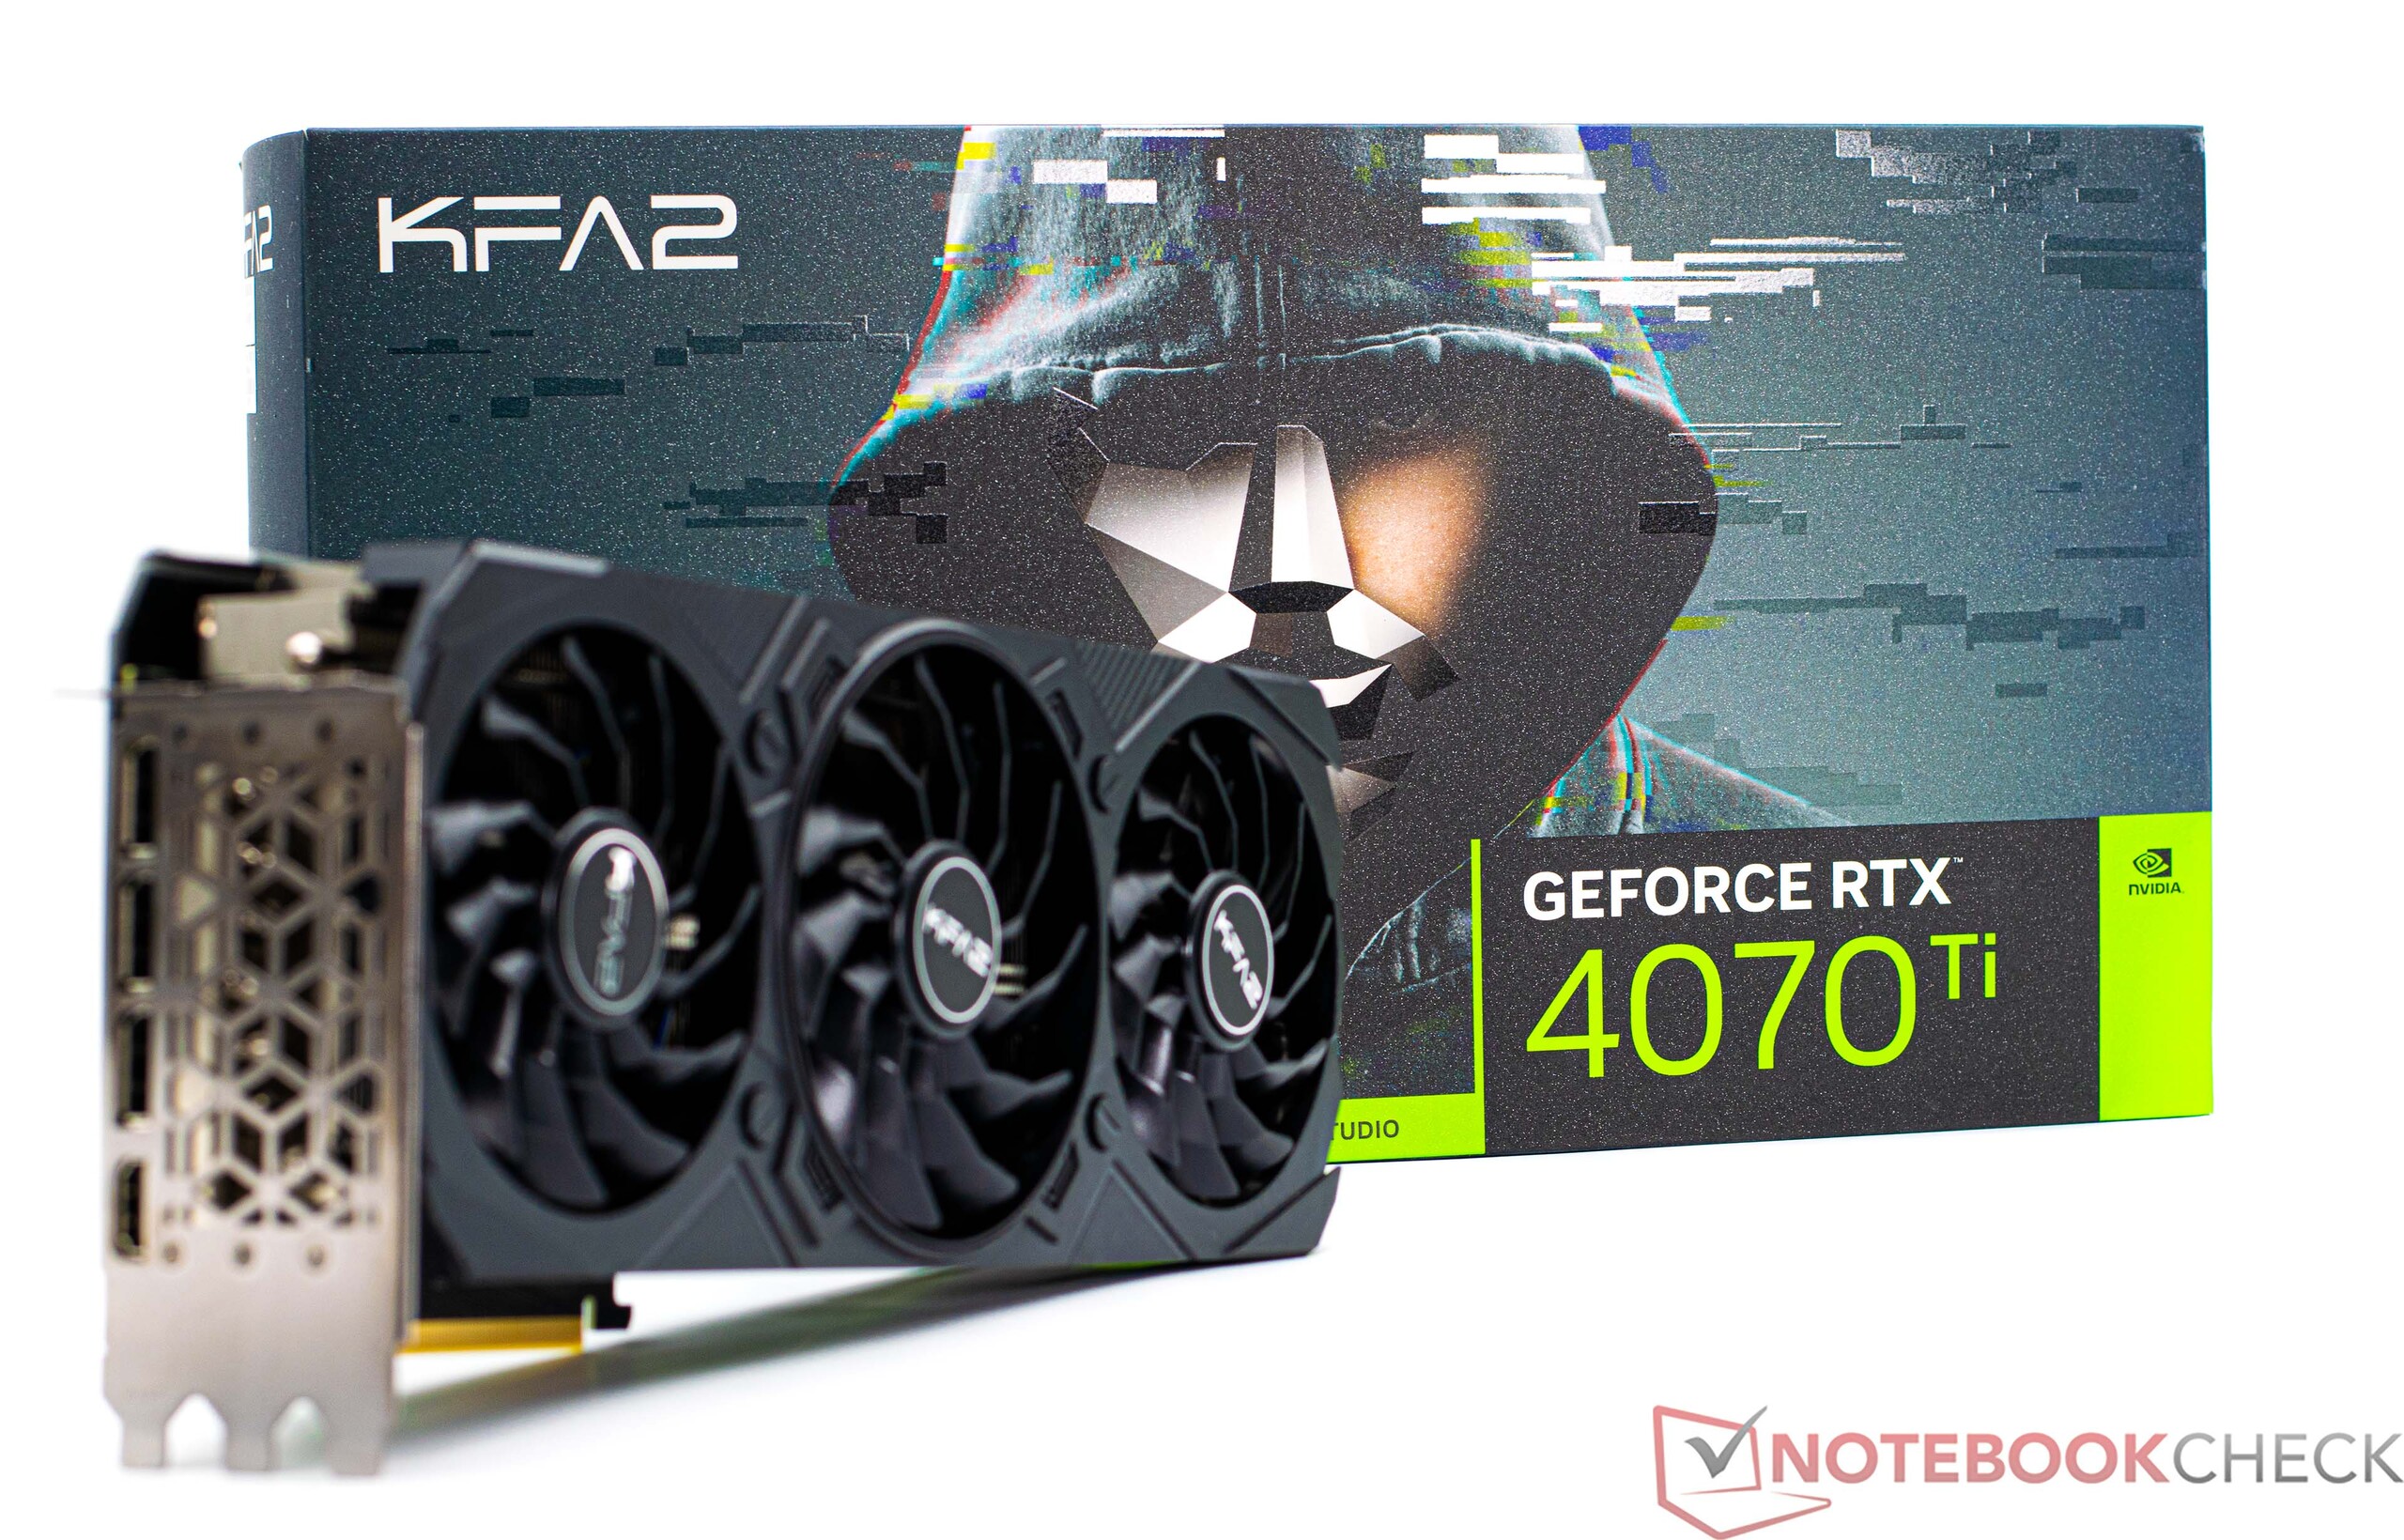
Złącza zewnętrzne są zgodne ze standardem. Obecnie nadal musisz żyć bez DisplayPort 2.1. Zamiast tego musisz zadowolić się 1x HDMI 2.1a i 3x DisplayPort 1.4a, co powinno być wystarczające dla większości użytkowników.
KFA2 GeForce RTX 4070 Ti EX Gamer w szczegółach

Porównanie specyfikacji kart graficznych GeForce
| Sprzęt | RTX 4090 | RTX 4080 | KFA2RTX 4070 Ti | RTX 4070 | RTX 3070 |
| Chip | AD102 | AD103 | AD104 | AD104 | GA104 |
| Proces FinFET | 4 nm | 4 nm | 4 nm | 4 nm | 8 nm |
| Rdzenie CUDA | 16 384 | 9 728 | 7680 | 5 888 | 5 888 |
| Jednostki tekstur | 512 | 304 | 240 | 184 | 184 |
| Rdzenie Tensor | 512 4. gen. | 304 4. gen. | 240 4. gen. | 184 4. gen. | 184 3. gen. |
| Rdzenie RT | 128 | 76 | 60 | 46 | 46 |
| Zegar bazowy GPU | 2,235 MHz | 2,205 MHz | 2,310 MHz | 1,920 MHz | 1,500 MHz |
| GPU Boost Clock | 2,520 MHz | 2,505 MHz | 2,670 MHz | 2,475 MHz | 1,750 MHz |
| Magistrala pamięci | 384 Bit | 256 Bit | 192 Bit | 192 Bit | 256 Bit |
| Przepustowość pamięci | 1 008 GB/s | 716,8 GB/s | 504,2 GB/s | 504,2 GB/s | 448 GB/s |
| Pamięć wideo | 24 GB GDDR6X | 16 GB GDDR6X | 12 GB GDDR6 | 12 GB GDDR6X | 8 GB GDDR6X |
| Pobór mocy | 450 W | 320 W | 285 W | 215 W | 290 W |
Infos on our Test System
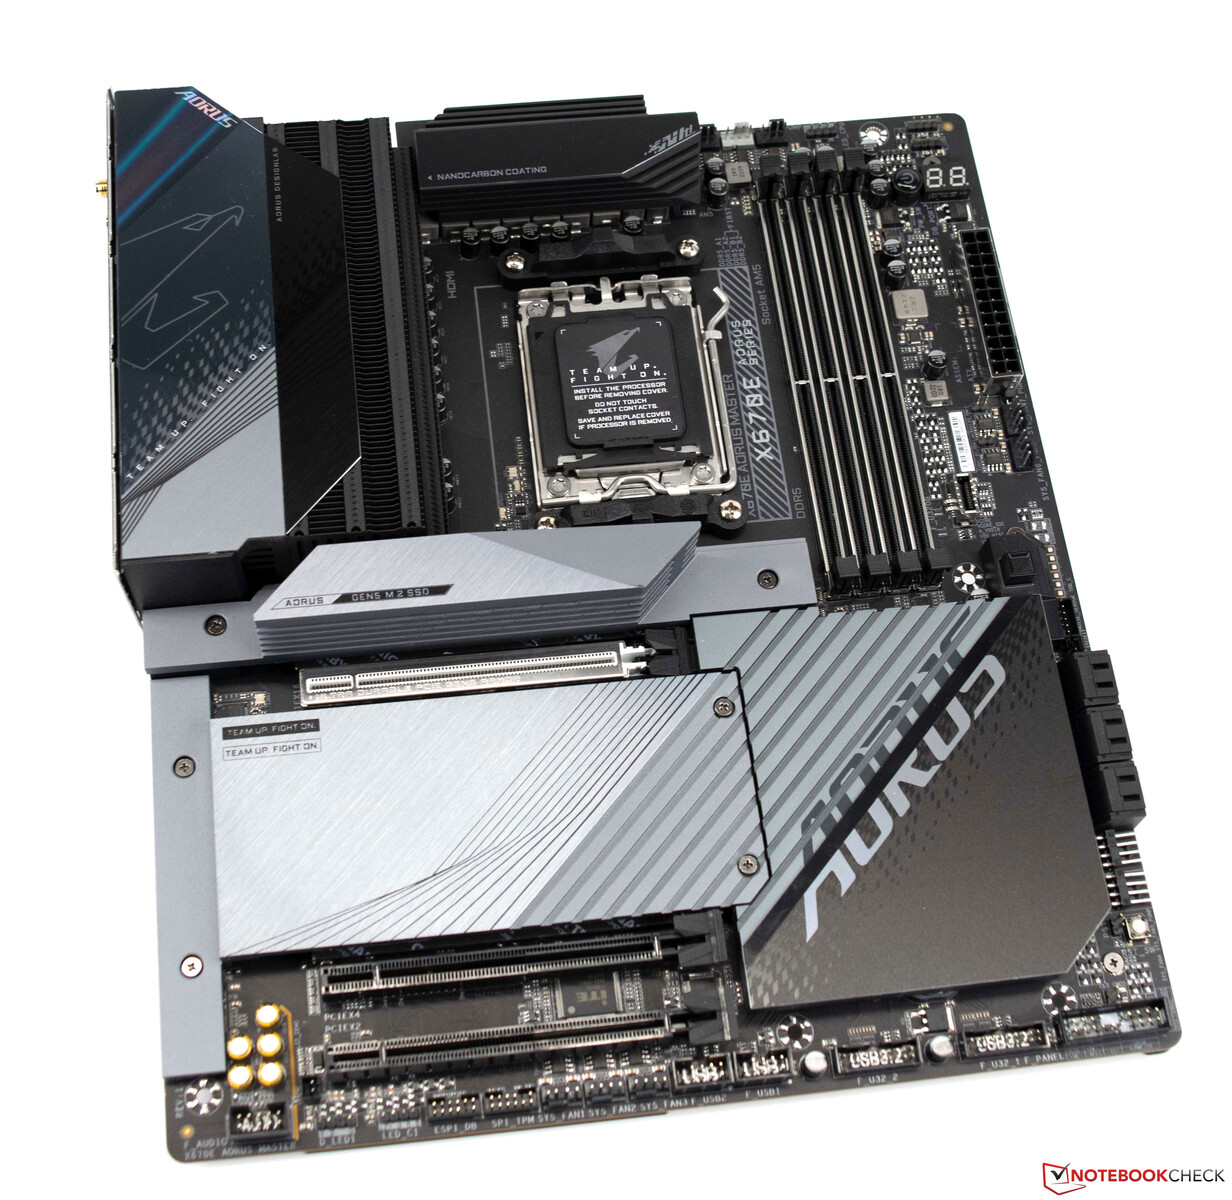
Jako system testowy posłużyła nam aktualna platforma AMD oparta na płycie Gigabyte X670E Aorus Master. Procesor AMD Ryzen 9 7950Xzapewnia dobrą wydajność, a my korzystamy z rozwiązania AiO od Alphacool (Alphacool Eisbear Aurora 360 mm) do chłodzenia. Pamięć robocza o pojemności 32 GB pochodzi od G.Skill i działa z odpowiednim profilem EXPO. Jako monitora używamy Gigabyte M32U.
System testowy w szczegółach
Używamy następującego systemu do testów porównawczych i testów poniżej:
- Lian-Li O11 Dynamic
- AMD Ryzen 9 7950X
- Gigabyte X670E Aorus Master, BIOS: F10c
- Alphacool Eisbear 360 AiO
- Zasilacz Corsair HX1200i
- G.Skill Trident Z5 Neo DDR5-6000 2x 16 GB, EXPO (DDR5-6000 CL30-38-38-96)
- Corsair MP600, 2 TB
- Crucial MX500, 2 TB
- Microsoft Windows 11 Professional 64-Bit (wersja 22H2)
Szczegóły dotyczące KFA2 GeForce RTX 4070 Ti EX Gamer
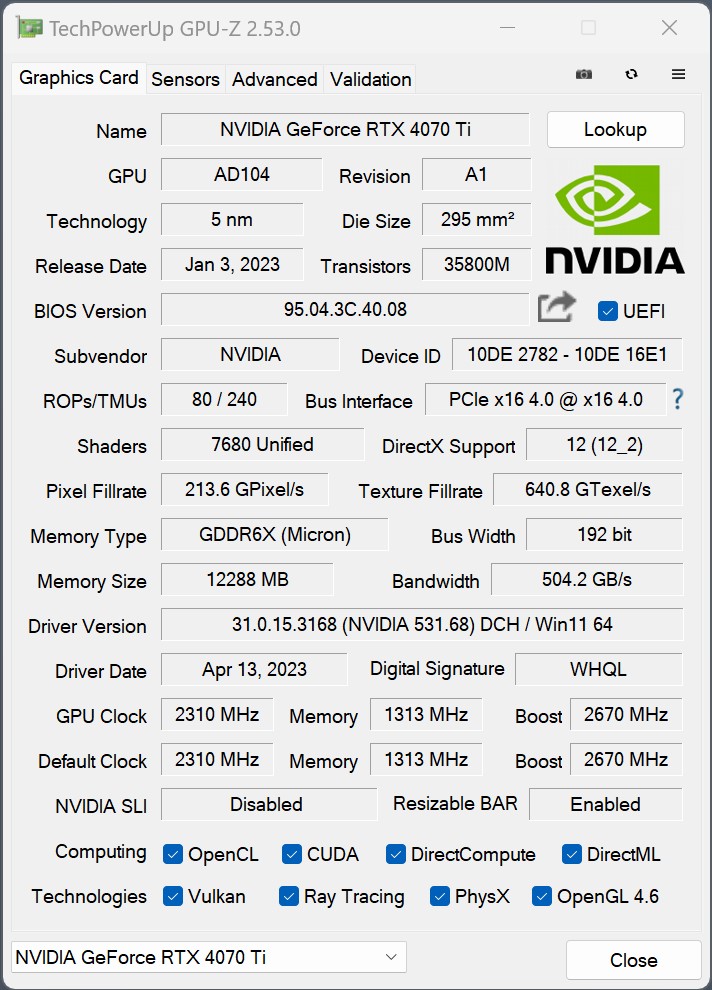
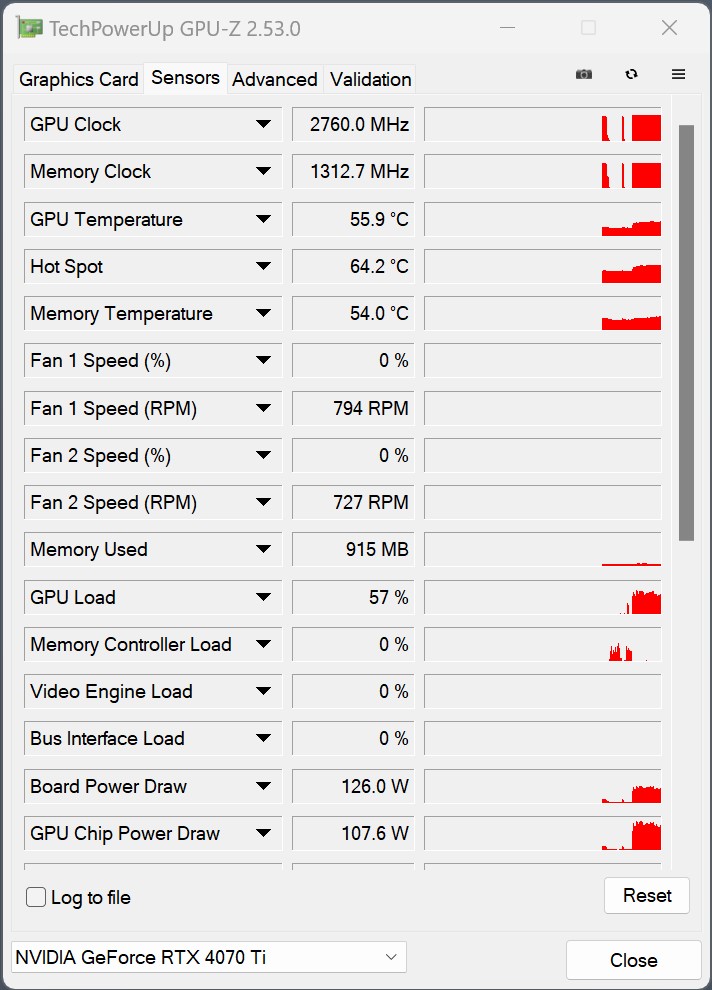
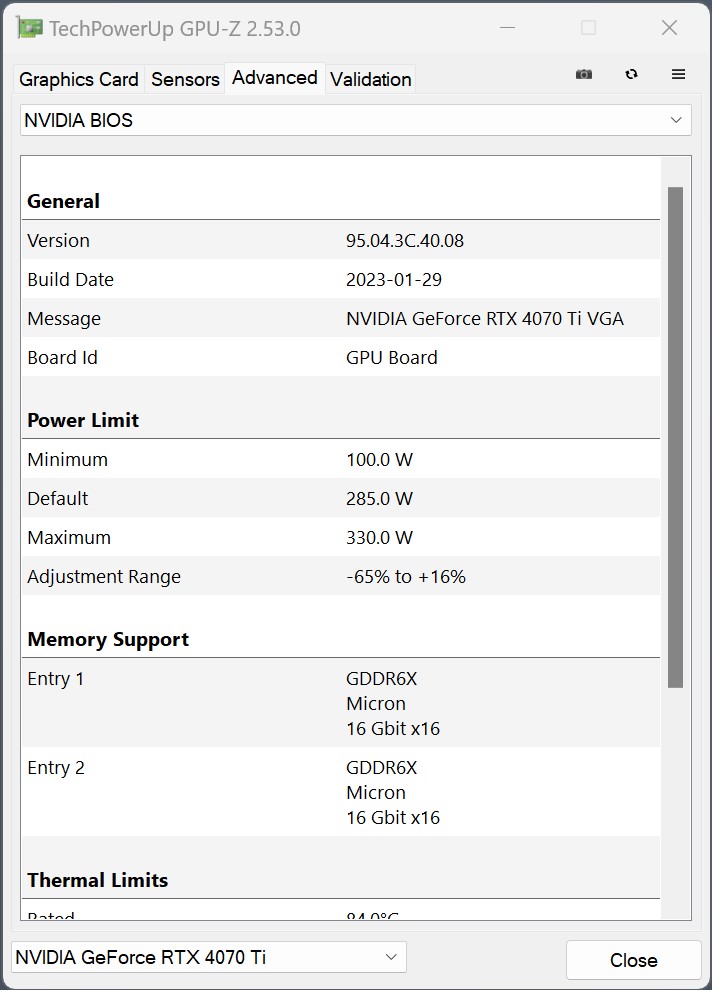
Jeśli chodzi o częstotliwości taktowania KFA2 GeForce RTX 4070 Ti EX Gamer, nie widzimy żadnych zmian w porównaniu do KFA2 GeForce RTX 4070 Ti SG. Tak więc zgodnie ze specyfikacją techniczną oba modele są identyczne. GPU Boost jest określony jako 2670 MHz. W praktyce, w naszych testach w grach widzimy prędkości taktowania GPU między 2750 a 2830 MHz, więc pełna wydajność jest optymalnie wykorzystywana.
Syntetyczne testy porównawcze
Jak już się spodziewaliśmy, porównując konkurentów, wydajność KFA2 GeForce RTX 4070 Ti EX Gamer jest na tym samym poziomie, co wydajność KFA2 RTX 4070 Ti EX Gamer KFA2 GeForce RTX 4070 Ti SG. Jeśli chodzi o AMD, GeForce RTX 4070 Ti konkuruje z AMD Radeon RX 6950 XT. Jednocześnie należy również wiedzieć, że linia kart AMD średniej klasy oparta na architekturze RDNA3 zostanie wprowadzona dopiero za jakiś czas. Obecnie AMD jest szybsze niż nasza jednostka testowa z dwoma topowymi modelami. Choć AMD Radeon RX 7900 XT w zasadzie nie jest bezpośrednim konkurentem dla KFA2 GeForce RTX 4070 Ti EX Gamer, to jednak druga co do szybkości karta graficzna AMD może stać się dla niej zagrożeniem, gdyż cena obu modeli jest na tym samym poziomie.
Patrząc na wydajność obliczeniową, żaden z dwóch modeli 4070-Ti nie jest w stanie zaznaczyć swojej obecności. Nie ma też wyraźnego zwycięzcy w pojedynku producentów. Ci, którzy przede wszystkim polegają na wysokiej wydajności obliczeniowej, muszą z wyprzedzeniem zbadać, jakie oprogramowanie jest używane. Oznacza to, że w tym momencie nie możemy dać jasnej rekomendacji, który produkt jest lepszy.
| Performance rating - Percent | |
| Palit GeForce RTX 4090 GameRock OC | |
| KFA2 GeForce RTX 4090 SG | |
| AMD Radeon RX 7900 XTX | |
| KFA2 GeForce RTX 4080 SG | |
| AMD Radeon RX 7900 XT | |
| KFA2 GeForce RTX 4070 Ti EX Gamer | |
| KFA2 GeForce RTX 4070 Ti SG | |
| MSI Radeon RX 6950 XT Gaming X Trio | |
| ASUS TUF Gaming GeForce RTX 3080 Ti OC | |
| NVIDIA GeForce RTX 3090 Founders Edition | |
| Sapphire AMD Radeon RX 6950 XT Nitro+ Pure | |
| KFA2 GeForce RTX 3080 SG | |
| KFA2 GeForce RTX 4070 EX Gamer | |
| Nvidia Titan RTX | |
| KFA2 GeForce RTX 3070 Ti SG | |
| Unigine Heaven 4.0 | |
| Extreme Preset DX11 | |
| Palit GeForce RTX 4090 GameRock OC | |
| KFA2 GeForce RTX 4090 SG | |
| KFA2 GeForce RTX 4080 SG | |
| AMD Radeon RX 7900 XTX | |
| AMD Radeon RX 7900 XT | |
| KFA2 GeForce RTX 4070 Ti SG | |
| MSI Radeon RX 6950 XT Gaming X Trio | |
| KFA2 GeForce RTX 4070 Ti EX Gamer | |
| ASUS TUF Gaming GeForce RTX 3080 Ti OC | |
| NVIDIA GeForce RTX 3090 Founders Edition | |
| Sapphire AMD Radeon RX 6950 XT Nitro+ Pure | |
| KFA2 GeForce RTX 3080 SG | |
| KFA2 GeForce RTX 4070 EX Gamer | |
| Nvidia Titan RTX | |
| KFA2 GeForce RTX 3070 Ti SG | |
| Extreme Preset OpenGL | |
| Palit GeForce RTX 4090 GameRock OC | |
| KFA2 GeForce RTX 4090 SG | |
| KFA2 GeForce RTX 4080 SG | |
| AMD Radeon RX 7900 XTX | |
| AMD Radeon RX 7900 XT | |
| KFA2 GeForce RTX 4070 Ti SG | |
| KFA2 GeForce RTX 4070 Ti EX Gamer | |
| ASUS TUF Gaming GeForce RTX 3080 Ti OC | |
| NVIDIA GeForce RTX 3090 Founders Edition | |
| MSI Radeon RX 6950 XT Gaming X Trio | |
| KFA2 GeForce RTX 3080 SG | |
| KFA2 GeForce RTX 4070 EX Gamer | |
| Sapphire AMD Radeon RX 6950 XT Nitro+ Pure | |
| KFA2 GeForce RTX 3070 Ti SG | |
| Nvidia Titan RTX | |
| Unigine Valley 1.0 | |
| 1920x1080 Extreme HD DirectX AA:x8 | |
| KFA2 GeForce RTX 4090 SG | |
| Palit GeForce RTX 4090 GameRock OC | |
| AMD Radeon RX 7900 XTX | |
| KFA2 GeForce RTX 4080 SG | |
| AMD Radeon RX 7900 XT | |
| MSI Radeon RX 6950 XT Gaming X Trio | |
| ASUS TUF Gaming GeForce RTX 3080 Ti OC | |
| NVIDIA GeForce RTX 3090 Founders Edition | |
| KFA2 GeForce RTX 4070 Ti EX Gamer | |
| KFA2 GeForce RTX 4070 Ti SG | |
| Sapphire AMD Radeon RX 6950 XT Nitro+ Pure | |
| KFA2 GeForce RTX 3080 SG | |
| KFA2 GeForce RTX 3070 Ti SG | |
| Nvidia Titan RTX | |
| KFA2 GeForce RTX 4070 EX Gamer | |
| 1920x1080 Extreme HD Preset OpenGL AA:x8 | |
| Palit GeForce RTX 4090 GameRock OC | |
| KFA2 GeForce RTX 4090 SG | |
| AMD Radeon RX 7900 XTX | |
| KFA2 GeForce RTX 4080 SG | |
| AMD Radeon RX 7900 XT | |
| ASUS TUF Gaming GeForce RTX 3080 Ti OC | |
| NVIDIA GeForce RTX 3090 Founders Edition | |
| KFA2 GeForce RTX 4070 Ti EX Gamer | |
| KFA2 GeForce RTX 4070 Ti SG | |
| MSI Radeon RX 6950 XT Gaming X Trio | |
| KFA2 GeForce RTX 3080 SG | |
| Sapphire AMD Radeon RX 6950 XT Nitro+ Pure | |
| KFA2 GeForce RTX 4070 EX Gamer | |
| KFA2 GeForce RTX 3070 Ti SG | |
| Nvidia Titan RTX | |
| 3DMark 11 | |
| 1280x720 Performance GPU | |
| Palit GeForce RTX 4090 GameRock OC | |
| KFA2 GeForce RTX 4090 SG | |
| KFA2 GeForce RTX 4080 SG | |
| AMD Radeon RX 7900 XTX | |
| AMD Radeon RX 7900 XT | |
| KFA2 GeForce RTX 4070 Ti SG | |
| KFA2 GeForce RTX 4070 Ti EX Gamer | |
| MSI Radeon RX 6950 XT Gaming X Trio | |
| Sapphire AMD Radeon RX 6950 XT Nitro+ Pure | |
| NVIDIA GeForce RTX 3090 Founders Edition | |
| ASUS TUF Gaming GeForce RTX 3080 Ti OC | |
| KFA2 GeForce RTX 4070 EX Gamer | |
| KFA2 GeForce RTX 3080 SG | |
| Nvidia Titan RTX | |
| KFA2 GeForce RTX 3070 Ti SG | |
| 1280x720 Performance | |
| Palit GeForce RTX 4090 GameRock OC | |
| KFA2 GeForce RTX 4090 SG | |
| KFA2 GeForce RTX 4080 SG | |
| KFA2 GeForce RTX 4070 Ti SG | |
| AMD Radeon RX 7900 XTX | |
| AMD Radeon RX 7900 XT | |
| KFA2 GeForce RTX 4070 Ti EX Gamer | |
| MSI Radeon RX 6950 XT Gaming X Trio | |
| ASUS TUF Gaming GeForce RTX 3080 Ti OC | |
| KFA2 GeForce RTX 4070 EX Gamer | |
| NVIDIA GeForce RTX 3090 Founders Edition | |
| Nvidia Titan RTX | |
| Sapphire AMD Radeon RX 6950 XT Nitro+ Pure | |
| KFA2 GeForce RTX 3070 Ti SG | |
| KFA2 GeForce RTX 3080 SG | |
Computing Benchmarks and Professional Applications
| LuxMark v2.0 64Bit | |
| Sala GPUs-only | |
| Sapphire AMD Radeon RX 6950 XT Nitro+ Pure | |
| Palit GeForce RTX 4090 GameRock OC | |
| KFA2 GeForce RTX 4090 SG | |
| KFA2 GeForce RTX 4080 SG | |
| KFA2 GeForce RTX 4070 Ti SG | |
| KFA2 GeForce RTX 4070 Ti EX Gamer | |
| ASUS TUF Gaming GeForce RTX 3080 Ti OC | |
| AMD Radeon RX 7900 XTX | |
| NVIDIA GeForce RTX 3090 Founders Edition | |
| KFA2 GeForce RTX 4070 EX Gamer | |
| KFA2 GeForce RTX 3080 SG | |
| AMD Radeon RX 7900 XT | |
| MSI Radeon RX 6950 XT Gaming X Trio | |
| KFA2 GeForce RTX 3070 Ti SG | |
| Nvidia Titan RTX | |
| Room GPUs-only | |
| Palit GeForce RTX 4090 GameRock OC | |
| KFA2 GeForce RTX 4090 SG | |
| KFA2 GeForce RTX 4080 SG | |
| KFA2 GeForce RTX 4070 Ti SG | |
| KFA2 GeForce RTX 4070 Ti EX Gamer | |
| KFA2 GeForce RTX 4070 EX Gamer | |
| NVIDIA GeForce RTX 3090 Founders Edition | |
| ASUS TUF Gaming GeForce RTX 3080 Ti OC | |
| KFA2 GeForce RTX 3080 SG | |
| AMD Radeon RX 7900 XTX | |
| Sapphire AMD Radeon RX 6950 XT Nitro+ Pure | |
| Nvidia Titan RTX | |
| KFA2 GeForce RTX 3070 Ti SG | |
| AMD Radeon RX 7900 XT | |
| MSI Radeon RX 6950 XT Gaming X Trio | |
| Blender | |
| v3.3 Classroom CUDA | |
| KFA2 GeForce RTX 3070 Ti SG | |
| Nvidia Titan RTX | |
| ASUS TUF Gaming GeForce RTX 3080 Ti OC | |
| KFA2 GeForce RTX 4070 Ti EX Gamer | |
| v3.3 Classroom OPTIX/RTX | |
| Nvidia Titan RTX | |
| KFA2 GeForce RTX 3070 Ti SG | |
| ASUS TUF Gaming GeForce RTX 3080 Ti OC | |
| KFA2 GeForce RTX 4070 EX Gamer | |
| KFA2 GeForce RTX 4070 Ti SG | |
| KFA2 GeForce RTX 4070 Ti EX Gamer | |
| KFA2 GeForce RTX 4080 SG | |
| Geekbench 5.5 | |
| OpenCL Score | |
| Palit GeForce RTX 4090 GameRock OC | |
| KFA2 GeForce RTX 4090 SG | |
| KFA2 GeForce RTX 4080 SG | |
| NVIDIA GeForce RTX 3090 Founders Edition | |
| KFA2 GeForce RTX 4070 Ti SG | |
| KFA2 GeForce RTX 4070 Ti EX Gamer | |
| KFA2 GeForce RTX 3080 SG | |
| Sapphire AMD Radeon RX 6950 XT Nitro+ Pure | |
| KFA2 GeForce RTX 4070 EX Gamer | |
| Nvidia Titan RTX | |
| Vulkan Score 5.5 | |
| Palit GeForce RTX 4090 GameRock OC | |
| KFA2 GeForce RTX 4090 SG | |
| KFA2 GeForce RTX 4070 Ti SG | |
| KFA2 GeForce RTX 4070 Ti EX Gamer | |
| Nvidia Titan RTX | |
| NVIDIA GeForce RTX 3090 Founders Edition | |
| Sapphire AMD Radeon RX 6950 XT Nitro+ Pure | |
| KFA2 GeForce RTX 4070 EX Gamer | |
| KFA2 GeForce RTX 3080 SG | |
| V-Ray 5 Benchmark | |
| GPU CUDA | |
| Palit GeForce RTX 4090 GameRock OC | |
| KFA2 GeForce RTX 4090 SG | |
| KFA2 GeForce RTX 4080 SG | |
| KFA2 GeForce RTX 4070 Ti SG | |
| KFA2 GeForce RTX 4070 Ti EX Gamer | |
| NVIDIA GeForce RTX 3090 Founders Edition | |
| ASUS TUF Gaming GeForce RTX 3080 Ti OC | |
| KFA2 GeForce RTX 4070 EX Gamer | |
| KFA2 GeForce RTX 3070 Ti SG | |
| KFA2 GeForce RTX 3080 SG | |
| Sapphire AMD Radeon RX 6950 XT Nitro+ Pure | |
| GPU RTX | |
| Palit GeForce RTX 4090 GameRock OC | |
| KFA2 GeForce RTX 4090 SG | |
| KFA2 GeForce RTX 4080 SG | |
| KFA2 GeForce RTX 4070 Ti SG | |
| KFA2 GeForce RTX 4070 Ti EX Gamer | |
| NVIDIA GeForce RTX 3090 Founders Edition | |
| ASUS TUF Gaming GeForce RTX 3080 Ti OC | |
| KFA2 GeForce RTX 4070 EX Gamer | |
| KFA2 GeForce RTX 3070 Ti SG | |
| Premiere Pro PugetBench | |
| Overall Score 0.9 | |
| Palit GeForce RTX 4090 GameRock OC | |
| KFA2 GeForce RTX 4070 EX Gamer | |
| KFA2 GeForce RTX 4070 Ti SG | |
| KFA2 GeForce RTX 4080 SG | |
| Nvidia Titan RTX | |
| KFA2 GeForce RTX 4070 Ti EX Gamer | |
| AMD Radeon RX 7900 XTX | |
| ASUS TUF Gaming GeForce RTX 3080 Ti OC | |
| KFA2 GeForce RTX 3070 Ti SG | |
| MSI Radeon RX 6950 XT Gaming X Trio | |
| AMD Radeon RX 7900 XT | |
| KFA2 GeForce RTX 3080 SG | |
| Sapphire AMD Radeon RX 6950 XT Nitro+ Pure | |
| GPU 0.9 | |
| Palit GeForce RTX 4090 GameRock OC | |
| KFA2 GeForce RTX 4080 SG | |
| ASUS TUF Gaming GeForce RTX 3080 Ti OC | |
| KFA2 GeForce RTX 3080 SG | |
| KFA2 GeForce RTX 4070 Ti SG | |
| KFA2 GeForce RTX 4070 Ti EX Gamer | |
| KFA2 GeForce RTX 4070 EX Gamer | |
| AMD Radeon RX 7900 XTX | |
| KFA2 GeForce RTX 3070 Ti SG | |
| Nvidia Titan RTX | |
| AMD Radeon RX 7900 XT | |
| MSI Radeon RX 6950 XT Gaming X Trio | |
| Sapphire AMD Radeon RX 6950 XT Nitro+ Pure | |
| Photoshop PugetBench | |
| Overall Score | |
| AMD Radeon RX 7900 XT | |
| AMD Radeon RX 7900 XTX | |
| KFA2 GeForce RTX 3070 Ti SG | |
| KFA2 GeForce RTX 4080 SG | |
| MSI Radeon RX 6950 XT Gaming X Trio | |
| Palit GeForce RTX 4090 GameRock OC | |
| ASUS TUF Gaming GeForce RTX 3080 Ti OC | |
| KFA2 GeForce RTX 4070 Ti SG | |
| KFA2 GeForce RTX 4070 EX Gamer | |
| Nvidia Titan RTX | |
| KFA2 GeForce RTX 4070 Ti EX Gamer | |
| Sapphire AMD Radeon RX 6950 XT Nitro+ Pure | |
| KFA2 GeForce RTX 3080 SG | |
| GPU Score | |
| AMD Radeon RX 7900 XT | |
| AMD Radeon RX 7900 XTX | |
| MSI Radeon RX 6950 XT Gaming X Trio | |
| KFA2 GeForce RTX 4080 SG | |
| KFA2 GeForce RTX 3070 Ti SG | |
| Palit GeForce RTX 4090 GameRock OC | |
| ASUS TUF Gaming GeForce RTX 3080 Ti OC | |
| Nvidia Titan RTX | |
| Sapphire AMD Radeon RX 6950 XT Nitro+ Pure | |
| KFA2 GeForce RTX 4070 Ti SG | |
| KFA2 GeForce RTX 4070 EX Gamer | |
| KFA2 GeForce RTX 4070 Ti EX Gamer | |
| KFA2 GeForce RTX 3080 SG | |
* ... im mniej tym lepiej
Testy porównawcze gier
Oprócz testów syntetycznych, KFA2 GeForce RTX 4070 Ti EX Gamer musi również pokazać, co potrafi w grach. Zasadniczo ponownie widzimy wydajność, która odpowiada wydajności KFA2 GeForce RTX 4070 Ti SG. Jednak w szczegółach nadal obserwujemy, że nasza jednostka testowa często kończy się bezpośrednio z tyłu, z minimalnym dystansem między nimi. Patrząc jednak subiektywnie, możemy stwierdzić, że oba modele GeForce RTX 4070 Ti od KFA2 oferują taką samą wydajność bez zauważalnej różnicy. Z drugiej strony, zauważalny jest skok wydajności w porównaniu do KFA2 GeForce RTX 3070 Ti SG, która jest o około 20 do 50% wolniejsza od naszej próbki testowej, w zależności od gry. Dzięki GeForce RTX 4070 Ti uzyskujesz wydajność Nvidii GeForce RTX 3090 lub AMD Radeon RX 6950 XT.
Podobnie jak wszystkie karty graficzne Ada Lovelace, KFA2 GeForce RTX 4070 Ti EX Gamer jest również w stanie korzystać z funkcji takich jak ray tracing i DLSS 3, w tym generowanie klatek. W A Plague Tale Requiem czy The Last of Us wyraźnie widać, że te funkcje działają. Obie gry stawiają ekstremalne wymagania karcie graficznej w rozdzielczości 2160p, przez co mierzymy średnio ledwo powyżej 40 klatek na sekundę. Dzięki DLSS liczba klatek na sekundę wzrasta o około 50%, osiągając łatwo grywalne wartości. Minimalna liczba klatek na sekundę również znacznie na tym zyskuje, zapewniając płynniejszą rozgrywkę.
| The Witcher 3 | |
| 3840x2160 High Graphics & Postprocessing (Nvidia HairWorks Off) | |
| KFA2 GeForce RTX 4090 SG | |
| KFA2 GeForce RTX 4080 SG | |
| AMD Radeon RX 7900 XTX | |
| AMD Radeon RX 7900 XT | |
| NVIDIA GeForce RTX 3090 Founders Edition | |
| ASUS TUF Gaming GeForce RTX 3080 Ti OC | |
| KFA2 GeForce RTX 4070 Ti SG | |
| MSI Radeon RX 6950 XT Gaming X Trio | |
| KFA2 GeForce RTX 4070 Ti EX Gamer | |
| KFA2 GeForce RTX 4070 EX Gamer | |
| KFA2 GeForce RTX 3070 Ti SG | |
| Nvidia Titan RTX | |
| AMD Radeon RX 6800 | |
| 1920x1080 Ultra Graphics & Postprocessing (HBAO+) | |
| KFA2 GeForce RTX 4090 SG | |
| AMD Radeon RX 7900 XTX | |
| KFA2 GeForce RTX 4080 SG | |
| AMD Radeon RX 7900 XT | |
| MSI Radeon RX 6950 XT Gaming X Trio | |
| KFA2 GeForce RTX 4070 Ti SG | |
| KFA2 GeForce RTX 4070 Ti EX Gamer | |
| NVIDIA GeForce RTX 3090 Founders Edition | |
| ASUS TUF Gaming GeForce RTX 3080 Ti OC | |
| KFA2 GeForce RTX 4070 EX Gamer | |
| AMD Radeon RX 6800 | |
| Nvidia Titan RTX | |
| KFA2 GeForce RTX 3070 Ti SG | |
| Need for Speed Unbound | |
| 3840x2160 Ultra Preset | |
| KFA2 GeForce RTX 4080 SG | |
| AMD Radeon RX 7900 XTX | |
| KFA2 GeForce RTX 4070 Ti SG | |
| ASUS TUF Gaming GeForce RTX 3080 Ti OC | |
| AMD Radeon RX 7900 XT | |
| MSI Radeon RX 6950 XT Gaming X Trio | |
| Nvidia Titan RTX | |
| KFA2 GeForce RTX 3070 Ti SG | |
| AMD Radeon RX 6800 | |
| 2560x1440 Ultra Preset | |
| KFA2 GeForce RTX 4080 SG | |
| KFA2 GeForce RTX 4070 Ti SG | |
| ASUS TUF Gaming GeForce RTX 3080 Ti OC | |
| AMD Radeon RX 7900 XTX | |
| AMD Radeon RX 7900 XT | |
| MSI Radeon RX 6950 XT Gaming X Trio | |
| KFA2 GeForce RTX 3070 Ti SG | |
| Nvidia Titan RTX | |
| AMD Radeon RX 6800 | |
| 1920x1080 Ultra Preset | |
| AMD Radeon RX 7900 XTX | |
| KFA2 GeForce RTX 4080 SG | |
| ASUS TUF Gaming GeForce RTX 3080 Ti OC | |
| KFA2 GeForce RTX 4070 Ti SG | |
| AMD Radeon RX 7900 XT | |
| KFA2 GeForce RTX 3070 Ti SG | |
| Nvidia Titan RTX | |
| MSI Radeon RX 6950 XT Gaming X Trio | |
| AMD Radeon RX 6800 | |
| GTA V | |
| 3840x2160 Highest AA:4xMSAA + FX AF:16x | |
| KFA2 GeForce RTX 4090 SG | |
| AMD Radeon RX 7900 XTX | |
| ASUS TUF Gaming GeForce RTX 3080 Ti OC | |
| NVIDIA GeForce RTX 3090 Founders Edition | |
| KFA2 GeForce RTX 4080 SG | |
| MSI Radeon RX 6950 XT Gaming X Trio | |
| AMD Radeon RX 7900 XT | |
| KFA2 GeForce RTX 4070 Ti SG | |
| KFA2 GeForce RTX 3070 Ti SG | |
| KFA2 GeForce RTX 4070 Ti EX Gamer | |
| Nvidia Titan RTX | |
| AMD Radeon RX 6800 | |
| KFA2 GeForce RTX 4070 EX Gamer | |
| 3840x2160 High/On (Advanced Graphics Off) AA:FX AF:8x | |
| KFA2 GeForce RTX 4090 SG | |
| AMD Radeon RX 7900 XTX | |
| KFA2 GeForce RTX 4080 SG | |
| ASUS TUF Gaming GeForce RTX 3080 Ti OC | |
| NVIDIA GeForce RTX 3090 Founders Edition | |
| MSI Radeon RX 6950 XT Gaming X Trio | |
| AMD Radeon RX 7900 XT | |
| KFA2 GeForce RTX 4070 Ti SG | |
| KFA2 GeForce RTX 4070 Ti EX Gamer | |
| KFA2 GeForce RTX 3070 Ti SG | |
| KFA2 GeForce RTX 4070 EX Gamer | |
| Nvidia Titan RTX | |
| AMD Radeon RX 6800 | |
| Spider-Man Miles Morales - 1920x0180 Very High Preset + Ray-Tracing AA:T | |
| KFA2 GeForce RTX 4090 SG | |
| KFA2 GeForce RTX 4080 SG | |
| KFA2 GeForce RTX 4070 Ti EX Gamer | |
| KFA2 GeForce RTX 4070 Ti SG | |
| AMD Radeon RX 7900 XTX | |
| ASUS TUF Gaming GeForce RTX 3080 Ti OC | |
| AMD Radeon RX 7900 XT | |
| KFA2 GeForce RTX 4070 EX Gamer | |
| MSI Radeon RX 6950 XT Gaming X Trio | |
| KFA2 GeForce RTX 3070 Ti SG | |
| Nvidia Titan RTX | |
| AMD Radeon RX 6800 | |
| Metro Exodus - 1920x1080 Ultra Quality DXR AF:16x | |
| KFA2 GeForce RTX 4090 SG | |
| KFA2 GeForce RTX 4080 SG | |
| AMD Radeon RX 7900 XTX | |
| KFA2 GeForce RTX 4070 Ti SG | |
| KFA2 GeForce RTX 4070 Ti EX Gamer | |
| AMD Radeon RX 7900 XT | |
| ASUS TUF Gaming GeForce RTX 3080 Ti OC | |
| NVIDIA GeForce RTX 3090 Founders Edition | |
| AMD Ryzen 9 7950X | |
| MSI Radeon RX 6950 XT Gaming X Trio | |
| KFA2 GeForce RTX 4070 EX Gamer | |
| KFA2 GeForce RTX 3070 Ti SG | |
| Nvidia Titan RTX | |
| Far Cry 6 - 1920x1080 Ultra Graphics Quality + HD Textures + DXR AA:T | |
| AMD Radeon RX 7900 XTX | |
| AMD Radeon RX 7900 XT | |
| KFA2 GeForce RTX 4070 Ti EX Gamer | |
| KFA2 GeForce RTX 4090 SG | |
| KFA2 GeForce RTX 4070 Ti SG | |
| MSI Radeon RX 6950 XT Gaming X Trio | |
| KFA2 GeForce RTX 4070 EX Gamer | |
| ASUS TUF Gaming GeForce RTX 3080 Ti OC | |
| NVIDIA GeForce RTX 3090 Founders Edition | |
| KFA2 GeForce RTX 4080 SG | |
| AMD Ryzen 9 7950X | |
| AMD Radeon RX 6800 | |
| Nvidia Titan RTX | |
| KFA2 GeForce RTX 3070 Ti SG | |
| Cyberpunk 2077 1.6 | |
| 3840x2160 Ray Tracing Ultra Preset (DLSS off) | |
| KFA2 GeForce RTX 4090 SG (1.61) | |
| KFA2 GeForce RTX 4080 SG (1.61) | |
| KFA2 GeForce RTX 4070 Ti EX Gamer | |
| KFA2 GeForce RTX 4070 Ti SG (1.5) | |
| AMD Ryzen 9 7950X (1.6) | |
| AMD Radeon RX 7900 XTX (1.61) | |
| ASUS TUF Gaming GeForce RTX 3080 Ti OC (1.61) | |
| KFA2 GeForce RTX 4070 EX Gamer | |
| AMD Radeon RX 7900 XT (1.61) | |
| MSI Radeon RX 6950 XT Gaming X Trio (1.61) | |
| AMD Radeon RX 6800 (1.61) | |
| KFA2 GeForce RTX 3070 Ti SG (1.61) | |
| 1920x1080 Ray Tracing Ultra Preset (DLSS off) | |
| KFA2 GeForce RTX 4090 SG (1.61) | |
| KFA2 GeForce RTX 4080 SG (1.61) | |
| KFA2 GeForce RTX 4070 Ti SG (1.5) | |
| KFA2 GeForce RTX 4070 Ti EX Gamer | |
| ASUS TUF Gaming GeForce RTX 3080 Ti OC (1.61) | |
| AMD Ryzen 9 7950X (1.6) | |
| AMD Radeon RX 7900 XTX (1.61) | |
| KFA2 GeForce RTX 4070 EX Gamer | |
| AMD Radeon RX 7900 XT (1.61) | |
| MSI Radeon RX 6950 XT Gaming X Trio (1.61) | |
| KFA2 GeForce RTX 3070 Ti SG (1.61) | |
| AMD Radeon RX 6800 (1.61) | |
| The Callisto Protocol - 1920x1080 Ultra Preset (without FSR Upscaling) + Full Ray-Tracing | |
| AMD Radeon RX 7900 XTX | |
| KFA2 GeForce RTX 4070 Ti EX Gamer | |
| AMD Radeon RX 7900 XT | |
| KFA2 GeForce RTX 4080 SG | |
| MSI Radeon RX 6950 XT Gaming X Trio | |
| KFA2 GeForce RTX 4070 Ti SG | |
| KFA2 GeForce RTX 4070 EX Gamer | |
| ASUS TUF Gaming GeForce RTX 3080 Ti OC | |
| AMD Radeon RX 6800 | |
| KFA2 GeForce RTX 3070 Ti SG | |
| Nvidia Titan RTX | |
| The Last of Us | |
| 3840x2160 Ultra Preset | |
| KFA2 GeForce RTX 4070 Ti EX Gamer | |
| KFA2 GeForce RTX 4070 EX Gamer | |
| 3840x2160 Ultra Preset + Quality DLSS | |
| KFA2 GeForce RTX 4070 Ti EX Gamer | |
| KFA2 GeForce RTX 4070 EX Gamer | |
| Control | |
| 3840x2160 High Quality Preset & High Ray Tracing Preset (DX12) | |
| KFA2 GeForce RTX 4070 Ti EX Gamer | |
| KFA2 GeForce RTX 4070 EX Gamer | |
| 3840x2160 High Quality, High Ray Tracing, DLSS | |
| KFA2 GeForce RTX 4070 Ti EX Gamer | |
| KFA2 GeForce RTX 4070 EX Gamer | |
| A Plague Tale Requiem | |
| 3840x2160 Ultra Preset | |
| KFA2 GeForce RTX 4070 Ti EX Gamer | |
| KFA2 GeForce RTX 4070 EX Gamer | |
| 3840x2160 Ultra DLSS Quality | |
| KFA2 GeForce RTX 4070 Ti EX Gamer | |
| KFA2 GeForce RTX 4070 EX Gamer | |
| 3840x2160 Ultra DLSS Quality + Frame Generation | |
| KFA2 GeForce RTX 4070 Ti EX Gamer | |
| KFA2 GeForce RTX 4070 EX Gamer | |
| low | med. | high | ultra | QHD | 4K DLSS | 4K | |
|---|---|---|---|---|---|---|---|
| GTA V (2015) | 188 | 187.5 | 187 | 158.4 | 146.7 | 169.7 | |
| The Witcher 3 (2015) | 781.2 | 644.2 | 440.7 | 216.8 | 143 | ||
| Dota 2 Reborn (2015) | 300.3 | 258.9 | 250.9 | 224.7 | 216.8 | ||
| Final Fantasy XV Benchmark (2018) | 237 | 231 | 204 | 160.1 | 87.6 | ||
| X-Plane 11.11 (2018) | 172.9 | 163.2 | 138.1 | 117.9 | |||
| Far Cry 5 (2018) | 239 | 209 | 202 | 188 | 182 | 111 | |
| Strange Brigade (2018) | 748 | 585 | 471 | 406 | 279 | 139.2 | |
| Shadow of the Tomb Raider (2018) | 308 | 289 | 277 | 263 | 195.9 | 102.7 | |
| Far Cry New Dawn (2019) | 193 | 173 | 166 | 150 | 148 | 112 | |
| Metro Exodus (2019) | 294 | 241 | 192.9 | 155.6 | 126.7 | 81.2 | |
| Control (2019) | 240 | 239 | 196.6 | 126.5 | 73.1 | 63.8 | |
| Borderlands 3 (2019) | 243 | 209 | 192 | 171.4 | 134.3 | 71.9 | |
| F1 2020 (2020) | 548 | 473 | 456 | 348 | 271 | 162.2 | |
| F1 2021 (2021) | 643 | 594 | 473 | 250 | 199.8 | 113.4 | |
| Far Cry 6 (2021) | 225 | 198.4 | 176.2 | 174.6 | 153.4 | 87.8 | |
| Guardians of the Galaxy (2021) | 222 | 220 | 222 | 212 | 203 | 111 | |
| GRID Legends (2022) | 282 | 263 | 236 | 220 | 198 | 133.5 | |
| Cyberpunk 2077 1.6 (2022) | 232.2 | 207.1 | 177.1 | 159.4 | 100.7 | 46.6 | |
| Ghostwire Tokyo (2022) | 274 | 273 | 271 | 269 | 185.7 | 90.6 | |
| Tiny Tina's Wonderlands (2022) | 414 | 335 | 239 | 187.1 | 129.8 | 68.9 | |
| F1 22 (2022) | 418 | 413 | 357 | 144.5 | 94.1 | 46.9 | |
| The Quarry (2022) | 327 | 249 | 208 | 166.2 | 114.1 | 60.1 | |
| A Plague Tale Requiem (2022) | 190.7 | 172.7 | 134.3 | 105 | 77.2 | 84.5 | 42.7 |
| Uncharted Legacy of Thieves Collection (2022) | 142.9 | 141.4 | 138.3 | 134.1 | 108.1 | 63.1 | |
| Spider-Man Miles Morales (2022) | 195.1 | 189.7 | 171.9 | 169.9 | 143.9 | 86.6 | |
| The Callisto Protocol (2022) | 239.6 | 219.3 | 214.5 | 161.9 | 129.3 | 81.2 | |
| High On Life (2023) | 383 | 317 | 248 | 205 | 132.3 | 57.2 | |
| The Witcher 3 v4 (2023) | 292 | 253 | 229 | 212 | 174 | 88.6 | |
| Dead Space Remake (2023) | 202 | 195.3 | 169.8 | 169.7 | 112.6 | 54.3 | |
| Hogwarts Legacy (2023) | 159.8 | 147 | 125.6 | 118 | 86.4 | 46.5 | |
| Returnal (2023) | 190 | 184 | 170 | 146 | 111 | 66 | |
| Atomic Heart (2023) | 316 | 253 | 180.1 | 148 | 112.3 | 63.4 | |
| Company of Heroes 3 (2023) | 350.6 | 329.1 | 272.3 | 263.5 | 204.7 | 119.1 | |
| Sons of the Forest (2023) | 119.3 | 116.8 | 113.4 | 112.7 | 109.8 | 82.7 | |
| Resident Evil 4 Remake (2023) | 292 | 233 | 220 | 153.7 | 117 | 66 | |
| The Last of Us (2023) | 176.8 | 154.7 | 141.8 | 127.6 | 87.9 | 72.6 | 44.2 |
| Dead Island 2 (2023) | 309 | 306 | 284 | 283 | 211 | 101.4 | |
| Star Wars Jedi Survivor (2023) | 145.5 | 139.9 | 138.2 | 128.4 | 87.4 | 42.9 |
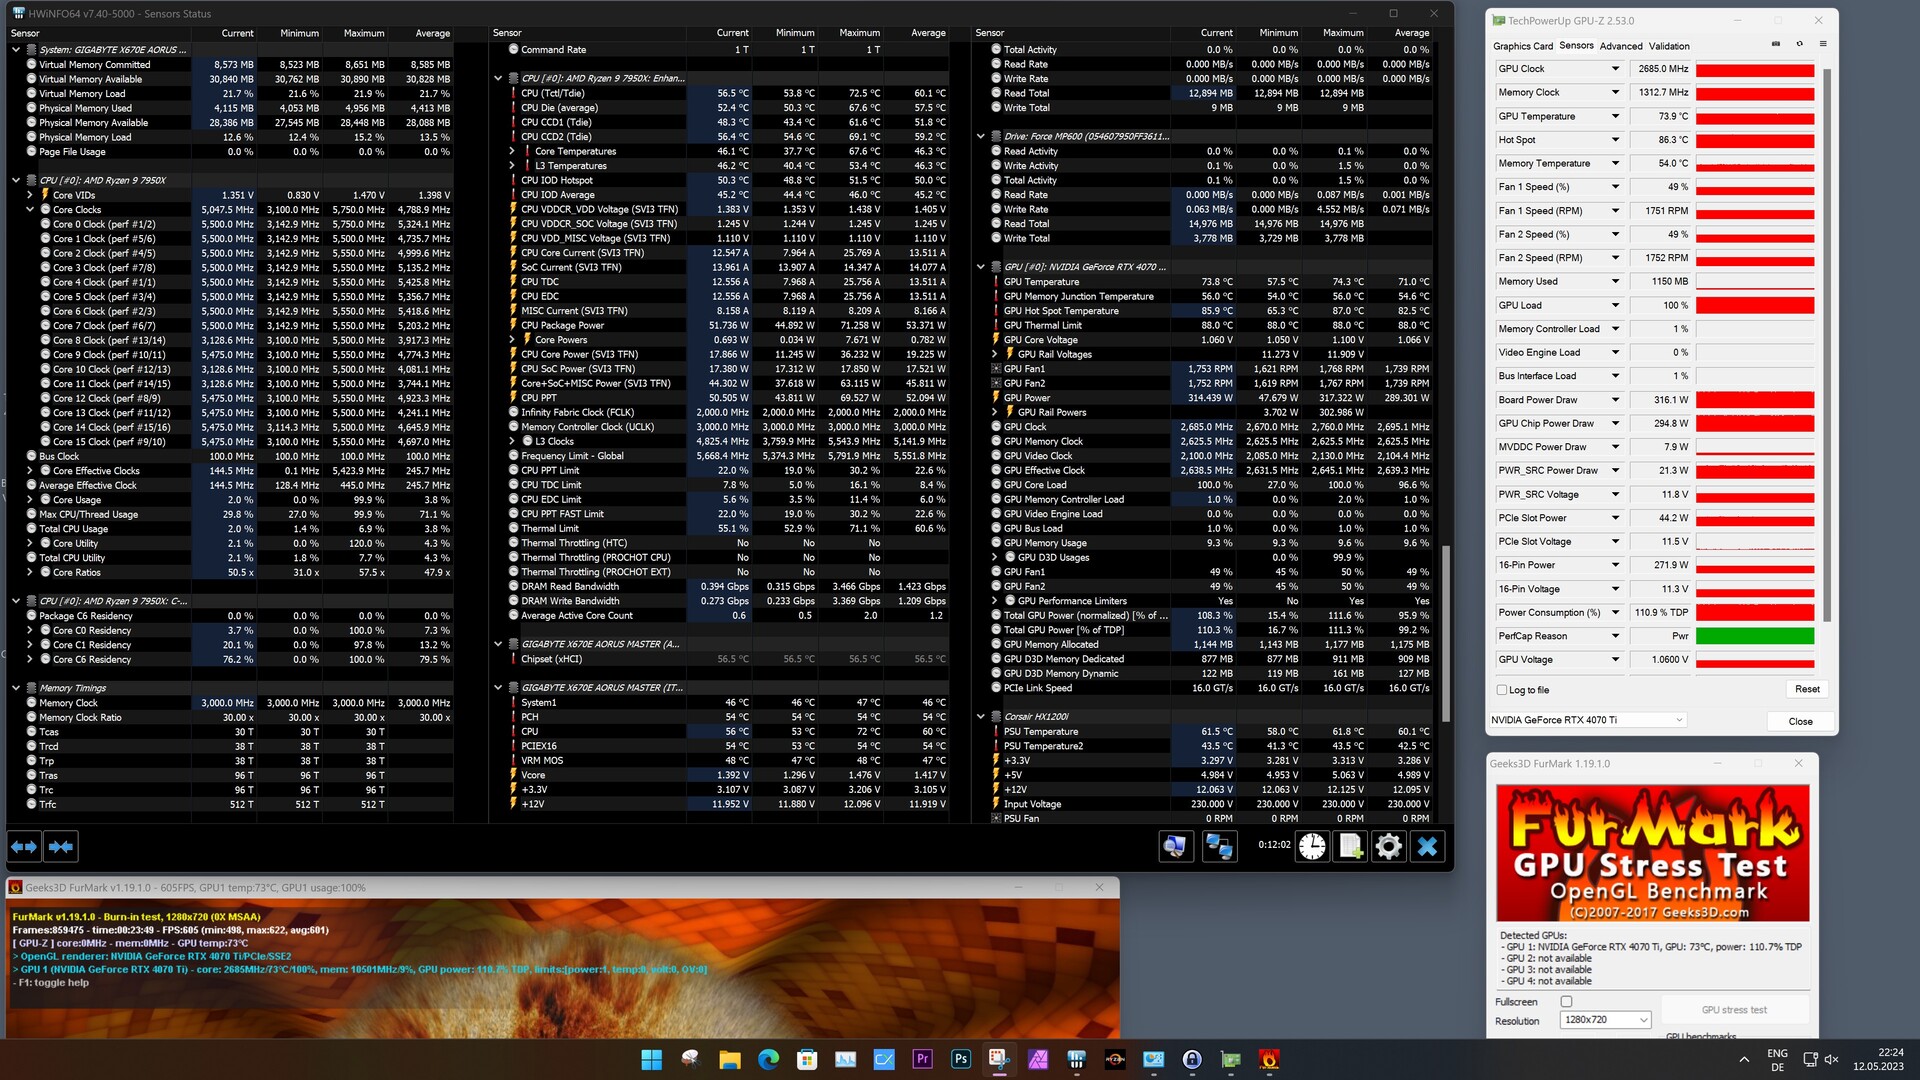
Emisja KFA2 GeForce RTX 4070 Ti EX Gamer
Poziomy hałasu
Zmierzyliśmy poziom hałasu karty graficznej KFA2 GeForce RTX 4070 Ti EX Gamer w naszej otwartej konfiguracji testowej bez dodatkowych wentylatorów procesora lub zasilacza. Bez obciążenia karta graficzna pozostaje cicha przez cały czas. Przy niskim lub średnim obciążeniu wentylatory początkowo również nie muszą pracować, a karta graficzna pozostaje cicha. W menu gier naszej gry testowej The Witcher 3 odnotowaliśmy poziom 30,7 do 33 dB(A), który jest cicho słyszalny. Podczas testu obciążeniowego karta graficzna jest wyraźnie słyszalna na poziomie 44,7 dB(A), a dzięki temu nie będzie już słychać wycie cewki. Podczas samego grania KFA2 GeForce RTX 4070 Ti EX działa nieco ciszej przy 40,2 dB(A) niż podczas testu warunków skrajnych.
Hałas
| luz |
| 30.1 / 30.1 / 30.1 dB |
| obciążenie |
| 30.2 / 44.7 dB |
 | ||
30 dB cichy 40 dB(A) słyszalny 50 dB(A) irytujący |
||
min: | ||
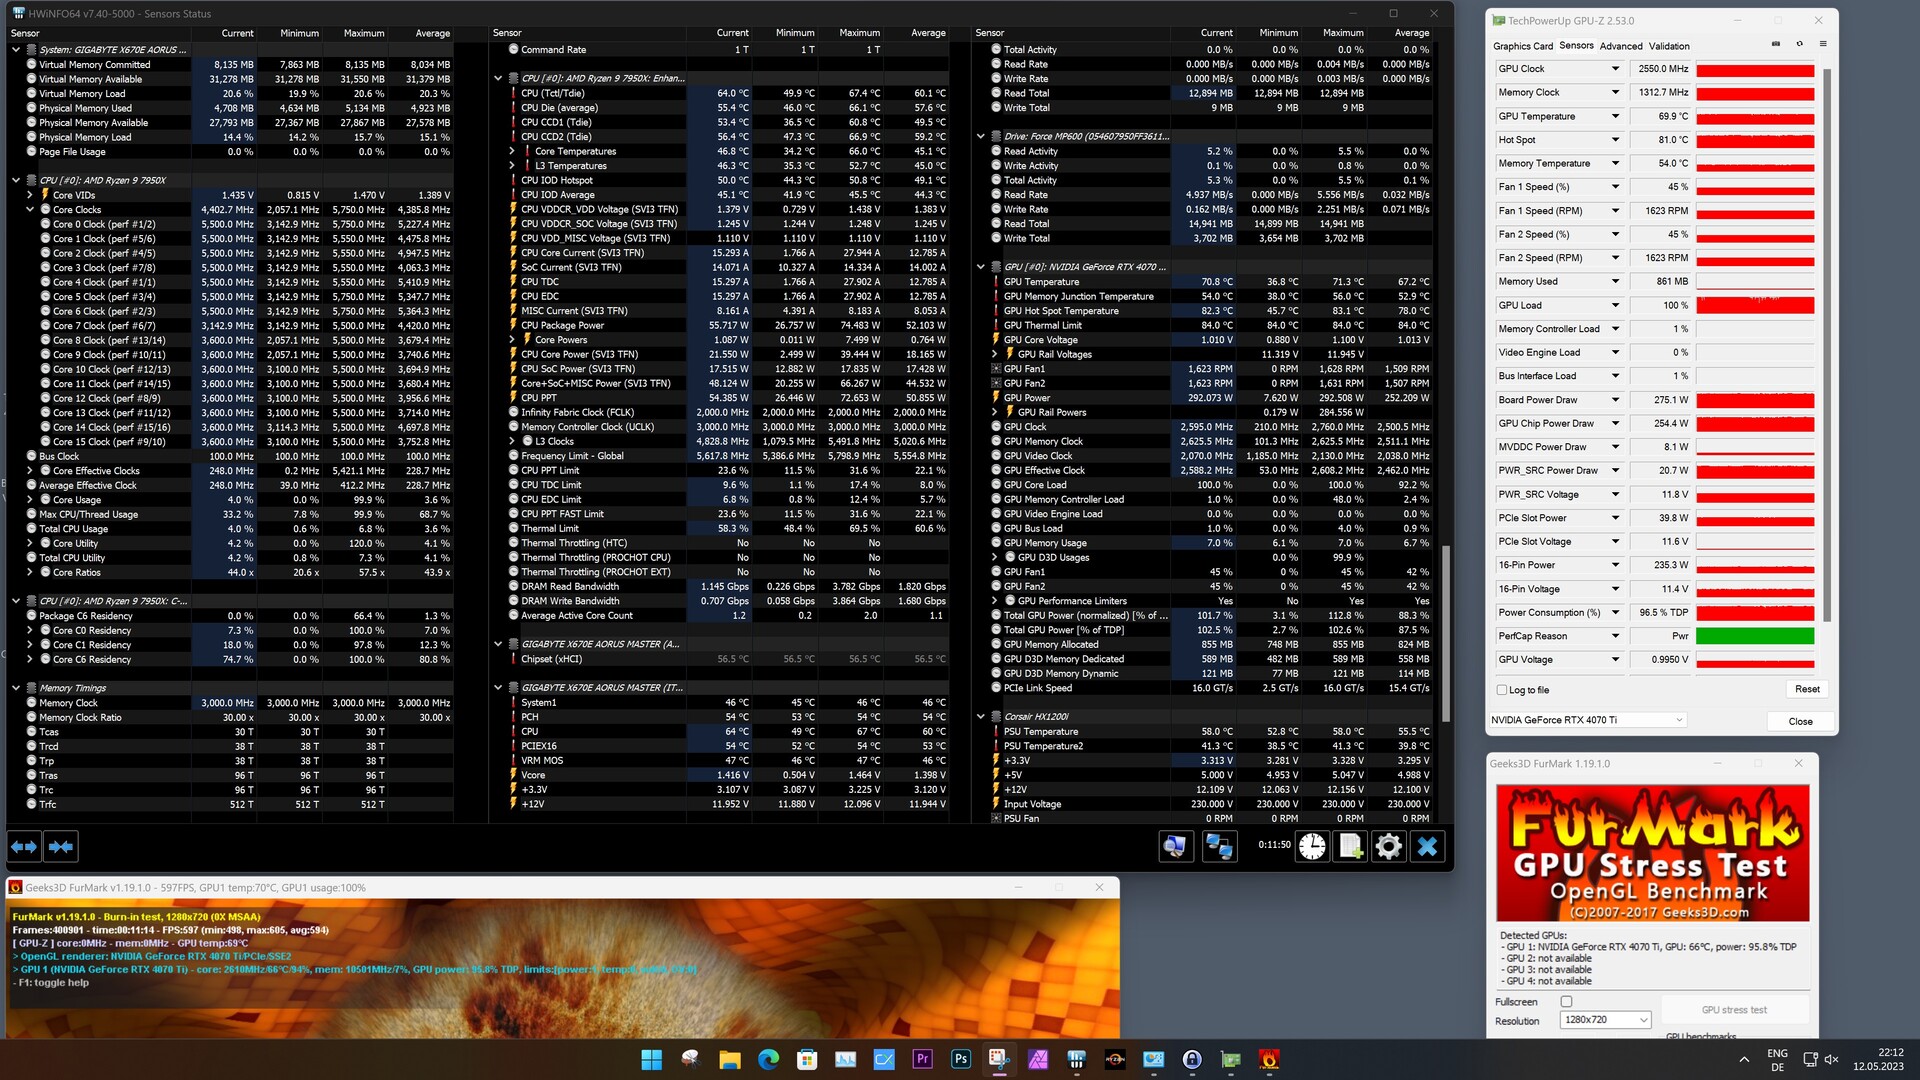
Temperatury i zużycie energii
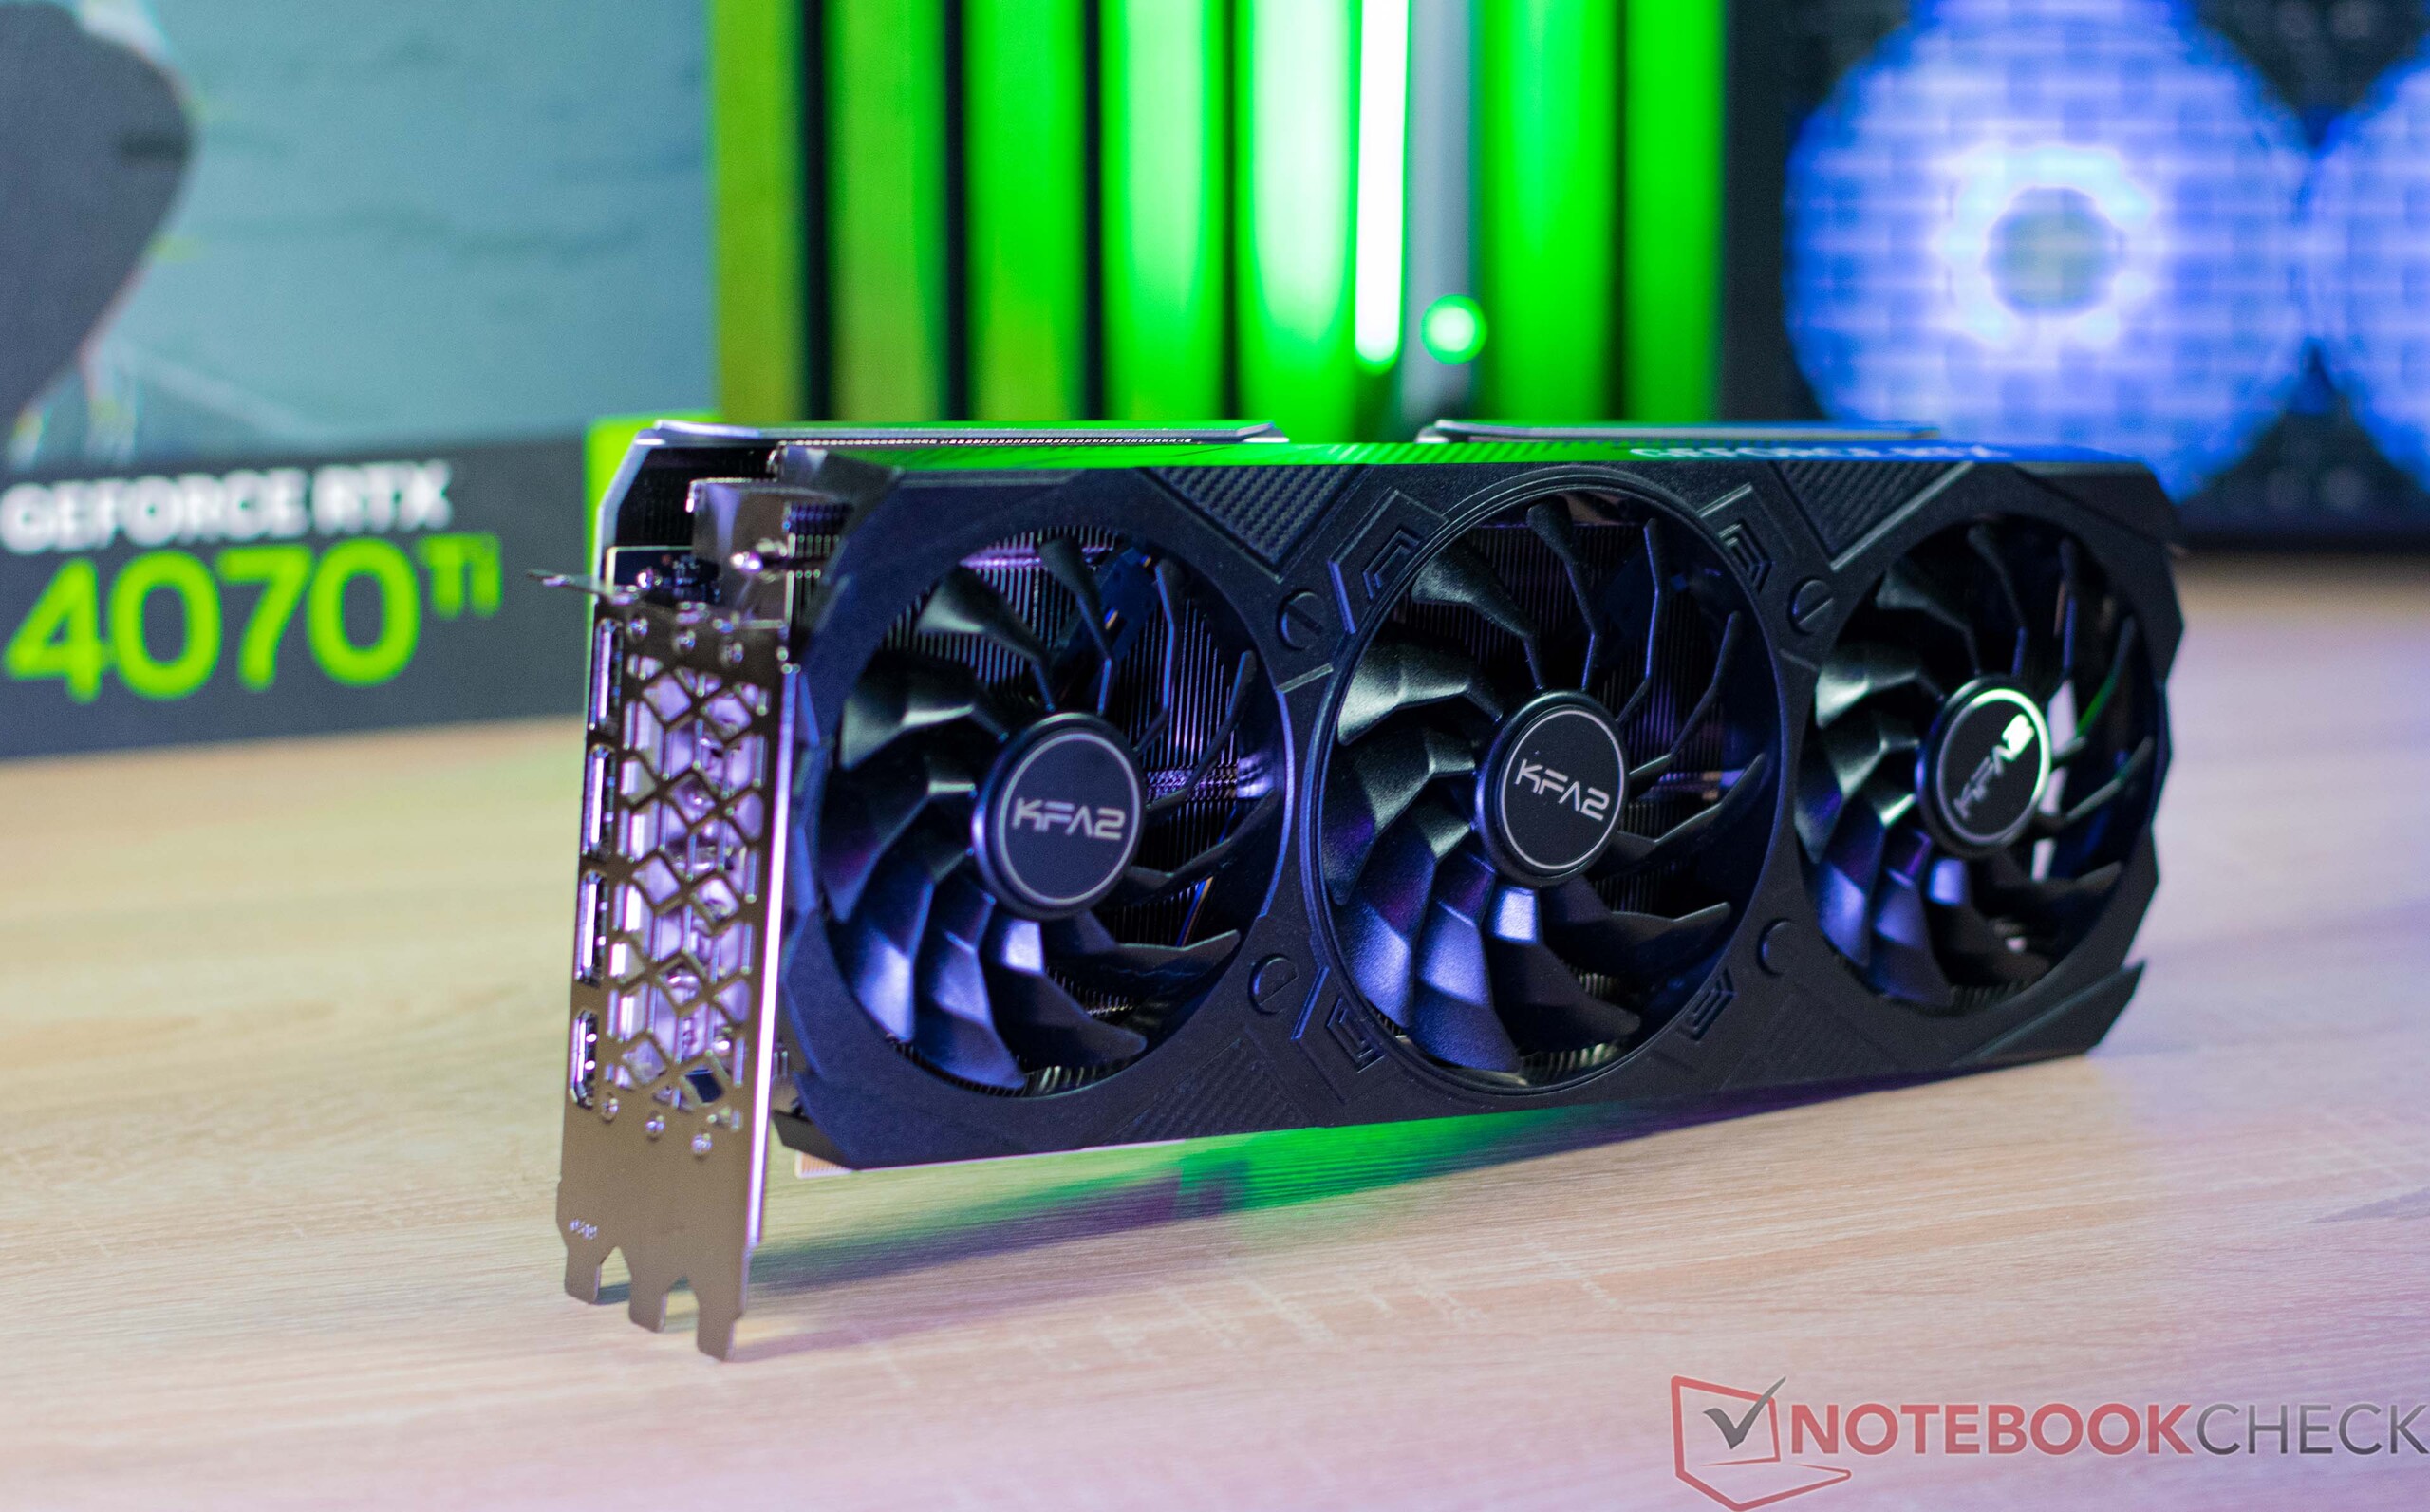
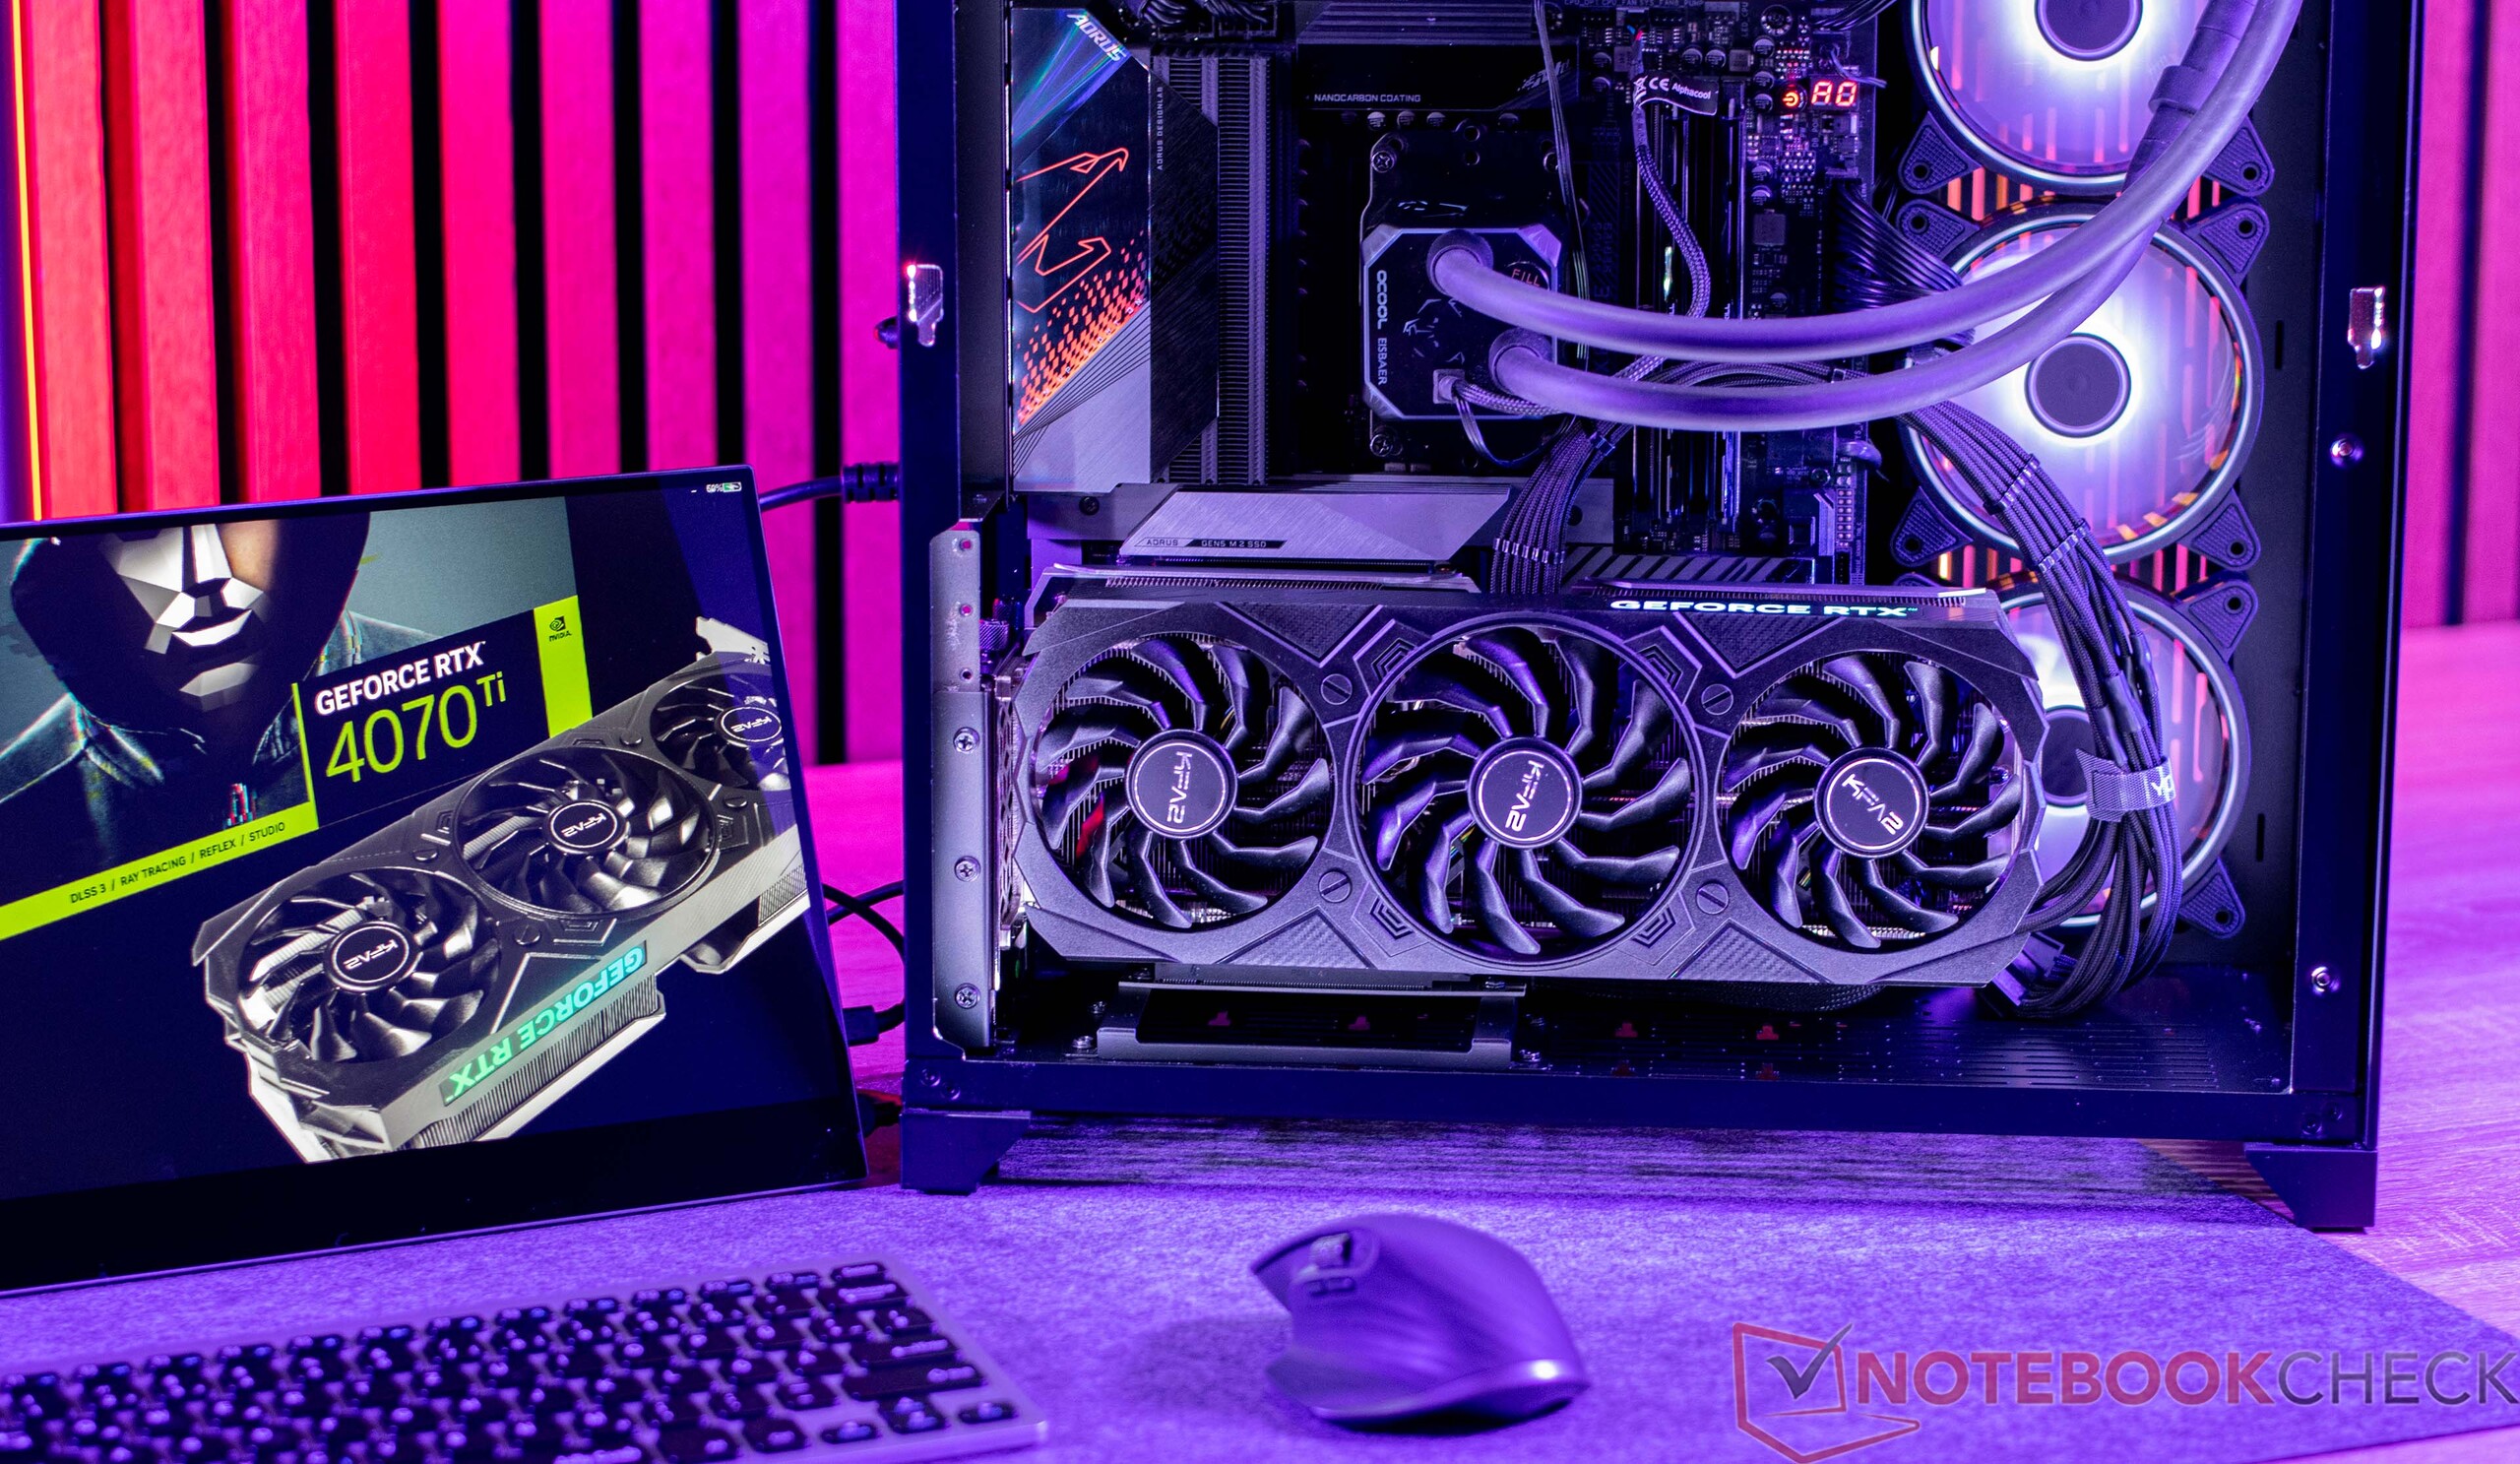
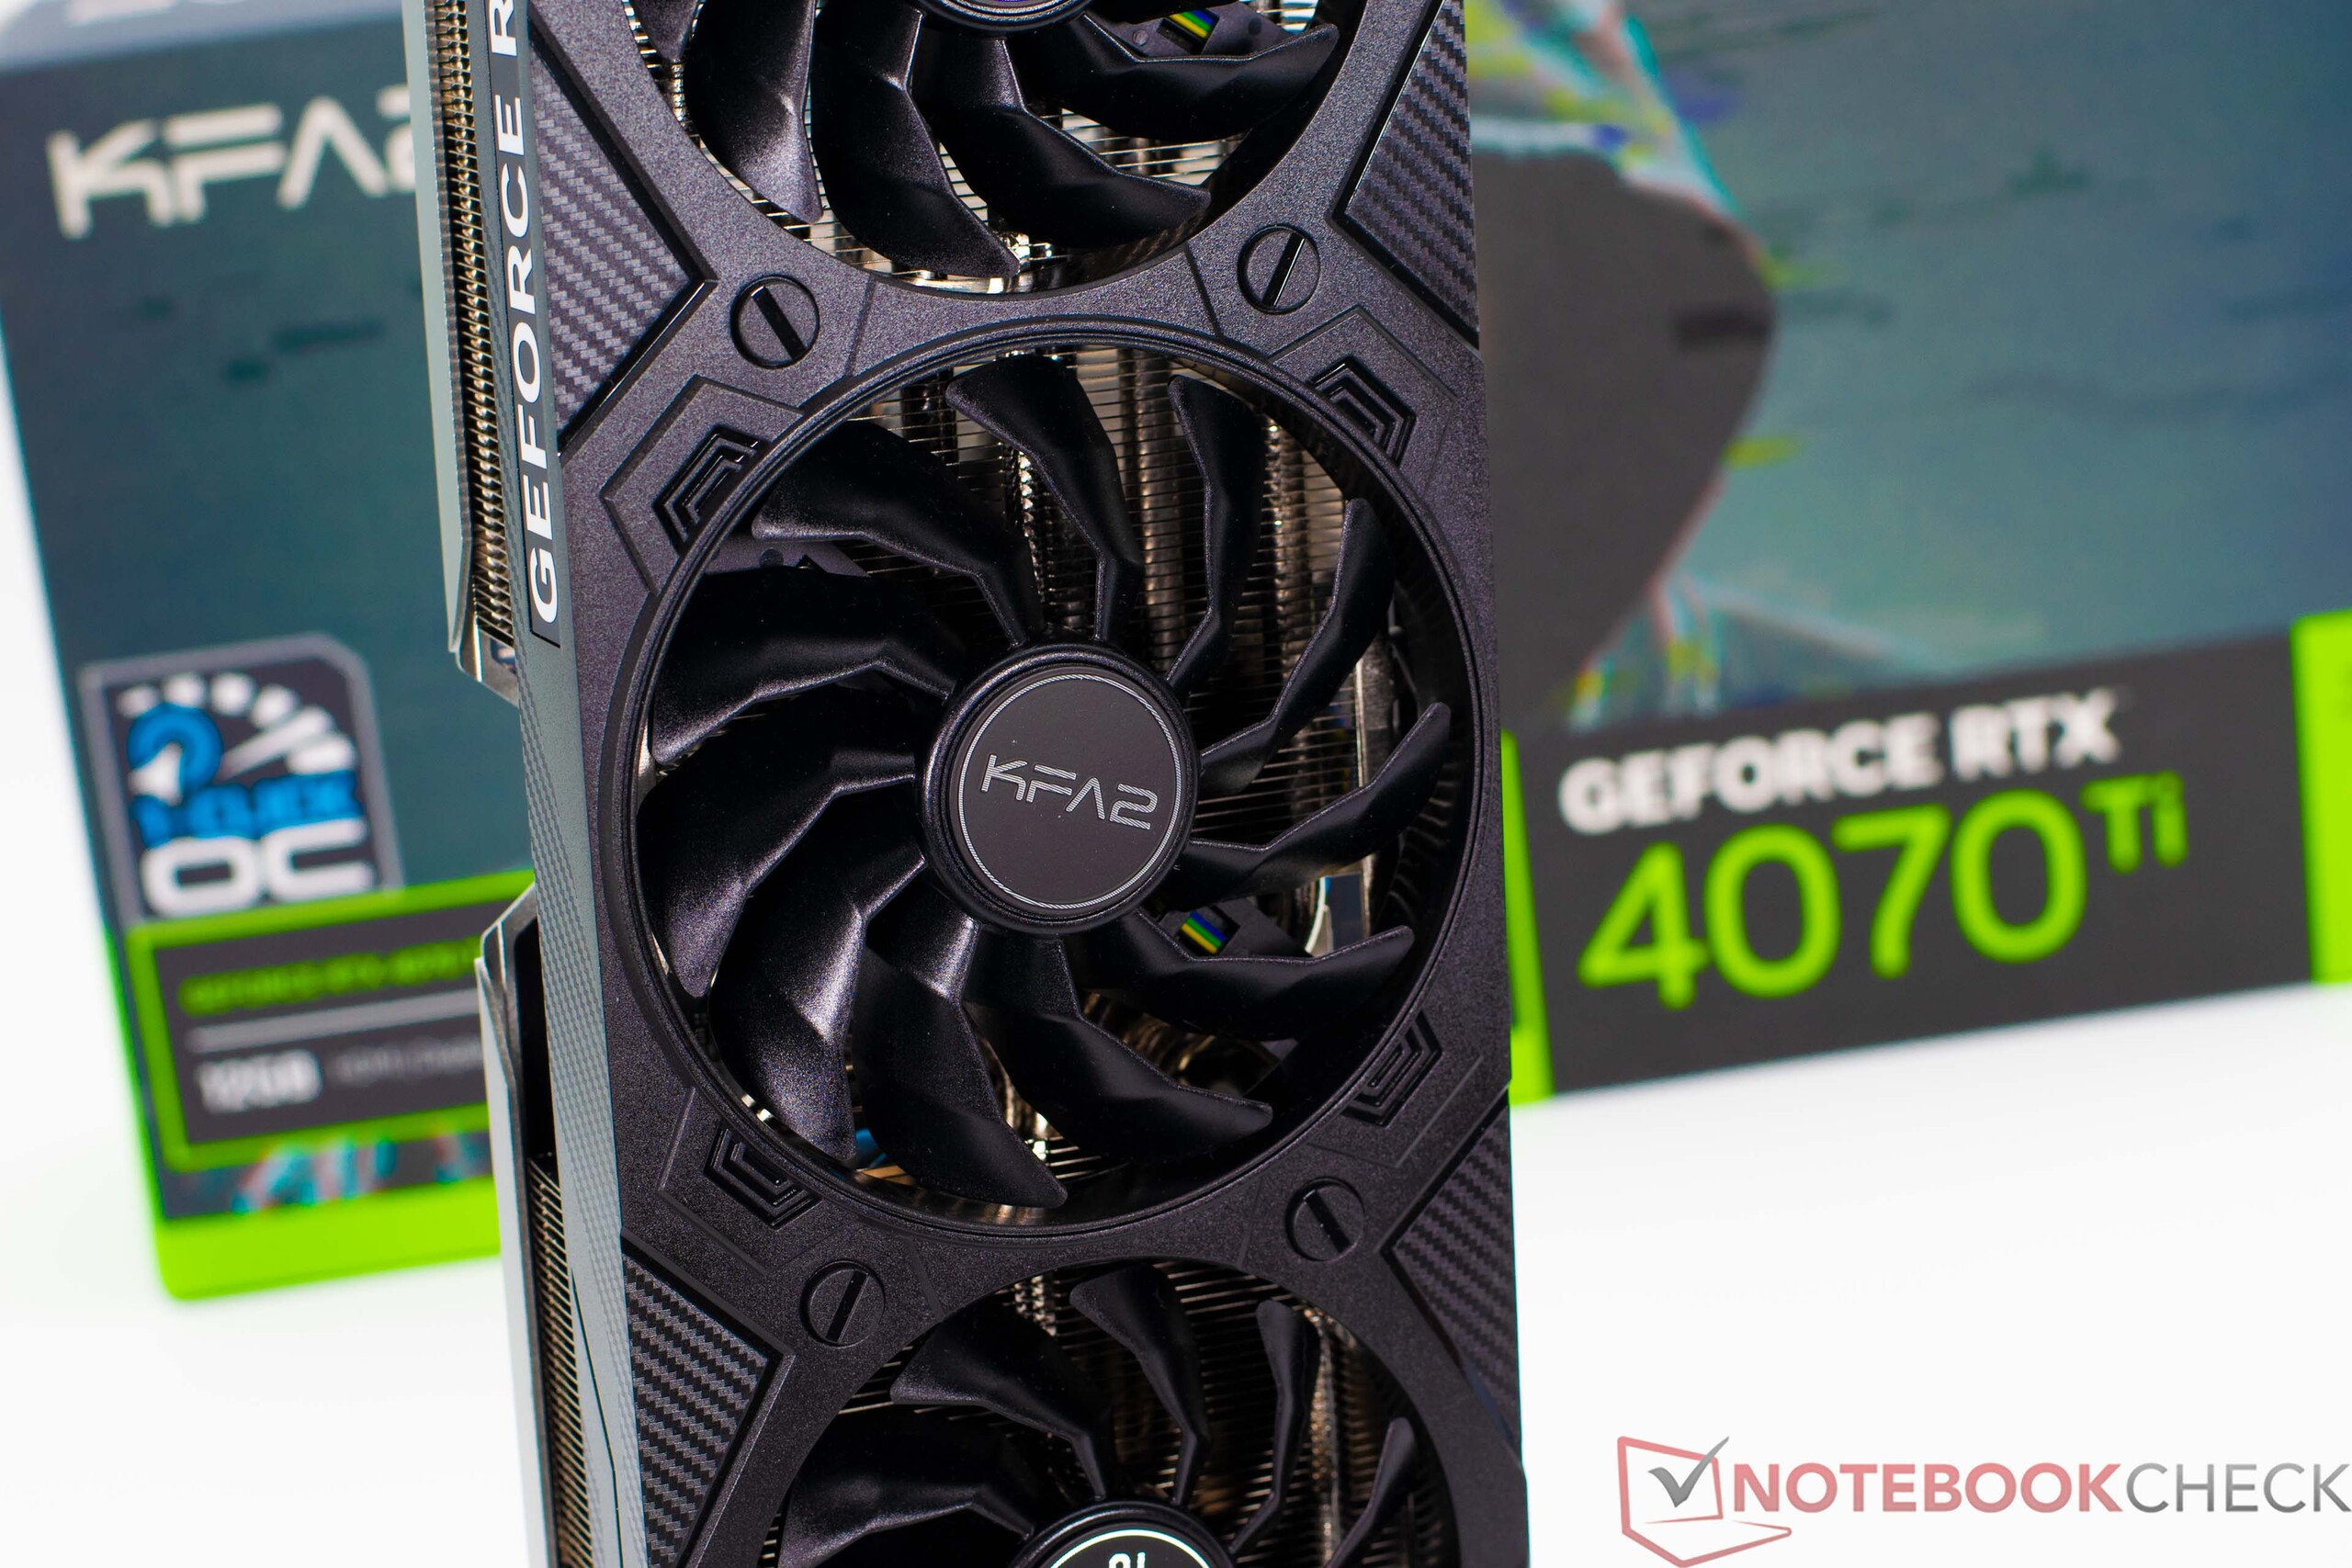
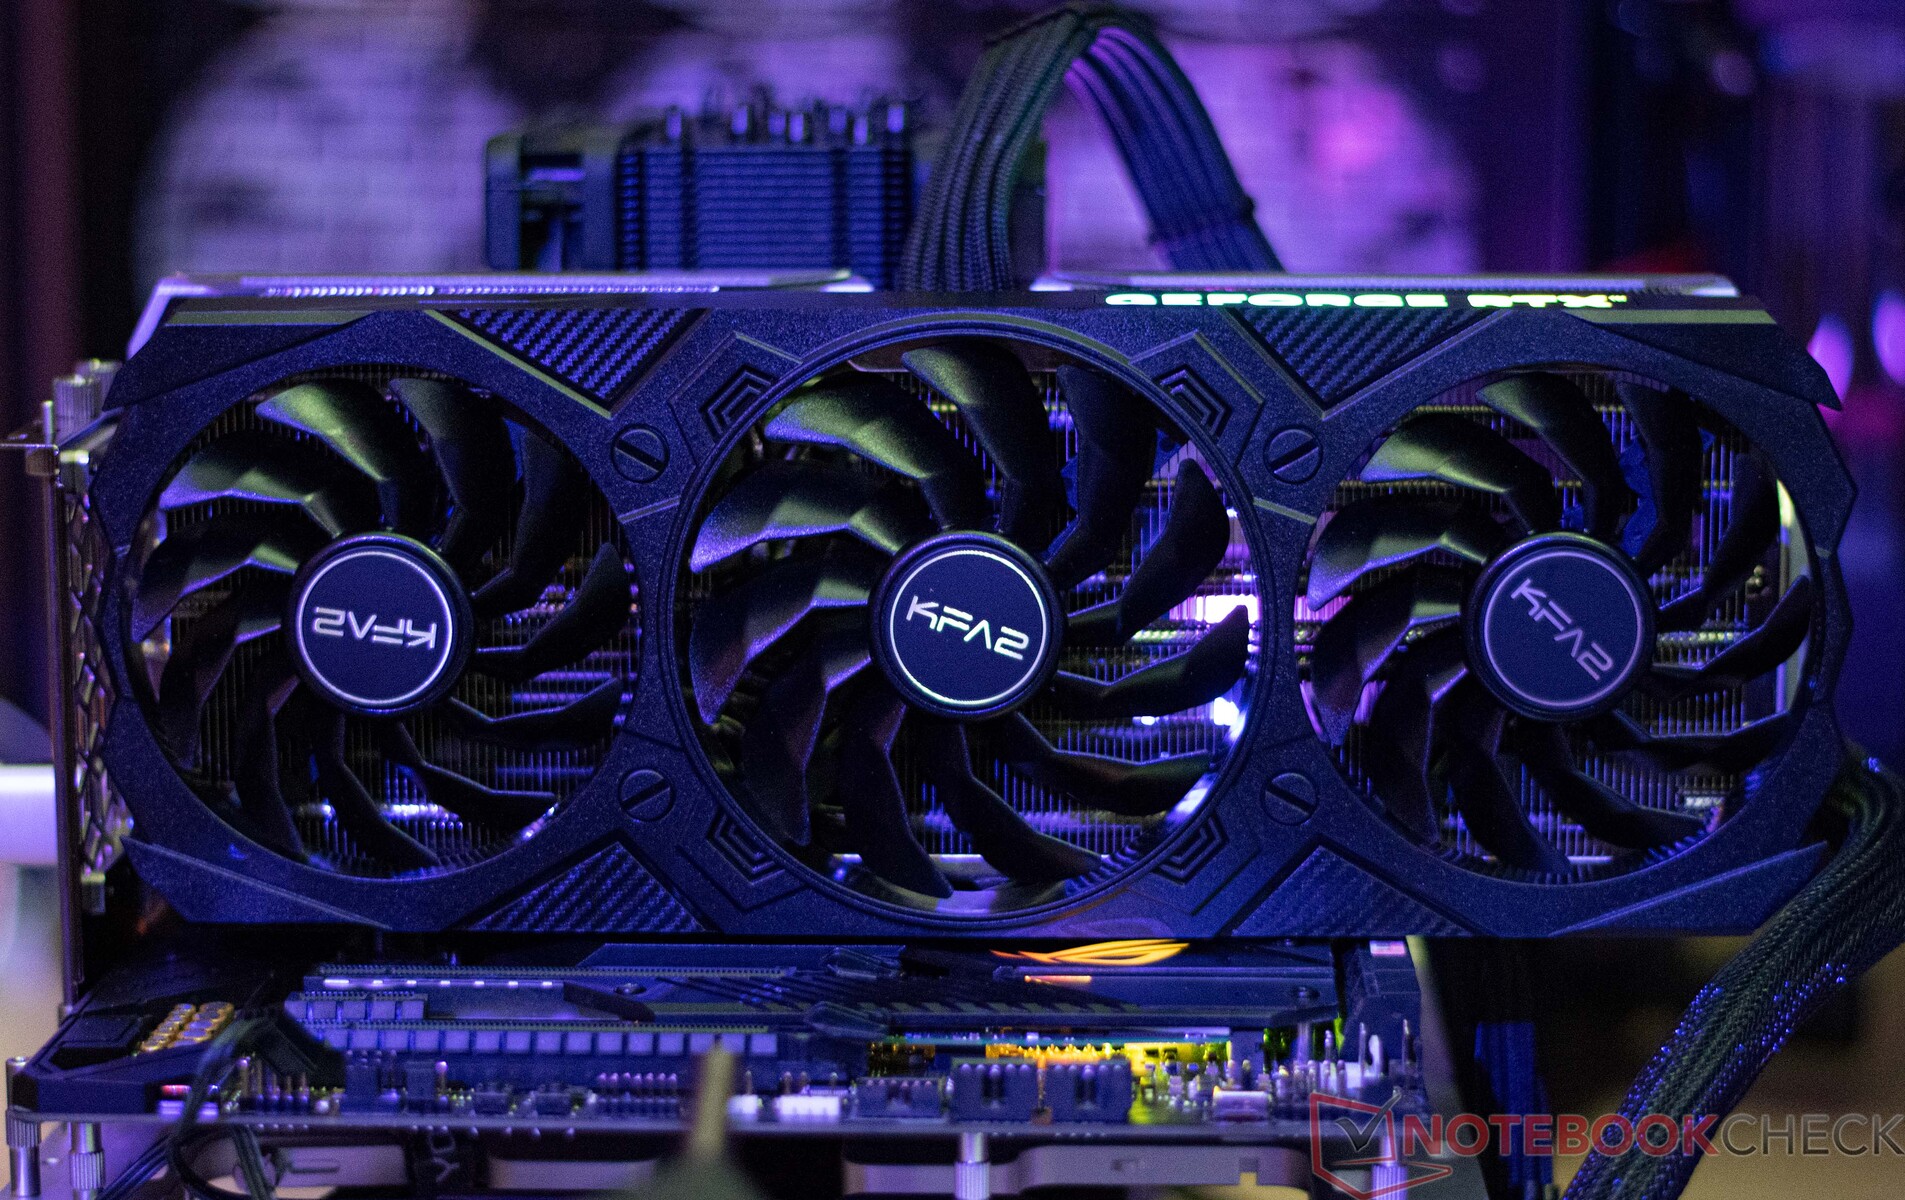
Ponieważ KFA2 GeForce RTX 4070 Ti EX Gamer jest wyposażona w duży cooler, nie ma problemów z temperaturą w żadnym momencie. Po włożeniu do komputera karta graficzna zajmuje trzy sloty. Laminowany blok chłodzący jest chłodzony przez trzy wentylatory osiowe o średnicy 92 i 102 milimetrów (~3,6 i 4 cale), z większym wentylatorem umieszczonym pośrodku. Konstrukcja przypomina nam KFA2 GeForce RTX 4070 EX Gamer, która wykorzystuje podobną konstrukcję wentylatora.
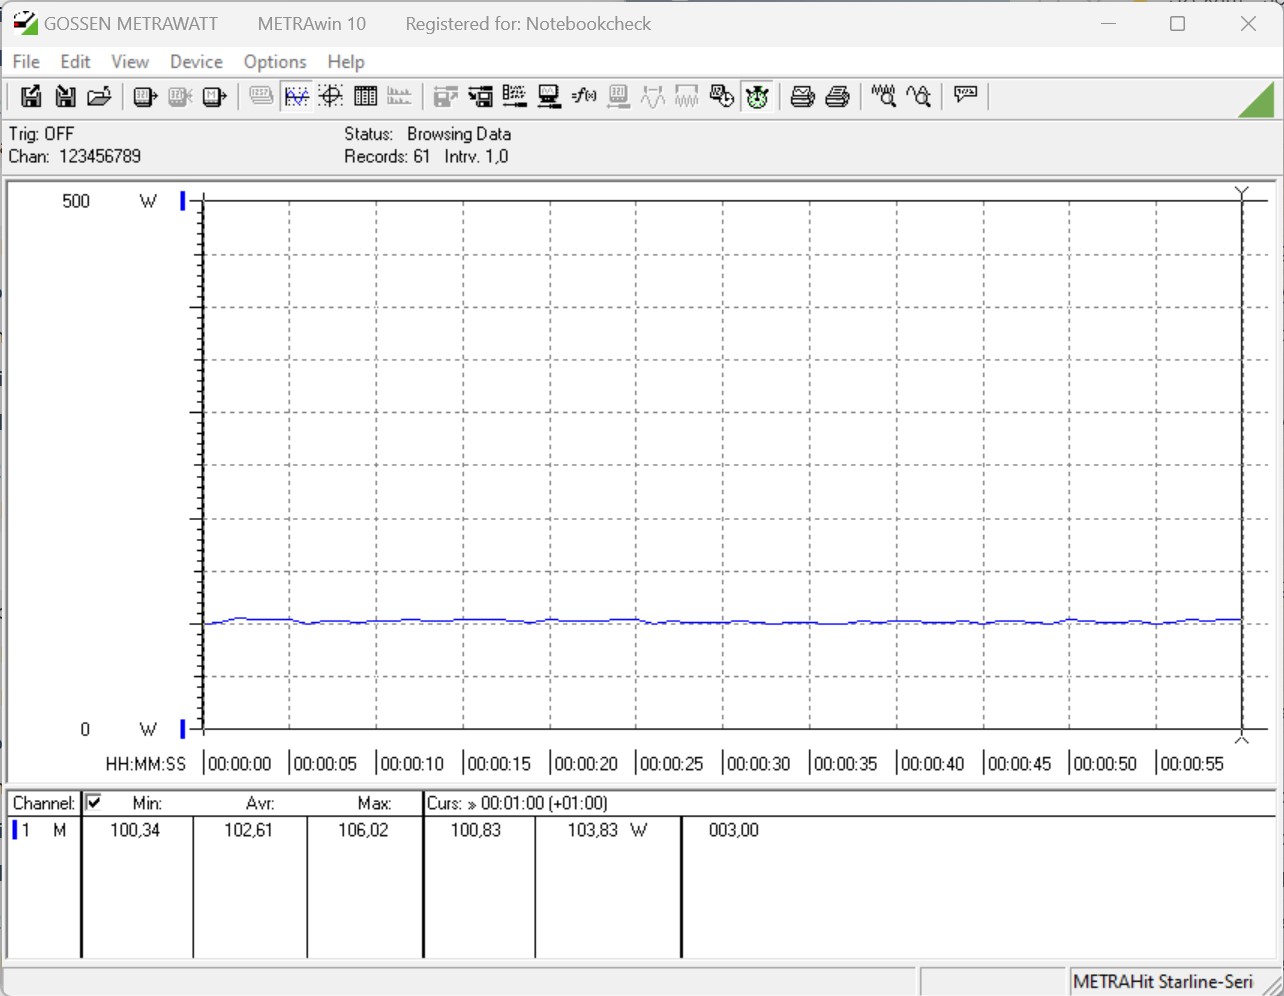
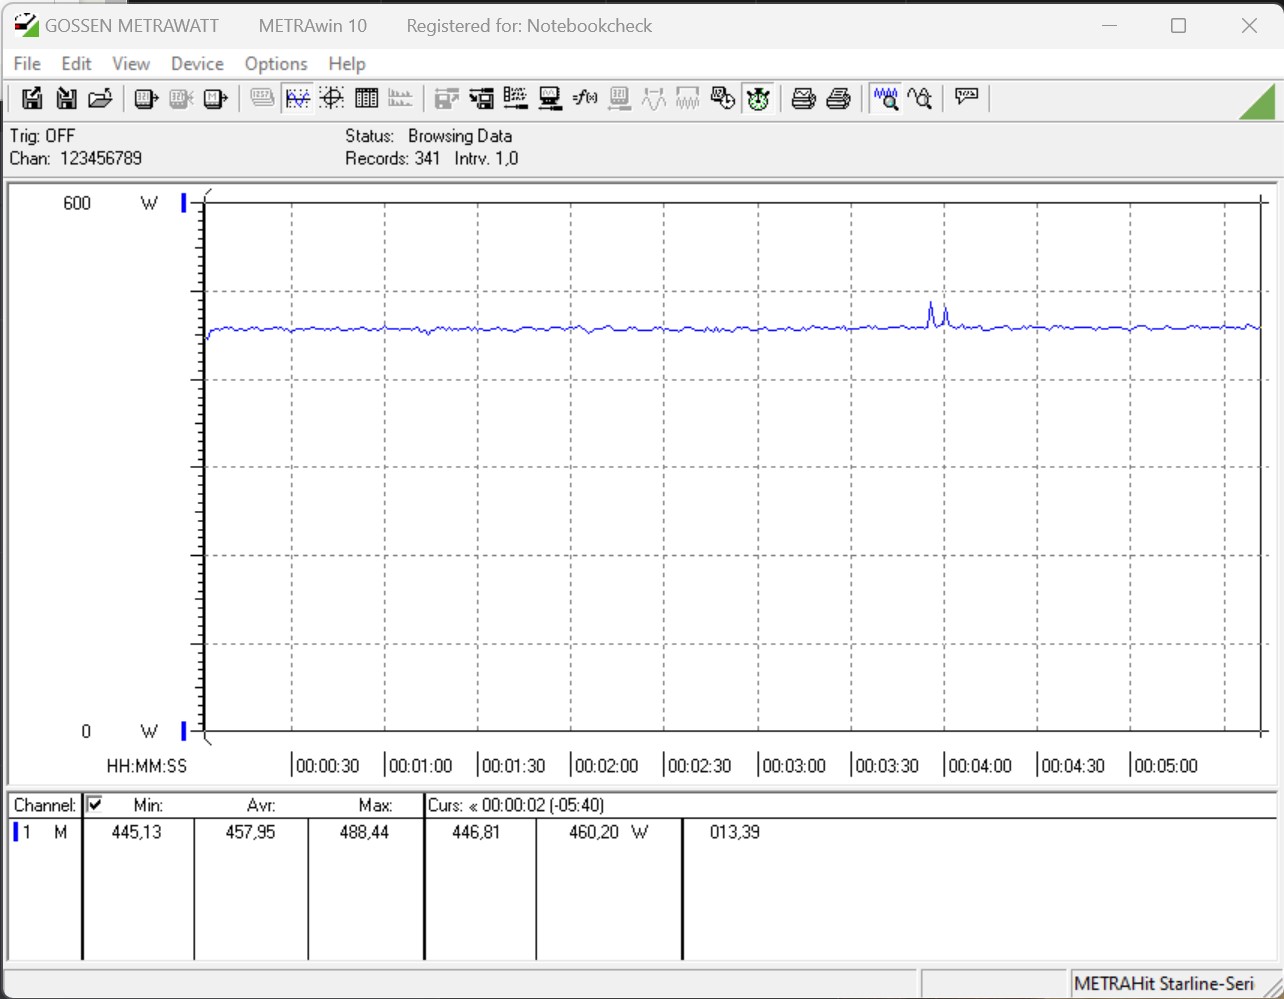
W najgorszym przypadku odnotowaliśmy 83,1 °C (~181,6 °F) jako temperaturę gorącego punktu, mimo że chip GPU osiąga średnio tylko 67,2 °C (~153 °F). Przy zwiększonym docelowym poborze mocy (+15%), nie widzimy wyższej temperatury gorącego punktu, co wynika z wyższych prędkości wentylatorów. Maksymalny pobór mocy na poziomie 317 W również nie stanowi problemu dla tego bardzo dużego coolera.
W poborze mocy, KFA2 GeForce RTX 4070 TI EX Gamer zaskakuje nieco wyższym wynikiem w porównaniu do KFA2 GeForce RTX 4070 Ti SG. Nie spodziewaliśmy się tego. Wydajność karty graficznej jest jednak nadal dobra, jeśli porównamy jej osiągi z kartą Nvidia GeForce RTX 3090 lub AMD Radeon RX 6950 XT.
Producent zaleca zasilacz o mocy 700 W. My również stosujemy się do tego zalecenia, jeśli używasz również bardzo energochłonnego procesora.
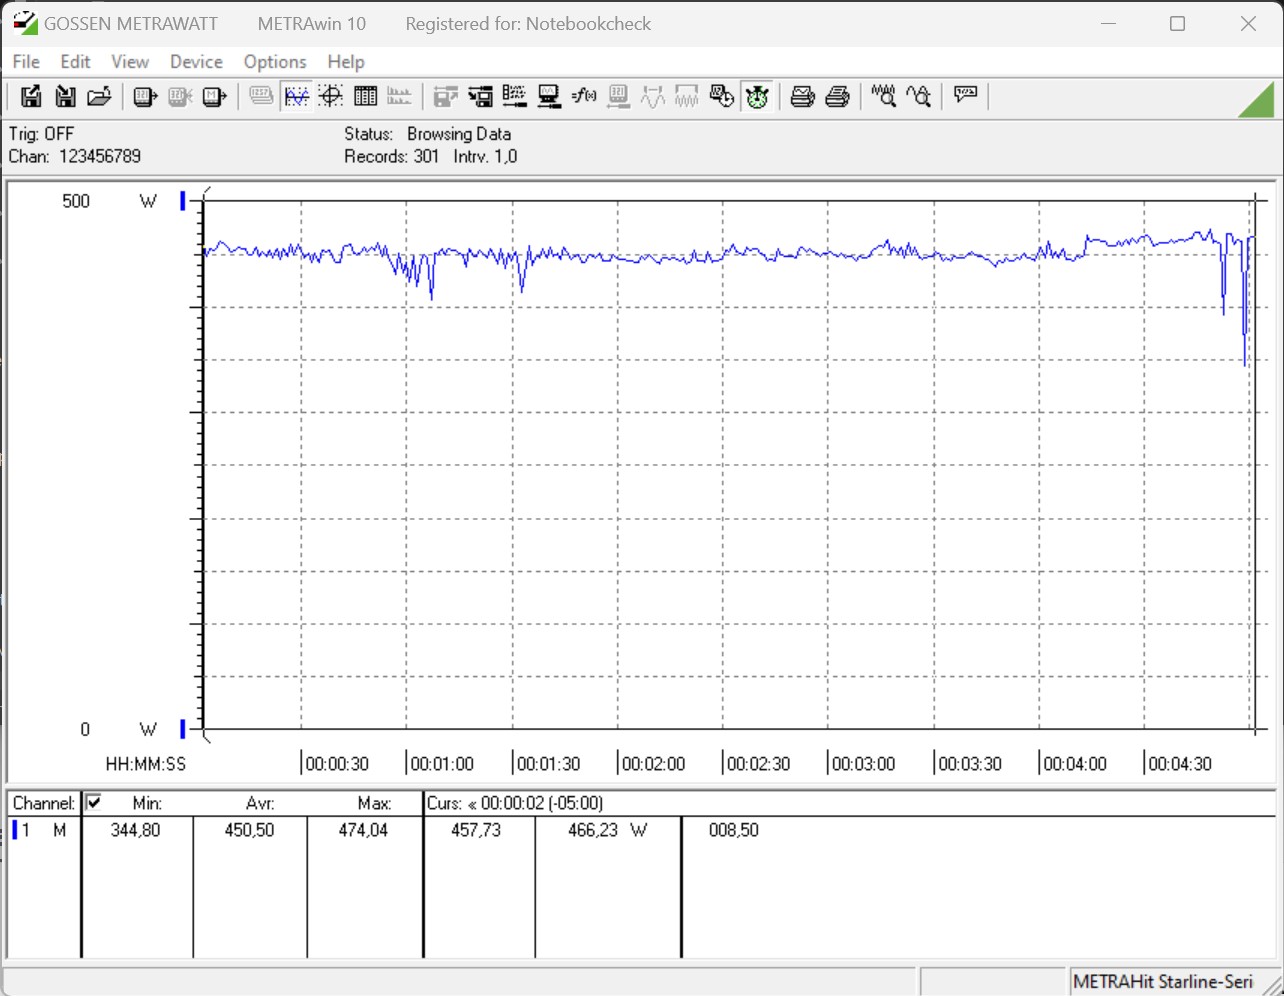
| Power Consumption / The Witcher 3 ultra (external Monitor) | |
| MSI Radeon RX 6950 XT Gaming X Trio (Idle: 79.6 W) | |
| KFA2 GeForce RTX 4090 SG | |
| AMD Radeon RX 7900 XTX (Idle: 86.5 W) | |
| NVIDIA GeForce RTX 3090 Founders Edition | |
| ASUS TUF Gaming GeForce RTX 3080 Ti OC (Idle: 78.2 W) | |
| KFA2 GeForce RTX 3080 SG | |
| AMD Radeon RX 6900 XT (Idle: 99.15 W) | |
| KFA2 GeForce RTX 4080 SG (Idle: 86.4 W) | |
| AMD Radeon RX 7900 XT (Idle: 84.6 W) | |
| KFA2 GeForce RTX 3070 Ti SG (Idle: 88.9 W) | |
| KFA2 GeForce RTX 4070 Ti EX Gamer | |
| KFA2 GeForce RTX 4070 Ti SG (Idle: 91.5 W) | |
| KFA2 GeForce RTX 4070 EX Gamer | |
| Power Consumption / FurMark 1.19 GPU Stress Test (external Monitor) | |
| KFA2 GeForce RTX 4090 SG | |
| MSI Radeon RX 6950 XT Gaming X Trio (Idle: 79.6 W) | |
| AMD Radeon RX 7900 XTX (Idle: 86.5 W) | |
| NVIDIA GeForce RTX 3090 Founders Edition | |
| ASUS TUF Gaming GeForce RTX 3080 Ti OC (Idle: 78.2 W) | |
| AMD Radeon RX 7900 XT (Idle: 84.6 W) | |
| KFA2 GeForce RTX 3080 SG | |
| KFA2 GeForce RTX 3070 Ti SG (Idle: 88.9 W) | |
| KFA2 GeForce RTX 4080 SG (Idle: 86.4 W) | |
| AMD Radeon RX 6900 XT (Idle: 99.15 W) | |
| KFA2 GeForce RTX 4070 Ti EX Gamer | |
| KFA2 GeForce RTX 4070 Ti SG (Idle: 91.5 W) | |
| KFA2 GeForce RTX 4070 EX Gamer | |
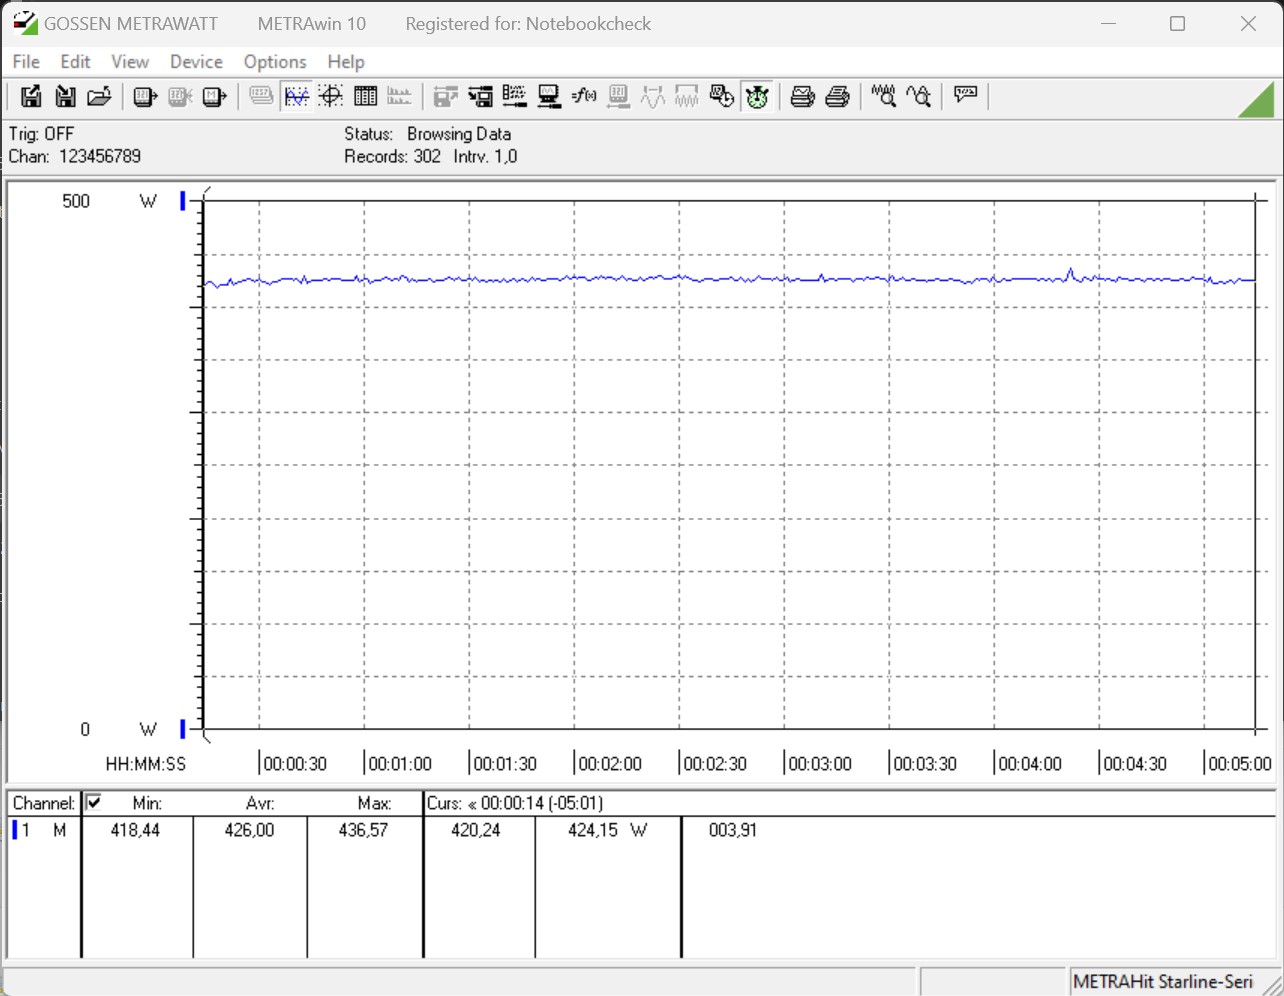
| Power Consumption / Witcher 3 ultra Efficiency (external Monitor) | |
| KFA2 GeForce RTX 4080 SG | |
| AMD Radeon RX 7900 XT | |
| KFA2 GeForce RTX 4090 SG | |
| AMD Radeon RX 7900 XTX | |
| KFA2 GeForce RTX 4070 Ti SG | |
| KFA2 GeForce RTX 4070 Ti EX Gamer | |
| KFA2 GeForce RTX 4070 EX Gamer | |
| MSI Radeon RX 6950 XT Gaming X Trio | |
| NVIDIA GeForce RTX 3090 Founders Edition | |
| ASUS TUF Gaming GeForce RTX 3080 Ti OC | |
| AMD Radeon RX 6900 XT | |
| KFA2 GeForce RTX 3070 Ti SG | |
| KFA2 GeForce RTX 3080 SG | |
* ... im mniej tym lepiej
Power Consumption With External Monitor
Za
Przeciw
Werdykt - Bardzo dobre GPU dla świadomego nabywcy

KFA2 GeForce RTX 4070 Ti EX Gamer to potężna karta graficzna, której wydajność doskonale sprawdzi się w grach w rozdzielczości 1440p. Ale w zasadzie KFA2 GeForce RTX 4070 EX Gamerktóry jest znacznie bardziej przystępny cenowo, również jest w stanie to zrobić. Jednak nasz test nadal wykazuje wiele zalet modelu Ti. Jest w stanie zdystansować się o około 20% od modelu bez Ti, co oznacza, że oferuje wyższy stopień odporności na przyszłość. Nie ma różnic w pamięci VRAM, a oba modele są wyposażone w 12 GB, co obecnie jest wystarczające. Nie jesteśmy w stanie dokonać bezpośredniego porównania z czerwoną drużyną, ponieważ wciąż czekamy na średnią gamę AMD. Jednak czasami Nvidia może jeszcze wpaść w kłopoty, jeśli nadchodząca średnia półka AMD będzie dostępna w dobrej cenie. W porównaniu do AMD Radeon RX 7900 XTkFA2 GeForce RTX 4070 Ti EX Gamer ma pewne problemy z dotrzymaniem kroku. Jeśli ktoś nie przywiązuje aż tak dużej wagi do raytracingu, to również otrzyma świetny produkt w przyzwoitej cenie. Różnica w cenie między tymi dwoma modelami wynosi zaledwie kilka euro, więc jesteśmy usprawiedliwieni dokonując tego porównania, nawet jeśli GeForce RTX 4070 Ti nie ma służyć na arenie gier 4K.
KFA2 GeForce RTX 4070 Ti EX Gamer to przystępna cenowo karta graficzna z tej samej ligi, co modele GeForce RTX 4070 Ti. Podczas gdy wydajność jest obecnie odpowiednia, 12 GB pamięci VRAM może łatwo stać się wąskim gardłem.
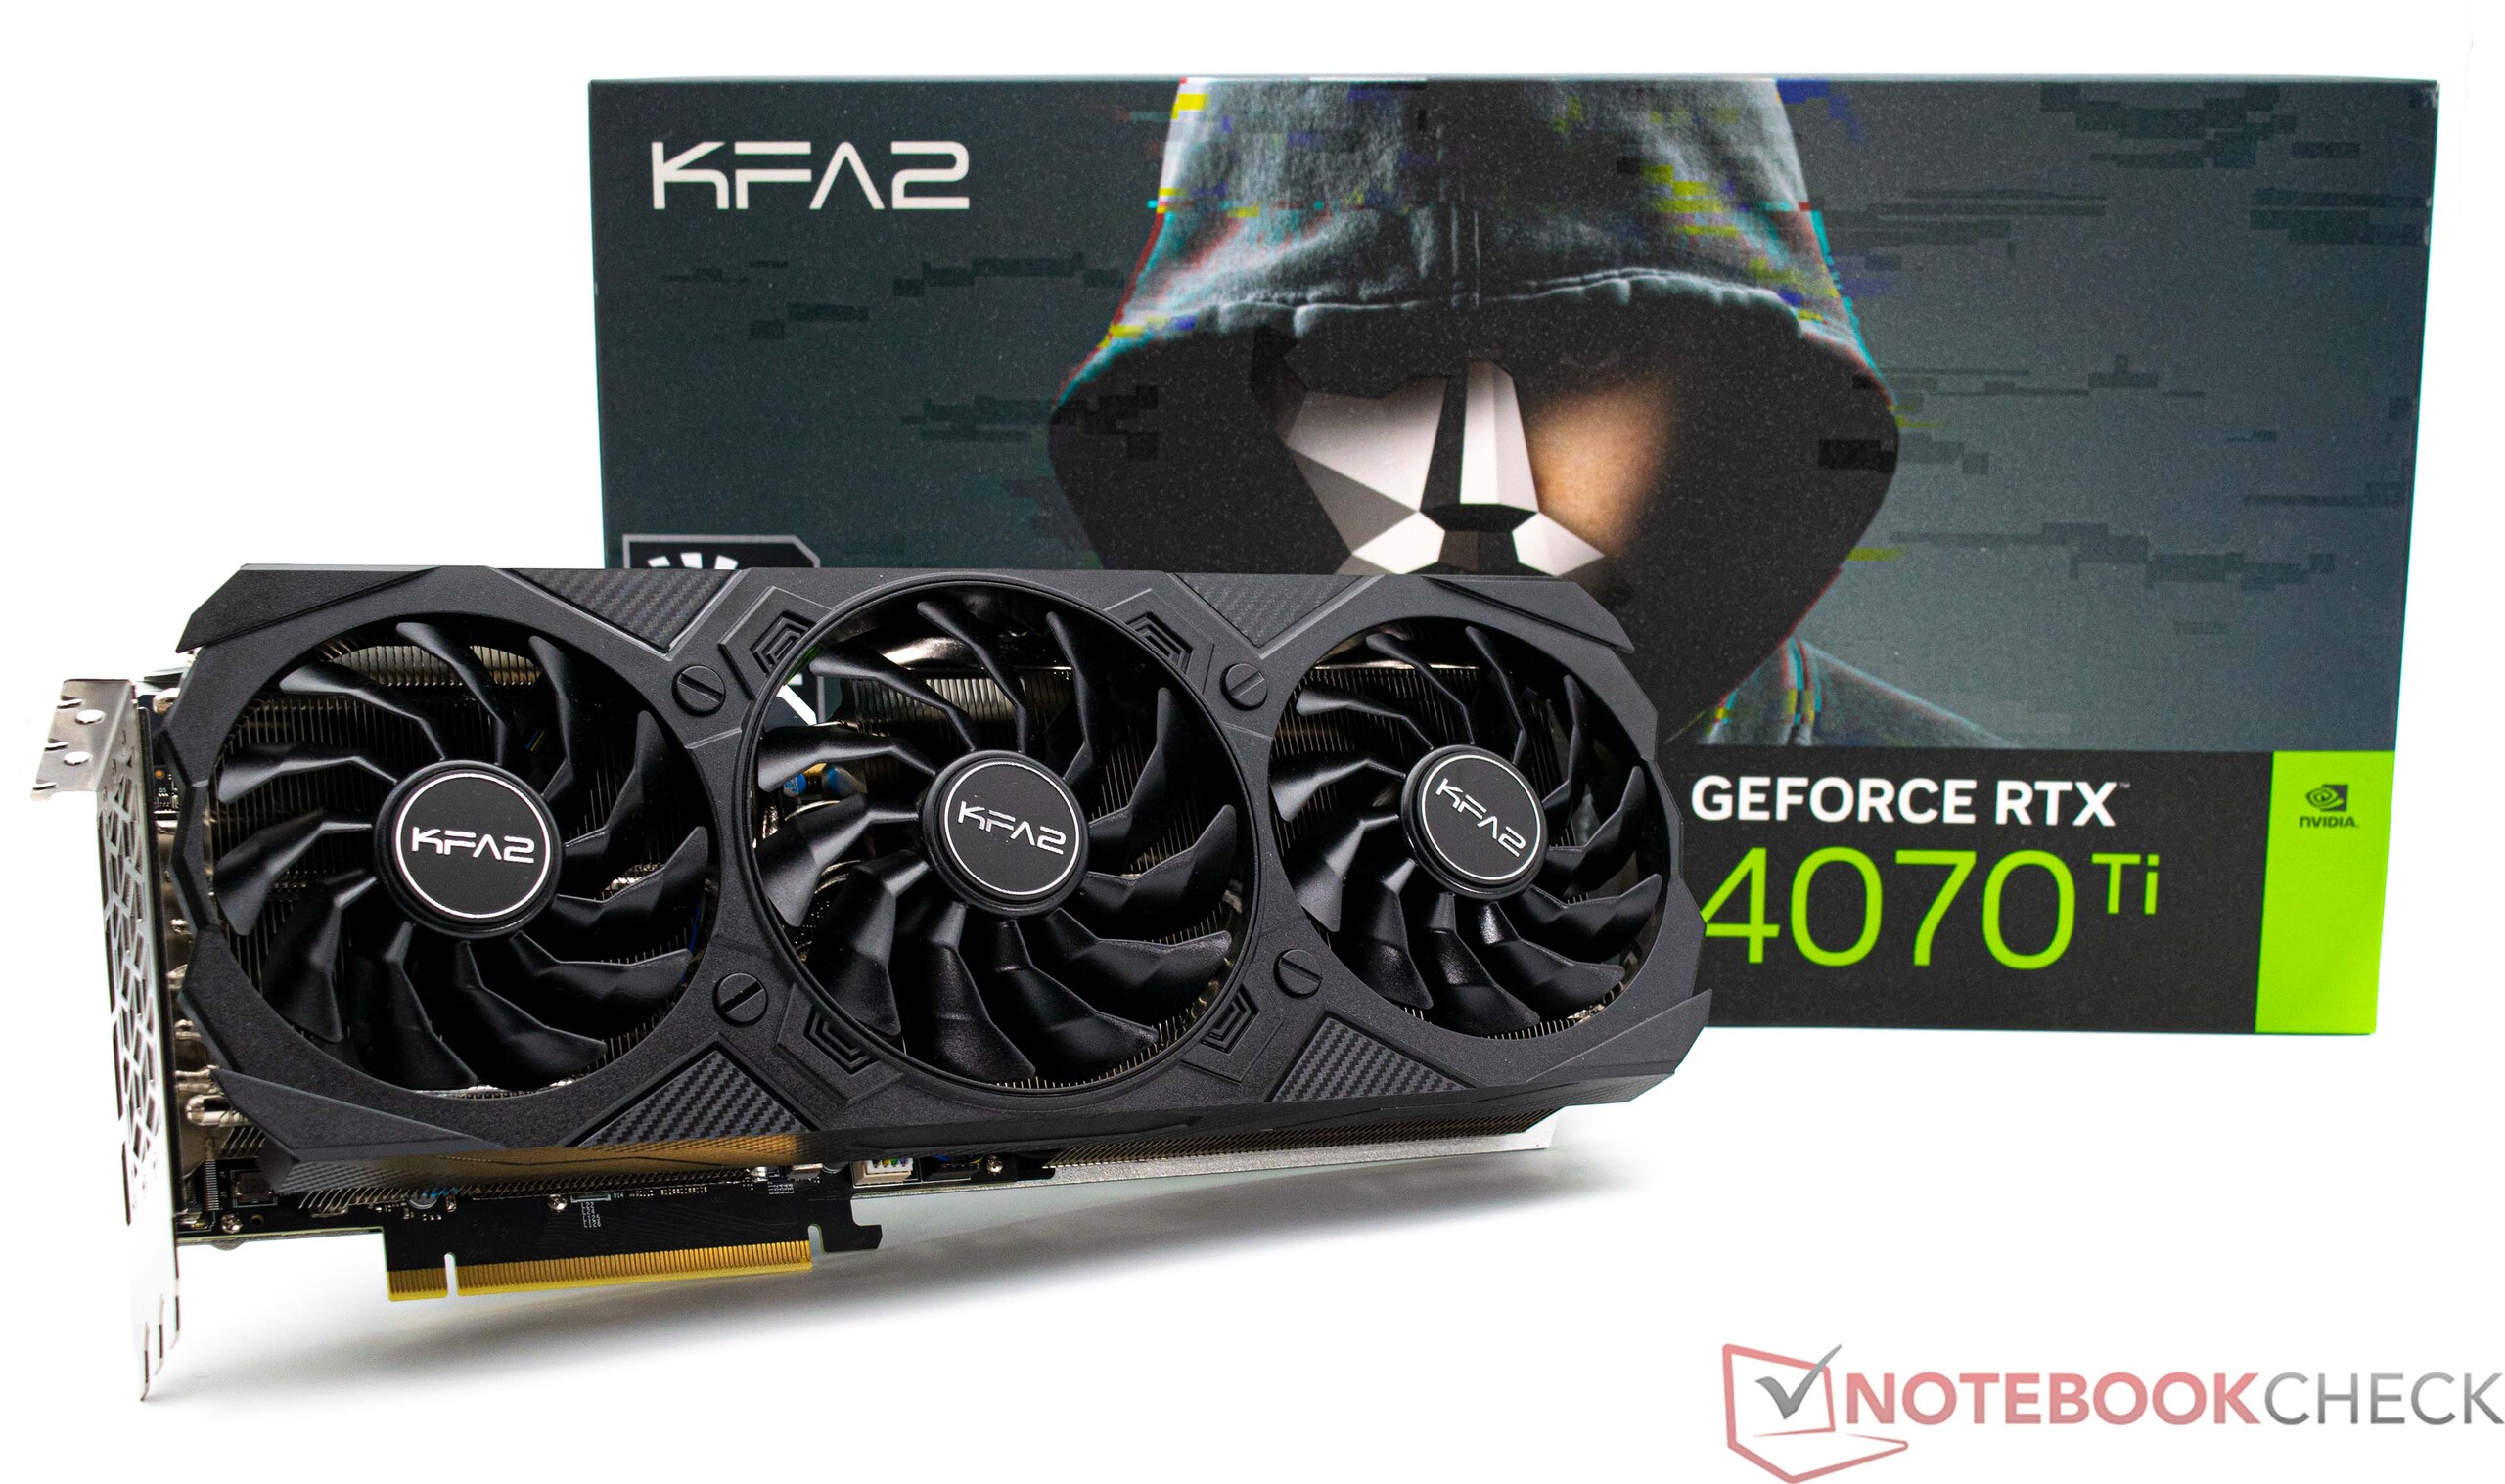
Nie zauważyliśmy żadnych wad w wykonaniu. Wszystko jest dobrze spasowane i perfekcyjnie wykonane. Aluminiowy backplate nie tylko zapewnia optymalną stabilność karty graficznej, ale także zapewnia jej wysoką jakość. KFA2 GeForce RTX 4070 Ti EX Gamer rezygnuje z nadmiernych sztuczek z kolorowym podświetleniem, a jedynie oznaczenie GeForce z boku karty graficznej jest podkreślone dyskretnym podświetleniem. Ci, którzy nie chcą żyć bez spektakularnego pokazu świetlnego, powinni przyjrzeć się bliżej modelowi KFA2 GeForce RTX 4070 Ti SG. Warto również rzucić okiem na KFA2 GeForce RTX 4070 EX Gamer, ponieważ ta karta graficzna podobnie oferuje dużo RGB i wystarczającą wydajność do gier WQHD.
Cena i dostępność
GeForce Chociaż wydaje się, że jest ona dostępna głównie w Europie, obecnie można ją nabyć w Stanach Zjednoczonych od międzynarodowych sprzedawców, takich jak grooves.land za 940 USDlub w serwisie eBay.

