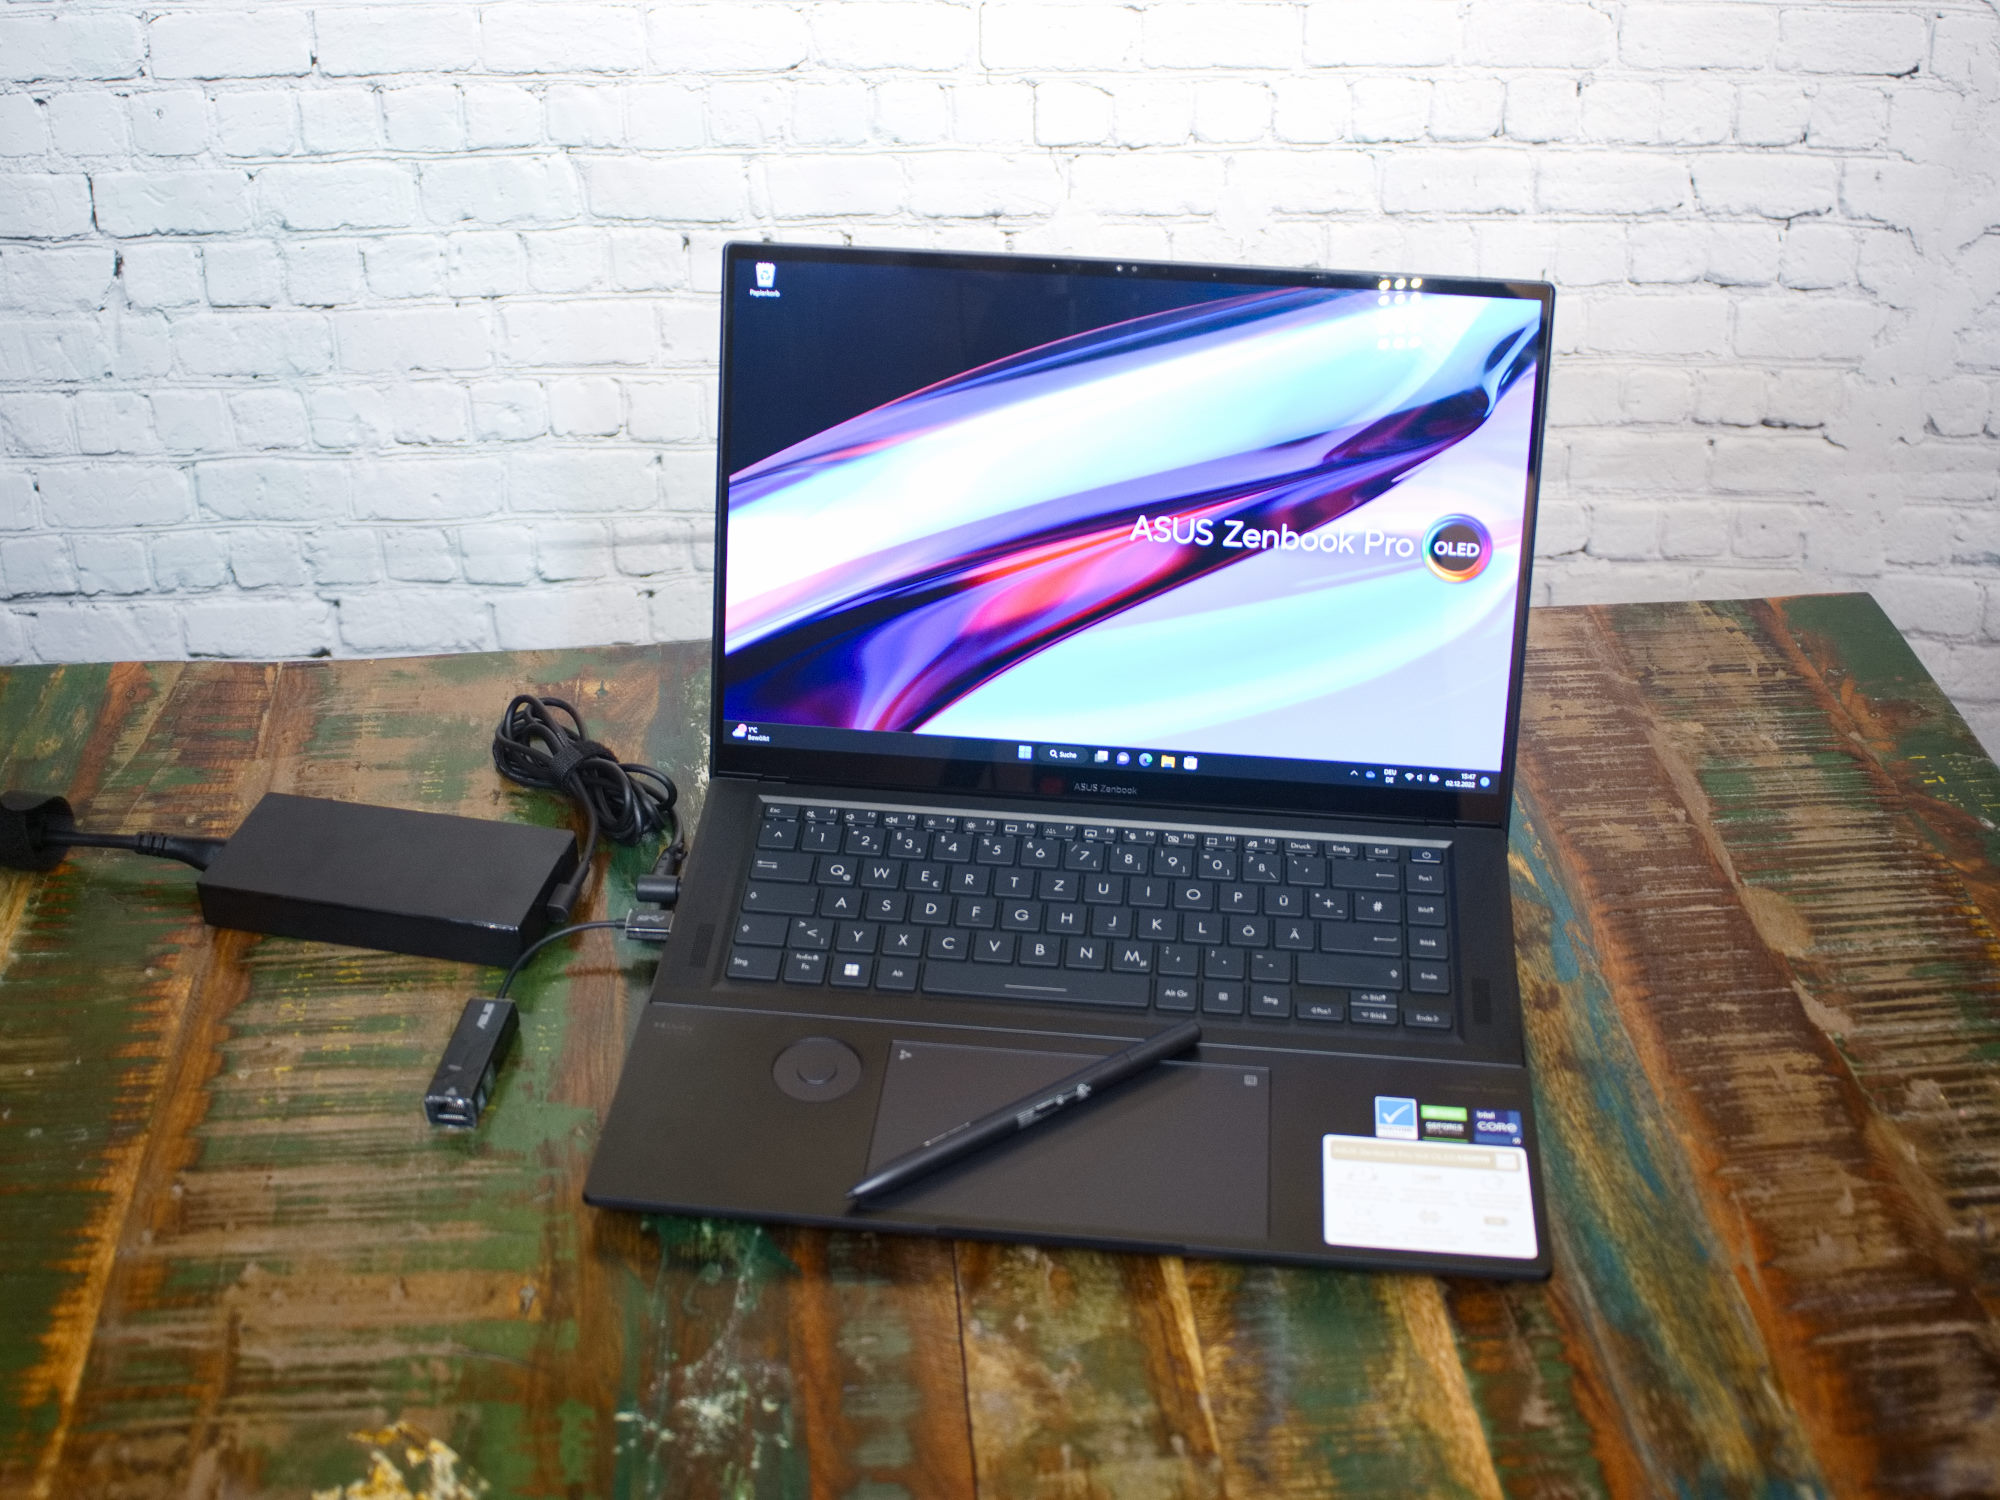
Recenzja Asus Zenbook Pro 16X OLED - ekstremalny laptop ze specjalną sztuczką
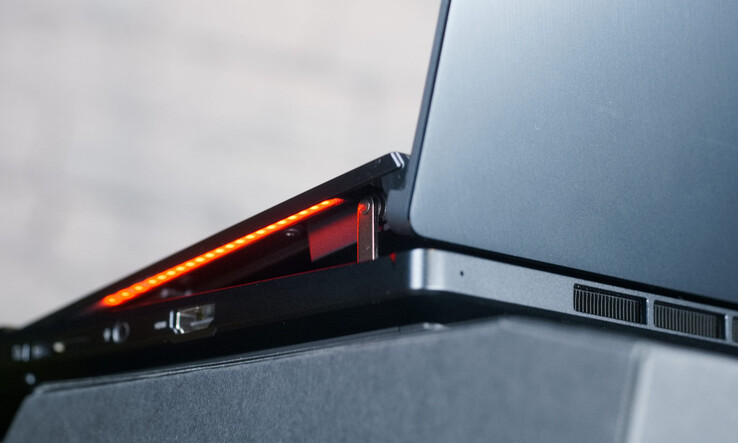
Zenbooki to zazwyczaj ekstrawaganckie laptopy o nietypowych funkcjach i ciekawym wzornictwie. Najbardziej nietypowym przedstawicielem serii może być m.in.Zenbook 17 Fold. Zenbook Pro 16X OLED wygląda obok składanego laptopa wręcz sterylnie, ale gdy tylko otworzy się wyświetlacz, Zenbook 17 nadal wyróżnia się spośród wielu innych notebooków. Jest to zasługa ASS Ultra Cooling, dla którego klawiatura jest składana razem z ekranem. Klawiatura jest umieszczona pod ergonomicznym, 7-stopniowym kątem, co zapewnia podobno o 30% większy przepływ powietrza. Z naszej recenzji wynika, że laptop nie zawsze ma przewagę wydajnościową, ale potrafi przez długi czas utrzymywać niskie temperatury pracy
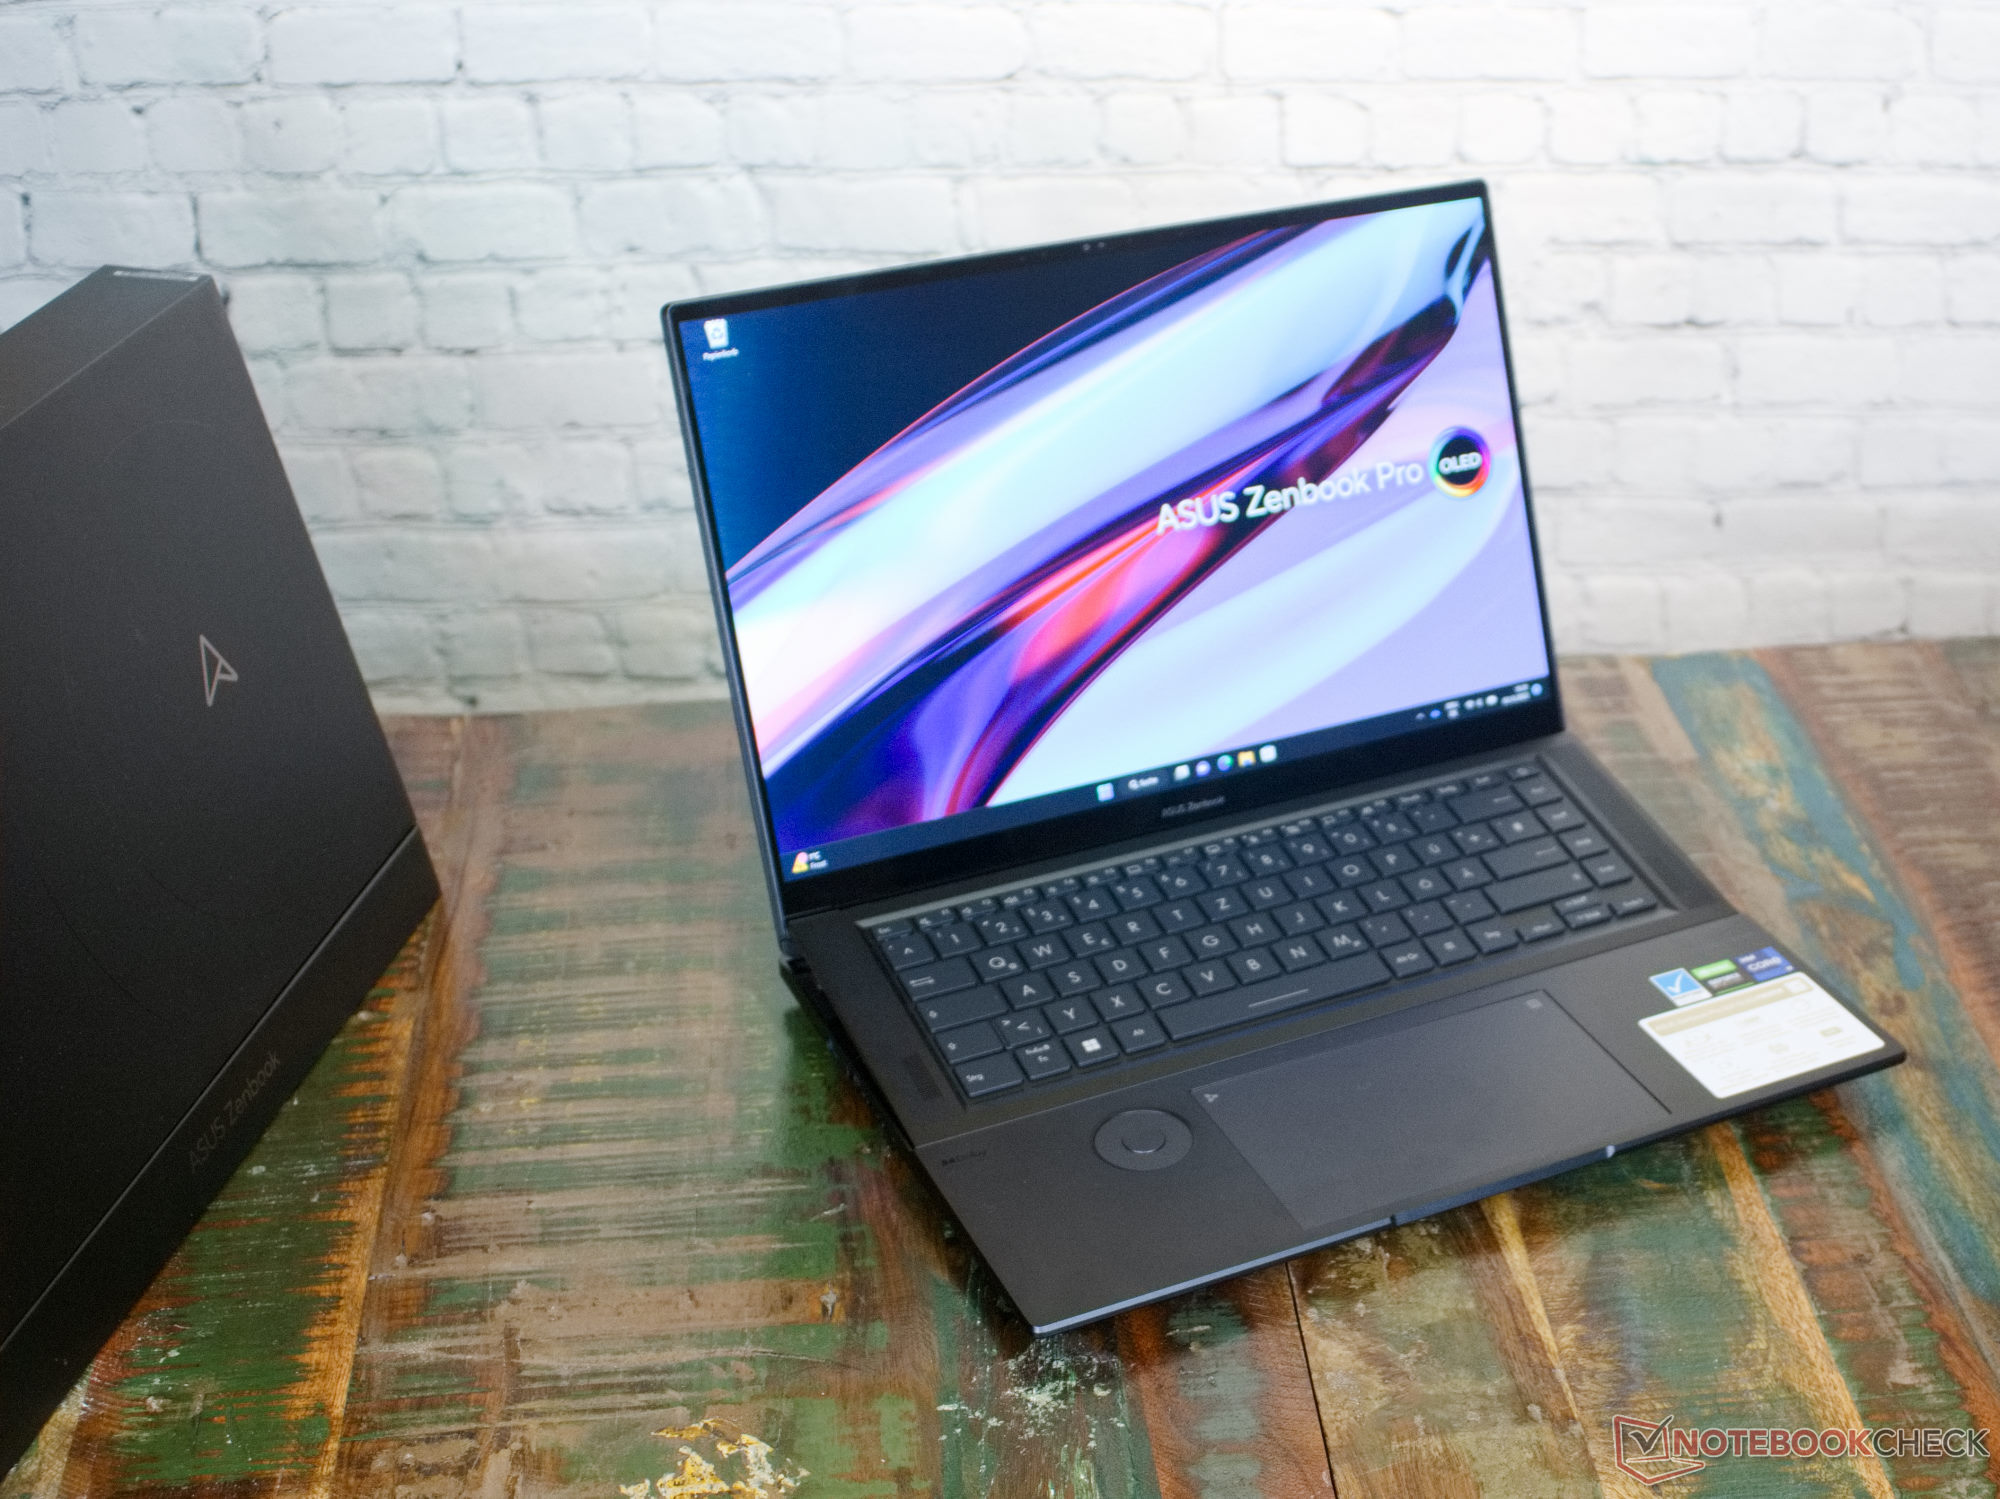
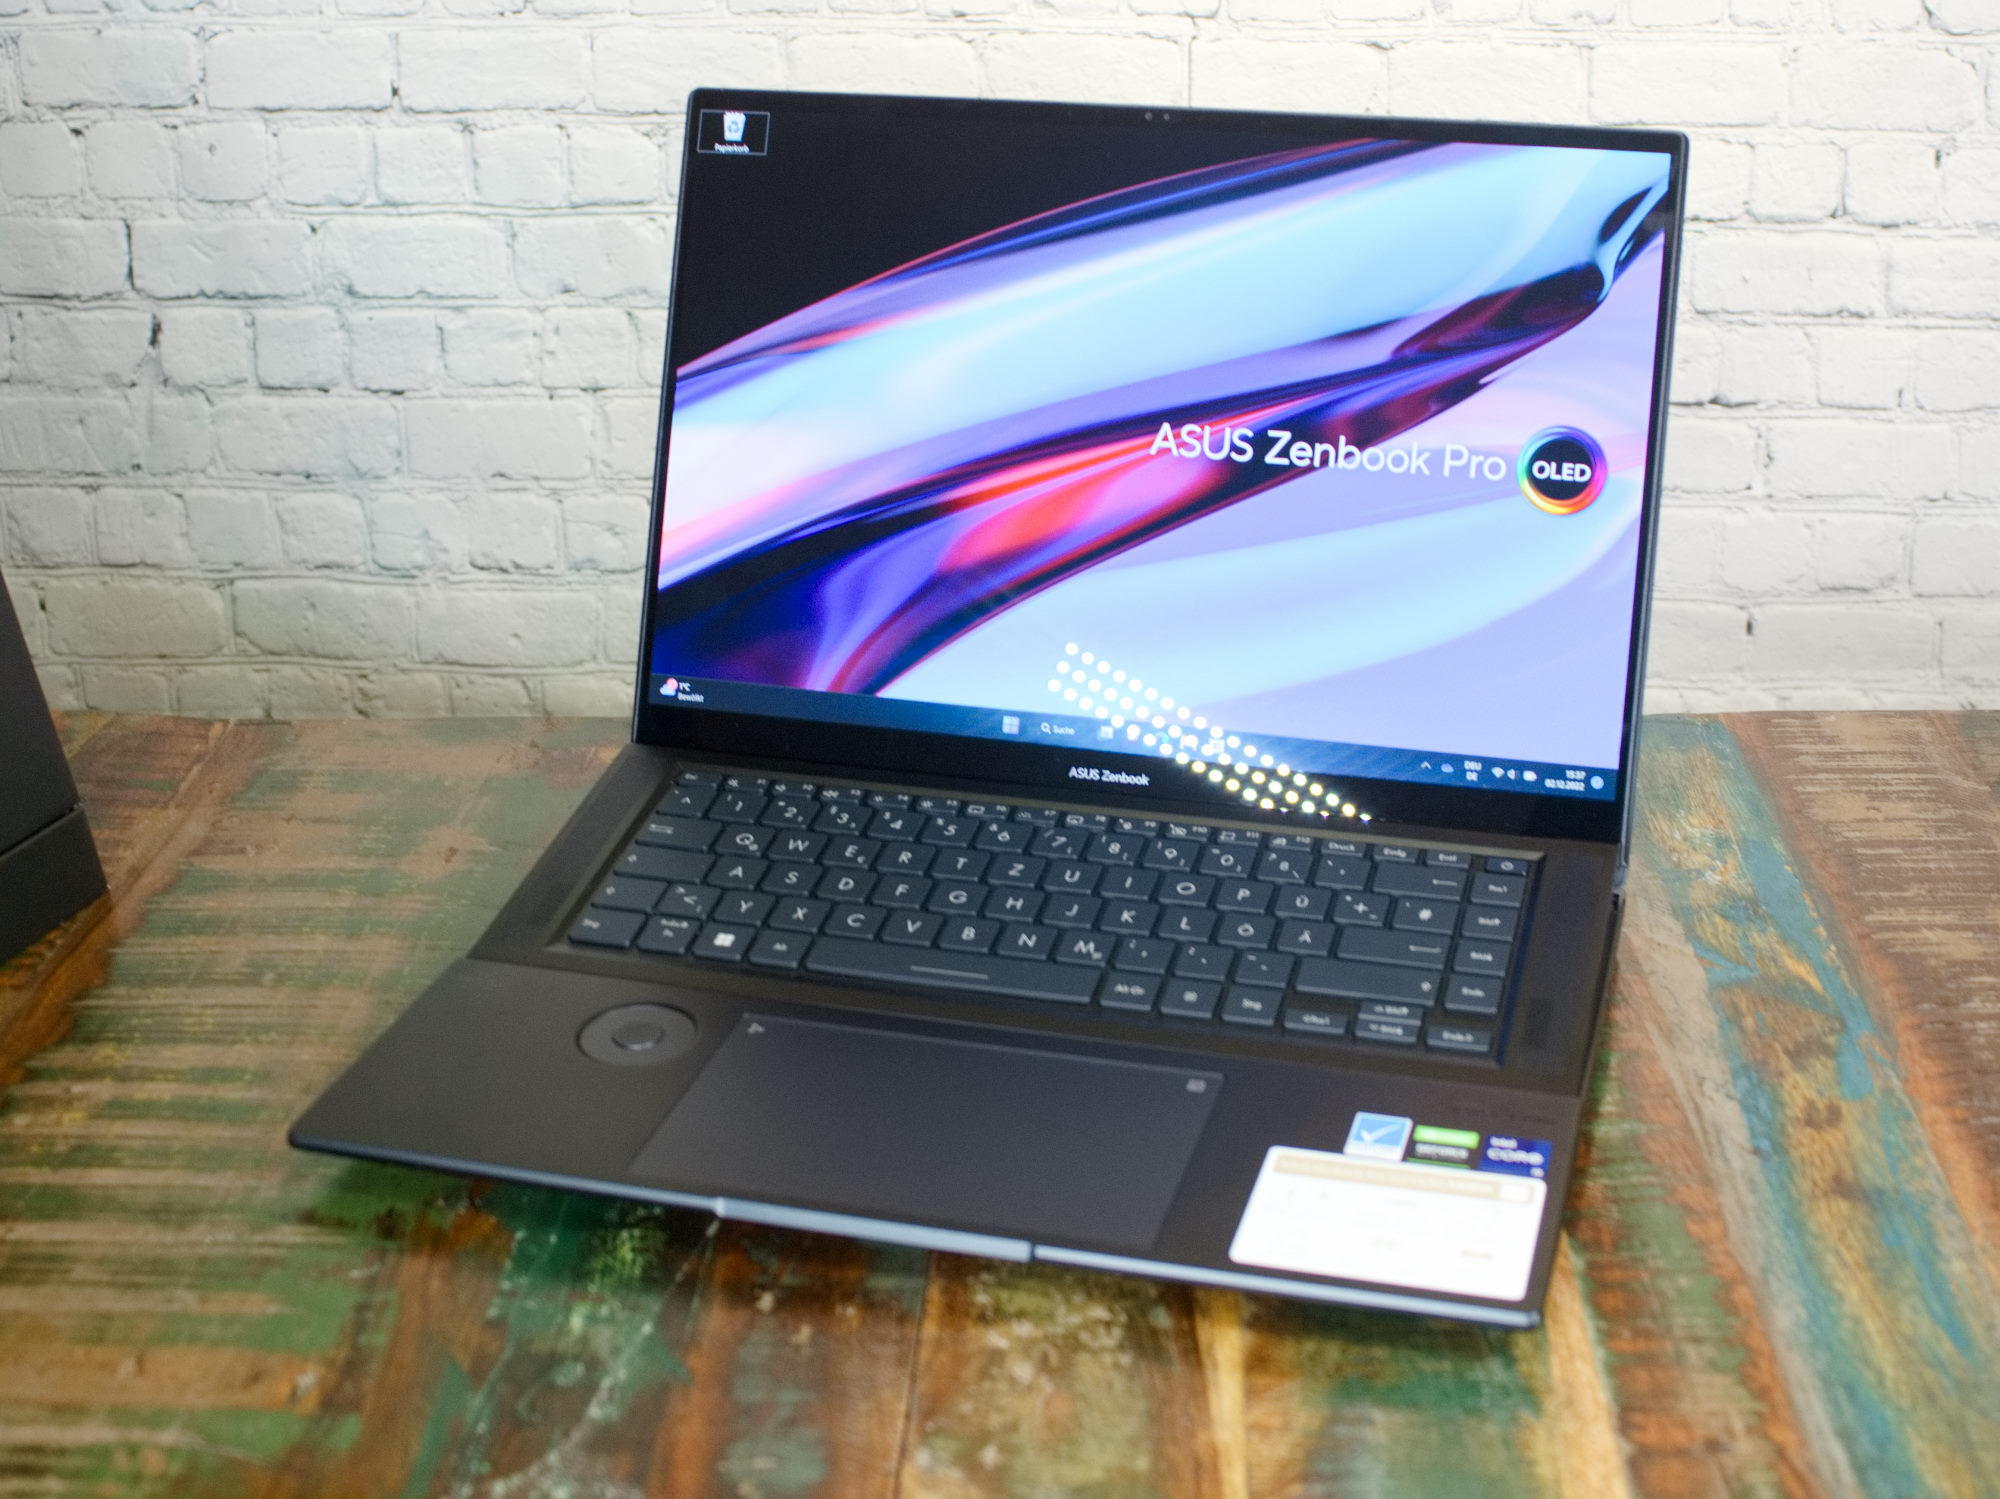
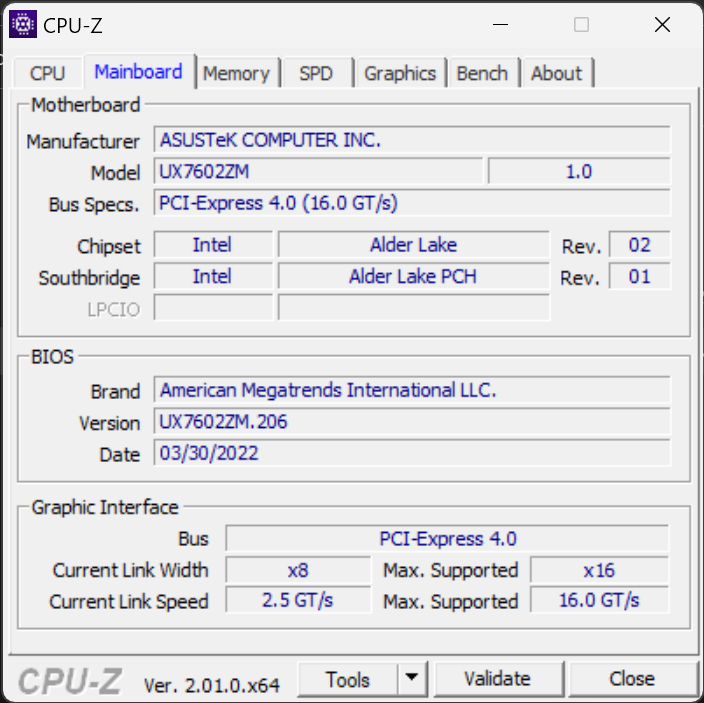
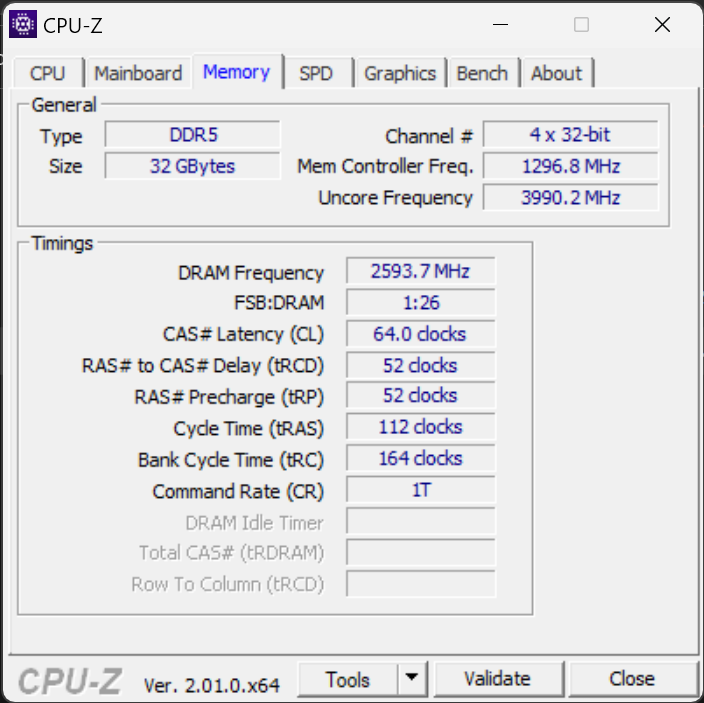
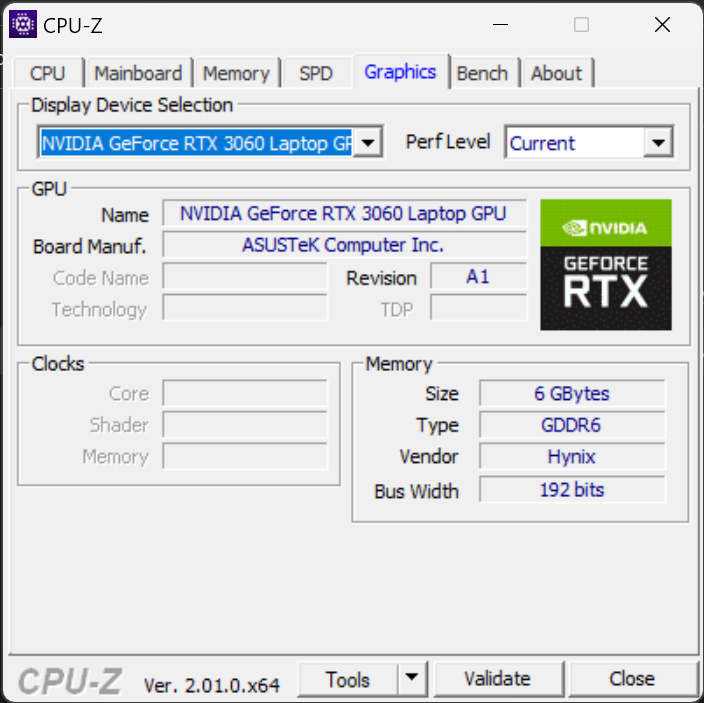
Ponadto Zenbook Pro 16X jest pełen ciekawych funkcji. W zestawie znajduje się pełne podświetlenie RGBW dla klawiatury, Asus Dial i wejście dla rysika, a także mocny wyświetlacz OLED z pełnym pokryciem przestrzeni kolorów DisplayP3. Na koniec wypada chyba wspomnieć o mocnym osprzęcie Zenbooka. A Intel Core i9-12900H, 32 GB LPDDR5 oraz Nvidia GeForce RTX 3060zostały tu zainstalowane i są chłodzone przez komorę parową. Zatwierdzony przez Pantone 16-calowy laptop w metalowej obudowie osiąga więc wysokie wyniki w wielu kategoriach. Pod względem ceny studyjny laptop mieści się w znośnym przedziale, przy czym Asus żąda około 3000 USD
Jako urządzenia porównawcze wybraliśmy różne 16-calowe notebooki z naszej bazy danych. Ponieważ Asus ZenBook Pro 16X OLED jest stosunkowo drogi, stanowi bezpośrednią konkurencję dla niektórych stacji roboczych z profesjonalnymi układami graficznymi, jak np.MSI CreatorPro Z16P czy też HP ZBook Studio 16 G9. Laptopy do gier, takie jak np Corsair Voyager A1600 można również uznać za dobrą alternatywę dla laptopa Asusa. Ci, którzy wolą prostotę od ekstrawagancji, powinni spojrzeć na Asusa VivoBook Pro 16X OLED, który również może być wyposażony w podobne funkcje jak ZenBook.
Potencjalni konkurenci w porównaniu
Ocena | Data | Model | Waga | Wysokość | Rozmiar | Rezolucja | Cena |
|---|---|---|---|---|---|---|---|
| 88.4 % v7 (old) | 12/2022 | Asus ZenBook Pro 16X OLED UX7602ZM-ME115W i9-12900H, GeForce RTX 3060 Laptop GPU | 2.4 kg | 19.5 mm | 16.00" | 3840x2400 | |
| 88.7 % v7 (old) | 12/2022 | Lenovo ThinkPad X1 Extreme G5-21DE003RGE i7-12700H, GeForce RTX 3060 Laptop GPU | 2.1 kg | 17.9 mm | 16.00" | 3840x2400 | |
| 86.4 % v7 (old) | 12/2022 | HP Omen 16-n0033dx R7 6800H, Radeon RX 6650M | 2.4 kg | 22.6 mm | 16.10" | 1920x1080 | |
| 90.1 % v7 (old) | 11/2022 | HP ZBook Studio 16 G9 62U04EA i7-12800H, RTX A2000 Laptop GPU | 1.8 kg | 19 mm | 16.00" | 3840x2400 | |
| 86.6 % v7 (old) | 12/2022 | Corsair Voyager a1600 R9 6900HS, Radeon RX 6800M | 2.4 kg | 19.9 mm | 16.00" | 2560x1600 | |
| 88.4 % v7 (old) | 10/2022 | Dell Precision 7670 i7-12850HX, RTX A2000 Laptop GPU | 2.7 kg | 24.7 mm | 16.00" | 3840x2400 | |
| 83.7 % v7 (old) | 11/2022 | Asus VivoBook Pro 16X OLED N7600PC-L2026X i7-11370H, GeForce RTX 3050 4GB Laptop GPU | 2 kg | 18.9 mm | 16.00" | 3840x2400 | |
| 84.3 % v7 (old) | 11/2022 | MSI CreatorPro Z16P B12UKST i7-12700H, RTX A3000 Laptop GPU | 2.4 kg | 19 mm | 16.00" | 2560x1600 |
Walizka - Niezwykła w każdym szczególe
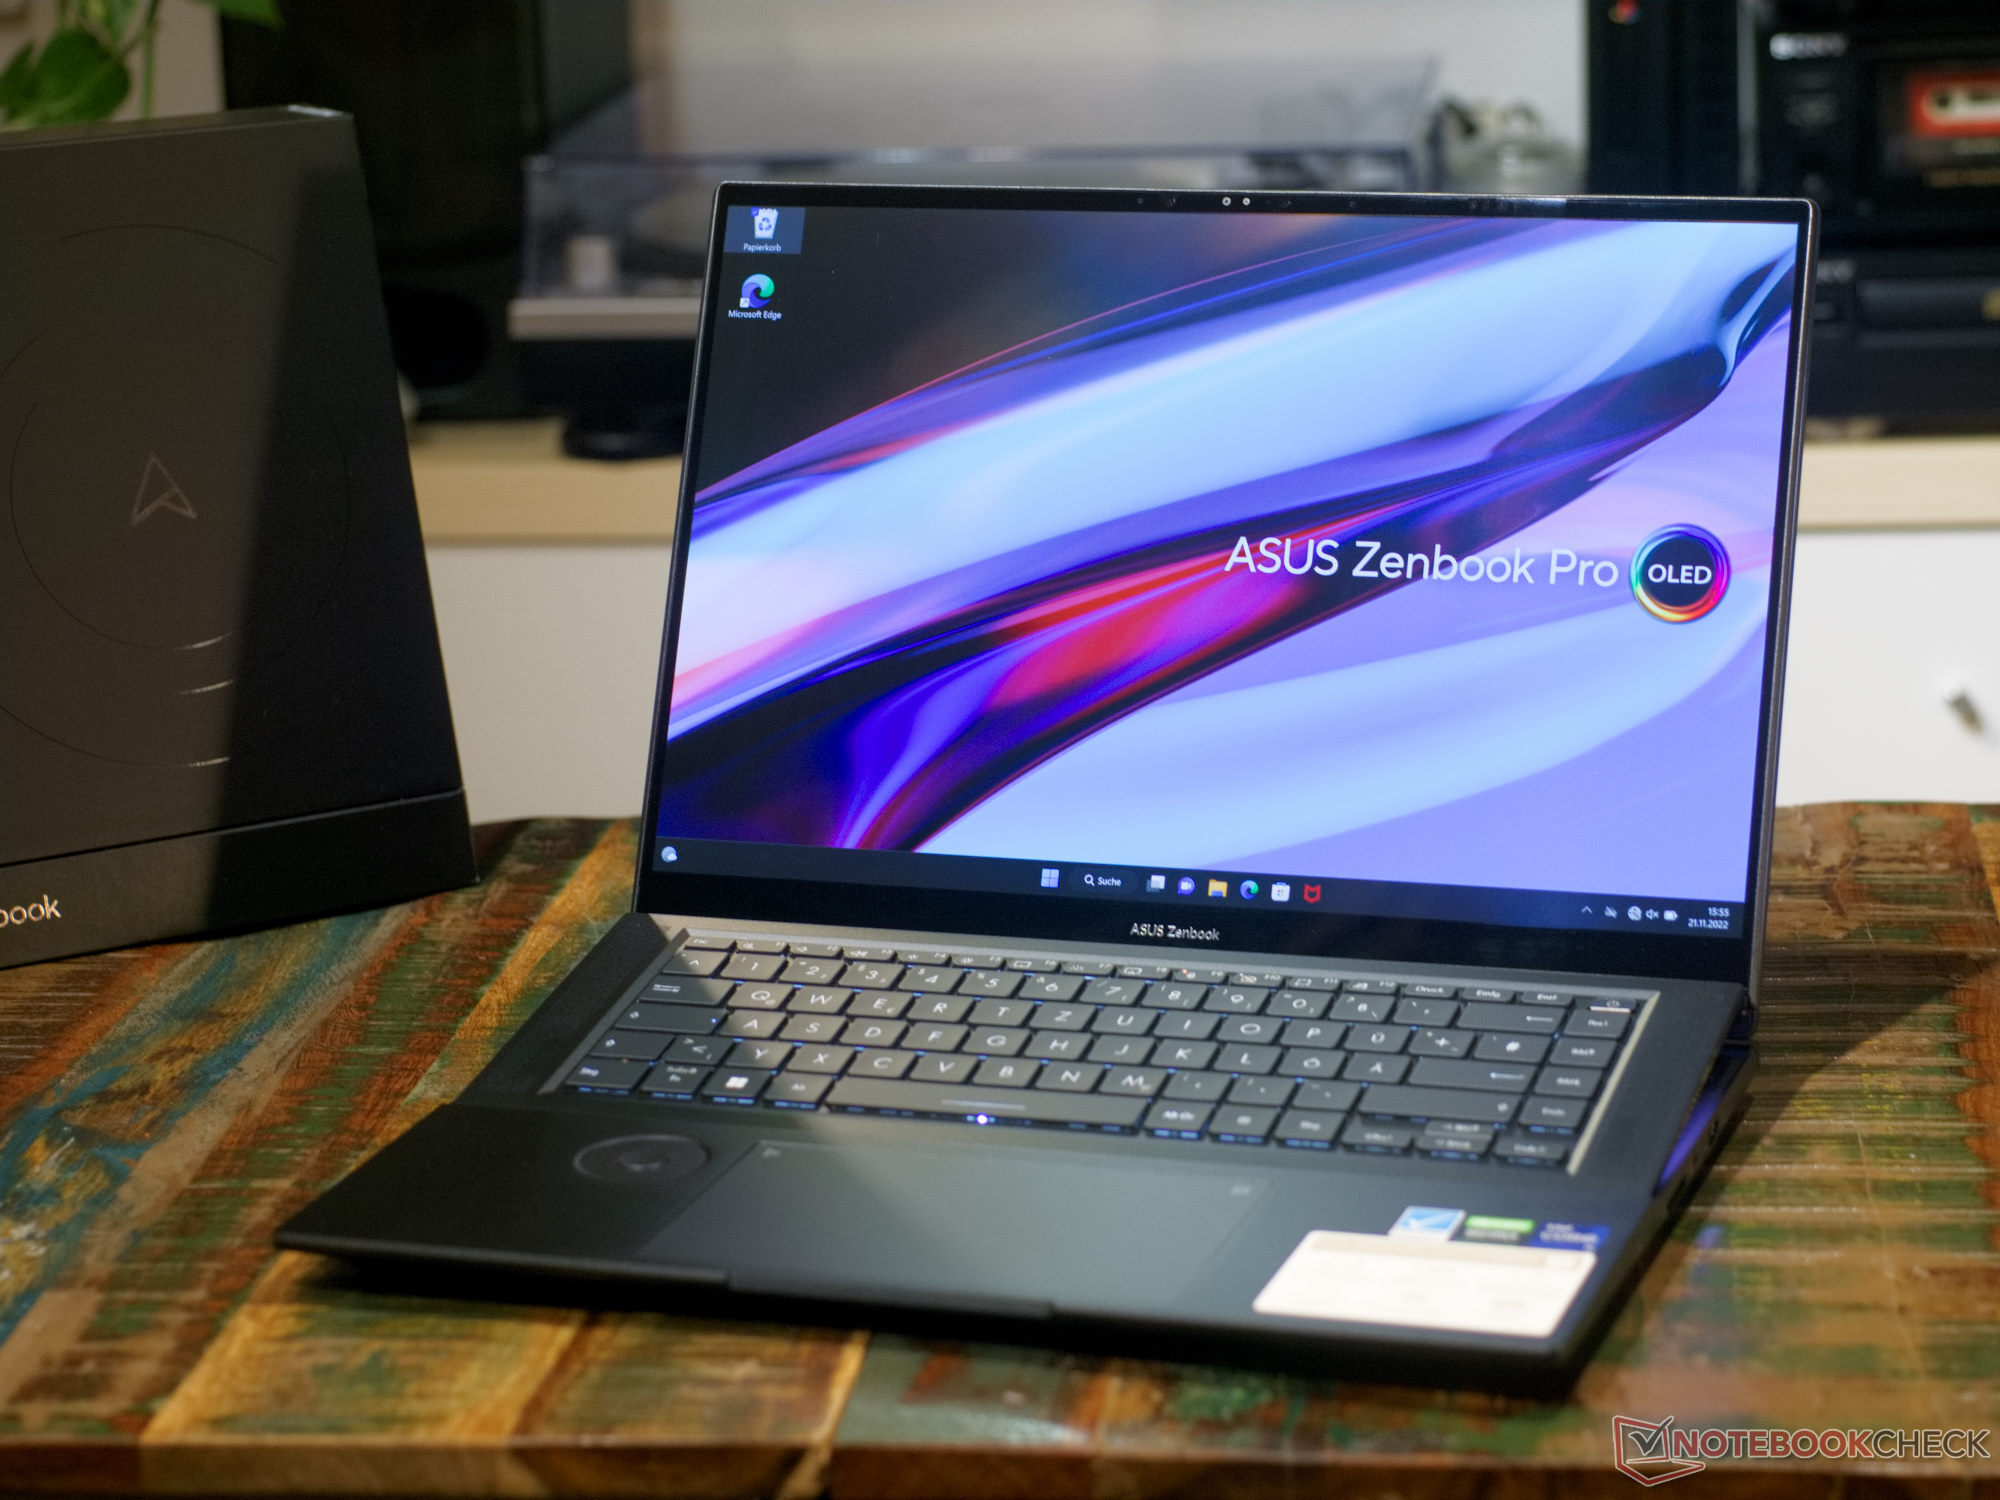
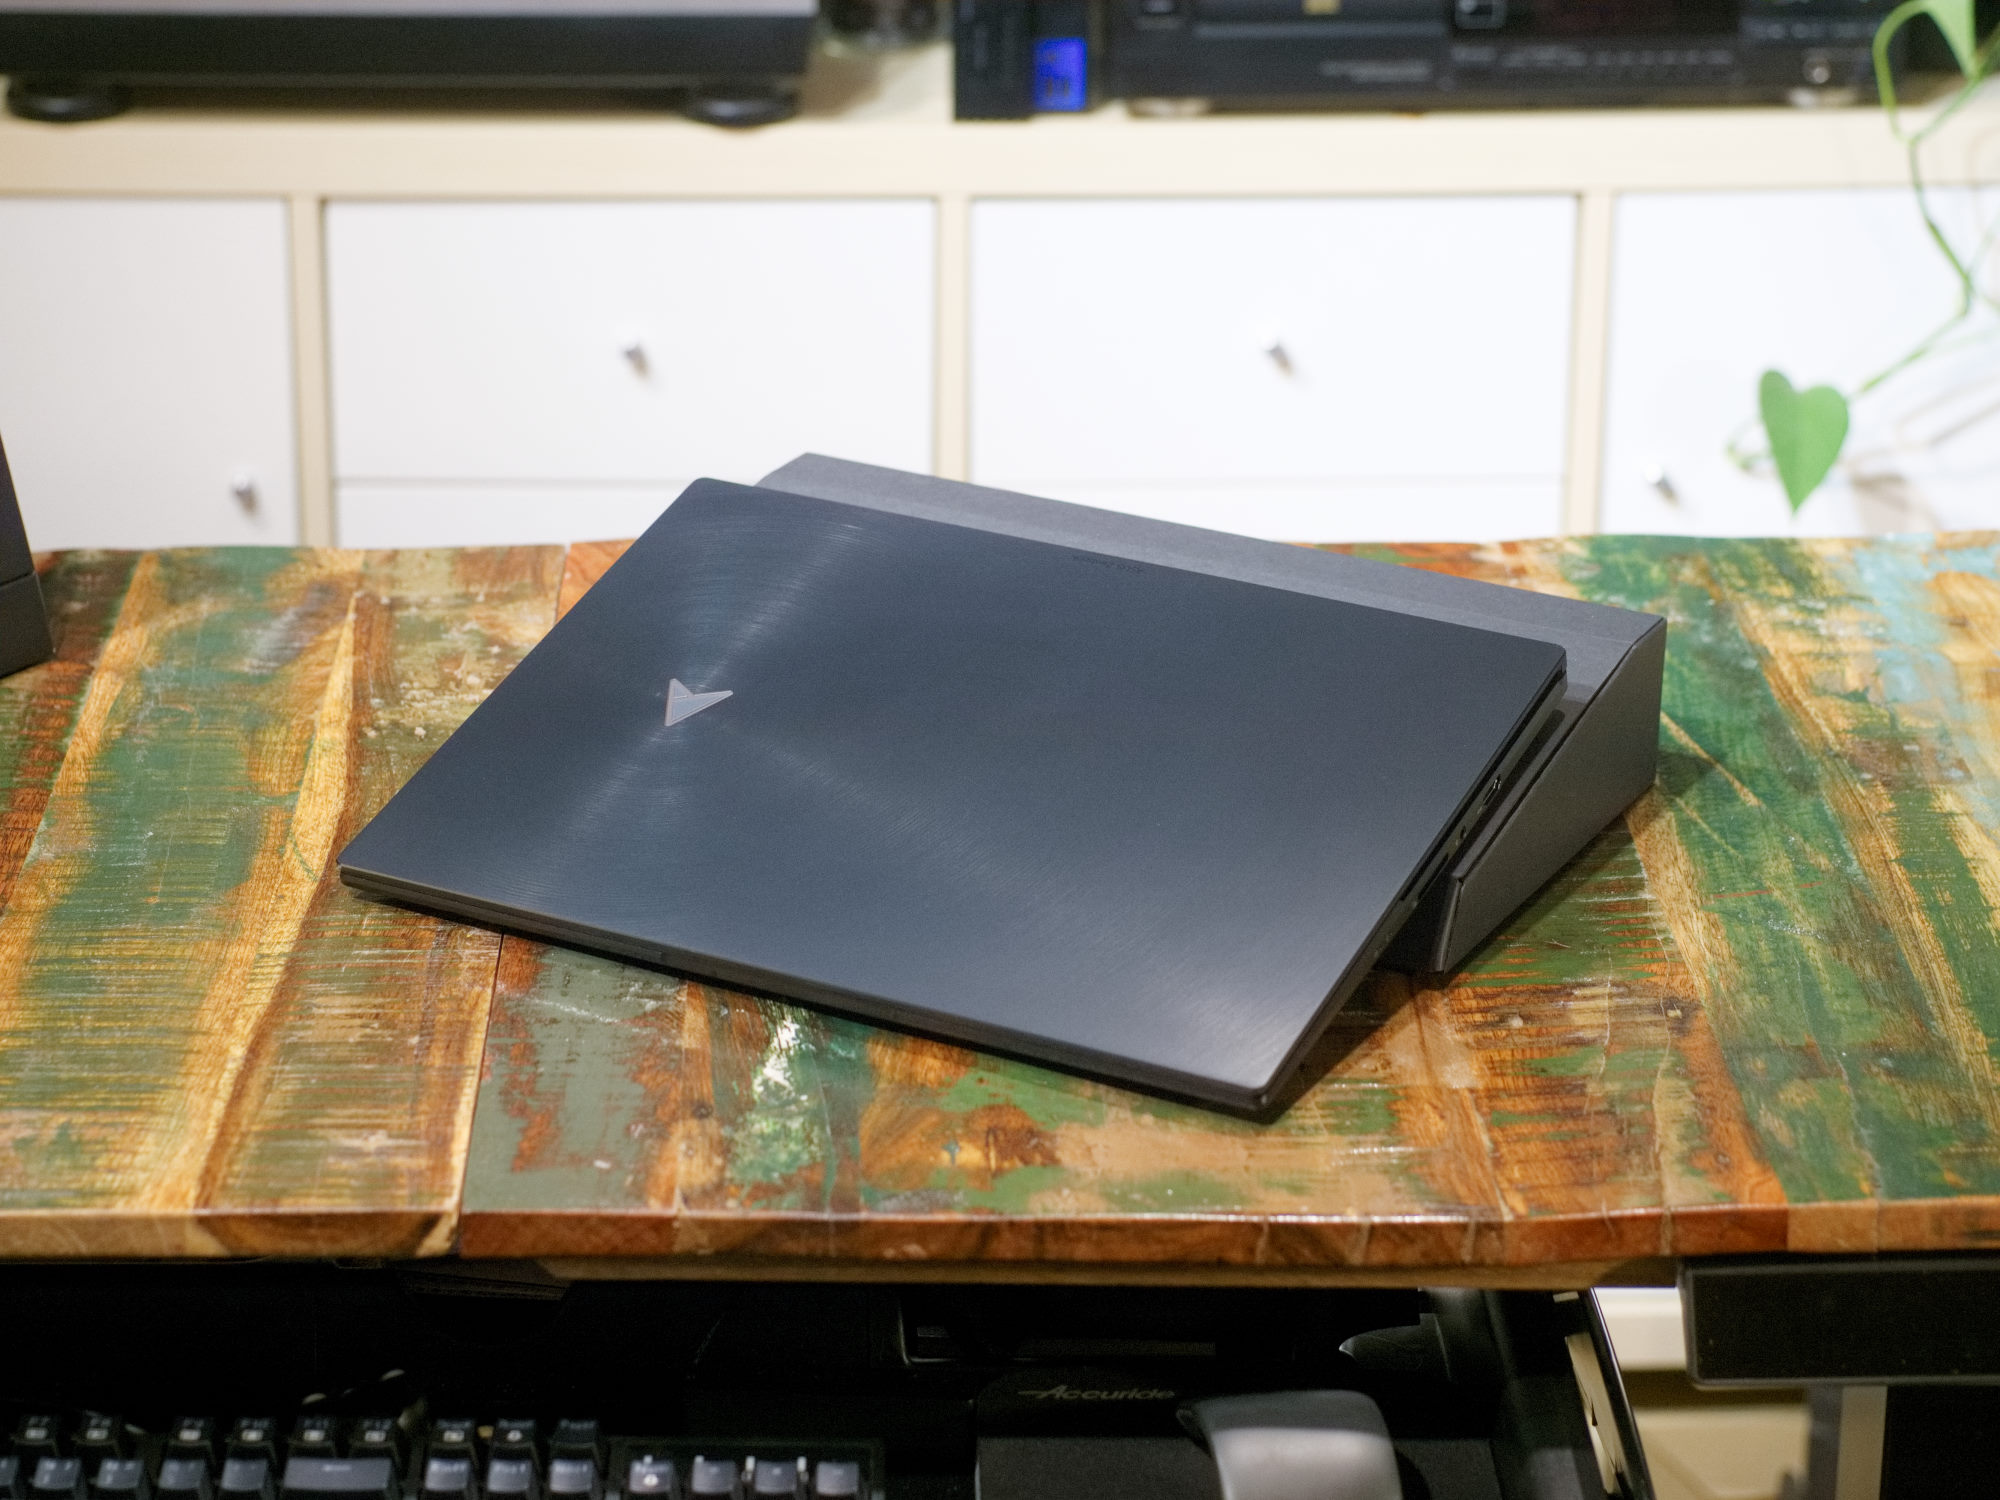
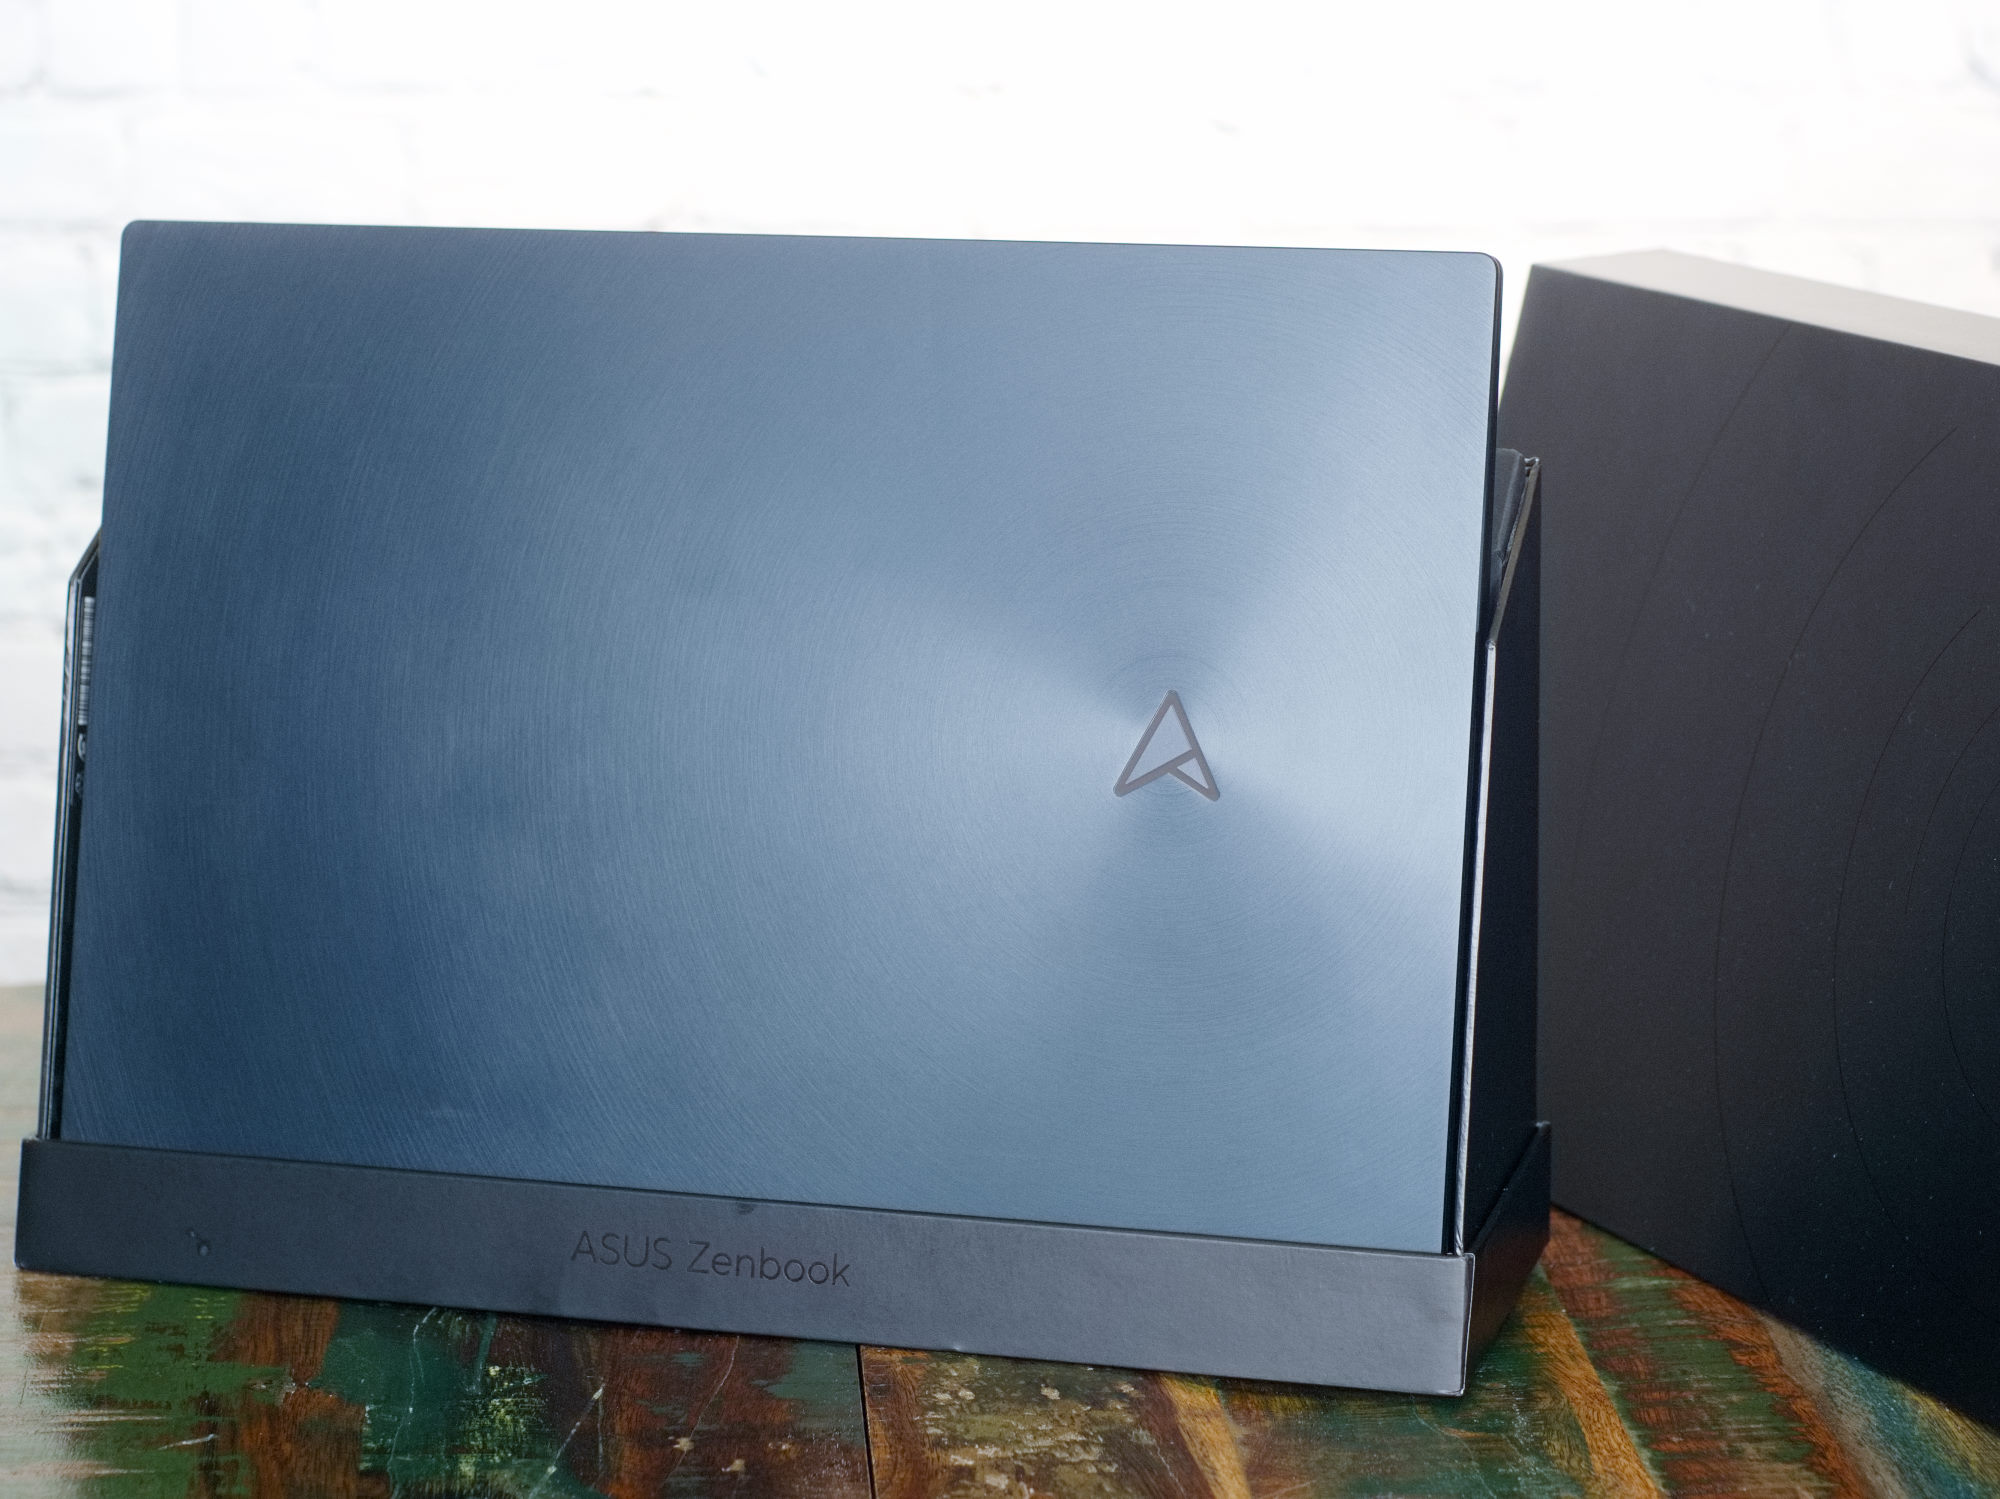
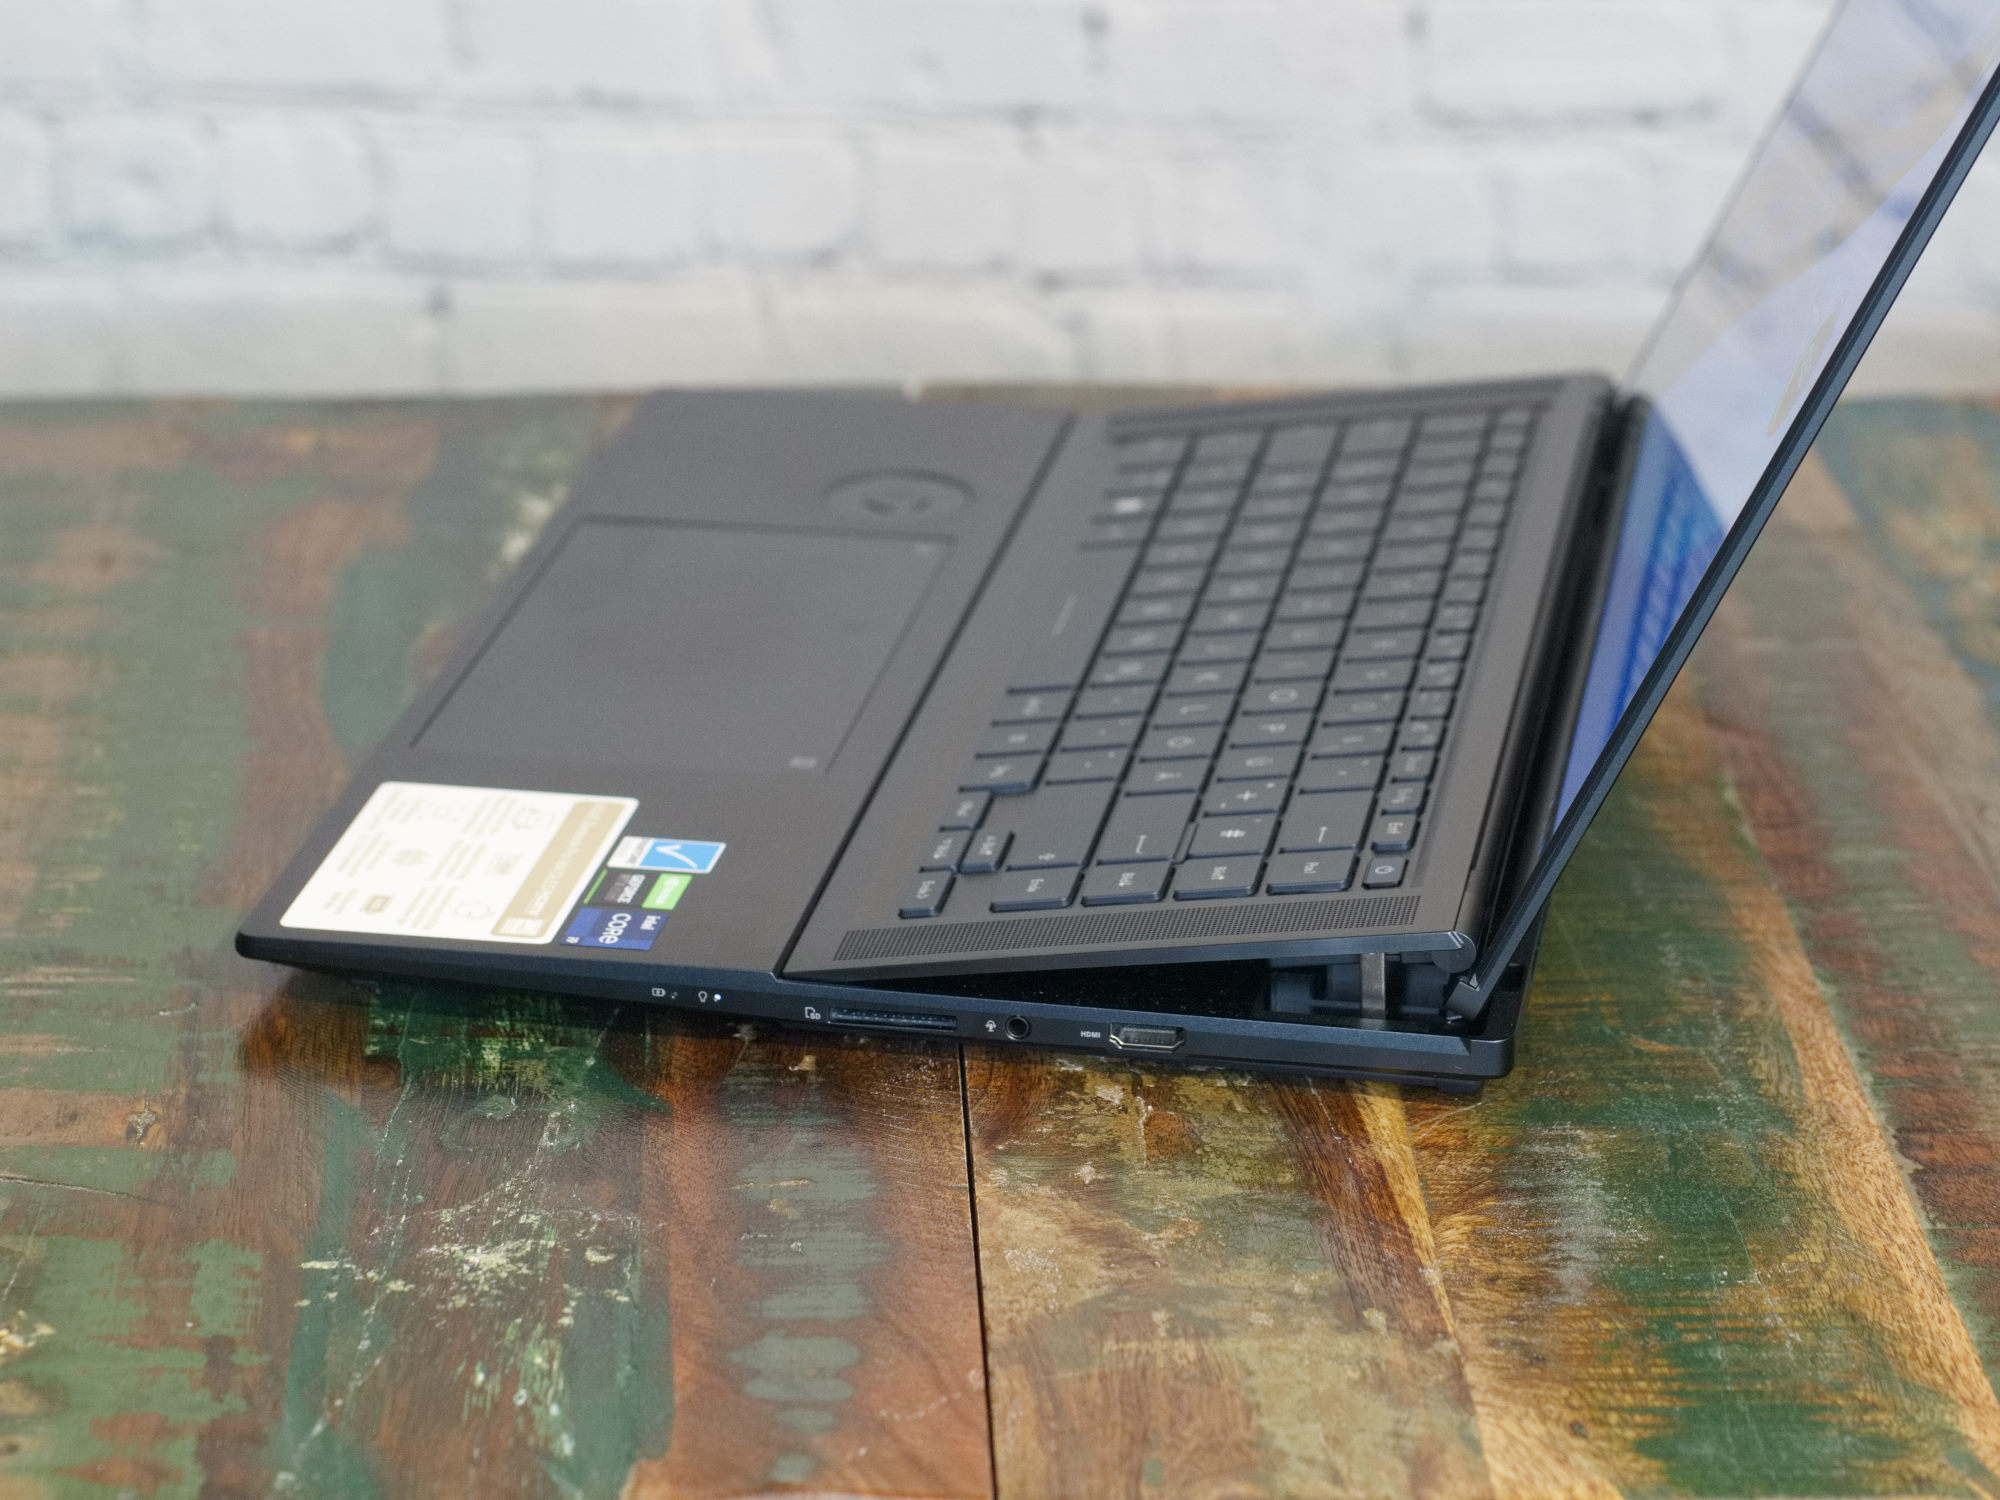
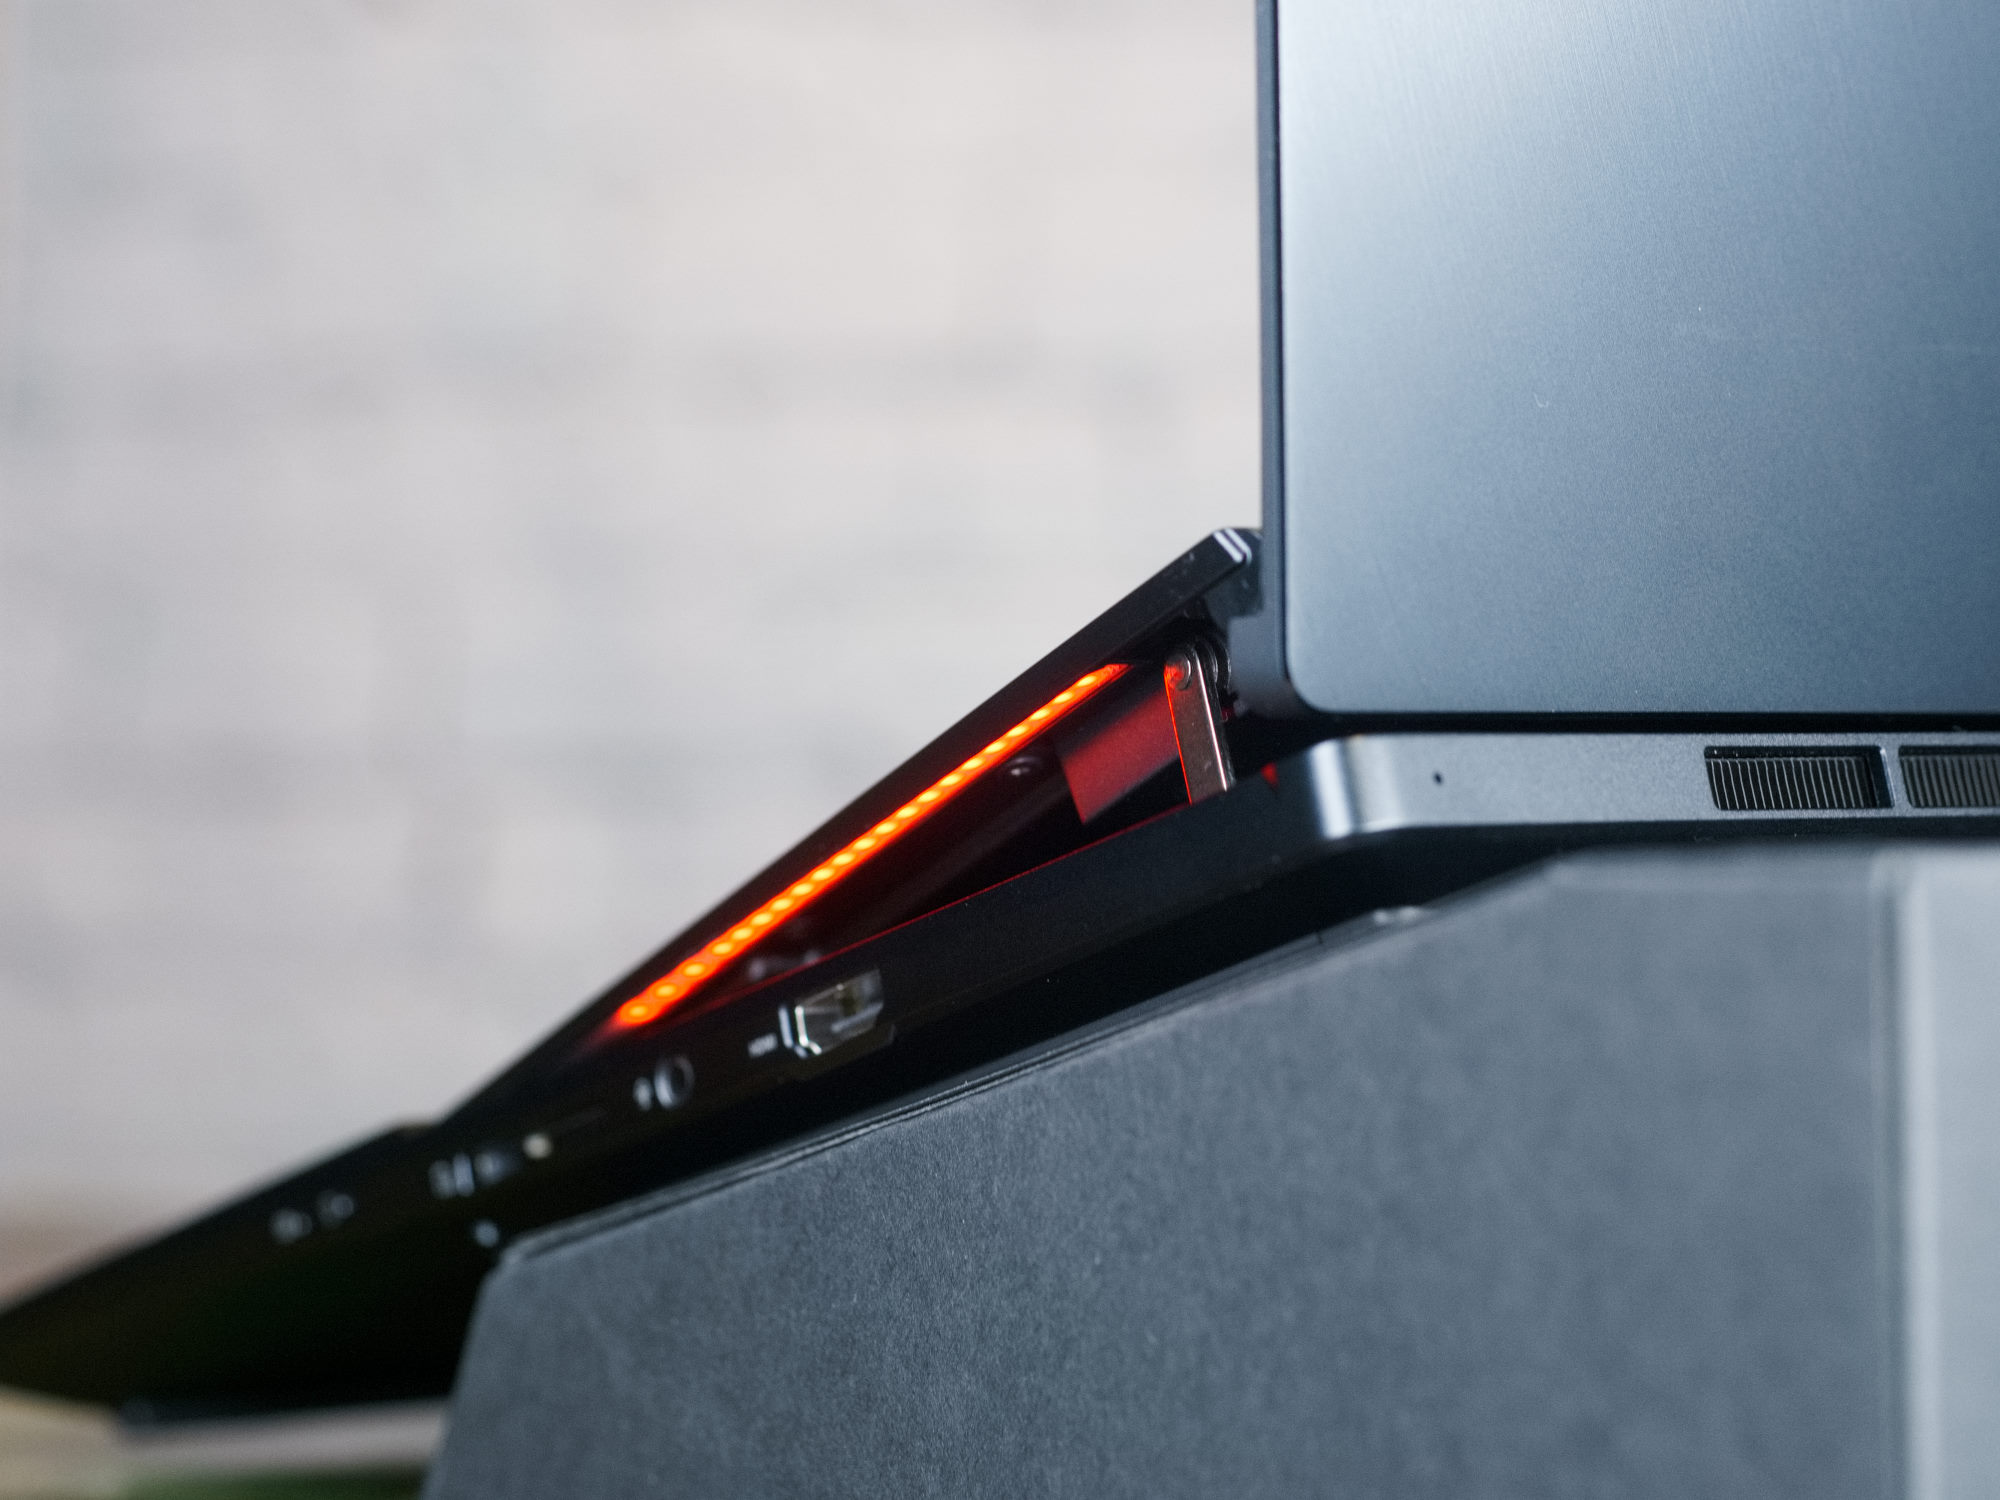
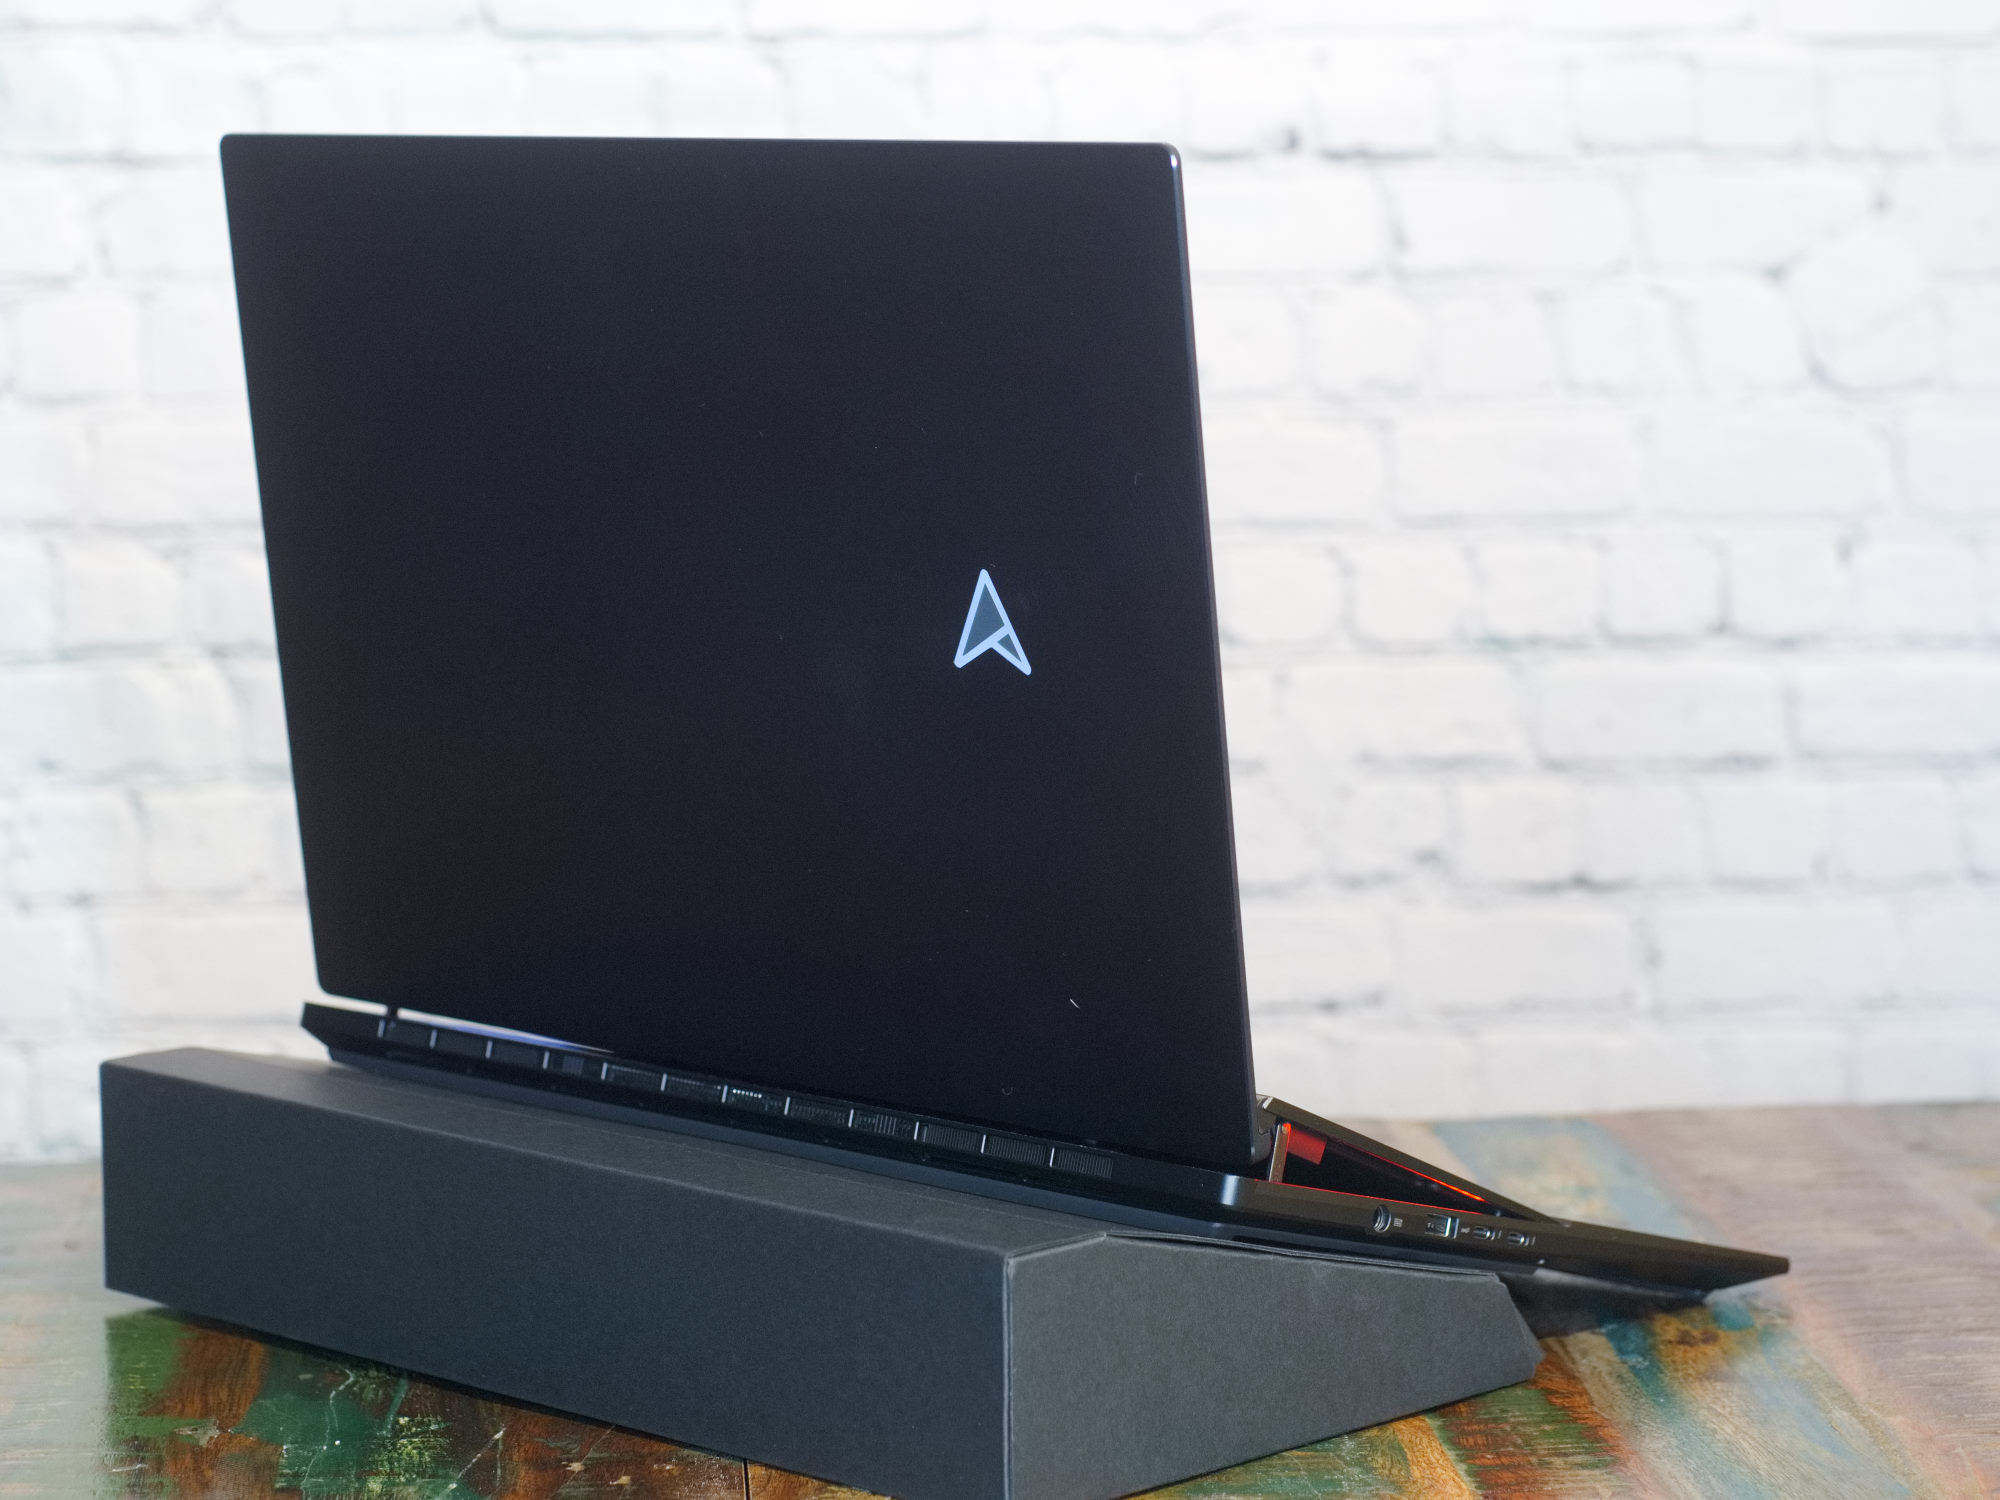
Asus zawsze prezentuje laptopy o wyjątkowym wzornictwie i ZenBook 16X OLED nie jest tu wyjątkiem. Nawet opakowanie laptopa jest nietypowe. Otwierając opakowanie po raz pierwszy, zauważamy, że design laptopa ma swoje odzwierciedlenie w opakowaniu. Ponownie znajdujemy koncentryczny wzór wokół stylizowanego A. Fani Star Treka mogą uznać ten laptop za szczególnie interesujący choćby z tego powodu. Podobnie jak klawiatura, strzałka w górę jest podświetlana RGB. Liczne krawędzie laptopa są złagodzone delikatnymi skosami, które jednak zachowują agresywny wygląd. Chwilami Zenbook Pro 16X OLED wygląda bardziej jak laptop do gier.
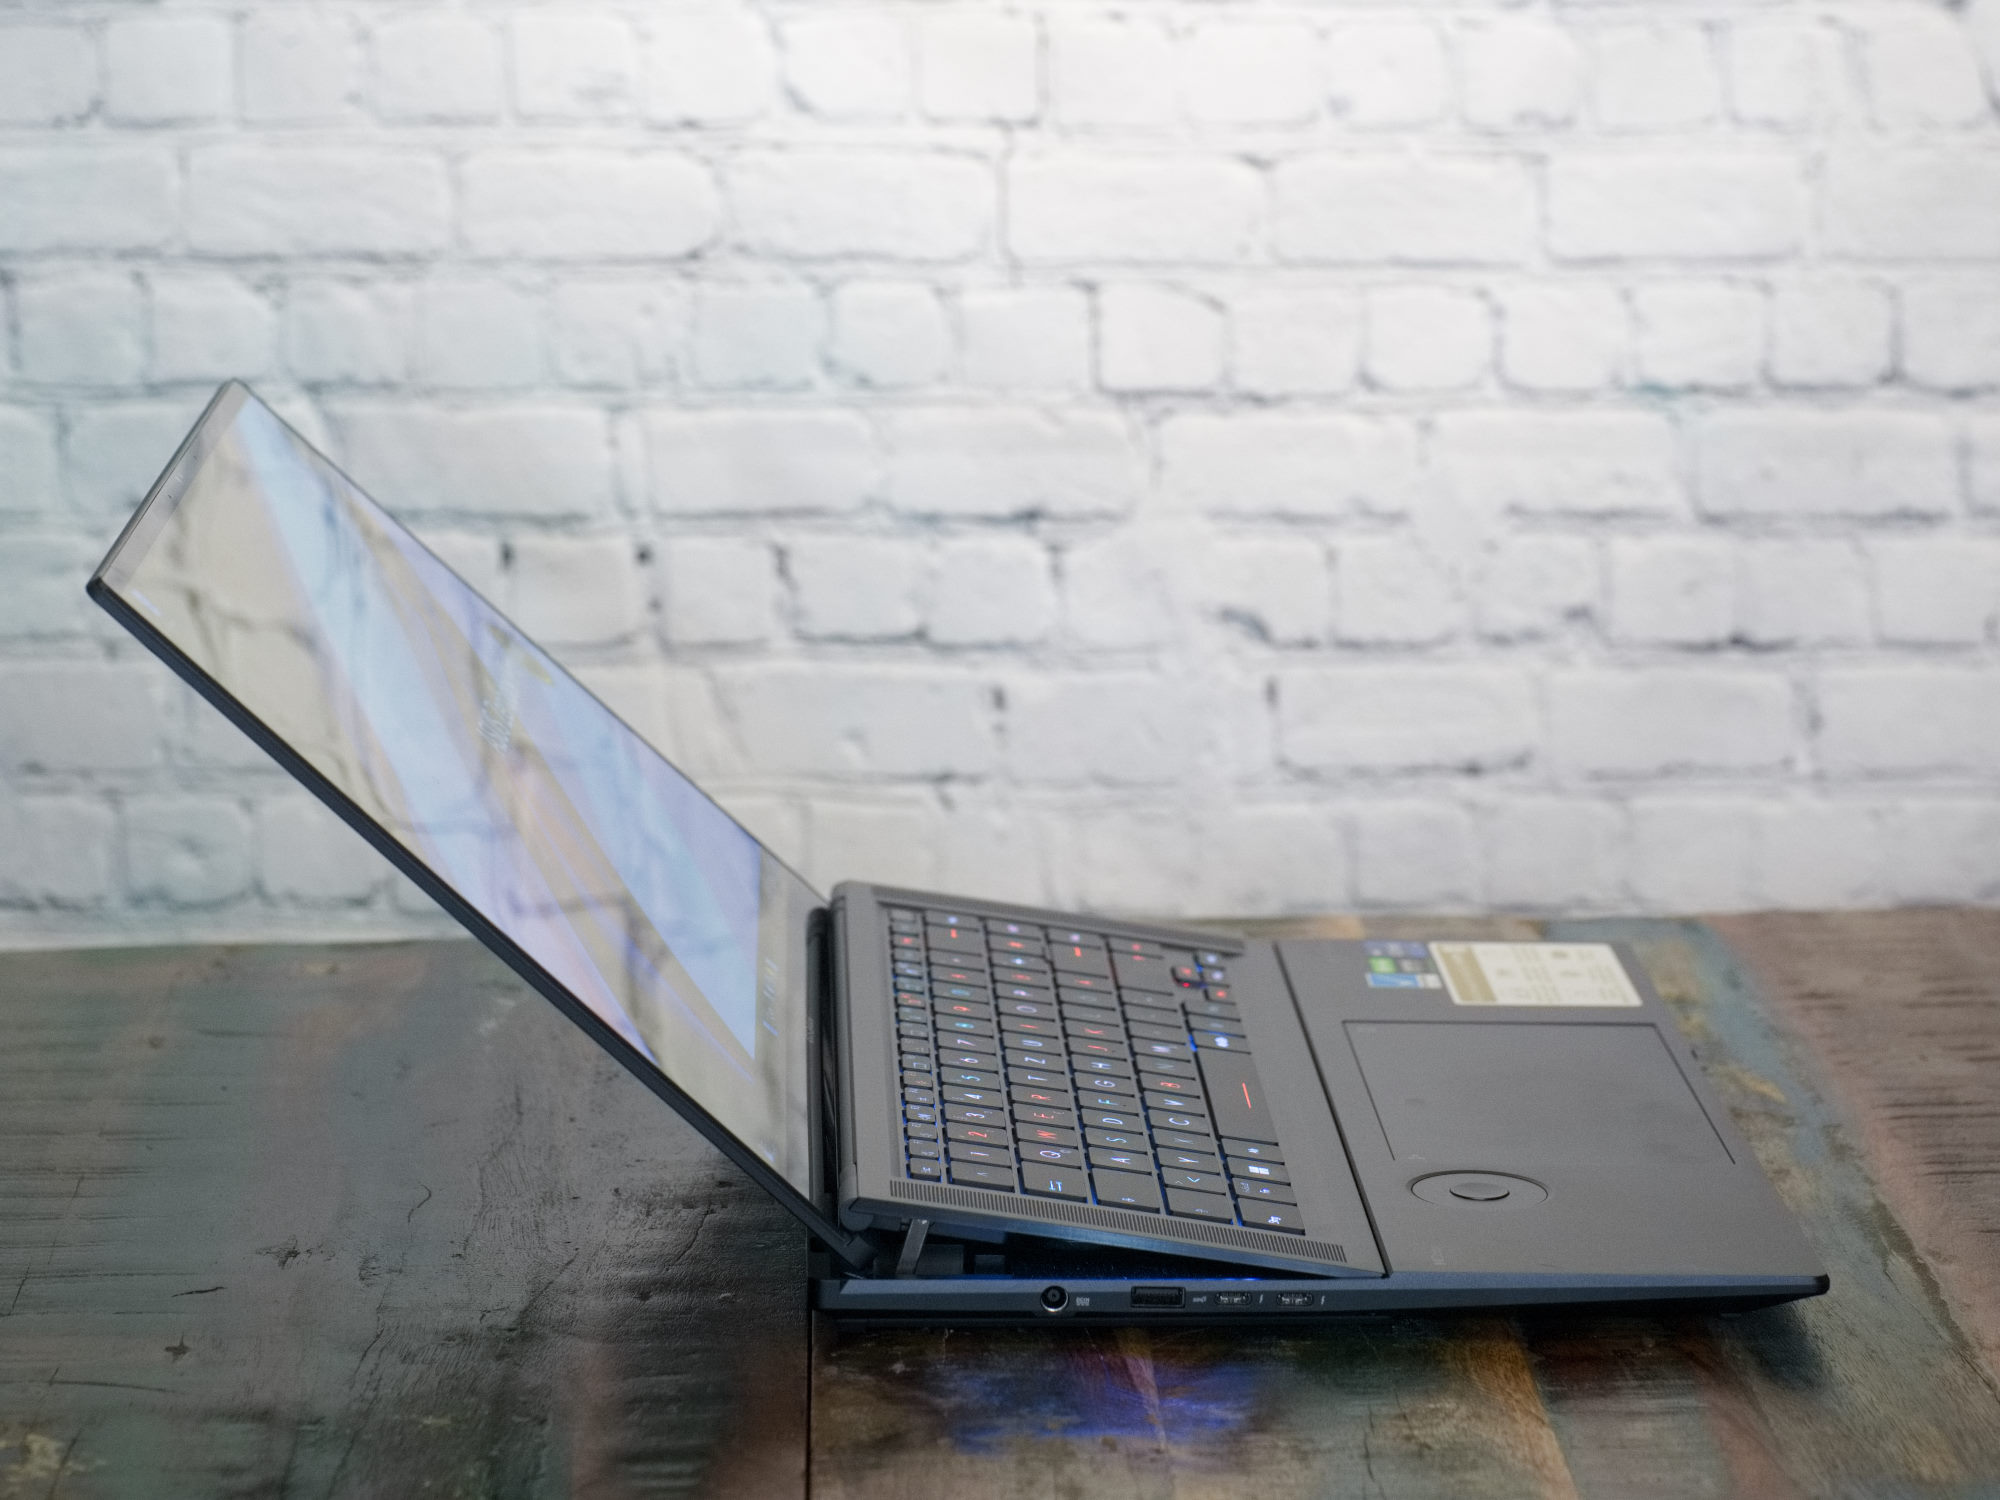
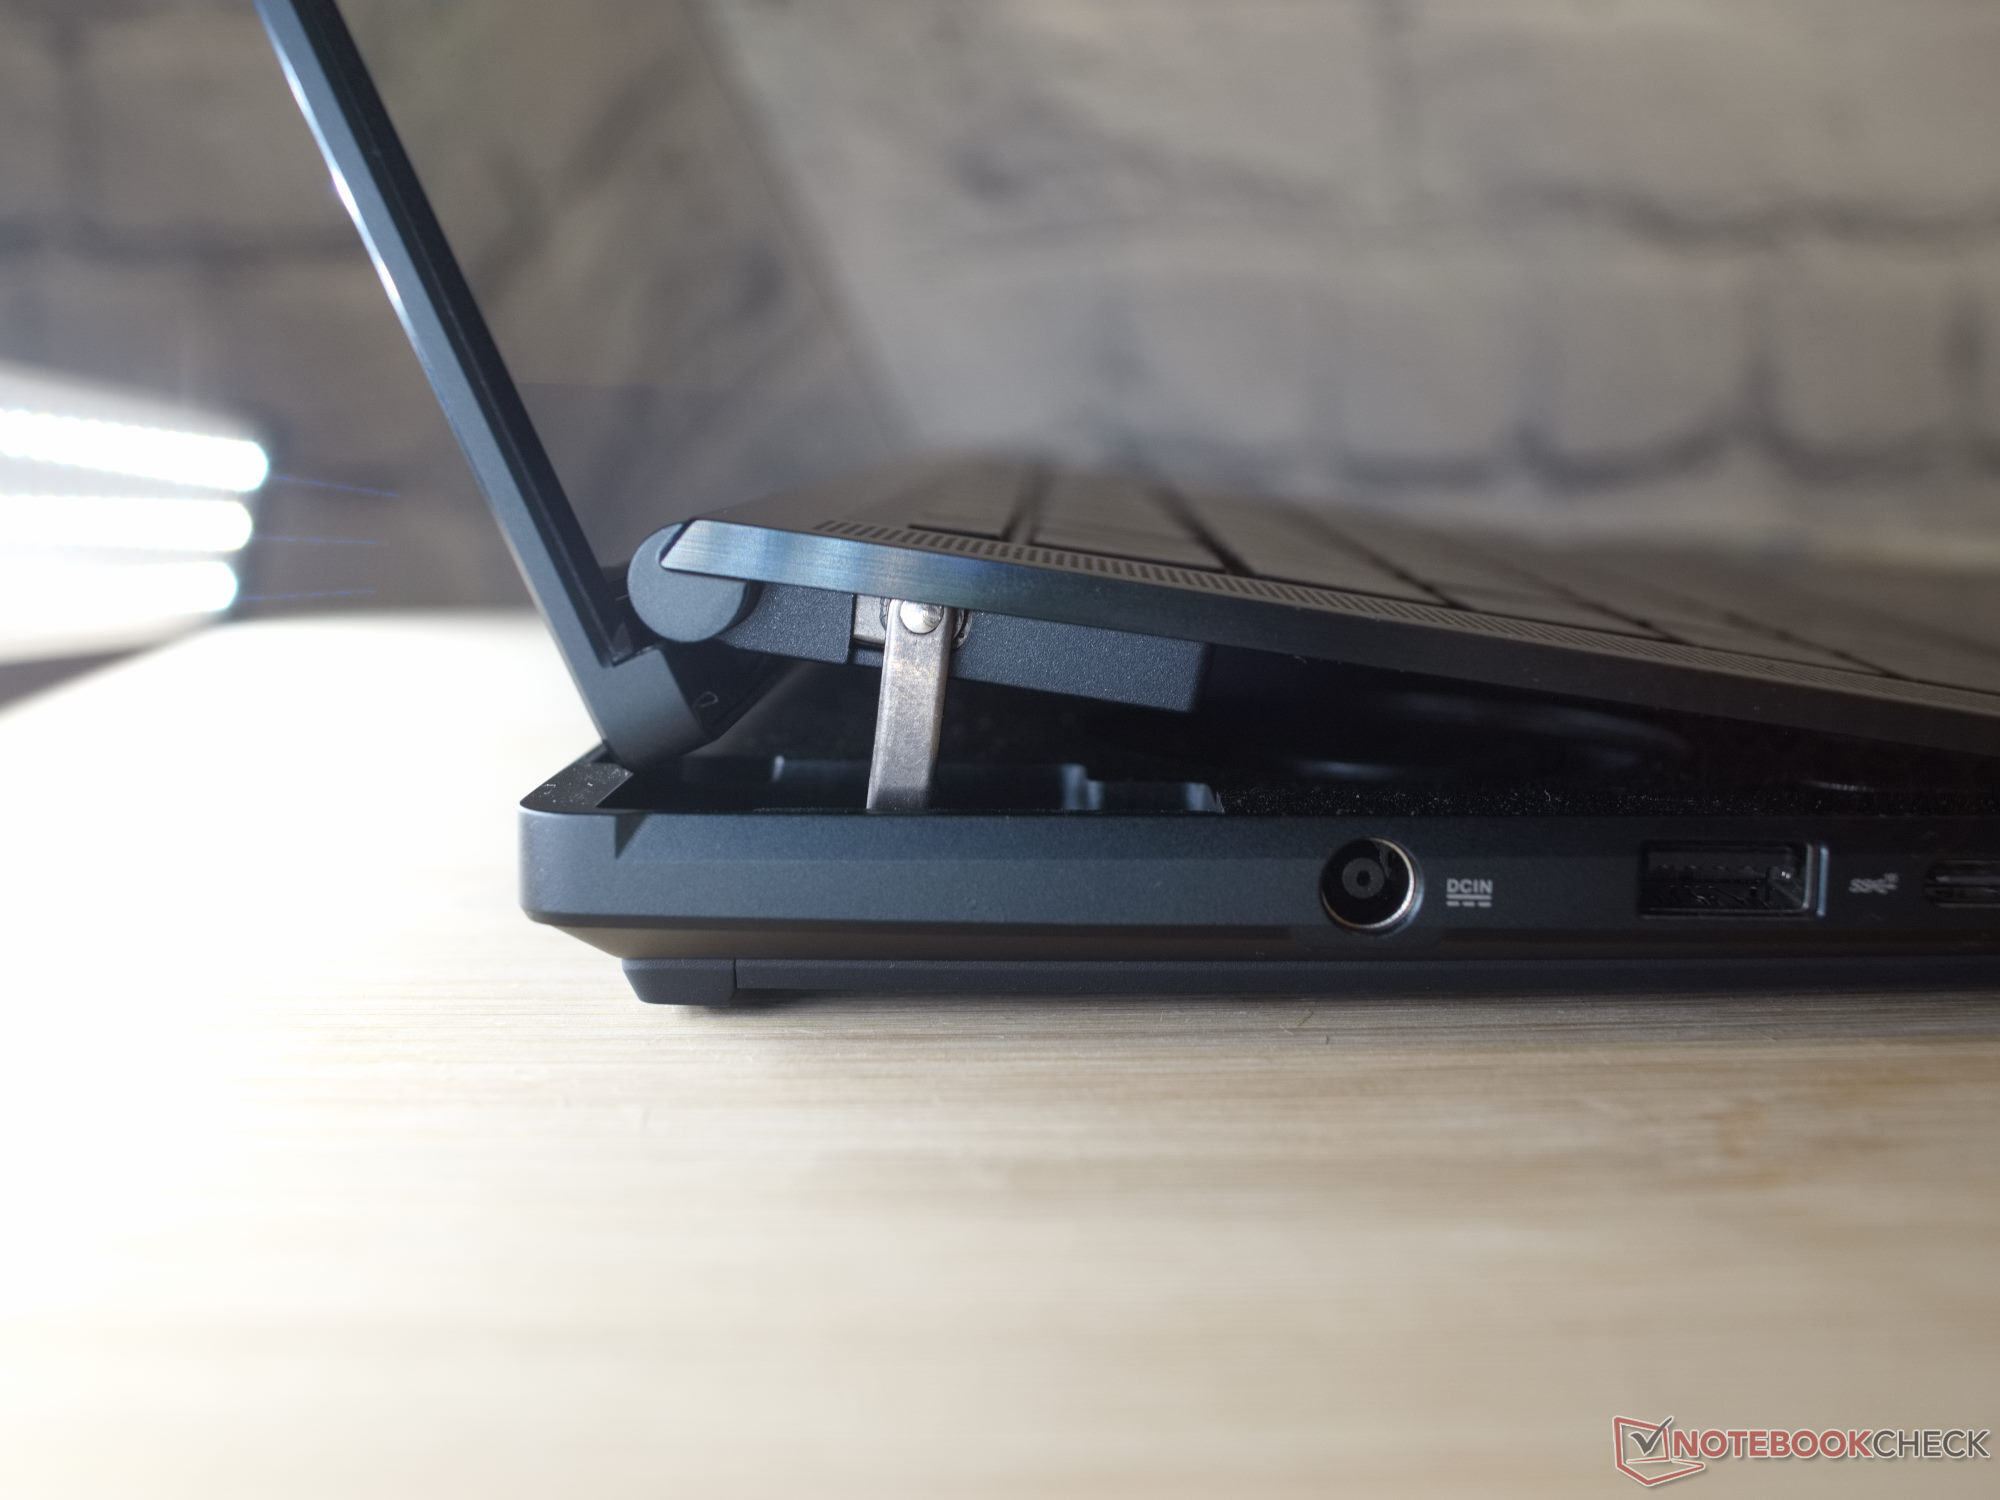
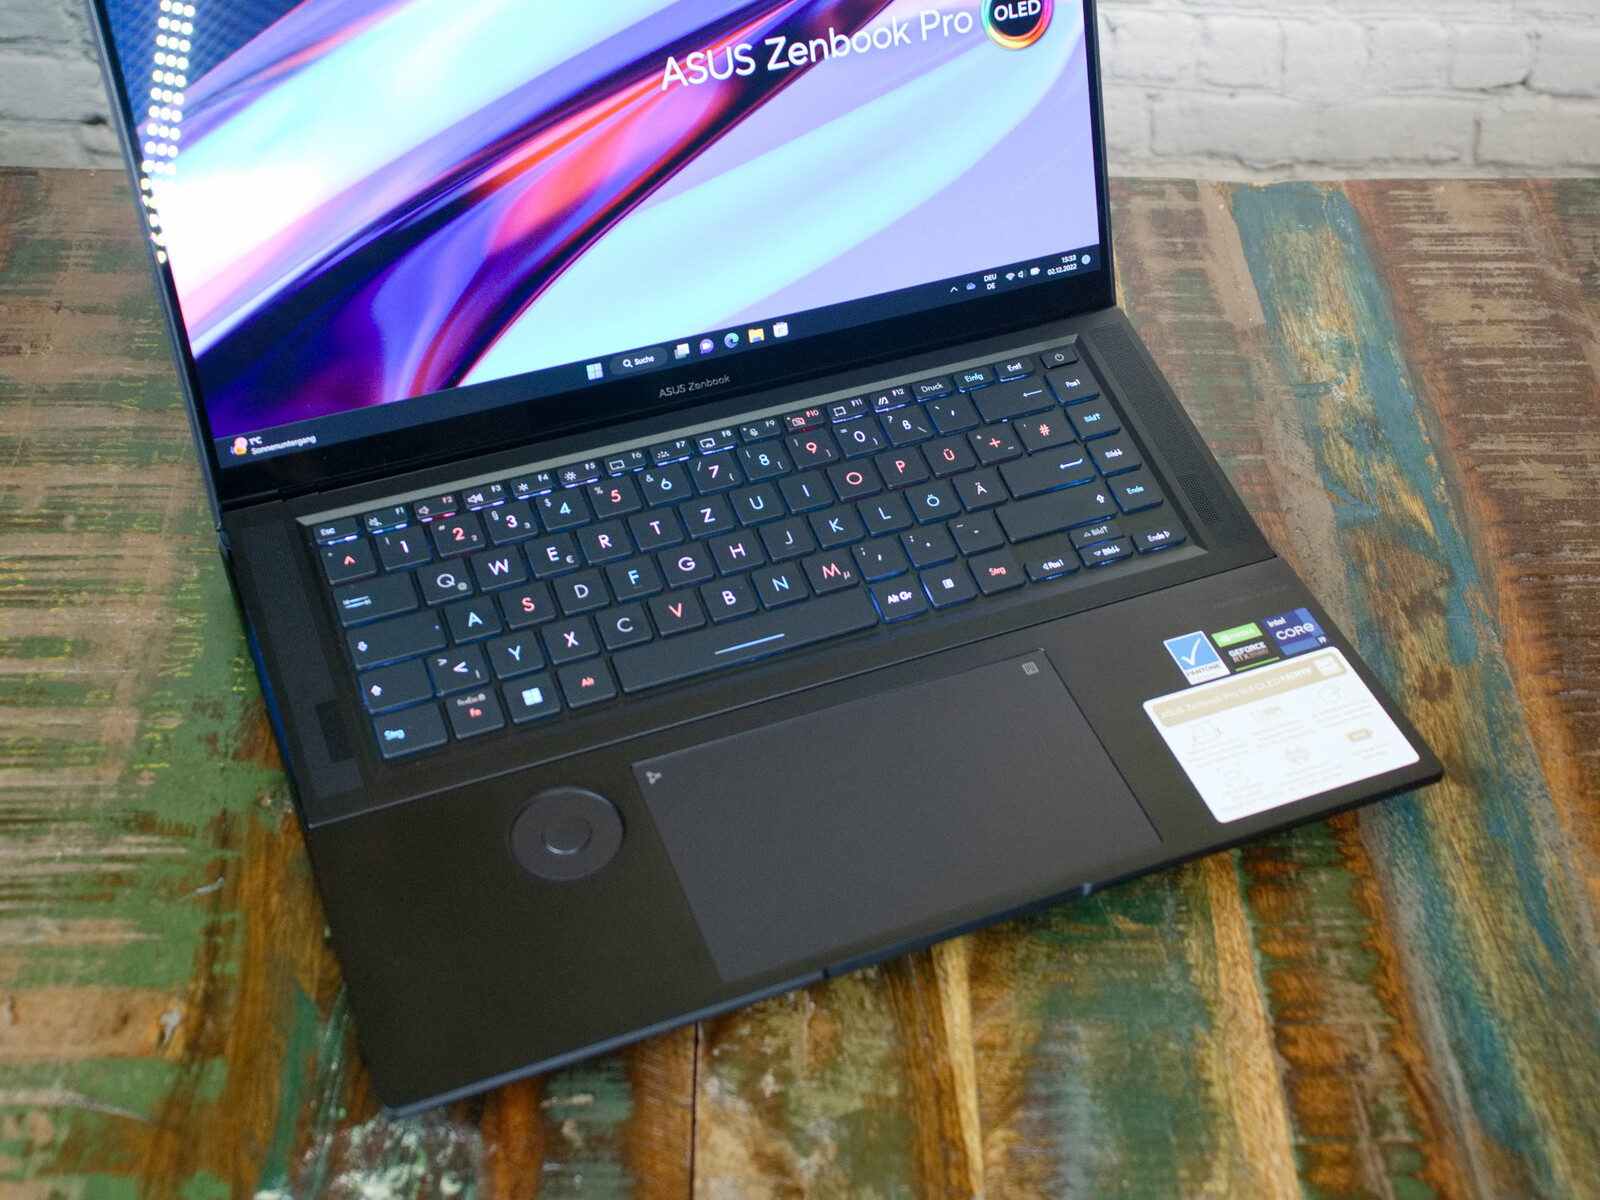
Po otwarciu ciemnoszarego laptopa, klawiatura jest podniesiona z tyłu o około 2 cm. Ma to zapewnić lepszą wentylację sprzętu i lepsze ułożenie dłoni podczas pisania. Asus określa ten system jako "AAS Ultra Cooling" i podaje, że daje on korzyść w postaci 30% zwiększonego przepływu powietrza. Maksymalny kąt otwarcia laptopa wynosi około 145°. Mimo skomplikowanego mechanizmu składania, otwieranie jest łatwe i można je wykonać jedną ręką, a całość sprawia wrażenie delikatnej i stabilnej zarazem. Nie widać zbyt wiele, ale wszystko pozostaje na swoim miejscu. Ekran wydaje się unosić w powietrzu kilka milimetrów nad podstawą. Niestety, mechanizm składania jest też nieco luźny, więc ekran może lekko grzechotać podczas drgań. Połączenie wysokiej jakości materiałów zapewnia obudowie poczucie stabilności - dużo szkła i aluminium tworzy powierzchnie laptopa.
Asus Zenbook Pro 16X OLED nie należy do wagi piórkowej, ale praktycznie nie wyróżnia się na tle konkurentów z mocnymi kartami graficznymi. Całe pole porównawcze z układami graficznymi będącymi odpowiednikiem Nvidii GeForce RTX 3060 jest na równi pod względem rozmiarów i wagi. Laptopy z układem graficznym GA107 (RTX 3050 i RTX A2000) są o około 400 do 500 gramów lżejsze
Wyposażenie - Mierny wybór portów
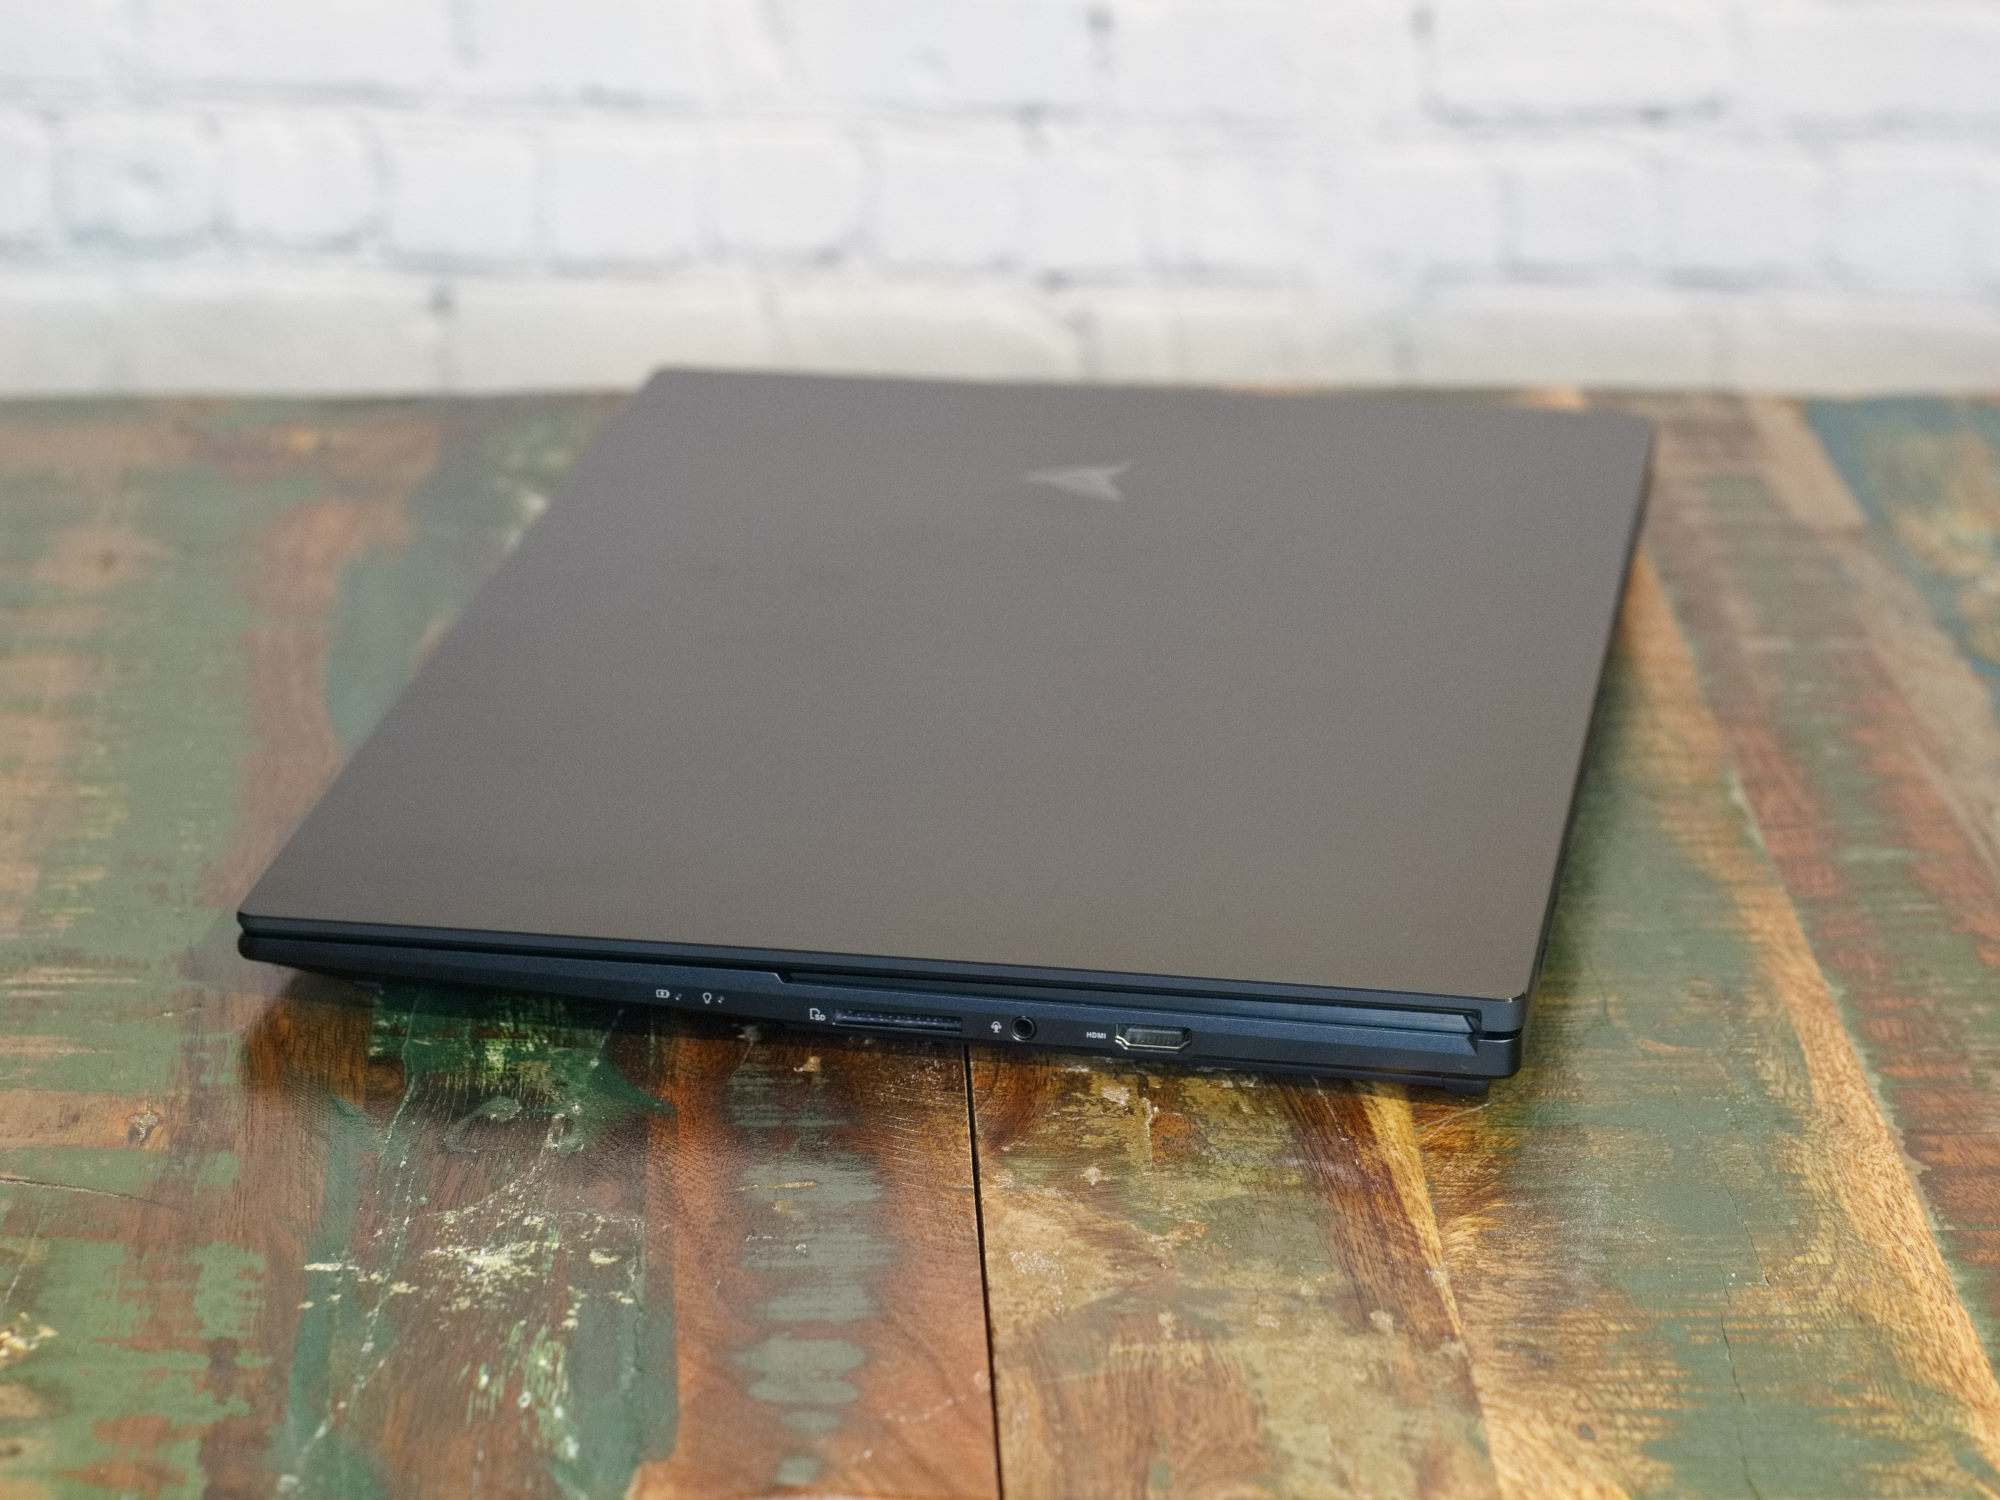
Dwa porty USB-C i jeden port USB-A - w notebooku nie znajdziemy wielu innych złączy peryferyjnych. Asus rozmieszcza tu porty bardzo oszczędnie. Na prawym boku notebooka znajdziemy jedynie czytnik kart, HDMI i gniazdo 3,5 mm, przez co rozmieszczenie portów jest nieco niepraktyczne. Ponieważ wszystkie porty USB i zasilacz znajdują się po lewej stronie notebooka, porty mogą się wzajemnie blokować, gdy wszystkie są w użyciu. Na dłuższą metę jedynym prawdopodobnym remedium są tutaj rozwiązania dokujące.

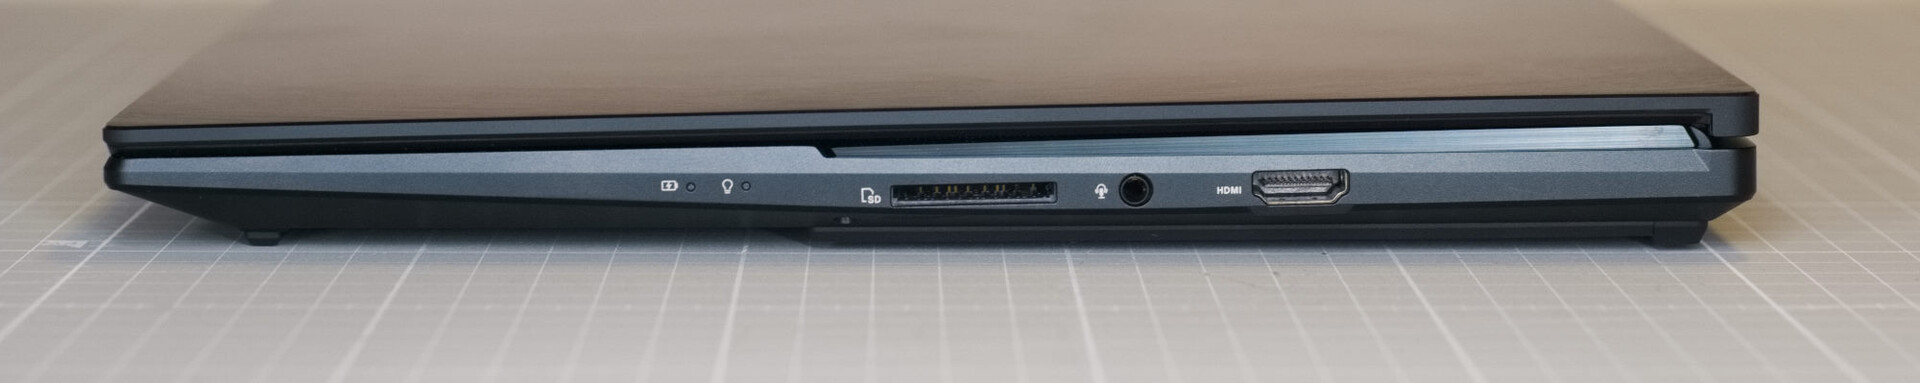
Czytnik kart SD
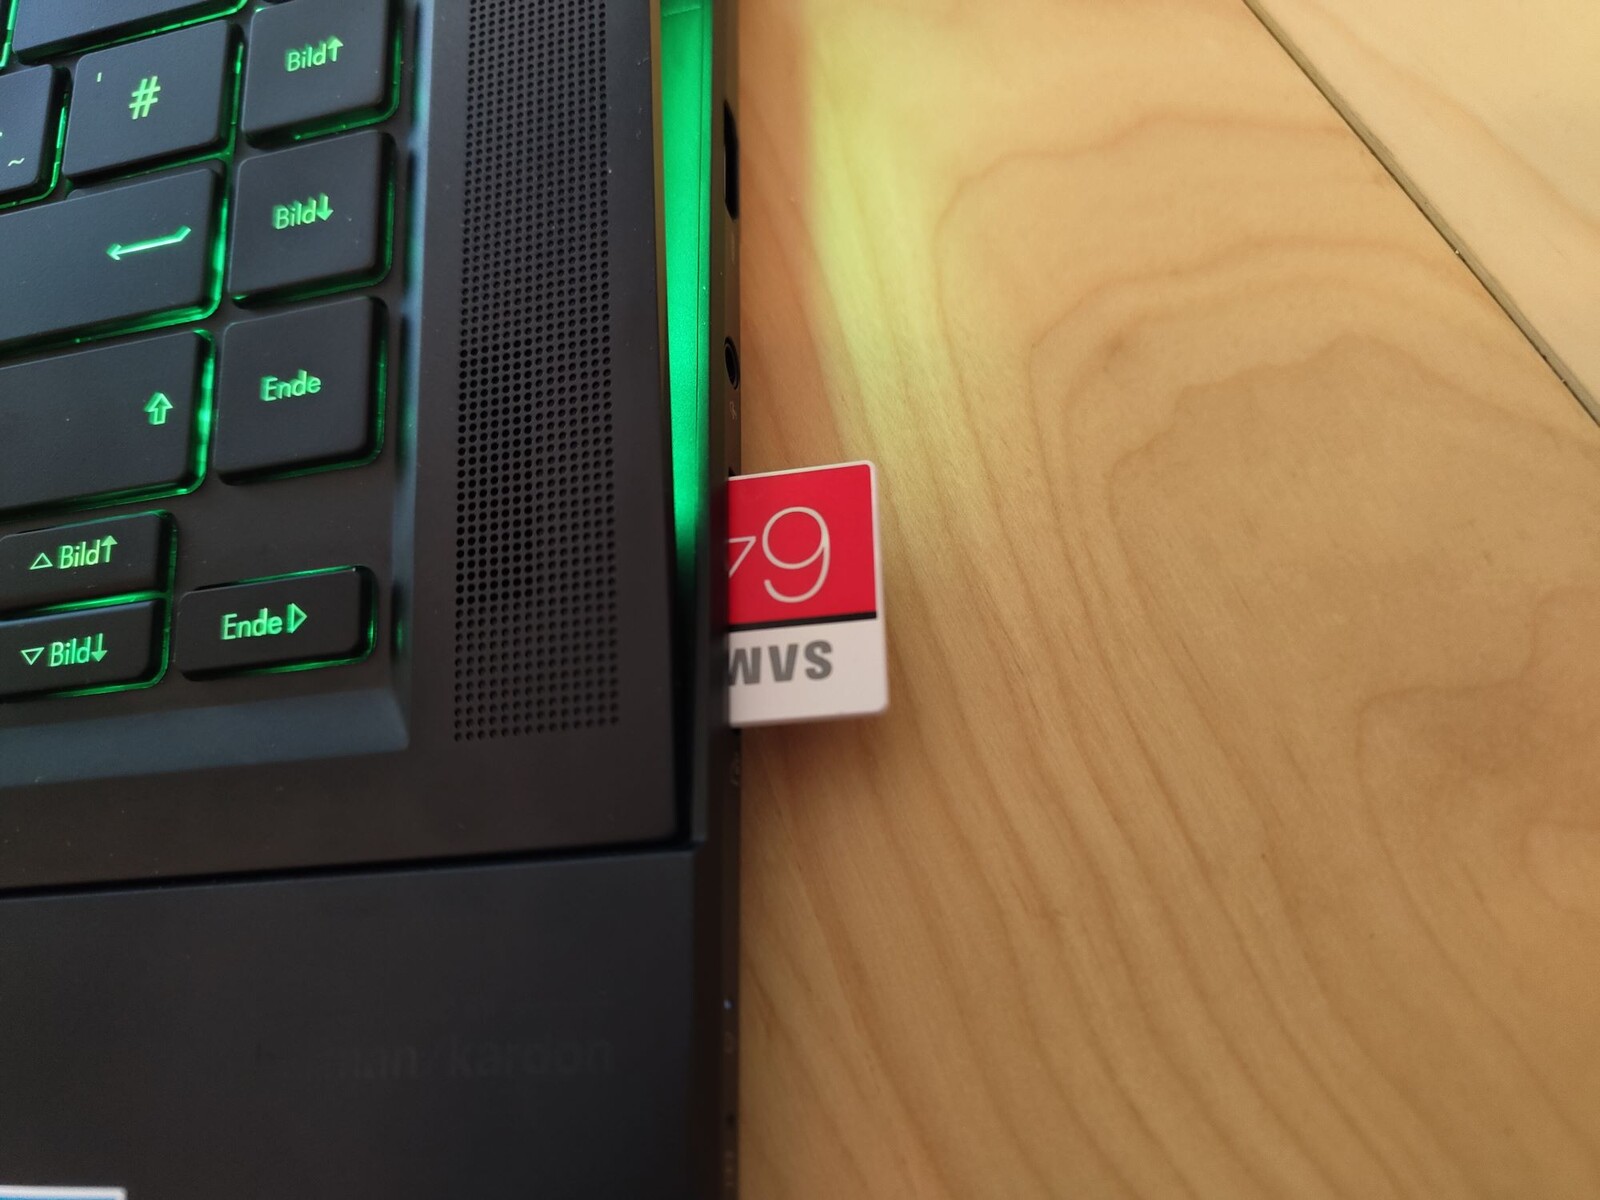
Oprócz skąpego wyboru portów czytnik kart zapewnia tylko przeciętną wydajność. Właściwie oczekujemy, że czytnik kart SD w laptopie kreatywnym będzie z najwyższej półki, ale w innych laptopach udaje się zapewnić wyższe prędkości transferu dzięki AV PRO microSD 128 GB V60.
Komunikacja
Rozmieszczenie anten WLAN może być trudne w laptopach z metalową obudową. Wydaje się, że Asus nie dokonał dobrego wyboru w rozmieszczeniu trzech anten w ZenBooku Pro 16X OLED. W konsekwencji prędkości wysyłania i pobierania danych spadają znacznie poniżej możliwości zainstalowanego modułu Intel AX211, choć Asus zainstalował wzmacniacz z automatycznym przełączaniem między dwiema antenami.
Kamera internetowa
W ZenBooku znajdują się dwie kamery. Kamera na podczerwień obsługuje proces identyfikacji użytkownika poprzez rozpoznawanie twarzy. Tuż obok niej znajduje się kolejna kamerka internetowa z matrycą Full HD, która oferuje dobrą jakość obrazu i dobrze radzi sobie w słabym oświetleniu otoczenia. Według instrukcji obsługi laptopa, korzystanie z kamery IR powinno być możliwe także w całkowicie ciemnym pomieszczeniu. Niestety, na potrzeby testów nie udało nam się aktywować tej funkcji. Dostępne są jednak inne funkcje AI, które mają poprawić jakość obrazu.


Bezpieczeństwo
do logowania do systemu Windows dostępne jest rozpoznawanie twarzy 3D przez kamerę internetową IR oraz skaner linii papilarnych. Wbudowany procesor Intel Core i9-12900H posiada również takie zabezpieczenia jak TPM2.0 i SecureBoot.
Akcesoria
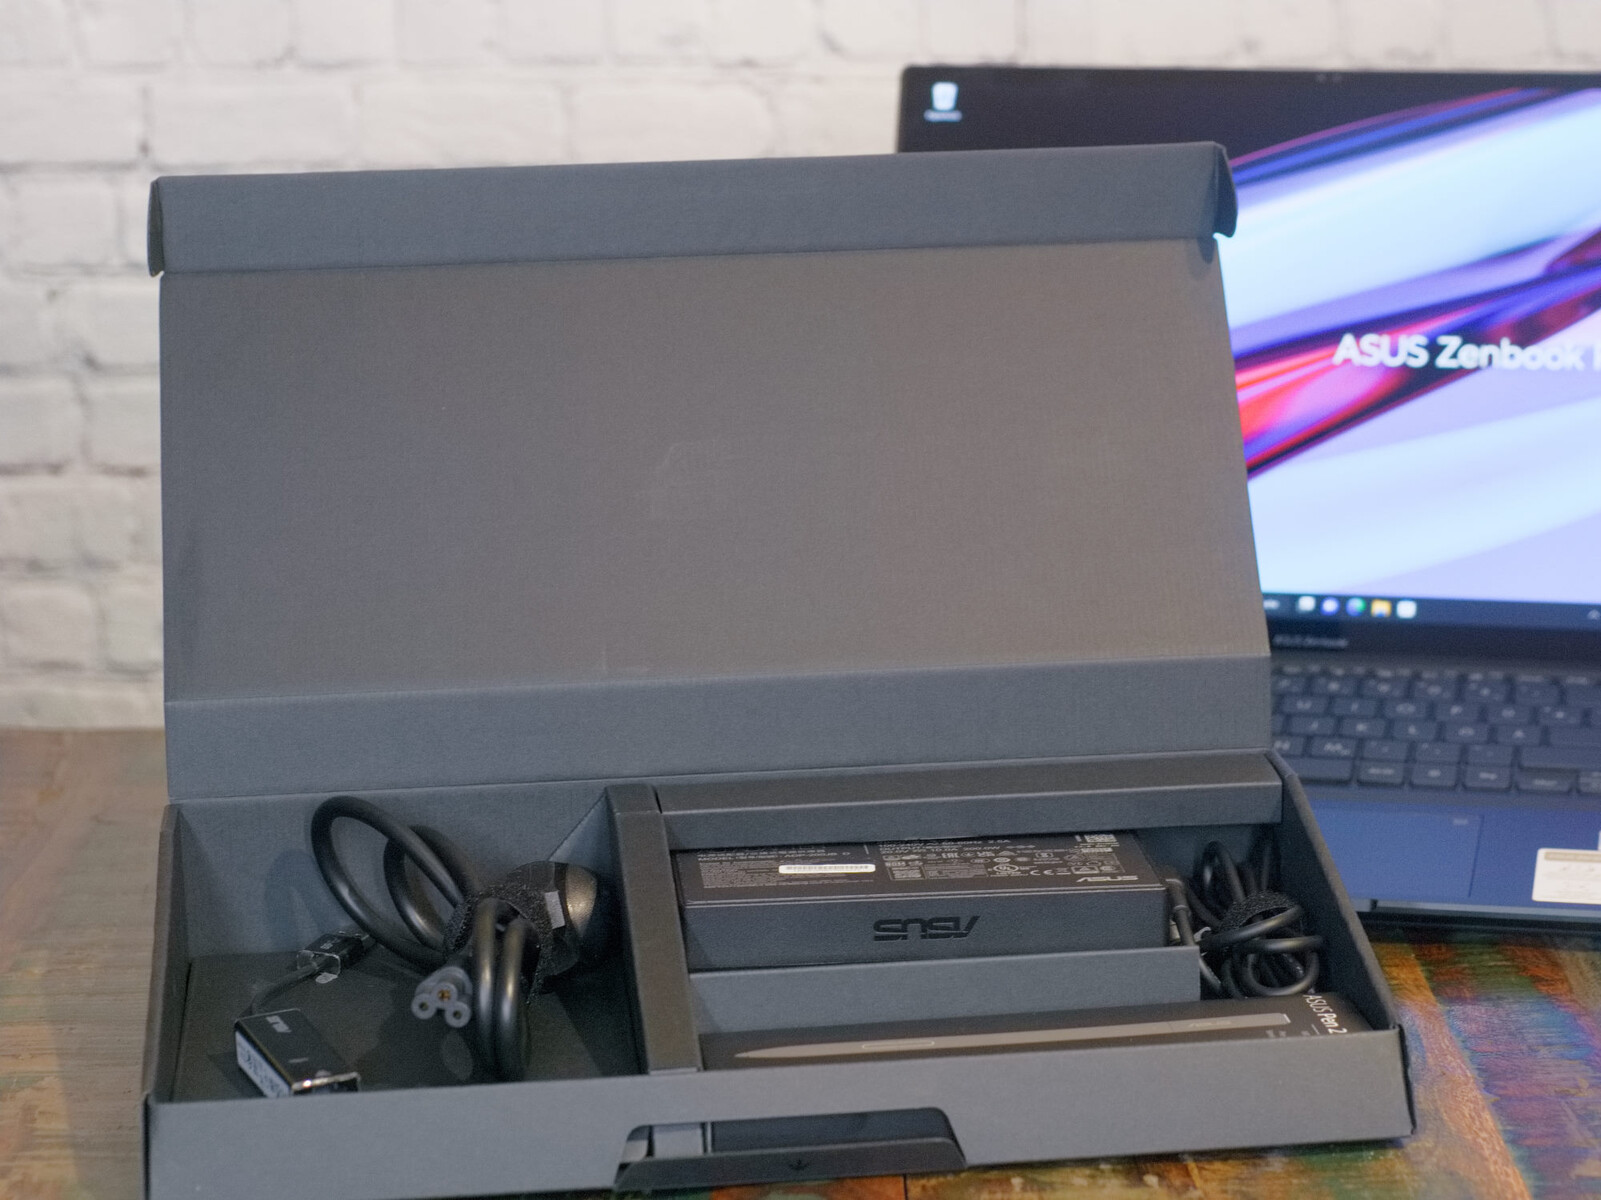
Akcesoria do Asusa ZenBook Pro 16X obejmują również opakowanie, które może służyć jako podwyższona platforma, na której można postawić laptopa. W pudełku znajdziemy pióro Asus Pen 2.0 z dołączonym kablem do ładowania oraz trzy dodatkowe końcówki pióra różniące się właściwościami ciernymi i twardością, zasilacz i adapter LAN. Wszystkie akcesoria można wygodnie schować w pudełku.
Konserwacja
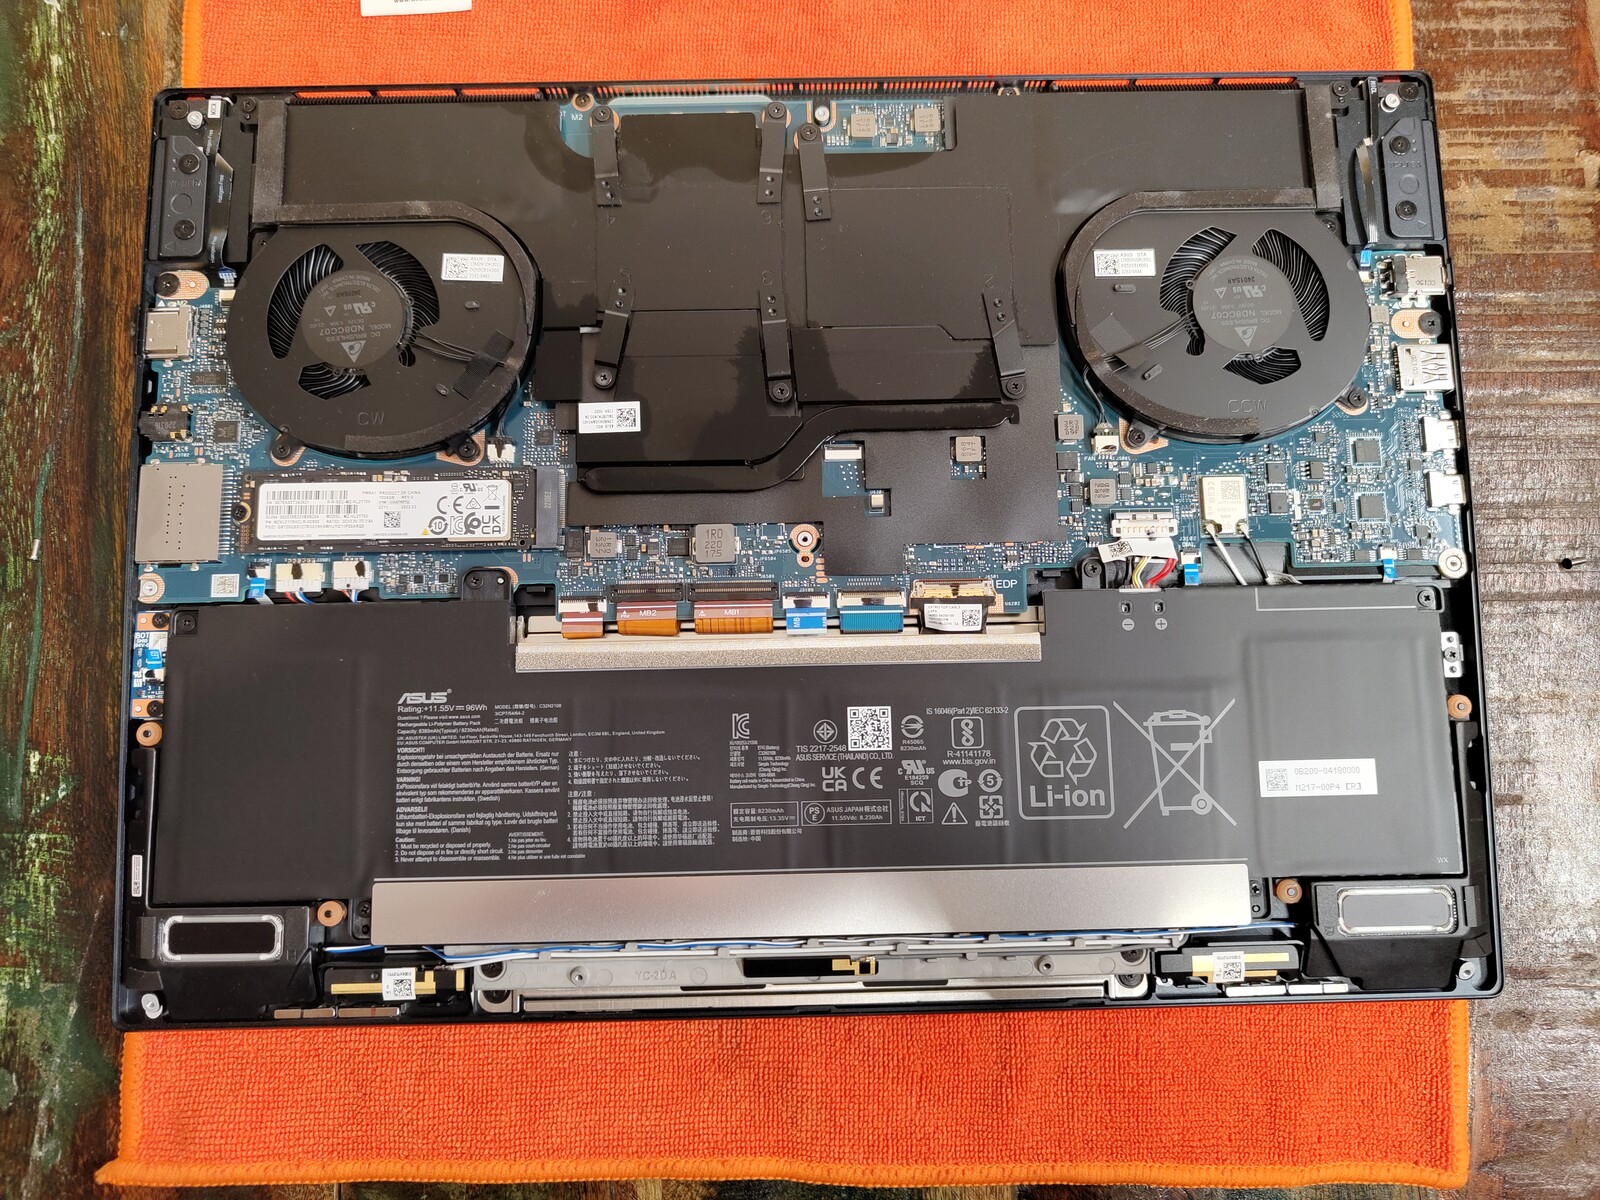
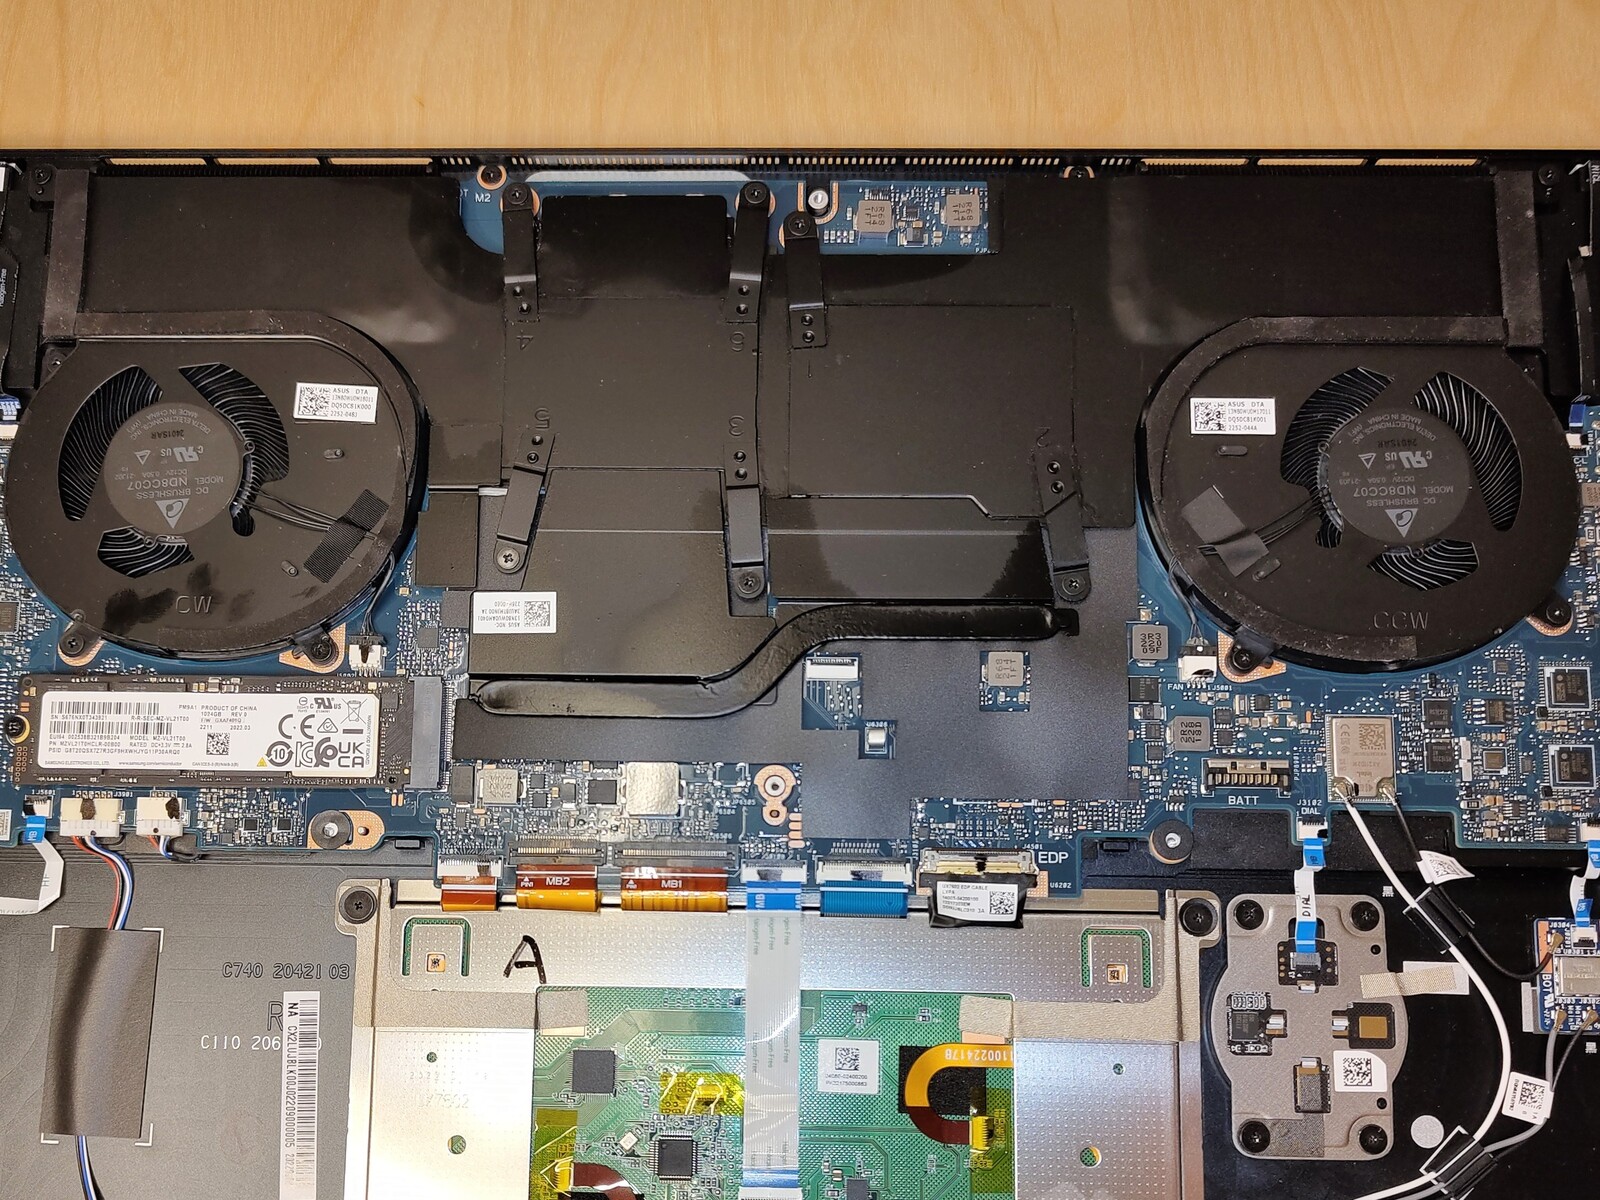
Możliwość rozbudowy raczej nie była priorytetem przy tworzeniu Asusa Zenbook Pro 16X. Po zdjęciu pokrywy podstawy można wymienić tylko dysk SSD NVMe.
Gwarancja
Asus Zenbook Pro 16X OLED jest sprzedawany na całym świecie z dwuletnią gwarancją. Istnieją jednak różnice w oferowanych usługach w zależności od regionu, więc zainteresowani nabywcy powinni przed zakupem sprawdzić u swojego dostawcy
Urządzenia wejściowe - Zenbook z Asus Dial, rysik, ekran dotykowy i pad haptyczny
Klawiatura, touchpad, ekran dotykowy, Asus Dial i Asus Pen 2.0 - Asus nie zostawił kamienia na kamieniu przy wyborze metod wprowadzania danych. Niestety, nie zawsze rozmieszczenie poszczególnych elementów jest tu dla nas praktyczne. Zbyt często poszczególne elementy wchodzą sobie w drogę.
Klawiatura
Kąt pod jakim umieszczona jest klawiatura sprawia, że pisanie na Zenbooku jest znacznie wygodniejsze niż na płaskim laptopie. Podświetlenie RGBW zapewnia doskonałą widoczność klawiszy. Każdy klawisz może być indywidualnie regulowany. Klawiatura typu chiclet z funkcją N-key rollover oferuje także skok klawiszy na poziomie 1,7 mm. Ergonomia klawiatury nie mogłaby być więc lepsza, gdyby nie nieco słaby punkt nacisku.
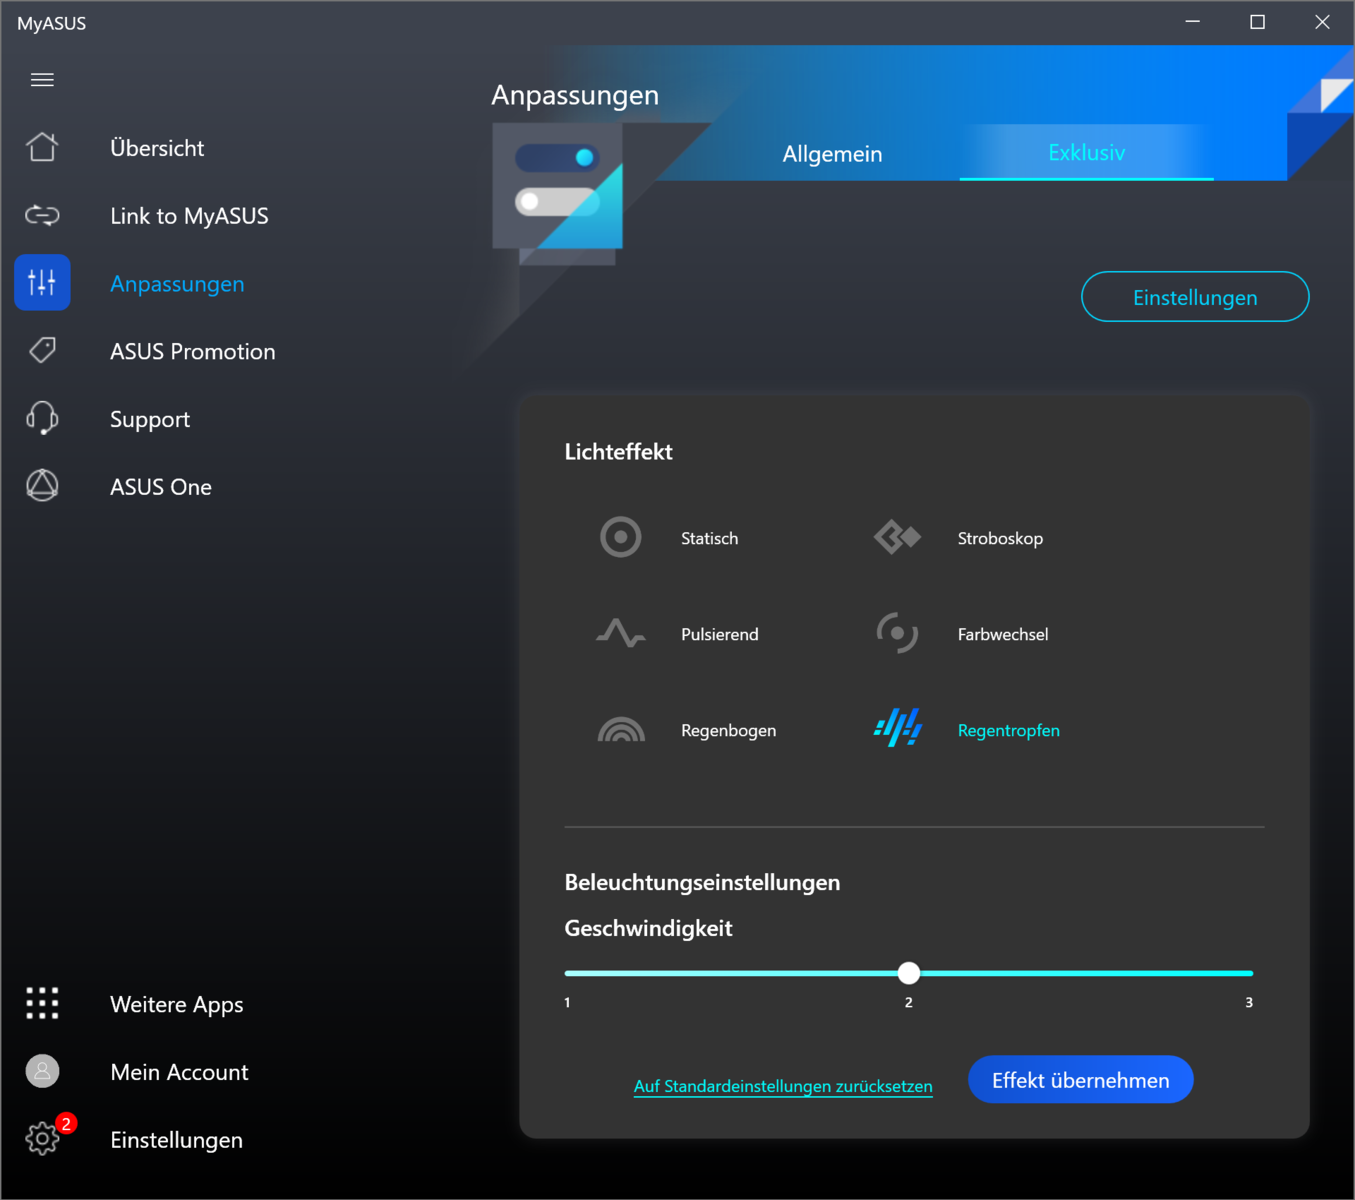
Nie tylko klawiatura jest tu podświetlana RGBW, ale w szczelinie między klawiaturą a podstawą znajduje się jeszcze jeden pasek świetlny z diodami RBGW, który dostosowuje się do koloru klawiatury. W ciemnych pomieszczeniach tworzy to efekt podobny do oświetlenia diagonalnego. Można też powiązać podświetlenie laptopa z powiadomieniami systemowymi w systemie Windows, tworząc w ten sposób dużą diodę powiadomień. Osoby szukające podświetlenia tylko niektórych klawiszy do gier będą zawiedzione. MyAsus oferuje tylko bardzo ograniczony wybór efektów świetlnych dla klawiatury, więc tworzenie indywidualnych wzorów nie jest możliwe.
Touchpad
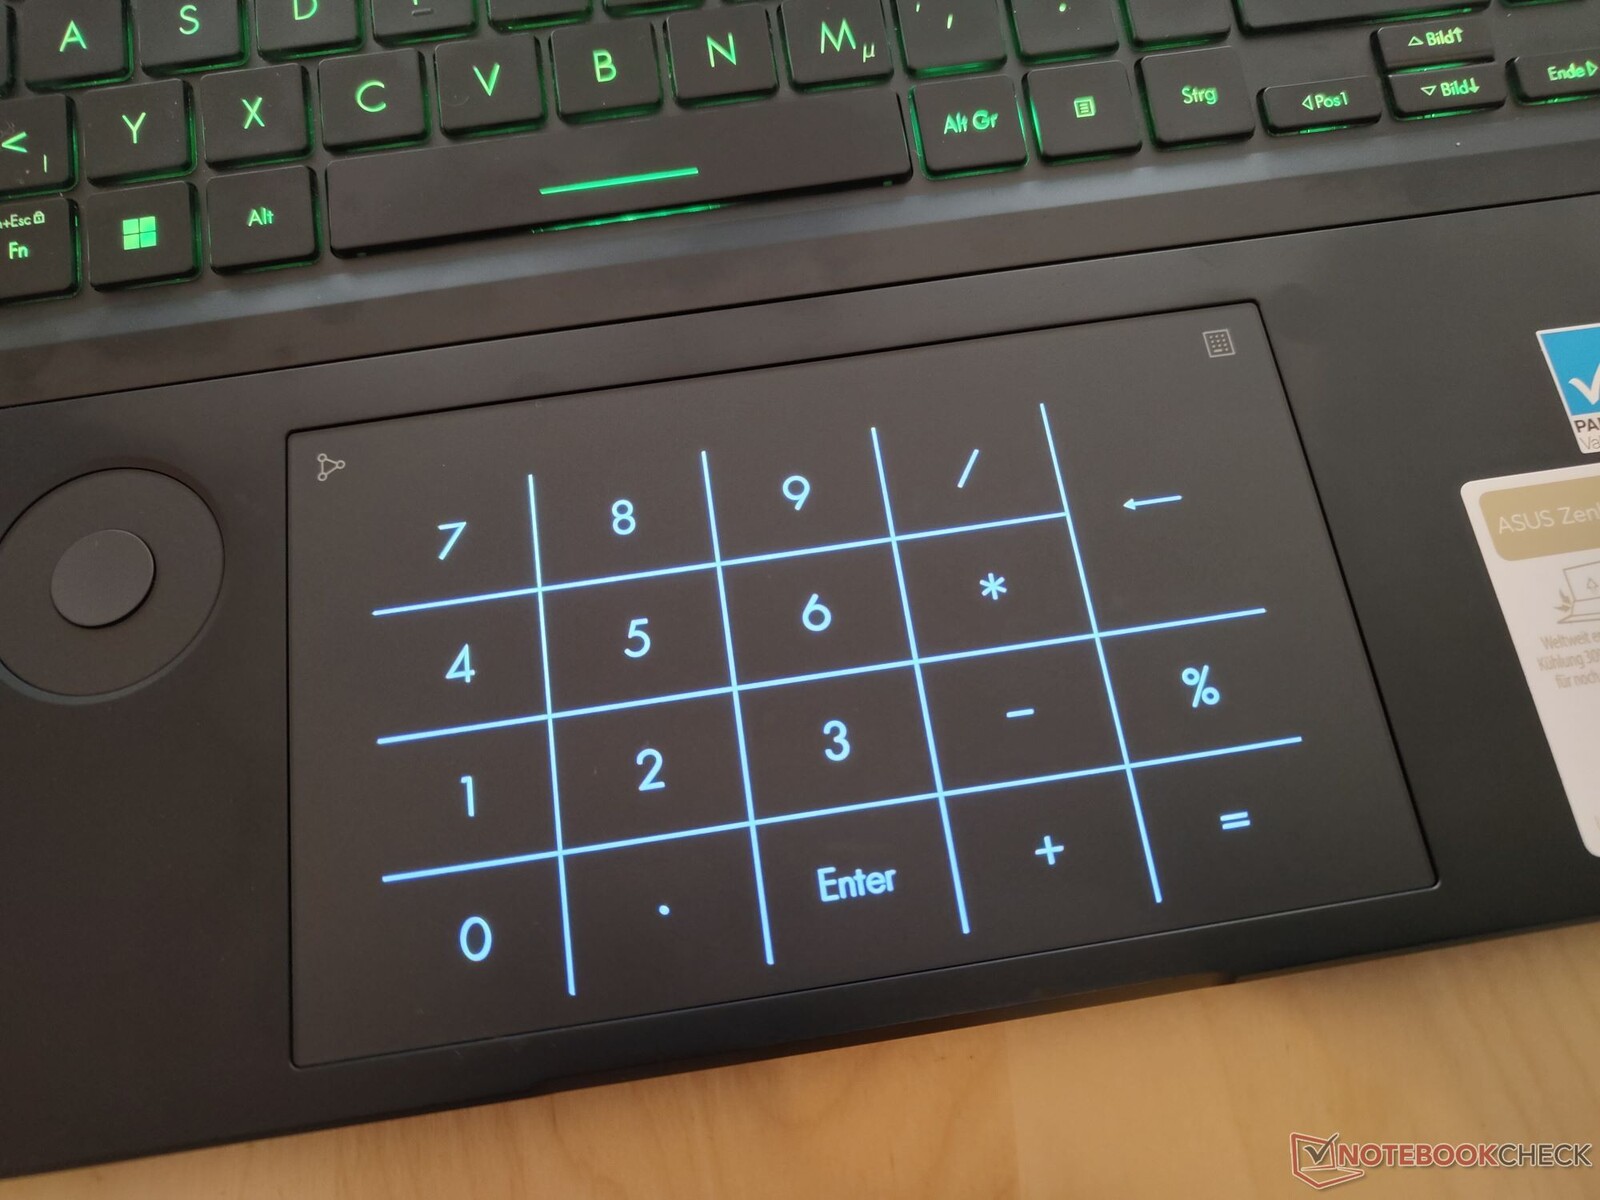
Touchpad w VivoBooku ma nieco ponad 15 × 9 cm. Wciskanie klawiszy działa na tym notebooku zupełnie inaczej niż zwykle. Nie zainstalowano tu ani przycisków dotykowych, ani przycisków myszy. Zamiast tego touchpad jest wrażliwy na nacisk i posiada silnik haptyczny, który symuluje naciśnięcie klawisza. Różnica jest mało zauważalna w odczuciu, ale technologia ta ma być bardziej wytrzymała i trwała niż zwykłe klawisze. Szklana powierzchnia touchpada jest przyjemna i powinna być bardzo trwała. Haptyczne sprzężenie zwrotne touchpada można również wyłączyć w ustawieniach systemu Windows, ale wtedy obsługa notebooka jest znacznie bardziej gąbczasta.
Podobnie jak w wielu notebookach Asusa, Zenbook Pro 16X oferuje także wirtualny numpad w touchpadzie. Po krótkim zapoznaniu się z nim można szybko wprowadzać długie rzędy liczb.
Od razu rzuca się w oczy, że w zimowych temperaturach ClickPad reaguje tylko powoli. Kursor myszy regularnie zawiesza się, gdy temperatura touchpada jest niższa od 15°C.
Asus Dial
Asus Dial powinien faktycznie okazać się praktyczny dla wielu użytkowników, ponieważ używasz go do szybkiego dostępu i dostosowania wielu elementów sterujących. Oferuje ono także pewne opcje dla programów Adobe Creative Cloud i może być używane do emulowania Microsoft Surface Dial i jego szeregu funkcji.
Jednak podczas pracy na klawiaturze laptopa, Asus Dial stale przeszkadza. Dzieje się tak dlatego, że jest ono umieszczone dokładnie w miejscu, gdzie podczas pisania spoczywa pięta dłoni, więc stale wykonuje się niechciane ruchy. Nie wydaje się też, by rozpoznawanie dłoni było możliwe i można je włączać i wyłączać za pośrednictwem aplikacji ProArt Creator Hub.
Asus Pen 2.0
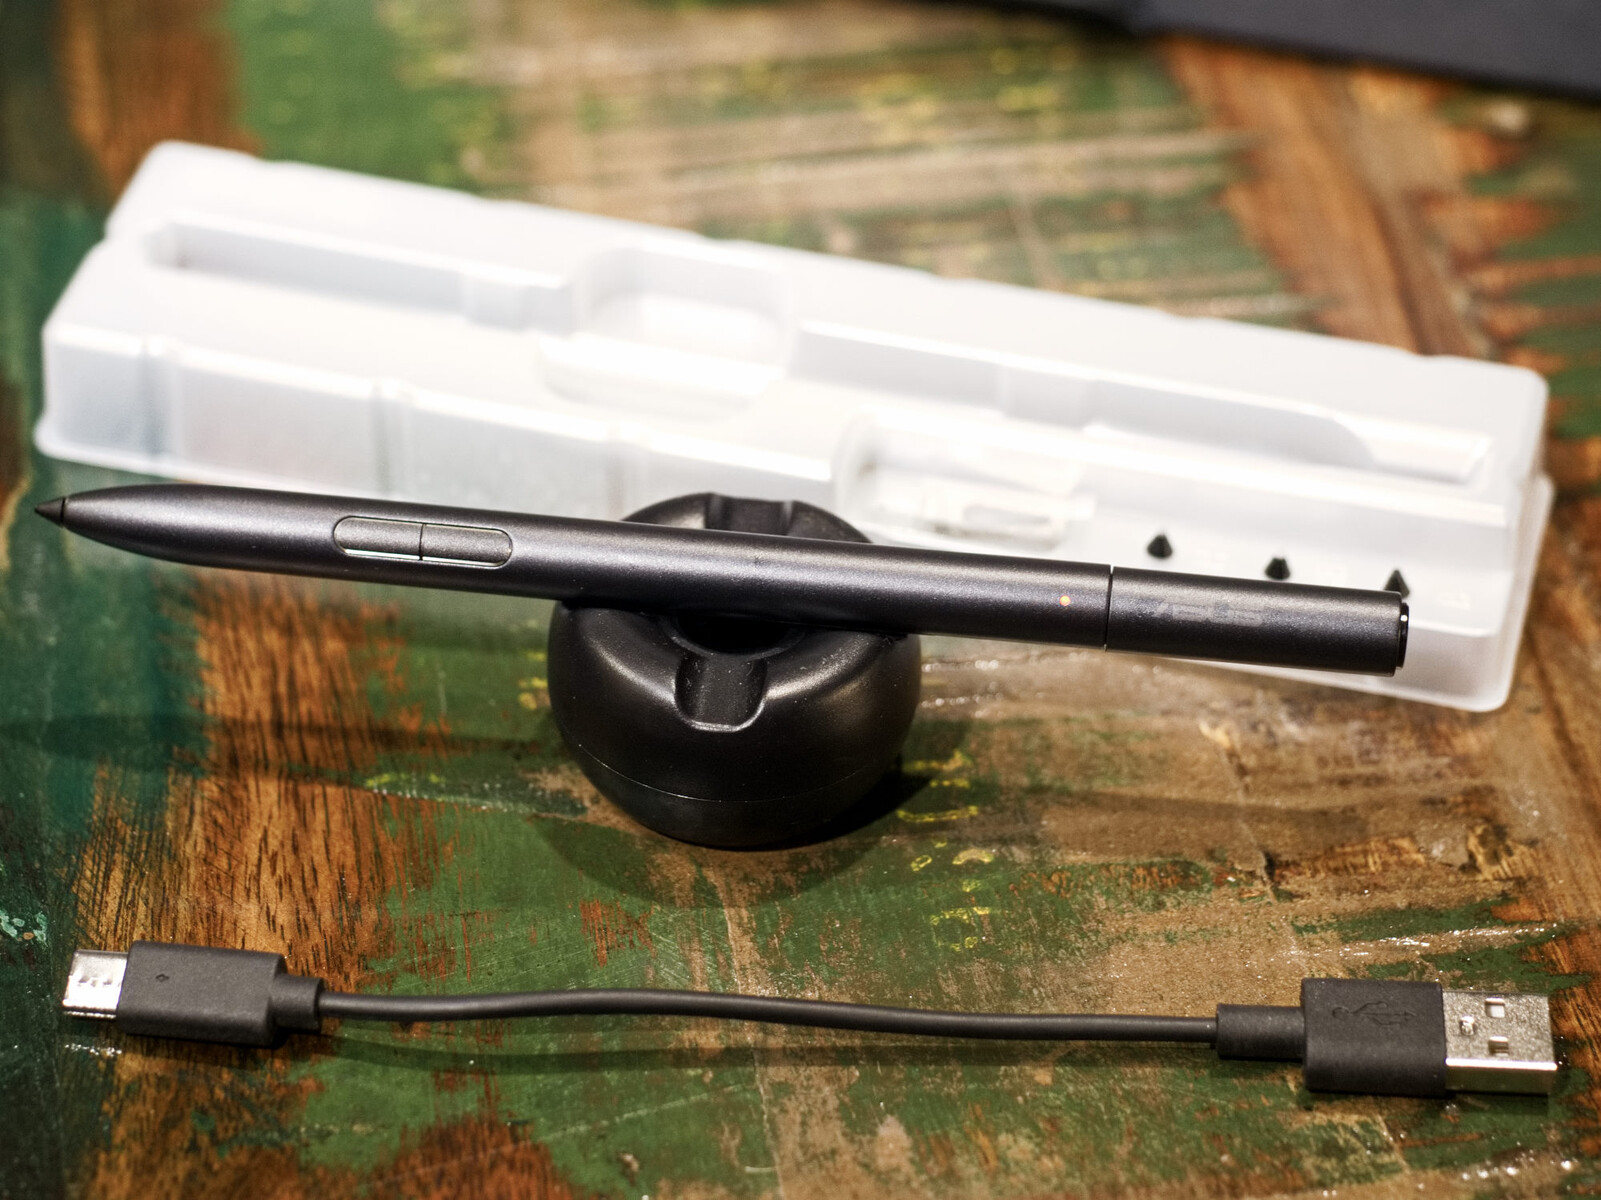
Samo pióro Asusa jest świetne, nie da się tego inaczej określić. 4096 poziomów nacisku i częstotliwość próbkowania na poziomie 266 Hz zapewniają precyzyjną pracę. Rysik oferuje trzy programowalne przyciski, z których można korzystać także w pewnej odległości od ekranu dzięki połączeniu Bluetooth. Pióro ładuje się w ciągu 30 minut przez USB-C. Według Asusa zapewnia to do 140 godzin pracy na baterii. Dzięki dołączonej gamie końcówek piszących użytkownik ma większą kontrolę nad stopniem tarcia pióra o ekran. Tu jednak zaczyna się problem rysika: kąt nachylenia ekranu i stabilność laptopa nie do końca sprzyjają pracy rysikiem. Ekran ugina się też nieco pod naciskiem, co czyni go raczej niepraktycznym do wprowadzania danych piórkiem.
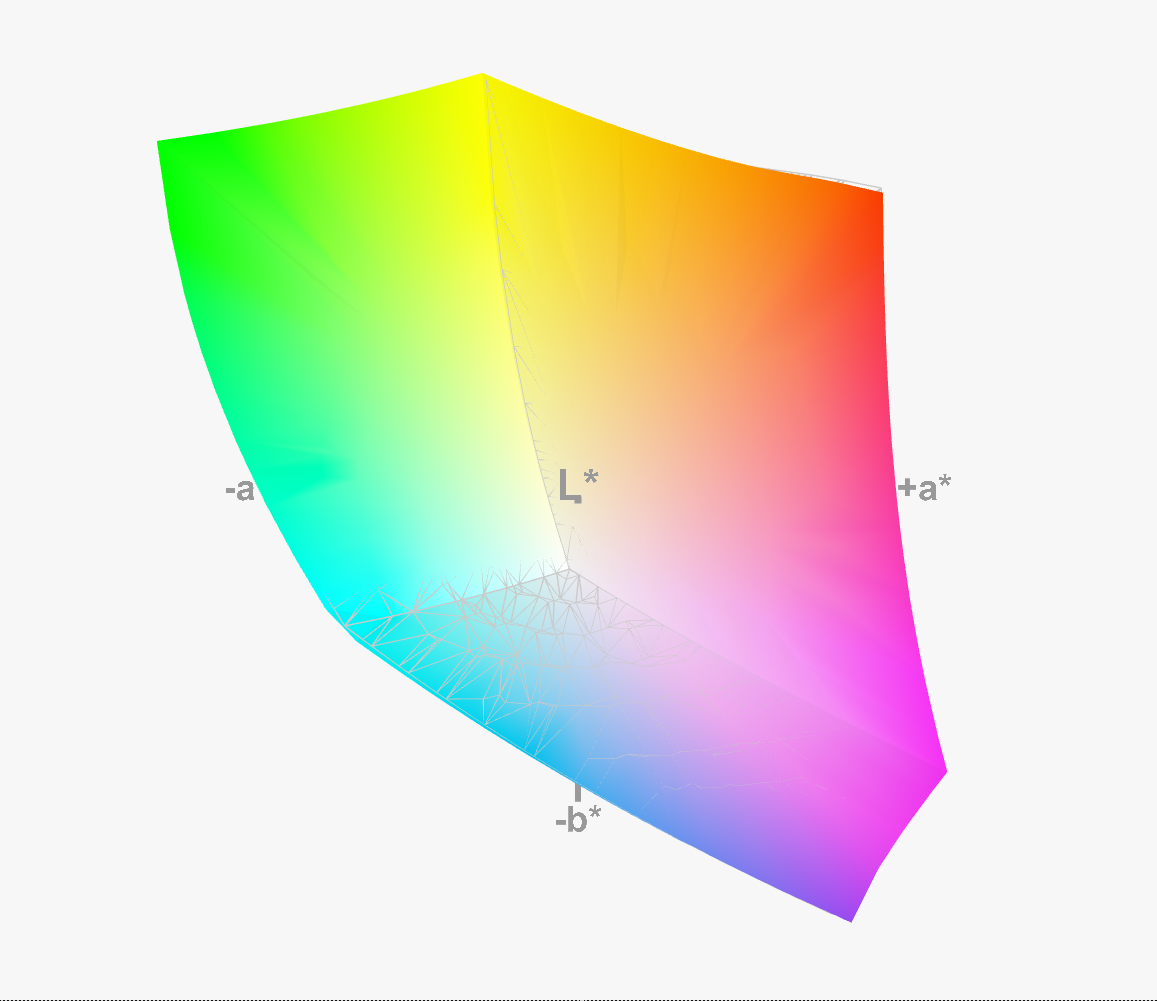
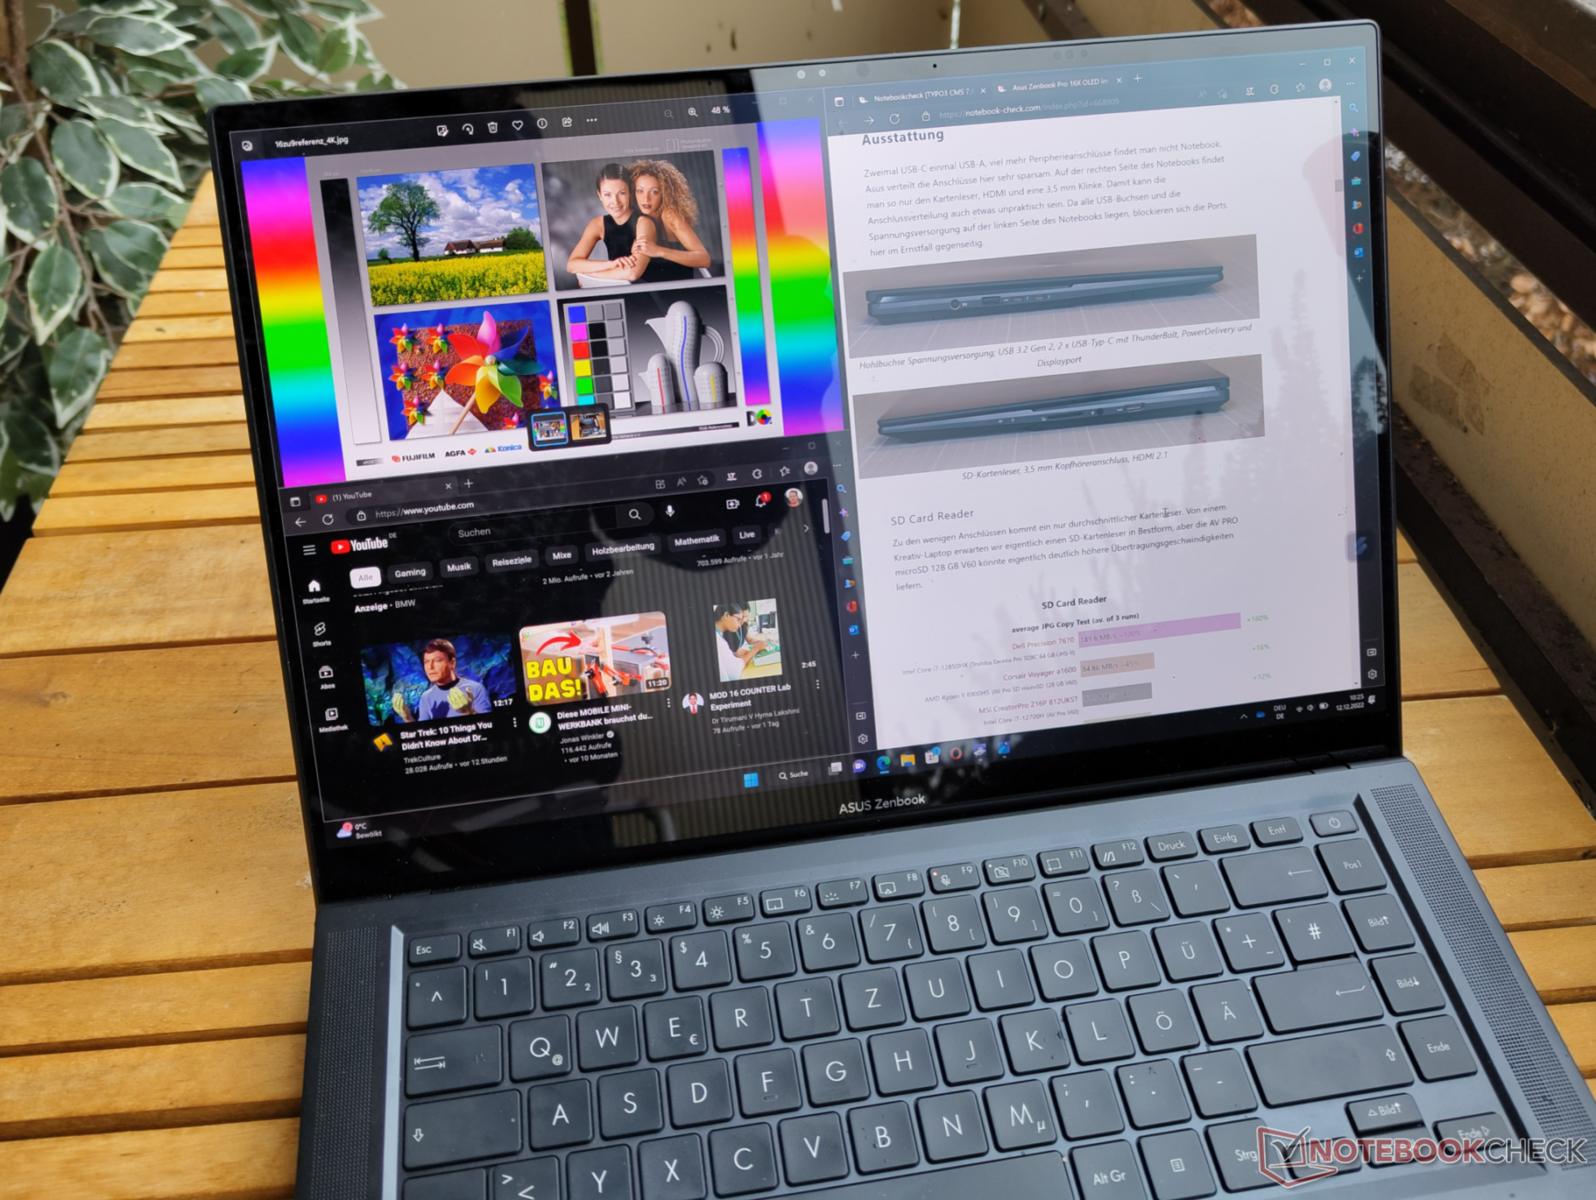
Wyświetlacz - OLED z walidacją Pantone i pokryciem przestrzeni barw DCI P3
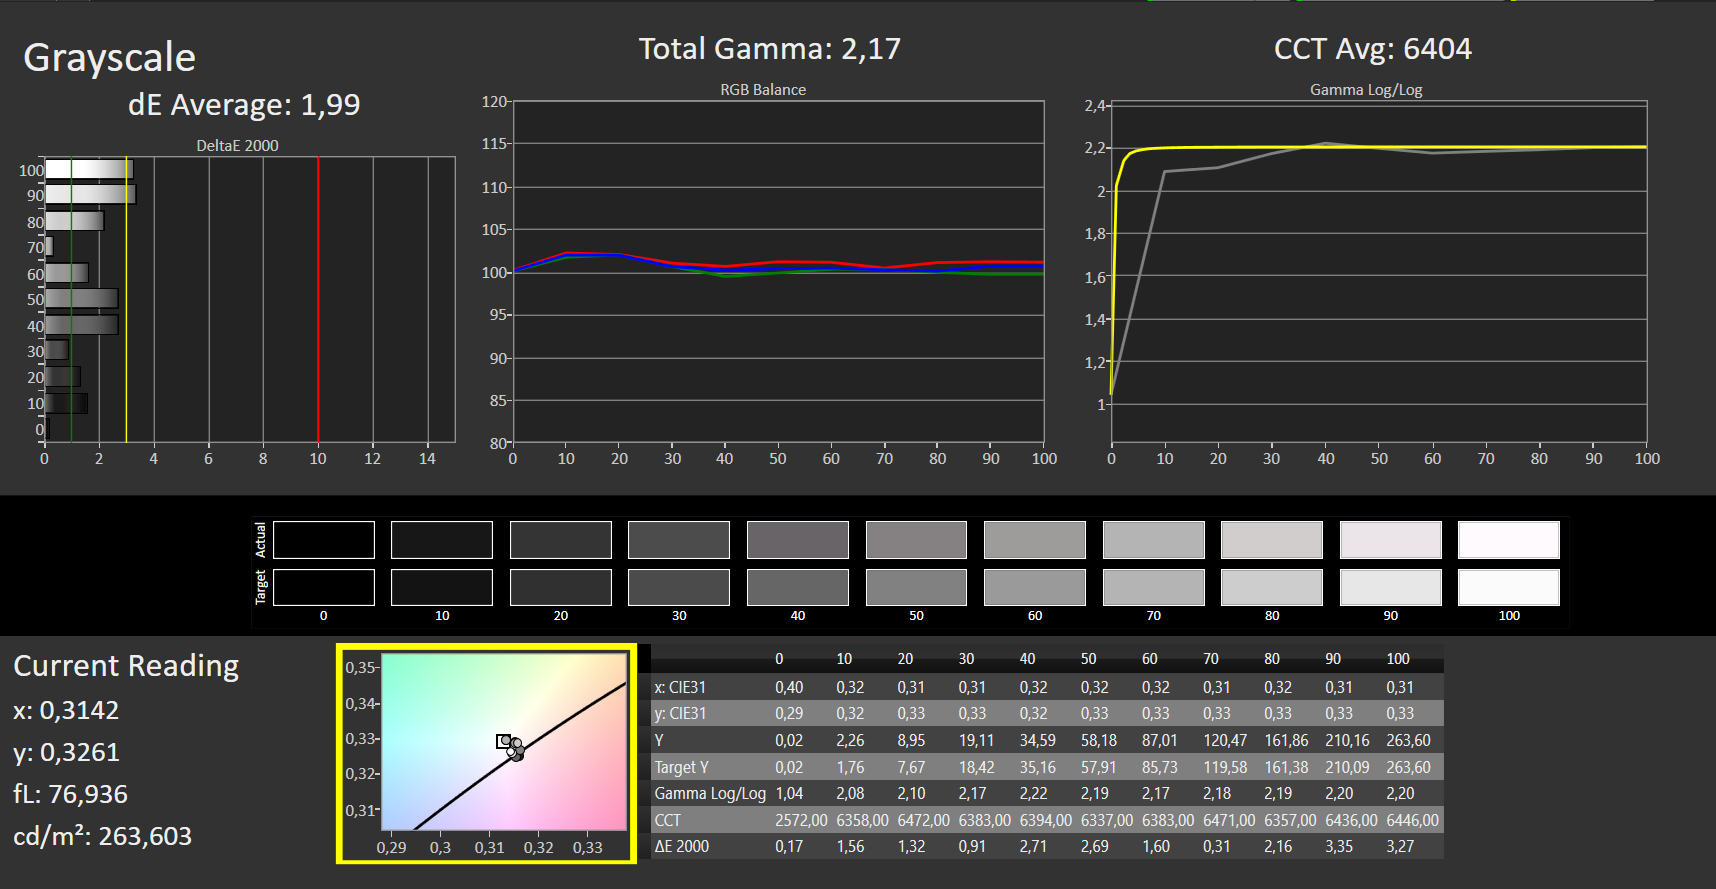
Wyświetlacz OLED w Zenbook Pro 16X ma rozdzielczość 3840 × 2400. Wyświetlacz UHD w formacie 16:10 oferuje mocne kontrasty i imponujące kolory. Screen bleeding czy nierównomierne podświetlenie zazwyczaj nie występują w wyświetlaczach OLED. Ustawienia wyświetlacza są regulowane za pośrednictwem aplikacji MyAsus i ProArt Creator Hub. Laptop posiada dwa czujniki światła, które dostosowują obraz i jasność ekranu do oświetlenia otoczenia. Ustaliliśmy tutaj maksymalną jasność na poziomie 360 cd/m². Temperatura barwowa i jasność są automatycznie regulowane w celu utrzymania doskonałej jakości obrazu. Wyświetlacz obsługuje dodatkowo kilka standardów HDR oraz Dolby Vision. Przy tak wielu opcjach ustawień można łatwo stracić orientację. Można tu spersonalizować reprezentację przestrzeni barw, temperaturę kolorów, regulację jasności, HDR, zachowanie czujnika i wiele innych czynników. Niestety, poszczególne opcje są rozłożone na trzy różne programy. Jednym z zarzutów wobec ekranu są zauważalne dziury w matrycy subpikselowej. Przy pełnej jasności na wyświetlaczu można czasem dostrzec małe szare kropki.
Kolejną cechą laptopa Asusa jest Asus GlideX. Preinstalowany program pozwala na rozszerzenie wyświetlacza na dowolne urządzenie z systemem Android lub iOS, dzięki czemu nawet starsze tablety mogą służyć jako rozszerzenie dla komputera.
| |||||||||||||||||||||||||
rozświetlenie: 96 %
na akumulatorze: 346 cd/m²
kontrast: ∞:1 (czerń: 0 cd/m²)
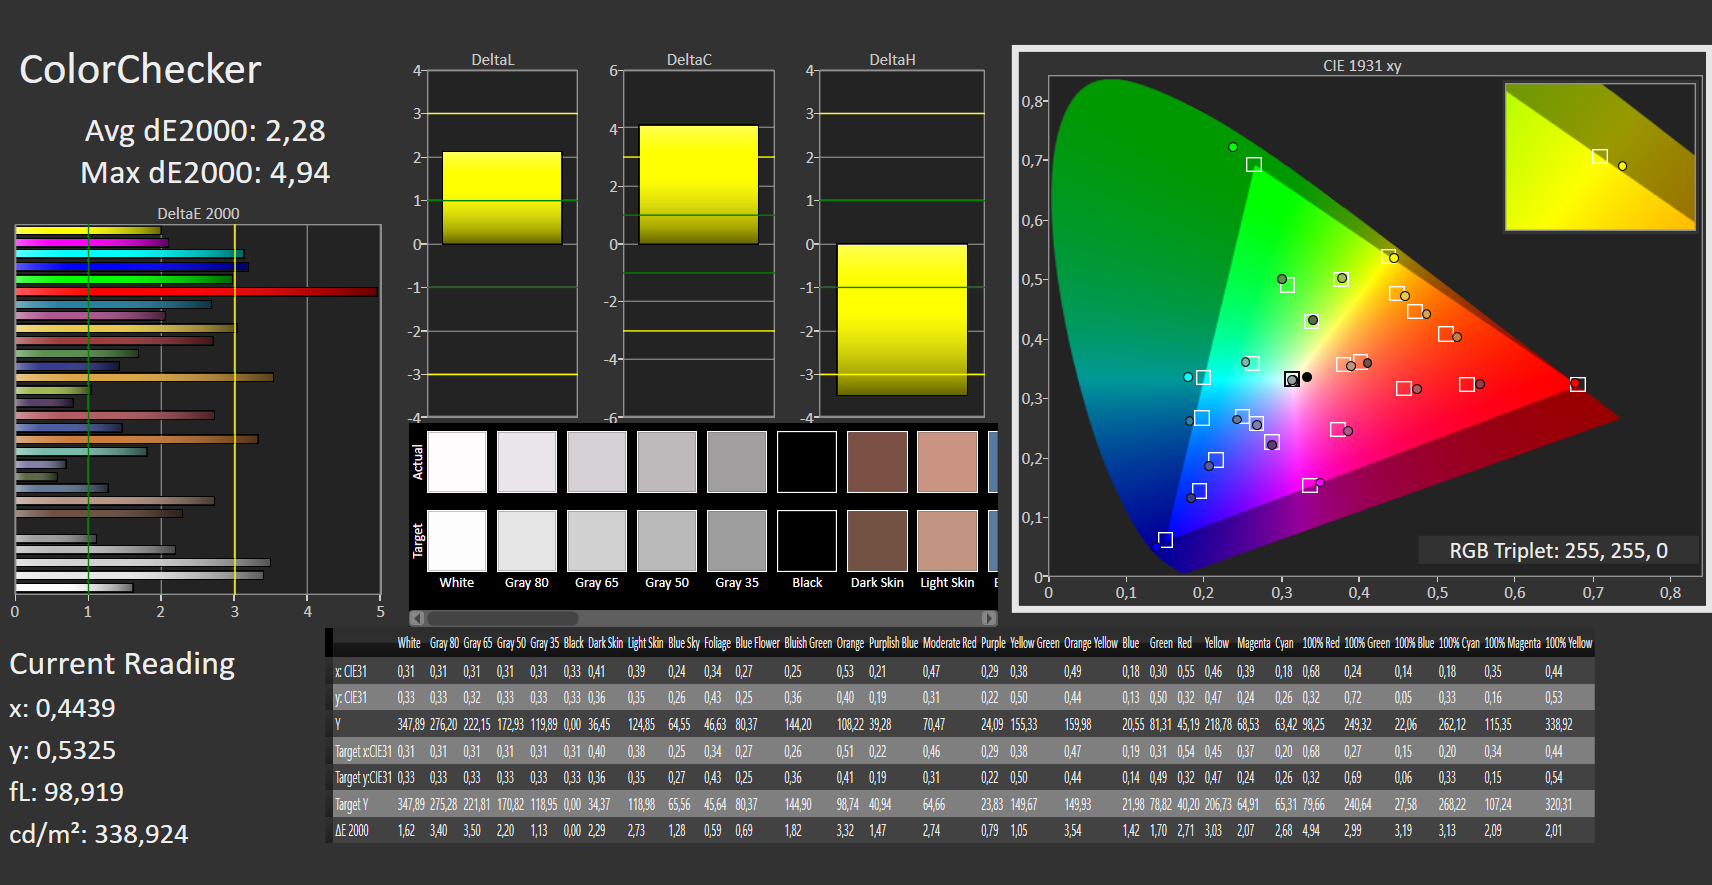
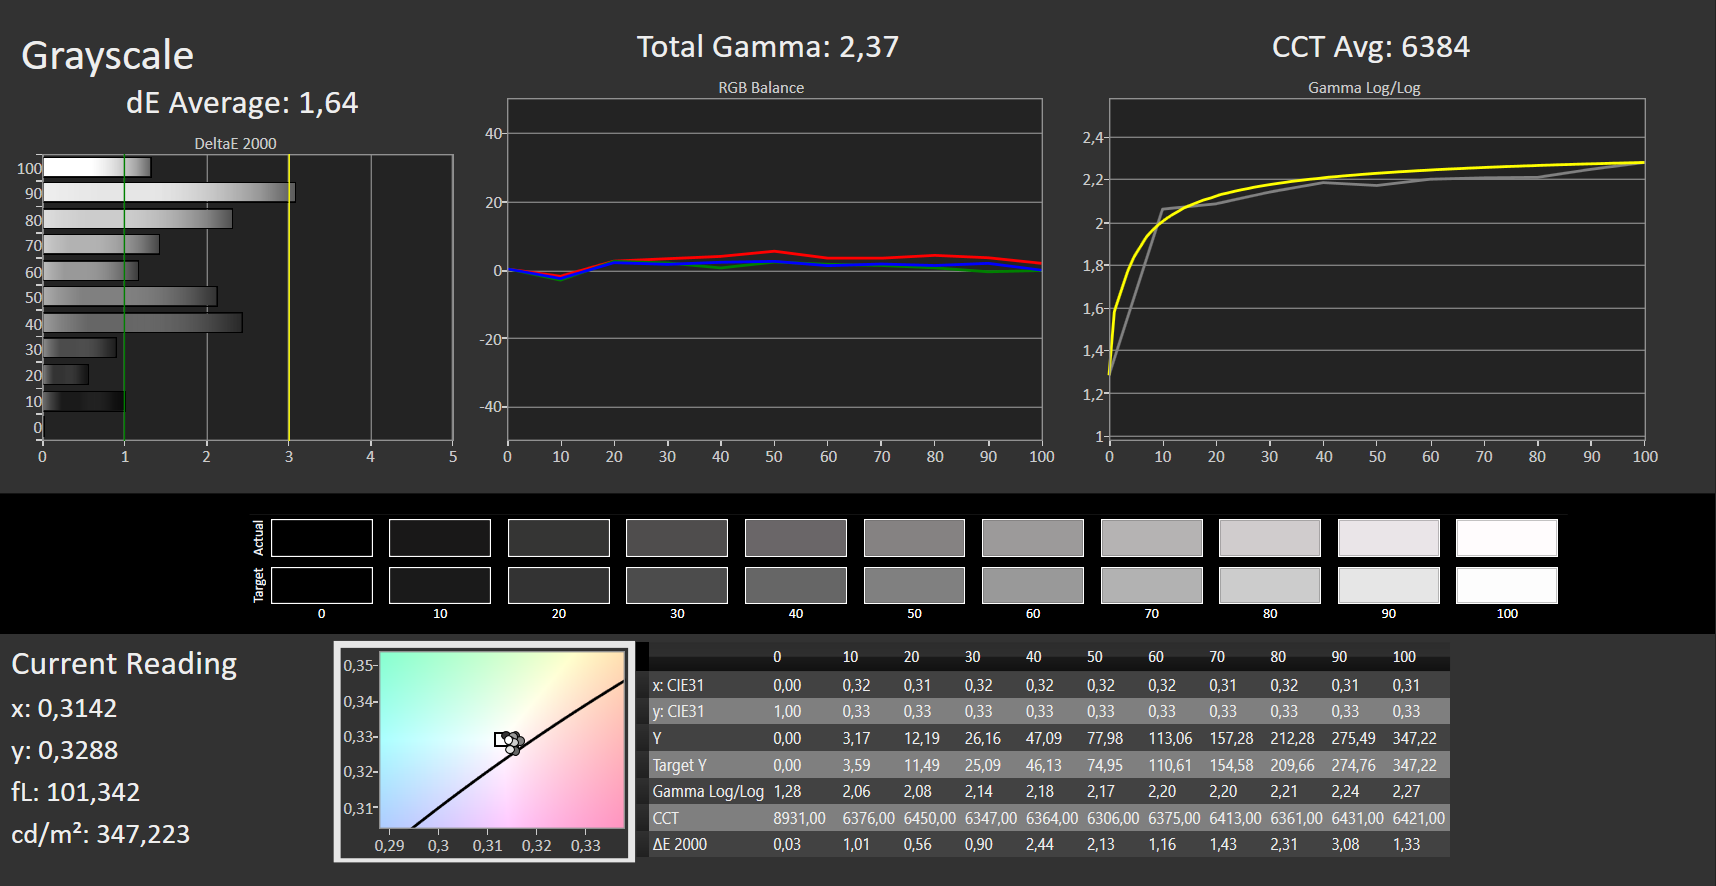
ΔE ColorChecker Calman: 2.28 | ∀{0.5-29.43 Ø4.72}
calibrated: 2.16
ΔE Greyscale Calman: 1.64 | ∀{0.09-98 Ø4.97}
88.9% AdobeRGB 1998 (Argyll 3D)
99.99% sRGB (Argyll 3D)
99.84% Display P3 (Argyll 3D)
Gamma: 2.37
CCT: 6384 K
| Asus ZenBook Pro 16X OLED UX7602ZM-ME115W Samsung SDC415D, OLED, 3840x2400, 16" | Lenovo ThinkPad X1 Extreme G5-21DE003RGE LP160UQ1-SPB1, IPS, 3840x2400, 16" | HP Omen 16-n0033dx BOE0AAE, IPS, 1920x1080, 16.1" | HP ZBook Studio 16 G9 62U04EA BOE0A52, IPS, 3840x2400, 16" | Corsair Voyager a1600 BOE0A3B, IPS, 2560x1600, 16" | Dell Precision 7670 Samsung 160YV03, OLED, 3840x2400, 16" | Asus VivoBook Pro 16X OLED N7600PC-L2026X Samsung ATNA60YV02-0, OLED, 3840x2400, 16" | MSI CreatorPro Z16P B12UKST B160QAN02.N, IPS, 2560x1600, 16" | |
|---|---|---|---|---|---|---|---|---|
| Display | -2% | -14% | -2% | -18% | 3% | 3% | -1% | |
| Display P3 Coverage (%) | 99.84 | 84.6 -15% | 74.4 -25% | 97.5 -2% | 68.7 -31% | 99.9 0% | 99.9 0% | 97.6 -2% |
| sRGB Coverage (%) | 99.99 | 99.2 -1% | 99.2 -1% | 99.9 0% | 98.2 -2% | 100 0% | 100 0% | 99.9 0% |
| AdobeRGB 1998 Coverage (%) | 88.9 | 97.7 10% | 73.4 -17% | 86.3 -3% | 70.1 -21% | 97.5 10% | 98.05 10% | 87.4 -2% |
| Response Times | -1530% | -620% | -435% | -475% | 3% | 25% | -405% | |
| Response Time Grey 50% / Grey 80% * (ms) | 2 ? | 46 ? -2200% | 17.6 ? -780% | 15.3 ? -665% | 13 ? -550% | 1.9 ? 5% | 1 50% | 12.8 ? -540% |
| Response Time Black / White * (ms) | 2 ? | 19.2 ? -860% | 11.2 ? -460% | 6.1 ? -205% | 10 ? -400% | 2 ? -0% | 2 ? -0% | 7.4 ? -270% |
| PWM Frequency (Hz) | 59 ? | 59.5 ? | 247 ? | |||||
| Screen | 12% | -9% | 39% | -2% | -32% | 7% | 22% | |
| Brightness middle (cd/m²) | 346 | 476 38% | 373.3 8% | 554 60% | 355 3% | 340.1 -2% | 383 11% | 407 18% |
| Brightness (cd/m²) | 354 | 470 33% | 361 2% | 516 46% | 340 -4% | 342 -3% | 390 10% | 388 10% |
| Brightness Distribution (%) | 96 | 90 -6% | 79 -18% | 84 -12% | 91 -5% | 98 2% | 96 0% | 88 -8% |
| Black Level * (cd/m²) | 0.35 | 0.44 | 0.47 | 0.53 | 0.027 | 0.36 | ||
| Colorchecker dE 2000 * | 2.28 | 1.9 17% | 2.12 7% | 1 56% | 2.43 -7% | 2.5 -10% | 2.29 -0% | 1.3 43% |
| Colorchecker dE 2000 max. * | 4.94 | 4.7 5% | 5.62 -14% | 2.4 51% | 4.31 13% | 8.19 -66% | 3.47 30% | 2.5 49% |
| Colorchecker dE 2000 calibrated * | 2.16 | 1.3 40% | 2.06 5% | 0.6 72% | 1.14 47% | 0.7 68% | ||
| Greyscale dE 2000 * | 1.64 | 2.4 -46% | 2.5 -52% | 1.6 2% | 2.62 -60% | 3.5 -113% | 1.84 -12% | 2.1 -28% |
| Gamma | 2.37 93% | 2.24 98% | 2.3 96% | 2.29 96% | 2.28 96% | 2.12 104% | 2.32 95% | 2.26 97% |
| CCT | 6384 102% | 6377 102% | 6408 101% | 6458 101% | 6909 94% | 6704 97% | 6308 103% | 6437 101% |
| Contrast (:1) | 1360 | 848 | 1179 | 670 | 14185 | 1131 | ||
| Całkowita średnia (program / ustawienia) | -507% /
-249% | -214% /
-112% | -133% /
-50% | -165% /
-85% | -9% /
-16% | 12% /
9% | -128% /
-55% |
* ... im mniej tym lepiej
Zenbook ma kilka opcji wyświetlania, które wpływają na wyświetlaną przestrzeń kolorów. Pomiary zostały tu przeprowadzone w trybie DisplayP3. Zenbook Pro 16X osiąga prawie 100% pokrycie przestrzeni DisplayP3 i sRGB. Około 88% przestrzeni kolorów jest odwzorowywane w Adobe RGB.
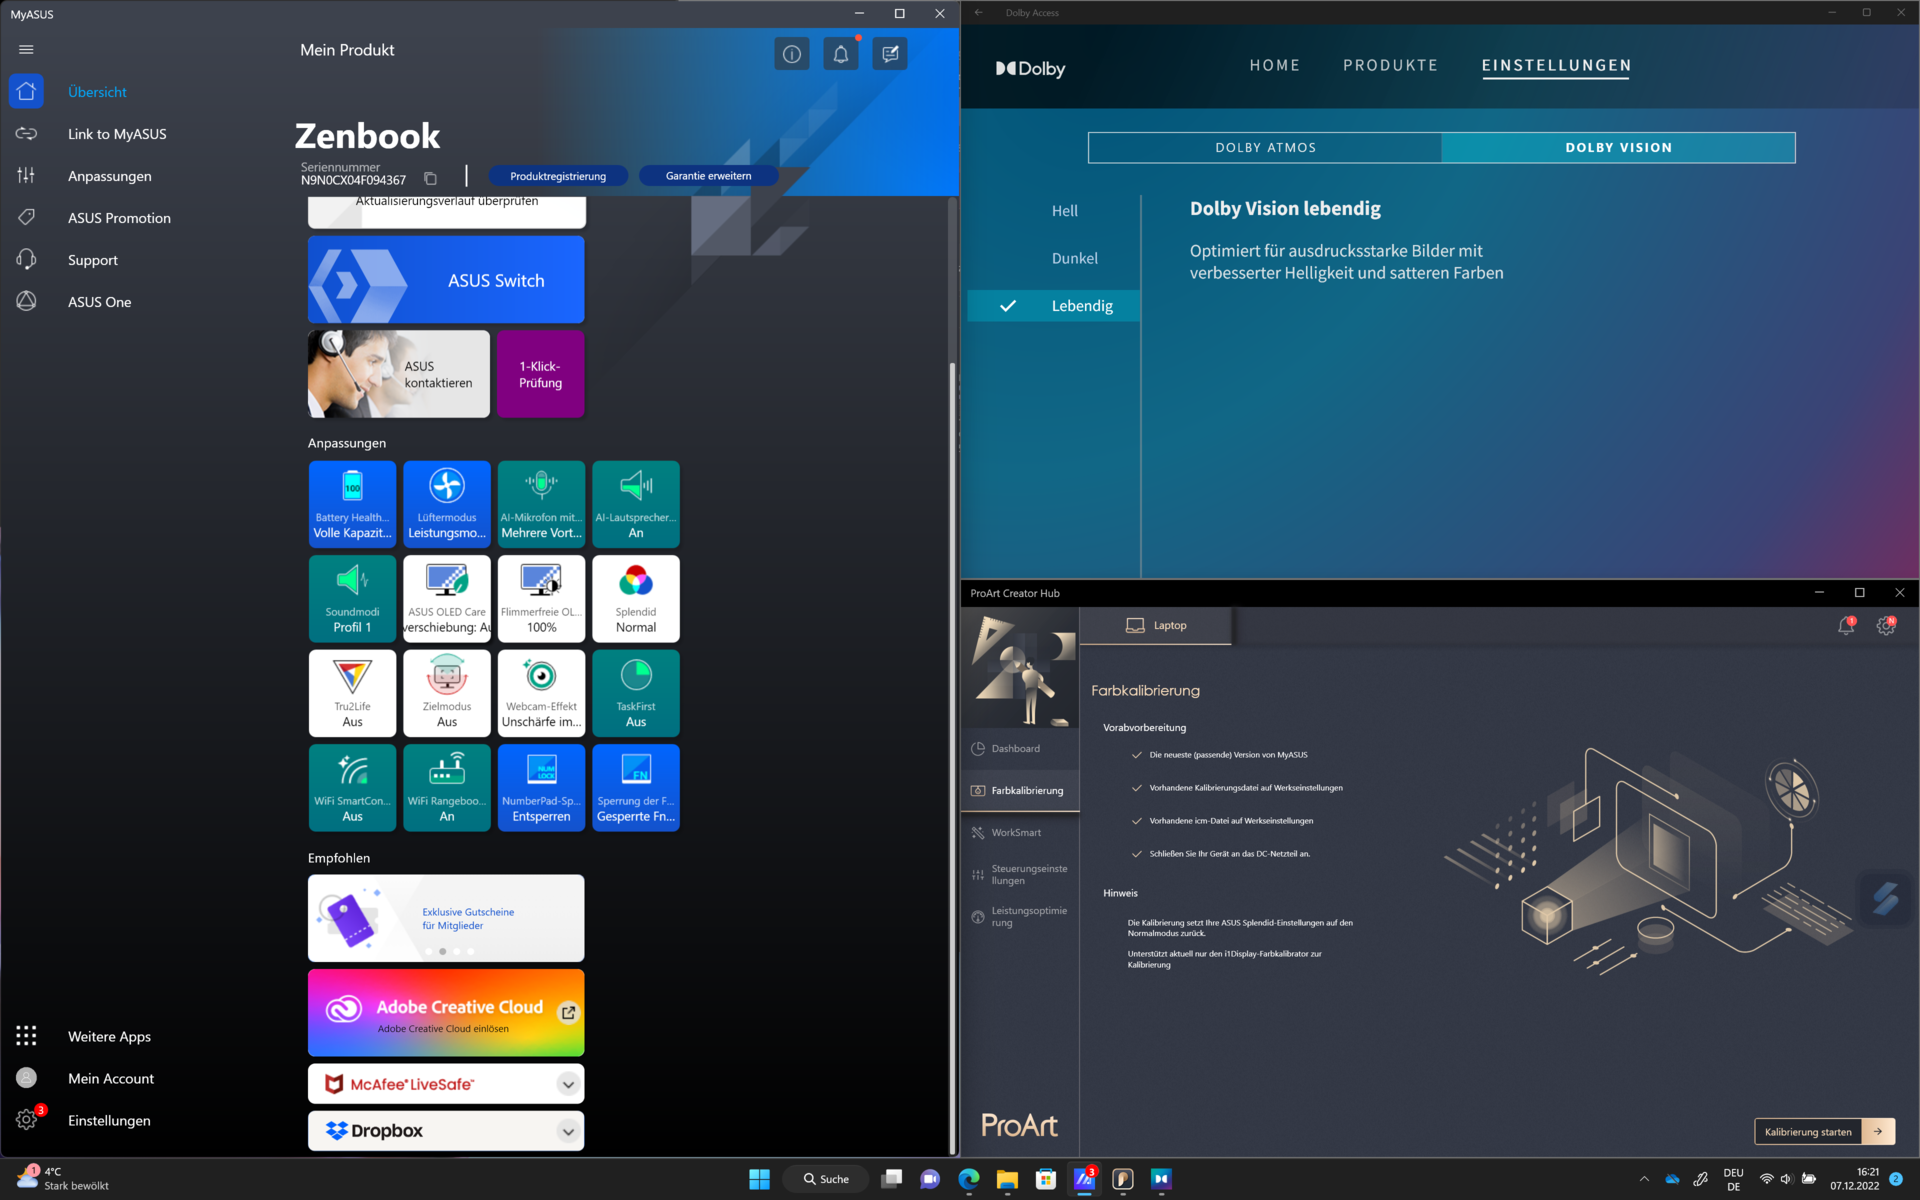
Ekran w wielu laptopach Asusa posiada walidację Pantone, a odpowiednią naklejkę można znaleźć na Zenbooku Pro 16X. Certyfikat ten stwierdza, że laptop bardzo dokładnie odwzorowuje około 4000 kolorów Pantone. W pełnej przestrzeni kolorów DisplayP3, którą laptop może wyświetlić, jest jednak ponad miliard kolorów. Sprawdziliśmy odchylenia za pomocą Calman ColorChecker i Xrite i1 Pro 2. Zatwierdzenie pomiarów może być trudne przy wielu ustawieniach, które wpływają na reprodukcję kolorów w tym laptopie. Może to być jeden z powodów, dla których Asus dołącza do ProArt Creator Hub własne oprogramowanie do kalibracji kolorów. To również wymaga kolorymetru Xrite i1 Display Pro lub i1 Display Plus. Aplikacja nie wydaje się być jednak kompatybilna z używanym przez nas i1 Pro 2. Asus przechowuje już także kilka profili kolorów, do których dostęp można uzyskać poprzez ustawienia wyświetlania systemu Windows.
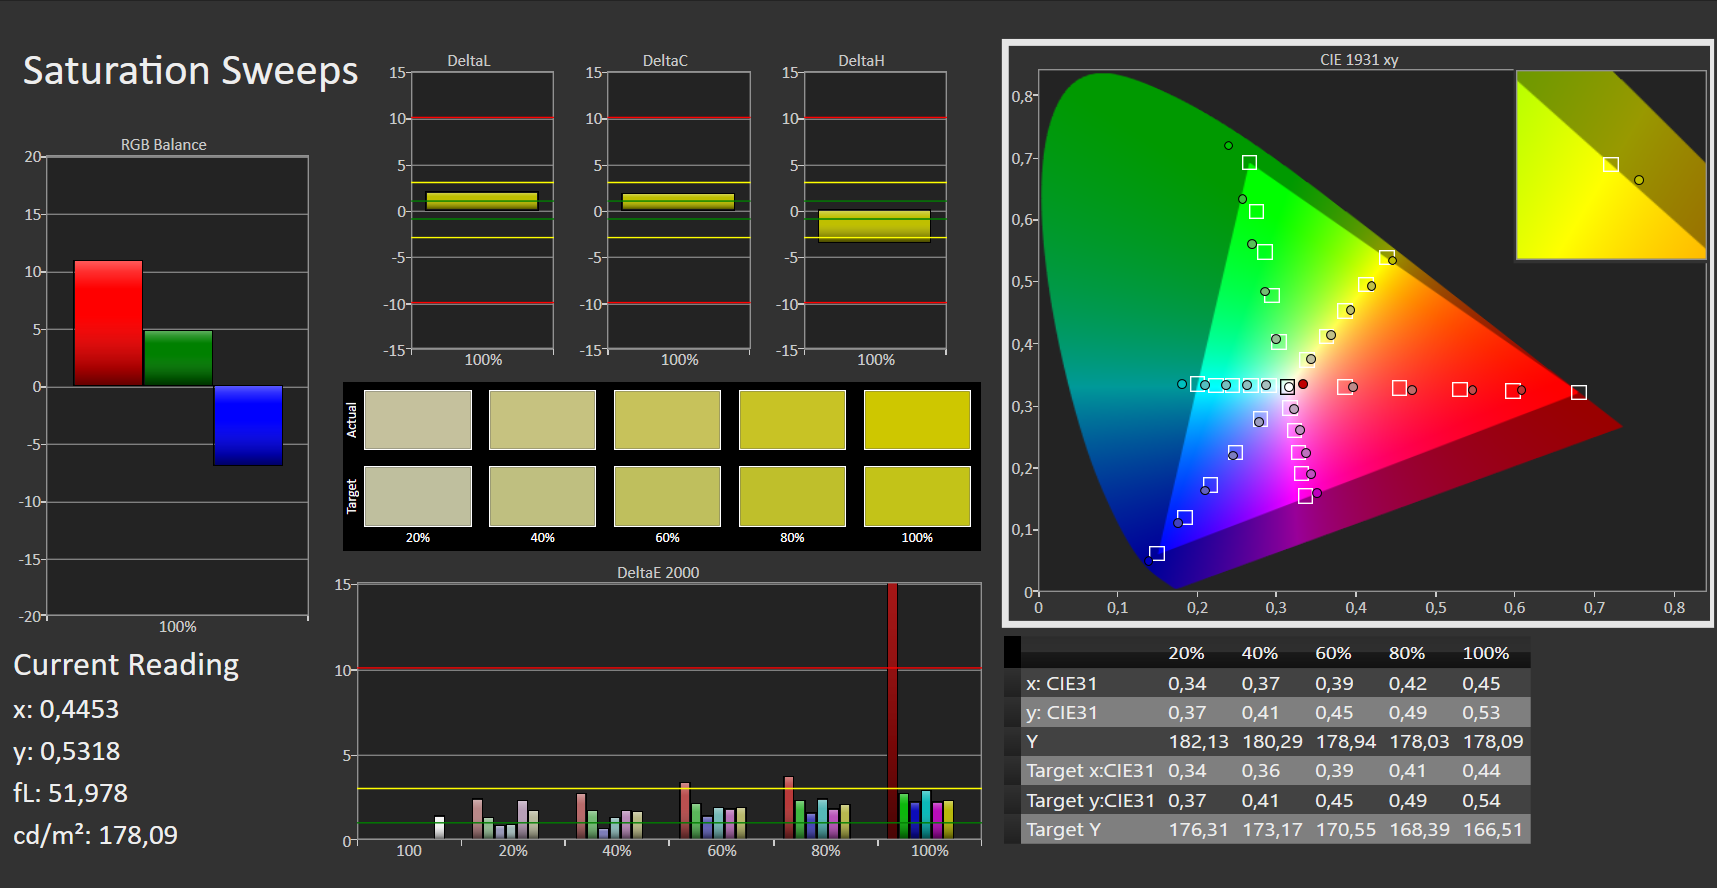
Pomiary odchyleń kolorów powtórzyliśmy kilkakrotnie przy różnych ustawieniach i wyszły mocno zróżnicowane wyniki dla odchyleń kolorów. Podczas testów zakrywaliśmy też czujnik światła otoczenia RGB, by uniknąć zafałszowania wyników. Najniższe odchylenia kolorów uzyskaliśmy w przestrzeni barw DisplayP3 przy profilu DisplyP3 ICC dostarczonym przez Asusa i aktywnym trybie ekranu DisplayP3. Średnie odchylenia kolorów wynoszą tutaj tylko ΔΕ 1,27.

Wyświetl czasy reakcji
| ↔ Czas reakcji od czerni do bieli | ||
|---|---|---|
| 2 ms ... wzrost ↗ i spadek ↘ łącznie | ↗ 1 ms wzrost |  |
| ↘ 1 ms upadek | ||
| W naszych testach ekran wykazuje bardzo szybką reakcję i powinien bardzo dobrze nadawać się do szybkich gier. Dla porównania, wszystkie testowane urządzenia wahają się od 0.1 (minimum) do 240 (maksimum) ms. » 11 % wszystkich urządzeń jest lepszych. Oznacza to, że zmierzony czas reakcji jest lepszy od średniej wszystkich testowanych urządzeń (19.8 ms). | ||
| ↔ Czas reakcji 50% szarości do 80% szarości | ||
| 2 ms ... wzrost ↗ i spadek ↘ łącznie | ↗ 1 ms wzrost |  |
| ↘ 1 ms upadek | ||
| W naszych testach ekran wykazuje bardzo szybką reakcję i powinien bardzo dobrze nadawać się do szybkich gier. Dla porównania, wszystkie testowane urządzenia wahają się od 0.165 (minimum) do 636 (maksimum) ms. » 10 % wszystkich urządzeń jest lepszych. Oznacza to, że zmierzony czas reakcji jest lepszy od średniej wszystkich testowanych urządzeń (31 ms). | ||
Migotanie ekranu / PWM (modulacja szerokości impulsu)
| Wykryto migotanie ekranu/wykryto PWM | 59 Hz | ≤ 80 % ustawienia jasności |  |
Podświetlenie wyświetlacza miga z częstotliwością 59 Hz (najgorszy przypadek, np. przy użyciu PWM) Wykryto migotanie przy ustawieniu jasności 80 % i poniżej. Powyżej tego ustawienia jasności nie powinno być żadnego migotania ani PWM. Częstotliwość 59 Hz jest bardzo niska, więc migotanie może powodować zmęczenie oczu i bóle głowy po dłuższym użytkowaniu. Dla porównania: 52 % wszystkich testowanych urządzeń nie używa PWM do przyciemniania wyświetlacza. Jeśli wykryto PWM, zmierzono średnio 7750 (minimum: 5 - maksimum: 343500) Hz. | |||
Jak to typowe dla wyświetlaczy OLED, ekran laptopa czasami dość mocno migocze, jeżeli patrzy się tylko na wyniki pomiarów. W rzeczywistości tylko zwijający się pasek ekranu robi się czarny. Jest to jednak normalne zjawisko w wyświetlaczach OLED. Gdybyśmy próbowali mierzyć migotanie w dalszej odległości od ekranu, praktycznie nie uzyskalibyśmy wyniku. Stąd, w zależności od użytkownika, migotanie wyświetlaczy OLED nie jest w ogóle zauważane lub bywa odbierane jako bardzo irytujące. Tutaj może zadecydować tylko własne doświadczenie


Jasność ekranu powinna zapewnić dobrą czytelność na zewnątrz. Jeśli jednak światło otoczenia jest niekorzystne dla monitora, widoczne stają się załamania w diodzie OLED i silne refleksy na odbijającej światło powierzchni ekranu.
Odwzorowanie kolorów i odczuwalna jasność prawie nie zmieniają się przy zmianie kąta patrzenia na ekran Zenbooka. Panel OLED jest wyjątkowo stabilny pod względem kąta widzenia.
Wydajność - AAS i Vapor-Chamber zapewniają niskie temperatury w Core i9
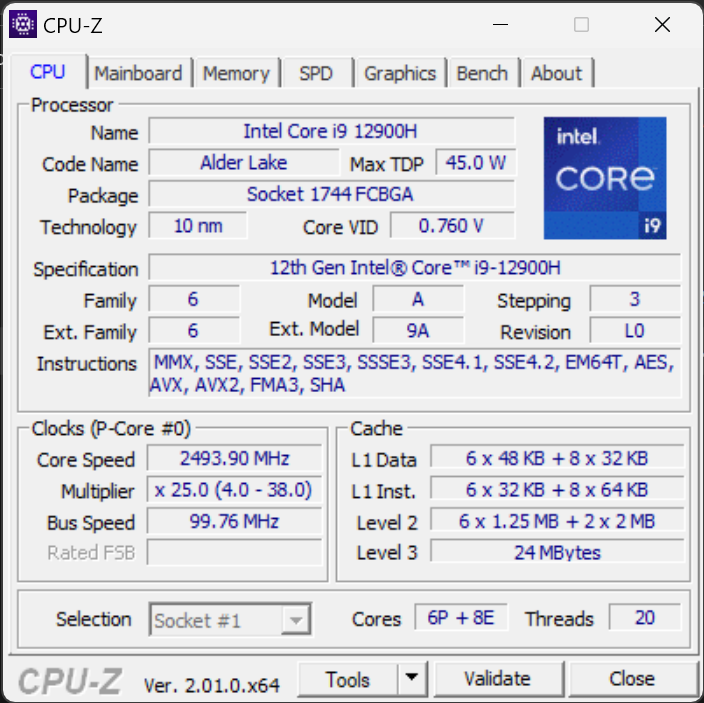
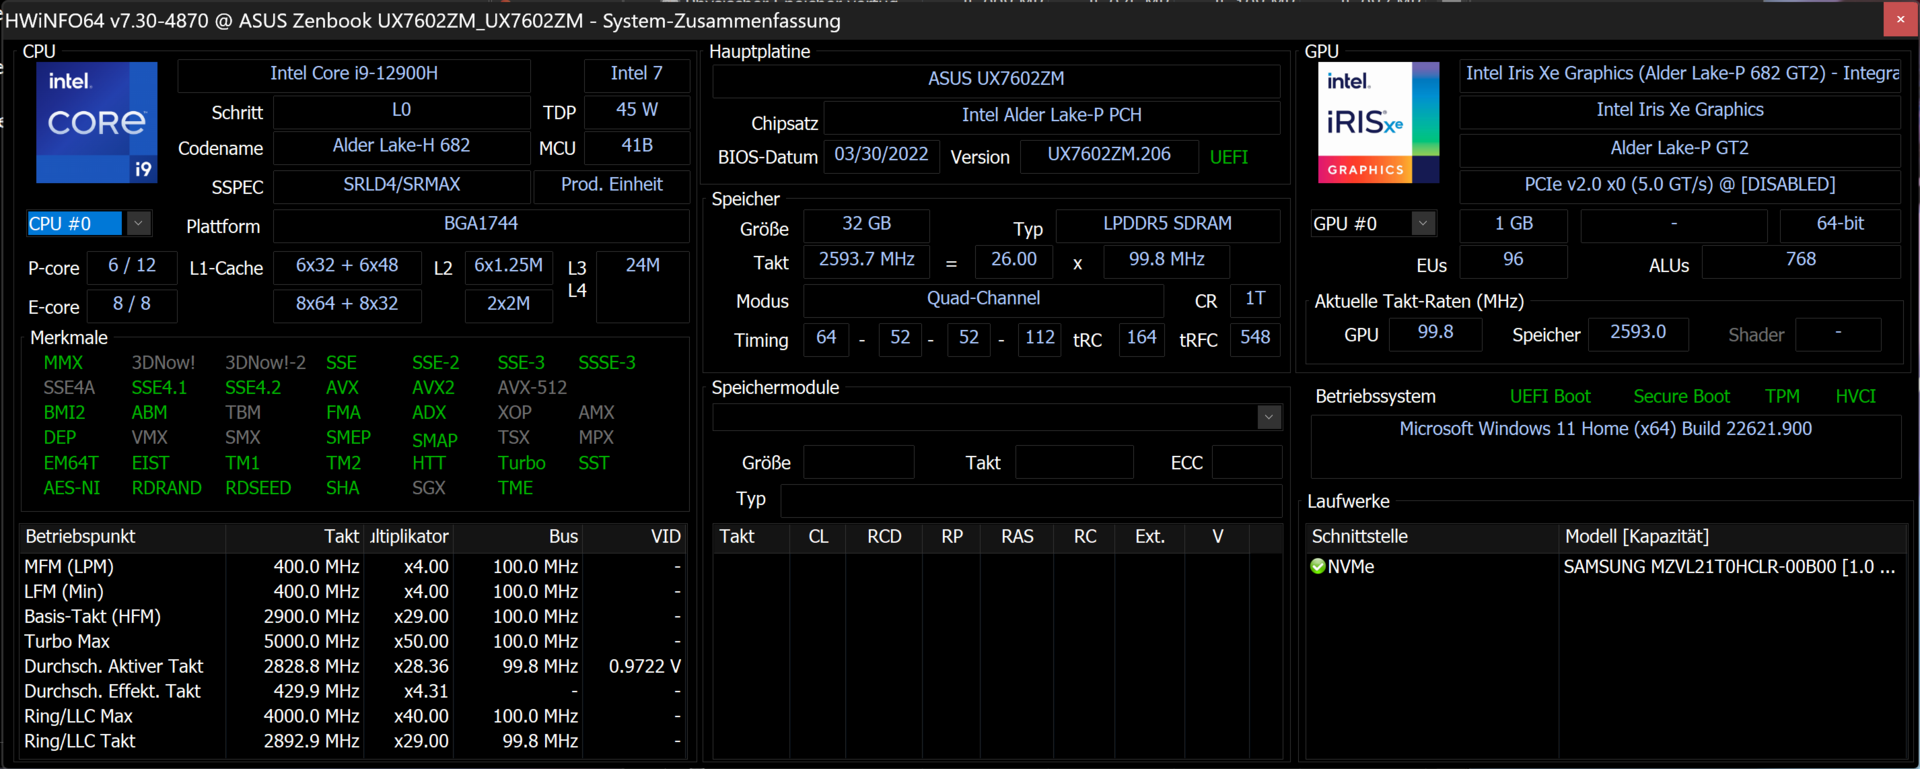
Według strony produktowej Asus Zenbook Pro16X OLED, multimedialny laptop jest dostępny tylko z procesorem Intel Core i9-12900H oraz kartą graficzną Nvidia GeForce RTX 3060. Użytkownik może wybrać pomiędzy 16 a 32 GB pamięci RAM. Nieco większy wybór jest w przypadku zainstalowanego dysku twardego. Nasz próbka recenzencka ma 32 GB LPDDR5 RAM i dysk twardy o pojemności 1 TB.
Sprzęt laptopa studyjnego jest wyraźnie przeznaczony do złożonych zastosowań. Edycja obrazu i wideo, renderowanie 3D oraz szeroki wachlarz aktualnych gier są obsługiwane bez problemu.
Warunki kontroli i testowania mocy

Za pośrednictwem aplikacji MyAsus można ustawić dużą liczbę ustawień, które zmieniają gotowość notebooka do pracy. Podczas pracy w sieci dostępne są trzy różne opcje wydajności (tryb cichy, tryb standardowy, tryb wydajnościowy). Te trzy tryby w mniejszym lub większym stopniu wpływają na dostępną wydajność GPU i CPU.
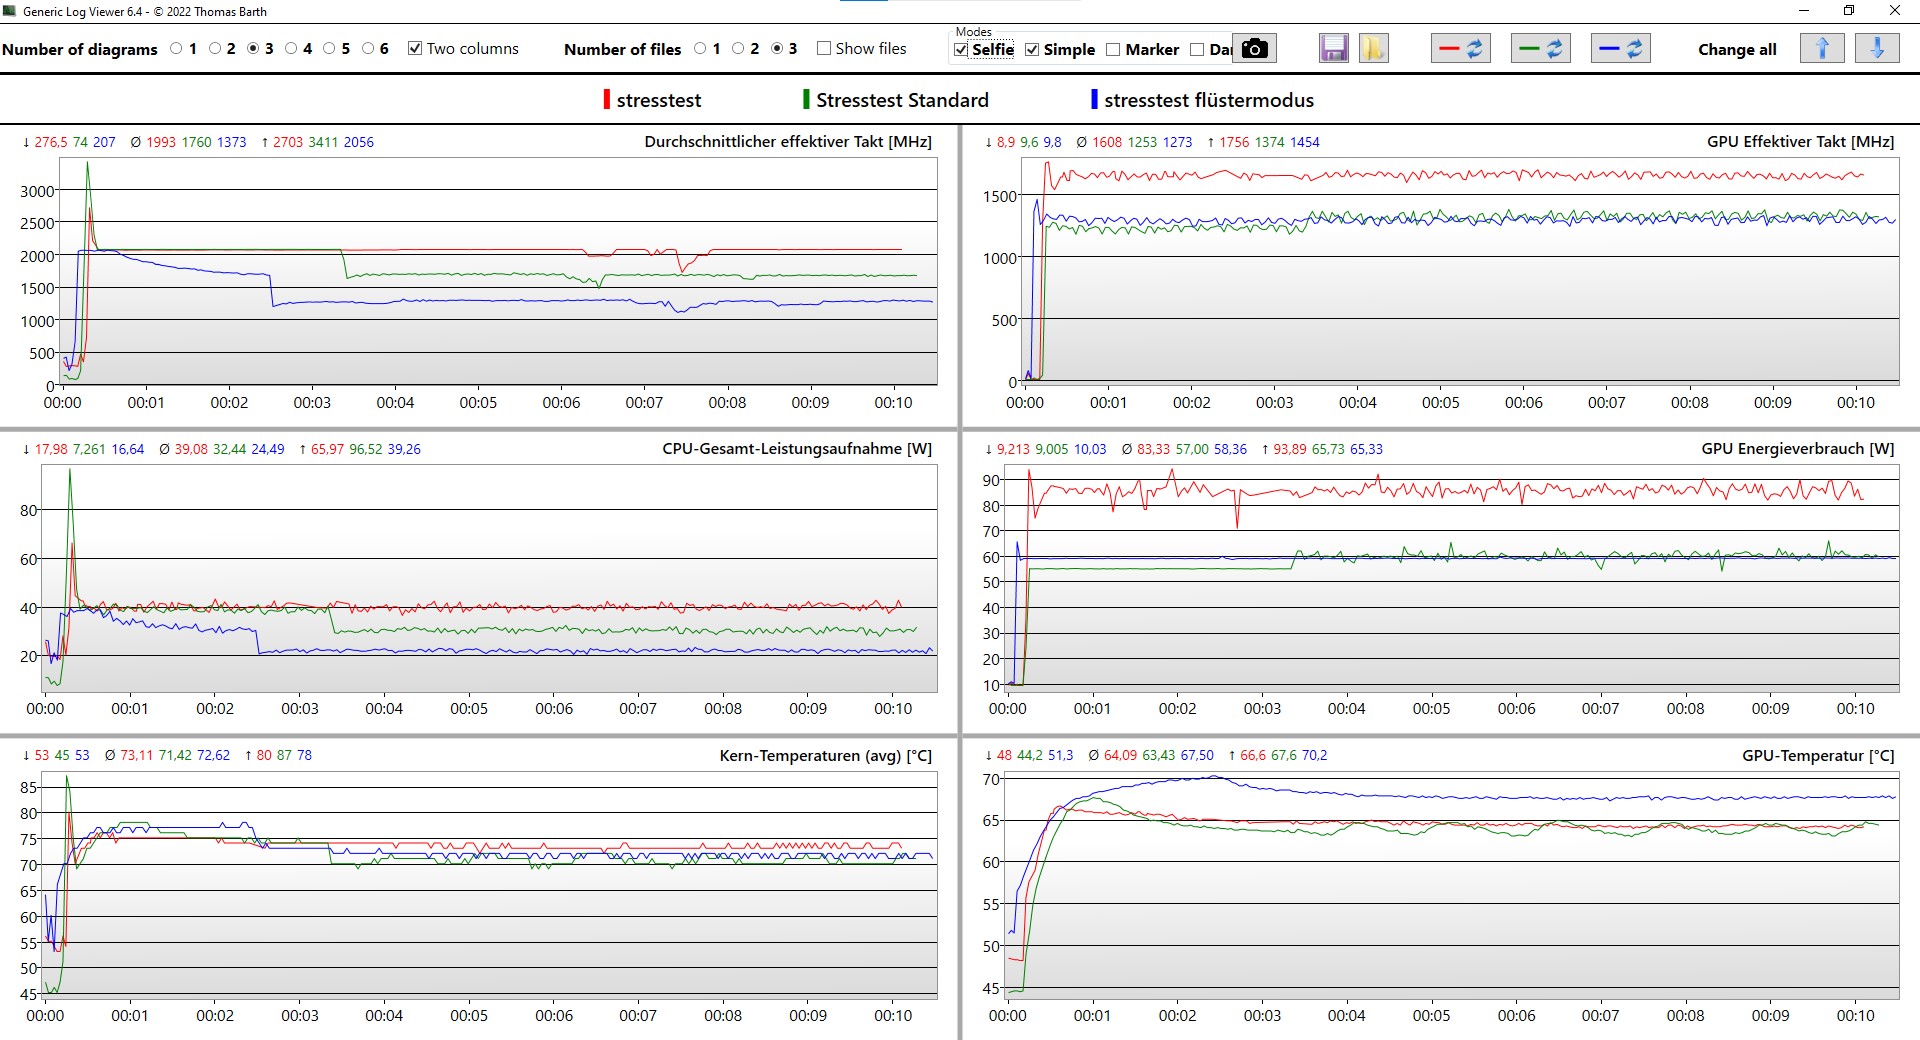
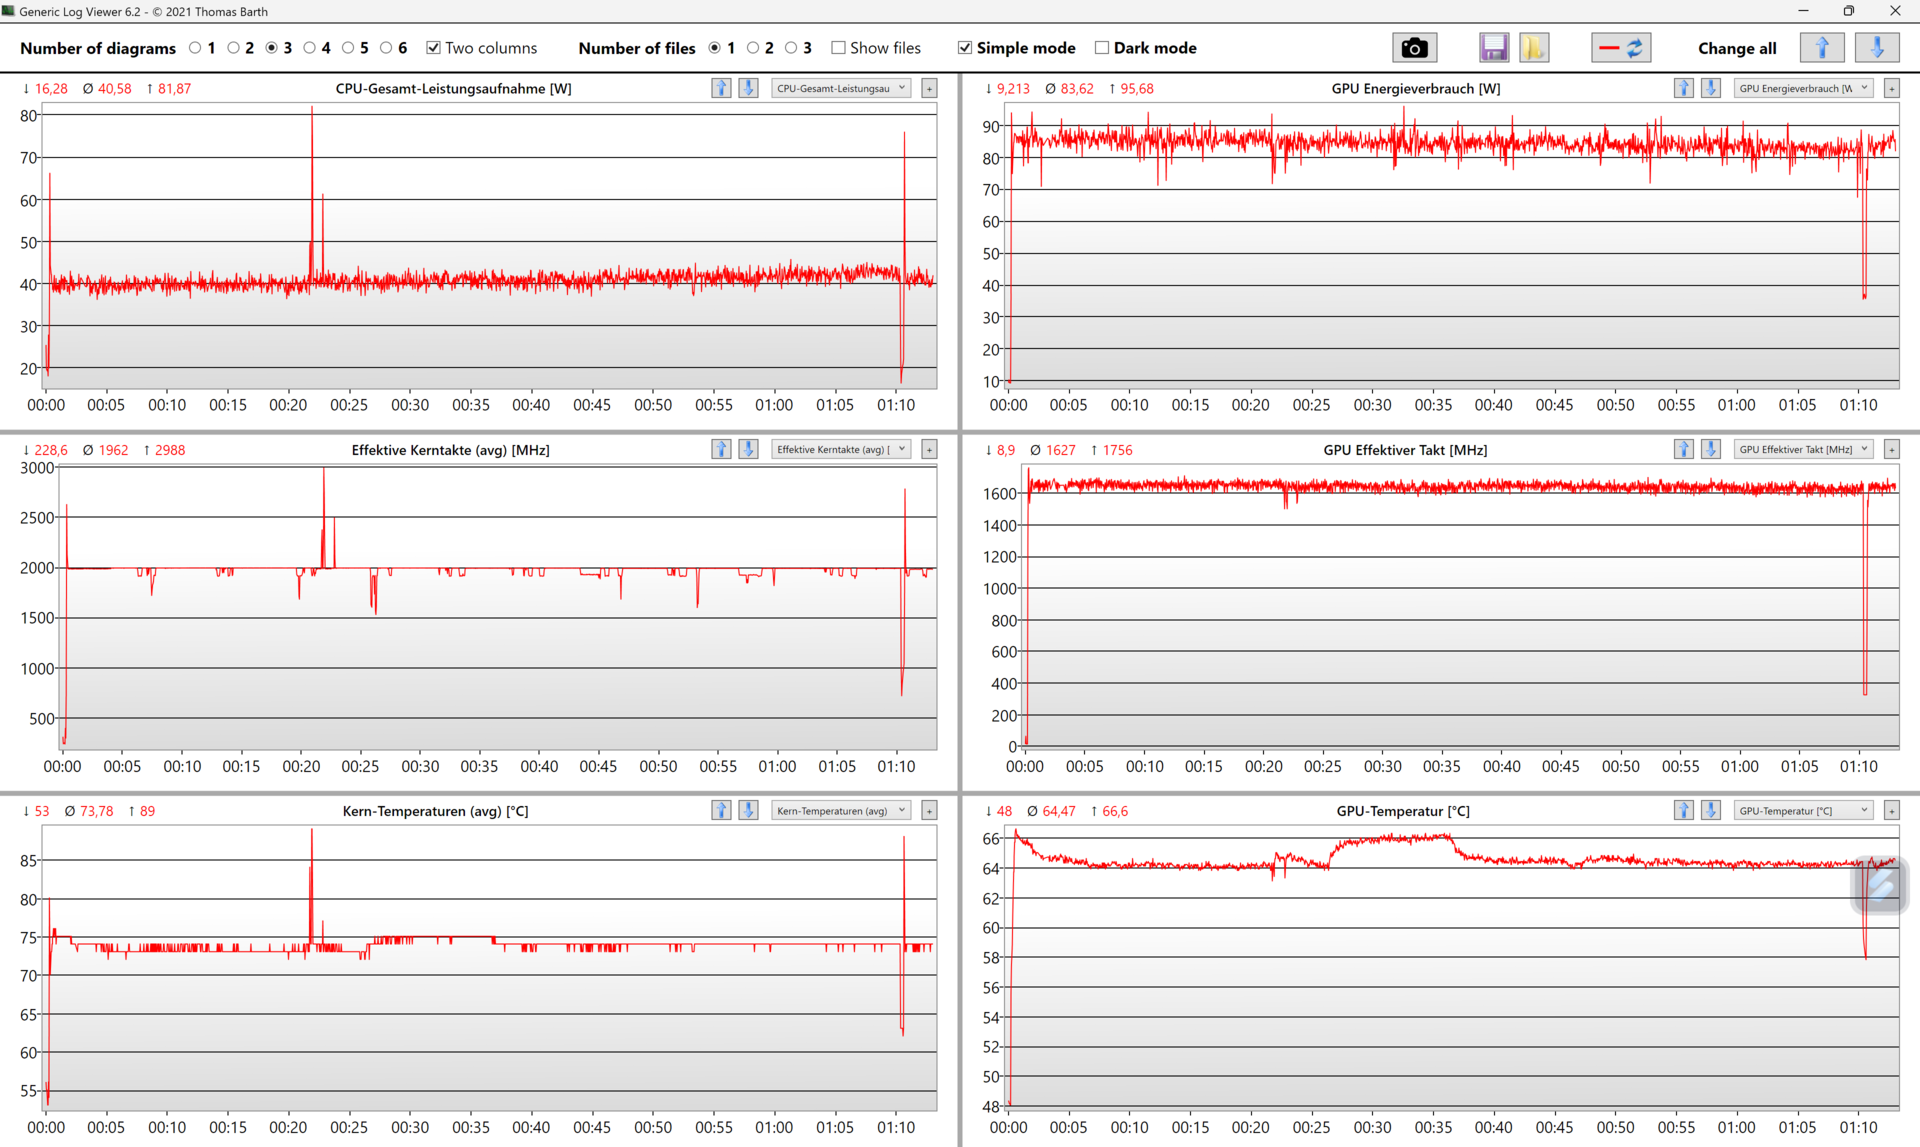
W trybie Performance, jak i w trybie Standard, moc boost procesora Intel Core i9 wynosi mocne 120 W, natomiast w trybie Silent jest on zasilany maksymalnie 45 W. Moc ciągła procesora z wyższej półki wynosi 85 W zarówno w trybie Standard, jak i Performance. W trybie Standard laptop ogranicza się jednak po dobrych pięciu minutach, a moc rdzenia kurczy się do około 75 W.
Jeśli układ graficzny i procesor pracują razem, ilość mocy dostępnej dla procesora kurczy się do około 40 watów. W zależności od trybu wydajności po pewnym czasie zmniejsza się również moc ciągła; do około 30 W w trybie Standard i 20 W w trybie Silent. Strona Nvidia GeForce 3060może pracować z mocą około 83 W w teście obciążeniowym przy ustawionym trybie Performance. W trybie Standard i Silent jest to 60 watów. Jeśli tylko karta graficzna jest obciążona, na przykład przez Furmark, jej ciągła moc wzrasta do nawet 95 watów
Asus podaje TDP systemu na poziomie do 140 W. Wartość ta została w naszym teście ledwo osiągnięta. W naszych dziennikach określiliśmy maksymalną łączną moc CPU i GPU na 137 watów.
Wszystkie benchmarki były uruchamiane w trybie Performance. Pomiary objętości i mocy były tworzone zgodnie z wymaganiami poszczególnych testów.
Prozessor
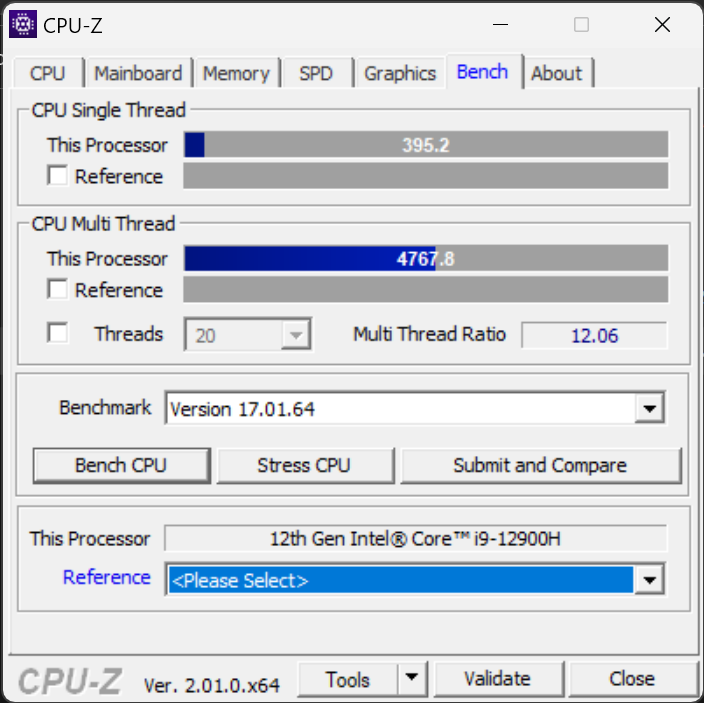
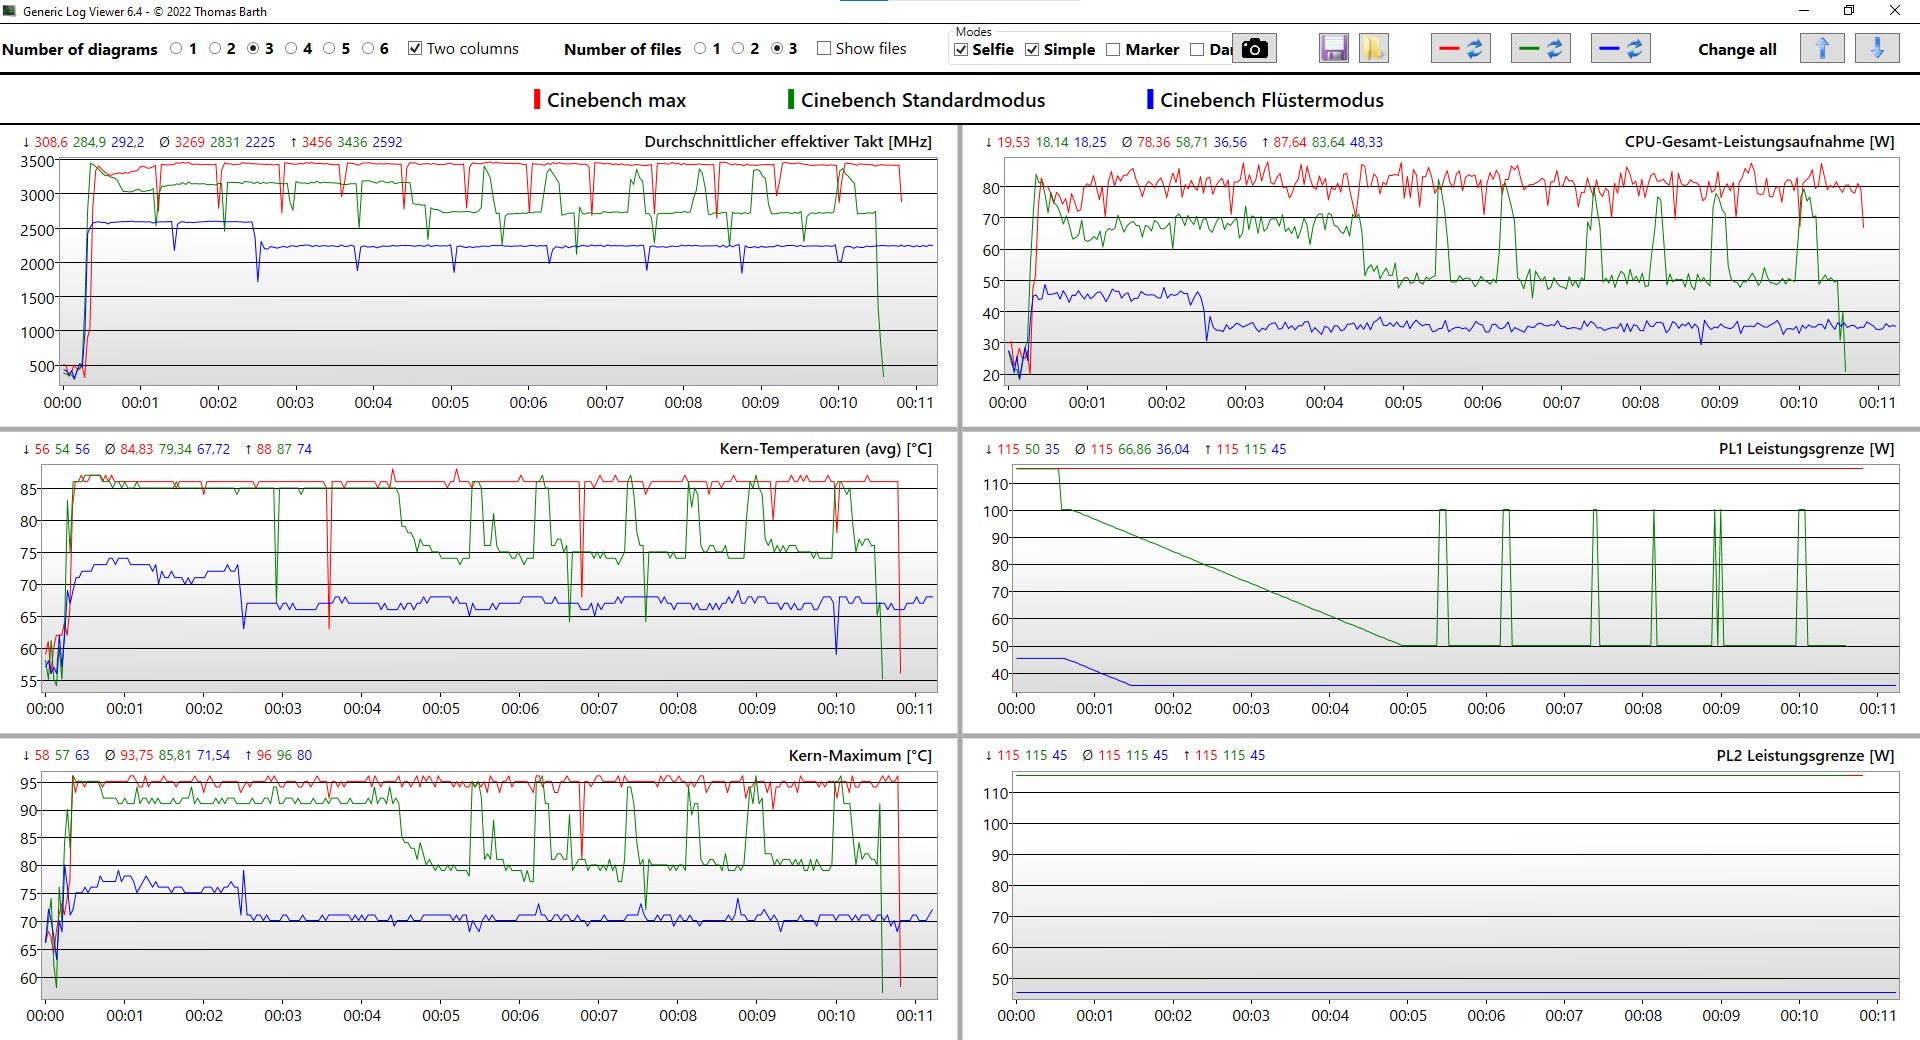
Na stronie Intel Core i9-12900H to jeden z najwydajniejszych procesorów Intela do laptopów. W Asusie Zenbook Pro 16X OLED procesor ten jest w stanie pracować z wysoką wydajnością przez długi czas. Z mocą do 80 W rozłożoną na sześć rdzeni P i osiem E szybko oczyszcza się z oczekujących zadań, dzięki czemu osiąga dobre wyniki. Procesor przyspiesza szybko do 5 GHz, a dzięki 20 wątkom jest w stanie przetwarzać wiele różnych zadań jednocześnie
Jedyne, co się tutaj wyróżnia, to nieco nieśmiała regulacja mocy. Procesor czasem osiąga pełną wydajność dopiero po dłuższym obciążeniu, a wentylatory Zenbooka zwlekają z odpaleniem. Laptop pozostaje więc przez długi czas maksymalnie cichy, ale przy tym nie może osiągnąć najwyższej wydajności w benchmarkach wymagających wyłącznie krótkotrwałej wydajności. Pod tym względem m.in Lenovo ThinkPad X1 Extreme G5 okazuje się trudnym przeciwnikiem dla Zenbooka. Nawet bez AAS laptop z rzekomo słabszym procesorem radzi sobie z równym lub wyższym wynikiem w prawie wszystkich benchmarkach procesorowych. Z drugiej strony, jeśli chodzi o benchmarki aplikacji kreatywnych, takich jak Blender, Zenbook wykonuje nadchodzące zadania szybciej niż ThinkPad. Wydaje się więc, że Asus dokonał tutaj odpowiednich korekt podczas dopracowywania urządzenia.
Cinebench R15 Multi Dauertest
Cinebench R23: Multi Core | Single Core
Cinebench R20: CPU (Multi Core) | CPU (Single Core)
Cinebench R15: CPU Multi 64Bit | CPU Single 64Bit
Blender: v2.79 BMW27 CPU
7-Zip 18.03: 7z b 4 | 7z b 4 -mmt1
Geekbench 5.5: Multi-Core | Single-Core
HWBOT x265 Benchmark v2.2: 4k Preset
LibreOffice : 20 Documents To PDF
R Benchmark 2.5: Overall mean
| CPU Performance rating | |
| HP ZBook Studio 16 G9 62U04EA | |
| Lenovo ThinkPad X1 Extreme G5-21DE003RGE | |
| Asus ZenBook Pro 16X OLED UX7602ZM-ME115W | |
| Średnia w klasie Multimedia | |
| MSI CreatorPro Z16P B12UKST | |
| Przeciętny Intel Core i9-12900H | |
| Dell Precision 7670 | |
| Corsair Voyager a1600 | |
| HP Omen 16-n0033dx | |
| Asus VivoBook Pro 16X OLED N7600PC-L2026X | |
| Cinebench R23 / Multi Core | |
| Lenovo ThinkPad X1 Extreme G5-21DE003RGE | |
| MSI CreatorPro Z16P B12UKST | |
| Średnia w klasie Multimedia (4861 - 33362, n=79, ostatnie 2 lata) | |
| Asus ZenBook Pro 16X OLED UX7602ZM-ME115W | |
| HP ZBook Studio 16 G9 62U04EA | |
| Przeciętny Intel Core i9-12900H (7359 - 19648, n=28) | |
| Dell Precision 7670 | |
| Corsair Voyager a1600 | |
| HP Omen 16-n0033dx | |
| Asus VivoBook Pro 16X OLED N7600PC-L2026X | |
| Cinebench R23 / Single Core | |
| Średnia w klasie Multimedia (1128 - 2459, n=71, ostatnie 2 lata) | |
| HP ZBook Studio 16 G9 62U04EA | |
| Przeciętny Intel Core i9-12900H (1634 - 1930, n=28) | |
| Lenovo ThinkPad X1 Extreme G5-21DE003RGE | |
| MSI CreatorPro Z16P B12UKST | |
| Asus ZenBook Pro 16X OLED UX7602ZM-ME115W | |
| Dell Precision 7670 | |
| Corsair Voyager a1600 | |
| Asus VivoBook Pro 16X OLED N7600PC-L2026X | |
| HP Omen 16-n0033dx | |
| Cinebench R20 / CPU (Multi Core) | |
| Lenovo ThinkPad X1 Extreme G5-21DE003RGE | |
| MSI CreatorPro Z16P B12UKST | |
| HP ZBook Studio 16 G9 62U04EA | |
| Średnia w klasie Multimedia (1887 - 12912, n=62, ostatnie 2 lata) | |
| Dell Precision 7670 | |
| Asus ZenBook Pro 16X OLED UX7602ZM-ME115W | |
| Przeciętny Intel Core i9-12900H (2681 - 7471, n=28) | |
| Corsair Voyager a1600 | |
| HP Omen 16-n0033dx | |
| Asus VivoBook Pro 16X OLED N7600PC-L2026X | |
| Cinebench R20 / CPU (Single Core) | |
| Średnia w klasie Multimedia (425 - 853, n=62, ostatnie 2 lata) | |
| HP ZBook Studio 16 G9 62U04EA | |
| Przeciętny Intel Core i9-12900H (624 - 738, n=28) | |
| Lenovo ThinkPad X1 Extreme G5-21DE003RGE | |
| Dell Precision 7670 | |
| Asus ZenBook Pro 16X OLED UX7602ZM-ME115W | |
| MSI CreatorPro Z16P B12UKST | |
| HP Omen 16-n0033dx | |
| Corsair Voyager a1600 | |
| Asus VivoBook Pro 16X OLED N7600PC-L2026X | |
| Cinebench R15 / CPU Multi 64Bit | |
| Lenovo ThinkPad X1 Extreme G5-21DE003RGE | |
| Asus ZenBook Pro 16X OLED UX7602ZM-ME115W | |
| Średnia w klasie Multimedia (856 - 5224, n=66, ostatnie 2 lata) | |
| HP ZBook Studio 16 G9 62U04EA | |
| Przeciętny Intel Core i9-12900H (1395 - 3077, n=28) | |
| Dell Precision 7670 | |
| MSI CreatorPro Z16P B12UKST | |
| Corsair Voyager a1600 | |
| HP Omen 16-n0033dx | |
| Asus VivoBook Pro 16X OLED N7600PC-L2026X | |
| Cinebench R15 / CPU Single 64Bit | |
| Średnia w klasie Multimedia (184.8 - 326, n=64, ostatnie 2 lata) | |
| HP ZBook Studio 16 G9 62U04EA | |
| Asus ZenBook Pro 16X OLED UX7602ZM-ME115W | |
| Asus ZenBook Pro 16X OLED UX7602ZM-ME115W | |
| Przeciętny Intel Core i9-12900H (235 - 277, n=29) | |
| Lenovo ThinkPad X1 Extreme G5-21DE003RGE | |
| Dell Precision 7670 | |
| Corsair Voyager a1600 | |
| HP Omen 16-n0033dx | |
| MSI CreatorPro Z16P B12UKST | |
| Asus VivoBook Pro 16X OLED N7600PC-L2026X | |
| Asus VivoBook Pro 16X OLED N7600PC-L2026X | |
| Blender / v2.79 BMW27 CPU | |
| Asus VivoBook Pro 16X OLED N7600PC-L2026X | |
| Średnia w klasie Multimedia (100 - 557, n=63, ostatnie 2 lata) | |
| HP Omen 16-n0033dx | |
| Przeciętny Intel Core i9-12900H (160 - 451, n=28) | |
| Corsair Voyager a1600 | |
| Dell Precision 7670 | |
| MSI CreatorPro Z16P B12UKST | |
| HP ZBook Studio 16 G9 62U04EA | |
| Lenovo ThinkPad X1 Extreme G5-21DE003RGE | |
| Asus ZenBook Pro 16X OLED UX7602ZM-ME115W | |
| 7-Zip 18.03 / 7z b 4 | |
| Asus ZenBook Pro 16X OLED UX7602ZM-ME115W | |
| HP ZBook Studio 16 G9 62U04EA | |
| MSI CreatorPro Z16P B12UKST | |
| Lenovo ThinkPad X1 Extreme G5-21DE003RGE | |
| Corsair Voyager a1600 | |
| Przeciętny Intel Core i9-12900H (34684 - 76677, n=28) | |
| HP Omen 16-n0033dx | |
| Średnia w klasie Multimedia (26062 - 130368, n=60, ostatnie 2 lata) | |
| Dell Precision 7670 | |
| Asus VivoBook Pro 16X OLED N7600PC-L2026X | |
| 7-Zip 18.03 / 7z b 4 -mmt1 | |
| HP ZBook Studio 16 G9 62U04EA | |
| Średnia w klasie Multimedia (3666 - 7545, n=61, ostatnie 2 lata) | |
| Lenovo ThinkPad X1 Extreme G5-21DE003RGE | |
| Przeciętny Intel Core i9-12900H (5302 - 6289, n=28) | |
| Asus ZenBook Pro 16X OLED UX7602ZM-ME115W | |
| Corsair Voyager a1600 | |
| MSI CreatorPro Z16P B12UKST | |
| HP Omen 16-n0033dx | |
| Dell Precision 7670 | |
| Asus VivoBook Pro 16X OLED N7600PC-L2026X | |
| Geekbench 5.5 / Multi-Core | |
| Asus ZenBook Pro 16X OLED UX7602ZM-ME115W | |
| Średnia w klasie Multimedia (4652 - 20422, n=60, ostatnie 2 lata) | |
| HP ZBook Studio 16 G9 62U04EA | |
| MSI CreatorPro Z16P B12UKST | |
| Przeciętny Intel Core i9-12900H (8519 - 14376, n=31) | |
| Lenovo ThinkPad X1 Extreme G5-21DE003RGE | |
| Dell Precision 7670 | |
| Corsair Voyager a1600 | |
| HP Omen 16-n0033dx | |
| Asus VivoBook Pro 16X OLED N7600PC-L2026X | |
| Geekbench 5.5 / Single-Core | |
| Średnia w klasie Multimedia (805 - 2974, n=60, ostatnie 2 lata) | |
| HP ZBook Studio 16 G9 62U04EA | |
| Asus ZenBook Pro 16X OLED UX7602ZM-ME115W | |
| Lenovo ThinkPad X1 Extreme G5-21DE003RGE | |
| Przeciętny Intel Core i9-12900H (1631 - 1897, n=31) | |
| MSI CreatorPro Z16P B12UKST | |
| Dell Precision 7670 | |
| HP Omen 16-n0033dx | |
| Asus VivoBook Pro 16X OLED N7600PC-L2026X | |
| Corsair Voyager a1600 | |
| HWBOT x265 Benchmark v2.2 / 4k Preset | |
| HP ZBook Studio 16 G9 62U04EA | |
| MSI CreatorPro Z16P B12UKST | |
| Asus ZenBook Pro 16X OLED UX7602ZM-ME115W | |
| Średnia w klasie Multimedia (5.26 - 36.1, n=61, ostatnie 2 lata) | |
| Dell Precision 7670 | |
| Lenovo ThinkPad X1 Extreme G5-21DE003RGE | |
| Przeciętny Intel Core i9-12900H (8.05 - 22.5, n=28) | |
| Corsair Voyager a1600 | |
| HP Omen 16-n0033dx | |
| Asus VivoBook Pro 16X OLED N7600PC-L2026X | |
| LibreOffice / 20 Documents To PDF | |
| HP Omen 16-n0033dx | |
| Corsair Voyager a1600 | |
| Asus VivoBook Pro 16X OLED N7600PC-L2026X | |
| Średnia w klasie Multimedia (23.9 - 146.7, n=62, ostatnie 2 lata) | |
| Dell Precision 7670 | |
| HP ZBook Studio 16 G9 62U04EA | |
| Przeciętny Intel Core i9-12900H (36.8 - 59.8, n=28) | |
| Lenovo ThinkPad X1 Extreme G5-21DE003RGE | |
| Asus ZenBook Pro 16X OLED UX7602ZM-ME115W | |
| MSI CreatorPro Z16P B12UKST | |
| R Benchmark 2.5 / Overall mean | |
| Asus VivoBook Pro 16X OLED N7600PC-L2026X | |
| HP Omen 16-n0033dx | |
| Corsair Voyager a1600 | |
| Dell Precision 7670 | |
| Średnia w klasie Multimedia (0.3604 - 0.947, n=61, ostatnie 2 lata) | |
| Lenovo ThinkPad X1 Extreme G5-21DE003RGE | |
| MSI CreatorPro Z16P B12UKST | |
| Przeciętny Intel Core i9-12900H (0.4218 - 0.506, n=28) | |
| Asus ZenBook Pro 16X OLED UX7602ZM-ME115W | |
| HP ZBook Studio 16 G9 62U04EA | |
* ... im mniej tym lepiej
AIDA64: FP32 Ray-Trace | FPU Julia | CPU SHA3 | CPU Queen | FPU SinJulia | FPU Mandel | CPU AES | CPU ZLib | FP64 Ray-Trace | CPU PhotoWorxx
| Performance rating | |
| Corsair Voyager a1600 | |
| HP Omen 16-n0033dx | |
| MSI CreatorPro Z16P B12UKST | |
| Średnia w klasie Multimedia | |
| HP ZBook Studio 16 G9 62U04EA | |
| Asus ZenBook Pro 16X OLED UX7602ZM-ME115W | |
| Lenovo ThinkPad X1 Extreme G5-21DE003RGE | |
| Przeciętny Intel Core i9-12900H | |
| Dell Precision 7670 | |
| Asus VivoBook Pro 16X OLED N7600PC-L2026X | |
| AIDA64 / FP32 Ray-Trace | |
| Średnia w klasie Multimedia (2214 - 50388, n=58, ostatnie 2 lata) | |
| Lenovo ThinkPad X1 Extreme G5-21DE003RGE | |
| Corsair Voyager a1600 | |
| HP Omen 16-n0033dx | |
| HP ZBook Studio 16 G9 62U04EA | |
| MSI CreatorPro Z16P B12UKST | |
| Asus ZenBook Pro 16X OLED UX7602ZM-ME115W | |
| Dell Precision 7670 | |
| Przeciętny Intel Core i9-12900H (4074 - 18289, n=29) | |
| Asus VivoBook Pro 16X OLED N7600PC-L2026X | |
| AIDA64 / FPU Julia | |
| Corsair Voyager a1600 | |
| HP Omen 16-n0033dx | |
| Średnia w klasie Multimedia (12867 - 201874, n=59, ostatnie 2 lata) | |
| Lenovo ThinkPad X1 Extreme G5-21DE003RGE | |
| HP ZBook Studio 16 G9 62U04EA | |
| Asus ZenBook Pro 16X OLED UX7602ZM-ME115W | |
| MSI CreatorPro Z16P B12UKST | |
| Dell Precision 7670 | |
| Przeciętny Intel Core i9-12900H (22307 - 93236, n=29) | |
| Asus VivoBook Pro 16X OLED N7600PC-L2026X | |
| AIDA64 / CPU SHA3 | |
| Średnia w klasie Multimedia (626 - 8623, n=59, ostatnie 2 lata) | |
| Lenovo ThinkPad X1 Extreme G5-21DE003RGE | |
| HP ZBook Studio 16 G9 62U04EA | |
| Asus ZenBook Pro 16X OLED UX7602ZM-ME115W | |
| MSI CreatorPro Z16P B12UKST | |
| Corsair Voyager a1600 | |
| HP Omen 16-n0033dx | |
| Dell Precision 7670 | |
| Przeciętny Intel Core i9-12900H (1378 - 4215, n=29) | |
| Asus VivoBook Pro 16X OLED N7600PC-L2026X | |
| AIDA64 / CPU Queen | |
| Asus ZenBook Pro 16X OLED UX7602ZM-ME115W | |
| HP ZBook Studio 16 G9 62U04EA | |
| HP Omen 16-n0033dx | |
| Corsair Voyager a1600 | |
| Lenovo ThinkPad X1 Extreme G5-21DE003RGE | |
| MSI CreatorPro Z16P B12UKST | |
| Przeciętny Intel Core i9-12900H (78172 - 111241, n=28) | |
| Średnia w klasie Multimedia (13483 - 181505, n=46, ostatnie 2 lata) | |
| Asus VivoBook Pro 16X OLED N7600PC-L2026X | |
| Dell Precision 7670 | |
| AIDA64 / FPU SinJulia | |
| Corsair Voyager a1600 | |
| HP Omen 16-n0033dx | |
| Lenovo ThinkPad X1 Extreme G5-21DE003RGE | |
| Dell Precision 7670 | |
| Asus ZenBook Pro 16X OLED UX7602ZM-ME115W | |
| HP ZBook Studio 16 G9 62U04EA | |
| MSI CreatorPro Z16P B12UKST | |
| Przeciętny Intel Core i9-12900H (5709 - 10410, n=29) | |
| Średnia w klasie Multimedia (886 - 28794, n=59, ostatnie 2 lata) | |
| Asus VivoBook Pro 16X OLED N7600PC-L2026X | |
| AIDA64 / FPU Mandel | |
| Corsair Voyager a1600 | |
| HP Omen 16-n0033dx | |
| Średnia w klasie Multimedia (6395 - 105740, n=58, ostatnie 2 lata) | |
| Lenovo ThinkPad X1 Extreme G5-21DE003RGE | |
| HP ZBook Studio 16 G9 62U04EA | |
| Asus ZenBook Pro 16X OLED UX7602ZM-ME115W | |
| MSI CreatorPro Z16P B12UKST | |
| Dell Precision 7670 | |
| Przeciętny Intel Core i9-12900H (11257 - 45581, n=29) | |
| Asus VivoBook Pro 16X OLED N7600PC-L2026X | |
| AIDA64 / CPU AES | |
| HP Omen 16-n0033dx | |
| Corsair Voyager a1600 | |
| MSI CreatorPro Z16P B12UKST | |
| Przeciętny Intel Core i9-12900H (31935 - 151546, n=29) | |
| Lenovo ThinkPad X1 Extreme G5-21DE003RGE | |
| HP ZBook Studio 16 G9 62U04EA | |
| Asus ZenBook Pro 16X OLED UX7602ZM-ME115W | |
| Średnia w klasie Multimedia (8171 - 126790, n=59, ostatnie 2 lata) | |
| Dell Precision 7670 | |
| Asus VivoBook Pro 16X OLED N7600PC-L2026X | |
| AIDA64 / CPU ZLib | |
| Lenovo ThinkPad X1 Extreme G5-21DE003RGE | |
| HP ZBook Studio 16 G9 62U04EA | |
| Asus ZenBook Pro 16X OLED UX7602ZM-ME115W | |
| MSI CreatorPro Z16P B12UKST | |
| Średnia w klasie Multimedia (143.8 - 2022, n=59, ostatnie 2 lata) | |
| Przeciętny Intel Core i9-12900H (449 - 1193, n=29) | |
| HP Omen 16-n0033dx | |
| Corsair Voyager a1600 | |
| Dell Precision 7670 | |
| Asus VivoBook Pro 16X OLED N7600PC-L2026X | |
| AIDA64 / FP64 Ray-Trace | |
| Średnia w klasie Multimedia (1014 - 26875, n=59, ostatnie 2 lata) | |
| Lenovo ThinkPad X1 Extreme G5-21DE003RGE | |
| HP ZBook Studio 16 G9 62U04EA | |
| Corsair Voyager a1600 | |
| HP Omen 16-n0033dx | |
| Asus ZenBook Pro 16X OLED UX7602ZM-ME115W | |
| MSI CreatorPro Z16P B12UKST | |
| Dell Precision 7670 | |
| Przeciętny Intel Core i9-12900H (2235 - 10511, n=29) | |
| Asus VivoBook Pro 16X OLED N7600PC-L2026X | |
| AIDA64 / CPU PhotoWorxx | |
| Średnia w klasie Multimedia (8187 - 88154, n=59, ostatnie 2 lata) | |
| Asus ZenBook Pro 16X OLED UX7602ZM-ME115W | |
| MSI CreatorPro Z16P B12UKST | |
| Dell Precision 7670 | |
| HP ZBook Studio 16 G9 62U04EA | |
| Przeciętny Intel Core i9-12900H (20960 - 48269, n=30) | |
| Corsair Voyager a1600 | |
| HP Omen 16-n0033dx | |
| Lenovo ThinkPad X1 Extreme G5-21DE003RGE | |
| Asus VivoBook Pro 16X OLED N7600PC-L2026X | |
Wydajność systemu
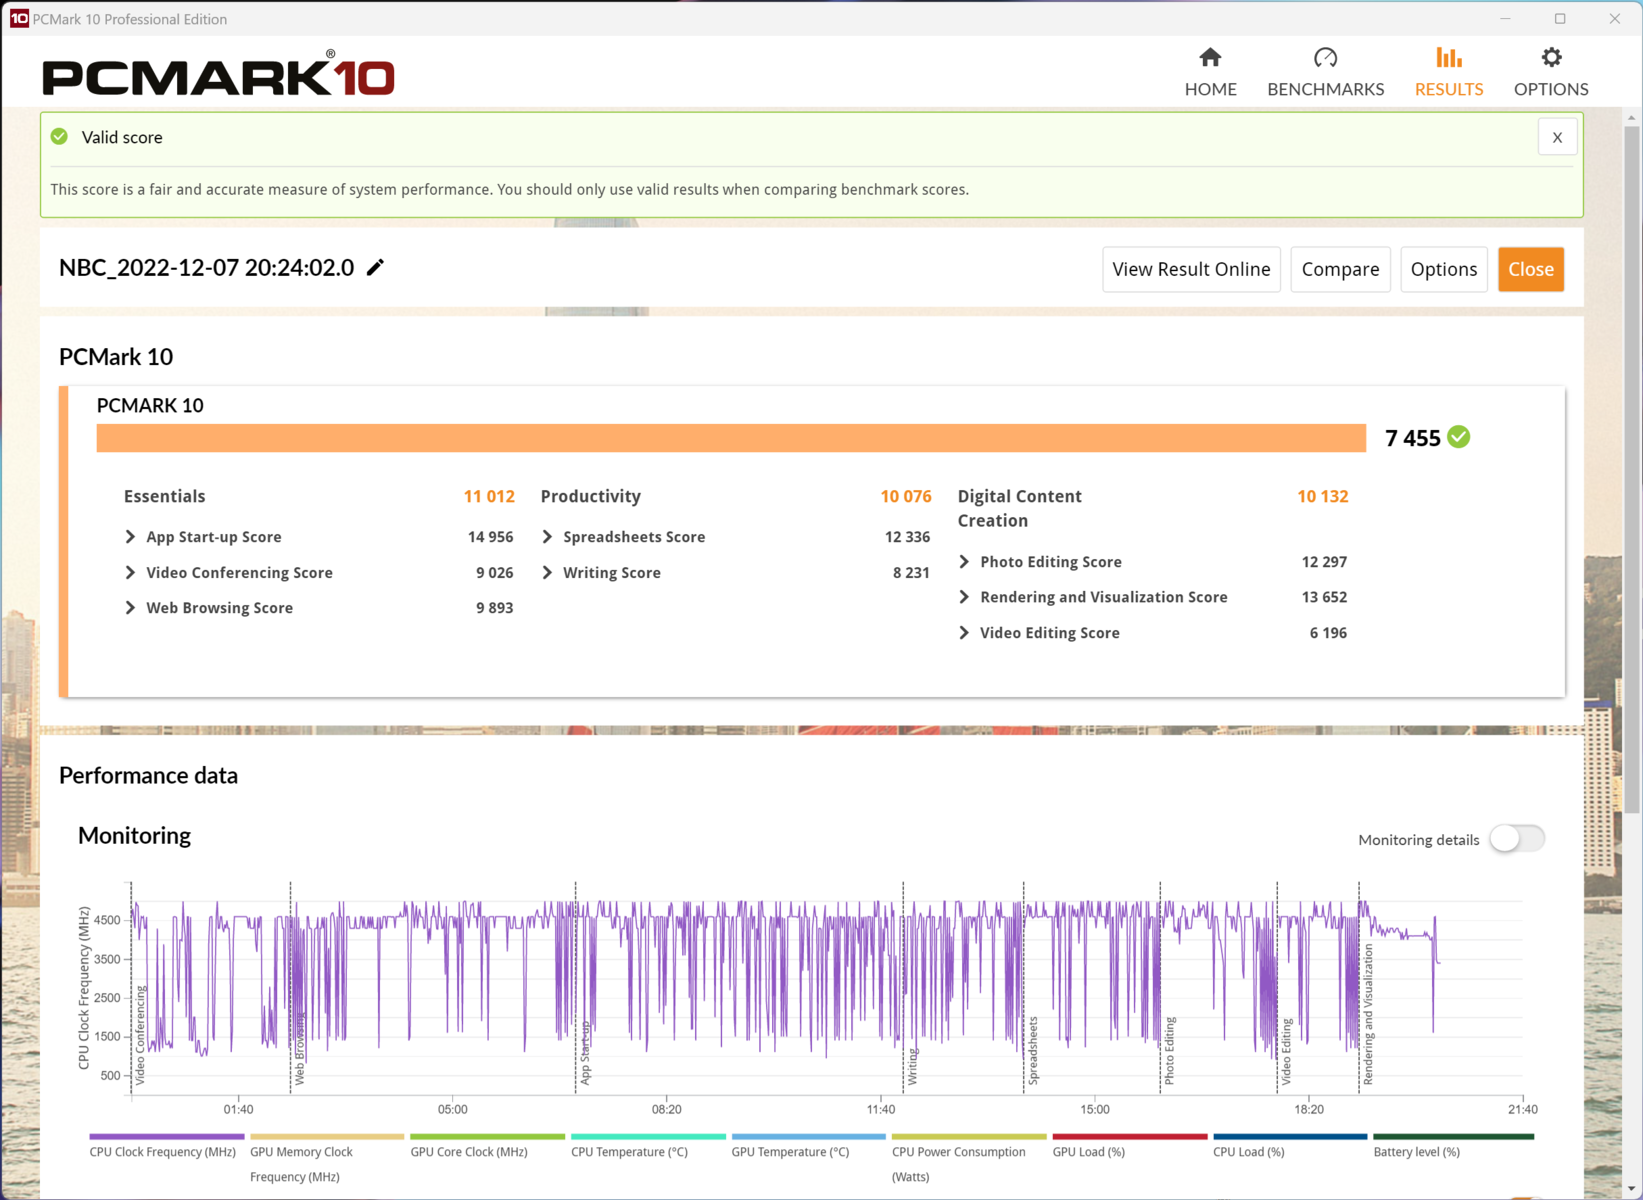
Jeżeli chodzi o benchmarki w wydajności systemowej, Asus Zenbook 16X OLED po raz pierwszy ma zdecydowaną przewagę nad ThinkPadem X1 Extreme. Wydajny laptop studyjny od Asusa jest w stanie zapewnić swojej karcie graficznej co najmniej 20 W więcej niż laptop Lenovo. Trudno się więc dziwić, że nasze urządzenie recenzenckie z komorą parową uzyskuje znakomite wyniki w benchmarkach wydajności systemu. Według Asusa Zenbook Pro 16X dysponuje całkowitym TDP na poziomie 140 W
O mocnych stronach notebooka świadczą również jego responsywność i niezwykle szybkie czasy reakcji. Niezależnie od ustawionego trybu wydajności, w codziennym użytkowaniu laptop nie wykazuje żadnych słabości. Praktycznie każda aplikacja uruchamia się szybciej niż przeciętnie. Niezależnie od tego, czy chodzi o Blendera, Fusion 360, Darktable czy DaVinci Resolve, laptop dobrze radzi sobie z edycją wideo, aplikacjami 3D i innymi programami. Prawdopodobnie częściowo odpowiada za to duża ilość pamięci RAM i jej wysoka przepustowość.
CrossMark: Overall | Productivity | Creativity | Responsiveness
| PCMark 10 / Score | |
| Średnia w klasie Multimedia (4325 - 10386, n=56, ostatnie 2 lata) | |
| Przeciętny Intel Core i9-12900H, NVIDIA GeForce RTX 3060 Laptop GPU (7135 - 7861, n=4) | |
| Asus ZenBook Pro 16X OLED UX7602ZM-ME115W | |
| Lenovo ThinkPad X1 Extreme G5-21DE003RGE | |
| Corsair Voyager a1600 | |
| HP Omen 16-n0033dx | |
| MSI CreatorPro Z16P B12UKST | |
| Dell Precision 7670 | |
| HP ZBook Studio 16 G9 62U04EA | |
| Asus VivoBook Pro 16X OLED N7600PC-L2026X | |
| PCMark 10 / Essentials | |
| Asus ZenBook Pro 16X OLED UX7602ZM-ME115W | |
| Przeciętny Intel Core i9-12900H, NVIDIA GeForce RTX 3060 Laptop GPU (10380 - 11198, n=4) | |
| MSI CreatorPro Z16P B12UKST | |
| Dell Precision 7670 | |
| Lenovo ThinkPad X1 Extreme G5-21DE003RGE | |
| Średnia w klasie Multimedia (8025 - 11664, n=55, ostatnie 2 lata) | |
| HP Omen 16-n0033dx | |
| Corsair Voyager a1600 | |
| HP ZBook Studio 16 G9 62U04EA | |
| Asus VivoBook Pro 16X OLED N7600PC-L2026X | |
| PCMark 10 / Productivity | |
| Średnia w klasie Multimedia (7323 - 18233, n=55, ostatnie 2 lata) | |
| Przeciętny Intel Core i9-12900H, NVIDIA GeForce RTX 3060 Laptop GPU (9751 - 10486, n=4) | |
| Asus ZenBook Pro 16X OLED UX7602ZM-ME115W | |
| Lenovo ThinkPad X1 Extreme G5-21DE003RGE | |
| MSI CreatorPro Z16P B12UKST | |
| HP Omen 16-n0033dx | |
| Dell Precision 7670 | |
| Corsair Voyager a1600 | |
| Asus VivoBook Pro 16X OLED N7600PC-L2026X | |
| HP ZBook Studio 16 G9 62U04EA | |
| PCMark 10 / Digital Content Creation | |
| Corsair Voyager a1600 | |
| HP Omen 16-n0033dx | |
| Średnia w klasie Multimedia (3651 - 16240, n=55, ostatnie 2 lata) | |
| Lenovo ThinkPad X1 Extreme G5-21DE003RGE | |
| Przeciętny Intel Core i9-12900H, NVIDIA GeForce RTX 3060 Laptop GPU (9741 - 11226, n=4) | |
| Asus ZenBook Pro 16X OLED UX7602ZM-ME115W | |
| MSI CreatorPro Z16P B12UKST | |
| HP ZBook Studio 16 G9 62U04EA | |
| Dell Precision 7670 | |
| Asus VivoBook Pro 16X OLED N7600PC-L2026X | |
| CrossMark / Overall | |
| Przeciętny Intel Core i9-12900H, NVIDIA GeForce RTX 3060 Laptop GPU (1789 - 2096, n=4) | |
| MSI CreatorPro Z16P B12UKST | |
| Średnia w klasie Multimedia (866 - 2728, n=65, ostatnie 2 lata) | |
| HP ZBook Studio 16 G9 62U04EA | |
| Asus ZenBook Pro 16X OLED UX7602ZM-ME115W | |
| Lenovo ThinkPad X1 Extreme G5-21DE003RGE | |
| HP Omen 16-n0033dx | |
| Dell Precision 7670 | |
| Corsair Voyager a1600 | |
| Asus VivoBook Pro 16X OLED N7600PC-L2026X | |
| CrossMark / Productivity | |
| Przeciętny Intel Core i9-12900H, NVIDIA GeForce RTX 3060 Laptop GPU (1677 - 2062, n=4) | |
| MSI CreatorPro Z16P B12UKST | |
| Średnia w klasie Multimedia (931 - 2489, n=65, ostatnie 2 lata) | |
| HP ZBook Studio 16 G9 62U04EA | |
| Asus ZenBook Pro 16X OLED UX7602ZM-ME115W | |
| Lenovo ThinkPad X1 Extreme G5-21DE003RGE | |
| HP Omen 16-n0033dx | |
| Dell Precision 7670 | |
| Corsair Voyager a1600 | |
| Asus VivoBook Pro 16X OLED N7600PC-L2026X | |
| CrossMark / Creativity | |
| Średnia w klasie Multimedia (907 - 3465, n=65, ostatnie 2 lata) | |
| HP ZBook Studio 16 G9 62U04EA | |
| Przeciętny Intel Core i9-12900H, NVIDIA GeForce RTX 3060 Laptop GPU (2032 - 2125, n=4) | |
| MSI CreatorPro Z16P B12UKST | |
| Asus ZenBook Pro 16X OLED UX7602ZM-ME115W | |
| Lenovo ThinkPad X1 Extreme G5-21DE003RGE | |
| Dell Precision 7670 | |
| HP Omen 16-n0033dx | |
| Corsair Voyager a1600 | |
| Asus VivoBook Pro 16X OLED N7600PC-L2026X | |
| CrossMark / Responsiveness | |
| Przeciętny Intel Core i9-12900H, NVIDIA GeForce RTX 3060 Laptop GPU (1486 - 2230, n=4) | |
| MSI CreatorPro Z16P B12UKST | |
| HP ZBook Studio 16 G9 62U04EA | |
| Średnia w klasie Multimedia (605 - 2024, n=65, ostatnie 2 lata) | |
| Asus ZenBook Pro 16X OLED UX7602ZM-ME115W | |
| Lenovo ThinkPad X1 Extreme G5-21DE003RGE | |
| Dell Precision 7670 | |
| HP Omen 16-n0033dx | |
| Asus VivoBook Pro 16X OLED N7600PC-L2026X | |
| Corsair Voyager a1600 | |
| PCMark 10 Score | 7455 pkt. | |
Pomoc | ||
| AIDA64 / Memory Copy | |
| Średnia w klasie Multimedia (11299 - 132135, n=59, ostatnie 2 lata) | |
| Asus ZenBook Pro 16X OLED UX7602ZM-ME115W | |
| Dell Precision 7670 | |
| MSI CreatorPro Z16P B12UKST | |
| HP ZBook Studio 16 G9 62U04EA | |
| Przeciętny Intel Core i9-12900H (34438 - 74264, n=29) | |
| Corsair Voyager a1600 | |
| HP Omen 16-n0033dx | |
| Lenovo ThinkPad X1 Extreme G5-21DE003RGE | |
| Asus VivoBook Pro 16X OLED N7600PC-L2026X | |
| AIDA64 / Memory Read | |
| Średnia w klasie Multimedia (11624 - 174586, n=59, ostatnie 2 lata) | |
| Asus ZenBook Pro 16X OLED UX7602ZM-ME115W | |
| Dell Precision 7670 | |
| MSI CreatorPro Z16P B12UKST | |
| HP ZBook Studio 16 G9 62U04EA | |
| Przeciętny Intel Core i9-12900H (36365 - 74642, n=29) | |
| Corsair Voyager a1600 | |
| HP Omen 16-n0033dx | |
| Lenovo ThinkPad X1 Extreme G5-21DE003RGE | |
| Asus VivoBook Pro 16X OLED N7600PC-L2026X | |
| AIDA64 / Memory Write | |
| Średnia w klasie Multimedia (11755 - 134998, n=59, ostatnie 2 lata) | |
| MSI CreatorPro Z16P B12UKST | |
| HP ZBook Studio 16 G9 62U04EA | |
| Dell Precision 7670 | |
| Asus ZenBook Pro 16X OLED UX7602ZM-ME115W | |
| Przeciętny Intel Core i9-12900H (32276 - 67858, n=29) | |
| Corsair Voyager a1600 | |
| HP Omen 16-n0033dx | |
| Asus VivoBook Pro 16X OLED N7600PC-L2026X | |
| Lenovo ThinkPad X1 Extreme G5-21DE003RGE | |
| AIDA64 / Memory Latency | |
| Średnia w klasie Multimedia (7 - 535, n=58, ostatnie 2 lata) | |
| Asus ZenBook Pro 16X OLED UX7602ZM-ME115W | |
| Corsair Voyager a1600 | |
| MSI CreatorPro Z16P B12UKST | |
| Asus VivoBook Pro 16X OLED N7600PC-L2026X | |
| HP ZBook Studio 16 G9 62U04EA | |
| Dell Precision 7670 | |
| HP Omen 16-n0033dx | |
| Lenovo ThinkPad X1 Extreme G5-21DE003RGE | |
| Przeciętny Intel Core i9-12900H (74.7 - 118.1, n=28) | |
* ... im mniej tym lepiej
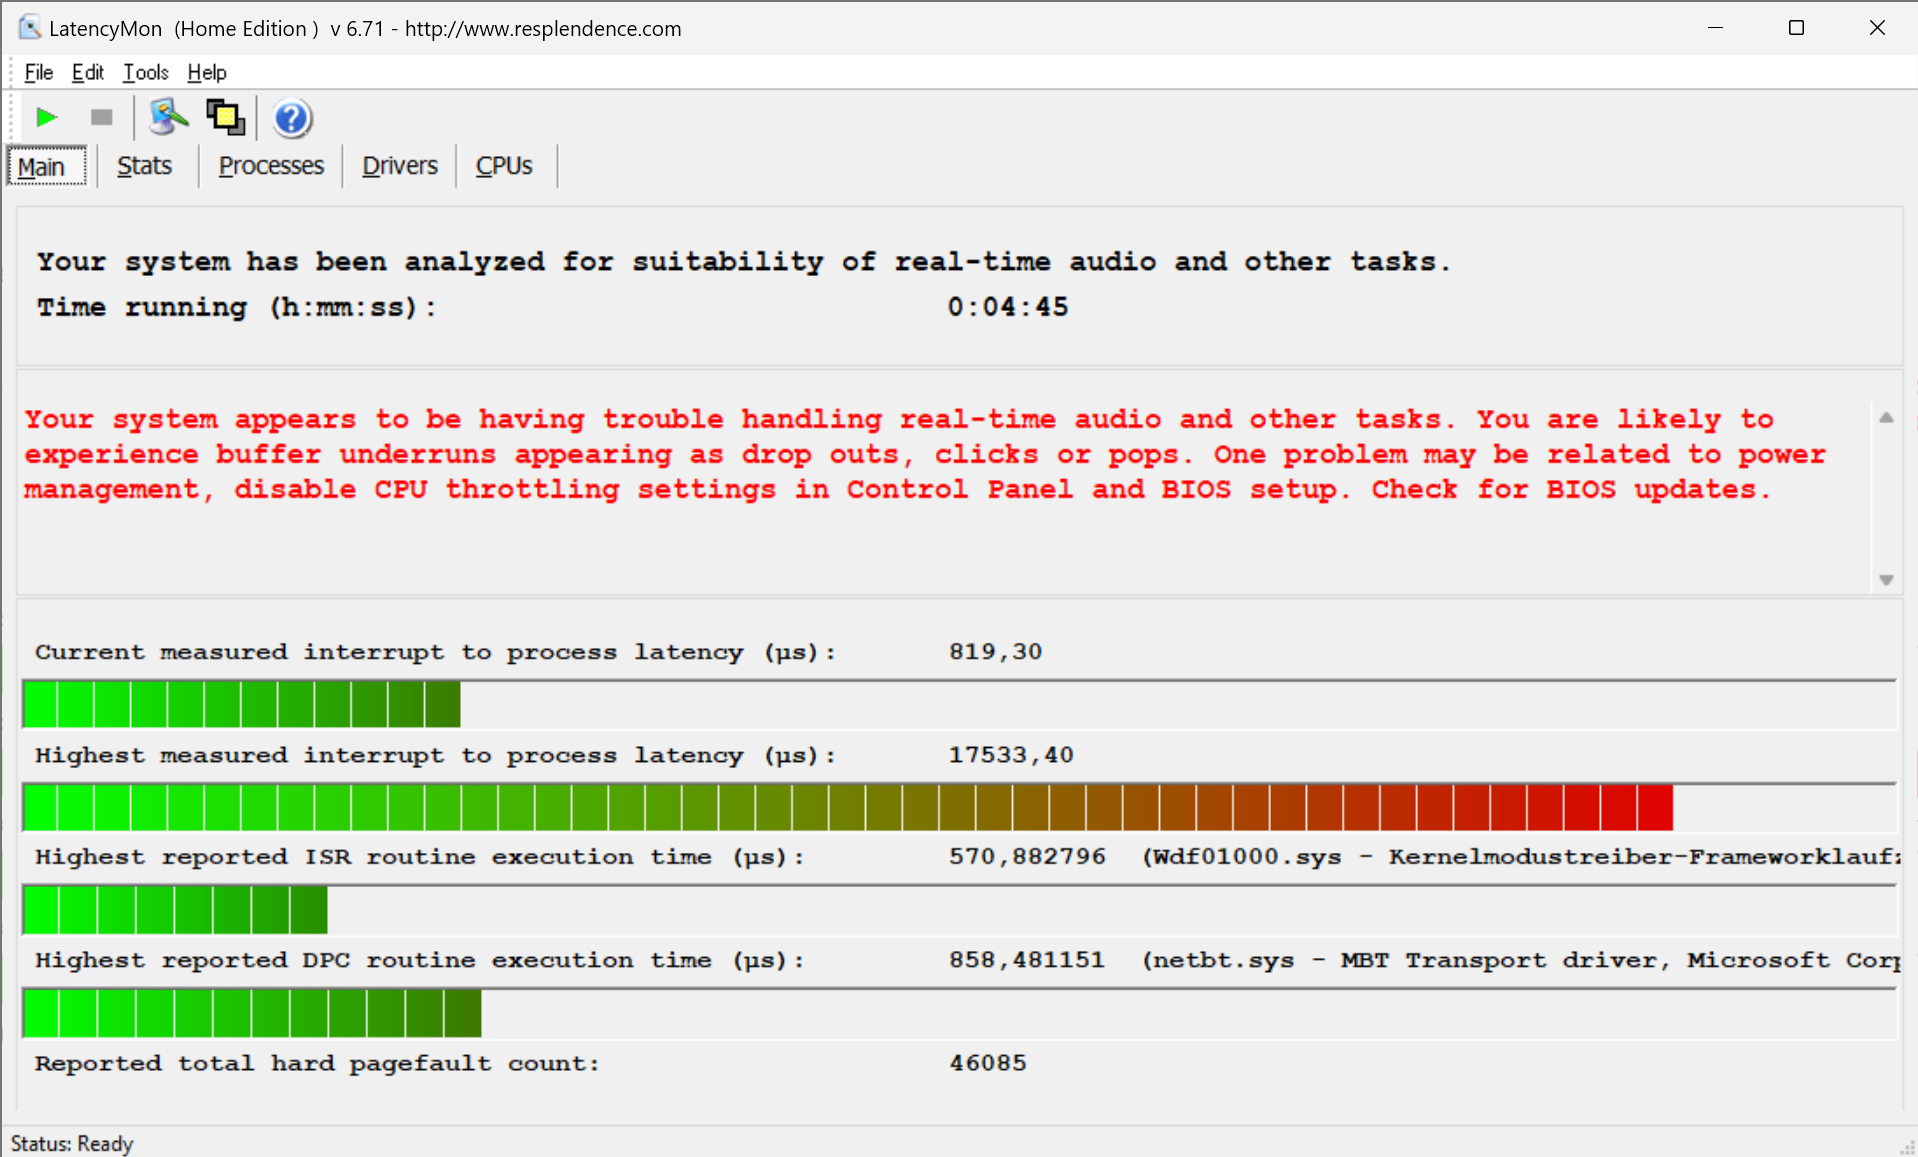
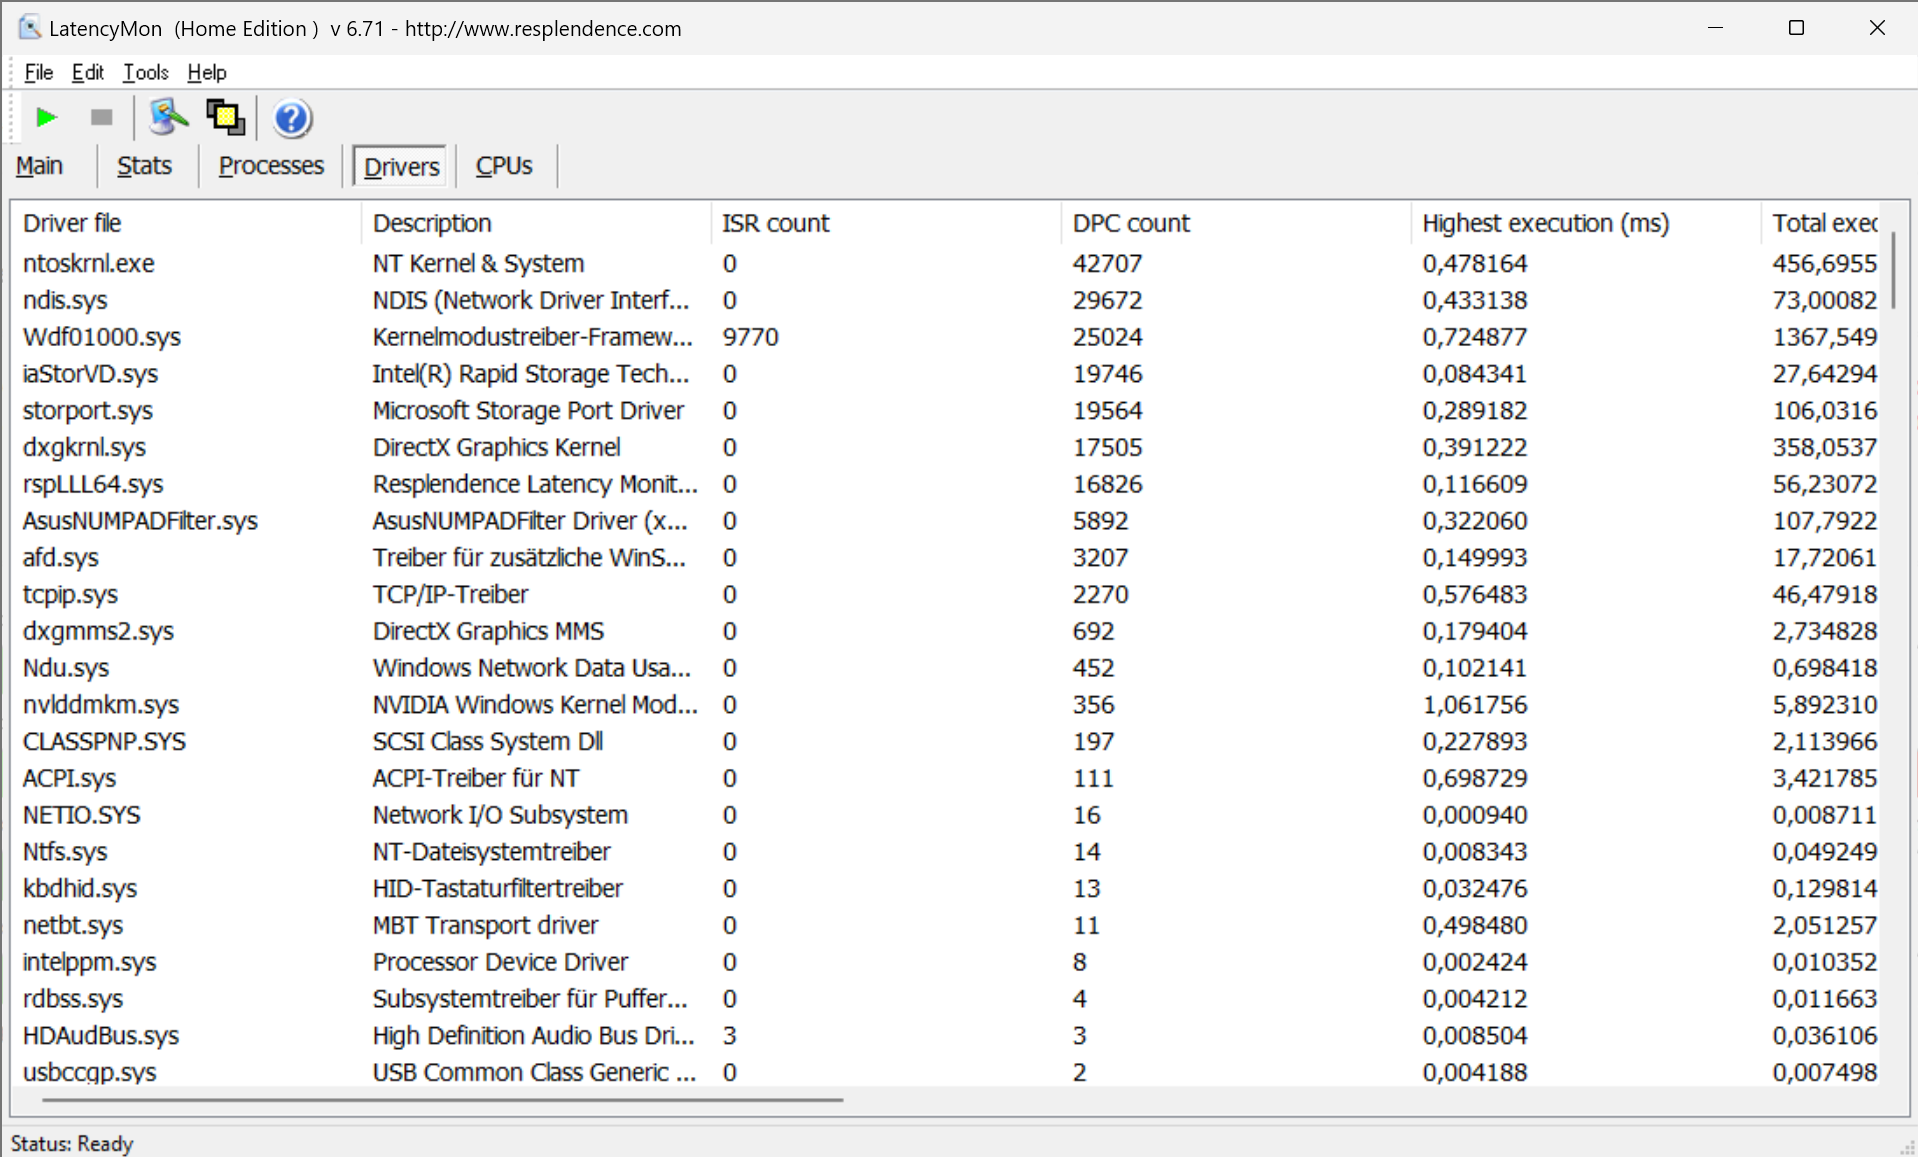
Opóźnienie DPC
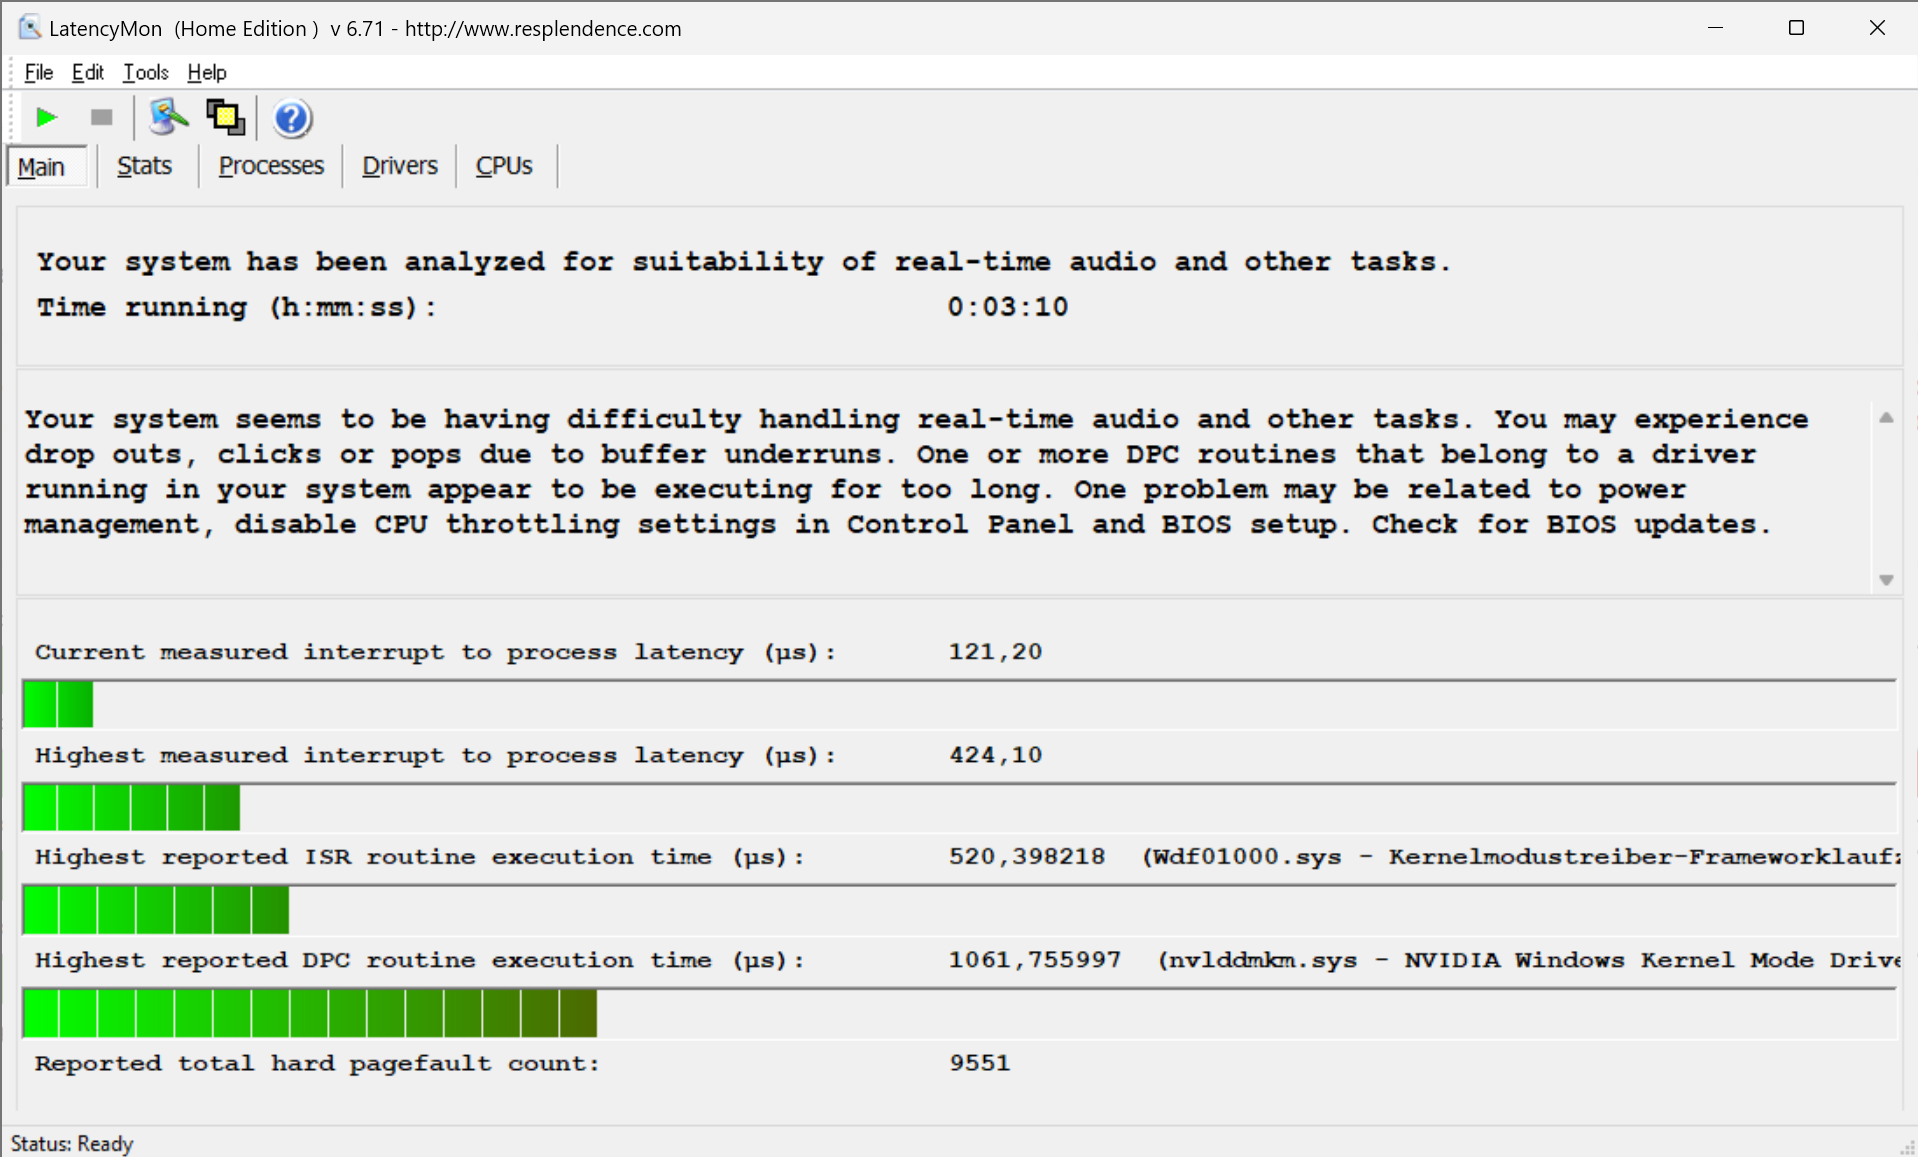
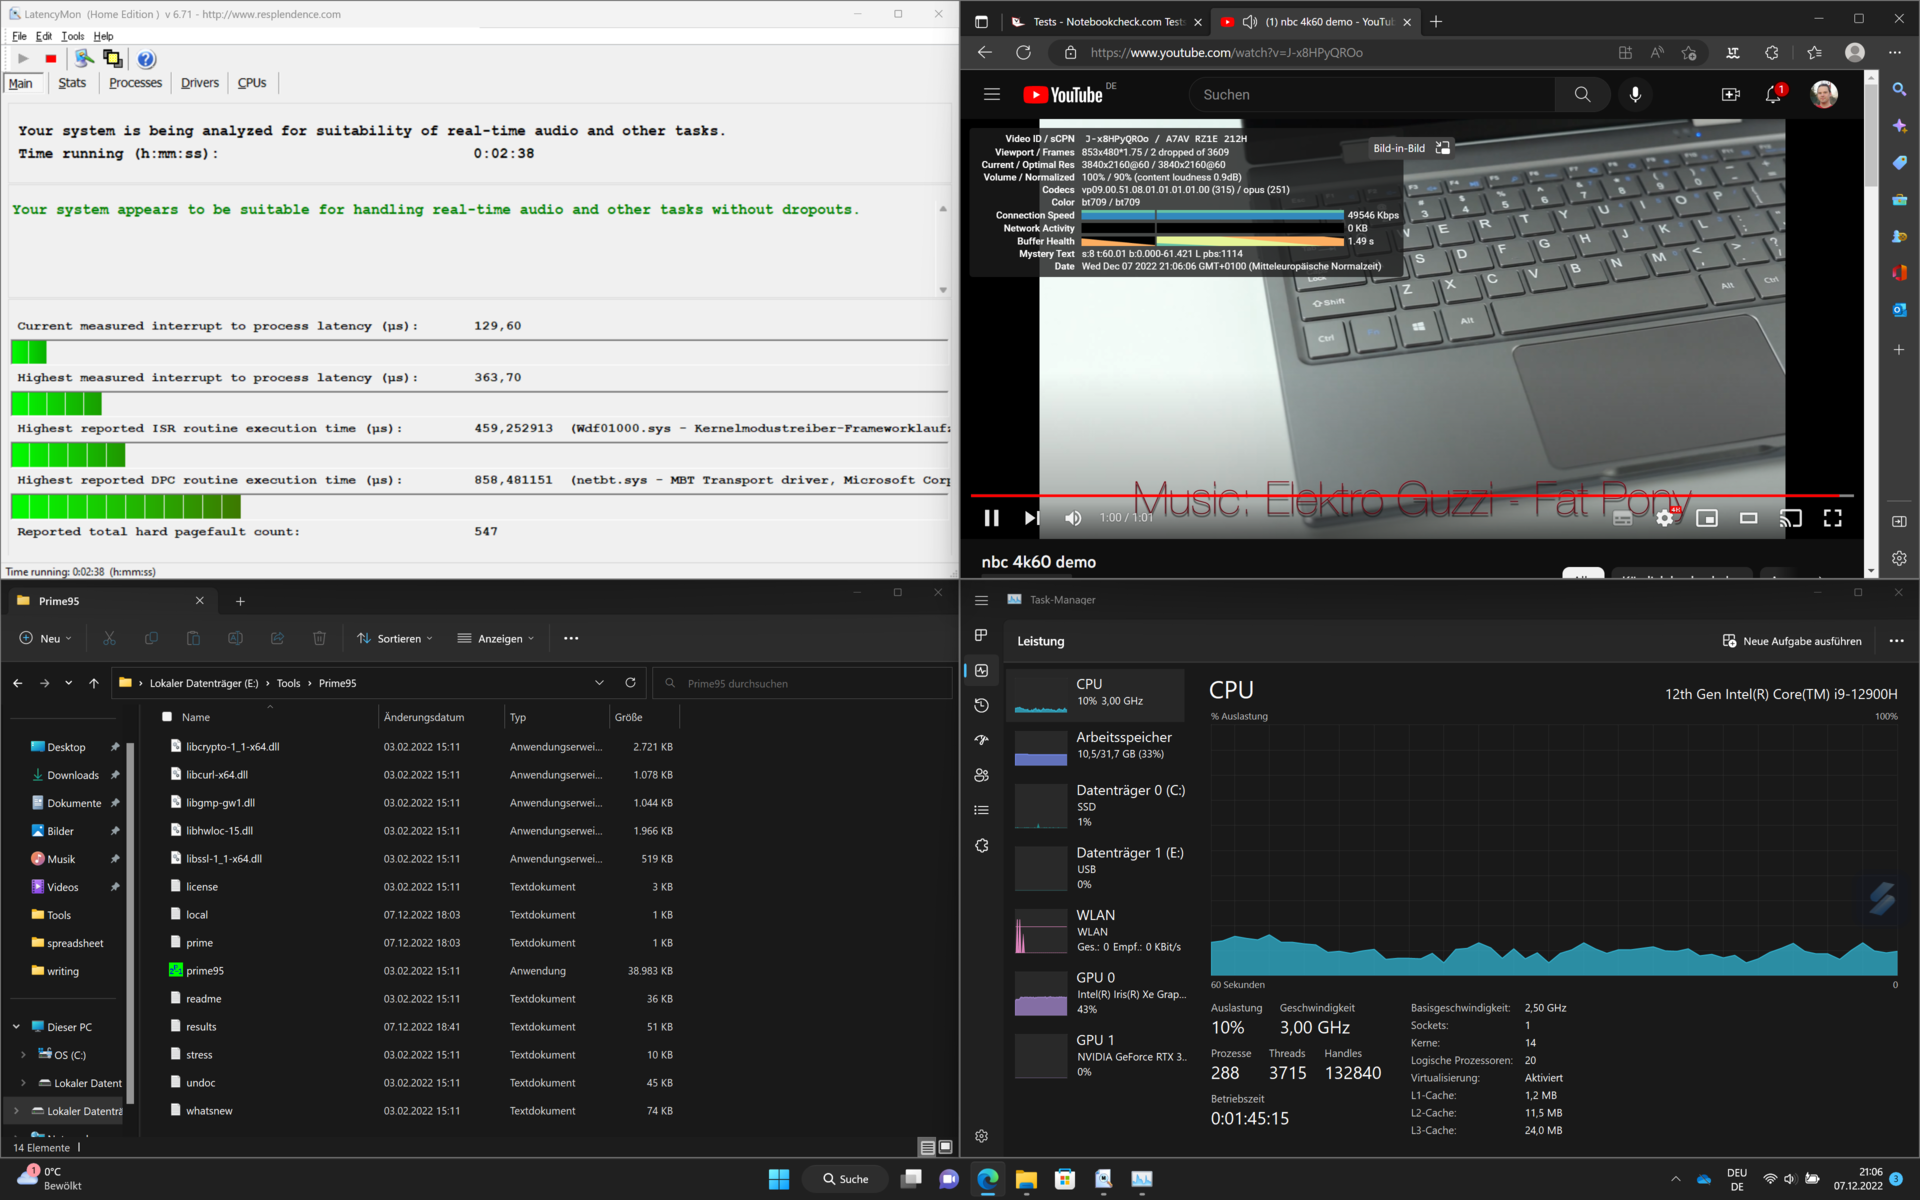
Test opóźnienia DPC przeprowadziliśmy na tym notebooku dwukrotnie. Przy pierwszej próbie Zenbook 16X prawie się zawiesił. Zaledwie kilka milisekund więcej zmusiłoby Windows Watchdog do przeprowadzenia awaryjnego wyłączenia. Zachowanie to jednak nie powtórzyło się mimo przemyślanych prób z naszej strony. Zakładamy więc, że był to jednorazowy przypadek
Test YouTube 4K60Hz nie dał powodów do narzekań. Brakowało tylko dwóch klatek
| DPC Latencies / LatencyMon - interrupt to process latency (max), Web, Youtube, Prime95 | |
| Dell Precision 7670 | |
| Lenovo ThinkPad X1 Extreme G5-21DE003RGE | |
| HP ZBook Studio 16 G9 62U04EA | |
| HP Omen 16-n0033dx | |
| Corsair Voyager a1600 | |
| MSI CreatorPro Z16P B12UKST | |
| Asus ZenBook Pro 16X OLED UX7602ZM-ME115W | |
| Asus VivoBook Pro 16X OLED N7600PC-L2026X | |
* ... im mniej tym lepiej
Urządzenia do przechowywania danych
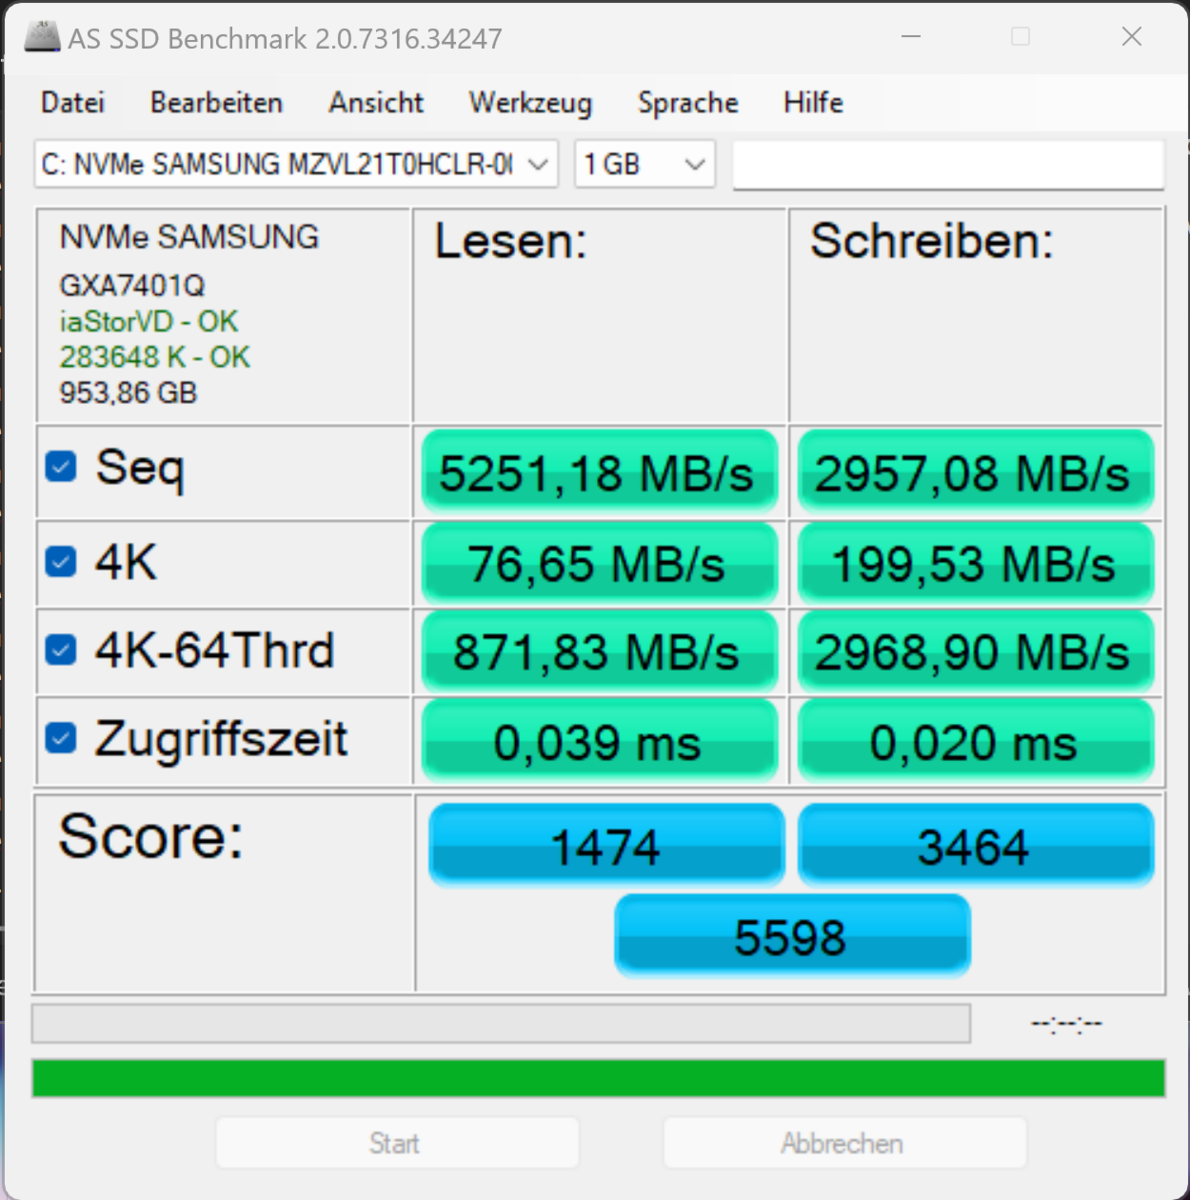
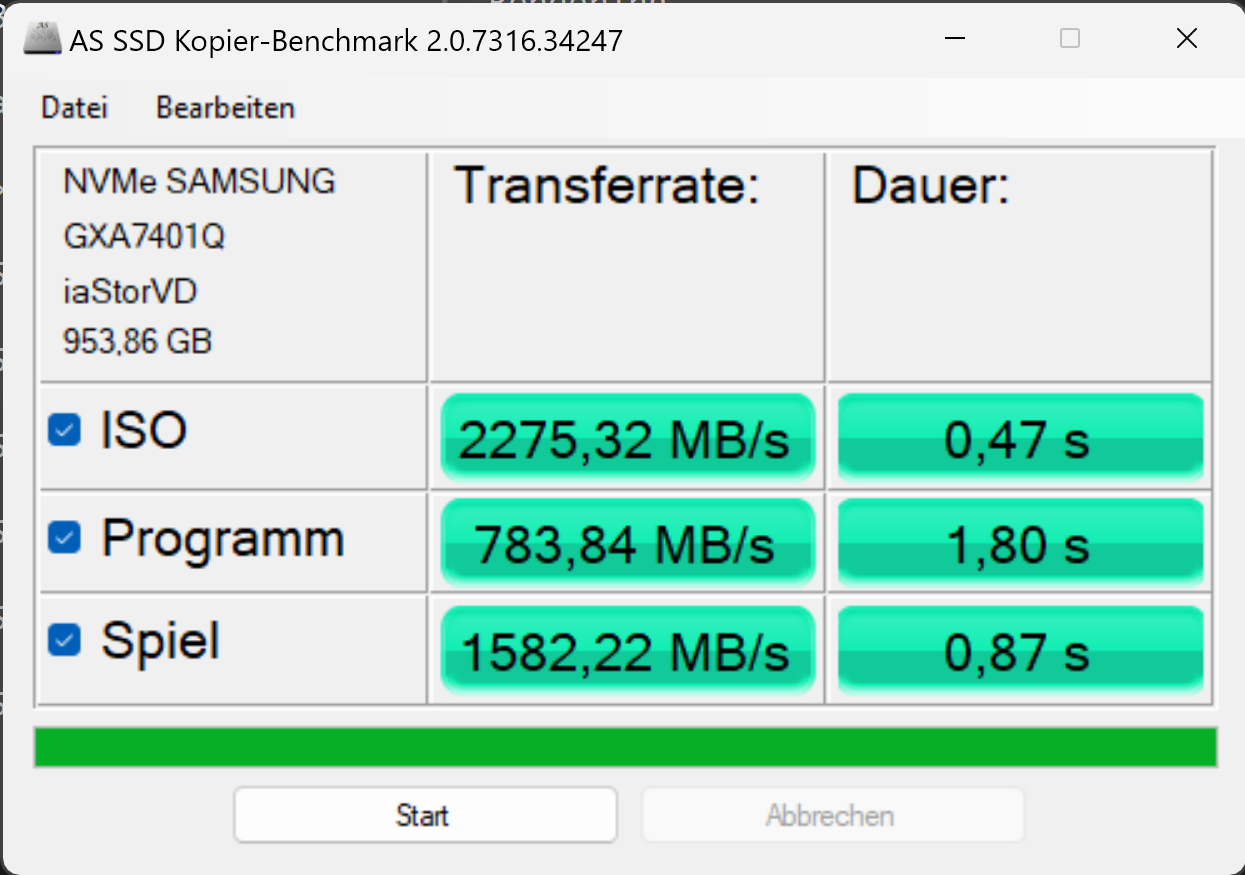
Samsung PM9A1 zainstalowany w naszym urządzeniu recenzenckim jest bardzo szybki. Transfery dysku twardego są bardzo wysokie, a żadne z urządzeń porównawczych nie ma szybszego dysku twardego. Nie należy jednak ignorować krótkich spadków prędkości transferu, które wskazują na problem z temperaturą w dysku SSD Samsunga

* ... im mniej tym lepiej
Sustained Read Performance: DiskSpd Read Loop, Queue Depth 8
Karta graficzna
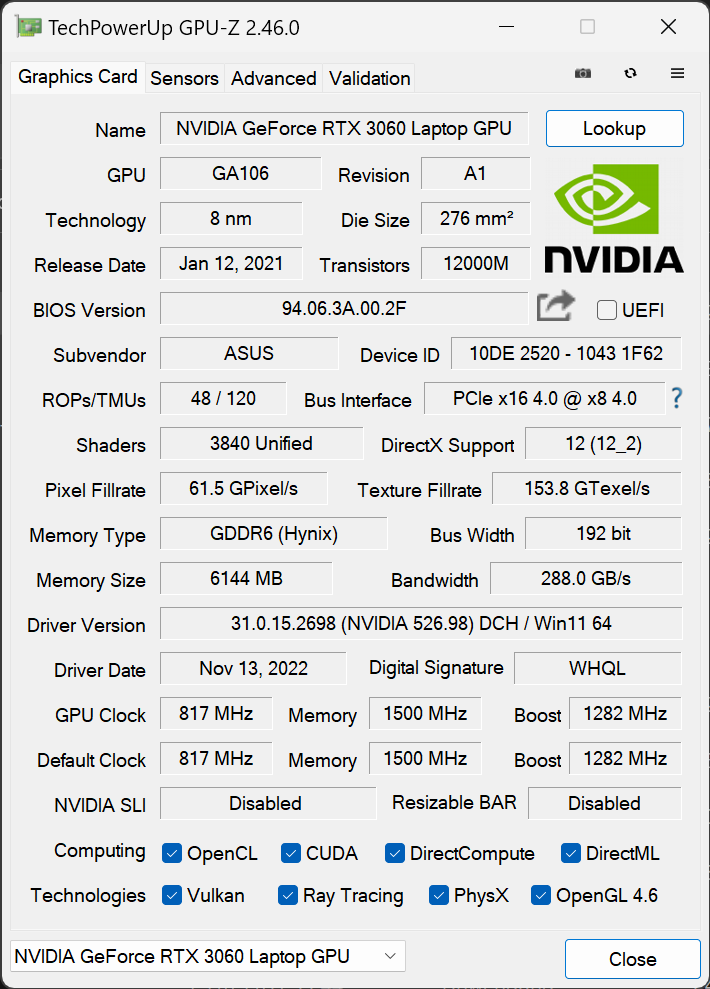
Nvidia GeForce RTX 3060 to jedno z mocniejszych GPU do laptopów. Odpowiedni układ graficzny w Zenbooku pracuje z mocą do 90 W TGP. Karta graficzna jest wystarczająco wydajna do kilku gier w rozdzielczości QHD i wszelkich innych zadań. W zastosowaniach, które wymagają pełnej mocy układu graficznego, pozytywny wpływ systemu chłodzenia AAS Ultra również staje się wyraźny: układ graficzny jest w stanie zapewnić znacznie większą wydajność niż w innych laptopach o porównywalnej wielkości, a jednocześnie przez długi czas utrzymuje niskie temperatury w granicach 60-70°C
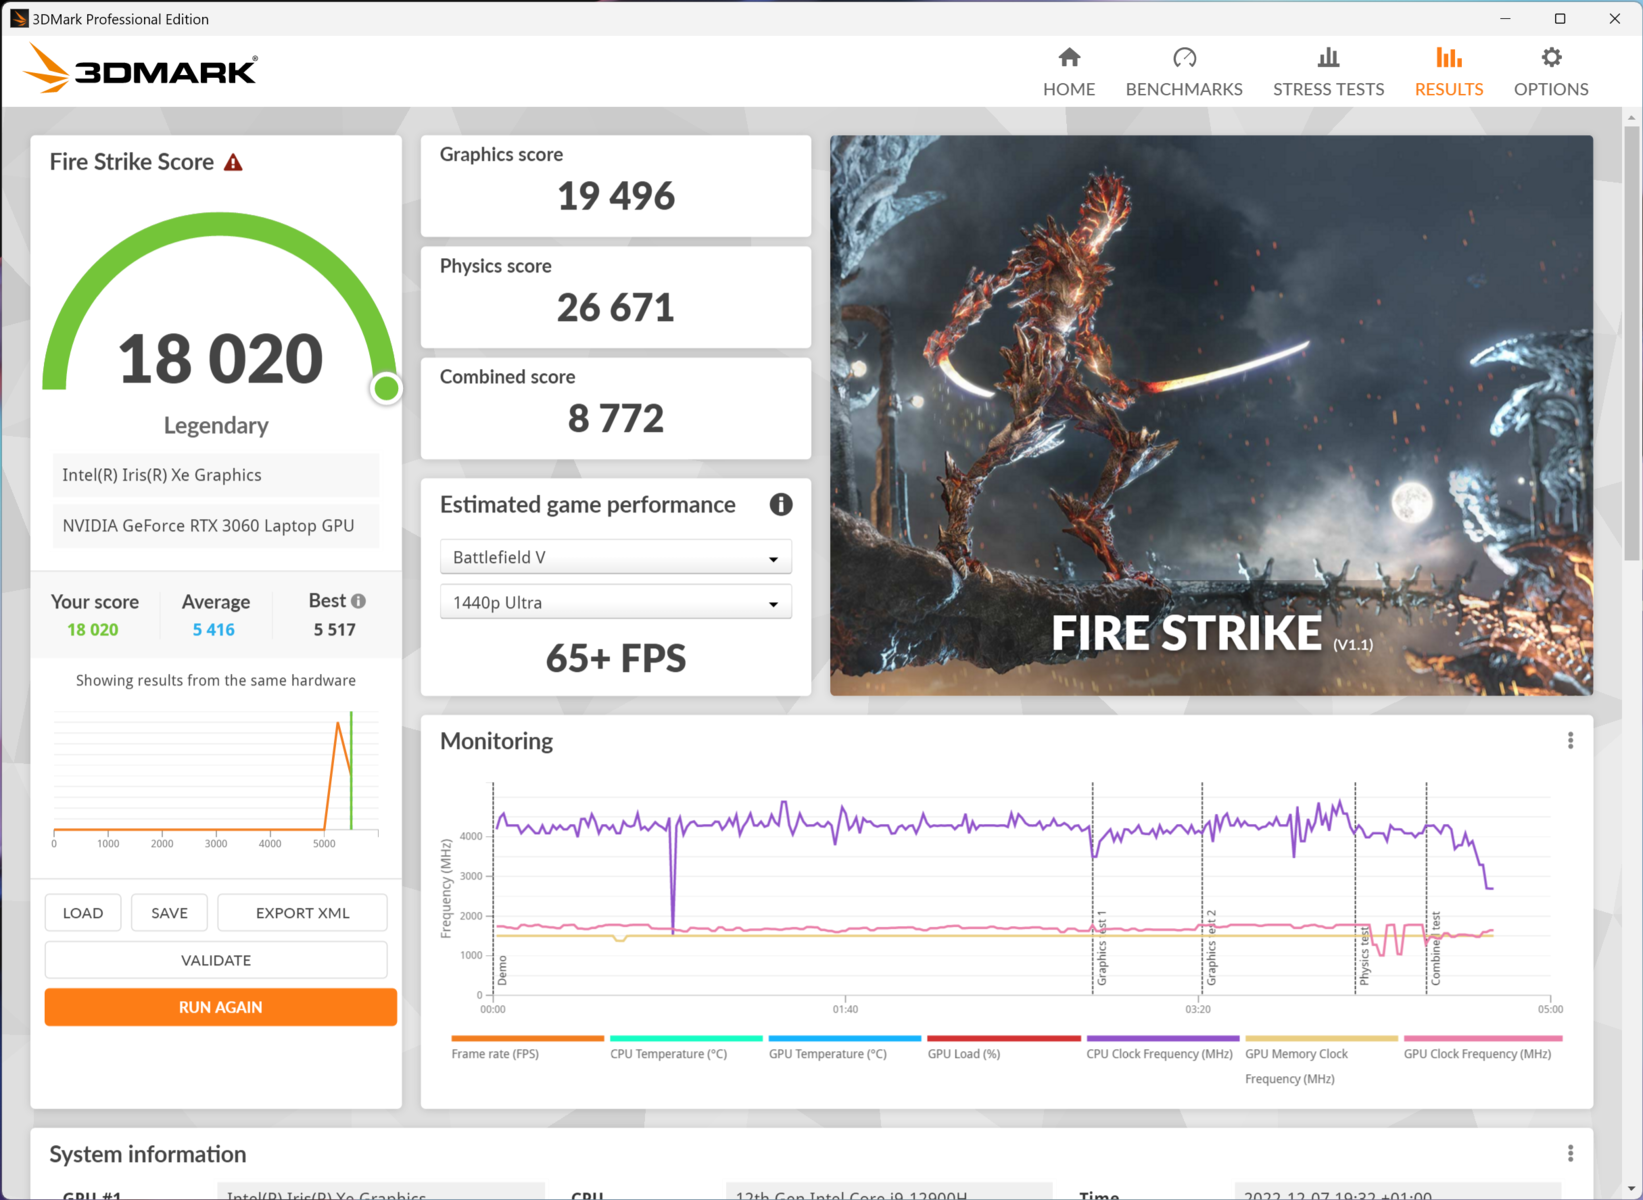
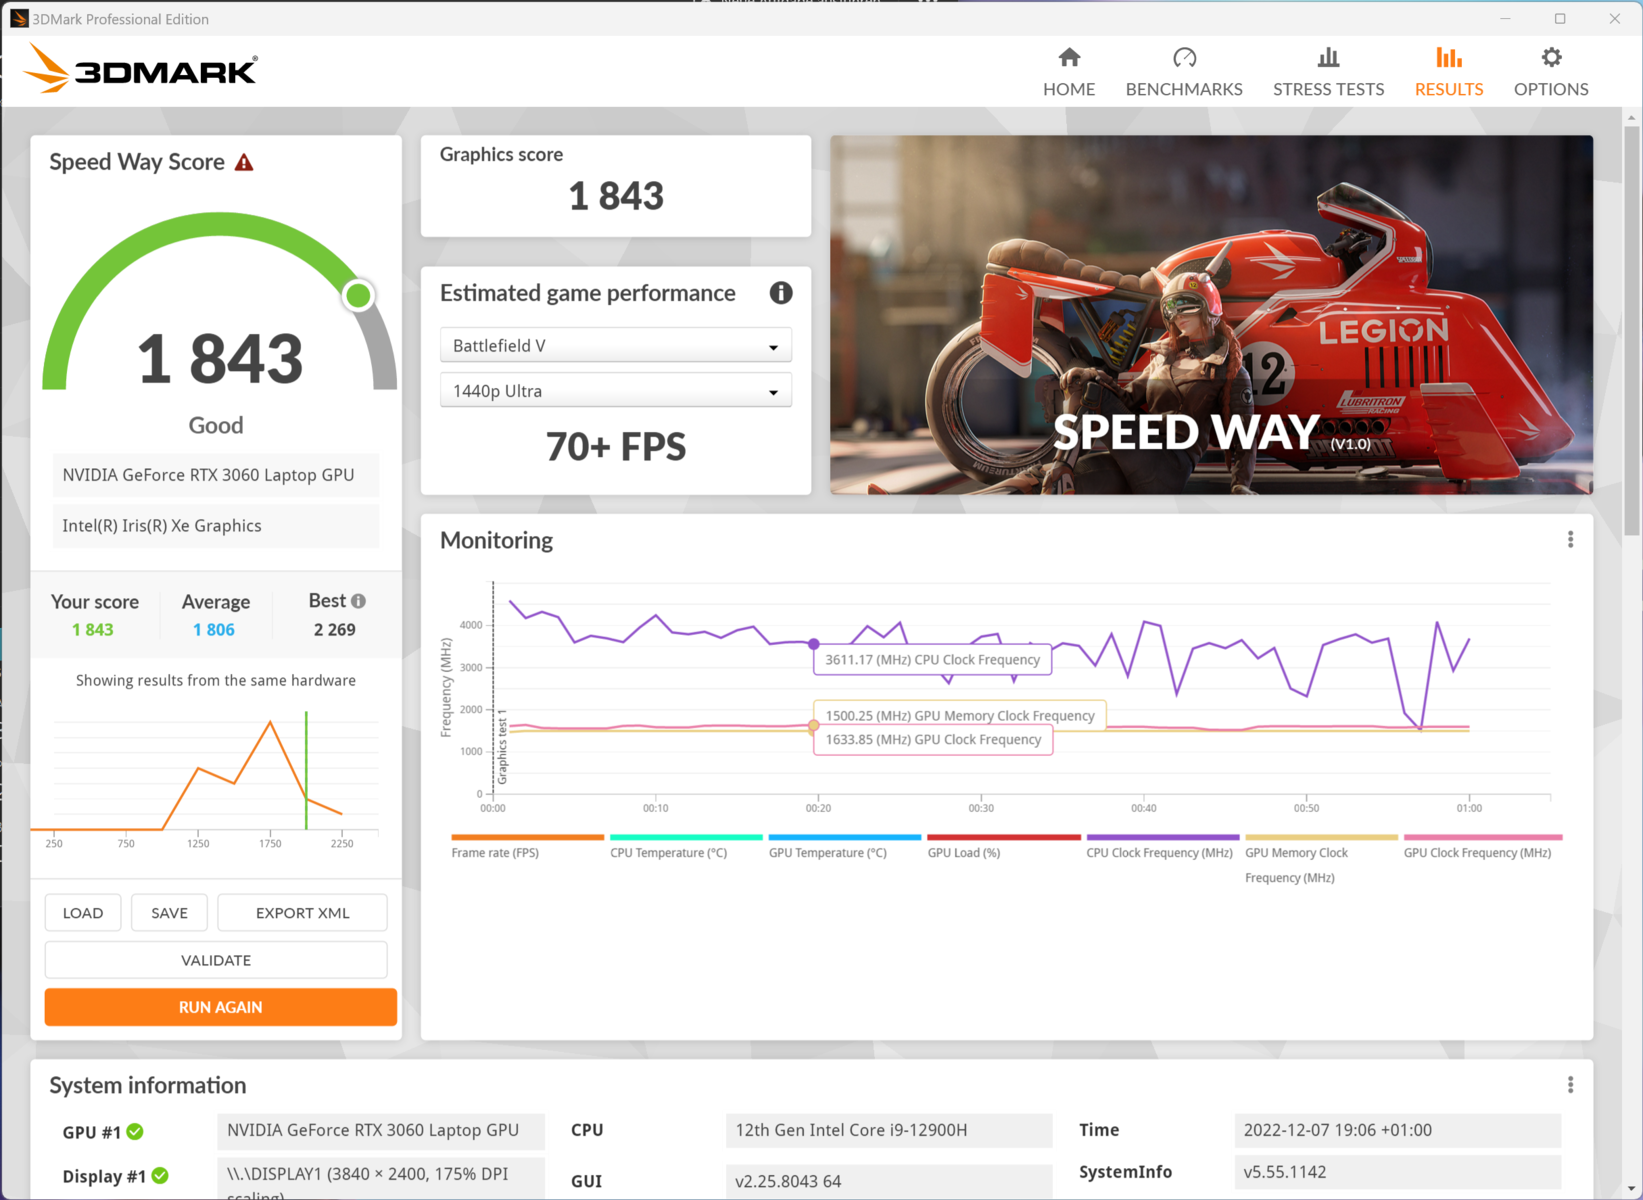
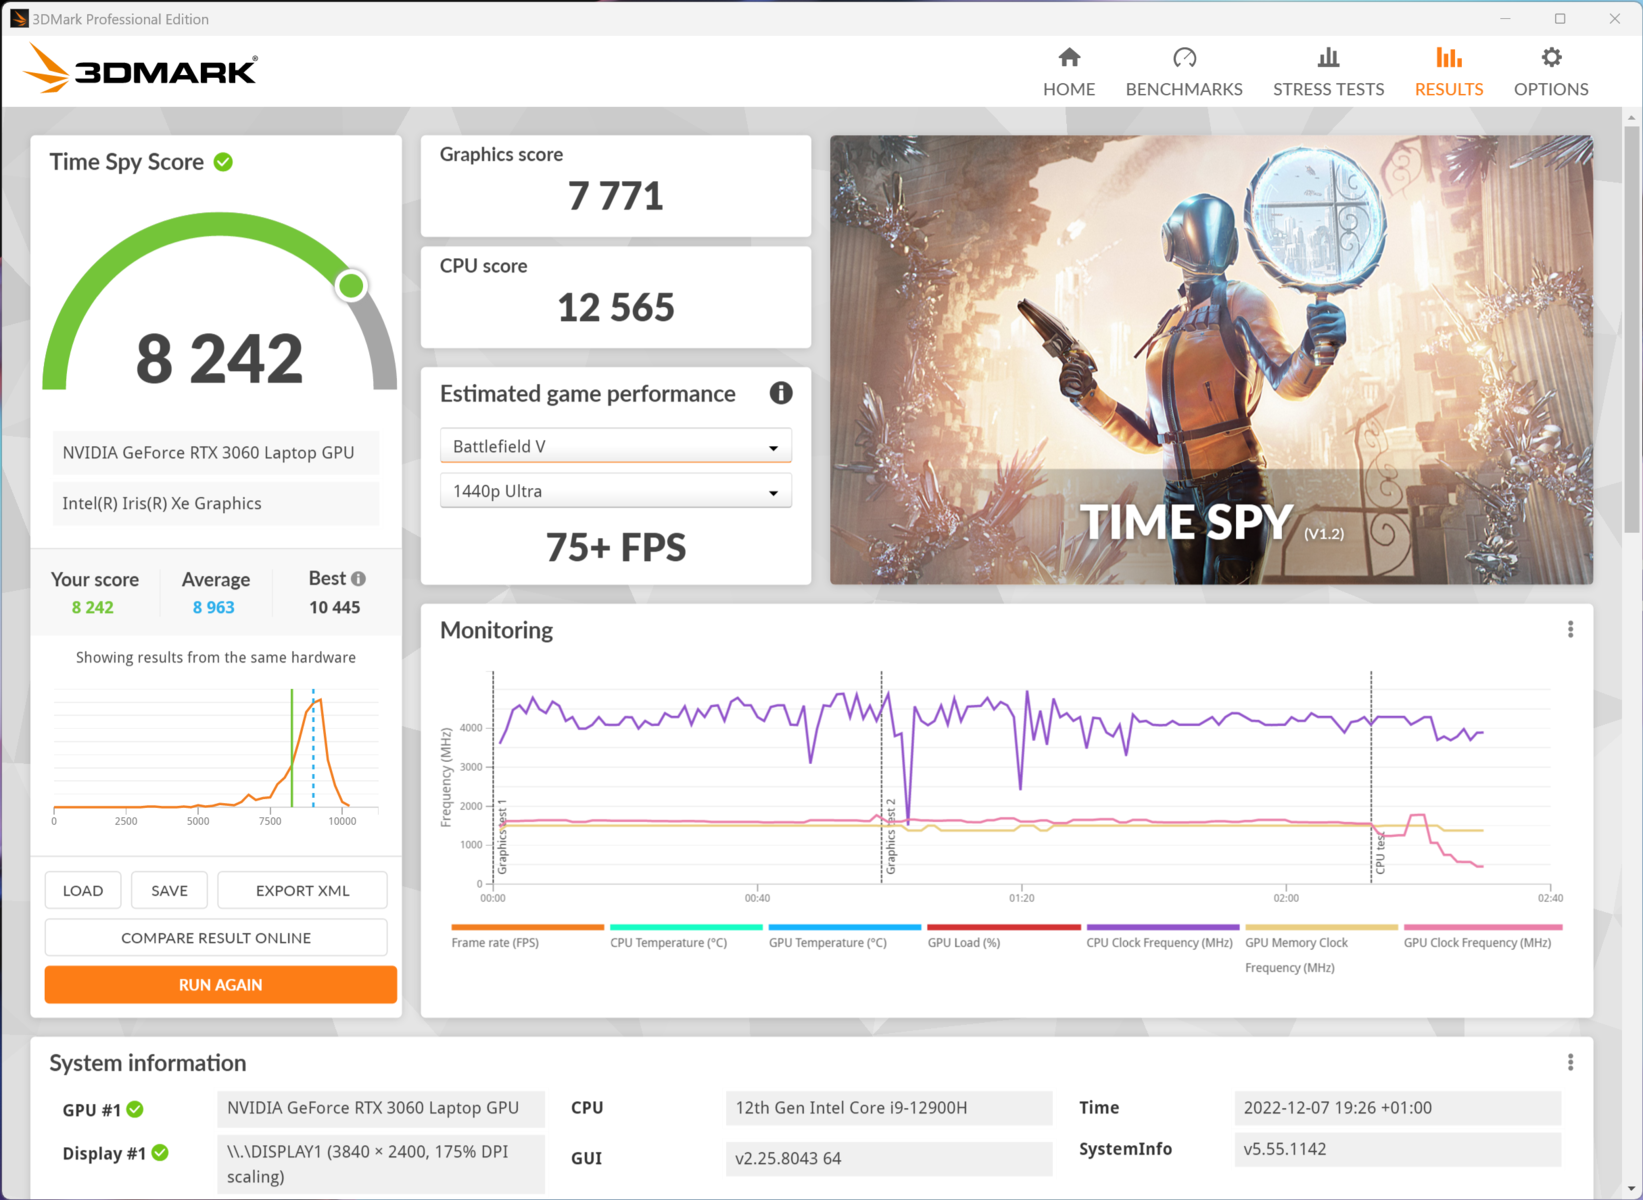
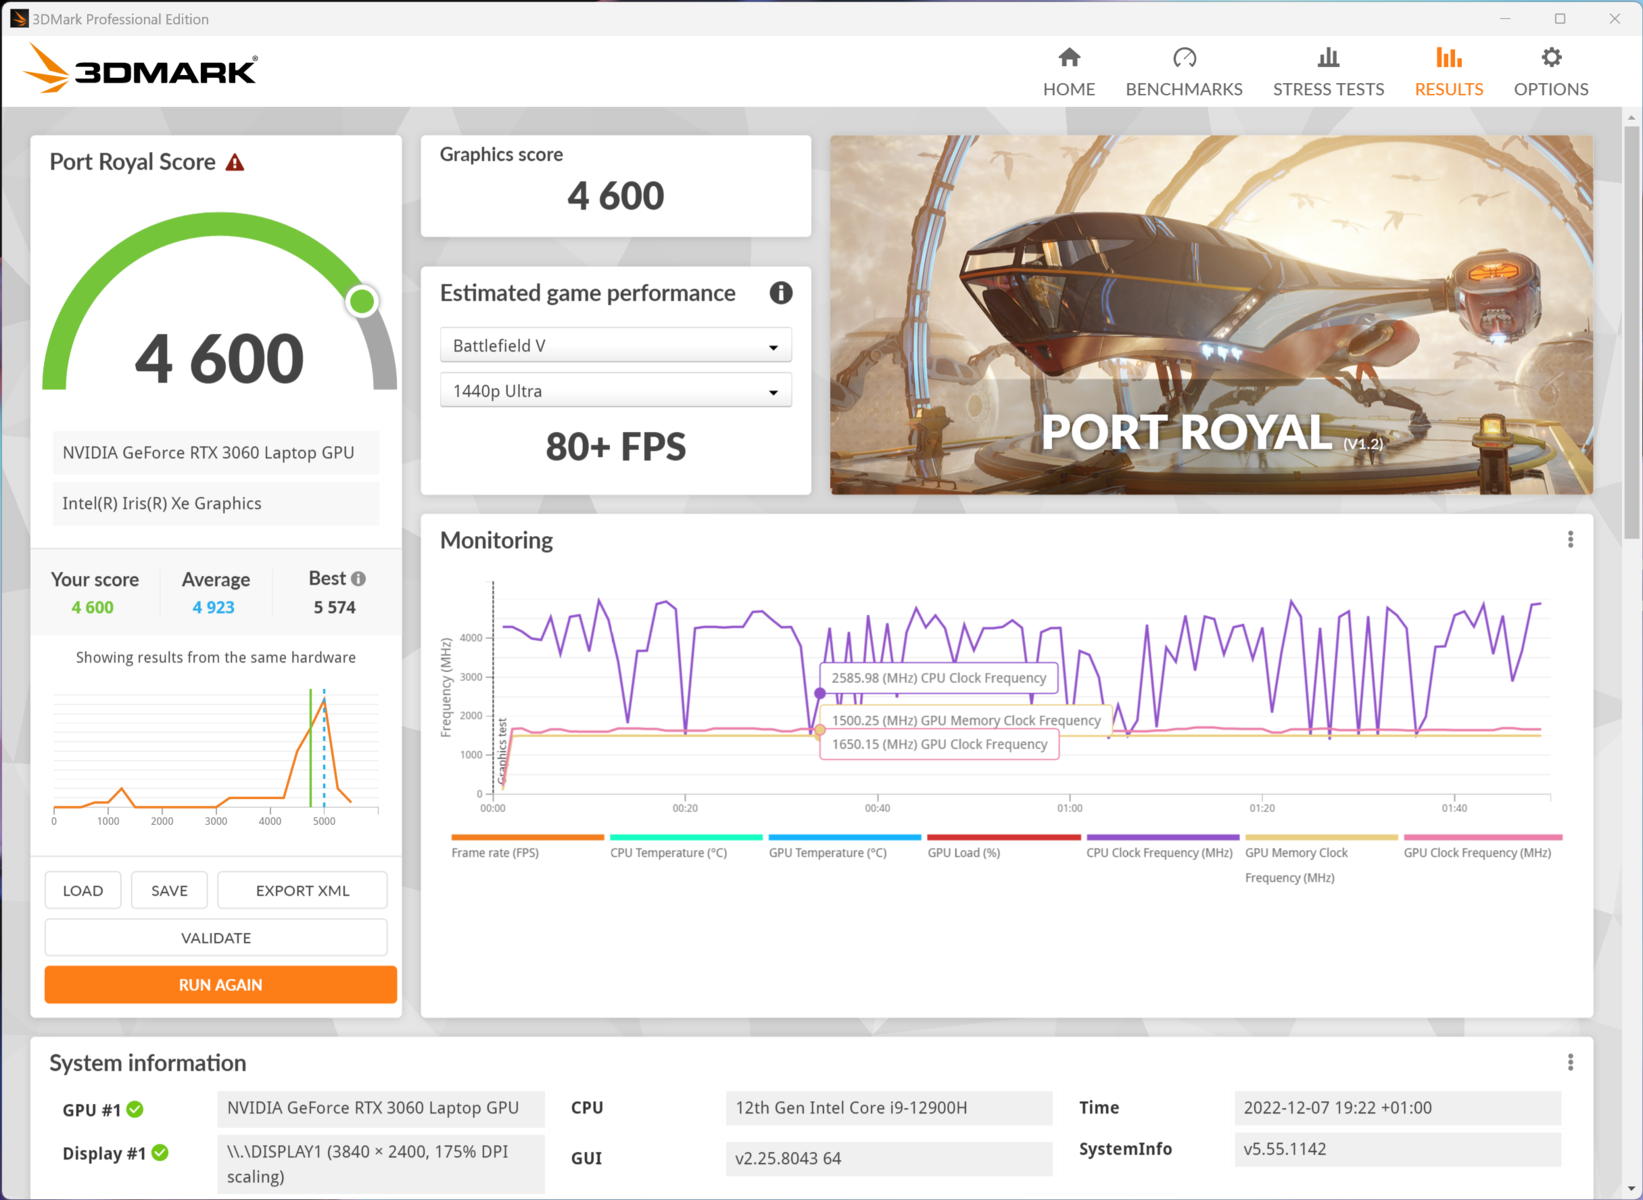
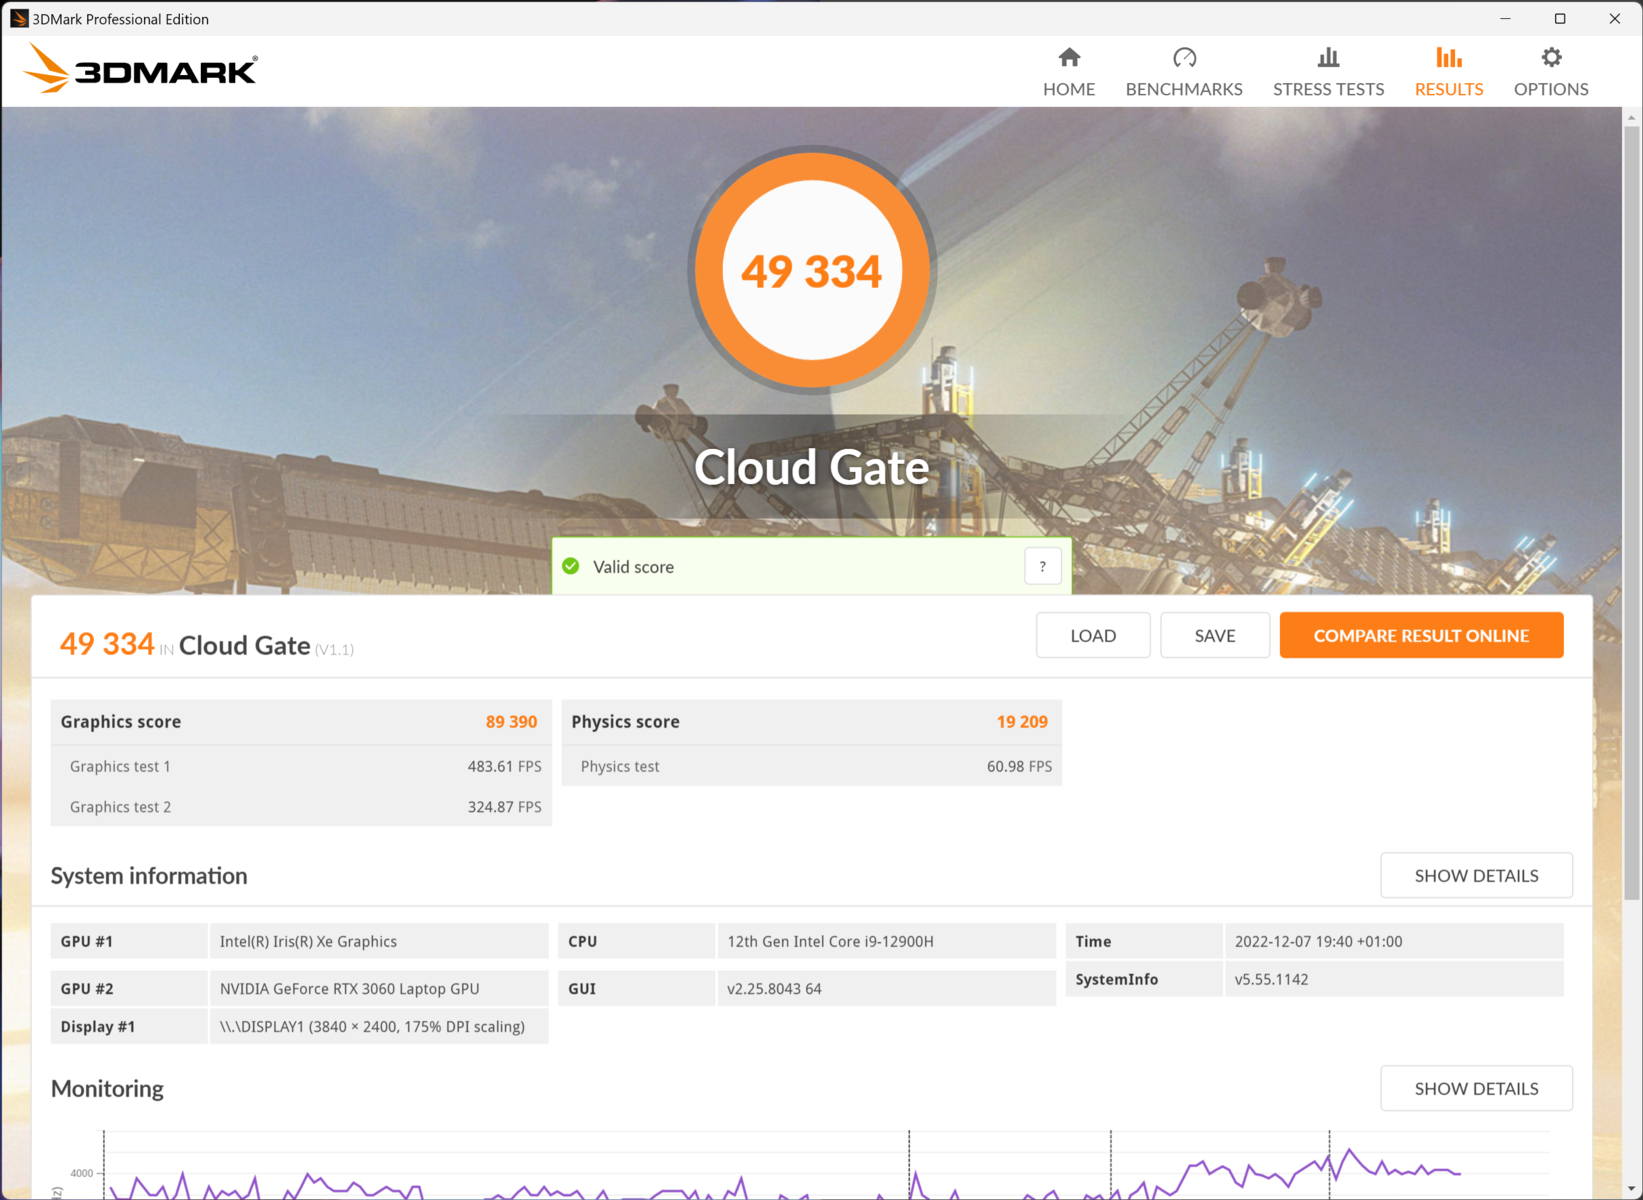
| 3DMark 11 Performance | 25678 pkt. | |
| 3DMark Cloud Gate Standard Score | 49334 pkt. | |
| 3DMark Fire Strike Score | 18020 pkt. | |
| 3DMark Time Spy Score | 8242 pkt. | |
Pomoc | ||
* ... im mniej tym lepiej
Wydajność w grach
Zenbook nie ma do końca wydajności high-endowego laptopa do gier, ale bardzo dobrze wykorzystuje sprzęt, którym dysponuje, i zdecydowanie nadaje się do gier. Wiele gier działa na najwyższych ustawieniach jakościowych w Full HD lub Quad HD z odpowiednio wysoką liczbą klatek na sekundę. Jedynie obecne wymagające tytuły, takie jak F1 22, przytłaczają Nvidia GeForce 3060 trochę. Ray tracing również obciąża kartę graficzną w pewnym stopniu, w zależności od rozdzielczości. Dostępna pamięć i liczba rdzeni ray tracing w jednostce graficznej są ledwie wystarczające dla pełnej rozdzielczości ekranu Zenbooka Pro16X OLED. Ponieważ w notebooku zainstalowano tylko ekran o częstotliwości 60 Hz, warto również tutaj skorzystać z V-Sync, by nie musieć wywoływać pełnej wydajności karty graficznej.
| The Witcher 3 - 1920x1080 Ultra Graphics & Postprocessing (HBAO+) | |
| Corsair Voyager a1600 | |
| Asus ZenBook Pro 16X OLED UX7602ZM-ME115W | |
| Lenovo ThinkPad X1 Extreme G5-21DE003RGE | |
| MSI CreatorPro Z16P B12UKST | |
| Dell Precision 7670 | |
| Średnia w klasie Multimedia (11 - 121, n=11, ostatnie 2 lata) | |
| HP ZBook Studio 16 G9 62U04EA | |
| Asus VivoBook Pro 16X OLED N7600PC-L2026X | |
| low | med. | high | ultra | QHD | 4K | |
|---|---|---|---|---|---|---|
| GTA V (2015) | 174.8 | 167.8 | 97.6 | 76.4 | ||
| The Witcher 3 (2015) | 111 | 70 | 31.5 | |||
| Dota 2 Reborn (2015) | 161.3 | 147.2 | 139.5 | 135.1 | 100.1 | |
| Final Fantasy XV Benchmark (2018) | 112.1 | 83.8 | 62.1 | 35 | ||
| X-Plane 11.11 (2018) | 138.1 | 116.8 | 94.7 | 75 | ||
| Far Cry 5 (2018) | 125 | 117 | 109 | 83 | 40 | |
| Strange Brigade (2018) | 201 | 160.9 | 139.1 | 100.6 | ||
| F1 22 (2022) | 194.1 | 190.5 | 148.8 | 51.8 | 14.4 |
Emisja - Raczej cicha mimo 140 W TDP
Hałas
Choć system AAS Ultra zapewnia większy przepływ powietrza, Zenbook nie jest głośniejszy ani cichszy od wielu innych laptopów multimedialnych z dedykowaną kartą grafiki. Jedyną zauważalną rzeczą jest to, że sterowanie wentylatorami jest dość nieprzewidywalne. Czasami pod obciążeniem mijają dwie minuty, zanim odpowiednio zareaguje i wentylatory rozkręcą się do pełnych obrotów. W zależności od użytkowania, może to również zapewnić, że Zenbook jest w dużej mierze cichy do cichego. Podczas przeglądania stron internetowych, uruchamiania aplikacji biurowych, a nawet programów, które powodują jedynie krótkie skoki obciążenia, notebook pozostaje ledwie słyszalny. Komora parowa Zenbooka jest w stanie wchłonąć obciążenia wielu z tych aplikacji bez konieczności użycia wentylatorów.
Hałas
| luz |
| 26 / 26 / 26 dB |
| obciążenie |
| 48 / 54.6 dB |
 | ||
30 dB cichy 40 dB(A) słyszalny 50 dB(A) irytujący |
||
min: | ||
| Asus ZenBook Pro 16X OLED UX7602ZM-ME115W GeForce RTX 3060 Laptop GPU, i9-12900H, Samsung PM9A1 MZVL21T0HCLR | Lenovo ThinkPad X1 Extreme G5-21DE003RGE GeForce RTX 3060 Laptop GPU, i7-12700H, Micron 3400 1TB MTFDKBA1T0TFH | HP Omen 16-n0033dx Radeon RX 6650M, R7 6800H, Samsung PM9A1 MZVL21T0HCLR | HP ZBook Studio 16 G9 62U04EA RTX A2000 Laptop GPU, i7-12800H, Micron 3400 1TB MTFDKBA1T0TFH | Corsair Voyager a1600 Radeon RX 6800M, R9 6900HS, Samsung PM9A1 MZVL22T0HBLB | Dell Precision 7670 RTX A2000 Laptop GPU, i7-12850HX, SK Hynix HFS001TEJ9X115N | Asus VivoBook Pro 16X OLED N7600PC-L2026X GeForce RTX 3050 4GB Laptop GPU, i7-11370H, Intel Optane Memory H10 with Solid State Storage 32GB + 512GB HBRPEKNX0202A(L/H) | MSI CreatorPro Z16P B12UKST RTX A3000 Laptop GPU, i7-12700H, Samsung PM9A1 MZVL21T0HCLR | |
|---|---|---|---|---|---|---|---|---|
| Noise | 11% | 2% | 5% | -9% | 8% | -13% | 3% | |
| wyłączone / środowisko * (dB) | 26 | 23.2 11% | 24.2 7% | 24 8% | 29.9 -15% | 22.7 13% | 25.15 3% | 24.1 7% |
| Idle Minimum * (dB) | 26 | 23.2 11% | 27.4 -5% | 24 8% | 30.5 -17% | 22.9 12% | 30 -15% | 27.1 -4% |
| Idle Average * (dB) | 26 | 23.2 11% | 27.4 -5% | 27.7 -7% | 30.6 -18% | 22.9 12% | 30 -15% | 27.1 -4% |
| Idle Maximum * (dB) | 26 | 23.2 11% | 28.9 -11% | 27.7 -7% | 30.7 -18% | 24.5 6% | 30 -15% | 27.1 -4% |
| Load Average * (dB) | 48 | 45.5 5% | 32.3 33% | 39.8 17% | 44.5 7% | 48.7 -1% | 57.6 -20% | 42.9 11% |
| Load Maximum * (dB) | 54.6 | 45.5 17% | 57.6 -5% | 47.7 13% | 51.1 6% | 52.1 5% | 62.9 -15% | 47 14% |
| Witcher 3 ultra * (dB) | 45.5 | 54.1 | 44.3 | 45.2 | 44 |
* ... im mniej tym lepiej
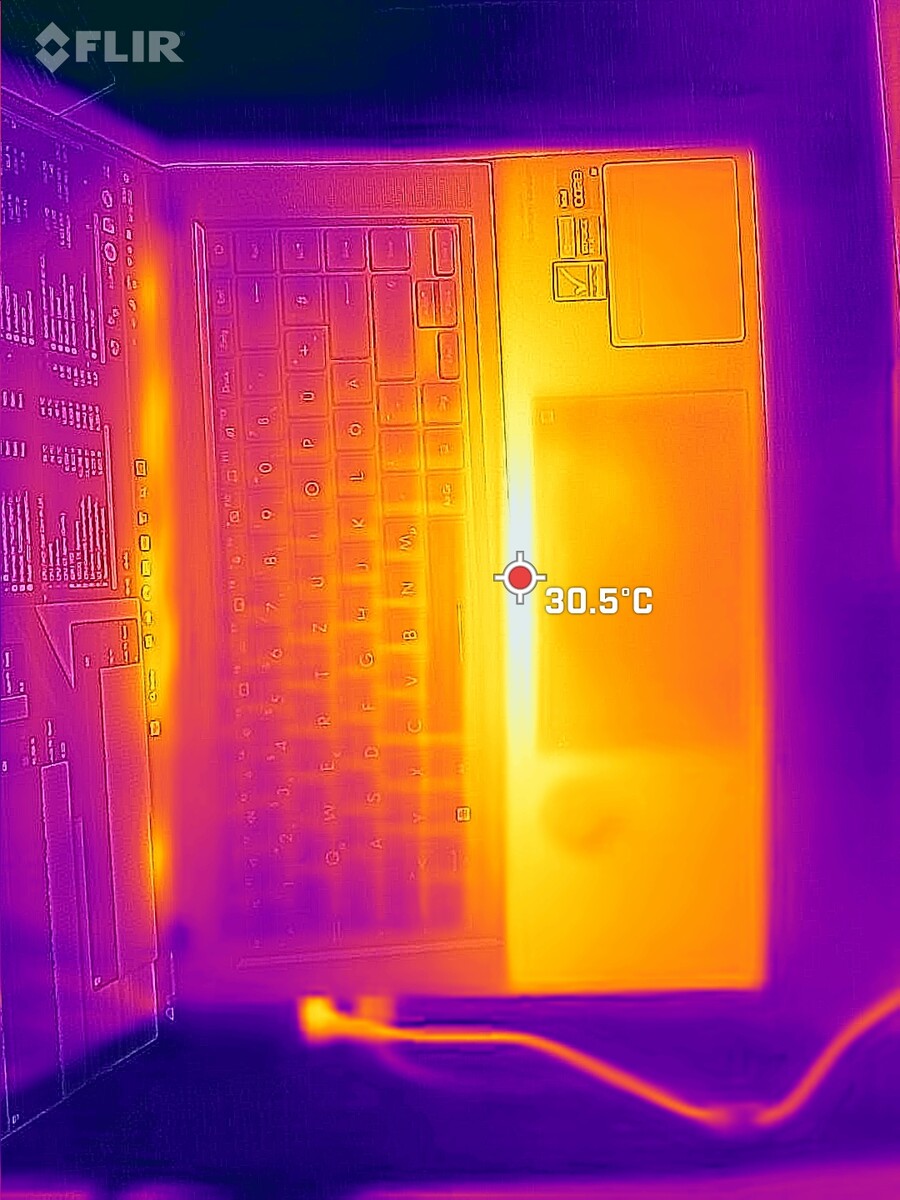
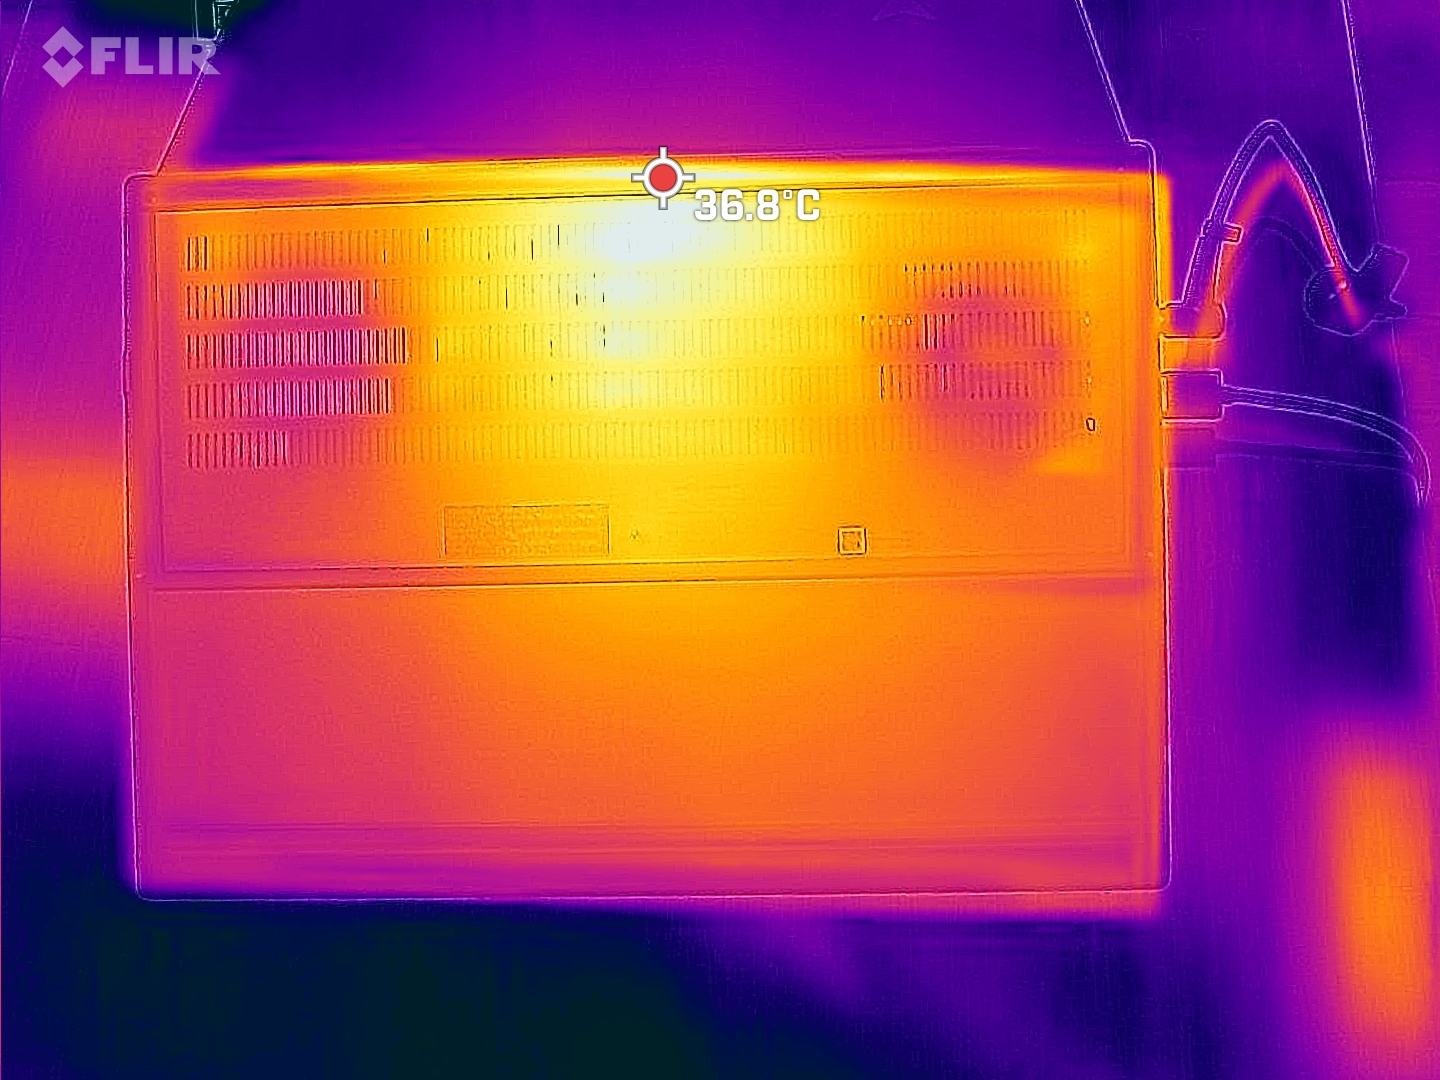
Temperatura
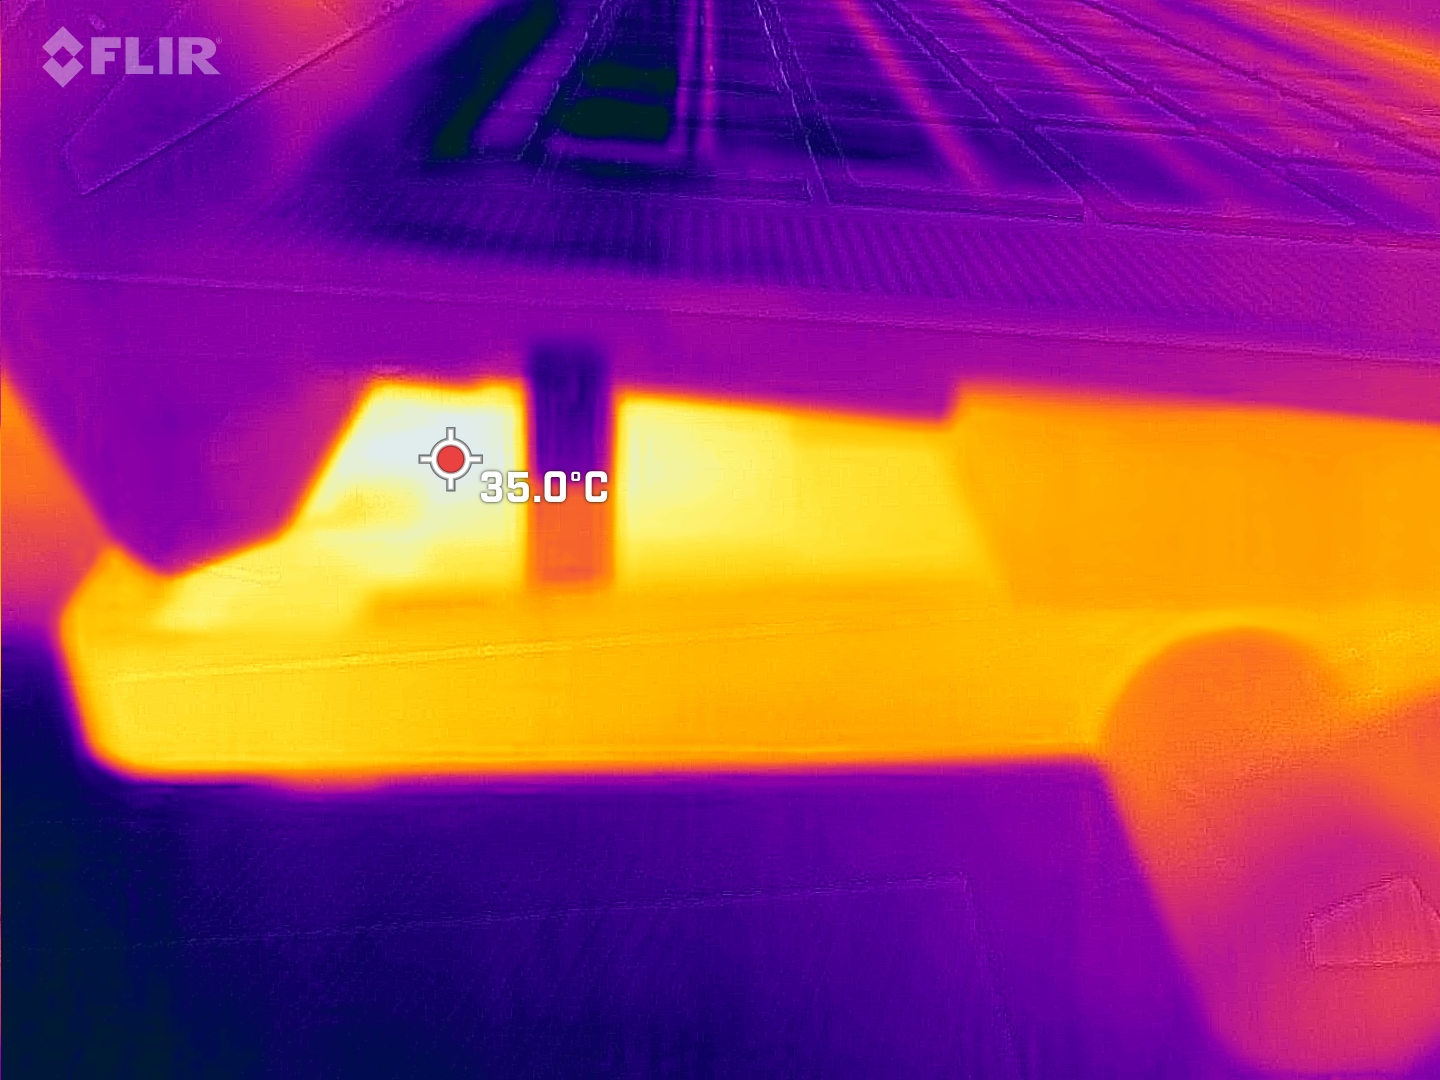
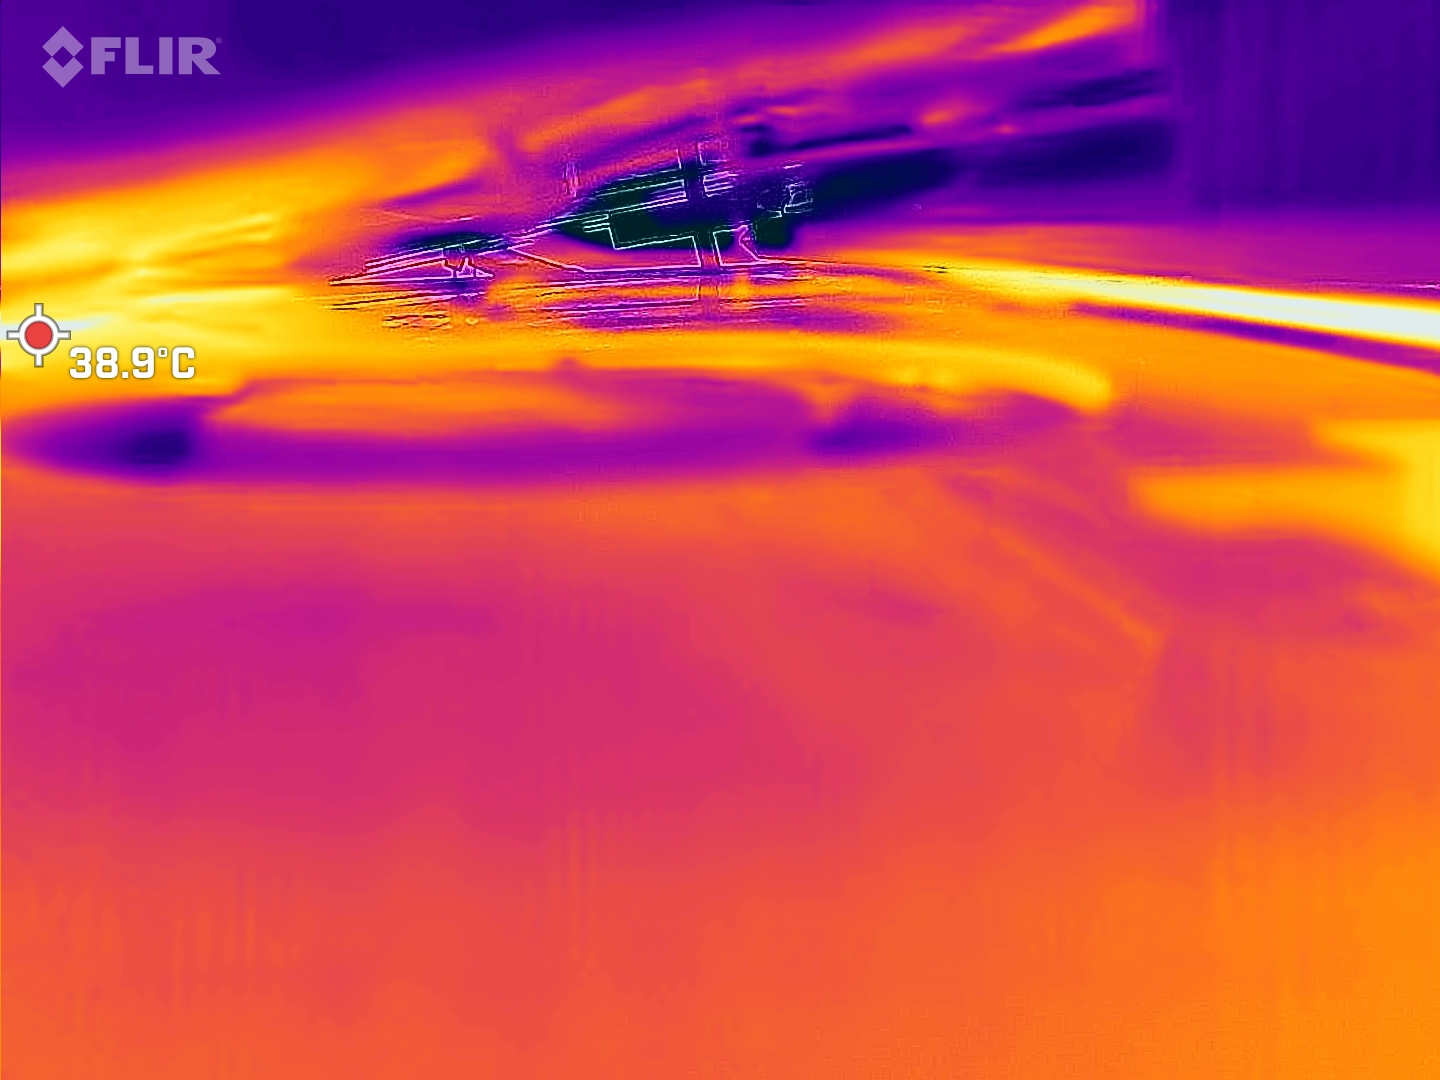
System AAS-Ultra, który podnosi wzrok na klawiaturę, ma przede wszystkim zapewnić chłód laptopowi. I to jest dokładnie to, co robi. Dzięki temu, że klawiatura jest nieco oddalona od źródeł ciepła laptopa, pozostaje ona zdecydowanie chłodna. W rzeczywistości najgorętsze miejsca na górnej stronie laptopa oscylują wokół 30°C, nawet po godzinie testów obciążeniowych. Również od spodu laptop utrzymuje się przeważnie poniżej 40°C. Temperatury w szczelinie między klawiaturą a podstawą są znacznie gorętsze, ale nie przekraczają zbytnio granicy 40°C. Komora parowa, chłodzenie AAS-Ultra i ustawione limity wydajności laptopa zapewniają chłodny system.
(+) Maksymalna temperatura w górnej części wynosi 32 °C / 90 F, w porównaniu do średniej 36.8 °C / 98 F , począwszy od 21 do 71 °C dla klasy Multimedia.
(±) Dno nagrzewa się maksymalnie do 41.6 °C / 107 F, w porównaniu do średniej 39.1 °C / 102 F
(+) W stanie bezczynności średnia temperatura górnej części wynosi 31.6 °C / 89 F, w porównaniu ze średnią temperaturą urządzenia wynoszącą 31.3 °C / ### class_avg_f### F.
(+) Podczas gry w Wiedźmina 3 średnia temperatura górnej części wynosi 30.3 °C / 87 F, w porównaniu do średniej temperatury urządzenia wynoszącej 31.3 °C / ## #class_avg_f### F.
(+) Podparcia dłoni i touchpad osiągają maksymalną temperaturę skóry (32.7 °C / 90.9 F) i dlatego nie są gorące.
(-) Średnia temperatura obszaru podparcia dłoni w podobnych urządzeniach wynosiła 28.7 °C / 83.7 F (-4 °C / -7.2 F).
| Asus ZenBook Pro 16X OLED UX7602ZM-ME115W Intel Core i9-12900H, NVIDIA GeForce RTX 3060 Laptop GPU | Lenovo ThinkPad X1 Extreme G5-21DE003RGE Intel Core i7-12700H, NVIDIA GeForce RTX 3060 Laptop GPU | HP Omen 16-n0033dx AMD Ryzen 7 6800H, AMD Radeon RX 6650M | HP ZBook Studio 16 G9 62U04EA Intel Core i7-12800H, NVIDIA RTX A2000 Laptop GPU | Corsair Voyager a1600 AMD Ryzen 9 6900HS, AMD Radeon RX 6800M | Asus VivoBook Pro 16X OLED N7600PC-L2026X Intel Core i7-11370H, NVIDIA GeForce RTX 3050 4GB Laptop GPU | |
|---|---|---|---|---|---|---|
| Heat | -14% | -4% | -5% | -23% | -6% | |
| Maximum Upper Side * (°C) | 32 | 52 -63% | 41.2 -29% | 38.7 -21% | 50.7 -58% | 40.6 -27% |
| Maximum Bottom * (°C) | 41.6 | 56.4 -36% | 53.2 -28% | 53.4 -28% | 54.2 -30% | 53 -27% |
| Idle Upper Side * (°C) | 32.6 | 26.4 19% | 26.4 19% | 27.3 16% | 35.8 -10% | 29 11% |
| Idle Bottom * (°C) | 36 | 27.2 24% | 27.8 23% | 31.6 12% | 33 8% | 28.3 21% |
* ... im mniej tym lepiej
Stress Test
Zenbook Pro 16X OLED był w stanie konsekwentnie utrzymać wysoki poziom wydajności w testach obciążeniowych. Dzięki odwróconej klawiaturze laptop studyjny jest w stanie, według wszelkich pozorów, stale odprowadzać ciepło robocze. 40 W mocy procesora i około 84 W mocy karty graficznej sprawiają, że temperatury procesora i układu graficznego nie są zbyt wysokie. Przy średnich, odpowiednio 75 i 65°C, Zenbook mógłby równie dobrze jeszcze bardziej obciążać oba układy. Jak wynika z analizy dziennika, ogólna wydajność była tu jednak ograniczona przez zużycie energii. Wydaje się, że Asus wyznaczył tu konkretne wartości, osiągając łączną wydajność CPU-GPU na poziomie około 140 W.
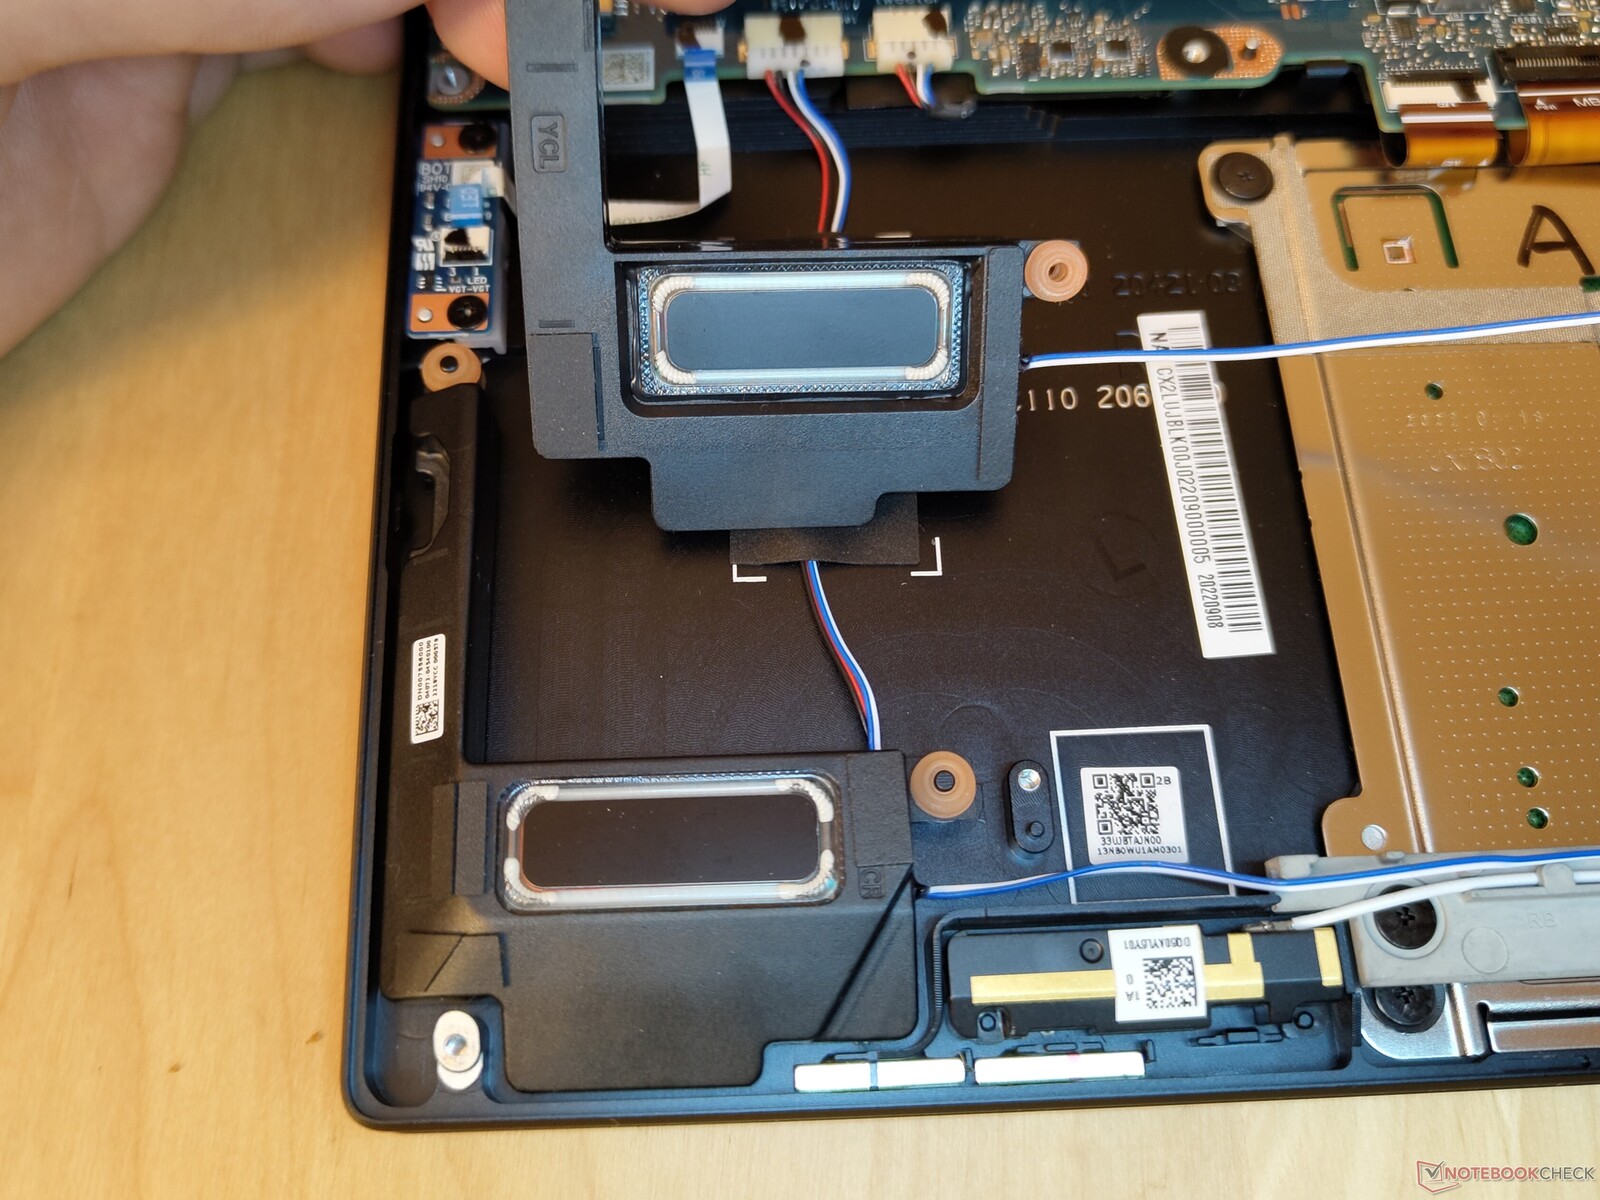
Mówcy
W Asusie Zenbook Pro 16X OLED zainstalowano sześć głośników. Na lewo i prawo od klawiatury znajdują się głośniki wysokotonowe laptopa. W podstawie kolejne dwie pary głośników dla tonów średnich i niskich skierowane są ku górze i ku dołowi, dzięki czemu wrażenia dźwiękowe są dobre. Jednocześnie laptop potrafi być naprawdę głośny - 94,7 dB(A) bez znacznego pogorszenia jakości dźwięku. Maksymalne zwiększenie głośności nie jest zalecane, gdyż niskie tony stają się wtedy nieco zbyt słabe. Przy 80% maksymalnej głośności laptop jest nadal więcej niż wystarczająco głośny, by zagłuszyć jego wentylatory. W Zenbooku dostępny jest też szeroki wachlarz ustawień Dolby Atmos, które mogą pozytywnie wpłynąć na wrażenia słuchowe. Podsumowując, urządzenie Asusa zapewnia ogólnie imponującą jakość dźwięku
Asus ZenBook Pro 16X OLED UX7602ZM-ME115W analiza dźwięku
(+) | głośniki mogą odtwarzać stosunkowo głośno (94.7 dB)
Bas 100 - 315 Hz
(-) | prawie brak basu - średnio 16% niższa od mediany
(±) | liniowość basu jest średnia (7.9% delta do poprzedniej częstotliwości)
Średnie 400 - 2000 Hz
(+) | zbalansowane środki średnie - tylko 1.8% od mediany
(+) | średnie są liniowe (3.8% delta do poprzedniej częstotliwości)
Wysokie 2–16 kHz
(±) | wyższe maksima - średnio 6.2% wyższe od mediany
(+) | wzloty są liniowe (2.8% delta do poprzedniej częstotliwości)
Ogólnie 100 - 16.000 Hz
(+) | ogólny dźwięk jest liniowy (13.3% różnicy w stosunku do mediany)
W porównaniu do tej samej klasy
» 28% wszystkich testowanych urządzeń w tej klasie było lepszych, 4% podobnych, 68% gorszych
» Najlepszy miał deltę 5%, średnia wynosiła ###średnia###%, najgorsza wynosiła 45%
W porównaniu do wszystkich testowanych urządzeń
» 14% wszystkich testowanych urządzeń było lepszych, 3% podobnych, 83% gorszych
» Najlepszy miał deltę 4%, średnia wynosiła ###średnia###%, najgorsza wynosiła 134%
Corsair Voyager a1600 analiza dźwięku
(-) | niezbyt głośne głośniki (###wartość### dB)
Bas 100 - 315 Hz
(±) | zredukowany bas - średnio 10.2% niższy od mediany
(±) | liniowość basu jest średnia (13.7% delta do poprzedniej częstotliwości)
Średnie 400 - 2000 Hz
(±) | wyższe średnie - średnio 7.8% wyższe niż mediana
(±) | liniowość środka jest średnia (7% delta do poprzedniej częstotliwości)
Wysokie 2–16 kHz
(+) | zrównoważone maksima - tylko 1.8% od mediany
(±) | liniowość wysokich wartości jest średnia (11.4% delta do poprzedniej częstotliwości)
Ogólnie 100 - 16.000 Hz
(±) | liniowość ogólnego dźwięku jest średnia (25.5% różnicy w stosunku do mediany)
W porównaniu do tej samej klasy
» 91% wszystkich testowanych urządzeń w tej klasie było lepszych, 2% podobnych, 7% gorszych
» Najlepszy miał deltę 6%, średnia wynosiła ###średnia###%, najgorsza wynosiła 132%
W porównaniu do wszystkich testowanych urządzeń
» 78% wszystkich testowanych urządzeń było lepszych, 4% podobnych, 17% gorszych
» Najlepszy miał deltę 4%, średnia wynosiła ###średnia###%, najgorsza wynosiła 134%
Zarządzanie energią - Ogromna bateria zapewnia wytrzymałość
Pobór mocy
Zenbook rzadko uruchamia swój 200-watowy zasilacz na pełnej mocy. Podczas różnych testów pomiaru energii 197 watów w Witcher 3 było najwyższym odnotowanym poziomem zużycia energii. Ogólnie rzecz biorąc, im mocniejszy sprzęt, tym większe zapotrzebowanie na energię. Wartości, które zmierzyliśmy dla laptopa Asusa, mieszczą się więc w odpowiednim przedziale jego klasy wydajności. Co najwyżej laptop ten jest winny nieco wyższym wskaźnikom zużycia energii w trybie bezczynności
| wyłączony / stan wstrzymania | |
| luz | |
| obciążenie |
|
Legenda:
min: | |
| Asus ZenBook Pro 16X OLED UX7602ZM-ME115W i9-12900H, GeForce RTX 3060 Laptop GPU, Samsung PM9A1 MZVL21T0HCLR, OLED, 3840x2400, 16" | Lenovo ThinkPad X1 Extreme G5-21DE003RGE i7-12700H, GeForce RTX 3060 Laptop GPU, Micron 3400 1TB MTFDKBA1T0TFH, IPS, 3840x2400, 16" | HP Omen 16-n0033dx R7 6800H, Radeon RX 6650M, Samsung PM9A1 MZVL21T0HCLR, IPS, 1920x1080, 16.1" | HP ZBook Studio 16 G9 62U04EA i7-12800H, RTX A2000 Laptop GPU, Micron 3400 1TB MTFDKBA1T0TFH, IPS, 3840x2400, 16" | Corsair Voyager a1600 R9 6900HS, Radeon RX 6800M, Samsung PM9A1 MZVL22T0HBLB, IPS, 2560x1600, 16" | Asus VivoBook Pro 16X OLED N7600PC-L2026X i7-11370H, GeForce RTX 3050 4GB Laptop GPU, Intel Optane Memory H10 with Solid State Storage 32GB + 512GB HBRPEKNX0202A(L/H), OLED, 3840x2400, 16" | Przeciętny NVIDIA GeForce RTX 3060 Laptop GPU | Średnia w klasie Multimedia | |
|---|---|---|---|---|---|---|---|---|
| Power Consumption | -29% | -7% | -1% | -46% | 26% | -11% | 34% | |
| Idle Minimum * (Watt) | 11.1 | 11.8 -6% | 7.9 29% | 7.2 35% | 16.9 -52% | 8.9 20% | 10.4 ? 6% | 5.65 ? 49% |
| Idle Average * (Watt) | 11.4 | 22.4 -96% | 11.5 -1% | 18.1 -59% | 20.3 -78% | 10.2 11% | 14.5 ? -27% | 10 ? 12% |
| Idle Maximum * (Watt) | 14.4 | 23.1 -60% | 18.3 -27% | 18.5 -28% | 22.2 -54% | 12 17% | 21.4 ? -49% | 12.3 ? 15% |
| Load Average * (Watt) | 137.4 | 138 -0% | 88.1 36% | 112.8 18% | 133.4 3% | 94 32% | 109.3 ? 20% | 65.1 ? 53% |
| Witcher 3 ultra * (Watt) | 136 | 129.9 4% | 206 -51% | 106.7 22% | 206 -51% | 93.1 32% | ||
| Load Maximum * (Watt) | 197 | 225.6 -15% | 246.4 -25% | 186 6% | 112 43% | 206 ? -5% | 112.5 ? 43% |
* ... im mniej tym lepiej
Power consumption Witcher 3 / Stress test
Power consumption with an external monitor
Czas pracy na baterii
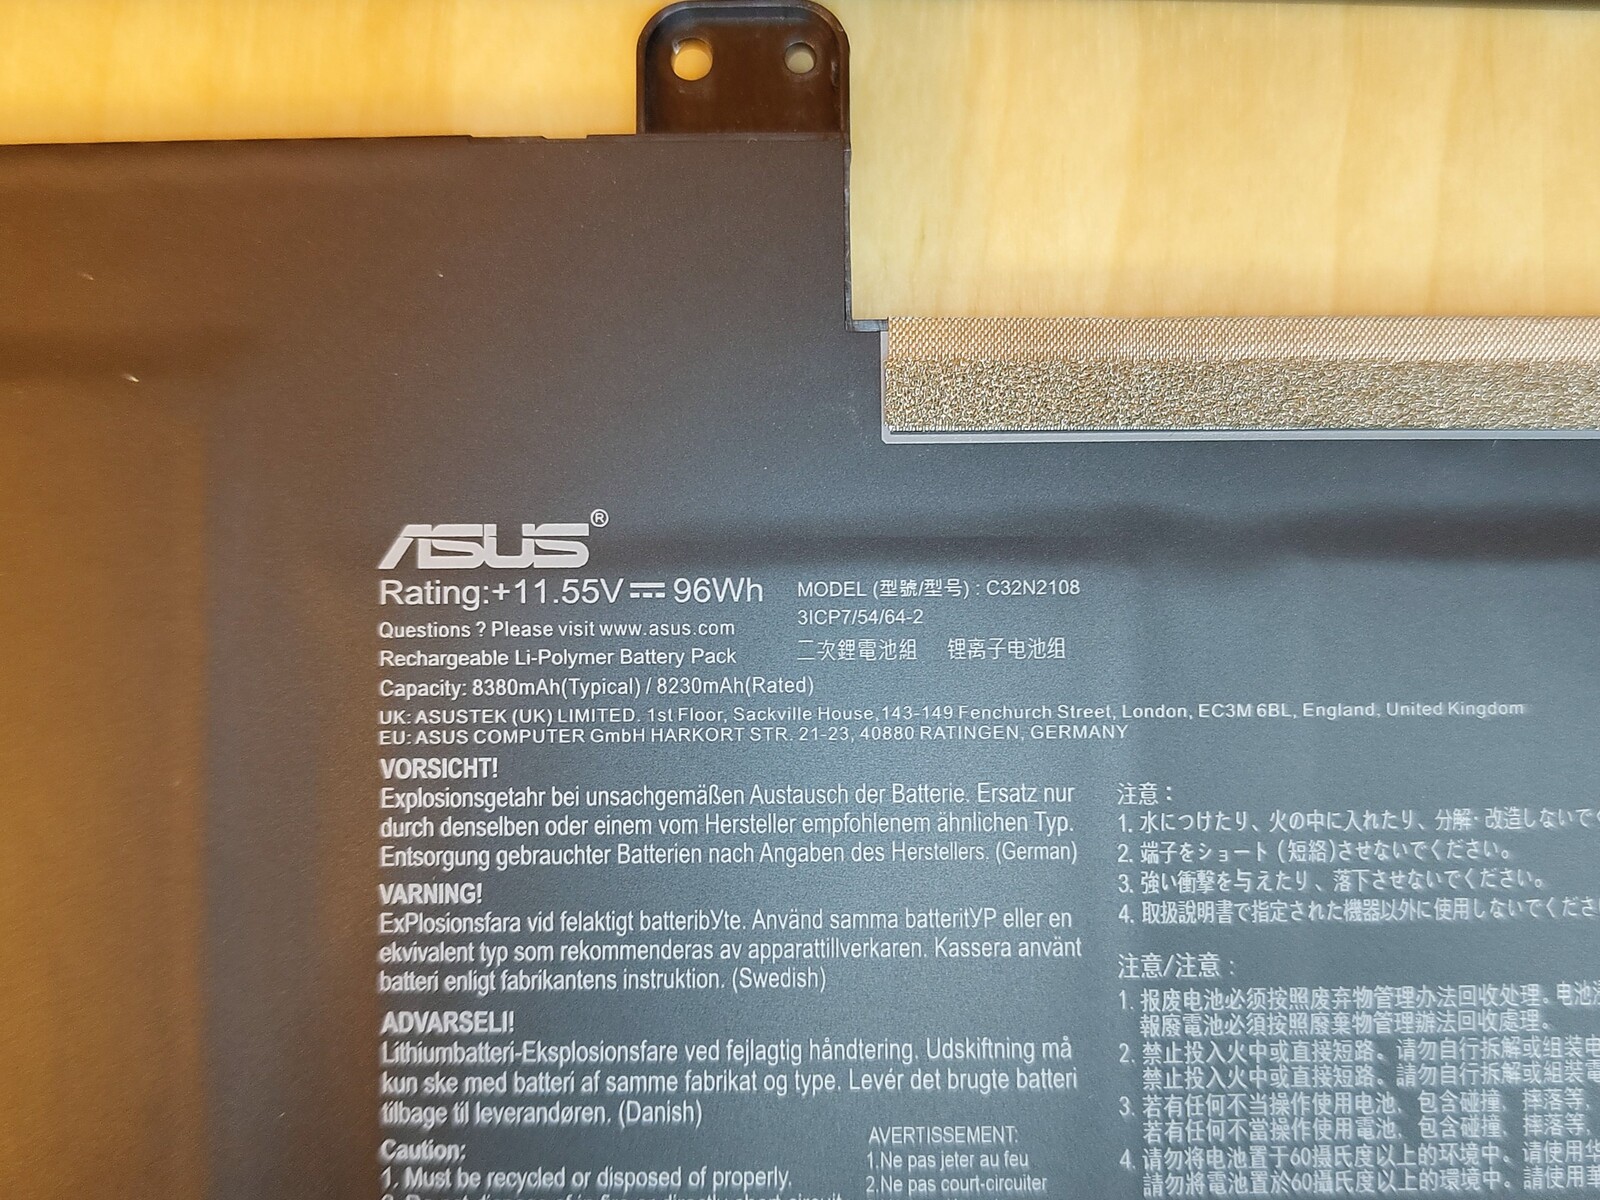
Asus Zenbook jest bardzo mocny pod względem czasu pracy na akumulatorze. Bateria laptopa może mieć maksymalnie 100 watogodzin, a Zenbook ma 96 Wh. Studyjny laptop Asusa wyprzedza więc konkurentów we wszystkich testach akumulatora. W porównaniu z Asus Vivobook Pro 16X OLED, Zenbook jest też znacznie dłużej działający przy nieco nowocześniejszym sprzęcie
| Asus ZenBook Pro 16X OLED UX7602ZM-ME115W i9-12900H, GeForce RTX 3060 Laptop GPU, 96 Wh | Lenovo ThinkPad X1 Extreme G5-21DE003RGE i7-12700H, GeForce RTX 3060 Laptop GPU, 90 Wh | HP Omen 16-n0033dx R7 6800H, Radeon RX 6650M, 68 Wh | HP ZBook Studio 16 G9 62U04EA i7-12800H, RTX A2000 Laptop GPU, 86 Wh | Corsair Voyager a1600 R9 6900HS, Radeon RX 6800M, 99 Wh | Asus VivoBook Pro 16X OLED N7600PC-L2026X i7-11370H, GeForce RTX 3050 4GB Laptop GPU, 96 Wh | Średnia w klasie Multimedia | |
|---|---|---|---|---|---|---|---|
| Czasy pracy | -30% | -33% | -44% | -33% | -6% | 32% | |
| Reader / Idle (h) | 12.7 | 10 -21% | 7 -45% | 11.1 -13% | 25.2 ? 98% | ||
| WiFi v1.3 (h) | 8.9 | 6.7 -25% | 7 -21% | 6.3 -29% | 5.8 -35% | 8.7 -2% | 12 ? 35% |
| Load (h) | 2.6 | 1.7 -35% | 1.1 -58% | 1.1 -58% | 2.1 -19% | 2.5 -4% | 1.669 ? -36% |
| H.264 (h) | 7.3 | 8.5 | 6 | 16.2 ? |
Za
Przeciw
Werdykt - Mocny występ, ale zmarnowany potencjał

Asus obecnie regularnie wprowadza do oferty laptopy wyróżniające się nietypowymi cechami. Odwracana klawiatura w Zenbooku Pro 16X jest z pewnością jedną z takich cech. Liczne diody RGBW również wyróżniają się, jeśli jest to pożądane. System AAS Ultra działa lepiej niż można się było spodziewać. Ogólnie rzecz biorąc, koncepcja laptopa jest ciekawa, ale z pewnością może on zrobić więcej. Asus zakłada smycz na sprzęt Zenbooka i niepotrzebnie spowalnia laptop nieśmiałymi kontrolami wydajności. Jasne, Zenbook jest szybszy od wielu konkurentów, ale wyniki dziennika pokazują, że sprzęt ma jeszcze pole do popisu. Z drugiej strony na pewno można powiedzieć, że laptop jest znacznie mocniejszy i chłodniejszy od np. podobnie wyposażonego Lenovo ThinkPad X1 Extreme ze swoim chłodzeniem z ciekłego metalu.
Laptop Asusa to niemalże flagowiec w swojej klasie. Duża moc obliczeniowa, wyświetlacz OLED o wiernych kolorach, zrównoważony dźwięk i dobra kamera internetowa to niektóre z atutów laptopa.
Nie znaleźliśmy w urządzeniu prawdziwych punktów krytyki. To raczej drobiazgi, które nas denerwują, takie jak touchpad, który odmawia poprawnego działania na mrozie, czy matryca subpikselowa, która staje się zauważalna przy pełnej jasności. Irytujący jest też kurz, który zbiera się w szczelinie między klawiaturą a podstawą, bo trudno go wyczyścić. Ostatecznie zakup Zenbooka to kwestia gustu i pieniędzy. W końcu wiele laptopów oferuje podobną wydajność w podobnej lub niższej cenie. Dla przykładu Vivobook Pro 16X OLED jest o dobre 500 USD tańszy w porównywalnym wariancie konfiguracyjnym. Osoby szukające bardziej profesjonalnego laptopa znajdą go w m.in HP ZBook Studio lub MSI CreatorPro. Oba mają profesjonalne karty graficzne Nvidii z zainstalowanymi specjalnymi sterownikami
Cena i dostępność
W USA Asus Zenbook Pro 16X OLED z 32 GB RAM jest obecnie notowany na Amazon w cenie 2,999,00 USD.
Asus ZenBook Pro 16X OLED UX7602ZM-ME115W
- 13/12/2022 v7 (old)
Marc Herter
Price comparison

