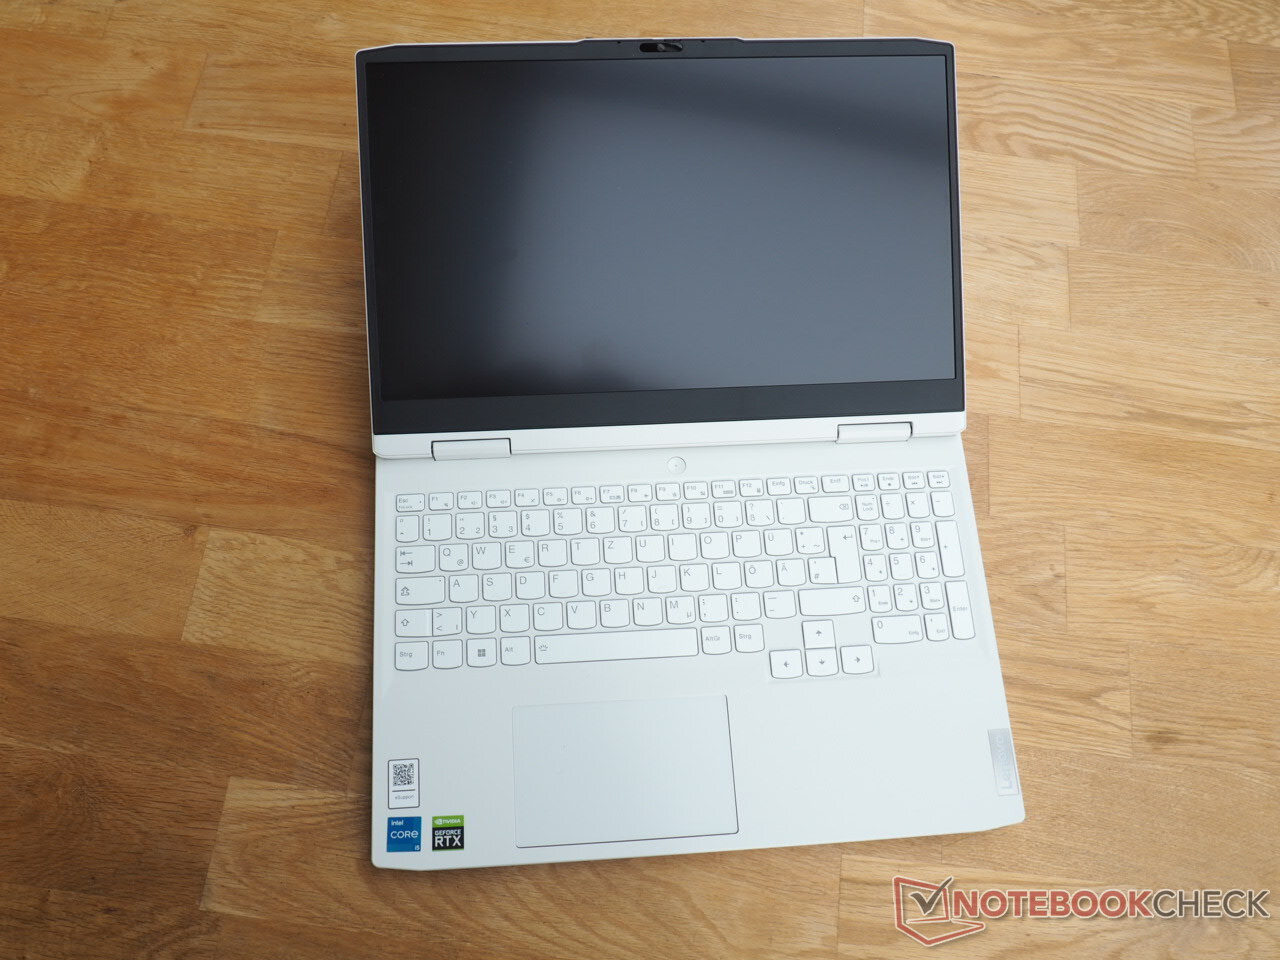
Recenzja Lenovo IdeaPad Gaming 3 15IAH7: Jeden z najmocniejszych laptopów z RTX 3050 Ti

Choć w przedziale cenowym w okolicach 1000 euro (~978 dolarów) dostępne są różne laptopy gamingowe, większość z nich rezygnuje z wyświetlacza o przyzwoitej jasności i solidnym pokryciu przestrzeni barw. Od czasu do czasu można jednak znaleźć pozytywny wyjątek, taki jak testowany przez nas IdeaPad Gaming 3 15IAH7, który oferuje m.in Core i5-12500H, aGeForce RTX 3050 Ti, 16 GB pamięci RAM DDR4 (niestety tylko w trybie jednokanałowym) oraz dysk SSD NVMe o pojemności 512 GB. 15,6-calowy ekran IPS ma częstotliwość odświeżania 165 Hz, co obiecuje dobre czasy reakcji, i rozdzielczość 1920 x 1080 pikseli.
Do konkurentów IdeaPad Gaming 3 15IAH7 należą inne laptopy z RTX 3050 Ti jak np HP Victus 16-e0145ng, theDell G15 5515, oraz Dell Inspiron 16 Plus 7620. Uwzględniamy też model rodzeństwa 15ARH7 ( angRyzen 5 6600H & RTX 3050) w naszych wykresach jako urządzenie porównawcze.
Potencjalni konkurenci w porównaniu
Ocena | Data | Model | Waga | Wysokość | Rozmiar | Rezolucja | Cena |
|---|---|---|---|---|---|---|---|
| 82.8 % v7 (old) | 10/2022 | Lenovo IdeaPad Gaming 3 15IAH7 i5-12500H, GeForce RTX 3050 Ti Laptop GPU | 2.4 kg | 26 mm | 15.60" | 1920x1080 | |
| 80.8 % v7 (old) | 10/2022 | Lenovo IdeaPad Gaming 3 15ARH7 R5 6600H, GeForce RTX 3050 4GB Laptop GPU | 2.4 kg | 21.8 mm | 15.60" | 1920x1080 | |
| 82.7 % v7 (old) | Dell G15 5515 R7 5800H, GeForce RTX 3050 Ti Laptop GPU | 2.4 kg | 24.9 mm | 15.60" | 1920x1080 | ||
| 82.3 % v7 (old) | 03/2025 | HP Victus 16-e0145ng R5 5600H, GeForce RTX 3050 Ti Laptop GPU | 2.4 kg | 23.5 mm | 16.10" | 1920x1080 | |
| 87.4 % v7 (old) | Dell Inspiron 16 Plus 7620 i7-12700H, GeForce RTX 3050 Ti Laptop GPU | 2.1 kg | 18.99 mm | 16.00" | 3072x1920 |
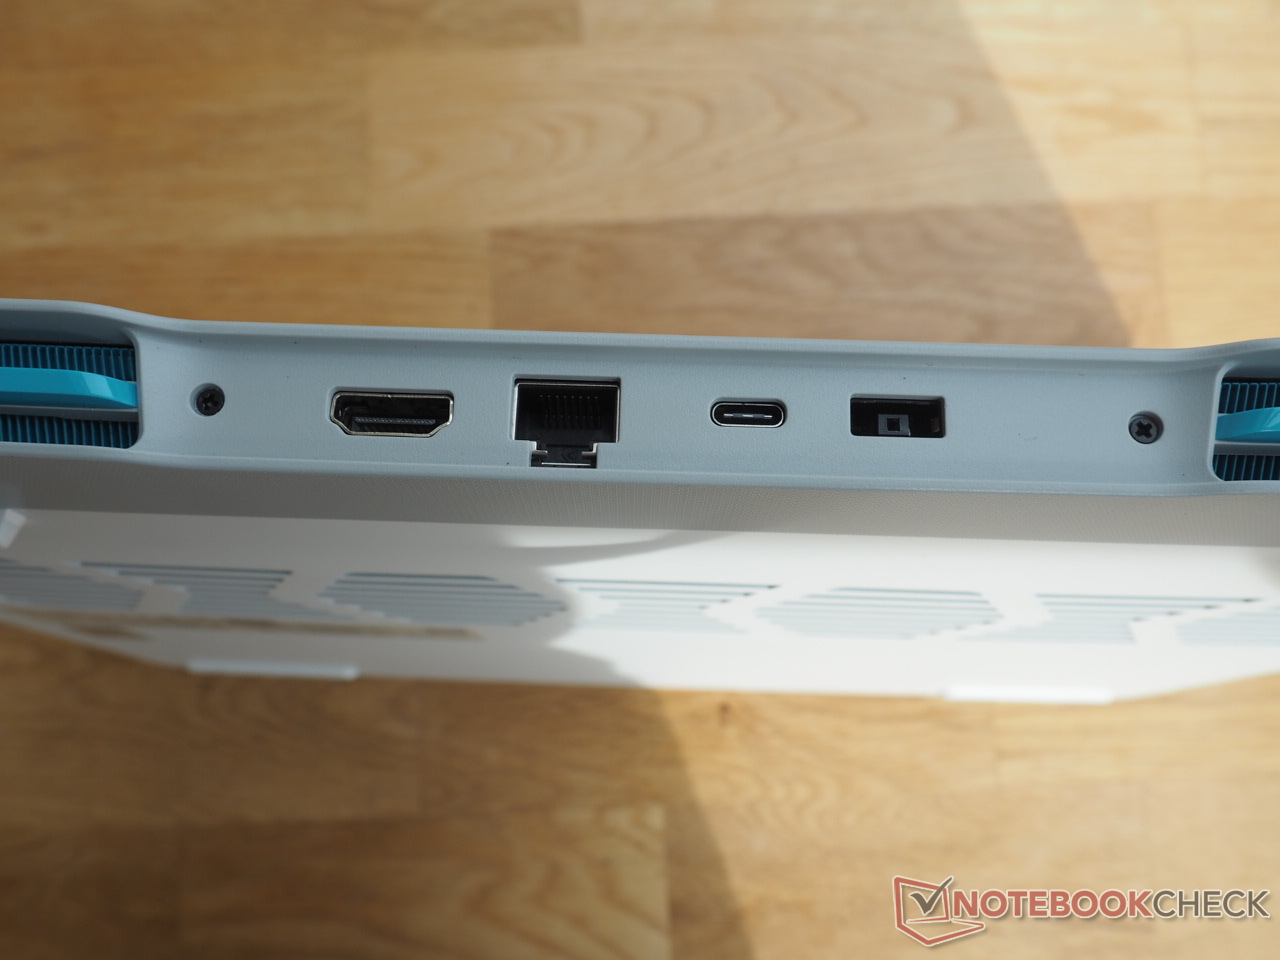
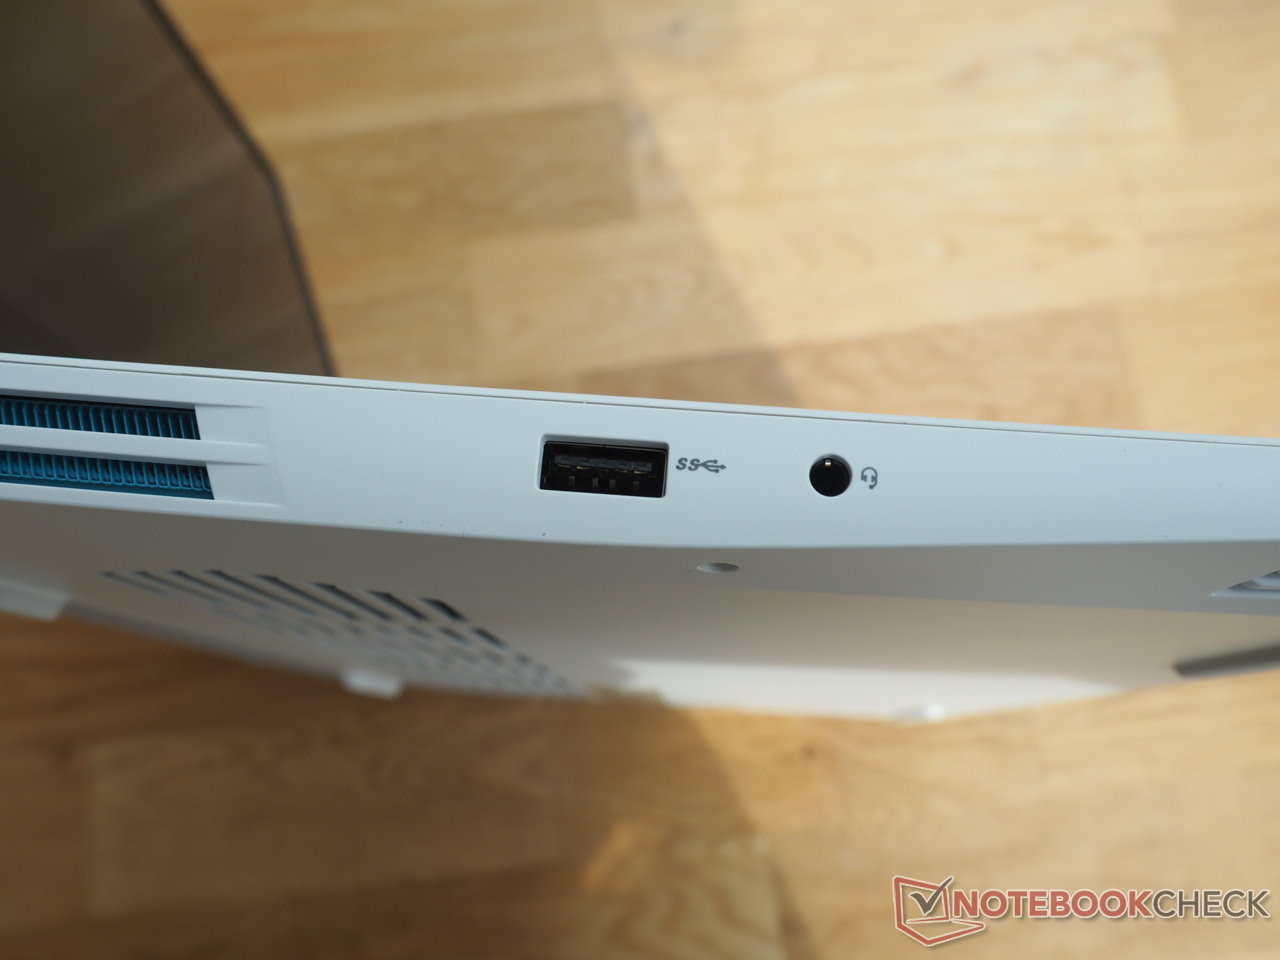
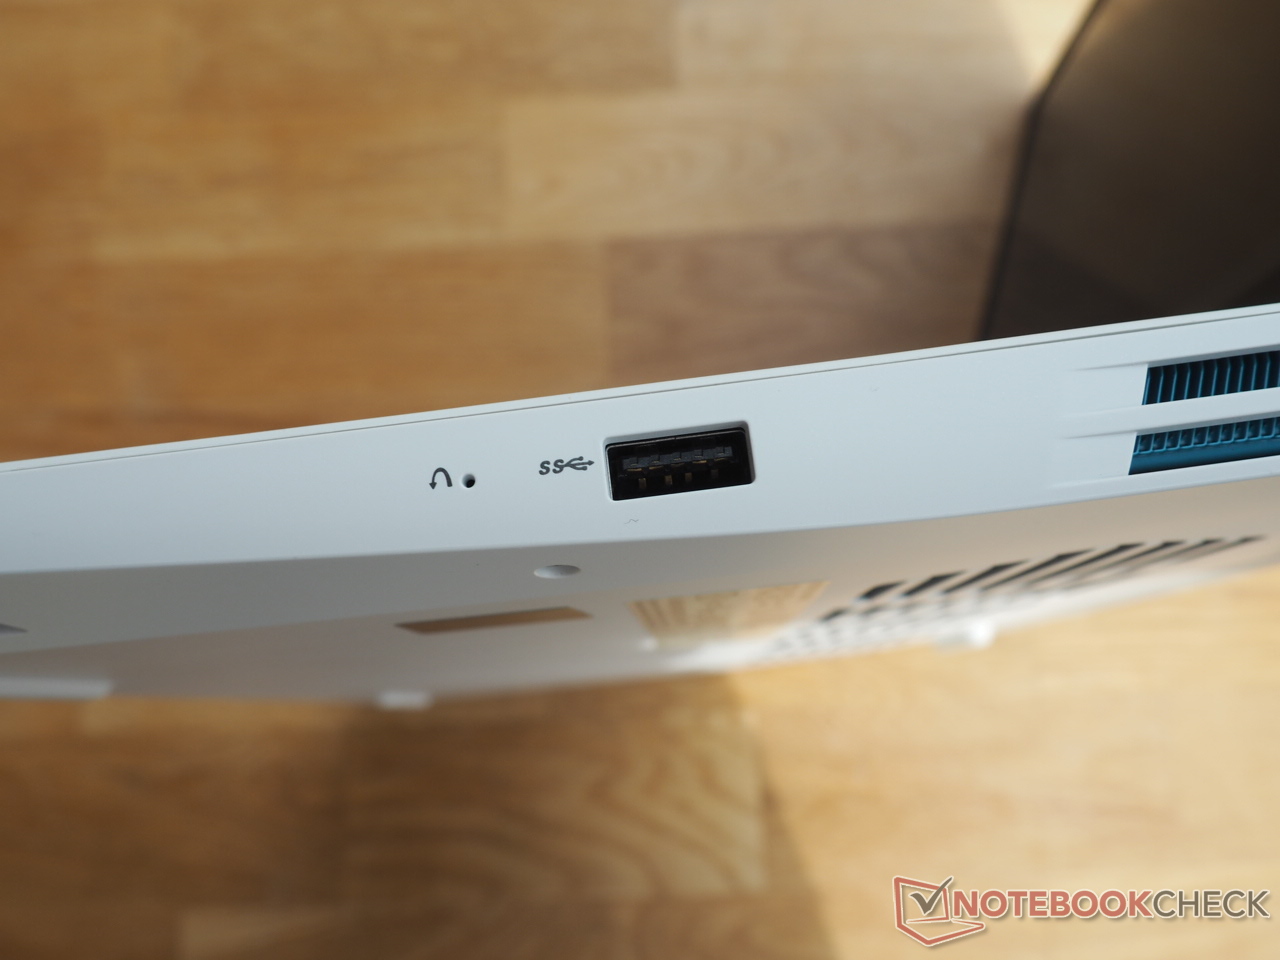
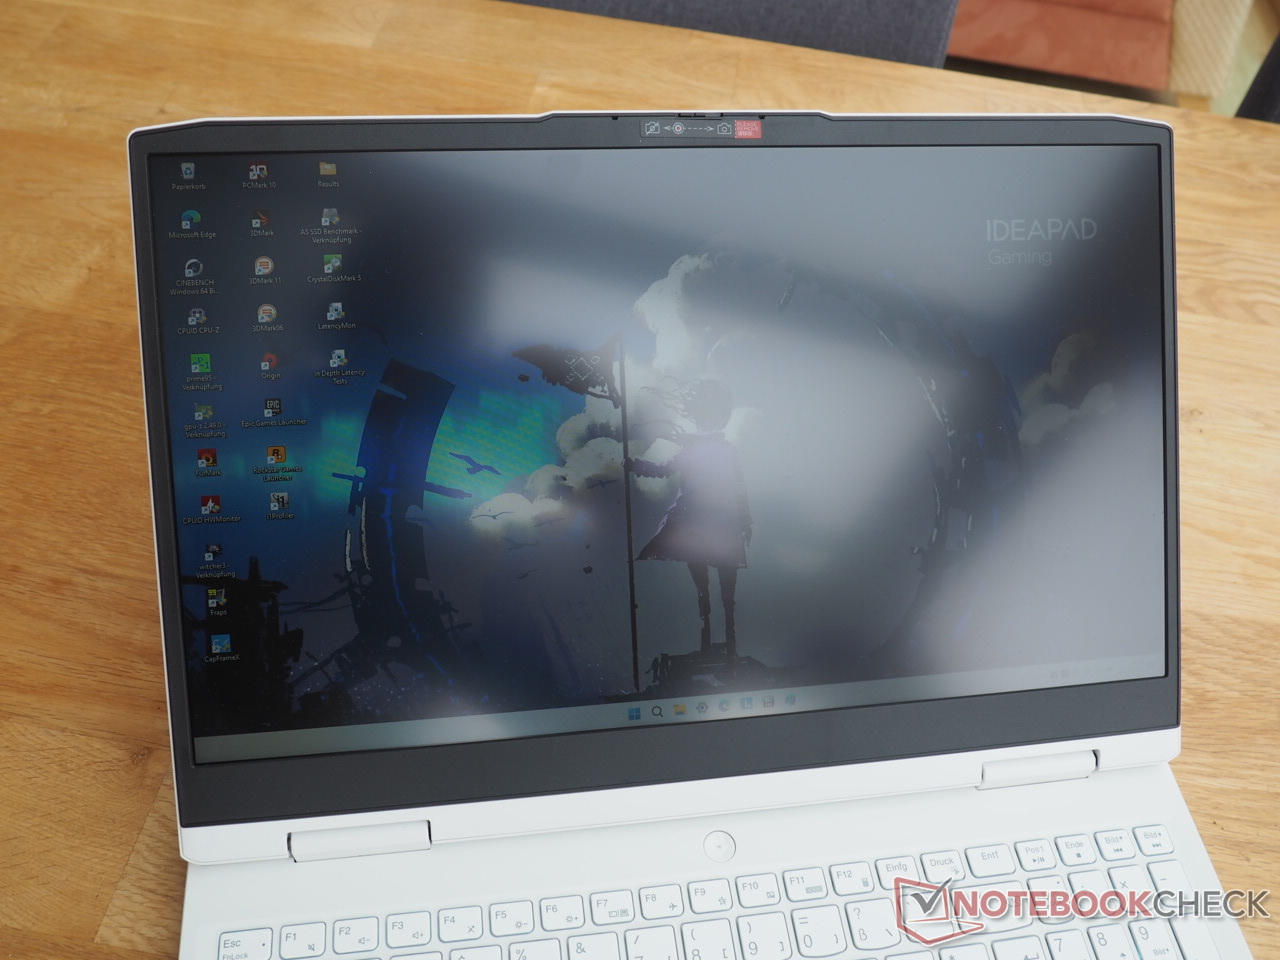
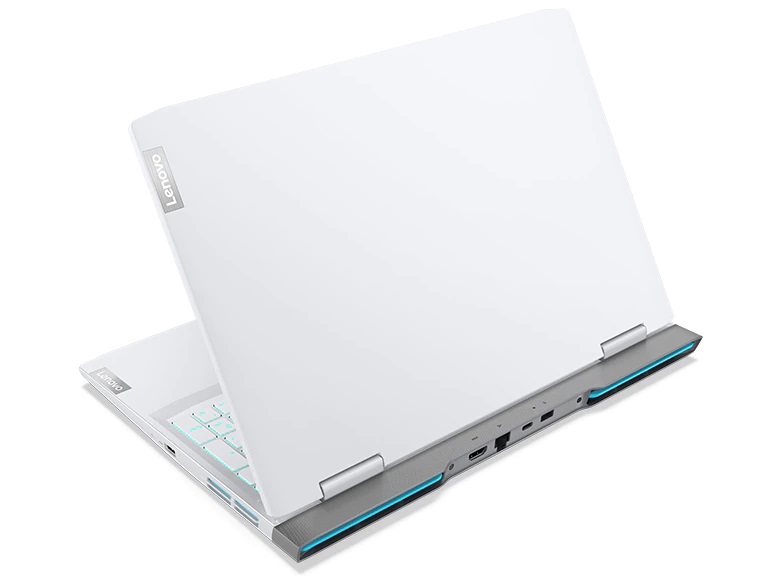
Ponieważ poza kolorem (Glacier White zamiast Onyx Grey) i układem klawiatury (German zamiast US) obudowa jest identyczna jak w przypadku wyżej wymienionego modelu rodzeństwa, nie będziemy tutaj szerzej omawiać obudowy, wyposażenia i urządzeń wejściowych. Odpowiednie informacje można znaleźć w m.in recenzji modelu rodzeństwa.
Kamera internetowa


Wyświetl
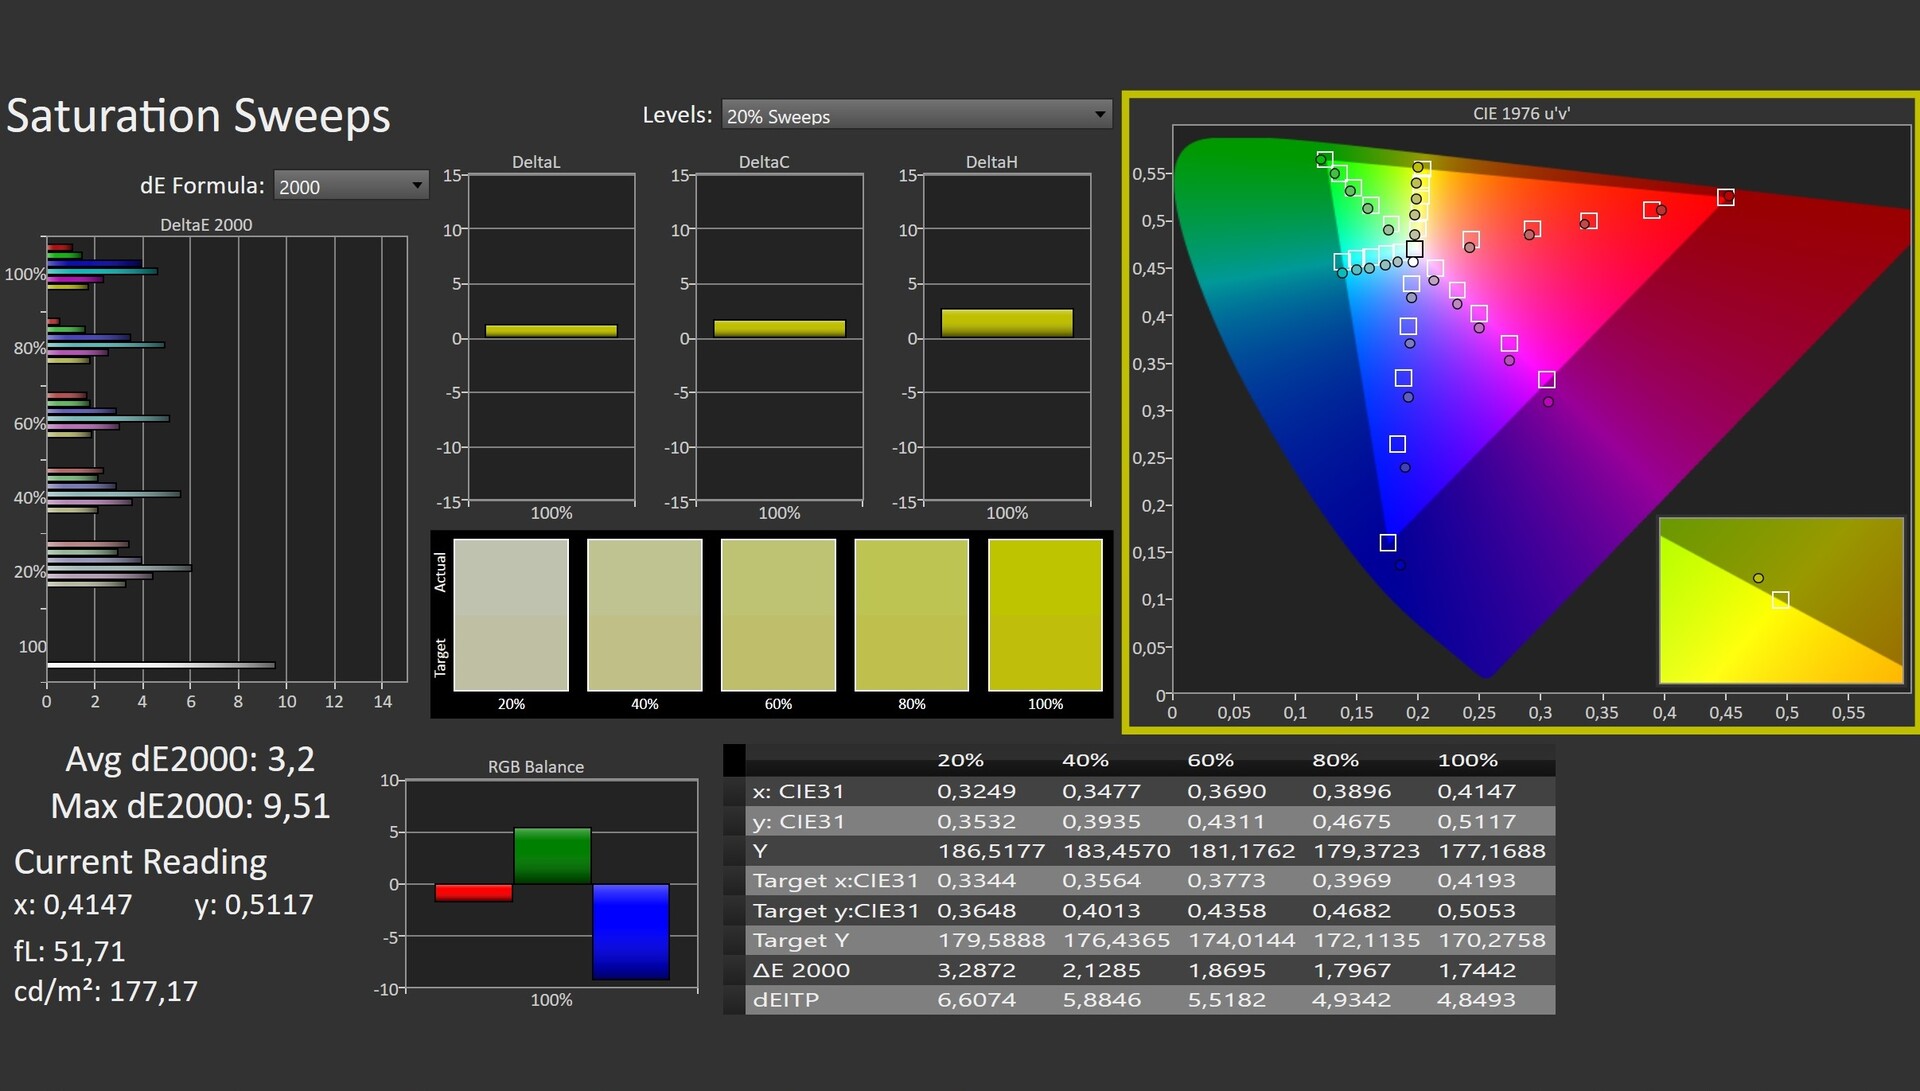
Patrząc na pole porównawcze, można łatwo zauważyć, że niedrogie laptopy do gier często wyposażone są w mizerny wyświetlacz.
| |||||||||||||||||||||||||
rozświetlenie: 92 %
na akumulatorze: 338 cd/m²
kontrast: 1252:1 (czerń: 0.27 cd/m²)
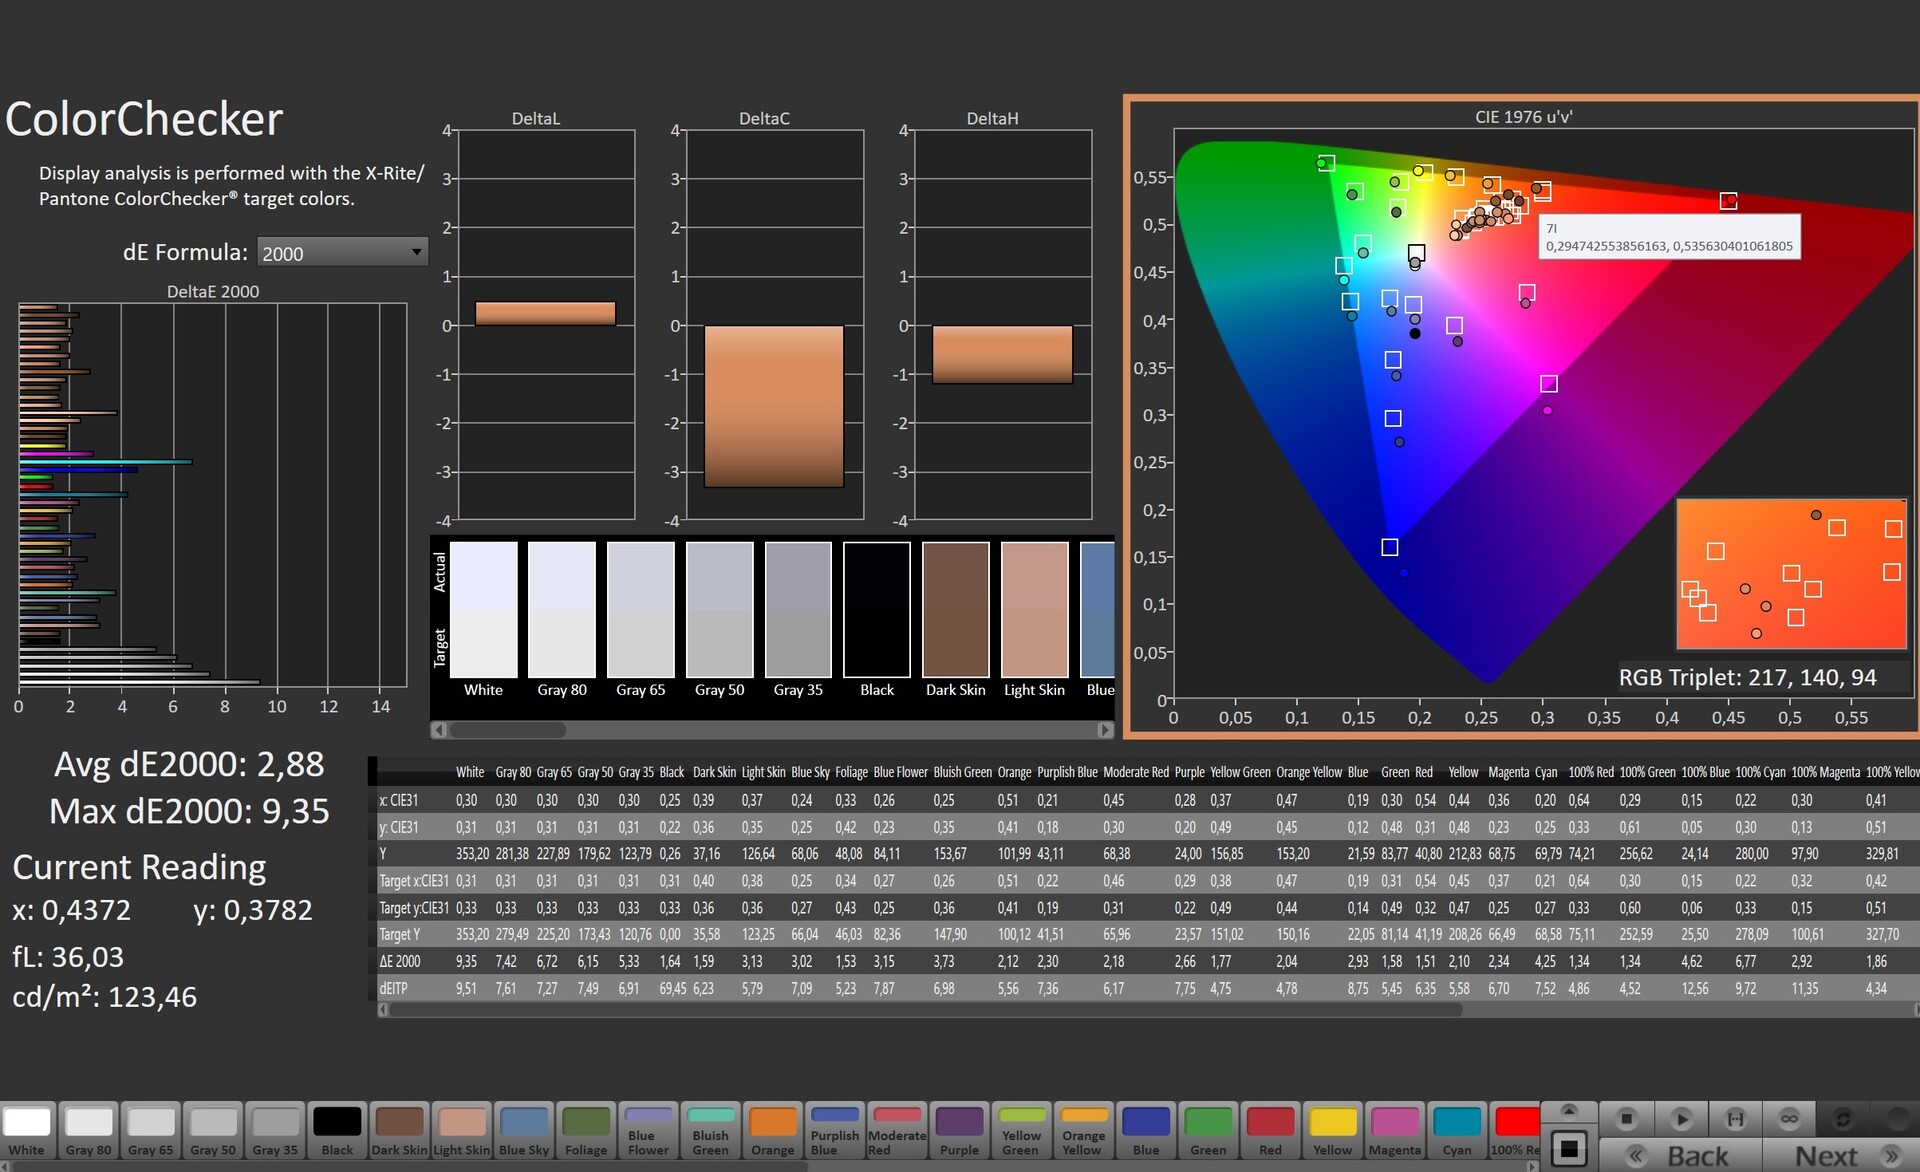
ΔE ColorChecker Calman: 2.88 | ∀{0.5-29.43 Ø4.73}
calibrated: 1.22
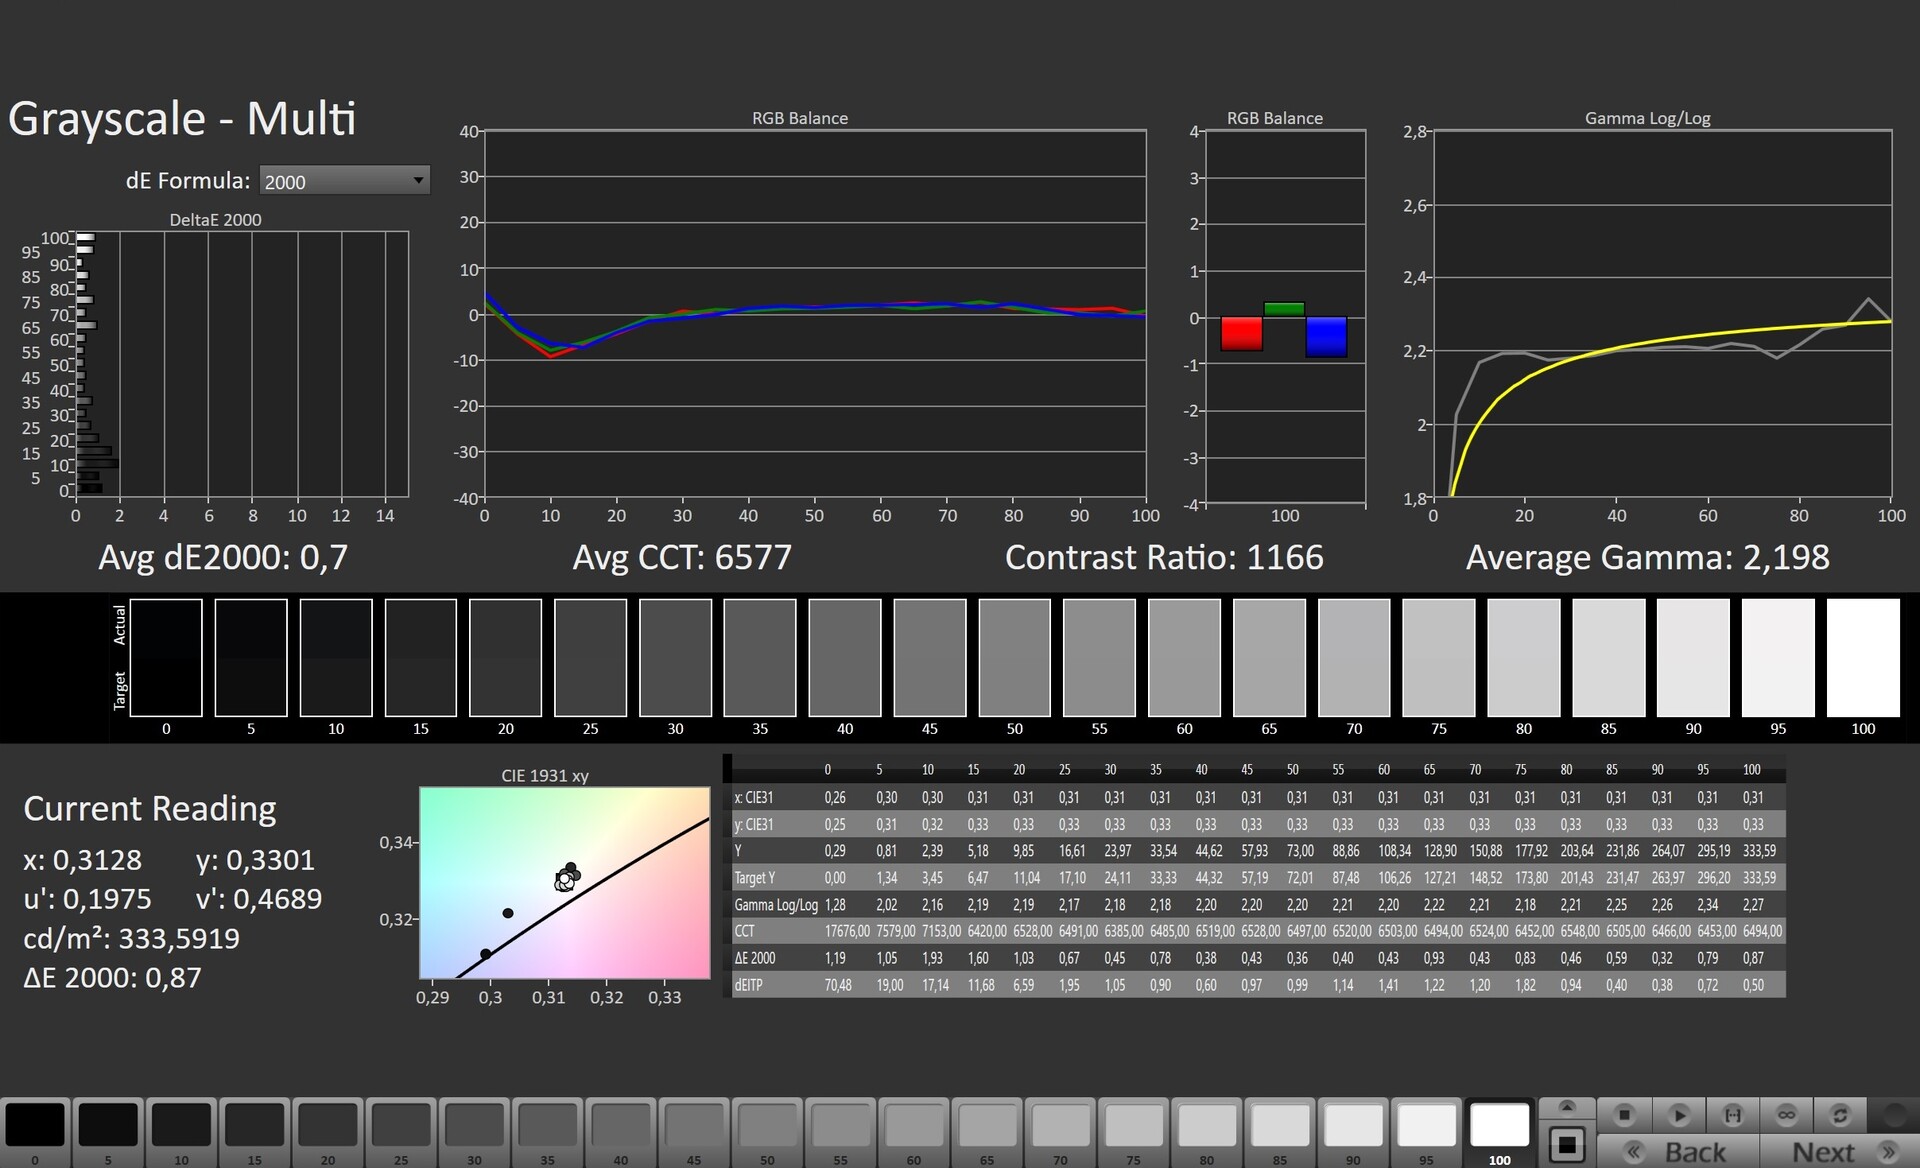
ΔE Greyscale Calman: 5 | ∀{0.09-98 Ø4.97}
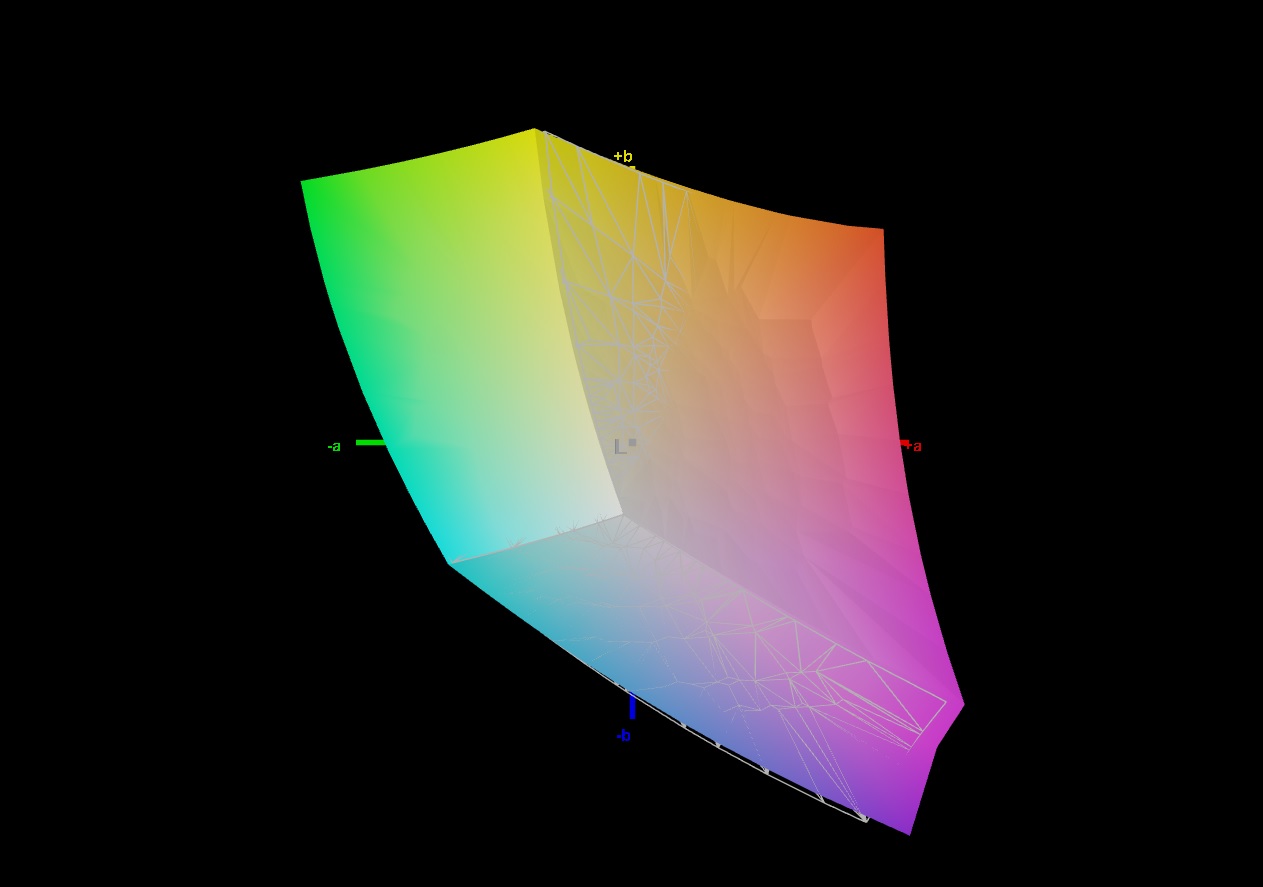
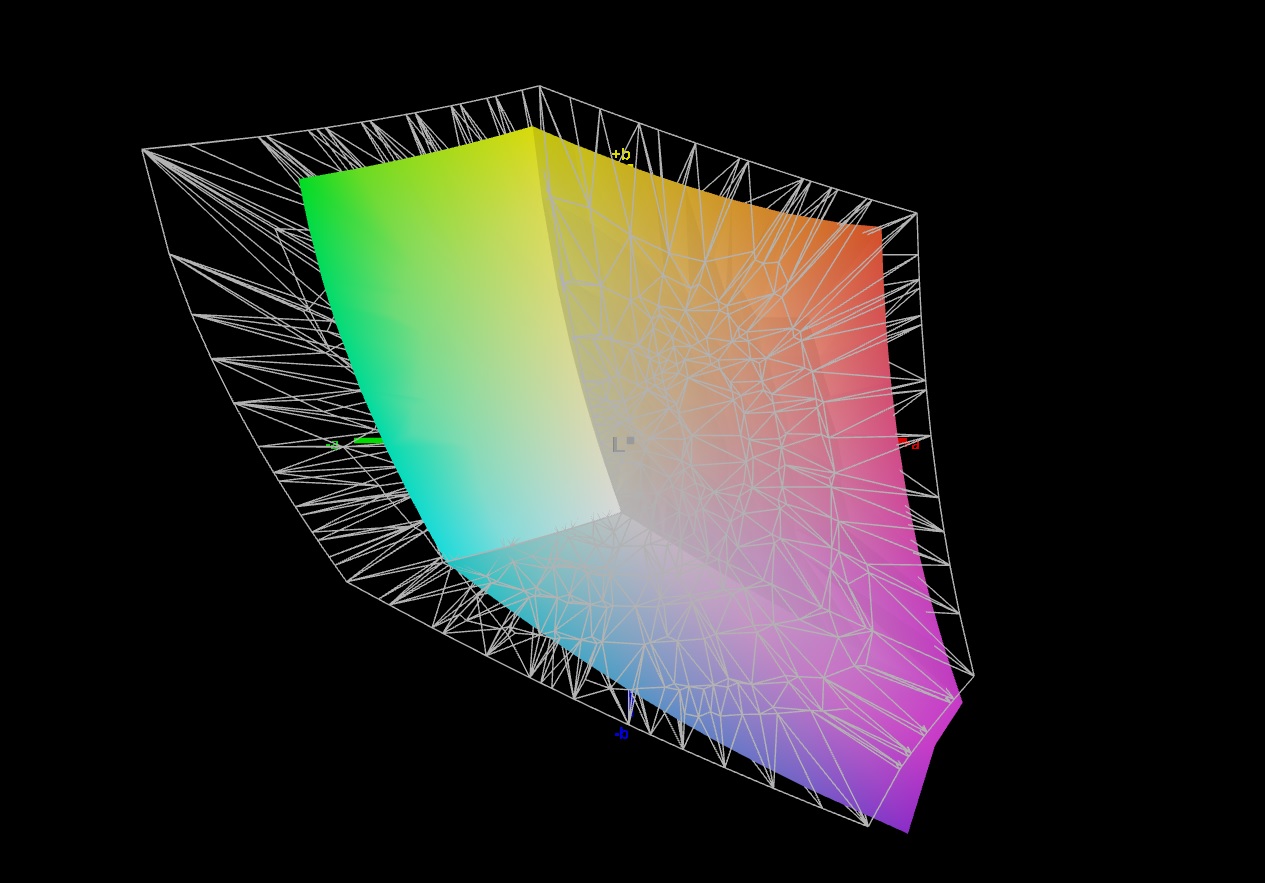
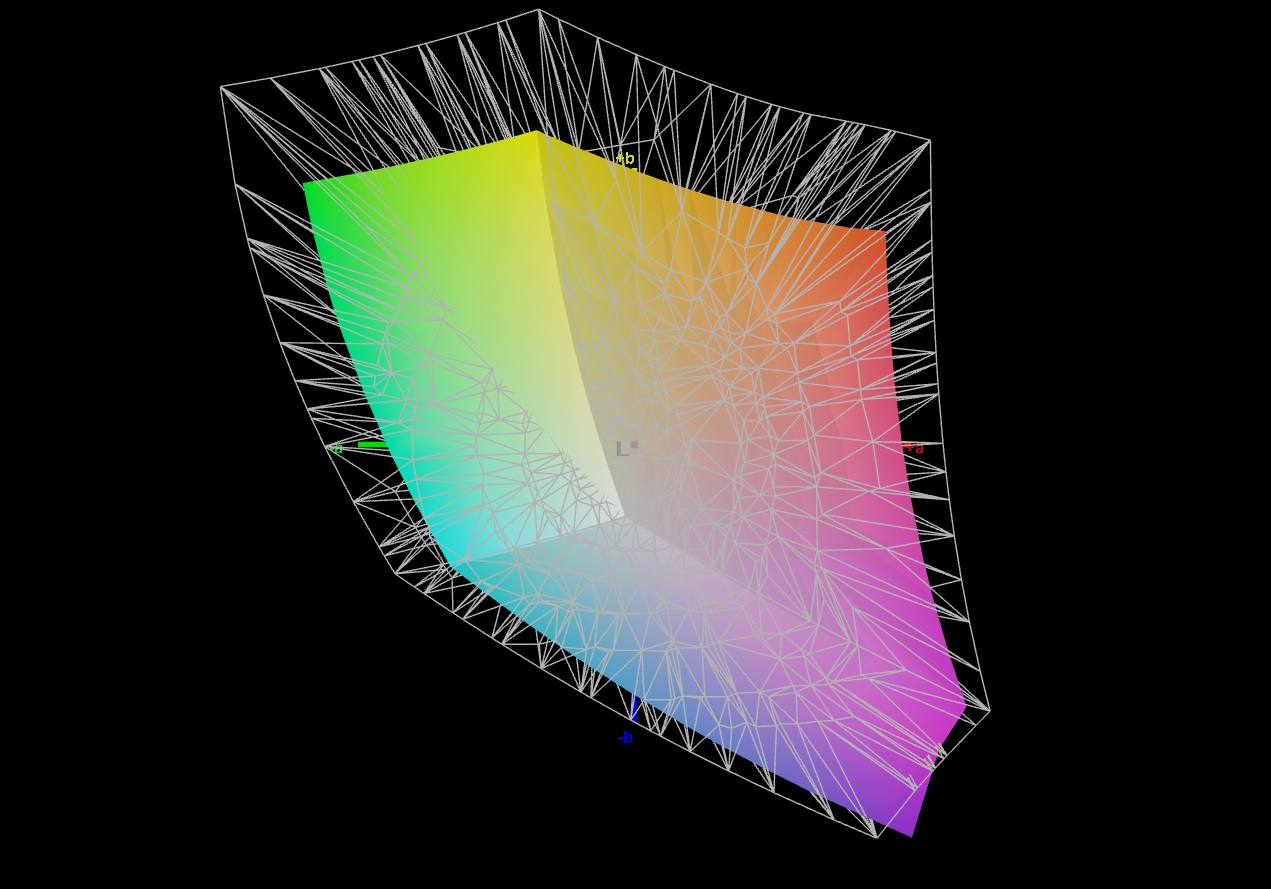
69.9% AdobeRGB 1998 (Argyll 3D)
99.2% sRGB (Argyll 3D)
69.1% Display P3 (Argyll 3D)
Gamma: 2.162
CCT: 7497 K
| Lenovo IdeaPad Gaming 3 15IAH7 Lenovo LEN156FHD, IPS, 1920x1080, 15.6" | Lenovo IdeaPad Gaming 3 15ARH7 LEN156FHD, IPS, 1920x1080, 15.6" | Dell G15 5515 BOE092A, IPS, 1920x1080, 15.6" | HP Victus 16-e0145ng CMN1609, IPS, 1920x1080, 16.1" | Dell Inspiron 16 Plus 7620 BOE NE16N41, IPS, 3072x1920, 16" | |
|---|---|---|---|---|---|
| Display | -42% | -43% | -39% | 2% | |
| Display P3 Coverage (%) | 69.1 | 39.4 -43% | 39.1 -43% | 41.6 -40% | 70.8 2% |
| sRGB Coverage (%) | 99.2 | 58 -42% | 56.9 -43% | 61.9 -38% | 99.5 0% |
| AdobeRGB 1998 Coverage (%) | 69.9 | 40.7 -42% | 40.4 -42% | 43 -38% | 73.2 5% |
| Response Times | -90% | -97% | -130% | -213% | |
| Response Time Grey 50% / Grey 80% * (ms) | 13 ? | 20.8 ? -60% | 25.2 ? -94% | 29.6 ? -128% | 38 ? -192% |
| Response Time Black / White * (ms) | 8.4 ? | 18.4 ? -119% | 16.8 ? -100% | 19.4 ? -131% | 28 ? -233% |
| PWM Frequency (Hz) | 200 ? | ||||
| Screen | -45% | -64% | -66% | 21% | |
| Brightness middle (cd/m²) | 338 | 287.8 -15% | 278 -18% | 257 -24% | 288.9 -15% |
| Brightness (cd/m²) | 329 | 268 -19% | 262 -20% | 239 -27% | 276 -16% |
| Brightness Distribution (%) | 92 | 86 -7% | 83 -10% | 88 -4% | 92 0% |
| Black Level * (cd/m²) | 0.27 | 0.3 -11% | 0.36 -33% | 0.25 7% | 0.26 4% |
| Contrast (:1) | 1252 | 959 -23% | 772 -38% | 1028 -18% | 1111 -11% |
| Colorchecker dE 2000 * | 2.88 | 6.3 -119% | 5.74 -99% | 6.91 -140% | 1.88 35% |
| Colorchecker dE 2000 max. * | 9.35 | 21.32 -128% | 19.63 -110% | 22.27 -138% | 4.37 53% |
| Colorchecker dE 2000 calibrated * | 1.22 | 2.53 -107% | 4.7 -285% | 3.61 -196% | 0.42 66% |
| Greyscale dE 2000 * | 5 | 4 20% | 3.1 38% | 7.5 -50% | 1.4 72% |
| Gamma | 2.162 102% | 2.21 100% | 2.011 109% | 2.125 104% | 2.3 96% |
| CCT | 7497 87% | 6762 96% | 6207 105% | 6025 108% | 6634 98% |
| Całkowita średnia (program / ustawienia) | -59% /
-51% | -68% /
-64% | -78% /
-69% | -63% /
-16% |
* ... im mniej tym lepiej
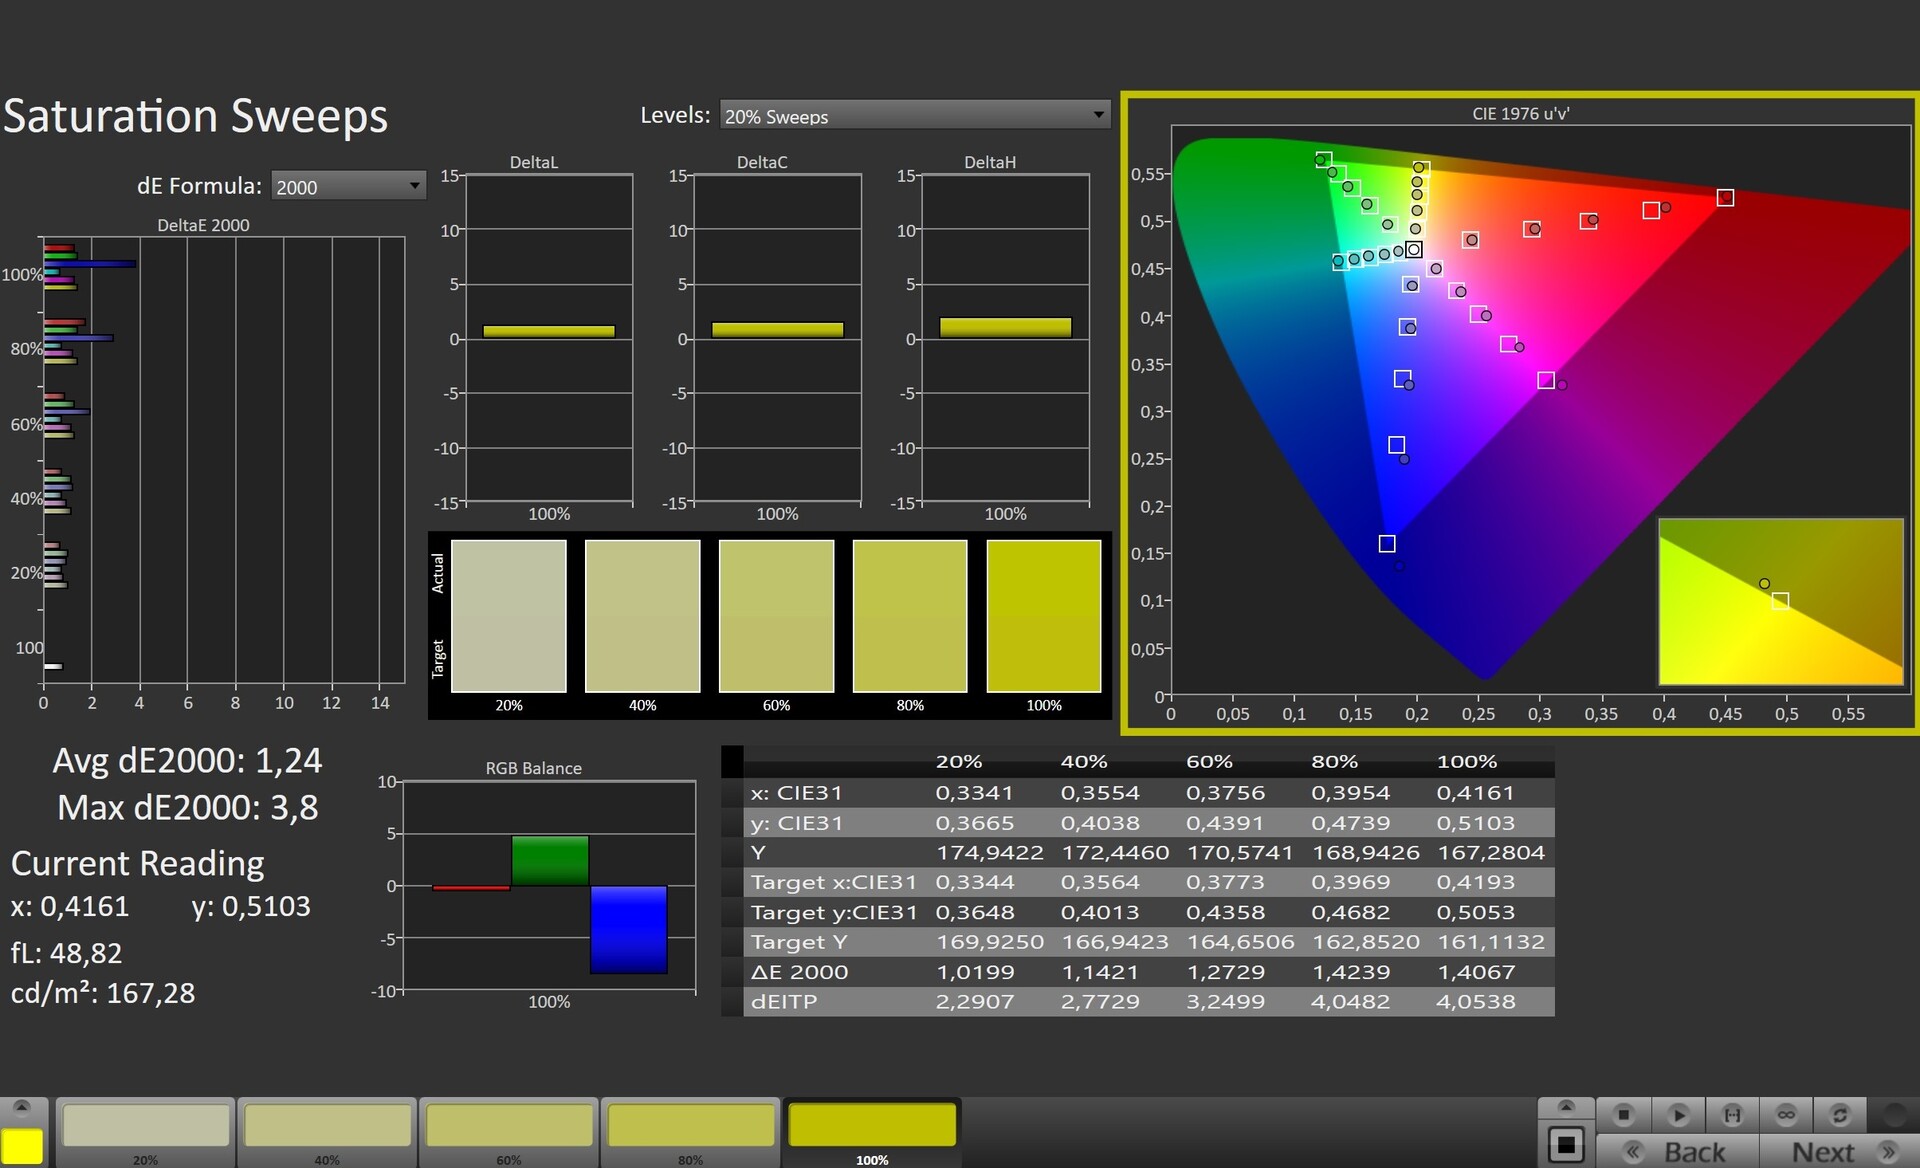
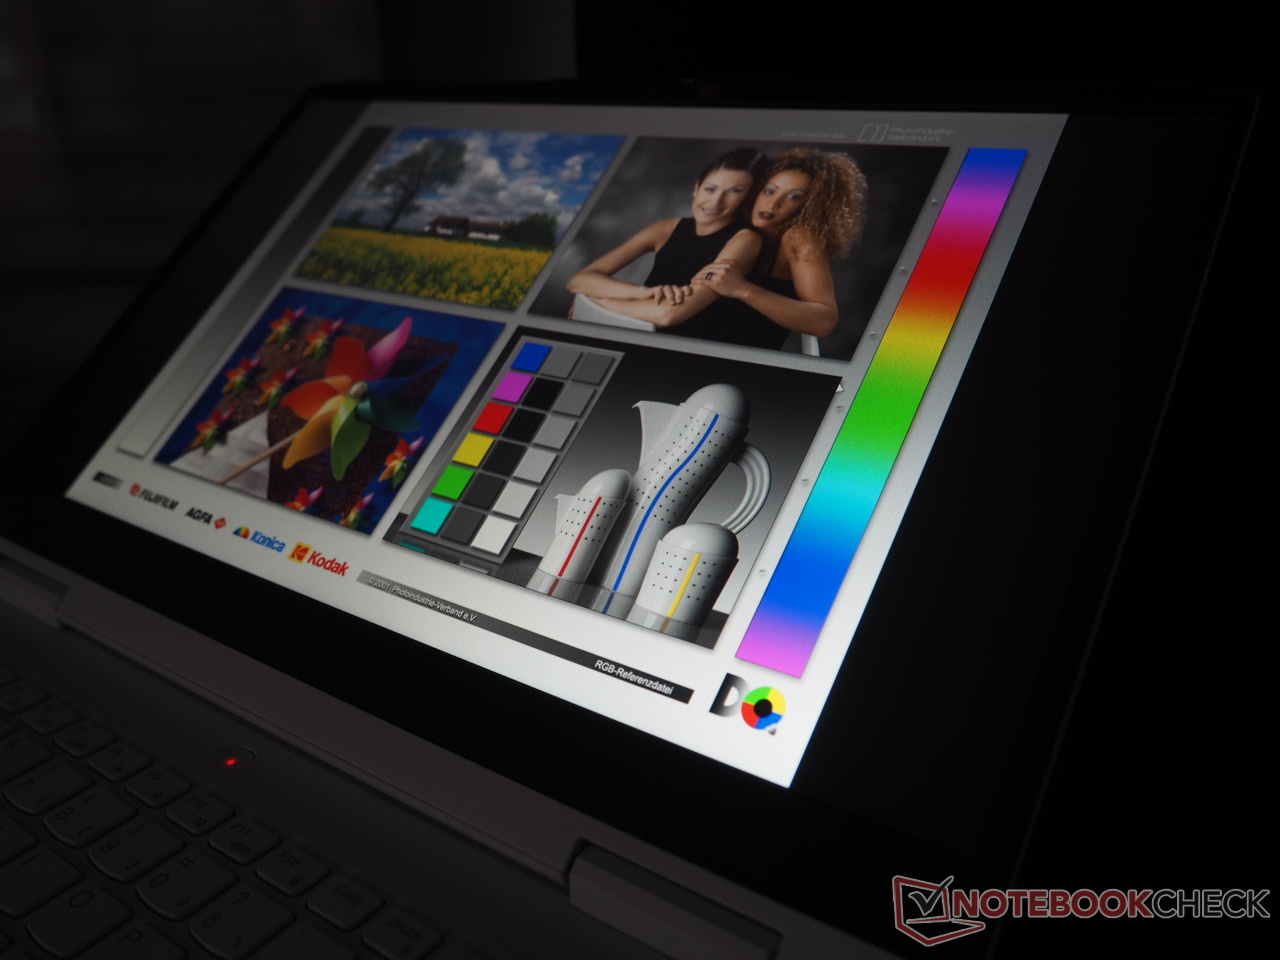
Małe przestrzenie barwne i niska jasność są powszechne w segmencie 1000 euro. Nie dotyczy to jednak IdeaPad Gaming 15 15IAH7: Około 100% pokrycia przestrzeni sRGB i średnia jasność 329 cd/m² oddają sprawiedliwość cenie laptopa.
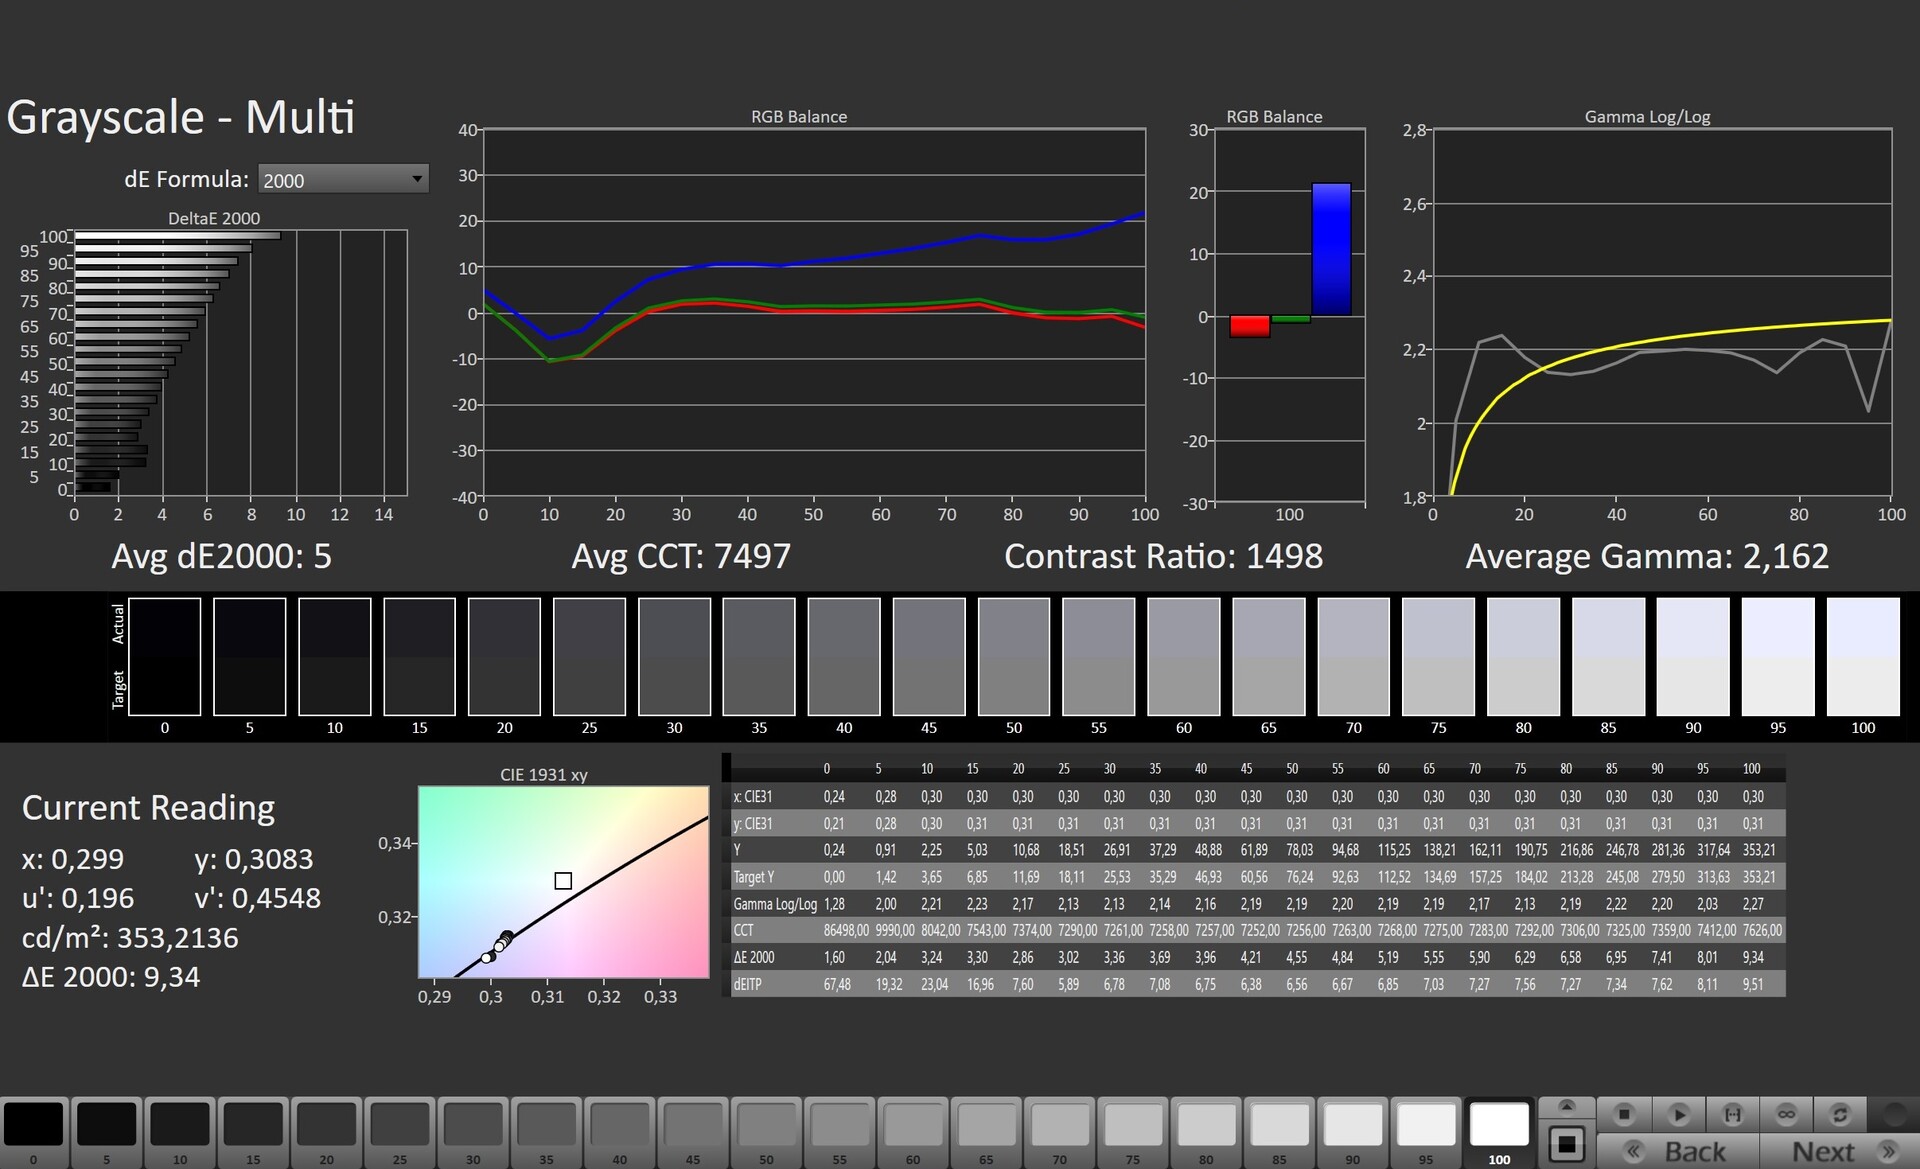
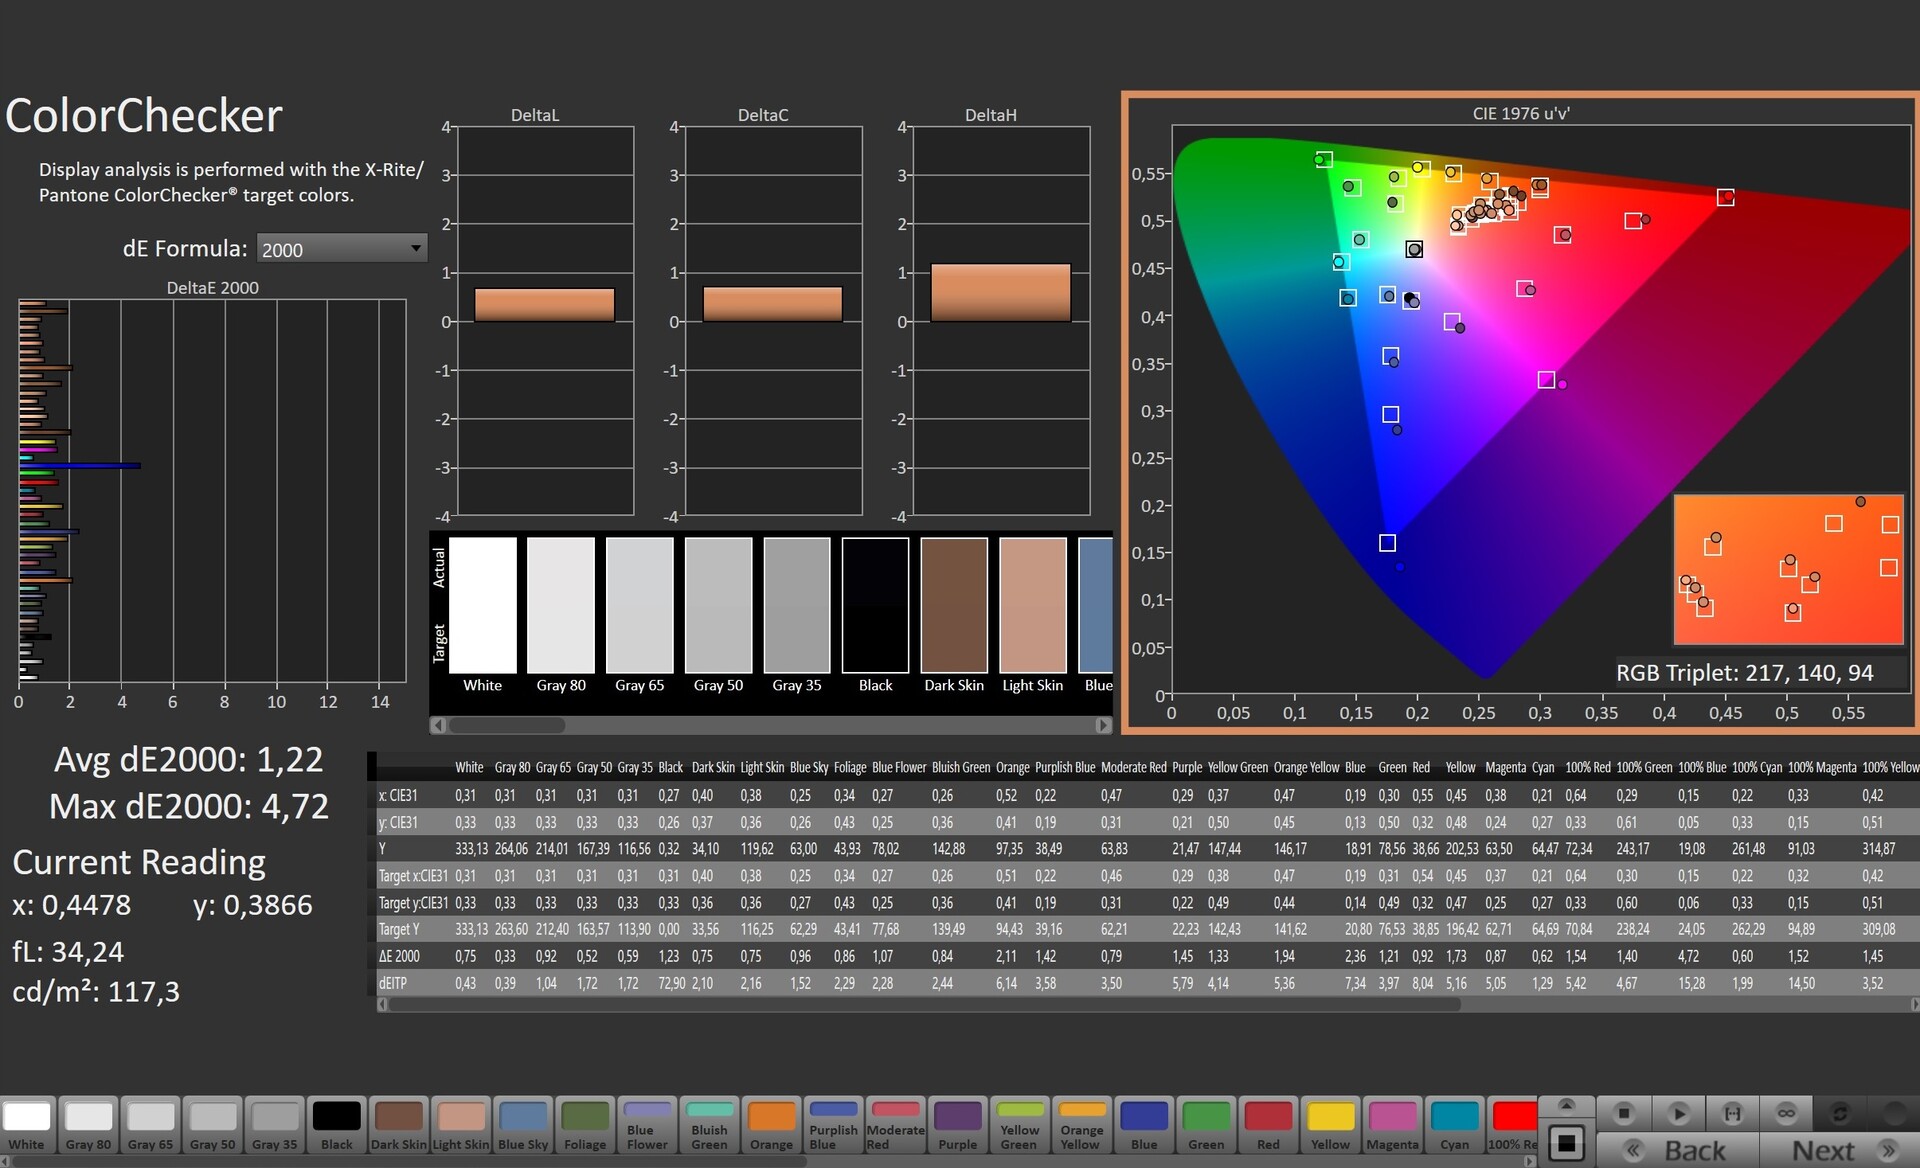
W pozostałych dyscyplinach 15-calowy laptop również wypada dobrze. Czas reakcji wynoszący od 8 do 13 ms to zdecydowanie dobra wartość. To samo dotyczy również kontrastu 1252:1, który również jest ponadprzeciętny.
Jedyne na co można by narzekać to dokładność odwzorowania kolorów. W stanie dostawy panel 165-Hz ma wyraźny niebieski odcień. Można to jednak skorygować za pomocą kalibracji (nasz plik ICC jest podlinkowany do darmowego pobrania powyżej po prawej stronie, obok grafiki rozkładu jasności). Nasz egzemplarz testowy nie wykazuje żadnych krwawień ekranu ani migotania PWM.
Wyświetl czasy reakcji
| ↔ Czas reakcji od czerni do bieli | ||
|---|---|---|
| 8.4 ms ... wzrost ↗ i spadek ↘ łącznie | ↗ 4.2 ms wzrost | 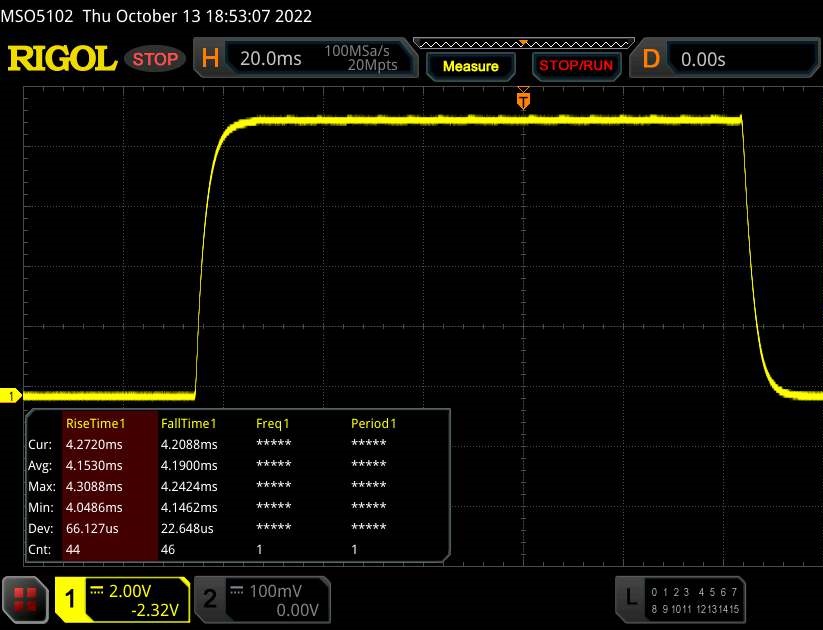 |
| ↘ 4.2 ms upadek | ||
| W naszych testach ekran wykazuje szybki czas reakcji i powinien nadawać się do gier. Dla porównania, wszystkie testowane urządzenia wahają się od 0.1 (minimum) do 240 (maksimum) ms. » 24 % wszystkich urządzeń jest lepszych. Oznacza to, że zmierzony czas reakcji jest lepszy od średniej wszystkich testowanych urządzeń (19.9 ms). | ||
| ↔ Czas reakcji 50% szarości do 80% szarości | ||
| 13 ms ... wzrost ↗ i spadek ↘ łącznie | ↗ 6.3 ms wzrost | 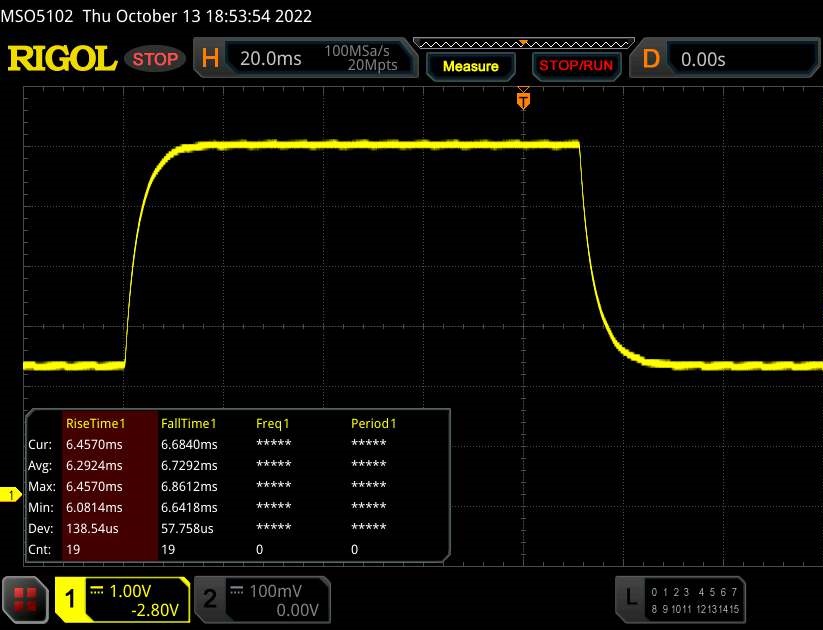 |
| ↘ 6.7 ms upadek | ||
| W naszych testach ekran wykazuje dobry współczynnik reakcji, ale może być zbyt wolny dla graczy rywalizujących ze sobą. Dla porównania, wszystkie testowane urządzenia wahają się od 0.165 (minimum) do 636 (maksimum) ms. » 26 % wszystkich urządzeń jest lepszych. Oznacza to, że zmierzony czas reakcji jest lepszy od średniej wszystkich testowanych urządzeń (31.1 ms). | ||
Migotanie ekranu / PWM (modulacja szerokości impulsu)
| Migotanie ekranu/nie wykryto PWM |  | ||
Dla porównania: 52 % wszystkich testowanych urządzeń nie używa PWM do przyciemniania wyświetlacza. Jeśli wykryto PWM, zmierzono średnio 7791 (minimum: 5 - maksimum: 343500) Hz. | |||
Wydajność
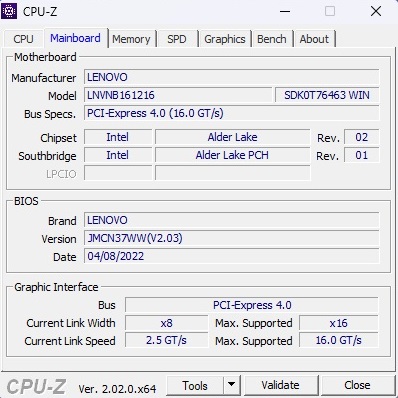
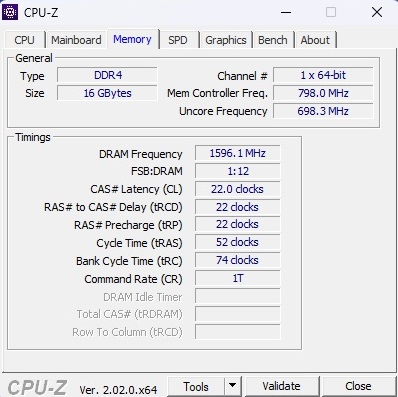
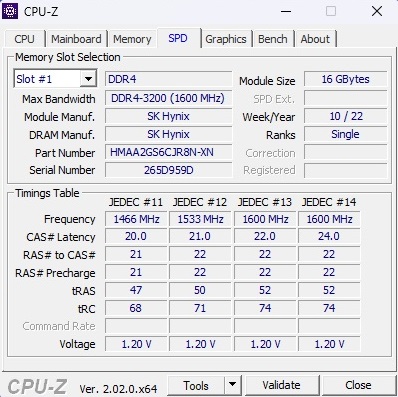
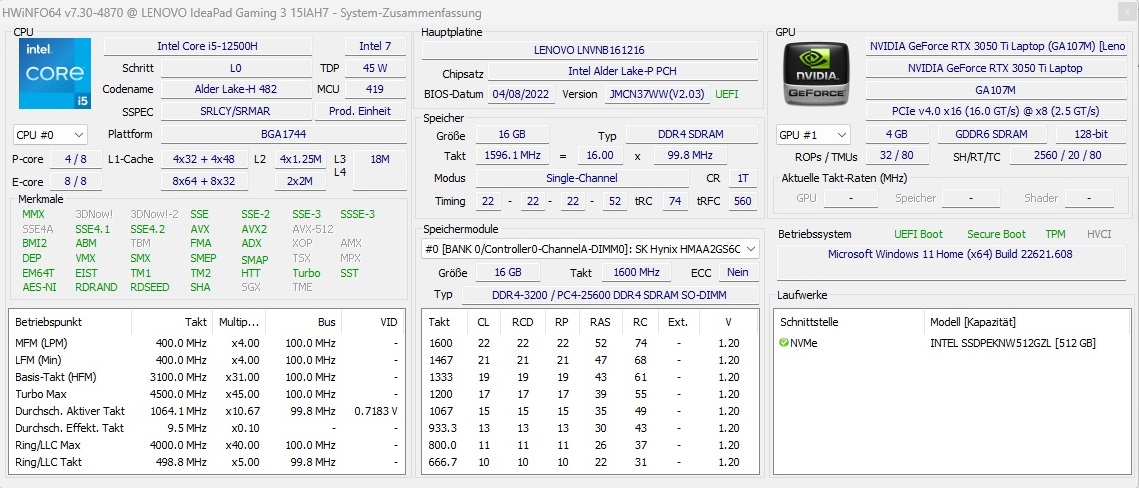
Wydajność IdeaPad Gaming 3 15IAH7 plasuje go w średniej klasie. Procesor z dużą ilością rdzeni i 16 GB pamięci roboczej powinny zapewnić wystarczające rezerwy na przyszłe lata, choć ze względów wydajnościowych Lenovo powinno było zastosować dwukanałową pamięć RAM zamiast pojedynczego modułu RAM. Choć wbudowany dysk SSD M.2 występuje tylko w formacie 2242, w obudowie wciąż jest miejsce na klasyczny dysk SSD 2280. Karta graficzna pozostawia mieszane wrażenia. Z jednej strony RTX 3050 Ti oferuje solidny stosunek ceny do wydajności, ale z drugiej strony 4 GB VRAM nie jest zbyt przyszłościowe.
Warunki badania
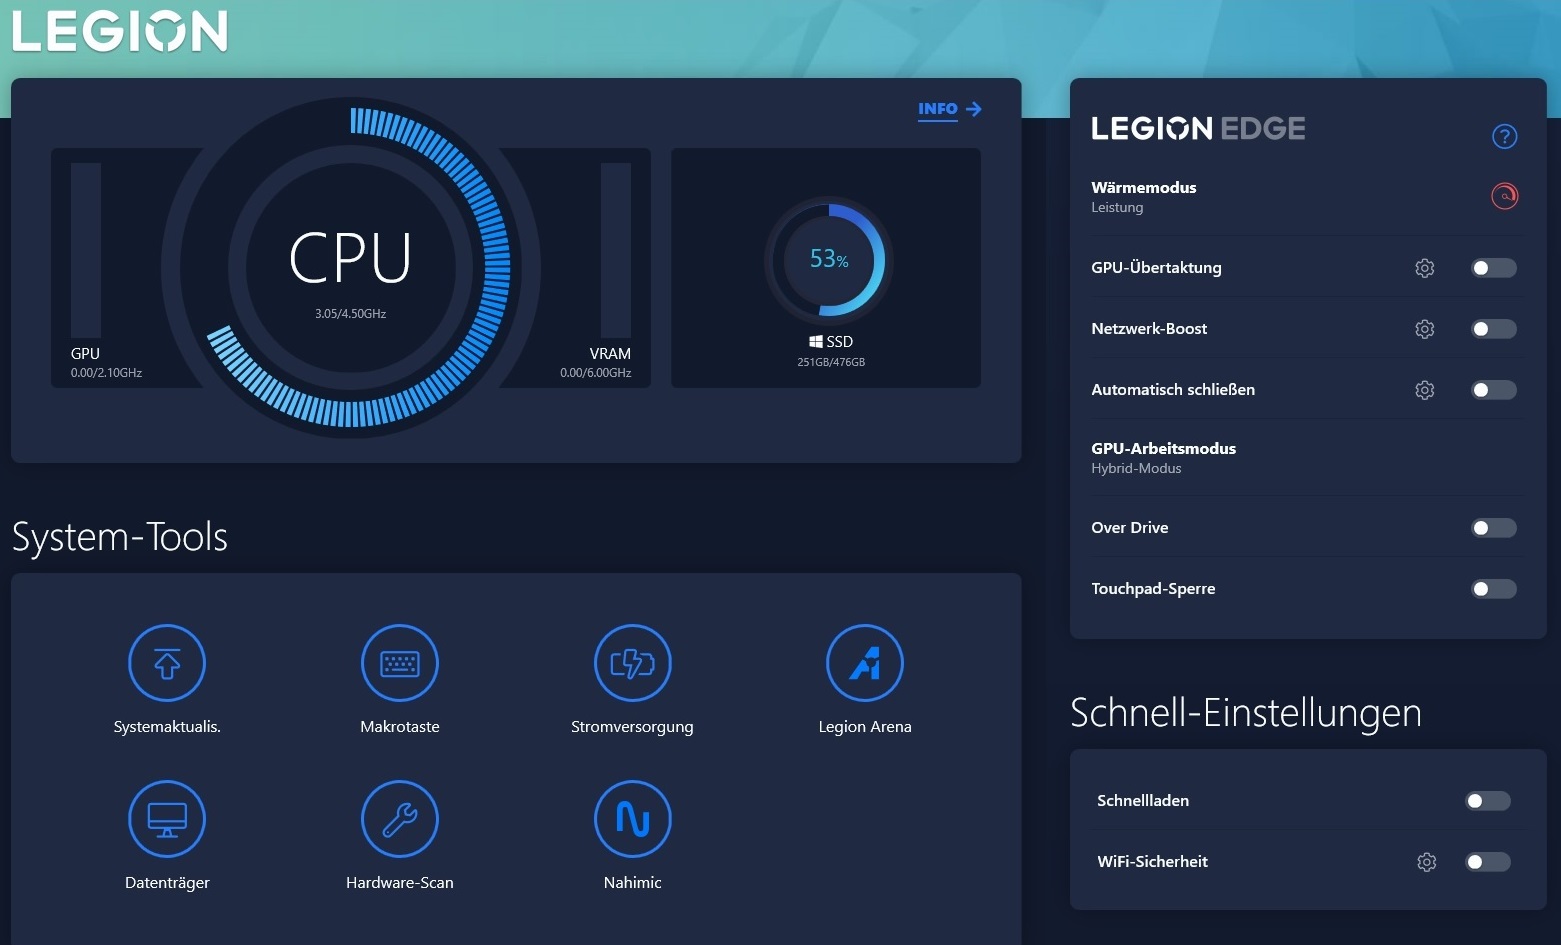
Preinstalowane oprogramowanie Lenovo Vantage oferuje dziesiątki opcji ustawień, z których szczególnie istotne są tryb zasilania i tryb pracy GPU. O ile nie wymieniamy inaczej, wszystkie nasze pomiary zostały przeprowadzone z trybem Performance i włączonym zwykłym hybrydowym przełączaniem grafiki. Biorąc jednak pod uwagę niewielki spadek wydajności (patrz wykres), w praktyce zalecalibyśmy raczej korzystanie z trybu zrównoważonego (Adjusted profile). W trybie Silent praca urządzenia jest ponownie wyraźnie cichsza. Mimo spadku liczby klatek na sekundę o około 30% wiele gier jest nadal grywalnych.


| Tryb Witcher 3 (FHD/Ultra) | Poziom hałasu | Wydajność |
| Tryb wydajności | 46 dB(A) | podstawa (~60 FPS) |
| Tryb dostosowany | 43 dB(A) | -7% (~56 FPS) |
| Trybcichy | 34 dB(A) | -30% (~42 FPS) |
Procesor
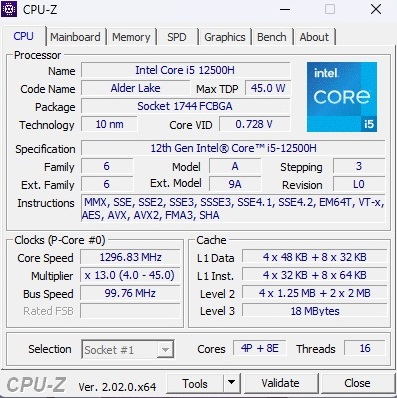
Core i5-12500H to 12-rdzeniowy model z generacji Alder Lake Intela, który obejmuje 4 rdzenie Performance (w tym hyperthreading) i 8 rdzeni Efficiency (bez hyperthreadingu), a jego TDP określono na 45 W. W testach CPU 10-nm układ zapewnia bardzo dobrą wydajność. Ponieważ wydajność również pozostaje stale stabilna, IdeaPad Gaming 3 15IAH7 plasuje się nawet przed m.in Core i7-12700Hz Dell Inspiron 16 Plus po pewnym czasie w pętli Cinebench, osiągając najwyższą pozycję. Procesory Ryzen pozostałych konkurentów (R5 5600H, R5 6600H & R7 5800H) pozostają nieco w tyle.
Cinebench R15 Multi Constant Load Test
| CPU Performance rating - Percent | |
| Średnia w klasie Gaming | |
| Dell Inspiron 16 Plus 7620 | |
| Lenovo IdeaPad Gaming 3 15IAH7 | |
| Przeciętny Intel Core i5-12500H | |
| Dell G15 5515 | |
| Lenovo IdeaPad Gaming 3 15ARH7 | |
| HP Victus 16-e0145ng | |
| Cinebench R23 | |
| Multi Core | |
| Średnia w klasie Gaming (10488 - 40970, n=112, ostatnie 2 lata) | |
| Dell Inspiron 16 Plus 7620 | |
| Lenovo IdeaPad Gaming 3 15IAH7 | |
| Przeciętny Intel Core i5-12500H (11330 - 14686, n=9) | |
| Dell G15 5515 | |
| Lenovo IdeaPad Gaming 3 15ARH7 | |
| HP Victus 16-e0145ng | |
| Single Core | |
| Średnia w klasie Gaming (1166 - 2356, n=112, ostatnie 2 lata) | |
| Dell Inspiron 16 Plus 7620 | |
| Lenovo IdeaPad Gaming 3 15IAH7 | |
| Przeciętny Intel Core i5-12500H (1558 - 1701, n=9) | |
| Lenovo IdeaPad Gaming 3 15ARH7 | |
| Dell G15 5515 | |
| HP Victus 16-e0145ng | |
| Cinebench R20 | |
| CPU (Multi Core) | |
| Średnia w klasie Gaming (4029 - 16108, n=111, ostatnie 2 lata) | |
| Dell Inspiron 16 Plus 7620 | |
| Lenovo IdeaPad Gaming 3 15IAH7 | |
| Przeciętny Intel Core i5-12500H (4687 - 5640, n=9) | |
| Dell G15 5515 | |
| Lenovo IdeaPad Gaming 3 15ARH7 | |
| HP Victus 16-e0145ng | |
| CPU (Single Core) | |
| Średnia w klasie Gaming (442 - 895, n=111, ostatnie 2 lata) | |
| Dell Inspiron 16 Plus 7620 | |
| Lenovo IdeaPad Gaming 3 15IAH7 | |
| Przeciętny Intel Core i5-12500H (602 - 656, n=9) | |
| Lenovo IdeaPad Gaming 3 15ARH7 | |
| Dell G15 5515 | |
| HP Victus 16-e0145ng | |
| Cinebench R15 | |
| CPU Multi 64Bit | |
| Średnia w klasie Gaming (1578 - 6271, n=111, ostatnie 2 lata) | |
| Dell Inspiron 16 Plus 7620 | |
| Lenovo IdeaPad Gaming 3 15IAH7 | |
| Przeciętny Intel Core i5-12500H (1970 - 2283, n=10) | |
| Dell G15 5515 | |
| Lenovo IdeaPad Gaming 3 15ARH7 | |
| HP Victus 16-e0145ng | |
| CPU Single 64Bit | |
| Średnia w klasie Gaming (188.8 - 343, n=111, ostatnie 2 lata) | |
| Dell Inspiron 16 Plus 7620 | |
| Lenovo IdeaPad Gaming 3 15IAH7 | |
| Przeciętny Intel Core i5-12500H (220 - 250, n=9) | |
| Lenovo IdeaPad Gaming 3 15ARH7 | |
| Dell G15 5515 | |
| HP Victus 16-e0145ng | |
| Blender - v2.79 BMW27 CPU | |
| HP Victus 16-e0145ng | |
| Lenovo IdeaPad Gaming 3 15ARH7 | |
| Dell G15 5515 | |
| Przeciętny Intel Core i5-12500H (223 - 288, n=9) | |
| Dell Inspiron 16 Plus 7620 | |
| Lenovo IdeaPad Gaming 3 15IAH7 | |
| Średnia w klasie Gaming (80 - 330, n=109, ostatnie 2 lata) | |
| 7-Zip 18.03 | |
| 7z b 4 | |
| Średnia w klasie Gaming (33491 - 148086, n=110, ostatnie 2 lata) | |
| Dell Inspiron 16 Plus 7620 | |
| Dell G15 5515 | |
| Przeciętny Intel Core i5-12500H (44105 - 54380, n=9) | |
| HP Victus 16-e0145ng | |
| Lenovo IdeaPad Gaming 3 15IAH7 | |
| Lenovo IdeaPad Gaming 3 15ARH7 | |
| 7z b 4 -mmt1 | |
| Średnia w klasie Gaming (4199 - 7436, n=110, ostatnie 2 lata) | |
| Dell Inspiron 16 Plus 7620 | |
| Dell G15 5515 | |
| Lenovo IdeaPad Gaming 3 15ARH7 | |
| Lenovo IdeaPad Gaming 3 15IAH7 | |
| HP Victus 16-e0145ng | |
| Przeciętny Intel Core i5-12500H (5151 - 5563, n=9) | |
| Geekbench 5.5 | |
| Multi-Core | |
| Średnia w klasie Gaming (6460 - 27010, n=110, ostatnie 2 lata) | |
| Dell Inspiron 16 Plus 7620 | |
| Przeciętny Intel Core i5-12500H (7962 - 10828, n=9) | |
| Lenovo IdeaPad Gaming 3 15IAH7 | |
| Dell G15 5515 | |
| HP Victus 16-e0145ng | |
| Lenovo IdeaPad Gaming 3 15ARH7 | |
| Single-Core | |
| Średnia w klasie Gaming (986 - 2474, n=110, ostatnie 2 lata) | |
| Dell Inspiron 16 Plus 7620 | |
| Lenovo IdeaPad Gaming 3 15IAH7 | |
| Przeciętny Intel Core i5-12500H (1471 - 1693, n=9) | |
| Dell G15 5515 | |
| Lenovo IdeaPad Gaming 3 15ARH7 | |
| HP Victus 16-e0145ng | |
| HWBOT x265 Benchmark v2.2 - 4k Preset | |
| Średnia w klasie Gaming (11.5 - 44.3, n=110, ostatnie 2 lata) | |
| Dell Inspiron 16 Plus 7620 | |
| Lenovo IdeaPad Gaming 3 15IAH7 | |
| Przeciętny Intel Core i5-12500H (12 - 16.6, n=9) | |
| Dell G15 5515 | |
| HP Victus 16-e0145ng | |
| Lenovo IdeaPad Gaming 3 15ARH7 | |
| LibreOffice - 20 Documents To PDF | |
| Dell G15 5515 | |
| HP Victus 16-e0145ng | |
| Lenovo IdeaPad Gaming 3 15ARH7 | |
| Średnia w klasie Gaming (19 - 88.8, n=110, ostatnie 2 lata) | |
| Lenovo IdeaPad Gaming 3 15IAH7 | |
| Przeciętny Intel Core i5-12500H (40.1 - 58.5, n=9) | |
| Dell Inspiron 16 Plus 7620 | |
| R Benchmark 2.5 - Overall mean | |
| Lenovo IdeaPad Gaming 3 15ARH7 | |
| HP Victus 16-e0145ng | |
| Dell G15 5515 | |
| Lenovo IdeaPad Gaming 3 15IAH7 | |
| Przeciętny Intel Core i5-12500H (0.4748 - 0.535, n=9) | |
| Dell Inspiron 16 Plus 7620 | |
| Średnia w klasie Gaming (0.3439 - 0.759, n=111, ostatnie 2 lata) | |
* ... im mniej tym lepiej
AIDA64: FP32 Ray-Trace | FPU Julia | CPU SHA3 | CPU Queen | FPU SinJulia | FPU Mandel | CPU AES | CPU ZLib | FP64 Ray-Trace | CPU PhotoWorxx
| Performance rating | |
| Średnia w klasie Gaming | |
| Dell G15 5515 | |
| Dell Inspiron 16 Plus 7620 | |
| Lenovo IdeaPad Gaming 3 15IAH7 | |
| Przeciętny Intel Core i5-12500H | |
| Lenovo IdeaPad Gaming 3 15ARH7 | |
| HP Victus 16-e0145ng | |
| AIDA64 / FP32 Ray-Trace | |
| Średnia w klasie Gaming (10227 - 85542, n=109, ostatnie 2 lata) | |
| Dell G15 5515 | |
| Lenovo IdeaPad Gaming 3 15IAH7 | |
| Dell Inspiron 16 Plus 7620 | |
| Lenovo IdeaPad Gaming 3 15ARH7 | |
| Przeciętny Intel Core i5-12500H (6851 - 13947, n=9) | |
| HP Victus 16-e0145ng | |
| AIDA64 / FPU Julia | |
| Średnia w klasie Gaming (51376 - 238426, n=109, ostatnie 2 lata) | |
| Dell G15 5515 | |
| Lenovo IdeaPad Gaming 3 15ARH7 | |
| HP Victus 16-e0145ng | |
| Lenovo IdeaPad Gaming 3 15IAH7 | |
| Dell Inspiron 16 Plus 7620 | |
| Przeciętny Intel Core i5-12500H (29874 - 68178, n=9) | |
| AIDA64 / CPU SHA3 | |
| Średnia w klasie Gaming (2180 - 9817, n=109, ostatnie 2 lata) | |
| Lenovo IdeaPad Gaming 3 15IAH7 | |
| Dell G15 5515 | |
| Przeciętny Intel Core i5-12500H (2287 - 3337, n=9) | |
| Dell Inspiron 16 Plus 7620 | |
| Lenovo IdeaPad Gaming 3 15ARH7 | |
| HP Victus 16-e0145ng | |
| AIDA64 / CPU Queen | |
| Średnia w klasie Gaming (49785 - 173351, n=100, ostatnie 2 lata) | |
| Dell G15 5515 | |
| Dell Inspiron 16 Plus 7620 | |
| Lenovo IdeaPad Gaming 3 15IAH7 | |
| Przeciętny Intel Core i5-12500H (77935 - 80703, n=9) | |
| Lenovo IdeaPad Gaming 3 15ARH7 | |
| HP Victus 16-e0145ng | |
| AIDA64 / FPU SinJulia | |
| Średnia w klasie Gaming (4424 - 33636, n=109, ostatnie 2 lata) | |
| Dell G15 5515 | |
| Lenovo IdeaPad Gaming 3 15ARH7 | |
| HP Victus 16-e0145ng | |
| Dell Inspiron 16 Plus 7620 | |
| Lenovo IdeaPad Gaming 3 15IAH7 | |
| Przeciętny Intel Core i5-12500H (6590 - 7431, n=9) | |
| AIDA64 / FPU Mandel | |
| Średnia w klasie Gaming (25115 - 128721, n=109, ostatnie 2 lata) | |
| Dell G15 5515 | |
| Lenovo IdeaPad Gaming 3 15ARH7 | |
| HP Victus 16-e0145ng | |
| Lenovo IdeaPad Gaming 3 15IAH7 | |
| Dell Inspiron 16 Plus 7620 | |
| Przeciętny Intel Core i5-12500H (18252 - 34041, n=9) | |
| AIDA64 / CPU AES | |
| Dell G15 5515 | |
| Lenovo IdeaPad Gaming 3 15IAH7 | |
| Średnia w klasie Gaming (39258 - 247074, n=109, ostatnie 2 lata) | |
| Lenovo IdeaPad Gaming 3 15ARH7 | |
| Przeciętny Intel Core i5-12500H (50298 - 111567, n=9) | |
| Dell Inspiron 16 Plus 7620 | |
| HP Victus 16-e0145ng | |
| AIDA64 / CPU ZLib | |
| Średnia w klasie Gaming (574 - 2531, n=109, ostatnie 2 lata) | |
| Dell Inspiron 16 Plus 7620 | |
| Lenovo IdeaPad Gaming 3 15IAH7 | |
| Przeciętny Intel Core i5-12500H (746 - 924, n=9) | |
| Dell G15 5515 | |
| Lenovo IdeaPad Gaming 3 15ARH7 | |
| HP Victus 16-e0145ng | |
| AIDA64 / FP64 Ray-Trace | |
| Średnia w klasie Gaming (5509 - 45446, n=109, ostatnie 2 lata) | |
| Dell G15 5515 | |
| Lenovo IdeaPad Gaming 3 15IAH7 | |
| Dell Inspiron 16 Plus 7620 | |
| Lenovo IdeaPad Gaming 3 15ARH7 | |
| Przeciętny Intel Core i5-12500H (3848 - 7405, n=9) | |
| HP Victus 16-e0145ng | |
| AIDA64 / CPU PhotoWorxx | |
| Średnia w klasie Gaming (12271 - 89891, n=109, ostatnie 2 lata) | |
| Dell Inspiron 16 Plus 7620 | |
| Przeciętny Intel Core i5-12500H (13686 - 43813, n=9) | |
| HP Victus 16-e0145ng | |
| Lenovo IdeaPad Gaming 3 15ARH7 | |
| Dell G15 5515 | |
| Lenovo IdeaPad Gaming 3 15IAH7 | |
Wydajność systemu
Według PCMark 10 wydajność systemu również jest godna szacunku. Z wynikiem 6 755 punktów bije go tylko Dell Inspiron 16 Plus. Subiektywnie rzecz biorąc, system operacyjny reaguje komfortowo szybko.
CrossMark: Overall | Productivity | Creativity | Responsiveness
| PCMark 10 / Score | |
| Średnia w klasie Gaming (5828 - 11574, n=95, ostatnie 2 lata) | |
| Dell Inspiron 16 Plus 7620 | |
| Lenovo IdeaPad Gaming 3 15IAH7 | |
| Lenovo IdeaPad Gaming 3 15ARH7 | |
| Dell G15 5515 | |
| HP Victus 16-e0145ng | |
| PCMark 10 / Essentials | |
| Średnia w klasie Gaming (8810 - 12600, n=99, ostatnie 2 lata) | |
| Dell Inspiron 16 Plus 7620 | |
| Lenovo IdeaPad Gaming 3 15IAH7 | |
| HP Victus 16-e0145ng | |
| Dell G15 5515 | |
| Lenovo IdeaPad Gaming 3 15ARH7 | |
| PCMark 10 / Productivity | |
| Średnia w klasie Gaming (6845 - 18766, n=97, ostatnie 2 lata) | |
| Lenovo IdeaPad Gaming 3 15IAH7 | |
| Dell Inspiron 16 Plus 7620 | |
| Lenovo IdeaPad Gaming 3 15ARH7 | |
| Dell G15 5515 | |
| HP Victus 16-e0145ng | |
| PCMark 10 / Digital Content Creation | |
| Średnia w klasie Gaming (7602 - 19657, n=97, ostatnie 2 lata) | |
| Dell Inspiron 16 Plus 7620 | |
| Lenovo IdeaPad Gaming 3 15IAH7 | |
| HP Victus 16-e0145ng | |
| Dell G15 5515 | |
| Lenovo IdeaPad Gaming 3 15ARH7 | |
| CrossMark / Overall | |
| Średnia w klasie Gaming (1366 - 2409, n=97, ostatnie 2 lata) | |
| Dell Inspiron 16 Plus 7620 | |
| Lenovo IdeaPad Gaming 3 15ARH7 | |
| CrossMark / Productivity | |
| Średnia w klasie Gaming (1386 - 2254, n=97, ostatnie 2 lata) | |
| Dell Inspiron 16 Plus 7620 | |
| Lenovo IdeaPad Gaming 3 15ARH7 | |
| CrossMark / Creativity | |
| Średnia w klasie Gaming (1343 - 2729, n=97, ostatnie 2 lata) | |
| Dell Inspiron 16 Plus 7620 | |
| Lenovo IdeaPad Gaming 3 15ARH7 | |
| CrossMark / Responsiveness | |
| Średnia w klasie Gaming (1226 - 2334, n=97, ostatnie 2 lata) | |
| Dell Inspiron 16 Plus 7620 | |
| Lenovo IdeaPad Gaming 3 15ARH7 | |
| PCMark 10 Score | 6755 pkt. | |
Pomoc | ||
| AIDA64 / Memory Copy | |
| Średnia w klasie Gaming (21750 - 129946, n=109, ostatnie 2 lata) | |
| Dell Inspiron 16 Plus 7620 | |
| Przeciętny Intel Core i5-12500H (23850 - 66598, n=9) | |
| HP Victus 16-e0145ng | |
| Dell G15 5515 | |
| Lenovo IdeaPad Gaming 3 15ARH7 | |
| Lenovo IdeaPad Gaming 3 15IAH7 | |
| AIDA64 / Memory Read | |
| Średnia w klasie Gaming (22956 - 118858, n=109, ostatnie 2 lata) | |
| Dell Inspiron 16 Plus 7620 | |
| Przeciętny Intel Core i5-12500H (24879 - 68013, n=9) | |
| HP Victus 16-e0145ng | |
| Dell G15 5515 | |
| Lenovo IdeaPad Gaming 3 15ARH7 | |
| Lenovo IdeaPad Gaming 3 15IAH7 | |
| AIDA64 / Memory Write | |
| Średnia w klasie Gaming (22297 - 135096, n=109, ostatnie 2 lata) | |
| Dell Inspiron 16 Plus 7620 | |
| Przeciętny Intel Core i5-12500H (23543 - 58797, n=9) | |
| HP Victus 16-e0145ng | |
| Dell G15 5515 | |
| Lenovo IdeaPad Gaming 3 15ARH7 | |
| Lenovo IdeaPad Gaming 3 15IAH7 | |
| AIDA64 / Memory Latency | |
| Średnia w klasie Gaming (75.3 - 259, n=109, ostatnie 2 lata) | |
| Przeciętny Intel Core i5-12500H (83.8 - 114.7, n=9) | |
| Dell Inspiron 16 Plus 7620 | |
| Lenovo IdeaPad Gaming 3 15IAH7 | |
| Lenovo IdeaPad Gaming 3 15ARH7 | |
| Dell G15 5515 | |
| HP Victus 16-e0145ng | |
* ... im mniej tym lepiej
Opóźnienia DPC
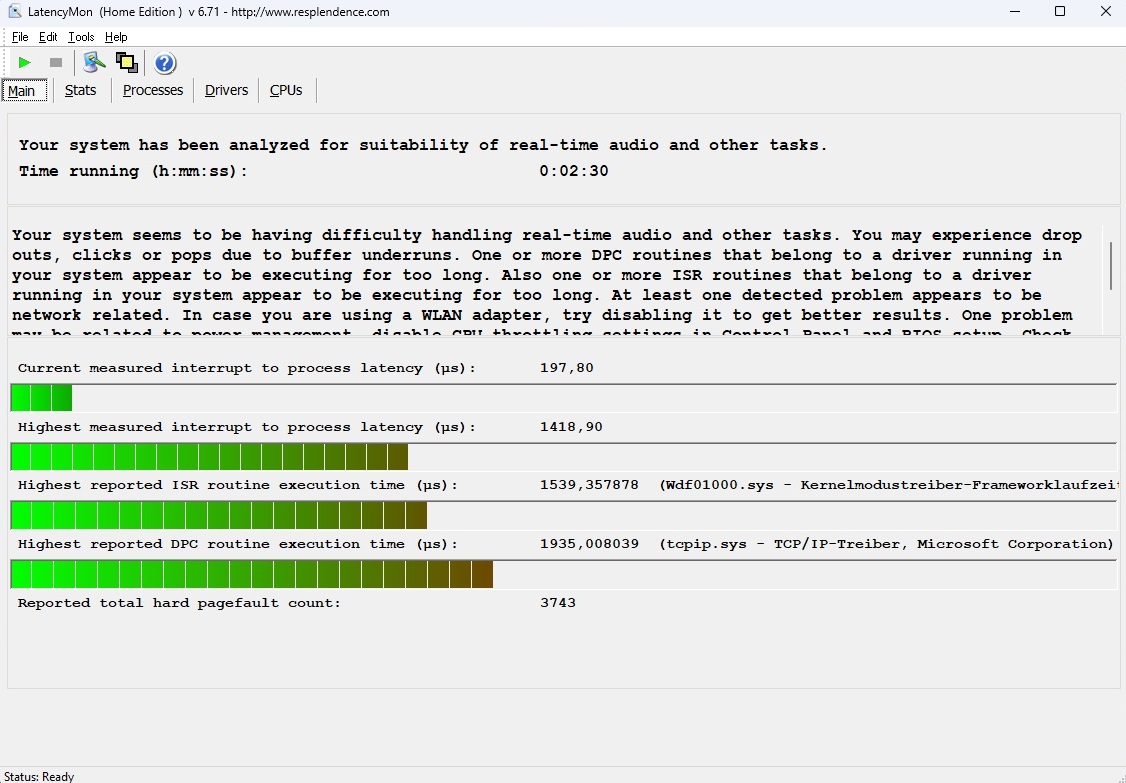
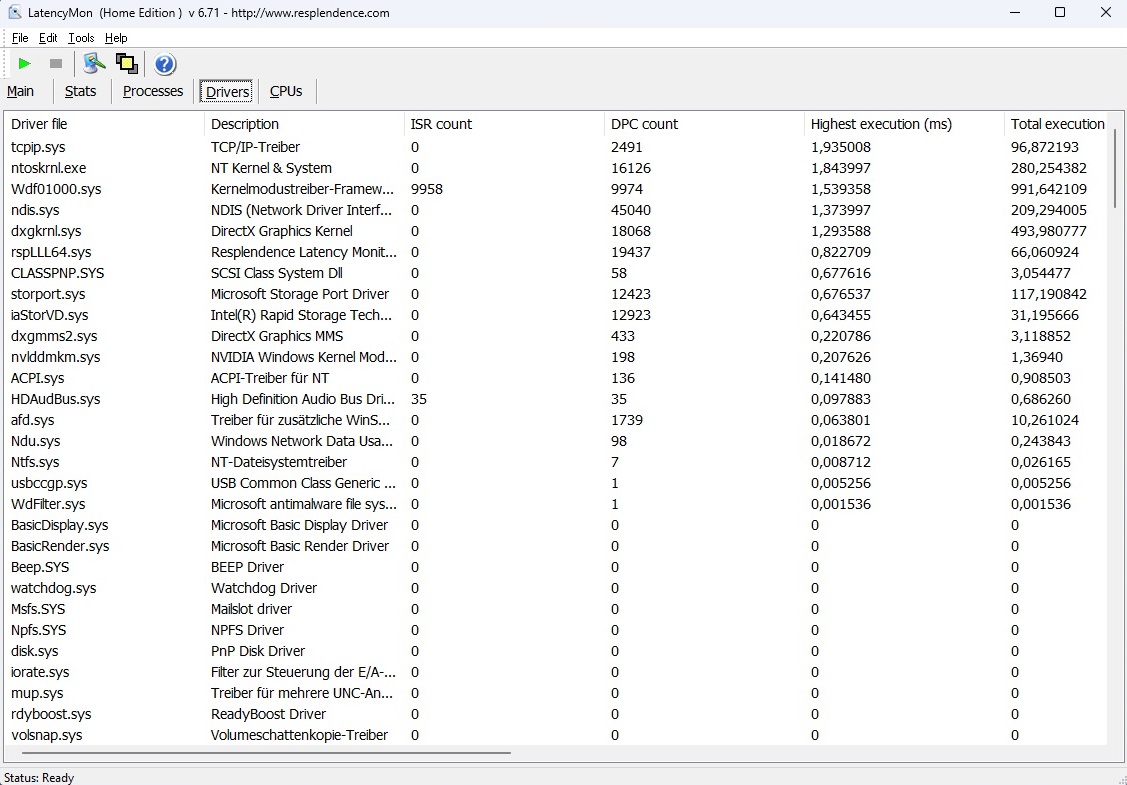
W teście latencji 15-calowy laptop nie wypada najlepiej. Narzędzie LatencyMon wspomina o potencjalnych problemach z przetwarzaniem audio i wideo w czasie rzeczywistym. Te scenariusze zastosowań powinny jednak dotyczyć tylko bardzo niewielu użytkowników.
| DPC Latencies / LatencyMon - interrupt to process latency (max), Web, Youtube, Prime95 | |
| Lenovo IdeaPad Gaming 3 15IAH7 | |
| Dell Inspiron 16 Plus 7620 | |
| HP Victus 16-e0145ng | |
| Lenovo IdeaPad Gaming 3 15ARH7 | |
| Dell G15 5515 | |
* ... im mniej tym lepiej
Rozwiązanie w zakresie przechowywania
Wydajność dysku SSD kończy się w środku pola naszego porównania. 512-GB model od Intela (660p) nie jest ani szczególnie szybki, ani szczególnie wolny jak na dysk NVMe. Świetne jest to, że - podobnie jak prędkość procesora - również prędkość SSD pozostaje względnie stała.

| Drive Performance rating - Percent | |
| Średnia w klasie Gaming | |
| HP Victus 16-e0145ng | |
| Lenovo IdeaPad Gaming 3 15ARH7 | |
| Lenovo IdeaPad Gaming 3 15IAH7 | |
| Dell Inspiron 16 Plus 7620 | |
| Dell G15 5515 | |
| Przeciętny Intel SSD 660p SSDPEKNW512G8 | |
* ... im mniej tym lepiej
Constant Performance Reading: DiskSpd Read Loop, Queue Depth 8
Karta graficzna
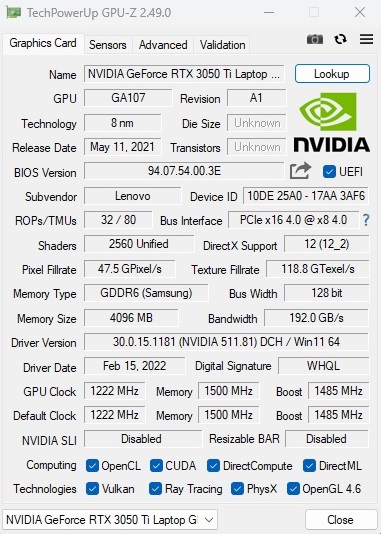
Wydajność procesorów graficznych Ampere firmy Nvidia zależy w dużej mierze od dostosowanego TGP. Lenovo zdecydowało się na stosunkowo wysoką wartość w IdeaPad Gaming 3, co korzystnie wpływa na wyniki benchmarku. 85 W to całkiem sporo jak na RTX 3050 Ti. 15-calowy laptop radzi sobie odpowiednio dobrze w benchmarkach 3DMarks. Jeśli dodać wszystkie wartości, RTX 3050 Ti jest prawie 25% szybszy od obecnej średniej tej karty grafiki. W pewnym stopniu rekompensuje to fakt, że można już dostać urządzenia z np RTX 3060, który zawiera 6 zamiast 4 GB VRAM, w segmencie 1000 euro.
| 3DMark Performance rating - Percent | |
| Średnia w klasie Gaming | |
| Lenovo IdeaPad Gaming 3 15IAH7 | |
| Dell G15 5515 | |
| Lenovo IdeaPad Gaming 3 15ARH7 | |
| HP Victus 16-e0145ng | |
| Dell Inspiron 16 Plus 7620 | |
| Przeciętny NVIDIA GeForce RTX 3050 Ti Laptop GPU | |
| 3DMark 11 - 1280x720 Performance GPU | |
| Średnia w klasie Gaming (21841 - 80022, n=108, ostatnie 2 lata) | |
| Lenovo IdeaPad Gaming 3 15IAH7 | |
| Dell G15 5515 | |
| HP Victus 16-e0145ng | |
| Dell Inspiron 16 Plus 7620 | |
| Lenovo IdeaPad Gaming 3 15ARH7 | |
| Przeciętny NVIDIA GeForce RTX 3050 Ti Laptop GPU (7952 - 20905, n=27) | |
| 3DMark | |
| 1280x720 Cloud Gate Standard Graphics | |
| Średnia w klasie Gaming (86886 - 223650, n=61, ostatnie 2 lata) | |
| Lenovo IdeaPad Gaming 3 15IAH7 | |
| Lenovo IdeaPad Gaming 3 15ARH7 | |
| Dell G15 5515 | |
| HP Victus 16-e0145ng | |
| Przeciętny NVIDIA GeForce RTX 3050 Ti Laptop GPU (30158 - 102432, n=23) | |
| Dell Inspiron 16 Plus 7620 | |
| 1920x1080 Fire Strike Graphics | |
| Średnia w klasie Gaming (12242 - 62849, n=120, ostatnie 2 lata) | |
| Lenovo IdeaPad Gaming 3 15IAH7 | |
| Dell G15 5515 | |
| HP Victus 16-e0145ng | |
| Lenovo IdeaPad Gaming 3 15ARH7 | |
| Dell Inspiron 16 Plus 7620 | |
| Przeciętny NVIDIA GeForce RTX 3050 Ti Laptop GPU (7917 - 15611, n=26) | |
| 2560x1440 Time Spy Graphics | |
| Średnia w klasie Gaming (5012 - 26212, n=119, ostatnie 2 lata) | |
| Lenovo IdeaPad Gaming 3 15IAH7 | |
| Dell G15 5515 | |
| HP Victus 16-e0145ng | |
| Dell Inspiron 16 Plus 7620 | |
| Lenovo IdeaPad Gaming 3 15ARH7 | |
| Przeciętny NVIDIA GeForce RTX 3050 Ti Laptop GPU (3744 - 6122, n=27) | |
| 3DMark 11 Performance | 19254 pkt. | |
| 3DMark Cloud Gate Standard Score | 48874 pkt. | |
| 3DMark Fire Strike Score | 14086 pkt. | |
| 3DMark Time Spy Score | 6213 pkt. | |
Pomoc | ||
| Blender | |
| v3.3 Classroom HIP/AMD | |
| Lenovo IdeaPad Gaming 3 15ARH7 | |
| v3.3 Classroom OPTIX/RTX | |
| Lenovo IdeaPad Gaming 3 15ARH7 | |
| Dell Inspiron 16 Plus 7620 | |
| Lenovo IdeaPad Gaming 3 15IAH7 | |
| Średnia w klasie Gaming (9 - 32, n=111, ostatnie 2 lata) | |
| v3.3 Classroom CUDA | |
| Lenovo IdeaPad Gaming 3 15ARH7 | |
| Dell Inspiron 16 Plus 7620 | |
| Lenovo IdeaPad Gaming 3 15IAH7 | |
| Średnia w klasie Gaming (15 - 228, n=111, ostatnie 2 lata) | |
| v3.3 Classroom CPU | |
| Lenovo IdeaPad Gaming 3 15ARH7 | |
| Dell Inspiron 16 Plus 7620 | |
| Lenovo IdeaPad Gaming 3 15IAH7 | |
| Średnia w klasie Gaming (122 - 565, n=107, ostatnie 2 lata) | |
* ... im mniej tym lepiej
Wydajność w grach
Pozytywny trend z testów grafiki syntetycznej utrzymuje się w naszych testach w grach. Chociaż wydajność w niektórych grach może znacznie ucierpieć z powodu jednokanałowej pamięci RAM (dlatego zalecamy przejście na 2x 8 GB), gry, które nie są obciążone pamięcią RAM, również działają znacznie szybciej niż na RTX 3050 Ti z niższym TGP.
| The Witcher 3 | |
| 1920x1080 High Graphics & Postprocessing (Nvidia HairWorks Off) | |
| Średnia w klasie Gaming (181 - 341, n=3, ostatnie 2 lata) | |
| Lenovo IdeaPad Gaming 3 15IAH7 | |
| Dell Inspiron 16 Plus 7620 | |
| Lenovo IdeaPad Gaming 3 15ARH7 | |
| HP Victus 16-e0145ng | |
| Dell G15 5515 | |
| Przeciętny NVIDIA GeForce RTX 3050 Ti Laptop GPU (30 - 110, n=26) | |
| 1920x1080 Ultra Graphics & Postprocessing (HBAO+) | |
| Średnia w klasie Gaming (95 - 240, n=8, ostatnie 2 lata) | |
| Lenovo IdeaPad Gaming 3 15IAH7 | |
| Dell Inspiron 16 Plus 7620 | |
| Dell G15 5515 | |
| Lenovo IdeaPad Gaming 3 15ARH7 | |
| HP Victus 16-e0145ng | |
| Przeciętny NVIDIA GeForce RTX 3050 Ti Laptop GPU (19 - 58.5, n=29) | |
Nie zauważyliśmy żadnych widocznych zachowań, które wyróżniałyby się w naszym 60-minutowym stałym teście z The Witcher 3. Zasadniczo IdeaPad Gaming 3 15IAH7 jest w stanie poradzić sobie z prawie wszystkimi nowoczesnymi grami na wysokich do maksymalnych detali w natywnej rozdzielczości 1920 x 1080 pikseli, tak długo, jak zrobisz to bez ray tracingu (gdzie RTX 3050 Ti pokazuje pewne znaczące słabości).
The Witcher 3 FPS Chart
| low | med. | high | ultra | |
|---|---|---|---|---|
| GTA V (2015) | 160.7 | 130.6 | 73.5 | |
| The Witcher 3 (2015) | 173 | 110 | 58.5 | |
| Dota 2 Reborn (2015) | 145.9 | 127.3 | 113.8 | 107.8 |
| Final Fantasy XV Benchmark (2018) | 81.5 | 58.8 | ||
| X-Plane 11.11 (2018) | 109.9 | 98.1 | 81.1 | |
| Strange Brigade (2018) | 145.5 | 117.3 | 101.3 | |
| Ghostwire Tokyo (2022) | 79.5 | 76.8 | 75.9 | |
| Tiny Tina's Wonderlands (2022) | 92.1 | 67.2 | 51.7 | |
| Vampire Bloodhunt (2022) | 111.8 | 110.9 | 106.1 | |
| F1 22 (2022) | 111 | 92 | 32 | |
| The Quarry (2022) | 69.7 | 58.3 | 45.8 |
Emisje
Emisja hałasu
W trybie Performance 15-calowy laptop nie jest zbyt cichy. Już podczas pracy w trybie jałowym można usłyszeć spory szum wentylatora o natężeniu 29 do 32 dB(A). Pod obciążeniem urządzenie wytwarza potężny hałas o natężeniu 42 do 54 dB(A), choć inne laptopy do gier, jak Victus 16, uzyskują podobną głośność. Dzięki dwóm innym trybom zasilania można jednak łatwo i szybko wyciszyć urządzenie.
Hałas
| luz |
| 29 / 30 / 32 dB |
| obciążenie |
| 42 / 54 dB |
 | ||
30 dB cichy 40 dB(A) słyszalny 50 dB(A) irytujący |
||
min: | ||
| Lenovo IdeaPad Gaming 3 15IAH7 GeForce RTX 3050 Ti Laptop GPU, i5-12500H | Lenovo IdeaPad Gaming 3 15ARH7 GeForce RTX 3050 4GB Laptop GPU, R5 6600H | Dell G15 5515 GeForce RTX 3050 Ti Laptop GPU, R7 5800H | HP Victus 16-e0145ng GeForce RTX 3050 Ti Laptop GPU, R5 5600H | Dell Inspiron 16 Plus 7620 GeForce RTX 3050 Ti Laptop GPU, i7-12700H | |
|---|---|---|---|---|---|
| Noise | 11% | 7% | 0% | 4% | |
| wyłączone / środowisko * (dB) | 25 | 23.3 7% | 24 4% | 26 -4% | 23.3 7% |
| Idle Minimum * (dB) | 29 | 23.8 18% | 25 14% | 26 10% | 25.7 11% |
| Idle Average * (dB) | 30 | 23.8 21% | 26 13% | 28 7% | 26.1 13% |
| Idle Maximum * (dB) | 32 | 27.2 15% | 30 6% | 34 -6% | 30.6 4% |
| Load Average * (dB) | 42 | 34.8 17% | 44 -5% | 44 -5% | 46.2 -10% |
| Witcher 3 ultra * (dB) | 46 | 49.3 -7% | 44 4% | 48 -4% | 49.2 -7% |
| Load Maximum * (dB) | 54 | 49.4 9% | 48 11% | 53 2% | 49.4 9% |
* ... im mniej tym lepiej
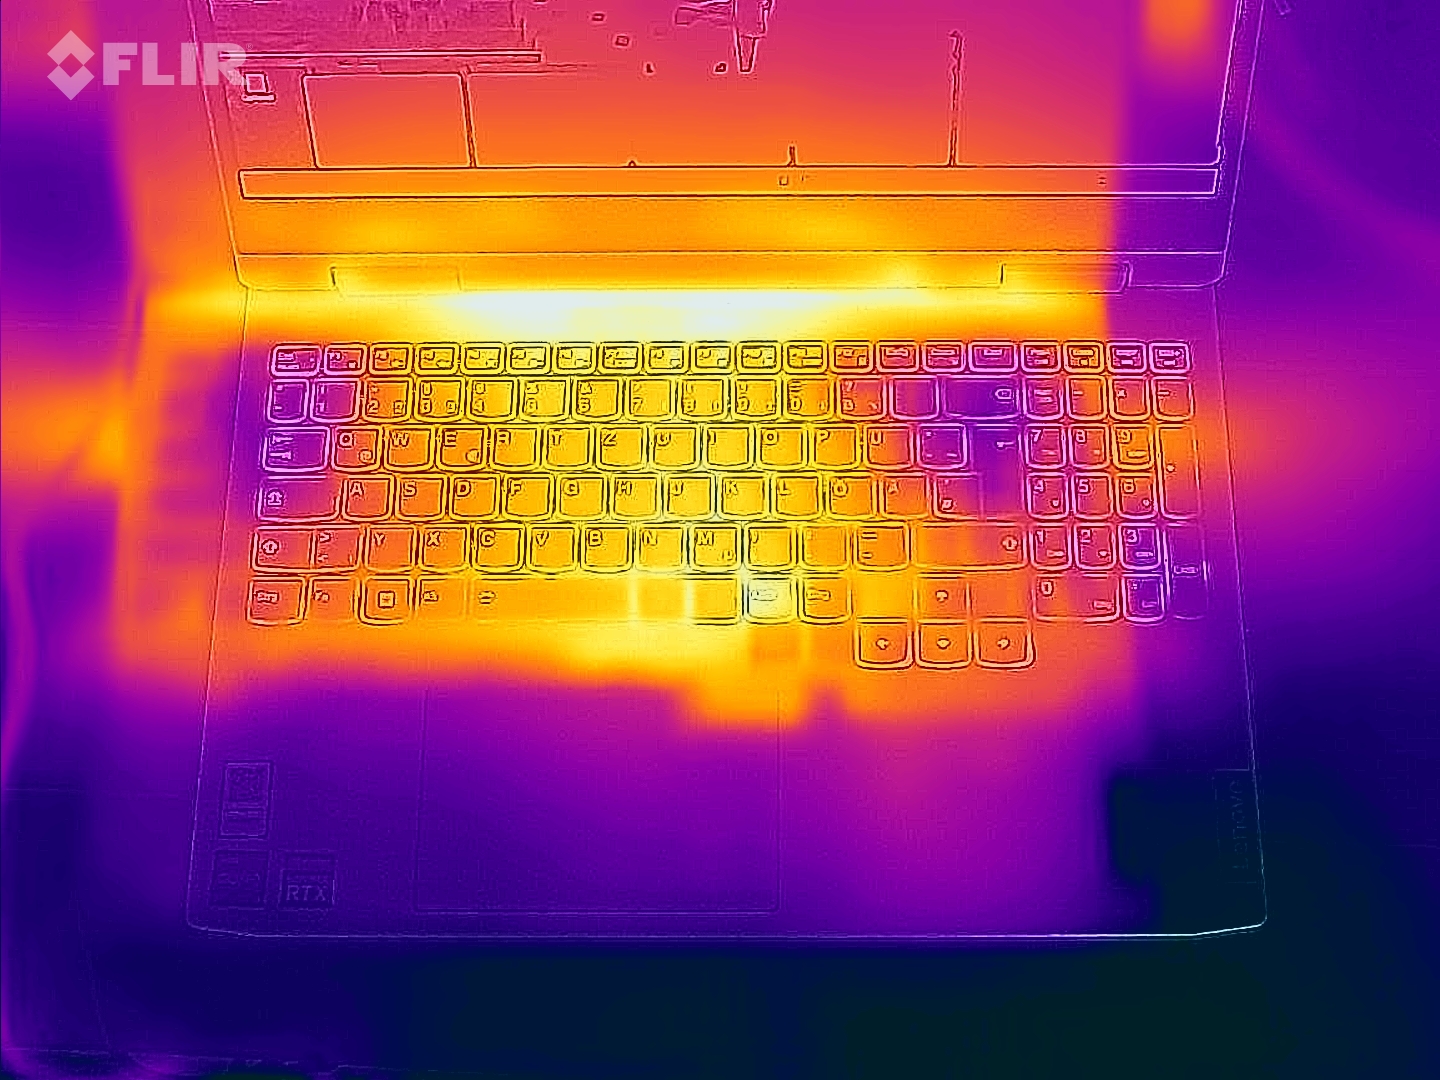
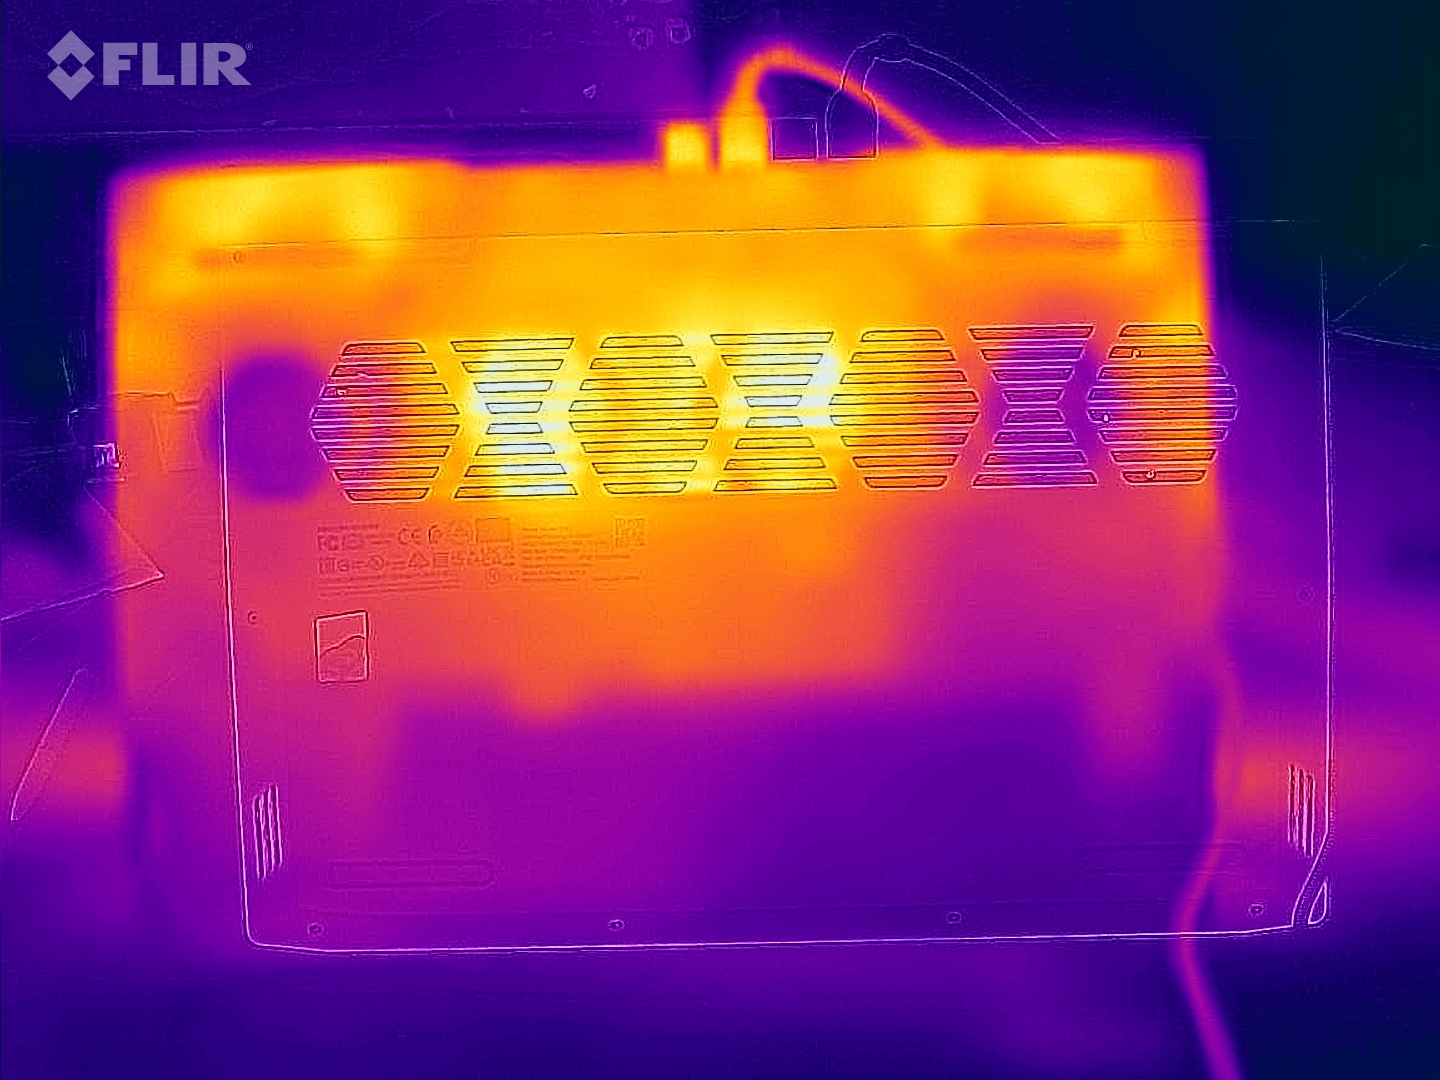
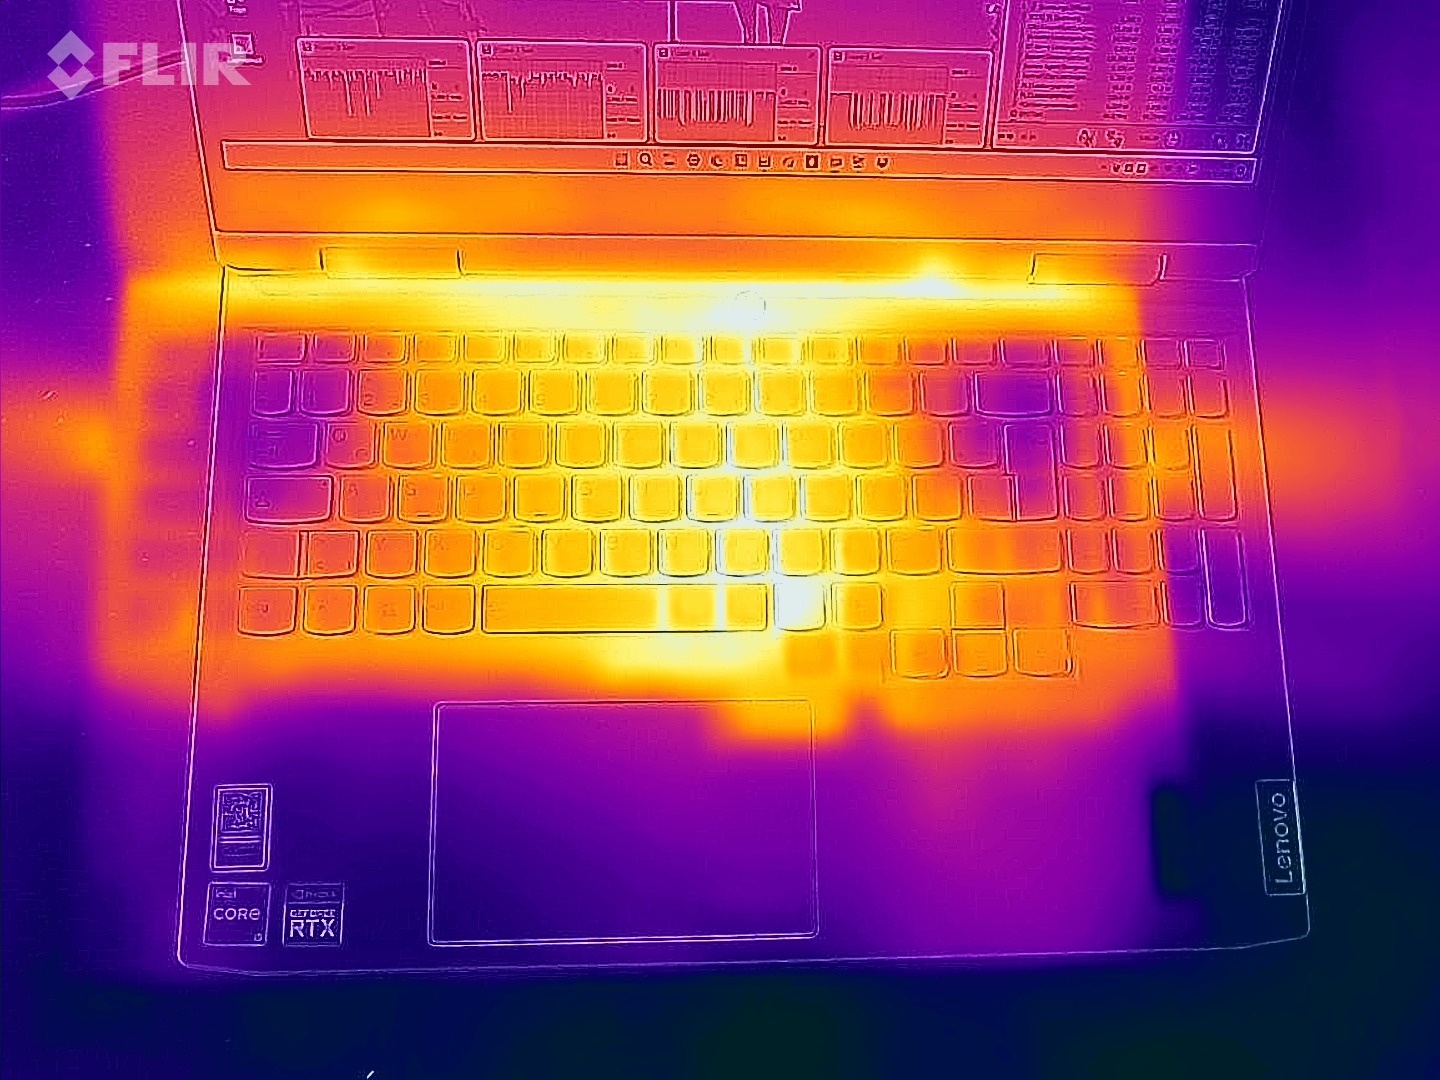
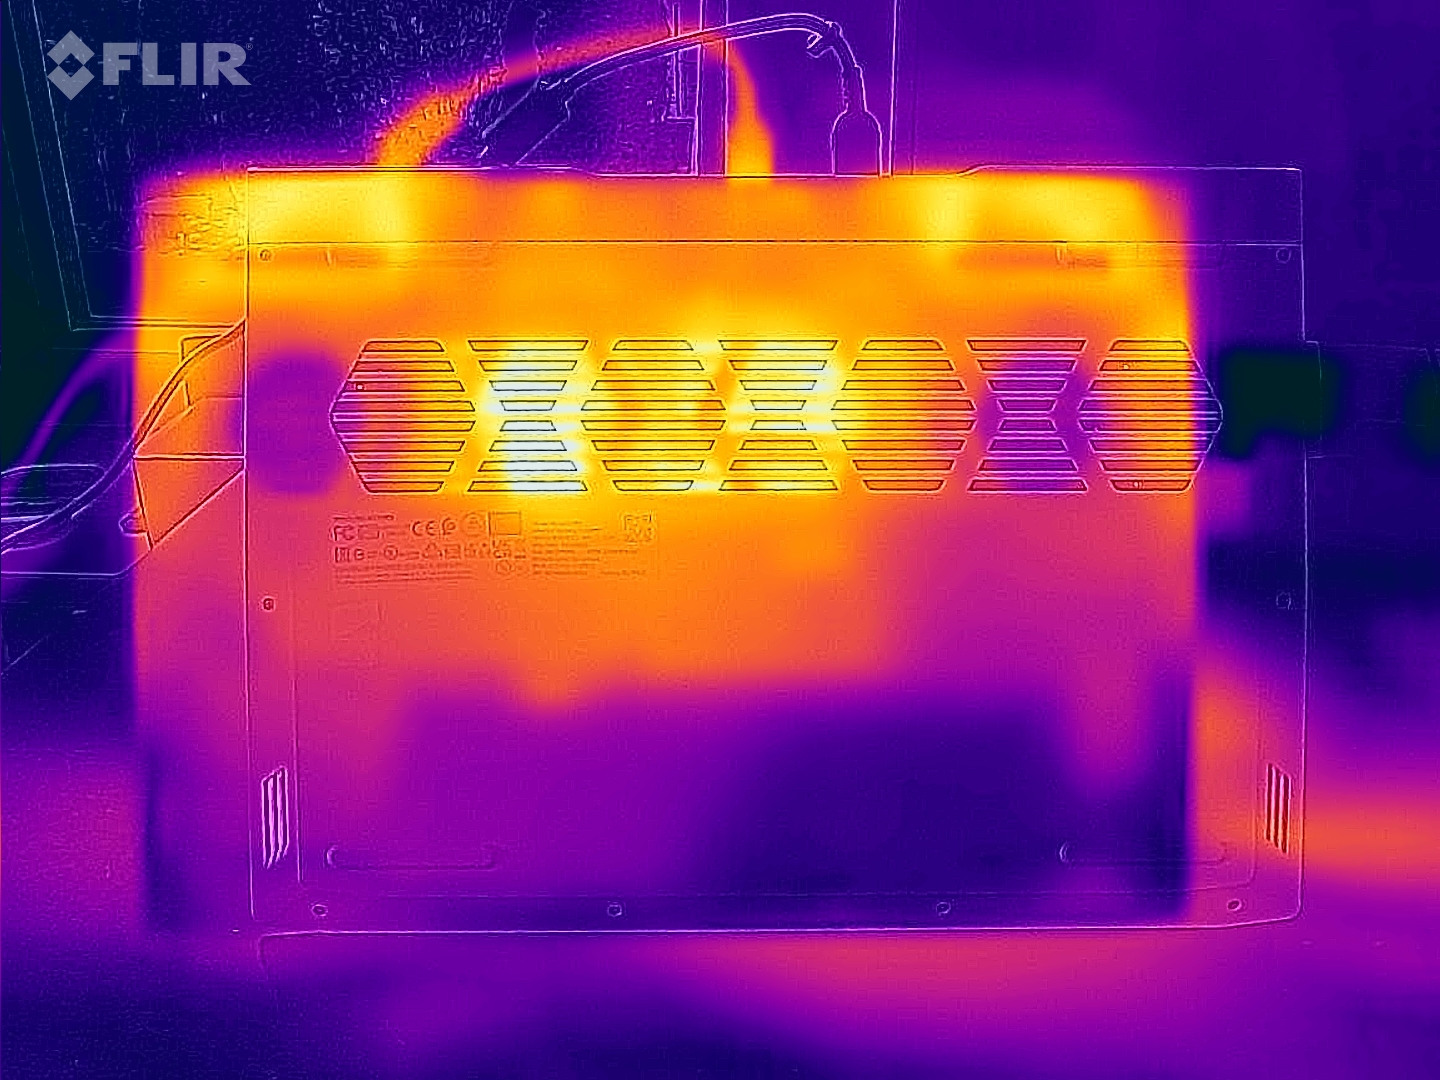
Temperatury
Rozwój temperatur jest również typowy dla laptopa do gier. Podczas gdy urządzenie Lenovo pozostaje komfortowo chłodne podczas pracy w trybie jałowym, temperatury osiągają do 47 °C (~117 °F) na górze i 52 °C (~126 °F) na dole podczas pracy 3D. Nie należy więc próbować grać z laptopem na kolanach.
(-) Maksymalna temperatura w górnej części wynosi 47 °C / 117 F, w porównaniu do średniej 40.4 °C / 105 F , począwszy od 21.2 do 68.8 °C dla klasy Gaming.
(-) Dno nagrzewa się maksymalnie do 52 °C / 126 F, w porównaniu do średniej 43.2 °C / 110 F
(+) W stanie bezczynności średnia temperatura górnej części wynosi 24.2 °C / 76 F, w porównaniu ze średnią temperaturą urządzenia wynoszącą 33.9 °C / ### class_avg_f### F.
(-) Podczas gry w Wiedźmina 3 średnia temperatura górnej części wynosi 39.2 °C / 103 F, w porównaniu do średniej temperatury urządzenia wynoszącej 33.9 °C / ## #class_avg_f### F.
(±) Podpórki pod nadgarstki i touchpad mogą się bardzo nagrzać w dotyku, maksymalnie do 37 °C / 98.6 F.
(-) Średnia temperatura obszaru podparcia dłoni w podobnych urządzeniach wynosiła 28.8 °C / 83.8 F (-8.2 °C / -14.8 F).
| Lenovo IdeaPad Gaming 3 15IAH7 GeForce RTX 3050 Ti Laptop GPU, i5-12500H | Lenovo IdeaPad Gaming 3 15ARH7 GeForce RTX 3050 4GB Laptop GPU, R5 6600H | Dell G15 5515 GeForce RTX 3050 Ti Laptop GPU, R7 5800H | HP Victus 16-e0145ng GeForce RTX 3050 Ti Laptop GPU, R5 5600H | Dell Inspiron 16 Plus 7620 GeForce RTX 3050 Ti Laptop GPU, i7-12700H | |
|---|---|---|---|---|---|
| Heat | -3% | -3% | -25% | -8% | |
| Maximum Upper Side * (°C) | 47 | 47.6 -1% | 50 -6% | 54 -15% | 46 2% |
| Maximum Bottom * (°C) | 52 | 46.6 10% | 49 6% | 47 10% | 45.8 12% |
| Idle Upper Side * (°C) | 25 | 27.2 -9% | 26 -4% | 41 -64% | 29.2 -17% |
| Idle Bottom * (°C) | 24 | 27.2 -13% | 26 -8% | 31 -29% | 31 -29% |
* ... im mniej tym lepiej
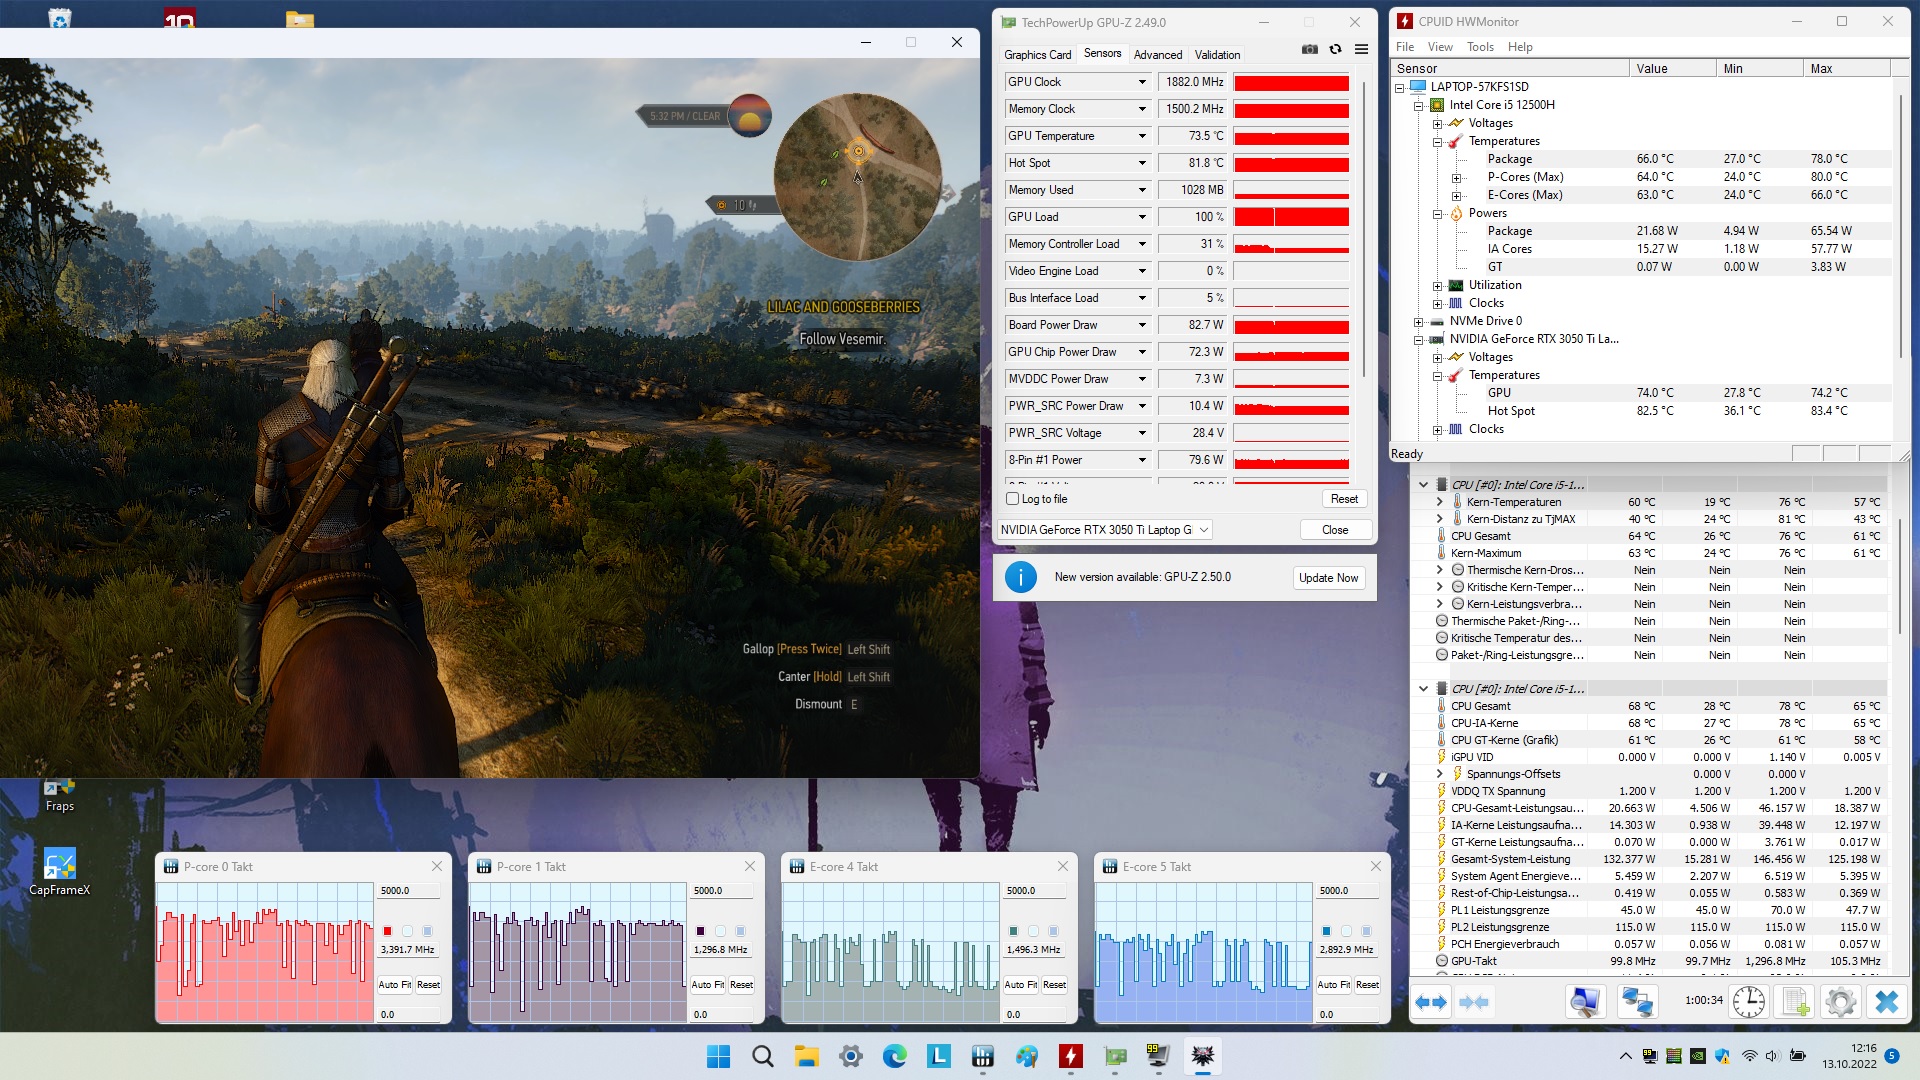
Stress Test
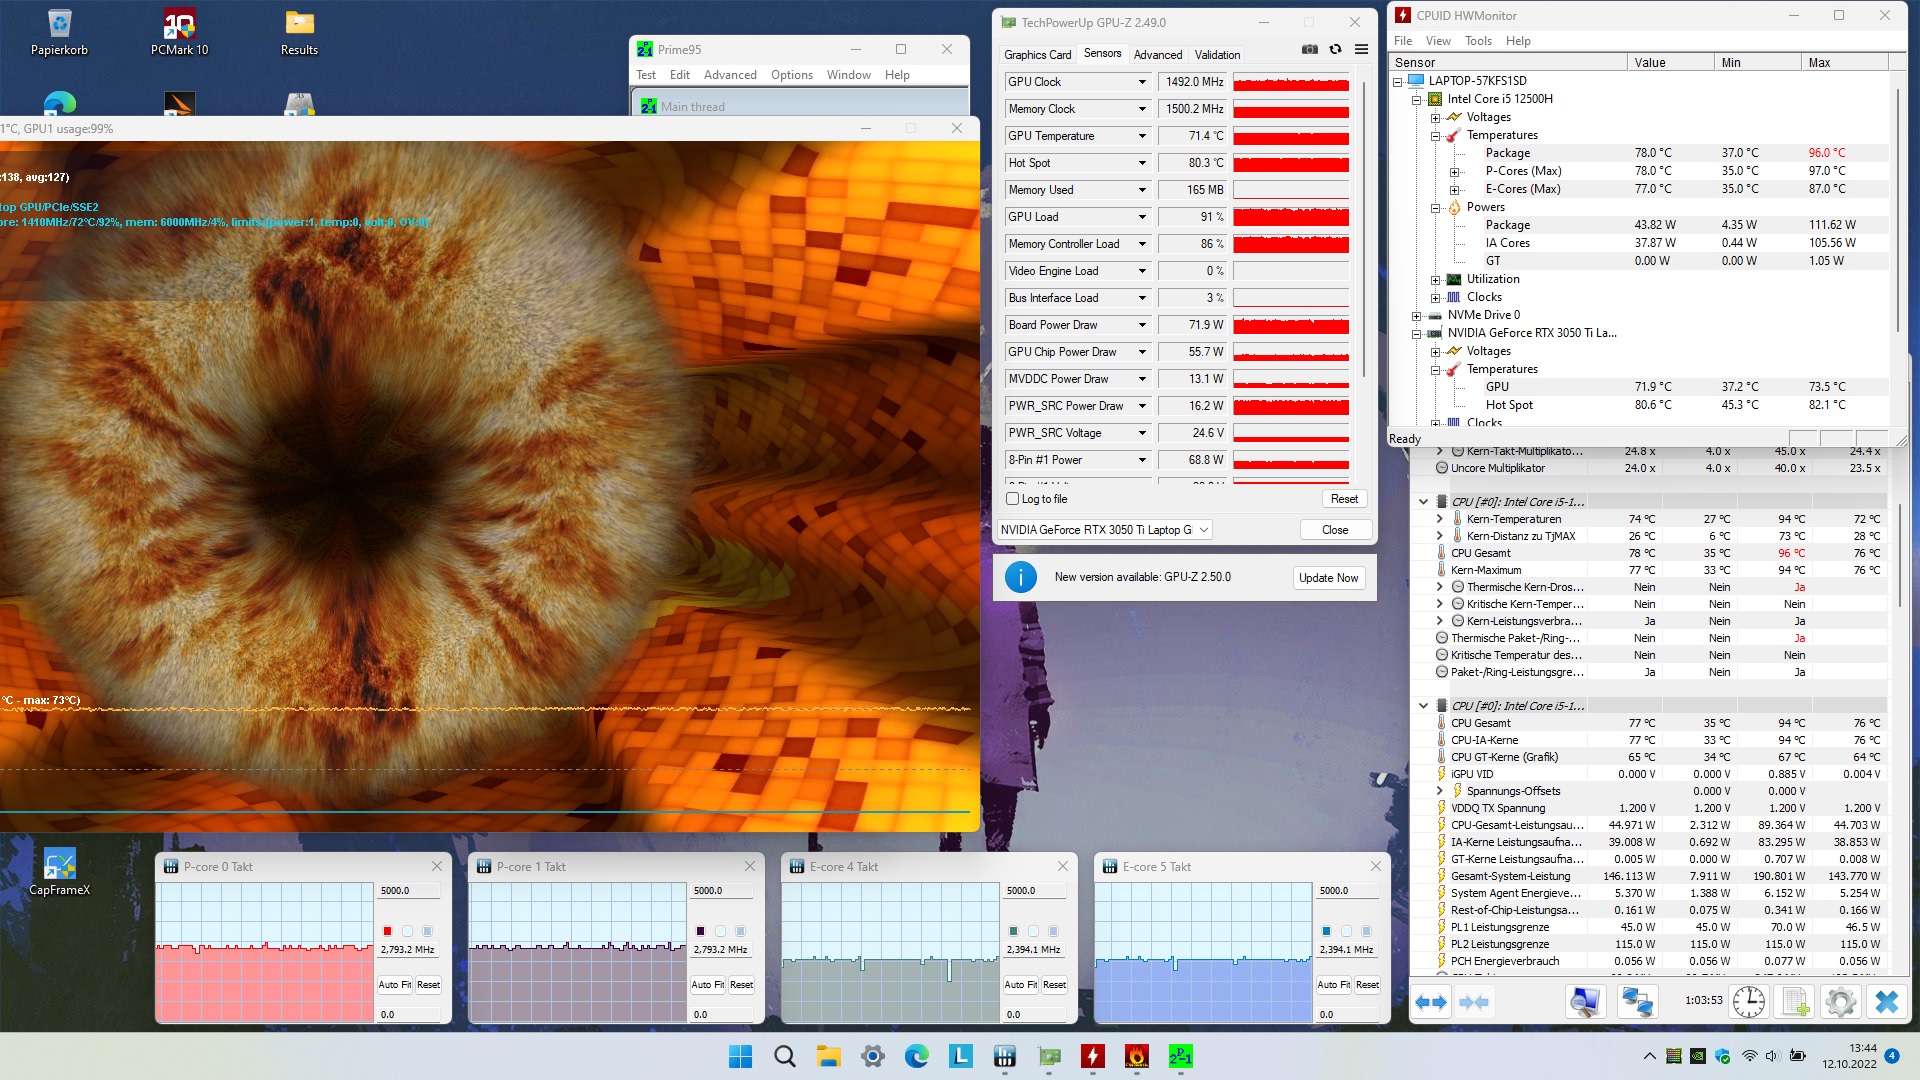
Testy obciążeniowe z godziną gry FurMark & Prime95 nie wykazują niczego dziwnego. 15-calowy laptop trzyma się z dala od throttlingu i krytycznych wartości sprzętowych. Za umiarkowane wartości uznalibyśmy około 71°C (~160°F) dla GPU i 78°C (~172°F) dla CPU pod pełnym obciążeniem.
Mówcy
Lenovo IdeaPad Gaming 3 15IAH7 analiza dźwięku
(+) | głośniki mogą odtwarzać stosunkowo głośno (83 dB)
Bas 100 - 315 Hz
(-) | prawie brak basu - średnio 17.1% niższa od mediany
(±) | liniowość basu jest średnia (12.8% delta do poprzedniej częstotliwości)
Średnie 400 - 2000 Hz
(±) | wyższe średnie - średnio 5.6% wyższe niż mediana
(+) | średnie są liniowe (4.5% delta do poprzedniej częstotliwości)
Wysokie 2–16 kHz
(+) | zrównoważone maksima - tylko 2% od mediany
(+) | wzloty są liniowe (4.6% delta do poprzedniej częstotliwości)
Ogólnie 100 - 16.000 Hz
(+) | ogólny dźwięk jest liniowy (14.4% różnicy w stosunku do mediany)
W porównaniu do tej samej klasy
» 27% wszystkich testowanych urządzeń w tej klasie było lepszych, 7% podobnych, 66% gorszych
» Najlepszy miał deltę 6%, średnia wynosiła ###średnia###%, najgorsza wynosiła 132%
W porównaniu do wszystkich testowanych urządzeń
» 18% wszystkich testowanych urządzeń było lepszych, 4% podobnych, 78% gorszych
» Najlepszy miał deltę 4%, średnia wynosiła ###średnia###%, najgorsza wynosiła 134%
Dell G15 5515 analiza dźwięku
(±) | głośność głośnika jest średnia, ale dobra (76 dB)
Bas 100 - 315 Hz
(-) | prawie brak basu - średnio 22% niższa od mediany
(±) | liniowość basu jest średnia (14.9% delta do poprzedniej częstotliwości)
Średnie 400 - 2000 Hz
(+) | zbalansowane środki średnie - tylko 2.8% od mediany
(+) | średnie są liniowe (3% delta do poprzedniej częstotliwości)
Wysokie 2–16 kHz
(+) | zrównoważone maksima - tylko 1.4% od mediany
(+) | wzloty są liniowe (3.7% delta do poprzedniej częstotliwości)
Ogólnie 100 - 16.000 Hz
(±) | liniowość ogólnego dźwięku jest średnia (16.8% różnicy w stosunku do mediany)
W porównaniu do tej samej klasy
» 44% wszystkich testowanych urządzeń w tej klasie było lepszych, 11% podobnych, 46% gorszych
» Najlepszy miał deltę 6%, średnia wynosiła ###średnia###%, najgorsza wynosiła 132%
W porównaniu do wszystkich testowanych urządzeń
» 29% wszystkich testowanych urządzeń było lepszych, 8% podobnych, 63% gorszych
» Najlepszy miał deltę 4%, średnia wynosiła ###średnia###%, najgorsza wynosiła 134%
Zarządzanie energią
Pobór mocy
Pobór mocy również nie wyróżnia się niczym szczególnym. Choć średnio Gaming 3 pobiera nieco więcej energii, niż inne laptopy z RTX 3050 Ti, wynika to przede wszystkim z wyższego TGP.
| wyłączony / stan wstrzymania | |
| luz | |
| obciążenie |
|
Legenda:
min: | |
| Lenovo IdeaPad Gaming 3 15IAH7 GeForce RTX 3050 Ti Laptop GPU, i5-12500H | Lenovo IdeaPad Gaming 3 15ARH7 GeForce RTX 3050 4GB Laptop GPU, R5 6600H | Dell G15 5515 GeForce RTX 3050 Ti Laptop GPU, R7 5800H | HP Victus 16-e0145ng GeForce RTX 3050 Ti Laptop GPU, R5 5600H | Dell Inspiron 16 Plus 7620 GeForce RTX 3050 Ti Laptop GPU, i7-12700H | Średnia w klasie Gaming | |
|---|---|---|---|---|---|---|
| Power Consumption | 8% | 7% | 5% | 6% | -53% | |
| Idle Minimum * (Watt) | 8 | 7.7 4% | 5 37% | 7 12% | 6.8 15% | 13.2 ? -65% |
| Idle Average * (Watt) | 10 | 9.1 9% | 9 10% | 9 10% | 9.6 4% | 18.9 ? -89% |
| Idle Maximum * (Watt) | 16 | 15.6 2% | 20 -25% | 15 6% | 17 -6% | 24.3 ? -52% |
| Load Average * (Watt) | 99 | 90.7 8% | 94 5% | 93 6% | 117.5 -19% | 108 ? -9% |
| Witcher 3 ultra * (Watt) | 144.6 | 122.9 15% | 123 15% | 134.5 7% | 113.1 22% | |
| Load Maximum * (Watt) | 168 | 155.2 8% | 172 -2% | 185 -10% | 137.4 18% | 254 ? -51% |
* ... im mniej tym lepiej
Power Consumption The Witcher 3 / Stress Test
Power Consumption With External Monitor
Czas pracy na baterii
W zależności od modelu IdeaPad oferuje akumulator o pojemności 45 Wh lub 60 Wh. W przeciwieństwie do swojego rodzeństwa z AMD, testowana wersja z Intelem na szczęście jest w stanie zapunktować mocniejszym akumulatorem. Ze względu na większe zużycie energii różnice pozostają jednak w granicach. Wynoszący ledwie 6 godzin czas pracy na baterii podczas bezprzewodowego surfowania po internecie przy jasności wyświetlacza zredukowanej do 150 cd/m² okazuje się nawet nieco niższy od wyniku wersji AMD. Pozostali konkurenci również wyprzedzają pod tym względem.
| Lenovo IdeaPad Gaming 3 15IAH7 GeForce RTX 3050 Ti Laptop GPU, i5-12500H, 60 Wh | Lenovo IdeaPad Gaming 3 15ARH7 GeForce RTX 3050 4GB Laptop GPU, R5 6600H, 45 Wh | Dell G15 5515 GeForce RTX 3050 Ti Laptop GPU, R7 5800H, 56 Wh | HP Victus 16-e0145ng GeForce RTX 3050 Ti Laptop GPU, R5 5600H, 70 Wh | Dell Inspiron 16 Plus 7620 GeForce RTX 3050 Ti Laptop GPU, i7-12700H, 86 Wh | Średnia w klasie Gaming | |
|---|---|---|---|---|---|---|
| Czasy pracy | 10% | 36% | 20% | 63% | 19% | |
| WiFi v1.3 (h) | 5.9 | 6.5 10% | 8 36% | 7.1 20% | 9.6 63% | 7.02 ? 19% |
| Reader / Idle (h) | 2.4 | 13.5 | 18.6 | 8.71 ? | ||
| Load (h) | 0.9 | 1.5 | 1.2 | 1.47 ? | ||
| H.264 (h) | 8.8 | 8.26 ? |
Za
Przeciw
Werdykt
Jeśli pominąć przeciętną jakość obudowy pod względem materiałów i wykonania, Lenovo stworzyło z IdeaPad Gaming 3 15IAH7 udany budżetowy laptop do gier.
Dzięki wysokiemu TDP i ciągłemu rozwojowi wydajności m.in.Core i5-12500Horaz GeForce RTX 3050 Tisą w stanie pokazać swoją pełną moc, podczas gdy dla kontrastu (w większości wolniejsi) konkurenci zapewniają lepsze czasy pracy na baterii. Mało który z alternatywnych laptopów jest jednak w stanie osiągnąć jakość obrazu na poziomie Gaming 3. Większość konkurentów zostaje w tyle pod względem przestrzeni barwnej i jasności. Na naszym polu porównawczym tylko Dell Inspiron 16 Plusjest w stanie zbliżyć się do laptopa Lenovo.
Osoby, które oczekują dobrego wyświetlacza, ale nie chcą wydawać zbyt dużo pieniędzy na laptop do gier, powinny przyjrzeć się bliżej modelowi IdeaPad Gaming 3 15IAH7.
Cena i dostępność
W chwili przeprowadzania tego testu IdeaPad Gaming 3 15IAH7 z procesorem Core i5-12500H, GeForce RTX 3050 Ti, 8 GB RAM i 512 GB SSD jest dostępny w BestBuy za 1031 dolarów.
Lenovo IdeaPad Gaming 3 15IAH7
- 14/10/2022 v7 (old)
Florian Glaser
Price comparison

