

Notebookcheck Logo
Teaser

Intel wyraźnie pokonuje Snapdragona - recenzja Microsoft Surface Laptop 15 Gen 8

Core Ultra X kontra Snapdragon X2.

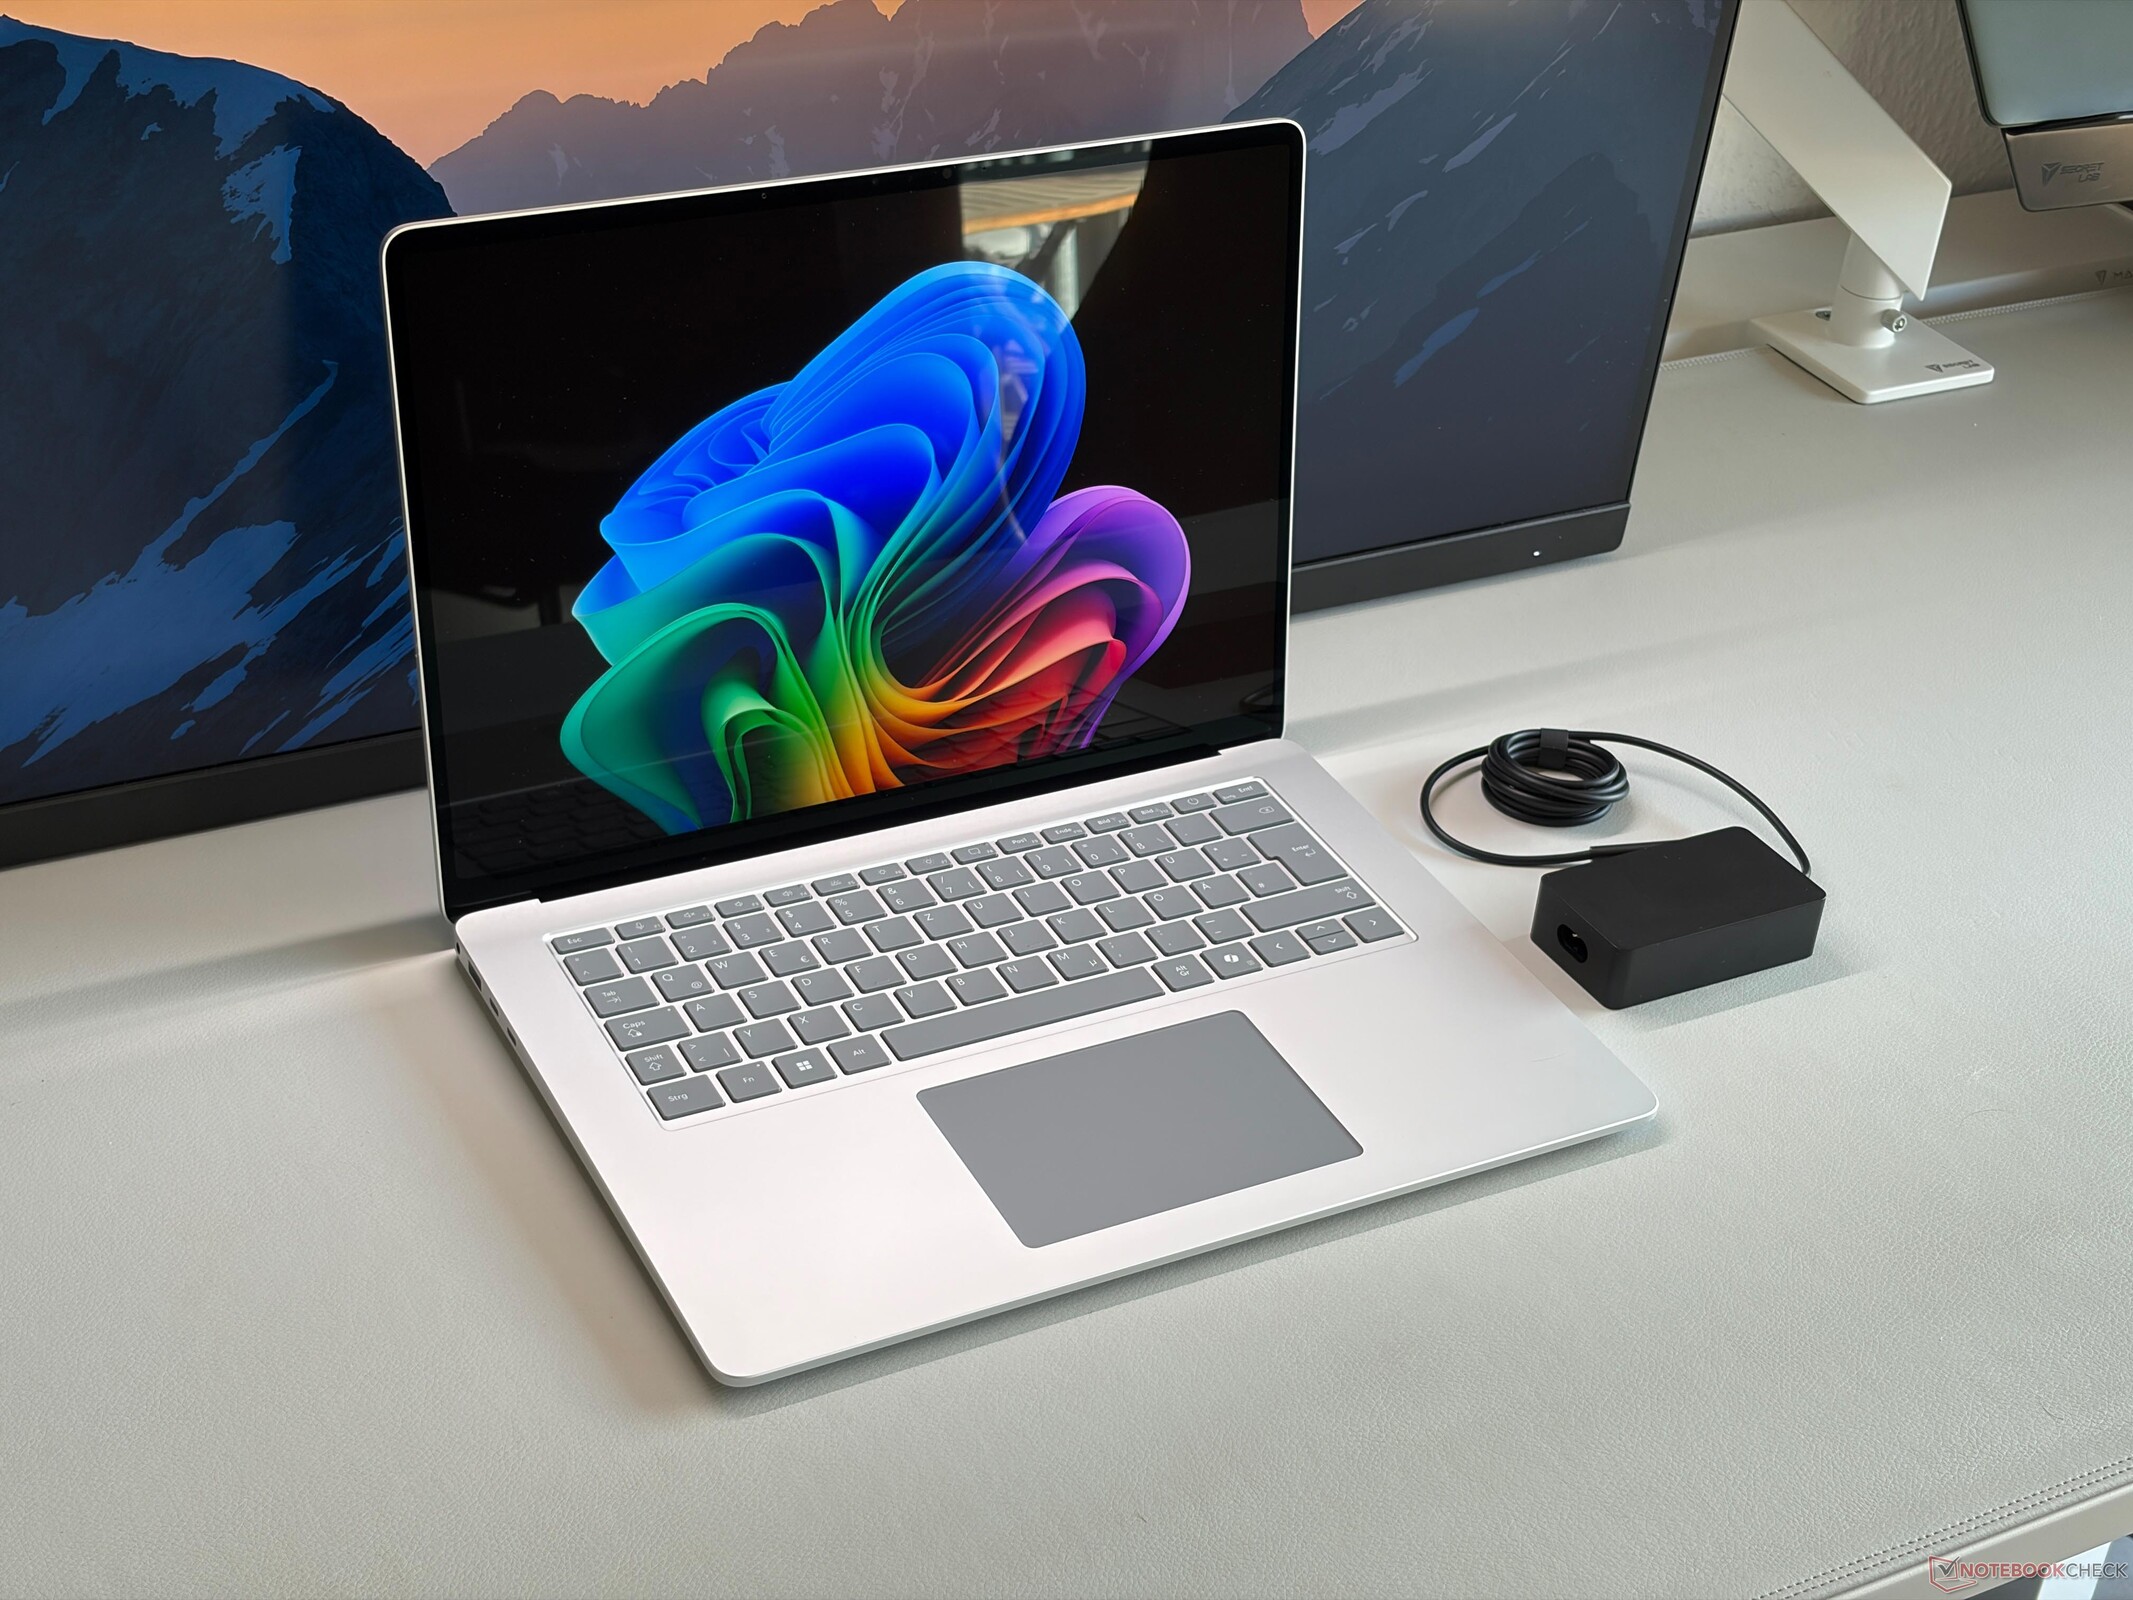
Obecny Microsoft Surface Laptop 15 for Business jest dostępny z wydajnymi procesorami Intel Core Ultra X, które mają również szybki zintegrowany układ graficzny Arc B390. W rezultacie jest to najlepszy laptop z systemem Windows, jaki można obecnie kupić, a do tego przewyższa modele ze Snapdragonem przeznaczone dla klientów indywidualnych.
Andreas Osthoff, 👁 Andreas Osthoff (tłumaczenie DeepL / Ninh Duy) Opublikowany 🇺🇸 🇳🇱 ...
Arc Business Laptop / Notebook MS Surface Microsoft Panther Lake Thunderbolt Touchscreen Wi-Fi 7 Windows

Werdykt - Surface Laptop 15 jest lepszy z Intelem

Surface Laptop 15 Gen 8 to dobry laptop multimedialny, a wersja z procesorem Intel oferuje wyższą wydajność GPU, lepszą kompatybilność z aplikacjami i grami oraz łączność Thunderbolt 4. Sama wydajność CPU jest prawdopodobnie wyższa w wariancie ze Snapdragonem, ale wersja z procesorem Intel i lepszym zintegrowanym GPU jest zdecydowanie lepszym wyborem dla większości użytkowników. Podejście Microsoftu, który oferuje użytkownikom indywidualnym modele ze Snapdragonem, jest naszym zdaniem błędne. Uważamy, że użytkownicy powinni mieć możliwość wyboru przy konkurencyjnych cenach, co zwykle nie ma miejsca w przypadku modeli biznesowych (choć mogą je kupować również użytkownicy indywidualni).

Podoba nam się wysoka jakość wykonania, wygodna klawiatura, dobre głośniki i jakość obrazu z kamery internetowej. To także jedno z niewielu urządzeń klasy premium z dotykowym ekranem IPS. Oferuje dobrą jakość obrazu z wiernym odwzorowaniem kolorów i częstotliwością odświeżania 120 Hz, a także brak migotania PWM, co jest dużą zaletą dla osób wrażliwych na migotanie ekranów OLED. Czas pracy na baterii wariantu z procesorem Intel jest również bardzo dobry (Microsoft w rzeczywistości deklaruje nieco krótszy czas pracy na baterii dla modelu ze Snapdragonem).

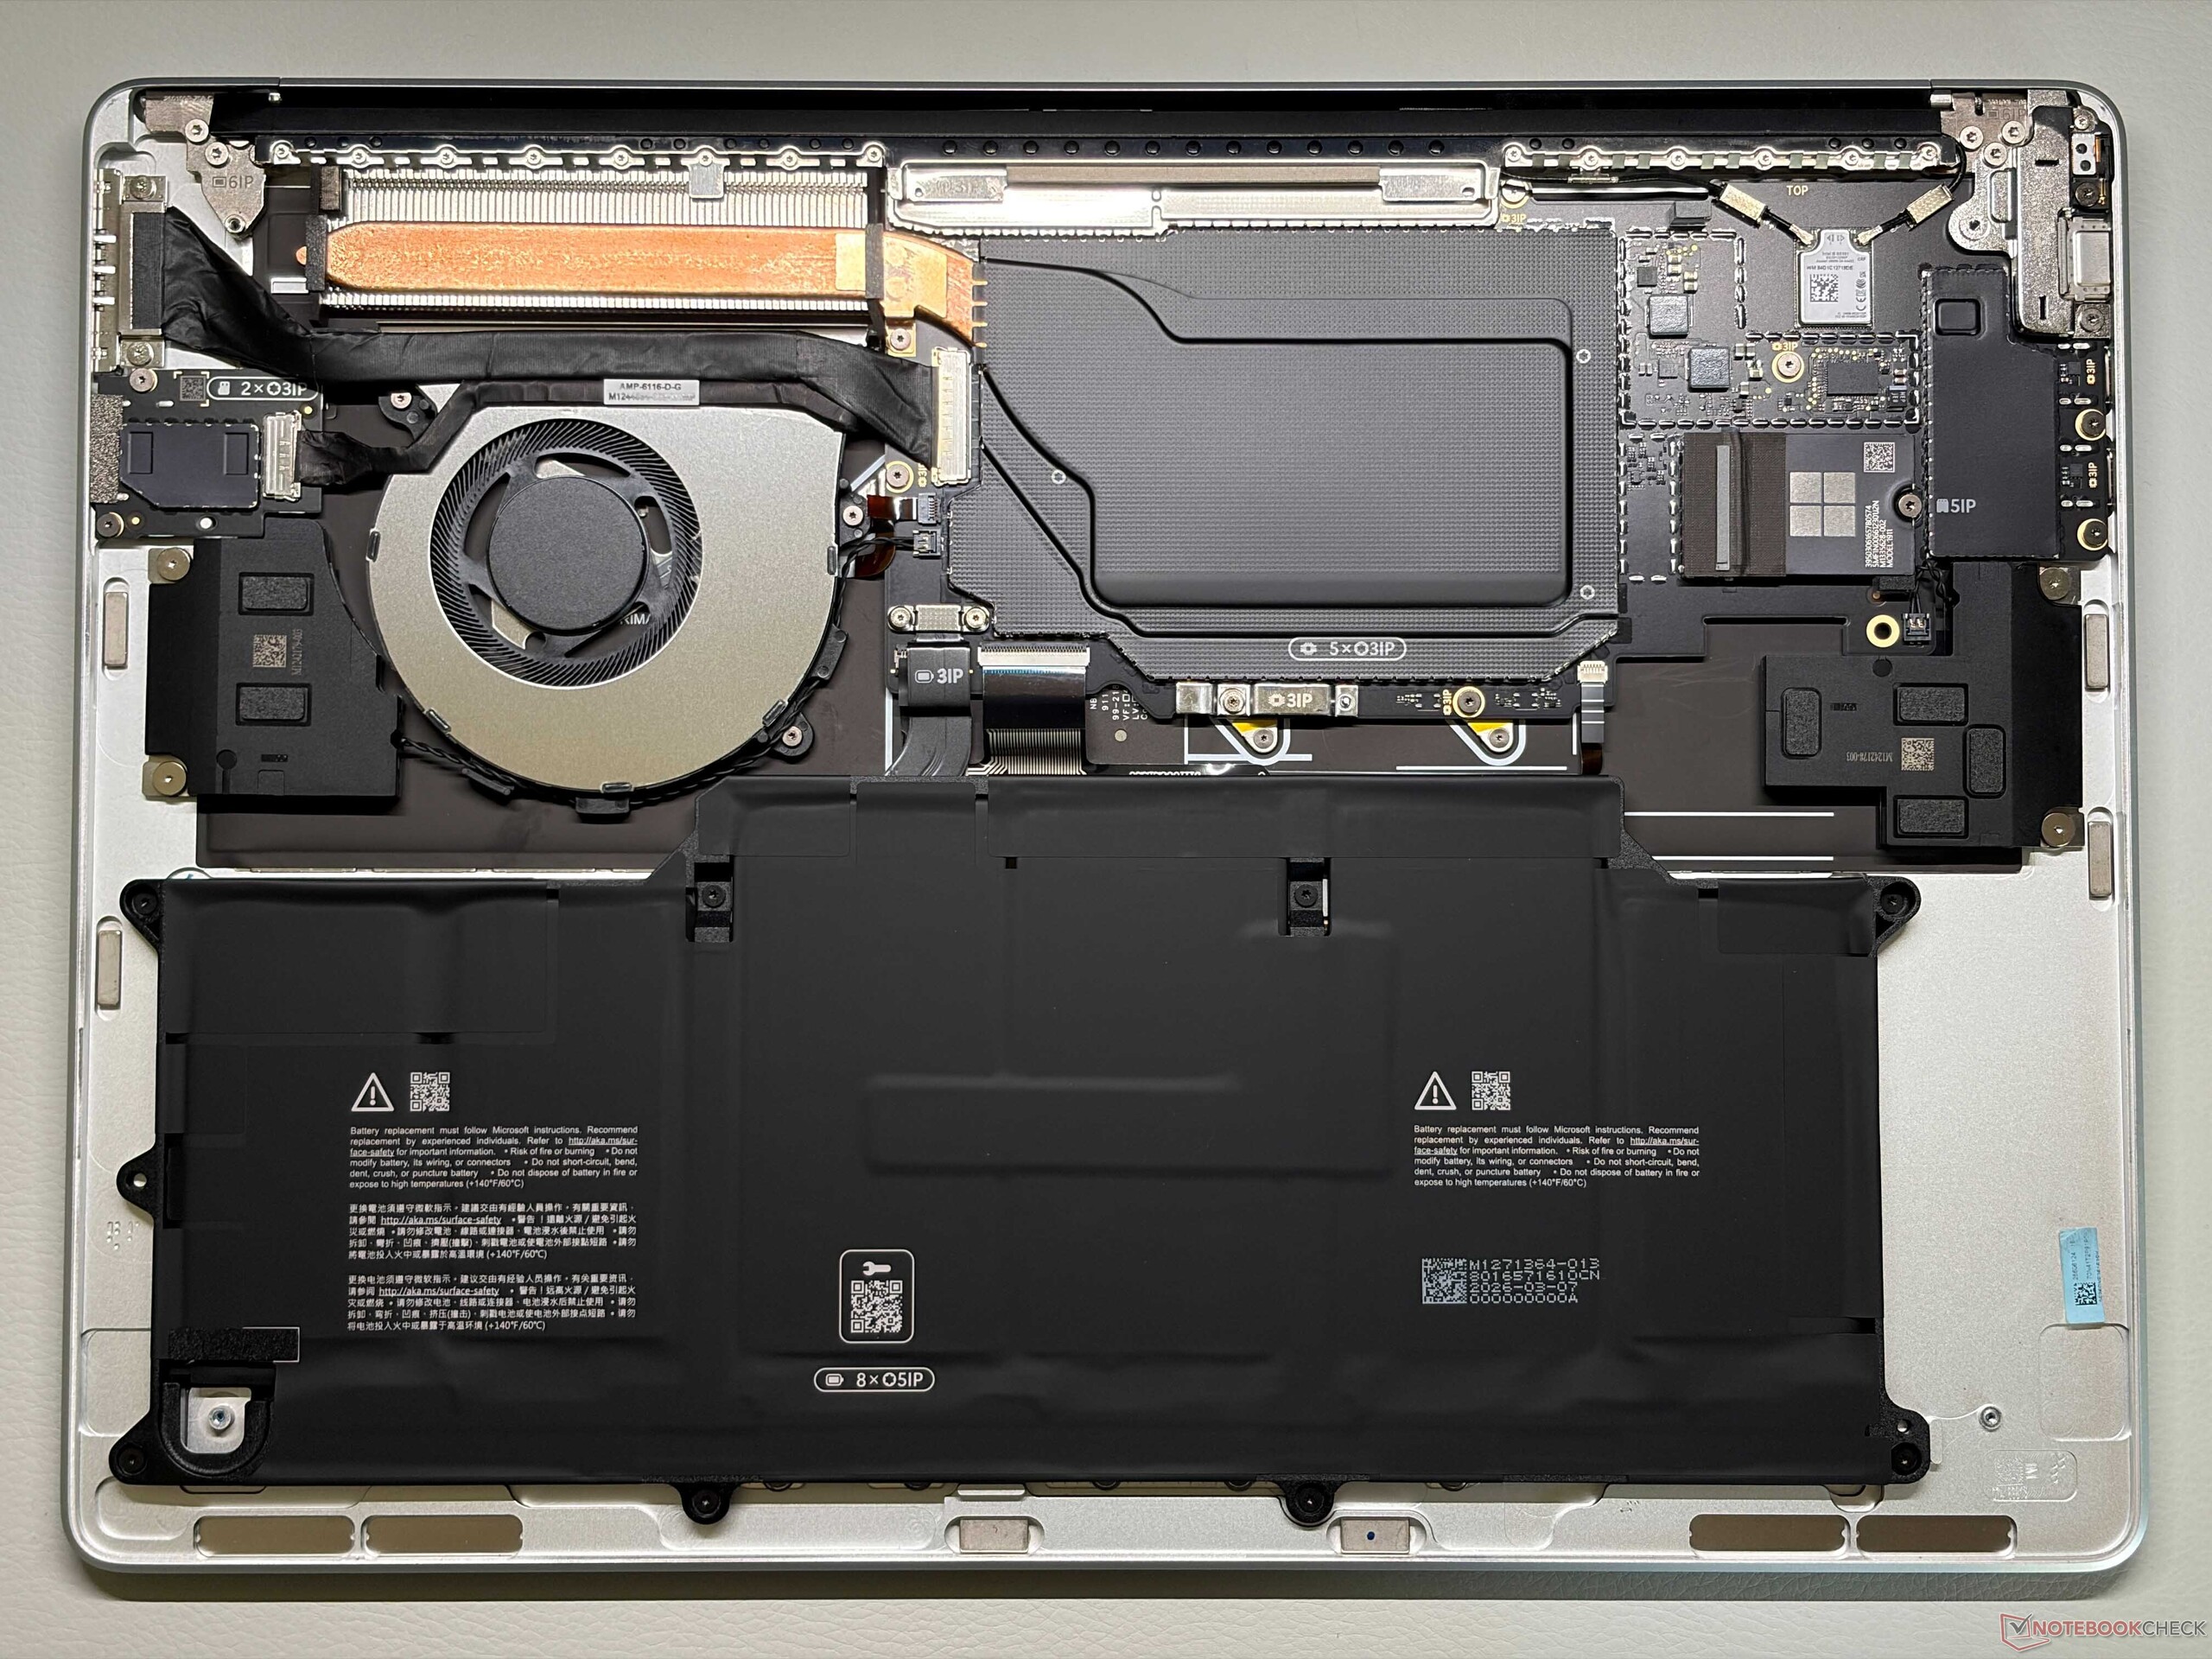
Nie oznacza to, że Surface Laptop 15 jest urządzeniem idealnym, ponieważ zdecydowanie ma swoje problemy. Wydajność chłodzenia z jednym wentylatorem nie jest najlepsza, a wydajność przy długotrwałym obciążeniu nieco na tym cierpi. Takie chłodzenie wystarczało w przypadku starszego procesora Lunar Lake, ale nie pozwala wykorzystać pełnego potencjału szybkiego układu Panther Lake. Zasilacz o mocy 65 W również jest niewystarczający pod obciążeniem, przynajmniej przez kilka minut, zanim wydajność zostanie ograniczona. Chcielibyśmy też standardowych dysków SSD M.2-2280, ponieważ wewnątrz obudowy jest mnóstwo wolnego miejsca. Port Surface Connect jest dość duży i wolelibyśmy zamiast niego kolejny port USB-C, a także być może standardowy czytnik kart SD zamiast microSD. Ceny zwiększenia pojemności pamięci RAM i dysku są również astronomiczne.

Podsumowując, Surface Laptop 15 Gen 8 to dobry laptop multimedialny, a wersja z procesorem Intel jest lepszym wyborem dla większości użytkowników, jednak konkurenci tacy jak Lenovo ThinkPad X9-15p oferują ogólnie lepszy zestaw możliwości. Mamy nadzieję, że Microsoft zaktualizuje urządzenie w przyszłym roku i rozwiąże część wspomnianych problemów, zamiast skupiać się wyłącznie na nadchodzącym modelu Surface Laptop Ultra z RTX Spark.

Za

+ wysokiej jakości i stabilna obudowa
+ dobra wydajność systemu
+ długi czas pracy na baterii
+ szybki czytnik kart microSD-Express
+ wygodne urządzenia wejściowe
+ doskonałe fabryczne profile kolorów
+ bardzo cicha praca podczas codziennego użytkowania
+ dobre możliwości konserwacji/dostęp do podzespołów

Przeciw

- Nie można rozbudować pamięci RAM
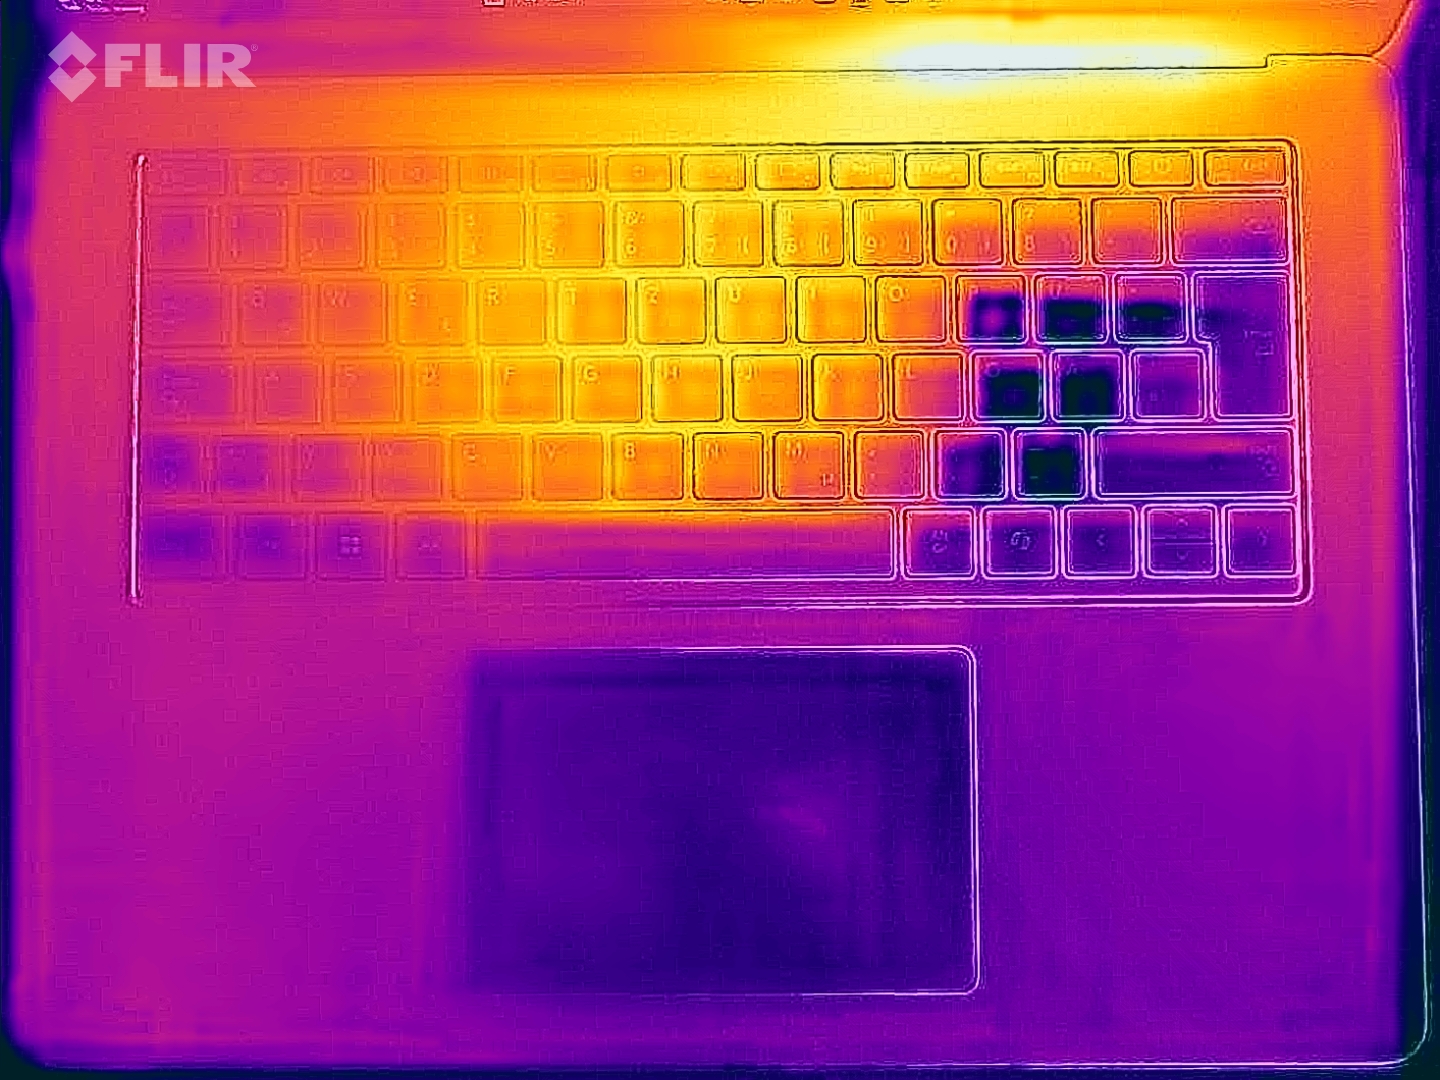
- klawiatura wyraźnie się nagrzewa pod obciążeniem
- piszczenie cewek
- zasilacz o niewystarczającej mocy
- kosztowne ulepszenia
- brak modułu WWAN
- tylko roczna gwarancja

Cena i dostępność

Surface Laptop 8 15 for Business z procesorem Core Ultra X można zamówić bezpośrednio od Microsoft w cenie od 2749,99 USD.

Amazon Logo
  • $238.94
    Microsoft Surface Laptop 3 15" Touch-Screen - CORE I5 1035G7 - 8GB Memory - 128GB Solid State Drive Platinum (Renewed)
  • $483.98
    Microsoft Surface Laptop 5 13.5" Touchscreen Notebook - 2256 x 1504 - Intel Core i7 12th Gen i7-1265U - Intel Evo Platform - 16 GB Total RAM - 512 GB SSD (Platinum) (Renewed)
  • $685.00
    Microsoft Surface Laptop 4 15” Touch-Screen – Intel Core i7 - 32GB - 1TB Solid State Drive - Matte Black

Specyfikacja

Microsoft Surface Laptop 15 Gen 8 (Surface Laptop Rodzina)
Procesor
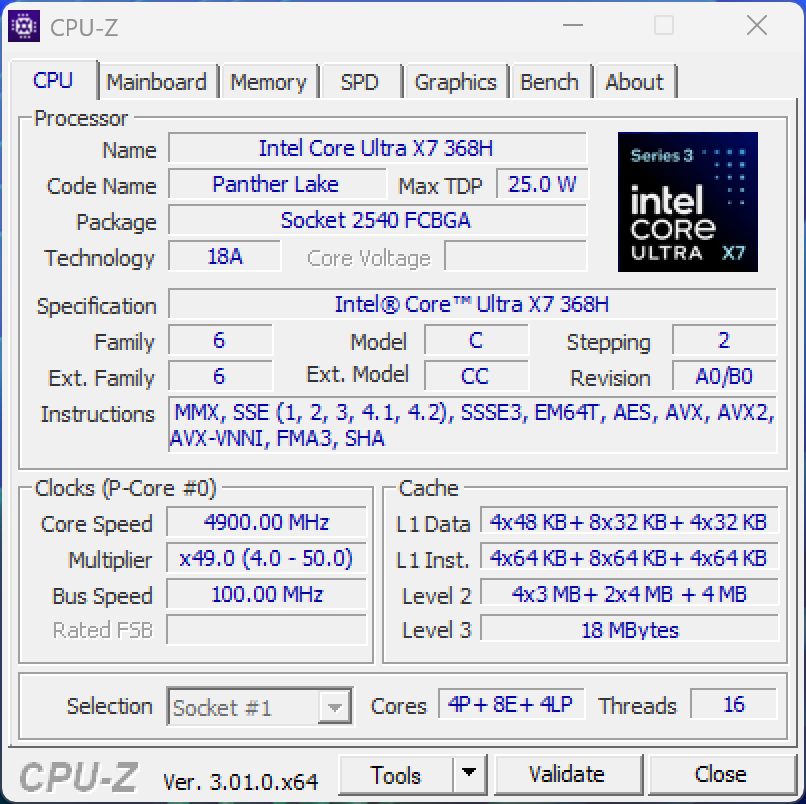
Intel Core Ultra X7 368H 16c/16t, 4 x 4.9 GHz Intel Cougar Cove P-Core, 8 x 4.0 GHz Intel Darkmont E-Core, 4 x 3.6 GHz Intel Darkmont E-Core, 65 W PL2 / Short Burst, 35 W PL1 / Sustained, Panther Lake
Karta grafiki
Intel Arc B390 12 Xe3 Panther Lake iGPU, rdzeń: 2500 MHz, pamięć: 800 MHz, 32.0.101.8738
Pamięć
16 GB 
, LPDDR5x-8533, Dual-Channel, onboard
Matryca
15.00 cali 3:2, 3270 x 2180 pikseli 262 PPI, capacitive, LP150UD2-SPA1, IPS, refleksująca: tak, 120 Hz
Chipset
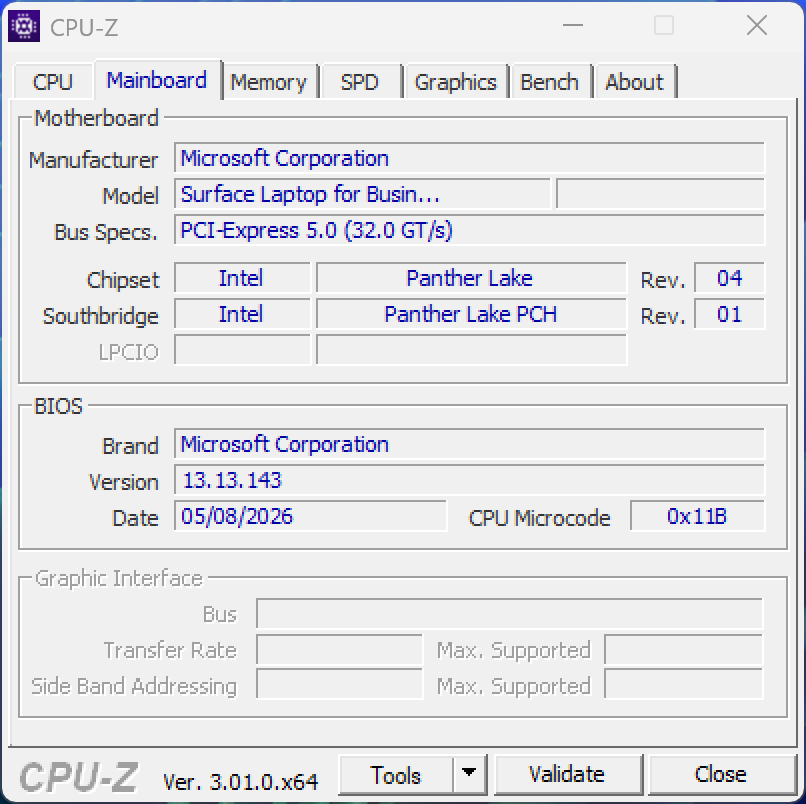
Intel Panther Lake-H PCH
Dysk twardy
SK hynix PVC10 HFS256GEM4X182N, 256 GB 
, 188 GB wolne miejsce
Karta dźwiękowa
Intel Panther Lake-H PCH - High Definition Audio - AVS (Audio, Voice, Speech)
Złącza
1 USB 3.0, 2 Thunderbolt 4, USB-C Power Delivery (PD), 2 DisplayPort, 1 złącze stacji dokującej, gniazda audio: 3.5 mm stereo, czytnik kart: microSD Express, Czujnik jasności
Łączność
Intel BE201 320MHz (a/b/g/h/n = Wi-Fi 4/ac = Wi-Fi 5/ax = Wi-Fi 6/ Wi-Fi 6E 6 GHz be = Wi-Fi 7), Bluetooth 5.4
Gabaryty
wysokość x szerokość x głębokość (mm): 18.3 x 329 x 239
Akumulator
66 Wh litowo-polimerowy
System operacyjny
Microsoft Windows 11 Home
Kamera
kamerka: IR
Główny aparat: 2 MPix
Inne
głośniki: Stereo, klawiatura: Chiclet, 65W PSU, 12 miesiące(y) gwarancji
Waga
1.651 kg, zasilacz: 255 g
Cena
2400 PLN
Uwaga: Producent może używać komponentów pochodzących od różnych dostawców, w tym paneli wyświetlaczy, napędów lub kart pamięci o podobnych specyfikacjach.


Obudowa, łączność i urządzenia wejściowe

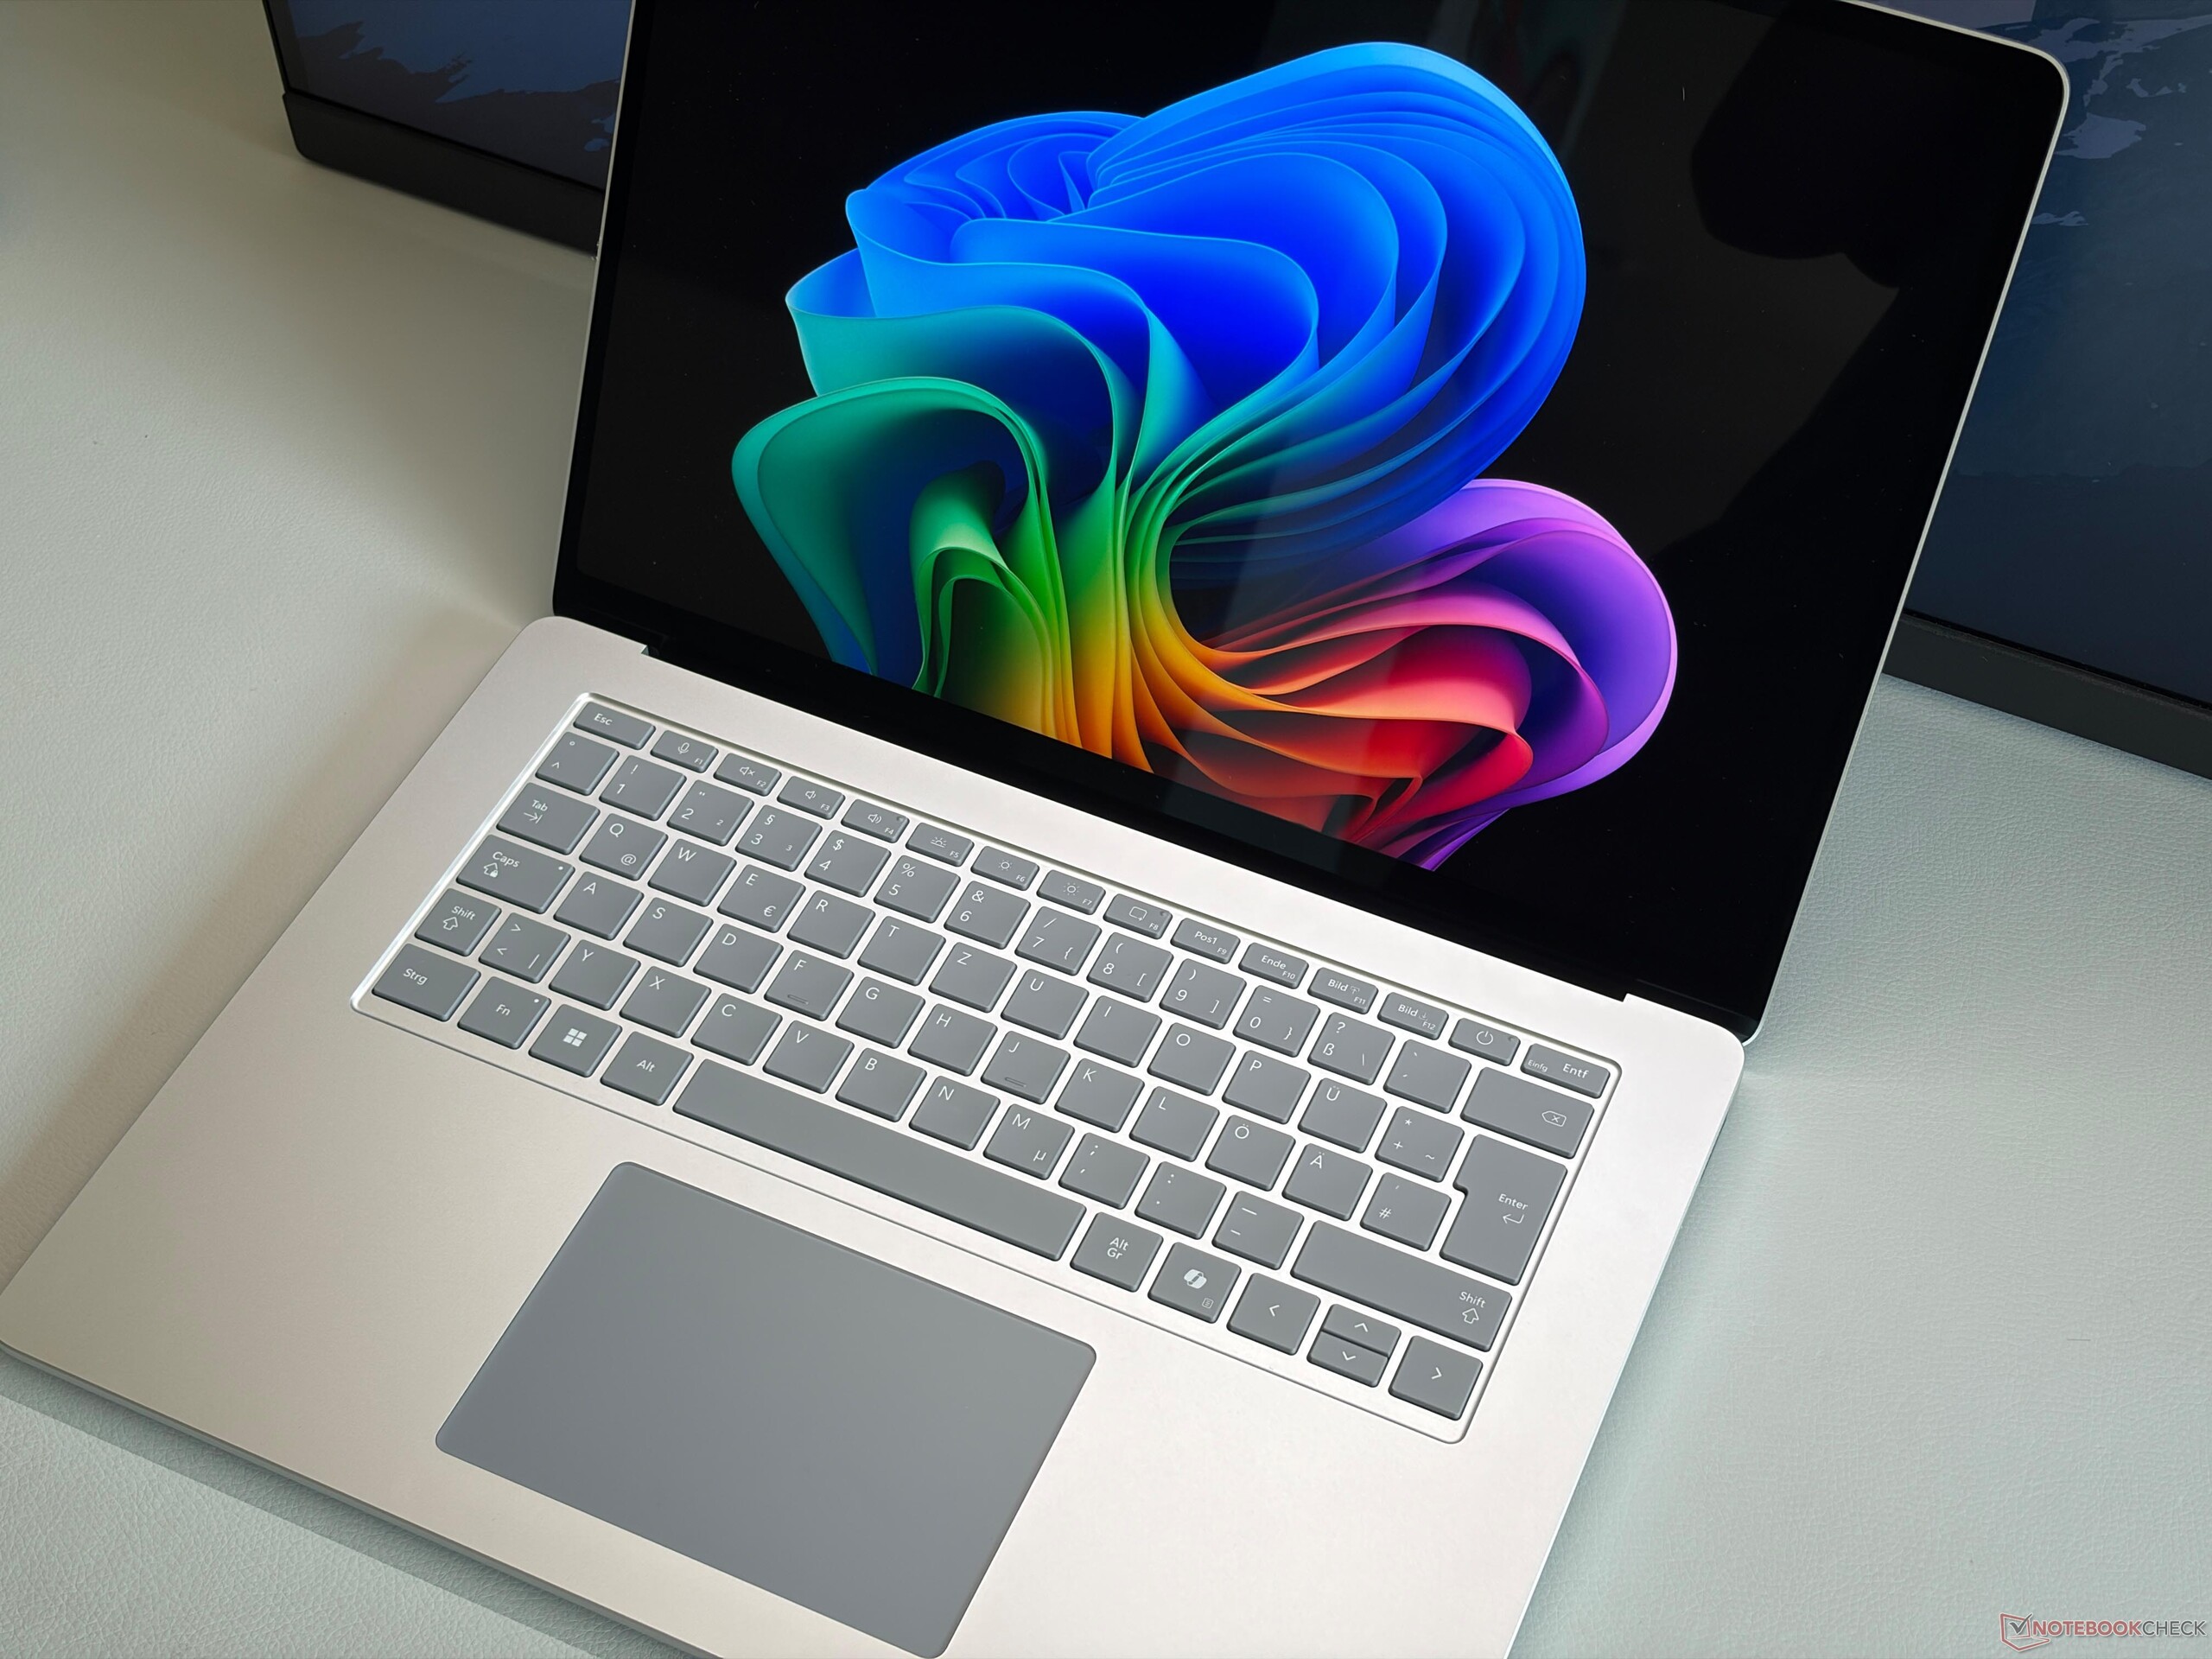
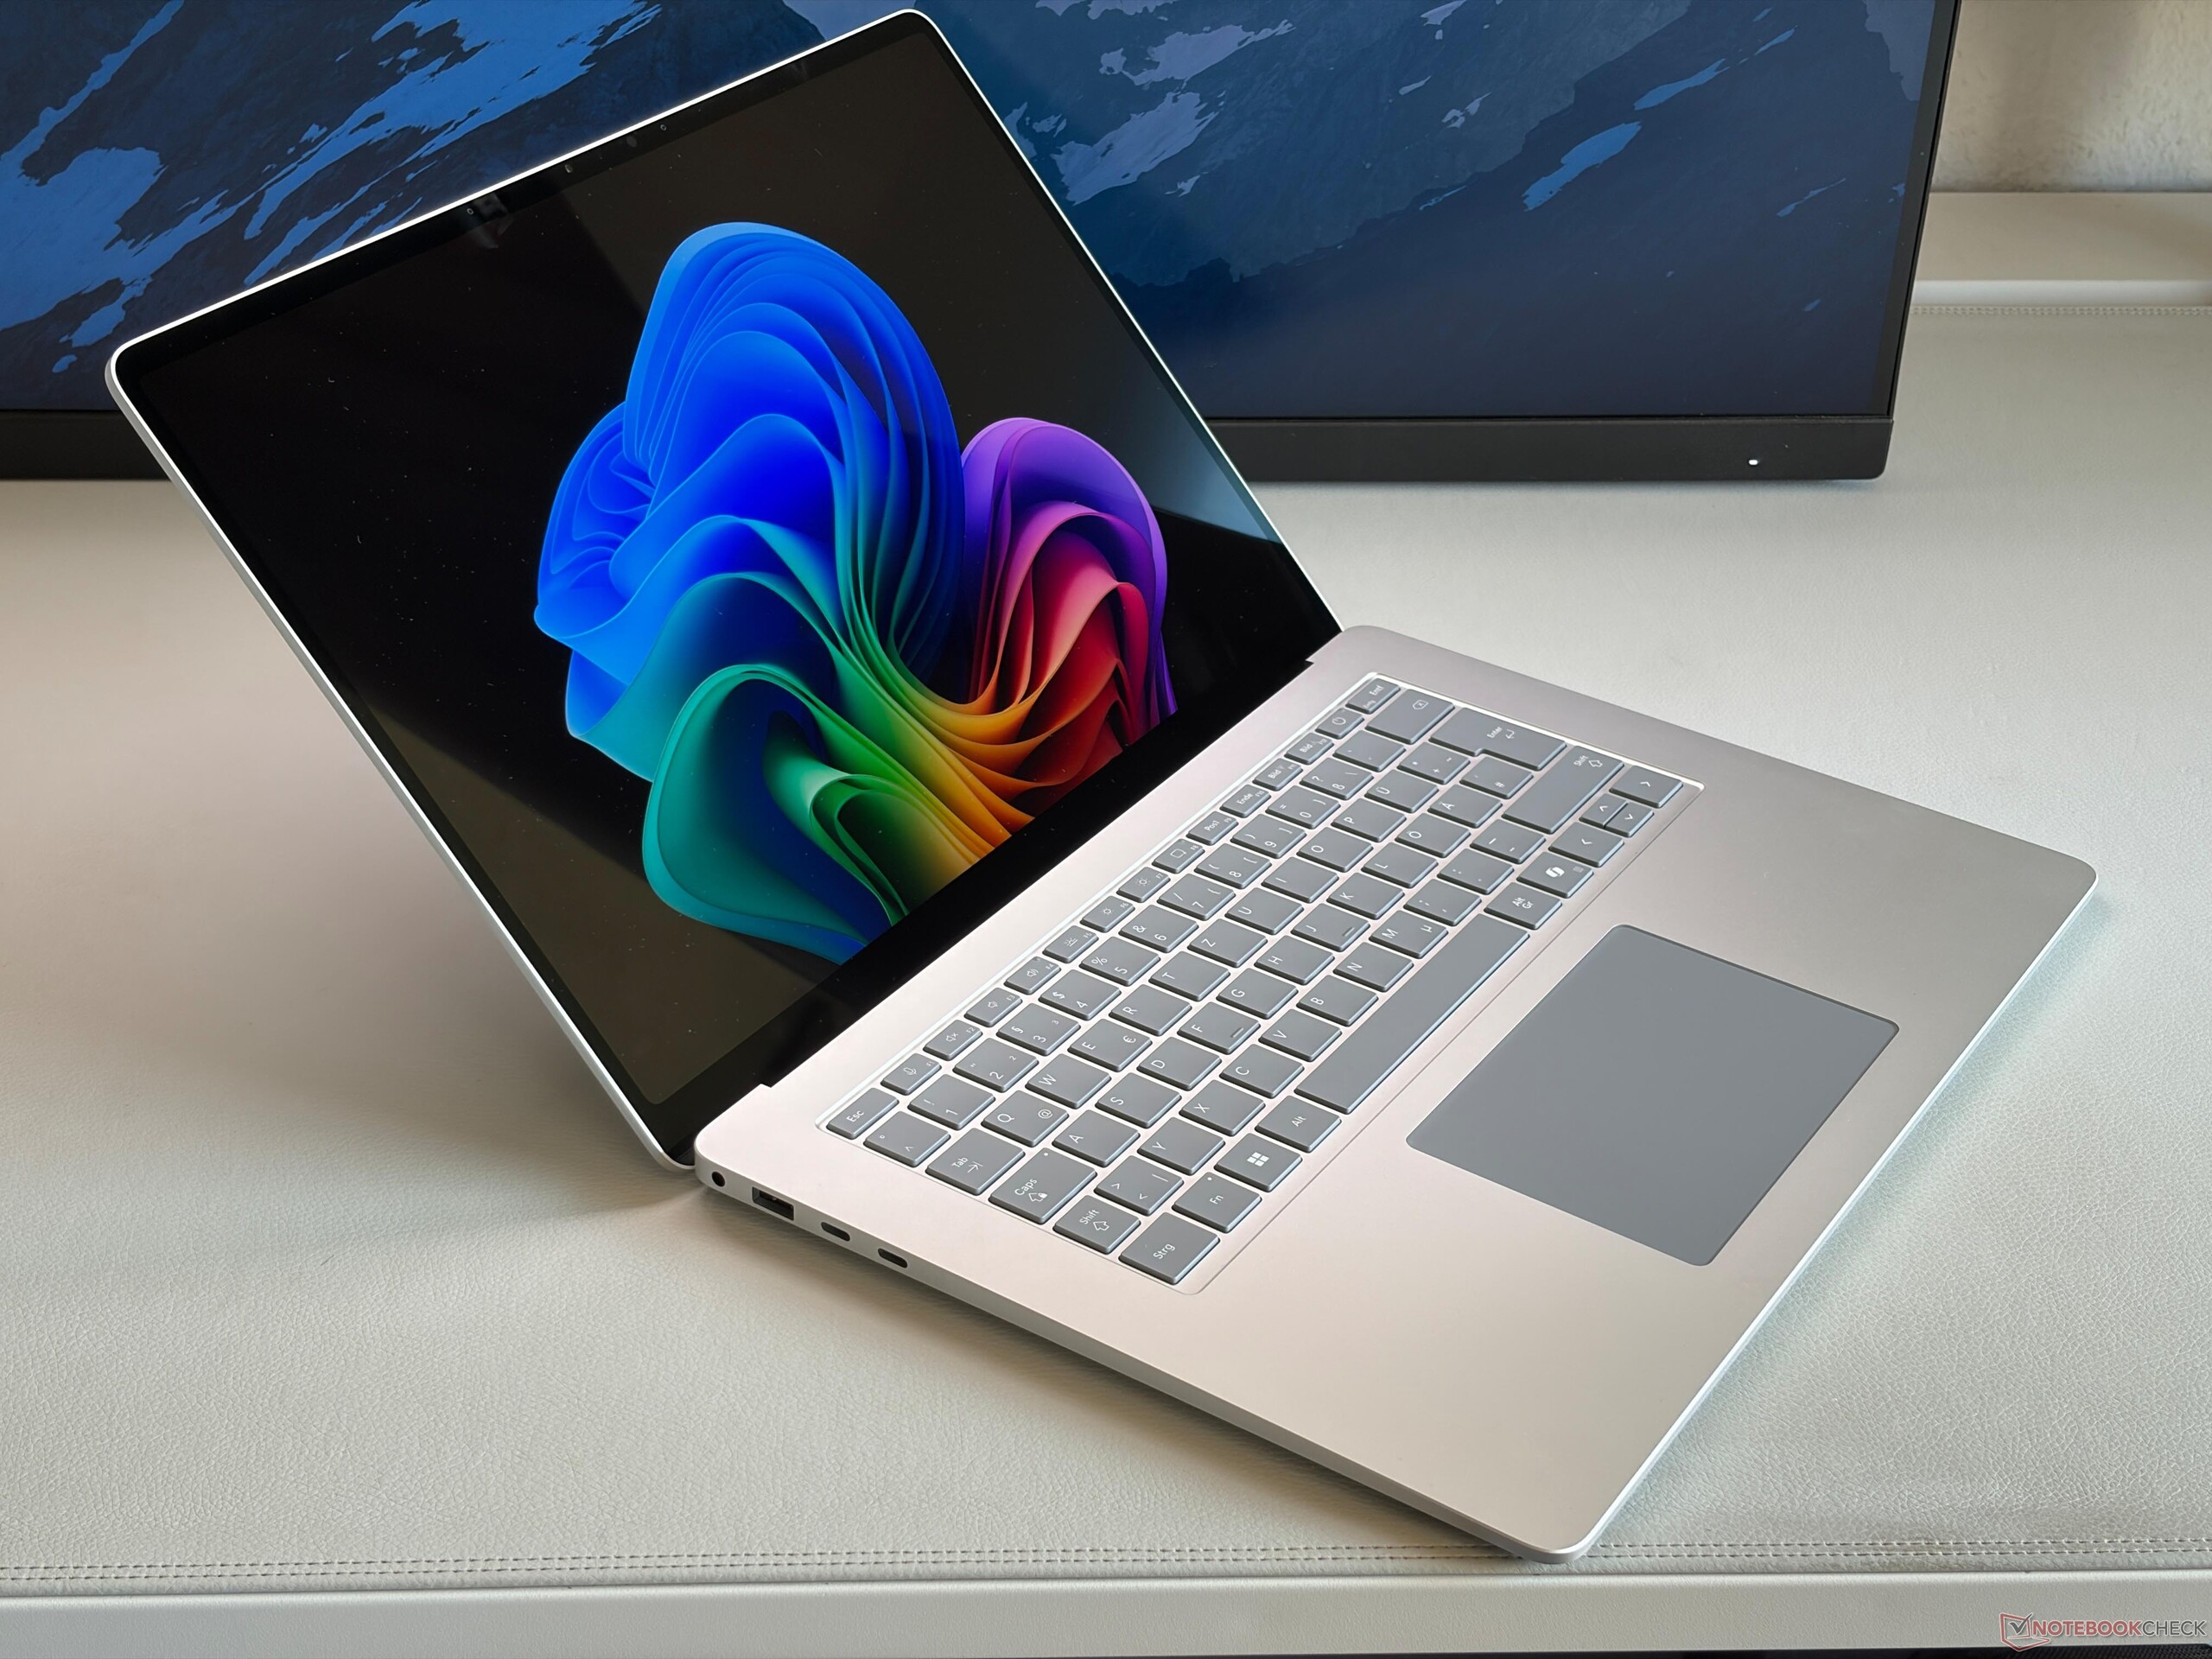
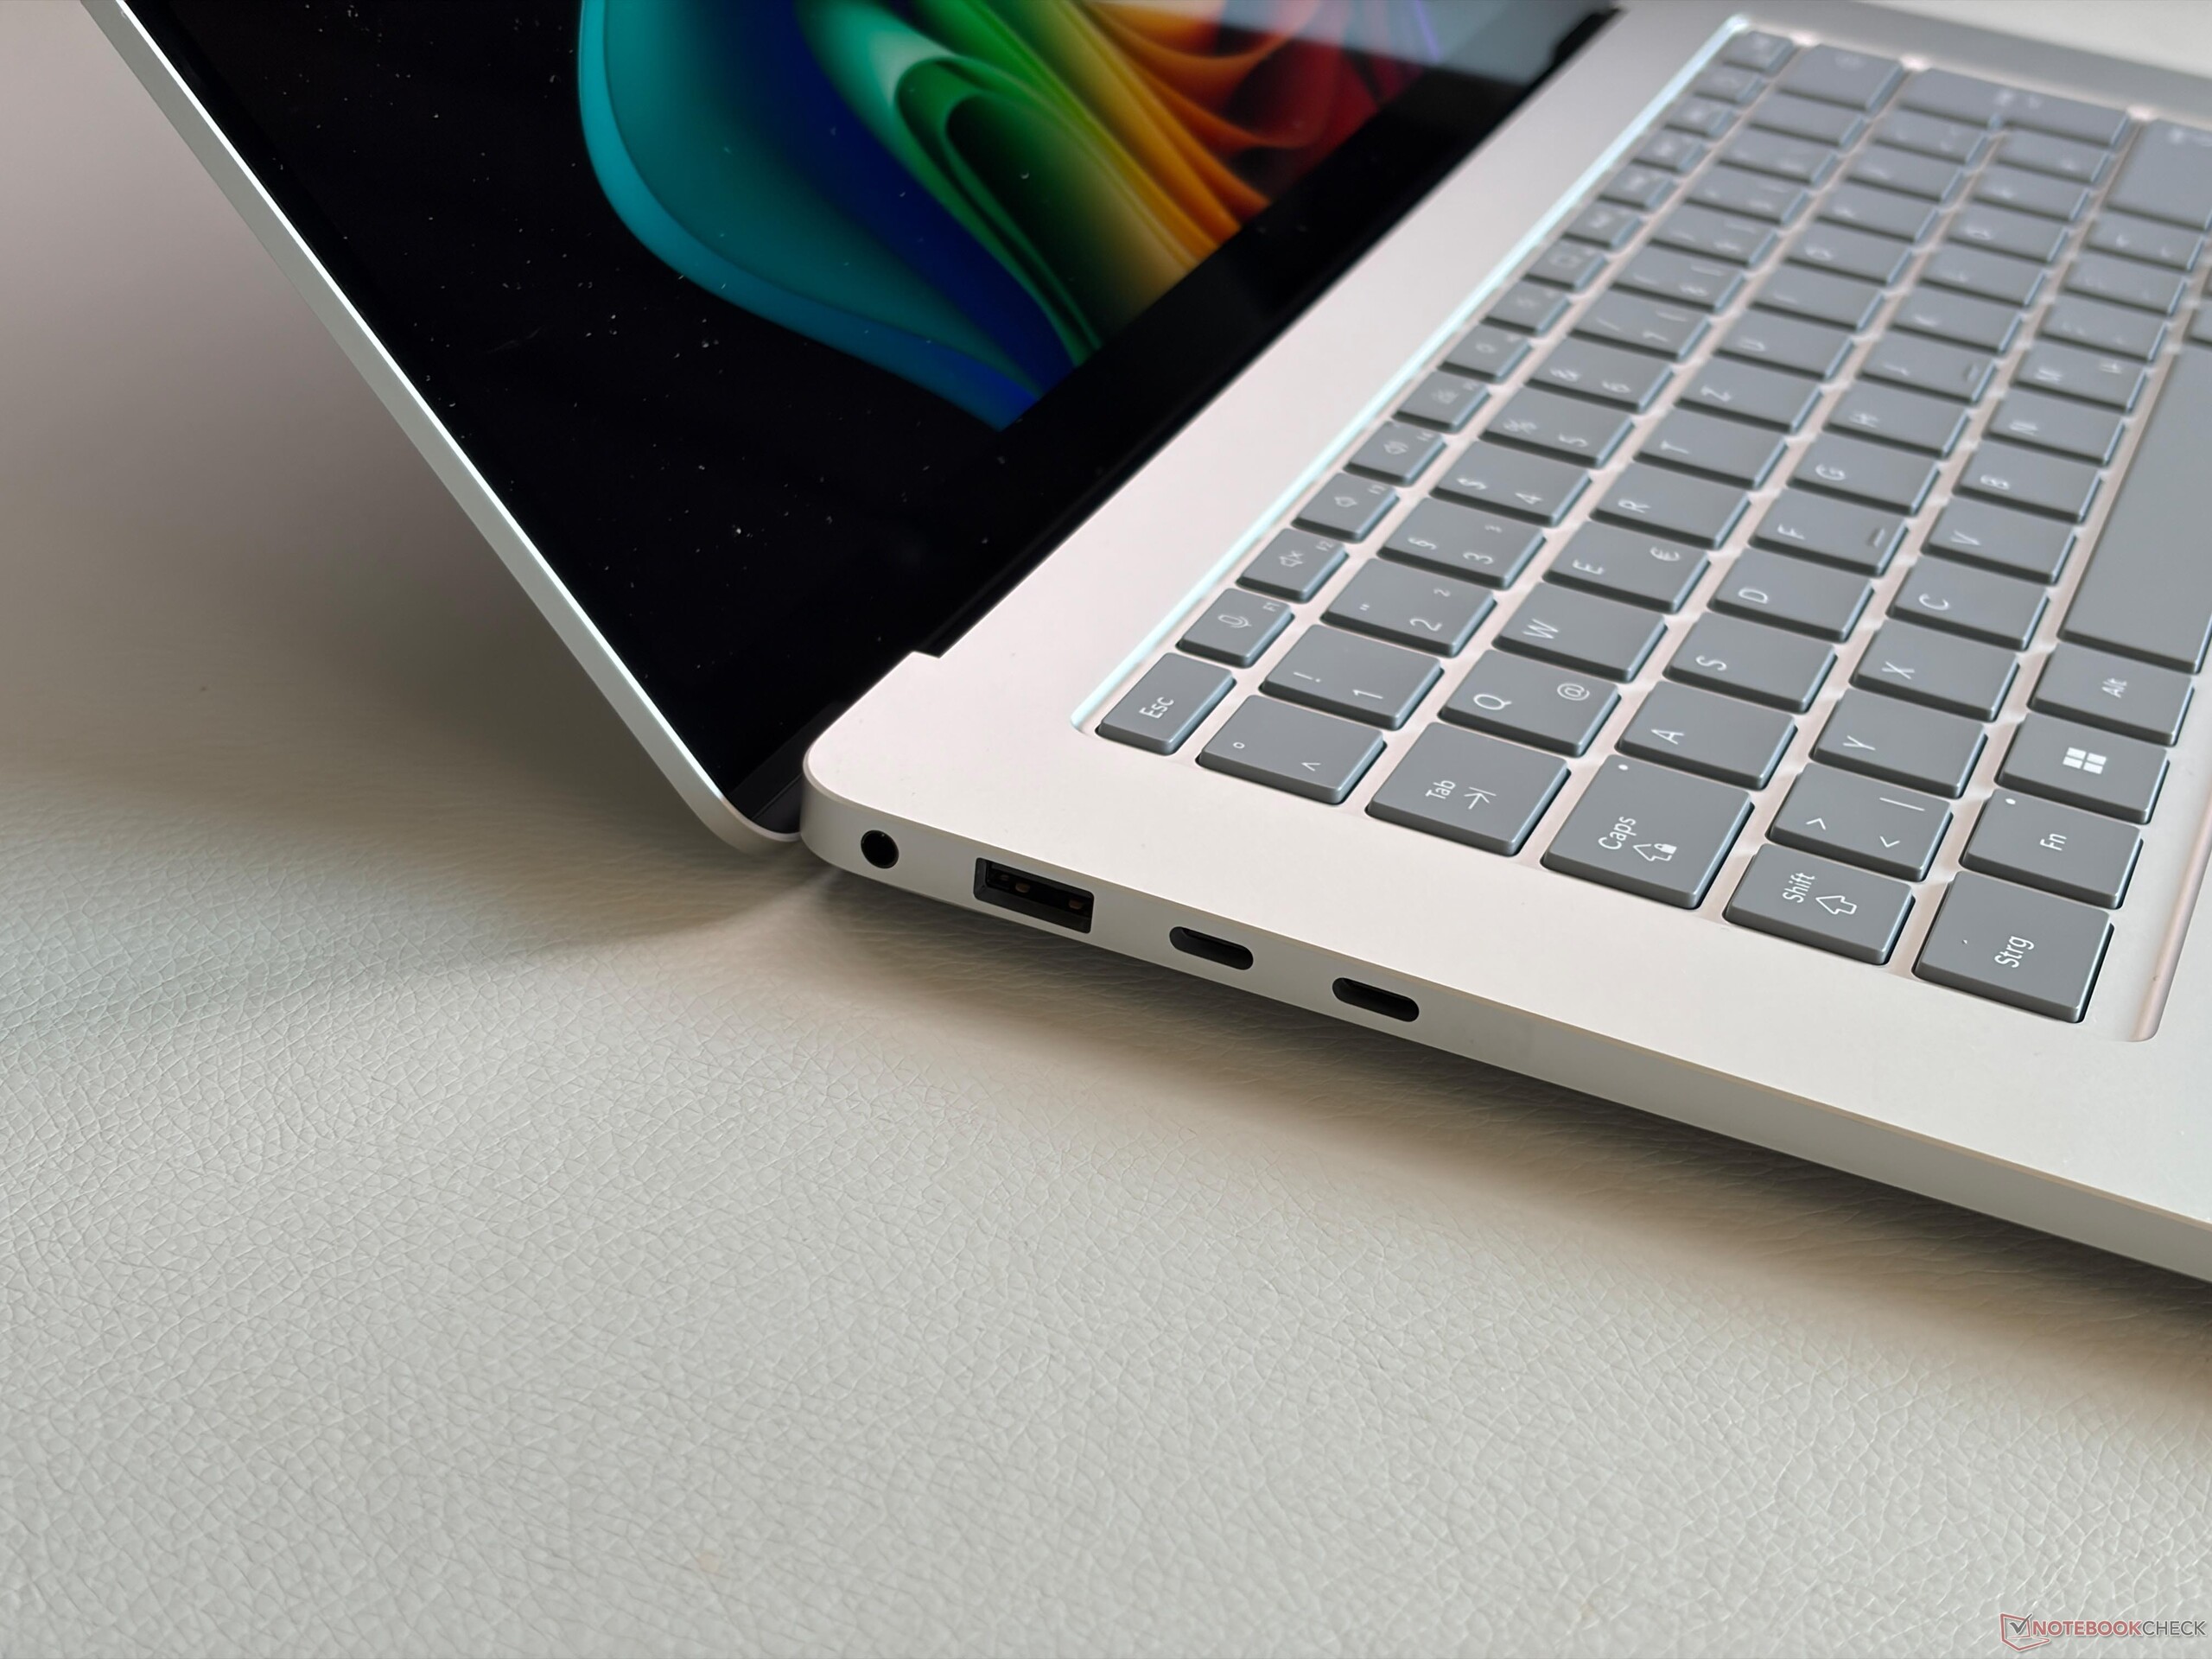
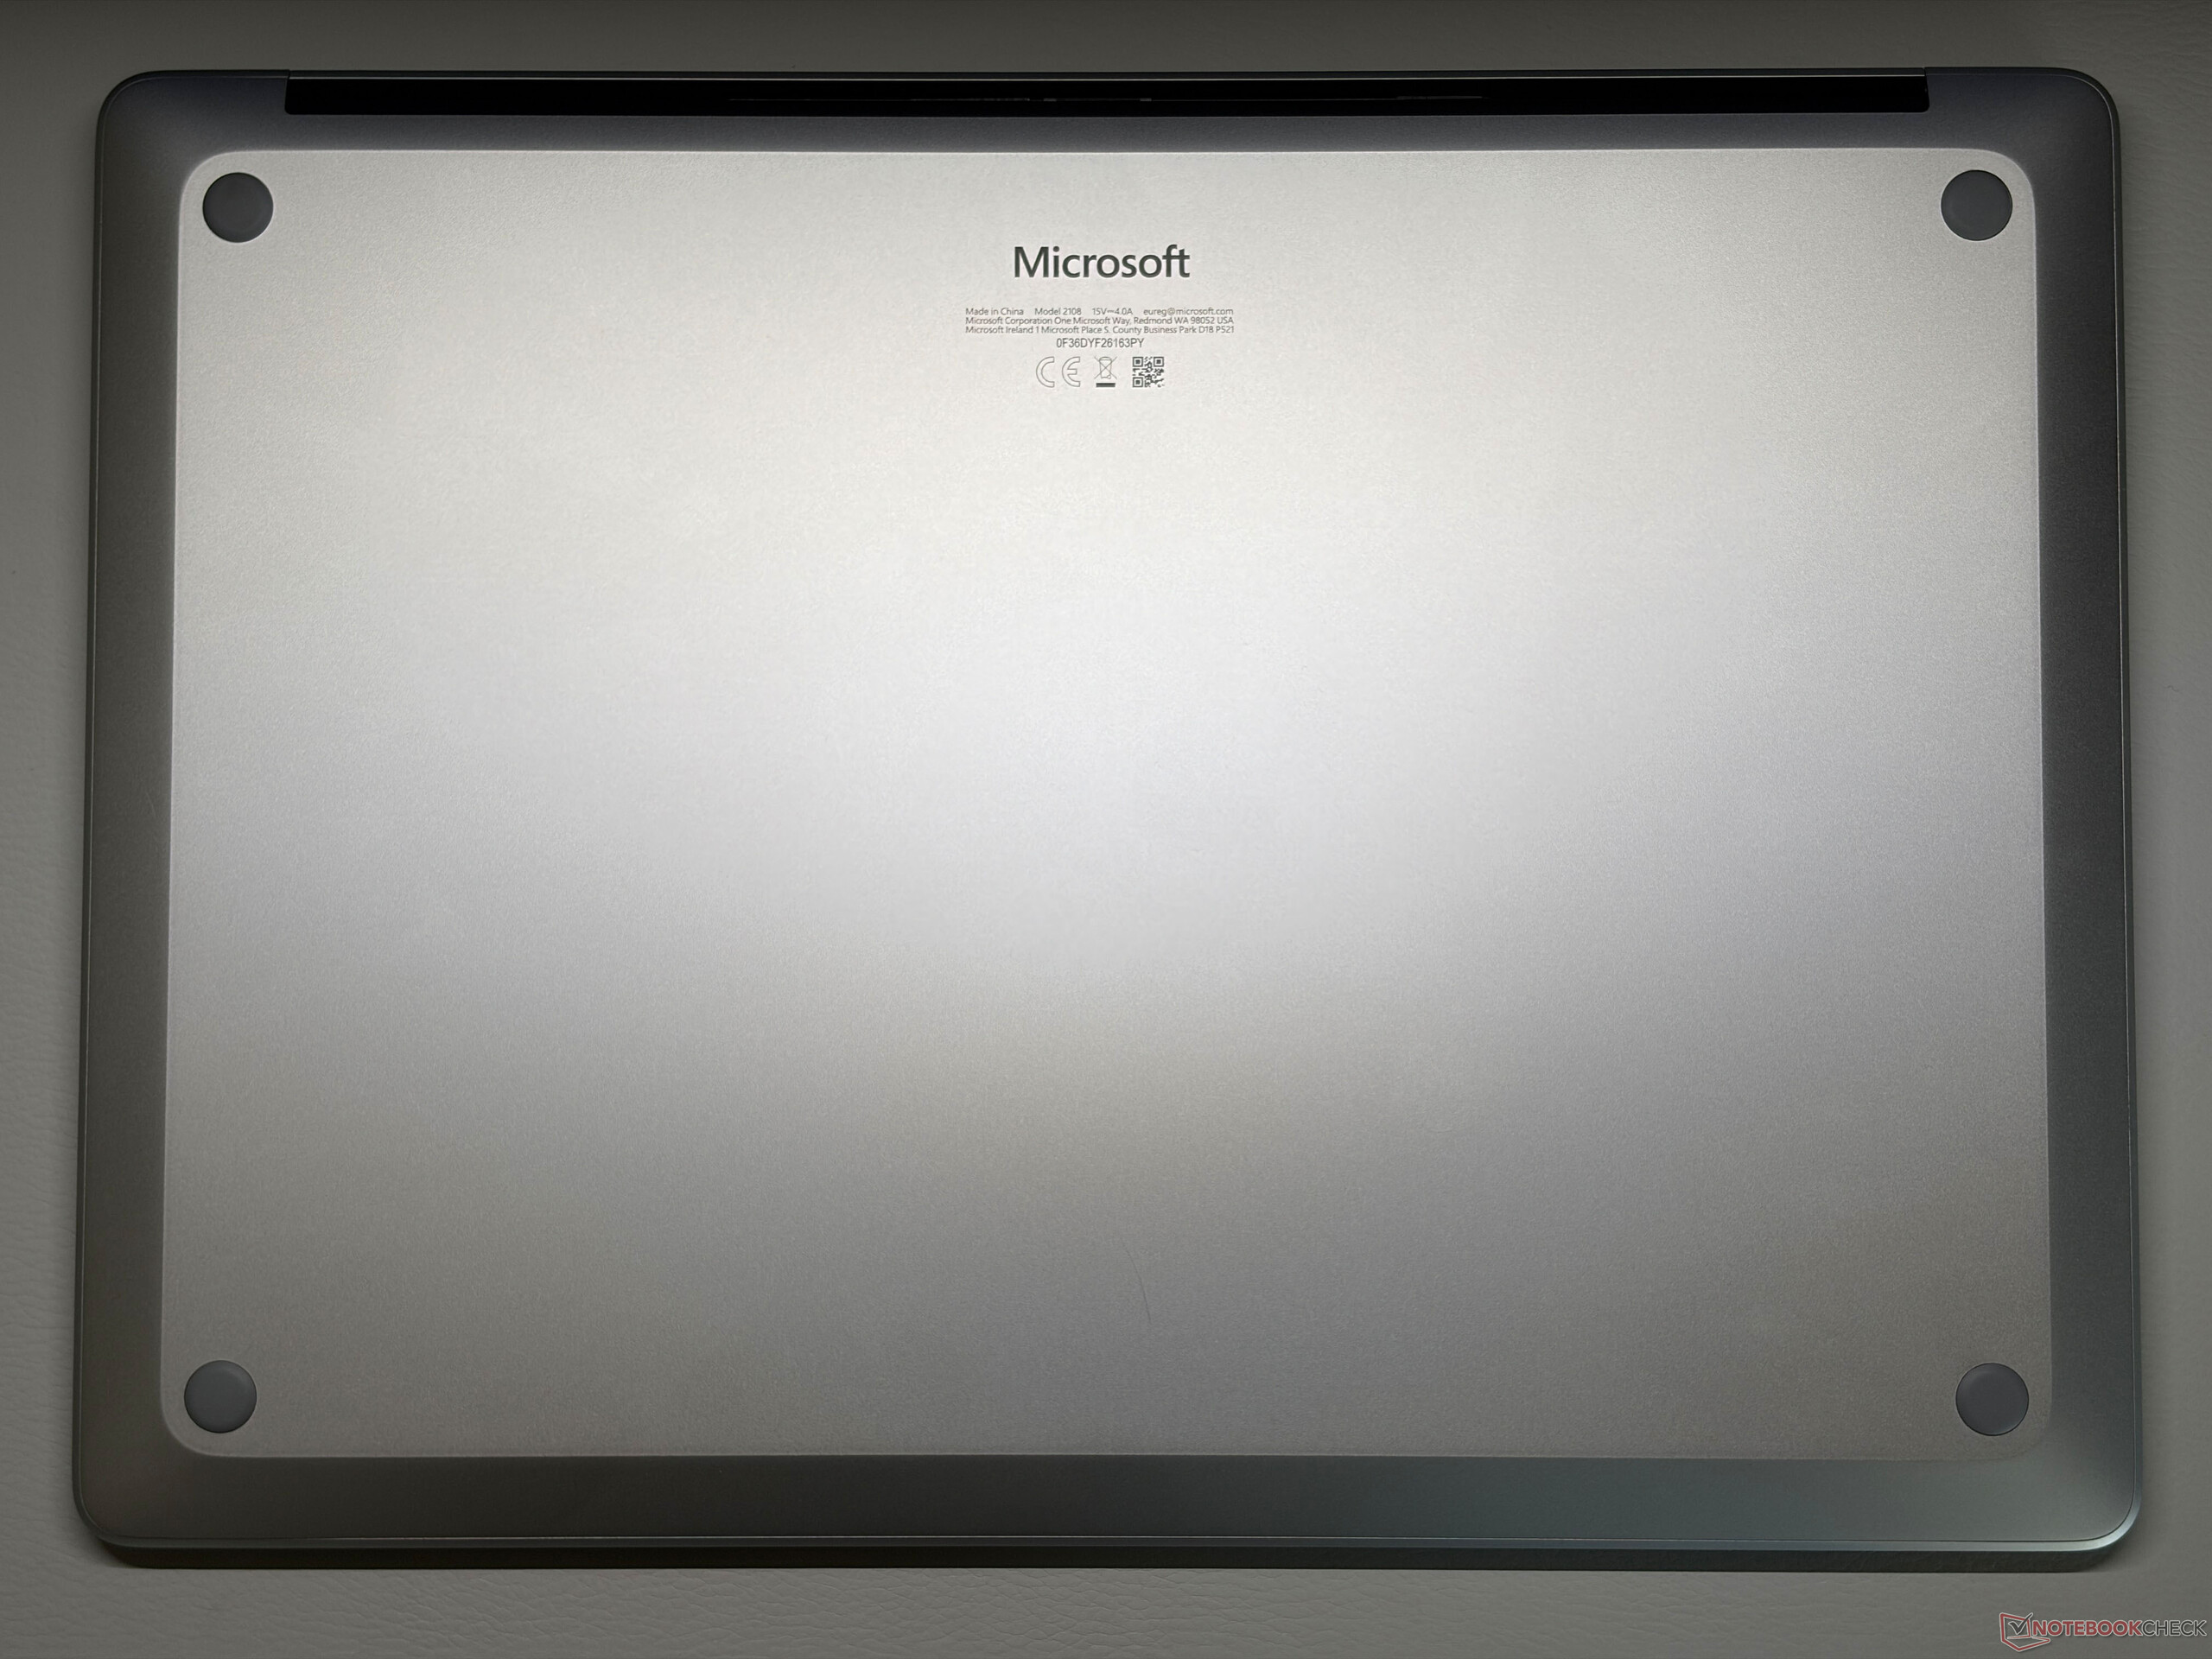
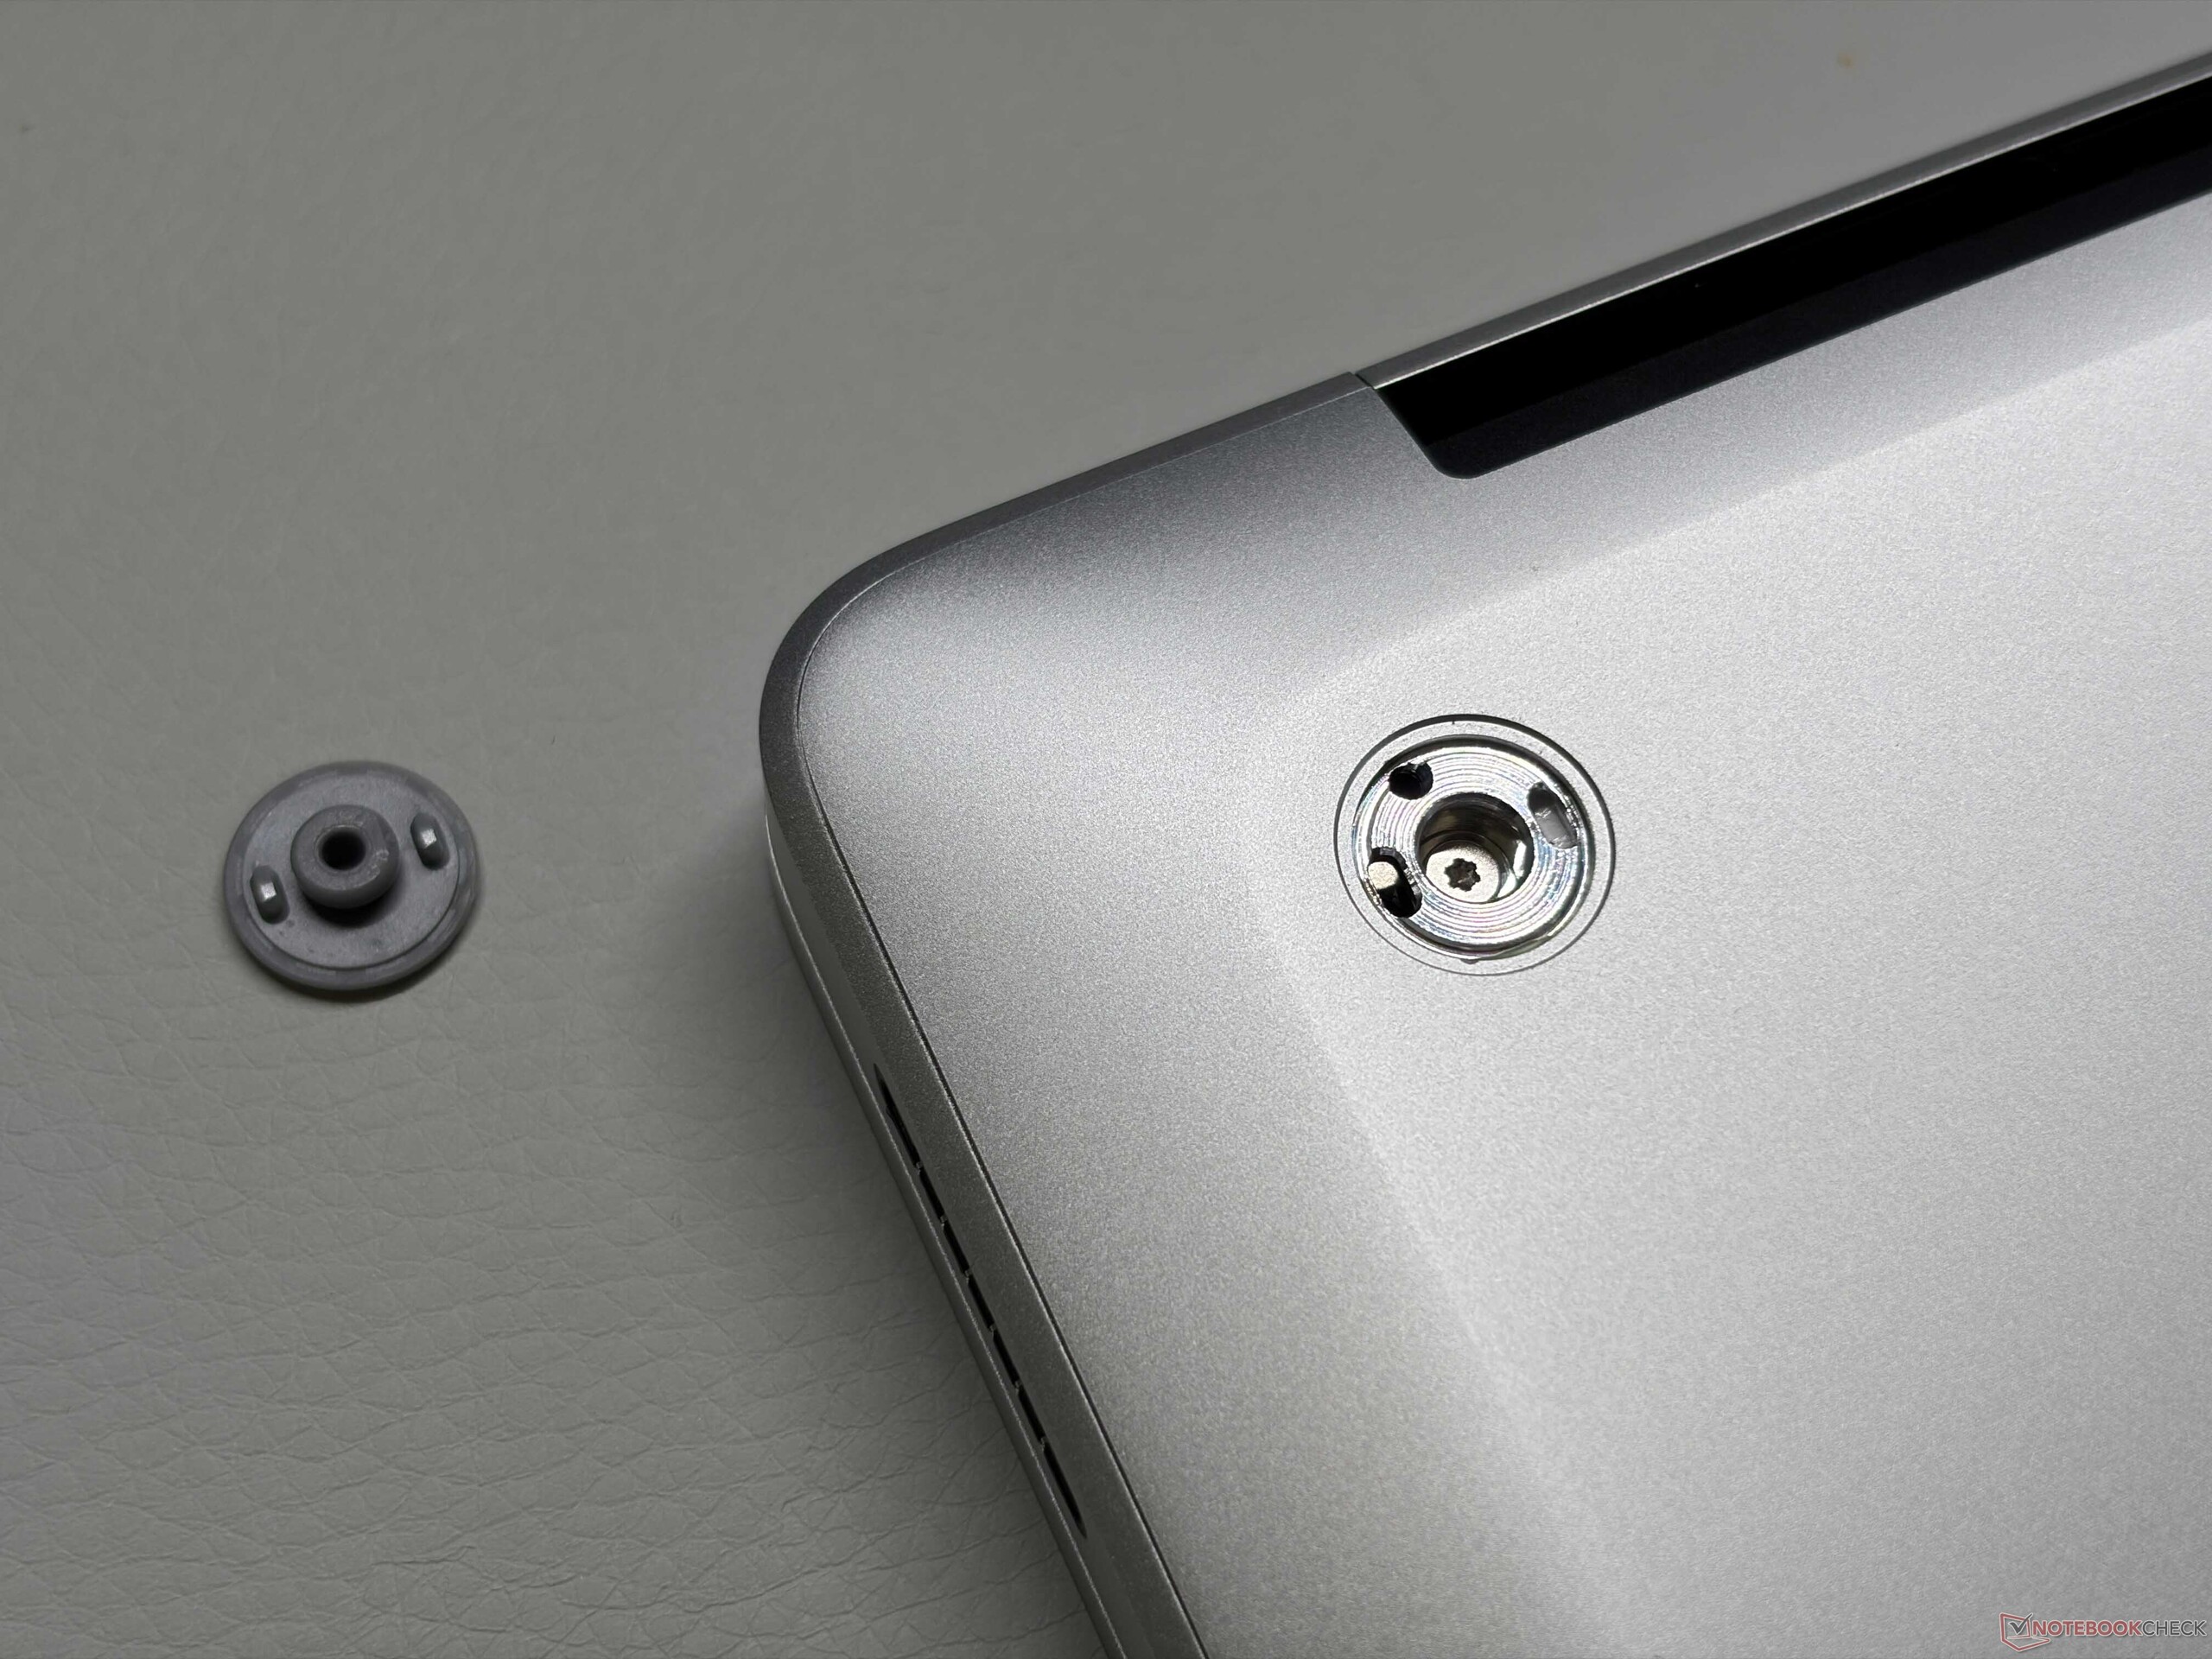
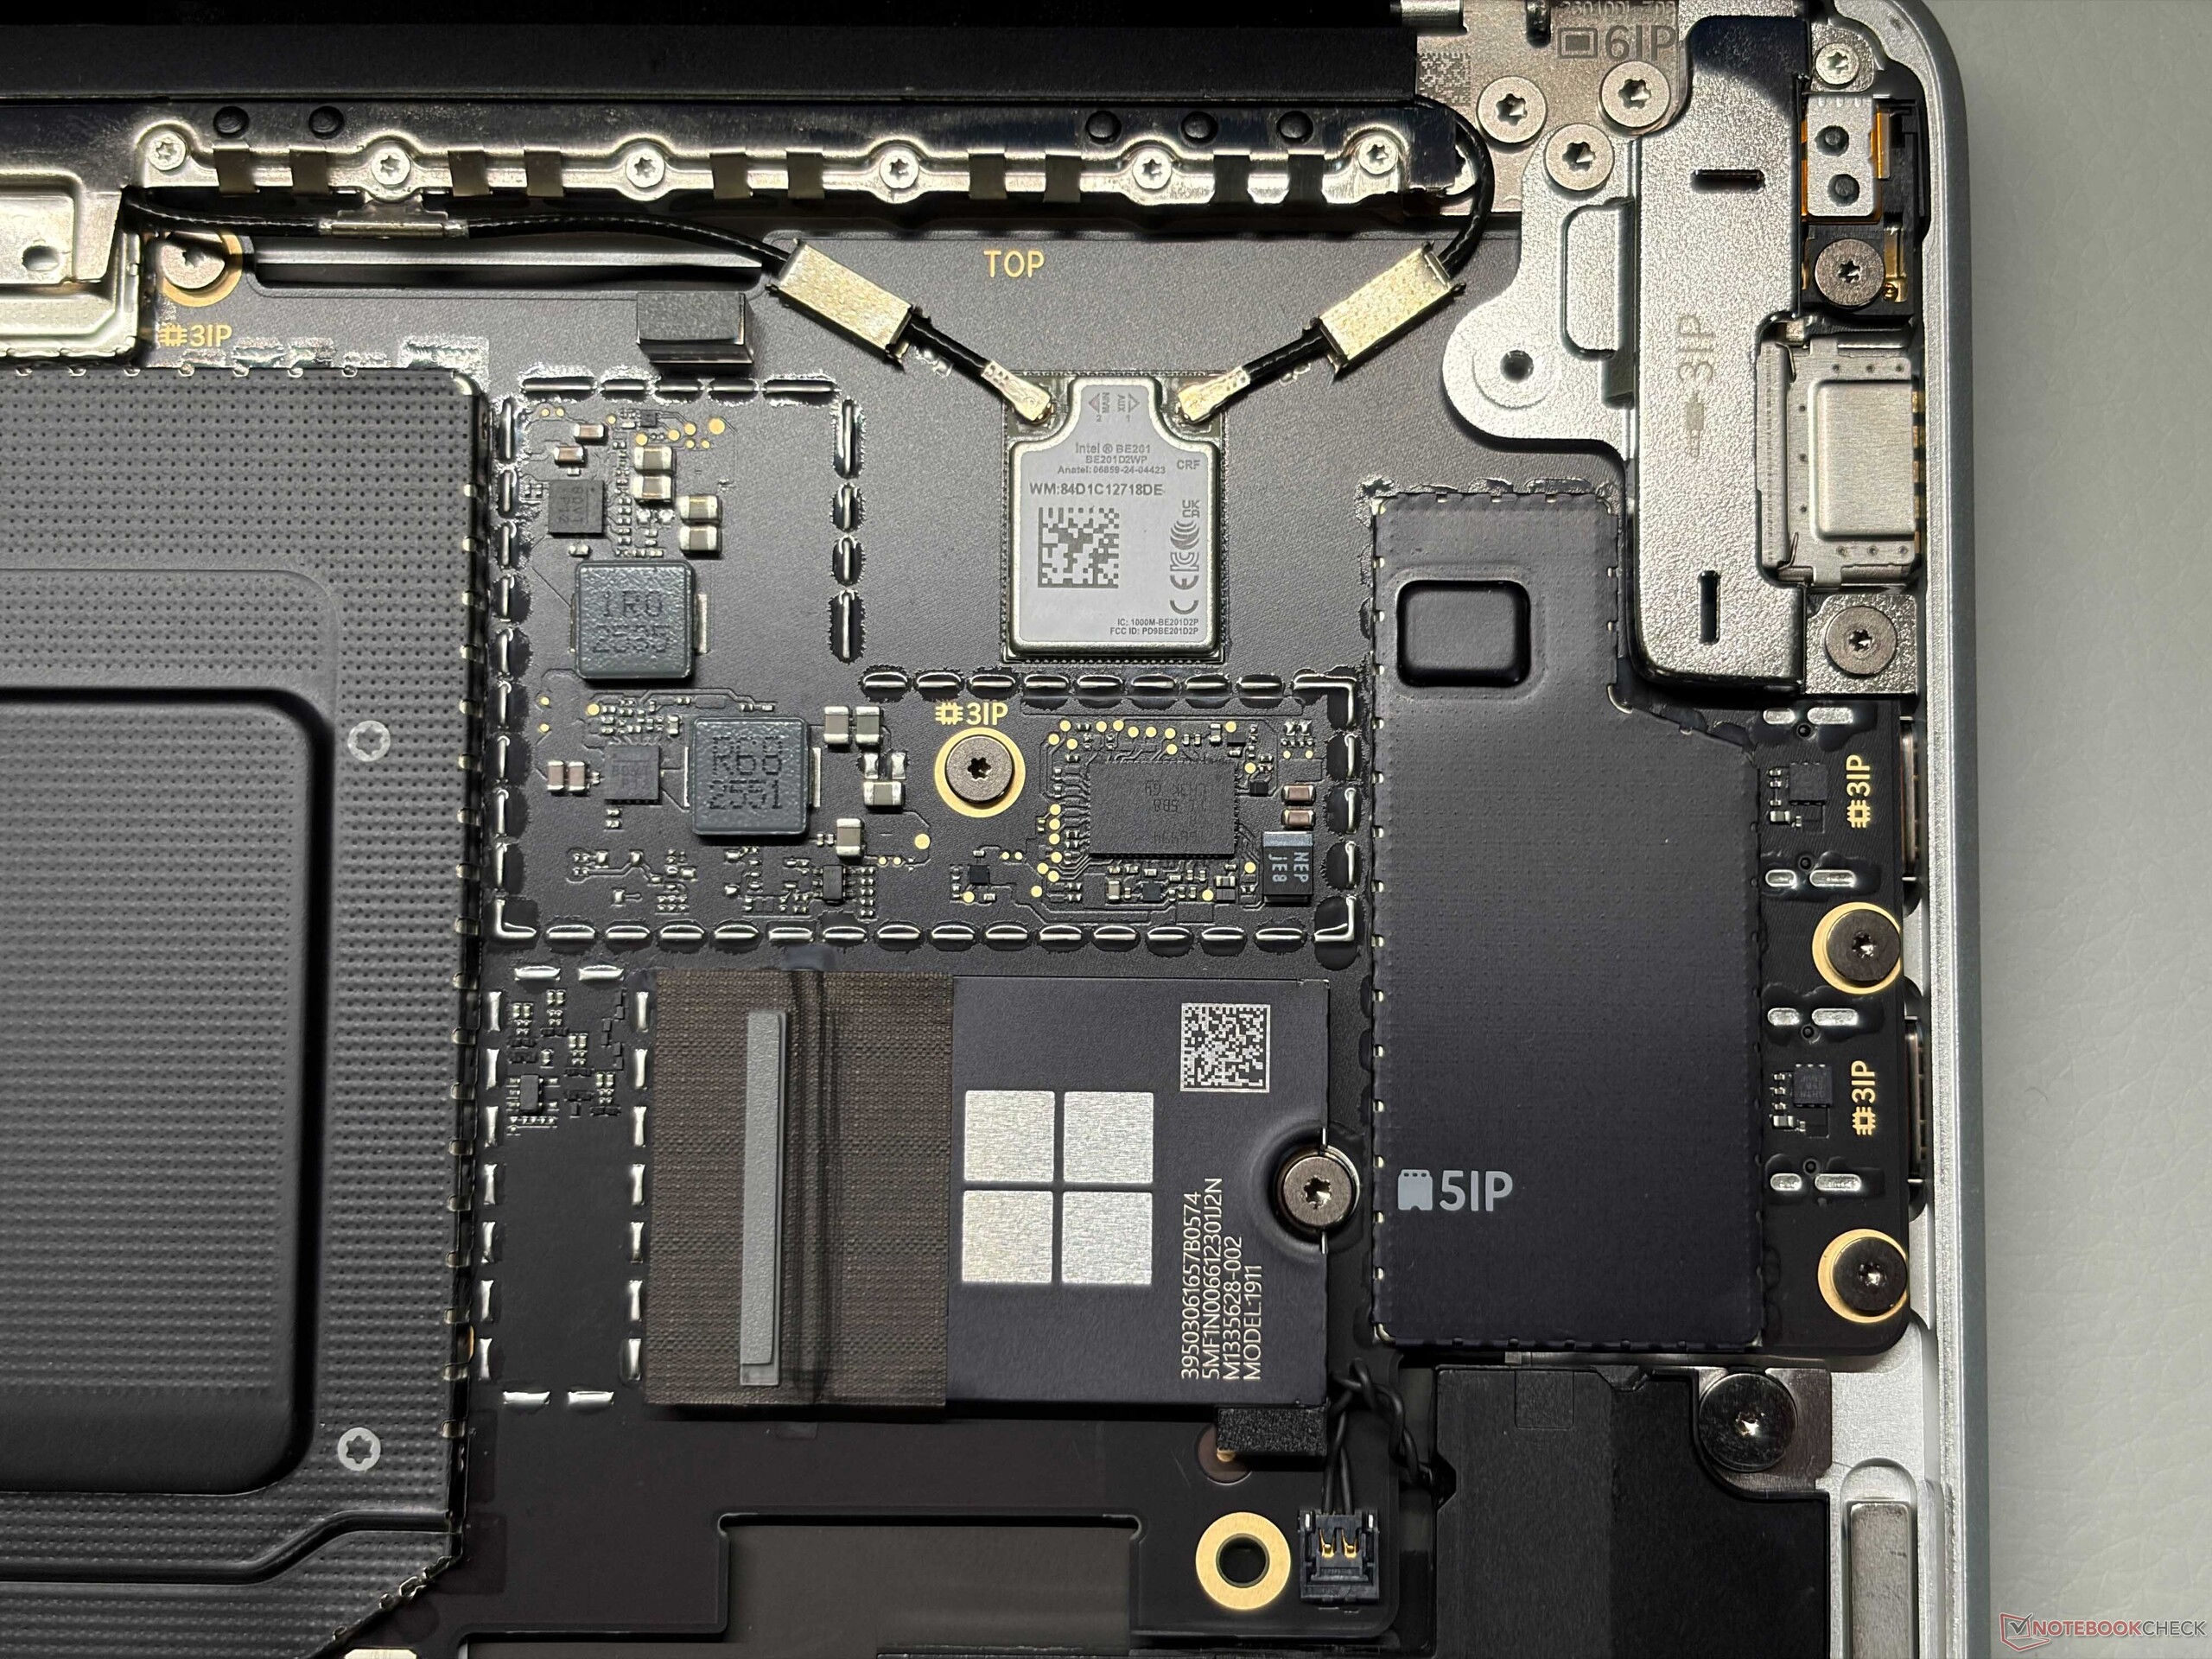
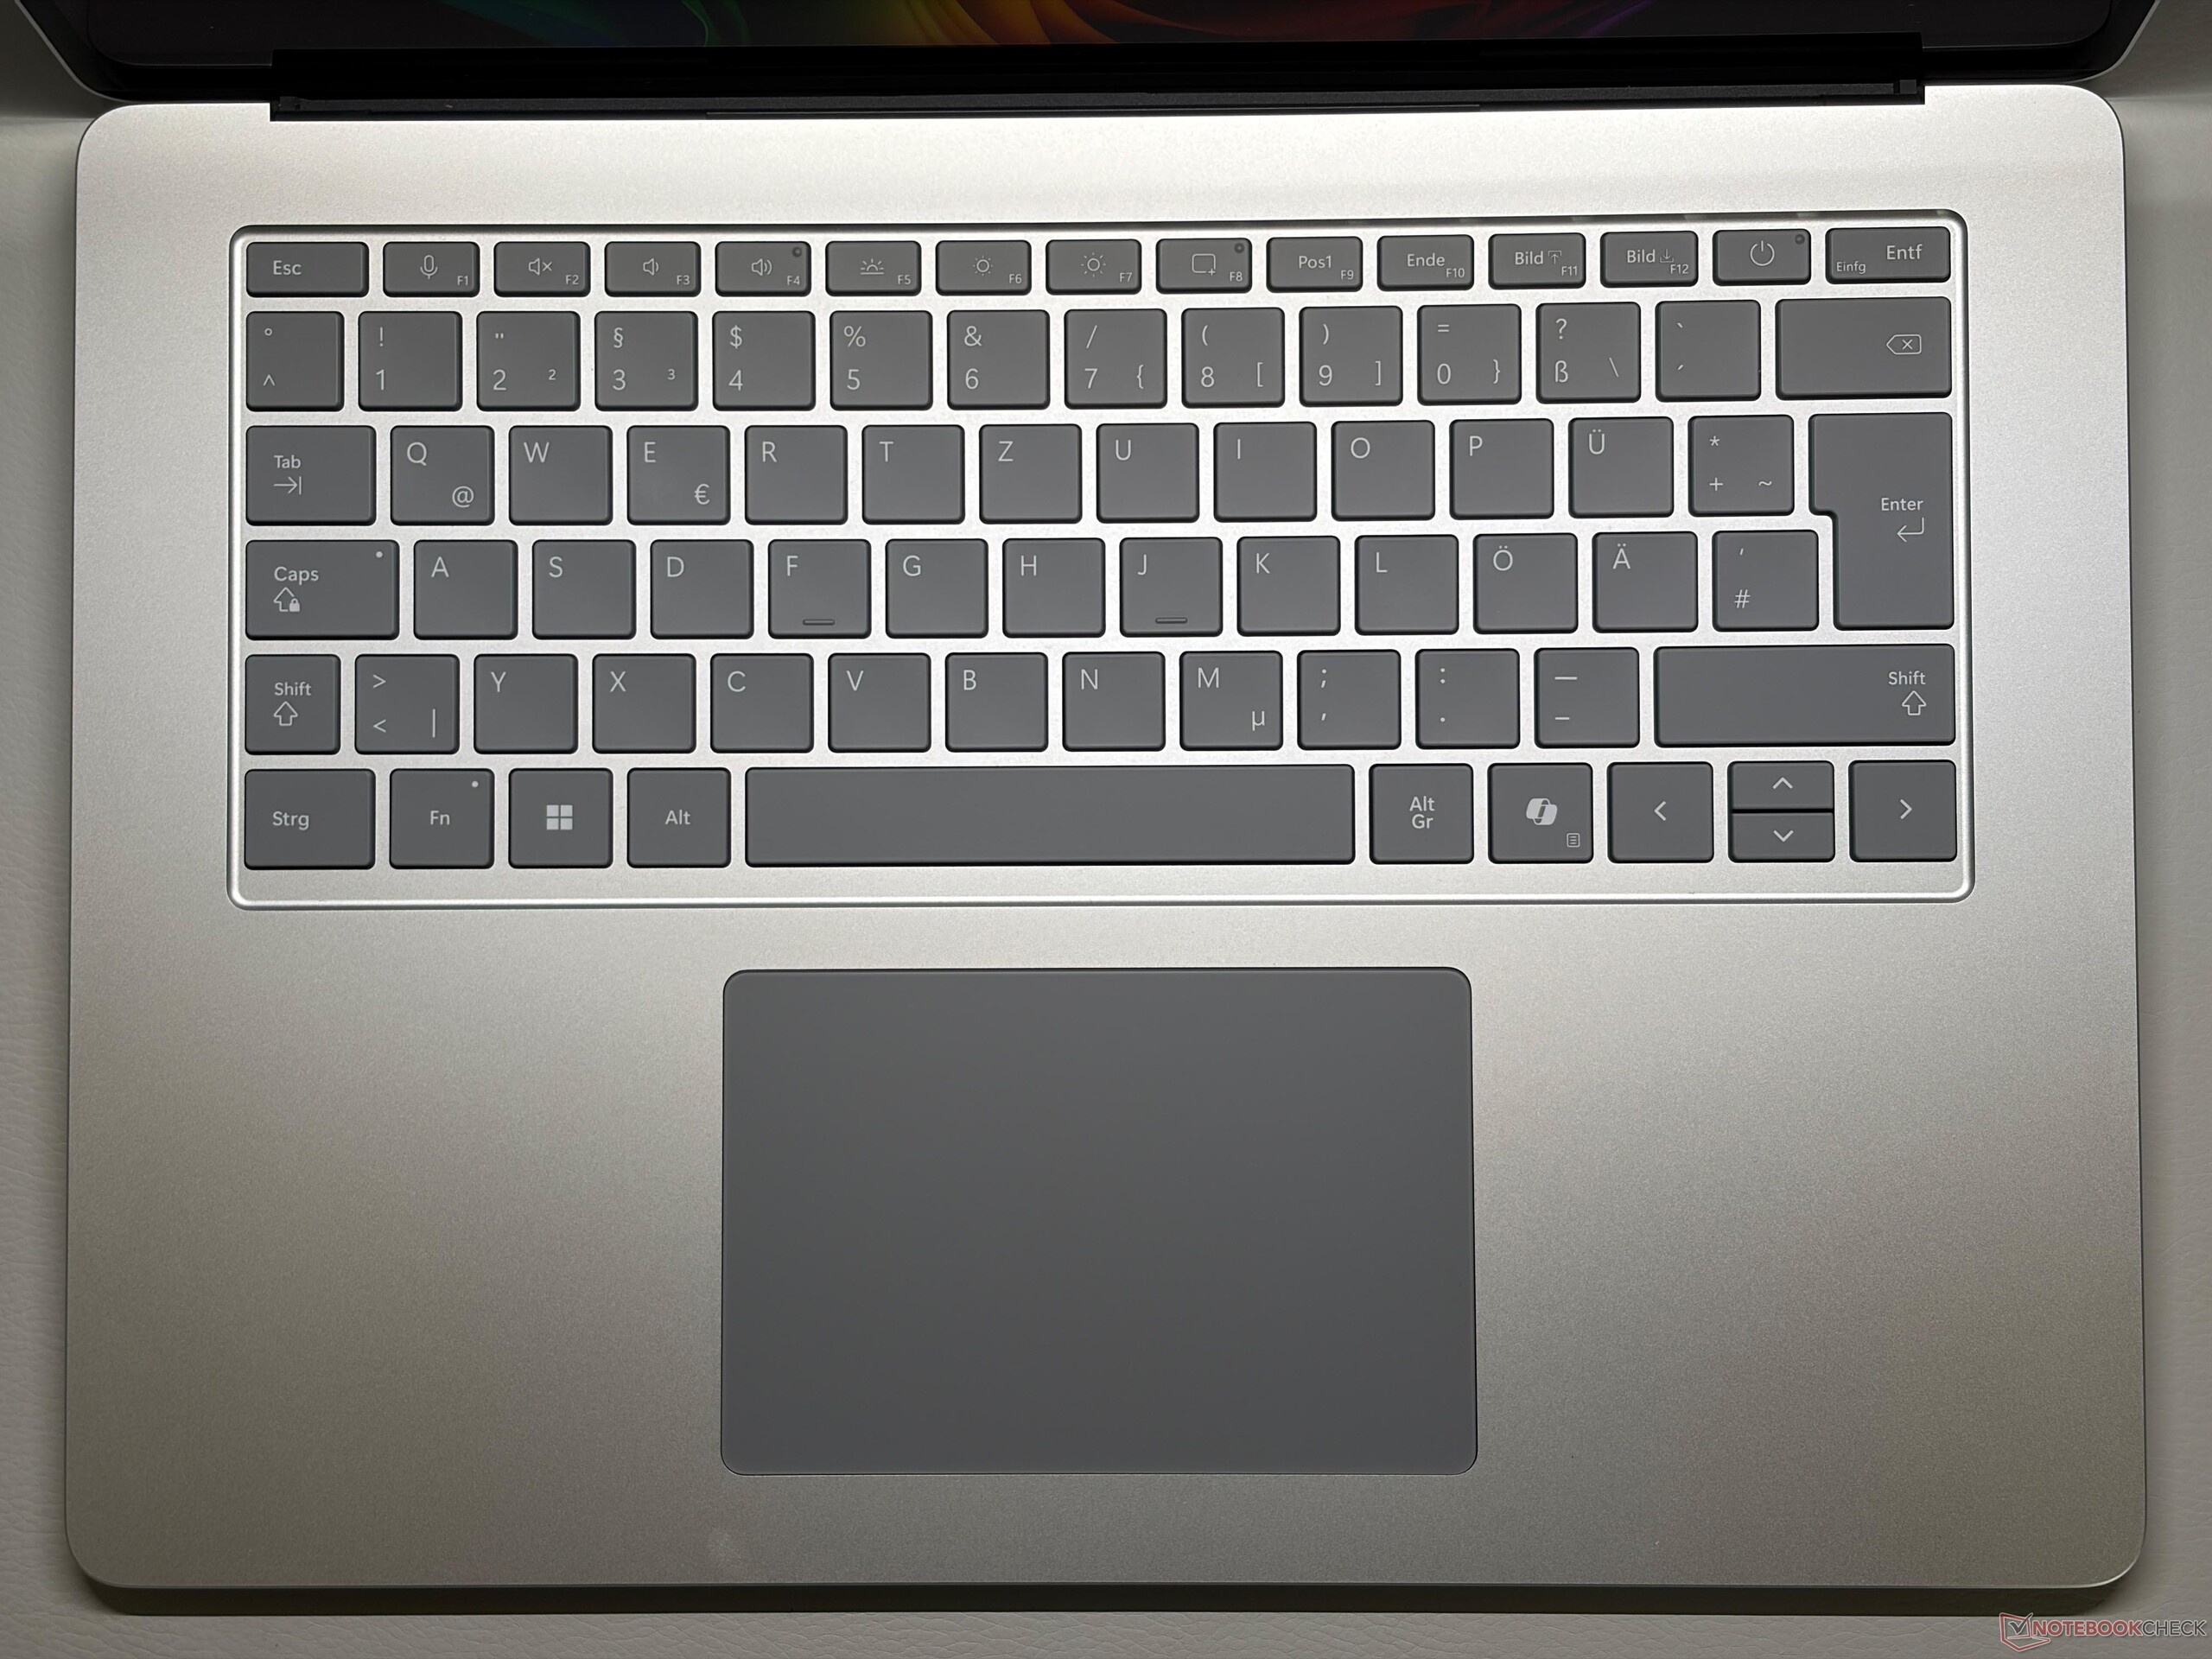
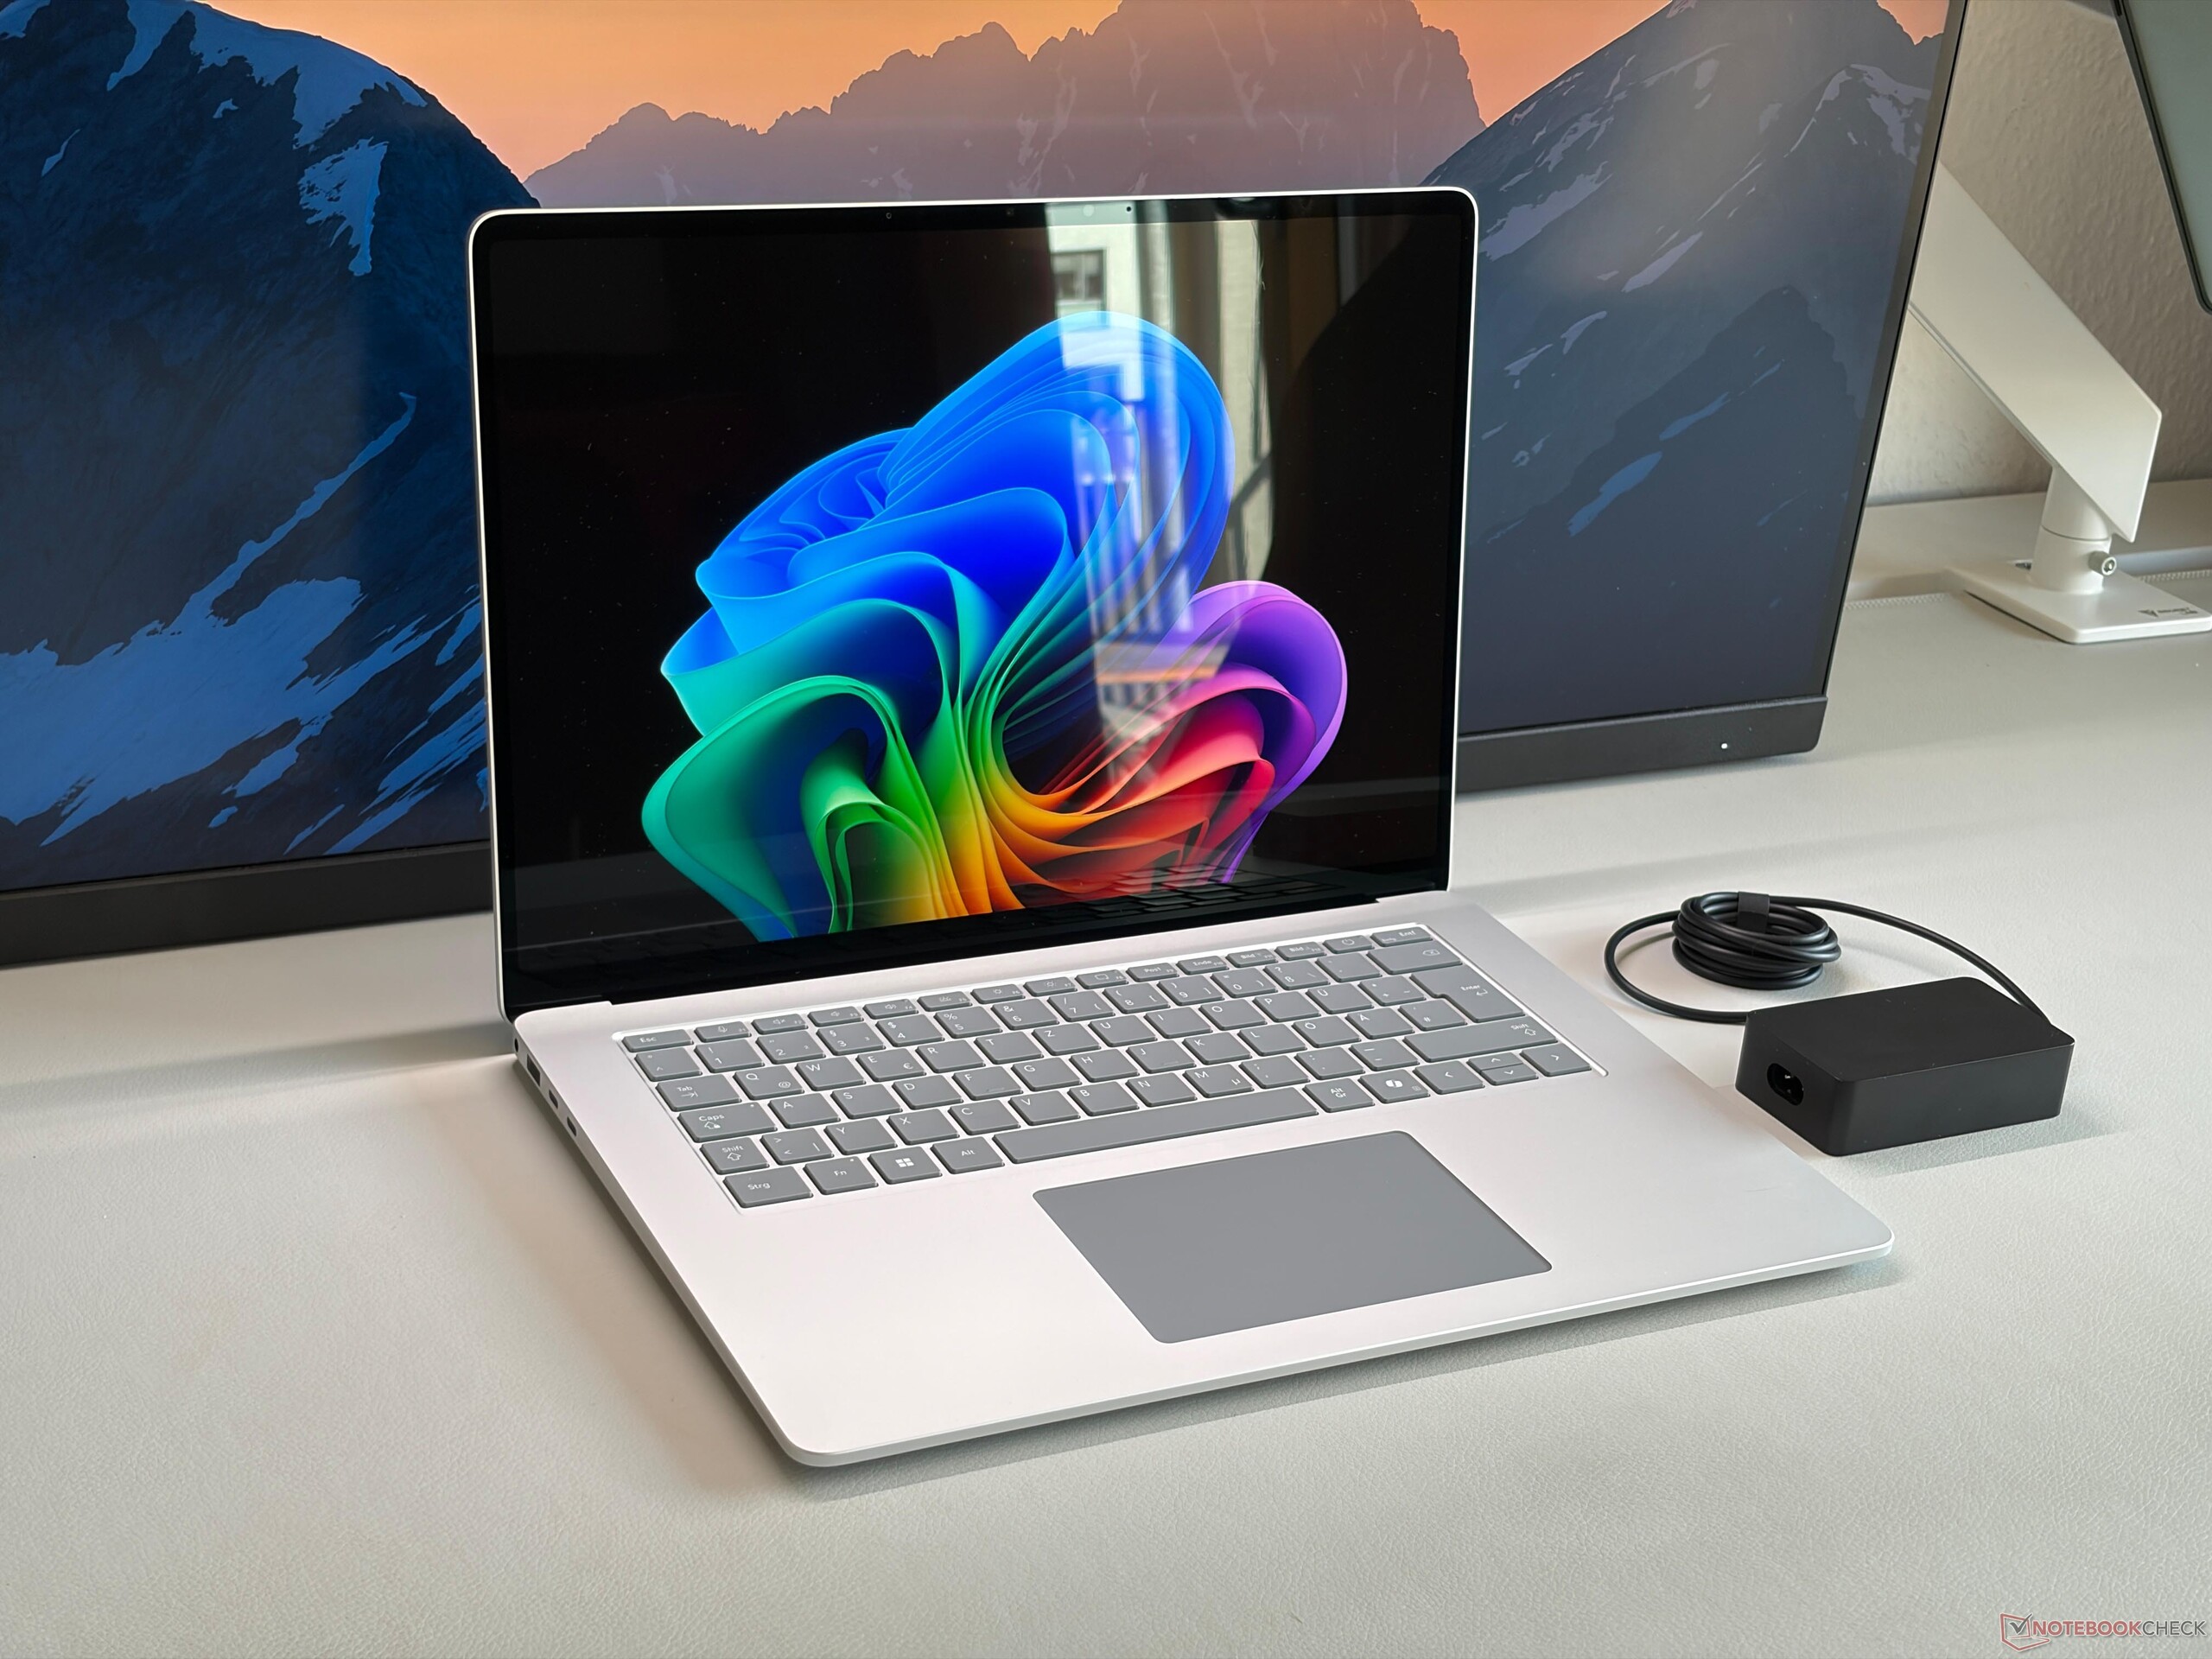
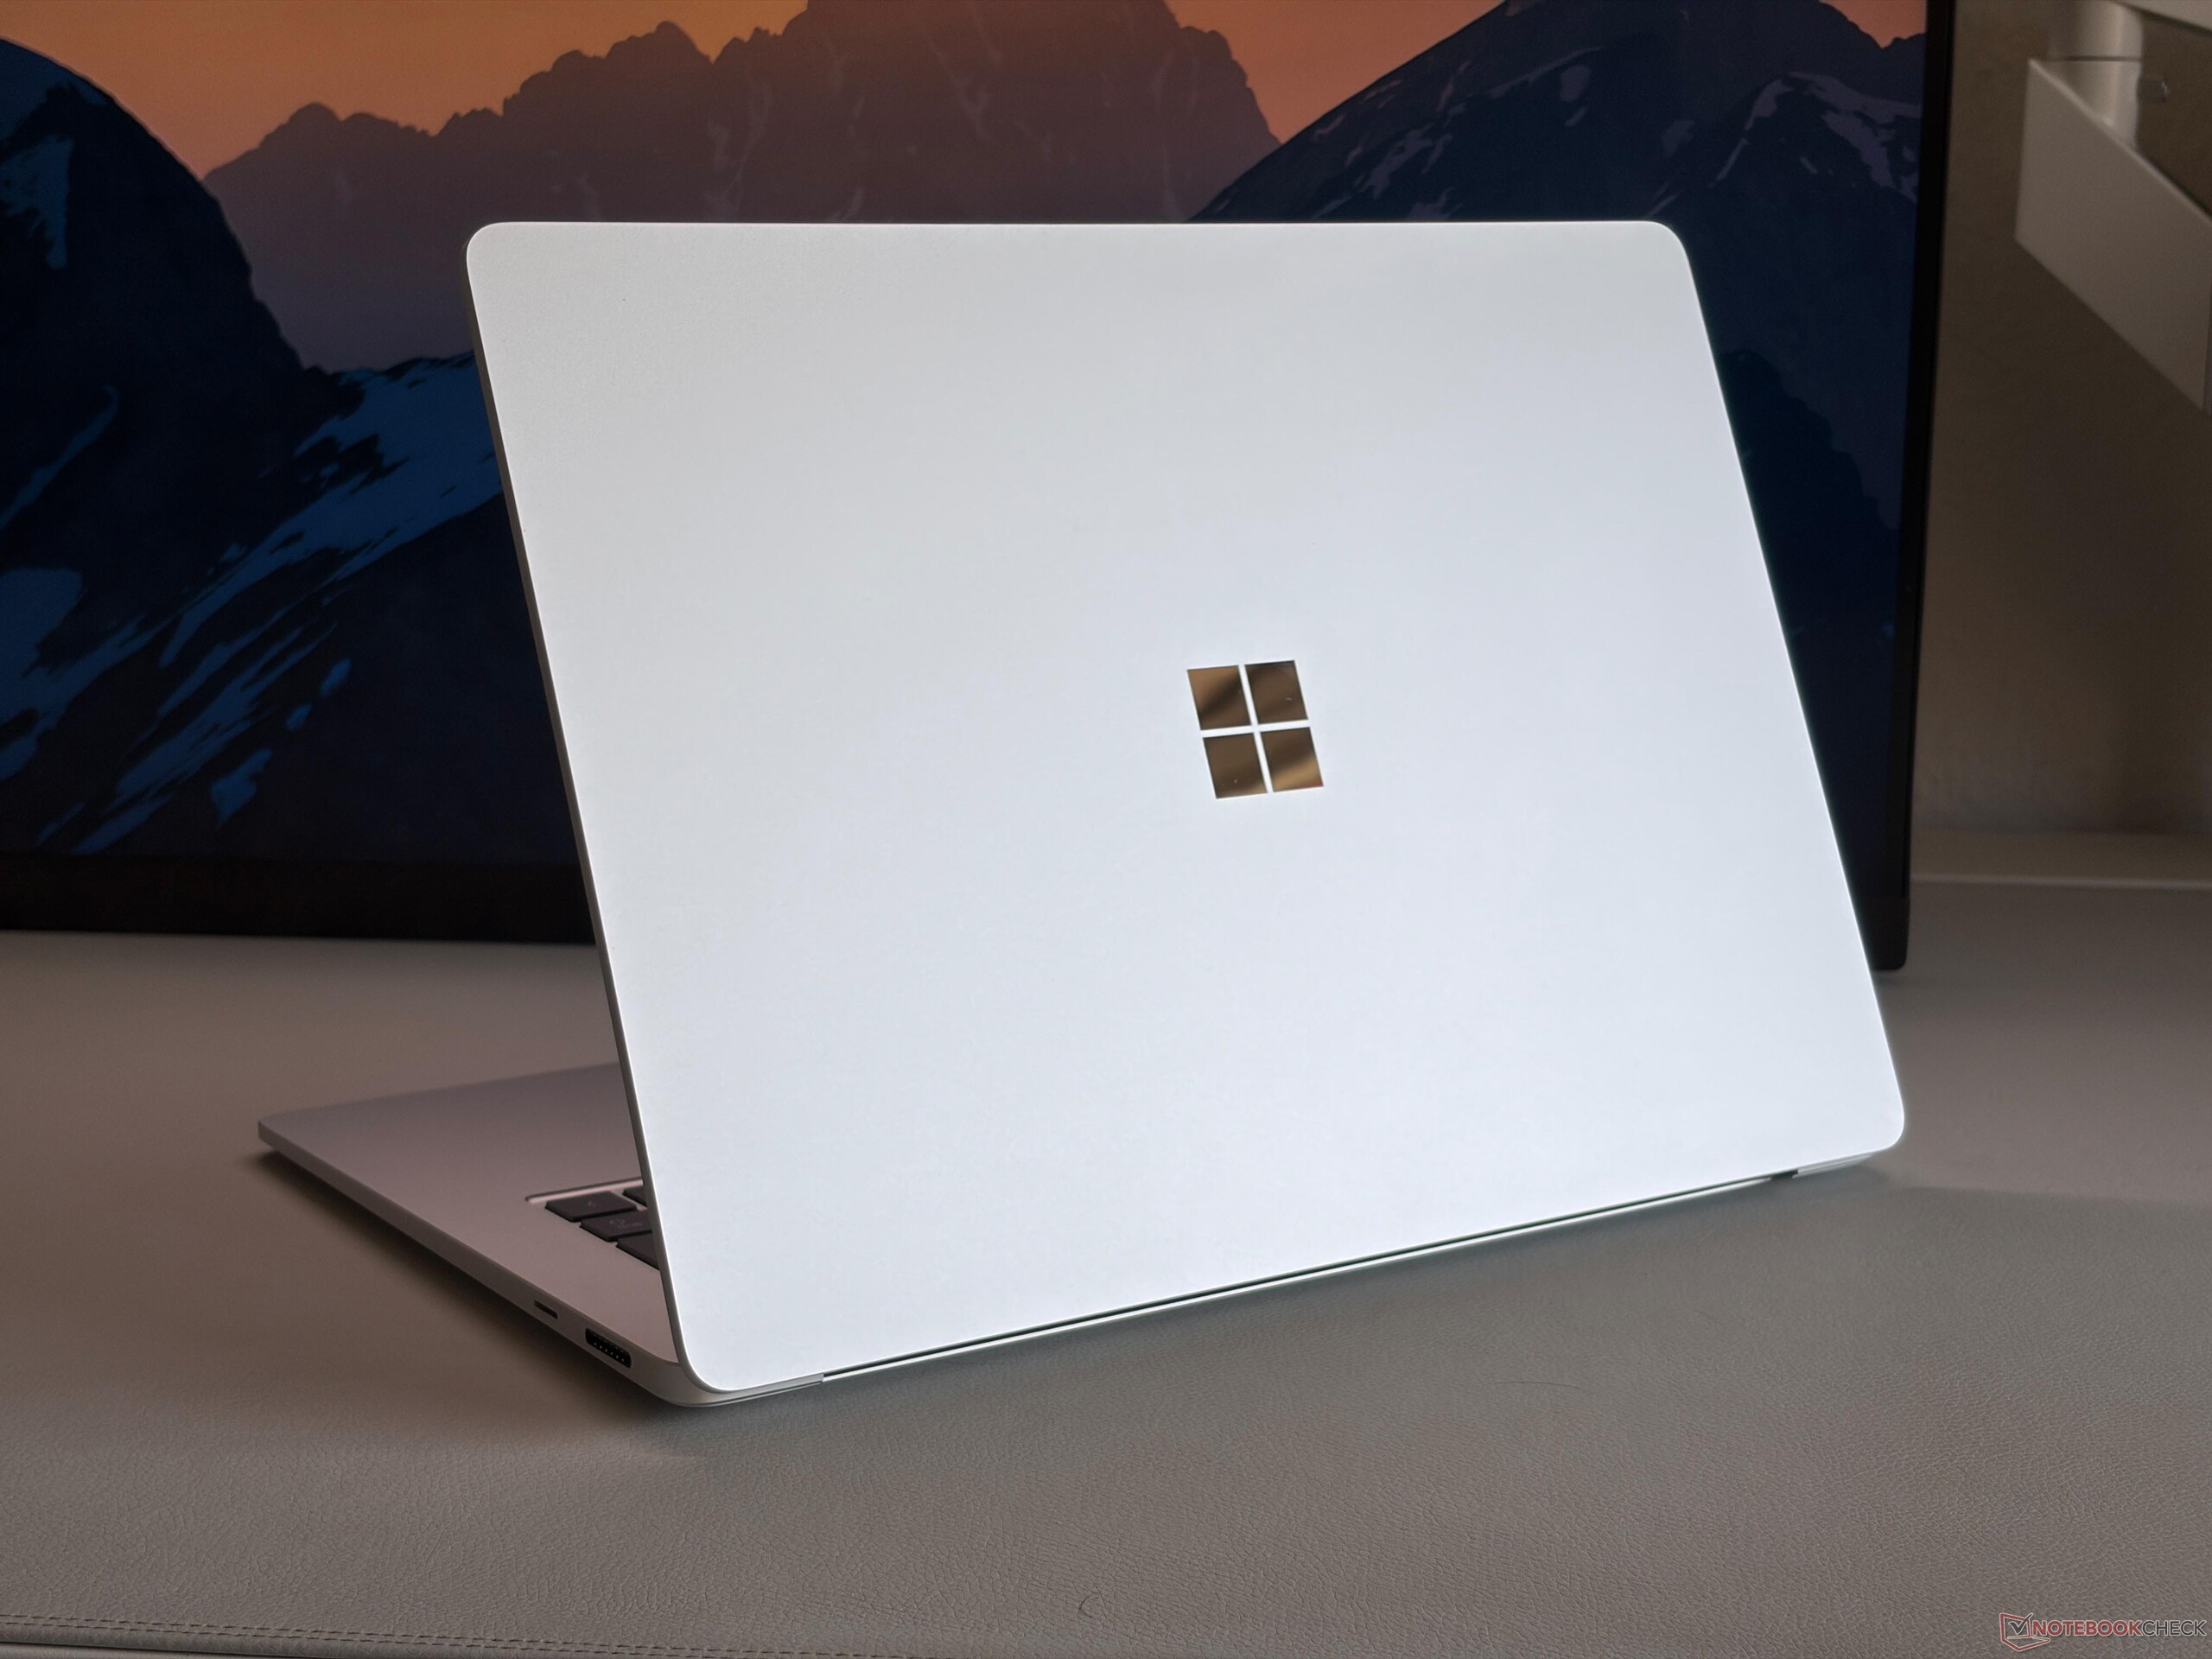
Microsoft nie zmienił obudowy Surface Laptop 15, więc nadal otrzymujemy wysokiej klasy aluminiową obudowę o doskonałej sztywności i jakości wykonania. Pisanie jest bardzo komfortowe, a haptyczny gładzik działa bardzo dobrze, choć mógłby być nieco większy. Ekran również jest bardzo stabilny, ale zawiasy mogłyby stawiać nieco większy opór. Na naszym srebrnym egzemplarzu testowym nie widać odcisków palców. Dostęp do podzespołów jest łatwy i można wymienić dysk SSD M.2-2242, ale widać też sporo niewykorzystanej przestrzeni, którą można by przeznaczyć na dodatkowe porty, standardowy dysk SSD M.2-2280 lub dodatkowy wentylator chłodzący.

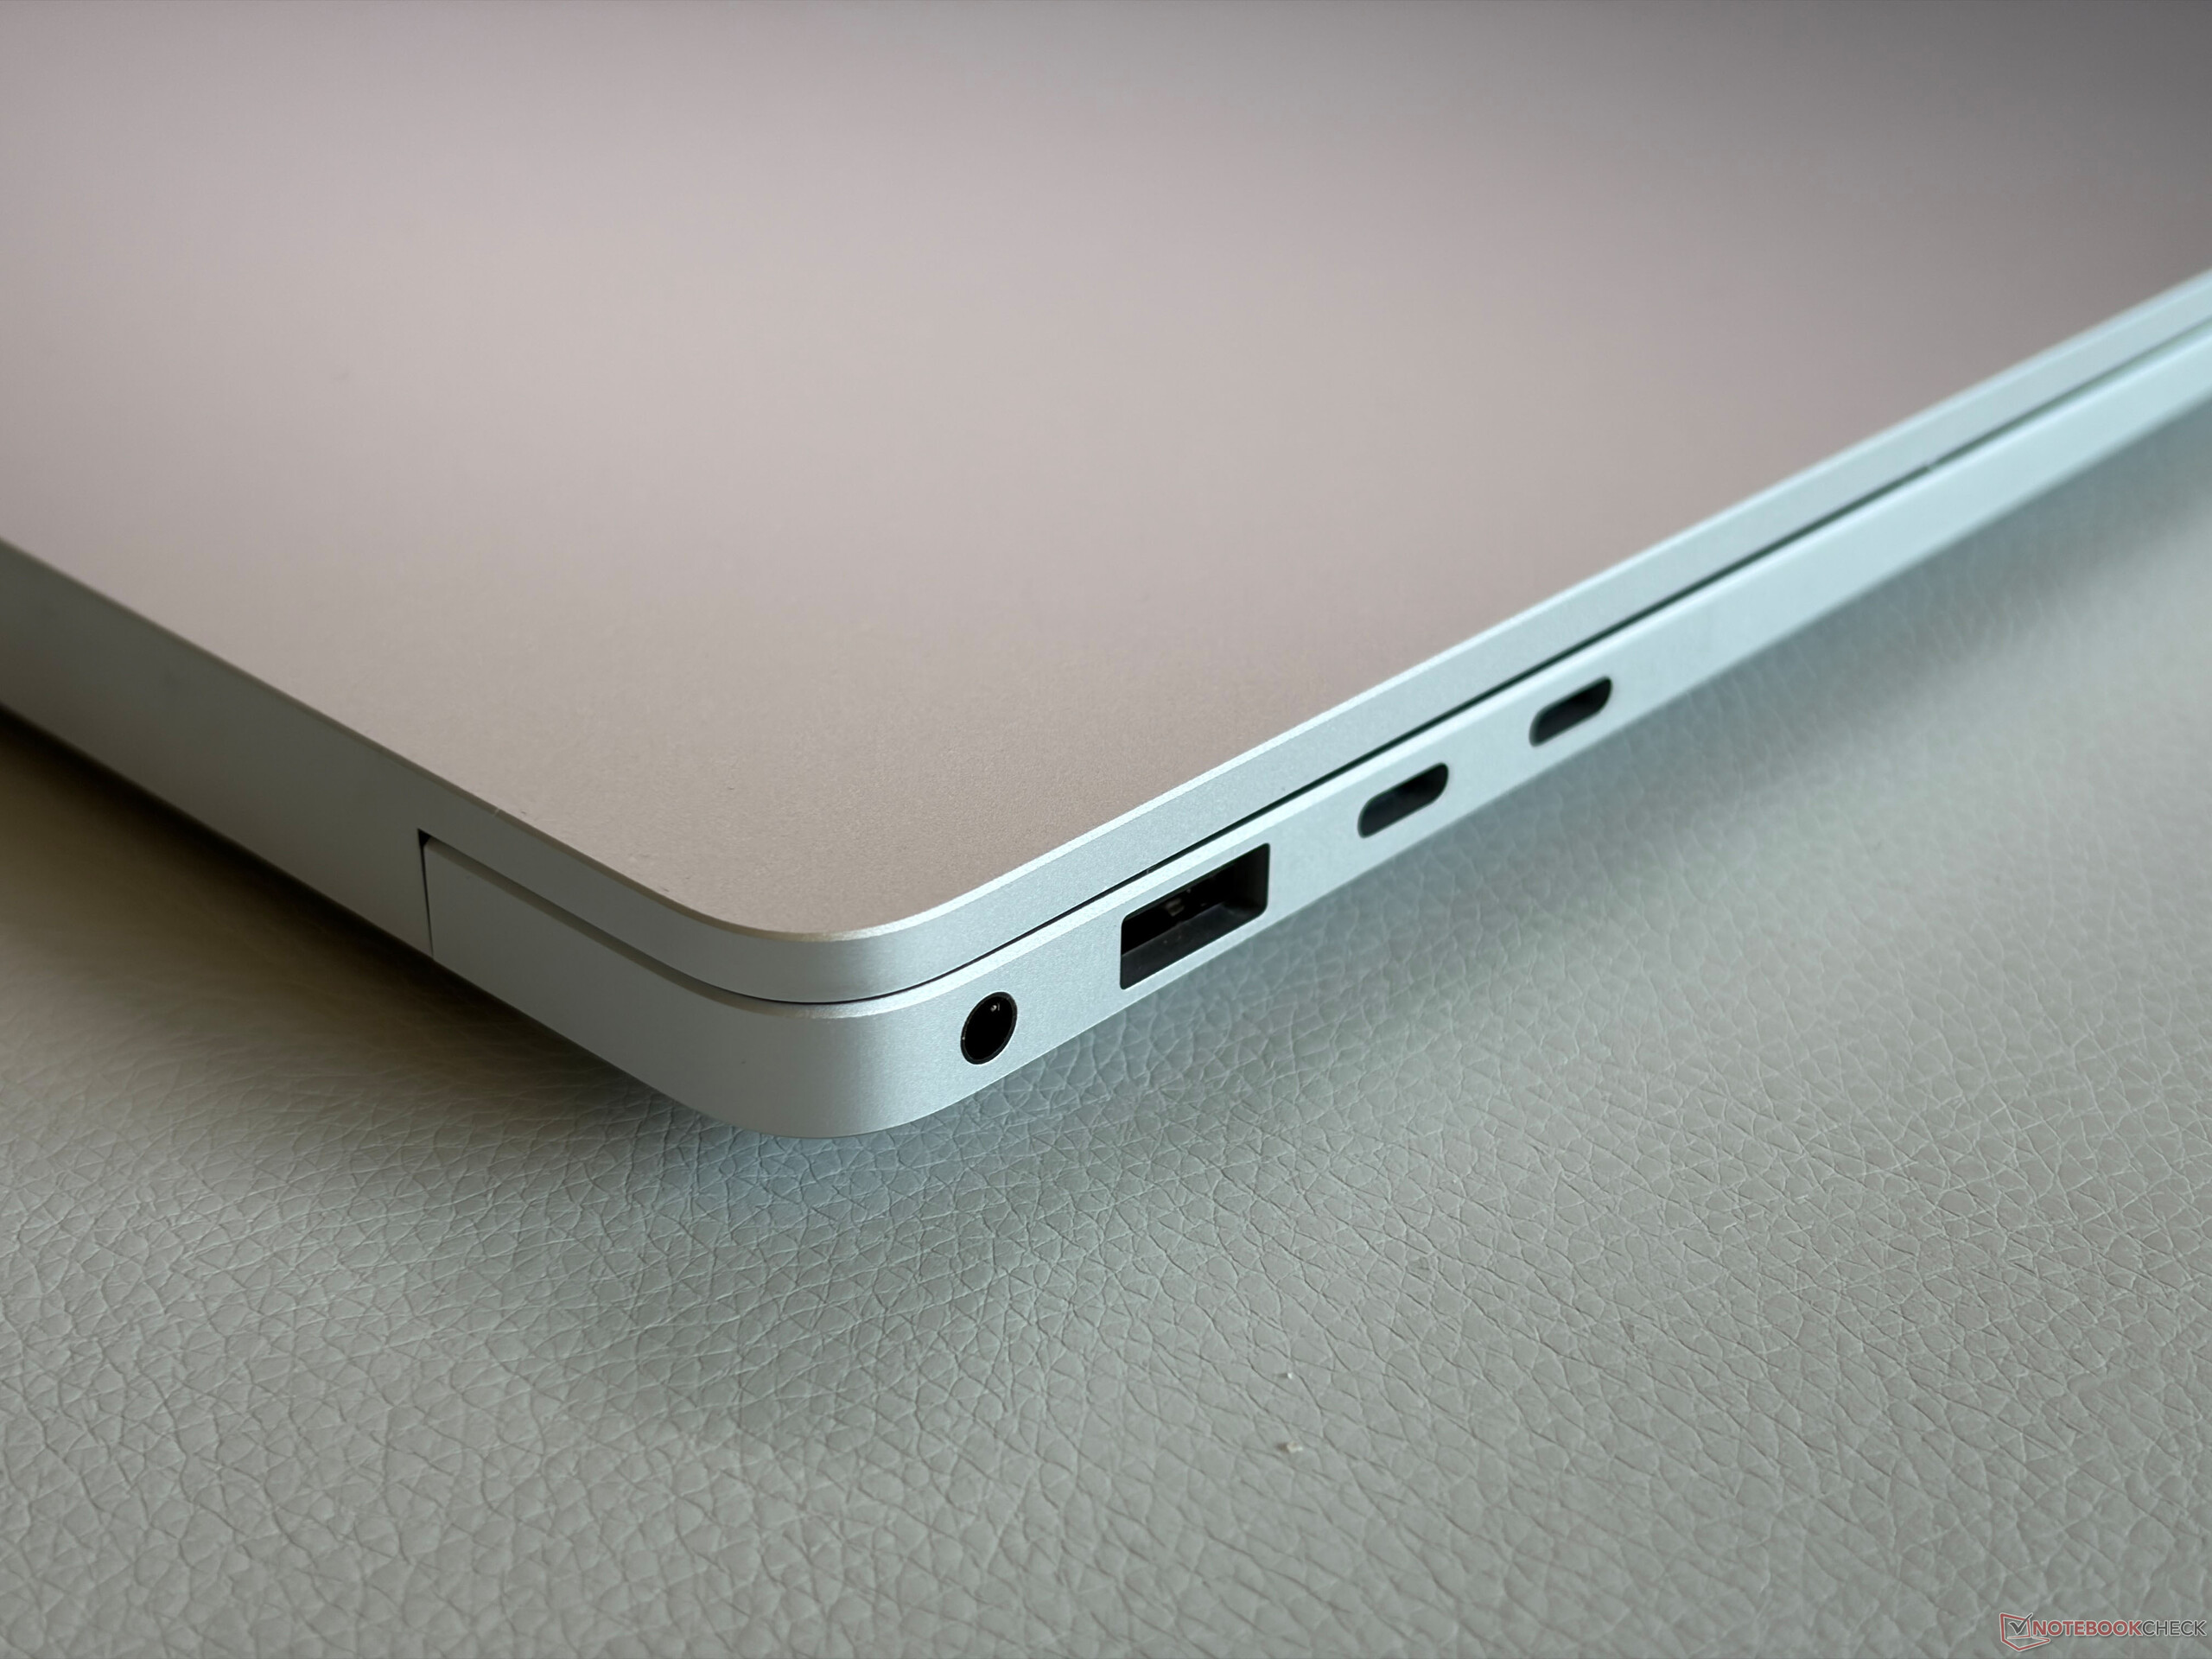
Model z procesorem Intel oferuje dwa porty Thunderbolt 4 (wersja ze Snapdragonem tylko USB 4) i może być nawet wyposażony w czytnik SmartCard. Port Surface Connect po prawej stronie jest naszym zdaniem nieco przestarzały, a do tego dość duży; wolelibyśmy dodatkowy port USB-C i ewentualnie standardowy czytnik kart SD. Czytnik kart microSD nadal jest bardzo szybki (prędkości transferu do 834 MB/s) dzięki obsłudze SD-Express, a jakość obrazu z kamery jest bardzo dobra. Moduł Wi-Fi 7 zapewnia stabilne prędkości transferu.
Porównanie rozmiarów

❌
353.5 mm 242.4 mm 16.5 mm 1.2 kg352.58 mm 237.47 mm 14.62 mm 1.7 kg339.5 mm 228.5 mm 18 mm 1.5 kg340.4 mm 237.6 mm 11.5 mm 1.5 kg329 mm 239 mm 18.3 mm 1.7 kg329 mm 239 mm 18.3 mm 1.7 kg297 mm 210 mm 1 mm 5.7 g
Po lewej: audio 3,5 mm, USB-A 3.2 Gen 1 (5 Gbit/s), 2x USB-C 4.0 z Thunderbolt 4 (40 Gbit/s, DisplayPort ALT Mode 2.1, Power Delivery 3.0)
Po prawej: czytnik kart microSD-Express, port Surface Connect
SD Card Reader
average JPG Copy Test (av. of 3 runs)
Microsoft Surface Laptop 15 Gen 8
Intel Core Ultra X7 368H (SanDisk microSD Express 256 GB)
567 MB/s
Asus Zenbook A16 UX3607
Qualcomm Snapdragon X2 Elite Extreme X2E-94-100 (Angelbird AV Pro V60)
211 MB/s -63%
Średnia w klasie Multimedia
  (22.3 - 567, n=34, ostatnie 2 lata)
140.2 MB/s -75%
Microsoft Surface Laptop 7 15 Lunar Lake
Intel Core Ultra 7 268V (Angelbird AV Pro V60)
86.2 MB/s -85%
Lenovo ThinkPad X9-15p Gen 1
Intel Core Ultra X7 358H
22.3 MB/s -96%
maximum AS SSD Seq Read Test (1GB)
Microsoft Surface Laptop 15 Gen 8
Intel Core Ultra X7 368H (SanDisk microSD Express 256 GB)
833.8 MB/s
Asus Zenbook A16 UX3607
Qualcomm Snapdragon X2 Elite Extreme X2E-94-100 (Angelbird AV Pro V60)
246.4 MB/s -70%
Średnia w klasie Multimedia
  (37.3 - 1455, n=33, ostatnie 2 lata)
218 MB/s -74%
Lenovo ThinkPad X9-15p Gen 1
Intel Core Ultra X7 358H
91.9 MB/s -89%
Microsoft Surface Laptop 7 15 Lunar Lake
Intel Core Ultra 7 268V (Angelbird AV Pro V60)
88.5 MB/s -89%
Networking
Microsoft Surface Laptop 15 Gen 8
Intel BE201 320MHz
iperf3 transmit Wi-Fi6/7 RT-BE96U
2440 (min: 2250) MBit/s ∼67%
iperf3 receive Wi-Fi6/7 RT-BE96U
2038 (min: 1980) MBit/s ∼71%
Lenovo ThinkPad X9-15p Gen 1
Intel Wi-Fi 7 BE211 320MHz
iperf3 transmit Wi-Fi6/7 RT-BE96U
3618 (min: 2749) MBit/s ∼100%
iperf3 receive Wi-Fi6/7 RT-BE96U
2878 (min: 2594) MBit/s ∼100%
Dell XPS 16 Core Ultra X7 358H
Intel Wi-Fi 7 BE211 320MHz
iperf3 receive AXE11000 6GHz
1735 (min: 1715) MBit/s ∼100%
iperf3 transmit AXE11000 6GHz
1619 (min: 1525) MBit/s ∼100%
iperf3 receive AXE11000
852 (min: 701) MBit/s ∼47%
iperf3 transmit AXE11000
875 (min: 459) MBit/s ∼49%
Apple MacBook Air 15 M5
Wi-Fi 7
iperf3 receive AXE11000
1827 (min: 1707) MBit/s ∼100%
iperf3 transmit AXE11000
1794 (min: 1717) MBit/s ∼100%
Microsoft Surface Laptop 7 15 Lunar Lake
Intel BE201 320MHz
iperf3 receive AXE11000
1562 (min: 1469) MBit/s ∼85%
iperf3 transmit AXE11000
1640 (min: 1449) MBit/s ∼91%
01002003004005006007008009001000110012001300140015001600170018001900200021002200230024002500Tooltip
Microsoft Surface Laptop 15 Gen 8; iperf3 transmit Wi-Fi6/7 RT-BE96U; iperf 3.1.3: Ø2440 (2250-2581) MBit/s
Microsoft Surface Laptop 15 Gen 8; iperf3 receive Wi-Fi6/7 RT-BE96U; iperf 3.1.3: Ø2038 (1980-2077) MBit/s
ColorChecker
10.8 ∆E
10.6 ∆E
14.9 ∆E
12.7 ∆E
10.3 ∆E
10.4 ∆E
9.7 ∆E
17.1 ∆E
13.9 ∆E
7.8 ∆E
11.8 ∆E
6.6 ∆E
9.7 ∆E
13.2 ∆E
18.6 ∆E
4.4 ∆E
12.9 ∆E
15.9 ∆E
5 ∆E
4.9 ∆E
8.6 ∆E
9.4 ∆E
4.3 ∆E
4.2 ∆E
ColorChecker Microsoft Surface Laptop 15 Gen 8: 10.32 ∆E min: 4.22 - max: 18.55 ∆E

Wyświetlacz - ekran dotykowy IPS o wyższej rozdzielczości

Układ subpikseli
Układ subpikseli
Tylko niewielkie przebijanie podświetlenia

Microsoft zaktualizował błyszczący ekran dotykowy IPS. Proporcje obrazu nadal wynoszą 3:2, ale rozdzielczość jest wyższa i wynosi 3270 x 2180 pikseli. Subiektywne wrażenia z oglądania są bardzo dobre dzięki ostremu obrazowi i nasyconym kolorom, ale poziom czerni oczywiście nie może konkurować z rywalami wyposażonymi w OLED. Panel obsługuje 120 Hz, ale nadal zauważamy pewne smużenie z powodu długich czasów reakcji. Nie występuje migotanie PWM, a nierównomierne podświetlenie również nie stanowi problemu. Ekran jest bardzo błyszczący, co stanowi spore wyzwanie na zewnątrz i w jasnym otoczeniu. Zarówno jasność, jak i kolory mogą być dostosowywane automatycznie.

Nasza analiza przeprowadzona za pomocą profesjonalnego oprogramowania CalMAN wykazuje wierne odwzorowanie kolorów już przy ustawieniach fabrycznych (dokładne profile dla sRGB i P3), a współczynnik kontrastu jest lepszy od deklarowanego i wynosi ~1800:1, ale maksymalna jasność jest niższa niż w ubiegłorocznym modelu. Zmierzyliśmy maksymalnie 537 nitów i średnio 520 nitów. HDR jest obsługiwany, ale jasność nie wzrasta.

530
cd/m²
516
cd/m²
505
cd/m²
533
cd/m²
537
cd/m²
505
cd/m²
534
cd/m²
525
cd/m²
498
cd/m²
podświetlenie ekranu
LP150UD2-SPA1 testowany z X-Rite i1Pro 3
maksimum: 537 cd/m² (Nits) średnia: 520.3 cd/m² Minimum: 1.7 cd/m²
rozświetlenie: 93 %
na akumulatorze: 537 cd/m²
kontrast: 1852:1 (czerń: 0.29 cd/m²)
ΔE ColorChecker Calman: 1 | ∀{0.5-29.43 Ø4.69}
ΔE Greyscale Calman: 1.6 | ∀{0.09-98 Ø4.94}
86.3% AdobeRGB 1998 (Argyll 3D)
100% sRGB (Argyll 3D)
97.9% Display P3 (Argyll 3D)
Gamma: 2.2
CCT: 6804 K
Microsoft Surface Laptop 15 Gen 8
LP150UD2-SPA1, IPS, 3270x2180, 15", 120 Hz
Lenovo ThinkPad X9-15p Gen 1
ATNA53JB03-0, OLED, 2880x1800, 15.3", 120 Hz
Asus Zenbook A16 UX3607
ATNA60HR07-0, OLED, 2880x1800, 16", 120 Hz
Dell XPS 16 Core Ultra X7 358H
LG Philips 160WV1, OLED, 3200x2000, 16", 120 Hz
Apple MacBook Air 15 M5
IPS, 2880x1864, 15.3", 60 Hz
Microsoft Surface Laptop 7 15 Lunar Lake
LQ150P1JX61, IPS, 2496x1664, 15", 120 Hz
Display
3%
2%
5%
-1%
0%
HDR Peak Brightness (cd/m²)
518
Display P3 Coverage (%)
97.9
99.1
1%
99.8
2%
99.5
2%
97.5
0%
98.1
0%
sRGB Coverage (%)
100
100
0%
100
0%
100
0%
98.3
-2%
100
0%
AdobeRGB 1998 Coverage (%)
86.3
94.3
9%
89
3%
96.5
12%
86.3
0%
87.2
1%
Response Times
96%
97%
98%
34%
30%
Response Time Grey 50% / Grey 80% * (ms)
45.7
1.1 ?(0.5, 0.6)
98%
2 ?(1, 1)
96%
0.65 ?(0.36, 0.29)
99%
26.9 ?(13.4, 13.5)
41%
33.4 ?(12.5, 20.9)
27%
Response Time Black / White * (ms)
21.5
1.4 ?(0.7, 0.7)
93%
0.48 ?(0.23, 0.25)
98%
0.87 ?(0.43, 0.44)
96%
15.9 ?(4.9, 11)
26%
14.7 ?(5.5, 9.2)
32%
PWM Frequency (Hz)
1194 ?(100)
960 ?(100)
240.2 ?(100)
PWM Amplitude * (%)
35
56
31
Screen
-112%
152%
-95%
-46%
18%
Brightness middle (cd/m²)
537
489
-9%
493
-8%
395.4
-26%
538
0%
599
12%
Brightness (cd/m²)
520
492
-5%
495
-5%
392
-25%
521
0%
590
13%
Brightness Distribution (%)
93
98
5%
98
5%
95
2%
90
-3%
93
0%
Black Level * (cd/m²)
0.29
0.02
93%
0.44
-52%
0.4
-38%
Contrast (:1)
1852
24650
1231%
1223
-34%
1498
-19%
Colorchecker dE 2000 *
1
4.6
-360%
1.1
-10%
3.69
-269%
2.1
-110%
0.5
50%
Colorchecker dE 2000 max. *
2.4
8.2
-242%
3.9
-63%
7.94
-231%
4.1
-71%
0.9
62%
Greyscale dE 2000 *
1.6
2.6
-63%
2.1
-31%
1.9
-19%
3.1
-94%
0.6
63%
Gamma
2.2 100%
2.18 101%
2.15 102%
2.28 96%
2.19 100%
2.16 102%
CCT
6804 96%
6334 103%
6544 99%
6274 104%
7075 92%
6543 99%
Colorchecker dE 2000 calibrated *
5
0.68
0.7
Całkowita średnia (program / ustawienia)
-4% / -43%
84% / 109%
3% / -33%
-4% / -23%
16% / 16%

* ... im mniej tym lepiej

Skala szarości CalMAN
CalMAN Colorchecker
CalMAN Colorchecker
w porównaniu z sRGB
w porównaniu z sRGB
kontra P3
kontra P3
vs. AdobeRGB
vs. AdobeRGB

Wyświetl czasy reakcji

ℹ
Czasy reakcji wyświetlacza pokazują, jak szybko ekran może zmieniać kolor z jednego koloru na drugi. Długi czas reakcji może powodować powstawanie powidoków i sprawiać, że poruszające się obiekty będą niewyraźne (duchy). Gracze szybkich tytułów 3D powinni zwrócić szczególną uwagę na szybki czas reakcji.
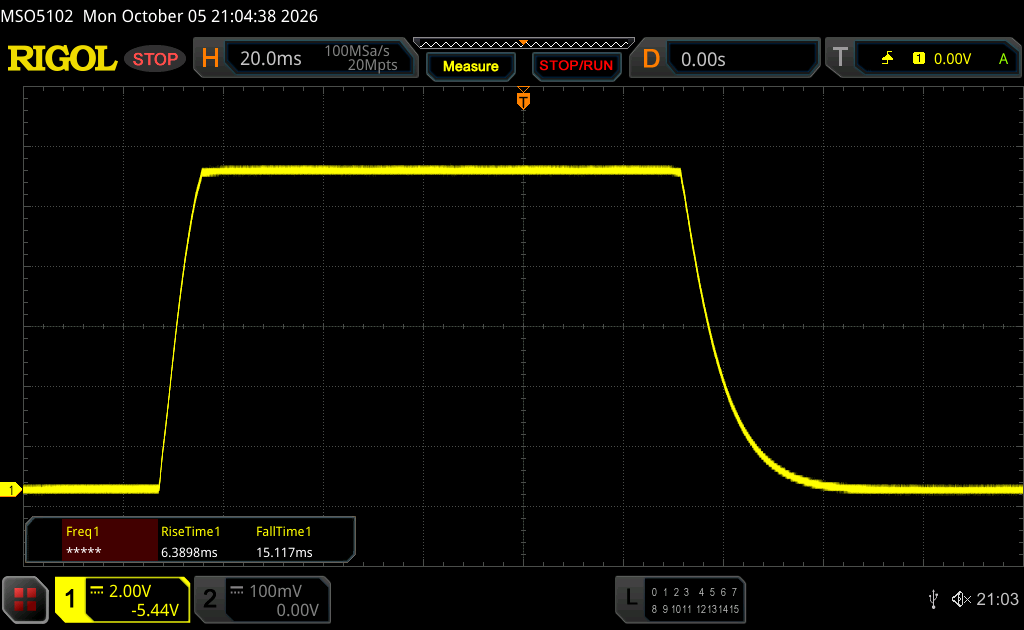
   ↔    Czas reakcji od czerni do bieli
21.5 ms ... wzrost ↗ i spadek ↘ łącznie↗ ms wzrost
↘ ms upadek
W naszych testach ekran wykazuje dobry współczynnik reakcji, ale może być zbyt wolny dla graczy rywalizujących ze sobą.
Dla porównania, wszystkie testowane urządzenia wahają się od 0.1 (minimum) do 240 (maksimum) ms. » 48 % wszystkich urządzeń jest lepszych.
Oznacza to, że zmierzony czas reakcji jest zbliżony do średniej wszystkich testowanych urządzeń (19.7 ms).
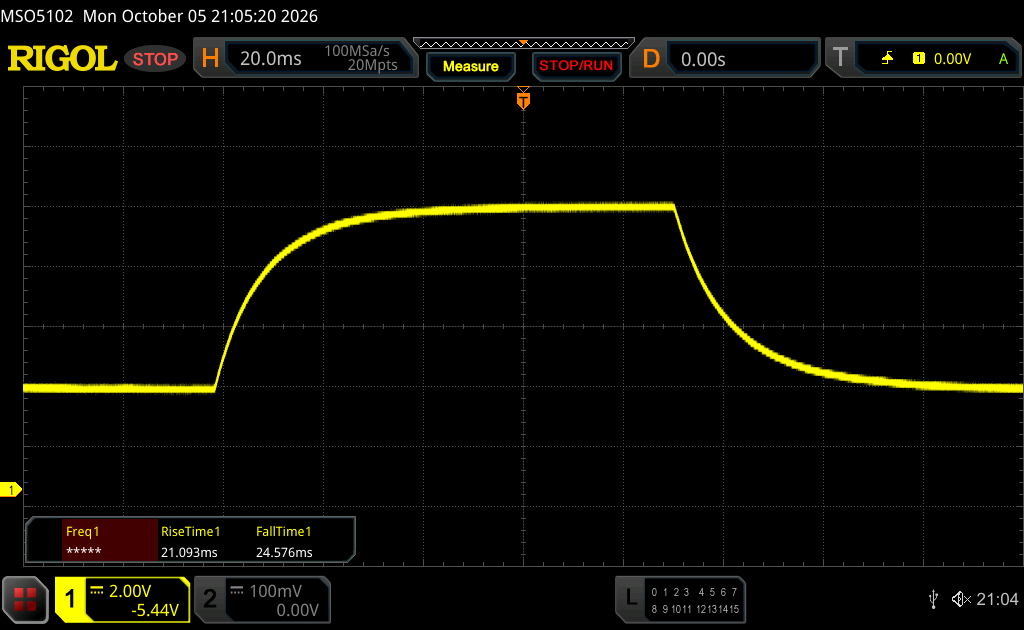
   ↔    Czas reakcji 50% szarości do 80% szarości
45.7 ms ... wzrost ↗ i spadek ↘ łącznie↗ ms wzrost
↘ ms upadek
W naszych testach ekran wykazuje powolne tempo reakcji, co będzie niezadowalające dla graczy.
Dla porównania, wszystkie testowane urządzenia wahają się od 0.13 (minimum) do 636 (maksimum) ms. » 79 % wszystkich urządzeń jest lepszych.
Oznacza to, że zmierzony czas reakcji jest gorszy od średniej wszystkich testowanych urządzeń (30.7 ms).

Migotanie ekranu / PWM (modulacja szerokości impulsu)

ℹ
Aby przyciemnić ekran, niektóre notebooki po prostu w krótkich odstępach czasu włączają i wyłączają podświetlenie — jest to metoda zwana modulacją szerokości impulsu (PWM). W idealnym przypadku ta częstotliwość cykli powinna być niewykrywalna dla ludzkiego oka. Jeśli wspomniana częstotliwość jest zbyt niska, użytkownicy o wrażliwych oczach mogą odczuwać zmęczenie lub bóle głowy, a nawet całkowicie zauważyć migotanie.
Migotanie ekranu/nie wykryto PWM

Dla porównania: 52 % wszystkich testowanych urządzeń nie używa PWM do przyciemniania wyświetlacza. Jeśli wykryto PWM, zmierzono średnio 7611 (minimum: 5 - maksimum: 343500) Hz.

W słońcu
W słońcu
Na zewnątrz (jasny dzień, bez bezpośredniego światła słonecznego)
Kąty widzenia
Kąty widzenia

Wydajność - Intel Core Ultra X7
Warunki testowania

W naszych testach wydajności i pomiarach używaliśmy trybu Najlepsza wydajność.

Wydajność procesora

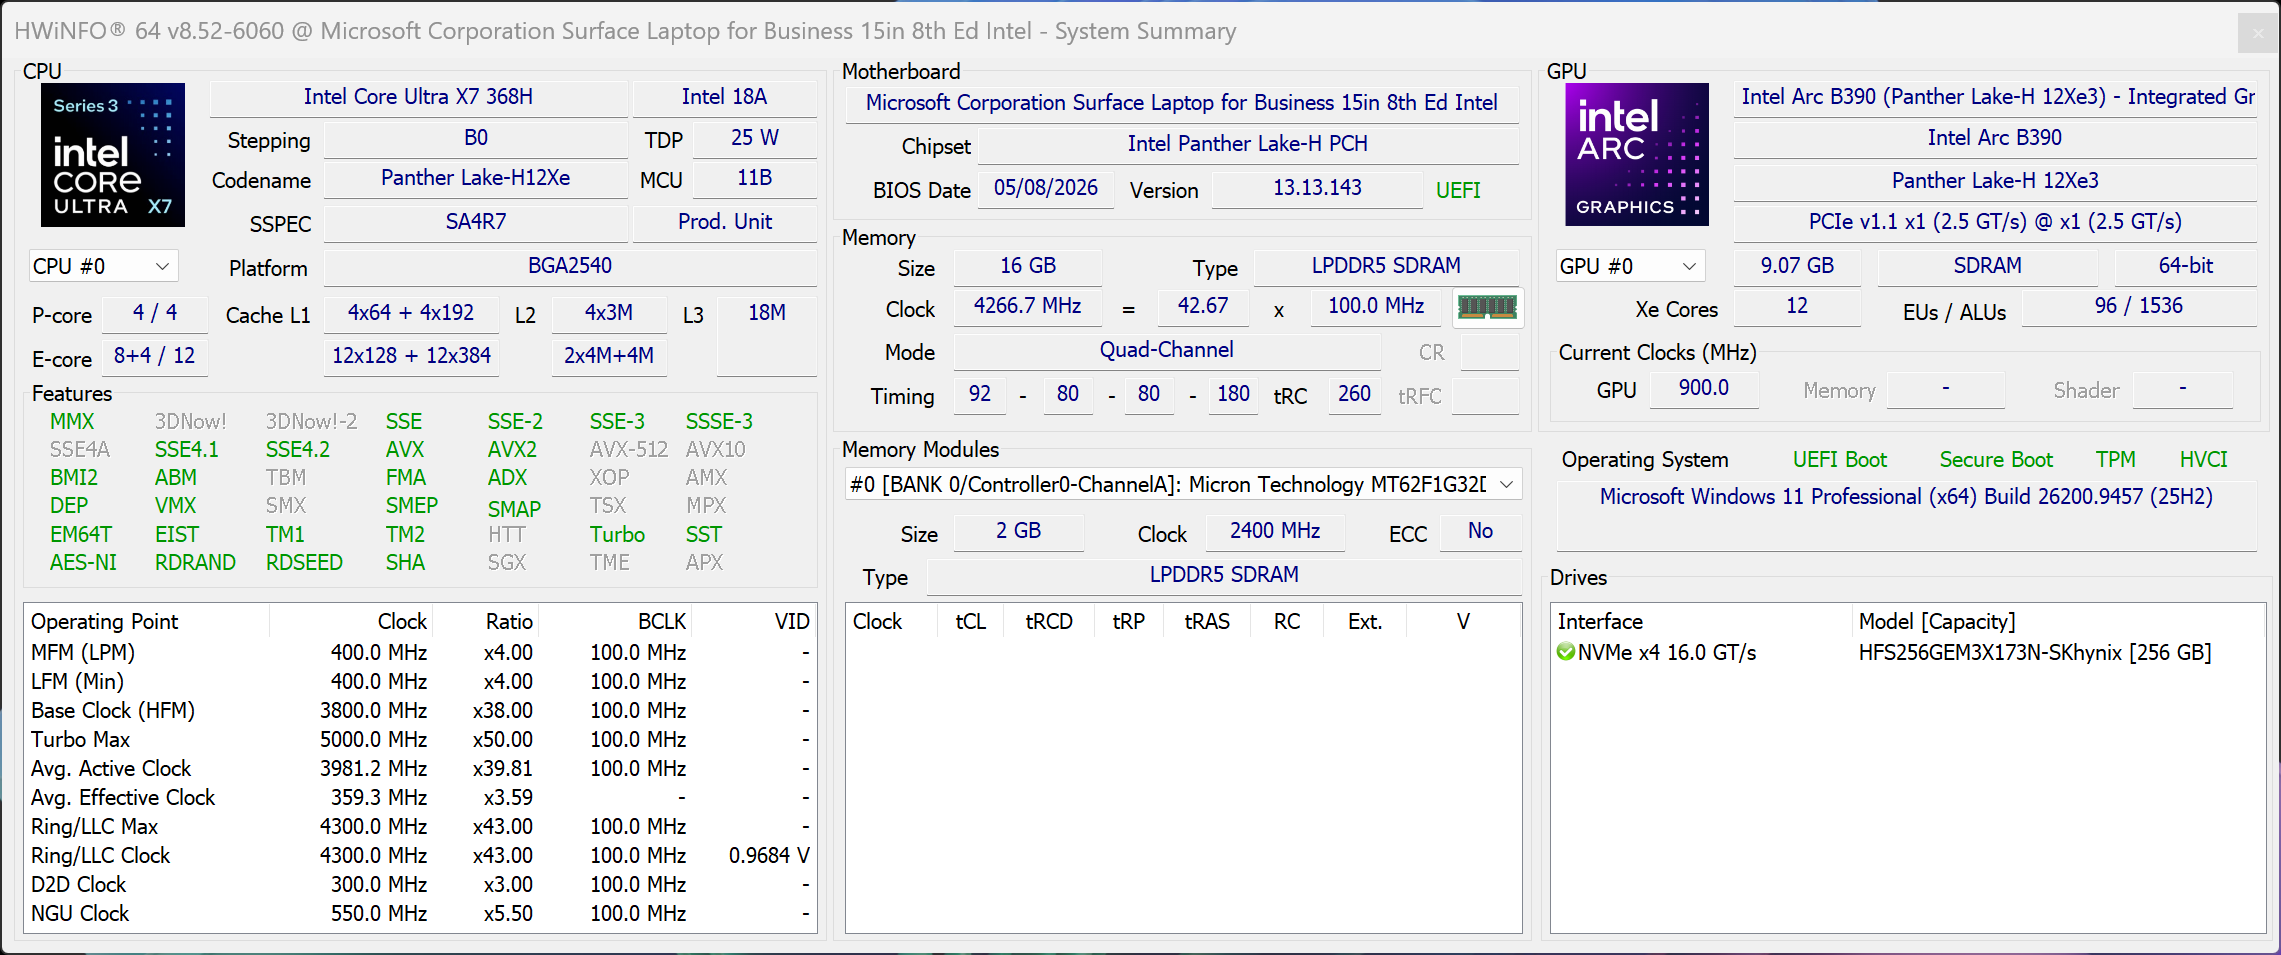
Intel Core Ultra X7 368H to jeden z najszybszych procesorów mobilnych Panther Lake, a jego pobór mocy może wynosić 65/35 W. Nie jest to idealne rozwiązanie dla 15-calowego laptopa, a wydajność wielordzeniowa mogłaby być nieco lepsza. Jednak Panther Lake kładzie większy nacisk na efektywność energetyczną niż na samą wydajność wielordzeniową. Wydajność jest bardzo zbliżona do tej oferowanej przez Dell XPS 16 przy porównywalnych limitach mocy. Model ze Snapdragonem wykorzystuje procesory Snapdragon X2 Plus lub X2 Elite (X2E-78-100), które powinny oferować nieco wyższą wydajność wielordzeniową CPU. 

CPU Performance rating: Percent
Cinebench 2024: CPU Multi Core | CPU Single Core
Geekbench 6.7: Multi-Core | Single-Core
CPU Performance rating
Asus Zenbook A16 UX3607
Qualcomm Snapdragon X2 Elite Extreme X2E-94-100
91.8 pt
Apple MacBook Air 15 M5
Apple M5 10-Core
82 pt
Lenovo ThinkPad X9-15p Gen 1 -2!
Intel Core Ultra X7 358H
70.9 pt
Microsoft Surface Pro 13 OLED
Qualcomm Snapdragon X2 Elite X2E-78-100
67.9 pt
Średnia w klasie Multimedia
 
67.1 pt
Microsoft Surface Laptop 15 Gen 8
Intel Core Ultra X7 368H
65.6 pt
Dell XPS 16 Core Ultra X7 358H
Intel Core Ultra X7 358H
65.3 pt
Przeciętny Intel Core Ultra X7 368H
 
65 pt
Microsoft Surface Laptop 8 13.8
Qualcomm Snapdragon X2 Plus X2P-64-100
63.8 pt
Microsoft Surface Laptop 7 15 Lunar Lake
Intel Core Ultra 7 268V
53.3 pt
Cinebench 2024 / CPU Multi Core
Asus Zenbook A16 UX3607
Qualcomm Snapdragon X2 Elite Extreme X2E-94-100
1761 Points +83%
Średnia w klasie Multimedia
  (327 - 2490, n=61, ostatnie 2 lata)
1120 Points +17%
Microsoft Surface Pro 13 OLED
Qualcomm Snapdragon X2 Elite X2E-78-100
1078 Points +12%
Przeciętny Intel Core Ultra X7 368H
  (960 - 1104, n=2)
1032 Points +8%
Dell XPS 16 Core Ultra X7 358H
Intel Core Ultra X7 358H
1004 Points +5%
Apple MacBook Air 15 M5
Apple M5 10-Core
962 Points 0%
Microsoft Surface Laptop 15 Gen 8
Intel Core Ultra X7 368H
960 Points
Microsoft Surface Laptop 8 13.8
Qualcomm Snapdragon X2 Plus X2P-64-100
854 Points -11%
Microsoft Surface Laptop 7 15 Lunar Lake
Intel Core Ultra 7 268V
600 Points -37%
Cinebench 2024 / CPU Single Core
Apple MacBook Air 15 M5
Apple M5 10-Core
199 Points +57%
Asus Zenbook A16 UX3607
Qualcomm Snapdragon X2 Elite Extreme X2E-94-100
151 Points +19%
Microsoft Surface Laptop 8 13.8
Qualcomm Snapdragon X2 Plus X2P-64-100
134 Points +5%
Microsoft Surface Pro 13 OLED
Qualcomm Snapdragon X2 Elite X2E-78-100
133 Points +5%
Średnia w klasie Multimedia
  (72.5 - 201, n=55, ostatnie 2 lata)
130.6 Points +3%
Przeciętny Intel Core Ultra X7 368H
  (127.1 - 128.8, n=2)
128 Points +1%
Microsoft Surface Laptop 15 Gen 8
Intel Core Ultra X7 368H
127.1 Points
Dell XPS 16 Core Ultra X7 358H
Intel Core Ultra X7 358H
123.7 Points -3%
Microsoft Surface Laptop 7 15 Lunar Lake
Intel Core Ultra 7 268V
123.3 Points -3%
Geekbench 6.7 / Multi-Core
Asus Zenbook A16 UX3607
Qualcomm Snapdragon X2 Elite Extreme X2E-94-100
23204 Points +37%
Apple MacBook Air 15 M5
Apple M5 10-Core
16995 Points 0%
Dell XPS 16 Core Ultra X7 358H
Intel Core Ultra X7 358H
16943 Points 0%
Microsoft Surface Laptop 15 Gen 8
Intel Core Ultra X7 368H
16943 Points
Lenovo ThinkPad X9-15p Gen 1
Intel Core Ultra X7 358H
16876 Points 0%
Średnia w klasie Multimedia
  (4983 - 30057, n=61, ostatnie 2 lata)
15748 Points -7%
Przeciętny Intel Core Ultra X7 368H
  (12050 - 17352, n=4)
15438 Points -9%
Microsoft Surface Pro 13 OLED
Qualcomm Snapdragon X2 Elite X2E-78-100
15102 Points -11%
Microsoft Surface Laptop 8 13.8
Qualcomm Snapdragon X2 Plus X2P-64-100
14277 Points -16%
Microsoft Surface Laptop 7 15 Lunar Lake
Intel Core Ultra 7 268V
11279 Points -33%
Geekbench 6.7 / Single-Core
Apple MacBook Air 15 M5
Apple M5 10-Core
4195 Points +41%
Asus Zenbook A16 UX3607
Qualcomm Snapdragon X2 Elite Extreme X2E-94-100
3826 Points +28%
Microsoft Surface Pro 13 OLED
Qualcomm Snapdragon X2 Elite X2E-78-100
3287 Points +10%
Microsoft Surface Laptop 8 13.8
Qualcomm Snapdragon X2 Plus X2P-64-100
3265 Points +10%
Średnia w klasie Multimedia
  (1591 - 4336, n=61, ostatnie 2 lata)
2990 Points 0%
Microsoft Surface Laptop 15 Gen 8
Intel Core Ultra X7 368H
2980 Points
Przeciętny Intel Core Ultra X7 368H
  (2924 - 2983, n=3)
2962 Points -1%
Dell XPS 16 Core Ultra X7 358H
Intel Core Ultra X7 358H
2903 Points -3%
Lenovo ThinkPad X9-15p Gen 1
Intel Core Ultra X7 358H
2901 Points -3%
Microsoft Surface Laptop 7 15 Lunar Lake
Intel Core Ultra 7 268V
2871 Points -4%

Cinebench R15 — pętla wielokrotna

075150225300375450525600675750825900975105011251200127513501425150015751650172518001875195020252100217522502325240024752550262527002775285029253000307531503225330033753450352536003675Tooltip
Microsoft Surface Laptop 15 Gen 8 Intel Core Ultra X7 368H: Ø2462 (2121.79-3156.32) Points
Lenovo ThinkPad X9-15p Gen 1 Intel Core Ultra X7 358H: Ø2913 (2846.57-3015.45) Points
Asus Zenbook A16 UX3607 Qualcomm Snapdragon X2 Elite Extreme X2E-94-100: Ø3638 (3524.54-3682.9) Points
Dell XPS 16 Core Ultra X7 358H Intel Core Ultra X7 358H: Ø2543 (2491.75-2985.52) Points
Microsoft Surface Laptop 7 15 Lunar Lake Intel Core Ultra 7 268V: Ø1469 (1435.9-1615.7) Points
CPU Performance rating: Percent
Cinebench R23: Multi Core | Single Core
Cinebench R20: CPU (Multi Core) | CPU (Single Core)
Cinebench R15: CPU Multi 64Bit | CPU Single 64Bit
Blender: v2.79 BMW27 CPU
7-Zip 18.03: 7z b 4 | 7z b 4 -mmt1
HWBOT x265 Benchmark v2.2: 4k Preset
LibreOffice : 20 Documents To PDF
R Benchmark 2.5: Overall mean
CPU Performance rating
Lenovo ThinkPad X9-15p Gen 1
Intel Core Ultra X7 358H
77.9 pt
Przeciętny Intel Core Ultra X7 368H
 
76.2 pt
Microsoft Surface Laptop 15 Gen 8
Intel Core Ultra X7 368H
75.8 pt
Dell XPS 16 Core Ultra X7 358H
Intel Core Ultra X7 358H
75.2 pt
Średnia w klasie Multimedia
 
69.1 pt
Asus Zenbook A16 UX3607 -1!
Qualcomm Snapdragon X2 Elite Extreme X2E-94-100
68.9 pt
Microsoft Surface Laptop 7 15 Lunar Lake
Intel Core Ultra 7 268V
53.1 pt
Cinebench R23 / Multi Core
Lenovo ThinkPad X9-15p Gen 1
Intel Core Ultra X7 358H
19360 Points +14%
Asus Zenbook A16 UX3607
Qualcomm Snapdragon X2 Elite Extreme X2E-94-100
19037 Points +12%
Dell XPS 16 Core Ultra X7 358H
Intel Core Ultra X7 358H
17884 (15984.6min - 17883.7max) Points +5%
Przeciętny Intel Core Ultra X7 368H
  (17052 - 17350, n=2)
17201 Points +1%
Microsoft Surface Laptop 15 Gen 8
Intel Core Ultra X7 368H
17052 Points
Średnia w klasie Multimedia
  (4861 - 33362, n=60, ostatnie 2 lata)
17050 Points 0%
Microsoft Surface Laptop 7 15 Lunar Lake
Intel Core Ultra 7 268V
10535 Points -38%
Cinebench R23 / Single Core
Przeciętny Intel Core Ultra X7 368H
  (2140 - 2169, n=2)
2155 Points +1%
Microsoft Surface Laptop 15 Gen 8
Intel Core Ultra X7 368H
2140 Points
Dell XPS 16 Core Ultra X7 358H
Intel Core Ultra X7 358H
2087 Points -2%
Lenovo ThinkPad X9-15p Gen 1
Intel Core Ultra X7 358H
2080 Points -3%
Średnia w klasie Multimedia
  (1237 - 2459, n=59, ostatnie 2 lata)
1982 Points -7%
Microsoft Surface Laptop 7 15 Lunar Lake
Intel Core Ultra 7 268V
1910 Points -11%
Asus Zenbook A16 UX3607
Qualcomm Snapdragon X2 Elite Extreme X2E-94-100
1622 Points -24%
Cinebench R20 / CPU (Multi Core)
Lenovo ThinkPad X9-15p Gen 1
Intel Core Ultra X7 358H
7531 Points +13%
Przeciętny Intel Core Ultra X7 368H
  (6681 - 7938, n=2)
7310 Points +9%
Asus Zenbook A16 UX3607
Qualcomm Snapdragon X2 Elite Extreme X2E-94-100
7298 Points +9%
Dell XPS 16 Core Ultra X7 358H
Intel Core Ultra X7 358H
7195 Points +8%
Microsoft Surface Laptop 15 Gen 8
Intel Core Ultra X7 368H
6681 Points
Średnia w klasie Multimedia
  (1887 - 12912, n=51, ostatnie 2 lata)
6585 Points -1%
Microsoft Surface Laptop 7 15 Lunar Lake
Intel Core Ultra 7 268V
4129 Points -38%
Cinebench R20 / CPU (Single Core)
Przeciętny Intel Core Ultra X7 368H
  (809 - 820, n=2)
815 Points +1%
Microsoft Surface Laptop 15 Gen 8
Intel Core Ultra X7 368H
809 Points
Lenovo ThinkPad X9-15p Gen 1
Intel Core Ultra X7 358H
785 Points -3%
Dell XPS 16 Core Ultra X7 358H
Intel Core Ultra X7 358H
780 Points -4%
Średnia w klasie Multimedia
  (482 - 833, n=51, ostatnie 2 lata)
744 Points -8%
Microsoft Surface Laptop 7 15 Lunar Lake
Intel Core Ultra 7 268V
736 Points -9%
Asus Zenbook A16 UX3607
Qualcomm Snapdragon X2 Elite Extreme X2E-94-100
620 Points -23%
Cinebench R15 / CPU Multi 64Bit
Asus Zenbook A16 UX3607
Qualcomm Snapdragon X2 Elite Extreme X2E-94-100
3683 (3524.54min - 3682.9max) Points +17%
Microsoft Surface Laptop 15 Gen 8
Intel Core Ultra X7 368H
3156 (2121.79min - 3156.32max) Points
Przeciętny Intel Core Ultra X7 368H
  (2976 - 3156, n=2)
3066 Points -3%
Lenovo ThinkPad X9-15p Gen 1
Intel Core Ultra X7 358H
3015 (2846.57min - 3015.45max) Points -4%
Dell XPS 16 Core Ultra X7 358H
Intel Core Ultra X7 358H
2986 (2491.75min - 2985.52max) Points -5%
Średnia w klasie Multimedia
  (856 - 5224, n=56, ostatnie 2 lata)
2713 Points -14%
Microsoft Surface Laptop 7 15 Lunar Lake
Intel Core Ultra 7 268V
1616 (1435.9min - 1615.7max) Points -49%
Cinebench R15 / CPU Single 64Bit
Przeciętny Intel Core Ultra X7 368H
  (308 - 323, n=2)
316 Points +3%
Microsoft Surface Laptop 15 Gen 8
Intel Core Ultra X7 368H
308 Points
Dell XPS 16 Core Ultra X7 358H
Intel Core Ultra X7 358H
304 Points -1%
Asus Zenbook A16 UX3607
Qualcomm Snapdragon X2 Elite Extreme X2E-94-100
303 Points -2%
Lenovo ThinkPad X9-15p Gen 1
Intel Core Ultra X7 358H
299 Points -3%
Microsoft Surface Laptop 7 15 Lunar Lake
Intel Core Ultra 7 268V
287 Points -7%
Średnia w klasie Multimedia
  (184.8 - 326, n=53, ostatnie 2 lata)
285 Points -7%
Blender / v2.79 BMW27 CPU
Microsoft Surface Laptop 7 15 Lunar Lake
Intel Core Ultra 7 268V
337 Seconds * -66%
Średnia w klasie Multimedia
  (100 - 557, n=52, ostatnie 2 lata)
239 Seconds * -18%
Microsoft Surface Laptop 15 Gen 8
Intel Core Ultra X7 368H
203 Seconds *
Dell XPS 16 Core Ultra X7 358H
Intel Core Ultra X7 358H
196 Seconds * +3%
Przeciętny Intel Core Ultra X7 368H
  (179 - 203, n=2)
191 Seconds * +6%
Lenovo ThinkPad X9-15p Gen 1
Intel Core Ultra X7 358H
175 Seconds * +14%
Asus Zenbook A16 UX3607
Qualcomm Snapdragon X2 Elite Extreme X2E-94-100
172 Seconds * +15%
7-Zip 18.03 / 7z b 4
Lenovo ThinkPad X9-15p Gen 1
Intel Core Ultra X7 358H
68930 MIPS +11%
Dell XPS 16 Core Ultra X7 358H
Intel Core Ultra X7 358H
64852 MIPS +4%
Przeciętny Intel Core Ultra X7 368H
  (62173 - 63679, n=2)
62926 MIPS +1%
Microsoft Surface Laptop 15 Gen 8
Intel Core Ultra X7 368H
62173 MIPS
Średnia w klasie Multimedia
  (26062 - 130368, n=49, ostatnie 2 lata)
58487 MIPS -6%
Microsoft Surface Laptop 7 15 Lunar Lake
Intel Core Ultra 7 268V
35687 MIPS -43%
7-Zip 18.03 / 7z b 4 -mmt1
Microsoft Surface Laptop 15 Gen 8
Intel Core Ultra X7 368H
6637 MIPS
Przeciętny Intel Core Ultra X7 368H
  (6434 - 6637, n=2)
6536 MIPS -2%
Lenovo ThinkPad X9-15p Gen 1
Intel Core Ultra X7 358H
6449 MIPS -3%
Dell XPS 16 Core Ultra X7 358H
Intel Core Ultra X7 358H
6441 MIPS -3%
Asus Zenbook A16 UX3607
Qualcomm Snapdragon X2 Elite Extreme X2E-94-100
6247 MIPS -6%
Microsoft Surface Laptop 7 15 Lunar Lake
Intel Core Ultra 7 268V
6021 MIPS -9%
Średnia w klasie Multimedia
  (4526 - 7337, n=50, ostatnie 2 lata)
5944 MIPS -10%
HWBOT x265 Benchmark v2.2 / 4k Preset
Lenovo ThinkPad X9-15p Gen 1
Intel Core Ultra X7 358H
22.1 fps +18%
Dell XPS 16 Core Ultra X7 358H
Intel Core Ultra X7 358H
21 fps +12%
Średnia w klasie Multimedia
  (6.08 - 36.1, n=50, ostatnie 2 lata)
19.3 fps +3%
Microsoft Surface Laptop 15 Gen 8
Intel Core Ultra X7 368H
18.7 fps
Przeciętny Intel Core Ultra X7 368H
  (14.1 - 18.7, n=2)
16.4 fps -12%
Asus Zenbook A16 UX3607
Qualcomm Snapdragon X2 Elite Extreme X2E-94-100
13.6 fps -27%
Microsoft Surface Laptop 7 15 Lunar Lake
Intel Core Ultra 7 268V
12.9 fps -31%
LibreOffice / 20 Documents To PDF
Dell XPS 16 Core Ultra X7 358H
Intel Core Ultra X7 358H
49.5 s * -22%
Microsoft Surface Laptop 7 15 Lunar Lake
Intel Core Ultra 7 268V
48 s * -19%
Średnia w klasie Multimedia
  (23.9 - 72.5, n=51, ostatnie 2 lata)
47.9 s * -18%
Lenovo ThinkPad X9-15p Gen 1
Intel Core Ultra X7 358H
47.6 s * -18%
Asus Zenbook A16 UX3607
Qualcomm Snapdragon X2 Elite Extreme X2E-94-100
44.2 s * -9%
Microsoft Surface Laptop 15 Gen 8
Intel Core Ultra X7 368H
40.5 s *
Przeciętny Intel Core Ultra X7 368H
  (39.1 - 40.5, n=2)
39.8 s * +2%
R Benchmark 2.5 / Overall mean
Asus Zenbook A16 UX3607
Qualcomm Snapdragon X2 Elite Extreme X2E-94-100
0.507 sec * -22%
Microsoft Surface Laptop 7 15 Lunar Lake
Intel Core Ultra 7 268V
0.4565 sec * -10%
Średnia w klasie Multimedia
  (0.3903 - 0.609, n=50, ostatnie 2 lata)
0.4464 sec * -8%
Lenovo ThinkPad X9-15p Gen 1
Intel Core Ultra X7 358H
0.4236 sec * -2%
Dell XPS 16 Core Ultra X7 358H
Intel Core Ultra X7 358H
0.4216 sec * -2%
Microsoft Surface Laptop 15 Gen 8
Intel Core Ultra X7 368H
0.4144 sec *
Przeciętny Intel Core Ultra X7 368H
  (0.4137 - 0.4144, n=2)
0.4141 sec * -0%

* ... im mniej tym lepiej

Cinebench R15 CPU Multi 64Bit
3156 Points
Cinebench R15 OpenGL 64Bit
253 fps
Cinebench R15 Ref. Match 64Bit
97.8 %
Cinebench R15 CPU Single 64Bit
308 Points
Cinebench R20 CPU (Multi Core)
6681 Points
Cinebench R20 CPU (Single Core)
809 Points
Cinebench R23 Single Core
2140 Points
Cinebench R23 Multi Core
17052 Points
Cinebench 2024 CPU Single Core
127.1 Points
Cinebench 2024 CPU Multi Core
960 Points
Pomoc
Performance rating
Lenovo ThinkPad X9-15p Gen 1 -1!
Intel Core Ultra X7 358H, Arc B390 Panther Lake iGPU
91.4 pt
Przeciętny Intel Core Ultra X7 368H -1!
 
84.2 pt
Średnia w klasie Multimedia
 
83.6 pt
Dell XPS 16 Core Ultra X7 358H -1!
Intel Core Ultra X7 358H, Arc B390 Panther Lake iGPU
82.6 pt
Microsoft Surface Laptop 15 Gen 8 -1!
Intel Core Ultra X7 368H, Arc B390 Panther Lake iGPU
79.2 pt
Asus Zenbook A16 UX3607 -1!
Qualcomm Snapdragon X2 Elite Extreme X2E-94-100, X2-90
70 pt
Microsoft Surface Laptop 7 15 Lunar Lake -1!
Intel Core Ultra 7 268V, Arc 140V
55 pt
AIDA64 / FP32 Ray-Trace
Lenovo ThinkPad X9-15p Gen 1
Intel Core Ultra X7 358H, Arc B390 Panther Lake iGPU (v8.20.8100)
18710 KRay/s +21%
Średnia w klasie Multimedia
  (2214 - 50388, n=48, ostatnie 2 lata)
18202 KRay/s +18%
Przeciętny Intel Core Ultra X7 368H
  (15419 - 17245, n=2)
16332 KRay/s +6%
Dell XPS 16 Core Ultra X7 358H
Intel Core Ultra X7 358H, Arc B390 Panther Lake iGPU (v8.20.8100)
15681 KRay/s +2%
Microsoft Surface Laptop 15 Gen 8
Intel Core Ultra X7 368H, Arc B390 Panther Lake iGPU (v8.20.8100)
15419 KRay/s
Asus Zenbook A16 UX3607
Qualcomm Snapdragon X2 Elite Extreme X2E-94-100, X2-90 (v8.20.8100)
12578 KRay/s -18%
Microsoft Surface Laptop 7 15 Lunar Lake
Intel Core Ultra 7 268V, Arc 140V (v6.92.6600)
11547 KRay/s -25%
AIDA64 / FPU Julia
Lenovo ThinkPad X9-15p Gen 1
Intel Core Ultra X7 358H, Arc B390 Panther Lake iGPU (v8.20.8100)
96559 Points +15%
Przeciętny Intel Core Ultra X7 368H
  (84167 - 90689, n=2)
87428 Points +4%
Średnia w klasie Multimedia
  (12867 - 201874, n=48, ostatnie 2 lata)
85899 Points +2%
Microsoft Surface Laptop 15 Gen 8
Intel Core Ultra X7 368H, Arc B390 Panther Lake iGPU (v8.20.8100)
84167 Points
Dell XPS 16 Core Ultra X7 358H
Intel Core Ultra X7 358H, Arc B390 Panther Lake iGPU (v8.20.8100)
83114 Points -1%
Microsoft Surface Laptop 7 15 Lunar Lake
Intel Core Ultra 7 268V, Arc 140V (v6.92.6600)
56299 Points -33%
Asus Zenbook A16 UX3607
Qualcomm Snapdragon X2 Elite Extreme X2E-94-100, X2-90 (v8.20.8100)
49008 Points -42%
AIDA64 / CPU SHA3
Asus Zenbook A16 UX3607
Qualcomm Snapdragon X2 Elite Extreme X2E-94-100, X2-90 (v8.20.8100)
5433 MB/s +34%
Lenovo ThinkPad X9-15p Gen 1
Intel Core Ultra X7 358H, Arc B390 Panther Lake iGPU (v8.20.8100)
4955 MB/s +22%
Przeciętny Intel Core Ultra X7 368H
  (4052 - 4537, n=2)
4295 MB/s +6%
Dell XPS 16 Core Ultra X7 358H
Intel Core Ultra X7 358H, Arc B390 Panther Lake iGPU (v8.20.8100)
4200 MB/s +4%
Microsoft Surface Laptop 15 Gen 8
Intel Core Ultra X7 368H, Arc B390 Panther Lake iGPU (v8.20.8100)
4052 MB/s
Średnia w klasie Multimedia
  (626 - 8623, n=48, ostatnie 2 lata)
3988 MB/s -2%
Microsoft Surface Laptop 7 15 Lunar Lake
Intel Core Ultra 7 268V, Arc 140V (v6.92.6600)
2538 MB/s -37%
AIDA64 / CPU Queen
Średnia w klasie Multimedia
  (13483 - 181505, n=31, ostatnie 2 lata)
70972 Points
Microsoft Surface Laptop 7 15 Lunar Lake
Intel Core Ultra 7 268V, Arc 140V (v6.92.6600)
49645 Points
AIDA64 / FPU SinJulia
Średnia w klasie Multimedia
  (886 - 28794, n=48, ostatnie 2 lata)
8498 Points +26%
Przeciętny Intel Core Ultra X7 368H
  (6765 - 7511, n=2)
7138 Points +6%
Lenovo ThinkPad X9-15p Gen 1
Intel Core Ultra X7 358H, Arc B390 Panther Lake iGPU (v8.20.8100)
7033 Points +4%
Dell XPS 16 Core Ultra X7 358H
Intel Core Ultra X7 358H, Arc B390 Panther Lake iGPU (v8.20.8100)
6892 Points +2%
Microsoft Surface Laptop 15 Gen 8
Intel Core Ultra X7 368H, Arc B390 Panther Lake iGPU (v8.20.8100)
6765 Points
Microsoft Surface Laptop 7 15 Lunar Lake
Intel Core Ultra 7 268V, Arc 140V (v6.92.6600)
4426 Points -35%
Asus Zenbook A16 UX3607
Qualcomm Snapdragon X2 Elite Extreme X2E-94-100, X2-90 (v8.20.8100)
4199 Points -38%
AIDA64 / FPU Mandel
Lenovo ThinkPad X9-15p Gen 1
Intel Core Ultra X7 358H, Arc B390 Panther Lake iGPU (v8.20.8100)
50766 Points +13%
Przeciętny Intel Core Ultra X7 368H
  (44784 - 48562, n=2)
46673 Points +4%
Średnia w klasie Multimedia
  (6395 - 105740, n=48, ostatnie 2 lata)
45242 Points +1%
Microsoft Surface Laptop 15 Gen 8
Intel Core Ultra X7 368H, Arc B390 Panther Lake iGPU (v8.20.8100)
44784 Points
Dell XPS 16 Core Ultra X7 358H
Intel Core Ultra X7 358H, Arc B390 Panther Lake iGPU (v8.20.8100)
44733 Points 0%
Microsoft Surface Laptop 7 15 Lunar Lake
Intel Core Ultra 7 268V, Arc 140V (v6.92.6600)
29637 Points -34%
Asus Zenbook A16 UX3607
Qualcomm Snapdragon X2 Elite Extreme X2E-94-100, X2-90 (v8.20.8100)
26387 Points -41%
AIDA64 / CPU AES
Asus Zenbook A16 UX3607
Qualcomm Snapdragon X2 Elite Extreme X2E-94-100, X2-90 (v8.20.8100)
110260 MB/s +88%
Lenovo ThinkPad X9-15p Gen 1
Intel Core Ultra X7 358H, Arc B390 Panther Lake iGPU (v8.20.8100)
68737 MB/s +17%
Średnia w klasie Multimedia
  (8171 - 126790, n=48, ostatnie 2 lata)
64193 MB/s +10%
Przeciętny Intel Core Ultra X7 368H
  (58572 - 68180, n=2)
63376 MB/s +8%
Dell XPS 16 Core Ultra X7 358H
Intel Core Ultra X7 358H, Arc B390 Panther Lake iGPU (v8.20.8100)
61102 MB/s +4%
Microsoft Surface Laptop 15 Gen 8
Intel Core Ultra X7 368H, Arc B390 Panther Lake iGPU (v8.20.8100)
58572 MB/s
Microsoft Surface Laptop 7 15 Lunar Lake
Intel Core Ultra 7 268V, Arc 140V (v6.92.6600)
38706 MB/s -34%
AIDA64 / CPU ZLib
Asus Zenbook A16 UX3607
Qualcomm Snapdragon X2 Elite Extreme X2E-94-100, X2-90 (v8.20.8100)
1337 MB/s +67%
Lenovo ThinkPad X9-15p Gen 1
Intel Core Ultra X7 358H, Arc B390 Panther Lake iGPU (v8.20.8100)
1111 MB/s +38%
Dell XPS 16 Core Ultra X7 358H
Intel Core Ultra X7 358H, Arc B390 Panther Lake iGPU (v8.20.8100)
991 MB/s +23%
Średnia w klasie Multimedia
  (143.8 - 2022, n=48, ostatnie 2 lata)
982 MB/s +22%
Przeciętny Intel Core Ultra X7 368H
  (803 - 1130, n=2)
967 MB/s +20%
Microsoft Surface Laptop 15 Gen 8
Intel Core Ultra X7 368H, Arc B390 Panther Lake iGPU (v8.20.8100)
803 MB/s
Microsoft Surface Laptop 7 15 Lunar Lake
Intel Core Ultra 7 268V, Arc 140V (v6.92.6600)
583 MB/s -27%
AIDA64 / FP64 Ray-Trace
Średnia w klasie Multimedia
  (1014 - 26875, n=48, ostatnie 2 lata)
9692 KRay/s +19%
Lenovo ThinkPad X9-15p Gen 1
Intel Core Ultra X7 358H, Arc B390 Panther Lake iGPU (v8.20.8100)
9612 KRay/s +18%
Przeciętny Intel Core Ultra X7 368H
  (8151 - 9131, n=2)
8641 KRay/s +6%
Dell XPS 16 Core Ultra X7 358H
Intel Core Ultra X7 358H, Arc B390 Panther Lake iGPU (v8.20.8100)
8285 KRay/s +2%
Microsoft Surface Laptop 15 Gen 8
Intel Core Ultra X7 368H, Arc B390 Panther Lake iGPU (v8.20.8100)
8151 KRay/s
Asus Zenbook A16 UX3607
Qualcomm Snapdragon X2 Elite Extreme X2E-94-100, X2-90 (v8.20.8100)
6811 KRay/s -16%
Microsoft Surface Laptop 7 15 Lunar Lake
Intel Core Ultra 7 268V, Arc 140V (v6.92.6600)
6214 KRay/s -24%
AIDA64 / CPU PhotoWorxx
Lenovo ThinkPad X9-15p Gen 1
Intel Core Ultra X7 358H, Arc B390 Panther Lake iGPU (v8.20.8100)
88533 MPixel/s +17%
Dell XPS 16 Core Ultra X7 358H
Intel Core Ultra X7 358H, Arc B390 Panther Lake iGPU (v8.20.8100)
88154 MPixel/s +16%
Przeciętny Intel Core Ultra X7 368H
  (75761 - 84065, n=2)
79913 MPixel/s +5%
Microsoft Surface Laptop 15 Gen 8
Intel Core Ultra X7 368H, Arc B390 Panther Lake iGPU (v8.20.8100)
75761 MPixel/s
Asus Zenbook A16 UX3607
Qualcomm Snapdragon X2 Elite Extreme X2E-94-100, X2-90 (v8.20.8100)
66951 MPixel/s -12%
Microsoft Surface Laptop 7 15 Lunar Lake
Intel Core Ultra 7 268V, Arc 140V (v6.92.6600)
53540 MPixel/s -29%
Średnia w klasie Multimedia
  (8187 - 88533, n=48, ostatnie 2 lata)
53006 MPixel/s -30%
AIDA64 / CPU CheckMate
Przeciętny Intel Core Ultra X7 368H
  (4328 - 4613, n=2)
4471 MP/s +3%
Microsoft Surface Laptop 15 Gen 8
Intel Core Ultra X7 368H, Arc B390 Panther Lake iGPU (v8.20.8100)
4328 MP/s
Lenovo ThinkPad X9-15p Gen 1
Intel Core Ultra X7 358H, Arc B390 Panther Lake iGPU (v8.20.8100)
4279 MP/s -1%
Dell XPS 16 Core Ultra X7 358H
Intel Core Ultra X7 358H, Arc B390 Panther Lake iGPU (v8.20.8100)
4269 MP/s -1%
Średnia w klasie Multimedia
  (569 - 4742, n=20, ostatnie 2 lata)
3548 MP/s -18%
Asus Zenbook A16 UX3607
Qualcomm Snapdragon X2 Elite Extreme X2E-94-100, X2-90 (v8.20.8100)
1570 MP/s -64%

System i urządzenia pamięci masowej

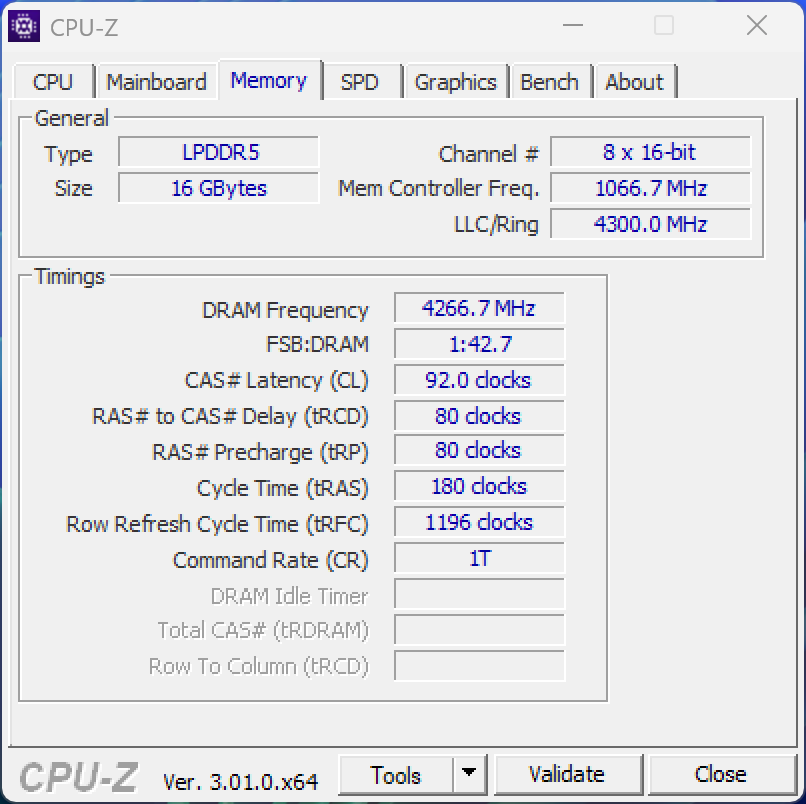
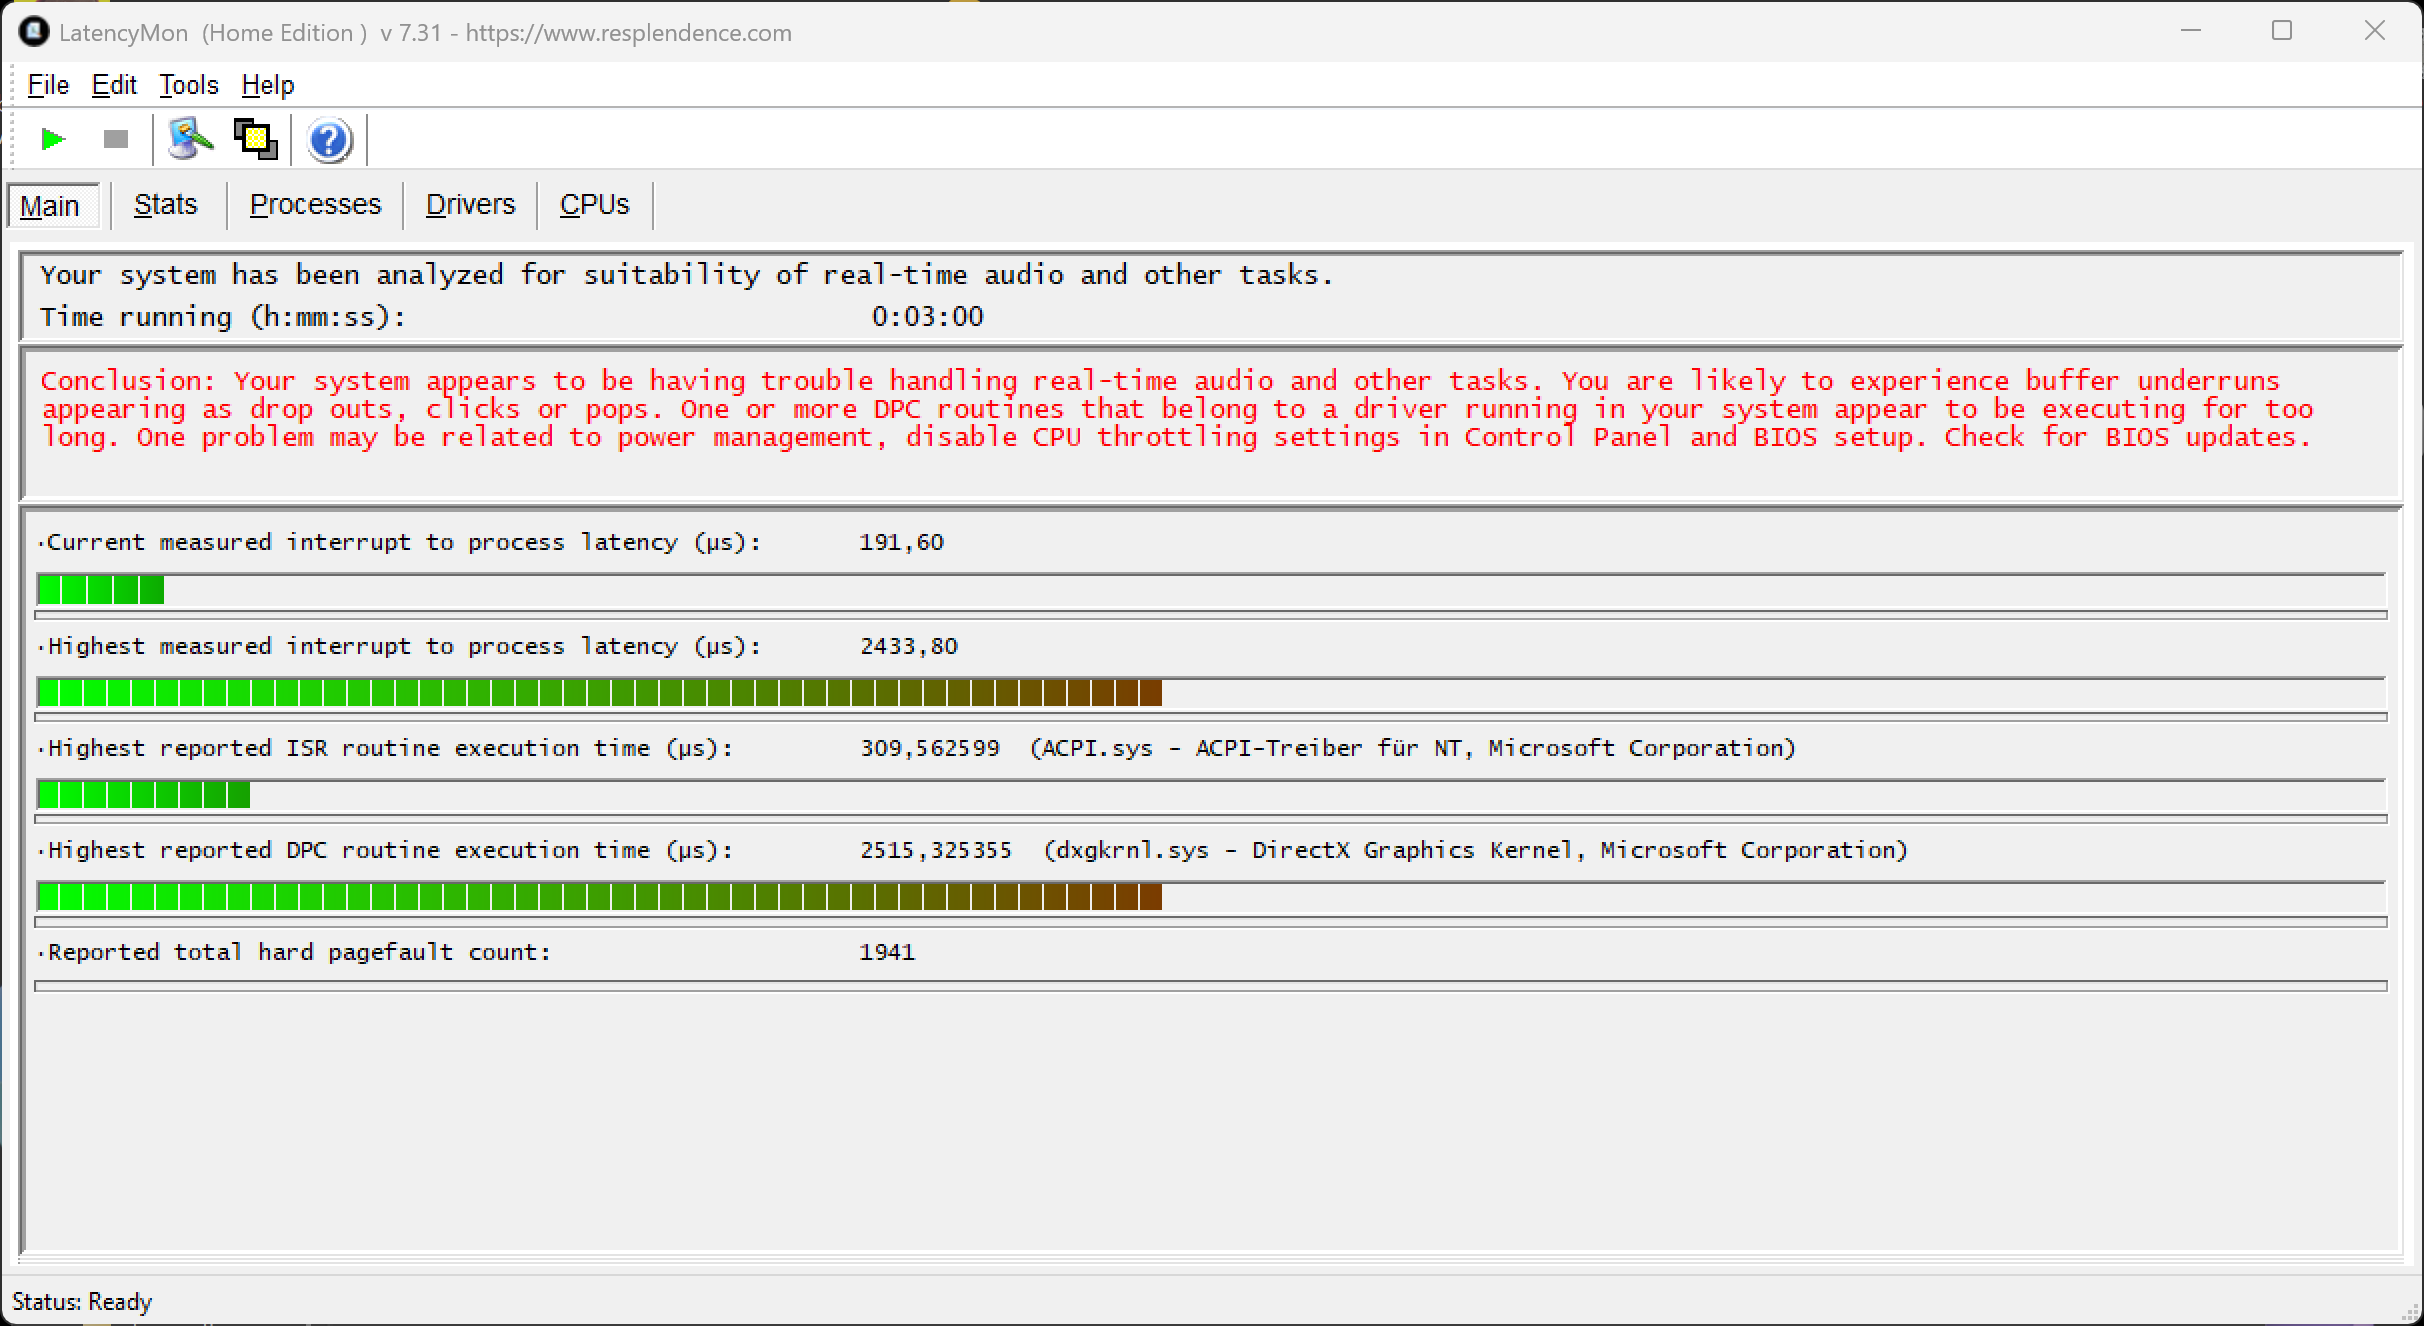
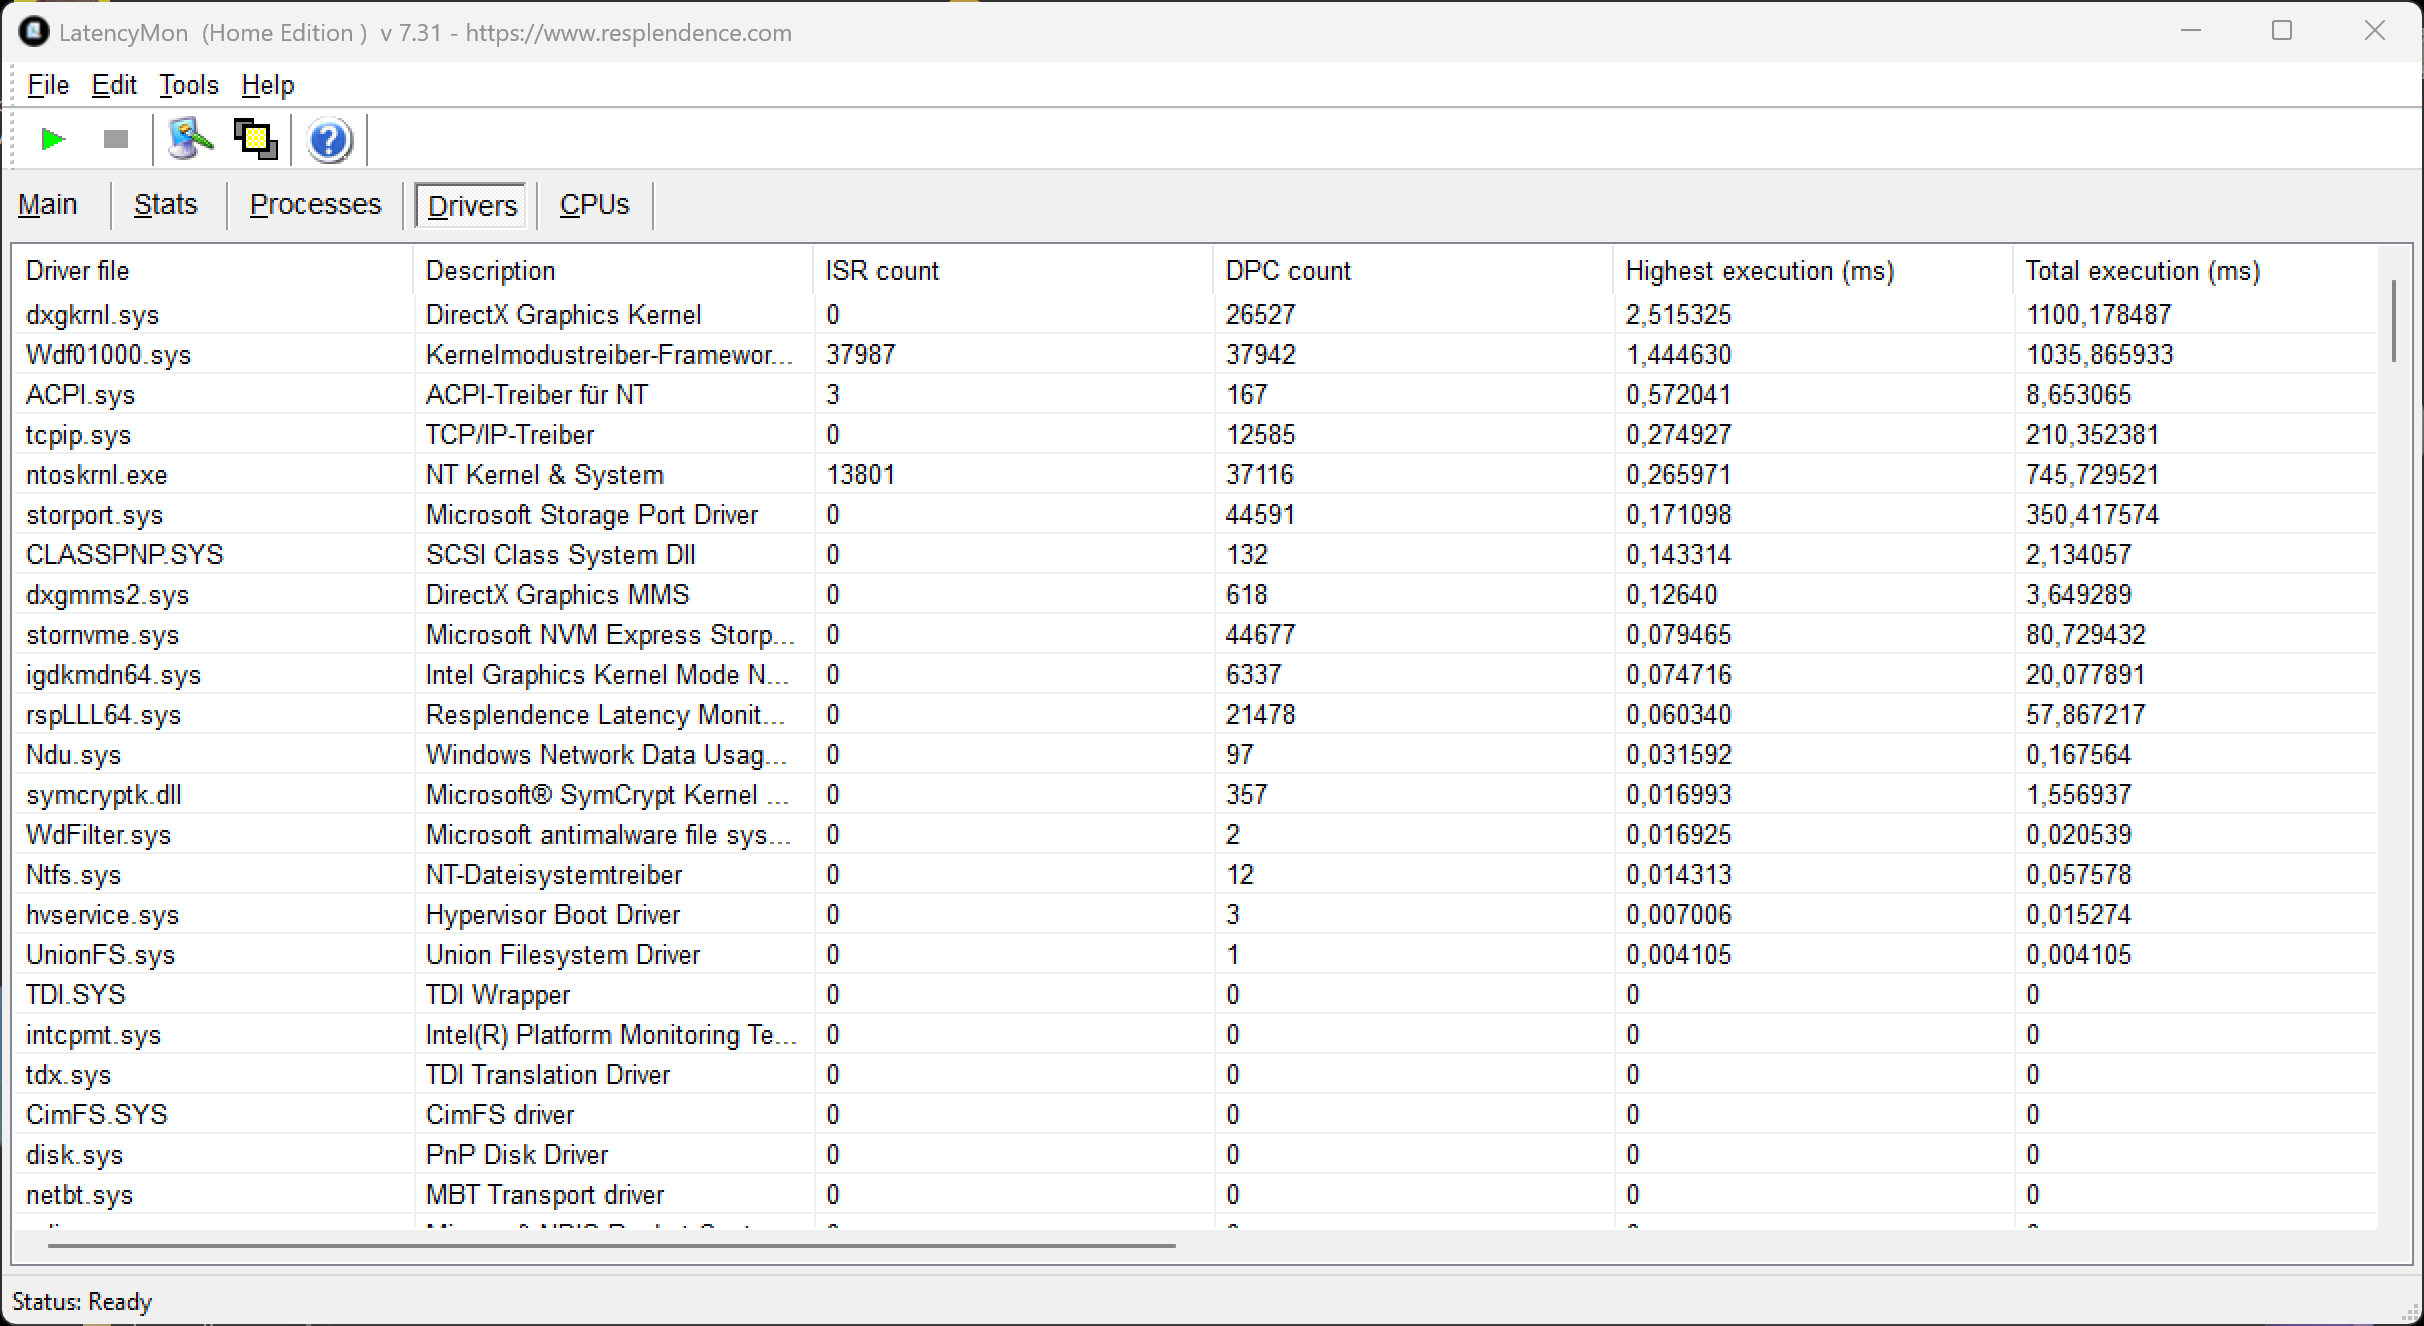
Ogólna wydajność systemu jest doskonała i nie zauważyliśmy też żadnych problemów ze stabilnością. W wariancie z procesorem Intel nie ma oczywiście problemów z kompatybilnością, co stanowi przewagę nad wersją ze Snapdragonem. Nasz egzemplarz testowy oferuje tylko 16 GB pamięci RAM, ale nie napotkaliśmy żadnych problemów i jeśli nie przesadzają Państwo z wielozadaniowością, ta tańsza wersja powinna wystarczyć. 32 GB byłoby oczywiście lepszym wyborem (można skonfigurować do 64 GB), ale dopłaty są wysokie. Nasz test opóźnień wykazał pewne problemy w zastosowaniach związanych z przetwarzaniem dźwięku w czasie rzeczywistym. Wydajność dysku SSD (PCIe 4.0) jest dobra i stabilna.

Performance rating: Percent
PCMark 10: Score | Essentials | Productivity | Digital Content Creation
CrossMark: Overall | Productivity | Creativity | Responsiveness
WebXPRT 3: Overall
WebXPRT 4: Overall
Mozilla Kraken 1.1: Total
Performance rating
Apple MacBook Air 15 M5 -4!
M5 10-Core GPU, M5 10-Core, Apple SSD AP2048Z
91.1 pt
Asus Zenbook A16 UX3607 -4!
X2-90, X2E-94-100, Samsung PM9C1b MZVL81T0HFLB-00BTW
83.5 pt
Microsoft Surface Laptop 15 Gen 8
Arc B390 Panther Lake iGPU, Ultra X7 368H, SK hynix PVC10 HFS256GEM4X182N
83.3 pt
Przeciętny Intel Core Ultra X7 368H, Intel Arc B390 12 Xe3 Panther Lake iGPU
 
83.1 pt
Lenovo ThinkPad X9-15p Gen 1
Arc B390 Panther Lake iGPU, Ultra X7 358H, Samsung PM9E1 1 TB MZVLC1T0HFLU
80.6 pt
Dell XPS 16 Core Ultra X7 358H
Arc B390 Panther Lake iGPU, Ultra X7 358H
80 pt
Średnia w klasie Multimedia
 
72.5 pt
Microsoft Surface Laptop 7 15 Lunar Lake
Arc 140V, Core Ultra 7 268V, Samsung PM9C1a MZ9L81T0HDLB
64.9 pt
PCMark 10 / Score
Przeciętny Intel Core Ultra X7 368H, Intel Arc B390 12 Xe3 Panther Lake iGPU
  (9923 - 10456, n=2)
10190 Points +3%
Microsoft Surface Laptop 15 Gen 8
Arc B390 Panther Lake iGPU, Ultra X7 368H, SK hynix PVC10 HFS256GEM4X182N
9923 Points
Dell XPS 16 Core Ultra X7 358H
Arc B390 Panther Lake iGPU, Ultra X7 358H
9717 Points -2%
Lenovo ThinkPad X9-15p Gen 1
Arc B390 Panther Lake iGPU, Ultra X7 358H, Samsung PM9E1 1 TB MZVLC1T0HFLU
9303 Points -6%
Średnia w klasie Multimedia
  (4325 - 10386, n=48, ostatnie 2 lata)
8022 Points -19%
Microsoft Surface Laptop 7 15 Lunar Lake
Arc 140V, Core Ultra 7 268V, Samsung PM9C1a MZ9L81T0HDLB
7236 Points -27%
PCMark 10 / Essentials
Przeciętny Intel Core Ultra X7 368H, Intel Arc B390 12 Xe3 Panther Lake iGPU
  (11288 - 11715, n=2)
11502 Points +2%
Microsoft Surface Laptop 15 Gen 8
Arc B390 Panther Lake iGPU, Ultra X7 368H, SK hynix PVC10 HFS256GEM4X182N
11288 Points
Dell XPS 16 Core Ultra X7 358H
Arc B390 Panther Lake iGPU, Ultra X7 358H
11122 Points -1%
Lenovo ThinkPad X9-15p Gen 1
Arc B390 Panther Lake iGPU, Ultra X7 358H, Samsung PM9E1 1 TB MZVLC1T0HFLU
10762 Points -5%
Microsoft Surface Laptop 7 15 Lunar Lake
Arc 140V, Core Ultra 7 268V, Samsung PM9C1a MZ9L81T0HDLB
10701 Points -5%
Średnia w klasie Multimedia
  (8025 - 11664, n=47, ostatnie 2 lata)
10507 Points -7%
PCMark 10 / Productivity
Przeciętny Intel Core Ultra X7 368H, Intel Arc B390 12 Xe3 Panther Lake iGPU
  (17463 - 18738, n=2)
18101 Points +4%
Microsoft Surface Laptop 15 Gen 8
Arc B390 Panther Lake iGPU, Ultra X7 368H, SK hynix PVC10 HFS256GEM4X182N
17463 Points
Dell XPS 16 Core Ultra X7 358H
Arc B390 Panther Lake iGPU, Ultra X7 358H
16422 Points -6%
Lenovo ThinkPad X9-15p Gen 1
Arc B390 Panther Lake iGPU, Ultra X7 358H, Samsung PM9E1 1 TB MZVLC1T0HFLU
14870 Points -15%
Średnia w klasie Multimedia
  (7323 - 18233, n=47, ostatnie 2 lata)
12568 Points -28%
Microsoft Surface Laptop 7 15 Lunar Lake
Arc 140V, Core Ultra 7 268V, Samsung PM9C1a MZ9L81T0HDLB
9217 Points -47%
PCMark 10 / Digital Content Creation
Przeciętny Intel Core Ultra X7 368H, Intel Arc B390 12 Xe3 Panther Lake iGPU
  (13454 - 14129, n=2)
13792 Points +3%
Lenovo ThinkPad X9-15p Gen 1
Arc B390 Panther Lake iGPU, Ultra X7 358H, Samsung PM9E1 1 TB MZVLC1T0HFLU
13652 Points +1%
Dell XPS 16 Core Ultra X7 358H
Arc B390 Panther Lake iGPU, Ultra X7 358H
13633 Points +1%
Microsoft Surface Laptop 15 Gen 8
Arc B390 Panther Lake iGPU, Ultra X7 368H, SK hynix PVC10 HFS256GEM4X182N
13454 Points
Średnia w klasie Multimedia
  (3738 - 16240, n=47, ostatnie 2 lata)
10853 Points -19%
Microsoft Surface Laptop 7 15 Lunar Lake
Arc 140V, Core Ultra 7 268V, Samsung PM9C1a MZ9L81T0HDLB
10427 Points -22%
CrossMark / Overall
Apple MacBook Air 15 M5
M5 10-Core GPU, M5 10-Core, Apple SSD AP2048Z
2356 Points +8%
Lenovo ThinkPad X9-15p Gen 1
Arc B390 Panther Lake iGPU, Ultra X7 358H, Samsung PM9E1 1 TB MZVLC1T0HFLU
2182 Points 0%
Microsoft Surface Laptop 15 Gen 8
Arc B390 Panther Lake iGPU, Ultra X7 368H, SK hynix PVC10 HFS256GEM4X182N
2182 Points
Dell XPS 16 Core Ultra X7 358H
Arc B390 Panther Lake iGPU, Ultra X7 358H
2114 Points -3%
Przeciętny Intel Core Ultra X7 368H, Intel Arc B390 12 Xe3 Panther Lake iGPU
  (2032 - 2182, n=2)
2107 Points -3%
Asus Zenbook A16 UX3607
X2-90, X2E-94-100, Samsung PM9C1b MZVL81T0HFLB-00BTW
1978 Points -9%
Średnia w klasie Multimedia
  (866 - 3231, n=56, ostatnie 2 lata)
1949 Points -11%
Microsoft Surface Laptop 7 15 Lunar Lake
Arc 140V, Core Ultra 7 268V, Samsung PM9C1a MZ9L81T0HDLB
1738 Points -20%
CrossMark / Productivity
Apple MacBook Air 15 M5
M5 10-Core GPU, M5 10-Core, Apple SSD AP2048Z
2277 Points +14%
Microsoft Surface Laptop 15 Gen 8
Arc B390 Panther Lake iGPU, Ultra X7 368H, SK hynix PVC10 HFS256GEM4X182N
1995 Points
Lenovo ThinkPad X9-15p Gen 1
Arc B390 Panther Lake iGPU, Ultra X7 358H, Samsung PM9E1 1 TB MZVLC1T0HFLU
1960 Points -2%
Przeciętny Intel Core Ultra X7 368H, Intel Arc B390 12 Xe3 Panther Lake iGPU
  (1916 - 1995, n=2)
1956 Points -2%
Dell XPS 16 Core Ultra X7 358H
Arc B390 Panther Lake iGPU, Ultra X7 358H
1898 Points -5%
Średnia w klasie Multimedia
  (931 - 2677, n=56, ostatnie 2 lata)
1817 Points -9%
Asus Zenbook A16 UX3607
X2-90, X2E-94-100, Samsung PM9C1b MZVL81T0HFLB-00BTW
1732 Points -13%
Microsoft Surface Laptop 7 15 Lunar Lake
Arc 140V, Core Ultra 7 268V, Samsung PM9C1a MZ9L81T0HDLB
1680 Points -16%
CrossMark / Creativity
Apple MacBook Air 15 M5
M5 10-Core GPU, M5 10-Core, Apple SSD AP2048Z
2743 Points +8%
Lenovo ThinkPad X9-15p Gen 1
Arc B390 Panther Lake iGPU, Ultra X7 358H, Samsung PM9E1 1 TB MZVLC1T0HFLU
2563 Points +1%
Microsoft Surface Laptop 15 Gen 8
Arc B390 Panther Lake iGPU, Ultra X7 368H, SK hynix PVC10 HFS256GEM4X182N
2530 Points
Dell XPS 16 Core Ultra X7 358H
Arc B390 Panther Lake iGPU, Ultra X7 358H
2529 Points 0%
Przeciętny Intel Core Ultra X7 368H, Intel Arc B390 12 Xe3 Panther Lake iGPU
  (2241 - 2530, n=2)
2386 Points -6%
Asus Zenbook A16 UX3607
X2-90, X2E-94-100, Samsung PM9C1b MZVL81T0HFLB-00BTW
2327 Points -8%
Średnia w klasie Multimedia
  (907 - 4522, n=56, ostatnie 2 lata)
2261 Points -11%
Microsoft Surface Laptop 7 15 Lunar Lake
Arc 140V, Core Ultra 7 268V, Samsung PM9C1a MZ9L81T0HDLB
1976 Points -22%
CrossMark / Responsiveness
Lenovo ThinkPad X9-15p Gen 1
Arc B390 Panther Lake iGPU, Ultra X7 358H, Samsung PM9E1 1 TB MZVLC1T0HFLU
1855 Points +1%
Microsoft Surface Laptop 15 Gen 8
Arc B390 Panther Lake iGPU, Ultra X7 368H, SK hynix PVC10 HFS256GEM4X182N
1832 Points
Przeciętny Intel Core Ultra X7 368H, Intel Arc B390 12 Xe3 Panther Lake iGPU
  (1808 - 1832, n=2)
1820 Points -1%
Asus Zenbook A16 UX3607
X2-90, X2E-94-100, Samsung PM9C1b MZVL81T0HFLB-00BTW
1811 Points -1%
Dell XPS 16 Core Ultra X7 358H
Arc B390 Panther Lake iGPU, Ultra X7 358H
1706 Points -7%
Apple MacBook Air 15 M5
M5 10-Core GPU, M5 10-Core, Apple SSD AP2048Z
1657 Points -10%
Średnia w klasie Multimedia
  (605 - 2073, n=56, ostatnie 2 lata)
1568 Points -14%
Microsoft Surface Laptop 7 15 Lunar Lake
Arc 140V, Core Ultra 7 268V, Samsung PM9C1a MZ9L81T0HDLB
1311 Points -28%
WebXPRT 3 / Overall
Apple MacBook Air 15 M5
M5 10-Core GPU, M5 10-Core, Apple SSD AP2048Z
530 Points +57%
Asus Zenbook A16 UX3607
X2-90, X2E-94-100, Samsung PM9C1b MZVL81T0HFLB-00BTW
514 Points +52%
Lenovo ThinkPad X9-15p Gen 1
Arc B390 Panther Lake iGPU, Ultra X7 358H, Samsung PM9E1 1 TB MZVLC1T0HFLU
350 Points +4%
Średnia w klasie Multimedia
  (197.4 - 622, n=59, ostatnie 2 lata)
346 Points +2%
Przeciętny Intel Core Ultra X7 368H, Intel Arc B390 12 Xe3 Panther Lake iGPU
  (338 - 342, n=2)
340 Points +1%
Microsoft Surface Laptop 15 Gen 8
Arc B390 Panther Lake iGPU, Ultra X7 368H, SK hynix PVC10 HFS256GEM4X182N
338 Points
Microsoft Surface Laptop 7 15 Lunar Lake
Arc 140V, Core Ultra 7 268V, Samsung PM9C1a MZ9L81T0HDLB
310 Points -8%
Dell XPS 16 Core Ultra X7 358H
Arc B390 Panther Lake iGPU, Ultra X7 358H
304 Points -10%
WebXPRT 4 / Overall
Asus Zenbook A16 UX3607
X2-90, X2E-94-100, Samsung PM9C1b MZVL81T0HFLB-00BTW
383 Points +22%
Apple MacBook Air 15 M5
M5 10-Core GPU, M5 10-Core, Apple SSD AP2048Z
378 Points +20%
Microsoft Surface Laptop 15 Gen 8
Arc B390 Panther Lake iGPU, Ultra X7 368H, SK hynix PVC10 HFS256GEM4X182N
314 Points
Przeciętny Intel Core Ultra X7 368H, Intel Arc B390 12 Xe3 Panther Lake iGPU
  (304 - 314, n=2)
309 Points -2%
Lenovo ThinkPad X9-15p Gen 1
Arc B390 Panther Lake iGPU, Ultra X7 358H, Samsung PM9E1 1 TB MZVLC1T0HFLU
307 Points -2%
Dell XPS 16 Core Ultra X7 358H
Arc B390 Panther Lake iGPU, Ultra X7 358H
300 Points -4%
Średnia w klasie Multimedia
  (167.3 - 415, n=59, ostatnie 2 lata)
295 Points -6%
Microsoft Surface Laptop 7 15 Lunar Lake
Arc 140V, Core Ultra 7 268V, Samsung PM9C1a MZ9L81T0HDLB
287 Points -9%
Mozilla Kraken 1.1 / Total
Microsoft Surface Laptop 7 15 Lunar Lake
Arc 140V, Core Ultra 7 268V, Samsung PM9C1a MZ9L81T0HDLB
475 ms * -11%
Lenovo ThinkPad X9-15p Gen 1
Arc B390 Panther Lake iGPU, Ultra X7 358H, Samsung PM9E1 1 TB MZVLC1T0HFLU
465 ms * -8%
Dell XPS 16 Core Ultra X7 358H
Arc B390 Panther Lake iGPU, Ultra X7 358H
450 ms * -5%
Średnia w klasie Multimedia
  (228 - 835, n=60, ostatnie 2 lata)
440 ms * -3%
Przeciętny Intel Core Ultra X7 368H, Intel Arc B390 12 Xe3 Panther Lake iGPU
  (429 - 437, n=2)
433 ms * -1%
Microsoft Surface Laptop 15 Gen 8
Arc B390 Panther Lake iGPU, Ultra X7 368H, SK hynix PVC10 HFS256GEM4X182N
429 ms *
Asus Zenbook A16 UX3607
X2-90, X2E-94-100, Samsung PM9C1b MZVL81T0HFLB-00BTW
261.4 ms * +39%
Apple MacBook Air 15 M5
M5 10-Core GPU, M5 10-Core, Apple SSD AP2048Z
238.6 ms * +44%

* ... im mniej tym lepiej

PCMark 10 Score
9923 pkt.
Pomoc
AIDA64 / Memory Copy
Dell XPS 16 Core Ultra X7 358H
Intel Core Ultra X7 358H, Arc B390 Panther Lake iGPU
132135 MB/s +20%
Lenovo ThinkPad X9-15p Gen 1
Intel Core Ultra X7 358H, Arc B390 Panther Lake iGPU
129389 MB/s +18%
Przeciętny Intel Core Ultra X7 368H
  (109931 - 114339, n=2)
112135 MB/s +2%
Microsoft Surface Laptop 15 Gen 8
Intel Core Ultra X7 368H, Arc B390 Panther Lake iGPU
109931 MB/s
Microsoft Surface Laptop 7 15 Lunar Lake
Intel Core Ultra 7 268V, Arc 140V
107108 MB/s -3%
Asus Zenbook A16 UX3607
Qualcomm Snapdragon X2 Elite Extreme X2E-94-100, X2-90
104879 MB/s -5%
Średnia w klasie Multimedia
  (11299 - 132135, n=48, ostatnie 2 lata)
85254 MB/s -22%
AIDA64 / Memory Read
Asus Zenbook A16 UX3607
Qualcomm Snapdragon X2 Elite Extreme X2E-94-100, X2-90
174586 MB/s +55%
Lenovo ThinkPad X9-15p Gen 1
Intel Core Ultra X7 358H, Arc B390 Panther Lake iGPU
120727 MB/s +7%
Dell XPS 16 Core Ultra X7 358H
Intel Core Ultra X7 358H, Arc B390 Panther Lake iGPU
118888 MB/s +6%
Microsoft Surface Laptop 15 Gen 8
Intel Core Ultra X7 368H, Arc B390 Panther Lake iGPU
112338 MB/s
Przeciętny Intel Core Ultra X7 368H
  (106702 - 112338, n=2)
109520 MB/s -3%
Microsoft Surface Laptop 7 15 Lunar Lake
Intel Core Ultra 7 268V, Arc 140V
88341 MB/s -21%
Średnia w klasie Multimedia
  (11624 - 174586, n=48, ostatnie 2 lata)
81379 MB/s -28%
AIDA64 / Memory Write
Dell XPS 16 Core Ultra X7 358H
Intel Core Ultra X7 358H, Arc B390 Panther Lake iGPU
134998 MB/s +12%
Lenovo ThinkPad X9-15p Gen 1
Intel Core Ultra X7 358H, Arc B390 Panther Lake iGPU
134848 MB/s +12%
Przeciętny Intel Core Ultra X7 368H
  (120698 - 120732, n=2)
120715 MB/s 0%
Microsoft Surface Laptop 15 Gen 8
Intel Core Ultra X7 368H, Arc B390 Panther Lake iGPU
120698 MB/s
Microsoft Surface Laptop 7 15 Lunar Lake
Intel Core Ultra 7 268V, Arc 140V
117888 MB/s -2%
Średnia w klasie Multimedia
  (11755 - 134998, n=48, ostatnie 2 lata)
86357 MB/s -28%
Asus Zenbook A16 UX3607
Qualcomm Snapdragon X2 Elite Extreme X2E-94-100, X2-90
73995 MB/s -39%
AIDA64 / Memory Latency
Średnia w klasie Multimedia
  (84.1 - 535, n=47, ostatnie 2 lata)
127.5 ns * -43%
Microsoft Surface Laptop 7 15 Lunar Lake
Intel Core Ultra 7 268V, Arc 140V
97.4 ns * -10%
Przeciętny Intel Core Ultra X7 368H
  (88.9 - 90.3, n=2)
89.6 ns * -1%
Microsoft Surface Laptop 15 Gen 8
Intel Core Ultra X7 368H, Arc B390 Panther Lake iGPU
88.9 ns *
Dell XPS 16 Core Ultra X7 358H
Intel Core Ultra X7 358H, Arc B390 Panther Lake iGPU
84.6 ns * +5%
Lenovo ThinkPad X9-15p Gen 1
Intel Core Ultra X7 358H, Arc B390 Panther Lake iGPU
84.1 ns * +5%

* ... im mniej tym lepiej

LatencyMon - Przegląd
LatencyMon - Sterowniki
DPC Latencies / LatencyMon - interrupt to process latency (max), Web, Youtube, Prime95
Lenovo ThinkPad X9-15p Gen 1
Arc B390 Panther Lake iGPU, Ultra X7 358H, Samsung PM9E1 1 TB MZVLC1T0HFLU
3844.3 μs * -58%
Microsoft Surface Laptop 15 Gen 8
Arc B390 Panther Lake iGPU, Ultra X7 368H, SK hynix PVC10 HFS256GEM4X182N
2433.8 μs *
Średnia w klasie Multimedia
  (327 - 7067, n=46, ostatnie 2 lata)
1815 μs * +25%
Microsoft Surface Laptop 7 15 Lunar Lake
Arc 140V, Core Ultra 7 268V, Samsung PM9C1a MZ9L81T0HDLB
891.9 μs * +63%
Dell XPS 16 Core Ultra X7 358H
Arc B390 Panther Lake iGPU, Ultra X7 358H
513.7 μs * +79%

* ... im mniej tym lepiej

SK hynix PVC10 HFS256GEM4X182N
CDM 5/6 Read Seq Q32T1: 5688 MB/s
CDM 5/6 Write Seq Q32T1: 2845 MB/s
CDM 5/6 Read 4K Q32T1: 602 MB/s
CDM 5/6 Write 4K Q32T1: 766 MB/s
CDM 5/6 Read 4K: 81.8 MB/s
CDM 5/6 Write 4K: 151.3 MB/s
CDM 6 Write 4K Q8T8: 2141 MB/s
CDM 6 Read 4K Q8T8: 1777 MB/s
Drive Performance rating - Percent
Lenovo ThinkPad X9-15p Gen 1
Samsung PM9E1 1 TB MZVLC1T0HFLU
93.3 pt
Asus Zenbook A16 UX3607
Samsung PM9C1b MZVL81T0HFLB-00BTW
54.4 pt
Microsoft Surface Laptop 15 Gen 8
SK hynix PVC10 HFS256GEM4X182N
51.3 pt
Średnia w klasie Multimedia
 
47.5 pt
Dell XPS 16 Core Ultra X7 358H
 
43.4 pt
Microsoft Surface Laptop 7 15 Lunar Lake
Samsung PM9C1a MZ9L81T0HDLB
42.9 pt
Przeciętny SK hynix PVC10 HFS256GEM4X182N
 
41.3 pt
DiskSpd
seq read
Lenovo ThinkPad X9-15p Gen 1
Samsung PM9E1 1 TB MZVLC1T0HFLU
7663 (7579.05min - 7663.4max) MB/s +241%
Dell XPS 16 Core Ultra X7 358H
 
3600 (3100.64min - 3600.18max) MB/s +60%
Asus Zenbook A16 UX3607
Samsung PM9C1b MZVL81T0HFLB-00BTW
3256 (3194.8min - 3255.62max) MB/s +45%
Średnia w klasie Multimedia
  (453 - 7811, n=51, ostatnie 2 lata)
3140 MB/s +40%
Przeciętny SK hynix PVC10 HFS256GEM4X182N
  (2249 - 3278, n=2)
2764 MB/s +23%
Microsoft Surface Laptop 7 15 Lunar Lake
Samsung PM9C1a MZ9L81T0HDLB
2302 (2064.86min - 2301.62max) MB/s +2%
Microsoft Surface Laptop 15 Gen 8
SK hynix PVC10 HFS256GEM4X182N
2249 (2210.19min - 2248.78max) MB/s
seq write
Lenovo ThinkPad X9-15p Gen 1
Samsung PM9E1 1 TB MZVLC1T0HFLU
9312 (3040.03min - 9311.98max) MB/s +433%
Asus Zenbook A16 UX3607
Samsung PM9C1b MZVL81T0HFLB-00BTW
3644 (3588.65min - 3643.8max) MB/s +109%
Średnia w klasie Multimedia
  (384 - 9952, n=51, ostatnie 2 lata)
3319 MB/s +90%
Dell XPS 16 Core Ultra X7 358H
 
2599 (796.92min - 2599.25max) MB/s +49%
Przeciętny SK hynix PVC10 HFS256GEM4X182N
  (1747 - 2155, n=2)
1951 MB/s +12%
Microsoft Surface Laptop 15 Gen 8
SK hynix PVC10 HFS256GEM4X182N
1747 (1666.63min - 1747.42max) MB/s
Microsoft Surface Laptop 7 15 Lunar Lake
Samsung PM9C1a MZ9L81T0HDLB
1718 (1595.51min - 1717.99max) MB/s -2%
seq q8 t1 read
Lenovo ThinkPad X9-15p Gen 1
Samsung PM9E1 1 TB MZVLC1T0HFLU
14162 (13273.2min - 14161.6max) MB/s +133%
Dell XPS 16 Core Ultra X7 358H
 
7039 (5536.1min - 7039.48max) MB/s +16%
Asus Zenbook A16 UX3607
Samsung PM9C1b MZVL81T0HFLB-00BTW
6940 (5727.82min - 6940.07max) MB/s +14%
Microsoft Surface Laptop 7 15 Lunar Lake
Samsung PM9C1a MZ9L81T0HDLB
6158 (5002.91min - 6158.13max) MB/s +1%
Średnia w klasie Multimedia
  (467 - 14162, n=51, ostatnie 2 lata)
6122 MB/s +1%
Microsoft Surface Laptop 15 Gen 8
SK hynix PVC10 HFS256GEM4X182N
6074 (4968.99min - 6073.77max) MB/s
Przeciętny SK hynix PVC10 HFS256GEM4X182N
  (5911 - 6074, n=2)
5993 MB/s -1%
seq q8 t1 write
Lenovo ThinkPad X9-15p Gen 1
Samsung PM9E1 1 TB MZVLC1T0HFLU
13512 (13475.9min - 13511.8max) MB/s +305%
Dell XPS 16 Core Ultra X7 358H
 
6101 (5938.22min - 6101.03max) MB/s +83%
Średnia w klasie Multimedia
  (247 - 13512, n=51, ostatnie 2 lata)
5102 MB/s +53%
Asus Zenbook A16 UX3607
Samsung PM9C1b MZVL81T0HFLB-00BTW
4986 (4743.29min - 4986.07max) MB/s +50%
Microsoft Surface Laptop 7 15 Lunar Lake
Samsung PM9C1a MZ9L81T0HDLB
4651 (3142.37min - 4651.2max) MB/s +40%
Microsoft Surface Laptop 15 Gen 8
SK hynix PVC10 HFS256GEM4X182N
3333 (2050.9min - 3333.21max) MB/s
Przeciętny SK hynix PVC10 HFS256GEM4X182N
  (3041 - 3333, n=2)
3187 MB/s -4%
4k q1 t1 read
Lenovo ThinkPad X9-15p Gen 1
Samsung PM9E1 1 TB MZVLC1T0HFLU
85.1 (79.62min - 85.09max) MB/s +35%
Asus Zenbook A16 UX3607
Samsung PM9C1b MZVL81T0HFLB-00BTW
81.4 (73.37min - 81.4max) MB/s +29%
Przeciętny SK hynix PVC10 HFS256GEM4X182N
  (63 - 68, n=2)
65.5 MB/s +4%
Średnia w klasie Multimedia
  (18.8 - 94.1, n=51, ostatnie 2 lata)
64.4 MB/s +2%
Microsoft Surface Laptop 15 Gen 8
SK hynix PVC10 HFS256GEM4X182N
63 (62.83min - 63max) MB/s
Dell XPS 16 Core Ultra X7 358H
 
59.1 (53.74min - 59.08max) MB/s -6%
Microsoft Surface Laptop 7 15 Lunar Lake
Samsung PM9C1a MZ9L81T0HDLB
55 (51.05min - 55.02max) MB/s -13%
4k q1 t1 write
Asus Zenbook A16 UX3607
Samsung PM9C1b MZVL81T0HFLB-00BTW
249 (236.18min - 248.88max) MB/s +33%
Lenovo ThinkPad X9-15p Gen 1
Samsung PM9E1 1 TB MZVLC1T0HFLU
206 (194.33min - 205.81max) MB/s +10%
Microsoft Surface Laptop 15 Gen 8
SK hynix PVC10 HFS256GEM4X182N
186.6 (149.98min - 186.58max) MB/s
Średnia w klasie Multimedia
  (40.3 - 278, n=51, ostatnie 2 lata)
161.6 MB/s -13%
Przeciętny SK hynix PVC10 HFS256GEM4X182N
  (115.1 - 186.6, n=2)
150.9 MB/s -19%
Dell XPS 16 Core Ultra X7 358H
 
145.5 (139.46min - 145.49max) MB/s -22%
Microsoft Surface Laptop 7 15 Lunar Lake
Samsung PM9C1a MZ9L81T0HDLB
113.9 (108.41min - 113.89max) MB/s -39%
4k q32 t16 read
Lenovo ThinkPad X9-15p Gen 1
Samsung PM9E1 1 TB MZVLC1T0HFLU
5278 (5224.04min - 5277.98max) MB/s +116%
Microsoft Surface Laptop 15 Gen 8
SK hynix PVC10 HFS256GEM4X182N
2446 (2400.1min - 2445.99max) MB/s
Przeciętny SK hynix PVC10 HFS256GEM4X182N
  (1450 - 2446, n=2)
1948 MB/s -20%
Średnia w klasie Multimedia
  (190.3 - 6121, n=51, ostatnie 2 lata)
1626 MB/s -34%
Microsoft Surface Laptop 7 15 Lunar Lake
Samsung PM9C1a MZ9L81T0HDLB
1546 (1446.52min - 1545.71max) MB/s -37%
Asus Zenbook A16 UX3607
Samsung PM9C1b MZVL81T0HFLB-00BTW
1184 (1174.4min - 1183.69max) MB/s -52%
Dell XPS 16 Core Ultra X7 358H
 
652 (602.16min - 651.54max) MB/s -73%
4k q32 t16 write
Lenovo ThinkPad X9-15p Gen 1
Samsung PM9E1 1 TB MZVLC1T0HFLU
3134 (3116.91min - 3133.98max) MB/s +30%
Microsoft Surface Laptop 15 Gen 8
SK hynix PVC10 HFS256GEM4X182N
2414 (735.3min - 2413.9max) MB/s
Przeciętny SK hynix PVC10 HFS256GEM4X182N
  (635 - 2414, n=2)
1525 MB/s -37%
Microsoft Surface Laptop 7 15 Lunar Lake
Samsung PM9C1a MZ9L81T0HDLB
1244 (771.44min - 1244.07max) MB/s -48%
Średnia w klasie Multimedia
  (154.9 - 4447, n=51, ostatnie 2 lata)
1148 MB/s -52%
Asus Zenbook A16 UX3607
Samsung PM9C1b MZVL81T0HFLB-00BTW
805 (790.83min - 804.52max) MB/s -67%
Dell XPS 16 Core Ultra X7 358H
 
447 (308.53min - 447.08max) MB/s -81%
AS SSD
Score Total
Lenovo ThinkPad X9-15p Gen 1
Samsung PM9E1 1 TB MZVLC1T0HFLU
11377 Points +108%
Microsoft Surface Laptop 15 Gen 8
SK hynix PVC10 HFS256GEM4X182N
5467 Points
Średnia w klasie Multimedia
  (482 - 11377, n=49, ostatnie 2 lata)
5379 Points -2%
Dell XPS 16 Core Ultra X7 358H
 
5309 Points -3%
Asus Zenbook A16 UX3607
Samsung PM9C1b MZVL81T0HFLB-00BTW
5124 Points -6%
Przeciętny SK hynix PVC10 HFS256GEM4X182N
  (2859 - 5467, n=2)
4163 Points -24%
Microsoft Surface Laptop 7 15 Lunar Lake
Samsung PM9C1a MZ9L81T0HDLB
3869 Points -29%
Score Read
Lenovo ThinkPad X9-15p Gen 1
Samsung PM9E1 1 TB MZVLC1T0HFLU
4351 Points +99%
Microsoft Surface Laptop 15 Gen 8
SK hynix PVC10 HFS256GEM4X182N
2182 Points
Przeciętny SK hynix PVC10 HFS256GEM4X182N
  (1628 - 2182, n=2)
1905 Points -13%
Średnia w klasie Multimedia
  (192 - 4351, n=49, ostatnie 2 lata)
1761 Points -19%
Microsoft Surface Laptop 7 15 Lunar Lake
Samsung PM9C1a MZ9L81T0HDLB
1470 Points -33%
Dell XPS 16 Core Ultra X7 358H
 
1423 Points -35%
Asus Zenbook A16 UX3607
Samsung PM9C1b MZVL81T0HFLB-00BTW
1188 Points -46%
Score Write
Lenovo ThinkPad X9-15p Gen 1
Samsung PM9E1 1 TB MZVLC1T0HFLU
4851 Points +113%
Asus Zenbook A16 UX3607
Samsung PM9C1b MZVL81T0HFLB-00BTW
3402 Points +49%
Dell XPS 16 Core Ultra X7 358H
 
3277 Points +44%
Średnia w klasie Multimedia
  (191 - 4851, n=49, ostatnie 2 lata)
2777 Points +22%
Microsoft Surface Laptop 15 Gen 8
SK hynix PVC10 HFS256GEM4X182N
2278 Points
Microsoft Surface Laptop 7 15 Lunar Lake
Samsung PM9C1a MZ9L81T0HDLB
1716 Points -25%
Przeciętny SK hynix PVC10 HFS256GEM4X182N
  (506 - 2278, n=2)
1392 Points -39%
Seq Read
Lenovo ThinkPad X9-15p Gen 1
Samsung PM9E1 1 TB MZVLC1T0HFLU
10401 MB/s +120%
Asus Zenbook A16 UX3607
Samsung PM9C1b MZVL81T0HFLB-00BTW
5391 MB/s +14%
Dell XPS 16 Core Ultra X7 358H
 
5083.41 MB/s +7%
Średnia w klasie Multimedia
  (484 - 10494, n=49, ostatnie 2 lata)
4775 MB/s +1%
Microsoft Surface Laptop 15 Gen 8
SK hynix PVC10 HFS256GEM4X182N
4734 MB/s
Microsoft Surface Laptop 7 15 Lunar Lake
Samsung PM9C1a MZ9L81T0HDLB
4668 MB/s -1%
Przeciętny SK hynix PVC10 HFS256GEM4X182N
  (3681 - 4734, n=2)
4208 MB/s -11%
Seq Write
Lenovo ThinkPad X9-15p Gen 1
Samsung PM9E1 1 TB MZVLC1T0HFLU
9596 MB/s +329%
Asus Zenbook A16 UX3607
Samsung PM9C1b MZVL81T0HFLB-00BTW
3527 MB/s +58%
Średnia w klasie Multimedia
  (344 - 9596, n=49, ostatnie 2 lata)
3353 MB/s +50%
Microsoft Surface Laptop 7 15 Lunar Lake
Samsung PM9C1a MZ9L81T0HDLB
3049 MB/s +36%
Dell XPS 16 Core Ultra X7 358H
 
2509.02 MB/s +12%
Microsoft Surface Laptop 15 Gen 8
SK hynix PVC10 HFS256GEM4X182N
2239 MB/s
Przeciętny SK hynix PVC10 HFS256GEM4X182N
  (1427 - 2239, n=2)
1833 MB/s -18%
4K Read
Microsoft Surface Laptop 15 Gen 8
SK hynix PVC10 HFS256GEM4X182N
80.7 MB/s
Lenovo ThinkPad X9-15p Gen 1
Samsung PM9E1 1 TB MZVLC1T0HFLU
78.9 MB/s -2%
Asus Zenbook A16 UX3607
Samsung PM9C1b MZVL81T0HFLB-00BTW
65.7 MB/s -19%
Przeciętny SK hynix PVC10 HFS256GEM4X182N
  (47.2 - 80.7, n=2)
64 MB/s -21%
Średnia w klasie Multimedia
  (17.5 - 89.9, n=49, ostatnie 2 lata)
63.4 MB/s -21%
Microsoft Surface Laptop 7 15 Lunar Lake
Samsung PM9C1a MZ9L81T0HDLB
57.6 MB/s -29%
Dell XPS 16 Core Ultra X7 358H
 
52.53 MB/s -35%
4K Write
Asus Zenbook A16 UX3607
Samsung PM9C1b MZVL81T0HFLB-00BTW
225 MB/s +50%
Lenovo ThinkPad X9-15p Gen 1
Samsung PM9E1 1 TB MZVLC1T0HFLU
181.3 MB/s +20%
Średnia w klasie Multimedia
  (43.1 - 265, n=49, ostatnie 2 lata)
181 MB/s +20%
Microsoft Surface Laptop 15 Gen 8
SK hynix PVC10 HFS256GEM4X182N
150.5 MB/s
Przeciętny SK hynix PVC10 HFS256GEM4X182N
  (110.8 - 150.5, n=2)
130.7 MB/s -13%
Microsoft Surface Laptop 7 15 Lunar Lake
Samsung PM9C1a MZ9L81T0HDLB
130.6 MB/s -13%
Dell XPS 16 Core Ultra X7 358H
 
125.58 MB/s -17%
4K-64 Read
Lenovo ThinkPad X9-15p Gen 1
Samsung PM9E1 1 TB MZVLC1T0HFLU
3232 MB/s +99%
Microsoft Surface Laptop 15 Gen 8
SK hynix PVC10 HFS256GEM4X182N
1628 MB/s
Przeciętny SK hynix PVC10 HFS256GEM4X182N
  (1213 - 1628, n=2)
1421 MB/s -13%
Średnia w klasie Multimedia
  (125.7 - 3394, n=49, ostatnie 2 lata)
1220 MB/s -25%
Microsoft Surface Laptop 7 15 Lunar Lake
Samsung PM9C1a MZ9L81T0HDLB
945 MB/s -42%
Dell XPS 16 Core Ultra X7 358H
 
862.49 MB/s -47%
Asus Zenbook A16 UX3607
Samsung PM9C1b MZVL81T0HFLB-00BTW
583 MB/s -64%
4K-64 Write
Lenovo ThinkPad X9-15p Gen 1
Samsung PM9E1 1 TB MZVLC1T0HFLU
3710 MB/s +95%
Dell XPS 16 Core Ultra X7 358H
 
2900.39 MB/s +52%
Asus Zenbook A16 UX3607
Samsung PM9C1b MZVL81T0HFLB-00BTW
2825 MB/s +48%
Średnia w klasie Multimedia
  (75.2 - 4042, n=49, ostatnie 2 lata)
2261 MB/s +19%
Microsoft Surface Laptop 15 Gen 8
SK hynix PVC10 HFS256GEM4X182N
1903 MB/s
Microsoft Surface Laptop 7 15 Lunar Lake
Samsung PM9C1a MZ9L81T0HDLB
1281 MB/s -33%
Przeciętny SK hynix PVC10 HFS256GEM4X182N
  (252 - 1903, n=2)
1078 MB/s -43%
Access Time Read
Przeciętny SK hynix PVC10 HFS256GEM4X182N
  (0.087 - 0.162, n=2)
0.1245 ms * -43%
Microsoft Surface Laptop 15 Gen 8
SK hynix PVC10 HFS256GEM4X182N
0.087 ms *
Lenovo ThinkPad X9-15p Gen 1
Samsung PM9E1 1 TB MZVLC1T0HFLU
0.077 ms * +11%
Asus Zenbook A16 UX3607
Samsung PM9C1b MZVL81T0HFLB-00BTW
0.075 ms * +14%
Średnia w klasie Multimedia
  (0.018 - 0.168, n=49, ostatnie 2 lata)
0.06484 ms * +25%
Dell XPS 16 Core Ultra X7 358H
 
0.059 ms * +32%
Microsoft Surface Laptop 7 15 Lunar Lake
Samsung PM9C1a MZ9L81T0HDLB
0.034 ms * +61%
Access Time Write
Dell XPS 16 Core Ultra X7 358H
 
0.082 ms * -273%
Średnia w klasie Multimedia
  (0.015 - 0.754, n=49, ostatnie 2 lata)
0.0771 ms * -250%
Przeciętny SK hynix PVC10 HFS256GEM4X182N
  (0.022 - 0.045, n=2)
0.0335 ms * -52%
Microsoft Surface Laptop 7 15 Lunar Lake
Samsung PM9C1a MZ9L81T0HDLB
0.03 ms * -36%
Microsoft Surface Laptop 15 Gen 8
SK hynix PVC10 HFS256GEM4X182N
0.022 ms *
Lenovo ThinkPad X9-15p Gen 1
Samsung PM9E1 1 TB MZVLC1T0HFLU
0.021 ms * +5%
Asus Zenbook A16 UX3607
Samsung PM9C1b MZVL81T0HFLB-00BTW
0.019 ms * +14%

* ... im mniej tym lepiej

Ograniczanie wydajności dysku: pętla odczytu DiskSpd, głębokość kolejki 8

0285570855114014251710199522802565285031353420370539904275456048455130541557005985627065556840712574107695798082658550883591209405969099751026010545108301111511400116851197012255125401282513110133951368013965Tooltip
Microsoft Surface Laptop 15 Gen 8 SK hynix PVC10 HFS256GEM4X182N; diskspd 2.0.17 f: Ø6131 (5502.51-6156.25) MB/s
Lenovo ThinkPad X9-15p Gen 1 Samsung PM9E1 1 TB MZVLC1T0HFLU; diskspd 2.0.17 f: Ø8537 (5788.93-14160.38) MB/s
Asus Zenbook A16 UX3607 Samsung PM9C1b MZVL81T0HFLB-00BTW; diskspd 2.0.17 f: Ø6739 (2925.13-6893.49) MB/s
Dell XPS 16 Core Ultra X7 358H  ; diskspd 2.0.17 f: Ø7017 (6000.16-7049.37) MB/s
Microsoft Surface Laptop 7 15 Lunar Lake Samsung PM9C1a MZ9L81T0HDLB; diskspd 2.0.17 f: Ø6146 (4937.32-6171.08) MB/s

Wydajność GPU i gier

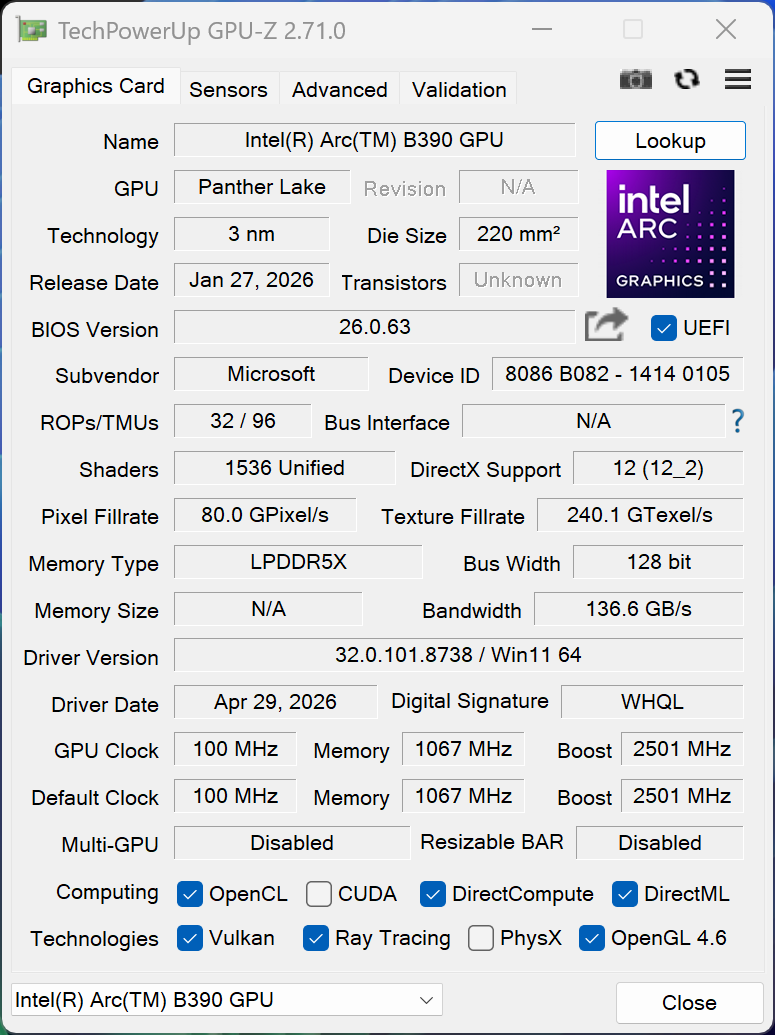
Największym atutem procesora Core Ultra X jest wydajny układ iGPU Arc B390, który jest znacznie szybszy niż Adreno X2-85 dostępny w wariantach ze Snapdragonem. Surface Laptop nie może jednak wykorzystać jego pełnego potencjału ze względu na spadek mocy do 35 watów przy długotrwałym obciążeniu, co skutkuje spadkiem wydajności o około 20 % po kilku minutach, wyraźnie zauważalnym również w naszym teście gry Cyberpunk. Nie jest to idealne rozwiązanie, ale Arc B390 nadal jest lepszym wyborem do laptopa multimedialnego i nie ma też problemów z kompatybilnością gier. 

3DMark Performance rating - Percent
Lenovo ThinkPad X9-15p Gen 1 -2!
Intel Arc B390 12 Xe3 Panther Lake iGPU, Intel Core Ultra X7 358H
98.5 pt
Dell XPS 16 Core Ultra X7 358H -2!
Intel Arc B390 12 Xe3 Panther Lake iGPU, Intel Core Ultra X7 358H
95.4 pt
Średnia w klasie Multimedia
 
94.8 pt
Przeciętny Intel Arc B390 12 Xe3 Panther Lake iGPU
 
85.4 pt
Microsoft Surface Laptop 15 Gen 8
Intel Arc B390 12 Xe3 Panther Lake iGPU, Intel Core Ultra X7 368H
83.5 pt
Asus Zenbook A16 UX3607
Qualcomm Adreno X2-90, Qualcomm Snapdragon X2 Elite Extreme X2E-94-100
64.5 pt
Apple MacBook Air 15 M5 -3!
Apple M5 10-Core GPU, Apple M5 10-Core
57.2 pt
Microsoft Surface Laptop 7 15 Lunar Lake
Intel Arc Graphics 140V, Intel Core Ultra 7 268V
54.7 pt
Microsoft Surface Pro 13 OLED
Qualcomm Adreno X2-85, Qualcomm Snapdragon X2 Elite X2E-78-100
40 pt
Microsoft Surface Laptop 8 13.8
Qualcomm SD X2 Adreno X2-45, Qualcomm Snapdragon X2 Plus X2P-64-100
34.8 pt
3DMark 11 - 1280x720 Performance GPU
Średnia w klasie Multimedia
  (3749 - 60002, n=49, ostatnie 2 lata)
19892 Points +3%
Microsoft Surface Laptop 15 Gen 8
Intel Arc B390 12 Xe3 Panther Lake iGPU, Intel Core Ultra X7 368H
19256 Points
Lenovo ThinkPad X9-15p Gen 1
Intel Arc B390 12 Xe3 Panther Lake iGPU, Intel Core Ultra X7 358H
18972 Points -1%
Przeciętny Intel Arc B390 12 Xe3 Panther Lake iGPU
  (14637 - 19804, n=16)
18495 Points -4%
Dell XPS 16 Core Ultra X7 358H
Intel Arc B390 12 Xe3 Panther Lake iGPU, Intel Core Ultra X7 358H
18308 Points -5%
Asus Zenbook A16 UX3607
Qualcomm Adreno X2-90, Qualcomm Snapdragon X2 Elite Extreme X2E-94-100
13847 Points -28%
Microsoft Surface Laptop 7 15 Lunar Lake
Intel Arc Graphics 140V, Intel Core Ultra 7 268V
12772 Points -34%
Microsoft Surface Pro 13 OLED
Qualcomm Adreno X2-85, Qualcomm Snapdragon X2 Elite X2E-78-100
8565 Points -56%
Microsoft Surface Laptop 8 13.8
Qualcomm SD X2 Adreno X2-45, Qualcomm Snapdragon X2 Plus X2P-64-100
7647 Points -60%
3DMark
1920x1080 Fire Strike Graphics
Lenovo ThinkPad X9-15p Gen 1
Intel Arc B390 12 Xe3 Panther Lake iGPU, Intel Core Ultra X7 358H
17351 Points +3%
Dell XPS 16 Core Ultra X7 358H
Intel Arc B390 12 Xe3 Panther Lake iGPU, Intel Core Ultra X7 358H
17018 Points +1%
Microsoft Surface Laptop 15 Gen 8
Intel Arc B390 12 Xe3 Panther Lake iGPU, Intel Core Ultra X7 368H
16839 Points
Przeciętny Intel Arc B390 12 Xe3 Panther Lake iGPU
  (13410 - 18327, n=16)
16743 Points -1%
Średnia w klasie Multimedia
  (2328 - 48907, n=53, ostatnie 2 lata)
15695 Points -7%
Asus Zenbook A16 UX3607
Qualcomm Adreno X2-90, Qualcomm Snapdragon X2 Elite Extreme X2E-94-100
11834 Points -30%
Microsoft Surface Laptop 7 15 Lunar Lake
Intel Arc Graphics 140V, Intel Core Ultra 7 268V
10476 Points -38%
Microsoft Surface Pro 13 OLED
Qualcomm Adreno X2-85, Qualcomm Snapdragon X2 Elite X2E-78-100
7617 Points -55%
Microsoft Surface Laptop 8 13.8
Qualcomm SD X2 Adreno X2-45, Qualcomm Snapdragon X2 Plus X2P-64-100
6626 Points -61%
2560x1440 Time Spy Graphics
Lenovo ThinkPad X9-15p Gen 1
Intel Arc B390 12 Xe3 Panther Lake iGPU, Intel Core Ultra X7 358H
7257 Points +13%
Dell XPS 16 Core Ultra X7 358H
Intel Arc B390 12 Xe3 Panther Lake iGPU, Intel Core Ultra X7 358H
6972 Points +9%
Przeciętny Intel Arc B390 12 Xe3 Panther Lake iGPU
  (4567 - 7257, n=23)
6497 Points +1%
Microsoft Surface Laptop 15 Gen 8
Intel Arc B390 12 Xe3 Panther Lake iGPU, Intel Core Ultra X7 368H
6407 Points
Średnia w klasie Multimedia
  (696 - 19403, n=53, ostatnie 2 lata)
6065 Points -5%
Microsoft Surface Laptop 7 15 Lunar Lake
Intel Arc Graphics 140V, Intel Core Ultra 7 268V
4415 Points -31%
Asus Zenbook A16 UX3607
Qualcomm Adreno X2-90, Qualcomm Snapdragon X2 Elite Extreme X2E-94-100
4064 Points -37%
Microsoft Surface Pro 13 OLED
Qualcomm Adreno X2-85, Qualcomm Snapdragon X2 Elite X2E-78-100
2605 Points -59%
Microsoft Surface Laptop 8 13.8
Qualcomm SD X2 Adreno X2-45, Qualcomm Snapdragon X2 Plus X2P-64-100
2262 Points -65%
Steel Nomad Score
Średnia w klasie Multimedia
  (342 - 4959, n=39, ostatnie 2 lata)
2011 Points +55%
Przeciętny Intel Arc B390 12 Xe3 Panther Lake iGPU
  (1301 - 1667, n=11)
1539 Points +18%
Microsoft Surface Laptop 15 Gen 8
Intel Arc B390 12 Xe3 Panther Lake iGPU, Intel Core Ultra X7 368H
1301 Points
Asus Zenbook A16 UX3607
Qualcomm Adreno X2-90, Qualcomm Snapdragon X2 Elite Extreme X2E-94-100
1264 Points -3%
Apple MacBook Air 15 M5
Apple M5 10-Core GPU, Apple M5 10-Core
1070 Points -18%
Microsoft Surface Laptop 7 15 Lunar Lake
Intel Arc Graphics 140V, Intel Core Ultra 7 268V
910 Points -30%
Microsoft Surface Pro 13 OLED
Qualcomm Adreno X2-85, Qualcomm Snapdragon X2 Elite X2E-78-100
711 Points -45%
Microsoft Surface Laptop 8 13.8
Qualcomm SD X2 Adreno X2-45, Qualcomm Snapdragon X2 Plus X2P-64-100
622 Points -52%
Steel Nomad Light Score
Średnia w klasie Multimedia
  (2001 - 21012, n=38, ostatnie 2 lata)
8315 Points +41%
Przeciętny Intel Arc B390 12 Xe3 Panther Lake iGPU
  (5562 - 6338, n=8)
5927 Points +1%
Microsoft Surface Laptop 15 Gen 8
Intel Arc B390 12 Xe3 Panther Lake iGPU, Intel Core Ultra X7 368H
5878 Points
Asus Zenbook A16 UX3607
Qualcomm Adreno X2-90, Qualcomm Snapdragon X2 Elite Extreme X2E-94-100
5492 Points -7%
Apple MacBook Air 15 M5
Apple M5 10-Core GPU, Apple M5 10-Core
5084 Points -14%
Microsoft Surface Laptop 7 15 Lunar Lake
Intel Arc Graphics 140V, Intel Core Ultra 7 268V
3555 Points -40%
Microsoft Surface Pro 13 OLED
Qualcomm Adreno X2-85, Qualcomm Snapdragon X2 Elite X2E-78-100
3464 Points -41%
Microsoft Surface Laptop 8 13.8
Qualcomm SD X2 Adreno X2-45, Qualcomm Snapdragon X2 Plus X2P-64-100
2935 Points -50%
3DMark 11 Performance
18531 pkt.
3DMark Fire Strike Score
13306 pkt.
3DMark Time Spy Score
6854 pkt.
3DMark Steel Nomad Score
1301 pkt.
3DMark Steel Nomad Light Score
5878 pkt.
Pomoc
Blender / v3.3 Classroom CPU
Microsoft Surface Laptop 7 15 Lunar Lake
Intel Arc Graphics 140V, Intel Core Ultra 7 268V
555 Seconds * -62%
Średnia w klasie Multimedia
  (133 - 1042, n=57, ostatnie 2 lata)
372 Seconds * -8%
Apple MacBook Air 15 M5
Apple M5 10-Core GPU, Apple M5 10-Core
344 Seconds * -0%
Microsoft Surface Laptop 15 Gen 8
Intel Arc B390 12 Xe3 Panther Lake iGPU, Intel Core Ultra X7 368H
343 Seconds *
Dell XPS 16 Core Ultra X7 358H
Intel Arc B390 12 Xe3 Panther Lake iGPU, Intel Core Ultra X7 358H
328 Seconds * +4%
Przeciętny Intel Arc B390 12 Xe3 Panther Lake iGPU
  (282 - 409, n=16)
327 Seconds * +5%
Asus Zenbook A16 UX3607
Qualcomm Adreno X2-90, Qualcomm Snapdragon X2 Elite Extreme X2E-94-100
320 Seconds * +7%
Lenovo ThinkPad X9-15p Gen 1
Intel Arc B390 12 Xe3 Panther Lake iGPU, Intel Core Ultra X7 358H
288 Seconds * +16%
Blender / v3.3 Classroom METAL
Apple MacBook Air 15 M5
Apple M5 10-Core GPU, Apple M5 10-Core
76.3 Seconds *
Średnia w klasie Multimedia
  (17.8 - 68, n=6, ostatnie 2 lata)
37.2 Seconds *
Blender / v3.3 Classroom oneAPI/Intel
Średnia w klasie Multimedia
  (105 - 492, n=17, ostatnie 2 lata)
249 Seconds *
Przeciętny Intel Arc B390 12 Xe3 Panther Lake iGPU
  (105 - 254, n=6)
131.5 Seconds *
Dell XPS 16 Core Ultra X7 358H
Intel Arc B390 12 Xe3 Panther Lake iGPU, Intel Core Ultra X7 358H
105 Seconds *

* ... im mniej tym lepiej

Performance rating - Percent
Średnia w klasie Multimedia
 
95 pt
Lenovo ThinkPad X9-15p Gen 1 -1!
Intel Core Ultra X7 358H, Intel Arc B390 12 Xe3 Panther Lake iGPU
93 pt
Dell XPS 16 Core Ultra X7 358H
Intel Core Ultra X7 358H, Intel Arc B390 12 Xe3 Panther Lake iGPU
88.9 pt
Microsoft Surface Laptop 15 Gen 8
Intel Core Ultra X7 368H, Intel Arc B390 12 Xe3 Panther Lake iGPU
79.3 pt
Asus Zenbook A16 UX3607
Qualcomm Snapdragon X2 Elite Extreme X2E-94-100, Qualcomm Adreno X2-90
73.1 pt
Microsoft Surface Laptop 7 15 Lunar Lake
Intel Core Ultra 7 268V, Intel Arc Graphics 140V
60.5 pt
Apple MacBook Air 15 M5 -5!
Apple M5 10-Core, Apple M5 10-Core GPU
58.3 pt
Cyberpunk 2077 - 1920x1080 Ultra Preset (FSR off)
Lenovo ThinkPad X9-15p Gen 1
Intel Core Ultra X7 358H, Intel Arc B390 12 Xe3 Panther Lake iGPU
50.4 (41.6min, 39.8P1) fps +19%
Dell XPS 16 Core Ultra X7 358H
Intel Core Ultra X7 358H, Intel Arc B390 12 Xe3 Panther Lake iGPU
48.7 (40min, 37.6P1) fps +15%
Średnia w klasie Multimedia
  (6.41 - 112.3, n=64, ostatnie 2 lata)
45.3 fps +7%
Microsoft Surface Laptop 15 Gen 8
Intel Core Ultra X7 368H, Intel Arc B390 12 Xe3 Panther Lake iGPU
42.3 (33.3min) fps
Asus Zenbook A16 UX3607
Qualcomm Snapdragon X2 Elite Extreme X2E-94-100, Qualcomm Adreno X2-90
38.2 (30.9min) fps -10%
Microsoft Surface Laptop 7 15 Lunar Lake
Intel Core Ultra 7 268V, Intel Arc Graphics 140V
29.6 (25min) fps -30%
Apple MacBook Air 15 M5
Apple M5 10-Core, Apple M5 10-Core GPU
23.3 fps -45%
Baldur's Gate 3 - 1920x1080 Ultra Preset AA:T
Średnia w klasie Multimedia
  (7.8 - 158.7, n=61, ostatnie 2 lata)
56 fps +20%
Dell XPS 16 Core Ultra X7 358H
Intel Core Ultra X7 358H, Intel Arc B390 12 Xe3 Panther Lake iGPU
54.3 (48.6min, 49.6P0.1, 51P1) fps +17%
Lenovo ThinkPad X9-15p Gen 1
Intel Core Ultra X7 358H, Intel Arc B390 12 Xe3 Panther Lake iGPU
50.1 (29.6min, 29.8P0.1, 29.9P1) fps +8%
Microsoft Surface Laptop 15 Gen 8
Intel Core Ultra X7 368H, Intel Arc B390 12 Xe3 Panther Lake iGPU
46.6 (42.1min, 42.2P0.1, 43.4P1) fps
Asus Zenbook A16 UX3607
Qualcomm Snapdragon X2 Elite Extreme X2E-94-100, Qualcomm Adreno X2-90
42.5 (28.7min, 29.8P0.1, 39.3P1) fps -9%
Apple MacBook Air 15 M5
Apple M5 10-Core, Apple M5 10-Core GPU
39.4 fps -15%
Microsoft Surface Laptop 7 15 Lunar Lake
Intel Core Ultra 7 268V, Intel Arc Graphics 140V
27.4 fps -41%
GTA V - 1920x1080 Highest AA:4xMSAA + FX AF:16x
Średnia w klasie Multimedia
  (7.92 - 141.6, n=48, ostatnie 2 lata)
55 fps +66%
Lenovo ThinkPad X9-15p Gen 1
Intel Core Ultra X7 358H, Intel Arc B390 12 Xe3 Panther Lake iGPU
46.2 (9.48min, 35.7P1) fps +39%
Dell XPS 16 Core Ultra X7 358H
Intel Core Ultra X7 358H, Intel Arc B390 12 Xe3 Panther Lake iGPU
45.2 (6.18min, 34.5P1) fps +36%
Asus Zenbook A16 UX3607
Qualcomm Snapdragon X2 Elite Extreme X2E-94-100, Qualcomm Adreno X2-90
41.1 (4.34min, 23.8P1) fps +24%
Microsoft Surface Laptop 15 Gen 8
Intel Core Ultra X7 368H, Intel Arc B390 12 Xe3 Panther Lake iGPU
33.2 (4.78min, 24.4P1) fps
Microsoft Surface Laptop 7 15 Lunar Lake
Intel Core Ultra 7 268V, Intel Arc Graphics 140V
25.3 (11.4min, 14.5P1) fps -24%
Final Fantasy XV Benchmark - 1920x1080 High Quality
Lenovo ThinkPad X9-15p Gen 1
Intel Core Ultra X7 358H, Intel Arc B390 12 Xe3 Panther Lake iGPU
57.9 fps +16%
Dell XPS 16 Core Ultra X7 358H
Intel Core Ultra X7 358H, Intel Arc B390 12 Xe3 Panther Lake iGPU
56.2 fps +12%
Średnia w klasie Multimedia
  (7.61 - 144.4, n=51, ostatnie 2 lata)
55.6 fps +11%
Microsoft Surface Laptop 15 Gen 8
Intel Core Ultra X7 368H, Intel Arc B390 12 Xe3 Panther Lake iGPU
50 fps
Microsoft Surface Laptop 7 15 Lunar Lake
Intel Core Ultra 7 268V, Intel Arc Graphics 140V
36.4 fps -27%
Asus Zenbook A16 UX3607
Qualcomm Snapdragon X2 Elite Extreme X2E-94-100, Qualcomm Adreno X2-90
34.5 fps -31%
Strange Brigade - 1920x1080 ultra AA:ultra AF:16
Średnia w klasie Multimedia
  (13.3 - 303, n=50, ostatnie 2 lata)
100.4 fps +13%
Dell XPS 16 Core Ultra X7 358H
Intel Core Ultra X7 358H, Intel Arc B390 12 Xe3 Panther Lake iGPU
90.6 (24.7min, 39.3P1) fps +2%
Microsoft Surface Laptop 15 Gen 8
Intel Core Ultra X7 368H, Intel Arc B390 12 Xe3 Panther Lake iGPU
89.2 (28.1min, 39.2P1) fps
Asus Zenbook A16 UX3607
Qualcomm Snapdragon X2 Elite Extreme X2E-94-100, Qualcomm Adreno X2-90
81.7 (17min, 25.1P1) fps -8%
Microsoft Surface Laptop 7 15 Lunar Lake
Intel Core Ultra 7 268V, Intel Arc Graphics 140V
61.7 (41.5min, 46.9P1) fps -31%
Dota 2 Reborn - 1920x1080 ultra (3/3) best looking
Lenovo ThinkPad X9-15p Gen 1
Intel Core Ultra X7 358H, Intel Arc B390 12 Xe3 Panther Lake iGPU
117.2 (87.1min) fps +47%
Dell XPS 16 Core Ultra X7 358H
Intel Core Ultra X7 358H, Intel Arc B390 12 Xe3 Panther Lake iGPU
96.9 (57min) fps +21%
Średnia w klasie Multimedia
  (30.3 - 170.9, n=52, ostatnie 2 lata)
92.8 fps +16%
Microsoft Surface Laptop 7 15 Lunar Lake
Intel Core Ultra 7 268V, Intel Arc Graphics 140V
82.4 (50.6min) fps +3%
Microsoft Surface Laptop 15 Gen 8
Intel Core Ultra X7 368H, Intel Arc B390 12 Xe3 Panther Lake iGPU
80 (48.4min) fps
Asus Zenbook A16 UX3607
Qualcomm Snapdragon X2 Elite Extreme X2E-94-100, Qualcomm Adreno X2-90
70.7 (51.1min) fps -12%
X-Plane 11.11 - 1920x1080 high (fps_test=3)
Średnia w klasie Multimedia
  (16.9 - 103, n=50, ostatnie 2 lata)
50.6 fps +19%
Lenovo ThinkPad X9-15p Gen 1
Intel Core Ultra X7 358H, Intel Arc B390 12 Xe3 Panther Lake iGPU
42.8 fps +1%
Asus Zenbook A16 UX3607
Qualcomm Snapdragon X2 Elite Extreme X2E-94-100, Qualcomm Adreno X2-90
42.6 fps 0%
Microsoft Surface Laptop 15 Gen 8
Intel Core Ultra X7 368H, Intel Arc B390 12 Xe3 Panther Lake iGPU
42.4 fps
Dell XPS 16 Core Ultra X7 358H
Intel Core Ultra X7 358H, Intel Arc B390 12 Xe3 Panther Lake iGPU
38.8 fps -8%
Microsoft Surface Laptop 7 15 Lunar Lake
Intel Core Ultra 7 268V, Intel Arc Graphics 140V
37.9 fps -11%

Wykres FPS Cyberpunk 2077 ultra

051015202530354045Tooltip
Microsoft Surface Laptop 15 Gen 8 Ultra X7 368H, Arc B390 Panther Lake iGPU: Ø34.9 (28.4-37.5) fps
Lenovo ThinkPad X9-15p Gen 1 Ultra X7 358H, Arc B390 Panther Lake iGPU: Ø44.9 (42.5-46.2) fps
Asus Zenbook A16 UX3607 X2E-94-100, X2-90: Ø32.7 (31.5-33.5) fps
Dell XPS 16 Core Ultra X7 358H Ultra X7 358H, Arc B390 Panther Lake iGPU: Ø46 (42.5-47) fps
Microsoft Surface Laptop 7 15 Lunar Lake Core Ultra 7 268V, Arc 140V: Ø26.8 (25-28) fps
lowmed.highultra
GTA V (2015) 176.4 170.4 87.7 33.2
Dota 2 Reborn (2015) 127 85.6 86.9 80
Final Fantasy XV Benchmark (2018) 116.7 68.7 50
X-Plane 11.11 (2018) 61.8 50.2 42.4
Strange Brigade (2018) 307 120.8 101.7 89.2
Baldur's Gate 3 (2023) 71.6 54.3 47.7 46.6
Cyberpunk 2077 (2023) 67.9 60.4 50 42.3
F1 24 (2024) 111.5 109.1 82 28.5

Emisje i zużycie energii

Szum systemowy

Jednostka chłodząca
Jednostka chłodząca

Surface Laptop 15 jest ogólnie bardzo cichym laptopem, ale układ chłodzenia z pojedynczym wentylatorem ma problemy z wysokim krótkotrwałym TDP wynoszącym 65 W, więc przy większym obciążeniu wentylator dość szybko staje się słyszalny. Podczas grania i naszego testu obciążeniowego zmierzyliśmy do 41.3 dB(A) oraz około 36-37 dB(A) w dwóch trybach pracy o niższej wydajności. Obciążenie GPU powodowało również piszczenie cewek w naszym egzemplarzu testowym.

Hałas

luz
24.9 / 24.9 / 24.9 dB
obciążenie
32.2 / 41.3 dB
  red to green bar
 
 
30 dB
cichy
40 dB(A)
słyszalny
50 dB(A)
irytujący
 
min: dark, med: mid, max: light   Earthworks M23R, Arta (odległość 15 cm)   hałas otoczenia: 24.9 dB(A)
dB(A) 0102030405060708090Deep BassMiddle BassHigh BassLower RangeMidsHigher MidsLower HighsMid HighsUpper HighsSuper Highs2042.340.438.242.72533.333.93533.93138.940.440.136.14040.841.439.639.55039.139.237.339.16335.735.832.532.18031.430.826.925.110028.632.927.324.612525.130.120.822.316025.527.52220.820026.228.524.121.225026.130.624.321.831528.42518.319.14003121.514.416.350031.422.312.614.163030.522.612.413.880028211112.1100027.319.810.912.8125029.319.910.712.616003320.710.412.2200032.62110.111.8250031.520.610.411.8315028.514.910.812.1400025.313.911.212.3500024.71811.512.4630023.816.911.812.6800027.713.711.612.61000018.213.211.612.41250015.313.311.412.21600013.212.410.611.5SPL41.332.224.925.5N3.81.70.70.7median 27.7median 20.7median 11.6median 12.6Delta2.66.13.32.9hearing rangehide median Fan NoiseMicrosoft Surface Laptop 15 Gen 8
Microsoft Surface Laptop 15 Gen 8
Ultra X7 368H, Arc B390 Panther Lake iGPU
Lenovo ThinkPad X9-15p Gen 1
Ultra X7 358H, Arc B390 Panther Lake iGPU
Asus Zenbook A16 UX3607
X2E-94-100, X2-90
Dell XPS 16 Core Ultra X7 358H
Ultra X7 358H, Arc B390 Panther Lake iGPU
Apple MacBook Air 15 M5
M5 10-Core, M5 10-Core GPU
Microsoft Surface Laptop 7 15 Lunar Lake
Core Ultra 7 268V, Arc 140V
Noise
3%
-5%
-2%
3%
wyłączone / środowisko * (dB)
24.9
22.9
8%
24.9
-0%
23.3
6%
23.9
4%
Idle Minimum * (dB)
24.9
22.9
8%
24.9
-0%
23.4
6%
23.9
4%
Idle Average * (dB)
24.9
22.9
8%
24.9
-0%
23.4
6%
23.9
4%
Idle Maximum * (dB)
24.9
22.9
8%
24.9
-0%
25.8
-4%
23.9
4%
Load Average * (dB)
32.2
31.4
2%
27.9
13%
38
-18%
31.8
1%
Cyberpunk 2077 ultra * (dB)
41.3
43.8
-6%
51.1
-24%
38.1
8%
38
8%
Load Maximum * (dB)
41.3
43.7
-6%
51.1
-24%
48.6
-18%
41.9
-1%

* ... im mniej tym lepiej

Temperatura

Aluminiowe powierzchnie mogą się dość mocno nagrzewać pod dużym obciążeniem i zdecydowanie można to odczuć podczas pisania. Dolny panel pozostaje zauważalnie chłodniejszy i bez problemu można trzymać laptop na kolanach. Podczas naszego testu obciążeniowego pobór mocy procesora szybko stabilizuje się na poziomie 28 watów (~79 °C).

Test obciążeniowy danych CPU/iGPU
40.7 °C44.2 °C43 °C
40.2 °C41.5 °C35.6 °C
31.7 °C29.2 °C30.7 °C
maks. w ogóle: 44.2 °C
średnia: 37.4 °C
39.9 °C41 °C39.4 °C
37.2 °C38.2 °C37.2 °C
31.7 °C32.5 °C32 °C
maks. w ogóle: 40.3 °C
średnia: 36.3 °C
zasilacz  42.4 °C | temperatura otoczenia 21 °C | Fluke t3000FC (calibrated), Voltcraft IR-900
(±) Średnia temperatura górnej części przy maksymalnym obciążeniu wynosi 37.4 °C / 99 F, w porównaniu do średniej 31.3 °C / ###class_avg_f# ## F dla urządzeń w klasie Multimedia.
(±) Maksymalna temperatura w górnej części wynosi 44.2 °C / 112 F, w porównaniu do średniej 36.8 °C / 98 F , począwszy od 21 do 71 °C dla klasy Multimedia.
(±) Dno nagrzewa się maksymalnie do 40.3 °C / 105 F, w porównaniu do średniej 39.1 °C / 102 F
(+) W stanie bezczynności średnia temperatura górnej części wynosi 25.4 °C / 78 F, w porównaniu ze średnią temperaturą urządzenia wynoszącą 31.3 °C / ### class_avg_f### F.
(±) 3: The average temperature for the upper side is 37.1 °C / 99 F, compared to the average of 31.3 °C / 88 F for the class Multimedia.
(+) Podpórki pod nadgarstki i touchpad są chłodniejsze niż temperatura skóry i maksymalnie 31.7 °C / 89.1 F i dlatego są chłodne w dotyku.
(-) Średnia temperatura obszaru podparcia dłoni w podobnych urządzeniach wynosiła 28.7 °C / 83.7 F (-3 °C / -5.4 F).
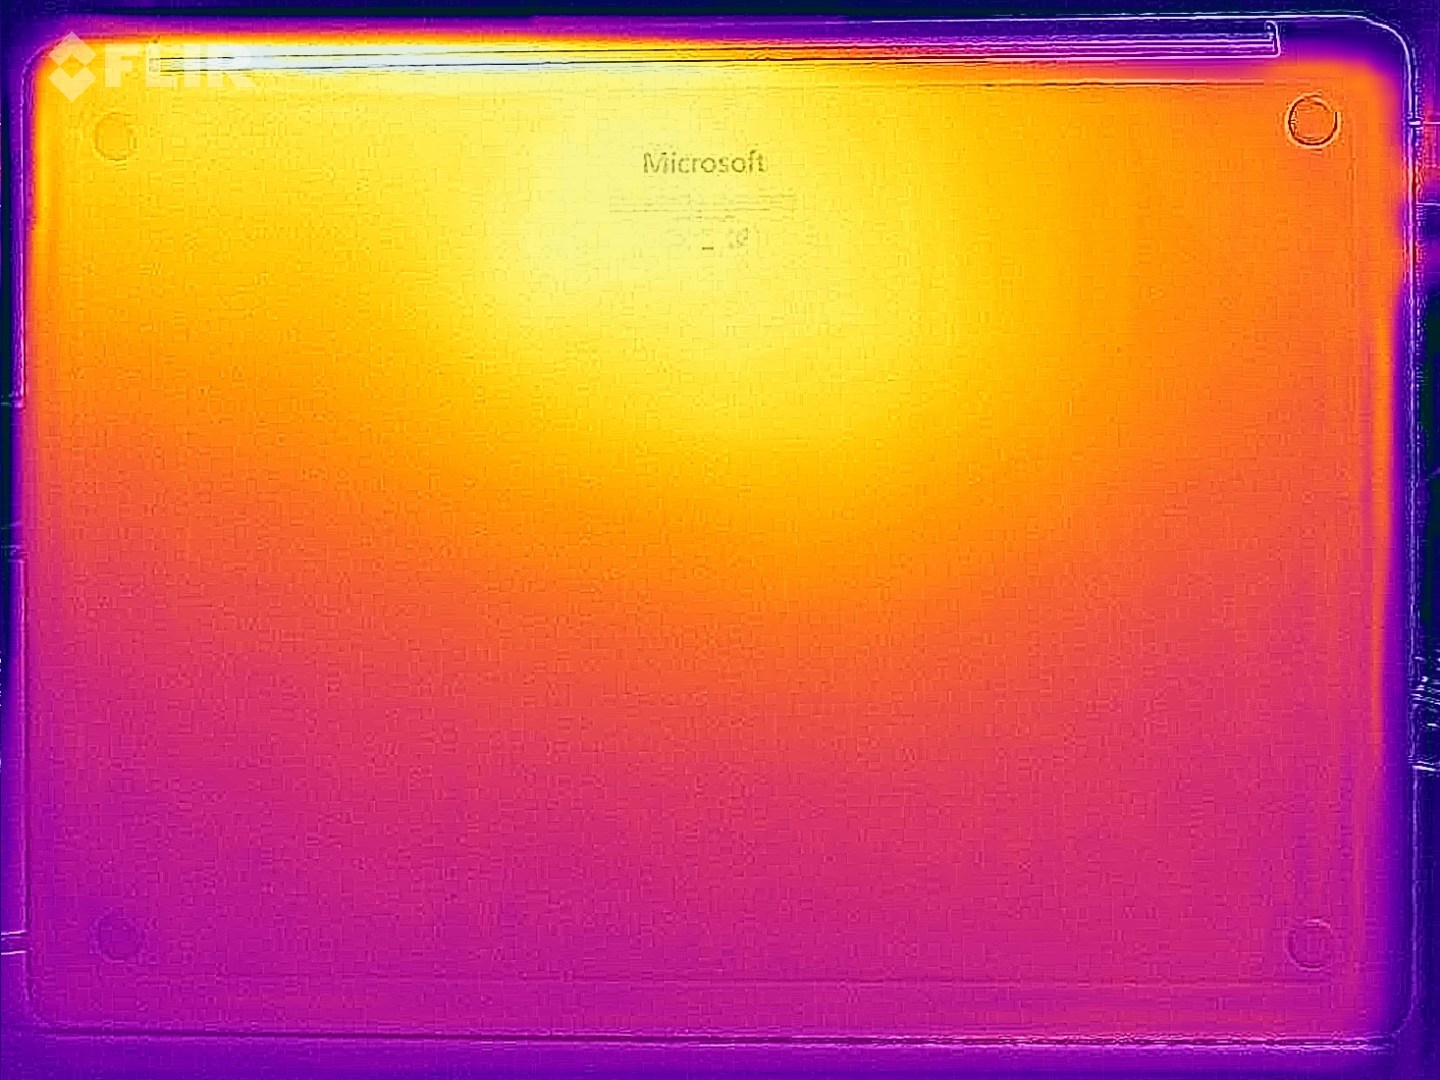
Test obciążeniowy mapy cieplnej (u góry)
Test obciążeniowy mapy cieplnej (na dole)
Microsoft Surface Laptop 15 Gen 8
Ultra X7 368H, Arc B390 Panther Lake iGPU
Lenovo ThinkPad X9-15p Gen 1
Ultra X7 358H, Arc B390 Panther Lake iGPU
Asus Zenbook A16 UX3607
X2E-94-100, X2-90
Dell XPS 16 Core Ultra X7 358H
Ultra X7 358H, Arc B390 Panther Lake iGPU
Apple MacBook Air 15 M5
M5 10-Core, M5 10-Core GPU
Microsoft Surface Laptop 7 15 Lunar Lake
Core Ultra 7 268V, Arc 140V
Heat
-9%
-2%
7%
2%
3%
Maximum Upper Side * (°C)
44.2
43.3
2%
43.2
2%
40.6
8%
44.1
-0%
45.7
-3%
Maximum Bottom * (°C)
40.3
38.6
4%
43.3
-7%
39.8
1%
43.1
-7%
42.9
-6%
Idle Upper Side * (°C)
26
32.6
-25%
26.7
-3%
23.2
11%
24
8%
23.6
9%
Idle Bottom * (°C)
25.8
30.4
-18%
26
-1%
23.8
8%
23.9
7%
23.1
10%

* ... im mniej tym lepiej

Głośniki

System dźwiękowy nadal jest bardzo dobry, choć konkurencyjne rozwiązania są nieco lepsze.

dB(A) 0102030405060708090Deep BassMiddle BassHigh BassLower RangeMidsHigher MidsLower HighsMid HighsUpper HighsSuper Highs2038.242.4253533.43140.140.54039.642.15037.339.66332.534.68026.937.110027.34212520.847.51602251.320024.158.125024.360.531518.364.740014.463.150012.665.963012.464.68001168.4100010.971.6125010.770.8160010.471.1200010.170250010.468.3315010.871.7400011.267500011.565.1630011.866.2800011.665.31000011.662.11250011.4621600010.661.8SPL24.980.8N0.750.4median 11.6median 65.1Delta3.34.332.233.127.830.126.326.32829.135.135.621.822.81941.718.454.715.761.618.464.914.470.320.167.112.468.91371.31369.512.373.31275.411.971.312.367.712.467.911.762.812.461.312.360.512.760.612.660.112.664.714.566.412.465.812.370.11270.225.180.30.651.3median 12.4median 67.10.74.337.338.429.33024.725.526.131.42729.526.136.121.545.418.953.61860.116.76219.268.721.570.415.473.313.269.410.469.51173.19.978.510.574.610.874.710.574.410.672.811.972.512.871.913.669.41465.314.466.11468.713.26013.458.413.25524.984.50.665median 13.2median 69.435.134.430.125.621.323.921.219.421.428.424.821.432.619.852.916.560.314.161.514.464.614.464.11468.914.274.212.473.710.977.910.373.110.274.49.475.29.675.41073.41070.510.8731172.611.473.312.369.412.167.712.766.112.772.712.672.812.472.323.485.10.570median 12.3median 72.71.82.744.343.434.933.735.236.733.532.227.330.334.739.425.149.92254.918.260.918.159.720.466.322.268.41770.414.568.413.368.613.370.412.268.11267.911.773.211.773.911.571.31270.212.36912.373.612.775.112.775.912.876.612.973.612.870.212.759.625.284.80.766.8median 12.8median 70.223.240.442.830.834.230.432.534.935.728.63326.533.92139.318.84418.650.916.350.71857.918.761.215.564.912.562.711.366.411.467.210.769.910.168.710.368.810.670.210.969.711.365.311.46611.964.412.263.912.159.912.158.612.260.712.261.811.859.123.978.80.545.3median 12.1median 63.92.14.1hearing rangehide median Pink NoiseMicrosoft Surface Laptop 15 Gen 8Lenovo ThinkPad X9-15p Gen 1Asus Zenbook A16 UX3607Dell XPS 16 Core Ultra X7 358HApple MacBook Air 15 M5Microsoft Surface Laptop 7 15 Lunar Lake
Wykres częstotliwości (pola wyboru można zaznaczyć i odznaczyć, aby porównać urządzenia)
Microsoft Surface Laptop 15 Gen 8 analiza dźwięku

(±) | głośność głośnika jest średnia, ale dobra (80.8 dB)
Bas 100 - 315 Hz
(±) | zredukowany bas - średnio 11.1% niższy od mediany
(±) | liniowość basu jest średnia (8.6% delta do poprzedniej częstotliwości)
Średnie 400 - 2000 Hz
(+) | zbalansowane środki średnie - tylko 3.7% od mediany
(+) | średnie są liniowe (3.5% delta do poprzedniej częstotliwości)
Wysokie 2–16 kHz
(+) | zrównoważone maksima - tylko 2.3% od mediany
(+) | wzloty są liniowe (4.5% delta do poprzedniej częstotliwości)
Ogólnie 100 - 16.000 Hz
(+) | ogólny dźwięk jest liniowy (11.1% różnicy w stosunku do mediany)
W porównaniu do tej samej klasy
» 17% wszystkich testowanych urządzeń w tej klasie było lepszych, 3% podobnych, 80% gorszych
» Najlepszy miał deltę 5%, średnia wynosiła ###średnia###%, najgorsza wynosiła 45%
W porównaniu do wszystkich testowanych urządzeń
» 7% wszystkich testowanych urządzeń było lepszych, 2% podobnych, 91% gorszych
» Najlepszy miał deltę 4%, średnia wynosiła ###średnia###%, najgorsza wynosiła 136%

Lenovo ThinkPad X9-15p Gen 1 analiza dźwięku

(±) | głośność głośnika jest średnia, ale dobra (80.3 dB)
Bas 100 - 315 Hz
(+) | dobry bas - tylko 4.2% od mediany
(±) | liniowość basu jest średnia (10.2% delta do poprzedniej częstotliwości)
Średnie 400 - 2000 Hz
(+) | zbalansowane środki średnie - tylko 3.9% od mediany
(+) | średnie są liniowe (5.2% delta do poprzedniej częstotliwości)
Wysokie 2–16 kHz
(+) | zrównoważone maksima - tylko 4.3% od mediany
(+) | wzloty są liniowe (2.6% delta do poprzedniej częstotliwości)
Ogólnie 100 - 16.000 Hz
(+) | ogólny dźwięk jest liniowy (8.9% różnicy w stosunku do mediany)
W porównaniu do tej samej klasy
» 11% wszystkich testowanych urządzeń w tej klasie było lepszych, 2% podobnych, 87% gorszych
» Najlepszy miał deltę 5%, średnia wynosiła ###średnia###%, najgorsza wynosiła 45%
W porównaniu do wszystkich testowanych urządzeń
» 3% wszystkich testowanych urządzeń było lepszych, 1% podobnych, 96% gorszych
» Najlepszy miał deltę 4%, średnia wynosiła ###średnia###%, najgorsza wynosiła 136%

Asus Zenbook A16 UX3607 analiza dźwięku

(+) | głośniki mogą odtwarzać stosunkowo głośno (84.5 dB)
Bas 100 - 315 Hz
(±) | zredukowany bas - średnio 6.4% niższy od mediany
(±) | liniowość basu jest średnia (8.3% delta do poprzedniej częstotliwości)
Średnie 400 - 2000 Hz
(+) | zbalansowane środki średnie - tylko 3.9% od mediany
(+) | średnie są liniowe (4.2% delta do poprzedniej częstotliwości)
Wysokie 2–16 kHz
(+) | zrównoważone maksima - tylko 3.3% od mediany
(+) | wzloty są liniowe (5% delta do poprzedniej częstotliwości)
Ogólnie 100 - 16.000 Hz
(+) | ogólny dźwięk jest liniowy (9.8% różnicy w stosunku do mediany)
W porównaniu do tej samej klasy
» 14% wszystkich testowanych urządzeń w tej klasie było lepszych, 2% podobnych, 84% gorszych
» Najlepszy miał deltę 5%, średnia wynosiła ###średnia###%, najgorsza wynosiła 45%
W porównaniu do wszystkich testowanych urządzeń
» 4% wszystkich testowanych urządzeń było lepszych, 1% podobnych, 95% gorszych
» Najlepszy miał deltę 4%, średnia wynosiła ###średnia###%, najgorsza wynosiła 136%

Dell XPS 16 Core Ultra X7 358H analiza dźwięku

(+) | głośniki mogą odtwarzać stosunkowo głośno (85.1 dB)
Bas 100 - 315 Hz
(±) | zredukowany bas - średnio 7.6% niższy od mediany
(+) | bas jest liniowy (6.1% delta do poprzedniej częstotliwości)
Średnie 400 - 2000 Hz
(+) | zbalansowane środki średnie - tylko 2.1% od mediany
(+) | średnie są liniowe (3.4% delta do poprzedniej częstotliwości)
Wysokie 2–16 kHz
(+) | zrównoważone maksima - tylko 2.3% od mediany
(+) | wzloty są liniowe (4.1% delta do poprzedniej częstotliwości)
Ogólnie 100 - 16.000 Hz
(+) | ogólny dźwięk jest liniowy (6.2% różnicy w stosunku do mediany)
W porównaniu do tej samej klasy
» 4% wszystkich testowanych urządzeń w tej klasie było lepszych, 0% podobnych, 96% gorszych
» Najlepszy miał deltę 5%, średnia wynosiła ###średnia###%, najgorsza wynosiła 45%
W porównaniu do wszystkich testowanych urządzeń
» 0% wszystkich testowanych urządzeń było lepszych, 0% podobnych, 99% gorszych
» Najlepszy miał deltę 4%, średnia wynosiła ###średnia###%, najgorsza wynosiła 136%

Apple MacBook Air 15 M5 analiza dźwięku

(+) | głośniki mogą odtwarzać stosunkowo głośno (84.8 dB)
Bas 100 - 315 Hz
(±) | zredukowany bas - średnio 6.8% niższy od mediany
(+) | bas jest liniowy (6.6% delta do poprzedniej częstotliwości)
Średnie 400 - 2000 Hz
(+) | zbalansowane środki średnie - tylko 2% od mediany
(+) | średnie są liniowe (3.3% delta do poprzedniej częstotliwości)
Wysokie 2–16 kHz
(+) | zrównoważone maksima - tylko 3.6% od mediany
(+) | wzloty są liniowe (3.2% delta do poprzedniej częstotliwości)
Ogólnie 100 - 16.000 Hz
(+) | ogólny dźwięk jest liniowy (7.7% różnicy w stosunku do mediany)
W porównaniu do tej samej klasy
» 2% wszystkich testowanych urządzeń w tej klasie było lepszych, 0% podobnych, 98% gorszych
» Najlepszy miał deltę 5%, średnia wynosiła ###średnia###%, najgorsza wynosiła 53%
W porównaniu do wszystkich testowanych urządzeń
» 1% wszystkich testowanych urządzeń było lepszych, 0% podobnych, 98% gorszych
» Najlepszy miał deltę 4%, średnia wynosiła ###średnia###%, najgorsza wynosiła 136%

Microsoft Surface Laptop 7 15 Lunar Lake analiza dźwięku

(±) | głośność głośnika jest średnia, ale dobra (78.8 dB)
Bas 100 - 315 Hz
(±) | zredukowany bas - średnio 9.3% niższy od mediany
(±) | liniowość basu jest średnia (8.4% delta do poprzedniej częstotliwości)
Średnie 400 - 2000 Hz
(+) | zbalansowane środki średnie - tylko 4.4% od mediany
(+) | średnie są liniowe (3% delta do poprzedniej częstotliwości)
Wysokie 2–16 kHz
(+) | zrównoważone maksima - tylko 2.4% od mediany
(+) | wzloty są liniowe (4.1% delta do poprzedniej częstotliwości)
Ogólnie 100 - 16.000 Hz
(+) | ogólny dźwięk jest liniowy (11.4% różnicy w stosunku do mediany)
W porównaniu do tej samej klasy
» 4% wszystkich testowanych urządzeń w tej klasie było lepszych, 2% podobnych, 95% gorszych
» Najlepszy miał deltę 7%, średnia wynosiła ###średnia###%, najgorsza wynosiła 53%
W porównaniu do wszystkich testowanych urządzeń
» 8% wszystkich testowanych urządzeń było lepszych, 2% podobnych, 90% gorszych
» Najlepszy miał deltę 4%, średnia wynosiła ###średnia###%, najgorsza wynosiła 136%

Zużycie energii i czas pracy na baterii

Zasilacz 65 W jest niewystarczający.

Wariant Panther Lake jest bardziej energooszczędny w stanie bezczynności niż starszy model Lunar Lake, mimo zmodernizowanego wyświetlacza. Czas pracy na baterii w naszym teście Wi-Fi jest jednak nieco krótszy, co wynika z wyższego krótkotrwałego TDP. Wyniki nadal są jednak bardzo dobre: niemal 16 godzin w naszym teście Wi-Fi przy jasności 150 nitów i 8,5 godziny przy maksymalnej jasności. Zasilacz o mocy 65 W jest jednak niewystarczający, co trudno uznać za zaskoczenie przy krótkotrwałym TDP wynoszącym 65 W. Oznacza to, że przy szczytowym obciążeniu konieczne jest korzystanie również z energii akumulatora. Wypróbowaliśmy także zasilacz o mocy 140 W, ale urządzenie po prostu nie pobiera więcej energii.

Pobór mocy
wyłączony / stan wstrzymaniadarklight 0.28 / 0.38 W
luzdarkmidlight 2 / 7.6 / 8.1 W
obciążenie midlight 54.4 / 62.6 W
 color bar
Legenda: min: dark, med: mid, max: light        Metrahit Energy

Pobór mocy Cyberpunk / Test obciążeniowy

051015202530354045505560Tooltip
Microsoft Surface Laptop 15 Gen 8; 1280x720 Prime95 28.10 and Furmark 1.25: Ø51.8 (46.4-62.3) Watt
Microsoft Surface Laptop 15 Gen 8; Idle 150cd/m2: Ø4.01 (3.89-4.61) Watt
Microsoft Surface Laptop 15 Gen 8; Cyberpunk 2077 FHD ultra no FSR 150cd: Ø51.1 (47.7-57.2) Watt

Pobór mocy monitora zewnętrznego

051015202530354045505560Tooltip
Microsoft Surface Laptop 15 Gen 8; Prime95 V2810 Stress (external Monitor): Ø54.6 (38.9-62.5) Watt
Microsoft Surface Laptop 15 Gen 8; Cinebench R23 Single (external Monitor): Ø25.1 (23.8-34.4) Watt
Microsoft Surface Laptop 15 Gen 8; Cinebench R23 Multi (external Monitor): Ø57.3 (53.5-62.6) Watt
Microsoft Surface Laptop 15 Gen 8; 1280x720 FurMark 1.19 GPU Stress Test (external Monitor): Ø56.4 (50.3-61.2) Watt
Microsoft Surface Laptop 15 Gen 8; Idle 1min (external Monitor): Ø6.93 (6.67-7.61) Watt
Microsoft Surface Laptop 15 Gen 8; Cyberpunk 2077 FHD ultra no FSR (external Monitor): Ø51.8 (50.9-55.1) Watt
Wydajność akumulatora
WiFi Websurfing
15h 46min
WiFi Websurfing max. Brightness
8h 35min
Battery Runtime
WiFi Websurfing
Lenovo ThinkPad X9-15p Gen 1
Ultra X7 358H, Arc B390 Panther Lake iGPU, 88 Wh (Edge 150, 60 Hz)
18.3 h +16%
Microsoft Surface Laptop 7 15 Lunar Lake
Core Ultra 7 268V, Arc 140V, 64 Wh
17.7 h +12%
Apple MacBook Air 15 M5
M5 10-Core, M5 10-Core GPU, 66.5 Wh
17.2 h +9%
Microsoft Surface Laptop 15 Gen 8
Ultra X7 368H, Arc B390 Panther Lake iGPU, 66 Wh
15.8 h
Asus Zenbook A16 UX3607
X2E-94-100, X2-90, 70 Wh
13 h -18%
Średnia w klasie Multimedia
  (4.37 - 26.6, n=59, ostatnie 2 lata)
13 h -18%
Dell XPS 16 Core Ultra X7 358H
Ultra X7 358H, Arc B390 Panther Lake iGPU, 70 Wh
10.3 h -35%
WiFi Websurfing max. Brightness
Lenovo ThinkPad X9-15p Gen 1
Ultra X7 358H, Arc B390 Panther Lake iGPU, 88 Wh (Edge 150, 30 - 120 Hz VRR)
9.6 h +12%
Lenovo ThinkPad X9-15p Gen 1
Ultra X7 358H, Arc B390 Panther Lake iGPU, 88 Wh (Edge 150, 60 Hz)
9.2 h +7%
Microsoft Surface Laptop 7 15 Lunar Lake
Core Ultra 7 268V, Arc 140V, 64 Wh
8.8 h +2%
Microsoft Surface Laptop 15 Gen 8
Ultra X7 368H, Arc B390 Panther Lake iGPU, 66 Wh
8.6 h
Średnia w klasie Multimedia
  (3.53 - 11.6, n=30, ostatnie 2 lata)
7.28 h -15%
Apple MacBook Air 15 M5
M5 10-Core, M5 10-Core GPU, 66.5 Wh
6.7 h -22%
Asus Zenbook A16 UX3607
X2E-94-100, X2-90, 70 Wh
6.4 h -26%

Ocena Notebookcheck

Microsoft Surface Laptop 15 Gen 8 - 05/10/2026 v8
Andreas Osthoff

Wykonanie
84 / 98 → 86%
Klawiatura
85%
Myszka
94%
Komunikacja
75 / 80 → 93%
Waga
67 / 20-74 → 87%
Akumulator
90 / 95 → 95%
Wyświetlacz
84%
Wydajność w grach
58 / 88 → 65%
Wydajność w programach użytkowych
89 / 92 → 96%
AI Performance
90%
Temperatura
91%
Hałas
77 / 95 → 81%
Głośniki
87%
Kamerka
40 / 75 → 53%
Średnio
75%
85%
Multimedia - Ważona średnia
CO2 Emissions
77.1%
Materials
50%
Packaging
100%
Power Use
88.7%
Repairability
60%
Software Updates
22.3%
Recycle Logo Total Sustainability Score: 66.4%

Porównanie potencjalnych konkurentów

Obraz
Model / recenzja
Cena
Waga
Wysokość
Ekran
1.
85.3%
Microsoft Surface Laptop 15 Gen 8
Intel Core Ultra X7 368H ⎘
Intel Arc B390 12 Xe3 Panther Lake iGPU ⎘
16 GB Pamięć, 256 GB SSD
Amazon:
1. $238.94
Microsoft Surface Laptop 3 1...
2. $483.98
Microsoft Surface Laptop 5 1...
3. $685.00
Microsoft Surface Laptop 4 1...
Cena katalogowa: 2400€
1.7 kg18.3 mm15.00"
3270x2180
262 PPI
IPS
2.
89.9%
Lenovo ThinkPad X9-15p Gen 1
Intel Core Ultra X7 358H ⎘
Intel Arc B390 12 Xe3 Panther Lake iGPU ⎘
32 GB Pamięć, 1024 GB SSD
Cena katalogowa: 2500 Euro1.5 kg18 mm15.30"
2880x1800
222 PPI
OLED
3.
87.5%
Asus Zenbook A16 UX3607
Qualcomm Snapdragon X2 Elite Extreme X2E-94-100 ⎘
Qualcomm Adreno X2-90 ⎘
48 GB Pamięć, 1000 GB SSD
Amazon:
1. $2,299.99
ASUS Zenbook A16 AI Laptop, ...
2. $2,299.99
ASUS Zenbook A16 16" Laptop,...
3. $2,059.99
ASUS Zenbook A16 AI Laptop, ...
1.2 kg16.5 mm16.00"
2880x1800
212 PPI
OLED
4.
87.2%
Dell XPS 16 Core Ultra X7 358H
Intel Core Ultra X7 358H ⎘
Intel Arc B390 12 Xe3 Panther Lake iGPU ⎘
32 GB Pamięć
Amazon:
1. $1,977.99
Dell Premium 16 (Previously ...
2. $2,599.00
Dell Premium 16 (XPS 16 2025...
3. $3,624.48
Dell 16 Premium (XPS 16 2025...
Cena katalogowa: 2350 USD
1.7 kg14.62 mm16.00"
3200x2000
236 PPI
OLED
5.
91.6%
Apple MacBook Air 15 M5
Apple M5 10-Core ⎘
Apple M5 10-Core GPU ⎘
32 GB Pamięć, 2048 GB SSD
1.5 kg11.5 mm15.30"
2880x1864
224 PPI
IPS
6.
87.4%
Microsoft Surface Laptop 7 15 Lunar Lake
Intel Core Ultra 7 268V ⎘
Intel Arc Graphics 140V ⎘
32 GB Pamięć, 1024 GB SSD
Cena katalogowa: 2760€1.7 kg18.3 mm15.00"
2496x1664
200 PPI
IPS

Przezroczystość

Wyboru urządzeń do recenzji dokonuje nasza redakcja. Próbka testowa została udostępniona autorowi jako pożyczka od producenta lub sprzedawcy detalicznego na potrzeby tej recenzji. Pożyczkodawca nie miał wpływu na tę recenzję, producent nie otrzymał też kopii tej recenzji przed publikacją. Nie było obowiązku publikowania tej recenzji. Jako niezależna firma medialna, Notebookcheck nie podlega władzy producentów, sprzedawców detalicznych ani wydawców.

Tak testuje Notebookcheck

Każdego roku Notebookcheck niezależnie sprawdza setki laptopów i smartfonów, stosując standardowe procedury, aby zapewnić porównywalność wszystkich wyników. Od około 20 lat stale rozwijamy nasze metody badawcze, ustanawiając przy tym standardy branżowe. W naszych laboratoriach testowych doświadczeni technicy i redaktorzy korzystają z wysokiej jakości sprzętu pomiarowego. Testy te obejmują wieloetapowy proces walidacji. Nasz kompleksowy system ocen opiera się na setkach uzasadnionych pomiarów i benchmarków, co pozwala zachować obiektywizm.
Google LogoAdd as a preferred source on Google
Mail Logo
> laptopy testy i recenzje notebooki > Laptopy > Intel wyraźnie pokonuje Snapdragona - recenzja Microsoft Surface Laptop 15 Gen 8
Andreas Osthoff, 2026-10- 6 (Update: 2026-10- 6)