Notebookcheck Logo
Teaser

Smukły OLED dla graczy z RTX 5070 i Lunar Lake - recenzja Acer Predator Triton 14 AI

Problemy z OLED.

Acer Predator Triton 14 to smukły, 14-calowy komputer dla graczy z ekranem dotykowym OLED, skierowany do kreatywnych użytkowników i graczy. Łączy w sobie wydajny procesor Lunar Lake ze 110-watową kartą graficzną GeForce RTX 5070. Jednak test najwyraźniej wykazał słabości OLED i hałasu wentylatora.
Andreas Osthoff, 👁 Andreas Osthoff (tłumaczenie DeepL / Ninh Duy) Opublikowany 🇺🇸 🇩🇪 ...
AI Blackwell RTX 5000 Gaming Intel Laptop / Notebook Lunar Lake Thunderbolt Touchscreen Wi-Fi 7 Windows

Werdykt - Predator Triton 14 AI nie jest przekonujący

Predator Triton 14 AI to kompaktowy komputer dla graczy w ofercie firmy Acer, który zachwyca przede wszystkim wysokiej jakości obudową i wygodnymi urządzeniami wejściowymi. Połączenie wydajnego procesora Lunar Lake i szybkiej karty graficznej GeForce RTX 5070 nie jest idealne, ponieważ procesor nieco spowalnia kartę graficzną podczas grania, a wydajność wielordzeniowa jest po prostu znacznie słabsza niż u konkurencji. Ponadto chłodzenie staje się nieprzyjemnie głośne, jeśli naprawdę chcemy wywołać pełną wydajność.

Ekran dotykowy OLED również nie był przekonujący. Największym problemem jest wyraźnie widoczny efekt rastra, który znacząco pogarsza subiektywną jakość obrazu. Występuje również PWM o bardzo niskiej częstotliwości, a odchylenia kolorów nie są idealne do przetwarzania obrazu.

W konkurencyjnym porównaniu z Asus ROG Zephyrus G14 i Razer Blade predator Triton nie jest tak naprawdę konkurencyjny. Poza problemami z jakością obrazu, Acer jest również zauważalnie droższy i kosztuje 2999 euro (~3529 USD).

Za

+ wysokiej jakości obudowa
+ Thunderbolt 4 i Wi-Fi 7
+ wygodna klawiatura
+ haptyczny touchpad z obsługą rysika
+ przyzwoity czas pracy na baterii

Przeciw

- widoczny efekt rastrowy panelu OLED
- bardzo głośny wentylator
- powolny czytnik kart
- stosunkowo wolny procesor
- Brak możliwości rozbudowy pamięci RAM
- wysokie zużycie energii w trybie czuwania

Cena i dostępność

Acer Predator Triton 14 AI jest dostępny w sklepach internetowych w cenie 2 999 euro (~3529 USD).

Amazon Logo
$69.99
PowerPortnerLink 330W 280W Charger Compatible with Acer Predator Helios Neo 18 16 14 16S Helios/Triton 18 16 300 500 700 3D 17 X Nitro 5 17 18 16 14 Series PHN18 PHN16 PH18-71 Laptop
  • $2,599.99
    acer Predator Triton 14 AI PT14-52T-96T3 Copilot+ PC – 14.5″ WQXGA+ OLED 120 Hz Touch | Intel Core Ultra 9 288V | NVIDIA GeForce RTX 5070 | 32 GB LPDDR5X | 2 TB PCIe

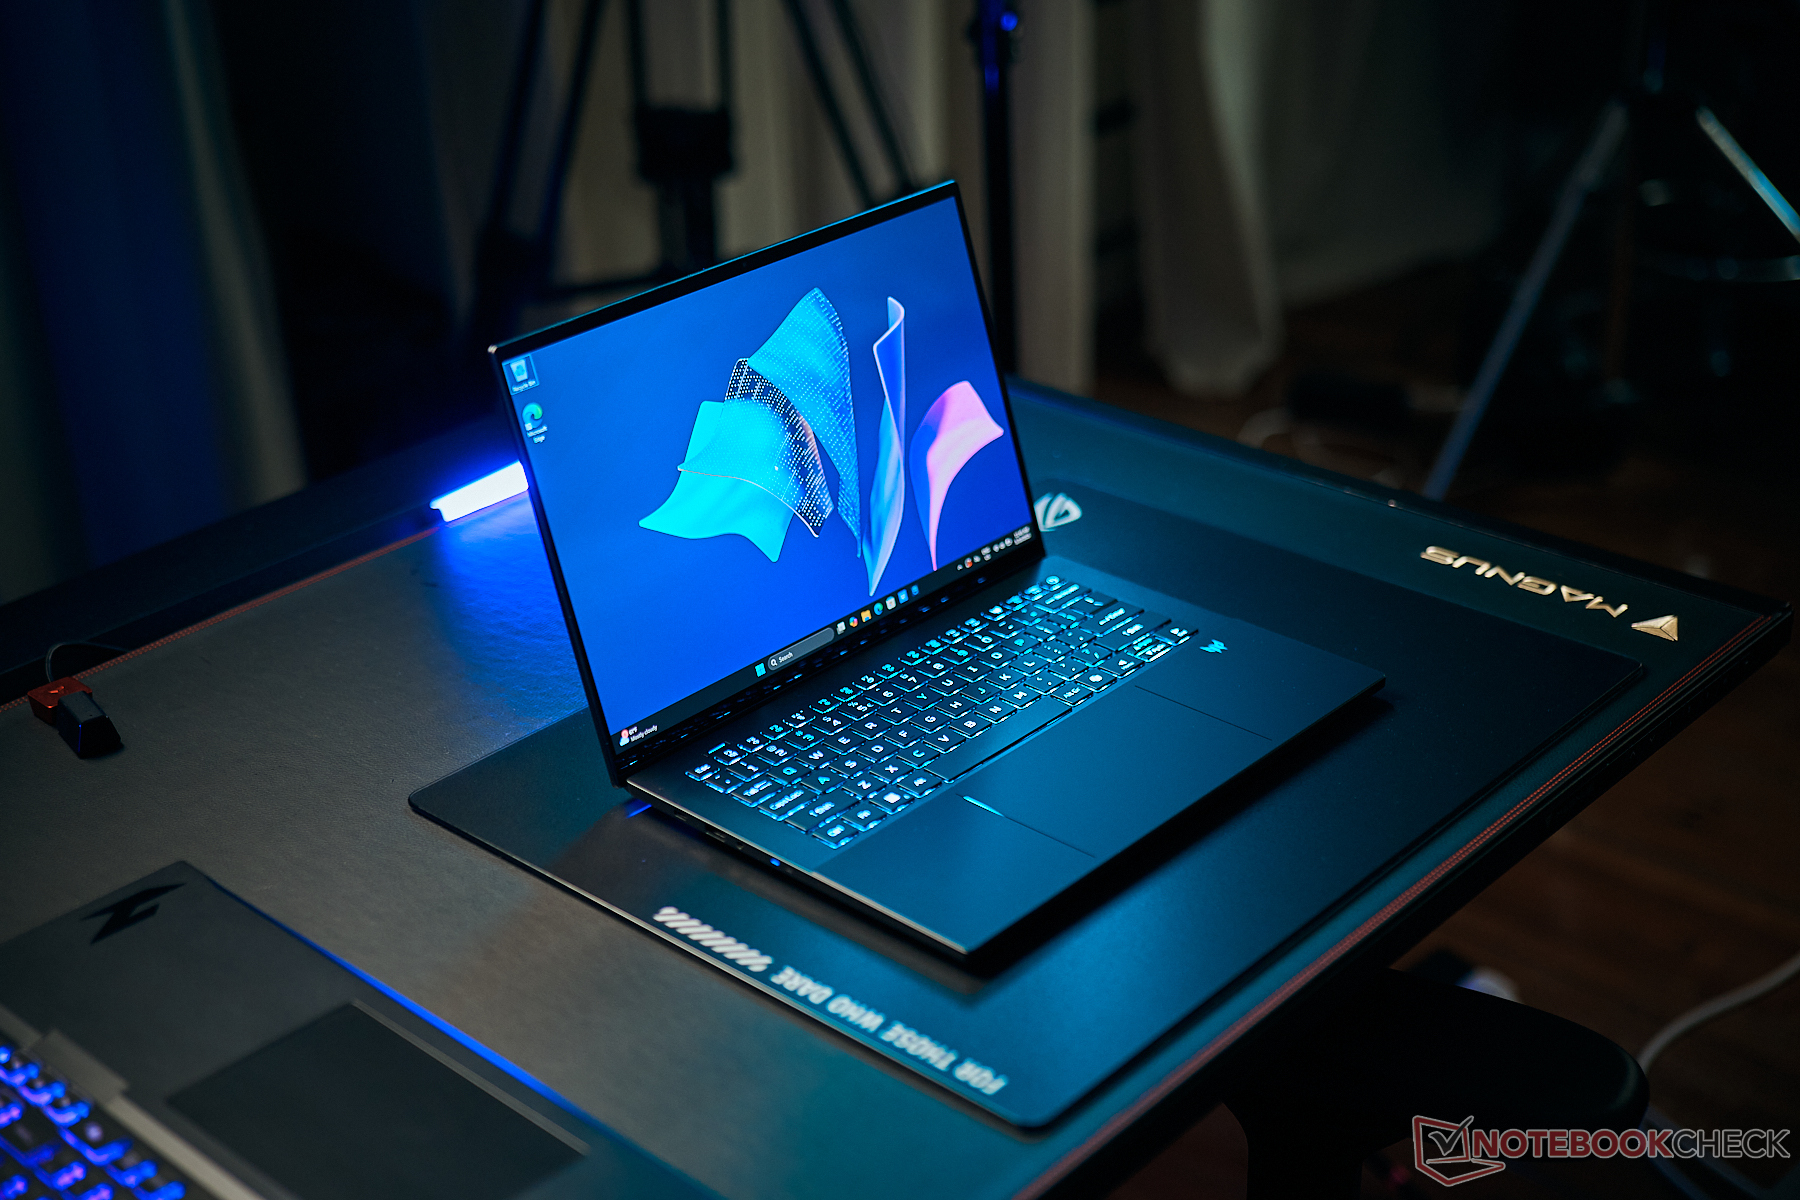
Wraz z Predator Triton 14 AI, Acer oferuje kompaktowy laptop do gier z procesorem Lunar Lake, laptopem GeForce RTX 5070 i ekranem dotykowym OLED. Tylko jeden model z 32 GB pamięci RAM i 2 TB dyskiem SSD jest obecnie dostępny w sklepach w cenie 2 999 EUR (~ 3529 USD).

Specyfikacje

Acer Predator Triton 14 AI PT14-52
Procesor
Intel Core Ultra 9 288V 8 x 3.3 - 5.1 GHz, 37 W PL2 / Short Burst, 37 W PL1 / Sustained, Lunar Lake
Karta grafiki
NVIDIA GeForce RTX 5070 Laptop - 8 GB VRAM, rdzeń: 2535 MHz, pamięć: 1481 MHz, 110 W TDP ( w tym 25 W Dynamic Boost), GDDR7, 591.59, Optimus, MUX-Switch
Pamięć
32 GB 
, LPDDR5x-8533, Dual-Channel, onboard
Matryca
14.50 cali 16:10, 2880 x 1800 pikseli 234 PPI, capacitive, ATNA45AF03-0, OLED, refleksująca: tak, HDR, 120 Hz
Dysk twardy
Micron 3400 1TB MTFDKBA1T0TFH, 1024 GB 
, M.2 PCIe, 870 GB wolne miejsce
Karta dźwiękowa
Intel Lunar Lake SOC - cAVS (Audio, Voice, Speech)
Złącza
2 USB 3.0, 1 USB 3.1 Gen2, 1 USB4 40 Gbps, 1 Thunderbolt 4, USB-C Power Delivery (PD), 1 HDMI, 2 DisplayPort, gniazda audio: 3.5mm, czytnik kart: microSD, Czujnik jasności
Łączność
Intel Killer AX1775s 320MHz (a/b/g/h/n = Wi-Fi 4/ac = Wi-Fi 5/ax = Wi-Fi 6/ Wi-Fi 6E 6 GHz), Bluetooth 5.4
Gabaryty
wysokość x szerokość x głębokość (mm): 17.31 x 320 x 221
Akumulator
76 Wh, 4930 mAh litowo-polimerowy
System operacyjny
Microsoft Windows 11 Home
Kamera
kamerka: 1080p + IR
Inne
głośniki: Stereo, klawiatura: Chiclet, podświetlanie klawiatury: tak, 140W PSU, 24 miesiące(y) gwarancji
Waga
1.587 kg, zasilacz: 496 g
Cena
2999 PLN
Uwaga: Producent może używać komponentów pochodzących od różnych dostawców, w tym paneli wyświetlaczy, napędów lub kart pamięci o podobnych specyfikacjach.


Walizka i wyposażenie

Podświetlane logo
Podświetlane logo

Acer zastosował czarną metalową obudowę frezowaną CNC, która ogólnie jest bardzo wysokiej jakości. Jakość wykonania jest doskonała, a stabilność jest bardzo dobra (zarówno jednostki bazowej, jak i pokrywy), tylko zawiasy (maksymalny kąt otwarcia 135 stopni) mogłyby być nieco ciaśniejsze, ponieważ występuje lekkie odbicie. Oprócz podświetlanej klawiatury, dwa logotypy (pokrywa i jednostka bazowa) mogą być również podświetlane w dowolnym kolorze. Gdy podświetlenie jest wyłączone, kompaktowy gracz wygląda bardzo prosto i nie jest szczególnie zauważalny. Powierzchnie są dość podatne na odciski palców, ale są również łatwe do czyszczenia.

Złącza znajdują się po obu stronach i wszystkie ważne standardy są tutaj dostępne. Czytnik kart microSD po prawej stronie jest bardzo wolny, a kamera internetowa 1080p (w tym IR do rozpoznawania twarzy) również nie robi szczególnie dobrych zdjęć. Moduł Wi-Fi obsługuje aktualny standard Wi-Fi 7 i osiąga bardzo dobre i stabilne prędkości transferu.

Porównanie rozmiarów

344.9 mm 255.4 mm 21.5 mm 1.9 kg324.12 mm 255.4 mm 20.9 mm 1.9 kg320 mm 221 mm 17.31 mm 1.6 kg313 mm 233 mm 18 mm 1.6 kg311 mm 227 mm 19.9 mm 1.5 kg311 mm 220 mm 18.3 mm 1.6 kg310.7 mm 224.3 mm 16.2 mm 1.6 kg297 mm 210 mm 1 mm 5.7 g
Po lewej: USB-C 3.2 Gen.2 (10 Gbit/s, tryb DisplayPort ALT, Power Delivery), USB-A 3.2 Gen.1 (5 Gbit/s), audio 3,5 mm
Po prawej: czytnik kart microSD, USB-C 4.0 z Thunderbolt 4 (40 Gbit/s, tryb DisplayPort ALT, Power Delivery), USB-A 3.2 Gen.1 (5 Gbit/s), HDMI 2.1
SD Card Reader
average JPG Copy Test (av. of 3 runs)
Razer Blade 14 2025
AMD Ryzen AI 9 365 (Angelbird AV Pro V60)
202 MB/s +767%
Asus ROG Zephyrus G14 2025 GA403WW
AMD Ryzen AI 9 HX 370 (Angelbird AV Pro V60)
187 MB/s +703%
Średnia w klasie Gaming
  (20 - 210, n=70, ostatnie 2 lata)
113.5 MB/s +387%
Asus TUF Gaming A14 FA401WV-WB94
AMD Ryzen AI 9 HX 370 (Angelbird AV Pro V60)
58.1 MB/s +149%
Acer Predator Helios Neo 14 (2024)
Intel Core Ultra 9 185H (AV PRO microSD 128 GB V60)
26 MB/s +12%
Acer Predator Triton 14 AI PT14-52
Intel Core Ultra 9 288V (Angelbird AV Pro V60)
23.3 MB/s
maximum AS SSD Seq Read Test (1GB)
Asus TUF Gaming A14 FA401WV-WB94
AMD Ryzen AI 9 HX 370 (Angelbird AV Pro V60)
226.1 MB/s +787%
Razer Blade 14 2025
AMD Ryzen AI 9 365 (Angelbird AV Pro V60)
211.3 MB/s +729%
Asus ROG Zephyrus G14 2025 GA403WW
AMD Ryzen AI 9 HX 370 (Angelbird AV Pro V60)
210.6 MB/s +726%
Średnia w klasie Gaming
  (25.5 - 261, n=66, ostatnie 2 lata)
143.6 MB/s +463%
Acer Predator Helios Neo 14 (2024)
Intel Core Ultra 9 185H (AV PRO microSD 128 GB V60)
27 MB/s +6%
Acer Predator Triton 14 AI PT14-52
Intel Core Ultra 9 288V (Angelbird AV Pro V60)
25.5 MB/s
Networking
Acer Predator Triton 14 AI PT14-52
Intel Killer AX1775s 320MHz
iperf3 transmit AXE11000
1563 (min: 1384) MBit/s ∼84%
iperf3 receive AXE11000
1656 (min: 1589) MBit/s ∼95%
Razer Blade 14 2025
Mediatek Wi-Fi 7 MT7925 Wireless LAN Card
iperf3 transmit AXE11000
1842 (min: 1618) MBit/s ∼99%
iperf3 receive AXE11000
1719 (min: 1648) MBit/s ∼99%
Asus ROG Zephyrus G14 2025 GA403WW
Mediatek Wi-Fi 7 MT7925 Wireless LAN Card
iperf3 transmit AXE11000
1862 (min: 1777) MBit/s ∼100%
iperf3 receive AXE11000
1741 (min: 1698) MBit/s ∼100%
Acer Predator Helios Neo 14 (2024)
Killer Wi-Fi 6E AX1675i 160MHz Wireless Network Adapter
iperf3 transmit AXE11000
1222 (min: 552) MBit/s ∼66%
iperf3 receive AXE11000
1691 (min: 1653) MBit/s ∼97%
Asus TUF Gaming A14 FA401WV-WB94
MediaTek Wi-Fi 6E MT7922 160MHz Wireless LAN Card
iperf3 transmit AXE11000
746 (min: 470) MBit/s ∼40%
iperf3 receive AXE11000
857 (min: 706) MBit/s ∼49%
iperf3 transmit AXE11000 6GHz
1102 (min: 1056) MBit/s ∼85%
iperf3 receive AXE11000 6GHz
1187 (min: 1171) MBit/s ∼85%
HP Omen Transcend 14-fb0014
Intel Wi-Fi 7 BE200 320MHz
iperf3 transmit AXE11000
1200 (min: 623) MBit/s ∼64%
iperf3 receive AXE11000
1418 (min: 1323) MBit/s ∼81%
iperf3 transmit AXE11000 6GHz
1298 (min: 1188) MBit/s ∼100%
iperf3 receive AXE11000 6GHz
1402 (min: 1366) MBit/s ∼100%
0501001502002503003504004505005506006507007508008509009501000105011001150120012501300135014001450150015501600165017001750Tooltip
Acer Predator Triton 14 AI PT14-52; iperf3 transmit AXE11000; iperf 3.1.3: Ø1563 (1384-1792)
Acer Predator Triton 14 AI PT14-52; iperf3 receive AXE11000; iperf 3.1.3: Ø1656 (1589-1704)
ColorChecker
7.6 ∆E
9.2 ∆E
16.2 ∆E
13 ∆E
14.5 ∆E
12 ∆E
4.8 ∆E
15.8 ∆E
4.3 ∆E
5.8 ∆E
8.9 ∆E
7.1 ∆E
10.3 ∆E
12.8 ∆E
4.6 ∆E
7 ∆E
8.3 ∆E
18.7 ∆E
2.7 ∆E
10 ∆E
11.4 ∆E
11.3 ∆E
8.9 ∆E
3.4 ∆E
ColorChecker Acer Predator Triton 14 AI PT14-52: 9.53 ∆E min: 2.75 - max: 18.69 ∆E

Konserwacja

Dolna pokrywa obudowy jest zabezpieczona kilkoma śrubami Torx (T6) i można ją łatwo zdjąć. Pamięć RAM jest zintegrowana z procesorem, więc prace konserwacyjne ograniczają się do wentylatorów, baterii, dysku SSD M.2 i modułu WLAN.

Struktura wewnętrzna
Moduł WLAN
Moduł WLAN
M.2-2280 SSD
M.2-2280 SSD

Zrównoważony rozwój

Acer nie podaje żadnych informacji na temat emisjiCO2 ani wykorzystania materiałów pochodzących z recyklingu. Opakowanie może być w pełni poddane recyklingowi.

Urządzenia wejściowe - Wygodna klawiatura RGB

Klawiatura RGB oferuje bardzo komfortowe pisanie i nawet długie teksty można pisać bez żadnych problemów. W porównaniu do jednostki bazowej, obudowa wokół klawiatury jest nieco obniżona, dlatego też można tutaj uzyskać dość obfity skok. W bezpośrednim porównaniu, klawiatura ROG Zephyrus G14 jest nieco wygodniejsza, ale naprawdę nie można tutaj narzekać. Jedynie klawisze strzałek są zbyt małe, szczególnie dla graczy.

Urządzenia wejściowe (urządzenie testowe z układem US)
Podświetlenie klawiatury

Acer zainstalował duży gładzik haptyczny, który jest praktycznie bezproblemowo zintegrowany z jednostką bazową. Na bocznych krawędziach znajdują się dwa paski LED, które krótko świecą na biało, gdy są używane, aby wskazać krawędź. Obsługa jest doskonała, a wprowadzanie danych za pomocą aktywnego rysika (w zestawie) jest również obsługiwane. Rysika nie można jednak używać na pojemnościowym ekranie dotykowym, który obsługuje tylko wprowadzanie danych palcami.

Haptyczny panel dotykowy z paskami ograniczającymi LED...
...i obsługa rysika.

Wyświetlacz - Problematyczny OLED

Rozmieszczenie subpikseli
Wyraźnie widoczny efekt rastra (nieznacznie wzmocniony przez kamerę)

Acer zastosował 14,5-calowy ekran dotykowy OLED (2880 x 1800 pikseli, 16:10) o częstotliwości odświeżania 120 Hz firmy Samsung. Podstawowe zalety OLED (żywe kolory, wysoki kontrast, krótki czas reakcji) są obecne, ale warstwa ekranu dotykowego powoduje wyraźnie widoczny efekt rastra, który znacznie pogarsza subiektywną jakość obrazu, szczególnie w przypadku jasnych treści. Próbowaliśmy uchwycić to na zdjęciu po prawej, ale kamera minimalnie zaostrza problem. Występuje również migotanie PWM przy 240 Hz na każdym poziomie jasności. Zarówno jasność, jak i temperatura barwowa mogą być kontrolowane przez czujnik. Ekran dotykowy jest bardzo odblaskowy, co ogranicza jego zastosowanie, szczególnie na zewnątrz.

Jasność w trybie SDR wynosi nieco poniżej 380 cd/m², a poziom czerni wynosi 0, co skutkuje bardzo wysokimi kontrastami. W trybie HDR maksymalna jasność wynosi 558 cd/m² dla sekcji obrazu i 478 cd/m² dla pełnego ekranu. Panel w pełni pokrywa zarówno przestrzeń kolorów sRGB, jak i P3, a Acer oferuje odpowiednie profile kolorów. W naszej analizie za pomocą profesjonalnego oprogramowania CalMAN, temperatura barwowa jest nieco zbyt ciepła, ale nie ma przebarwień. Odchylenia kolorów są jednak częściowo powyżej docelowej wartości 3, której nie mogliśmy poprawić za pomocą własnej kalibracji. Panel nie jest zatem idealny do edycji obrazu.

378
cd/m²
375
cd/m²
376
cd/m²
378
cd/m²
376
cd/m²
377
cd/m²
377
cd/m²
378
cd/m²
376
cd/m²
podświetlenie ekranu
ATNA45AF03-0 testowany z X-Rite i1Pro 3
maksimum: 378 cd/m² (Nits) średnia: 376.8 cd/m² Minimum: 21.1 cd/m²
rozświetlenie: 99 %
na akumulatorze: 376 cd/m²
kontrast: ∞:1 (czerń: 0 cd/m²)
ΔE ColorChecker Calman: 2.7 | ∀{0.5-29.43 Ø4.78}
ΔE Greyscale Calman: 2.7 | ∀{0.09-98 Ø5}
95.1% AdobeRGB 1998 (Argyll 3D)
99.9% sRGB (Argyll 3D)
99.6% Display P3 (Argyll 3D)
Gamma: 2.23
CCT: 6138 K
Acer Predator Triton 14 AI PT14-52
ATNA45AF03-0, OLED, 2880x1800, 14.5", 120 Hz
Razer Blade 14 2025
ATNA40CU05-0, OLED, 2880x1800, 14", 120 Hz
Asus ROG Zephyrus G14 2025 GA403WW
ATNA40CU05-0, OLED, 2880x1800, 14", 120 Hz
Acer Predator Helios Neo 14 (2024)
BOE CQ NE145F8M-NY1, IPS, 3072x1920, 14.5", 165 Hz
Asus TUF Gaming A14 FA401WV-WB94
BOE NE140QDM-NX7, IPS, 2560x1600, 14", 165 Hz
HP Omen Transcend 14-fb0014
Samsung SDC4197, OLED, 2880x1800, 14", 120 Hz
Lenovo Legion 5 15IRX10 5070
LEN151WQXGA, OLED, 2560x1600, 15.1", 165 Hz
Display
-2%
-2%
-23%
-24%
0%
Display P3 Coverage (%)
99.6
99.5
0%
99.6
0%
65
-35%
65.1
-35%
99.6
0%
sRGB Coverage (%)
99.9
100
0%
100
0%
95.3
-5%
94
-6%
100
0%
AdobeRGB 1998 Coverage (%)
95.1
89.2
-6%
89.9
-5%
66.8
-30%
65.6
-31%
96.1
1%
Response Times
6%
-19%
-917%
-1561%
-66%
Response Time Grey 50% / Grey 80% * (ms)
0.48 ?(0.24, 0.24)
0.59 ?(0.32, 0.27)
-23%
0.62 ?(0.33, 0.29)
-29%
5.4 ?(2.5, 2.9)
-1025%
10.7 ?(5, 5.7)
-2129%
0.86 ?(0.45, 0.41)
-79%
Response Time Black / White * (ms)
0.65 ?(0.35, 0.3)
0.63 ?(0.35, 0.28)
3%
0.68 ?(0.36, 0.32)
-5%
5.9 ?(1.9, 4)
-808%
7.1 ?(3.9, 3.2)
-992%
0.99 ?(0.46, 0.53)
-52%
PWM Frequency (Hz)
240 ?(100)
960 ?(90)
960 ?(60)
479 ?(100)
PWM Amplitude * (%)
41
26
37%
50
-22%
Screen
11%
39%
-4%
-13%
-2%
Brightness middle (cd/m²)
376
361
-4%
423
13%
450
20%
455.8
21%
386.3
3%
Brightness (cd/m²)
377
363
-4%
424
12%
433
15%
436
16%
389
3%
Brightness Distribution (%)
99
98
-1%
98
-1%
87
-12%
93
-6%
98
-1%
Black Level * (cd/m²)
0.01
0.45
0.38
Colorchecker dE 2000 *
2.7
1.7
37%
0.7
74%
2.26
16%
3.39
-26%
4.03
-49%
Colorchecker dE 2000 max. *
5.3
3.9
26%
1.8
66%
7.5
-42%
7.3
-38%
6.69
-26%
Greyscale dE 2000 *
2.7
2.4
11%
0.8
70%
3.2
-19%
3.9
-44%
1.2
56%
Gamma
2.23 99%
2.14 103%
2.18 101%
2.214 99%
2.17 101%
2.25 98%
CCT
6138 106%
6571 99%
6505 100%
6121 106%
7340 89%
6280 104%
Contrast (:1)
42300
1000
1199
Colorchecker dE 2000 calibrated *
1.21
1.67
1.07
Całkowita średnia (program / ustawienia)
5% / 6%
6% / 14%
-315% / -175%
-533% / -297%
-23% / -13%

* ... im mniej tym lepiej

CalMAN Grayscale (Profil: P3)
Nasycenie CalMAN (profil: P3)
CalMAN ColorChecker (Profil: P3)
Skala szarości CalMAN (profil: sRGB)
Nasycenie CalMAN (profil: sRGB)
CalMAN ColorChecker (profil: sRGB)
vs. sRGB
vs. sRGB
vs. P3
vs. P3
vs. AdobeRGB
vs. AdobeRGB

Wyświetl czasy reakcji

Czasy reakcji wyświetlacza pokazują, jak szybko ekran może zmieniać kolor z jednego koloru na drugi. Długi czas reakcji może powodować powstawanie powidoków i sprawiać, że poruszające się obiekty będą niewyraźne (duchy). Gracze szybkich tytułów 3D powinni zwrócić szczególną uwagę na szybki czas reakcji.
       Czas reakcji od czerni do bieli
0.65 ms ... wzrost ↗ i spadek ↘ łącznie↗ 0.35 ms wzrost
↘ 0.3 ms upadek
W naszych testach ekran wykazuje bardzo szybką reakcję i powinien bardzo dobrze nadawać się do szybkich gier.
Dla porównania, wszystkie testowane urządzenia wahają się od 0.1 (minimum) do 240 (maksimum) ms. » 1 % wszystkich urządzeń jest lepszych.
Oznacza to, że zmierzony czas reakcji jest lepszy od średniej wszystkich testowanych urządzeń (20.2 ms).
       Czas reakcji 50% szarości do 80% szarości
0.48 ms ... wzrost ↗ i spadek ↘ łącznie↗ 0.24 ms wzrost
↘ 0.24 ms upadek
W naszych testach ekran wykazuje bardzo szybką reakcję i powinien bardzo dobrze nadawać się do szybkich gier.
Dla porównania, wszystkie testowane urządzenia wahają się od 0.165 (minimum) do 636 (maksimum) ms. » 1 % wszystkich urządzeń jest lepszych.
Oznacza to, że zmierzony czas reakcji jest lepszy od średniej wszystkich testowanych urządzeń (31.6 ms).

Migotanie ekranu / PWM (modulacja szerokości impulsu)

Aby przyciemnić ekran, niektóre notebooki po prostu w krótkich odstępach czasu włączają i wyłączają podświetlenie — jest to metoda zwana modulacją szerokości impulsu (PWM). W idealnym przypadku ta częstotliwość cykli powinna być niewykrywalna dla ludzkiego oka. Jeśli wspomniana częstotliwość jest zbyt niska, użytkownicy o wrażliwych oczach mogą odczuwać zmęczenie lub bóle głowy, a nawet całkowicie zauważyć migotanie.
Wykryto migotanie ekranu/wykryto PWM 240 Hz
Amplitude: 41 %
≤ 100 % ustawienia jasności

Podświetlenie wyświetlacza miga z częstotliwością 240 Hz (najgorszy przypadek, np. przy użyciu PWM) Wykryto migotanie przy ustawieniu jasności 100 % i poniżej. Powyżej tego ustawienia jasności nie powinno być żadnego migotania ani PWM.

Częstotliwość 240 Hz jest stosunkowo niska, więc wrażliwi użytkownicy prawdopodobnie zauważą migotanie i odczują zmęczenie oczu przy podanym ustawieniu jasności i poniżej.

Dla porównania: 53 % wszystkich testowanych urządzeń nie używa PWM do przyciemniania wyświetlacza. Jeśli wykryto PWM, zmierzono średnio 8091 (minimum: 5 - maksimum: 343500) Hz.

PWM (0 % jasności)
PWM (0 % jasności)
PWM (jasność 20%)
PWM (jasność 20%)
PWM (40% jasności)
PWM (40% jasności)
PWM (60% jasności)
PWM (60% jasności)
PWM (80 % jasności)
PWM (80 % jasności)
PWM (100% jasności)
PWM (100% jasności)
W słońcu
W słońcu
Stabilność kąta widzenia

Wydajność - Lunar Lake & Blackwell

Warunki testu

Predator Sense
Predator Sense

Acer oferuje różne profile energetyczne, które można przełączać za pomocą oprogramowania Predator Sense lub odpowiedniego przycisku. Wydajność procesora jest praktycznie identyczna we wszystkich profilach, ale pełna wydajność GPU jest dostępna tylko w trybie Turbo, który wykorzystaliśmy również do testów porównawczych. W trybie baterii, tryb zrównoważony jest maksymalnym dostępnym trybem.

Profil energetyczny TDP CB24 Multi TGP Time Spy Grafika CP2077 QHD Ultra maks. Głośność wentylatora
Cichy 37 watów 664 punktów 65 watów 9,820 punktów 46.5 FPS 40 dB(A)
Zrównoważony 37 watów 667 punktów 65 watów 9,974 punktów 47.3 FPS 47.6 dB(A)
Wydajność 37 watów 668 punktów 85 watów 11 375 punktów 54,3 FPS 53,3 dB(A)
Turbo 37 W 670 punktów 110 W 12 401 punktów 59 FPS 57,9 dB(A)
bateria (zbalansowana) 35/17 watów 480 punktów 65 watów 9 839 punktów 46,7 FPS 40 dB(A)

Procesor

Lunar Lake Core Ultra 9 288V może zużywać maksymalnie 37 watów i robi to w Predator Triton. Wydajność jest również w porządku w codziennym użytkowaniu ze względu na wysoką wydajność jednordzeniową, ale 8-rdzeniowy po prostu nie ma szans z konkurencją, zwłaszcza jeśli chodzi o wydajność wielordzeniową.

Test wytrzymałości Cinebench R15 Multi

018036054072090010801260144016201800198021602340252027002880306032403420Tooltip
Acer Predator Triton 14 AI PT14-52 Intel Core Ultra 9 288V: Ø1625 (1583.03-1639.81)
Razer Blade 14 2025 AMD Ryzen AI 9 365: Ø2928 (2910.57-2975.97)
Asus ROG Zephyrus G14 2025 GA403WW AMD Ryzen AI 9 HX 370: Ø3508 (3409.77-3551.38)
Acer Predator Helios Neo 14 (2024) Intel Core Ultra 9 185H: Ø2619 (2486.48-2745.37)
Asus TUF Gaming A14 FA401WV-WB94 AMD Ryzen AI 9 HX 370: Ø3426 (3408.61-3447.98)
HP Omen Transcend 14-fb0014 Intel Core Ultra 7 155H: Ø2510 (2462.6-2628.12)
Lenovo Legion 5 15IRX10 5070 Intel Core i7-13650HX: Ø2889 (2835.47-3073.14)
CPU Performance rating: Percent
Cinebench R23: Multi Core | Single Core
Cinebench R20: CPU (Multi Core) | CPU (Single Core)
Cinebench R15: CPU Multi 64Bit | CPU Single 64Bit
Blender: v2.79 BMW27 CPU
7-Zip 18.03: 7z b 4 | 7z b 4 -mmt1
Geekbench 6.5: Multi-Core | Single-Core
Geekbench 5.5: Multi-Core | Single-Core
HWBOT x265 Benchmark v2.2: 4k Preset
LibreOffice : 20 Documents To PDF
R Benchmark 2.5: Overall mean
CPU Performance rating
Średnia w klasie Gaming
 
84.5 pt
Asus ROG Zephyrus G14 2025 GA403WW
AMD Ryzen AI 9 HX 370
83.9 pt
Asus TUF Gaming A14 FA401WV-WB94
AMD Ryzen AI 9 HX 370
80.2 pt
Lenovo Legion 5 15IRX10 5070
Intel Core i7-13650HX
74.8 pt
Razer Blade 14 2025
AMD Ryzen AI 9 365
74.4 pt
Acer Predator Helios Neo 14 (2024)
Intel Core Ultra 9 185H
72 pt
HP Omen Transcend 14-fb0014
Intel Core Ultra 7 155H
65.8 pt
Acer Predator Triton 14 AI PT14-52
Intel Core Ultra 9 288V
61 pt
Przeciętny Intel Core Ultra 9 288V
 
58 pt
Cinebench R23 / Multi Core
Średnia w klasie Gaming
  (5668 - 40970, n=148, ostatnie 2 lata)
25205 Points +130%
Asus ROG Zephyrus G14 2025 GA403WW
AMD Ryzen AI 9 HX 370
23902 Points +118%
Asus TUF Gaming A14 FA401WV-WB94
AMD Ryzen AI 9 HX 370
23456 (23201.9min - 23456.3max) Points +114%
Lenovo Legion 5 15IRX10 5070
Intel Core i7-13650HX
20325 Points +86%
Razer Blade 14 2025
AMD Ryzen AI 9 365
19449 Points +78%
Acer Predator Helios Neo 14 (2024)
Intel Core Ultra 9 185H
17787 Points +63%
HP Omen Transcend 14-fb0014
Intel Core Ultra 7 155H
16758 (15790min - 16758.1max) Points +53%
Acer Predator Triton 14 AI PT14-52
Intel Core Ultra 9 288V
10941 Points
Przeciętny Intel Core Ultra 9 288V
  (9091 - 10941, n=4)
10097 Points -8%
Cinebench R23 / Single Core
Acer Predator Triton 14 AI PT14-52
Intel Core Ultra 9 288V
2013 Points
Asus ROG Zephyrus G14 2025 GA403WW
AMD Ryzen AI 9 HX 370
1997 Points -1%
Razer Blade 14 2025
AMD Ryzen AI 9 365
1987 Points -1%
Średnia w klasie Gaming
  (1136 - 2267, n=148, ostatnie 2 lata)
1985 Points -1%
Asus TUF Gaming A14 FA401WV-WB94
AMD Ryzen AI 9 HX 370
1979 Points -2%
Przeciętny Intel Core Ultra 9 288V
  (1794 - 2013, n=5)
1929 Points -4%
Acer Predator Helios Neo 14 (2024)
Intel Core Ultra 9 185H
1883 Points -6%
Lenovo Legion 5 15IRX10 5070
Intel Core i7-13650HX
1858 Points -8%
HP Omen Transcend 14-fb0014
Intel Core Ultra 7 155H
1666 Points -17%
Cinebench R20 / CPU (Multi Core)
Średnia w klasie Gaming
  (2179 - 16108, n=147, ostatnie 2 lata)
9721 Points +130%
Asus ROG Zephyrus G14 2025 GA403WW
AMD Ryzen AI 9 HX 370
9280 Points +119%
Asus TUF Gaming A14 FA401WV-WB94
AMD Ryzen AI 9 HX 370
9151 Points +116%
Lenovo Legion 5 15IRX10 5070
Intel Core i7-13650HX
7811 Points +85%
Razer Blade 14 2025
AMD Ryzen AI 9 365
7576 Points +79%
Acer Predator Helios Neo 14 (2024)
Intel Core Ultra 9 185H
6910 Points +63%
HP Omen Transcend 14-fb0014
Intel Core Ultra 7 155H
6529 Points +54%
Acer Predator Triton 14 AI PT14-52
Intel Core Ultra 9 288V
4230 Points
Przeciętny Intel Core Ultra 9 288V
  (4091 - 4230, n=3)
4162 Points -2%
Cinebench R20 / CPU (Single Core)
Asus ROG Zephyrus G14 2025 GA403WW
AMD Ryzen AI 9 HX 370
791 Points +2%
Asus TUF Gaming A14 FA401WV-WB94
AMD Ryzen AI 9 HX 370
782 Points +1%
Razer Blade 14 2025
AMD Ryzen AI 9 365
779 Points 0%
Acer Predator Triton 14 AI PT14-52
Intel Core Ultra 9 288V
777 Points
Średnia w klasie Gaming
  (439 - 870, n=147, ostatnie 2 lata)
767 Points -1%
Przeciętny Intel Core Ultra 9 288V
  (703 - 777, n=3)
743 Points -4%
Acer Predator Helios Neo 14 (2024)
Intel Core Ultra 9 185H
733 Points -6%
Lenovo Legion 5 15IRX10 5070
Intel Core i7-13650HX
719 Points -7%
HP Omen Transcend 14-fb0014
Intel Core Ultra 7 155H
644 Points -17%
Cinebench R15 / CPU Multi 64Bit
Średnia w klasie Gaming
  (1537 - 6271, n=147, ostatnie 2 lata)
3901 Points +138%
Asus ROG Zephyrus G14 2025 GA403WW
AMD Ryzen AI 9 HX 370
3551 Points +117%
Asus TUF Gaming A14 FA401WV-WB94
AMD Ryzen AI 9 HX 370
3448 (3408.61min - 3447.98max) Points +110%
Lenovo Legion 5 15IRX10 5070
Intel Core i7-13650HX
3073 (2835.47min - 3073.14max) Points +87%
Razer Blade 14 2025
AMD Ryzen AI 9 365
2976 (2910.57min - 2975.97max) Points +81%
Acer Predator Helios Neo 14 (2024)
Intel Core Ultra 9 185H
2745 Points +67%
HP Omen Transcend 14-fb0014
Intel Core Ultra 7 155H
2628 (2462.6min - 2628.12max) Points +60%
Acer Predator Triton 14 AI PT14-52
Intel Core Ultra 9 288V
1640 (1583.03min - 1639.81max) Points
Przeciętny Intel Core Ultra 9 288V
  (1500 - 1640, n=3)
1574 Points -4%
Cinebench R15 / CPU Single 64Bit
Acer Predator Triton 14 AI PT14-52
Intel Core Ultra 9 288V
309 Points
Asus ROG Zephyrus G14 2025 GA403WW
AMD Ryzen AI 9 HX 370
307 Points -1%
Przeciętny Intel Core Ultra 9 288V
  (294 - 309, n=2)
302 Points -2%
Asus TUF Gaming A14 FA401WV-WB94
AMD Ryzen AI 9 HX 370
301 Points -3%
Średnia w klasie Gaming
  (188.8 - 343, n=146, ostatnie 2 lata)
294 Points -5%
Acer Predator Helios Neo 14 (2024)
Intel Core Ultra 9 185H
281 Points -9%
Lenovo Legion 5 15IRX10 5070
Intel Core i7-13650HX
268 Points -13%
HP Omen Transcend 14-fb0014
Intel Core Ultra 7 155H
253 Points -18%
Razer Blade 14 2025
AMD Ryzen AI 9 365
195.7 Points -37%
Blender / v2.79 BMW27 CPU
Przeciętny Intel Core Ultra 9 288V
  (310 - 441, n=4)
381 Seconds * -23%
Acer Predator Triton 14 AI PT14-52
Intel Core Ultra 9 288V
310 Seconds *
HP Omen Transcend 14-fb0014
Intel Core Ultra 7 155H
195 Seconds * +37%
Acer Predator Helios Neo 14 (2024)
Intel Core Ultra 9 185H
177 Seconds * +43%
Razer Blade 14 2025
AMD Ryzen AI 9 365
169 Seconds * +45%
Lenovo Legion 5 15IRX10 5070
Intel Core i7-13650HX
168 Seconds * +46%
Średnia w klasie Gaming
  (80 - 517, n=143, ostatnie 2 lata)
154.5 Seconds * +50%
Asus TUF Gaming A14 FA401WV-WB94
AMD Ryzen AI 9 HX 370
143 Seconds * +54%
Asus ROG Zephyrus G14 2025 GA403WW
AMD Ryzen AI 9 HX 370
139 Seconds * +55%
7-Zip 18.03 / 7z b 4
Średnia w klasie Gaming
  (23795 - 148086, n=145, ostatnie 2 lata)
91131 MIPS +148%
Asus ROG Zephyrus G14 2025 GA403WW
AMD Ryzen AI 9 HX 370
83139 MIPS +127%
Asus TUF Gaming A14 FA401WV-WB94
AMD Ryzen AI 9 HX 370
80277 MIPS +119%
Lenovo Legion 5 15IRX10 5070
Intel Core i7-13650HX
78404 MIPS +114%
Acer Predator Helios Neo 14 (2024)
Intel Core Ultra 9 185H
71752 MIPS +96%
Razer Blade 14 2025
AMD Ryzen AI 9 365
71550 MIPS +95%
HP Omen Transcend 14-fb0014
Intel Core Ultra 7 155H
63817 MIPS +74%
Acer Predator Triton 14 AI PT14-52
Intel Core Ultra 9 288V
36683 MIPS
Przeciętny Intel Core Ultra 9 288V
  (32105 - 36683, n=5)
34617 MIPS -6%
7-Zip 18.03 / 7z b 4 -mmt1
Średnia w klasie Gaming
  (4199 - 7508, n=145, ostatnie 2 lata)
6416 MIPS +8%
Asus ROG Zephyrus G14 2025 GA403WW
AMD Ryzen AI 9 HX 370
6183 MIPS +4%
Asus TUF Gaming A14 FA401WV-WB94
AMD Ryzen AI 9 HX 370
6106 MIPS +3%
Razer Blade 14 2025
AMD Ryzen AI 9 365
6017 MIPS +1%
Lenovo Legion 5 15IRX10 5070
Intel Core i7-13650HX
5992 MIPS +1%
Acer Predator Triton 14 AI PT14-52
Intel Core Ultra 9 288V
5929 MIPS
Przeciętny Intel Core Ultra 9 288V
  (5734 - 5993, n=5)
5919 MIPS 0%
Acer Predator Helios Neo 14 (2024)
Intel Core Ultra 9 185H
5519 MIPS -7%
HP Omen Transcend 14-fb0014
Intel Core Ultra 7 155H
5054 MIPS -15%
Geekbench 6.5 / Multi-Core
Asus ROG Zephyrus G14 2025 GA403WW
AMD Ryzen AI 9 HX 370
15994 Points +43%
Średnia w klasie Gaming
  (5340 - 22104, n=145, ostatnie 2 lata)
15689 Points +40%
Razer Blade 14 2025
AMD Ryzen AI 9 365
15137 Points +35%
Lenovo Legion 5 15IRX10 5070
Intel Core i7-13650HX
14378 Points +28%
Acer Predator Helios Neo 14 (2024)
Intel Core Ultra 9 185H
14039 Points +25%
Asus TUF Gaming A14 FA401WV-WB94
AMD Ryzen AI 9 HX 370
13799 Points +23%
HP Omen Transcend 14-fb0014
Intel Core Ultra 7 155H
13313 Points +19%
Acer Predator Triton 14 AI PT14-52
Intel Core Ultra 9 288V
11190 Points
Przeciętny Intel Core Ultra 9 288V
  (10969 - 11190, n=5)
11050 Points -1%
Geekbench 6.5 / Single-Core
Asus ROG Zephyrus G14 2025 GA403WW
AMD Ryzen AI 9 HX 370
2929 Points +1%
Razer Blade 14 2025
AMD Ryzen AI 9 365
2888 Points 0%
Acer Predator Triton 14 AI PT14-52
Intel Core Ultra 9 288V
2887 Points
Asus TUF Gaming A14 FA401WV-WB94
AMD Ryzen AI 9 HX 370
2846 Points -1%
Przeciętny Intel Core Ultra 9 288V
  (2797 - 2887, n=4)
2843 Points -2%
Średnia w klasie Gaming
  (1490 - 3253, n=145, ostatnie 2 lata)
2793 Points -3%
Lenovo Legion 5 15IRX10 5070
Intel Core i7-13650HX
2595 Points -10%
Acer Predator Helios Neo 14 (2024)
Intel Core Ultra 9 185H
2490 Points -14%
HP Omen Transcend 14-fb0014
Intel Core Ultra 7 155H
2386 Points -17%
Geekbench 5.5 / Multi-Core
Średnia w klasie Gaming
  (4557 - 27010, n=144, ostatnie 2 lata)
16858 Points +73%
Asus ROG Zephyrus G14 2025 GA403WW
AMD Ryzen AI 9 HX 370
15759 Points +62%
Lenovo Legion 5 15IRX10 5070
Intel Core i7-13650HX
14778 Points +52%
Asus TUF Gaming A14 FA401WV-WB94
AMD Ryzen AI 9 HX 370
14068 Points +44%
Razer Blade 14 2025
AMD Ryzen AI 9 365
13981 Points +43%
Acer Predator Helios Neo 14 (2024)
Intel Core Ultra 9 185H
13613 Points +40%
HP Omen Transcend 14-fb0014
Intel Core Ultra 7 155H
13119 Points +35%
Acer Predator Triton 14 AI PT14-52
Intel Core Ultra 9 288V
9745 Points
Przeciętny Intel Core Ultra 9 288V
  (9588 - 9745, n=3)
9655 Points -1%
Geekbench 5.5 / Single-Core
Asus ROG Zephyrus G14 2025 GA403WW
AMD Ryzen AI 9 HX 370
2160 Points +3%
Razer Blade 14 2025
AMD Ryzen AI 9 365
2104 Points 0%
Acer Predator Triton 14 AI PT14-52
Intel Core Ultra 9 288V
2094 Points
Przeciętny Intel Core Ultra 9 288V
  (2024 - 2114, n=3)
2077 Points -1%
Asus TUF Gaming A14 FA401WV-WB94
AMD Ryzen AI 9 HX 370
2030 Points -3%
Średnia w klasie Gaming
  (986 - 2423, n=144, ostatnie 2 lata)
2012 Points -4%
Acer Predator Helios Neo 14 (2024)
Intel Core Ultra 9 185H
1873 Points -11%
Lenovo Legion 5 15IRX10 5070
Intel Core i7-13650HX
1856 Points -11%
HP Omen Transcend 14-fb0014
Intel Core Ultra 7 155H
1741 Points -17%
HWBOT x265 Benchmark v2.2 / 4k Preset
Asus ROG Zephyrus G14 2025 GA403WW
AMD Ryzen AI 9 HX 370
28.4 fps +99%
Średnia w klasie Gaming
  (7.7 - 44.3, n=145, ostatnie 2 lata)
27.2 fps +90%
Asus TUF Gaming A14 FA401WV-WB94
AMD Ryzen AI 9 HX 370
26 fps +82%
Razer Blade 14 2025
AMD Ryzen AI 9 365
24.2 fps +69%
Lenovo Legion 5 15IRX10 5070
Intel Core i7-13650HX
21.9 fps +53%
Acer Predator Helios Neo 14 (2024)
Intel Core Ultra 9 185H
20.1 fps +41%
HP Omen Transcend 14-fb0014
Intel Core Ultra 7 155H
19.3 fps +35%
Acer Predator Triton 14 AI PT14-52
Intel Core Ultra 9 288V
14.3 fps
Przeciętny Intel Core Ultra 9 288V
  (11.2 - 14.3, n=3)
12.9 fps -10%
LibreOffice / 20 Documents To PDF
Razer Blade 14 2025
AMD Ryzen AI 9 365
54.3 s * -19%
Asus TUF Gaming A14 FA401WV-WB94
AMD Ryzen AI 9 HX 370
51.7 s * -13%
Asus ROG Zephyrus G14 2025 GA403WW
AMD Ryzen AI 9 HX 370
50.7 s * -11%
Średnia w klasie Gaming
  (19 - 88.8, n=144, ostatnie 2 lata)
47.6 s * -4%
Przeciętny Intel Core Ultra 9 288V
  (39.9 - 56.9, n=4)
46.4 s * -1%
Acer Predator Triton 14 AI PT14-52
Intel Core Ultra 9 288V
45.8 s *
HP Omen Transcend 14-fb0014
Intel Core Ultra 7 155H
45.1 s * +2%
Lenovo Legion 5 15IRX10 5070
Intel Core i7-13650HX
44.3 s * +3%
Acer Predator Helios Neo 14 (2024)
Intel Core Ultra 9 185H
38.4 s * +16%
R Benchmark 2.5 / Overall mean
HP Omen Transcend 14-fb0014
Intel Core Ultra 7 155H
0.4637 sec * -10%
Lenovo Legion 5 15IRX10 5070
Intel Core i7-13650HX
0.4461 sec * -5%
Acer Predator Helios Neo 14 (2024)
Intel Core Ultra 9 185H
0.4424 sec * -5%
Przeciętny Intel Core Ultra 9 288V
  (0.4218 - 0.4503, n=4)
0.4318 sec * -2%
Średnia w klasie Gaming
  (0.3551 - 0.759, n=146, ostatnie 2 lata)
0.4279 sec * -1%
Acer Predator Triton 14 AI PT14-52
Intel Core Ultra 9 288V
0.4229 sec *
Asus TUF Gaming A14 FA401WV-WB94
AMD Ryzen AI 9 HX 370
0.419 sec * +1%
Razer Blade 14 2025
AMD Ryzen AI 9 365
0.4091 sec * +3%
Asus ROG Zephyrus G14 2025 GA403WW
AMD Ryzen AI 9 HX 370
0.4077 sec * +4%

* ... im mniej tym lepiej

Cinebench R15 CPU Multi 64Bit
1640 Points
Cinebench R15 OpenGL 64Bit
196.3 fps
Cinebench R15 Ref. Match 64Bit
99.6 %
Cinebench R15 CPU Single 64Bit
309 Points
Cinebench R20 CPU (Multi Core)
4230 Points
Cinebench R20 CPU (Single Core)
777 Points
Cinebench R23 Single Core
2013 Points
Cinebench R23 Multi Core
10941 Points
Cinebench 2024 CPU Single Core
127.7 Points
Cinebench 2024 CPU Multi Core
670 Points
Pomoc
Performance rating
Asus ROG Zephyrus G14 2025 GA403WW
AMD Ryzen AI 9 HX 370, GeForce RTX 5080 Laptop
96.7 pt
Asus TUF Gaming A14 FA401WV-WB94
AMD Ryzen AI 9 HX 370, GeForce RTX 4060 Laptop GPU
89.1 pt
Średnia w klasie Gaming
 
84.7 pt
Razer Blade 14 2025
AMD Ryzen AI 9 365, GeForce RTX 5070 Laptop
82.2 pt
Lenovo Legion 5 15IRX10 5070
Intel Core i7-13650HX, GeForce RTX 5070 Laptop
67.4 pt
Acer Predator Helios Neo 14 (2024)
Intel Core Ultra 9 185H, GeForce RTX 4070 Laptop GPU
63.2 pt
HP Omen Transcend 14-fb0014
Intel Core Ultra 7 155H, GeForce RTX 4060 Laptop GPU
59.8 pt
Acer Predator Triton 14 AI PT14-52
Intel Core Ultra 9 288V, GeForce RTX 5070 Laptop
43.8 pt
Przeciętny Intel Core Ultra 9 288V
 
41.3 pt
AIDA64 / FP32 Ray-Trace
Asus ROG Zephyrus G14 2025 GA403WW
AMD Ryzen AI 9 HX 370, GeForce RTX 5080 Laptop
37804 KRay/s +189%
Asus TUF Gaming A14 FA401WV-WB94
AMD Ryzen AI 9 HX 370, GeForce RTX 4060 Laptop GPU
37654 KRay/s +188%
Razer Blade 14 2025
AMD Ryzen AI 9 365, GeForce RTX 5070 Laptop
30940 KRay/s +137%
Średnia w klasie Gaming
  (7192 - 85542, n=144, ostatnie 2 lata)
28123 KRay/s +115%
Lenovo Legion 5 15IRX10 5070
Intel Core i7-13650HX, GeForce RTX 5070 Laptop
19427 KRay/s +49%
Acer Predator Helios Neo 14 (2024)
Intel Core Ultra 9 185H, GeForce RTX 4070 Laptop GPU
17300 KRay/s +32%
HP Omen Transcend 14-fb0014
Intel Core Ultra 7 155H, GeForce RTX 4060 Laptop GPU
15430 KRay/s +18%
Acer Predator Triton 14 AI PT14-52
Intel Core Ultra 9 288V, GeForce RTX 5070 Laptop
13061 KRay/s
Przeciętny Intel Core Ultra 9 288V
  (9953 - 13061, n=3)
11987 KRay/s -8%
AIDA64 / FPU Julia
Asus TUF Gaming A14 FA401WV-WB94
AMD Ryzen AI 9 HX 370, GeForce RTX 4060 Laptop GPU
147937 Points +128%
Asus ROG Zephyrus G14 2025 GA403WW
AMD Ryzen AI 9 HX 370, GeForce RTX 5080 Laptop
142843 Points +120%
Średnia w klasie Gaming
  (35040 - 238426, n=144, ostatnie 2 lata)
127182 Points +96%
Razer Blade 14 2025
AMD Ryzen AI 9 365, GeForce RTX 5070 Laptop
119210 Points +84%
Lenovo Legion 5 15IRX10 5070
Intel Core i7-13650HX, GeForce RTX 5070 Laptop
96081 Points +48%
Acer Predator Helios Neo 14 (2024)
Intel Core Ultra 9 185H, GeForce RTX 4070 Laptop GPU
88782 Points +37%
HP Omen Transcend 14-fb0014
Intel Core Ultra 7 155H, GeForce RTX 4060 Laptop GPU
80482 Points +24%
Acer Predator Triton 14 AI PT14-52
Intel Core Ultra 9 288V, GeForce RTX 5070 Laptop
64847 Points
Przeciętny Intel Core Ultra 9 288V
  (49602 - 64847, n=3)
59589 Points -8%
AIDA64 / CPU SHA3
Asus ROG Zephyrus G14 2025 GA403WW
AMD Ryzen AI 9 HX 370, GeForce RTX 5080 Laptop
5926 MB/s +108%
Średnia w klasie Gaming
  (1728 - 9817, n=144, ostatnie 2 lata)
5857 MB/s +105%
Asus TUF Gaming A14 FA401WV-WB94
AMD Ryzen AI 9 HX 370, GeForce RTX 4060 Laptop GPU
5816 MB/s +104%
Razer Blade 14 2025
AMD Ryzen AI 9 365, GeForce RTX 5070 Laptop
4971 MB/s +74%
Lenovo Legion 5 15IRX10 5070
Intel Core i7-13650HX, GeForce RTX 5070 Laptop
4381 MB/s +53%
Acer Predator Helios Neo 14 (2024)
Intel Core Ultra 9 185H, GeForce RTX 4070 Laptop GPU
4087 MB/s +43%
HP Omen Transcend 14-fb0014
Intel Core Ultra 7 155H, GeForce RTX 4060 Laptop GPU
3698 MB/s +30%
Acer Predator Triton 14 AI PT14-52
Intel Core Ultra 9 288V, GeForce RTX 5070 Laptop
2855 MB/s
Przeciętny Intel Core Ultra 9 288V
  (2285 - 2855, n=3)
2665 MB/s -7%
AIDA64 / CPU Queen
Średnia w klasie Gaming
  (49785 - 173351, n=144, ostatnie 2 lata)
118926 Points +139%
Lenovo Legion 5 15IRX10 5070
Intel Core i7-13650HX, GeForce RTX 5070 Laptop
109639 Points +120%
Asus TUF Gaming A14 FA401WV-WB94
AMD Ryzen AI 9 HX 370, GeForce RTX 4060 Laptop GPU
95053 Points +91%
Asus ROG Zephyrus G14 2025 GA403WW
AMD Ryzen AI 9 HX 370, GeForce RTX 5080 Laptop
94986 Points +91%
Razer Blade 14 2025
AMD Ryzen AI 9 365, GeForce RTX 5070 Laptop
92790 Points +86%
HP Omen Transcend 14-fb0014
Intel Core Ultra 7 155H, GeForce RTX 4060 Laptop GPU
87166 Points +75%
Acer Predator Helios Neo 14 (2024)
Intel Core Ultra 9 185H, GeForce RTX 4070 Laptop GPU
86970 Points +75%
Acer Predator Triton 14 AI PT14-52
Intel Core Ultra 9 288V, GeForce RTX 5070 Laptop
49785 Points
Przeciętny Intel Core Ultra 9 288V
  (49647 - 49785, n=3)
49725 Points 0%
AIDA64 / FPU SinJulia
Asus TUF Gaming A14 FA401WV-WB94
AMD Ryzen AI 9 HX 370, GeForce RTX 4060 Laptop GPU
18943 Points +328%
Asus ROG Zephyrus G14 2025 GA403WW
AMD Ryzen AI 9 HX 370, GeForce RTX 5080 Laptop
18778 Points +324%
Razer Blade 14 2025
AMD Ryzen AI 9 365, GeForce RTX 5070 Laptop
16240 Points +267%
Średnia w klasie Gaming
  (4424 - 33636, n=144, ostatnie 2 lata)
14202 Points +221%
Acer Predator Helios Neo 14 (2024)
Intel Core Ultra 9 185H, GeForce RTX 4070 Laptop GPU
11336 Points +156%
Lenovo Legion 5 15IRX10 5070
Intel Core i7-13650HX, GeForce RTX 5070 Laptop
10887 Points +146%
HP Omen Transcend 14-fb0014
Intel Core Ultra 7 155H, GeForce RTX 4060 Laptop GPU
10200 Points +131%
Acer Predator Triton 14 AI PT14-52
Intel Core Ultra 9 288V, GeForce RTX 5070 Laptop
4424 Points
Przeciętny Intel Core Ultra 9 288V
  (4421 - 4424, n=3)
4422 Points 0%
AIDA64 / FPU Mandel
Asus ROG Zephyrus G14 2025 GA403WW
AMD Ryzen AI 9 HX 370, GeForce RTX 5080 Laptop
93798 Points +172%
Asus TUF Gaming A14 FA401WV-WB94
AMD Ryzen AI 9 HX 370, GeForce RTX 4060 Laptop GPU
79251 Points +130%
Średnia w klasie Gaming
  (17585 - 128721, n=144, ostatnie 2 lata)
65663 Points +90%
Razer Blade 14 2025
AMD Ryzen AI 9 365, GeForce RTX 5070 Laptop
63459 Points +84%
Lenovo Legion 5 15IRX10 5070
Intel Core i7-13650HX, GeForce RTX 5070 Laptop
47256 Points +37%
Acer Predator Helios Neo 14 (2024)
Intel Core Ultra 9 185H, GeForce RTX 4070 Laptop GPU
43997 Points +28%
HP Omen Transcend 14-fb0014
Intel Core Ultra 7 155H, GeForce RTX 4060 Laptop GPU
39208 Points +14%
Acer Predator Triton 14 AI PT14-52
Intel Core Ultra 9 288V, GeForce RTX 5070 Laptop
34507 Points
Przeciętny Intel Core Ultra 9 288V
  (26344 - 34507, n=3)
31164 Points -10%
AIDA64 / CPU AES
Asus ROG Zephyrus G14 2025 GA403WW
AMD Ryzen AI 9 HX 370, GeForce RTX 5080 Laptop
118806 MB/s +203%
Średnia w klasie Gaming
  (19065 - 247074, n=144, ostatnie 2 lata)
108553 MB/s +177%
Razer Blade 14 2025
AMD Ryzen AI 9 365, GeForce RTX 5070 Laptop
99502 MB/s +153%
Acer Predator Helios Neo 14 (2024)
Intel Core Ultra 9 185H, GeForce RTX 4070 Laptop GPU
87147 MB/s +122%
Lenovo Legion 5 15IRX10 5070
Intel Core i7-13650HX, GeForce RTX 5070 Laptop
82705 MB/s +111%
Asus TUF Gaming A14 FA401WV-WB94
AMD Ryzen AI 9 HX 370, GeForce RTX 4060 Laptop GPU
81059 MB/s +106%
HP Omen Transcend 14-fb0014
Intel Core Ultra 7 155H, GeForce RTX 4060 Laptop GPU
76827 MB/s +96%
Acer Predator Triton 14 AI PT14-52
Intel Core Ultra 9 288V, GeForce RTX 5070 Laptop
39258 MB/s
Przeciętny Intel Core Ultra 9 288V
  (35250 - 39258, n=3)
37879 MB/s -4%
AIDA64 / CPU ZLib
Średnia w klasie Gaming
  (373 - 2531, n=144, ostatnie 2 lata)
1524 MB/s +142%
Asus ROG Zephyrus G14 2025 GA403WW
AMD Ryzen AI 9 HX 370, GeForce RTX 5080 Laptop
1516 MB/s +141%
Asus TUF Gaming A14 FA401WV-WB94
AMD Ryzen AI 9 HX 370, GeForce RTX 4060 Laptop GPU
1514 MB/s +141%
Lenovo Legion 5 15IRX10 5070
Intel Core i7-13650HX, GeForce RTX 5070 Laptop
1285 MB/s +104%
Razer Blade 14 2025
AMD Ryzen AI 9 365, GeForce RTX 5070 Laptop
1271 MB/s +102%
Acer Predator Helios Neo 14 (2024)
Intel Core Ultra 9 185H, GeForce RTX 4070 Laptop GPU
1197 MB/s +90%
HP Omen Transcend 14-fb0014
Intel Core Ultra 7 155H, GeForce RTX 4060 Laptop GPU
1064 MB/s +69%
Acer Predator Triton 14 AI PT14-52
Intel Core Ultra 9 288V, GeForce RTX 5070 Laptop
629 MB/s
Przeciętny Intel Core Ultra 9 288V
  (527 - 629, n=3)
582 MB/s -7%
AIDA64 / FP64 Ray-Trace
Asus ROG Zephyrus G14 2025 GA403WW
AMD Ryzen AI 9 HX 370, GeForce RTX 5080 Laptop
20648 KRay/s +188%
Asus TUF Gaming A14 FA401WV-WB94
AMD Ryzen AI 9 HX 370, GeForce RTX 4060 Laptop GPU
19238 KRay/s +169%
Razer Blade 14 2025
AMD Ryzen AI 9 365, GeForce RTX 5070 Laptop
16696 KRay/s +133%
Średnia w klasie Gaming
  (3856 - 45446, n=144, ostatnie 2 lata)
15064 KRay/s +110%
Lenovo Legion 5 15IRX10 5070
Intel Core i7-13650HX, GeForce RTX 5070 Laptop
10597 KRay/s +48%
Acer Predator Helios Neo 14 (2024)
Intel Core Ultra 9 185H, GeForce RTX 4070 Laptop GPU
8976 KRay/s +25%
HP Omen Transcend 14-fb0014
Intel Core Ultra 7 155H, GeForce RTX 4060 Laptop GPU
8056 KRay/s +12%
Acer Predator Triton 14 AI PT14-52
Intel Core Ultra 9 288V, GeForce RTX 5070 Laptop
7164 KRay/s
Przeciętny Intel Core Ultra 9 288V
  (4862 - 7164, n=3)
6352 KRay/s -11%
AIDA64 / CPU PhotoWorxx
Acer Predator Triton 14 AI PT14-52
Intel Core Ultra 9 288V, GeForce RTX 5070 Laptop
55531 MPixel/s
HP Omen Transcend 14-fb0014
Intel Core Ultra 7 155H, GeForce RTX 4060 Laptop GPU
54223 MPixel/s -2%
Przeciętny Intel Core Ultra 9 288V
  (50790 - 55531, n=3)
53893 MPixel/s -3%
Razer Blade 14 2025
AMD Ryzen AI 9 365, GeForce RTX 5070 Laptop
53550 MPixel/s -4%
Asus ROG Zephyrus G14 2025 GA403WW
AMD Ryzen AI 9 HX 370, GeForce RTX 5080 Laptop
51050 MPixel/s -8%
Acer Predator Helios Neo 14 (2024)
Intel Core Ultra 9 185H, GeForce RTX 4070 Laptop GPU
45768 MPixel/s -18%
Średnia w klasie Gaming
  (10805 - 62916, n=144, ostatnie 2 lata)
43435 MPixel/s -22%
Lenovo Legion 5 15IRX10 5070
Intel Core i7-13650HX, GeForce RTX 5070 Laptop
43289 MPixel/s -22%
Asus TUF Gaming A14 FA401WV-WB94
AMD Ryzen AI 9 HX 370, GeForce RTX 4060 Laptop GPU
37747 MPixel/s -32%

Wydajność systemu

Ogólne wrażenie wydajności jest dobre i nie ma żadnych problemów w codziennym użytkowaniu. Podczas testu nie wystąpiły również żadne problemy ze stabilnością.

Performance rating: Percent
PCMark 10: Score | Essentials | Productivity | Digital Content Creation
CrossMark: Overall | Productivity | Creativity | Responsiveness
WebXPRT 3: Overall
WebXPRT 4: Overall
Mozilla Kraken 1.1: Total
Performance rating
Asus ROG Zephyrus G14 2025 GA403WW
GeForce RTX 5080 Laptop, Ryzen AI 9 HX 370, WD PC SN740 SDDPNQE-2T00
89.1 pt
Średnia w klasie Gaming
 
88.9 pt
Razer Blade 14 2025
GeForce RTX 5070 Laptop, Ryzen AI 9 365, Samsung PM9A1 MZVL21T0HCLR
86.8 pt
Acer Predator Helios Neo 14 (2024)
GeForce RTX 4070 Laptop GPU, Ultra 9 185H, SK Hynix PC801 HFS001TEJ9X125N
83.7 pt
Acer Predator Triton 14 AI PT14-52
GeForce RTX 5070 Laptop, Core Ultra 9 288V, Micron 3400 1TB MTFDKBA1T0TFH
80.8 pt
Asus TUF Gaming A14 FA401WV-WB94
GeForce RTX 4060 Laptop GPU, Ryzen AI 9 HX 370, WD PC SN560 SDDPNQE-1T00
80.8 pt
Przeciętny Intel Core Ultra 9 288V, NVIDIA GeForce RTX 5070 Laptop
 
80.8 pt
Lenovo Legion 5 15IRX10 5070
GeForce RTX 5070 Laptop, i7-13650HX, WD PC SN7100S SDFPMSL-1T00-1101
80.5 pt
HP Omen Transcend 14-fb0014
GeForce RTX 4060 Laptop GPU, Ultra 7 155H, WDC PC SN810 1TB
71.3 pt
PCMark 10 / Score
Średnia w klasie Gaming
  (5776 - 9667, n=121, ostatnie 2 lata)
8066 Points +7%
Asus ROG Zephyrus G14 2025 GA403WW
GeForce RTX 5080 Laptop, Ryzen AI 9 HX 370, WD PC SN740 SDDPNQE-2T00
8012 Points +7%
Razer Blade 14 2025
GeForce RTX 5070 Laptop, Ryzen AI 9 365, Samsung PM9A1 MZVL21T0HCLR
7866 Points +5%
Asus TUF Gaming A14 FA401WV-WB94
GeForce RTX 4060 Laptop GPU, Ryzen AI 9 HX 370, WD PC SN560 SDDPNQE-1T00
7645 Points +2%
Acer Predator Triton 14 AI PT14-52
GeForce RTX 5070 Laptop, Core Ultra 9 288V, Micron 3400 1TB MTFDKBA1T0TFH
7517 Points
Przeciętny Intel Core Ultra 9 288V, NVIDIA GeForce RTX 5070 Laptop
  (n=1)
7517 Points 0%
Acer Predator Helios Neo 14 (2024)
GeForce RTX 4070 Laptop GPU, Ultra 9 185H, SK Hynix PC801 HFS001TEJ9X125N
7490 Points 0%
Lenovo Legion 5 15IRX10 5070
GeForce RTX 5070 Laptop, i7-13650HX, WD PC SN7100S SDFPMSL-1T00-1101
7187 Points -4%
HP Omen Transcend 14-fb0014
GeForce RTX 4060 Laptop GPU, Ultra 7 155H, WDC PC SN810 1TB
6962 Points -7%
PCMark 10 / Essentials
Acer Predator Helios Neo 14 (2024)
GeForce RTX 4070 Laptop GPU, Ultra 9 185H, SK Hynix PC801 HFS001TEJ9X125N
10752 Points +22%
Średnia w klasie Gaming
  (8810 - 12600, n=125, ostatnie 2 lata)
10718 Points +22%
Razer Blade 14 2025
GeForce RTX 5070 Laptop, Ryzen AI 9 365, Samsung PM9A1 MZVL21T0HCLR
10647 Points +21%
Asus ROG Zephyrus G14 2025 GA403WW
GeForce RTX 5080 Laptop, Ryzen AI 9 HX 370, WD PC SN740 SDDPNQE-2T00
10582 Points +20%
Lenovo Legion 5 15IRX10 5070
GeForce RTX 5070 Laptop, i7-13650HX, WD PC SN7100S SDFPMSL-1T00-1101
10363 Points +18%
Asus TUF Gaming A14 FA401WV-WB94
GeForce RTX 4060 Laptop GPU, Ryzen AI 9 HX 370, WD PC SN560 SDDPNQE-1T00
10236 Points +16%
HP Omen Transcend 14-fb0014
GeForce RTX 4060 Laptop GPU, Ultra 7 155H, WDC PC SN810 1TB
9850 Points +12%
Acer Predator Triton 14 AI PT14-52
GeForce RTX 5070 Laptop, Core Ultra 9 288V, Micron 3400 1TB MTFDKBA1T0TFH
8810 Points
Przeciętny Intel Core Ultra 9 288V, NVIDIA GeForce RTX 5070 Laptop
  (n=1)
8810 Points 0%
PCMark 10 / Productivity
Acer Predator Triton 14 AI PT14-52
GeForce RTX 5070 Laptop, Core Ultra 9 288V, Micron 3400 1TB MTFDKBA1T0TFH
12095 Points
Przeciętny Intel Core Ultra 9 288V, NVIDIA GeForce RTX 5070 Laptop
  (n=1)
12095 Points 0%
Asus ROG Zephyrus G14 2025 GA403WW
GeForce RTX 5080 Laptop, Ryzen AI 9 HX 370, WD PC SN740 SDDPNQE-2T00
10039 Points -17%
Asus TUF Gaming A14 FA401WV-WB94
GeForce RTX 4060 Laptop GPU, Ryzen AI 9 HX 370, WD PC SN560 SDDPNQE-1T00
9925 Points -18%
Razer Blade 14 2025
GeForce RTX 5070 Laptop, Ryzen AI 9 365, Samsung PM9A1 MZVL21T0HCLR
9890 Points -18%
Średnia w klasie Gaming
  (6662 - 16716, n=121, ostatnie 2 lata)
9881 Points -18%
HP Omen Transcend 14-fb0014
GeForce RTX 4060 Laptop GPU, Ultra 7 155H, WDC PC SN810 1TB
9477 Points -22%
Acer Predator Helios Neo 14 (2024)
GeForce RTX 4070 Laptop GPU, Ultra 9 185H, SK Hynix PC801 HFS001TEJ9X125N
9330 Points -23%
Lenovo Legion 5 15IRX10 5070
GeForce RTX 5070 Laptop, i7-13650HX, WD PC SN7100S SDFPMSL-1T00-1101
7600 Points -37%
PCMark 10 / Digital Content Creation
Średnia w klasie Gaming
  (7440 - 19351, n=121, ostatnie 2 lata)
13639 Points +26%
Asus TUF Gaming A14 FA401WV-WB94
GeForce RTX 4060 Laptop GPU, Ryzen AI 9 HX 370, WD PC SN560 SDDPNQE-1T00
13395 Points +24%
Asus ROG Zephyrus G14 2025 GA403WW
GeForce RTX 5080 Laptop, Ryzen AI 9 HX 370, WD PC SN740 SDDPNQE-2T00
13138 Points +21%
Lenovo Legion 5 15IRX10 5070
GeForce RTX 5070 Laptop, i7-13650HX, WD PC SN7100S SDFPMSL-1T00-1101
12795 Points +18%
Razer Blade 14 2025
GeForce RTX 5070 Laptop, Ryzen AI 9 365, Samsung PM9A1 MZVL21T0HCLR
12547 Points +16%
Acer Predator Helios Neo 14 (2024)
GeForce RTX 4070 Laptop GPU, Ultra 9 185H, SK Hynix PC801 HFS001TEJ9X125N
11369 Points +5%
Acer Predator Triton 14 AI PT14-52
GeForce RTX 5070 Laptop, Core Ultra 9 288V, Micron 3400 1TB MTFDKBA1T0TFH
10816 Points
Przeciętny Intel Core Ultra 9 288V, NVIDIA GeForce RTX 5070 Laptop
  (n=1)
10816 Points 0%
HP Omen Transcend 14-fb0014
GeForce RTX 4060 Laptop GPU, Ultra 7 155H, WDC PC SN810 1TB
9811 Points -9%
CrossMark / Overall
Średnia w klasie Gaming
  (1247 - 2344, n=118, ostatnie 2 lata)
1984 Points +15%
Asus ROG Zephyrus G14 2025 GA403WW
GeForce RTX 5080 Laptop, Ryzen AI 9 HX 370, WD PC SN740 SDDPNQE-2T00
1981 Points +15%
Razer Blade 14 2025
GeForce RTX 5070 Laptop, Ryzen AI 9 365, Samsung PM9A1 MZVL21T0HCLR
1964 Points +14%
Acer Predator Helios Neo 14 (2024)
GeForce RTX 4070 Laptop GPU, Ultra 9 185H, SK Hynix PC801 HFS001TEJ9X125N
1917 Points +11%
Lenovo Legion 5 15IRX10 5070
GeForce RTX 5070 Laptop, i7-13650HX, WD PC SN7100S SDFPMSL-1T00-1101
1839 Points +6%
Acer Predator Triton 14 AI PT14-52
GeForce RTX 5070 Laptop, Core Ultra 9 288V, Micron 3400 1TB MTFDKBA1T0TFH
1728 Points
Przeciętny Intel Core Ultra 9 288V, NVIDIA GeForce RTX 5070 Laptop
  (n=1)
1728 Points 0%
Asus TUF Gaming A14 FA401WV-WB94
GeForce RTX 4060 Laptop GPU, Ryzen AI 9 HX 370, WD PC SN560 SDDPNQE-1T00
1710 Points -1%
HP Omen Transcend 14-fb0014
GeForce RTX 4060 Laptop GPU, Ultra 7 155H, WDC PC SN810 1TB
1540 Points -11%
CrossMark / Productivity
Średnia w klasie Gaming
  (1299 - 2211, n=118, ostatnie 2 lata)
1862 Points +11%
Acer Predator Helios Neo 14 (2024)
GeForce RTX 4070 Laptop GPU, Ultra 9 185H, SK Hynix PC801 HFS001TEJ9X125N
1849 Points +11%
Razer Blade 14 2025
GeForce RTX 5070 Laptop, Ryzen AI 9 365, Samsung PM9A1 MZVL21T0HCLR
1808 Points +8%
Asus ROG Zephyrus G14 2025 GA403WW
GeForce RTX 5080 Laptop, Ryzen AI 9 HX 370, WD PC SN740 SDDPNQE-2T00
1795 Points +7%
Lenovo Legion 5 15IRX10 5070
GeForce RTX 5070 Laptop, i7-13650HX, WD PC SN7100S SDFPMSL-1T00-1101
1719 Points +3%
Acer Predator Triton 14 AI PT14-52
GeForce RTX 5070 Laptop, Core Ultra 9 288V, Micron 3400 1TB MTFDKBA1T0TFH
1670 Points
Przeciętny Intel Core Ultra 9 288V, NVIDIA GeForce RTX 5070 Laptop
  (n=1)
1670 Points 0%
Asus TUF Gaming A14 FA401WV-WB94
GeForce RTX 4060 Laptop GPU, Ryzen AI 9 HX 370, WD PC SN560 SDDPNQE-1T00
1574 Points -6%
HP Omen Transcend 14-fb0014
GeForce RTX 4060 Laptop GPU, Ultra 7 155H, WDC PC SN810 1TB
1436 Points -14%
CrossMark / Creativity
Asus ROG Zephyrus G14 2025 GA403WW
GeForce RTX 5080 Laptop, Ryzen AI 9 HX 370, WD PC SN740 SDDPNQE-2T00
2377 Points +20%
Razer Blade 14 2025
GeForce RTX 5070 Laptop, Ryzen AI 9 365, Samsung PM9A1 MZVL21T0HCLR
2253 Points +13%
Średnia w klasie Gaming
  (1275 - 2729, n=118, ostatnie 2 lata)
2221 Points +12%
Asus TUF Gaming A14 FA401WV-WB94
GeForce RTX 4060 Laptop GPU, Ryzen AI 9 HX 370, WD PC SN560 SDDPNQE-1T00
2077 Points +4%
Lenovo Legion 5 15IRX10 5070
GeForce RTX 5070 Laptop, i7-13650HX, WD PC SN7100S SDFPMSL-1T00-1101
2047 Points +3%
Acer Predator Helios Neo 14 (2024)
GeForce RTX 4070 Laptop GPU, Ultra 9 185H, SK Hynix PC801 HFS001TEJ9X125N
2008 Points +1%
Acer Predator Triton 14 AI PT14-52
GeForce RTX 5070 Laptop, Core Ultra 9 288V, Micron 3400 1TB MTFDKBA1T0TFH
1989 Points
Przeciętny Intel Core Ultra 9 288V, NVIDIA GeForce RTX 5070 Laptop
  (n=1)
1989 Points 0%
HP Omen Transcend 14-fb0014
GeForce RTX 4060 Laptop GPU, Ultra 7 155H, WDC PC SN810 1TB
1813 Points -9%
CrossMark / Responsiveness
Acer Predator Helios Neo 14 (2024)
GeForce RTX 4070 Laptop GPU, Ultra 9 185H, SK Hynix PC801 HFS001TEJ9X125N
1856 Points +47%
Średnia w klasie Gaming
  (1030 - 2330, n=118, ostatnie 2 lata)
1726 Points +37%
Razer Blade 14 2025
GeForce RTX 5070 Laptop, Ryzen AI 9 365, Samsung PM9A1 MZVL21T0HCLR
1666 Points +32%
Lenovo Legion 5 15IRX10 5070
GeForce RTX 5070 Laptop, i7-13650HX, WD PC SN7100S SDFPMSL-1T00-1101
1629 Points +29%
Asus ROG Zephyrus G14 2025 GA403WW
GeForce RTX 5080 Laptop, Ryzen AI 9 HX 370, WD PC SN740 SDDPNQE-2T00
1540 Points +22%
Acer Predator Triton 14 AI PT14-52
GeForce RTX 5070 Laptop, Core Ultra 9 288V, Micron 3400 1TB MTFDKBA1T0TFH
1259 Points
Przeciętny Intel Core Ultra 9 288V, NVIDIA GeForce RTX 5070 Laptop
  (n=1)
1259 Points 0%
Asus TUF Gaming A14 FA401WV-WB94
GeForce RTX 4060 Laptop GPU, Ryzen AI 9 HX 370, WD PC SN560 SDDPNQE-1T00
1226 Points -3%
HP Omen Transcend 14-fb0014
GeForce RTX 4060 Laptop GPU, Ultra 7 155H, WDC PC SN810 1TB
1165 Points -7%
WebXPRT 3 / Overall
Asus ROG Zephyrus G14 2025 GA403WW
GeForce RTX 5080 Laptop, Ryzen AI 9 HX 370, WD PC SN740 SDDPNQE-2T00
347 Points +16%
Średnia w klasie Gaming
  (237 - 532, n=123, ostatnie 2 lata)
315 Points +5%
Acer Predator Triton 14 AI PT14-52
GeForce RTX 5070 Laptop, Core Ultra 9 288V, Micron 3400 1TB MTFDKBA1T0TFH
300 Points
Przeciętny Intel Core Ultra 9 288V, NVIDIA GeForce RTX 5070 Laptop
  (n=1)
300 Points 0%
Razer Blade 14 2025
GeForce RTX 5070 Laptop, Ryzen AI 9 365, Samsung PM9A1 MZVL21T0HCLR
289 Points -4%
Asus TUF Gaming A14 FA401WV-WB94
GeForce RTX 4060 Laptop GPU, Ryzen AI 9 HX 370, WD PC SN560 SDDPNQE-1T00
288 Points -4%
Acer Predator Helios Neo 14 (2024)
GeForce RTX 4070 Laptop GPU, Ultra 9 185H, SK Hynix PC801 HFS001TEJ9X125N
287 Points -4%
Lenovo Legion 5 15IRX10 5070
GeForce RTX 5070 Laptop, i7-13650HX, WD PC SN7100S SDFPMSL-1T00-1101
277 Points -8%
HP Omen Transcend 14-fb0014
GeForce RTX 4060 Laptop GPU, Ultra 7 155H, WDC PC SN810 1TB
274 Points -9%
WebXPRT 4 / Overall
Acer Predator Triton 14 AI PT14-52
GeForce RTX 5070 Laptop, Core Ultra 9 288V, Micron 3400 1TB MTFDKBA1T0TFH
284 Points
Przeciętny Intel Core Ultra 9 288V, NVIDIA GeForce RTX 5070 Laptop
  (n=1)
284 Points 0%
Średnia w klasie Gaming
  (176.4 - 345, n=118, ostatnie 2 lata)
283 Points 0%
Asus ROG Zephyrus G14 2025 GA403WW
GeForce RTX 5080 Laptop, Ryzen AI 9 HX 370, WD PC SN740 SDDPNQE-2T00
275 Points -3%
Razer Blade 14 2025
GeForce RTX 5070 Laptop, Ryzen AI 9 365, Samsung PM9A1 MZVL21T0HCLR
271 Points -5%
Lenovo Legion 5 15IRX10 5070
GeForce RTX 5070 Laptop, i7-13650HX, WD PC SN7100S SDFPMSL-1T00-1101
266 Points -6%
Acer Predator Helios Neo 14 (2024)
GeForce RTX 4070 Laptop GPU, Ultra 9 185H, SK Hynix PC801 HFS001TEJ9X125N
260 Points -8%
Asus TUF Gaming A14 FA401WV-WB94
GeForce RTX 4060 Laptop GPU, Ryzen AI 9 HX 370, WD PC SN560 SDDPNQE-1T00
252 Points -11%
HP Omen Transcend 14-fb0014
GeForce RTX 4060 Laptop GPU, Ultra 7 155H, WDC PC SN810 1TB
236 Points -17%
Mozilla Kraken 1.1 / Total
HP Omen Transcend 14-fb0014
GeForce RTX 4060 Laptop GPU, Ultra 7 155H, WDC PC SN810 1TB
585 ms * -24%
Lenovo Legion 5 15IRX10 5070
GeForce RTX 5070 Laptop, i7-13650HX, WD PC SN7100S SDFPMSL-1T00-1101
521 ms * -10%
Acer Predator Helios Neo 14 (2024)
GeForce RTX 4070 Laptop GPU, Ultra 9 185H, SK Hynix PC801 HFS001TEJ9X125N
508 ms * -8%
Acer Predator Triton 14 AI PT14-52
GeForce RTX 5070 Laptop, Core Ultra 9 288V, Micron 3400 1TB MTFDKBA1T0TFH
472 ms *
Przeciętny Intel Core Ultra 9 288V, NVIDIA GeForce RTX 5070 Laptop
  (n=1)
472 ms * -0%
Średnia w klasie Gaming
  (397 - 674, n=132, ostatnie 2 lata)
471 ms * -0%
Asus TUF Gaming A14 FA401WV-WB94
GeForce RTX 4060 Laptop GPU, Ryzen AI 9 HX 370, WD PC SN560 SDDPNQE-1T00
450 ms * +5%
Razer Blade 14 2025
GeForce RTX 5070 Laptop, Ryzen AI 9 365, Samsung PM9A1 MZVL21T0HCLR
437 ms * +7%
Asus ROG Zephyrus G14 2025 GA403WW
GeForce RTX 5080 Laptop, Ryzen AI 9 HX 370, WD PC SN740 SDDPNQE-2T00
425 ms * +10%

* ... im mniej tym lepiej

PCMark 10 Score
7517 pkt.
Pomoc
AIDA64 / Memory Copy
Przeciętny Intel Core Ultra 9 288V
  (108104 - 108894, n=3)
108471 MB/s 0%
Acer Predator Triton 14 AI PT14-52
Intel Core Ultra 9 288V, GeForce RTX 5070 Laptop
108104 MB/s
Razer Blade 14 2025
AMD Ryzen AI 9 365, GeForce RTX 5070 Laptop
94015 MB/s -13%
HP Omen Transcend 14-fb0014
Intel Core Ultra 7 155H, GeForce RTX 4060 Laptop GPU
92565 MB/s -14%
Asus ROG Zephyrus G14 2025 GA403WW
AMD Ryzen AI 9 HX 370, GeForce RTX 5080 Laptop
92291 MB/s -15%
Asus TUF Gaming A14 FA401WV-WB94
AMD Ryzen AI 9 HX 370, GeForce RTX 4060 Laptop GPU
92030 MB/s -15%
Acer Predator Helios Neo 14 (2024)
Intel Core Ultra 9 185H, GeForce RTX 4070 Laptop GPU
84317 MB/s -22%
Średnia w klasie Gaming
  (21750 - 108104, n=144, ostatnie 2 lata)
71814 MB/s -34%
Lenovo Legion 5 15IRX10 5070
Intel Core i7-13650HX, GeForce RTX 5070 Laptop
66372 MB/s -39%
AIDA64 / Memory Read
Razer Blade 14 2025
AMD Ryzen AI 9 365, GeForce RTX 5070 Laptop
104349 MB/s +20%
Asus ROG Zephyrus G14 2025 GA403WW
AMD Ryzen AI 9 HX 370, GeForce RTX 5080 Laptop
100437 MB/s +15%
Asus TUF Gaming A14 FA401WV-WB94
AMD Ryzen AI 9 HX 370, GeForce RTX 4060 Laptop GPU
99673 MB/s +14%
HP Omen Transcend 14-fb0014
Intel Core Ultra 7 155H, GeForce RTX 4060 Laptop GPU
90647 MB/s +4%
Przeciętny Intel Core Ultra 9 288V
  (86694 - 87810, n=3)
87193 MB/s 0%
Acer Predator Triton 14 AI PT14-52
Intel Core Ultra 9 288V, GeForce RTX 5070 Laptop
87076 MB/s
Acer Predator Helios Neo 14 (2024)
Intel Core Ultra 9 185H, GeForce RTX 4070 Laptop GPU
76163 MB/s -13%
Średnia w klasie Gaming
  (22956 - 104349, n=144, ostatnie 2 lata)
74513 MB/s -14%
Lenovo Legion 5 15IRX10 5070
Intel Core i7-13650HX, GeForce RTX 5070 Laptop
71022 MB/s -18%
AIDA64 / Memory Write
Acer Predator Triton 14 AI PT14-52
Intel Core Ultra 9 288V, GeForce RTX 5070 Laptop
117889 MB/s
Przeciętny Intel Core Ultra 9 288V
  (113427 - 117889, n=3)
116380 MB/s -1%
Asus TUF Gaming A14 FA401WV-WB94
AMD Ryzen AI 9 HX 370, GeForce RTX 4060 Laptop GPU
108954 MB/s -8%
Asus ROG Zephyrus G14 2025 GA403WW
AMD Ryzen AI 9 HX 370, GeForce RTX 5080 Laptop
105190 MB/s -11%
Razer Blade 14 2025
AMD Ryzen AI 9 365, GeForce RTX 5070 Laptop
105106 MB/s -11%
HP Omen Transcend 14-fb0014
Intel Core Ultra 7 155H, GeForce RTX 4060 Laptop GPU
75414 MB/s -36%
Średnia w klasie Gaming
  (22297 - 133486, n=144, ostatnie 2 lata)
73721 MB/s -37%
Lenovo Legion 5 15IRX10 5070
Intel Core i7-13650HX, GeForce RTX 5070 Laptop
68225 MB/s -42%
Acer Predator Helios Neo 14 (2024)
Intel Core Ultra 9 185H, GeForce RTX 4070 Laptop GPU
51880 MB/s -56%
AIDA64 / Memory Latency
HP Omen Transcend 14-fb0014
Intel Core Ultra 7 155H, GeForce RTX 4060 Laptop GPU
152.5 ns * -55%
Acer Predator Helios Neo 14 (2024)
Intel Core Ultra 9 185H, GeForce RTX 4070 Laptop GPU
144.3 ns * -46%
Asus TUF Gaming A14 FA401WV-WB94
AMD Ryzen AI 9 HX 370, GeForce RTX 4060 Laptop GPU
119.4 ns * -21%
Asus ROG Zephyrus G14 2025 GA403WW
AMD Ryzen AI 9 HX 370, GeForce RTX 5080 Laptop
106.6 ns * -8%
Razer Blade 14 2025
AMD Ryzen AI 9 365, GeForce RTX 5070 Laptop
103.6 ns * -5%
Średnia w klasie Gaming
  (59.5 - 259, n=144, ostatnie 2 lata)
101.9 ns * -3%
Acer Predator Triton 14 AI PT14-52
Intel Core Ultra 9 288V, GeForce RTX 5070 Laptop
98.5 ns *
Przeciętny Intel Core Ultra 9 288V
  (97.9 - 98.5, n=3)
98.2 ns * -0%
Lenovo Legion 5 15IRX10 5070
Intel Core i7-13650HX, GeForce RTX 5070 Laptop
88.4 ns * +10%

* ... im mniej tym lepiej

Opóźnienia DPC

W naszym standardowym teście opóźnień (surfowanie po Internecie, odtwarzanie w 4K YouTube, obciążenie procesora), urządzenie testowe z aktualną wersją BIOS-u nie wykazuje żadnych ograniczeń podczas korzystania z aplikacji audio w czasie rzeczywistym.

LatencyMon - Przegląd
LatencyMon - sterownik
DPC Latencies / LatencyMon - interrupt to process latency (max), Web, Youtube, Prime95
Razer Blade 14 2025
GeForce RTX 5070 Laptop, Ryzen AI 9 365, Samsung PM9A1 MZVL21T0HCLR
8940.3 μs * -1167%
Lenovo Legion 5 15IRX10 5070
GeForce RTX 5070 Laptop, i7-13650HX, WD PC SN7100S SDFPMSL-1T00-1101
1010.7 μs * -43%
Acer Predator Helios Neo 14 (2024)
GeForce RTX 4070 Laptop GPU, Ultra 9 185H, SK Hynix PC801 HFS001TEJ9X125N
864.8 μs * -23%
Acer Predator Triton 14 AI PT14-52
GeForce RTX 5070 Laptop, Core Ultra 9 288V, Micron 3400 1TB MTFDKBA1T0TFH
705.4 μs *
HP Omen Transcend 14-fb0014
GeForce RTX 4060 Laptop GPU, Ultra 7 155H, WDC PC SN810 1TB
638.9 μs * +9%
Asus ROG Zephyrus G14 2025 GA403WW
GeForce RTX 5080 Laptop, Ryzen AI 9 HX 370, WD PC SN740 SDDPNQE-2T00
543.3 μs * +23%

* ... im mniej tym lepiej

Pamięć masowa

W urządzeniu testowym zainstalowano dysk SSD o pojemności 1 TB (870 GB wolnego miejsca) firmy Micron, ale model sprzedażowy jest wyposażony w dysk SSD o pojemności 2 TB. Wydajność dysku SSD PCIe 4.0 jest przeciętna i pozostaje stabilna przy długotrwałym obciążeniu.

Micron 3400 1TB MTFDKBA1T0TFH
CDM 5/6 Read Seq Q32T1: 6546 MB/s
CDM 5/6 Write Seq Q32T1: 4796 MB/s
CDM 5/6 Read 4K Q32T1: 463 MB/s
CDM 5/6 Write 4K Q32T1: 422 MB/s
CDM 5/6 Read 4K: 56.3 MB/s
CDM 5/6 Write 4K: 119.5 MB/s
CDM 6 Write 4K Q8T8: 405 MB/s
CDM 6 Read 4K Q8T8: 683 MB/s
Drive Performance rating - Percent
Acer Predator Helios Neo 14 (2024)
SK Hynix PC801 HFS001TEJ9X125N
93.4 pt
Razer Blade 14 2025
Samsung PM9A1 MZVL21T0HCLR
80.6 pt
Lenovo Legion 5 15IRX10 5070
WD PC SN7100S SDFPMSL-1T00-1101
76.9 pt
Średnia w klasie Gaming
 
74 pt
Przeciętny Micron 3400 1TB MTFDKBA1T0TFH
 
66.1 pt
Asus ROG Zephyrus G14 2025 GA403WW
WD PC SN740 SDDPNQE-2T00
56.1 pt
HP Omen Transcend 14-fb0014
WDC PC SN810 1TB
49.3 pt
Acer Predator Triton 14 AI PT14-52
Micron 3400 1TB MTFDKBA1T0TFH
48.3 pt
Asus TUF Gaming A14 FA401WV-WB94
WD PC SN560 SDDPNQE-1T00
38 pt
DiskSpd
seq read
Acer Predator Helios Neo 14 (2024)
SK Hynix PC801 HFS001TEJ9X125N
5314 (5307.13min - 5313.55max) MB/s +115%
Razer Blade 14 2025
Samsung PM9A1 MZVL21T0HCLR
3813 (3801.51min - 3813.46max) MB/s +54%
Lenovo Legion 5 15IRX10 5070
WD PC SN7100S SDFPMSL-1T00-1101
3569 (3518.49min - 3569.14max) MB/s +44%
Średnia w klasie Gaming
  (281 - 8300, n=128, ostatnie 2 lata)
3479 MB/s +41%
HP Omen Transcend 14-fb0014
WDC PC SN810 1TB
3464 (3425.98min - 3464.29max) MB/s +40%
Przeciętny Micron 3400 1TB MTFDKBA1T0TFH
  (1306 - 4343, n=24)
3249 MB/s +31%
Asus TUF Gaming A14 FA401WV-WB94
WD PC SN560 SDDPNQE-1T00
2972 (2943.76min - 2971.8max) MB/s +20%
Asus ROG Zephyrus G14 2025 GA403WW
WD PC SN740 SDDPNQE-2T00
2934 (2919.69min - 2934.34max) MB/s +19%
Acer Predator Triton 14 AI PT14-52
Micron 3400 1TB MTFDKBA1T0TFH
2472 (2385.56min - 2471.79max) MB/s
seq write
Acer Predator Helios Neo 14 (2024)
SK Hynix PC801 HFS001TEJ9X125N
5300 (5260.88min - 5299.6max) MB/s +126%
Lenovo Legion 5 15IRX10 5070
WD PC SN7100S SDFPMSL-1T00-1101
4107 (1382.44min - 4106.61max) MB/s +75%
Średnia w klasie Gaming
  (1454 - 9699, n=128, ostatnie 2 lata)
3969 MB/s +69%
Przeciętny Micron 3400 1TB MTFDKBA1T0TFH
  (2345 - 4954, n=24)
3793 MB/s +62%
Razer Blade 14 2025
Samsung PM9A1 MZVL21T0HCLR
3469 (2223.57min - 3469.11max) MB/s +48%
Asus ROG Zephyrus G14 2025 GA403WW
WD PC SN740 SDDPNQE-2T00
3237 (3157.45min - 3236.98max) MB/s +38%
HP Omen Transcend 14-fb0014
WDC PC SN810 1TB
2767 (2730.91min - 2767.11max) MB/s +18%
Asus TUF Gaming A14 FA401WV-WB94
WD PC SN560 SDDPNQE-1T00
2552 (2410.68min - 2552.16max) MB/s +9%
Acer Predator Triton 14 AI PT14-52
Micron 3400 1TB MTFDKBA1T0TFH
2345 (2113.3min - 2344.75max) MB/s
seq q8 t1 read
Acer Predator Helios Neo 14 (2024)
SK Hynix PC801 HFS001TEJ9X125N
7150 (6584.05min - 7150.03max) MB/s +9%
Średnia w klasie Gaming
  (3193 - 15056, n=128, ostatnie 2 lata)
6992 MB/s +7%
HP Omen Transcend 14-fb0014
WDC PC SN810 1TB
6984 (6240.18min - 6983.73max) MB/s +7%
Razer Blade 14 2025
Samsung PM9A1 MZVL21T0HCLR
6691 (5876.63min - 6691.17max) MB/s +2%
Lenovo Legion 5 15IRX10 5070
WD PC SN7100S SDFPMSL-1T00-1101
6624 (5414.29min - 6624.48max) MB/s +1%
Przeciętny Micron 3400 1TB MTFDKBA1T0TFH
  (6207 - 6734, n=24)
6570 MB/s 0%
Acer Predator Triton 14 AI PT14-52
Micron 3400 1TB MTFDKBA1T0TFH
6550 (5807.77min - 6549.94max) MB/s
Asus ROG Zephyrus G14 2025 GA403WW
WD PC SN740 SDDPNQE-2T00
5041 (4233.02min - 5040.5max) MB/s -23%
Asus TUF Gaming A14 FA401WV-WB94
WD PC SN560 SDDPNQE-1T00
5011 (4175.89min - 5010.98max) MB/s -23%
seq q8 t1 write
Lenovo Legion 5 15IRX10 5070
WD PC SN7100S SDFPMSL-1T00-1101
6650 (3228.82min - 6649.56max) MB/s +48%
Acer Predator Helios Neo 14 (2024)
SK Hynix PC801 HFS001TEJ9X125N
6519 (6480.83min - 6519.17max) MB/s +45%
Średnia w klasie Gaming
  (1699 - 13519, n=128, ostatnie 2 lata)
5648 MB/s +26%
Przeciętny Micron 3400 1TB MTFDKBA1T0TFH
  (4259 - 4991, n=24)
4794 MB/s +7%
Acer Predator Triton 14 AI PT14-52
Micron 3400 1TB MTFDKBA1T0TFH
4493 (4216.07min - 4492.76max) MB/s
HP Omen Transcend 14-fb0014
WDC PC SN810 1TB
4454 (4349.91min - 4453.83max) MB/s -1%
Razer Blade 14 2025
Samsung PM9A1 MZVL21T0HCLR
4123 (2408.79min - 4122.72max) MB/s -8%
Asus ROG Zephyrus G14 2025 GA403WW
WD PC SN740 SDDPNQE-2T00
4034 (3884.75min - 4033.56max) MB/s -10%
Asus TUF Gaming A14 FA401WV-WB94
WD PC SN560 SDDPNQE-1T00
3464 (3397.72min - 3464.49max) MB/s -23%
4k q1 t1 read
Lenovo Legion 5 15IRX10 5070
WD PC SN7100S SDFPMSL-1T00-1101
89.3 (87.63min - 89.25max) MB/s +94%
Acer Predator Helios Neo 14 (2024)
SK Hynix PC801 HFS001TEJ9X125N
78.3 (78.02min - 78.33max) MB/s +70%
Średnia w klasie Gaming
  (32.2 - 110.2, n=128, ostatnie 2 lata)
69.1 MB/s +50%
HP Omen Transcend 14-fb0014
WDC PC SN810 1TB
63.8 (62.98min - 63.76max) MB/s +38%
Przeciętny Micron 3400 1TB MTFDKBA1T0TFH
  (39.2 - 74.3, n=24)
58.9 MB/s +28%
Asus ROG Zephyrus G14 2025 GA403WW
WD PC SN740 SDDPNQE-2T00
57.7 (56.74min - 57.73max) MB/s +25%
Razer Blade 14 2025
Samsung PM9A1 MZVL21T0HCLR
55.9 (55.71min - 55.9max) MB/s +21%
Acer Predator Triton 14 AI PT14-52
Micron 3400 1TB MTFDKBA1T0TFH
46.1 (45.76min - 46.14max) MB/s
Asus TUF Gaming A14 FA401WV-WB94
WD PC SN560 SDDPNQE-1T00
41.9 (41.34min - 41.93max) MB/s -9%
4k q1 t1 write
Acer Predator Helios Neo 14 (2024)
SK Hynix PC801 HFS001TEJ9X125N
268 (265.39min - 267.72max) MB/s +156%
Średnia w klasie Gaming
  (78 - 397, n=128, ostatnie 2 lata)
205 MB/s +96%
Razer Blade 14 2025
Samsung PM9A1 MZVL21T0HCLR
203 (200.63min - 203.18max) MB/s +94%
Przeciętny Micron 3400 1TB MTFDKBA1T0TFH
  (104.8 - 273, n=24)
185.9 MB/s +77%
Lenovo Legion 5 15IRX10 5070
WD PC SN7100S SDFPMSL-1T00-1101
166.3 (162.99min - 166.26max) MB/s +59%
Asus ROG Zephyrus G14 2025 GA403WW
WD PC SN740 SDDPNQE-2T00
160.1 (157.11min - 160.13max) MB/s +53%
Acer Predator Triton 14 AI PT14-52
Micron 3400 1TB MTFDKBA1T0TFH
104.8 (102.33min - 104.81max) MB/s
HP Omen Transcend 14-fb0014
WDC PC SN810 1TB
85 (82.48min - 84.96max) MB/s -19%
Asus TUF Gaming A14 FA401WV-WB94
WD PC SN560 SDDPNQE-1T00
78 (75.5min - 77.97max) MB/s -26%
4k q32 t16 read
Acer Predator Helios Neo 14 (2024)
SK Hynix PC801 HFS001TEJ9X125N
4820 (4785.11min - 4819.55max) MB/s +537%
Razer Blade 14 2025
Samsung PM9A1 MZVL21T0HCLR
3222 (3205.72min - 3221.76max) MB/s +326%
Średnia w klasie Gaming
  (417 - 8067, n=128, ostatnie 2 lata)
2500 MB/s +230%
Przeciętny Micron 3400 1TB MTFDKBA1T0TFH
  (636 - 2868, n=24)
2021 MB/s +167%
Lenovo Legion 5 15IRX10 5070
WD PC SN7100S SDFPMSL-1T00-1101
1477 (1412.34min - 1477.22max) MB/s +95%
Asus ROG Zephyrus G14 2025 GA403WW
WD PC SN740 SDDPNQE-2T00
859 (798.15min - 859.48max) MB/s +13%
Acer Predator Triton 14 AI PT14-52
Micron 3400 1TB MTFDKBA1T0TFH
757 (675.71min - 757.36max) MB/s
Asus TUF Gaming A14 FA401WV-WB94
WD PC SN560 SDDPNQE-1T00
620 (586.37min - 620.02max) MB/s -18%
HP Omen Transcend 14-fb0014
WDC PC SN810 1TB
417 (370.38min - 417.19max) MB/s -45%
4k q32 t16 write
Acer Predator Helios Neo 14 (2024)
SK Hynix PC801 HFS001TEJ9X125N
3091 (3068.4min - 3091.44max) MB/s +705%
Lenovo Legion 5 15IRX10 5070
WD PC SN7100S SDFPMSL-1T00-1101
2770 (2736.74min - 2770.31max) MB/s +621%
Razer Blade 14 2025
Samsung PM9A1 MZVL21T0HCLR
2479 (2210.04min - 2479.14max) MB/s +546%
Średnia w klasie Gaming
  (162.3 - 5653, n=128, ostatnie 2 lata)
2058 MB/s +436%
Przeciętny Micron 3400 1TB MTFDKBA1T0TFH
  (328 - 2786, n=24)
1707 MB/s +345%
Asus ROG Zephyrus G14 2025 GA403WW
WD PC SN740 SDDPNQE-2T00
577 (533.21min - 577.37max) MB/s +50%
Acer Predator Triton 14 AI PT14-52
Micron 3400 1TB MTFDKBA1T0TFH
384 (275.96min - 384.29max) MB/s
Asus TUF Gaming A14 FA401WV-WB94
WD PC SN560 SDDPNQE-1T00
227 (189.21min - 227.15max) MB/s -41%
HP Omen Transcend 14-fb0014
WDC PC SN810 1TB
162.3 (149.98min - 162.25max) MB/s -58%
AS SSD
Score Total
Razer Blade 14 2025
Samsung PM9A1 MZVL21T0HCLR
8561 Points +155%
Acer Predator Helios Neo 14 (2024)
SK Hynix PC801 HFS001TEJ9X125N
8486 Points +153%
Średnia w klasie Gaming
  (2912 - 13854, n=125, ostatnie 2 lata)
6891 Points +105%
Lenovo Legion 5 15IRX10 5070
WD PC SN7100S SDFPMSL-1T00-1101
6187 Points +84%
Przeciętny Micron 3400 1TB MTFDKBA1T0TFH
  (3356 - 7575, n=22)
6169 Points +84%
Asus ROG Zephyrus G14 2025 GA403WW
WD PC SN740 SDDPNQE-2T00
4276 Points +27%
HP Omen Transcend 14-fb0014
WDC PC SN810 1TB
4112 Points +23%
Asus TUF Gaming A14 FA401WV-WB94
WD PC SN560 SDDPNQE-1T00
3357 Points 0%
Acer Predator Triton 14 AI PT14-52
Micron 3400 1TB MTFDKBA1T0TFH
3356 Points
Score Read
Razer Blade 14 2025
Samsung PM9A1 MZVL21T0HCLR
3165 Points +179%
Acer Predator Helios Neo 14 (2024)
SK Hynix PC801 HFS001TEJ9X125N
2908 Points +157%
Lenovo Legion 5 15IRX10 5070
WD PC SN7100S SDFPMSL-1T00-1101
2434 Points +115%
Średnia w klasie Gaming
  (953 - 4418, n=125, ostatnie 2 lata)
2332 Points +106%
Przeciętny Micron 3400 1TB MTFDKBA1T0TFH
  (1123 - 2855, n=22)
2208 Points +95%
HP Omen Transcend 14-fb0014
WDC PC SN810 1TB
1211 Points +7%
Asus ROG Zephyrus G14 2025 GA403WW
WD PC SN740 SDDPNQE-2T00
1171 Points +3%
Acer Predator Triton 14 AI PT14-52
Micron 3400 1TB MTFDKBA1T0TFH
1133 Points
Asus TUF Gaming A14 FA401WV-WB94
WD PC SN560 SDDPNQE-1T00
962 Points -15%
Score Write
Acer Predator Helios Neo 14 (2024)
SK Hynix PC801 HFS001TEJ9X125N
4106 Points +140%
Razer Blade 14 2025
Samsung PM9A1 MZVL21T0HCLR
3851 Points +125%
Średnia w klasie Gaming
  (1136 - 7208, n=125, ostatnie 2 lata)
3428 Points +100%
Przeciętny Micron 3400 1TB MTFDKBA1T0TFH
  (1714 - 3304, n=22)
2887 Points +68%
Lenovo Legion 5 15IRX10 5070
WD PC SN7100S SDFPMSL-1T00-1101
2582 Points +51%
Asus ROG Zephyrus G14 2025 GA403WW
WD PC SN740 SDDPNQE-2T00
2543 Points +48%
HP Omen Transcend 14-fb0014
WDC PC SN810 1TB
2416 Points +41%
Asus TUF Gaming A14 FA401WV-WB94
WD PC SN560 SDDPNQE-1T00
1980 Points +16%
Acer Predator Triton 14 AI PT14-52
Micron 3400 1TB MTFDKBA1T0TFH
1714 Points
Seq Read
Acer Predator Helios Neo 14 (2024)
SK Hynix PC801 HFS001TEJ9X125N
5686.51 MB/s +22%
Lenovo Legion 5 15IRX10 5070
WD PC SN7100S SDFPMSL-1T00-1101
5561 MB/s +19%
Średnia w klasie Gaming
  (2272 - 9890, n=125, ostatnie 2 lata)
5311 MB/s +14%
Razer Blade 14 2025
Samsung PM9A1 MZVL21T0HCLR
5295 MB/s +13%
HP Omen Transcend 14-fb0014
WDC PC SN810 1TB
5251.35 MB/s +12%
Acer Predator Triton 14 AI PT14-52
Micron 3400 1TB MTFDKBA1T0TFH
4670 MB/s
Przeciętny Micron 3400 1TB MTFDKBA1T0TFH
  (2201 - 5348, n=22)
4477 MB/s -4%
Asus ROG Zephyrus G14 2025 GA403WW
WD PC SN740 SDDPNQE-2T00
4236 MB/s -9%
Asus TUF Gaming A14 FA401WV-WB94
WD PC SN560 SDDPNQE-1T00
3746.58 MB/s -20%
Seq Write
Acer Predator Helios Neo 14 (2024)
SK Hynix PC801 HFS001TEJ9X125N
5335.07 MB/s +80%
Średnia w klasie Gaming
  (114.5 - 9926, n=125, ostatnie 2 lata)
3915 MB/s +32%
Razer Blade 14 2025
Samsung PM9A1 MZVL21T0HCLR
3815 MB/s +28%
Lenovo Legion 5 15IRX10 5070
WD PC SN7100S SDFPMSL-1T00-1101
3716 MB/s +25%
Przeciętny Micron 3400 1TB MTFDKBA1T0TFH
  (1876 - 4539, n=22)
3296 MB/s +11%
Asus ROG Zephyrus G14 2025 GA403WW
WD PC SN740 SDDPNQE-2T00
3245 MB/s +9%
Acer Predator Triton 14 AI PT14-52
Micron 3400 1TB MTFDKBA1T0TFH
2972 MB/s
HP Omen Transcend 14-fb0014
WDC PC SN810 1TB
2228.73 MB/s -25%
Asus TUF Gaming A14 FA401WV-WB94
WD PC SN560 SDDPNQE-1T00
2070.14 MB/s -30%
4K Read
Lenovo Legion 5 15IRX10 5070
WD PC SN7100S SDFPMSL-1T00-1101
94.3 MB/s +70%
Razer Blade 14 2025
Samsung PM9A1 MZVL21T0HCLR
71.8 MB/s +30%
Acer Predator Helios Neo 14 (2024)
SK Hynix PC801 HFS001TEJ9X125N
70.28 MB/s +27%
Średnia w klasie Gaming
  (27.8 - 108.4, n=125, ostatnie 2 lata)
68.5 MB/s +24%
HP Omen Transcend 14-fb0014
WDC PC SN810 1TB
61.7 MB/s +11%
Przeciętny Micron 3400 1TB MTFDKBA1T0TFH
  (40.6 - 67.7, n=22)
58.5 MB/s +6%
Acer Predator Triton 14 AI PT14-52
Micron 3400 1TB MTFDKBA1T0TFH
55.4 MB/s
Asus ROG Zephyrus G14 2025 GA403WW
WD PC SN740 SDDPNQE-2T00
50.9 MB/s -8%
Asus TUF Gaming A14 FA401WV-WB94
WD PC SN560 SDDPNQE-1T00
36.63 MB/s -34%
4K Write
Acer Predator Helios Neo 14 (2024)
SK Hynix PC801 HFS001TEJ9X125N
231.27 MB/s +68%
Lenovo Legion 5 15IRX10 5070
WD PC SN7100S SDFPMSL-1T00-1101
227 MB/s +65%
Średnia w klasie Gaming
  (75.6 - 512, n=125, ostatnie 2 lata)
216 MB/s +57%
Asus ROG Zephyrus G14 2025 GA403WW
WD PC SN740 SDDPNQE-2T00
201 MB/s +46%
Razer Blade 14 2025
Samsung PM9A1 MZVL21T0HCLR
183.2 MB/s +33%
HP Omen Transcend 14-fb0014
WDC PC SN810 1TB
176.41 MB/s +28%
Przeciętny Micron 3400 1TB MTFDKBA1T0TFH
  (97.9 - 242, n=22)
176.1 MB/s +28%
Asus TUF Gaming A14 FA401WV-WB94
WD PC SN560 SDDPNQE-1T00
157.35 MB/s +14%
Acer Predator Triton 14 AI PT14-52
Micron 3400 1TB MTFDKBA1T0TFH
137.7 MB/s
4K-64 Read
Razer Blade 14 2025
Samsung PM9A1 MZVL21T0HCLR
2564 MB/s +320%
Acer Predator Helios Neo 14 (2024)
SK Hynix PC801 HFS001TEJ9X125N
2268.99 MB/s +271%
Lenovo Legion 5 15IRX10 5070
WD PC SN7100S SDFPMSL-1T00-1101
1783 MB/s +192%
Średnia w klasie Gaming
  (517 - 3630, n=125, ostatnie 2 lata)
1734 MB/s +184%
Przeciętny Micron 3400 1TB MTFDKBA1T0TFH
  (603 - 2264, n=22)
1702 MB/s +179%
Asus ROG Zephyrus G14 2025 GA403WW
WD PC SN740 SDDPNQE-2T00
696 MB/s +14%
HP Omen Transcend 14-fb0014
WDC PC SN810 1TB
623.99 MB/s +2%
Acer Predator Triton 14 AI PT14-52
Micron 3400 1TB MTFDKBA1T0TFH
611 MB/s
Asus TUF Gaming A14 FA401WV-WB94
WD PC SN560 SDDPNQE-1T00
550.75 MB/s -10%
4K-64 Write
Acer Predator Helios Neo 14 (2024)
SK Hynix PC801 HFS001TEJ9X125N
3341.31 MB/s +161%
Razer Blade 14 2025
Samsung PM9A1 MZVL21T0HCLR
3286 MB/s +157%
Średnia w klasie Gaming
  (850 - 5909, n=125, ostatnie 2 lata)
2823 MB/s +121%
Przeciętny Micron 3400 1TB MTFDKBA1T0TFH
  (1279 - 2807, n=22)
2381 MB/s +86%
Asus ROG Zephyrus G14 2025 GA403WW
WD PC SN740 SDDPNQE-2T00
2018 MB/s +58%
HP Omen Transcend 14-fb0014
WDC PC SN810 1TB
2016.6 MB/s +58%
Lenovo Legion 5 15IRX10 5070
WD PC SN7100S SDFPMSL-1T00-1101
1983 MB/s +55%
Asus TUF Gaming A14 FA401WV-WB94
WD PC SN560 SDDPNQE-1T00
1615.58 MB/s +26%
Acer Predator Triton 14 AI PT14-52
Micron 3400 1TB MTFDKBA1T0TFH
1279 MB/s
Access Time Read
Asus TUF Gaming A14 FA401WV-WB94
WD PC SN560 SDDPNQE-1T00
0.093 ms * -166%
HP Omen Transcend 14-fb0014
WDC PC SN810 1TB
0.077 ms * -120%
Średnia w klasie Gaming
  (0.016 - 0.17, n=125, ostatnie 2 lata)
0.05416 ms * -55%
Przeciętny Micron 3400 1TB MTFDKBA1T0TFH
  (0.023 - 0.089, n=21)
0.04619 ms * -32%
Acer Predator Helios Neo 14 (2024)
SK Hynix PC801 HFS001TEJ9X125N
0.038 ms * -9%
Acer Predator Triton 14 AI PT14-52
Micron 3400 1TB MTFDKBA1T0TFH
0.035 ms *
Asus ROG Zephyrus G14 2025 GA403WW
WD PC SN740 SDDPNQE-2T00
0.026 ms * +26%
Lenovo Legion 5 15IRX10 5070
WD PC SN7100S SDFPMSL-1T00-1101
0.026 ms * +26%
Razer Blade 14 2025
Samsung PM9A1 MZVL21T0HCLR
0.025 ms * +29%
Access Time Write
Asus TUF Gaming A14 FA401WV-WB94
WD PC SN560 SDDPNQE-1T00
0.072 ms * -106%
HP Omen Transcend 14-fb0014
WDC PC SN810 1TB
0.061 ms * -74%
Średnia w klasie Gaming
  (0.012 - 0.277, n=125, ostatnie 2 lata)
0.03818 ms * -9%
Przeciętny Micron 3400 1TB MTFDKBA1T0TFH
  (0.019 - 0.092, n=22)
0.03682 ms * -5%
Acer Predator Triton 14 AI PT14-52
Micron 3400 1TB MTFDKBA1T0TFH
0.035 ms *
Lenovo Legion 5 15IRX10 5070
WD PC SN7100S SDFPMSL-1T00-1101
0.027 ms * +23%
Razer Blade 14 2025
Samsung PM9A1 MZVL21T0HCLR
0.023 ms * +34%
Asus ROG Zephyrus G14 2025 GA403WW
WD PC SN740 SDDPNQE-2T00
0.019 ms * +46%
Acer Predator Helios Neo 14 (2024)
SK Hynix PC801 HFS001TEJ9X125N
0.018 ms * +49%

* ... im mniej tym lepiej

Ciągła wydajność odczytu: Pętla odczytu DiskSpd, głębokość kolejki 8

03306609901320165019802310264029703300363039604290462049505280561059406270Tooltip
Acer Predator Triton 14 AI PT14-52; diskspd 2.0.17 f: Ø6458 (5557.24-6577.15)

Wydajność GPU

Dedykowanym procesorem graficznym jest GeForce RTX 5070 z TGP wynoszącym 110 W, czyli bardzo szybkim wariantem. Model 5070 oferuje 8 GB pamięci VRAM, co może prowadzić do ograniczeń w obecnych grach, zwłaszcza w wysokich rozdzielczościach, co omówimy w specjalnym artykule specjalnym artykule który został już omówiony bardziej szczegółowo. Przełączanie grafiki odbywa się za pośrednictwem zwykłej technologii Optimus, ale zainstalowano przełącznik MUX i można całkowicie przełączyć się na dGPU, ale wymaga to ponownego uruchomienia.

Czysta wydajność graficzna jest w zasadzie w porządku, ale raczej słaby procesor Lunar Lake jest zauważalny podczas grania i nie można wykorzystać pełnego potencjału RTX 5070. Tutaj Razer Blade 14 z procesorem AMD jest na przykład o 10% szybszy. Niemniej jednak można grać we wszystkie nowoczesne tytuły (zwłaszcza w rozdzielczości Full HD), nawet jeśli nie zawsze przy maksymalnych detalach.

3DMark Performance rating - Percent
Asus ROG Zephyrus G14 2025 GA403WW
NVIDIA GeForce RTX 5080 Laptop, AMD Ryzen AI 9 HX 370
100 pt
Asus ROG Zephyrus G14 2025 5070 Ti
NVIDIA GeForce RTX 5070 Ti Laptop, AMD Ryzen AI 9 HX 370
94 pt
Lenovo Legion 5 15IRX10 5070
NVIDIA GeForce RTX 5070 Laptop, Intel Core i7-13650HX
89.9 pt
Średnia w klasie Gaming
 
89 pt
Razer Blade 14 2025
NVIDIA GeForce RTX 5070 Laptop, AMD Ryzen AI 9 365
82.6 pt
Przeciętny NVIDIA GeForce RTX 5070 Laptop
 
82.6 pt
Acer Predator Triton 14 AI PT14-52
NVIDIA GeForce RTX 5070 Laptop, Intel Core Ultra 9 288V
76.8 pt
Asus TUF Gaming A14 FA401WV-WB94
NVIDIA GeForce RTX 4060 Laptop GPU, AMD Ryzen AI 9 HX 370
64.7 pt
Acer Predator Helios Neo 14 (2024)
NVIDIA GeForce RTX 4070 Laptop GPU, Intel Core Ultra 9 185H
64.1 pt
HP Omen Transcend 14-fb0014
NVIDIA GeForce RTX 4060 Laptop GPU, Intel Core Ultra 7 155H
50.3 pt
3DMark 11 - 1280x720 Performance GPU
Asus ROG Zephyrus G14 2025 GA403WW
NVIDIA GeForce RTX 5080 Laptop, AMD Ryzen AI 9 HX 370
54868 Points +31%
Asus ROG Zephyrus G14 2025 5070 Ti
NVIDIA GeForce RTX 5070 Ti Laptop, AMD Ryzen AI 9 HX 370
50966 Points +22%
Lenovo Legion 5 15IRX10 5070
NVIDIA GeForce RTX 5070 Laptop, Intel Core i7-13650HX
49568 Points +18%
Średnia w klasie Gaming
  (13523 - 80022, n=140, ostatnie 2 lata)
48442 Points +16%
Razer Blade 14 2025
NVIDIA GeForce RTX 5070 Laptop, AMD Ryzen AI 9 365
45246 Points +8%
Przeciętny NVIDIA GeForce RTX 5070 Laptop
  (36721 - 49568, n=23)
44424 Points +6%
Acer Predator Triton 14 AI PT14-52
NVIDIA GeForce RTX 5070 Laptop, Intel Core Ultra 9 288V
41871 Points
Asus TUF Gaming A14 FA401WV-WB94
NVIDIA GeForce RTX 4060 Laptop GPU, AMD Ryzen AI 9 HX 370
36372 Points -13%
Acer Predator Helios Neo 14 (2024)
NVIDIA GeForce RTX 4070 Laptop GPU, Intel Core Ultra 9 185H
36209 Points -14%
HP Omen Transcend 14-fb0014
NVIDIA GeForce RTX 4060 Laptop GPU, Intel Core Ultra 7 155H
29246 Points -30%
3DMark
1920x1080 Fire Strike Graphics
Asus ROG Zephyrus G14 2025 GA403WW
NVIDIA GeForce RTX 5080 Laptop, AMD Ryzen AI 9 HX 370
40859 Points +26%
Asus ROG Zephyrus G14 2025 5070 Ti
NVIDIA GeForce RTX 5070 Ti Laptop, AMD Ryzen AI 9 HX 370
40606 Points +25%
Lenovo Legion 5 15IRX10 5070
NVIDIA GeForce RTX 5070 Laptop, Intel Core i7-13650HX
38323 Points +18%
Średnia w klasie Gaming
  (6487 - 62849, n=153, ostatnie 2 lata)
36188 Points +11%
Przeciętny NVIDIA GeForce RTX 5070 Laptop
  (28759 - 38680, n=25)
35363 Points +9%
Razer Blade 14 2025
NVIDIA GeForce RTX 5070 Laptop, AMD Ryzen AI 9 365
33878 Points +4%
Acer Predator Triton 14 AI PT14-52
NVIDIA GeForce RTX 5070 Laptop, Intel Core Ultra 9 288V
32456 Points
Asus TUF Gaming A14 FA401WV-WB94
NVIDIA GeForce RTX 4060 Laptop GPU, AMD Ryzen AI 9 HX 370
26679 Points -18%
Acer Predator Helios Neo 14 (2024)
NVIDIA GeForce RTX 4070 Laptop GPU, Intel Core Ultra 9 185H
26653 Points -18%
HP Omen Transcend 14-fb0014
NVIDIA GeForce RTX 4060 Laptop GPU, Intel Core Ultra 7 155H
20867 Points -36%
2560x1440 Time Spy Graphics
Asus ROG Zephyrus G14 2025 GA403WW
NVIDIA GeForce RTX 5080 Laptop, AMD Ryzen AI 9 HX 370
16644 Points +34%
Średnia w klasie Gaming
  (2295 - 25984, n=150, ostatnie 2 lata)
14988 Points +21%
Asus ROG Zephyrus G14 2025 5070 Ti
NVIDIA GeForce RTX 5070 Ti Laptop, AMD Ryzen AI 9 HX 370
14945 Points +21%
Lenovo Legion 5 15IRX10 5070
NVIDIA GeForce RTX 5070 Laptop, Intel Core i7-13650HX
14258 Points +15%
Razer Blade 14 2025
NVIDIA GeForce RTX 5070 Laptop, AMD Ryzen AI 9 365
13734 Points +11%
Przeciętny NVIDIA GeForce RTX 5070 Laptop
  (10851 - 14771, n=25)
13342 Points +8%
Acer Predator Triton 14 AI PT14-52
NVIDIA GeForce RTX 5070 Laptop, Intel Core Ultra 9 288V
12401 Points
Asus TUF Gaming A14 FA401WV-WB94
NVIDIA GeForce RTX 4060 Laptop GPU, AMD Ryzen AI 9 HX 370
10397 Points -16%
Acer Predator Helios Neo 14 (2024)
NVIDIA GeForce RTX 4070 Laptop GPU, Intel Core Ultra 9 185H
10182 Points -18%
HP Omen Transcend 14-fb0014
NVIDIA GeForce RTX 4060 Laptop GPU, Intel Core Ultra 7 155H
7758 Points -37%
3DMark 11 Performance
29568 pkt.
3DMark Fire Strike Score
24366 pkt.
3DMark Time Spy Score
11572 pkt.
3DMark Steel Nomad Score
2884 pkt.
3DMark Steel Nomad Light Score
12857 pkt.
Pomoc
Blender / v3.3 Classroom OPTIX/RTX
HP Omen Transcend 14-fb0014
NVIDIA GeForce RTX 4060 Laptop GPU, Intel Core Ultra 7 155H
24 Seconds * -4%
Acer Predator Triton 14 AI PT14-52
NVIDIA GeForce RTX 5070 Laptop, Intel Core Ultra 9 288V
23 Seconds *
Asus TUF Gaming A14 FA401WV-WB94
NVIDIA GeForce RTX 4060 Laptop GPU, AMD Ryzen AI 9 HX 370
22 Seconds * +4%
Acer Predator Helios Neo 14 (2024)
NVIDIA GeForce RTX 4070 Laptop GPU, Intel Core Ultra 9 185H
21 Seconds * +9%
Przeciętny NVIDIA GeForce RTX 5070 Laptop
  (17 - 24, n=23)
19.7 Seconds * +14%
Średnia w klasie Gaming
  (9 - 95, n=141, ostatnie 2 lata)
19.1 Seconds * +17%
Razer Blade 14 2025
NVIDIA GeForce RTX 5070 Laptop, AMD Ryzen AI 9 365
19 Seconds * +17%
Lenovo Legion 5 15IRX10 5070
NVIDIA GeForce RTX 5070 Laptop, Intel Core i7-13650HX
18 Seconds * +22%
Asus ROG Zephyrus G14 2025 GA403WW
NVIDIA GeForce RTX 5080 Laptop, AMD Ryzen AI 9 HX 370
17 Seconds * +26%
Asus ROG Zephyrus G14 2025 5070 Ti
NVIDIA GeForce RTX 5070 Ti Laptop, AMD Ryzen AI 9 HX 370
16 Seconds * +30%
Blender / v3.3 Classroom CUDA
HP Omen Transcend 14-fb0014
NVIDIA GeForce RTX 4060 Laptop GPU, Intel Core Ultra 7 155H
48 Seconds * -41%
Przeciętny NVIDIA GeForce RTX 5070 Laptop
  (29 - 228, n=24)
40.4 Seconds * -19%
Asus TUF Gaming A14 FA401WV-WB94
NVIDIA GeForce RTX 4060 Laptop GPU, AMD Ryzen AI 9 HX 370
40 Seconds * -18%
Acer Predator Helios Neo 14 (2024)
NVIDIA GeForce RTX 4070 Laptop GPU, Intel Core Ultra 9 185H
34 Seconds * -0%
Acer Predator Triton 14 AI PT14-52
NVIDIA GeForce RTX 5070 Laptop, Intel Core Ultra 9 288V
34 Seconds *
Średnia w klasie Gaming
  (15 - 228, n=145, ostatnie 2 lata)
33.1 Seconds * +3%
Razer Blade 14 2025
NVIDIA GeForce RTX 5070 Laptop, AMD Ryzen AI 9 365
31 Seconds * +9%
Lenovo Legion 5 15IRX10 5070
NVIDIA GeForce RTX 5070 Laptop, Intel Core i7-13650HX
29 Seconds * +15%
Asus ROG Zephyrus G14 2025 5070 Ti
NVIDIA GeForce RTX 5070 Ti Laptop, AMD Ryzen AI 9 HX 370
26 Seconds * +24%
Asus ROG Zephyrus G14 2025 GA403WW
NVIDIA GeForce RTX 5080 Laptop, AMD Ryzen AI 9 HX 370
23 Seconds * +32%
Blender / v3.3 Classroom CPU
Acer Predator Triton 14 AI PT14-52
NVIDIA GeForce RTX 5070 Laptop, Intel Core Ultra 9 288V
507 Seconds *
HP Omen Transcend 14-fb0014
NVIDIA GeForce RTX 4060 Laptop GPU, Intel Core Ultra 7 155H
338 Seconds * +33%
Acer Predator Helios Neo 14 (2024)
NVIDIA GeForce RTX 4070 Laptop GPU, Intel Core Ultra 9 185H
306 Seconds * +40%
Lenovo Legion 5 15IRX10 5070
NVIDIA GeForce RTX 5070 Laptop, Intel Core i7-13650HX
294 Seconds * +42%
Razer Blade 14 2025
NVIDIA GeForce RTX 5070 Laptop, AMD Ryzen AI 9 365
261 Seconds * +49%
Średnia w klasie Gaming
  (122 - 962, n=142, ostatnie 2 lata)
260 Seconds * +49%
Przeciętny NVIDIA GeForce RTX 5070 Laptop
  (137 - 507, n=21)
257 Seconds * +49%
Asus ROG Zephyrus G14 2025 5070 Ti
NVIDIA GeForce RTX 5070 Ti Laptop, AMD Ryzen AI 9 HX 370
217 Seconds * +57%
Asus TUF Gaming A14 FA401WV-WB94
NVIDIA GeForce RTX 4060 Laptop GPU, AMD Ryzen AI 9 HX 370
215 Seconds * +58%
Asus ROG Zephyrus G14 2025 GA403WW
NVIDIA GeForce RTX 5080 Laptop, AMD Ryzen AI 9 HX 370
208 Seconds * +59%

* ... im mniej tym lepiej

Performance rating - Percent
Średnia w klasie Gaming
 
93.5 pt
Asus ROG Zephyrus G14 2025 GA403WW
AMD Ryzen AI 9 HX 370, NVIDIA GeForce RTX 5080 Laptop
92.5 pt
Lenovo Legion 5 15IRX10 5070
Intel Core i7-13650HX, NVIDIA GeForce RTX 5070 Laptop
91.4 pt
Asus ROG Zephyrus G14 2025 5070 Ti
AMD Ryzen AI 9 HX 370, NVIDIA GeForce RTX 5070 Ti Laptop
89.1 pt
Razer Blade 14 2025
AMD Ryzen AI 9 365, NVIDIA GeForce RTX 5070 Laptop
88.3 pt
Acer Predator Triton 14 AI PT14-52
Intel Core Ultra 9 288V, NVIDIA GeForce RTX 5070 Laptop
80.6 pt
Acer Predator Helios Neo 14 (2024)
Intel Core Ultra 9 185H, NVIDIA GeForce RTX 4070 Laptop GPU
72.3 pt
Asus TUF Gaming A14 FA401WV-WB94
AMD Ryzen AI 9 HX 370, NVIDIA GeForce RTX 4060 Laptop GPU
70.3 pt
HP Omen Transcend 14-fb0014
Intel Core Ultra 7 155H, NVIDIA GeForce RTX 4060 Laptop GPU
61.7 pt
Cyberpunk 2077 - 1920x1080 Ultra Preset (FSR off)
Asus ROG Zephyrus G14 2025 GA403WW
AMD Ryzen AI 9 HX 370, NVIDIA GeForce RTX 5080 Laptop
109.9 (79.8min) fps +24%
Asus ROG Zephyrus G14 2025 5070 Ti
AMD Ryzen AI 9 HX 370, NVIDIA GeForce RTX 5070 Ti Laptop
104.9 (79.7min) fps +18%
Lenovo Legion 5 15IRX10 5070
Intel Core i7-13650HX, NVIDIA GeForce RTX 5070 Laptop
101.5 (81.8min) fps +15%
Średnia w klasie Gaming
  (17.7 - 169.9, n=145, ostatnie 2 lata)
101.2 fps +14%
Razer Blade 14 2025
AMD Ryzen AI 9 365, NVIDIA GeForce RTX 5070 Laptop
98.9 (73.1min) fps +12%
Acer Predator Triton 14 AI PT14-52
Intel Core Ultra 9 288V, NVIDIA GeForce RTX 5070 Laptop
88.6 (68.6min) fps
Asus TUF Gaming A14 FA401WV-WB94
AMD Ryzen AI 9 HX 370, NVIDIA GeForce RTX 4060 Laptop GPU
73.3 (60min) fps -17%
Acer Predator Helios Neo 14 (2024)
Intel Core Ultra 9 185H, NVIDIA GeForce RTX 4070 Laptop GPU
72.4 (59.8min) fps -18%
HP Omen Transcend 14-fb0014
Intel Core Ultra 7 155H, NVIDIA GeForce RTX 4060 Laptop GPU
56.7 (31.1min) fps -36%
Baldur's Gate 3 - 1920x1080 Ultra Preset AA:T
Asus ROG Zephyrus G14 2025 GA403WW
AMD Ryzen AI 9 HX 370, NVIDIA GeForce RTX 5080 Laptop
144 fps +34%
Średnia w klasie Gaming
  (37.2 - 246, n=112, ostatnie 2 lata)
134.4 fps +25%
Asus ROG Zephyrus G14 2025 5070 Ti
AMD Ryzen AI 9 HX 370, NVIDIA GeForce RTX 5070 Ti Laptop
131.7 fps +23%
Razer Blade 14 2025
AMD Ryzen AI 9 365, NVIDIA GeForce RTX 5070 Laptop
128.4 fps +20%
Lenovo Legion 5 15IRX10 5070
Intel Core i7-13650HX, NVIDIA GeForce RTX 5070 Laptop
127.2 fps +19%
Acer Predator Helios Neo 14 (2024)
Intel Core Ultra 9 185H, NVIDIA GeForce RTX 4070 Laptop GPU
107.9 (57.2min, 71.4P0.1, 87.3P1) fps +1%
Acer Predator Triton 14 AI PT14-52
Intel Core Ultra 9 288V, NVIDIA GeForce RTX 5070 Laptop
107.2 (87.9min, 90.3P0.1, 95.7P1) fps
Asus TUF Gaming A14 FA401WV-WB94
AMD Ryzen AI 9 HX 370, NVIDIA GeForce RTX 4060 Laptop GPU
90.1 fps -16%
HP Omen Transcend 14-fb0014
Intel Core Ultra 7 155H, NVIDIA GeForce RTX 4060 Laptop GPU
73.2 fps -32%
GTA V - 1920x1080 Highest AA:4xMSAA + FX AF:16x
Lenovo Legion 5 15IRX10 5070
Intel Core i7-13650HX, NVIDIA GeForce RTX 5070 Laptop
143.7 (2.97min, 111.1P1) fps +23%
Razer Blade 14 2025
AMD Ryzen AI 9 365, NVIDIA GeForce RTX 5070 Laptop
127.2 (4.9min, 90.9P1) fps +9%
Średnia w klasie Gaming
  (12.1 - 186.9, n=130, ostatnie 2 lata)
125.1 fps +7%
Asus ROG Zephyrus G14 2025 GA403WW
AMD Ryzen AI 9 HX 370, NVIDIA GeForce RTX 5080 Laptop
124.8 (4.45min, 83.3P1) fps +7%
Asus ROG Zephyrus G14 2025 5070 Ti
AMD Ryzen AI 9 HX 370, NVIDIA GeForce RTX 5070 Ti Laptop
124.7 fps +7%
Acer Predator Triton 14 AI PT14-52
Intel Core Ultra 9 288V, NVIDIA GeForce RTX 5070 Laptop
116.4 (1.933min, 83.3P1) fps
Asus TUF Gaming A14 FA401WV-WB94
AMD Ryzen AI 9 HX 370, NVIDIA GeForce RTX 4060 Laptop GPU
110.8 (3.47min, 71.4P1) fps -5%
Acer Predator Helios Neo 14 (2024)
Intel Core Ultra 9 185H, NVIDIA GeForce RTX 4070 Laptop GPU
104.8 (4.53min, 71.4P1) fps -10%
HP Omen Transcend 14-fb0014
Intel Core Ultra 7 155H, NVIDIA GeForce RTX 4060 Laptop GPU
96.7 (4.16min, 62.5P1) fps -17%
Final Fantasy XV Benchmark - 1920x1080 High Quality
Asus ROG Zephyrus G14 2025 GA403WW
AMD Ryzen AI 9 HX 370, NVIDIA GeForce RTX 5080 Laptop
146 fps +20%
Lenovo Legion 5 15IRX10 5070
Intel Core i7-13650HX, NVIDIA GeForce RTX 5070 Laptop
139.7 fps +15%
Razer Blade 14 2025
AMD Ryzen AI 9 365, NVIDIA GeForce RTX 5070 Laptop
138.3 fps +14%
Średnia w klasie Gaming
  (19.2 - 215, n=141, ostatnie 2 lata)
137.1 fps +13%
Asus ROG Zephyrus G14 2025 5070 Ti
AMD Ryzen AI 9 HX 370, NVIDIA GeForce RTX 5070 Ti Laptop
135.8 fps +11%
Acer Predator Triton 14 AI PT14-52
Intel Core Ultra 9 288V, NVIDIA GeForce RTX 5070 Laptop
121.8 fps
Acer Predator Helios Neo 14 (2024)
Intel Core Ultra 9 185H, NVIDIA GeForce RTX 4070 Laptop GPU
104.6 fps -14%
Asus TUF Gaming A14 FA401WV-WB94
AMD Ryzen AI 9 HX 370, NVIDIA GeForce RTX 4060 Laptop GPU
100.6 fps -17%
HP Omen Transcend 14-fb0014
Intel Core Ultra 7 155H, NVIDIA GeForce RTX 4060 Laptop GPU
83.2 fps -32%
Strange Brigade - 1920x1080 ultra AA:ultra AF:16
Asus ROG Zephyrus G14 2025 GA403WW
AMD Ryzen AI 9 HX 370, NVIDIA GeForce RTX 5080 Laptop
299 (10.8min, 213P1) fps +32%
Asus ROG Zephyrus G14 2025 5070 Ti
AMD Ryzen AI 9 HX 370, NVIDIA GeForce RTX 5070 Ti Laptop
276 (7.8min, 203P1) fps +22%
Średnia w klasie Gaming
  (38.9 - 456, n=129, ostatnie 2 lata)
263 fps +16%
Razer Blade 14 2025
AMD Ryzen AI 9 365, NVIDIA GeForce RTX 5070 Laptop
258 (53.6min, 127.9P1) fps +14%
Acer Predator Triton 14 AI PT14-52
Intel Core Ultra 9 288V, NVIDIA GeForce RTX 5070 Laptop
226 (130.1min, 164.9P1) fps
Lenovo Legion 5 15IRX10 5070
Intel Core i7-13650HX, NVIDIA GeForce RTX 5070 Laptop
208 fps -8%
Asus TUF Gaming A14 FA401WV-WB94
AMD Ryzen AI 9 HX 370, NVIDIA GeForce RTX 4060 Laptop GPU
193.5 (45.4min, 142.5P1) fps -14%
Acer Predator Helios Neo 14 (2024)
Intel Core Ultra 9 185H, NVIDIA GeForce RTX 4070 Laptop GPU
183 (33.8min, 138.5P1) fps -19%
HP Omen Transcend 14-fb0014
Intel Core Ultra 7 155H, NVIDIA GeForce RTX 4060 Laptop GPU
151.1 (81.6min, 109.2P1) fps -33%
Dota 2 Reborn - 1920x1080 ultra (3/3) best looking
Średnia w klasie Gaming
  (65.1 - 248, n=146, ostatnie 2 lata)
154.6 fps +21%
Lenovo Legion 5 15IRX10 5070
Intel Core i7-13650HX, NVIDIA GeForce RTX 5070 Laptop
150.2 (129min) fps +18%
Razer Blade 14 2025
AMD Ryzen AI 9 365, NVIDIA GeForce RTX 5070 Laptop
137.6 (116.8min) fps +8%
Asus TUF Gaming A14 FA401WV-WB94
AMD Ryzen AI 9 HX 370, NVIDIA GeForce RTX 4060 Laptop GPU
135 (117.6min) fps +6%
Asus ROG Zephyrus G14 2025 GA403WW
AMD Ryzen AI 9 HX 370, NVIDIA GeForce RTX 5080 Laptop
134.2 (114.4min) fps +5%
Asus ROG Zephyrus G14 2025 5070 Ti
AMD Ryzen AI 9 HX 370, NVIDIA GeForce RTX 5070 Ti Laptop
134.2 (115.1min) fps +5%
Acer Predator Helios Neo 14 (2024)
Intel Core Ultra 9 185H, NVIDIA GeForce RTX 4070 Laptop GPU
130.8 (114.6min) fps +3%
Acer Predator Triton 14 AI PT14-52
Intel Core Ultra 9 288V, NVIDIA GeForce RTX 5070 Laptop
127.5 (109.9min) fps
HP Omen Transcend 14-fb0014
Intel Core Ultra 7 155H, NVIDIA GeForce RTX 4060 Laptop GPU
121.1 (104.5min) fps -5%
X-Plane 11.11 - 1920x1080 high (fps_test=3)
Średnia w klasie Gaming
  (33.4 - 150.2, n=149, ostatnie 2 lata)
103.7 fps +16%
Lenovo Legion 5 15IRX10 5070
Intel Core i7-13650HX, NVIDIA GeForce RTX 5070 Laptop
100.2 fps +12%
Acer Predator Triton 14 AI PT14-52
Intel Core Ultra 9 288V, NVIDIA GeForce RTX 5070 Laptop
89.7 fps
Razer Blade 14 2025
AMD Ryzen AI 9 365, NVIDIA GeForce RTX 5070 Laptop
83.1 fps -7%
Asus ROG Zephyrus G14 2025 5070 Ti
AMD Ryzen AI 9 HX 370, NVIDIA GeForce RTX 5070 Ti Laptop
80.7 fps -10%
HP Omen Transcend 14-fb0014
Intel Core Ultra 7 155H, NVIDIA GeForce RTX 4060 Laptop GPU
79.5 fps -11%
Acer Predator Helios Neo 14 (2024)
Intel Core Ultra 9 185H, NVIDIA GeForce RTX 4070 Laptop GPU
78 fps -13%
Asus ROG Zephyrus G14 2025 GA403WW
AMD Ryzen AI 9 HX 370, NVIDIA GeForce RTX 5080 Laptop
76.9 fps -14%
Asus TUF Gaming A14 FA401WV-WB94
AMD Ryzen AI 9 HX 370, NVIDIA GeForce RTX 4060 Laptop GPU
67.3 fps -25%

Cyberpunk 2077 - wykres ultra FPS

05101520253035404550556065707580Tooltip
Acer Predator Triton 14 AI PT14-52 Core Ultra 9 288V, GeForce RTX 5070 Laptop: Ø82.5 (79.3-84.5)
Dane CPU/GPU Cyberpunk 2077 (1080p, Ultra)
lowmed.highultraQHD DLSSQHD
GTA V (2015) 116.4
Dota 2 Reborn (2015) 160 142 137.6 127.5
Final Fantasy XV Benchmark (2018) 161.8 157.8 121.8 88.8
X-Plane 11.11 (2018) 97.7 87.9 89.7
Strange Brigade (2018) 374 294 251 226 157.2
Baldur's Gate 3 (2023) 148.6 124 108 107.2 75.2
Cyberpunk 2077 (2023) 122.5 117.3 100 88.6 65 59
F1 24 (2024) 197.8 195.5 190.6 78.5 78 51

Emisje i energia

Emisja hałasu

Chłodzenie komory parowej

Chłodzenie ma dwie strony. Z jednej strony, wydajny procesor Lunar Lake o niskim maksymalnym zużyciu energii oznacza, że notebooki są generalnie bardzo ciche podczas codziennych zadań bez korzystania z dGPU, nawet w trybie Turbo. Jednakże, gdy tylko RTX 5070 wentylatory stają się naprawdę głośne, choć Acer zastosował tu już komorę parową. W trybie Turbo jest to bardzo głośne i irytujące 57,9 dB(A), a w trybie wydajności wciąż ponad 53 dB(A). To również czyni go zdecydowanie najgłośniejszym urządzeniem w naszej grupie porównawczej. Nie było żadnych innych odgłosów elektronicznych.

Hałas

luz
24.9 / 24.9 / 30.5 dB
obciążenie
36.1 / 57.9 dB
  red to green bar
 
 
30 dB
cichy
40 dB(A)
słyszalny
50 dB(A)
irytujący
 
min: dark, med: mid, max: light   Earthworks M23R, Arta (odległość 15 cm)   hałas otoczenia: 24.9 dB(A)
dB(A) 0102030405060708090Deep BassMiddle BassHigh BassLower RangeMidsHigher MidsLower HighsMid HighsUpper HighsSuper Highs2041.341.141.241.543.42531.431.530.630.828.93129.726.828.426.926.6402927.7282527502828.426.828.327.86328.624.127.227.126.18026.821.221.119.631.610032.722.419.621.624.512527.219.218.818.524.816027.919.616.917.425.720031.521.11815.72825032.922.920.919.131.131534.222.419.516.832.340037.122.219.314.334.750039.423.220.812.336.963040.223.219.311.437.180043.325.720.211.338.8100044.126.320.410.540.3125043.925.520.710.740.5160047.426.921.310.943200048.426.920.111.443.7250047.723.617.412.443315048.124.516.814.543.4400047.222.115.512.842.5500046.119.413.812.640.563004518.713.813.639.4800043.518.613.512.737.91000042.320.413.313.333.51250038.620.913.913.530.11600034.421.313.613.226.4SPL57.936.130.524.953.2N11.72.31.30.68.6median 42.3median 22.4median 18.8median 13.2median 37.1Delta6.12.42.52.65.5hearing rangehide median Fan NoiseAcer Predator Triton 14 AI PT14-52
Acer Predator Triton 14 AI PT14-52
Core Ultra 9 288V, GeForce RTX 5070 Laptop
Razer Blade 14 2025
Ryzen AI 9 365, GeForce RTX 5070 Laptop
Asus ROG Zephyrus G14 2025 GA403WW
Ryzen AI 9 HX 370, GeForce RTX 5080 Laptop
Acer Predator Helios Neo 14 (2024)
Ultra 9 185H, GeForce RTX 4070 Laptop GPU
Asus TUF Gaming A14 FA401WV-WB94
Ryzen AI 9 HX 370, GeForce RTX 4060 Laptop GPU
HP Omen Transcend 14-fb0014
Ultra 7 155H, GeForce RTX 4060 Laptop GPU
Lenovo Legion 5 15IRX10 5070
i7-13650HX, GeForce RTX 5070 Laptop
Noise
2%
-9%
-9%
4%
11%
5%
wyłączone / środowisko * (dB)
24.9
23.7
5%
23.3
6%
24
4%
22.9
8%
24.5
2%
24
4%
Idle Minimum * (dB)
24.9
23.7
5%
29.1
-17%
29
-16%
22.9
8%
24.7
1%
24
4%
Idle Average * (dB)
24.9
23.7
5%
29.1
-17%
31
-24%
28.3
-14%
24.7
1%
24
4%
Idle Maximum * (dB)
30.5
27
11%
29.1
5%
36
-18%
28.8
6%
24.7
19%
28.3
7%
Load Average * (dB)
36.1
44.9
-24%
54.4
-51%
47
-30%
37.3
-3%
25.2
30%
39.6
-10%
Cyberpunk 2077 ultra * (dB)
57.9
54.6
6%
54.4
6%
50
14%
50.6
13%
50.1
13%
Load Maximum * (dB)
57.9
54.6
6%
54.4
6%
52
10%
50.6
13%
52
10%
50.1
13%
Witcher 3 ultra * (dB)
47

* ... im mniej tym lepiej

Temperatura

Metalowa obudowa pozostaje przyjemnie chłodna w codziennym użytkowaniu, ale znacznie nagrzewa się pod obciążeniem. Nie staje się to jednak krytyczne przy maksymalnej temperaturze 47 °C (116,6 °F) na spodzie. W teście obciążeniowym procesor działał z pełną mocą 37 W (~80 °C/176 °F), a karta graficzna z mocą około 87 W (~81 °C/177,8 °F).

Test obciążeniowy danych CPU/GPU
 41.9 °C42.9 °C41.5 °C 
 37.9 °C42.7 °C37.5 °C 
 33.3 °C38 °C35 °C 
maks. w ogóle: 42.9 °C
średnia: 39 °C
44.5 °C47.4 °C43 °C
41.1 °C43.9 °C38.2 °C
37.6 °C39.4 °C34.7 °C
maks. w ogóle: 47.4 °C
średnia: 41.1 °C
zasilacz  44.7 °C | temperatura otoczenia 20.8 °C | Fluke t3000FC (calibrated), Voltcraft IR-900
(-) Średnia temperatura górnej części przy maksymalnym obciążeniu wynosi 39 °C / 102 F, w porównaniu do średniej 33.9 °C / ###class_avg_f# ## F dla urządzeń w klasie Gaming.
(±) Maksymalna temperatura w górnej części wynosi 42.9 °C / 109 F, w porównaniu do średniej 40.4 °C / 105 F , począwszy od 21.2 do 68.8 °C dla klasy Gaming.
(-) Dno nagrzewa się maksymalnie do 47.4 °C / 117 F, w porównaniu do średniej 43.3 °C / 110 F
(+) W stanie bezczynności średnia temperatura górnej części wynosi 26.2 °C / 79 F, w porównaniu ze średnią temperaturą urządzenia wynoszącą 33.9 °C / ### class_avg_f### F.
(±) 3: The average temperature for the upper side is 35.8 °C / 96 F, compared to the average of 33.9 °C / 93 F for the class Gaming.
(±) Podpórki pod nadgarstki i touchpad mogą się bardzo nagrzać w dotyku, maksymalnie do 38 °C / 100.4 F.
(-) Średnia temperatura obszaru podparcia dłoni w podobnych urządzeniach wynosiła 28.8 °C / 83.8 F (-9.2 °C / -16.6 F).
Test naprężeń temperatury powierzchni (górna strona)
Test naprężeń temperatury powierzchni (spód)
Acer Predator Triton 14 AI PT14-52
Core Ultra 9 288V, GeForce RTX 5070 Laptop
Razer Blade 14 2025
Ryzen AI 9 365, GeForce RTX 5070 Laptop
Asus ROG Zephyrus G14 2025 GA403WW
Ryzen AI 9 HX 370, GeForce RTX 5080 Laptop
Acer Predator Helios Neo 14 (2024)
Ultra 9 185H, GeForce RTX 4070 Laptop GPU
Asus TUF Gaming A14 FA401WV-WB94
Ryzen AI 9 HX 370, GeForce RTX 4060 Laptop GPU
HP Omen Transcend 14-fb0014
Ultra 7 155H, GeForce RTX 4060 Laptop GPU
Lenovo Legion 5 15IRX10 5070
i7-13650HX, GeForce RTX 5070 Laptop
Heat
-8%
-12%
-21%
-8%
9%
-12%
Maximum Upper Side * (°C)
42.9
47
-10%
51.2
-19%
57
-33%
49.8
-16%
41.2
4%
41.6
3%
Maximum Bottom * (°C)
47.4
49.6
-5%
50.3
-6%
55
-16%
46
3%
39
18%
52.7
-11%
Idle Upper Side * (°C)
27.3
29.8
-9%
30.2
-11%
32
-17%
30.2
-11%
26.2
4%
32.6
-19%
Idle Bottom * (°C)
28.1
30.7
-9%
30.9
-10%
33
-17%
29.8
-6%
25.4
10%
33.9
-21%

* ... im mniej tym lepiej

Głośnik

System dźwiękowy składa się z 6 modułów, a maksymalna głośność jest bardzo wysoka, ale głośniki nie są naprawdę przekonujące. Nawet przy około 50% głośności dźwięk jest dość dudniący, a odtwarzanie muzyki lub filmów nie jest już naprawdę przyjemne.

dB(A) 0102030405060708090Deep BassMiddle BassHigh BassLower RangeMidsHigher MidsLower HighsMid HighsUpper HighsSuper Highs2041.540.92530.833.23126.930.3402529.55028.331.46327.133.18019.63610021.644.312518.548.716017.45420015.764.225019.164.531516.870.540014.372.150012.376.163011.483.180011.388.2100010.583.4125010.779.8160010.975.4200011.475.7250012.472.8315014.569.1400012.867.1500012.665.5630013.663.4800012.758.61000013.358.31250013.553.41600013.251.4SPL24.990.7N0.675.7median 13.2median 69.1Delta2.68.137.236.432.130.529.429.928.53225.231.6263421.338.618.843.118.848.317.347.718.554.42056.116.159.21463.312.169.410.472.210.470.81069.110.3689.770.910.571.910.964.611.164.411.263.611.457.511.757.51256.811.758.911.560.51158.323.779.60.544.8median 11.5median 60.52.66.634.839.129.433.126.634.426.733.525.23722.142.318.449.118.16216.866.91664.716.16915.169.714.571.811.569.810.968.610.271.310.274.610.171.39.973.410.16710.67110.869.211.365.611.665.811.760.411.859.911.956.311.954.711.855.11151.723.381.20.553.1median 11.6median 671.85.3hearing rangehide median Pink NoiseAcer Predator Triton 14 AI PT14-52Razer Blade 14 2025Asus ROG Zephyrus G14 2025 GA403WW
Wykres częstotliwości (pola wyboru można zaznaczyć i odznaczyć, aby porównać urządzenia)
Acer Predator Triton 14 AI PT14-52 analiza dźwięku

(+) | głośniki mogą odtwarzać stosunkowo głośno (90.7 dB)
Bas 100 - 315 Hz
(±) | zredukowany bas - średnio 11.9% niższy od mediany
(±) | liniowość basu jest średnia (10.3% delta do poprzedniej częstotliwości)
Średnie 400 - 2000 Hz
(±) | wyższe średnie - średnio 10.1% wyższe niż mediana
(+) | średnie są liniowe (6.9% delta do poprzedniej częstotliwości)
Wysokie 2–16 kHz
(±) | obniżone maksima - średnio 5.2% niższe od mediany
(+) | wzloty są liniowe (4.4% delta do poprzedniej częstotliwości)
Ogólnie 100 - 16.000 Hz
(±) | liniowość ogólnego dźwięku jest średnia (17.9% różnicy w stosunku do mediany)
W porównaniu do tej samej klasy
» 54% wszystkich testowanych urządzeń w tej klasie było lepszych, 9% podobnych, 37% gorszych
» Najlepszy miał deltę 6%, średnia wynosiła ###średnia###%, najgorsza wynosiła 132%
W porównaniu do wszystkich testowanych urządzeń
» 36% wszystkich testowanych urządzeń było lepszych, 8% podobnych, 56% gorszych
» Najlepszy miał deltę 4%, średnia wynosiła ###średnia###%, najgorsza wynosiła 134%

Razer Blade 14 2025 analiza dźwięku

(±) | głośność głośnika jest średnia, ale dobra (79.6 dB)
Bas 100 - 315 Hz
(±) | zredukowany bas - średnio 9% niższy od mediany
(±) | liniowość basu jest średnia (7.4% delta do poprzedniej częstotliwości)
Średnie 400 - 2000 Hz
(±) | wyższe średnie - średnio 9% wyższe niż mediana
(+) | średnie są liniowe (5.4% delta do poprzedniej częstotliwości)
Wysokie 2–16 kHz
(+) | zrównoważone maksima - tylko 3.2% od mediany
(+) | wzloty są liniowe (5% delta do poprzedniej częstotliwości)
Ogólnie 100 - 16.000 Hz
(±) | liniowość ogólnego dźwięku jest średnia (15.1% różnicy w stosunku do mediany)
W porównaniu do tej samej klasy
» 32% wszystkich testowanych urządzeń w tej klasie było lepszych, 6% podobnych, 62% gorszych
» Najlepszy miał deltę 6%, średnia wynosiła ###średnia###%, najgorsza wynosiła 132%
W porównaniu do wszystkich testowanych urządzeń
» 20% wszystkich testowanych urządzeń było lepszych, 4% podobnych, 76% gorszych
» Najlepszy miał deltę 4%, średnia wynosiła ###średnia###%, najgorsza wynosiła 134%

Asus ROG Zephyrus G14 2025 GA403WW analiza dźwięku

(±) | głośność głośnika jest średnia, ale dobra (81.2 dB)
Bas 100 - 315 Hz
(+) | dobry bas - tylko 2.8% od mediany
(±) | liniowość basu jest średnia (8.1% delta do poprzedniej częstotliwości)
Średnie 400 - 2000 Hz
(+) | zbalansowane środki średnie - tylko 3.9% od mediany
(+) | średnie są liniowe (5.6% delta do poprzedniej częstotliwości)
Wysokie 2–16 kHz
(±) | obniżone maksima - średnio 5.9% niższe od mediany
(+) | wzloty są liniowe (4.3% delta do poprzedniej częstotliwości)
Ogólnie 100 - 16.000 Hz
(+) | ogólny dźwięk jest liniowy (10.4% różnicy w stosunku do mediany)
W porównaniu do tej samej klasy
» 6% wszystkich testowanych urządzeń w tej klasie było lepszych, 2% podobnych, 92% gorszych
» Najlepszy miał deltę 6%, średnia wynosiła ###średnia###%, najgorsza wynosiła 132%
W porównaniu do wszystkich testowanych urządzeń
» 5% wszystkich testowanych urządzeń było lepszych, 1% podobnych, 94% gorszych
» Najlepszy miał deltę 4%, średnia wynosiła ###średnia###%, najgorsza wynosiła 134%

Zużycie energii

W stanie bezczynności urządzenie pobiera dość dużo energii i nie ma tutaj żadnych zalet w zakresie wydajności. Jest to zauważalne tylko pod obciążeniem, które wynosi około 135 watów podczas grania. Dołączony zasilacz o mocy 140 W jest zatem wystarczający, ale nie oferuje możliwości ładowania baterii. Zużycie energii w trybie czuwania na poziomie 2,6 W jest zdecydowanie zbyt wysokie.

Pobór mocy
wyłączony / stan wstrzymaniadarklight 0.54 / 2.6 W
luzdarkmidlight 9.3 / 12.2 / 12.5 W
obciążenie midlight 68.4 / 145.4 W
 color bar
Legenda: min: dark, med: mid, max: light        Metrahit Energy
Acer Predator Triton 14 AI PT14-52
Core Ultra 9 288V, GeForce RTX 5070 Laptop, Micron 3400 1TB MTFDKBA1T0TFH, OLED, 2880x1800, 14.5"
Razer Blade 14 2025
Ryzen AI 9 365, GeForce RTX 5070 Laptop, Samsung PM9A1 MZVL21T0HCLR, OLED, 2880x1800, 14"
Asus ROG Zephyrus G14 2025 GA403WW
Ryzen AI 9 HX 370, GeForce RTX 5080 Laptop, WD PC SN740 SDDPNQE-2T00, OLED, 2880x1800, 14"
Acer Predator Helios Neo 14 (2024)
Ultra 9 185H, GeForce RTX 4070 Laptop GPU, SK Hynix PC801 HFS001TEJ9X125N, IPS, 3072x1920, 14.5"
Asus TUF Gaming A14 FA401WV-WB94
Ryzen AI 9 HX 370, GeForce RTX 4060 Laptop GPU, WD PC SN560 SDDPNQE-1T00, IPS, 2560x1600, 14"
HP Omen Transcend 14-fb0014
Ultra 7 155H, GeForce RTX 4060 Laptop GPU, WDC PC SN810 1TB, OLED, 2880x1800, 14"
Lenovo Legion 5 15IRX10 5070
i7-13650HX, GeForce RTX 5070 Laptop, WD PC SN7100S SDFPMSL-1T00-1101, OLED, 2560x1600, 15.1"
Przeciętny NVIDIA GeForce RTX 5070 Laptop
 
Średnia w klasie Gaming
 
Power Consumption
-15%
-12%
-22%
-23%
-21%
-31%
-47%
-70%
Idle Minimum * (Watt)
9.3
9.3
-0%
6.7
28%
6
35%
9.1
2%
9.1
2%
11.4
-23%
11.5 ?(4.6 - 32, n=22)
-24%
Idle Average * (Watt)
12.2
11.1
9%
8.8
28%
11
10%
15.3
-25%
12.6
-3%
12.8
-5%
16.3 ?(8.1 - 36, n=22)
-34%
Idle Maximum * (Watt)
12.5
11.2
10%
9.3
26%
21
-68%
22.6
-81%
27.4
-119%
13.4
-7%
21.6 ?(10.2 - 47, n=22)
-73%
Load Average * (Watt)
68.4
91.9
-34%
121.5
-78%
93
-36%
72.1
-5%
63.5
7%
103.7
-52%
Cyberpunk 2077 ultra external monitor * (Watt)
132.2
168.6
-28%
155.5
-18%
146.3
-11%
141.7
-7%
171.5
-30%
Cyberpunk 2077 ultra * (Watt)
134
171.5
-28%
157.4
-17%
147.9
-10%
144.7
-8%
171.5
-28%
Load Maximum * (Watt)
145.4
195
-34%
218.1
-50%
252
-73%
198
-36%
135.3
7%
246.8
-70%
Witcher 3 ultra * (Watt)
118.9

* ... im mniej tym lepiej

Zużycie energii Cyberpunk / Test warunków skrajnych

0102030405060708090100110120130140Tooltip
Acer Predator Triton 14 AI PT14-52; 1280x720 Prime95 28.10 and Furmark 1.25: Ø140.5 (131.9-145.4)
Acer Predator Triton 14 AI PT14-52; Idle 150cd/m2: Ø12.9 (11.9-14.4)
Acer Predator Triton 14 AI PT14-52; Cyberpunk 2077 FHD ultra no FSR 150cd: Ø134 (131.9-137.7)

Zużycie energii z zewnętrznym monitorem

0102030405060708090100110120130Tooltip
Acer Predator Triton 14 AI PT14-52; Prime95 V2810 Stress (external Monitor): Ø63.4 (62.1-66.1)
Acer Predator Triton 14 AI PT14-52; Cinebench R15 Multi (external Monitor): Ø61.8 (61.1-64.3)
Acer Predator Triton 14 AI PT14-52; Cinebench R23 Single (external Monitor): Ø27.6 (25.7-43.8)
Acer Predator Triton 14 AI PT14-52; Cinebench R23 Multi (external Monitor): Ø60.3 (57.8-62.4)
Acer Predator Triton 14 AI PT14-52; 1280x720 FurMark 1.19 GPU Stress Test (external Monitor): Ø135.5 (131.9-139.7)
Acer Predator Triton 14 AI PT14-52; Idle 1min (external Monitor): Ø8.56 (7.93-10.4)
Acer Predator Triton 14 AI PT14-52; Cyberpunk 2077 FHD ultra no FSR (external Monitor): Ø132.2 (130.4-134.2)

Żywotność baterii

Akumulator o pojemności 76 Wh zapewnia rozsądne czasy pracy, ale procesor Lunar Lake nie zapewnia tutaj przewagi. Z 9 godzinami w teście WLAN przy 150 cd/m² i 6:45 godzinami przy pełnej jasności, Acer wyprzedza tylko Razer Blade 14 (72 Wh), ale także wyraźnie za ROG Zephyrus G14 (73 Wh).

bateria - informacje na temat
Proces ładowania
Proces ładowania
Wydajność akumulatora
WiFi Websurfing
9h 01min
WiFi Websurfing max. Brightness
6h 45min
Battery Runtime
WiFi Websurfing
Asus ROG Zephyrus G14 2025 GA403WW
Ryzen AI 9 HX 370, GeForce RTX 5080 Laptop, 73 Wh
10.5 h +17%
Acer Predator Triton 14 AI PT14-52
Core Ultra 9 288V, GeForce RTX 5070 Laptop, 76 Wh
9 h
Razer Blade 14 2025
Ryzen AI 9 365, GeForce RTX 5070 Laptop, 72 Wh
8.9 h -1%
Acer Predator Helios Neo 14 (2024)
Ultra 9 185H, GeForce RTX 4070 Laptop GPU, 76 Wh
8.7 h -3%
HP Omen Transcend 14-fb0014
Ultra 7 155H, GeForce RTX 4060 Laptop GPU, 71 Wh
8.6 h -4%
Asus TUF Gaming A14 FA401WV-WB94
Ryzen AI 9 HX 370, GeForce RTX 4060 Laptop GPU, 73 Wh
7 h -22%
Średnia w klasie Gaming
  (1.967 - 14.8, n=125, ostatnie 2 lata)
6.79 h -25%
Lenovo Legion 5 15IRX10 5070
i7-13650HX, GeForce RTX 5070 Laptop, 80 Wh
4.9 h -46%
WiFi Websurfing max. Brightness
Asus ROG Zephyrus G14 2025 GA403WW
Ryzen AI 9 HX 370, GeForce RTX 5080 Laptop, 73 Wh
7.7 h +13%
Acer Predator Triton 14 AI PT14-52
Core Ultra 9 288V, GeForce RTX 5070 Laptop, 76 Wh
6.8 h
Razer Blade 14 2025
Ryzen AI 9 365, GeForce RTX 5070 Laptop, 72 Wh
6 h -12%
Średnia w klasie Gaming
  (2.35 - 8.93, n=37, ostatnie 2 lata)
5.3 h -22%

Ogólna ocena Notebookcheck

Acer Predator Triton 14 AI PT14-52 - 28/12/2025 v8
Andreas Osthoff

Wykonanie
87 / 98 → 88%
Klawiatura
87%
Myszka
100%
Komunikacja
68 / 80 → 85%
Waga
68 / 10-68 → 100%
Akumulator
83 / 95 → 88%
Wyświetlacz
71%
Wydajność w grach
87%
Wydajność w programach użytkowych
86%
Temperatura
87 / 95 → 91%
Hałas
59 / 90 → 66%
Głośniki
78%
Kamerka
32 / 75 → 43%
Średnio
60%
82%
Gaming - Ważona średnia
CO2 Emissions
No Data
Materials
0%
Packaging
50%
Power Use
68.7%
Repairability
40%
Software Updates
22.3%
Recycle Logo Total Sustainability Score: 30.2%

Możliwe alternatywy w porównaniu

Obraz
Model / recenzja
Cena
Waga
Wysokość
Ekran
1.
82.3%
Acer Predator Triton 14 AI PT14-52
Intel Core Ultra 9 288V ⎘
NVIDIA GeForce RTX 5070 Laptop ⎘
32 GB Pamięć, 1024 GB SSD
Amazon:
1. $69.99
PowerPortnerLink 330W 280W C...
2. $2,599.99
acer Predator Triton 14 AI P...
Cena katalogowa: 2999€
1.6 kg17.31 mm14.50"
2880x1800
234 PPI
OLED
2.
87.2%
Razer Blade 14 2025
Razer Blade 14 2025
AMD Ryzen AI 9 365 ⎘
NVIDIA GeForce RTX 5070 Laptop ⎘
32 GB Pamięć, 1024 GB SSD
Amazon:
1. $2,067.90
Razer Blade 14 (2025) Gaming...
2. $2,099.99
Razer Blade 14 (2025) Gaming...
3. $1,799.99
Razer Blade 14 (2025) Gaming...
Cena katalogowa: 2399€
1.6 kg16.2 mm14.00"
2880x1800
243 PPI
OLED
3.
88.9%
Asus ROG Zephyrus G14 2025 GA403WW
AMD Ryzen AI 9 HX 370 ⎘
NVIDIA GeForce RTX 5080 Laptop ⎘
64 GB Pamięć, 2048 GB SSD
Amazon:
1. 
JUYOON 240W Laptop Charger C...
2. $1,593.00
EXCaliberPC [2025] ASUS ROG ...
3. $52.99
180W AC Charger for Asus ROG...
Cena katalogowa: 3899€
1.6 kg18.3 mm14.00"
2880x1800
243 PPI
OLED
4.
80.5%
Acer Predator Helios Neo 14 (2024)
Intel Core Ultra 9 185H ⎘
NVIDIA GeForce RTX 4070 Laptop GPU ⎘
32 GB Pamięć, 1024 GB SSD
Amazon: $1,699.00
Cena katalogowa: 2100 Euro
1.9 kg20.9 mm14.50"
3072x1920
250 PPI
IPS
5.
80.3%
Asus TUF Gaming A14 FA401WV-WB94
AMD Ryzen AI 9 HX 370 ⎘
NVIDIA GeForce RTX 4060 Laptop GPU ⎘
16 GB Pamięć, 1024 GB SSD
Amazon:
Cena katalogowa: 1500 USD
1.5 kg19.9 mm14.00"
2560x1600
216 PPI
IPS
6.
88.5% v7 (old)
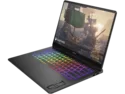
HP Omen Transcend 14-fb0014
Intel Core Ultra 7 155H ⎘
NVIDIA GeForce RTX 4060 Laptop GPU ⎘
16 GB Pamięć, 1024 GB SSD
Amazon:
1. $1,549.00
HP OMEN Transcend 14-fb0761n...
2. $1,649.00
HP Omen Transcend 14 Gaming ...
3. $38.99
Replacement Backlit Keyboard...
Cena katalogowa: 1700 USD
1.6 kg18 mm14.00"
2880x1800
243 PPI
OLED
7.
86.5%
Lenovo Legion 5 15IRX10 5070
Intel Core i7-13650HX ⎘
NVIDIA GeForce RTX 5070 Laptop ⎘
32 GB Pamięć, 1024 GB SSD
Amazon:
1. $1,668.00
Lenovo Legion 5 15IRX10 15.1...
2. $1,429.99
Lenovo Legion 5 15IAX10 15.1...
3. $1,919.00
Lenovo Legion 5 15IRX10 Gami...
Cena katalogowa: 1499€
1.9 kg21.5 mm15.10"
2560x1600
200 PPI
OLED

Przezroczystość

Wyboru urządzeń do recenzji dokonuje nasza redakcja. Próbka testowa została udostępniona autorowi jako pożyczka od producenta lub sprzedawcy detalicznego na potrzeby tej recenzji. Pożyczkodawca nie miał wpływu na tę recenzję, producent nie otrzymał też kopii tej recenzji przed publikacją. Nie było obowiązku publikowania tej recenzji. Jako niezależna firma medialna, Notebookcheck nie podlega władzy producentów, sprzedawców detalicznych ani wydawców.

Tak testuje Notebookcheck

Każdego roku Notebookcheck niezależnie sprawdza setki laptopów i smartfonów, stosując standardowe procedury, aby zapewnić porównywalność wszystkich wyników. Od około 20 lat stale rozwijamy nasze metody badawcze, ustanawiając przy tym standardy branżowe. W naszych laboratoriach testowych doświadczeni technicy i redaktorzy korzystają z wysokiej jakości sprzętu pomiarowego. Testy te obejmują wieloetapowy proces walidacji. Nasz kompleksowy system ocen opiera się na setkach uzasadnionych pomiarów i benchmarków, co pozwala zachować obiektywizm.
Please share our article, every link counts!
Mail Logo
> laptopy testy i recenzje notebooki > Laptopy > Smukły OLED dla graczy z RTX 5070 i Lunar Lake - recenzja Acer Predator Triton 14 AI
Andreas Osthoff, 2025-12-31 (Update: 2025-12-31)