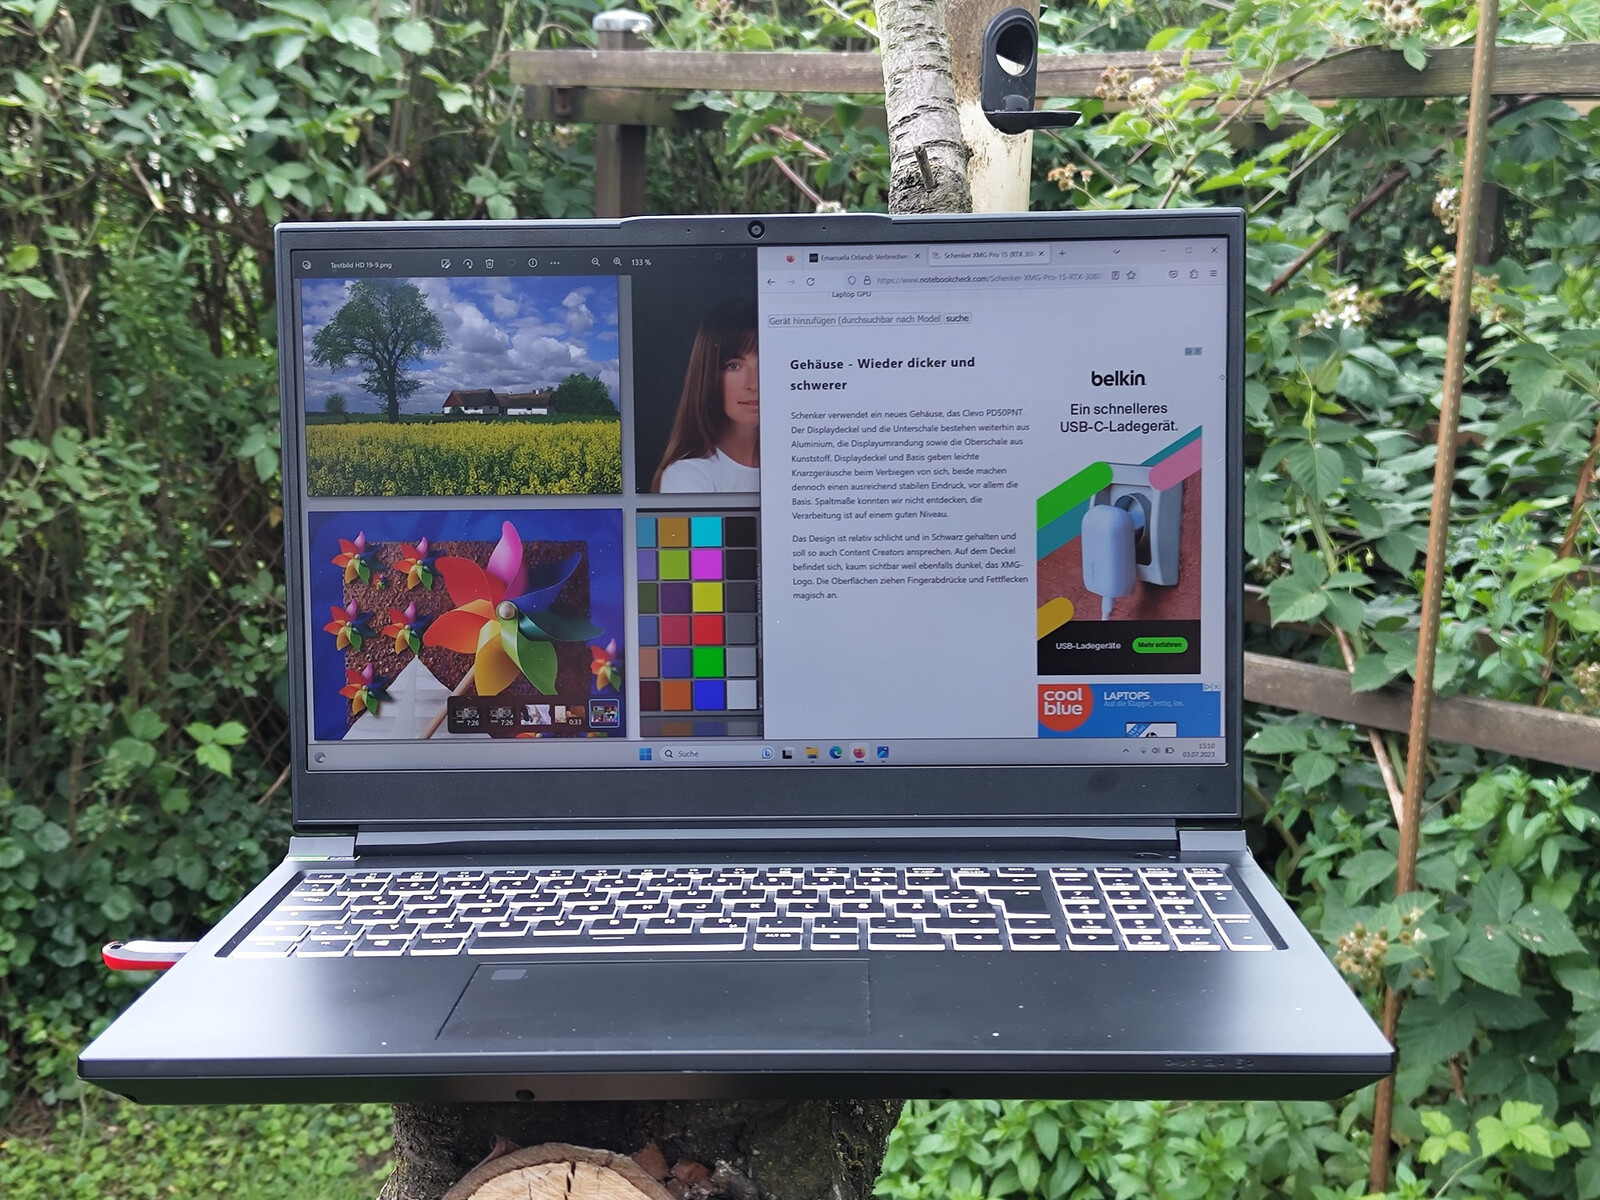
Recenzja gamingowego laptopa Schenker XMG Pro 15 E23 (PD50SND-G): Oto równowaga między pracą a zabawą!
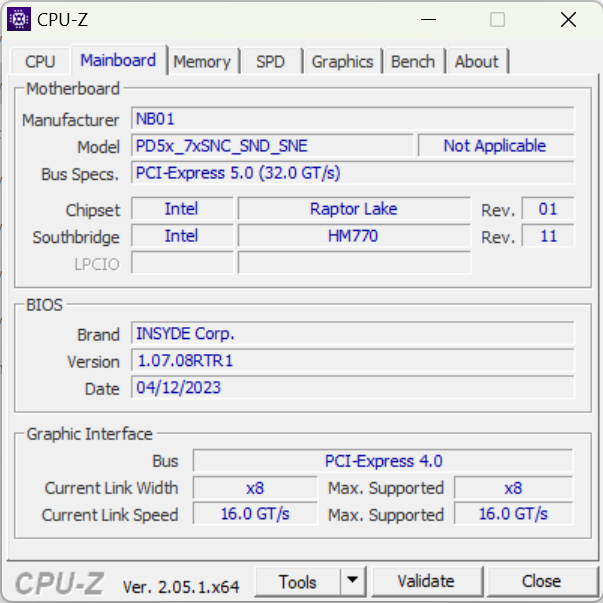
Laptopy Schenker są regularnie aktualizowane, a w zeszłym roku recenzowaliśmy dwóch poprzedników XMG Pro 15. Jeden zTiger Lake CPUi jeden z Alder Lakei oba wyposażone w RTX 3080. Jeśli chodzi o procesor, nasze recenzowane urządzenie jest wyposażone w najnowszą generację Raptor Lake i zdecydowało się na układNvidia GeForce RTX 4060. Ale laptop otrzymał nie tylko wewnętrzne poprawki, ponieważ projekt został również poddany niewielkiej metamorfozie. Urządzenie jest teraz oparte na płycie głównej Clevo PD50SND-G.
Porównanie z poprzednikiem jest interesujące, ponieważ chociaż karta graficzna pochodzi teraz z najnowszej generacji Ada Lovelace firmy Nvidia, jej klasa została obniżona z 80 do 60. Kolejna opcja konfiguracji jest dostępna w postaciRTX 4070. Obie karty graficzne działają z mocą od 140 do 150 watów. Pro 15 E23 udało się uzyskać imponującą wydajność i dobrze wypada w porównaniu z laptopami do gier, takimi jak Dell G15 5530 lubAorus 15X ASF. Nieco powyżej tego poziomu jestAsus ZenBook Pro 14 Duo. Jednak ten multimedialny laptop może pochwalić się również wysoką liczbą klatek na sekundę w wielu aktualnych tytułach.
Potencjalni konkurenci w porównaniu
Ocena | Data | Model | Waga | Wysokość | Rozmiar | Rezolucja | Cena |
|---|---|---|---|---|---|---|---|
| 86.2 % v7 (old) | 07/2023 | Schenker XMG Pro 15 (E23) i9-13900HX, GeForce RTX 4060 Laptop GPU | 2.4 kg | 24.9 mm | 15.60" | 2560x1440 | |
| 86.9 % v7 (old) | Schenker XMG Pro 15 (i7-12700H, RTX 3080 Ti) i7-12700H, GeForce RTX 3080 Ti Laptop GPU | 2.4 kg | 25 mm | 15.60" | 2560x1440 | ||
| 84.2 % v7 (old) | 06/2023 | Dell G15 5530 i7-13650HX, GeForce RTX 4060 Laptop GPU | 3 kg | 26.95 mm | 15.60" | 1920x1080 | |
| 86.3 % v7 (old) | 06/2023 | Asus TUF A15 FA507 R7 7735HS, GeForce RTX 4050 Laptop GPU | 2.2 kg | 24.9 mm | 15.60" | 1920x1080 | |
| 86.2 % v7 (old) | 04/2023 | Aorus 15X ASF i7-13700HX, GeForce RTX 4070 Laptop GPU | 2.3 kg | 19.7 mm | 15.60" | 2560x1440 | |
| 87 % v7 (old) | 06/2023 | Asus ZenBook Pro 14 Duo UX8402VV-P1021W i9-13900H, GeForce RTX 4060 Laptop GPU | 1.8 kg | 21 mm | 14.50" | 2880x1800 | |
| 82.4 % v7 (old) | 04/2023 | MSI Cyborg 15 A12VF i7-12650H, GeForce RTX 4060 Laptop GPU | 2 kg | 22.9 mm | 15.60" | 1920x1080 | |
| 88.4 % v7 (old) | 06/2023 | Alienware x16 R1 i9-13900HK, GeForce RTX 4080 Laptop GPU | 2.6 kg | 18.57 mm | 16.00" | 2560x1600 |
Obudowa i funkcje - Wysoka zawartość metalu
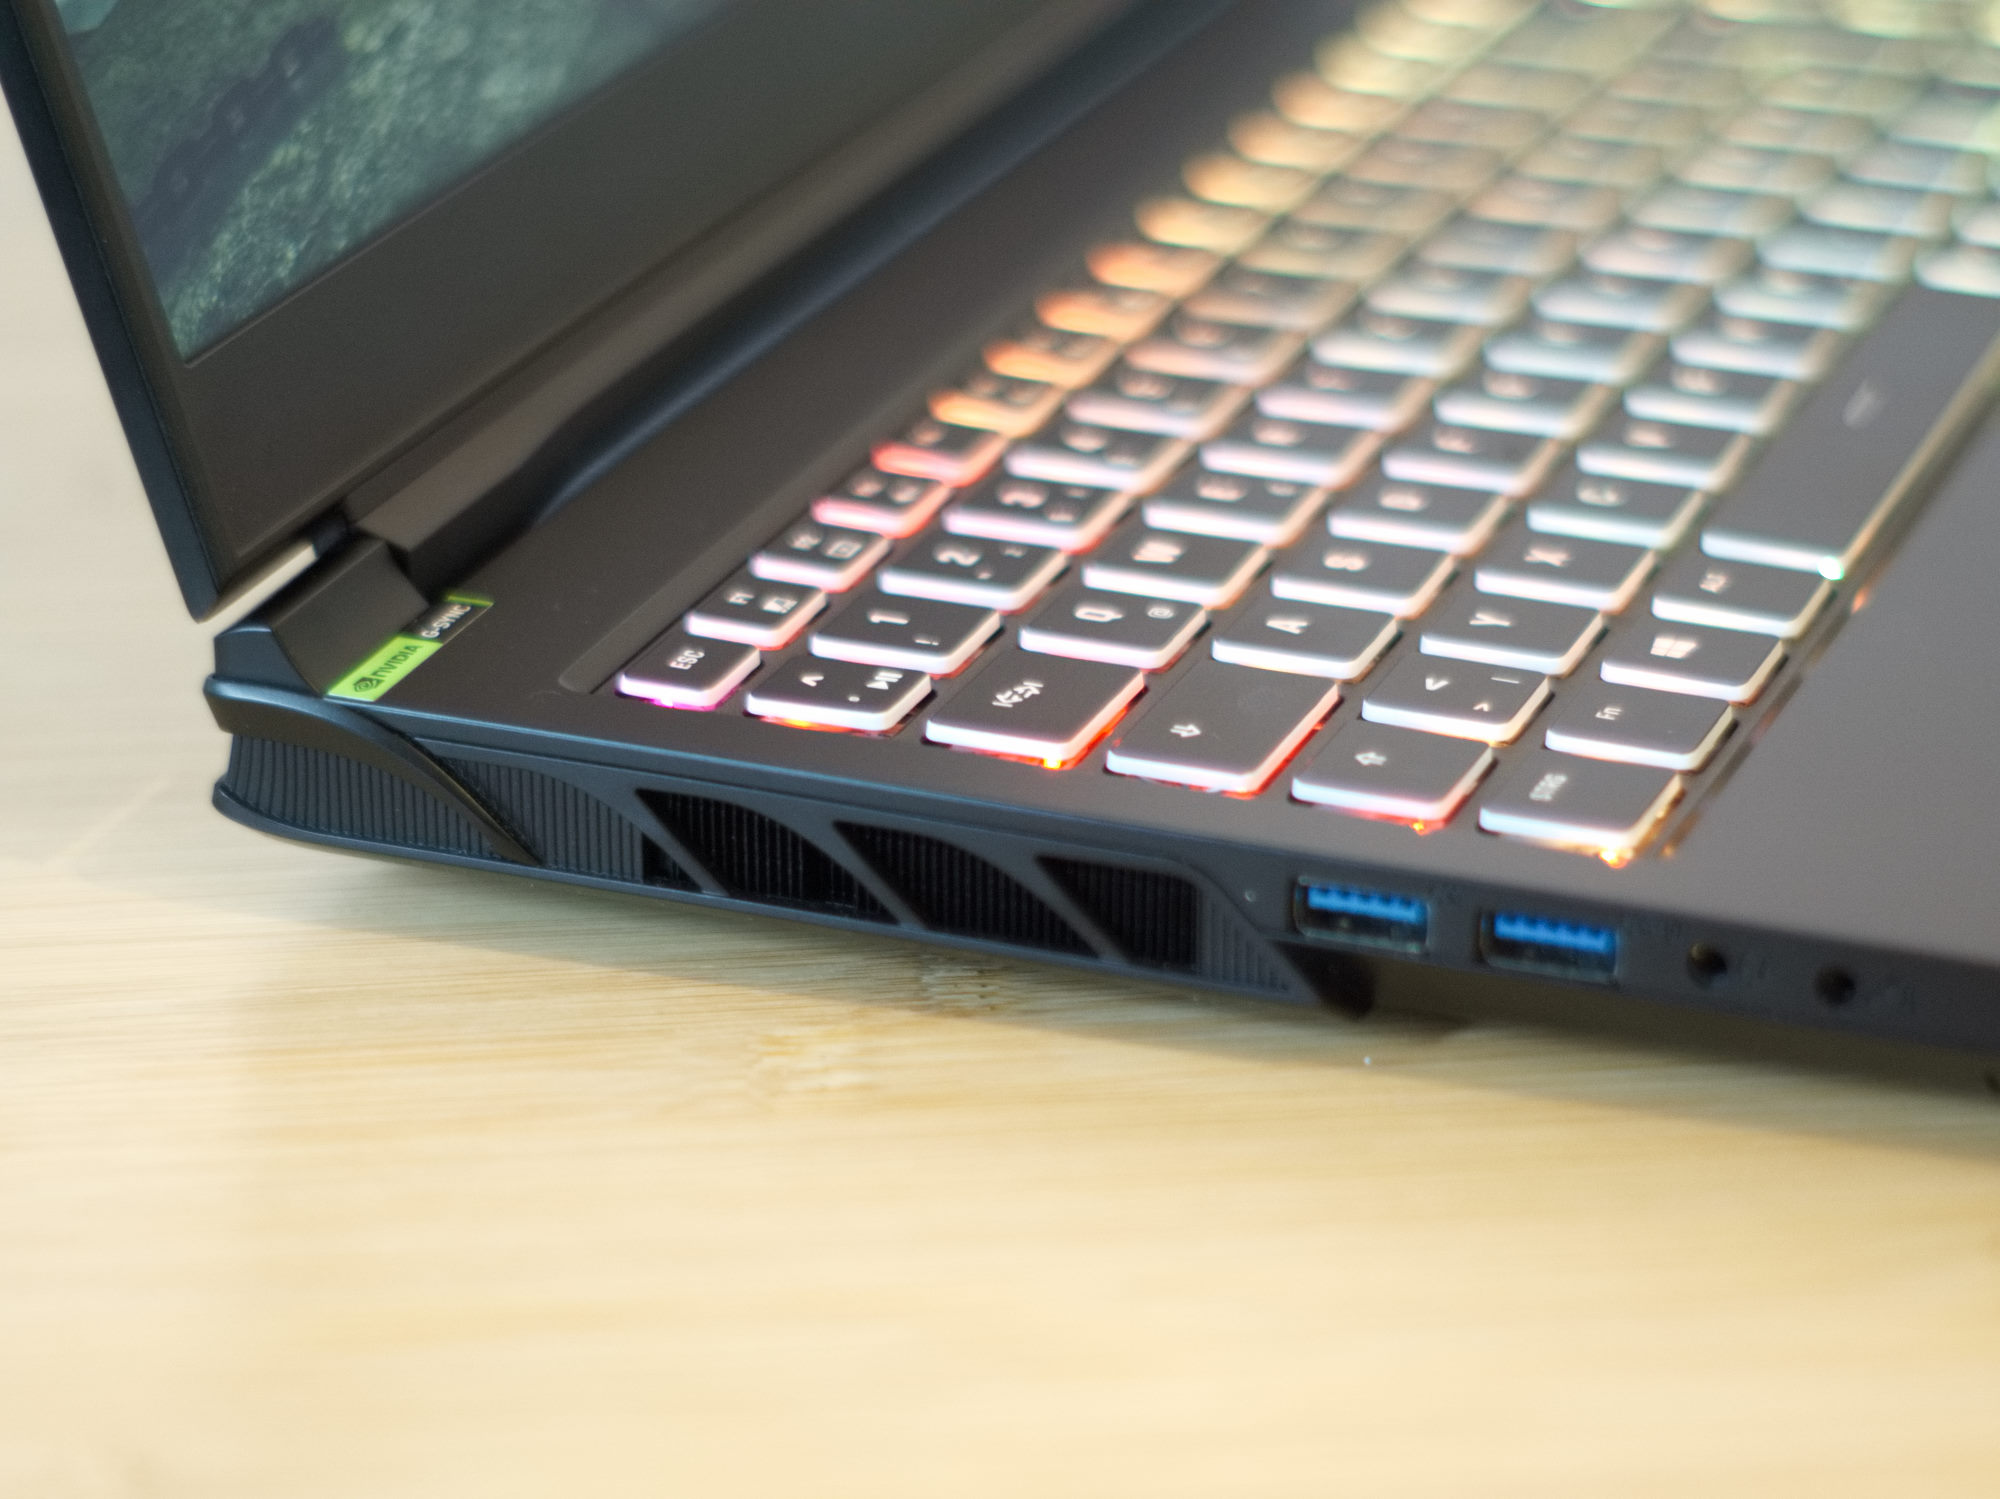
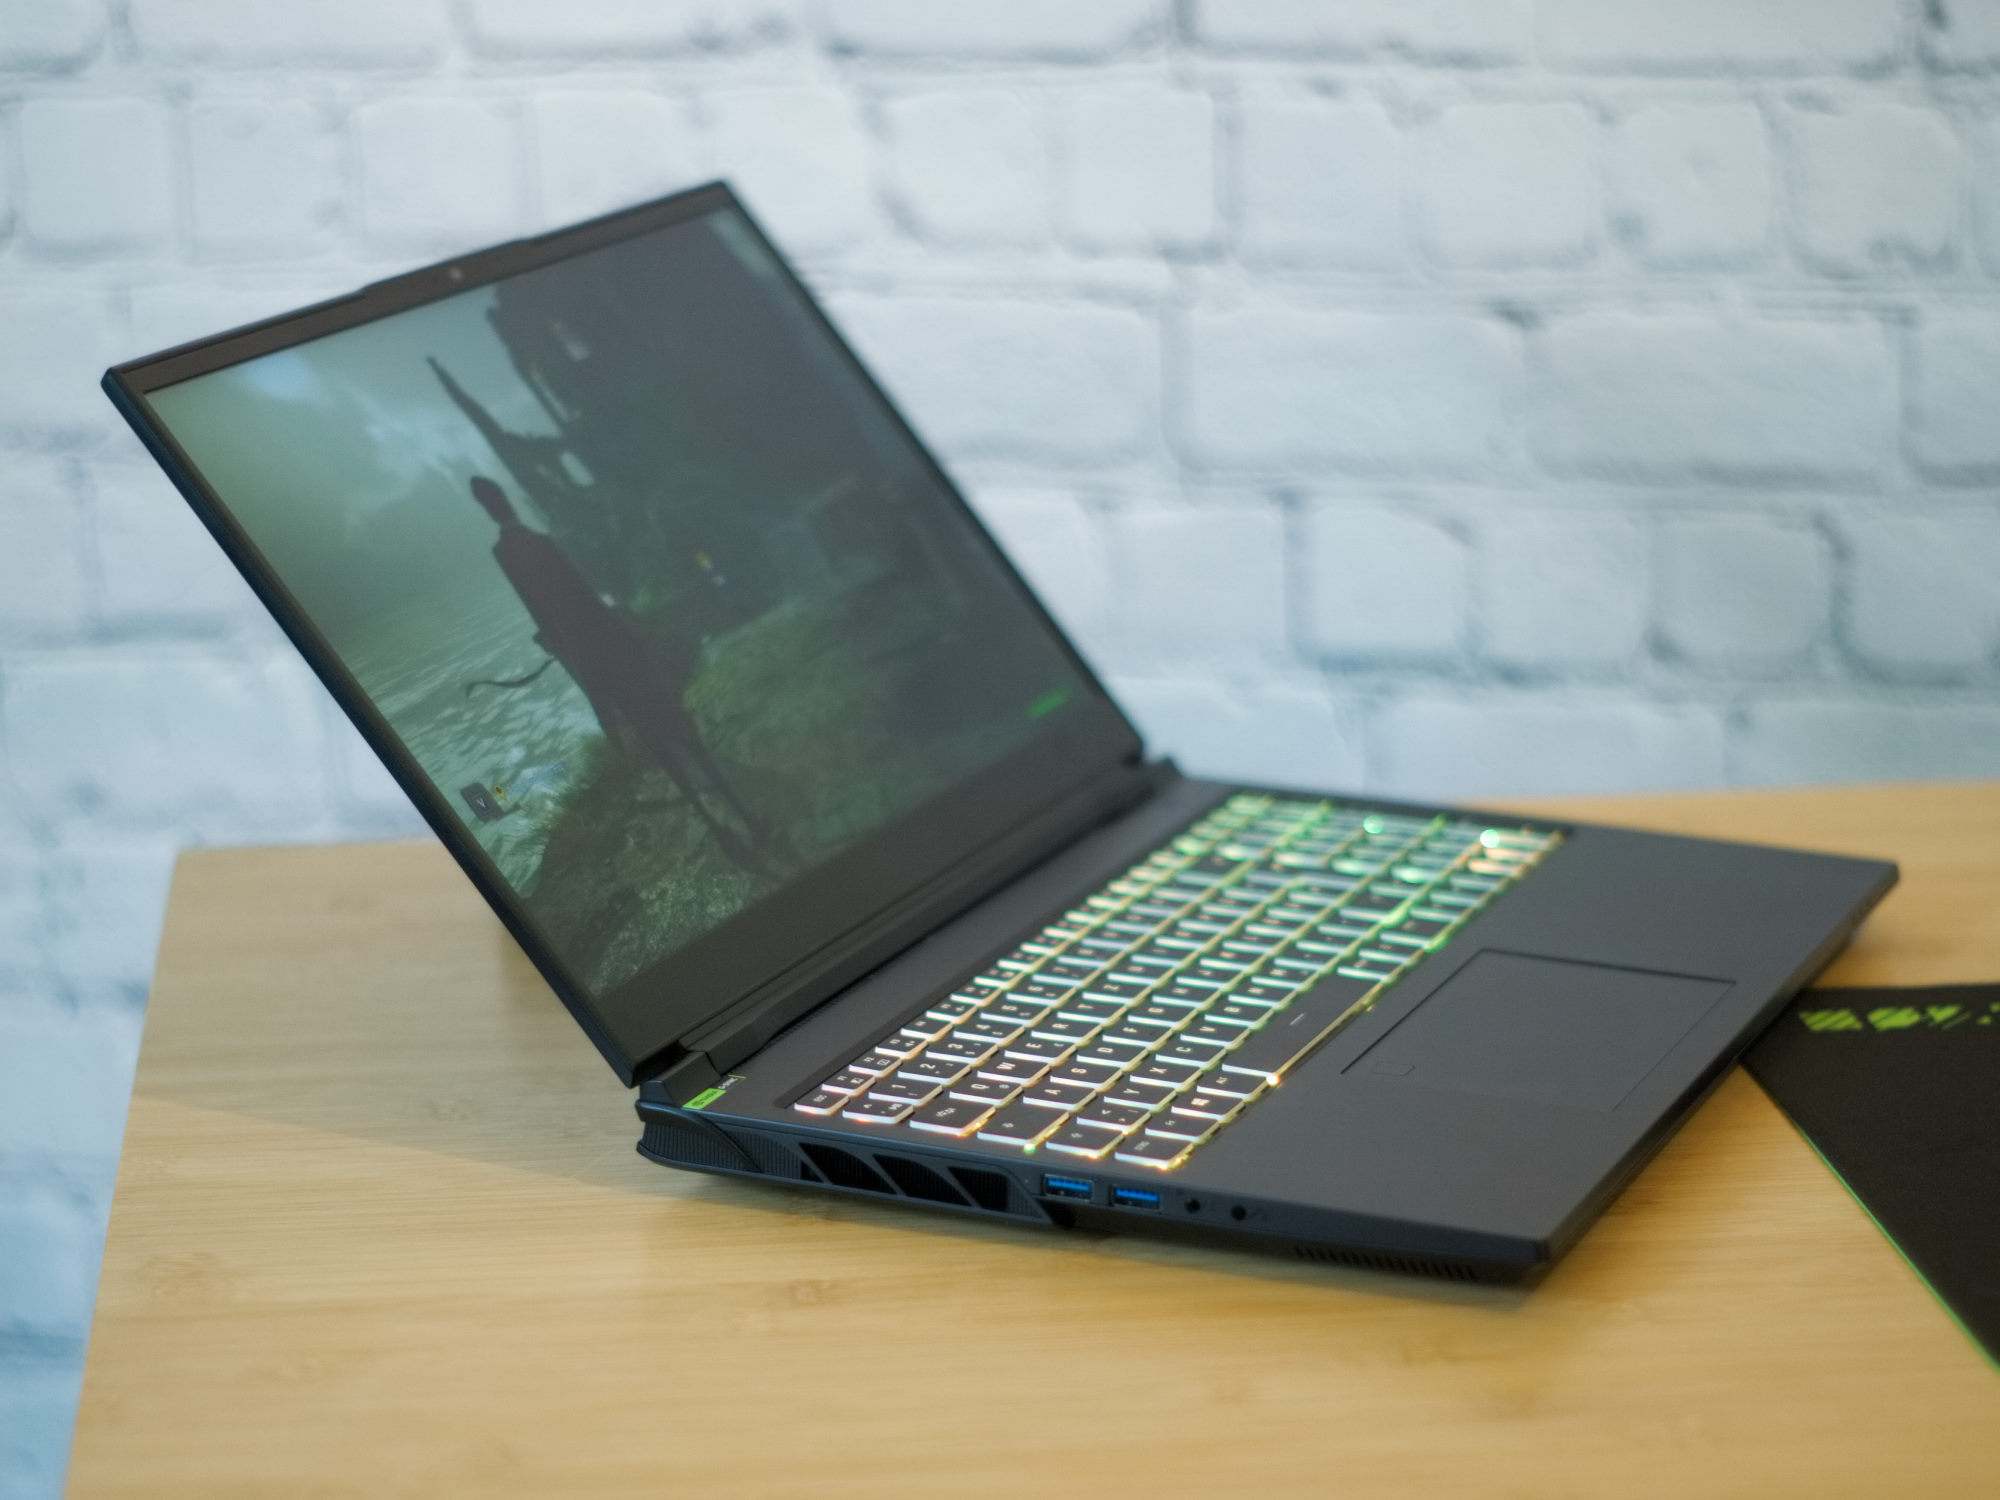
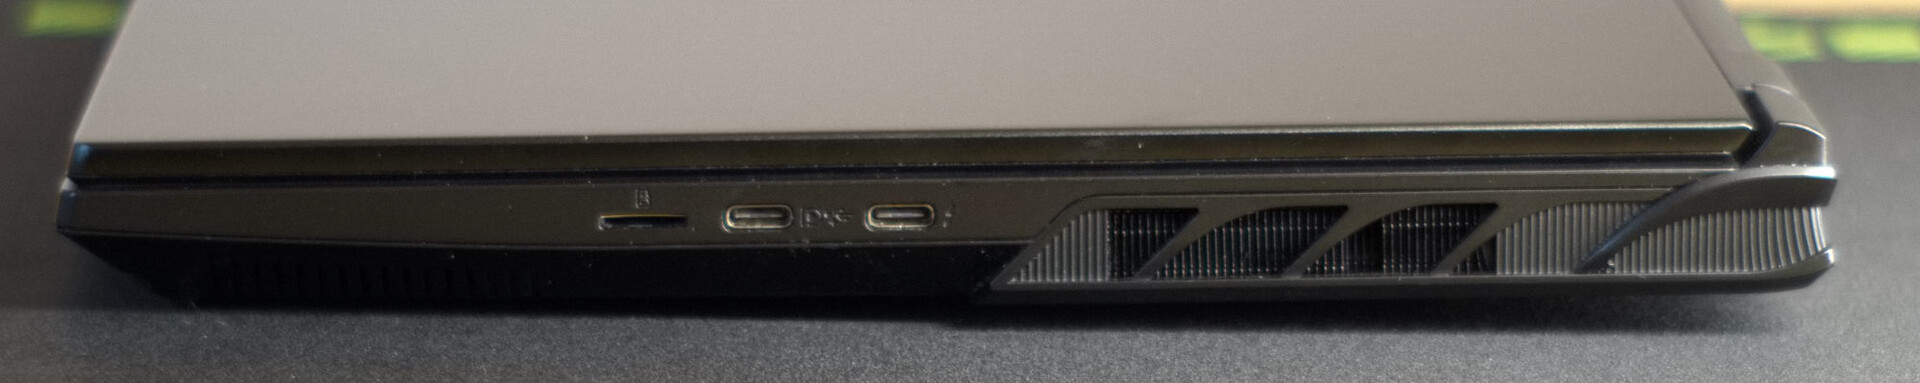
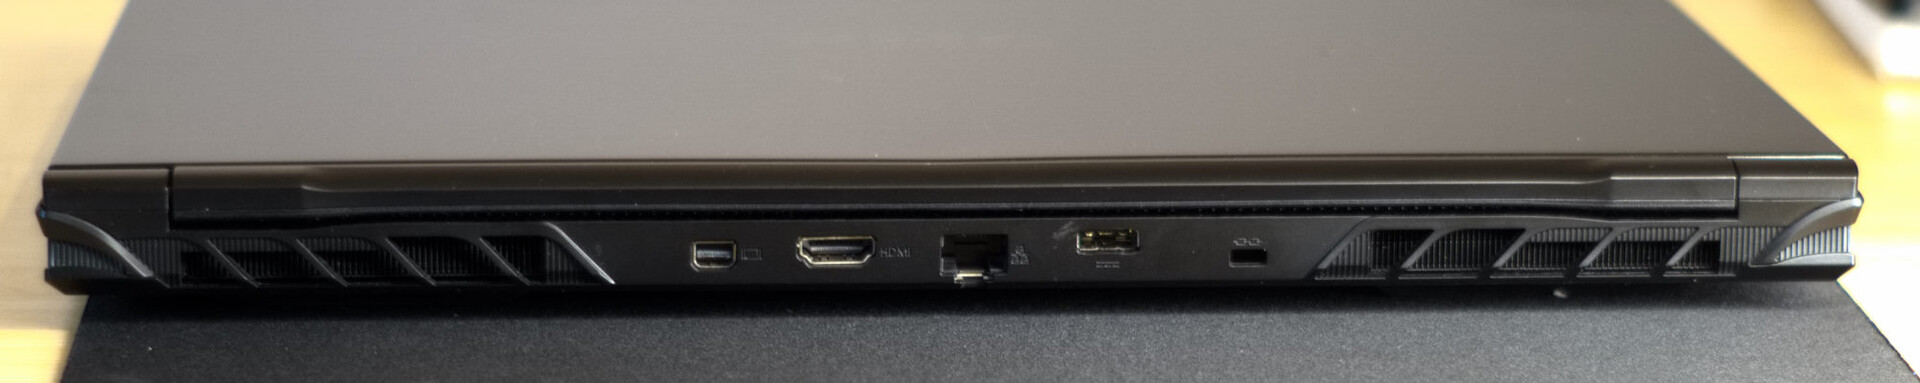
W porównaniu do swojego poprzednika, Pro 15 E23 otrzymał kilka drobnych poprawek detali. Dotyczą one głównie otworów wentylacyjnych po bokach laptopa oraz zamiany położenia gniazda RJ45 i gniazda USB-C. Teraz wszystkie porty USB znajdują się po bokach urządzenia.
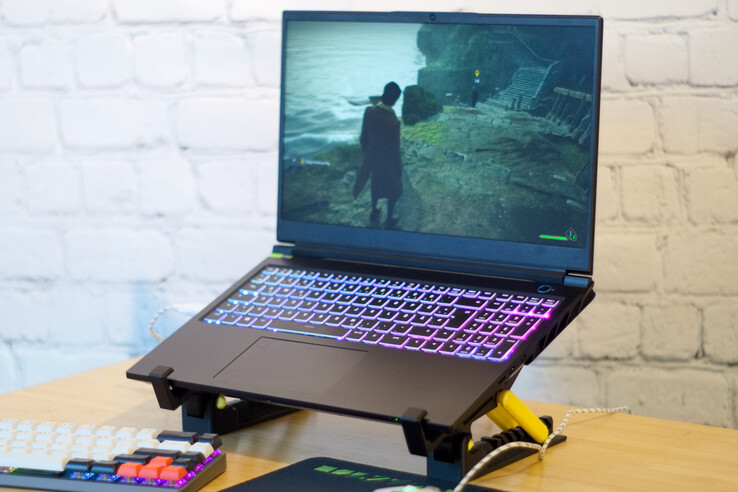
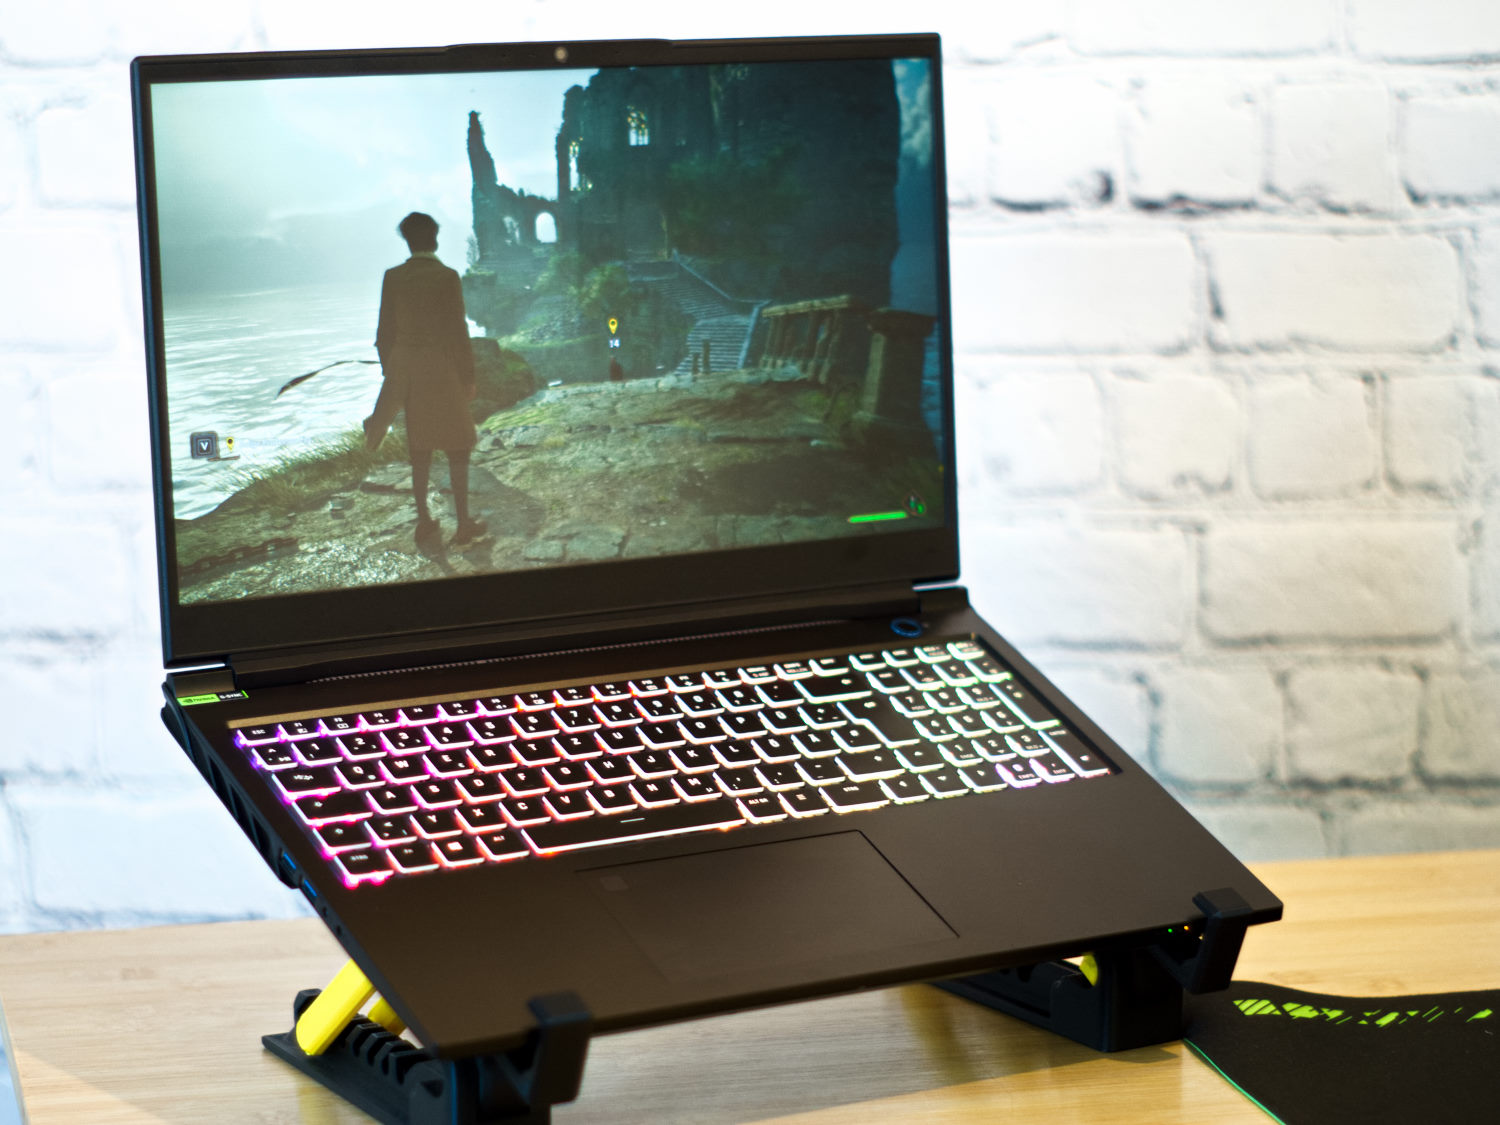
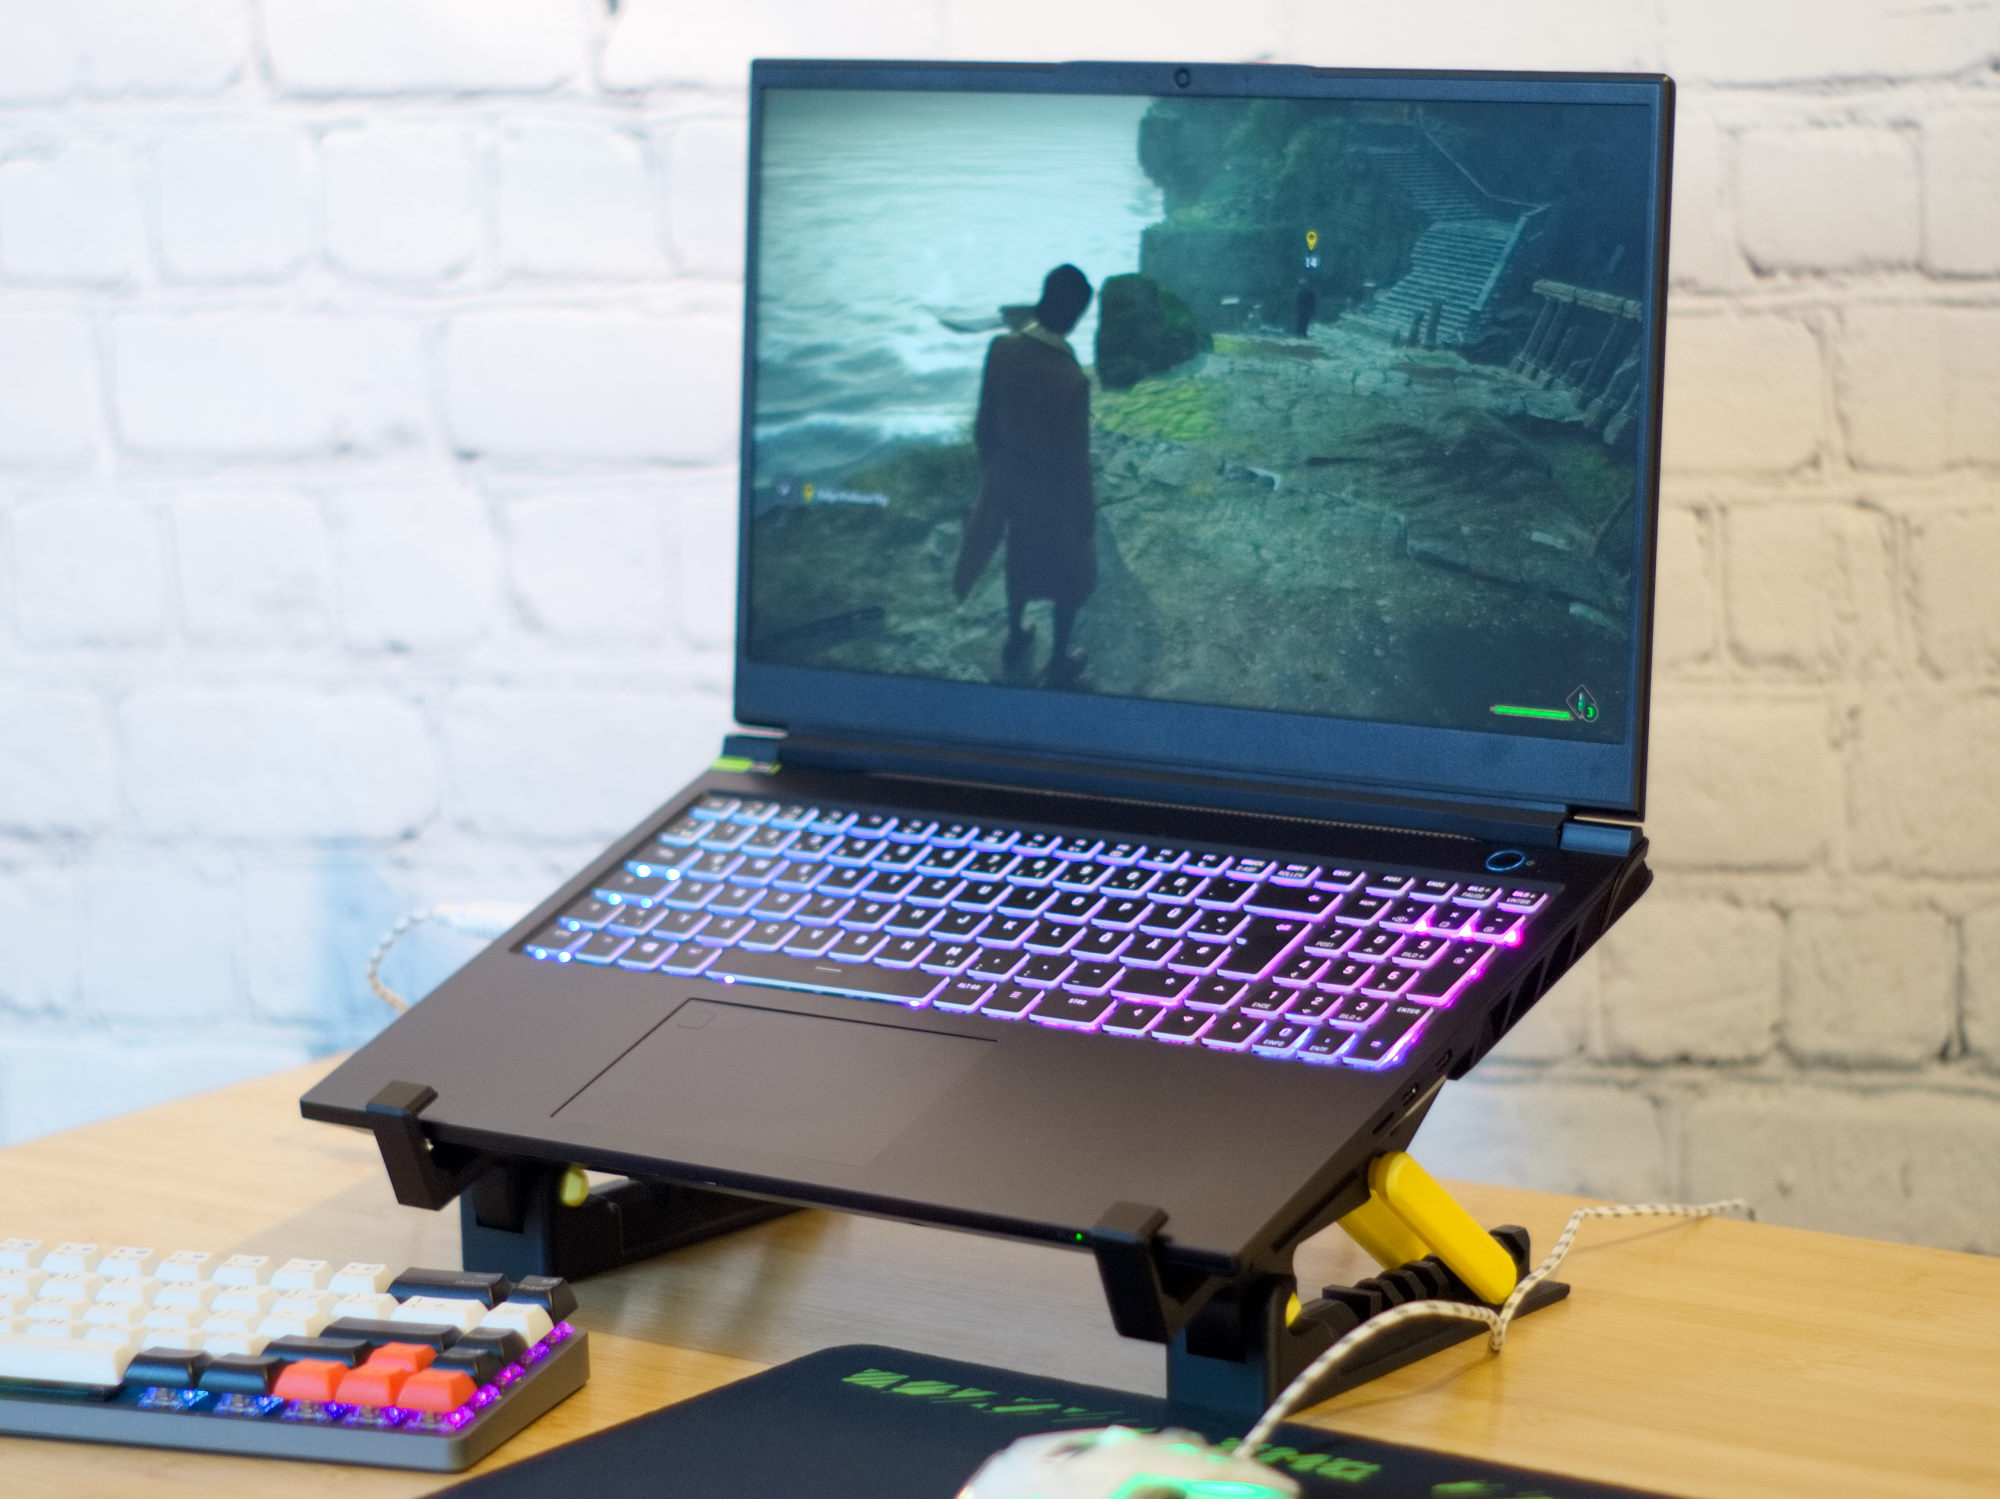
Konstrukcja pozostaje stonowana, czarna i w dużej mierze wolna od brandingu. Zarówno rozmiar, jak i waga laptopa są niemal identyczne jak w przypadku jego poprzednika. Pokrywa wyświetlacza i spód obudowy laptopa są nadal wykonane z aluminium, podczas gdy górna część obudowy jest wykonana z tworzywa sztucznego. Wyświetlacz jest otoczony szeroko wyglądającą plastikową obręczą, która ma tylko 5 mm grubości po bokach, jeden centymetr na górze i dwa centymetry na dole. Możliwe jest wydobycie niewielkiego skrzypienia z ekranu i podstawy poprzez ich przekręcenie. Trzeba jednak włożyć w to sporo wysiłku, gdyż wszystkie elementy laptopa są bardzo dobrze wykonane i solidne. Klawiatura i pokrywa ekranu uginają się tylko nieznacznie, gdy wywierany jest duży nacisk, a zawiasy bezpiecznie utrzymują monitor w każdej możliwej pozycji od 0° do 135°.

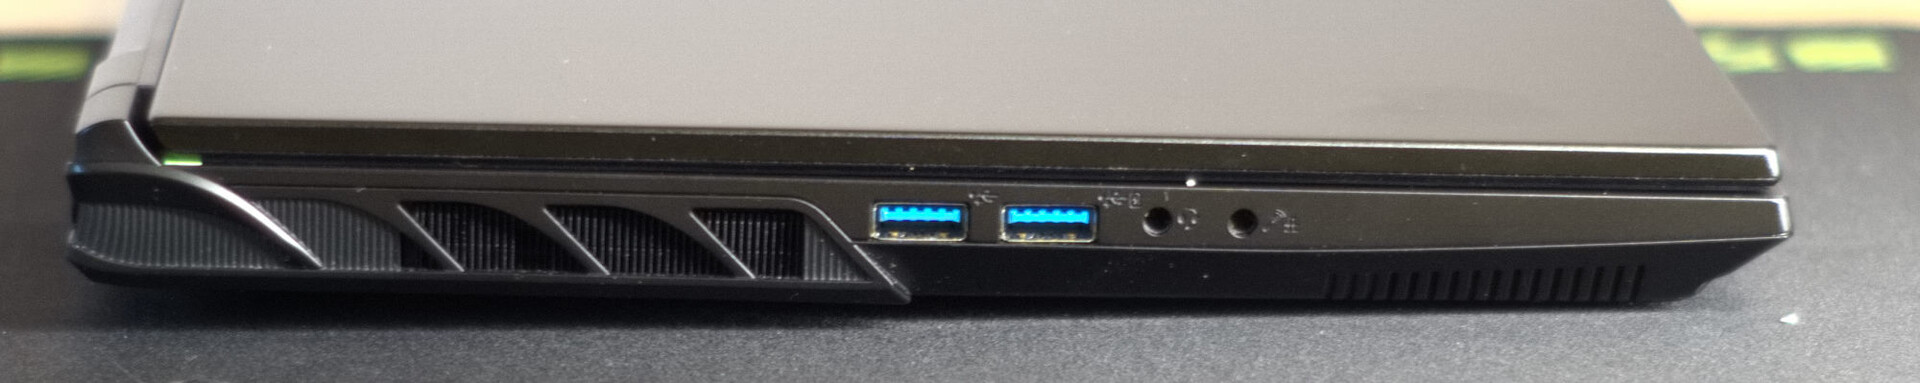
Czytnik kart SD, Wi-Fi i kamera internetowa
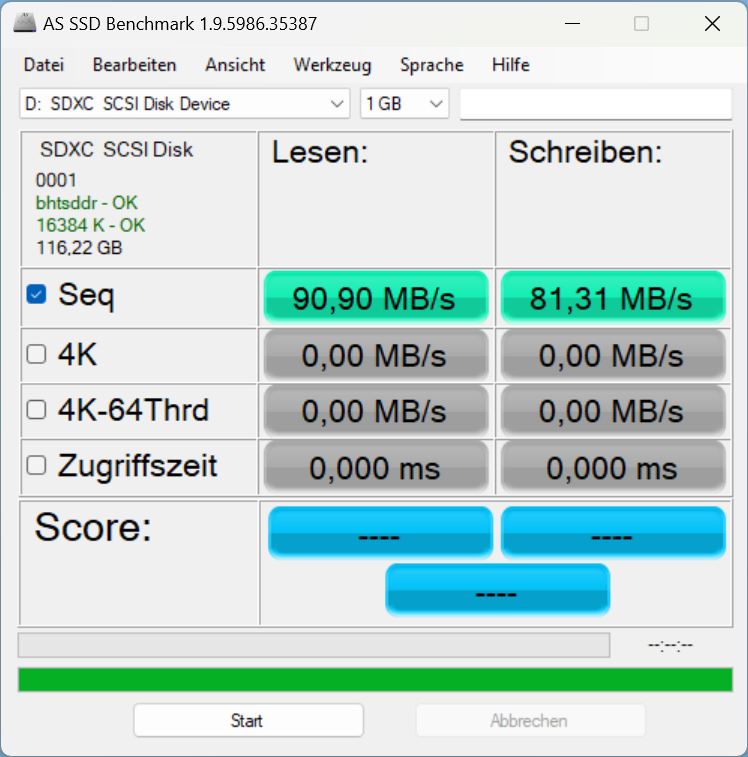
Das Pro 15 posiada, przynajmniej w porównaniu do wielu innych laptopów gamingowych, czytnik kart microSD. W połączeniu z naszą kartą AV Pro microSD (V60) odnotowaliśmy dobre prędkości transferu w zakresie od 80 do 90 MB/s.
W sieci 6 GHz, Intel Wi-Fi 6E AX211 laptopa wykazał się przeważnie doskonałymi prędkościami danych, ale w sieci 5 GHz zwrócił raczej wartości poniżej średniej, jeśli chodzi o prędkość transferu.
W przypadku streamerów jakość wbudowanej kamery internetowej Full HD będzie prawdopodobnie niewystarczająca, zwłaszcza w słabych warunkach oświetleniowych. Można jej jednak używać do okazjonalnych połączeń wideo.
| SD Card Reader | |
| average JPG Copy Test (av. of 3 runs) | |
| Średnia w klasie Gaming (20.9 - 210, n=54, ostatnie 2 lata) | |
| Schenker XMG Pro 15 (E23) | |
| Schenker XMG Pro 15 (i7-12700H, RTX 3080 Ti) | |
| Asus ZenBook Pro 14 Duo UX8402VV-P1021W (AV Pro SD microSD 128 GB V60) | |
| Alienware x16 R1 (AV PRO microSD 128 GB V60) | |
| maximum AS SSD Seq Read Test (1GB) | |
| Alienware x16 R1 (AV PRO microSD 128 GB V60) | |
| Średnia w klasie Gaming (25.5 - 261, n=51, ostatnie 2 lata) | |
| Schenker XMG Pro 15 (i7-12700H, RTX 3080 Ti) | |
| Schenker XMG Pro 15 (E23) | |
| Asus ZenBook Pro 14 Duo UX8402VV-P1021W (AV Pro SD microSD 128 GB V60) | |

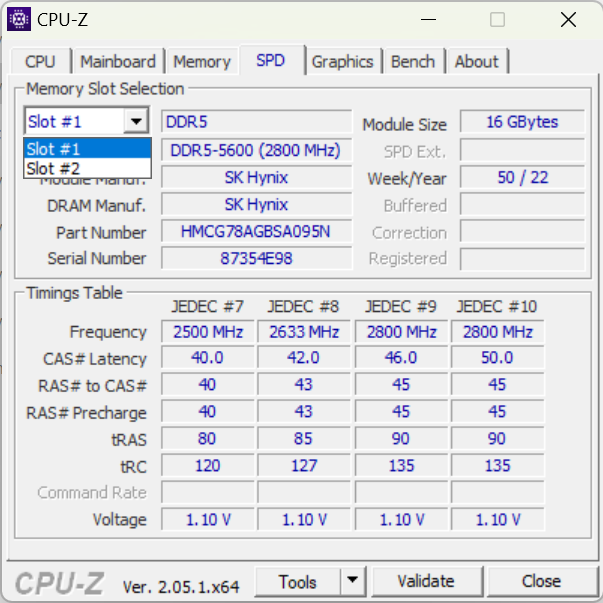
 GeForce RTX 4060 Laptop GPU, i9-13900HX, Crucial P5 Plus 1TB CT1000P5PSSD8")
 GeForce RTX 4060 Laptop GPU, i9-13900HX, Crucial P5 Plus 1TB CT1000P5PSSD8")
Akcesoria i konserwacja
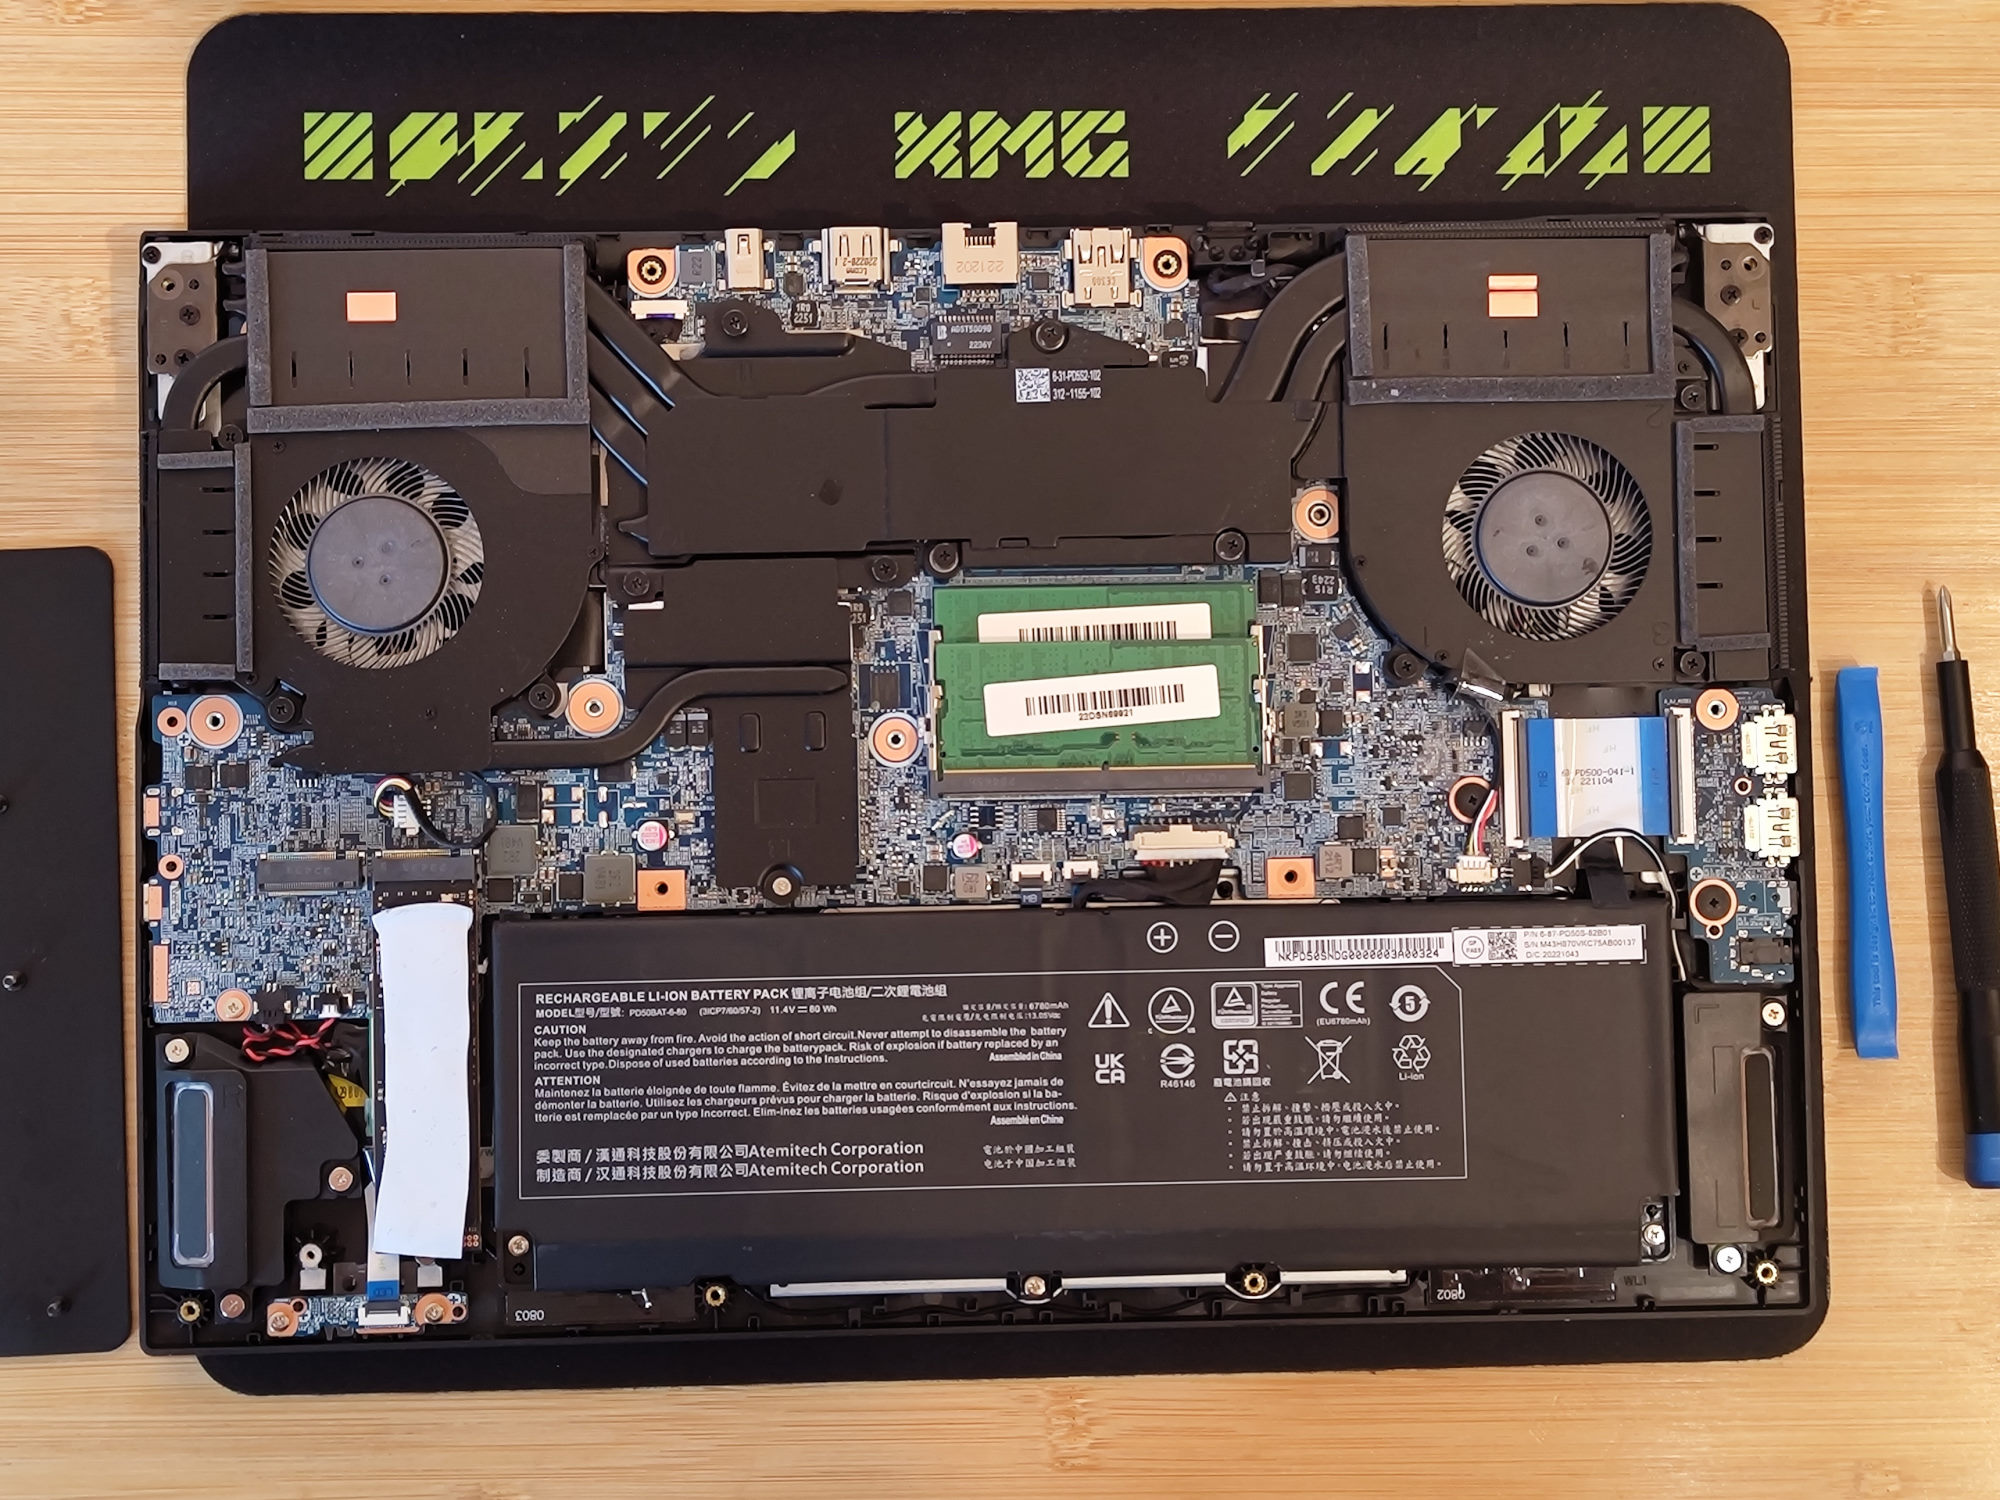
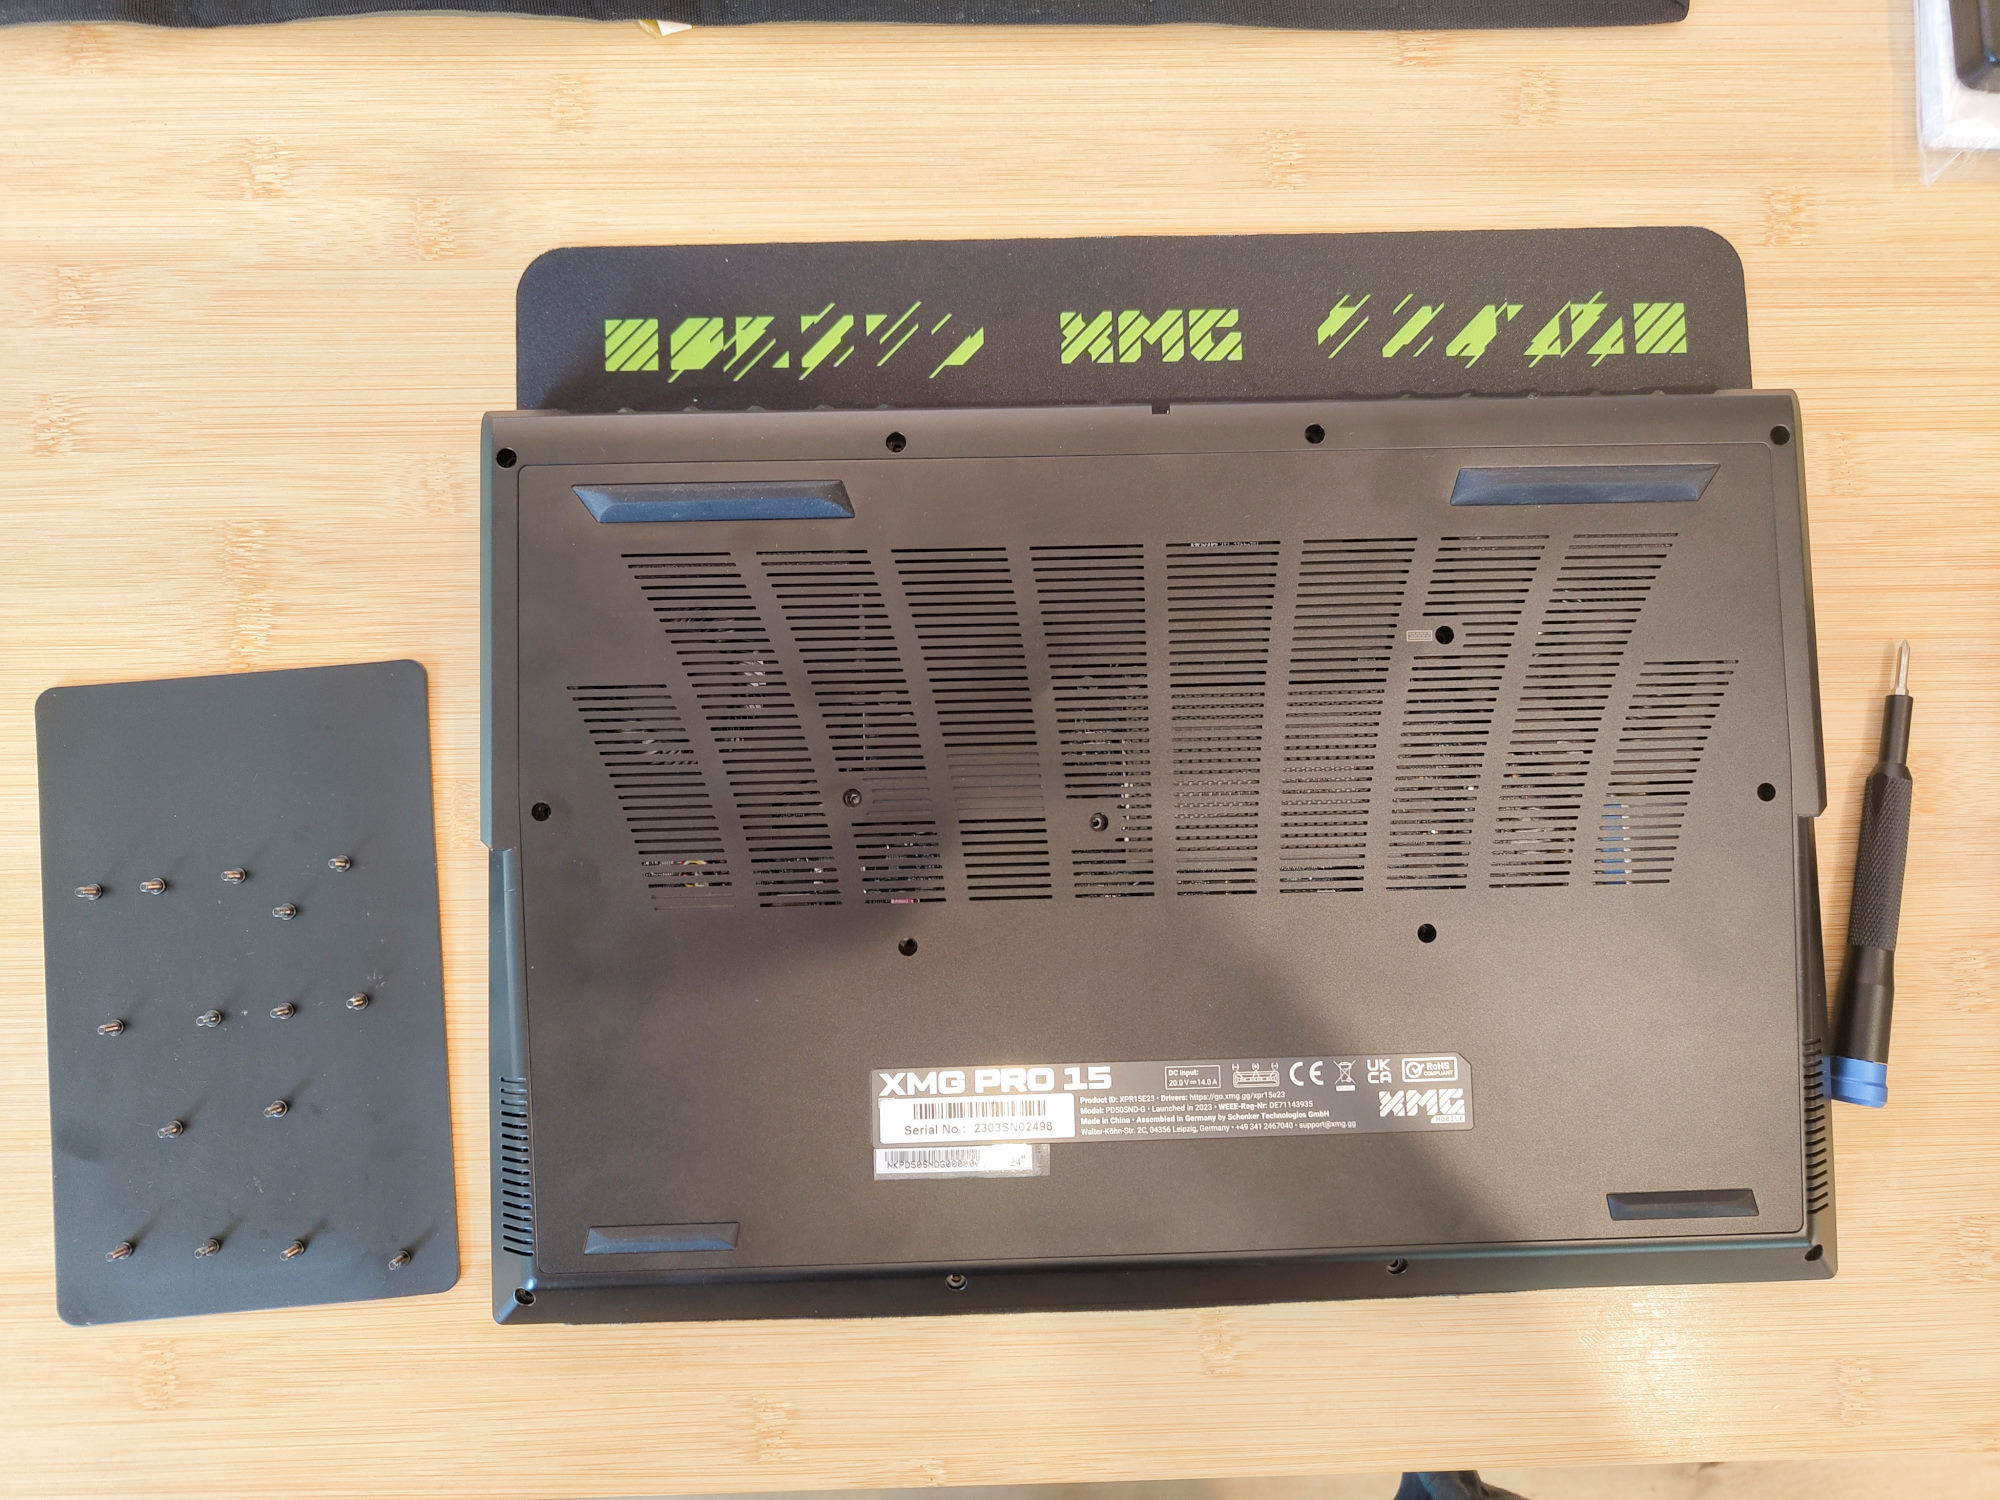
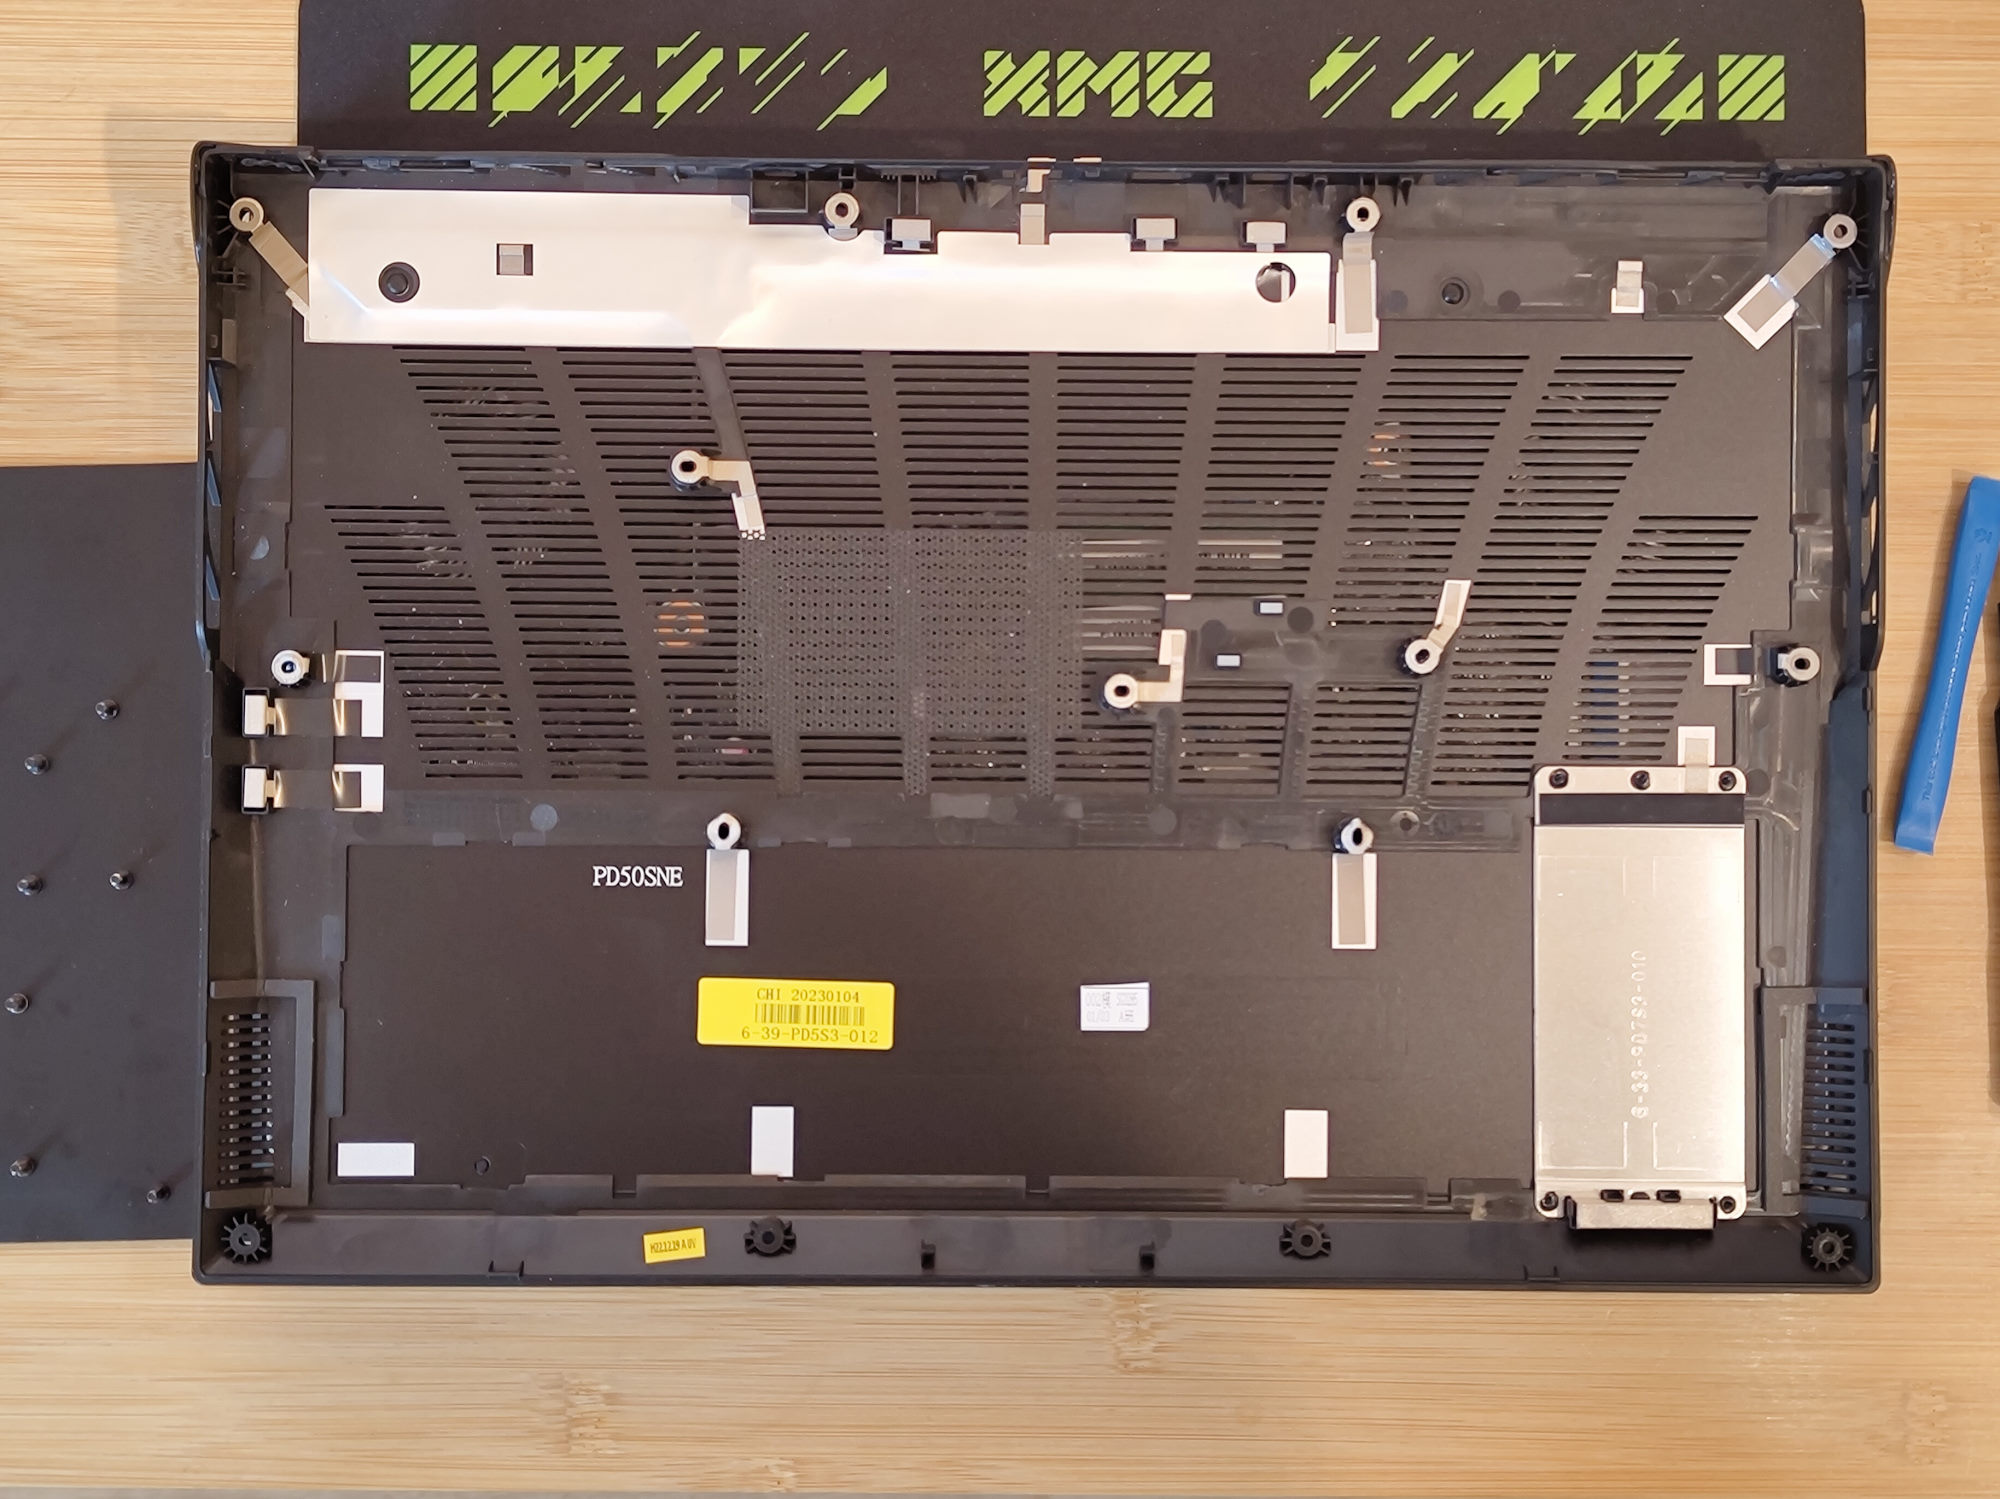
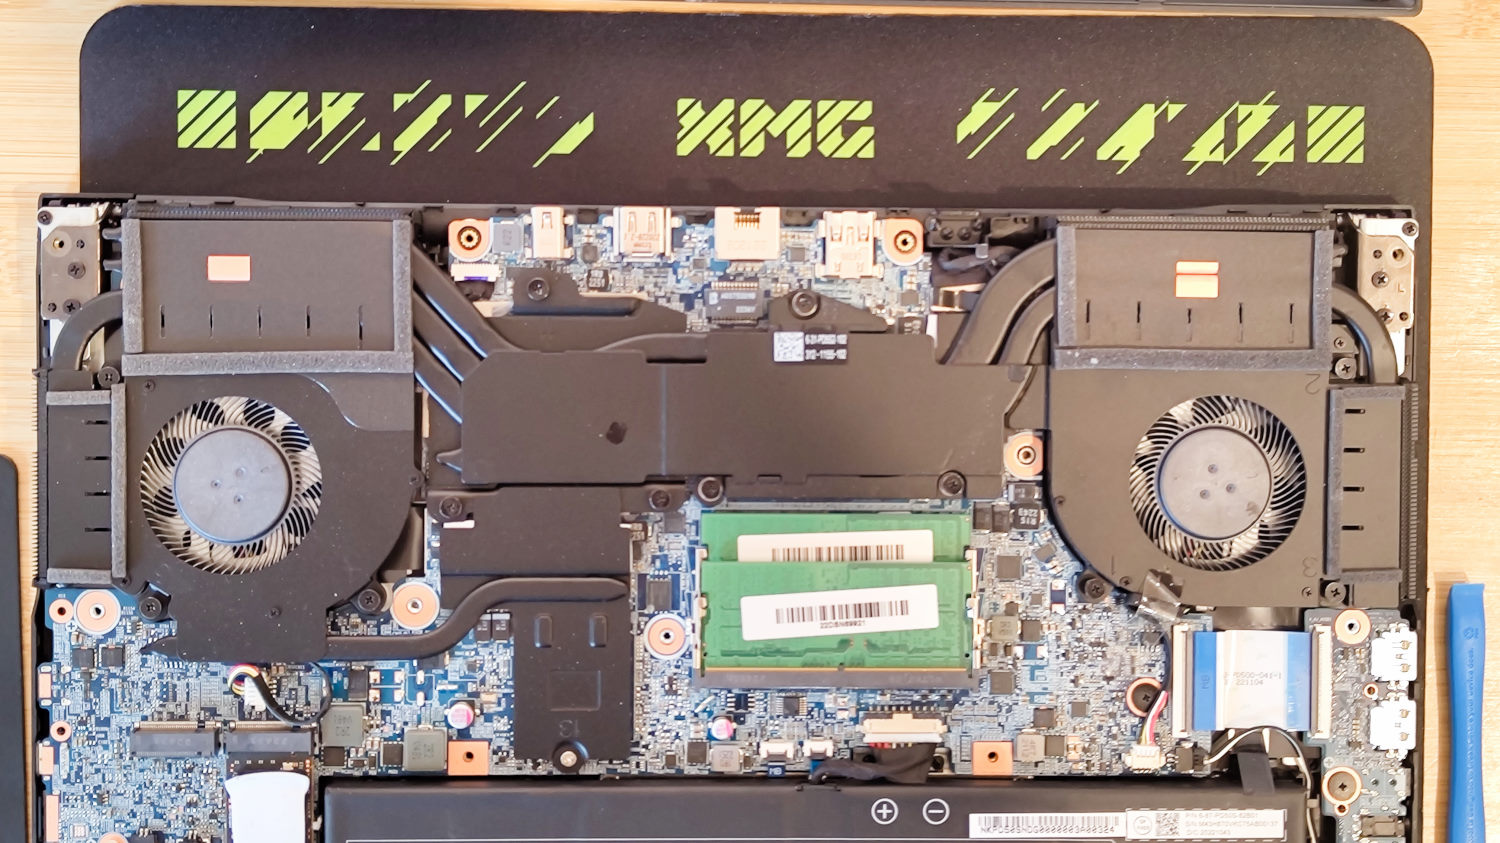
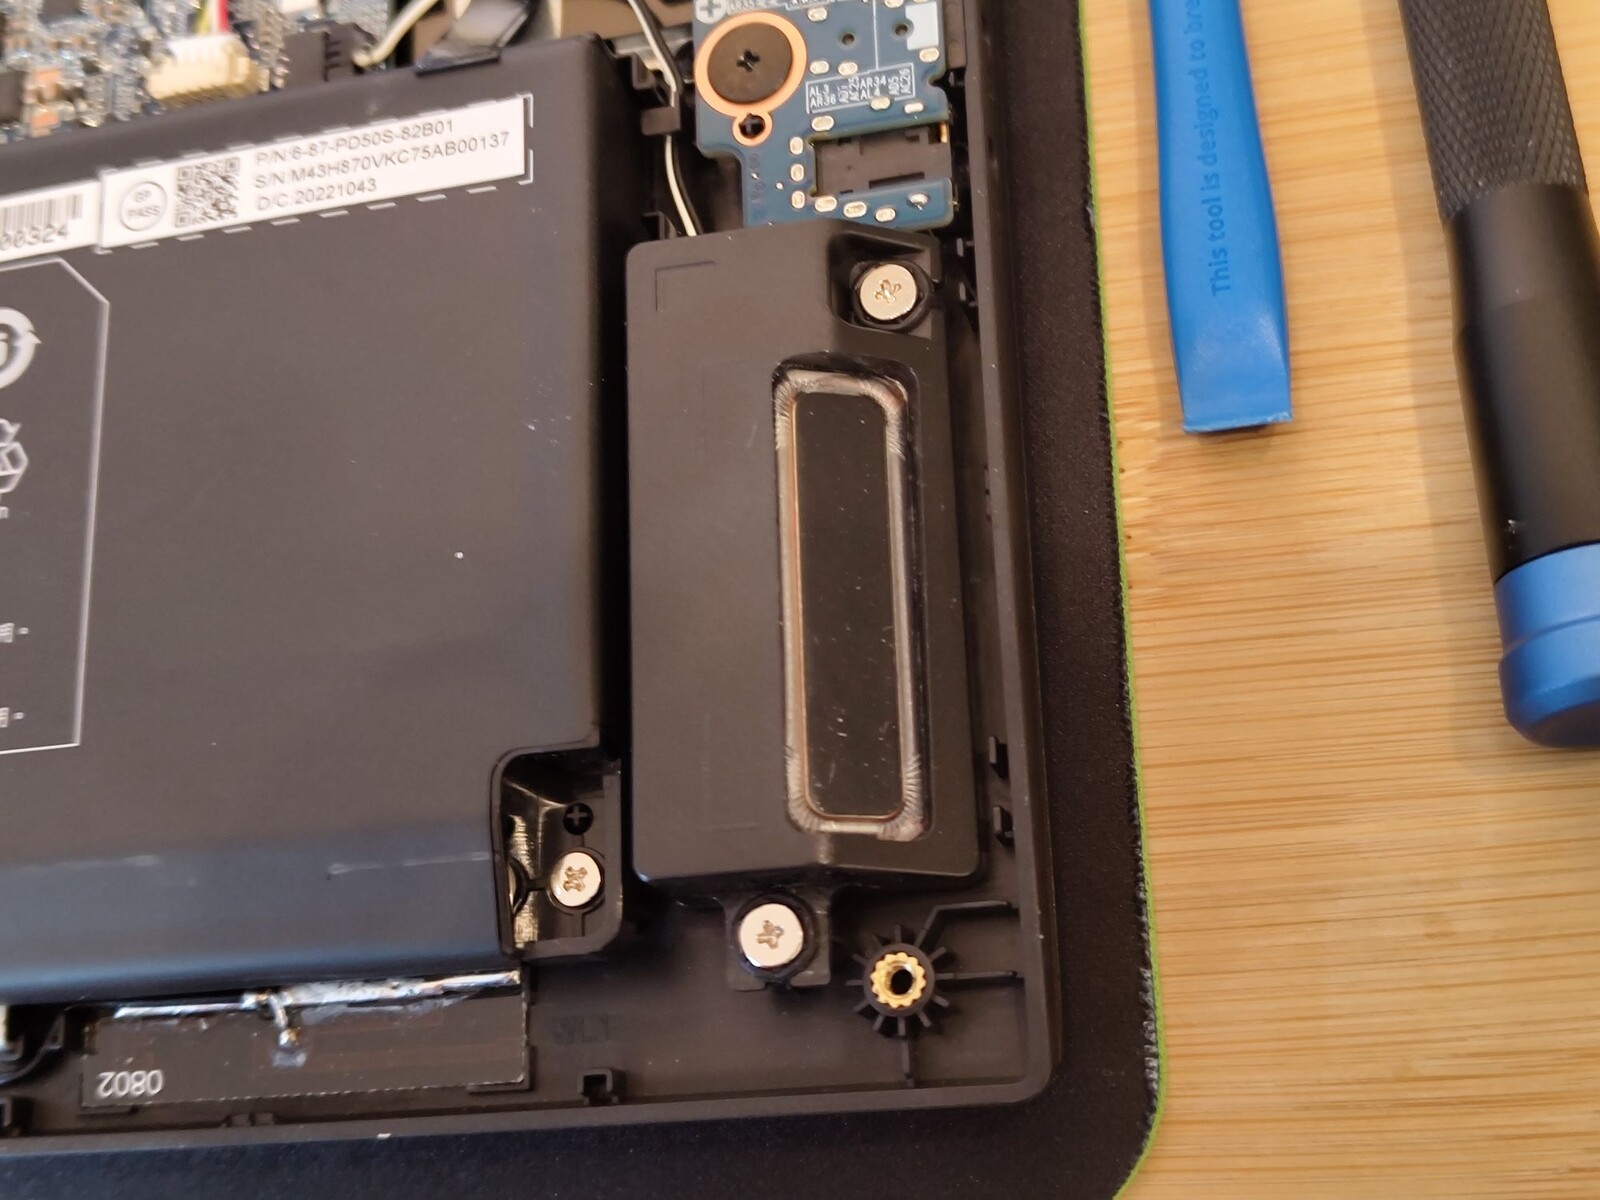
Pokrywę podstawy mocuje 15 śrub. Po ich odkręceniu pokrywę można łatwo otworzyć od przodu za pomocą plastikowego narzędzia do otwierania. Pod nią znajdziemy wymienną pamięć RAM oraz wolny slot M.2 na dodatkowy dysk SSD. Do laptopa dołączona jest odpowiednia podkładka termiczna, płyta CD ze sterownikami, pamięć USB z tą samą zawartością, duża podkładka pod mysz i otwieracz do butelek.
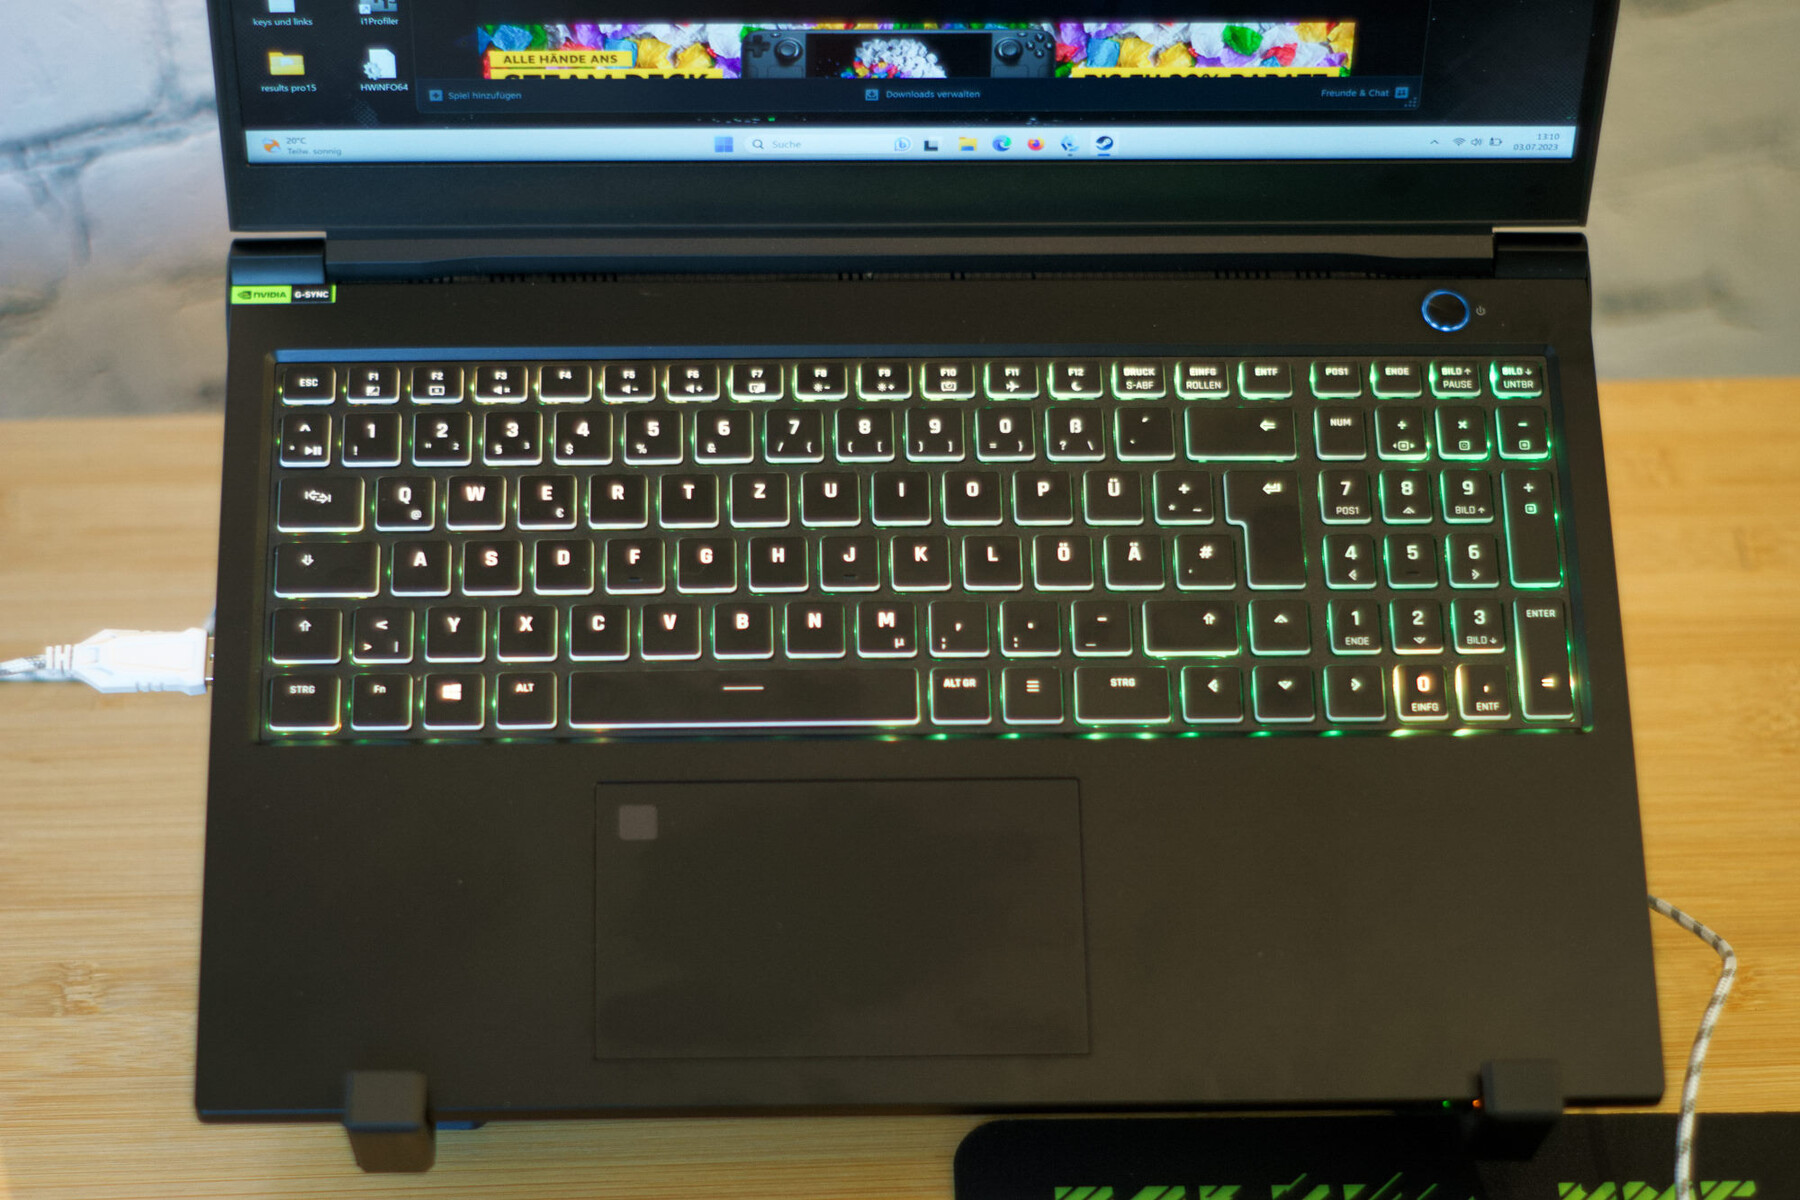
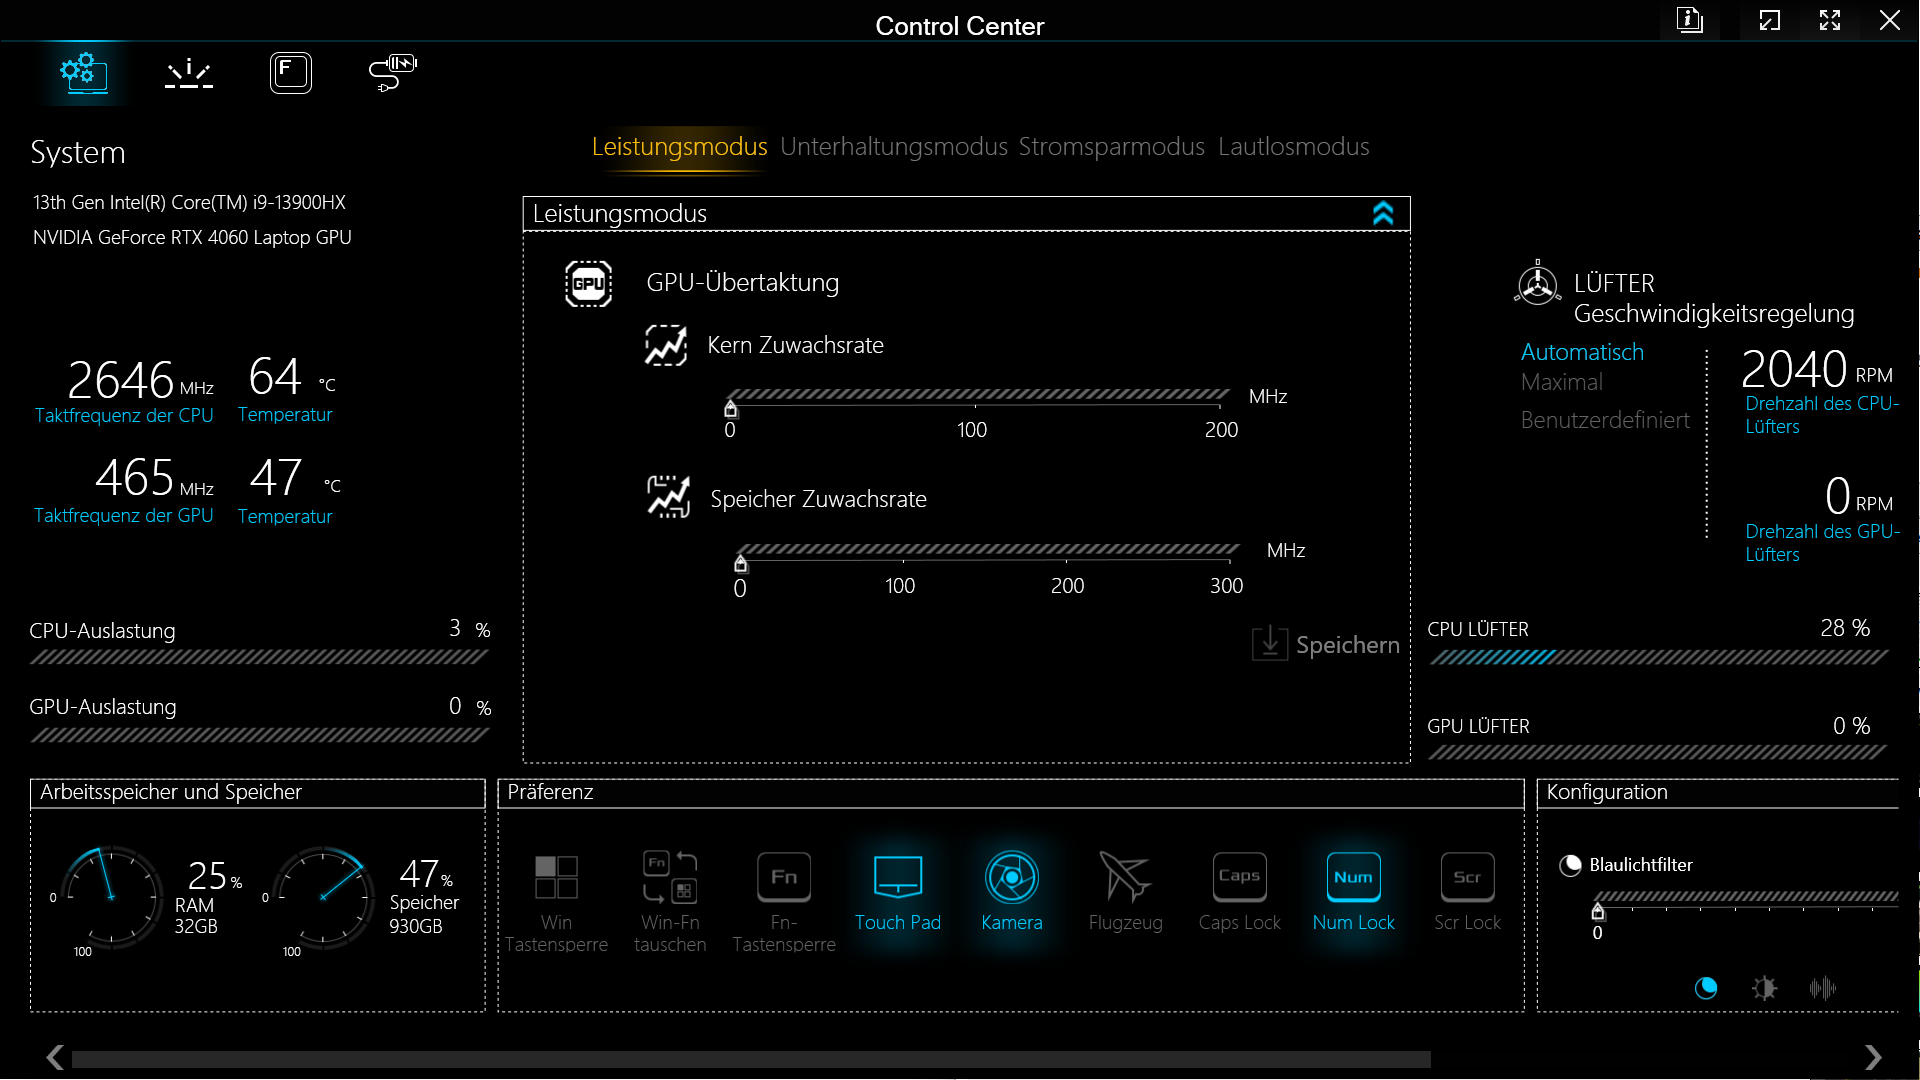
Urządzenia wejściowe - Pełnowymiarowa klawiatura RGB
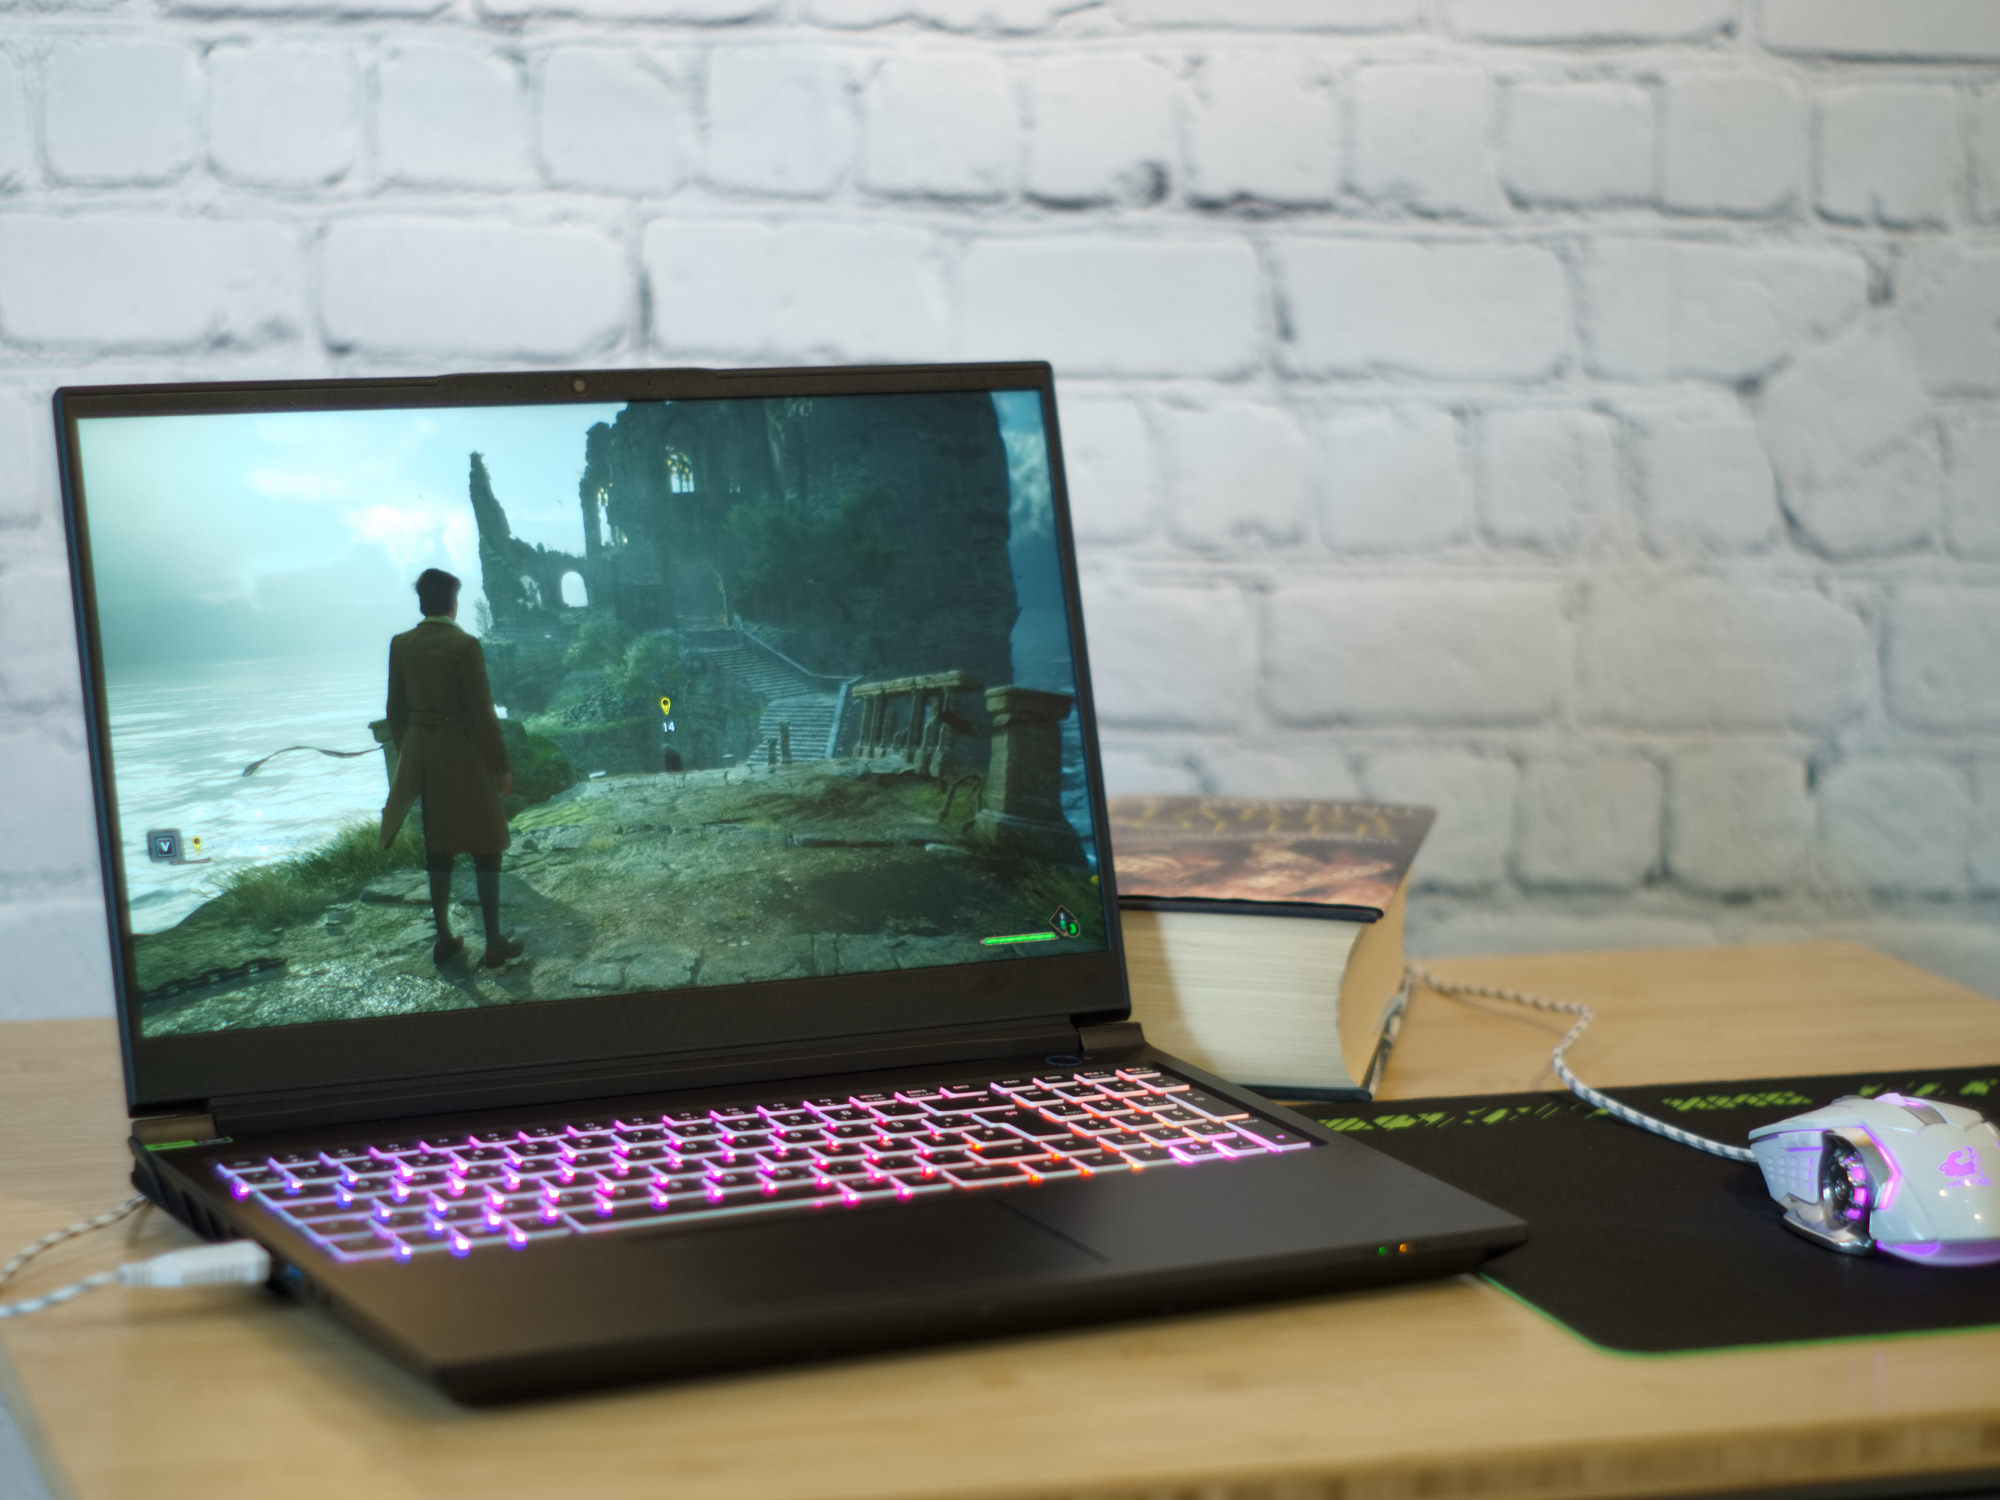
Clickpad 12 × 7 cm ze skanerem linii papilarnych i pełnowymiarowa klawiatura z klawiaturą numeryczną składają się na urządzenia wejściowe XMG Pro 15. Oba mają przyjemną haptykę i namacalny punkt nacisku. Jeśli chodzi o klawiaturę, skok klawiszy wynosi około 1,5 mm. Wszystkie klawisze mogą być indywidualnie podświetlane za pomocą oświetlenia RGB.
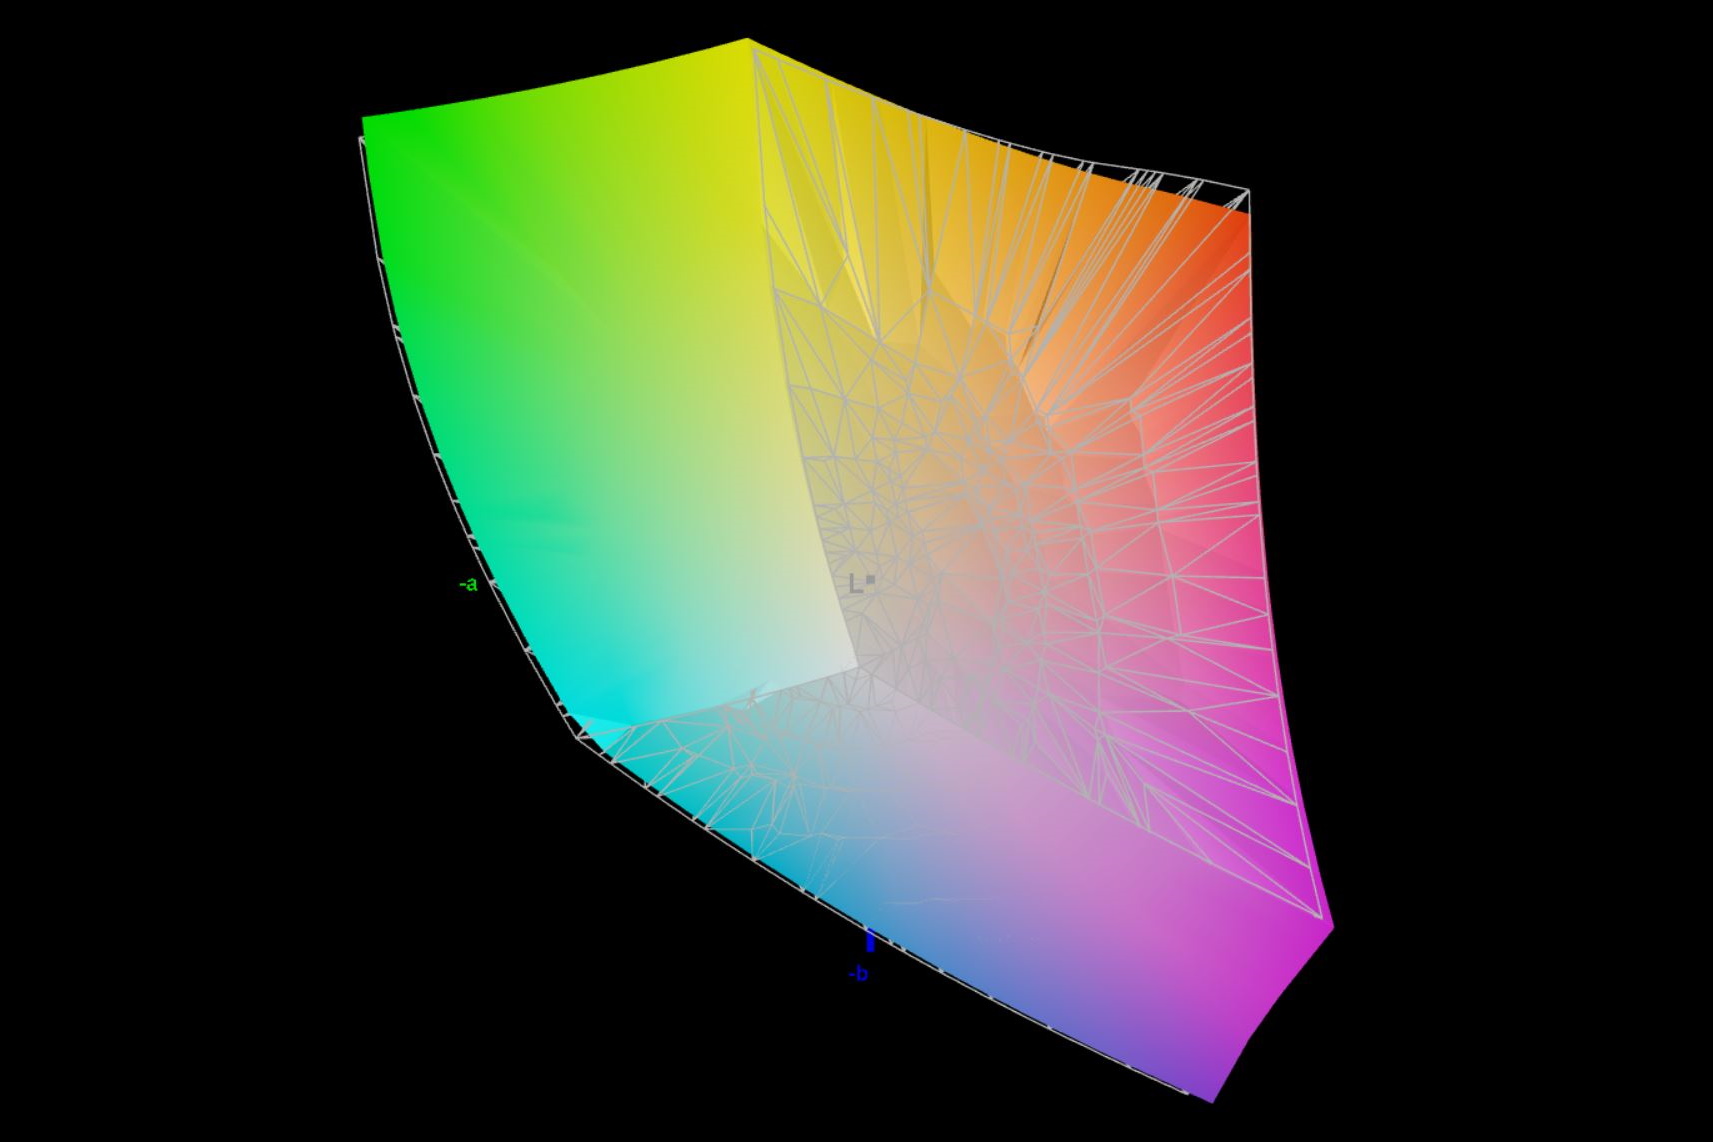
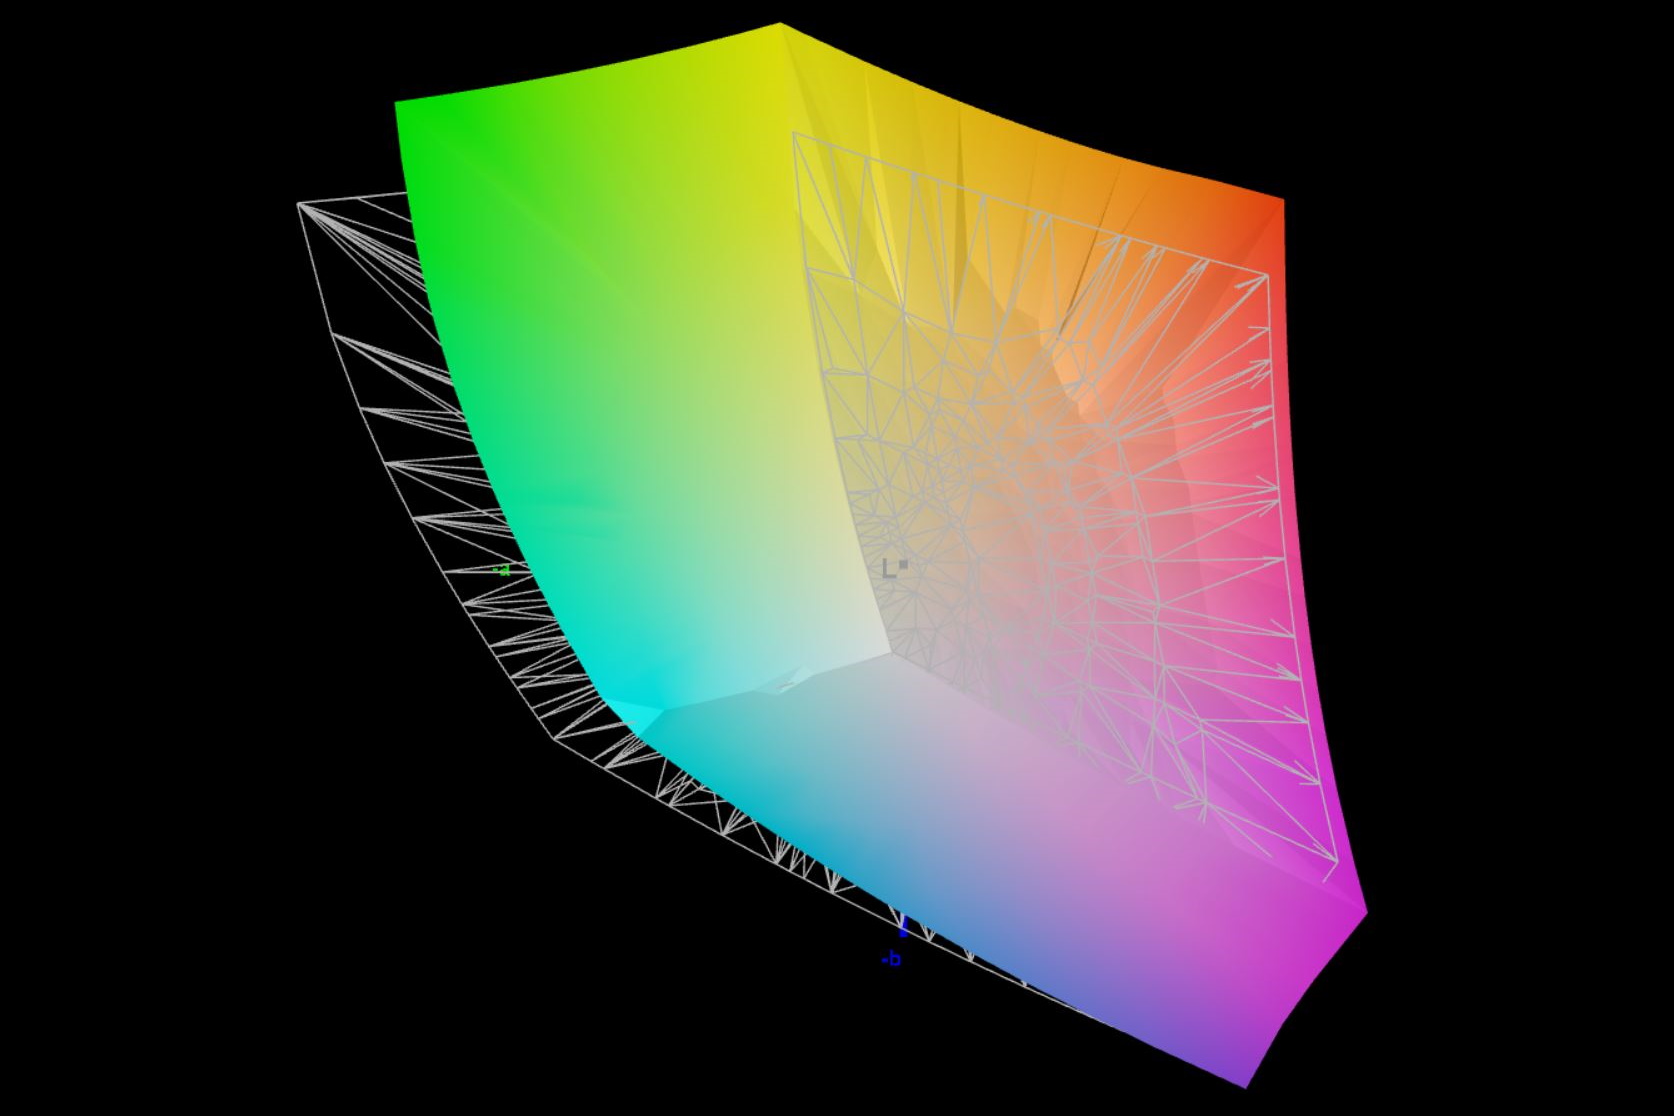
Wyświetlacz - 240 Hz QHD i DisplayP3
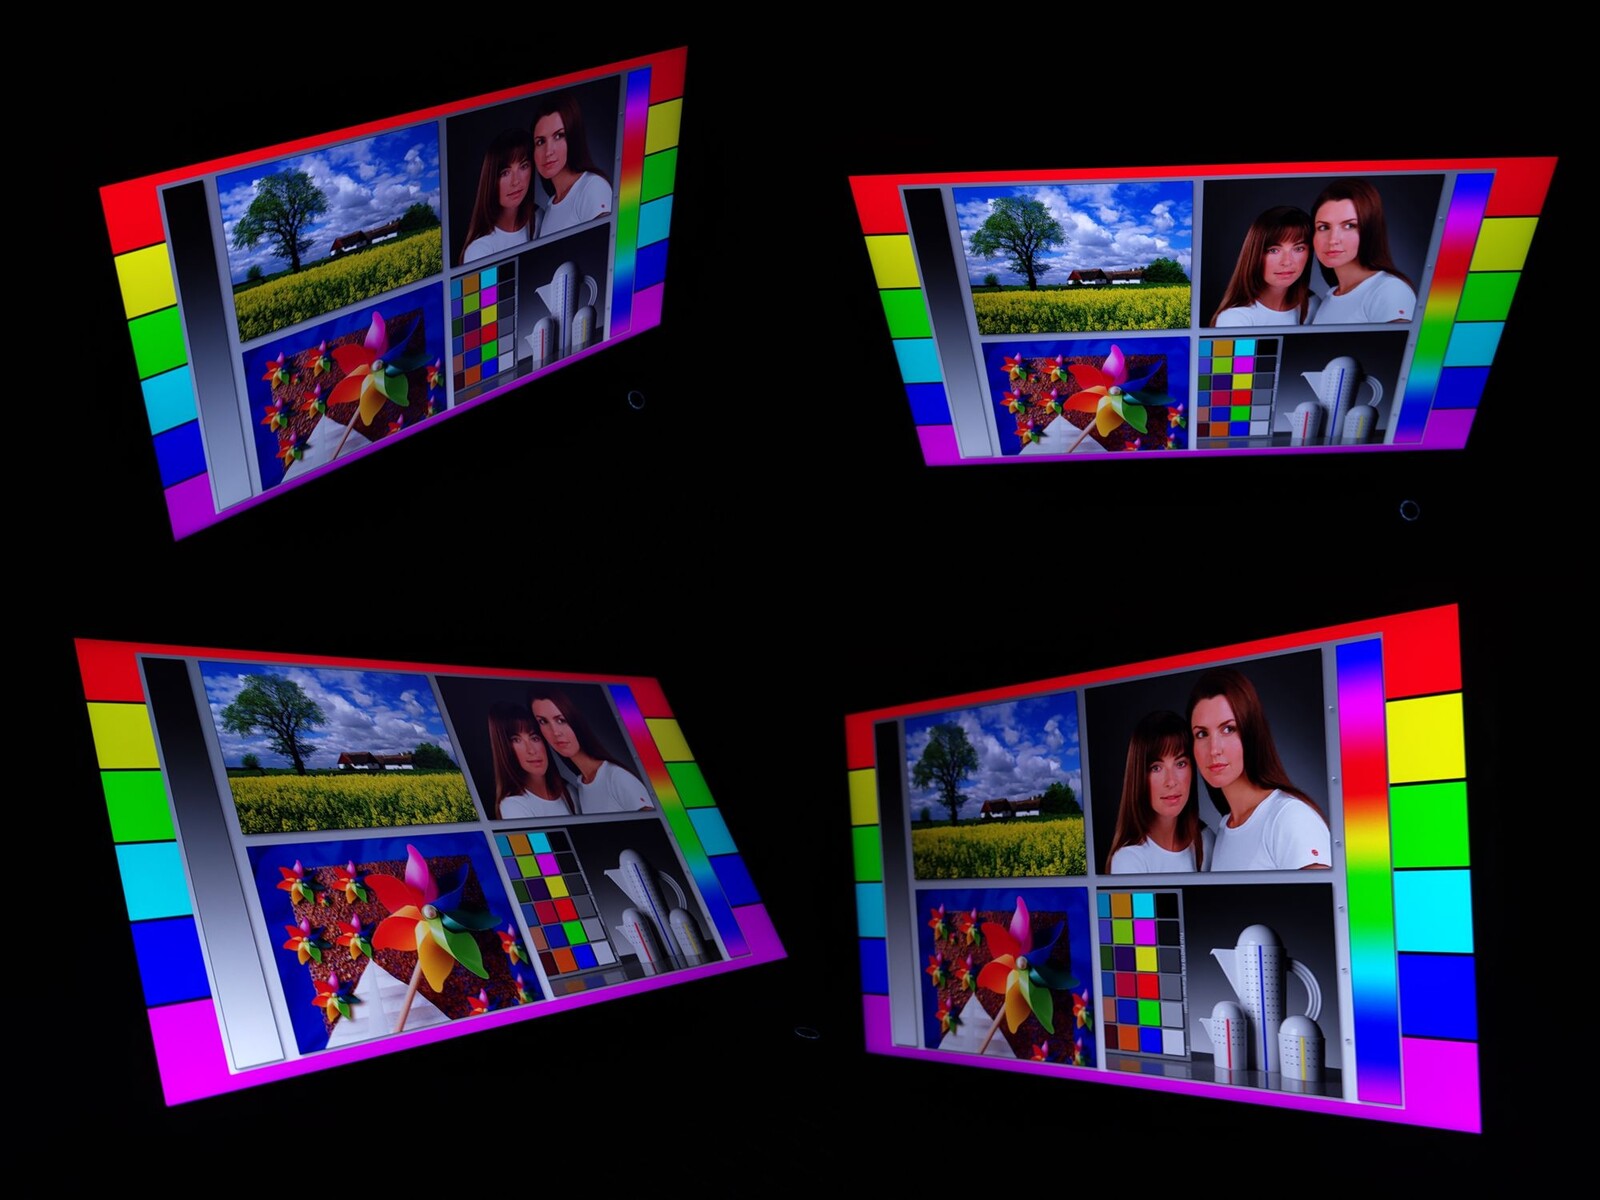
Chociaż nie jest to OLED, XMG Pro 15 posiada dobry wyświetlacz G-Sync, IPS. Przy 240 Hz i rozdzielczości 2560 × 1660 pikseli, przestrzenie kolorów sRGB i DisplayP3 są prawie całkowicie pokryte. Przy pełnej jasności jest jednak nieco zauważalne, że wyświetlacz 300 cd/m² jest podświetlony zauważalnie bardziej na środku ekranu niż na krawędziach. Jednak w przeciwieństwie do poprzednika, nie objawia się to wyraźnie widocznym krwawieniem ekranu.
W porównaniu do modelu poprzedniej generacji, czasy reakcji wyświetlacza są w dużej mierze niezmienione. Częstotliwość odświeżania została zwiększona ze 165 Hz do 240 Hz. Nie wykryliśmy żadnego migotania ekranu.
| |||||||||||||||||||||||||
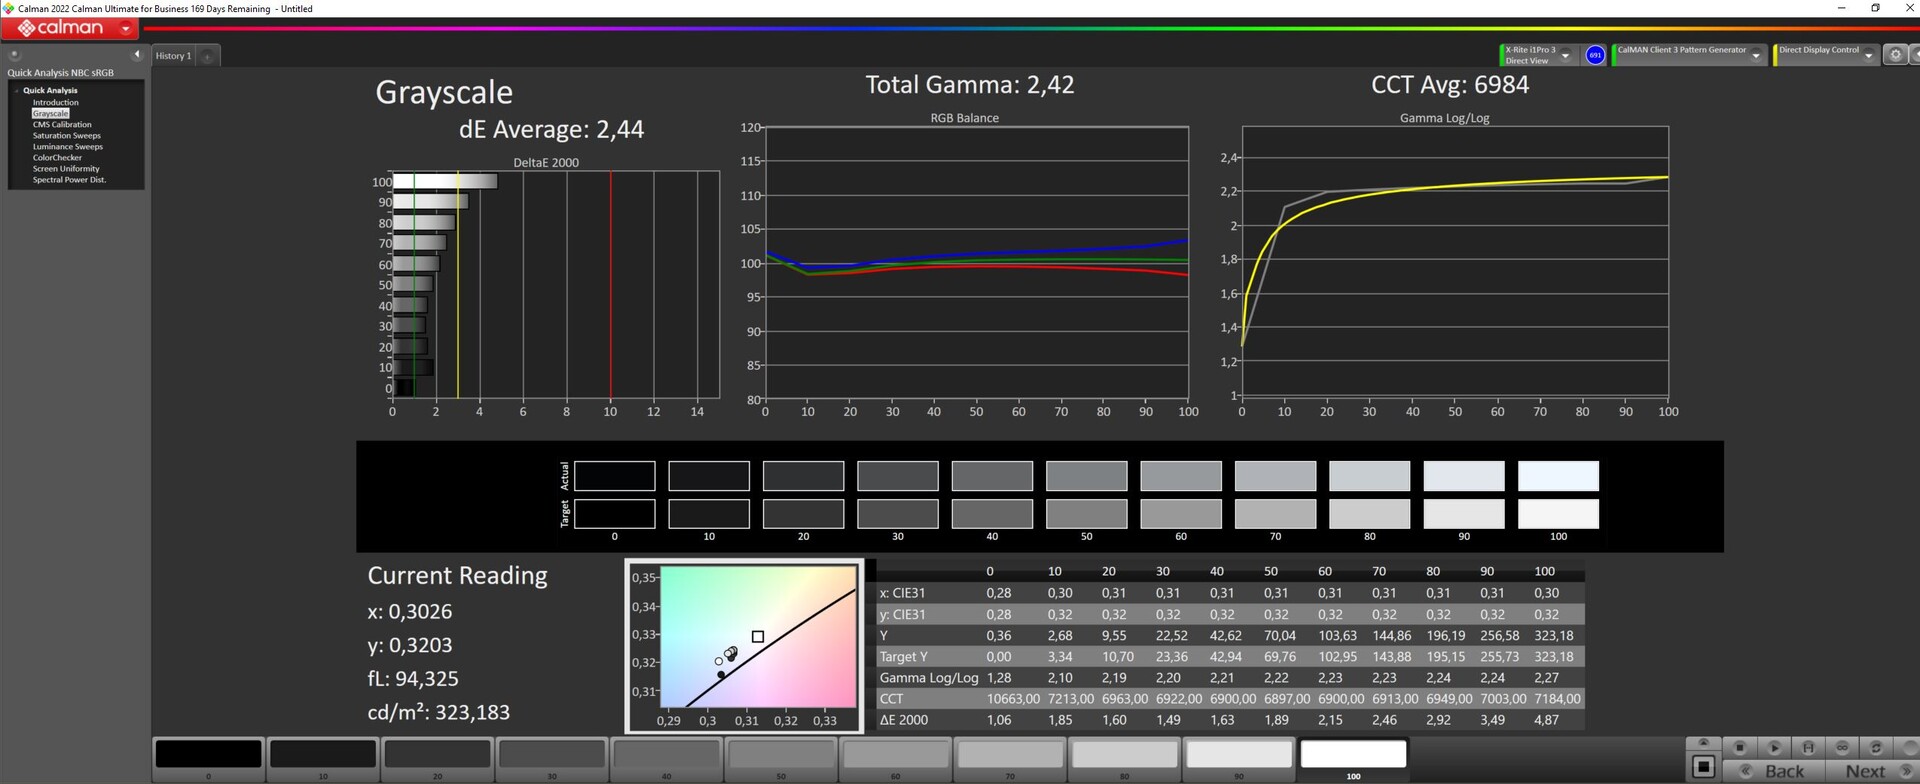
rozświetlenie: 85 %
kontrast: 894:1 (czerń: 0.36 cd/m²)
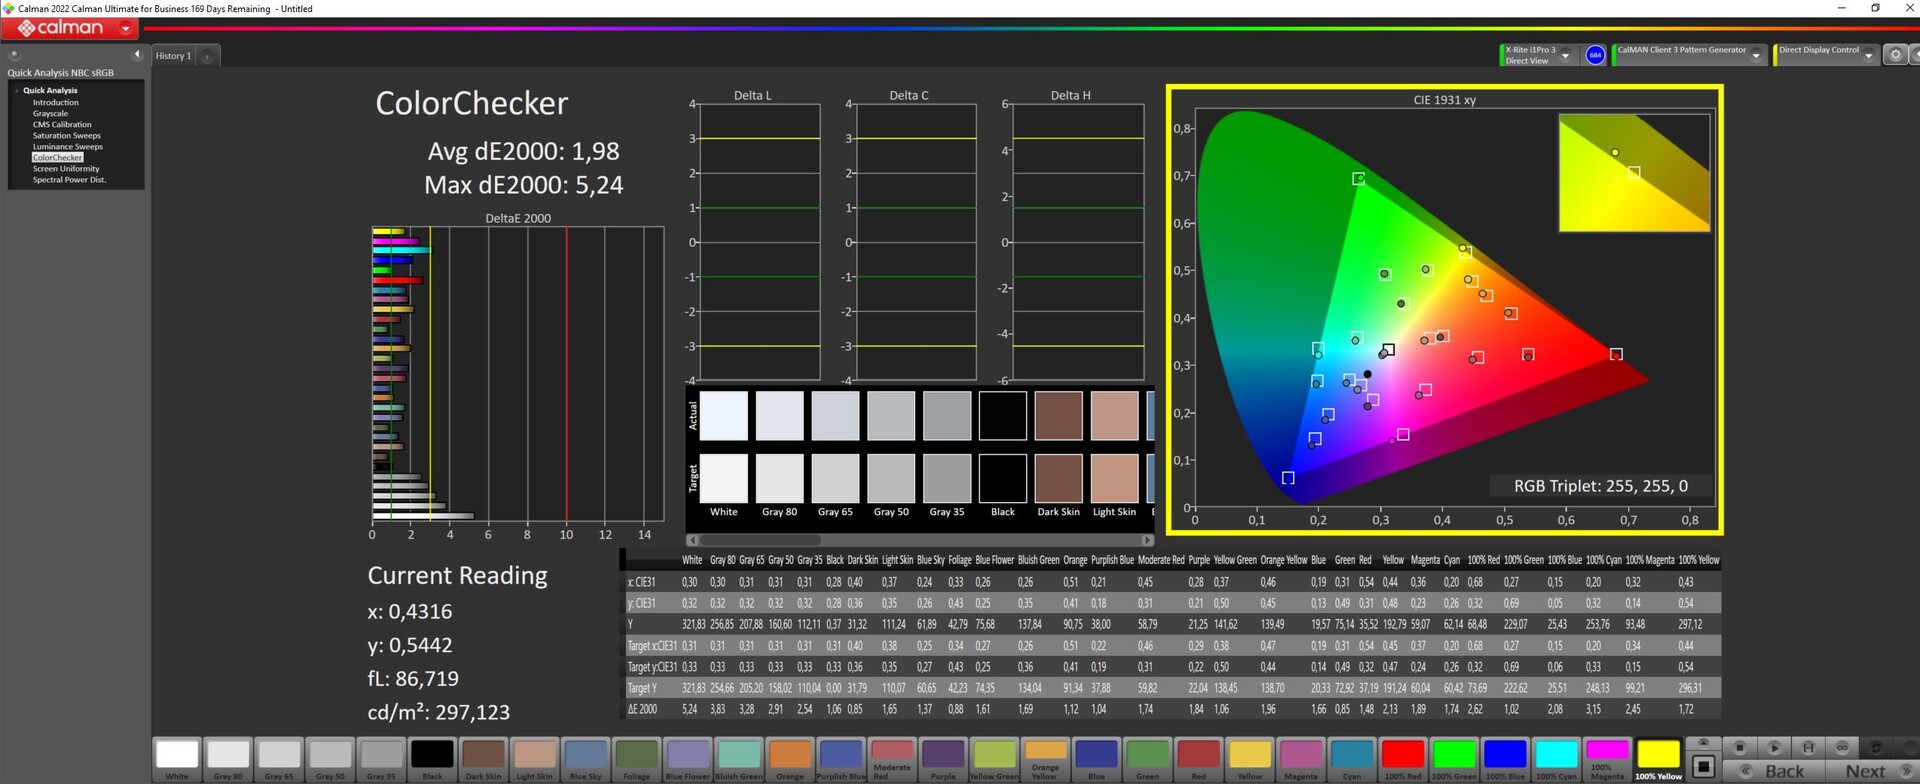
ΔE ColorChecker Calman: 1.98 | ∀{0.5-29.43 Ø4.72}
calibrated: 1.98
ΔE Greyscale Calman: 2.44 | ∀{0.09-98 Ø4.97}
85.4% AdobeRGB 1998 (Argyll 3D)
99.9% sRGB (Argyll 3D)
97.8% Display P3 (Argyll 3D)
Gamma: 2.42
CCT: 6984 K
| Schenker XMG Pro 15 (E23) BOE0AD1, IPS, 2560x1440, 15.6" | Schenker XMG Pro 15 (i7-12700H, RTX 3080 Ti) BOE09C2 (BOE CQ NE156QHM-NY1), IPS, 2560x1440, 15.6" | Dell G15 5530 AUO B156HAN, IPS, 1920x1080, 15.6" | Aorus 15X ASF BOE CQ NE156QHM-NZ1, IPS, 2560x1440, 15.6" | MSI Cyborg 15 A12VF AU Optronics B156HAN15.1, IPS, 1920x1080, 15.6" | Alienware x16 R1 BOE NE16NZ4, IPS, 2560x1600, 16" | |
|---|---|---|---|---|---|---|
| Display | 0% | -13% | -16% | -48% | 2% | |
| Display P3 Coverage (%) | 97.8 | 97.5 0% | 73.1 -25% | 69.3 -29% | 42.3 -57% | 99.2 1% |
| sRGB Coverage (%) | 99.9 | 99.9 0% | 98.4 -2% | 98.2 -2% | 62.6 -37% | 100 0% |
| AdobeRGB 1998 Coverage (%) | 85.4 | 85.2 0% | 74.4 -13% | 70.5 -17% | 43.7 -49% | 88.6 4% |
| Response Times | 7% | 60% | 7% | -52% | 29% | |
| Response Time Grey 50% / Grey 80% * (ms) | 14 ? | 13.2 ? 6% | 3.39 ? 76% | 12.4 ? 11% | 22 ? -57% | 5.1 ? 64% |
| Response Time Black / White * (ms) | 9.6 ? | 8.8 ? 8% | 5.35 ? 44% | 9.4 ? 2% | 14 ? -46% | 10.3 ? -7% |
| PWM Frequency (Hz) | 21620 ? | |||||
| Screen | -33% | -25% | 24% | -22% | 14% | |
| Brightness middle (cd/m²) | 322 | 317 -2% | 320 -1% | 316 -2% | 247 -23% | 302.2 -6% |
| Brightness (cd/m²) | 301 | 294 -2% | 316 5% | 301 0% | 234 -22% | 285 -5% |
| Brightness Distribution (%) | 85 | 83 -2% | 94 11% | 90 6% | 89 5% | 89 5% |
| Black Level * (cd/m²) | 0.36 | 0.32 11% | 0.21 42% | 0.28 22% | 0.25 31% | 0.26 28% |
| Contrast (:1) | 894 | 991 11% | 1524 70% | 1129 26% | 988 11% | 1162 30% |
| Colorchecker dE 2000 * | 1.98 | 4.22 -113% | 4.55 -130% | 1.54 22% | 3.78 -91% | 1.63 18% |
| Colorchecker dE 2000 max. * | 5.24 | 5.97 -14% | 9.83 -88% | 2.46 53% | 6.42 -23% | 4.13 21% |
| Colorchecker dE 2000 calibrated * | 1.98 | 4.09 -107% | 1.51 24% | 1.21 39% | 3.94 -99% | 1.17 41% |
| Greyscale dE 2000 * | 2.44 | 4.41 -81% | 6.2 -154% | 1.3 47% | 2.16 11% | 2.5 -2% |
| Gamma | 2.42 91% | 2.29 96% | 2.07 106% | 2.307 95% | 2.33 94% | 2.23 99% |
| CCT | 6984 93% | 6733 97% | 6479 100% | 6456 101% | 6906 94% | 6590 99% |
| Całkowita średnia (program / ustawienia) | -9% /
-20% | 7% /
-10% | 5% /
13% | -41% /
-32% | 15% /
14% |
* ... im mniej tym lepiej
Po wyjęciu z pudełka odchylenia kolorów są więcej niż odpowiednio małe dla laptopa do gier Z kolorami i skalami szarości w Calman ColorChecker, odpowiednio ΔΕ 1,98 i ΔΕ 2,44, XMG Pro 15 wyraźnie mieści się w docelowym zakresie ΔΕ < 3. Nasz własny profil ICC (do pobrania w polu informacyjnym) powinien być w stanie nieco zmniejszyć nieco nadmiernie podkreślony niebieski i znacznie poprawić zarówno skale szarości, jak i reprodukcję kolorów. Wraz z prawie całkowicie pokrytą przestrzenią kolorów DisplayP3, mamy do czynienia z wyświetlaczem, który wydaje się być odpowiedni do profesjonalnej edycji wideo.
Wyświetl czasy reakcji
| ↔ Czas reakcji od czerni do bieli | ||
|---|---|---|
| 9.6 ms ... wzrost ↗ i spadek ↘ łącznie | ↗ 4.2 ms wzrost | 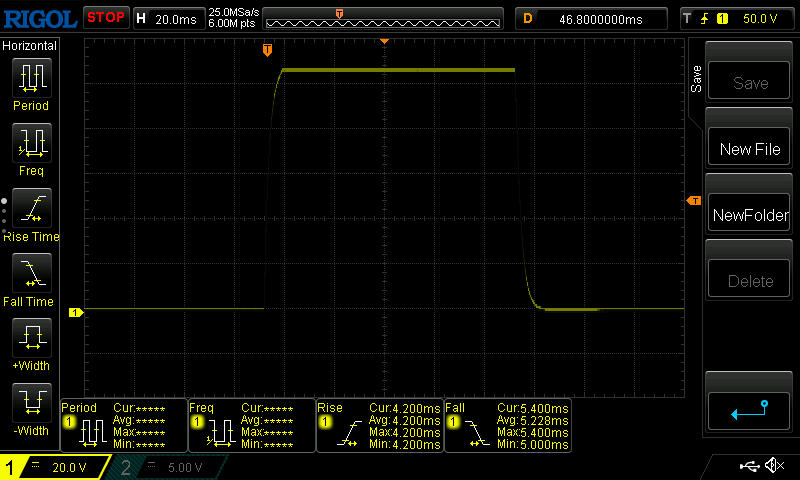 |
| ↘ 5.4 ms upadek | ||
| W naszych testach ekran wykazuje szybki czas reakcji i powinien nadawać się do gier. Dla porównania, wszystkie testowane urządzenia wahają się od 0.1 (minimum) do 240 (maksimum) ms. » 26 % wszystkich urządzeń jest lepszych. Oznacza to, że zmierzony czas reakcji jest lepszy od średniej wszystkich testowanych urządzeń (19.8 ms). | ||
| ↔ Czas reakcji 50% szarości do 80% szarości | ||
| 14 ms ... wzrost ↗ i spadek ↘ łącznie | ↗ 6.6 ms wzrost | 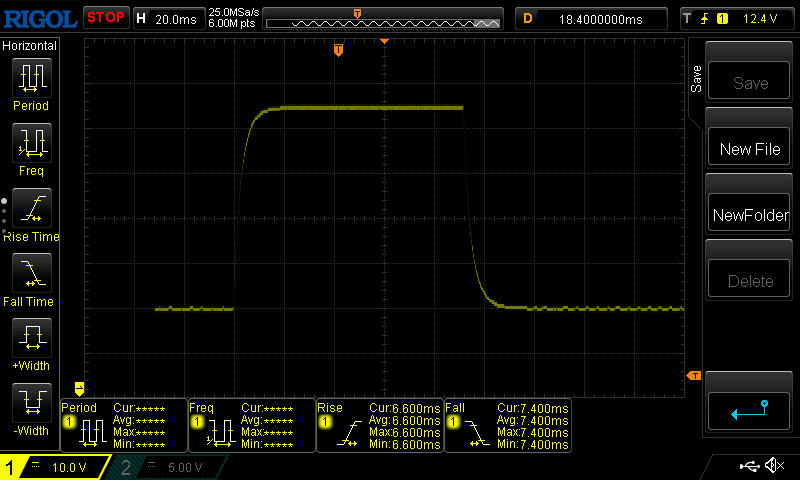 |
| ↘ 7.4 ms upadek | ||
| W naszych testach ekran wykazuje dobry współczynnik reakcji, ale może być zbyt wolny dla graczy rywalizujących ze sobą. Dla porównania, wszystkie testowane urządzenia wahają się od 0.165 (minimum) do 636 (maksimum) ms. » 28 % wszystkich urządzeń jest lepszych. Oznacza to, że zmierzony czas reakcji jest lepszy od średniej wszystkich testowanych urządzeń (31 ms). | ||
Migotanie ekranu / PWM (modulacja szerokości impulsu)
| Migotanie ekranu/nie wykryto PWM |  | ||
Dla porównania: 52 % wszystkich testowanych urządzeń nie używa PWM do przyciemniania wyświetlacza. Jeśli wykryto PWM, zmierzono średnio 7763 (minimum: 5 - maksimum: 343500) Hz. | |||
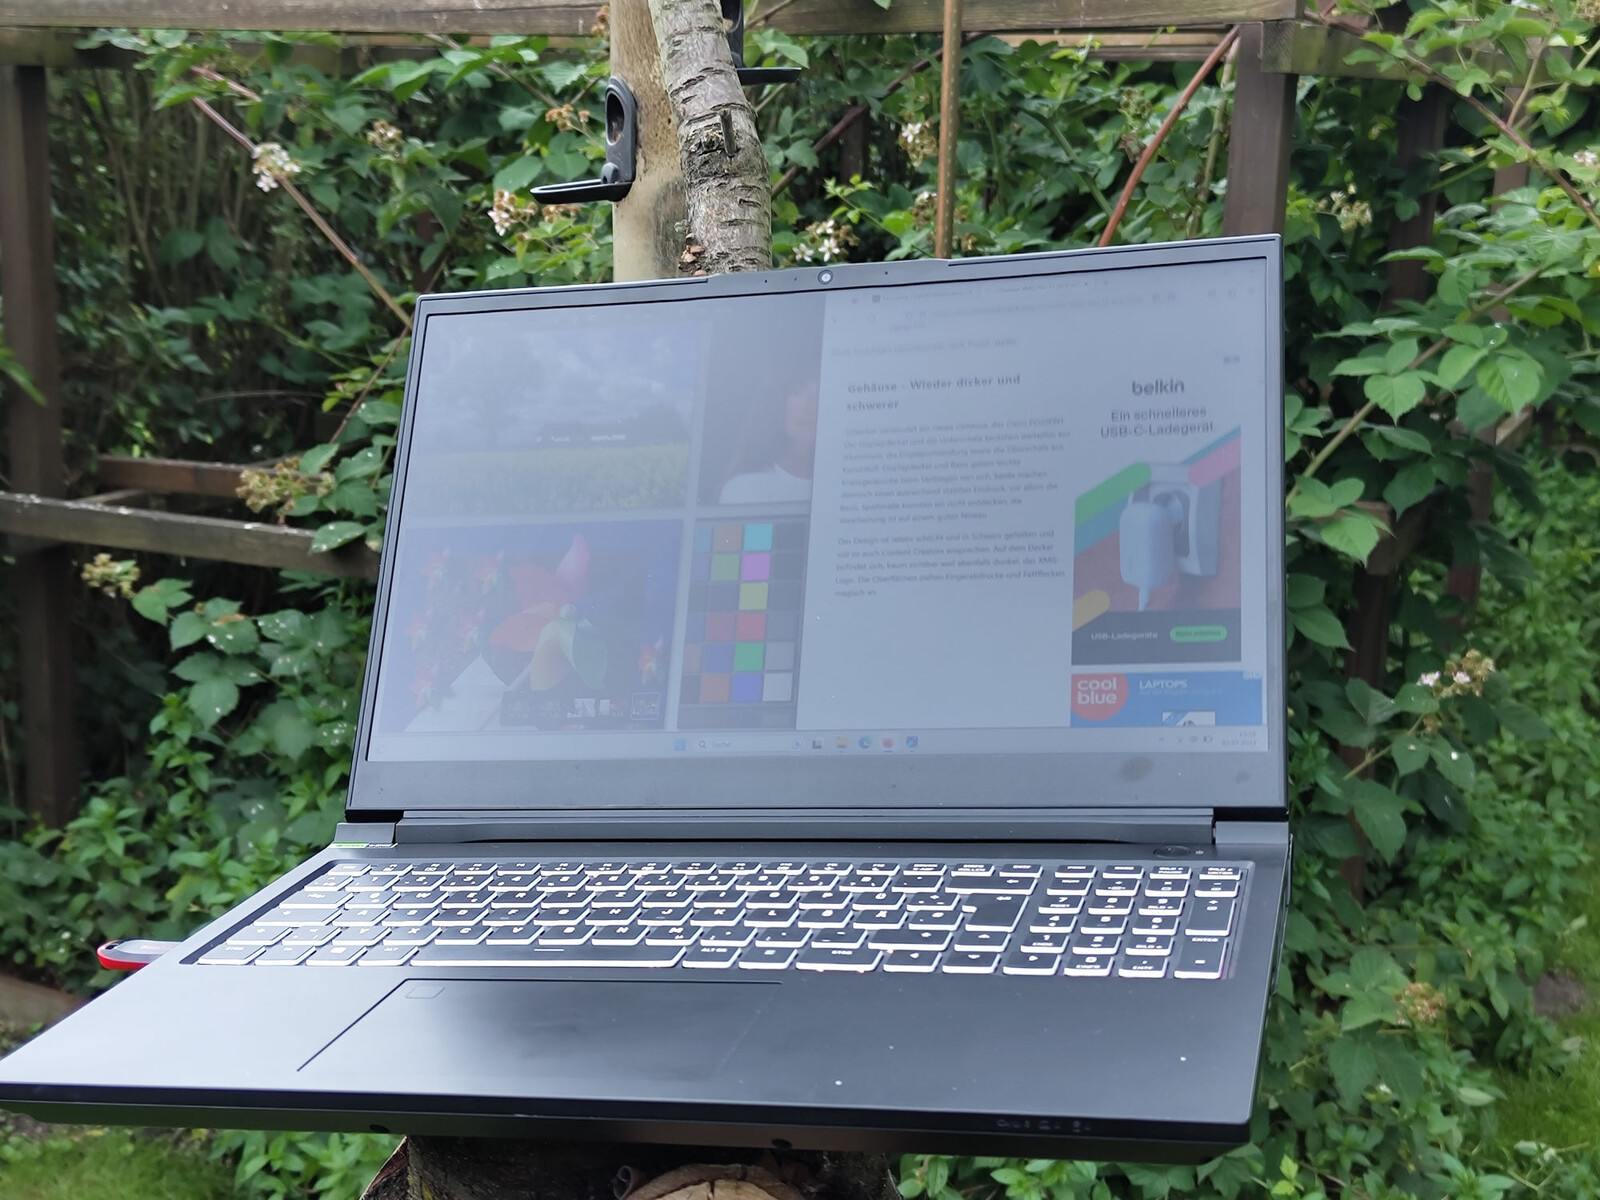
Możliwe jest również korzystanie z 15-calowego laptopa na zewnątrz, dzięki matowemu i stosunkowo jasnemu wyświetlaczowi. W zależności od lokalizacji, należy wybrać odpowiedni kąt widzenia, aby doświadczyć jak najmniejszej ilości odbić. Na szczęście panel IPS posiada bardzo stabilne kąty widzenia.
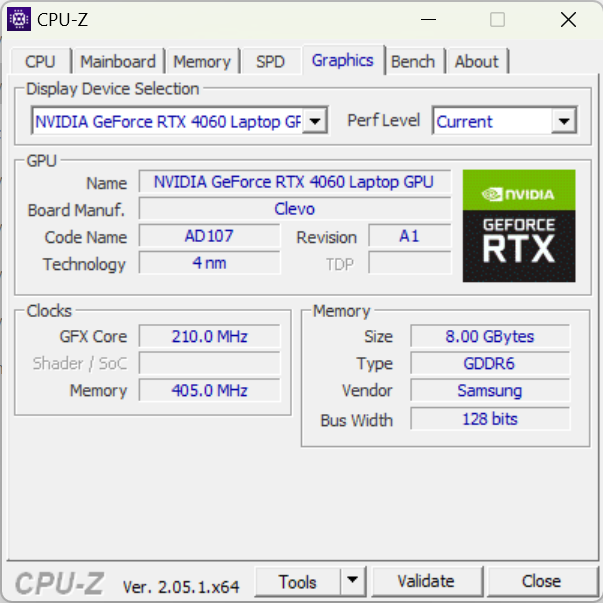
Wydajność - procesor Intel Core i9 i karta graficzna Nvidia GeForce RTX 4060 mają moc obliczeniową
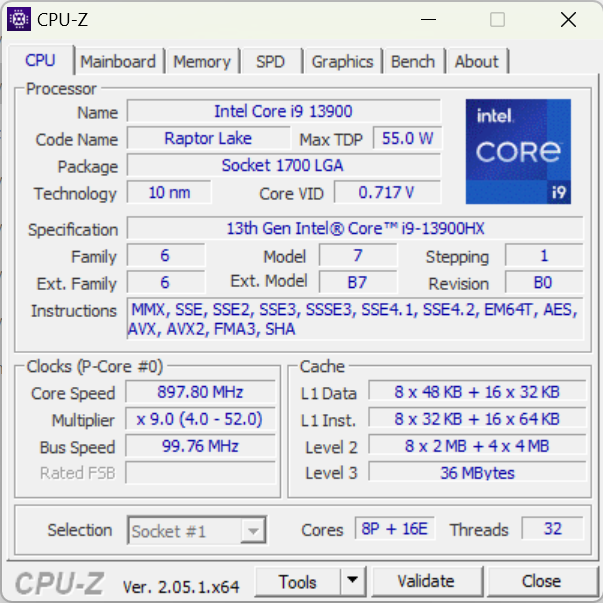
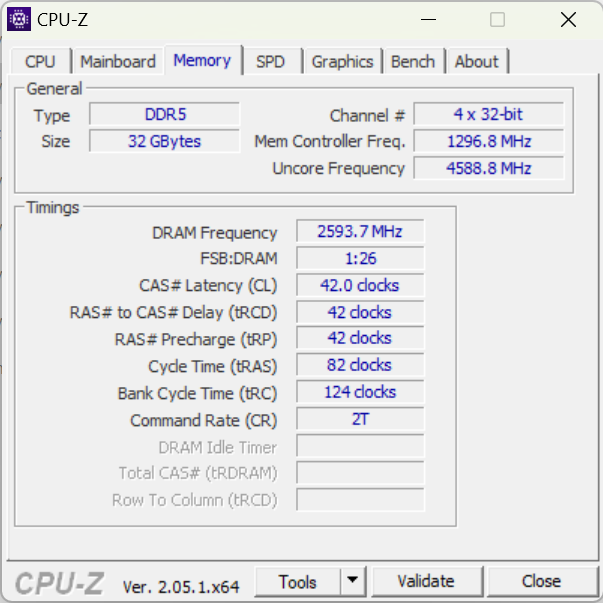
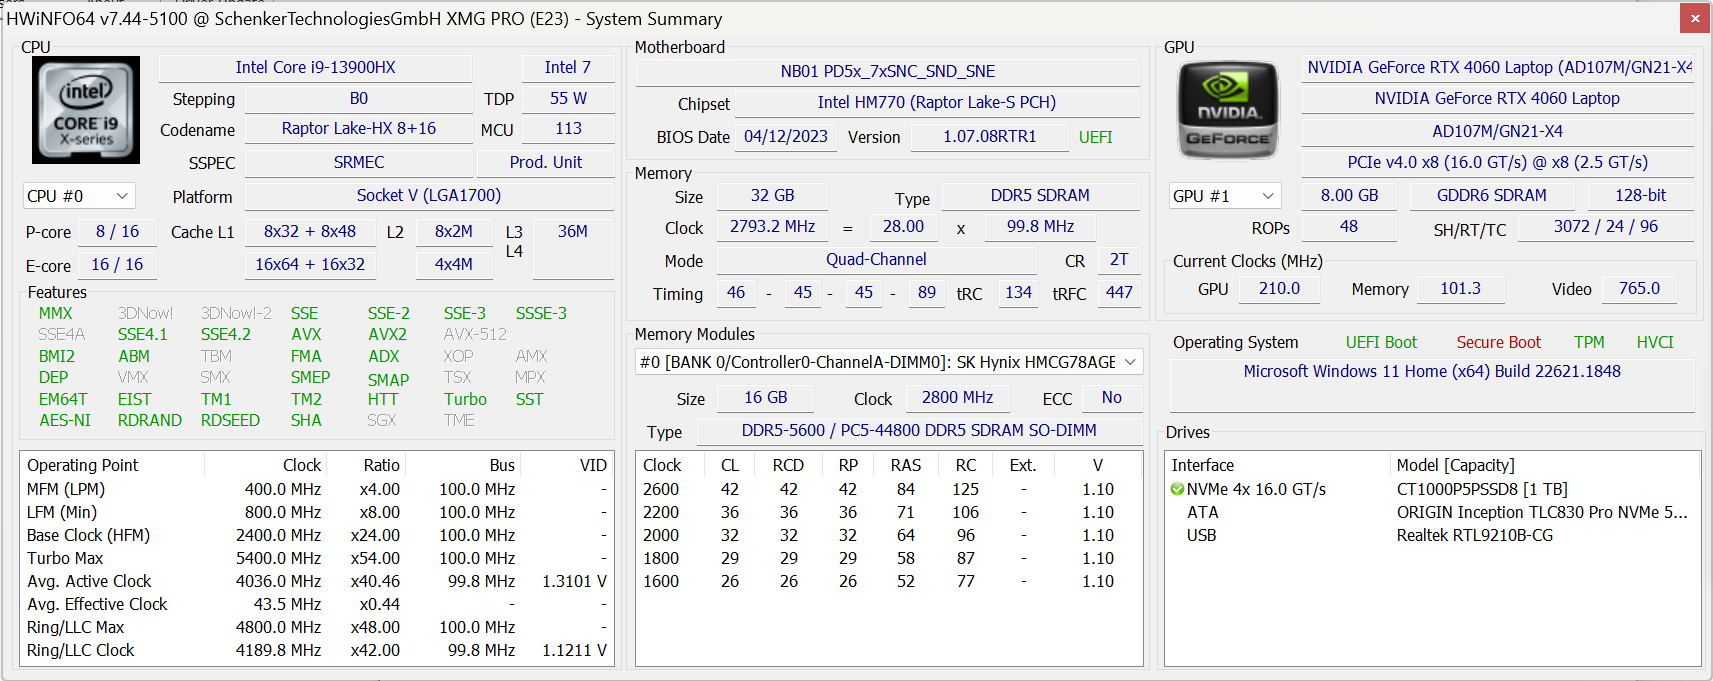
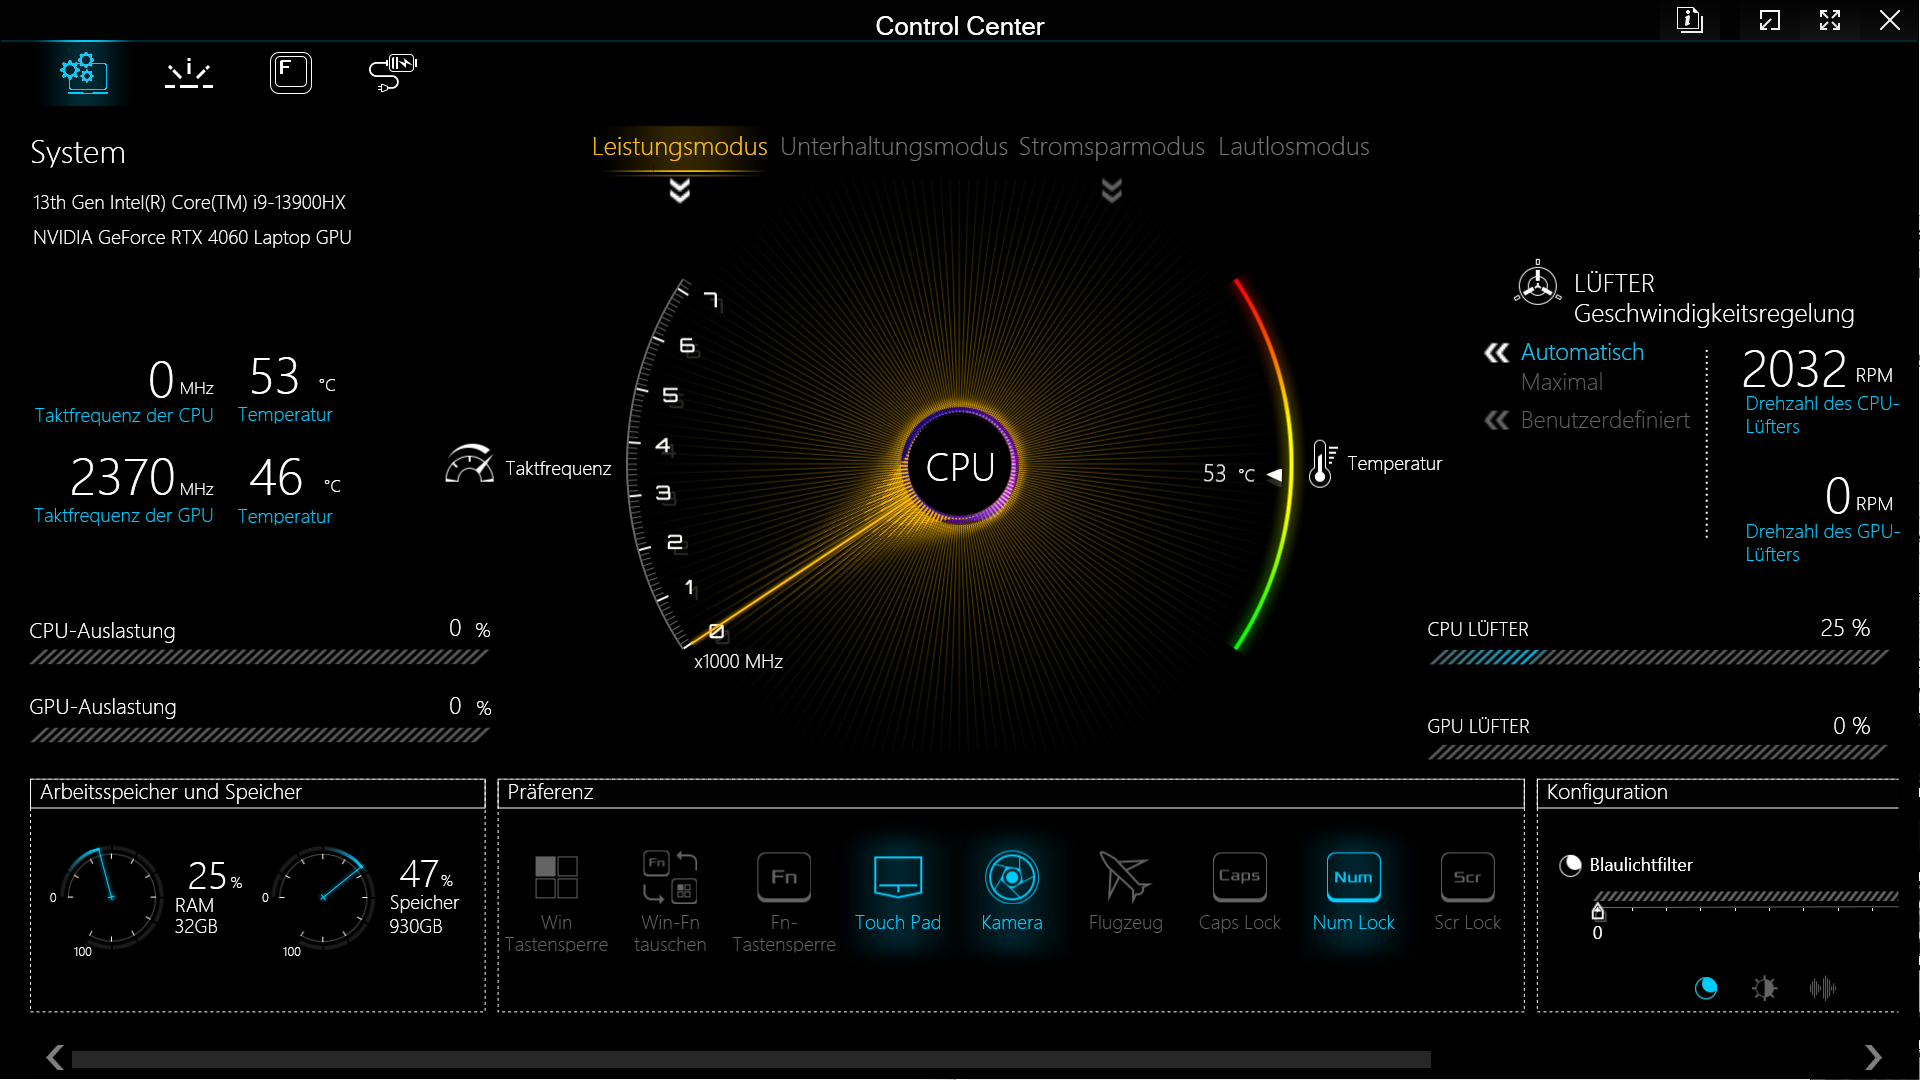
W naszym urządzeniu testowym, potężnyIntel Core i9-13900HX iNvidia GeForce RTX 4060 odpowiadają za moc wystarczającą do obsługi gier i większości kreatywnych zadań. Laptop może być skonfigurowany z 8 do 64 GB pamięci RAM DDR5. Nasz egzemplarz testowy został wyposażony w 32 GB. Typowe dla Schenkera, wiele różnych opcji można wybrać w ramach procesu zamawiania Bestware. Oprócz RTX 4060 można również skonfigurować RTX 4070. Jeśli chodzi o dyski SSD i opcje WiFi, dostępny jest również szeroki wybór.
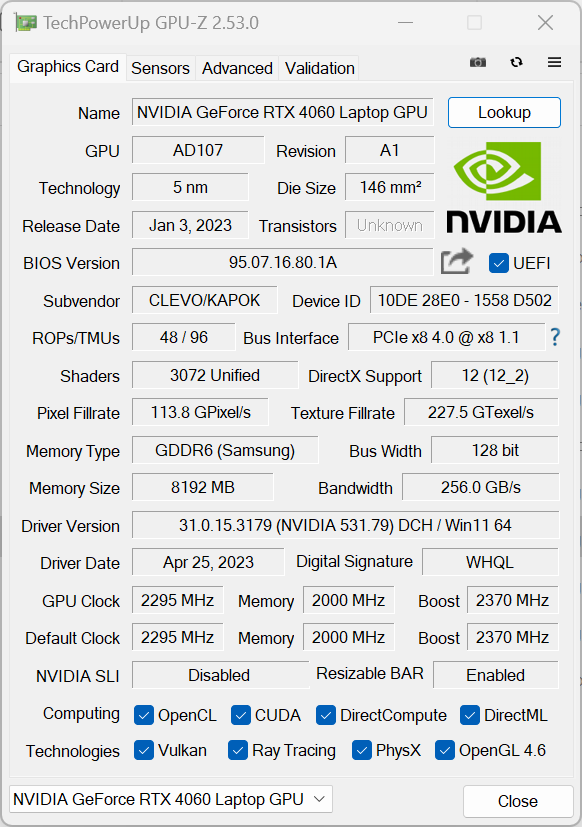
Warunki testowe
Różne poziomy wydajności - tryb wydajności, tryb rozrywki, tryb oszczędzania energii i tryb cichy, można wybrać za pośrednictwem Centrum sterowania. Dodatkowo w trybie wydajności dostępne są opcje lekkiego podkręcenia GPU i pamięci graficznej. Intel Core i9 jest zasilany maksymalnie 135 W, a GeForce RTX 4060 140 W, jeśli 25 W zostanie przełączone z procesora na kartę graficzną. W poszczególnych trybach oszczędzania energii obowiązują następujące wartości docelowe:
| Tryb: | Tryb wydajności | Tryb rozrywki | Tryb oszczędzania energii | Tryb cichy |
|---|---|---|---|---|
| CPU PL1 | 135 W | 65 W | 55 W | 45 W |
| CPU PL2 | 162 W | 115 W | 115 W | 115 W |
| Docelowa temperatura CPU | 93 °C | 87 °C | 85 °C | 85 °C |
| GPU TGP + Dynamic Boost | 115 W + 25 W | 115 W + 0 W | 115 W + 0 W | 115 W + 0 W |
| Temperatura docelowa GPU | 87 °C | 87 °C | 87 °C | 87 °C |
Dzienniki, które skompilowaliśmy, pokazują, że laptop do gier może wytrzymać bardzo wysoki wzrost wydajności przez maksymalnie 90 sekund zarówno w trybie rozrywki, jak i wydajności. Schenker sugeruje wykonywanie codziennych zadań w trybie rozrywki. My jednak zdecydowaliśmy się wykonać wszystkie benchmarki w trybie wydajności.
Procesor
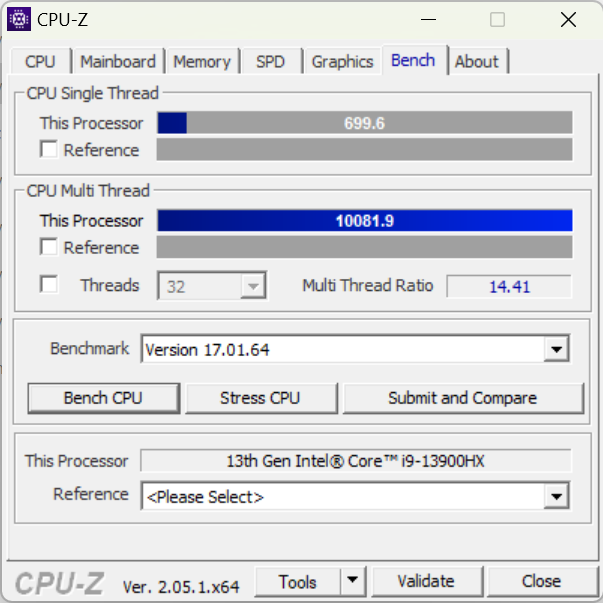
ProcesorIntel Core i9-13900HX to najpotężniejszy procesor do laptopów w obecnej generacji Raptor Lake. Ten procesor jest w stanie jednocześnie przetwarzać 32 wątki rozłożone na 8 rdzeni P i 16 rdzeni E. Dzięki wysokim wartościom PL1 i PL2 i9 naprawdę pokazuje swój potencjał, a XMG Pro 15 przewyższa wszystkie inne urządzenia w testach porównawczych procesora.
Cinebench R15 Multi Continuous Test
Cinebench R23: Multi Core | Single Core
Cinebench R20: CPU (Multi Core) | CPU (Single Core)
Cinebench R15: CPU Multi 64Bit | CPU Single 64Bit
Blender: v2.79 BMW27 CPU
7-Zip 18.03: 7z b 4 | 7z b 4 -mmt1
Geekbench 5.5: Multi-Core | Single-Core
HWBOT x265 Benchmark v2.2: 4k Preset
LibreOffice : 20 Documents To PDF
R Benchmark 2.5: Overall mean
| CPU Performance rating | |
| Przeciętny Intel Core i9-13900HX | |
| Średnia w klasie Gaming | |
| Schenker XMG Pro 15 (E23) | |
| Alienware x16 R1 -1! | |
| Aorus 15X ASF | |
| Dell G15 5530 | |
| Asus ZenBook Pro 14 Duo UX8402VV-P1021W | |
| Schenker XMG Pro 15 (i7-12700H, RTX 3080 Ti) | |
| MSI Cyborg 15 A12VF | |
| Asus TUF A15 FA507 | |
| Cinebench R23 / Multi Core | |
| Przeciętny Intel Core i9-13900HX (24270 - 32623, n=23) | |
| Średnia w klasie Gaming (10488 - 40970, n=110, ostatnie 2 lata) | |
| Schenker XMG Pro 15 (E23) | |
| Dell G15 5530 | |
| Aorus 15X ASF | |
| Alienware x16 R1 | |
| Asus ZenBook Pro 14 Duo UX8402VV-P1021W | |
| Schenker XMG Pro 15 (i7-12700H, RTX 3080 Ti) | |
| MSI Cyborg 15 A12VF | |
| Asus TUF A15 FA507 | |
| Cinebench R23 / Single Core | |
| Przeciętny Intel Core i9-13900HX (1867 - 2105, n=20) | |
| Średnia w klasie Gaming (1166 - 2356, n=110, ostatnie 2 lata) | |
| Asus ZenBook Pro 14 Duo UX8402VV-P1021W | |
| Alienware x16 R1 | |
| Aorus 15X ASF | |
| Schenker XMG Pro 15 (E23) | |
| Dell G15 5530 | |
| Schenker XMG Pro 15 (i7-12700H, RTX 3080 Ti) | |
| MSI Cyborg 15 A12VF | |
| Asus TUF A15 FA507 | |
| Cinebench R20 / CPU (Multi Core) | |
| Przeciętny Intel Core i9-13900HX (9152 - 12541, n=21) | |
| Średnia w klasie Gaming (4029 - 16108, n=109, ostatnie 2 lata) | |
| Schenker XMG Pro 15 (E23) | |
| Dell G15 5530 | |
| Aorus 15X ASF | |
| Alienware x16 R1 | |
| Asus ZenBook Pro 14 Duo UX8402VV-P1021W | |
| Schenker XMG Pro 15 (i7-12700H, RTX 3080 Ti) | |
| MSI Cyborg 15 A12VF | |
| Asus TUF A15 FA507 | |
| Cinebench R20 / CPU (Single Core) | |
| Przeciętny Intel Core i9-13900HX (722 - 810, n=21) | |
| Średnia w klasie Gaming (442 - 895, n=109, ostatnie 2 lata) | |
| Asus ZenBook Pro 14 Duo UX8402VV-P1021W | |
| Alienware x16 R1 | |
| Aorus 15X ASF | |
| Schenker XMG Pro 15 (E23) | |
| Dell G15 5530 | |
| Schenker XMG Pro 15 (i7-12700H, RTX 3080 Ti) | |
| MSI Cyborg 15 A12VF | |
| Asus TUF A15 FA507 | |
| Cinebench R15 / CPU Multi 64Bit | |
| Przeciętny Intel Core i9-13900HX (3913 - 4970, n=22) | |
| Średnia w klasie Gaming (1578 - 6271, n=108, ostatnie 2 lata) | |
| Schenker XMG Pro 15 (E23) | |
| Aorus 15X ASF | |
| Dell G15 5530 | |
| Alienware x16 R1 | |
| Asus ZenBook Pro 14 Duo UX8402VV-P1021W | |
| Schenker XMG Pro 15 (i7-12700H, RTX 3080 Ti) | |
| Asus TUF A15 FA507 | |
| MSI Cyborg 15 A12VF | |
| Cinebench R15 / CPU Single 64Bit | |
| Średnia w klasie Gaming (188.8 - 343, n=109, ostatnie 2 lata) | |
| Przeciętny Intel Core i9-13900HX (247 - 304, n=22) | |
| Asus ZenBook Pro 14 Duo UX8402VV-P1021W | |
| Alienware x16 R1 | |
| Aorus 15X ASF | |
| Dell G15 5530 | |
| Schenker XMG Pro 15 (i7-12700H, RTX 3080 Ti) | |
| Asus TUF A15 FA507 | |
| Schenker XMG Pro 15 (E23) | |
| MSI Cyborg 15 A12VF | |
| Blender / v2.79 BMW27 CPU | |
| MSI Cyborg 15 A12VF | |
| Asus TUF A15 FA507 | |
| Schenker XMG Pro 15 (i7-12700H, RTX 3080 Ti) | |
| Asus ZenBook Pro 14 Duo UX8402VV-P1021W | |
| Aorus 15X ASF | |
| Dell G15 5530 | |
| Średnia w klasie Gaming (80 - 330, n=107, ostatnie 2 lata) | |
| Schenker XMG Pro 15 (E23) | |
| Przeciętny Intel Core i9-13900HX (101 - 153, n=22) | |
| 7-Zip 18.03 / 7z b 4 | |
| Przeciętny Intel Core i9-13900HX (90675 - 127283, n=21) | |
| Schenker XMG Pro 15 (E23) | |
| Średnia w klasie Gaming (33491 - 148086, n=108, ostatnie 2 lata) | |
| Dell G15 5530 | |
| Alienware x16 R1 | |
| Aorus 15X ASF | |
| Asus ZenBook Pro 14 Duo UX8402VV-P1021W | |
| Schenker XMG Pro 15 (i7-12700H, RTX 3080 Ti) | |
| Asus TUF A15 FA507 | |
| MSI Cyborg 15 A12VF | |
| 7-Zip 18.03 / 7z b 4 -mmt1 | |
| Przeciętny Intel Core i9-13900HX (6340 - 7177, n=21) | |
| Aorus 15X ASF | |
| Średnia w klasie Gaming (4199 - 7436, n=108, ostatnie 2 lata) | |
| Schenker XMG Pro 15 (E23) | |
| Asus ZenBook Pro 14 Duo UX8402VV-P1021W | |
| Alienware x16 R1 | |
| Dell G15 5530 | |
| Asus TUF A15 FA507 | |
| Schenker XMG Pro 15 (i7-12700H, RTX 3080 Ti) | |
| MSI Cyborg 15 A12VF | |
| Geekbench 5.5 / Multi-Core | |
| Przeciętny Intel Core i9-13900HX (17614 - 21075, n=22) | |
| Schenker XMG Pro 15 (E23) | |
| Średnia w klasie Gaming (6460 - 27010, n=108, ostatnie 2 lata) | |
| Aorus 15X ASF | |
| Alienware x16 R1 | |
| Dell G15 5530 | |
| Asus ZenBook Pro 14 Duo UX8402VV-P1021W | |
| Schenker XMG Pro 15 (i7-12700H, RTX 3080 Ti) | |
| MSI Cyborg 15 A12VF | |
| Asus TUF A15 FA507 | |
| Geekbench 5.5 / Single-Core | |
| Średnia w klasie Gaming (986 - 2474, n=108, ostatnie 2 lata) | |
| Przeciętny Intel Core i9-13900HX (1345 - 2093, n=22) | |
| Alienware x16 R1 | |
| Asus ZenBook Pro 14 Duo UX8402VV-P1021W | |
| Aorus 15X ASF | |
| Dell G15 5530 | |
| Schenker XMG Pro 15 (E23) | |
| MSI Cyborg 15 A12VF | |
| Schenker XMG Pro 15 (i7-12700H, RTX 3080 Ti) | |
| Asus TUF A15 FA507 | |
| HWBOT x265 Benchmark v2.2 / 4k Preset | |
| Przeciętny Intel Core i9-13900HX (23.5 - 34.4, n=22) | |
| Średnia w klasie Gaming (11.5 - 44.3, n=108, ostatnie 2 lata) | |
| Schenker XMG Pro 15 (E23) | |
| Dell G15 5530 | |
| Alienware x16 R1 | |
| Aorus 15X ASF | |
| Schenker XMG Pro 15 (i7-12700H, RTX 3080 Ti) | |
| Asus ZenBook Pro 14 Duo UX8402VV-P1021W | |
| Asus TUF A15 FA507 | |
| MSI Cyborg 15 A12VF | |
| MSI Cyborg 15 A12VF | |
| LibreOffice / 20 Documents To PDF | |
| Schenker XMG Pro 15 (E23) | |
| Asus TUF A15 FA507 | |
| Średnia w klasie Gaming (19 - 88.8, n=108, ostatnie 2 lata) | |
| Schenker XMG Pro 15 (i7-12700H, RTX 3080 Ti) | |
| Dell G15 5530 | |
| Alienware x16 R1 | |
| Aorus 15X ASF | |
| Przeciętny Intel Core i9-13900HX (32.8 - 51.1, n=21) | |
| Asus ZenBook Pro 14 Duo UX8402VV-P1021W | |
| MSI Cyborg 15 A12VF | |
| R Benchmark 2.5 / Overall mean | |
| Asus TUF A15 FA507 | |
| MSI Cyborg 15 A12VF | |
| Schenker XMG Pro 15 (E23) | |
| Schenker XMG Pro 15 (i7-12700H, RTX 3080 Ti) | |
| Aorus 15X ASF | |
| Asus ZenBook Pro 14 Duo UX8402VV-P1021W | |
| Średnia w klasie Gaming (0.3439 - 0.759, n=109, ostatnie 2 lata) | |
| Alienware x16 R1 | |
| Dell G15 5530 | |
| Przeciętny Intel Core i9-13900HX (0.375 - 0.4564, n=22) | |
* ... im mniej tym lepiej
AIDA64: FP32 Ray-Trace | FPU Julia | CPU SHA3 | CPU Queen | FPU SinJulia | FPU Mandel | CPU AES | CPU ZLib | FP64 Ray-Trace | CPU PhotoWorxx
| Performance rating | |
| Średnia w klasie Gaming | |
| Przeciętny Intel Core i9-13900HX | |
| Schenker XMG Pro 15 (E23) | |
| Alienware x16 R1 | |
| Aorus 15X ASF | |
| Dell G15 5530 | |
| Asus TUF A15 FA507 | |
| Asus ZenBook Pro 14 Duo UX8402VV-P1021W | |
| MSI Cyborg 15 A12VF | |
| Schenker XMG Pro 15 (i7-12700H, RTX 3080 Ti) | |
| AIDA64 / FP32 Ray-Trace | |
| Średnia w klasie Gaming (10227 - 85542, n=107, ostatnie 2 lata) | |
| Przeciętny Intel Core i9-13900HX (17589 - 27615, n=22) | |
| Alienware x16 R1 | |
| Dell G15 5530 | |
| Schenker XMG Pro 15 (E23) | |
| Aorus 15X ASF | |
| Asus TUF A15 FA507 | |
| Asus ZenBook Pro 14 Duo UX8402VV-P1021W | |
| MSI Cyborg 15 A12VF | |
| Schenker XMG Pro 15 (i7-12700H, RTX 3080 Ti) | |
| AIDA64 / FPU Julia | |
| Średnia w klasie Gaming (51376 - 238426, n=107, ostatnie 2 lata) | |
| Przeciętny Intel Core i9-13900HX (88686 - 137015, n=22) | |
| Asus TUF A15 FA507 | |
| Schenker XMG Pro 15 (E23) | |
| Alienware x16 R1 | |
| Dell G15 5530 | |
| Aorus 15X ASF | |
| Asus ZenBook Pro 14 Duo UX8402VV-P1021W | |
| MSI Cyborg 15 A12VF | |
| Schenker XMG Pro 15 (i7-12700H, RTX 3080 Ti) | |
| AIDA64 / CPU SHA3 | |
| Średnia w klasie Gaming (2180 - 9817, n=107, ostatnie 2 lata) | |
| Przeciętny Intel Core i9-13900HX (4362 - 7029, n=22) | |
| Schenker XMG Pro 15 (E23) | |
| Dell G15 5530 | |
| Alienware x16 R1 | |
| Aorus 15X ASF | |
| Asus TUF A15 FA507 | |
| Asus ZenBook Pro 14 Duo UX8402VV-P1021W | |
| MSI Cyborg 15 A12VF | |
| Schenker XMG Pro 15 (i7-12700H, RTX 3080 Ti) | |
| AIDA64 / CPU Queen | |
| Przeciętny Intel Core i9-13900HX (125644 - 141385, n=22) | |
| Schenker XMG Pro 15 (E23) | |
| Alienware x16 R1 | |
| Średnia w klasie Gaming (49785 - 173351, n=95, ostatnie 2 lata) | |
| Aorus 15X ASF | |
| Asus ZenBook Pro 14 Duo UX8402VV-P1021W | |
| Dell G15 5530 | |
| Asus TUF A15 FA507 | |
| Schenker XMG Pro 15 (i7-12700H, RTX 3080 Ti) | |
| MSI Cyborg 15 A12VF | |
| AIDA64 / FPU SinJulia | |
| Przeciętny Intel Core i9-13900HX (12334 - 17179, n=22) | |
| Średnia w klasie Gaming (4424 - 33636, n=107, ostatnie 2 lata) | |
| Asus TUF A15 FA507 | |
| Schenker XMG Pro 15 (E23) | |
| Aorus 15X ASF | |
| Alienware x16 R1 | |
| Dell G15 5530 | |
| Schenker XMG Pro 15 (i7-12700H, RTX 3080 Ti) | |
| Asus ZenBook Pro 14 Duo UX8402VV-P1021W | |
| MSI Cyborg 15 A12VF | |
| AIDA64 / FPU Mandel | |
| Średnia w klasie Gaming (25115 - 128721, n=107, ostatnie 2 lata) | |
| Przeciętny Intel Core i9-13900HX (43850 - 69202, n=22) | |
| Asus TUF A15 FA507 | |
| Alienware x16 R1 | |
| Schenker XMG Pro 15 (E23) | |
| Dell G15 5530 | |
| Aorus 15X ASF | |
| Asus ZenBook Pro 14 Duo UX8402VV-P1021W | |
| MSI Cyborg 15 A12VF | |
| Schenker XMG Pro 15 (i7-12700H, RTX 3080 Ti) | |
| AIDA64 / CPU AES | |
| Aorus 15X ASF | |
| Przeciętny Intel Core i9-13900HX (89413 - 237881, n=22) | |
| Średnia w klasie Gaming (39258 - 247074, n=107, ostatnie 2 lata) | |
| Schenker XMG Pro 15 (E23) | |
| Dell G15 5530 | |
| Alienware x16 R1 | |
| Asus TUF A15 FA507 | |
| MSI Cyborg 15 A12VF | |
| Asus ZenBook Pro 14 Duo UX8402VV-P1021W | |
| Schenker XMG Pro 15 (i7-12700H, RTX 3080 Ti) | |
| AIDA64 / CPU ZLib | |
| Przeciętny Intel Core i9-13900HX (1284 - 1958, n=22) | |
| Średnia w klasie Gaming (574 - 2531, n=107, ostatnie 2 lata) | |
| Schenker XMG Pro 15 (E23) | |
| Dell G15 5530 | |
| Alienware x16 R1 | |
| Aorus 15X ASF | |
| Schenker XMG Pro 15 (i7-12700H, RTX 3080 Ti) | |
| MSI Cyborg 15 A12VF | |
| Asus ZenBook Pro 14 Duo UX8402VV-P1021W | |
| Asus TUF A15 FA507 | |
| AIDA64 / FP64 Ray-Trace | |
| Średnia w klasie Gaming (5509 - 45446, n=107, ostatnie 2 lata) | |
| Przeciętny Intel Core i9-13900HX (9481 - 15279, n=22) | |
| Alienware x16 R1 | |
| Dell G15 5530 | |
| Schenker XMG Pro 15 (E23) | |
| Aorus 15X ASF | |
| Asus TUF A15 FA507 | |
| Asus ZenBook Pro 14 Duo UX8402VV-P1021W | |
| MSI Cyborg 15 A12VF | |
| Schenker XMG Pro 15 (i7-12700H, RTX 3080 Ti) | |
| AIDA64 / CPU PhotoWorxx | |
| Schenker XMG Pro 15 (E23) | |
| Alienware x16 R1 | |
| Przeciętny Intel Core i9-13900HX (42994 - 51994, n=22) | |
| Średnia w klasie Gaming (12271 - 89891, n=107, ostatnie 2 lata) | |
| Asus ZenBook Pro 14 Duo UX8402VV-P1021W | |
| Dell G15 5530 | |
| MSI Cyborg 15 A12VF | |
| Aorus 15X ASF | |
| Schenker XMG Pro 15 (i7-12700H, RTX 3080 Ti) | |
| Asus TUF A15 FA507 | |
Wydajność systemu
W obszarze wydajności systemu, recenzowane urządzenie również osiągnęło dobre wyniki, a nawet przewyższyło Aorus 15X ASFpomimo dzielenia podobnych wartości TDP i TGP. W PCMark 10, XMG Pro 15 jest tylko kilka punktów za smukłym Asus ZenBook Pro 14 Duo co pokazuje, że wydajny laptop do gier nie zawsze musi być ciężkim laptopem do gier.
CrossMark: Overall | Productivity | Creativity | Responsiveness
| PCMark 10 / Score | |
| Średnia w klasie Gaming (5828 - 11574, n=95, ostatnie 2 lata) | |
| Alienware x16 R1 | |
| Asus ZenBook Pro 14 Duo UX8402VV-P1021W | |
| Schenker XMG Pro 15 (E23) | |
| Przeciętny Intel Core i9-13900HX, NVIDIA GeForce RTX 4060 Laptop GPU (n=1) | |
| Asus TUF A15 FA507 | |
| Aorus 15X ASF | |
| MSI Cyborg 15 A12VF | |
| Dell G15 5530 | |
| Schenker XMG Pro 15 (i7-12700H, RTX 3080 Ti) | |
| PCMark 10 / Essentials | |
| Schenker XMG Pro 15 (E23) | |
| Przeciętny Intel Core i9-13900HX, NVIDIA GeForce RTX 4060 Laptop GPU (n=1) | |
| Asus ZenBook Pro 14 Duo UX8402VV-P1021W | |
| Alienware x16 R1 | |
| Dell G15 5530 | |
| Schenker XMG Pro 15 (i7-12700H, RTX 3080 Ti) | |
| Aorus 15X ASF | |
| MSI Cyborg 15 A12VF | |
| Średnia w klasie Gaming (8810 - 12600, n=99, ostatnie 2 lata) | |
| Asus TUF A15 FA507 | |
| PCMark 10 / Productivity | |
| Średnia w klasie Gaming (6845 - 21327, n=97, ostatnie 2 lata) | |
| Schenker XMG Pro 15 (E23) | |
| Przeciętny Intel Core i9-13900HX, NVIDIA GeForce RTX 4060 Laptop GPU (n=1) | |
| Dell G15 5530 | |
| MSI Cyborg 15 A12VF | |
| Alienware x16 R1 | |
| Asus ZenBook Pro 14 Duo UX8402VV-P1021W | |
| Aorus 15X ASF | |
| Asus TUF A15 FA507 | |
| Schenker XMG Pro 15 (i7-12700H, RTX 3080 Ti) | |
| PCMark 10 / Digital Content Creation | |
| Alienware x16 R1 | |
| Średnia w klasie Gaming (7602 - 19657, n=97, ostatnie 2 lata) | |
| Asus ZenBook Pro 14 Duo UX8402VV-P1021W | |
| Asus TUF A15 FA507 | |
| Aorus 15X ASF | |
| Schenker XMG Pro 15 (E23) | |
| Przeciętny Intel Core i9-13900HX, NVIDIA GeForce RTX 4060 Laptop GPU (n=1) | |
| MSI Cyborg 15 A12VF | |
| Schenker XMG Pro 15 (i7-12700H, RTX 3080 Ti) | |
| Dell G15 5530 | |
| CrossMark / Overall | |
| Aorus 15X ASF | |
| Średnia w klasie Gaming (1366 - 2409, n=96, ostatnie 2 lata) | |
| Schenker XMG Pro 15 (E23) | |
| Przeciętny Intel Core i9-13900HX, NVIDIA GeForce RTX 4060 Laptop GPU (n=1) | |
| Alienware x16 R1 | |
| Asus ZenBook Pro 14 Duo UX8402VV-P1021W | |
| Dell G15 5530 | |
| MSI Cyborg 15 A12VF | |
| Asus TUF A15 FA507 | |
| CrossMark / Productivity | |
| Aorus 15X ASF | |
| Średnia w klasie Gaming (1386 - 2254, n=96, ostatnie 2 lata) | |
| Alienware x16 R1 | |
| Schenker XMG Pro 15 (E23) | |
| Przeciętny Intel Core i9-13900HX, NVIDIA GeForce RTX 4060 Laptop GPU (n=1) | |
| Asus ZenBook Pro 14 Duo UX8402VV-P1021W | |
| Dell G15 5530 | |
| MSI Cyborg 15 A12VF | |
| Asus TUF A15 FA507 | |
| CrossMark / Creativity | |
| Średnia w klasie Gaming (1343 - 2729, n=96, ostatnie 2 lata) | |
| Schenker XMG Pro 15 (E23) | |
| Przeciętny Intel Core i9-13900HX, NVIDIA GeForce RTX 4060 Laptop GPU (n=1) | |
| Aorus 15X ASF | |
| Asus ZenBook Pro 14 Duo UX8402VV-P1021W | |
| Dell G15 5530 | |
| Alienware x16 R1 | |
| MSI Cyborg 15 A12VF | |
| Asus TUF A15 FA507 | |
| CrossMark / Responsiveness | |
| Aorus 15X ASF | |
| Alienware x16 R1 | |
| Schenker XMG Pro 15 (E23) | |
| Przeciętny Intel Core i9-13900HX, NVIDIA GeForce RTX 4060 Laptop GPU (n=1) | |
| Średnia w klasie Gaming (1226 - 2334, n=96, ostatnie 2 lata) | |
| MSI Cyborg 15 A12VF | |
| Asus ZenBook Pro 14 Duo UX8402VV-P1021W | |
| Dell G15 5530 | |
| Asus TUF A15 FA507 | |
| PCMark 10 Score | 7521 pkt. | |
Pomoc | ||
| AIDA64 / Memory Copy | |
| Schenker XMG Pro 15 (E23) | |
| Przeciętny Intel Core i9-13900HX (67716 - 79193, n=22) | |
| Alienware x16 R1 | |
| Średnia w klasie Gaming (21750 - 129946, n=107, ostatnie 2 lata) | |
| Asus ZenBook Pro 14 Duo UX8402VV-P1021W | |
| Dell G15 5530 | |
| Aorus 15X ASF | |
| MSI Cyborg 15 A12VF | |
| Asus TUF A15 FA507 | |
| Schenker XMG Pro 15 (i7-12700H, RTX 3080 Ti) | |
| AIDA64 / Memory Read | |
| Schenker XMG Pro 15 (E23) | |
| Przeciętny Intel Core i9-13900HX (73998 - 88462, n=22) | |
| Średnia w klasie Gaming (22956 - 118858, n=107, ostatnie 2 lata) | |
| Dell G15 5530 | |
| Alienware x16 R1 | |
| Aorus 15X ASF | |
| MSI Cyborg 15 A12VF | |
| Asus ZenBook Pro 14 Duo UX8402VV-P1021W | |
| Asus TUF A15 FA507 | |
| Schenker XMG Pro 15 (i7-12700H, RTX 3080 Ti) | |
| AIDA64 / Memory Write | |
| Alienware x16 R1 | |
| Średnia w klasie Gaming (22297 - 135096, n=107, ostatnie 2 lata) | |
| Schenker XMG Pro 15 (E23) | |
| Przeciętny Intel Core i9-13900HX (65472 - 77045, n=22) | |
| Asus ZenBook Pro 14 Duo UX8402VV-P1021W | |
| Dell G15 5530 | |
| MSI Cyborg 15 A12VF | |
| Aorus 15X ASF | |
| Asus TUF A15 FA507 | |
| Schenker XMG Pro 15 (i7-12700H, RTX 3080 Ti) | |
| AIDA64 / Memory Latency | |
| Średnia w klasie Gaming (75.3 - 259, n=107, ostatnie 2 lata) | |
| Alienware x16 R1 | |
| Asus ZenBook Pro 14 Duo UX8402VV-P1021W | |
| MSI Cyborg 15 A12VF | |
| Dell G15 5530 | |
| Aorus 15X ASF | |
| Przeciętny Intel Core i9-13900HX (75.3 - 91.1, n=22) | |
| Schenker XMG Pro 15 (E23) | |
| Asus TUF A15 FA507 | |
* ... im mniej tym lepiej
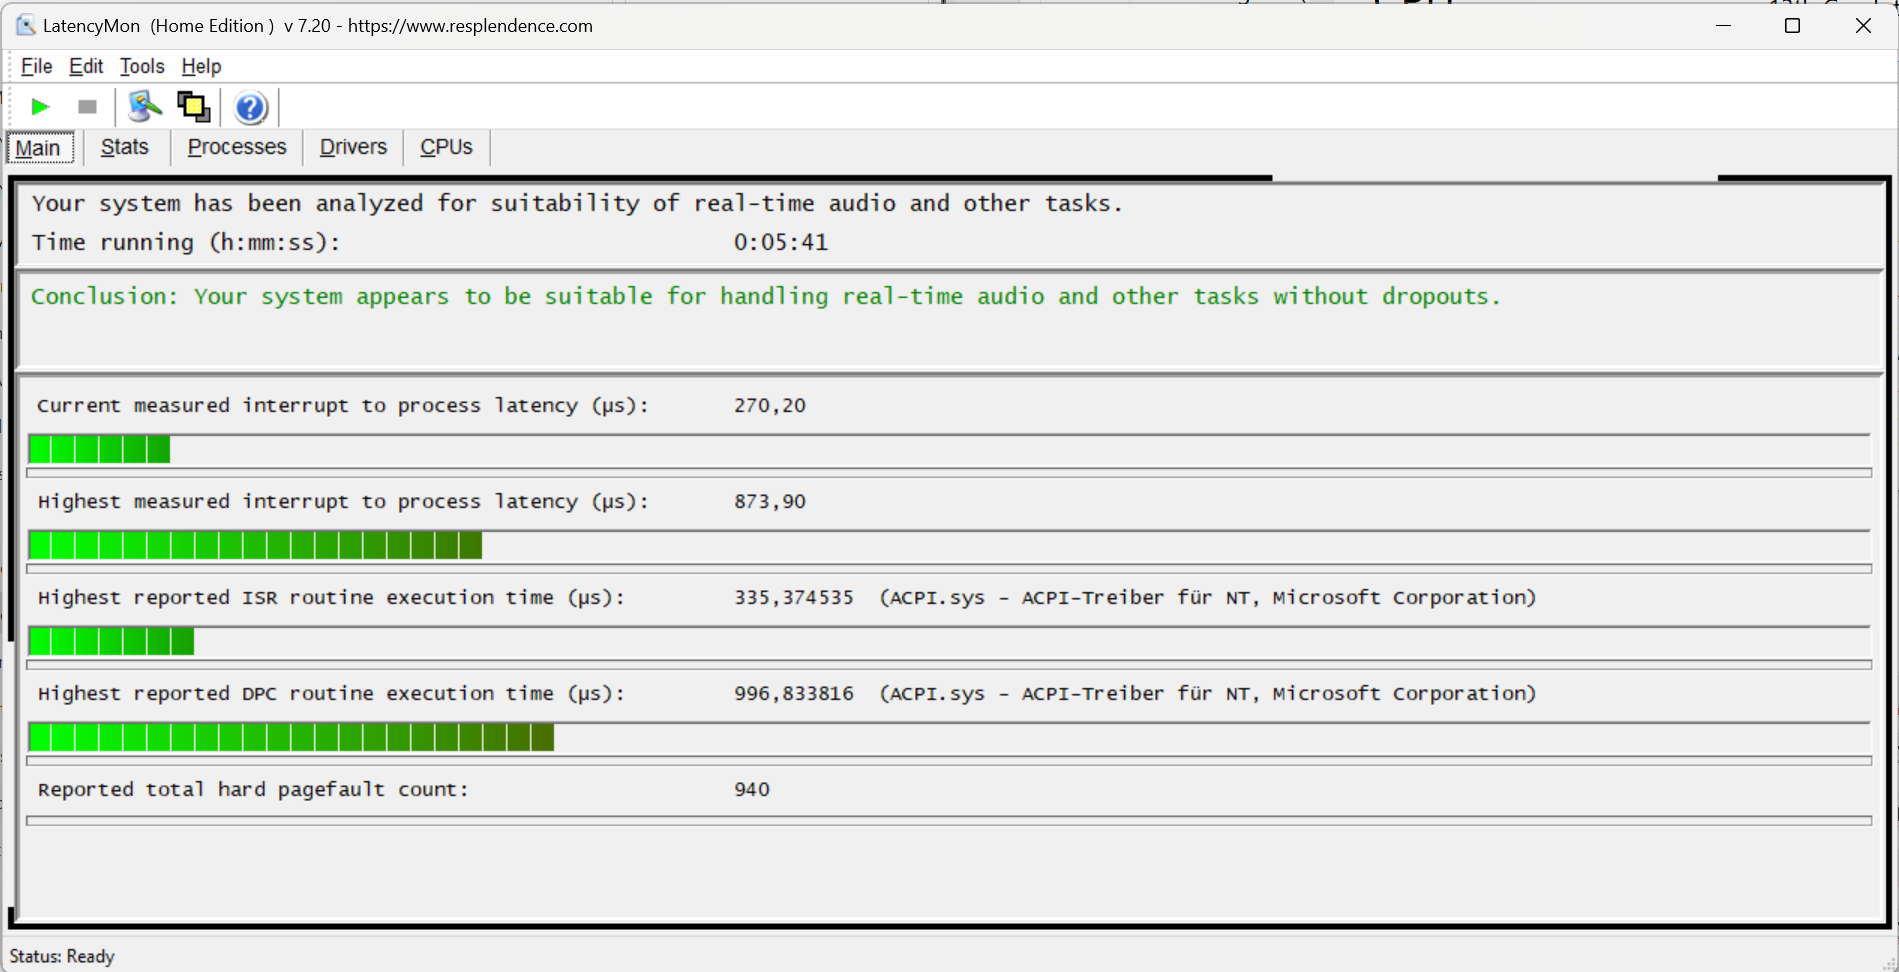
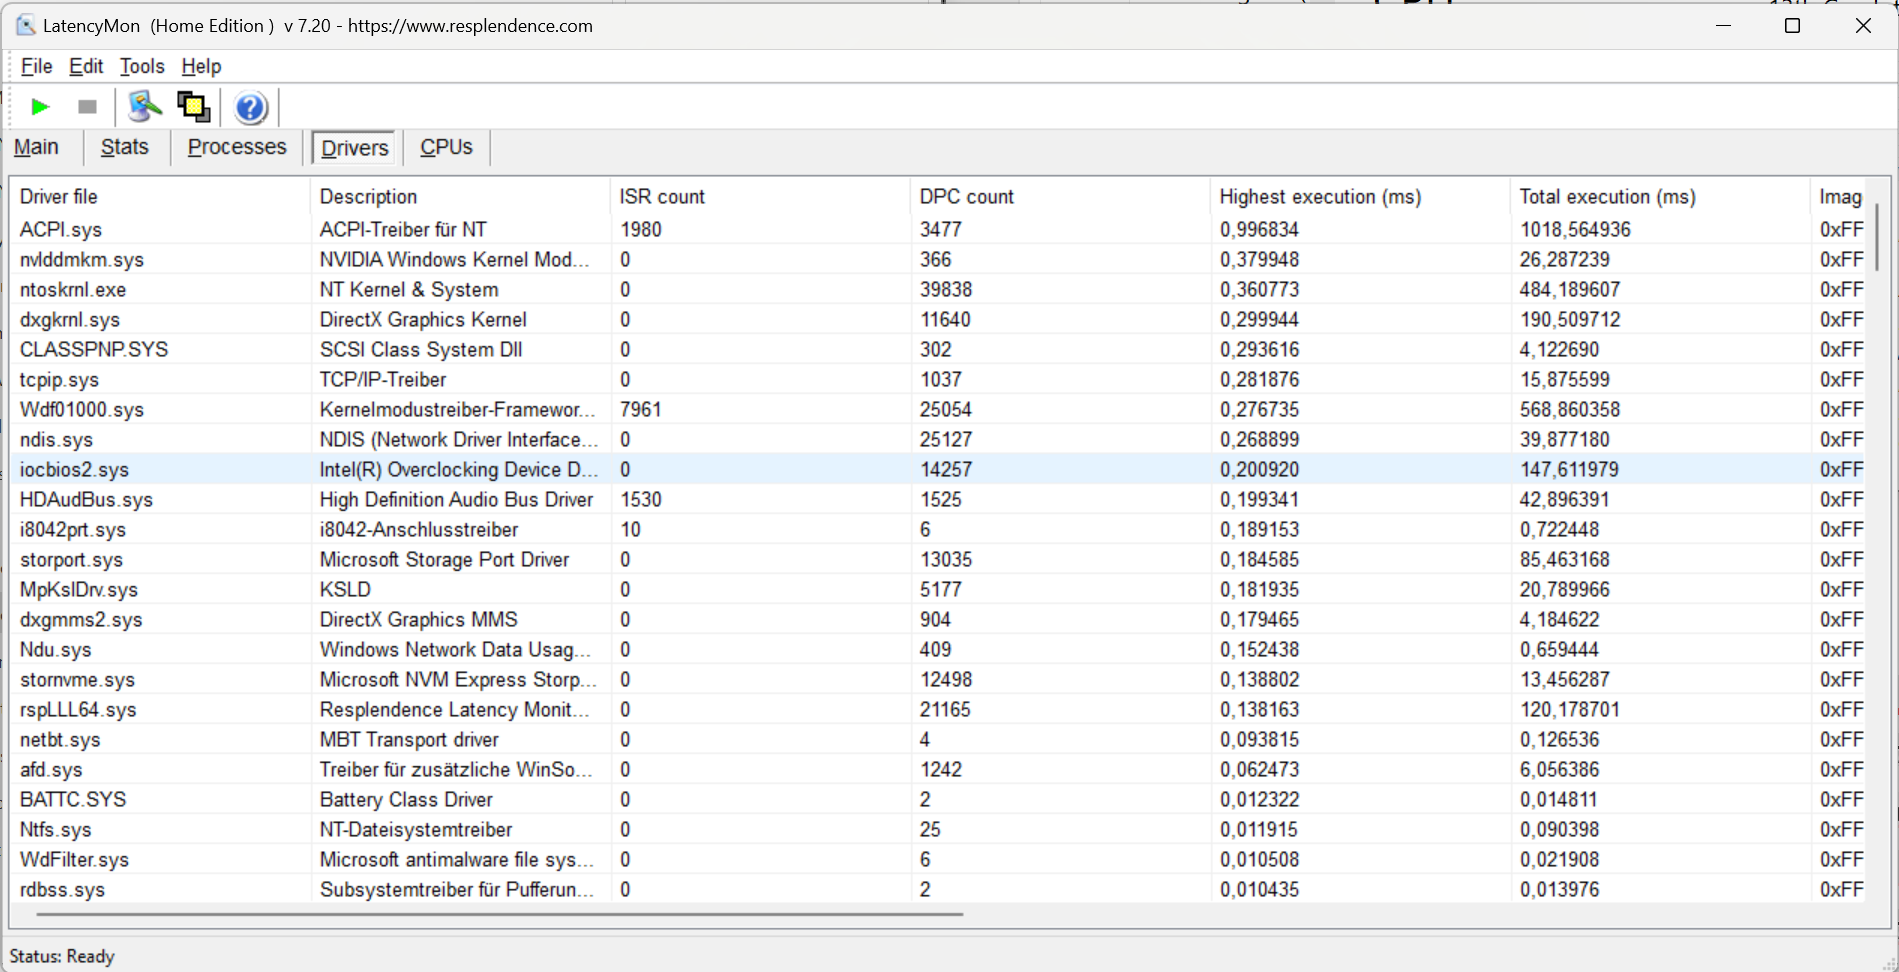
Opóźnienia DPC
W tym obszarze można zauważyć, że problemy z interakcją między sterownikami Nvidia a innymi sterownikami zostały w międzyczasie przezwyciężone. W tym laptopie, w czasie testów, opóźnienia DPC są na niskim poziomie przy obecnych sterownikach i oprogramowaniu układowym.
| DPC Latencies / LatencyMon - interrupt to process latency (max), Web, Youtube, Prime95 | |
| Dell G15 5530 | |
| Aorus 15X ASF | |
| Schenker XMG Pro 15 (i7-12700H, RTX 3080 Ti) | |
| Alienware x16 R1 | |
| MSI Cyborg 15 A12VF | |
| Asus ZenBook Pro 14 Duo UX8402VV-P1021W | |
| Schenker XMG Pro 15 (E23) | |
* ... im mniej tym lepiej
Pamięć masowa

Ze wszystkich dysków SSD NVMe oferowanych przez Schenker dla XMG Pro 15, Crucial P5 Plus prawdopodobnie nie jest najszybszą opcją. Jednak w testach zapewnił dobre wartości, które utrzymywał przez dłuższy czas. W pętli DiskSpd zaobserwowaliśmy jedynie minimalny throttling po kilku uruchomieniach.

| Drive Performance rating - Percent | |
| Alienware x16 R1 | |
| Aorus 15X ASF | |
| Schenker XMG Pro 15 (i7-12700H, RTX 3080 Ti) | |
| Średnia w klasie Gaming | |
| Schenker XMG Pro 15 (E23) | |
| Przeciętny Crucial P5 Plus 1TB CT1000P5PSSD8 | |
| Asus ZenBook Pro 14 Duo UX8402VV-P1021W -11! | |
| MSI Cyborg 15 A12VF | |
| Asus TUF A15 FA507 | |
| Dell G15 5530 | |
* ... im mniej tym lepiej
Continuous Performance Read: DiskSpd Read Loop, Queue Depth 8
Karta graficzna
Teraz dochodzimy do głównego pytania naszej recenzji. Czy kartaNvidia GeForce RTX 4060 w naszej recenzji dotrzymuje kroku poprzednikowiRTX 3080 Ti? Szczera odpowiedź na to pytanie brzmi jednoznacznie tak i nie. W zależności od benchmarku, trzeba będzie liczyć się z od 10% do 20% niższą wydajnością. W grach różnica w wydajności między obecnym XMG Pro 15 a poprzednikiem zależy raczej od gry. Podczas gdy coś takiego jak The Witcher 3 korzysta z wyższego taktowania 4060 i osiąga wyższą liczbę klatek na sekundę, w GTA V Pro 15 E23 pozostaje nieco w tyle za swoim poprzednikiem. Jednak XMG Pro 15 można również skonfigurować z kartą graficznąRTX 4070. KartaAorus 15X ASFpokazuje, że różnica w wydajności między RTX 3080 Ti a RTX 4070 jest bardzo niska - w każdej sytuacji. Ponieważ Aorus i XMG Pro 15 działają z niemal identycznymi wartościami TDP i TGP, wskazuje to na możliwą wydajność, jakiej można oczekiwać w XMG Pro 15 z RTX 4070.
| 3DMark Performance rating - Percent | |
| Alienware x16 R1 -3! | |
| Średnia w klasie Gaming | |
| Schenker XMG Pro 15 (i7-12700H, RTX 3080 Ti) -3! | |
| Aorus 15X ASF | |
| Dell G15 5530 -2! | |
| Przeciętny NVIDIA GeForce RTX 4060 Laptop GPU | |
| Schenker XMG Pro 15 (E23) | |
| Asus ZenBook Pro 14 Duo UX8402VV-P1021W -2! | |
| MSI Cyborg 15 A12VF | |
| Asus TUF A15 FA507 -1! | |
| 3DMark 11 - 1280x720 Performance GPU | |
| Alienware x16 R1 | |
| Średnia w klasie Gaming (21841 - 80022, n=106, ostatnie 2 lata) | |
| Schenker XMG Pro 15 (i7-12700H, RTX 3080 Ti) | |
| Aorus 15X ASF | |
| Dell G15 5530 | |
| Schenker XMG Pro 15 (E23) | |
| Przeciętny NVIDIA GeForce RTX 4060 Laptop GPU (28136 - 38912, n=57) | |
| Asus TUF A15 FA507 | |
| Asus ZenBook Pro 14 Duo UX8402VV-P1021W | |
| MSI Cyborg 15 A12VF | |
| Geekbench 5.5 - OpenCL Score | |
| Alienware x16 R1 | |
| Średnia w klasie Gaming (80702 - 277970, n=105, ostatnie 2 lata) | |
| Schenker XMG Pro 15 (i7-12700H, RTX 3080 Ti) | |
| Aorus 15X ASF | |
| Schenker XMG Pro 15 (E23) | |
| Dell G15 5530 | |
| Przeciętny NVIDIA GeForce RTX 4060 Laptop GPU (5039 - 112238, n=53) | |
| MSI Cyborg 15 A12VF | |
| Asus TUF A15 FA507 | |
| Asus ZenBook Pro 14 Duo UX8402VV-P1021W | |
| V-Ray Benchmark Next 4.10 - GPU | |
| Średnia w klasie Gaming (427 - 1627, n=103, ostatnie 2 lata) | |
| Dell G15 5530 | |
| Schenker XMG Pro 15 (E23) | |
| Przeciętny NVIDIA GeForce RTX 4060 Laptop GPU (483 - 715, n=46) | |
| Aorus 15X ASF | |
| Asus ZenBook Pro 14 Duo UX8402VV-P1021W | |
| Schenker XMG Pro 15 (i7-12700H, RTX 3080 Ti) | |
| Asus TUF A15 FA507 | |
| MSI Cyborg 15 A12VF | |
| 3DMark 11 Performance | 29518 pkt. | |
| 3DMark Ice Storm Standard Score | 146918 pkt. | |
| 3DMark Cloud Gate Standard Score | 54429 pkt. | |
| 3DMark Fire Strike Score | 23131 pkt. | |
| 3DMark Time Spy Score | 10776 pkt. | |
Pomoc | ||
* ... im mniej tym lepiej
| Performance rating - Percent | |
| Alienware x16 R1 | |
| Średnia w klasie Gaming | |
| Schenker XMG Pro 15 (E23) -1! | |
| Aorus 15X ASF | |
| Schenker XMG Pro 15 (i7-12700H, RTX 3080 Ti) | |
| Dell G15 5530 | |
| Asus ZenBook Pro 14 Duo UX8402VV-P1021W | |
| MSI Cyborg 15 A12VF | |
| Asus TUF A15 FA507 | |
| The Witcher 3 - 1920x1080 Ultra Graphics & Postprocessing (HBAO+) | |
| Średnia w klasie Gaming (95 - 240, n=8, ostatnie 2 lata) | |
| Alienware x16 R1 | |
| Schenker XMG Pro 15 (E23) | |
| Asus ZenBook Pro 14 Duo UX8402VV-P1021W | |
| Schenker XMG Pro 15 (i7-12700H, RTX 3080 Ti) | |
| Aorus 15X ASF | |
| Dell G15 5530 | |
| Asus TUF A15 FA507 | |
| MSI Cyborg 15 A12VF | |
| GTA V - 1920x1080 Highest AA:4xMSAA + FX AF:16x | |
| Średnia w klasie Gaming (48.3 - 186.9, n=98, ostatnie 2 lata) | |
| Alienware x16 R1 | |
| Schenker XMG Pro 15 (i7-12700H, RTX 3080 Ti) | |
| Aorus 15X ASF | |
| Dell G15 5530 | |
| Schenker XMG Pro 15 (E23) | |
| MSI Cyborg 15 A12VF | |
| Asus ZenBook Pro 14 Duo UX8402VV-P1021W | |
| Asus TUF A15 FA507 | |
| Final Fantasy XV Benchmark - 1920x1080 High Quality | |
| Alienware x16 R1 | |
| Średnia w klasie Gaming (41 - 215, n=99, ostatnie 2 lata) | |
| Aorus 15X ASF | |
| Schenker XMG Pro 15 (i7-12700H, RTX 3080 Ti) | |
| Dell G15 5530 | |
| Asus ZenBook Pro 14 Duo UX8402VV-P1021W | |
| Asus TUF A15 FA507 | |
| MSI Cyborg 15 A12VF | |
| Strange Brigade - 1920x1080 ultra AA:ultra AF:16 | |
| Alienware x16 R1 | |
| Średnia w klasie Gaming (76.3 - 456, n=89, ostatnie 2 lata) | |
| Aorus 15X ASF | |
| Schenker XMG Pro 15 (i7-12700H, RTX 3080 Ti) | |
| Dell G15 5530 | |
| Schenker XMG Pro 15 (E23) | |
| Asus ZenBook Pro 14 Duo UX8402VV-P1021W | |
| Asus TUF A15 FA507 | |
| MSI Cyborg 15 A12VF | |
| Dota 2 Reborn - 1920x1080 ultra (3/3) best looking | |
| Schenker XMG Pro 15 (E23) | |
| Średnia w klasie Gaming (84.8 - 248, n=110, ostatnie 2 lata) | |
| Aorus 15X ASF | |
| Alienware x16 R1 | |
| Asus ZenBook Pro 14 Duo UX8402VV-P1021W | |
| Dell G15 5530 | |
| MSI Cyborg 15 A12VF | |
| Schenker XMG Pro 15 (i7-12700H, RTX 3080 Ti) | |
| Asus TUF A15 FA507 | |
| X-Plane 11.11 - 1920x1080 high (fps_test=3) | |
| Aorus 15X ASF | |
| Dell G15 5530 | |
| Schenker XMG Pro 15 (E23) | |
| Asus ZenBook Pro 14 Duo UX8402VV-P1021W | |
| Asus ZenBook Pro 14 Duo UX8402VV-P1021W | |
| Alienware x16 R1 | |
| Schenker XMG Pro 15 (i7-12700H, RTX 3080 Ti) | |
| Średnia w klasie Gaming (52.1 - 143.5, n=113, ostatnie 2 lata) | |
| MSI Cyborg 15 A12VF | |
| Asus TUF A15 FA507 | |
| Hogwarts Legacy | |
| 2560x1440 Ultra Preset AA:High T | |
| Średnia w klasie Gaming (n=1ostatnie 2 lata) | |
| Schenker XMG Pro 15 (E23) | |
| Przeciętny NVIDIA GeForce RTX 4060 Laptop GPU (42.8 - 45, n=4) | |
| 1920x1080 Ultra Preset AA:High T | |
| Średnia w klasie Gaming (n=1ostatnie 2 lata) | |
| Przeciętny NVIDIA GeForce RTX 4060 Laptop GPU (61.9 - 91.9, n=6) | |
| Schenker XMG Pro 15 (E23) | |
| MSI Cyborg 15 A12VF | |
| Asus TUF A15 FA507 | |
| 1920x1080 High Preset AA:High T | |
| Asus TUF A15 FA507 | |
| Przeciętny NVIDIA GeForce RTX 4060 Laptop GPU (70.8 - 107.7, n=6) | |
| MSI Cyborg 15 A12VF | |
| Schenker XMG Pro 15 (E23) | |
| low | med. | high | ultra | QHD | 4K | |
|---|---|---|---|---|---|---|
| GTA V (2015) | 184.5 | 178.9 | 170.6 | 107.2 | 87 | |
| The Witcher 3 (2015) | 112 | 159.7 | ||||
| Dota 2 Reborn (2015) | 210 | 182.9 | 176.1 | 154.3 | 126.4 | |
| X-Plane 11.11 (2018) | 154.9 | 135.9 | 111 | 102 | ||
| Strange Brigade (2018) | 377 | 267 | 213 | 183.3 | 127.5 | |
| Shadow of the Tomb Raider (2018) | 142 | 94 | ||||
| Cyberpunk 2077 1.6 (2022) | 80.6 | 48.56 | ||||
| Tiny Tina's Wonderlands (2022) | 89.29 | 60.01 | ||||
| F1 22 (2022) | 245 | 235 | 179.8 | 66.4 | 43 | |
| Call of Duty Modern Warfare 2 2022 (2022) | 91 | 66 | ||||
| Hogwarts Legacy (2023) | 90.4 | 70.8 | 64 | 44.4 |
Emisje i energia - ciche głośniki i głośne wentylatory
Emisja hałasu
Niestety, w testach XMG Pro 15 okazał się bardzo głośny. Używając aktywowanego trybu wydajności pod pełnym obciążeniem i w odległości 15 centymetrów, zmierzyliśmy całe 53 dB(A) w Prime95 i Furmark. Wentylatory mają jednak inne sztuczki w zanadrzu. Z naszego doświadczenia wynika, że tryb rozrywkowy również oferuje wystarczającą wydajność dla wielu gier. Znacząco obniża to poziom hałasu emitowanego z laptopa. W normalnym użytkowaniu bez aplikacji 3D można nawet oczekiwać bardzo cichej lub cichej pracy. To przynajmniej pomaga mu mieć nos nieco z przodu w porównaniu do poprzednika.
Hałas
| luz |
| 24 / 24 / 24 dB |
| obciążenie |
| 53.65 / 53.65 dB |
 | ||
30 dB cichy 40 dB(A) słyszalny 50 dB(A) irytujący |
||
min: | ||
| Schenker XMG Pro 15 (E23) GeForce RTX 4060 Laptop GPU, i9-13900HX, Crucial P5 Plus 1TB CT1000P5PSSD8 | Schenker XMG Pro 15 (i7-12700H, RTX 3080 Ti) GeForce RTX 3080 Ti Laptop GPU, i7-12700H, Samsung SSD 980 Pro 1TB MZ-V8P1T0BW | Dell G15 5530 GeForce RTX 4060 Laptop GPU, i7-13650HX, SSTC CL4-3D512-Q11 | Asus TUF A15 FA507 GeForce RTX 4050 Laptop GPU, R7 7735HS, Micron 2400 MTFDKBA512QFM | Aorus 15X ASF GeForce RTX 4070 Laptop GPU, i7-13700HX, Gigabyte AG470S1TB-SI B10 | Asus ZenBook Pro 14 Duo UX8402VV-P1021W GeForce RTX 4060 Laptop GPU, i9-13900H, Samsung PM9A1 MZVL22T0HBLB | MSI Cyborg 15 A12VF GeForce RTX 4060 Laptop GPU, i7-12650H, Samsung PM9B1 1024GB MZVL41T0HBLB | Alienware x16 R1 GeForce RTX 4080 Laptop GPU, i9-13900HK, SK hynix PC801 HFS001TEJ9X101N | |
|---|---|---|---|---|---|---|---|---|
| Noise | -11% | 7% | 14% | -13% | -13% | -25% | 4% | |
| wyłączone / środowisko * (dB) | 24 | 23 4% | 20.41 15% | 23.3 3% | 25 -4% | 25.2 -5% | 27 -13% | 22.7 5% |
| Idle Minimum * (dB) | 24 | 23 4% | 26.85 -12% | 23.3 3% | 28 -17% | 25.2 -5% | 27 -13% | 23.1 4% |
| Idle Average * (dB) | 24 | 31.22 -30% | 26.85 -12% | 23.3 3% | 29 -21% | 25.2 -5% | 37.5 -56% | 25.8 -8% |
| Idle Maximum * (dB) | 24 | 33.09 -38% | 26.85 -12% | 23.3 3% | 36 -50% | 32.5 -35% | 38 -58% | 25.8 -8% |
| Load Average * (dB) | 53.65 | 56.35 -5% | 27.65 48% | 29.6 45% | 50 7% | 59.7 -11% | 56.3 -5% | 39.3 27% |
| Witcher 3 ultra * (dB) | 53.53 | 56.89 -6% | 47.9 11% | 43 20% | 54 -1% | 49.9 7% | ||
| Load Maximum * (dB) | 53.65 | 56.89 -6% | 47.86 11% | 43 20% | 58 -8% | 60.9 -14% | 56.3 -5% | 54.8 -2% |
* ... im mniej tym lepiej
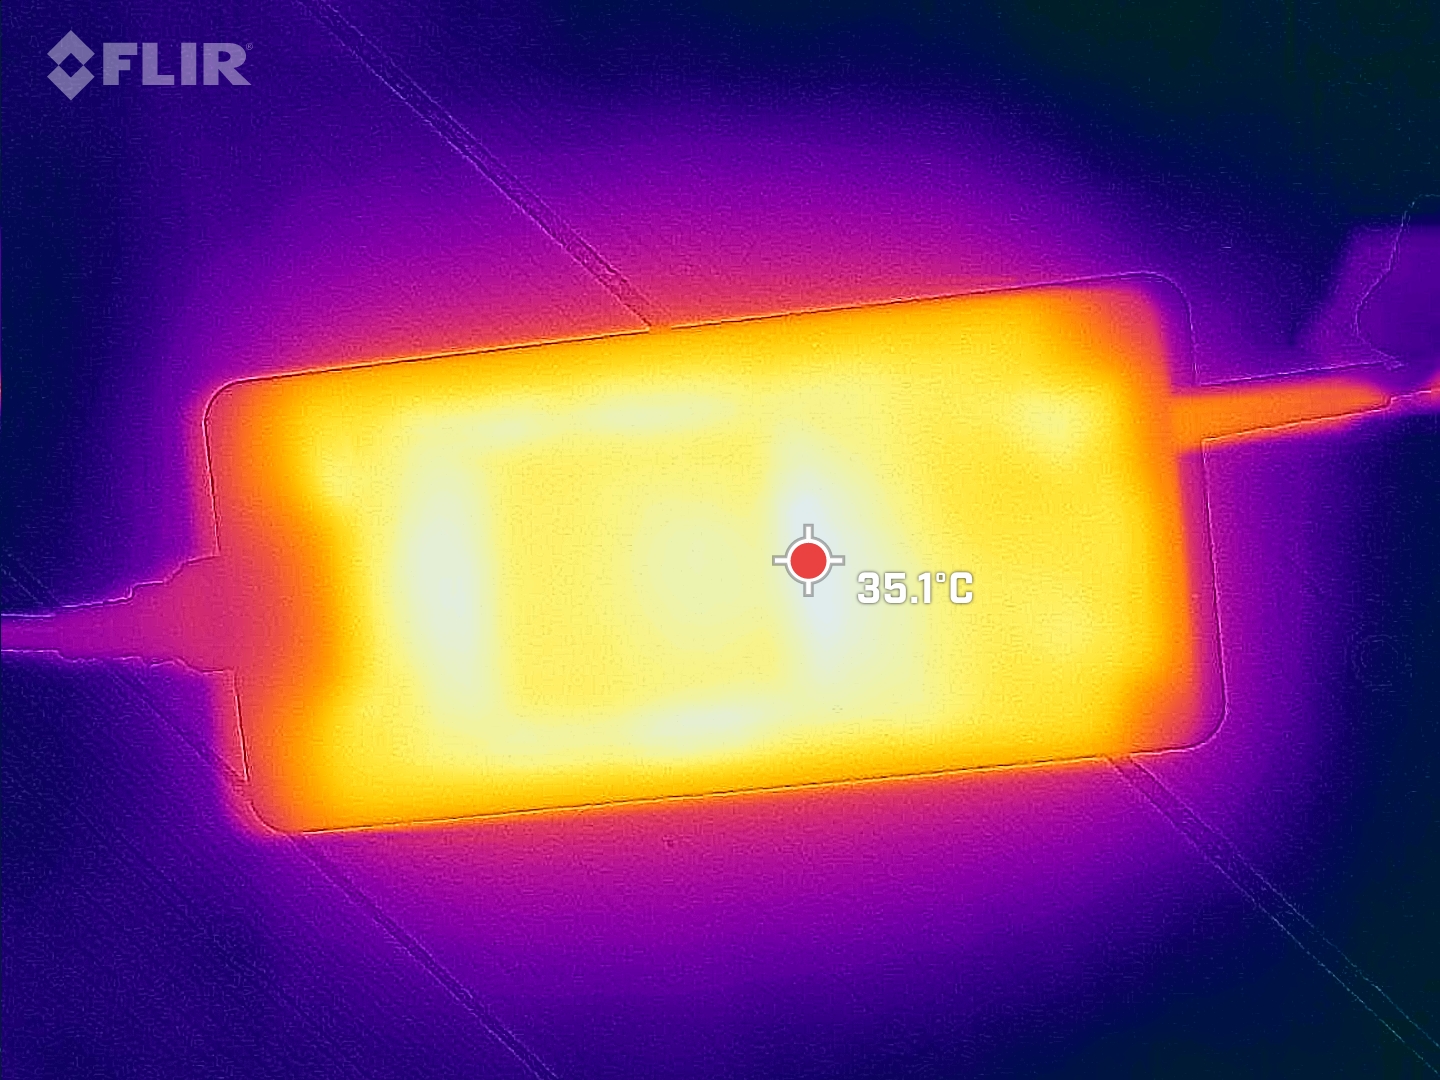
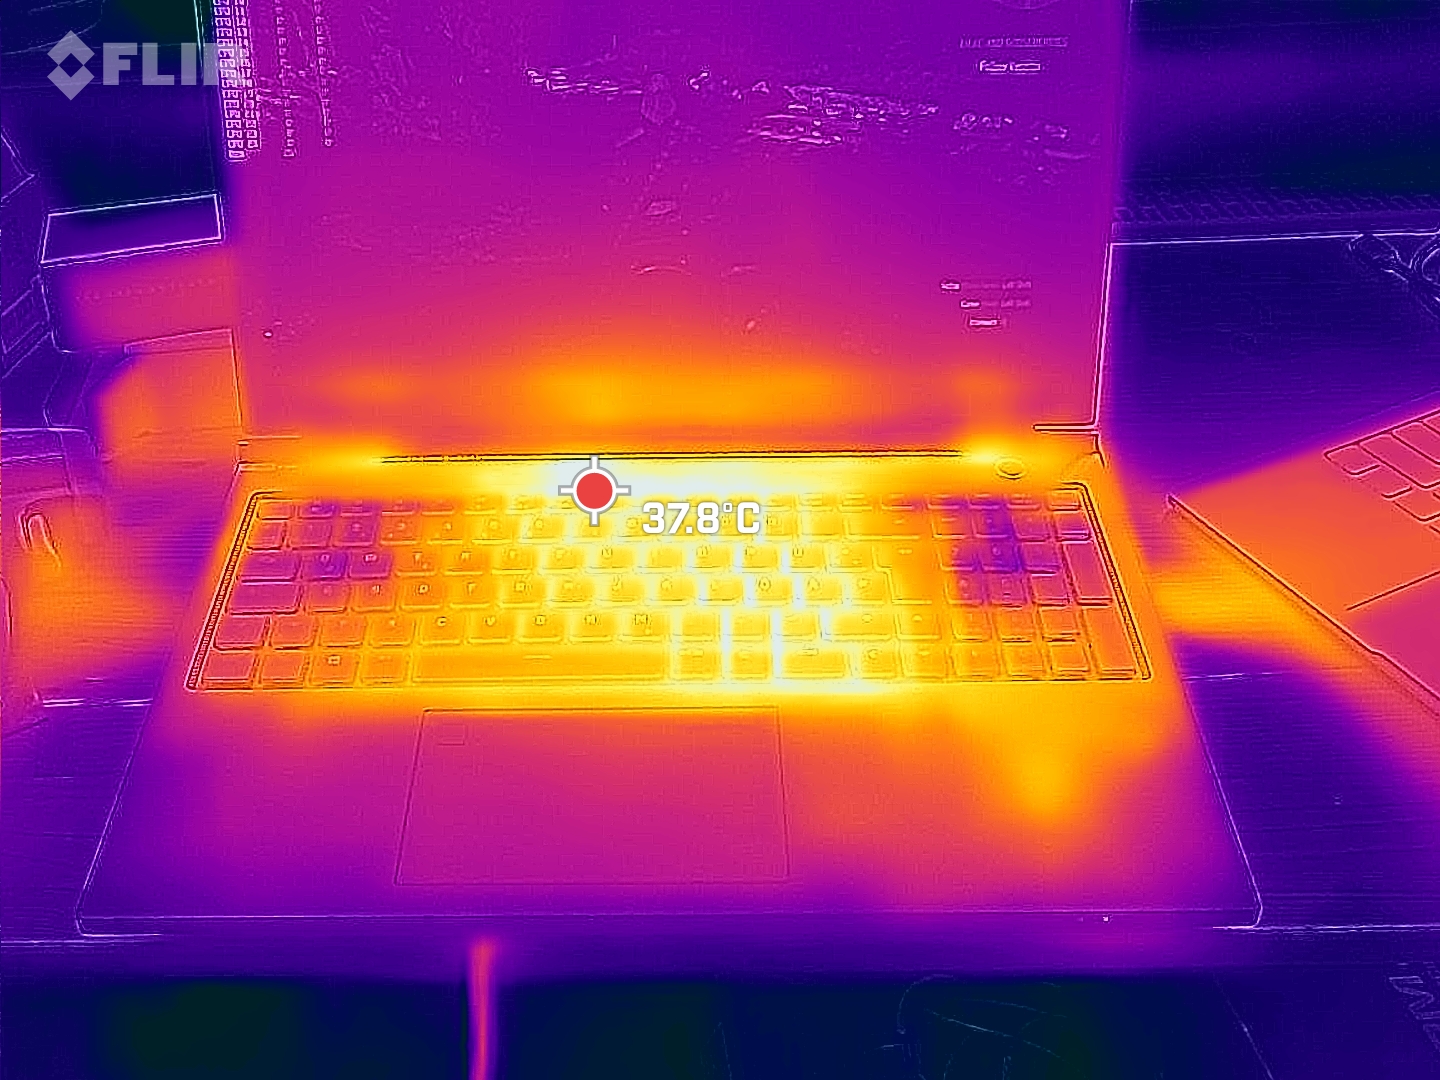
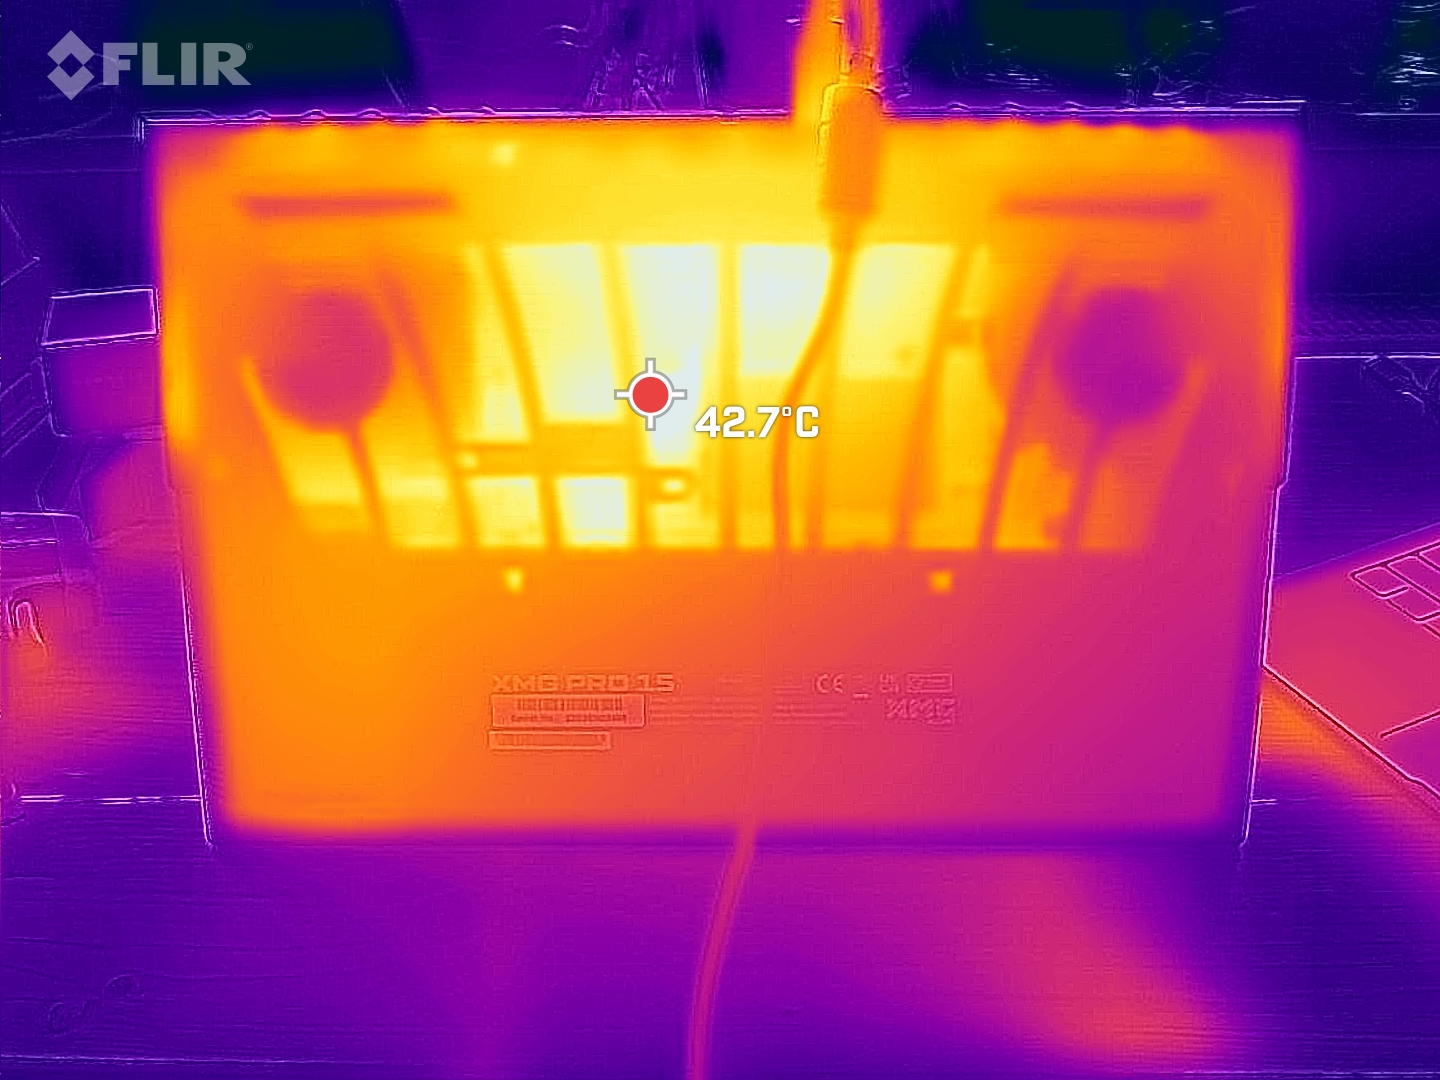
Temperatura
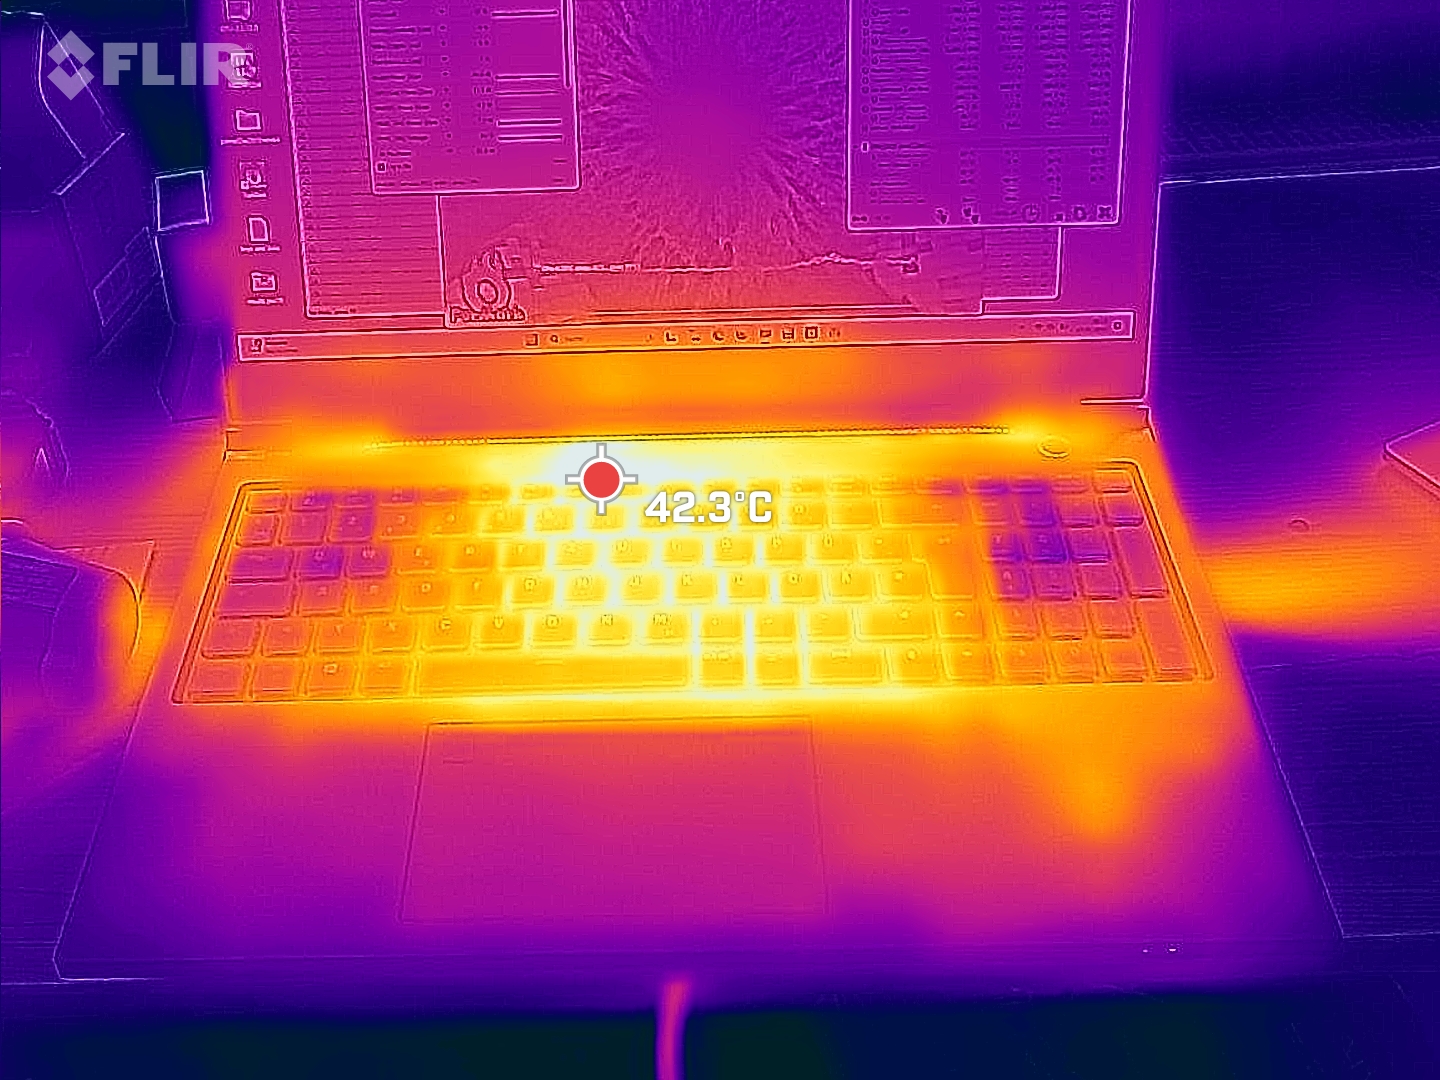
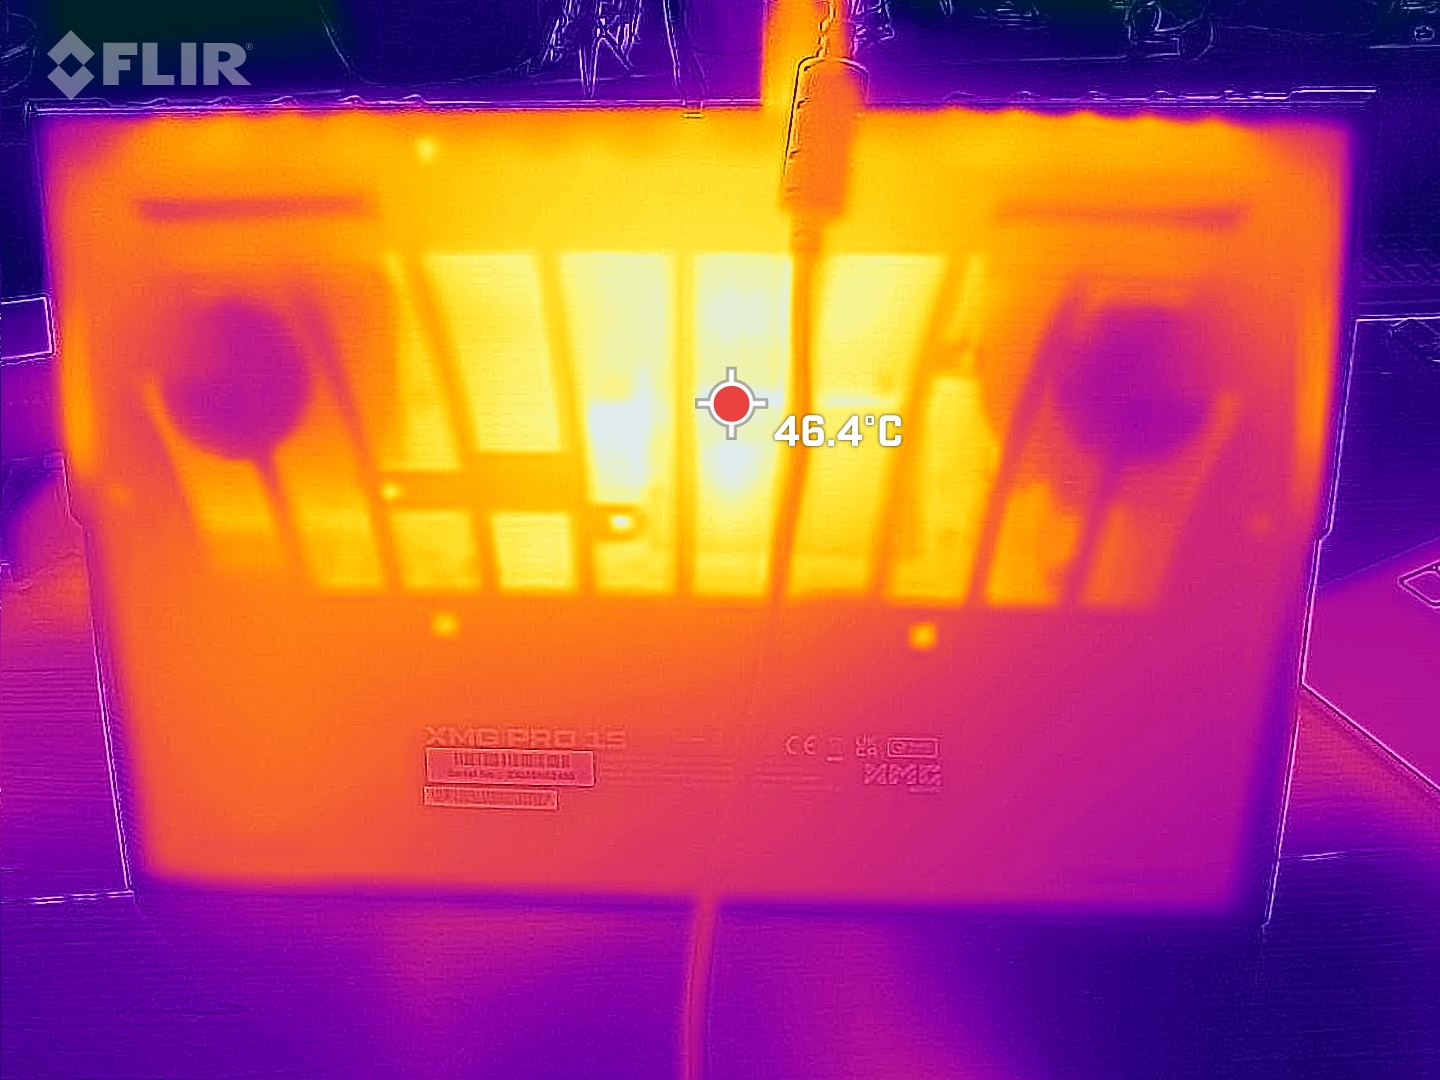
Przy temperaturach powierzchni sięgających 50 °C w teście obciążeniowym, XMG Pro 15 jest znacznie cieplejszy niż wielu jego konkurentów. Jednak po pierwsze, mówimy tylko o stosunkowo niewielkich hotspotach, a po drugie, powierzchnia jednostki bazowej jest wykonana z tworzywa sztucznego. W kontakcie sprawia to, że wysokie temperatury wydają się znacznie niższe. Podczas grania błędem byłoby określenie klawiatury jako chłodnej, niemniej jednak nie jest ona nieprzyjemnie ciepła. Wydajność laptopa nie jest również dławiona w czasie.
(-) Maksymalna temperatura w górnej części wynosi 50 °C / 122 F, w porównaniu do średniej 40.4 °C / 105 F , począwszy od 21.2 do 68.8 °C dla klasy Gaming.
(-) Dno nagrzewa się maksymalnie do 50 °C / 122 F, w porównaniu do średniej 43.2 °C / 110 F
(+) W stanie bezczynności średnia temperatura górnej części wynosi 28.7 °C / 84 F, w porównaniu ze średnią temperaturą urządzenia wynoszącą 33.9 °C / ### class_avg_f### F.
(±) Podczas gry w Wiedźmina 3 średnia temperatura górnej części wynosi 35.6 °C / 96 F, w porównaniu do średniej temperatury urządzenia wynoszącej 33.9 °C / ## #class_avg_f### F.
(+) Podparcia dłoni i touchpad osiągają maksymalną temperaturę skóry (34 °C / 93.2 F) i dlatego nie są gorące.
(-) Średnia temperatura obszaru podparcia dłoni w podobnych urządzeniach wynosiła 28.8 °C / 83.8 F (-5.2 °C / -9.4 F).
| Schenker XMG Pro 15 (E23) Intel Core i9-13900HX, NVIDIA GeForce RTX 4060 Laptop GPU | Schenker XMG Pro 15 (i7-12700H, RTX 3080 Ti) Intel Core i7-12700H, NVIDIA GeForce RTX 3080 Ti Laptop GPU | Dell G15 5530 Intel Core i7-13650HX, NVIDIA GeForce RTX 4060 Laptop GPU | Asus TUF A15 FA507 AMD Ryzen 7 7735HS, NVIDIA GeForce RTX 4050 Laptop GPU | Aorus 15X ASF Intel Core i7-13700HX, NVIDIA GeForce RTX 4070 Laptop GPU | Asus ZenBook Pro 14 Duo UX8402VV-P1021W Intel Core i9-13900H, NVIDIA GeForce RTX 4060 Laptop GPU | MSI Cyborg 15 A12VF Intel Core i7-12650H, NVIDIA GeForce RTX 4060 Laptop GPU | Alienware x16 R1 Intel Core i9-13900HK, NVIDIA GeForce RTX 4080 Laptop GPU | |
|---|---|---|---|---|---|---|---|---|
| Heat | -5% | -9% | 11% | 13% | 9% | 15% | -4% | |
| Maximum Upper Side * (°C) | 50 | 57 -14% | 54 -8% | 48.9 2% | 42 16% | 37.1 26% | 47.5 5% | 47.2 6% |
| Maximum Bottom * (°C) | 50 | 52 -4% | 62.2 -24% | 44.6 11% | 51 -2% | 49.4 1% | 35.5 29% | 47.8 4% |
| Idle Upper Side * (°C) | 33 | 32 3% | 33.4 -1% | 27.1 18% | 27 18% | 30 9% | 27.7 16% | 36.8 -12% |
| Idle Bottom * (°C) | 32 | 34 -6% | 33.4 -4% | 27.5 14% | 26 19% | 32.4 -1% | 29.5 8% | 35.8 -12% |
* ... im mniej tym lepiej
Głośniki
Średnia postrzegana głośność dwóch głośników XMG Pro 15 wynosi zaledwie 72,5 dB(A). Wiele zakresów częstotliwości jest znacznie poniżej głośności wentylatora pod obciążeniem. W rezultacie, podczas grania, zestaw słuchawkowy lub zewnętrzne głośniki są koniecznością. Można je podłączyć przez gniazdo słuchawkowe 3,5 mm, Bluetooth lub optyczne S/PDIF przez złącze 3,5 mm. Korzystając z tej metody, możliwe jest również podłączenie systemu Surround Sound bezpośrednio do komputera.
Schenker XMG Pro 15 (E23) analiza dźwięku
(±) | głośność głośnika jest średnia, ale dobra (72.52 dB)
Bas 100 - 315 Hz
(±) | zredukowany bas - średnio 12.9% niższy od mediany
(±) | liniowość basu jest średnia (7.2% delta do poprzedniej częstotliwości)
Średnie 400 - 2000 Hz
(±) | wyższe średnie - średnio 6.2% wyższe niż mediana
(±) | liniowość środka jest średnia (7.8% delta do poprzedniej częstotliwości)
Wysokie 2–16 kHz
(+) | zrównoważone maksima - tylko 2.5% od mediany
(+) | wzloty są liniowe (4.6% delta do poprzedniej częstotliwości)
Ogólnie 100 - 16.000 Hz
(±) | liniowość ogólnego dźwięku jest średnia (18% różnicy w stosunku do mediany)
W porównaniu do tej samej klasy
» 55% wszystkich testowanych urządzeń w tej klasie było lepszych, 9% podobnych, 36% gorszych
» Najlepszy miał deltę 6%, średnia wynosiła ###średnia###%, najgorsza wynosiła 132%
W porównaniu do wszystkich testowanych urządzeń
» 38% wszystkich testowanych urządzeń było lepszych, 8% podobnych, 54% gorszych
» Najlepszy miał deltę 4%, średnia wynosiła ###średnia###%, najgorsza wynosiła 134%
Asus ZenBook Pro 14 Duo UX8402VV-P1021W analiza dźwięku
(+) | głośniki mogą odtwarzać stosunkowo głośno (83.7 dB)
Bas 100 - 315 Hz
(-) | prawie brak basu - średnio 19.9% niższa od mediany
(±) | liniowość basu jest średnia (11.9% delta do poprzedniej częstotliwości)
Średnie 400 - 2000 Hz
(+) | zbalansowane środki średnie - tylko 1.2% od mediany
(+) | średnie są liniowe (4.7% delta do poprzedniej częstotliwości)
Wysokie 2–16 kHz
(±) | wyższe maksima - średnio 5.5% wyższe od mediany
(+) | wzloty są liniowe (5.9% delta do poprzedniej częstotliwości)
Ogólnie 100 - 16.000 Hz
(±) | liniowość ogólnego dźwięku jest średnia (16.1% różnicy w stosunku do mediany)
W porównaniu do tej samej klasy
» 41% wszystkich testowanych urządzeń w tej klasie było lepszych, 6% podobnych, 53% gorszych
» Najlepszy miał deltę 5%, średnia wynosiła ###średnia###%, najgorsza wynosiła 45%
W porównaniu do wszystkich testowanych urządzeń
» 26% wszystkich testowanych urządzeń było lepszych, 5% podobnych, 69% gorszych
» Najlepszy miał deltę 4%, średnia wynosiła ###średnia###%, najgorsza wynosiła 134%
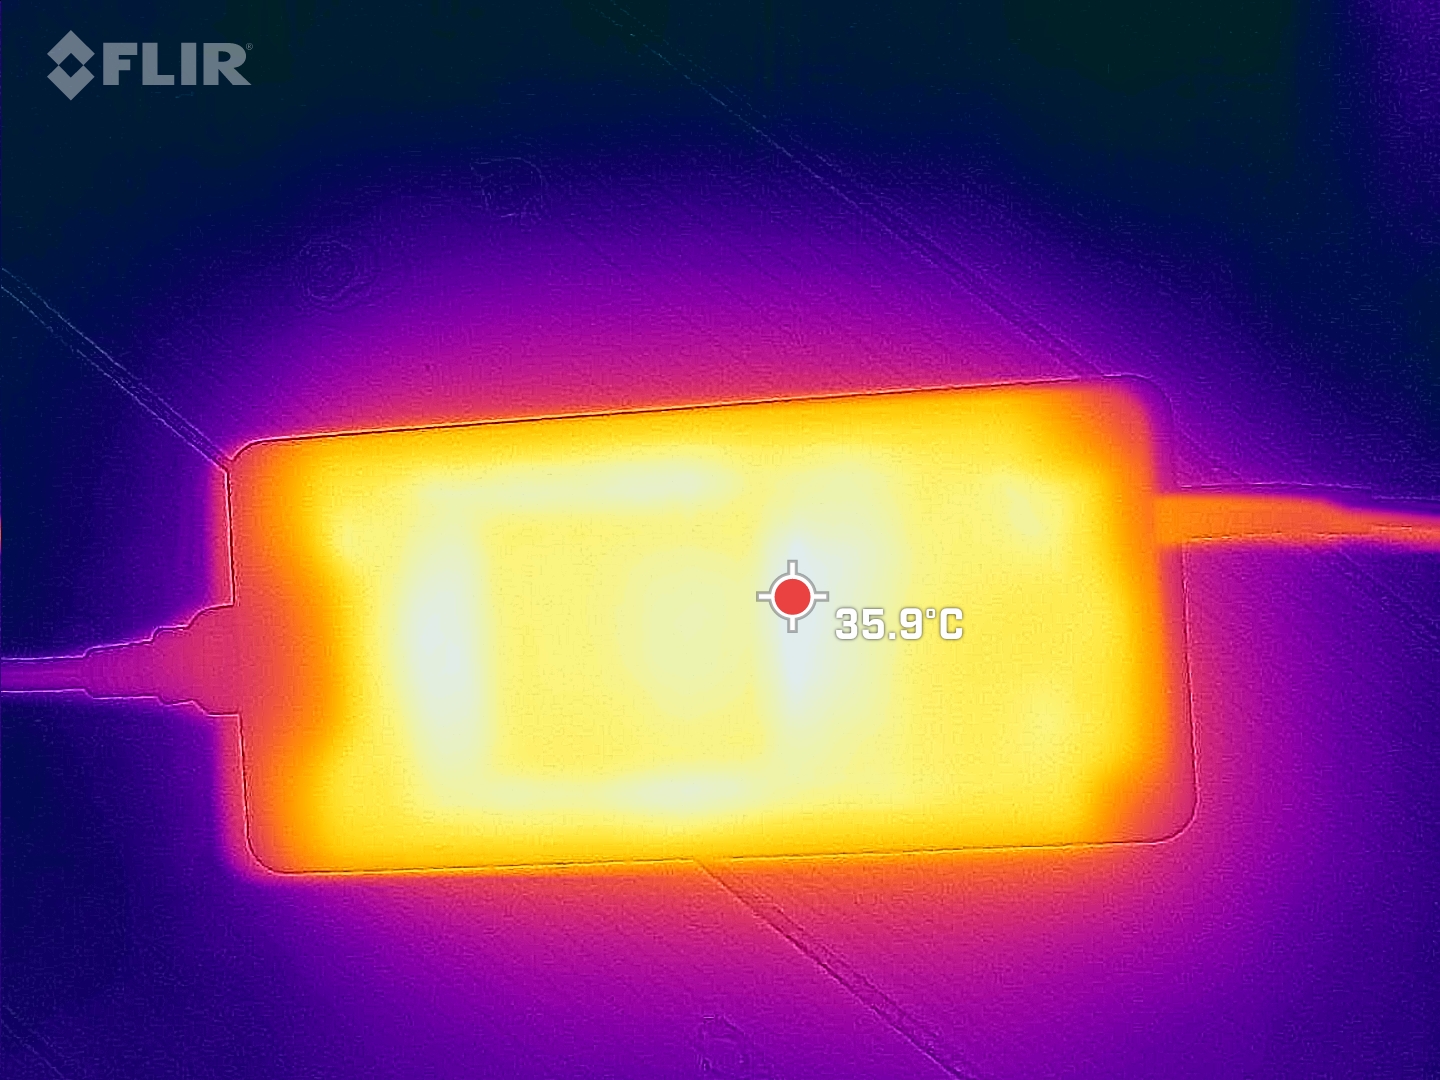
Zużycie energii
Zgodnie ze swoją kategorią, Schenker XMG Pro 15 nie jest energooszczędnym cudem. W zestawie znajduje się duży zasilacz, który może dostarczyć do 280 watów. W połączeniu z laptopem do gier oznacza to, że wciąż ma trochę w rezerwie. W teście obciążeniowym Prime95 i Furmark pobierał maksymalnie 269 watów, ale średnio było to raczej 215 watów.
| wyłączony / stan wstrzymania | |
| luz | |
| obciążenie |
|
Legenda:
min: | |
Power consumption Witcher 3 / stress test
Power consumption with an external monitor
Żywotność baterii
W naszym teście surfowania po Internecie przez Wi-Fi, XMG Pro 15 E23 nie był w stanie pracować dłużej niż sześć godzin. Niewiele więcej można jednak oczekiwać od baterii o pojemności 80 Wh. Recenzowane urządzenie ma jednak mały problem, jeśli chodzi o tryb uśpienia dGPU. Nie zawsze włącza się on niezawodnie, ale Schenker jest świadomy tego problemu i pracuje nad jego rozwiązaniem.
| Schenker XMG Pro 15 (E23) i9-13900HX, GeForce RTX 4060 Laptop GPU, 80 Wh | Schenker XMG Pro 15 (i7-12700H, RTX 3080 Ti) i7-12700H, GeForce RTX 3080 Ti Laptop GPU, 80 Wh | Dell G15 5530 i7-13650HX, GeForce RTX 4060 Laptop GPU, 86 Wh | Asus TUF A15 FA507 R7 7735HS, GeForce RTX 4050 Laptop GPU, 90 Wh | Aorus 15X ASF i7-13700HX, GeForce RTX 4070 Laptop GPU, 99 Wh | Asus ZenBook Pro 14 Duo UX8402VV-P1021W i9-13900H, GeForce RTX 4060 Laptop GPU, 76 Wh | MSI Cyborg 15 A12VF i7-12650H, GeForce RTX 4060 Laptop GPU, 53.5 Wh | Alienware x16 R1 i9-13900HK, GeForce RTX 4080 Laptop GPU, 90 Wh | Średnia w klasie Gaming | |
|---|---|---|---|---|---|---|---|---|---|
| Czasy pracy | -2% | -22% | 29% | 25% | 71% | 27% | -60% | -1% | |
| WiFi v1.3 (h) | 5.7 | 5.8 2% | 6.5 14% | 11.7 105% | 8.2 44% | 9 58% | 7.5 32% | 2.5 -56% | 6.96 ? 22% |
| Load (h) | 1.9 | 1.8 -5% | 0.8 -58% | 1 -47% | 2 5% | 3.5 84% | 2.3 21% | 0.7 -63% | 1.47 ? -23% |
| H.264 (h) | 5.3 | 6.8 | 12.5 | 7.9 | 8 | 8.28 ? | |||
| Witcher 3 ultra (h) | 0.8 | ||||||||
| Reader / Idle (h) | 11.3 | 13.6 | 7.3 | 8.71 ? |
Za
Przeciw
Werdykt - idealny dla równowagi między pracą a zabawą

XMG Pro 15 E23 jest reklamowany jako gamingowa stacja robocza. W naszej recenzji spełnia on wszystkie wymagania dobrego laptopa do gier średniej klasy, ale także wiele aspektów, które czynią go przyzwoitym laptopem do pracy wideo i filmowej. Niepozorna konstrukcja w żaden sposób nie odzwierciedla piorunującej wydajności 15,6-calowego urządzenia. Po wyjęciu z pudełka Schenker udoskonalił solidny barebone, który jest wyposażony w dobre urządzenia wejściowe i duży wybór portów, a także wysokiej jakości komponenty.
Niektóre wady poprzednika zostały znacznie zredukowane lub całkowicie wyeliminowane. Teraz dysk SSD działa stabilnie przy wysokich prędkościach, wyświetlacz jest jaśniejszy, a głośność została nieznacznie dostosowana. Laptop do gier nadal nie jest cichy, ale teraz wie, kiedy zachowywać się właściwie.
Kilka postrzępionych krawędzi XMG Pro 15 E23 zostało wygładzonych, co oznacza, że laptop do gier ma teraz tylko kilka drobnych niedogodności.
Nie ma wyraźnych negatywnych punktów, które by się wyróżniały. Brak tylnego portu USB jest raczej niefortunny, co oznacza, że tylko bezprzewodowa mysz i klawiatura zapewnią pulpit bez kabli. Każdy, kto nie chce stale przesuwać laptopa do granic jego wydajności, będzie zadowolony z korzystania z cichego trybu rozrywki. Większość gier również działa dobrze. Jedynie wolne czasy reakcji wyświetlacza QHD 240 Hz nas niepokoją. W międzyczasie różnica w stosunku do konkurentów, takich jakAorus 15X ASF lub MSI Cyborg 15 można znaleźć tylko w szczegółach. Każdy, kto ma oko na bardziej ekscytujący laptop do gier, lepiej przyjrzałby sięAlienware x16 R1 lubAsus ROG Strix G16- ale nie zostaniesz nagrodzony o wiele większą mocą.
Cena i dostępność
XMG Pro 15 można skonfigurować w Bestware. Bez systemu Windows, dysku SSD i minimalnej ilości pamięci RAM cena laptopa zaczyna się od 1893 euro. Nasze urządzenie testowe bez systemu Windows 11 kosztuje 2150 euro. Za aktywowany system Windows 11 Home, Bestware żąda dodatkowych 100 euro. Schenker wyraźnie nie podąża za spiralą wzrostu cen. W zeszłym roku Pro 15 E22z RTX 3070 Ti, 32 GB pamięci RAM i dyskiem SSD 1 TB kosztował 2510 euro. W przypadku E23 z RTX 4070, 32 GB pamięci RAM i 1 TB SSD Bestware ma cenę wywoławczą 2400 euro.
Schenker XMG Pro 15 (E23)
- 04/07/2023 v7 (old)
Marc Herter
Przezroczystość
Wyboru urządzeń do recenzji dokonuje nasza redakcja. Próbka testowa została udostępniona autorowi jako pożyczka od producenta lub sprzedawcy detalicznego na potrzeby tej recenzji. Pożyczkodawca nie miał wpływu na tę recenzję, producent nie otrzymał też kopii tej recenzji przed publikacją. Nie było obowiązku publikowania tej recenzji. Jako niezależna firma medialna, Notebookcheck nie podlega władzy producentów, sprzedawców detalicznych ani wydawców.
Tak testuje Notebookcheck
Każdego roku Notebookcheck niezależnie sprawdza setki laptopów i smartfonów, stosując standardowe procedury, aby zapewnić porównywalność wszystkich wyników. Od około 20 lat stale rozwijamy nasze metody badawcze, ustanawiając przy tym standardy branżowe. W naszych laboratoriach testowych doświadczeni technicy i redaktorzy korzystają z wysokiej jakości sprzętu pomiarowego. Testy te obejmują wieloetapowy proces walidacji. Nasz kompleksowy system ocen opiera się na setkach uzasadnionych pomiarów i benchmarków, co pozwala zachować obiektywizm.Price comparison

