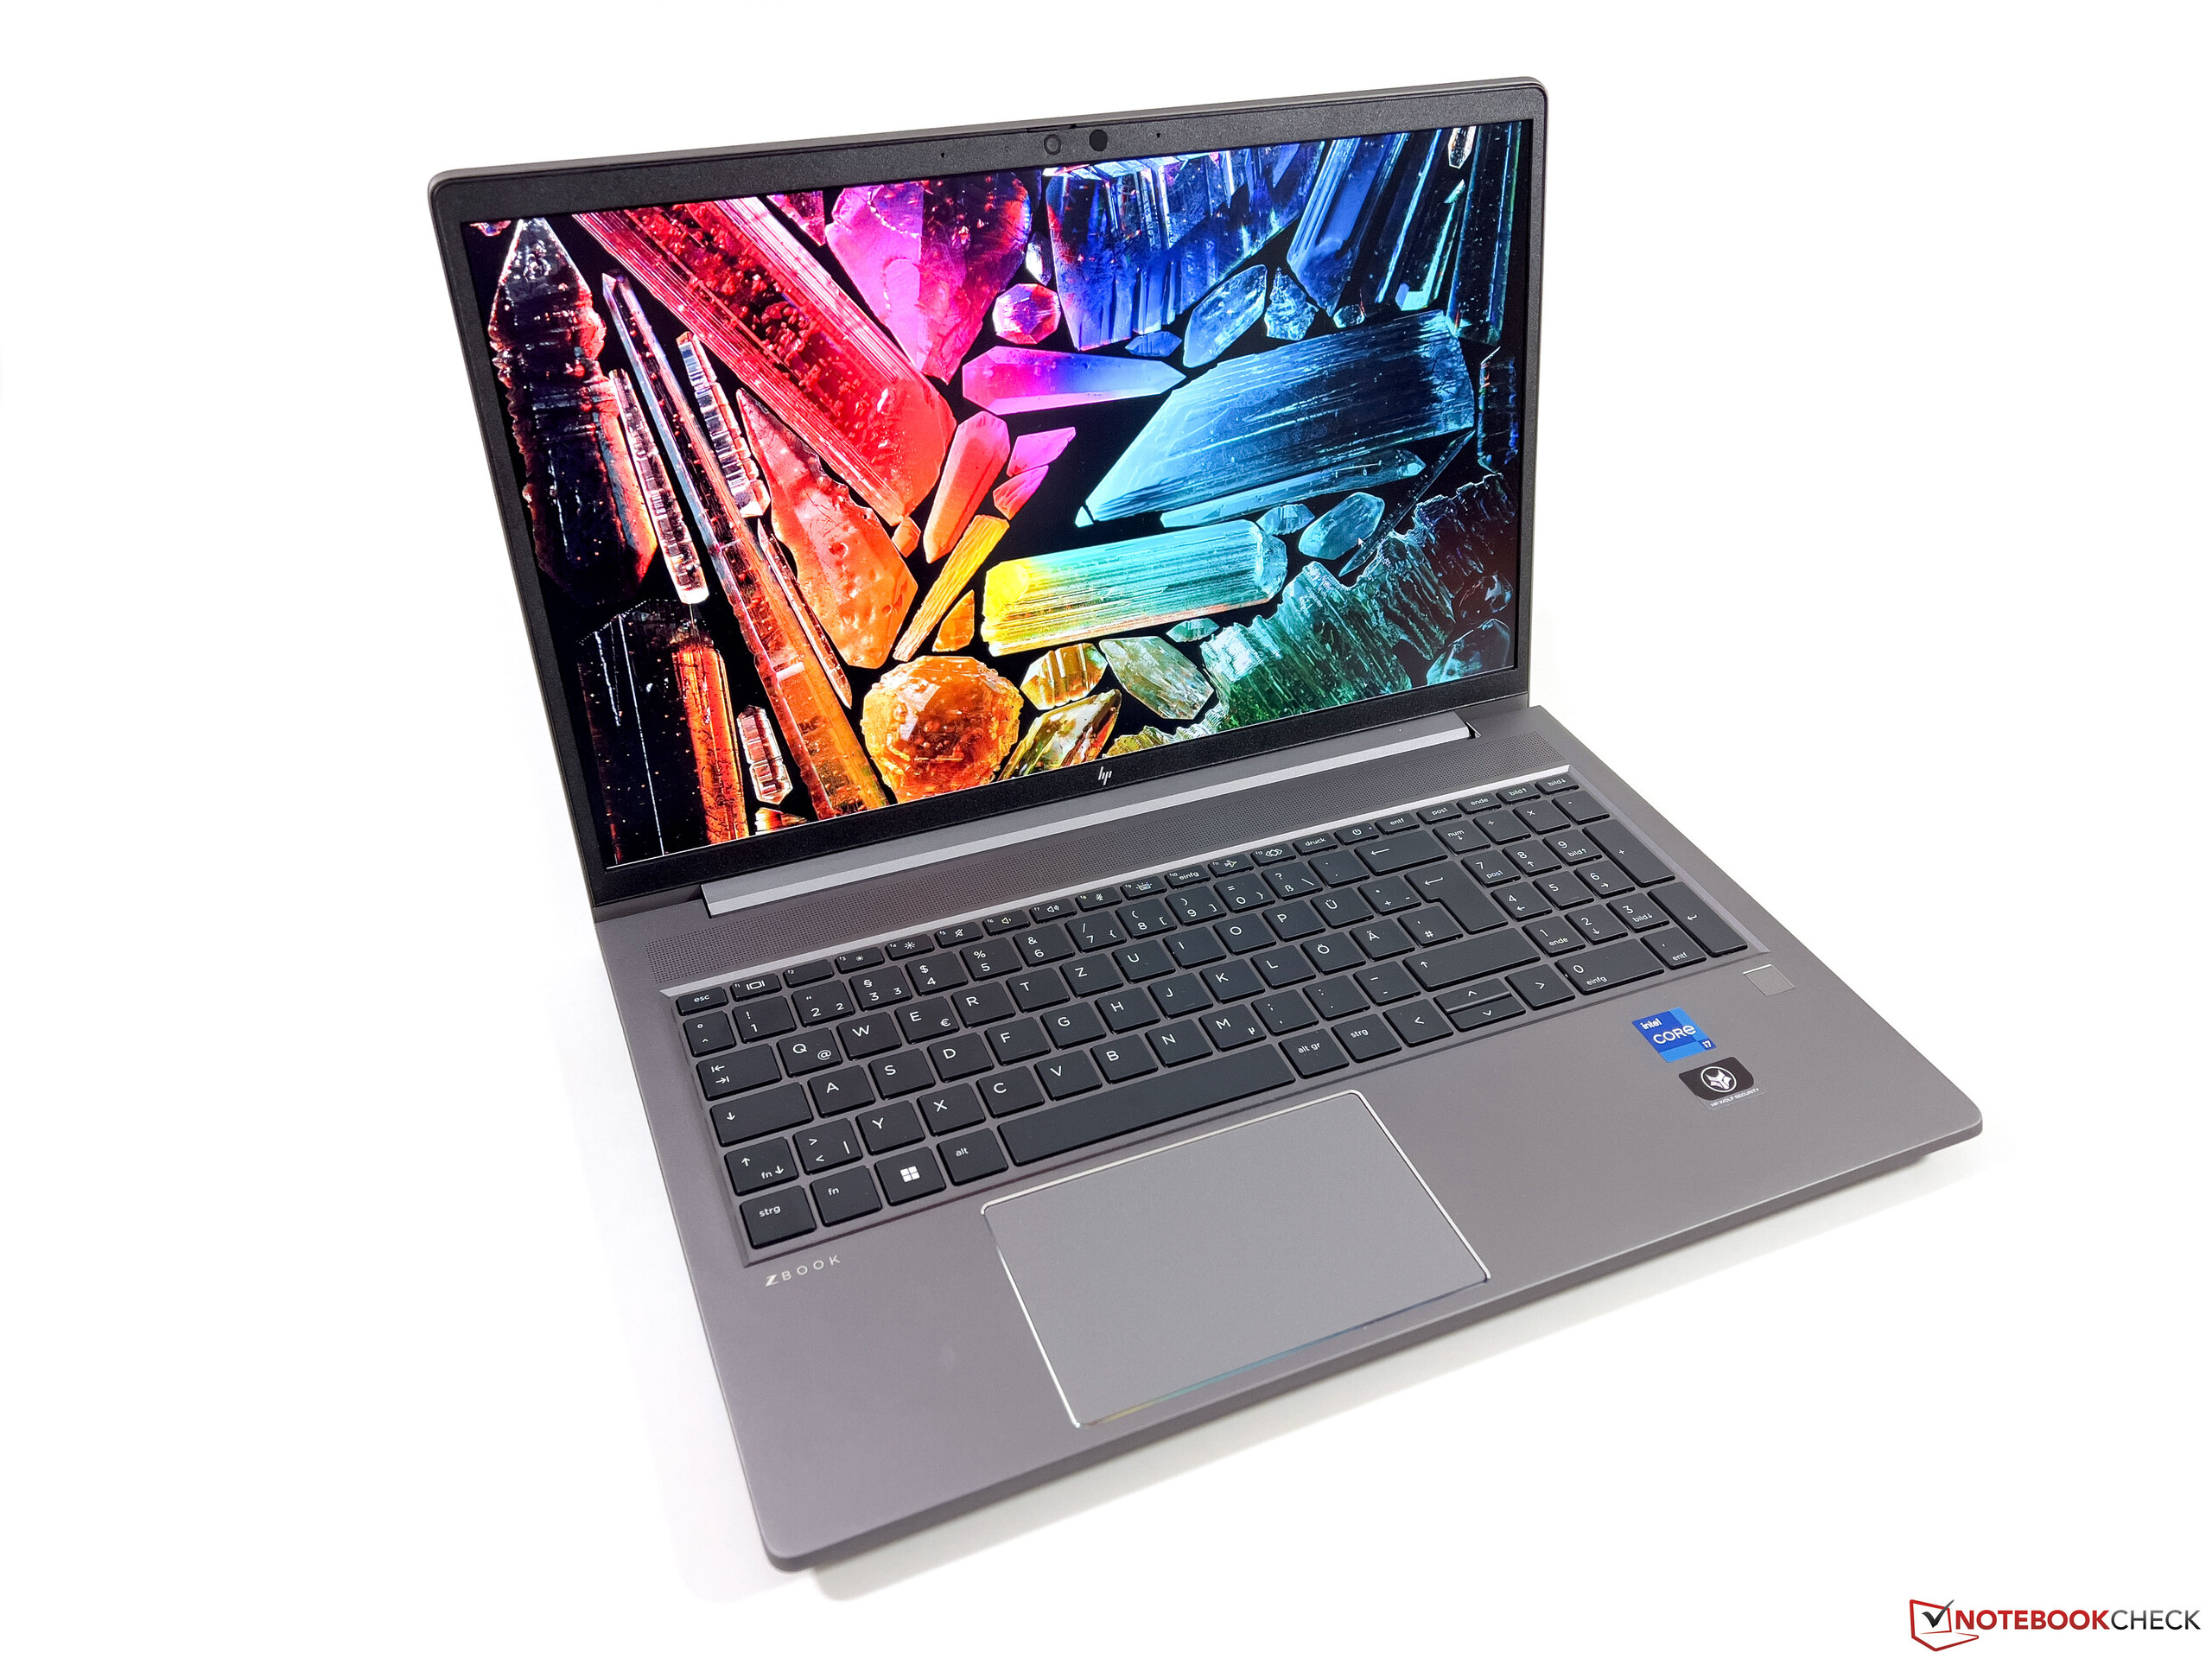
Recenzja stacji roboczej HP ZBook Power 15 G10: Doskonała alternatywa dla ThinkPada P15v

HP ZBook Power 15 G10 zastępuje zeszłoroczny model ZBook Power 15 G9, zastępując procesory Intel Alder Lake 12. generacji nowszymi Raptor Lake 13. generacji i AMD Ryzen Zen 4. Poza tym obudowa jest identyczna z ZBook Power 15 G9 lub ZBook Power 15 G8 dlatego też zalecamy zapoznanie się z naszymi starszymi recenzjami, aby dowiedzieć się więcej o fizycznych cechach tego modelu.
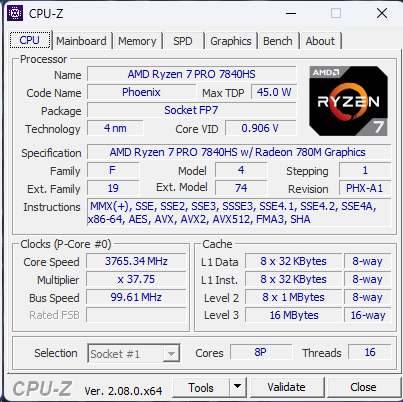
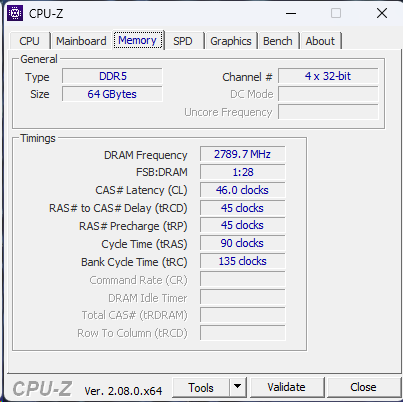
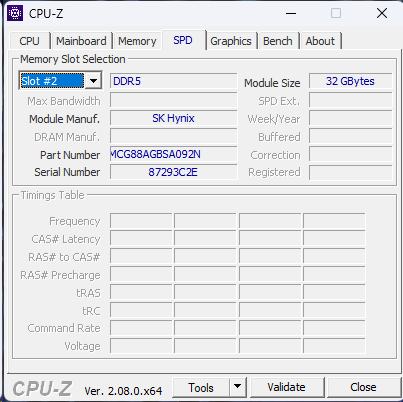
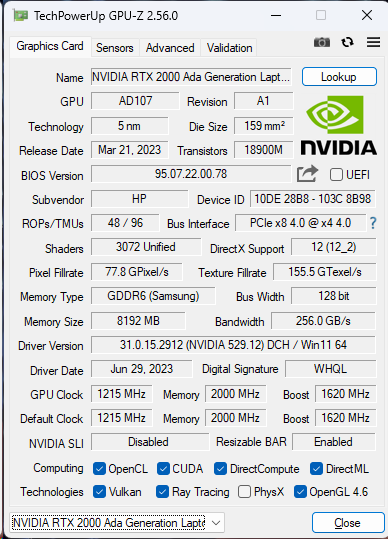
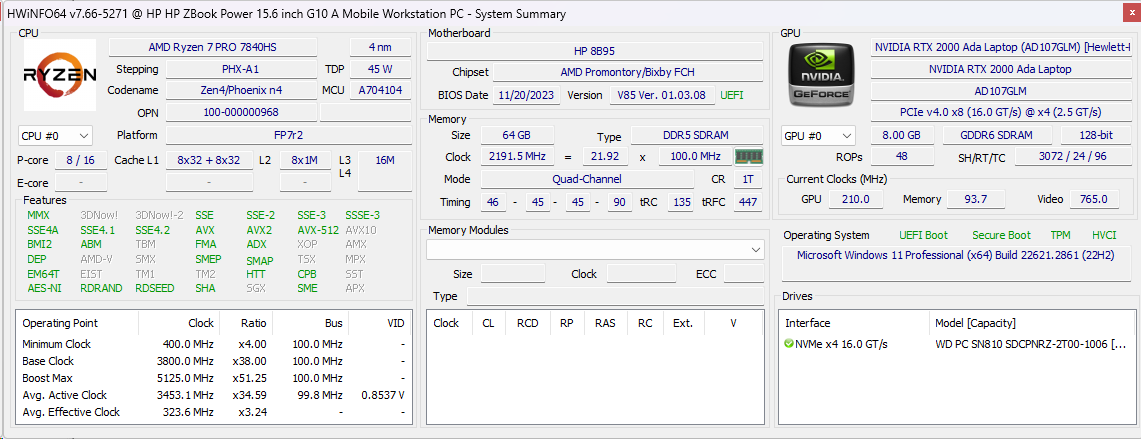
Nasza konkretna jednostka testowa to najwyższej klasy konfiguracja AMD z procesorem Ryzen 7 Pro 7940HS, kartą graficzną Nvidia RTX 2000 Ada, wyświetlaczem IPS 1440p i 64 GB pamięci RAM DDR5-5600 za około 2600 USD. Mniejsze jednostki SKU zaczynające się od Ryzen 5 7640HS, wyświetlacza 1080p i tylko zintegrowanej grafiki są również dostępne w cenie już od 1600 USD. Proszę zauważyć, że konfiguracje z procesorami Intela noszą nazwę ZBook Power 15 G10, podczas gdy te z procesorami AMD są sprzedawane jako ZBook Power 15 G10 A.
Alternatywy dla ZBook Power 15 G10 obejmują inne ultracienkie stacje robocze, takie jak Dell Precision 5560, Lenovo ThinkPad P15v G3 lub Asus ExpertBook B6 Flip.
Więcej recenzji HP:
Potencjalni konkurenci w porównaniu
Ocena | Data | Model | Waga | Wysokość | Rozmiar | Rezolucja | Cena |
|---|---|---|---|---|---|---|---|
| 88.9 % v7 (old) | 12/2023 | HP ZBook Power 15 G10 R7 PRO 7840HS, RTX 2000 Ada Generation Laptop | 2 kg | 22.9 mm | 15.60" | 2560x1440 | |
| 87.4 % v7 (old) | 01/2023 | HP ZBook Power 15 G9 6B8C4EA i7-12700H, RTX A2000 Laptop GPU | 2 kg | 22.8 mm | 15.60" | 3840x2160 | |
| 87.8 % v7 (old) | 04/2023 | Lenovo ThinkPad P15v G3 21EM001AGE R7 PRO 6850H, RTX A2000 Laptop GPU | 2.2 kg | 22.7 mm | 15.60" | 3840x2160 | |
| 88.3 % v7 (old) | Dell Precision 5000 5560 i7-11850H, RTX A2000 Laptop GPU | 2 kg | 18 mm | 15.60" | 3840x2400 | ||
| 91.7 % v7 (old) | 10/2023 | Lenovo ThinkPad P1 G6-21FV000DGE i9-13900H, RTX 2000 Ada Generation Laptop | 1.9 kg | 17.5 mm | 16.00" | 2560x1600 | |
| 89.6 % v7 (old) | 01/2023 | Asus ExpertBook B6 Flip B6602FC2 i9-12950HX, RTX A2000 Laptop GPU | 2.8 kg | 27.2 mm | 16.00" | 2560x1600 |
Sprawa
Komunikacja
| Networking | |
| iperf3 transmit AX12 | |
| Dell Precision 5000 5560 | |
| iperf3 receive AX12 | |
| Dell Precision 5000 5560 | |
| iperf3 transmit AXE11000 | |
| HP ZBook Power 15 G10 | |
| Lenovo ThinkPad P1 G6-21FV000DGE | |
| Asus ExpertBook B6 Flip B6602FC2 | |
| Lenovo ThinkPad P15v G3 21EM001AGE | |
| iperf3 receive AXE11000 | |
| Lenovo ThinkPad P1 G6-21FV000DGE | |
| Lenovo ThinkPad P15v G3 21EM001AGE | |
| Asus ExpertBook B6 Flip B6602FC2 | |
| HP ZBook Power 15 G10 | |
| iperf3 transmit AXE11000 6GHz | |
| HP ZBook Power 15 G9 6B8C4EA | |
| HP ZBook Power 15 G10 | |
| Asus ExpertBook B6 Flip B6602FC2 | |
| Lenovo ThinkPad P15v G3 21EM001AGE | |
| iperf3 receive AXE11000 6GHz | |
| HP ZBook Power 15 G9 6B8C4EA | |
| Asus ExpertBook B6 Flip B6602FC2 | |
| Lenovo ThinkPad P15v G3 21EM001AGE | |
| HP ZBook Power 15 G10 | |
Kamera internetowa
Podczas gdy nasz ZBook Power G9 był skonfigurowany z kamerą internetową 1 MP, nasz Power G10 jest wyposażony w kamerę internetową 5 MP, która zapewnia znacznie ostrzejszy obraz. Funkcje podczerwieni i fizycznej migawki pozostały niezmienione.


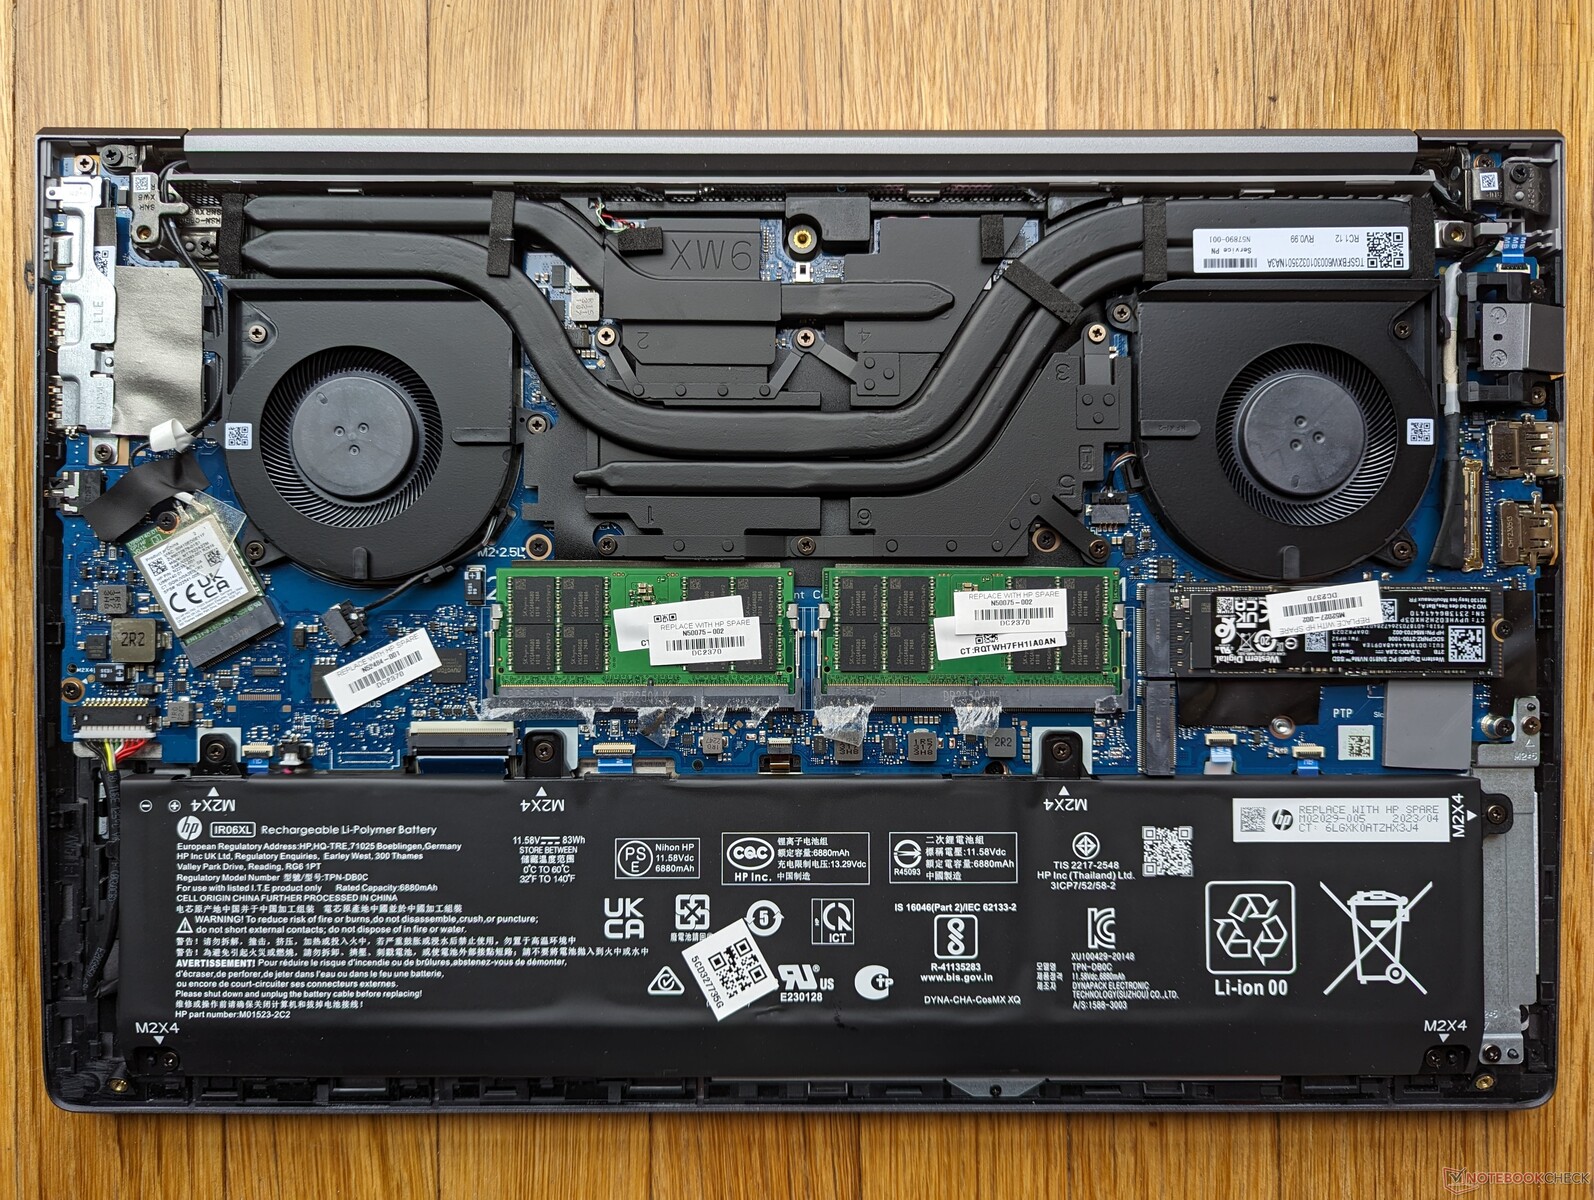
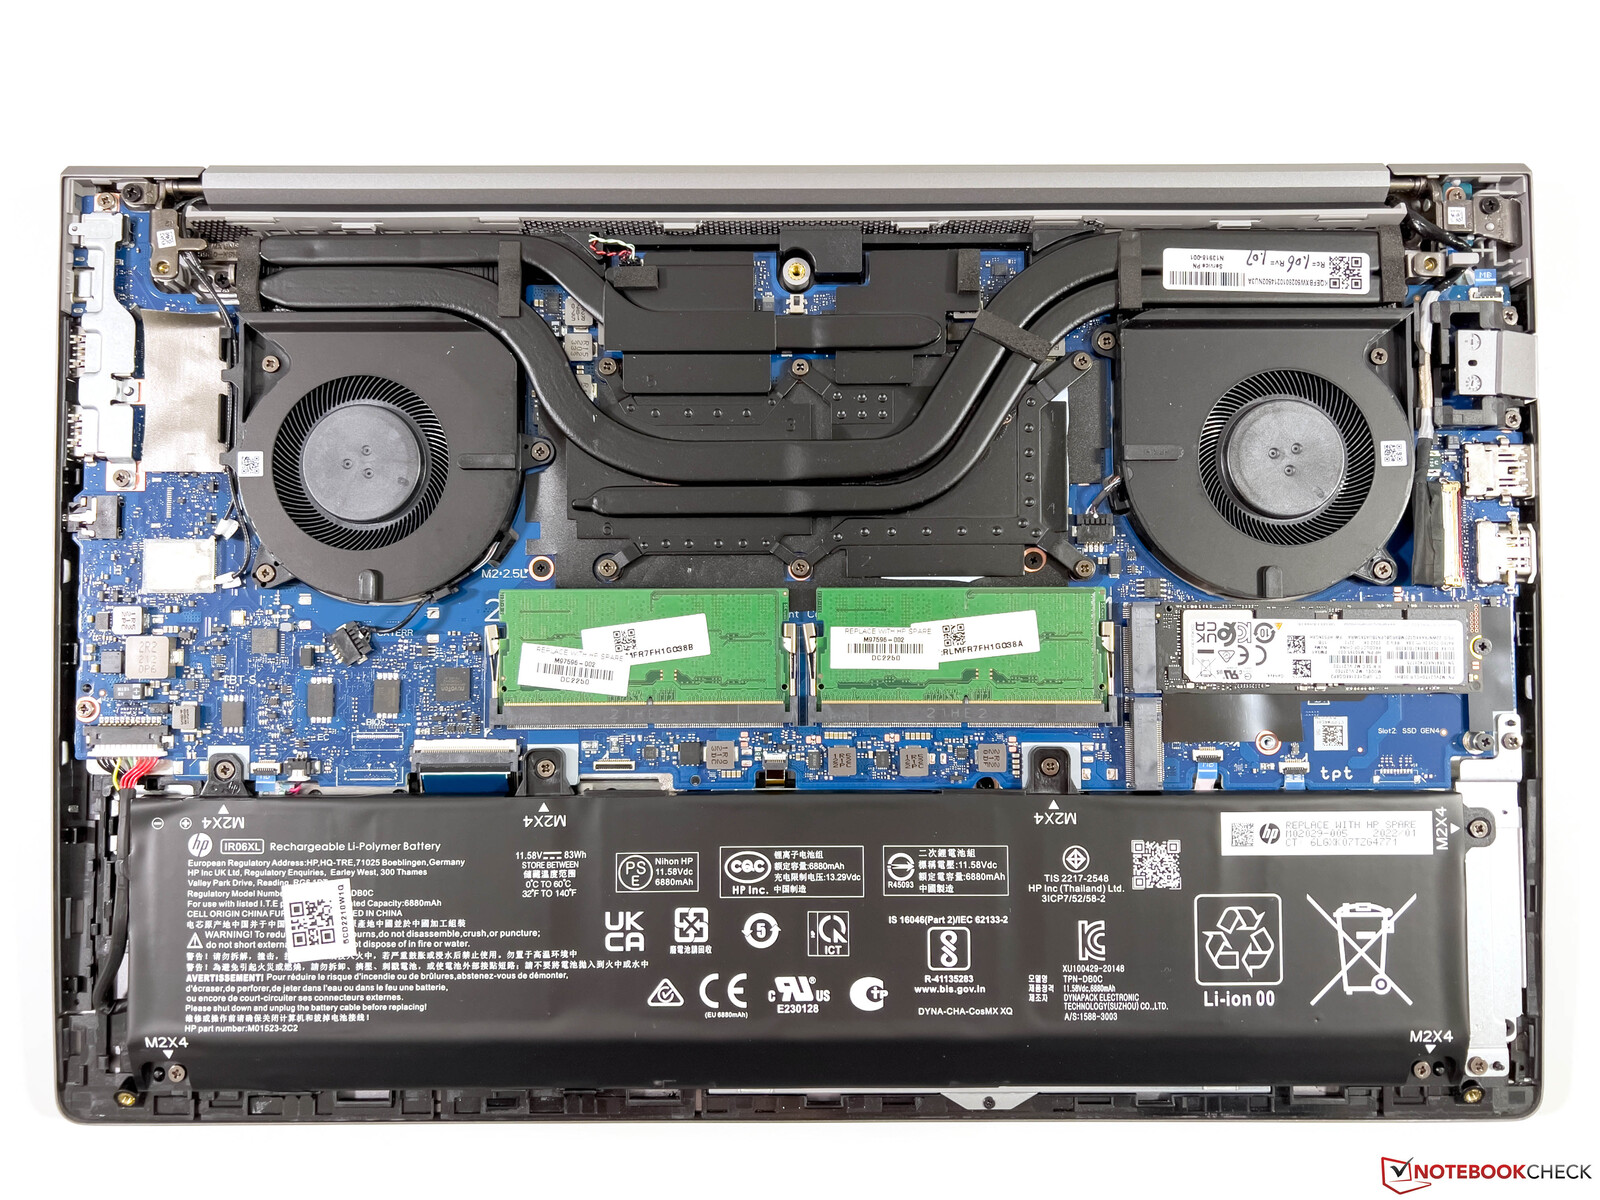
Konserwacja
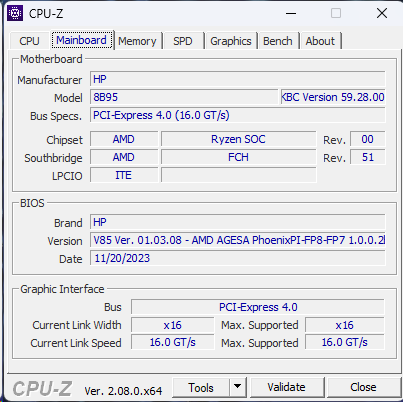
HP wprowadziło jedną małą, ale zauważalną zmianę: moduł M.2 WLAN jest teraz wymienny, podczas gdy w zeszłorocznym ZBook Power 15 G9 był on przylutowany. Większość pozostałych elementów pozostała nietknięta, w tym dwa gniazda DDR5 SODIMM i dwa gniazda M.2 PCIe4 x4.
Wyświetlacz
Model ten oferuje cztery następujące opcje matowego wyświetlacza:
- 1080p, 250 nitów, 60% sRGB, ekran dotykowy
- 1080p, 250 nitów, 60% sRGB, bezdotykowy
- 1080p, 400 nitów, 100% sRGB, bezdotykowy
- 1440p, 300 nitów, 100% sRGB, bezdotykowy, 120 Hz
O ile ekran dotykowy nie jest koniecznością, zalecamy unikanie dwóch 250-nitowych opcji, ponieważ każda z nich pokrywa tylko 45% NTSC, zapewniając zauważalnie płytsze kolory.
Z nieznanych powodów HP nie oferuje opcji 4K dla żadnej konfiguracji ZBook Power G10, mimo że były one wcześniej dostępne w ZBook Power G9. Podejrzewamy, że może to być spowodowane problemami z dostawami, ponieważ producenci obecnie odchodzą od 15,6-calowych paneli 16:9 na rzecz 16-calowych paneli 16:10.
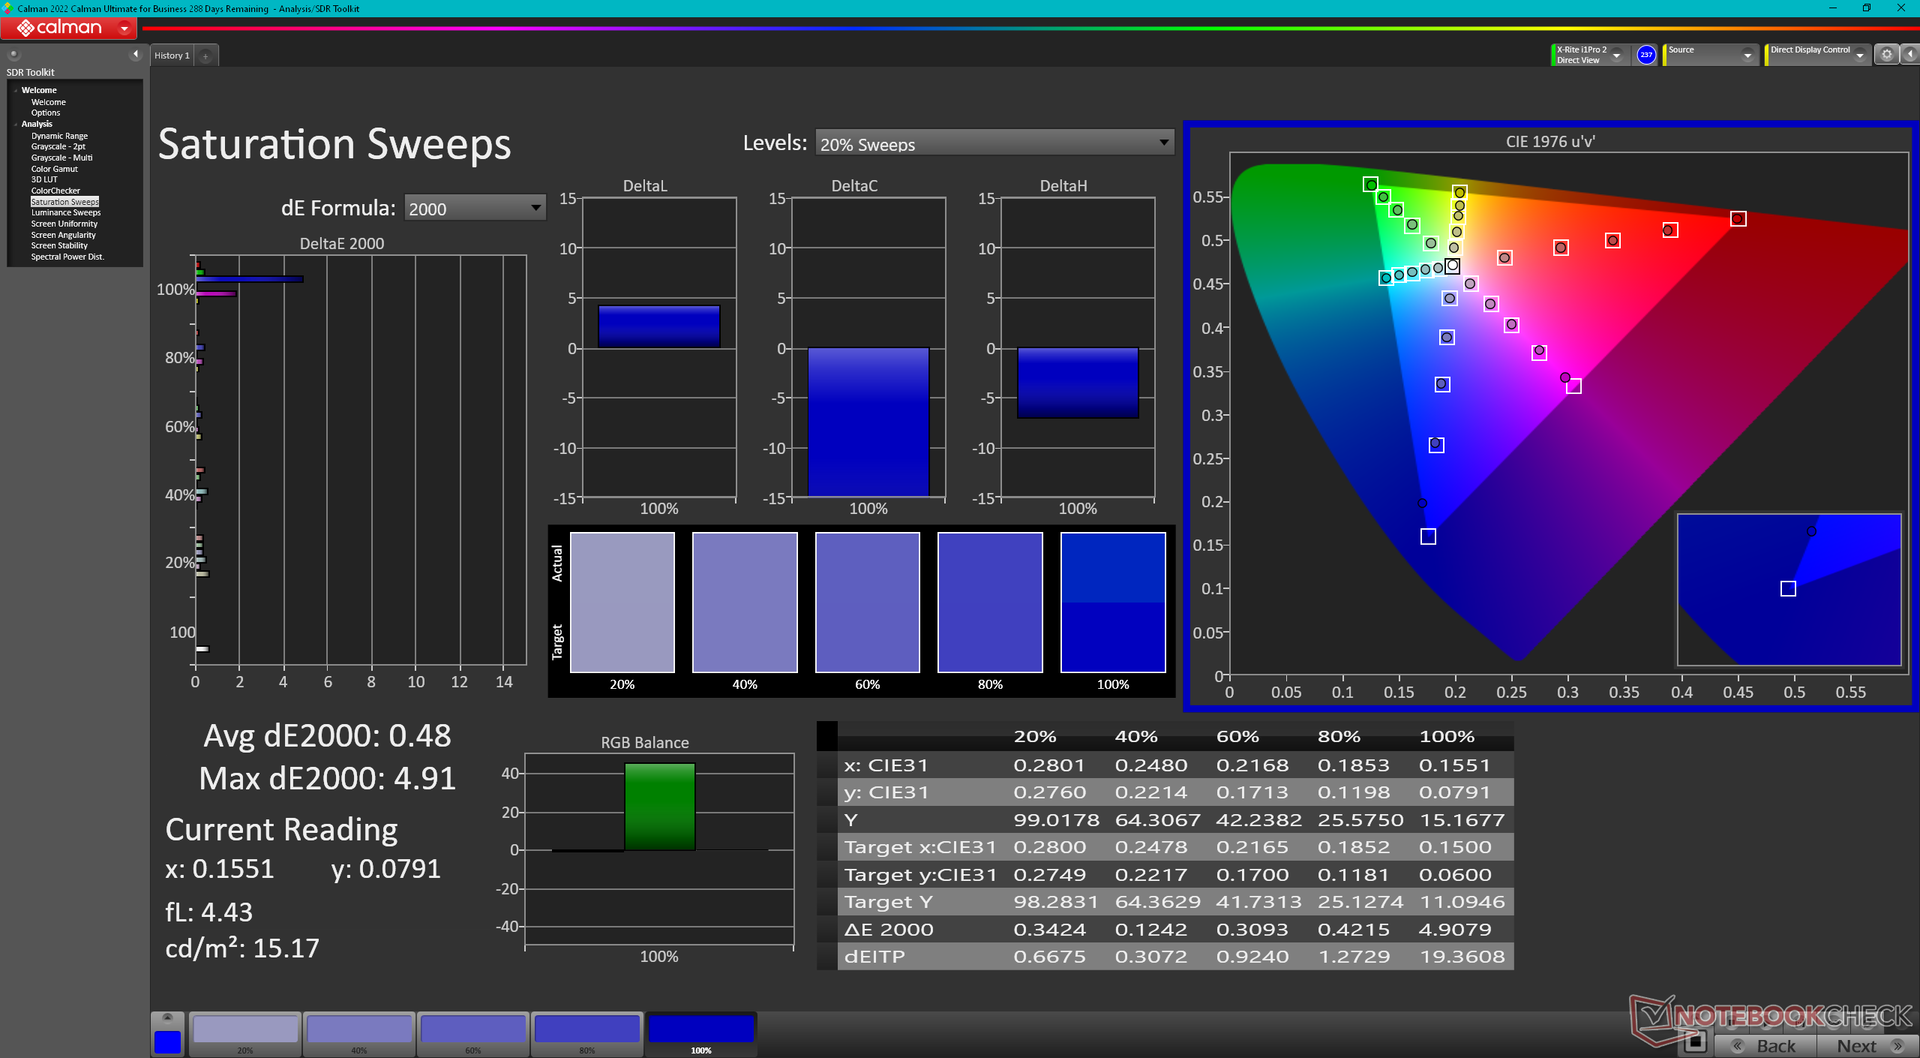
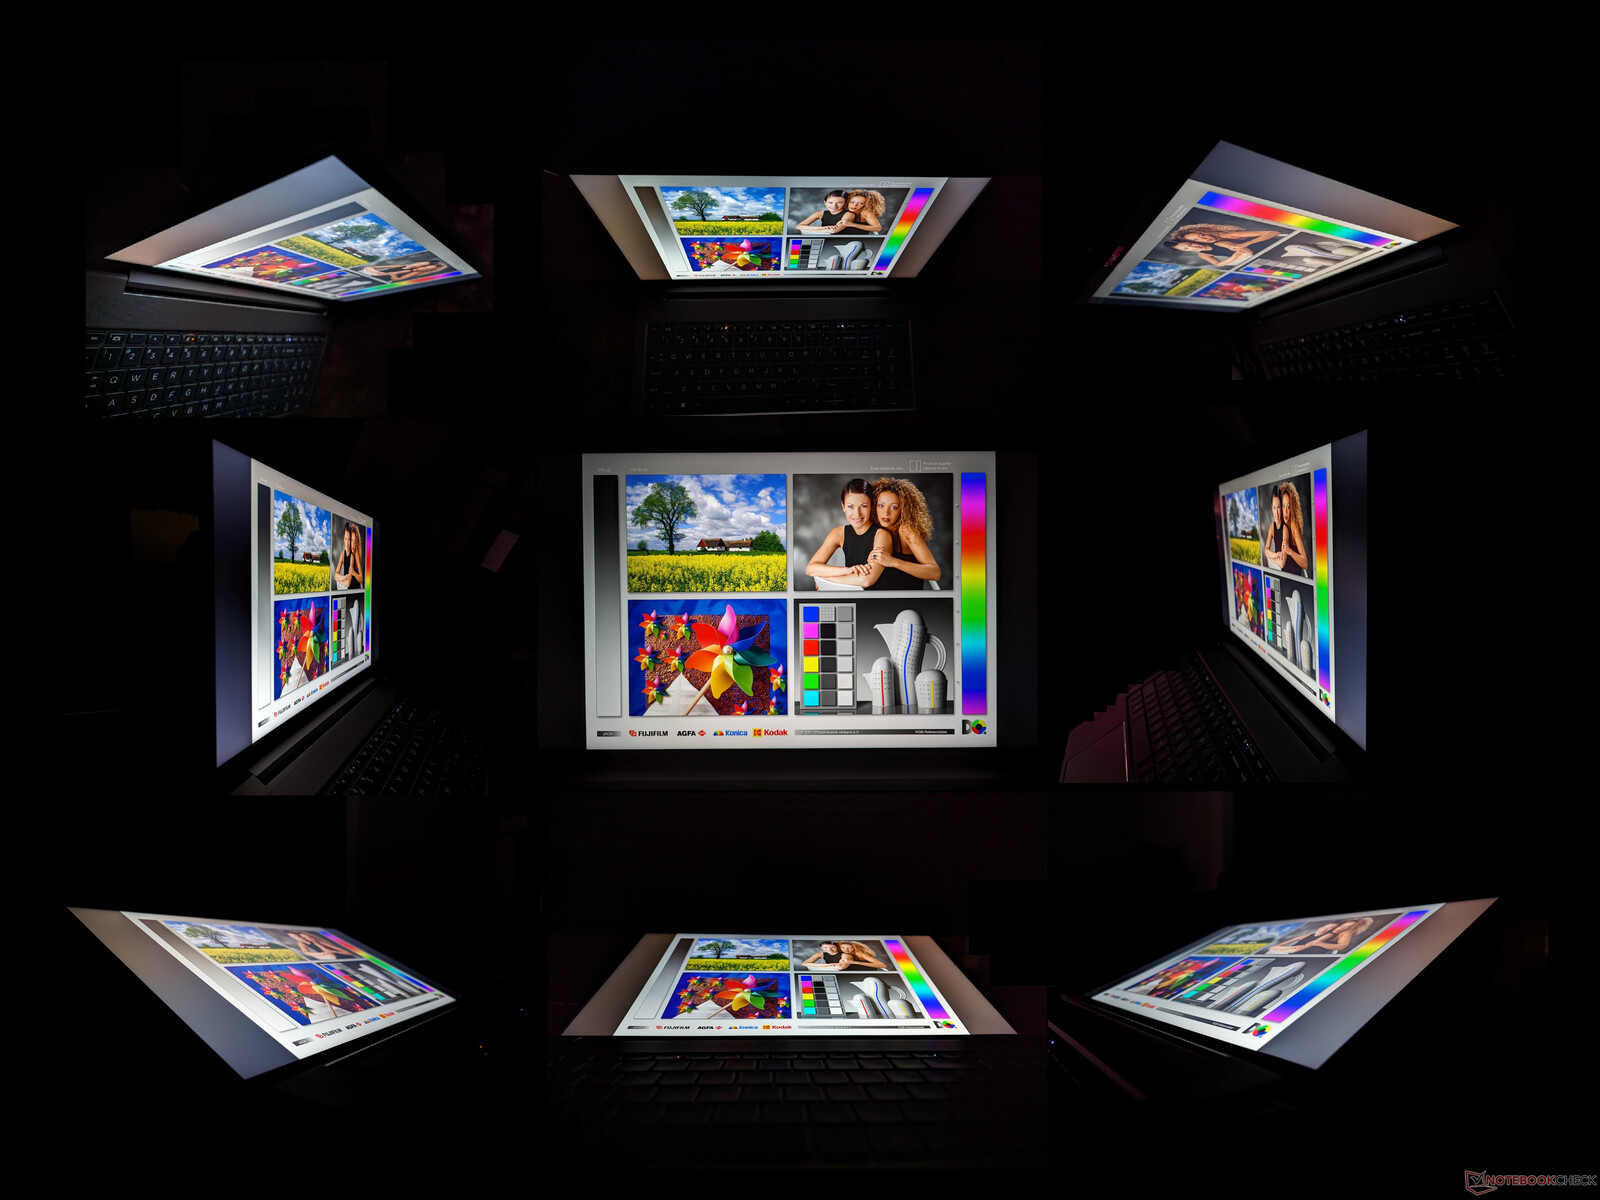
Nasz panel 1440p jest jednak doskonały dzięki szybkiej częstotliwości odświeżania, krótkiemu czasowi reakcji i dokładnym kolorom sRGB odpowiednim do tworzenia treści, a nawet gier. Może nie jest to OLED lub 4K, ale nadal jest to jeden z lepszych 15,6-calowych wyświetlaczy IPS.


| |||||||||||||||||||||||||
rozświetlenie: 83 %
na akumulatorze: 313.8 cd/m²
kontrast: 1082:1 (czerń: 0.29 cd/m²)
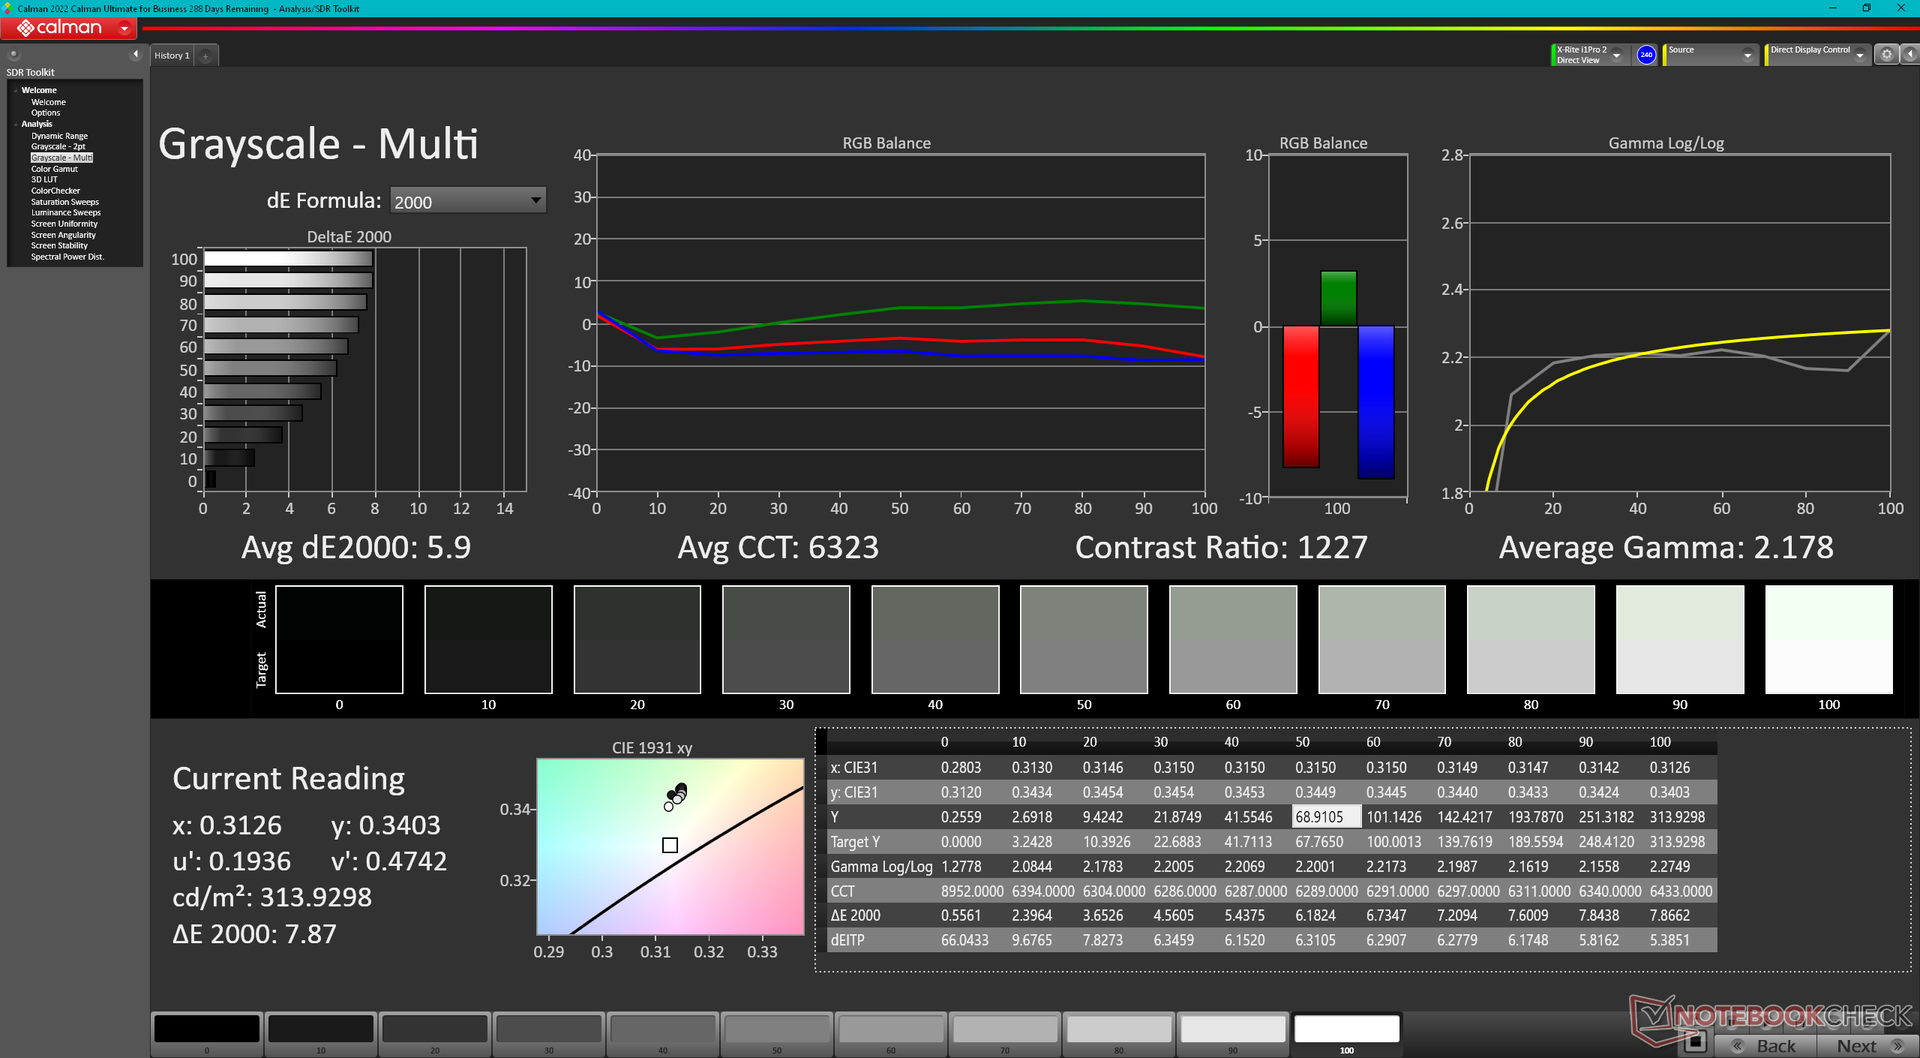
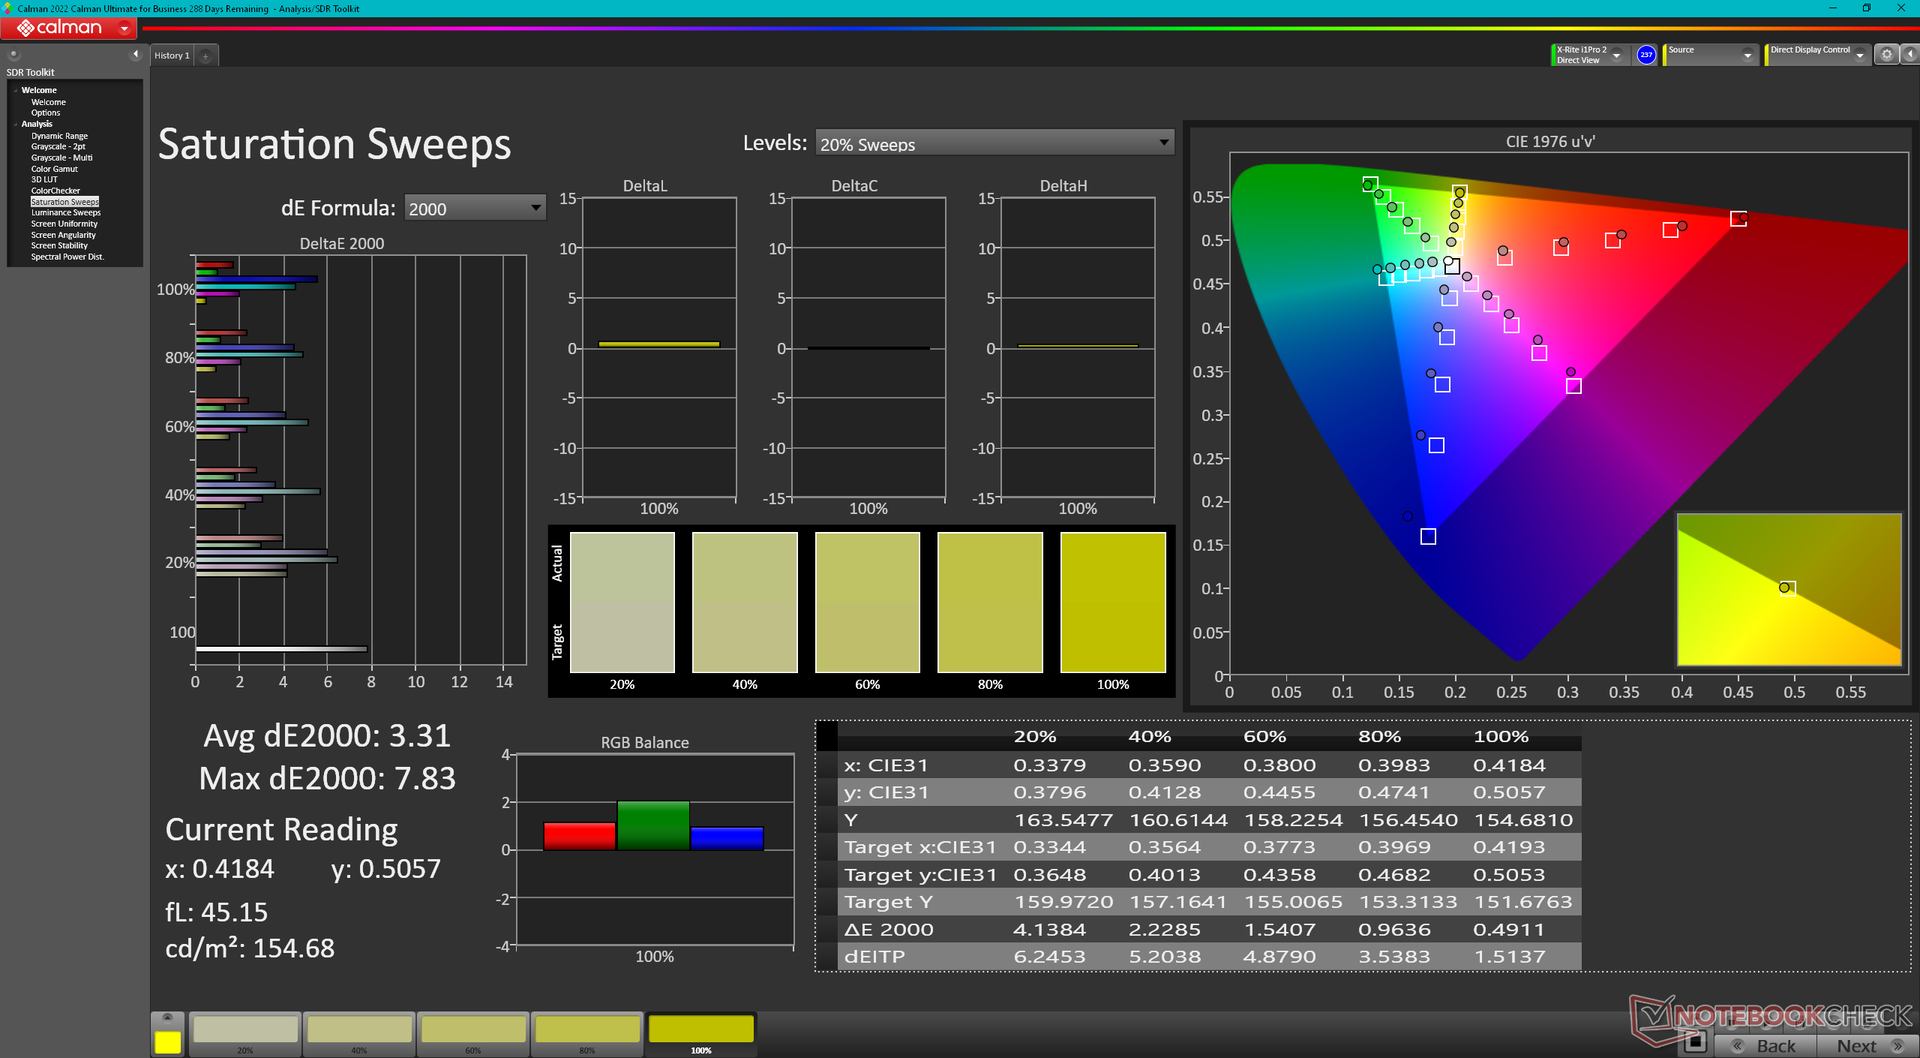
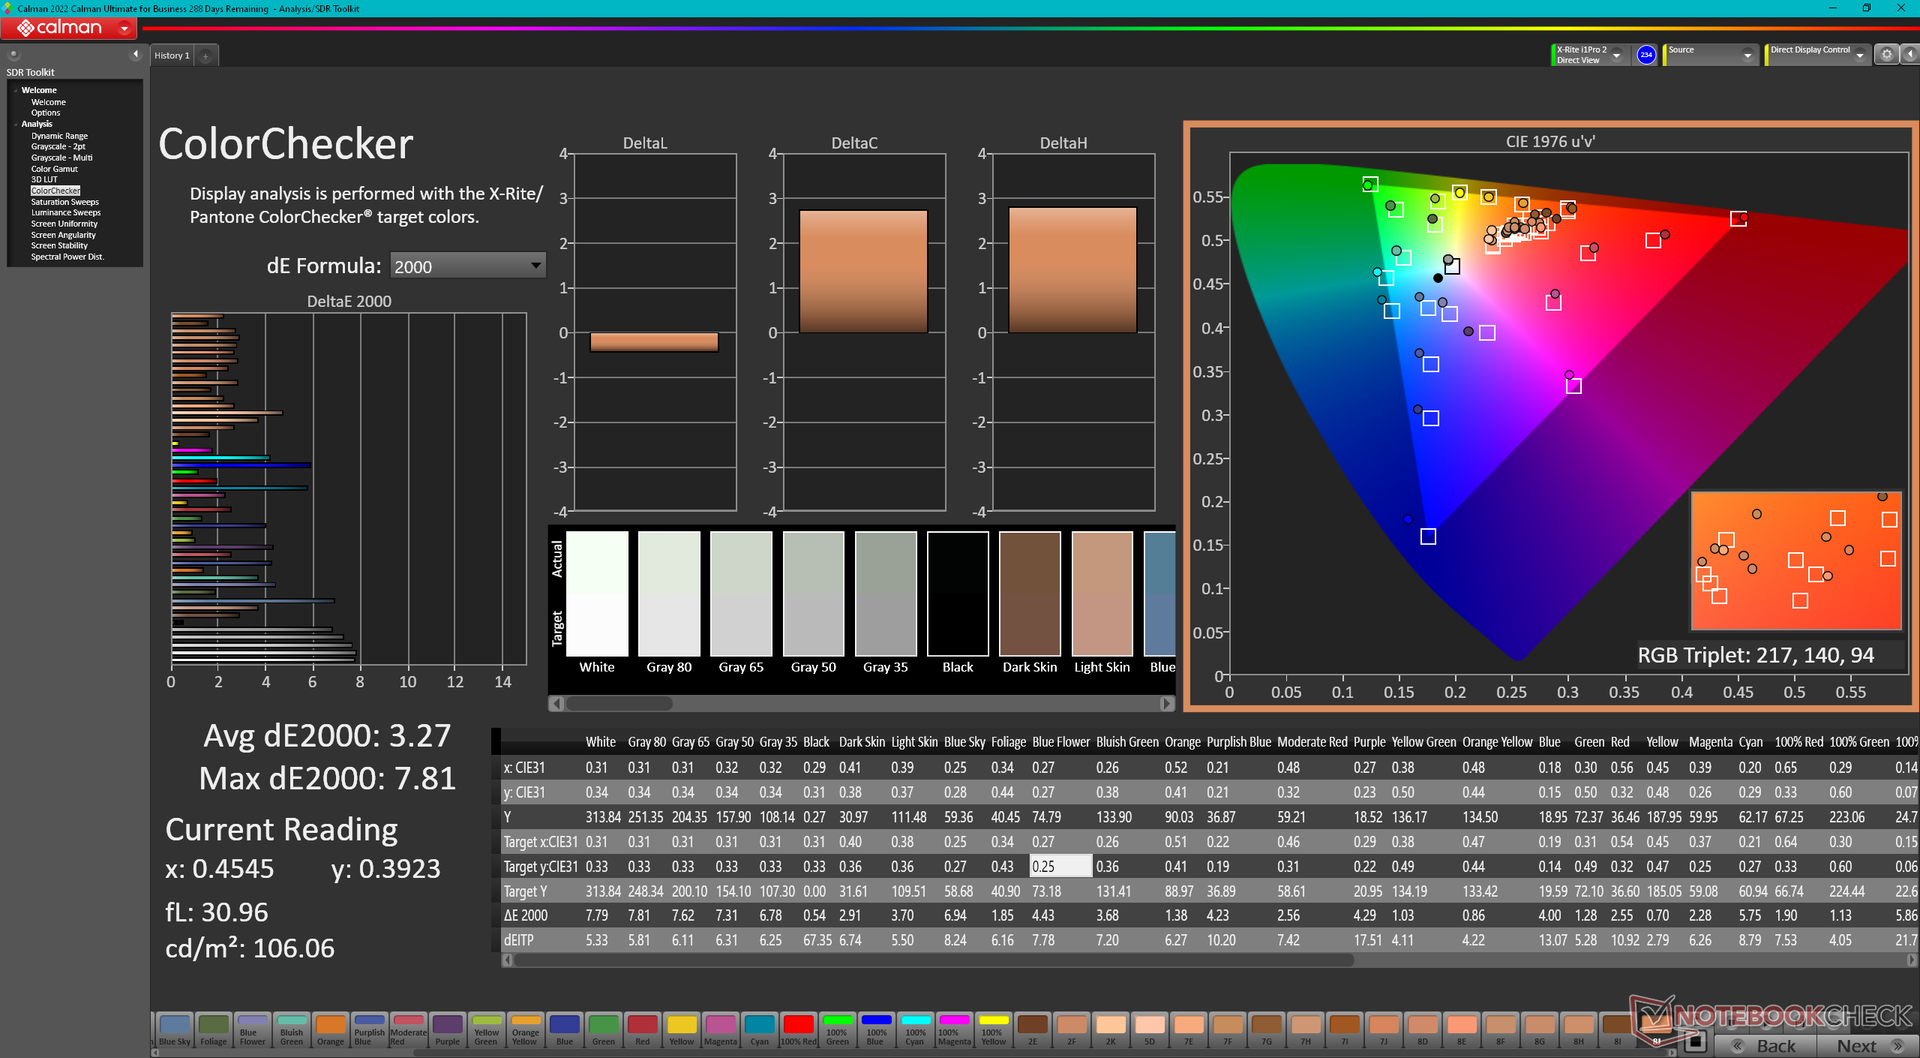
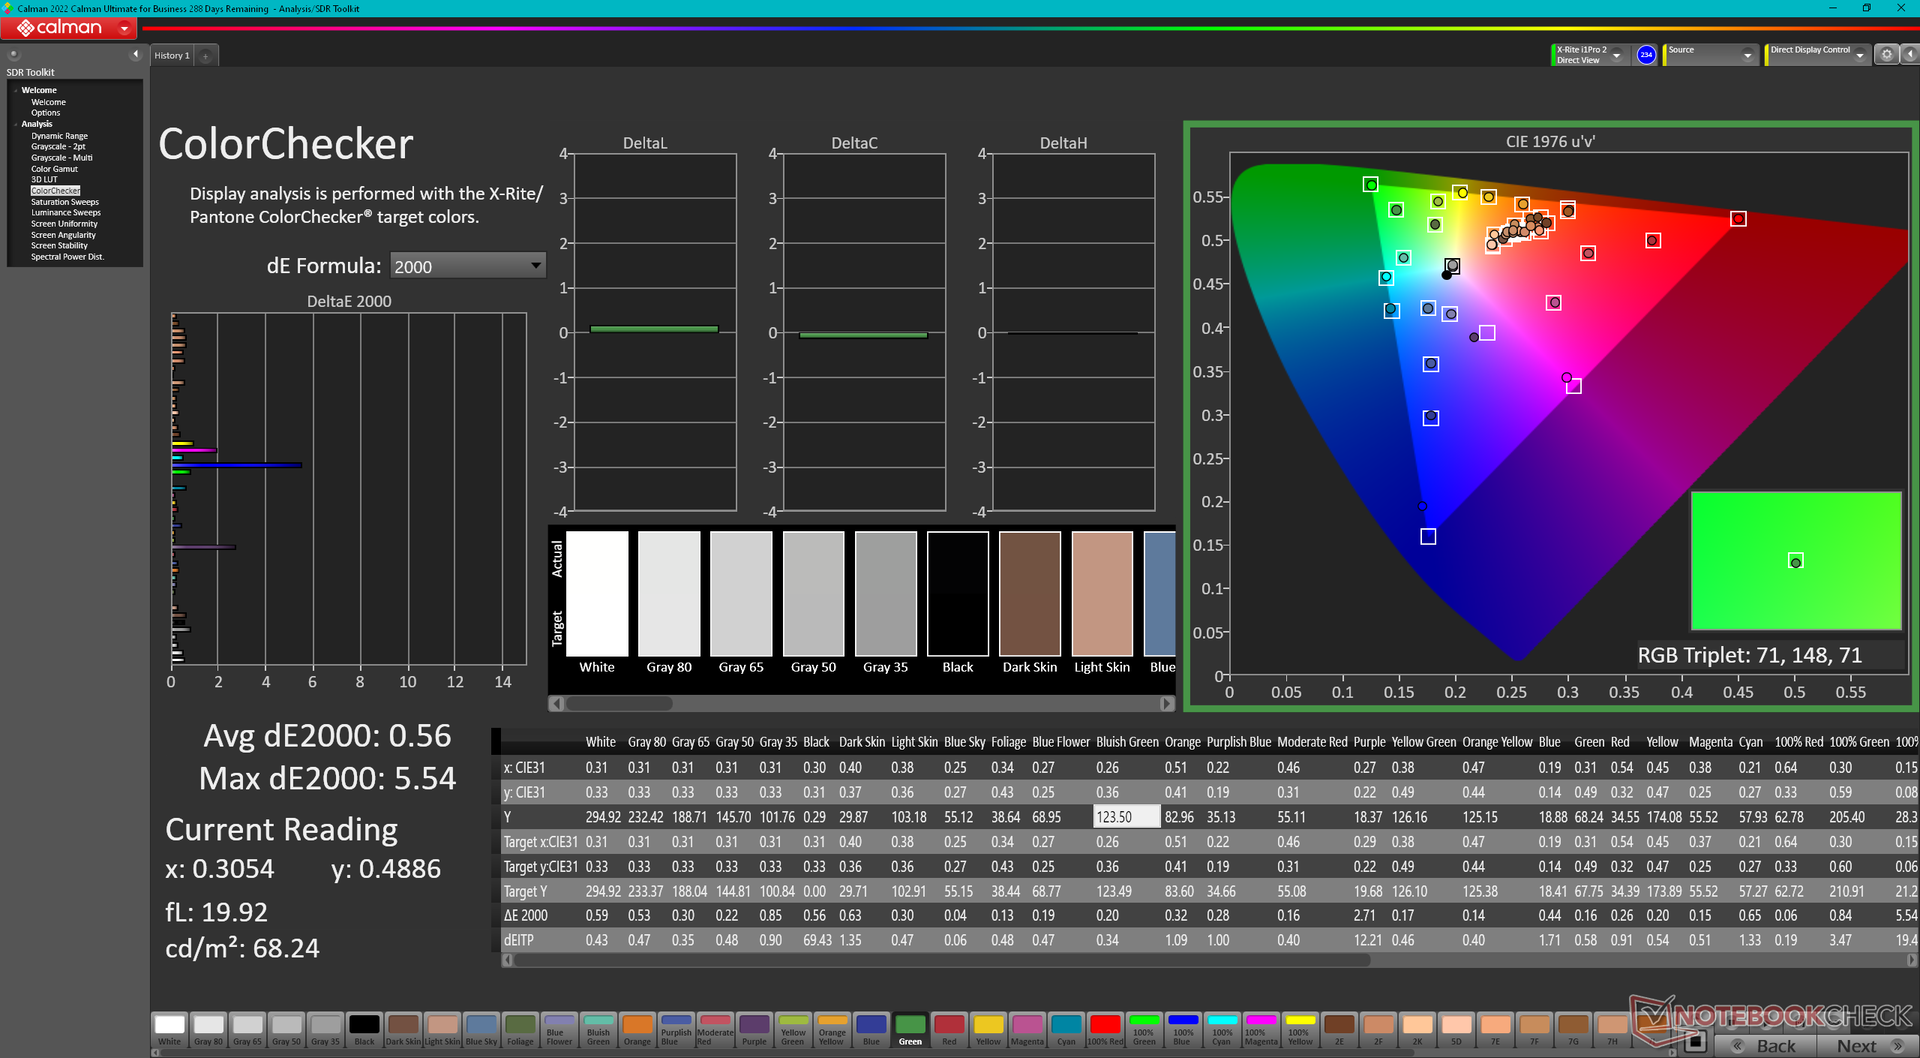
ΔE ColorChecker Calman: 3.27 | ∀{0.5-29.43 Ø4.72}
calibrated: 0.56
ΔE Greyscale Calman: 5.9 | ∀{0.09-98 Ø4.97}
70.5% AdobeRGB 1998 (Argyll 3D)
95.6% sRGB (Argyll 3D)
68.2% Display P3 (Argyll 3D)
Gamma: 2.18
CCT: 6323 K
| HP ZBook Power 15 G10 BOE0B6A, IPS, 2560x1440, 15.6" | HP ZBook Power 15 G9 6B8C4EA LGD073F, IPS, 3840x2160, 15.6" | Lenovo ThinkPad P15v G3 21EM001AGE NE156QUM-N6C, IPS LED, 3840x2160, 15.6" | Dell Precision 5000 5560 Sharp LQ156R1, IPS, 3840x2400, 15.6" | Lenovo ThinkPad P1 G6-21FV000DGE NE160QDM-NY1, IPS, 2560x1600, 16" | Asus ExpertBook B6 Flip B6602FC2 AU Optronics Model: AUOE495, IPS, 2560x1600, 16" | |
|---|---|---|---|---|---|---|
| Display | 1% | 26% | 29% | 1% | 23% | |
| Display P3 Coverage (%) | 68.2 | 69.1 1% | 89.9 32% | 94.9 39% | 68.1 0% | 97.9 44% |
| sRGB Coverage (%) | 95.6 | 97.7 2% | 100 5% | 100 5% | 97.5 2% | 99.89 4% |
| AdobeRGB 1998 Coverage (%) | 70.5 | 69.6 -1% | 99.9 42% | 100 42% | 70.2 0% | 85.52 21% |
| Response Times | -214% | -211% | -228% | 2% | -120% | |
| Response Time Grey 50% / Grey 80% * (ms) | 13 ? | 45.8 ? -252% | 46.7 ? -259% | 47.2 ? -263% | 13.7 ? -5% | 36 ? -177% |
| Response Time Black / White * (ms) | 10.4 ? | 28.6 ? -175% | 27.3 ? -163% | 30.4 ? -192% | 9.6 ? 8% | 17 ? -63% |
| PWM Frequency (Hz) | ||||||
| Screen | 18% | 5% | 7% | 30% | -20% | |
| Brightness middle (cd/m²) | 313.8 | 392 25% | 588 87% | 501.5 60% | 521 66% | 440 40% |
| Brightness (cd/m²) | 302 | 388 28% | 536 77% | 467 55% | 484 60% | 418 38% |
| Brightness Distribution (%) | 83 | 88 6% | 83 0% | 83 0% | 89 7% | 82 -1% |
| Black Level * (cd/m²) | 0.29 | 0.15 48% | 0.38 -31% | 0.44 -52% | 0.36 -24% | 0.3 -3% |
| Contrast (:1) | 1082 | 2613 141% | 1547 43% | 1140 5% | 1447 34% | 1467 36% |
| Colorchecker dE 2000 * | 3.27 | 3.2 2% | 3.9 -19% | 4.73 -45% | 1.2 63% | 2.81 14% |
| Colorchecker dE 2000 max. * | 7.81 | 7 10% | 8.8 -13% | 8.45 -8% | 2.5 68% | 4.62 41% |
| Colorchecker dE 2000 calibrated * | 0.56 | 1.2 -114% | 1 -79% | 0.51 9% | 1 -79% | 2.99 -434% |
| Greyscale dE 2000 * | 5.9 | 4.9 17% | 7.1 -20% | 3.6 39% | 1.4 76% | 0.91 85% |
| Gamma | 2.18 101% | 2.13 103% | 2.12 104% | 2.08 106% | 2.25 98% | 2.2 100% |
| CCT | 6323 103% | 5982 109% | 7268 89% | 6447 101% | 6682 97% | 6600 98% |
| Całkowita średnia (program / ustawienia) | -65% /
-19% | -60% /
-21% | -64% /
-22% | 11% /
20% | -39% /
-25% |
* ... im mniej tym lepiej
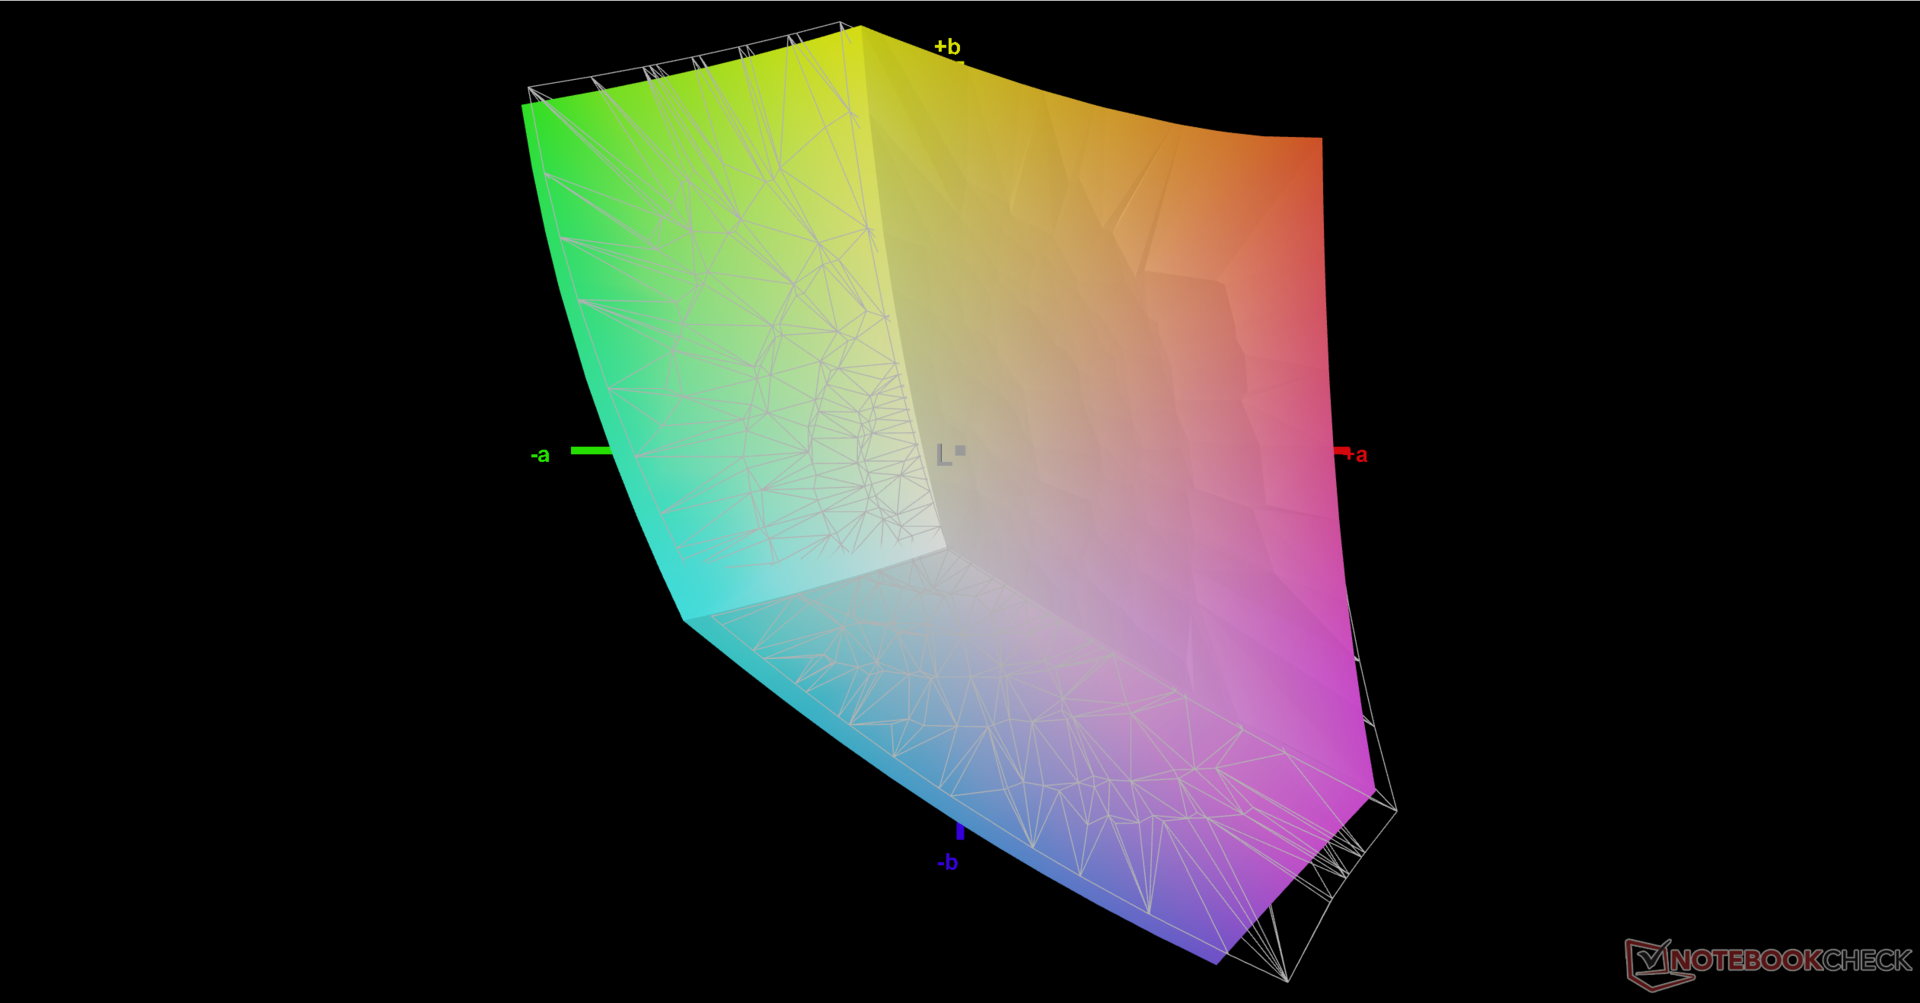
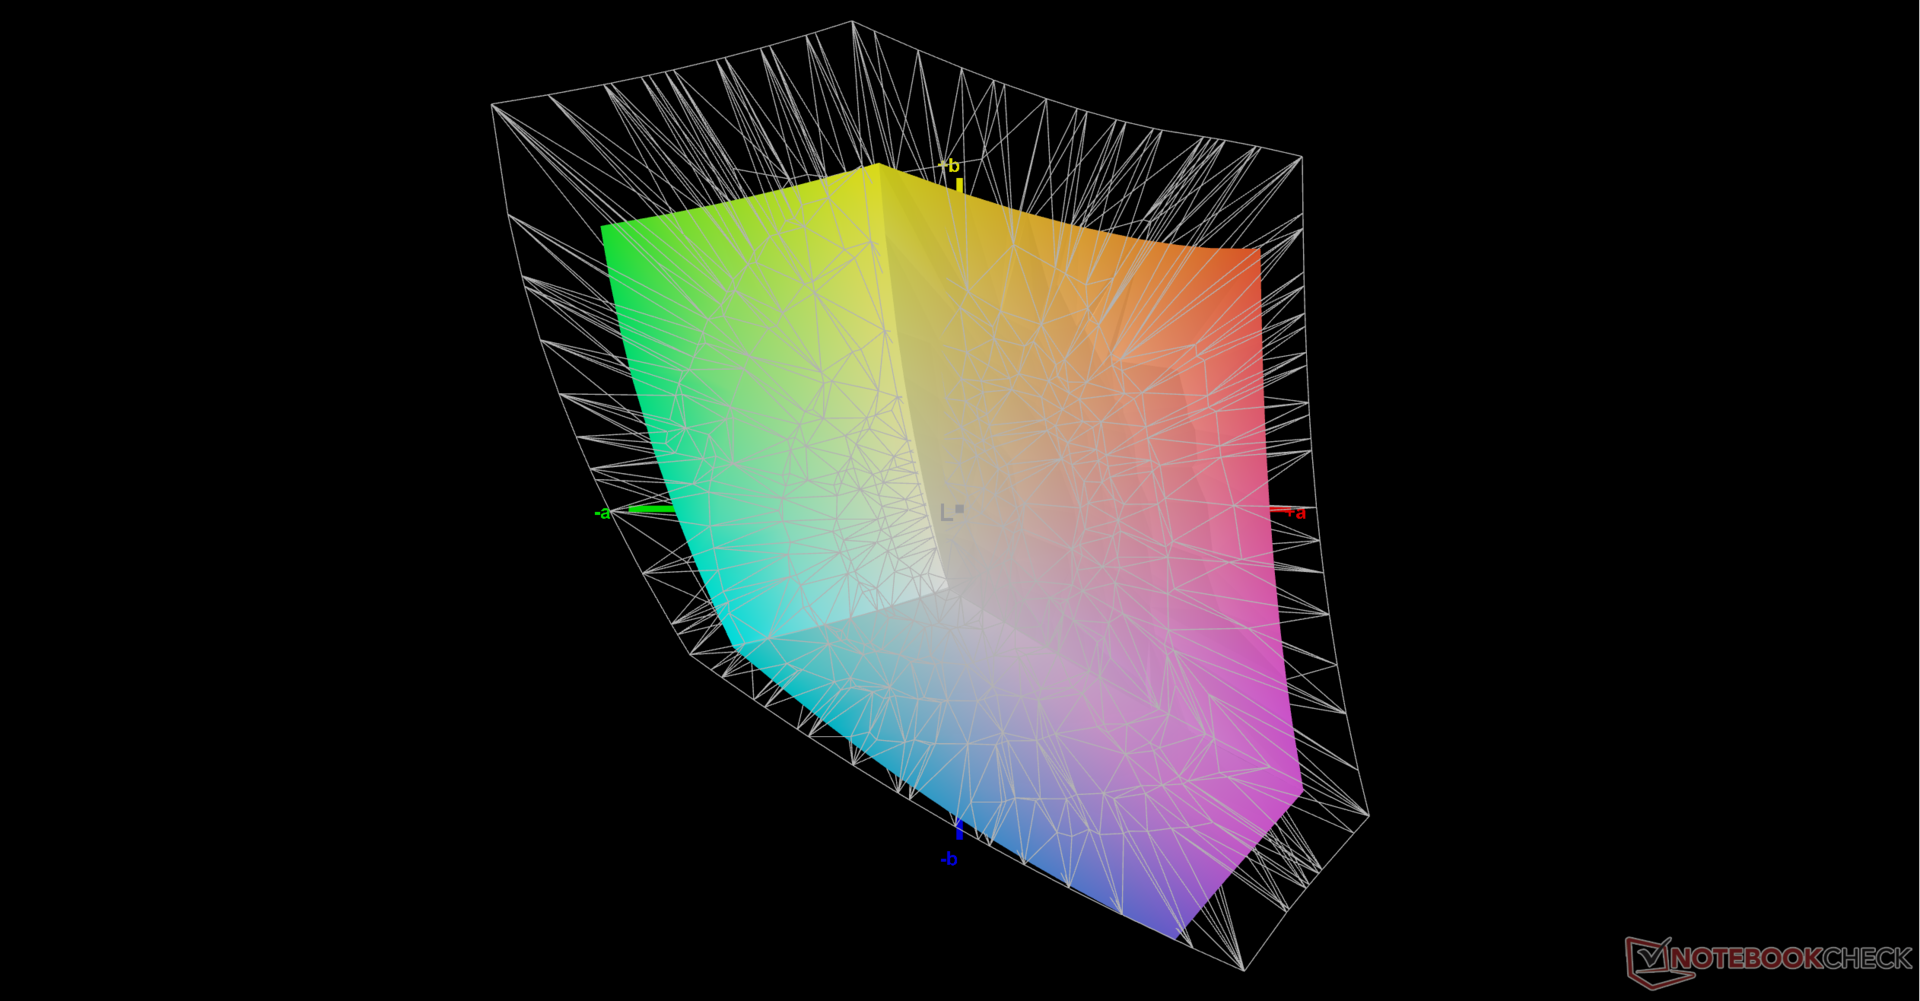
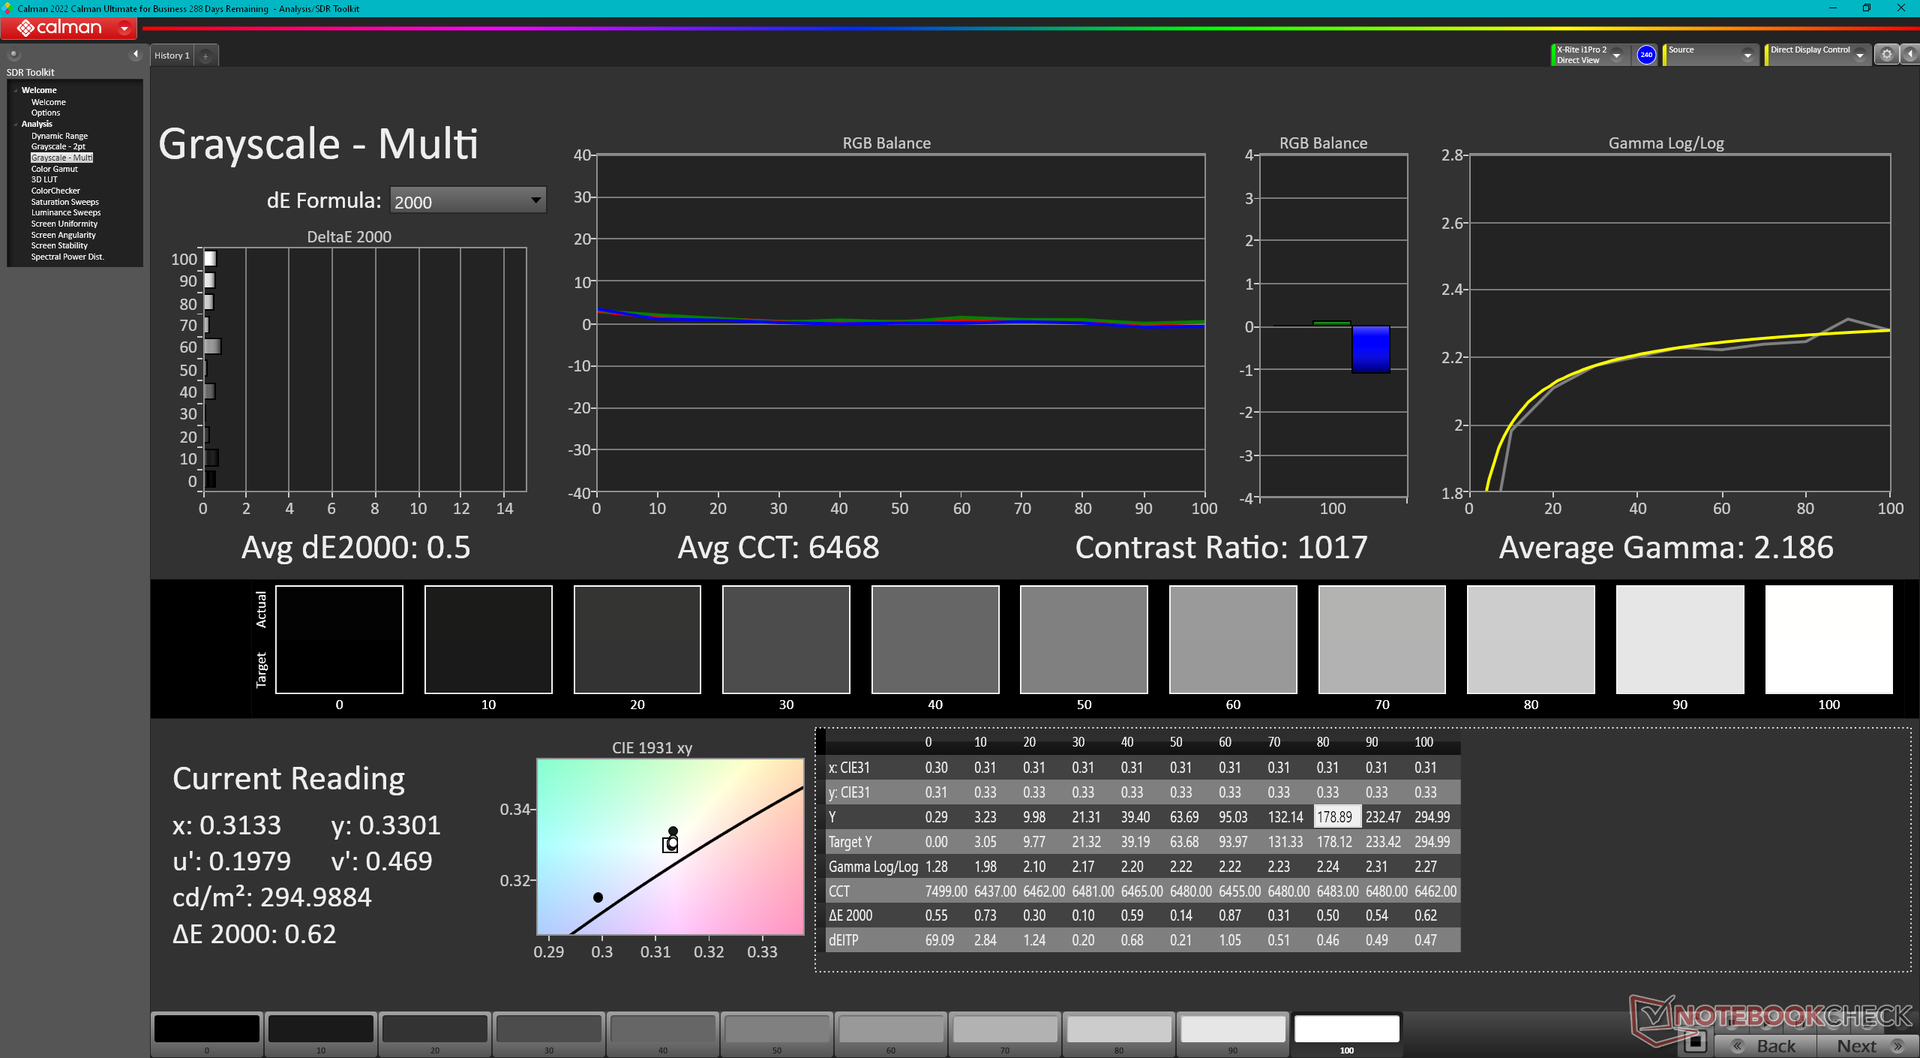
HP nie dostarcza tego modelu wstępnie skalibrowanego, co jest wstydem dla laptopa klasy ZBook. Średnie wartości DeltaE dla skali szarości i kolorów po wyjęciu z pudełka wyniosłyby odpowiednio 5,9 i 3,27, a temperatura barwowa byłaby nieco zbyt ciepła. Samodzielna kalibracja wyświetlacza poprawiłaby średnie wartości deltaE do zaledwie 0,5 i 0,56. Nasz skalibrowany plik ICM można pobrać bezpłatnie powyżej.
Wyświetl czasy reakcji
| ↔ Czas reakcji od czerni do bieli | ||
|---|---|---|
| 10.4 ms ... wzrost ↗ i spadek ↘ łącznie | ↗ 5.5 ms wzrost | 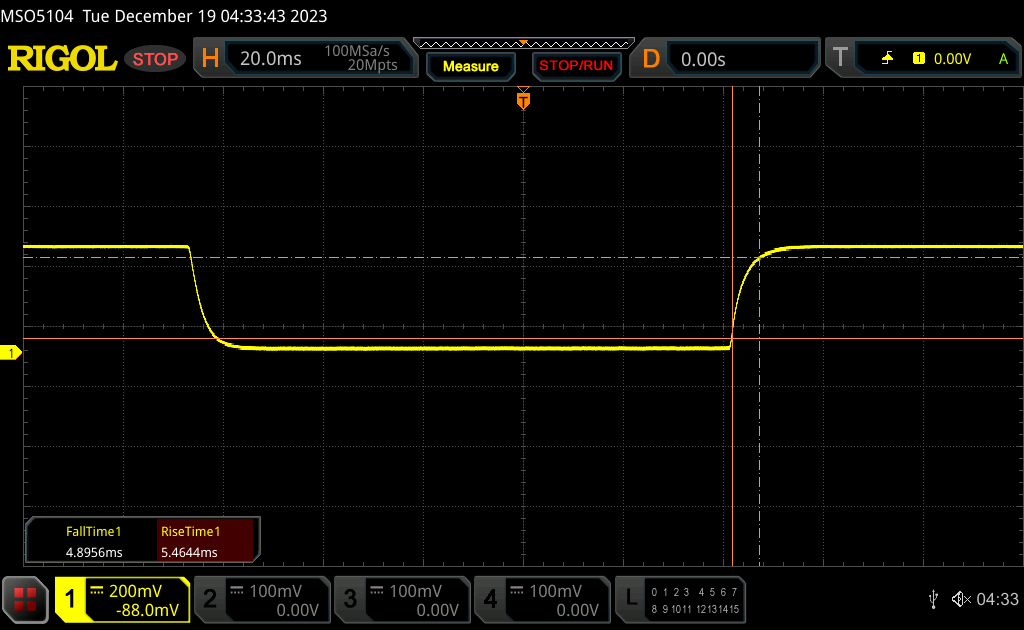 |
| ↘ 4.9 ms upadek | ||
| W naszych testach ekran wykazuje dobry współczynnik reakcji, ale może być zbyt wolny dla graczy rywalizujących ze sobą. Dla porównania, wszystkie testowane urządzenia wahają się od 0.1 (minimum) do 240 (maksimum) ms. » 28 % wszystkich urządzeń jest lepszych. Oznacza to, że zmierzony czas reakcji jest lepszy od średniej wszystkich testowanych urządzeń (19.8 ms). | ||
| ↔ Czas reakcji 50% szarości do 80% szarości | ||
| 13 ms ... wzrost ↗ i spadek ↘ łącznie | ↗ 6.4 ms wzrost | 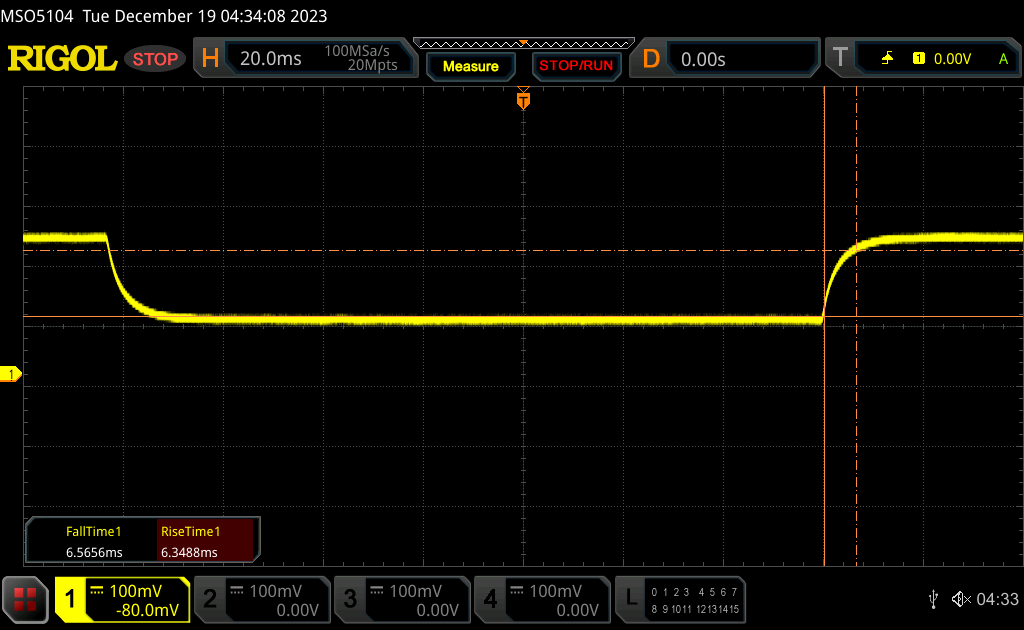 |
| ↘ 6.6 ms upadek | ||
| W naszych testach ekran wykazuje dobry współczynnik reakcji, ale może być zbyt wolny dla graczy rywalizujących ze sobą. Dla porównania, wszystkie testowane urządzenia wahają się od 0.165 (minimum) do 636 (maksimum) ms. » 27 % wszystkich urządzeń jest lepszych. Oznacza to, że zmierzony czas reakcji jest lepszy od średniej wszystkich testowanych urządzeń (31 ms). | ||
Migotanie ekranu / PWM (modulacja szerokości impulsu)
| Migotanie ekranu/nie wykryto PWM | 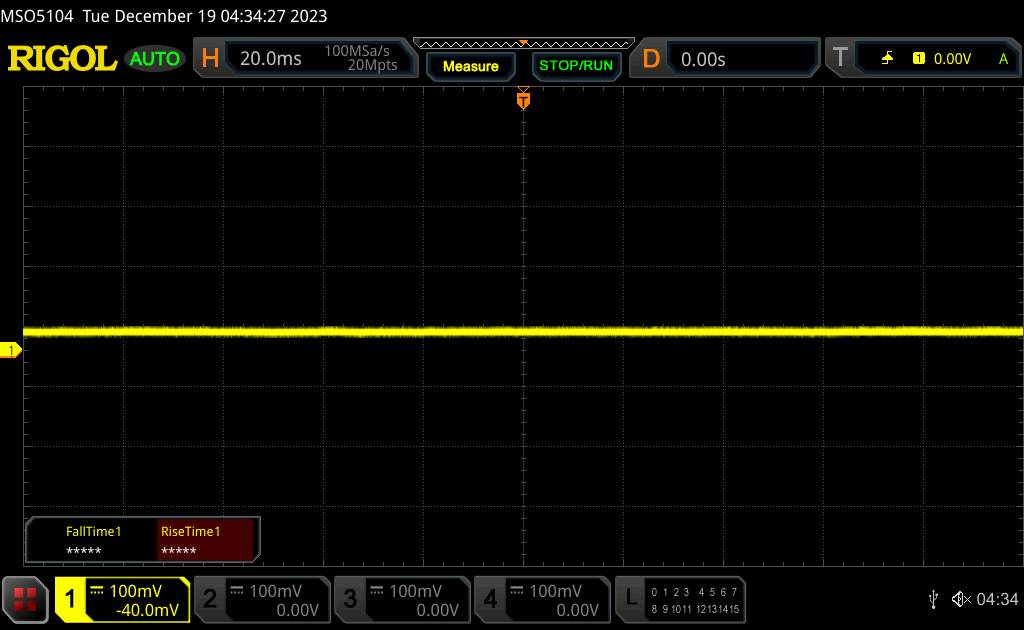 | ||
Dla porównania: 52 % wszystkich testowanych urządzeń nie używa PWM do przyciemniania wyświetlacza. Jeśli wykryto PWM, zmierzono średnio 7769 (minimum: 5 - maksimum: 343500) Hz. | |||
Wydajność
Warunki testowania
Przed wykonaniem poniższych testów porównawczych ustawiliśmy zarówno system Windows, jak i Panel sterowania Nvidia na tryb wydajności. System nie wydaje się mieć żadnych dodatkowych profili zasilania od HP.
Optimus jest obsługiwany zgodnie z oczekiwaniami, ale nie ma trybu ECC VRAM w przeciwieństwie do grubszego ZBook Fury 16 G10 z szybszą RTX 5000 Ada.
Procesor
Ryzen Ryzen 7 Pro 7840HS oferuje do 20 procent wyższą wydajność wielowątkową niż Core i7-12700H w zeszłorocznym ZBook Power 15 G9. Aby jednak uzyskać jeszcze wyższą wydajność, użytkownicy powinni skonfigurować komputer z procesorem Intel Core i9-13900H który może działać do 30 procent szybciej niż nasz Ryzen 7.
Obniżenie wersji do Ryzen 5 Pro 7640HS z naszej konfiguracji Ryzen 7 Pro 7840HS powinien wpłynąć na wydajność nawet o 25 do 30 procent. Z drugiej strony, aktualizacja do konfiguracji Ryzen 9 Pro 7940HS tylko nieznacznie zwiększy wydajność o około 5 do 10 procent w oparciu o nasz czas spędzony z Lenovo ThinkPad Z16 Gen 2. Tym samym, wydajność w przeliczeniu na dolara znacząco spada w przypadku konfiguracji z Ryzen 9 zamiast Ryzen 7.
Cinebench R15 Multi Loop
Cinebench R23: Multi Core | Single Core
Cinebench R20: CPU (Multi Core) | CPU (Single Core)
Cinebench R15: CPU Multi 64Bit | CPU Single 64Bit
Blender: v2.79 BMW27 CPU
7-Zip 18.03: 7z b 4 | 7z b 4 -mmt1
Geekbench 5.5: Multi-Core | Single-Core
HWBOT x265 Benchmark v2.2: 4k Preset
LibreOffice : 20 Documents To PDF
R Benchmark 2.5: Overall mean
| CPU Performance rating | |
| HP ZBook Fury 16 G10 | |
| Asus ExpertBook B6 Flip B6602FC2 | |
| Lenovo ThinkPad P1 G6-21FV000DGE | |
| Lenovo ThinkPad Z16 Gen 2 | |
| HP ZBook Studio 16 G9 62U04EA | |
| HP ZBook Power 15 G10 | |
| Przeciętny AMD Ryzen 7 PRO 7840HS | |
| HP ZBook Power 15 G9 6B8C4EA | |
| HP ZBook Firefly 14 G10 A | |
| Lenovo ThinkPad P15v G3 21EM001AGE | |
| Dell Precision 5000 5560 -2! | |
| Lenovo ThinkPad P15v G2 21A9000XGE -1! | |
| Cinebench R23 / Multi Core | |
| HP ZBook Fury 16 G10 | |
| Asus ExpertBook B6 Flip B6602FC2 | |
| Lenovo ThinkPad P1 G6-21FV000DGE | |
| Lenovo ThinkPad Z16 Gen 2 | |
| HP ZBook Studio 16 G9 62U04EA | |
| HP ZBook Power 15 G10 | |
| Przeciętny AMD Ryzen 7 PRO 7840HS (14240 - 15863, n=2) | |
| HP ZBook Power 15 G9 6B8C4EA | |
| Lenovo ThinkPad P15v G3 21EM001AGE | |
| HP ZBook Firefly 14 G10 A | |
| Lenovo ThinkPad P15v G2 21A9000XGE | |
| Dell Precision 5000 5560 | |
| Cinebench R23 / Single Core | |
| HP ZBook Fury 16 G10 | |
| Lenovo ThinkPad P1 G6-21FV000DGE | |
| Asus ExpertBook B6 Flip B6602FC2 | |
| HP ZBook Studio 16 G9 62U04EA | |
| Lenovo ThinkPad Z16 Gen 2 | |
| HP ZBook Power 15 G10 | |
| HP ZBook Power 15 G9 6B8C4EA | |
| Przeciętny AMD Ryzen 7 PRO 7840HS (1691 - 1774, n=2) | |
| HP ZBook Firefly 14 G10 A | |
| Dell Precision 5000 5560 | |
| Lenovo ThinkPad P15v G3 21EM001AGE | |
| Cinebench R20 / CPU (Multi Core) | |
| HP ZBook Fury 16 G10 | |
| Asus ExpertBook B6 Flip B6602FC2 | |
| Lenovo ThinkPad P1 G6-21FV000DGE | |
| Lenovo ThinkPad Z16 Gen 2 | |
| HP ZBook Studio 16 G9 62U04EA | |
| HP ZBook Power 15 G10 | |
| Przeciętny AMD Ryzen 7 PRO 7840HS (5327 - 6235, n=2) | |
| HP ZBook Power 15 G9 6B8C4EA | |
| Lenovo ThinkPad P15v G3 21EM001AGE | |
| Lenovo ThinkPad P15v G3 21EM001AGE | |
| HP ZBook Firefly 14 G10 A | |
| Dell Precision 5000 5560 | |
| Lenovo ThinkPad P15v G2 21A9000XGE | |
| Cinebench R20 / CPU (Single Core) | |
| HP ZBook Fury 16 G10 | |
| Lenovo ThinkPad P1 G6-21FV000DGE | |
| Asus ExpertBook B6 Flip B6602FC2 | |
| HP ZBook Studio 16 G9 62U04EA | |
| Lenovo ThinkPad Z16 Gen 2 | |
| HP ZBook Power 15 G10 | |
| HP ZBook Power 15 G9 6B8C4EA | |
| Przeciętny AMD Ryzen 7 PRO 7840HS (651 - 693, n=2) | |
| HP ZBook Firefly 14 G10 A | |
| Dell Precision 5000 5560 | |
| Lenovo ThinkPad P15v G3 21EM001AGE | |
| Lenovo ThinkPad P15v G3 21EM001AGE | |
| Lenovo ThinkPad P15v G2 21A9000XGE | |
| Cinebench R15 / CPU Multi 64Bit | |
| HP ZBook Fury 16 G10 | |
| Asus ExpertBook B6 Flip B6602FC2 | |
| Lenovo ThinkPad Z16 Gen 2 | |
| Lenovo ThinkPad P1 G6-21FV000DGE | |
| HP ZBook Power 15 G10 | |
| HP ZBook Studio 16 G9 62U04EA | |
| Przeciętny AMD Ryzen 7 PRO 7840HS (2361 - 2519, n=2) | |
| Lenovo ThinkPad P15v G3 21EM001AGE | |
| HP ZBook Power 15 G9 6B8C4EA | |
| HP ZBook Firefly 14 G10 A | |
| Lenovo ThinkPad P15v G2 21A9000XGE | |
| Dell Precision 5000 5560 | |
| Cinebench R15 / CPU Single 64Bit | |
| HP ZBook Fury 16 G10 | |
| Lenovo ThinkPad P1 G6-21FV000DGE | |
| Lenovo ThinkPad Z16 Gen 2 | |
| HP ZBook Power 15 G10 | |
| Asus ExpertBook B6 Flip B6602FC2 | |
| HP ZBook Studio 16 G9 62U04EA | |
| Przeciętny AMD Ryzen 7 PRO 7840HS (262 - 276, n=2) | |
| HP ZBook Power 15 G9 6B8C4EA | |
| HP ZBook Firefly 14 G10 A | |
| Dell Precision 5000 5560 | |
| Lenovo ThinkPad P15v G2 21A9000XGE | |
| Lenovo ThinkPad P15v G3 21EM001AGE | |
| Blender / v2.79 BMW27 CPU | |
| Lenovo ThinkPad P15v G2 21A9000XGE | |
| Dell Precision 5000 5560 | |
| HP ZBook Firefly 14 G10 A | |
| Lenovo ThinkPad P15v G3 21EM001AGE | |
| HP ZBook Power 15 G9 6B8C4EA | |
| Przeciętny AMD Ryzen 7 PRO 7840HS (201 - 205, n=2) | |
| HP ZBook Power 15 G10 | |
| Lenovo ThinkPad P1 G6-21FV000DGE | |
| HP ZBook Studio 16 G9 62U04EA | |
| Lenovo ThinkPad Z16 Gen 2 | |
| Asus ExpertBook B6 Flip B6602FC2 | |
| HP ZBook Fury 16 G10 | |
| 7-Zip 18.03 / 7z b 4 | |
| HP ZBook Fury 16 G10 | |
| Asus ExpertBook B6 Flip B6602FC2 | |
| Lenovo ThinkPad P1 G6-21FV000DGE | |
| HP ZBook Power 15 G10 | |
| HP ZBook Studio 16 G9 62U04EA | |
| Lenovo ThinkPad Z16 Gen 2 | |
| Przeciętny AMD Ryzen 7 PRO 7840HS (62497 - 70387, n=2) | |
| HP ZBook Power 15 G9 6B8C4EA | |
| Lenovo ThinkPad P15v G3 21EM001AGE | |
| HP ZBook Firefly 14 G10 A | |
| Dell Precision 5000 5560 | |
| Lenovo ThinkPad P15v G2 21A9000XGE | |
| 7-Zip 18.03 / 7z b 4 -mmt1 | |
| HP ZBook Fury 16 G10 | |
| Lenovo ThinkPad P1 G6-21FV000DGE | |
| Przeciętny AMD Ryzen 7 PRO 7840HS (6493 - 6498, n=2) | |
| HP ZBook Power 15 G10 | |
| Lenovo ThinkPad Z16 Gen 2 | |
| Asus ExpertBook B6 Flip B6602FC2 | |
| HP ZBook Studio 16 G9 62U04EA | |
| HP ZBook Firefly 14 G10 A | |
| HP ZBook Power 15 G9 6B8C4EA | |
| Dell Precision 5000 5560 | |
| Lenovo ThinkPad P15v G3 21EM001AGE | |
| Lenovo ThinkPad P15v G2 21A9000XGE | |
| Geekbench 5.5 / Multi-Core | |
| HP ZBook Fury 16 G10 | |
| Asus ExpertBook B6 Flip B6602FC2 | |
| HP ZBook Studio 16 G9 62U04EA | |
| HP ZBook Power 15 G10 | |
| Lenovo ThinkPad Z16 Gen 2 | |
| HP ZBook Power 15 G9 6B8C4EA | |
| Lenovo ThinkPad P1 G6-21FV000DGE | |
| Przeciętny AMD Ryzen 7 PRO 7840HS (10034 - 12039, n=2) | |
| HP ZBook Firefly 14 G10 A | |
| Lenovo ThinkPad P15v G3 21EM001AGE | |
| Lenovo ThinkPad P15v G2 21A9000XGE | |
| Geekbench 5.5 / Single-Core | |
| HP ZBook Fury 16 G10 | |
| Lenovo ThinkPad P1 G6-21FV000DGE | |
| Lenovo ThinkPad Z16 Gen 2 | |
| HP ZBook Power 15 G10 | |
| Przeciętny AMD Ryzen 7 PRO 7840HS (1822 - 1953, n=2) | |
| Asus ExpertBook B6 Flip B6602FC2 | |
| HP ZBook Studio 16 G9 62U04EA | |
| HP ZBook Firefly 14 G10 A | |
| HP ZBook Power 15 G9 6B8C4EA | |
| Lenovo ThinkPad P15v G2 21A9000XGE | |
| Lenovo ThinkPad P15v G3 21EM001AGE | |
| HWBOT x265 Benchmark v2.2 / 4k Preset | |
| HP ZBook Fury 16 G10 | |
| Asus ExpertBook B6 Flip B6602FC2 | |
| Lenovo ThinkPad Z16 Gen 2 | |
| HP ZBook Power 15 G10 | |
| HP ZBook Studio 16 G9 62U04EA | |
| Lenovo ThinkPad P1 G6-21FV000DGE | |
| Przeciętny AMD Ryzen 7 PRO 7840HS (18.1 - 19.9, n=2) | |
| HP ZBook Power 15 G9 6B8C4EA | |
| HP ZBook Firefly 14 G10 A | |
| Lenovo ThinkPad P15v G3 21EM001AGE | |
| Dell Precision 5000 5560 | |
| Lenovo ThinkPad P15v G2 21A9000XGE | |
| LibreOffice / 20 Documents To PDF | |
| Lenovo ThinkPad P15v G3 21EM001AGE | |
| HP ZBook Firefly 14 G10 A | |
| HP ZBook Power 15 G10 | |
| Lenovo ThinkPad P15v G2 21A9000XGE | |
| Przeciętny AMD Ryzen 7 PRO 7840HS (45.9 - 54.7, n=2) | |
| Dell Precision 5000 5560 | |
| Lenovo ThinkPad P1 G6-21FV000DGE | |
| Lenovo ThinkPad Z16 Gen 2 | |
| HP ZBook Power 15 G9 6B8C4EA | |
| HP ZBook Fury 16 G10 | |
| HP ZBook Studio 16 G9 62U04EA | |
| Asus ExpertBook B6 Flip B6602FC2 | |
| R Benchmark 2.5 / Overall mean | |
| Lenovo ThinkPad P15v G2 21A9000XGE | |
| Dell Precision 5000 5560 | |
| Lenovo ThinkPad P15v G3 21EM001AGE | |
| HP ZBook Firefly 14 G10 A | |
| HP ZBook Power 15 G9 6B8C4EA | |
| Asus ExpertBook B6 Flip B6602FC2 | |
| Lenovo ThinkPad Z16 Gen 2 | |
| HP ZBook Power 15 G10 | |
| Przeciętny AMD Ryzen 7 PRO 7840HS (0.44 - 0.4487, n=2) | |
| HP ZBook Studio 16 G9 62U04EA | |
| Lenovo ThinkPad P1 G6-21FV000DGE | |
| HP ZBook Fury 16 G10 | |
* ... im mniej tym lepiej
AIDA64: FP32 Ray-Trace | FPU Julia | CPU SHA3 | CPU Queen | FPU SinJulia | FPU Mandel | CPU AES | CPU ZLib | FP64 Ray-Trace | CPU PhotoWorxx
| Performance rating | |
| HP ZBook Power 15 G10 | |
| Przeciętny AMD Ryzen 7 PRO 7840HS | |
| Lenovo ThinkPad P1 G6-21FV000DGE | |
| Lenovo ThinkPad P15v G3 21EM001AGE | |
| Asus ExpertBook B6 Flip B6602FC2 | |
| HP ZBook Power 15 G9 6B8C4EA | |
| Dell Precision 5000 5560 -9! | |
| AIDA64 / FP32 Ray-Trace | |
| HP ZBook Power 15 G10 | |
| Przeciętny AMD Ryzen 7 PRO 7840HS (25606 - 25776, n=2) | |
| Lenovo ThinkPad P1 G6-21FV000DGE | |
| Asus ExpertBook B6 Flip B6602FC2 | |
| Lenovo ThinkPad P15v G3 21EM001AGE | |
| HP ZBook Power 15 G9 6B8C4EA | |
| AIDA64 / FPU Julia | |
| HP ZBook Power 15 G10 | |
| Przeciętny AMD Ryzen 7 PRO 7840HS (107907 - 109059, n=2) | |
| Lenovo ThinkPad P15v G3 21EM001AGE | |
| Lenovo ThinkPad P1 G6-21FV000DGE | |
| Asus ExpertBook B6 Flip B6602FC2 | |
| HP ZBook Power 15 G9 6B8C4EA | |
| AIDA64 / CPU SHA3 | |
| HP ZBook Power 15 G10 | |
| Przeciętny AMD Ryzen 7 PRO 7840HS (4631 - 4656, n=2) | |
| Lenovo ThinkPad P1 G6-21FV000DGE | |
| Asus ExpertBook B6 Flip B6602FC2 | |
| HP ZBook Power 15 G9 6B8C4EA | |
| Lenovo ThinkPad P15v G3 21EM001AGE | |
| AIDA64 / CPU Queen | |
| Lenovo ThinkPad P1 G6-21FV000DGE | |
| HP ZBook Power 15 G10 | |
| Przeciętny AMD Ryzen 7 PRO 7840HS (97729 - 115640, n=2) | |
| Asus ExpertBook B6 Flip B6602FC2 | |
| Lenovo ThinkPad P15v G3 21EM001AGE | |
| HP ZBook Power 15 G9 6B8C4EA | |
| AIDA64 / FPU SinJulia | |
| HP ZBook Power 15 G10 | |
| Przeciętny AMD Ryzen 7 PRO 7840HS (14693 - 14742, n=2) | |
| Lenovo ThinkPad P15v G3 21EM001AGE | |
| Asus ExpertBook B6 Flip B6602FC2 | |
| Lenovo ThinkPad P1 G6-21FV000DGE | |
| HP ZBook Power 15 G9 6B8C4EA | |
| AIDA64 / FPU Mandel | |
| HP ZBook Power 15 G10 | |
| Przeciętny AMD Ryzen 7 PRO 7840HS (57502 - 58181, n=2) | |
| Lenovo ThinkPad P15v G3 21EM001AGE | |
| Lenovo ThinkPad P1 G6-21FV000DGE | |
| Asus ExpertBook B6 Flip B6602FC2 | |
| HP ZBook Power 15 G9 6B8C4EA | |
| AIDA64 / CPU AES | |
| Lenovo ThinkPad P15v G3 21EM001AGE | |
| HP ZBook Power 15 G10 | |
| Przeciętny AMD Ryzen 7 PRO 7840HS (84454 - 85341, n=2) | |
| Lenovo ThinkPad P1 G6-21FV000DGE | |
| Asus ExpertBook B6 Flip B6602FC2 | |
| HP ZBook Power 15 G9 6B8C4EA | |
| AIDA64 / CPU ZLib | |
| Lenovo ThinkPad P1 G6-21FV000DGE | |
| HP ZBook Power 15 G10 | |
| Przeciętny AMD Ryzen 7 PRO 7840HS (1032 - 1043, n=2) | |
| Asus ExpertBook B6 Flip B6602FC2 | |
| HP ZBook Power 15 G9 6B8C4EA | |
| Lenovo ThinkPad P15v G3 21EM001AGE | |
| Dell Precision 5000 5560 | |
| AIDA64 / FP64 Ray-Trace | |
| HP ZBook Power 15 G10 | |
| Przeciętny AMD Ryzen 7 PRO 7840HS (13545 - 13800, n=2) | |
| Lenovo ThinkPad P1 G6-21FV000DGE | |
| Asus ExpertBook B6 Flip B6602FC2 | |
| Lenovo ThinkPad P15v G3 21EM001AGE | |
| HP ZBook Power 15 G9 6B8C4EA | |
| AIDA64 / CPU PhotoWorxx | |
| HP ZBook Power 15 G10 | |
| HP ZBook Power 15 G9 6B8C4EA | |
| Asus ExpertBook B6 Flip B6602FC2 | |
| Przeciętny AMD Ryzen 7 PRO 7840HS (24325 - 42810, n=2) | |
| Lenovo ThinkPad P1 G6-21FV000DGE | |
| Lenovo ThinkPad P15v G3 21EM001AGE | |
Wydajność systemu
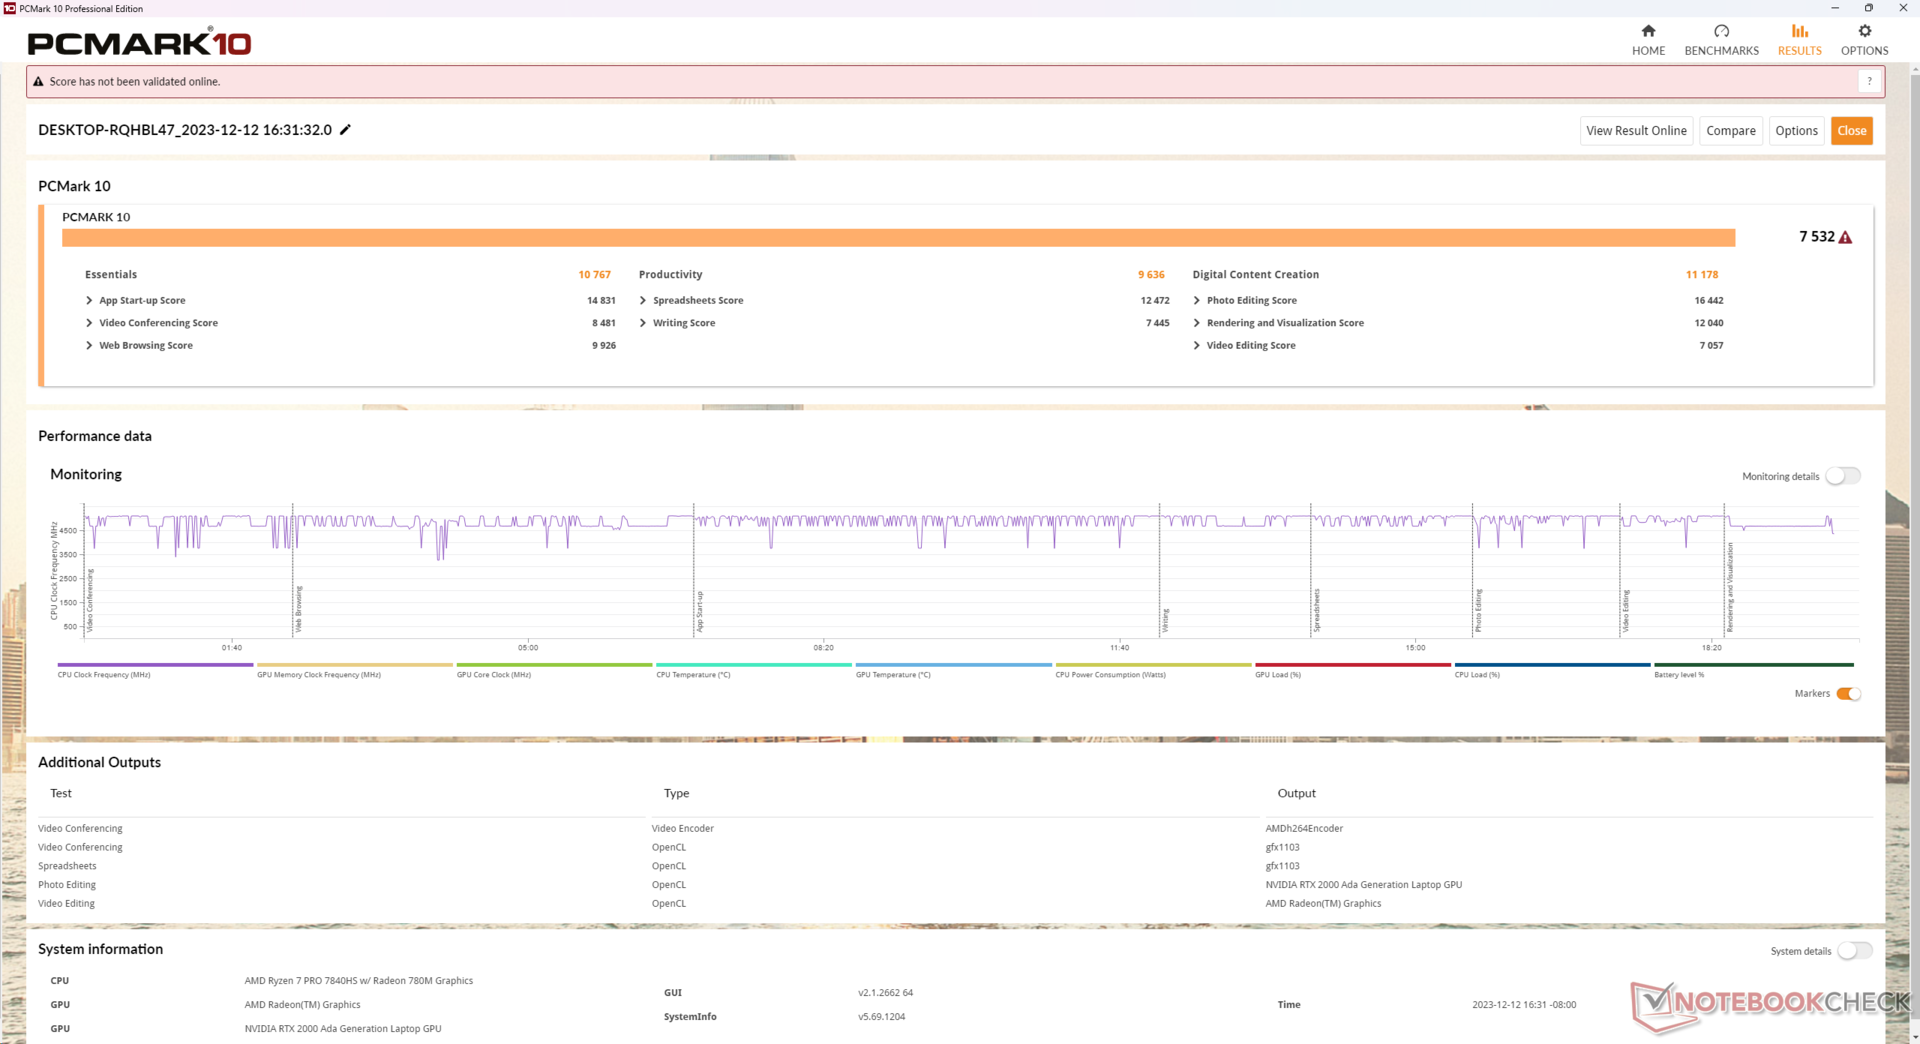
Wyniki PCMark są doskonałe, a wyniki są konsekwentnie wyższe niż w przypadku innych stacji roboczych działających na starszej karcie Nvidia RTX A2000, w tym ZBook Power 15 G9. Szybka pamięć RAM 5600 MHz jest również atrakcją, o czym świadczą wysokie wyniki pamięci AIDA64.
CrossMark: Overall | Productivity | Creativity | Responsiveness
WebXPRT 3: Overall
WebXPRT 4: Overall
Mozilla Kraken 1.1: Total
| PCMark 10 / Score | |
| HP ZBook Power 15 G10 | |
| Przeciętny AMD Ryzen 7 PRO 7840HS, NVIDIA RTX 2000 Ada Generation Laptop (n=1) | |
| Lenovo ThinkPad P1 G6-21FV000DGE | |
| Asus ExpertBook B6 Flip B6602FC2 | |
| Dell Precision 5000 5560 | |
| Lenovo ThinkPad P15v G3 21EM001AGE | |
| HP ZBook Power 15 G9 6B8C4EA | |
| PCMark 10 / Essentials | |
| Lenovo ThinkPad P1 G6-21FV000DGE | |
| Asus ExpertBook B6 Flip B6602FC2 | |
| HP ZBook Power 15 G10 | |
| Przeciętny AMD Ryzen 7 PRO 7840HS, NVIDIA RTX 2000 Ada Generation Laptop (n=1) | |
| Dell Precision 5000 5560 | |
| Lenovo ThinkPad P15v G3 21EM001AGE | |
| HP ZBook Power 15 G9 6B8C4EA | |
| PCMark 10 / Productivity | |
| Asus ExpertBook B6 Flip B6602FC2 | |
| Lenovo ThinkPad P1 G6-21FV000DGE | |
| HP ZBook Power 15 G10 | |
| Przeciętny AMD Ryzen 7 PRO 7840HS, NVIDIA RTX 2000 Ada Generation Laptop (n=1) | |
| Dell Precision 5000 5560 | |
| Lenovo ThinkPad P15v G3 21EM001AGE | |
| HP ZBook Power 15 G9 6B8C4EA | |
| PCMark 10 / Digital Content Creation | |
| HP ZBook Power 15 G10 | |
| Przeciętny AMD Ryzen 7 PRO 7840HS, NVIDIA RTX 2000 Ada Generation Laptop (n=1) | |
| Lenovo ThinkPad P1 G6-21FV000DGE | |
| Asus ExpertBook B6 Flip B6602FC2 | |
| Lenovo ThinkPad P15v G3 21EM001AGE | |
| HP ZBook Power 15 G9 6B8C4EA | |
| Dell Precision 5000 5560 | |
| CrossMark / Overall | |
| Asus ExpertBook B6 Flip B6602FC2 | |
| Lenovo ThinkPad P1 G6-21FV000DGE | |
| HP ZBook Power 15 G9 6B8C4EA | |
| HP ZBook Power 15 G10 | |
| Przeciętny AMD Ryzen 7 PRO 7840HS, NVIDIA RTX 2000 Ada Generation Laptop (n=1) | |
| Lenovo ThinkPad P15v G3 21EM001AGE | |
| CrossMark / Productivity | |
| Asus ExpertBook B6 Flip B6602FC2 | |
| Lenovo ThinkPad P1 G6-21FV000DGE | |
| HP ZBook Power 15 G10 | |
| Przeciętny AMD Ryzen 7 PRO 7840HS, NVIDIA RTX 2000 Ada Generation Laptop (n=1) | |
| HP ZBook Power 15 G9 6B8C4EA | |
| Lenovo ThinkPad P15v G3 21EM001AGE | |
| CrossMark / Creativity | |
| Asus ExpertBook B6 Flip B6602FC2 | |
| Lenovo ThinkPad P1 G6-21FV000DGE | |
| HP ZBook Power 15 G9 6B8C4EA | |
| HP ZBook Power 15 G10 | |
| Przeciętny AMD Ryzen 7 PRO 7840HS, NVIDIA RTX 2000 Ada Generation Laptop (n=1) | |
| Lenovo ThinkPad P15v G3 21EM001AGE | |
| CrossMark / Responsiveness | |
| Asus ExpertBook B6 Flip B6602FC2 | |
| Lenovo ThinkPad P1 G6-21FV000DGE | |
| HP ZBook Power 15 G9 6B8C4EA | |
| HP ZBook Power 15 G10 | |
| Przeciętny AMD Ryzen 7 PRO 7840HS, NVIDIA RTX 2000 Ada Generation Laptop (n=1) | |
| Lenovo ThinkPad P15v G3 21EM001AGE | |
| WebXPRT 3 / Overall | |
| Lenovo ThinkPad P1 G6-21FV000DGE | |
| HP ZBook Power 15 G10 | |
| Przeciętny AMD Ryzen 7 PRO 7840HS, NVIDIA RTX 2000 Ada Generation Laptop (n=1) | |
| Asus ExpertBook B6 Flip B6602FC2 | |
| HP ZBook Power 15 G9 6B8C4EA | |
| Dell Precision 5000 5560 | |
| Lenovo ThinkPad P15v G3 21EM001AGE | |
| WebXPRT 4 / Overall | |
| Lenovo ThinkPad P1 G6-21FV000DGE | |
| Asus ExpertBook B6 Flip B6602FC2 | |
| HP ZBook Power 15 G9 6B8C4EA | |
| HP ZBook Power 15 G10 | |
| Przeciętny AMD Ryzen 7 PRO 7840HS, NVIDIA RTX 2000 Ada Generation Laptop (n=1) | |
| Lenovo ThinkPad P15v G3 21EM001AGE | |
| Mozilla Kraken 1.1 / Total | |
| Lenovo ThinkPad P15v G3 21EM001AGE | |
| Dell Precision 5000 5560 | |
| HP ZBook Power 15 G10 | |
| Przeciętny AMD Ryzen 7 PRO 7840HS, NVIDIA RTX 2000 Ada Generation Laptop (n=1) | |
| HP ZBook Power 15 G9 6B8C4EA | |
| Asus ExpertBook B6 Flip B6602FC2 | |
| Lenovo ThinkPad P1 G6-21FV000DGE | |
* ... im mniej tym lepiej
| PCMark 10 Score | 7532 pkt. | |
Pomoc | ||
| AIDA64 / Memory Copy | |
| HP ZBook Power 15 G10 | |
| HP ZBook Power 15 G9 6B8C4EA | |
| Asus ExpertBook B6 Flip B6602FC2 | |
| Przeciętny AMD Ryzen 7 PRO 7840HS (34323 - 67943, n=2) | |
| Lenovo ThinkPad P1 G6-21FV000DGE | |
| Lenovo ThinkPad P15v G3 21EM001AGE | |
| AIDA64 / Memory Read | |
| HP ZBook Power 15 G9 6B8C4EA | |
| HP ZBook Power 15 G10 | |
| Asus ExpertBook B6 Flip B6602FC2 | |
| Przeciętny AMD Ryzen 7 PRO 7840HS (30787 - 61660, n=2) | |
| Lenovo ThinkPad P1 G6-21FV000DGE | |
| Lenovo ThinkPad P15v G3 21EM001AGE | |
| AIDA64 / Memory Write | |
| HP ZBook Power 15 G10 | |
| HP ZBook Power 15 G9 6B8C4EA | |
| Przeciętny AMD Ryzen 7 PRO 7840HS (39362 - 83167, n=2) | |
| Asus ExpertBook B6 Flip B6602FC2 | |
| Lenovo ThinkPad P1 G6-21FV000DGE | |
| Lenovo ThinkPad P15v G3 21EM001AGE | |
| AIDA64 / Memory Latency | |
| Przeciętny AMD Ryzen 7 PRO 7840HS (99.6 - 101.2, n=2) | |
| HP ZBook Power 15 G10 | |
| Lenovo ThinkPad P15v G3 21EM001AGE | |
| Asus ExpertBook B6 Flip B6602FC2 | |
| HP ZBook Power 15 G9 6B8C4EA | |
| Lenovo ThinkPad P1 G6-21FV000DGE | |
* ... im mniej tym lepiej
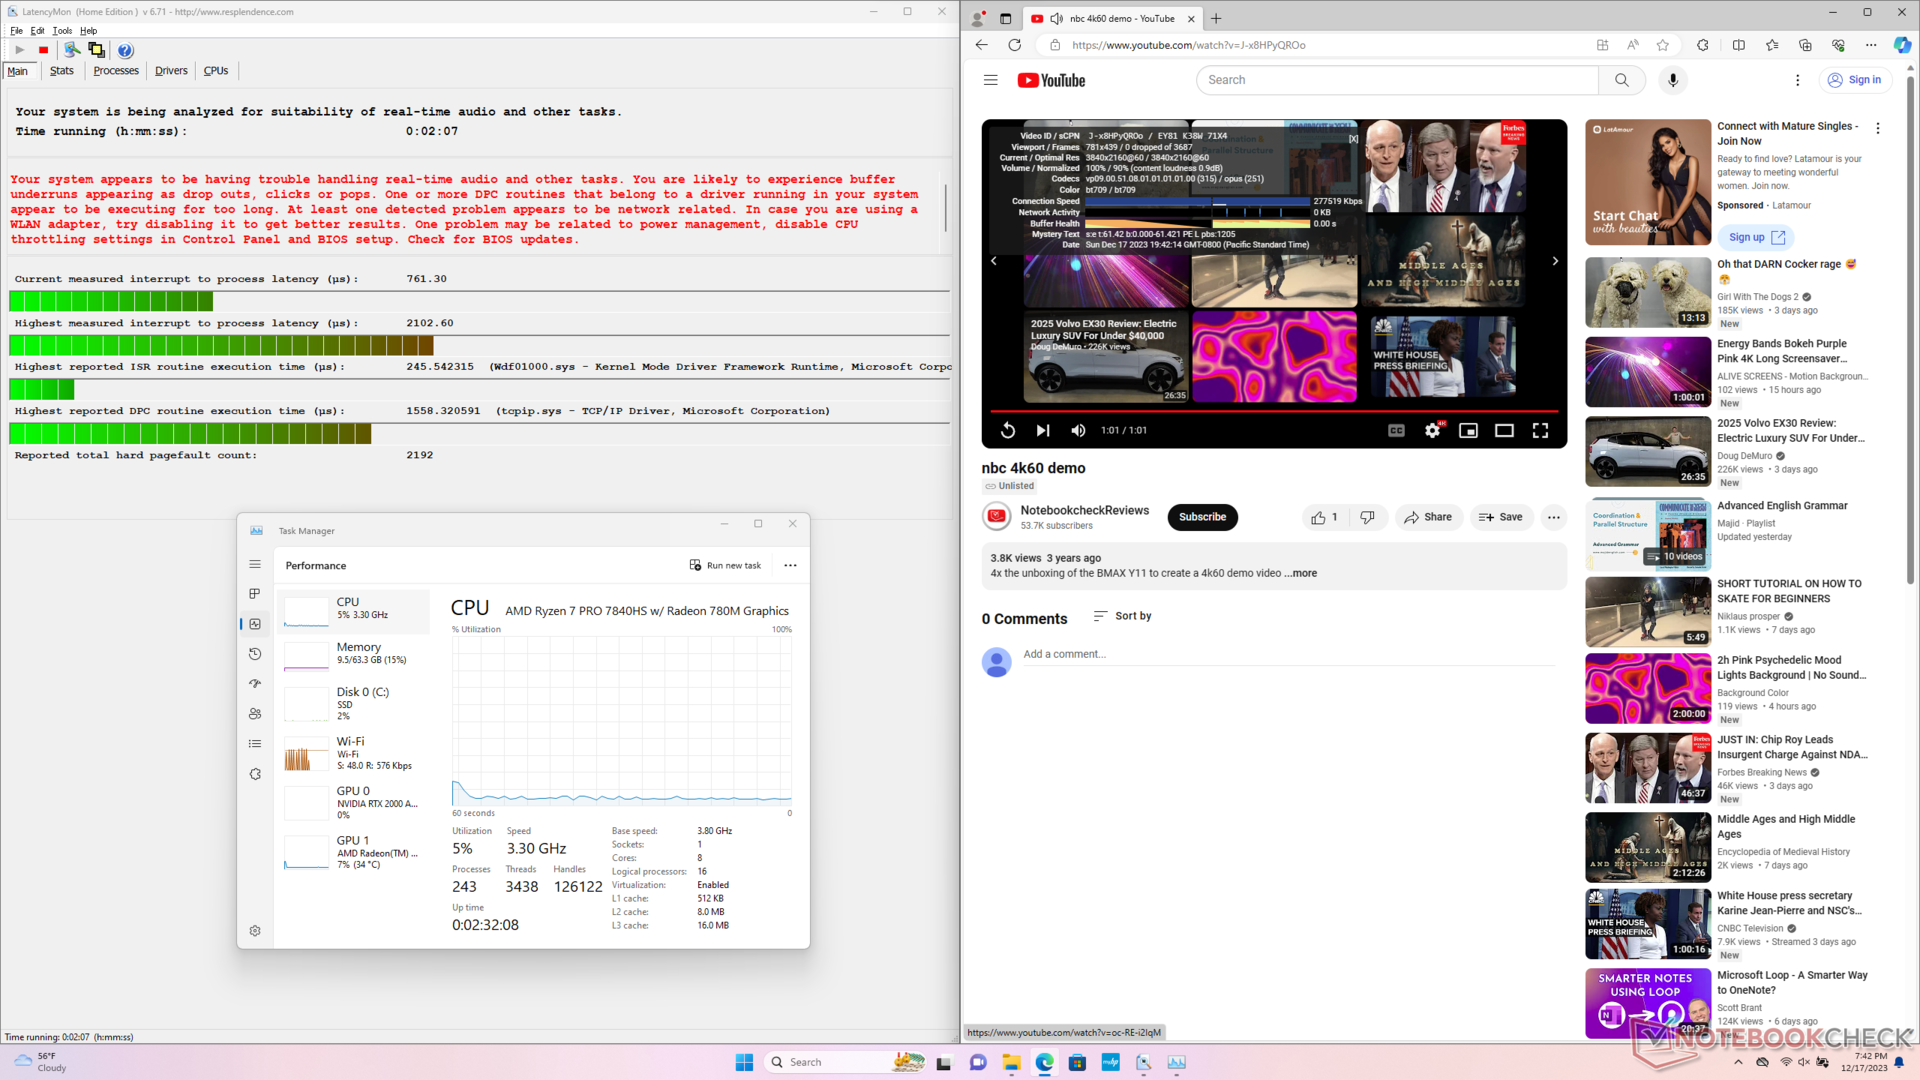
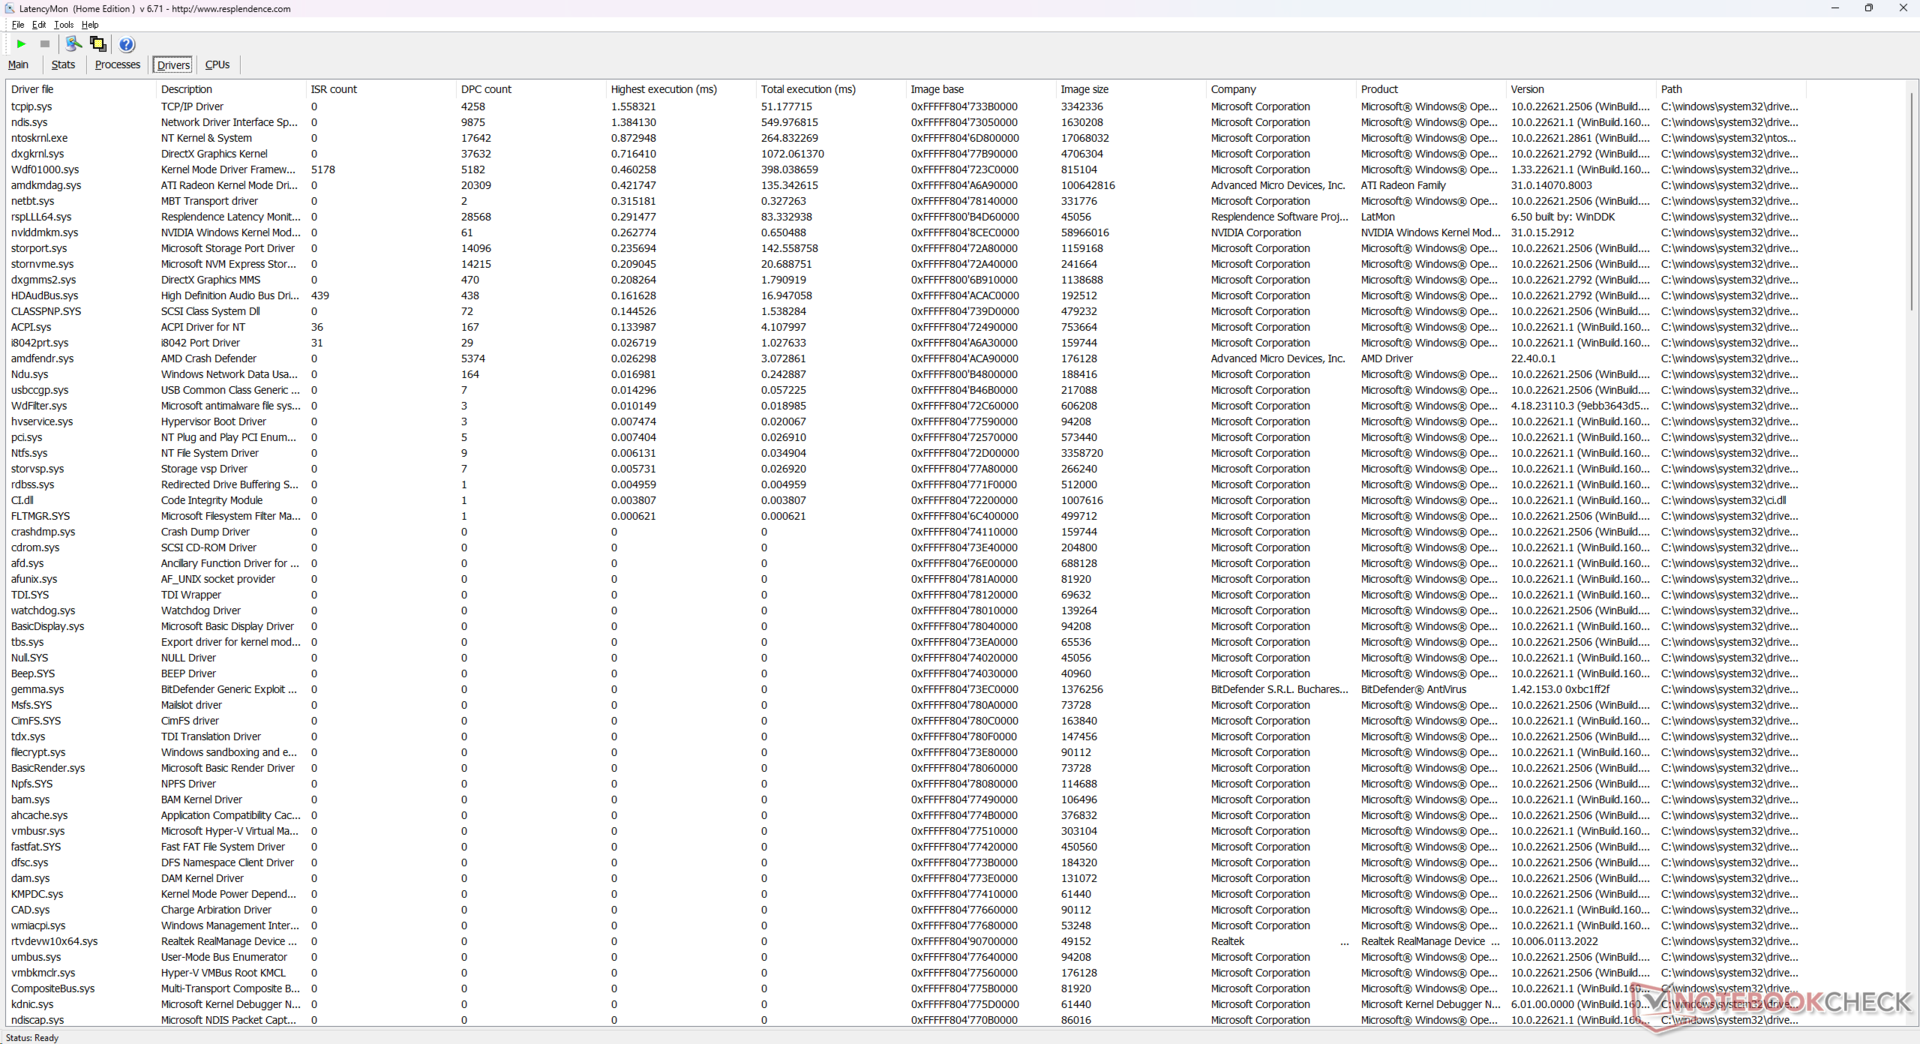
Opóźnienie DPC
LatencyMon ujawnia problemy z DPC podczas otwierania wielu kart przeglądarki na naszej stronie głównej. odtwarzanie wideo 4K przy 60 FPS jest poza tym idealne i nie odnotowano żadnych spadków klatek.
| DPC Latencies / LatencyMon - interrupt to process latency (max), Web, Youtube, Prime95 | |
| Lenovo ThinkPad P1 G6-21FV000DGE | |
| Asus ExpertBook B6 Flip B6602FC2 | |
| HP ZBook Power 15 G10 | |
| HP ZBook Power 15 G9 6B8C4EA | |
| Dell Precision 5000 5560 | |
| Lenovo ThinkPad P15v G3 21EM001AGE | |
* ... im mniej tym lepiej
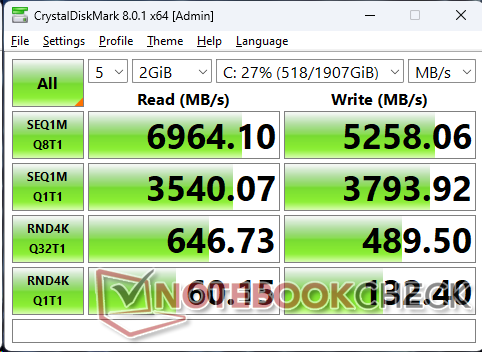
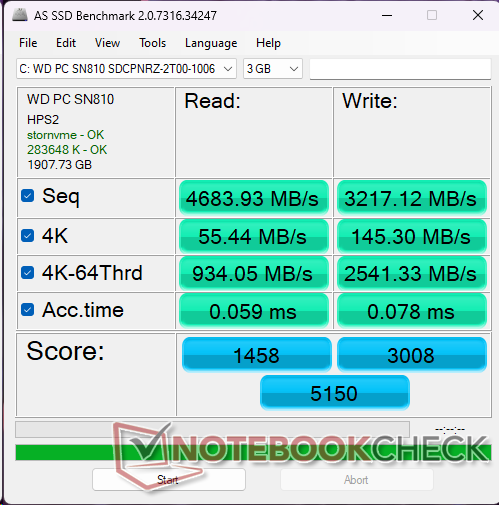
Urządzenia pamięci masowej
Nasze urządzenie jest skonfigurowane z WDC PC SN810 zamiast Samsung PM9A1 z zeszłorocznego modelu. Ogólnie rzecz biorąc, dysk WDC jest wolniejszy niż Samsung, jeśli chodzi o odczyt i zapis małych bloków 4K przy dużej głębokości kolejki. HP umożliwia nabywcom konfigurację z dyskami SED lub bez SED, ale HP nie wymienia wyraźnie marek SSD, o których mowa.

| Drive Performance rating - Percent | |
| Asus ExpertBook B6 Flip B6602FC2 | |
| Lenovo ThinkPad P1 G6-21FV000DGE | |
| HP ZBook Power 15 G9 6B8C4EA | |
| Dell Precision 5000 5560 | |
| Lenovo ThinkPad P15v G3 21EM001AGE | |
| HP ZBook Power 15 G10 | |
* ... im mniej tym lepiej
Disk Throttling: DiskSpd Read Loop, Queue Depth 8
Wydajność GPU
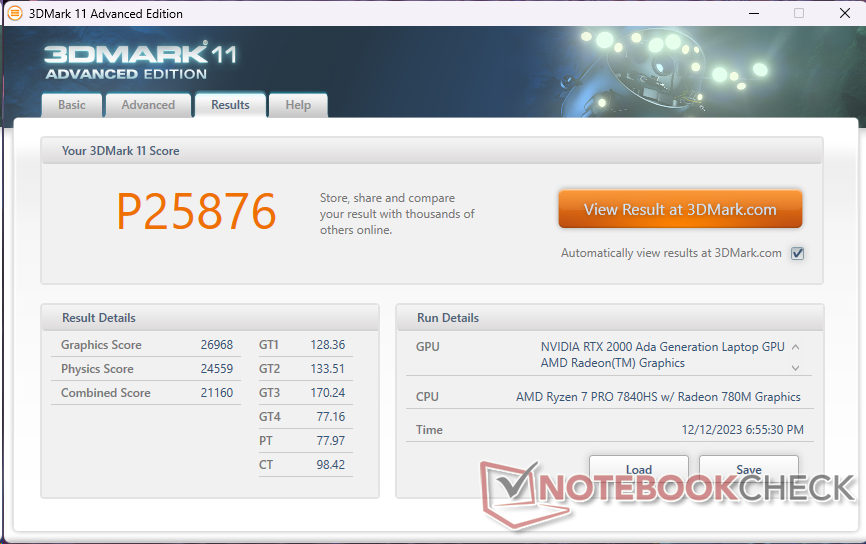
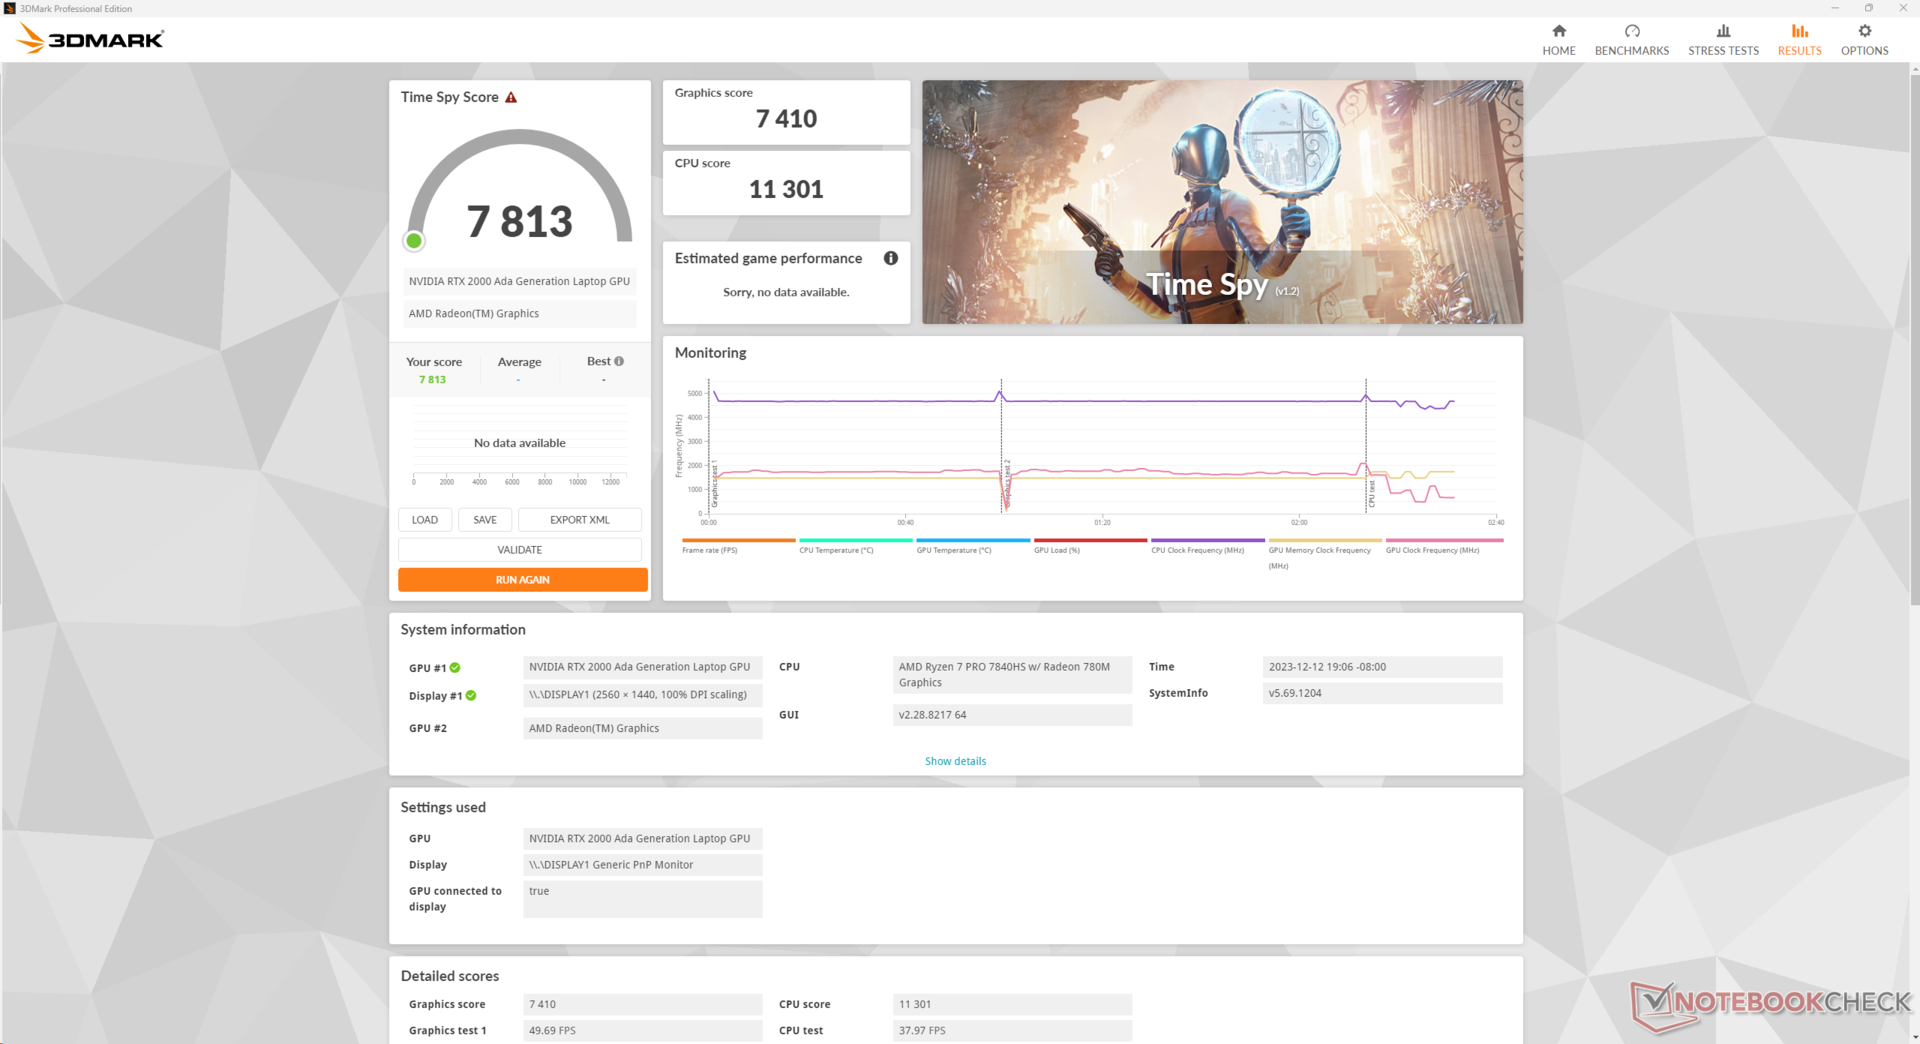
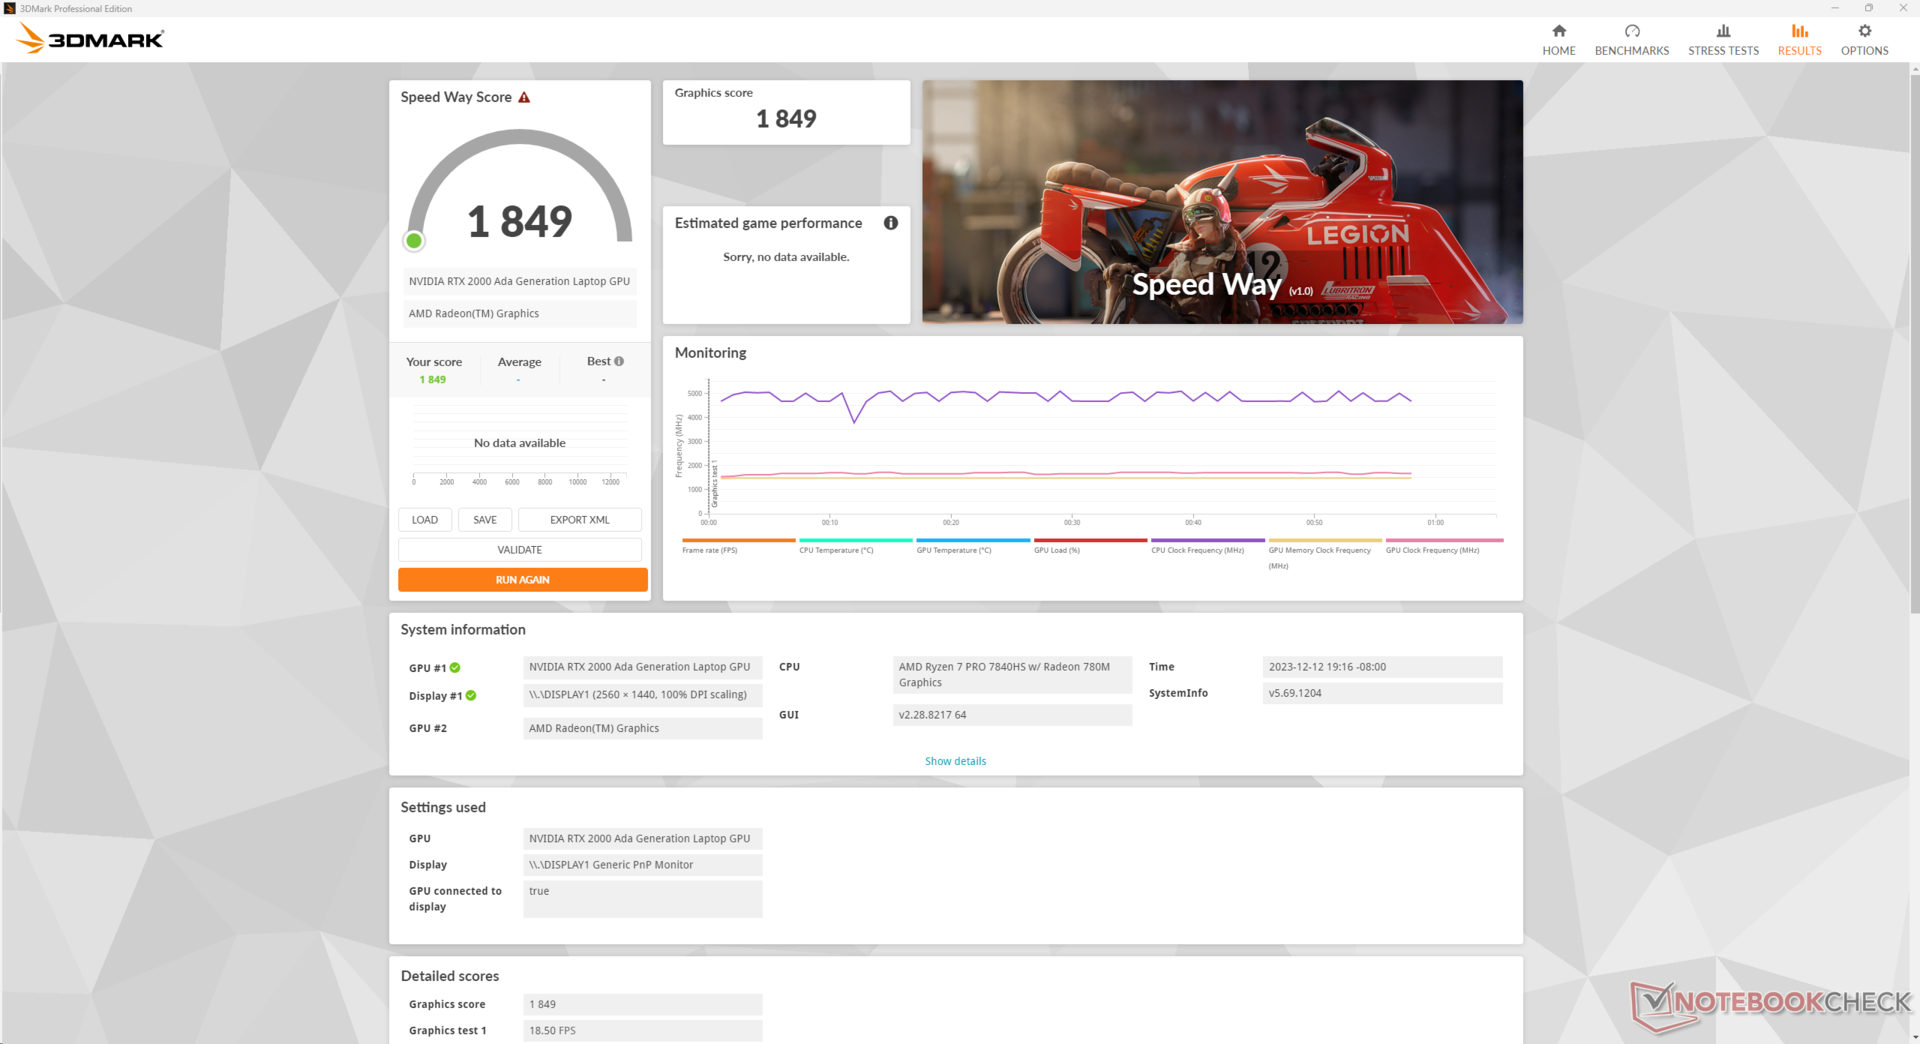
Karta graficzna Nvidia RTX 2000 Ada jest zauważalnym ulepszeniem w stosunku do RTX A2000 w zeszłorocznym ZBooku Power 15 G9 i główny powód wyboru nowszego modelu G10 zamiast poprzedniej wersji. Surowa moc graficzna jest o około 55 do 65 procent szybsza, a wyniki SpecViewPerf są również konsekwentnie wyższe.
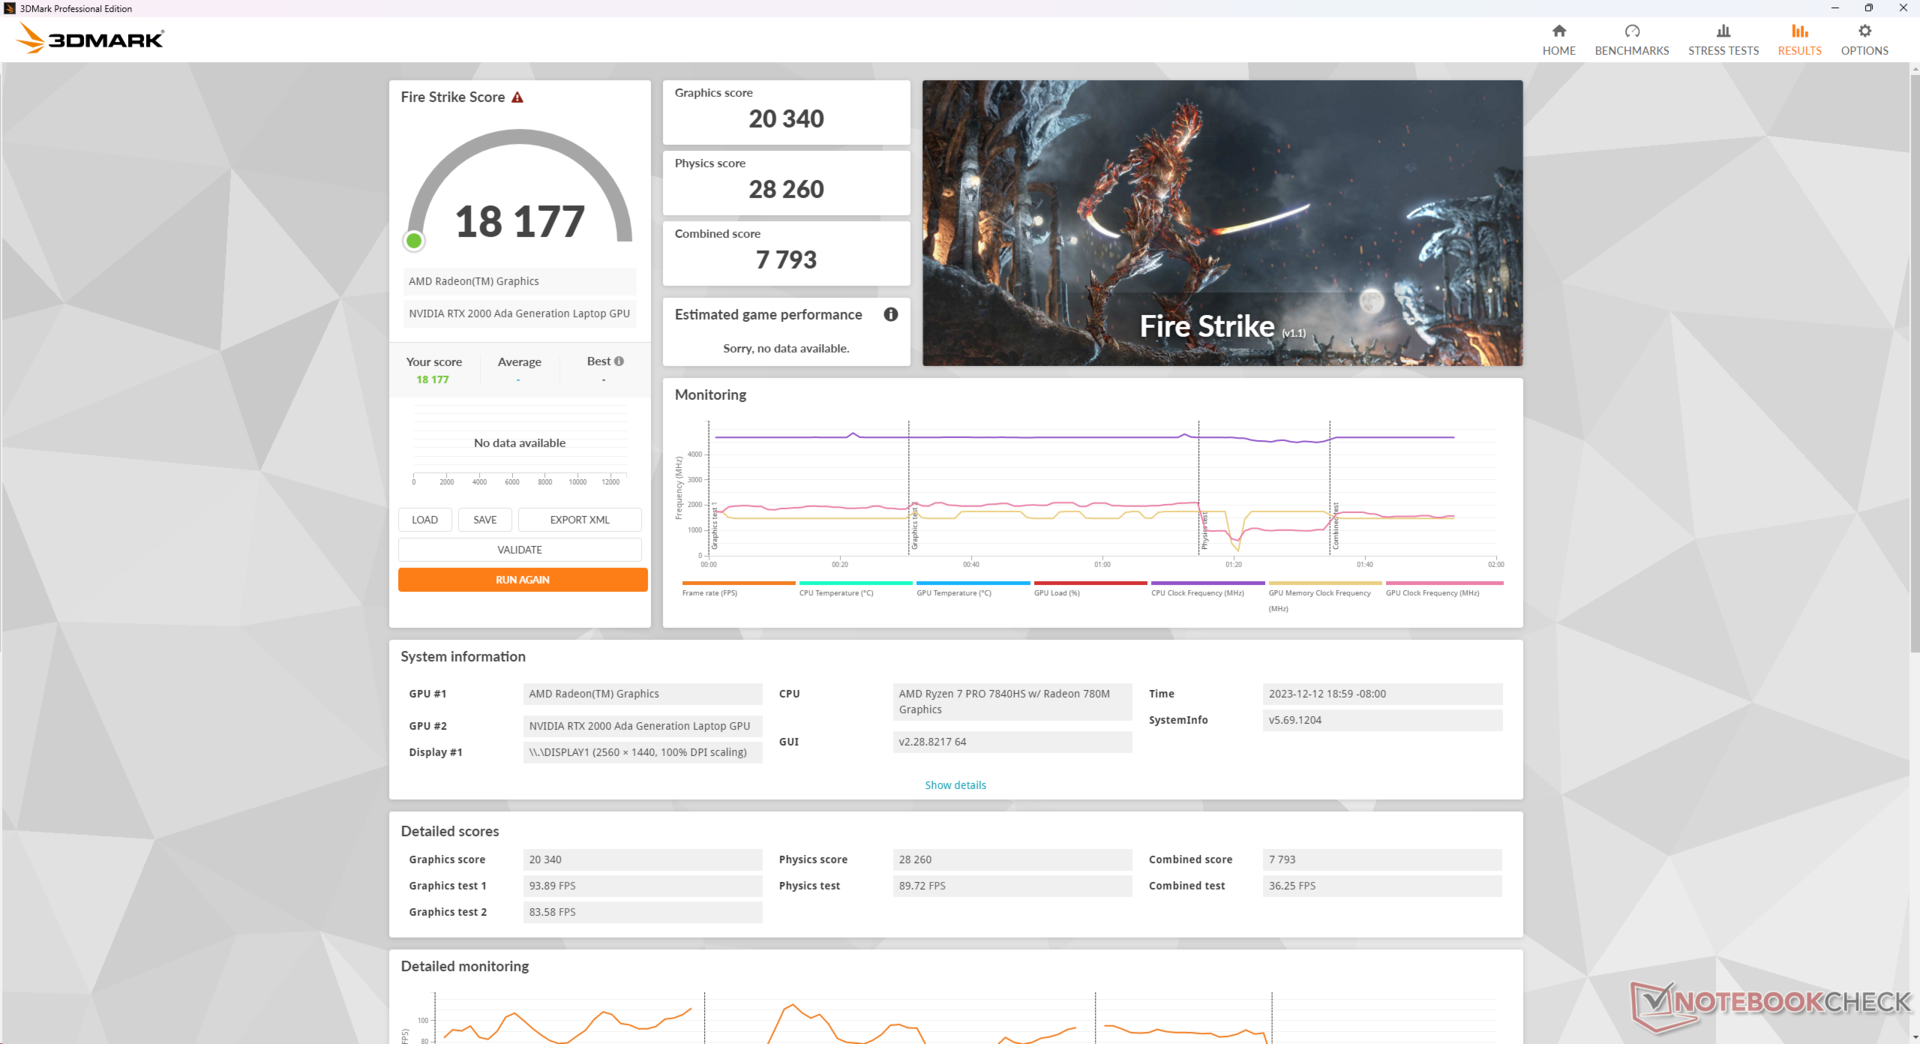
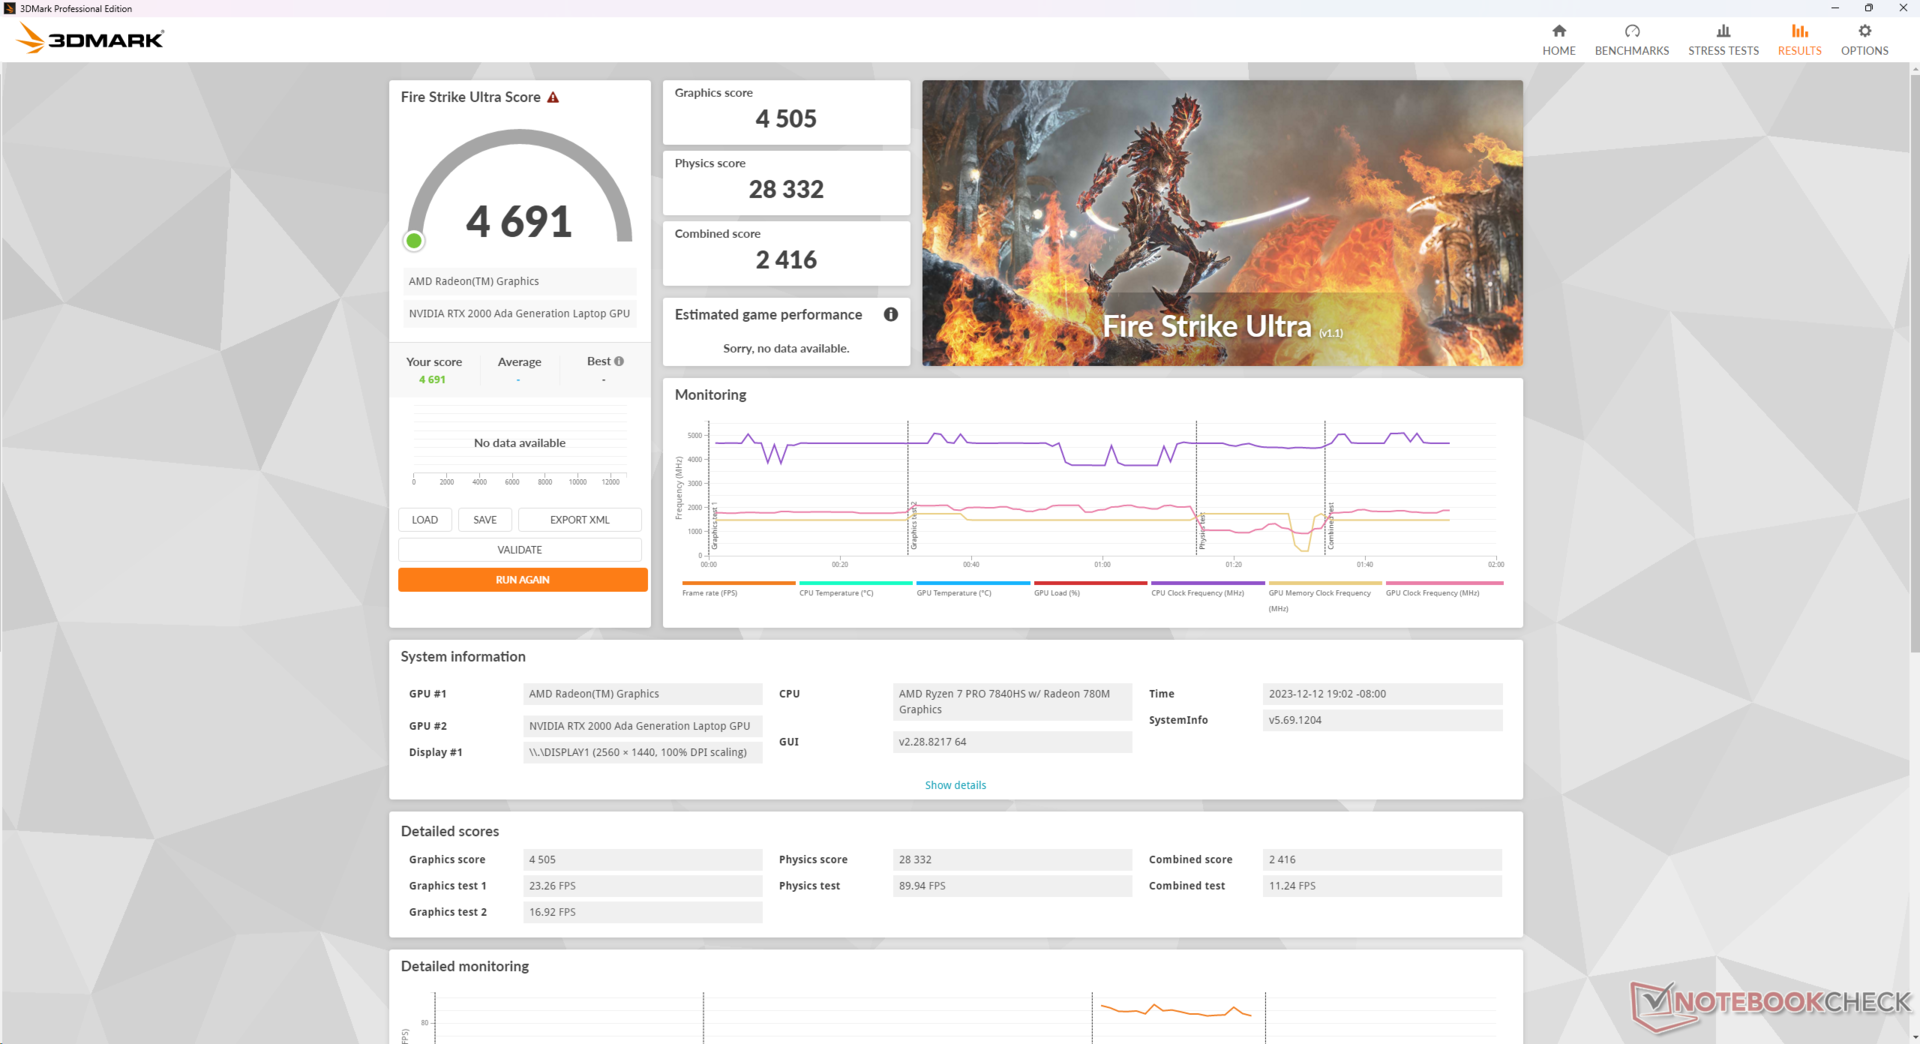
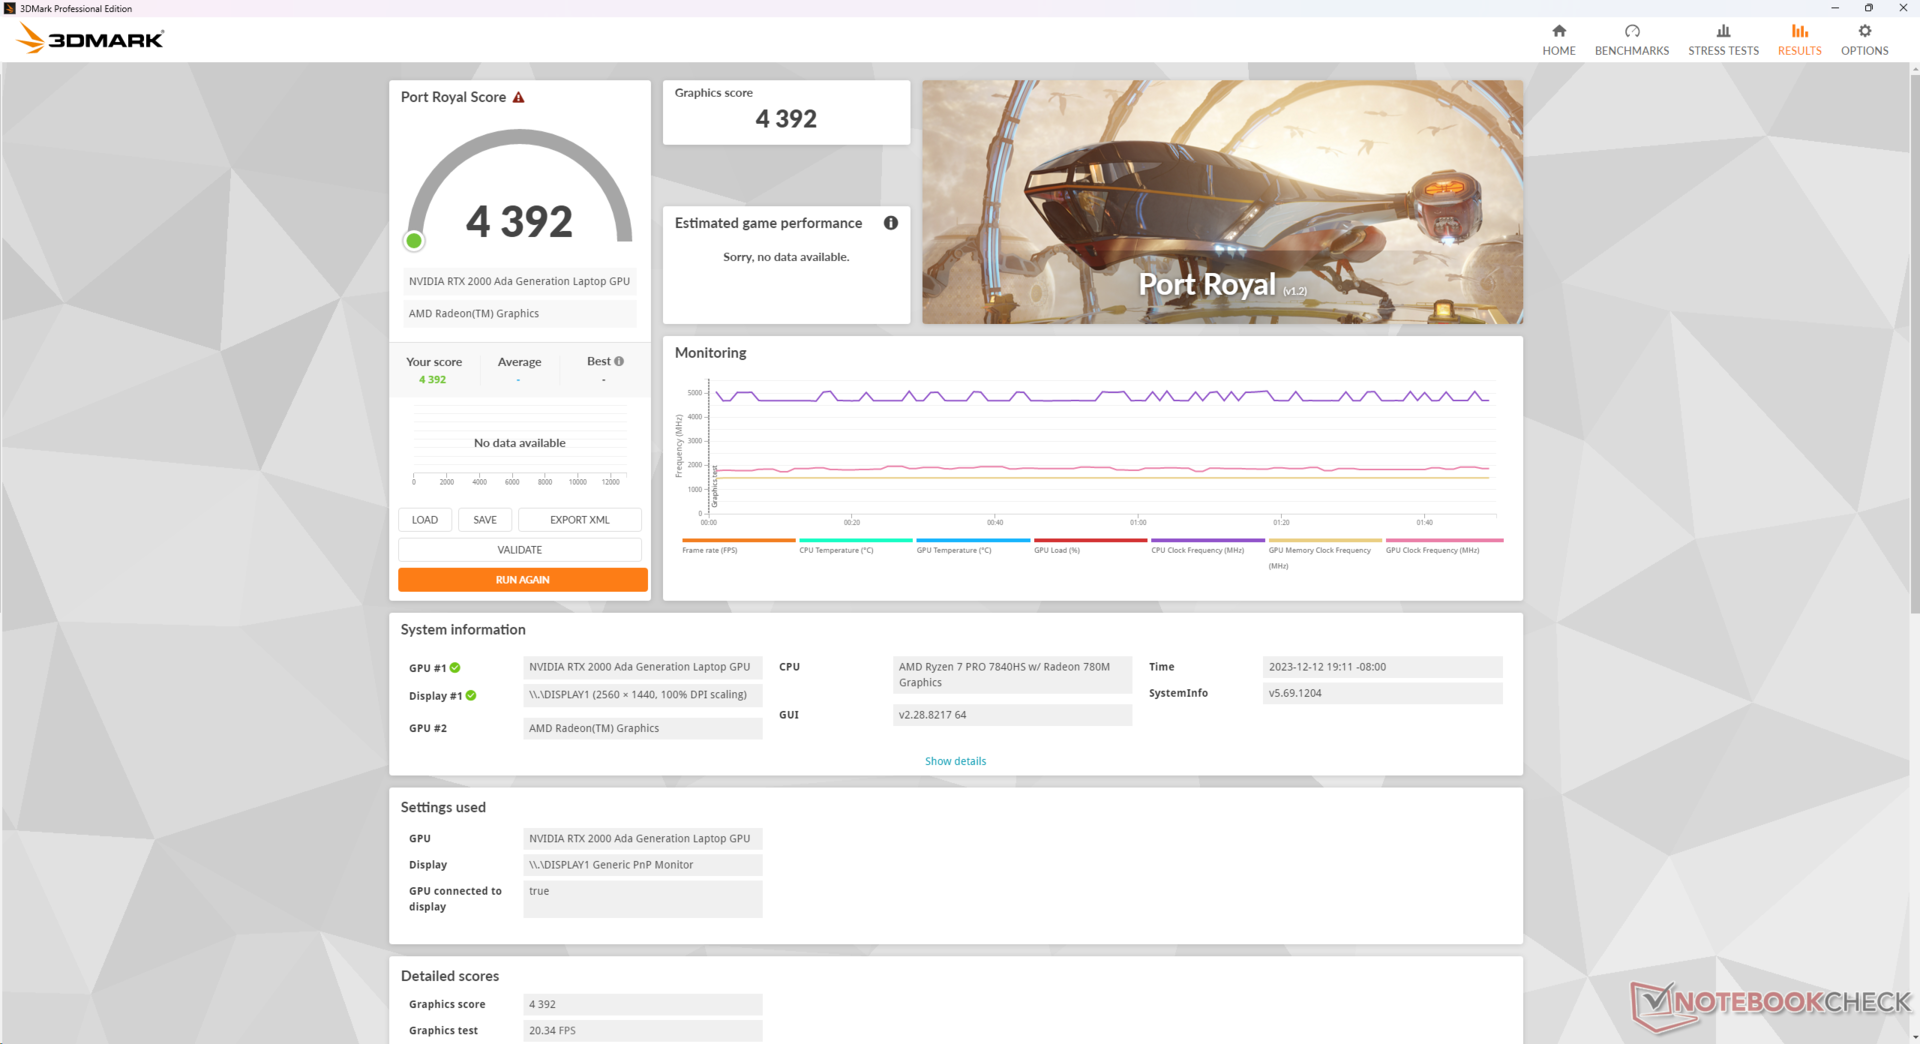
Praca w trybie zrównoważonym zamiast w trybie wydajności nie wydaje się wpływać na wydajność procesora lub karty graficznej, jak pokazują poniższe wyniki Fire Strike. Praca na zasilaniu bateryjnym znacząco obniża jednak wydajność, nawet jeśli ustawiony jest tryb Wydajności.
| Profil zasilania | Wynik fizyki | Wynik grafiki | Wynik łączny |
| Tryb wydajności (na głównych testach) | 28260 | 20340 | 7793 |
| Tryb zrównoważony (w sieci) | 27579 (-0%) | 20812 (-0%) | 7877 (-0%) |
| Tryb wydajności (na baterii) | 6105 (-78%) | 12744 (-37%) | 2392 (-69%) |
Irytujące jest to, że HP oferuje RTX 3000 Ada GPU tylko dla konfiguracji Intel ZBook Power 15 G10, podczas gdy konfiguracje AMD są ograniczone do RTX 2000 Ada. Procesor graficzny 3000 Ada oferuje od 5 do 15 procent wyższą wydajność niż 2000 Ada, w oparciu o nasz czas spędzony z mniejszym procesorem Dell Precision 5480.
| 3DMark Performance rating - Percent | |
| HP ZBook Fury 16 G10 | |
| Lenovo ThinkPad P1 G6-21FV000DGE -8! | |
| Dell Precision 5480 | |
| Przeciętny NVIDIA RTX 2000 Ada Generation Laptop | |
| HP ZBook Power 15 G10 | |
| Asus ExpertBook B6 Flip B6602FC2 -8! | |
| HP ZBook Power 15 G9 6B8C4EA -8! | |
| Lenovo ThinkPad P15v G3 21EM001AGE -1! | |
| Dell Precision 5000 5470 -8! | |
| Lenovo ThinkPad Z16 Gen 2 -25! | |
| Lenovo ThinkPad P15v G2 21A9000XGE -9! | |
| HP ZBook Firefly 14 G10 A -26! | |
| 3DMark 11 Performance | 25876 pkt. | |
| 3DMark Fire Strike Score | 18177 pkt. | |
| 3DMark Time Spy Score | 7813 pkt. | |
Pomoc | ||
* ... im mniej tym lepiej
Wydajność w grach
Ogólna wydajność w grach jest najbardziej zbliżona do GeForce RTX 4050 mimo że Ada 2000 integruje więcej zunifikowanych potoków, jednostek TMU, pamięci VRAM i szerszą przepustowość pamięci. Wymagające gry, takie jak Cyberpunk 2077, są grywalne w rozdzielczości 1080p i ustawieniach Extreme, ale niższe ustawienia są wymagane w przypadku grania w natywnej rozdzielczości 1440p.
| Cyberpunk 2077 | |
| 1920x1080 Low Preset (FSR off) | |
| HP ZBook Power 15 G10 | |
| Przeciętny NVIDIA RTX 2000 Ada Generation Laptop (81.1 - 85.4, n=2) | |
| Lenovo ThinkPad Z16 Gen 2 | |
| 1920x1080 Medium Preset (FSR off) | |
| HP ZBook Power 15 G10 | |
| Przeciętny NVIDIA RTX 2000 Ada Generation Laptop (61.4 - 64.5, n=2) | |
| Lenovo ThinkPad Z16 Gen 2 | |
| 1920x1080 High Preset (FSR off) | |
| HP ZBook Power 15 G10 | |
| Przeciętny NVIDIA RTX 2000 Ada Generation Laptop (51.7 - 55.2, n=2) | |
| Lenovo ThinkPad Z16 Gen 2 | |
| 1920x1080 Ultra Preset (FSR off) | |
| HP ZBook Power 15 G10 | |
| Przeciętny NVIDIA RTX 2000 Ada Generation Laptop (44.8 - 48.3, n=2) | |
| Lenovo ThinkPad Z16 Gen 2 | |
| 2560x1440 Ultra Preset (FSR off) | |
| HP ZBook Power 15 G10 | |
| Przeciętny NVIDIA RTX 2000 Ada Generation Laptop (29.7 - 29.9, n=2) | |
| Lenovo ThinkPad Z16 Gen 2 | |
| 1920x1080 Ray Tracing Ultra Preset (DLSS off) | |
| HP ZBook Power 15 G10 | |
| Przeciętny NVIDIA RTX 2000 Ada Generation Laptop (19.2 - 21.6, n=2) | |
| Lenovo ThinkPad Z16 Gen 2 | |
Witcher 3 FPS Chart
| low | med. | high | ultra | QHD | |
|---|---|---|---|---|---|
| GTA V (2015) | 178.1 | 170.6 | 157.7 | 86.2 | 60.6 |
| The Witcher 3 (2015) | 336.4 | 219 | 127.9 | 65.5 | |
| Dota 2 Reborn (2015) | 155 | 140.8 | 136.9 | 132 | |
| Final Fantasy XV Benchmark (2018) | 173.3 | 93.5 | 67.7 | 50.3 | |
| X-Plane 11.11 (2018) | 80.6 | 73 | 52.5 | ||
| Far Cry 5 (2018) | 151 | 110 | 102 | 95 | 63 |
| Strange Brigade (2018) | 332 | 183 | 148.4 | 132.5 | 94.1 |
| Tiny Tina's Wonderlands (2022) | 119.8 | 110.5 | 77.3 | 62.3 | 43.5 |
| F1 22 (2022) | 166.7 | 151.8 | 119.9 | 44.2 | 28.9 |
| Cyberpunk 2077 (2023) | 85.4 | 64.5 | 55.2 | 48.3 | 29.9 |
Emisje
Hałas systemowy
Hałas wentylatorów jest zasadniczo identyczny jak w zeszłorocznym modelu, z podobnymi wartościami minimalnymi i maksymalnymi pomimo różnic w wydajności. Co warto podkreślić, wewnętrzne wentylatory naszej jednostki G10 są w stanie pozostać cichsze przez nieco dłuższy czas niż w naszej jednostce G9 podczas uruchamiania 3DMark 06, ale jest to oczywiście zależne od początkowych warunków temperaturowych.
Hałas wentylatorów podczas pracy Witcher 3 pozostałby taki sam pomiędzy trybami Balanced i Performance, co koreluje z naszymi wynikami testów pokazującymi minimalne różnice pomiędzy dwoma profilami zasilania.
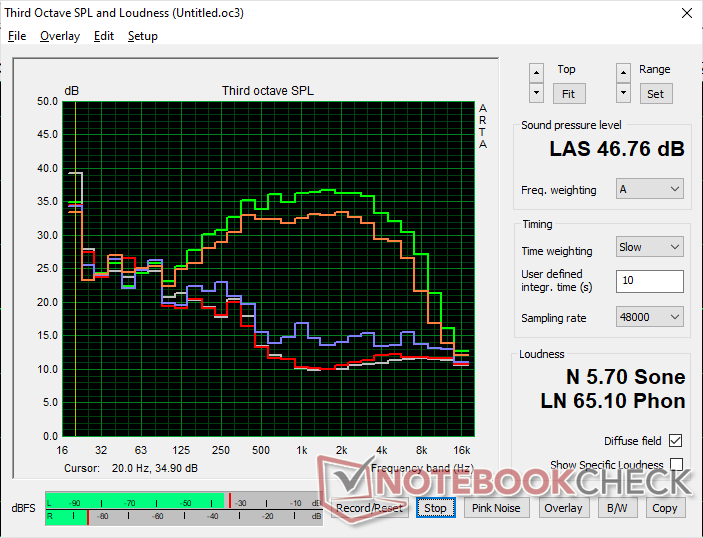
Hałas
| luz |
| 24.4 / 24.4 / 24.4 dB |
| obciążenie |
| 27.4 / 46.8 dB |
 | ||
30 dB cichy 40 dB(A) słyszalny 50 dB(A) irytujący |
||
min: | ||
| HP ZBook Power 15 G10 RTX 2000 Ada Generation Laptop, R7 PRO 7840HS, WDC PC SN810 2TB | HP ZBook Power 15 G9 6B8C4EA RTX A2000 Laptop GPU, i7-12700H, Samsung PM9A1 MZVL21T0HCLR | Lenovo ThinkPad P15v G3 21EM001AGE RTX A2000 Laptop GPU, R7 PRO 6850H, SK Hynix PC711 1TB HFS001TDE9X081N | Dell Precision 5000 5560 RTX A2000 Laptop GPU, i7-11850H, Samsung PM9A1 MZVL22T0HBLB | Lenovo ThinkPad P1 G6-21FV000DGE RTX 2000 Ada Generation Laptop, i9-13900H, SK Hynix PC711 1TB HFS001TDE9X084N | Asus ExpertBook B6 Flip B6602FC2 RTX A2000 Laptop GPU, i9-12950HX, Samsung PM9A1 MZVL21T0HCLR | |
|---|---|---|---|---|---|---|
| Noise | -8% | 3% | 5% | -10% | -34% | |
| wyłączone / środowisko * (dB) | 24.2 | 23.8 2% | 23.2 4% | 23.4 3% | 24.5 -1% | 26 -7% |
| Idle Minimum * (dB) | 24.4 | 23.8 2% | 23.2 5% | 23.6 3% | 24.5 -0% | 32.4 -33% |
| Idle Average * (dB) | 24.4 | 23.8 2% | 23.2 5% | 23.6 3% | 24.5 -0% | 32.4 -33% |
| Idle Maximum * (dB) | 24.4 | 23.8 2% | 23.2 5% | 23.6 3% | 24.5 -0% | 32.4 -33% |
| Load Average * (dB) | 27.4 | 42.9 -57% | 35 -28% | 25.8 6% | 48 -75% | 51.9 -89% |
| Witcher 3 ultra * (dB) | 43.3 | 44.5 -3% | 37.9 12% | 40.1 7% | 40.7 6% | |
| Load Maximum * (dB) | 46.8 | 47.9 -2% | 37.5 20% | 41.4 12% | 48 -3% | 52.1 -11% |
* ... im mniej tym lepiej
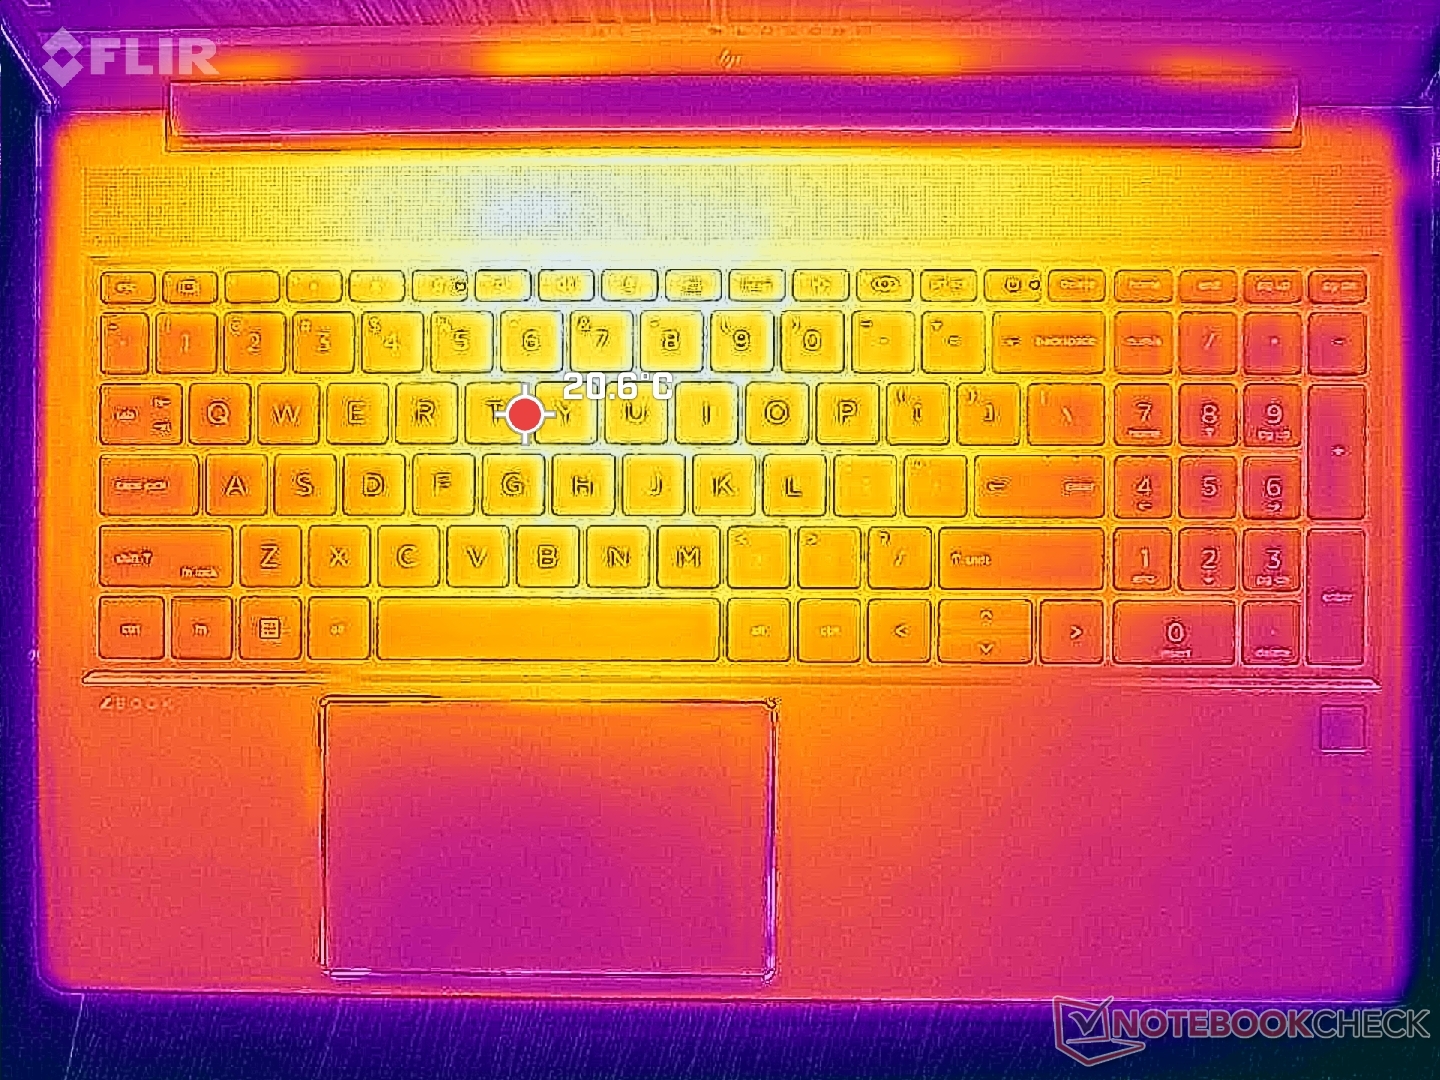
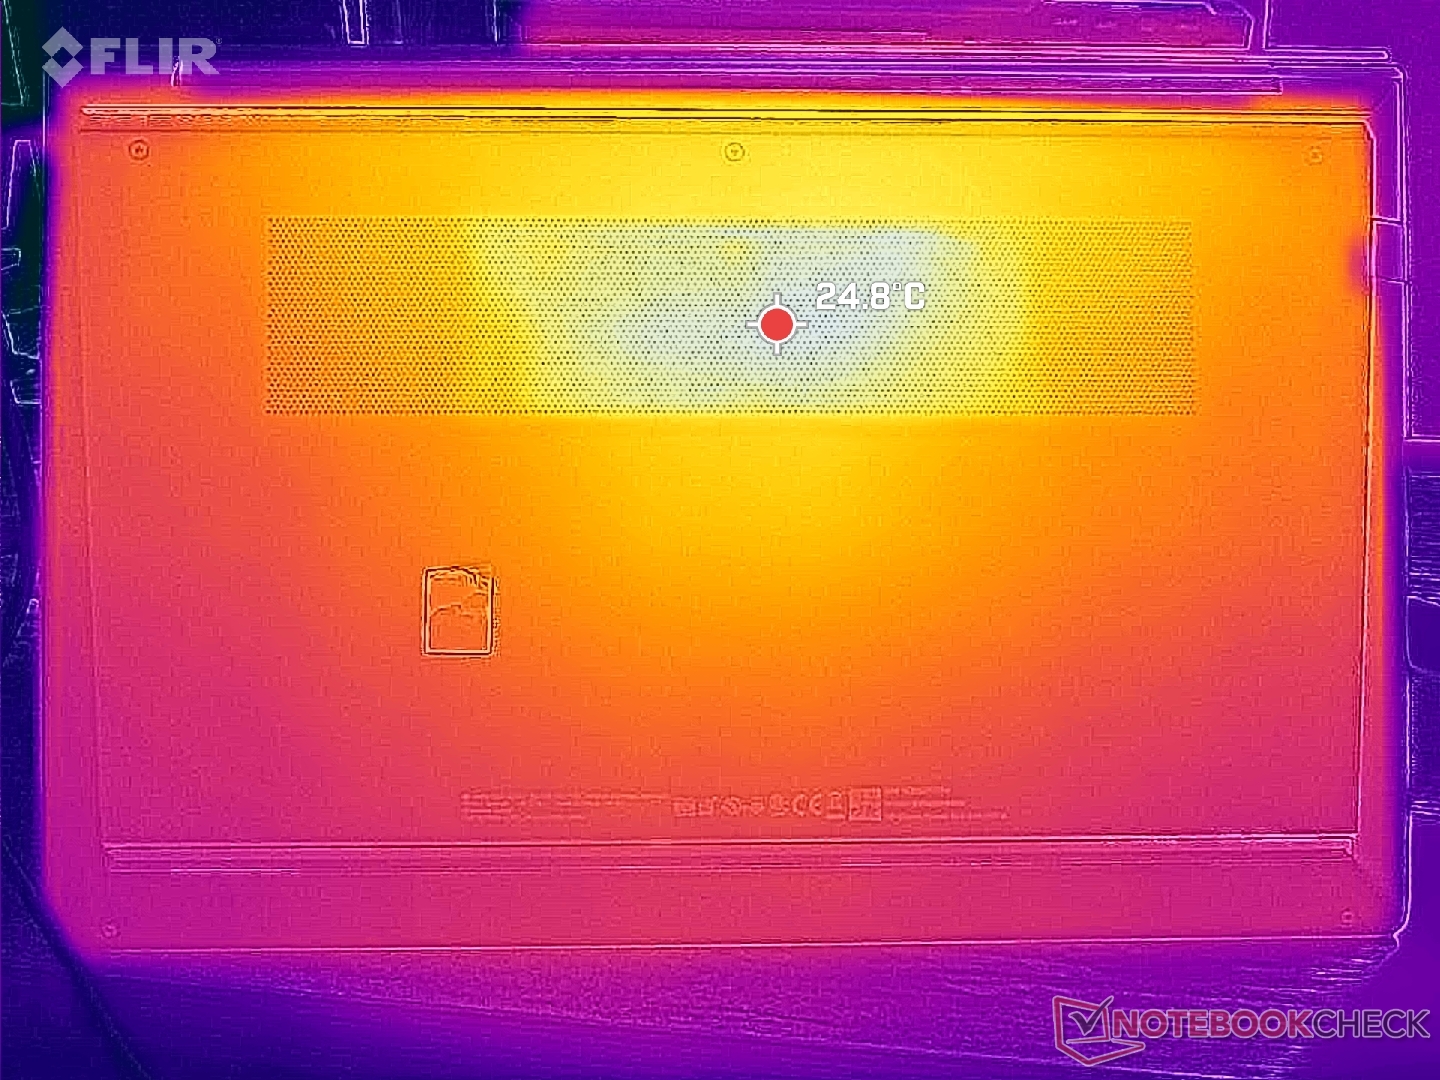
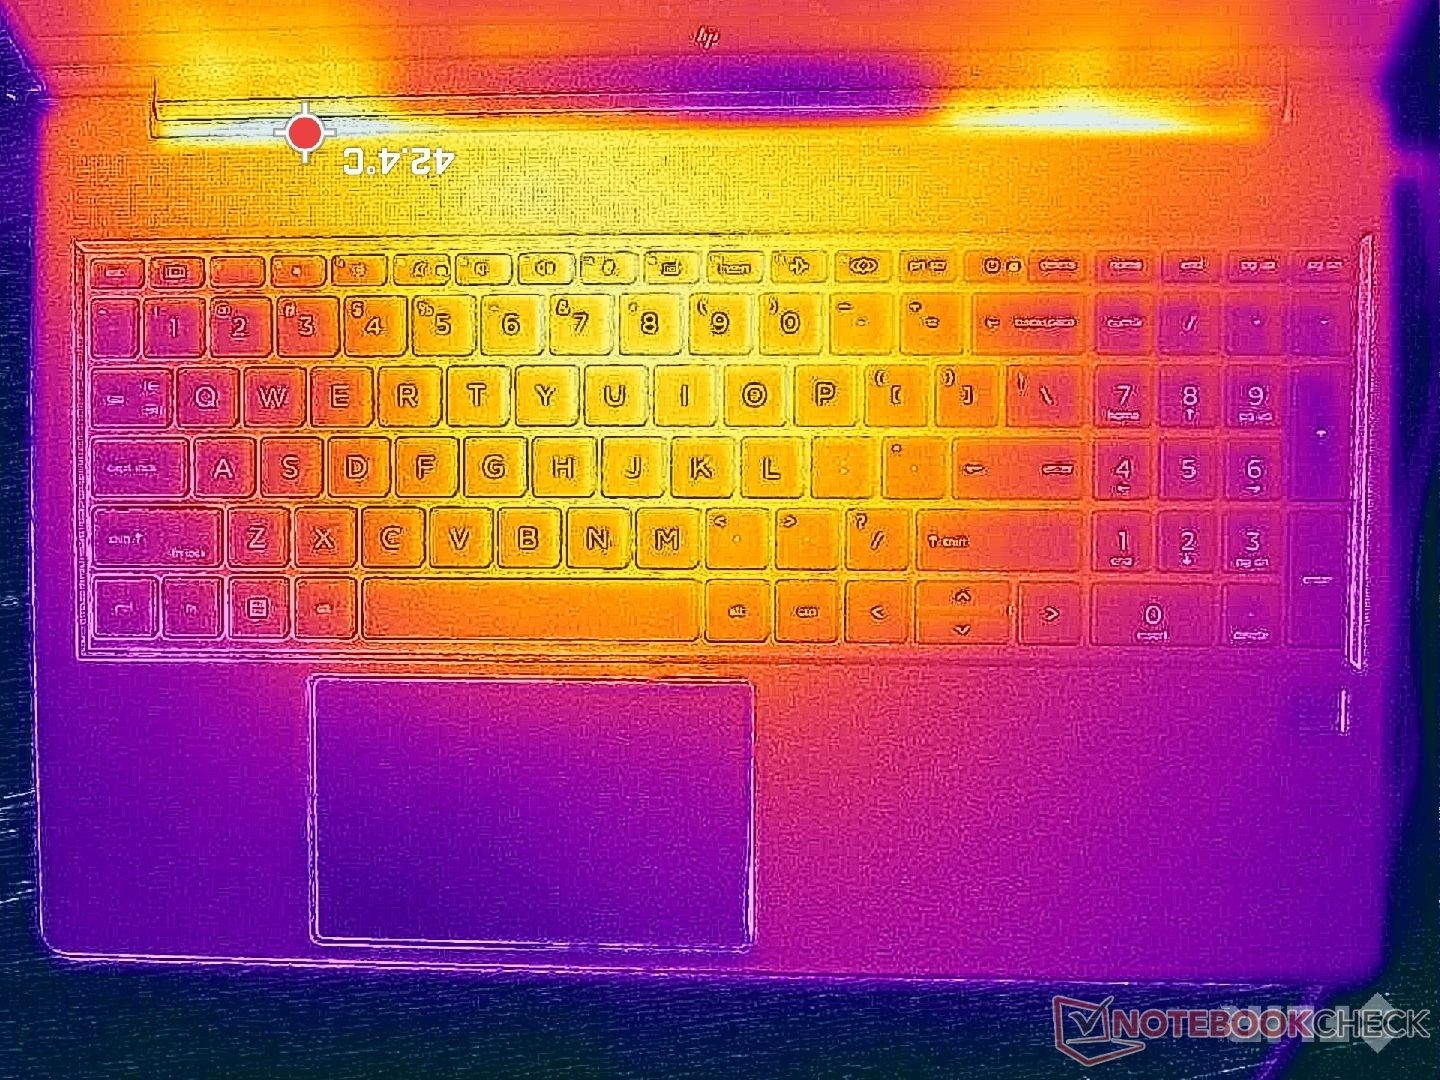
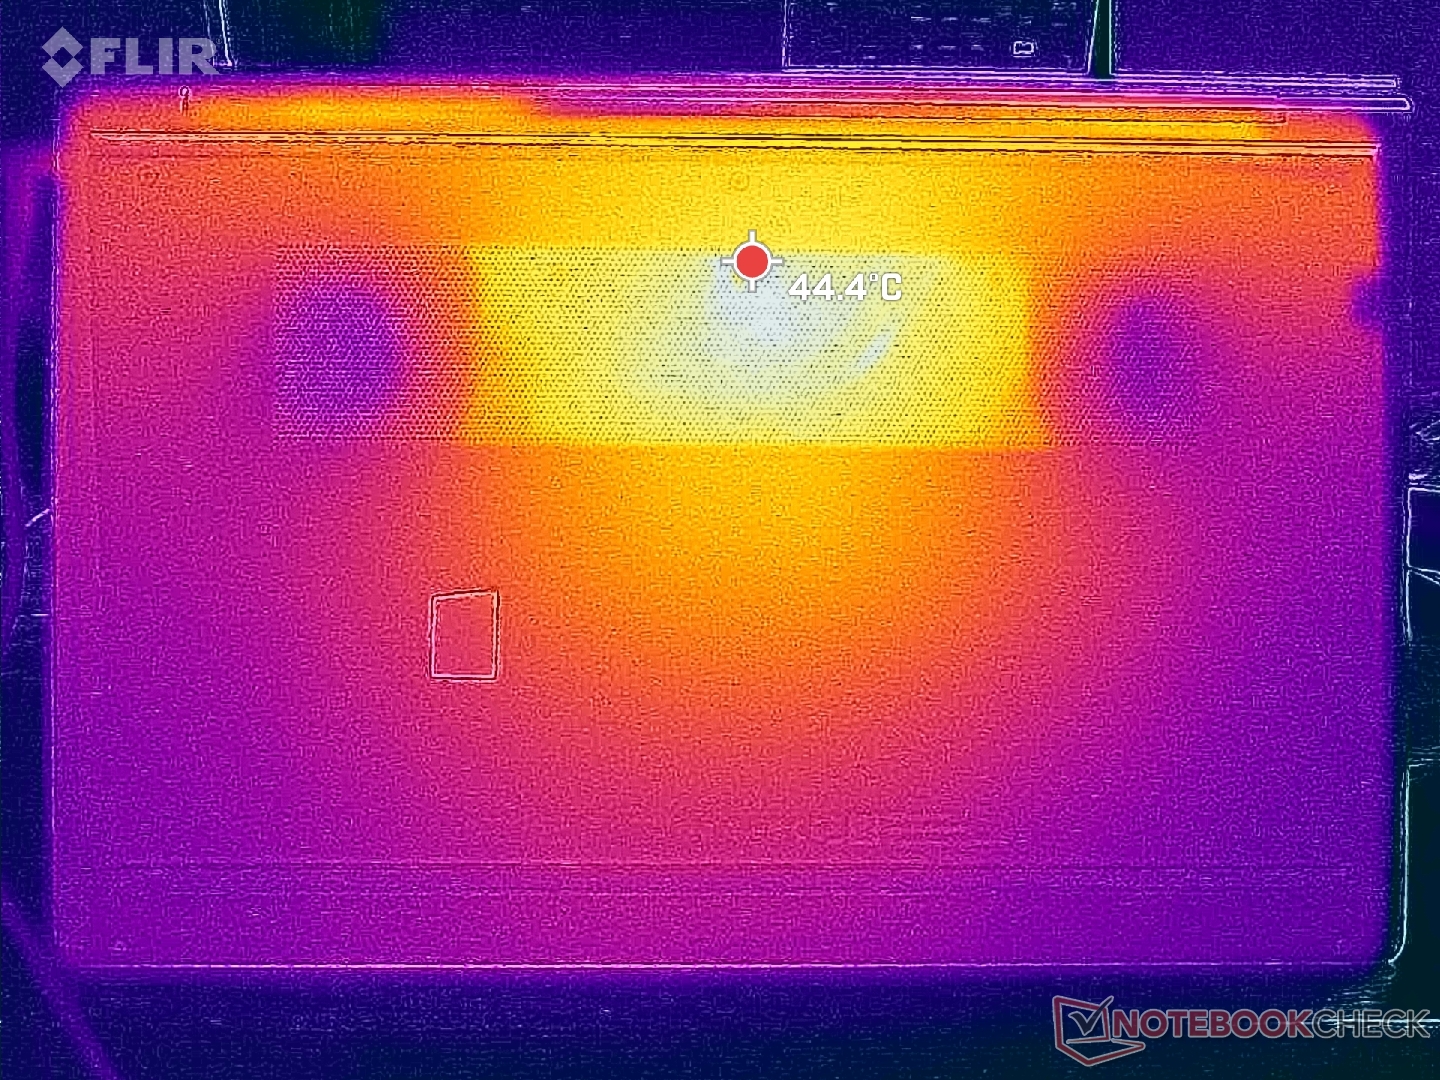
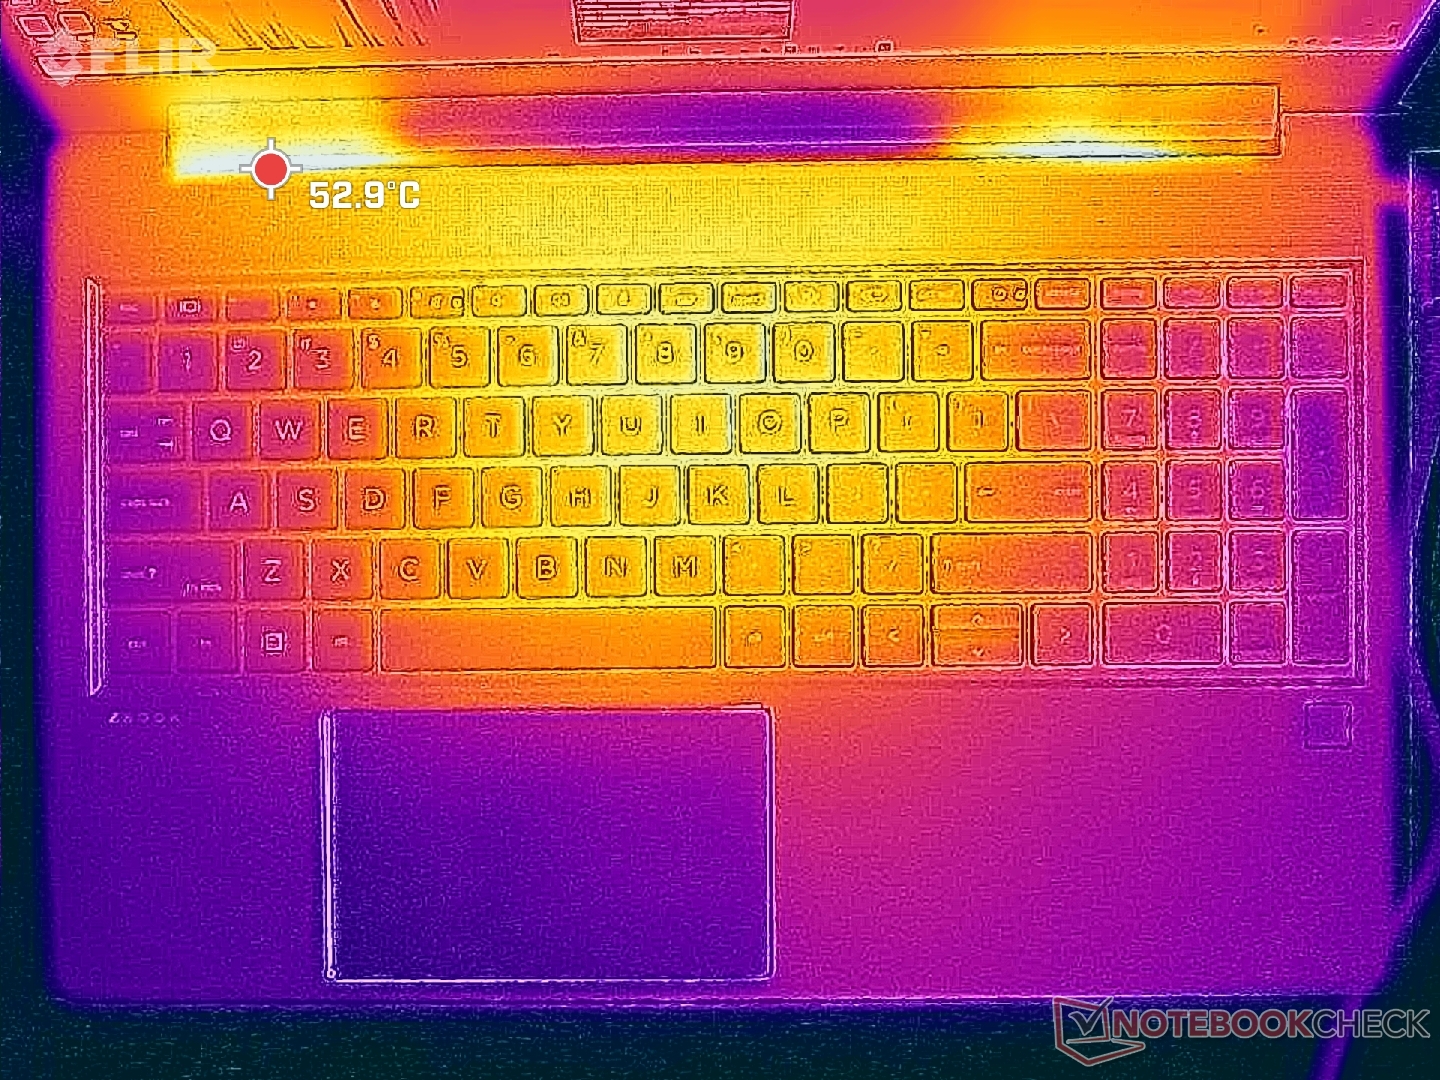
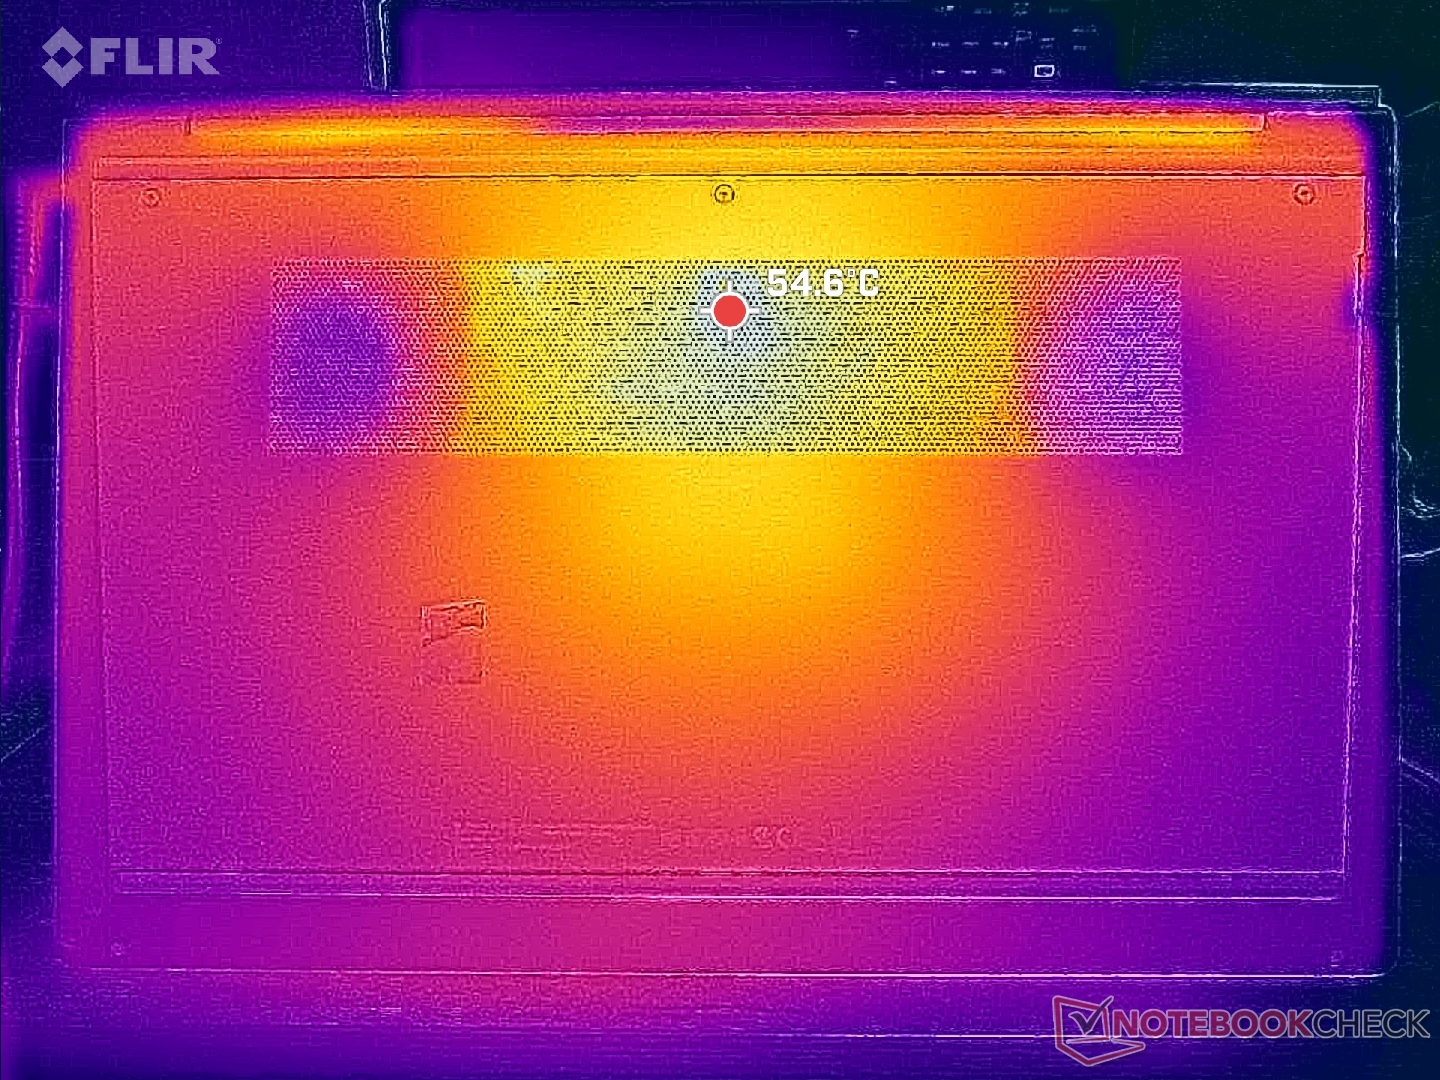
Temperatura
Temperatury powierzchni są najcieplejsze w kierunku środka i chłodniejsze wzdłuż boków klawiatury lub krawędzi obudowy. Gorące punkty na środku i spodzie klawiatury mogą osiągnąć ponad 42°C, czyli o kilka stopni niższą temperaturę niż w konkurencyjnych modelach ThinkPad P1 G6 z tym samym GPU RTX 2000.
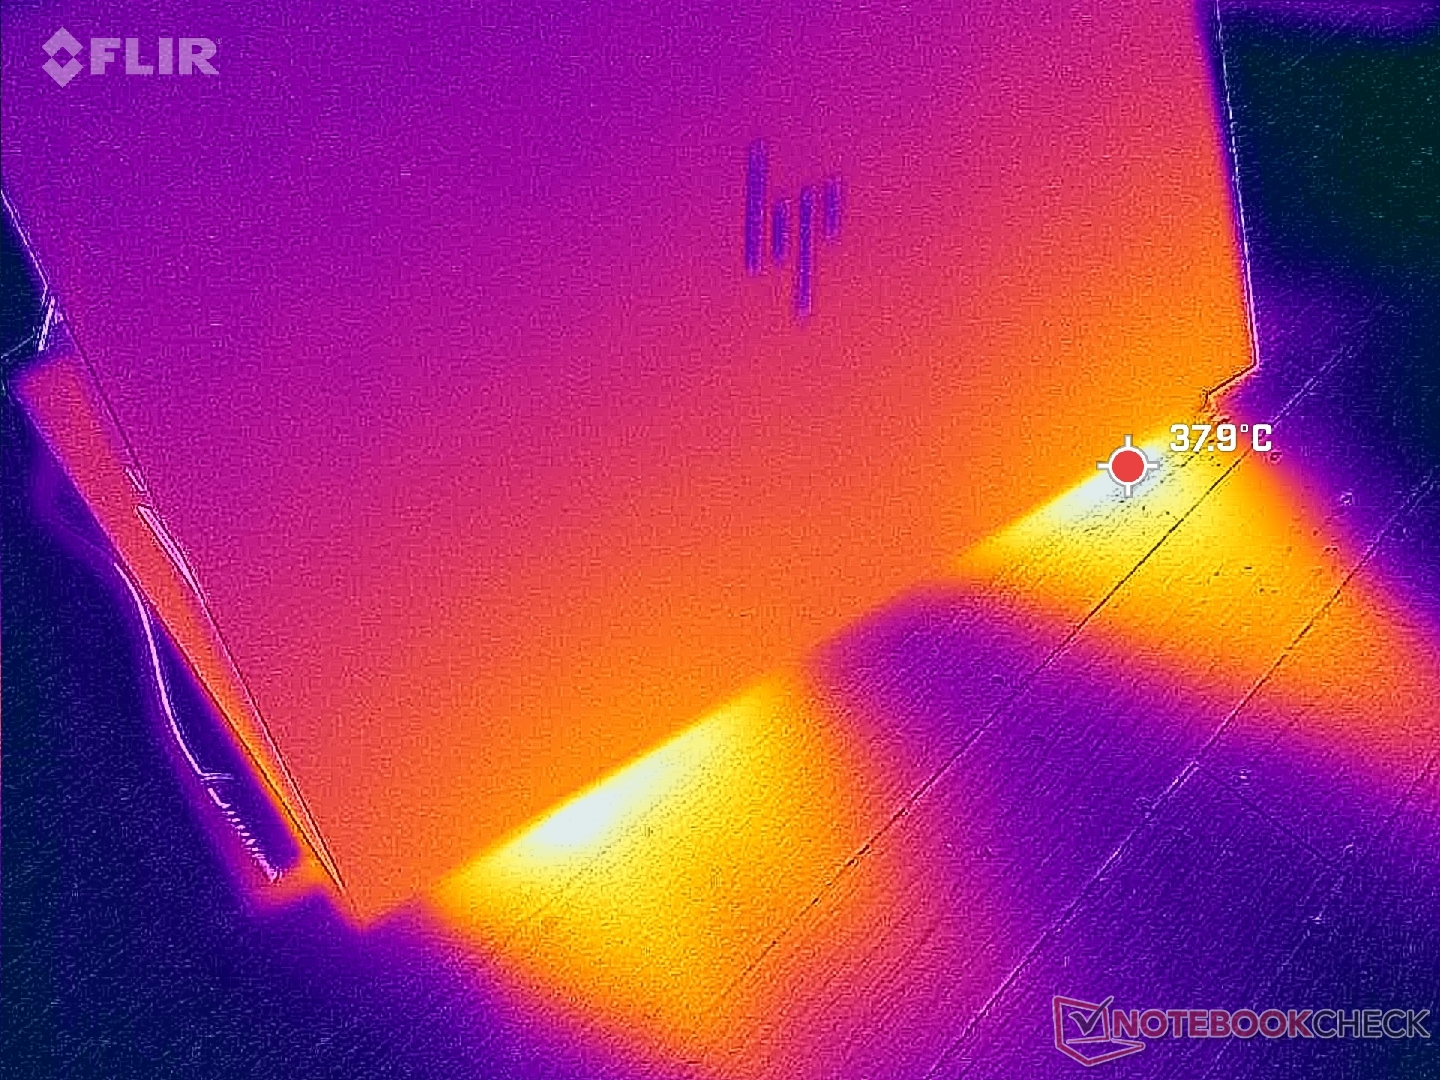
(±) Maksymalna temperatura w górnej części wynosi 42.4 °C / 108 F, w porównaniu do średniej 38.2 °C / 101 F , począwszy od 22.2 do 69.8 °C dla klasy Workstation.
(-) Dno nagrzewa się maksymalnie do 47.8 °C / 118 F, w porównaniu do średniej 41.1 °C / 106 F
(+) W stanie bezczynności średnia temperatura górnej części wynosi 24.4 °C / 76 F, w porównaniu ze średnią temperaturą urządzenia wynoszącą 32 °C / ### class_avg_f### F.
(+) Podczas gry w Wiedźmina 3 średnia temperatura górnej części wynosi 31.2 °C / 88 F, w porównaniu do średniej temperatury urządzenia wynoszącej 32 °C / ## #class_avg_f### F.
(+) Podpórki pod nadgarstki i touchpad są chłodniejsze niż temperatura skóry i maksymalnie 27.6 °C / 81.7 F i dlatego są chłodne w dotyku.
(±) Średnia temperatura obszaru podparcia dłoni w podobnych urządzeniach wynosiła 27.8 °C / 82 F (+0.2 °C / 0.3 F).
| HP ZBook Power 15 G10 AMD Ryzen 7 PRO 7840HS, NVIDIA RTX 2000 Ada Generation Laptop | HP ZBook Power 15 G9 6B8C4EA Intel Core i7-12700H, NVIDIA RTX A2000 Laptop GPU | Lenovo ThinkPad P15v G3 21EM001AGE AMD Ryzen 7 PRO 6850H, NVIDIA RTX A2000 Laptop GPU | Dell Precision 5000 5560 Intel Core i7-11850H, NVIDIA RTX A2000 Laptop GPU | Lenovo ThinkPad P1 G6-21FV000DGE Intel Core i9-13900H, NVIDIA RTX 2000 Ada Generation Laptop | Asus ExpertBook B6 Flip B6602FC2 Intel Core i9-12950HX, NVIDIA RTX A2000 Laptop GPU | |
|---|---|---|---|---|---|---|
| Heat | 7% | -2% | -16% | -9% | -10% | |
| Maximum Upper Side * (°C) | 42.4 | 40.3 5% | 48.7 -15% | 48.2 -14% | 47.1 -11% | 48.4 -14% |
| Maximum Bottom * (°C) | 47.8 | 48.3 -1% | 50.5 -6% | 42.6 11% | 56.5 -18% | 52.3 -9% |
| Idle Upper Side * (°C) | 26.8 | 23.7 12% | 25 7% | 34.8 -30% | 28.1 -5% | 27.8 -4% |
| Idle Bottom * (°C) | 27.2 | 23.8 12% | 25.4 7% | 35.2 -29% | 27.6 -1% | 30.3 -11% |
* ... im mniej tym lepiej
Test warunków skrajnych
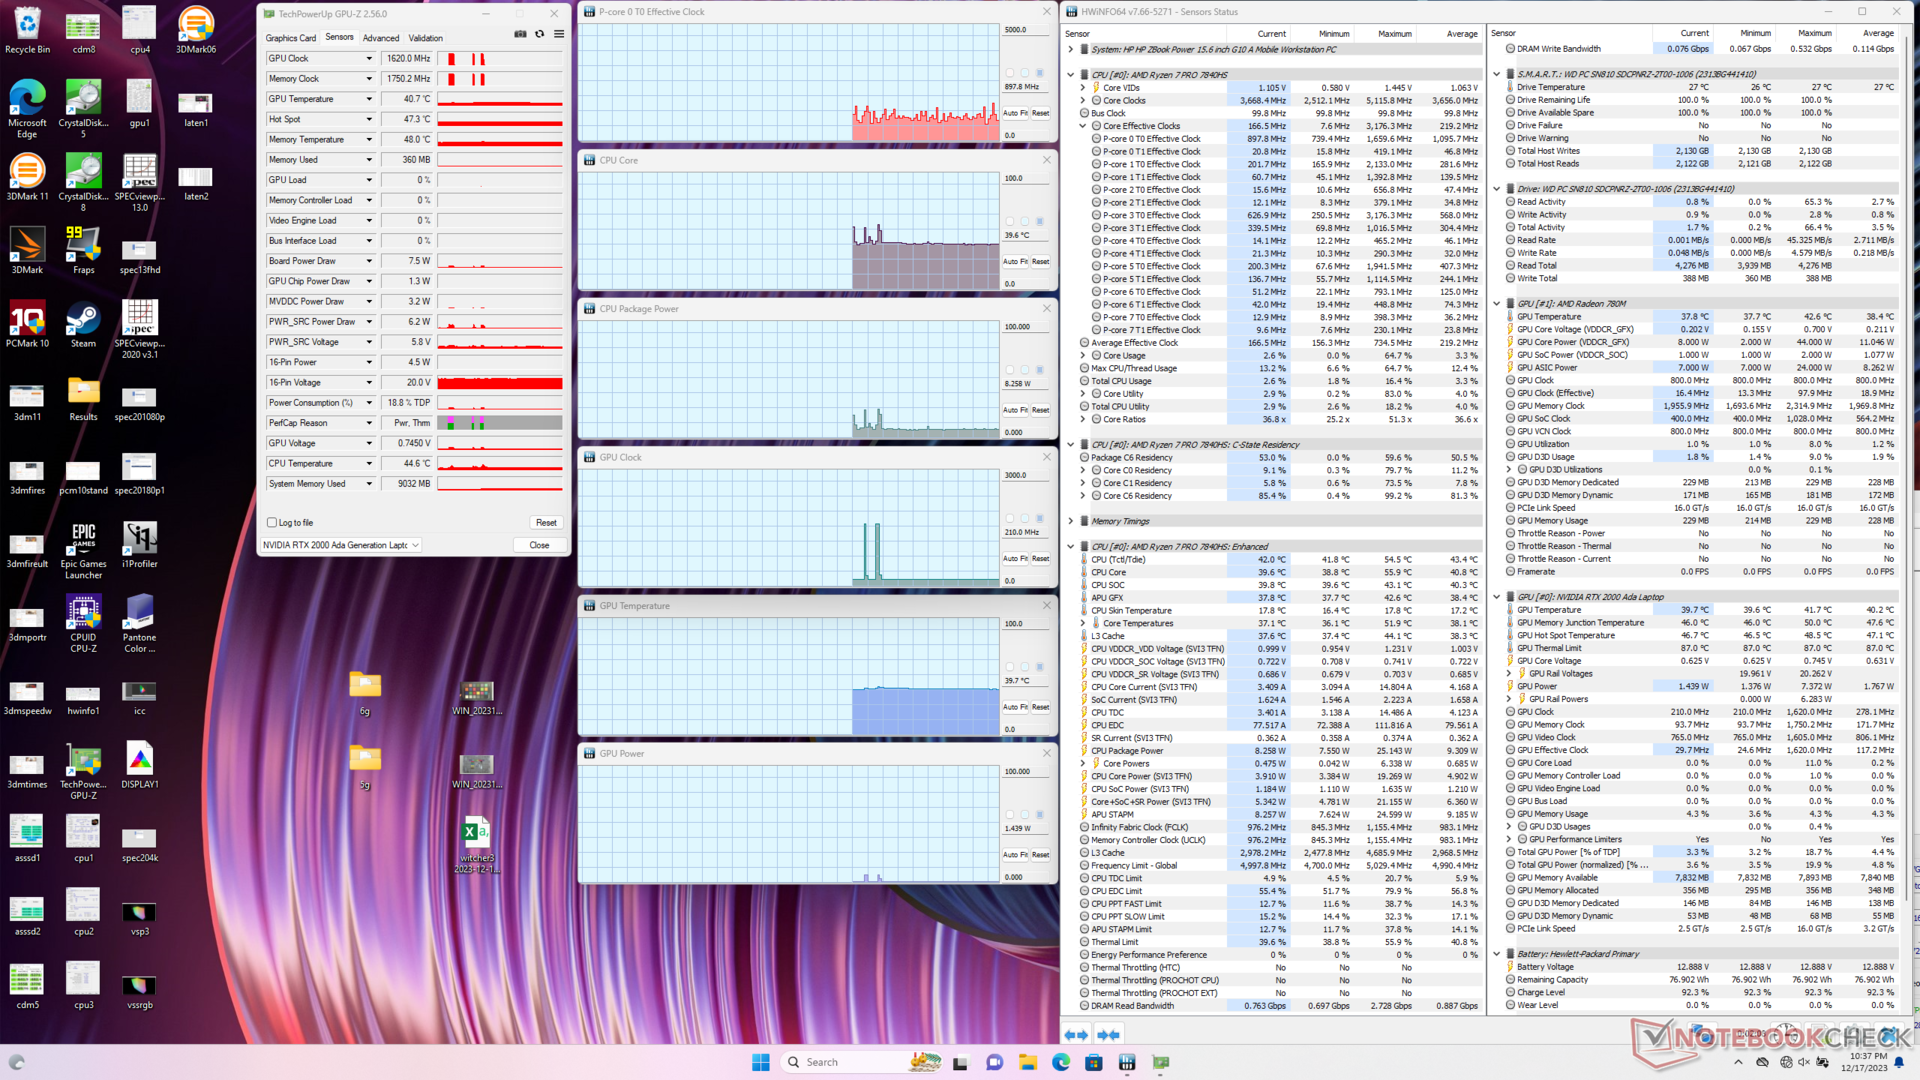
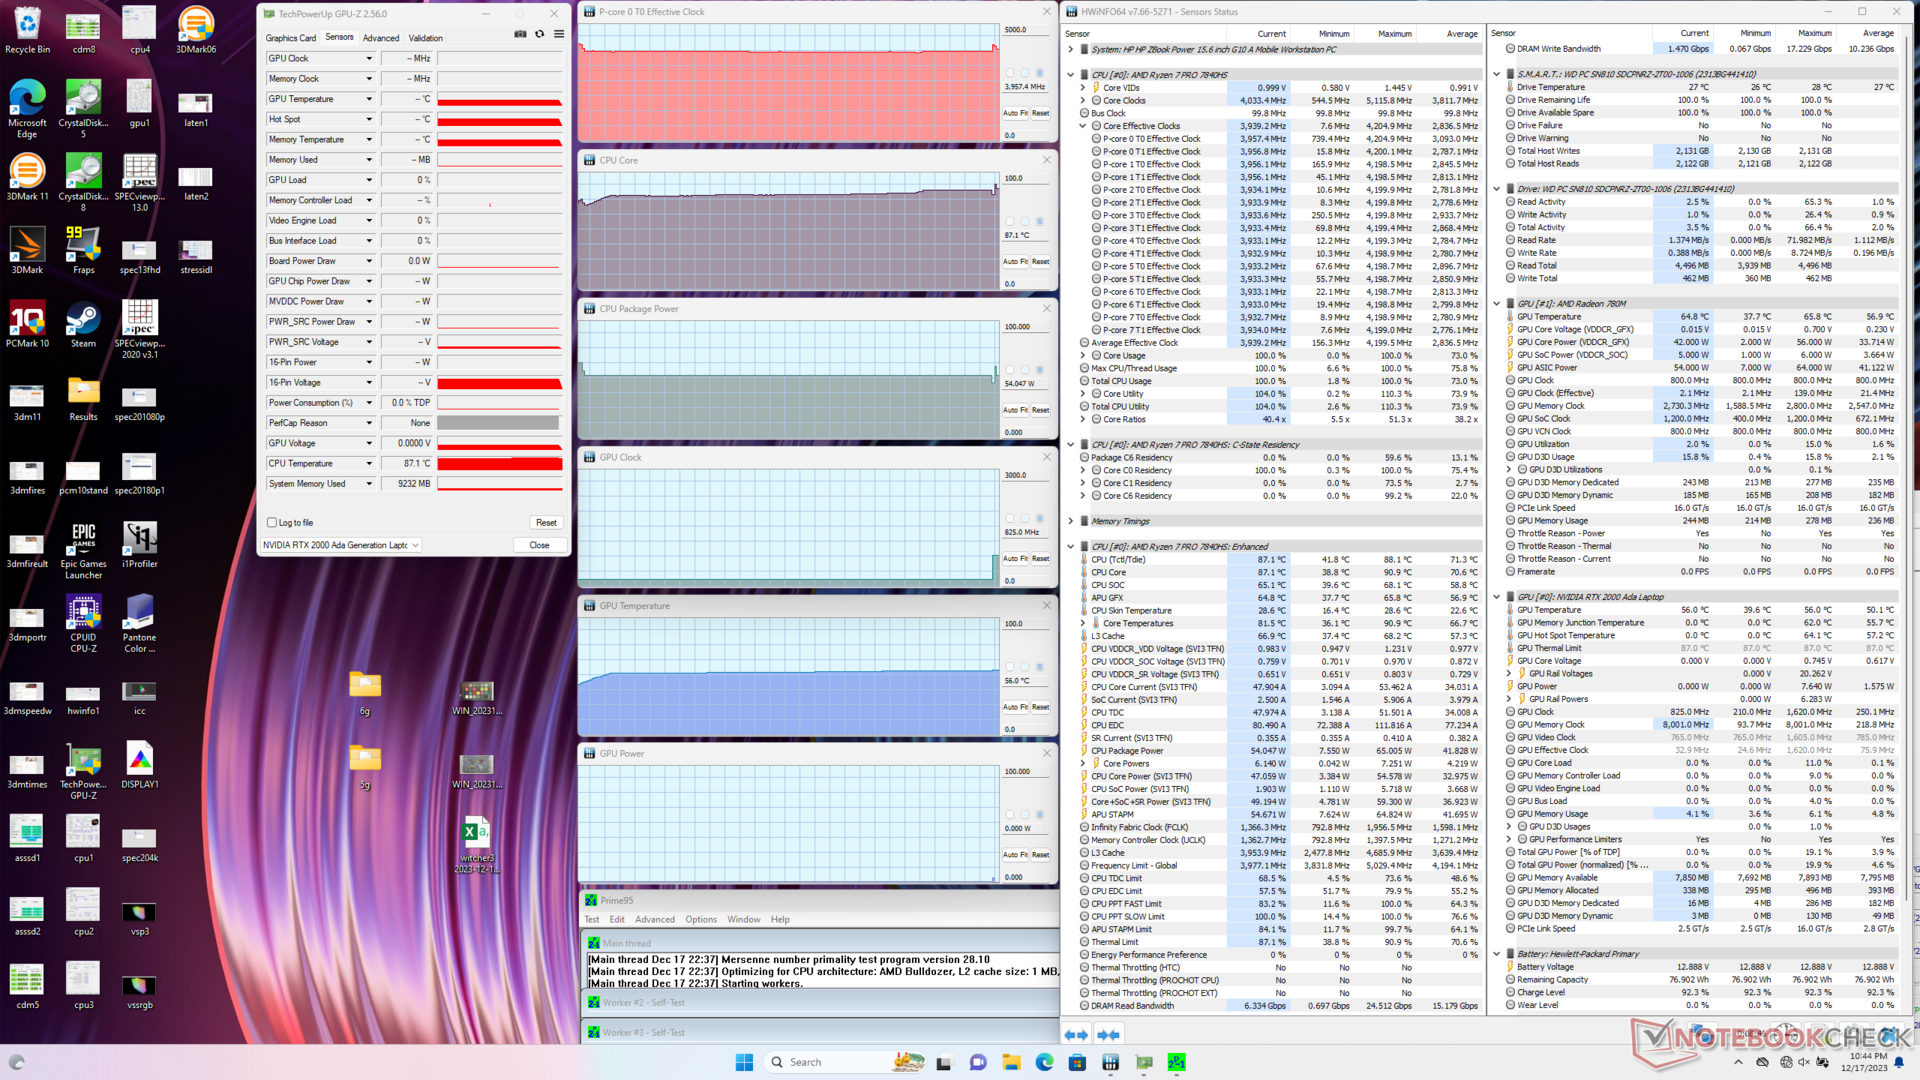
Po obciążeniu za pomocą Prime95, procesor przyspieszyłby do 4,2 GHz i 65 W tylko przez kilka pierwszych sekund, po czym nieznacznie spadł i ustabilizował się na poziomie 4,0 GHz i 54 W. Temperatura rdzenia byłaby dość wysoka i wynosiłaby 87 C, ale może to być normalne w przypadku wielu laptopów z procesorem Zen 4. Powtarzając ten test na ThinkPad Z16 G2na przykład, spowodowałoby, że jego procesor Ryzen 9 ustabilizowałby się na jeszcze cieplejszym poziomie 100 C.
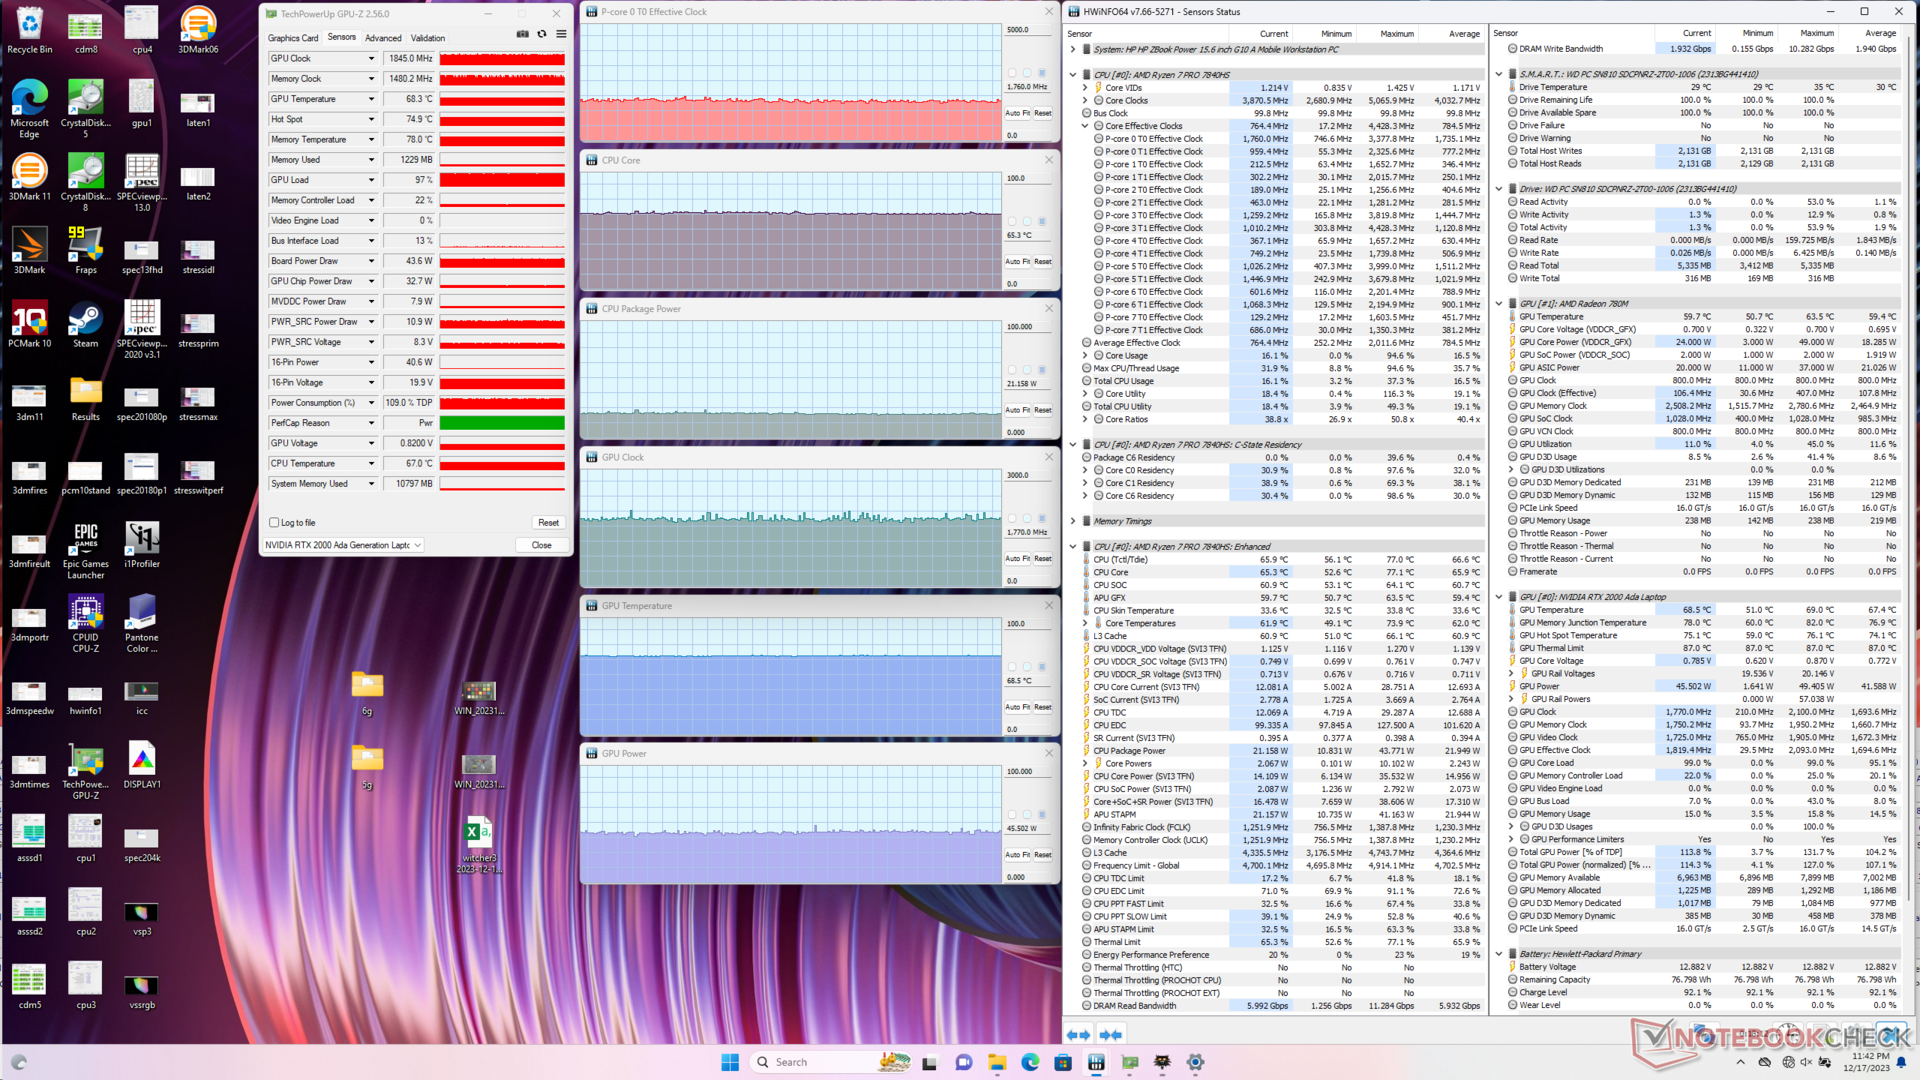
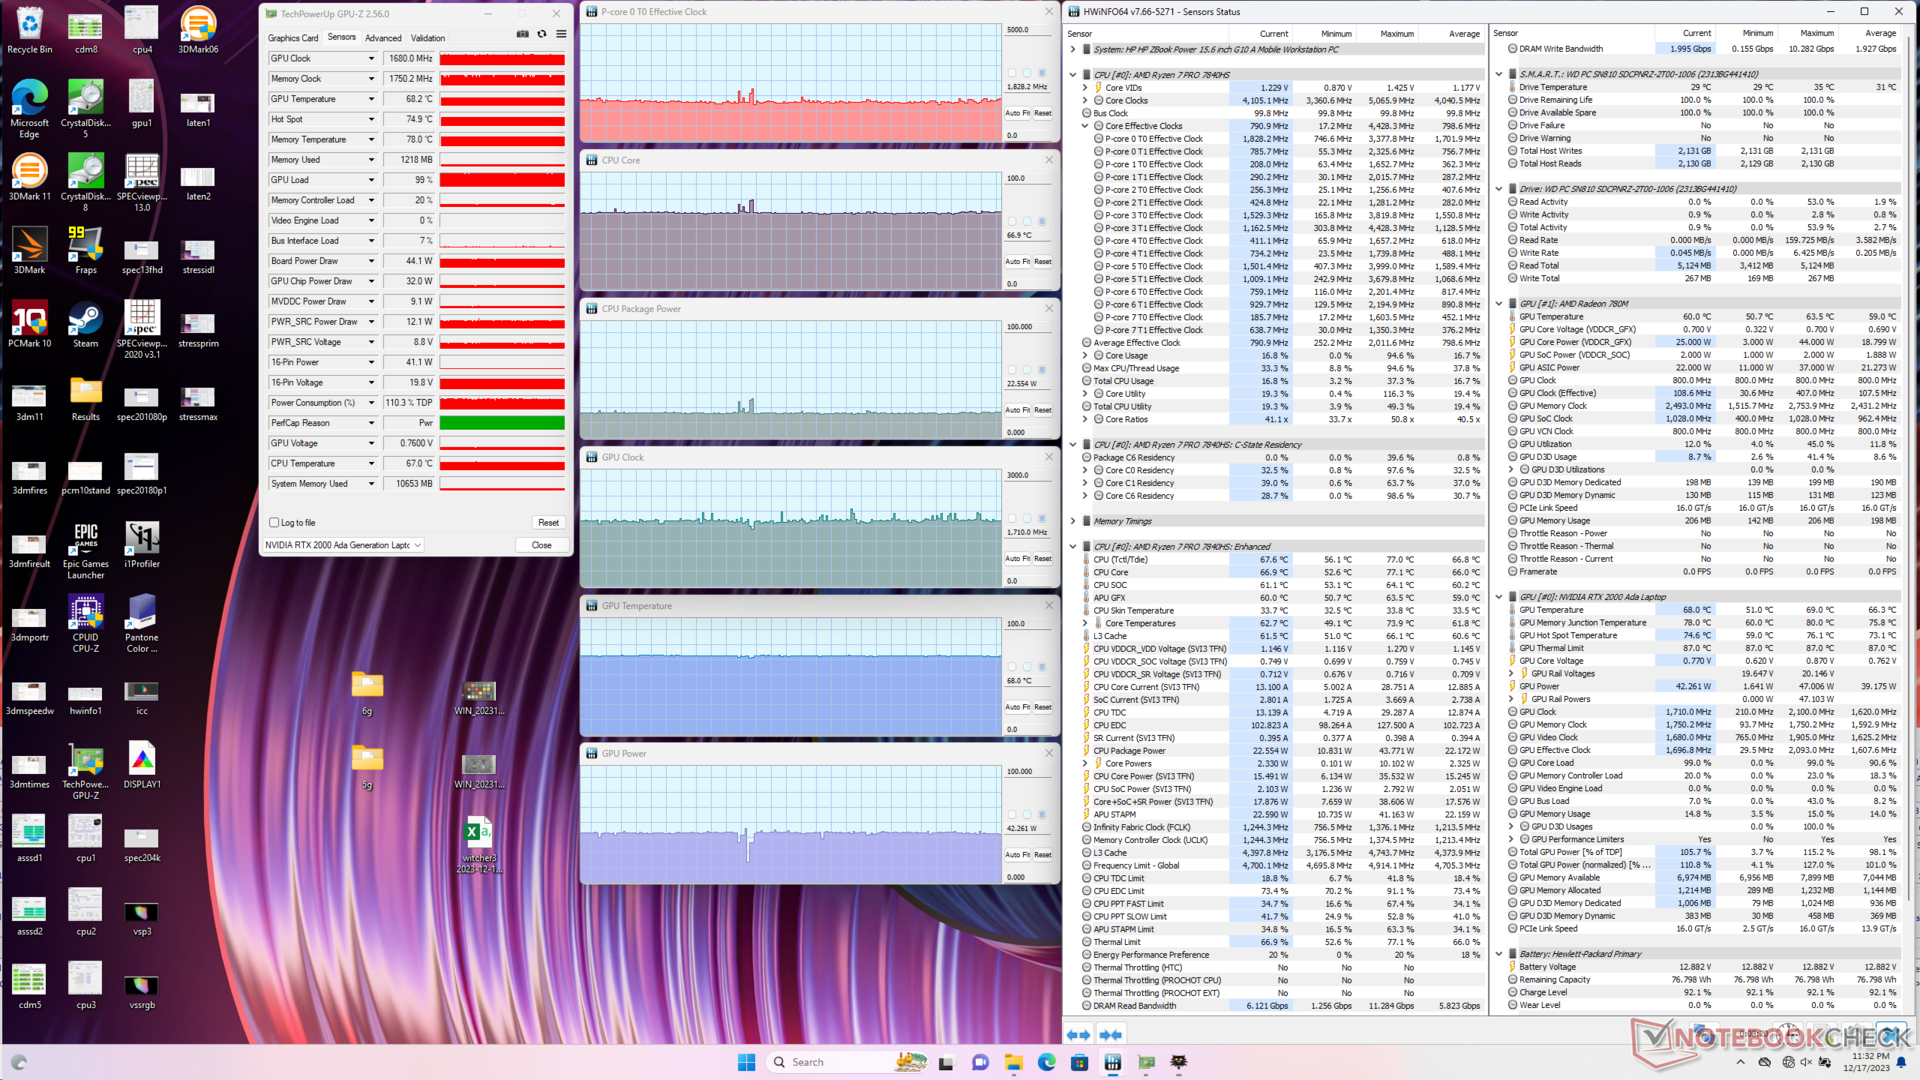
Uruchomienie Witcher 3 w trybie zrównoważonym nie wykazałoby znaczących różnic w temperaturach lub częstotliwościach taktowania w porównaniu z trybem wydajności, co jest zgodne z naszymi obserwacjami Fire Strike w powyższej sekcji. Pobór mocy karty graficznej oscylowałby wokół 44 W w porównaniu do docelowych 50 W.
| Taktowanie CPU (GHz) | Taktowanie GPU (MHz) | Średnia temperatura CPU (°C) | Średnia temperatura GPU (°C) | |
| System w stanie spoczynku | -- | -- | 40 | 40 |
| Prime95Stress | 4.0 | -- | 87 | 56 |
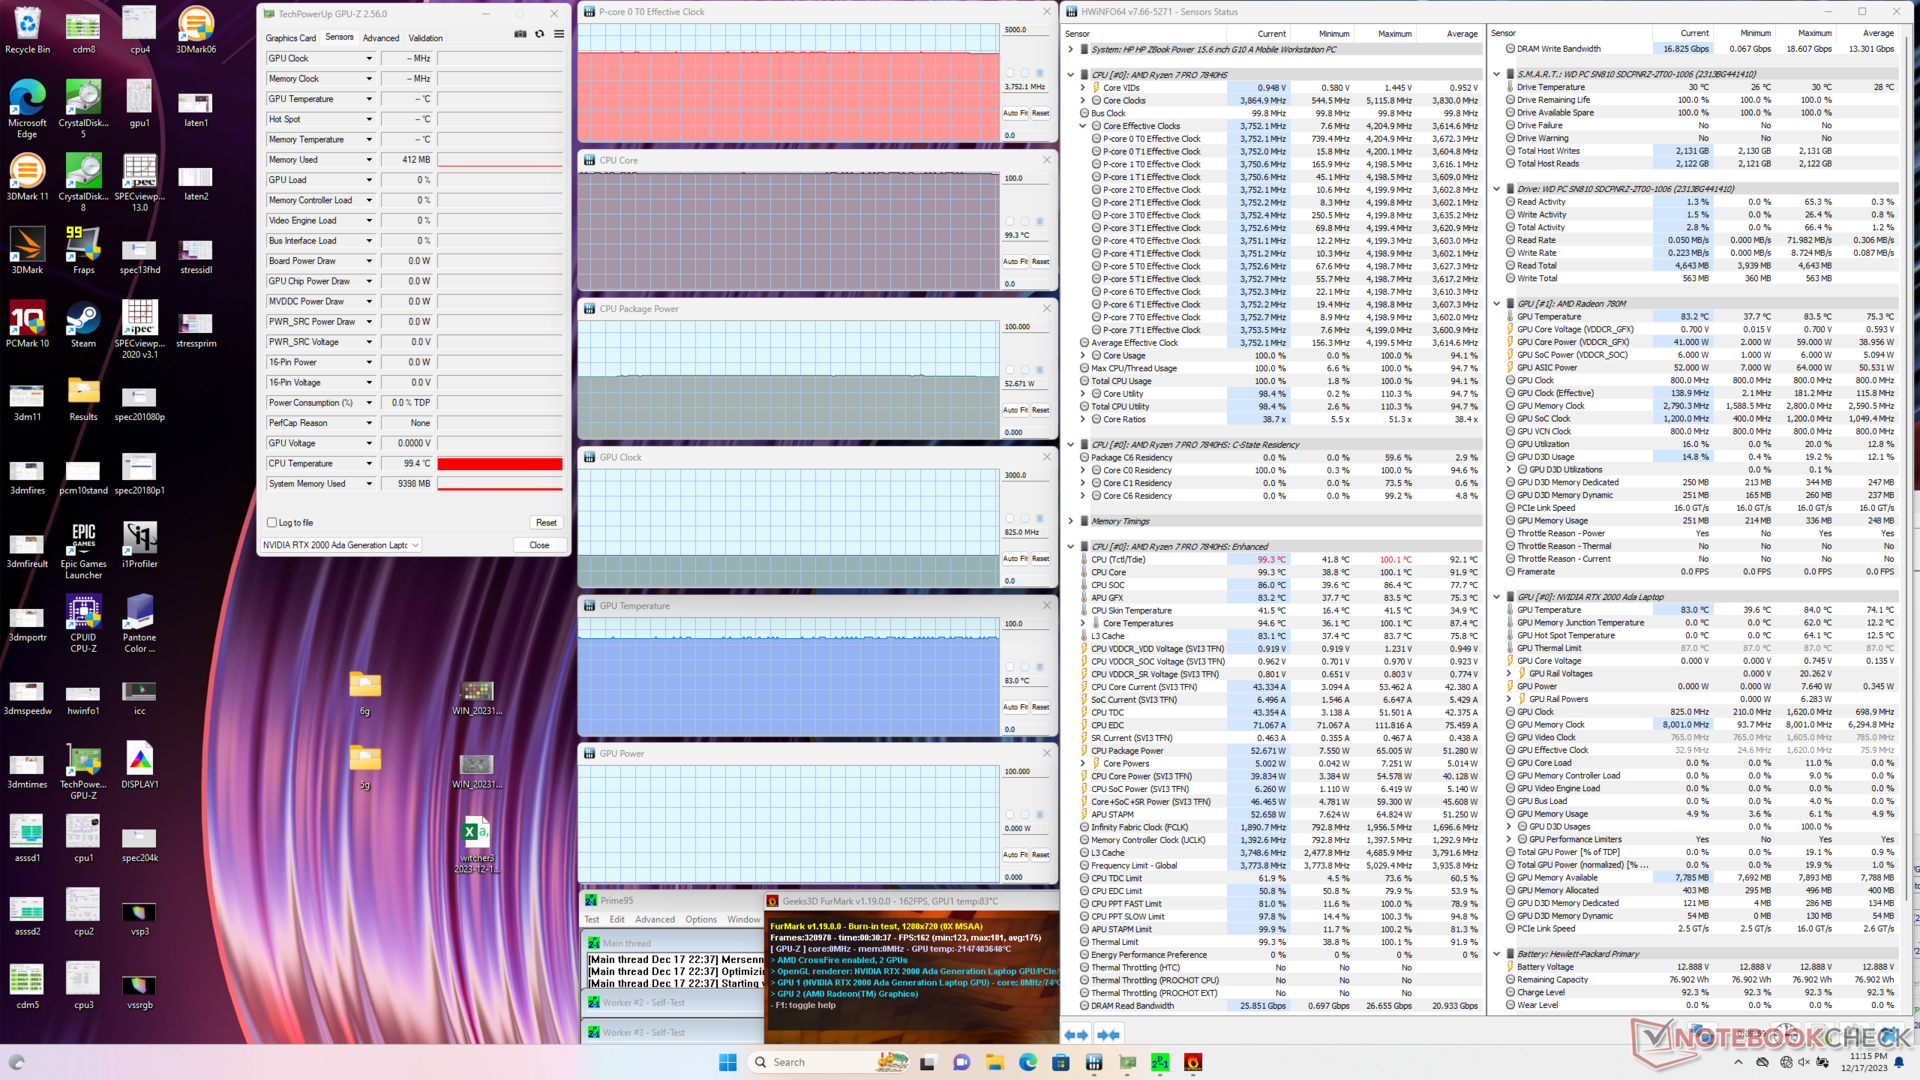
| Prime95+ FurMark Stress | 3.8 | 825 | 99 | 83 |
| Witcher 3 Obciążenie (trybzrównoważony) | 1.8 | 1770 | 65 | 69 |
| Witcher 3 Obciążenie (tryb wydajności) | 1.8 | 1710 | 67 | 68 |
Zarządzanie energią
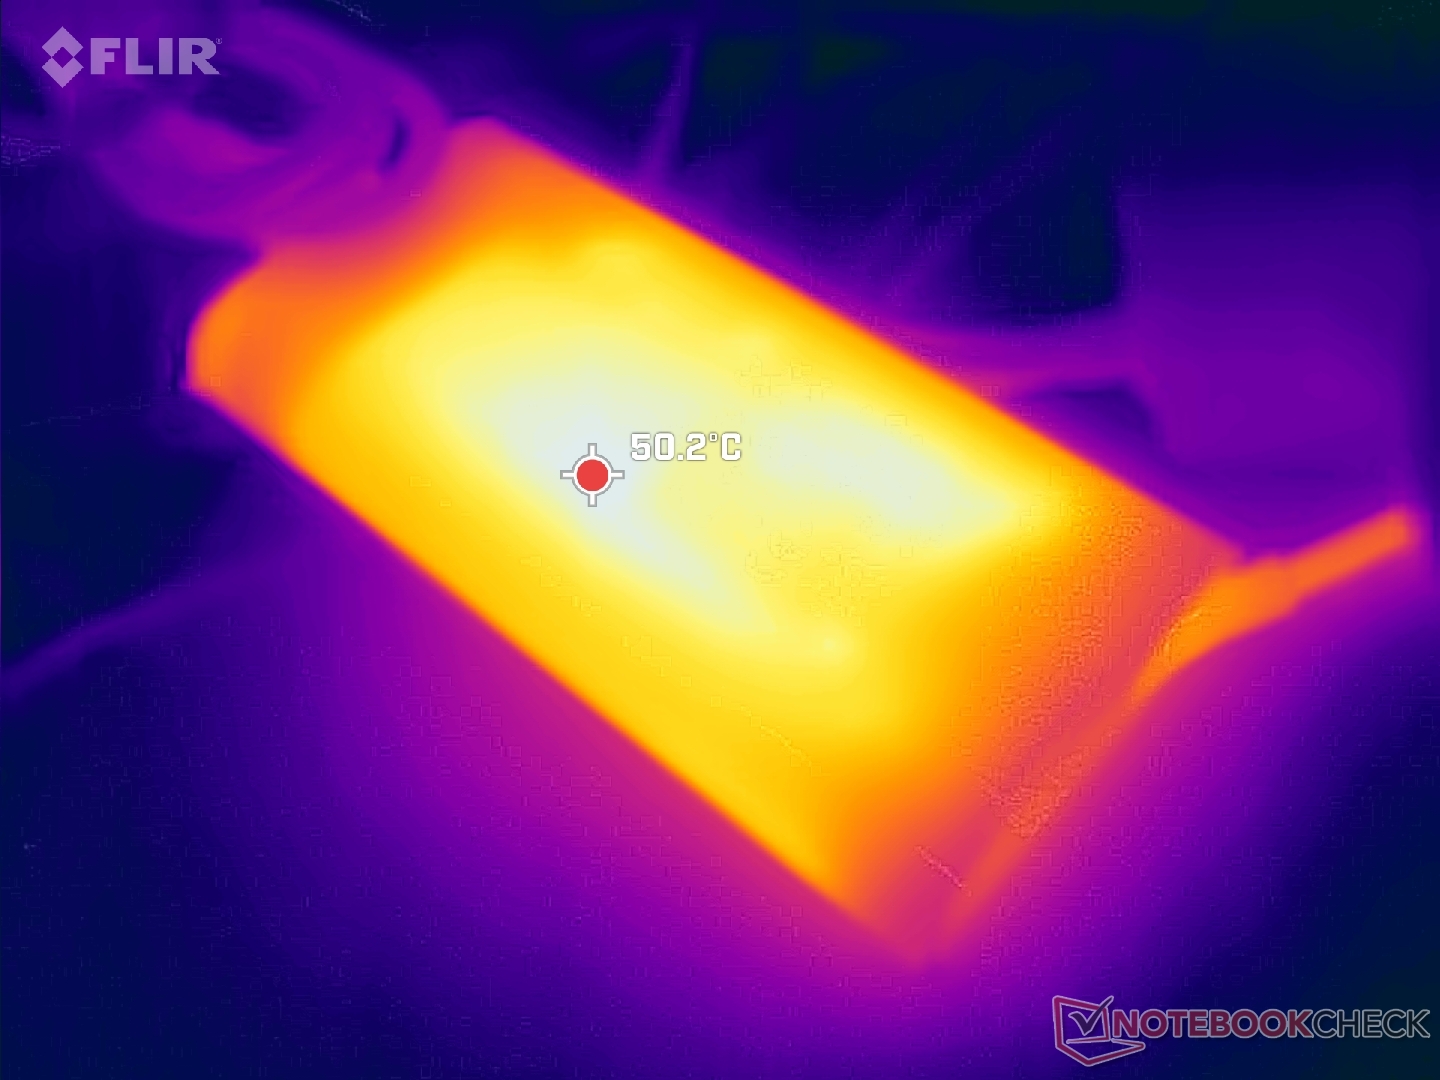
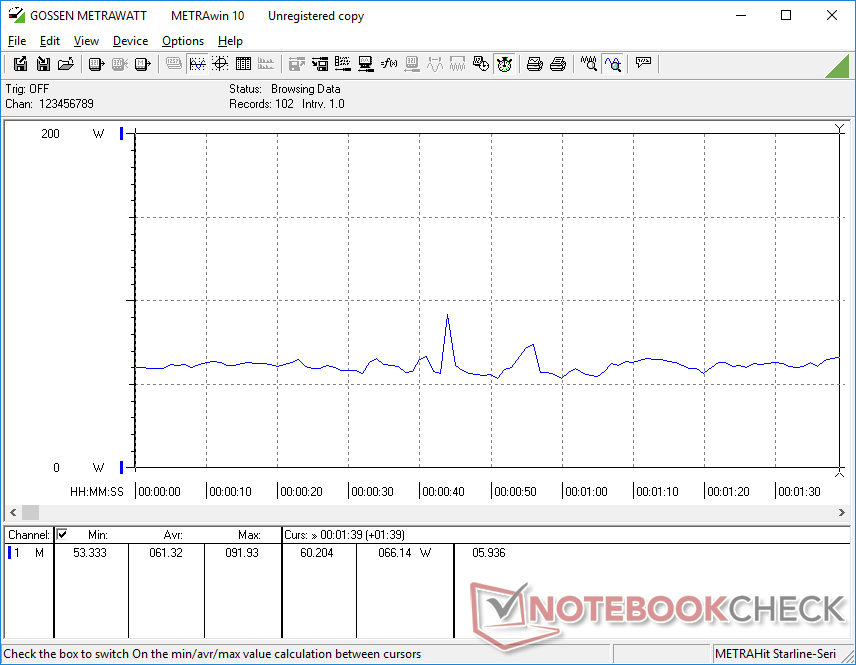
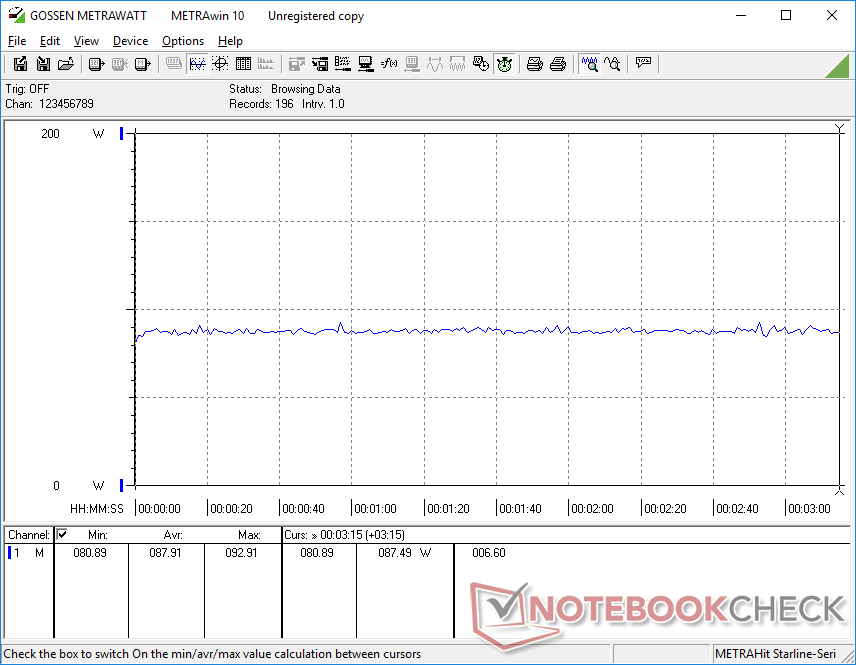
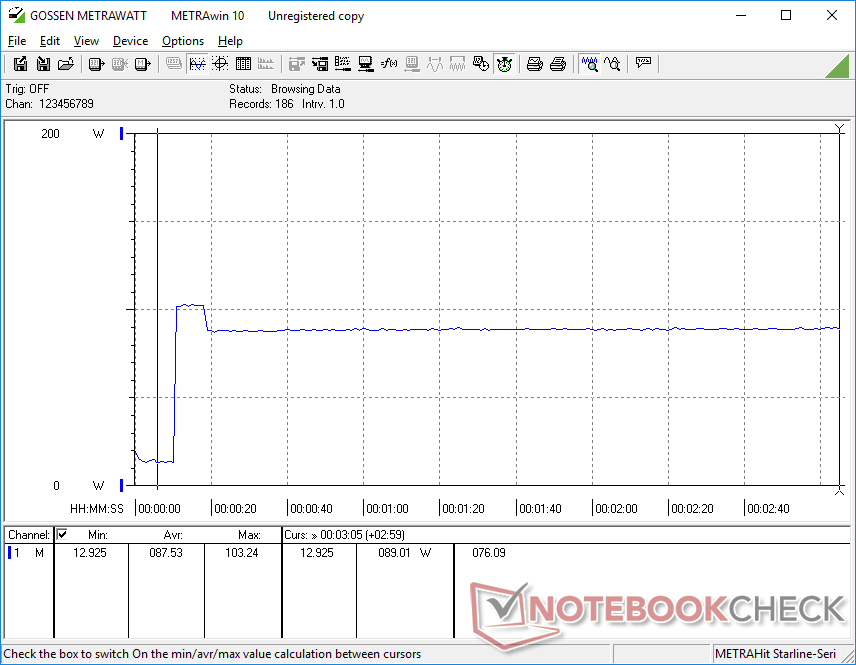
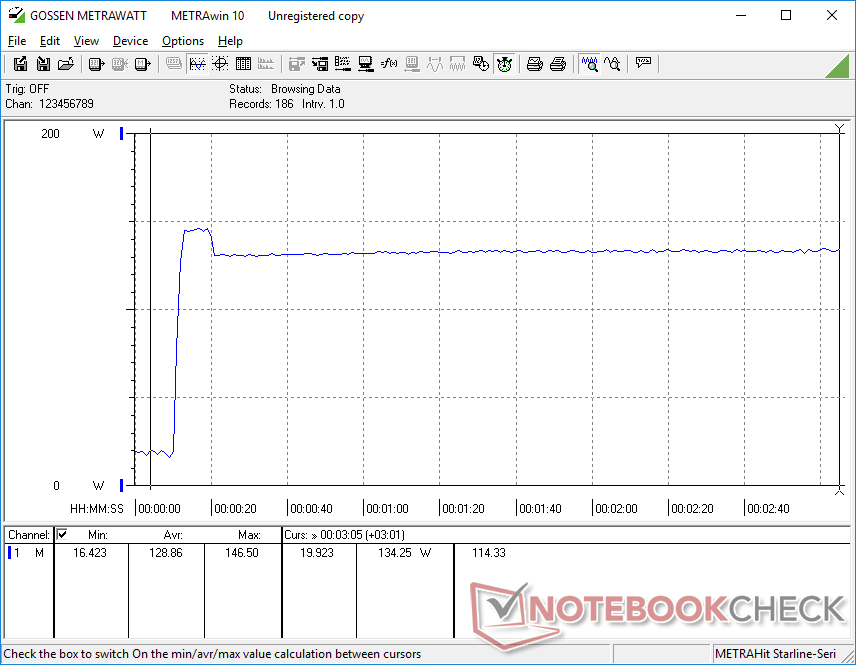
Zużycie energii
Ogólny pobór mocy jest wyższy niż w zeszłorocznym modelu, co koreluje z wyższą wydajnością naszej konfiguracji. Niemniej jednak, wydajność w przeliczeniu na wat nadal faworyzuje nasz nowszy model, zwłaszcza jeśli chodzi o wydajność graficzną. Dla przykładu, uruchomienie Prime95 wymaga o 16 procent więcej mocy przy o 20 procent szybszej wydajności wielowątkowej w porównaniu do Core i7-12700H w ZBook Power 15 G9, podczas gdy uruchomienie FurMark wymagałoby zaledwie 14 procent więcej mocy przy nawet o 65 procent wyższej wydajności graficznej.
Średniej wielkości (~13,8 x 6,5 x 2,3 cm) zasilacz sieciowy o mocy 150 W nie uległ zmianie, ponieważ ZBook Power 15 G10 działa w tym samym zakresie mocy co ZBook Power 15 G9. Niemniej jednak ładowanie USB-C jest obsługiwane; na przykład nasza 135 W ładowarka USB-C od Lenovo jest kompatybilna z naszą jednostką testową HP.
| wyłączony / stan wstrzymania | |
| luz | |
| obciążenie |
|
Legenda:
min: | |
| HP ZBook Power 15 G10 R7 PRO 7840HS, RTX 2000 Ada Generation Laptop, WDC PC SN810 2TB, IPS, 2560x1440, 15.6" | HP ZBook Power 15 G9 6B8C4EA i7-12700H, RTX A2000 Laptop GPU, Samsung PM9A1 MZVL21T0HCLR, IPS, 3840x2160, 15.6" | Lenovo ThinkPad P15v G3 21EM001AGE R7 PRO 6850H, RTX A2000 Laptop GPU, SK Hynix PC711 1TB HFS001TDE9X081N, IPS LED, 3840x2160, 15.6" | Dell Precision 5000 5560 i7-11850H, RTX A2000 Laptop GPU, Samsung PM9A1 MZVL22T0HBLB, IPS, 3840x2400, 15.6" | Lenovo ThinkPad P1 G6-21FV000DGE i9-13900H, RTX 2000 Ada Generation Laptop, SK Hynix PC711 1TB HFS001TDE9X084N, IPS, 2560x1600, 16" | Asus ExpertBook B6 Flip B6602FC2 i9-12950HX, RTX A2000 Laptop GPU, Samsung PM9A1 MZVL21T0HCLR, IPS, 2560x1600, 16" | |
|---|---|---|---|---|---|---|
| Power Consumption | 11% | -11% | -24% | -30% | -81% | |
| Idle Minimum * (Watt) | 5.3 | 3.9 26% | 6.3 -19% | 6.2 -17% | 8.3 -57% | 10.5 -98% |
| Idle Average * (Watt) | 9.9 | 7.2 27% | 13.9 -40% | 13.9 -40% | 14.5 -46% | 11.9 -20% |
| Idle Maximum * (Watt) | 16.7 | 8.5 49% | 14.5 13% | 23.8 -43% | 15.3 8% | 18 -8% |
| Load Average * (Watt) | 61.3 | 87.2 -42% | 82.8 -35% | 95.7 -56% | 91.8 -50% | 182 -197% |
| Witcher 3 ultra * (Watt) | 87.9 | 86.8 1% | 88.8 -1% | 87 1% | 104.7 -19% | 177.5 -102% |
| Load Maximum * (Watt) | 145.3 | 139 4% | 124.8 14% | 132.6 9% | 164.5 -13% | 229 -58% |
* ... im mniej tym lepiej
Power Consumption Witcher 3 / Stresstest
Power Consumption external Monitor
Żywotność baterii
Czasy pracy są niemal dokładnie takie same, jak w przypadku zeszłorocznego modelu, pomimo różnic w procesorze, karcie graficznej i wyświetlaczu. Dziesięć godzin rzeczywistego przeglądania jest podobne do wielu Ultrabooków klasy konsumenckiej.
| HP ZBook Power 15 G10 R7 PRO 7840HS, RTX 2000 Ada Generation Laptop, 83 Wh | HP ZBook Power 15 G9 6B8C4EA i7-12700H, RTX A2000 Laptop GPU, 83 Wh | Lenovo ThinkPad P15v G3 21EM001AGE R7 PRO 6850H, RTX A2000 Laptop GPU, 68 Wh | Dell Precision 5000 5560 i7-11850H, RTX A2000 Laptop GPU, 86 Wh | Lenovo ThinkPad P1 G6-21FV000DGE i9-13900H, RTX 2000 Ada Generation Laptop, 90 Wh | Asus ExpertBook B6 Flip B6602FC2 i9-12950HX, RTX A2000 Laptop GPU, 90 Wh | |
|---|---|---|---|---|---|---|
| Czasy pracy | 0% | -31% | -37% | -5% | -13% | |
| WiFi v1.3 (h) | 10 | 10 0% | 6.9 -31% | 6.3 -37% | 9.5 -5% | 8.7 -13% |
| H.264 (h) | 10.7 | 11.2 | 5.8 | |||
| Load (h) | 1.8 | 1.8 | 1.1 | 1.7 | ||
| Reader / Idle (h) | 12 | 12.5 |
Za
Przeciw
Werdykt - jeśli coś nie jest zepsute, proszę tego nie naprawiać
Konstrukcja ZBook Power 15 G10 zbliża się do trzech lat. Jest to jedna z nielicznych 15,6-calowych stacji roboczych o proporcjach 16:19, w których pozostały zarówno procesory AMD Zen 4 Pro, jak i układy GPU Nvidia RTX Ada, podczas gdy większość innych w tej kategorii przeszła na 16-calowe formaty 16:10 z dodatkowymi opcjami wyświetlania, w tym OLED i 4K. Jeśli wyższa obudowa i nowsze wyświetlacze są ważne dla Państwa pracy, warto poczekać, aż HP odświeży konstrukcję ZBook Power lub poszukać alternatyw, takich jak Lenovo ThinkPad P1 G6 zamiast tego. Jeśli nie, to ZBook Power 15 G10 jest nadal klasyczną i niezawodną opcją.
W przypadku potencjalnych wersji 16:10 w przyszłości, chcielibyśmy, aby HP poszło o krok dalej, włączając zarówno obsługę pamięci ECC RAM i ECC VRAM, jak i pełne ładowanie tylko przez USB-C. Własna ładowarka sieciowa staje się coraz trudniejsza do uzasadnienia teraz, gdy Thunderbolt nowej generacji może obsługiwać ładowanie USB-C o mocy do 240 W.
ZBook Power 15 G10 będzie prawdopodobnie jedną z ostatnich 15,6-calowych stacji roboczych HP, zanim seria zostanie odświeżona o bardziej nowoczesny design 16:10.
Główną różnicą między ZBook Power 15 G9 i G10 jest to, że ten drugi jest wyposażony w procesory graficzne Ada Lovelace, które zapewniają znacznie wyższą wydajność w przeliczeniu na wat niż starsze procesory graficzne Ampere. Jeśli nowsze procesory i układy graficzne są wartościowe, to G10 jest zalecany zamiast G9. W przeciwnym razie wrażenia użytkownika między modelami są zasadniczo identyczne, w tym nawet czas pracy na baterii.
Cena i dostępność
HP dostarcza obecnie ZBook Power 15 G10 w cenie od 1600 USD za konfigurację z procesorem Ryzen 5 do 2100 USD za konfigurację z procesorem Ryzen 7 i kartą graficzną Nvidia 2000 Ada lub wyższą.
HP ZBook Power 15 G10
- 20/12/2023 v7 (old)
Allen Ngo
Przezroczystość
Wyboru urządzeń do recenzji dokonuje nasza redakcja. Próbka testowa została udostępniona autorowi jako pożyczka od producenta lub sprzedawcy detalicznego na potrzeby tej recenzji. Pożyczkodawca nie miał wpływu na tę recenzję, producent nie otrzymał też kopii tej recenzji przed publikacją. Nie było obowiązku publikowania tej recenzji. Jako niezależna firma medialna, Notebookcheck nie podlega władzy producentów, sprzedawców detalicznych ani wydawców.
Tak testuje Notebookcheck
Każdego roku Notebookcheck niezależnie sprawdza setki laptopów i smartfonów, stosując standardowe procedury, aby zapewnić porównywalność wszystkich wyników. Od około 20 lat stale rozwijamy nasze metody badawcze, ustanawiając przy tym standardy branżowe. W naszych laboratoriach testowych doświadczeni technicy i redaktorzy korzystają z wysokiej jakości sprzętu pomiarowego. Testy te obejmują wieloetapowy proces walidacji. Nasz kompleksowy system ocen opiera się na setkach uzasadnionych pomiarów i benchmarków, co pozwala zachować obiektywizm.Price comparison

