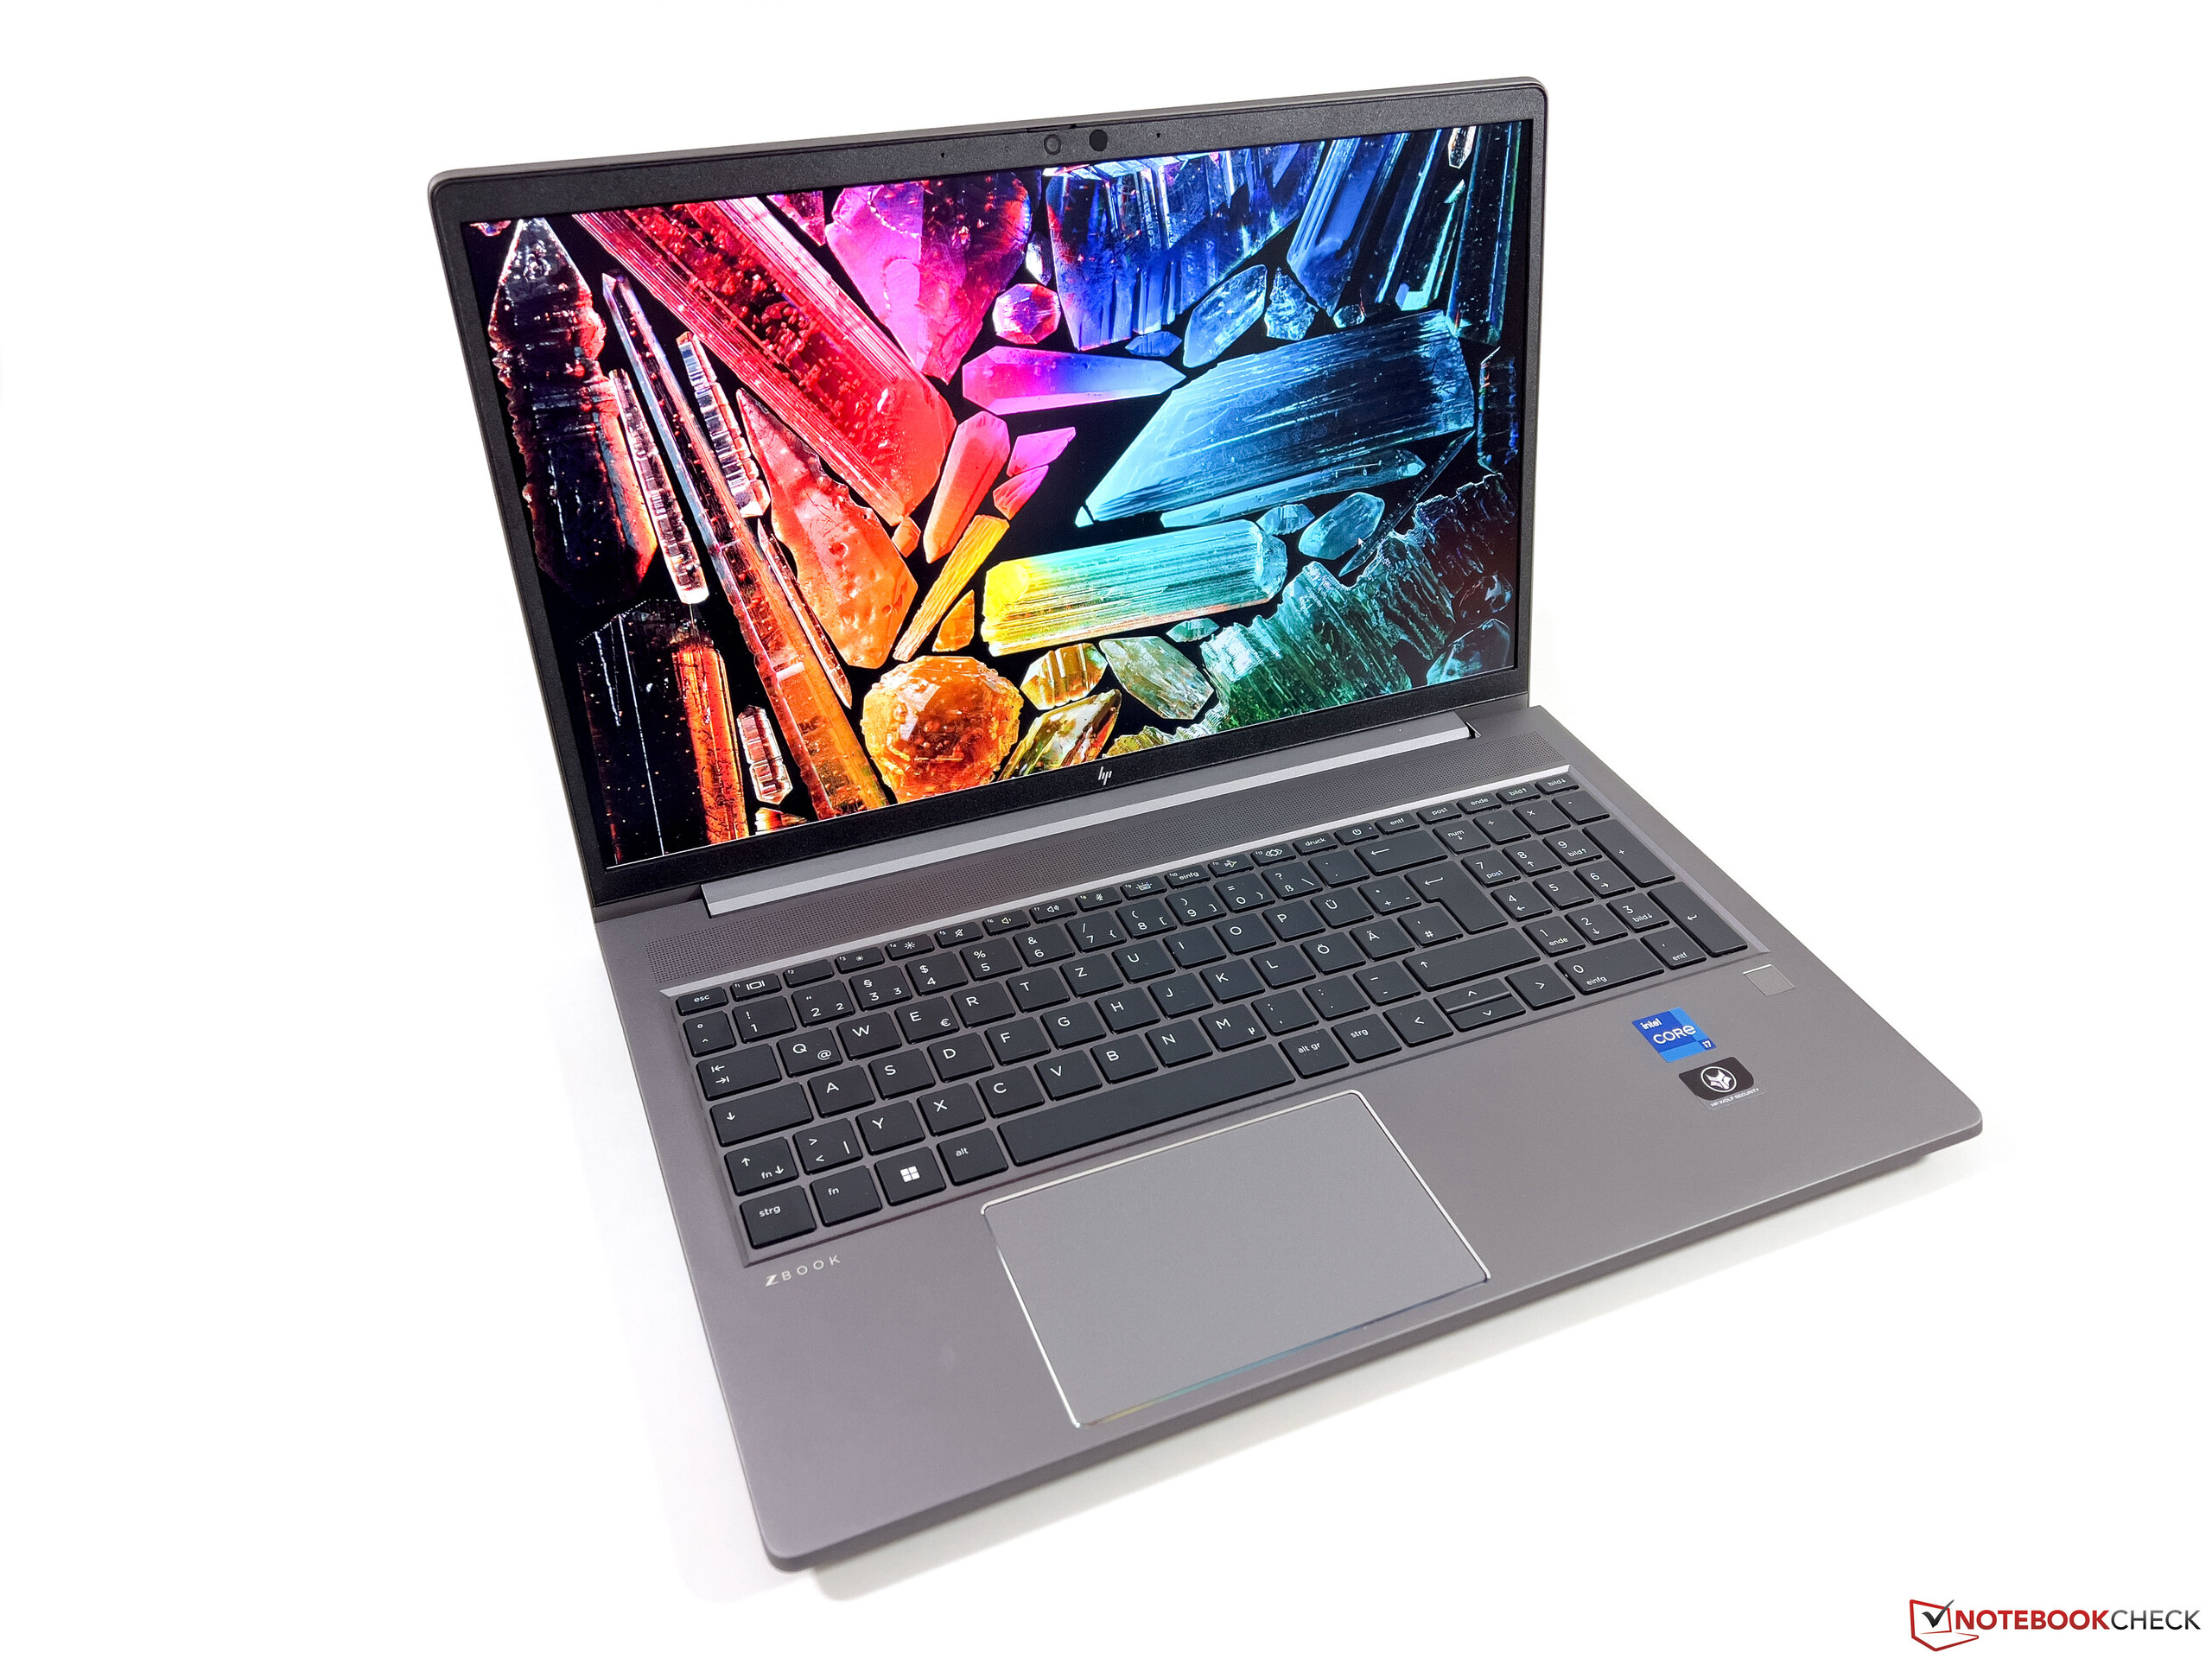
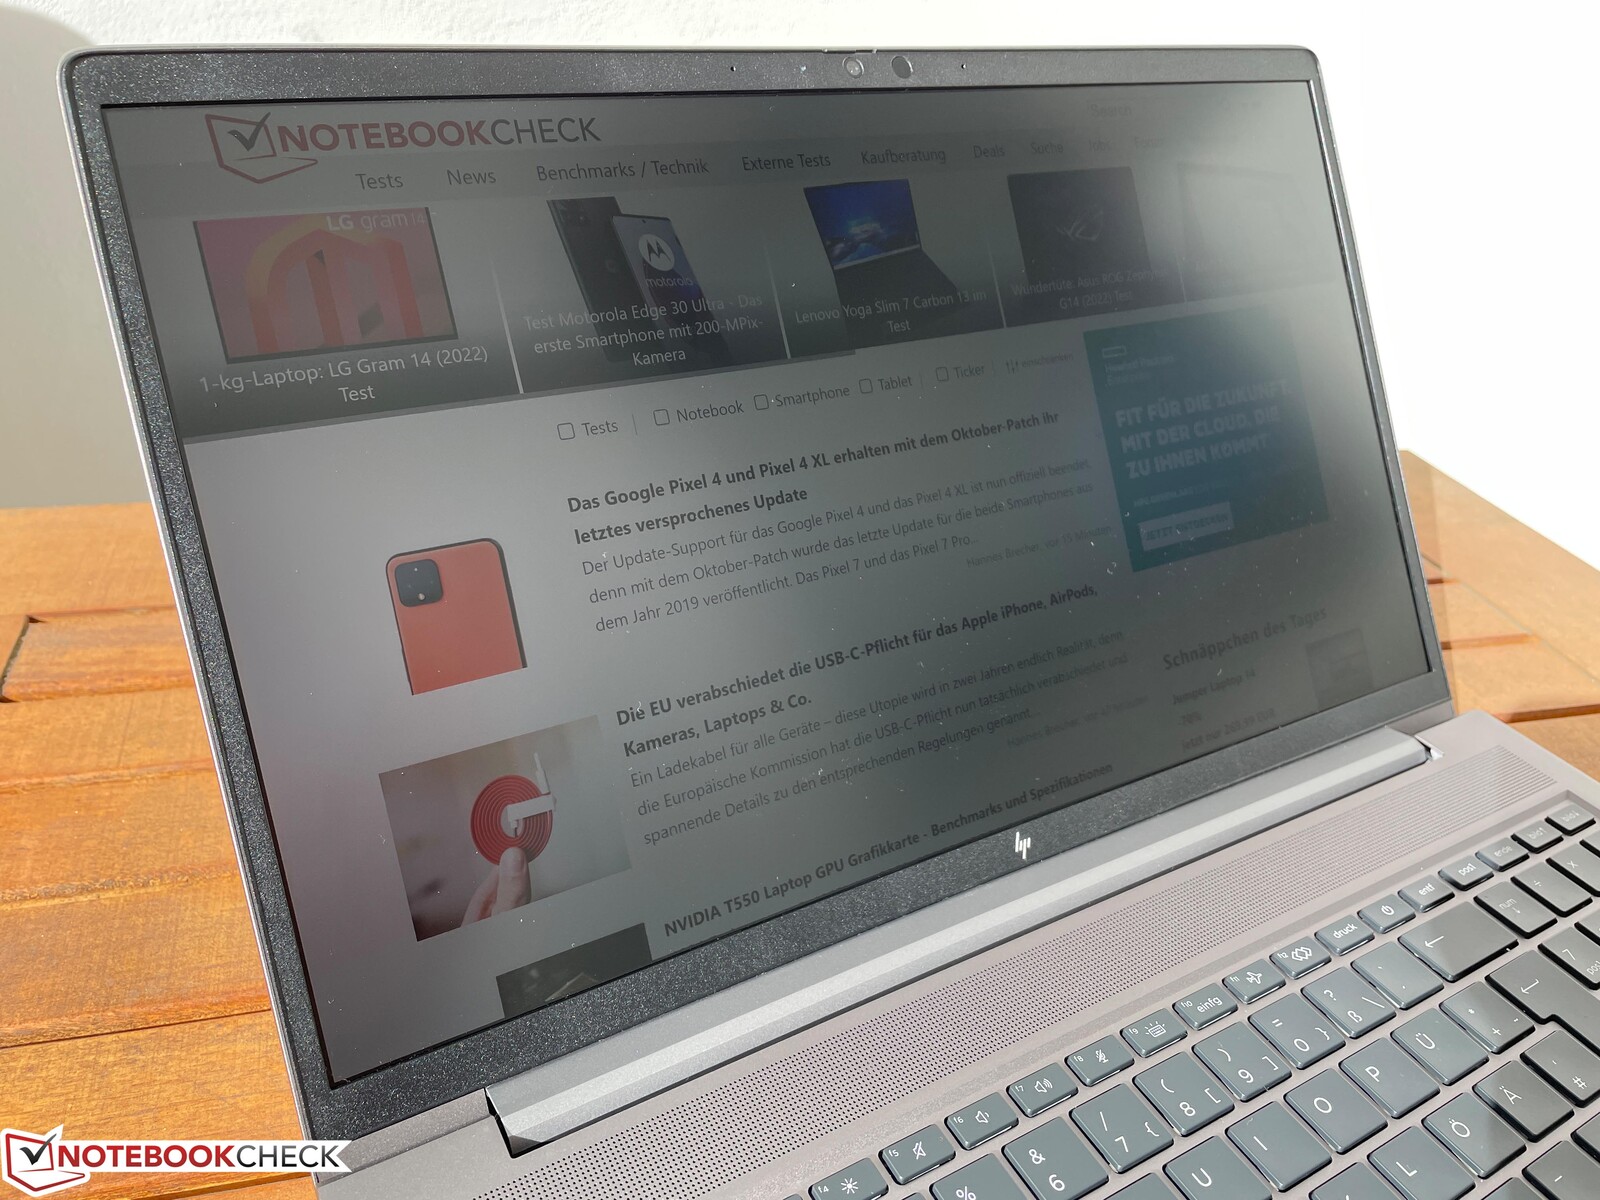
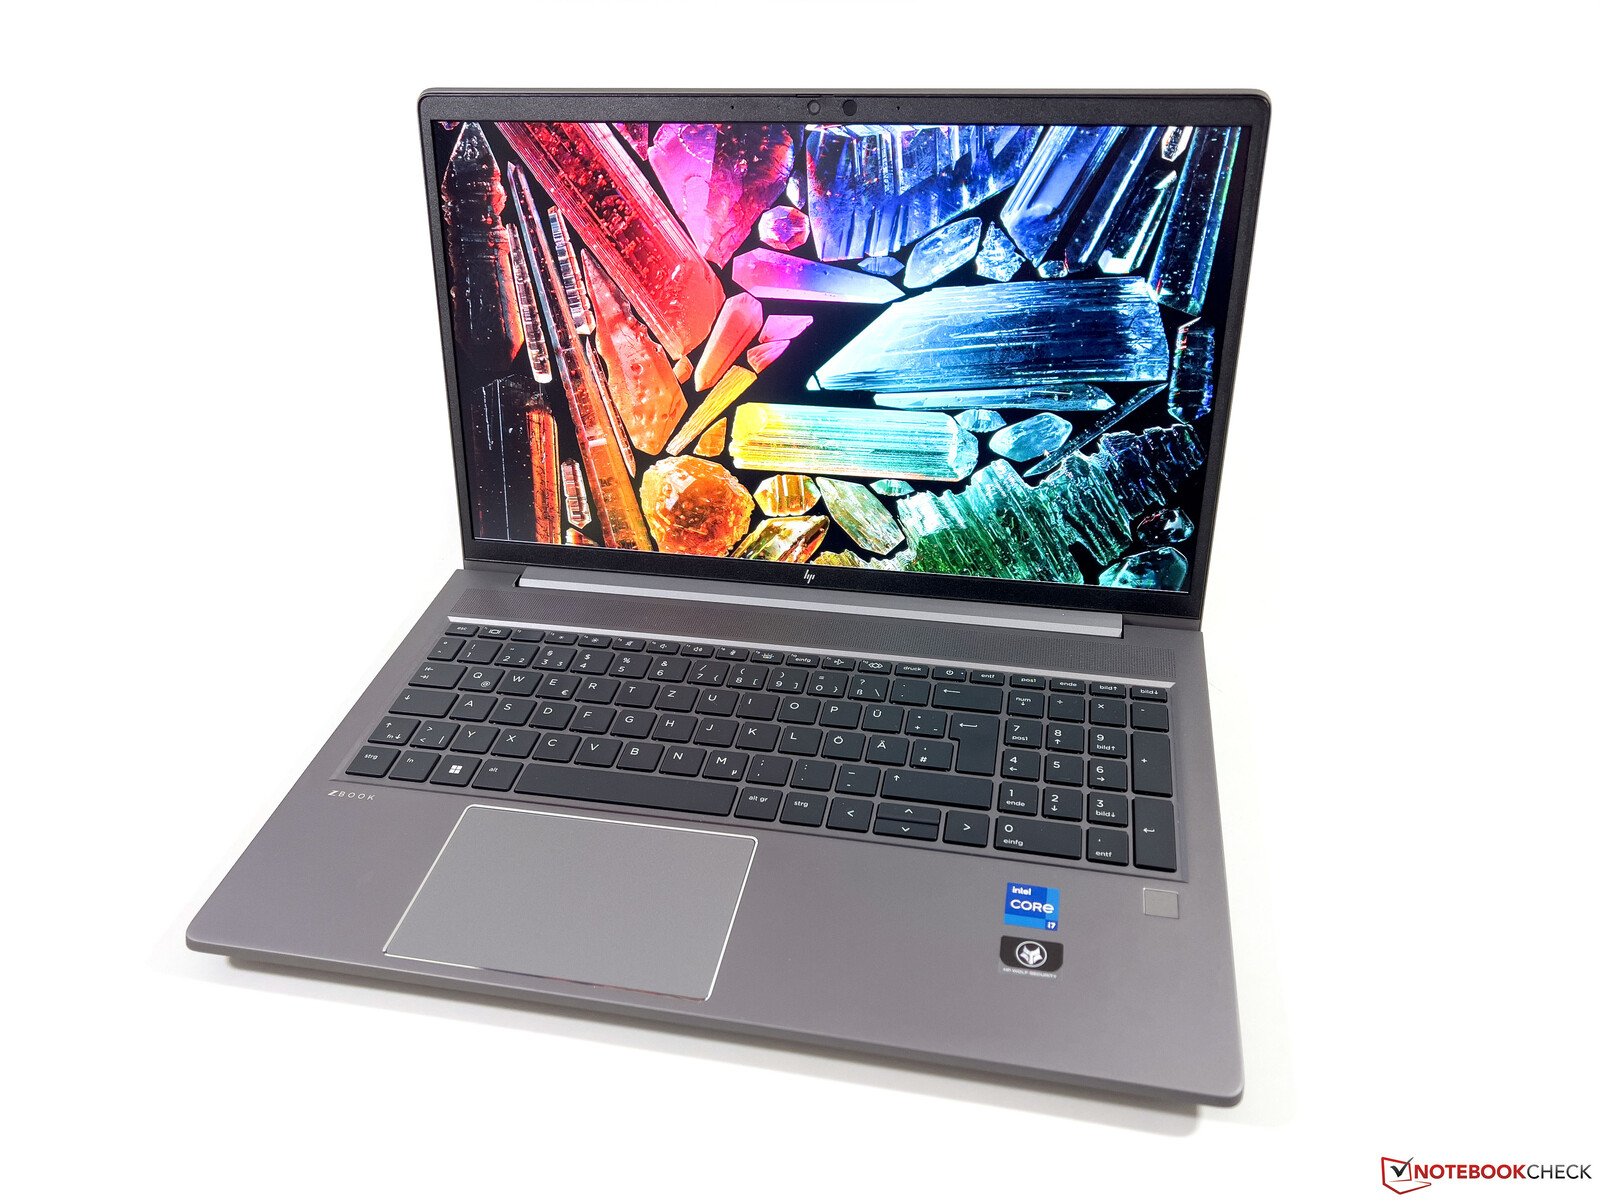
Recenzja laptopa HP ZBook Power 15 G9 - mobilna stacja robocza z matowym wyświetlaczem 4K
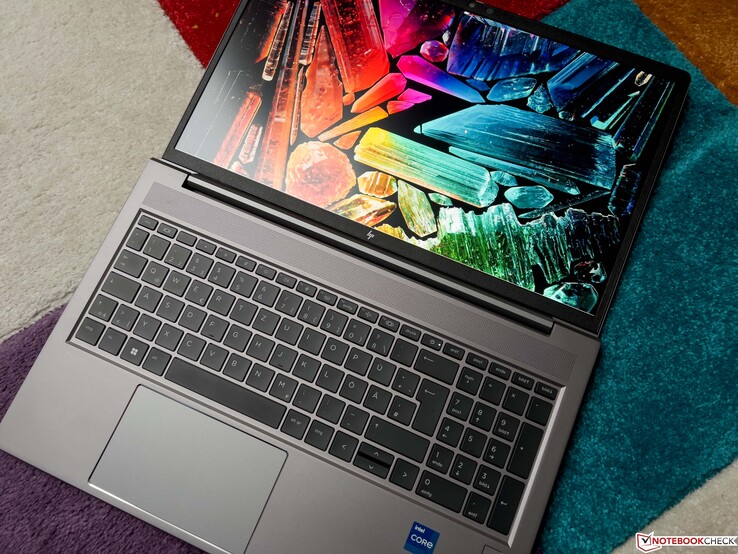
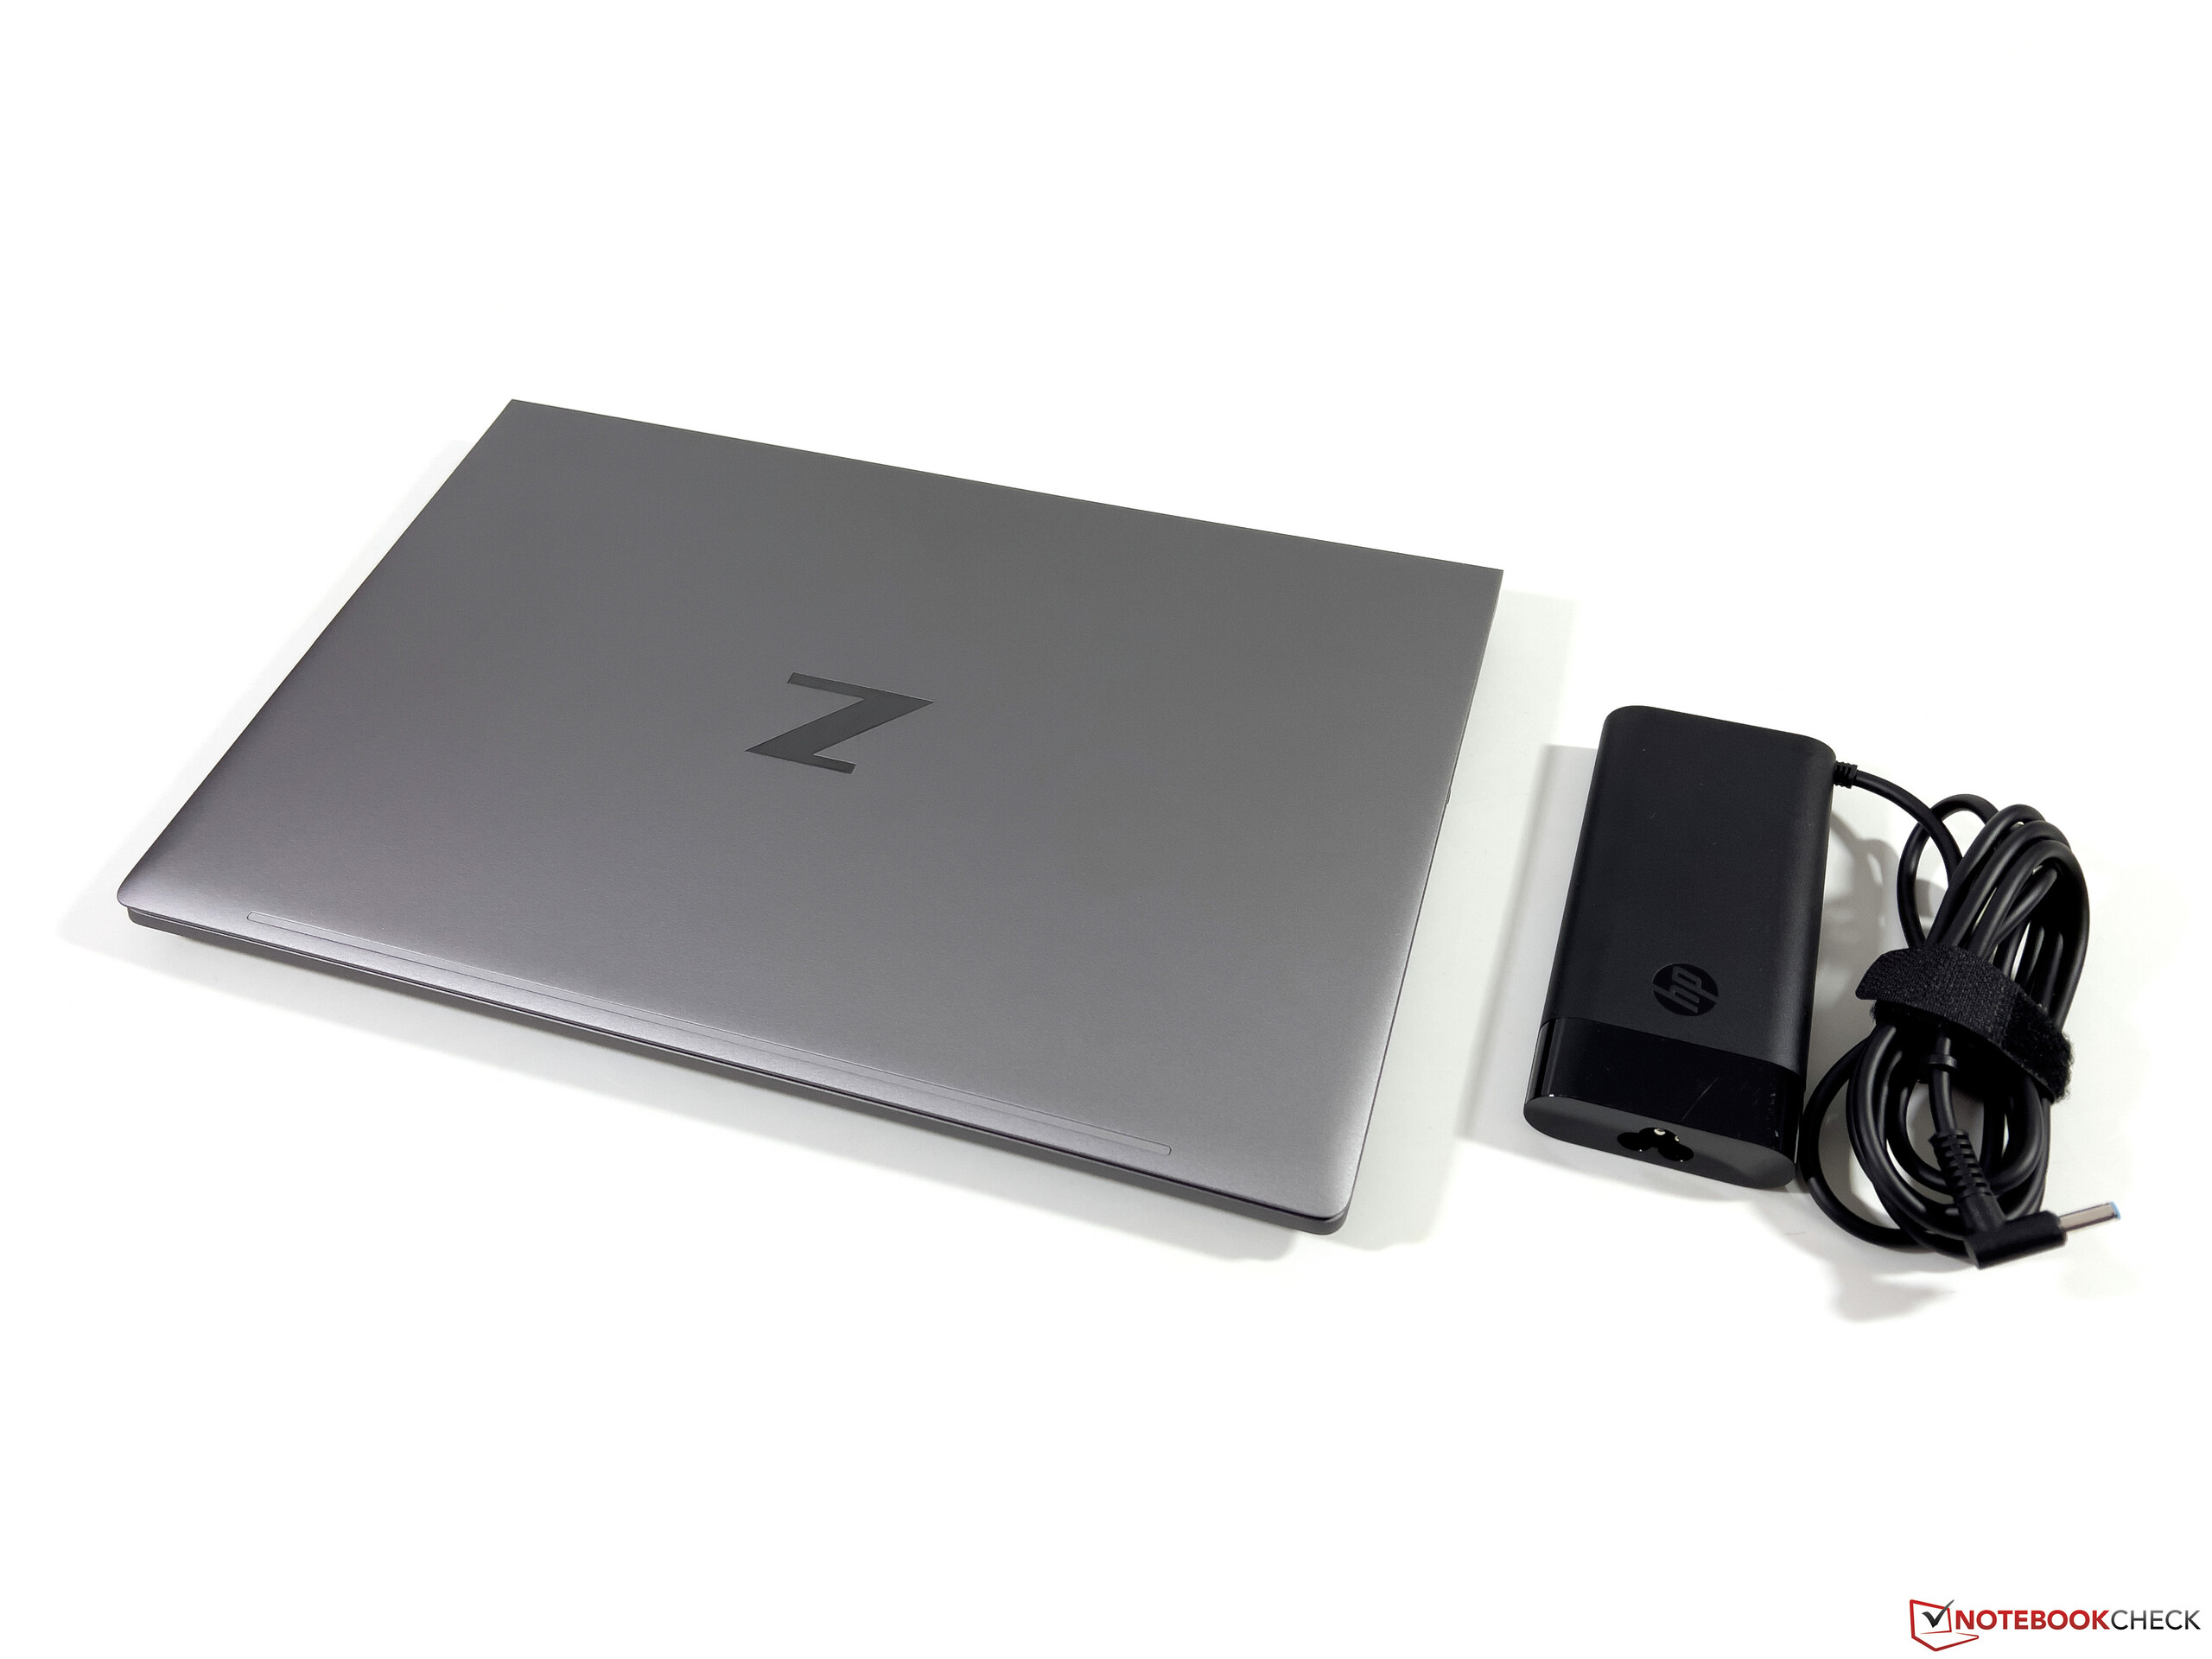
HP oferuje różne serie modeli mobilnych stacji roboczych, począwszy od cienkiego ZBook Fireflyurządzenia podstawowe, a następnieZBook Studio, ZBook Studio ZBook Furymodele high-endowe, oraz ZBook Power, który ma stanowić dobre połączenie ceny i wydajności. Choć obudowa nie jest szczególnie smukła, niesie to za sobą również odpowiednią liczbę portów. Testujemy wersję ZBook Power 15 G9 6B8C4EA za około 2800 euro (~2981 dolarów), która jest bardzo dobrze wyposażona w Core i7-12700H, m.in.RTX A2000, 32 GB pamięci RAM, 1-TB SSD oraz matowy wyświetlacz 4K. W porównaniu z poprzednikiem ZBook Power 15 G8 (tutaj w naszym teście), nie ma żadnych zmian w obudowie i urządzeniach wejściowych, więc te sekcje będziemy tutaj skracać, skupiając się zamiast tego na sekcjach dotyczących wydajności.
Potencjalni konkurenci w porównaniu
Ocena | Data | Model | Waga | Wysokość | Rozmiar | Rezolucja | Cena |
|---|---|---|---|---|---|---|---|
| 87.4 % v7 (old) | 01/2023 | HP ZBook Power 15 G9 6B8C4EA i7-12700H, RTX A2000 Laptop GPU | 2 kg | 22.8 mm | 15.60" | 3840x2160 | |
| 90.1 % v7 (old) | 11/2022 | HP ZBook Studio 16 G9 62U04EA i7-12800H, RTX A2000 Laptop GPU | 1.8 kg | 19 mm | 16.00" | 3840x2400 | |
| 88.3 % v7 (old) | Dell Precision 5000 5560 i7-11850H, RTX A2000 Laptop GPU | 2 kg | 18 mm | 15.60" | 3840x2400 | ||
| 86.2 % v7 (old) | Lenovo ThinkPad P15v G2 21A9000XGE i7-11800H, T1200 Laptop GPU | 2.3 kg | 22.7 mm | 15.60" | 1920x1080 | ||
| 87.7 % v7 (old) | HP ZBook Power 15 G8 313S5EA i7-11800H, T600 Laptop GPU | 2 kg | 22.8 mm | 15.60" | 1920x1080 |
Skrzynia i wyposażenie
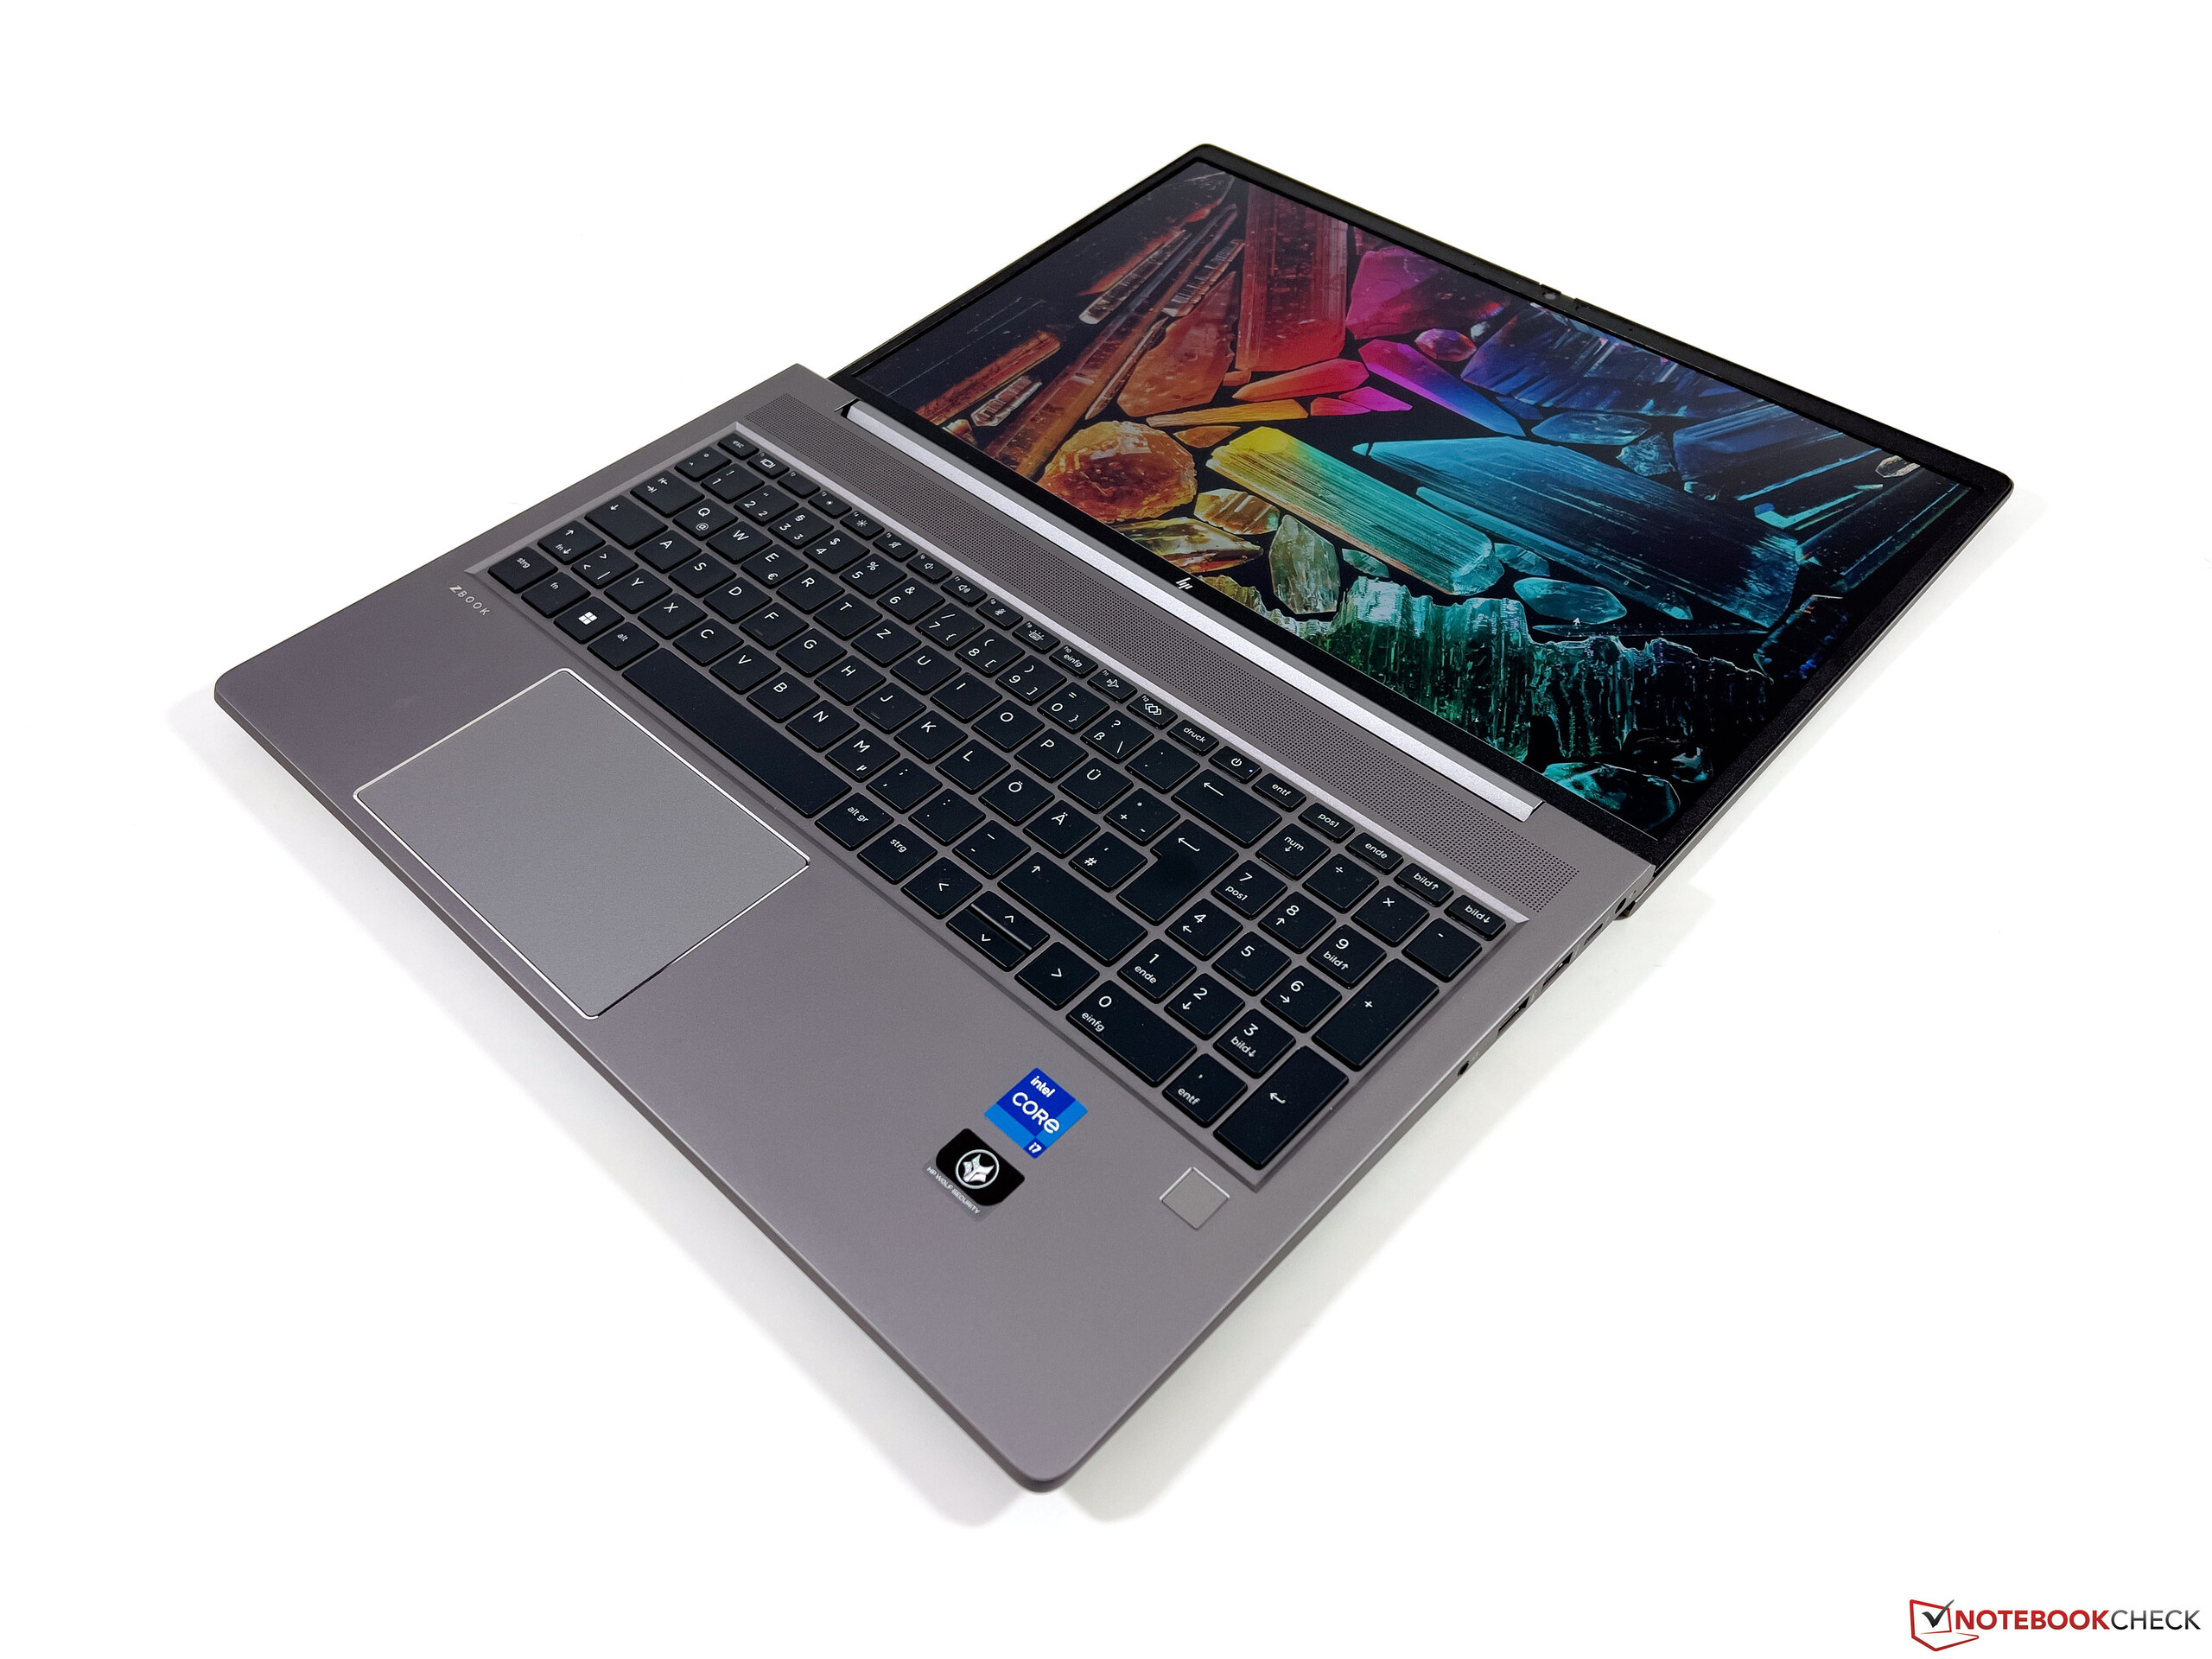
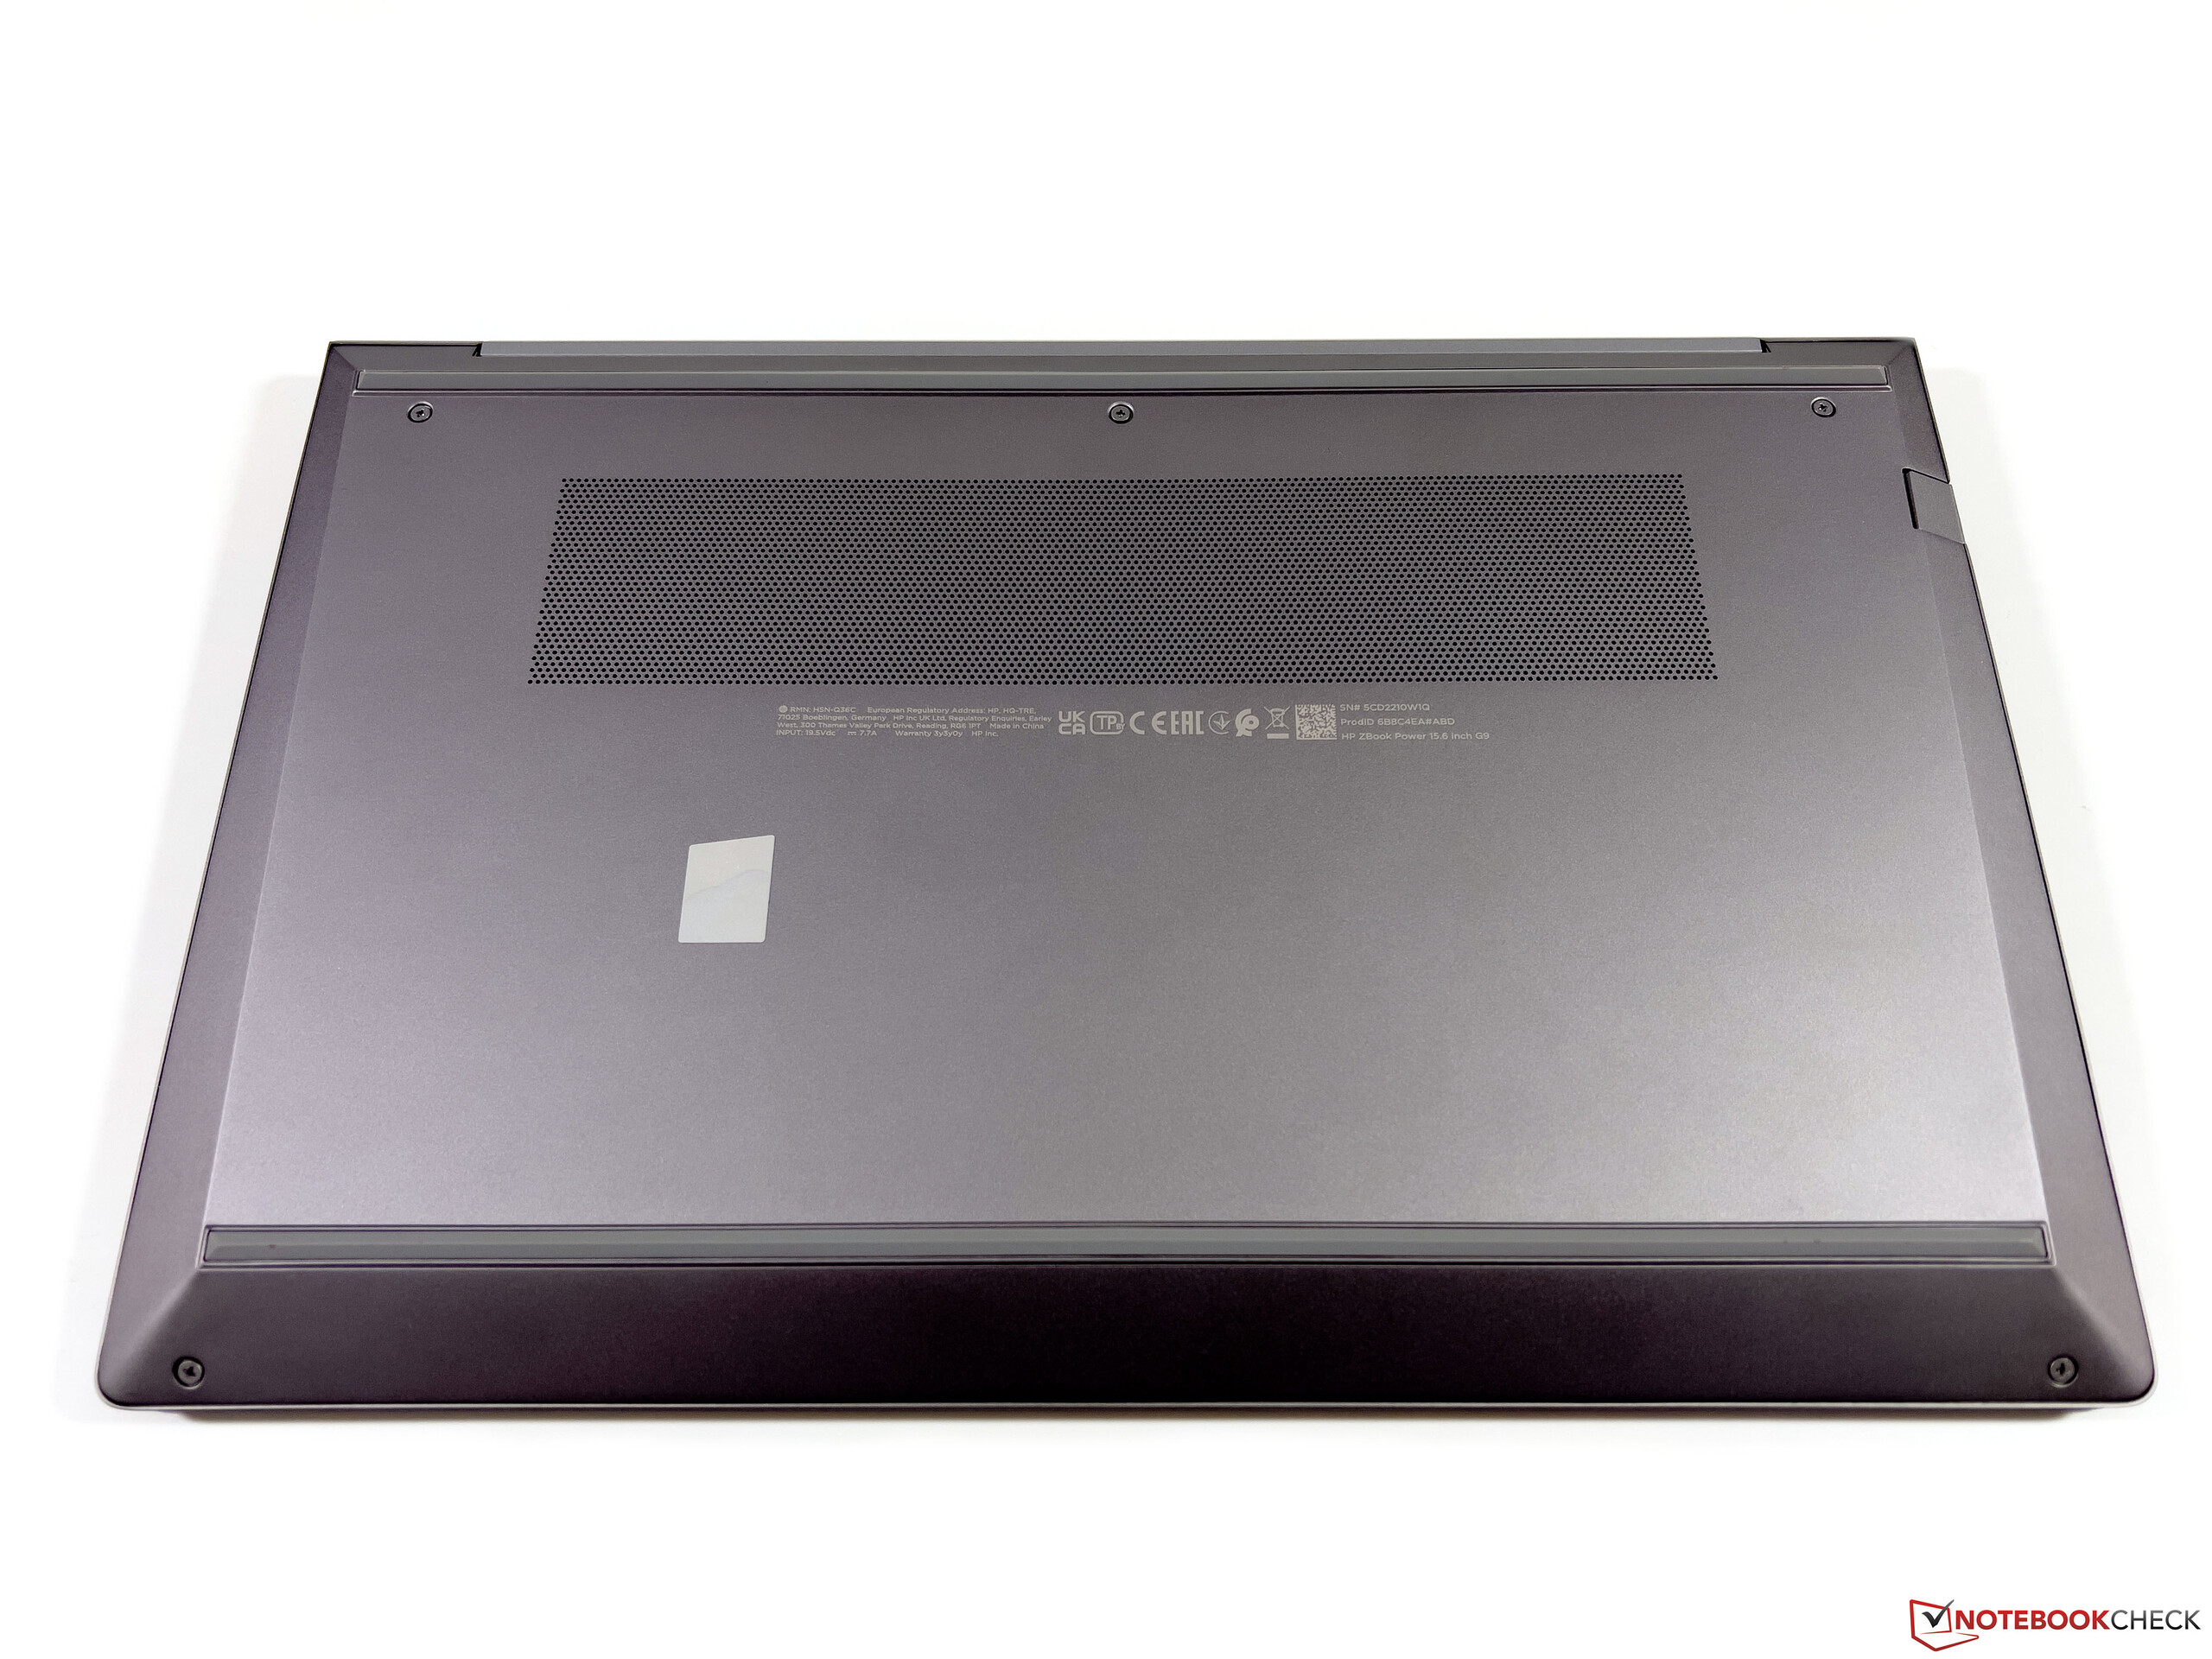
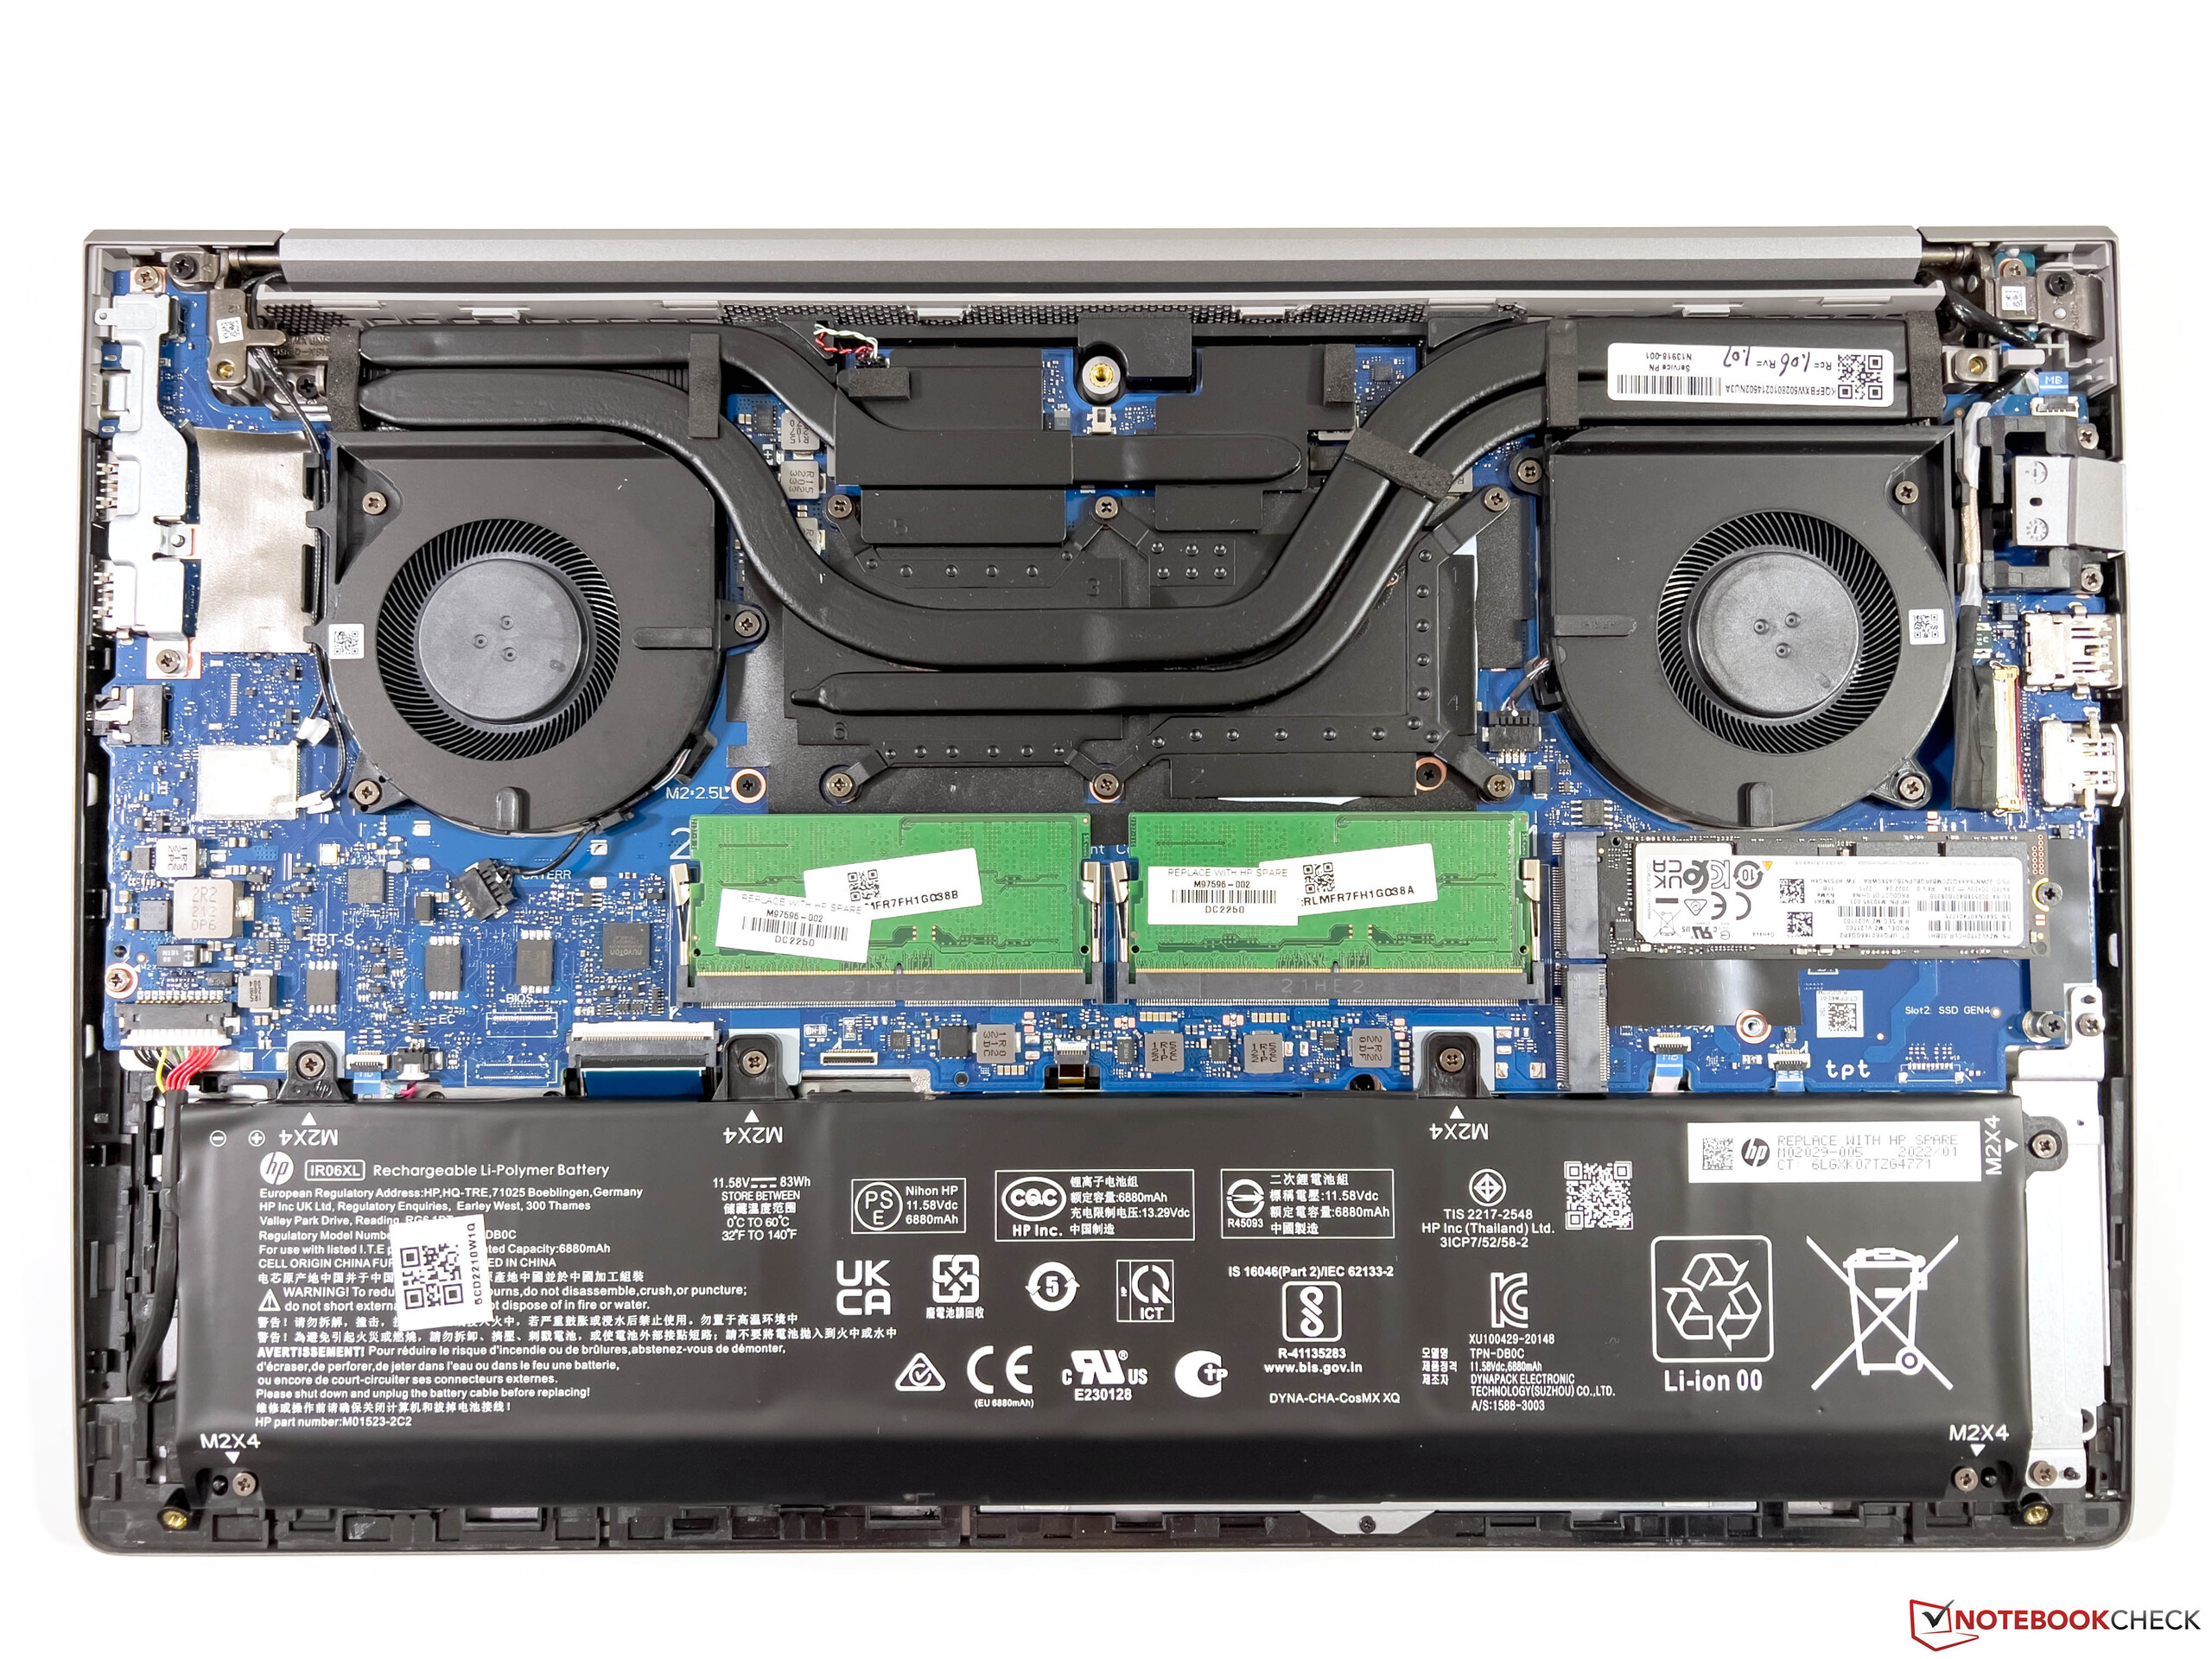
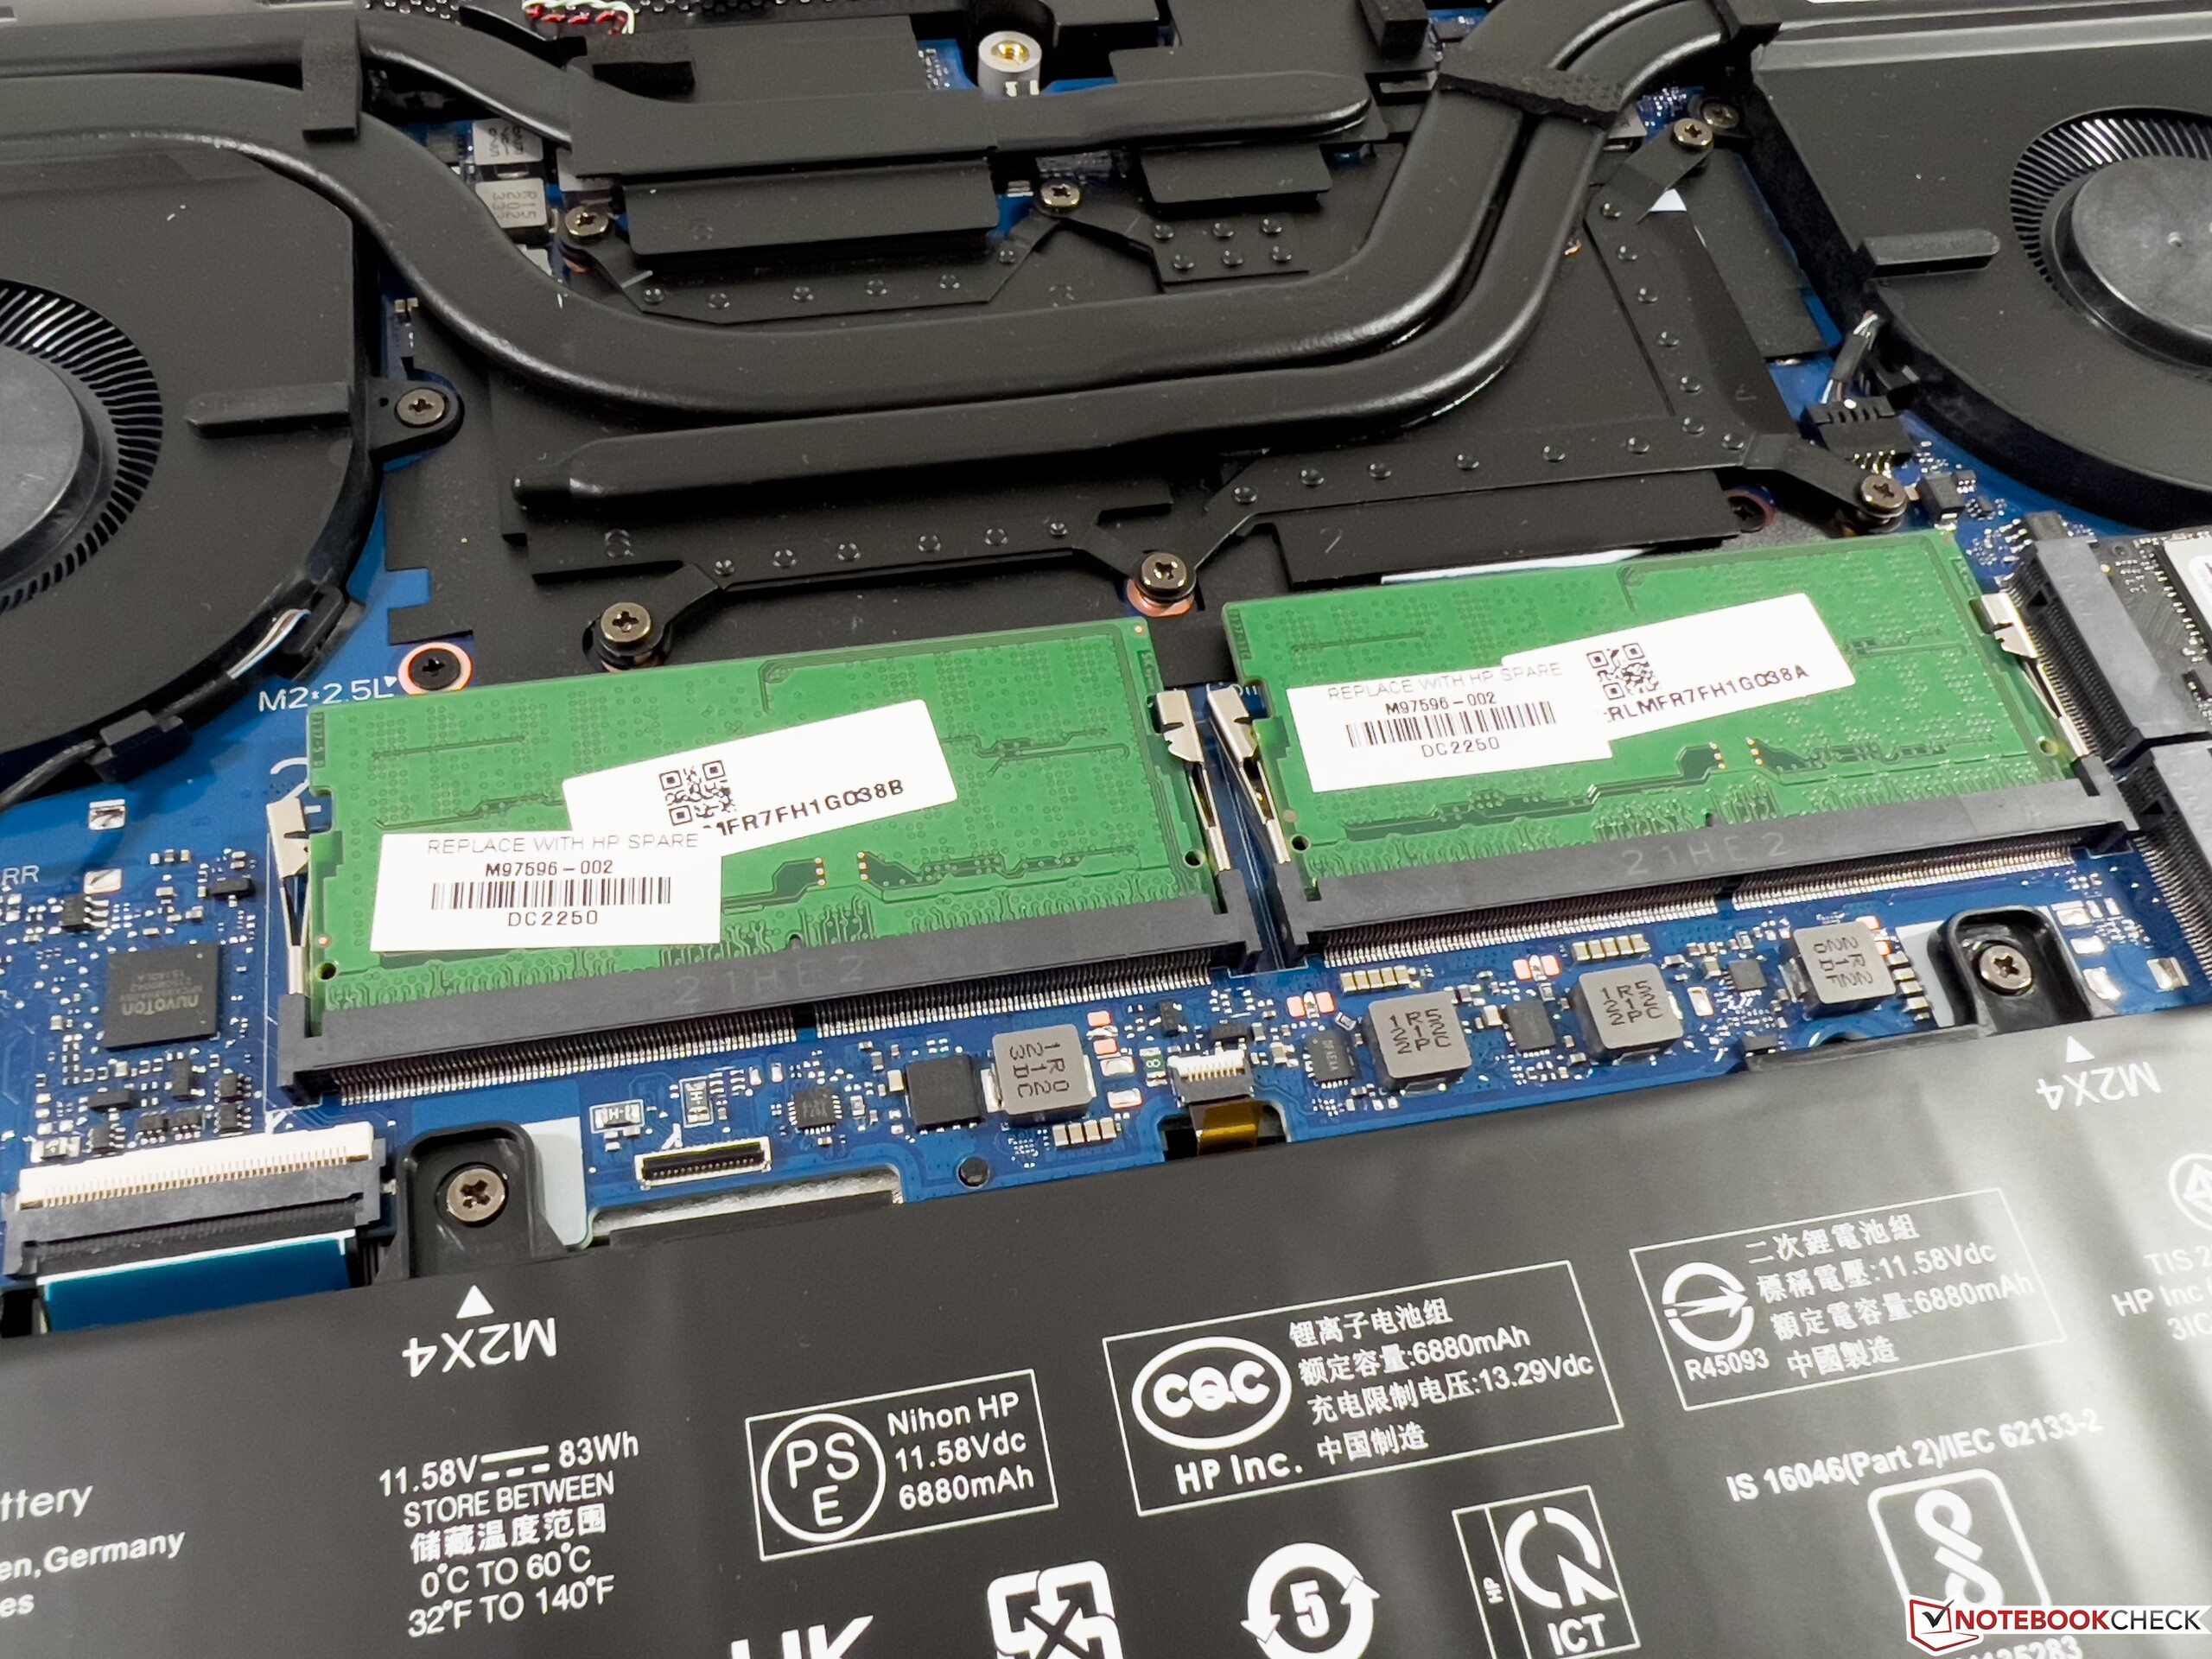
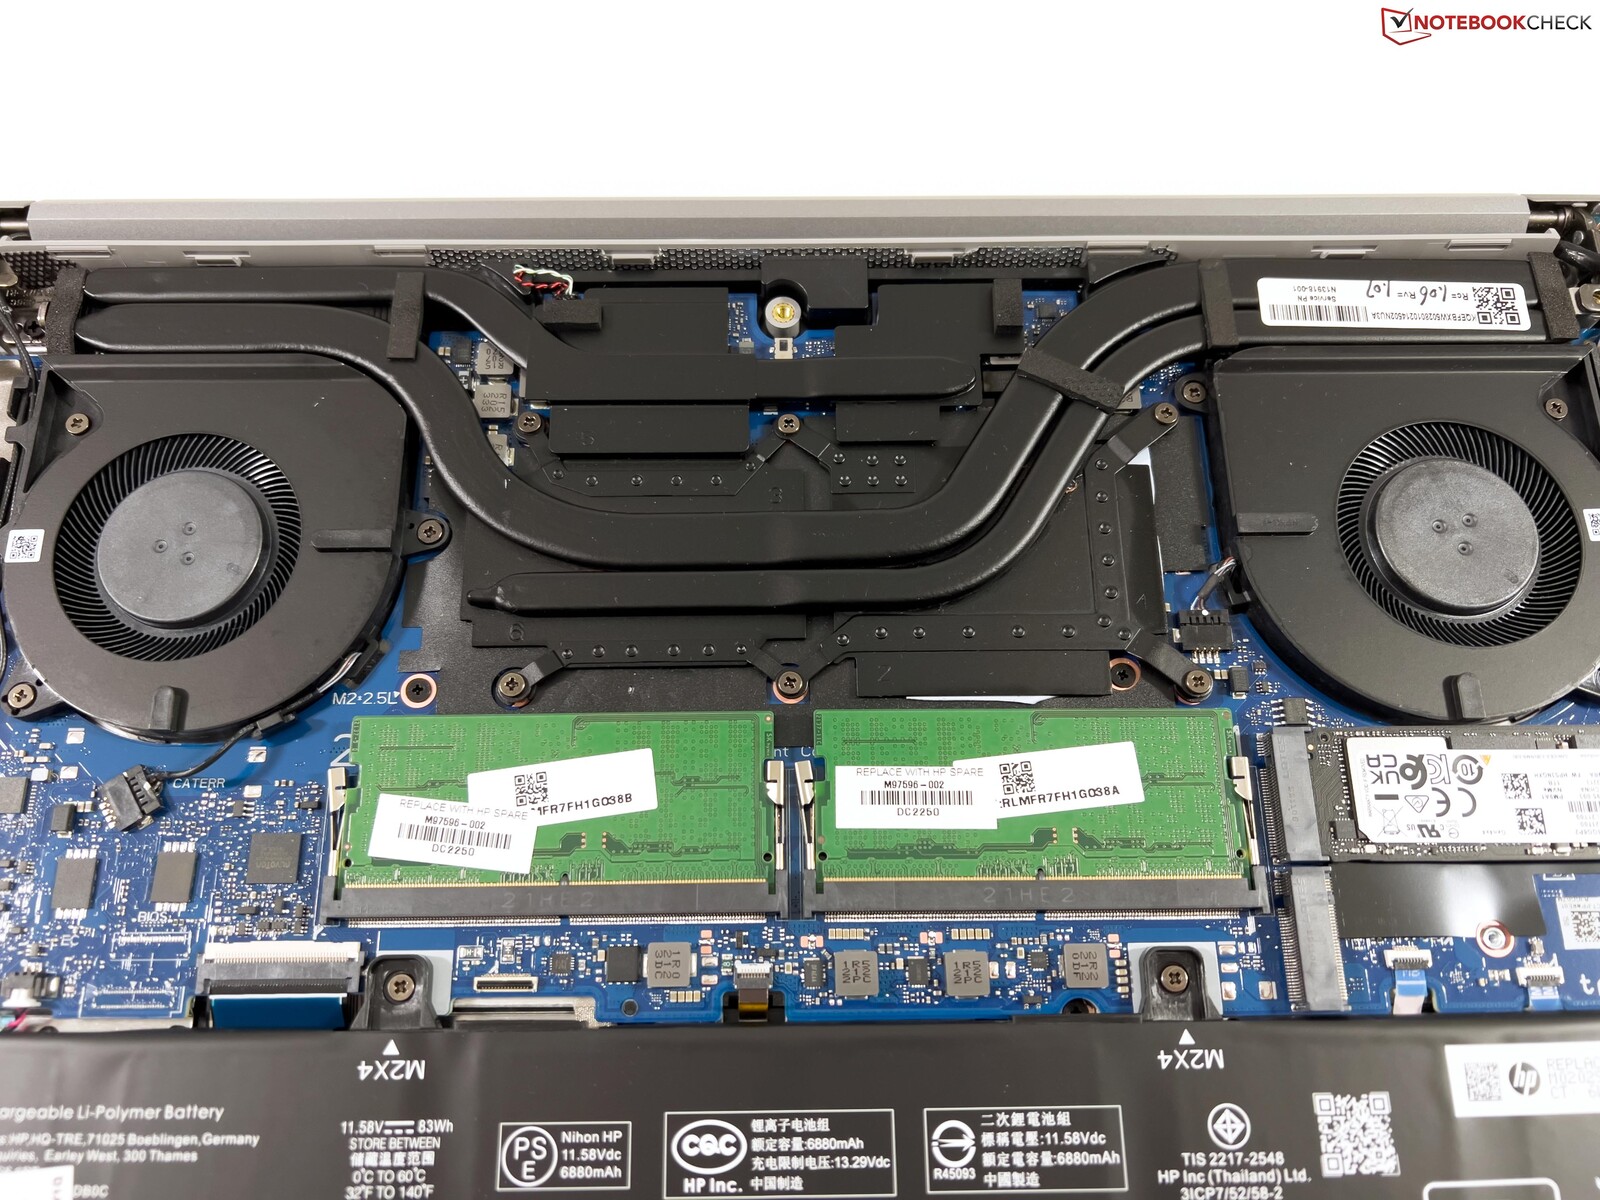
Aluminiowa obudowa pozostaje niezmieniona w stosunku do poprzedniego modelu G8. O ile jakość wykonania jest ogólnie dobra, o tyle stabilność nie dorównuje droższym modelom stacji roboczych, takim jak ZBook Studio czy ZBook Fury. Ponadto wyświetlacz chwieje się nieco po zmianie kąta otwarcia. Wizualnie ZBook Power 15 G9 wygląda skromnie i nie wyróżnia się ciemnoszarym kolorem. Spód obudowy jest tylko przykręcony i można go łatwo zdjąć. Poza pamięcią roboczą użytkownik ma dostęp do dwóch gniazd na dyski SSD M.2, ale moduł WLAN jest wlutowany.
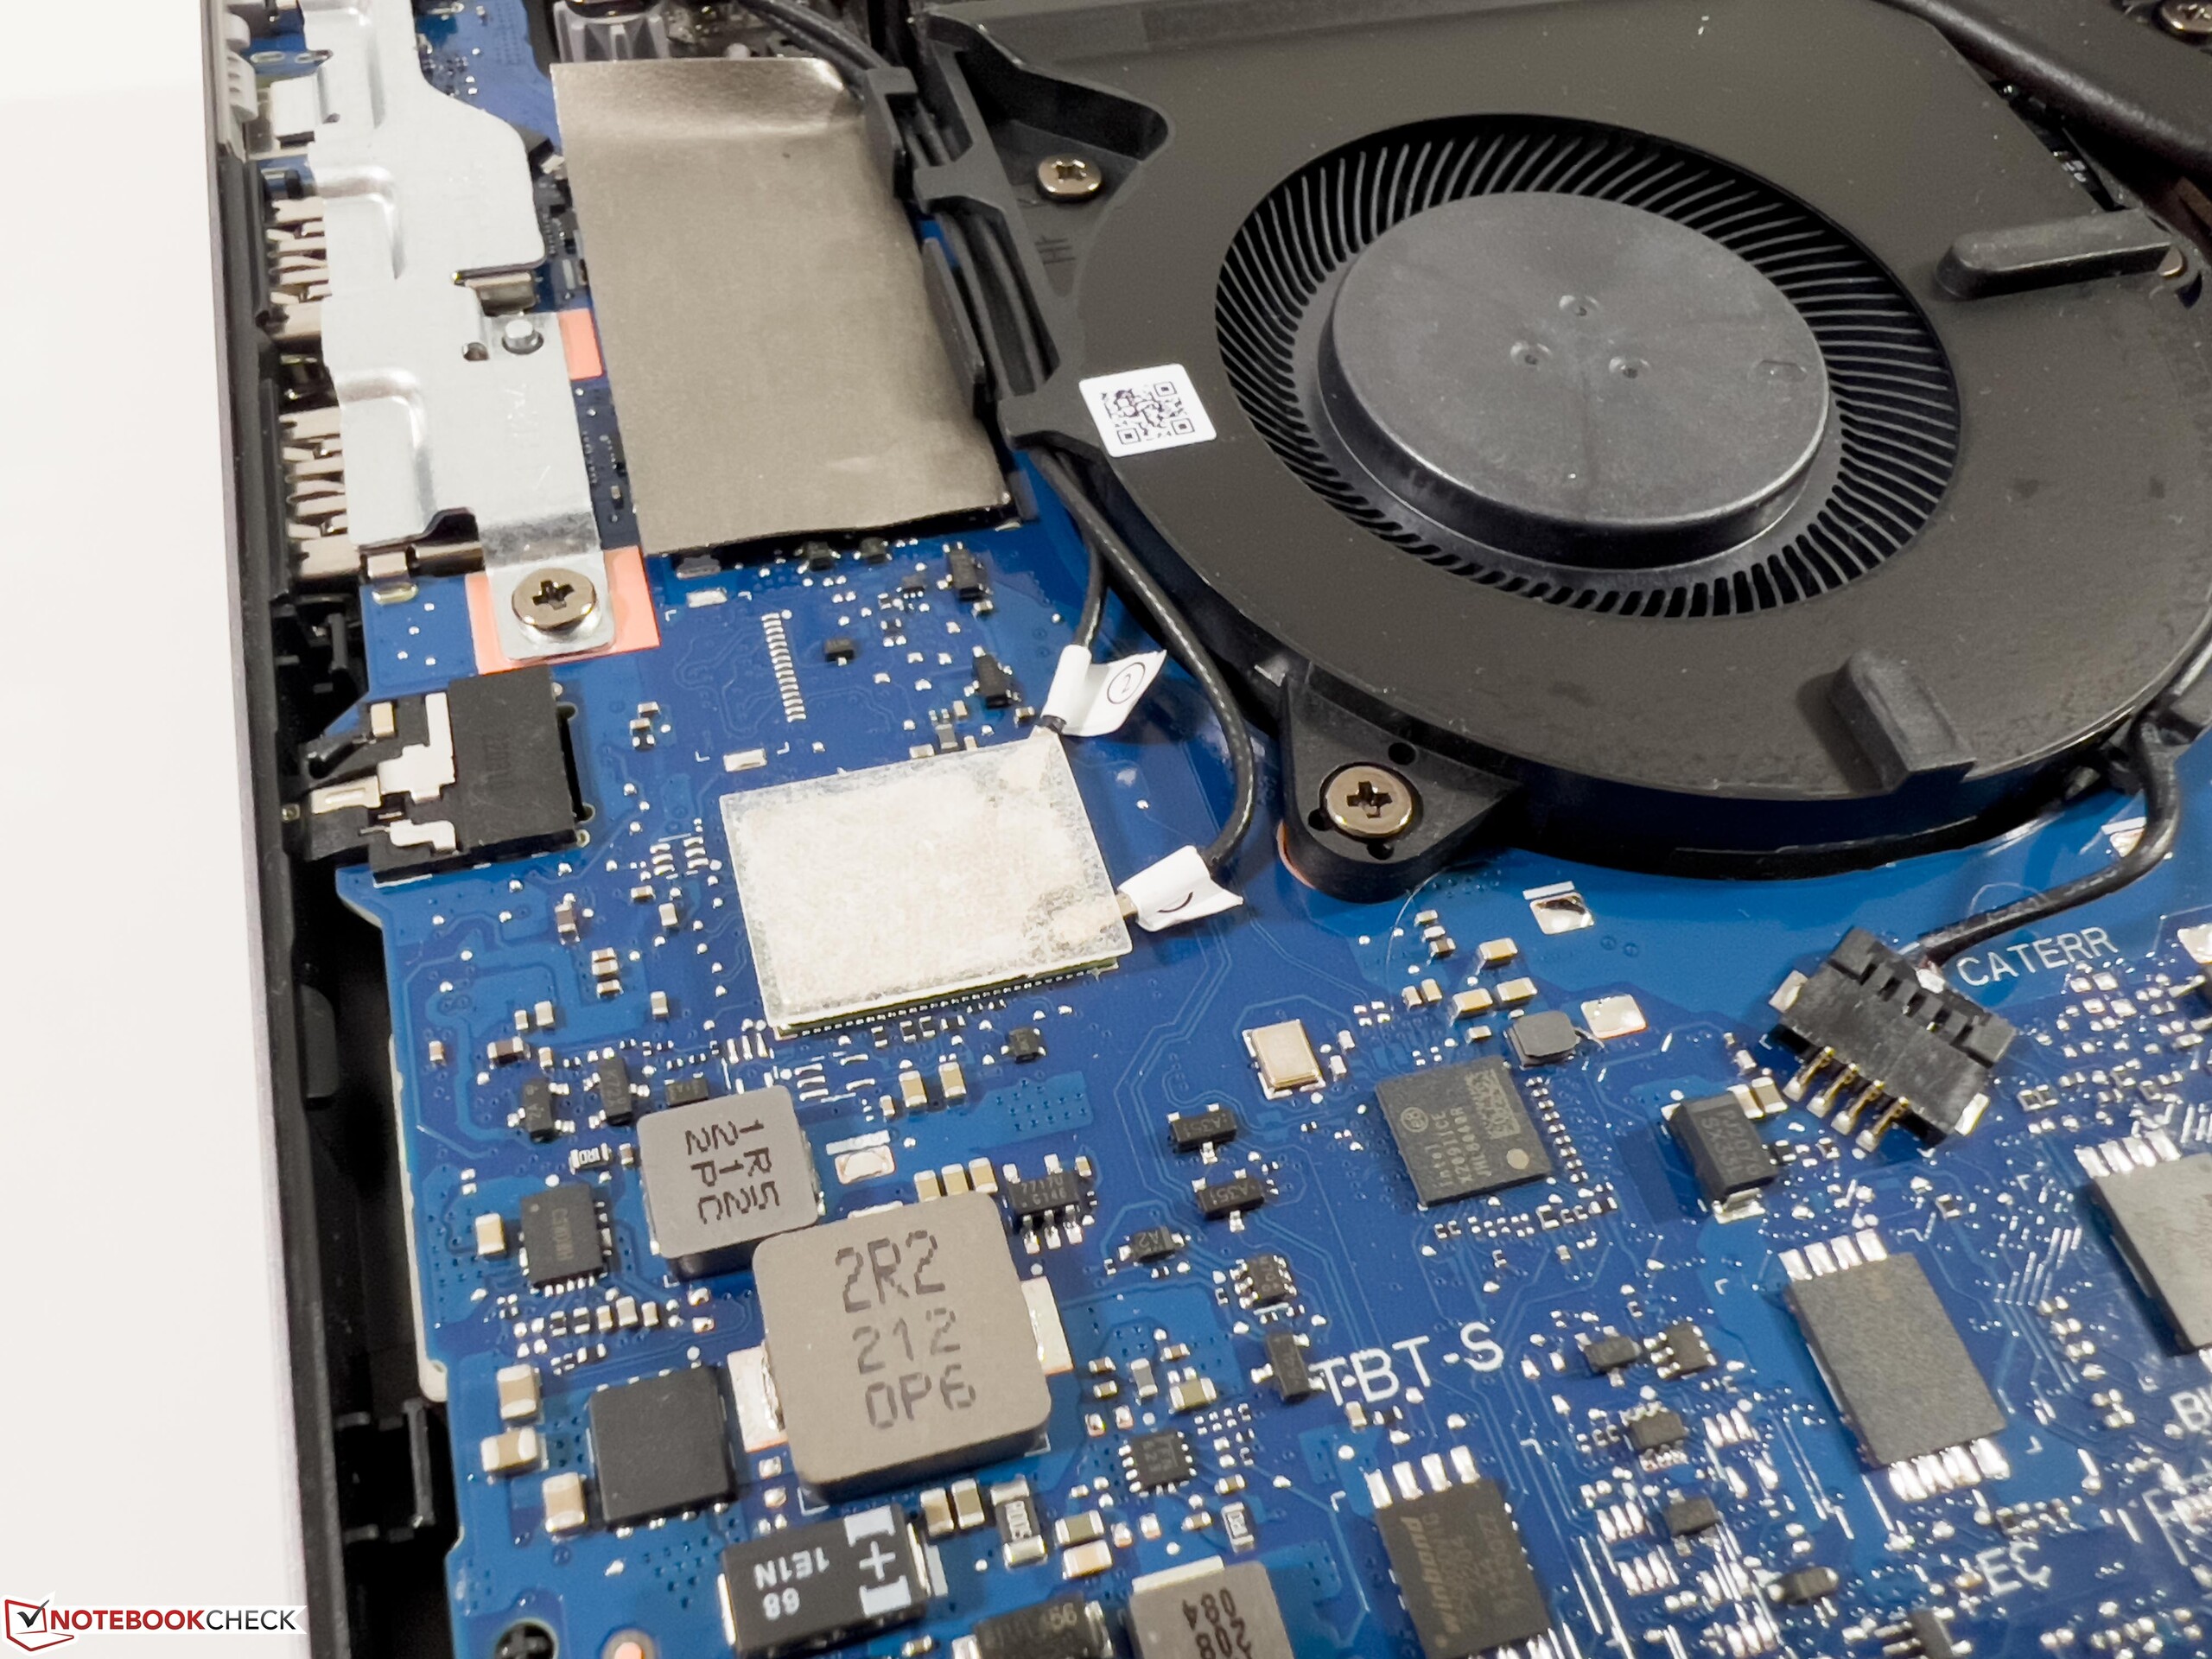
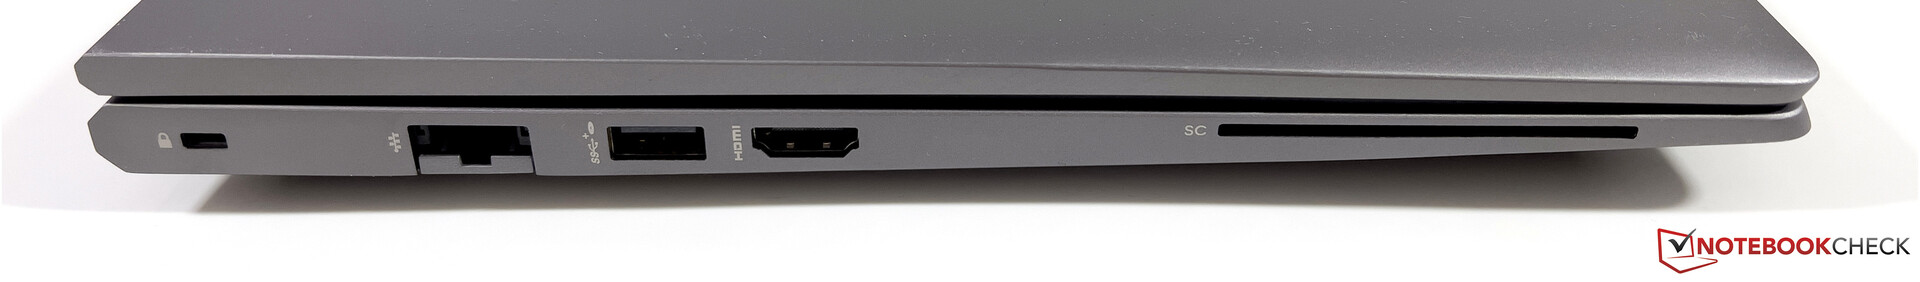
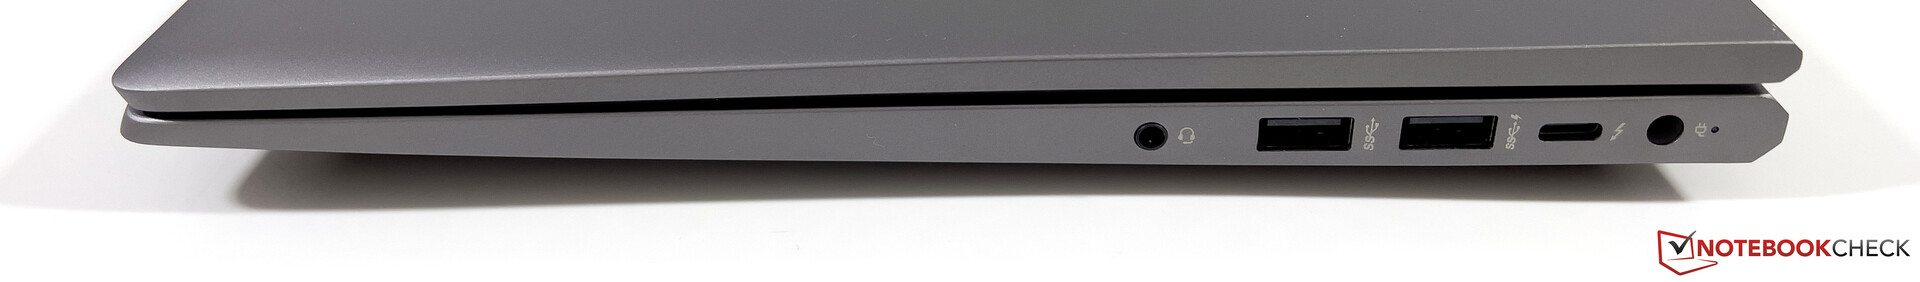
Jeżeli chodzi o wyposażenie w złącza, to nadal mamy do dyspozycji szereg portów USB-A, a także USB-C z Thunderbolt 4, Ethernet i port HDMI. Brakuje w nim jednak czytnika kart. Moduł WLAN został zmodernizowany i karta AX211 od Intela obsługuje teraz także standard Wi-Fi 6E. Bez problemu jesteśmy w stanie połączyć się z siecią 6-GHz z naszego referencyjnego routera Asusa. Mierzone przez nas prędkości transferu są bardzo wysokie, a także stabilne. Moduł LTE/5G nie jest dostępny dla ZBooków Power.
Jako kamerka internetowa nadal jest matryca 720p wraz z kamerką IR do rozpoznawania twarzy. Kamera internetowa spełnia swoje zadanie, ale jakość obrazu nie jest zbyt dobra nawet w dobrych warunkach oświetleniowych.
| Networking | |
| HP ZBook Power 15 G9 6B8C4EA | |
| iperf3 receive AXE11000 6GHz | |
| iperf3 transmit AXE11000 6GHz | |
| HP ZBook Studio 16 G9 62U04EA | |
| iperf3 receive AXE11000 6GHz | |
| iperf3 transmit AXE11000 6GHz | |
| Dell Precision 5000 5560 | |
| iperf3 transmit AX12 | |
| iperf3 receive AX12 | |
| Lenovo ThinkPad P15v G2 21A9000XGE | |
| iperf3 transmit AX12 | |
| iperf3 receive AX12 | |
| HP ZBook Power 15 G8 313S5EA | |
| iperf3 transmit AX12 | |
| iperf3 receive AX12 | |


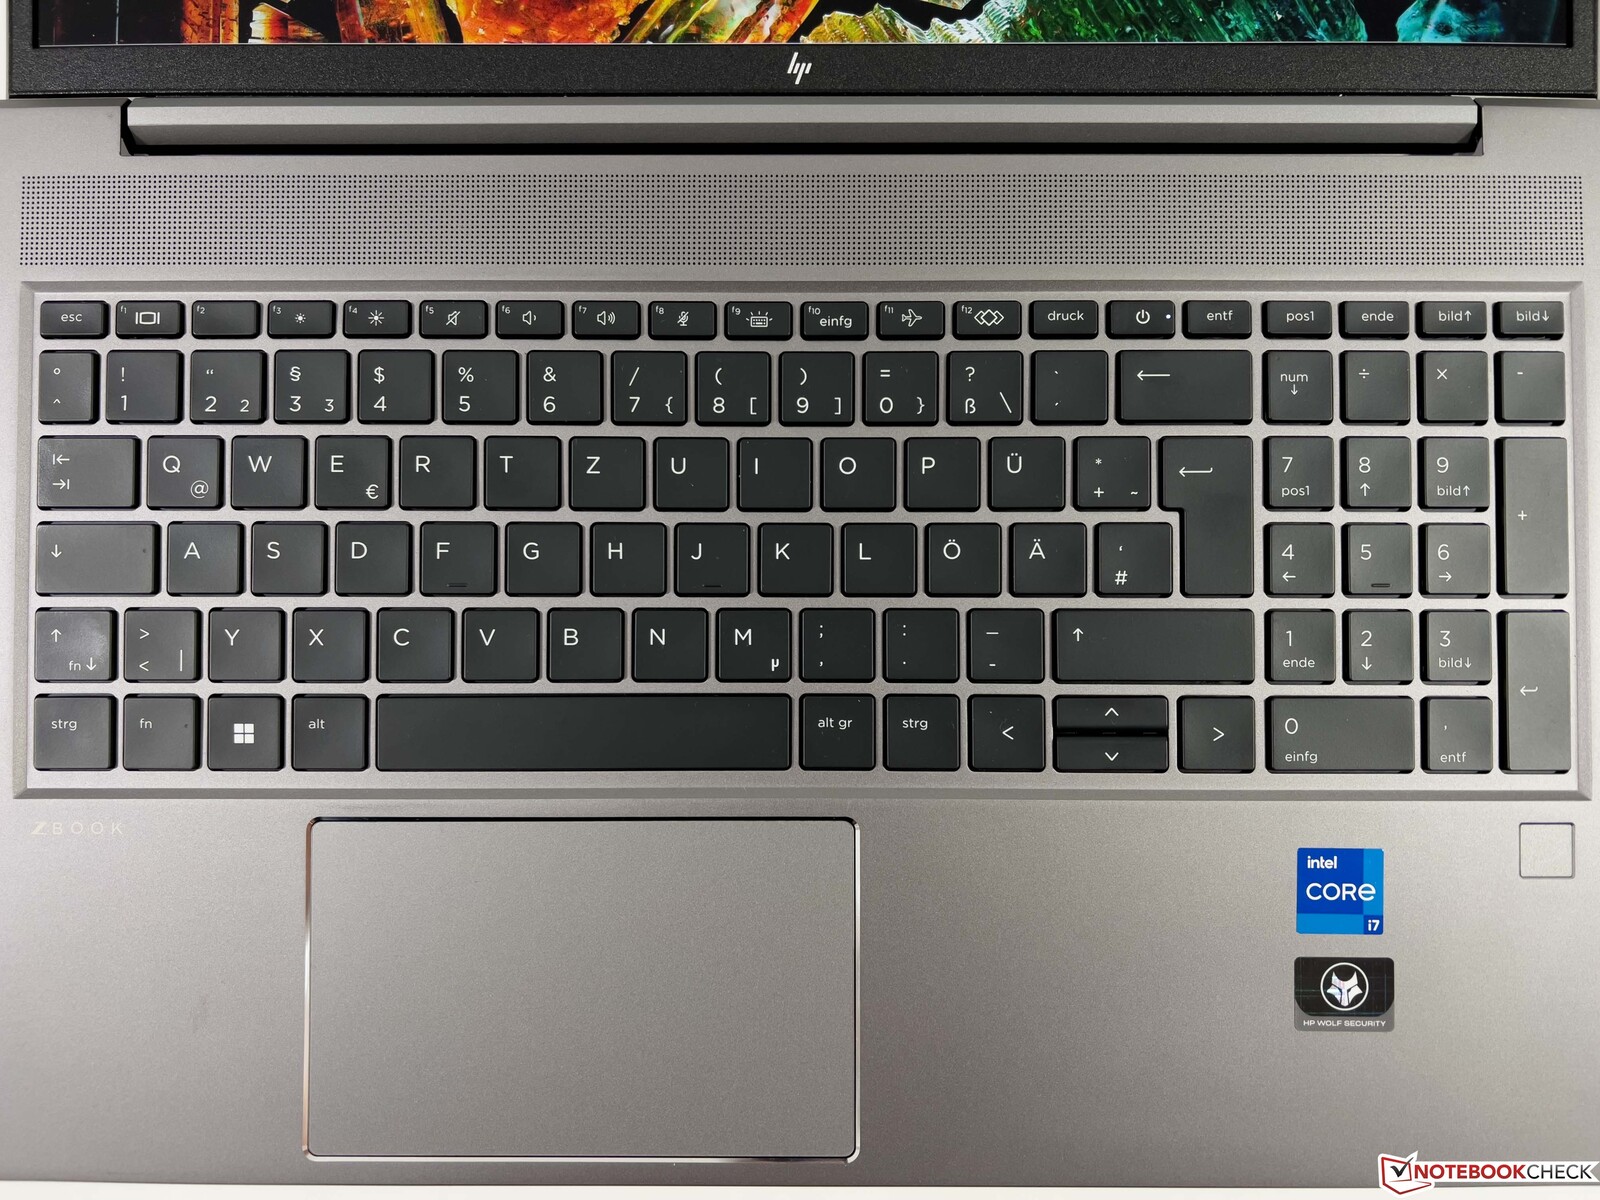
Urządzenia wejściowe - ZBook Power z dobrą klawiaturą
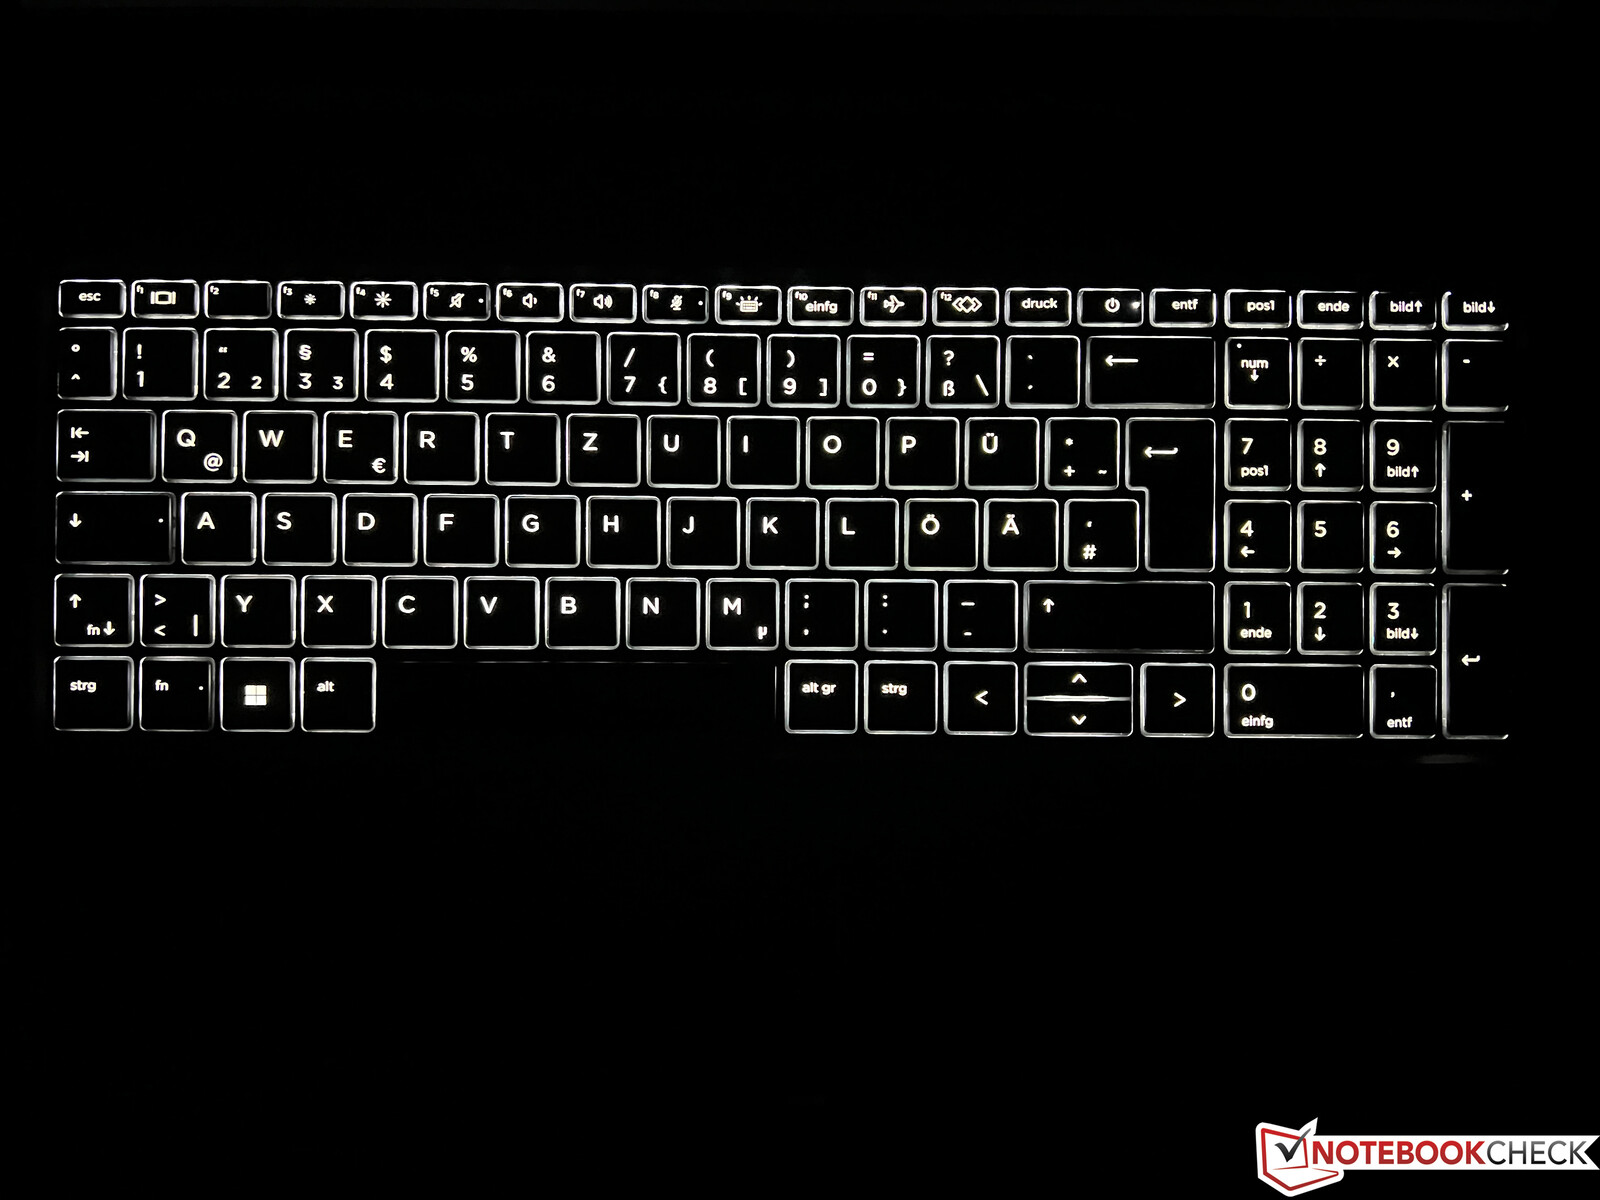
W porównaniu z ZBook Power 15 G8, nie ma też zmian w urządzeniach wejścia. Klawiatura z podświetleniem oferuje bardzo dobre wrażenia z pisania, a po prawej stronie znajduje się dedykowany blok numeryczny. Jeśli chodzi o układ, to trzeba się przyzwyczaić do nieco mniejszych klawiszy strzałek i przycisku Power w górnym rzędzie klawiszy. Skaner linii papilarnych umieszczono po prawej stronie, poniżej klawiatury. W naszym teście ClickPad działa niezawodnie, ale dźwięk klikania jest nieco głośny.
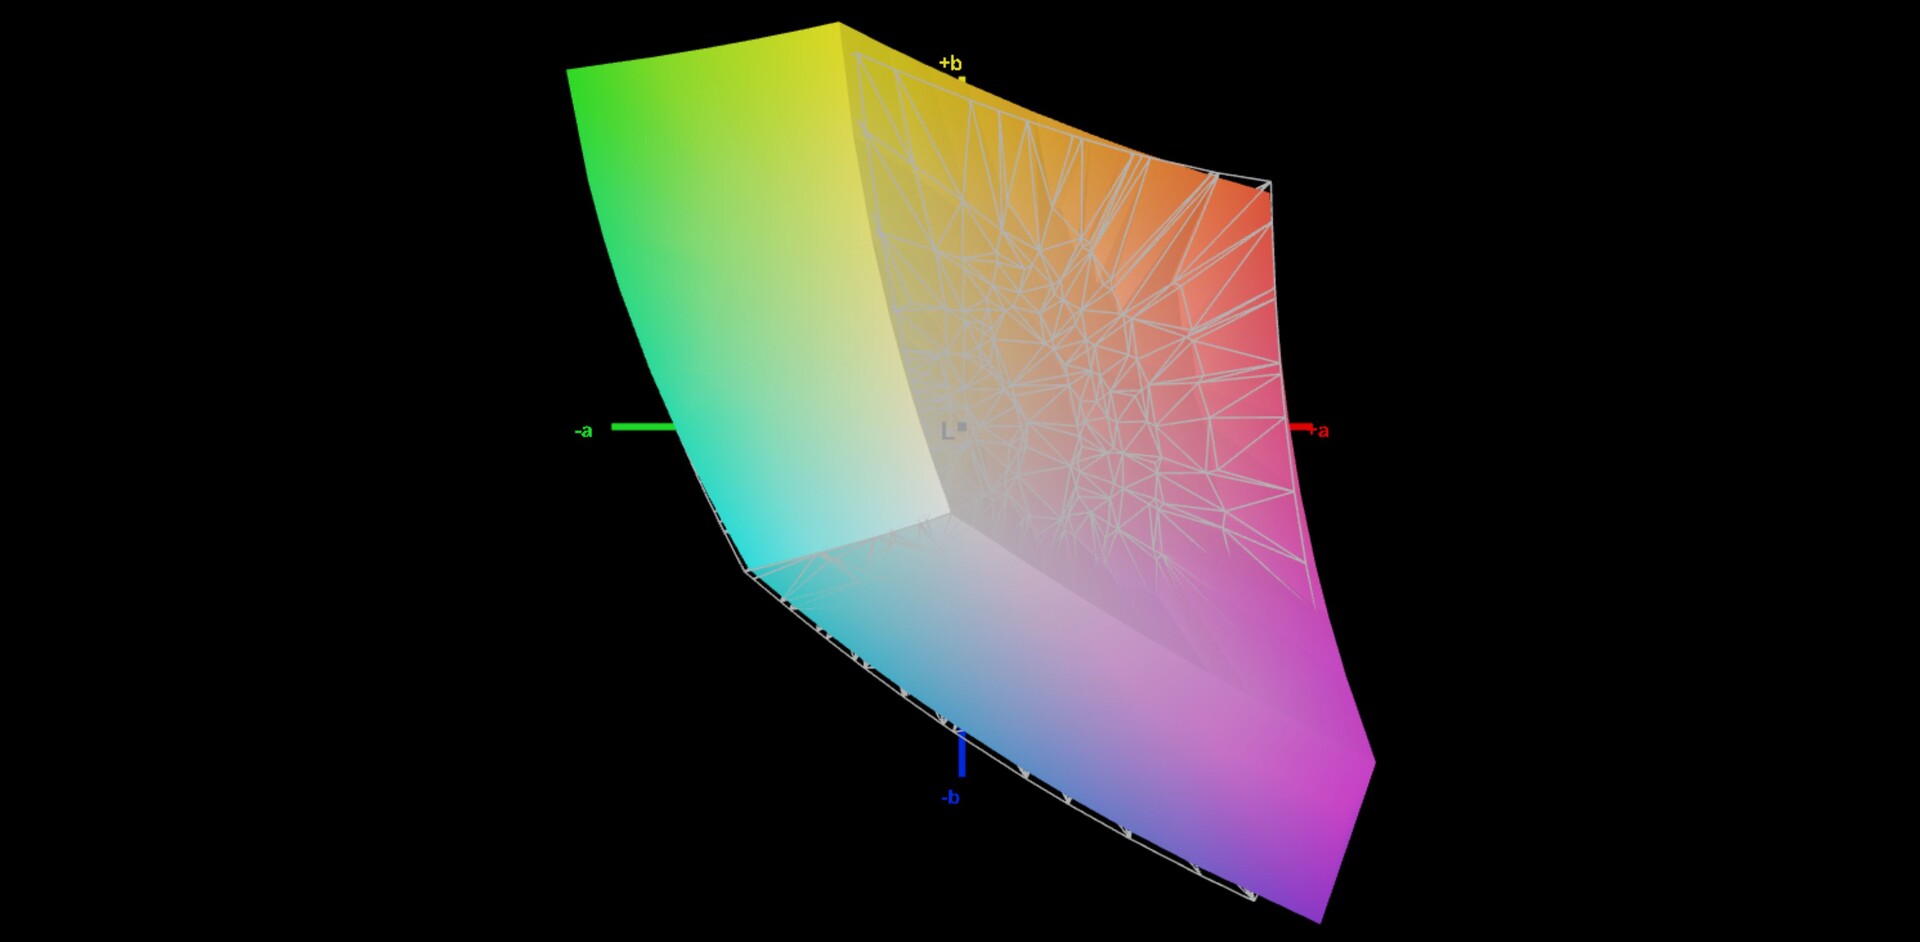
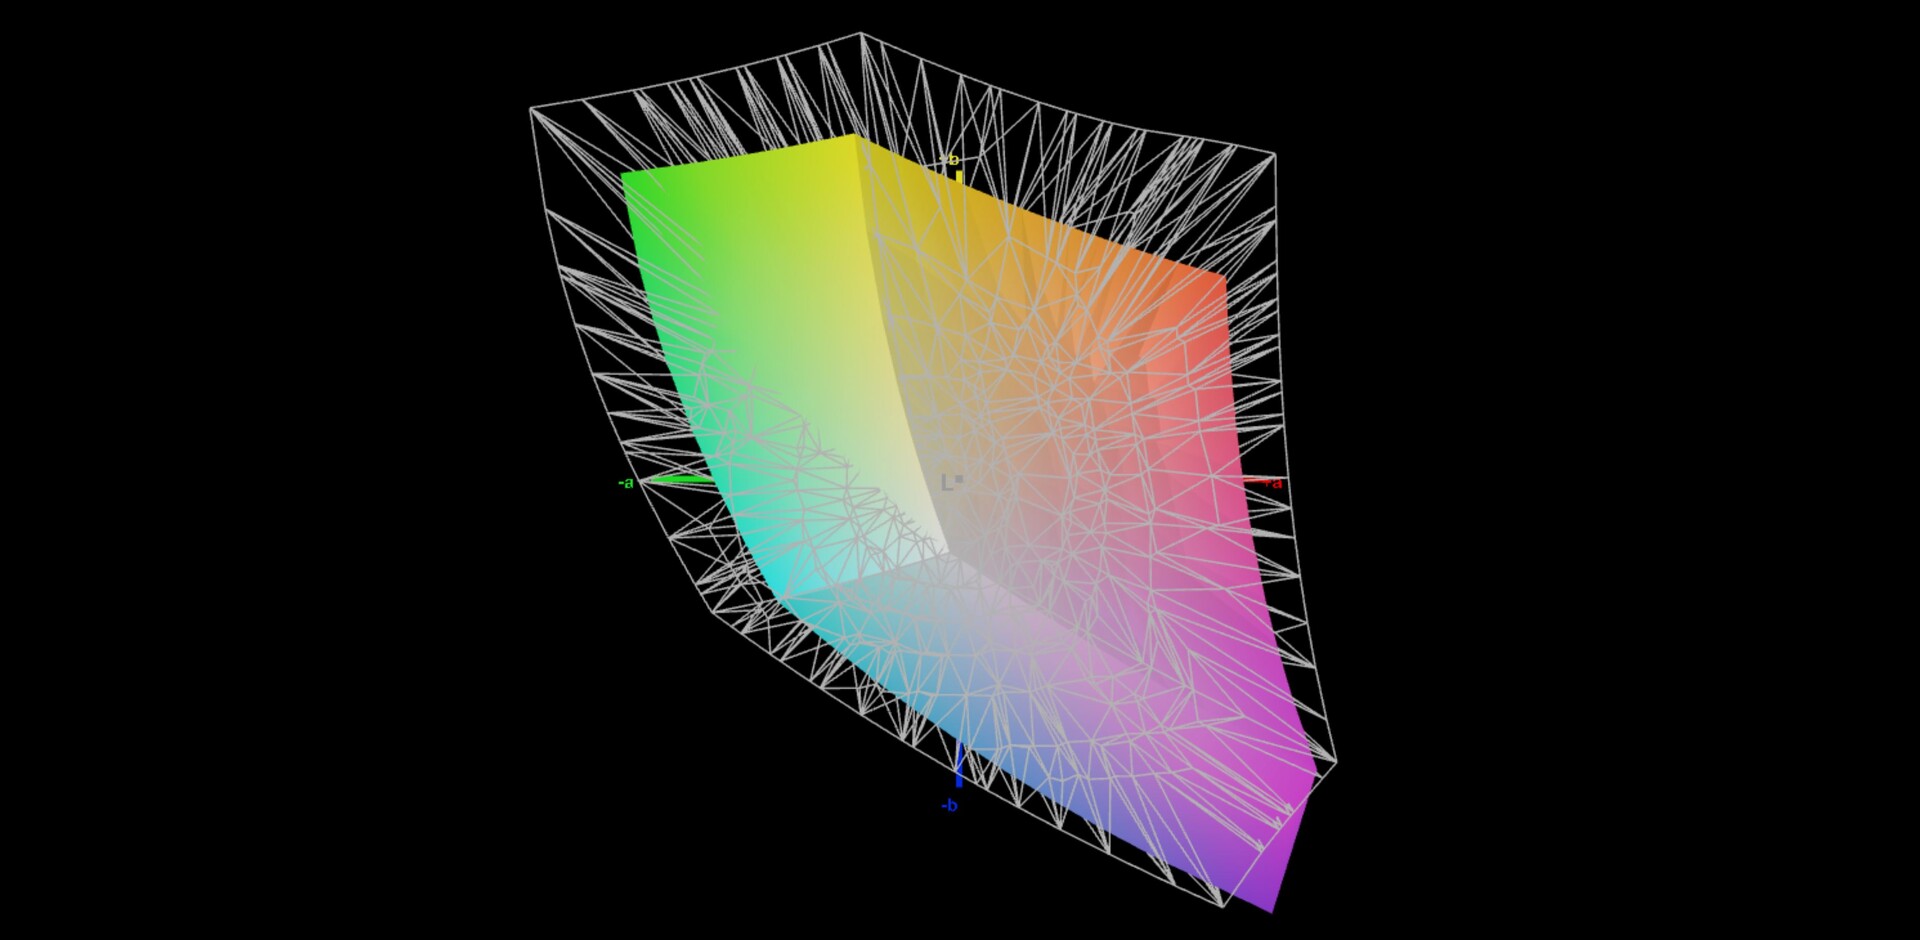
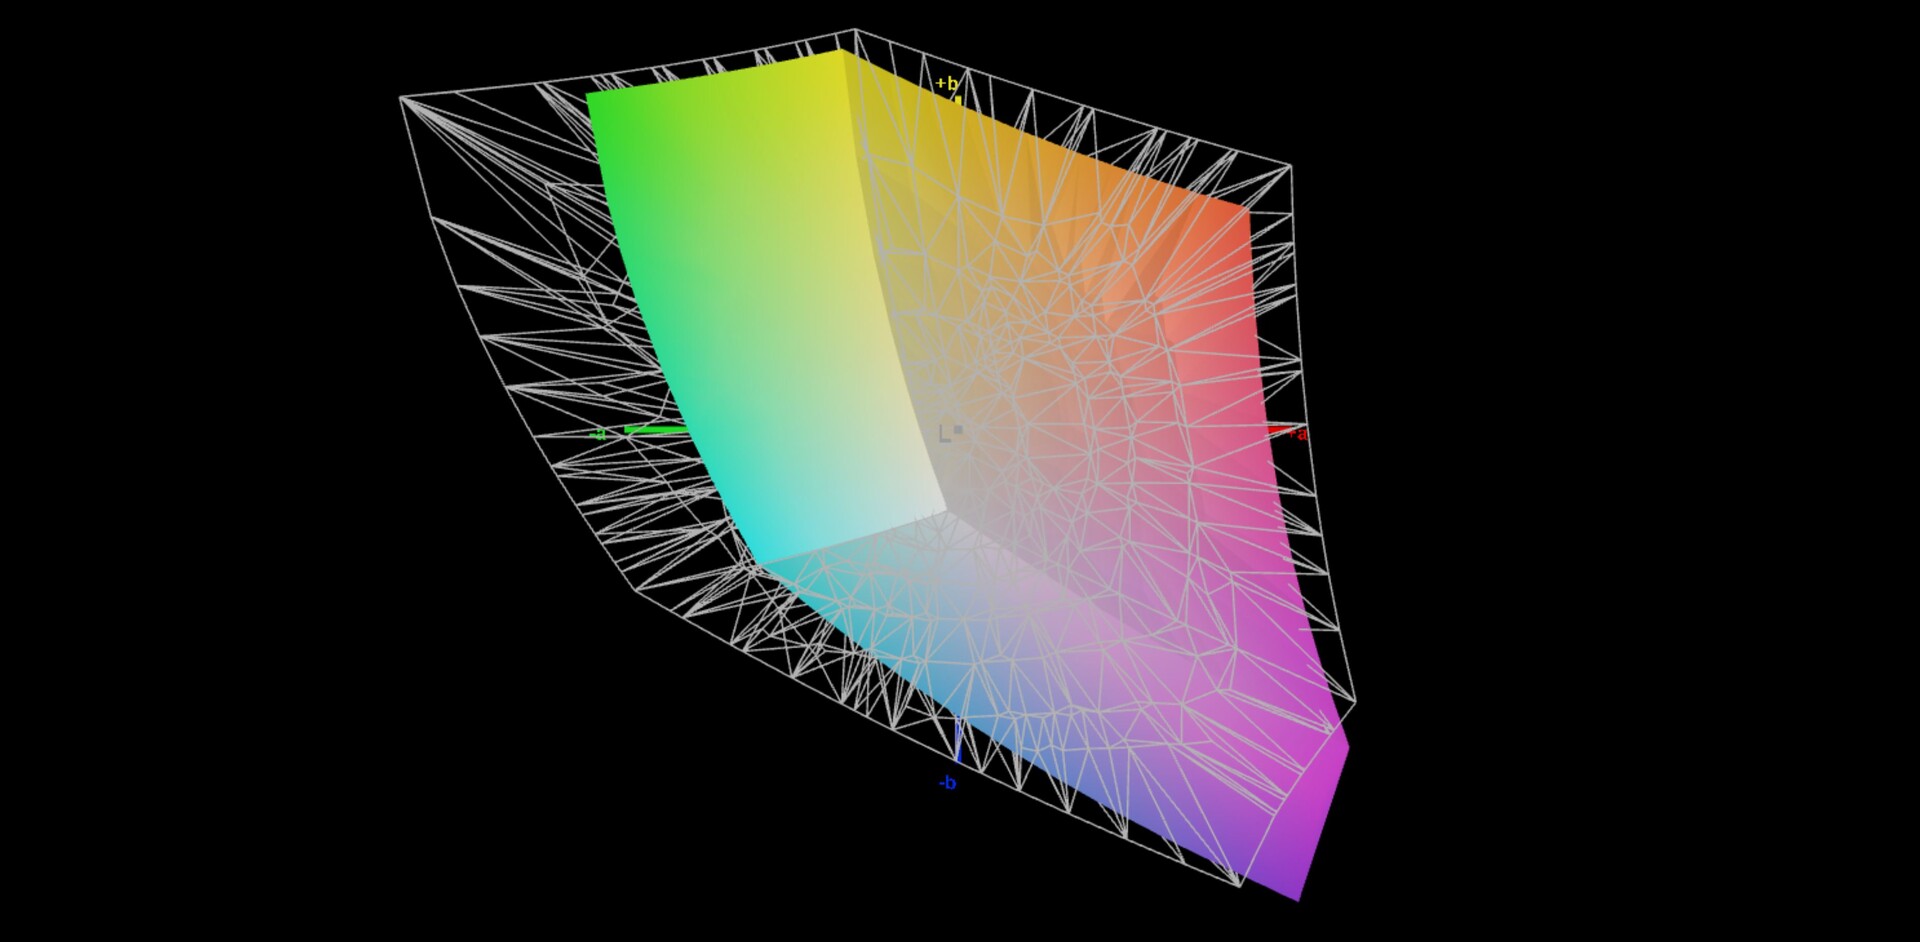
Wyświetlacz - 4K IPS ze 100% pokryciem sRGB
Testowaliśmy już zwykły panel Full HD z poprzednika, a nasza obecna konfiguracja testowa ZBooka Power G9 jest wyposażona w opcjonalny, energooszczędny wyświetlacz 4K IPS. Podobnie jak w poprzedniku, ten nadal ma format 16:9 (3 840 x 2 160 pikseli). Subiektywnie panel LG-Philipsa daje dobrą jakość obrazu, ale jasne treści wydają się nieco ziarniste na matowej powierzchni wyświetlacza. Ponadto czasy reakcji nie są szczególnie szybkie, a w praktyce widzimy też kilka wyraźnych efektów smużenia, na przykład we wskaźniku myszy.
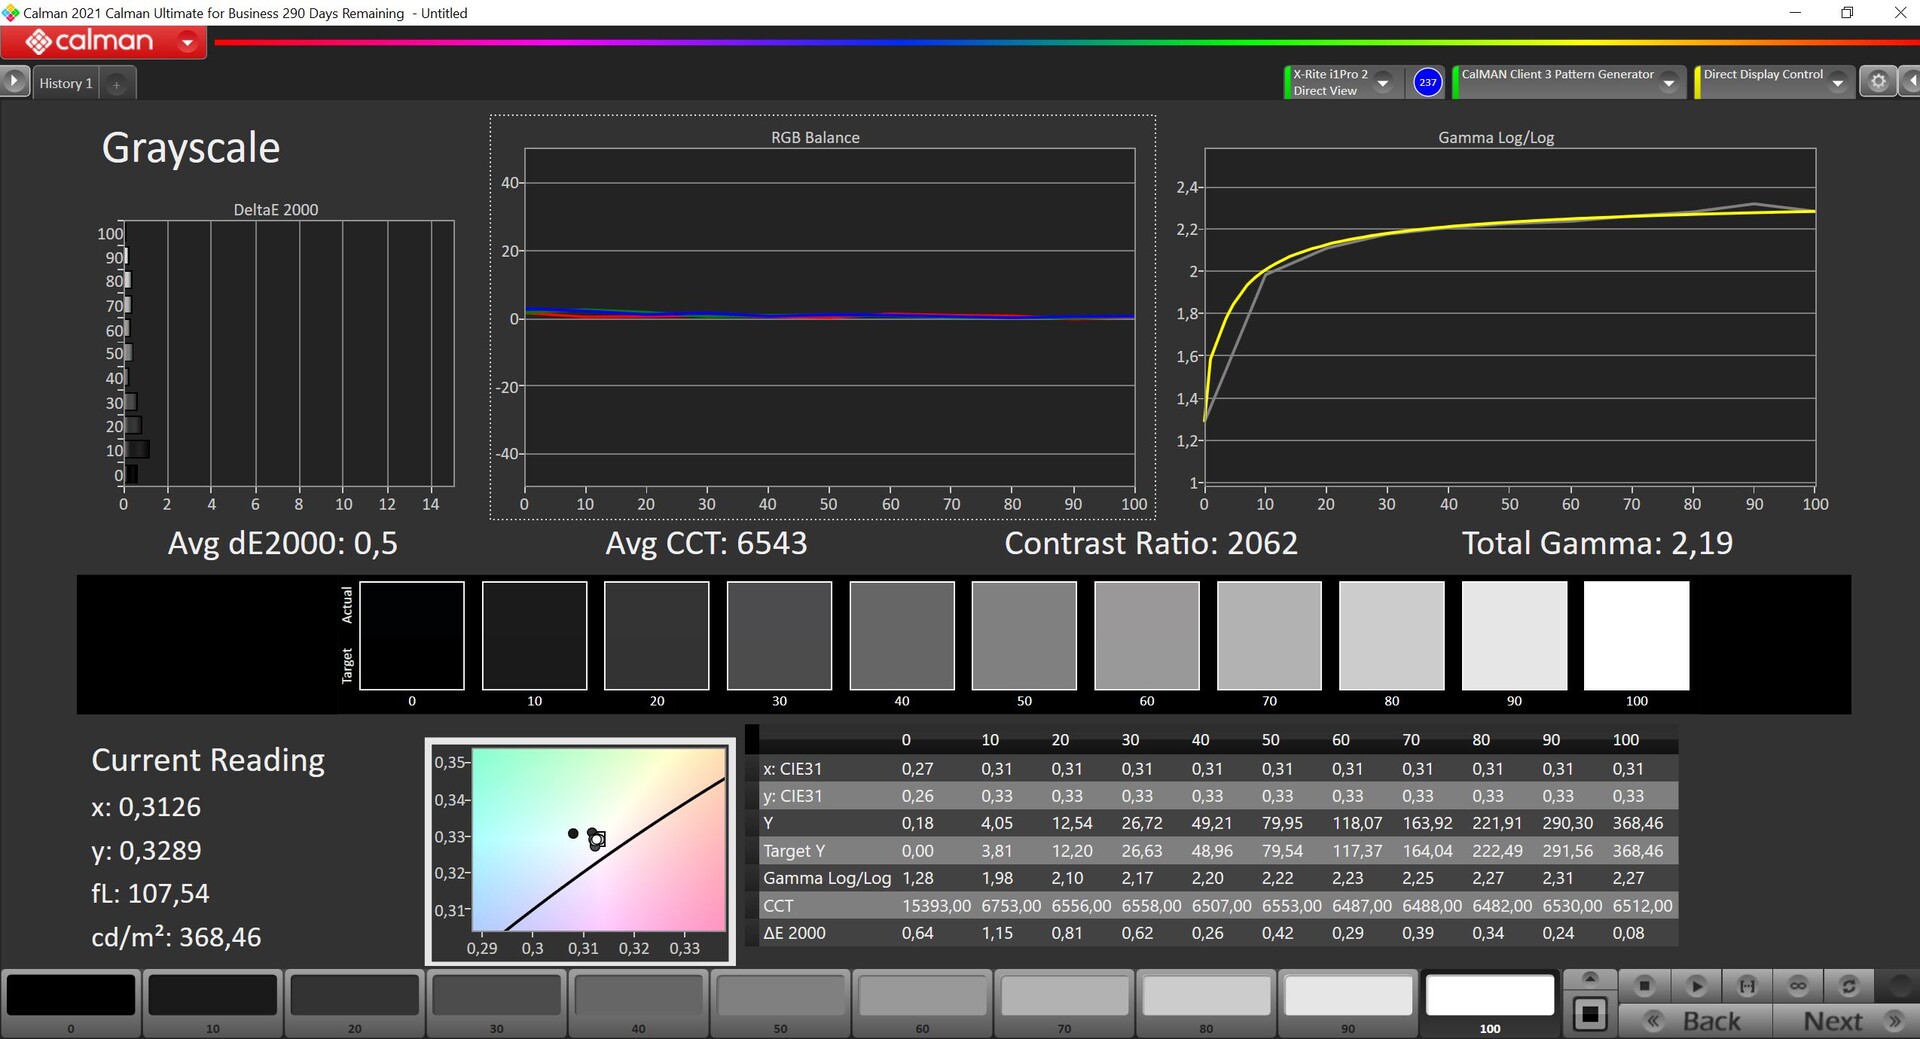
HP reklamuje jasność na poziomie 400 cd/m² i nasz testowy egzemplarz również osiąga ją w górnym zakresie. Jednocześnie wartość czerni jest bardzo niska i wynosi 0,15, co prowadzi do bardzo dobrego współczynnika kontrastu wynoszącego ponad 2500:1. Przy pełnej jasności i na ciemnym tle występują pewne zauważalne aureole świetlne. PWM nie jest wykorzystywany.
| |||||||||||||||||||||||||
rozświetlenie: 88 %
na akumulatorze: 391 cd/m²
kontrast: 2613:1 (czerń: 0.15 cd/m²)
ΔE ColorChecker Calman: 3.2 | ∀{0.5-29.43 Ø4.71}
calibrated: 1.2
ΔE Greyscale Calman: 4.9 | ∀{0.09-98 Ø4.96}
69.6% AdobeRGB 1998 (Argyll 3D)
97.7% sRGB (Argyll 3D)
69.1% Display P3 (Argyll 3D)
Gamma: 2.13
CCT: 5982 K
| HP ZBook Power 15 G9 6B8C4EA LGD073F, IPS, 3840x2160, 15.6" | HP ZBook Studio 16 G9 62U04EA BOE0A52, IPS, 3840x2400, 16" | Dell Precision 5000 5560 Sharp LQ156R1, IPS, 3840x2400, 15.6" | Lenovo ThinkPad P15v G2 21A9000XGE N156HCA-EAC, IPS LED, 1920x1080, 15.6" | HP ZBook Power 15 G8 313S5EA AUOA08B, IPS LED, 1920x1080, 15.6" | |
|---|---|---|---|---|---|
| Display | 22% | 28% | -35% | 2% | |
| Display P3 Coverage (%) | 69.1 | 97.5 41% | 94.9 37% | 43.7 -37% | 70.5 2% |
| sRGB Coverage (%) | 97.7 | 99.9 2% | 100 2% | 65.1 -33% | 99 1% |
| AdobeRGB 1998 Coverage (%) | 69.6 | 86.3 24% | 100 44% | 45.3 -35% | 71.3 2% |
| Response Times | 73% | -5% | -2% | -33% | |
| Response Time Grey 50% / Grey 80% * (ms) | 45.8 ? | 15.3 ? 67% | 47.2 ? -3% | 48 ? -5% | 61 -33% |
| Response Time Black / White * (ms) | 28.6 ? | 6.1 ? 79% | 30.4 ? -6% | 28 ? 2% | 38 ? -33% |
| PWM Frequency (Hz) | |||||
| Screen | 6% | -21% | -87% | 3% | |
| Brightness middle (cd/m²) | 392 | 554 41% | 501.5 28% | 305 -22% | 393 0% |
| Brightness (cd/m²) | 388 | 516 33% | 467 20% | 281 -28% | 385 -1% |
| Brightness Distribution (%) | 88 | 84 -5% | 83 -6% | 88 0% | 78 -11% |
| Black Level * (cd/m²) | 0.15 | 0.47 -213% | 0.44 -193% | 0.32 -113% | 0.25 -67% |
| Contrast (:1) | 2613 | 1179 -55% | 1140 -56% | 953 -64% | 1572 -40% |
| Colorchecker dE 2000 * | 3.2 | 1 69% | 4.73 -48% | 5.9 -84% | 1.5 53% |
| Colorchecker dE 2000 max. * | 7 | 2.4 66% | 8.45 -21% | 20.1 -187% | 4.3 39% |
| Colorchecker dE 2000 calibrated * | 1.2 | 0.6 50% | 0.51 57% | 4.5 -275% | 1.4 -17% |
| Greyscale dE 2000 * | 4.9 | 1.6 67% | 3.6 27% | 5.3 -8% | 1.3 73% |
| Gamma | 2.13 103% | 2.29 96% | 2.08 106% | 2.1 105% | 2.26 97% |
| CCT | 5982 109% | 6458 101% | 6447 101% | 6307 103% | 6435 101% |
| Całkowita średnia (program / ustawienia) | 34% /
19% | 1% /
-8% | -41% /
-64% | -9% /
-2% |
* ... im mniej tym lepiej
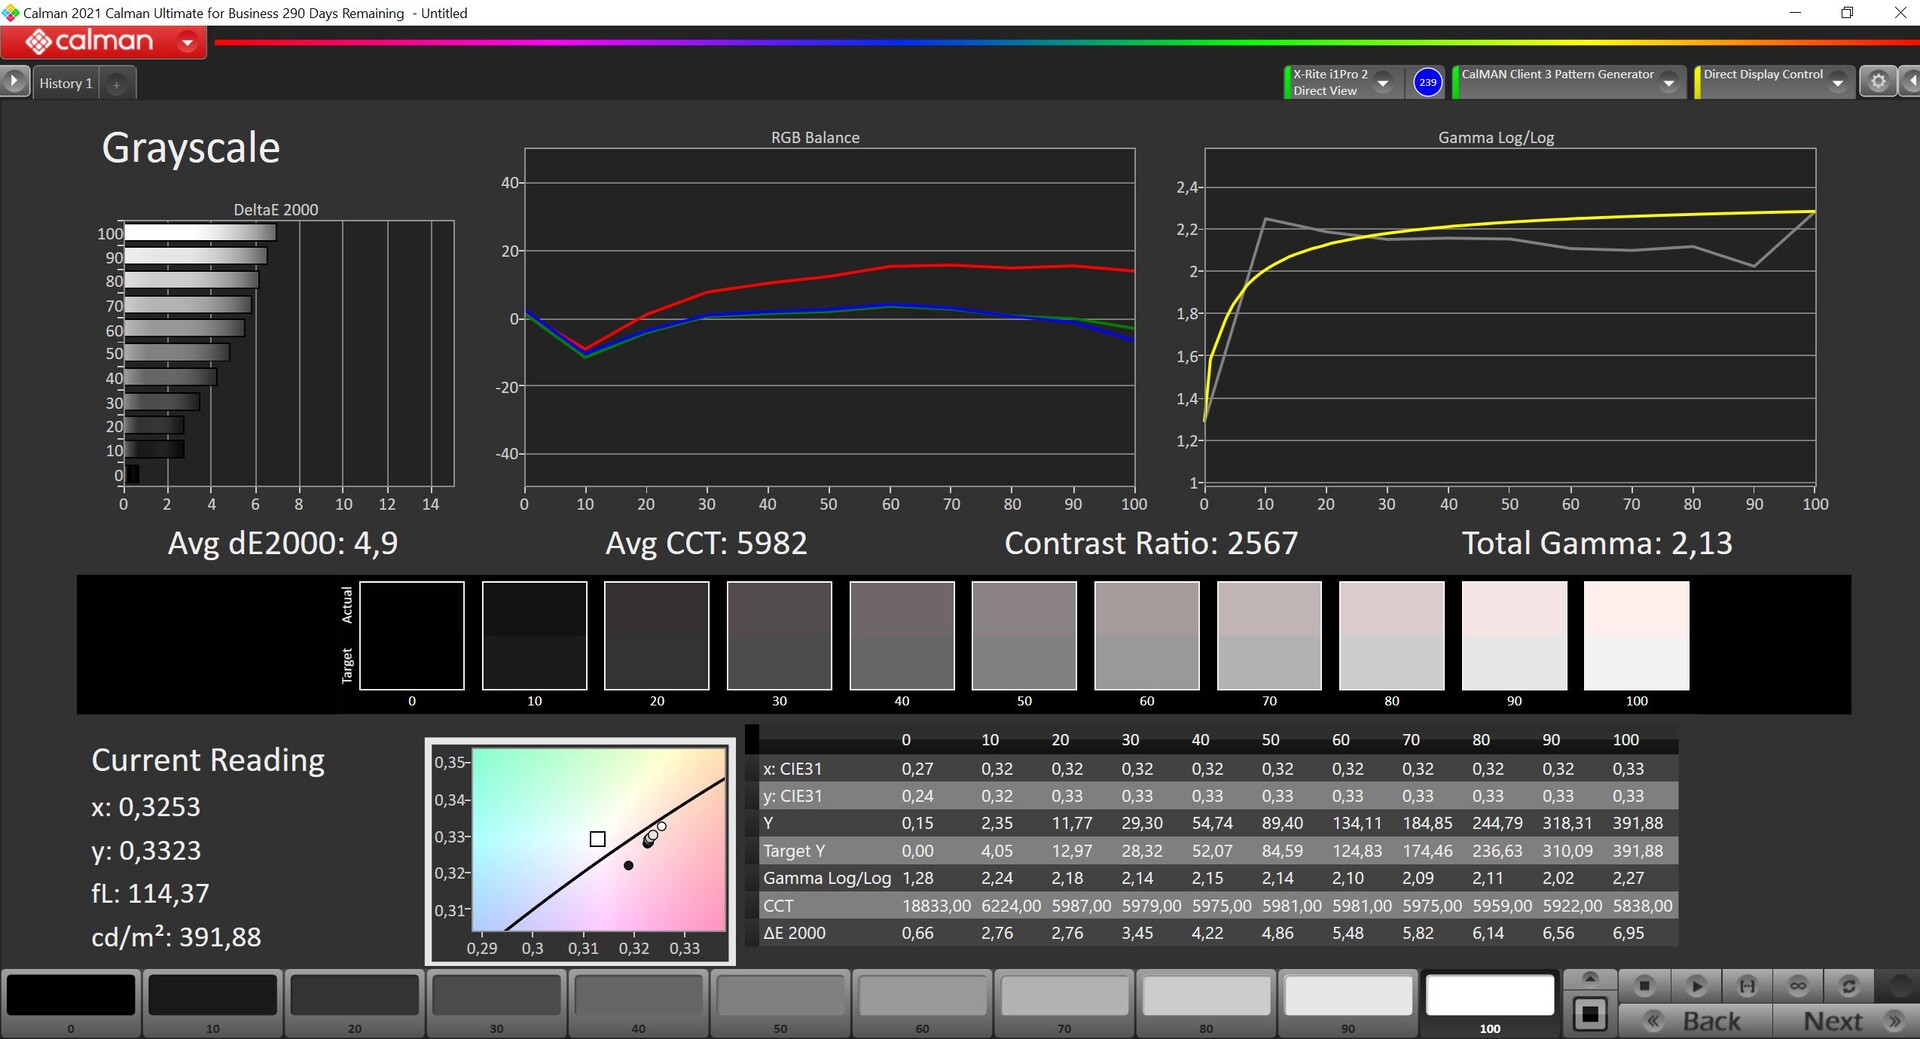
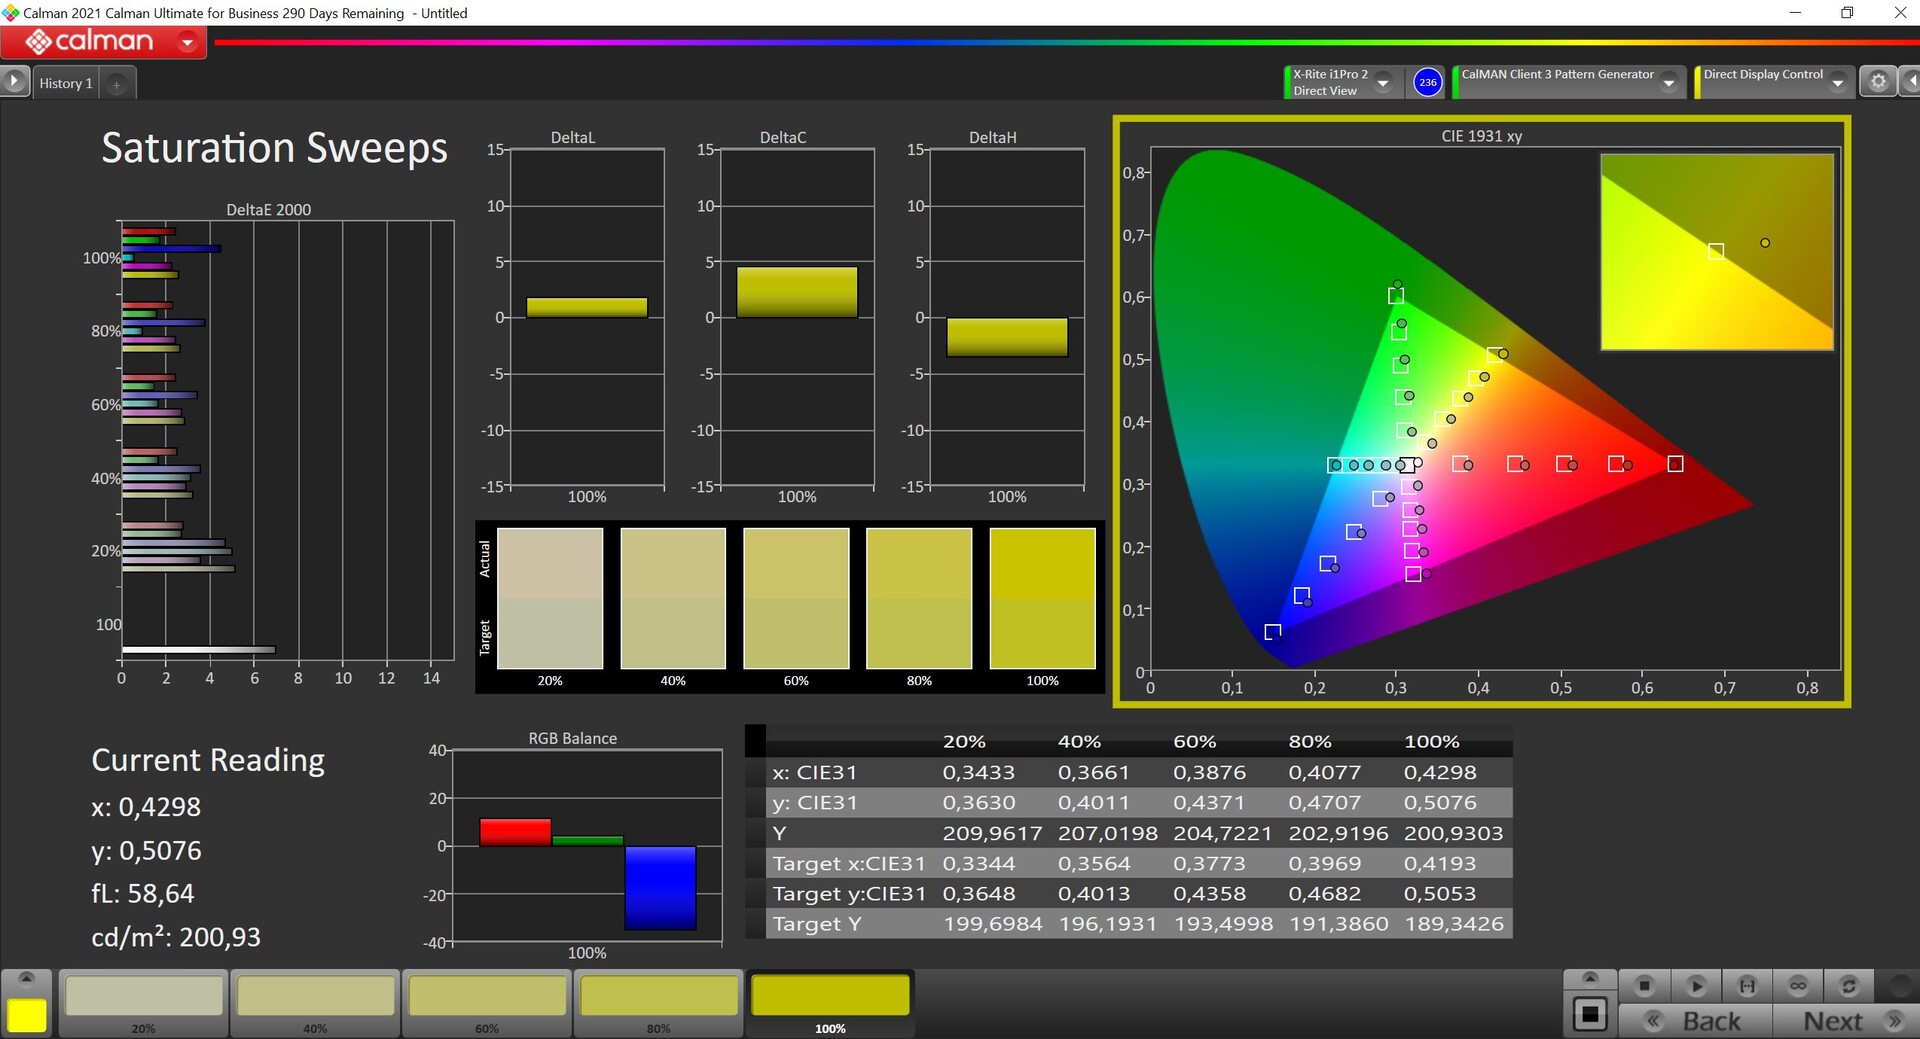
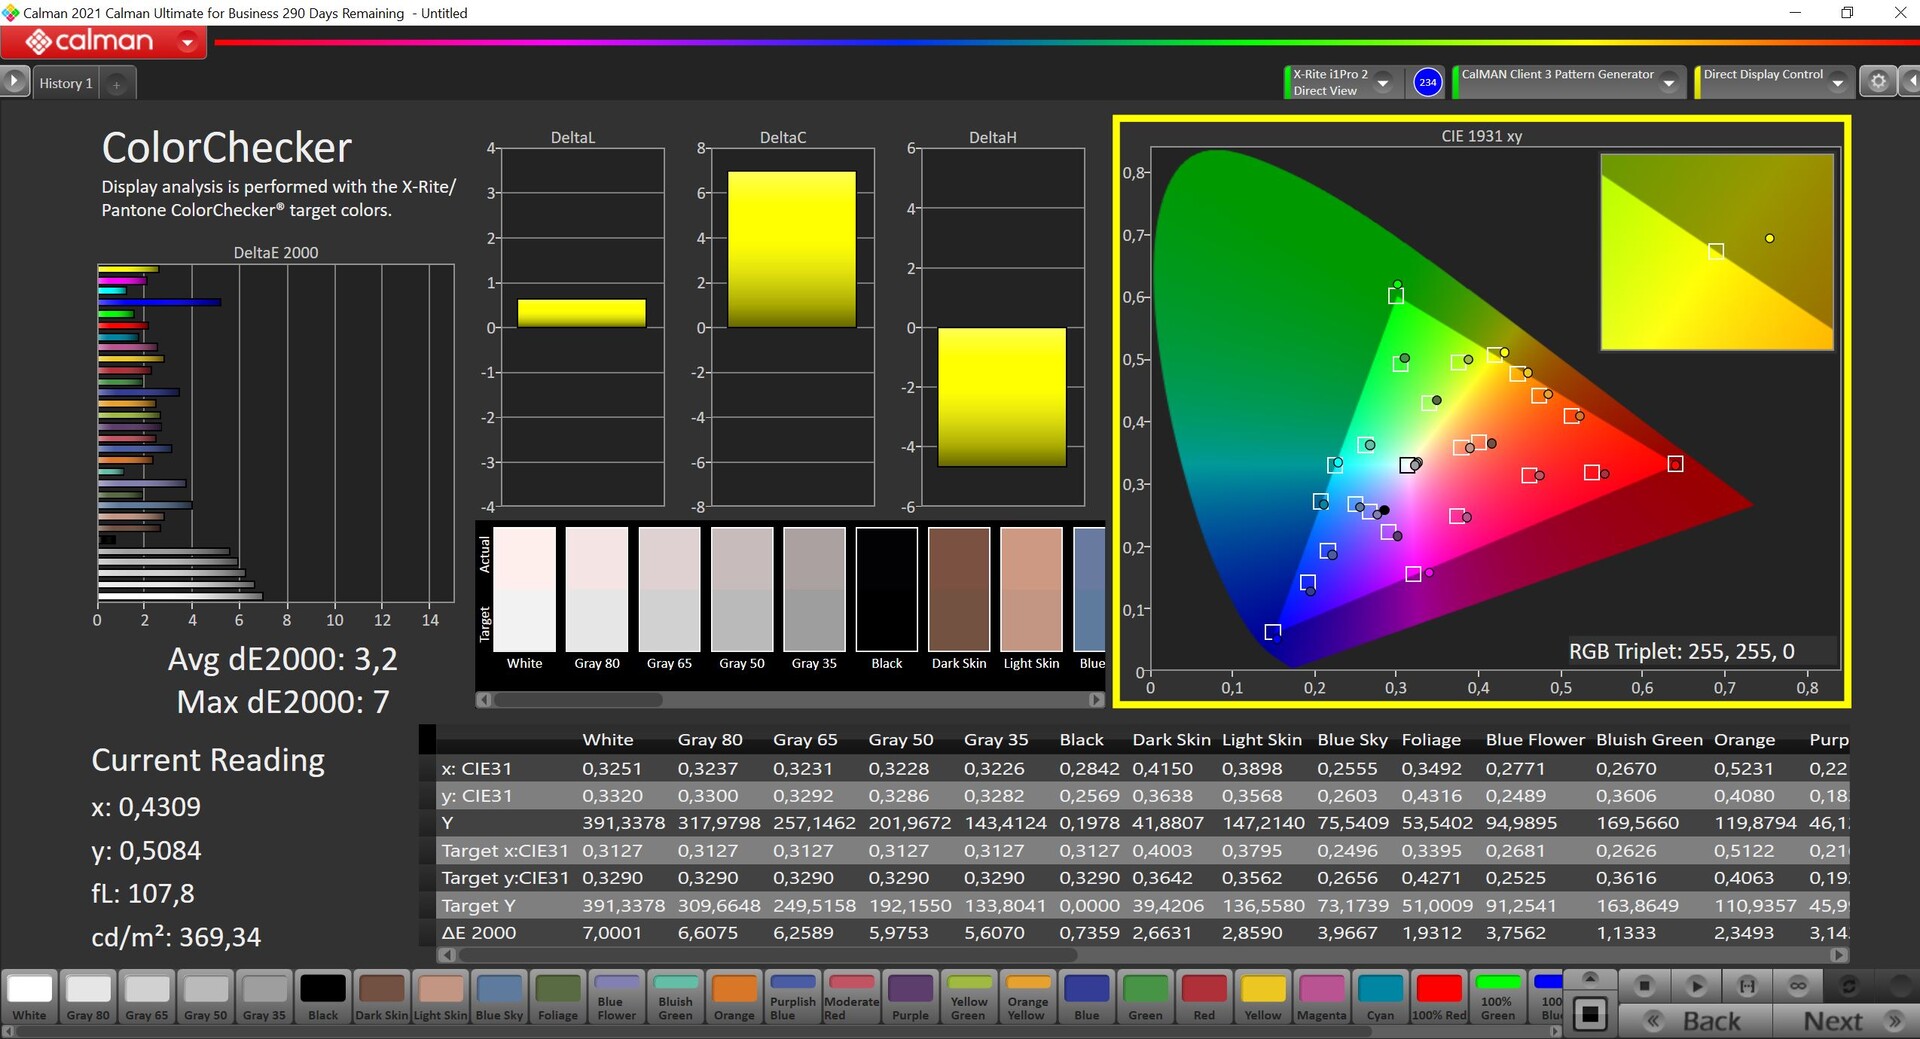
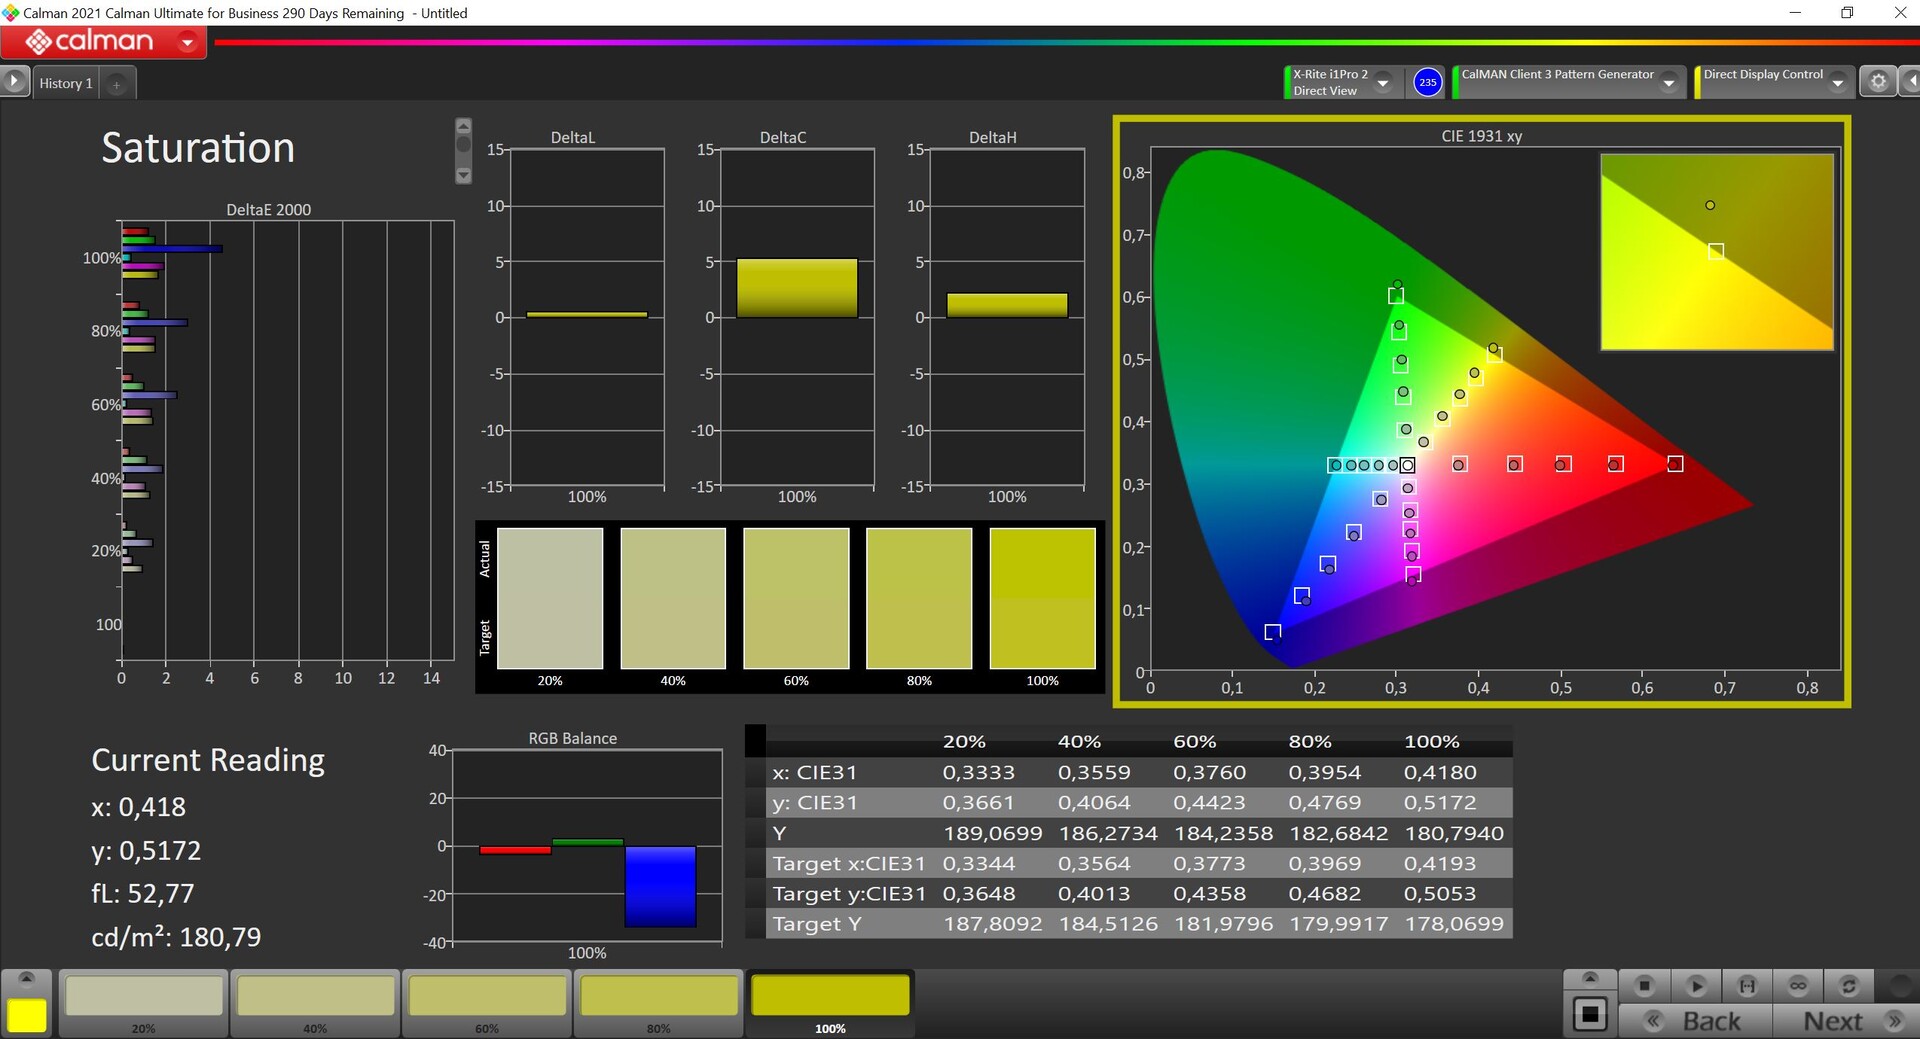
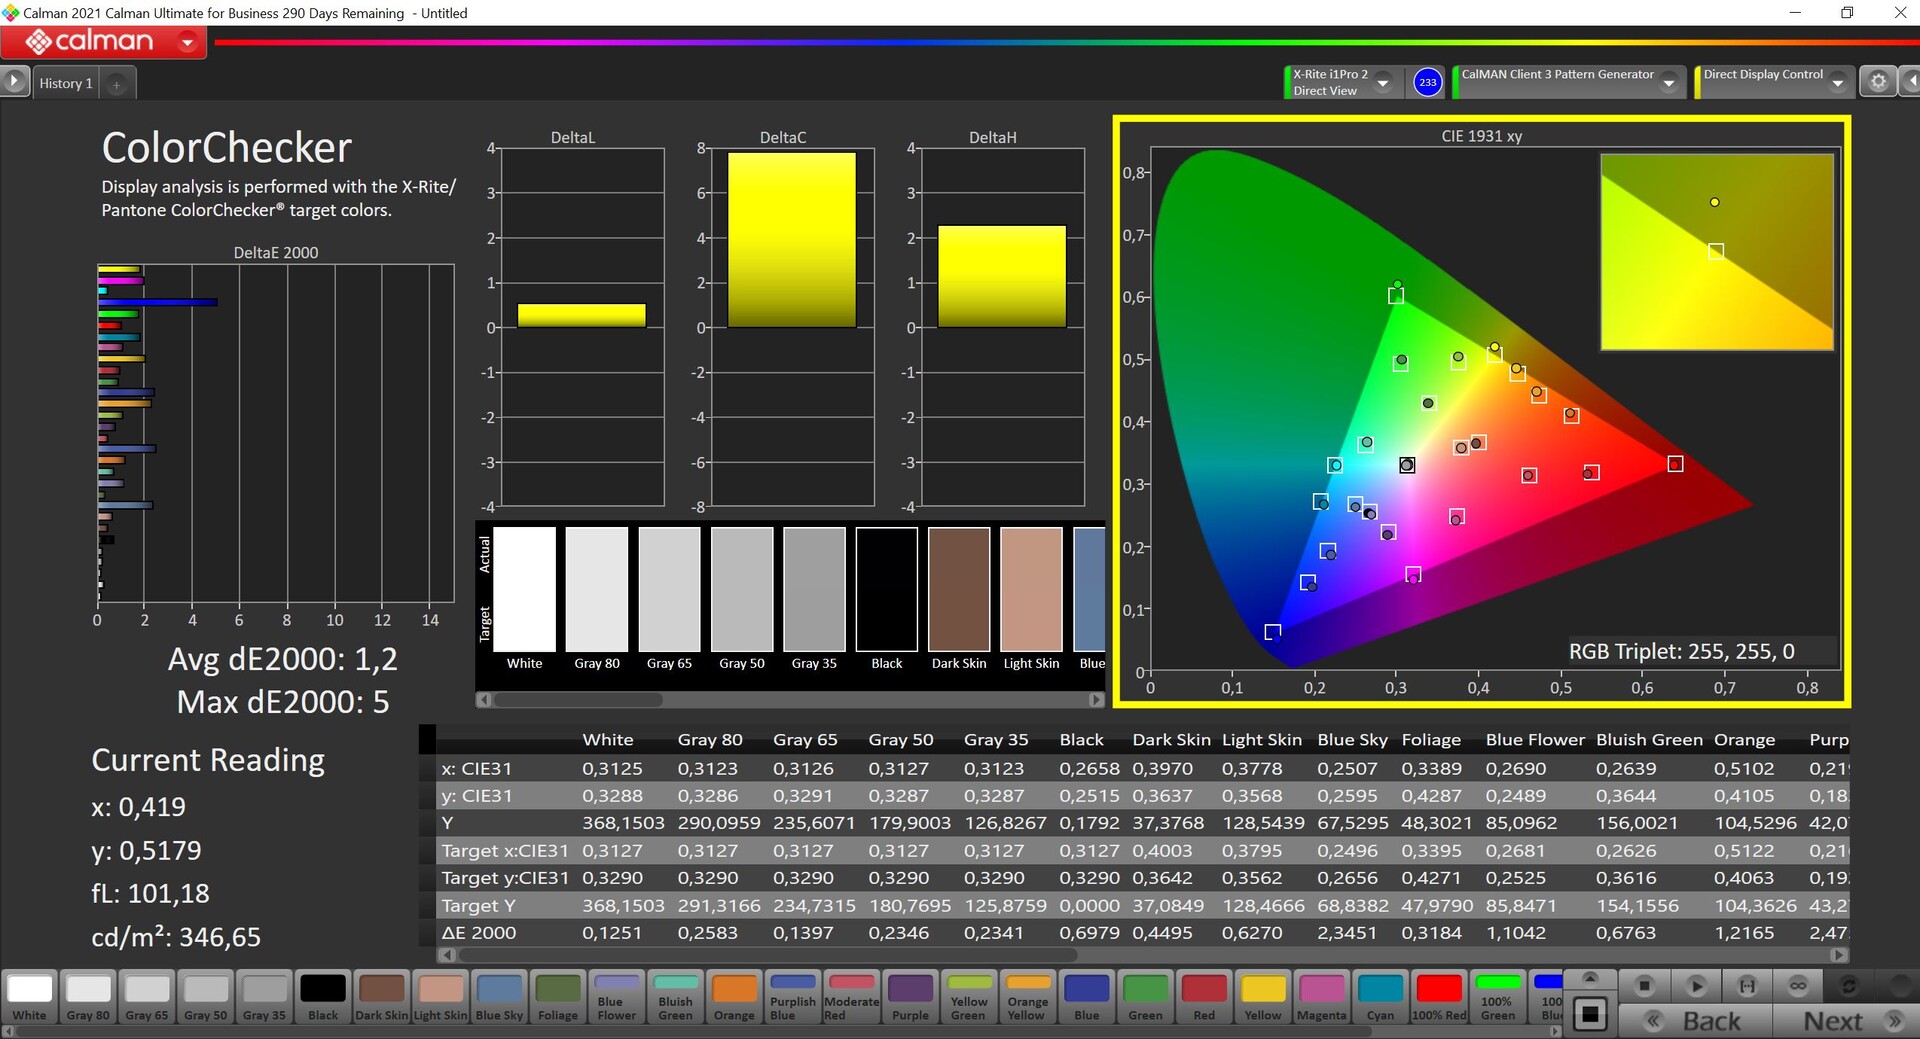
Panel mierzymy za pomocą profesjonalnego oprogramowania CalMAN. W stanie dostawy jest wyraźnie widoczny czerwony odcień, a temperatura barwowa jest również zbyt ciepła. Jest to niefortunne, ponieważ jesteśmy w stanie znacznie poprawić wyświetlacz za pomocą własnej kalibracji (profil kolorów dostępny do pobrania za darmo z linku powyżej), która prowadzi do doskonałych wyników szczególnie w skali szarości i całkowicie pozbywa się odcienia koloru. Odchylenia kolorów w stosunku do referencyjnej przestrzeni barw sRGB (która została w pełni pokryta) są również nieco niższe, pozostawiając jedynie 100% niebieski jako odstający. Skalibrowany panel nadal jednak nadaje się do obróbki obrazu.
Wyświetl czasy reakcji
| ↔ Czas reakcji od czerni do bieli | ||
|---|---|---|
| 28.6 ms ... wzrost ↗ i spadek ↘ łącznie | ↗ 14.5 ms wzrost | 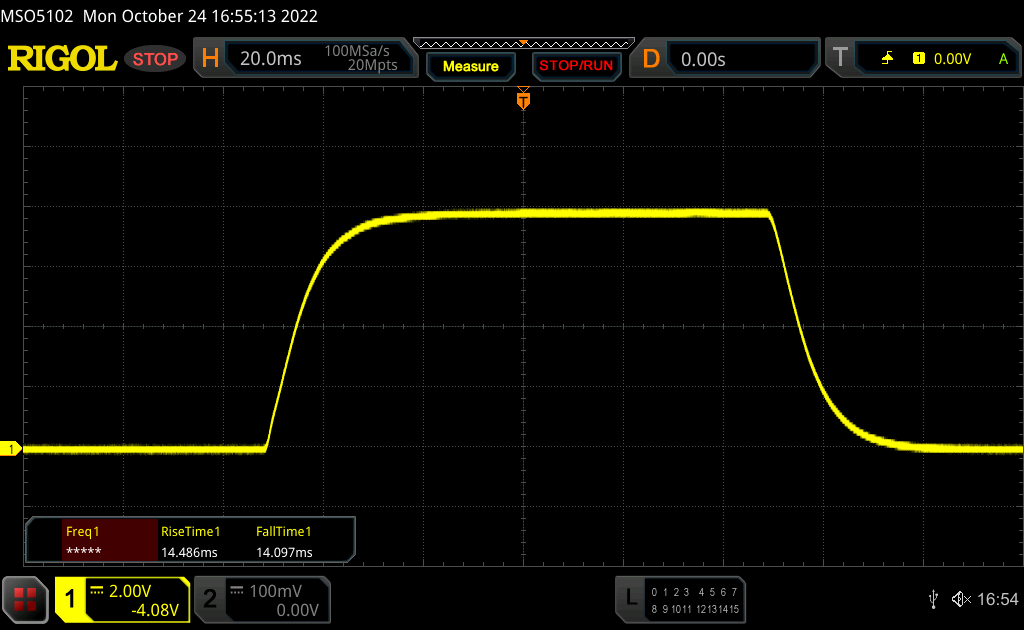 |
| ↘ 14.1 ms upadek | ||
| W naszych testach ekran wykazuje stosunkowo powolne tempo reakcji i może być zbyt wolny dla graczy. Dla porównania, wszystkie testowane urządzenia wahają się od 0.1 (minimum) do 240 (maksimum) ms. » 76 % wszystkich urządzeń jest lepszych. Oznacza to, że zmierzony czas reakcji jest gorszy od średniej wszystkich testowanych urządzeń (19.8 ms). | ||
| ↔ Czas reakcji 50% szarości do 80% szarości | ||
| 45.8 ms ... wzrost ↗ i spadek ↘ łącznie | ↗ 21.2 ms wzrost | 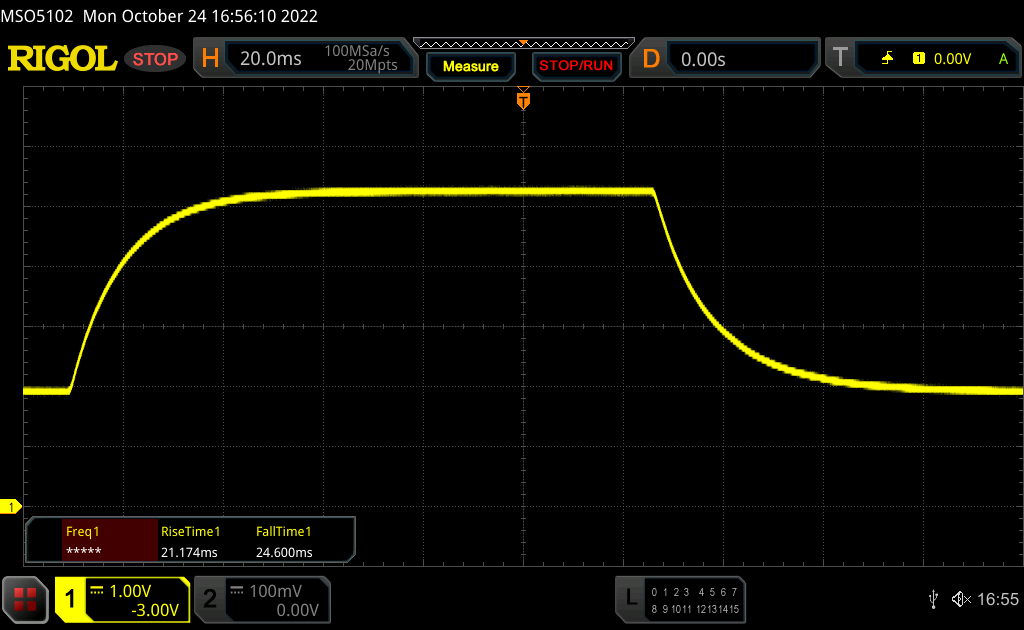 |
| ↘ 24.6 ms upadek | ||
| W naszych testach ekran wykazuje powolne tempo reakcji, co będzie niezadowalające dla graczy. Dla porównania, wszystkie testowane urządzenia wahają się od 0.165 (minimum) do 636 (maksimum) ms. » 79 % wszystkich urządzeń jest lepszych. Oznacza to, że zmierzony czas reakcji jest gorszy od średniej wszystkich testowanych urządzeń (31 ms). | ||
Migotanie ekranu / PWM (modulacja szerokości impulsu)
| Migotanie ekranu/nie wykryto PWM | 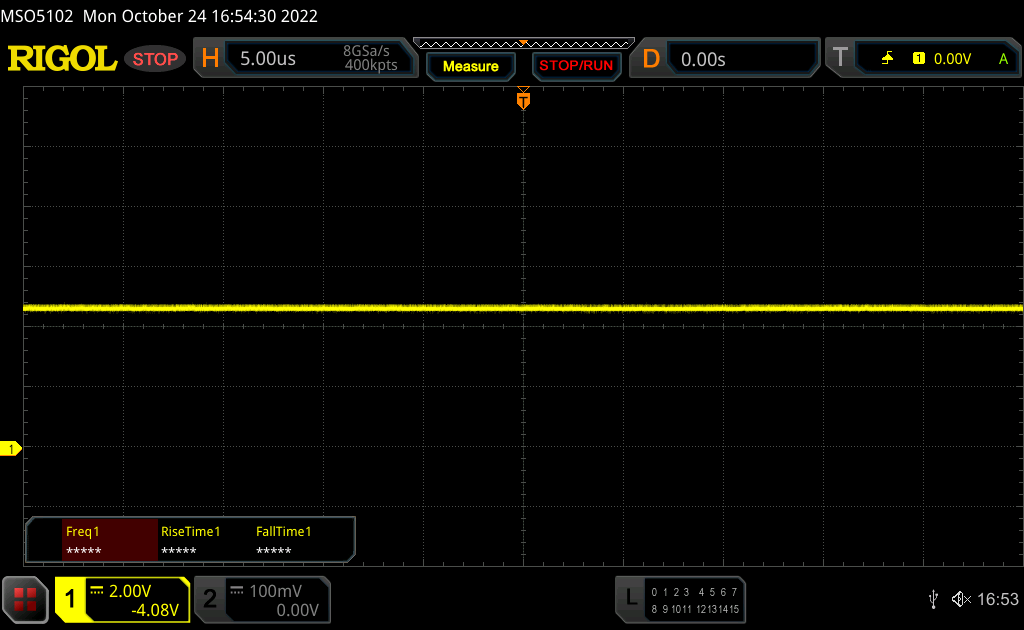 | ||
Dla porównania: 52 % wszystkich testowanych urządzeń nie używa PWM do przyciemniania wyświetlacza. Jeśli wykryto PWM, zmierzono średnio 7757 (minimum: 5 - maksimum: 343500) Hz. | |||
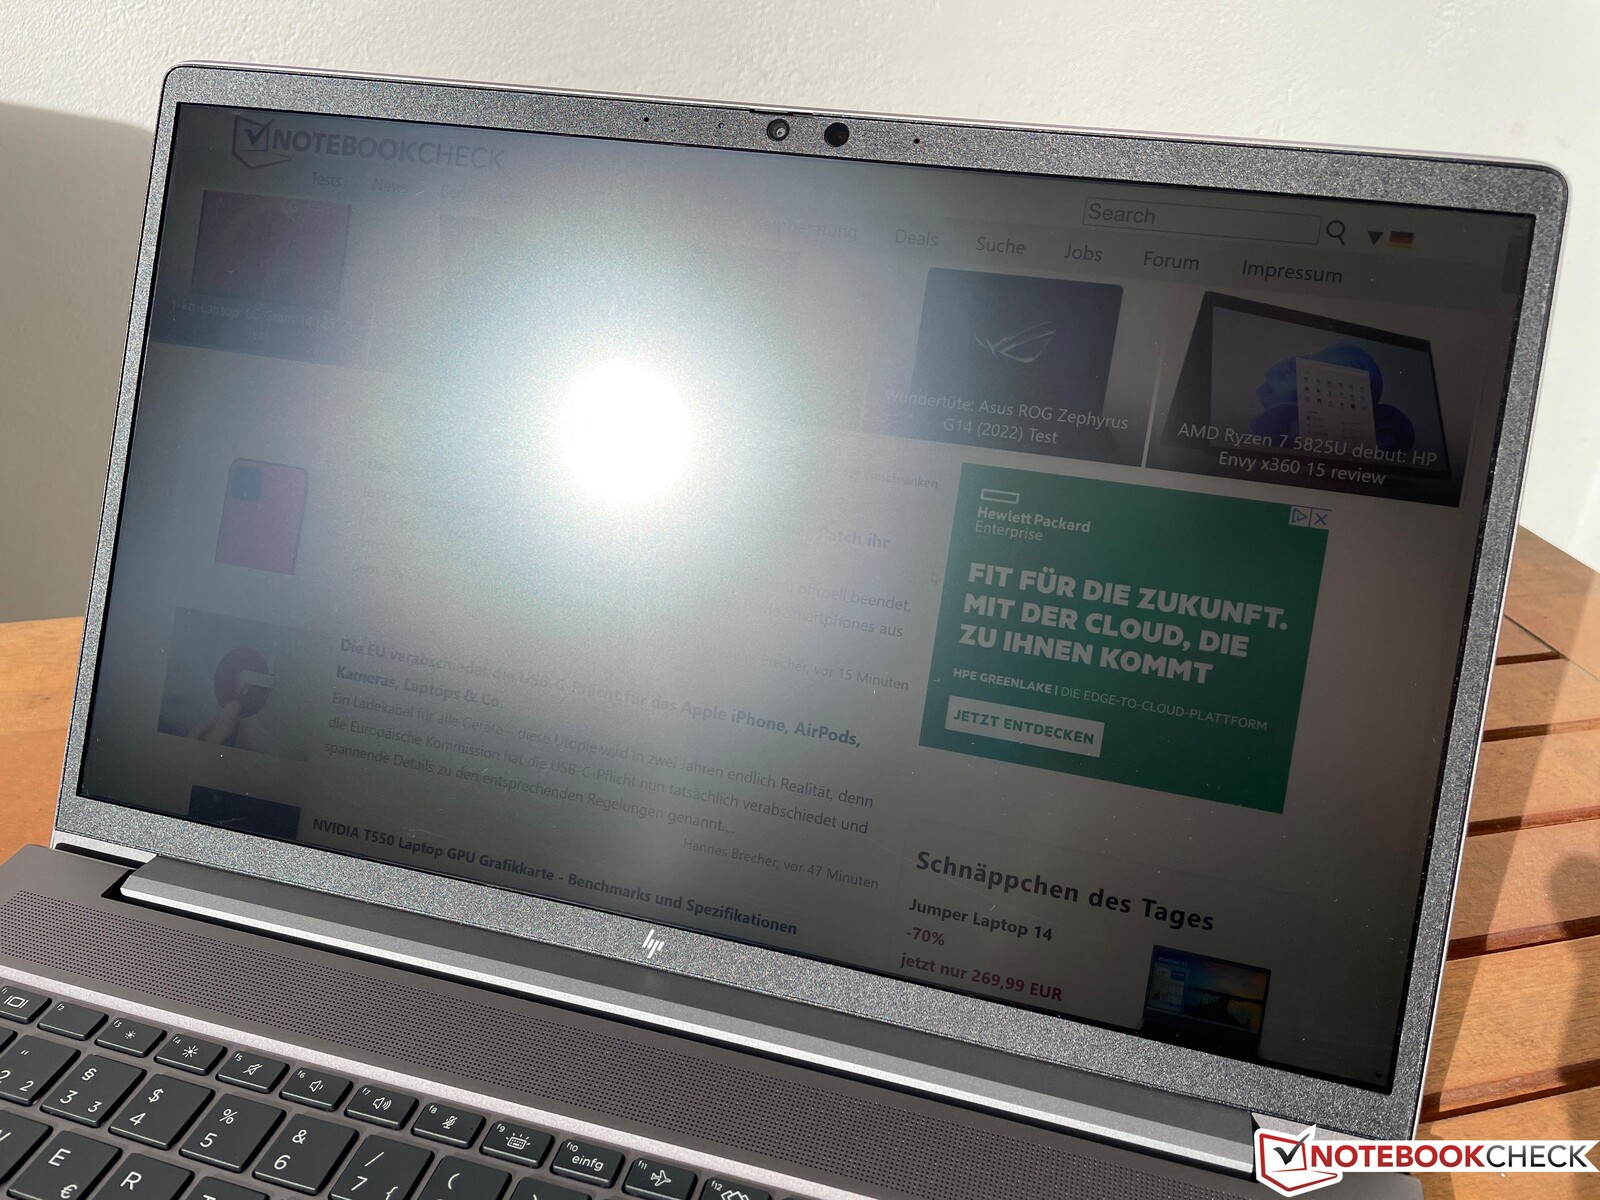
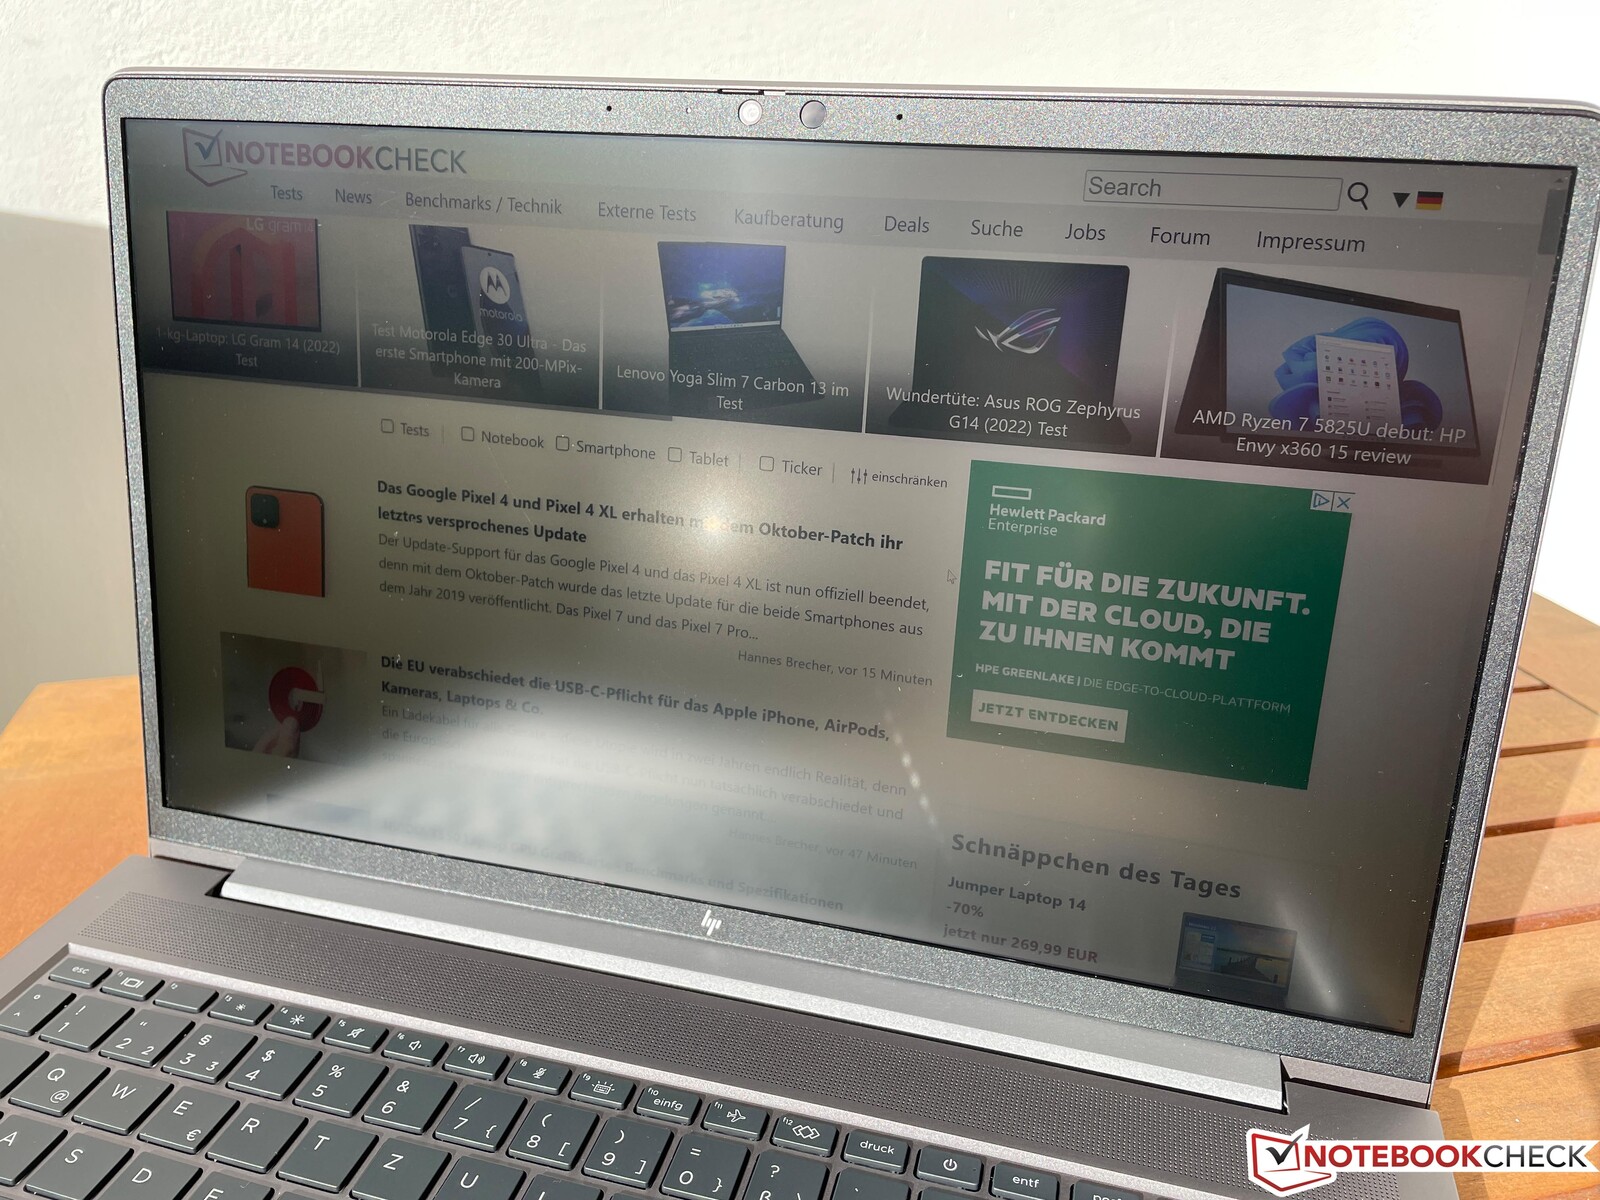
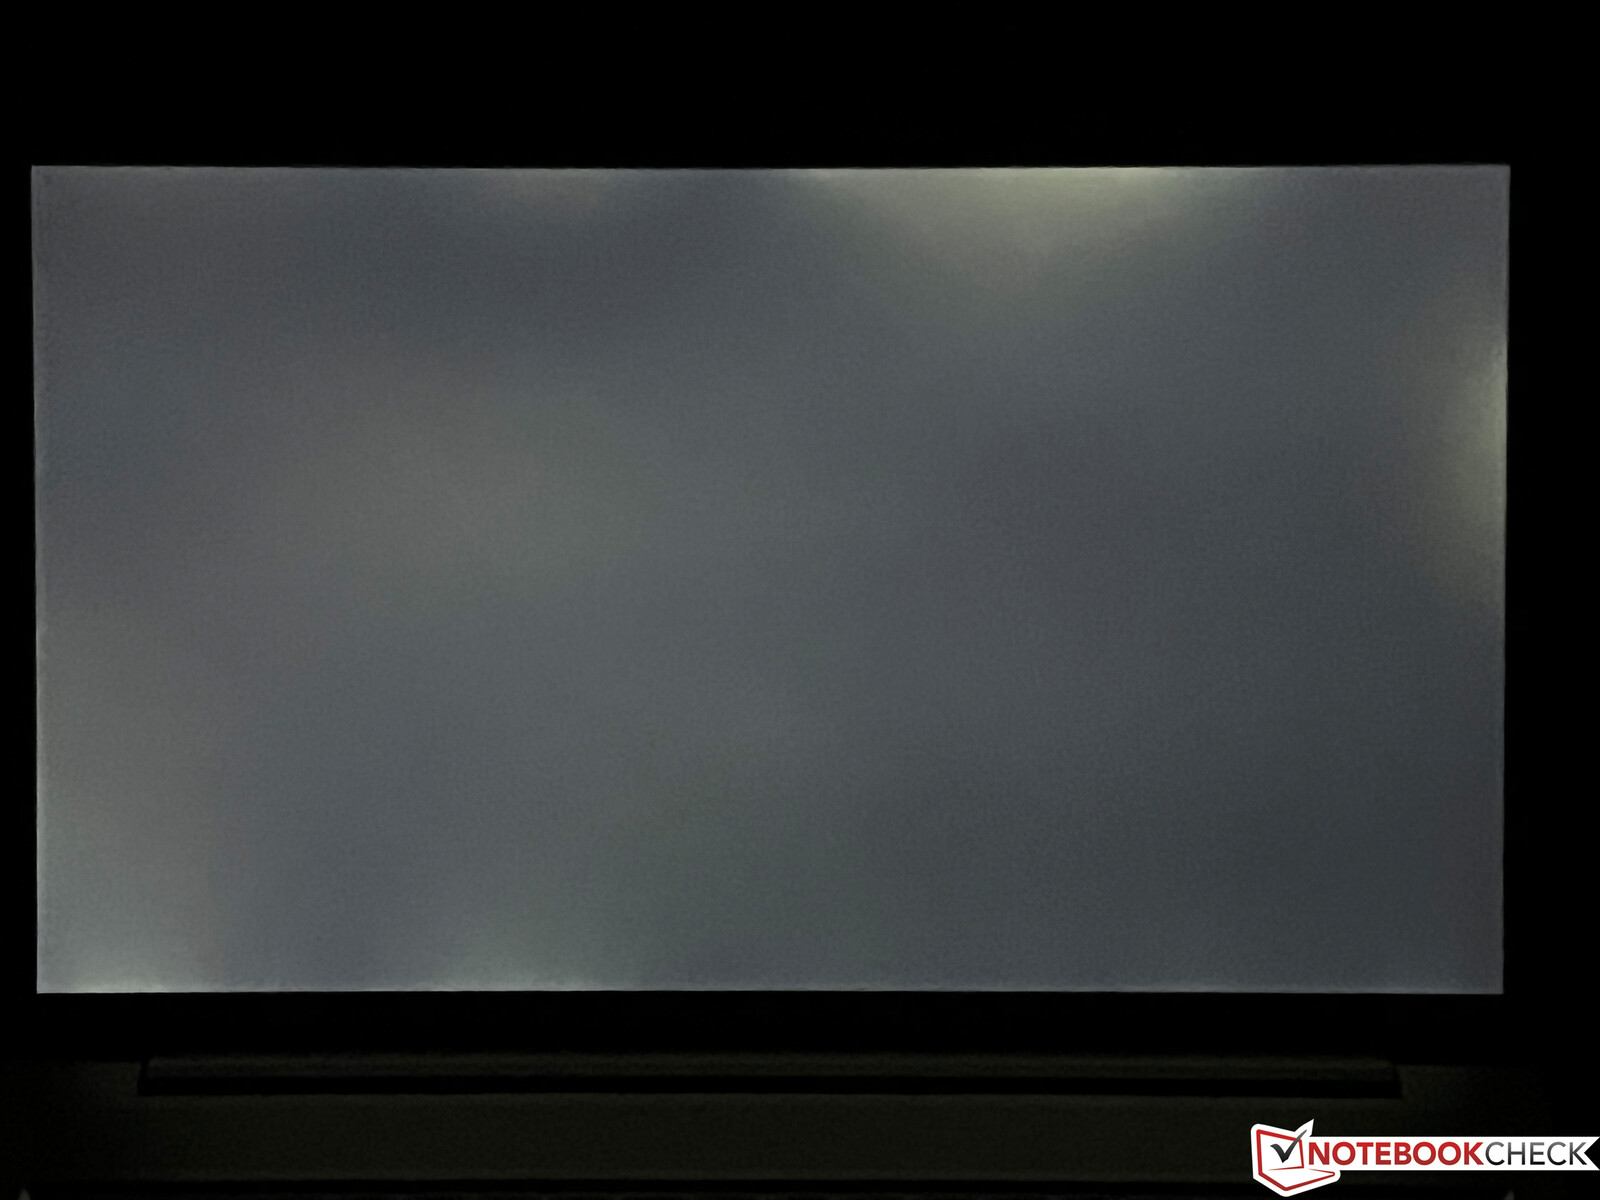
Na zewnątrz wyświetlacz korzysta z matowej powierzchni i o ile unikniemy bezpośrednich odbić źródeł światła, możemy bez problemu rozpoznać zawartość wyświetlacza nawet w jasne dni. Stabilność kątów widzenia panelu IPS jest bardzo dobra.

Wydajność - ZBook z Intel Alder Lake
Warunki badania
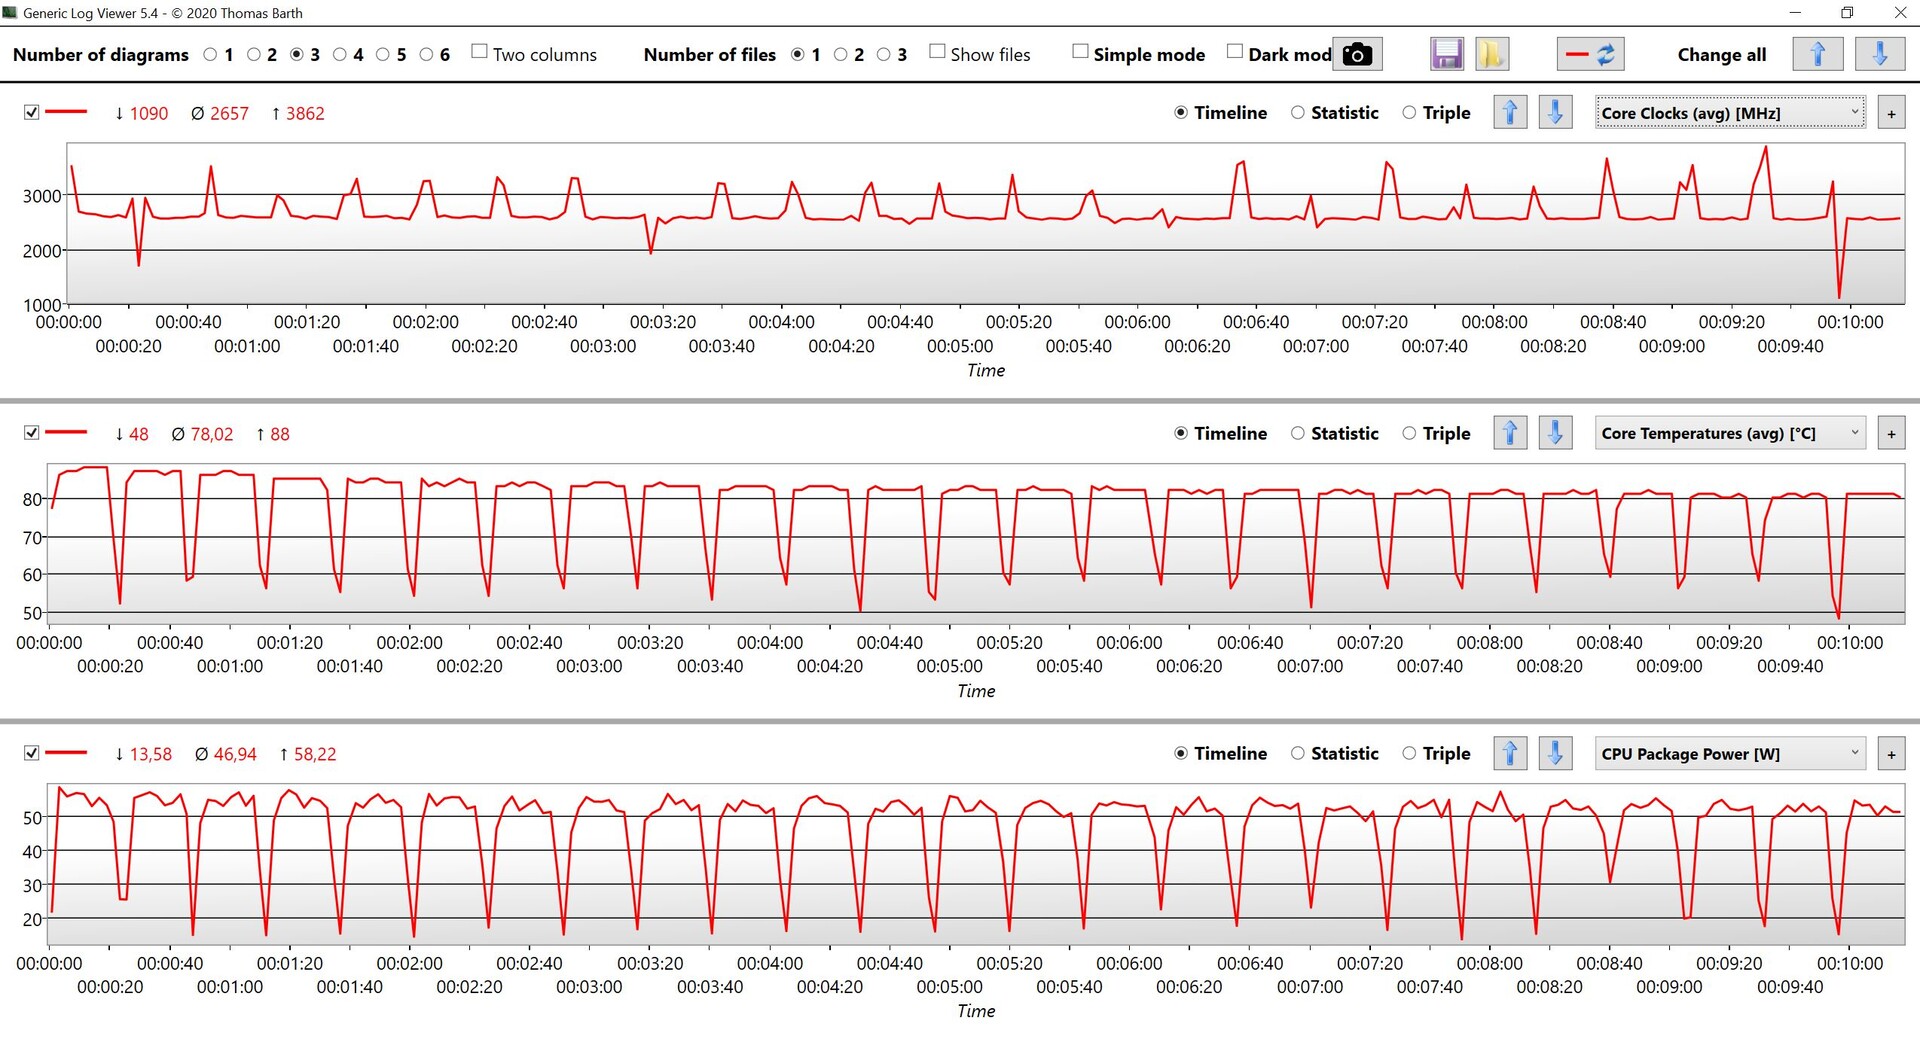
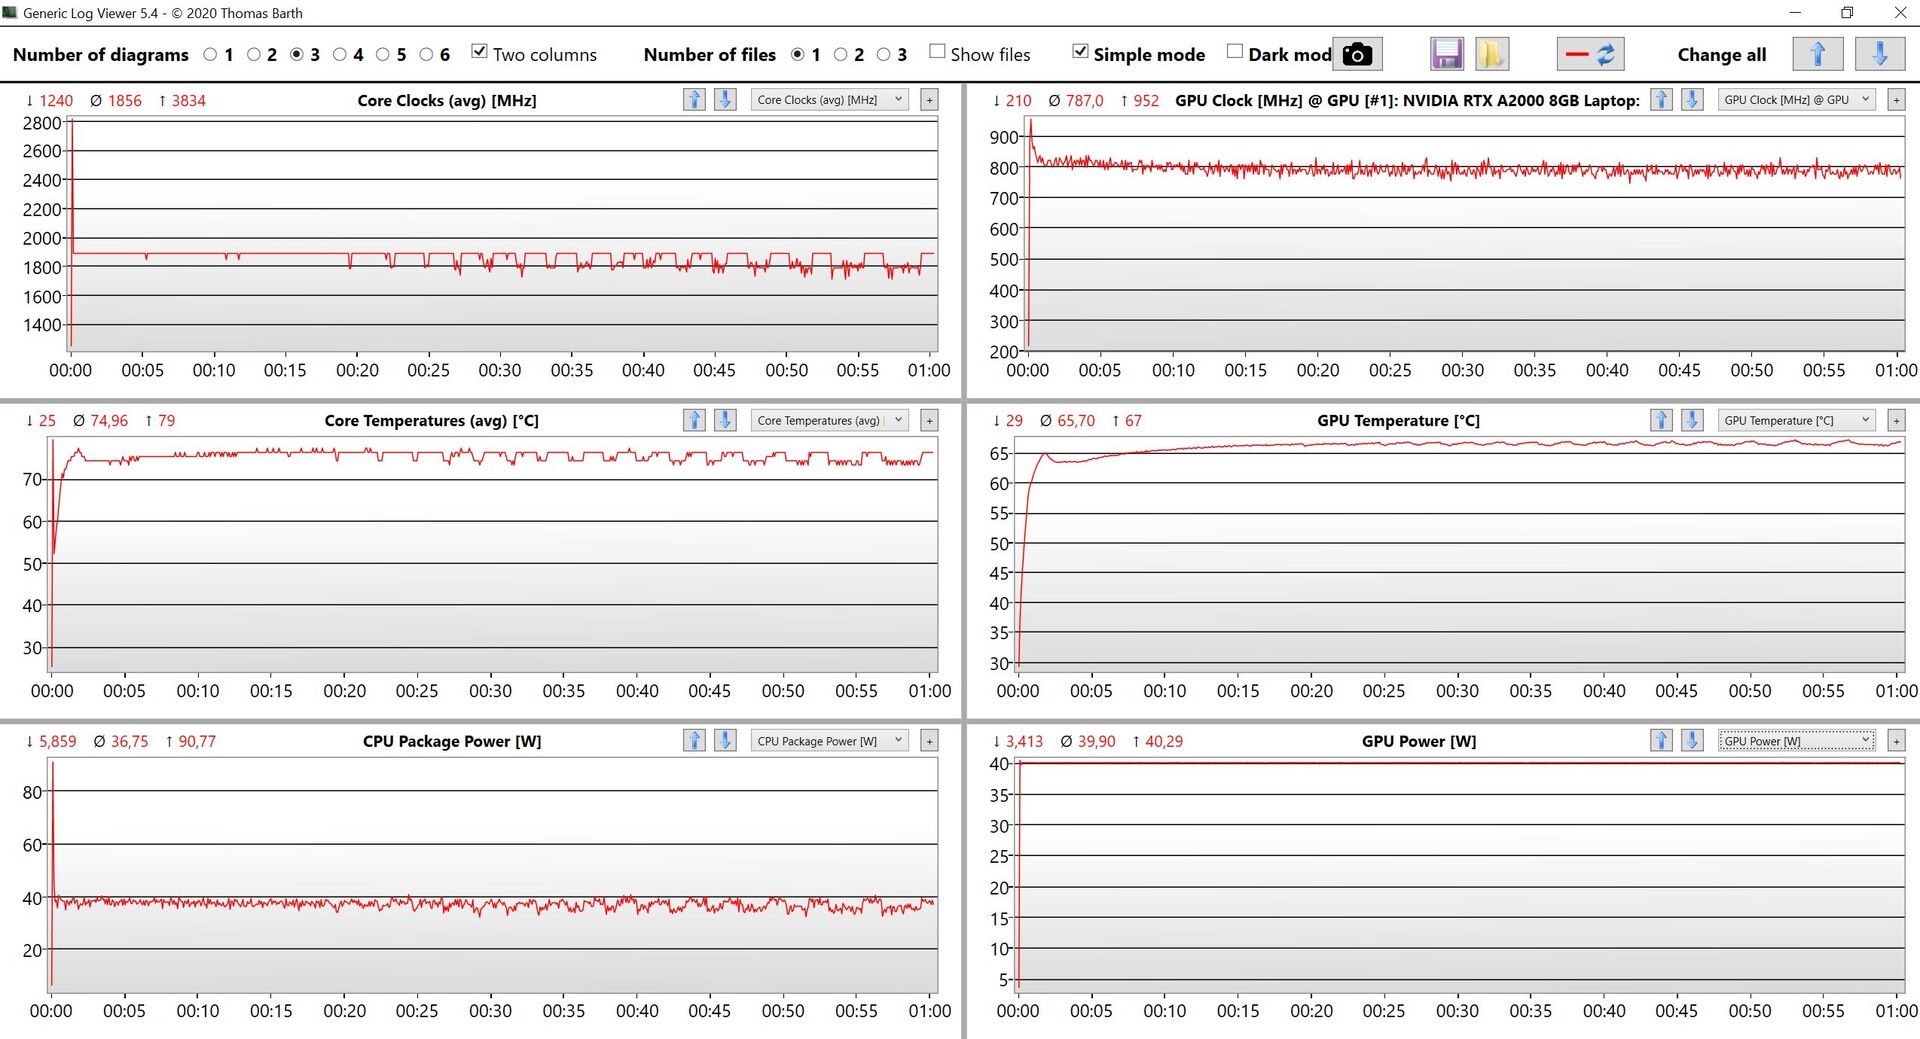
HP nie oferuje żadnych dodatkowych opcji konfiguracji zasilania. Podczas testu jesteśmy w stanie zaobserwować kilka mocno zróżnicowanych wartości wydajności. Co prawda sytuacja poprawia się nieco dzięki kilku aktualizacjom BIOS-u, ale nadal nie jest całkowicie stabilna. Przy 105/75 W wartości TDP są w zasadzie skonfigurowane wysoko, ale procesor jest w stanie wykorzystać maksymalnie 90 W przez sekundę tylko raz na jakiś czas, zanim szybko wyrówna się w okolicach 55 W. Chwilami procesor zaczyna nawet od tej wartości (przy poprzednich wersjach BIOS-u było to nawet mniej niż 40 W).
Procesor
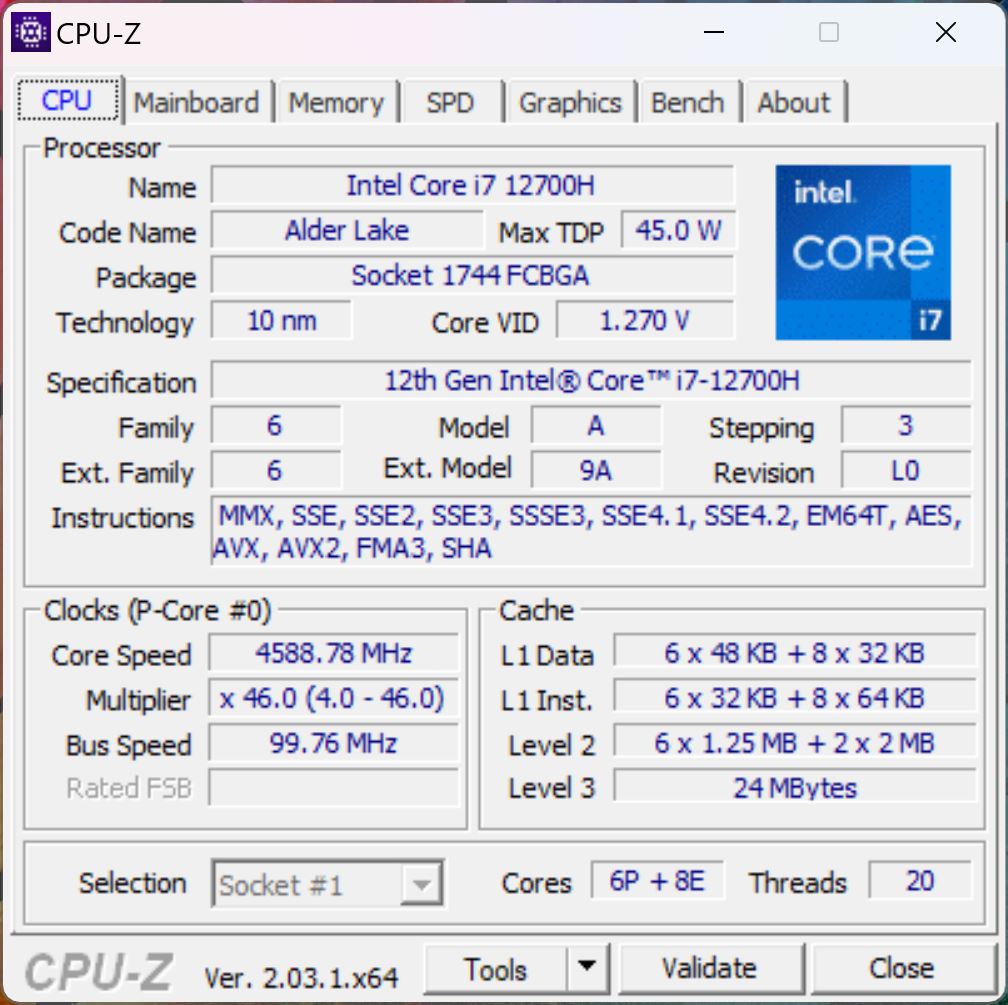
Na stronie .Core i7-12700Hpochodzi z obecnej generacji Alder Lake firmy Intel, łącząc 6 szybkich rdzeni Performance z 8 rdzeniami Efficiency. Wydajność jednordzeniowa jest bardzo dobra i o około 15-20% szybsza od poprzednika z Core i7-11800H. W benchmarkach wielordzeniowych wydajność jest jednak nieco rozczarowująca, zważywszy na dużą obudowę, a spory potencjał pozostaje niewykorzystany. Przykładowo.ZBook Studio 16 G9z tym samym procesorem jest o około 20% szybszy w testach wielordzeniowych. Próbujemy też ręcznie podnieść wartości TDP, ale chłodzenie nie jest w stanie obsłużyć więcej niż 60-65 W, gdyż temperatury CPU wzrosną wtedy do ponad 95°C (203°F).
Podczas pracy na akumulatorze pobór mocy przez procesor jest ograniczony do 30 W. Nie ma to wpływu na wydajność jednordzeniową, ale skutkuje deficytem wydajności o około 30% w testach wielordzeniowych (9 926 pkt. CB R23 Multi). Dodatkowe benchmarki CPU można znaleźć w naszym dziale technicznym.
Cinebench R15 Multi Constant Load Test
Cinebench R23: Multi Core | Single Core
Cinebench R20: CPU (Multi Core) | CPU (Single Core)
Cinebench R15: CPU Multi 64Bit | CPU Single 64Bit
Blender: v2.79 BMW27 CPU
7-Zip 18.03: 7z b 4 | 7z b 4 -mmt1
Geekbench 5.5: Multi-Core | Single-Core
HWBOT x265 Benchmark v2.2: 4k Preset
LibreOffice : 20 Documents To PDF
R Benchmark 2.5: Overall mean
| CPU Performance rating | |
| Średnia w klasie Workstation | |
| HP ZBook Studio 16 G9 62U04EA | |
| Przeciętny Intel Core i7-12700H | |
| HP ZBook Power 15 G9 6B8C4EA | |
| HP ZBook Power 15 G8 313S5EA | |
| Dell Precision 5000 5560 -2! | |
| Lenovo ThinkPad P15v G2 21A9000XGE -1! | |
| Cinebench R23 / Multi Core | |
| Średnia w klasie Workstation (14621 - 38520, n=23, ostatnie 2 lata) | |
| HP ZBook Studio 16 G9 62U04EA | |
| Przeciętny Intel Core i7-12700H (4032 - 19330, n=64) | |
| HP ZBook Power 15 G9 6B8C4EA | |
| HP ZBook Power 15 G8 313S5EA | |
| Lenovo ThinkPad P15v G2 21A9000XGE | |
| Dell Precision 5000 5560 | |
| Cinebench R23 / Single Core | |
| Średnia w klasie Workstation (1712 - 2228, n=23, ostatnie 2 lata) | |
| HP ZBook Studio 16 G9 62U04EA | |
| HP ZBook Power 15 G9 6B8C4EA | |
| Przeciętny Intel Core i7-12700H (778 - 1826, n=63) | |
| HP ZBook Power 15 G8 313S5EA | |
| Dell Precision 5000 5560 | |
| Cinebench R20 / CPU (Multi Core) | |
| Średnia w klasie Workstation (5760 - 15043, n=23, ostatnie 2 lata) | |
| HP ZBook Studio 16 G9 62U04EA | |
| Przeciętny Intel Core i7-12700H (1576 - 7407, n=64) | |
| HP ZBook Power 15 G9 6B8C4EA | |
| HP ZBook Power 15 G8 313S5EA | |
| Dell Precision 5000 5560 | |
| Lenovo ThinkPad P15v G2 21A9000XGE | |
| Cinebench R20 / CPU (Single Core) | |
| Średnia w klasie Workstation (671 - 857, n=23, ostatnie 2 lata) | |
| HP ZBook Studio 16 G9 62U04EA | |
| HP ZBook Power 15 G9 6B8C4EA | |
| Przeciętny Intel Core i7-12700H (300 - 704, n=64) | |
| HP ZBook Power 15 G8 313S5EA | |
| Dell Precision 5000 5560 | |
| Lenovo ThinkPad P15v G2 21A9000XGE | |
| Cinebench R15 / CPU Multi 64Bit | |
| Średnia w klasie Workstation (2489 - 5810, n=23, ostatnie 2 lata) | |
| HP ZBook Studio 16 G9 62U04EA | |
| Przeciętny Intel Core i7-12700H (1379 - 2916, n=70) | |
| HP ZBook Power 15 G8 313S5EA | |
| HP ZBook Power 15 G8 313S5EA | |
| HP ZBook Power 15 G9 6B8C4EA | |
| Lenovo ThinkPad P15v G2 21A9000XGE | |
| Dell Precision 5000 5560 | |
| Cinebench R15 / CPU Single 64Bit | |
| Średnia w klasie Workstation (191.4 - 328, n=23, ostatnie 2 lata) | |
| HP ZBook Studio 16 G9 62U04EA | |
| Przeciętny Intel Core i7-12700H (113 - 263, n=65) | |
| HP ZBook Power 15 G9 6B8C4EA | |
| Dell Precision 5000 5560 | |
| HP ZBook Power 15 G8 313S5EA | |
| Lenovo ThinkPad P15v G2 21A9000XGE | |
| Blender / v2.79 BMW27 CPU | |
| Lenovo ThinkPad P15v G2 21A9000XGE | |
| Dell Precision 5000 5560 | |
| HP ZBook Power 15 G8 313S5EA | |
| HP ZBook Power 15 G9 6B8C4EA | |
| Przeciętny Intel Core i7-12700H (168 - 732, n=63) | |
| HP ZBook Studio 16 G9 62U04EA | |
| Średnia w klasie Workstation (91 - 222, n=23, ostatnie 2 lata) | |
| 7-Zip 18.03 / 7z b 4 | |
| Średnia w klasie Workstation (60489 - 116969, n=23, ostatnie 2 lata) | |
| HP ZBook Studio 16 G9 62U04EA | |
| Przeciętny Intel Core i7-12700H (22844 - 73067, n=63) | |
| HP ZBook Power 15 G9 6B8C4EA | |
| HP ZBook Power 15 G8 313S5EA | |
| Dell Precision 5000 5560 | |
| Lenovo ThinkPad P15v G2 21A9000XGE | |
| 7-Zip 18.03 / 7z b 4 -mmt1 | |
| Średnia w klasie Workstation (5126 - 6960, n=23, ostatnie 2 lata) | |
| HP ZBook Studio 16 G9 62U04EA | |
| HP ZBook Power 15 G9 6B8C4EA | |
| Dell Precision 5000 5560 | |
| HP ZBook Power 15 G8 313S5EA | |
| Przeciętny Intel Core i7-12700H (2743 - 5972, n=63) | |
| Lenovo ThinkPad P15v G2 21A9000XGE | |
| Geekbench 5.5 / Multi-Core | |
| Średnia w klasie Workstation (11542 - 25554, n=23, ostatnie 2 lata) | |
| HP ZBook Studio 16 G9 62U04EA | |
| HP ZBook Power 15 G9 6B8C4EA | |
| Przeciętny Intel Core i7-12700H (5144 - 13745, n=64) | |
| HP ZBook Power 15 G8 313S5EA | |
| Lenovo ThinkPad P15v G2 21A9000XGE | |
| Geekbench 5.5 / Single-Core | |
| Średnia w klasie Workstation (1783 - 2183, n=23, ostatnie 2 lata) | |
| HP ZBook Studio 16 G9 62U04EA | |
| Przeciętny Intel Core i7-12700H (803 - 1851, n=64) | |
| HP ZBook Power 15 G9 6B8C4EA | |
| HP ZBook Power 15 G8 313S5EA | |
| Lenovo ThinkPad P15v G2 21A9000XGE | |
| HWBOT x265 Benchmark v2.2 / 4k Preset | |
| Średnia w klasie Workstation (17.8 - 40.5, n=23, ostatnie 2 lata) | |
| HP ZBook Studio 16 G9 62U04EA | |
| Przeciętny Intel Core i7-12700H (4.67 - 21.8, n=64) | |
| HP ZBook Power 15 G9 6B8C4EA | |
| HP ZBook Power 15 G8 313S5EA | |
| Dell Precision 5000 5560 | |
| Lenovo ThinkPad P15v G2 21A9000XGE | |
| LibreOffice / 20 Documents To PDF | |
| Lenovo ThinkPad P15v G2 21A9000XGE | |
| Dell Precision 5000 5560 | |
| Średnia w klasie Workstation (37.1 - 74.7, n=23, ostatnie 2 lata) | |
| Przeciętny Intel Core i7-12700H (34.2 - 95.3, n=63) | |
| HP ZBook Power 15 G9 6B8C4EA | |
| HP ZBook Studio 16 G9 62U04EA | |
| HP ZBook Power 15 G8 313S5EA | |
| R Benchmark 2.5 / Overall mean | |
| HP ZBook Power 15 G8 313S5EA | |
| Lenovo ThinkPad P15v G2 21A9000XGE | |
| Dell Precision 5000 5560 | |
| HP ZBook Power 15 G9 6B8C4EA | |
| Przeciętny Intel Core i7-12700H (0.4441 - 1.052, n=63) | |
| HP ZBook Studio 16 G9 62U04EA | |
| Średnia w klasie Workstation (0.3825 - 0.603, n=23, ostatnie 2 lata) | |
* ... im mniej tym lepiej
AIDA64: FP32 Ray-Trace | FPU Julia | CPU SHA3 | CPU Queen | FPU SinJulia | FPU Mandel | CPU AES | CPU ZLib | FP64 Ray-Trace | CPU PhotoWorxx
| Performance rating | |
| Średnia w klasie Workstation | |
| HP ZBook Studio 16 G9 62U04EA | |
| HP ZBook Power 15 G9 6B8C4EA | |
| HP ZBook Power 15 G8 313S5EA | |
| Przeciętny Intel Core i7-12700H | |
| Lenovo ThinkPad P15v G2 21A9000XGE | |
| Dell Precision 5000 5560 -9! | |
| AIDA64 / FP32 Ray-Trace | |
| Średnia w klasie Workstation (16730 - 61611, n=23, ostatnie 2 lata) | |
| HP ZBook Studio 16 G9 62U04EA | |
| HP ZBook Power 15 G8 313S5EA | |
| HP ZBook Power 15 G9 6B8C4EA | |
| Lenovo ThinkPad P15v G2 21A9000XGE | |
| Przeciętny Intel Core i7-12700H (2585 - 17957, n=64) | |
| AIDA64 / FPU Julia | |
| Średnia w klasie Workstation (89597 - 186971, n=23, ostatnie 2 lata) | |
| HP ZBook Studio 16 G9 62U04EA | |
| HP ZBook Power 15 G9 6B8C4EA | |
| HP ZBook Power 15 G8 313S5EA | |
| Przeciętny Intel Core i7-12700H (12439 - 90760, n=64) | |
| Lenovo ThinkPad P15v G2 21A9000XGE | |
| AIDA64 / CPU SHA3 | |
| Średnia w klasie Workstation (4178 - 8975, n=23, ostatnie 2 lata) | |
| HP ZBook Power 15 G8 313S5EA | |
| HP ZBook Studio 16 G9 62U04EA | |
| Lenovo ThinkPad P15v G2 21A9000XGE | |
| HP ZBook Power 15 G9 6B8C4EA | |
| Przeciętny Intel Core i7-12700H (833 - 4242, n=64) | |
| AIDA64 / CPU Queen | |
| Średnia w klasie Workstation (60778 - 144411, n=23, ostatnie 2 lata) | |
| HP ZBook Studio 16 G9 62U04EA | |
| HP ZBook Power 15 G9 6B8C4EA | |
| Przeciętny Intel Core i7-12700H (57923 - 103202, n=63) | |
| HP ZBook Power 15 G8 313S5EA | |
| Lenovo ThinkPad P15v G2 21A9000XGE | |
| AIDA64 / FPU SinJulia | |
| Średnia w klasie Workstation (8165 - 29343, n=23, ostatnie 2 lata) | |
| HP ZBook Power 15 G8 313S5EA | |
| HP ZBook Studio 16 G9 62U04EA | |
| Przeciętny Intel Core i7-12700H (3249 - 9939, n=64) | |
| Lenovo ThinkPad P15v G2 21A9000XGE | |
| HP ZBook Power 15 G9 6B8C4EA | |
| AIDA64 / FPU Mandel | |
| Średnia w klasie Workstation (44497 - 98153, n=23, ostatnie 2 lata) | |
| HP ZBook Studio 16 G9 62U04EA | |
| HP ZBook Power 15 G8 313S5EA | |
| HP ZBook Power 15 G9 6B8C4EA | |
| Lenovo ThinkPad P15v G2 21A9000XGE | |
| Przeciętny Intel Core i7-12700H (7135 - 44760, n=64) | |
| AIDA64 / CPU AES | |
| Średnia w klasie Workstation (73133 - 187841, n=23, ostatnie 2 lata) | |
| Przeciętny Intel Core i7-12700H (31839 - 144360, n=64) | |
| HP ZBook Power 15 G8 313S5EA | |
| Lenovo ThinkPad P15v G2 21A9000XGE | |
| HP ZBook Studio 16 G9 62U04EA | |
| HP ZBook Power 15 G9 6B8C4EA | |
| AIDA64 / CPU ZLib | |
| Średnia w klasie Workstation (929 - 2148, n=23, ostatnie 2 lata) | |
| HP ZBook Studio 16 G9 62U04EA | |
| Przeciętny Intel Core i7-12700H (305 - 1171, n=64) | |
| HP ZBook Power 15 G9 6B8C4EA | |
| HP ZBook Power 15 G8 313S5EA | |
| Lenovo ThinkPad P15v G2 21A9000XGE | |
| Dell Precision 5000 5560 | |
| AIDA64 / FP64 Ray-Trace | |
| Średnia w klasie Workstation (8545 - 32891, n=23, ostatnie 2 lata) | |
| HP ZBook Studio 16 G9 62U04EA | |
| HP ZBook Power 15 G8 313S5EA | |
| HP ZBook Power 15 G9 6B8C4EA | |
| Lenovo ThinkPad P15v G2 21A9000XGE | |
| Przeciętny Intel Core i7-12700H (1437 - 9692, n=64) | |
| AIDA64 / CPU PhotoWorxx | |
| Średnia w klasie Workstation (37151 - 93684, n=23, ostatnie 2 lata) | |
| HP ZBook Power 15 G9 6B8C4EA | |
| HP ZBook Studio 16 G9 62U04EA | |
| Przeciętny Intel Core i7-12700H (12863 - 52207, n=64) | |
| HP ZBook Power 15 G8 313S5EA | |
| Lenovo ThinkPad P15v G2 21A9000XGE | |
Wydajność systemu
ZBook Power 15 G9 jest urządzeniem bardzo responsywnym i podczas naszych testów nie napotkaliśmy żadnych problemów. Wyniki syntetycznych benchmarków są również bardzo dobre i potwierdzają nasze subiektywne wrażenie co do wydajności.
CrossMark: Overall | Productivity | Creativity | Responsiveness
| PCMark 10 / Score | |
| Średnia w klasie Workstation (6563 - 10409, n=19, ostatnie 2 lata) | |
| Dell Precision 5000 5560 | |
| HP ZBook Studio 16 G9 62U04EA | |
| HP ZBook Power 15 G9 6B8C4EA | |
| Przeciętny Intel Core i7-12700H, NVIDIA RTX A2000 Laptop GPU (n=1) | |
| Lenovo ThinkPad P15v G2 21A9000XGE | |
| HP ZBook Power 15 G8 313S5EA | |
| PCMark 10 / Essentials | |
| Dell Precision 5000 5560 | |
| Średnia w klasie Workstation (9622 - 11157, n=19, ostatnie 2 lata) | |
| HP ZBook Power 15 G9 6B8C4EA | |
| Przeciętny Intel Core i7-12700H, NVIDIA RTX A2000 Laptop GPU (n=1) | |
| Lenovo ThinkPad P15v G2 21A9000XGE | |
| HP ZBook Studio 16 G9 62U04EA | |
| HP ZBook Power 15 G8 313S5EA | |
| PCMark 10 / Productivity | |
| Średnia w klasie Workstation (8789 - 20616, n=19, ostatnie 2 lata) | |
| Dell Precision 5000 5560 | |
| Lenovo ThinkPad P15v G2 21A9000XGE | |
| HP ZBook Studio 16 G9 62U04EA | |
| HP ZBook Power 15 G9 6B8C4EA | |
| Przeciętny Intel Core i7-12700H, NVIDIA RTX A2000 Laptop GPU (n=1) | |
| HP ZBook Power 15 G8 313S5EA | |
| PCMark 10 / Digital Content Creation | |
| Średnia w klasie Workstation (8108 - 15631, n=19, ostatnie 2 lata) | |
| HP ZBook Studio 16 G9 62U04EA | |
| HP ZBook Power 15 G9 6B8C4EA | |
| Przeciętny Intel Core i7-12700H, NVIDIA RTX A2000 Laptop GPU (n=1) | |
| Dell Precision 5000 5560 | |
| Lenovo ThinkPad P15v G2 21A9000XGE | |
| HP ZBook Power 15 G8 313S5EA | |
| CrossMark / Overall | |
| Średnia w klasie Workstation (1307 - 2267, n=22, ostatnie 2 lata) | |
| HP ZBook Studio 16 G9 62U04EA | |
| HP ZBook Power 15 G9 6B8C4EA | |
| Przeciętny Intel Core i7-12700H, NVIDIA RTX A2000 Laptop GPU (n=1) | |
| HP ZBook Power 15 G8 313S5EA | |
| Lenovo ThinkPad P15v G2 21A9000XGE | |
| CrossMark / Productivity | |
| Średnia w klasie Workstation (1130 - 2122, n=22, ostatnie 2 lata) | |
| HP ZBook Studio 16 G9 62U04EA | |
| HP ZBook Power 15 G9 6B8C4EA | |
| Przeciętny Intel Core i7-12700H, NVIDIA RTX A2000 Laptop GPU (n=1) | |
| HP ZBook Power 15 G8 313S5EA | |
| Lenovo ThinkPad P15v G2 21A9000XGE | |
| CrossMark / Creativity | |
| Średnia w klasie Workstation (1657 - 2725, n=22, ostatnie 2 lata) | |
| HP ZBook Studio 16 G9 62U04EA | |
| HP ZBook Power 15 G9 6B8C4EA | |
| Przeciętny Intel Core i7-12700H, NVIDIA RTX A2000 Laptop GPU (n=1) | |
| HP ZBook Power 15 G8 313S5EA | |
| Lenovo ThinkPad P15v G2 21A9000XGE | |
| CrossMark / Responsiveness | |
| Średnia w klasie Workstation (993 - 2096, n=22, ostatnie 2 lata) | |
| HP ZBook Studio 16 G9 62U04EA | |
| HP ZBook Power 15 G9 6B8C4EA | |
| Przeciętny Intel Core i7-12700H, NVIDIA RTX A2000 Laptop GPU (n=1) | |
| HP ZBook Power 15 G8 313S5EA | |
| Lenovo ThinkPad P15v G2 21A9000XGE | |
| PCMark 10 Score | 6232 pkt. | |
Pomoc | ||
| AIDA64 / Memory Copy | |
| Średnia w klasie Workstation (56003 - 164795, n=23, ostatnie 2 lata) | |
| HP ZBook Power 15 G9 6B8C4EA | |
| HP ZBook Studio 16 G9 62U04EA | |
| Przeciętny Intel Core i7-12700H (25615 - 80511, n=64) | |
| HP ZBook Power 15 G8 313S5EA | |
| Lenovo ThinkPad P15v G2 21A9000XGE | |
| AIDA64 / Memory Read | |
| Średnia w klasie Workstation (55795 - 121563, n=23, ostatnie 2 lata) | |
| HP ZBook Power 15 G9 6B8C4EA | |
| HP ZBook Studio 16 G9 62U04EA | |
| Przeciętny Intel Core i7-12700H (25586 - 79442, n=64) | |
| HP ZBook Power 15 G8 313S5EA | |
| Lenovo ThinkPad P15v G2 21A9000XGE | |
| AIDA64 / Memory Write | |
| Średnia w klasie Workstation (55663 - 214520, n=23, ostatnie 2 lata) | |
| HP ZBook Power 15 G9 6B8C4EA | |
| HP ZBook Studio 16 G9 62U04EA | |
| Przeciętny Intel Core i7-12700H (23679 - 88660, n=64) | |
| HP ZBook Power 15 G8 313S5EA | |
| Lenovo ThinkPad P15v G2 21A9000XGE | |
| AIDA64 / Memory Latency | |
| Średnia w klasie Workstation (84.5 - 165.2, n=23, ostatnie 2 lata) | |
| Lenovo ThinkPad P15v G2 21A9000XGE | |
| HP ZBook Power 15 G9 6B8C4EA | |
| HP ZBook Studio 16 G9 62U04EA | |
| Przeciętny Intel Core i7-12700H (76.2 - 133.9, n=62) | |
| HP ZBook Power 15 G8 313S5EA | |
* ... im mniej tym lepiej
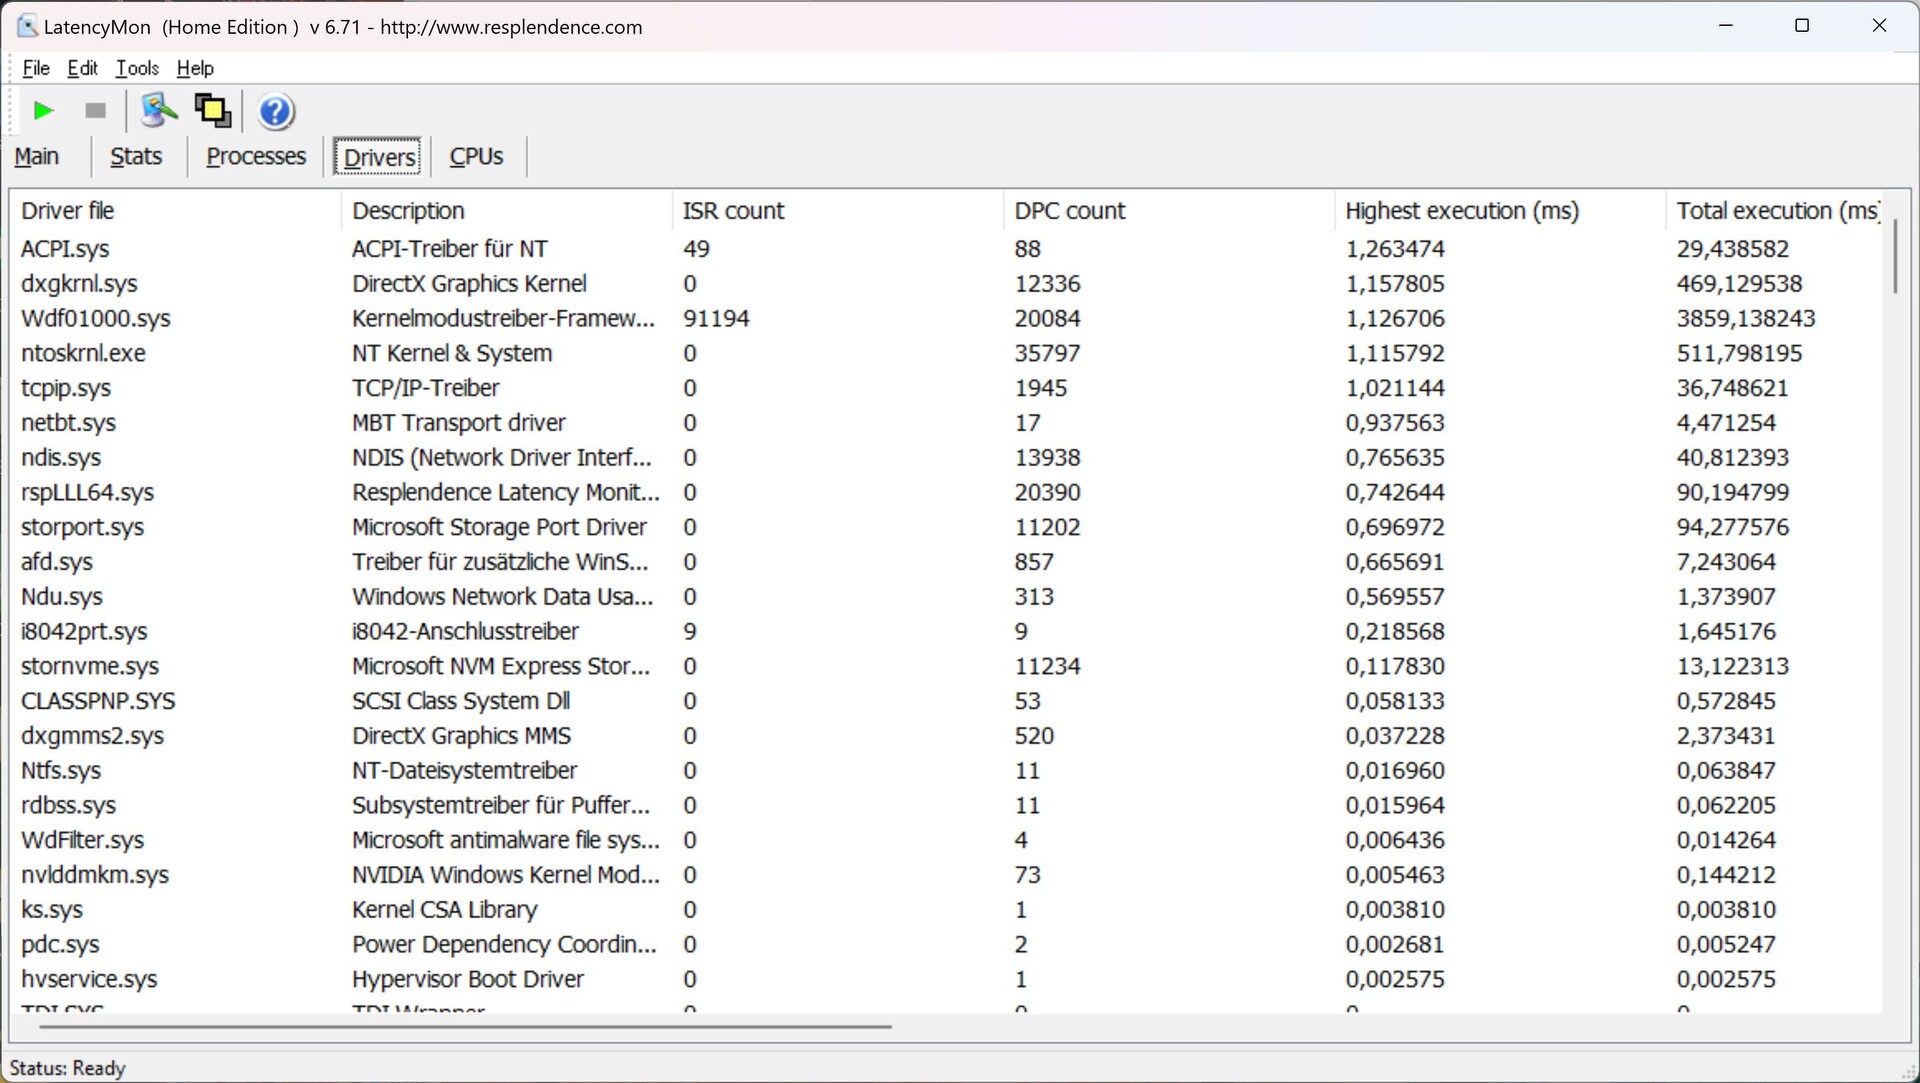
Opóźnienia DPC
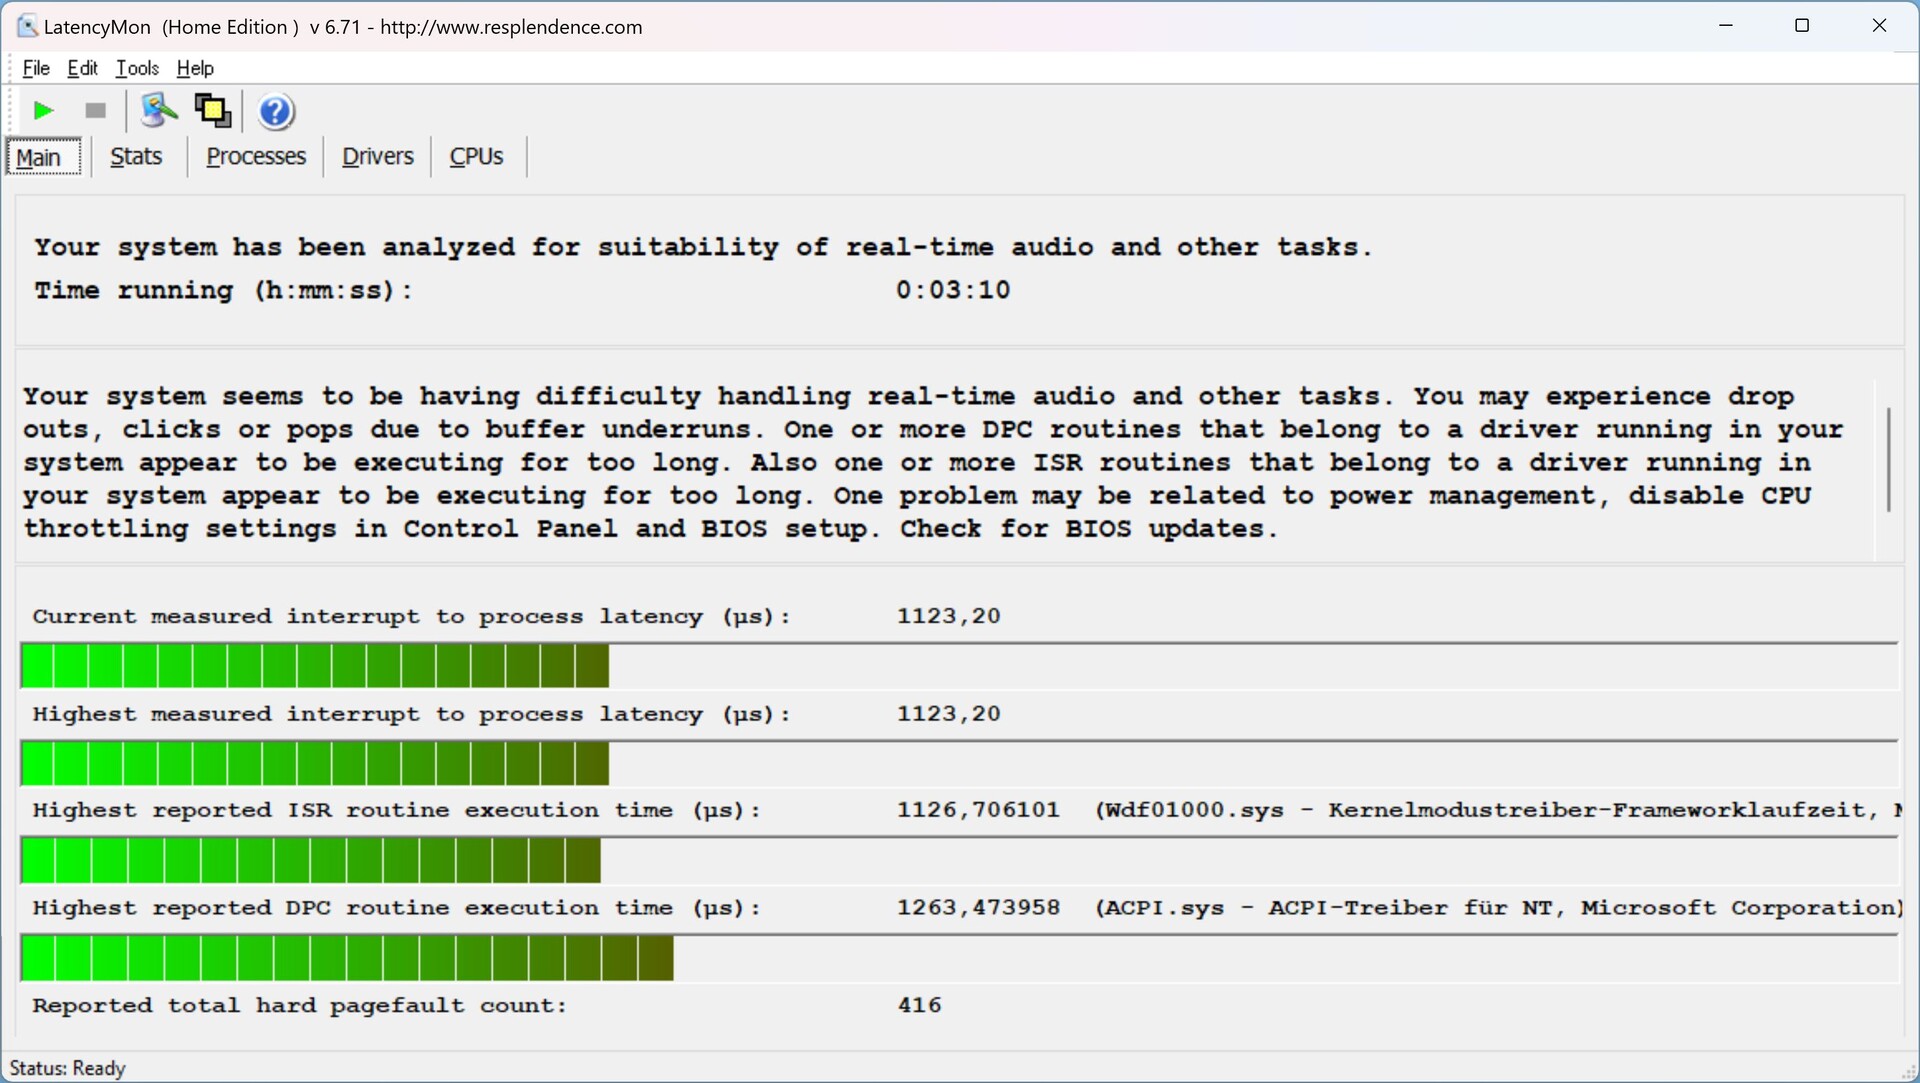
W naszym standardowym teście opóźnień (surfowanie po internecie, odtwarzanie filmów 4K z YouTube, obciążenie procesora) pojawiły się pewne niewielkie ograniczenia. W rezultacie urządzenie z obecną wersją BIOS-u nie jest optymalnie przystosowane do korzystania z aplikacji audio w czasie rzeczywistym.
| DPC Latencies / LatencyMon - interrupt to process latency (max), Web, Youtube, Prime95 | |
| Lenovo ThinkPad P15v G2 21A9000XGE | |
| HP ZBook Studio 16 G9 62U04EA | |
| HP ZBook Power 15 G9 6B8C4EA | |
| Dell Precision 5000 5560 | |
| HP ZBook Power 15 G8 313S5EA | |
* ... im mniej tym lepiej
Rozwiązanie w zakresie przechowywania
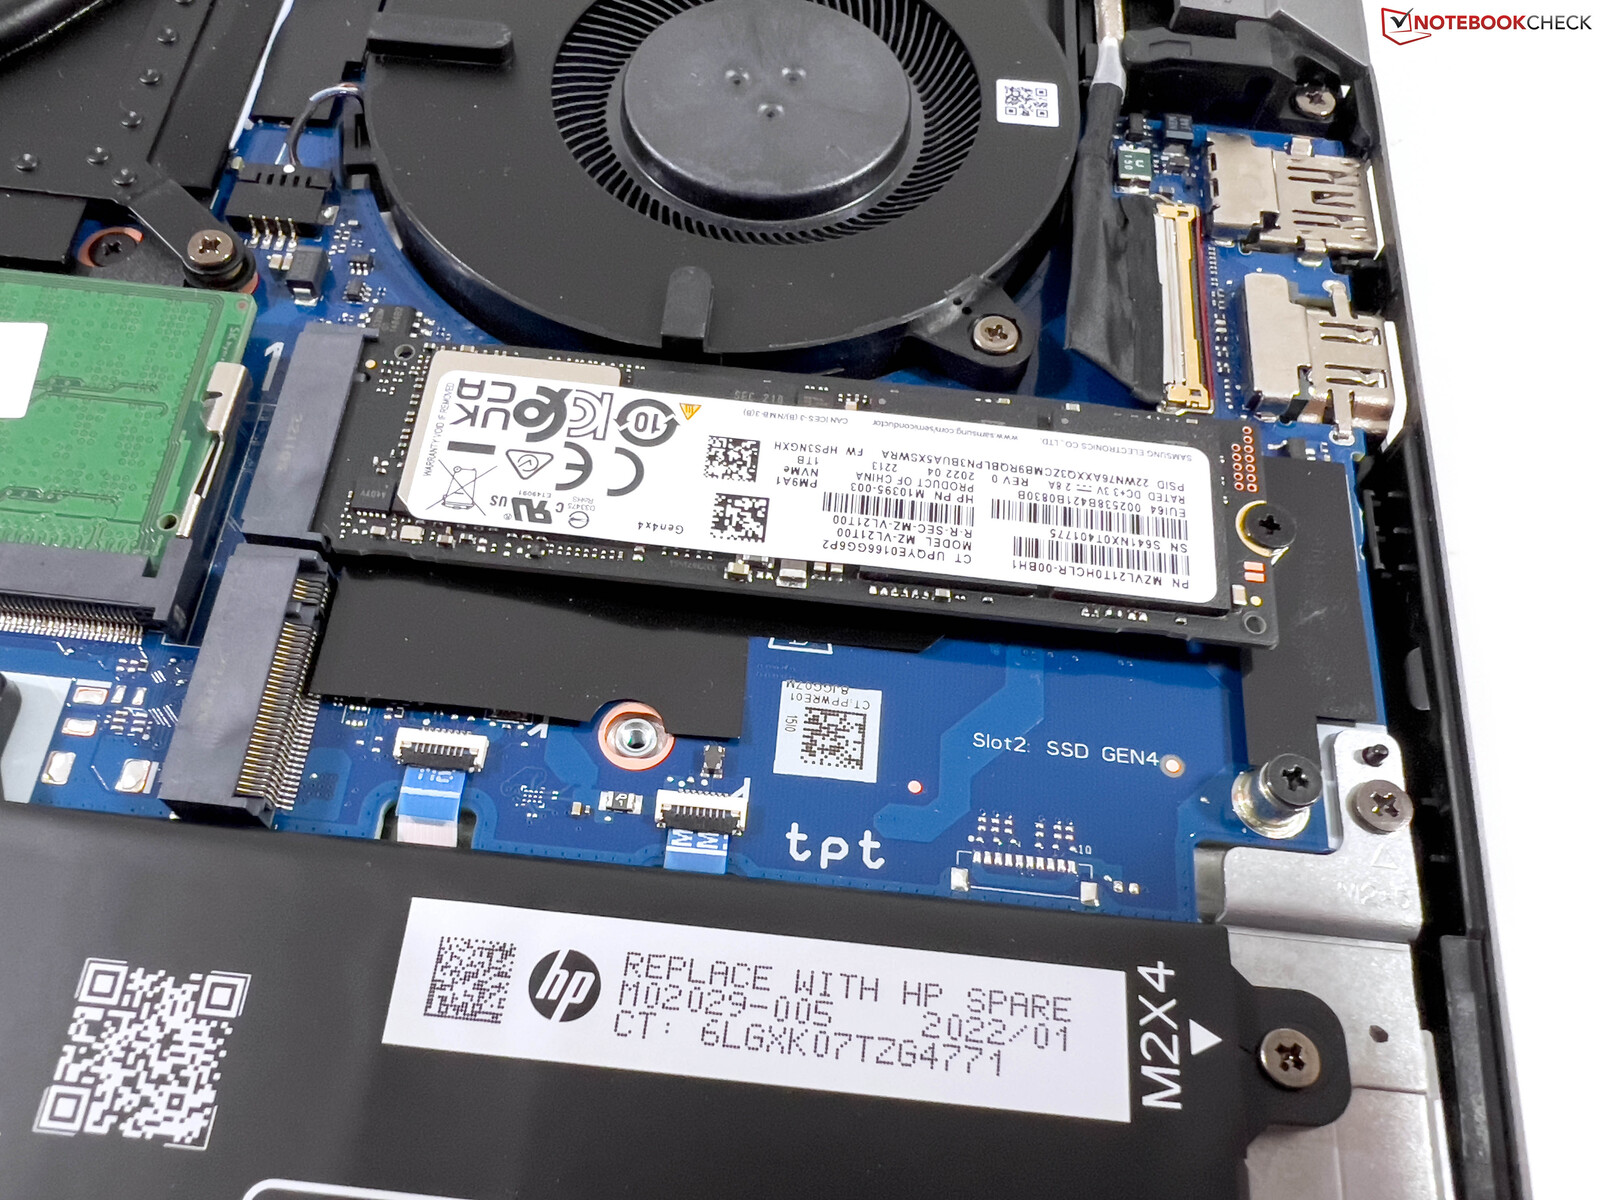
ZBook Power 15 G9 oferuje dwa szybkie gniazda PCIe 4.0 dla dysków SSD M.2. W naszym egzemplarzu testowym zastosowano duży, 1-TB dysk PM9A1 od Samsunga (wersja OEM z modelu 980 Pro). Po jego pierwszym włączeniu do dyspozycji użytkownika jest 890 GB. Transfery dysku SSD są znakomite, a wydajność również pozostaje niemal całkowicie stabilna nawet po dłuższym obciążeniu. Dodatkowe benchmarki dysków SSD można znaleźć m.in tutaj.

| Drive Performance rating - Percent | |
| Średnia w klasie Workstation | |
| Przeciętny Samsung PM9A1 MZVL21T0HCLR | |
| HP ZBook Power 15 G9 6B8C4EA | |
| HP ZBook Power 15 G8 313S5EA | |
| Dell Precision 5000 5560 | |
| HP ZBook Studio 16 G9 62U04EA | |
| Lenovo ThinkPad P15v G2 21A9000XGE | |
* ... im mniej tym lepiej
Disk Throttling: DiskSpd Read Loop, Queue Depth 8
Karta graficzna
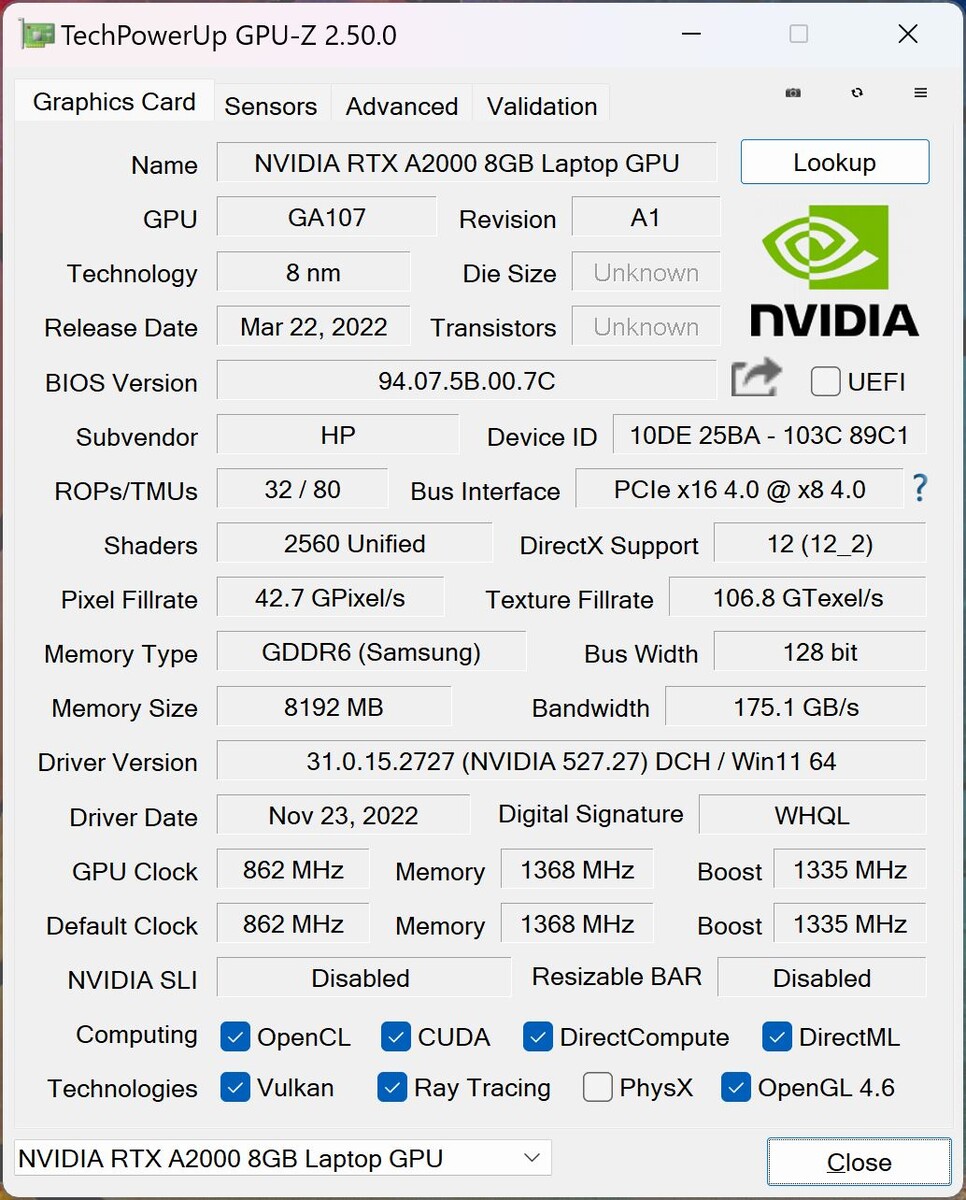
Na stronie .Nvidia RTX A2000 to najszybsze GPU, jakie HP oferuje do ZBooków Power 15 G9. Jest to zaktualizowana wersja z 8 GB pamięci GDDR6-VRAM. GPU może jednak zużywać maksymalnie 45 W (w tym 5 W Dynamic Boost), co czyni go jedną z najwolniejszych wersji. W naszych benchmarkach GPU wypada więc również poniżej średniej wyników, które dotychczas mierzyliśmy dla RTX A2000. Wydajność w grach jest porównywalna z m.in GeForce RTX 3050 Ti "consumer GPU, ale dzięki certyfikowanym sterownikom również wydajność w zastosowaniach profesjonalnych może okazać się znacznie lepsza.
Pod stałym obciążeniem wydajność GPU pozostaje całkowicie stabile. Podobnie jak w przypadku procesora, również zużycie energii przez kartę graficzną w trybie bateryjnym jest ograniczone do 30 watów, co prowadzi do spadku wydajności o prawie 25% (3 589 punktów Time Spy Graphics). Dodatkowe benchmarki GPU można znaleźć tutaj.
| 3DMark 11 - 1280x720 Performance GPU | |
| Średnia w klasie Workstation (12535 - 69594, n=23, ostatnie 2 lata) | |
| HP ZBook Studio 16 G9 62U04EA | |
| Przeciętny NVIDIA RTX A2000 Laptop GPU (14831 - 19823, n=9) | |
| HP ZBook Power 15 G9 6B8C4EA | |
| Dell Precision 5000 5560 | |
| Lenovo ThinkPad P15v G2 21A9000XGE | |
| HP ZBook Power 15 G8 313S5EA | |
| 3DMark | |
| 1920x1080 Fire Strike Graphics | |
| Średnia w klasie Workstation (8293 - 52560, n=23, ostatnie 2 lata) | |
| Przeciętny NVIDIA RTX A2000 Laptop GPU (10415 - 15988, n=9) | |
| HP ZBook Studio 16 G9 62U04EA | |
| HP ZBook Power 15 G9 6B8C4EA | |
| Dell Precision 5000 5560 | |
| Lenovo ThinkPad P15v G2 21A9000XGE | |
| HP ZBook Power 15 G8 313S5EA | |
| 2560x1440 Time Spy Graphics | |
| Średnia w klasie Workstation (2725 - 24806, n=23, ostatnie 2 lata) | |
| Przeciętny NVIDIA RTX A2000 Laptop GPU (4228 - 6108, n=9) | |
| HP ZBook Studio 16 G9 62U04EA | |
| HP ZBook Power 15 G9 6B8C4EA | |
| Dell Precision 5000 5560 | |
| Lenovo ThinkPad P15v G2 21A9000XGE | |
| HP ZBook Power 15 G8 313S5EA | |
| Geekbench 5.5 - OpenCL Score | |
| Średnia w klasie Workstation (33651 - 272866, n=23, ostatnie 2 lata) | |
| Przeciętny NVIDIA RTX A2000 Laptop GPU (58687 - 72661, n=7) | |
| HP ZBook Power 15 G9 6B8C4EA | |
| HP ZBook Studio 16 G9 62U04EA | |
| Lenovo ThinkPad P15v G2 21A9000XGE | |
| HP ZBook Power 15 G8 313S5EA | |
| V-Ray 5 Benchmark | |
| GPU CUDA | |
| Średnia w klasie Workstation (989 - 3239, n=9, ostatnie 2 lata) | |
| Przeciętny NVIDIA RTX A2000 Laptop GPU (506 - 607, n=2) | |
| HP ZBook Power 15 G9 6B8C4EA | |
| Lenovo ThinkPad P15v G2 21A9000XGE | |
| HP ZBook Power 15 G8 313S5EA | |
| GPU RTX | |
| Średnia w klasie Workstation (1411 - 4241, n=9, ostatnie 2 lata) | |
| Przeciętny NVIDIA RTX A2000 Laptop GPU (632 - 803, n=2) | |
| HP ZBook Power 15 G9 6B8C4EA | |
| 3DMark 11 Performance | 16503 pkt. | |
| 3DMark Fire Strike Score | 11074 pkt. | |
| 3DMark Time Spy Score | 5106 pkt. | |
Pomoc | ||
| Blender / v3.3 Classroom OPTIX/RTX | |
| HP ZBook Studio 16 G9 62U04EA | |
| HP ZBook Power 15 G9 6B8C4EA | |
| Przeciętny NVIDIA RTX A2000 Laptop GPU (42 - 54, n=7) | |
| Średnia w klasie Workstation (10 - 43, n=17, ostatnie 2 lata) | |
| Blender / v3.3 Classroom CUDA | |
| HP ZBook Studio 16 G9 62U04EA | |
| HP ZBook Power 15 G9 6B8C4EA | |
| Przeciętny NVIDIA RTX A2000 Laptop GPU (78 - 98, n=7) | |
| Średnia w klasie Workstation (16 - 74, n=17, ostatnie 2 lata) | |
| Blender / v3.3 Classroom CPU | |
| HP ZBook Power 15 G9 6B8C4EA | |
| Przeciętny NVIDIA RTX A2000 Laptop GPU (312 - 414, n=7) | |
| HP ZBook Studio 16 G9 62U04EA | |
| Średnia w klasie Workstation (148 - 364, n=23, ostatnie 2 lata) | |
* ... im mniej tym lepiej
| Performance rating - Percent | |
| Średnia w klasie Workstation | |
| HP ZBook Studio 16 G9 62U04EA | |
| Dell Precision 5000 5560 -1! | |
| HP ZBook Power 15 G9 6B8C4EA | |
| HP ZBook Power 15 G8 313S5EA | |
| Lenovo ThinkPad P15v G2 21A9000XGE | |
| The Witcher 3 - 1920x1080 Ultra Graphics & Postprocessing (HBAO+) | |
| Średnia w klasie Workstation (n=1ostatnie 2 lata) | |
| Dell Precision 5000 5560 | |
| HP ZBook Studio 16 G9 62U04EA | |
| HP ZBook Power 15 G9 6B8C4EA | |
| Lenovo ThinkPad P15v G2 21A9000XGE | |
| HP ZBook Power 15 G8 313S5EA | |
| GTA V - 1920x1080 Highest AA:4xMSAA + FX AF:16x | |
| Średnia w klasie Workstation (18.1 - 156.1, n=23, ostatnie 2 lata) | |
| HP ZBook Studio 16 G9 62U04EA | |
| HP ZBook Power 15 G9 6B8C4EA | |
| Dell Precision 5000 5560 | |
| Lenovo ThinkPad P15v G2 21A9000XGE | |
| HP ZBook Power 15 G8 313S5EA | |
| Final Fantasy XV Benchmark - 1920x1080 High Quality | |
| Średnia w klasie Workstation (26.4 - 197.6, n=23, ostatnie 2 lata) | |
| HP ZBook Studio 16 G9 62U04EA | |
| HP ZBook Power 15 G9 6B8C4EA | |
| Dell Precision 5000 5560 | |
| Lenovo ThinkPad P15v G2 21A9000XGE | |
| HP ZBook Power 15 G8 313S5EA | |
| Strange Brigade - 1920x1080 ultra AA:ultra AF:16 | |
| Średnia w klasie Workstation (93.2 - 418, n=17, ostatnie 2 lata) | |
| HP ZBook Studio 16 G9 62U04EA | |
| HP ZBook Power 15 G9 6B8C4EA | |
| Lenovo ThinkPad P15v G2 21A9000XGE | |
| HP ZBook Power 15 G8 313S5EA | |
| Dota 2 Reborn - 1920x1080 ultra (3/3) best looking | |
| HP ZBook Studio 16 G9 62U04EA | |
| Średnia w klasie Workstation (50.7 - 178.4, n=23, ostatnie 2 lata) | |
| Dell Precision 5000 5560 | |
| HP ZBook Power 15 G9 6B8C4EA | |
| HP ZBook Power 15 G8 313S5EA | |
| Lenovo ThinkPad P15v G2 21A9000XGE | |
| X-Plane 11.11 - 1920x1080 high (fps_test=3) | |
| HP ZBook Studio 16 G9 62U04EA | |
| HP ZBook Power 15 G9 6B8C4EA | |
| Średnia w klasie Workstation (30.5 - 139.7, n=23, ostatnie 2 lata) | |
| HP ZBook Power 15 G8 313S5EA | |
| Dell Precision 5000 5560 | |
| Lenovo ThinkPad P15v G2 21A9000XGE | |
The Witcher 3 FPS Chart
| low | med. | high | ultra | QHD | 4K | |
|---|---|---|---|---|---|---|
| GTA V (2015) | 182.9 | 177.1 | 134.7 | 65.4 | 47.3 | 45 |
| The Witcher 3 (2015) | 264 | 171 | 45 | 44.5 | ||
| Dota 2 Reborn (2015) | 179.3 | 133.5 | 126.1 | 118.6 | 68.9 | |
| Final Fantasy XV Benchmark (2018) | 121.9 | 68.2 | 48.6 | 34.9 | 20.6 | |
| X-Plane 11.11 (2018) | 122.6 | 103.6 | 87.6 | 73.1 | ||
| Strange Brigade (2018) | 266 | 126 | 100 | 86 | 36 | |
| F1 2021 (2021) | 287 | 153.1 | 124.4 | 62.7 | 44.4 | 23.9 |
| F1 22 (2022) | 147.1 | 137.9 | 100.6 | 30.8 | 19.1 | 9.05 |
Emisje i zarządzanie energią
Poziom hałasu
Zazwyczaj dwa wentylatory ZBooka Power 15 G9 pozostają często nieaktywne podczas wykonywania prostych zadań. Dopiero kiedy obciążymy procesor lub dedykowaną kartę graficzną, wentylatory włączają się szybko, wytwarzając zwykle szum o natężeniu od 42 do 45 dB(A), przy czym prędkość obrotowa wentylatorów nie zawsze pozostaje stabilna, ale czasem się waha. Podczas stress testu z maksymalnym obciążeniem dla obu podzespołów mierzymy maksymalnie 47,9 dB(A). Dzięki temu obecna generacja G9 pozostaje nieco cichsza od poprzednika. Nie ma żadnych innych elektronicznych odgłosów.
Hałas
| luz |
| 23.8 / 23.8 / 23.8 dB |
| obciążenie |
| 42.9 / 47.9 dB |
 | ||
30 dB cichy 40 dB(A) słyszalny 50 dB(A) irytujący |
||
min: | ||
| HP ZBook Power 15 G9 6B8C4EA RTX A2000 Laptop GPU, i7-12700H, Samsung PM9A1 MZVL21T0HCLR | HP ZBook Studio 16 G9 62U04EA RTX A2000 Laptop GPU, i7-12800H, Micron 3400 1TB MTFDKBA1T0TFH | Dell Precision 5000 5560 RTX A2000 Laptop GPU, i7-11850H, Samsung PM9A1 MZVL22T0HBLB | Lenovo ThinkPad P15v G2 21A9000XGE T1200 Laptop GPU, i7-11800H, Toshiba XG6 KXG6AZNV512G | HP ZBook Power 15 G8 313S5EA T600 Laptop GPU, i7-11800H, Samsung PM9A1 MZVL2512HCJQ | |
|---|---|---|---|---|---|
| Noise | -4% | 10% | 2% | -8% | |
| wyłączone / środowisko * (dB) | 23.8 | 24 -1% | 23.4 2% | 25.21 -6% | 25.54 -7% |
| Idle Minimum * (dB) | 23.8 | 24 -1% | 23.6 1% | 25.21 -6% | 25.54 -7% |
| Idle Average * (dB) | 23.8 | 27.7 -16% | 23.6 1% | 25.21 -6% | 25.54 -7% |
| Idle Maximum * (dB) | 23.8 | 27.7 -16% | 23.6 1% | 25.21 -6% | 25.54 -7% |
| Load Average * (dB) | 42.9 | 39.8 7% | 25.8 40% | 39.09 9% | 48.85 -14% |
| Witcher 3 ultra * (dB) | 44.5 | 44.3 -0% | 40.1 10% | 36.6 18% | 46.58 -5% |
| Load Maximum * (dB) | 47.9 | 47.7 -0% | 41.4 14% | 43.53 9% | 50.98 -6% |
* ... im mniej tym lepiej
Temperatury
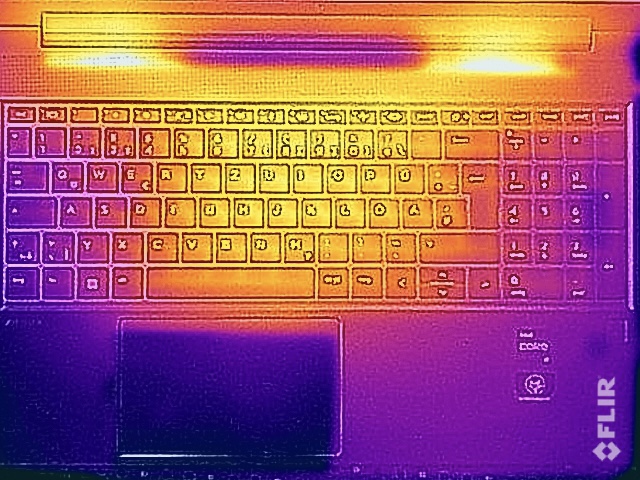
W codziennej eksploatacji temperatury powierzchni mobilnej stacji roboczej pozostają zwykle bardzo niskie, nie dając w ogóle powodów do obaw, nawet pod obciążeniem. Przy 48 °C (118 °F) jedyny punkt gorąca znajduje się na spodzie w centralnym obszarze w kierunku tyłu, ale ze względu na jego położenie można nadal umieścić urządzenie na kolanach. Wierzch jednostki zasadniczej, w tym klawiatura, pozostaje jednak znacznie chłodniejszy, osiągając maksymalnie 40°C (104°F).
Podczas testu obciążeniowego procesor wyrównuje się do 35-39 W po krótkim szczycie 90 W, a karta grafiki pozostaje stabilna na poziomie 40 W. Po teście obciążeniowym wydajność nie spada. W trybie pracy na akumulatorze wartości te nieco spadają, przy czym procesor nadal może pobierać 25 W, a karta graficzna - 30 W pod łącznym obciążeniem.
(±) Maksymalna temperatura w górnej części wynosi 40.3 °C / 105 F, w porównaniu do średniej 38.2 °C / 101 F , począwszy od 22.2 do 69.8 °C dla klasy Workstation.
(-) Dno nagrzewa się maksymalnie do 48.3 °C / 119 F, w porównaniu do średniej 41.1 °C / 106 F
(+) W stanie bezczynności średnia temperatura górnej części wynosi 23.1 °C / 74 F, w porównaniu ze średnią temperaturą urządzenia wynoszącą 32 °C / ### class_avg_f### F.
(±) Podczas gry w Wiedźmina 3 średnia temperatura górnej części wynosi 33.5 °C / 92 F, w porównaniu do średniej temperatury urządzenia wynoszącej 32 °C / ## #class_avg_f### F.
(+) Podpórki pod nadgarstki i touchpad są chłodniejsze niż temperatura skóry i maksymalnie 28.6 °C / 83.5 F i dlatego są chłodne w dotyku.
(±) Średnia temperatura obszaru podparcia dłoni w podobnych urządzeniach wynosiła 27.8 °C / 82 F (-0.8 °C / -1.5 F).
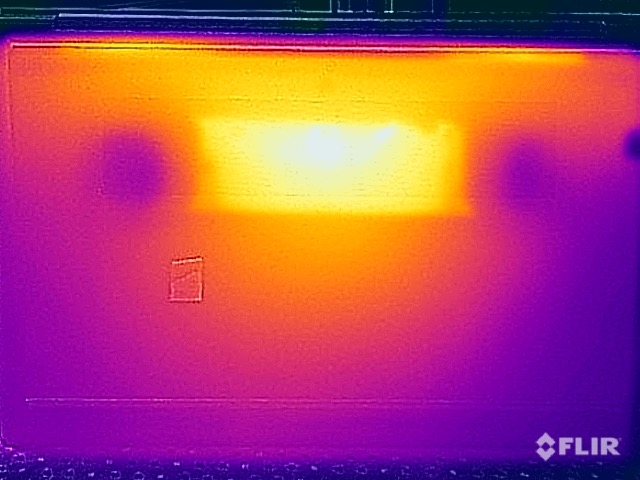
| HP ZBook Power 15 G9 6B8C4EA Intel Core i7-12700H, NVIDIA RTX A2000 Laptop GPU | HP ZBook Studio 16 G9 62U04EA Intel Core i7-12800H, NVIDIA RTX A2000 Laptop GPU | Dell Precision 5000 5560 Intel Core i7-11850H, NVIDIA RTX A2000 Laptop GPU | Lenovo ThinkPad P15v G2 21A9000XGE Intel Core i7-11800H, NVIDIA T1200 Laptop GPU | HP ZBook Power 15 G8 313S5EA Intel Core i7-11800H, NVIDIA T600 Laptop GPU | |
|---|---|---|---|---|---|
| Heat | -14% | -26% | -18% | 2% | |
| Maximum Upper Side * (°C) | 40.3 | 38.7 4% | 48.2 -20% | 53.8 -33% | 41.4 -3% |
| Maximum Bottom * (°C) | 48.3 | 53.4 -11% | 42.6 12% | 52.1 -8% | 41.5 14% |
| Idle Upper Side * (°C) | 23.7 | 27.3 -15% | 34.8 -47% | 27.6 -16% | 23.8 -0% |
| Idle Bottom * (°C) | 23.8 | 31.6 -33% | 35.2 -48% | 27.7 -16% | 25 -5% |
* ... im mniej tym lepiej
Mówcy
Dwa głośniki stereo stanowią jedną ze słabości mobilnej stacji roboczej, ponieważ ich dźwięk jest bardzo cienki i mało przekonujący. Podczas gdy spełniają one swoje zadanie podczas wideokonferencji lub połączeń głosowych, zdecydowanie zalecalibyśmy korzystanie ze słuchawek lub głośników zewnętrznych do odtwarzania muzyki lub filmów.
HP ZBook Power 15 G9 6B8C4EA analiza dźwięku
(±) | głośność głośnika jest średnia, ale dobra (77.9 dB)
Bas 100 - 315 Hz
(-) | prawie brak basu - średnio 28.5% niższa od mediany
(±) | liniowość basu jest średnia (9.4% delta do poprzedniej częstotliwości)
Średnie 400 - 2000 Hz
(+) | zbalansowane środki średnie - tylko 3.9% od mediany
(+) | średnie są liniowe (5.1% delta do poprzedniej częstotliwości)
Wysokie 2–16 kHz
(±) | wyższe maksima - średnio 5.1% wyższe od mediany
(+) | wzloty są liniowe (4.1% delta do poprzedniej częstotliwości)
Ogólnie 100 - 16.000 Hz
(±) | liniowość ogólnego dźwięku jest średnia (22.9% różnicy w stosunku do mediany)
W porównaniu do tej samej klasy
» 82% wszystkich testowanych urządzeń w tej klasie było lepszych, 3% podobnych, 15% gorszych
» Najlepszy miał deltę 7%, średnia wynosiła ###średnia###%, najgorsza wynosiła 35%
W porównaniu do wszystkich testowanych urządzeń
» 68% wszystkich testowanych urządzeń było lepszych, 6% podobnych, 26% gorszych
» Najlepszy miał deltę 4%, średnia wynosiła ###średnia###%, najgorsza wynosiła 134%
Dell Precision 5000 5560 analiza dźwięku
(±) | głośność głośnika jest średnia, ale dobra (75.2 dB)
Bas 100 - 315 Hz
(±) | zredukowany bas - średnio 9.8% niższy od mediany
(±) | liniowość basu jest średnia (8.8% delta do poprzedniej częstotliwości)
Średnie 400 - 2000 Hz
(±) | wyższe średnie - średnio 5.7% wyższe niż mediana
(+) | średnie są liniowe (3.7% delta do poprzedniej częstotliwości)
Wysokie 2–16 kHz
(+) | zrównoważone maksima - tylko 2.7% od mediany
(+) | wzloty są liniowe (6.4% delta do poprzedniej częstotliwości)
Ogólnie 100 - 16.000 Hz
(+) | ogólny dźwięk jest liniowy (14.8% różnicy w stosunku do mediany)
W porównaniu do tej samej klasy
» 33% wszystkich testowanych urządzeń w tej klasie było lepszych, 6% podobnych, 61% gorszych
» Najlepszy miał deltę 7%, średnia wynosiła ###średnia###%, najgorsza wynosiła 35%
W porównaniu do wszystkich testowanych urządzeń
» 20% wszystkich testowanych urządzeń było lepszych, 4% podobnych, 76% gorszych
» Najlepszy miał deltę 4%, średnia wynosiła ###średnia###%, najgorsza wynosiła 134%
Pobór mocy
Pomimo wyświetlacza 4K, ZBook Power 15 G9 jest bardzo wydajnym urządzeniem, którego pobór mocy podczas pracy jałowej wynosi maksymalnie 8,5 W. Pod obciążeniem można spodziewać się około 85-100 W, a po krótkim szczycie poboru 139 W, po kilku minutach podczas stress testu również wyrównuje się w tym zakresie. Dołączony do zestawu 150-watowy zasilacz jest więc całkowicie wystarczający.
| wyłączony / stan wstrzymania | |
| luz | |
| obciążenie |
|
Legenda:
min: | |
Power Consumption The Witcher 3 / Stress Test
Power Consumption With External Monitor
Czas pracy na baterii
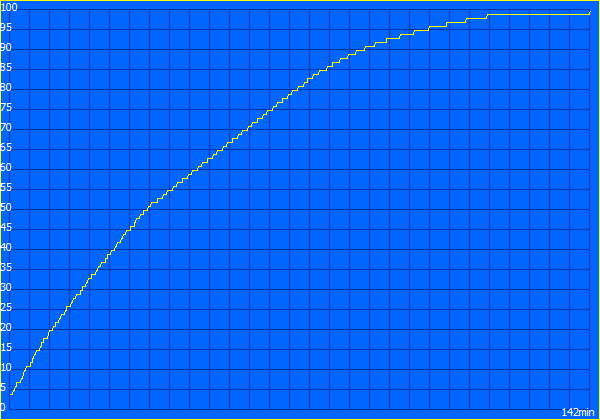
Duży akumulator o pojemności 83 Wh pozostaje niezmieniony, co pozwala na dobre czasy pracy na baterii, nawet jeśli poprzednik z panelem Full HD wciąż działał dłużej. Biorąc pod uwagę panel 4K, z około 10 godzinami w naszym teście WLAN przy 150 cd/m² (co odpowiada 65% maksymalnej jasności w naszym egzemplarzu testowym) i nadal 9 godzinami przy maksymalnej jasności, wyniki są bardzo dobre. Wyświetlacz o niskim poborze mocy staje się tu zdecydowanie zauważalny.
Całkowite naładowanie urządzenia po jego włączeniu zajmuje mi około 2,5 godziny, z czego 50% jest już dostępne po 34 minutach, a 80% po 70 minutach.
| Battery Runtime | |
| WiFi Websurfing | |
| HP ZBook Power 15 G8 313S5EA | |
| HP ZBook Power 15 G9 6B8C4EA | |
| Średnia w klasie Workstation (2.47 - 14.2, n=23, ostatnie 2 lata) | |
| Lenovo ThinkPad P15v G2 21A9000XGE | |
| Dell Precision 5000 5560 | |
| HP ZBook Studio 16 G9 62U04EA | |
| WiFi Websurfing max. Brightness | |
| HP ZBook Power 15 G9 6B8C4EA | |
| Średnia w klasie Workstation (4.55 - 8.98, n=6, ostatnie 2 lata) | |
| HP ZBook Studio 16 G9 62U04EA | |
Za
Przeciw
Werdykt - HP ZBook Power 15 G9 przydałoby się mocniejsze chłodzenie
ZBook Power 15 G9 to stacja robocza klasy podstawowej, skierowana do użytkowników, którzy potrzebują niezawodnej wydajności i profesjonalnych kart graficznych. Pomijając procesor, nasza konfiguracja testowa odpowiada już maksymalnej konfiguracji z wyświetlaczem 4K, kartą Nvidia RTX A2000 i obfitą pamięcią masową, co oczywiście również podnosi cenę. Podobnie jak jego poprzednikHP ZBook Power 15 G8 laptop review: A lot of high-end in an affordable workstation , ZBook Power G9 również oferuje solidną wydajność w wielu obszarach. Ale szczególnie w wydajności procesora wyniki znów nie zawsze są stałe. Sytuacja ustabilizowała się nieco dzięki kilku aktualizacjom BIOS-u, ale stacja robocza nadal nie jest w stanie w pełni wykorzystać prawdziwego potencjału Core i7-12700H.
Szczególnie pod względem rozwoju wydajności ZBook Power 15 G9 nie jest w stanie osiągnąć najwyższych wartości, ale dzięki kilku aktualizacjom BIOS-u wydajność procesora w dużym stopniu się ustabilizowała. Po kalibracji wyświetlacz 4K o niskim poborze mocy oferuje dobrą jakość obrazu i pozwala na długi czas pracy na baterii.
Aby być sprawiedliwym musimy jednak również wspomnieć, że podstawowe stacje robocze konkurencji, np Lenovo ThinkPad P15v lub Dell Precision 5560również nie zapewniają dużo większej wydajności, a trzy modele osiągają w sumie wyniki na poziomie oczu. Panel 4K jest w zasadzie bardzo dobrym wyborem, gdyż działa bardzo wydajnie bez napędzania poboru mocy, ale w miarę możliwości należy go skalibrować.
Cena i dostępność
ZBook Power 15 G9 jest obecnie dostępny bezpośrednio od HP w cenie od około 1455 dolarów, a niektóre konfiguracje są również dostępne np. w serwisie Amazon.
HP ZBook Power 15 G9 6B8C4EA
- 05/01/2023 v7 (old)
Andreas Osthoff
Price comparison

