Werdykt - Obejmuje wszystkie podstawy
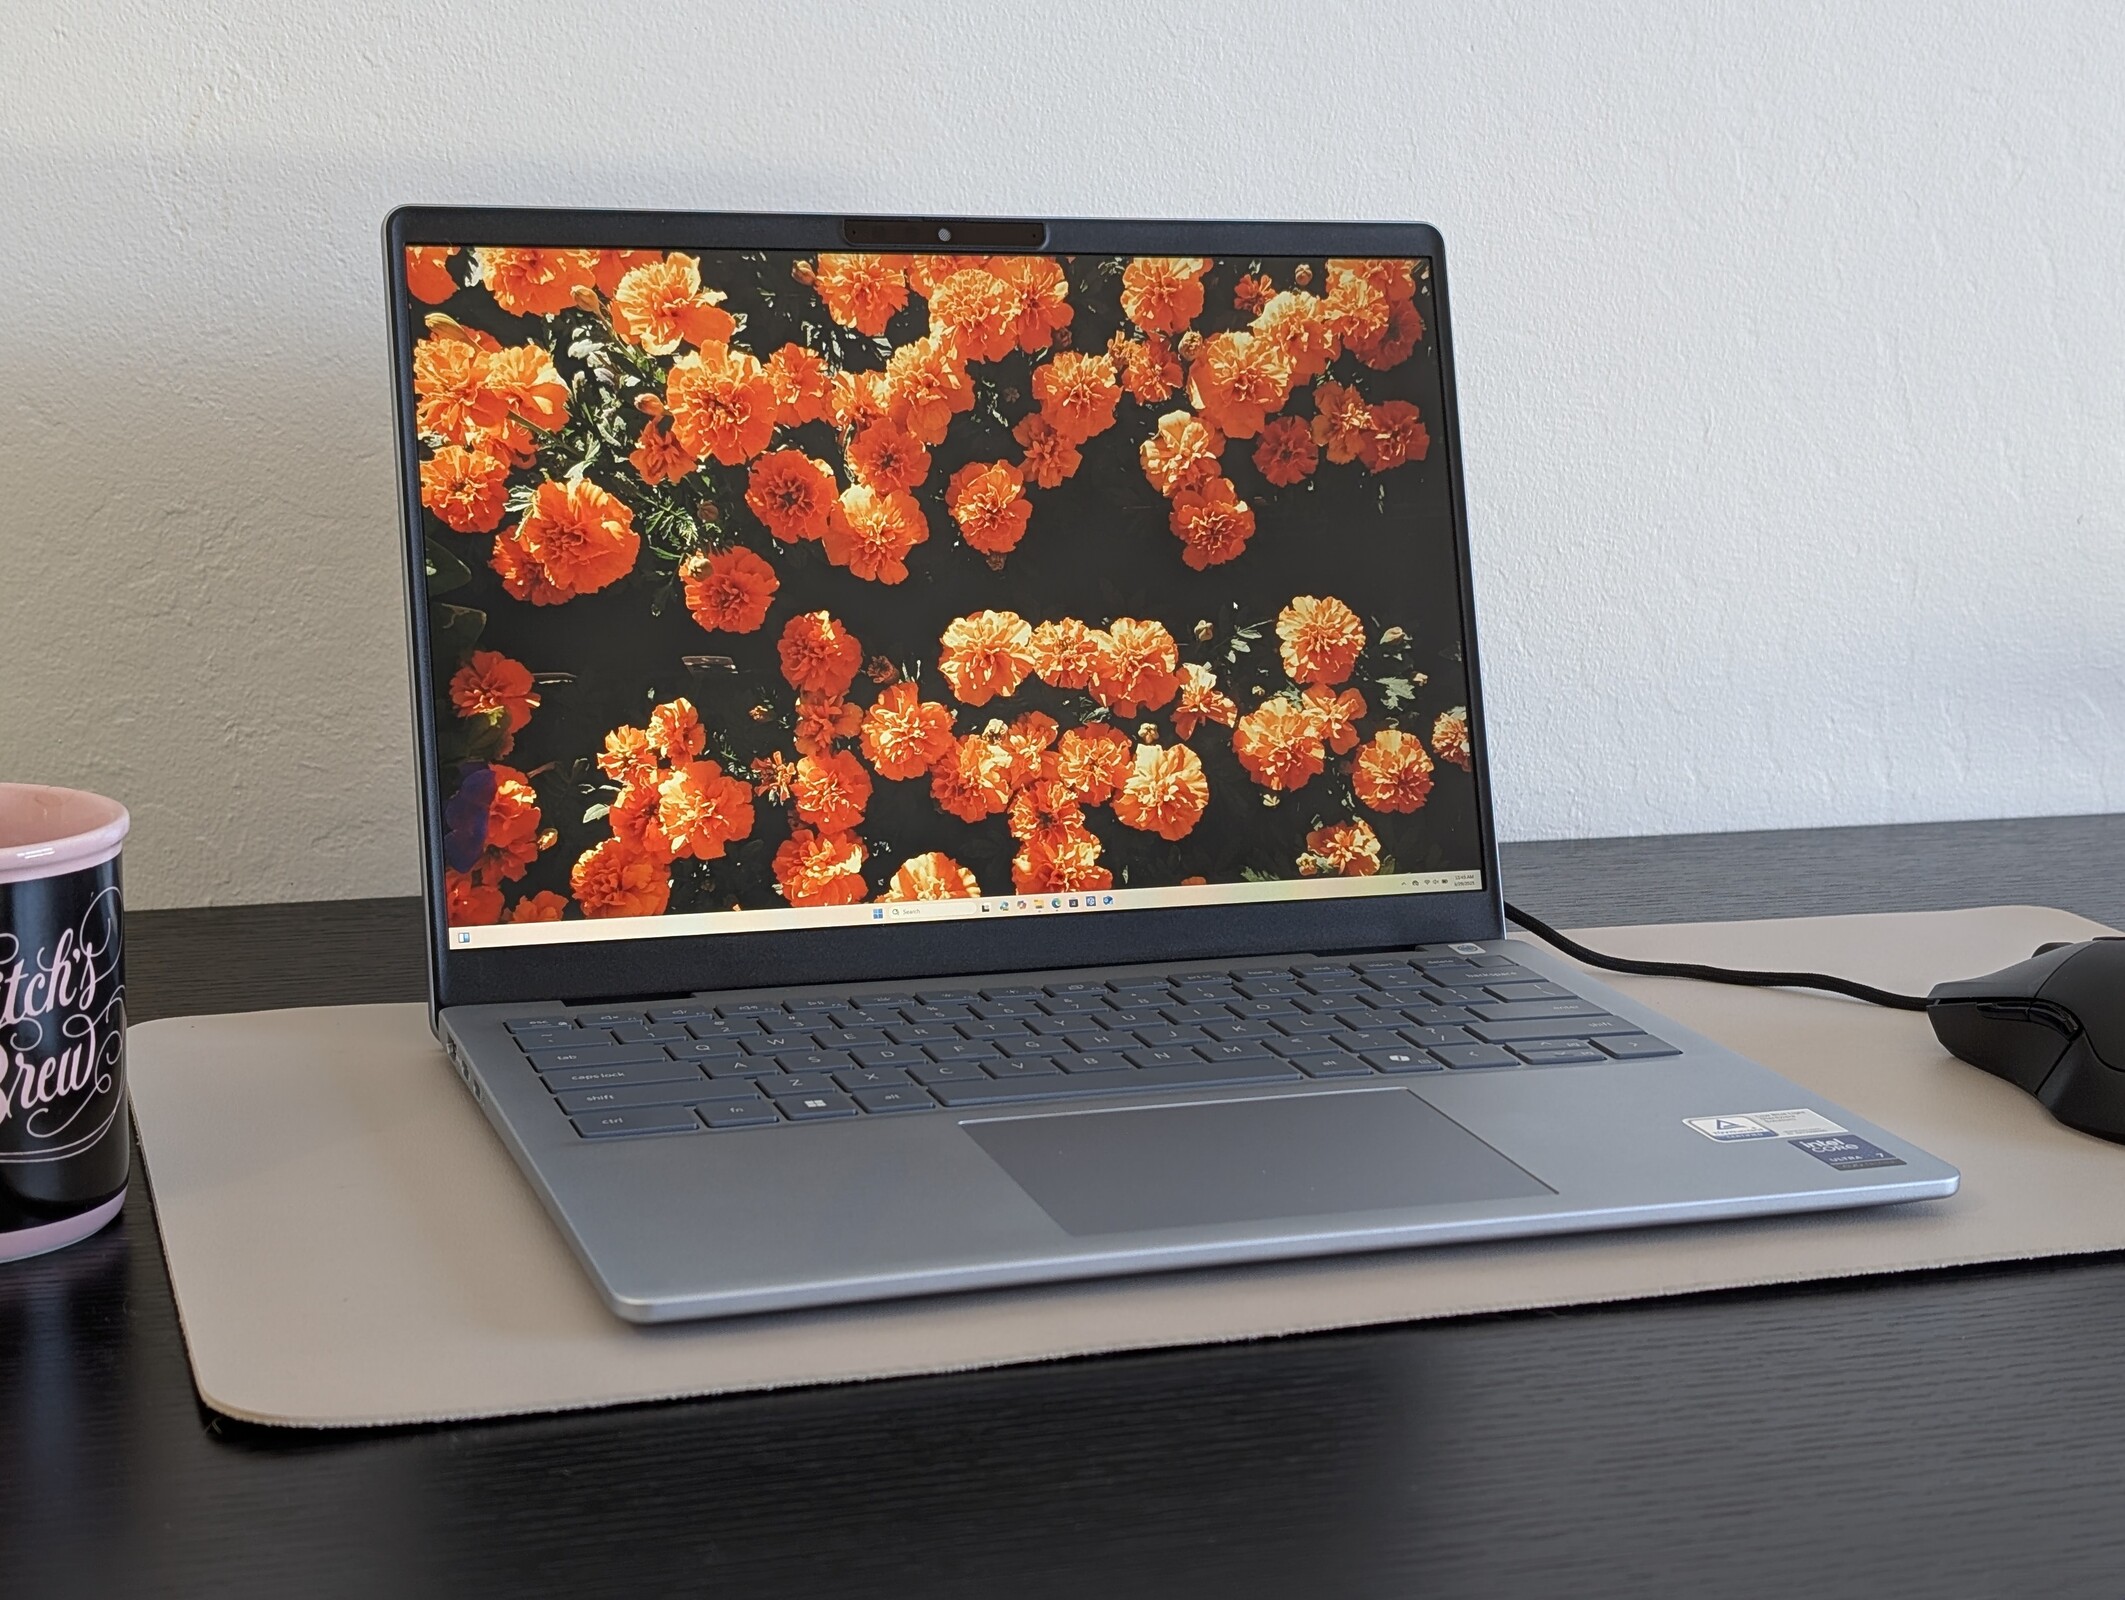
Jako niedrogi subnotebook średniej klasy, Dell 14 Plus nie oferuje zbyt wielu wymyślnych dzwonków i gwizdków ani błyszczących, przyciągających wzrok wzorów. Zamiast tego skupia się na podstawowych funkcjach, na których zależy użytkownikom dbającym o budżet, w tym na nowoczesnym procesorze, wysokiej rozdzielczości wyświetlaczu IPS z pełnymi kolorami sRGB oraz stosunkowo cienkiej i lekkiej konstrukcji ułatwiającej transport. Sam procesor jest odpowiedzialny za długi czas pracy na baterii i wyższą wydajność w porównaniu do modeli poprzedniej generacji.
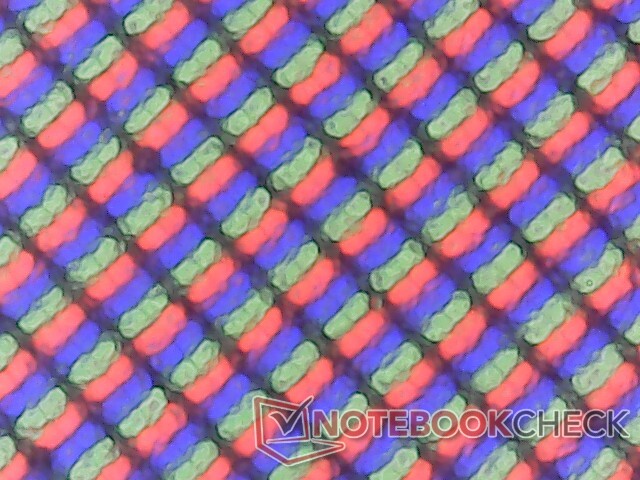
Kilka wad obejmuje słabo działający zintegrowany procesor graficzny, przeciętny czas reakcji czerni i bieli oraz nieco ziarnisty matowy panel. System nie jest więc idealny, jeśli chodzi o gry, ale nawet wtedy gra znacznie lepiej niż jego poprzednicy z grafiką Iris Xe. Brak jakichkolwiek opcji ekranu dotykowego może również rozczarować niektórych użytkowników.
Za
Przeciw
Cena i dostępność
Dell wysyła teraz Dell 14 Plus w cenie 1100 USD. Alternatywnie, Amazon ma również określone SKU w magazynie.
Dell 14 Plus jest następcą zeszłorocznego modelu Inspiron 14 Plus 7440 i jest przyjazną dla budżetu opcją średniej klasy przeznaczoną dla domowych multimediów lub studentów. Jak pokazuje nasza poniższa recenzja, dzieli on główne cechy konstrukcyjne z Inspironem.
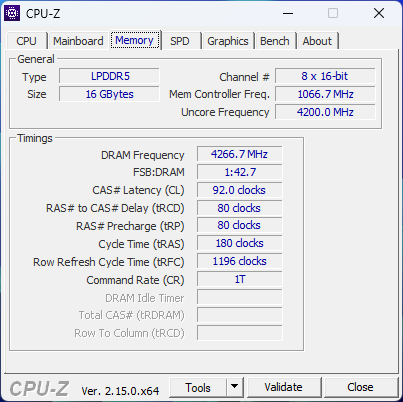
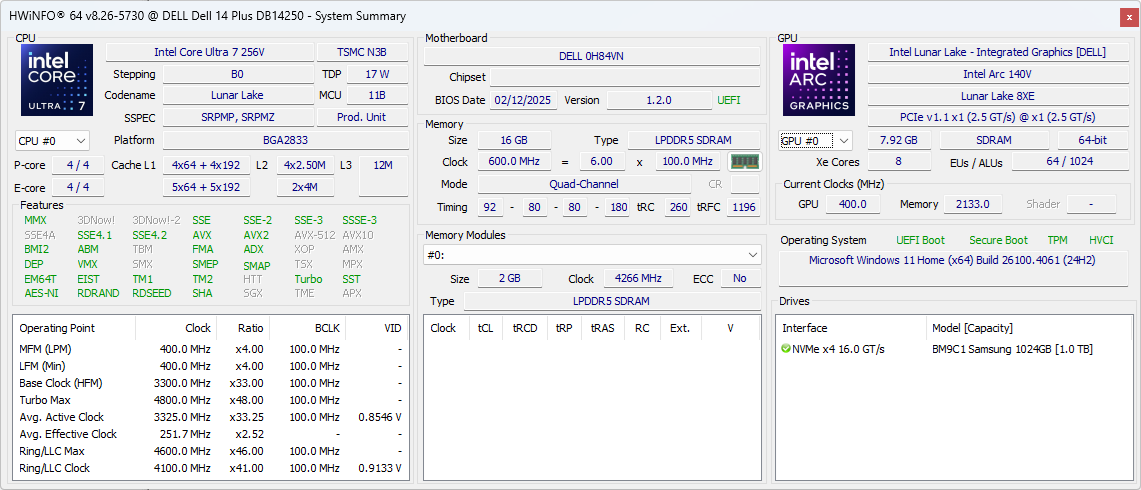
Nasza jednostka testowa to konfiguracja z niższej półki z procesorem Core Ultra 7 256V i 16 GB pamięci RAM za około 1100 USD. Wyższe jednostki SKU są wyposażone w Core Ultra 7 258V lub Core Ultra 9 288V z podwójną ilością pamięci RAM, ale wyświetlacz 2,5K 90 Hz pozostaje niezmienny we wszystkich obecnych konfiguracjach.
Alternatywy dla Dell 14 Plus obejmują inne 14-calowe klapki konsumenckie, takie jak Lenovo IdeaPad Pro 5 14 lub HP Pavilion Plus 14.
Więcej recenzji Dell:
Specyfikacje
Przypadek
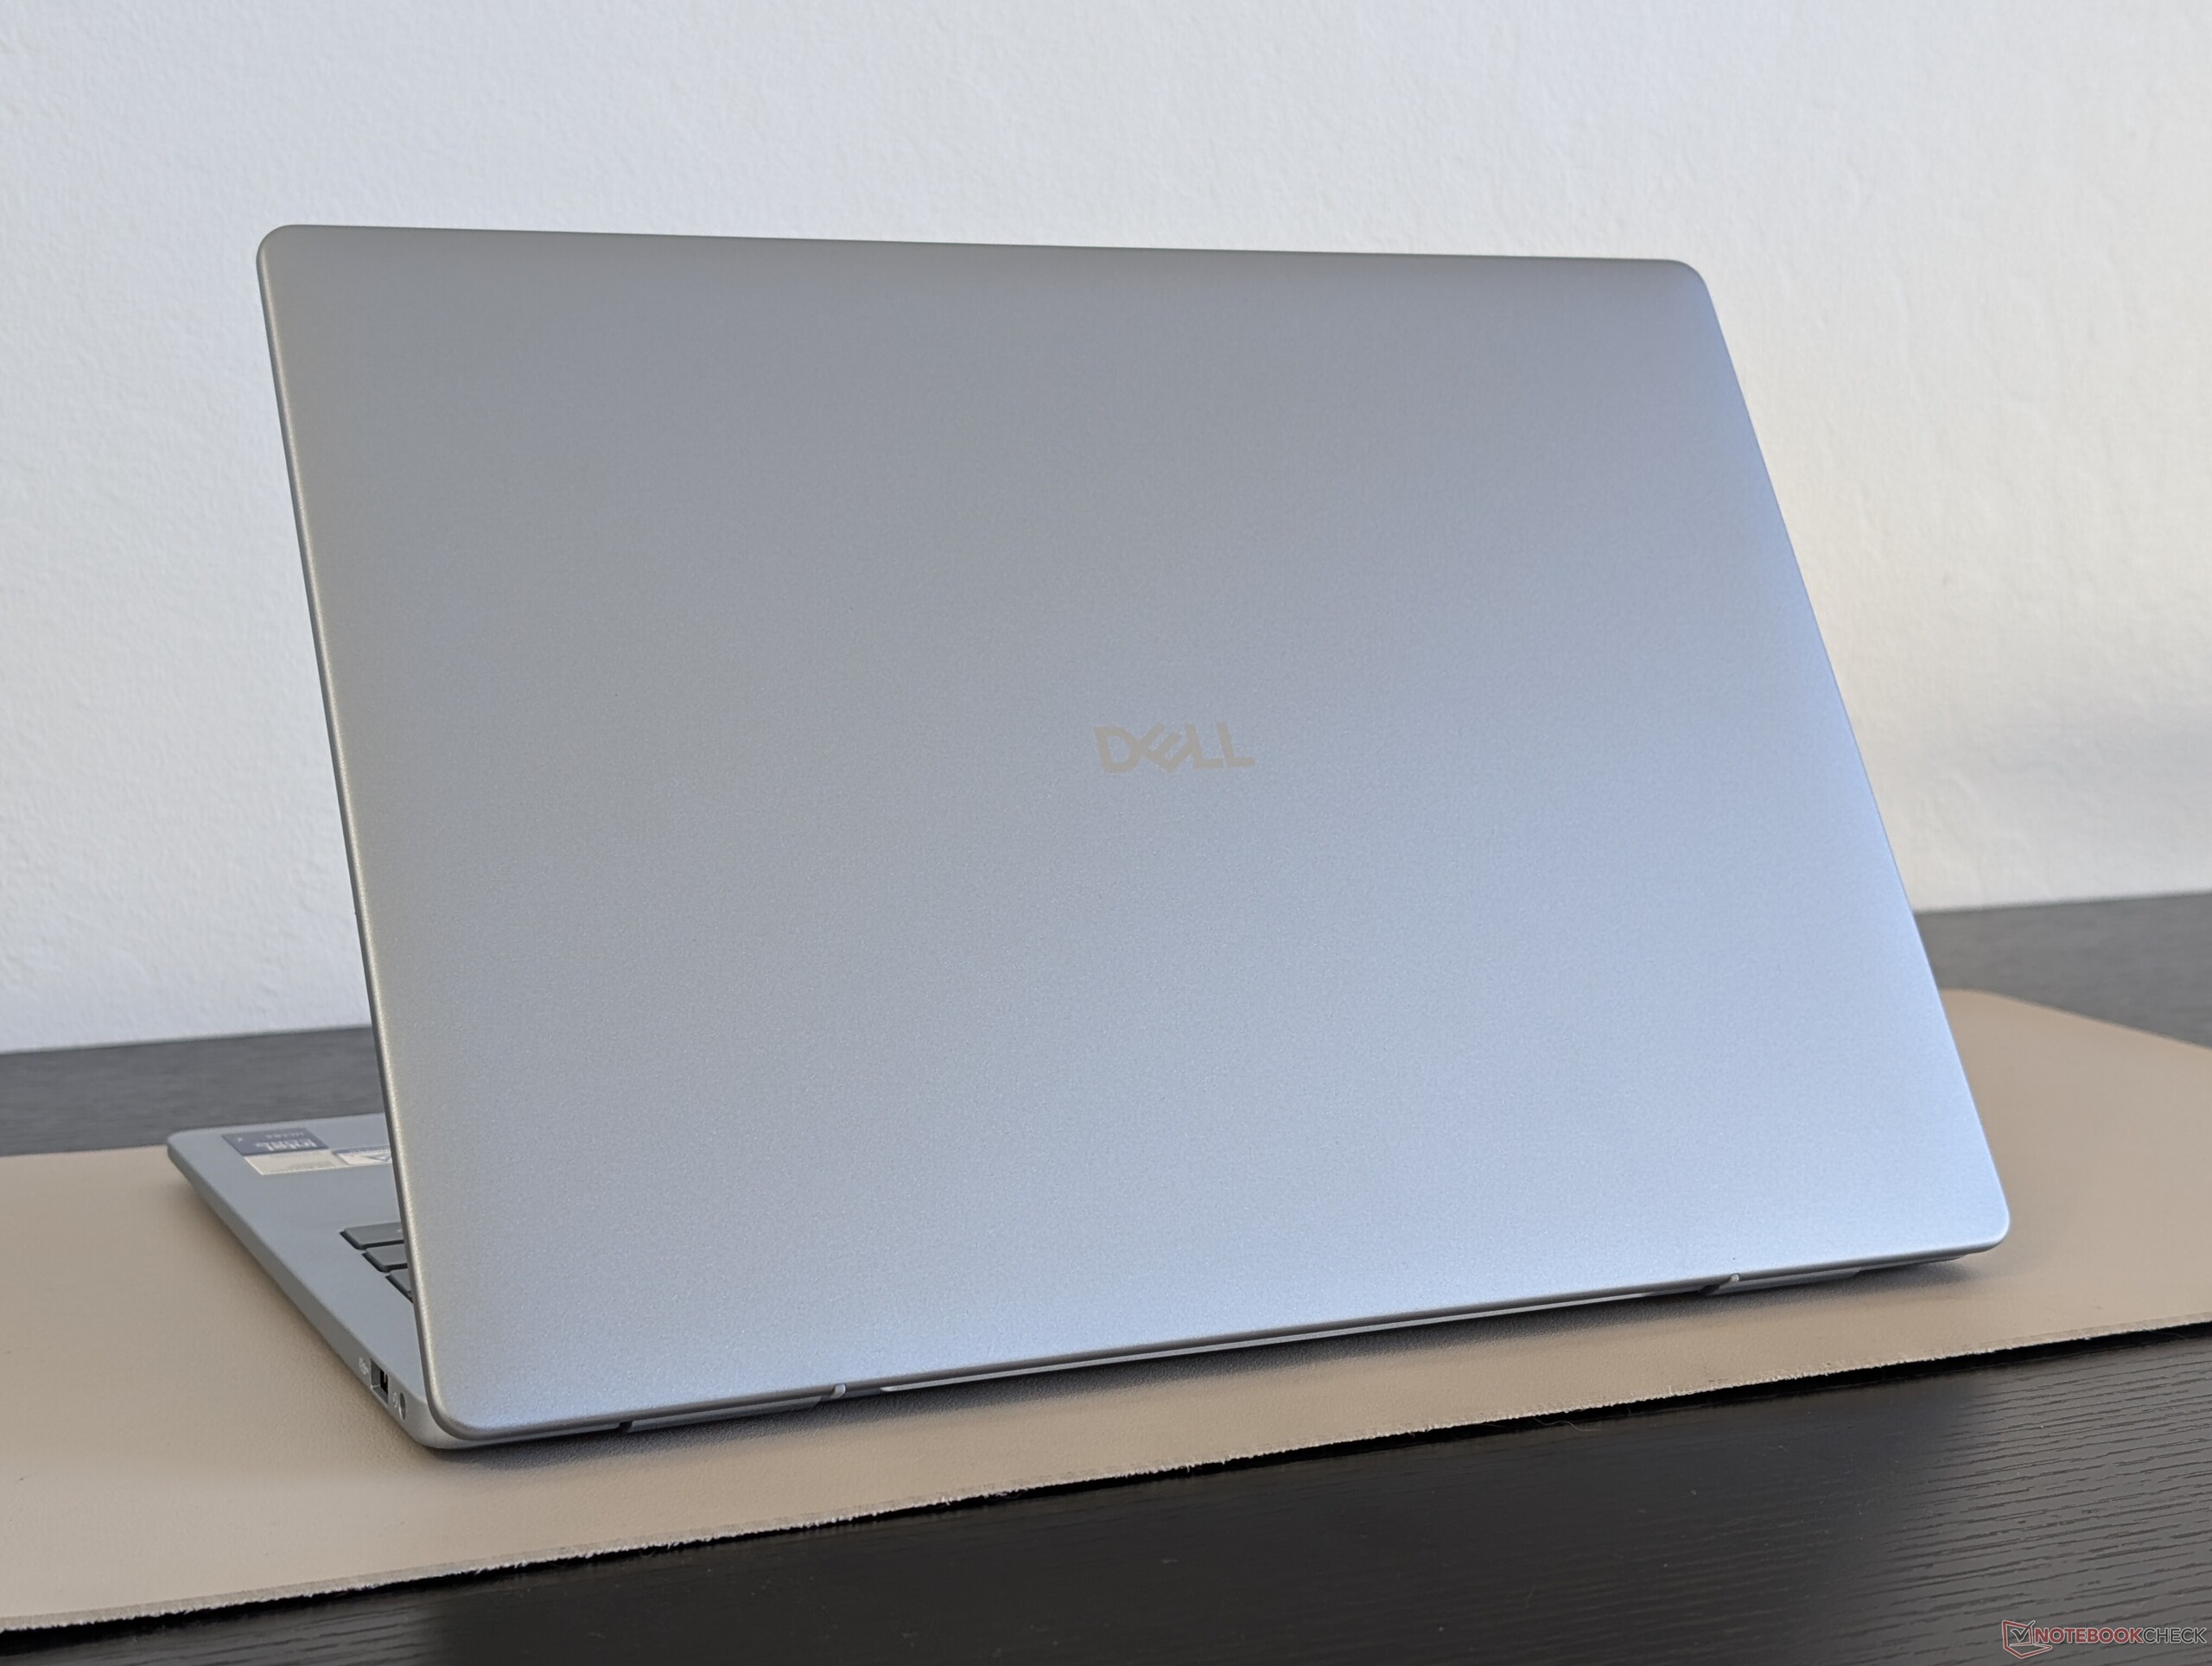
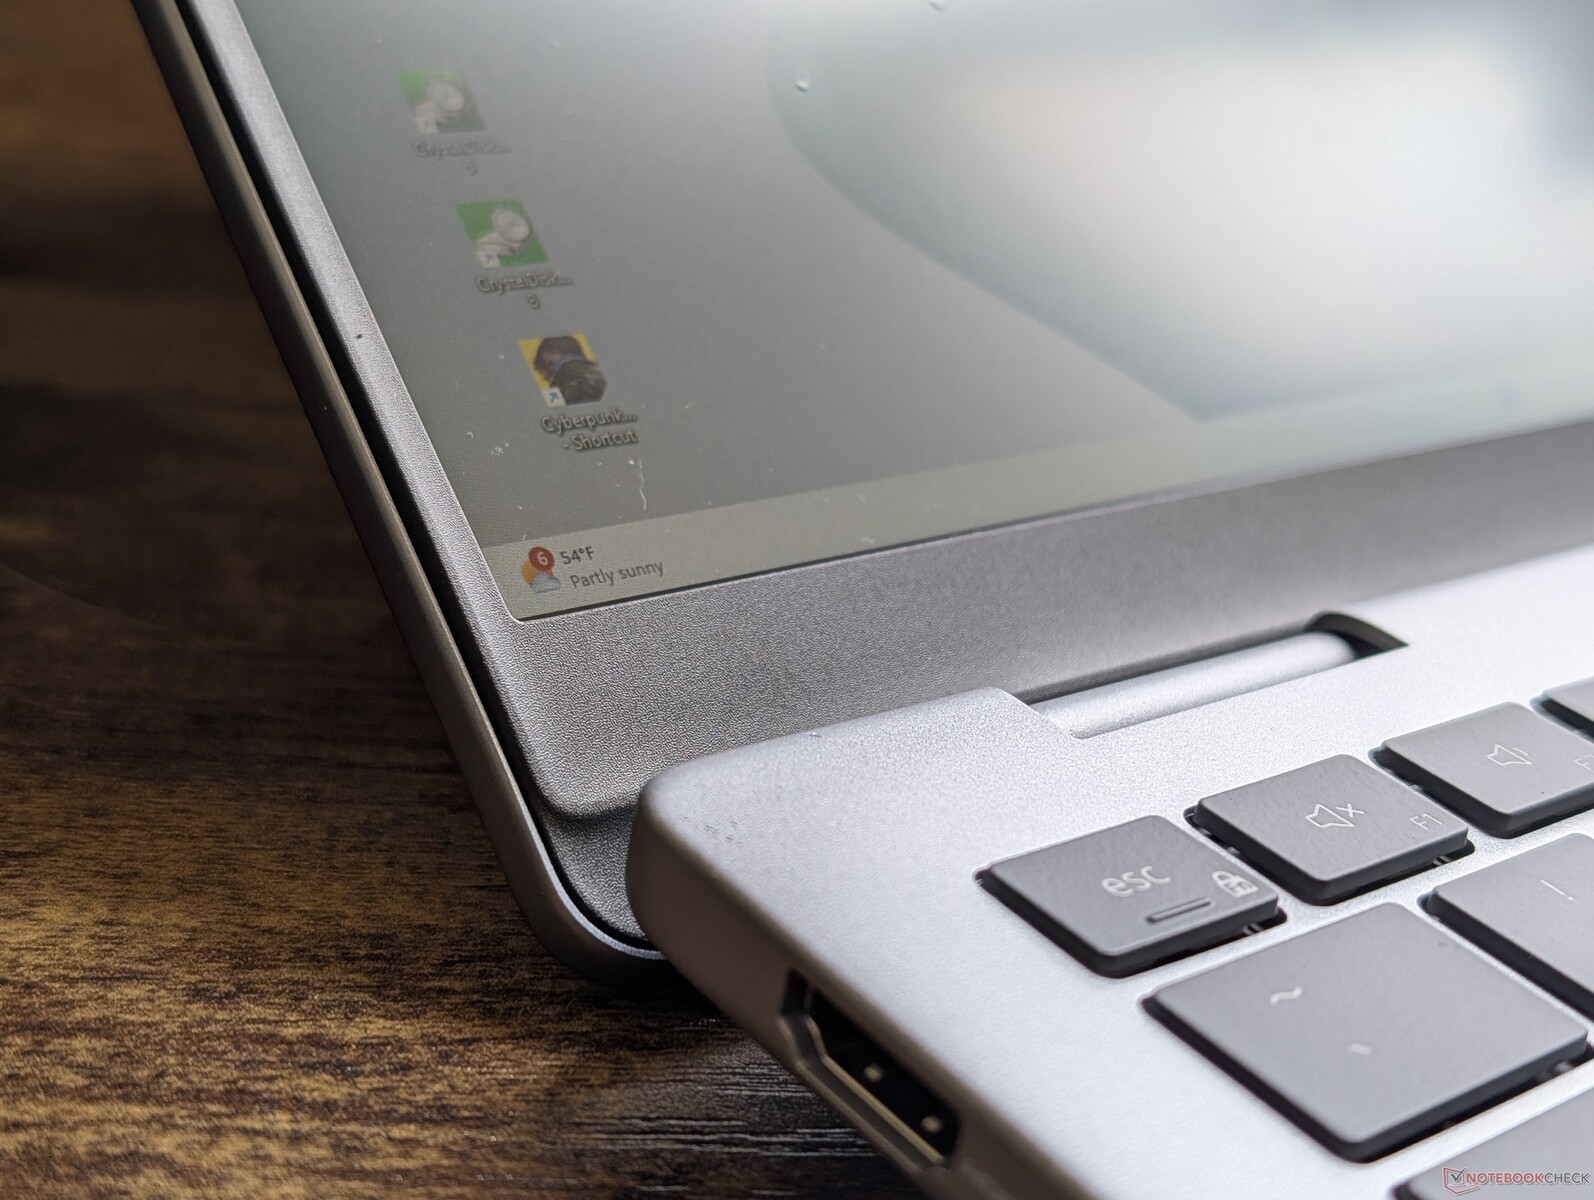
Obudowa ma wiele wspólnego z Inspironem 14 Plus 7440, jeśli chodzi o materiały, kolorystykę, a nawet wymiary. Być może najbardziej zauważalną różnicą są zawiasy, ponieważ pokrywa w nowszym modelu może otworzyć się o pełne 180 stopni, podczas gdy zeszłoroczny model był ograniczony do maksymalnie ~150 stopni. Istnieją również drobne różnice w tylnych kratkach wentylacyjnych i logo na zewnętrznej pokrywie. W przeciwnym razie nadal wydaje się, że jest to Inspiron, pomimo porzucenia nazwy.
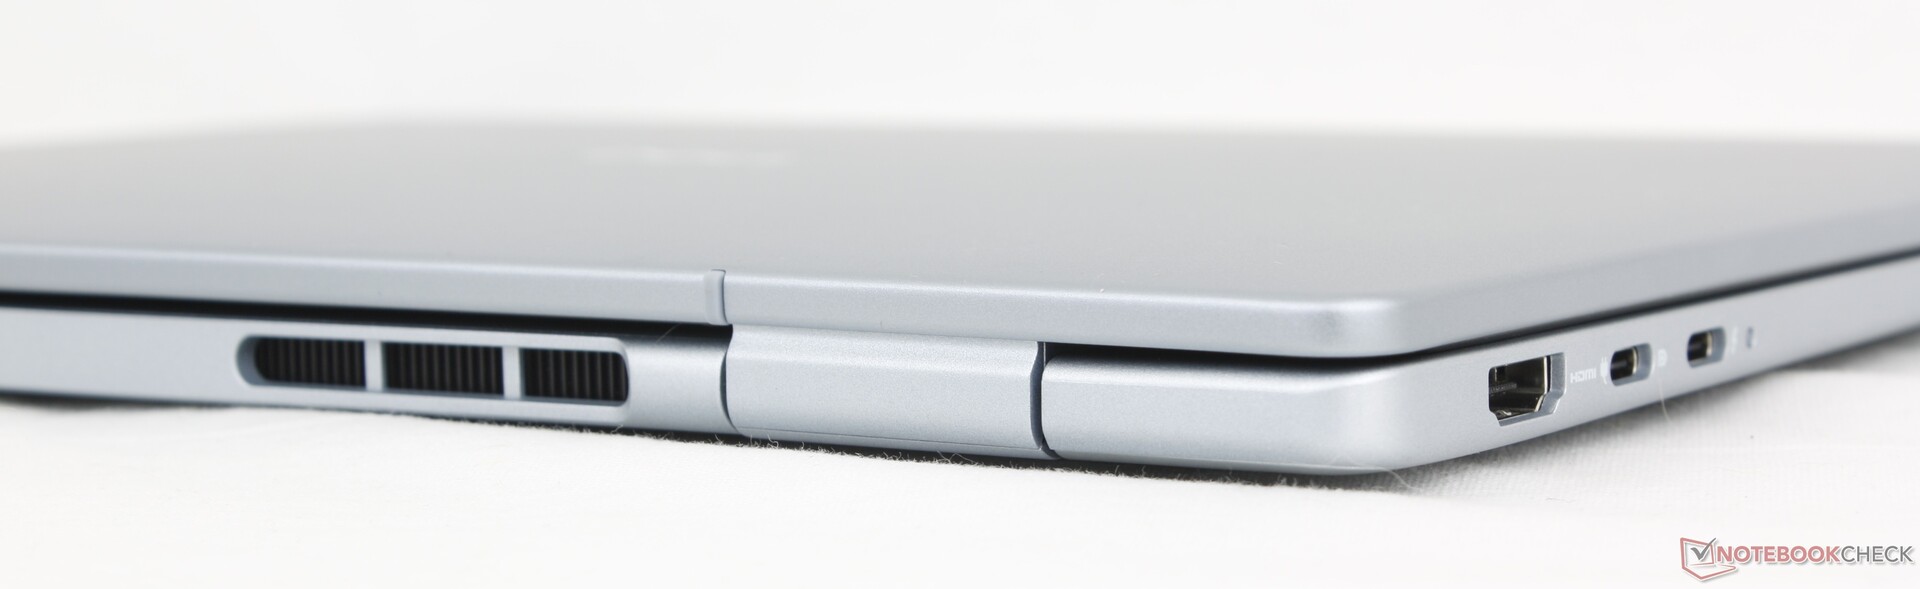
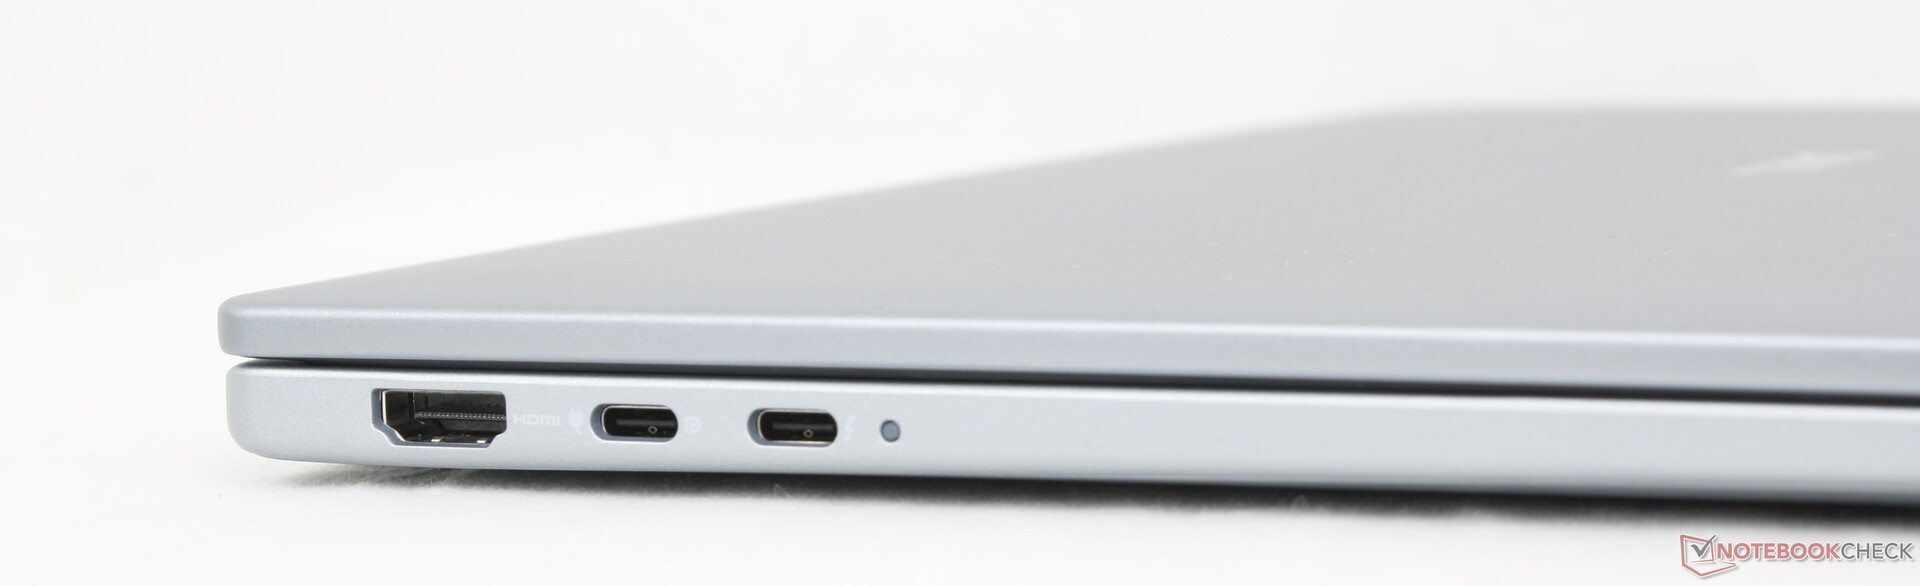
Łączność
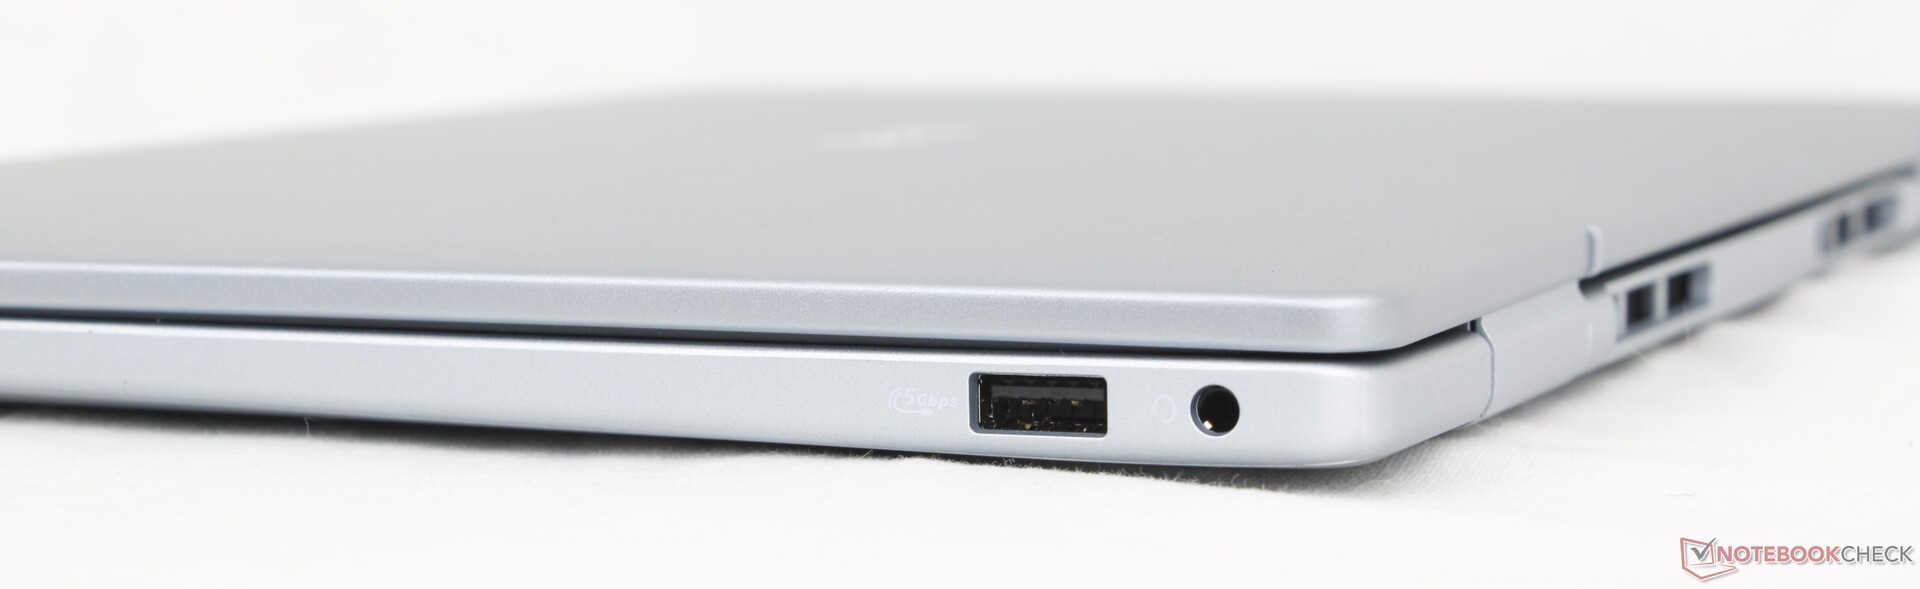
Opcje portów są przyzwoite z dwoma portami USB-C i tylko jednym portem USB-A. Baryłkowy port zasilacza sieciowego, który był obecny w starszych modelach Inspiron, został porzucony, aby w pełni wykorzystać ładowanie USB-C.
Proszę zauważyć, że tylko jeden z dwóch portów USB-C obsługuje Thunderbolt 4 i DisplayPort 2.1.
Komunikacja
| Networking | |
| iperf3 transmit AX12 | |
| Dell Inspiron 14 5425 6VPKR | |
| iperf3 receive AX12 | |
| Dell Inspiron 14 5425 6VPKR | |
| iperf3 transmit AXE11000 | |
| Lenovo IdeaPad Pro 5 14AKP G10 | |
| HP Pavilion Plus 14-ew0153TU | |
| Dell 14 Plus | |
| Dell Latitude 3440 | |
| Lenovo ThinkPad E14 G6 | |
| iperf3 receive AXE11000 | |
| Lenovo IdeaPad Pro 5 14AKP G10 | |
| HP Pavilion Plus 14-ew0153TU | |
| Dell 14 Plus | |
| Dell Latitude 3440 | |
| Lenovo ThinkPad E14 G6 | |
| iperf3 transmit AXE11000 6GHz | |
| HP Pavilion Plus 14-ew0153TU | |
| Dell 14 Plus | |
| Dell Latitude 3440 | |
| iperf3 receive AXE11000 6GHz | |
| HP Pavilion Plus 14-ew0153TU | |
| Dell 14 Plus | |
| Dell Latitude 3440 | |
Kamera internetowa
Kamera internetowa 2 MP jest standardem wraz z podczerwienią i fizyczną migawką.


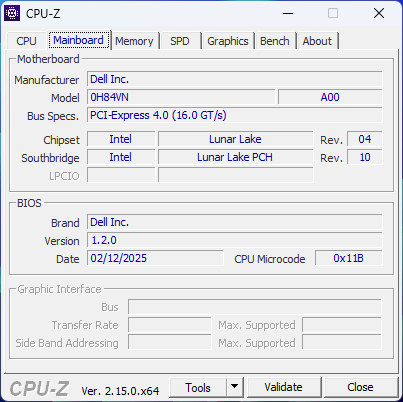
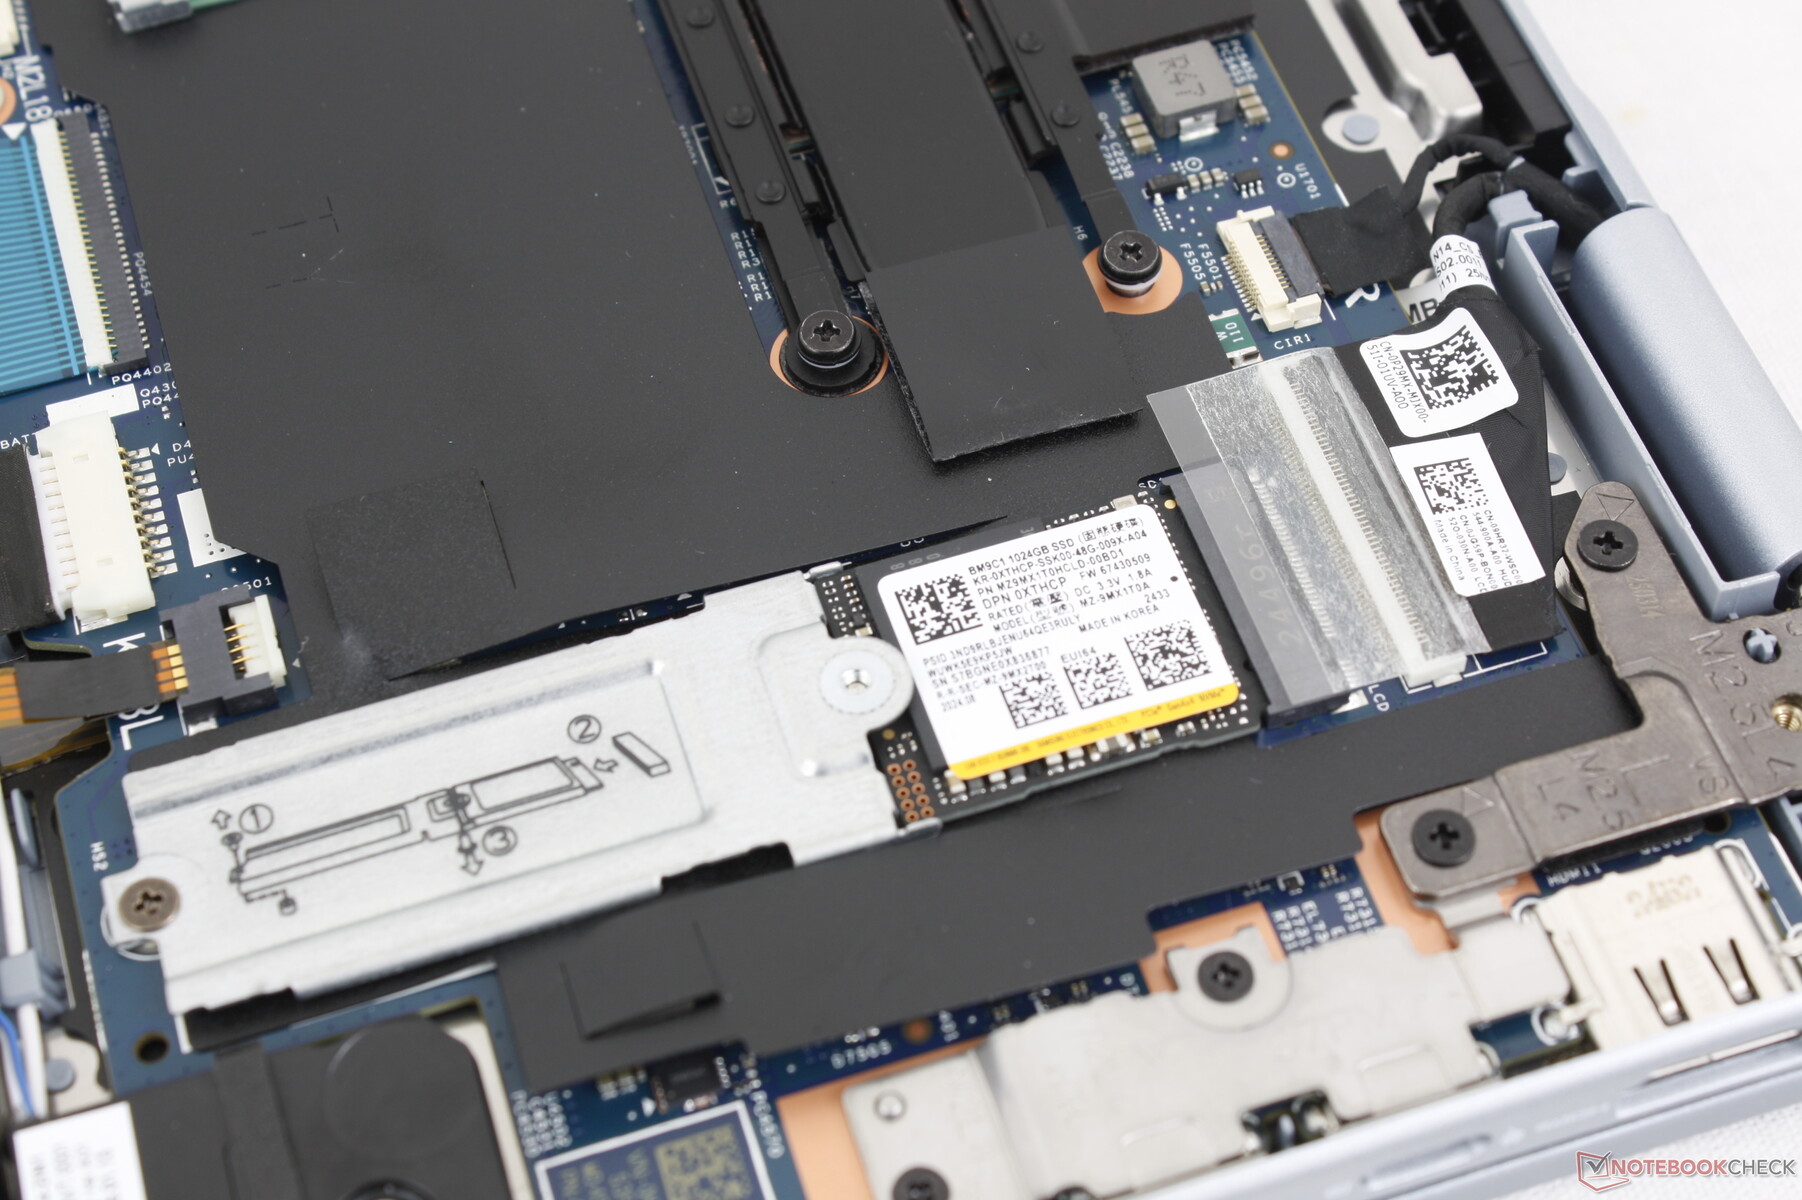
Konserwacja
Płyta główna jest niemal identyczna jak w Inspiron 14 Plus 7440, z niewielkimi zmianami w rozwiązaniu chłodzącym.
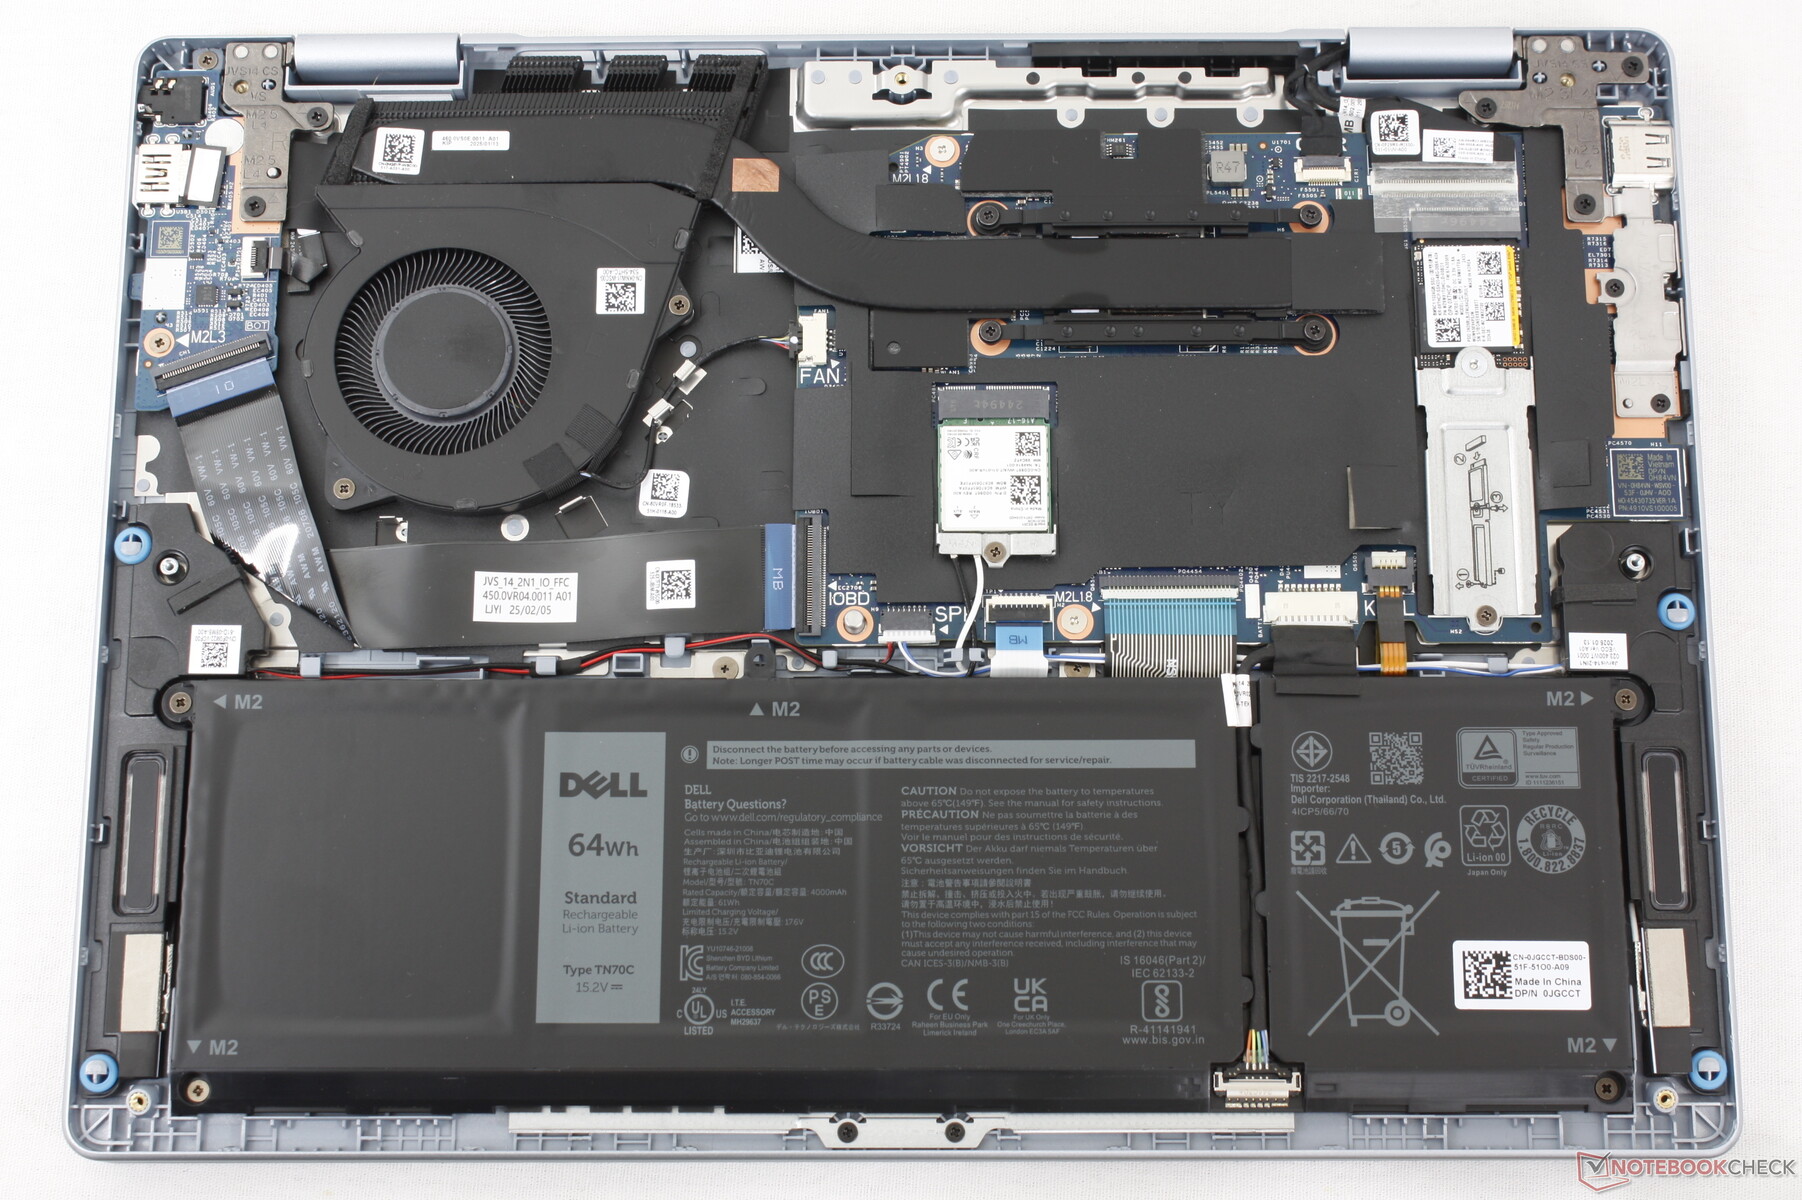
Zrównoważony rozwój
Górna pokrywa składa się w 50 procentach z aluminium pochodzącego z recyklingu, podczas gdy obudowa wentylatora składa się w 25 procentach z tworzyw sztucznych pochodzących z oceanów. Wspornik podparcia dłoni składa się w 15 procentach ze stali pochodzącej z recyklingu.
Opakowanie nie zawiera plastiku, co ułatwia recykling.
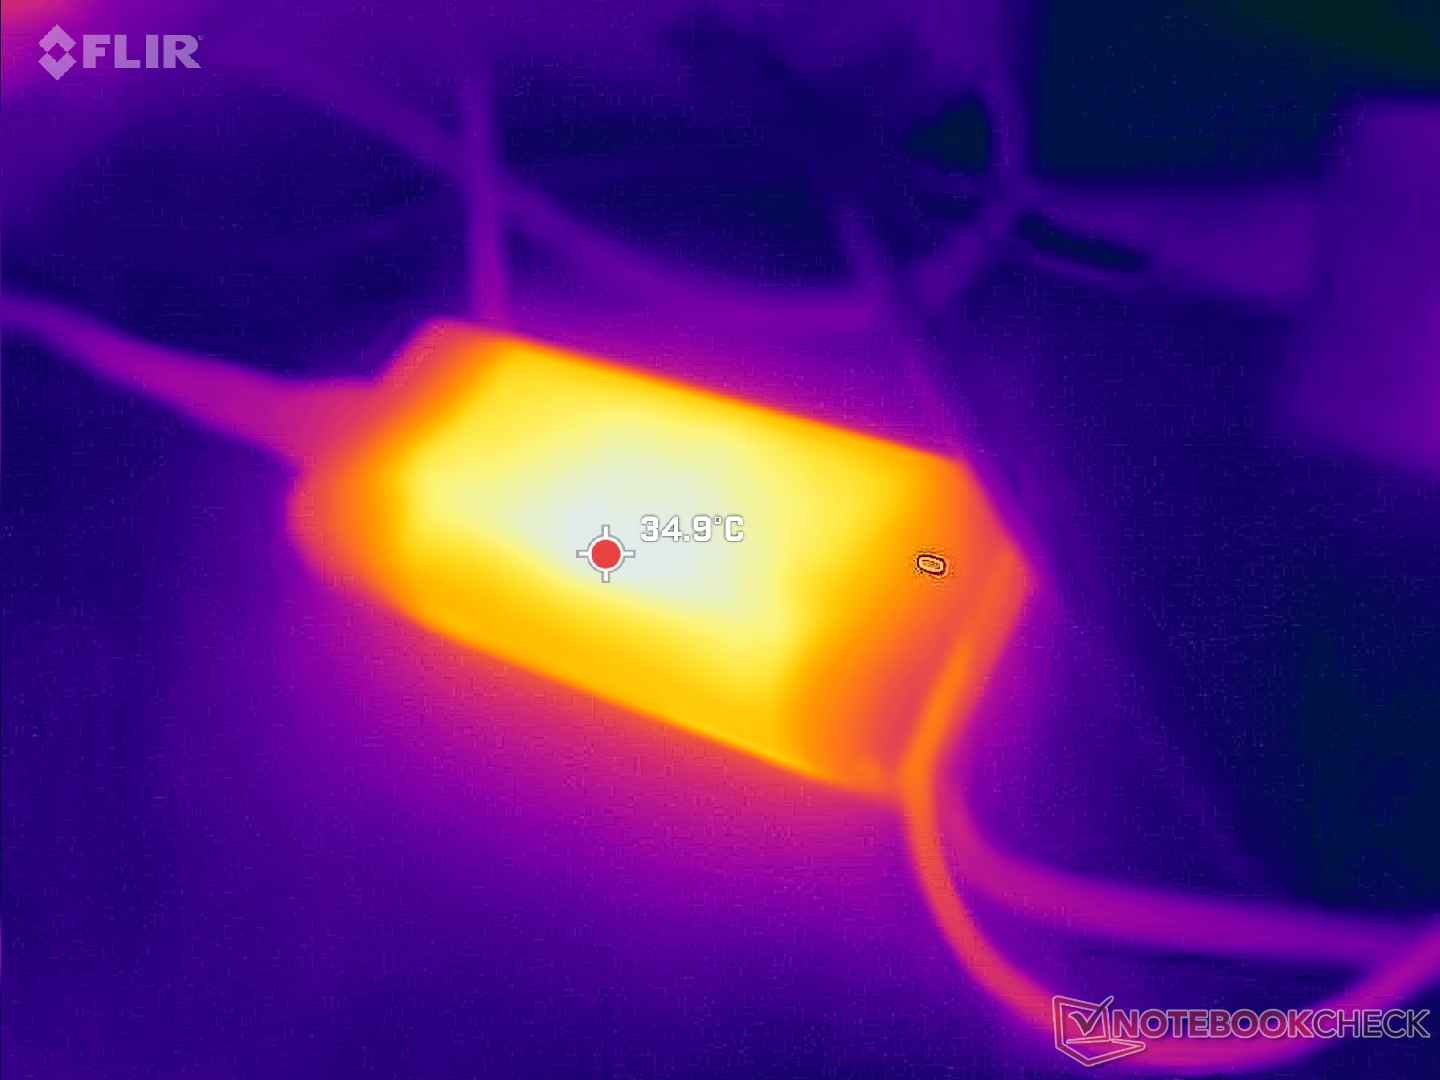
Akcesoria i gwarancja
Pudełko detaliczne zawiera niewielki (~11,1 x 5 x 2,8 cm) zasilacz sieciowy USB-C o mocy 65 W oraz zwykłą dokumentację. W przypadku zakupu w Stanach Zjednoczonych obowiązuje roczna ograniczona gwarancja producenta.
Urządzenia wejściowe
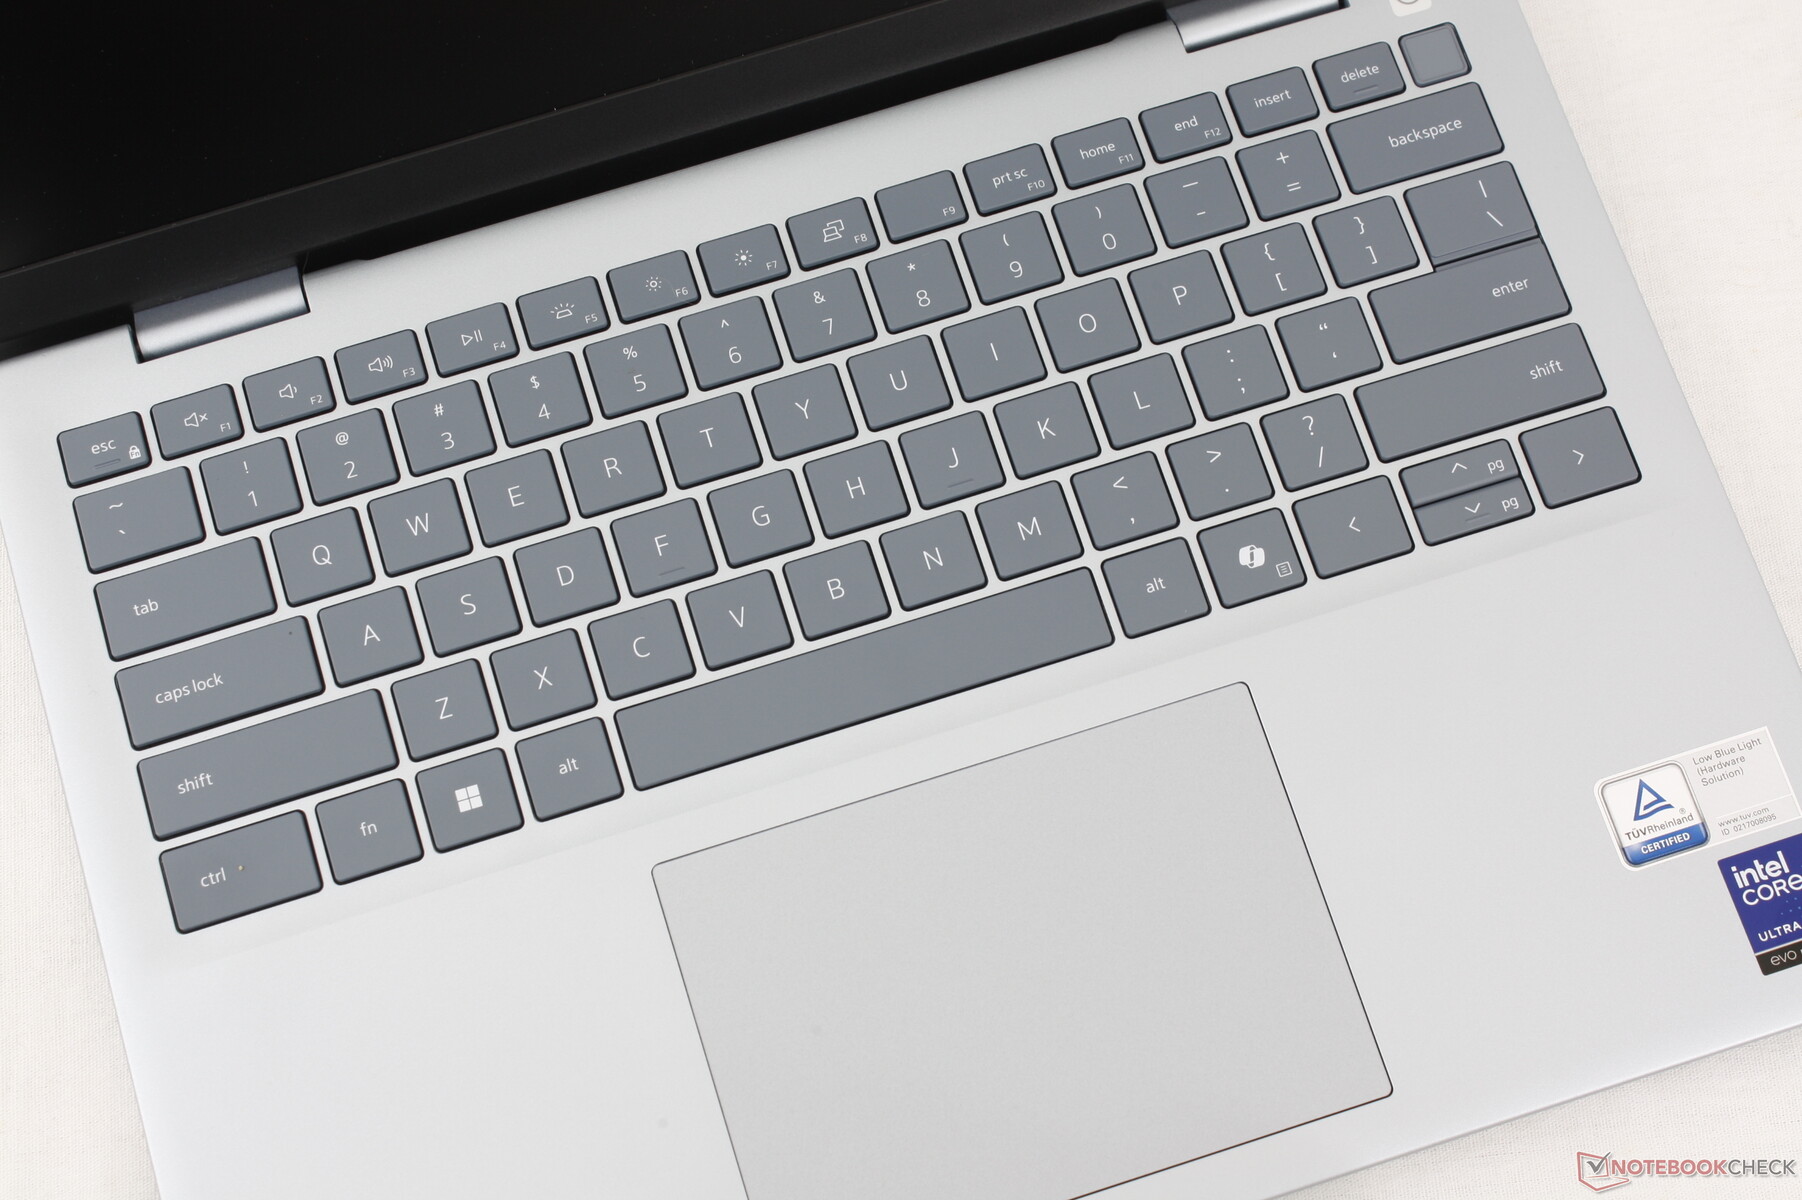
Klawiatura
Klawiatura jest zasadniczo identyczna z zeszłorocznym Inspironem 14 Plus 7440 pod względem sprzężenia zwrotnego, czcionki, a nawet funkcji dodatkowych. Jedyną wizualną różnicą jest dedykowany klawisz Co-Pilot, który zastępuje prawy klawisz Ctrl.
Panel dotykowy
Klawiatura ma dokładnie taki sam rozmiar jak ta w zeszłorocznym Inspironie 14 Plus 7440, czyli 12,5 x 8 cm. Sterowanie kursorem jest przestronne i niezawodne, ale sprzężenie zwrotne podczas naciskania powierzchni jest zdecydowanie zbyt słabe i płytkie.
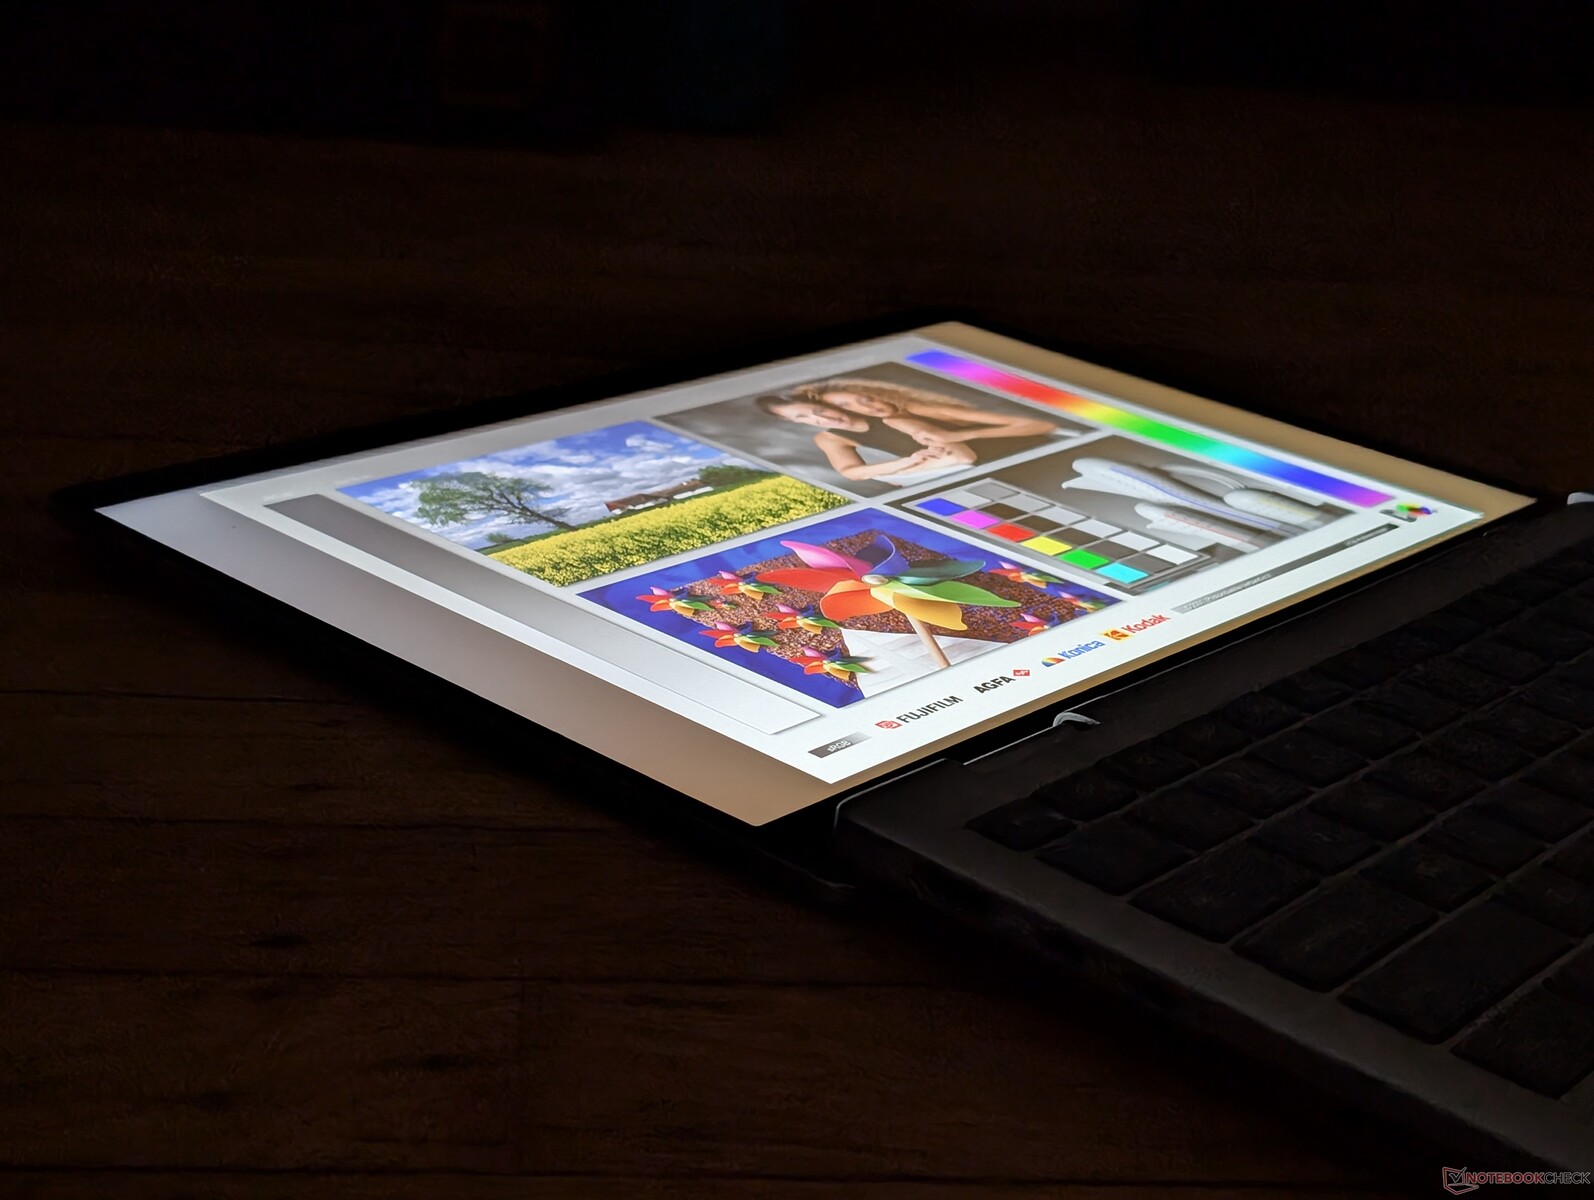
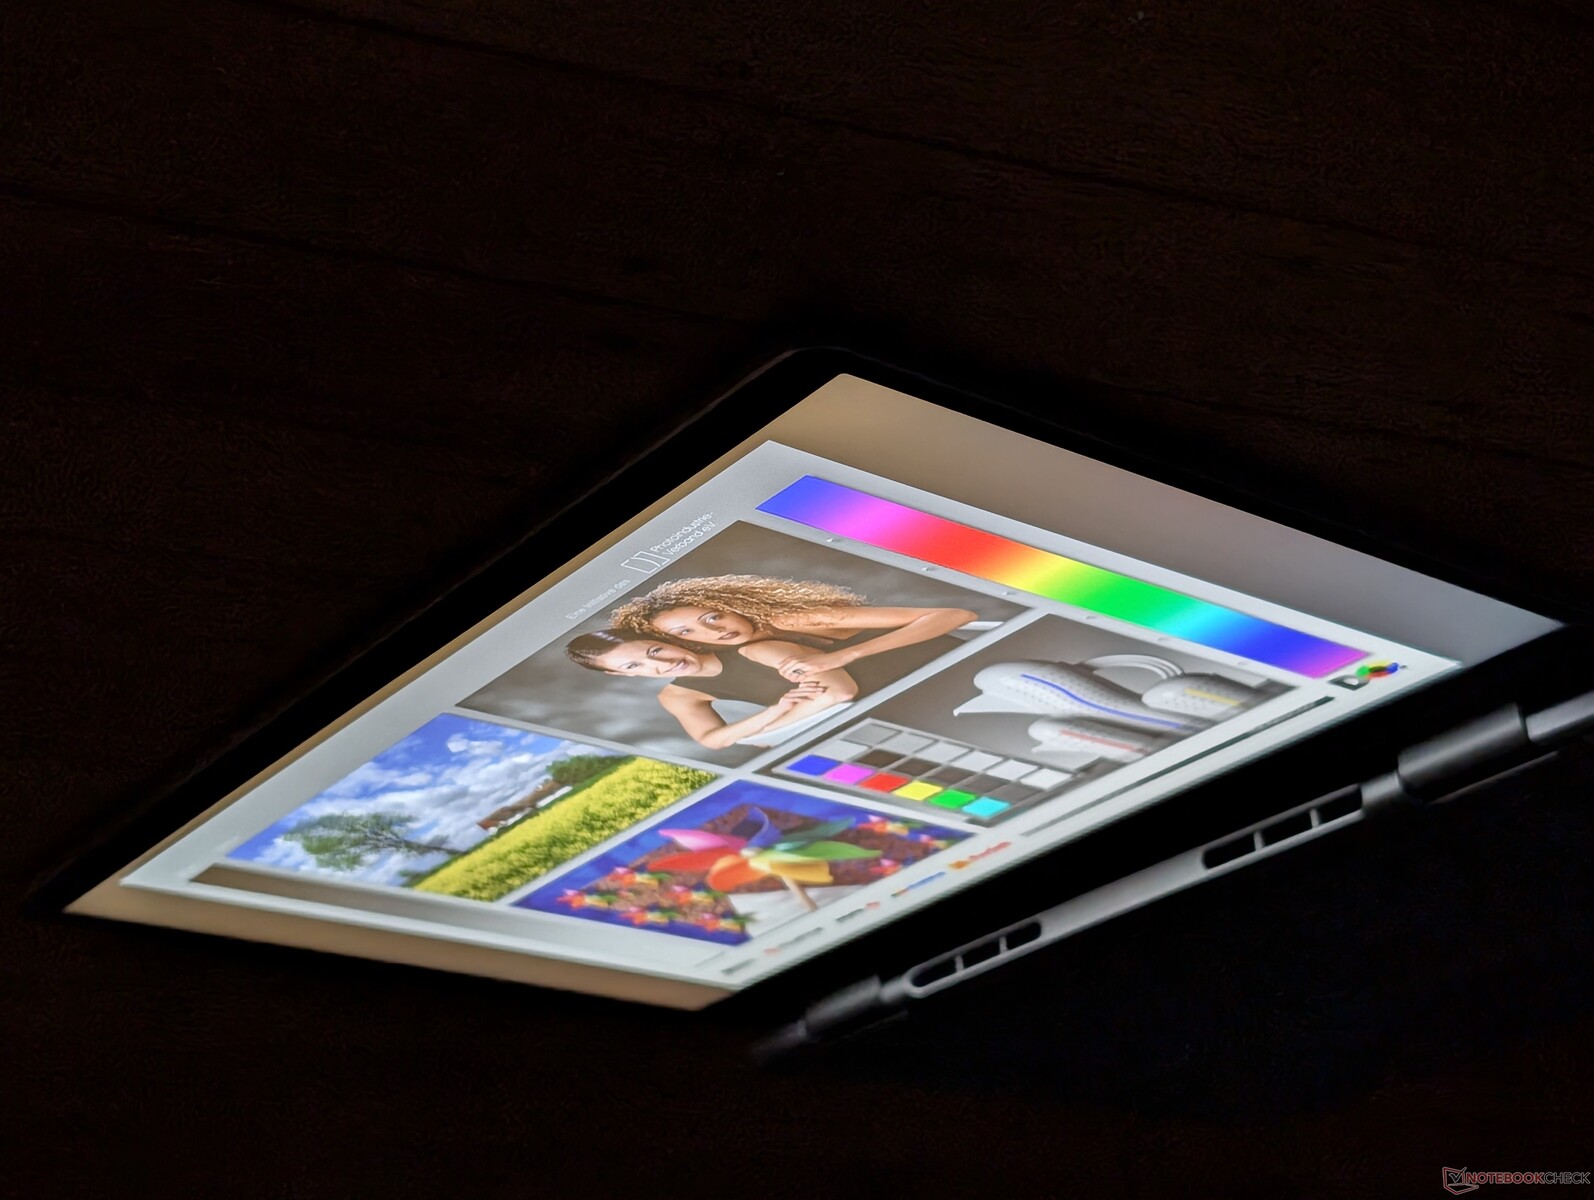
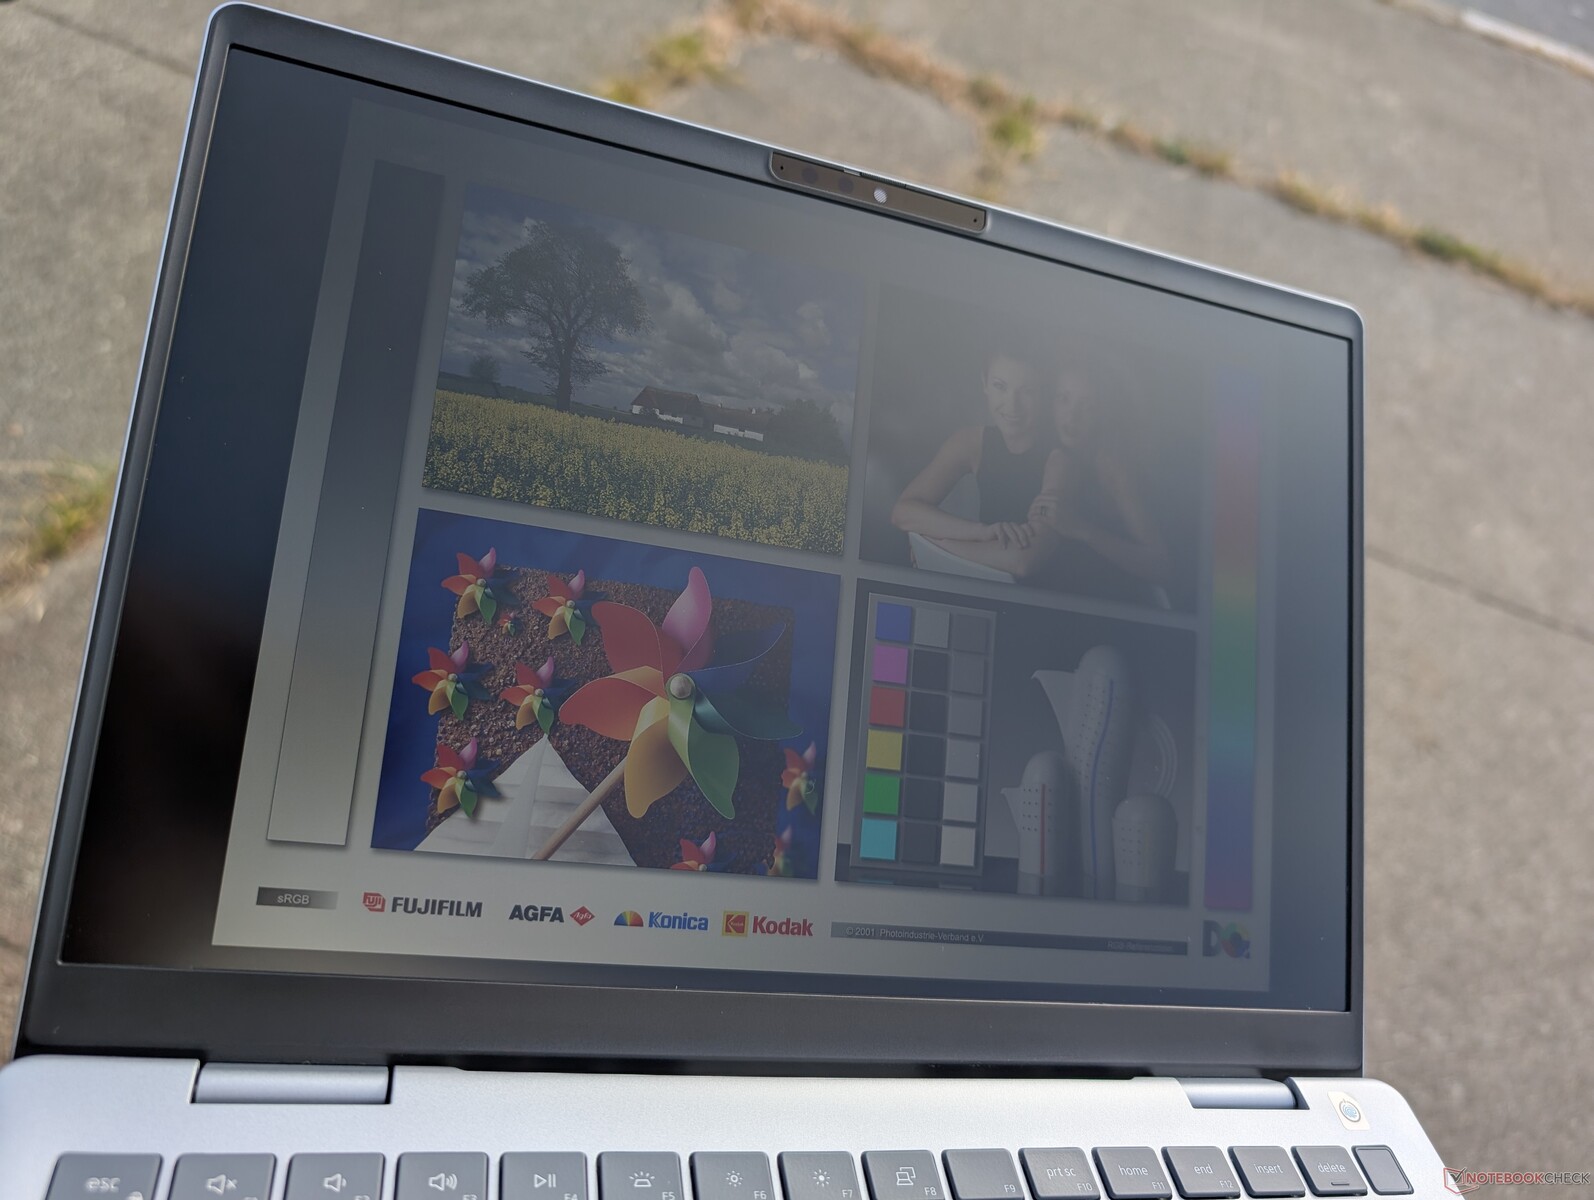
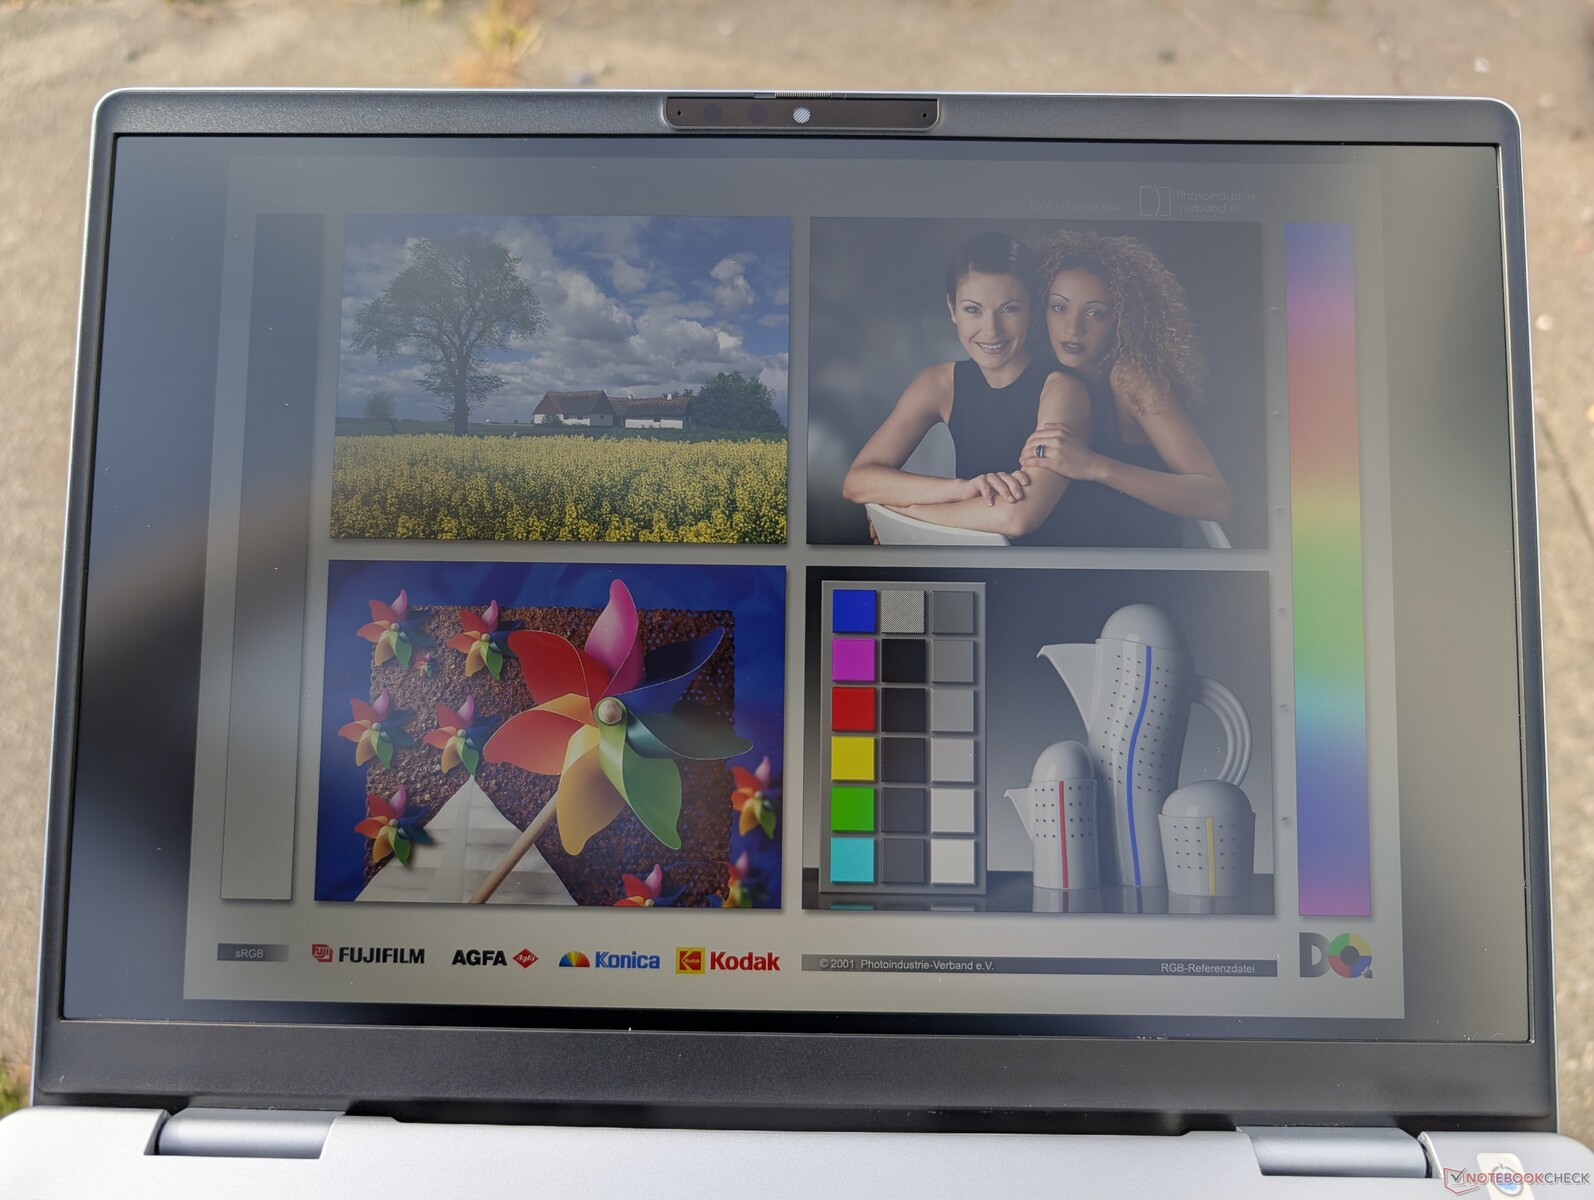
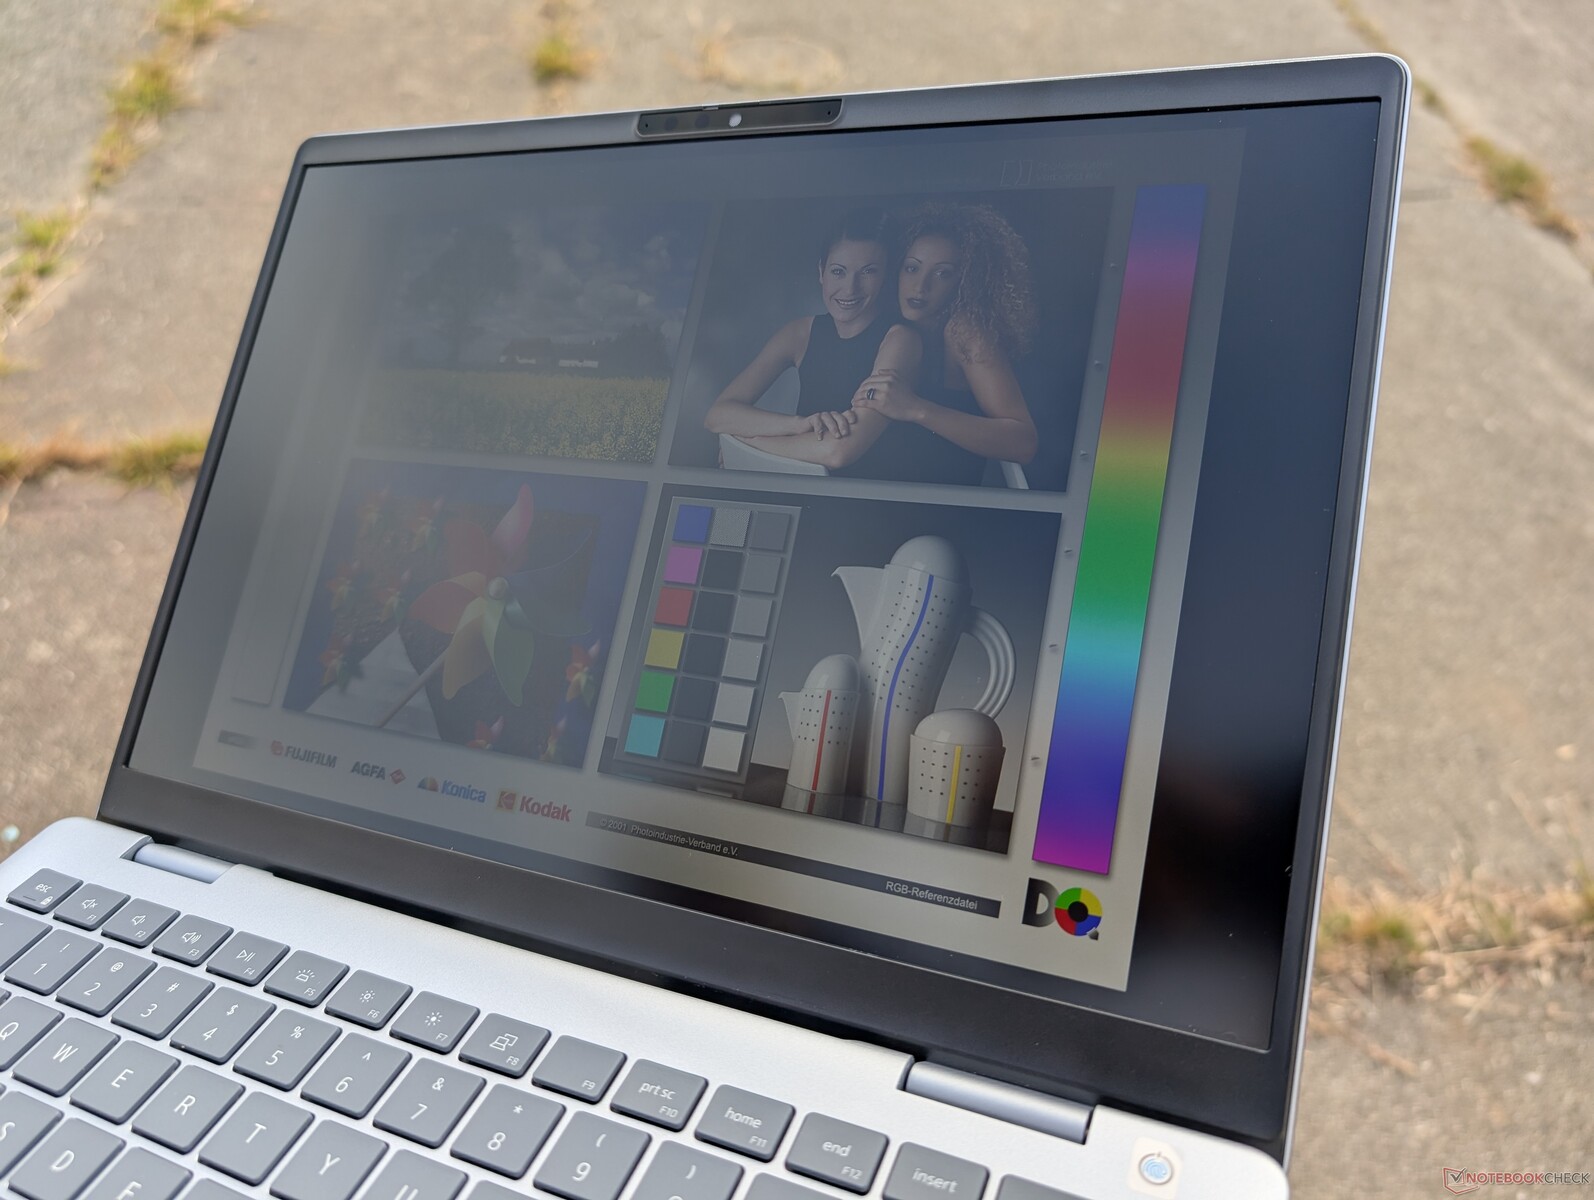
Wyświetlacz
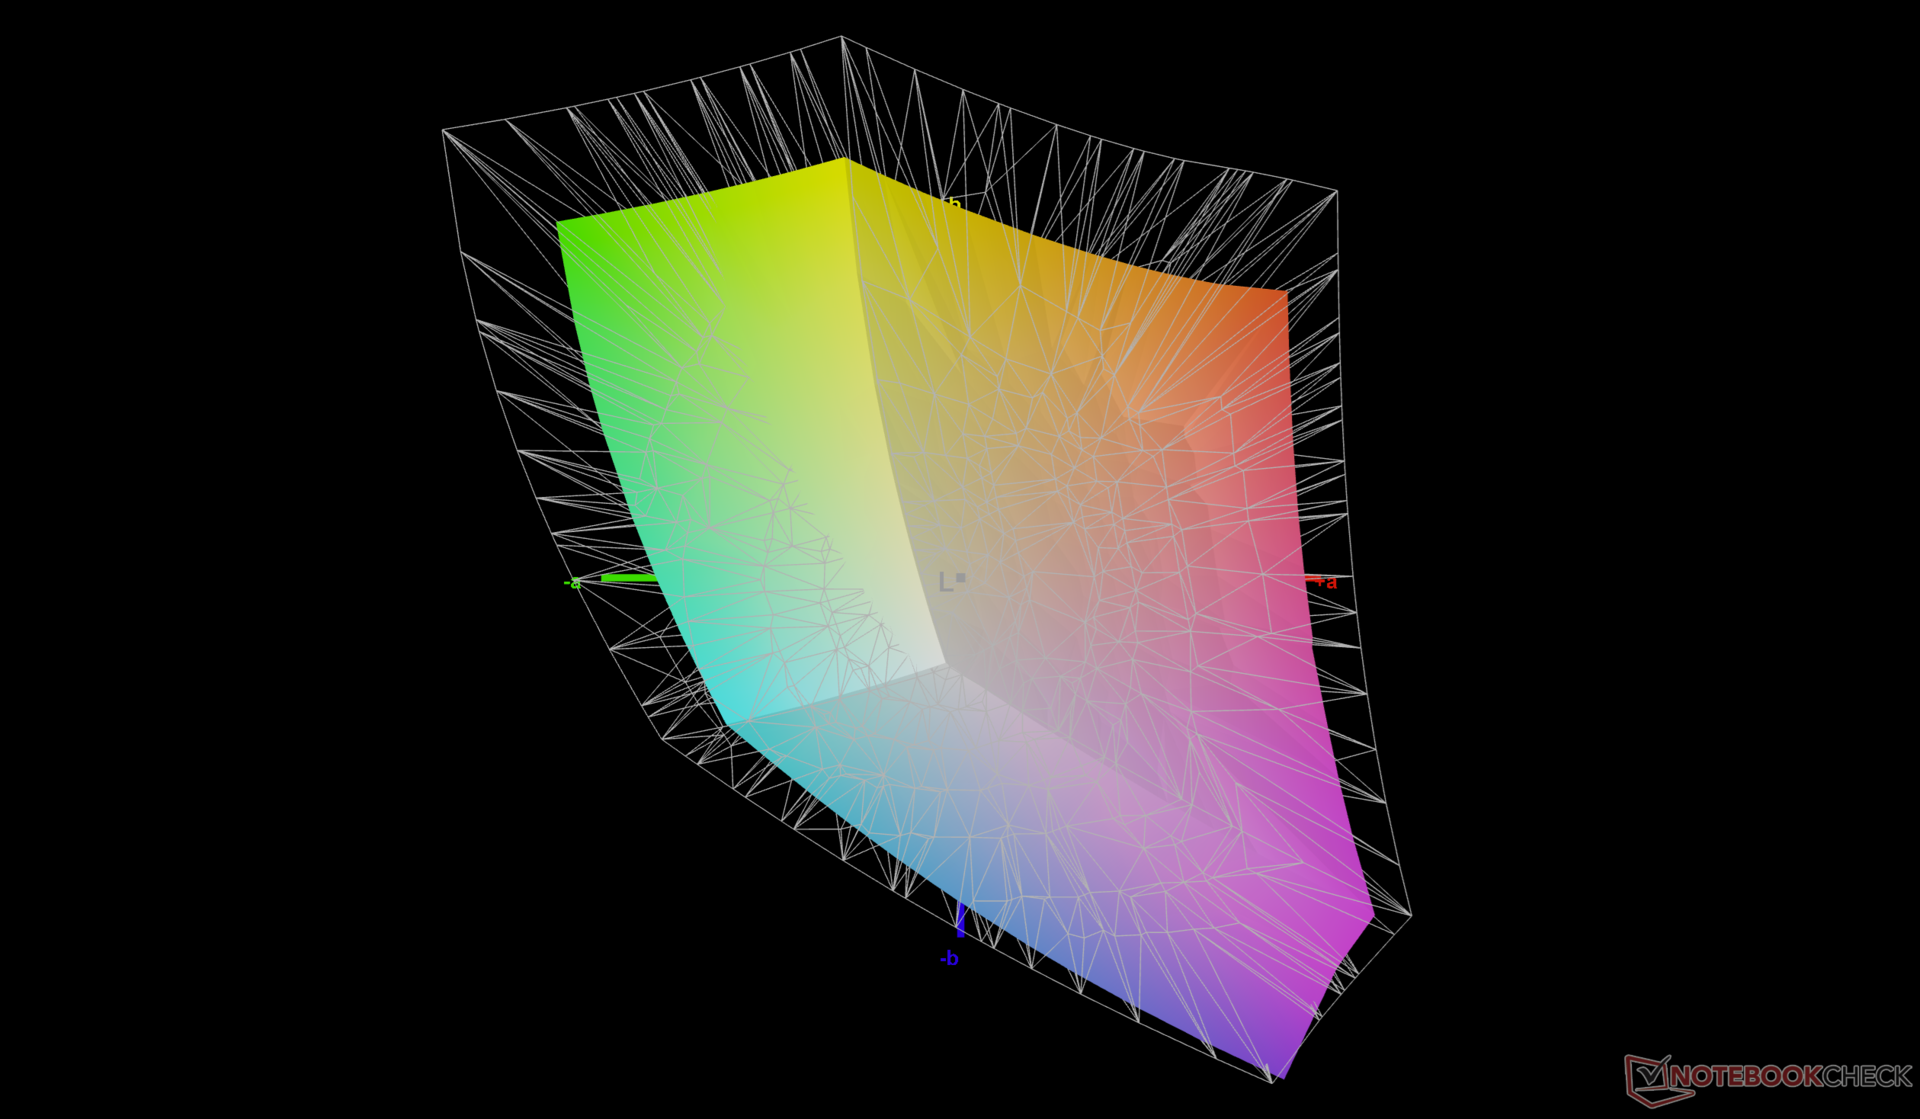
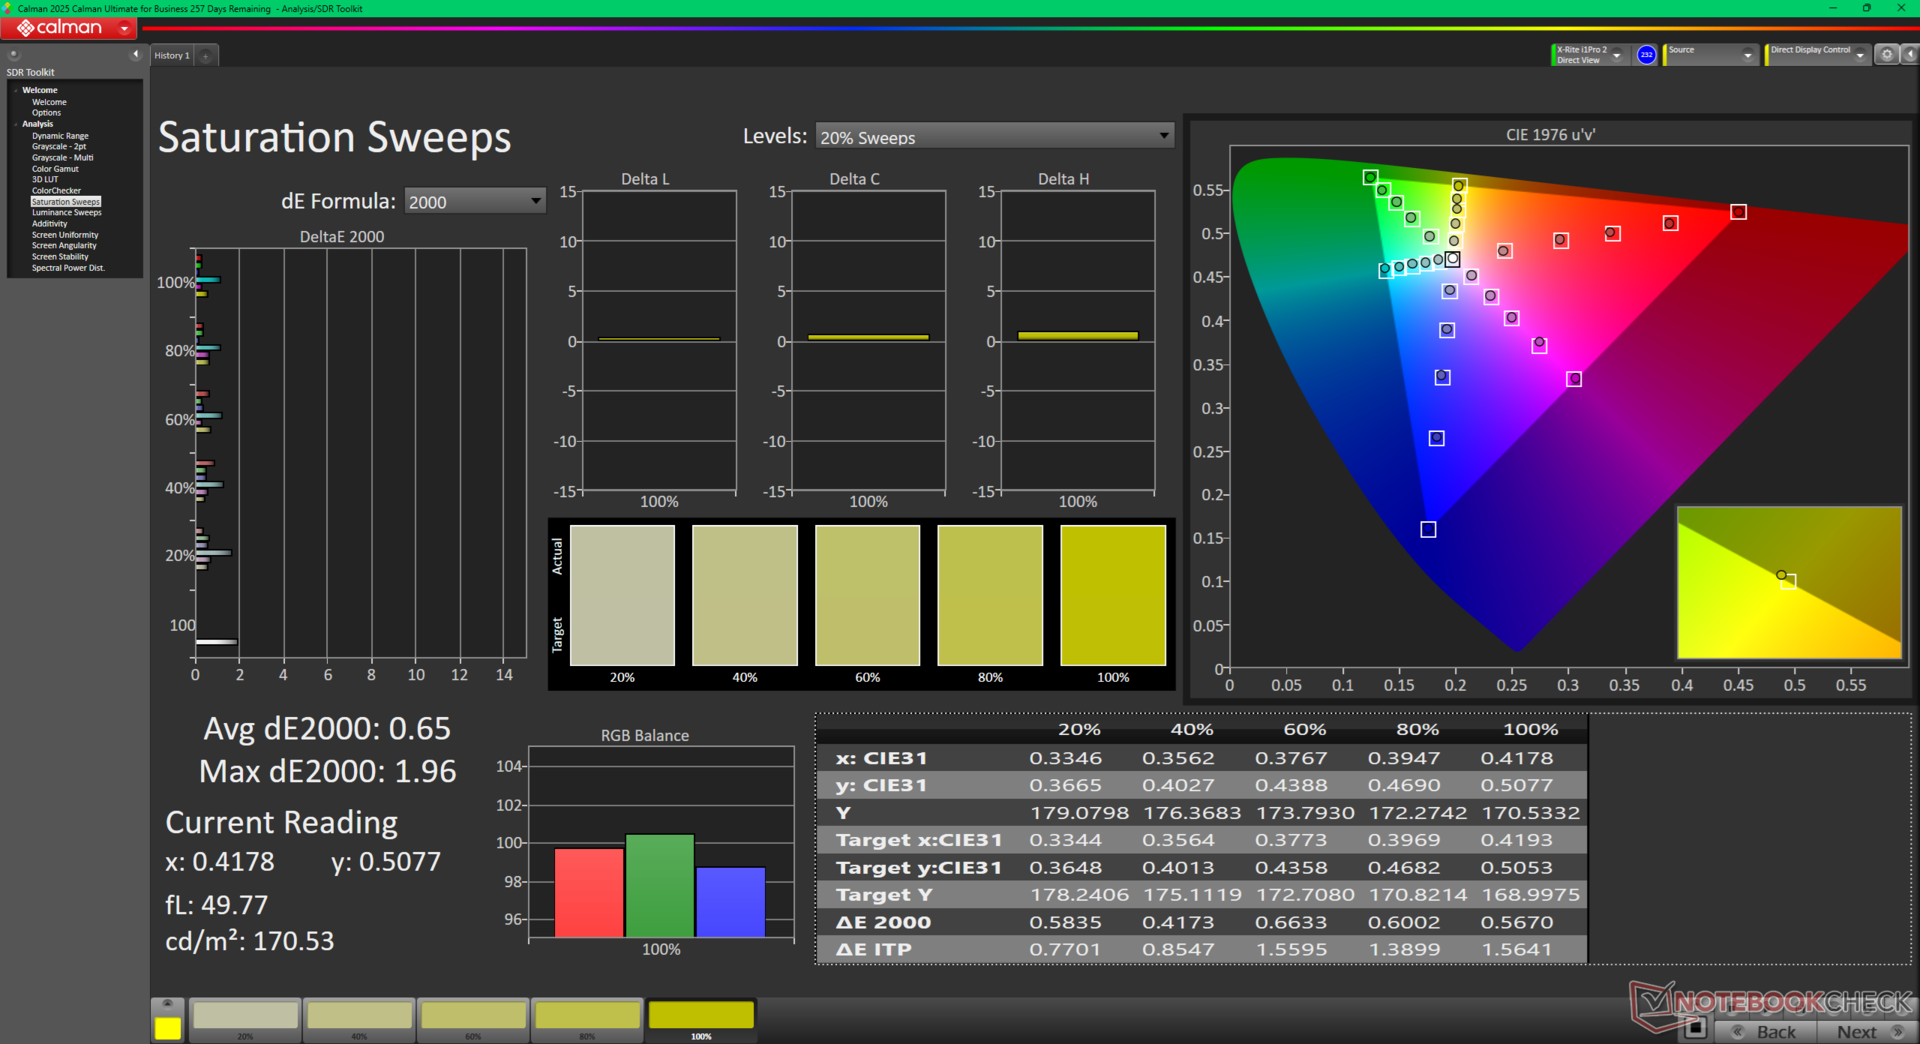
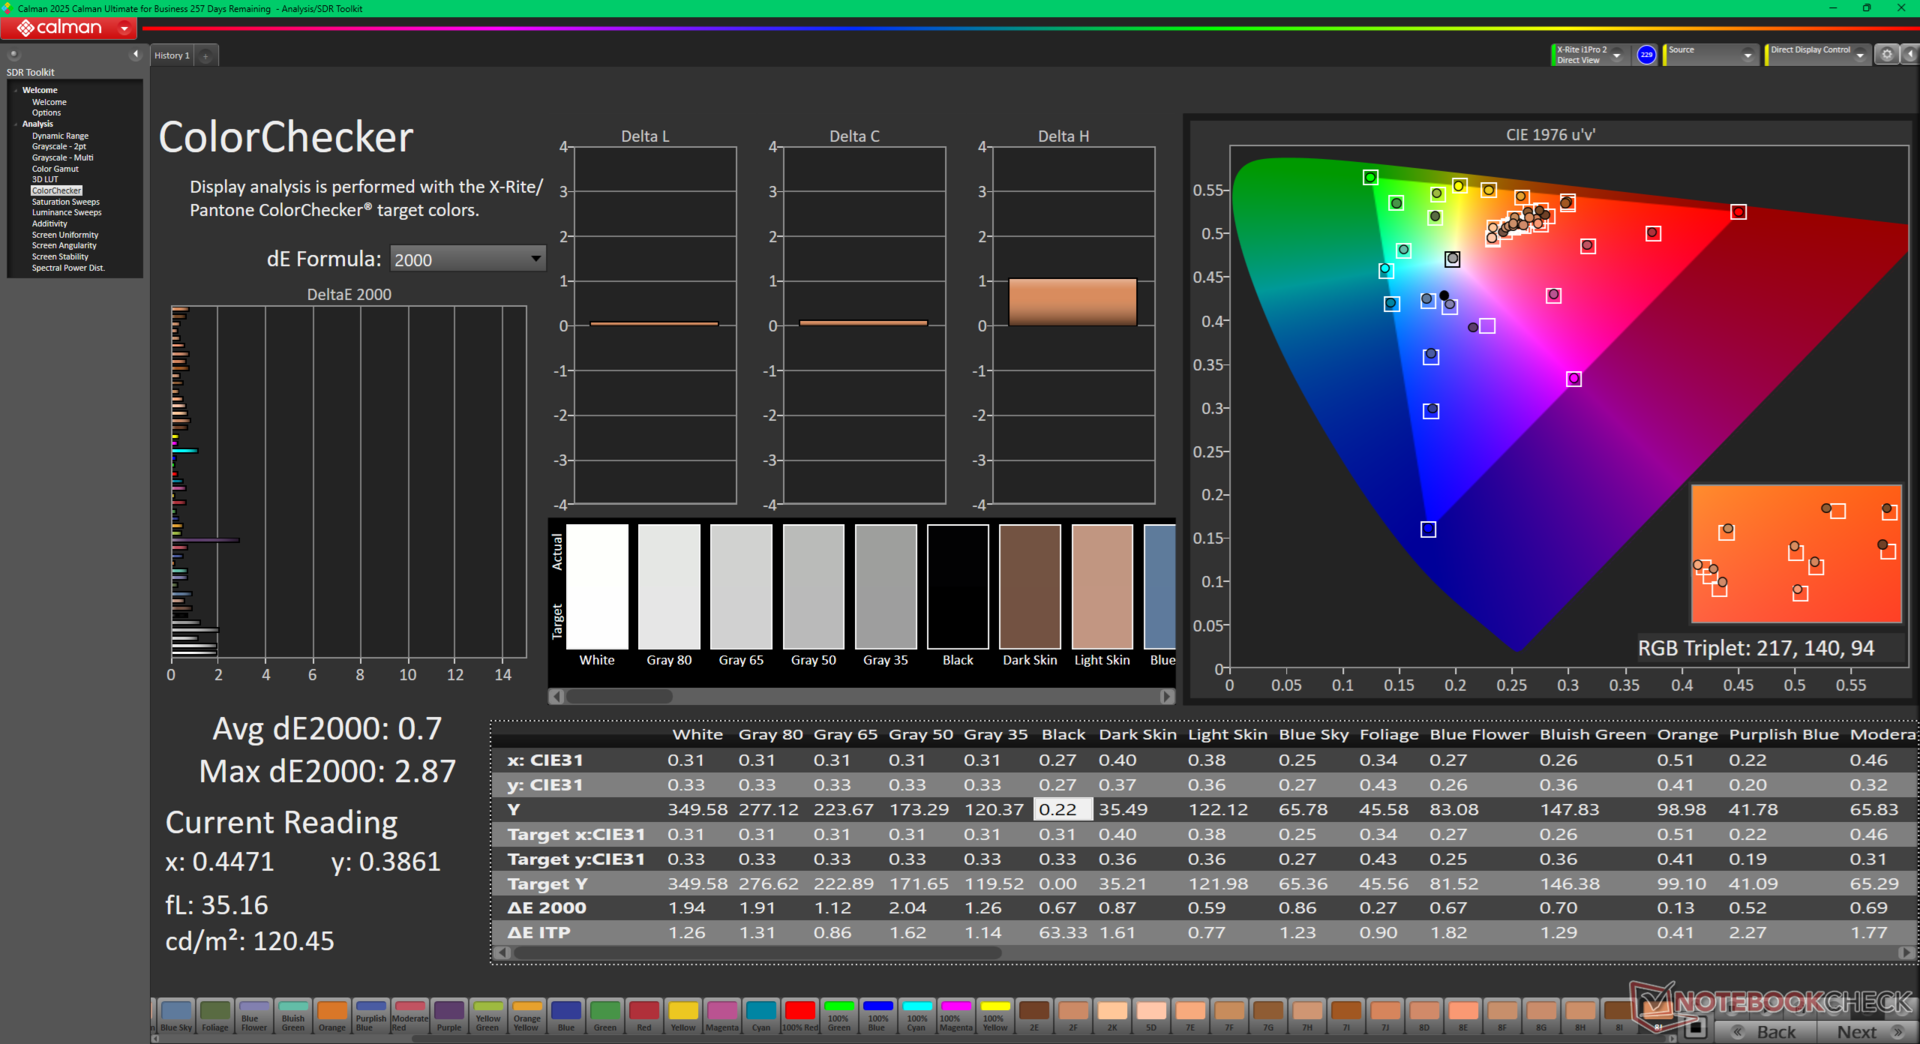
Wyświetlacz o rozdzielczości 1600p oferuje pełne kolory sRGB, wysoki współczynnik kontrastu dla panelu IPS i częstotliwość odświeżania 90 Hz, dzięki czemu jest lepszy niż większość wyświetlaczy w budżetowych laptopach. Głównymi zastrzeżeniami są tutaj stosunkowo wolne czasy reakcji czerni i bieli oraz lekko ziarnista, matowa powłoka. W przypadku przeglądania stron internetowych i odtwarzania wideo wady te powinny mieć jednak minimalny wpływ na wrażenia z oglądania.

| |||||||||||||||||||||||||
rozświetlenie: 92 %
na akumulatorze: 354 cd/m²
kontrast: 1686:1 (czerń: 0.21 cd/m²)
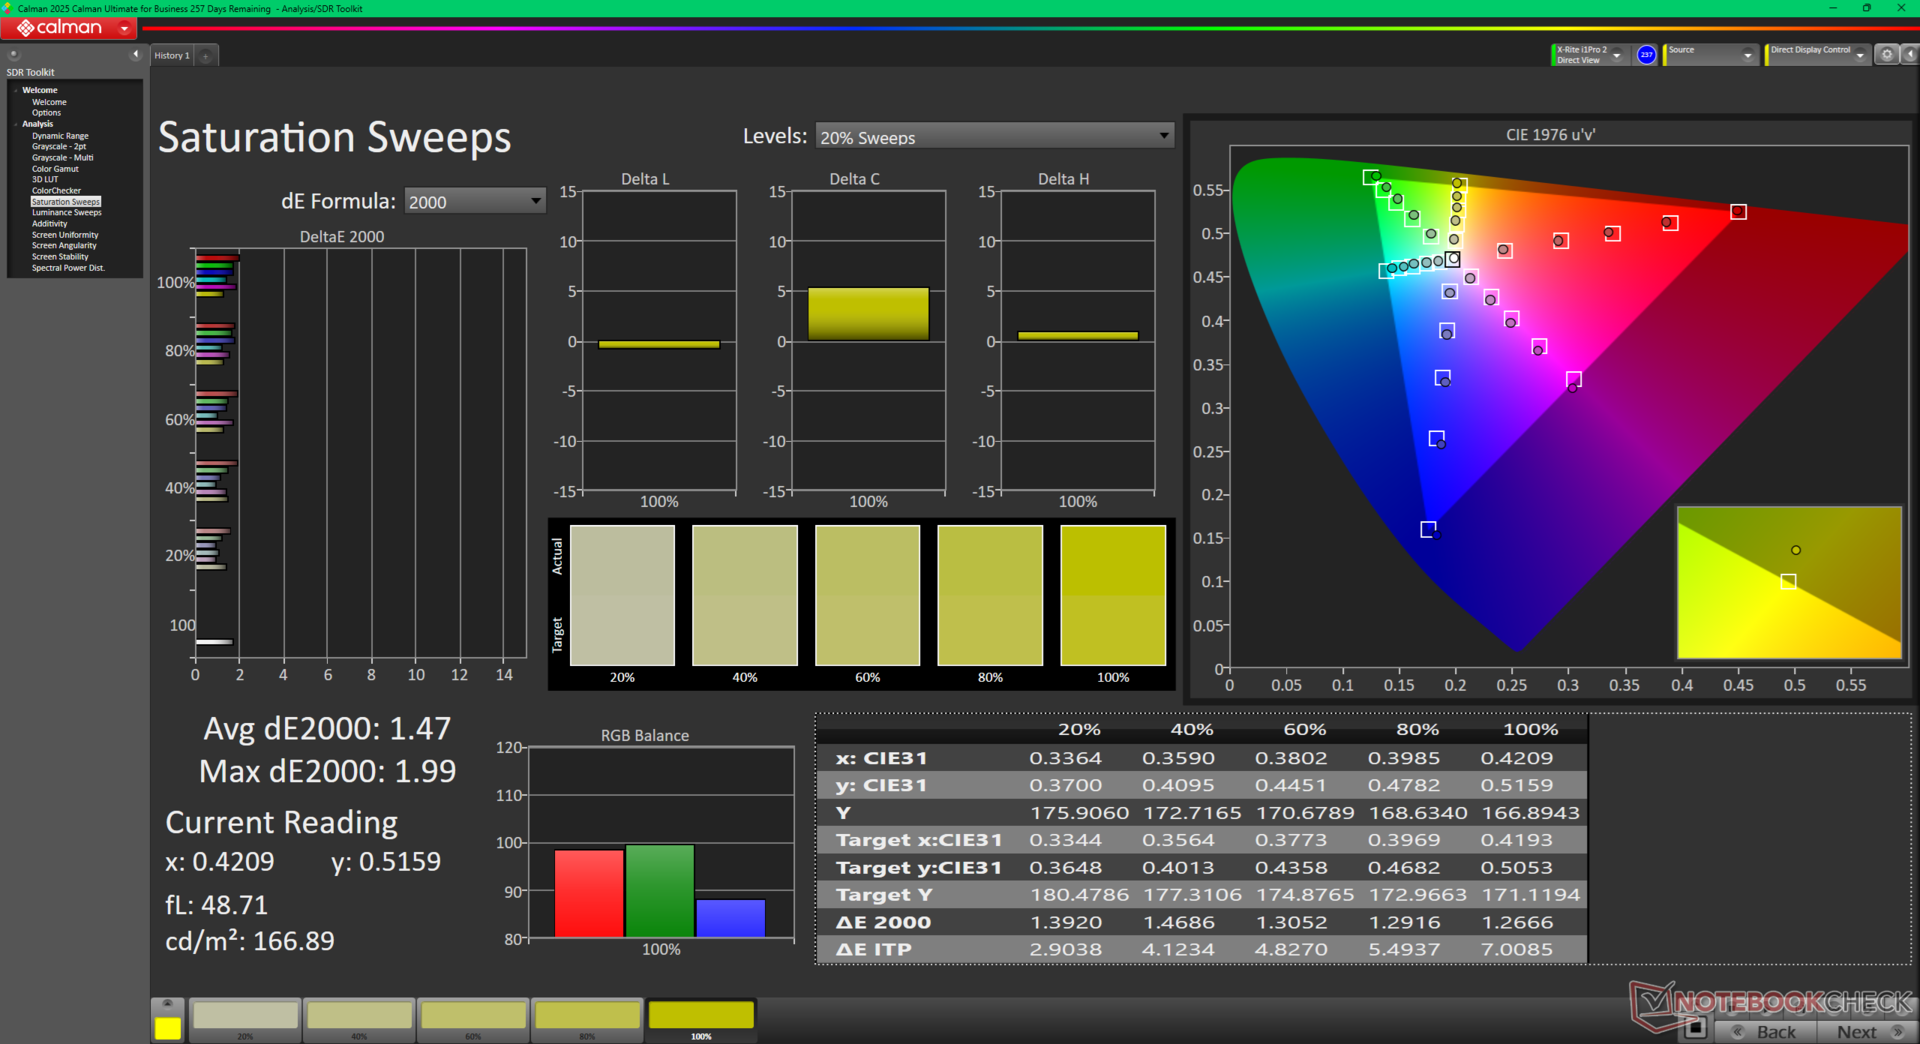
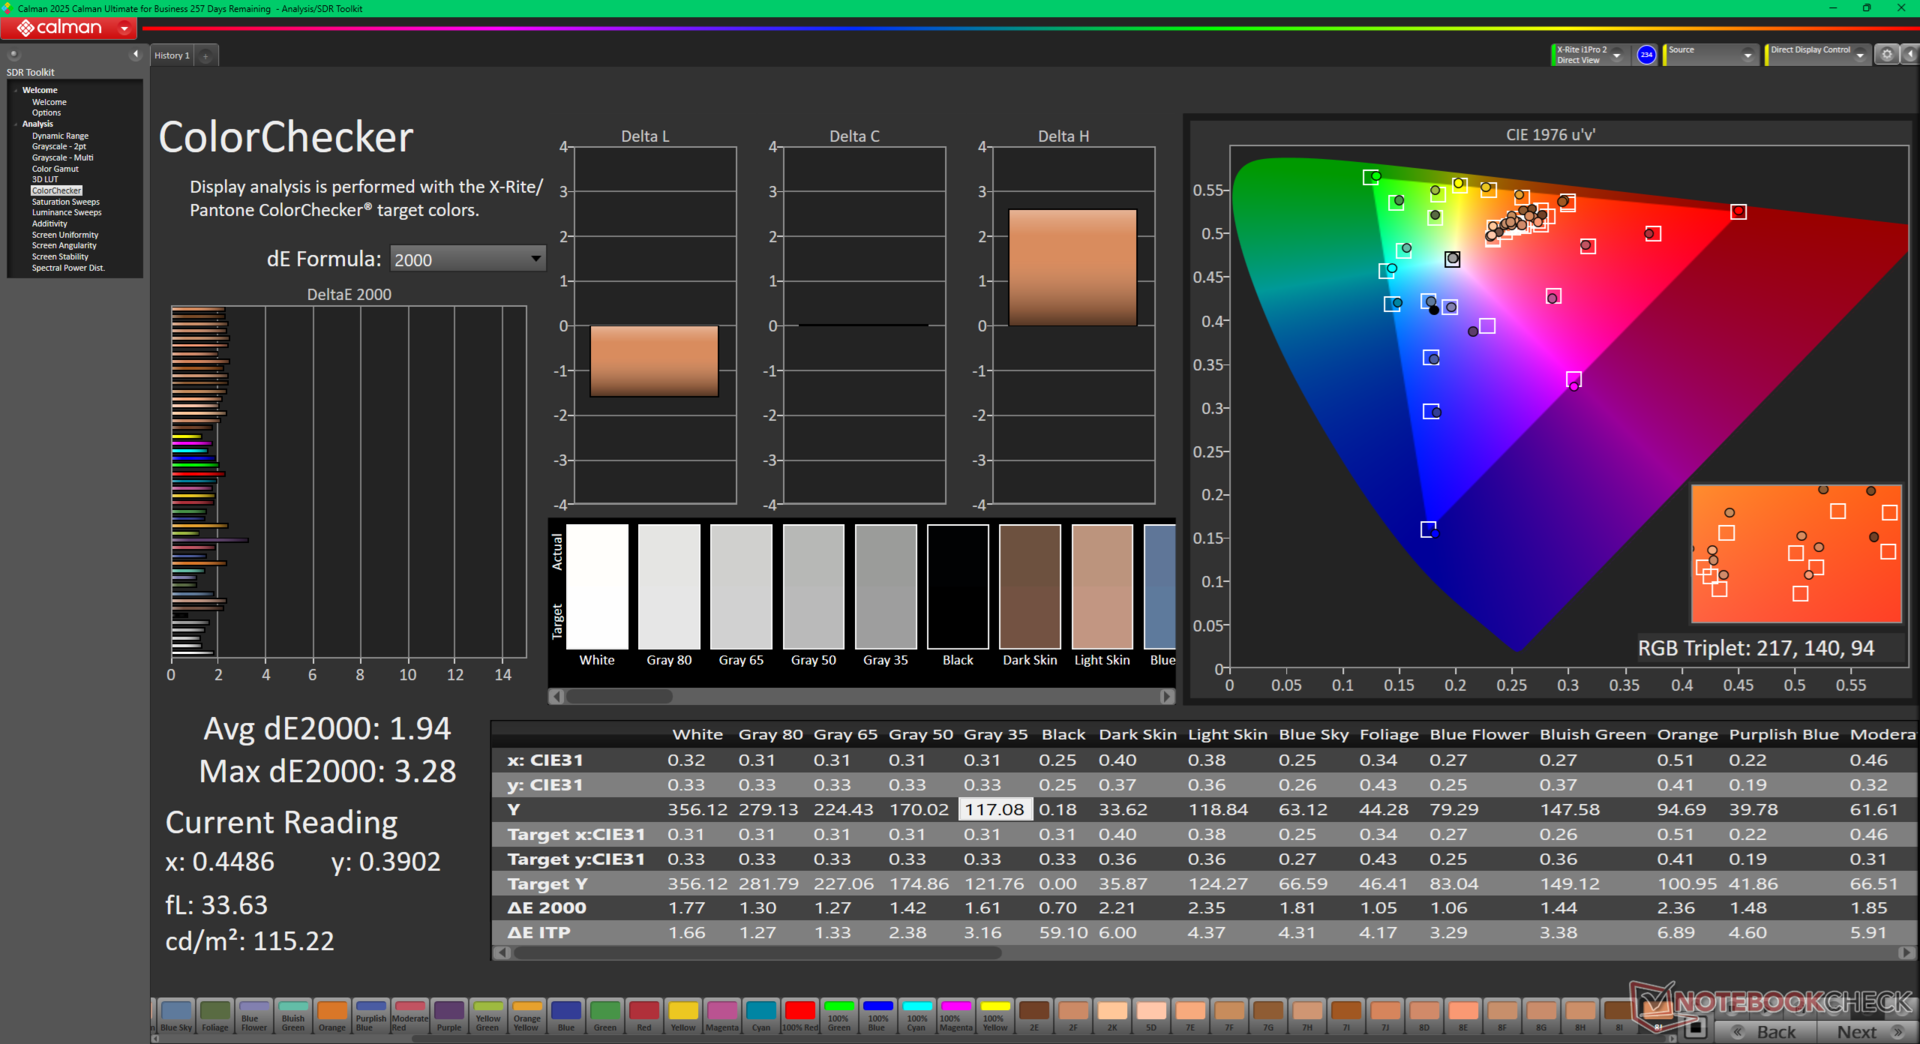
ΔE ColorChecker Calman: 1.94 | ∀{0.5-29.43 Ø4.72}
calibrated: 0.7
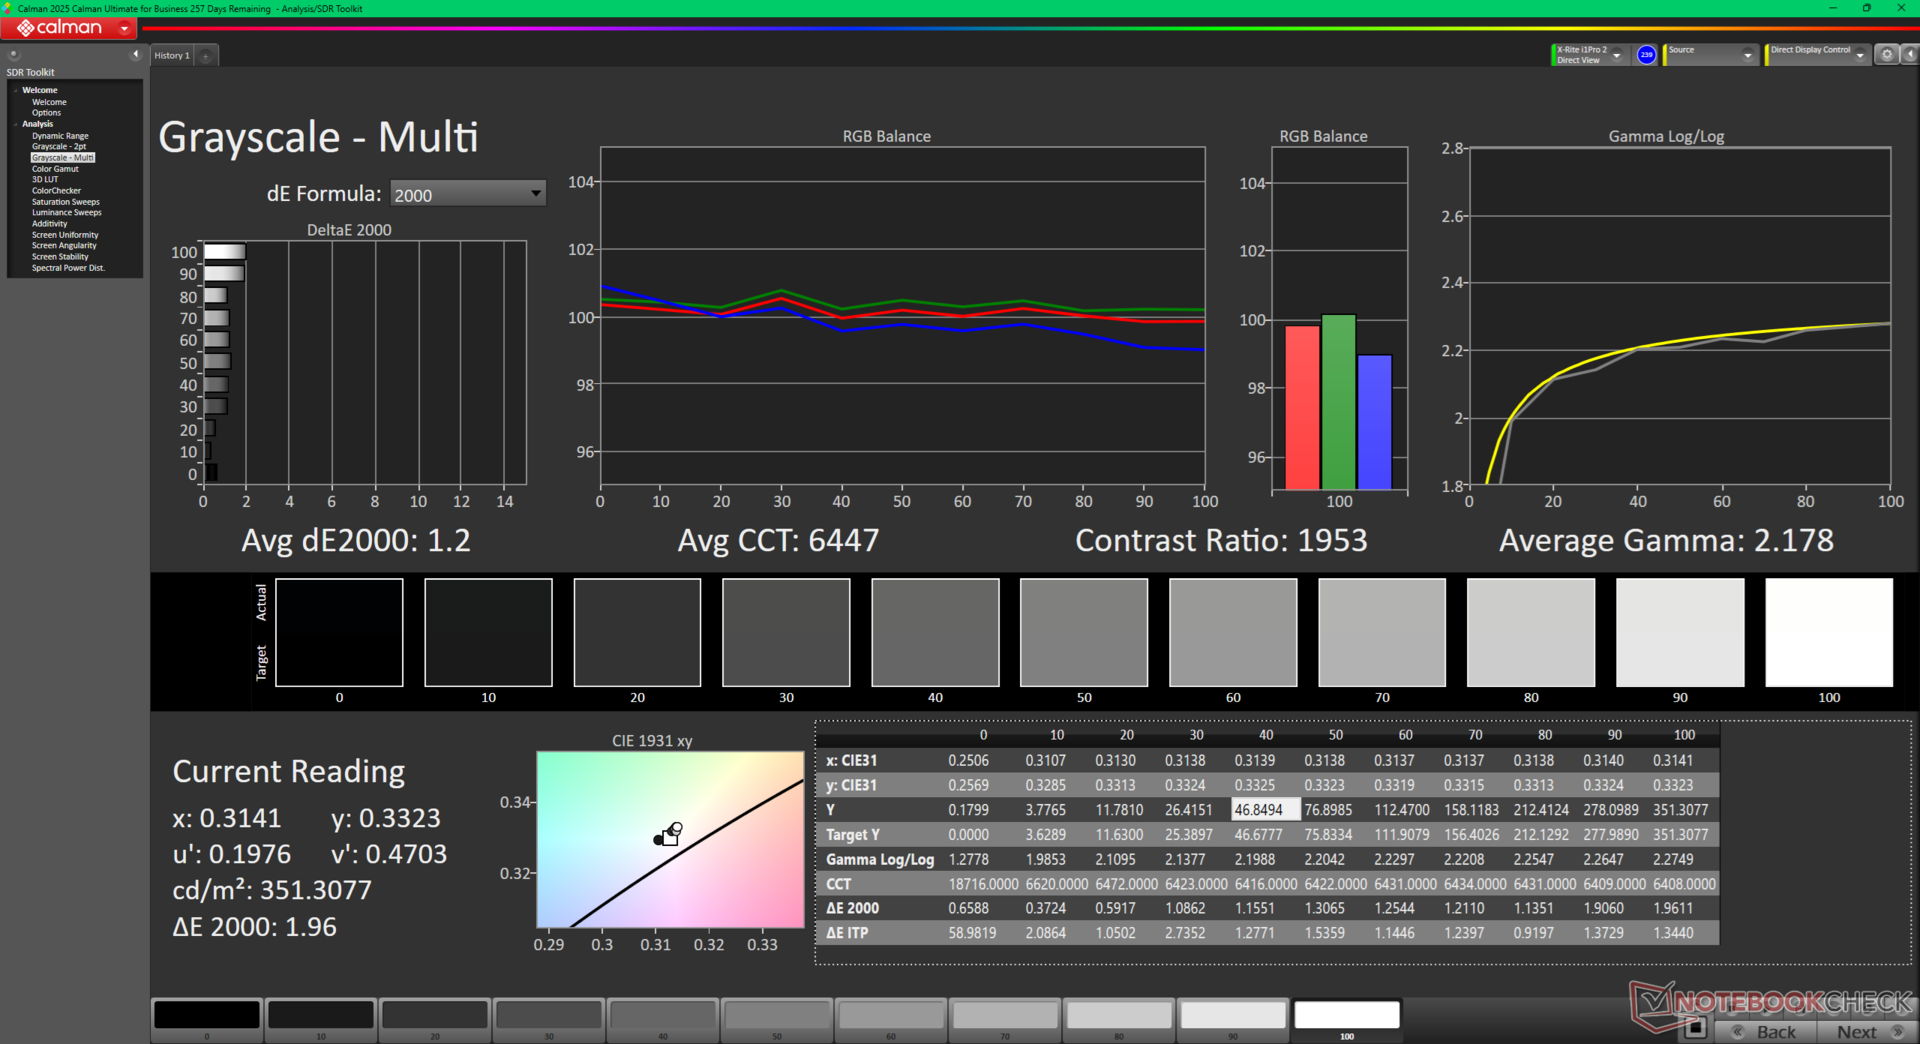
ΔE Greyscale Calman: 1.4 | ∀{0.09-98 Ø4.97}
71.9% AdobeRGB 1998 (Argyll 3D)
99.9% sRGB (Argyll 3D)
71.7% Display P3 (Argyll 3D)
Gamma: 2.25
CCT: 6453 K
| Dell 14 Plus BOE NE14N42, IPS, 2560x1600, 14", 90 Hz | Dell Inspiron 14 5425 6VPKR BOE NV14N42, IPS, 1920x1200, 14", 60 Hz | Dell Latitude 3440 BOE NE140FH, IPS, 1920x1080, 14", 60 Hz | Lenovo IdeaPad Pro 5 14AKP G10 LEN140WQ+, OLED, 2880x1800, 14", 120 Hz | Lenovo ThinkPad E14 G6 AU Optronics B140UAN03.2, IPS, 1920x1200, 14", 60 Hz | HP Pavilion Plus 14-ew0153TU Samsung SDC4197, OLED, 2880x1800, 14", 120 Hz | |
|---|---|---|---|---|---|---|
| Display | -44% | -42% | 23% | -40% | 22% | |
| Display P3 Coverage (%) | 71.7 | 39.2 -45% | 40.4 -44% | 99.9 39% | 41.3 -42% | 97.9 37% |
| sRGB Coverage (%) | 99.9 | 57.4 -43% | 60.7 -39% | 100 0% | 61.8 -38% | 99.6 0% |
| AdobeRGB 1998 Coverage (%) | 71.9 | 40.5 -44% | 41.8 -42% | 94.5 31% | 42.7 -41% | 92.1 28% |
| Response Times | 43% | -1% | 99% | 29% | 69% | |
| Response Time Grey 50% / Grey 80% * (ms) | 42.7 ? | 23 ? 46% | 35.3 ? 17% | 0.39 ? 99% | 28.8 ? 33% | 10.8 ? 75% |
| Response Time Black / White * (ms) | 25.2 ? | 15 ? 40% | 29.8 ? -18% | 0.49 ? 98% | 19.1 ? 24% | 9.29 ? 63% |
| PWM Frequency (Hz) | 1200 ? | 120 ? | ||||
| PWM Amplitude * (%) | 22 | |||||
| Screen | -133% | -104% | 17% | -109% | 234% | |
| Brightness middle (cd/m²) | 354 | 292 -18% | 292.6 -17% | 473 34% | 369.9 4% | 387 9% |
| Brightness (cd/m²) | 333 | 279 -16% | 270 -19% | 474 42% | 361 8% | 387 16% |
| Brightness Distribution (%) | 92 | 90 -2% | 88 -4% | 99 8% | 93 1% | 97 5% |
| Black Level * (cd/m²) | 0.21 | 0.34 -62% | 0.19 10% | 0.24 -14% | 0.01 95% | |
| Contrast (:1) | 1686 | 859 -49% | 1540 -9% | 1541 -9% | 38700 2195% | |
| Colorchecker dE 2000 * | 1.94 | 6.26 -223% | 4.63 -139% | 1.2 38% | 5.2 -168% | 2.03 -5% |
| Colorchecker dE 2000 max. * | 3.28 | 19.14 -484% | 17.1 -421% | 3.8 -16% | 18.41 -461% | 3.86 -18% |
| Colorchecker dE 2000 calibrated * | 0.7 | 2.13 -204% | 2.04 -191% | 1.6 -129% | ||
| Greyscale dE 2000 * | 1.4 | 4.31 -208% | 3.2 -129% | 1.5 -7% | 3.5 -150% | 2.3 -64% |
| Gamma | 2.25 98% | 2.27 97% | 2.34 94% | 2.27 97% | 2.06 107% | 2.23 99% |
| CCT | 6453 101% | 6102 107% | 7184 90% | 6214 105% | 6204 105% | 6523 100% |
| Całkowita średnia (program / ustawienia) | -45% /
-85% | -49% /
-76% | 46% /
33% | -40% /
-75% | 108% /
165% |
* ... im mniej tym lepiej
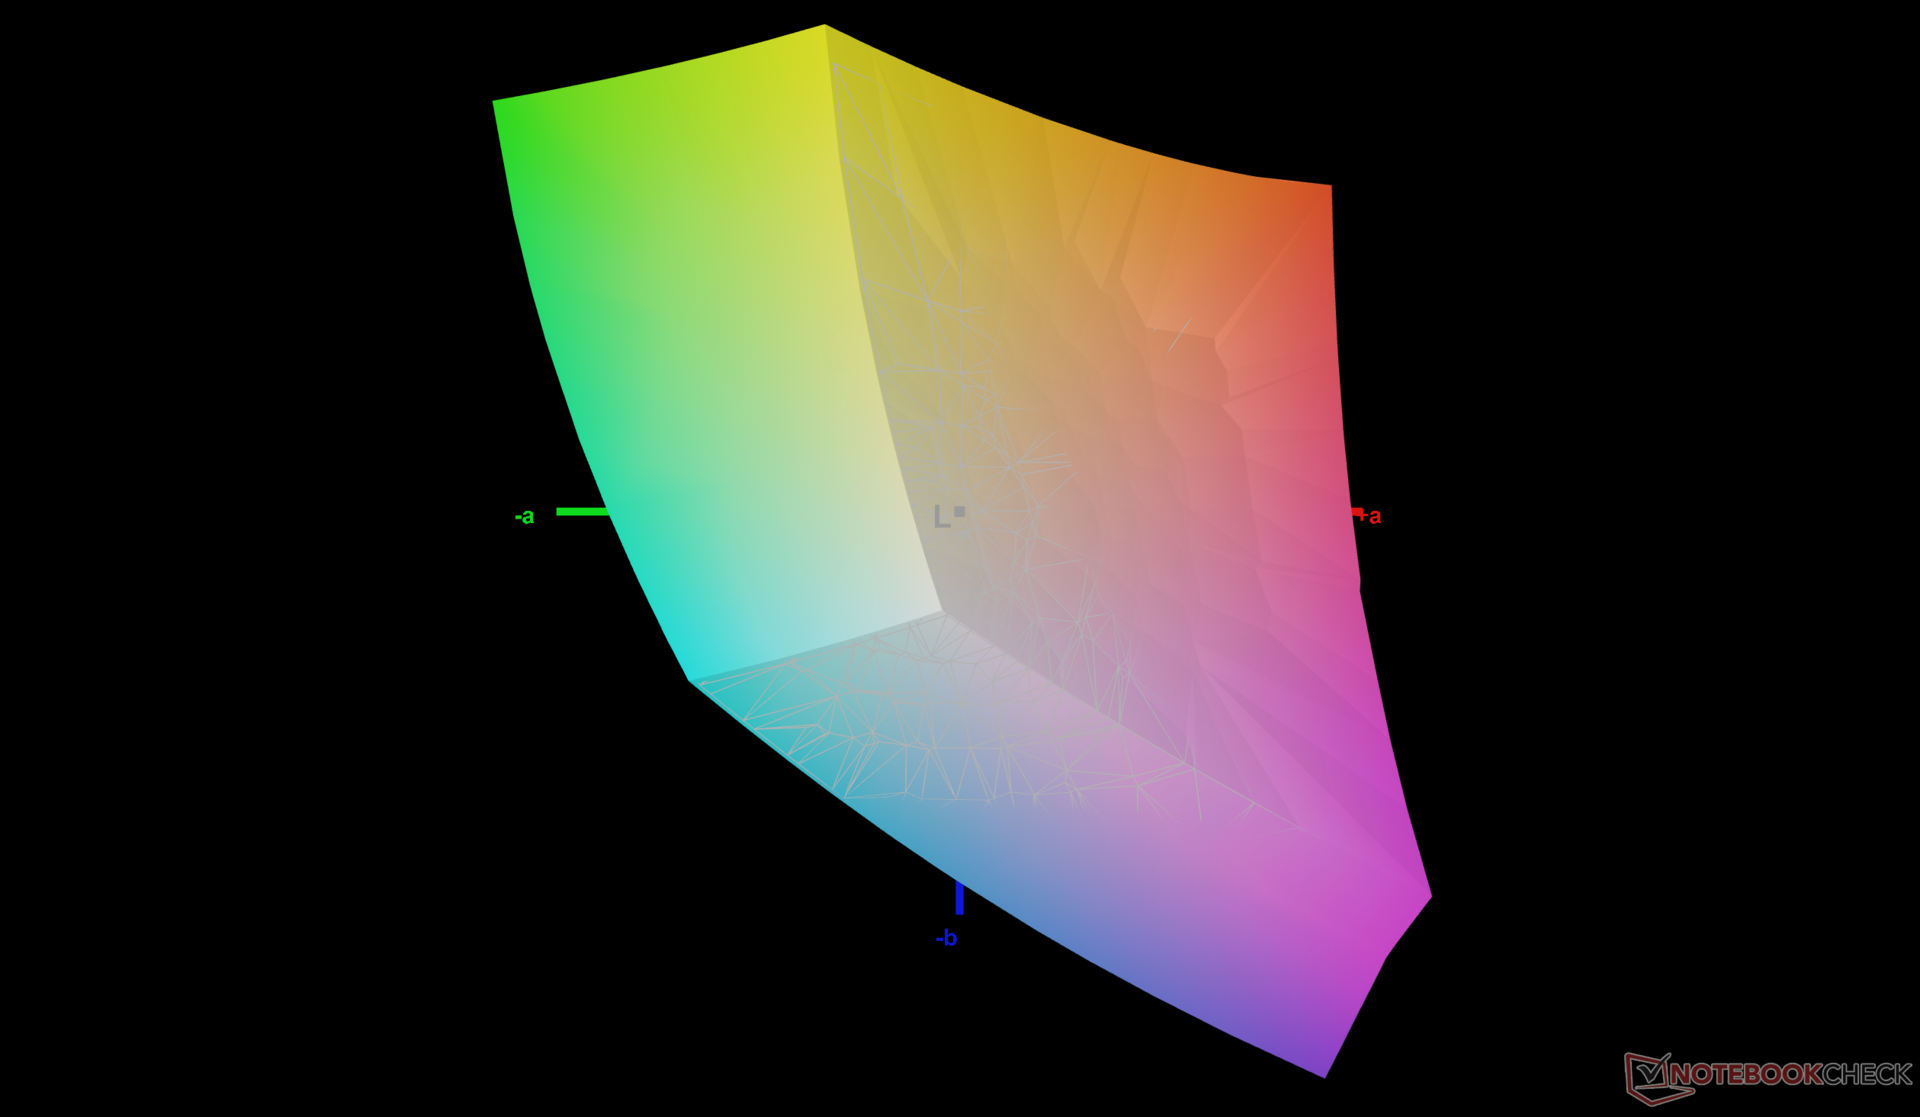
Dell 14 Plus jest jednym z niewielu niedrogich laptopów, które są dobrze skalibrowane wraz z certyfikatem TUV. Średnie wartości DeltaE dla skali szarości i kolorów wynoszą odpowiednio tylko 1,4 i 1,89, nawet przed próbami kalibracji przez użytkownika końcowego.

Wyświetl czasy reakcji
| ↔ Czas reakcji od czerni do bieli | ||
|---|---|---|
| 25.2 ms ... wzrost ↗ i spadek ↘ łącznie | ↗ 12.7 ms wzrost | 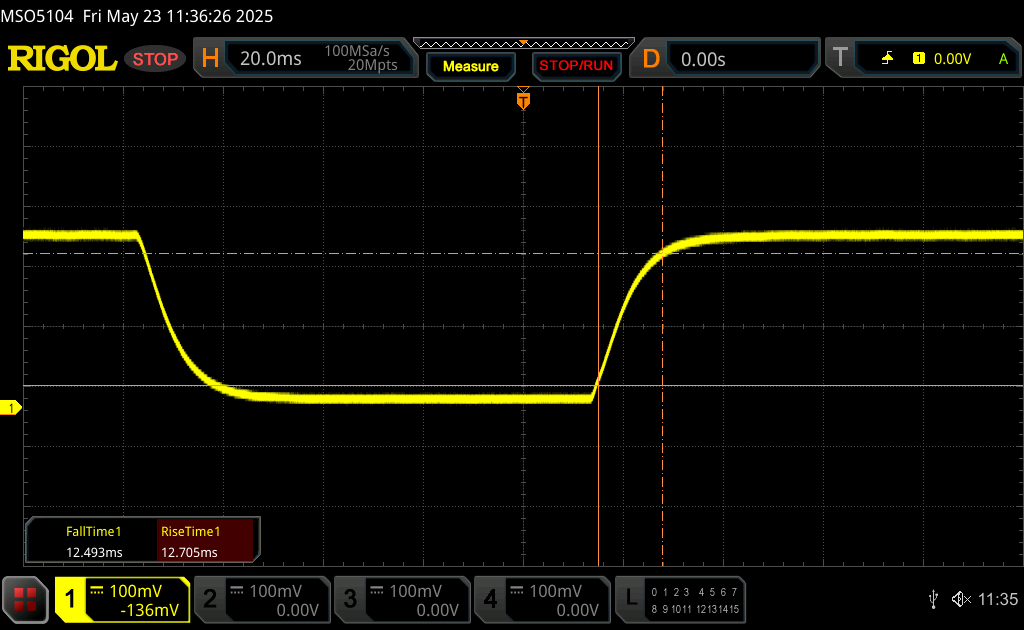 |
| ↘ 12.5 ms upadek | ||
| W naszych testach ekran wykazuje stosunkowo powolne tempo reakcji i może być zbyt wolny dla graczy. Dla porównania, wszystkie testowane urządzenia wahają się od 0.1 (minimum) do 240 (maksimum) ms. » 61 % wszystkich urządzeń jest lepszych. Oznacza to, że zmierzony czas reakcji jest gorszy od średniej wszystkich testowanych urządzeń (19.8 ms). | ||
| ↔ Czas reakcji 50% szarości do 80% szarości | ||
| 42.7 ms ... wzrost ↗ i spadek ↘ łącznie | ↗ 20.2 ms wzrost | 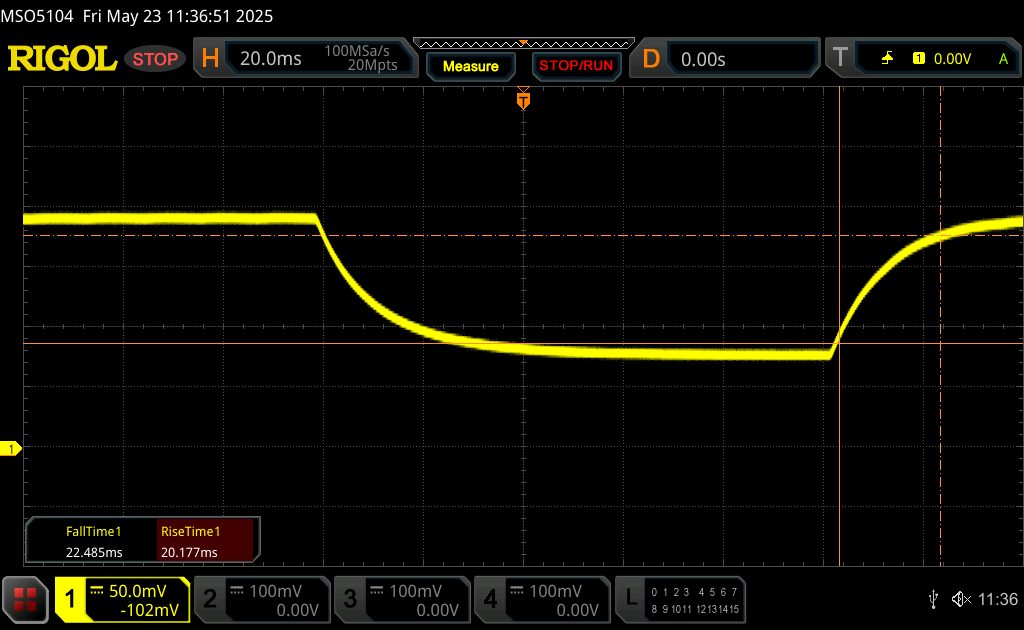 |
| ↘ 22.5 ms upadek | ||
| W naszych testach ekran wykazuje powolne tempo reakcji, co będzie niezadowalające dla graczy. Dla porównania, wszystkie testowane urządzenia wahają się od 0.165 (minimum) do 636 (maksimum) ms. » 70 % wszystkich urządzeń jest lepszych. Oznacza to, że zmierzony czas reakcji jest gorszy od średniej wszystkich testowanych urządzeń (31 ms). | ||
Migotanie ekranu / PWM (modulacja szerokości impulsu)
| Migotanie ekranu/nie wykryto PWM | 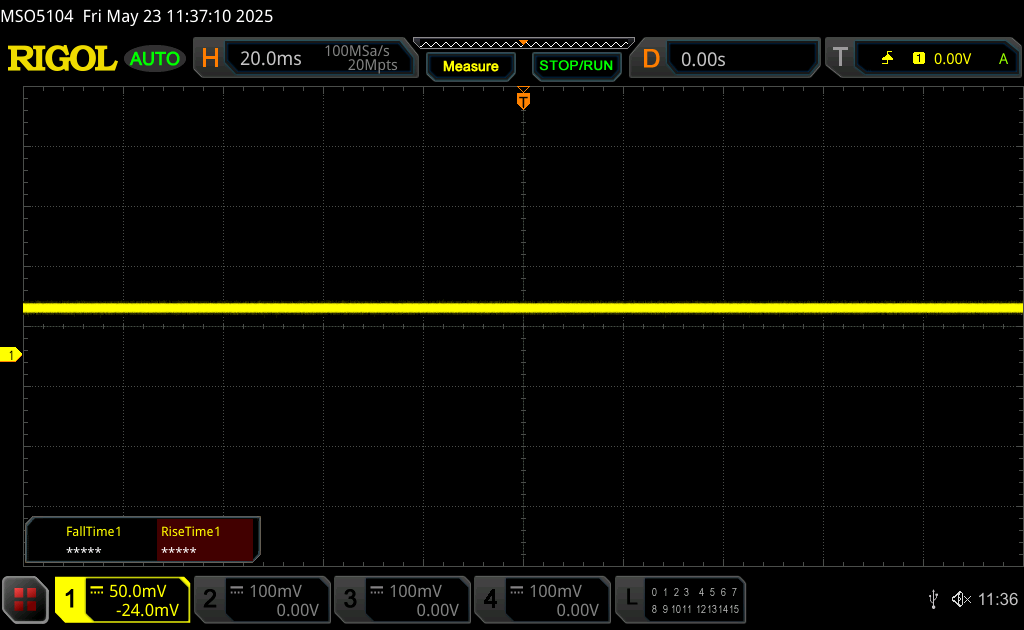 | ||
Dla porównania: 52 % wszystkich testowanych urządzeń nie używa PWM do przyciemniania wyświetlacza. Jeśli wykryto PWM, zmierzono średnio 7747 (minimum: 5 - maksimum: 343500) Hz. | |||

Wydajność
Warunki testowania
Przed uruchomieniem poniższych testów porównawczych ustawiliśmy system Windows w tryb wydajności.
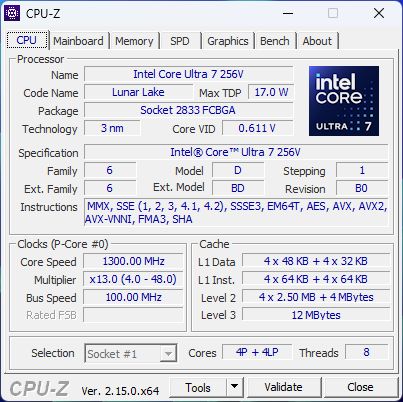
Procesor
Surowa wydajność procesora jest najbardziej porównywalna do starszego Core Ultra 7 155U. Główne zalety nowszego Core Ultra 7 256V to wydajność w przeliczeniu na wat, zintegrowana jednostka NPU, szybsza pamięć RAM i ulepszony zintegrowany procesor graficzny.
Zrównoważony rozwój Turbo Boost mógłby być lepszy; wydajność spadłaby o około 17 procent w czasie podczas uruchamiania CineBench R15 xT w pętli, jak pokazuje nasz wykres porównawczy poniżej.
Cinebench R15 Multi Loop
Cinebench R23: Multi Core | Single Core
Cinebench R20: CPU (Multi Core) | CPU (Single Core)
Cinebench R15: CPU Multi 64Bit | CPU Single 64Bit
Blender: v2.79 BMW27 CPU
7-Zip 18.03: 7z b 4 | 7z b 4 -mmt1
Geekbench 6.7: Multi-Core | Single-Core
Geekbench 5.5: Multi-Core | Single-Core
HWBOT x265 Benchmark v2.2: 4k Preset
LibreOffice : 20 Documents To PDF
R Benchmark 2.5: Overall mean
| CPU Performance rating | |
| Lenovo IdeaPad Pro 5 14AKP G10 | |
| Lenovo ThinkBook Plus Gen5 Hybrid | |
| Lenovo Yoga 7 2-in-1 14AKP10 | |
| Lenovo ThinkPad X1 2-in-1 Gen 10 | |
| Przeciętny Intel Core Ultra 7 256V | |
| Dell 14 Plus | |
| Lenovo ThinkPad E14 G6 | |
| Asus Vivobook S 14 OLED S5406SA | |
| Lenovo ThinkPad X1 Carbon G10 Core i7-1265U -2! | |
| HP Pavilion Plus 14-ew0153TU | |
| Dell Latitude 3440 -2! | |
| Dell Inspiron 14 5425 6VPKR -2! | |
| Acer Aspire Spin 14 ASP14-52MTN-51V5 | |
| Cinebench R23 / Multi Core | |
| Lenovo IdeaPad Pro 5 14AKP G10 | |
| Lenovo ThinkBook Plus Gen5 Hybrid | |
| Lenovo Yoga 7 2-in-1 14AKP10 | |
| Lenovo ThinkPad E14 G6 | |
| Lenovo ThinkPad X1 2-in-1 Gen 10 | |
| Przeciętny Intel Core Ultra 7 256V (8589 - 10864, n=8) | |
| Dell 14 Plus | |
| Asus Vivobook S 14 OLED S5406SA | |
| Lenovo ThinkPad X1 Carbon G10 Core i7-1265U | |
| Dell Inspiron 14 5425 6VPKR | |
| Dell Latitude 3440 | |
| Acer Aspire Spin 14 ASP14-52MTN-51V5 | |
| HP Pavilion Plus 14-ew0153TU | |
| Cinebench R23 / Single Core | |
| Lenovo IdeaPad Pro 5 14AKP G10 | |
| Lenovo Yoga 7 2-in-1 14AKP10 | |
| Przeciętny Intel Core Ultra 7 256V (1799 - 1909, n=8) | |
| Lenovo ThinkPad X1 2-in-1 Gen 10 | |
| Dell 14 Plus | |
| Lenovo ThinkPad E14 G6 | |
| HP Pavilion Plus 14-ew0153TU | |
| Asus Vivobook S 14 OLED S5406SA | |
| Lenovo ThinkBook Plus Gen5 Hybrid | |
| Dell Latitude 3440 | |
| Lenovo ThinkPad X1 Carbon G10 Core i7-1265U | |
| Acer Aspire Spin 14 ASP14-52MTN-51V5 | |
| Dell Inspiron 14 5425 6VPKR | |
| Cinebench R20 / CPU (Multi Core) | |
| Lenovo IdeaPad Pro 5 14AKP G10 | |
| Lenovo ThinkBook Plus Gen5 Hybrid | |
| Lenovo Yoga 7 2-in-1 14AKP10 | |
| Lenovo ThinkPad E14 G6 | |
| Przeciętny Intel Core Ultra 7 256V (3822 - 4233, n=7) | |
| Lenovo ThinkPad X1 2-in-1 Gen 10 | |
| Dell 14 Plus | |
| Asus Vivobook S 14 OLED S5406SA | |
| Lenovo ThinkPad X1 Carbon G10 Core i7-1265U | |
| Dell Inspiron 14 5425 6VPKR | |
| HP Pavilion Plus 14-ew0153TU | |
| Acer Aspire Spin 14 ASP14-52MTN-51V5 | |
| Dell Latitude 3440 | |
| Cinebench R20 / CPU (Single Core) | |
| Lenovo IdeaPad Pro 5 14AKP G10 | |
| Lenovo Yoga 7 2-in-1 14AKP10 | |
| Przeciętny Intel Core Ultra 7 256V (700 - 733, n=7) | |
| Lenovo ThinkPad X1 2-in-1 Gen 10 | |
| Dell 14 Plus | |
| Lenovo ThinkPad E14 G6 | |
| Lenovo ThinkBook Plus Gen5 Hybrid | |
| Dell Latitude 3440 | |
| HP Pavilion Plus 14-ew0153TU | |
| Asus Vivobook S 14 OLED S5406SA | |
| Lenovo ThinkPad X1 Carbon G10 Core i7-1265U | |
| Acer Aspire Spin 14 ASP14-52MTN-51V5 | |
| Dell Inspiron 14 5425 6VPKR | |
| Cinebench R15 / CPU Multi 64Bit | |
| Lenovo ThinkBook Plus Gen5 Hybrid | |
| Lenovo IdeaPad Pro 5 14AKP G10 | |
| Lenovo Yoga 7 2-in-1 14AKP10 | |
| Lenovo ThinkPad E14 G6 | |
| Lenovo ThinkPad X1 2-in-1 Gen 10 | |
| Przeciętny Intel Core Ultra 7 256V (1500 - 1627, n=6) | |
| Asus Vivobook S 14 OLED S5406SA | |
| Dell 14 Plus | |
| Lenovo ThinkPad X1 Carbon G10 Core i7-1265U | |
| Dell Inspiron 14 5425 6VPKR | |
| HP Pavilion Plus 14-ew0153TU | |
| Dell Latitude 3440 | |
| Acer Aspire Spin 14 ASP14-52MTN-51V5 | |
| Cinebench R15 / CPU Single 64Bit | |
| Lenovo IdeaPad Pro 5 14AKP G10 | |
| Lenovo Yoga 7 2-in-1 14AKP10 | |
| Lenovo ThinkPad X1 2-in-1 Gen 10 | |
| Przeciętny Intel Core Ultra 7 256V (275 - 290, n=6) | |
| Dell 14 Plus | |
| Asus Vivobook S 14 OLED S5406SA | |
| Lenovo ThinkBook Plus Gen5 Hybrid | |
| Lenovo ThinkPad E14 G6 | |
| HP Pavilion Plus 14-ew0153TU | |
| Lenovo ThinkPad X1 Carbon G10 Core i7-1265U | |
| Dell Latitude 3440 | |
| Dell Inspiron 14 5425 6VPKR | |
| Acer Aspire Spin 14 ASP14-52MTN-51V5 | |
| Blender / v2.79 BMW27 CPU | |
| HP Pavilion Plus 14-ew0153TU | |
| Acer Aspire Spin 14 ASP14-52MTN-51V5 | |
| Dell Latitude 3440 | |
| Lenovo ThinkPad X1 Carbon G10 Core i7-1265U | |
| Dell 14 Plus | |
| Dell Inspiron 14 5425 6VPKR | |
| Lenovo ThinkPad X1 2-in-1 Gen 10 | |
| Asus Vivobook S 14 OLED S5406SA | |
| Przeciętny Intel Core Ultra 7 256V (315 - 373, n=7) | |
| Lenovo ThinkPad E14 G6 | |
| Lenovo Yoga 7 2-in-1 14AKP10 | |
| Lenovo ThinkBook Plus Gen5 Hybrid | |
| Lenovo IdeaPad Pro 5 14AKP G10 | |
| 7-Zip 18.03 / 7z b 4 | |
| Lenovo IdeaPad Pro 5 14AKP G10 | |
| Lenovo ThinkBook Plus Gen5 Hybrid | |
| Lenovo Yoga 7 2-in-1 14AKP10 | |
| Lenovo ThinkPad E14 G6 | |
| Dell Inspiron 14 5425 6VPKR | |
| Lenovo ThinkPad X1 Carbon G10 Core i7-1265U | |
| Lenovo ThinkPad X1 2-in-1 Gen 10 | |
| Przeciętny Intel Core Ultra 7 256V (33926 - 36572, n=7) | |
| Dell 14 Plus | |
| Dell Latitude 3440 | |
| Asus Vivobook S 14 OLED S5406SA | |
| HP Pavilion Plus 14-ew0153TU | |
| Acer Aspire Spin 14 ASP14-52MTN-51V5 | |
| 7-Zip 18.03 / 7z b 4 -mmt1 | |
| Lenovo IdeaPad Pro 5 14AKP G10 | |
| Lenovo Yoga 7 2-in-1 14AKP10 | |
| Lenovo ThinkPad X1 2-in-1 Gen 10 | |
| Przeciętny Intel Core Ultra 7 256V (5528 - 5763, n=7) | |
| Dell Latitude 3440 | |
| Dell 14 Plus | |
| HP Pavilion Plus 14-ew0153TU | |
| Lenovo ThinkPad X1 Carbon G10 Core i7-1265U | |
| Asus Vivobook S 14 OLED S5406SA | |
| Dell Inspiron 14 5425 6VPKR | |
| Lenovo ThinkBook Plus Gen5 Hybrid | |
| Lenovo ThinkPad E14 G6 | |
| Acer Aspire Spin 14 ASP14-52MTN-51V5 | |
| Geekbench 5.5 / Multi-Core | |
| Lenovo IdeaPad Pro 5 14AKP G10 | |
| Lenovo ThinkBook Plus Gen5 Hybrid | |
| Dell 14 Plus | |
| Lenovo ThinkPad X1 2-in-1 Gen 10 | |
| Przeciętny Intel Core Ultra 7 256V (9044 - 9715, n=7) | |
| Asus Vivobook S 14 OLED S5406SA | |
| Lenovo ThinkPad E14 G6 | |
| Lenovo Yoga 7 2-in-1 14AKP10 | |
| Lenovo ThinkPad X1 Carbon G10 Core i7-1265U | |
| HP Pavilion Plus 14-ew0153TU | |
| Dell Latitude 3440 | |
| Dell Inspiron 14 5425 6VPKR | |
| Acer Aspire Spin 14 ASP14-52MTN-51V5 | |
| Geekbench 5.5 / Single-Core | |
| Lenovo IdeaPad Pro 5 14AKP G10 | |
| Lenovo ThinkPad X1 2-in-1 Gen 10 | |
| Lenovo Yoga 7 2-in-1 14AKP10 | |
| Przeciętny Intel Core Ultra 7 256V (1972 - 2013, n=7) | |
| Dell 14 Plus | |
| Asus Vivobook S 14 OLED S5406SA | |
| HP Pavilion Plus 14-ew0153TU | |
| Lenovo ThinkPad X1 Carbon G10 Core i7-1265U | |
| Lenovo ThinkBook Plus Gen5 Hybrid | |
| Lenovo ThinkPad E14 G6 | |
| Dell Latitude 3440 | |
| Acer Aspire Spin 14 ASP14-52MTN-51V5 | |
| Dell Inspiron 14 5425 6VPKR | |
| HWBOT x265 Benchmark v2.2 / 4k Preset | |
| Lenovo IdeaPad Pro 5 14AKP G10 | |
| Lenovo ThinkBook Plus Gen5 Hybrid | |
| Lenovo Yoga 7 2-in-1 14AKP10 | |
| Przeciętny Intel Core Ultra 7 256V (11.9 - 13.9, n=7) | |
| Asus Vivobook S 14 OLED S5406SA | |
| Lenovo ThinkPad E14 G6 | |
| Dell 14 Plus | |
| Lenovo ThinkPad X1 2-in-1 Gen 10 | |
| Dell Inspiron 14 5425 6VPKR | |
| Lenovo ThinkPad X1 Carbon G10 Core i7-1265U | |
| HP Pavilion Plus 14-ew0153TU | |
| Acer Aspire Spin 14 ASP14-52MTN-51V5 | |
| Dell Latitude 3440 | |
| LibreOffice / 20 Documents To PDF | |
| Acer Aspire Spin 14 ASP14-52MTN-51V5 | |
| Asus Vivobook S 14 OLED S5406SA | |
| Lenovo Yoga 7 2-in-1 14AKP10 | |
| HP Pavilion Plus 14-ew0153TU | |
| Lenovo ThinkPad E14 G6 | |
| Dell Inspiron 14 5425 6VPKR | |
| Dell 14 Plus | |
| Lenovo IdeaPad Pro 5 14AKP G10 | |
| Dell Latitude 3440 | |
| Przeciętny Intel Core Ultra 7 256V (42.7 - 55.6, n=7) | |
| Lenovo ThinkPad X1 Carbon G10 Core i7-1265U | |
| Lenovo ThinkPad X1 2-in-1 Gen 10 | |
| Lenovo ThinkBook Plus Gen5 Hybrid | |
| R Benchmark 2.5 / Overall mean | |
| Dell Inspiron 14 5425 6VPKR | |
| Acer Aspire Spin 14 ASP14-52MTN-51V5 | |
| Lenovo ThinkBook Plus Gen5 Hybrid | |
| Dell Latitude 3440 | |
| Lenovo ThinkPad X1 Carbon G10 Core i7-1265U | |
| Asus Vivobook S 14 OLED S5406SA | |
| Lenovo ThinkPad E14 G6 | |
| HP Pavilion Plus 14-ew0153TU | |
| Dell 14 Plus | |
| Lenovo ThinkPad X1 2-in-1 Gen 10 | |
| Przeciętny Intel Core Ultra 7 256V (0.439 - 0.4645, n=7) | |
| Lenovo Yoga 7 2-in-1 14AKP10 | |
| Lenovo IdeaPad Pro 5 14AKP G10 | |
Cinebench R23: Multi Core | Single Core
Cinebench R20: CPU (Multi Core) | CPU (Single Core)
Cinebench R15: CPU Multi 64Bit | CPU Single 64Bit
Blender: v2.79 BMW27 CPU
7-Zip 18.03: 7z b 4 | 7z b 4 -mmt1
Geekbench 6.7: Multi-Core | Single-Core
Geekbench 5.5: Multi-Core | Single-Core
HWBOT x265 Benchmark v2.2: 4k Preset
LibreOffice : 20 Documents To PDF
R Benchmark 2.5: Overall mean
* ... im mniej tym lepiej
AIDA64: FP32 Ray-Trace | FPU Julia | CPU SHA3 | CPU Queen | FPU SinJulia | FPU Mandel | CPU AES | CPU ZLib | FP64 Ray-Trace | CPU PhotoWorxx
| Performance rating | |
| Lenovo IdeaPad Pro 5 14AKP G10 | |
| Przeciętny Intel Core Ultra 7 256V | |
| Dell 14 Plus | |
| Lenovo ThinkPad E14 G6 | |
| Dell Inspiron 14 5425 6VPKR | |
| Dell Latitude 3440 | |
| HP Pavilion Plus 14-ew0153TU | |
| AIDA64 / FP32 Ray-Trace | |
| Lenovo IdeaPad Pro 5 14AKP G10 | |
| Przeciętny Intel Core Ultra 7 256V (10524 - 12898, n=7) | |
| Dell 14 Plus | |
| Dell Inspiron 14 5425 6VPKR | |
| Lenovo ThinkPad E14 G6 | |
| Dell Latitude 3440 | |
| HP Pavilion Plus 14-ew0153TU | |
| AIDA64 / FPU Julia | |
| Lenovo IdeaPad Pro 5 14AKP G10 | |
| Dell Inspiron 14 5425 6VPKR | |
| Przeciętny Intel Core Ultra 7 256V (52443 - 62522, n=7) | |
| Dell 14 Plus | |
| Lenovo ThinkPad E14 G6 | |
| Dell Latitude 3440 | |
| HP Pavilion Plus 14-ew0153TU | |
| AIDA64 / CPU SHA3 | |
| Lenovo IdeaPad Pro 5 14AKP G10 | |
| Przeciętny Intel Core Ultra 7 256V (2364 - 2915, n=7) | |
| Lenovo ThinkPad E14 G6 | |
| Dell 14 Plus | |
| Dell Inspiron 14 5425 6VPKR | |
| Dell Latitude 3440 | |
| HP Pavilion Plus 14-ew0153TU | |
| AIDA64 / CPU Queen | |
| Lenovo IdeaPad Pro 5 14AKP G10 | |
| Dell Inspiron 14 5425 6VPKR | |
| Dell Latitude 3440 | |
| HP Pavilion Plus 14-ew0153TU | |
| Dell 14 Plus | |
| Przeciętny Intel Core Ultra 7 256V (49622 - 49794, n=6) | |
| Lenovo ThinkPad E14 G6 | |
| AIDA64 / FPU SinJulia | |
| Lenovo IdeaPad Pro 5 14AKP G10 | |
| Dell Inspiron 14 5425 6VPKR | |
| Lenovo ThinkPad E14 G6 | |
| Dell Latitude 3440 | |
| Dell 14 Plus | |
| Przeciętny Intel Core Ultra 7 256V (4401 - 4434, n=7) | |
| HP Pavilion Plus 14-ew0153TU | |
| AIDA64 / FPU Mandel | |
| Lenovo IdeaPad Pro 5 14AKP G10 | |
| Dell Inspiron 14 5425 6VPKR | |
| Przeciętny Intel Core Ultra 7 256V (27382 - 33019, n=7) | |
| Dell 14 Plus | |
| Lenovo ThinkPad E14 G6 | |
| Dell Latitude 3440 | |
| HP Pavilion Plus 14-ew0153TU | |
| AIDA64 / CPU AES | |
| Lenovo IdeaPad Pro 5 14AKP G10 | |
| Lenovo ThinkPad E14 G6 | |
| Przeciętny Intel Core Ultra 7 256V (38495 - 75938, n=7) | |
| Dell 14 Plus | |
| Dell Latitude 3440 | |
| Dell Inspiron 14 5425 6VPKR | |
| HP Pavilion Plus 14-ew0153TU | |
| AIDA64 / CPU ZLib | |
| Lenovo IdeaPad Pro 5 14AKP G10 | |
| Lenovo ThinkPad E14 G6 | |
| Przeciętny Intel Core Ultra 7 256V (536 - 632, n=7) | |
| Dell 14 Plus | |
| Dell Latitude 3440 | |
| Dell Inspiron 14 5425 6VPKR | |
| HP Pavilion Plus 14-ew0153TU | |
| AIDA64 / FP64 Ray-Trace | |
| Lenovo IdeaPad Pro 5 14AKP G10 | |
| Przeciętny Intel Core Ultra 7 256V (5655 - 6878, n=7) | |
| Dell 14 Plus | |
| Dell Inspiron 14 5425 6VPKR | |
| Lenovo ThinkPad E14 G6 | |
| Dell Latitude 3440 | |
| HP Pavilion Plus 14-ew0153TU | |
| AIDA64 / CPU PhotoWorxx | |
| Przeciętny Intel Core Ultra 7 256V (49906 - 57060, n=7) | |
| Dell 14 Plus | |
| Lenovo IdeaPad Pro 5 14AKP G10 | |
| Lenovo ThinkPad E14 G6 | |
| HP Pavilion Plus 14-ew0153TU | |
| Dell Latitude 3440 | |
| Dell Inspiron 14 5425 6VPKR | |
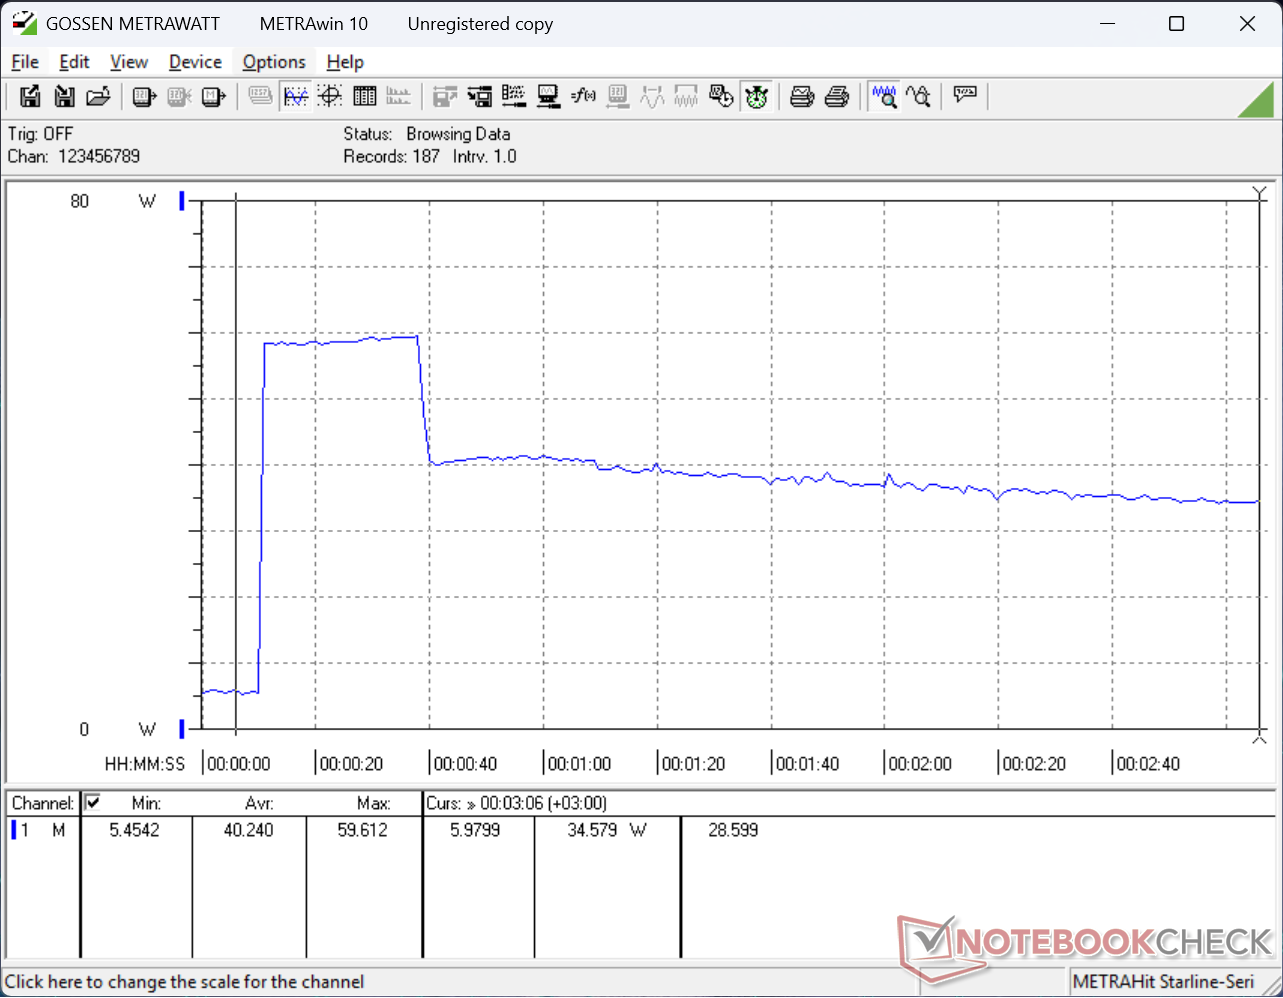
Test warunków skrajnych
Po uruchomieniu obciążenia Prime95, procesor zwiększył częstotliwość taktowania do 3,4 GHz i 39 W, a następnie osiągnął temperaturę rdzenia 80 C około 30 sekund później. Następnie procesor ustabilizował się na poziomie 2,6 GHz, 20 W i 67 C.
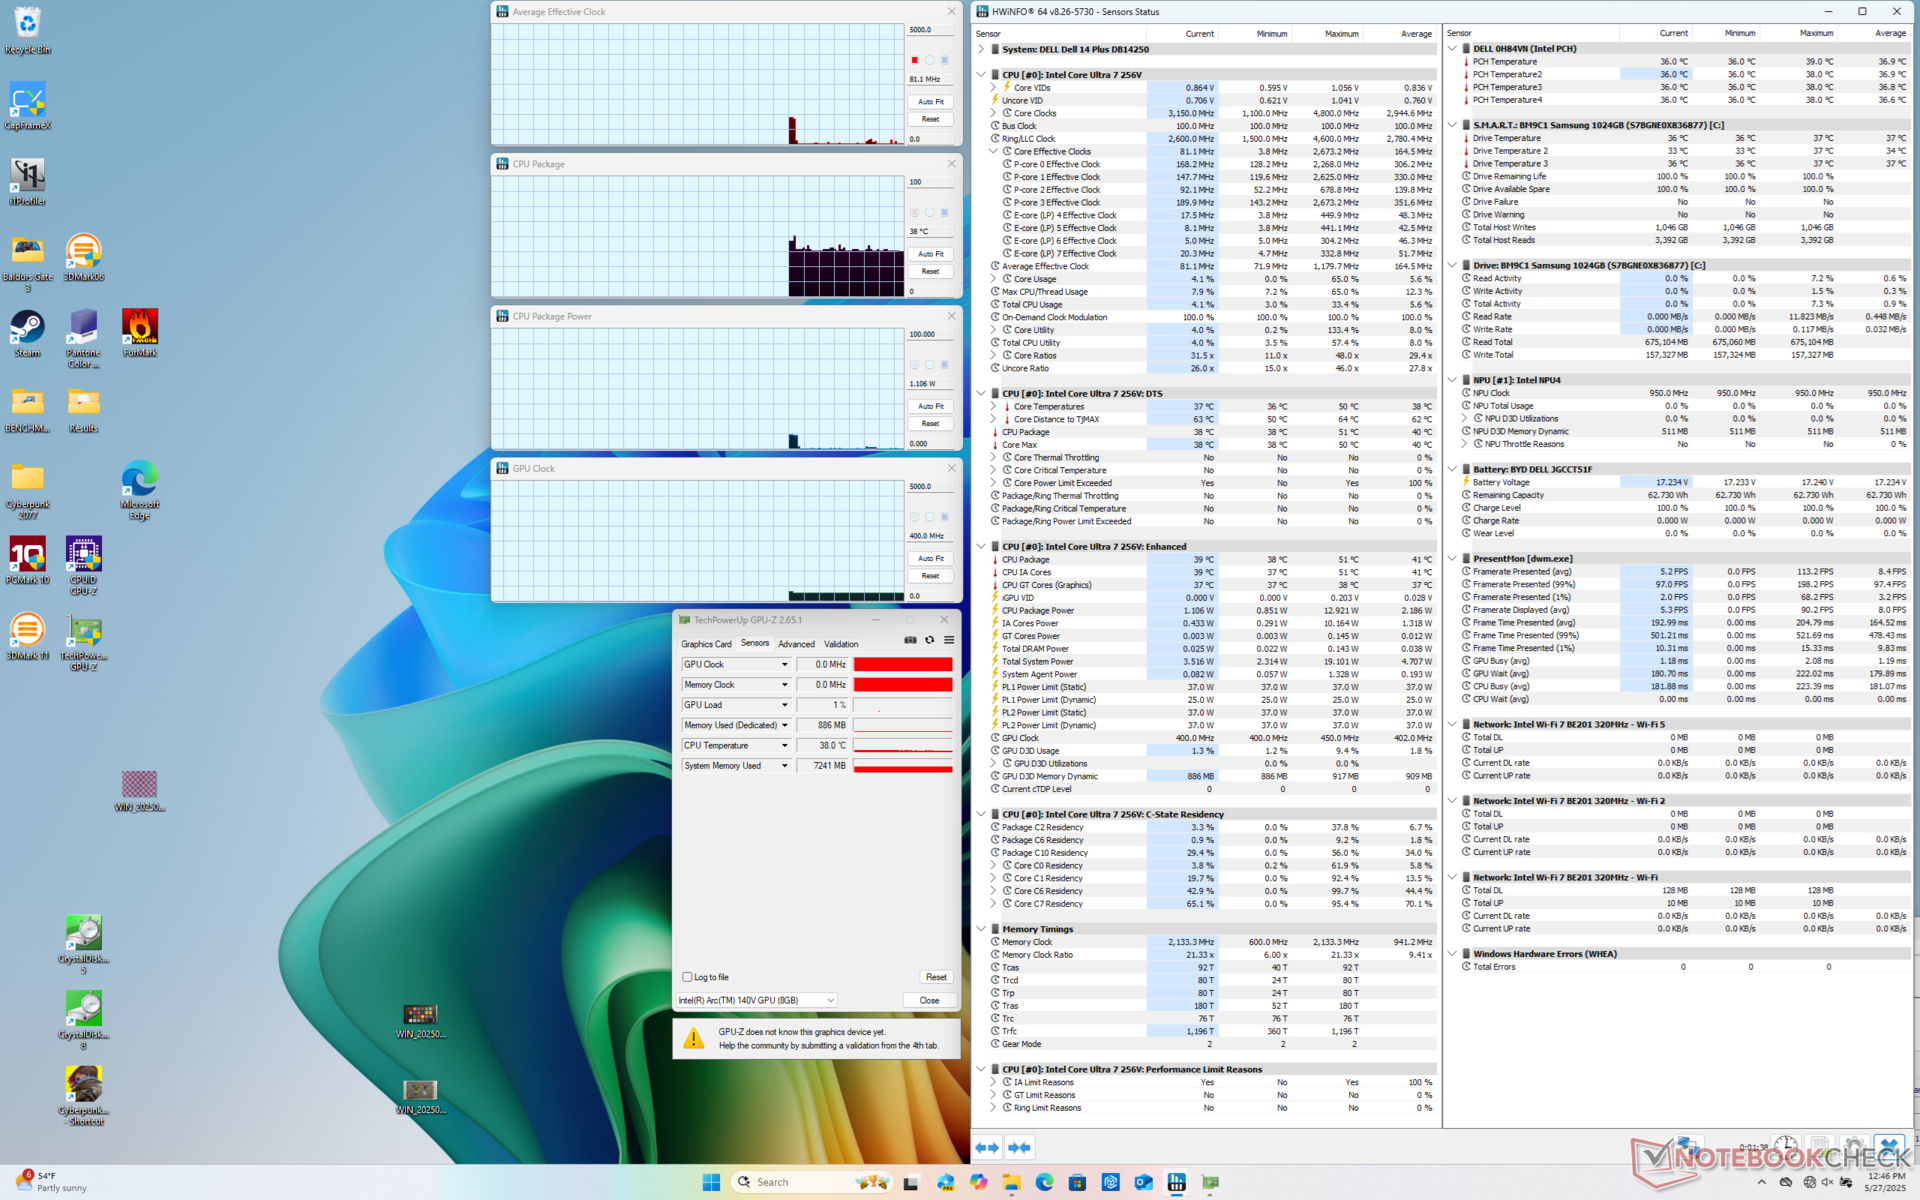
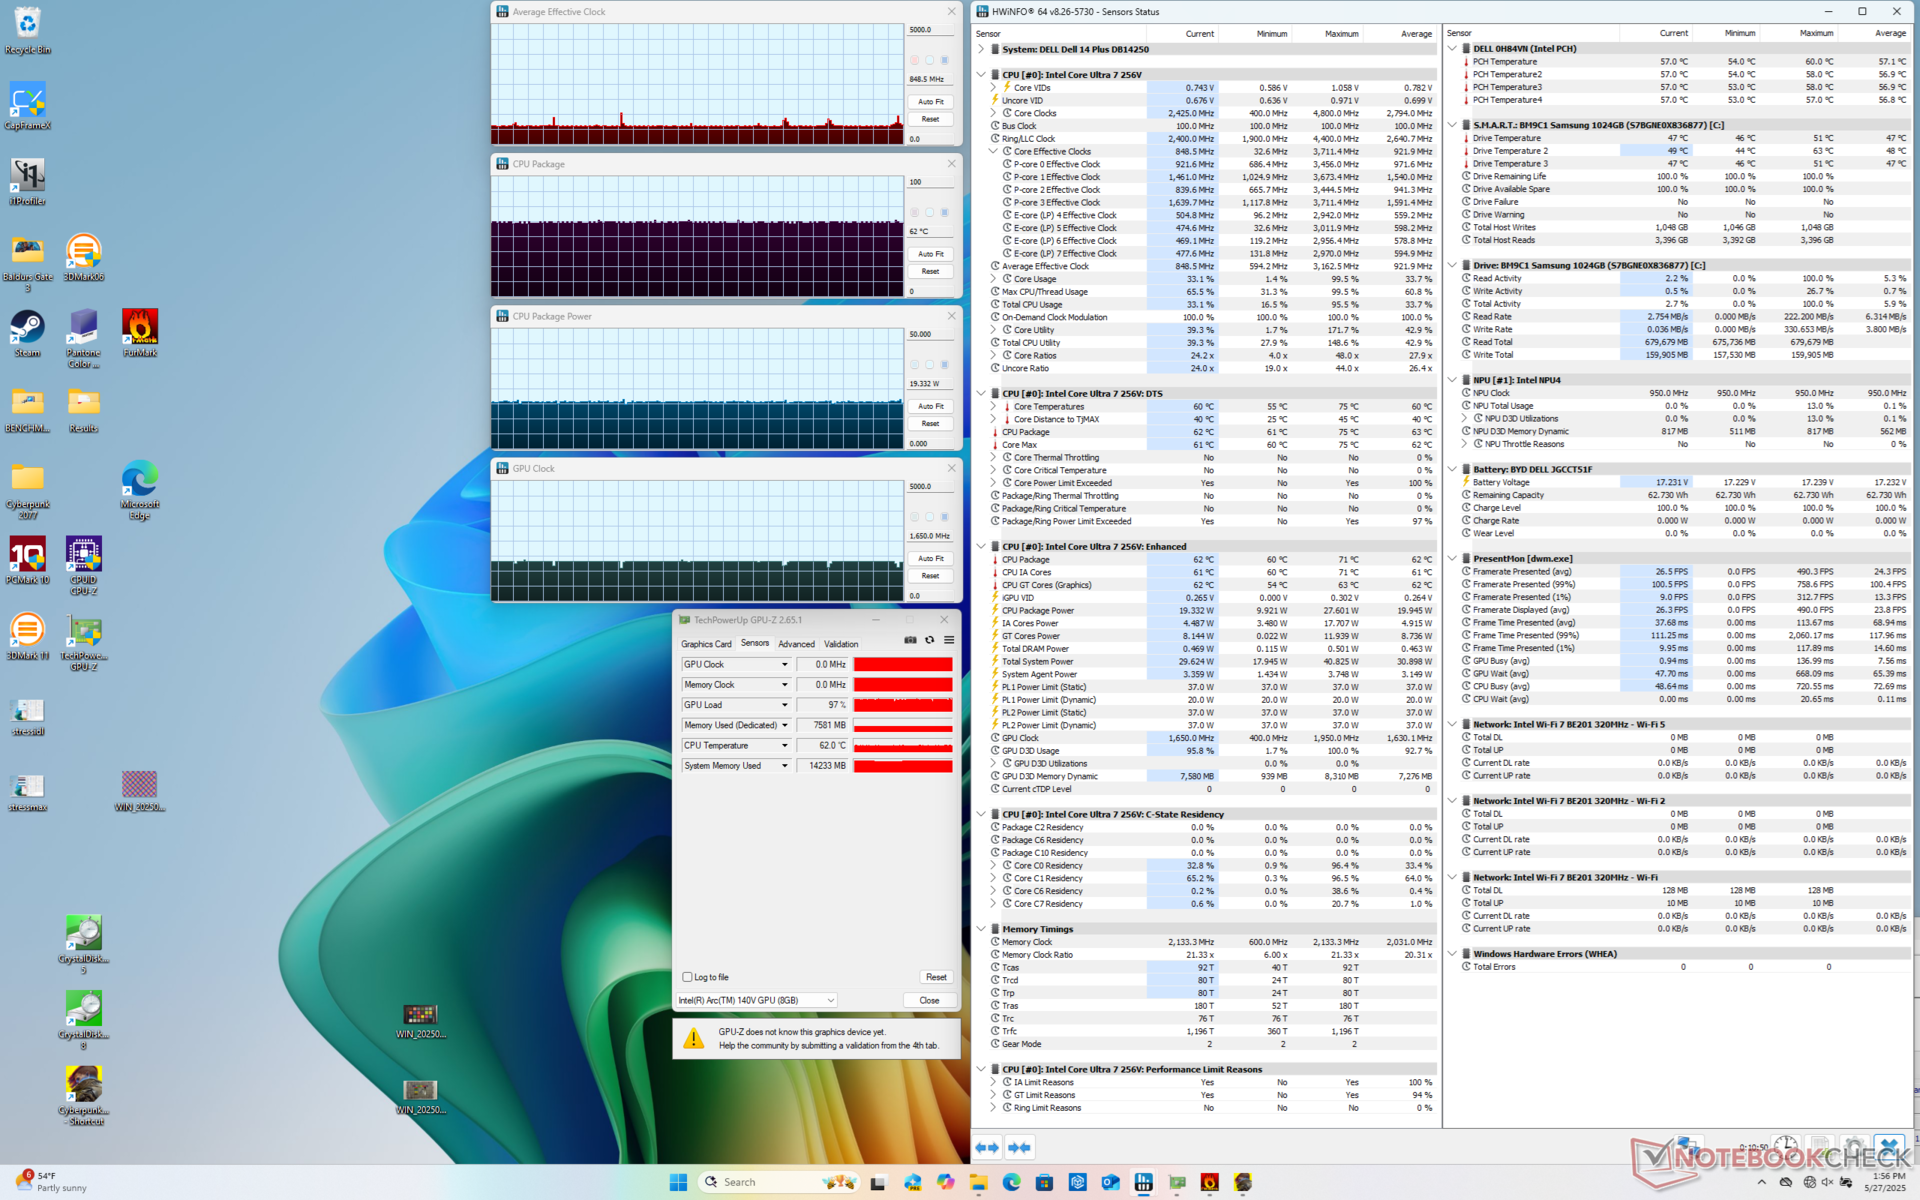
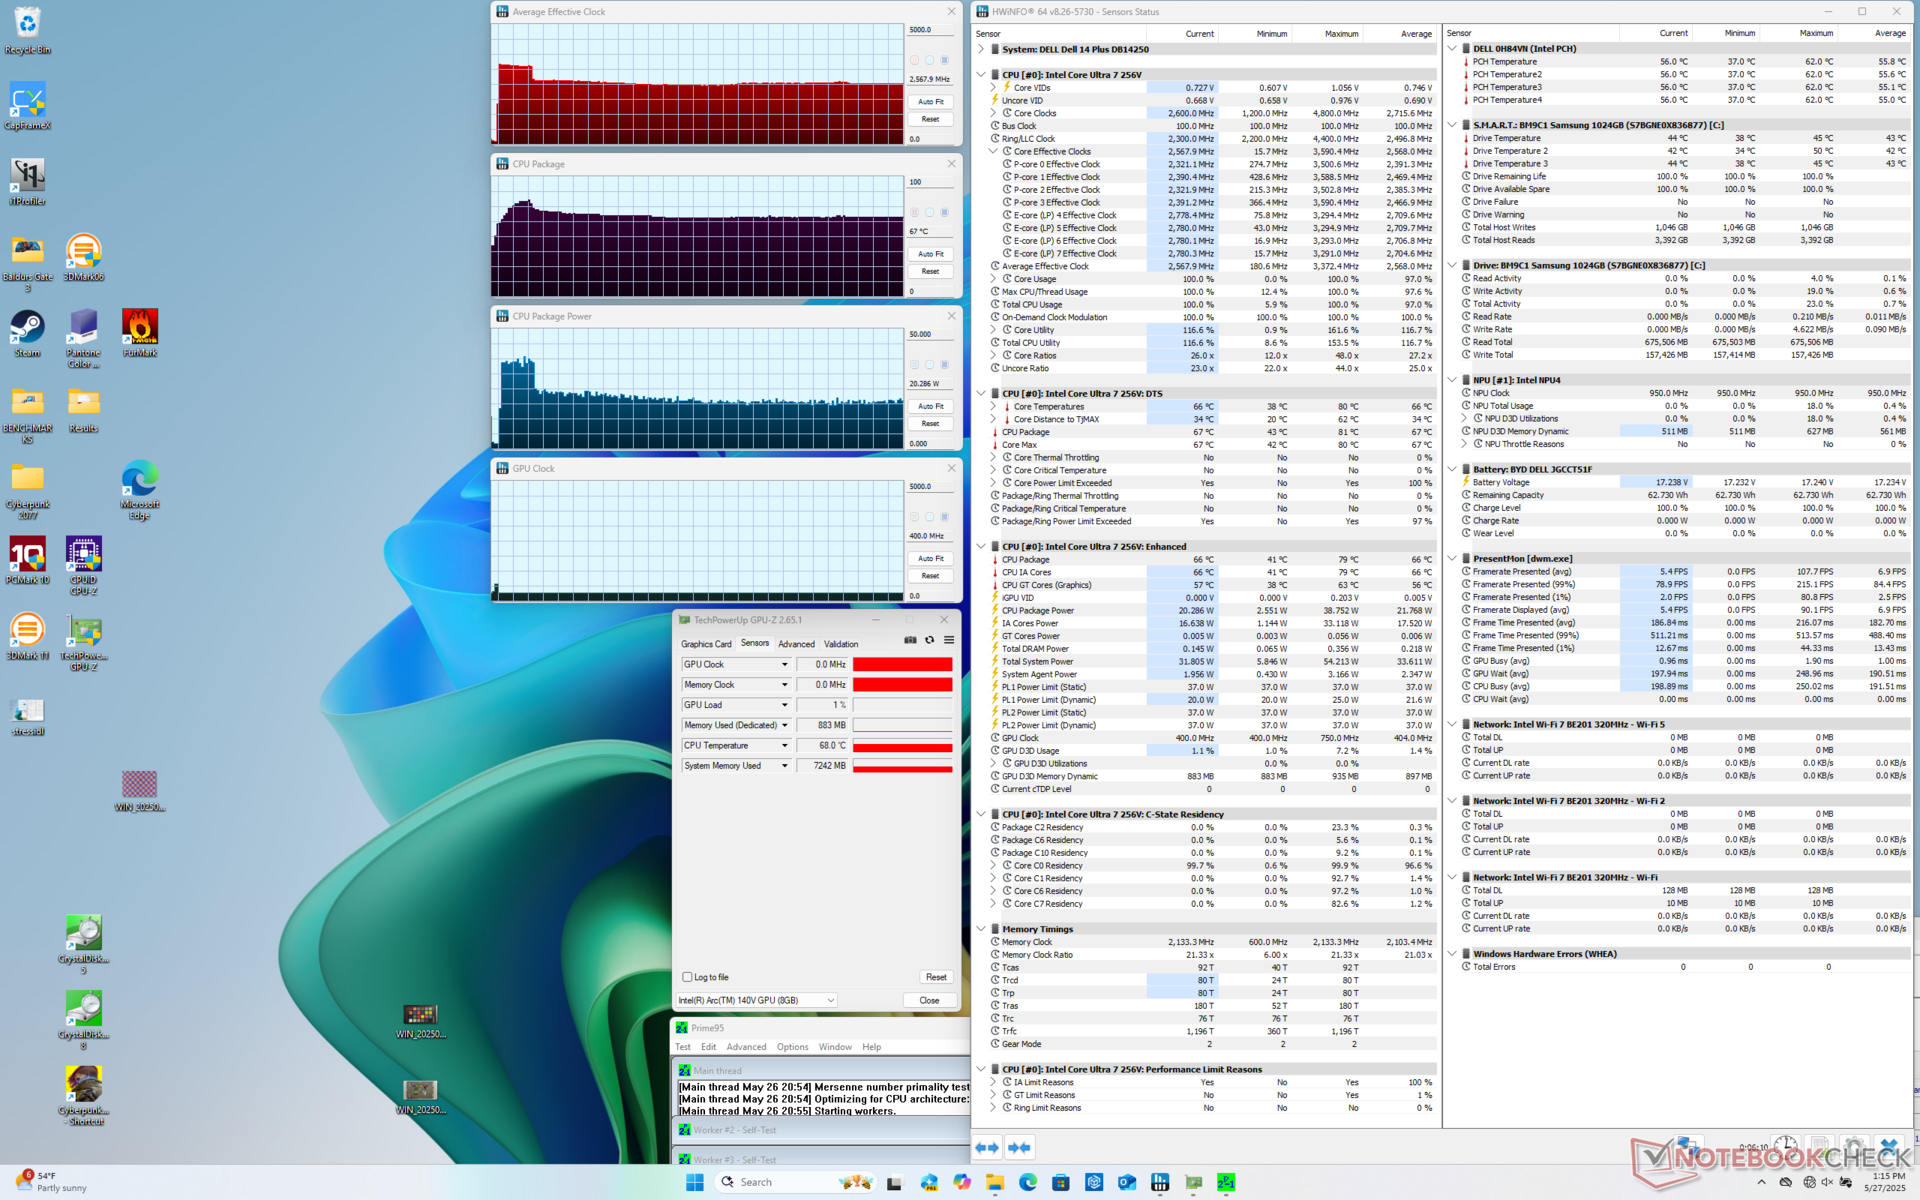
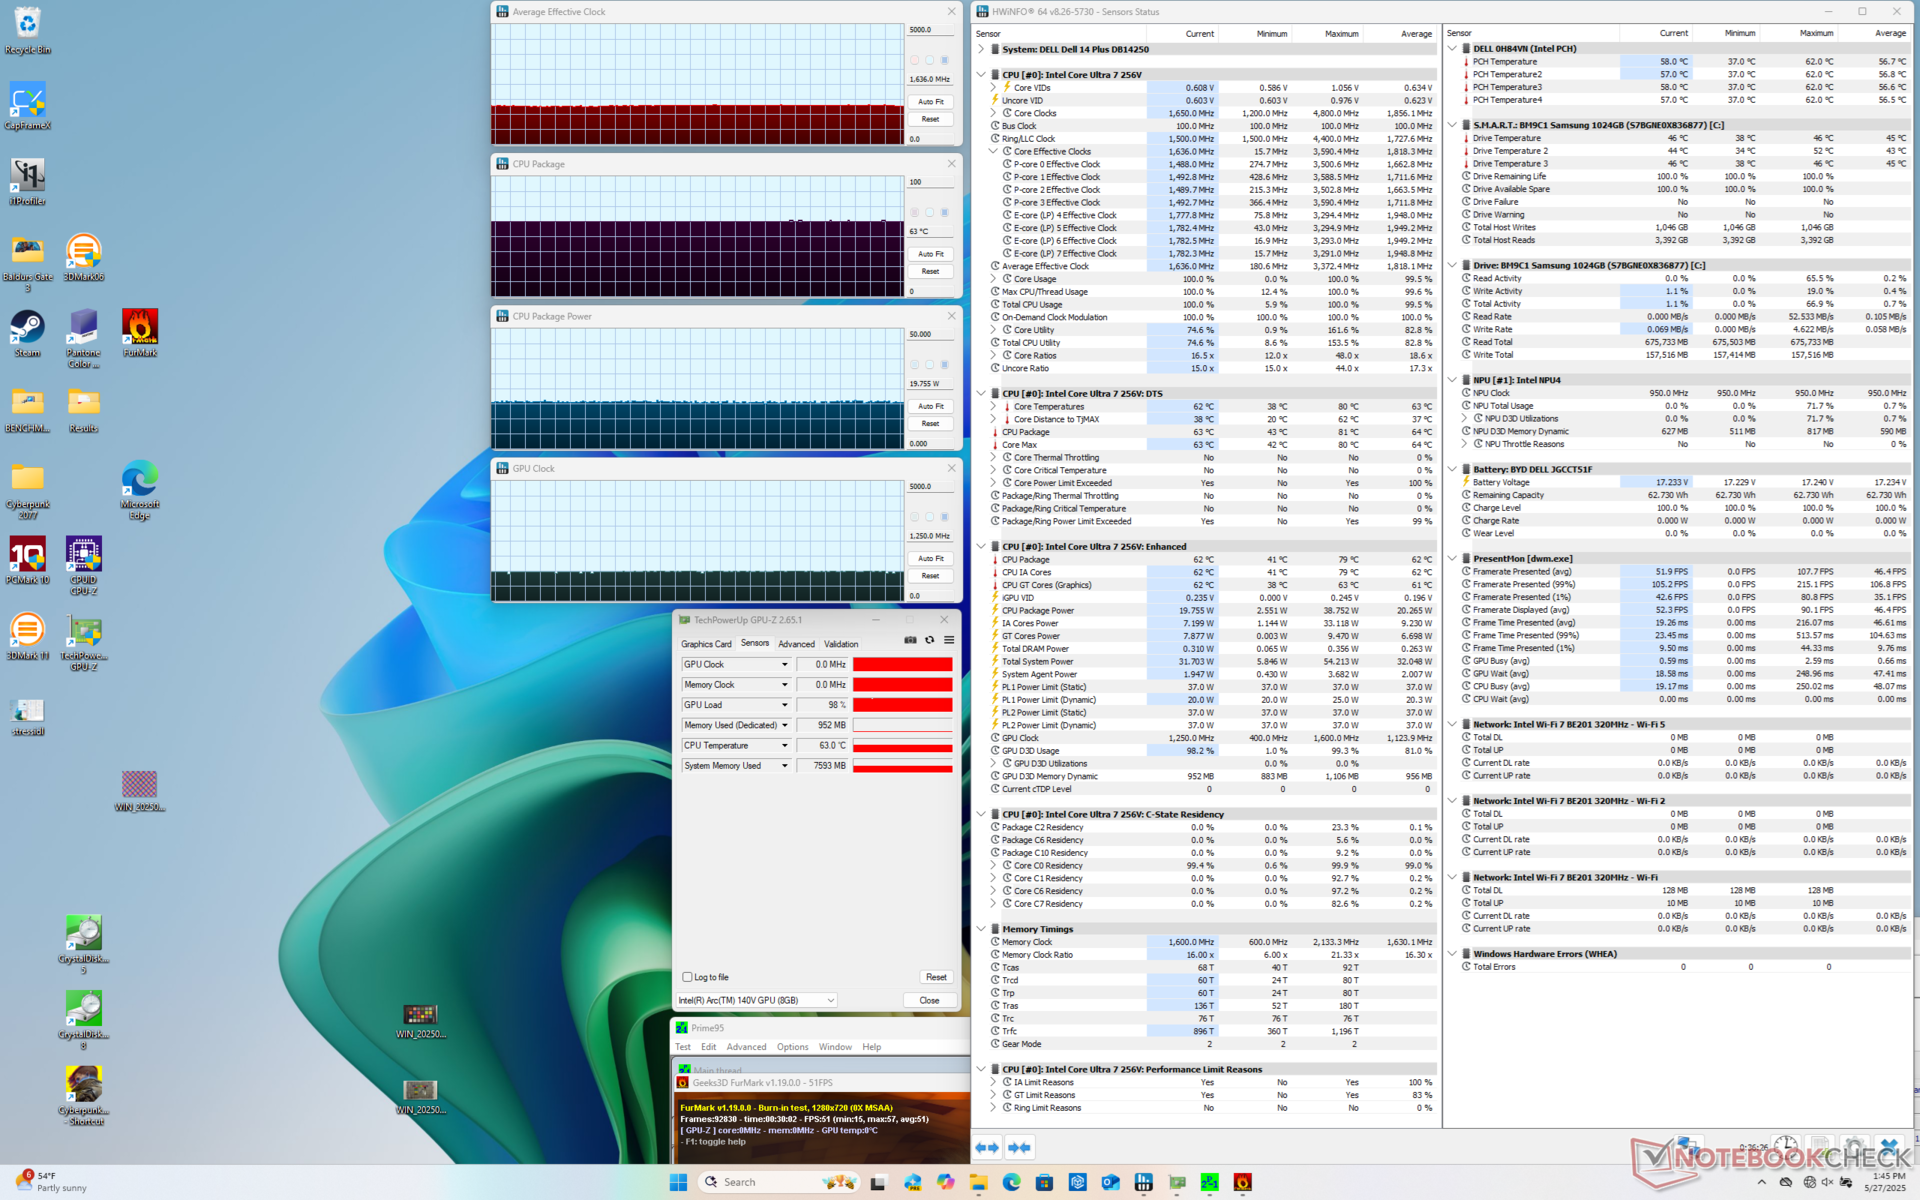
| Średnie taktowanie CPU (GHz) | Taktowanie GPU (MHz) | Średnia temperatura CPU (°C) | |
| System bezczynności | -- | -- | 38 |
| Prime95 Stress | 2.6 | -- | 67 |
| Prime95 + FurMark Stress | 1.6 | 1250 | 63 |
| Cyberpunk 2077 Stress | 0.8 | 1650 | 62 |
Wydajność systemu
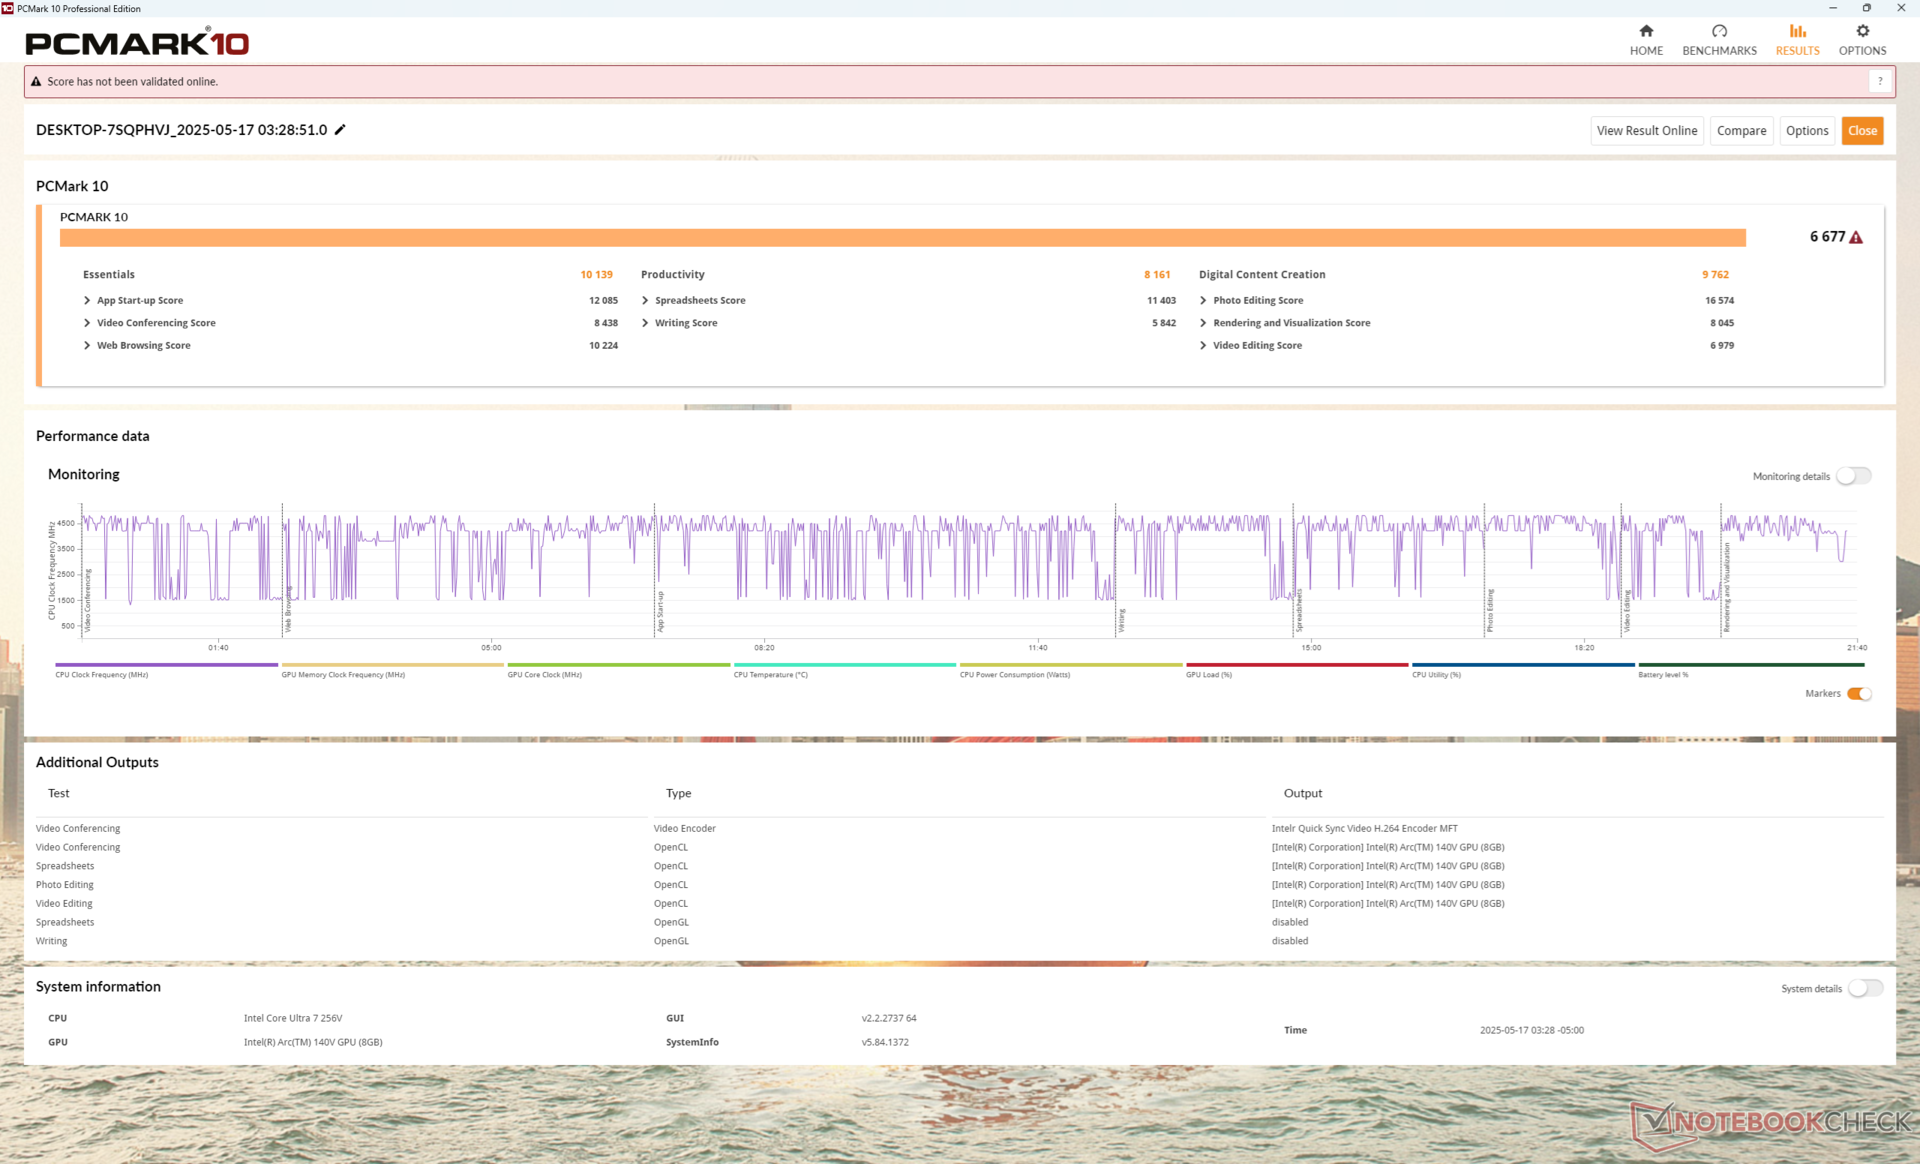
PCMark 10: Score | Essentials | Productivity | Digital Content Creation
CrossMark: Overall | Productivity | Creativity | Responsiveness
WebXPRT 3: Overall
WebXPRT 4: Overall
Mozilla Kraken 1.1: Total
| Performance rating | |
| Lenovo IdeaPad Pro 5 14AKP G10 | |
| Przeciętny Intel Core Ultra 7 256V, Intel Arc Graphics 140V | |
| Dell 14 Plus | |
| Lenovo ThinkPad E14 G6 | |
| HP Pavilion Plus 14-ew0153TU | |
| Dell Latitude 3440 | |
| Dell Inspiron 14 5425 6VPKR | |
| PCMark 10 / Score | |
| Lenovo IdeaPad Pro 5 14AKP G10 | |
| Przeciętny Intel Core Ultra 7 256V, Intel Arc Graphics 140V (6677 - 7702, n=7) | |
| Dell 14 Plus | |
| Lenovo ThinkPad E14 G6 | |
| Dell Inspiron 14 5425 6VPKR | |
| HP Pavilion Plus 14-ew0153TU | |
| Dell Latitude 3440 | |
| PCMark 10 / Essentials | |
| Lenovo IdeaPad Pro 5 14AKP G10 | |
| Dell Latitude 3440 | |
| Lenovo ThinkPad E14 G6 | |
| Przeciętny Intel Core Ultra 7 256V, Intel Arc Graphics 140V (9627 - 11365, n=7) | |
| HP Pavilion Plus 14-ew0153TU | |
| Dell 14 Plus | |
| Dell Inspiron 14 5425 6VPKR | |
| PCMark 10 / Productivity | |
| Lenovo IdeaPad Pro 5 14AKP G10 | |
| Przeciętny Intel Core Ultra 7 256V, Intel Arc Graphics 140V (8161 - 12672, n=7) | |
| Dell Inspiron 14 5425 6VPKR | |
| Lenovo ThinkPad E14 G6 | |
| Dell 14 Plus | |
| Dell Latitude 3440 | |
| HP Pavilion Plus 14-ew0153TU | |
| PCMark 10 / Digital Content Creation | |
| Przeciętny Intel Core Ultra 7 256V, Intel Arc Graphics 140V (9481 - 10126, n=7) | |
| Dell 14 Plus | |
| Lenovo IdeaPad Pro 5 14AKP G10 | |
| Lenovo ThinkPad E14 G6 | |
| HP Pavilion Plus 14-ew0153TU | |
| Dell Inspiron 14 5425 6VPKR | |
| Dell Latitude 3440 | |
| CrossMark / Overall | |
| Lenovo IdeaPad Pro 5 14AKP G10 | |
| Dell 14 Plus | |
| Przeciętny Intel Core Ultra 7 256V, Intel Arc Graphics 140V (1636 - 1736, n=7) | |
| Lenovo ThinkPad E14 G6 | |
| HP Pavilion Plus 14-ew0153TU | |
| Dell Latitude 3440 | |
| Dell Inspiron 14 5425 6VPKR | |
| CrossMark / Productivity | |
| Lenovo IdeaPad Pro 5 14AKP G10 | |
| Dell 14 Plus | |
| Przeciętny Intel Core Ultra 7 256V, Intel Arc Graphics 140V (1563 - 1682, n=7) | |
| HP Pavilion Plus 14-ew0153TU | |
| Lenovo ThinkPad E14 G6 | |
| Dell Latitude 3440 | |
| Dell Inspiron 14 5425 6VPKR | |
| CrossMark / Creativity | |
| Lenovo IdeaPad Pro 5 14AKP G10 | |
| Dell 14 Plus | |
| Przeciętny Intel Core Ultra 7 256V, Intel Arc Graphics 140V (1862 - 1962, n=7) | |
| Lenovo ThinkPad E14 G6 | |
| HP Pavilion Plus 14-ew0153TU | |
| Dell Latitude 3440 | |
| Dell Inspiron 14 5425 6VPKR | |
| CrossMark / Responsiveness | |
| Lenovo IdeaPad Pro 5 14AKP G10 | |
| Lenovo ThinkPad E14 G6 | |
| HP Pavilion Plus 14-ew0153TU | |
| Przeciętny Intel Core Ultra 7 256V, Intel Arc Graphics 140V (1215 - 1371, n=7) | |
| Dell 14 Plus | |
| Dell Latitude 3440 | |
| Dell Inspiron 14 5425 6VPKR | |
| WebXPRT 3 / Overall | |
| Lenovo IdeaPad Pro 5 14AKP G10 | |
| Dell 14 Plus | |
| Przeciętny Intel Core Ultra 7 256V, Intel Arc Graphics 140V (243 - 310, n=7) | |
| Lenovo ThinkPad E14 G6 | |
| Dell Latitude 3440 | |
| HP Pavilion Plus 14-ew0153TU | |
| Dell Inspiron 14 5425 6VPKR | |
| WebXPRT 4 / Overall | |
| Dell 14 Plus | |
| Przeciętny Intel Core Ultra 7 256V, Intel Arc Graphics 140V (282 - 286, n=7) | |
| Lenovo IdeaPad Pro 5 14AKP G10 | |
| HP Pavilion Plus 14-ew0153TU | |
| Lenovo ThinkPad E14 G6 | |
| Dell Latitude 3440 | |
| Dell Inspiron 14 5425 6VPKR | |
| Mozilla Kraken 1.1 / Total | |
| Dell Inspiron 14 5425 6VPKR | |
| Dell Latitude 3440 | |
| Lenovo ThinkPad E14 G6 | |
| HP Pavilion Plus 14-ew0153TU | |
| Dell 14 Plus | |
| Przeciętny Intel Core Ultra 7 256V, Intel Arc Graphics 140V (470 - 480, n=7) | |
| Lenovo IdeaPad Pro 5 14AKP G10 | |
* ... im mniej tym lepiej
| PCMark 10 Score | 6677 pkt. | |
Pomoc | ||
| AIDA64 / Memory Copy | |
| Przeciętny Intel Core Ultra 7 256V (99227 - 104459, n=7) | |
| Dell 14 Plus | |
| Lenovo IdeaPad Pro 5 14AKP G10 | |
| Lenovo ThinkPad E14 G6 | |
| HP Pavilion Plus 14-ew0153TU | |
| Dell Latitude 3440 | |
| Dell Inspiron 14 5425 6VPKR | |
| AIDA64 / Memory Read | |
| Przeciętny Intel Core Ultra 7 256V (86352 - 89848, n=7) | |
| Dell 14 Plus | |
| Lenovo ThinkPad E14 G6 | |
| Lenovo IdeaPad Pro 5 14AKP G10 | |
| HP Pavilion Plus 14-ew0153TU | |
| Dell Latitude 3440 | |
| Dell Inspiron 14 5425 6VPKR | |
| AIDA64 / Memory Write | |
| Dell 14 Plus | |
| Przeciętny Intel Core Ultra 7 256V (108692 - 117933, n=7) | |
| Lenovo IdeaPad Pro 5 14AKP G10 | |
| HP Pavilion Plus 14-ew0153TU | |
| Lenovo ThinkPad E14 G6 | |
| Dell Latitude 3440 | |
| Dell Inspiron 14 5425 6VPKR | |
| AIDA64 / Memory Latency | |
| Lenovo ThinkPad E14 G6 | |
| HP Pavilion Plus 14-ew0153TU | |
| Lenovo IdeaPad Pro 5 14AKP G10 | |
| Dell Inspiron 14 5425 6VPKR | |
| Przeciętny Intel Core Ultra 7 256V (96.1 - 99.6, n=7) | |
| Dell 14 Plus | |
| Dell Latitude 3440 | |
* ... im mniej tym lepiej
Opóźnienie DPC

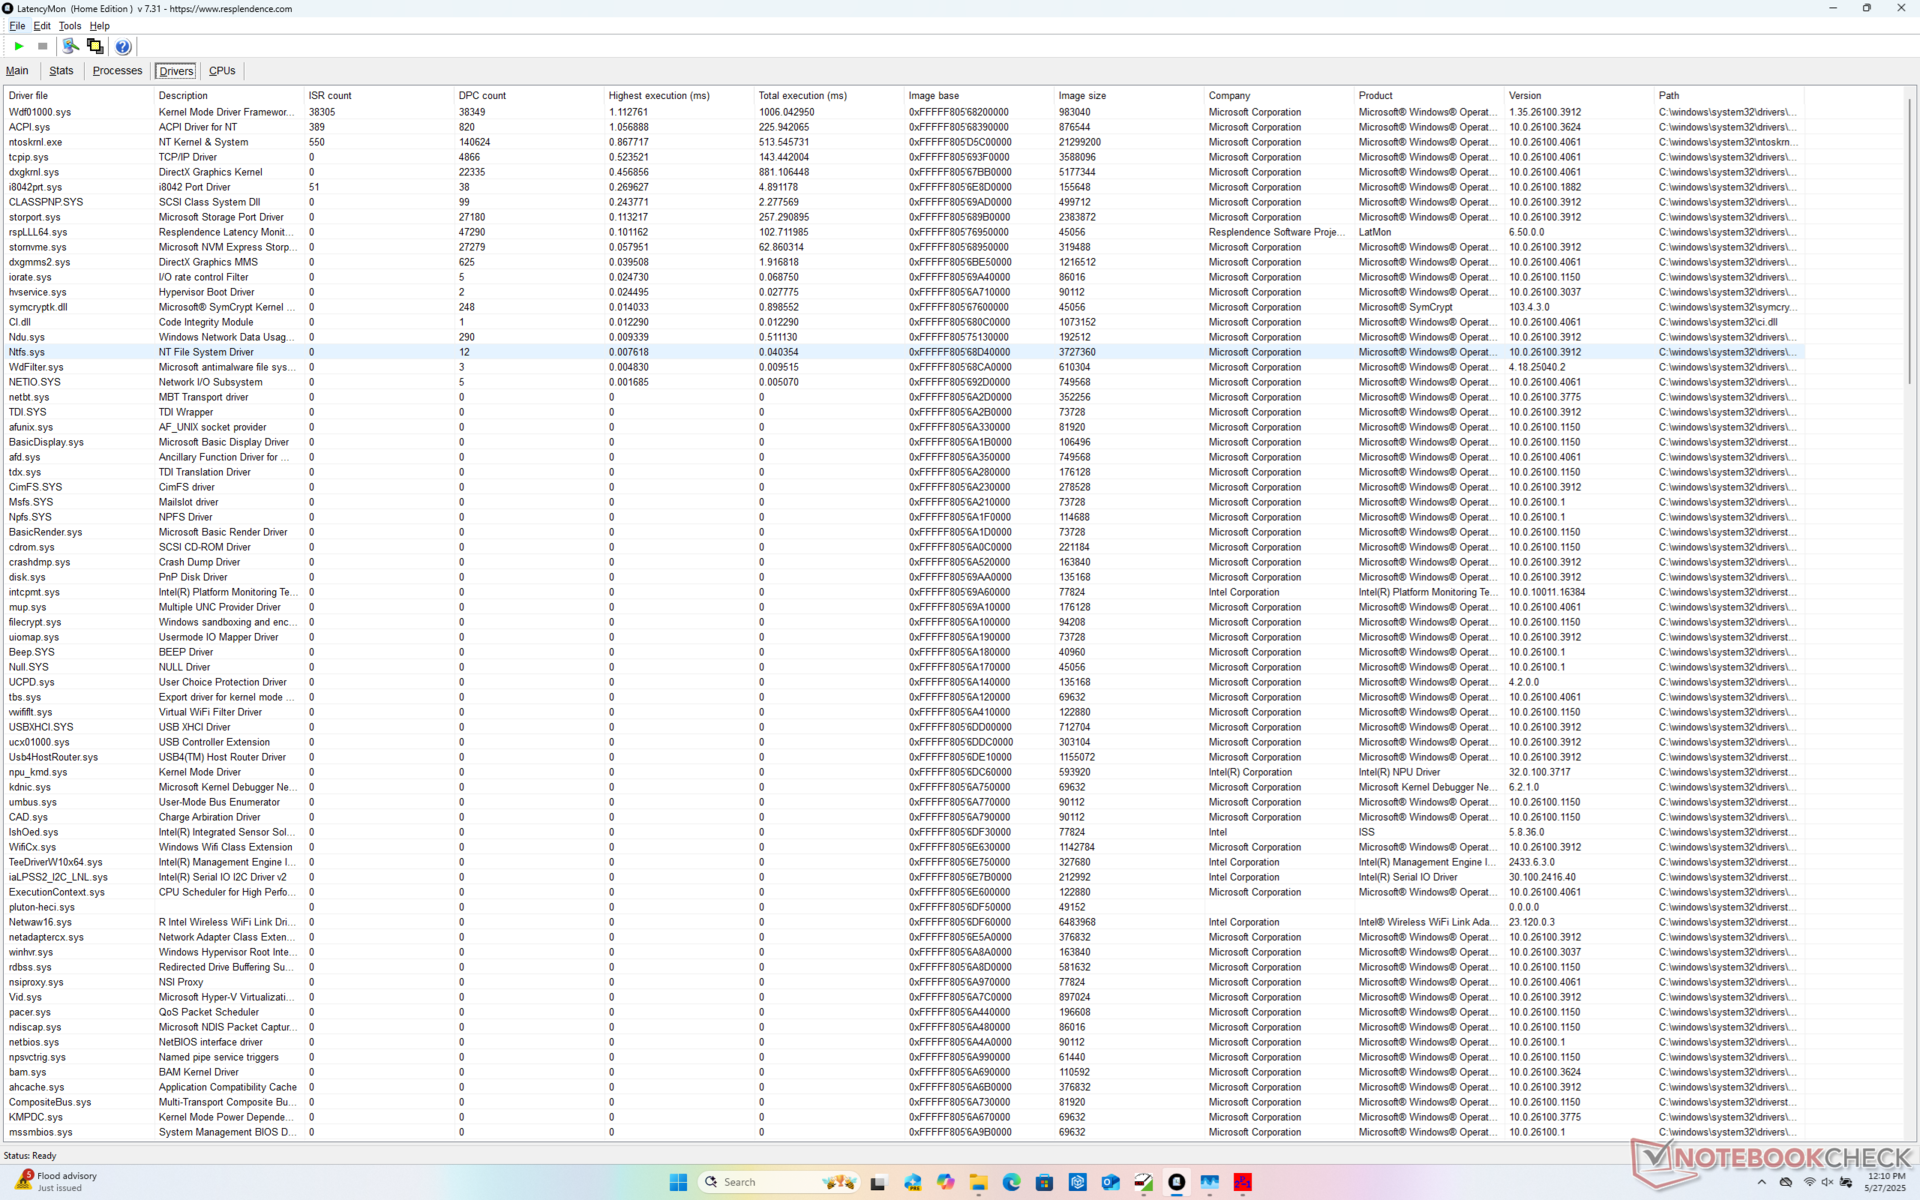
| DPC Latencies / LatencyMon - interrupt to process latency (max), Web, Youtube, Prime95 | |
| Lenovo ThinkPad E14 G6 | |
| Dell Latitude 3440 | |
| HP Pavilion Plus 14-ew0153TU | |
| Dell 14 Plus | |
| Dell Inspiron 14 5425 6VPKR | |
| Lenovo IdeaPad Pro 5 14AKP G10 | |
* ... im mniej tym lepiej
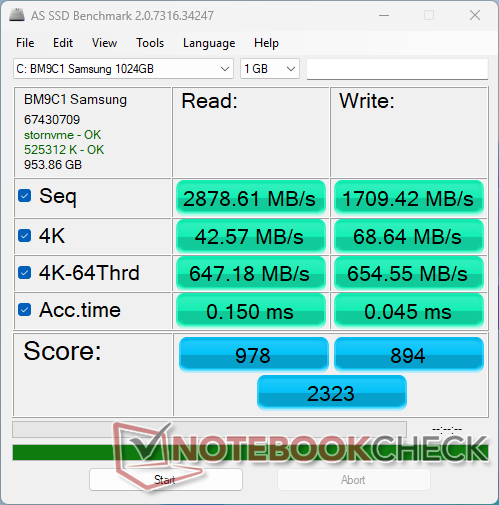
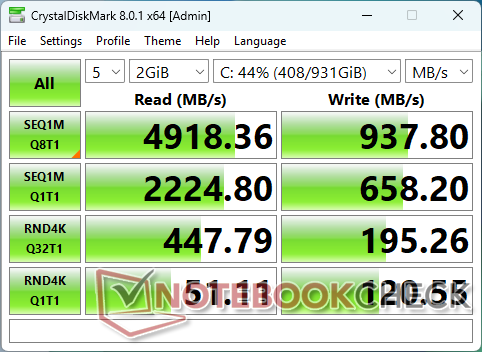
Urządzenia pamięci masowej
Nasze urządzenie jest dostarczane ze średniej klasy Samsung BM9C1 PCIe4 NVMe SSD z przyzwoitymi prędkościami odczytu do 4900 MB/s. Szybkość zapisu może być jednak znacznie niższa i wynosić mniej niż połowę tej wartości.

| Drive Performance rating - Percent | |
| Lenovo IdeaPad Pro 5 14AKP G10 | |
| HP Pavilion Plus 14-ew0153TU | |
| Lenovo ThinkPad E14 G6 | |
| Dell Latitude 3440 | |
| Dell Inspiron 14 5425 6VPKR | |
| Dell 14 Plus | |
* ... im mniej tym lepiej
Disk Throttling: DiskSpd Read Loop, Queue Depth 8
Wydajność GPU
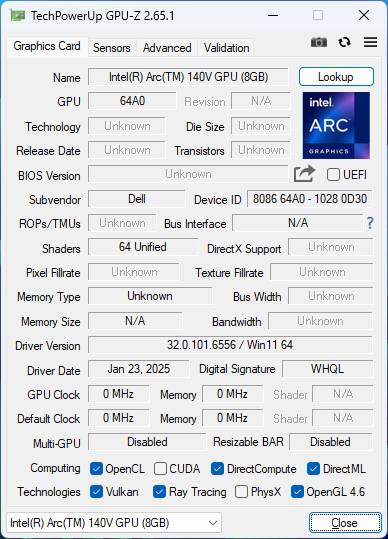
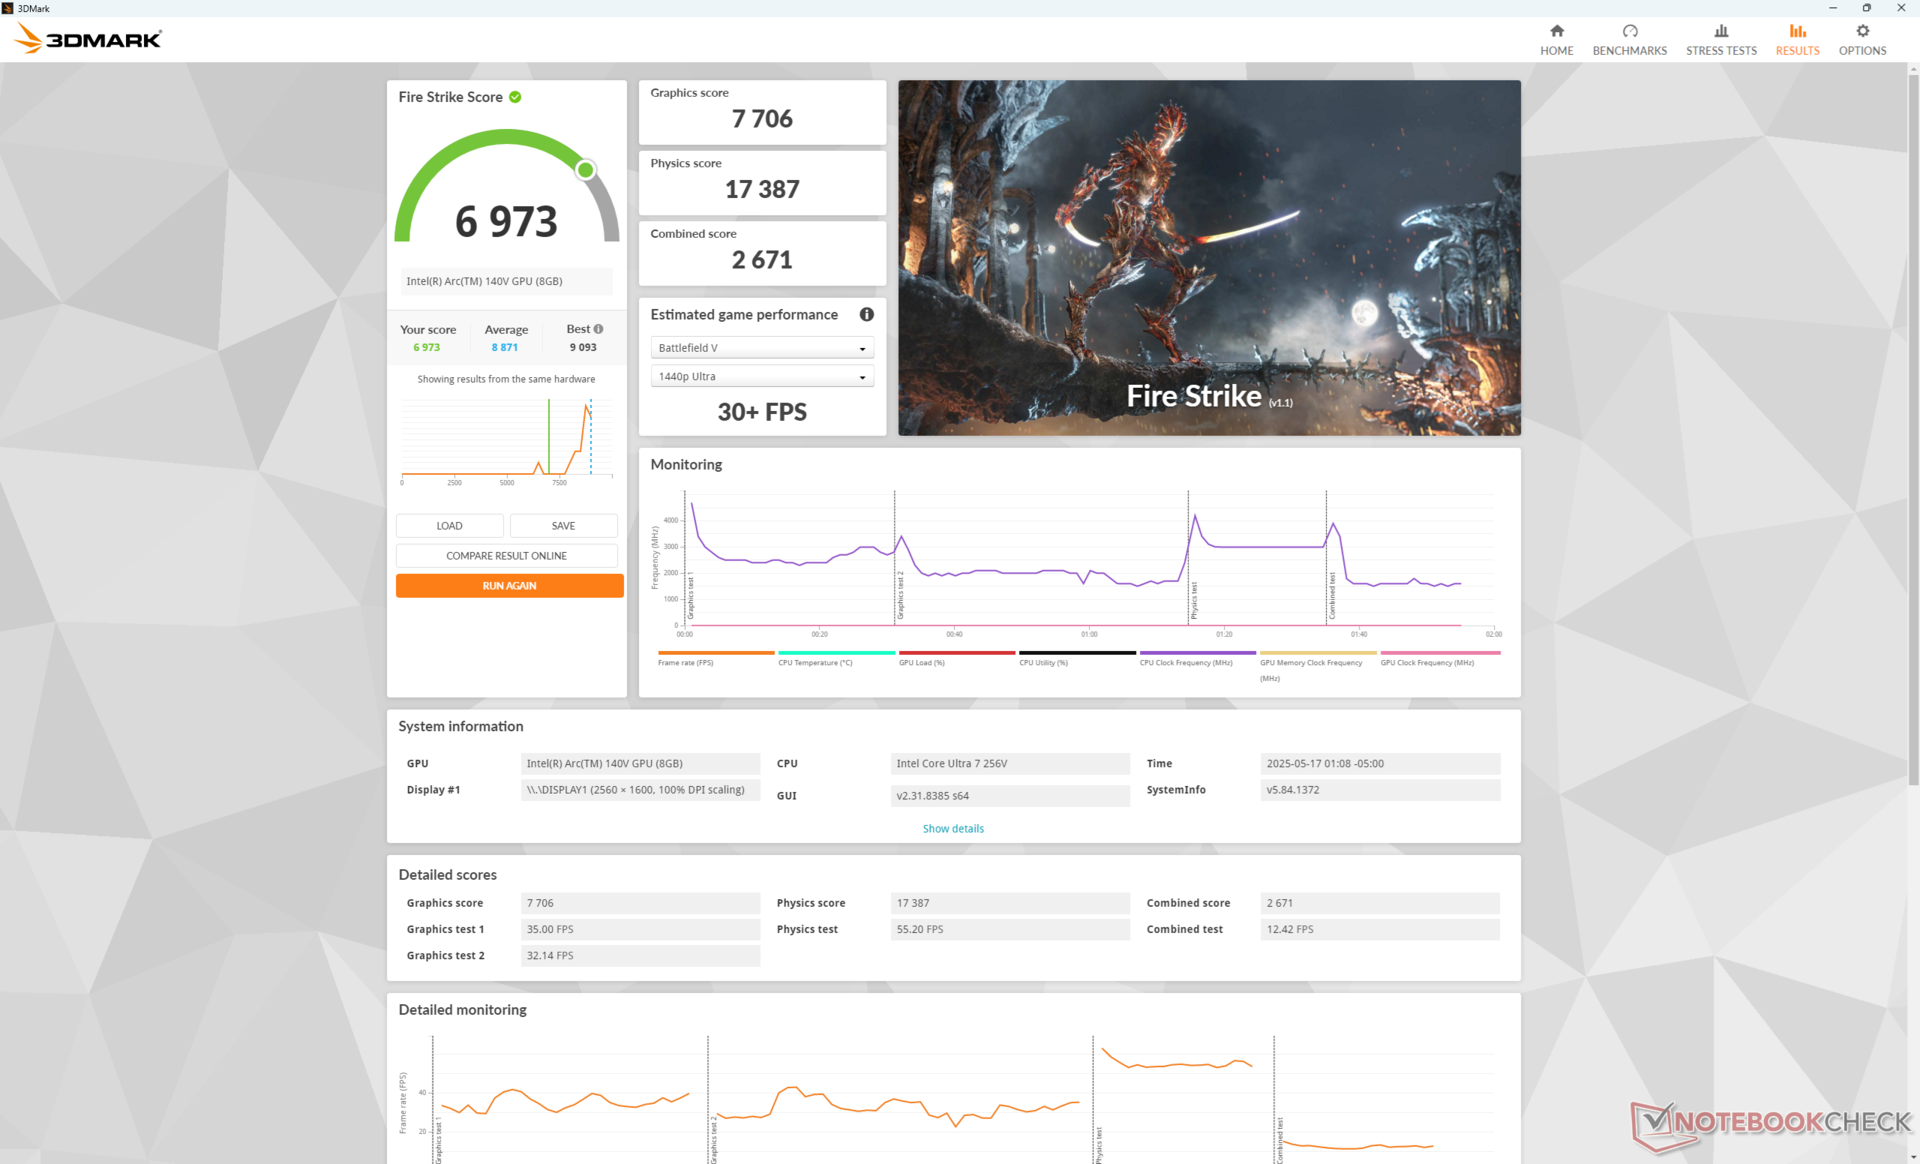
The Arc 140V w naszym egzemplarzu działa wolniej niż przeciętny laptop w naszej bazie danych z tym samym iGPU nawet o 20 procent. Mimo to, system jest nadal znaczącym ulepszeniem w stosunku do starzejącego się Iris Xe 96 EUs z których wielu nabywców będzie dokonywać aktualizacji.
| Profil zasilania | Wynik grafiki | Wynik fizyki | Łączny wynik |
| Tryb wydajności | 7706 | 17387 | 2671 |
| Tryb zrównoważony | 7182 (-7%) | 16601 (-5%) | 2426 (-9%) |
| Zasilanie bateryjne | 7374(-4%) | 16277 (-6%) | 2373 (-11%) |
Praca w trybie zrównoważonym lub na zasilaniu bateryjnym zmniejsza wydajność tylko o kilka punktów procentowych, jak pokazuje nasza tabela wyników Fire Strike powyżej.
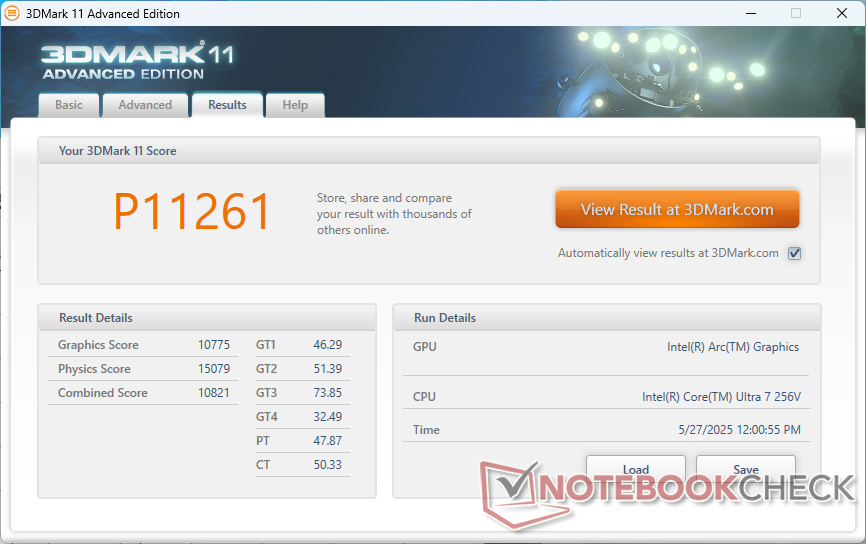
| 3DMark 11 Performance | 11261 pkt. | |
| 3DMark Fire Strike Score | 6973 pkt. | |
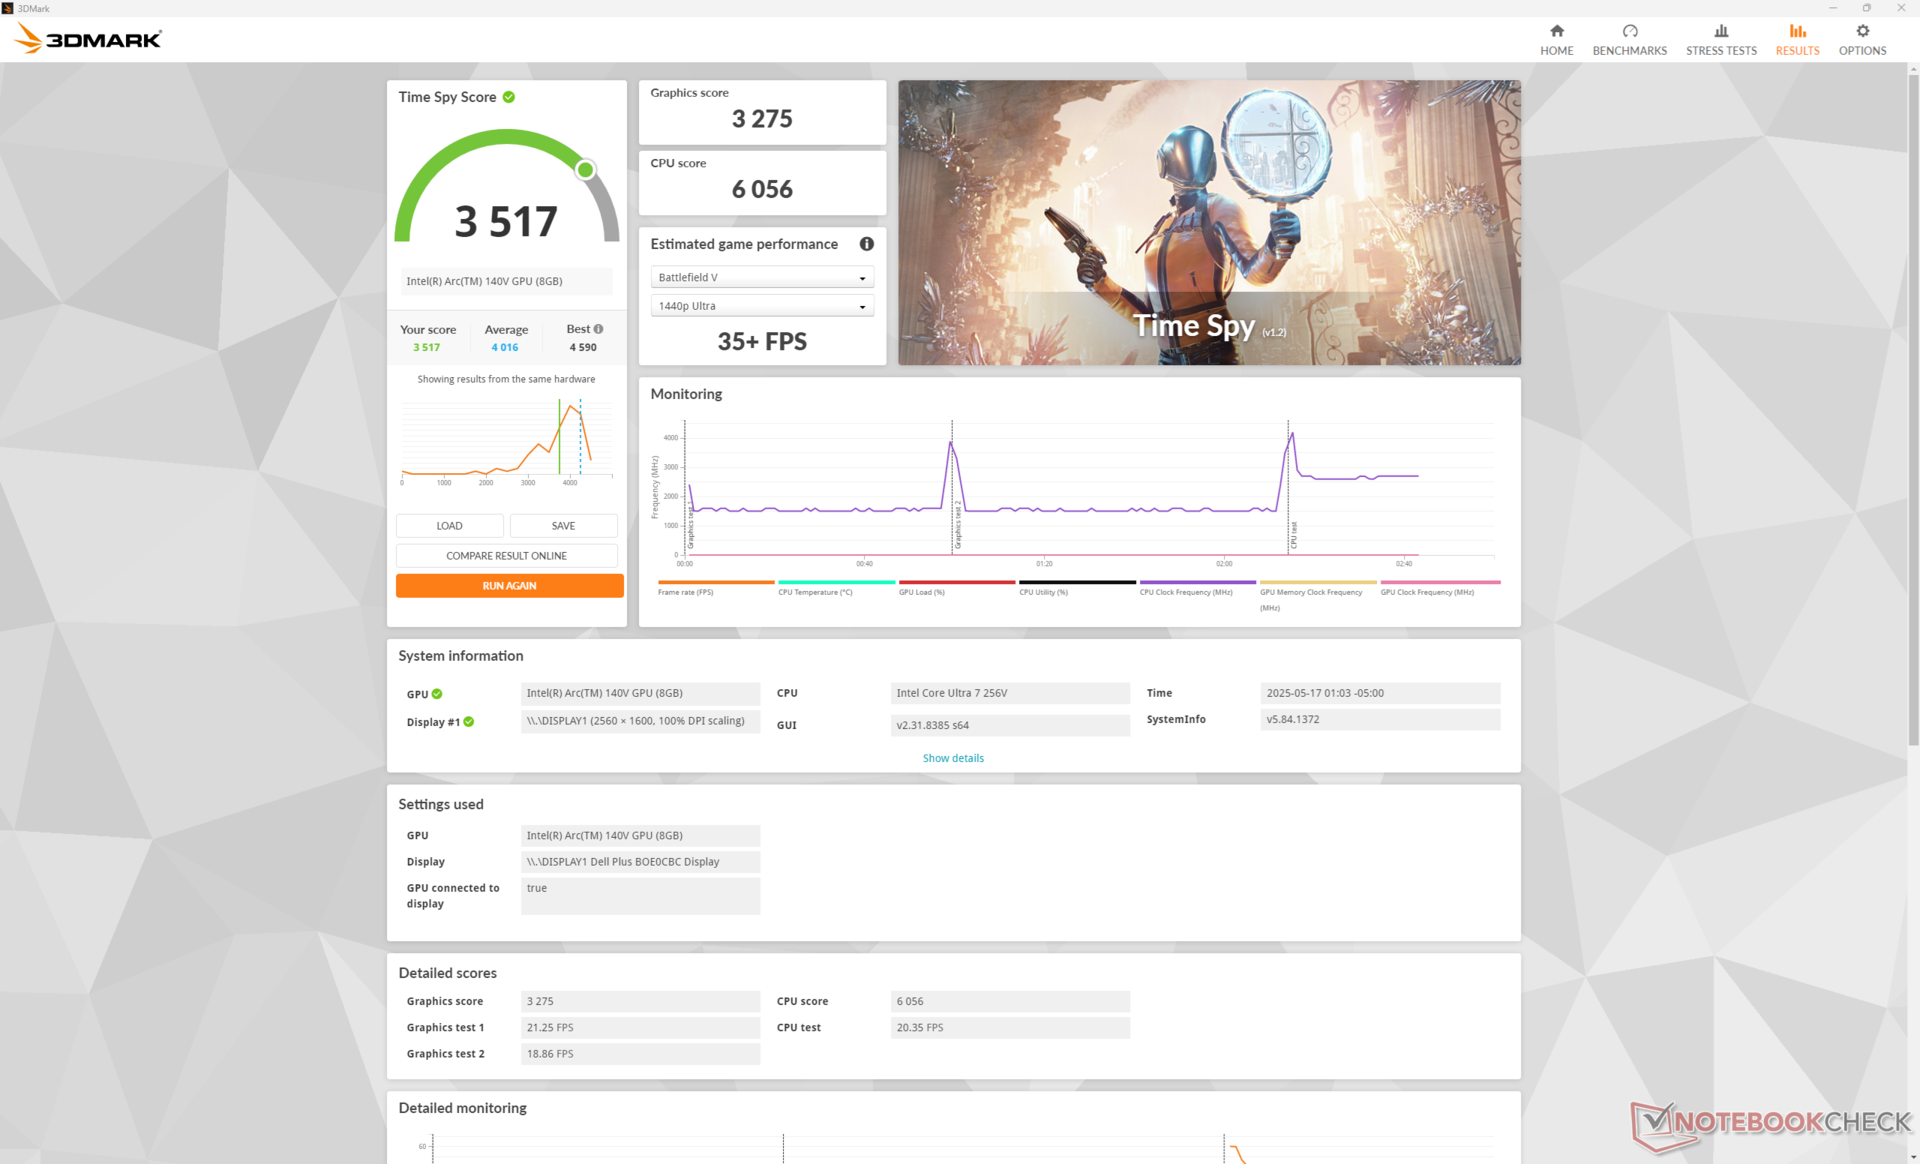
| 3DMark Time Spy Score | 3517 pkt. | |
Pomoc | ||
* ... im mniej tym lepiej
| F1 24 | |
| 1920x1080 High Preset AA:T AF:16x | |
| Przeciętny Intel Arc Graphics 140V (34.4 - 66.4, n=27) | |
| Lenovo ThinkPad X1 2-in-1 Gen 10 | |
| Lenovo IdeaPad Pro 5 14AKP G10 | |
| Dell 14 Plus | |
| Lenovo Yoga 7 2-in-1 14AKP10 | |
| 1920x1080 Ultra High Preset AA:T AF:16x | |
| Przeciętny Intel Arc Graphics 140V (14.6 - 22, n=25) | |
| Lenovo ThinkPad X1 2-in-1 Gen 10 | |
| Dell 14 Plus | |
| Lenovo IdeaPad Pro 5 14AKP G10 | |
Cyberpunk 2077 ultra FPS Chart
| low | med. | high | ultra | |
|---|---|---|---|---|
| Dota 2 Reborn (2015) | 98.6 | 59.7 | 74.5 | 69.1 |
| Final Fantasy XV Benchmark (2018) | 76.9 | 42.8 | 32.3 | |
| X-Plane 11.11 (2018) | 43.8 | 35.3 | 36 | |
| Strange Brigade (2018) | 193.4 | 56.2 | 52.6 | 48.8 |
| Baldur's Gate 3 (2023) | 38.1 | 32.1 | 27.9 | 27.4 |
| Cyberpunk 2077 (2023) | 43.5 | 35.1 | 26 | 24.2 |
| F1 24 (2024) | 64.3 | 62.2 | 45.9 | 16.5 |
Emisje
Hałas systemowy
Wewnętrzny wentylator jest generalnie ospały i cichy przy większości niskich i średnich obciążeń, podobnie jak w przypadku większości subnotebooków z procesorami Lunar Lake. Wentylator potrzebuje trochę czasu, aby naprawdę zacząć działać przy wyższych obciążeniach, ale poza tym osiąga podobny poziom pułapu, jak większość innych 14-calowych konkurentów.
Hałas
| luz |
| 23.8 / 23.8 / 23.8 dB |
| obciążenie |
| 31.4 / 45.2 dB |
 | ||
30 dB cichy 40 dB(A) słyszalny 50 dB(A) irytujący |
||
min: | ||
| Dell 14 Plus Arc 140V, Core Ultra 7 256V | Dell Inspiron 14 5425 6VPKR Vega 7, R5 5625U, SK Hynix BC711 512GB HFM512GD3GX013N | Dell Latitude 3440 Iris Xe G7 80EUs, i5-1345U, Samsung PM9A1 MZVL2512HCJQ | Lenovo IdeaPad Pro 5 14AKP G10 Radeon 860M, Ryzen AI 7 350, SK hynix PVC10 HFS001TEM4X182N | Lenovo ThinkPad E14 G6 Graphics 4-Core iGPU (Arrow Lake), Ultra 7 155U, Samsung PM9C1a MZAL8512HDLU | HP Pavilion Plus 14-ew0153TU Iris Xe G7 96EUs, i7-1355U, SK hynix PC801 HFS001TEJ9X101N | |
|---|---|---|---|---|---|---|
| Noise | -7% | -3% | -10% | 2% | 15% | |
| wyłączone / środowisko * (dB) | 23.8 | 25.5 -7% | 23.9 -0% | 23.6 1% | 24.6 -3% | 19.35 19% |
| Idle Minimum * (dB) | 23.8 | 25.5 -7% | 24.4 -3% | 23.6 1% | 24.6 -3% | 20.57 14% |
| Idle Average * (dB) | 23.8 | 25.5 -7% | 24.4 -3% | 23.6 1% | 24.6 -3% | 20.57 14% |
| Idle Maximum * (dB) | 23.8 | 25.5 -7% | 24.4 -3% | 23.6 1% | 24.6 -3% | 20.57 14% |
| Load Average * (dB) | 31.4 | 37.7 -20% | 37.1 -18% | 46.5 -48% | 27.5 12% | 32.18 -2% |
| Cyberpunk 2077 ultra * (dB) | 42 | 48.9 -16% | 39.4 6% | |||
| Load Maximum * (dB) | 45.2 | 43.3 4% | 40.2 11% | 48.9 -8% | 42.5 6% | 32.26 29% |
| Witcher 3 ultra * (dB) | 38.2 | 29.44 |
* ... im mniej tym lepiej
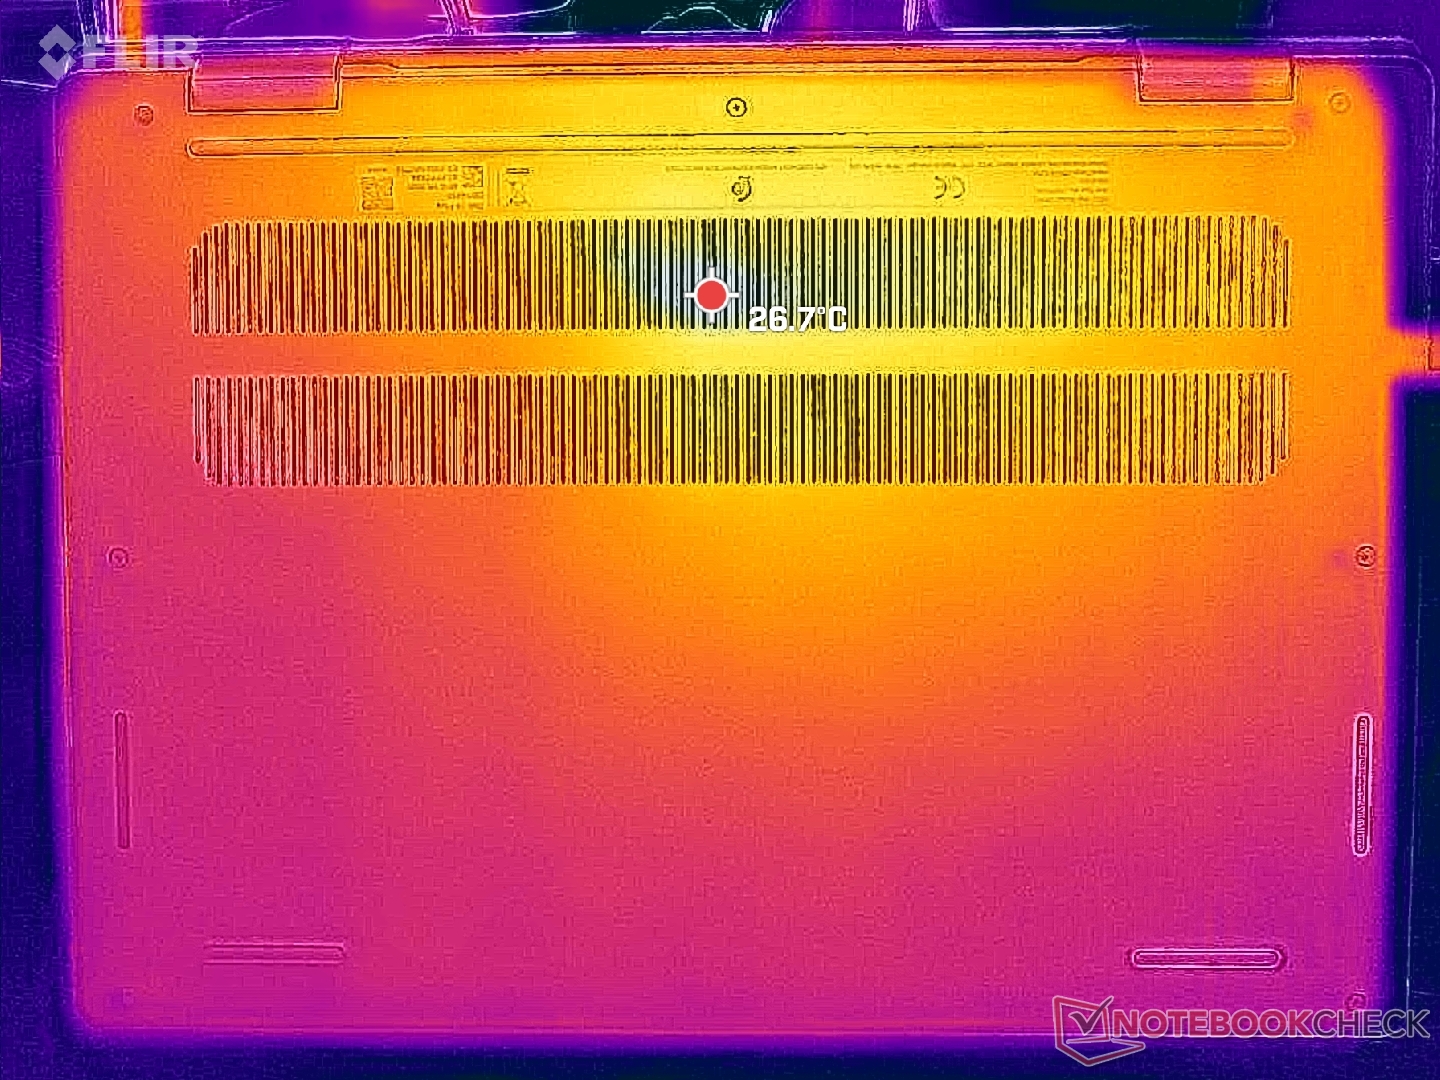
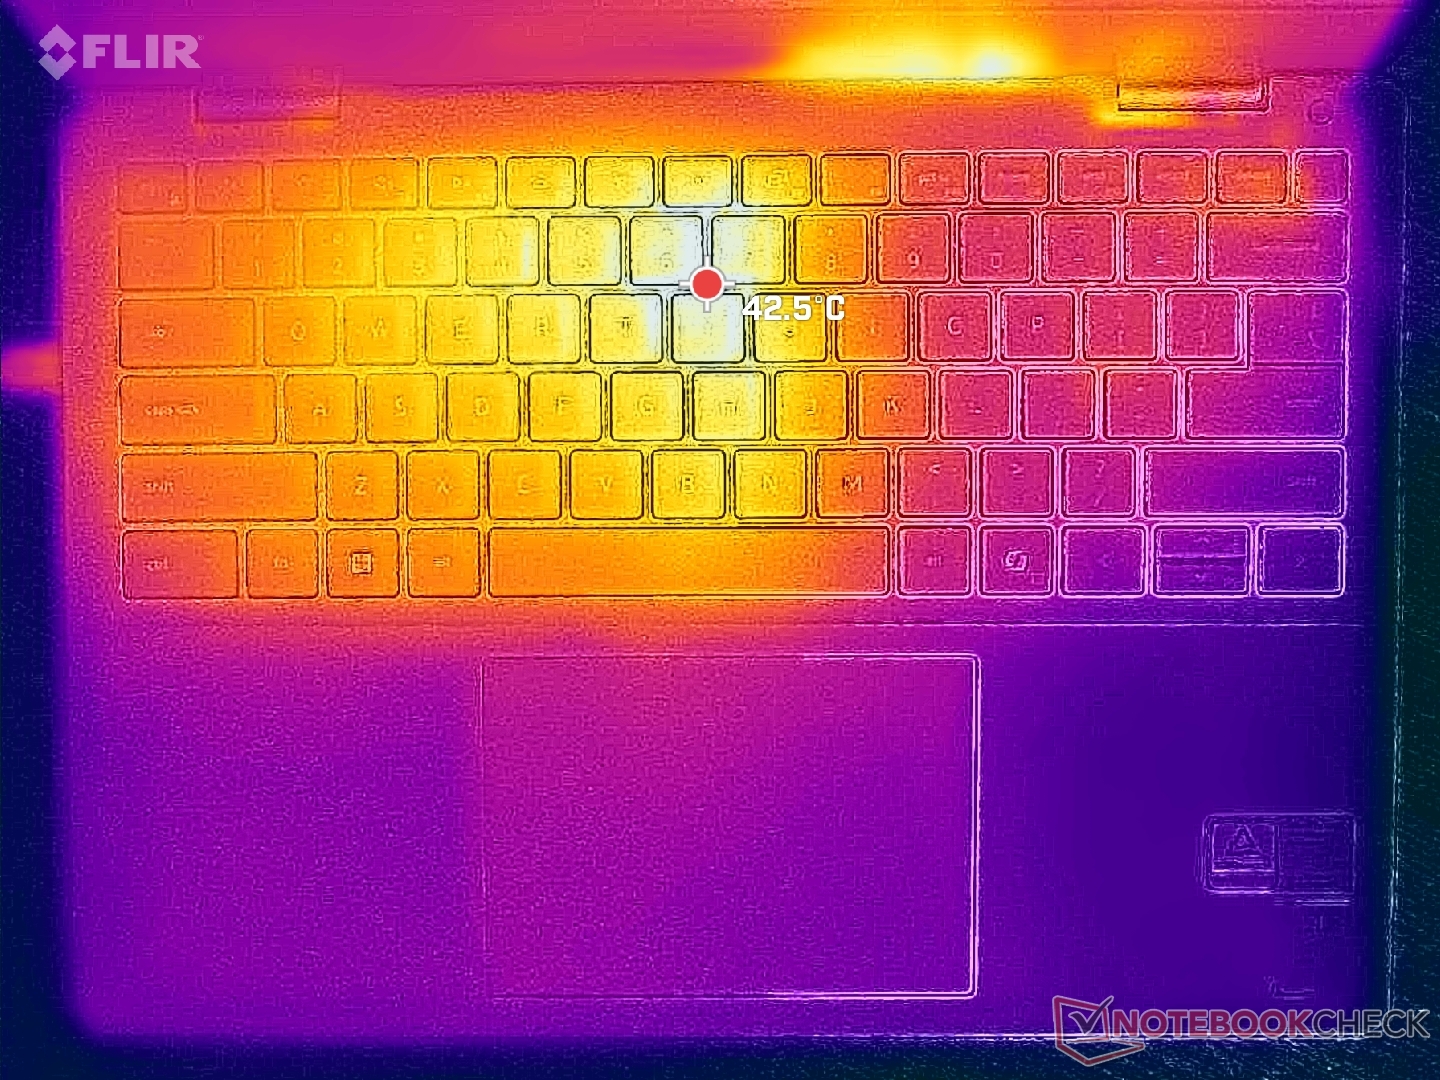
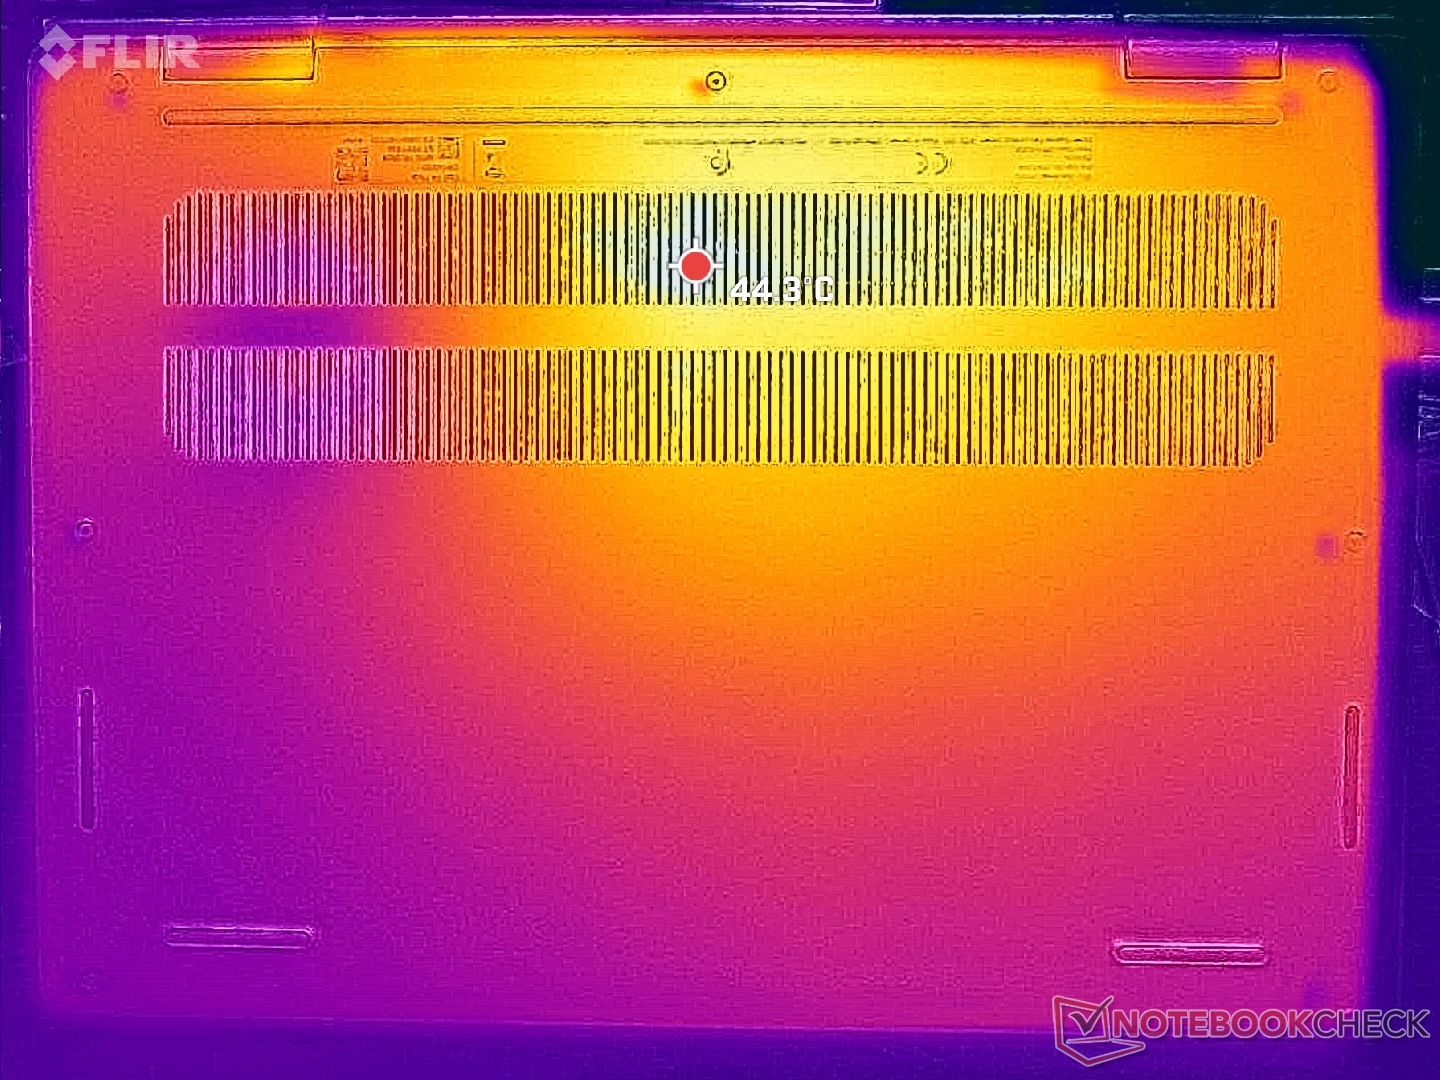
Temperatura
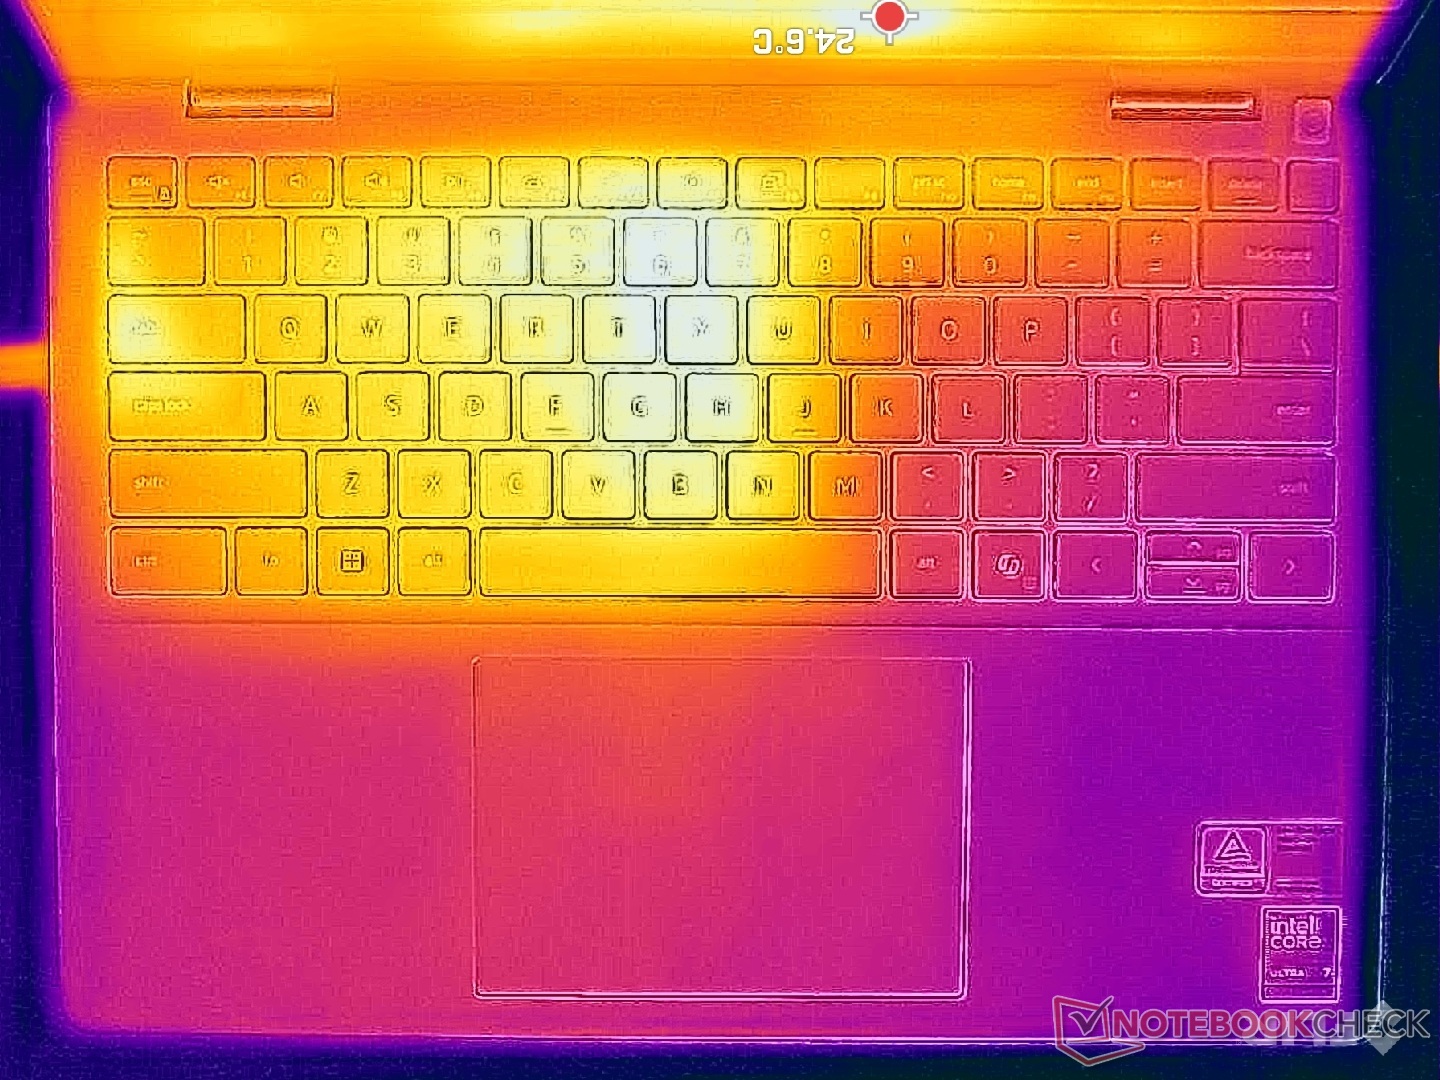
Temperatura powierzchni w gorących punktach pod obciążeniem może osiągnąć do 43 C zarówno na pokładzie klawiatury, jak i na spodzie, aby być zauważalnie cieplejszym niż to, co zarejestrowaliśmy na HP Pavilion Plus 14 o kilka stopni.
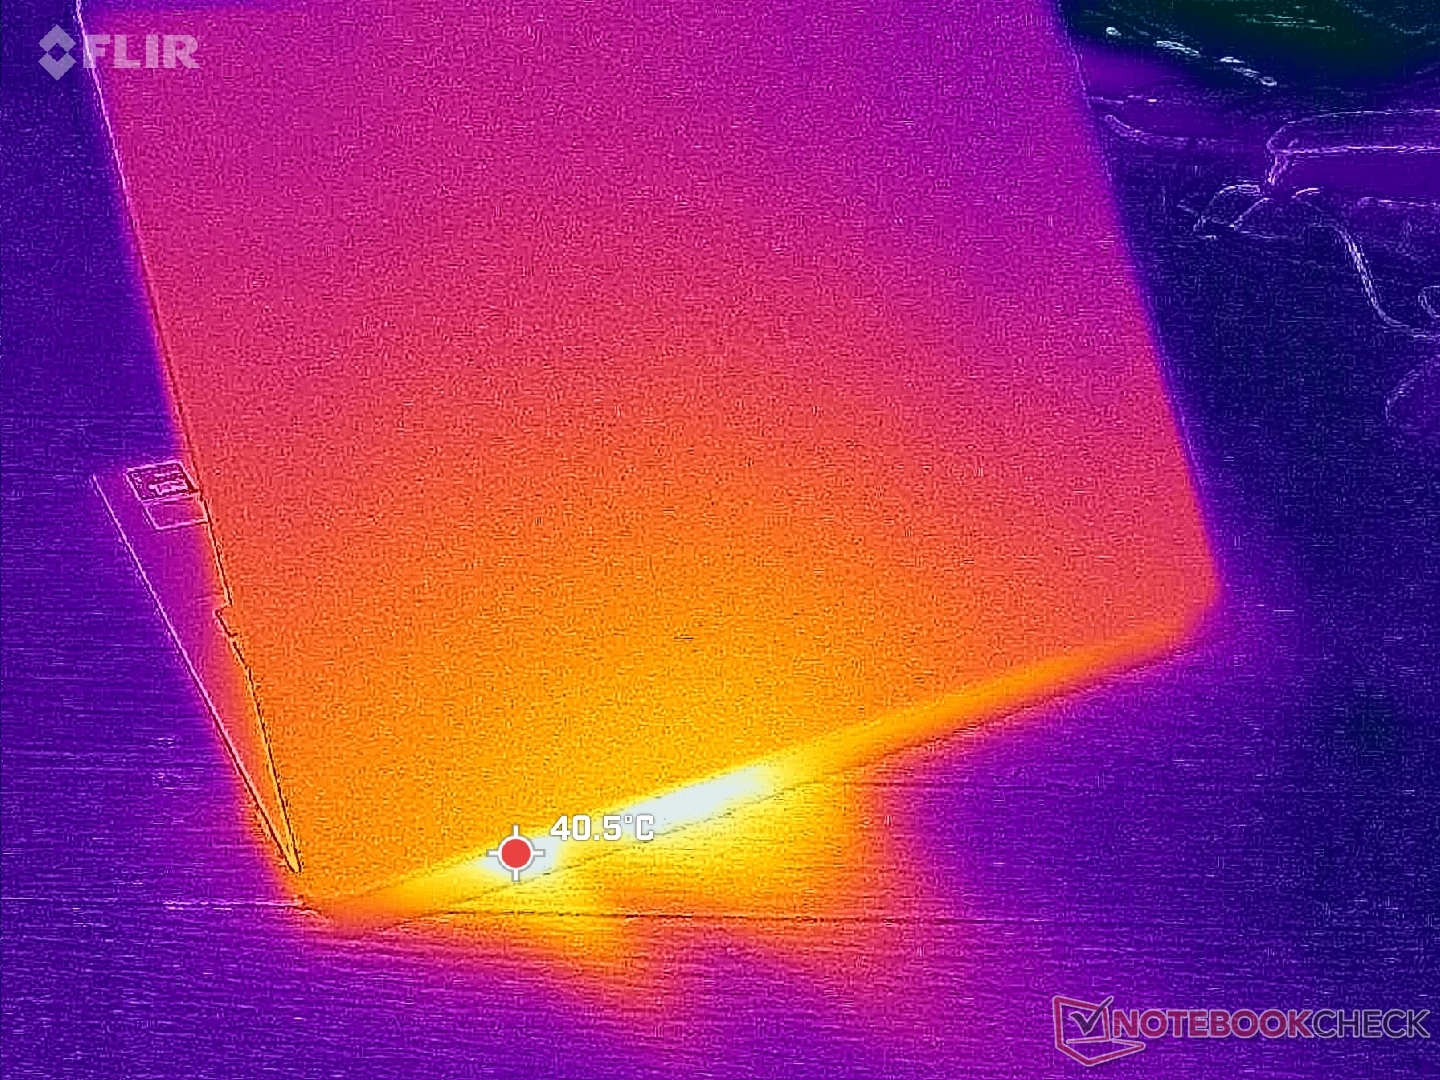
(±) Maksymalna temperatura w górnej części wynosi 43 °C / 109 F, w porównaniu do średniej 35.9 °C / 97 F , począwszy od 21.4 do 59 °C dla klasy Subnotebook.
(±) Dno nagrzewa się maksymalnie do 42.6 °C / 109 F, w porównaniu do średniej 39.2 °C / 103 F
(+) W stanie bezczynności średnia temperatura górnej części wynosi 28.8 °C / 84 F, w porównaniu ze średnią temperaturą urządzenia wynoszącą 30.8 °C / ### class_avg_f### F.
(+) Podpórki pod nadgarstki i touchpad są chłodniejsze niż temperatura skóry i maksymalnie 28.4 °C / 83.1 F i dlatego są chłodne w dotyku.
(±) Średnia temperatura obszaru podparcia dłoni w podobnych urządzeniach wynosiła 28.2 °C / 82.8 F (-0.2 °C / -0.3 F).
| Dell 14 Plus Intel Core Ultra 7 256V, Intel Arc Graphics 140V | Dell Inspiron 14 5425 6VPKR AMD Ryzen 5 5625U, AMD Radeon RX Vega 7 | Dell Latitude 3440 Intel Core i5-1345U, Intel Iris Xe Graphics G7 80EUs | Lenovo IdeaPad Pro 5 14AKP G10 AMD Ryzen AI 7 350, AMD Radeon 860M | Lenovo ThinkPad E14 G6 Intel Core Ultra 7 155U, Intel Graphics 4-Core iGPU (Meteor / Arrow Lake) | HP Pavilion Plus 14-ew0153TU Intel Core i7-1355U, Intel Iris Xe Graphics G7 96EUs | |
|---|---|---|---|---|---|---|
| Heat | 3% | 6% | 10% | 20% | 8% | |
| Maximum Upper Side * (°C) | 43 | 39.1 9% | 35.2 18% | 42.2 2% | 35 19% | 36.6 15% |
| Maximum Bottom * (°C) | 42.6 | 41.9 2% | 41 4% | 42.4 -0% | 35.6 16% | 37.2 13% |
| Idle Upper Side * (°C) | 31.6 | 31.2 1% | 29.8 6% | 25.4 20% | 23.8 25% | 31.6 -0% |
| Idle Bottom * (°C) | 30.6 | 30.9 -1% | 32 -5% | 25.7 16% | 24.8 19% | 30 2% |
* ... im mniej tym lepiej
Głośniki
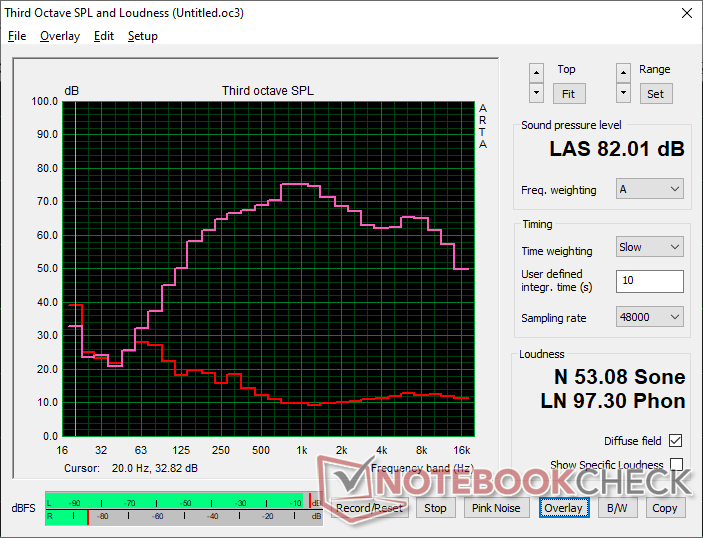
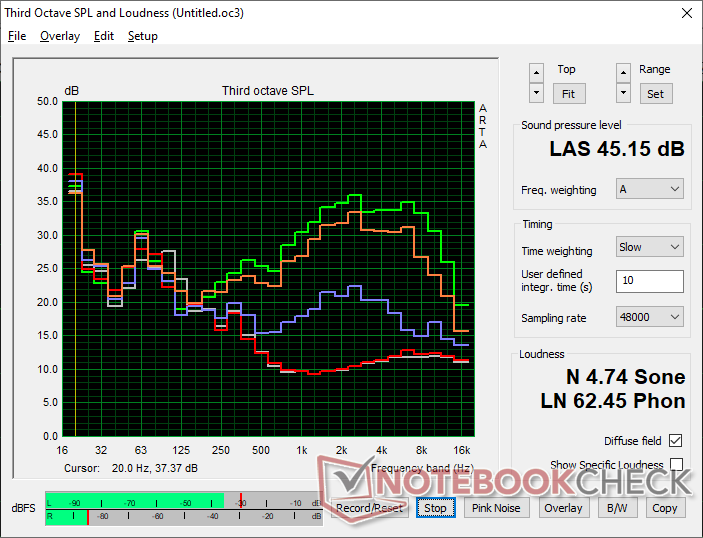
Dell 14 Plus analiza dźwięku
(+) | głośniki mogą odtwarzać stosunkowo głośno (82 dB)
Bas 100 - 315 Hz
(±) | zredukowany bas - średnio 7.8% niższy od mediany
(±) | liniowość basu jest średnia (9.2% delta do poprzedniej częstotliwości)
Średnie 400 - 2000 Hz
(±) | wyższe średnie - średnio 6.5% wyższe niż mediana
(+) | średnie są liniowe (3.6% delta do poprzedniej częstotliwości)
Wysokie 2–16 kHz
(+) | zrównoważone maksima - tylko 1.9% od mediany
(+) | wzloty są liniowe (3.7% delta do poprzedniej częstotliwości)
Ogólnie 100 - 16.000 Hz
(+) | ogólny dźwięk jest liniowy (12.4% różnicy w stosunku do mediany)
W porównaniu do tej samej klasy
» 16% wszystkich testowanych urządzeń w tej klasie było lepszych, 4% podobnych, 79% gorszych
» Najlepszy miał deltę 5%, średnia wynosiła ###średnia###%, najgorsza wynosiła 53%
W porównaniu do wszystkich testowanych urządzeń
» 11% wszystkich testowanych urządzeń było lepszych, 2% podobnych, 87% gorszych
» Najlepszy miał deltę 4%, średnia wynosiła ###średnia###%, najgorsza wynosiła 134%
Apple MacBook Pro 16 2021 M1 Pro analiza dźwięku
(+) | głośniki mogą odtwarzać stosunkowo głośno (84.7 dB)
Bas 100 - 315 Hz
(+) | dobry bas - tylko 3.8% od mediany
(+) | bas jest liniowy (5.2% delta do poprzedniej częstotliwości)
Średnie 400 - 2000 Hz
(+) | zbalansowane środki średnie - tylko 1.3% od mediany
(+) | średnie są liniowe (2.1% delta do poprzedniej częstotliwości)
Wysokie 2–16 kHz
(+) | zrównoważone maksima - tylko 1.9% od mediany
(+) | wzloty są liniowe (2.7% delta do poprzedniej częstotliwości)
Ogólnie 100 - 16.000 Hz
(+) | ogólny dźwięk jest liniowy (4.6% różnicy w stosunku do mediany)
W porównaniu do tej samej klasy
» 0% wszystkich testowanych urządzeń w tej klasie było lepszych, 0% podobnych, 100% gorszych
» Najlepszy miał deltę 5%, średnia wynosiła ###średnia###%, najgorsza wynosiła 45%
W porównaniu do wszystkich testowanych urządzeń
» 0% wszystkich testowanych urządzeń było lepszych, 0% podobnych, 100% gorszych
» Najlepszy miał deltę 4%, średnia wynosiła ###średnia###%, najgorsza wynosiła 134%
Zarządzanie energią
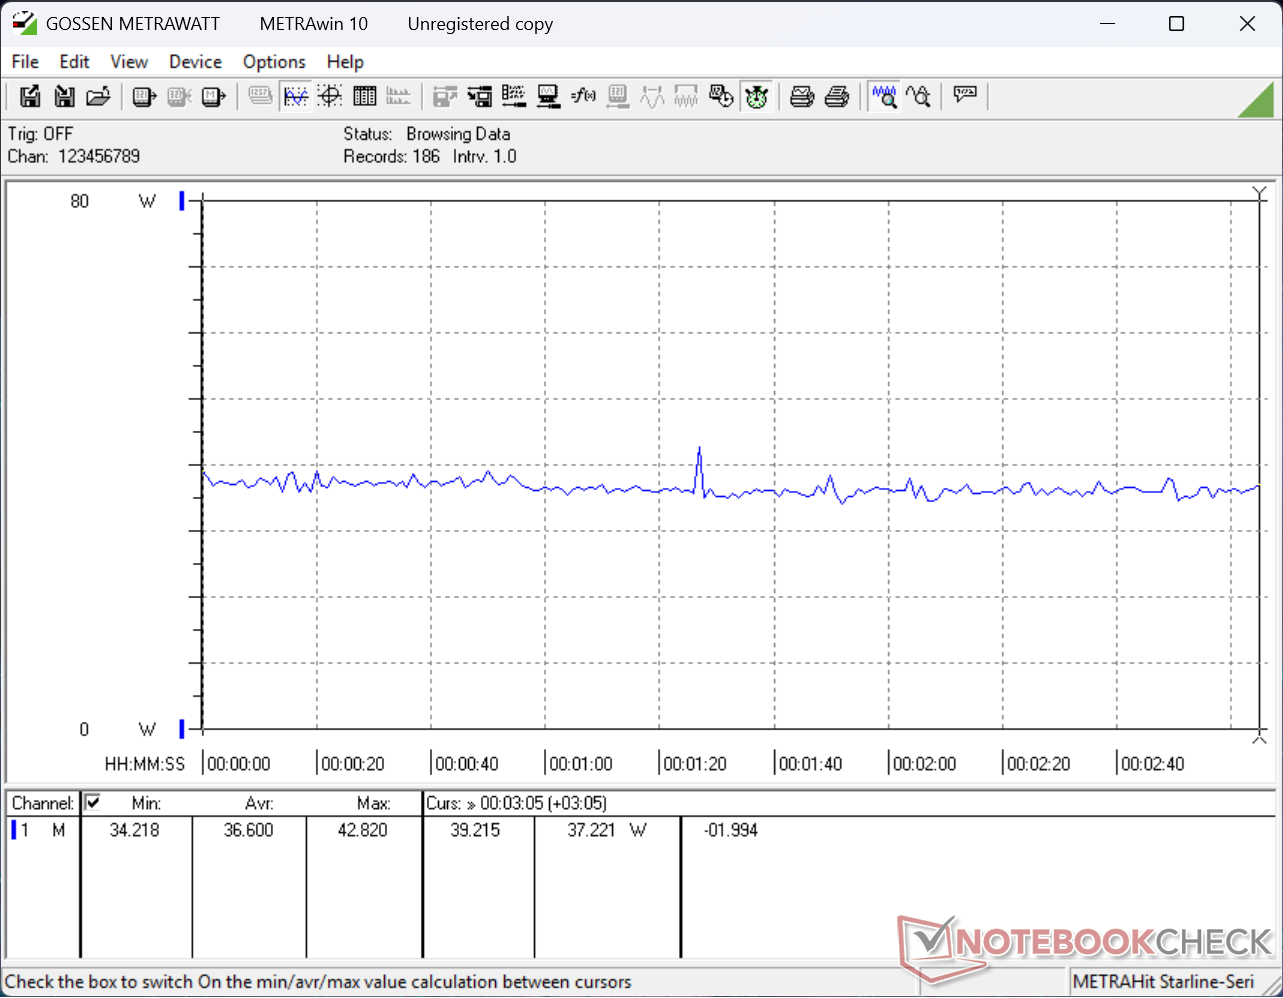
Zużycie energii
Ogólne zużycie energii jest dość zbliżone do Dell Latitude 7450 2-in-1 zasilanego przez Core Ultra 7 165U, mimo że nasz Dell 14 Plus oferuje znacznie szybszą akcelerację AI, wydajność pamięci RAM i wydajność iGPU w celu zwiększenia wydajności na wat.
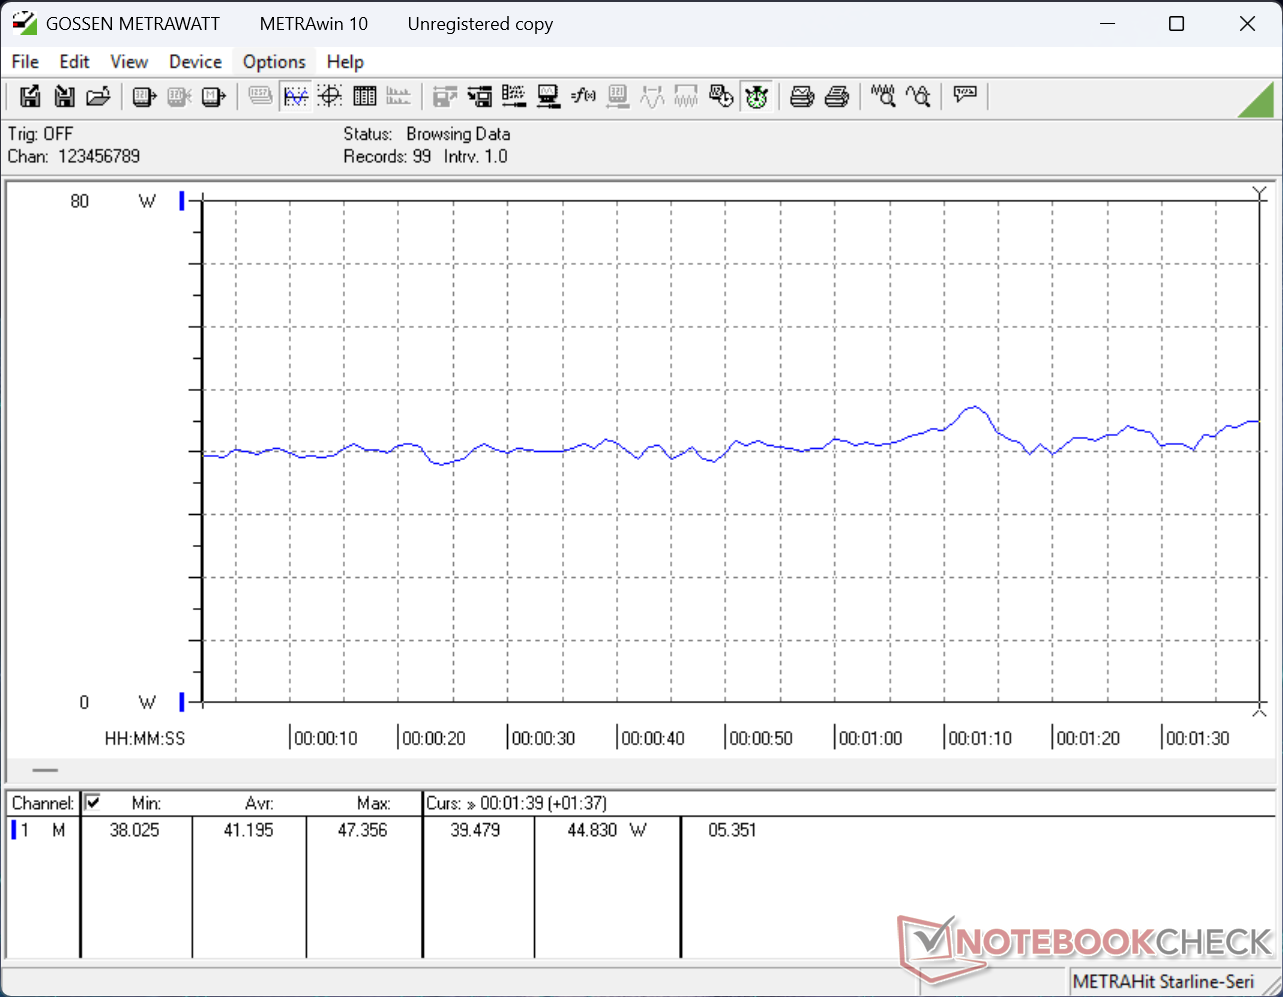
| wyłączony / stan wstrzymania | |
| luz | |
| obciążenie |
|
Legenda:
min: | |
| Dell 14 Plus Core Ultra 7 256V, Arc 140V, , IPS, 2560x1600, 14" | Dell Inspiron 14 5425 6VPKR R5 5625U, Vega 7, SK Hynix BC711 512GB HFM512GD3GX013N, IPS, 1920x1200, 14" | Dell Latitude 3440 i5-1345U, Iris Xe G7 80EUs, Samsung PM9A1 MZVL2512HCJQ, IPS, 1920x1080, 14" | Lenovo IdeaPad Pro 5 14AKP G10 Ryzen AI 7 350, Radeon 860M, SK hynix PVC10 HFS001TEM4X182N, OLED, 2880x1800, 14" | Lenovo ThinkPad E14 G6 Ultra 7 155U, Graphics 4-Core iGPU (Arrow Lake), Samsung PM9C1a MZAL8512HDLU, IPS, 1920x1200, 14" | HP Pavilion Plus 14-ew0153TU i7-1355U, Iris Xe G7 96EUs, SK hynix PC801 HFS001TEJ9X101N, OLED, 2880x1800, 14" | |
|---|---|---|---|---|---|---|
| Power Consumption | -4% | -12% | -66% | -36% | -34% | |
| Idle Minimum * (Watt) | 3.6 | 4 -11% | 3.7 -3% | 5.1 -42% | 5.4 -50% | 6.7 -86% |
| Idle Average * (Watt) | 6.7 | 6.6 1% | 6.5 3% | 6.8 -1% | 9.7 -45% | 7.16 -7% |
| Idle Maximum * (Watt) | 6.9 | 9.4 -36% | 9.5 -38% | 6.9 -0% | 10.4 -51% | 11.17 -62% |
| Load Average * (Watt) | 41.2 | 37 10% | 46.9 -14% | 71.7 -74% | 49.2 -19% | 46.5 -13% |
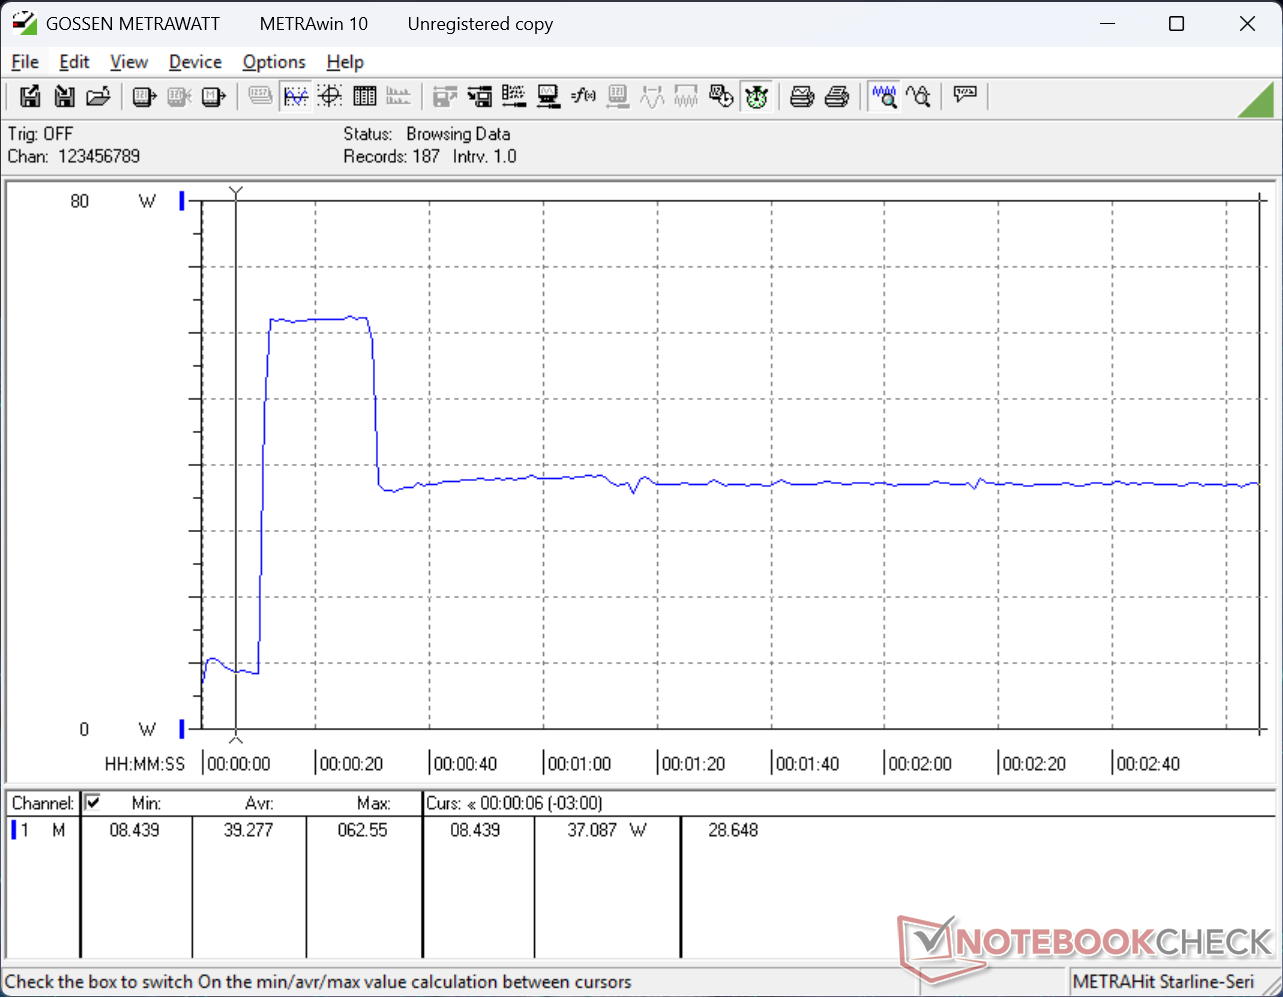
| Cyberpunk 2077 ultra external monitor * (Watt) | 34.2 | 83.5 -144% | 47.1 -38% | |||
| Cyberpunk 2077 ultra * (Watt) | 36.6 | 84.8 -132% | 50.1 -37% | |||
| Load Maximum * (Watt) | 62.6 | 53.7 14% | 67 -7% | 104.8 -67% | 68.9 -10% | 64.36 -3% |
| Witcher 3 ultra * (Watt) | 37.1 | 42.1 | 37.2 |
* ... im mniej tym lepiej
Power Consumption Cyberpunk / Stress Test
Power Consumption external Monitor
Żywotność baterii
Czas pracy w sieci WLAN jest bardzo długi i wynosi ponad 14 godzin z baterii o pojemności 64 Wh.
| Dell 14 Plus Core Ultra 7 256V, Arc 140V, 64 Wh | Dell Inspiron 14 5425 6VPKR R5 5625U, Vega 7, 54 Wh | Dell Latitude 3440 i5-1345U, Iris Xe G7 80EUs, 54 Wh | Lenovo IdeaPad Pro 5 14AKP G10 Ryzen AI 7 350, Radeon 860M, 84 Wh | Lenovo ThinkPad E14 G6 Ultra 7 155U, Graphics 4-Core iGPU (Arrow Lake), 47 Wh | HP Pavilion Plus 14-ew0153TU i7-1355U, Iris Xe G7 96EUs, 68 Wh | |
|---|---|---|---|---|---|---|
| Czasy pracy | -10% | -38% | -3% | -34% | -33% | |
| WiFi v1.3 (h) | 14.3 | 12.8 -10% | 8.8 -38% | 13.9 -3% | 9.4 -34% | 9.6 -33% |
| H.264 (h) | 19.6 | 12 | ||||
| Load (h) | 0.9 | 1.5 | ||||
| Reader / Idle (h) | 22.8 |
Ocena Notebookcheck
Dell 14 Plus
- 01/06/2025 v8
Allen Ngo
 Total Sustainability Score:
 Potential Competitors in Comparison
Obraz | Model / recenzja | Cena | Waga | Wysokość | Ekran |
|---|---|---|---|---|---|
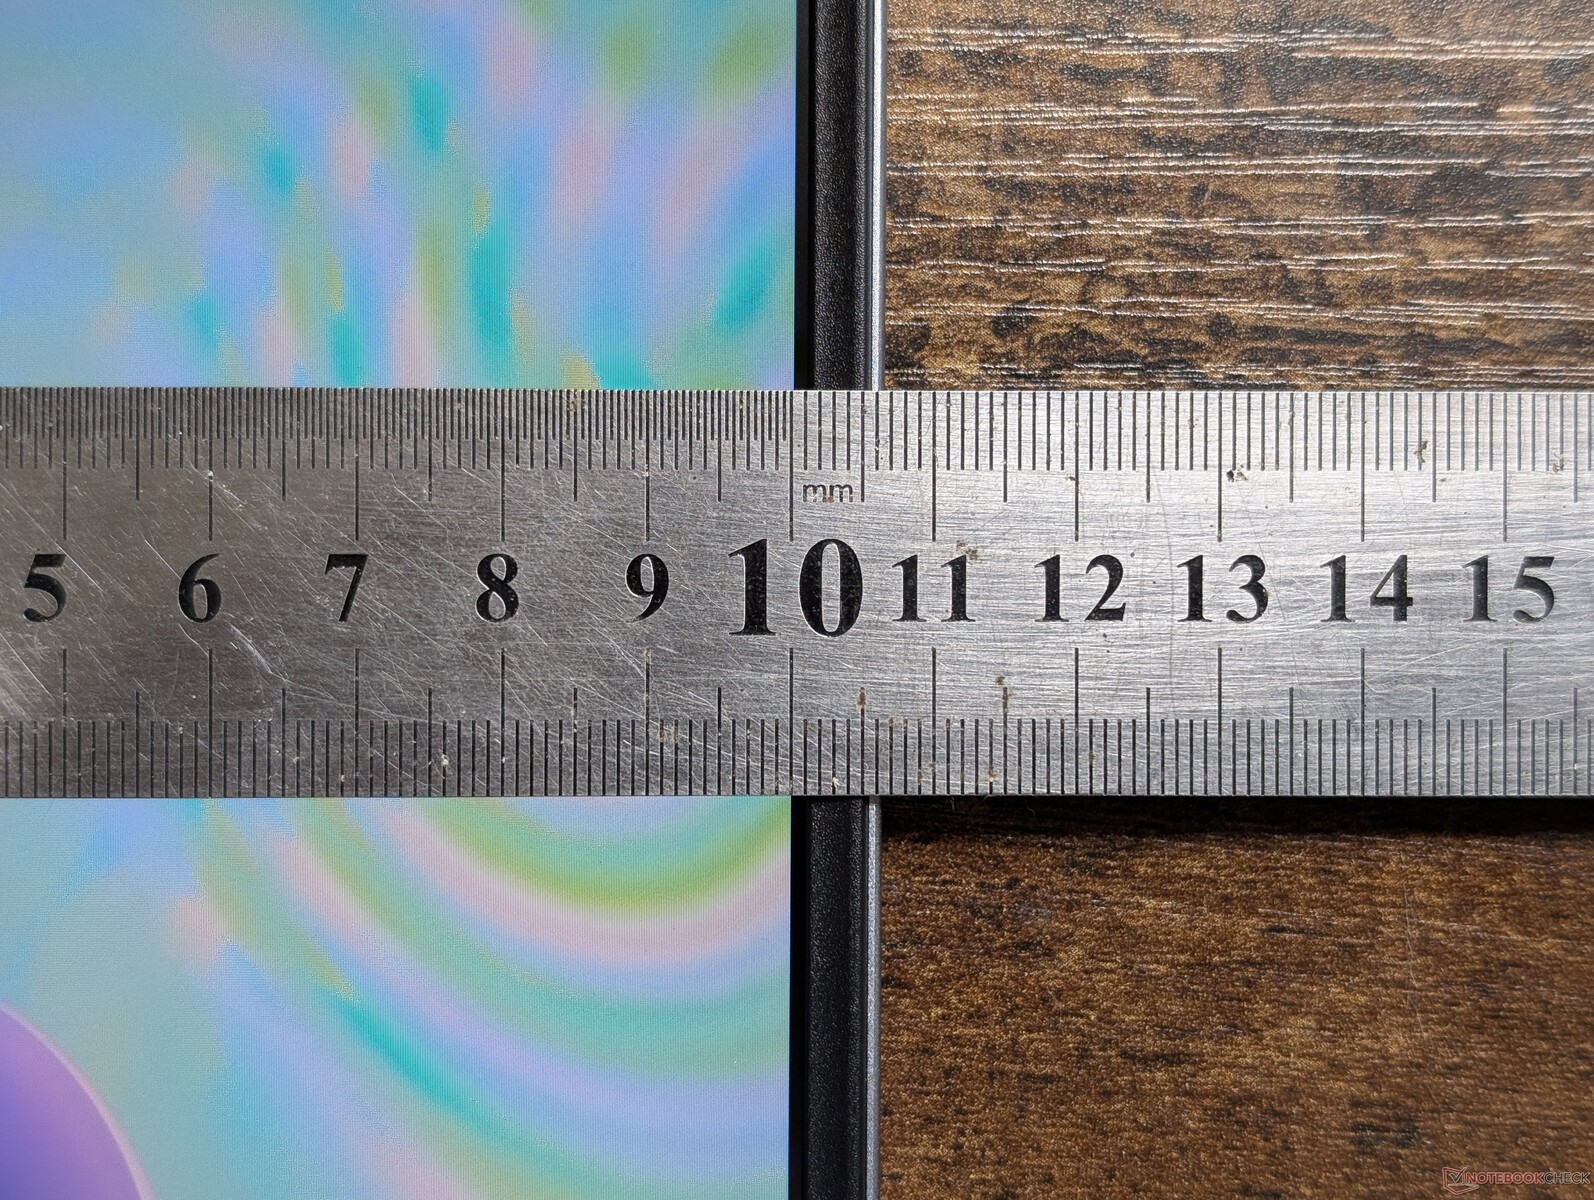
1. 83.4% 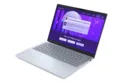 | Dell 14 Plus Intel Core Ultra 7 256V ⎘ Intel Arc Graphics 140V ⎘ 16 GB Pamięć | Amazon: Cena katalogowa: 1100 USD | 1.5 kg | 16.95 mm | 14.00" 2560x1600 216 PPI IPS |
2. 84.6% v7 (old)  | Dell Inspiron 14 5425 6VPKR AMD Ryzen 5 5625U ⎘ AMD Radeon RX Vega 7 ⎘ 16 GB Pamięć, 512 GB SSD | Amazon: 1. $37.75 54Wh V6W33 Battery for Dell ... 2. $297.99 Dell Inspiron 14 5440 Laptop... 3. $429.00 Dell Inspiron 14 5425 Notebo... Cena katalogowa: 849 Euro | 1.6 kg | 18.37 mm | 14.00" 1920x1200 162 PPI IPS |
3. 85.3% v7 (old) 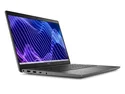 | Dell Latitude 3440 Intel Core i5-1345U ⎘ Intel Iris Xe Graphics G7 80EUs ⎘ 16 GB Pamięć, 512 GB SSD | Amazon: 1. $446.96 Dell Latitude 3440 14" Busin... 2. $421.96 Dell Latitude 3440 Laptop Bu... 3. $499.99 Dell Latitude 3000 3440 (Lat... Cena katalogowa: 1100 USD | 1.5 kg | 19.4 mm | 14.00" 1920x1080 157 PPI IPS |
4. 87.4% 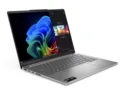 | Lenovo IdeaPad Pro 5 14AKP G10 AMD Ryzen AI 7 350 ⎘ AMD Radeon 860M ⎘ 32 GB Pamięć, 1024 GB SSD | Amazon: Cena katalogowa: 989€ | 1.4 kg | 15.5 mm | 14.00" 2880x1800 243 PPI OLED |
5. 84.8% 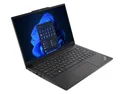 | Lenovo ThinkPad E14 G6 Intel Core Ultra 7 155U ⎘ Intel Graphics 4-Core iGPU (Meteor / Arrow Lake) ⎘ 16 GB Pamięć, 512 GB SSD | Amazon: Cena katalogowa: 990 USD | 1.5 kg | 17.99 mm | 14.00" 1920x1200 162 PPI IPS |
6. 87.5% v7 (old)  | HP Pavilion Plus 14-ew0153TU Intel Core i7-1355U ⎘ Intel Iris Xe Graphics G7 96EUs ⎘ 16 GB Pamięć, 1024 GB SSD | Amazon: 1. $45.99 68Wh WE04XL N39857-005 Repla... 2. $22.00 FRUPART for HP Pavilion Plus... 3. $24.00 Laptop CPU Fan for HP Pavili... Cena katalogowa: 1020 USD | 1.4 kg | 17.5 mm | 14.00" 2880x1800 243 PPI OLED |
Przezroczystość
Wyboru urządzeń do recenzji dokonuje nasza redakcja. Próbka testowa została udostępniona autorowi jako pożyczka od producenta lub sprzedawcy detalicznego na potrzeby tej recenzji. Pożyczkodawca nie miał wpływu na tę recenzję, producent nie otrzymał też kopii tej recenzji przed publikacją. Nie było obowiązku publikowania tej recenzji. Jako niezależna firma medialna, Notebookcheck nie podlega władzy producentów, sprzedawców detalicznych ani wydawców.
Tak testuje Notebookcheck
Każdego roku Notebookcheck niezależnie sprawdza setki laptopów i smartfonów, stosując standardowe procedury, aby zapewnić porównywalność wszystkich wyników. Od około 20 lat stale rozwijamy nasze metody badawcze, ustanawiając przy tym standardy branżowe. W naszych laboratoriach testowych doświadczeni technicy i redaktorzy korzystają z wysokiej jakości sprzętu pomiarowego. Testy te obejmują wieloetapowy proces walidacji. Nasz kompleksowy system ocen opiera się na setkach uzasadnionych pomiarów i benchmarków, co pozwala zachować obiektywizm.
