Recenzja Lenovo ThinkPad E16 G1 Intel: Core i5 dorównuje AMD Ryzen 7

Seria ThinkPad E składa się z przystępnych cenowo modeli dla użytkowników biznesowych, w przeciwieństwie do bardziej luksusowej serii ThinkPad T lub ostrzejszej serii ThinkPad X. W tym roku wprowadzono 16-calową rodzinę ThinkPad E16, która uzupełnia istniejące 14-calowe ThinkPad E14 i 15-calowe ThinkPad E15 opcje. W momencie premiery dostępne są dwie wersje ThinkPad E16 z procesorami Intel lub AMD. Niedawno recenzowaliśmy wersję ThinkPad E16 AMD Ryzen 7, więc teraz nadszedł czas, aby sprawdzić wersję ThinkPad E16 Intel Core i5, aby zobaczyć, jak ich różnice układają się względem siebie.
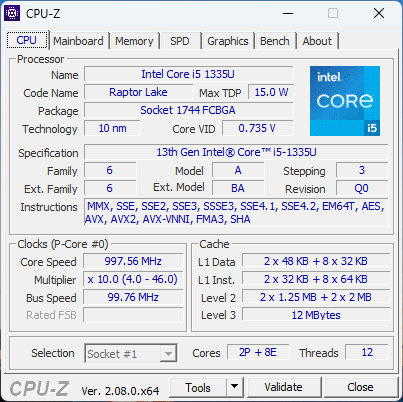
Nasza konkretna jednostka testowa Intela to konfiguracja z niższej półki z procesorem Core i5-1335U i ekranem dotykowym 1200p za około 800-900 USD w sprzedaży detalicznej. Inne konfiguracje mogą sięgać po Core i7-1365U, Core i7-1360P, a nawet Core i7-13700H z dyskretną grafiką GeForce MX550 i wyświetlaczem o wyższej rozdzielczości 1600p za znacznie wyższe ceny. Takie opcje nie są jeszcze dostępne w momencie publikacji.
Alternatywy dla ThinkPada E16 obejmują inne 16-calowe laptopy multimedialne lub biznesowe, takie jak Acer TravelMate P4, Samsung Galaxy Book3 Pro 16 lub LG Gram 16. Zalecamy sprawdzenie naszej istniejącej recenzji na ThinkPad E16 G1 w wersji AMD, ponieważ nasza wersja Intel ma tę samą konstrukcję obudowy i cechy fizyczne.
Więcej recenzji Lenovo:
Potencjalni konkurenci w porównaniu
Ocena | Data | Model | Waga | Wysokość | Rozmiar | Rezolucja | Cena |
|---|---|---|---|---|---|---|---|
| 85.5 % v7 (old) | 11/2023 | Lenovo ThinkPad E16 G1 Core i5-1335U i5-1335U, Iris Xe G7 80EUs | 1.8 kg | 19.85 mm | 16.00" | 1920x1200 | |
| 88.1 % v7 (old) | 09/2023 | Lenovo ThinkPad E16 G1-21JUS08X00 R7 7730U, Vega 8 | 1.8 kg | 19.85 mm | 16.00" | 2560x1600 | |
| 84.6 % v7 (old) | 07/2023 | Dell Inspiron 16 7635 2-in-1 R5 7530U, Vega 7 | 2 kg | 18.99 mm | 16.00" | 1920x1200 | |
| 86 % v7 (old) | 04/2023 | Acer TravelMate P4 TMP416-51-55KN i5-1240P, Iris Xe G7 80EUs | 1.6 kg | 18.5 mm | 16.00" | 1920x1200 | |
| 85.6 % v7 (old) | 05/2023 | Samsung Galaxy Book3 Pro 16 i5-1340P, Iris Xe G7 80EUs | 1.6 kg | 12.5 mm | 16.00" | 2880x1800 | |
| 86.6 % v7 (old) | 01/2023 | LG Gram 16Z90Q i7-1260P, Iris Xe G7 96EUs | 1.2 kg | 16.8 mm | 16.00" | 2560x1600 |
Sprawa
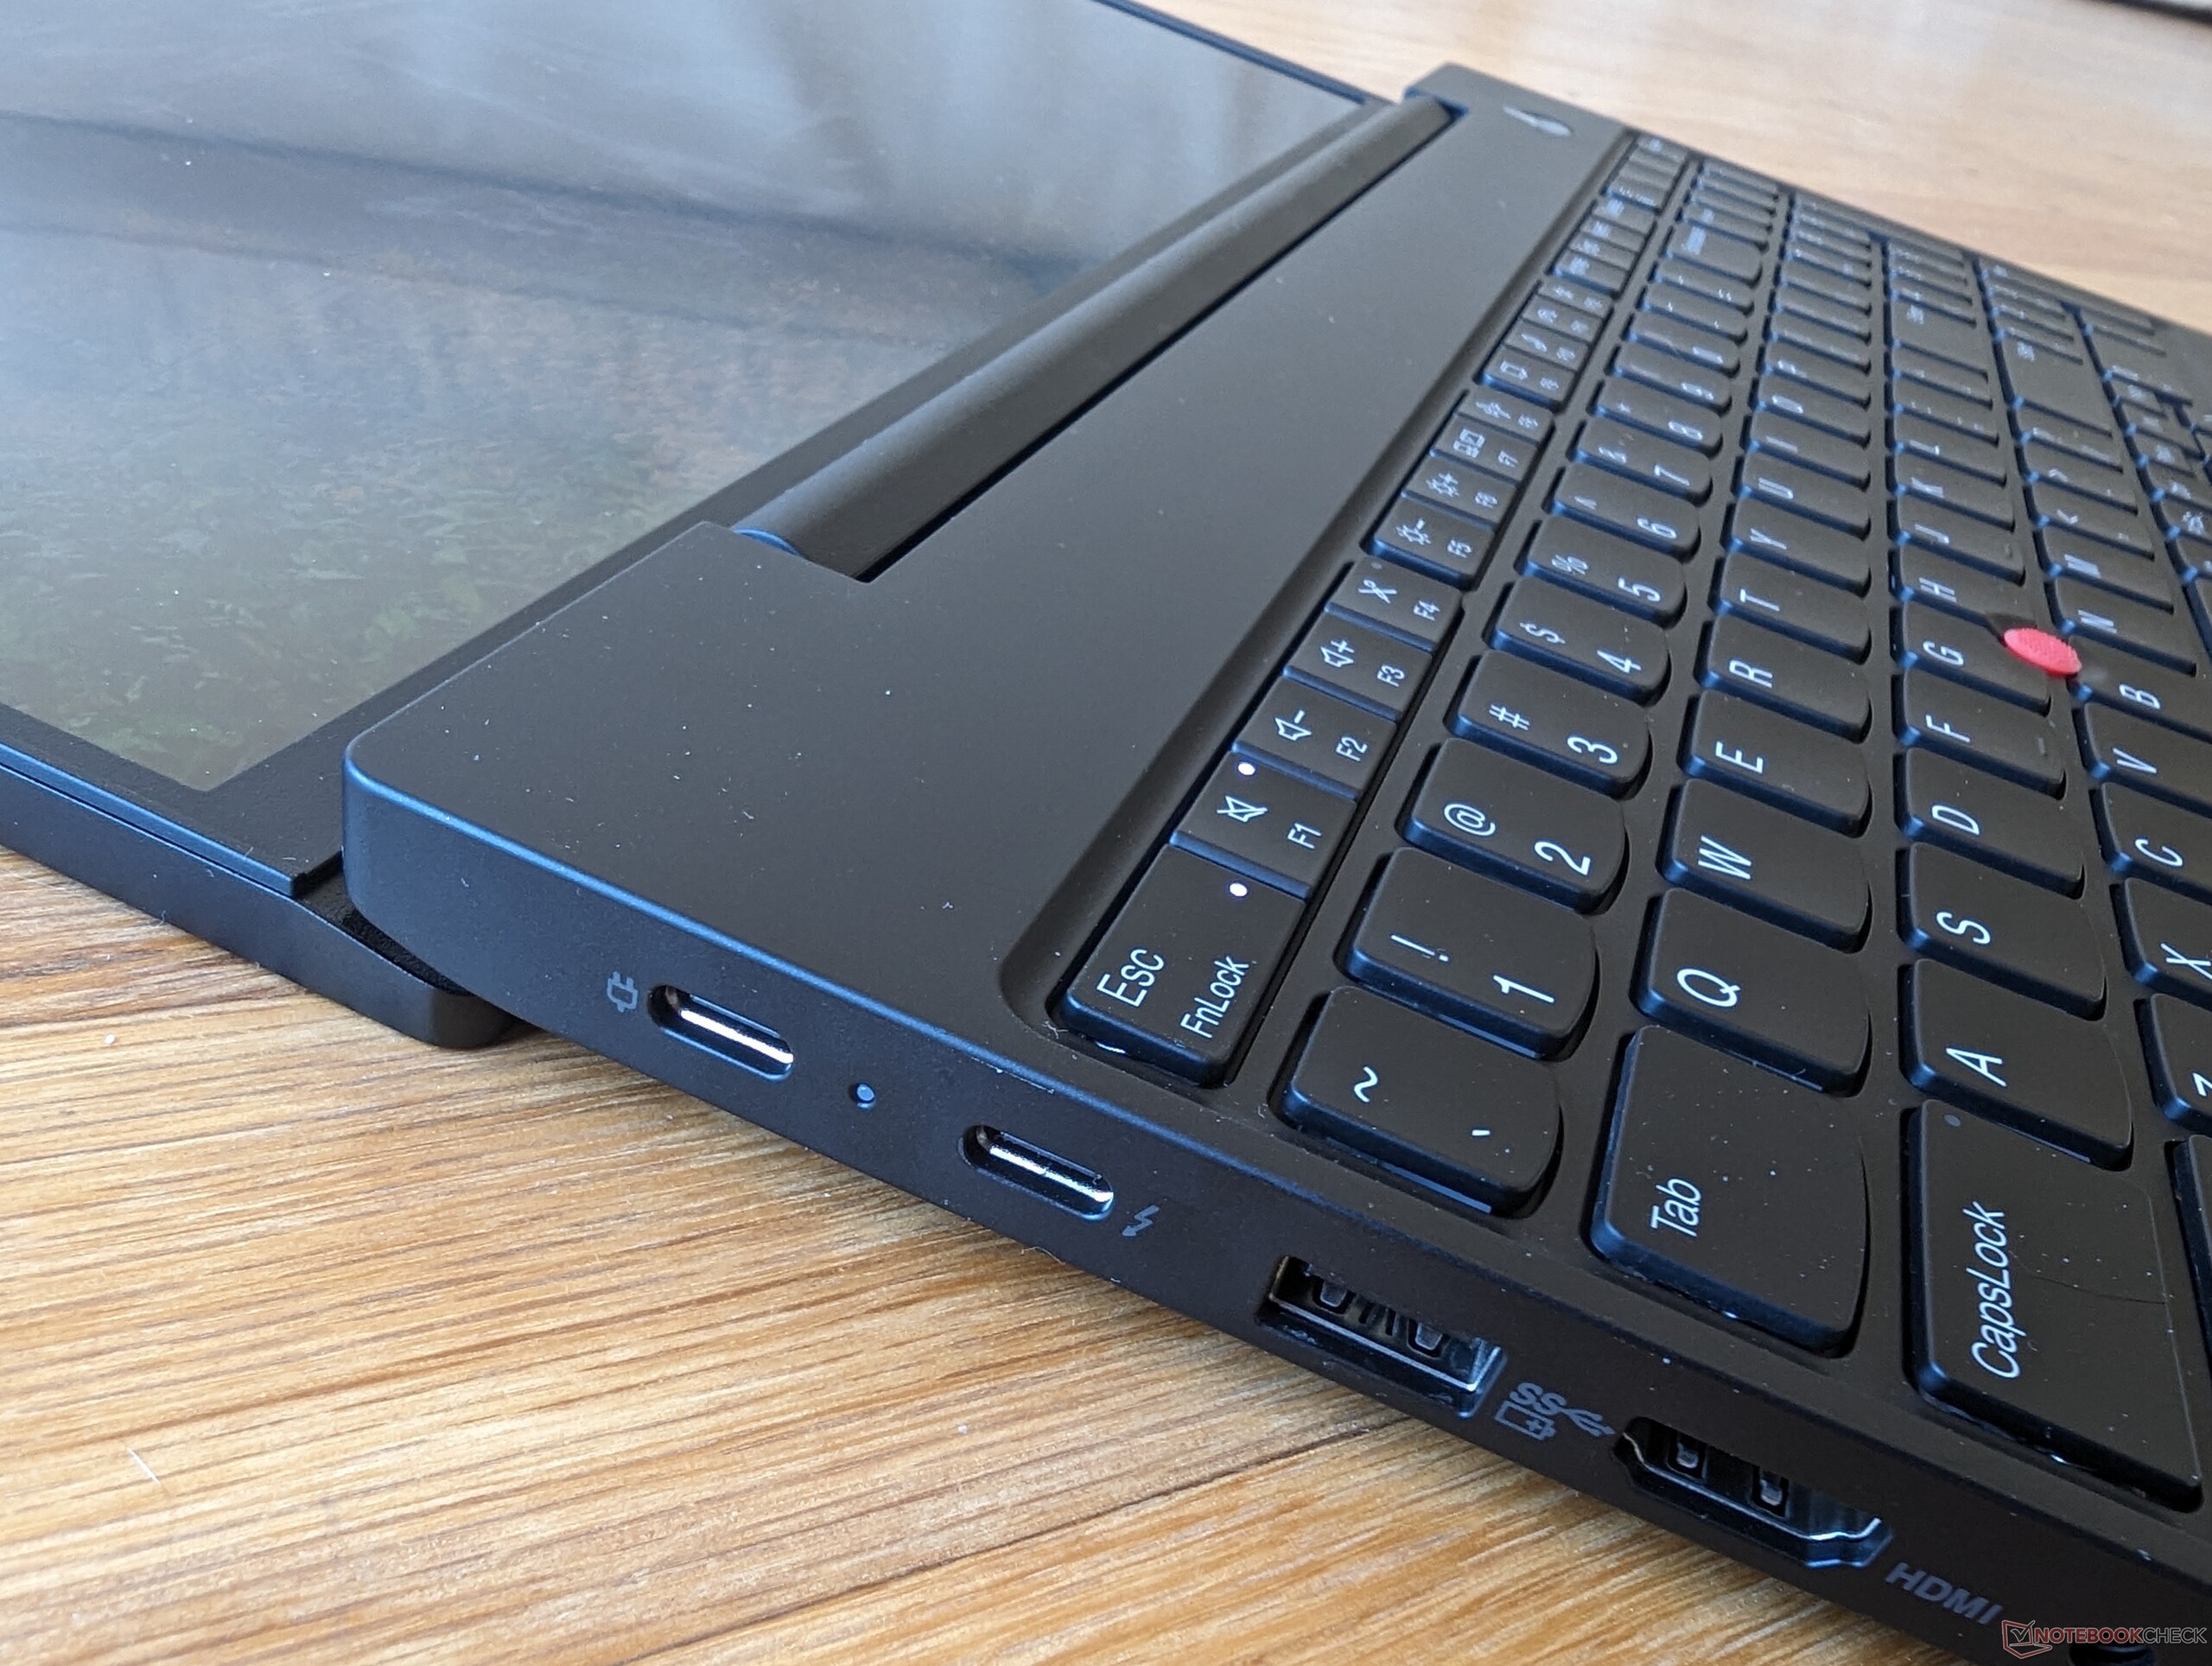
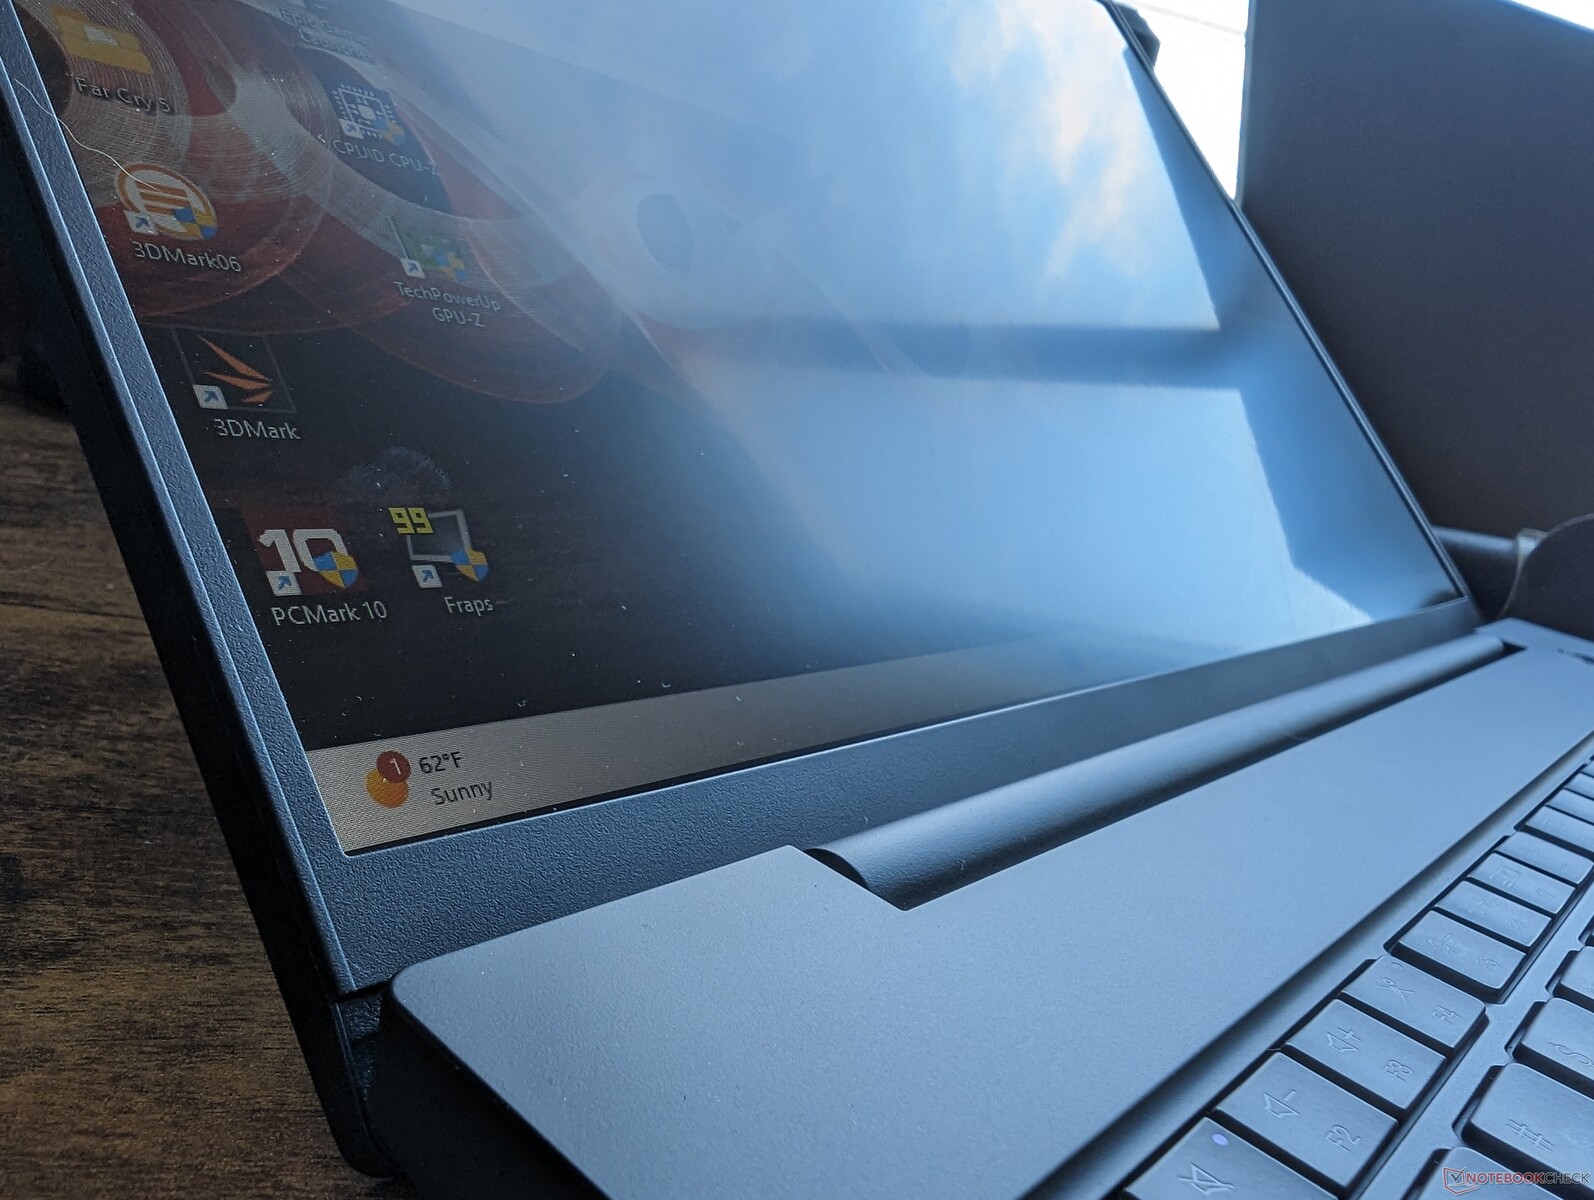
Najłatwiejszym sposobem na odróżnienie wersji Intel od wersji AMD jest poszukanie logo Thunderbolt wzdłuż lewej krawędzi. Thunderbolt jest obsługiwany tylko w wersjach Intel, ponieważ obecne wersje AMD nie są dostarczane z USB4.
Komunikacja
Kamera internetowa


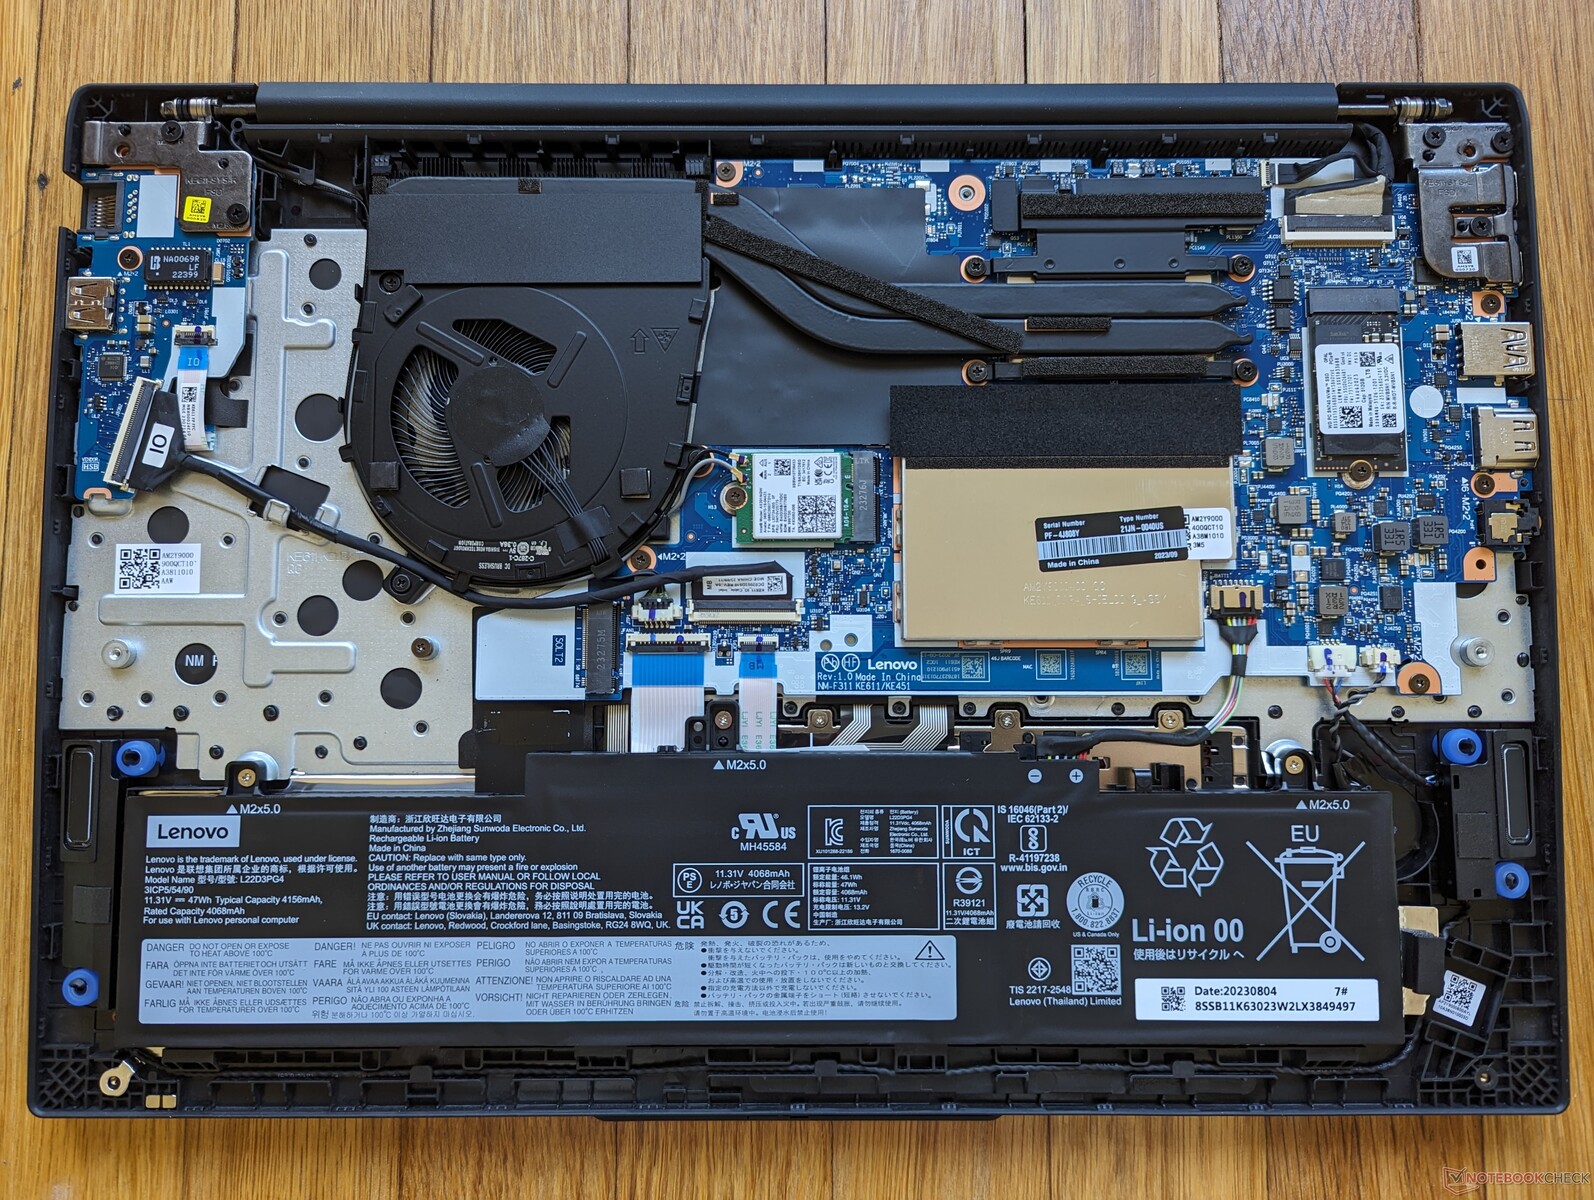
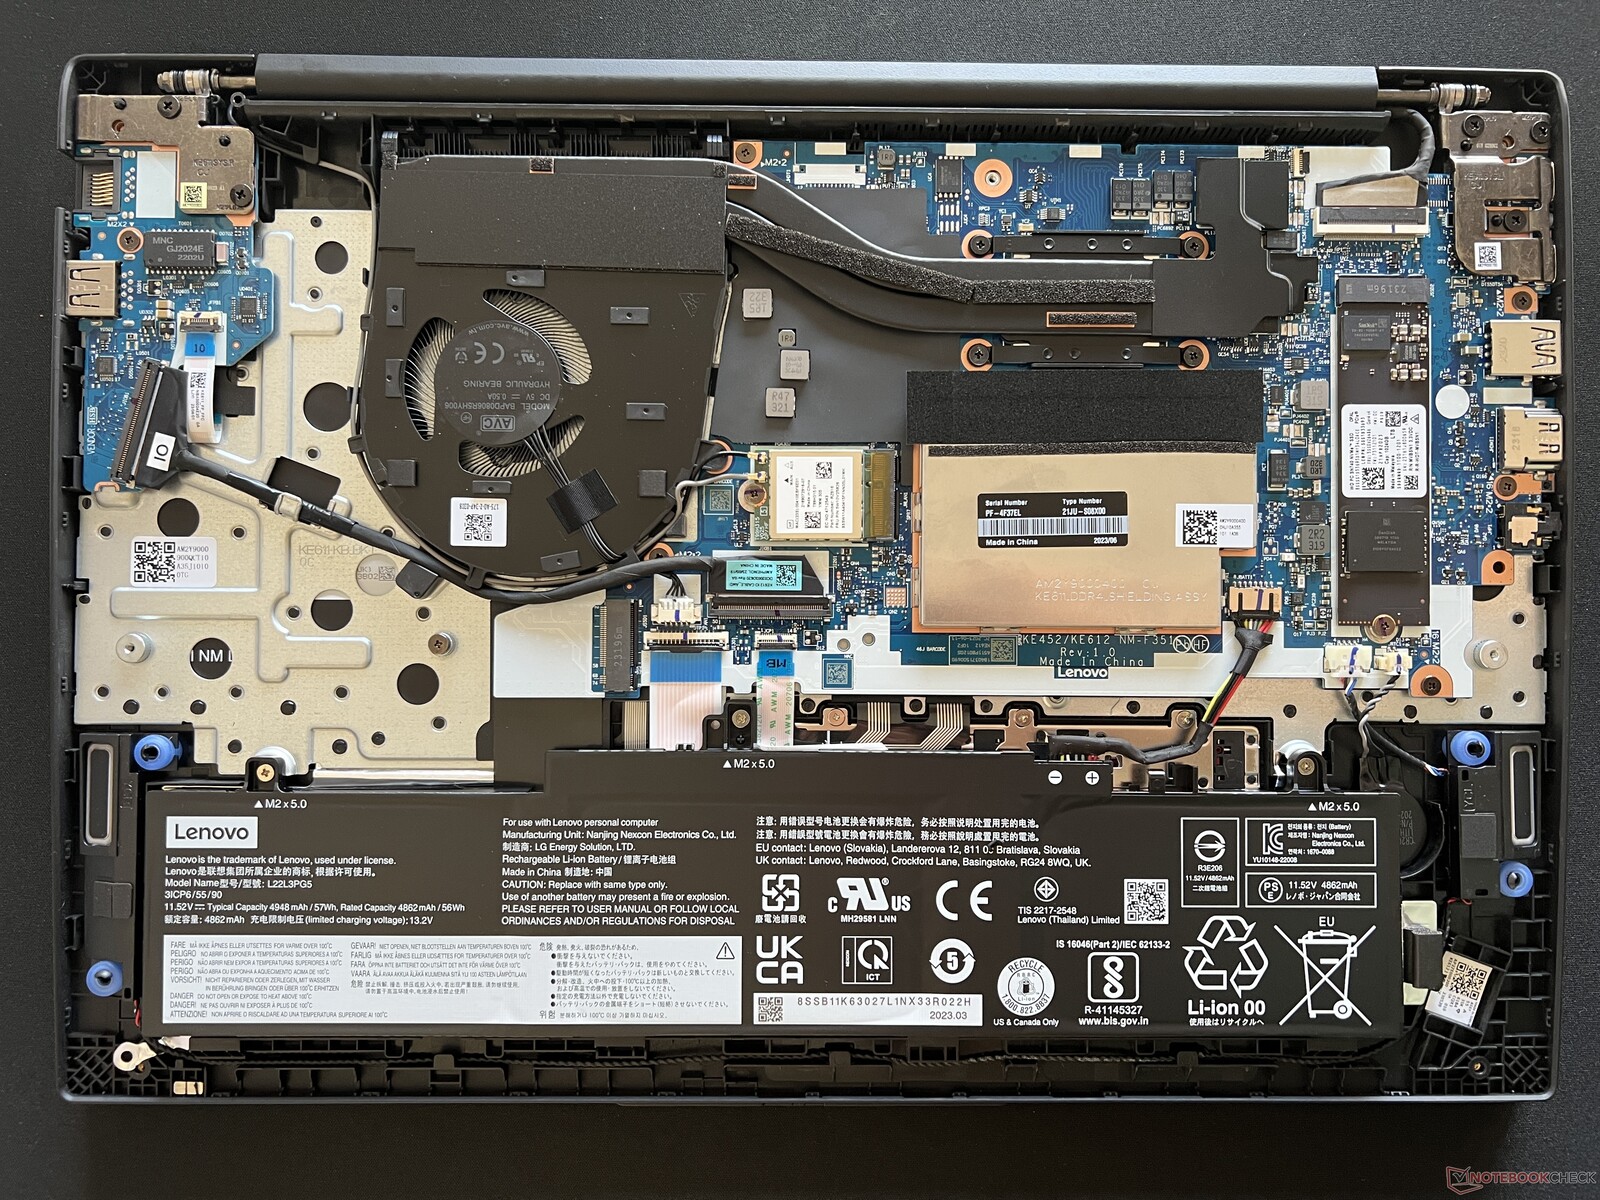
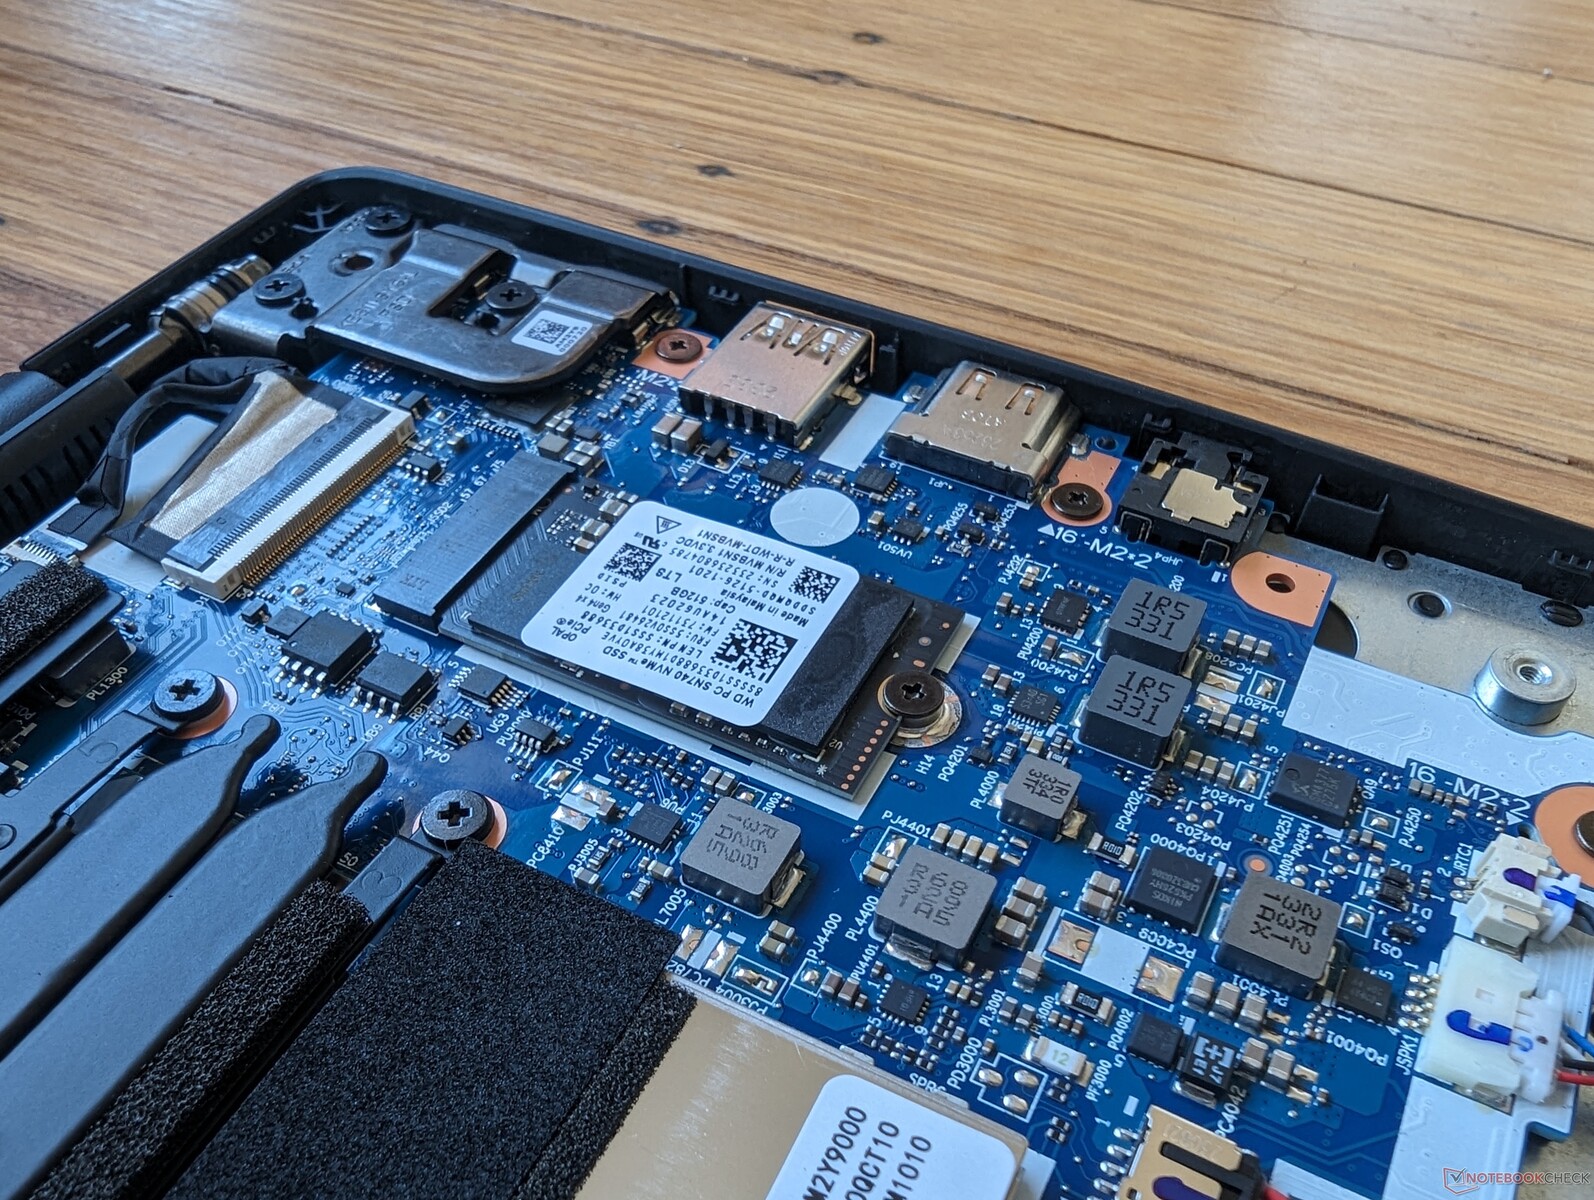
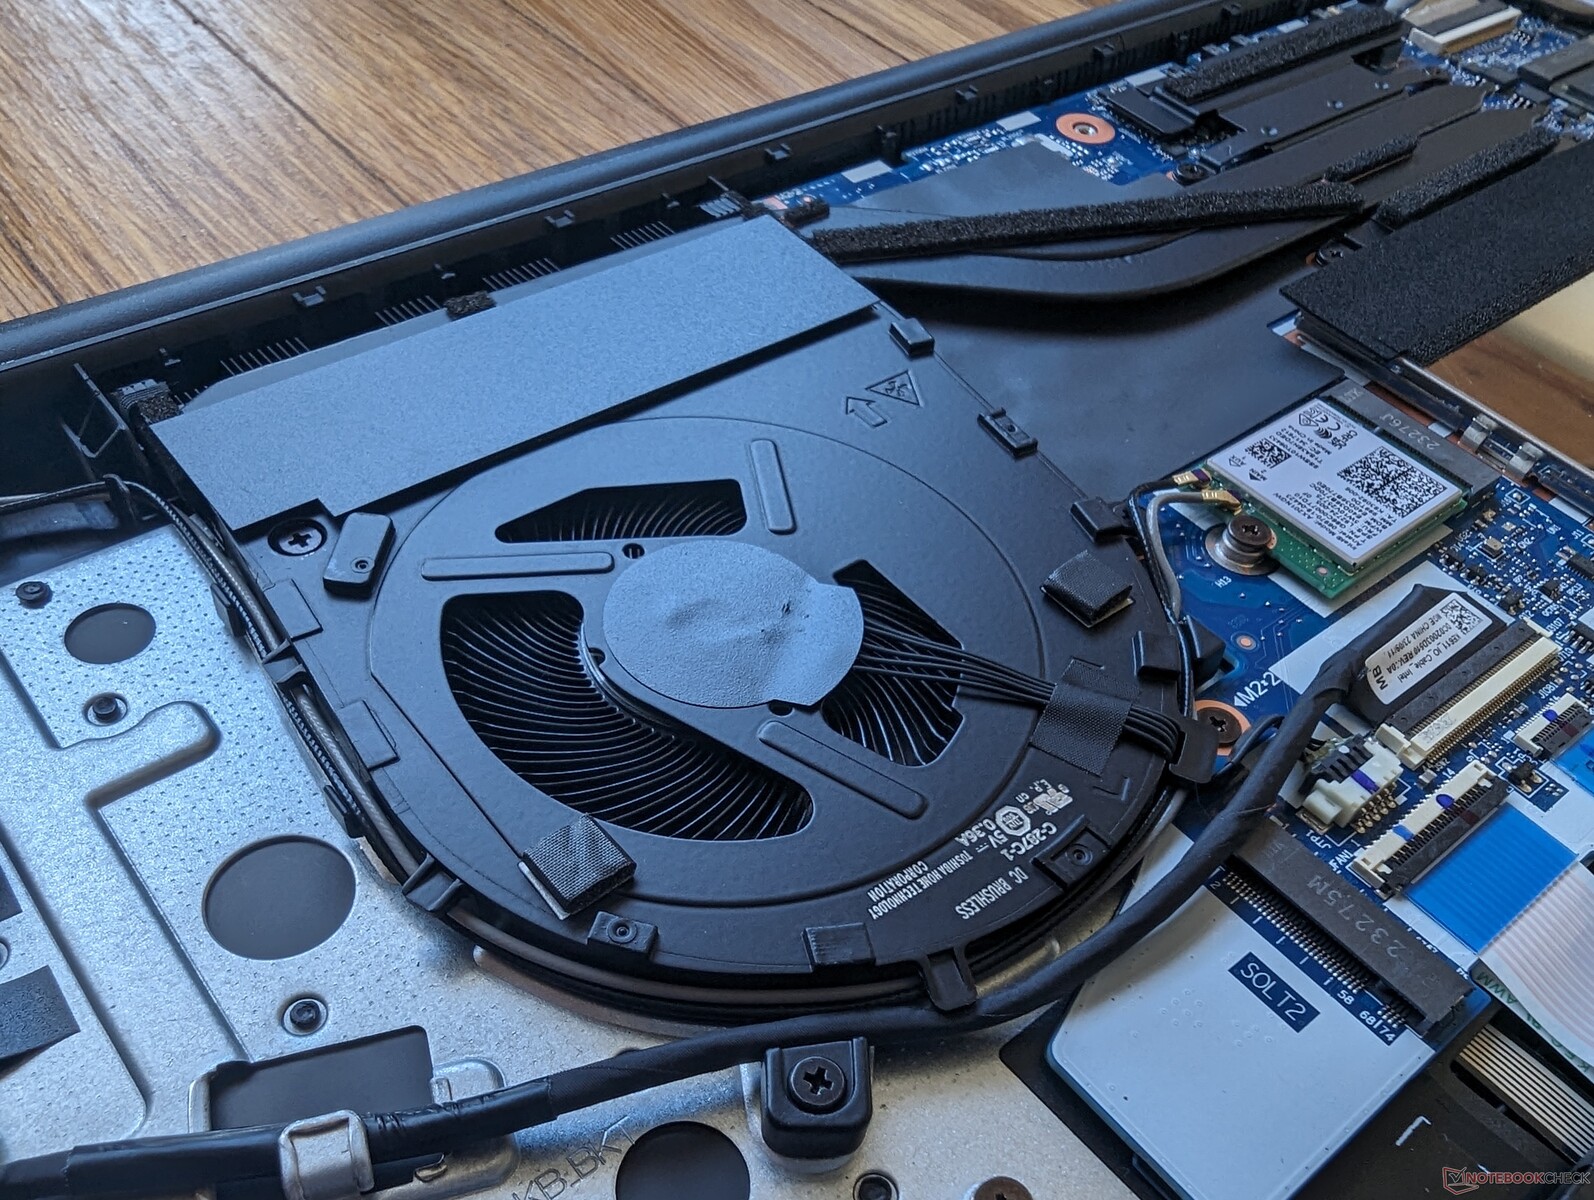
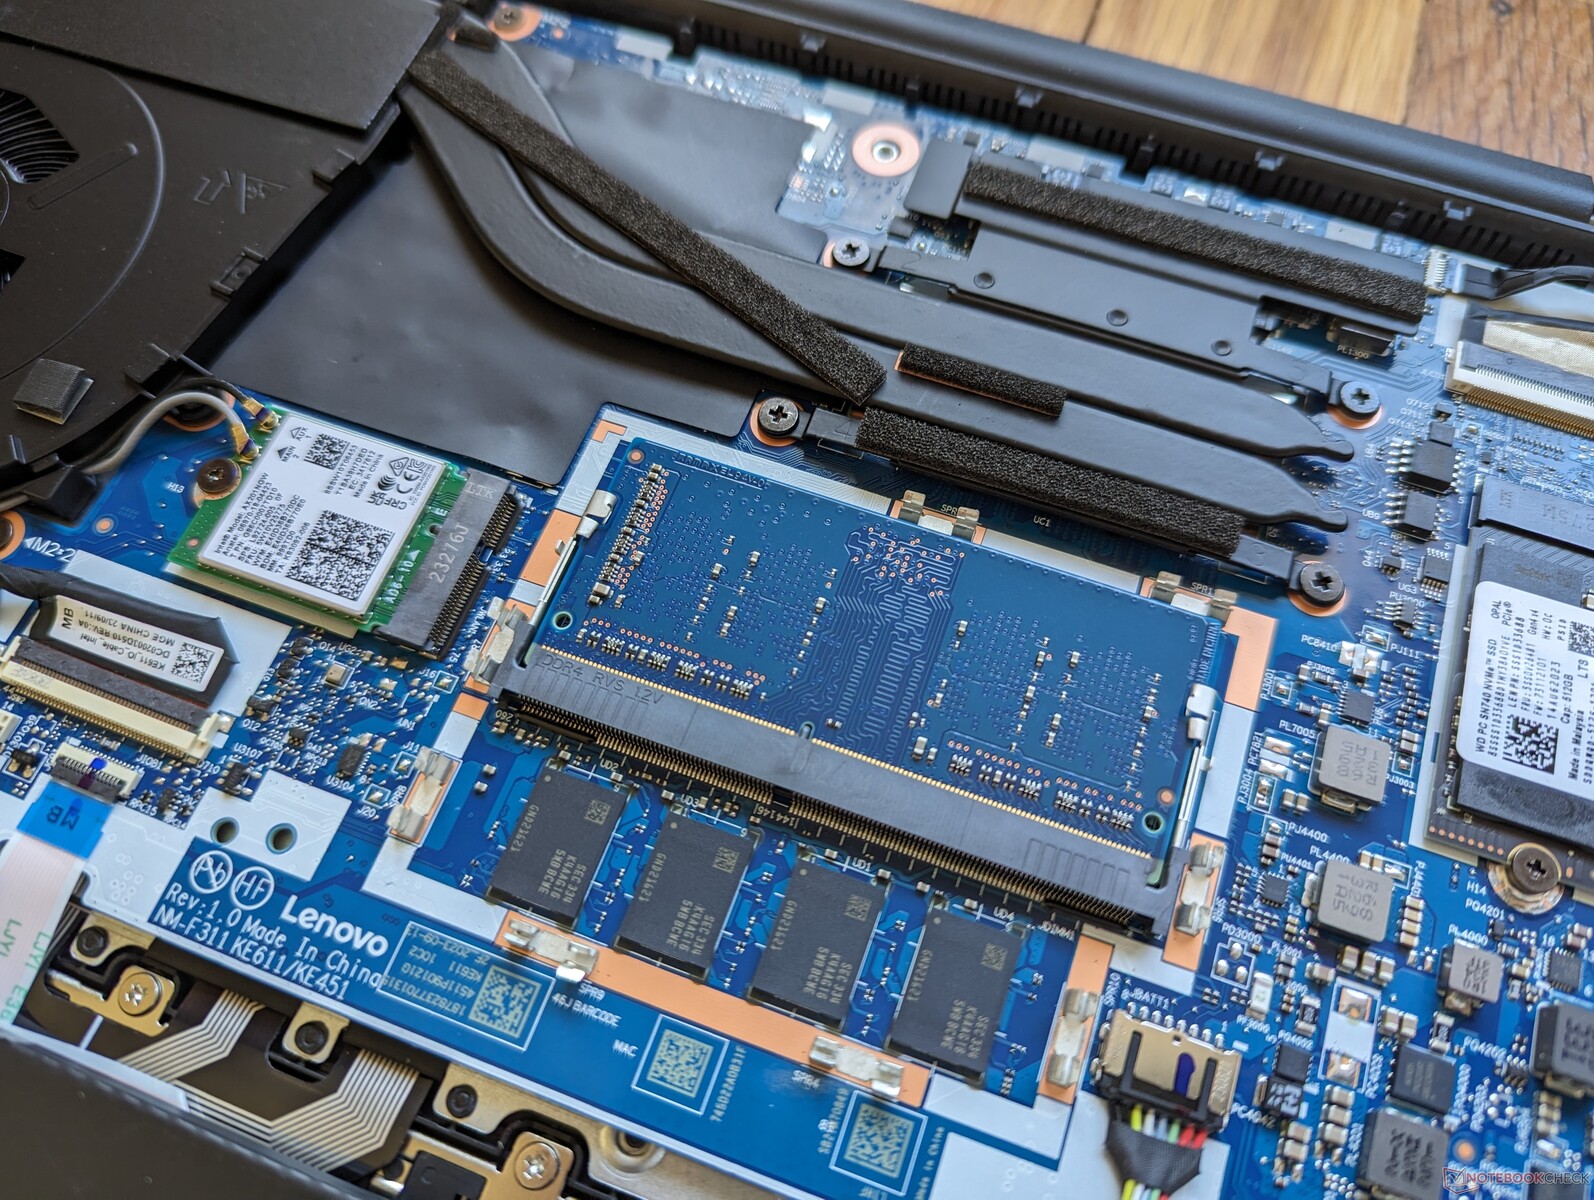
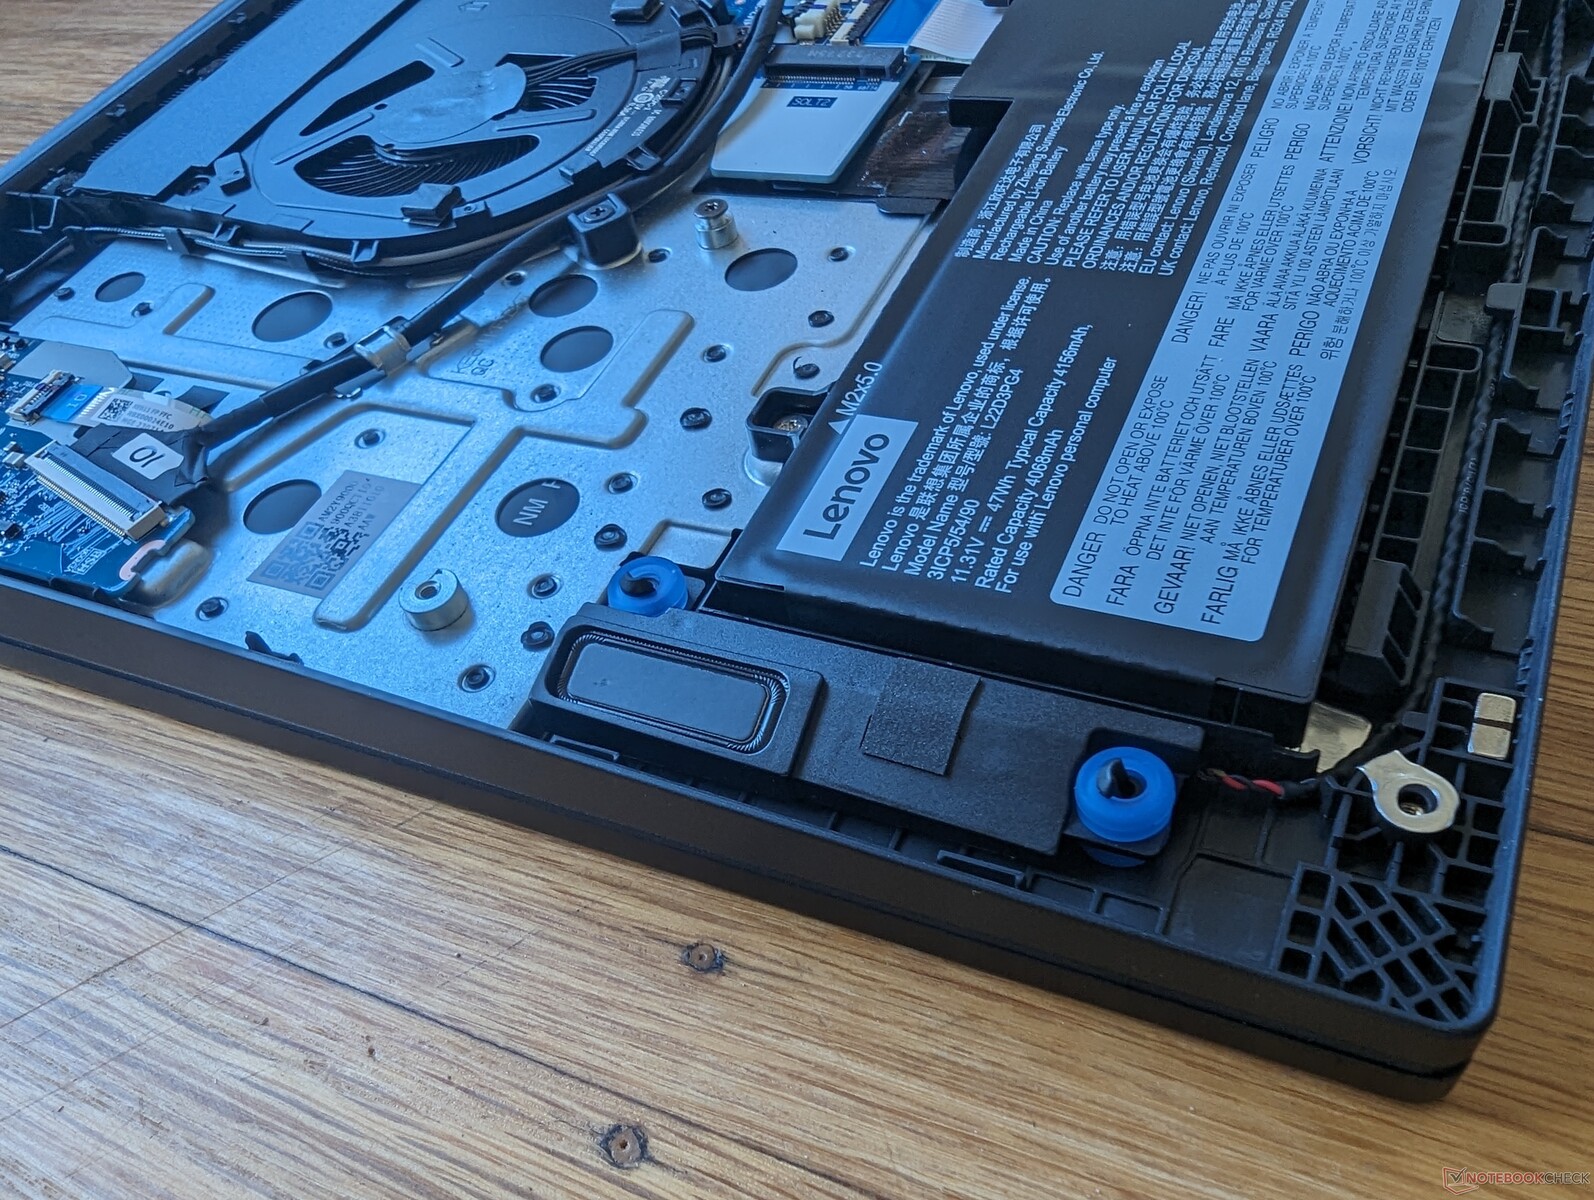
Konserwacja
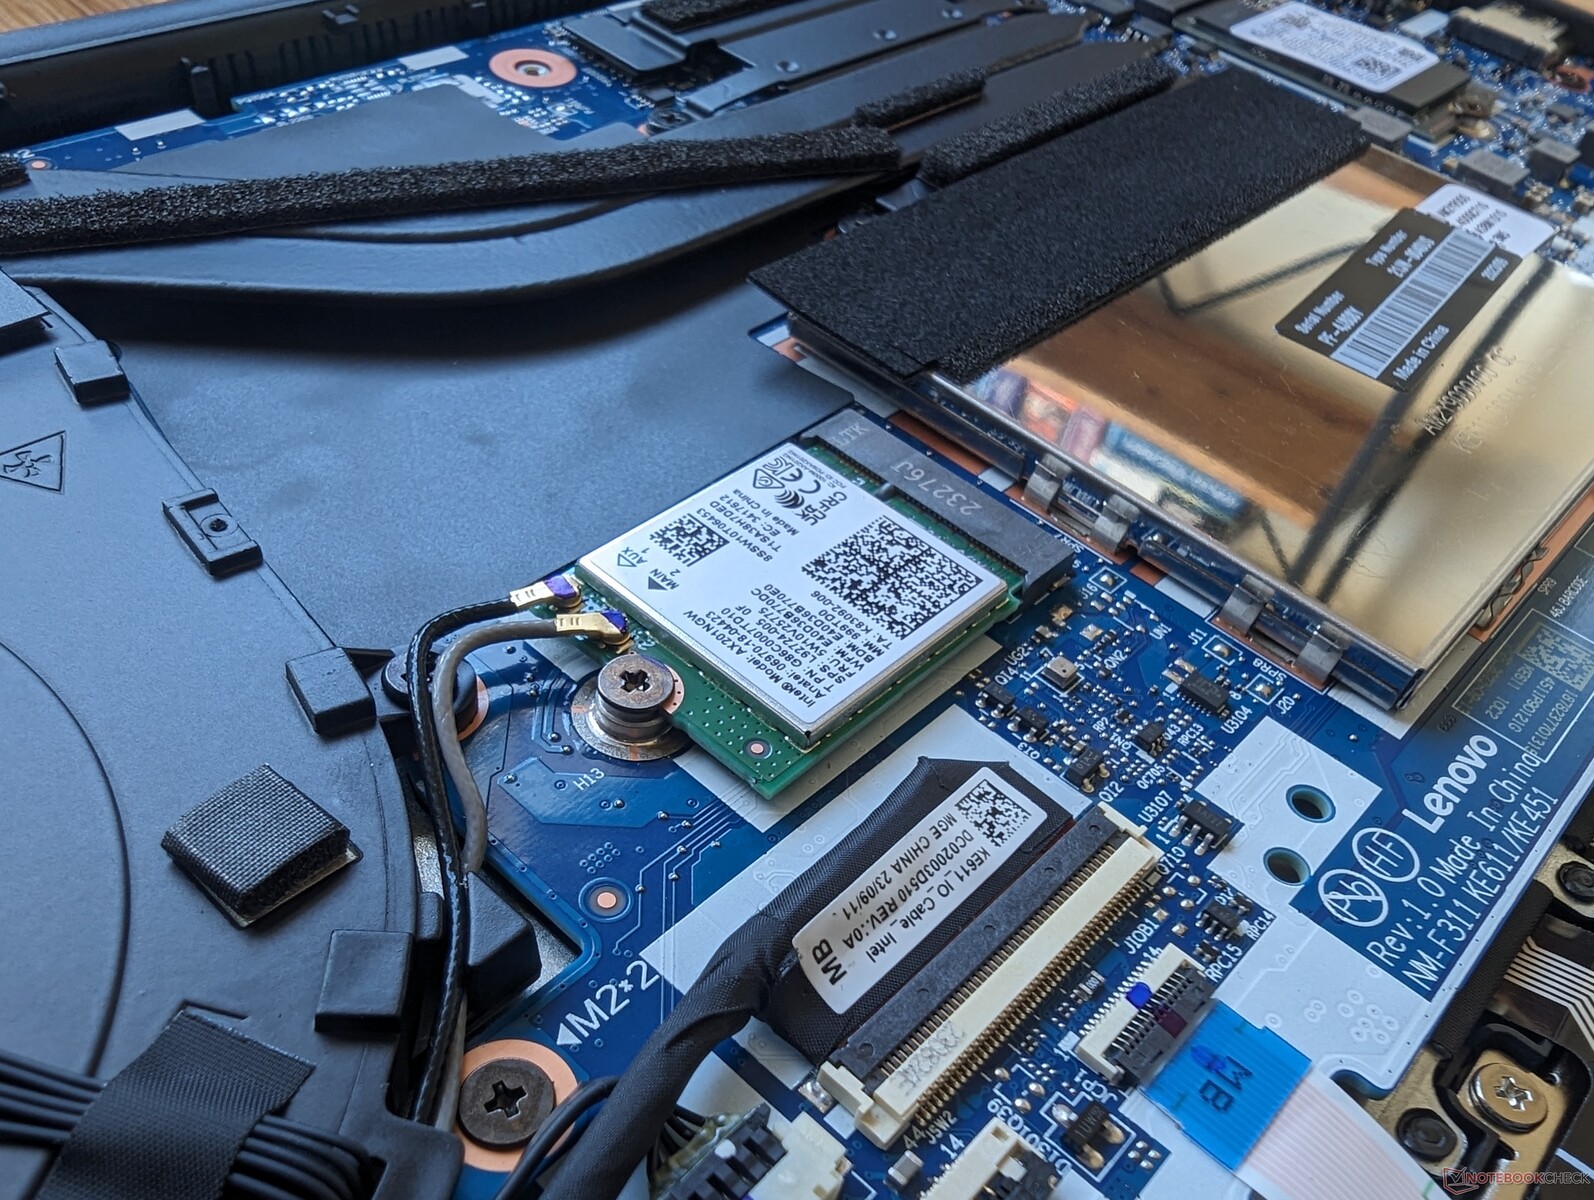
Zarówno wersja Intel, jak i AMD obsługują do dwóch dysków SSD M.2 każdy. Wersja Intela obsługuje jednak tylko dyski o długości do 42 mm, podczas gdy wersja AMD może obsługiwać jeden dysk o długości do 80 mm. Jest to podobne do tego, co zaobserwowaliśmy między mniejszym 14-calowym ThinkPad E14 G5 Intel i AMD.
Gwarancja
W przypadku zakupu w Stanach Zjednoczonych obowiązuje roczna ograniczona gwarancja producenta. Dla porównania, wyższej klasy modele ThinkPad z serii T lub X są zazwyczaj standardowo objęte trzyletnią gwarancją.
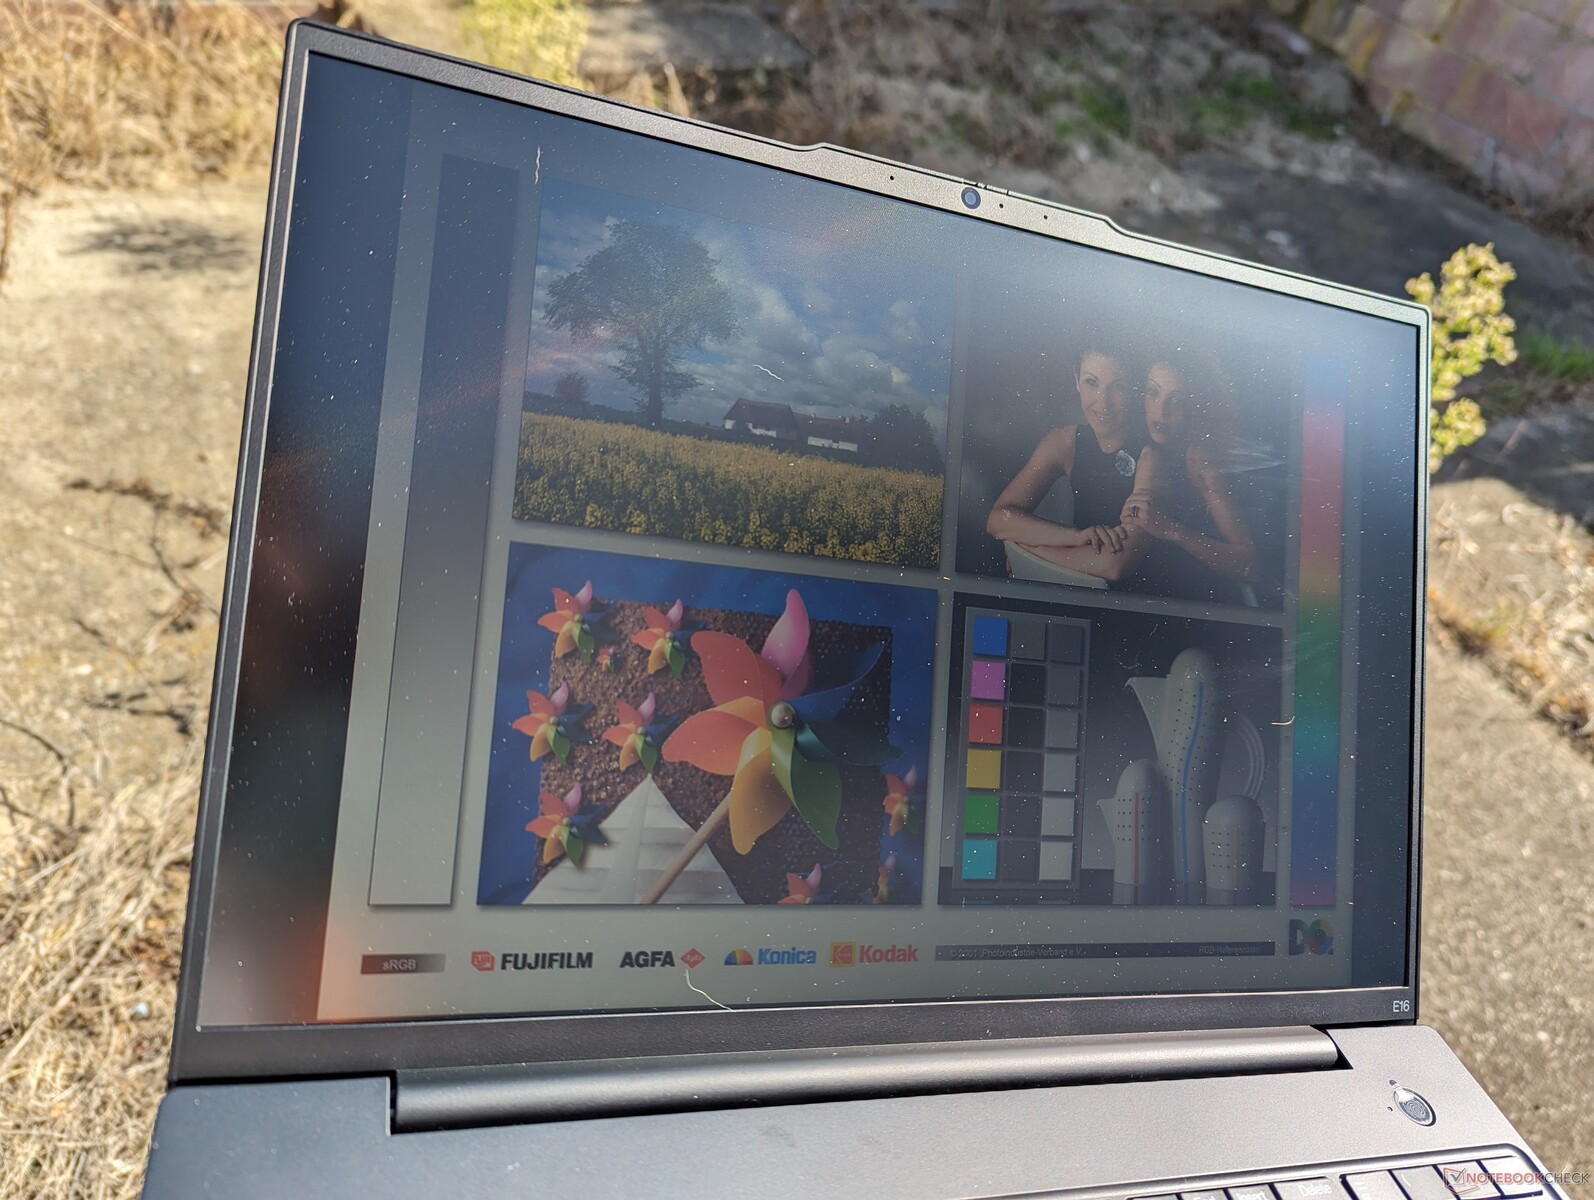
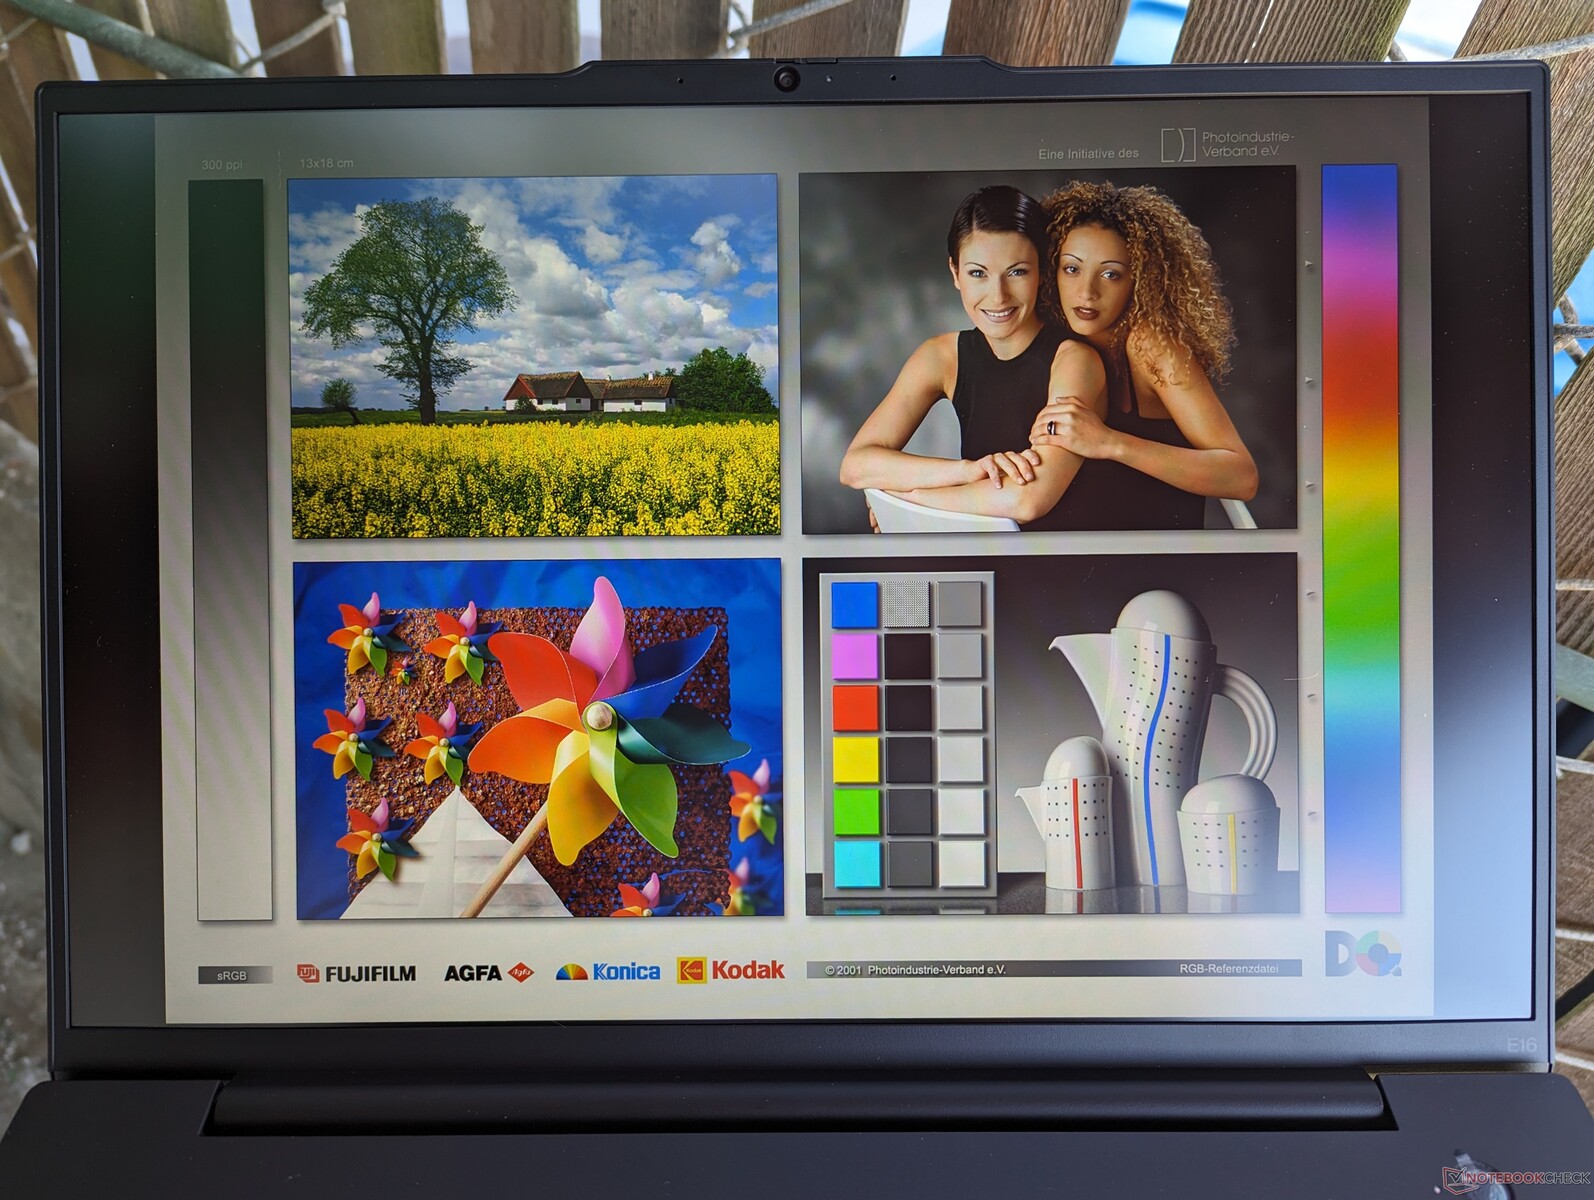
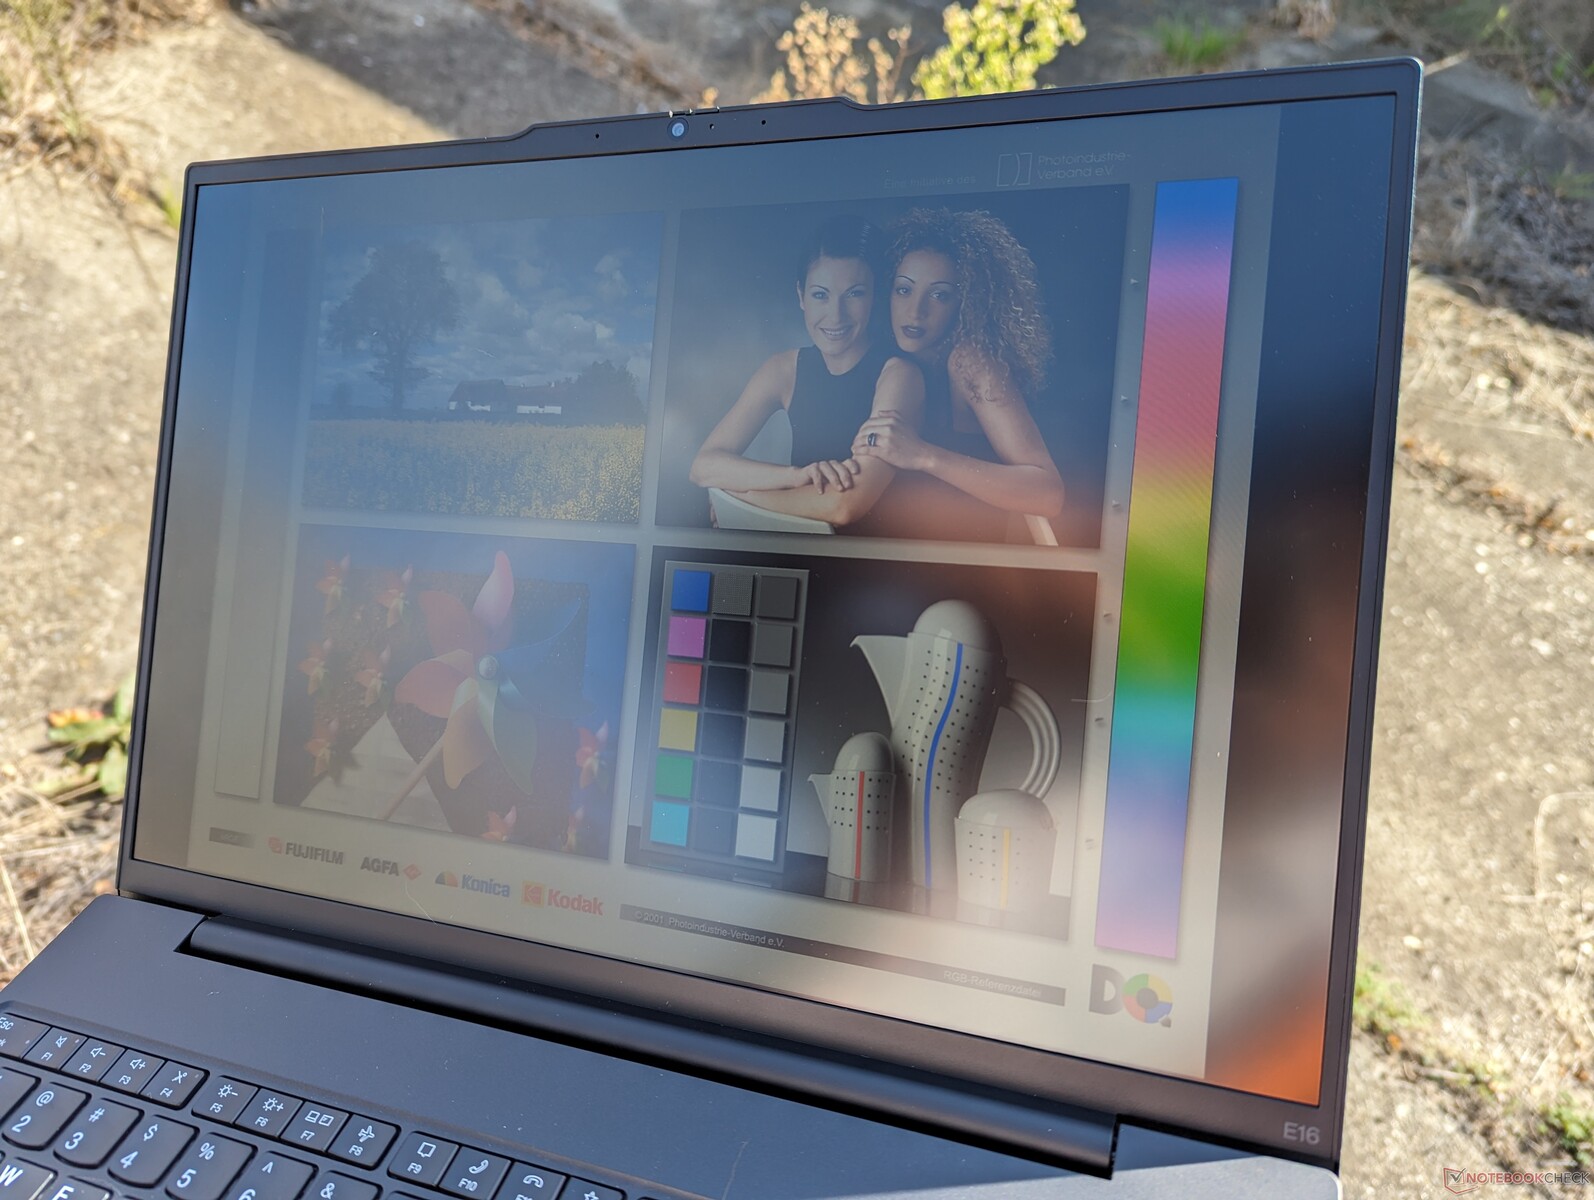
Wyświetlacz
Dostępne są cztery opcje matowej matrycy IPS:
- 1200p, 60% sRGB, 300 nitów, 60 Hz, bezdotykowy
- 1200p, 60% sRGB, 300 nitów, 60 Hz, dotykowy
- 1200p, 100% sRGB, 300 nitów, 60 Hz, bezdotykowy
- 1600p, 100% sRGB, 400 nitów, 60 Hz, bezdotykowy
Nasza konkretna jednostka testowa Intel jest wyposażona w pogrubioną opcję powyżej, podczas gdy nasza jednostka AMD jest wyposażona w opcję 1600p. Jakość obrazu jest jak noc i dzień między naszymi jednostkami Intel i AMD, ponieważ ta druga wydaje się ostrzejsza, bardziej żywa i z krótszym czasem reakcji, co zapewnia zauważalnie lepsze wrażenia podczas oglądania. Zalecamy unikanie naszej konkretnej opcji panelu, chyba że funkcjonalność ekranu dotykowego jest koniecznością.

| |||||||||||||||||||||||||
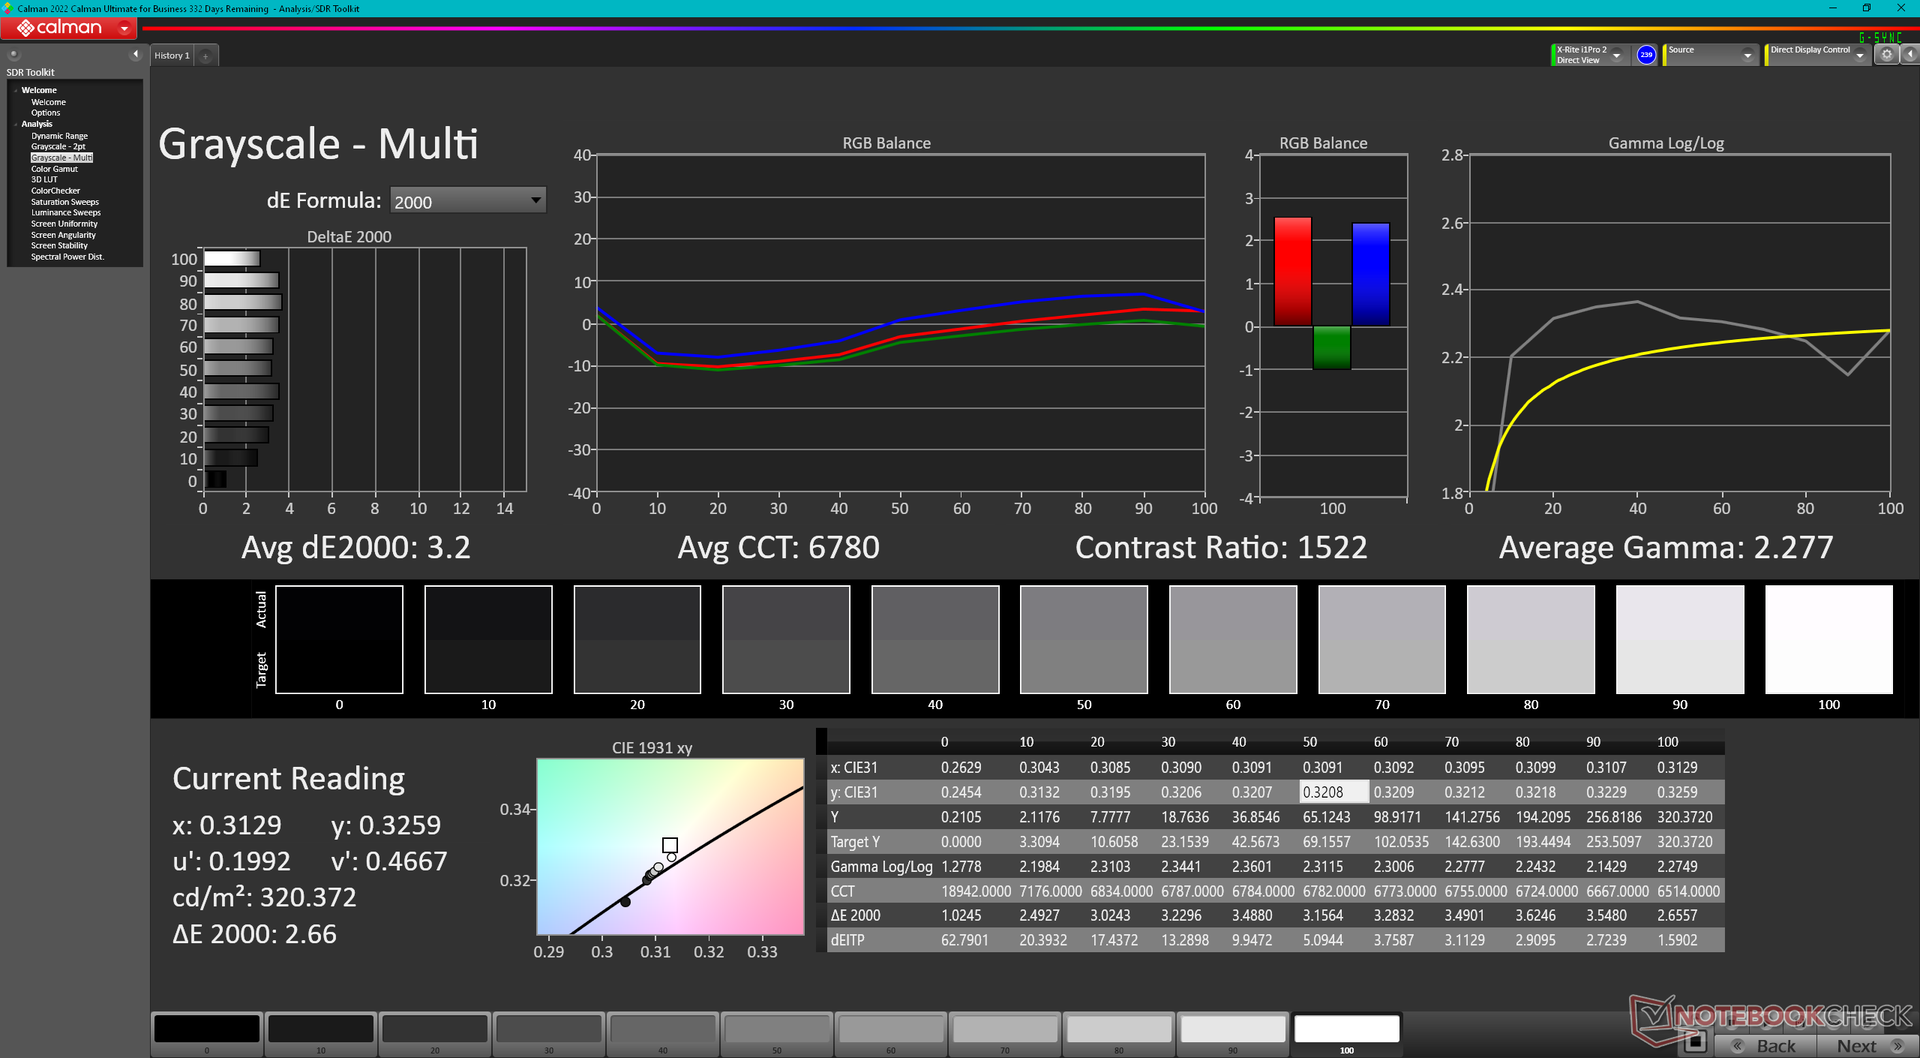
rozświetlenie: 91 %
na akumulatorze: 318.6 cd/m²
kontrast: 1099:1 (czerń: 0.29 cd/m²)
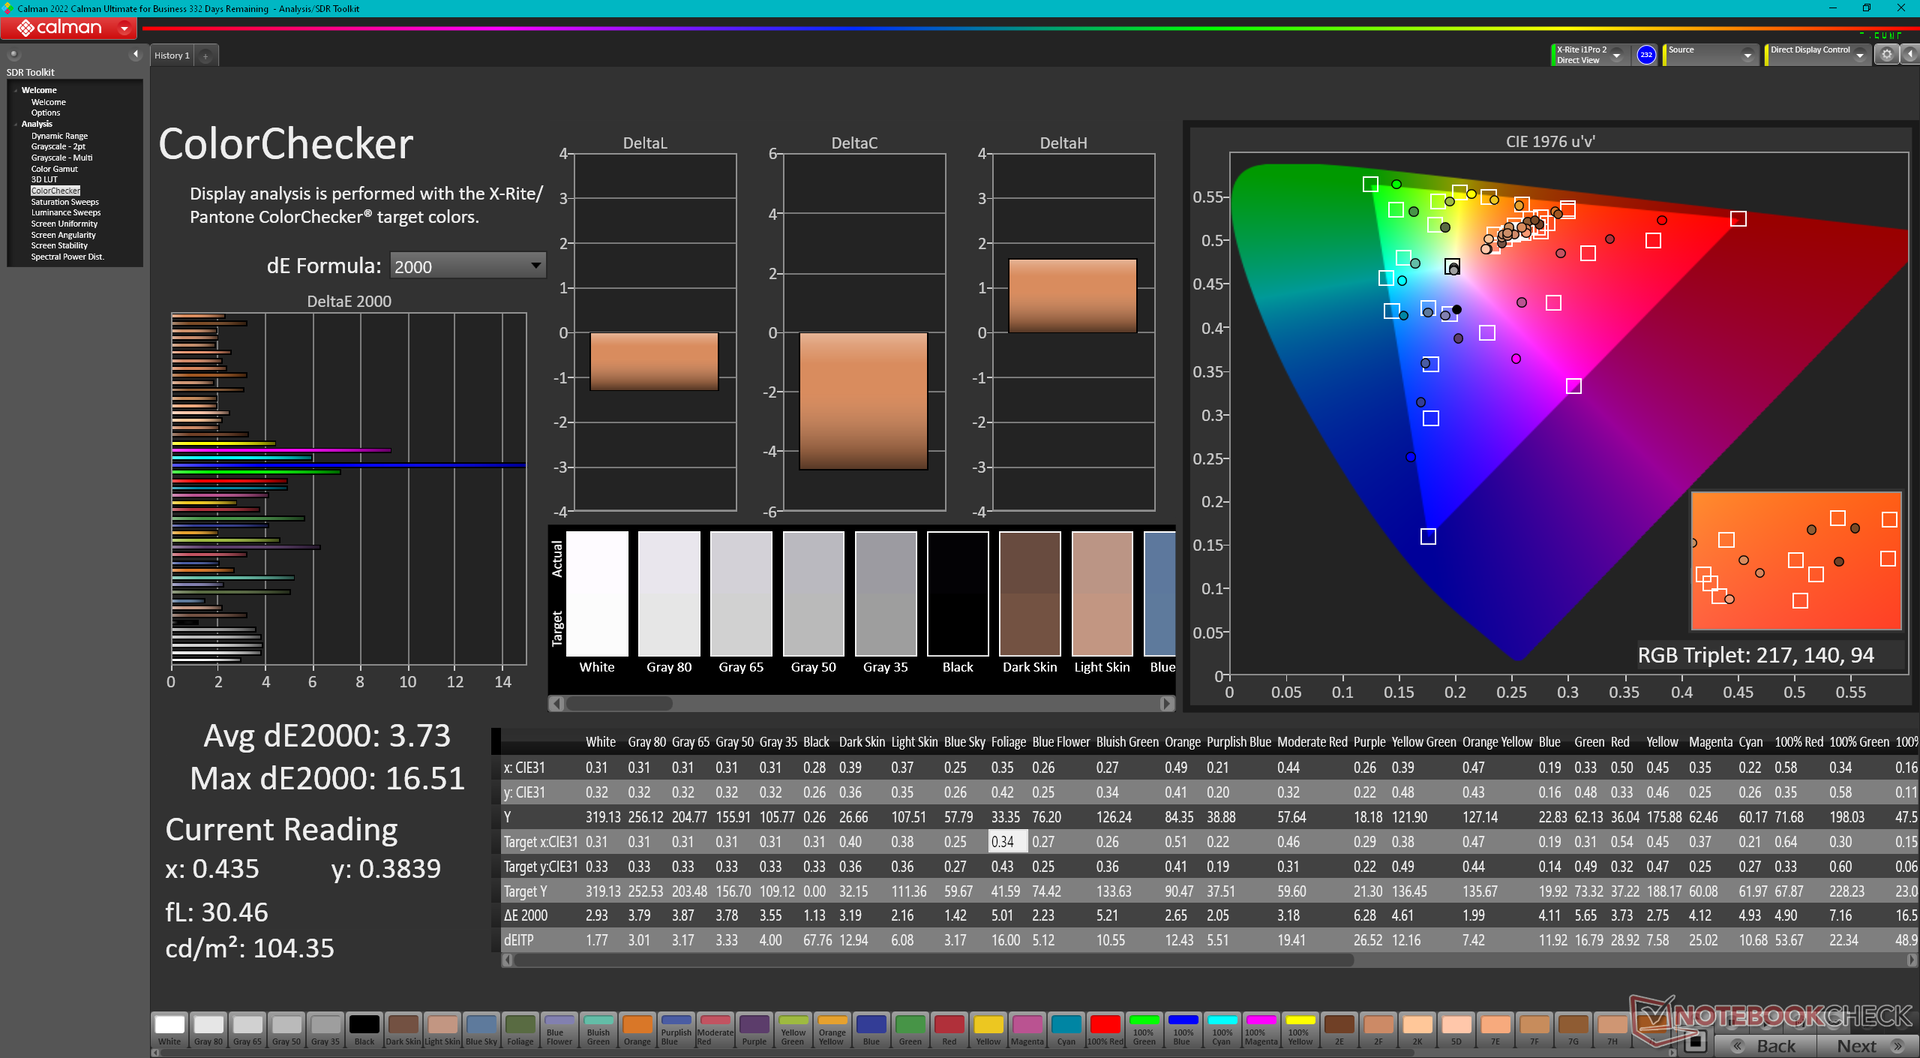
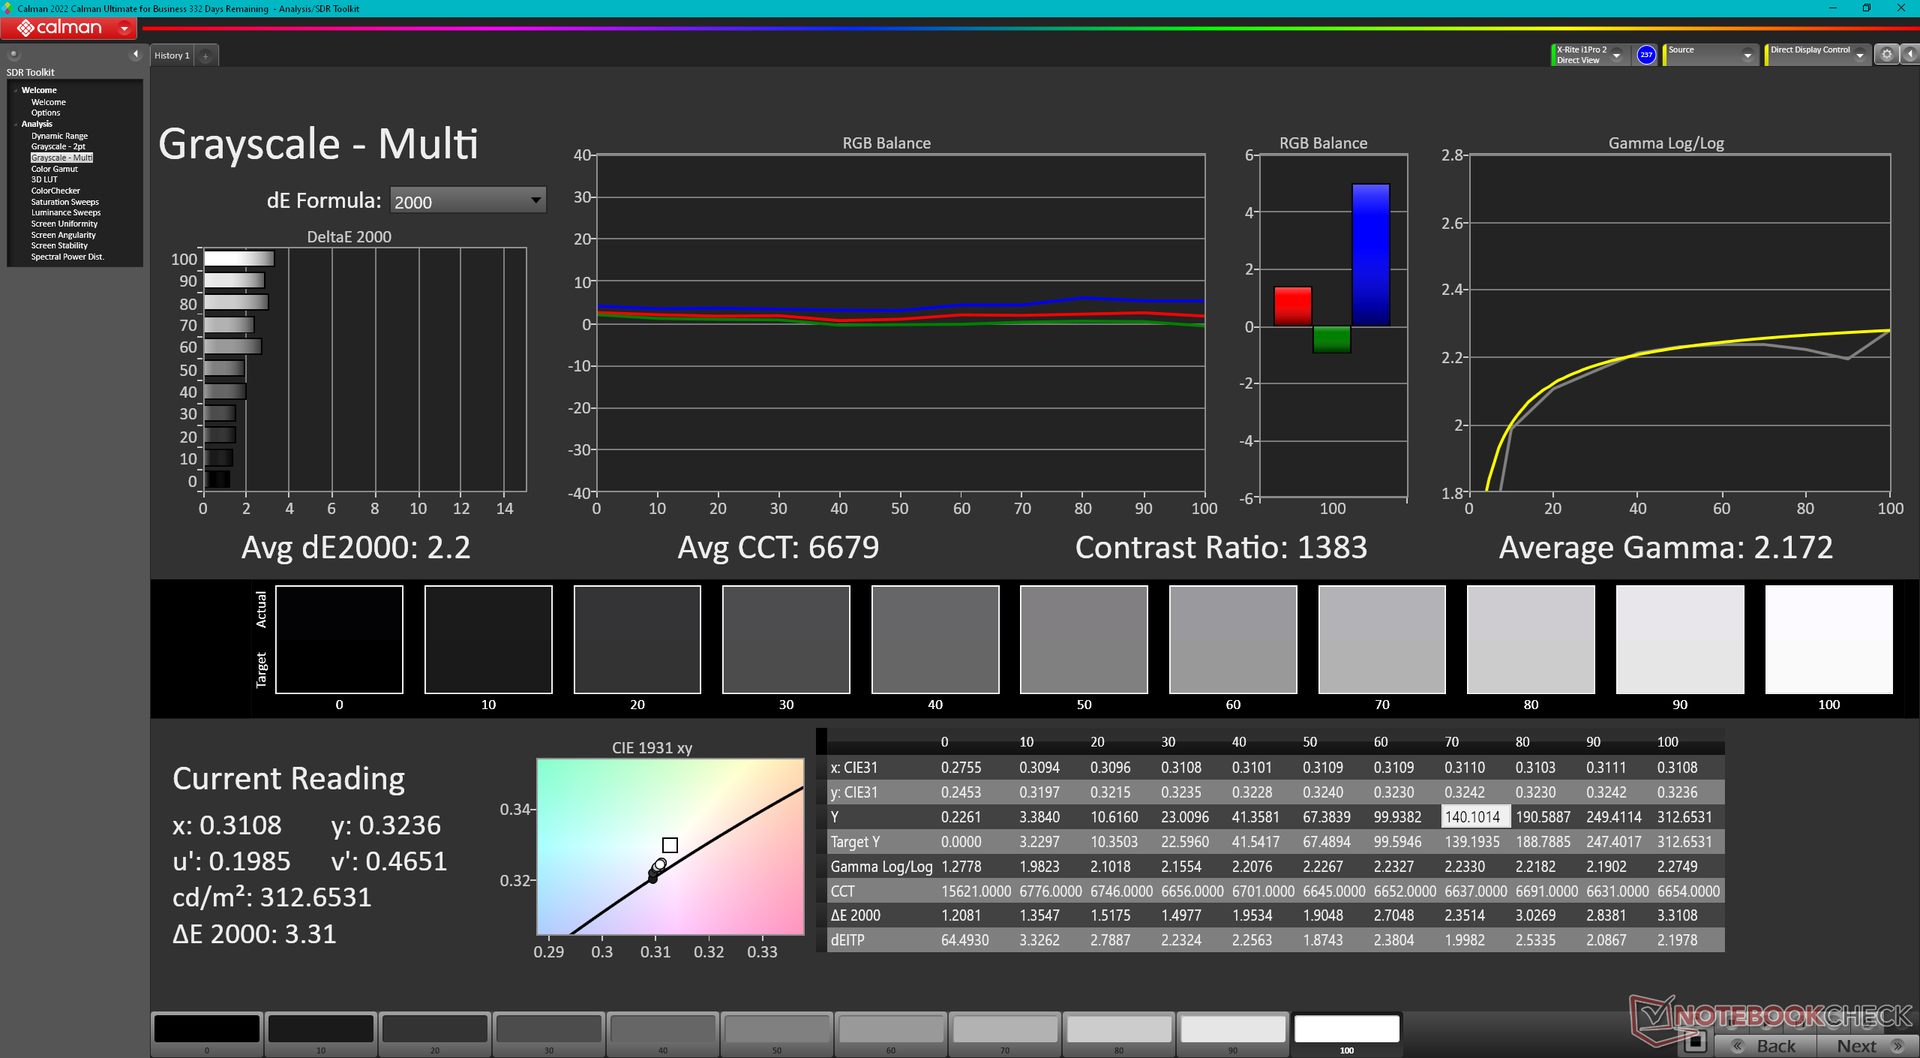
ΔE ColorChecker Calman: 3.73 | ∀{0.5-29.43 Ø4.72}
calibrated: 2.03
ΔE Greyscale Calman: 3.2 | ∀{0.09-98 Ø4.97}
43.3% AdobeRGB 1998 (Argyll 3D)
62.6% sRGB (Argyll 3D)
42% Display P3 (Argyll 3D)
Gamma: 2.28
CCT: 6780 K
| Lenovo ThinkPad E16 G1 Core i5-1335U R160NW41 R2, IPS, 1920x1200, 16" | Lenovo ThinkPad E16 G1-21JUS08X00 MNG007DA1-C, IPS, 2560x1600, 16" | Dell Inspiron 16 7635 2-in-1 Chi Mei 160JCA, IPS, 1920x1200, 16" | Acer TravelMate P4 TMP416-51-55KN BOE BOE0A32, IPS, 1920x1200, 16" | Samsung Galaxy Book3 Pro 16 Samsung ATNA60CL03-0, AMOLED, 2880x1800, 16" | LG Gram 16Z90Q LG LP160WQ1-SPB2 (LGD06EB), IPS, 2560x1600, 16" | |
|---|---|---|---|---|---|---|
| Display | 58% | 59% | -7% | 107% | 95% | |
| Display P3 Coverage (%) | 42 | 67.6 61% | 67.4 60% | 38.9 -7% | 99.7 137% | 96.8 130% |
| sRGB Coverage (%) | 62.6 | 95.3 52% | 98.2 57% | 58.1 -7% | 100 60% | 99.9 60% |
| AdobeRGB 1998 Coverage (%) | 43.3 | 70 62% | 69.5 61% | 40.2 -7% | 97 124% | 84.6 95% |
| Response Times | 30% | 38% | 62% | 95% | 16% | |
| Response Time Grey 50% / Grey 80% * (ms) | 46.4 ? | 32.4 ? 30% | 27.6 ? 41% | 20 ? 57% | 2 ? 96% | 45.7 ? 2% |
| Response Time Black / White * (ms) | 27.6 ? | 19.6 ? 29% | 18.2 ? 34% | 9 ? 67% | 2 ? 93% | 19.7 ? 29% |
| PWM Frequency (Hz) | ||||||
| Screen | 30% | 12% | -20% | 295% | 13% | |
| Brightness middle (cd/m²) | 318.6 | 404 27% | 301.3 -5% | 269 -16% | 412 29% | 366 15% |
| Brightness (cd/m²) | 302 | 389 29% | 269 -11% | 265 -12% | 412 36% | 347 15% |
| Brightness Distribution (%) | 91 | 91 0% | 79 -13% | 94 3% | 98 8% | 89 -2% |
| Black Level * (cd/m²) | 0.29 | 0.24 17% | 0.28 3% | 0.305 -5% | 0.015 95% | 0.32 -10% |
| Contrast (:1) | 1099 | 1683 53% | 1076 -2% | 882 -20% | 27467 2399% | 1144 4% |
| Colorchecker dE 2000 * | 3.73 | 2.1 44% | 3.1 17% | 4.89 -31% | 2.34 37% | 2.82 24% |
| Colorchecker dE 2000 max. * | 16.51 | 4.2 75% | 5.5 67% | 8.81 47% | 3.34 80% | 4.65 72% |
| Colorchecker dE 2000 calibrated * | 2.03 | 1.4 31% | 0.49 76% | 5.12 -152% | 2.95 -45% | 2.69 -33% |
| Greyscale dE 2000 * | 3.2 | 3.3 -3% | 3.9 -22% | 2.91 9% | 2.78 13% | 2.3 28% |
| Gamma | 2.28 96% | 2.24 98% | 2.19 100% | 2.28 96% | 2.5 88% | 1.971 112% |
| CCT | 6780 96% | 7038 92% | 6186 105% | 6920 94% | 6879 94% | 6796 96% |
| Całkowita średnia (program / ustawienia) | 39% /
36% | 36% /
26% | 12% /
-5% | 166% /
226% | 41% /
31% |
* ... im mniej tym lepiej
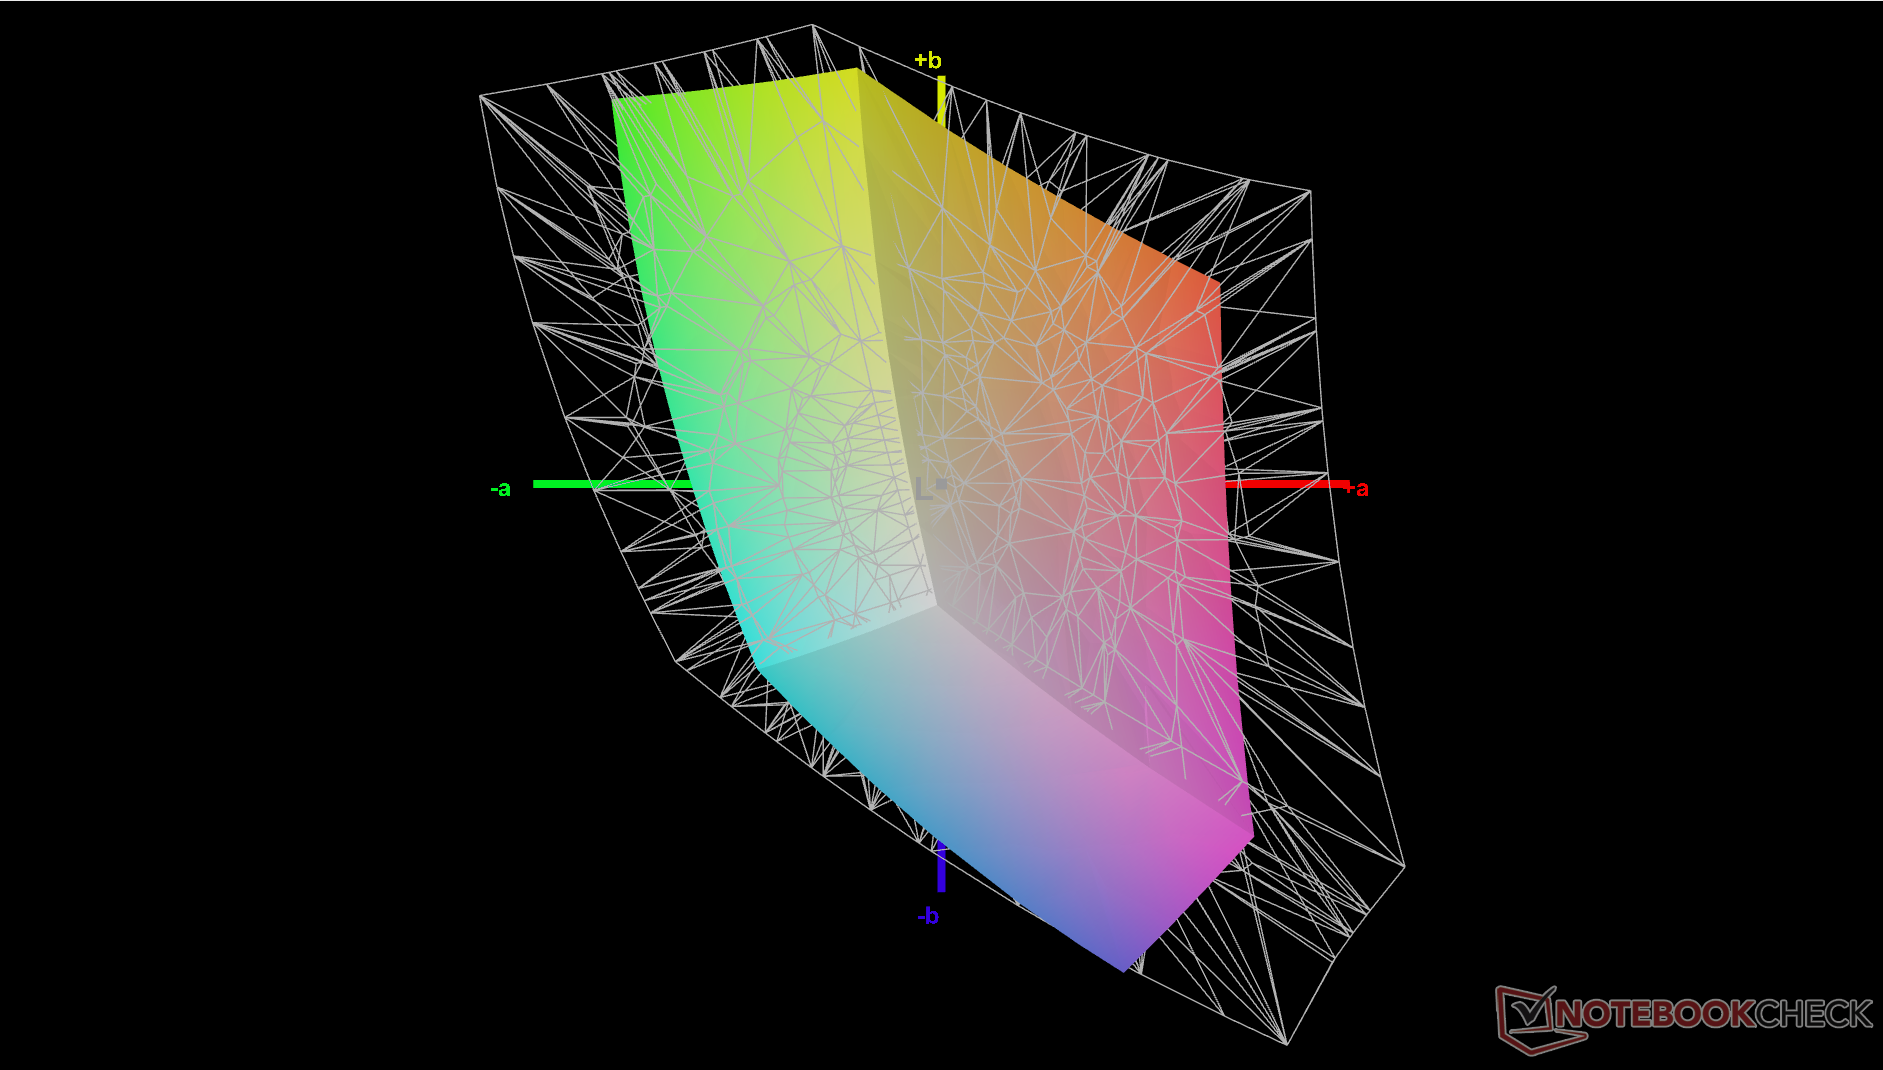
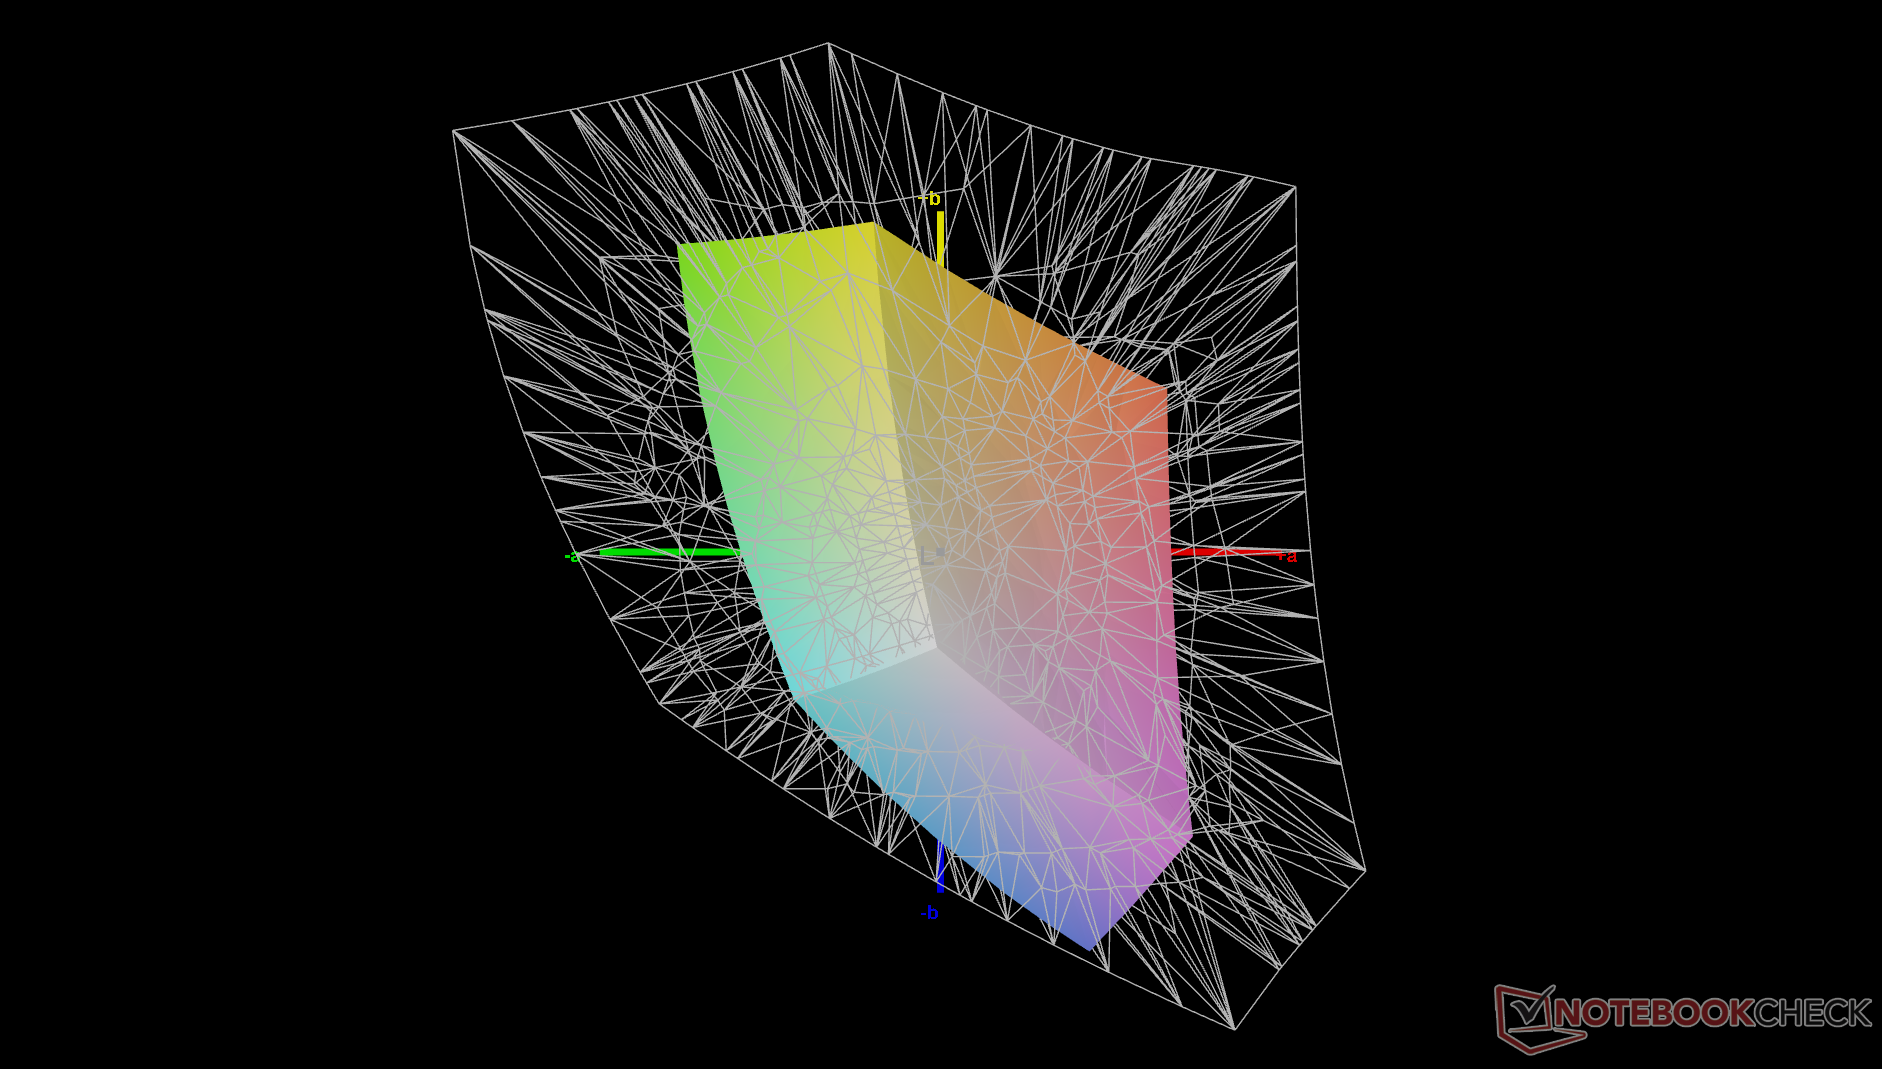
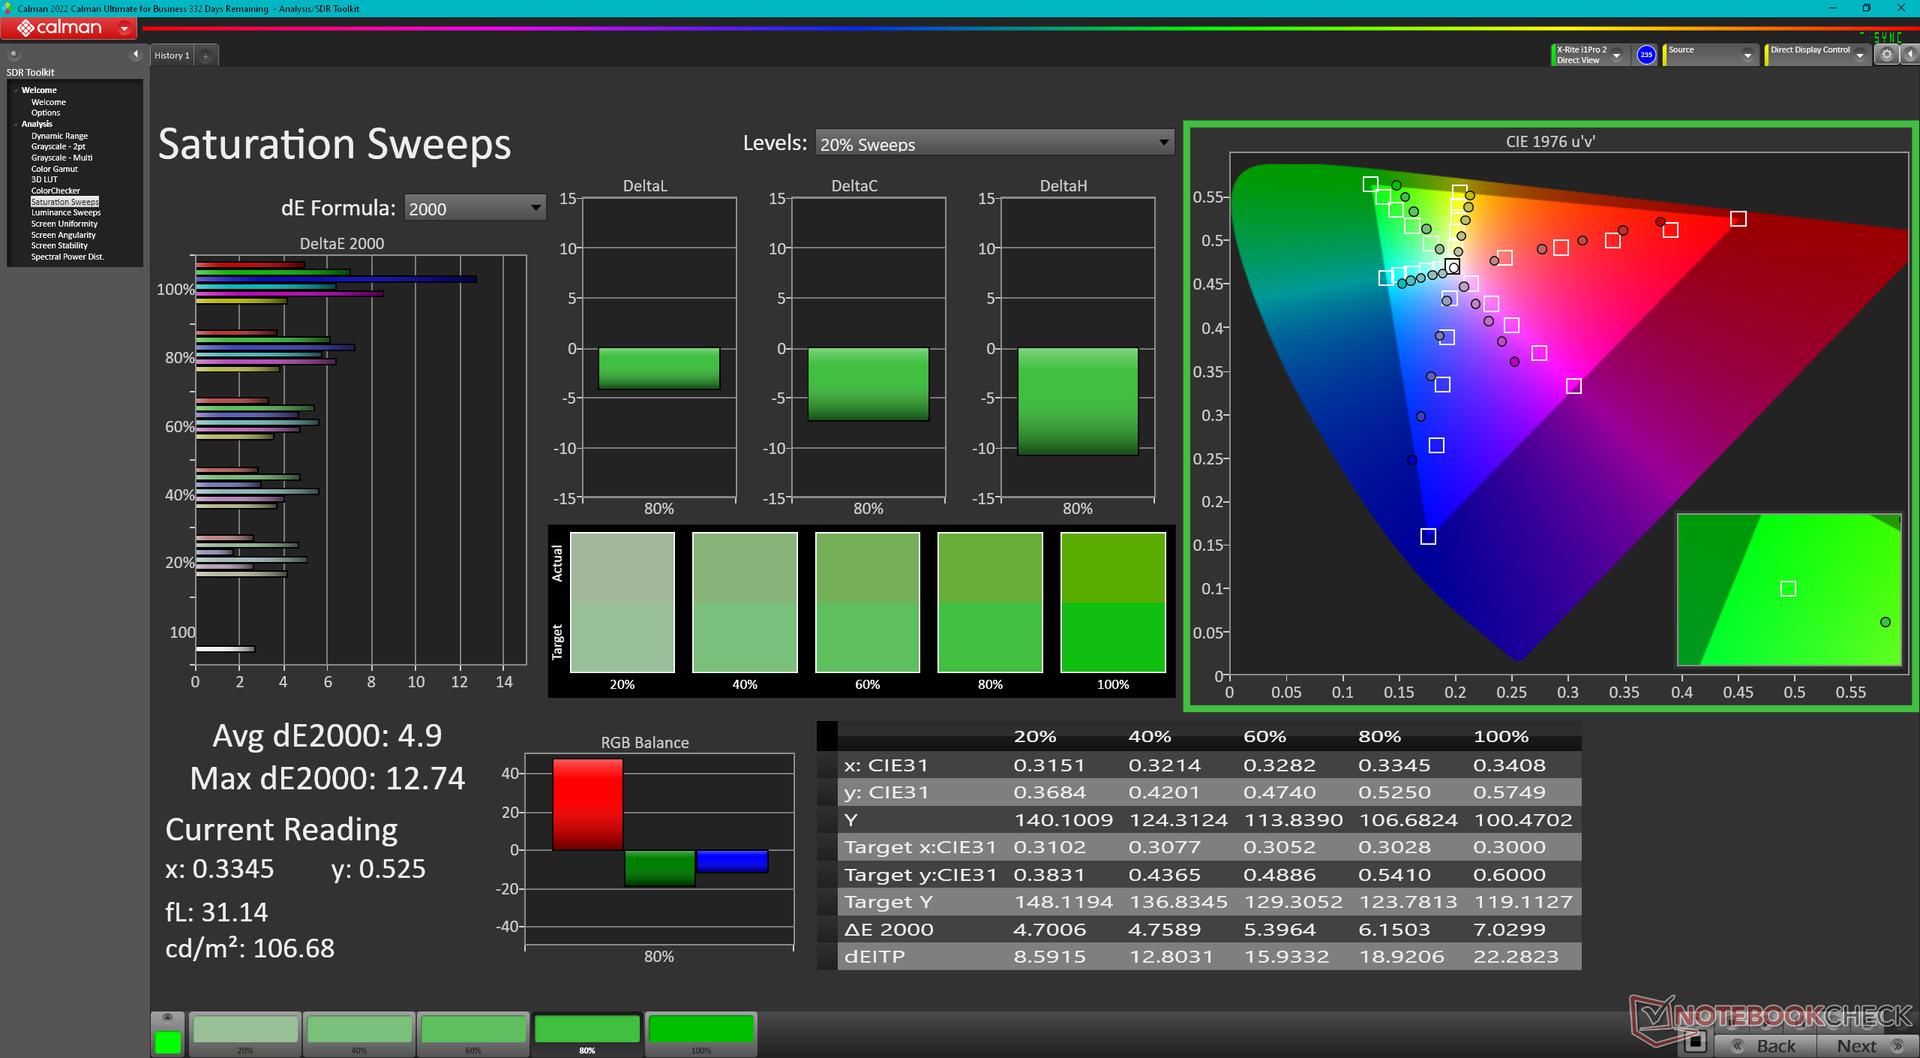
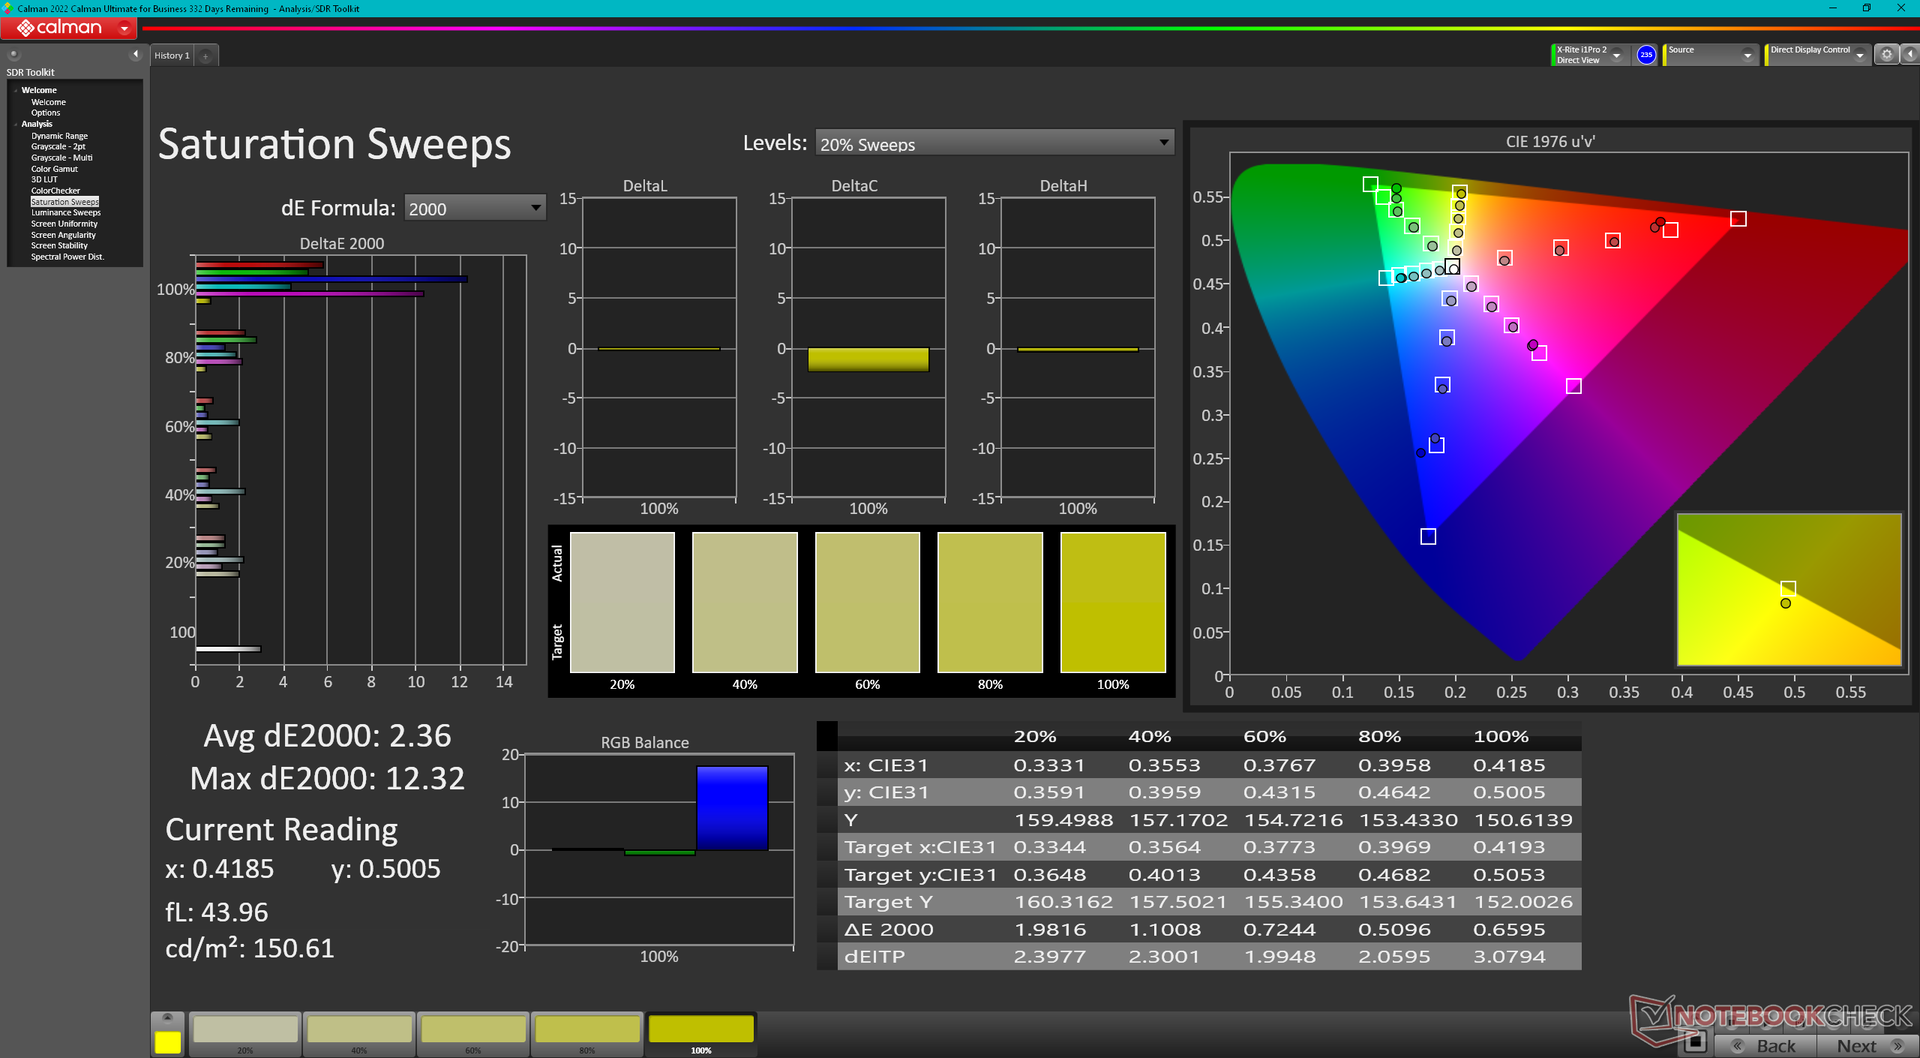
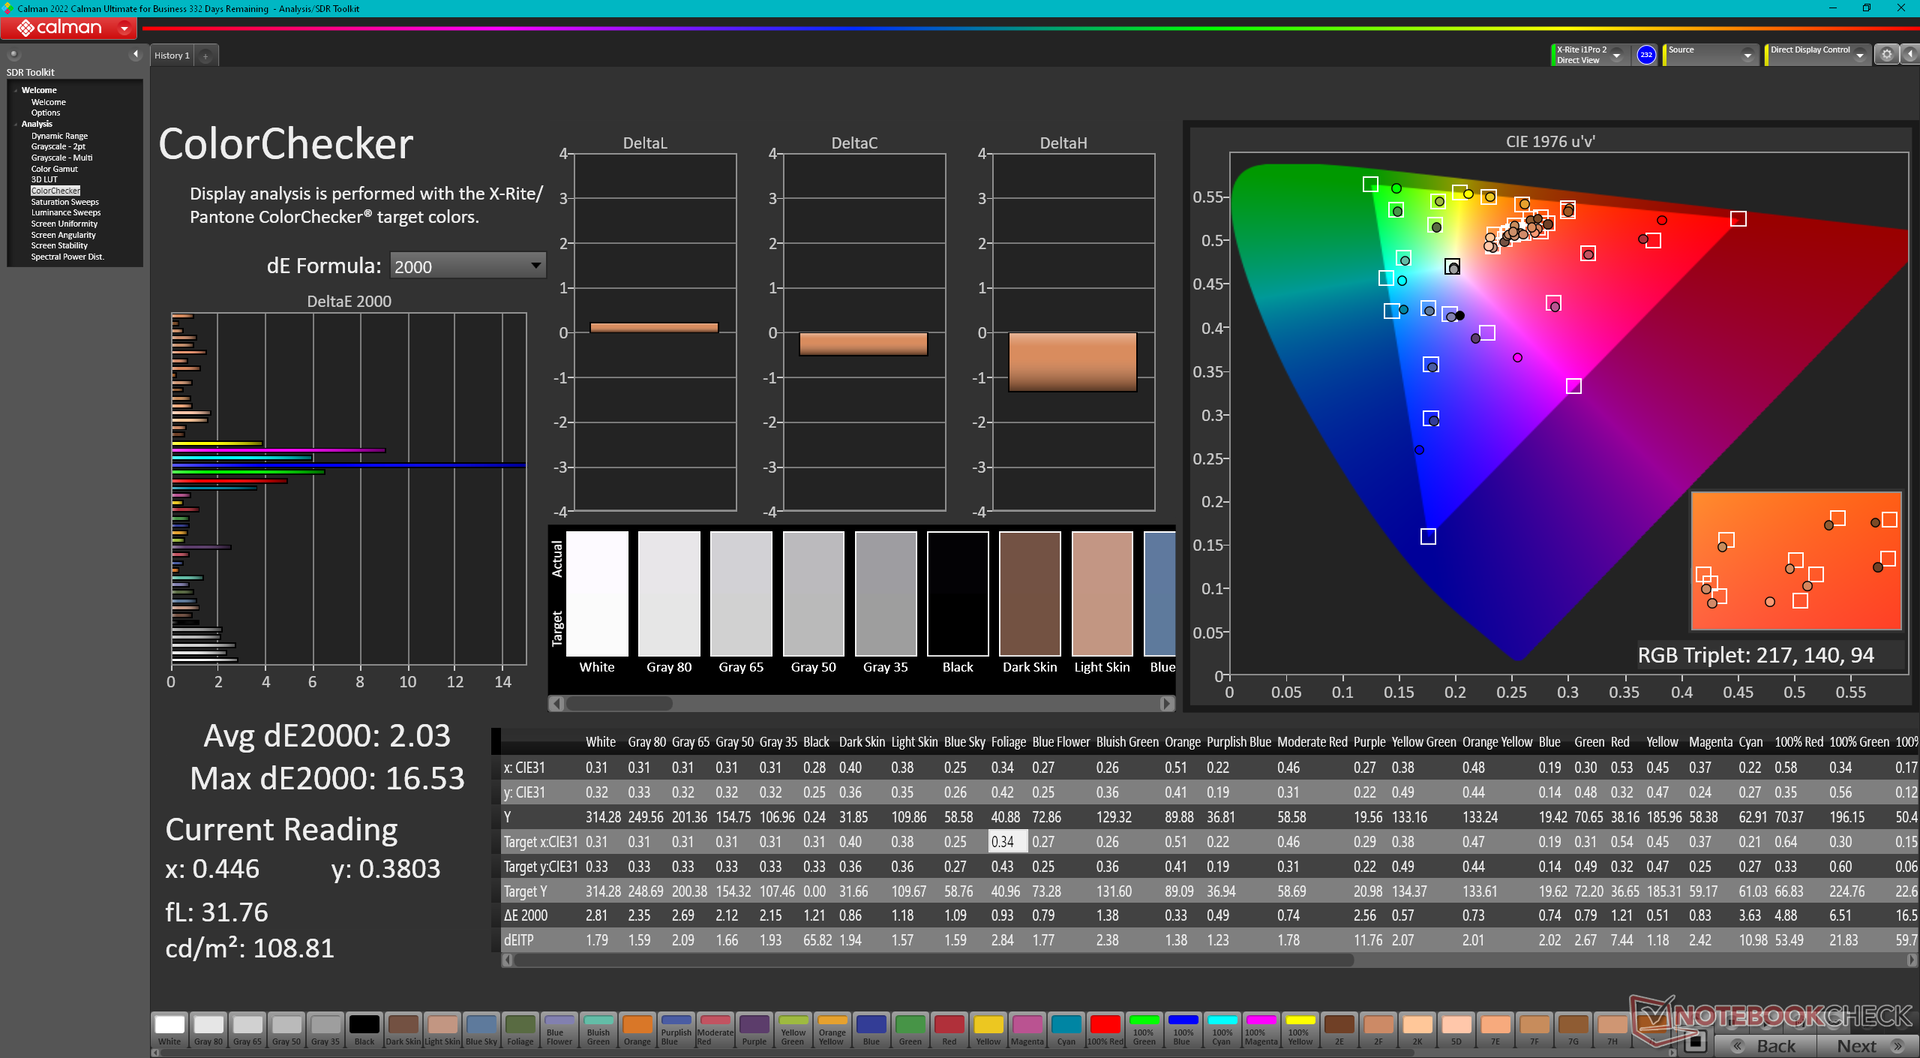
Kalibracja wyświetlacza za pomocą kolorymetru X-Rite nieznacznie poprawiłaby średnie wartości deltaE skali szarości i kolorów z odpowiednio 3,2 i 3,73 do 2,2 i 2,03. Jednak kolory nadal stają się coraz bardziej niedokładne przy wyższych poziomach nasycenia bez względu na wszystko, ze względu na wąskie pokrycie kolorów sRGB wspomniane powyżej.
Wyświetl czasy reakcji
| ↔ Czas reakcji od czerni do bieli | ||
|---|---|---|
| 27.6 ms ... wzrost ↗ i spadek ↘ łącznie | ↗ 12.9 ms wzrost | 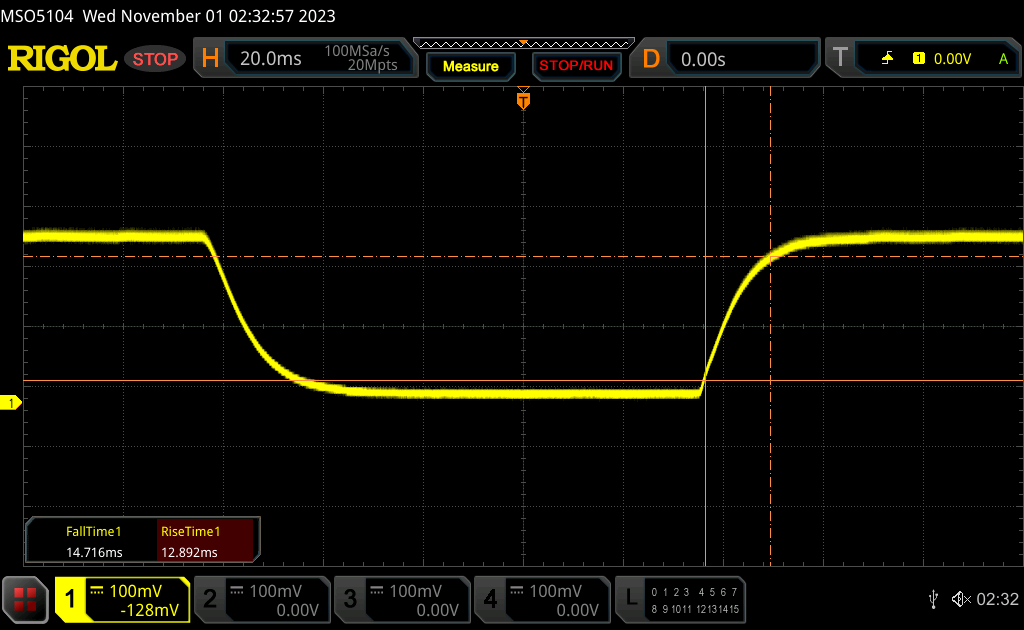 |
| ↘ 14.7 ms upadek | ||
| W naszych testach ekran wykazuje stosunkowo powolne tempo reakcji i może być zbyt wolny dla graczy. Dla porównania, wszystkie testowane urządzenia wahają się od 0.1 (minimum) do 240 (maksimum) ms. » 70 % wszystkich urządzeń jest lepszych. Oznacza to, że zmierzony czas reakcji jest gorszy od średniej wszystkich testowanych urządzeń (19.9 ms). | ||
| ↔ Czas reakcji 50% szarości do 80% szarości | ||
| 46.4 ms ... wzrost ↗ i spadek ↘ łącznie | ↗ 19.5 ms wzrost | 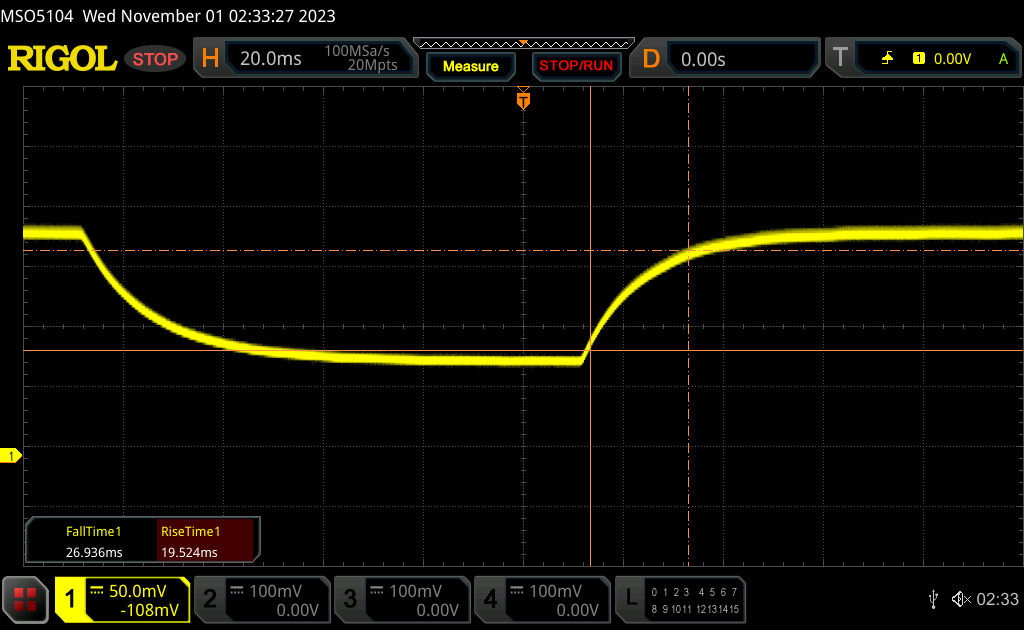 |
| ↘ 26.9 ms upadek | ||
| W naszych testach ekran wykazuje powolne tempo reakcji, co będzie niezadowalające dla graczy. Dla porównania, wszystkie testowane urządzenia wahają się od 0.165 (minimum) do 636 (maksimum) ms. » 80 % wszystkich urządzeń jest lepszych. Oznacza to, że zmierzony czas reakcji jest gorszy od średniej wszystkich testowanych urządzeń (31.1 ms). | ||
Migotanie ekranu / PWM (modulacja szerokości impulsu)
| Migotanie ekranu/nie wykryto PWM | 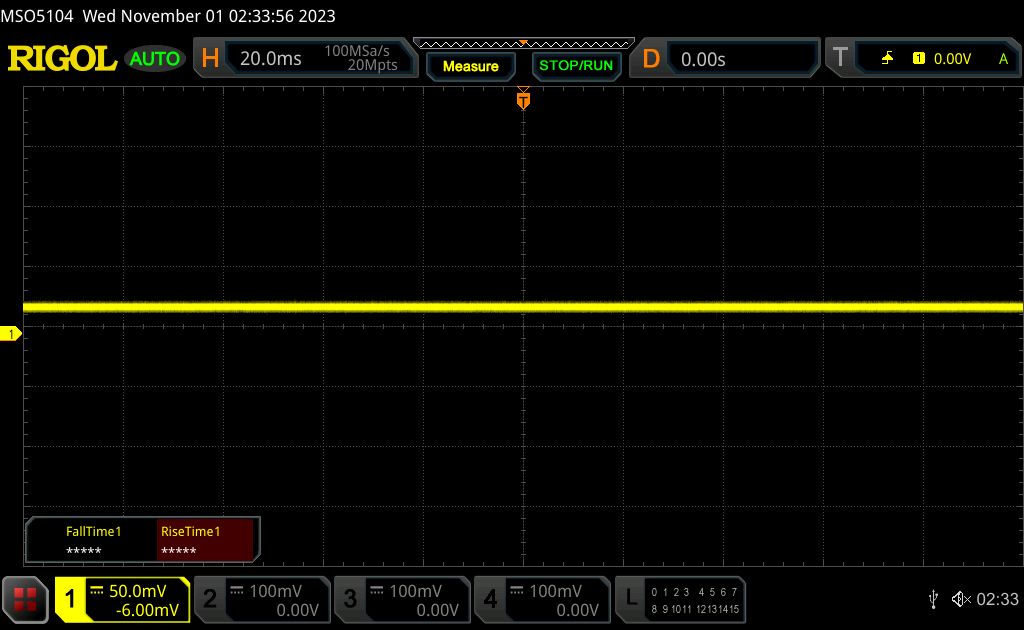 | ||
Dla porównania: 52 % wszystkich testowanych urządzeń nie używa PWM do przyciemniania wyświetlacza. Jeśli wykryto PWM, zmierzono średnio 7784 (minimum: 5 - maksimum: 343500) Hz. | |||
Wydajność
Warunki testowania
Przed uruchomieniem poniższych testów porównawczych ustawiliśmy system Windows na tryb wydajności. Użytkownicy powinni zapoznać się z wbudowanym oprogramowaniem Vantage, ponieważ jest to centralne centrum funkcji specyficznych dla Lenovo i aktualizacji BIOS-u.


Procesor
W przeciwieństwie do większości innych procesorów Core i5 i Core i7, procesor Core i5-1335U jest znacznie bardziej zbliżony wydajnością do droższego Core i7-1355U niż można by się początkowo spodziewać. W testach porównawczych Core i5-1335U wypada zaledwie od 5 do 10 procent wolniej niż Core i7-1355U, co oznacza, że można zaoszczędzić kilkaset złotych decydując się na konfigurację z Core i5, jeśli nie przeszkadza nam niewielki deficyt wydajności procesora. Największym powodem, dla którego warto wybrać opcję Core i7, jest natomiast zintegrowany układ graficzny, o czym świadczy poniższa sekcja Wydajność GPU.
W porównaniu do Ryzen 7 7730U nasza wersja Intel Core i5 jest o około 10 do 15 procent wolniejsza pod względem wydajności wielowątkowej, podczas gdy odwrotna sytuacja ma miejsce w przypadku wydajności jednowątkowej.
Cinebench R15 Multi Loop
Cinebench R23: Multi Core | Single Core
Cinebench R20: CPU (Multi Core) | CPU (Single Core)
Cinebench R15: CPU Multi 64Bit | CPU Single 64Bit
Blender: v2.79 BMW27 CPU
7-Zip 18.03: 7z b 4 | 7z b 4 -mmt1
Geekbench 5.5: Multi-Core | Single-Core
HWBOT x265 Benchmark v2.2: 4k Preset
LibreOffice : 20 Documents To PDF
R Benchmark 2.5: Overall mean
| CPU Performance rating | |
| Acer Swift Edge SFE16 Ryzen 7 7840U | |
| Samsung Galaxy Book3 Pro 16 | |
| Lenovo Yoga 7-14ARB G7 | |
| Acer TravelMate P4 TMP416-51-55KN | |
| Lenovo ThinkPad T16 G2 21HH003AGE | |
| Lenovo ThinkPad E16 G1 Core i5-1335U -1! | |
| Lenovo ThinkPad E16 G1-21JUS08X00 | |
| Lenovo ThinkPad T14s G3 21BR00CDGE | |
| Microsoft Surface Laptop 5 15, i7-1255U | |
| Przeciętny Intel Core i5-1335U | |
| Dell Inspiron 16 7635 2-in-1 | |
| LG Gram 16Z90Q | |
| Lenovo V17 G2 ITL-82NX00EUGE | |
| Cinebench R23 / Multi Core | |
| Acer Swift Edge SFE16 Ryzen 7 7840U | |
| Lenovo Yoga 7-14ARB G7 | |
| Samsung Galaxy Book3 Pro 16 | |
| Acer TravelMate P4 TMP416-51-55KN | |
| Lenovo ThinkPad E16 G1-21JUS08X00 | |
| Lenovo ThinkPad T16 G2 21HH003AGE | |
| Lenovo ThinkPad T14s G3 21BR00CDGE | |
| Lenovo ThinkPad E16 G1 Core i5-1335U | |
| Microsoft Surface Laptop 5 15, i7-1255U | |
| Przeciętny Intel Core i5-1335U (6957 - 9438, n=12) | |
| Dell Inspiron 16 7635 2-in-1 | |
| LG Gram 16Z90Q | |
| Lenovo V17 G2 ITL-82NX00EUGE | |
| Cinebench R23 / Single Core | |
| Lenovo ThinkPad T16 G2 21HH003AGE | |
| Samsung Galaxy Book3 Pro 16 | |
| Acer Swift Edge SFE16 Ryzen 7 7840U | |
| Lenovo ThinkPad E16 G1 Core i5-1335U | |
| Lenovo ThinkPad T14s G3 21BR00CDGE | |
| Microsoft Surface Laptop 5 15, i7-1255U | |
| Przeciętny Intel Core i5-1335U (1532 - 1733, n=12) | |
| Acer TravelMate P4 TMP416-51-55KN | |
| LG Gram 16Z90Q | |
| Lenovo Yoga 7-14ARB G7 | |
| Lenovo V17 G2 ITL-82NX00EUGE | |
| Lenovo ThinkPad E16 G1-21JUS08X00 | |
| Dell Inspiron 16 7635 2-in-1 | |
| Cinebench R20 / CPU (Multi Core) | |
| Acer Swift Edge SFE16 Ryzen 7 7840U | |
| Lenovo Yoga 7-14ARB G7 | |
| Samsung Galaxy Book3 Pro 16 | |
| Acer TravelMate P4 TMP416-51-55KN | |
| Lenovo ThinkPad E16 G1-21JUS08X00 | |
| Lenovo ThinkPad E16 G1 Core i5-1335U | |
| Lenovo ThinkPad T16 G2 21HH003AGE | |
| Lenovo ThinkPad T14s G3 21BR00CDGE | |
| Microsoft Surface Laptop 5 15, i7-1255U | |
| Dell Inspiron 16 7635 2-in-1 | |
| LG Gram 16Z90Q | |
| Przeciętny Intel Core i5-1335U (2602 - 3849, n=11) | |
| Lenovo V17 G2 ITL-82NX00EUGE | |
| Cinebench R20 / CPU (Single Core) | |
| Lenovo ThinkPad T16 G2 21HH003AGE | |
| Acer Swift Edge SFE16 Ryzen 7 7840U | |
| Lenovo ThinkPad E16 G1 Core i5-1335U | |
| Samsung Galaxy Book3 Pro 16 | |
| Lenovo ThinkPad T14s G3 21BR00CDGE | |
| Microsoft Surface Laptop 5 15, i7-1255U | |
| Acer TravelMate P4 TMP416-51-55KN | |
| Przeciętny Intel Core i5-1335U (593 - 663, n=11) | |
| LG Gram 16Z90Q | |
| Lenovo Yoga 7-14ARB G7 | |
| Lenovo ThinkPad E16 G1-21JUS08X00 | |
| Lenovo V17 G2 ITL-82NX00EUGE | |
| Dell Inspiron 16 7635 2-in-1 | |
| Cinebench R15 / CPU Multi 64Bit | |
| Acer Swift Edge SFE16 Ryzen 7 7840U | |
| Lenovo Yoga 7-14ARB G7 | |
| Acer TravelMate P4 TMP416-51-55KN | |
| Samsung Galaxy Book3 Pro 16 | |
| Lenovo ThinkPad E16 G1-21JUS08X00 | |
| Lenovo ThinkPad T16 G2 21HH003AGE | |
| Lenovo ThinkPad T14s G3 21BR00CDGE | |
| Microsoft Surface Laptop 5 15, i7-1255U | |
| Lenovo ThinkPad E16 G1 Core i5-1335U | |
| LG Gram 16Z90Q | |
| Dell Inspiron 16 7635 2-in-1 | |
| Przeciętny Intel Core i5-1335U (1109 - 1547, n=11) | |
| Lenovo V17 G2 ITL-82NX00EUGE | |
| Cinebench R15 / CPU Single 64Bit | |
| Acer Swift Edge SFE16 Ryzen 7 7840U | |
| Lenovo ThinkPad T16 G2 21HH003AGE | |
| Lenovo Yoga 7-14ARB G7 | |
| Lenovo ThinkPad T14s G3 21BR00CDGE | |
| Microsoft Surface Laptop 5 15, i7-1255U | |
| Samsung Galaxy Book3 Pro 16 | |
| Przeciętny Intel Core i5-1335U (222 - 248, n=11) | |
| Acer TravelMate P4 TMP416-51-55KN | |
| Lenovo ThinkPad E16 G1 Core i5-1335U | |
| Lenovo ThinkPad E16 G1-21JUS08X00 | |
| Dell Inspiron 16 7635 2-in-1 | |
| LG Gram 16Z90Q | |
| Lenovo V17 G2 ITL-82NX00EUGE | |
| 7-Zip 18.03 / 7z b 4 -mmt1 | |
| Acer Swift Edge SFE16 Ryzen 7 7840U | |
| Lenovo ThinkPad T16 G2 21HH003AGE | |
| Lenovo Yoga 7-14ARB G7 | |
| Lenovo ThinkPad E16 G1-21JUS08X00 | |
| Acer TravelMate P4 TMP416-51-55KN | |
| Samsung Galaxy Book3 Pro 16 | |
| Dell Inspiron 16 7635 2-in-1 | |
| Microsoft Surface Laptop 5 15, i7-1255U | |
| Lenovo ThinkPad T14s G3 21BR00CDGE | |
| Przeciętny Intel Core i5-1335U (4872 - 5545, n=11) | |
| Lenovo ThinkPad E16 G1 Core i5-1335U | |
| LG Gram 16Z90Q | |
| Lenovo V17 G2 ITL-82NX00EUGE | |
| Geekbench 5.5 / Multi-Core | |
| Samsung Galaxy Book3 Pro 16 | |
| Acer Swift Edge SFE16 Ryzen 7 7840U | |
| Acer TravelMate P4 TMP416-51-55KN | |
| LG Gram 16Z90Q | |
| Lenovo Yoga 7-14ARB G7 | |
| Microsoft Surface Laptop 5 15, i7-1255U | |
| Lenovo ThinkPad T14s G3 21BR00CDGE | |
| Lenovo ThinkPad T16 G2 21HH003AGE | |
| Przeciętny Intel Core i5-1335U (5459 - 8618, n=11) | |
| Lenovo ThinkPad E16 G1 Core i5-1335U | |
| Lenovo ThinkPad E16 G1-21JUS08X00 | |
| Dell Inspiron 16 7635 2-in-1 | |
| Lenovo V17 G2 ITL-82NX00EUGE | |
| Geekbench 5.5 / Single-Core | |
| Acer Swift Edge SFE16 Ryzen 7 7840U | |
| Lenovo ThinkPad T16 G2 21HH003AGE | |
| Samsung Galaxy Book3 Pro 16 | |
| Lenovo ThinkPad E16 G1 Core i5-1335U | |
| Microsoft Surface Laptop 5 15, i7-1255U | |
| LG Gram 16Z90Q | |
| Lenovo ThinkPad T14s G3 21BR00CDGE | |
| Przeciętny Intel Core i5-1335U (1506 - 1700, n=11) | |
| Acer TravelMate P4 TMP416-51-55KN | |
| Lenovo Yoga 7-14ARB G7 | |
| Lenovo V17 G2 ITL-82NX00EUGE | |
| Lenovo ThinkPad E16 G1-21JUS08X00 | |
| Dell Inspiron 16 7635 2-in-1 | |
| HWBOT x265 Benchmark v2.2 / 4k Preset | |
| Acer Swift Edge SFE16 Ryzen 7 7840U | |
| Lenovo Yoga 7-14ARB G7 | |
| Samsung Galaxy Book3 Pro 16 | |
| Acer TravelMate P4 TMP416-51-55KN | |
| Lenovo ThinkPad E16 G1-21JUS08X00 | |
| Dell Inspiron 16 7635 2-in-1 | |
| Microsoft Surface Laptop 5 15, i7-1255U | |
| Lenovo ThinkPad T16 G2 21HH003AGE | |
| Lenovo ThinkPad E16 G1 Core i5-1335U | |
| Lenovo ThinkPad T14s G3 21BR00CDGE | |
| Przeciętny Intel Core i5-1335U (6.55 - 10.7, n=11) | |
| LG Gram 16Z90Q | |
| Lenovo V17 G2 ITL-82NX00EUGE | |
| LibreOffice / 20 Documents To PDF | |
| Lenovo V17 G2 ITL-82NX00EUGE | |
| Lenovo Yoga 7-14ARB G7 | |
| LG Gram 16Z90Q | |
| Acer TravelMate P4 TMP416-51-55KN | |
| Przeciętny Intel Core i5-1335U (45 - 58.7, n=11) | |
| Lenovo ThinkPad E16 G1 Core i5-1335U | |
| Lenovo ThinkPad E16 G1-21JUS08X00 | |
| Dell Inspiron 16 7635 2-in-1 | |
| Microsoft Surface Laptop 5 15, i7-1255U | |
| Lenovo ThinkPad T14s G3 21BR00CDGE | |
| Lenovo ThinkPad T16 G2 21HH003AGE | |
| Acer Swift Edge SFE16 Ryzen 7 7840U | |
| Samsung Galaxy Book3 Pro 16 | |
| R Benchmark 2.5 / Overall mean | |
| Lenovo V17 G2 ITL-82NX00EUGE | |
| LG Gram 16Z90Q | |
| Dell Inspiron 16 7635 2-in-1 | |
| Acer TravelMate P4 TMP416-51-55KN | |
| Lenovo ThinkPad E16 G1-21JUS08X00 | |
| Przeciętny Intel Core i5-1335U (0.4892 - 0.524, n=10) | |
| Lenovo Yoga 7-14ARB G7 | |
| Samsung Galaxy Book3 Pro 16 | |
| Lenovo ThinkPad T14s G3 21BR00CDGE | |
| Microsoft Surface Laptop 5 15, i7-1255U | |
| Lenovo ThinkPad T16 G2 21HH003AGE | |
| Acer Swift Edge SFE16 Ryzen 7 7840U | |
Cinebench R23: Multi Core | Single Core
Cinebench R20: CPU (Multi Core) | CPU (Single Core)
Cinebench R15: CPU Multi 64Bit | CPU Single 64Bit
Blender: v2.79 BMW27 CPU
7-Zip 18.03: 7z b 4 | 7z b 4 -mmt1
Geekbench 5.5: Multi-Core | Single-Core
HWBOT x265 Benchmark v2.2: 4k Preset
LibreOffice : 20 Documents To PDF
R Benchmark 2.5: Overall mean
* ... im mniej tym lepiej
AIDA64: FP32 Ray-Trace | FPU Julia | CPU SHA3 | CPU Queen | FPU SinJulia | FPU Mandel | CPU AES | CPU ZLib | FP64 Ray-Trace | CPU PhotoWorxx
| Performance rating | |
| Lenovo ThinkPad E16 G1-21JUS08X00 | |
| Samsung Galaxy Book3 Pro 16 | |
| Dell Inspiron 16 7635 2-in-1 | |
| Acer TravelMate P4 TMP416-51-55KN | |
| Lenovo ThinkPad E16 G1 Core i5-1335U | |
| Przeciętny Intel Core i5-1335U | |
| LG Gram 16Z90Q | |
| AIDA64 / FP32 Ray-Trace | |
| Lenovo ThinkPad E16 G1-21JUS08X00 | |
| Dell Inspiron 16 7635 2-in-1 | |
| Acer TravelMate P4 TMP416-51-55KN | |
| Samsung Galaxy Book3 Pro 16 | |
| Lenovo ThinkPad E16 G1 Core i5-1335U | |
| Przeciętny Intel Core i5-1335U (5661 - 7809, n=11) | |
| LG Gram 16Z90Q | |
| AIDA64 / FPU Julia | |
| Lenovo ThinkPad E16 G1-21JUS08X00 | |
| Dell Inspiron 16 7635 2-in-1 | |
| Samsung Galaxy Book3 Pro 16 | |
| Acer TravelMate P4 TMP416-51-55KN | |
| Lenovo ThinkPad E16 G1 Core i5-1335U | |
| Przeciętny Intel Core i5-1335U (29483 - 43636, n=11) | |
| LG Gram 16Z90Q | |
| AIDA64 / CPU SHA3 | |
| Samsung Galaxy Book3 Pro 16 | |
| Lenovo ThinkPad E16 G1-21JUS08X00 | |
| Acer TravelMate P4 TMP416-51-55KN | |
| Lenovo ThinkPad E16 G1 Core i5-1335U | |
| Dell Inspiron 16 7635 2-in-1 | |
| Przeciętny Intel Core i5-1335U (1515 - 2278, n=11) | |
| LG Gram 16Z90Q | |
| AIDA64 / CPU Queen | |
| Lenovo ThinkPad E16 G1-21JUS08X00 | |
| Samsung Galaxy Book3 Pro 16 | |
| Acer TravelMate P4 TMP416-51-55KN | |
| LG Gram 16Z90Q | |
| Dell Inspiron 16 7635 2-in-1 | |
| Lenovo ThinkPad E16 G1 Core i5-1335U | |
| Przeciętny Intel Core i5-1335U (53839 - 60992, n=11) | |
| AIDA64 / FPU SinJulia | |
| Lenovo ThinkPad E16 G1-21JUS08X00 | |
| Dell Inspiron 16 7635 2-in-1 | |
| Samsung Galaxy Book3 Pro 16 | |
| Acer TravelMate P4 TMP416-51-55KN | |
| Lenovo ThinkPad E16 G1 Core i5-1335U | |
| LG Gram 16Z90Q | |
| Przeciętny Intel Core i5-1335U (3873 - 5008, n=11) | |
| AIDA64 / FPU Mandel | |
| Lenovo ThinkPad E16 G1-21JUS08X00 | |
| Dell Inspiron 16 7635 2-in-1 | |
| Samsung Galaxy Book3 Pro 16 | |
| Acer TravelMate P4 TMP416-51-55KN | |
| Lenovo ThinkPad E16 G1 Core i5-1335U | |
| Przeciętny Intel Core i5-1335U (14376 - 20553, n=11) | |
| LG Gram 16Z90Q | |
| AIDA64 / CPU AES | |
| Samsung Galaxy Book3 Pro 16 | |
| Acer TravelMate P4 TMP416-51-55KN | |
| Lenovo ThinkPad E16 G1 Core i5-1335U | |
| Lenovo ThinkPad E16 G1-21JUS08X00 | |
| Przeciętny Intel Core i5-1335U (31154 - 65997, n=11) | |
| Dell Inspiron 16 7635 2-in-1 | |
| LG Gram 16Z90Q | |
| AIDA64 / CPU ZLib | |
| Samsung Galaxy Book3 Pro 16 | |
| Acer TravelMate P4 TMP416-51-55KN | |
| Lenovo ThinkPad E16 G1 Core i5-1335U | |
| Lenovo ThinkPad E16 G1-21JUS08X00 | |
| Dell Inspiron 16 7635 2-in-1 | |
| Przeciętny Intel Core i5-1335U (378 - 676, n=11) | |
| LG Gram 16Z90Q | |
| AIDA64 / FP64 Ray-Trace | |
| Lenovo ThinkPad E16 G1-21JUS08X00 | |
| Dell Inspiron 16 7635 2-in-1 | |
| Acer TravelMate P4 TMP416-51-55KN | |
| Samsung Galaxy Book3 Pro 16 | |
| Lenovo ThinkPad E16 G1 Core i5-1335U | |
| LG Gram 16Z90Q | |
| Przeciętny Intel Core i5-1335U (2878 - 4214, n=11) | |
| AIDA64 / CPU PhotoWorxx | |
| Samsung Galaxy Book3 Pro 16 | |
| LG Gram 16Z90Q | |
| Przeciętny Intel Core i5-1335U (13584 - 41123, n=11) | |
| Acer TravelMate P4 TMP416-51-55KN | |
| Lenovo ThinkPad E16 G1 Core i5-1335U | |
| Dell Inspiron 16 7635 2-in-1 | |
| Lenovo ThinkPad E16 G1-21JUS08X00 | |
Wydajność systemu
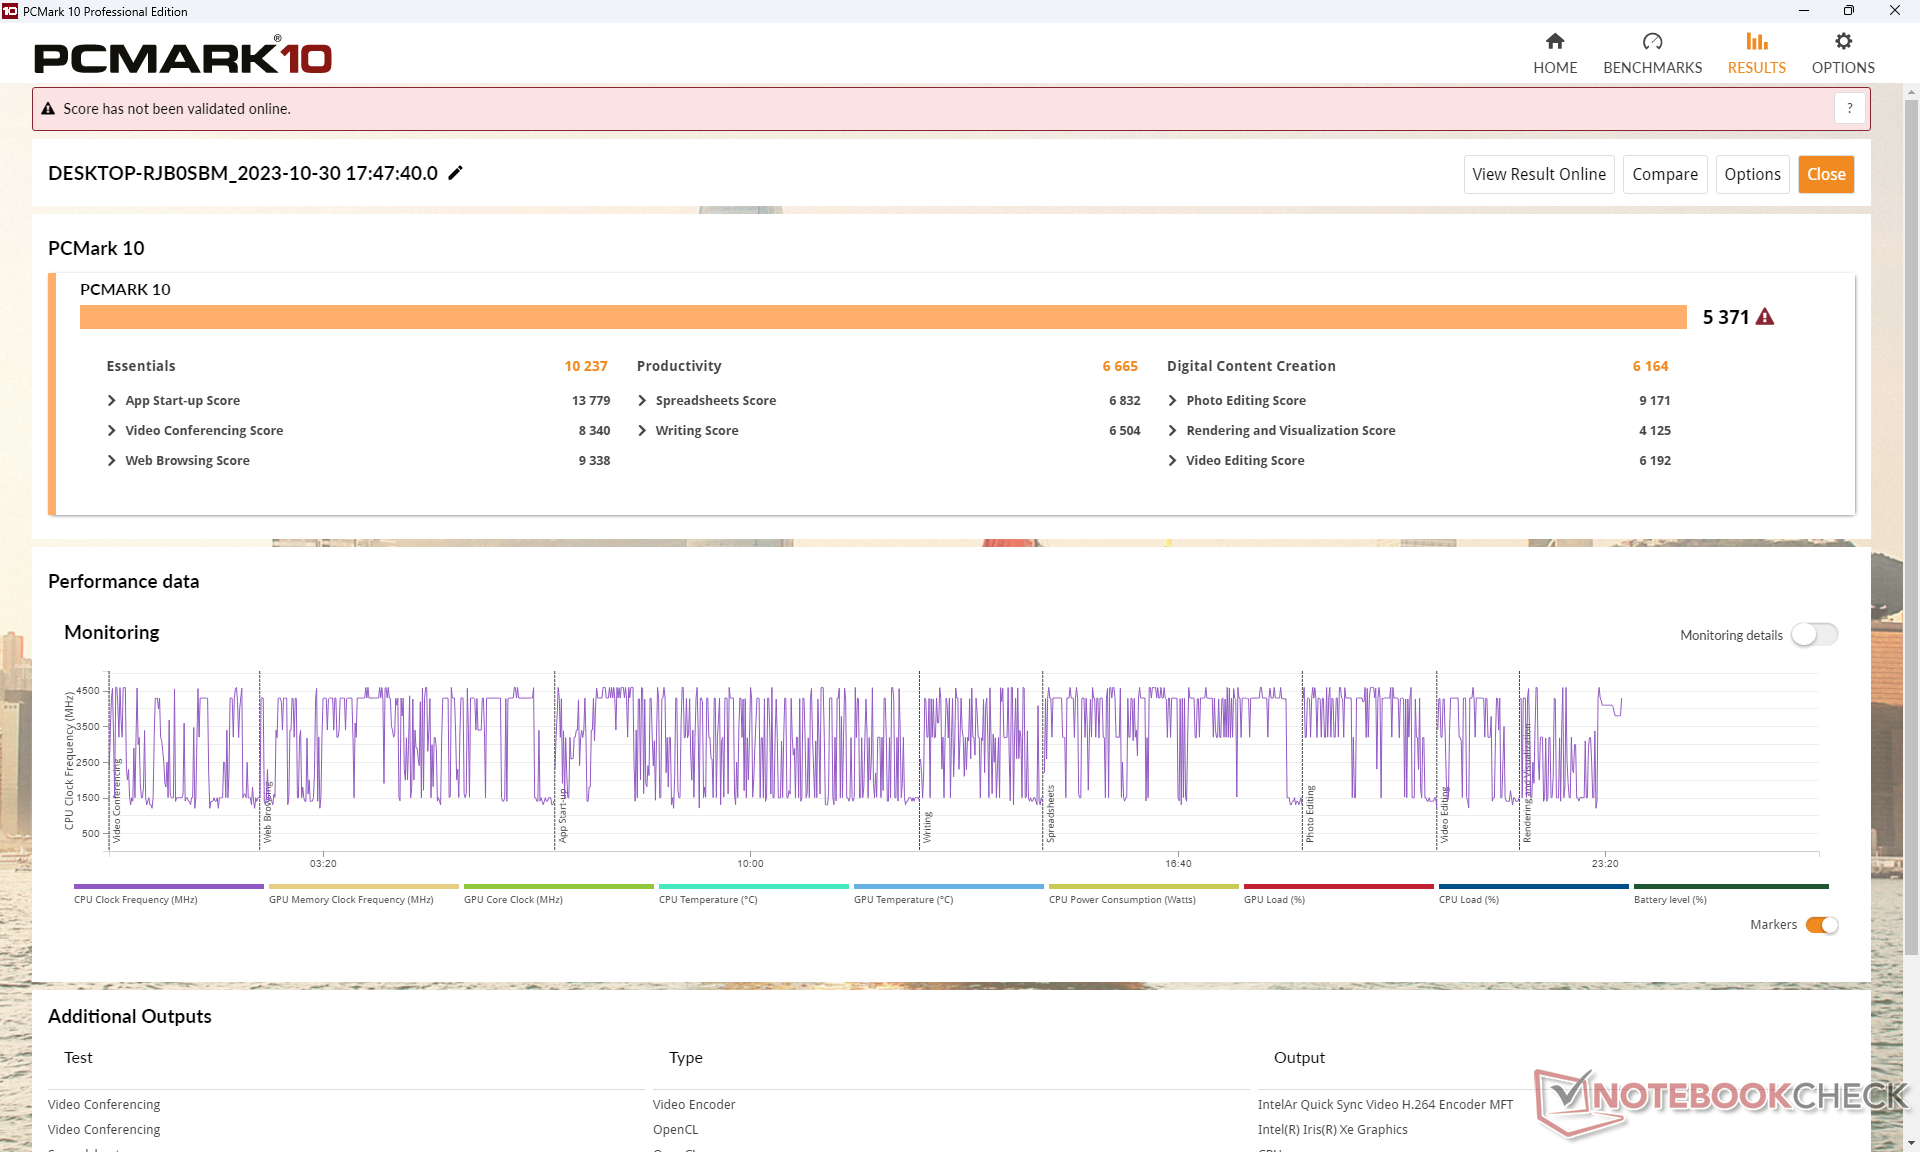
Wyniki PCMark są zbliżone do alternatywy Ryzen 7 AMD, z wyjątkiem podtestu Produktywność, ze względu na wyższą wydajność wielowątkową Ryzen 7 7730U w porównaniu do naszego Core i5-1335U.
CrossMark: Overall | Productivity | Creativity | Responsiveness
| PCMark 10 / Score | |
| Dell Inspiron 16 7635 2-in-1 | |
| Lenovo ThinkPad E16 G1-21JUS08X00 | |
| Samsung Galaxy Book3 Pro 16 | |
| Lenovo ThinkPad E16 G1 Core i5-1335U | |
| Przeciętny Intel Core i5-1335U, Intel Iris Xe Graphics G7 80EUs (5068 - 5600, n=11) | |
| Acer TravelMate P4 TMP416-51-55KN | |
| LG Gram 16Z90Q | |
| PCMark 10 / Essentials | |
| Dell Inspiron 16 7635 2-in-1 | |
| Samsung Galaxy Book3 Pro 16 | |
| Lenovo ThinkPad E16 G1-21JUS08X00 | |
| Przeciętny Intel Core i5-1335U, Intel Iris Xe Graphics G7 80EUs (9828 - 11912, n=11) | |
| Lenovo ThinkPad E16 G1 Core i5-1335U | |
| LG Gram 16Z90Q | |
| Acer TravelMate P4 TMP416-51-55KN | |
| PCMark 10 / Productivity | |
| Dell Inspiron 16 7635 2-in-1 | |
| Lenovo ThinkPad E16 G1-21JUS08X00 | |
| Przeciętny Intel Core i5-1335U, Intel Iris Xe Graphics G7 80EUs (6196 - 7261, n=11) | |
| Acer TravelMate P4 TMP416-51-55KN | |
| Samsung Galaxy Book3 Pro 16 | |
| Lenovo ThinkPad E16 G1 Core i5-1335U | |
| LG Gram 16Z90Q | |
| PCMark 10 / Digital Content Creation | |
| Samsung Galaxy Book3 Pro 16 | |
| Acer TravelMate P4 TMP416-51-55KN | |
| Lenovo ThinkPad E16 G1 Core i5-1335U | |
| Lenovo ThinkPad E16 G1-21JUS08X00 | |
| LG Gram 16Z90Q | |
| Dell Inspiron 16 7635 2-in-1 | |
| Przeciętny Intel Core i5-1335U, Intel Iris Xe Graphics G7 80EUs (5361 - 6164, n=11) | |
| CrossMark / Overall | |
| Samsung Galaxy Book3 Pro 16 | |
| Acer TravelMate P4 TMP416-51-55KN | |
| Przeciętny Intel Core i5-1335U, Intel Iris Xe Graphics G7 80EUs (1339 - 1599, n=11) | |
| Lenovo ThinkPad E16 G1 Core i5-1335U | |
| Lenovo ThinkPad E16 G1-21JUS08X00 | |
| Dell Inspiron 16 7635 2-in-1 | |
| CrossMark / Productivity | |
| Samsung Galaxy Book3 Pro 16 | |
| Acer TravelMate P4 TMP416-51-55KN | |
| Przeciętny Intel Core i5-1335U, Intel Iris Xe Graphics G7 80EUs (1337 - 1638, n=11) | |
| Lenovo ThinkPad E16 G1 Core i5-1335U | |
| Lenovo ThinkPad E16 G1-21JUS08X00 | |
| Dell Inspiron 16 7635 2-in-1 | |
| CrossMark / Creativity | |
| Samsung Galaxy Book3 Pro 16 | |
| Acer TravelMate P4 TMP416-51-55KN | |
| Przeciętny Intel Core i5-1335U, Intel Iris Xe Graphics G7 80EUs (1315 - 1620, n=11) | |
| Lenovo ThinkPad E16 G1 Core i5-1335U | |
| Lenovo ThinkPad E16 G1-21JUS08X00 | |
| Dell Inspiron 16 7635 2-in-1 | |
| CrossMark / Responsiveness | |
| Acer TravelMate P4 TMP416-51-55KN | |
| Samsung Galaxy Book3 Pro 16 | |
| Przeciętny Intel Core i5-1335U, Intel Iris Xe Graphics G7 80EUs (1023 - 1868, n=11) | |
| Lenovo ThinkPad E16 G1 Core i5-1335U | |
| Lenovo ThinkPad E16 G1-21JUS08X00 | |
| Dell Inspiron 16 7635 2-in-1 | |
| PCMark 10 Score | 5371 pkt. | |
Pomoc | ||
| AIDA64 / Memory Copy | |
| LG Gram 16Z90Q | |
| Samsung Galaxy Book3 Pro 16 | |
| Przeciętny Intel Core i5-1335U (22417 - 60884, n=11) | |
| Acer TravelMate P4 TMP416-51-55KN | |
| Dell Inspiron 16 7635 2-in-1 | |
| Lenovo ThinkPad E16 G1 Core i5-1335U | |
| Lenovo ThinkPad E16 G1-21JUS08X00 | |
| AIDA64 / Memory Read | |
| LG Gram 16Z90Q | |
| Samsung Galaxy Book3 Pro 16 | |
| Acer TravelMate P4 TMP416-51-55KN | |
| Przeciętny Intel Core i5-1335U (23104 - 61555, n=11) | |
| Dell Inspiron 16 7635 2-in-1 | |
| Lenovo ThinkPad E16 G1-21JUS08X00 | |
| Lenovo ThinkPad E16 G1 Core i5-1335U | |
| AIDA64 / Memory Write | |
| Samsung Galaxy Book3 Pro 16 | |
| LG Gram 16Z90Q | |
| Przeciętny Intel Core i5-1335U (22936 - 72584, n=11) | |
| Acer TravelMate P4 TMP416-51-55KN | |
| Lenovo ThinkPad E16 G1 Core i5-1335U | |
| Dell Inspiron 16 7635 2-in-1 | |
| Lenovo ThinkPad E16 G1-21JUS08X00 | |
| AIDA64 / Memory Latency | |
| Dell Inspiron 16 7635 2-in-1 | |
| LG Gram 16Z90Q | |
| Przeciętny Intel Core i5-1335U (78.6 - 112.8, n=11) | |
| Samsung Galaxy Book3 Pro 16 | |
| Lenovo ThinkPad E16 G1-21JUS08X00 | |
| Lenovo ThinkPad E16 G1 Core i5-1335U | |
| Acer TravelMate P4 TMP416-51-55KN | |
* ... im mniej tym lepiej
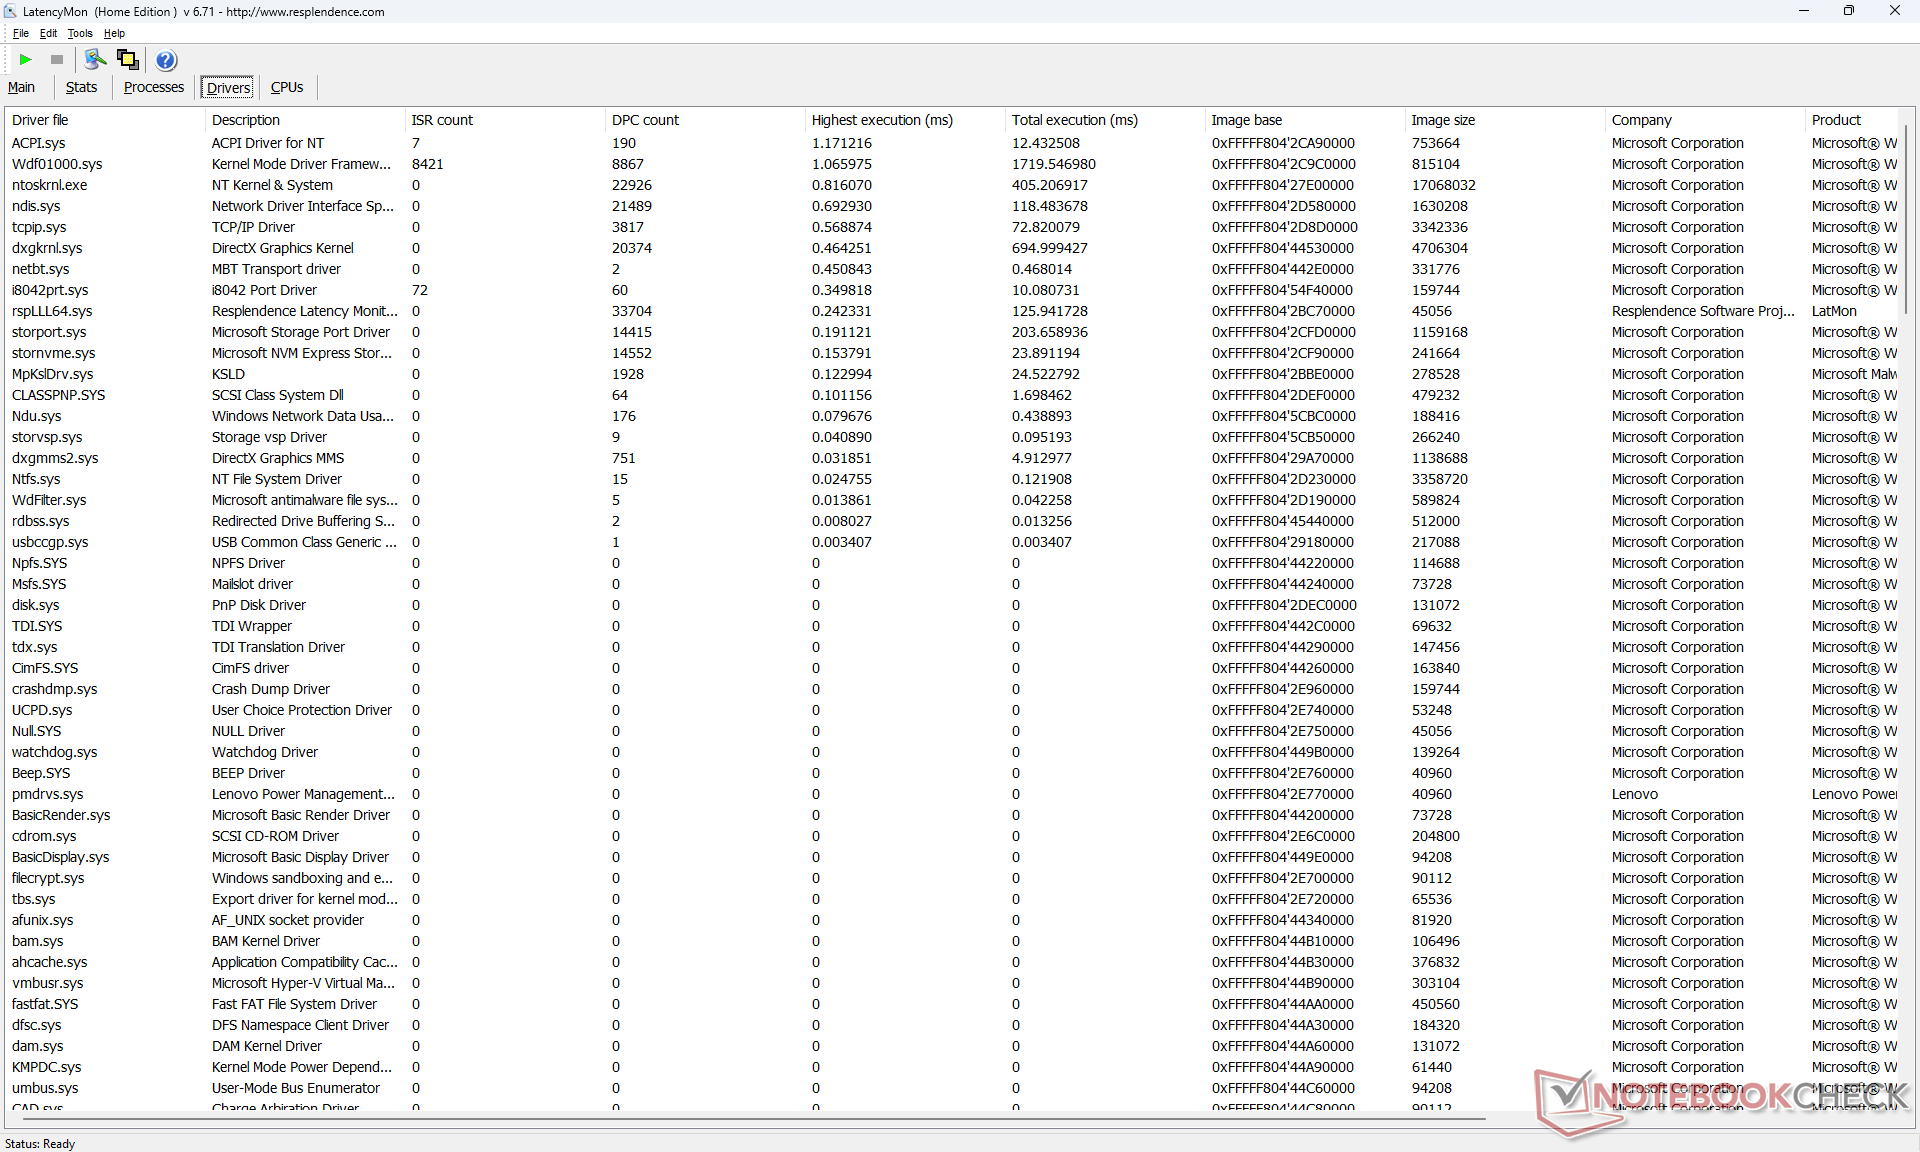
Opóźnienie DPC
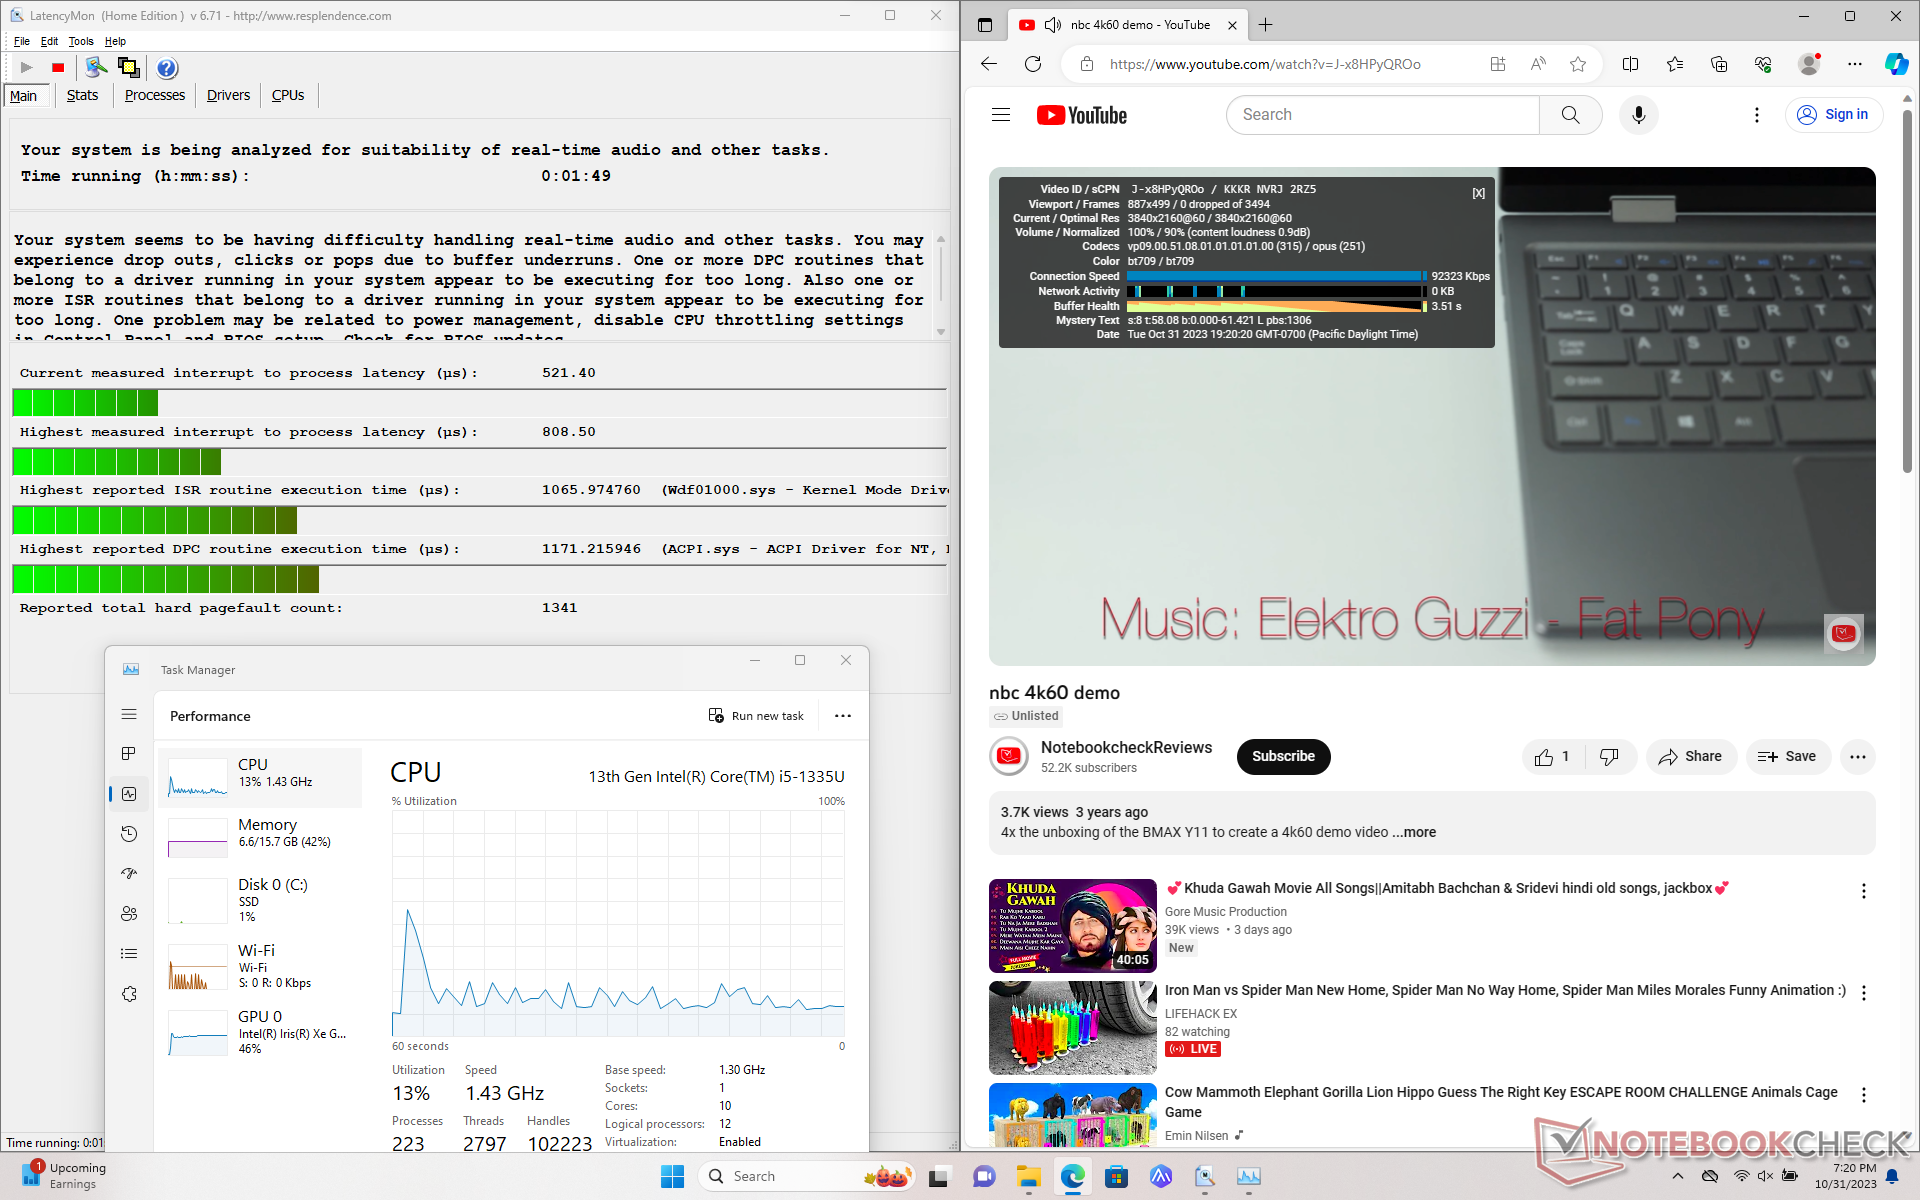
LatencyMon ujawnia tylko niewielkie problemy z DPC podczas otwierania wielu kart przeglądarki na naszej stronie głównej. odtwarzanie wideo 4K przy 60 FPS jest poza tym idealnie płynne i nie odnotowano żadnych spadków klatek.
| DPC Latencies / LatencyMon - interrupt to process latency (max), Web, Youtube, Prime95 | |
| Acer TravelMate P4 TMP416-51-55KN | |
| LG Gram 16Z90Q | |
| Lenovo ThinkPad E16 G1-21JUS08X00 | |
| Lenovo ThinkPad E16 G1 Core i5-1335U | |
| Dell Inspiron 16 7635 2-in-1 | |
| Samsung Galaxy Book3 Pro 16 | |
* ... im mniej tym lepiej
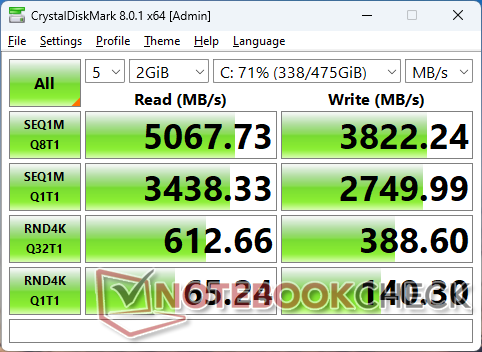
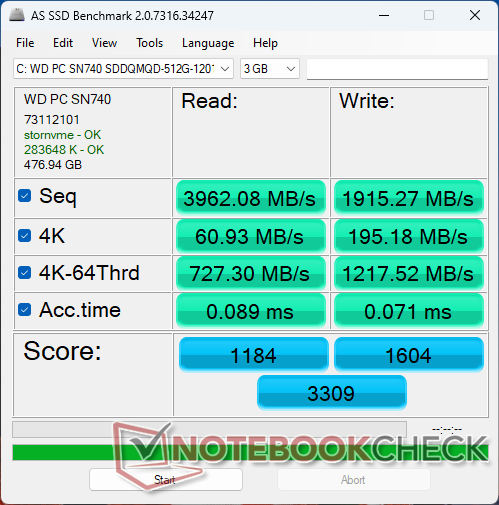
Urządzenia pamięci masowej
Nasza jednostka testowa obejmuje Western Digital SN740 który jest średniej klasy dyskiem SSD PCIe4 x4 NVMe oferującym rzeczywiste prędkości sekwencyjnego odczytu i zapisu danych na poziomie odpowiednio 5100 MB/s i 3900 MB/s. Dysk 2242 nie wykazywał żadnych problemów z utrzymaniem tych maksymalnych prędkości pomimo braku jakichkolwiek podkładek termicznych lub systemów chłodzenia.

* ... im mniej tym lepiej
Disk Throttling: DiskSpd Read Loop, Queue Depth 8
Wydajność GPU
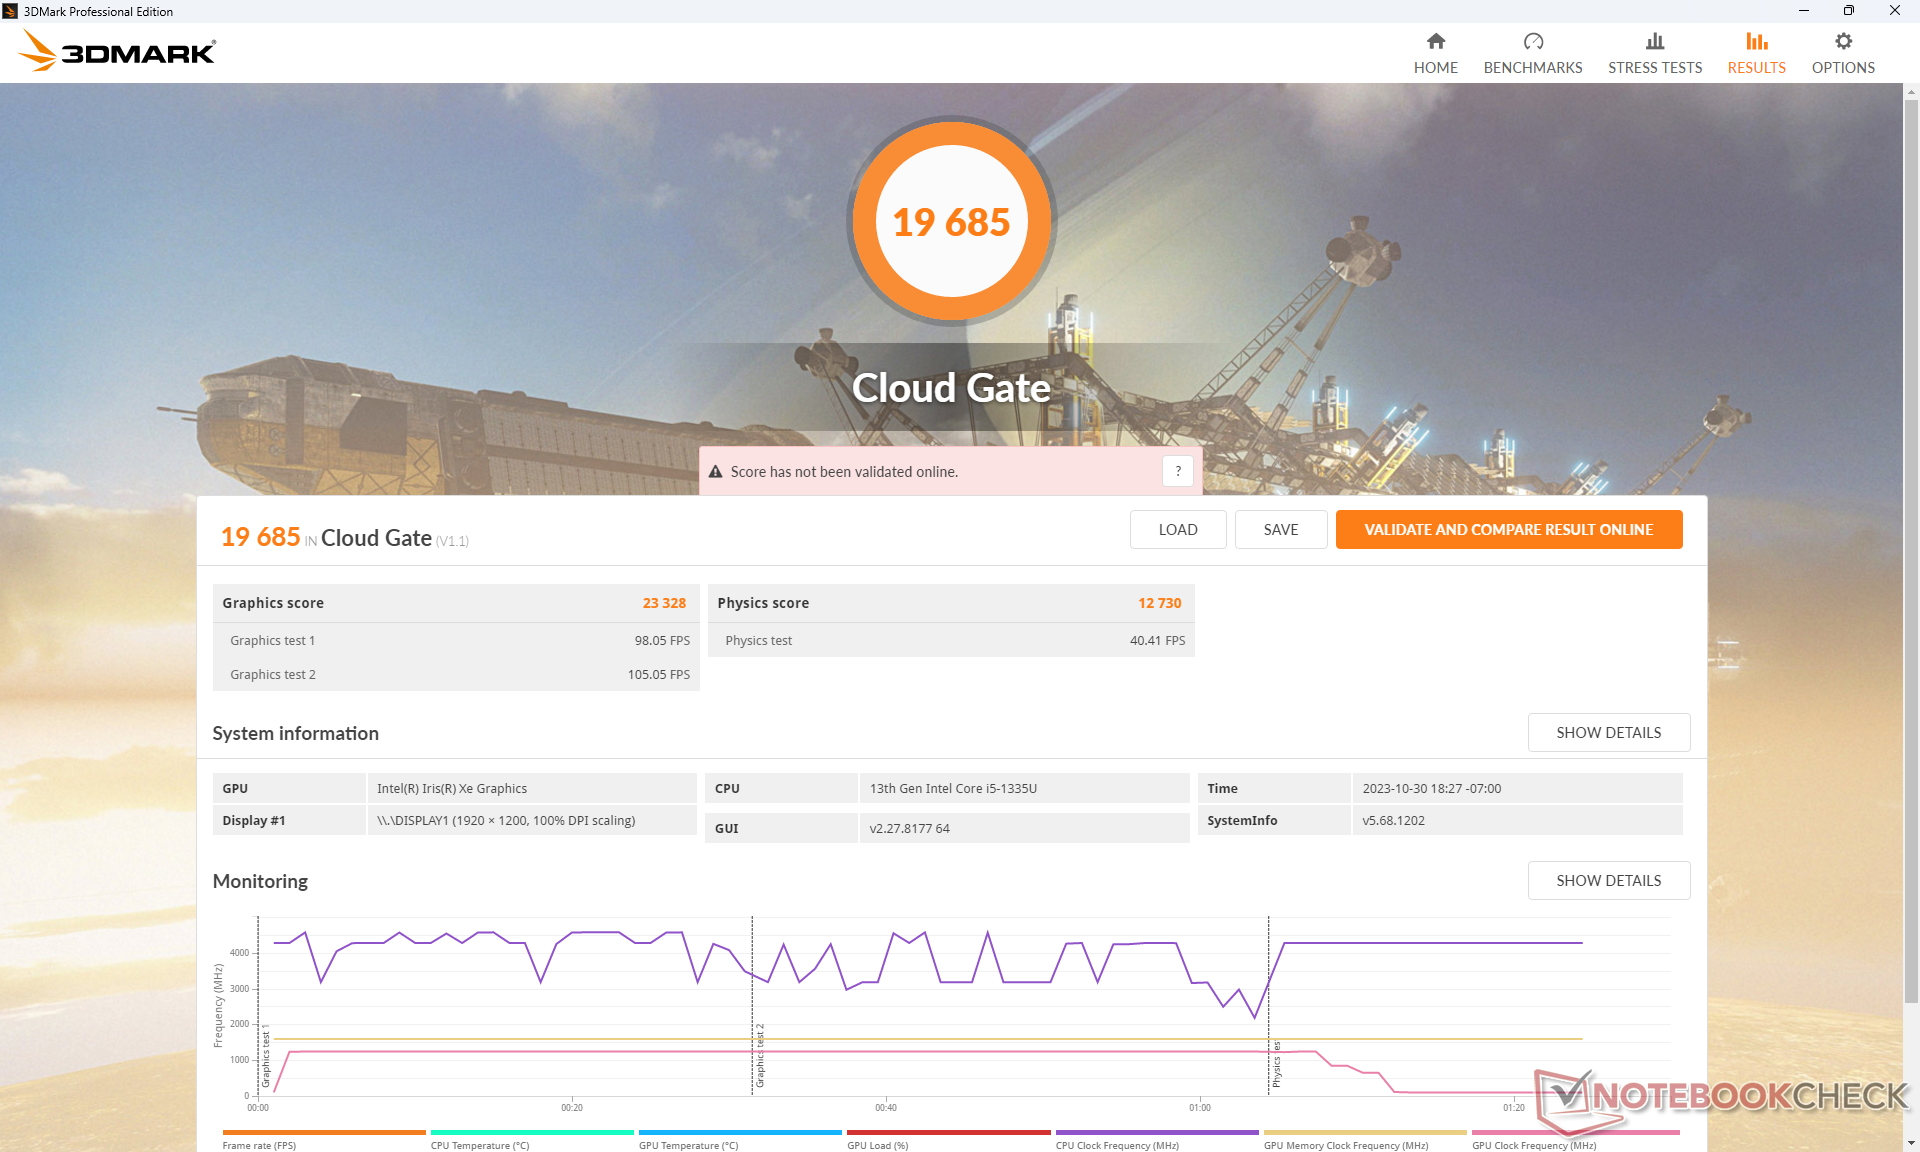
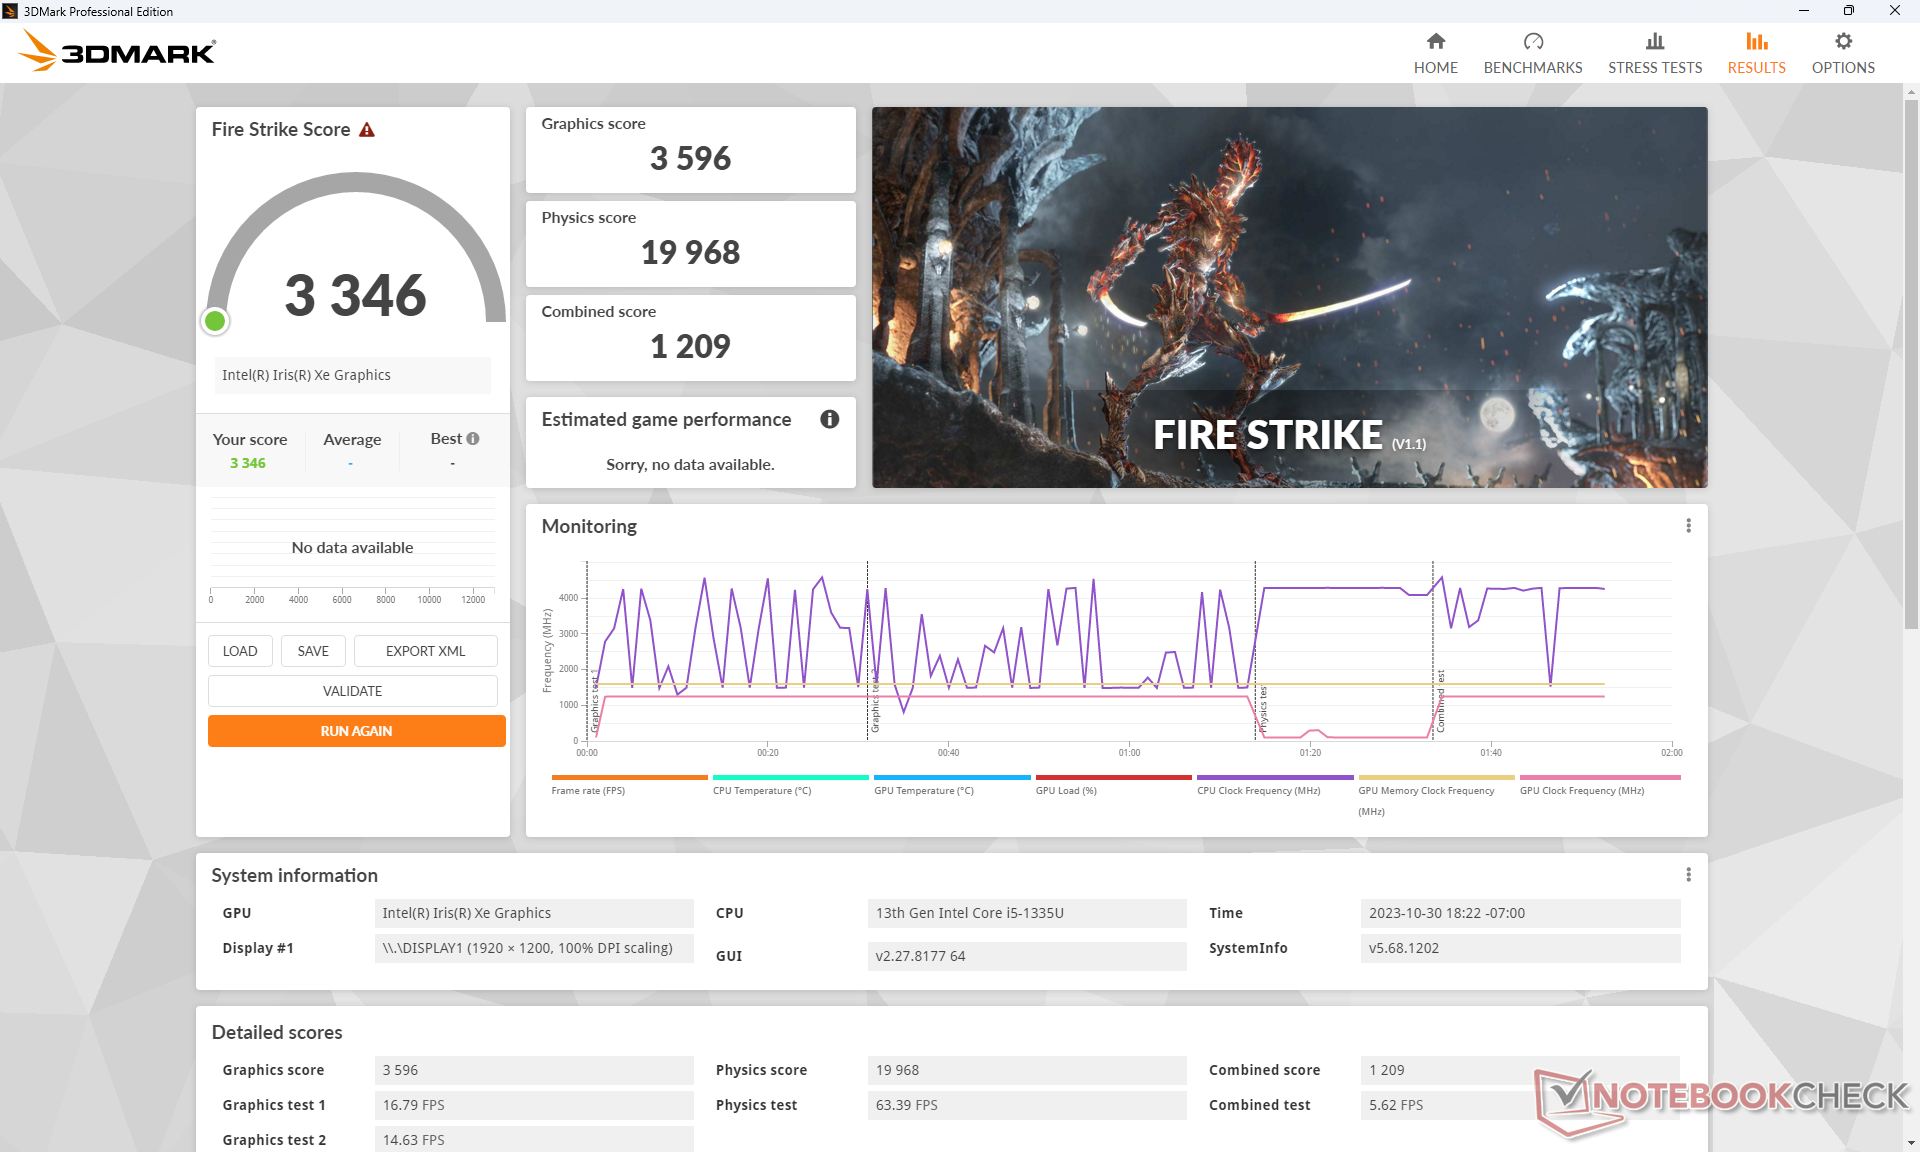
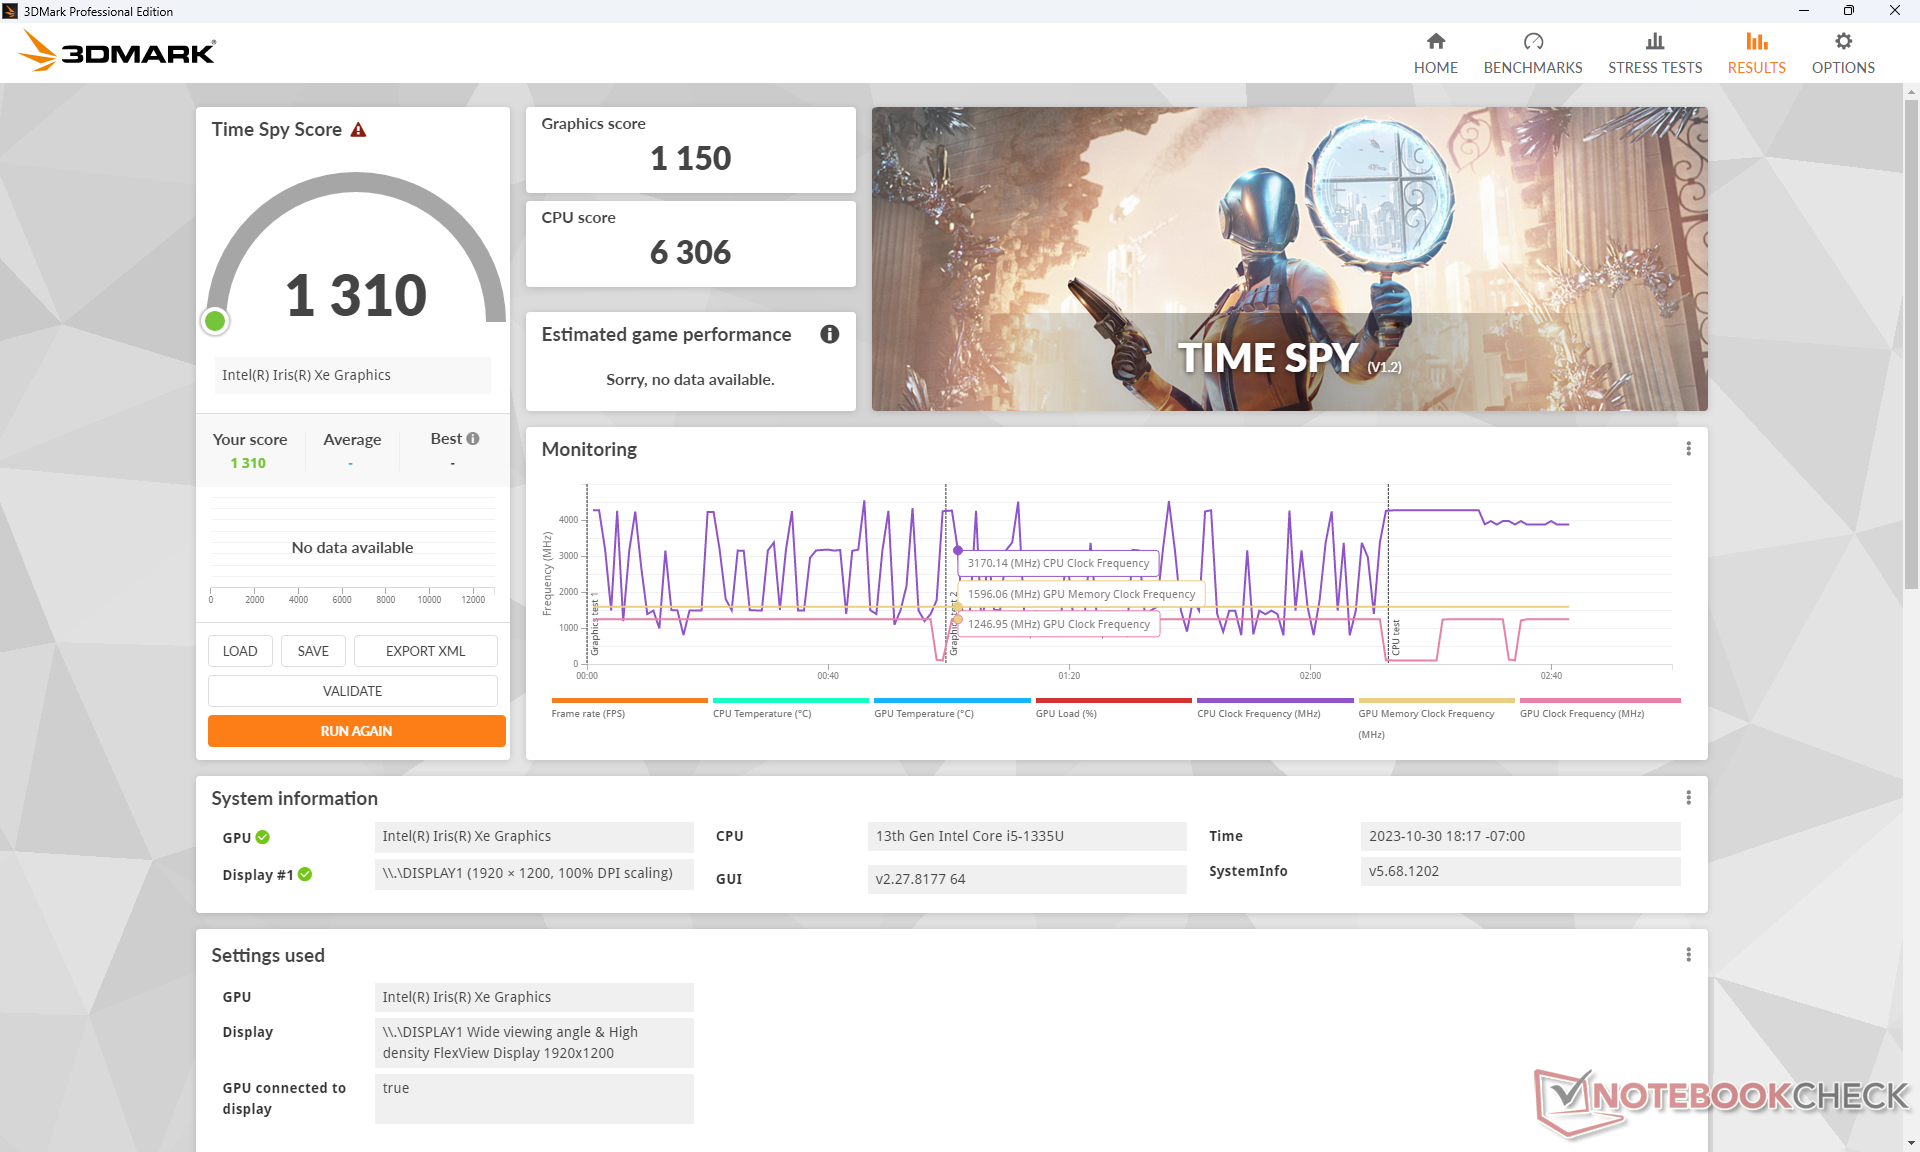
Nasze zintegrowane Iris Xe 80 EUs działa zgodnie z naszymi oczekiwaniami w stosunku do innych laptopów z tym samym GPU, jeśli nie nieco wolniej. Aktualizacja do konfiguracji Core i7 z Iris Xe 96 EUs lub GeForce MX550 zwiększyłaby wydajność odpowiednio o około 25 do 30 procent lub 70 do 100 procent.
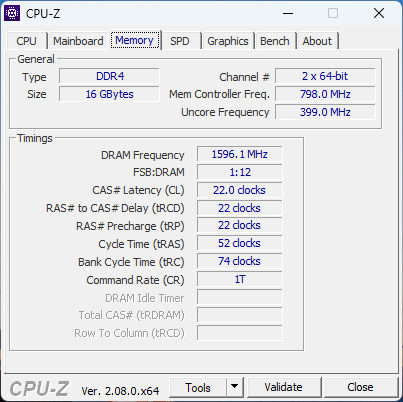
Proszę pamiętać o konfiguracji z dwukanałową pamięcią RAM, w przeciwnym razie wydajność iGPU znacznie spadnie.
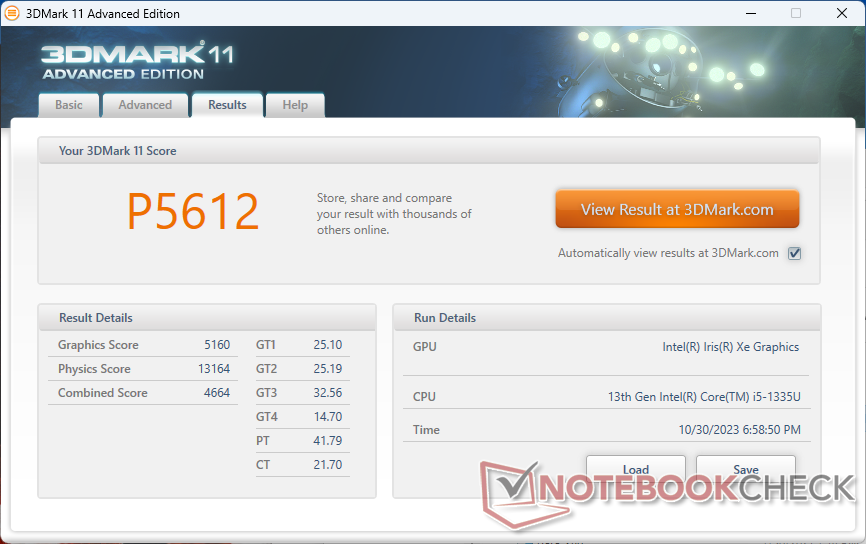
| 3DMark 11 Performance | 5612 pkt. | |
| 3DMark Cloud Gate Standard Score | 19685 pkt. | |
| 3DMark Fire Strike Score | 3346 pkt. | |
| 3DMark Time Spy Score | 1310 pkt. | |
Pomoc | ||
| Blender | |
| v3.3 Classroom HIP/AMD | |
| Lenovo ThinkPad E16 G1-21JUS08X00 | |
| Dell Inspiron 16 7635 2-in-1 | |
| Lenovo Yoga 7-14ARB G7 | |
| v3.3 Classroom CUDA | |
| Lenovo V17 G2 ITL-82NX00EUGE | |
| v3.3 Classroom CPU | |
| Lenovo V17 G2 ITL-82NX00EUGE | |
| Przeciętny Intel Iris Xe Graphics G7 80EUs (463 - 3047, n=53) | |
| LG Gram 16Z90Q | |
| Lenovo ThinkPad T14s G3 21BR00CDGE | |
| Lenovo ThinkPad T16 G2 21HH003AGE | |
| Microsoft Surface Laptop 5 15, i7-1255U | |
| Lenovo ThinkPad E16 G1 Core i5-1335U | |
| Dell Inspiron 16 7635 2-in-1 | |
| Acer TravelMate P4 TMP416-51-55KN | |
| Samsung Galaxy Book3 Pro 16 | |
| Lenovo ThinkPad E16 G1-21JUS08X00 | |
| Lenovo Yoga 7-14ARB G7 | |
| Acer Swift Edge SFE16 Ryzen 7 7840U | |
* ... im mniej tym lepiej
Liczba klatek na sekundę na biegu jałowym na stronie Witcher 3 spadała dość mocno na początku testu, sugerując jakąś przeszkadzającą aktywność w tle. Na szczęście nie powtórzyło się to przez resztę testu.
Witcher 3 FPS Chart
| low | med. | high | ultra | |
|---|---|---|---|---|
| GTA V (2015) | 84.5 | 68.8 | 13.2 | 5.41 |
| The Witcher 3 (2015) | 73.6 | 45.1 | 22.1 | 11.1 |
| Dota 2 Reborn (2015) | 100.7 | 75.2 | 49.2 | 45 |
| Final Fantasy XV Benchmark (2018) | 31 | 16.9 | 12.1 | |
| X-Plane 11.11 (2018) | 28.6 | 22.5 | 21 | |
| Far Cry 5 (2018) | 40 | 19 | 18 | 17 |
| Strange Brigade (2018) | 70.3 | 27.3 | 22.4 | 18.3 |
| Cyberpunk 2077 1.6 (2022) | 14.1 | |||
| Tiny Tina's Wonderlands (2022) | 20.6 | 15.3 | 10.4 | 8.1 |
| F1 22 (2022) | 32.8 | 29.1 | 21.3 | 16.5 |
Emisje
Hałas systemowy
Hałas wentylatorów jest ogólnie głośniejszy niż ten, którego doświadczyliśmy w wersji Ryzen 7, prawdopodobnie ze względu na wyższe zapotrzebowanie na moc naszej wersji Intel. Wersja AMD jest w stanie pozostać cichsza przez dłuższy czas, gdy wprowadzany jest stres. Na przykład podczas uruchamiania 3DMark 06 hałas wentylatora pozostawał względnie cichy na poziomie nieco poniżej 25 dB(A) w porównaniu do prawie 33 dB(A) w naszej wersji Intel.
Hałas
| luz |
| 24.6 / 24.6 / 24.6 dB |
| obciążenie |
| 32.7 / 39.2 dB |
 | ||
30 dB cichy 40 dB(A) słyszalny 50 dB(A) irytujący |
||
min: | ||
| Lenovo ThinkPad E16 G1 Core i5-1335U Iris Xe G7 80EUs, i5-1335U | Lenovo ThinkPad E16 G1-21JUS08X00 Vega 8, R7 7730U, WD PC SN740 SDDPNQD-1T00 | Dell Inspiron 16 7635 2-in-1 Vega 7, R5 7530U, Kioxia BG5 KBG50ZNS512G | Acer TravelMate P4 TMP416-51-55KN Iris Xe G7 80EUs, i5-1240P, Micron 2450 512GB MTFDKBA512TFK | Samsung Galaxy Book3 Pro 16 Iris Xe G7 80EUs, i5-1340P, WD PC SN740 256GB SDDPNQD-256G | LG Gram 16Z90Q Iris Xe G7 96EUs, i7-1260P, Samsung PM9A1 MZVL21T0HCLR | |
|---|---|---|---|---|---|---|
| Noise | 11% | -7% | -10% | -14% | -7% | |
| wyłączone / środowisko * (dB) | 24.6 | 22.4 9% | 23.6 4% | 25.4 -3% | 25.2 -2% | 25 -2% |
| Idle Minimum * (dB) | 24.6 | 22.4 9% | 23.6 4% | 25.4 -3% | 25.2 -2% | 26 -6% |
| Idle Average * (dB) | 24.6 | 22.4 9% | 23.6 4% | 25.4 -3% | 25.2 -2% | 27 -10% |
| Idle Maximum * (dB) | 24.6 | 23.7 4% | 23.6 4% | 25.4 -3% | 29.3 -19% | 28 -14% |
| Load Average * (dB) | 32.7 | 24.8 24% | 40.3 -23% | 43.9 -34% | 46.4 -42% | 38 -16% |
| Witcher 3 ultra * (dB) | 34.7 | 29.8 14% | 44.2 -27% | 37 -7% | ||
| Load Maximum * (dB) | 39.2 | 36.1 8% | 44.2 -13% | 43.7 -11% | 46.4 -18% | 38 3% |
* ... im mniej tym lepiej
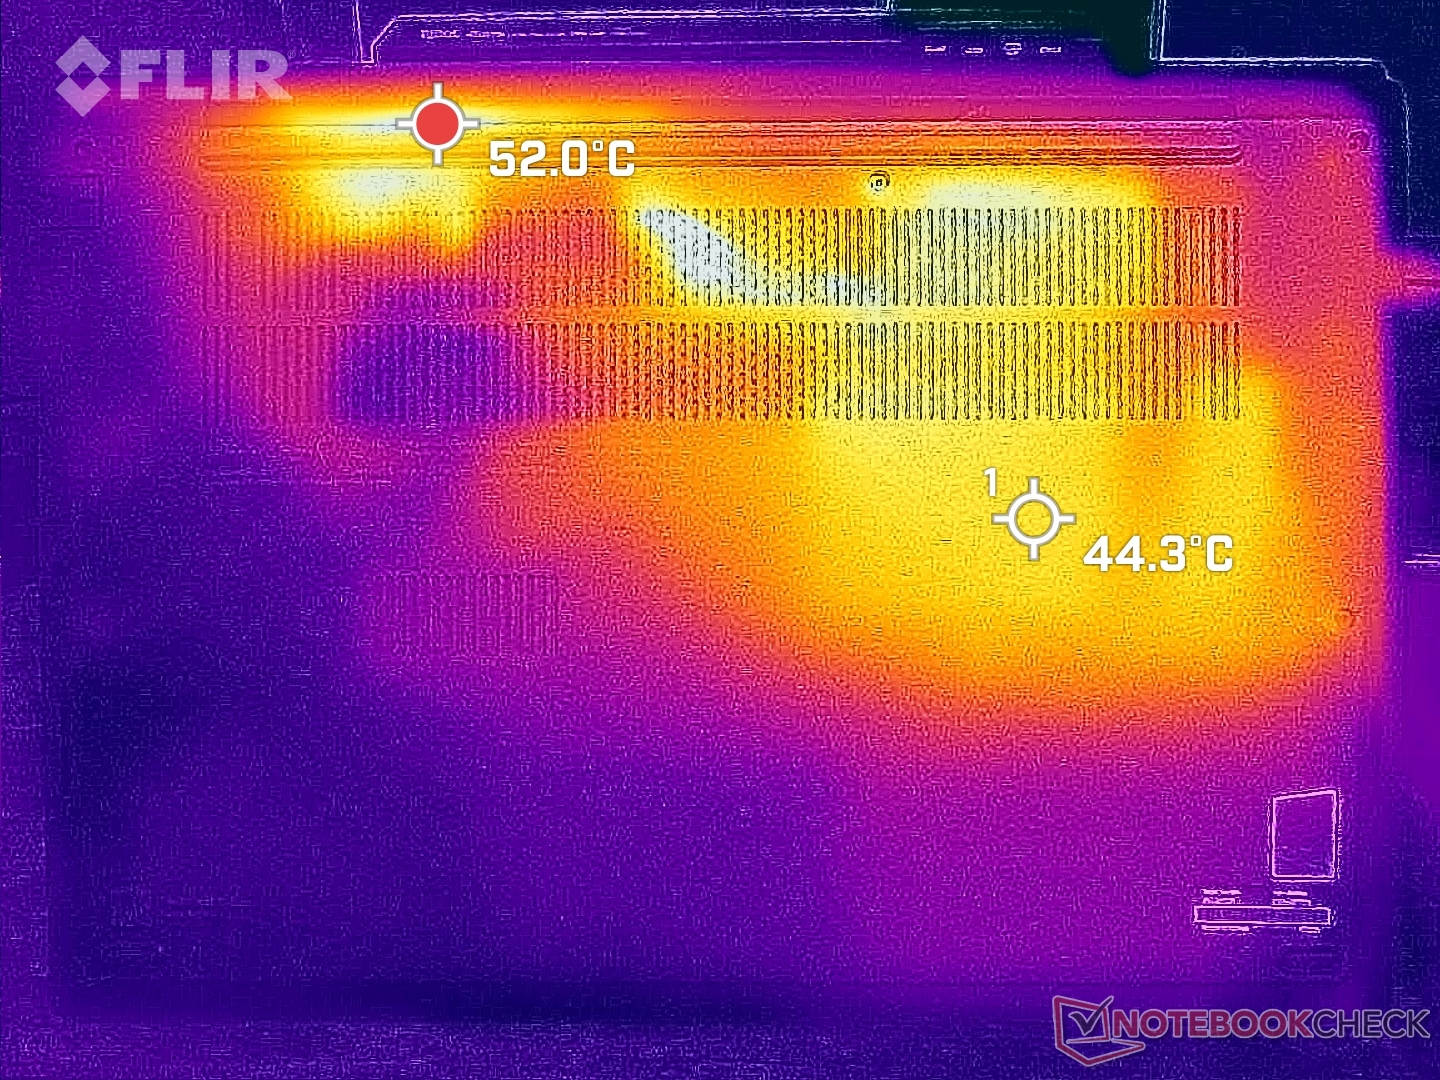
Temperatura
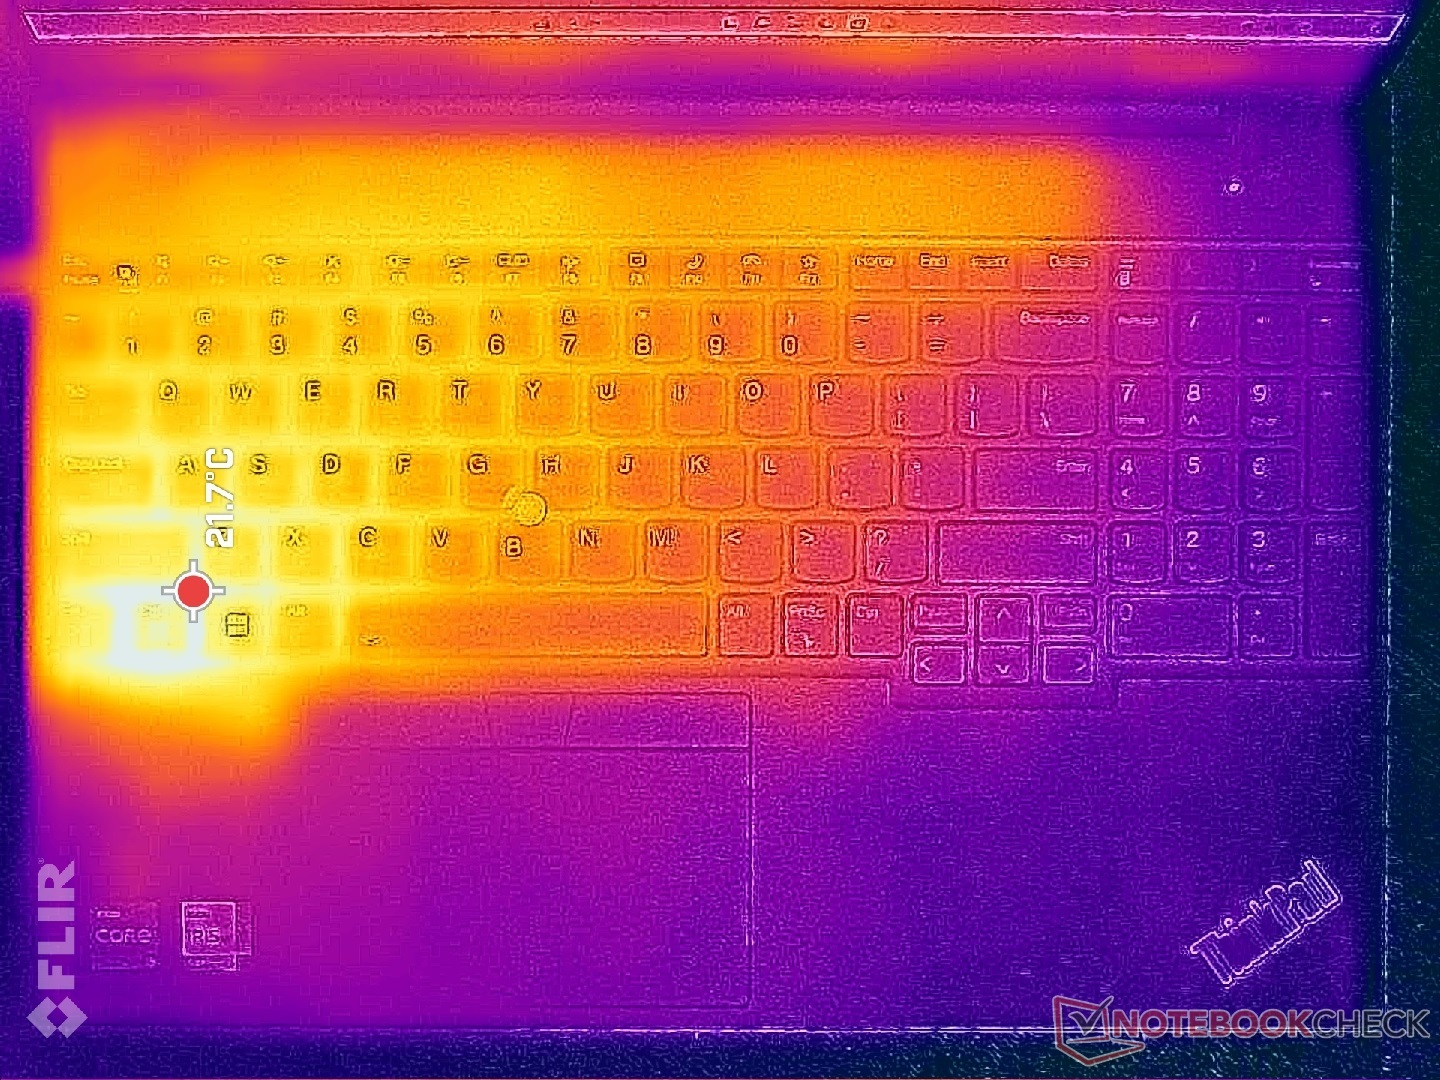
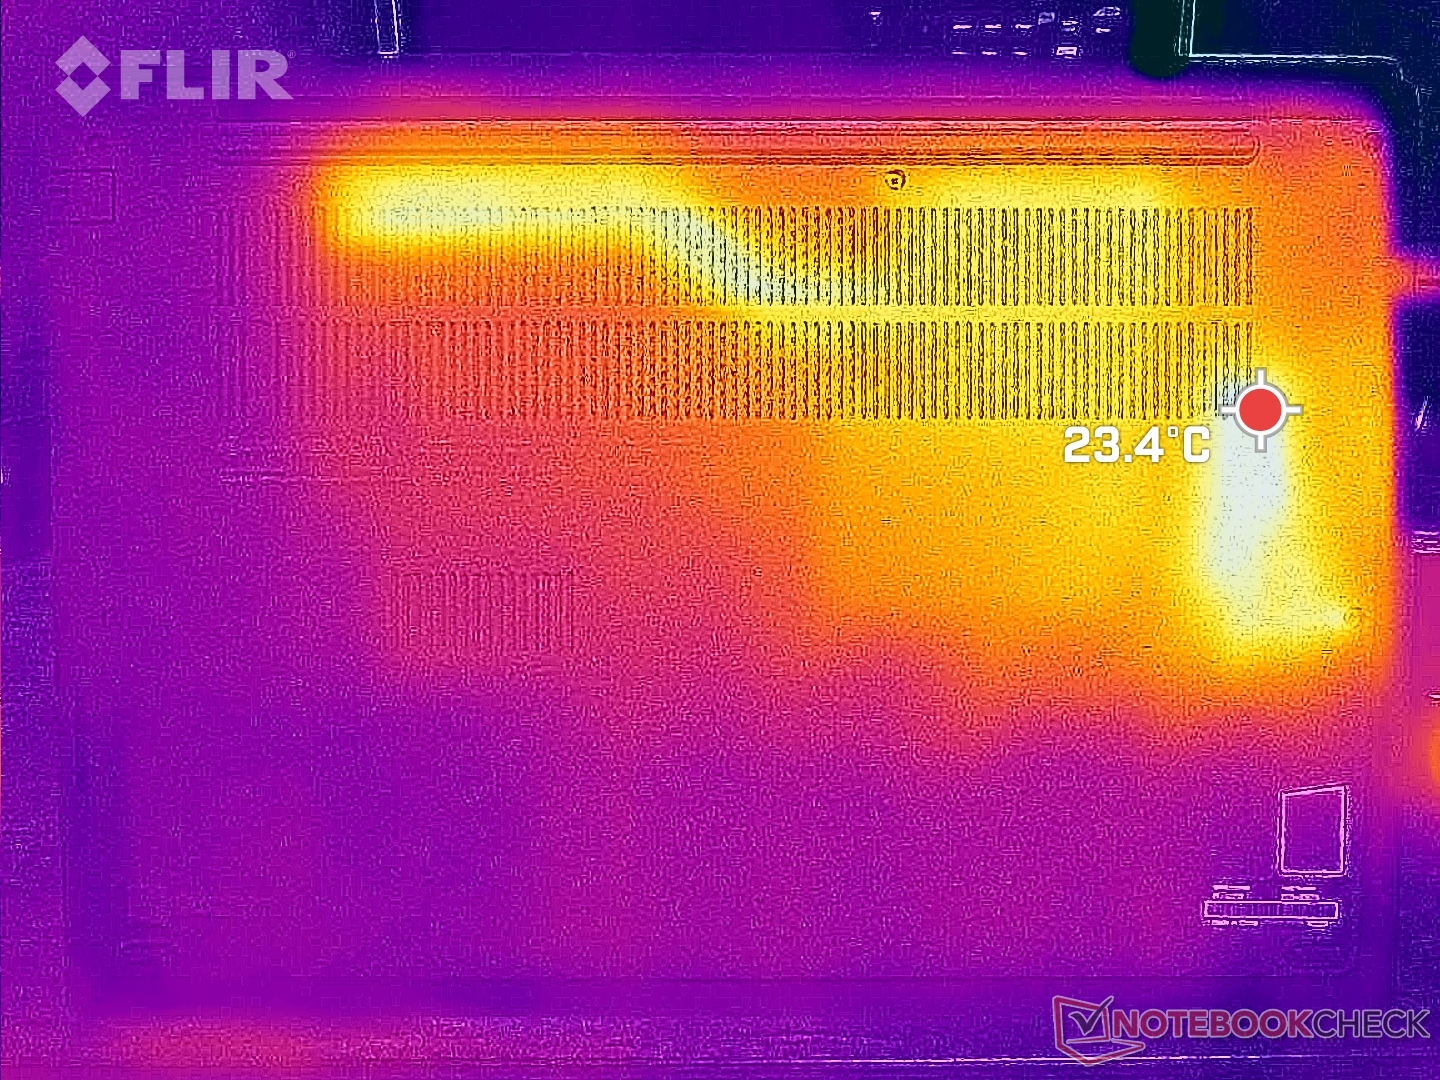
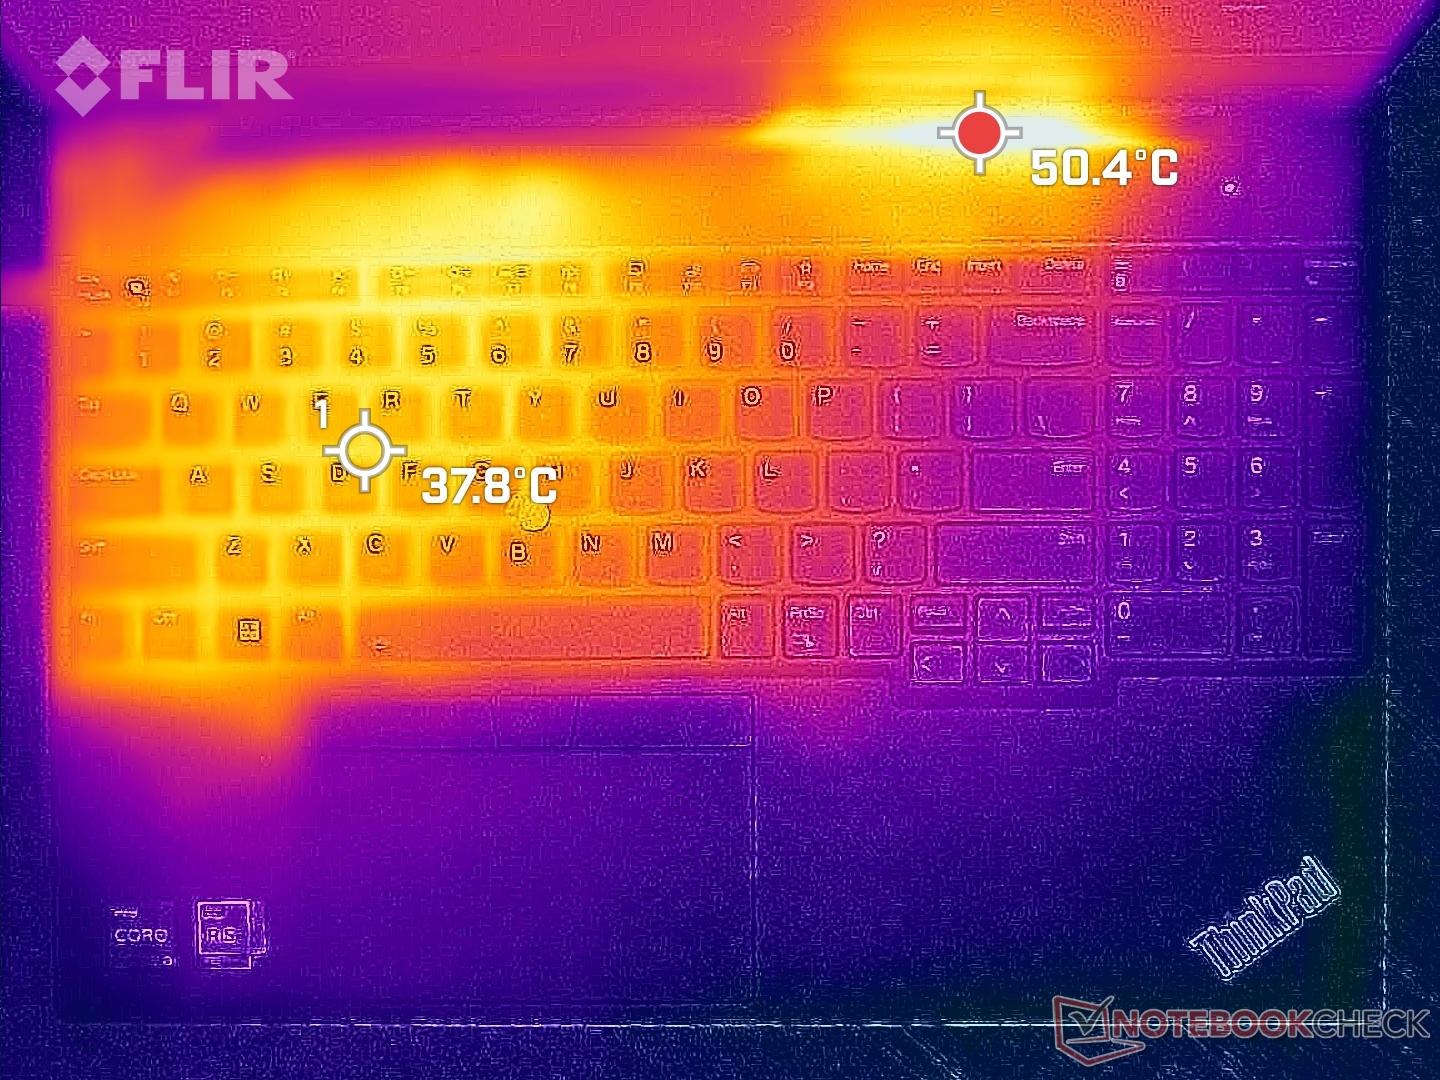
Temperatury powierzchniowe są cieplejsze na lewej połowie laptopa niż na prawej, po prostu ze względu na umiejscowienie procesora i rozwiązania chłodzącego wewnątrz. Gorące punkty podczas uruchamiania wymagających obciążeń mogą osiągnąć do 38 C i 45 C odpowiednio na górnej i dolnej stronie, jak pokazują poniższe mapy temperatur. Wyniki są w rzeczywistości o kilka stopni C niższe niż te, które odnotowaliśmy w konfiguracji AMD, być może ze względu na głośniejszy wentylator wspomniany powyżej. Podczas gdy różnice temperatur między cieplejszymi i chłodniejszymi ćwiartkami są zauważalne w dotyku, nie są one niewygodne ani rozpraszające podczas użytkowania.
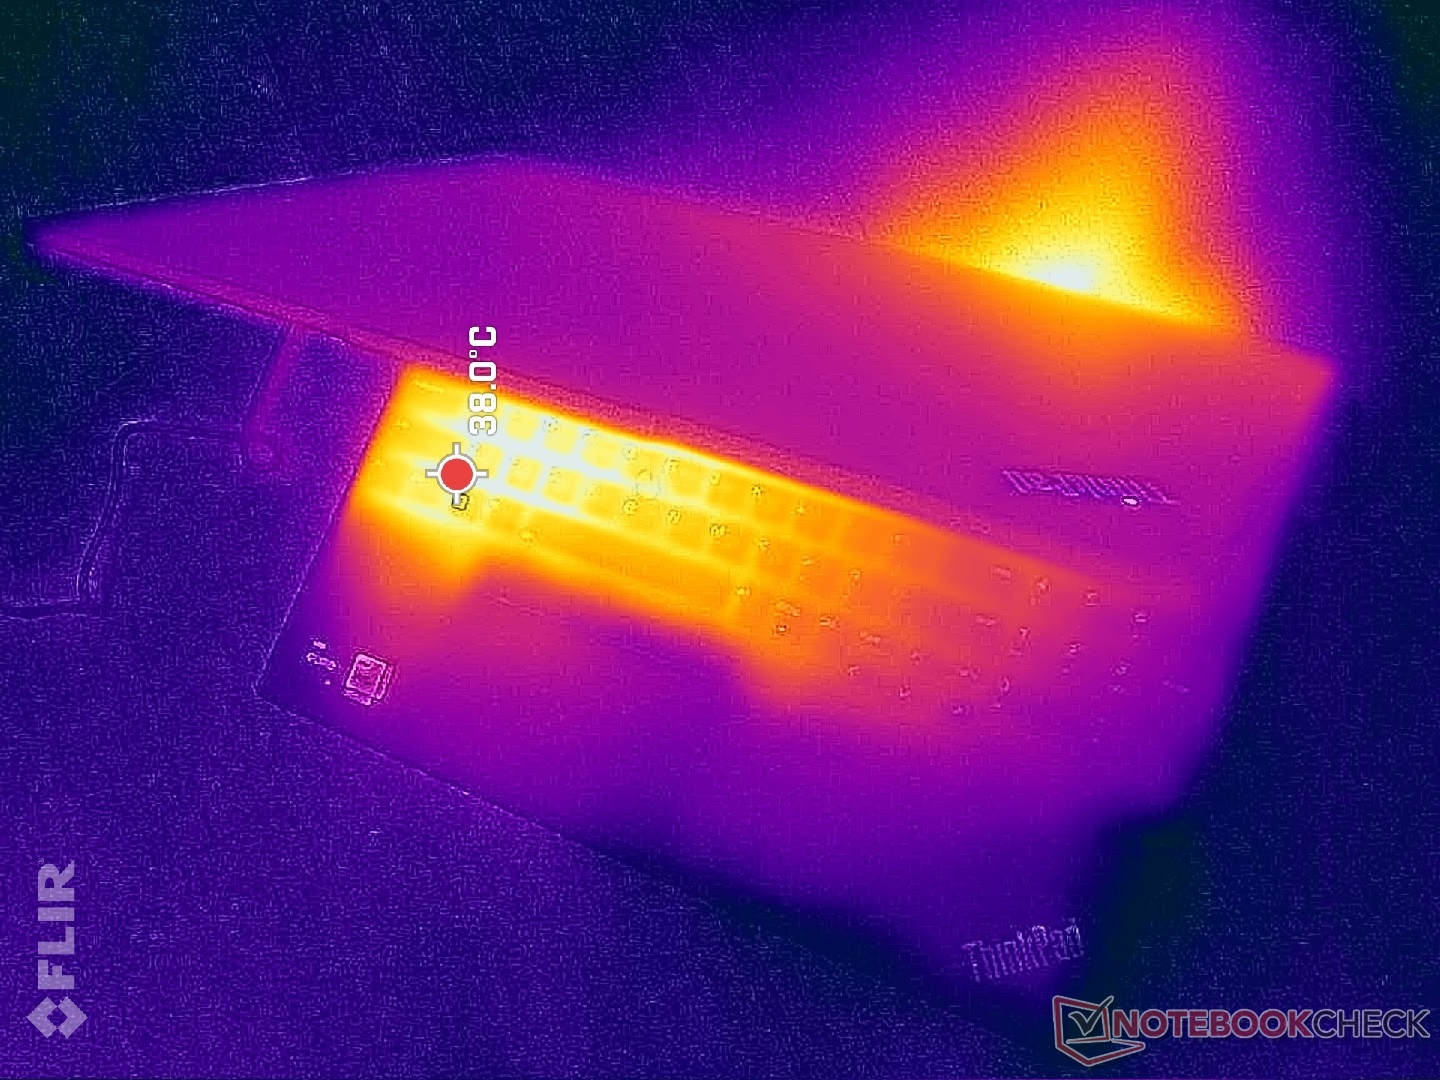
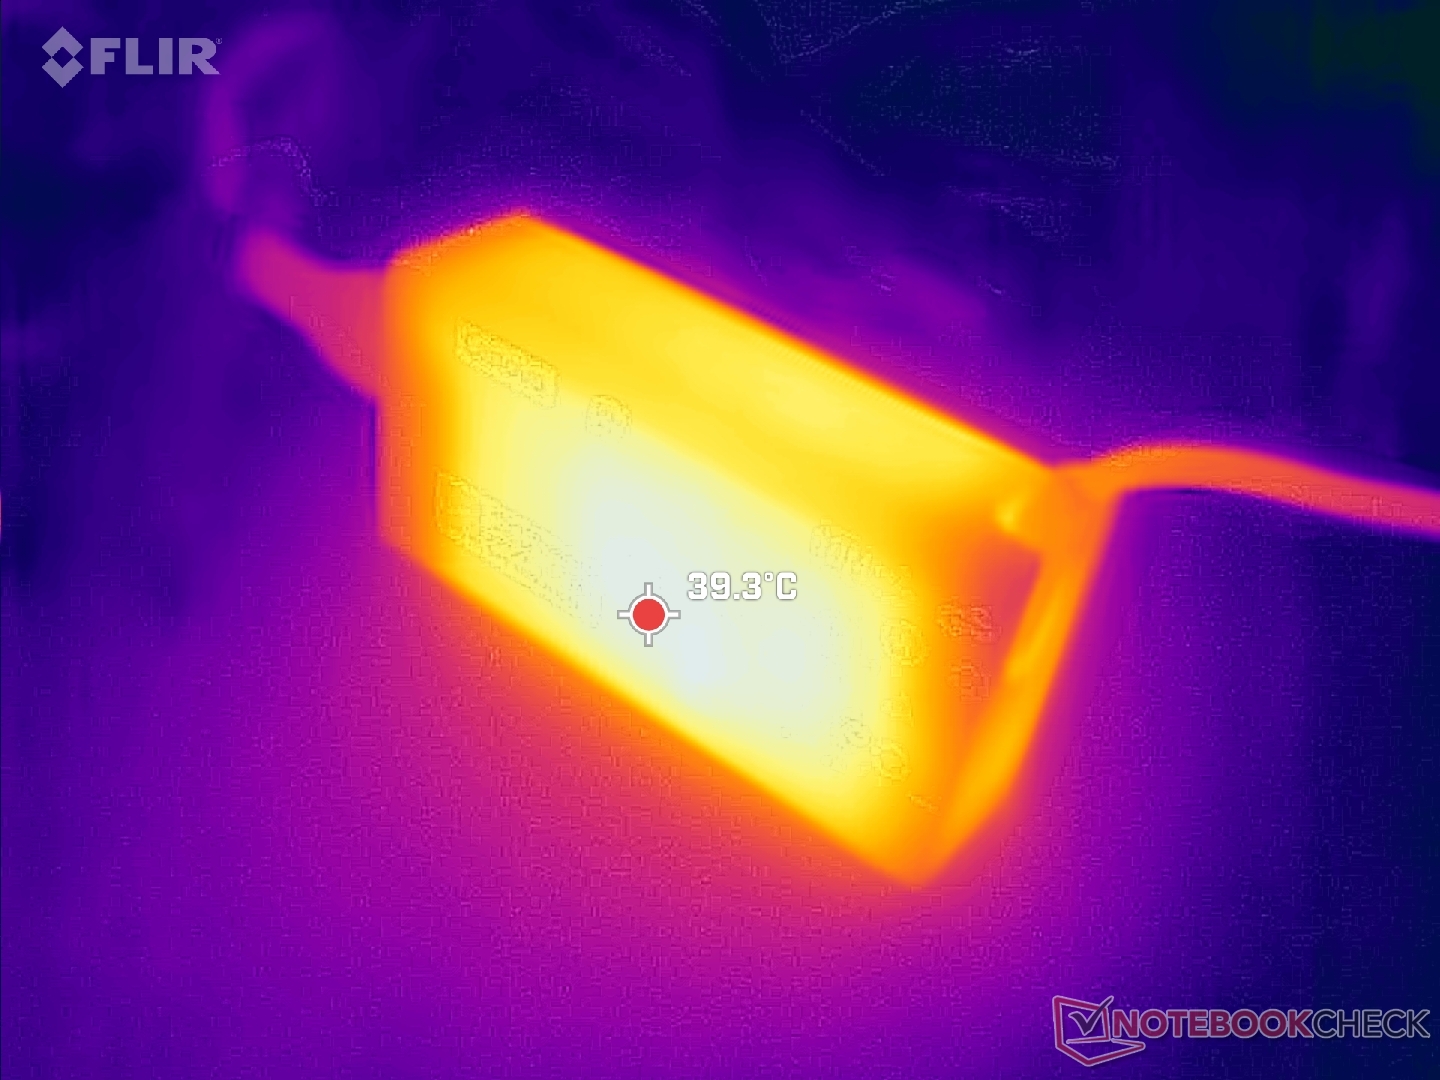
(±) Maksymalna temperatura w górnej części wynosi 44 °C / 111 F, w porównaniu do średniej 34.3 °C / 94 F , począwszy od 21.2 do 62.5 °C dla klasy Office.
(-) Dno nagrzewa się maksymalnie do 50.4 °C / 123 F, w porównaniu do średniej 36.8 °C / 98 F
(+) W stanie bezczynności średnia temperatura górnej części wynosi 24.3 °C / 76 F, w porównaniu ze średnią temperaturą urządzenia wynoszącą 29.5 °C / ### class_avg_f### F.
(+) Podpórki pod nadgarstki i touchpad są chłodniejsze niż temperatura skóry i maksymalnie 27 °C / 80.6 F i dlatego są chłodne w dotyku.
(±) Średnia temperatura obszaru podparcia dłoni w podobnych urządzeniach wynosiła 27.5 °C / 81.5 F (+0.5 °C / 0.9 F).
| Lenovo ThinkPad E16 G1 Core i5-1335U Intel Core i5-1335U, Intel Iris Xe Graphics G7 80EUs | Lenovo ThinkPad E16 G1-21JUS08X00 AMD Ryzen 7 7730U, AMD Radeon RX Vega 8 (Ryzen 4000/5000) | Dell Inspiron 16 7635 2-in-1 AMD Ryzen 5 7530U, AMD Radeon RX Vega 7 | Acer TravelMate P4 TMP416-51-55KN Intel Core i5-1240P, Intel Iris Xe Graphics G7 80EUs | Samsung Galaxy Book3 Pro 16 Intel Core i5-1340P, Intel Iris Xe Graphics G7 80EUs | LG Gram 16Z90Q Intel Core i7-1260P, Intel Iris Xe Graphics G7 96EUs | |
|---|---|---|---|---|---|---|
| Heat | 0% | 4% | -1% | -5% | 6% | |
| Maximum Upper Side * (°C) | 44 | 46.1 -5% | 41.6 5% | 38.6 12% | 41.6 5% | 45 -2% |
| Maximum Bottom * (°C) | 50.4 | 52.2 -4% | 39 23% | 44.4 12% | 45 11% | 43 15% |
| Idle Upper Side * (°C) | 27.2 | 25.7 6% | 29.4 -8% | 28.9 -6% | 31 -14% | 26 4% |
| Idle Bottom * (°C) | 27.8 | 26.7 4% | 28.6 -3% | 34 -22% | 33.6 -21% | 26 6% |
* ... im mniej tym lepiej
Test warunków skrajnych
Po uruchomieniu Prime95 procesor osiągał 4 GHz, 50 W i 94 C tylko przez kilka pierwszych sekund, po czym stopniowo spadał i stabilizował się na poziomie 2,4 GHz, 86 C i 28 W, ponieważ szczytowe Turbo Boost jest nie do utrzymania. Wysoki zakres 80 C jest dość ciepły jak na 16-calowy laptop z serii Core U. Przeprowadzając ten sam test naAcer Swift Edge 16 z procesorem Ryzen 7 7840U spowodowałoby ustabilizowanie się temperatury procesora na poziomie zaledwie 64 C.
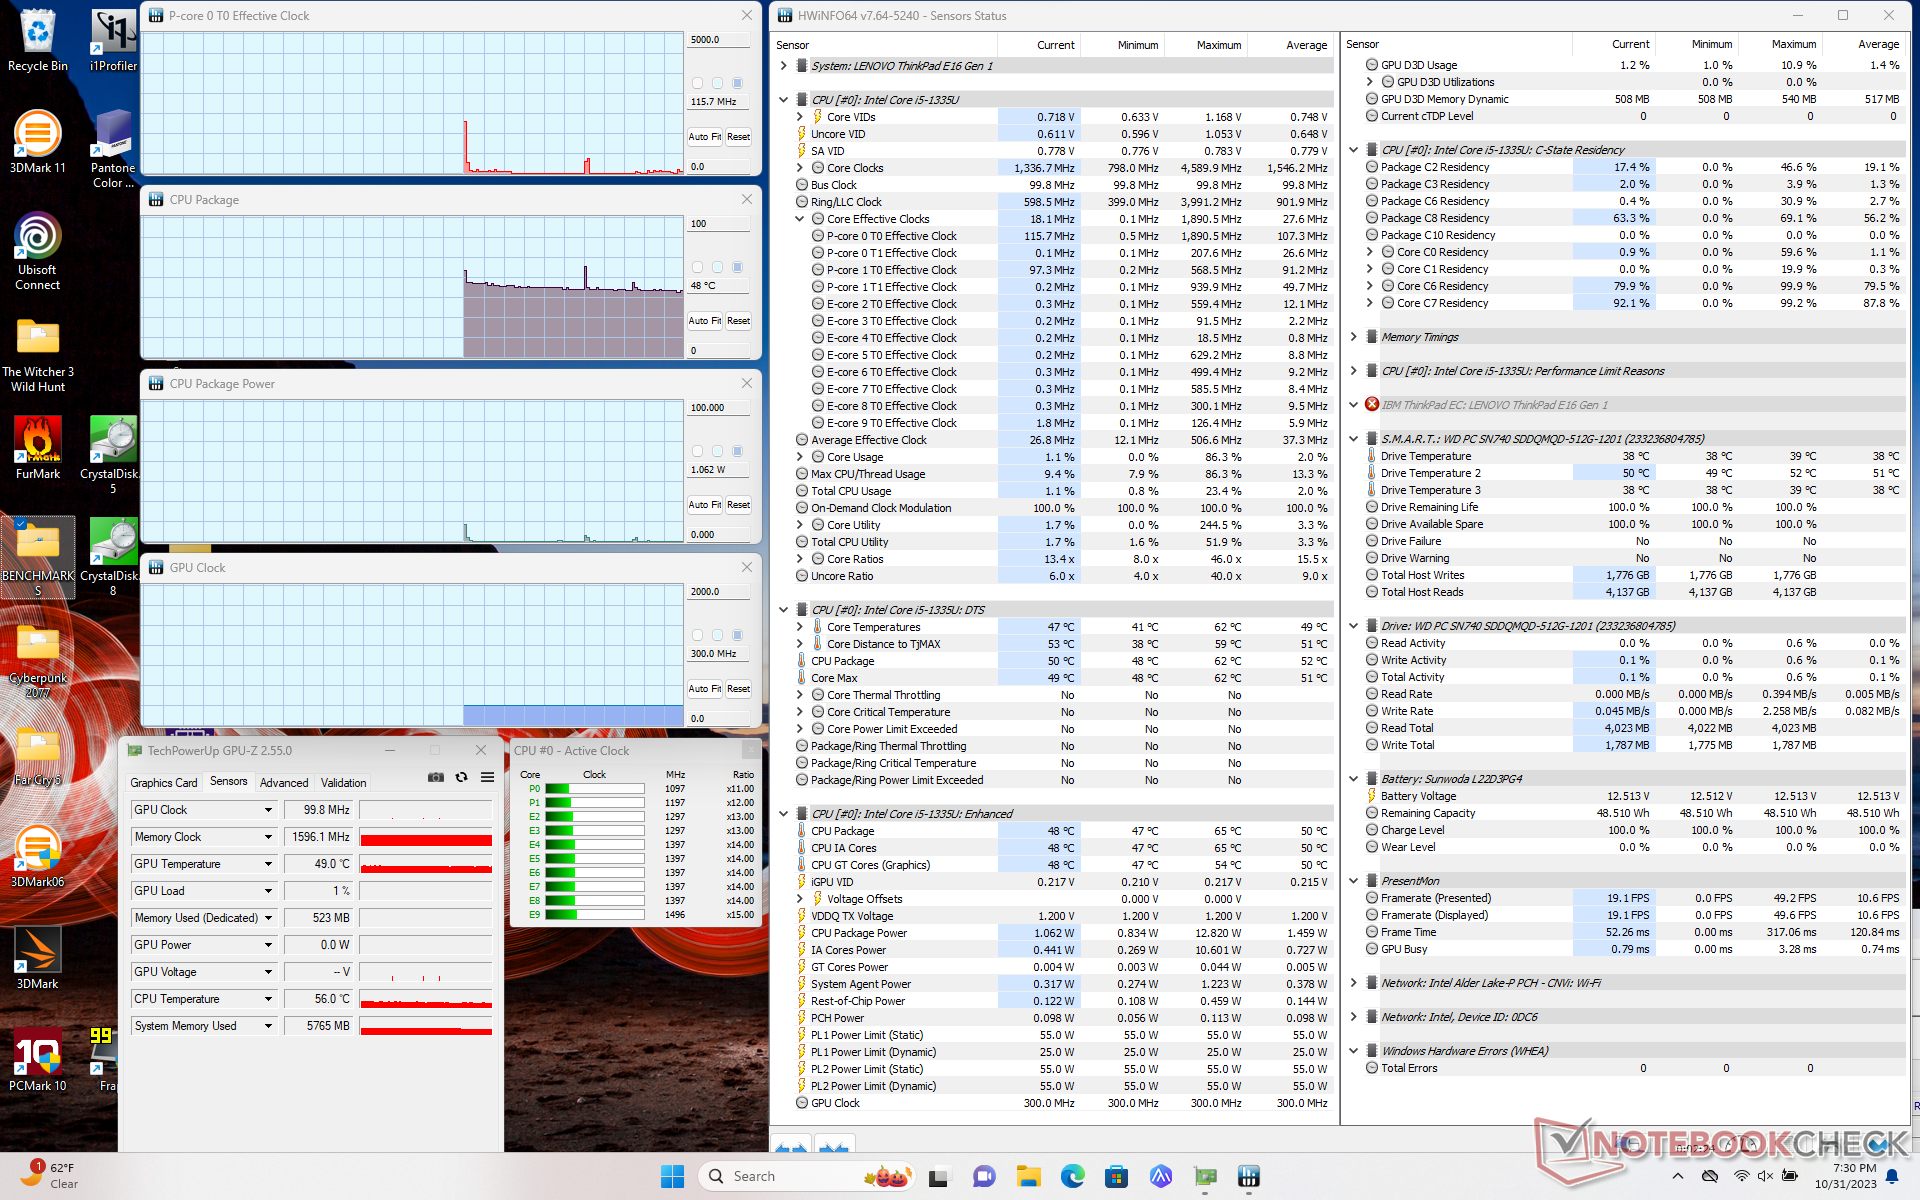
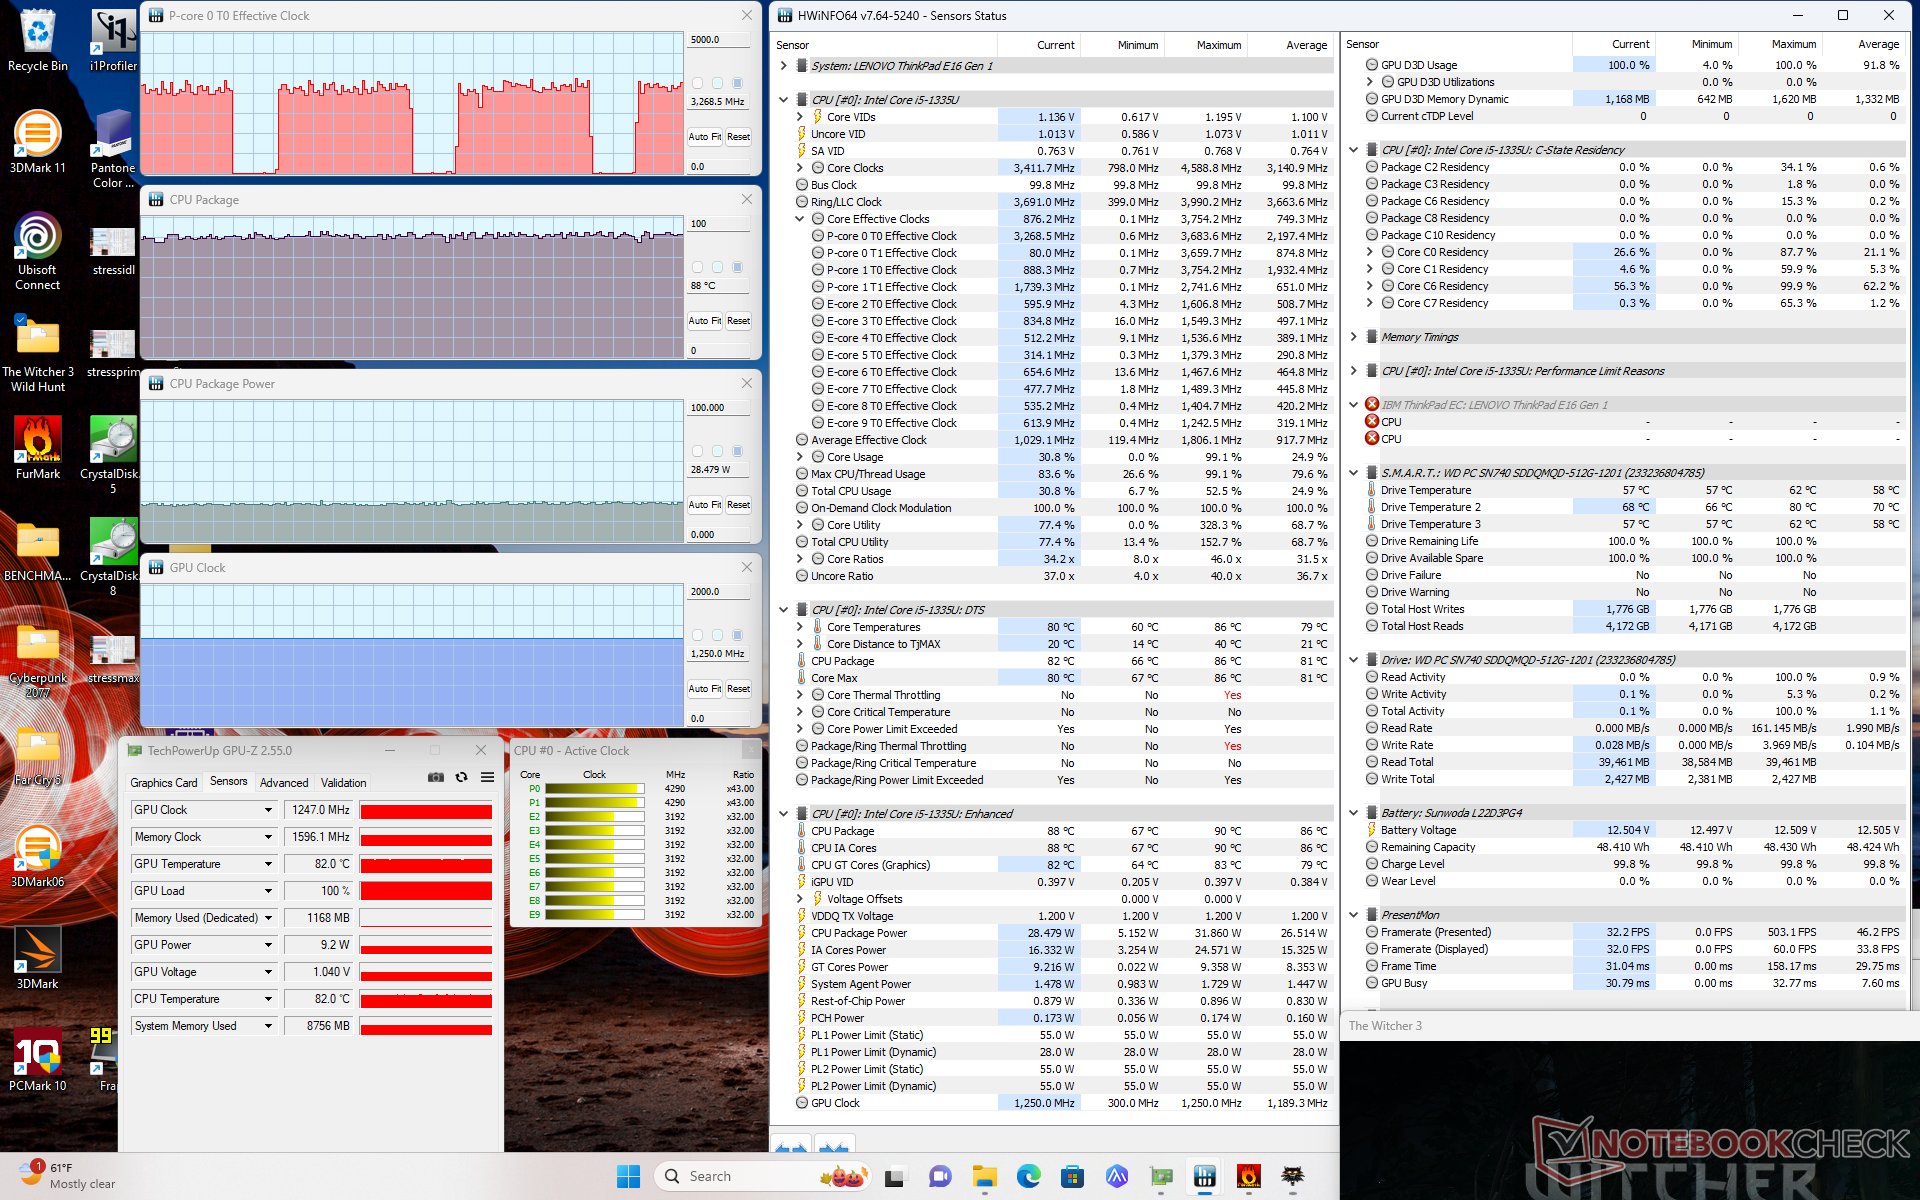
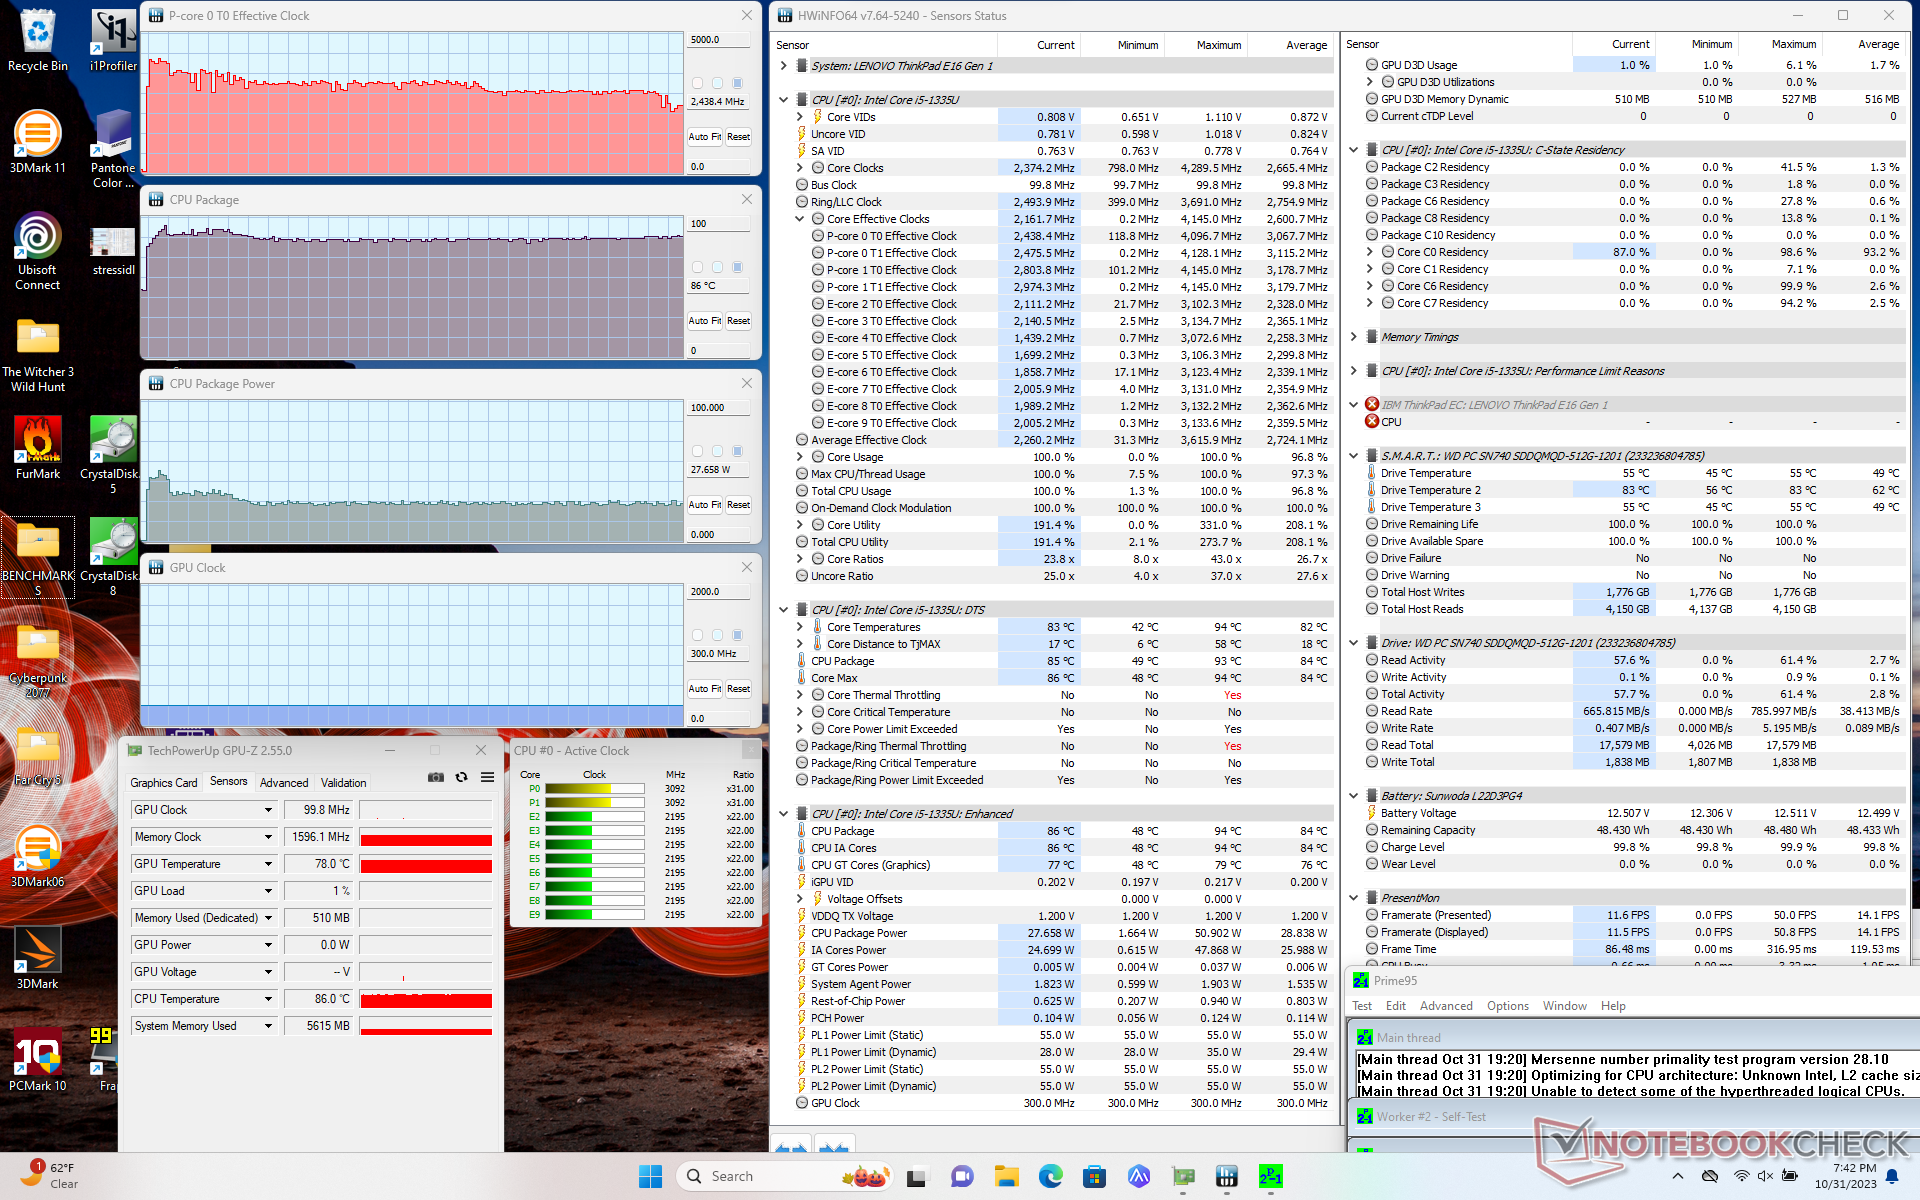
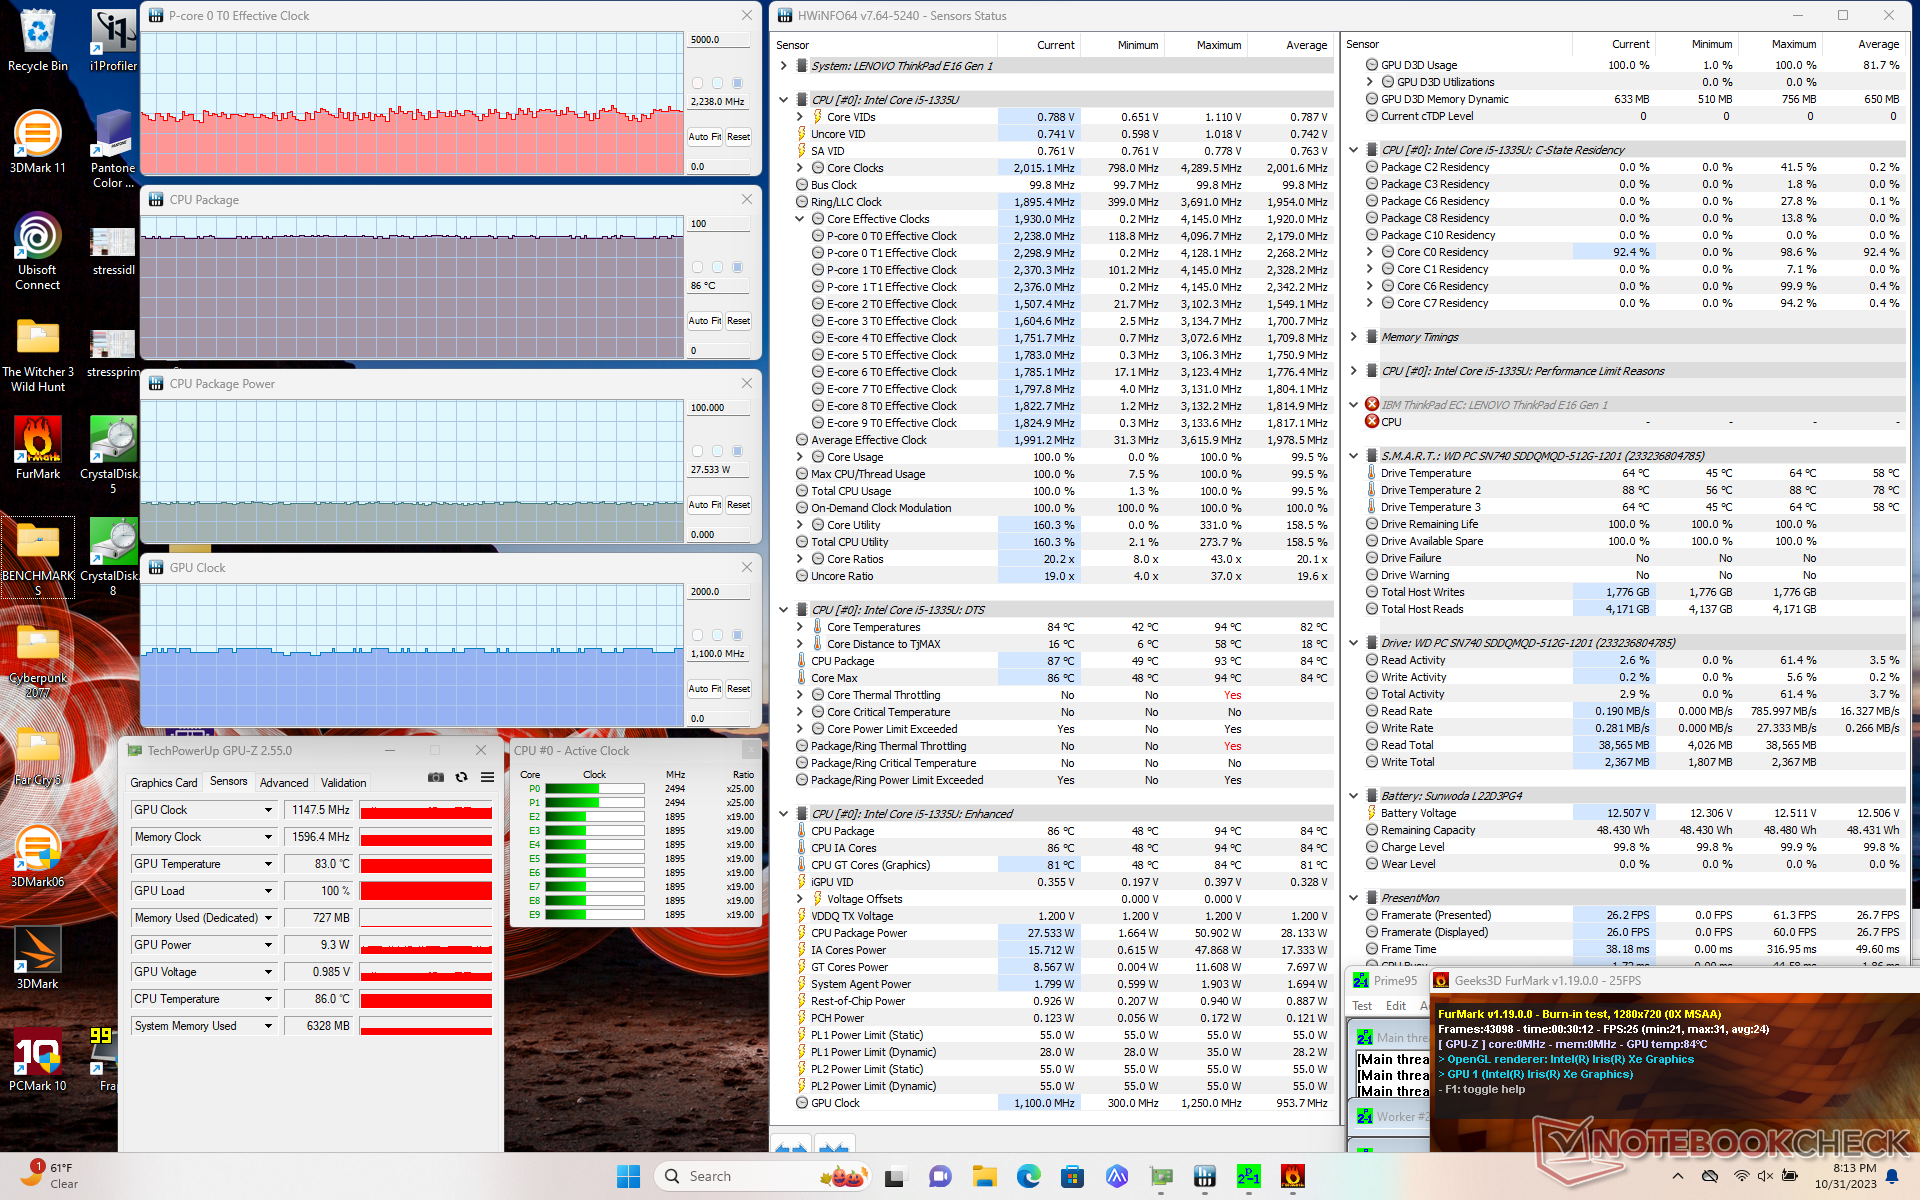
| Taktowanie CPU (GHz) | Taktowanie GPU (MHz) | Średnia temperatura CPU (°C) | |
| System bezczynności | -- | -- | 48 |
| Prime95Stress | 2.4 | -- | 86 |
| Prime95+ FurMark Stress | ~2.2 | 1100 | 86 |
| Witcher 3 Obciążenie | ~3.2 | 1250 | 88 |
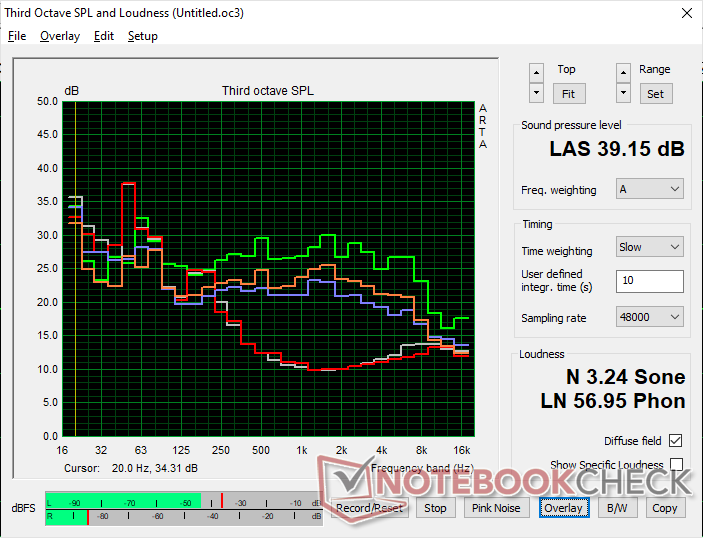
Głośniki
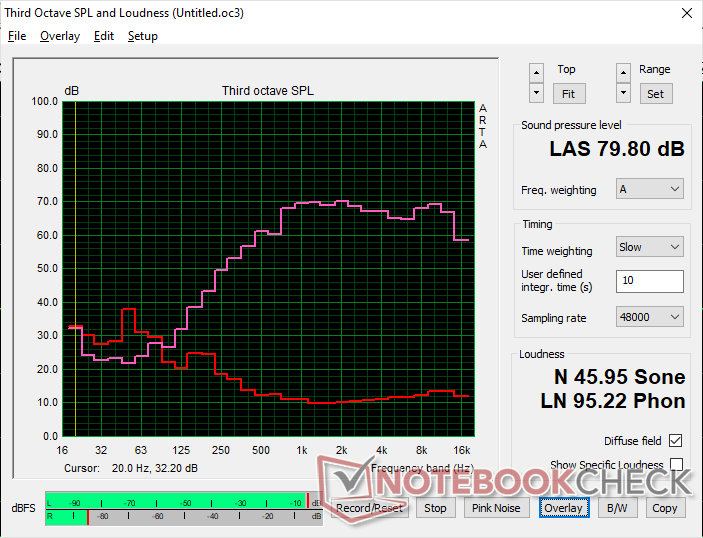
Lenovo ThinkPad E16 G1 Core i5-1335U analiza dźwięku
(±) | głośność głośnika jest średnia, ale dobra (79.8 dB)
Bas 100 - 315 Hz
(-) | prawie brak basu - średnio 24.7% niższa od mediany
(±) | liniowość basu jest średnia (8.8% delta do poprzedniej częstotliwości)
Średnie 400 - 2000 Hz
(+) | zbalansowane środki średnie - tylko 4.8% od mediany
(+) | średnie są liniowe (4.8% delta do poprzedniej częstotliwości)
Wysokie 2–16 kHz
(+) | zrównoważone maksima - tylko 2.1% od mediany
(+) | wzloty są liniowe (2.7% delta do poprzedniej częstotliwości)
Ogólnie 100 - 16.000 Hz
(±) | liniowość ogólnego dźwięku jest średnia (18.4% różnicy w stosunku do mediany)
W porównaniu do tej samej klasy
» 33% wszystkich testowanych urządzeń w tej klasie było lepszych, 7% podobnych, 60% gorszych
» Najlepszy miał deltę 7%, średnia wynosiła ###średnia###%, najgorsza wynosiła 53%
W porównaniu do wszystkich testowanych urządzeń
» 41% wszystkich testowanych urządzeń było lepszych, 8% podobnych, 52% gorszych
» Najlepszy miał deltę 4%, średnia wynosiła ###średnia###%, najgorsza wynosiła 134%
Apple MacBook Pro 16 2021 M1 Pro analiza dźwięku
(+) | głośniki mogą odtwarzać stosunkowo głośno (84.7 dB)
Bas 100 - 315 Hz
(+) | dobry bas - tylko 3.8% od mediany
(+) | bas jest liniowy (5.2% delta do poprzedniej częstotliwości)
Średnie 400 - 2000 Hz
(+) | zbalansowane środki średnie - tylko 1.3% od mediany
(+) | średnie są liniowe (2.1% delta do poprzedniej częstotliwości)
Wysokie 2–16 kHz
(+) | zrównoważone maksima - tylko 1.9% od mediany
(+) | wzloty są liniowe (2.7% delta do poprzedniej częstotliwości)
Ogólnie 100 - 16.000 Hz
(+) | ogólny dźwięk jest liniowy (4.6% różnicy w stosunku do mediany)
W porównaniu do tej samej klasy
» 0% wszystkich testowanych urządzeń w tej klasie było lepszych, 0% podobnych, 100% gorszych
» Najlepszy miał deltę 5%, średnia wynosiła ###średnia###%, najgorsza wynosiła 45%
W porównaniu do wszystkich testowanych urządzeń
» 0% wszystkich testowanych urządzeń było lepszych, 0% podobnych, 100% gorszych
» Najlepszy miał deltę 4%, średnia wynosiła ###średnia###%, najgorsza wynosiła 134%
Zarządzanie energią
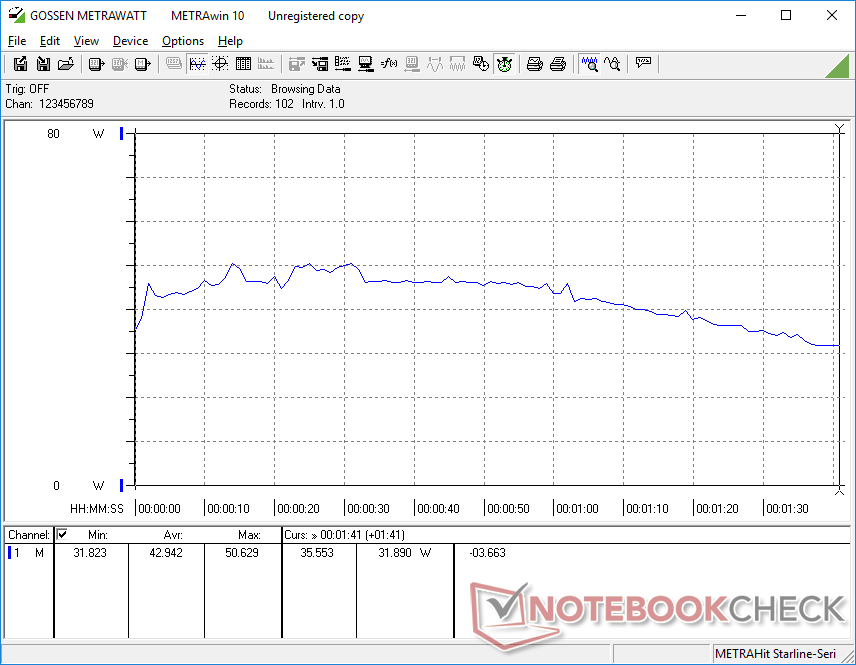
Zużycie energii
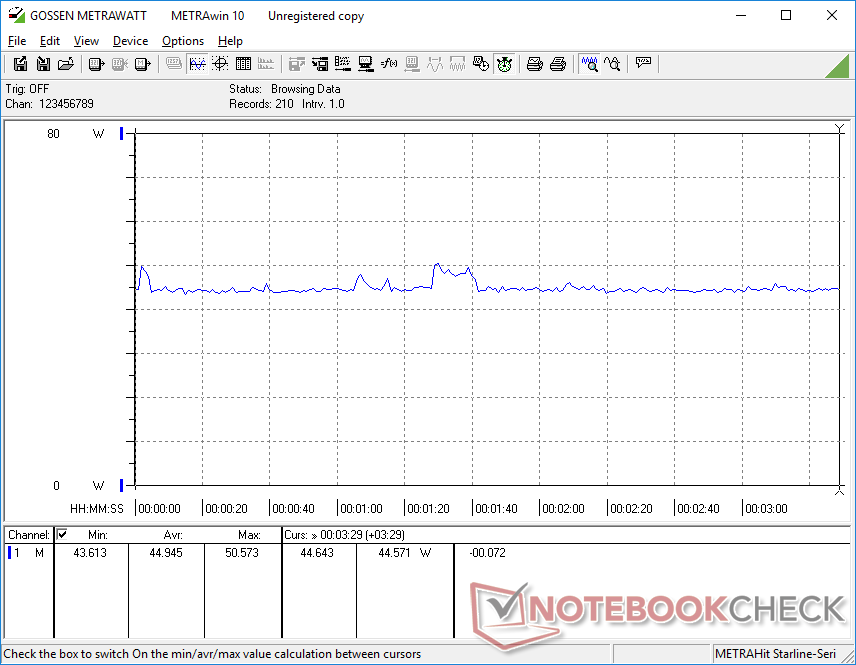
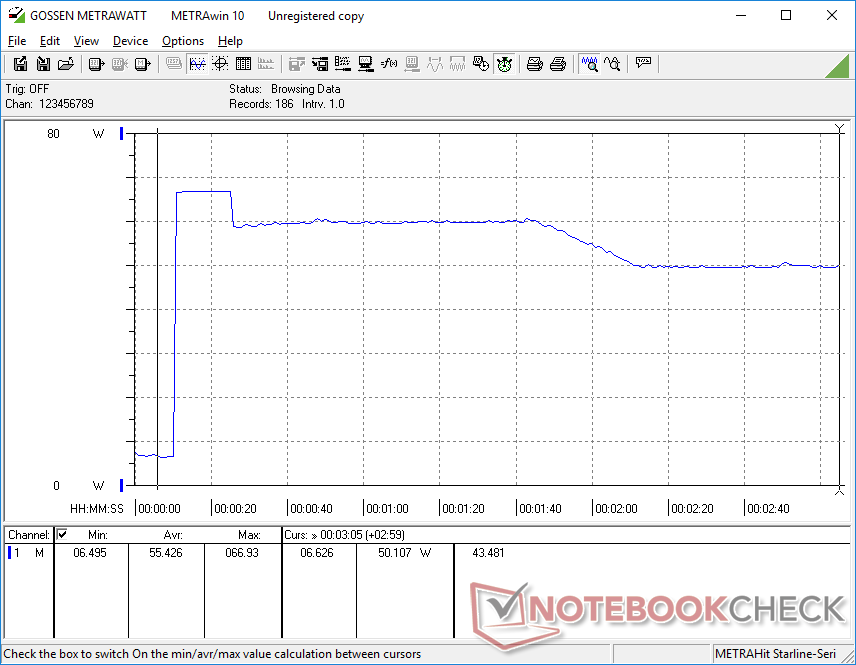
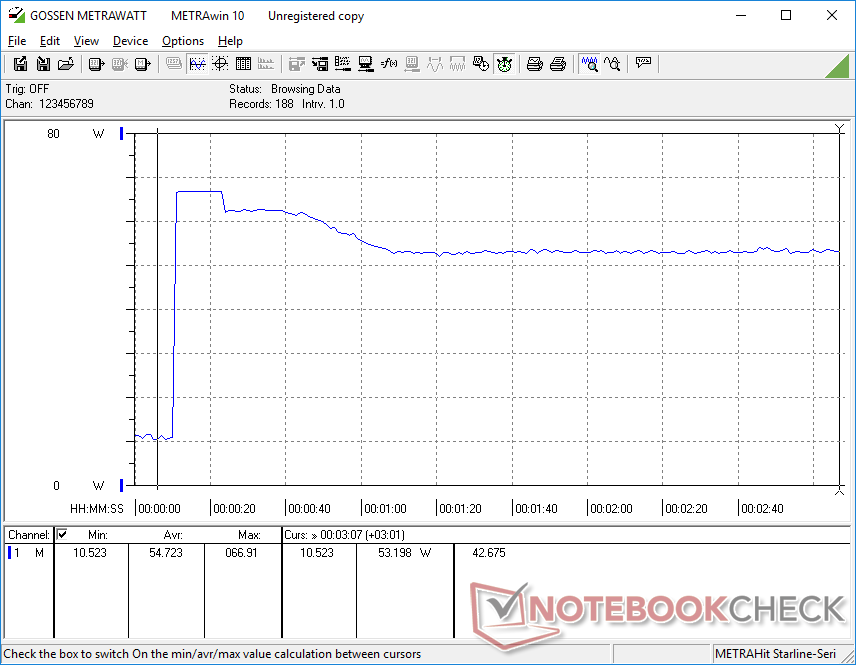
System Intela jest generalnie bardziej wymagający niż wersja AMD podczas wykonywania zadań intensywnie wykorzystujących procesor, mimo że procesor AMD jest generalnie szybszy niż Intel, jeśli chodzi o obciążenia wielowątkowe. Przykładowo, podczas uruchamiania programu CineBench R15 xT, zużycie energii wyniosło aż 68 W na naszej jednostce Intela w porównaniu do zaledwie 45 W na jednostce AMD. Podobne wyniki można również zaobserwować podczas uruchamiania Prime95. Całkowite zużycie energii podczas bezczynności na pulpicie lub podczas wykonywania zadań intensywnie wykorzystujących GPU, takich jak Witcher 3 jest mniej więcej takie samo pomiędzy wersjami Intel i AMD.
| wyłączony / stan wstrzymania | |
| luz | |
| obciążenie |
|
Legenda:
min: | |
| Lenovo ThinkPad E16 G1 Core i5-1335U i5-1335U, Iris Xe G7 80EUs, , IPS, 1920x1200, 16" | Lenovo ThinkPad E16 G1-21JUS08X00 R7 7730U, Vega 8, WD PC SN740 SDDPNQD-1T00, IPS, 2560x1600, 16" | Dell Inspiron 16 7635 2-in-1 R5 7530U, Vega 7, Kioxia BG5 KBG50ZNS512G, IPS, 1920x1200, 16" | Acer TravelMate P4 TMP416-51-55KN i5-1240P, Iris Xe G7 80EUs, Micron 2450 512GB MTFDKBA512TFK, IPS, 1920x1200, 16" | Samsung Galaxy Book3 Pro 16 i5-1340P, Iris Xe G7 80EUs, WD PC SN740 256GB SDDPNQD-256G, AMOLED, 2880x1800, 16" | LG Gram 16Z90Q i7-1260P, Iris Xe G7 96EUs, Samsung PM9A1 MZVL21T0HCLR, IPS, 2560x1600, 16" | |
|---|---|---|---|---|---|---|
| Power Consumption | -3% | 2% | 1% | 9% | -7% | |
| Idle Minimum * (Watt) | 4.9 | 4.1 16% | 4.8 2% | 5.2 -6% | 3.9 20% | 5 -2% |
| Idle Average * (Watt) | 8.3 | 9.6 -16% | 7.6 8% | 7.1 14% | 4.8 42% | 8 4% |
| Idle Maximum * (Watt) | 8.6 | 10.2 -19% | 8.7 -1% | 9.6 -12% | 10 -16% | 14 -63% |
| Load Average * (Watt) | 42.9 | 47.3 -10% | 47.1 -10% | 47 -10% | 44 -3% | 47 -10% |
| Witcher 3 ultra * (Watt) | 44.9 | 46.7 -4% | 46.6 -4% | 43.3 4% | 42.3 6% | 37.8 16% |
| Load Maximum * (Watt) | 67 | 55.7 17% | 56.4 16% | 56 16% | 63 6% | 56 16% |
* ... im mniej tym lepiej
Power Consumption Witcher 3 / Stresstest
Power Consumption external Monitor
Żywotność baterii
Model ten jest dostępny z dwiema opcjami pojemności baterii: 47 Wh i 57 Wh. Nasza jednostka Intel jest dostarczana z mniejszą opcją, podczas gdy nasza jednostka AMD jest dostarczana z większą. Czas pracy na baterii jest tylko o połowę krótszy niż w naszej jednostce AMD przy zaledwie 5 godzinach przeglądania w świecie rzeczywistym. Jak na 16-calowego laptopa, opcja 47 Wh jest znacznie mniejsza niż oczekiwano i jest zdecydowanie okrojona.
Ładowanie od stanu pustego do pełnej pojemności jest na szczęście dość szybkie i trwa nieco ponad godzinę.
| Lenovo ThinkPad E16 G1 Core i5-1335U i5-1335U, Iris Xe G7 80EUs, 47 Wh | Lenovo ThinkPad E16 G1-21JUS08X00 R7 7730U, Vega 8, 57 Wh | Dell Inspiron 16 7635 2-in-1 R5 7530U, Vega 7, 64 Wh | Acer TravelMate P4 TMP416-51-55KN i5-1240P, Iris Xe G7 80EUs, 56 Wh | Samsung Galaxy Book3 Pro 16 i5-1340P, Iris Xe G7 80EUs, 76 Wh | LG Gram 16Z90Q i7-1260P, Iris Xe G7 96EUs, 80 Wh | |
|---|---|---|---|---|---|---|
| Czasy pracy | 117% | 179% | 81% | 96% | 94% | |
| WiFi v1.3 (h) | 5.2 | 11.3 117% | 14.5 179% | 9.4 81% | 10.2 96% | 10.1 94% |
| H.264 (h) | 11.7 | 14.4 | ||||
| Load (h) | 1.3 | 1.9 | 2 | 2.6 | ||
| Reader / Idle (h) | 26 | 30.4 | 18.1 |
Za
Przeciw
Werdykt - AMD wygrywa pod względem żywotności baterii
Decydując się na Intel ThinkPad E16 G1 zamiast AMD, zyskają Państwo obsługę Thunderbolt, szybszą wydajność jednowątkową i szybszą zintegrowaną wydajność graficzną, zakładając, że wybiorą Państwo Core i7-1355U. Jednak korzyści te prawdopodobnie bledną w porównaniu z tym, co oferuje wersja Wersji AMD z AMD: zauważalnie dłuższym czasem pracy na baterii, wyższą wydajnością w przeliczeniu na wat, szybszą wydajnością wielowątkową i obsługą dysków SSD M.2 2280. Tak więc, jeśli zdecydują się Państwo pominąć opcje AMD, będą Państwo musieli naprawdę docenić doskonałe możliwości dokowania wersji Intel.
Jeśli nie planują Państwo podłączać monitorów Thunderbolt lub eGPU do swojego ThinkPada E16 G1, to wersje AMD mogą zaoferować zarówno dłuższy czas pracy na baterii, jak i szybszą wydajność wielowątkową niż opcje Intela za mniej więcej tę samą cenę.
Niezależnie od preferowanej wersji, użytkownicy nadal będą chcieli zwrócić uwagę na rozmiar wyświetlacza i baterii przed zakupem. Niestety, nie każdy sprzedawca podaje pokrycie kolorów lub pojemność baterii, więc łatwo jest przypadkowo kupić konfigurację z wyświetlaczem z niższej półki lub mniejszym akumulatorem 47 Wh. Zalecamy dążenie do pełnego pokrycia sRGB i większego akumulatora 57 Wh, jeśli to możliwe, ponieważ są to znaczące skoki w stosunku do konfiguracji podstawowej.
Cena i dostępność
Lenovo dostarcza obecnie ThinkPad E16 G1 w cenie od 638 USD za konfigurację z procesorem Core i3 lub od 724 USD za konfigurację z procesorem Core i5.
Lenovo ThinkPad E16 G1 Core i5-1335U
- 02/11/2023 v7 (old)
Allen Ngo
Przezroczystość
Wyboru urządzeń do recenzji dokonuje nasza redakcja. Próbka testowa została udostępniona autorowi jako pożyczka od producenta lub sprzedawcy detalicznego na potrzeby tej recenzji. Pożyczkodawca nie miał wpływu na tę recenzję, producent nie otrzymał też kopii tej recenzji przed publikacją. Nie było obowiązku publikowania tej recenzji. Jako niezależna firma medialna, Notebookcheck nie podlega władzy producentów, sprzedawców detalicznych ani wydawców.
Tak testuje Notebookcheck
Każdego roku Notebookcheck niezależnie sprawdza setki laptopów i smartfonów, stosując standardowe procedury, aby zapewnić porównywalność wszystkich wyników. Od około 20 lat stale rozwijamy nasze metody badawcze, ustanawiając przy tym standardy branżowe. W naszych laboratoriach testowych doświadczeni technicy i redaktorzy korzystają z wysokiej jakości sprzętu pomiarowego. Testy te obejmują wieloetapowy proces walidacji. Nasz kompleksowy system ocen opiera się na setkach uzasadnionych pomiarów i benchmarków, co pozwala zachować obiektywizm.Price comparison

