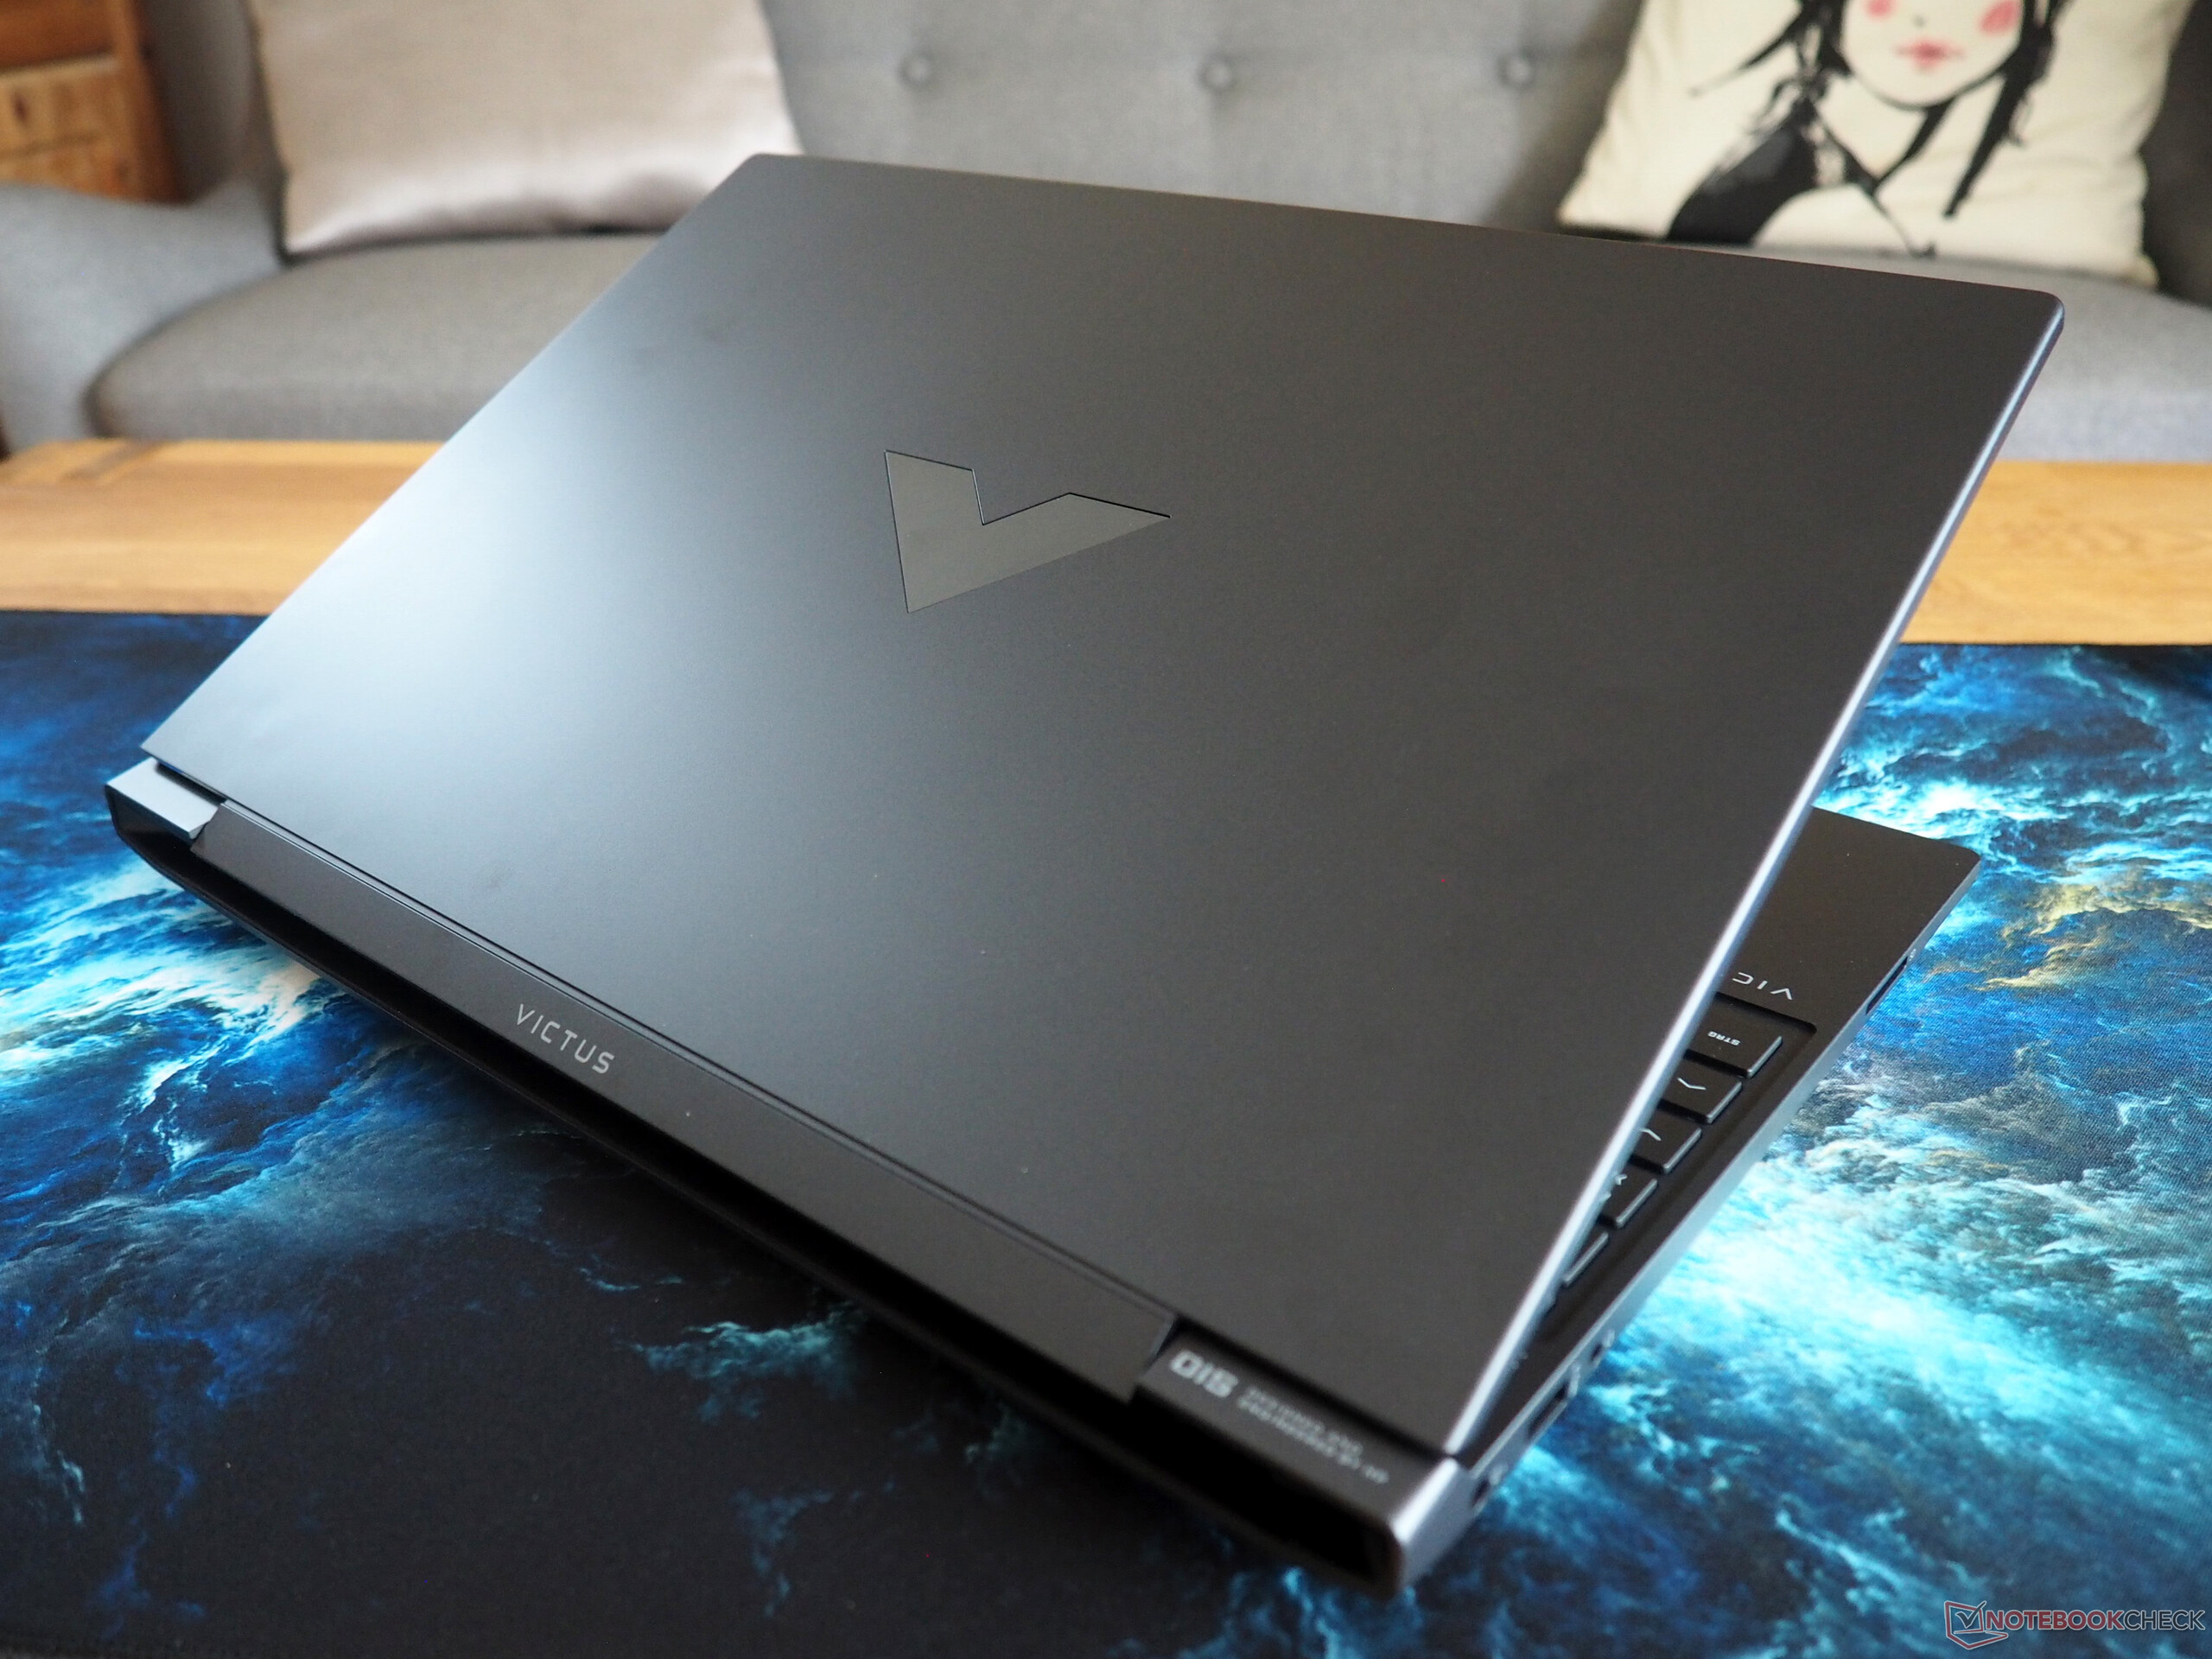
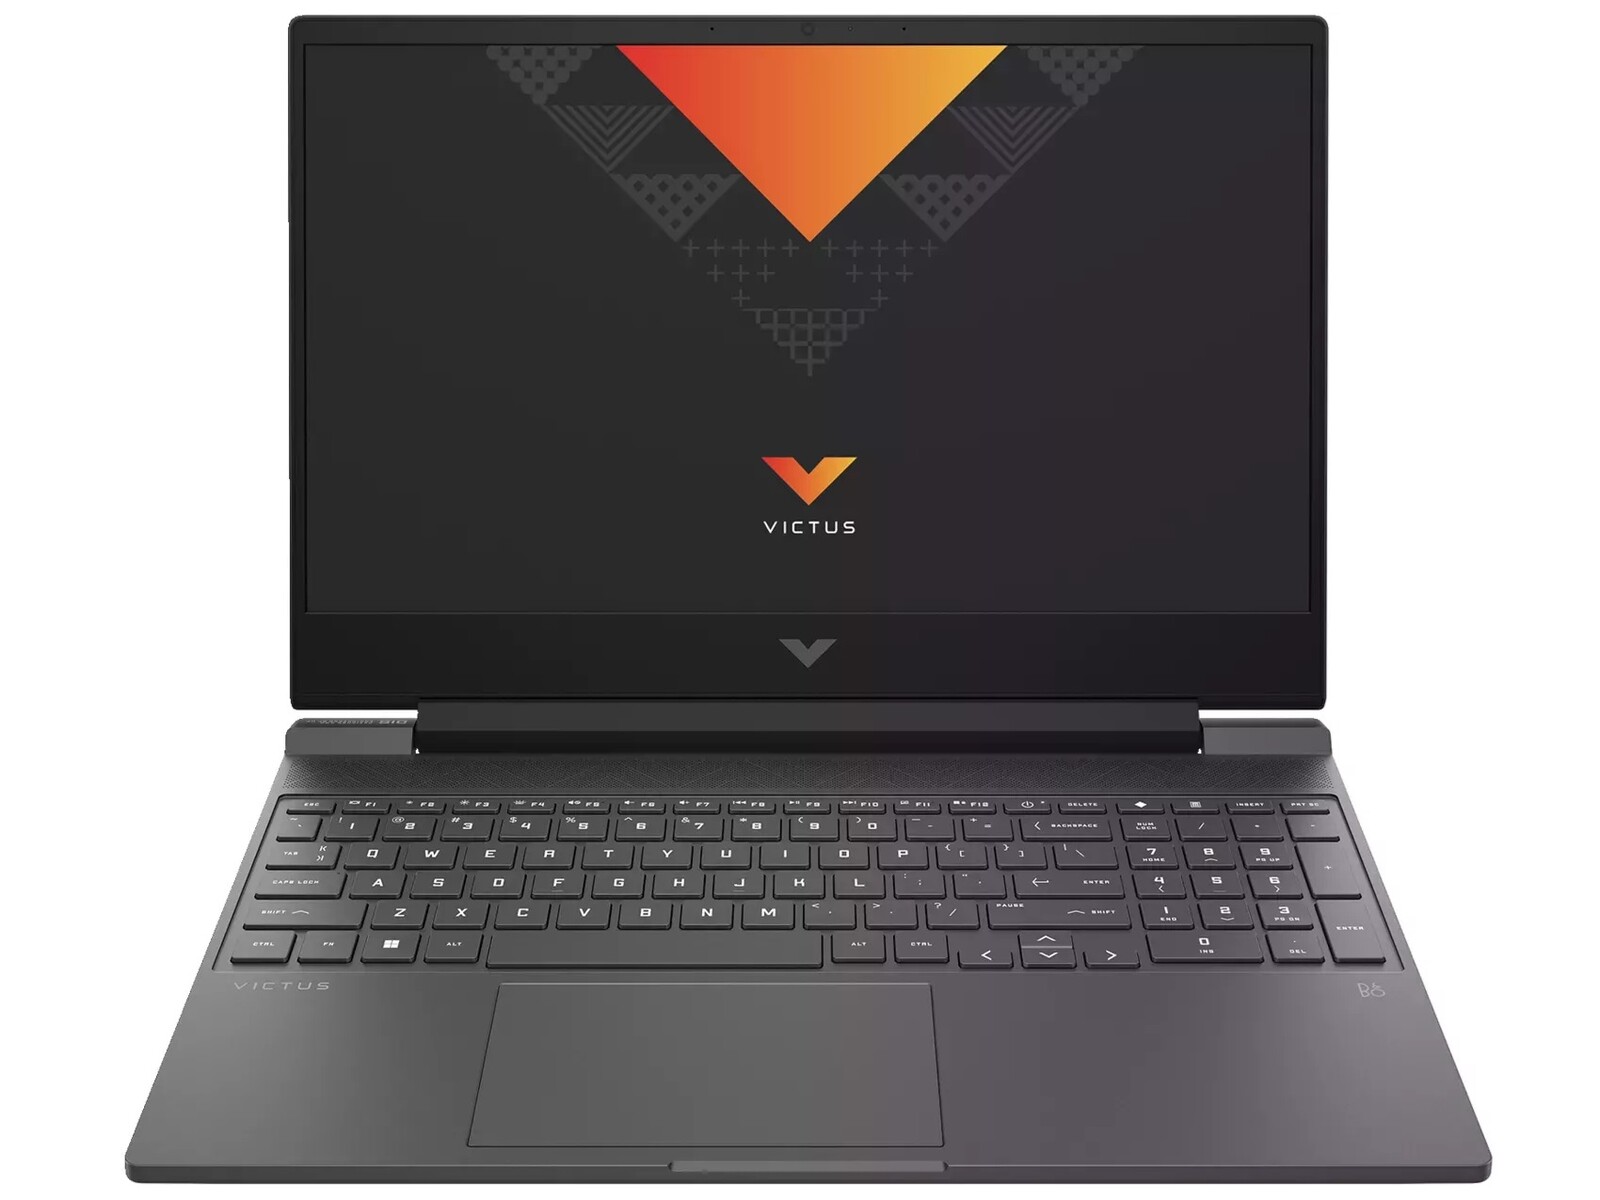
Recenzja gamingowego laptopa HP Victus 15 z Raptor Lake i Adą Lovelace

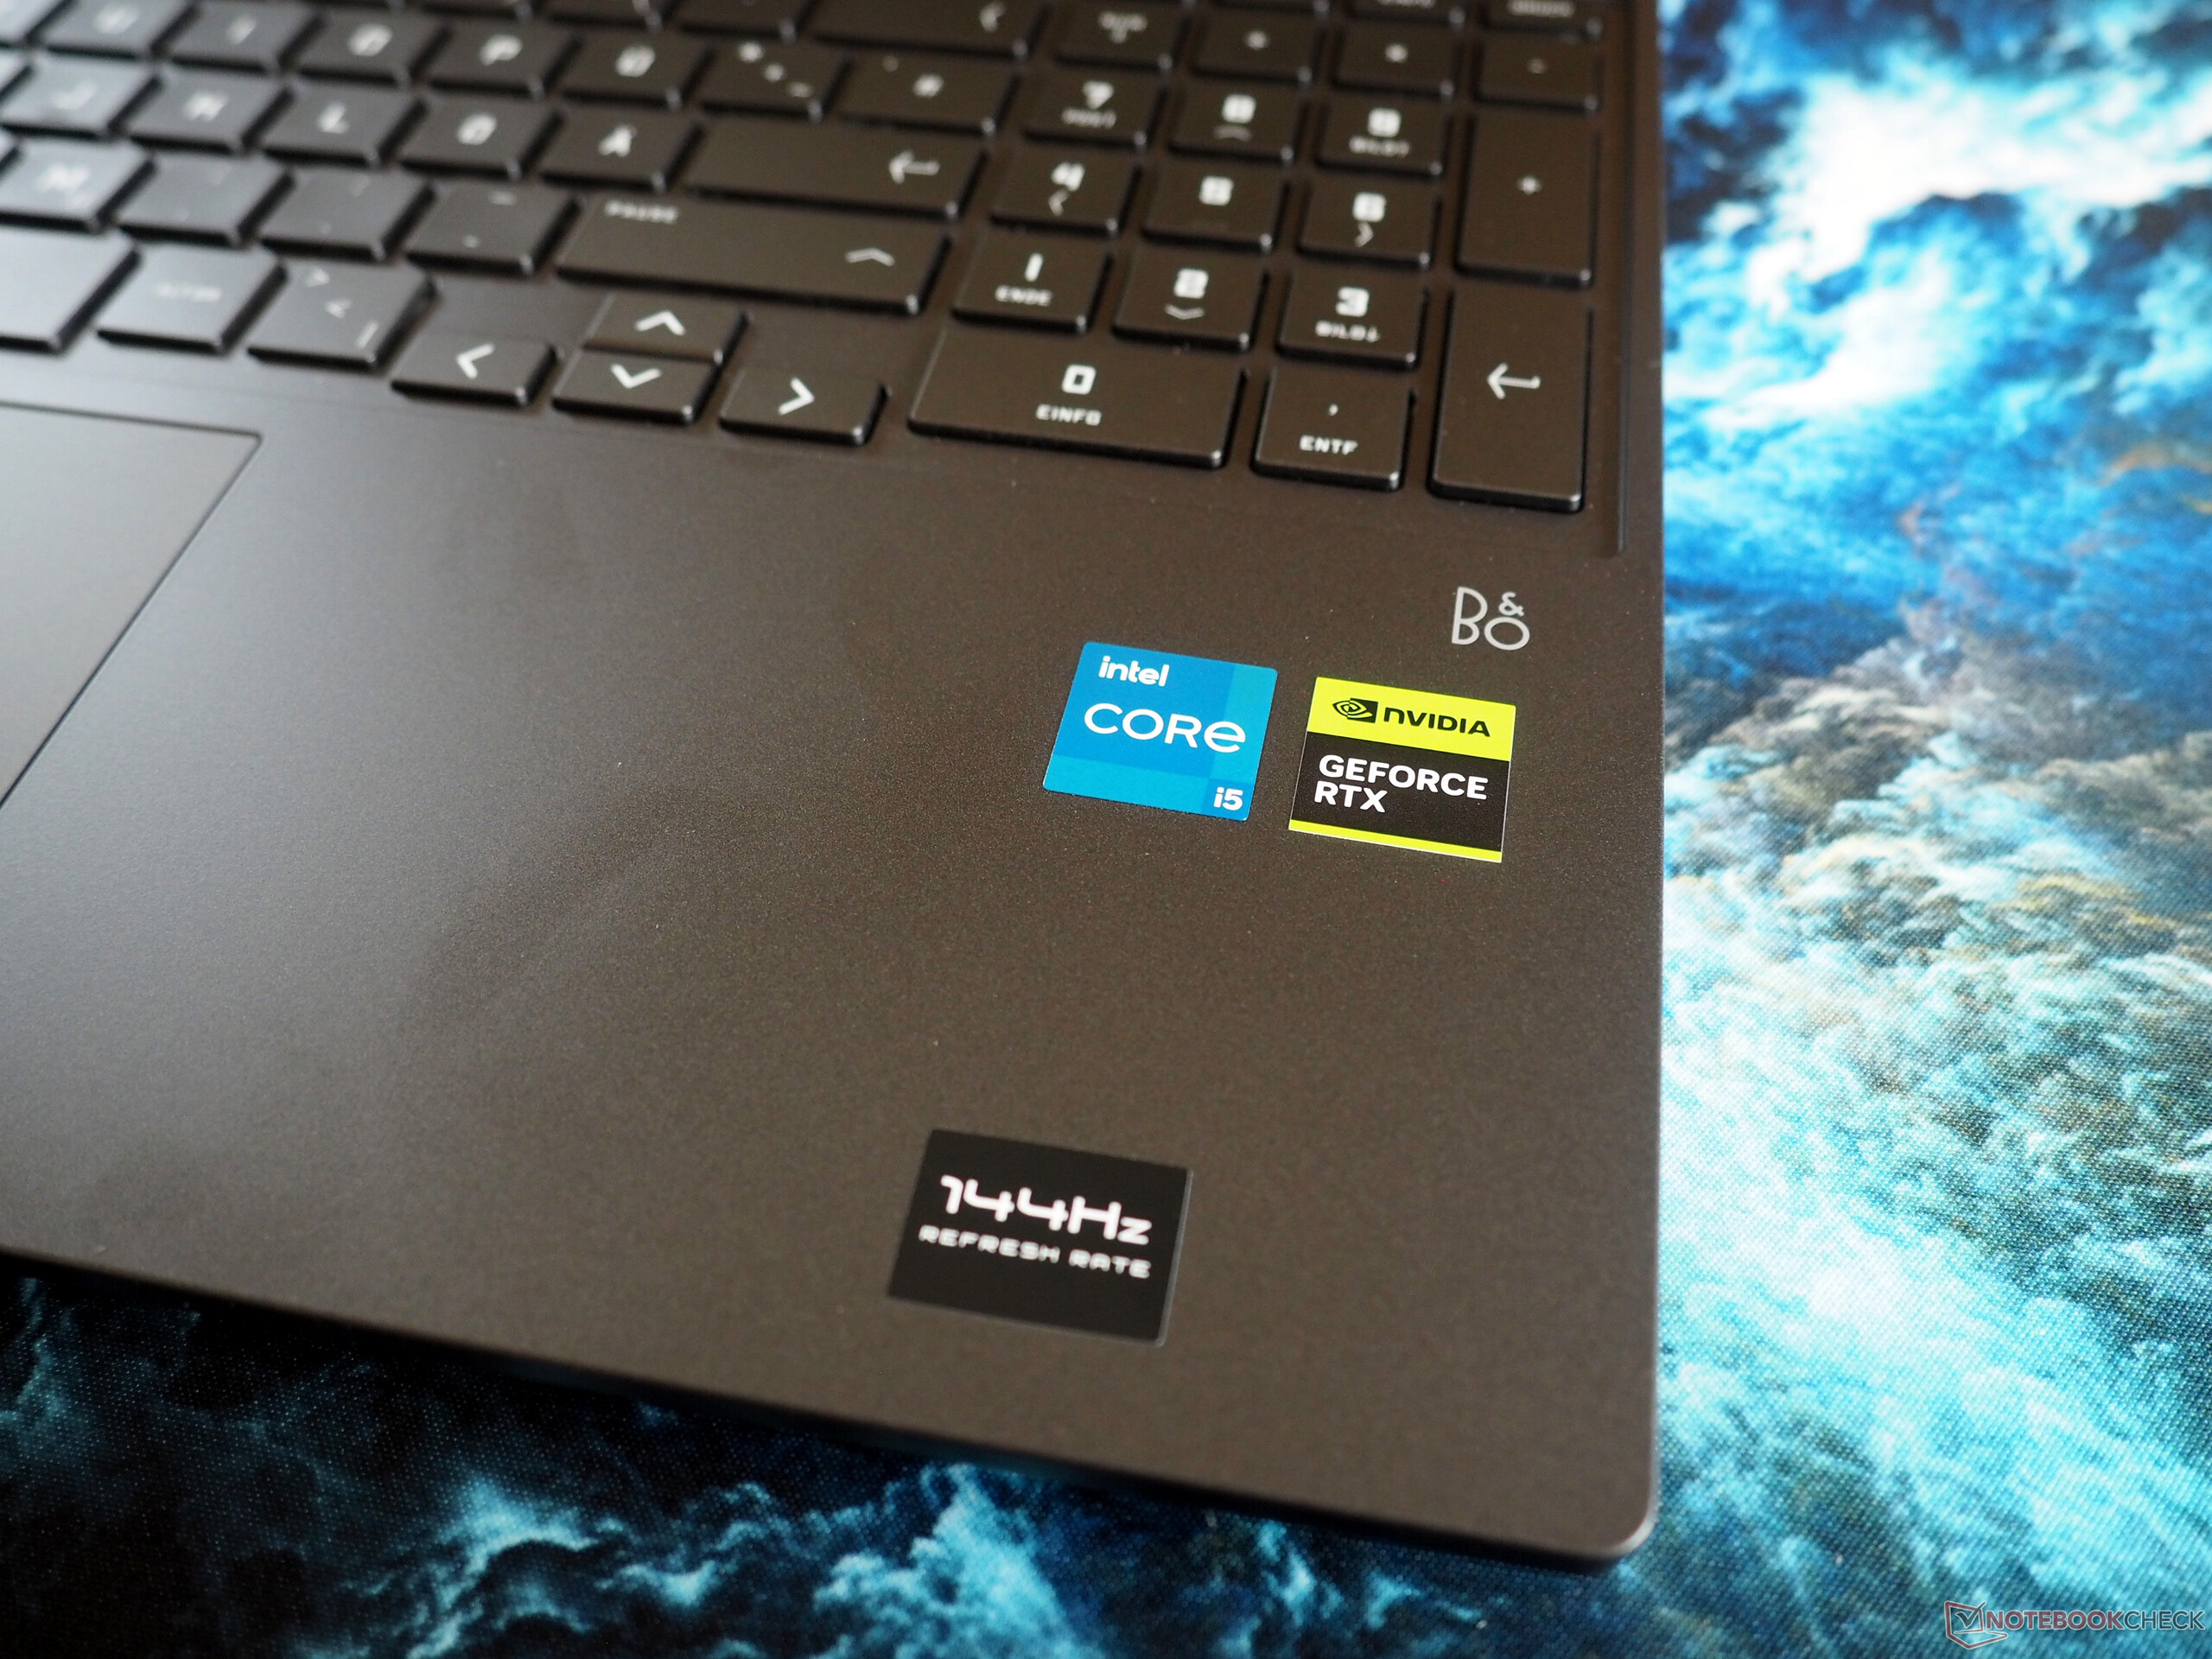
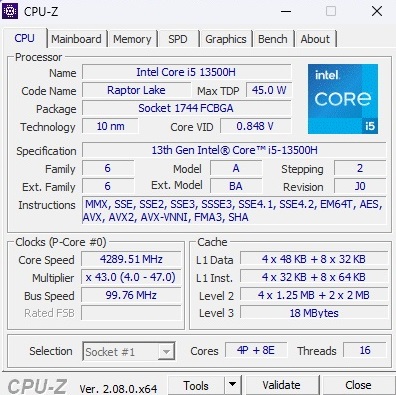
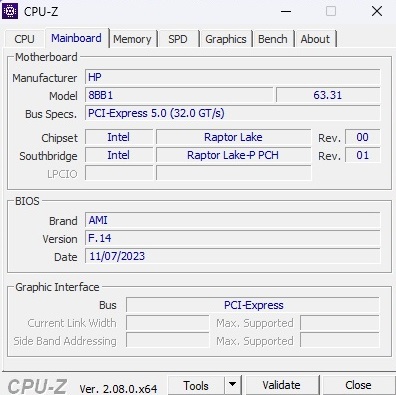
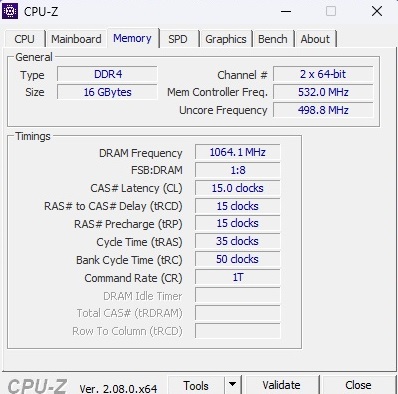
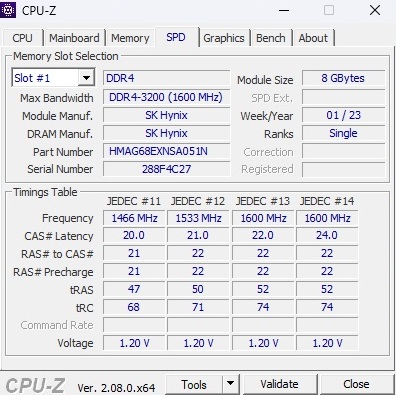
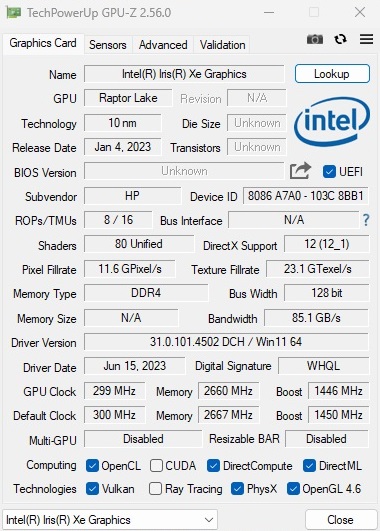
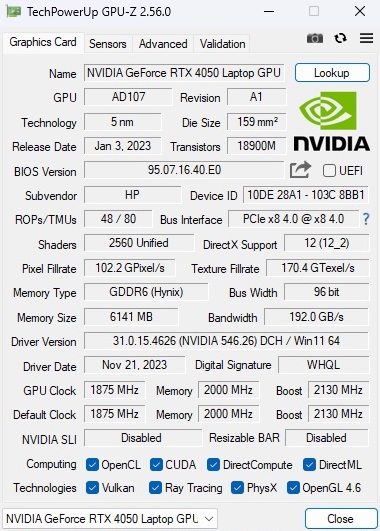
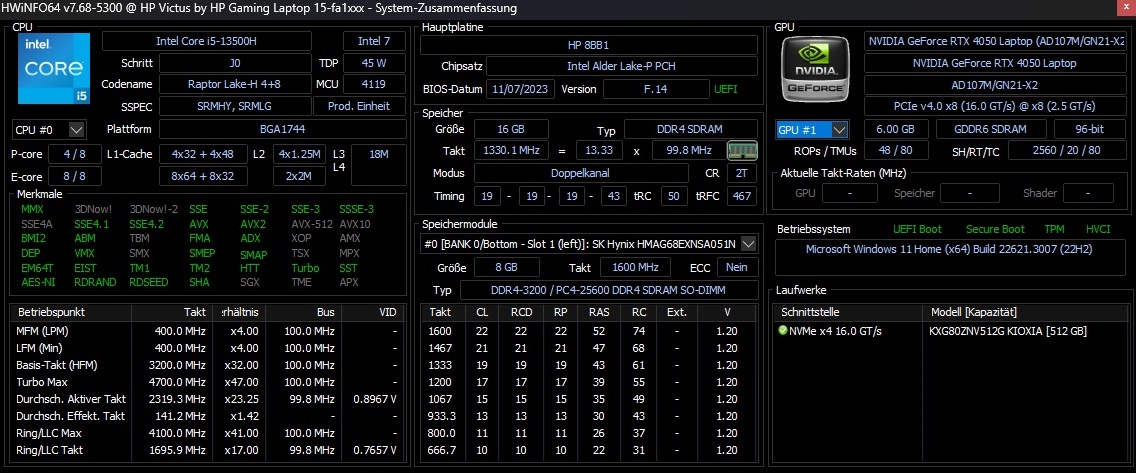
Podczas gdy laptopy premium z roku na rok stają się coraz droższe, segment budżetowy w 2024 roku oferuje mnóstwo ekscytujących produktów. Takim przykładem jest Victus 15-fa1057ng, dostępny za mniej niż 1000 USD. Wyróżniając się na tle wielu konkurentów, posiada kartę graficzną GeForce RTX 4050 z 6 GB pamięci VRAM GDDR6. Uzupełnieniem jest procesor Core i5-13500H (12 rdzeni, 16 wątków), 16 GB pamięci RAM DDR4-3,200 (2x 8 GB SO-DIMM) oraz 512 GB dysk SSD M.2 oparty na PCIe. Za wyświetlanie obrazu odpowiada matowy wyświetlacz IPS Full HD 144 Hz, choć jego jasność wynosi 250 nitów i 45% NTSC - wartości, które uważamy za przestarzałe, nawet dla sektora budżetowego. Pakiet uzupełnia system operacyjny Windows 11 Home (dostępne są również tańsze wersje z FreeDOS).
Rywalami Victusa 15 są inne laptopy do gier wyposażone w RTX 4050 i najnowsze procesory, takie jak Dell G15 5530czy Acer Nitro V 15 ANV15-51 lub Asus TUF A15 FA507, z których wszystkie są wymienione w tabelach dla porównania.
Ponieważ obudowa jest w większości identyczna z poprzednika wyposażony w Core i7-12700H i GeForce RTX 3050 Ti w tym artykule znajdą Państwo krótkie objaśnienia dotyczące obudowy, funkcji i kategorii urządzeń wejściowych.
Potencjalni konkurenci w porównaniu
Ocena | Data | Model | Waga | Wysokość | Rozmiar | Rezolucja | Cena |
|---|---|---|---|---|---|---|---|
| 84 % v7 (old) | 02/2024 | HP Victus 15-fa1057ng i5-13500H, GeForce RTX 4050 Laptop GPU | 2.3 kg | 24 mm | 15.60" | 1920x1080 | |
| 81 % v7 (old) | 01/2023 | HP Victus 15 fa0020nr i7-12700H, GeForce RTX 3050 Ti Laptop GPU | 2.3 kg | 23.6 mm | 15.60" | 1920x1080 | |
| 84.7 % v7 (old) | 01/2024 | Dell G15 5530, i5-13450HX RTX 4050 i5-13450HX, GeForce RTX 4050 Laptop GPU | 2.7 kg | 27 mm | 15.60" | 1920x1080 | |
| 82.8 % v7 (old) | 01/2024 | Acer Nitro V 15 ANV15-51-582S i5-13420H, GeForce RTX 4050 Laptop GPU | 2.1 kg | 23.5 mm | 15.60" | 1920x1080 | |
| 86.3 % v7 (old) | 06/2023 | Asus TUF A15 FA507 R7 7735HS, GeForce RTX 4050 Laptop GPU | 2.2 kg | 24.9 mm | 15.60" | 1920x1080 |
Sprawa
Klienci otrzymują solidną plastikową obudowę, co jest powszechne w tej kategorii cenowej, choć może ona wykazywać pewne grzechotanie w niektórych obszarach i brakuje jej wysokiej jakości dźwięku i dotyku. Przeprojektowanie lub optymalizacja może być korzystna dla nieco chwiejnych zawiasów. Ogólna stabilność jest podobna. Przede wszystkim, przy wywieraniu większego nacisku, podpórka pod nadgarstki może się znacznie ugiąć. Victus 15 ma piękną estetykę, która łączy w sobie subtelne i zabawne cechy konstrukcyjne. Wymiary i waga mieszczą się w średnim zakresie, choć nie są szczególnie godne uwagi w porównaniu do konkurencji.

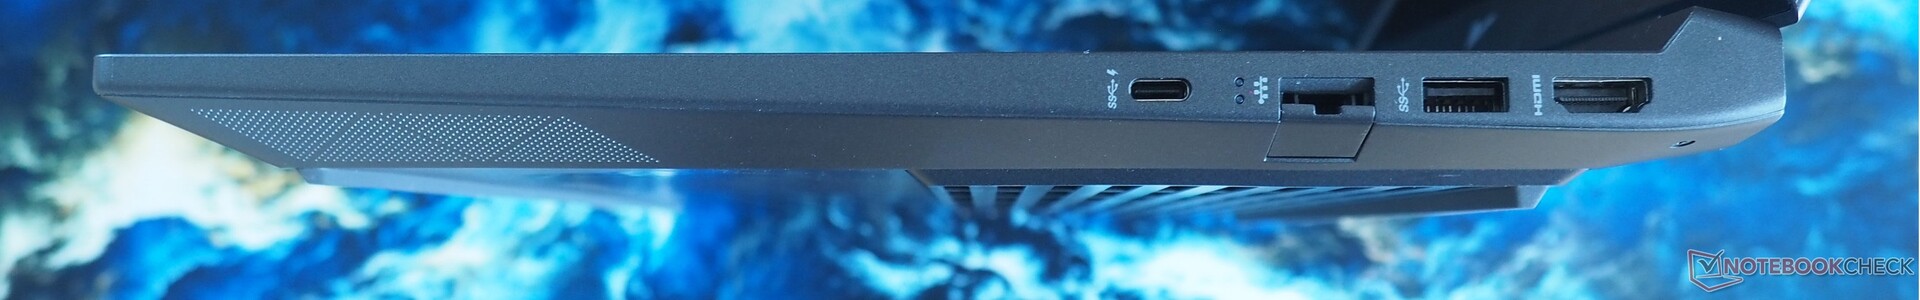
Łączność
Zakres łączności wywołuje różne reakcje. Podczas gdy brak czytnika kart jest godny uwagi, HP idzie na kompromis w kwestii współczesnych portów USB. Dostępne porty USB (2x Type-A, 1x Type-C wraz z DisplayPort) są ograniczone do 5 Gbit/s. Na szczęście port HDMI jest określony przez producenta jako wersja 2.1. Dodatkowo obecne jest gniazdo audio i port RJ45 (ograniczony do 1 Gbit LAN zamiast 2,5). Dzięki umieszczeniu większości złączy w tylnej części obudowy, korzystanie z myszki nie nastręcza żadnych trudności.
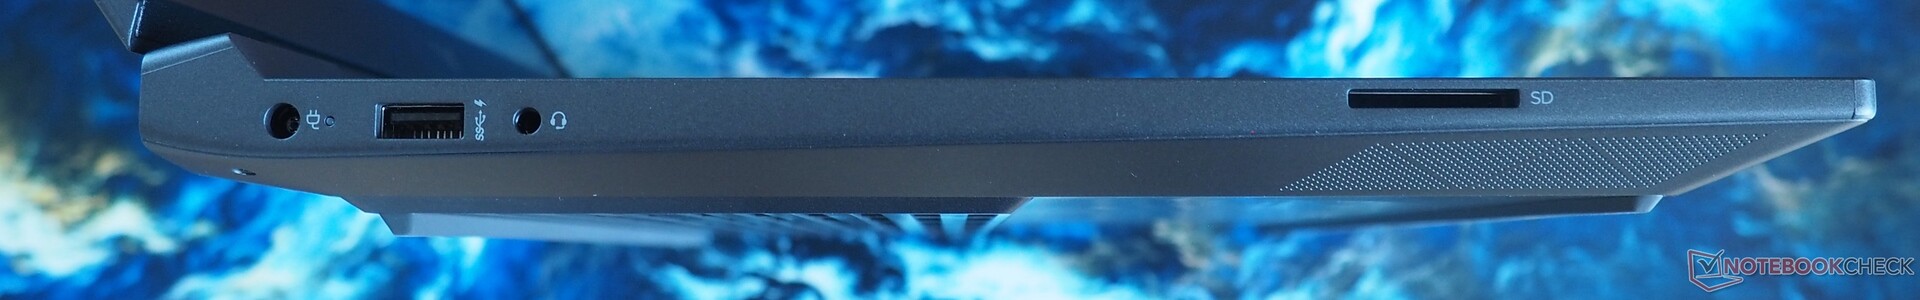
Czytnik kart SD
Szybkość czytnika kart mieści się w średnim zakresie. Odnotowaliśmy niezawodne 80 MB/s podczas przesyłania wielu obrazów jpg.
| SD Card Reader - average JPG Copy Test (av. of 3 runs) | |
| Średnia w klasie Gaming (20.9 - 210, n=54, ostatnie 2 lata) | |
| HP Victus 15-fa1057ng (AV PRO microSD 128 GB V60) | |
| HP Victus 15 fa0020nr (Toshiba Exceria Pro SDXC 64 GB UHS-II) | |
Komunikacja
Wydajność Wi-Fi jest nieco niewystarczająca. Podczas naszego testu zasięgu, w odległości 3,28 stopy od routera referencyjnego, zintegrowany moduł MediaTek zajął ostatnie miejsce w polu porównawczym.
Kamera internetowa
Wydajność kamery internetowej 720p nie jest wyjątkowa, pozostawiając miejsce na poprawę, szczególnie pod względem ostrości obrazu.


Akcesoria
Do laptopa dołączono kilka broszur informacyjnych i niezbyt duży 200-watowy zasilacz.
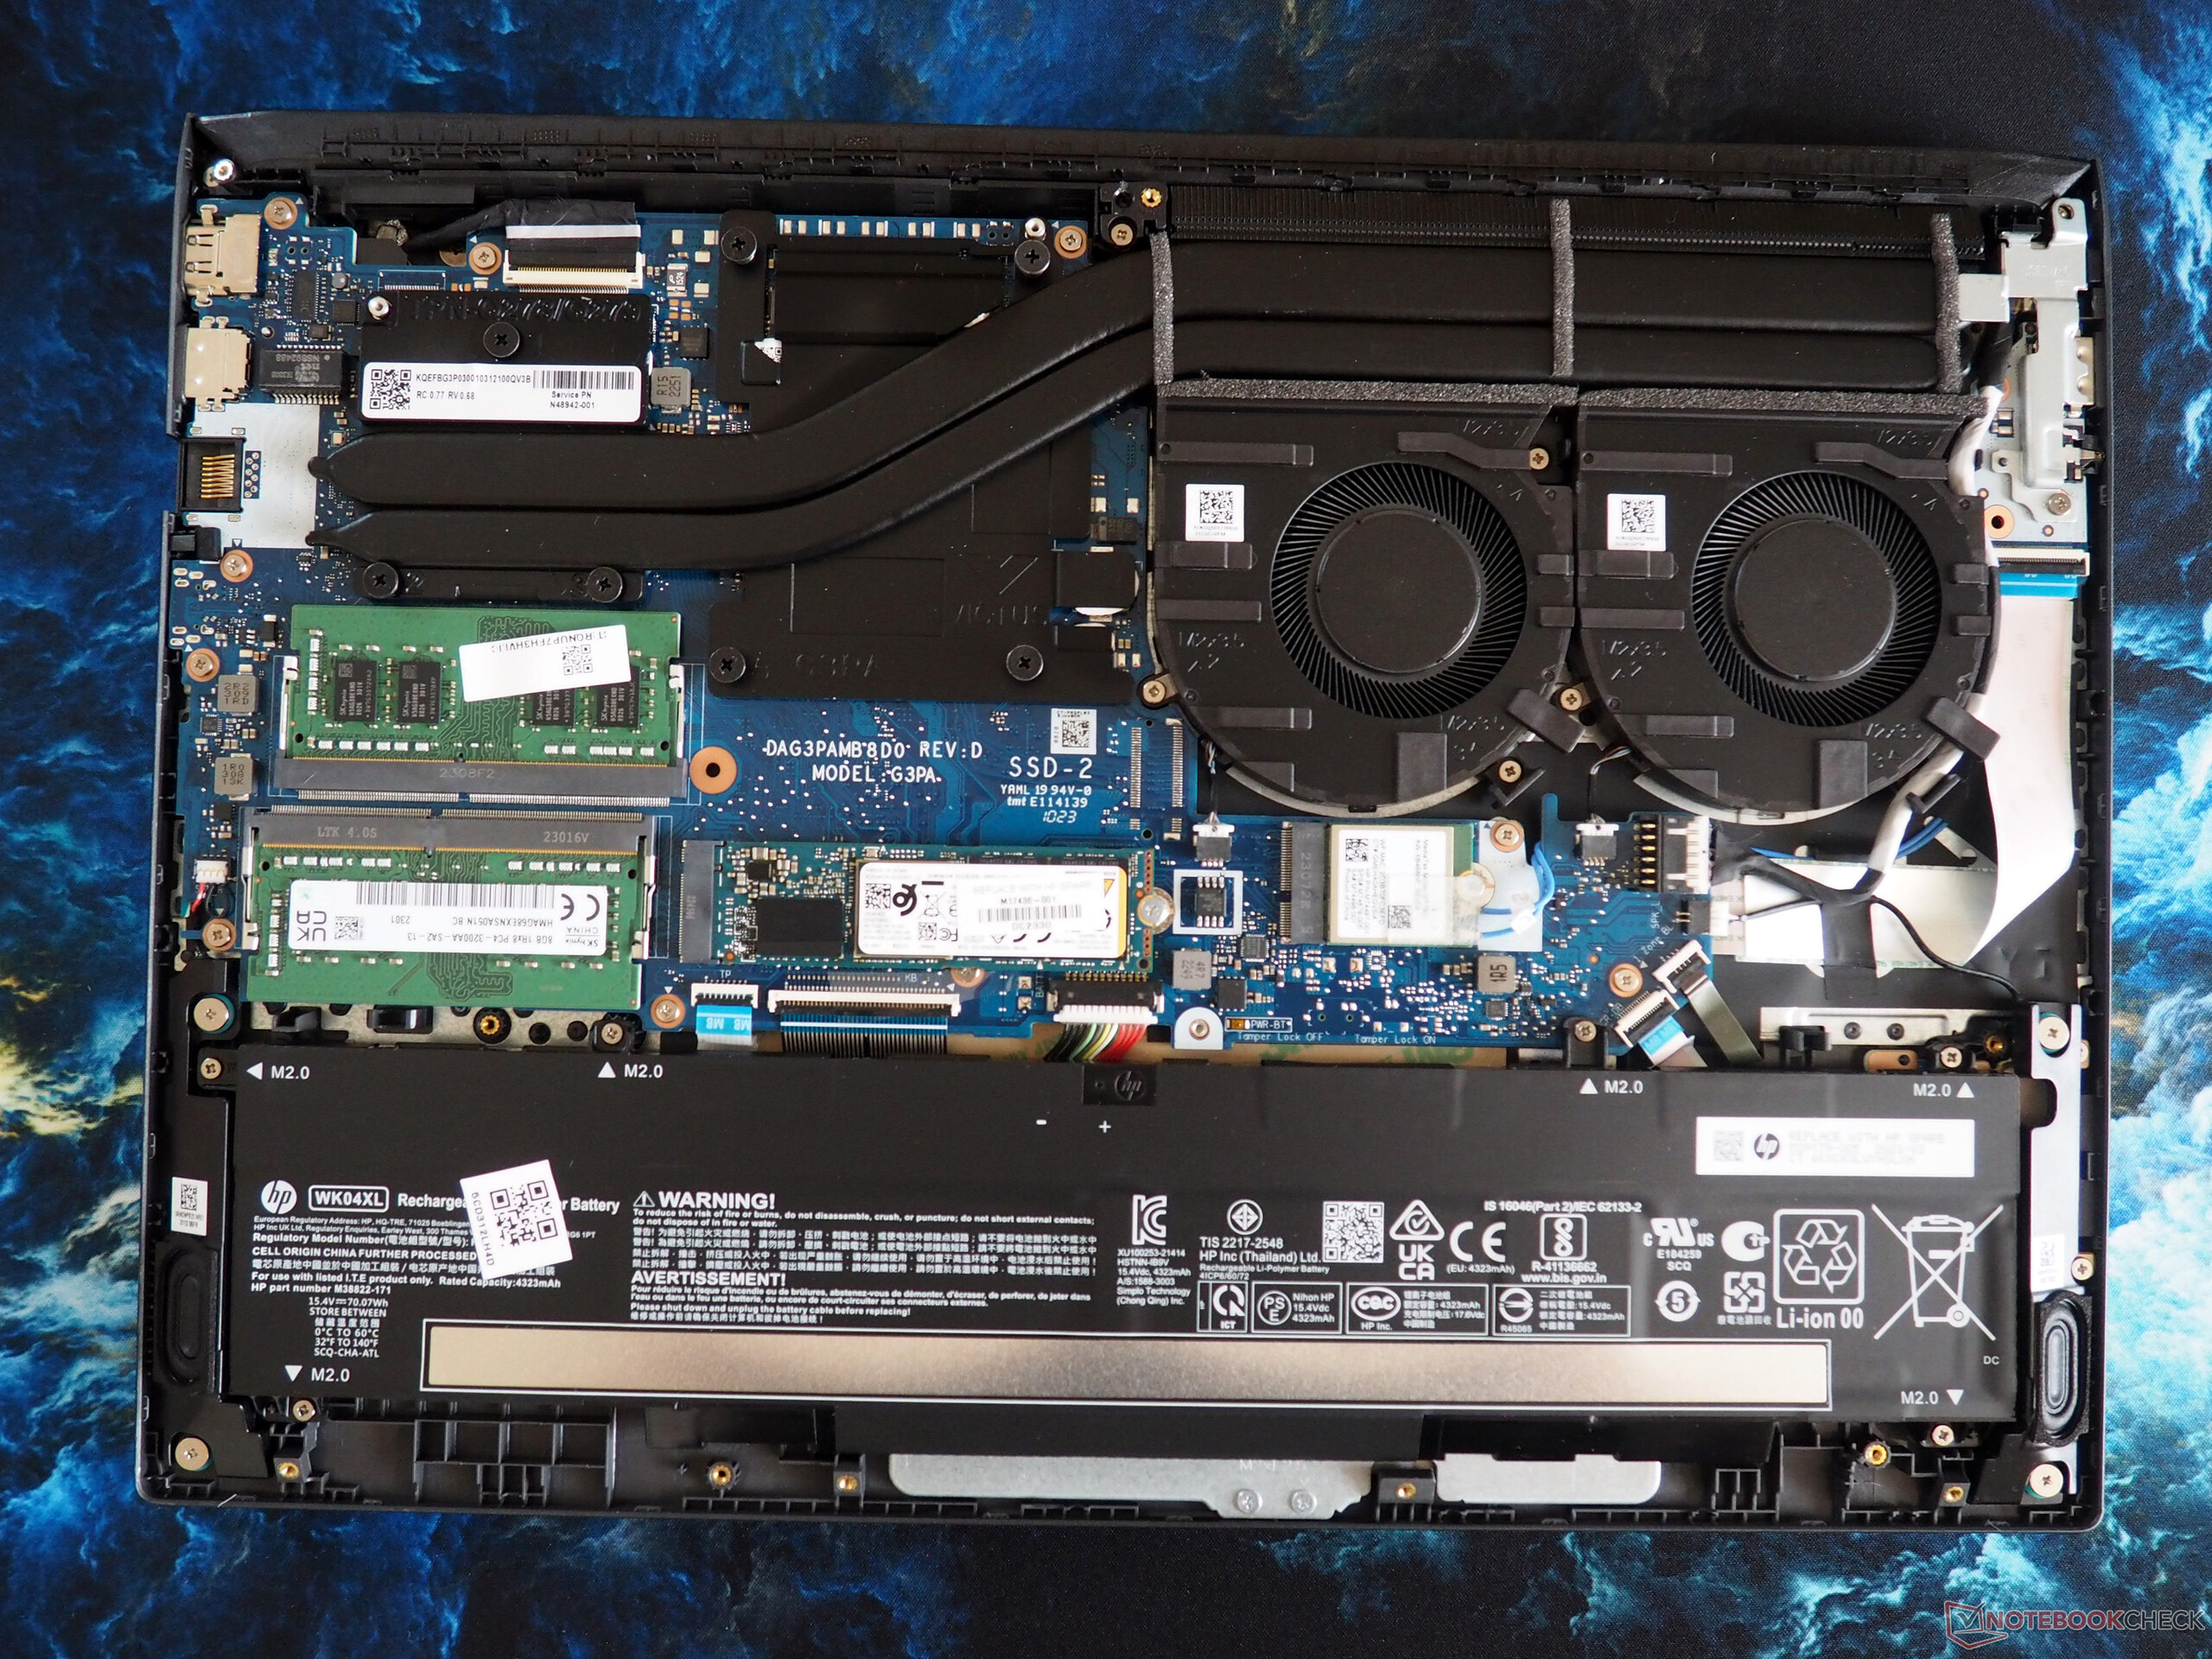
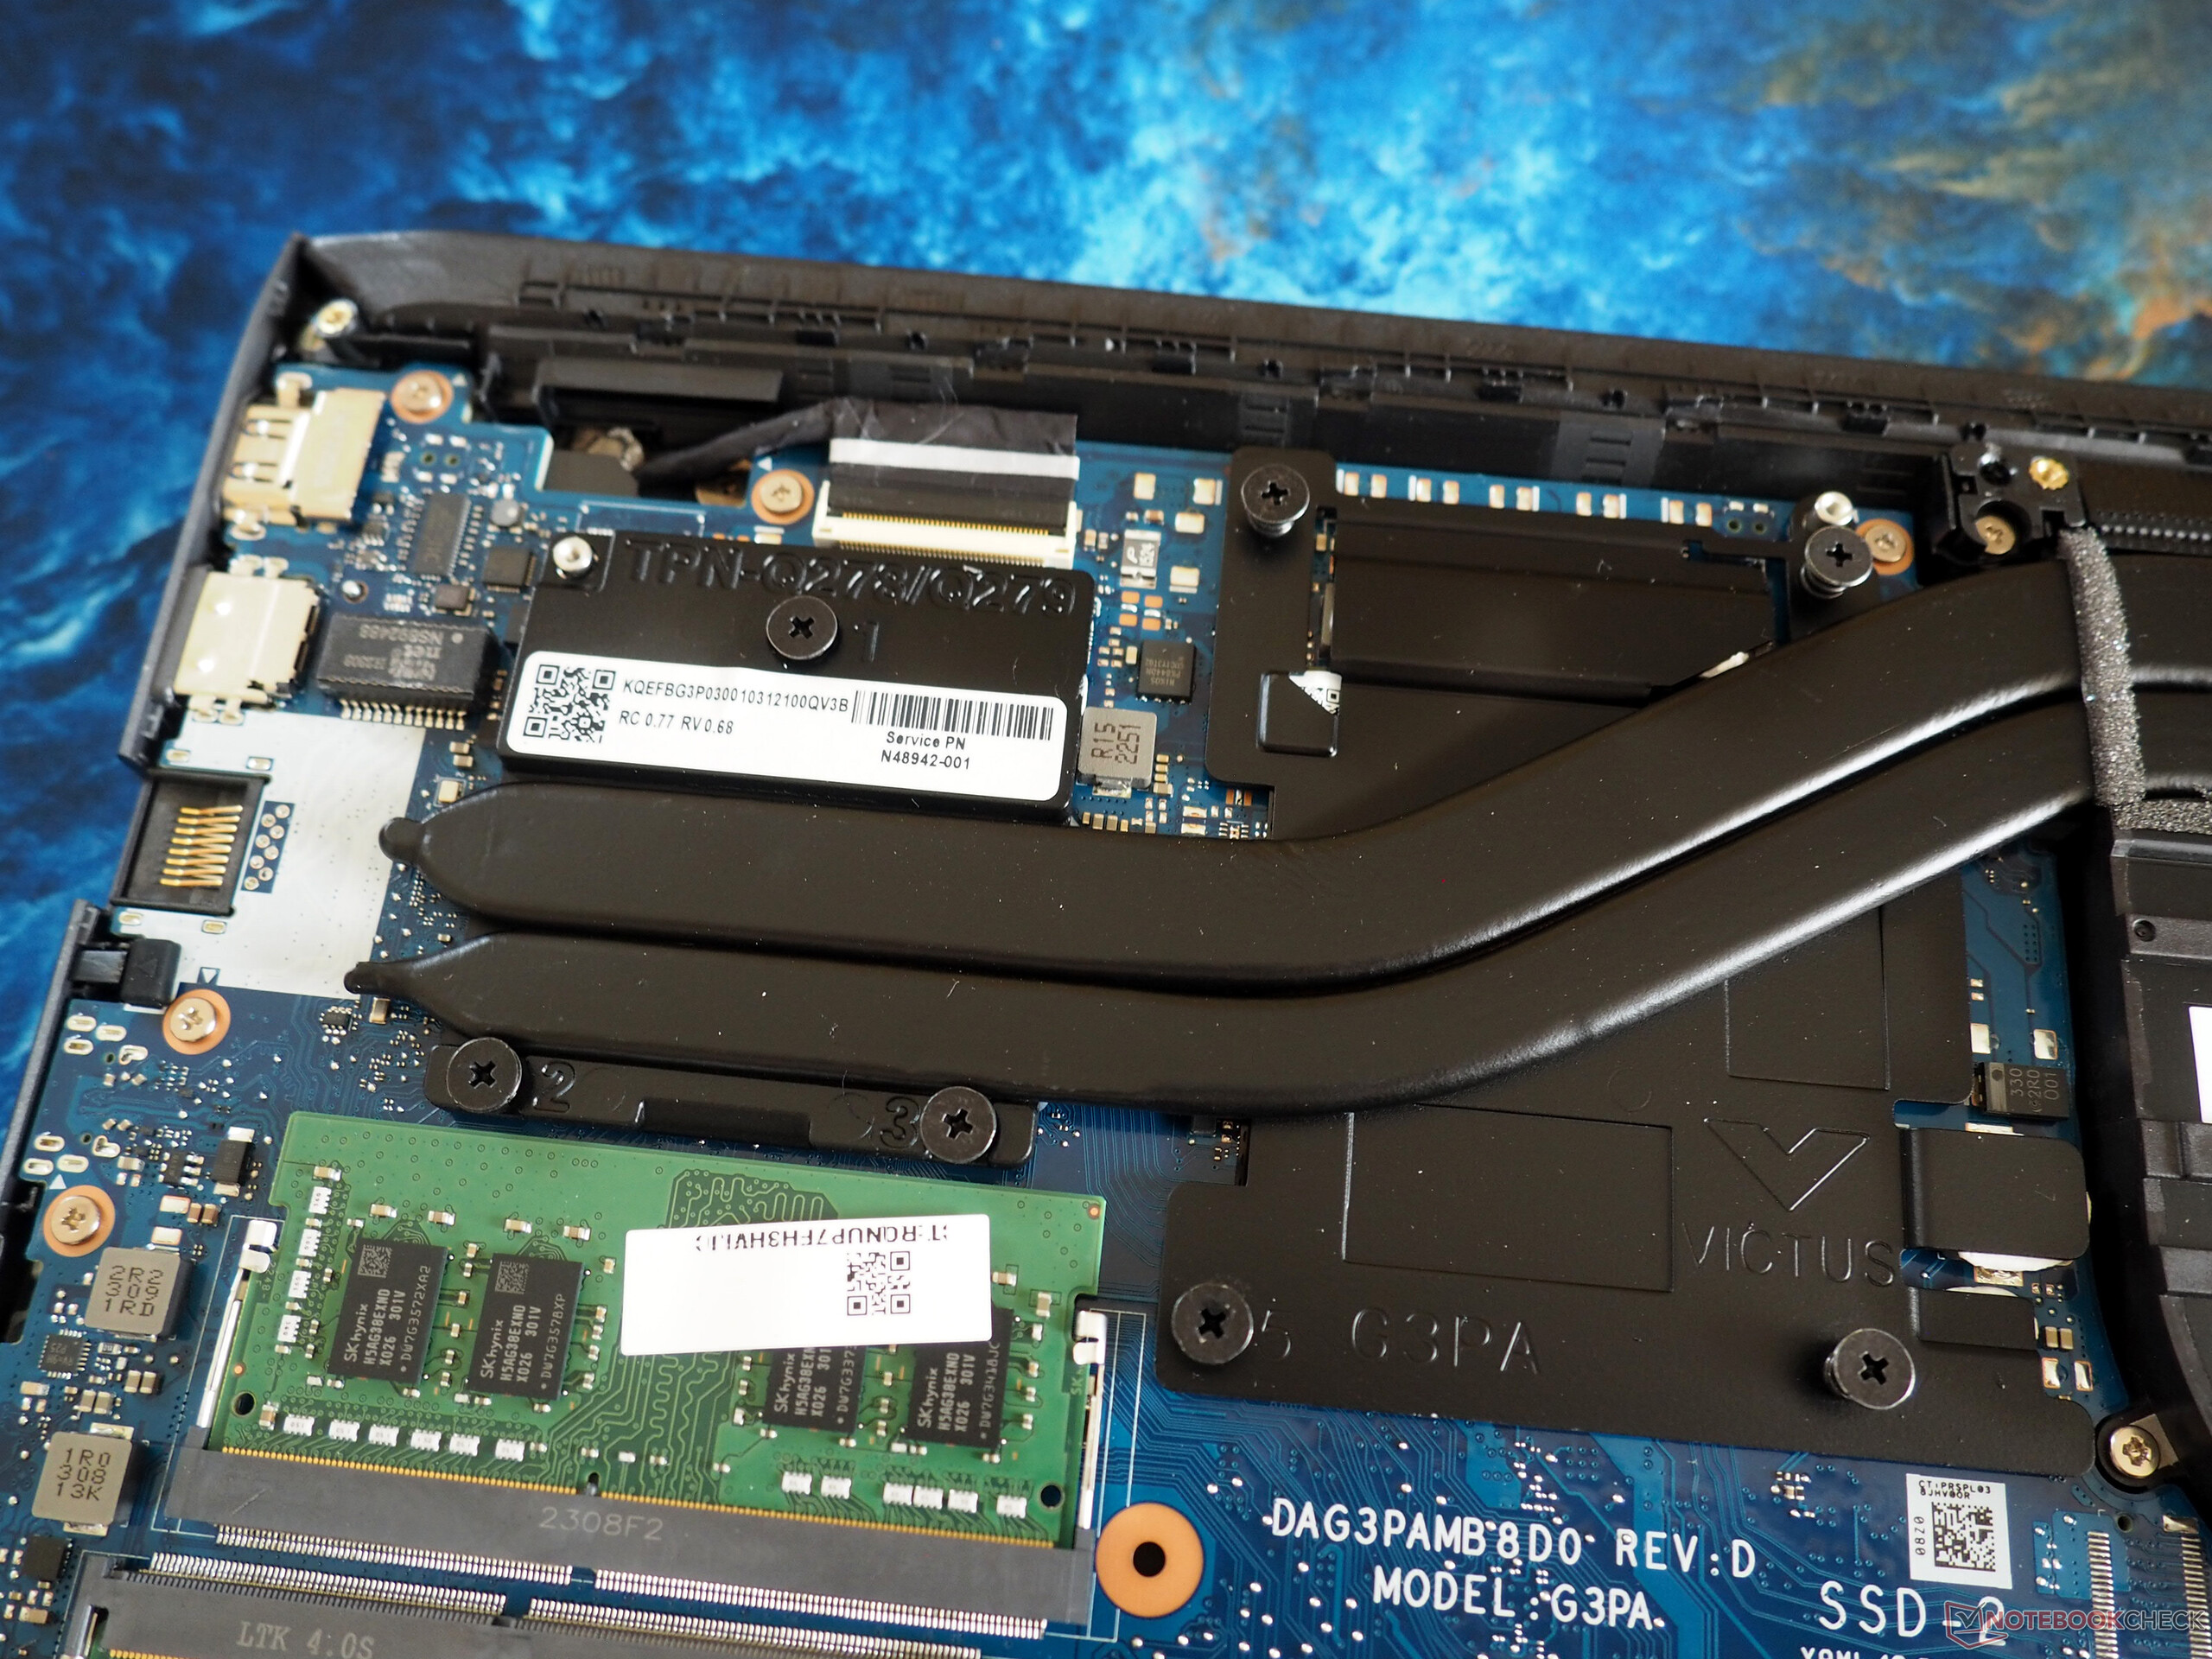
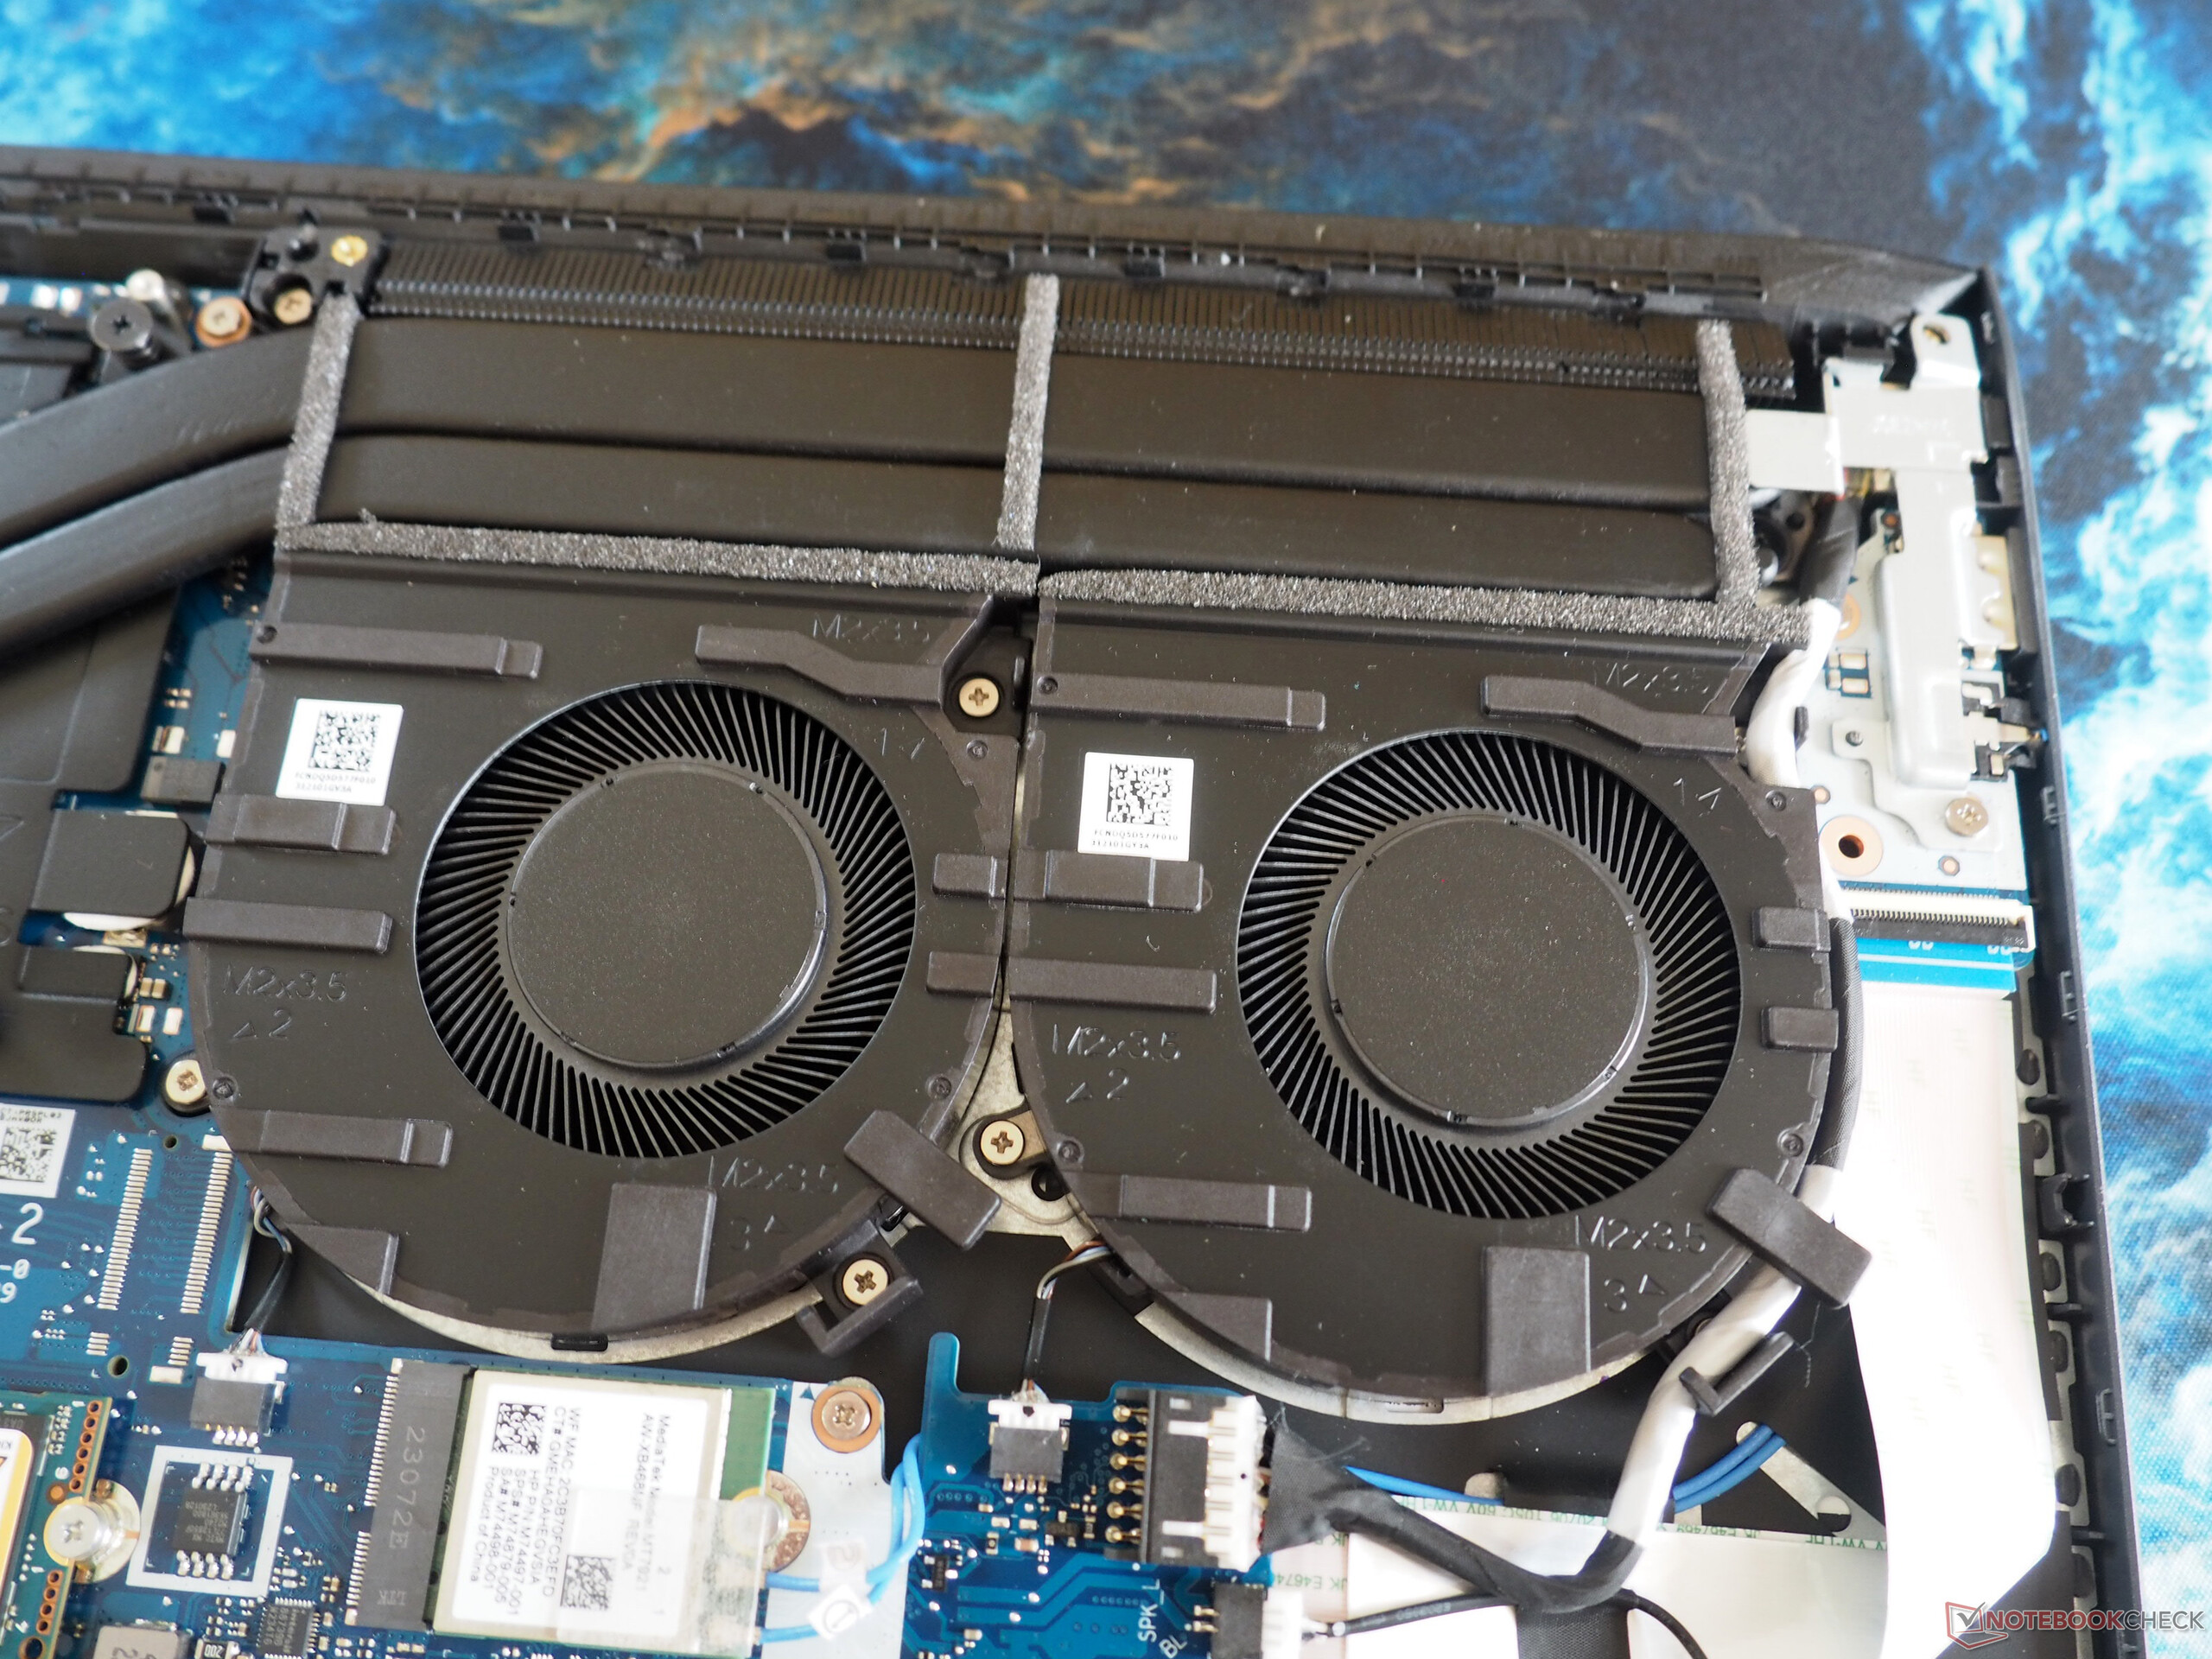
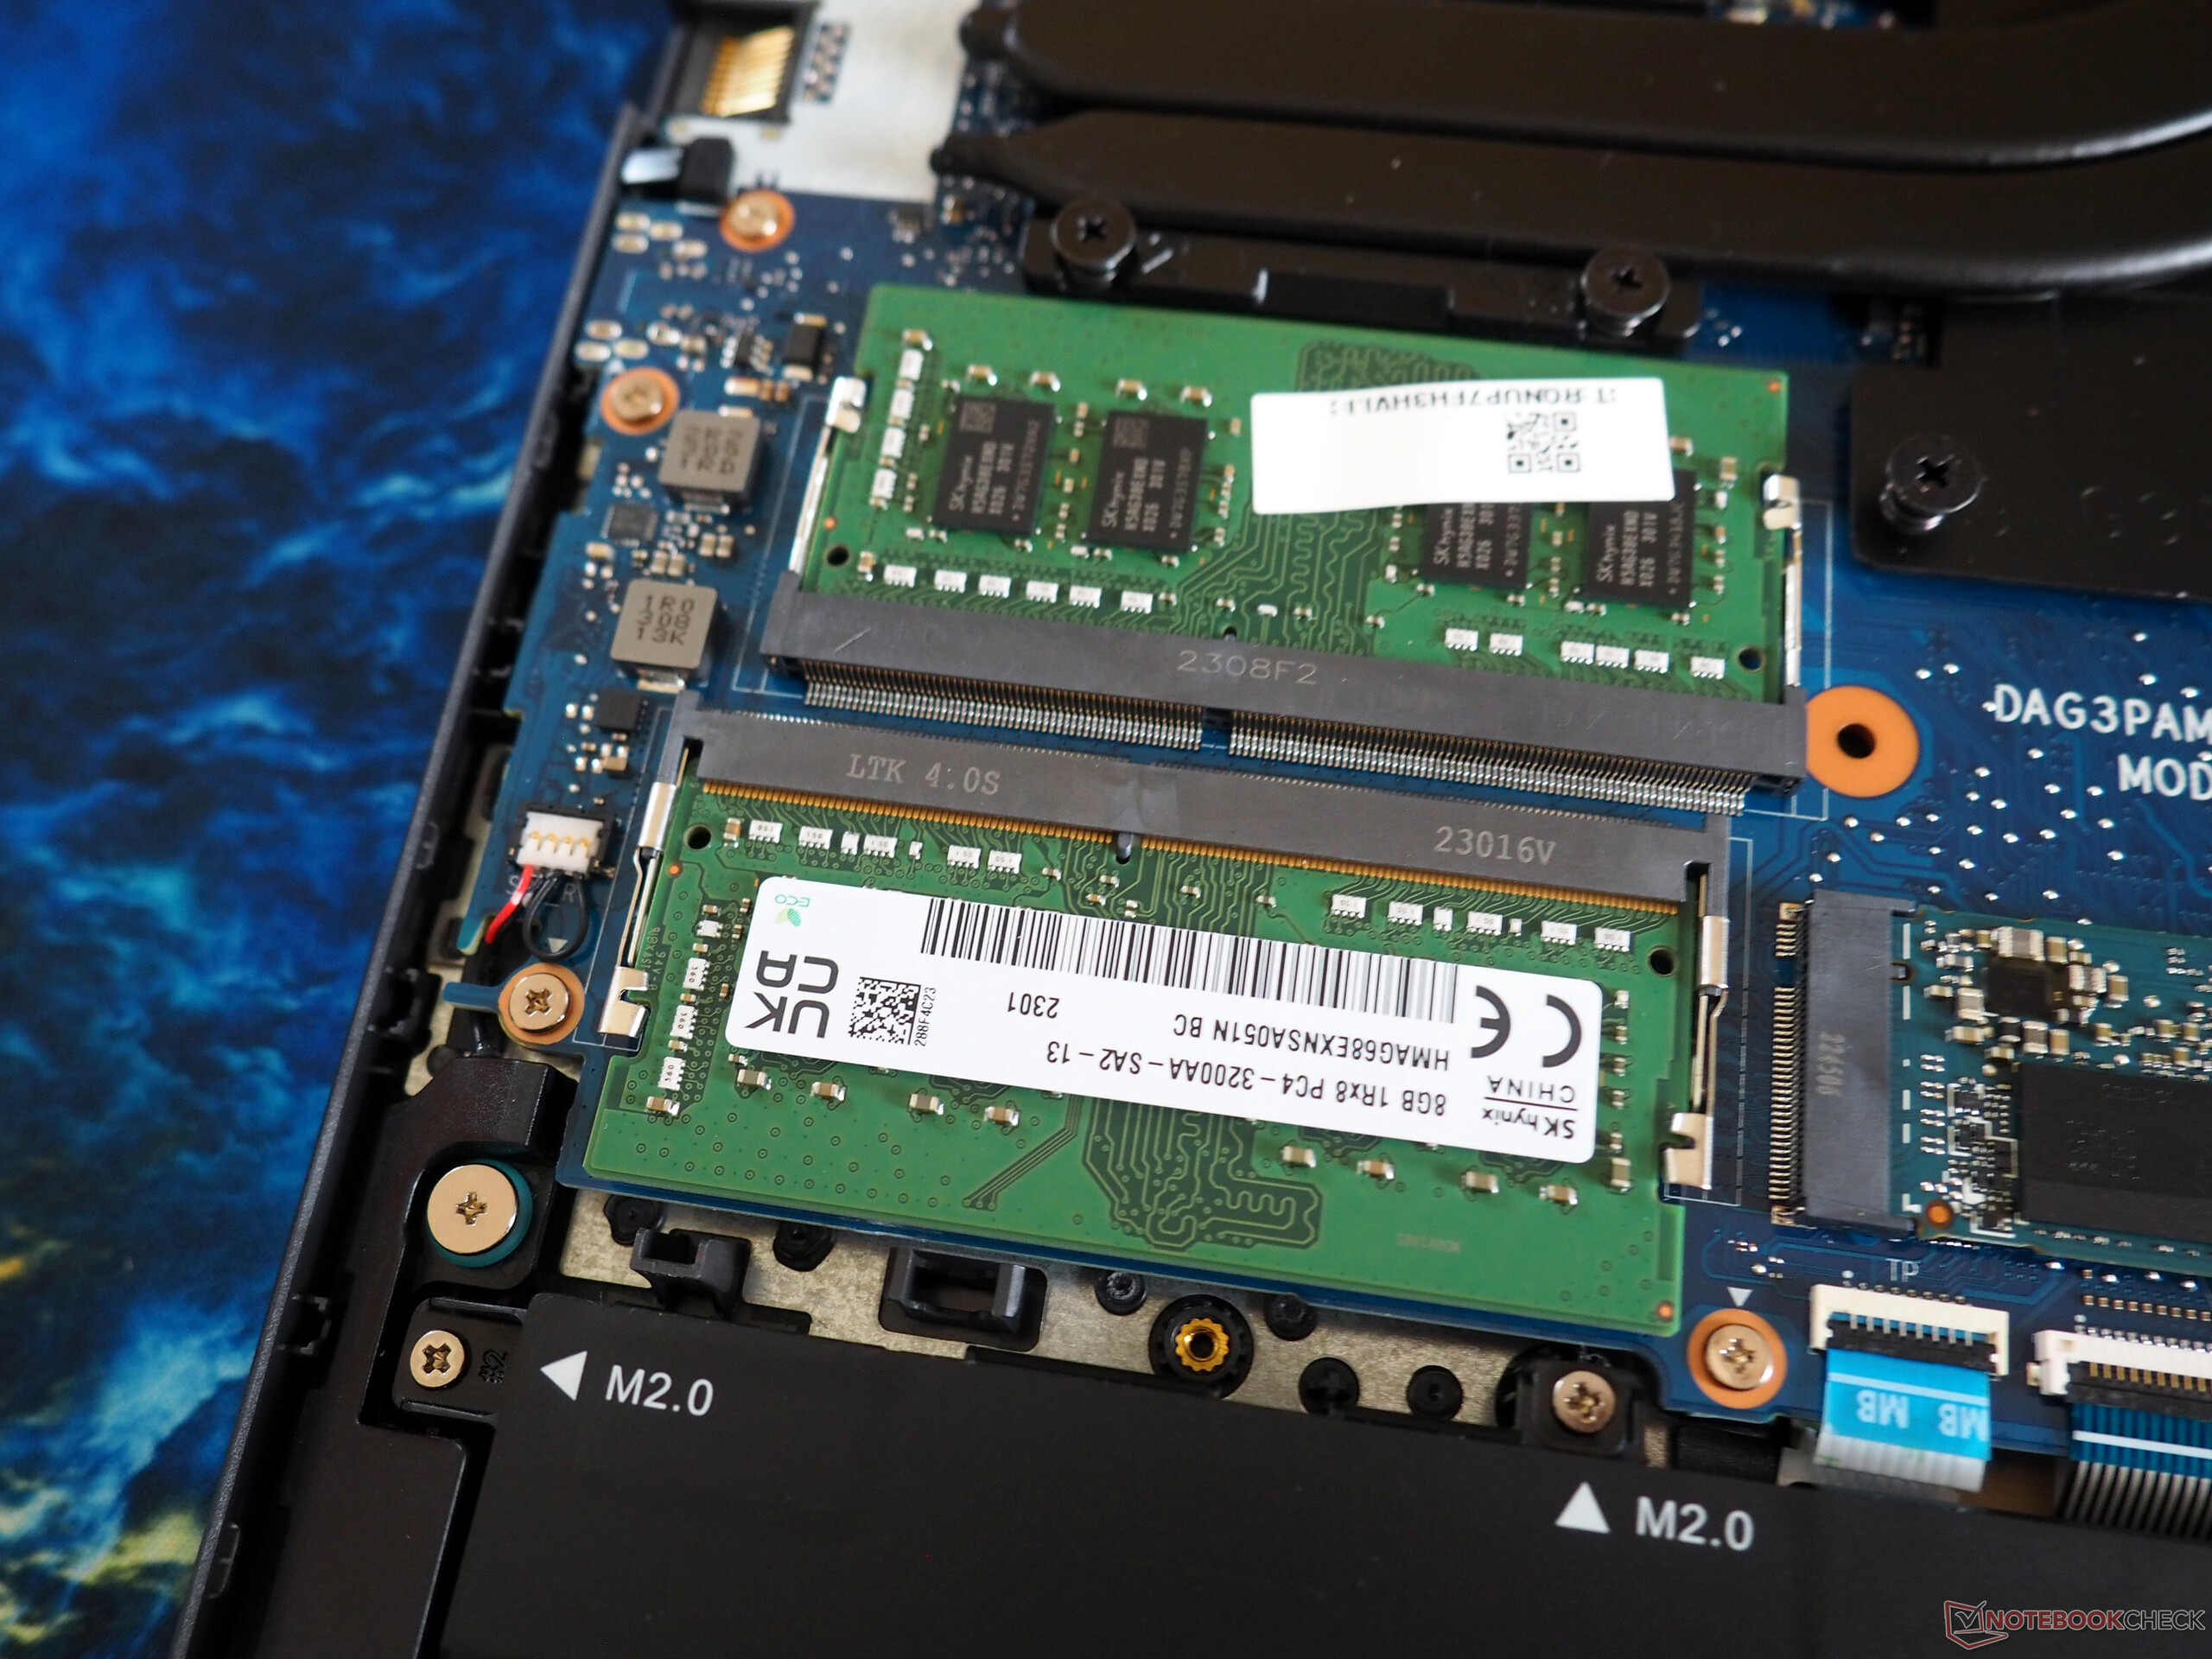
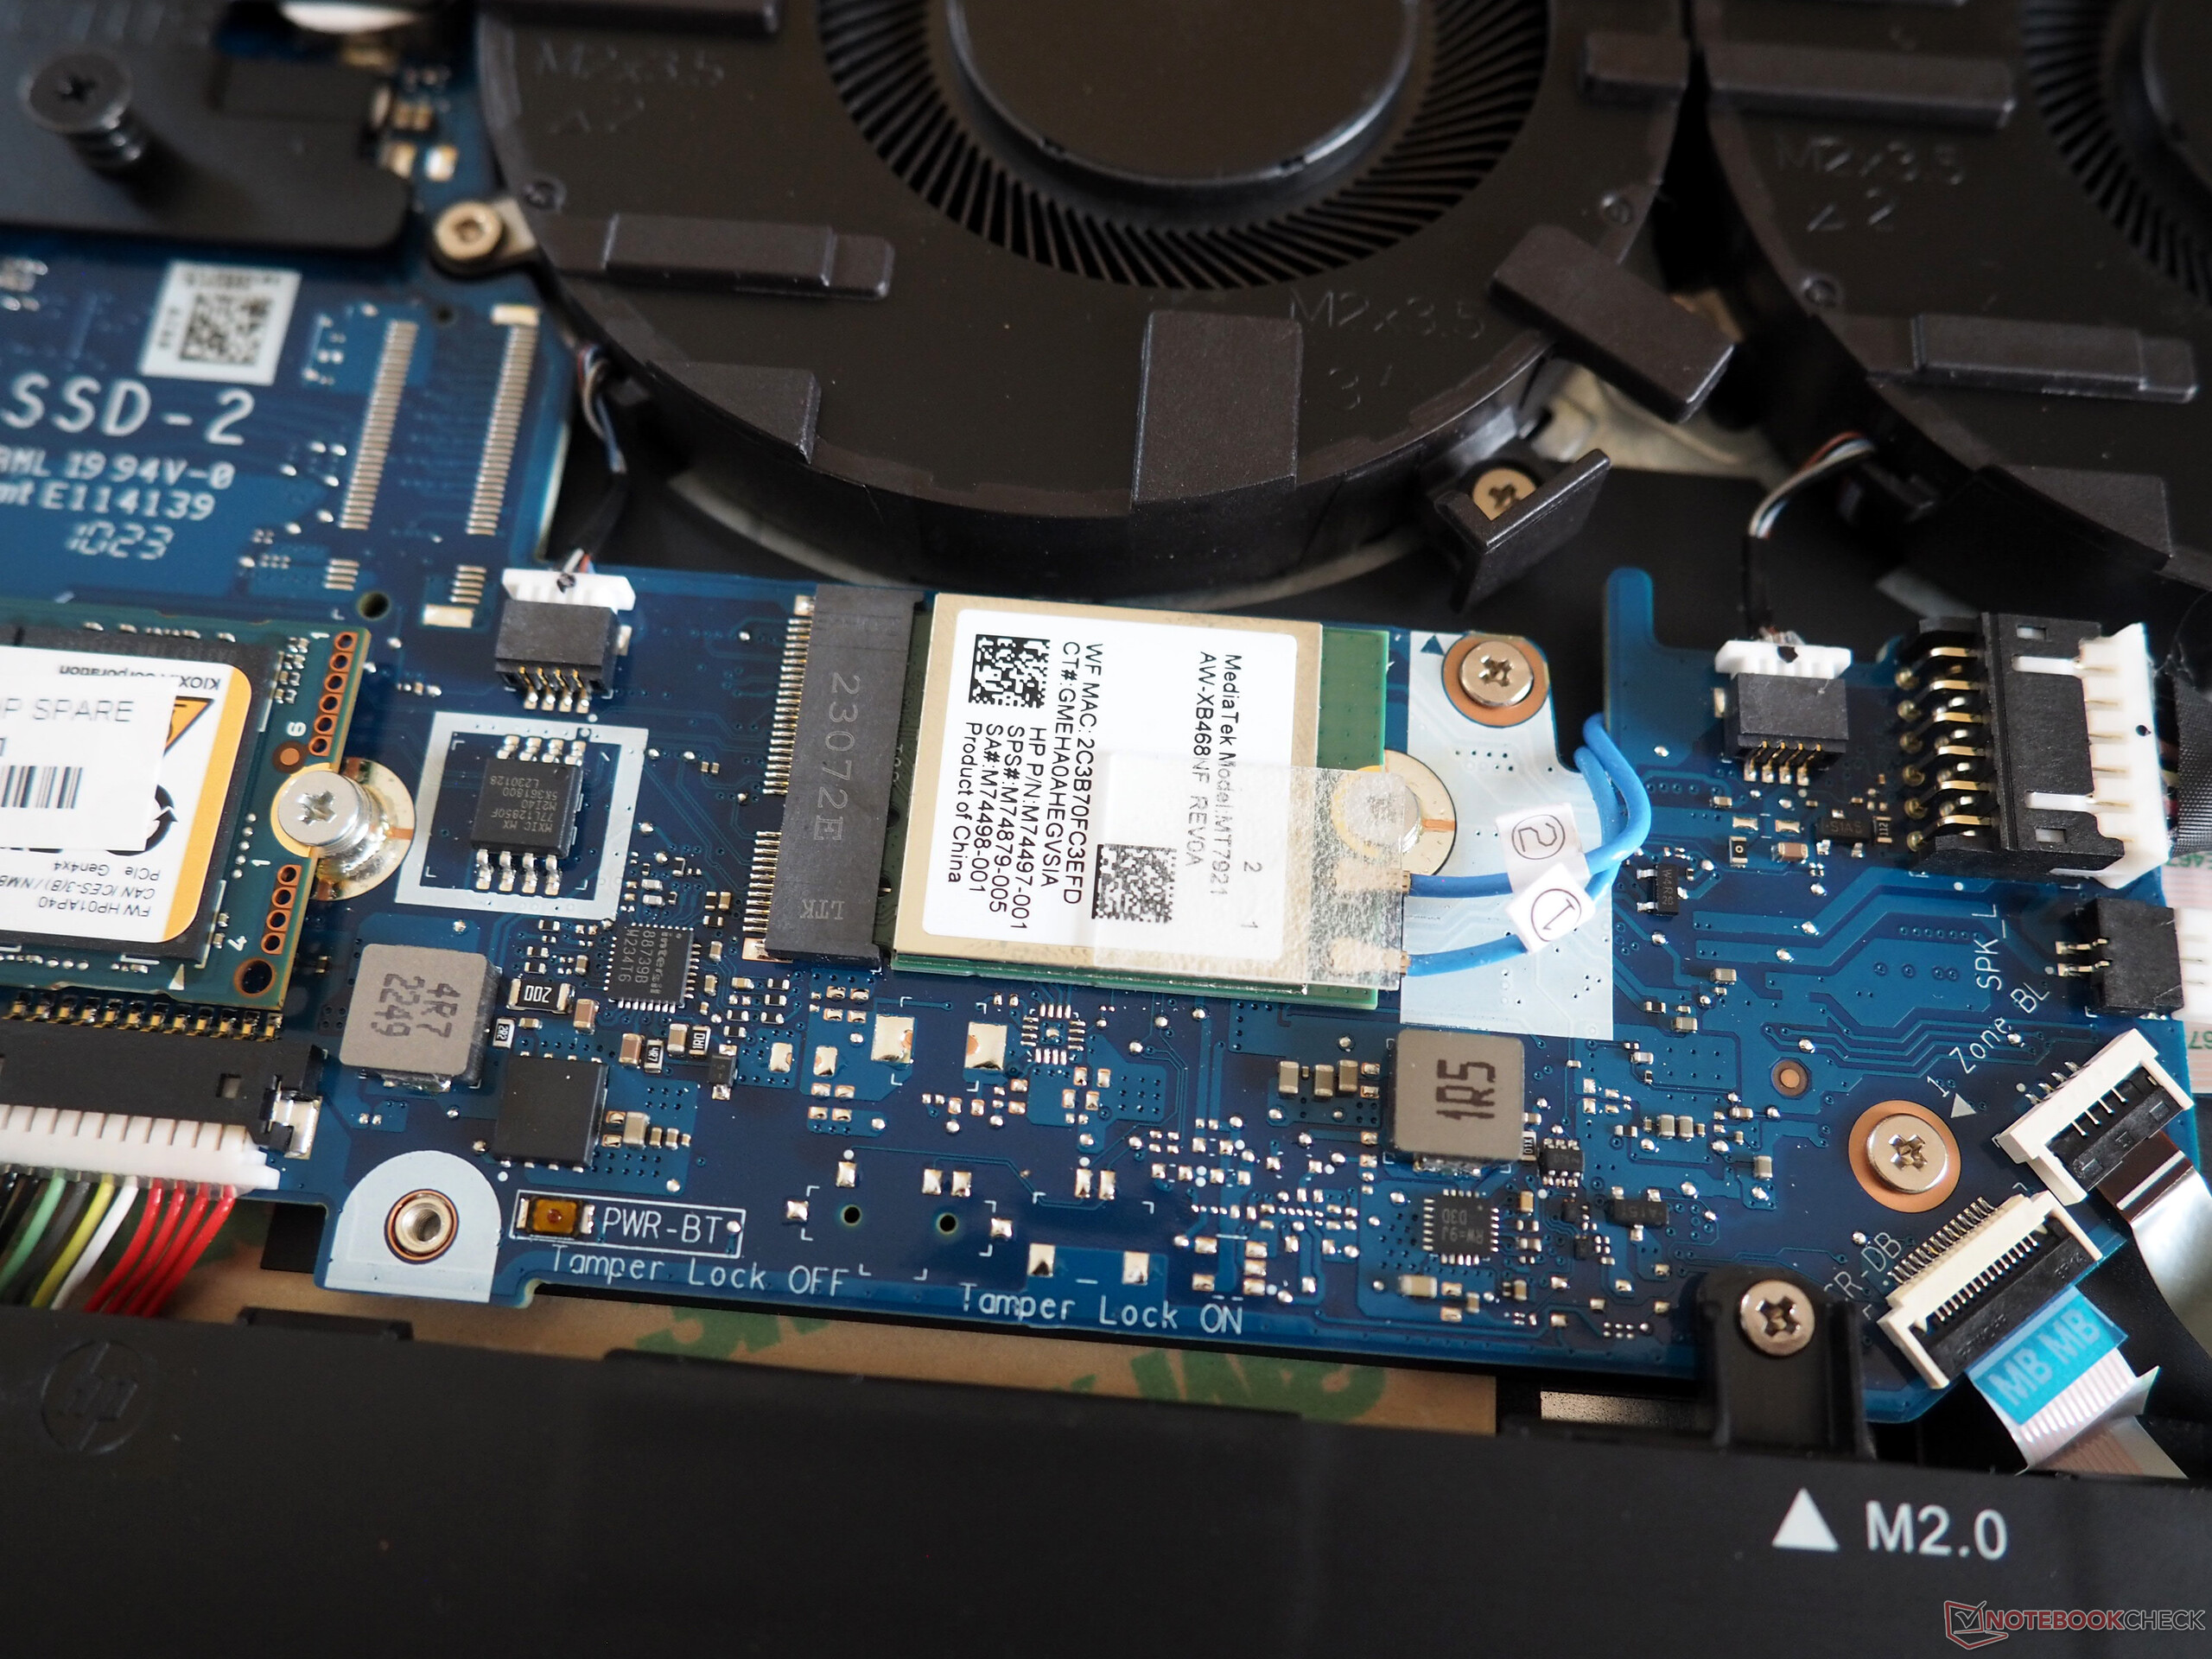
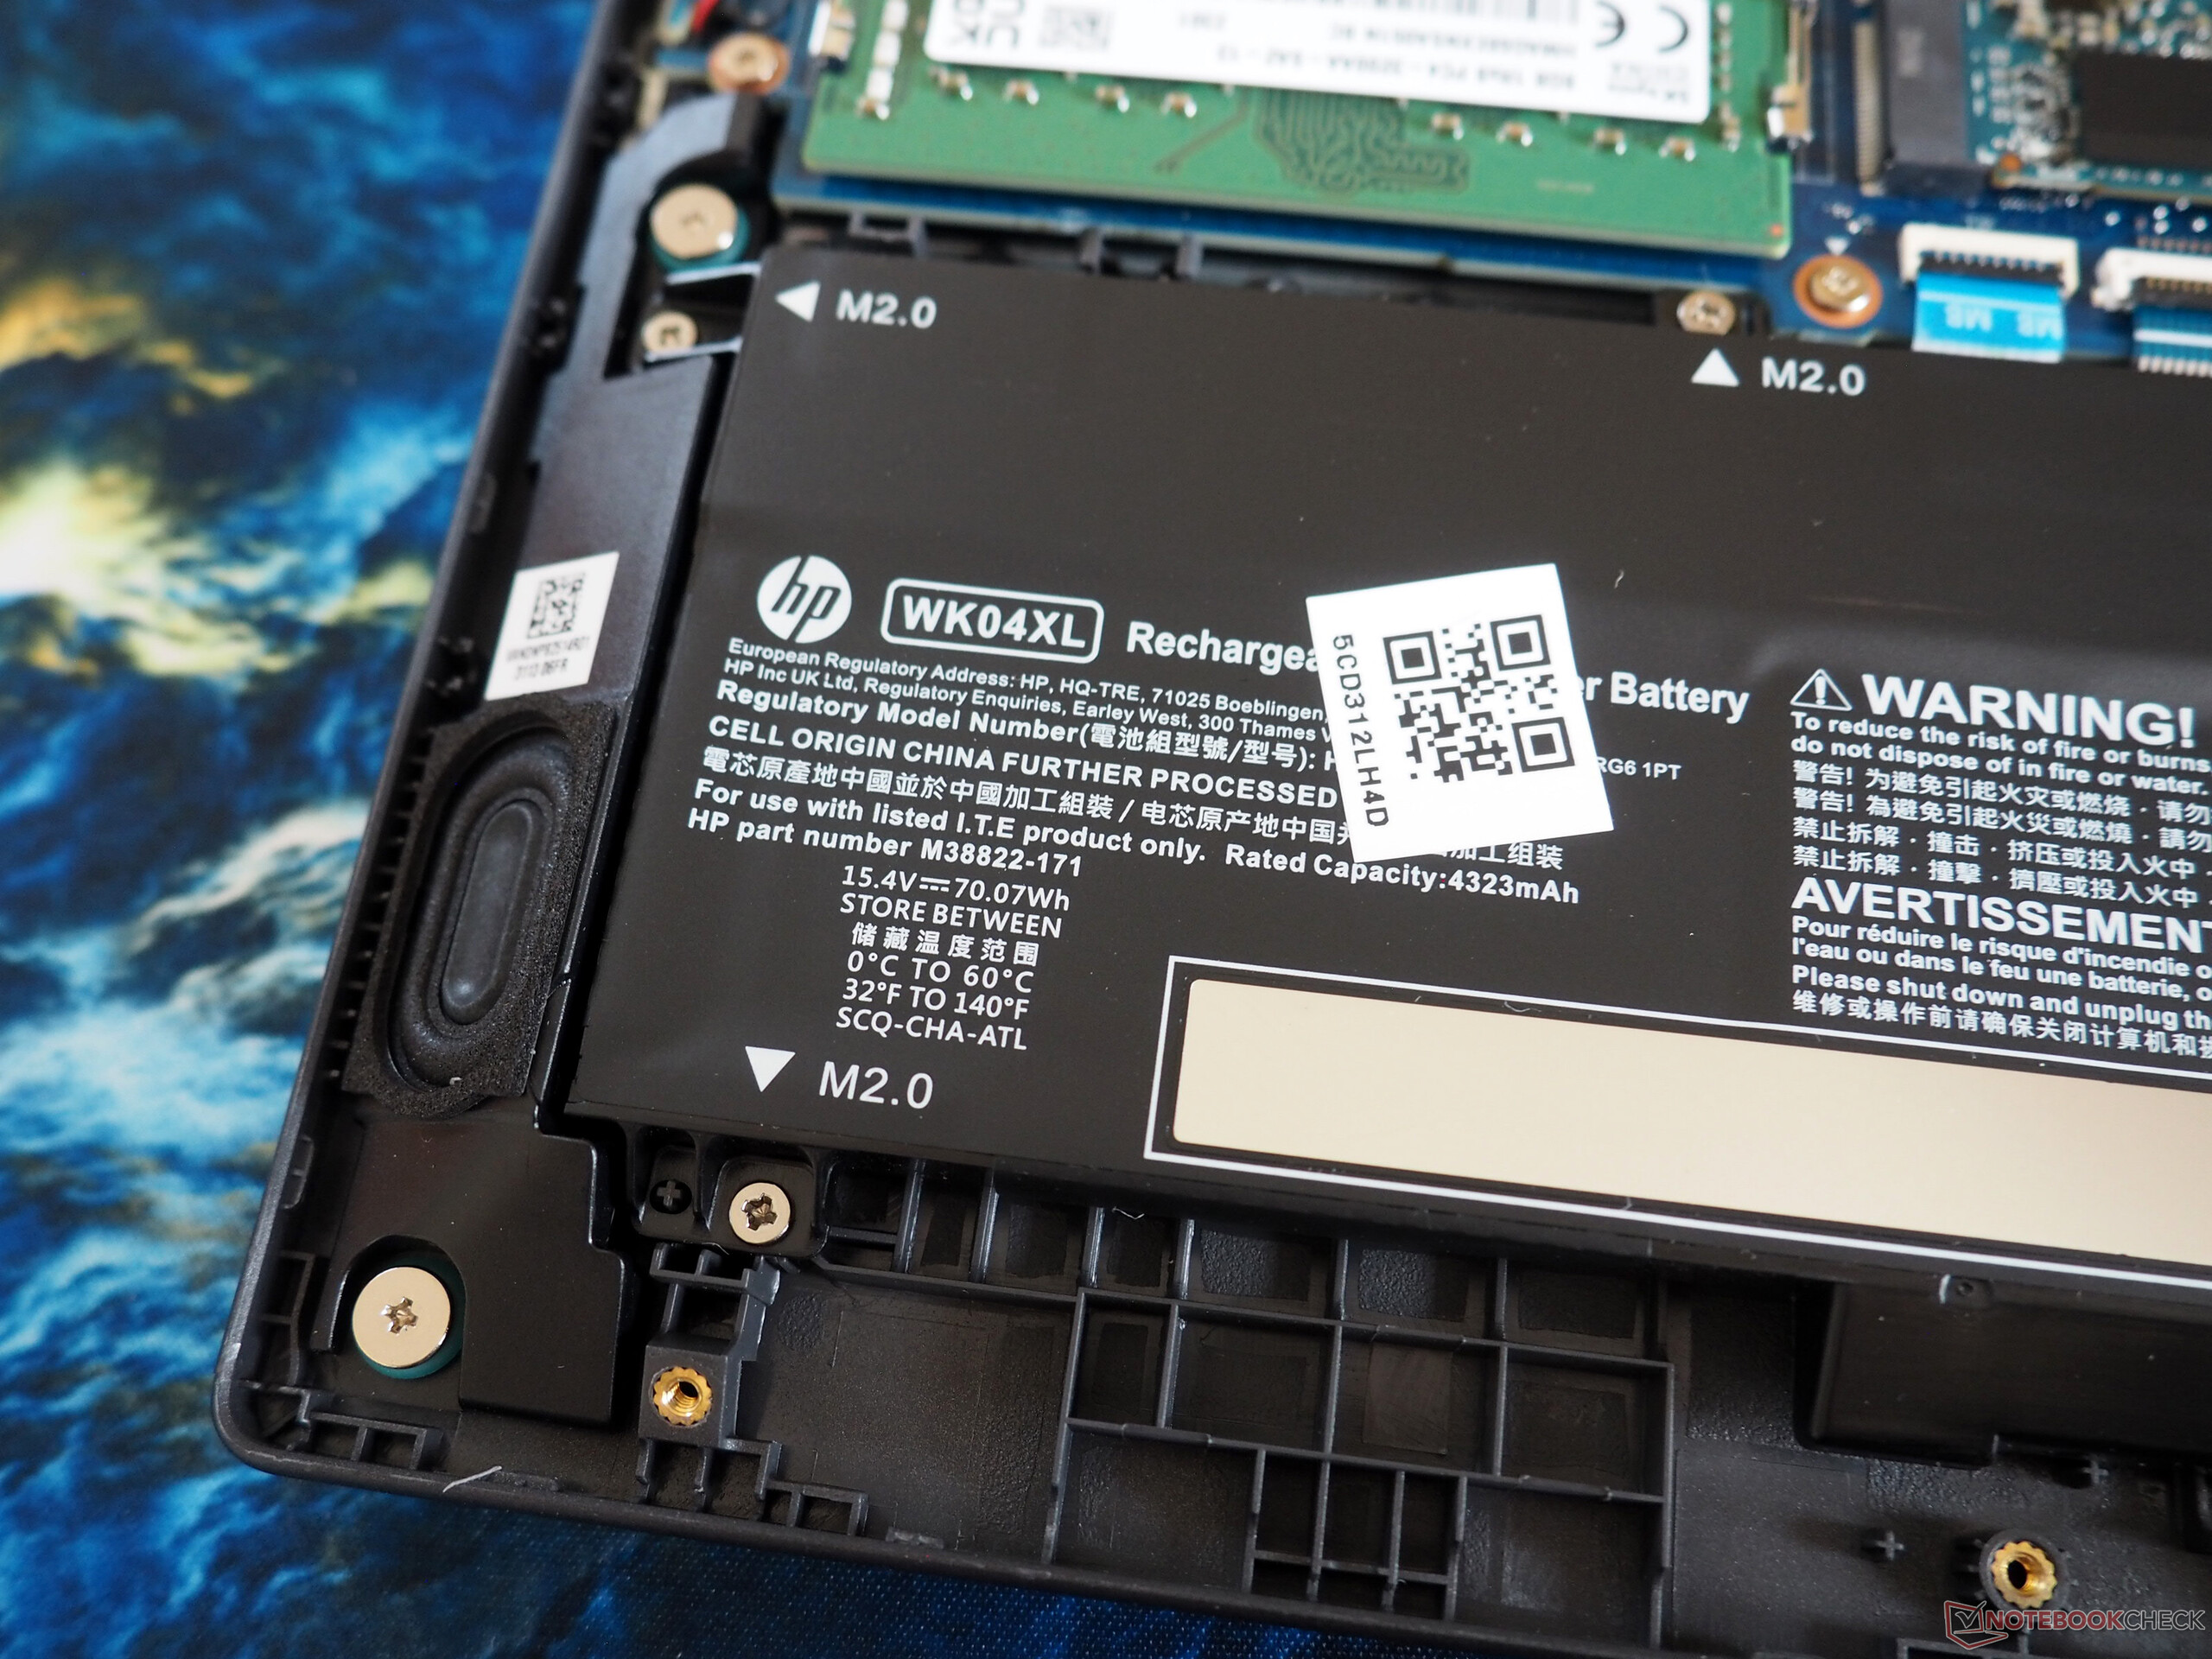
Konserwacja
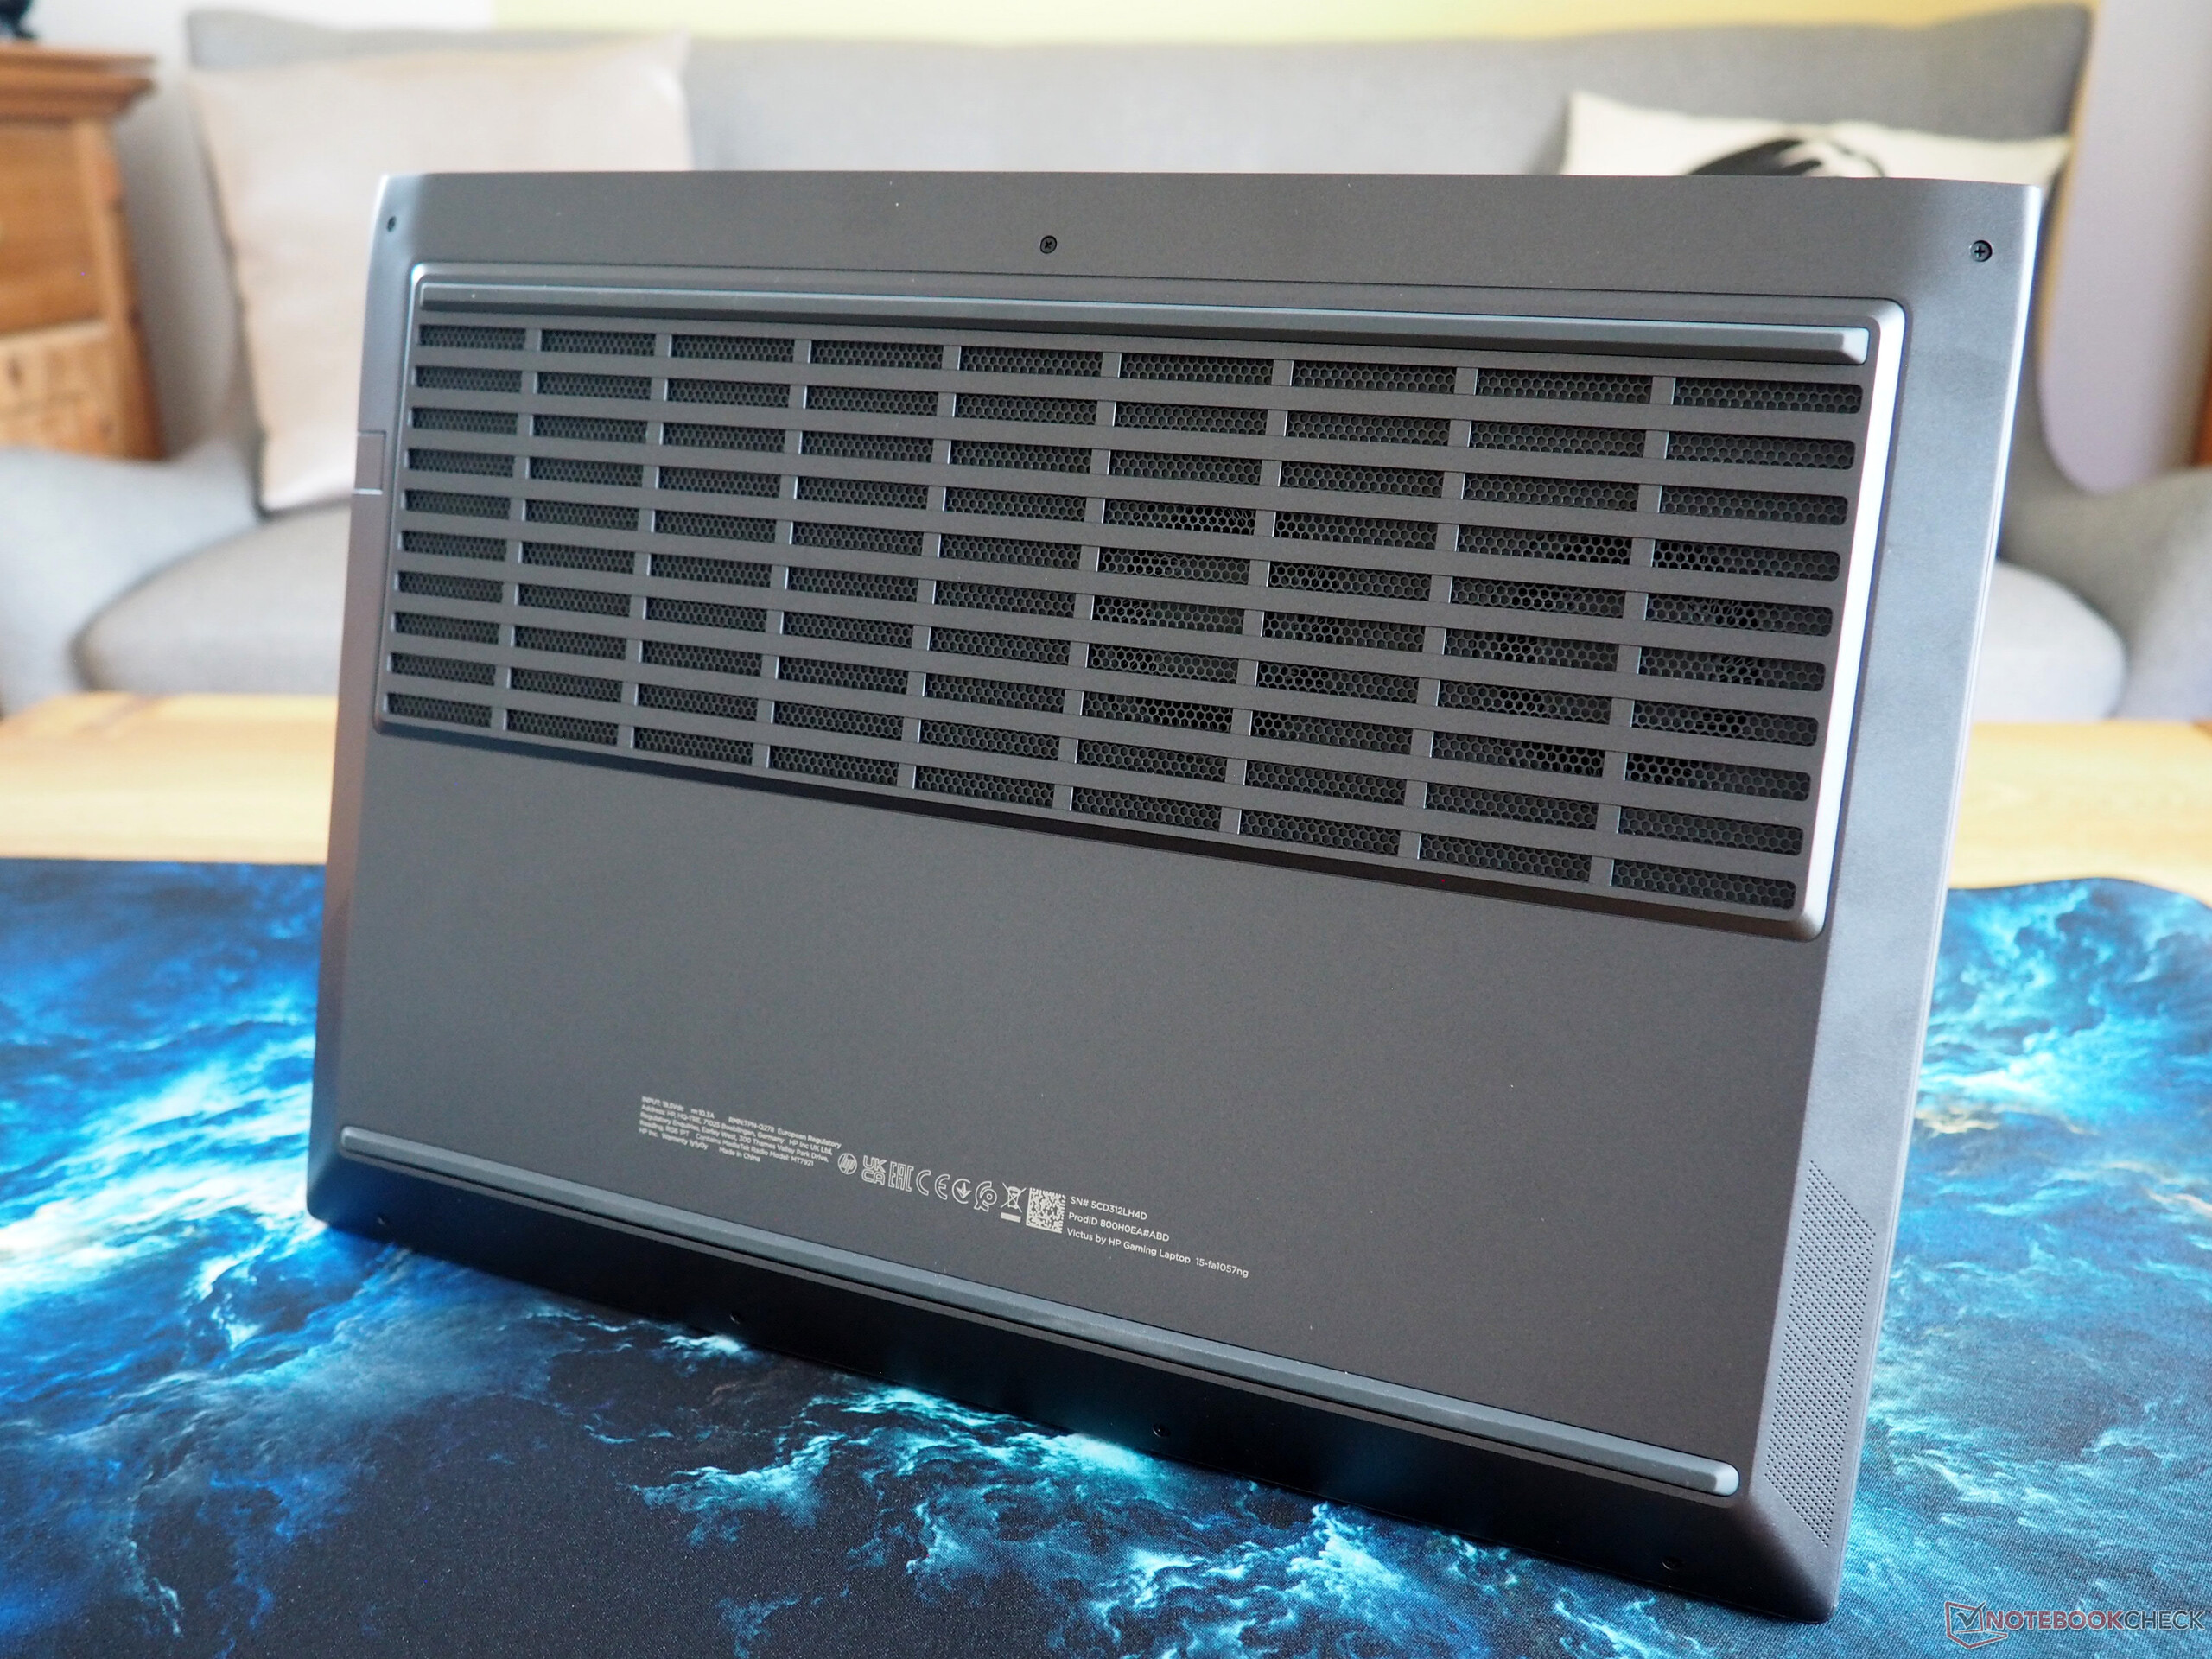
Podczas konserwacji należy zachować pewną ostrożność. Podczas gdy śruby krzyżakowe na płycie bazowej można usunąć stosunkowo szybko, poluzowanie klipsów mocujących okazuje się nieco trudne, nawet przy użyciu odpowiedniego narzędzia. Zdjęcia przedstawiają wnętrze obudowy, a wszystkie istotne elementy są dostępne.
Gwarancja
Gwarancja obejmuje tylko 12 miesięcy.
Urządzenia wejściowe
Klawiatura
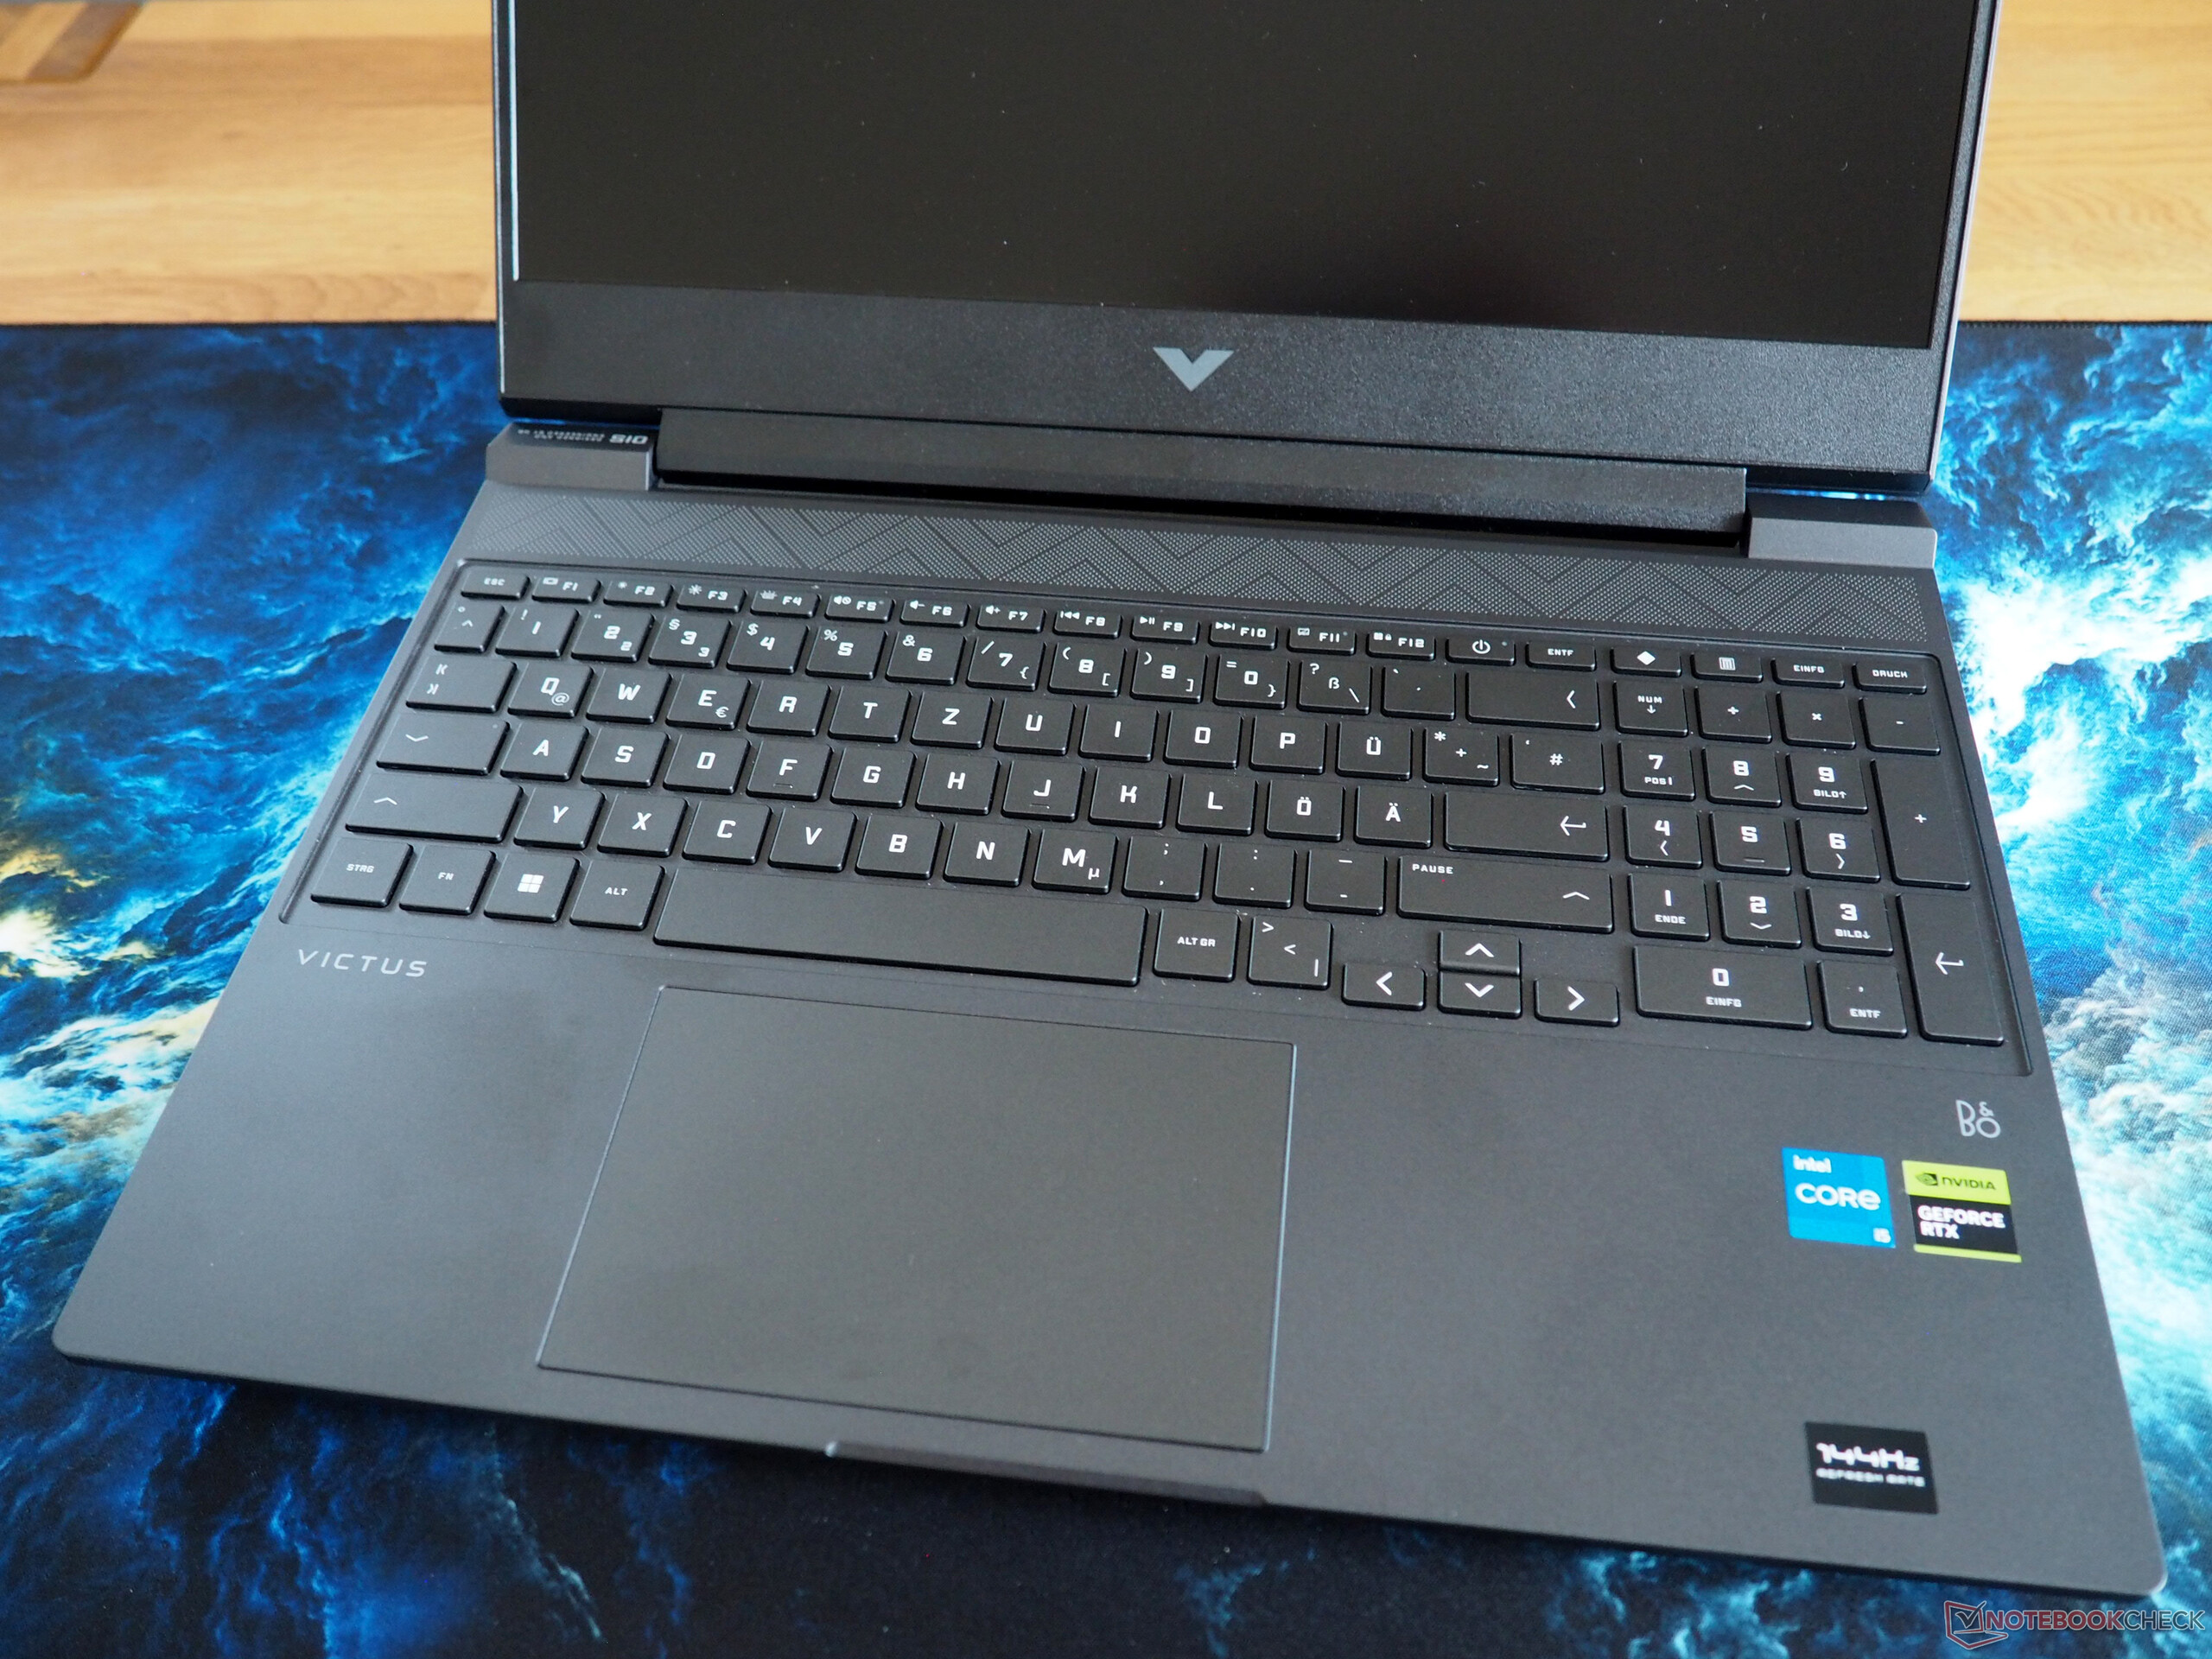
Jeśli chodzi o klawiaturę, to jej układ wymaga pewnej adaptacji. Niewielkie strzałki kierunkowe i niekonwencjonalne rozmieszczenie wiersza F (przycisk zasilania nie na zewnętrznej krawędzi, Ins i Del nie sąsiadują ze sobą itp.) mogą również budzić pewne wątpliwości. Niemniej jednak klawiatura zapewnia satysfakcjonujące wrażenia z pisania. Białe podświetlenie ma tylko dwa ustawienia: włączone lub wyłączone, bez regulowanych poziomów jasności.
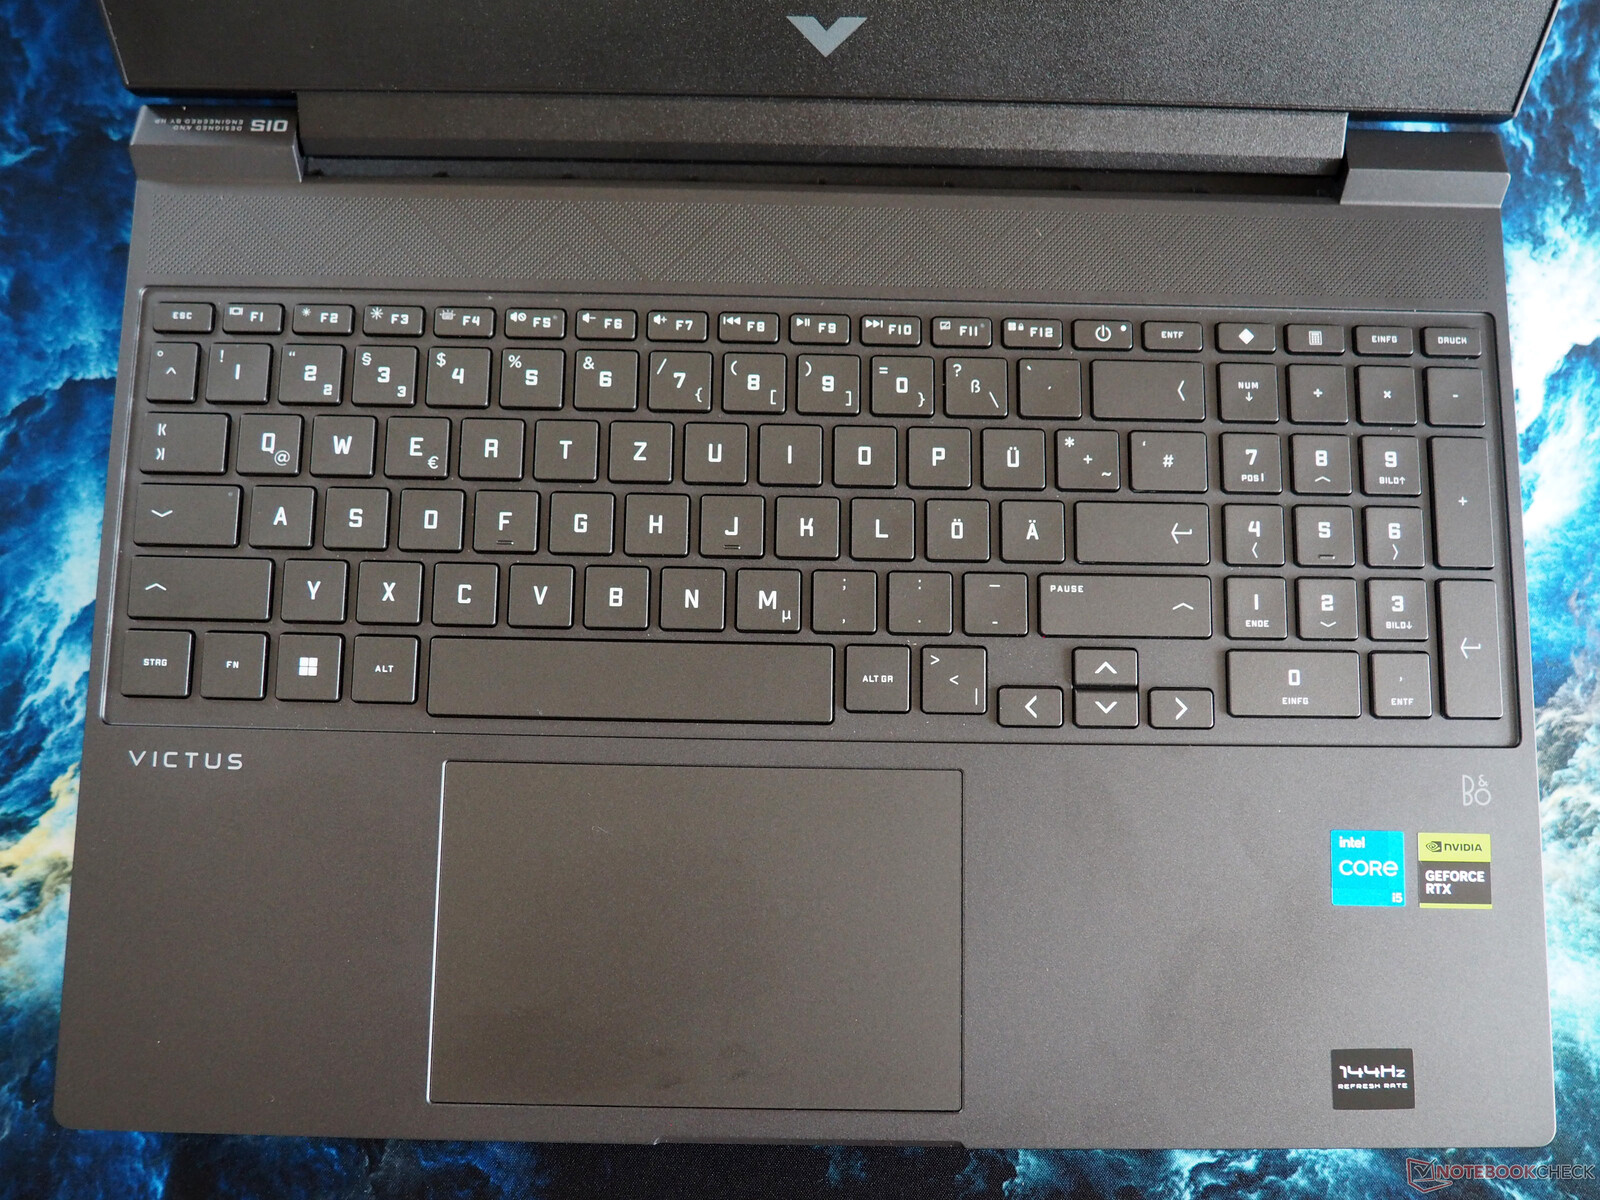
Panel dotykowy
Jakość touchpada nie odbiega od konkurencji. Właściwości ślizgowe i funkcjonalność powierzchni kliknięć nie są ani słabe, ani wyjątkowo dobre. Nie było zauważalnych problemów z obsługą gestów. Rozmiar jest przyzwoity i wynosi około 4,92 x 3,15 cala.
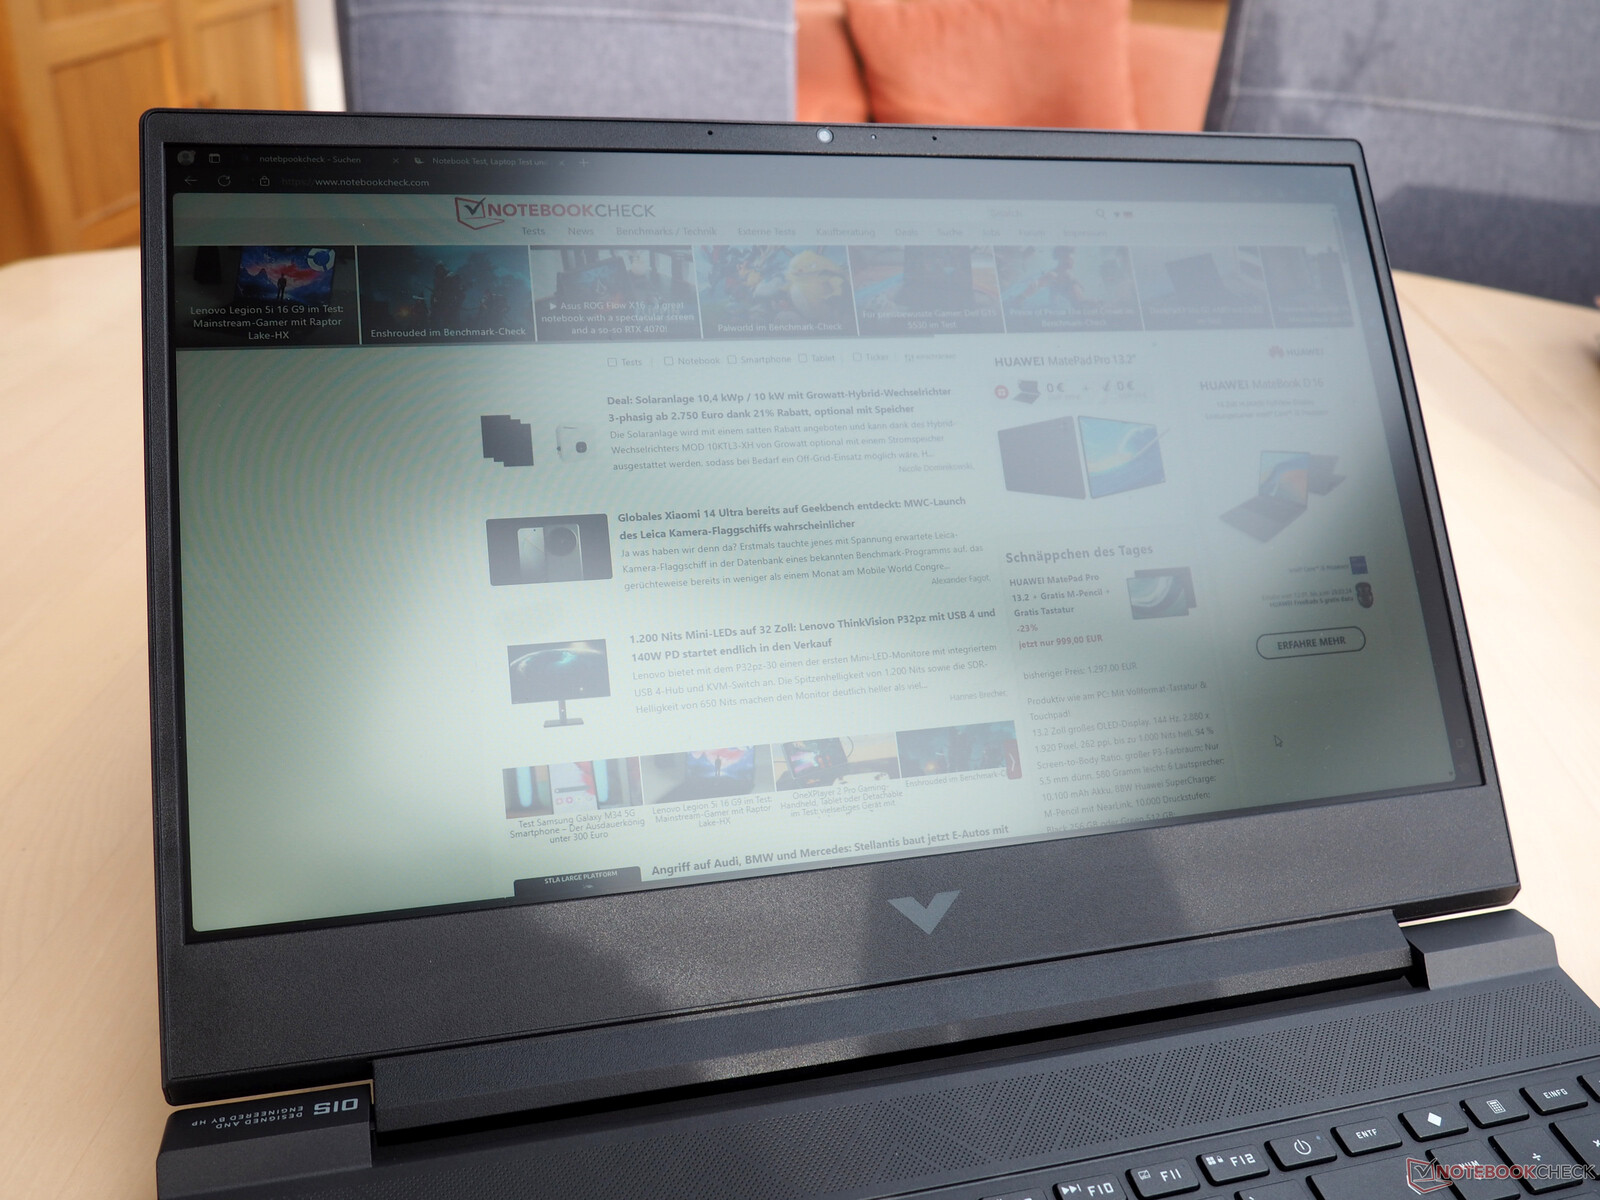
Wyświetlacz
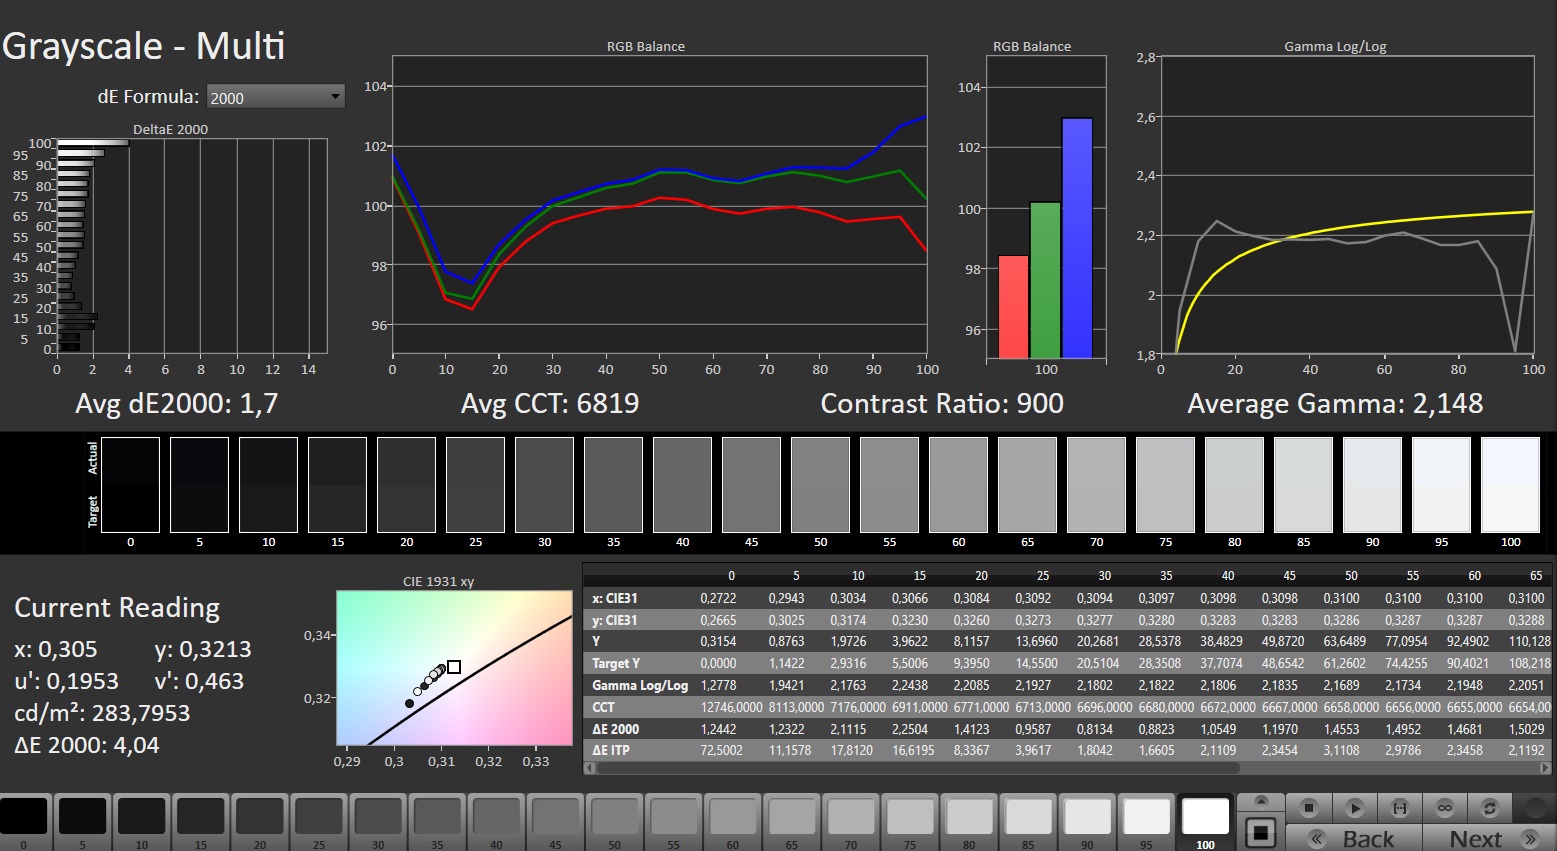
Najbardziej znaczącą wadą okazuje się być kiepski wyświetlacz. O ile poziom czerni (0,28 cd/m²) i kontrast (975:1) są jeszcze przyzwoite, o tyle jasność pozostawia wiele do życzenia. Średnia na poziomie 249 cd/m² może być problematyczna nawet w pomieszczeniach. Victus 15 zupełnie nie nadaje się do użytku na zewnątrz.
| |||||||||||||||||||||||||
rozświetlenie: 84 %
na akumulatorze: 273 cd/m²
kontrast: 975:1 (czerń: 0.28 cd/m²)
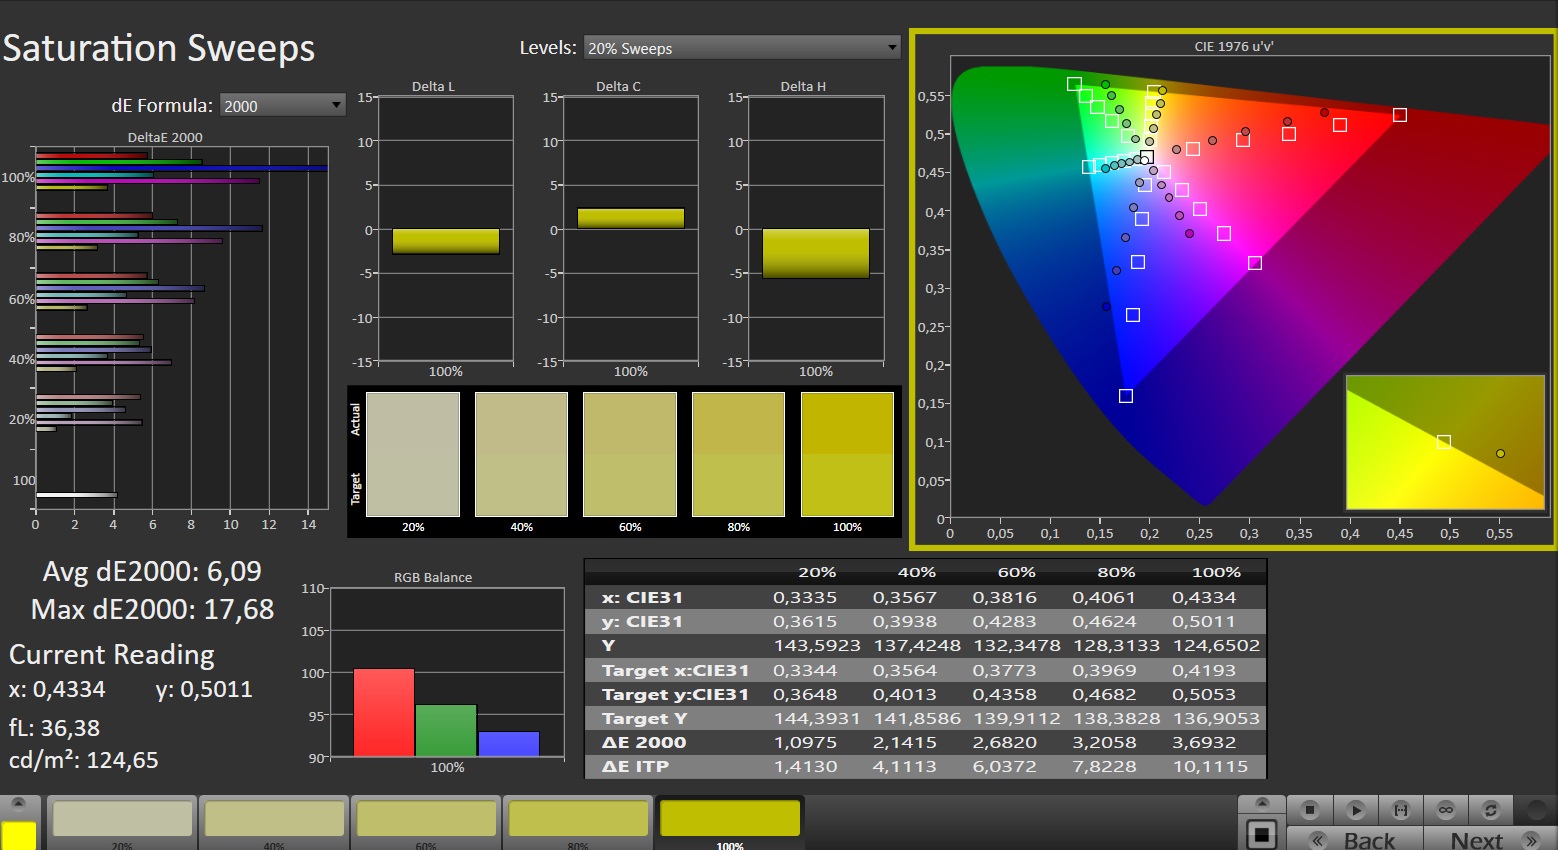
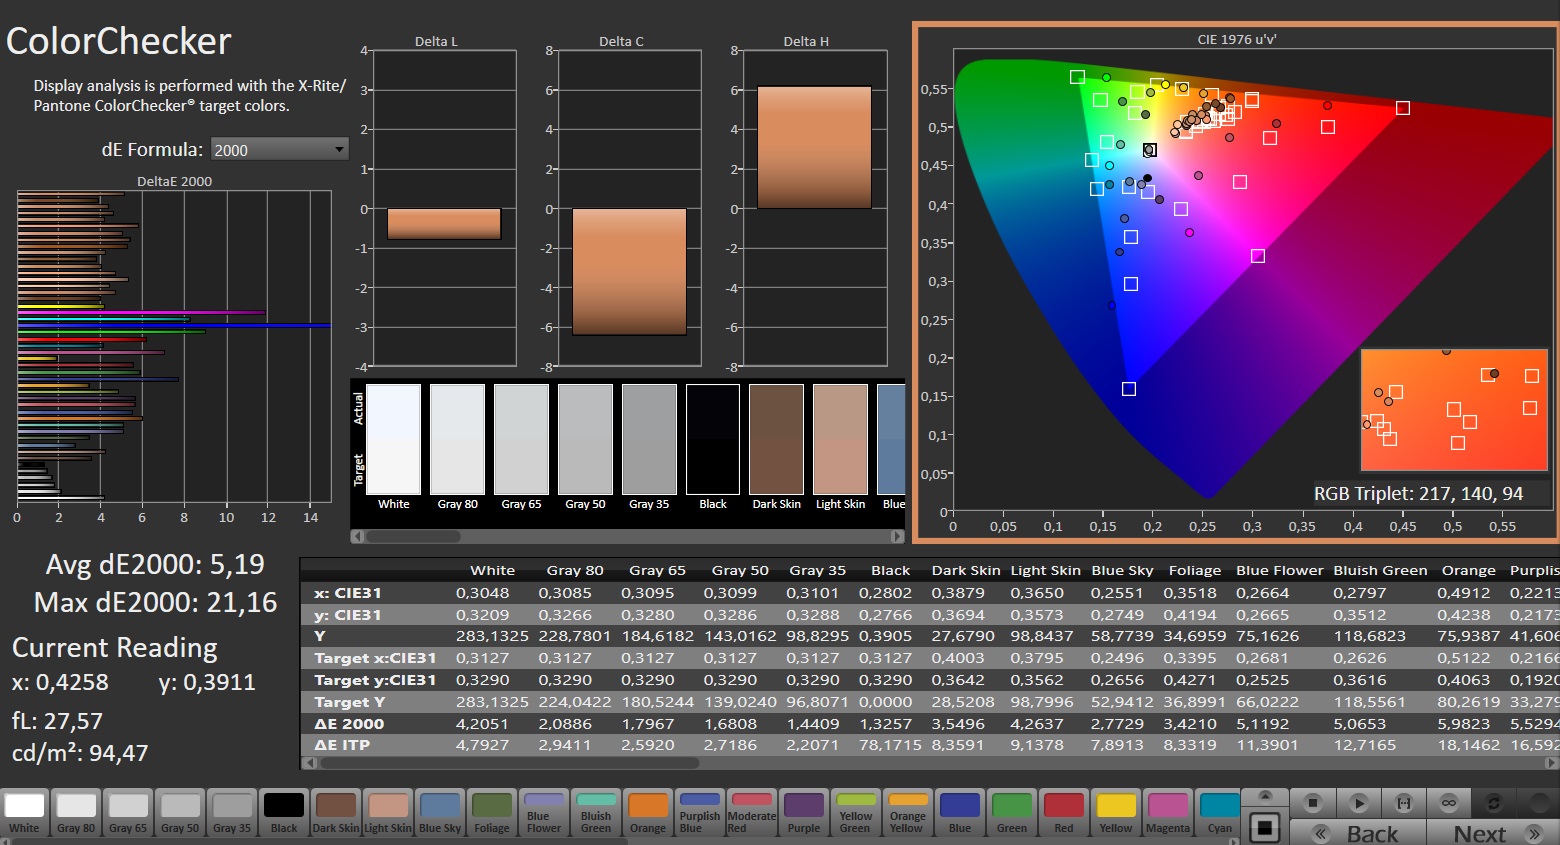
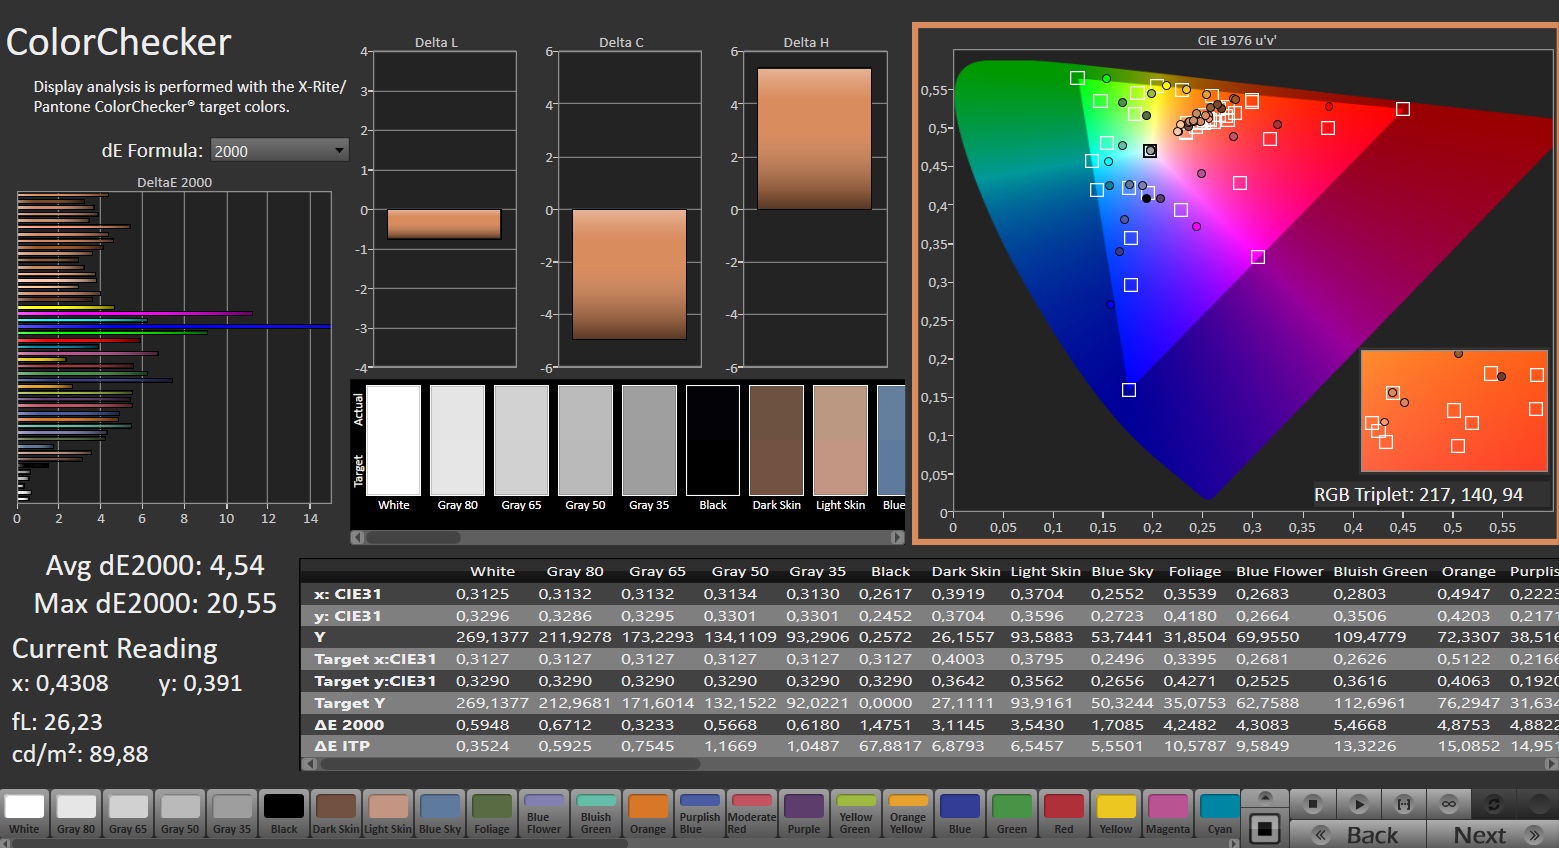
ΔE ColorChecker Calman: 5.19 | ∀{0.5-29.43 Ø4.72}
calibrated: 4.54
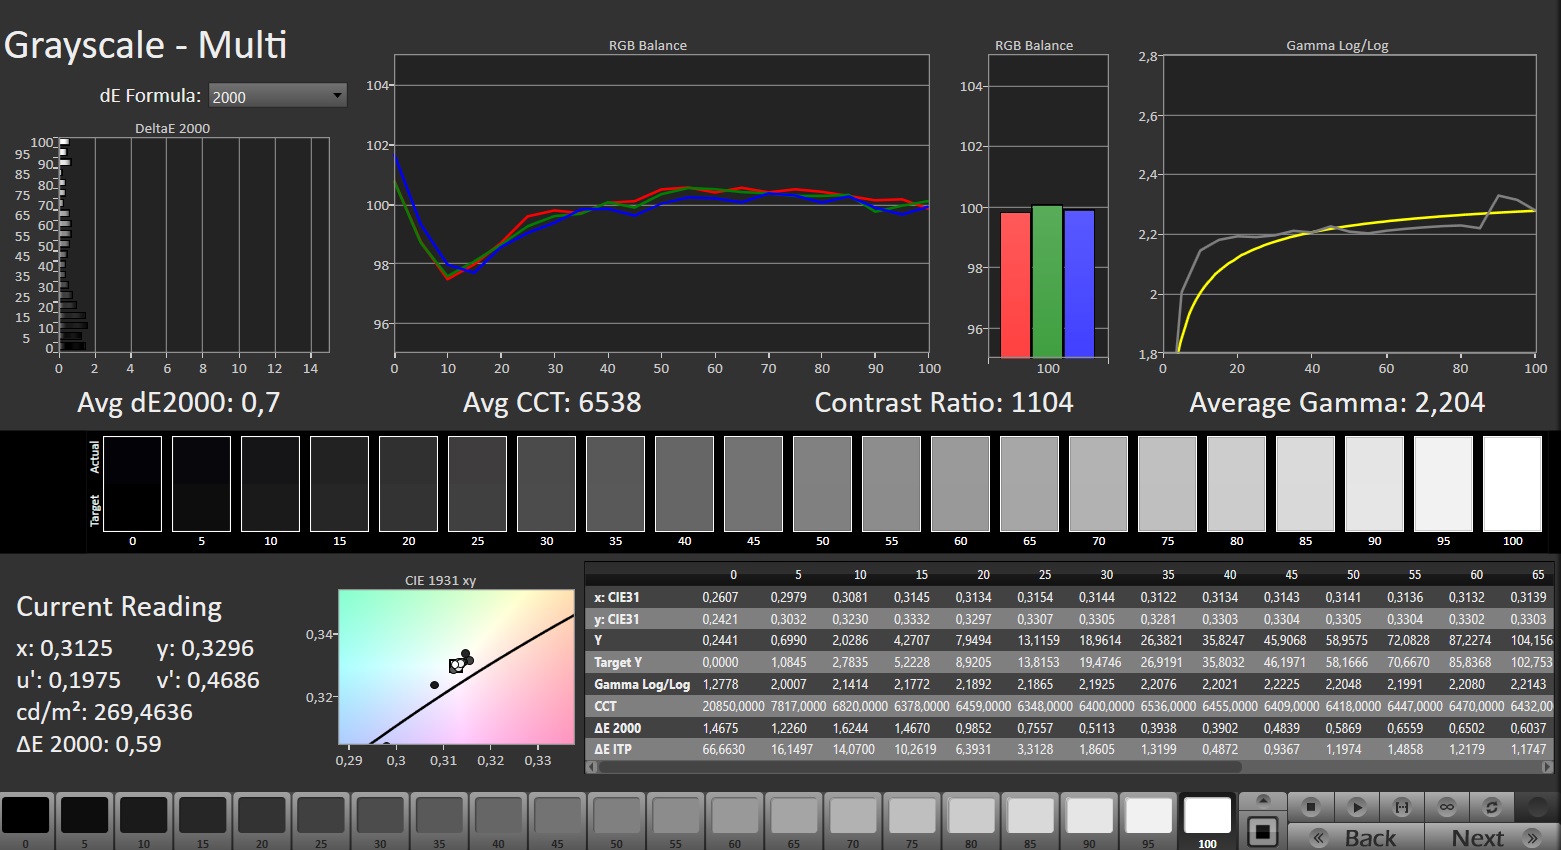
ΔE Greyscale Calman: 1.7 | ∀{0.09-98 Ø4.97}
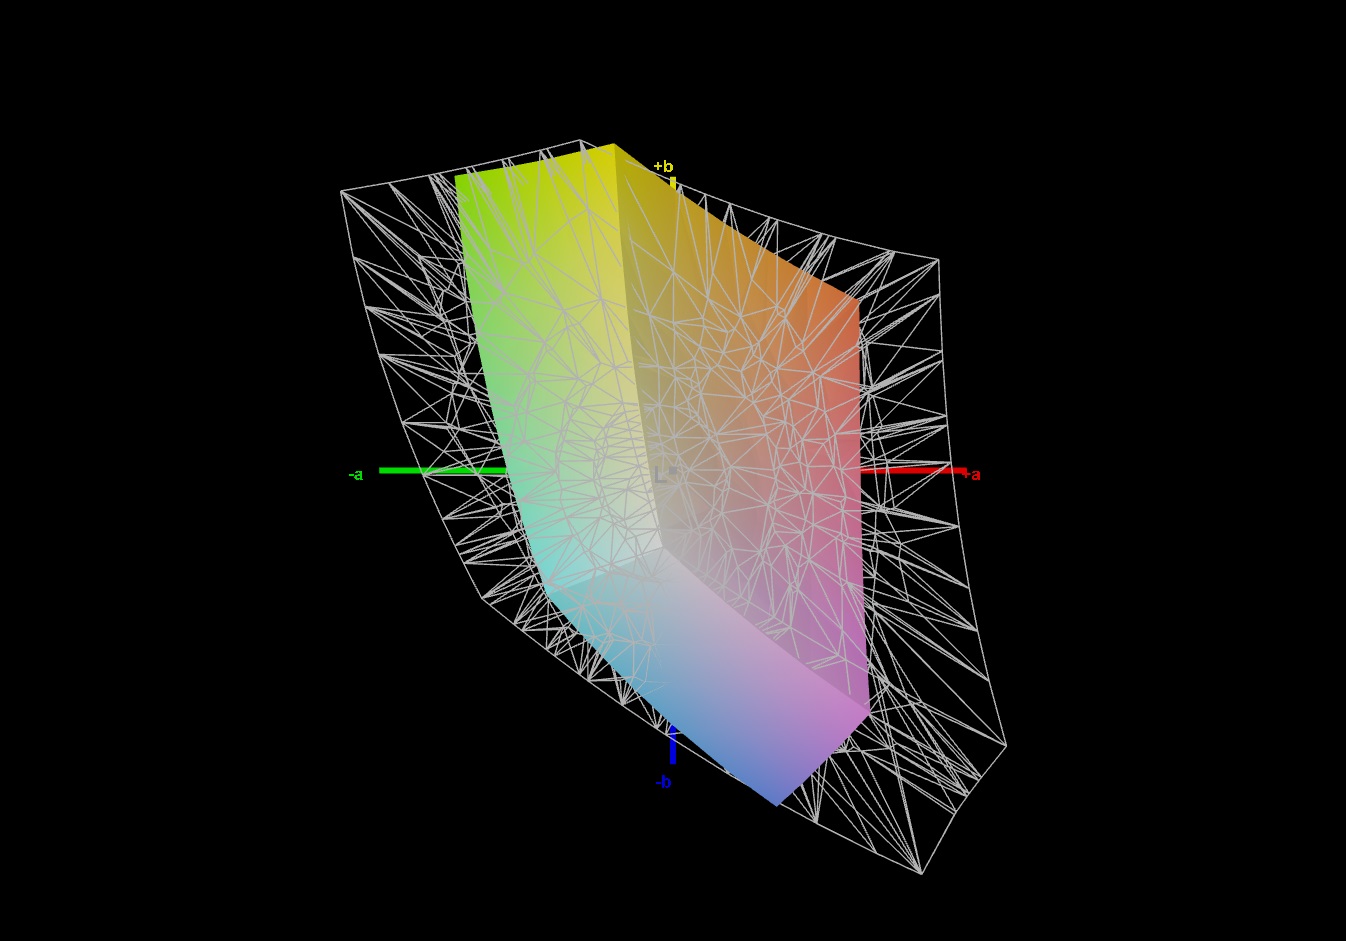
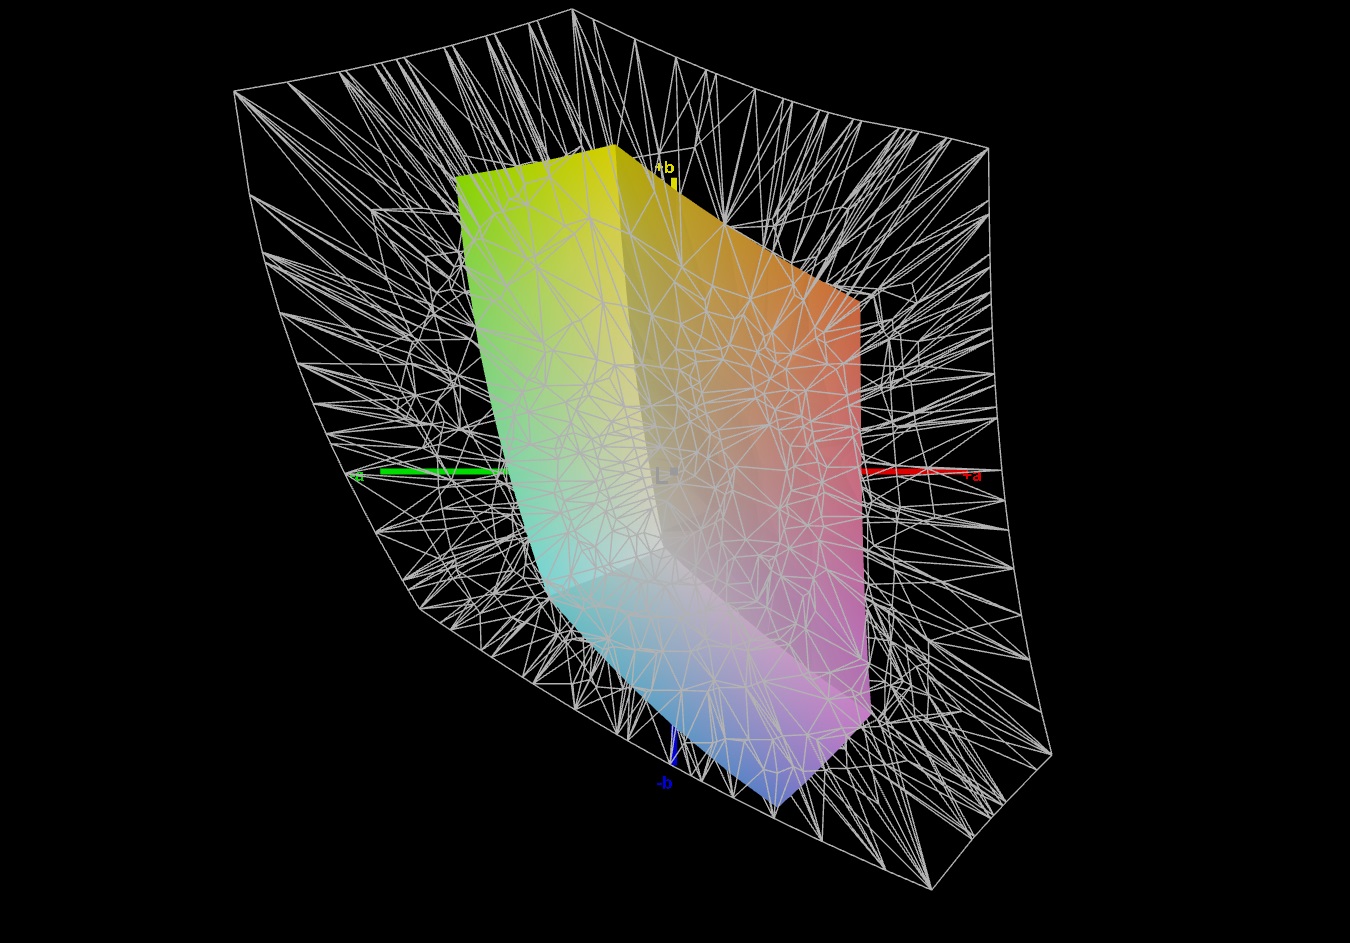
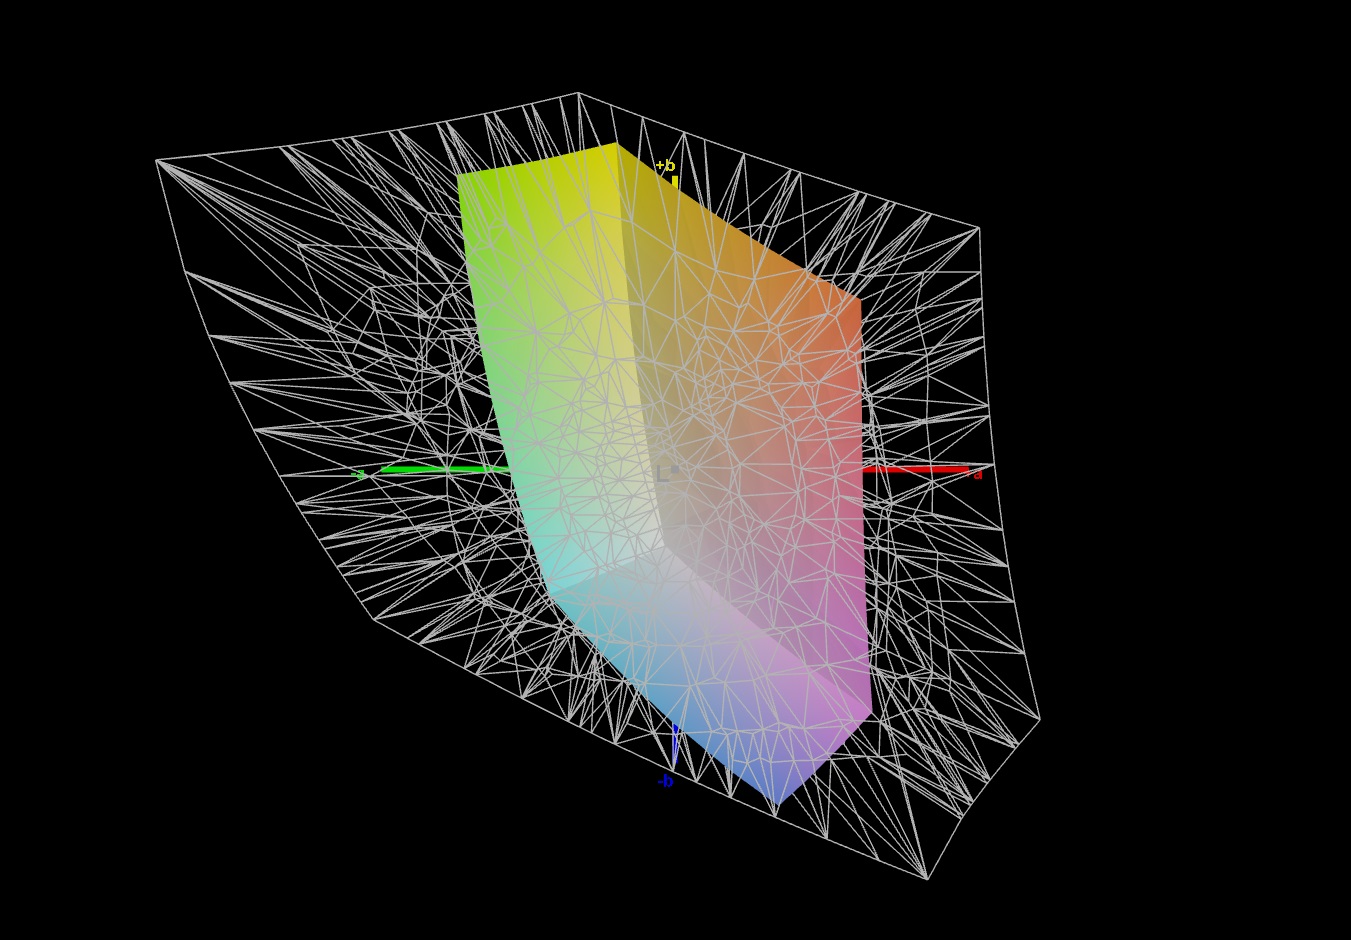
40.5% AdobeRGB 1998 (Argyll 3D)
57.9% sRGB (Argyll 3D)
39.2% Display P3 (Argyll 3D)
Gamma: 2.148
CCT: 6819 K
| HP Victus 15-fa1057ng BOE094D, IPS, 1920x1080, 15.6" | HP Victus 15 fa0020nr CMN1521, IPS, 1920x1080, 15.6" | Dell G15 5530, i5-13450HX RTX 4050 BOEhydis NV15NY9 (Dell 18PJX), IPS, 1920x1080, 15.6" | Acer Nitro V 15 ANV15-51-582S LG LP156WFJ-SPB4 (LGD0742), IPS, 1920x1080, 15.6" | Asus TUF A15 FA507 N156HMA-GA1, IPS, 1920x1080, 15.6" | |
|---|---|---|---|---|---|
| Display | 7% | 76% | 3% | 66% | |
| Display P3 Coverage (%) | 39.2 | 42 7% | 71.1 81% | 40 2% | 64.9 66% |
| sRGB Coverage (%) | 57.9 | 62.7 8% | 99.3 72% | 60 4% | 96.5 67% |
| AdobeRGB 1998 Coverage (%) | 40.5 | 43.4 7% | 71.4 76% | 41.4 2% | 66.6 64% |
| Response Times | -58% | 62% | -51% | -28% | |
| Response Time Grey 50% / Grey 80% * (ms) | 23.8 ? | 35.2 ? -48% | 8.5 ? 64% | 34.2 ? -44% | 30.4 ? -28% |
| Response Time Black / White * (ms) | 16.3 ? | 27.2 ? -67% | 6.7 ? 59% | 25.8 ? -58% | 20.8 ? -28% |
| PWM Frequency (Hz) | |||||
| Screen | 8% | 13% | -17% | 34% | |
| Brightness middle (cd/m²) | 273 | 284.3 4% | 389 42% | 292 7% | 288 5% |
| Brightness (cd/m²) | 249 | 262 5% | 374 50% | 263 6% | 271 9% |
| Brightness Distribution (%) | 84 | 87 4% | 89 6% | 80 -5% | 91 8% |
| Black Level * (cd/m²) | 0.28 | 0.17 39% | 0.35 -25% | 0.25 11% | 0.17 39% |
| Contrast (:1) | 975 | 1672 71% | 1111 14% | 1168 20% | 1694 74% |
| Colorchecker dE 2000 * | 5.19 | 4.52 13% | 3.08 41% | 7.15 -38% | 1.9 63% |
| Colorchecker dE 2000 max. * | 21.16 | 18.67 12% | 5.44 74% | 15.51 27% | 3.3 84% |
| Colorchecker dE 2000 calibrated * | 4.54 | 1.55 66% | 1.17 74% | 4.13 9% | 0.9 80% |
| Greyscale dE 2000 * | 1.7 | 4.1 -141% | 4.4 -159% | 4.9 -188% | 2.7 -59% |
| Gamma | 2.148 102% | 2.3 96% | 2.409 91% | 2.014 109% | 2.32 95% |
| CCT | 6819 95% | 6529 100% | 6350 102% | 7178 91% | 6535 99% |
| Całkowita średnia (program / ustawienia) | -14% /
-1% | 50% /
34% | -22% /
-18% | 24% /
32% |
* ... im mniej tym lepiej
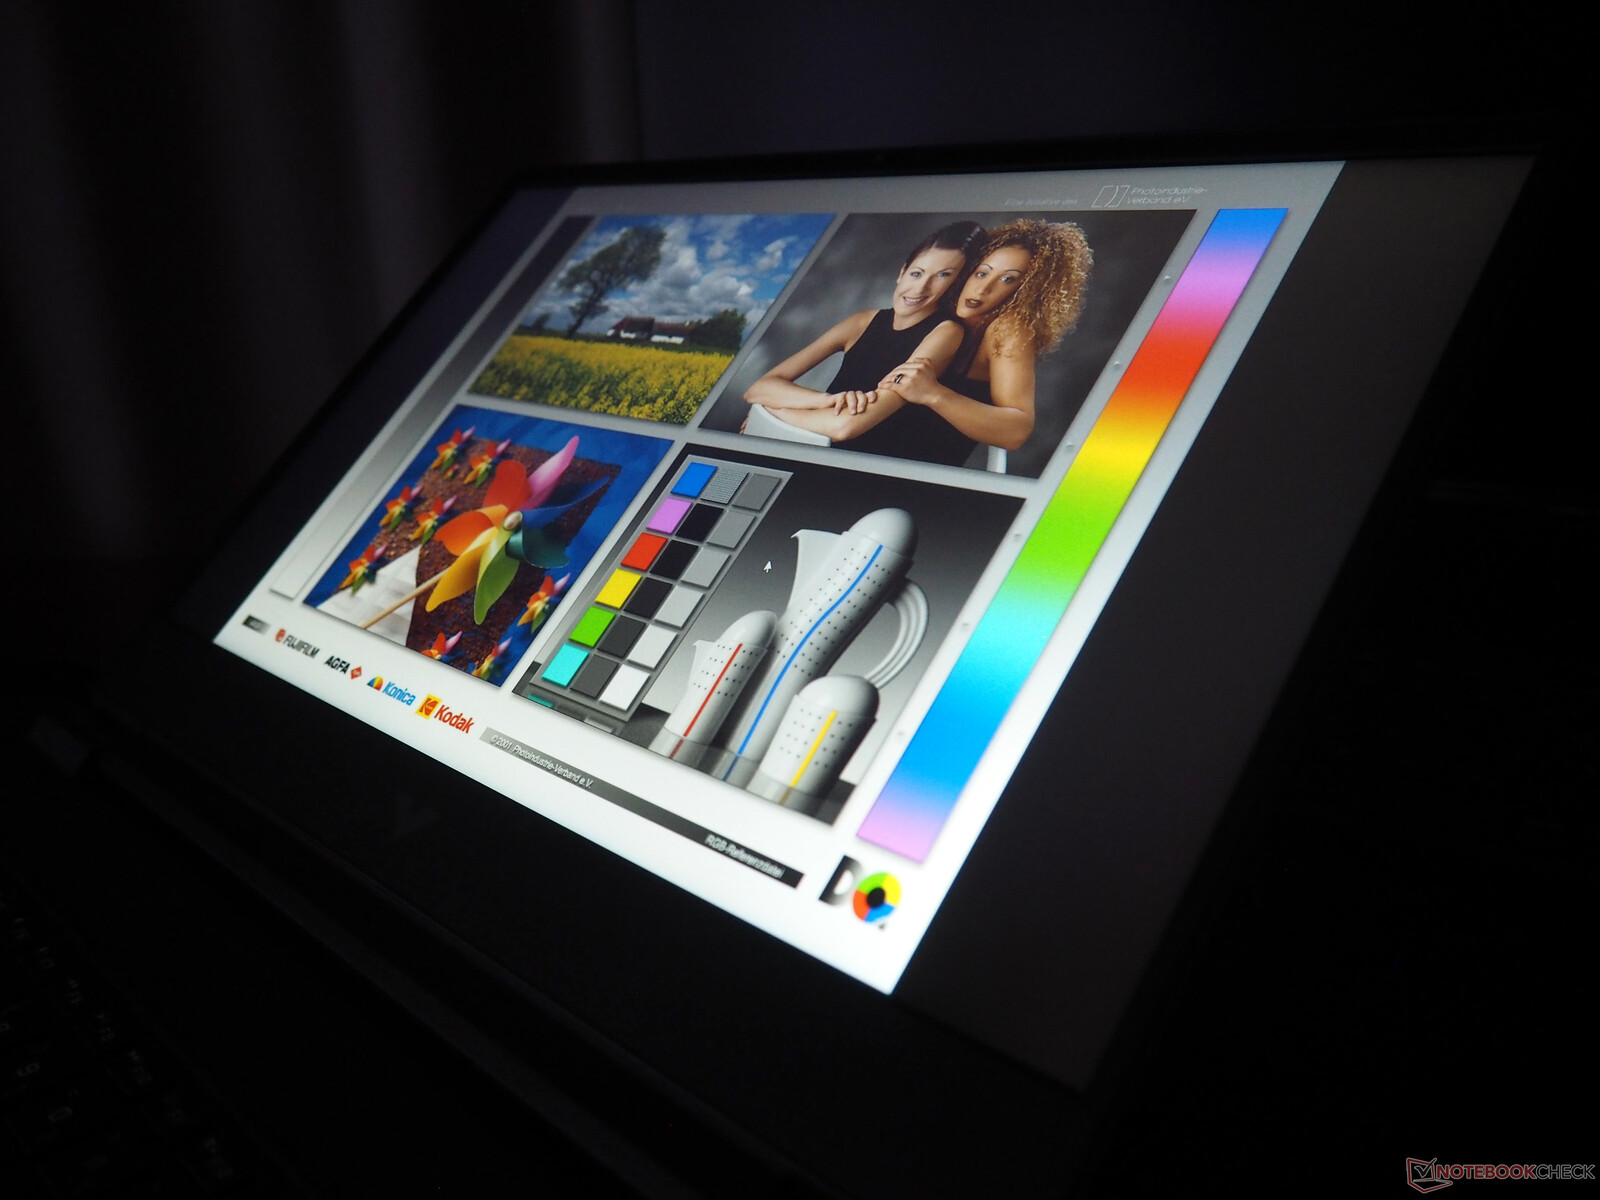
15-calowe urządzenie spotyka się z poważną krytyką dotyczącą przestrzeni kolorów. Przy 58% sRGB obraz jest raczej słaby, co ogranicza atrakcyjność wizualną filmów, zdjęć i gier. Niektórzy konkurenci, jak Dell G15 czy Asus TUF A15, wypadają pod tym względem znacznie lepiej.
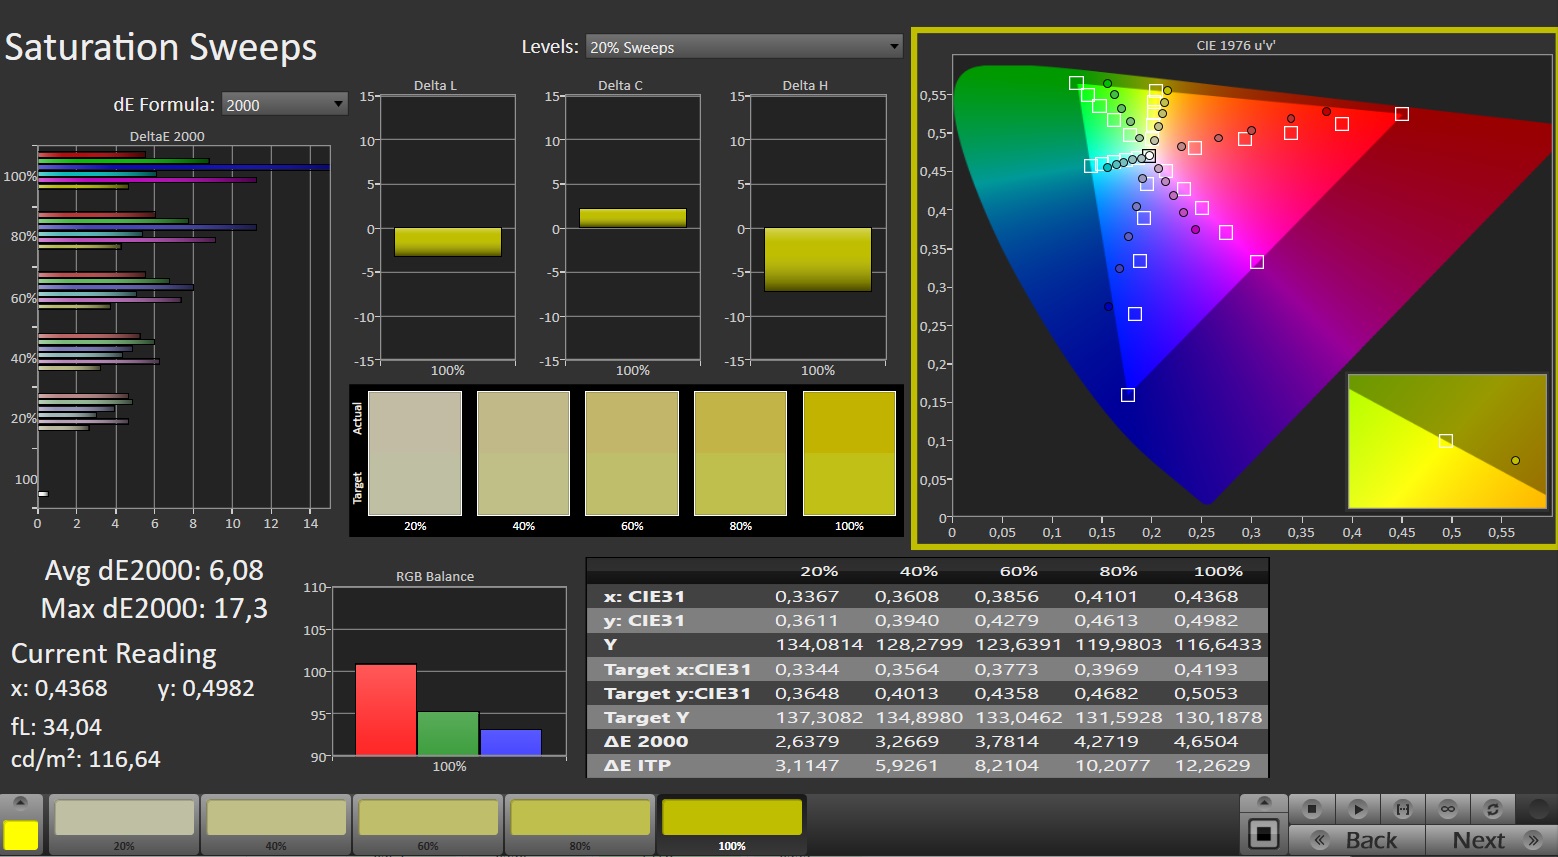
Tymczasem stabilność kąta widzenia i czas reakcji są zgodne z typowym standardem IPS.
Wyświetl czasy reakcji
| ↔ Czas reakcji od czerni do bieli | ||
|---|---|---|
| 16.3 ms ... wzrost ↗ i spadek ↘ łącznie | ↗ 7.6 ms wzrost | 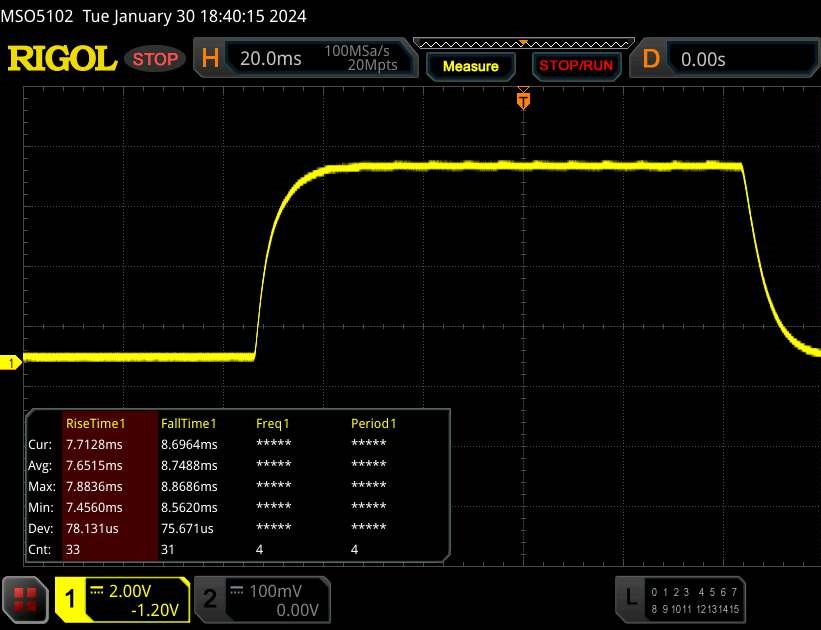 |
| ↘ 8.7 ms upadek | ||
| W naszych testach ekran wykazuje dobry współczynnik reakcji, ale może być zbyt wolny dla graczy rywalizujących ze sobą. Dla porównania, wszystkie testowane urządzenia wahają się od 0.1 (minimum) do 240 (maksimum) ms. » 38 % wszystkich urządzeń jest lepszych. Oznacza to, że zmierzony czas reakcji jest lepszy od średniej wszystkich testowanych urządzeń (19.8 ms). | ||
| ↔ Czas reakcji 50% szarości do 80% szarości | ||
| 23.8 ms ... wzrost ↗ i spadek ↘ łącznie | ↗ 11.1 ms wzrost | 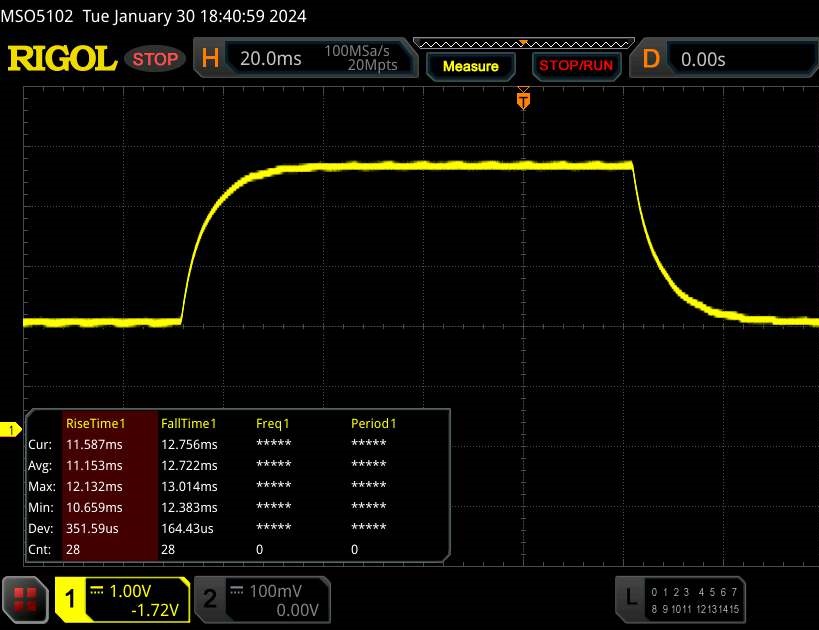 |
| ↘ 12.7 ms upadek | ||
| W naszych testach ekran wykazuje dobry współczynnik reakcji, ale może być zbyt wolny dla graczy rywalizujących ze sobą. Dla porównania, wszystkie testowane urządzenia wahają się od 0.165 (minimum) do 636 (maksimum) ms. » 34 % wszystkich urządzeń jest lepszych. Oznacza to, że zmierzony czas reakcji jest lepszy od średniej wszystkich testowanych urządzeń (31 ms). | ||
Migotanie ekranu / PWM (modulacja szerokości impulsu)
| Migotanie ekranu/nie wykryto PWM |  | ||
Dla porównania: 52 % wszystkich testowanych urządzeń nie używa PWM do przyciemniania wyświetlacza. Jeśli wykryto PWM, zmierzono średnio 7763 (minimum: 5 - maksimum: 343500) Hz. | |||
Wydajność
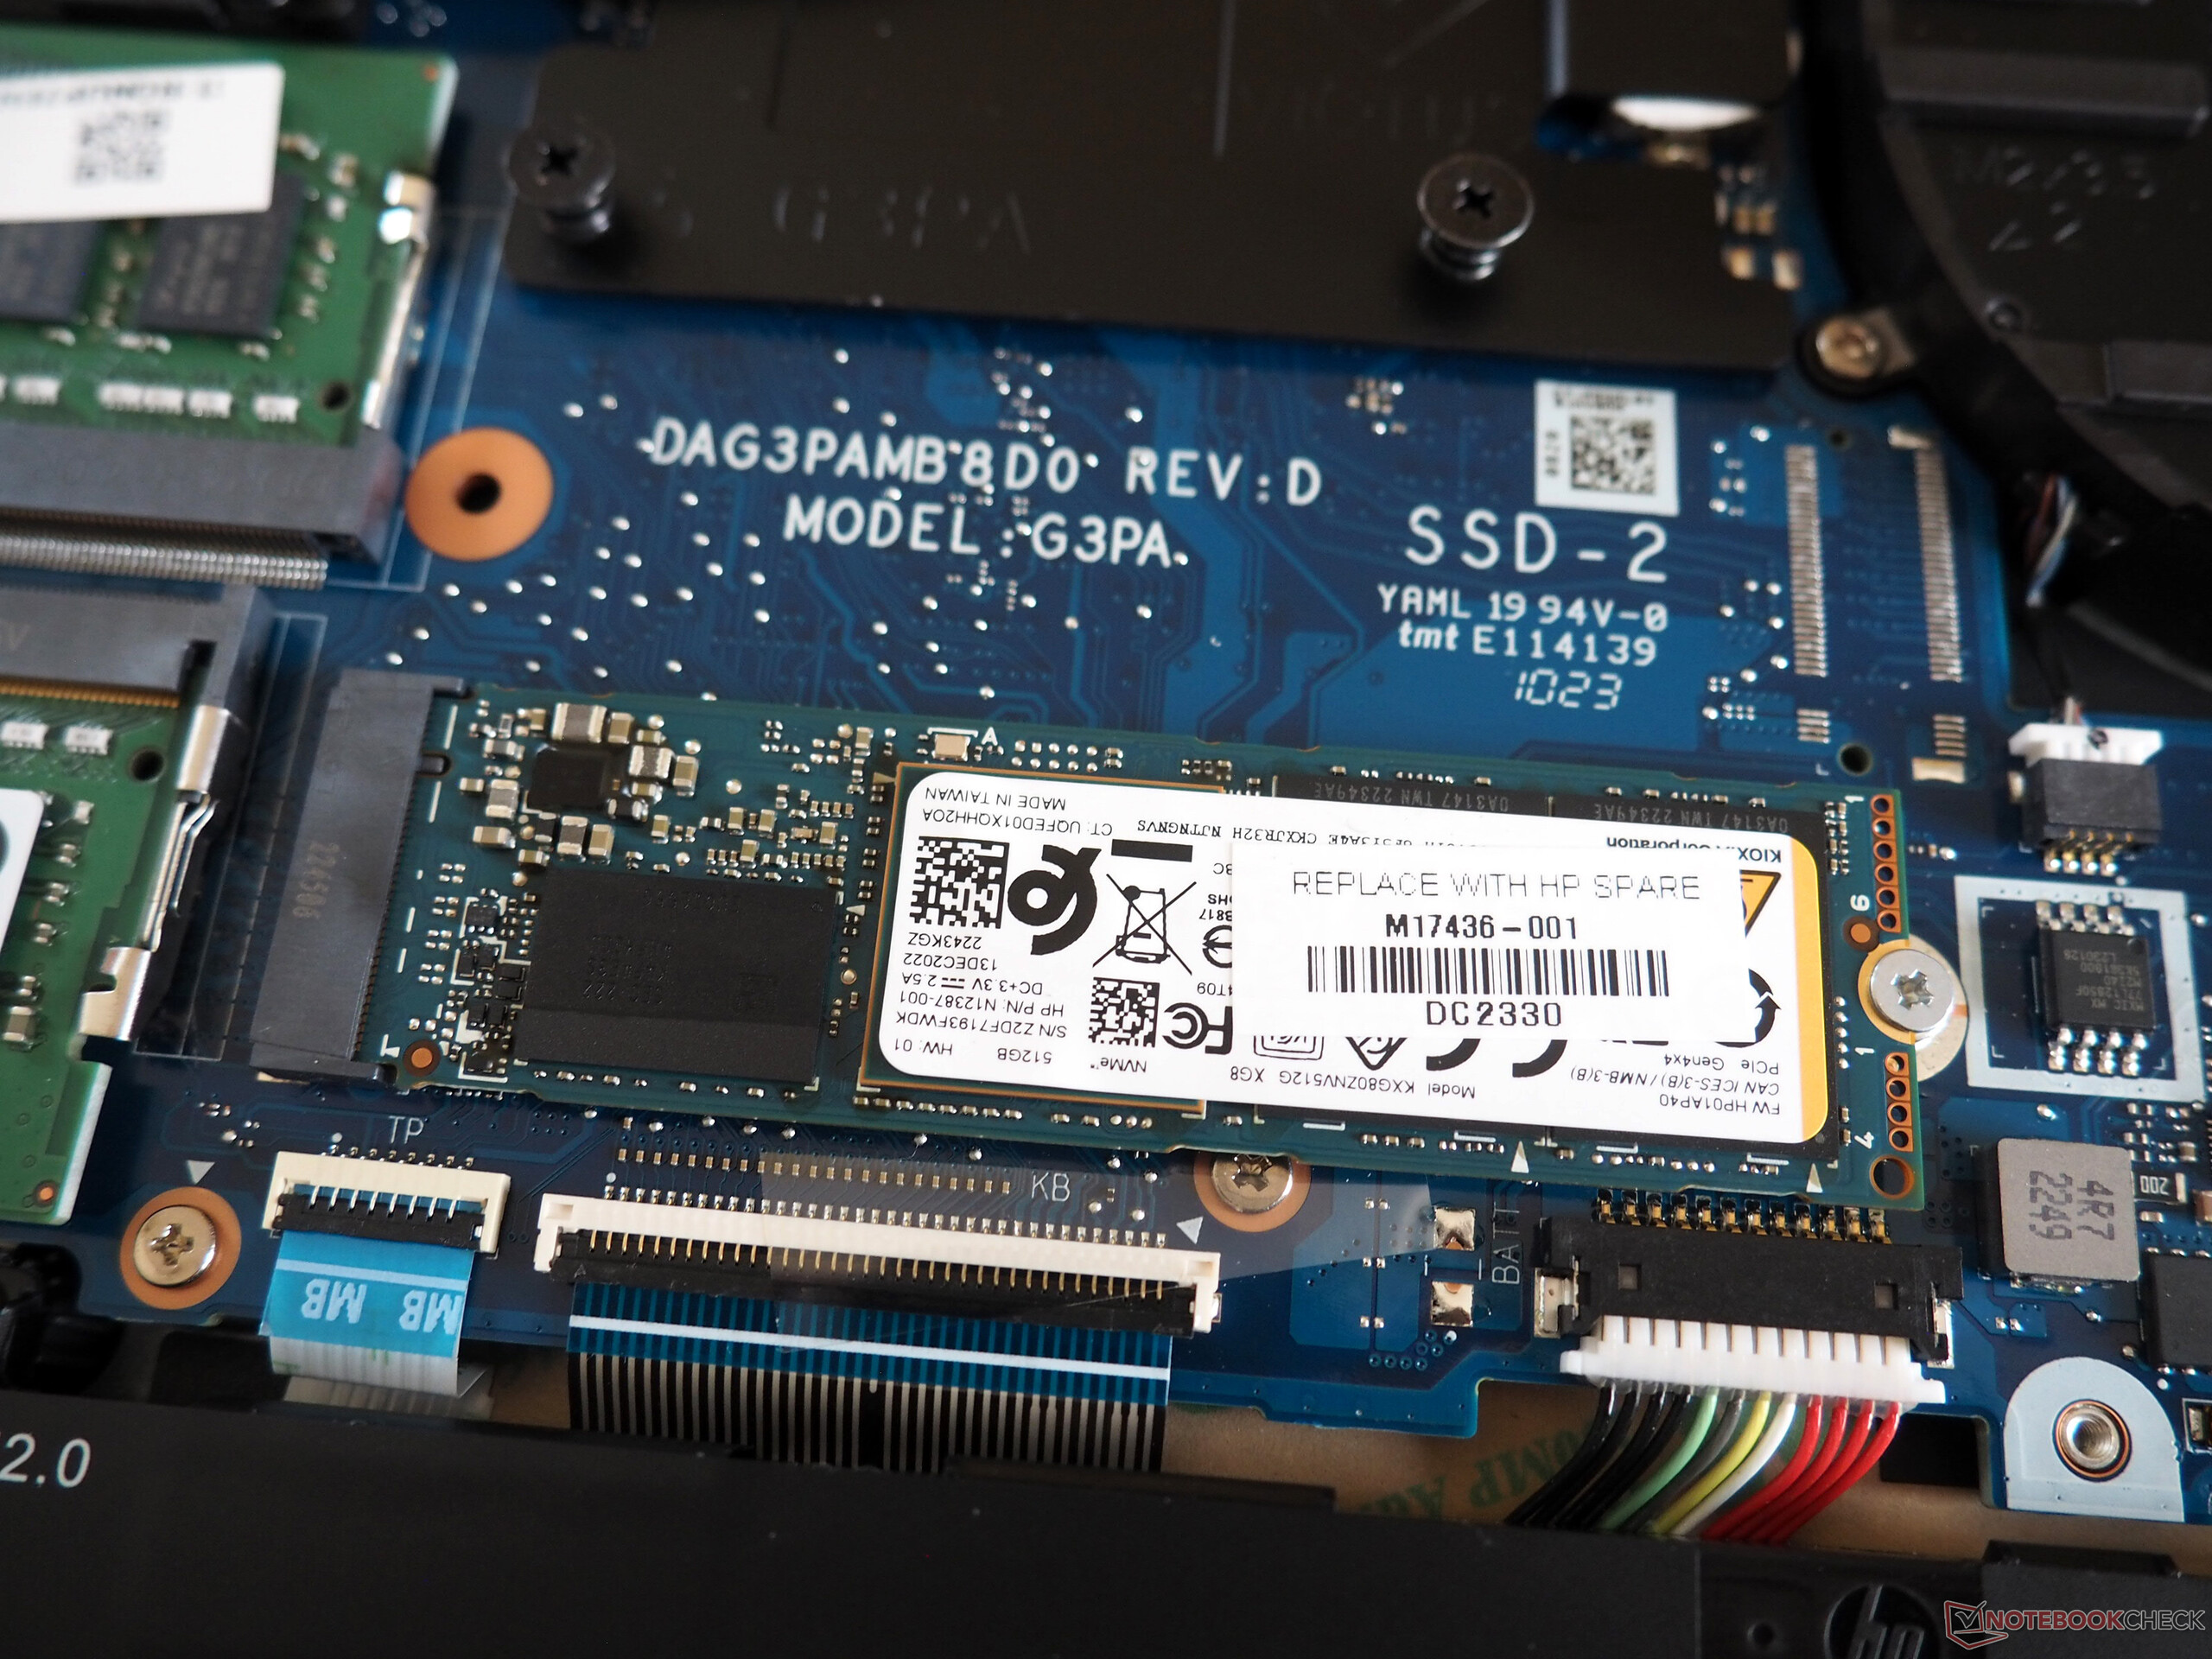
W tej konfiguracji Victus 15 jest wyraźnie notebookiem ze średniej półki. Podczas gdy 16 GB pamięci RAM jest obecnie wystarczające do gier, jedyny dysk SSD o pojemności 512 GB może szybko stać się ciasny, zwłaszcza że 15-calowy model nie oferuje drugiego gniazda M.2.
Warunki testowania
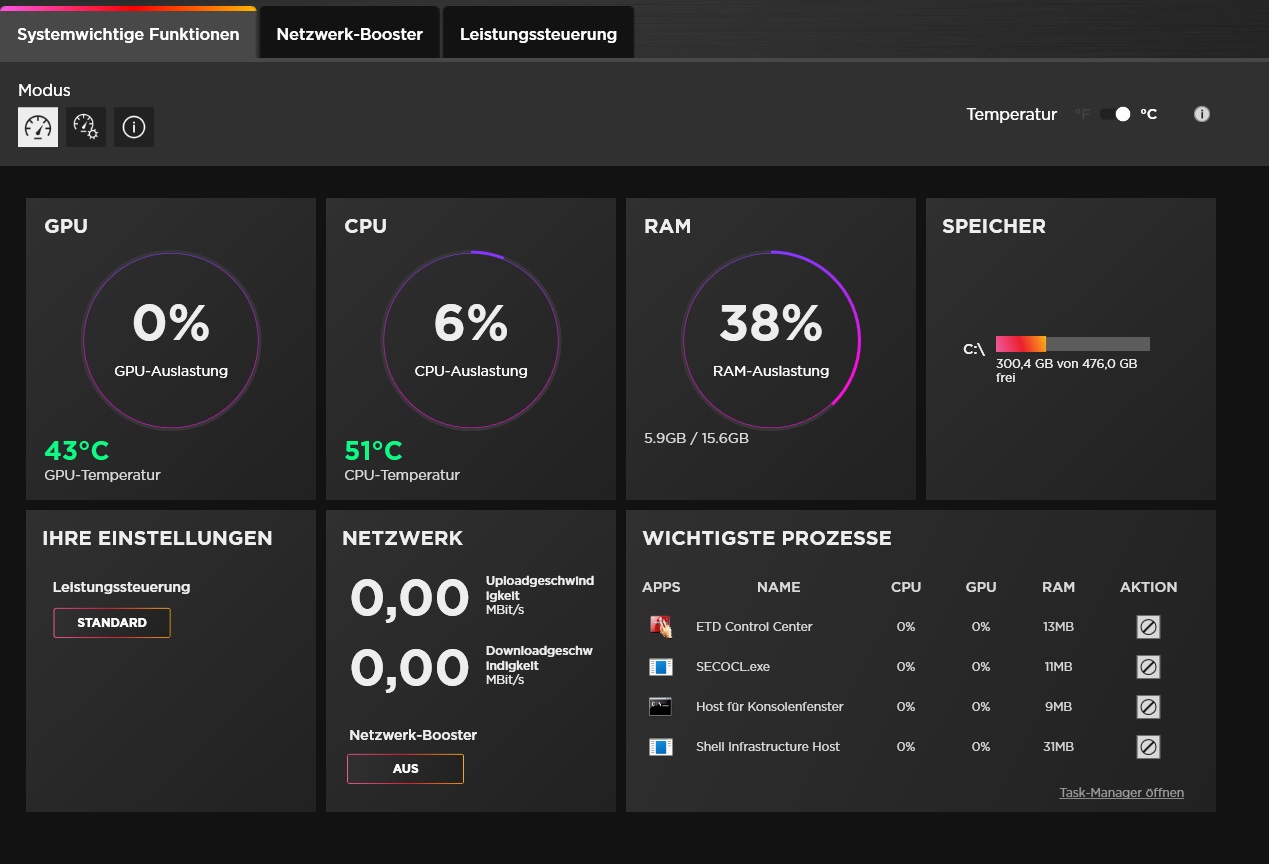
Omen Gaming Hub umożliwia użytkownikom wpływanie na zachowanie systemu. Różne tryby kontroli zasilania wpływają nie tylko na głośność, ale także na wydajność (patrz tabela). Nasze testy zostały przeprowadzone w trybie "Standard", ponieważ wzrost liczby klatek na sekundę w trybie "Performance" jest, jak to często bywa, nieproporcjonalny do wzrostu hałasu. Co ciekawe, tryb "Cichy" konsekwentnie powodował wyższą emisję hałasu niż "Standardowy" na urządzeniu testowym, pomimo niższych wartości FPS.
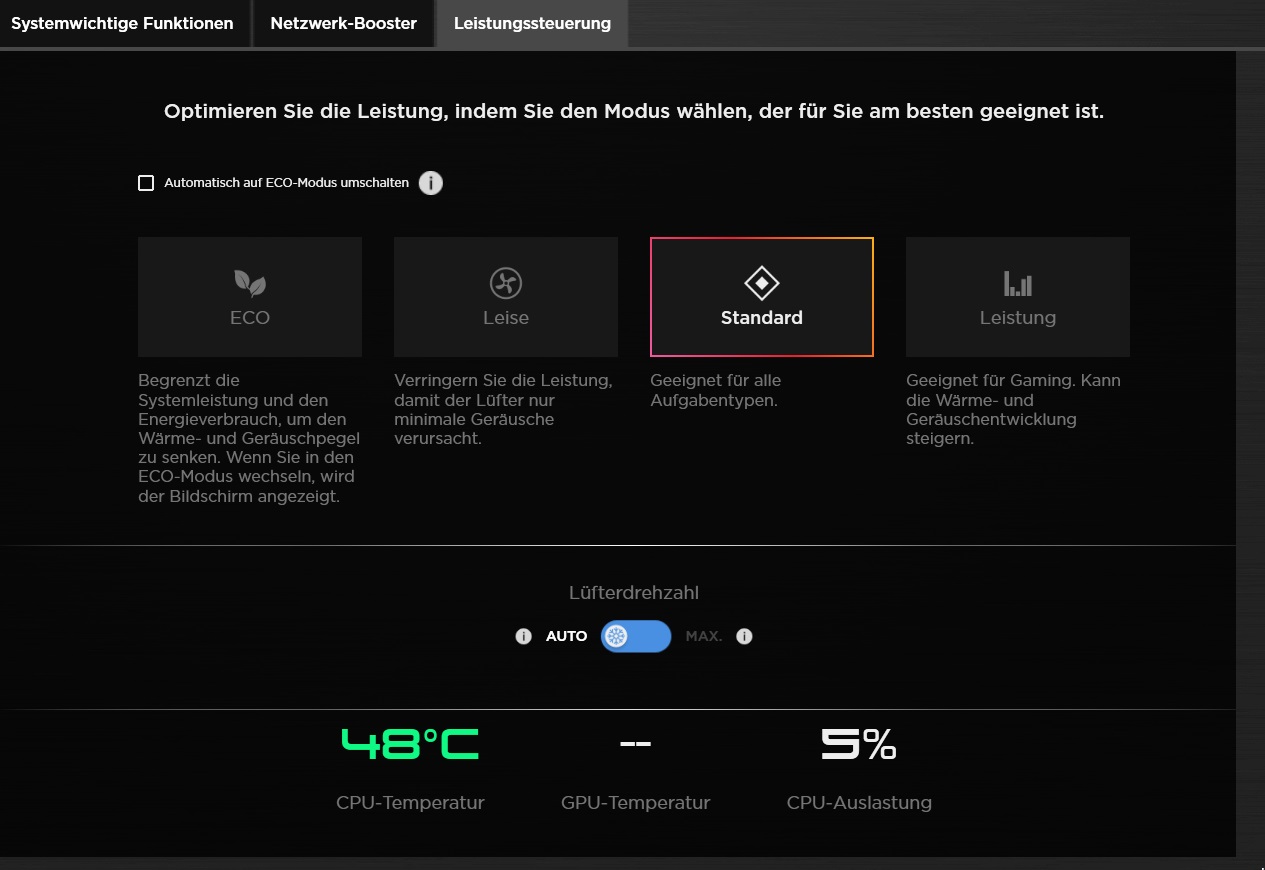
| Witcher 3 (FHD/Ultra) | Eco | Quiet | Standard | Wydajność |
| Hałas | 36 dB(A) | 46 dB(A) | 42 dB(A) | 48 dB(A) |
| Wydajność | Blokada 60 fps | 54 fps | 78 fps | 80 fps |
Procesor
Core i5-13500H jest częścią generacji Intel Raptor Lake, wyposażonej w cztery wydajne rdzenie z Hyper-Threading i osiem wydajnych rdzeni bez HT. Jego prędkość w wynikach testów porównawczych plasuje się pomiędzy Acer Nitro V 15 Core i5-13420H a Dell G15 Core i5-13450HX. Procesor Ryzen 7 7735HS jest początkowo mniej więcej na równi, ale Core i5 traci więcej punktów i wykazuje mniej spójną wydajność w teście pętli. Porównywanie go do poprzednika jest nieco niesprawiedliwe, ponieważ Core i7 starego Victusa należy bardziej do zakresu high-end.
Cinebench R15 Multi continuous test
| CPU Performance rating - Percent | |
| Średnia w klasie Gaming | |
| Dell G15 5530, i5-13450HX RTX 4050 | |
| Przeciętny Intel Core i5-13500H | |
| HP Victus 15 fa0020nr -2! | |
| Asus TUF A15 FA507 -2! | |
| Acer Nitro V 15 ANV15-51-582S | |
| HP Victus 15-fa1057ng -4! | |
* ... im mniej tym lepiej
AIDA64: FP32 Ray-Trace | FPU Julia | CPU SHA3 | CPU Queen | FPU SinJulia | FPU Mandel | CPU AES | CPU ZLib | FP64 Ray-Trace | CPU PhotoWorxx
| Performance rating | |
| Średnia w klasie Gaming | |
| Asus TUF A15 FA507 | |
| Dell G15 5530, i5-13450HX RTX 4050 | |
| Przeciętny Intel Core i5-13500H | |
| HP Victus 15 fa0020nr | |
| HP Victus 15-fa1057ng | |
| Acer Nitro V 15 ANV15-51-582S | |
| AIDA64 / FP32 Ray-Trace | |
| Średnia w klasie Gaming (10227 - 85542, n=107, ostatnie 2 lata) | |
| Dell G15 5530, i5-13450HX RTX 4050 | |
| Asus TUF A15 FA507 | |
| Przeciętny Intel Core i5-13500H (11081 - 15390, n=6) | |
| HP Victus 15 fa0020nr | |
| HP Victus 15-fa1057ng | |
| Acer Nitro V 15 ANV15-51-582S | |
| AIDA64 / FPU Julia | |
| Średnia w klasie Gaming (51376 - 238426, n=107, ostatnie 2 lata) | |
| Asus TUF A15 FA507 | |
| Dell G15 5530, i5-13450HX RTX 4050 | |
| Przeciętny Intel Core i5-13500H (56813 - 74251, n=6) | |
| HP Victus 15 fa0020nr | |
| Acer Nitro V 15 ANV15-51-582S | |
| HP Victus 15-fa1057ng | |
| AIDA64 / CPU SHA3 | |
| Średnia w klasie Gaming (2180 - 9817, n=107, ostatnie 2 lata) | |
| Dell G15 5530, i5-13450HX RTX 4050 | |
| Asus TUF A15 FA507 | |
| Przeciętny Intel Core i5-13500H (2621 - 3623, n=6) | |
| HP Victus 15 fa0020nr | |
| Acer Nitro V 15 ANV15-51-582S | |
| HP Victus 15-fa1057ng | |
| AIDA64 / CPU Queen | |
| Średnia w klasie Gaming (49785 - 173351, n=95, ostatnie 2 lata) | |
| Asus TUF A15 FA507 | |
| HP Victus 15 fa0020nr | |
| Dell G15 5530, i5-13450HX RTX 4050 | |
| Przeciętny Intel Core i5-13500H (77835 - 85727, n=6) | |
| HP Victus 15-fa1057ng | |
| Acer Nitro V 15 ANV15-51-582S | |
| AIDA64 / FPU SinJulia | |
| Średnia w klasie Gaming (4424 - 33636, n=107, ostatnie 2 lata) | |
| Asus TUF A15 FA507 | |
| Dell G15 5530, i5-13450HX RTX 4050 | |
| HP Victus 15 fa0020nr | |
| Przeciętny Intel Core i5-13500H (7249 - 8086, n=6) | |
| HP Victus 15-fa1057ng | |
| Acer Nitro V 15 ANV15-51-582S | |
| AIDA64 / FPU Mandel | |
| Średnia w klasie Gaming (25115 - 128721, n=107, ostatnie 2 lata) | |
| Asus TUF A15 FA507 | |
| Dell G15 5530, i5-13450HX RTX 4050 | |
| Przeciętny Intel Core i5-13500H (27820 - 38336, n=6) | |
| HP Victus 15 fa0020nr | |
| HP Victus 15-fa1057ng | |
| Acer Nitro V 15 ANV15-51-582S | |
| AIDA64 / CPU AES | |
| Średnia w klasie Gaming (39258 - 247074, n=107, ostatnie 2 lata) | |
| Acer Nitro V 15 ANV15-51-582S | |
| Przeciętny Intel Core i5-13500H (62657 - 120493, n=6) | |
| Dell G15 5530, i5-13450HX RTX 4050 | |
| Asus TUF A15 FA507 | |
| HP Victus 15-fa1057ng | |
| HP Victus 15 fa0020nr | |
| AIDA64 / CPU ZLib | |
| Średnia w klasie Gaming (574 - 2531, n=107, ostatnie 2 lata) | |
| Dell G15 5530, i5-13450HX RTX 4050 | |
| HP Victus 15-fa1057ng | |
| Przeciętny Intel Core i5-13500H (782 - 992, n=6) | |
| HP Victus 15 fa0020nr | |
| Acer Nitro V 15 ANV15-51-582S | |
| Asus TUF A15 FA507 | |
| AIDA64 / FP64 Ray-Trace | |
| Średnia w klasie Gaming (5509 - 45446, n=107, ostatnie 2 lata) | |
| Dell G15 5530, i5-13450HX RTX 4050 | |
| Asus TUF A15 FA507 | |
| Przeciętny Intel Core i5-13500H (5955 - 8495, n=6) | |
| HP Victus 15 fa0020nr | |
| HP Victus 15-fa1057ng | |
| Acer Nitro V 15 ANV15-51-582S | |
| AIDA64 / CPU PhotoWorxx | |
| Średnia w klasie Gaming (12271 - 89891, n=107, ostatnie 2 lata) | |
| Dell G15 5530, i5-13450HX RTX 4050 | |
| Przeciętny Intel Core i5-13500H (20212 - 37618, n=6) | |
| Asus TUF A15 FA507 | |
| HP Victus 15-fa1057ng | |
| Acer Nitro V 15 ANV15-51-582S | |
| HP Victus 15 fa0020nr | |
Wydajność systemu
Jeśli chodzi o wydajność systemu, konkurenci nie mają ze sobą prawie nic wspólnego. Ogólny wynik PCMark 10 jest bardzo podobny we wszystkich przypadkach, z bardziej zauważalnymi różnicami w szybkości pamięci RAM.
CrossMark: Overall | Productivity | Creativity | Responsiveness
WebXPRT 3: Overall
WebXPRT 4: Overall
Mozilla Kraken 1.1: Total
| PCMark 10 / Score | |
| Średnia w klasie Gaming (5828 - 11574, n=95, ostatnie 2 lata) | |
| Asus TUF A15 FA507 | |
| Przeciętny Intel Core i5-13500H, NVIDIA GeForce RTX 4050 Laptop GPU (6812 - 7228, n=2) | |
| Dell G15 5530, i5-13450HX RTX 4050 | |
| HP Victus 15 fa0020nr | |
| HP Victus 15-fa1057ng | |
| Acer Nitro V 15 ANV15-51-582S | |
| PCMark 10 / Essentials | |
| Średnia w klasie Gaming (8810 - 12600, n=99, ostatnie 2 lata) | |
| Asus TUF A15 FA507 | |
| HP Victus 15 fa0020nr | |
| Przeciętny Intel Core i5-13500H, NVIDIA GeForce RTX 4050 Laptop GPU (9521 - 10019, n=2) | |
| Dell G15 5530, i5-13450HX RTX 4050 | |
| HP Victus 15-fa1057ng | |
| Acer Nitro V 15 ANV15-51-582S | |
| PCMark 10 / Productivity | |
| Średnia w klasie Gaming (6845 - 21327, n=97, ostatnie 2 lata) | |
| Asus TUF A15 FA507 | |
| HP Victus 15 fa0020nr | |
| Przeciętny Intel Core i5-13500H, NVIDIA GeForce RTX 4050 Laptop GPU (8890 - 8968, n=2) | |
| HP Victus 15-fa1057ng | |
| Dell G15 5530, i5-13450HX RTX 4050 | |
| Acer Nitro V 15 ANV15-51-582S | |
| PCMark 10 / Digital Content Creation | |
| Średnia w klasie Gaming (7602 - 19657, n=97, ostatnie 2 lata) | |
| Przeciętny Intel Core i5-13500H, NVIDIA GeForce RTX 4050 Laptop GPU (10134 - 11405, n=2) | |
| Dell G15 5530, i5-13450HX RTX 4050 | |
| Asus TUF A15 FA507 | |
| HP Victus 15-fa1057ng | |
| HP Victus 15 fa0020nr | |
| Acer Nitro V 15 ANV15-51-582S | |
| CrossMark / Overall | |
| Średnia w klasie Gaming (1366 - 2409, n=96, ostatnie 2 lata) | |
| Przeciętny Intel Core i5-13500H, NVIDIA GeForce RTX 4050 Laptop GPU (n=1) | |
| HP Victus 15 fa0020nr | |
| Asus TUF A15 FA507 | |
| CrossMark / Productivity | |
| Średnia w klasie Gaming (1386 - 2254, n=96, ostatnie 2 lata) | |
| Przeciętny Intel Core i5-13500H, NVIDIA GeForce RTX 4050 Laptop GPU (n=1) | |
| HP Victus 15 fa0020nr | |
| Asus TUF A15 FA507 | |
| CrossMark / Creativity | |
| Średnia w klasie Gaming (1343 - 2729, n=96, ostatnie 2 lata) | |
| Przeciętny Intel Core i5-13500H, NVIDIA GeForce RTX 4050 Laptop GPU (n=1) | |
| HP Victus 15 fa0020nr | |
| Asus TUF A15 FA507 | |
| CrossMark / Responsiveness | |
| Przeciętny Intel Core i5-13500H, NVIDIA GeForce RTX 4050 Laptop GPU (n=1) | |
| Średnia w klasie Gaming (1226 - 2334, n=96, ostatnie 2 lata) | |
| HP Victus 15 fa0020nr | |
| Asus TUF A15 FA507 | |
| WebXPRT 3 / Overall | |
| Średnia w klasie Gaming (220 - 532, n=100, ostatnie 2 lata) | |
| HP Victus 15 fa0020nr | |
| Asus TUF A15 FA507 | |
| Dell G15 5530, i5-13450HX RTX 4050 | |
| Dell G15 5530, i5-13450HX RTX 4050 | |
| HP Victus 15-fa1057ng | |
| Przeciętny Intel Core i5-13500H, NVIDIA GeForce RTX 4050 Laptop GPU (267 - 267, n=2) | |
| Acer Nitro V 15 ANV15-51-582S | |
| WebXPRT 4 / Overall | |
| Średnia w klasie Gaming (165 - 354, n=101, ostatnie 2 lata) | |
| HP Victus 15 fa0020nr | |
| Acer Nitro V 15 ANV15-51-582S | |
| Przeciętny Intel Core i5-13500H, NVIDIA GeForce RTX 4050 Laptop GPU (n=1) | |
| Asus TUF A15 FA507 | |
| Mozilla Kraken 1.1 / Total | |
| Asus TUF A15 FA507 | |
| Acer Nitro V 15 ANV15-51-582S | |
| HP Victus 15-fa1057ng | |
| Przeciętny Intel Core i5-13500H, NVIDIA GeForce RTX 4050 Laptop GPU (530 - 545, n=2) | |
| HP Victus 15 fa0020nr | |
| Dell G15 5530, i5-13450HX RTX 4050 | |
| Dell G15 5530, i5-13450HX RTX 4050 | |
| Średnia w klasie Gaming (391 - 590, n=105, ostatnie 2 lata) | |
* ... im mniej tym lepiej
| PCMark 10 Score | 6812 pkt. | |
Pomoc | ||
| AIDA64 / Memory Copy | |
| Średnia w klasie Gaming (21750 - 129946, n=107, ostatnie 2 lata) | |
| Dell G15 5530, i5-13450HX RTX 4050 | |
| Przeciętny Intel Core i5-13500H (36916 - 57830, n=6) | |
| Asus TUF A15 FA507 | |
| HP Victus 15-fa1057ng | |
| HP Victus 15 fa0020nr | |
| Acer Nitro V 15 ANV15-51-582S | |
| AIDA64 / Memory Read | |
| Średnia w klasie Gaming (22956 - 118858, n=107, ostatnie 2 lata) | |
| Dell G15 5530, i5-13450HX RTX 4050 | |
| Przeciętny Intel Core i5-13500H (41676 - 65633, n=6) | |
| Asus TUF A15 FA507 | |
| HP Victus 15 fa0020nr | |
| HP Victus 15-fa1057ng | |
| Acer Nitro V 15 ANV15-51-582S | |
| AIDA64 / Memory Write | |
| Średnia w klasie Gaming (22297 - 135096, n=107, ostatnie 2 lata) | |
| Dell G15 5530, i5-13450HX RTX 4050 | |
| Asus TUF A15 FA507 | |
| Przeciętny Intel Core i5-13500H (36826 - 60523, n=6) | |
| HP Victus 15-fa1057ng | |
| HP Victus 15 fa0020nr | |
| Acer Nitro V 15 ANV15-51-582S | |
| AIDA64 / Memory Latency | |
| Średnia w klasie Gaming (75.3 - 259, n=107, ostatnie 2 lata) | |
| Dell G15 5530, i5-13450HX RTX 4050 | |
| Przeciętny Intel Core i5-13500H (86.2 - 96.1, n=6) | |
| Acer Nitro V 15 ANV15-51-582S | |
| HP Victus 15-fa1057ng | |
| Asus TUF A15 FA507 | |
| HP Victus 15 fa0020nr | |
* ... im mniej tym lepiej
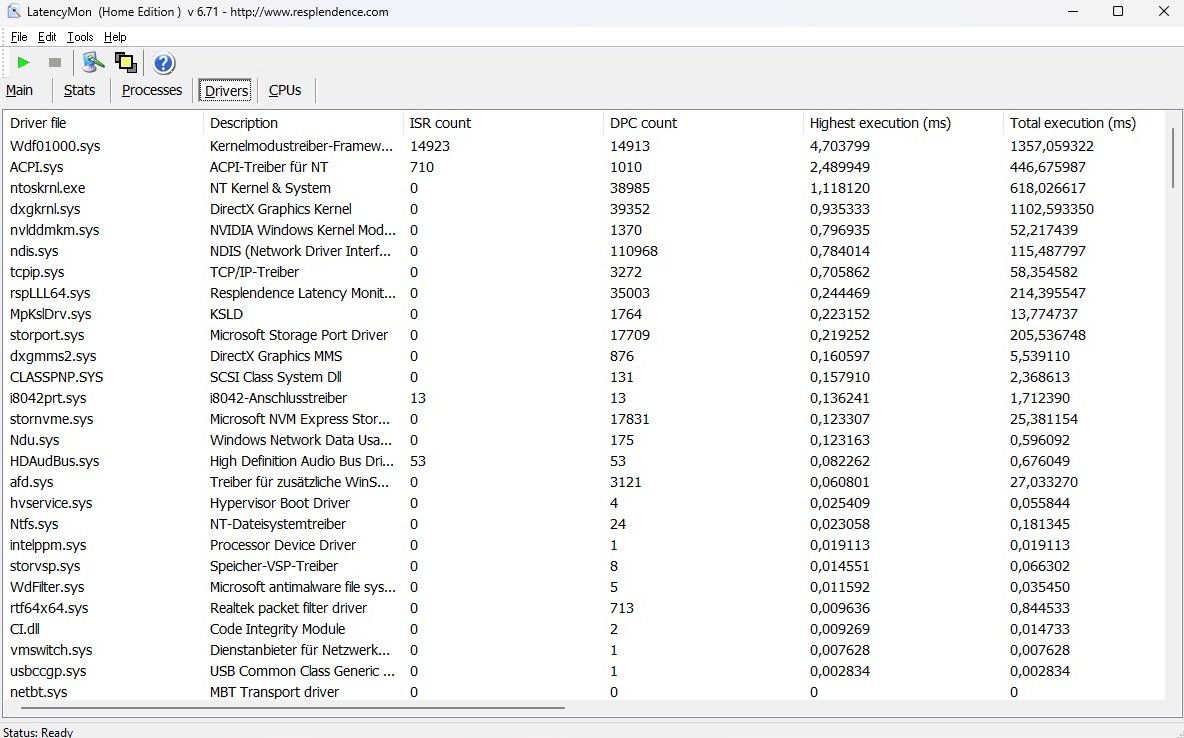
Opóźnienie DPC
Jeśli zamierzają Państwo wykorzystywać system do edycji audio i wideo w czasie rzeczywistym, warto rozważyć alternatywne rozwiązania. Według narzędzia LatencyMon, opóźnienia w stanie fabrycznym są dość skromne, co może prowadzić do problemów z niektórymi zadaniami.
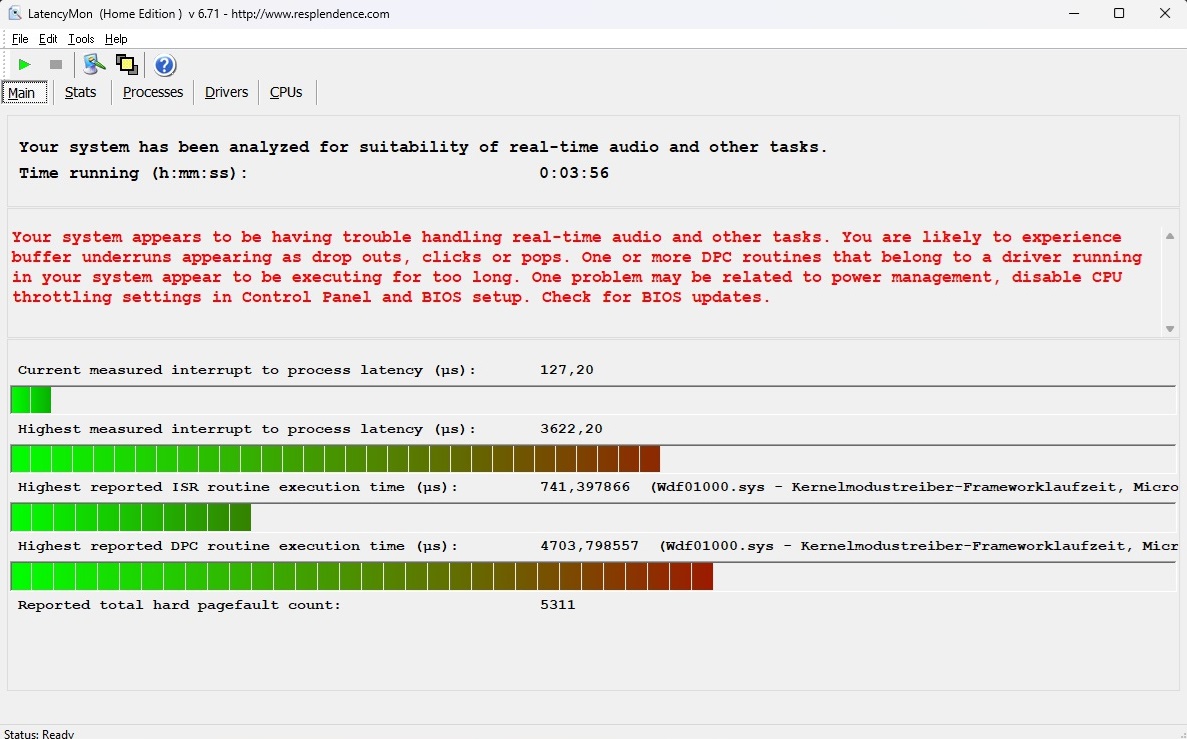
| DPC Latencies / LatencyMon - interrupt to process latency (max), Web, Youtube, Prime95 | |
| HP Victus 15-fa1057ng | |
| Dell G15 5530, i5-13450HX RTX 4050 | |
| HP Victus 15 fa0020nr | |
| Acer Nitro V 15 ANV15-51-582S | |
* ... im mniej tym lepiej
Urządzenia pamięci masowej
Chłodzenie dysku SSD również nie jest optymalne. Podczas gdy zainstalowany dysk Kioxia początkowo zapewnia godne pochwały wyniki w kilku pierwszych uruchomieniach, z czasem doświadcza znacznego dławienia, co wykazał nasz test pętli.

* ... im mniej tym lepiej
Reading continuous performance: DiskSpd Read Loop, Queue Depth 8
Karta graficzna
Wydajność obecnych kart graficznych Nvidii w dużym stopniu zależy od wybranego TDP. HP wybrało 75 watów (w tym Dynamic Boost) dla Victusa 15, co jest stosunkowo niską wartością dla RTX 4050, ale jest odzwierciedlone tylko w ograniczonym stopniu w wielu benchmarkach. Ogólnie rzecz biorąc, wydajność 3D jest zgodna ze średnią dla tej karty graficznej. Przyszłościowe możliwości RTX 4050 nie są zbyt obiecujące, ponieważ 6 GB pamięci VRAM i 96-bitowy interfejs już teraz mogą stać się czynnikami ograniczającymi w wymagających tytułach.
| 3DMark 11 Performance | 25418 pkt. | |
| 3DMark Ice Storm Standard Score | 189586 pkt. | |
| 3DMark Cloud Gate Standard Score | 55024 pkt. | |
| 3DMark Fire Strike Score | 19211 pkt. | |
| 3DMark Time Spy Score | 8149 pkt. | |
Pomoc | ||
* ... im mniej tym lepiej
Wydajność w grach
Niemniej jednak, Victus 15 jest wystarczająco szybki, aby płynnie uruchamiać większość aktualnych gier w natywnej rozdzielczości 1,920 x 1,080 przy ustawieniach od wysokich do maksymalnych. Wyzwania pojawiają się tylko w pojedynczych przypadkach, takich jak Enshrouded. Fakt, że RTX 4050 działa z maksymalnym TDP wynoszącym 75 watów, nie ma żadnego zauważalnego wpływu w porównaniu do laptopów z wyższym TGP, podobnie jak w testach syntetycznych.
| The Witcher 3 - 1920x1080 Ultra Graphics & Postprocessing (HBAO+) | |
| Średnia w klasie Gaming (95 - 240, n=8, ostatnie 2 lata) | |
| Dell G15 5530, i5-13450HX RTX 4050 | |
| Asus TUF A15 FA507 | |
| Acer Nitro V 15 ANV15-51-582S | |
| HP Victus 15-fa1057ng | |
| Przeciętny NVIDIA GeForce RTX 4050 Laptop GPU (18.5 - 94.7, n=40) | |
| HP Victus 15 fa0020nr | |
| Enshrouded - 1920x1080 Max. Quality AA:FX | |
| Medion Erazer Scout E20 | |
| Przeciętny NVIDIA GeForce RTX 4050 Laptop GPU (37.3 - 37.7, n=2) | |
| HP Victus 15-fa1057ng | |
| Średnia w klasie Gaming (n=1ostatnie 2 lata) | |
| Palworld - 1920x1080 Epic Preset AA:TSR | |
| Medion Erazer Scout E20 | |
| Przeciętny NVIDIA GeForce RTX 4050 Laptop GPU (71.9 - 74.9, n=2) | |
| HP Victus 15-fa1057ng | |
| Średnia w klasie Gaming (n=1ostatnie 2 lata) | |
| Prince of Persia The Lost Crown - 1920x1080 Ultra Preset AA:SM | |
| Medion Erazer Scout E20 | |
| Przeciętny NVIDIA GeForce RTX 4050 Laptop GPU (349 - 353, n=2) | |
| HP Victus 15-fa1057ng | |
| Średnia w klasie Gaming (321 - 357, n=6, ostatnie 2 lata) | |
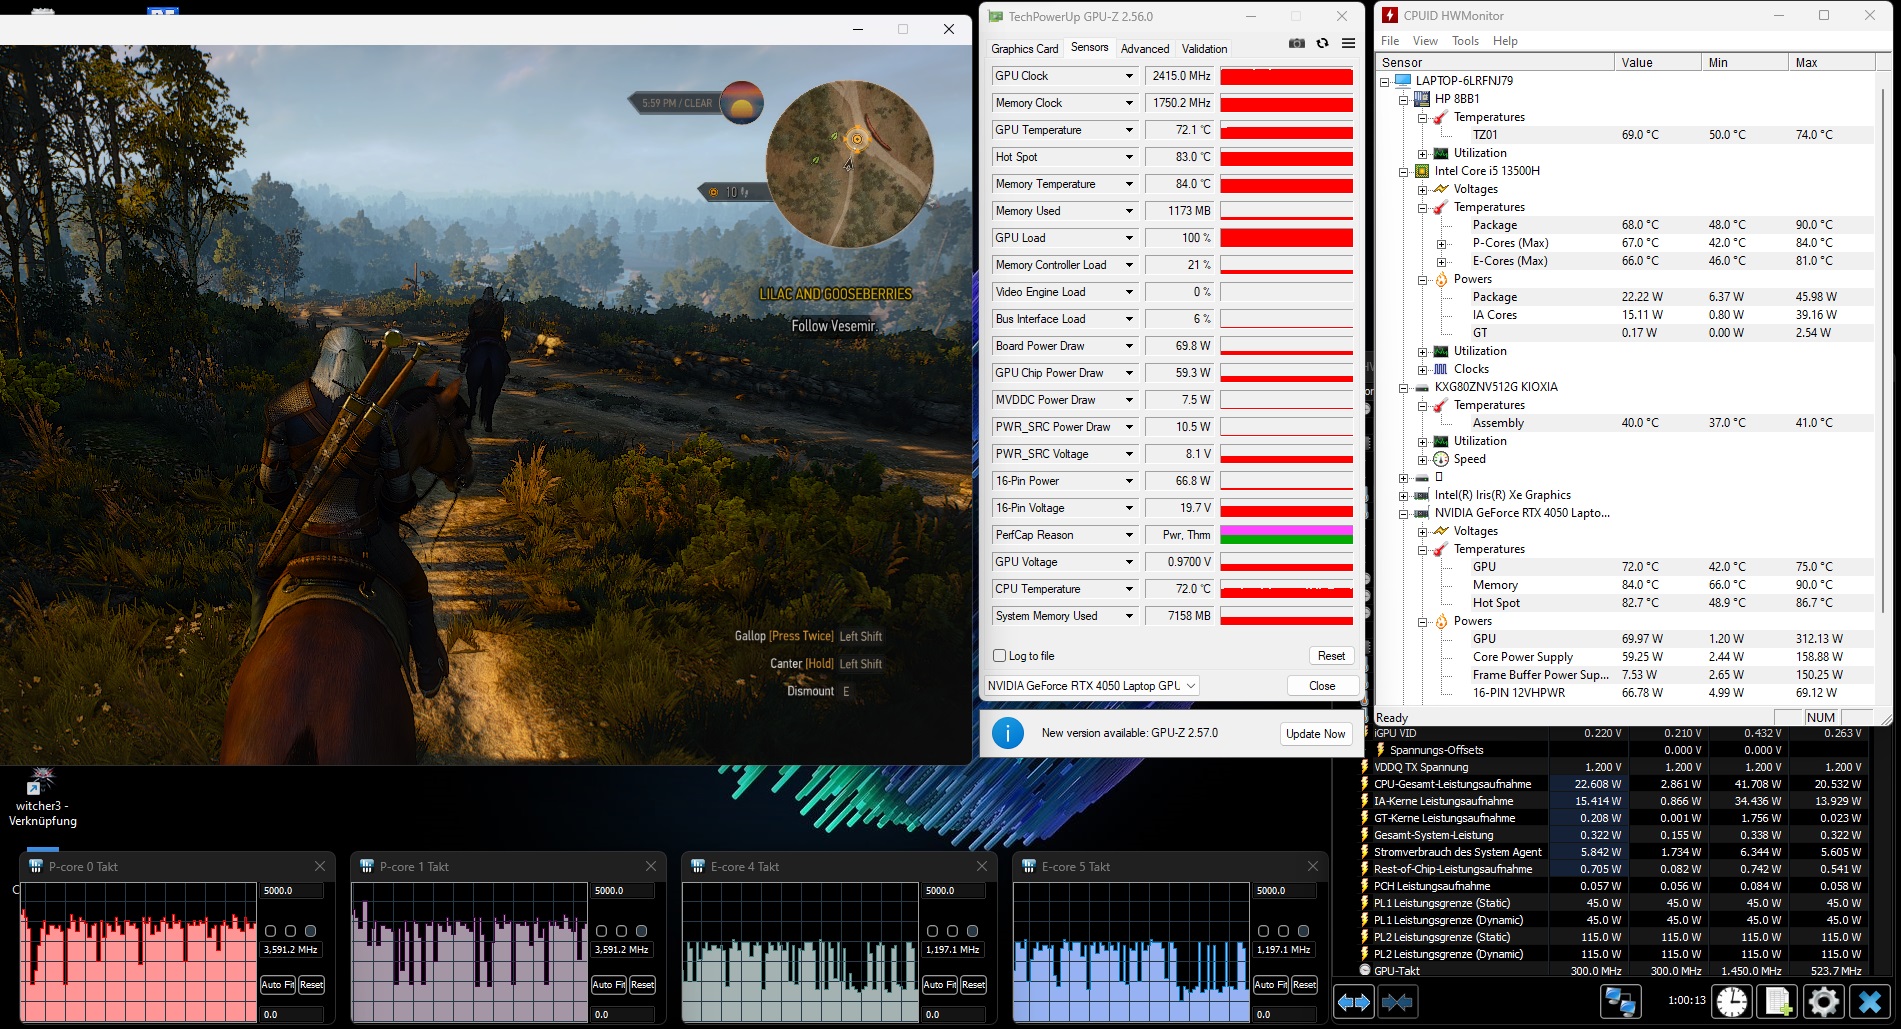
Sprawdziliśmy, jak wydajność 3D zachowuje się w dłuższym okresie czasu, a konkretnie przez 60 minut w grze fabularnej The Witcher 3 (FHD/Ultra). Liczba klatek na sekundę pozostała dość stabilna przez dłuższy czas.
Witcher 3 FPS diagram
| low | med. | high | ultra | |
|---|---|---|---|---|
| GTA V (2015) | 172.4 | 160.7 | 89.1 | |
| The Witcher 3 (2015) | 78 | |||
| Dota 2 Reborn (2015) | 159.7 | 141.1 | 130.7 | 122.5 |
| Final Fantasy XV Benchmark (2018) | 105.1 | 80.3 | ||
| X-Plane 11.11 (2018) | 113 | 101.1 | 81.5 | |
| Strange Brigade (2018) | 197.1 | 159 | 139.1 | |
| Prince of Persia The Lost Crown (2024) | 352 | 350 | 349 | |
| Palworld (2024) | 93.3 | 72.5 | 71.9 | |
| Enshrouded (2024) | 45.8 | 45.1 | 37.3 |
Emisje
Hałas systemowy
Rozwój hałasu opisalibyśmy zgodnie z oczekiwaniami. Przy 29-31 dB (bezczynność) i 40-48 dB (obciążenie), 15-calowy laptop nie jest ani bardzo cichy, ani bardzo głośny w trybie "Standard", ale osiąga średni poziom, który powinien być akceptowalny dla większości kupujących nawet bez zestawu słuchawkowego.
Hałas
| luz |
| 29 / 30 / 31 dB |
| obciążenie |
| 40 / 48 dB |
 | ||
30 dB cichy 40 dB(A) słyszalny 50 dB(A) irytujący |
||
min: | ||
| HP Victus 15-fa1057ng GeForce RTX 4050 Laptop GPU, i5-13500H | HP Victus 15 fa0020nr GeForce RTX 3050 Ti Laptop GPU, i7-12700H | Dell G15 5530, i5-13450HX RTX 4050 GeForce RTX 4050 Laptop GPU, i5-13450HX | Acer Nitro V 15 ANV15-51-582S GeForce RTX 4050 Laptop GPU, i5-13420H | Asus TUF A15 FA507 GeForce RTX 4050 Laptop GPU, R7 7735HS | |
|---|---|---|---|---|---|
| Noise | 7% | 4% | -4% | 15% | |
| wyłączone / środowisko * (dB) | 25 | 24.8 1% | 25 -0% | 25 -0% | 23.3 7% |
| Idle Minimum * (dB) | 29 | 26.2 10% | 25 14% | 25 14% | 23.3 20% |
| Idle Average * (dB) | 30 | 29.2 3% | 26 13% | 29 3% | 23.3 22% |
| Idle Maximum * (dB) | 31 | 29.4 5% | 30 3% | 30 3% | 23.3 25% |
| Load Average * (dB) | 40 | 29.9 25% | 38 5% | 49 -23% | 29.6 26% |
| Witcher 3 ultra * (dB) | 42 | 41.1 2% | 44 -5% | 49 -17% | 43 -2% |
| Load Maximum * (dB) | 48 | 45.5 5% | 50 -4% | 51 -6% | 43 10% |
* ... im mniej tym lepiej
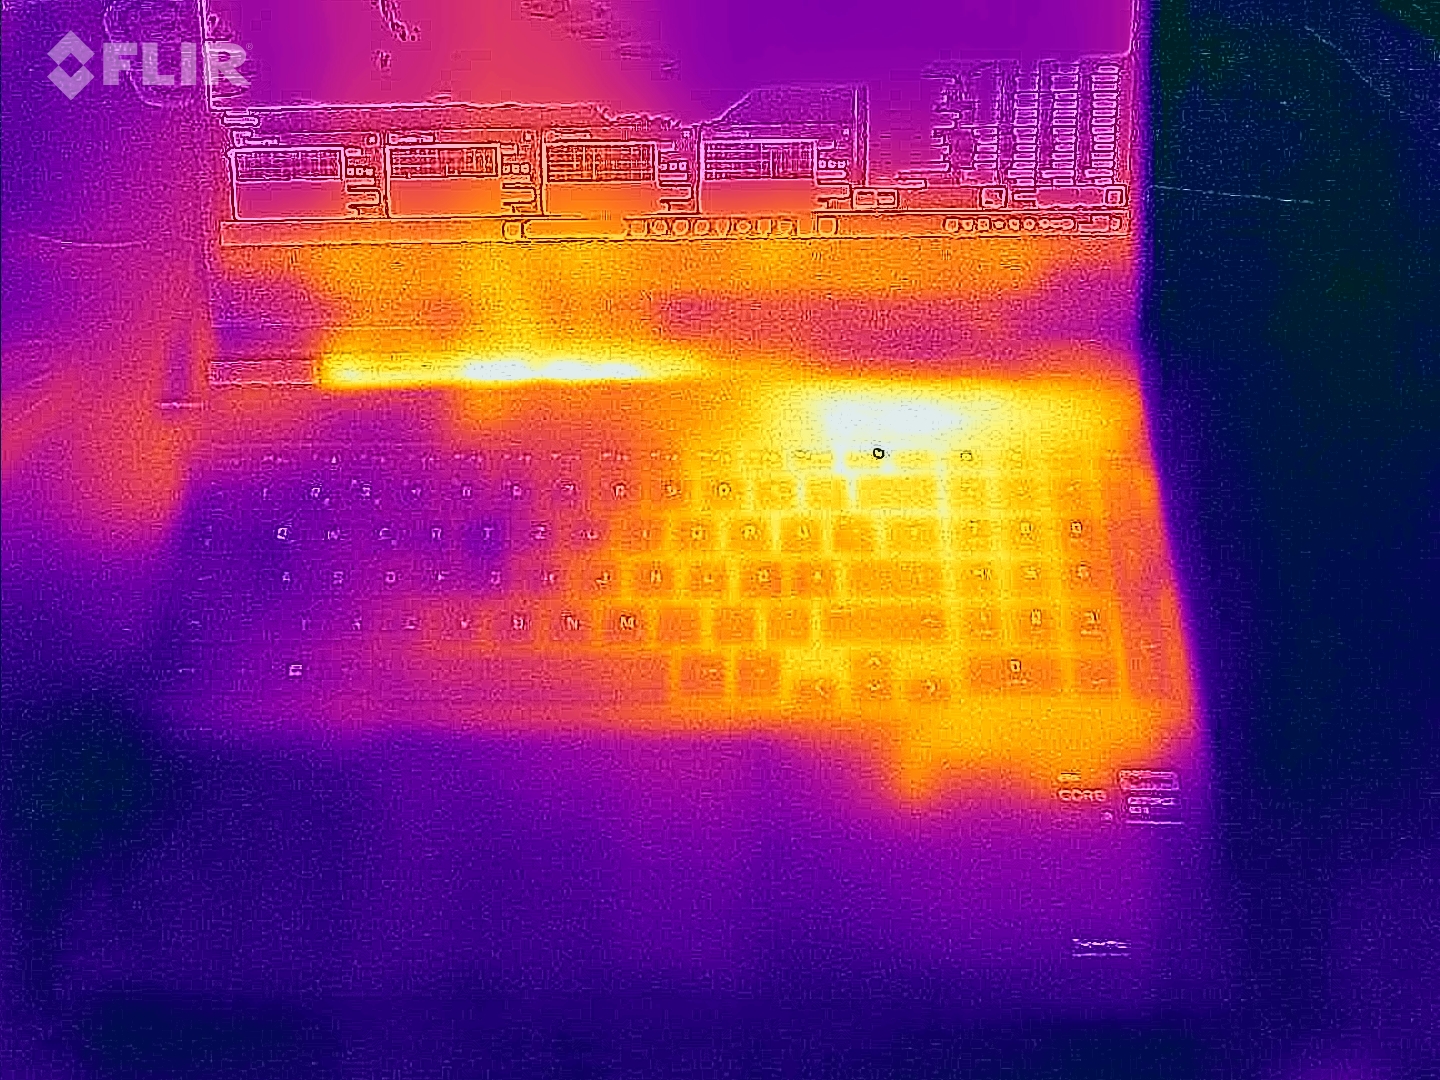
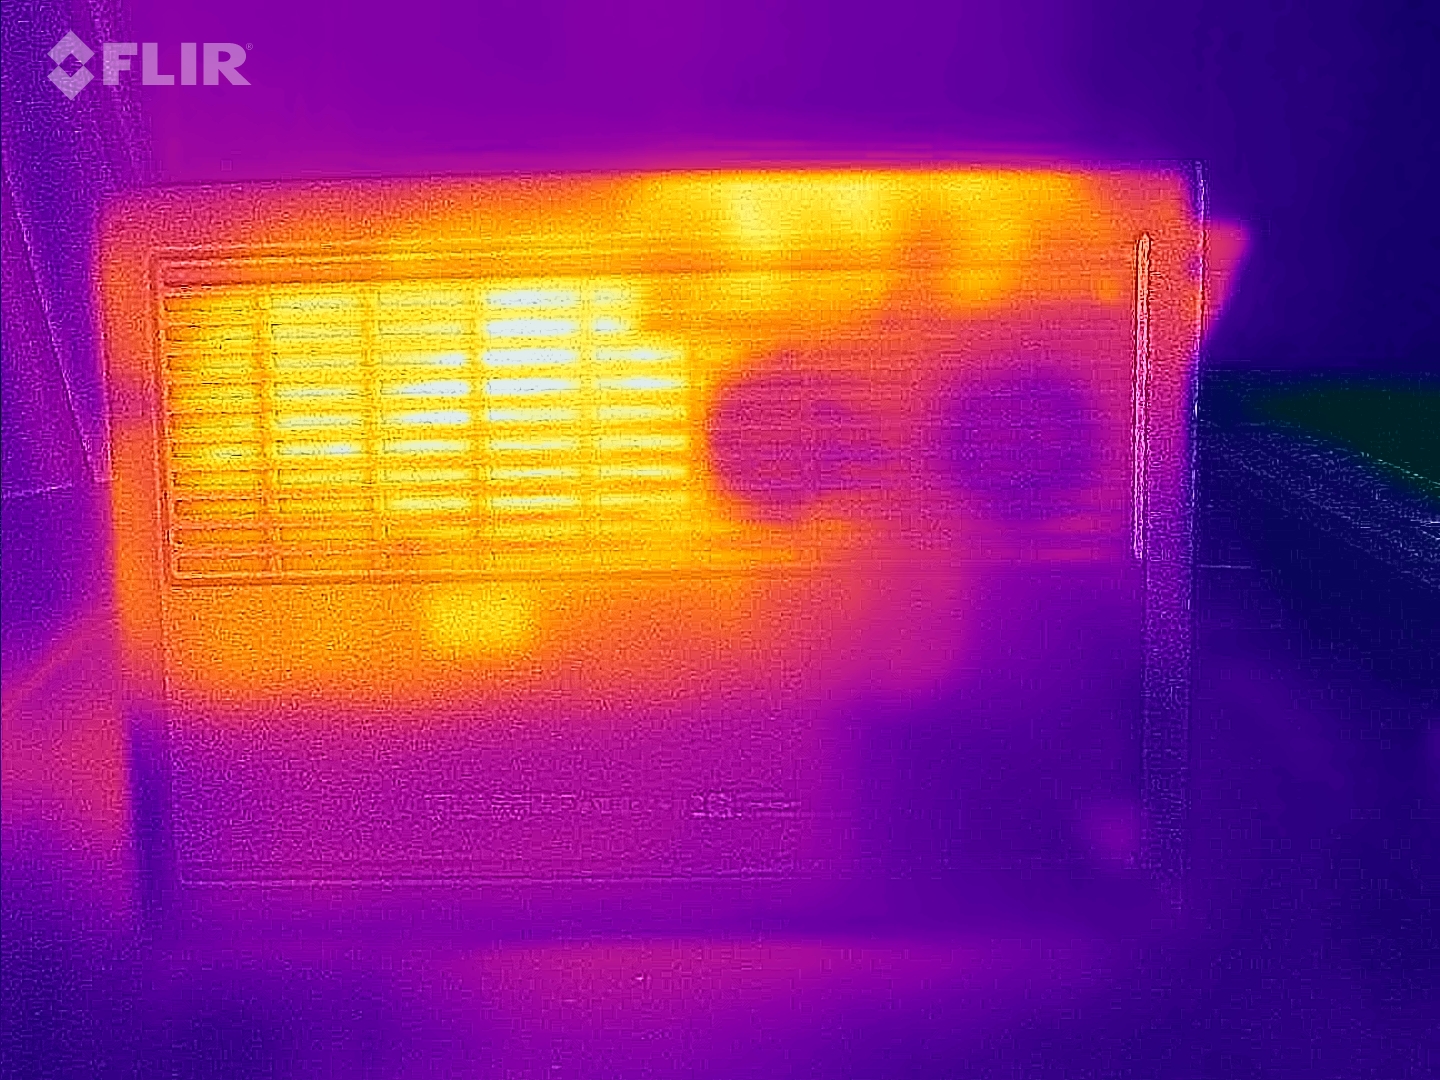
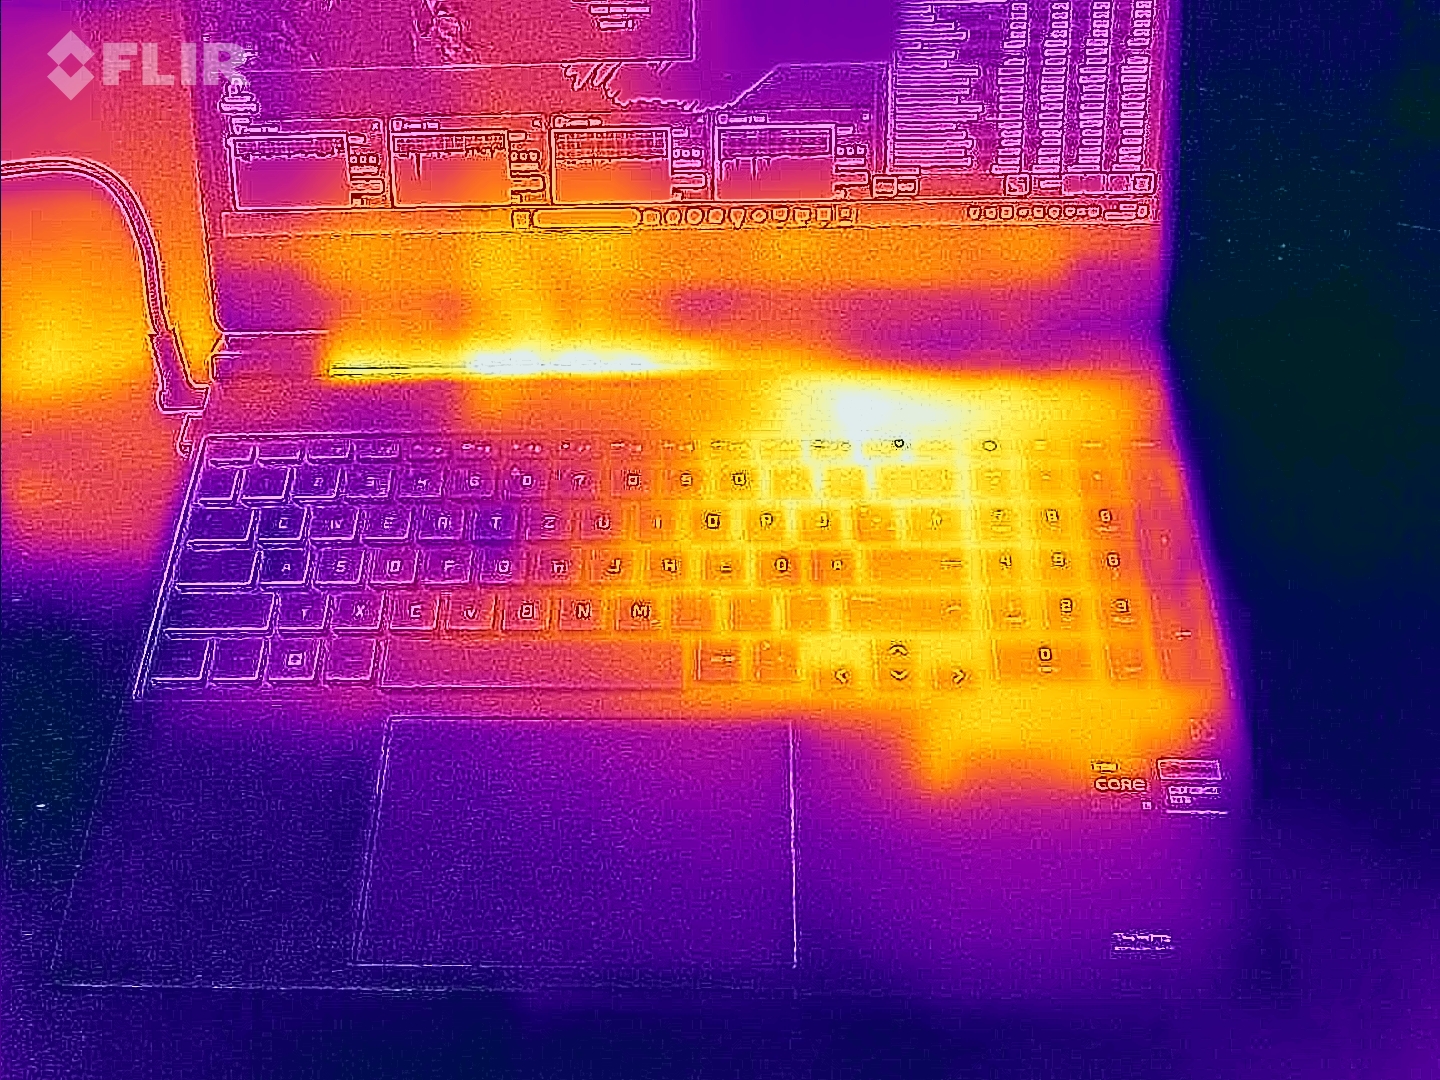
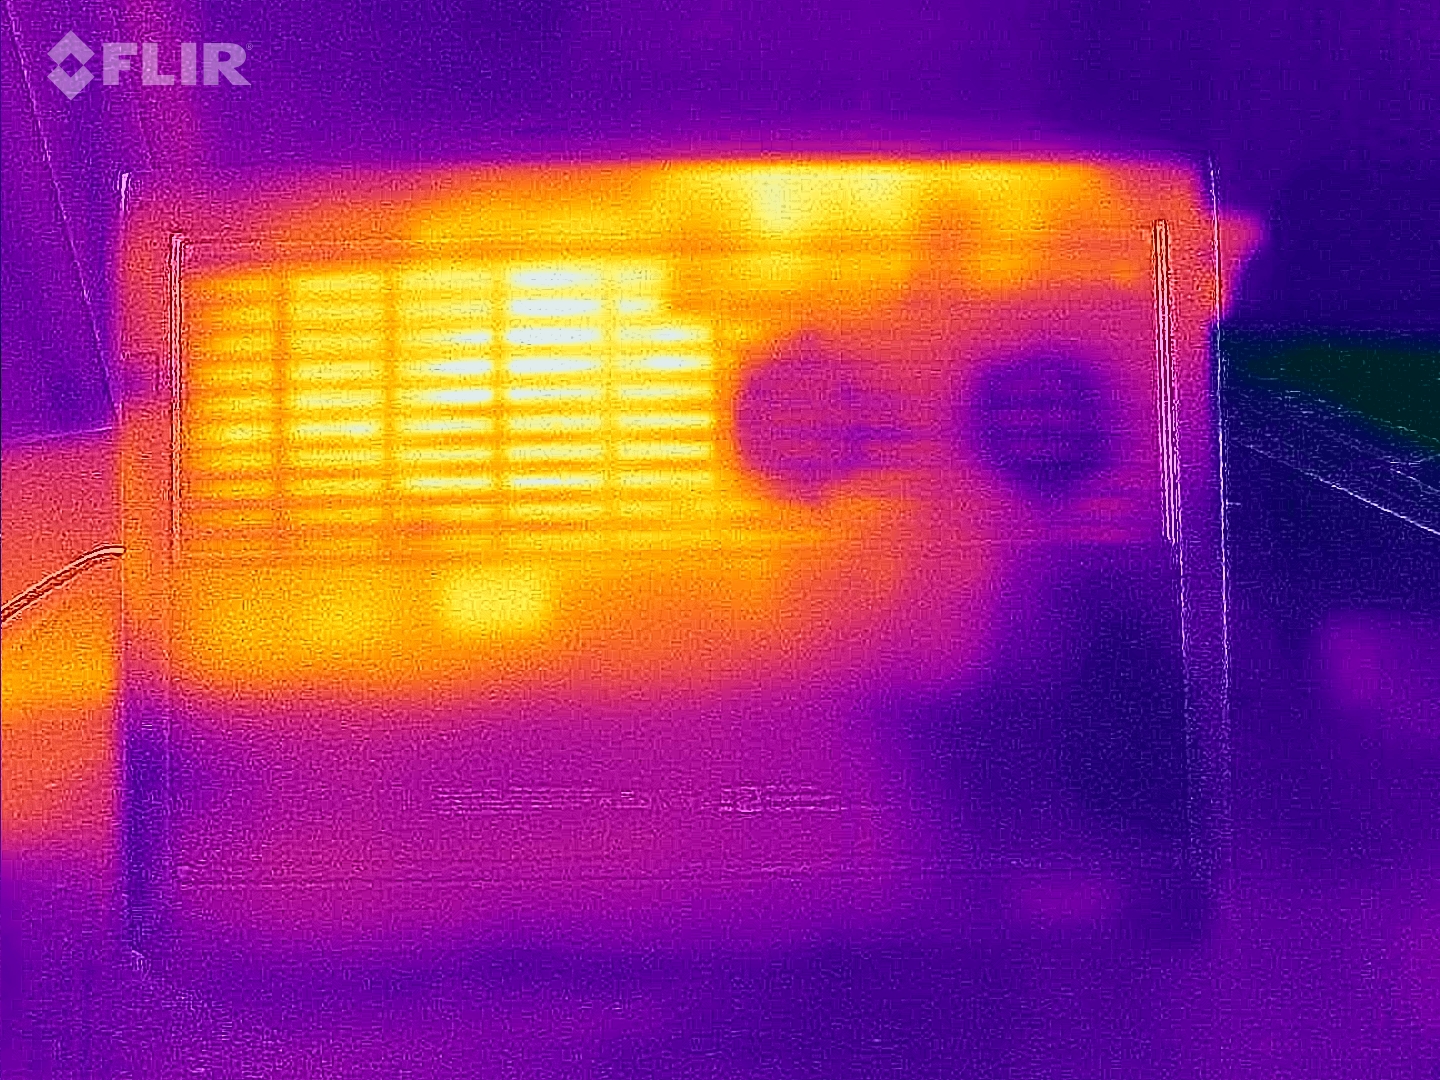
Temperatura
Temperatury obudowy są zaskakująco niskie. Nawet po godzinie testów obciążeniowych za pomocą narzędzi Furmark i Prime95, obudowa osiąga temperaturę zaledwie 107,6 °F. Oznacza to, że Victus 15 można z łatwością umieścić na kolanach podczas grania. Konkurencja w niektórych przypadkach staje się zauważalnie cieplejsza.
(±) Maksymalna temperatura w górnej części wynosi 42 °C / 108 F, w porównaniu do średniej 40.4 °C / 105 F , począwszy od 21.2 do 68.8 °C dla klasy Gaming.
(±) Dno nagrzewa się maksymalnie do 42 °C / 108 F, w porównaniu do średniej 43.2 °C / 110 F
(+) W stanie bezczynności średnia temperatura górnej części wynosi 23.6 °C / 74 F, w porównaniu ze średnią temperaturą urządzenia wynoszącą 33.9 °C / ### class_avg_f### F.
(±) Podczas gry w Wiedźmina 3 średnia temperatura górnej części wynosi 33.8 °C / 93 F, w porównaniu do średniej temperatury urządzenia wynoszącej 33.9 °C / ## #class_avg_f### F.
(+) Podparcia dłoni i touchpad osiągają maksymalną temperaturę skóry (33 °C / 91.4 F) i dlatego nie są gorące.
(-) Średnia temperatura obszaru podparcia dłoni w podobnych urządzeniach wynosiła 28.8 °C / 83.8 F (-4.2 °C / -7.6 F).
| HP Victus 15-fa1057ng GeForce RTX 4050 Laptop GPU, i5-13500H | HP Victus 15 fa0020nr GeForce RTX 3050 Ti Laptop GPU, i7-12700H | Dell G15 5530, i5-13450HX RTX 4050 GeForce RTX 4050 Laptop GPU, i5-13450HX | Acer Nitro V 15 ANV15-51-582S GeForce RTX 4050 Laptop GPU, i5-13420H | Asus TUF A15 FA507 GeForce RTX 4050 Laptop GPU, R7 7735HS | |
|---|---|---|---|---|---|
| Heat | 10% | -30% | -14% | -13% | |
| Maximum Upper Side * (°C) | 42 | 37.2 11% | 58 -38% | 46 -10% | 48.9 -16% |
| Maximum Bottom * (°C) | 42 | 35.4 16% | 57 -36% | 48 -14% | 44.6 -6% |
| Idle Upper Side * (°C) | 24 | 22.4 7% | 30 -25% | 27 -13% | 27.1 -13% |
| Idle Bottom * (°C) | 24 | 22.6 6% | 29 -21% | 28 -17% | 27.5 -15% |
* ... im mniej tym lepiej
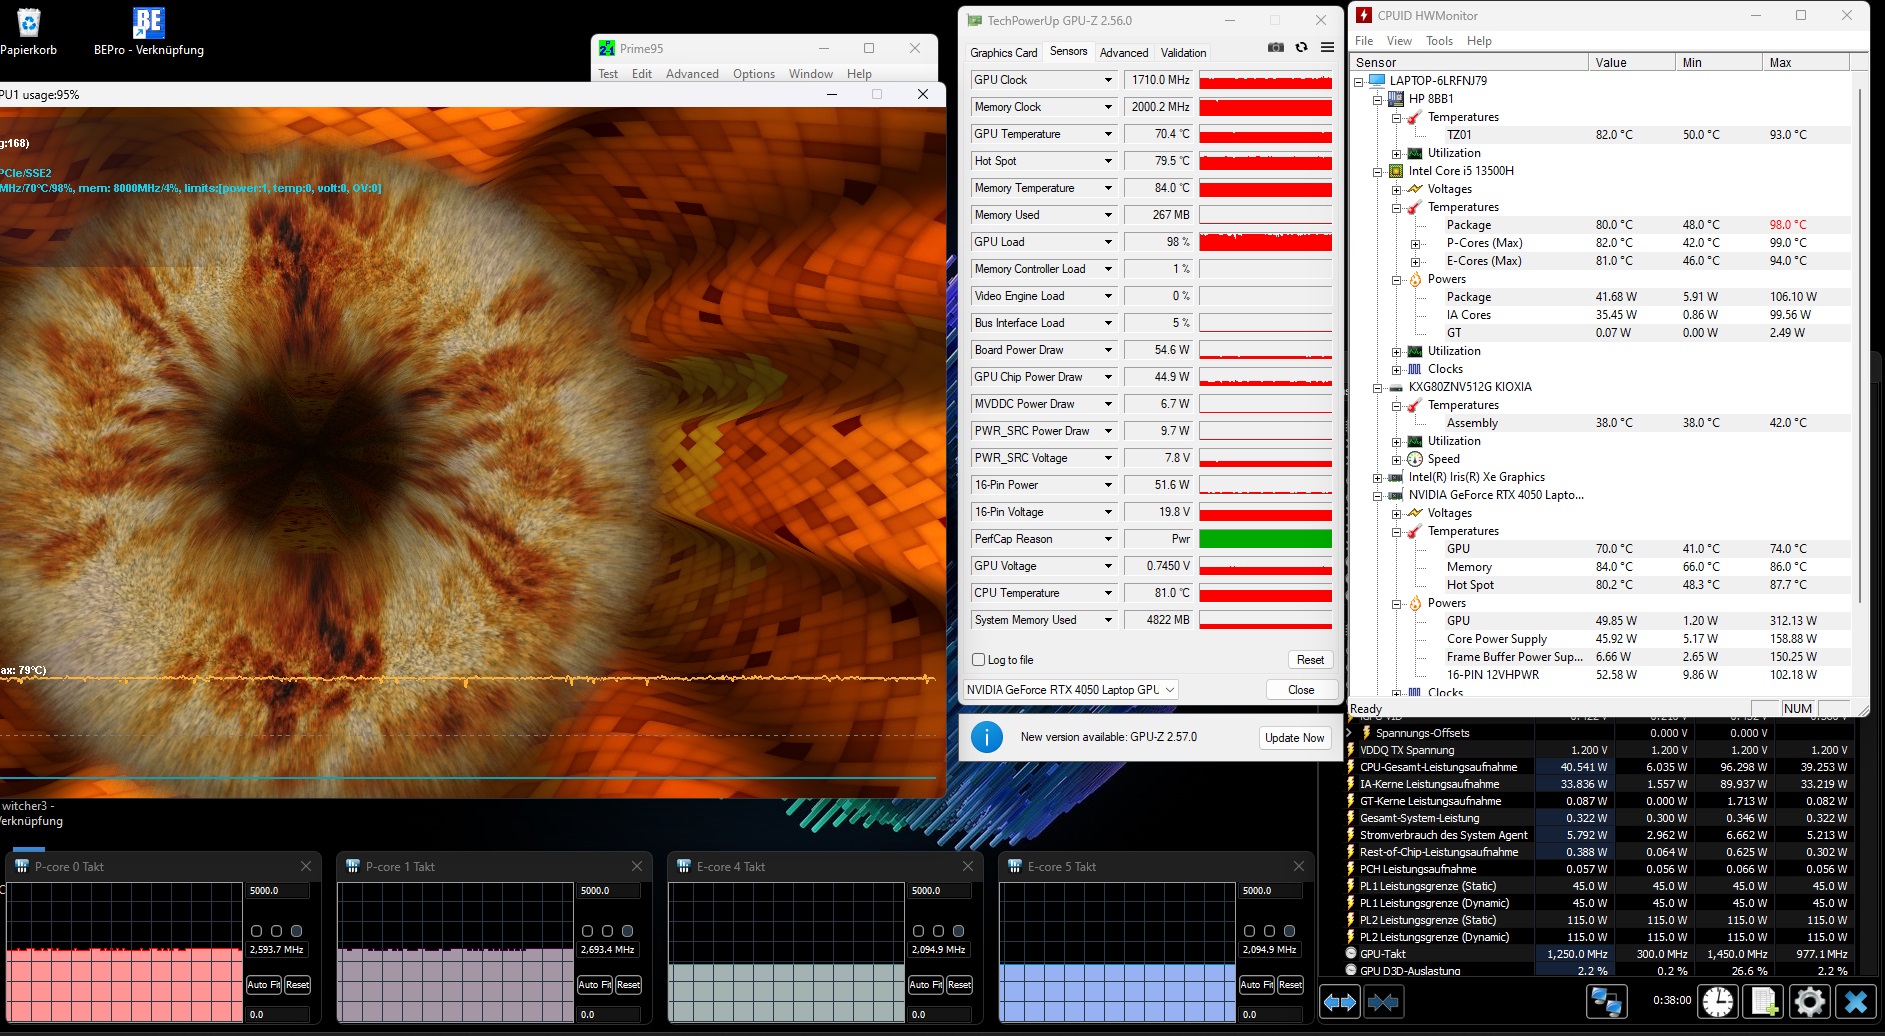
Test warunków skrajnych
Komponenty nie dostarczyły żadnych niepożądanych niespodzianek. Po dłuższym okresie pełnego obciążenia, CPU ustabilizowało się na poziomie około 176°F, podczas gdy GPU utrzymywało średnią 158°F, co również jest całkowicie akceptowalne dla tego scenariusza.
Głośniki
Jeśli to możliwe, należy podłączyć zestaw słuchawkowy lub głośniki zewnętrzne, aby cieszyć się multimediami. System audio Victus 15 2.0 osiągnął tylko przeciętny wynik w analizie dźwięku, z zauważalnymi brakami w reprodukcji basów i maksymalnej głośności.
HP Victus 15-fa1057ng analiza dźwięku
(±) | głośność głośnika jest średnia, ale dobra (79 dB)
Bas 100 - 315 Hz
(-) | prawie brak basu - średnio 26.2% niższa od mediany
(±) | liniowość basu jest średnia (12.8% delta do poprzedniej częstotliwości)
Średnie 400 - 2000 Hz
(+) | zbalansowane środki średnie - tylko 1.7% od mediany
(+) | średnie są liniowe (4.1% delta do poprzedniej częstotliwości)
Wysokie 2–16 kHz
(+) | zrównoważone maksima - tylko 3% od mediany
(+) | wzloty są liniowe (3.7% delta do poprzedniej częstotliwości)
Ogólnie 100 - 16.000 Hz
(±) | liniowość ogólnego dźwięku jest średnia (18.4% różnicy w stosunku do mediany)
W porównaniu do tej samej klasy
» 59% wszystkich testowanych urządzeń w tej klasie było lepszych, 9% podobnych, 32% gorszych
» Najlepszy miał deltę 6%, średnia wynosiła ###średnia###%, najgorsza wynosiła 132%
W porównaniu do wszystkich testowanych urządzeń
» 41% wszystkich testowanych urządzeń było lepszych, 8% podobnych, 52% gorszych
» Najlepszy miał deltę 4%, średnia wynosiła ###średnia###%, najgorsza wynosiła 134%
HP Victus 15 fa0020nr analiza dźwięku
(±) | głośność głośnika jest średnia, ale dobra (81 dB)
Bas 100 - 315 Hz
(-) | prawie brak basu - średnio 24.6% niższa od mediany
(±) | liniowość basu jest średnia (12.8% delta do poprzedniej częstotliwości)
Średnie 400 - 2000 Hz
(+) | zbalansowane środki średnie - tylko 2.5% od mediany
(+) | średnie są liniowe (3.4% delta do poprzedniej częstotliwości)
Wysokie 2–16 kHz
(+) | zrównoważone maksima - tylko 3.7% od mediany
(+) | wzloty są liniowe (4.9% delta do poprzedniej częstotliwości)
Ogólnie 100 - 16.000 Hz
(±) | liniowość ogólnego dźwięku jest średnia (19.7% różnicy w stosunku do mediany)
W porównaniu do tej samej klasy
» 69% wszystkich testowanych urządzeń w tej klasie było lepszych, 6% podobnych, 25% gorszych
» Najlepszy miał deltę 6%, średnia wynosiła ###średnia###%, najgorsza wynosiła 132%
W porównaniu do wszystkich testowanych urządzeń
» 50% wszystkich testowanych urządzeń było lepszych, 7% podobnych, 43% gorszych
» Najlepszy miał deltę 4%, średnia wynosiła ###średnia###%, najgorsza wynosiła 134%
Zarządzanie energią
Zużycie energii
Docenić należy umiarkowany pobór mocy. Biorąc pod uwagę dostępną wydajność, pobór mocy na poziomie 5-9 W w spoczynku i 72-176 W pod obciążeniem jest rozsądny. Zasilacz jest odpowiedniej wielkości.
| wyłączony / stan wstrzymania | |
| luz | |
| obciążenie |
|
Legenda:
min: | |
| HP Victus 15-fa1057ng i5-13500H, GeForce RTX 4050 Laptop GPU | HP Victus 15 fa0020nr i7-12700H, GeForce RTX 3050 Ti Laptop GPU | Dell G15 5530, i5-13450HX RTX 4050 i5-13450HX, GeForce RTX 4050 Laptop GPU | Acer Nitro V 15 ANV15-51-582S i5-13420H, GeForce RTX 4050 Laptop GPU | Asus TUF A15 FA507 R7 7735HS, GeForce RTX 4050 Laptop GPU | Średnia w klasie Gaming | |
|---|---|---|---|---|---|---|
| Power Consumption | -18% | -21% | 9% | -14% | -75% | |
| Idle Minimum * (Watt) | 5 | 5.1 -2% | 2 60% | 7 -40% | 8 -60% | 13.1 ? -162% |
| Idle Average * (Watt) | 9 | 15.1 -68% | 12 -33% | 8 11% | 12.1 -34% | 18.8 ? -109% |
| Idle Maximum * (Watt) | 22 | 18.9 14% | 27 -23% | 11 50% | 12.5 43% | 24.4 ? -11% |
| Load Average * (Watt) | 72 | 114.5 -59% | 100 -39% | 76 -6% | 74.9 -4% | 108.6 ? -51% |
| Witcher 3 ultra * (Watt) | 113 | 113.9 -1% | 161.9 -43% | 98.2 13% | 136.6 -21% | |
| Load Maximum * (Watt) | 176 | 165.8 6% | 262 -49% | 136 23% | 185 -5% | 254 ? -44% |
* ... im mniej tym lepiej
Power consumption Witcher 3 / stress test
Power consumption with external monitor
Czas trwania
15-calowy laptop nie musi też chować się za konkurencją pod względem czasu pracy - wręcz przeciwnie. Odrośl HP wytrzymała około 7,5 godziny w naszym teście WLAN z jasnością zredukowaną do 150 cd/m² - to dobry wynik jak na notebooka do gier. Wartości poprzednika są prawdopodobnie znacznie gorsze z powodu błędu.
| HP Victus 15-fa1057ng i5-13500H, GeForce RTX 4050 Laptop GPU, 70 Wh | HP Victus 15 fa0020nr i7-12700H, GeForce RTX 3050 Ti Laptop GPU, 70 Wh | Dell G15 5530, i5-13450HX RTX 4050 i5-13450HX, GeForce RTX 4050 Laptop GPU, 86 Wh | Acer Nitro V 15 ANV15-51-582S i5-13420H, GeForce RTX 4050 Laptop GPU, 57 Wh | Asus TUF A15 FA507 R7 7735HS, GeForce RTX 4050 Laptop GPU, 90 Wh | Średnia w klasie Gaming | |
|---|---|---|---|---|---|---|
| Czasy pracy | -72% | -5% | 25% | 56% | -7% | |
| WiFi v1.3 (h) | 7.5 | 2.1 -72% | 7.1 -5% | 9.4 25% | 11.7 56% | 6.96 ? -7% |
| Reader / Idle (h) | 2.6 | 21.5 | 8.71 ? | |||
| Load (h) | 1.1 | 1.7 | 1 | 1.47 ? | ||
| H.264 (h) | 12.5 | 8.28 ? |
Za
Przeciw
Werdykt
Victus 15-fa1057ng wyłania się jako typowy budżetowy notebook do gier, przeznaczony dla graczy zwracających uwagę na cenę.
Plastikowa obudowa, choć nie emanuje wysoką jakością wykonania, niezawodnie spełnia swoją funkcję, podobnie jak urządzenia wejściowe. Sprzęt dobrze współgra z rozdzielczością Full HD, zapewniając przyzwoite wrażenia z rozgrywki w większości tytułów, nawet jeśli wyświetlacz 144 Hz nie jest w pełni wykorzystywany. Emisja z Core i5-13500H i GeForce RTX 4050 pozostają do opanowania.
Jedną z zalet jest znacznie wydłużony czas pracy na baterii.
Użytkownicy muszą jednak zaakceptować wyświetlacz o ograniczonej dokładności kolorów i jasności. Dla tych, dla których priorytetem jest jakość obrazu, warto rozważyć alternatywy, takie jak Dell G15 5530 lub Asus TUF A15 FA507 w podobnym przedziale cenowym. W związku z tym, lepsza jakość wyświetlania byłaby znaczącym ulepszeniem dla następcy.
Cena i dostępność
HP Victus 15 wyposażony w procesor Core i5-13500H jest dostępny w cenie około 690 USD u różnych sprzedawców internetowych (np. Amazon).
HP Victus 15-fa1057ng
- 31/01/2024 v7 (old)
Florian Glaser
Przezroczystość
Wyboru urządzeń do recenzji dokonuje nasza redakcja. Próbka testowa została udostępniona autorowi jako pożyczka od producenta lub sprzedawcy detalicznego na potrzeby tej recenzji. Pożyczkodawca nie miał wpływu na tę recenzję, producent nie otrzymał też kopii tej recenzji przed publikacją. Nie było obowiązku publikowania tej recenzji. Jako niezależna firma medialna, Notebookcheck nie podlega władzy producentów, sprzedawców detalicznych ani wydawców.
Tak testuje Notebookcheck
Każdego roku Notebookcheck niezależnie sprawdza setki laptopów i smartfonów, stosując standardowe procedury, aby zapewnić porównywalność wszystkich wyników. Od około 20 lat stale rozwijamy nasze metody badawcze, ustanawiając przy tym standardy branżowe. W naszych laboratoriach testowych doświadczeni technicy i redaktorzy korzystają z wysokiej jakości sprzętu pomiarowego. Testy te obejmują wieloetapowy proces walidacji. Nasz kompleksowy system ocen opiera się na setkach uzasadnionych pomiarów i benchmarków, co pozwala zachować obiektywizm.Price comparison

