Notebookcheck Logo

Recenzja Gigabyte Aorus GeForce RTX 4070 Ti Master 12G: RTX 3090 Ti z dodatkowym blingiem za 1000 USD

Sokół. Aorus GeForce RTX 4070 Ti Master 12G to propozycja Gigabyte AD104 klasy premium, skierowana do graczy z wyższej półki cenowej. Aorus RTX 4070 Ti Master działa dokładnie tak samo, jak RTX 4070 Ti oferowane przez Asusa i KFA2 i stanowi kolejną realną opcję, zwłaszcza jeśli lubisz wymyślne funkcje jakości życia i nie masz nic przeciwko wydatkom. Jednak topowa oferta RDNA 3 firmy AMD stara się zaoferować więcej korzyści za złotówkę.
Desktop GPU Geforce Gaming

Nvidia wypuściła RTX 4070 Ti oparty na AD104 na początku stycznia z szumnymi zapowiedziami wydajności w cenie 799 USD MSRP. W przeciwieństwie do RTX 4080 FE i RTX 4090 FEtym razem nie ma kart Founders Edition, ale w planach jest wiele kart partnerskich typu add-in board (AiB).

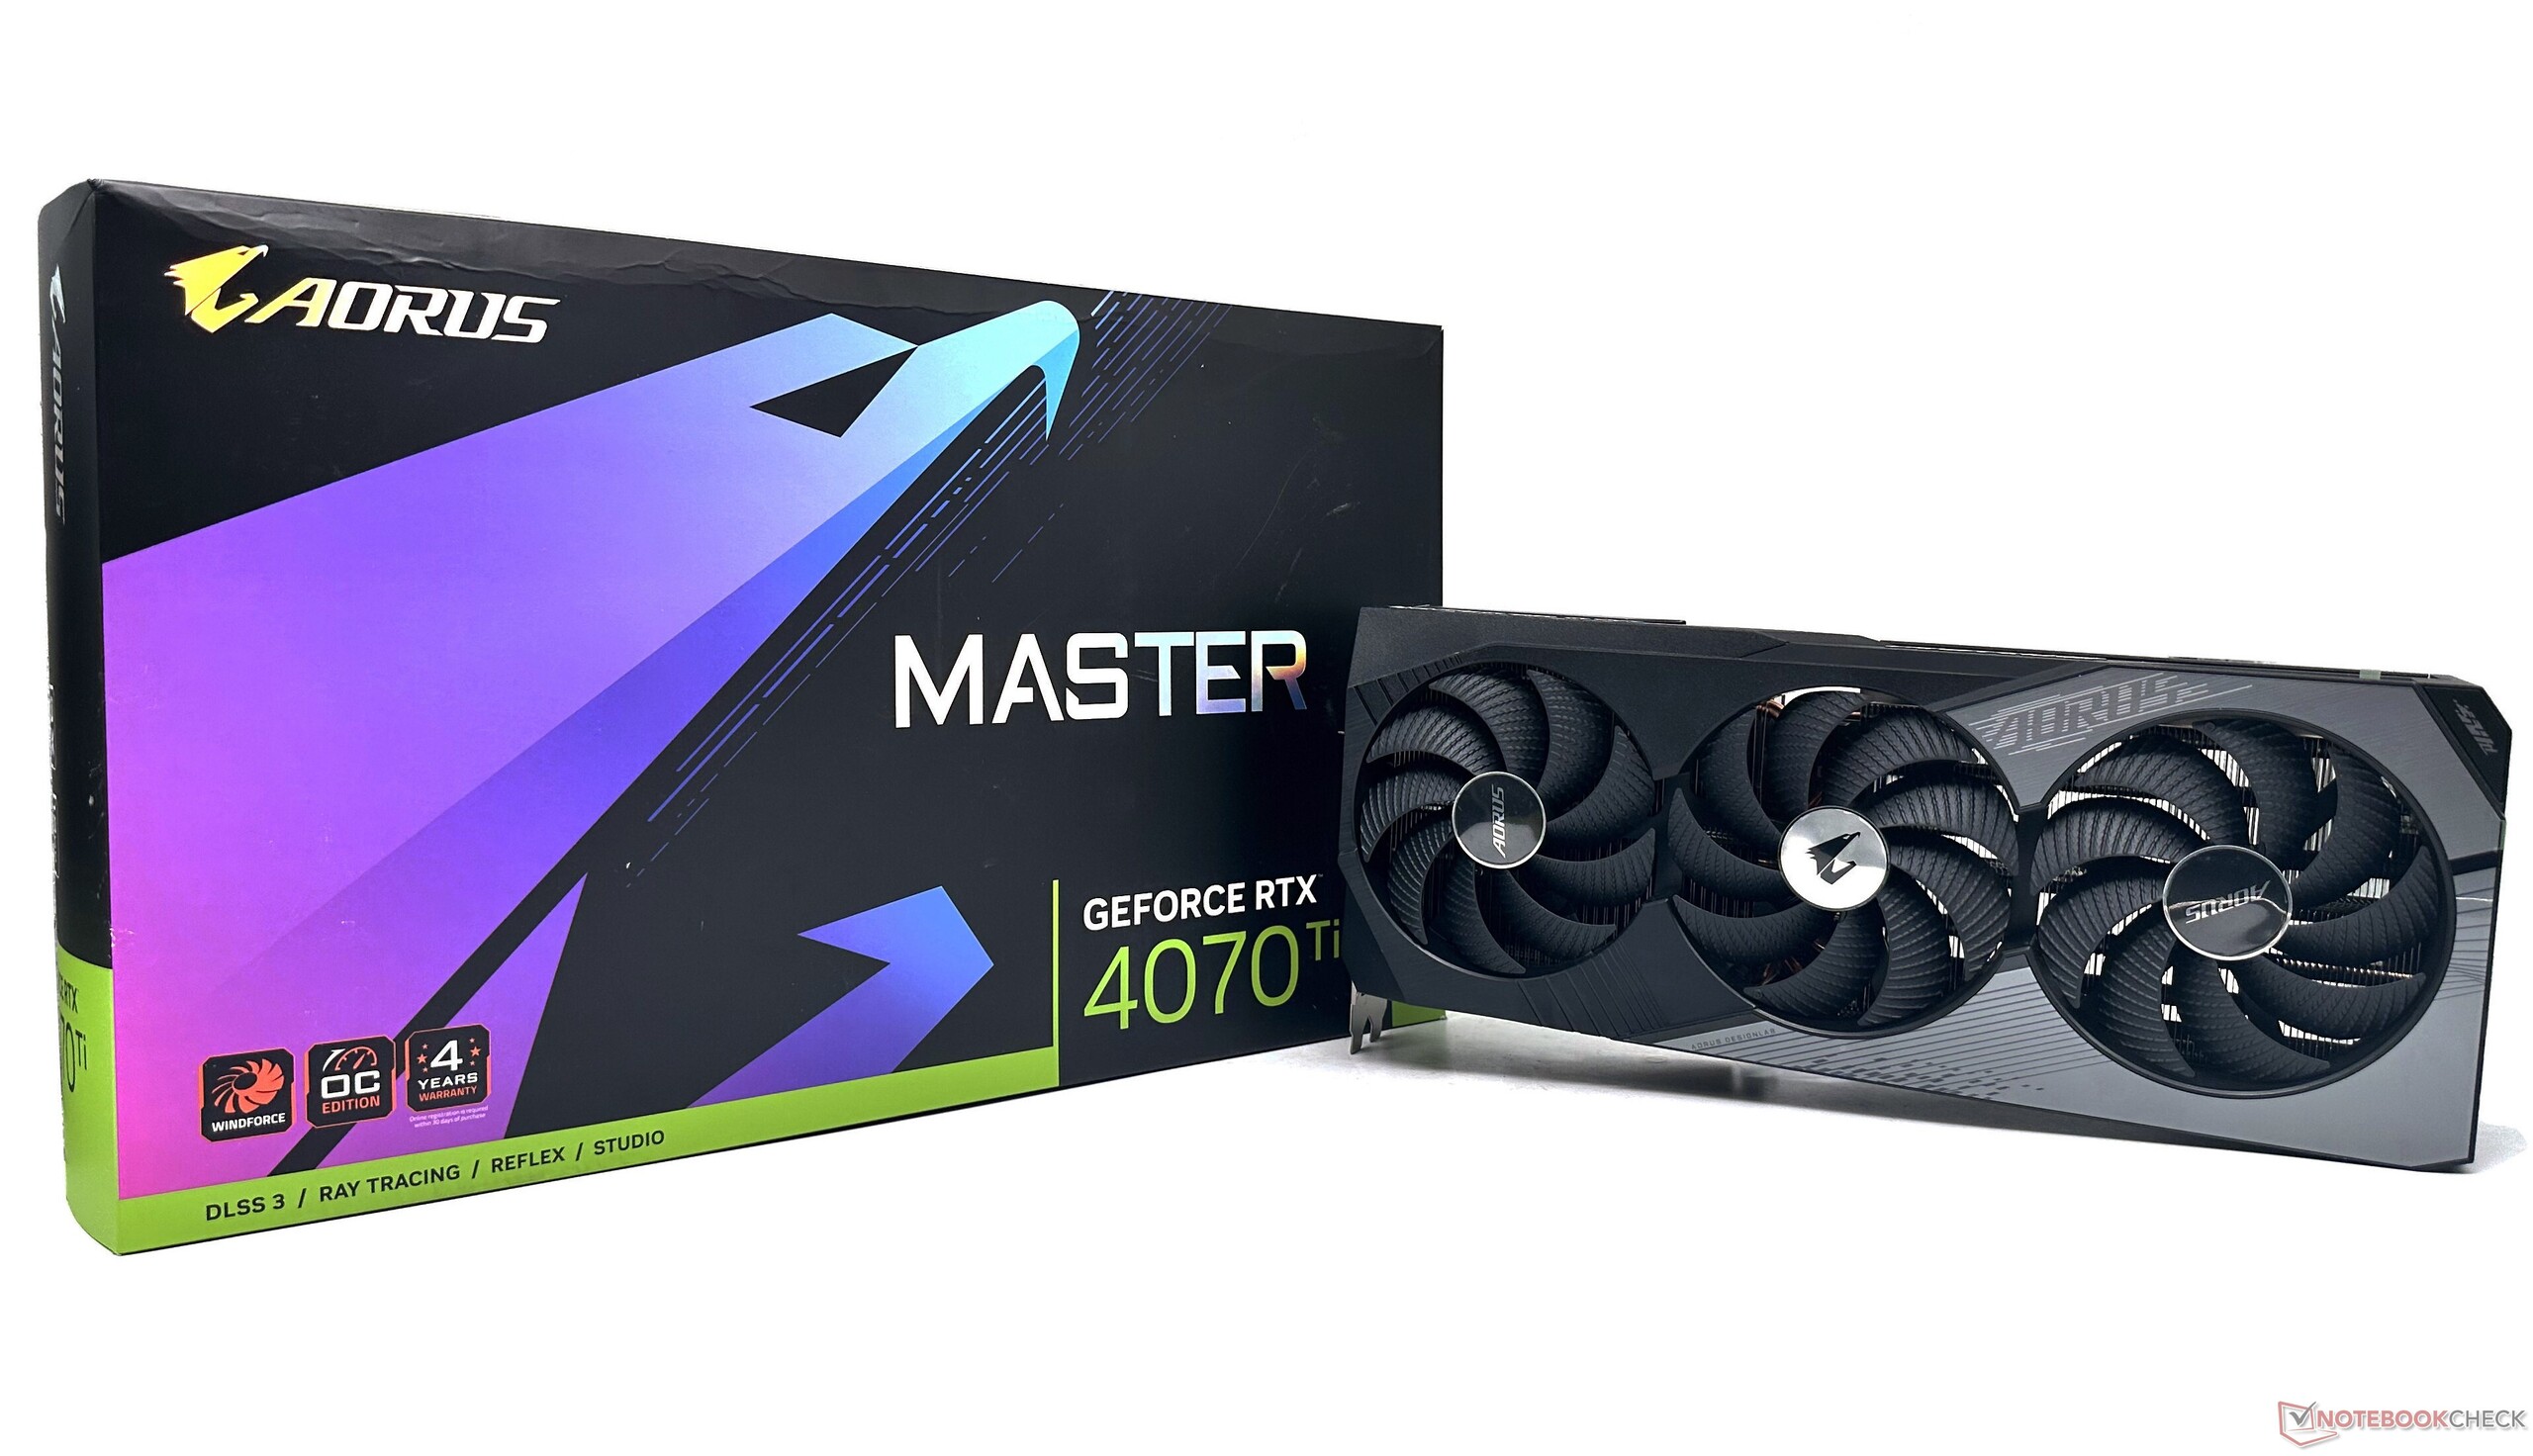
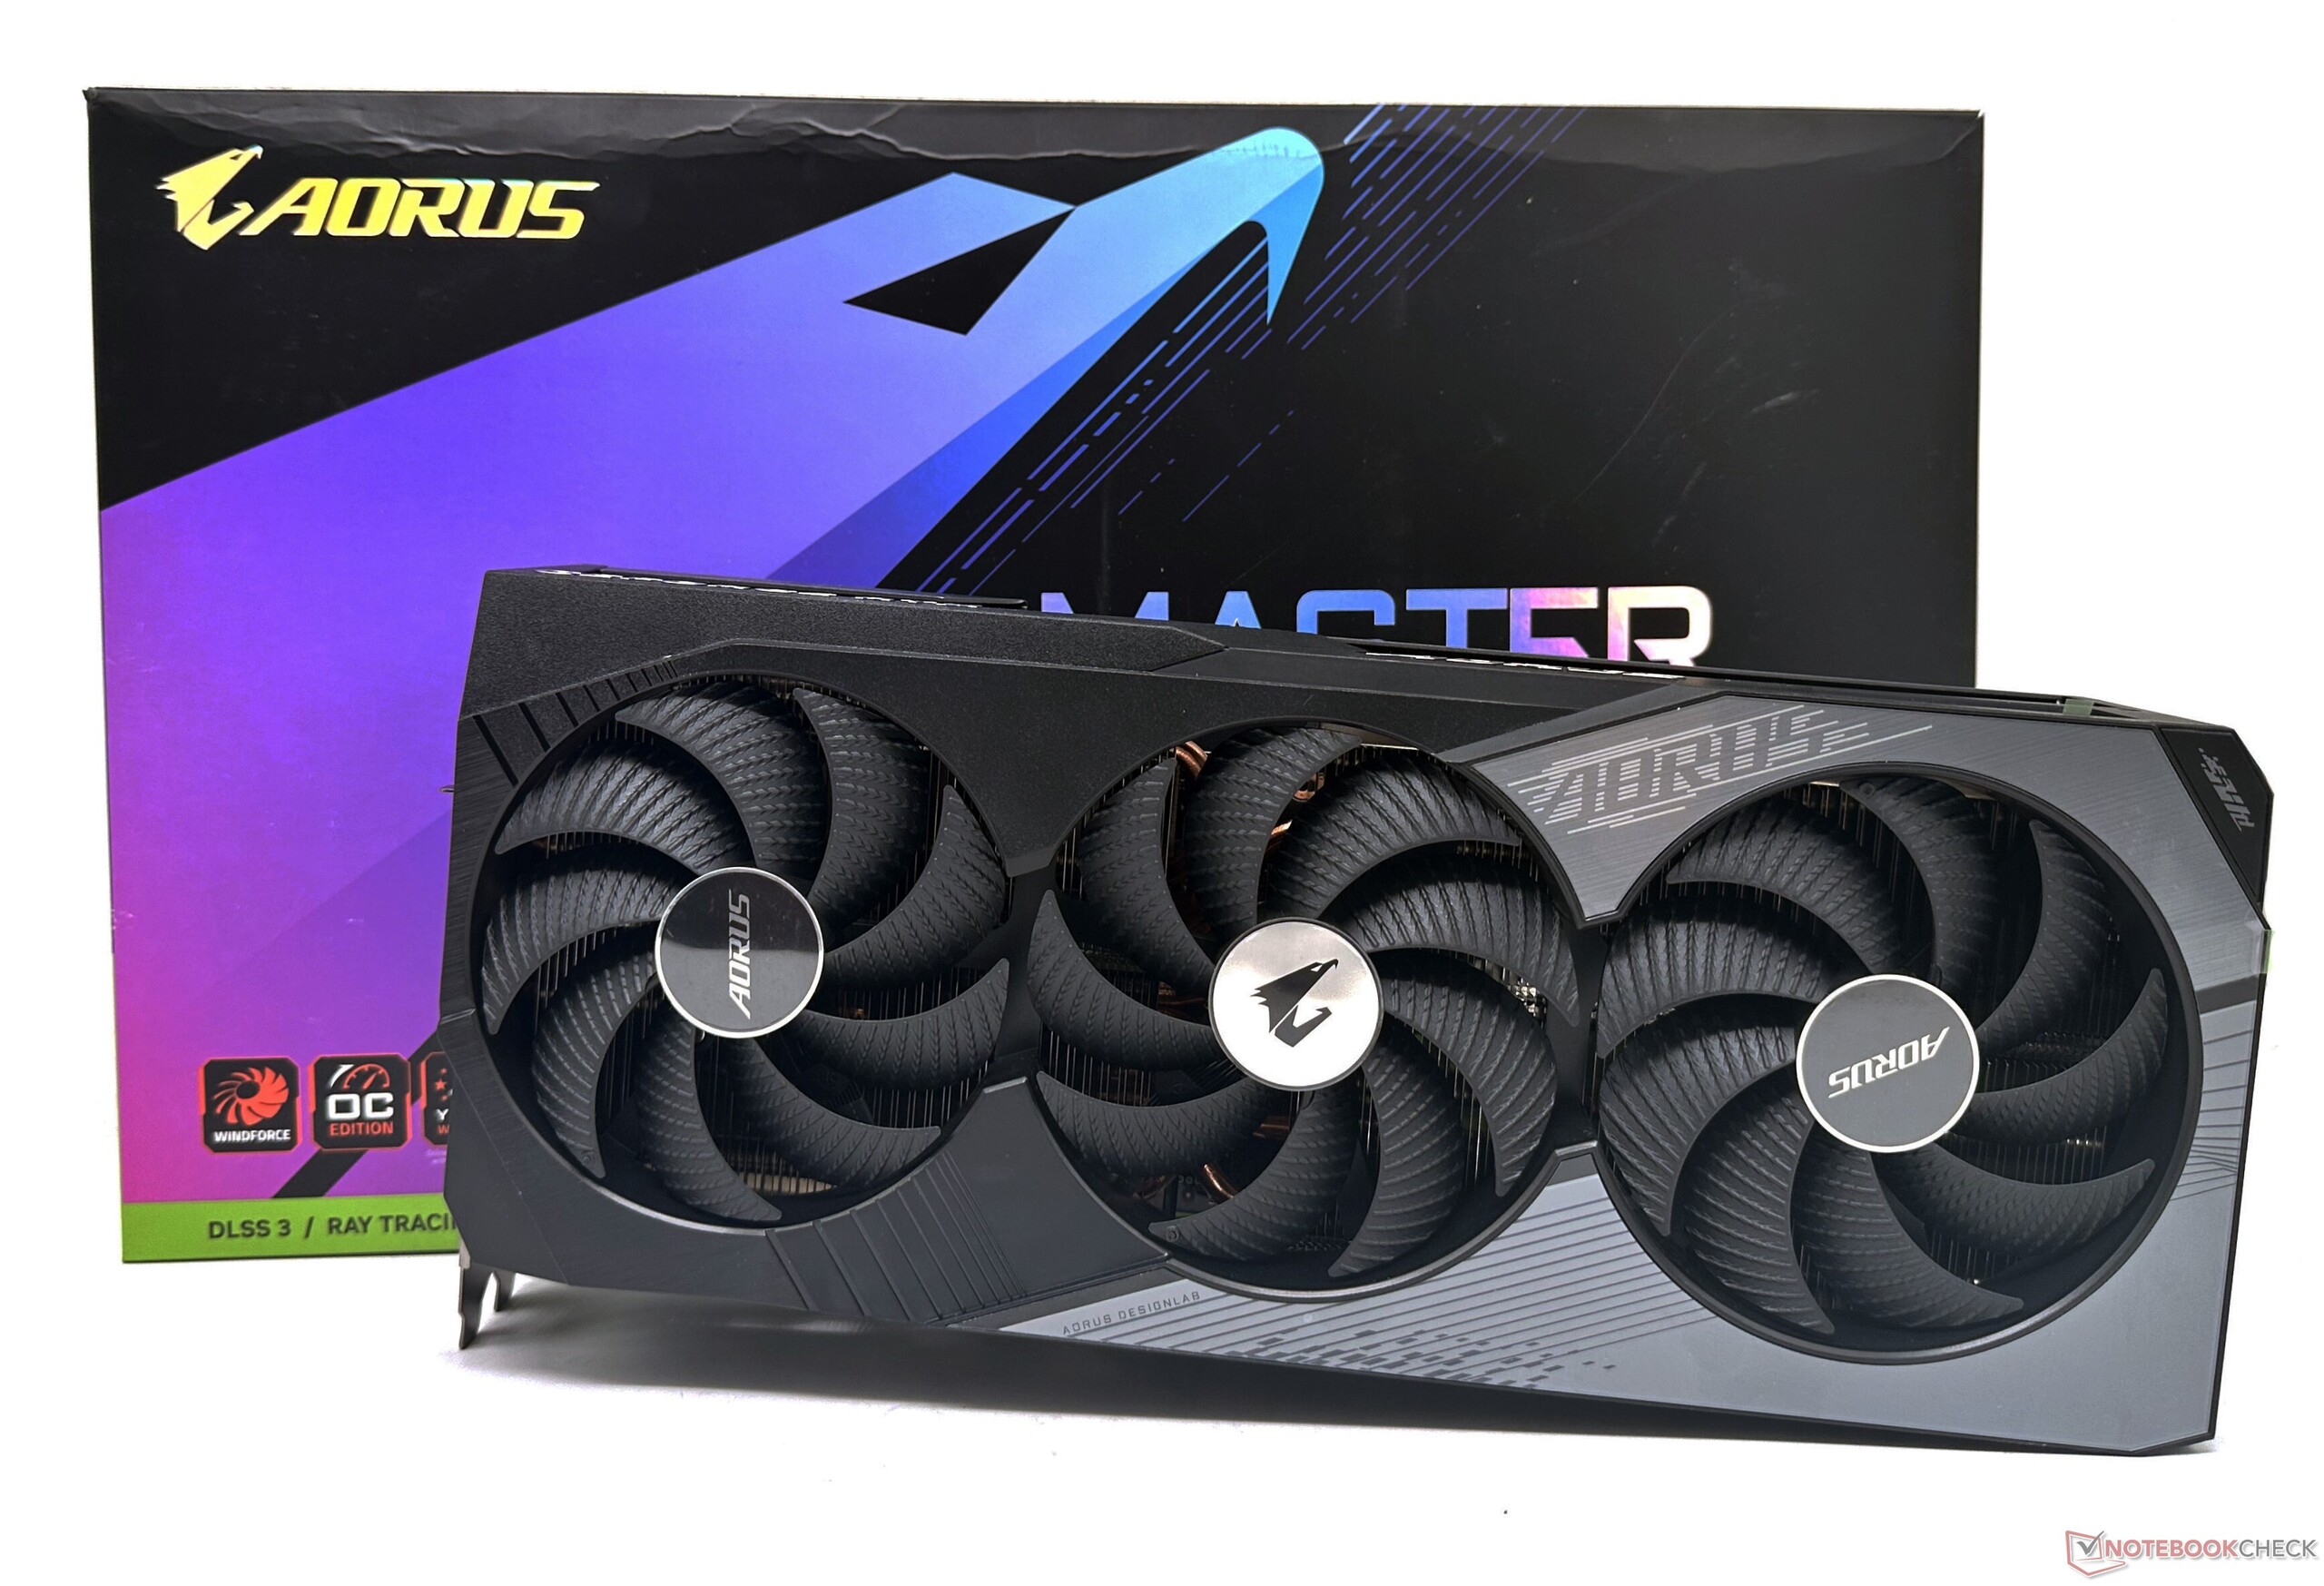
Wcześniej recenzowaliśmy Asus TUF Gaming GeForce RTX 4070 Ti OC Edition a teraz jest z nami Gigabyte Aorus GeForce RTX 4070 Ti Master 12G, która jest ofertą premium firmy w submarce Aorus dla RTX 4070 Ti.

Gigabyte Aorus RTX 4070 Ti Master 12G sprzedaje się w Indiach w cenie ₹94,127, a w USA jest dostępny w cenie 1000 USD. Karta objęta jest trzyletnią gwarancją z dodatkowym rokiem oferowanym po zarejestrowaniu produktu w firmie Gigabyte.

W niniejszej recenzji przyjrzymy się temu, co wyróżnia flagową kartę Aorus RTX 4070 Ti na tle konkurencji oraz porównamy jej wydajność z dotychczas recenzowanymi GPU.

Porównanie Aorus RTX 4070 Ti Master z innymi układami graficznymi Nvidii

Specyfikacja RTX 4090 FE RTX 4080 FE Aorus RTX4070 Ti Master RTX 3090 Ti FE RTX 3090 FE RTX3080 Ti FE RTX 3080 FE RTX 3070 FE Titan RTX Titan X Pascal
Chip AD102 AD103 AD104 GA102 GA102 GA102 GA102 GA104 TU102 GP102
Proces FinFET Custom 4N Custom 4N Custom 4N 8 nm 8 nm 8 nm 8 nm 8 nm 12 nm 16 nm
Rdzenie CUDA 16,384 9,728 7,680 10,752 10,496 10,240 8,704 5,888 4,608 3,584
Jednostki tekstury 512 304 240 336 328 320 272 184 288 224
Tensor Cores 512 4th Gen. 304 4th Gen. 240 4th Gen. 336 3rd Gen. 328 3rd Gen. 320 3rd Gen. 272 3rd Gen. 184 3rd Gen. 576 2nd Gen. -
RT Cores 128 3rd Gen. 76 3rd Gen. 60 3rd Gen. 84 2nd Gen. 82 2nd Gen. 80 2nd Gen. 68 2nd Gen. 46 2nd Gen. 72 -
Zegar podstawowy procesora graficznego 2,235 MHz 2,205 MHz 2,310 MHz 1,560 MHz 1,395 MHz 1,365 MHz 1,440 MHz 1,500 MHz 1,350 MHz 1,417 MHz
Zegar zwiększający częstotliwość pracy układu GPU 2,520 MHz 2,505 MHz 2,670 MHz 1,860 MHz 1,695 MHz 1,665 MHz 1,710 MHz 1,750 MHz 1,770 MHz 1,531 MHz
Szyna pamięci 384-bit 256-bit 192-bit 384-bit 384-bit 384-bit 320-bit 256-bit 384-bit 384-bit
Przepustowość pamięci 1 008 GB/s 716,8 GB/s 504 GB/s 1 008 GB/s 936 GB/s 912 GB/s 760 GB/s 448 GB/s 672 GB/s 480,4 GB/s
Pamięć wideo 24 GB GDDR6X 16 GB GDDR6X 12 GB GDDR6X 24 GB GDDR6X 24 GB GDDR6X 12 GB GDDR6X 10 GB GDDR6X 8 GB GDDR6 24 GB GDDR6 12 GB GDDR5X
Pobór mocy 450 W 320 W 285 W 450 W 350 W 350 W 320 W 220 W 280 W 250 W

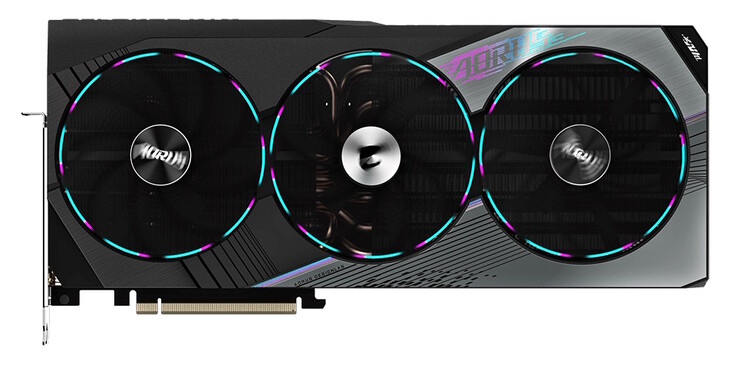
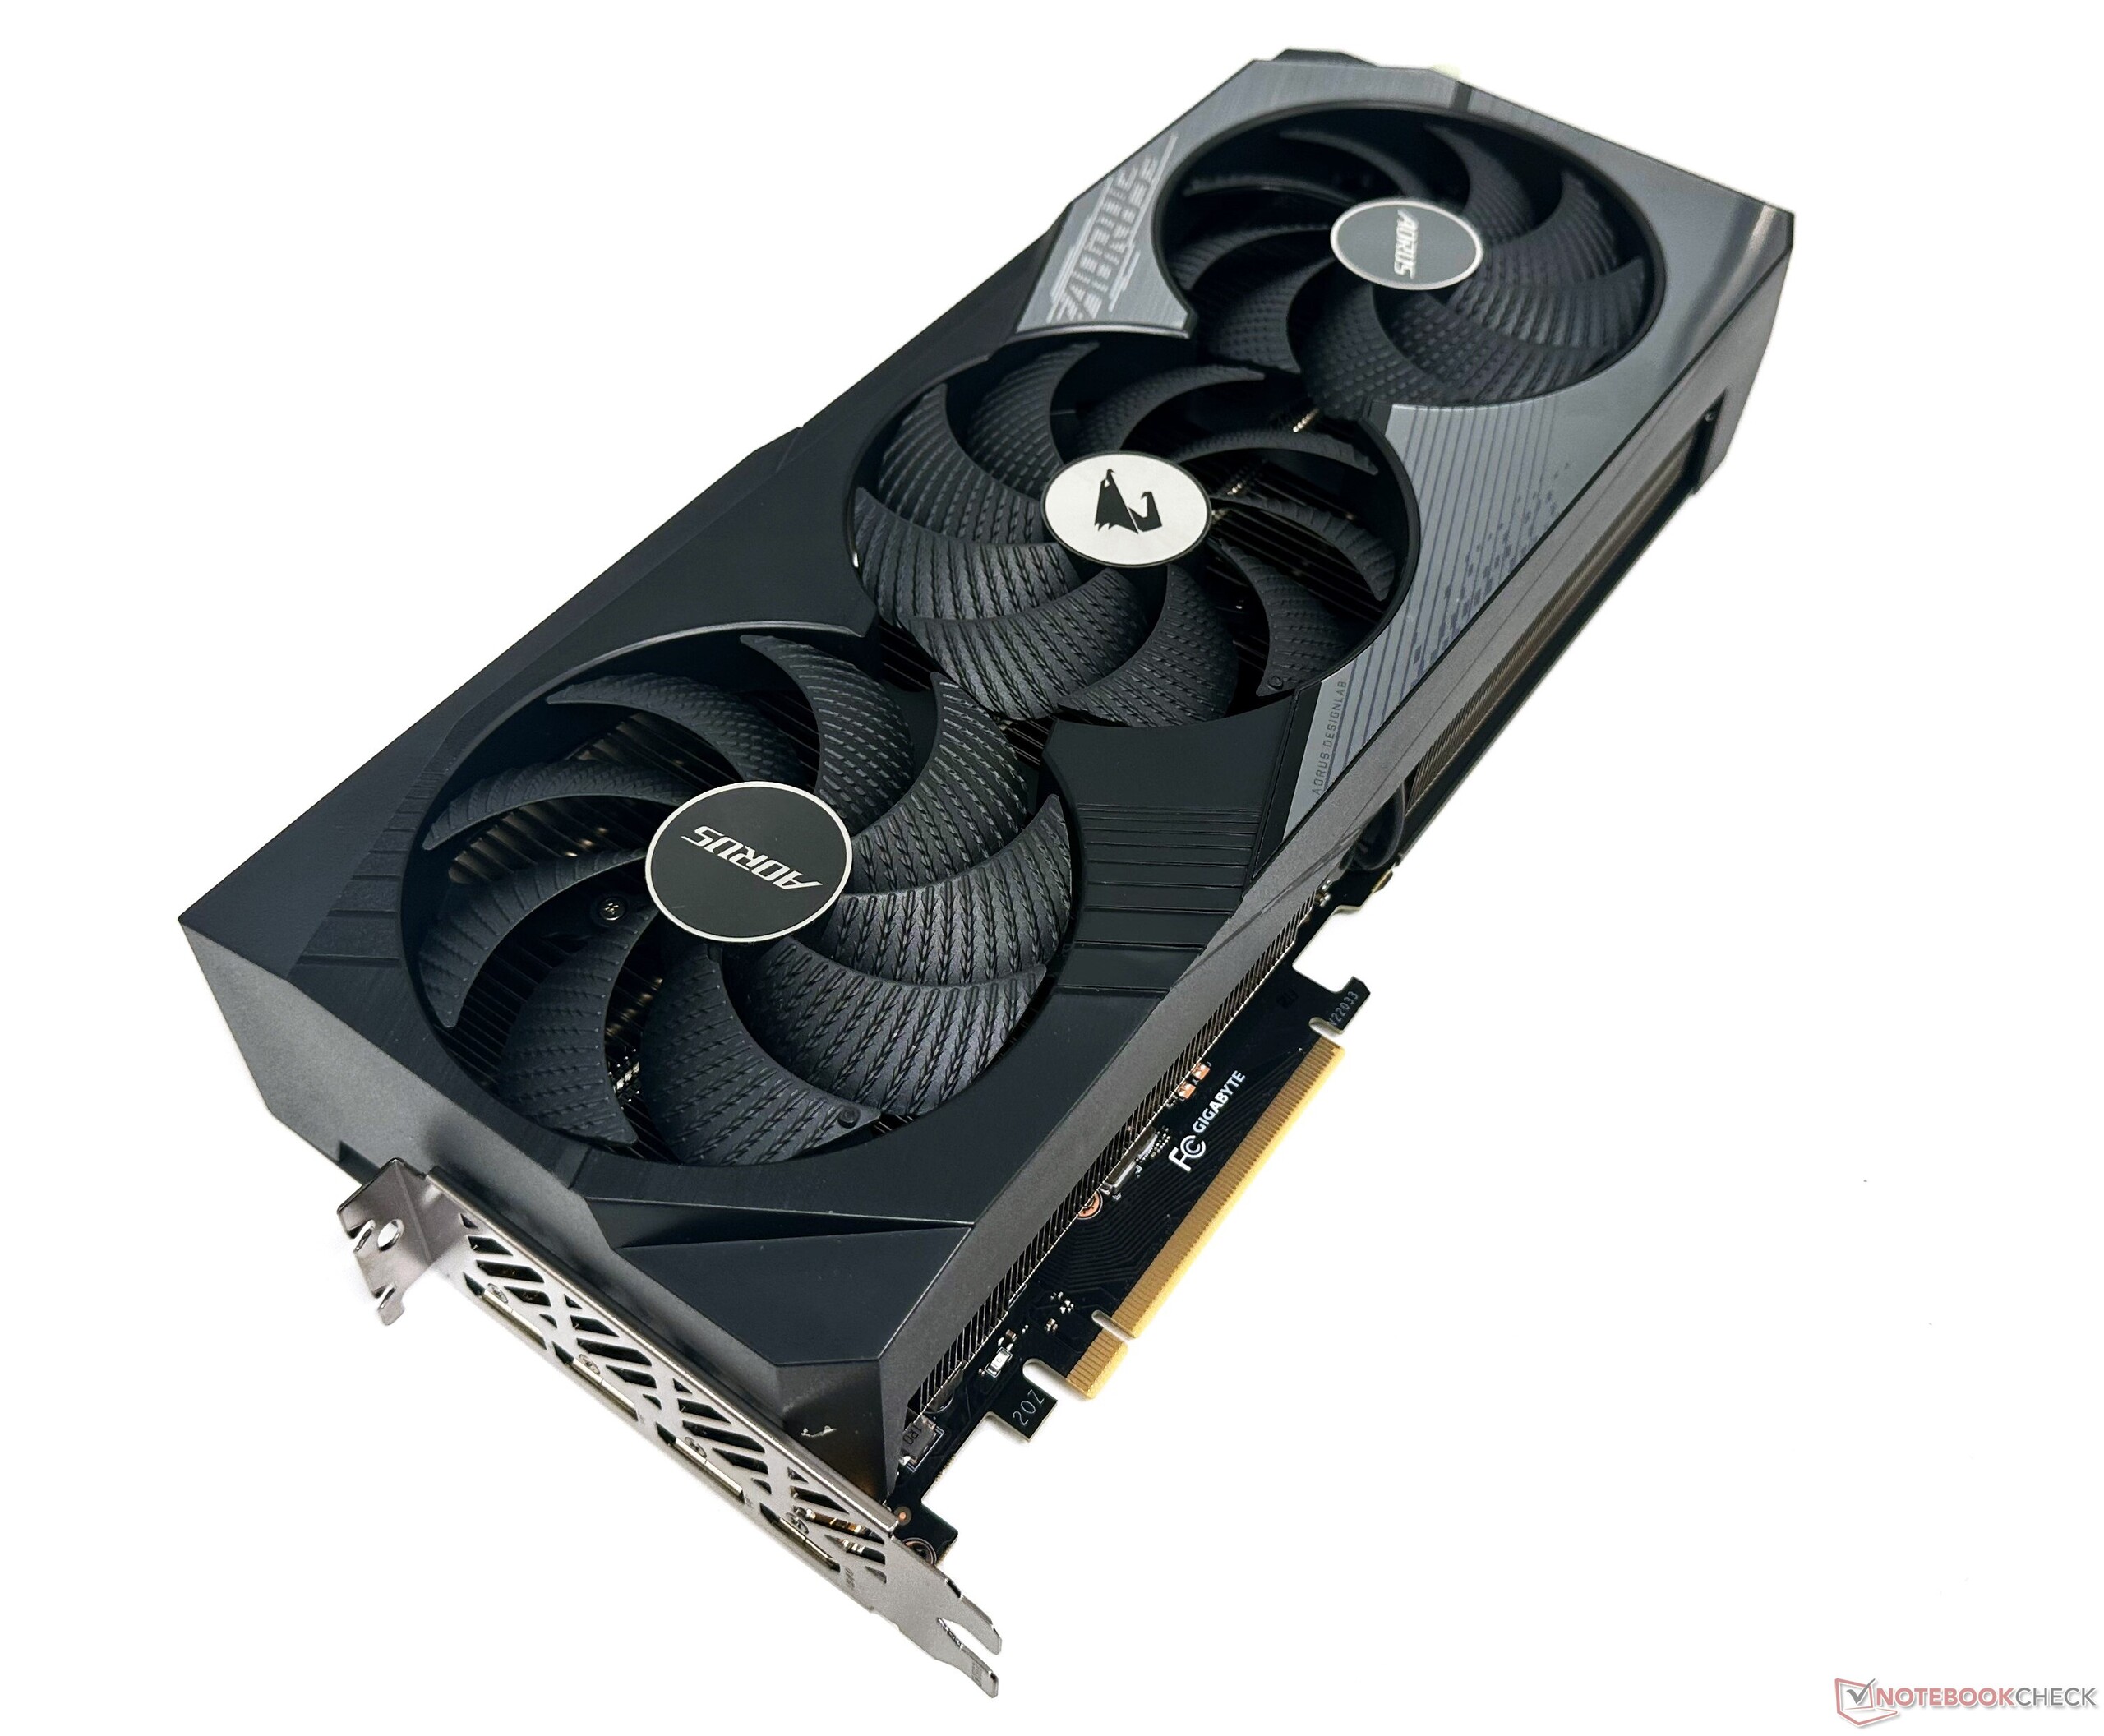
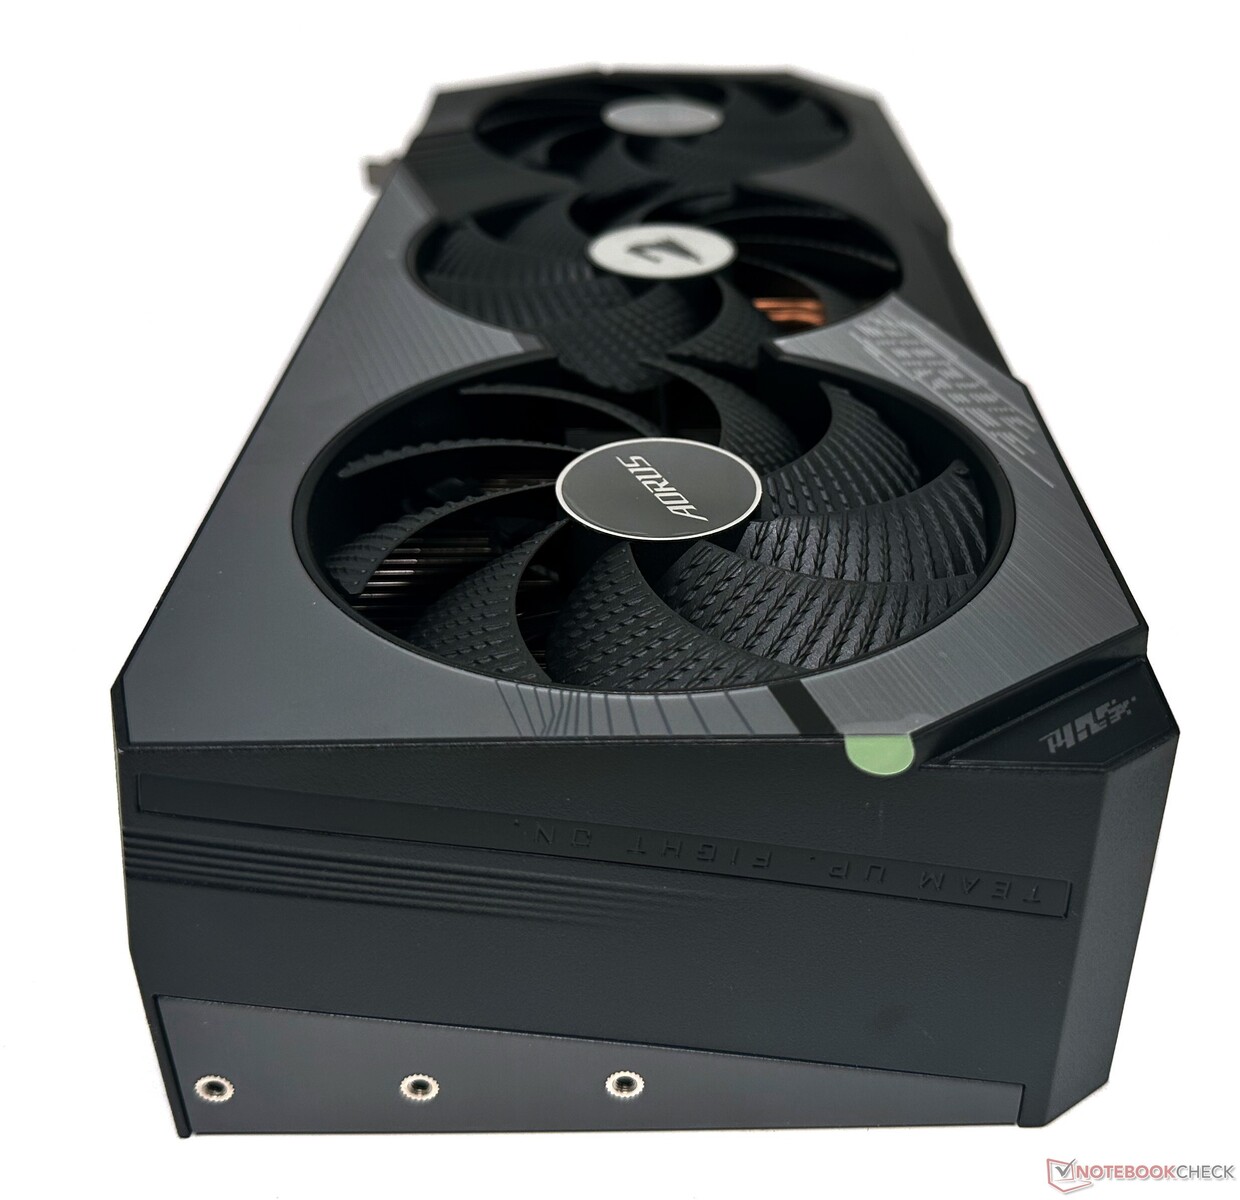
Aorus GeForce RTX 4070 Ti Master z bliska

Aorus GeForce RTX 4070 Ti Master (góra) i RTX 4080 Master (dół)

Aorus GeForce RTX 4070 Ti Master na pierwszy rzut oka wygląda dość podobnie do Aorus GeForce RTX 4080 Master, ale ma stosunkowo mniejsze wymiary - 342 x 153 x 70,6 mm.

Długość nie powinna stwarzać problemów ze zmieszczeniem się wewnątrz typowej obudowy ATX.

Aorus GeForce RTX 4070 Ti Master - akcesoria w pudełku

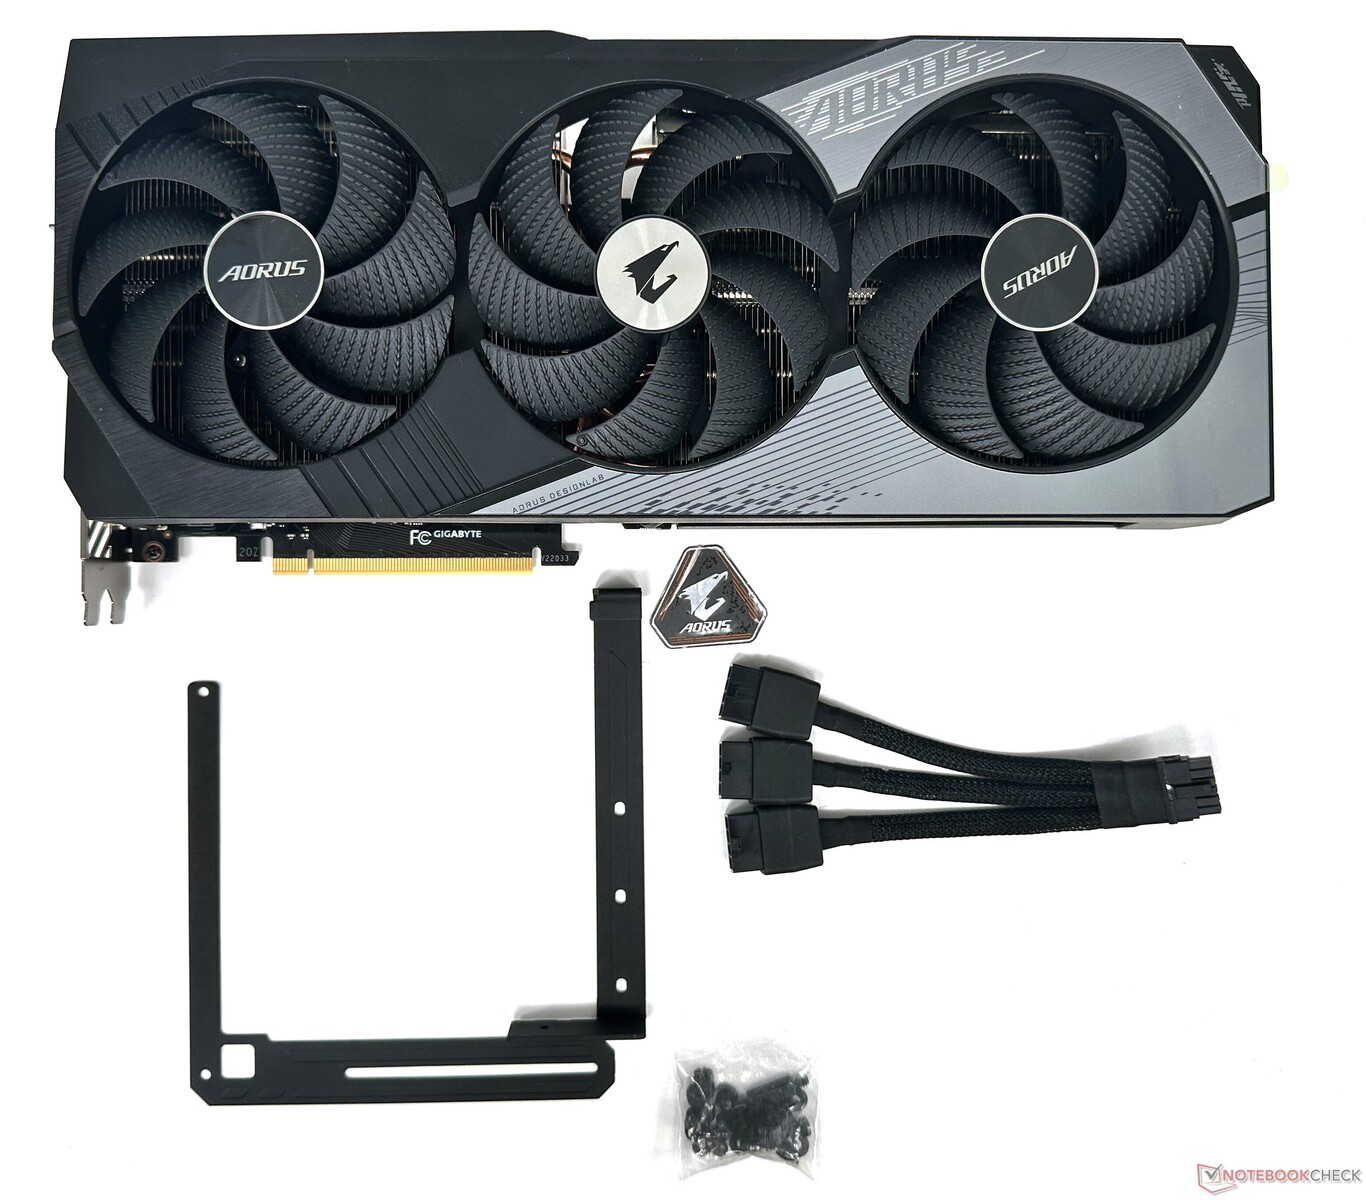
W pudełku znajdziemy następujące elementy:

  • Skrócona instrukcja obsługi
  • Informacje o gwarancji
  • Uchwyt antyzagięciowy, śruby i instrukcja instalacji
  • kabel zasilający 12VHPWR do 3x 8-pin
  • Metalowa naklejka Aorus

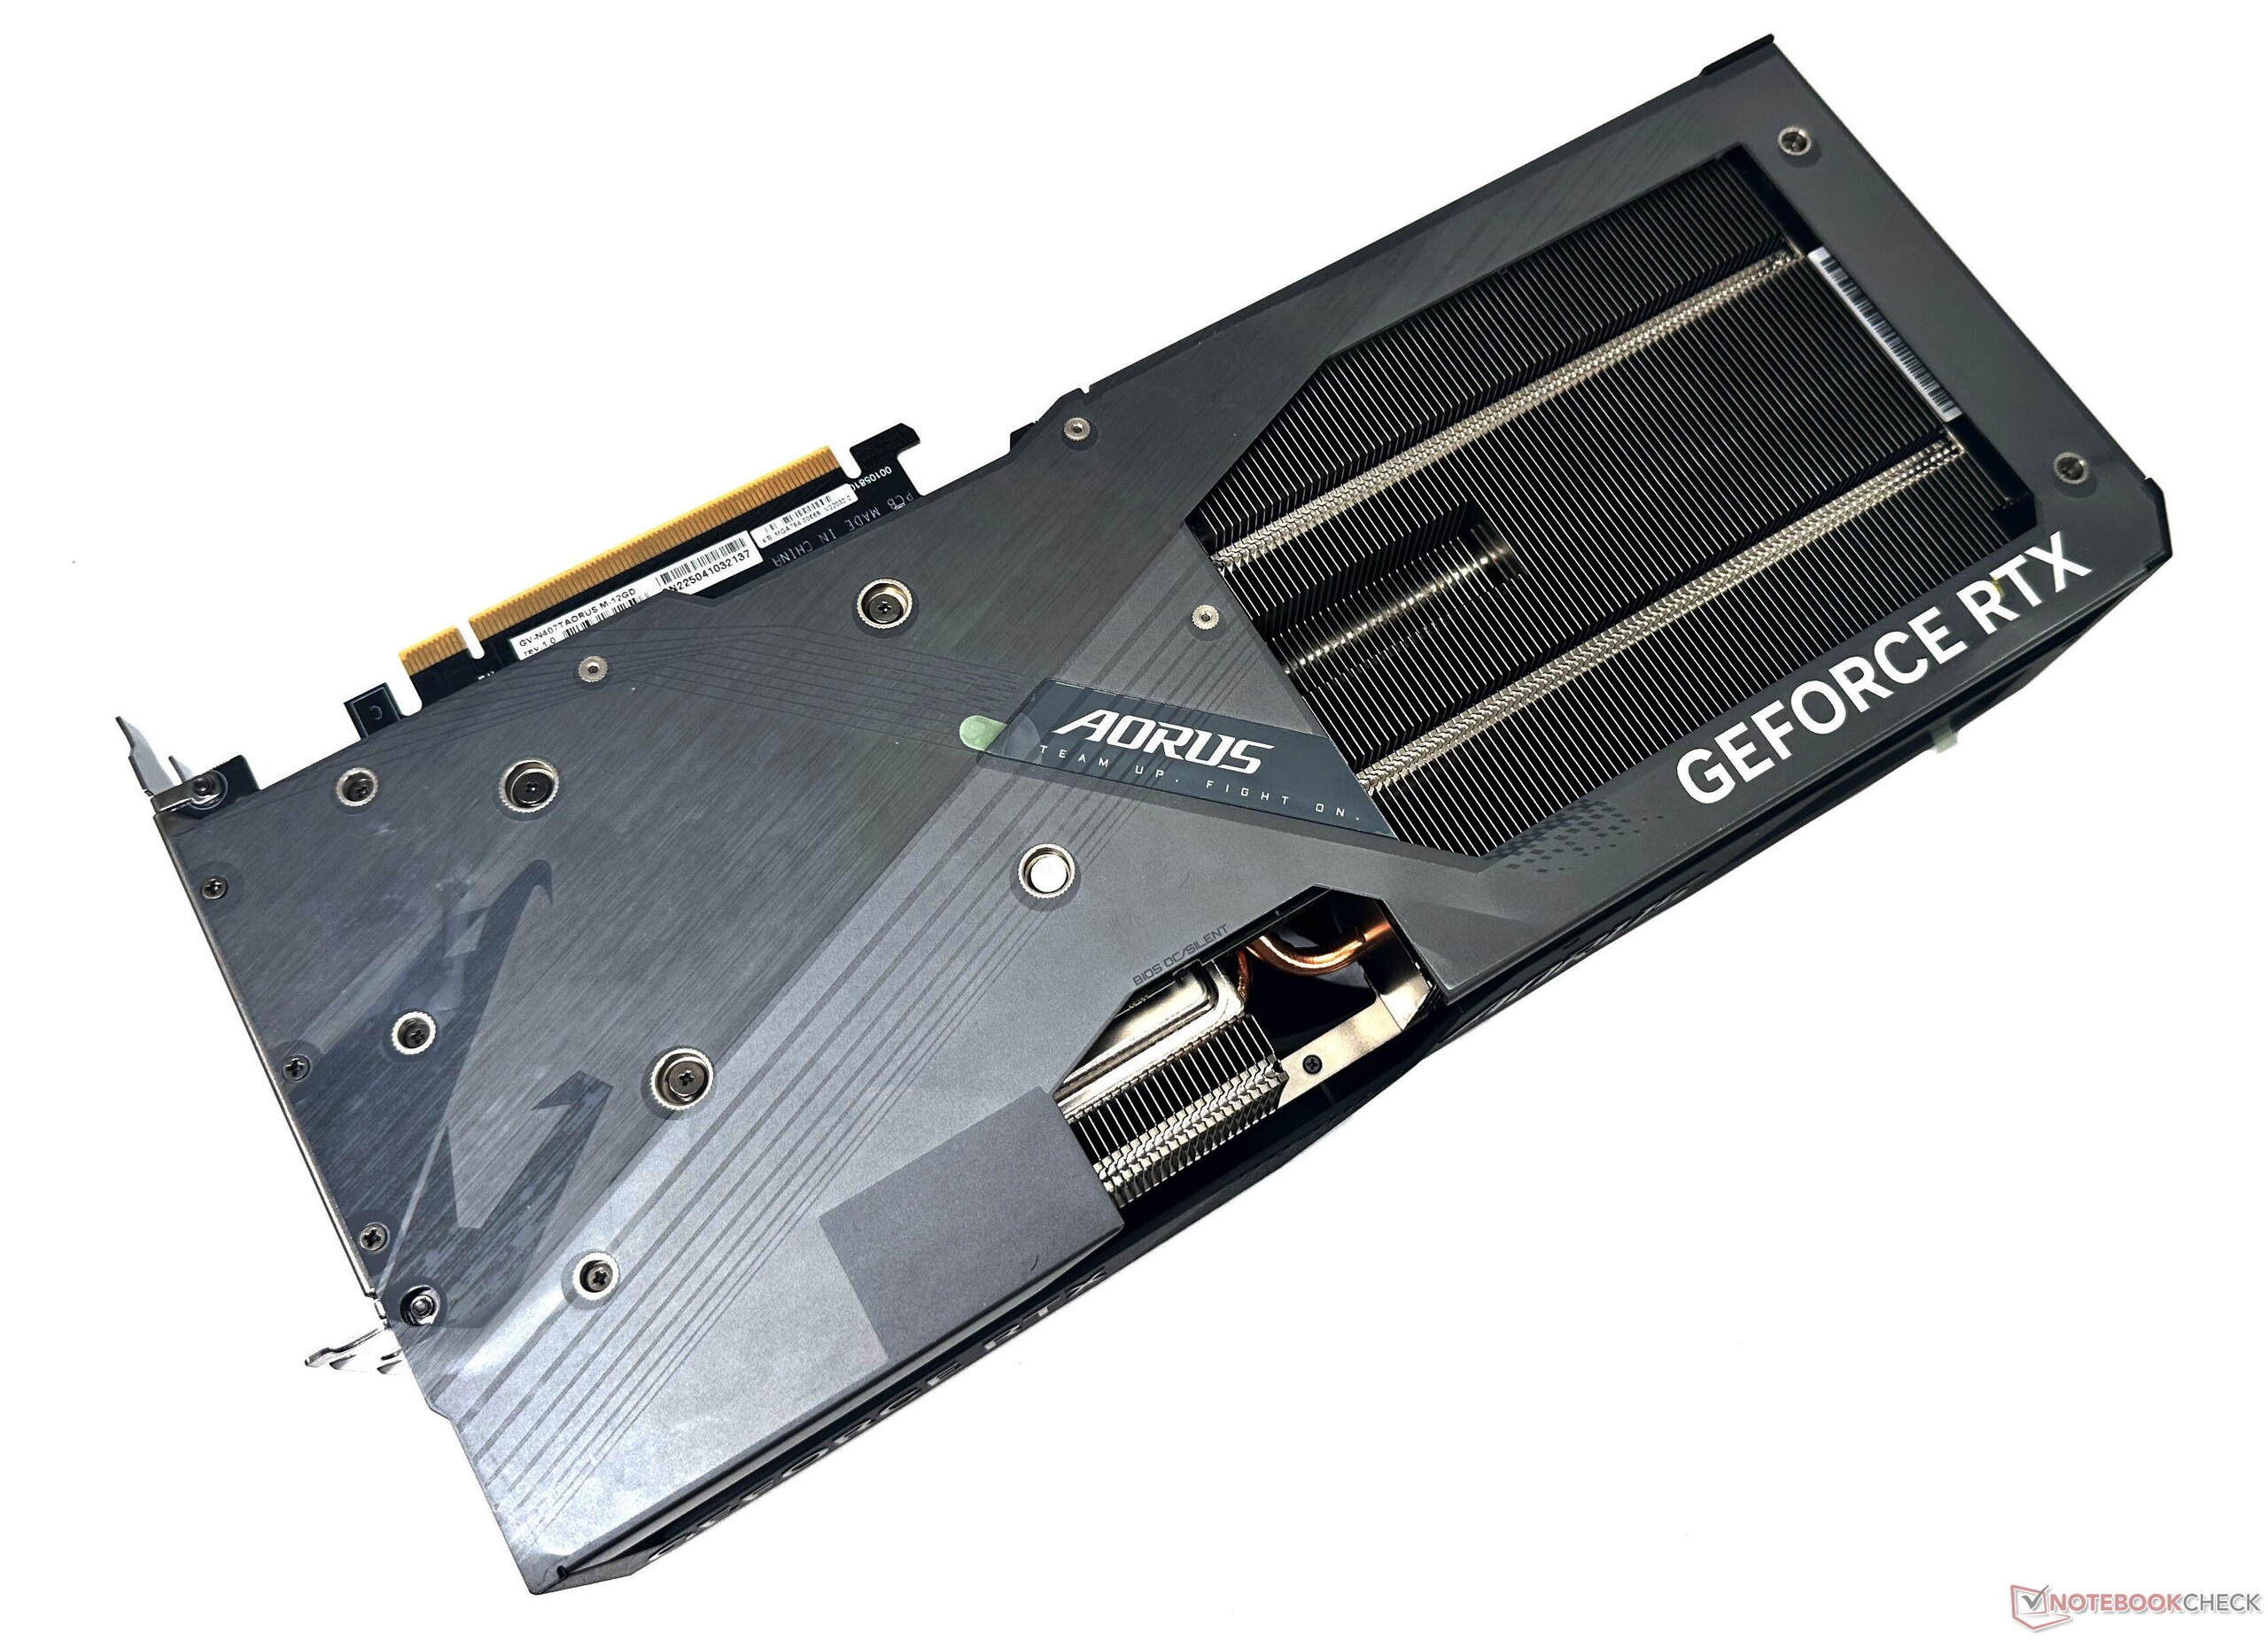
Karta graficzna posiada plastikową osłonę, ale w zestawie znajduje się metalowy backplate z dużym wycięciem na żebra wentylacyjne. Metalowy backplate wraz z dołączonym wspornikiem Anti-Sag pomaga umocować ważącą 1,6 kg kartę mocno na slocie PCIe, zapobiegając jednocześnie jej zwisaniu.

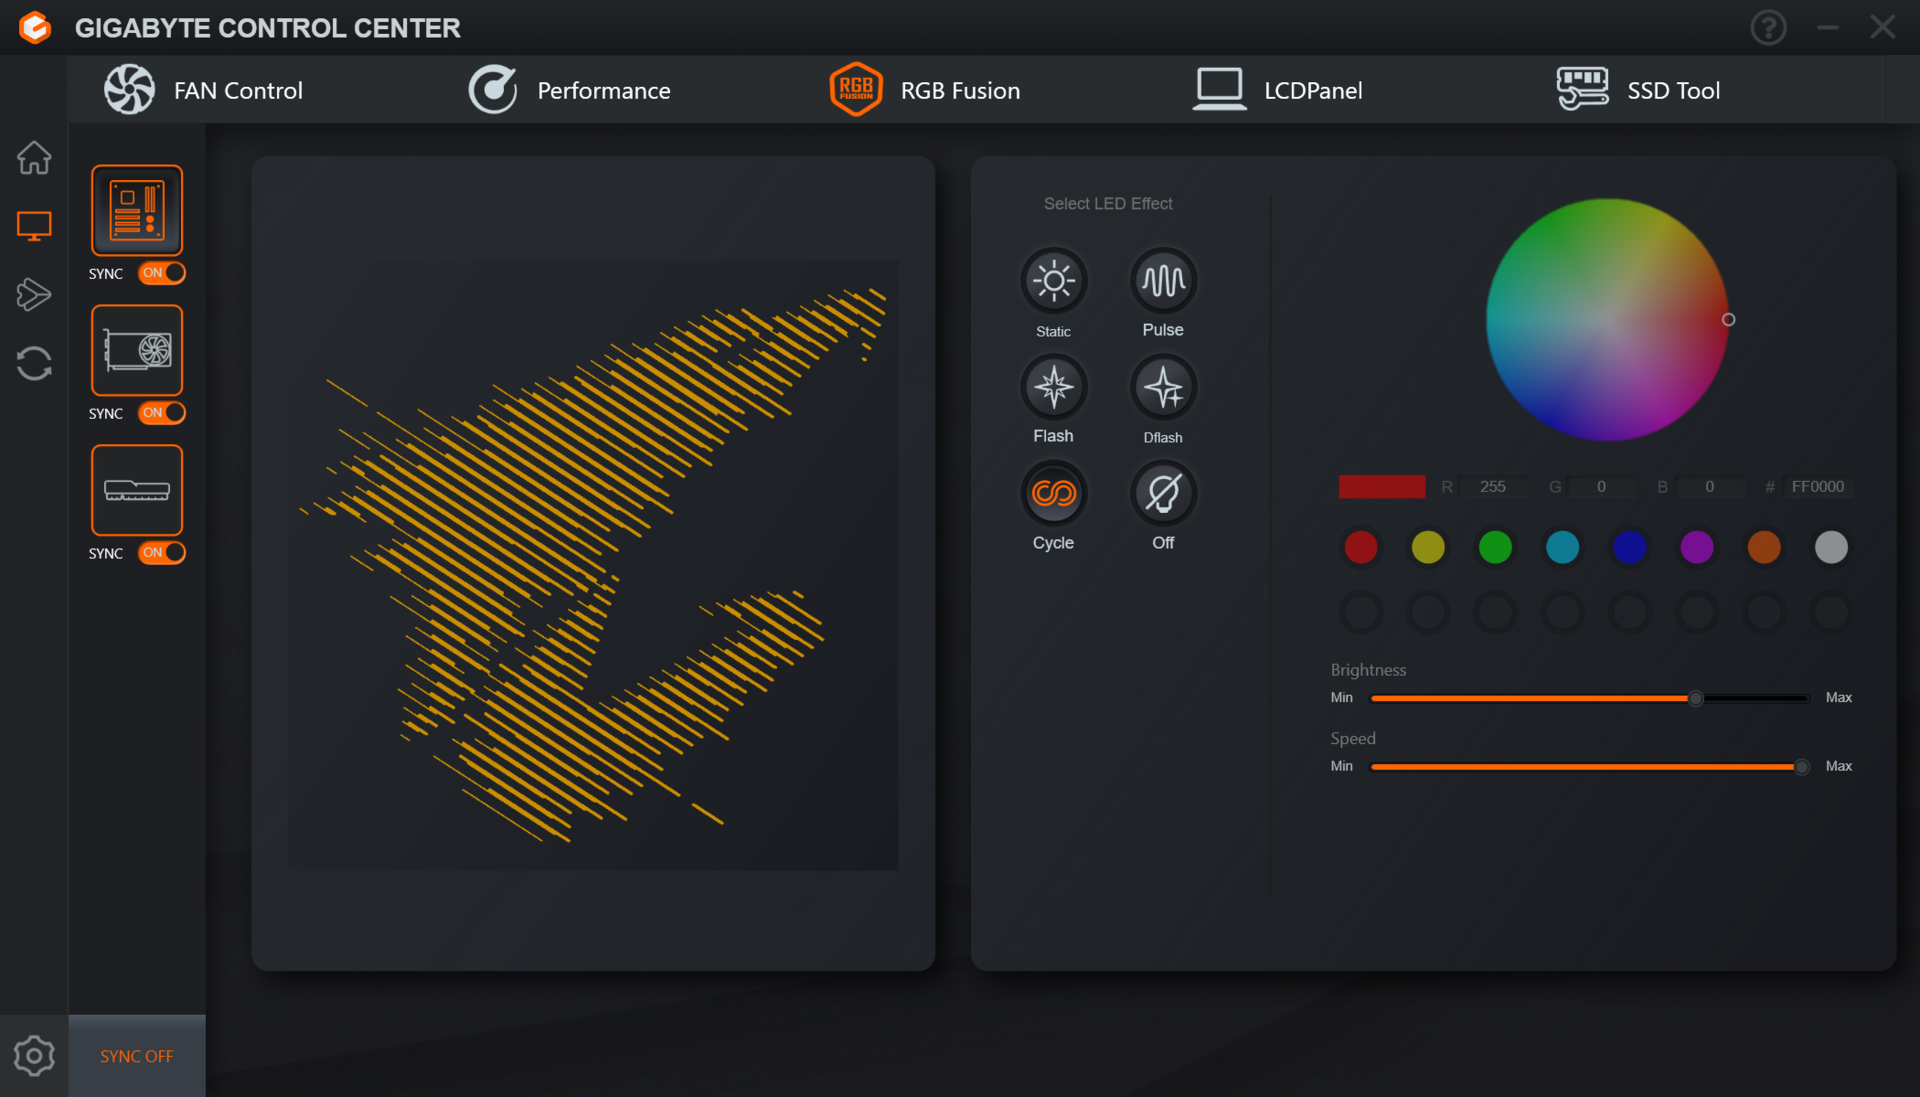
W przeciwieństwie do Asusa TUF Gaming RTX 4070 Ti, Aorus RTX 4070 Ti Master nie stroni od pokazywania swojego blingu RGB.

Gigabyte stosuje w tym aspekcie unikalne podejście. Zamiast pierścienia RGB wokół wentylatorów, każdy z nich posiada pojedynczą diodę LED na jednym z finów, która świeci się tylko wtedy, gdy wentylatory są aktywne. Daje to coś w rodzaju złamanego pierścienia halo, który może się podobać lub nie - pierścień wydaje się być jednak spójny, gdy wentylatory obracają się z pełną prędkością.

Na logo Aorus z przodu i z tyłu jest oświetlenie RGB, ale nie ma go na górnych logach. Gigabyte zaleca zresztą instalację karty na kablu PCIe riser, aby uzyskać najlepszy pokaz świetlny.

Wyświetlacz LCD
Wyświetlacz LCD

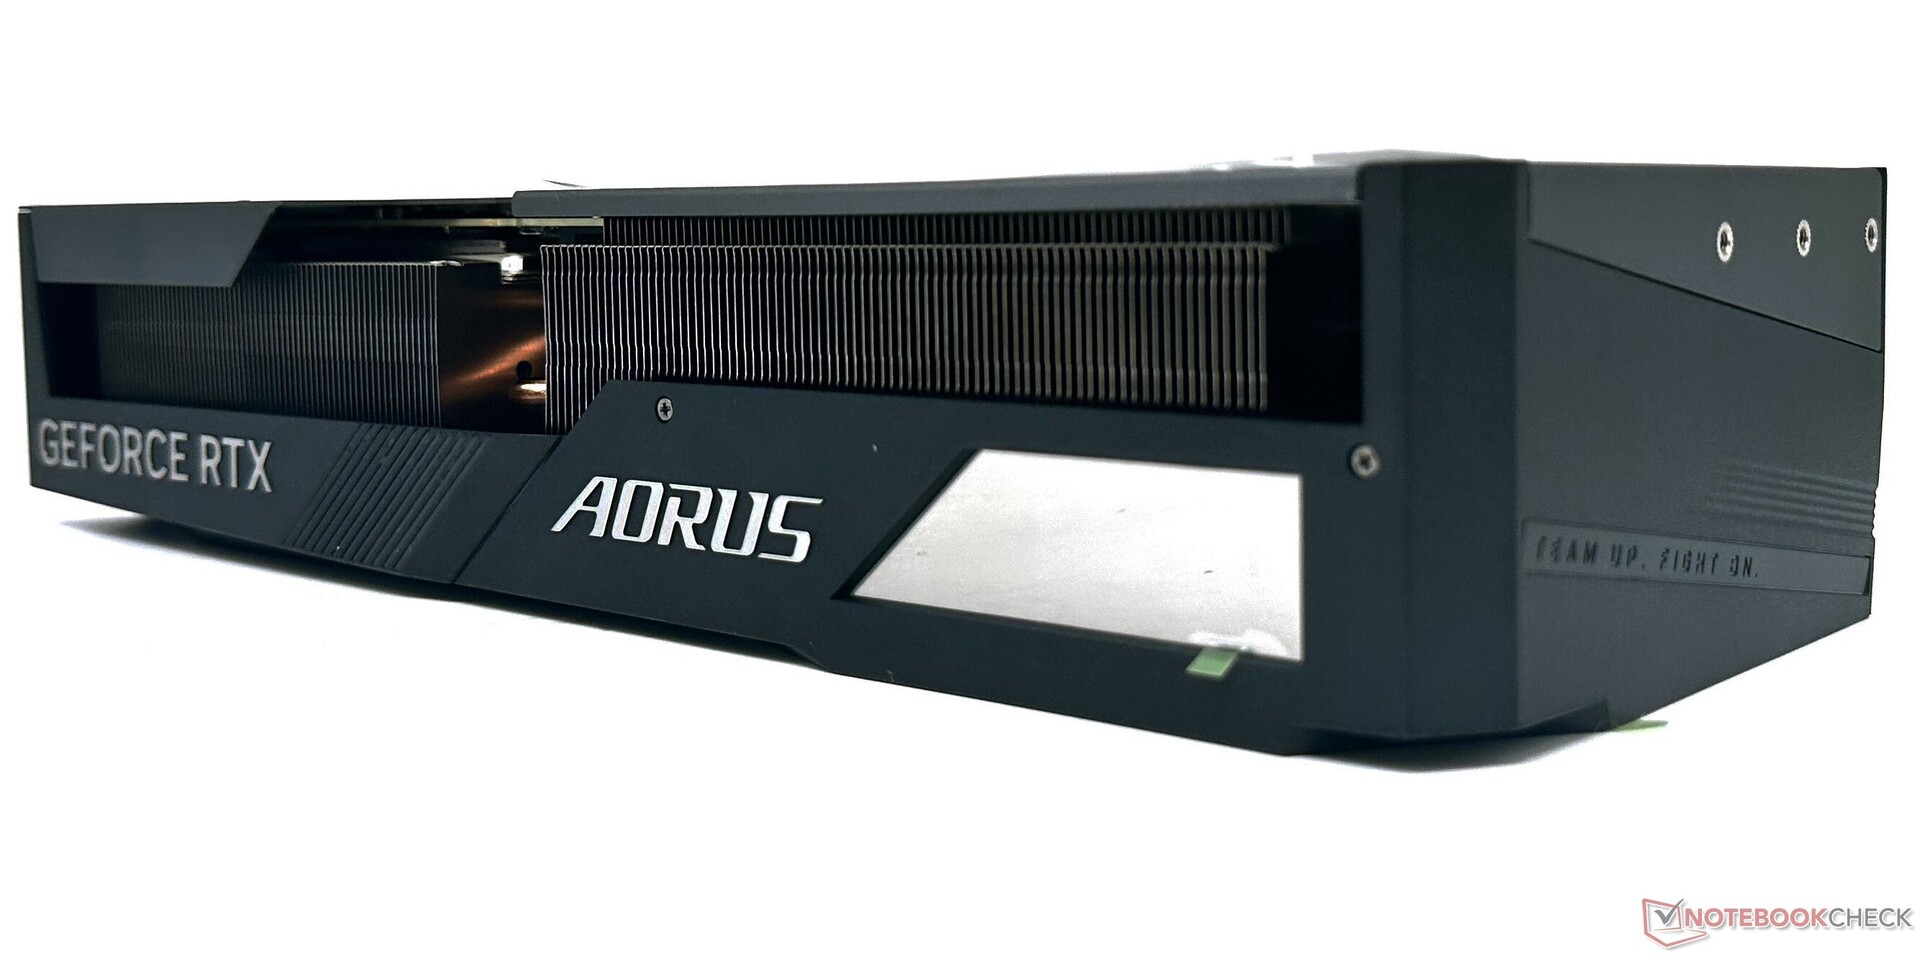
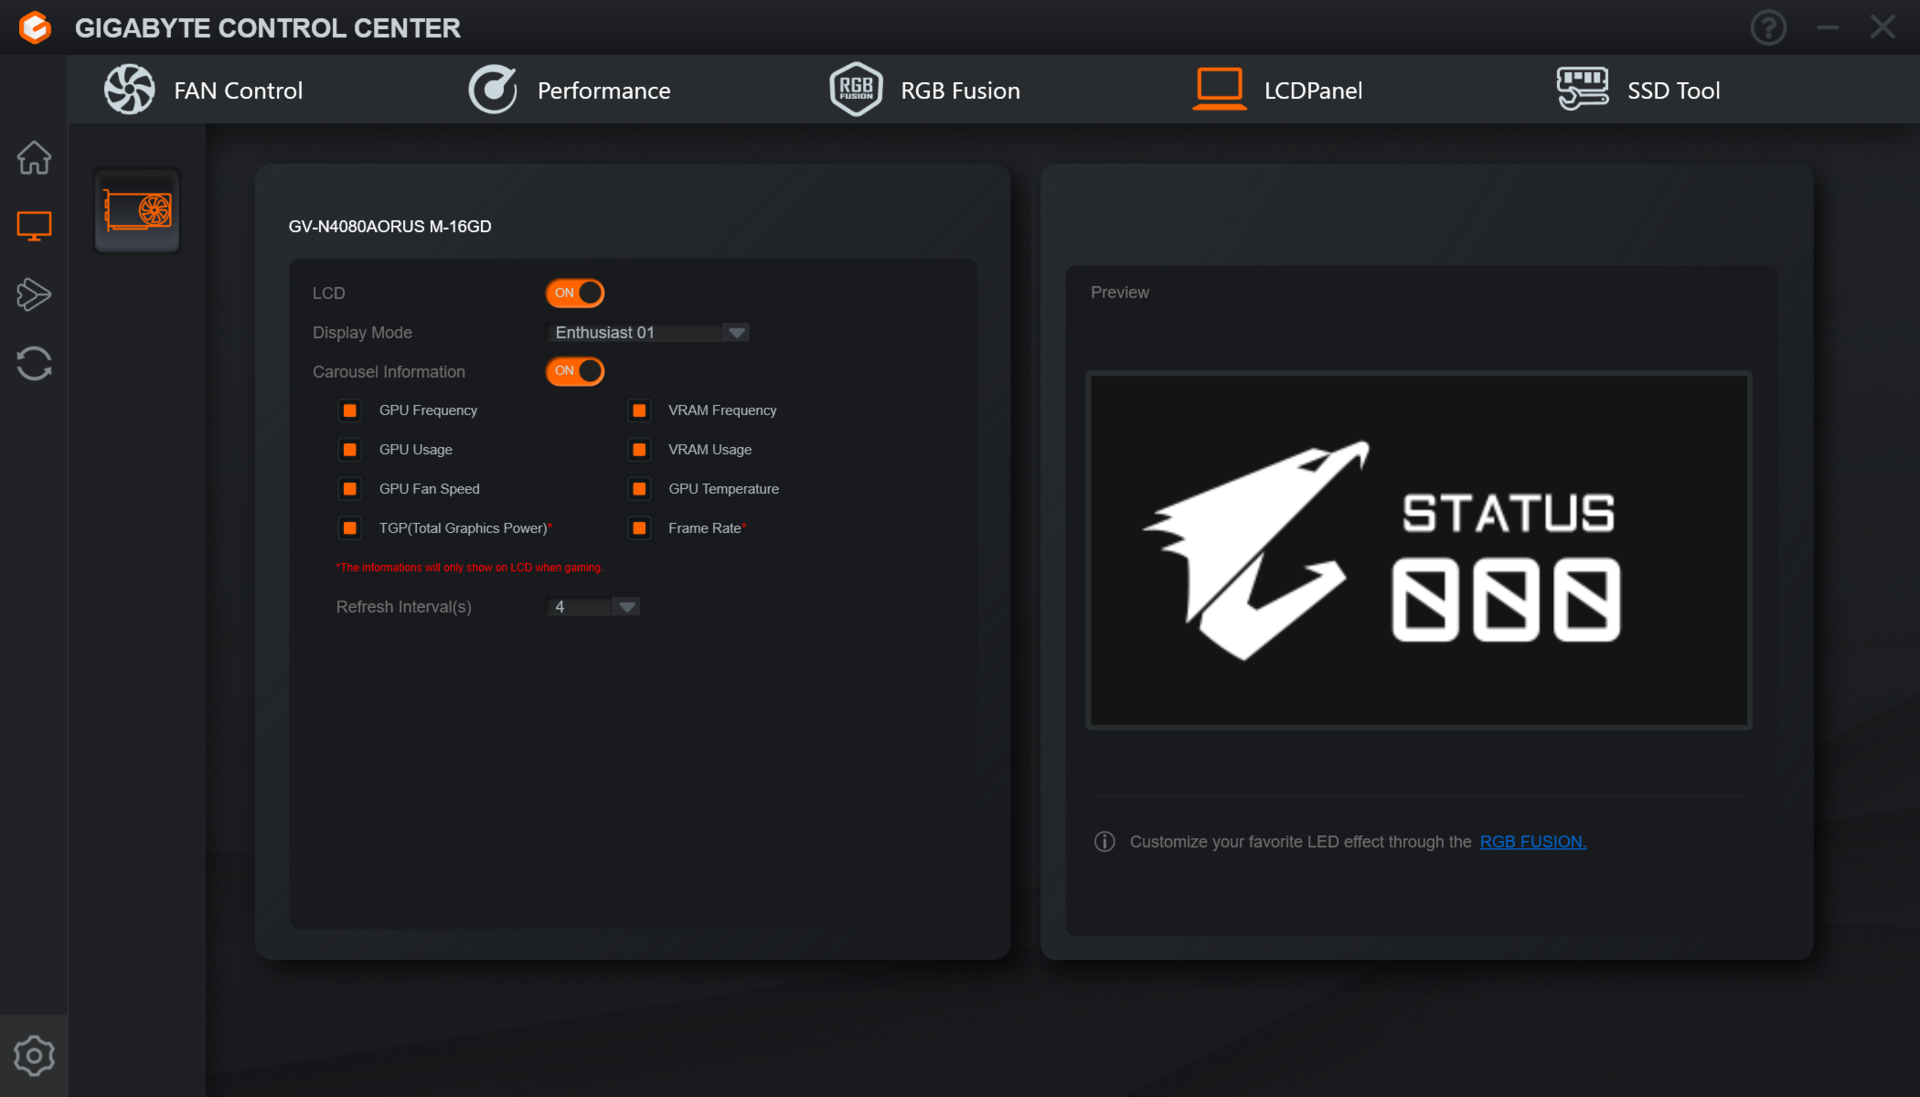
Aorus RTX 4070 Ti Master wyposażony jest również w monitor LCD View na górze.

Użytkownicy mogą dostosować funkcjonalność tego panelu za pośrednictwem Gigabyte Control Center, aby wyświetlać wszelkiego rodzaju statystyki systemowe, GIF-y i niestandardowe teksty.

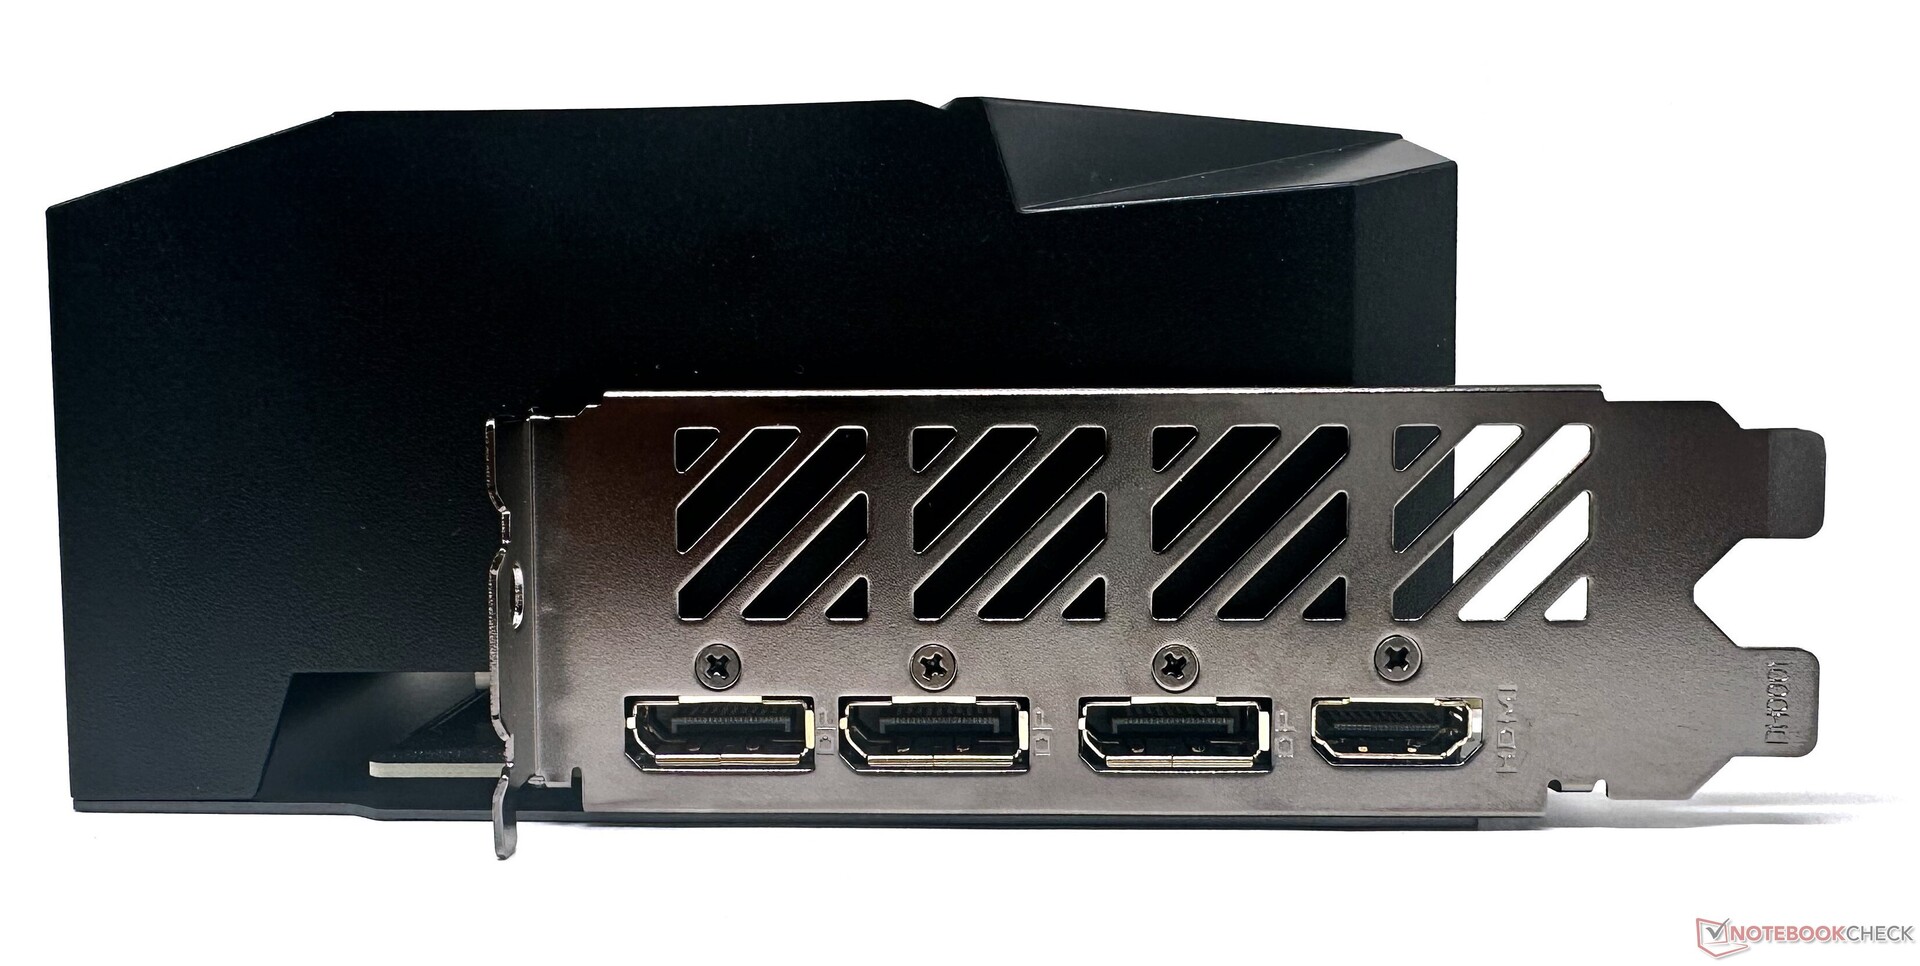
Jak w przypadku większości nowoczesnych GPU, Aorus GeForce RTX 4070 Ti Master oferuje również trzy porty DisplayPort 1.4 i jedno wyjście HDMI 2.1. Brakuje tutaj wygody w postaci dodatkowego wyjścia HDMI 2.1-out, które można zaobserwować w TUF Gaming RTX 4070 Ti.

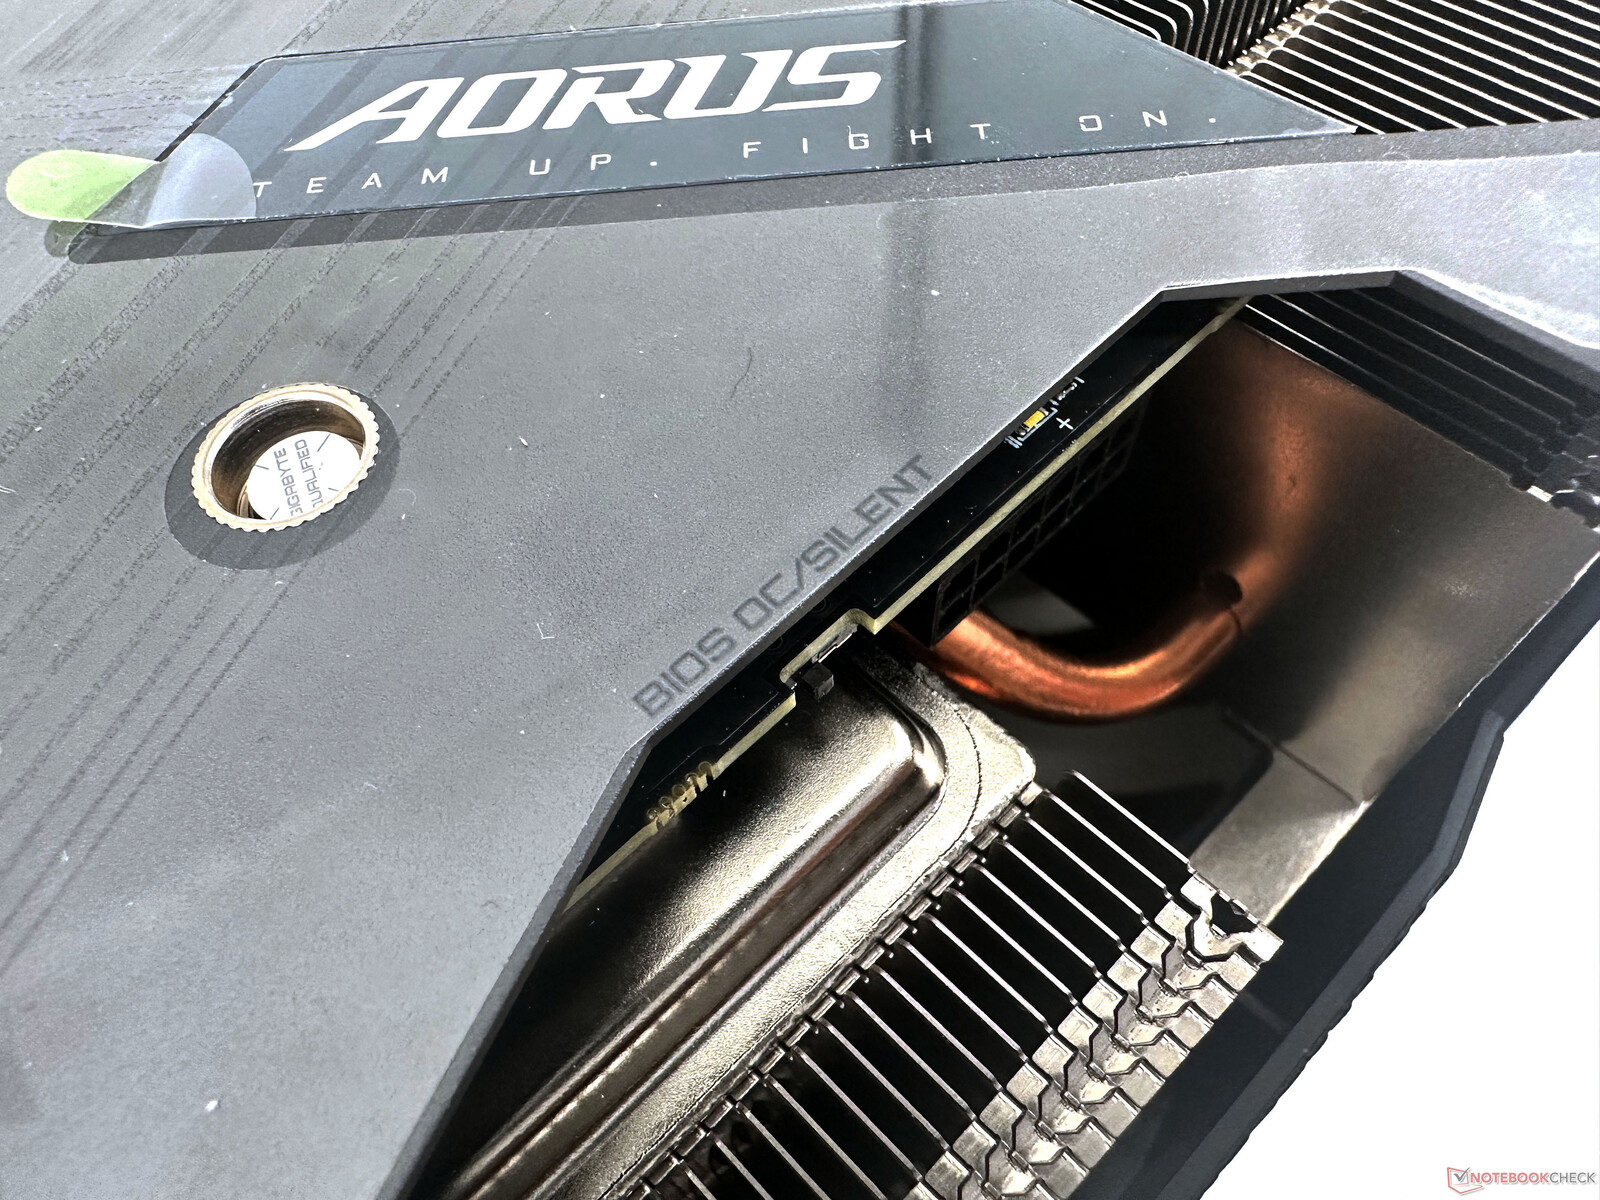
Podobnie jak większość kart AiB, Aorus GeForce RTX 4070 Ti Master jest wyposażony w podwójny przełącznik BIOS, który można przełączać między trybami BIOS OC i Silent.

Karta wykorzystuje nowe złącze 12VHPWR z trzema 8-pinowymi wyjściami. Dioda LED w pobliżu złącza zasilania służy do sygnalizacji stanu zasilania. Dioda zapala się, gdy zasilacz jest odłączony i gaśnie, gdy zasilanie jest stabilne. Migająca dioda LED wskazuje na nieprawidłowe zasilanie lub źle osadzony kabel.

Aorus GeForce RTX 4070 Ti Master - Porty: 3x DisplayPort 1.4a-out, 1x HDMI 2.1-out
Przełącznik BIOS i wskaźnik LED 12VHPWR

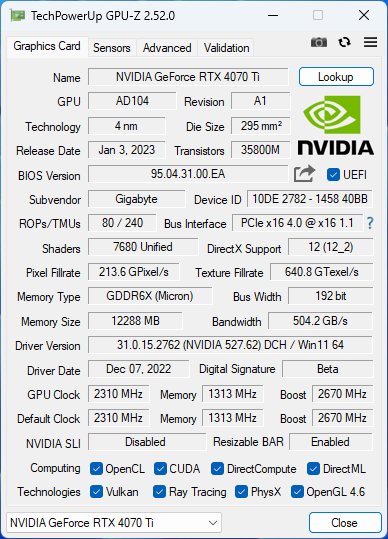
Aorus GeForce RTX 4070 Ti Master może podbić do 2 670 MHz przy 285 W TGP, czyli nieco wyżej niż referencyjne 2 610 MHz.

Karta Aorus jest jednak taktowana o 90 MHz niżej niż TUF Gaming OC o częstotliwości 2 760 MHz. Możliwe jest zwiększenie TGP o 28% do nawet 366 W.

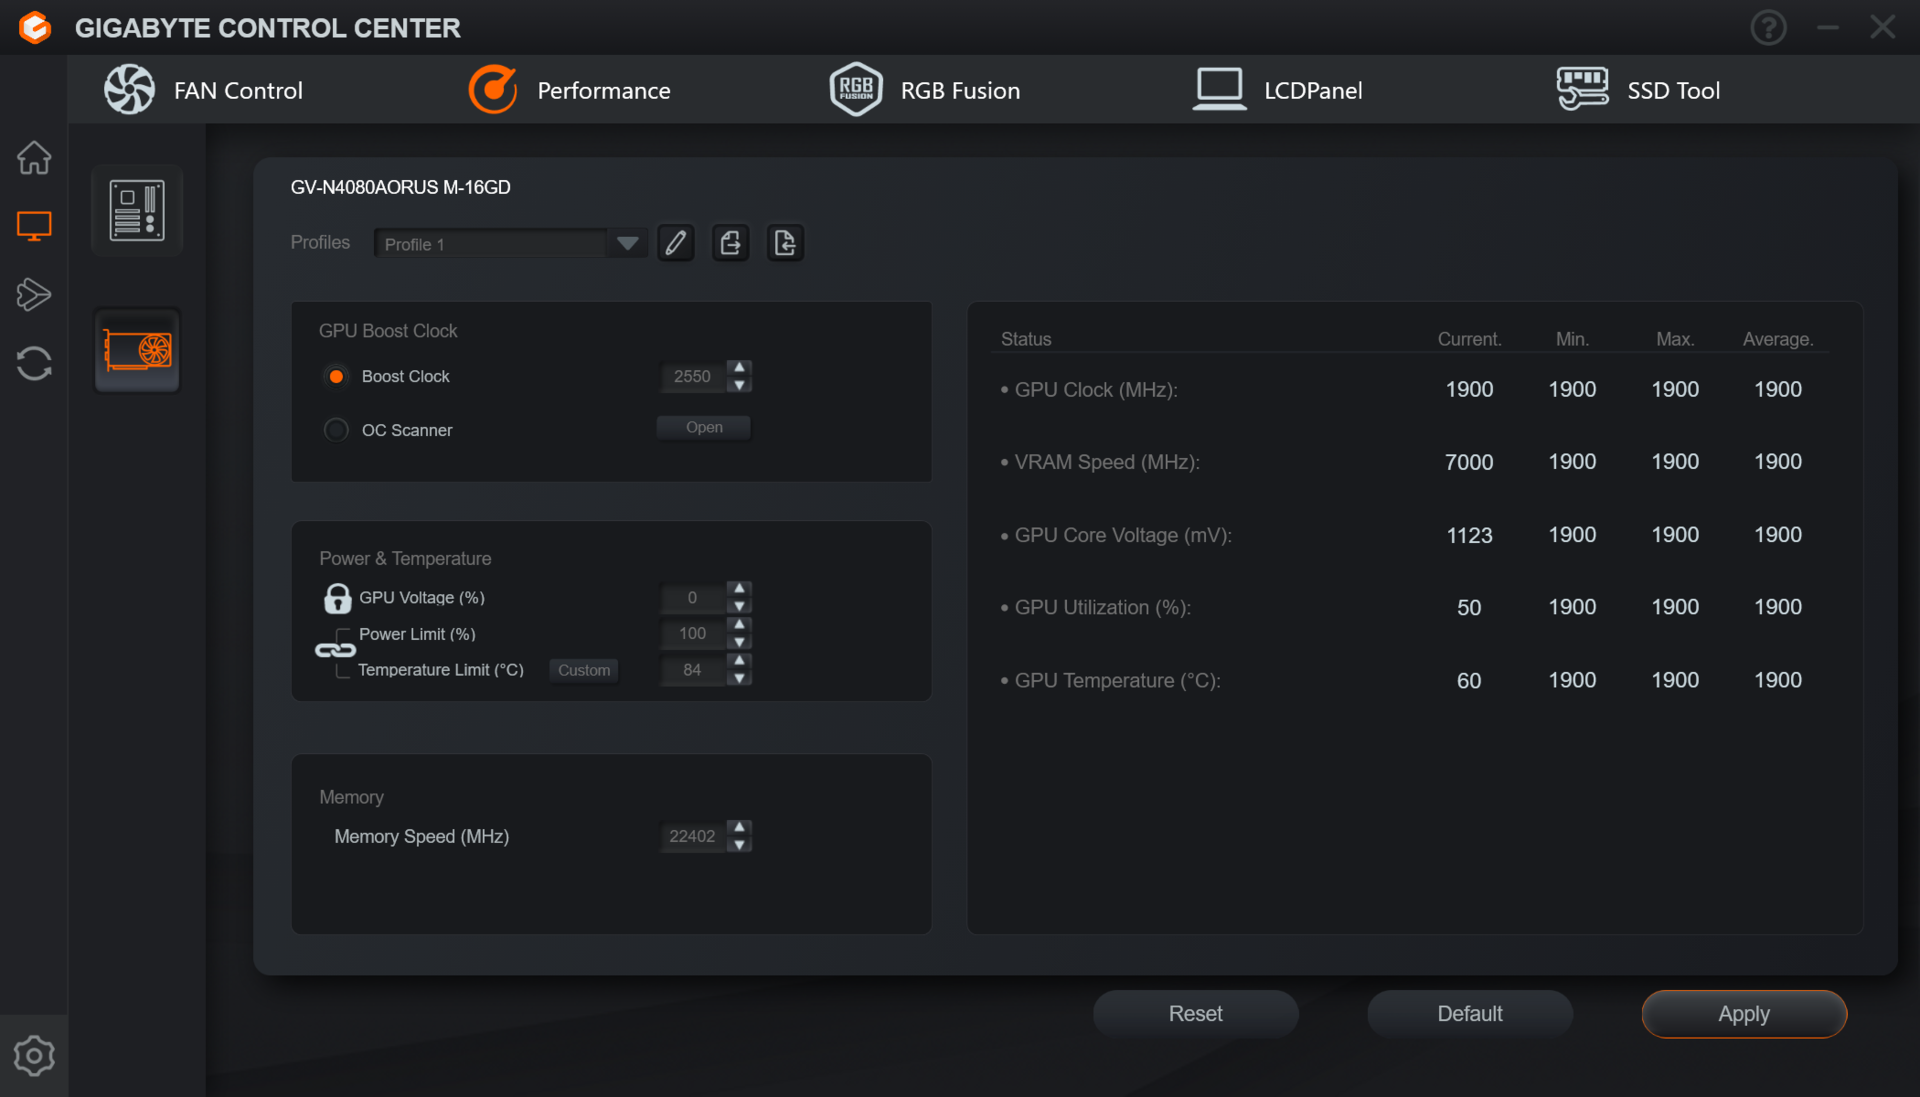
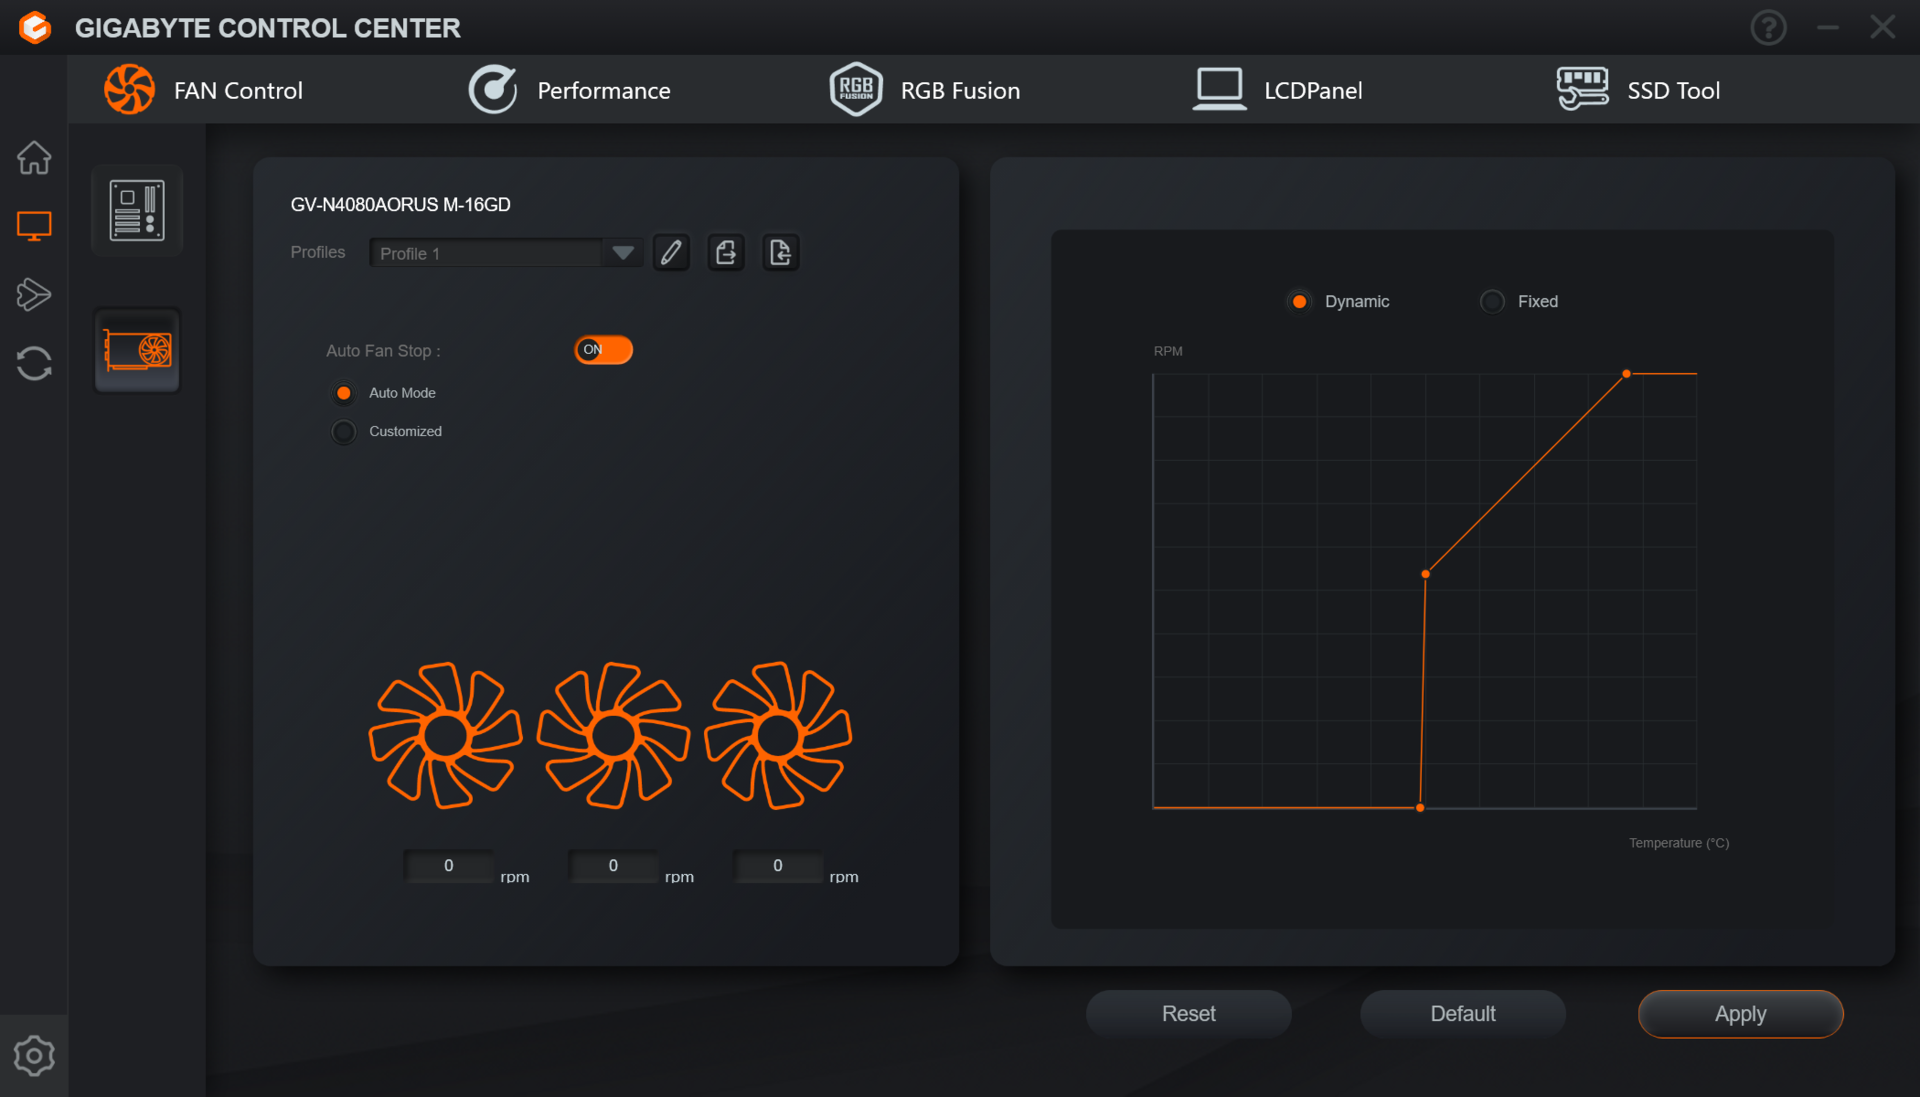
Centrum sterowania Gigabyte wymaga sporo pracy

Gigabyte tradycyjnie oferuje szereg narzędzi dla płyt głównych, dysków SSD i procesorów graficznych, ale teraz wszystkie one zostały skonsolidowane w ramach jednolitego interfejsu o nazwie Gigabyte Control Center (GCC).

Pomysł jest świetny, ale wykonanie w tej chwili wydaje się raczej kiepskie. Aplikacja jest bardzo podatna na błędy, często się zawiesza, a zastosowanie jakiegoś ustawienia może trwać wieki. Wydaje się, że dzieje się tak nawet w najnowszej wersji aplikacji w czasie testów.

Podczas gdy narzędzia innych firm, takie jak MSI Afterburner i EVGA Precision X1 nadal współpracują z kartami Ada, ich status rozwoju jest obecnie w zawieszeniu. Mamy nadzieję, że Gigabyte doprowadzi aplikację do stanu używalności wraz z kolejnymi aktualizacjami, dzięki czemu użytkownicy będą mieli do dyspozycji odpowiednie rozwiązanie do tuningu GPU.

Poniższe screeny przedstawiają GCC z Aorus RTX 4080 Master, ale funkcjonalność jest taka sama także w przypadku RTX 4070 Ti Master.

Ustawienia podkręcania GPU
Regulacja krzywej wentylatora
Dostosowanie widoku LCD
RGB Fusion
RGB Fusion

Testy: Aorus GeForce RTX 4070 Ti Master zostaje sparowany z Intel Core i9-13900K

Nasza ławka testowa pozostaje podobna do tej, której używaliśmy wcześniej dla TUF Gaming RTX 4070 Ti OC i kilku innych GPU. Konstrukcja składa się z następujących komponentów:

  • Ławka testowa Cooler Master MasterFrame 700
  • Intel Core i9-13900K
  • Płyta główna Gigabyte Z790 Aorus Master
  • Gigabyte Aorus Gen 4 2 TB NVMe SSD do benchmarków i gier
  • 2x 16 GB RAM Kingston Fury Renegade DDR5-6400 z timingami 32-39-39-80 przy 1,40 V
  • Monitor Gigabyte M28U 4K 144 Hz
  • Cooler Master MasterLiquid ML360L V2 ARGB AIO cooler
  • Thermaltake ToughPower Grand RGB 850 W

Wykorzystaliśmy świeżą instalację systemu Windows 11 22H2 z najnowszymi łatkami wraz ze sterownikami Game Ready w wersji 527.62.

Dziękujemy firmie Cooler Master za dostarczenie stanowiska testowego i AIO, firmie Gigabyte za procesor Core i9-13900K, płytę główną Z790, monitor M28U i dysk SSD NVMe oraz firmie Kingston za zestaw pamięci DDR5.

Benchmarki syntetyczne: Szybszy niż RTX 3090 Ti, dobrze wiąże się z innymi kartami RTX 4070 Ti

Aorus GeForce RTX 4070 Ti Master nie rzuca żadnych niespodzianek i dokładnie remisuje z TUF Gaming RTX 4070 Ti OC w ogólnej wydajności w syntetycznych benchmarkach. Różnice względem swojej konkurencji z Asusa są wyjątkowo niewielkie i można uznać, że mieszczą się w granicach marginesu lub błędu.

To powiedziawszy, benchmarki takie jak Unigine Valley 1.0 DirectX pokazują, że karta TUF Gaming OC ma 11% przewagę, ale widzimy odwrócenie ról z Aorus RTX 4070 Ti Master prowadzącym o 12% w wersji OpenGL testu.

Na stronie KFA2 GeForce RTX 4070 Ti SGrównież remisuje z pozostałymi dwoma RTX 4070 Tis w testach 3DMark i Unigine przez większość czasu i jest tylko około 3% za Aorusem i Asusem.

Zarówno Asus jak i Aorus mają lekką przewagę w Unigine Superposition 720p low w porównaniu z KFA2, co być może wynika z tego, że Intel Core i9-13900K jest korzystniejszy w niższych rozdzielczościach w porównaniu do AMD Ryzen 9 7950X.

Ogólnie rzecz biorąc, Aorus GeForce RTX 4070 Ti Master jest odczuwalnie szybszy od RTX 3090i wyprzedza RTX 3090 Ti i jest w zasięgu ręki AMD Radeon RX 7900 XT w łącznej syntetycznej wydajności.

Performance Rating - Percent
NVIDIA GeForce RTX 4090 Founders Edition
Intel Core i9-13900K, NVIDIA GeForce RTX 4090
99.9 pt
AMD Radeon RX 7900 XTX
AMD Ryzen 9 7950X, AMD Radeon RX 7900 XTX
82.5 pt
NVIDIA GeForce RTX 4080 Founders Edition
Intel Core i9-13900K, NVIDIA GeForce RTX 4080
81.2 pt
AMD Radeon RX 7900 XT
AMD Ryzen 9 7950X, AMD Radeon RX 7900 XT
72.8 pt
Aorus GeForce RTX 4070 Ti Master
Intel Core i9-13900K, NVIDIA GeForce RTX 4070 Ti
67.6 pt
Asus TUF Gaming GeForce RTX 4070 Ti
Intel Core i9-13900K, NVIDIA GeForce RTX 4070 Ti
67.5 pt
Zotac Gaming GeForce RTX 3090 Ti AMP Extreme Holo
AMD Ryzen 7 5800X3D, NVIDIA GeForce RTX 3090 Ti
66.1 pt
KFA2 GeForce RTX 4070 Ti SG
AMD Ryzen 9 7950X, NVIDIA GeForce RTX 4070 Ti
65.7 pt
Intel Core i9-13900K
Intel Core i9-13900K, NVIDIA GeForce RTX 3090
63.1 pt
Sapphire AMD Radeon RX 6950 XT Nitro+ Pure
AMD Ryzen 9 5900X, AMD Radeon RX 6950 XT
62.6 pt
Average NVIDIA GeForce RTX 3080 Ti
 
61.5 pt
Average NVIDIA GeForce RTX 3090
 
61.3 pt
AMD Radeon RX 6900 XT
AMD Ryzen 9 5950X, AMD Radeon RX 6900 XT
56.2 pt
AMD Radeon RX 6800 XT
AMD Ryzen 9 5950X, AMD Radeon RX 6800 XT
53 pt
Average NVIDIA GeForce RTX 3080
 
51.3 pt
Average NVIDIA Titan RTX
 
47.9 pt
Average of class
 
26.4 pt
3DMark 11 - 1280x720 Performance GPU
NVIDIA GeForce RTX 4090 Founders Edition
Intel Core i9-13900K, NVIDIA GeForce RTX 4090
99834 Points +31%
NVIDIA GeForce RTX 4080 Founders Edition
Intel Core i9-13900K, NVIDIA GeForce RTX 4080
86838 Points +14%
AMD Radeon RX 7900 XTX
AMD Ryzen 9 7950X, AMD Radeon RX 7900 XTX
83322 Points +9%
AMD Radeon RX 7900 XT
AMD Ryzen 9 7950X, AMD Radeon RX 7900 XT
77784 Points +2%
Aorus GeForce RTX 4070 Ti Master
Intel Core i9-13900K, NVIDIA GeForce RTX 4070 Ti
76483 Points
Asus TUF Gaming GeForce RTX 4070 Ti
Intel Core i9-13900K, NVIDIA GeForce RTX 4070 Ti
75990 Points -1%
Asus TUF Gaming GeForce RTX 4070 Ti
Intel Core i9-13900K, NVIDIA GeForce RTX 4070 Ti (Quiet BIOS)
75612 Points -1%
KFA2 GeForce RTX 4070 Ti SG
AMD Ryzen 9 7950X, NVIDIA GeForce RTX 4070 Ti
75231 Points -2%
Sapphire AMD Radeon RX 6950 XT Nitro+ Pure
AMD Ryzen 9 5900X, AMD Radeon RX 6950 XT
70480 Points -8%
Zotac Gaming GeForce RTX 3090 Ti AMP Extreme Holo
AMD Ryzen 7 5800X3D, NVIDIA GeForce RTX 3090 Ti
69481 Points -9%
Average NVIDIA GeForce RTX 3080 Ti
  (59799 - 62189, n=4)
60987 Points -20%
Average NVIDIA GeForce RTX 3090
  (55144 - 66934, n=17)
60853 Points -20%
Intel Core i9-13900K
Intel Core i9-13900K, NVIDIA GeForce RTX 3090
59972 Points -22%
AMD Radeon RX 6900 XT
AMD Ryzen 9 5950X, AMD Radeon RX 6900 XT
59119 Points -23%
Average NVIDIA GeForce RTX 3080
  (47287 - 57662, n=4)
53094 Points -31%
AMD Radeon RX 6800 XT
AMD Ryzen 9 5950X, AMD Radeon RX 6800 XT
52046 Points -32%
Average NVIDIA Titan RTX
  (43461 - 51863, n=30)
49062 Points -36%
Average of class
  (-1 - 116361, n=5026)
11206 Points -85%
3DMark
1920x1080 Fire Strike Graphics
AMD Radeon RX 7900 XTX
AMD Ryzen 9 7950X, AMD Radeon RX 7900 XTX
66967 Points +27%
NVIDIA GeForce RTX 4090 Founders Edition
Intel Core i9-13900K, NVIDIA GeForce RTX 4090
65879 Points +25%
AMD Radeon RX 7900 XT
AMD Ryzen 9 7950X, AMD Radeon RX 7900 XT
63712 Points +21%
Sapphire AMD Radeon RX 6950 XT Nitro+ Pure
AMD Ryzen 9 5900X, AMD Radeon RX 6950 XT
60092 Points +14%
NVIDIA GeForce RTX 4080 Founders Edition
Intel Core i9-13900K, NVIDIA GeForce RTX 4080
58893 Points +12%
Asus TUF Gaming GeForce RTX 4070 Ti
Intel Core i9-13900K, NVIDIA GeForce RTX 4070 Ti
53729 Points +2%
Asus TUF Gaming GeForce RTX 4070 Ti
Intel Core i9-13900K, NVIDIA GeForce RTX 4070 Ti (Quiet BIOS)
52903 Points 0%
KFA2 GeForce RTX 4070 Ti SG
AMD Ryzen 9 7950X, NVIDIA GeForce RTX 4070 Ti
53360 Points +1%
Zotac Gaming GeForce RTX 3090 Ti AMP Extreme Holo
AMD Ryzen 7 5800X3D, NVIDIA GeForce RTX 3090 Ti
53110 Points +1%
Aorus GeForce RTX 4070 Ti Master
Intel Core i9-13900K, NVIDIA GeForce RTX 4070 Ti
52769 Points
AMD Radeon RX 6900 XT
AMD Ryzen 9 5950X, AMD Radeon RX 6900 XT
50587 Points -4%
AMD Radeon RX 6800 XT
AMD Ryzen 9 5950X, AMD Radeon RX 6800 XT
49735 Points -6%
Intel Core i9-13900K
Intel Core i9-13900K, NVIDIA GeForce RTX 3090
47241 Points -10%
Average NVIDIA GeForce RTX 3080 Ti
  (45785 - 48709, n=4)
47180 Points -11%
Average NVIDIA GeForce RTX 3090
  (41298 - 49282, n=17)
46856 Points -11%
Average NVIDIA GeForce RTX 3080
  (37604 - 40910, n=2)
39257 Points -26%
Average NVIDIA Titan RTX
  (33377 - 40910, n=30)
36062 Points -32%
Average of class
  (90 - 88564, n=4203)
9603 Points -82%
3840x2160 Fire Strike Ultra Graphics
NVIDIA GeForce RTX 4090 Founders Edition
Intel Core i9-13900K, NVIDIA GeForce RTX 4090
24276 Points +78%
AMD Radeon RX 7900 XTX
AMD Ryzen 9 7950X, AMD Radeon RX 7900 XTX
20214 Points +48%
NVIDIA GeForce RTX 4080 Founders Edition
Intel Core i9-13900K, NVIDIA GeForce RTX 4080
17122 Points +26%
AMD Radeon RX 7900 XT
AMD Ryzen 9 7950X, AMD Radeon RX 7900 XT
17078 Points +25%
Sapphire AMD Radeon RX 6950 XT Nitro+ Pure
AMD Ryzen 9 5900X, AMD Radeon RX 6950 XT
14978 Points +10%
Zotac Gaming GeForce RTX 3090 Ti AMP Extreme Holo
AMD Ryzen 7 5800X3D, NVIDIA GeForce RTX 3090 Ti
14026 Points +3%
Aorus GeForce RTX 4070 Ti Master
Intel Core i9-13900K, NVIDIA GeForce RTX 4070 Ti
13616 Points
Asus TUF Gaming GeForce RTX 4070 Ti
Intel Core i9-13900K, NVIDIA GeForce RTX 4070 Ti
13546 Points -1%
Asus TUF Gaming GeForce RTX 4070 Ti
Intel Core i9-13900K, NVIDIA GeForce RTX 4070 Ti (Quiet BIOS)
13487 Points -1%
AMD Radeon RX 6900 XT
AMD Ryzen 9 5950X, AMD Radeon RX 6900 XT
13370 Points -2%
KFA2 GeForce RTX 4070 Ti SG
AMD Ryzen 9 7950X, NVIDIA GeForce RTX 4070 Ti
13112 Points -4%
AMD Radeon RX 6800 XT
AMD Ryzen 9 5950X, AMD Radeon RX 6800 XT
12626 Points -7%
Intel Core i9-13900K
Intel Core i9-13900K, NVIDIA GeForce RTX 3090
12301 Points -10%
Average NVIDIA GeForce RTX 3090
  (11613 - 12587, n=14)
12289 Points -10%
Average NVIDIA GeForce RTX 3080 Ti
  (12050 - 12341, n=4)
12173 Points -11%
Average NVIDIA GeForce RTX 3080
  (10645 - 10793, n=2)
10719 Points -21%
Average NVIDIA Titan RTX
  (8461 - 10793, n=29)
8868 Points -35%
Average of class
  (71 - 25703, n=1236)
4370 Points -68%
Fire Strike Extreme Graphics
NVIDIA GeForce RTX 4090 Founders Edition
Intel Core i9-13900K, NVIDIA GeForce RTX 4090
44295 Points +63%
AMD Radeon RX 7900 XTX
AMD Ryzen 9 7950X, AMD Radeon RX 7900 XTX
39570 Points +46%
AMD Radeon RX 7900 XT
AMD Ryzen 9 7950X, AMD Radeon RX 7900 XT
33747 Points +24%
NVIDIA GeForce RTX 4080 Founders Edition
Intel Core i9-13900K, NVIDIA GeForce RTX 4080
33475 Points +23%
Sapphire AMD Radeon RX 6950 XT Nitro+ Pure
AMD Ryzen 9 5900X, AMD Radeon RX 6950 XT
29704 Points +9%
Aorus GeForce RTX 4070 Ti Master
Intel Core i9-13900K, NVIDIA GeForce RTX 4070 Ti
27167 Points
Asus TUF Gaming GeForce RTX 4070 Ti
Intel Core i9-13900K, NVIDIA GeForce RTX 4070 Ti
26970 Points -1%
Asus TUF Gaming GeForce RTX 4070 Ti
Intel Core i9-13900K, NVIDIA GeForce RTX 4070 Ti (Quiet BIOS)
26925 Points -1%
Zotac Gaming GeForce RTX 3090 Ti AMP Extreme Holo
AMD Ryzen 7 5800X3D, NVIDIA GeForce RTX 3090 Ti
26797 Points -1%
AMD Radeon RX 6900 XT
AMD Ryzen 9 5950X, AMD Radeon RX 6900 XT
26650 Points -2%
KFA2 GeForce RTX 4070 Ti SG
AMD Ryzen 9 7950X, NVIDIA GeForce RTX 4070 Ti
26470 Points -3%
AMD Radeon RX 6800 XT
AMD Ryzen 9 5950X, AMD Radeon RX 6800 XT
25015 Points -8%
Intel Core i9-13900K
Intel Core i9-13900K, NVIDIA GeForce RTX 3090
23839 Points -12%
Average NVIDIA GeForce RTX 3090
  (22075 - 24730, n=14)
23806 Points -12%
Average NVIDIA GeForce RTX 3080 Ti
  (23127 - 24250, n=4)
23668 Points -13%
Average NVIDIA GeForce RTX 3080
  (20007 - 20861, n=2)
20434 Points -25%
Average NVIDIA Titan RTX
  (16484 - 20861, n=29)
17649 Points -35%
Average of class
  (144 - 48048, n=985)
7381 Points -73%
2560x1440 Time Spy Graphics
NVIDIA GeForce RTX 4090 Founders Edition
Intel Core i9-13900K, NVIDIA GeForce RTX 4090
36101 Points +56%
AMD Radeon RX 7900 XTX
AMD Ryzen 9 7950X, AMD Radeon RX 7900 XTX
29699 Points +28%
NVIDIA GeForce RTX 4080 Founders Edition
Intel Core i9-13900K, NVIDIA GeForce RTX 4080
28133 Points +22%
AMD Radeon RX 7900 XT
AMD Ryzen 9 7950X, AMD Radeon RX 7900 XT
25874 Points +12%
Aorus GeForce RTX 4070 Ti Master
Intel Core i9-13900K, NVIDIA GeForce RTX 4070 Ti
23136 Points
Asus TUF Gaming GeForce RTX 4070 Ti
Intel Core i9-13900K, NVIDIA GeForce RTX 4070 Ti
22982 Points -1%
Asus TUF Gaming GeForce RTX 4070 Ti
Intel Core i9-13900K, NVIDIA GeForce RTX 4070 Ti (Quiet BIOS)
22949 Points -1%
KFA2 GeForce RTX 4070 Ti SG
AMD Ryzen 9 7950X, NVIDIA GeForce RTX 4070 Ti
22584 Points -2%
Sapphire AMD Radeon RX 6950 XT Nitro+ Pure
AMD Ryzen 9 5900X, AMD Radeon RX 6950 XT
21719 Points -6%
Zotac Gaming GeForce RTX 3090 Ti AMP Extreme Holo
AMD Ryzen 7 5800X3D, NVIDIA GeForce RTX 3090 Ti
21645 Points -6%
Average NVIDIA GeForce RTX 3090
  (18685 - 20433, n=17)
19266 Points -17%
Average NVIDIA GeForce RTX 3080 Ti
  (19041 - 19460, n=4)
19237 Points -17%
Intel Core i9-13900K
Intel Core i9-13900K, NVIDIA GeForce RTX 3090
19198 Points -17%
AMD Radeon RX 6900 XT
AMD Ryzen 9 5950X, AMD Radeon RX 6900 XT
18210 Points -21%
AMD Radeon RX 6800 XT
AMD Ryzen 9 5950X, AMD Radeon RX 6800 XT
17603 Points -24%
Average NVIDIA GeForce RTX 3080
  (17467 - 17604, n=2)
17536 Points -24%
Average NVIDIA Titan RTX
  (14216 - 15283, n=29)
14884 Points -36%
Average of class
  (76 - 37809, n=2303)
5717 Points -75%
Unigine Heaven 4.0
Extreme Preset DX11
NVIDIA GeForce RTX 4090 Founders Edition
Intel Core i9-13900K, NVIDIA GeForce RTX 4090
466 (11min - 1031max) fps +47%
NVIDIA GeForce RTX 4080 Founders Edition
Intel Core i9-13900K, NVIDIA GeForce RTX 4080
389.4 (11.3min - 813.1max) fps +22%
AMD Radeon RX 7900 XTX
AMD Ryzen 9 7950X, AMD Radeon RX 7900 XTX
357.6 fps +12%
AMD Radeon RX 7900 XT
AMD Ryzen 9 7950X, AMD Radeon RX 7900 XT
319.7 fps +1%
KFA2 GeForce RTX 4070 Ti SG
AMD Ryzen 9 7950X, NVIDIA GeForce RTX 4070 Ti
318.6 fps 0%
Aorus GeForce RTX 4070 Ti Master
Intel Core i9-13900K, NVIDIA GeForce RTX 4070 Ti
317.9 (52.3min - 701.6max) fps
Asus TUF Gaming GeForce RTX 4070 Ti
Intel Core i9-13900K, NVIDIA GeForce RTX 4070 Ti
317.6 (57.8min - 692.1max) fps 0%
Intel Core i9-13900K
Intel Core i9-13900K, NVIDIA GeForce RTX 3090
309.2 fps -3%
Zotac Gaming GeForce RTX 3090 Ti AMP Extreme Holo
AMD Ryzen 7 5800X3D, NVIDIA GeForce RTX 3090 Ti
308.5 (9.7min - 627.1max) fps -3%
Average NVIDIA GeForce RTX 3090
  (272 - 315, n=11)
300 fps -6%
Average NVIDIA GeForce RTX 3080 Ti
  (290 - 312, n=4)
300 fps -6%
Sapphire AMD Radeon RX 6950 XT Nitro+ Pure
AMD Ryzen 9 5900X, AMD Radeon RX 6950 XT
293.8 fps -8%
AMD Radeon RX 6900 XT
AMD Ryzen 9 5950X, AMD Radeon RX 6900 XT
259.5 (49.3min - 537.2max) fps -18%
AMD Radeon RX 6800 XT
AMD Ryzen 9 5950X, AMD Radeon RX 6800 XT
247.9 fps -22%
Average NVIDIA GeForce RTX 3080
  (233 - 253, n=2)
243 fps -24%
Average NVIDIA Titan RTX
  (207 - 248, n=12)
236 fps -26%
Average of class
  (1.2 - 493, n=598)
109.5 fps -66%
Extreme Preset OpenGL
NVIDIA GeForce RTX 4090 Founders Edition
Intel Core i9-13900K, NVIDIA GeForce RTX 4090
443 (15min - 902max) fps +50%
AMD Radeon RX 7900 XTX
AMD Ryzen 9 7950X, AMD Radeon RX 7900 XTX
370.2 fps +25%
NVIDIA GeForce RTX 4080 Founders Edition
Intel Core i9-13900K, NVIDIA GeForce RTX 4080
364.2 (15min - 770.5max) fps +23%
AMD Radeon RX 7900 XT
AMD Ryzen 9 7950X, AMD Radeon RX 7900 XT
330.2 fps +12%
KFA2 GeForce RTX 4070 Ti SG
AMD Ryzen 9 7950X, NVIDIA GeForce RTX 4070 Ti
297.2 fps +1%
Aorus GeForce RTX 4070 Ti Master
Intel Core i9-13900K, NVIDIA GeForce RTX 4070 Ti
295.5 (50.3min - 602max) fps
Asus TUF Gaming GeForce RTX 4070 Ti
Intel Core i9-13900K, NVIDIA GeForce RTX 4070 Ti
292.6 (15.2min - 600.3max) fps -1%
Zotac Gaming GeForce RTX 3090 Ti AMP Extreme Holo
AMD Ryzen 7 5800X3D, NVIDIA GeForce RTX 3090 Ti
292.5 (11.4min - 577.9max) fps -1%
Intel Core i9-13900K
Intel Core i9-13900K, NVIDIA GeForce RTX 3090
277.9 fps -6%
Average NVIDIA GeForce RTX 3080 Ti
  (264 - 282, n=4)
274 fps -7%
Average NVIDIA GeForce RTX 3090
  (188.2 - 284, n=10)
270 fps -9%
Average NVIDIA GeForce RTX 3080
  (232 - 243, n=2)
238 fps -19%
Average NVIDIA Titan RTX
  (203 - 299, n=12)
223 fps -25%
Sapphire AMD Radeon RX 6950 XT Nitro+ Pure
AMD Ryzen 9 5900X, AMD Radeon RX 6950 XT
222.7 fps -25%
AMD Radeon RX 6900 XT
AMD Ryzen 9 5950X, AMD Radeon RX 6900 XT
206.5 (8.2min - 453.7max) fps -30%
AMD Radeon RX 6800 XT
AMD Ryzen 9 5950X, AMD Radeon RX 6800 XT
204 fps -31%
Average of class
  (1.2 - 465, n=421)
119.9 fps -59%
Unigine Valley 1.0
1920x1080 Extreme HD DirectX AA:x8
NVIDIA GeForce RTX 4090 Founders Edition
Intel Core i9-13900K, NVIDIA GeForce RTX 4090
283 (80min - 527max) fps +36%
NVIDIA GeForce RTX 4080 Founders Edition
Intel Core i9-13900K, NVIDIA GeForce RTX 4080
277.5 (71.7min - 487.9max) fps +34%
AMD Radeon RX 7900 XTX
AMD Ryzen 9 7950X, AMD Radeon RX 7900 XTX
264.5 fps +27%
Intel Core i9-13900K
Intel Core i9-13900K, NVIDIA GeForce RTX 3090
245 fps +18%
AMD Radeon RX 7900 XT
AMD Ryzen 9 7950X, AMD Radeon RX 7900 XT
243.3 fps +17%
Asus TUF Gaming GeForce RTX 4070 Ti
Intel Core i9-13900K, NVIDIA GeForce RTX 4070 Ti
230.3 (78.9min - 451.1max) fps +11%
Average NVIDIA GeForce RTX 3080 Ti
  (206 - 240, n=4)
228 fps +10%
Average NVIDIA GeForce RTX 3090
  (184.2 - 247, n=11)
225 fps +8%
KFA2 GeForce RTX 4070 Ti SG
AMD Ryzen 9 7950X, NVIDIA GeForce RTX 4070 Ti
216.3 fps +4%
Sapphire AMD Radeon RX 6950 XT Nitro+ Pure
AMD Ryzen 9 5900X, AMD Radeon RX 6950 XT
209.2 fps +1%
Aorus GeForce RTX 4070 Ti Master
Intel Core i9-13900K, NVIDIA GeForce RTX 4070 Ti
207.5 (75.3min - 371.2max) fps
Zotac Gaming GeForce RTX 3090 Ti AMP Extreme Holo
AMD Ryzen 7 5800X3D, NVIDIA GeForce RTX 3090 Ti
201.7 (48.5min - 338.7max) fps -3%
AMD Radeon RX 6900 XT
AMD Ryzen 9 5950X, AMD Radeon RX 6900 XT
200.8 (53.4min - 359.1max) fps -3%
AMD Radeon RX 6800 XT
AMD Ryzen 9 5950X, AMD Radeon RX 6800 XT
190.6 fps -8%
Average NVIDIA GeForce RTX 3080
  (176.2 - 181.8, n=2)
179 fps -14%
Average NVIDIA Titan RTX
  (135 - 191.4, n=12)
173.3 fps -16%
Average of class
  (1.1 - 305, n=459)
89.4 fps -57%
1920x1080 Extreme HD Preset OpenGL AA:x8
NVIDIA GeForce RTX 4090 Founders Edition
Intel Core i9-13900K, NVIDIA GeForce RTX 4090
315 (64min - 559max) fps +36%
NVIDIA GeForce RTX 4080 Founders Edition
Intel Core i9-13900K, NVIDIA GeForce RTX 4080
257 (79.3min - 462.8max) fps +11%
AMD Radeon RX 7900 XTX
AMD Ryzen 9 7950X, AMD Radeon RX 7900 XTX
254.2 fps +10%
Aorus GeForce RTX 4070 Ti Master
Intel Core i9-13900K, NVIDIA GeForce RTX 4070 Ti
230.9 (56.3min - 480.2max) fps
AMD Radeon RX 7900 XT
AMD Ryzen 9 7950X, AMD Radeon RX 7900 XT
225.9 fps -2%
Intel Core i9-13900K
Intel Core i9-13900K, NVIDIA GeForce RTX 3090
210.8 fps -9%
Zotac Gaming GeForce RTX 3090 Ti AMP Extreme Holo
AMD Ryzen 7 5800X3D, NVIDIA GeForce RTX 3090 Ti
208.4 (49.3min - 353max) fps -10%
Asus TUF Gaming GeForce RTX 4070 Ti
Intel Core i9-13900K, NVIDIA GeForce RTX 4070 Ti
206.8 (64.6min - 374.1max) fps -10%
Average NVIDIA GeForce RTX 3080 Ti
  (195.1 - 210, n=4)
204 fps -12%
Average NVIDIA GeForce RTX 3090
  (158.8 - 226, n=10)
203 fps -12%
KFA2 GeForce RTX 4070 Ti SG
AMD Ryzen 9 7950X, NVIDIA GeForce RTX 4070 Ti
197.4 fps -15%
Sapphire AMD Radeon RX 6950 XT Nitro+ Pure
AMD Ryzen 9 5900X, AMD Radeon RX 6950 XT
176.9 fps -23%
Average NVIDIA GeForce RTX 3080
  (163.8 - 172, n=2)
167.9 fps -27%
AMD Radeon RX 6900 XT
AMD Ryzen 9 5950X, AMD Radeon RX 6900 XT
167.4 (56.7min - 375.7max) fps -28%
AMD Radeon RX 6800 XT
AMD Ryzen 9 5950X, AMD Radeon RX 6800 XT
158.2 fps -31%
Average NVIDIA Titan RTX
  (139.2 - 181.2, n=12)
158.1 fps -32%
Average of class
  (1.1 - 322, n=425)
84.1 fps -64%
Unigine Superposition
1280x720 720p Low
Asus TUF Gaming GeForce RTX 4070 Ti
Intel Core i9-13900K, NVIDIA GeForce RTX 4070 Ti
56132 Points +2%
NVIDIA GeForce RTX 4090 Founders Edition
Intel Core i9-13900K, NVIDIA GeForce RTX 4090
55915 Points +1%
NVIDIA GeForce RTX 4080 Founders Edition
Intel Core i9-13900K, NVIDIA GeForce RTX 4080
55670 Points +1%
Aorus GeForce RTX 4070 Ti Master
Intel Core i9-13900K, NVIDIA GeForce RTX 4070 Ti
55232 Points
Intel Core i9-13900K
Intel Core i9-13900K, NVIDIA GeForce RTX 3090
53341 Points -3%
KFA2 GeForce RTX 4070 Ti SG
AMD Ryzen 9 7950X, NVIDIA GeForce RTX 4070 Ti
48835 Points -12%
Average NVIDIA GeForce RTX 3080 Ti
  (43163 - 50738, n=4)
47400 Points -14%
AMD Radeon RX 7900 XTX
AMD Ryzen 9 7950X, AMD Radeon RX 7900 XTX
47274 Points -14%
Average NVIDIA GeForce RTX 3090
  (33329 - 54879, n=10)
46049 Points -17%
AMD Radeon RX 7900 XT
AMD Ryzen 9 7950X, AMD Radeon RX 7900 XT
45904 Points -17%
Zotac Gaming GeForce RTX 3090 Ti AMP Extreme Holo
AMD Ryzen 7 5800X3D, NVIDIA GeForce RTX 3090 Ti
45444 Points -18%
Average NVIDIA Titan RTX
  (25622 - 50876, n=9)
40891 Points -26%
AMD Radeon RX 6900 XT
AMD Ryzen 9 5950X, AMD Radeon RX 6900 XT
37023 Points -33%
AMD Radeon RX 6800 XT
AMD Ryzen 9 5950X, AMD Radeon RX 6800 XT
36452 Points -34%
Sapphire AMD Radeon RX 6950 XT Nitro+ Pure
AMD Ryzen 9 5900X, AMD Radeon RX 6950 XT
33955 Points -39%
Average NVIDIA GeForce RTX 3080
  (30851 - 32183, n=2)
31517 Points -43%
Average of class
  (450 - 58018, n=287)
27853 Points -50%
1920x1080 1080p High
NVIDIA GeForce RTX 4090 Founders Edition
Intel Core i9-13900K, NVIDIA GeForce RTX 4090
47981 Points +60%
NVIDIA GeForce RTX 4080 Founders Edition
Intel Core i9-13900K, NVIDIA GeForce RTX 4080
37399 Points +25%
AMD Radeon RX 7900 XTX
AMD Ryzen 9 7950X, AMD Radeon RX 7900 XTX
36536 Points +22%
AMD Radeon RX 7900 XT
AMD Ryzen 9 7950X, AMD Radeon RX 7900 XT
31426 Points +5%
Aorus GeForce RTX 4070 Ti Master
Intel Core i9-13900K, NVIDIA GeForce RTX 4070 Ti
29999 Points
Asus TUF Gaming GeForce RTX 4070 Ti
Intel Core i9-13900K, NVIDIA GeForce RTX 4070 Ti
29686 Points -1%
KFA2 GeForce RTX 4070 Ti SG
AMD Ryzen 9 7950X, NVIDIA GeForce RTX 4070 Ti
29566 Points -1%
Zotac Gaming GeForce RTX 3090 Ti AMP Extreme Holo
AMD Ryzen 7 5800X3D, NVIDIA GeForce RTX 3090 Ti
29422 Points -2%
Sapphire AMD Radeon RX 6950 XT Nitro+ Pure
AMD Ryzen 9 5900X, AMD Radeon RX 6950 XT
28478 Points -5%
Intel Core i9-13900K
Intel Core i9-13900K, NVIDIA GeForce RTX 3090
26393 Points -12%
Average NVIDIA GeForce RTX 3090
  (23626 - 27207, n=11)
26018 Points -13%
Average NVIDIA GeForce RTX 3080 Ti
  (24997 - 26711, n=4)
26008 Points -13%
AMD Radeon RX 6900 XT
AMD Ryzen 9 5950X, AMD Radeon RX 6900 XT
25029 Points -17%
AMD Radeon RX 6800 XT
AMD Ryzen 9 5950X, AMD Radeon RX 6800 XT
22265 Points -26%
Average NVIDIA GeForce RTX 3080
  (21333 - 21912, n=2)
21623 Points -28%
Average NVIDIA Titan RTX
  (19460 - 20658, n=9)
20301 Points -32%
Average of class
  (135 - 50399, n=287)
14428 Points -52%
1920x1080 1080p Extreme
NVIDIA GeForce RTX 4090 Founders Edition
Intel Core i9-13900K, NVIDIA GeForce RTX 4090
20729 Points +54%
AMD Radeon RX 7900 XTX
AMD Ryzen 9 7950X, AMD Radeon RX 7900 XTX
17264 Points +28%
NVIDIA GeForce RTX 4080 Founders Edition
Intel Core i9-13900K, NVIDIA GeForce RTX 4080
16623 Points +24%
AMD Radeon RX 7900 XT
AMD Ryzen 9 7950X, AMD Radeon RX 7900 XT
14181 Points +5%
Zotac Gaming GeForce RTX 3090 Ti AMP Extreme Holo
AMD Ryzen 7 5800X3D, NVIDIA GeForce RTX 3090 Ti
13803 Points +3%
Aorus GeForce RTX 4070 Ti Master
Intel Core i9-13900K, NVIDIA GeForce RTX 4070 Ti
13448 Points
Asus TUF Gaming GeForce RTX 4070 Ti
Intel Core i9-13900K, NVIDIA GeForce RTX 4070 Ti
13266 Points -1%
KFA2 GeForce RTX 4070 Ti SG
AMD Ryzen 9 7950X, NVIDIA GeForce RTX 4070 Ti
13120 Points -2%
Average NVIDIA GeForce RTX 3090
  (11806 - 12694, n=11)
12209 Points -9%
Average NVIDIA GeForce RTX 3080 Ti
  (12038 - 12347, n=4)
12139 Points -10%
Sapphire AMD Radeon RX 6950 XT Nitro+ Pure
AMD Ryzen 9 5900X, AMD Radeon RX 6950 XT
12079 Points -10%
Intel Core i9-13900K
Intel Core i9-13900K, NVIDIA GeForce RTX 3090
12069 Points -10%
Average NVIDIA GeForce RTX 3080
  (10572 - 10822, n=2)
10697 Points -20%
AMD Radeon RX 6900 XT
AMD Ryzen 9 5950X, AMD Radeon RX 6900 XT
10683 Points -21%
AMD Radeon RX 6800 XT
AMD Ryzen 9 5950X, AMD Radeon RX 6800 XT
10046 Points -25%
Average NVIDIA Titan RTX
  (8916 - 9285, n=9)
9051 Points -33%
Average of class
  (133 - 22618, n=284)
6829 Points -49%
3840x2160 4k Optimized
NVIDIA GeForce RTX 4090 Founders Edition
Intel Core i9-13900K, NVIDIA GeForce RTX 4090
32977 Points +91%
AMD Radeon RX 7900 XTX
AMD Ryzen 9 7950X, AMD Radeon RX 7900 XTX
23174 Points +34%
NVIDIA GeForce RTX 4080 Founders Edition
Intel Core i9-13900K, NVIDIA GeForce RTX 4080
22343 Points +29%
AMD Radeon RX 7900 XT
AMD Ryzen 9 7950X, AMD Radeon RX 7900 XT
18806 Points +9%
Zotac Gaming GeForce RTX 3090 Ti AMP Extreme Holo
AMD Ryzen 7 5800X3D, NVIDIA GeForce RTX 3090 Ti
18426 Points +7%
Sapphire AMD Radeon RX 6950 XT Nitro+ Pure
AMD Ryzen 9 5900X, AMD Radeon RX 6950 XT
17725 Points +3%
Aorus GeForce RTX 4070 Ti Master
Intel Core i9-13900K, NVIDIA GeForce RTX 4070 Ti
17290 Points
Asus TUF Gaming GeForce RTX 4070 Ti
Intel Core i9-13900K, NVIDIA GeForce RTX 4070 Ti
17184 Points -1%
KFA2 GeForce RTX 4070 Ti SG
AMD Ryzen 9 7950X, NVIDIA GeForce RTX 4070 Ti
17109 Points -1%
Average NVIDIA GeForce RTX 3090
  (15794 - 16868, n=11)
16326 Points -6%
Intel Core i9-13900K
Intel Core i9-13900K, NVIDIA GeForce RTX 3090
16322 Points -6%
Average NVIDIA GeForce RTX 3080 Ti
  (16108 - 16412, n=4)
16199 Points -6%
AMD Radeon RX 6900 XT
AMD Ryzen 9 5950X, AMD Radeon RX 6900 XT
14955 Points -14%
Average NVIDIA GeForce RTX 3080
  (13984 - 14243, n=2)
14114 Points -18%
AMD Radeon RX 6800 XT
AMD Ryzen 9 5950X, AMD Radeon RX 6800 XT
13471 Points -22%
Average NVIDIA Titan RTX
  (11937 - 12644, n=9)
12203 Points -29%
Average of class
  (111 - 33987, n=223)
11515 Points -33%
7680x4320 8k Optimized
NVIDIA GeForce RTX 4090 Founders Edition
Intel Core i9-13900K, NVIDIA GeForce RTX 4090
12826 Points +99%
AMD Radeon RX 7900 XTX
AMD Ryzen 9 7950X, AMD Radeon RX 7900 XTX
8751 Points +36%
NVIDIA GeForce RTX 4080 Founders Edition
Intel Core i9-13900K, NVIDIA GeForce RTX 4080
8556 Points +33%
Zotac Gaming GeForce RTX 3090 Ti AMP Extreme Holo
AMD Ryzen 7 5800X3D, NVIDIA GeForce RTX 3090 Ti
8213 Points +27%
Average NVIDIA GeForce RTX 3090
  (6969 - 7521, n=11)
7144 Points +11%
Intel Core i9-13900K
Intel Core i9-13900K, NVIDIA GeForce RTX 3090
7072 Points +10%
Average NVIDIA GeForce RTX 3080 Ti
  (6920 - 7161, n=4)
7070 Points +10%
AMD Radeon RX 7900 XT
AMD Ryzen 9 7950X, AMD Radeon RX 7900 XT
7034 Points +9%
Sapphire AMD Radeon RX 6950 XT Nitro+ Pure
AMD Ryzen 9 5900X, AMD Radeon RX 6950 XT
6645 Points +3%
Aorus GeForce RTX 4070 Ti Master
Intel Core i9-13900K, NVIDIA GeForce RTX 4070 Ti
6454 Points
KFA2 GeForce RTX 4070 Ti SG
AMD Ryzen 9 7950X, NVIDIA GeForce RTX 4070 Ti
6439 Points 0%
Asus TUF Gaming GeForce RTX 4070 Ti
Intel Core i9-13900K, NVIDIA GeForce RTX 4070 Ti
6427 Points 0%
Average NVIDIA GeForce RTX 3080
  (6243 - 6346, n=2)
6295 Points -2%
AMD Radeon RX 6900 XT
AMD Ryzen 9 5950X, AMD Radeon RX 6900 XT
5764 Points -11%
Average NVIDIA Titan RTX
  (5255 - 5571, n=9)
5393 Points -16%
AMD Radeon RX 6800 XT
AMD Ryzen 9 5950X, AMD Radeon RX 6800 XT
5256 Points -19%
Average of class
  (237 - 13133, n=219)
4731 Points -27%
3DMark 11 Performance
56489 pkt.
3DMark Ice Storm Standard Score
274632 pkt.
3DMark Cloud Gate Standard Score
82725 pkt.
3DMark Fire Strike Score
41391 pkt.
3DMark Fire Strike Extreme Score
26501 pkt.
3DMark Time Spy Score
22611 pkt.
Pomoc

Benchmarki obliczeniowe: W większości przypadków dorównuje flagowcom Ampere

Podobną wydajność widać również w testach obliczeniowych. Wszystkie testowane karty RTX 4070 Ti mniej więcej walczą o te same czołówki. Aorus GeForce RTX 4070 Ti Master ma niewielką przewagę w testach V-Ray 5, podczas gdy w benchmarku V-Ray 4.0 przyszła kolej na Asusa i KFA2.

LuxMark Room GPU widzi, że karty Aorus i Asus remisują, podczas gdy KFA2 jest 8% za nimi. Karty AMD są znane z dobrych wyników w LuxMark Sala GPU i widzimy to tutaj po raz kolejny. Na stronie Radeon RX 6900 XT oraz RX 6800 XT są odpowiednio o 55% i 38% szybsze od Aorus RTX 4070 Ti.

Ogólne wyniki ComputeMark są takie same dla tych trzech kart RTX 4070 Ti, przy czym Aorus jest o sekundę szybszy w Blenderze 3.3 Classroom Optix.

V-Ray 5 Benchmark
GPU CUDA
NVIDIA GeForce RTX 4090 Founders Edition
Intel Core i9-13900K, NVIDIA GeForce RTX 4090 (5.0.1)
4224 mpaths +78%
NVIDIA GeForce RTX 4080 Founders Edition
Intel Core i9-13900K, NVIDIA GeForce RTX 4080 (5.0.1)
3067 mpaths +29%
Aorus GeForce RTX 4070 Ti Master
Intel Core i9-13900K, NVIDIA GeForce RTX 4070 Ti (5.0.1)
2371 mpaths
Asus TUF Gaming GeForce RTX 4070 Ti
Intel Core i9-13900K, NVIDIA GeForce RTX 4070 Ti (5.0.1)
2322 mpaths -2%
KFA2 GeForce RTX 4070 Ti SG
AMD Ryzen 9 7950X, NVIDIA GeForce RTX 4070 Ti (5.0.1)
2302 mpaths -3%
Zotac Gaming GeForce RTX 3090 Ti AMP Extreme Holo
AMD Ryzen 7 5800X3D, NVIDIA GeForce RTX 3090 Ti (5.0.1)
2195 mpaths -7%
Intel Core i9-13900K
Intel Core i9-13900K, NVIDIA GeForce RTX 3090 (5.0.1)
2106 mpaths -11%
Average NVIDIA GeForce RTX 3080 Ti
  (2045 - 2070, n=3)
2057 mpaths -13%
Average NVIDIA GeForce RTX 3090
  (1616 - 2131, n=14)
2019 mpaths -15%
Average of class
  (6 - 6733, n=498)
1050 mpaths -56%
Average NVIDIA Titan RTX
  (668 - 1052, n=7)
910 mpaths -62%
Sapphire AMD Radeon RX 6950 XT Nitro+ Pure
AMD Ryzen 9 5900X, AMD Radeon RX 6950 XT (5.0.1)
383 mpaths -84%
GPU RTX
NVIDIA GeForce RTX 4090 Founders Edition
Intel Core i9-13900K, NVIDIA GeForce RTX 4090 (5.0.1)
5935 mpaths +84%
NVIDIA GeForce RTX 4080 Founders Edition
Intel Core i9-13900K, NVIDIA GeForce RTX 4080 (5.0.1)
4193 mpaths +30%
Aorus GeForce RTX 4070 Ti Master
Intel Core i9-13900K, NVIDIA GeForce RTX 4070 Ti (5.0.1)
3221 mpaths
Asus TUF Gaming GeForce RTX 4070 Ti
Intel Core i9-13900K, NVIDIA GeForce RTX 4070 Ti (5.0.1)
3180 mpaths -1%
KFA2 GeForce RTX 4070 Ti SG
AMD Ryzen 9 7950X, NVIDIA GeForce RTX 4070 Ti (5.0.1)
3150 mpaths -2%
Intel Core i9-13900K
Intel Core i9-13900K, NVIDIA GeForce RTX 3090 (5.0.1)
2913 mpaths -10%
Zotac Gaming GeForce RTX 3090 Ti AMP Extreme Holo
AMD Ryzen 7 5800X3D, NVIDIA GeForce RTX 3090 Ti (5.0.1)
2880 mpaths -11%
Average NVIDIA GeForce RTX 3090
  (2551 - 2979, n=14)
2813 mpaths -13%
Average NVIDIA GeForce RTX 3080 Ti
  (2727 - 2883, n=3)
2784 mpaths -14%
Average of class
  (171 - 11043, n=352)
2108 mpaths -35%
Average NVIDIA Titan RTX
  (1246 - 1348, n=7)
1299 mpaths -60%
V-Ray Benchmark Next 4.10 - GPU
NVIDIA GeForce RTX 4090 Founders Edition
Intel Core i9-13900K, NVIDIA GeForce RTX 4090 (v4.10.07 )
1847 mpaths +75%
NVIDIA GeForce RTX 4080 Founders Edition
Intel Core i9-13900K, NVIDIA GeForce RTX 4080 (v4.10.07 )
1455 mpaths +38%
KFA2 GeForce RTX 4070 Ti SG
AMD Ryzen 9 7950X, NVIDIA GeForce RTX 4070 Ti (v4.10.07 )
1076 mpaths +2%
Asus TUF Gaming GeForce RTX 4070 Ti
Intel Core i9-13900K, NVIDIA GeForce RTX 4070 Ti (v4.10.07 )
1060 mpaths 0%
Aorus GeForce RTX 4070 Ti Master
Intel Core i9-13900K, NVIDIA GeForce RTX 4070 Ti (v4.10.07 )
1056 mpaths
Zotac Gaming GeForce RTX 3090 Ti AMP Extreme Holo
AMD Ryzen 7 5800X3D, NVIDIA GeForce RTX 3090 Ti (v4.10.07 )
902 mpaths -15%
Intel Core i9-13900K
Intel Core i9-13900K, NVIDIA GeForce RTX 3090 (v4.10.07 )
875 mpaths -17%
Average NVIDIA GeForce RTX 3090
  (781 - 877, n=16)
856 mpaths -19%
Average NVIDIA GeForce RTX 3080 Ti
  (854 - 855, n=3)
854 mpaths -19%
Average NVIDIA GeForce RTX 3080
  (636 - 643, n=2)
640 mpaths -39%
Average NVIDIA Titan RTX
  (386 - 439, n=16)
400 mpaths -62%
Average of class
  (2 - 2921, n=1248)
268 mpaths -75%
AMD Radeon RX 6800 XT
AMD Ryzen 9 5950X, AMD Radeon RX 6800 XT (v4.10.07 )
157 mpaths -85%
Sapphire AMD Radeon RX 6950 XT Nitro+ Pure
AMD Ryzen 9 5900X, AMD Radeon RX 6950 XT (v4.10.07 )
137 mpaths -87%
Blender - v3.3 Classroom OPTIX/RTX
Average of class
  (7 - 269, n=338)
29 Seconds * -164%
Average NVIDIA Titan RTX
  ()
21 Seconds * -91%
Average NVIDIA GeForce RTX 3080 Ti
  (14 - 15, n=2)
14.5 Seconds * -32%
Average NVIDIA GeForce RTX 3090
  (13 - 14, n=11)
13.4 Seconds * -22%
Intel Core i9-13900K
Intel Core i9-13900K, NVIDIA GeForce RTX 3090 (3.3.0)
13 Seconds * -18%
Asus TUF Gaming GeForce RTX 4070 Ti
Intel Core i9-13900K, NVIDIA GeForce RTX 4070 Ti (3.3.2)
12 Seconds * -9%
KFA2 GeForce RTX 4070 Ti SG
AMD Ryzen 9 7950X, NVIDIA GeForce RTX 4070 Ti (3.3.2)
12 Seconds * -9%
Aorus GeForce RTX 4070 Ti Master
Intel Core i9-13900K, NVIDIA GeForce RTX 4070 Ti (3.3.2)
11 Seconds *
NVIDIA GeForce RTX 4080 Founders Edition
Intel Core i9-13900K, NVIDIA GeForce RTX 4080 (3.3.0)
10 Seconds * +9%
NVIDIA GeForce RTX 4090 Founders Edition
Intel Core i9-13900K, NVIDIA GeForce RTX 4090 (3.3.0)
8 Seconds * +27%
LuxMark v2.0 64Bit
Room GPUs-only
NVIDIA GeForce RTX 4090 Founders Edition
Intel Core i9-13900K, NVIDIA GeForce RTX 4090
12730 Samples/s +51%
NVIDIA GeForce RTX 4080 Founders Edition
Intel Core i9-13900K, NVIDIA GeForce RTX 4080
10491 Samples/s +24%
Aorus GeForce RTX 4070 Ti Master
Intel Core i9-13900K, NVIDIA GeForce RTX 4070 Ti
8436 Samples/s
Asus TUF Gaming GeForce RTX 4070 Ti
Intel Core i9-13900K, NVIDIA GeForce RTX 4070 Ti
8413 Samples/s 0%
KFA2 GeForce RTX 4070 Ti SG
AMD Ryzen 9 7950X, NVIDIA GeForce RTX 4070 Ti
7785 Samples/s -8%
Zotac Gaming GeForce RTX 3090 Ti AMP Extreme Holo
AMD Ryzen 7 5800X3D, NVIDIA GeForce RTX 3090 Ti
6221 Samples/s -26%
Average NVIDIA GeForce RTX 3080 Ti
  (5772 - 6464, n=4)
6138 Samples/s -27%
Intel Core i9-13900K
Intel Core i9-13900K, NVIDIA GeForce RTX 3090
5930 Samples/s -30%
Average NVIDIA GeForce RTX 3090
  (5727 - 5985, n=9)
5893 Samples/s -30%
AMD Radeon RX 7900 XTX
AMD Ryzen 9 7950X, AMD Radeon RX 7900 XTX
5161 Samples/s -39%
Average NVIDIA GeForce RTX 3080
  (5112 - 5198, n=2)
5155 Samples/s -39%
Sapphire AMD Radeon RX 6950 XT Nitro+ Pure
AMD Ryzen 9 5900X, AMD Radeon RX 6950 XT
5097 Samples/s -40%
AMD Radeon RX 6900 XT
AMD Ryzen 9 5950X, AMD Radeon RX 6900 XT
5084 Samples/s -40%
AMD Radeon RX 6800 XT
AMD Ryzen 9 5950X, AMD Radeon RX 6800 XT
5057 Samples/s -40%
Average NVIDIA Titan RTX
  (4643 - 4703, n=2)
4673 Samples/s -45%
AMD Radeon RX 7900 XT
AMD Ryzen 9 7950X, AMD Radeon RX 7900 XT
4451 Samples/s -47%
Average of class
  (14 - 22134, n=837)
1590 Samples/s -81%
Sala GPUs-only
Sapphire AMD Radeon RX 6950 XT Nitro+ Pure
AMD Ryzen 9 5900X, AMD Radeon RX 6950 XT
31954 Samples/s +57%
AMD Radeon RX 6900 XT
AMD Ryzen 9 5950X, AMD Radeon RX 6900 XT
31400 Samples/s +55%
AMD Radeon RX 6800 XT
AMD Ryzen 9 5950X, AMD Radeon RX 6800 XT
28023 Samples/s +38%
NVIDIA GeForce RTX 4090 Founders Edition
Intel Core i9-13900K, NVIDIA GeForce RTX 4090
27828 Samples/s +37%
NVIDIA GeForce RTX 4080 Founders Edition
Intel Core i9-13900K, NVIDIA GeForce RTX 4080
24835 Samples/s +22%
Aorus GeForce RTX 4070 Ti Master
Intel Core i9-13900K, NVIDIA GeForce RTX 4070 Ti
20305 Samples/s
Asus TUF Gaming GeForce RTX 4070 Ti
Intel Core i9-13900K, NVIDIA GeForce RTX 4070 Ti
20171 Samples/s -1%
KFA2 GeForce RTX 4070 Ti SG
AMD Ryzen 9 7950X, NVIDIA GeForce RTX 4070 Ti
18407 Samples/s -9%
Zotac Gaming GeForce RTX 3090 Ti AMP Extreme Holo
AMD Ryzen 7 5800X3D, NVIDIA GeForce RTX 3090 Ti
16046 Samples/s -21%
Average NVIDIA GeForce RTX 3080 Ti
  (14871 - 16438, n=4)
15612 Samples/s -23%
Intel Core i9-13900K
Intel Core i9-13900K, NVIDIA GeForce RTX 3090
15088 Samples/s -26%
AMD Radeon RX 7900 XTX
AMD Ryzen 9 7950X, AMD Radeon RX 7900 XTX
15019 Samples/s -26%
Average NVIDIA GeForce RTX 3090
  (14590 - 15242, n=9)
14945 Samples/s -26%
AMD Radeon RX 7900 XT
AMD Ryzen 9 7950X, AMD Radeon RX 7900 XT
13489 Samples/s -34%
Average NVIDIA GeForce RTX 3080
  (12797 - 12980, n=2)
12889 Samples/s -37%
Average NVIDIA Titan RTX
  (10799 - 10996, n=2)
10898 Samples/s -46%
Average of class
  (26 - 57054, n=843)
3589 Samples/s -82%
ComputeMark v2.1
1024x600 Normal, Score
NVIDIA GeForce RTX 4090 Founders Edition
Intel Core i9-13900K, NVIDIA GeForce RTX 4090
86583 Points +66%
AMD Radeon RX 7900 XTX
AMD Ryzen 9 7950X, AMD Radeon RX 7900 XTX
62963 Points +21%
NVIDIA GeForce RTX 4080 Founders Edition
Intel Core i9-13900K, NVIDIA GeForce RTX 4080
62720 Points +20%
AMD Radeon RX 7900 XT
AMD Ryzen 9 7950X, AMD Radeon RX 7900 XT
57570 Points +10%
Zotac Gaming GeForce RTX 3090 Ti AMP Extreme Holo
AMD Ryzen 7 5800X3D, NVIDIA GeForce RTX 3090 Ti
52258 Points 0%
Aorus GeForce RTX 4070 Ti Master
Intel Core i9-13900K, NVIDIA GeForce RTX 4070 Ti
52251 Points
KFA2 GeForce RTX 4070 Ti SG
AMD Ryzen 9 7950X, NVIDIA GeForce RTX 4070 Ti
51835 Points -1%
Asus TUF Gaming GeForce RTX 4070 Ti
Intel Core i9-13900K, NVIDIA GeForce RTX 4070 Ti
51616 Points -1%
Intel Core i9-13900K
Intel Core i9-13900K, NVIDIA GeForce RTX 3090
49118 Points -6%
Average NVIDIA GeForce RTX 3080 Ti
  (47377 - 48892, n=4)
48266 Points -8%
Average NVIDIA GeForce RTX 3090
  (44948 - 49118, n=9)
47804 Points -9%
Sapphire AMD Radeon RX 6950 XT Nitro+ Pure
AMD Ryzen 9 5900X, AMD Radeon RX 6950 XT
44959 Points -14%
AMD Radeon RX 6900 XT
AMD Ryzen 9 5950X, AMD Radeon RX 6900 XT
40857 Points -22%
Average NVIDIA GeForce RTX 3080
  (39924 - 41594, n=2)
40759 Points -22%
AMD Radeon RX 6800 XT
AMD Ryzen 9 5950X, AMD Radeon RX 6800 XT
38823 Points -26%
Average NVIDIA Titan RTX
  (27907 - 29830, n=3)
28802 Points -45%
Average of class
  (31 - 92521, n=947)
10075 Points -81%
1024x600 Normal, QJuliaRayTrace
NVIDIA GeForce RTX 4090 Founders Edition
Intel Core i9-13900K, NVIDIA GeForce RTX 4090
31780 Points +47%
NVIDIA GeForce RTX 4080 Founders Edition
Intel Core i9-13900K, NVIDIA GeForce RTX 4080
24307 Points +12%
Aorus GeForce RTX 4070 Ti Master
Intel Core i9-13900K, NVIDIA GeForce RTX 4070 Ti
21619 Points
KFA2 GeForce RTX 4070 Ti SG
AMD Ryzen 9 7950X, NVIDIA GeForce RTX 4070 Ti
21330 Points -1%
Asus TUF Gaming GeForce RTX 4070 Ti
Intel Core i9-13900K, NVIDIA GeForce RTX 4070 Ti
21276 Points -2%
Zotac Gaming GeForce RTX 3090 Ti AMP Extreme Holo
AMD Ryzen 7 5800X3D, NVIDIA GeForce RTX 3090 Ti
18550 Points -14%
AMD Radeon RX 7900 XTX
AMD Ryzen 9 7950X, AMD Radeon RX 7900 XTX
17915 Points -17%
Intel Core i9-13900K
Intel Core i9-13900K, NVIDIA GeForce RTX 3090
17911 Points -17%
Average NVIDIA GeForce RTX 3080 Ti
  (17050 - 17749, n=4)
17475 Points -19%
Average NVIDIA GeForce RTX 3090
  (16403 - 18223, n=10)
17454 Points -19%
AMD Radeon RX 7900 XT
AMD Ryzen 9 7950X, AMD Radeon RX 7900 XT
16990 Points -21%
Average NVIDIA GeForce RTX 3080
  (14718 - 15508, n=2)
15113 Points -30%
Sapphire AMD Radeon RX 6950 XT Nitro+ Pure
AMD Ryzen 9 5900X, AMD Radeon RX 6950 XT
13580 Points -37%
AMD Radeon RX 6900 XT
AMD Ryzen 9 5950X, AMD Radeon RX 6900 XT
12255 Points -43%
AMD Radeon RX 6800 XT
AMD Ryzen 9 5950X, AMD Radeon RX 6800 XT
11304 Points -48%
Average NVIDIA Titan RTX
  (9418 - 10129, n=3)
9748 Points -55%
Average of class
  (12 - 34494, n=943)
3644 Points -83%
1024x600 Normal, Mandel Scalar
NVIDIA GeForce RTX 4090 Founders Edition
Intel Core i9-13900K, NVIDIA GeForce RTX 4090
21571 Points +73%
AMD Radeon RX 7900 XTX
AMD Ryzen 9 7950X, AMD Radeon RX 7900 XTX
15458 Points +24%
NVIDIA GeForce RTX 4080 Founders Edition
Intel Core i9-13900K, NVIDIA GeForce RTX 4080
14733 Points +18%
AMD Radeon RX 7900 XT
AMD Ryzen 9 7950X, AMD Radeon RX 7900 XT
13989 Points +12%
Aorus GeForce RTX 4070 Ti Master
Intel Core i9-13900K, NVIDIA GeForce RTX 4070 Ti
12449 Points
Zotac Gaming GeForce RTX 3090 Ti AMP Extreme Holo
AMD Ryzen 7 5800X3D, NVIDIA GeForce RTX 3090 Ti
12406 Points 0%
Asus TUF Gaming GeForce RTX 4070 Ti
Intel Core i9-13900K, NVIDIA GeForce RTX 4070 Ti
12320 Points -1%
KFA2 GeForce RTX 4070 Ti SG
AMD Ryzen 9 7950X, NVIDIA GeForce RTX 4070 Ti
12313 Points -1%
Sapphire AMD Radeon RX 6950 XT Nitro+ Pure
AMD Ryzen 9 5900X, AMD Radeon RX 6950 XT
11854 Points -5%
Intel Core i9-13900K
Intel Core i9-13900K, NVIDIA GeForce RTX 3090
11344 Points -9%
Average NVIDIA GeForce RTX 3080 Ti
  (11049 - 11318, n=4)
11196 Points -10%
Average NVIDIA GeForce RTX 3090
  (10650 - 11564, n=10)
11162 Points -10%
AMD Radeon RX 6900 XT
AMD Ryzen 9 5950X, AMD Radeon RX 6900 XT
10834 Points -13%
AMD Radeon RX 6800 XT
AMD Ryzen 9 5950X, AMD Radeon RX 6800 XT
10018 Points -20%
Average NVIDIA GeForce RTX 3080
  (9554 - 9938, n=2)
9746 Points -22%
Average NVIDIA Titan RTX
  (5977 - 6406, n=3)
6184 Points -50%
Average of class
  (15 - 23006, n=943)
2412 Points -81%
1024x600 Normal, Mandel Vector
NVIDIA GeForce RTX 4090 Founders Edition
Intel Core i9-13900K, NVIDIA GeForce RTX 4090
16199 Points +49%
AMD Radeon RX 7900 XTX
AMD Ryzen 9 7950X, AMD Radeon RX 7900 XTX
13737 Points +26%
AMD Radeon RX 7900 XT
AMD Ryzen 9 7950X, AMD Radeon RX 7900 XT
13022 Points +20%
NVIDIA GeForce RTX 4080 Founders Edition
Intel Core i9-13900K, NVIDIA GeForce RTX 4080
11772 Points +8%
Aorus GeForce RTX 4070 Ti Master
Intel Core i9-13900K, NVIDIA GeForce RTX 4070 Ti
10888 Points
Asus TUF Gaming GeForce RTX 4070 Ti
Intel Core i9-13900K, NVIDIA GeForce RTX 4070 Ti
10771 Points -1%
KFA2 GeForce RTX 4070 Ti SG
AMD Ryzen 9 7950X, NVIDIA GeForce RTX 4070 Ti
10711 Points -2%
Zotac Gaming GeForce RTX 3090 Ti AMP Extreme Holo
AMD Ryzen 7 5800X3D, NVIDIA GeForce RTX 3090 Ti
10652 Points -2%
Intel Core i9-13900K
Intel Core i9-13900K, NVIDIA GeForce RTX 3090
9836 Points -10%
Average NVIDIA GeForce RTX 3080 Ti
  (9513 - 9860, n=4)
9730 Points -11%
Sapphire AMD Radeon RX 6950 XT Nitro+ Pure
AMD Ryzen 9 5900X, AMD Radeon RX 6950 XT
9555 Points -12%
Average NVIDIA GeForce RTX 3090
  (8038 - 10097, n=10)
9467 Points -13%
AMD Radeon RX 6900 XT
AMD Ryzen 9 5950X, AMD Radeon RX 6900 XT
8690 Points -20%
AMD Radeon RX 6800 XT
AMD Ryzen 9 5950X, AMD Radeon RX 6800 XT
8399 Points -23%
Average NVIDIA GeForce RTX 3080
  (7148 - 7540, n=2)
7344 Points -33%
Average NVIDIA Titan RTX
  (4944 - 5440, n=3)
5158 Points -53%
Average of class
  (35 - 17390, n=943)
2094 Points -81%
1024x600 Normal, Fluid 2DTexArr
AMD Radeon RX 7900 XTX
AMD Ryzen 9 7950X, AMD Radeon RX 7900 XTX
7315 Points +104%
NVIDIA GeForce RTX 4090 Founders Edition
Intel Core i9-13900K, NVIDIA GeForce RTX 4090
6567 Points +83%
AMD Radeon RX 7900 XT
AMD Ryzen 9 7950X, AMD Radeon RX 7900 XT
6460 Points +80%
NVIDIA GeForce RTX 4080 Founders Edition
Intel Core i9-13900K, NVIDIA GeForce RTX 4080
5523 Points +54%
Zotac Gaming GeForce RTX 3090 Ti AMP Extreme Holo
AMD Ryzen 7 5800X3D, NVIDIA GeForce RTX 3090 Ti
4886 Points +36%
Intel Core i9-13900K
Intel Core i9-13900K, NVIDIA GeForce RTX 3090
4548 Points +27%
Average NVIDIA GeForce RTX 3080 Ti
  (4453 - 4546, n=4)
4498 Points +25%
Average NVIDIA GeForce RTX 3090
  (4344 - 4608, n=10)
4492 Points +25%
Sapphire AMD Radeon RX 6950 XT Nitro+ Pure
AMD Ryzen 9 5900X, AMD Radeon RX 6950 XT
4455 Points +24%
Average NVIDIA GeForce RTX 3080
  (4087 - 4159, n=2)
4123 Points +15%
AMD Radeon RX 6800 XT
AMD Ryzen 9 5950X, AMD Radeon RX 6800 XT
3947 Points +10%
AMD Radeon RX 6900 XT
AMD Ryzen 9 5950X, AMD Radeon RX 6900 XT
3924 Points +9%
Average NVIDIA Titan RTX
  (3691 - 3828, n=3)
3757 Points +5%
KFA2 GeForce RTX 4070 Ti SG
AMD Ryzen 9 7950X, NVIDIA GeForce RTX 4070 Ti
3706 Points +3%
Aorus GeForce RTX 4070 Ti Master
Intel Core i9-13900K, NVIDIA GeForce RTX 4070 Ti
3590 Points
Asus TUF Gaming GeForce RTX 4070 Ti
Intel Core i9-13900K, NVIDIA GeForce RTX 4070 Ti
3566 Points -1%
Average of class
  (22 - 7993, n=942)
964 Points -73%
1024x600 Normal, Fluid 3DTex
NVIDIA GeForce RTX 4090 Founders Edition
Intel Core i9-13900K, NVIDIA GeForce RTX 4090
10465 Points +182%
AMD Radeon RX 7900 XTX
AMD Ryzen 9 7950X, AMD Radeon RX 7900 XTX
8537 Points +130%
AMD Radeon RX 7900 XT
AMD Ryzen 9 7950X, AMD Radeon RX 7900 XT
7109 Points +92%
NVIDIA GeForce RTX 4080 Founders Edition
Intel Core i9-13900K, NVIDIA GeForce RTX 4080
6385 Points +72%
Zotac Gaming GeForce RTX 3090 Ti AMP Extreme Holo
AMD Ryzen 7 5800X3D, NVIDIA GeForce RTX 3090 Ti
5764 Points +56%
Sapphire AMD Radeon RX 6950 XT Nitro+ Pure
AMD Ryzen 9 5900X, AMD Radeon RX 6950 XT
5515 Points +49%
Intel Core i9-13900K
Intel Core i9-13900K, NVIDIA GeForce RTX 3090
5479 Points +48%
Average NVIDIA GeForce RTX 3090
  (5246 - 5520, n=10)
5448 Points +47%
Average NVIDIA GeForce RTX 3080 Ti
  (5312 - 5422, n=4)
5368 Points +45%
AMD Radeon RX 6800 XT
AMD Ryzen 9 5950X, AMD Radeon RX 6800 XT
5154 Points +39%
AMD Radeon RX 6900 XT
AMD Ryzen 9 5950X, AMD Radeon RX 6900 XT
5154 Points +39%
Average NVIDIA GeForce RTX 3080
  (4417 - 4450, n=2)
4434 Points +20%
Average NVIDIA Titan RTX
  (3877 - 4027, n=3)
3955 Points +7%
KFA2 GeForce RTX 4070 Ti SG
AMD Ryzen 9 7950X, NVIDIA GeForce RTX 4070 Ti
3774 Points +2%
Aorus GeForce RTX 4070 Ti Master
Intel Core i9-13900K, NVIDIA GeForce RTX 4070 Ti
3705 Points
Asus TUF Gaming GeForce RTX 4070 Ti
Intel Core i9-13900K, NVIDIA GeForce RTX 4070 Ti
3683 Points -1%
Average of class
  (23 - 10875, n=943)
1100 Points -70%

* ... im mniej tym lepiej

Wydajność w grach: Łatwe 60 fps w 4K Ultra, ale QHD to słodki punkt

Aorus GeForce RTX 4070 Ti Master trafia na bardzo zdolne GPU do gier 4K w swojej cenie. Większość nowoczesnych tytułów bez problemu osiąga 60 fps+ w ustawieniach 4K Ultra. Skumulowana wydajność w testowanych grach jest taka sama jak w przypadku Asusa TUF Gaming 4070 Ti. KFA2 przegrywa tylko o coraz mniejszy margines w ujęciu skumulowanym.

Aorus RTX 4070 Ti Master jest w stanie wykorzystać DLSS 3.0, więc możliwe jest uzyskanie znacznego wzrostu fps w 4K w obsługiwanych tytułach. Mimo to, QHD to słodki punkt dla kart AD104.

Karta Aorus 4070 Ti jest o około 11% szybsza od RTX 3090 ogółem i mniej więcej remisuje z RTX 3090 Ti. Radeon RX 7900 XT uzyskuje tylko 4% przewagi w porównaniu do Aorusa.

Podczas gdy gra w 4K nie powinna być problemem dla RTX 4070 Ti, mniejsza ilość pamięci i przepustowość może stanowić wąskie gardło podczas grania w tytuły wymagające dużej ilości tekstur.

Performance Rating - Percent
NVIDIA GeForce RTX 4090 Founders Edition
Intel Core i9-13900K, NVIDIA GeForce RTX 4090
99.8 pt
NVIDIA GeForce RTX 4080 Founders Edition
Intel Core i9-13900K, NVIDIA GeForce RTX 4080
85.2 pt
AMD Radeon RX 7900 XTX -3!
AMD Ryzen 9 7950X, AMD Radeon RX 7900 XTX
83.8 pt
AMD Radeon RX 7900 XT -3!
AMD Ryzen 9 7950X, AMD Radeon RX 7900 XT
74.6 pt
Asus TUF Gaming GeForce RTX 4070 Ti
Intel Core i9-13900K, NVIDIA GeForce RTX 4070 Ti
71.4 pt
Aorus GeForce RTX 4070 Ti Master
Intel Core i9-13900K, NVIDIA GeForce RTX 4070 Ti
71.3 pt
Zotac Gaming GeForce RTX 3090 Ti AMP Extreme Holo
AMD Ryzen 7 5800X3D, NVIDIA GeForce RTX 3090 Ti
71.1 pt
KFA2 GeForce RTX 4070 Ti SG -3!
AMD Ryzen 9 7950X, NVIDIA GeForce RTX 4070 Ti
68.1 pt
Intel Core i9-13900K -7!
Intel Core i9-13900K, NVIDIA GeForce RTX 3090
64 pt
Sapphire AMD Radeon RX 6950 XT Nitro+ Pure
AMD Ryzen 9 5900X, AMD Radeon RX 6950 XT
62.4 pt
Average NVIDIA GeForce RTX 3080 Ti
 
61.8 pt
Average NVIDIA GeForce RTX 3090
 
61.3 pt
AMD Radeon RX 6900 XT
AMD Ryzen 9 5950X, AMD Radeon RX 6900 XT
54.1 pt
Average NVIDIA GeForce RTX 3080
 
53 pt
AMD Radeon RX 6800 XT -1!
AMD Ryzen 9 5950X, AMD Radeon RX 6800 XT
50.7 pt
Average NVIDIA Titan RTX
 
45 pt
Average of class
 
35.2 pt
The Witcher 3
3840x2160 Ultra Graphics & Postprocessing (HBAO+)
NVIDIA GeForce RTX 4090 Founders Edition
Intel Core i9-13900K, NVIDIA GeForce RTX 4090
170.7 (154min, 154.59P1) fps +81%
NVIDIA GeForce RTX 4080 Founders Edition
Intel Core i9-13900K, NVIDIA GeForce RTX 4080
128 (113min, 114.12P1) fps +36%
AMD Radeon RX 7900 XTX
AMD Ryzen 9 7950X, AMD Radeon RX 7900 XTX
125.8 (9.5min, 66.1P0.1, 94.8P1) fps +33%
AMD Radeon RX 7900 XT
AMD Ryzen 9 7950X, AMD Radeon RX 7900 XT
109.4 (57.5min, 60.1P0.1, 86.2P1) fps +16%
Zotac Gaming GeForce RTX 3090 Ti AMP Extreme Holo
AMD Ryzen 7 5800X3D, NVIDIA GeForce RTX 3090 Ti
107.5 (97min, 97.56P1) fps +14%
Asus TUF Gaming GeForce RTX 4070 Ti
Intel Core i9-13900K, NVIDIA GeForce RTX 4070 Ti
98.3 (88min, 88.56P1) fps +4%
KFA2 GeForce RTX 4070 Ti SG
AMD Ryzen 9 7950X, NVIDIA GeForce RTX 4070 Ti
95.7 (62.8min, 68.4P0.1, 83.2P1) fps +1%
Average NVIDIA GeForce RTX 3080 Ti
  (93.1 - 96.4, n=4)
94.7 fps 0%
Aorus GeForce RTX 4070 Ti Master
Intel Core i9-13900K, NVIDIA GeForce RTX 4070 Ti
94.4 (86min, 86.46P1) fps
Average NVIDIA GeForce RTX 3090
  (85.4 - 98.5, n=8)
93.4 fps -1%
Sapphire AMD Radeon RX 6950 XT Nitro+ Pure
AMD Ryzen 9 5900X, AMD Radeon RX 6950 XT
92.3 (10.8min, 48.8P0.1, 54.2P1) fps -2%
Average NVIDIA GeForce RTX 3080
  (78 - 85.7, n=2)
81.9 fps -13%
AMD Radeon RX 6900 XT
AMD Ryzen 9 5950X, AMD Radeon RX 6900 XT
76.6 (70min, 70P1) fps -19%
Average NVIDIA Titan RTX
  ()
71.8 fps -24%
Average of class
  (8.71 - 181.3, n=202)
68.2 fps -28%
3840x2160 High Graphics & Postprocessing (Nvidia HairWorks Off)
NVIDIA GeForce RTX 4090 Founders Edition
Intel Core i9-13900K, NVIDIA GeForce RTX 4090
274 (243min, 244.12P1) fps +84%
NVIDIA GeForce RTX 4080 Founders Edition
Intel Core i9-13900K, NVIDIA GeForce RTX 4080
204 (183min, 183.55P1) fps +37%
Zotac Gaming GeForce RTX 3090 Ti AMP Extreme Holo
AMD Ryzen 7 5800X3D, NVIDIA GeForce RTX 3090 Ti
172.9 (152min, 152.57P1) fps +16%
AMD Radeon RX 7900 XTX
AMD Ryzen 9 7950X, AMD Radeon RX 7900 XTX
163.8 (49.6min, 112P0.1, 134.1P1) fps +10%
AMD Radeon RX 7900 XT
AMD Ryzen 9 7950X, AMD Radeon RX 7900 XT
158.5 (83.2min, 111.2P0.1, 122.8P1) fps +7%
Average NVIDIA GeForce RTX 3080 Ti
  (149 - 156.8, n=4)
152.4 fps +2%
Asus TUF Gaming GeForce RTX 4070 Ti
Intel Core i9-13900K, NVIDIA GeForce RTX 4070 Ti
151.9 (137min, 138.12P1) fps +2%
Intel Core i9-13900K
Intel Core i9-13900K, NVIDIA GeForce RTX 3090
151.6 (24.7min, 114.1P0.1, 131.8P1) fps +2%
Average NVIDIA GeForce RTX 3090
  (128 - 160.2, n=12)
151.5 fps +2%
KFA2 GeForce RTX 4070 Ti SG
AMD Ryzen 9 7950X, NVIDIA GeForce RTX 4070 Ti
149.3 (71min, 104.6P0.1, 129.1P1) fps 0%
Aorus GeForce RTX 4070 Ti Master
Intel Core i9-13900K, NVIDIA GeForce RTX 4070 Ti
148.7 (130min, 130.59P1) fps
Sapphire AMD Radeon RX 6950 XT Nitro+ Pure
AMD Ryzen 9 5900X, AMD Radeon RX 6950 XT
139.7 (10.4min, 105.6P0.1, 118.6P1) fps -6%
AMD Radeon RX 6900 XT
AMD Ryzen 9 5950X, AMD Radeon RX 6900 XT
122 (105min, 105P1) fps -18%
Average NVIDIA GeForce RTX 3080
  (114 - 115, n=2)
114.5 fps -23%
AMD Radeon RX 6800 XT
AMD Ryzen 9 5950X, AMD Radeon RX 6800 XT
110 (97min) fps -26%
Average NVIDIA Titan RTX
  (94 - 107.1, n=28)
102.4 fps -31%
Average of class
  (5.1 - 294, n=531)
74.3 fps -50%
1920x1080 Ultra Graphics & Postprocessing (HBAO+)
NVIDIA GeForce RTX 4090 Founders Edition
Intel Core i9-13900K, NVIDIA GeForce RTX 4090
297 (271min, 271P1) fps +35%
AMD Radeon RX 7900 XTX
AMD Ryzen 9 7950X, AMD Radeon RX 7900 XTX
297 (41.3min, 167.7P0.1, 245P1) fps +35%
AMD Radeon RX 7900 XT
AMD Ryzen 9 7950X, AMD Radeon RX 7900 XT
265 (104.1min, 151.5P0.1, 214P1) fps +20%
NVIDIA GeForce RTX 4080 Founders Edition
Intel Core i9-13900K, NVIDIA GeForce RTX 4080
254 (227min, 227P1) fps +15%
Asus TUF Gaming GeForce RTX 4070 Ti
Intel Core i9-13900K, NVIDIA GeForce RTX 4070 Ti
230 (207min, 208.68P1) fps +5%
KFA2 GeForce RTX 4070 Ti SG
AMD Ryzen 9 7950X, NVIDIA GeForce RTX 4070 Ti
224 (32.7min, 123.6P0.1, 183.9P1) fps +2%
Aorus GeForce RTX 4070 Ti Master
Intel Core i9-13900K, NVIDIA GeForce RTX 4070 Ti
220 (199min, 199.56P1) fps
Sapphire AMD Radeon RX 6950 XT Nitro+ Pure
AMD Ryzen 9 5900X, AMD Radeon RX 6950 XT
205 (10.2min, 109.8P0.1, 161.2P1) fps -7%
Zotac Gaming GeForce RTX 3090 Ti AMP Extreme Holo
AMD Ryzen 7 5800X3D, NVIDIA GeForce RTX 3090 Ti (110% PT)
196.3 (192min, 193P1) fps -11%
Zotac Gaming GeForce RTX 3090 Ti AMP Extreme Holo
AMD Ryzen 7 5800X3D, NVIDIA GeForce RTX 3090 Ti (100% PT)
193.4 (173min, 173.56P1) fps -12%
Average NVIDIA GeForce RTX 3080 Ti
  (174 - 184.6, n=4)
180.2 fps -18%
Average NVIDIA GeForce RTX 3090
  (160 - 192.6, n=16)
179.9 fps -18%
Intel Core i9-13900K
Intel Core i9-13900K, NVIDIA GeForce RTX 3090
179.8 (98.3min, 120.2P0.1, 148.7P1) fps -18%
AMD Radeon RX 6900 XT
AMD Ryzen 9 5950X, AMD Radeon RX 6900 XT
163.6 (139min) fps -26%
AMD Radeon RX 6800 XT
AMD Ryzen 9 5950X, AMD Radeon RX 6800 XT
160 (138min) fps -27%
Average NVIDIA GeForce RTX 3080
  (145 - 152, n=2)
148.5 fps -32%
Average NVIDIA Titan RTX
  (124 - 150, n=28)
137.7 fps -37%
Average of class
  (1.2 - 328, n=2206)
59.1 fps -73%
Metro Exodus
3840x2160 Ultra Quality AF:16x
NVIDIA GeForce RTX 4090 Founders Edition
Intel Core i9-13900K, NVIDIA GeForce RTX 4090
135 (72.48min) fps +59%
NVIDIA GeForce RTX 4080 Founders Edition
Intel Core i9-13900K, NVIDIA GeForce RTX 4080
105.7 (67.17min) fps +24%
AMD Radeon RX 7900 XTX
AMD Ryzen 9 7950X, AMD Radeon RX 7900 XTX
103.5 (66.43min) fps +22%
AMD Radeon RX 7900 XT
AMD Ryzen 9 7950X, AMD Radeon RX 7900 XT
86.9 (56.86min) fps +2%
Aorus GeForce RTX 4070 Ti Master
Intel Core i9-13900K, NVIDIA GeForce RTX 4070 Ti
85 (54.63min) fps
Asus TUF Gaming GeForce RTX 4070 Ti
Intel Core i9-13900K, NVIDIA GeForce RTX 4070 Ti
84.5 (55.02min) fps -1%
Zotac Gaming GeForce RTX 3090 Ti AMP Extreme Holo
AMD Ryzen 7 5800X3D, NVIDIA GeForce RTX 3090 Ti
84.3 (52.3min) fps -1%
KFA2 GeForce RTX 4070 Ti SG
AMD Ryzen 9 7950X, NVIDIA GeForce RTX 4070 Ti
82.8 (51min) fps -3%
Intel Core i9-13900K
Intel Core i9-13900K, NVIDIA GeForce RTX 3090
76.2 (48.9min) fps -10%
Average NVIDIA GeForce RTX 3080 Ti
  (74.2 - 77.1, n=4)
75.7 fps -11%
Sapphire AMD Radeon RX 6950 XT Nitro+ Pure
AMD Ryzen 9 5900X, AMD Radeon RX 6950 XT
75 (50.07min) fps -12%
Average NVIDIA GeForce RTX 3090
  (70.6 - 77.3, n=12)
75 fps -12%
AMD Radeon RX 6900 XT
AMD Ryzen 9 5950X, AMD Radeon RX 6900 XT
66.7 (42.71min) fps -22%
Average NVIDIA GeForce RTX 3080
  (64.1 - 65.9, n=2)
65 fps -24%
AMD Radeon RX 6800 XT
AMD Ryzen 9 5950X, AMD Radeon RX 6800 XT
56.3 (40.14min) fps -34%
Average NVIDIA Titan RTX
  (51.3 - 57.9, n=27)
54.9 fps -35%
Average of class
  (4.7 - 143.4, n=294)
49 fps -42%
2560x1440 Ultra Quality AF:16x
NVIDIA GeForce RTX 4090 Founders Edition
Intel Core i9-13900K, NVIDIA GeForce RTX 4090
176 (81.25min) fps +33%
NVIDIA GeForce RTX 4080 Founders Edition
Intel Core i9-13900K, NVIDIA GeForce RTX 4080
155.1 (77.58min) fps +17%
AMD Radeon RX 7900 XTX
AMD Ryzen 9 7950X, AMD Radeon RX 7900 XTX
154.5 (90.83min) fps +17%
AMD Radeon RX 7900 XT
AMD Ryzen 9 7950X, AMD Radeon RX 7900 XT
135 (79.57min) fps +2%
Aorus GeForce RTX 4070 Ti Master
Intel Core i9-13900K, NVIDIA GeForce RTX 4070 Ti
132.3 (73.1min) fps
Asus TUF Gaming GeForce RTX 4070 Ti
Intel Core i9-13900K, NVIDIA GeForce RTX 4070 Ti
132.1 (72.92min) fps 0%
KFA2 GeForce RTX 4070 Ti SG
AMD Ryzen 9 7950X, NVIDIA GeForce RTX 4070 Ti
129 (70.23min) fps -2%
Zotac Gaming GeForce RTX 3090 Ti AMP Extreme Holo
AMD Ryzen 7 5800X3D, NVIDIA GeForce RTX 3090 Ti
125.3 (64.48min) fps -5%
Intel Core i9-13900K
Intel Core i9-13900K, NVIDIA GeForce RTX 3090
116.4 (67.43min) fps -12%
Sapphire AMD Radeon RX 6950 XT Nitro+ Pure
AMD Ryzen 9 5900X, AMD Radeon RX 6950 XT
115.5 (70.52min) fps -13%
Average NVIDIA GeForce RTX 3080 Ti
  (110 - 118, n=4)
114 fps -14%
Average NVIDIA GeForce RTX 3090
  (102 - 118.2, n=12)
113.2 fps -14%
AMD Radeon RX 6900 XT
AMD Ryzen 9 5950X, AMD Radeon RX 6900 XT
102 (59.52min) fps -23%
Average NVIDIA GeForce RTX 3080
  (92.2 - 97.4, n=2)
94.8 fps -28%
AMD Radeon RX 6800 XT
AMD Ryzen 9 5950X, AMD Radeon RX 6800 XT
94.6 (55.44min) fps -28%
Average NVIDIA Titan RTX
  (69 - 92.9, n=26)
84 fps -37%
Average of class
  (8.24 - 199.8, n=298)
72.7 fps -45%
1920x1080 Ultra Quality AF:16x
NVIDIA GeForce RTX 4090 Founders Edition
Intel Core i9-13900K, NVIDIA GeForce RTX 4090
191.2 (84.99min) fps +19%
AMD Radeon RX 7900 XTX
AMD Ryzen 9 7950X, AMD Radeon RX 7900 XTX
183.5 (102.51min) fps +14%
NVIDIA GeForce RTX 4080 Founders Edition
Intel Core i9-13900K, NVIDIA GeForce RTX 4080
180 (82.56min) fps +12%
AMD Radeon RX 7900 XT
AMD Ryzen 9 7950X, AMD Radeon RX 7900 XT
164.6 (92.11min) fps +2%
Asus TUF Gaming GeForce RTX 4070 Ti
Intel Core i9-13900K, NVIDIA GeForce RTX 4070 Ti
161.4 (78.05min) fps 0%
Aorus GeForce RTX 4070 Ti Master
Intel Core i9-13900K, NVIDIA GeForce RTX 4070 Ti
161.2 (77.88min) fps
KFA2 GeForce RTX 4070 Ti SG
AMD Ryzen 9 7950X, NVIDIA GeForce RTX 4070 Ti
156.9 (75.17min) fps -3%
Zotac Gaming GeForce RTX 3090 Ti AMP Extreme Holo
AMD Ryzen 7 5800X3D, NVIDIA GeForce RTX 3090 Ti
145.9 (68.14min) fps -9%
Intel Core i9-13900K
Intel Core i9-13900K, NVIDIA GeForce RTX 3090
141.3 (72.08min) fps -12%
Sapphire AMD Radeon RX 6950 XT Nitro+ Pure
AMD Ryzen 9 5900X, AMD Radeon RX 6950 XT
140 (81.08min) fps -13%
Average NVIDIA GeForce RTX 3080 Ti
  (131 - 144.2, n=5)
135.4 fps -16%
Average NVIDIA GeForce RTX 3090
  (108 - 145, n=12)
135.3 fps -16%
AMD Radeon RX 6900 XT
AMD Ryzen 9 5950X, AMD Radeon RX 6900 XT
123 (67.67min) fps -24%
AMD Radeon RX 6800 XT
AMD Ryzen 9 5950X, AMD Radeon RX 6800 XT
115 (64.52min) fps -29%
Average NVIDIA GeForce RTX 3080
  (111 - 116, n=2)
113.5 fps -30%
Average NVIDIA Titan RTX
  (73 - 116, n=27)
102.2 fps -37%
Average of class
  (2.42 - 219, n=432)
69.7 fps -57%
Control
3840x2160 High Quality Preset (DX11)
NVIDIA GeForce RTX 4090 Founders Edition
Intel Core i9-13900K, NVIDIA GeForce RTX 4090
107.7 (83.4min, 85.3P0.1, 91.1P1) fps +66%
AMD Radeon RX 7900 XTX
AMD Ryzen 9 7950X, AMD Radeon RX 7900 XTX
89.4 (46.8min, 48.3P0.1, 52.1P1) fps +38%
NVIDIA GeForce RTX 4080 Founders Edition
Intel Core i9-13900K, NVIDIA GeForce RTX 4080
82.6 (15.4min, 68.7P0.1, 71.9P1) fps +27%
AMD Radeon RX 7900 XT
AMD Ryzen 9 7950X, AMD Radeon RX 7900 XT
75.8 (40.1min, 41.7P0.1, 43.6P1) fps +17%
Zotac Gaming GeForce RTX 3090 Ti AMP Extreme Holo
AMD Ryzen 7 5800X3D, NVIDIA GeForce RTX 3090 Ti
73.9 (46.2min, 53.2P0.1, 62.6P1) fps +14%
KFA2 GeForce RTX 4070 Ti SG
AMD Ryzen 9 7950X, NVIDIA GeForce RTX 4070 Ti
66.2 (39.7min, 49.6P0.1, 58.7P1) fps +2%
Asus TUF Gaming GeForce RTX 4070 Ti
Intel Core i9-13900K, NVIDIA GeForce RTX 4070 Ti
64.9 (50min, 51.9P0.1, 56.5P1) fps 0%
Aorus GeForce RTX 4070 Ti Master
Intel Core i9-13900K, NVIDIA GeForce RTX 4070 Ti
64.9 (26.4min, 32.6P0.1, 55.9P1) fps
Sapphire AMD Radeon RX 6950 XT Nitro+ Pure
AMD Ryzen 9 5900X, AMD Radeon RX 6950 XT
64.8 (33.1min, 33.6P0.1, 36.3P1) fps 0%
Average NVIDIA GeForce RTX 3080 Ti
  (63.9 - 64.9, n=3)
64.3 fps -1%
Average NVIDIA GeForce RTX 3090
  (61.3 - 66, n=5)
62.9 fps -3%
Average NVIDIA GeForce RTX 3080
  (56.2 - 56.7, n=2)
56.5 fps -13%
AMD Radeon RX 6900 XT
AMD Ryzen 9 5950X, AMD Radeon RX 6900 XT
54.7 (39.8min, 41.7P0.1, 44.9P1) fps -16%
AMD Radeon RX 6900 XT
AMD Ryzen 9 5950X, AMD Radeon RX 6900 XT (SAM ENABLED)
53.9 (36.6min, 41.7P0.1, 43.5P1) fps -17%
AMD Radeon RX 6800 XT
AMD Ryzen 9 5950X, AMD Radeon RX 6800 XT
51.6 (46min) fps -20%
Average NVIDIA Titan RTX
  (45.2 - 47.3, n=3)
46.5 fps -28%
Average of class
  (3.3 - 114.4, n=161)
39.1 fps -40%
2560x1440 High Quality Preset (DX11)
NVIDIA GeForce RTX 4090 Founders Edition
Intel Core i9-13900K, NVIDIA GeForce RTX 4090
201 (84.1min, 146.6P0.1, 159P1) fps +54%
AMD Radeon RX 7900 XTX
AMD Ryzen 9 7950X, AMD Radeon RX 7900 XTX
184.9 (66.6min, 105.1P0.1, 121.7P1) fps +42%
NVIDIA GeForce RTX 4080 Founders Edition
Intel Core i9-13900K, NVIDIA GeForce RTX 4080
164.2 (59.2min, 121.2P0.1, 135.5P1) fps +26%
AMD Radeon RX 7900 XT
AMD Ryzen 9 7950X, AMD Radeon RX 7900 XT
156.4 (53.3min, 89.4P0.1, 95.9P1) fps +20%
Zotac Gaming GeForce RTX 3090 Ti AMP Extreme Holo
AMD Ryzen 7 5800X3D, NVIDIA GeForce RTX 3090 Ti
142.5 (51.8min, 81.9P0.1, 115.5P1) fps +9%
Sapphire AMD Radeon RX 6950 XT Nitro+ Pure
AMD Ryzen 9 5900X, AMD Radeon RX 6950 XT
133.5 (73.5min, 75.3P0.1, 83.4P1) fps +2%
Asus TUF Gaming GeForce RTX 4070 Ti
Intel Core i9-13900K, NVIDIA GeForce RTX 4070 Ti
130.6 (59min, 74P0.1, 107.3P1) fps 0%
Aorus GeForce RTX 4070 Ti Master
Intel Core i9-13900K, NVIDIA GeForce RTX 4070 Ti
130.6 (24.9min, 47.8P0.1, 108.8P1) fps
Average NVIDIA GeForce RTX 3080 Ti
  (122 - 125.5, n=3)
123.8 fps -5%
Average NVIDIA GeForce RTX 3090
  (115.8 - 123.7, n=5)
120.4 fps -8%
AMD Radeon RX 6900 XT
AMD Ryzen 9 5950X, AMD Radeon RX 6900 XT
113 (71.5min, 73.2P0.1, 79.6P1) fps -13%
AMD Radeon RX 6900 XT
AMD Ryzen 9 5950X, AMD Radeon RX 6900 XT (SAM ENABLED)
113 (68min, 71.3P0.1, 81.1P1) fps -13%
AMD Radeon RX 6800 XT
AMD Ryzen 9 5950X, AMD Radeon RX 6800 XT
108 (93min) fps -17%
Average NVIDIA GeForce RTX 3080
  (105 - 106, n=2)
105.5 fps -19%
KFA2 GeForce RTX 4070 Ti SG
AMD Ryzen 9 7950X, NVIDIA GeForce RTX 4070 Ti
100 (2.12min, 16.8P0.1, 56.9P1) fps -23%
Average NVIDIA Titan RTX
  (89 - 93.6, n=3)
91.5 fps -30%
Average of class
  (7.68 - 232, n=165)
76.8 fps -41%
1920x1080 High Quality Preset (DX11)
AMD Radeon RX 7900 XTX
AMD Ryzen 9 7950X, AMD Radeon RX 7900 XTX
240 (18.1min, 136.2P0.1, 151.8P1) fps +19%
NVIDIA GeForce RTX 4090 Founders Edition
Intel Core i9-13900K, NVIDIA GeForce RTX 4090
238 (14.4min, 62.9P0.1, 153.8P1) fps +18%
NVIDIA GeForce RTX 4080 Founders Edition
Intel Core i9-13900K, NVIDIA GeForce RTX 4080
233 (7.49min, 27.2P0.1, 156.1P1) fps +16%
AMD Radeon RX 7900 XT
AMD Ryzen 9 7950X, AMD Radeon RX 7900 XT
233 (67.8min, 133.8P0.1, 152.6P1) fps +16%
Zotac Gaming GeForce RTX 3090 Ti AMP Extreme Holo
AMD Ryzen 7 5800X3D, NVIDIA GeForce RTX 3090 Ti
209 (55.6min, 119.8P0.1, 162.7P1) fps +4%
Sapphire AMD Radeon RX 6950 XT Nitro+ Pure
AMD Ryzen 9 5900X, AMD Radeon RX 6950 XT
205 (45.2min, 129.1P0.1, 150.8P1) fps +2%
Asus TUF Gaming GeForce RTX 4070 Ti
Intel Core i9-13900K, NVIDIA GeForce RTX 4070 Ti
202 (88min, 151.4P0.1, 165P1) fps 0%
Aorus GeForce RTX 4070 Ti Master
Intel Core i9-13900K, NVIDIA GeForce RTX 4070 Ti
201 (51.3min, 64.4P0.1, 157.9P1) fps
KFA2 GeForce RTX 4070 Ti SG
AMD Ryzen 9 7950X, NVIDIA GeForce RTX 4070 Ti
200 (57.7min, 86.1P0.1, 158.9P1) fps 0%
Average NVIDIA GeForce RTX 3080 Ti
  (181 - 190.7, n=3)
186.2 fps -7%
Average NVIDIA GeForce RTX 3090
  (172.2 - 189.2, n=5)
179.9 fps -10%
AMD Radeon RX 6900 XT
AMD Ryzen 9 5950X, AMD Radeon RX 6900 XT
175 (56.8min, 96P0.1, 112P1) fps -13%
AMD Radeon RX 6900 XT
AMD Ryzen 9 5950X, AMD Radeon RX 6900 XT (SAM ENABLED)
174 (54min, 99P0.1, 112P1) fps -13%
AMD Radeon RX 6800 XT
AMD Ryzen 9 5950X, AMD Radeon RX 6800 XT
168 (145min) fps -16%
Average NVIDIA GeForce RTX 3080
  (151 - 155, n=2)
153 fps -24%
Average NVIDIA Titan RTX
  (135 - 141.9, n=3)
137.3 fps -32%
Average of class
  (3.3 - 240, n=238)
88.1 fps -56%
Borderlands 3
3840x2160 Badass Overall Quality (DX11)
NVIDIA GeForce RTX 4090 Founders Edition
Intel Core i9-13900K, NVIDIA GeForce RTX 4090
133.4 fps +78%
NVIDIA GeForce RTX 4080 Founders Edition
Intel Core i9-13900K, NVIDIA GeForce RTX 4080
95.7 fps +28%
AMD Radeon RX 7900 XTX
AMD Ryzen 9 7950X, AMD Radeon RX 7900 XTX
88.4 fps +18%
Zotac Gaming GeForce RTX 3090 Ti AMP Extreme Holo
AMD Ryzen 7 5800X3D, NVIDIA GeForce RTX 3090 Ti
83.8 fps +12%
Aorus GeForce RTX 4070 Ti Master
Intel Core i9-13900K, NVIDIA GeForce RTX 4070 Ti
74.9 fps
AMD Radeon RX 7900 XT
AMD Ryzen 9 7950X, AMD Radeon RX 7900 XT
74.6 fps 0%
Asus TUF Gaming GeForce RTX 4070 Ti
Intel Core i9-13900K, NVIDIA GeForce RTX 4070 Ti
74.1 fps -1%
Intel Core i9-13900K
Intel Core i9-13900K, NVIDIA GeForce RTX 3090
73.1 fps -2%
Average NVIDIA GeForce RTX 3090
  (68 - 75.3, n=13)
72.8 fps -3%
Average NVIDIA GeForce RTX 3080 Ti
  (71.2 - 74, n=4)
72.8 fps -3%
KFA2 GeForce RTX 4070 Ti SG
AMD Ryzen 9 7950X, NVIDIA GeForce RTX 4070 Ti
72.5 fps -3%
Average NVIDIA GeForce RTX 3080
  (61.5 - 61.9, n=2)
61.7 fps -18%
Sapphire AMD Radeon RX 6950 XT Nitro+ Pure
AMD Ryzen 9 5900X, AMD Radeon RX 6950 XT
59.9 fps -20%
AMD Radeon RX 6900 XT
AMD Ryzen 9 5950X, AMD Radeon RX 6900 XT (SAM ENABLED)
59.8 fps -20%
AMD Radeon RX 6900 XT
AMD Ryzen 9 5950X, AMD Radeon RX 6900 XT
57.1 fps -24%
AMD Radeon RX 6800 XT
AMD Ryzen 9 5950X, AMD Radeon RX 6800 XT
53.6 fps -28%
Average NVIDIA Titan RTX
  (46 - 52.8, n=29)
47.3 fps -37%
Average of class
  (2.1 - 143.4, n=288)
45.5 fps -39%
2560x1440 Badass Overall Quality (DX11)
NVIDIA GeForce RTX 4090 Founders Edition
Intel Core i9-13900K, NVIDIA GeForce RTX 4090
190 fps +34%
NVIDIA GeForce RTX 4080 Founders Edition
Intel Core i9-13900K, NVIDIA GeForce RTX 4080
170.5 fps +20%
AMD Radeon RX 7900 XTX
AMD Ryzen 9 7950X, AMD Radeon RX 7900 XTX
152.2 fps +7%
Zotac Gaming GeForce RTX 3090 Ti AMP Extreme Holo
AMD Ryzen 7 5800X3D, NVIDIA GeForce RTX 3090 Ti
143.1 fps +1%
Aorus GeForce RTX 4070 Ti Master
Intel Core i9-13900K, NVIDIA GeForce RTX 4070 Ti
142 fps
Asus TUF Gaming GeForce RTX 4070 Ti
Intel Core i9-13900K, NVIDIA GeForce RTX 4070 Ti
140.6 fps -1%
KFA2 GeForce RTX 4070 Ti SG
AMD Ryzen 9 7950X, NVIDIA GeForce RTX 4070 Ti
136.3 fps -4%
AMD Radeon RX 7900 XT
AMD Ryzen 9 7950X, AMD Radeon RX 7900 XT
135.2 fps -5%
Intel Core i9-13900K
Intel Core i9-13900K, NVIDIA GeForce RTX 3090
128.3 fps -10%
Average NVIDIA GeForce RTX 3080 Ti
  (114 - 130.2, n=4)
124.5 fps -12%
Average NVIDIA GeForce RTX 3090
  (105 - 131.6, n=13)
123.8 fps -13%
Sapphire AMD Radeon RX 6950 XT Nitro+ Pure
AMD Ryzen 9 5900X, AMD Radeon RX 6950 XT
110 fps -23%
AMD Radeon RX 6900 XT
AMD Ryzen 9 5950X, AMD Radeon RX 6900 XT (SAM ENABLED)
107 fps -25%
AMD Radeon RX 6900 XT
AMD Ryzen 9 5950X, AMD Radeon RX 6900 XT
105 fps -26%
Average NVIDIA GeForce RTX 3080
  (95.7 - 103, n=2)
99.4 fps -30%
AMD Radeon RX 6800 XT
AMD Ryzen 9 5950X, AMD Radeon RX 6800 XT
93.6 fps -34%
Average NVIDIA Titan RTX
  (74 - 93.1, n=29)
84.7 fps -40%
Average of class
  (7.1 - 224, n=299)
76.3 fps -46%
1920x1080 Badass Overall Quality (DX11)
NVIDIA GeForce RTX 4090 Founders Edition
Intel Core i9-13900K, NVIDIA GeForce RTX 4090
201 fps +8%
NVIDIA GeForce RTX 4080 Founders Edition
Intel Core i9-13900K, NVIDIA GeForce RTX 4080
199.4 fps +8%
Asus TUF Gaming GeForce RTX 4070 Ti
Intel Core i9-13900K, NVIDIA GeForce RTX 4070 Ti
186.9 fps +1%
Aorus GeForce RTX 4070 Ti Master
Intel Core i9-13900K, NVIDIA GeForce RTX 4070 Ti
185.3 fps
AMD Radeon RX 7900 XTX
AMD Ryzen 9 7950X, AMD Radeon RX 7900 XTX
180.2 fps -3%
Zotac Gaming GeForce RTX 3090 Ti AMP Extreme Holo
AMD Ryzen 7 5800X3D, NVIDIA GeForce RTX 3090 Ti
173.3 fps -6%
KFA2 GeForce RTX 4070 Ti SG
AMD Ryzen 9 7950X, NVIDIA GeForce RTX 4070 Ti
171.9 fps -7%
AMD Radeon RX 7900 XT
AMD Ryzen 9 7950X, AMD Radeon RX 7900 XT
169.4 fps -9%
Intel Core i9-13900K
Intel Core i9-13900K, NVIDIA GeForce RTX 3090
163 fps -12%
Average NVIDIA GeForce RTX 3080 Ti
  (129 - 164.9, n=4)
151.5 fps -18%
Average NVIDIA GeForce RTX 3090
  (117 - 170.1, n=13)
150.7 fps -19%
AMD Radeon RX 6900 XT
AMD Ryzen 9 5950X, AMD Radeon RX 6900 XT (SAM ENABLED)
131 fps -29%
AMD Radeon RX 6900 XT
AMD Ryzen 9 5950X, AMD Radeon RX 6900 XT
130 fps -30%
Sapphire AMD Radeon RX 6950 XT Nitro+ Pure
AMD Ryzen 9 5900X, AMD Radeon RX 6950 XT
128.5 fps -31%
Average NVIDIA GeForce RTX 3080
  (117 - 128, n=2)
122.5 fps -34%
AMD Radeon RX 6800 XT
AMD Ryzen 9 5950X, AMD Radeon RX 6800 XT
120 fps -35%
Average NVIDIA Titan RTX
  (77.2 - 128.7, n=29)
112 fps -40%
Average of class
  (2.05 - 242, n=455)
74 fps -60%
Shadow of the Tomb Raider
3840x2160 Highest Preset AA:T
NVIDIA GeForce RTX 4090 Founders Edition
Intel Core i9-13900K, NVIDIA GeForce RTX 4090
182 fps +73%
NVIDIA GeForce RTX 4080 Founders Edition
Intel Core i9-13900K, NVIDIA GeForce RTX 4080
134 fps +28%
AMD Radeon RX 7900 XTX
AMD Ryzen 9 7950X, AMD Radeon RX 7900 XTX
130.1 fps +24%
AMD Radeon RX 7900 XT
AMD Ryzen 9 7950X, AMD Radeon RX 7900 XT
109.6 fps +4%
Zotac Gaming GeForce RTX 3090 Ti AMP Extreme Holo
AMD Ryzen 7 5800X3D, NVIDIA GeForce RTX 3090 Ti
106 fps +1%
Aorus GeForce RTX 4070 Ti Master
Intel Core i9-13900K, NVIDIA GeForce RTX 4070 Ti
104.9 fps
Asus TUF Gaming GeForce RTX 4070 Ti
Intel Core i9-13900K, NVIDIA GeForce RTX 4070 Ti
104.4 fps 0%
KFA2 GeForce RTX 4070 Ti SG
AMD Ryzen 9 7950X, NVIDIA GeForce RTX 4070 Ti
103.3 fps -2%
Sapphire AMD Radeon RX 6950 XT Nitro+ Pure
AMD Ryzen 9 5900X, AMD Radeon RX 6950 XT
97.4 fps -7%
Intel Core i9-13900K
Intel Core i9-13900K, NVIDIA GeForce RTX 3090
97.1 fps -7%
Average NVIDIA GeForce RTX 3090
  (89.3 - 99.7, n=12)
96.4 fps -8%
Average NVIDIA GeForce RTX 3080 Ti
  (93 - 98.6, n=3)
95.1 fps -9%
AMD Radeon RX 6900 XT
AMD Ryzen 9 5950X, AMD Radeon RX 6900 XT (SAM ENABLED)
86 fps -18%
AMD Radeon RX 6900 XT
AMD Ryzen 9 5950X, AMD Radeon RX 6900 XT
84 fps -20%
Average NVIDIA GeForce RTX 3080
  (83.9 - 87.9, n=2)
85.9 fps -18%
AMD Radeon RX 6800 XT
AMD Ryzen 9 5950X, AMD Radeon RX 6800 XT
79.6 fps -24%
Average NVIDIA Titan RTX
  (59 - 71.1, n=24)
66.9 fps -36%
Average of class
  (2 - 189.7, n=340)
58.9 fps -44%
2560x1440 Highest Preset AA:T
NVIDIA GeForce RTX 4090 Founders Edition
Intel Core i9-13900K, NVIDIA GeForce RTX 4090
282 fps +38%
NVIDIA GeForce RTX 4080 Founders Edition
Intel Core i9-13900K, NVIDIA GeForce RTX 4080
248 fps +22%
AMD Radeon RX 7900 XTX
AMD Ryzen 9 7950X, AMD Radeon RX 7900 XTX
230 fps +13%
Aorus GeForce RTX 4070 Ti Master
Intel Core i9-13900K, NVIDIA GeForce RTX 4070 Ti
204 fps
AMD Radeon RX 7900 XT
AMD Ryzen 9 7950X, AMD Radeon RX 7900 XT
203 fps 0%
Asus TUF Gaming GeForce RTX 4070 Ti
Intel Core i9-13900K, NVIDIA GeForce RTX 4070 Ti
202 fps -1%
KFA2 GeForce RTX 4070 Ti SG
AMD Ryzen 9 7950X, NVIDIA GeForce RTX 4070 Ti
197.7 fps -3%
Zotac Gaming GeForce RTX 3090 Ti AMP Extreme Holo
AMD Ryzen 7 5800X3D, NVIDIA GeForce RTX 3090 Ti
184 fps -10%
Sapphire AMD Radeon RX 6950 XT Nitro+ Pure
AMD Ryzen 9 5900X, AMD Radeon RX 6950 XT
184 fps -10%
Intel Core i9-13900K
Intel Core i9-13900K, NVIDIA GeForce RTX 3090
167.4 fps -18%
Average NVIDIA GeForce RTX 3090
  (137 - 172.3, n=12)
165.6 fps -19%
Average NVIDIA GeForce RTX 3080 Ti
  (157 - 173.3, n=3)
164.8 fps -19%
AMD Radeon RX 6900 XT
AMD Ryzen 9 5950X, AMD Radeon RX 6900 XT (SAM ENABLED)
163 fps -20%
AMD Radeon RX 6900 XT
AMD Ryzen 9 5950X, AMD Radeon RX 6900 XT
155 fps -24%
Average NVIDIA GeForce RTX 3080
  (147 - 152, n=2)
149.5 fps -27%
AMD Radeon RX 6800 XT
AMD Ryzen 9 5950X, AMD Radeon RX 6800 XT
148 fps -27%
Average NVIDIA Titan RTX
  (98 - 128, n=23)
117.8 fps -42%
Average of class
  (10.4 - 322, n=334)
106.4 fps -48%
1920x1080 Highest Preset AA:T
NVIDIA GeForce RTX 4090 Founders Edition
Intel Core i9-13900K, NVIDIA GeForce RTX 4090
306 fps +9%
NVIDIA GeForce RTX 4080 Founders Edition
Intel Core i9-13900K, NVIDIA GeForce RTX 4080
303 fps +8%
AMD Radeon RX 7900 XTX
AMD Ryzen 9 7950X, AMD Radeon RX 7900 XTX
301 fps +8%
AMD Radeon RX 7900 XT
AMD Ryzen 9 7950X, AMD Radeon RX 7900 XT
282 fps +1%
Asus TUF Gaming GeForce RTX 4070 Ti
Intel Core i9-13900K, NVIDIA GeForce RTX 4070 Ti
280 fps 0%
Aorus GeForce RTX 4070 Ti Master
Intel Core i9-13900K, NVIDIA GeForce RTX 4070 Ti
280 fps
KFA2 GeForce RTX 4070 Ti SG
AMD Ryzen 9 7950X, NVIDIA GeForce RTX 4070 Ti
264 fps -6%
Zotac Gaming GeForce RTX 3090 Ti AMP Extreme Holo
AMD Ryzen 7 5800X3D, NVIDIA GeForce RTX 3090 Ti
244 fps -13%
Intel Core i9-13900K
Intel Core i9-13900K, NVIDIA GeForce RTX 3090
230 fps -18%
Sapphire AMD Radeon RX 6950 XT Nitro+ Pure
AMD Ryzen 9 5900X, AMD Radeon RX 6950 XT
227 fps -19%
Average NVIDIA GeForce RTX 3080 Ti
  (178 - 238, n=3)
209 fps -25%
Average NVIDIA GeForce RTX 3090
  (145 - 240, n=14)
204 fps -27%
AMD Radeon RX 6900 XT
AMD Ryzen 9 5950X, AMD Radeon RX 6900 XT
202 fps -28%
AMD Radeon RX 6900 XT
AMD Ryzen 9 5950X, AMD Radeon RX 6900 XT (SAM ENABLED)
199 fps -29%
AMD Radeon RX 6800 XT
AMD Ryzen 9 5950X, AMD Radeon RX 6800 XT
194 fps -31%
Average NVIDIA GeForce RTX 3080
  (177 - 185, n=2)
181 fps -35%
Average NVIDIA Titan RTX
  (106 - 178.8, n=24)
149.5 fps -47%
Average of class
  (6 - 375, n=611)
100.8 fps -64%
Mafia Definitive Edition
3840x2160 High Preset
NVIDIA GeForce RTX 4090 Founders Edition
Intel Core i9-13900K, NVIDIA GeForce RTX 4090
160.2 (42.5min, 66.5P0.1, 122.8P1) fps +82%
NVIDIA GeForce RTX 4080 Founders Edition
Intel Core i9-13900K, NVIDIA GeForce RTX 4080
115.6 (34.7min, 70.3P0.1, 99.3P1) fps +31%
Zotac Gaming GeForce RTX 3090 Ti AMP Extreme Holo
AMD Ryzen 7 5800X3D, NVIDIA GeForce RTX 3090 Ti
99.2 (29.7min, 56P0.1, 77.1P1) fps +12%
Asus TUF Gaming GeForce RTX 4070 Ti
Intel Core i9-13900K, NVIDIA GeForce RTX 4070 Ti
88.9 (34.4min, 62P0.1, 77.4P1) fps +1%
Aorus GeForce RTX 4070 Ti Master
Intel Core i9-13900K, NVIDIA GeForce RTX 4070 Ti
88.2 (38min, 50P0.1, 75.9P1) fps
Average NVIDIA GeForce RTX 3090
  (84.5 - 89.1, n=2)
86.8 fps -2%
Average NVIDIA GeForce RTX 3080 Ti
  ()
86.6 fps -2%
Sapphire AMD Radeon RX 6950 XT Nitro+ Pure
AMD Ryzen 9 5900X, AMD Radeon RX 6950 XT
80.4 (44.2min, 56.8P0.1, 70.5P1) fps -9%
Average NVIDIA GeForce RTX 3080
  (78.1 - 78.2, n=2)
78.2 fps -11%
AMD Radeon RX 6900 XT
AMD Ryzen 9 5950X, AMD Radeon RX 6900 XT
67 (32.3min, 41.7P0.1, 44.7P1) fps -24%
Average NVIDIA Titan RTX
  ()
63.4 fps -28%
AMD Radeon RX 6800 XT
AMD Ryzen 9 5950X, AMD Radeon RX 6800 XT
62.6 (28min, 37.6P0.1, 49.2P1) fps -29%
Average of class
  (6.96 - 162.7, n=83)
51 fps -42%
2560x1440 High Preset
NVIDIA GeForce RTX 4090 Founders Edition
Intel Core i9-13900K, NVIDIA GeForce RTX 4090
238 (71.6min, 84.3P0.1, 162.7P1) fps +36%
NVIDIA GeForce RTX 4080 Founders Edition
Intel Core i9-13900K, NVIDIA GeForce RTX 4080
214 (100.6min, 149.1P0.1, 172.3P1) fps +22%
Aorus GeForce RTX 4070 Ti Master
Intel Core i9-13900K, NVIDIA GeForce RTX 4070 Ti
175.5 (51.6min, 61P0.1, 140.4P1) fps
Zotac Gaming GeForce RTX 3090 Ti AMP Extreme Holo
AMD Ryzen 7 5800X3D, NVIDIA GeForce RTX 3090 Ti
173.9 (73.1min, 101.4P0.1, 134.6P1) fps -1%
Asus TUF Gaming GeForce RTX 4070 Ti
Intel Core i9-13900K, NVIDIA GeForce RTX 4070 Ti
171.9 (100min, 119.6P0.1, 144.6P1) fps -2%
Sapphire AMD Radeon RX 6950 XT Nitro+ Pure
AMD Ryzen 9 5900X, AMD Radeon RX 6950 XT
156.2 (30min, 87.3P0.1, 114P1) fps -11%
Average NVIDIA GeForce RTX 3090
  (142.3 - 149, n=2)
145.7 fps -17%
Average NVIDIA GeForce RTX 3080 Ti
  ()
142 fps -19%
Average NVIDIA GeForce RTX 3080
  (127 - 137, n=2)
132 fps -25%
AMD Radeon RX 6900 XT
AMD Ryzen 9 5950X, AMD Radeon RX 6900 XT
120 (17.6min, 61.2P0.1, 83.1P1) fps -32%
AMD Radeon RX 6800 XT
AMD Ryzen 9 5950X, AMD Radeon RX 6800 XT
112 (23.5min, 64P0.1, 80.8P1) fps -36%
Average NVIDIA Titan RTX
  ()
109 fps -38%
Average of class
  (10.9 - 238, n=88)
89.3 fps -49%
1920x1080 High Preset
NVIDIA GeForce RTX 4080 Founders Edition
Intel Core i9-13900K, NVIDIA GeForce RTX 4080
260 (58.1min, 133.7P0.1, 187.5P1) fps +4%
NVIDIA GeForce RTX 4090 Founders Edition
Intel Core i9-13900K, NVIDIA GeForce RTX 4090
255 (80.7min, 89.2P0.1, 169.4P1) fps +2%
Aorus GeForce RTX 4070 Ti Master
Intel Core i9-13900K, NVIDIA GeForce RTX 4070 Ti
249 (29.7min, 62.5P0.1, 182.6P1) fps
Asus TUF Gaming GeForce RTX 4070 Ti
Intel Core i9-13900K, NVIDIA GeForce RTX 4070 Ti
241 (107.5min, 136.3P0.1, 183.2P1) fps -3%
Zotac Gaming GeForce RTX 3090 Ti AMP Extreme Holo
AMD Ryzen 7 5800X3D, NVIDIA GeForce RTX 3090 Ti
231 (84.7min, 116.2P0.1, 160.4P1) fps -7%
Sapphire AMD Radeon RX 6950 XT Nitro+ Pure
AMD Ryzen 9 5900X, AMD Radeon RX 6950 XT
175.5 (38.6min, 86.6P0.1, 117.6P1) fps -30%
Average NVIDIA GeForce RTX 3080 Ti
  ()
163 fps -35%
Average NVIDIA GeForce RTX 3090
  (157 - 158.8, n=2)
157.9 fps -37%
Average NVIDIA GeForce RTX 3080
  (144 - 169, n=2)
156.5 fps -37%
AMD Radeon RX 6900 XT
AMD Ryzen 9 5950X, AMD Radeon RX 6900 XT
138 (32.8min, 68.1P0.1, 90.2P1) fps -45%
Average NVIDIA Titan RTX
  ()
123.7 fps -50%
AMD Radeon RX 6800 XT
AMD Ryzen 9 5950X, AMD Radeon RX 6800 XT
121 (23.7min, 68P0.1, 83.3P1) fps -51%
Average of class
  (13.8 - 260, n=123)
98.9 fps -60%

Wydajność śledzenia promieni

Ray tracing w połączeniu z DLSS 3.0 to główna zaleta kart Nvidia RTX 40 w porównaniu do ich rywali z AMD RDNA 3. Aorus GeForce RTX 4070 Ti Master generalnie przewodzi grupie 4070 Ti w większości testów ray tracingu, choć tylko z niewielkim marginesem.

Szczególnie dobre wyniki widzimy w przypadku Cyberpunk 2077 4K Ultra ray tracing, gdzie karta Aorus jest o 15% szybsza od Radeon RX 7900 XTX i około 11% szybsza od KFA2 RTX 4070 Ti SG.

Dying Light 2, który może stać się wymagający przy maksymalnych ustawieniach ray tracingu, widzi Aorus RTX 4070 Ti zyskując ładne 8% przewagi nad RTX 3090 Ti.

Co ciekawe, RTX 4090 Founders Edition wyprzedza Aorus RTX 4070 Ti tylko o 5% w Metro Exodus (non-Enhanced Edition) i Far Cry 6 Ultra ray tracing 1080p. Możliwe, że w grę wchodzą tu inne wąskie gardła lub że te gry po prostu nie są w stanie w pełni wykorzystać możliwości nowej architektury.

Metro Exodus - 1920x1080 Ultra Quality DXR AF:16x
AMD Radeon RX 7900 XTX
AMD Ryzen 9 7950X, AMD Radeon RX 7900 XTX
141.2 (89.03min) fps +9%
NVIDIA GeForce RTX 4080 Founders Edition
Intel Core i9-13900K, NVIDIA GeForce RTX 4080
137.2 (68.42min) fps +6%
NVIDIA GeForce RTX 4090 Founders Edition
Intel Core i9-13900K, NVIDIA GeForce RTX 4090
135 (73.53min) fps +5%
KFA2 GeForce RTX 4070 Ti SG
AMD Ryzen 9 7950X, NVIDIA GeForce RTX 4070 Ti
133.3 (68.29min) fps +3%
Aorus GeForce RTX 4070 Ti Master
Intel Core i9-13900K, NVIDIA GeForce RTX 4070 Ti
129 (64.57min) fps
Asus TUF Gaming GeForce RTX 4070 Ti
Intel Core i9-13900K, NVIDIA GeForce RTX 4070 Ti
128.8 (62.96min) fps 0%
Zotac Gaming GeForce RTX 3090 Ti AMP Extreme Holo
AMD Ryzen 7 5800X3D, NVIDIA GeForce RTX 3090 Ti
128.5 (64.07min) fps 0%
AMD Radeon RX 7900 XT
AMD Ryzen 9 7950X, AMD Radeon RX 7900 XT
124.3 (78.88min) fps -4%
Intel Core i9-13900K
Intel Core i9-13900K, NVIDIA GeForce RTX 3090
116.1 (61.11min) fps -10%
Average NVIDIA GeForce RTX 3080 Ti
  (110 - 121.2, n=4)
114.8 fps -11%
Average NVIDIA GeForce RTX 3090
  (68.6 - 122.2, n=12)
111.4 fps -14%
Average NVIDIA GeForce RTX 3080
  (91.5 - 102, n=2)
96.8 fps -25%
AMD Radeon RX 6900 XT
AMD Ryzen 9 5950X, AMD Radeon RX 6900 XT
90.5 (55.53min) fps -30%
Average NVIDIA Titan RTX
  (69 - 95.5, n=23)
86.1 fps -33%
AMD Radeon RX 6800 XT
AMD Ryzen 9 5950X, AMD Radeon RX 6800 XT
85.5 (52.71min) fps -34%
Average of class
  (14.7 - 195, n=209)
84.2 fps -35%
Control - 1920x1080 High Quality Preset & High Ray Tracing Preset (DX12)
NVIDIA GeForce RTX 4090 Founders Edition
Intel Core i9-13900K, NVIDIA GeForce RTX 4090
185.1 (103.4min, 132.2P0.1, 140.8P1) fps +43%
NVIDIA GeForce RTX 4080 Founders Edition
Intel Core i9-13900K, NVIDIA GeForce RTX 4080
162.8 (28.9min, 60.8P0.1, 129.4P1) fps +26%
AMD Radeon RX 7900 XTX
AMD Ryzen 9 7950X, AMD Radeon RX 7900 XTX
133.7 (23.2min, 92.6P0.1, 104.6P1) fps +4%
Zotac Gaming GeForce RTX 3090 Ti AMP Extreme Holo
AMD Ryzen 7 5800X3D, NVIDIA GeForce RTX 3090 Ti
130.8 (62.6min, 107.5P0.1, 113.8P1) fps +1%
Aorus GeForce RTX 4070 Ti Master
Intel Core i9-13900K, NVIDIA GeForce RTX 4070 Ti
129.1 (38.7min, 49.1P0.1, 101.2P1) fps
Asus TUF Gaming GeForce RTX 4070 Ti
Intel Core i9-13900K, NVIDIA GeForce RTX 4070 Ti
128.3 (6.22min, 61.8P0.1, 107P1) fps -1%
KFA2 GeForce RTX 4070 Ti SG
AMD Ryzen 9 7950X, NVIDIA GeForce RTX 4070 Ti
125.7 (17.4min, 80.4P0.1, 100.7P1) fps -3%
AMD Radeon RX 7900 XT
AMD Ryzen 9 7950X, AMD Radeon RX 7900 XT
116.1 (8.47min, 62.1P0.1, 91.4P1) fps -10%
Average NVIDIA GeForce RTX 3080 Ti
  (111 - 120.6, n=3)
115.2 fps -11%
Average NVIDIA GeForce RTX 3090
  (91.4 - 122.6, n=5)
111.1 fps -14%
Average NVIDIA GeForce RTX 3080
  (98.1 - 103, n=2)
100.6 fps -22%
Sapphire AMD Radeon RX 6950 XT Nitro+ Pure
AMD Ryzen 9 5900X, AMD Radeon RX 6950 XT
97.7 (7.66min, 62.8P0.1, 73.5P1) fps -24%
Average NVIDIA Titan RTX
  (63 - 120, n=3)
88.1 fps -32%
AMD Radeon RX 6900 XT
AMD Ryzen 9 5950X, AMD Radeon RX 6900 XT (SAM ENABLED)
76.2 (38.7min, 43.3P0.1, 62.8P1) fps -41%
AMD Radeon RX 6900 XT
AMD Ryzen 9 5950X, AMD Radeon RX 6900 XT
73.1 (31.6min, 40.9P0.1, 62.6P1) fps -43%
Average of class
  (8.4 - 221, n=130)
76.2 fps -41%
AMD Radeon RX 6800 XT
AMD Ryzen 9 5950X, AMD Radeon RX 6800 XT
66.9 (60min) fps -48%
Watch Dogs Legion - 1920x1080 Ultra Preset + Ultra Ray Tracing (DX12)
NVIDIA GeForce RTX 4090 Founders Edition
Intel Core i9-13900K, NVIDIA GeForce RTX 4090
115.7 (18.56min, 92.59P1) fps +16%
NVIDIA GeForce RTX 4080 Founders Edition
Intel Core i9-13900K, NVIDIA GeForce RTX 4080
111.6 (76.88min, 90.46P1) fps +12%
Aorus GeForce RTX 4070 Ti Master
Intel Core i9-13900K, NVIDIA GeForce RTX 4070 Ti
99.4 (37.32min, 77.35P1) fps
Asus TUF Gaming GeForce RTX 4070 Ti
Intel Core i9-13900K, NVIDIA GeForce RTX 4070 Ti
98.9 (72.06min, 82.17P1) fps -1%
Zotac Gaming GeForce RTX 3090 Ti AMP Extreme Holo
AMD Ryzen 7 5800X3D, NVIDIA GeForce RTX 3090 Ti
88.7 (50.06min, 72.42P1) fps -11%
Average NVIDIA GeForce RTX 3090
  (75.7 - 110, n=3)
88 fps -11%
Average NVIDIA GeForce RTX 3080 Ti
  ()
75.1 fps -24%
AMD Radeon RX 6800 XT
AMD Ryzen 9 5950X, AMD Radeon RX 6800 XT
71.4 (47.71min, 55.63P1) fps -28%
Average NVIDIA GeForce RTX 3080
  (70.9 - 71.3, n=2)
71.1 fps -28%
Sapphire AMD Radeon RX 6950 XT Nitro+ Pure
AMD Ryzen 9 5900X, AMD Radeon RX 6950 XT
69 fps -31%
AMD Radeon RX 6900 XT
AMD Ryzen 9 5950X, AMD Radeon RX 6900 XT
55.6 (35.81min, 41.86P1) fps -44%
AMD Radeon RX 6900 XT
AMD Ryzen 9 5950X, AMD Radeon RX 6900 XT (SAM ENABLED)
55.5 (36.48min, 43.27P1) fps -44%
Average NVIDIA Titan RTX
  ()
55.4 fps -44%
Average of class
  (3.46 - 115.9, n=100)
47.6 fps -52%
Far Cry 6 - 1920x1080 Ultra Graphics Quality + HD Textures + DXR AA:T
NVIDIA GeForce RTX 4080 Founders Edition
Intel Core i9-13900K, NVIDIA GeForce RTX 4080
154 (125min) fps +10%
AMD Radeon RX 7900 XTX
AMD Ryzen 9 7950X, AMD Radeon RX 7900 XTX
152.1 (75min) fps +9%
NVIDIA GeForce RTX 4090 Founders Edition
Intel Core i9-13900K, NVIDIA GeForce RTX 4090
147 (125min) fps +5%
Asus TUF Gaming GeForce RTX 4070 Ti
Intel Core i9-13900K, NVIDIA GeForce RTX 4070 Ti
146 (122min) fps +5%
AMD Radeon RX 7900 XT
AMD Ryzen 9 7950X, AMD Radeon RX 7900 XT
143.6 (46min) fps +3%
Aorus GeForce RTX 4070 Ti Master
Intel Core i9-13900K, NVIDIA GeForce RTX 4070 Ti
139.5 (114min) fps
KFA2 GeForce RTX 4070 Ti SG
AMD Ryzen 9 7950X, NVIDIA GeForce RTX 4070 Ti
133.4 (109min) fps -4%
Zotac Gaming GeForce RTX 3090 Ti AMP Extreme Holo
AMD Ryzen 7 5800X3D, NVIDIA GeForce RTX 3090 Ti
122 (95min) fps -13%
Average NVIDIA GeForce RTX 3080 Ti
  (112 - 128.6, n=2)
120.3 fps -14%
Average NVIDIA GeForce RTX 3090
  (76 - 138.2, n=8)
112.6 fps -19%
Average NVIDIA Titan RTX
  (97 - 109.3, n=2)
103.2 fps -26%
Sapphire AMD Radeon RX 6950 XT Nitro+ Pure
AMD Ryzen 9 5900X, AMD Radeon RX 6950 XT
101.6 (24min) fps -27%
Average of class
  (4.04 - 187.9, n=122)
95.7 fps -31%
Average NVIDIA GeForce RTX 3080
  ()
73 fps -48%
Dying Light 2 - 1920x1080 High Quality Raytracing
NVIDIA GeForce RTX 4090 Founders Edition
Intel Core i9-13900K, NVIDIA GeForce RTX 4090
130 (49min, 97.7P0.1, 106.7P1) fps +57%
NVIDIA GeForce RTX 4080 Founders Edition
Intel Core i9-13900K, NVIDIA GeForce RTX 4080
98.7 (37.6min, 46.5P0.1, 74.3P1) fps +19%
Average NVIDIA GeForce RTX 3080 Ti
  ()
83.5 fps +1%
Asus TUF Gaming GeForce RTX 4070 Ti
Intel Core i9-13900K, NVIDIA GeForce RTX 4070 Ti
82.9 (36.6min, 45.4P0.1, 69.2P1) fps 0%
Aorus GeForce RTX 4070 Ti Master
Intel Core i9-13900K, NVIDIA GeForce RTX 4070 Ti
82.8 (27.4min, 39.9P0.1, 59.6P1) fps
Average NVIDIA Titan RTX
  ()
80.1 fps -3%
Zotac Gaming GeForce RTX 3090 Ti AMP Extreme Holo
AMD Ryzen 7 5800X3D, NVIDIA GeForce RTX 3090 Ti
76.4 (33.4min, 57.9P0.1, 62.6P1) fps -8%
Average NVIDIA GeForce RTX 3090
  (67.9 - 80.2, n=2)
74.1 fps -11%
Average NVIDIA GeForce RTX 3080
  ()
59.7 fps -28%
Average of class
  (1.346 - 130, n=59)
50.9 fps -39%
Cyberpunk 2077 1.6
3840x2160 Ray Tracing Ultra Preset (DLSS off)
NVIDIA GeForce RTX 4090 Founders Edition
Intel Core i9-13900K, NVIDIA GeForce RTX 4090 (1.6)
42.6 (32min) fps +78%
NVIDIA GeForce RTX 4080 Founders Edition
Intel Core i9-13900K, NVIDIA GeForce RTX 4080 (1.6)
30.7 (23.5min) fps +28%
Zotac Gaming GeForce RTX 3090 Ti AMP Extreme Holo
AMD Ryzen 7 5800X3D, NVIDIA GeForce RTX 3090 Ti (1.52)
24.3 (16.3min) fps +2%
Aorus GeForce RTX 4070 Ti Master
Intel Core i9-13900K, NVIDIA GeForce RTX 4070 Ti (1.61)
23.9 (18min) fps
Asus TUF Gaming GeForce RTX 4070 Ti
Intel Core i9-13900K, NVIDIA GeForce RTX 4070 Ti (1.61)
23.7 (18.1min) fps -1%
KFA2 GeForce RTX 4070 Ti SG
AMD Ryzen 9 7950X, NVIDIA GeForce RTX 4070 Ti (1.5)
21.6 (9.54min) fps -10%
Average NVIDIA GeForce RTX 3090
  (19.8 - 22.1, n=5)
21 fps -12%
AMD Radeon RX 7900 XTX
AMD Ryzen 9 7950X, AMD Radeon RX 7900 XTX (1.61)
20.7 (14.4min) fps -13%
Average NVIDIA GeForce RTX 3080 Ti
  ()
18.6 fps -22%
AMD Radeon RX 7900 XT
AMD Ryzen 9 7950X, AMD Radeon RX 7900 XT (1.61)
17.6 (12min) fps -26%
Average of class
  (1.1 - 44.7, n=96)
16.5 fps -31%
Average NVIDIA Titan RTX
  ()
13.4 fps -44%
Average NVIDIA GeForce RTX 3080
  ()
12.1 fps -49%
1920x1080 Ray Tracing Ultra Preset (DLSS off)
NVIDIA GeForce RTX 4090 Founders Edition
Intel Core i9-13900K, NVIDIA GeForce RTX 4090 (1.6)
118.4 (92min) fps +44%
NVIDIA GeForce RTX 4080 Founders Edition
Intel Core i9-13900K, NVIDIA GeForce RTX 4080 (1.6)
100.1 (77.6min) fps +21%
Aorus GeForce RTX 4070 Ti Master
Intel Core i9-13900K, NVIDIA GeForce RTX 4070 Ti (1.61)
82.5 (32.1min) fps
KFA2 GeForce RTX 4070 Ti SG
AMD Ryzen 9 7950X, NVIDIA GeForce RTX 4070 Ti (1.5)
81.5 (62.2min) fps -1%
Asus TUF Gaming GeForce RTX 4070 Ti
Intel Core i9-13900K, NVIDIA GeForce RTX 4070 Ti (1.61)
81 (62.6min) fps -2%
Zotac Gaming GeForce RTX 3090 Ti AMP Extreme Holo
AMD Ryzen 7 5800X3D, NVIDIA GeForce RTX 3090 Ti (1.52)
74.7 (57.7min) fps -9%
Average NVIDIA GeForce RTX 3080 Ti
  ()
69.1 fps -16%
Average NVIDIA GeForce RTX 3090
  (61.3 - 68, n=5)
65.5 fps -21%
AMD Radeon RX 7900 XTX
AMD Ryzen 9 7950X, AMD Radeon RX 7900 XTX (1.61)
64.6 (49.1min) fps -22%
Average NVIDIA GeForce RTX 3080
  ()
61.1 fps -26%
AMD Radeon RX 7900 XT
AMD Ryzen 9 7950X, AMD Radeon RX 7900 XT (1.61)
57.1 (41.7min) fps -31%
Average of class
  (4.18 - 206, n=142)
50.6 fps -39%
Average NVIDIA Titan RTX
  ()
43.3 fps -48%
Ghostwire Tokyo - 1920x1080 Highest Settings + Maximum Ray Tracing
NVIDIA GeForce RTX 4090 Founders Edition
Intel Core i9-13900K, NVIDIA GeForce RTX 4090
193.7 (38.5min, 66.5P0.1, 142.5P1) fps +40%
NVIDIA GeForce RTX 4080 Founders Edition
Intel Core i9-13900K, NVIDIA GeForce RTX 4080
166.2 (30.4min, 60P0.1, 115.2P1) fps +20%
Asus TUF Gaming GeForce RTX 4070 Ti
Intel Core i9-13900K, NVIDIA GeForce RTX 4070 Ti
139.3 (31.3min, 53.2P0.1, 89.7P1) fps 0%
Aorus GeForce RTX 4070 Ti Master
Intel Core i9-13900K, NVIDIA GeForce RTX 4070 Ti
138.7 (38.5min, 54.6P0.1, 89.8P1) fps
AMD Radeon RX 7900 XTX
AMD Ryzen 9 7950X, AMD Radeon RX 7900 XTX
136.3 (39.1min, 76.4P0.1, 95.8P1) fps -2%
KFA2 GeForce RTX 4070 Ti SG
AMD Ryzen 9 7950X, NVIDIA GeForce RTX 4070 Ti
130.7 (40.2min, 67.1P0.1, 87.4P1) fps -6%
Zotac Gaming GeForce RTX 3090 Ti AMP Extreme Holo
AMD Ryzen 7 5800X3D, NVIDIA GeForce RTX 3090 Ti
120.2 (33.8min, 55.2P0.1, 79.1P1) fps -13%
Average NVIDIA GeForce RTX 3080 Ti
  ()
119.9 fps -14%
AMD Radeon RX 7900 XT
AMD Ryzen 9 7950X, AMD Radeon RX 7900 XT
116.5 (30.3min, 71.6P0.1, 78.1P1) fps -16%
Average NVIDIA GeForce RTX 3090
  (106 - 122, n=3)
111.6 fps -20%
Average NVIDIA GeForce RTX 3080
  ()
97.9 fps -29%
Average of class
  (13.9 - 193.7, n=91)
85.5 fps -38%
Average NVIDIA Titan RTX
  (74.5 - 79, n=2)
76.8 fps -45%
The Callisto Protocol - 1920x1080 Ultra Preset (without FSR Upscaling) + Full Ray-Tracing
AMD Radeon RX 7900 XTX
AMD Ryzen 9 7950X, AMD Radeon RX 7900 XTX
98 fps +13%
AMD Radeon RX 7900 XT
AMD Ryzen 9 7950X, AMD Radeon RX 7900 XT
89 fps +2%
Asus TUF Gaming GeForce RTX 4070 Ti
Intel Core i9-13900K, NVIDIA GeForce RTX 4070 Ti
88.58 fps +2%
Aorus GeForce RTX 4070 Ti Master
Intel Core i9-13900K, NVIDIA GeForce RTX 4070 Ti
87 fps
KFA2 GeForce RTX 4070 Ti SG
AMD Ryzen 9 7950X, NVIDIA GeForce RTX 4070 Ti
82.1 fps -6%
Average NVIDIA GeForce RTX 3080 Ti
  ()
76 fps -13%
Average NVIDIA GeForce RTX 3080
  ()
71.3 fps -18%
Average of class
  (7.1 - 279, n=81)
67 fps -23%
Average NVIDIA Titan RTX
  ()
58.7 fps -33%
low med. high ultraQHD4K
GTA V (2015) 188.1 187.9 187.4 172 158.4 172.4
The Witcher 3 (2015) 445 220 148.7
Dota 2 Reborn (2015) 302.5 267.6 258.8 243.4 225.9
Final Fantasy XV Benchmark (2018) 237 237 212 169.2 90.9
X-Plane 11.11 (2018) 254 222 166.8 141.7
Shadow of the Tomb Raider (2018) 299 280 204 104.9
Metro Exodus (2019) 194.9 161.2 132.3 85
Control (2019) 201 130.6 64.9
Borderlands 3 (2019) 212 185.3 142 74.9
Mafia Definitive Edition (2020) 249 175.5 88.2
Watch Dogs Legion (2020) 177.5 151.8 121 68.4
F1 2021 (2021) 704 606 491 262 201 114.9
Far Cry 6 (2021) 192.7 171.7 157 88.7
Dying Light 2 (2022) 176.9 120 58.2
Cyberpunk 2077 1.6 (2022) 184.9 167.1 107.1 50.7
Ghostwire Tokyo (2022) 332 321 217 101.1
F1 22 (2022) 423 416 342 142.5 94.4 47.3
Uncharted Legacy of Thieves Collection (2022) 140.8 133.8 108.4 63.9
Call of Duty Modern Warfare 2 2022 (2022) 188 180 132 82
The Callisto Protocol (2022) 155 155 117 69

Emisje: Brak praktycznej różnicy między trybami OC i Silent BIOS-u

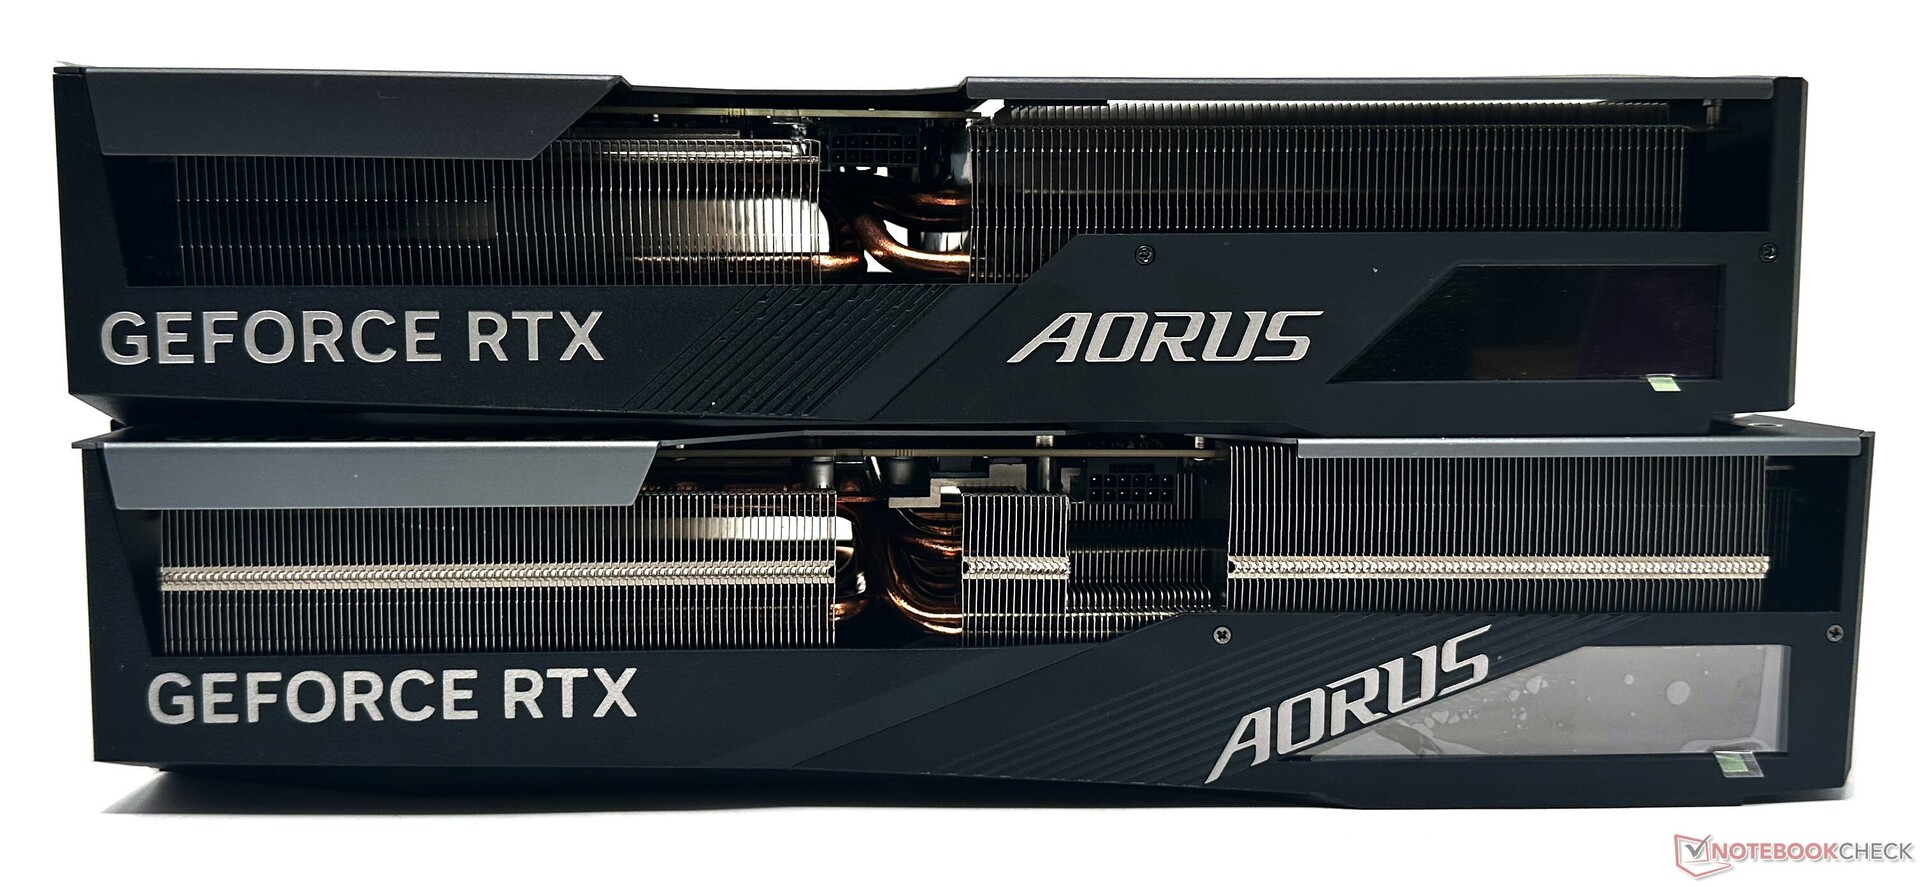
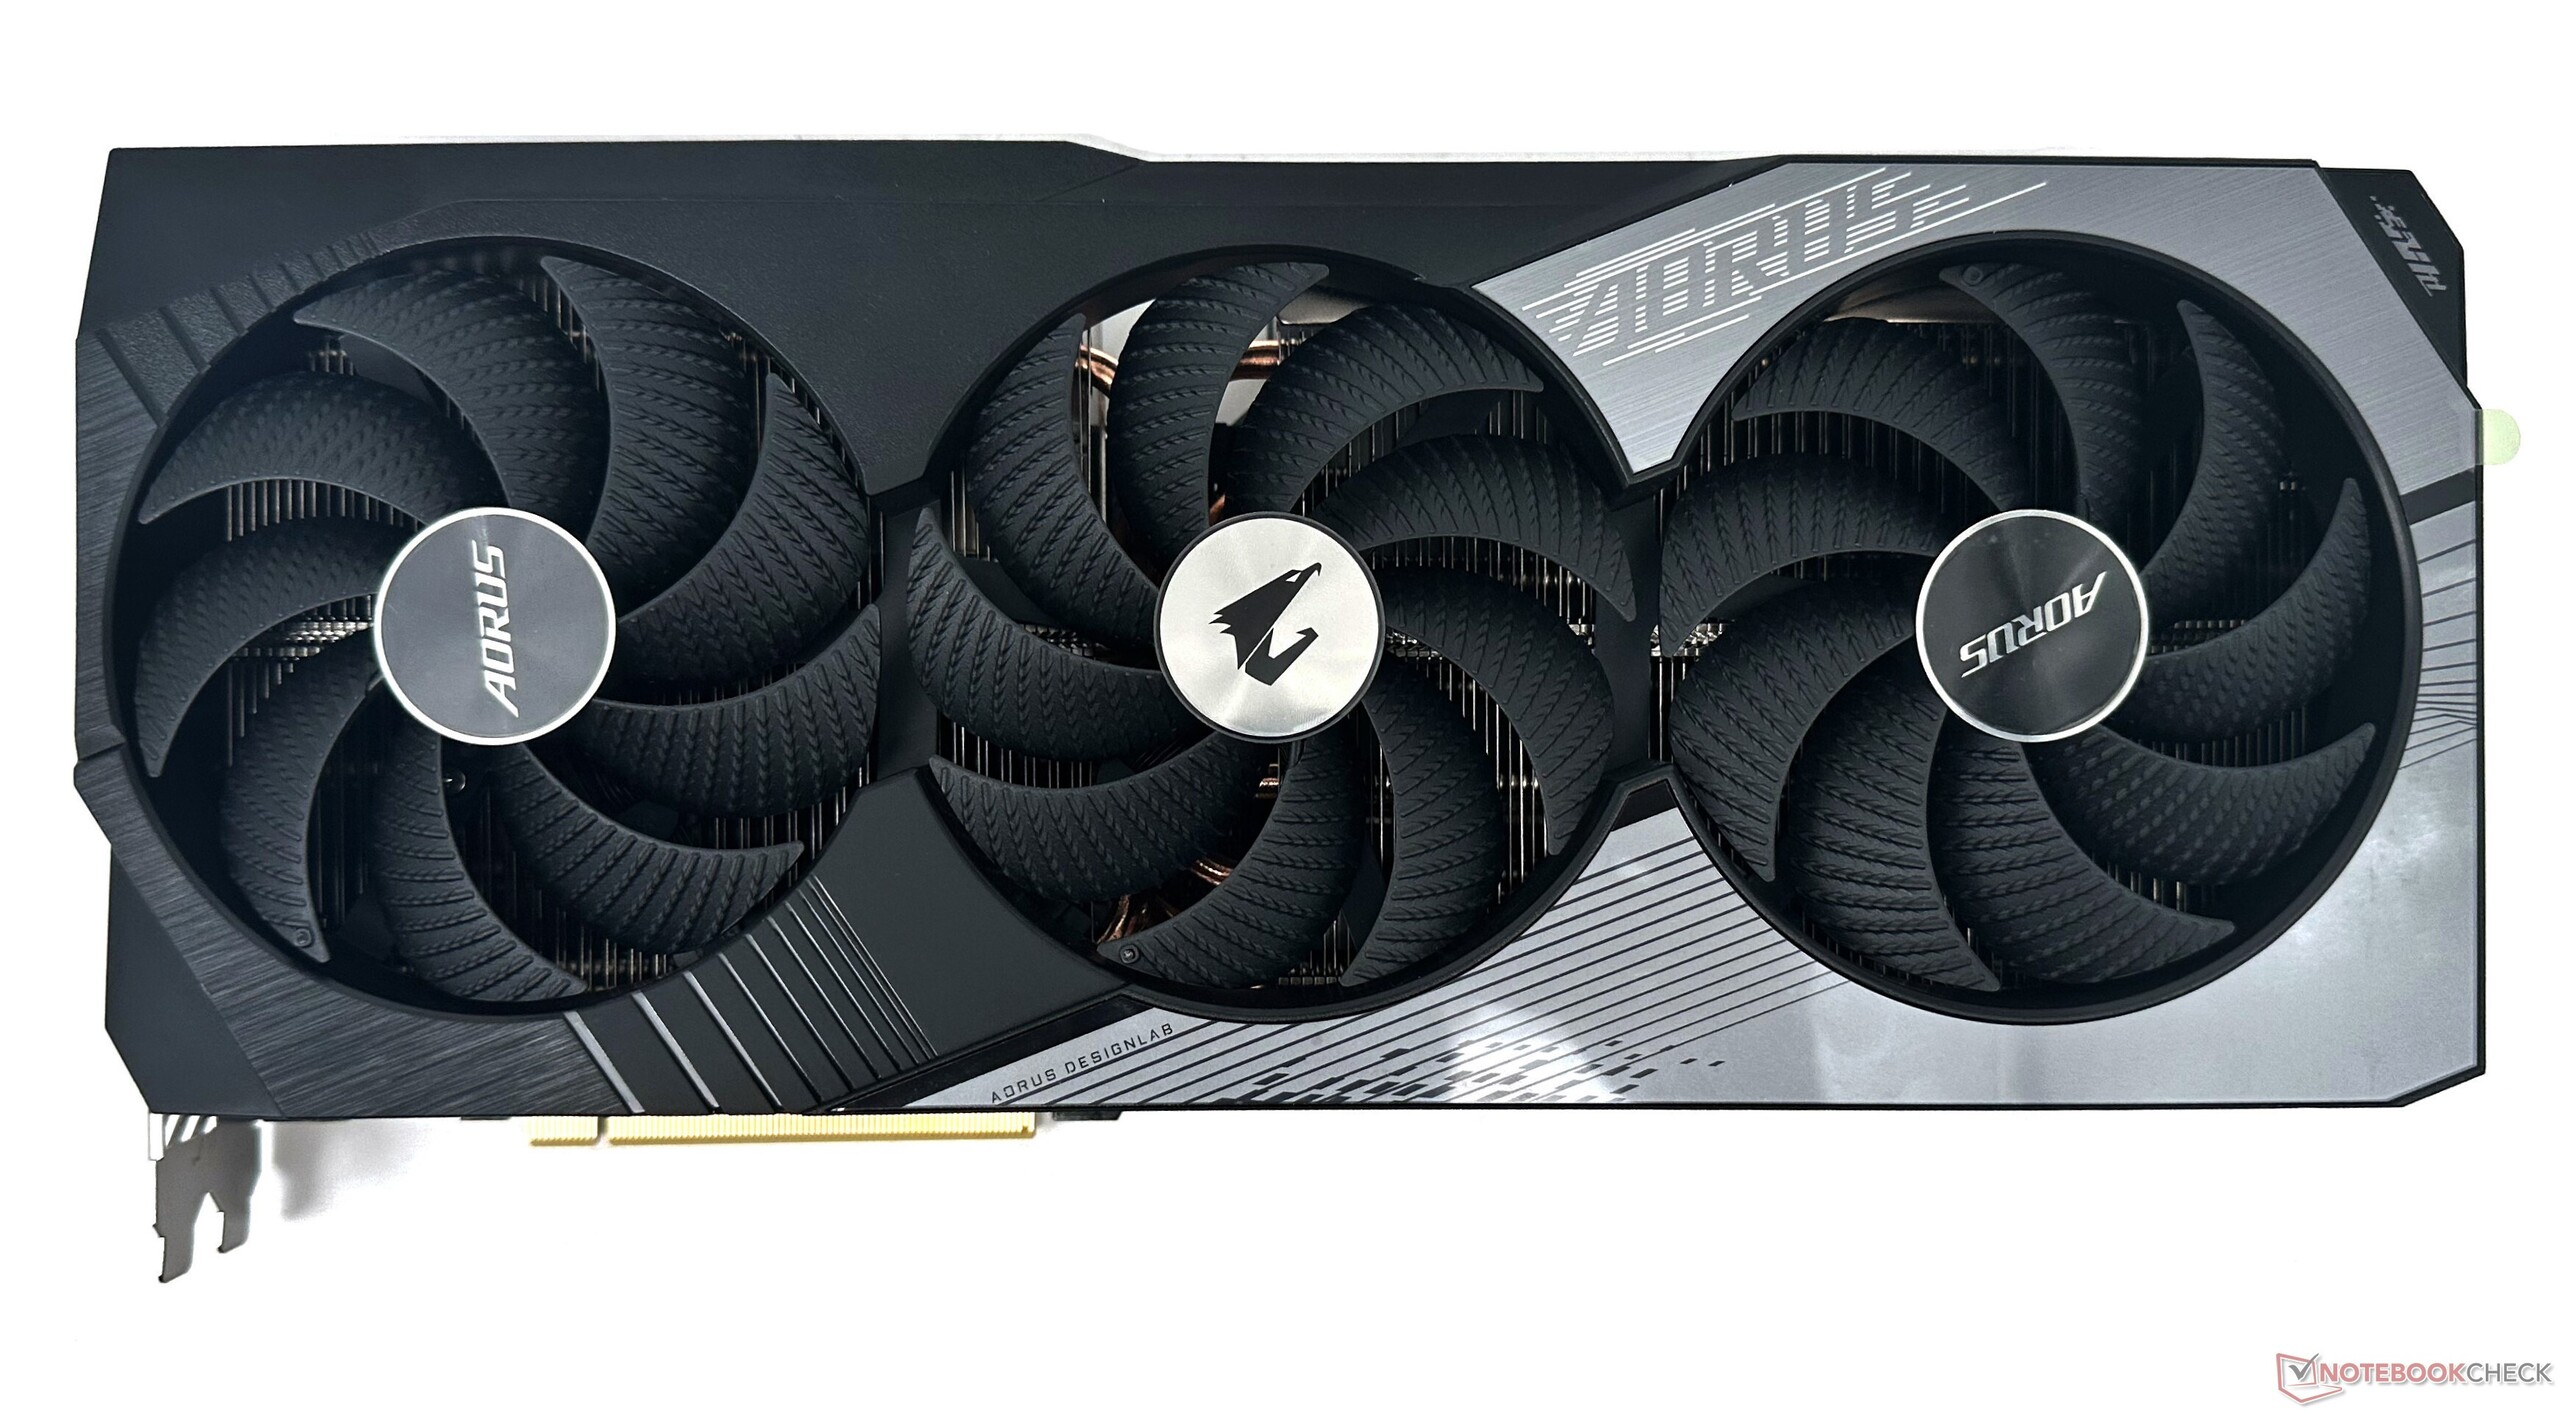
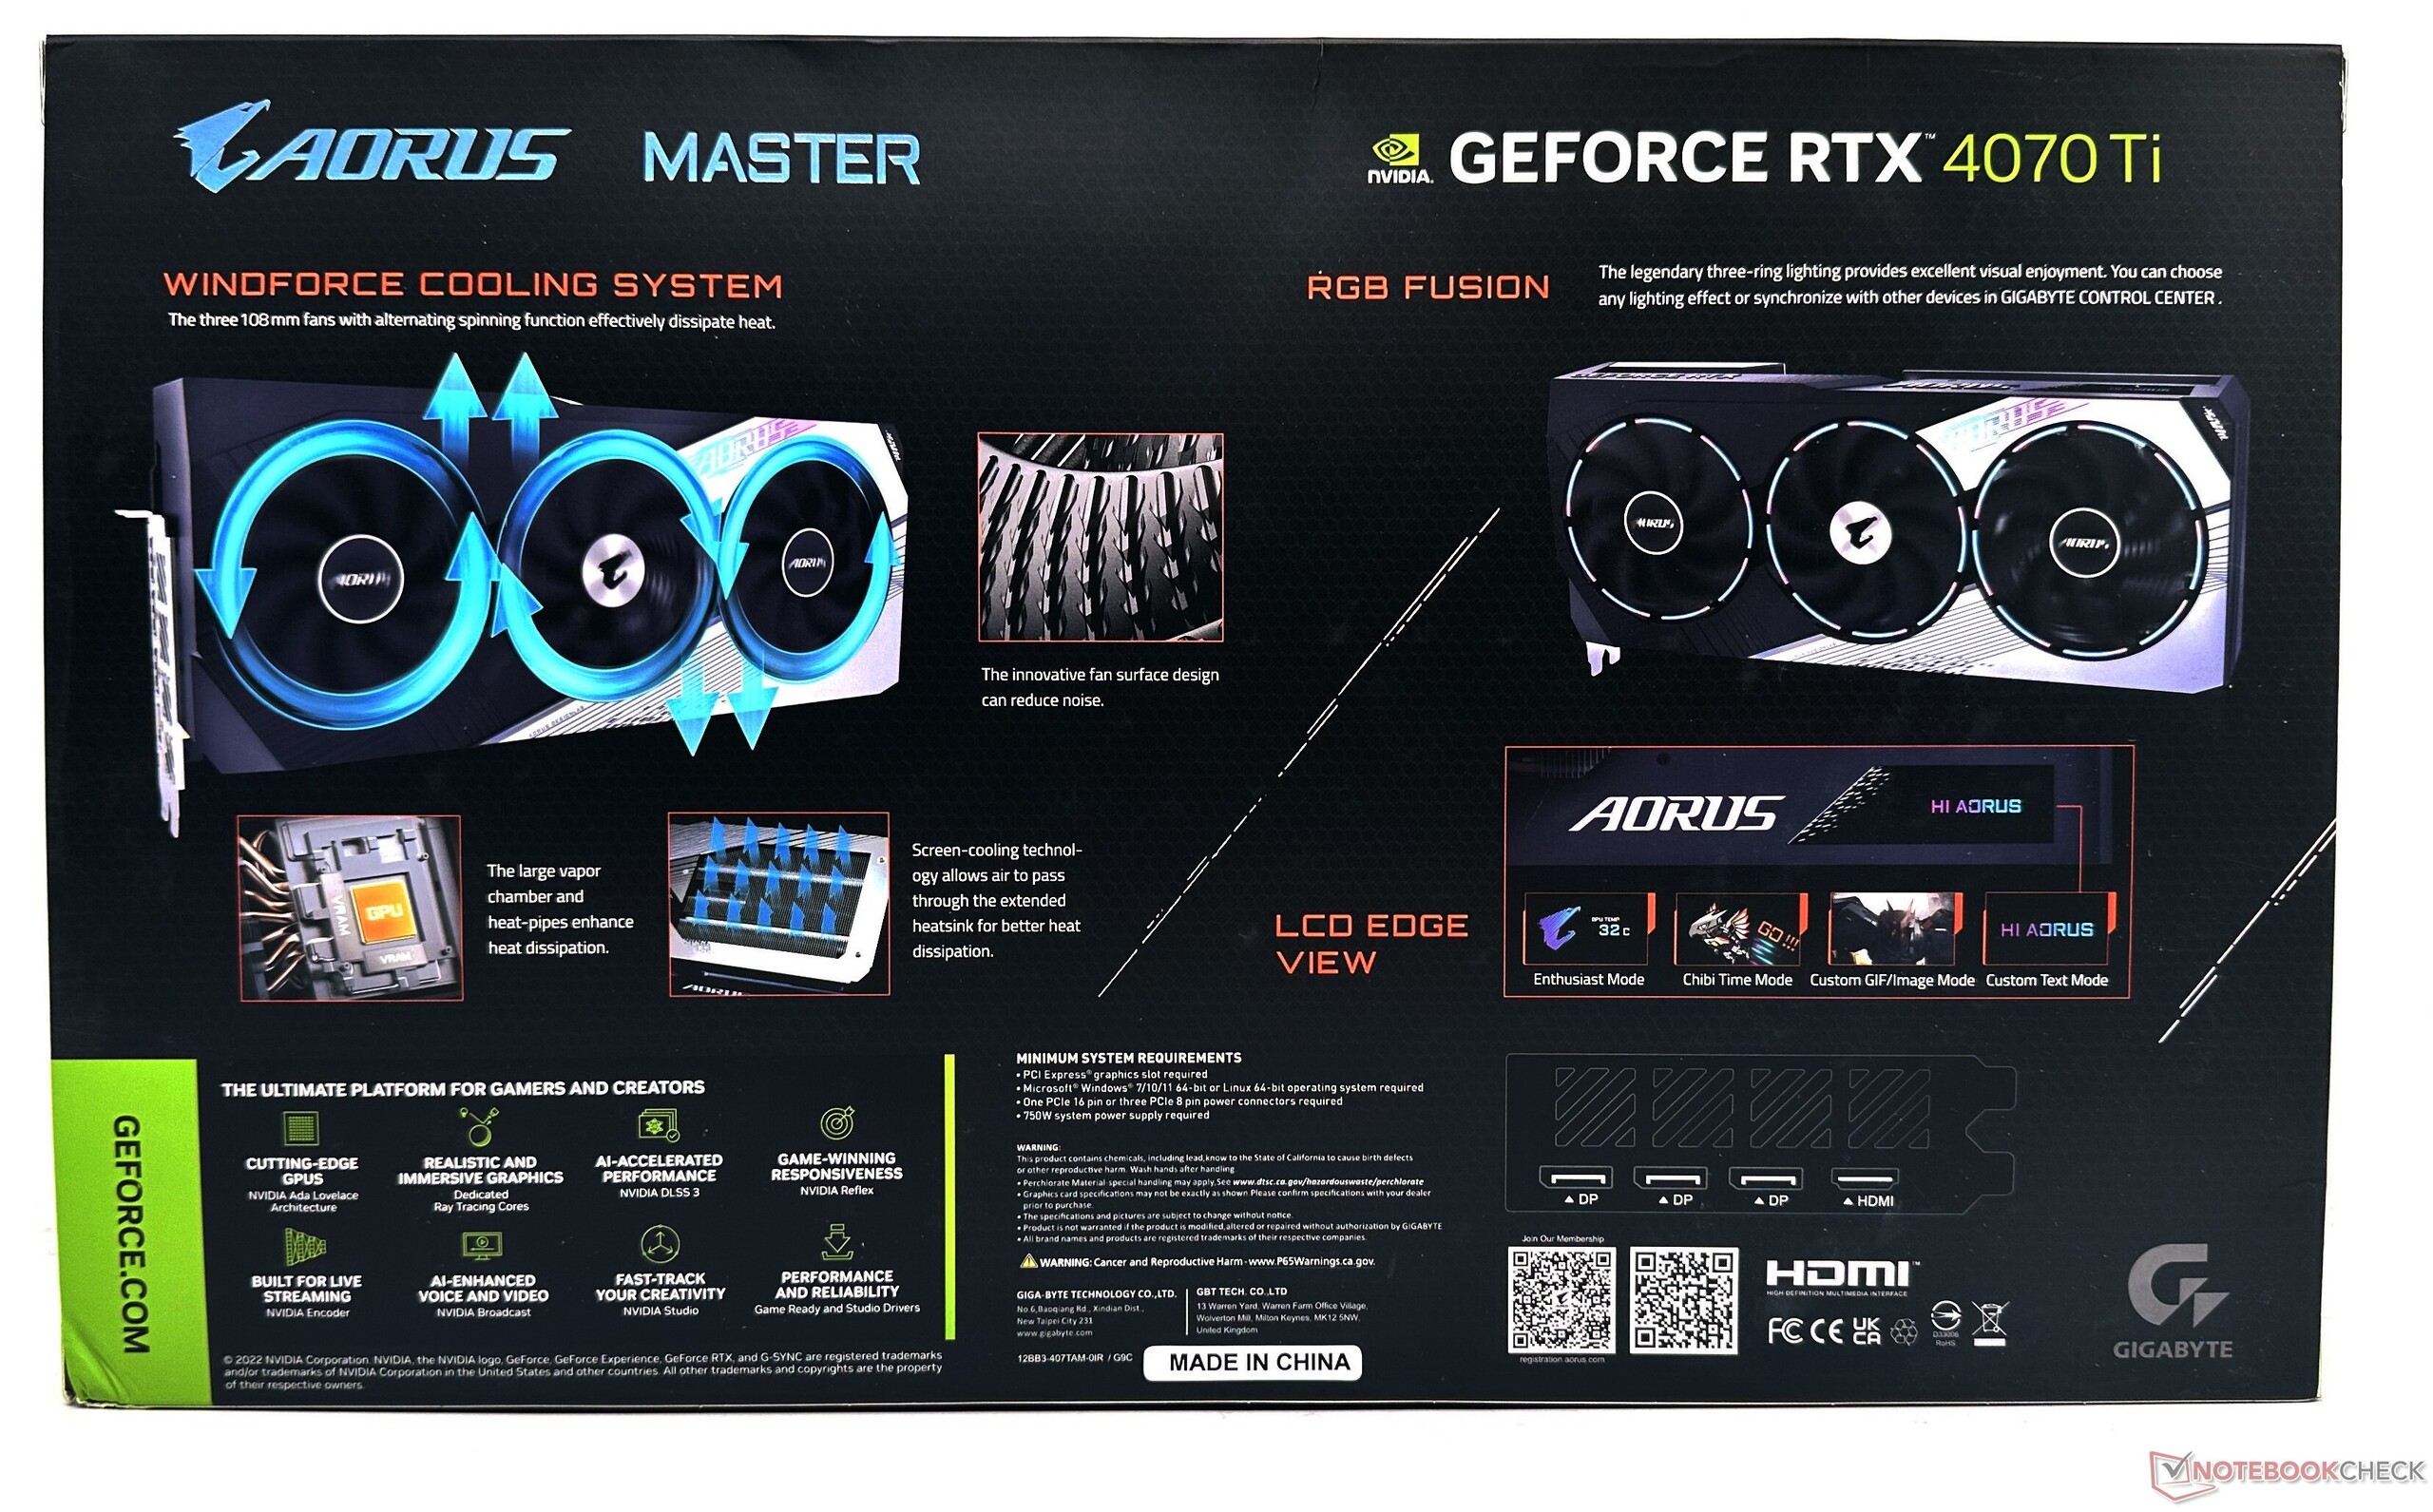
Gigabyte stosuje w Aorusie GeForce RTX 4070 Ti Master potrójny cooler z naprzemiennie wirującymi wentylatorami. Firma kładzie duży nacisk na ulepszenia w swoim systemie chłodzenia Windforce z 108 mm naprzemiennie wirującymi wentylatorami.

Według Gigabyte, karta Aorus wykorzystuje chłodzenie z komorą parową z dziewięcioma miedzianymi heatpipes dla efektywnego rozpraszania ciepła. Karta posiada również rozbudowany radiator z dużymi otworami wentylacyjnymi w tylnej części, co pozwala na bardziej efektywne odprowadzanie ciepła.

Potencjał podkręcania jest przyzwoity dzięki możliwości zwiększenia mocy docelowej o 28% do 366 W.

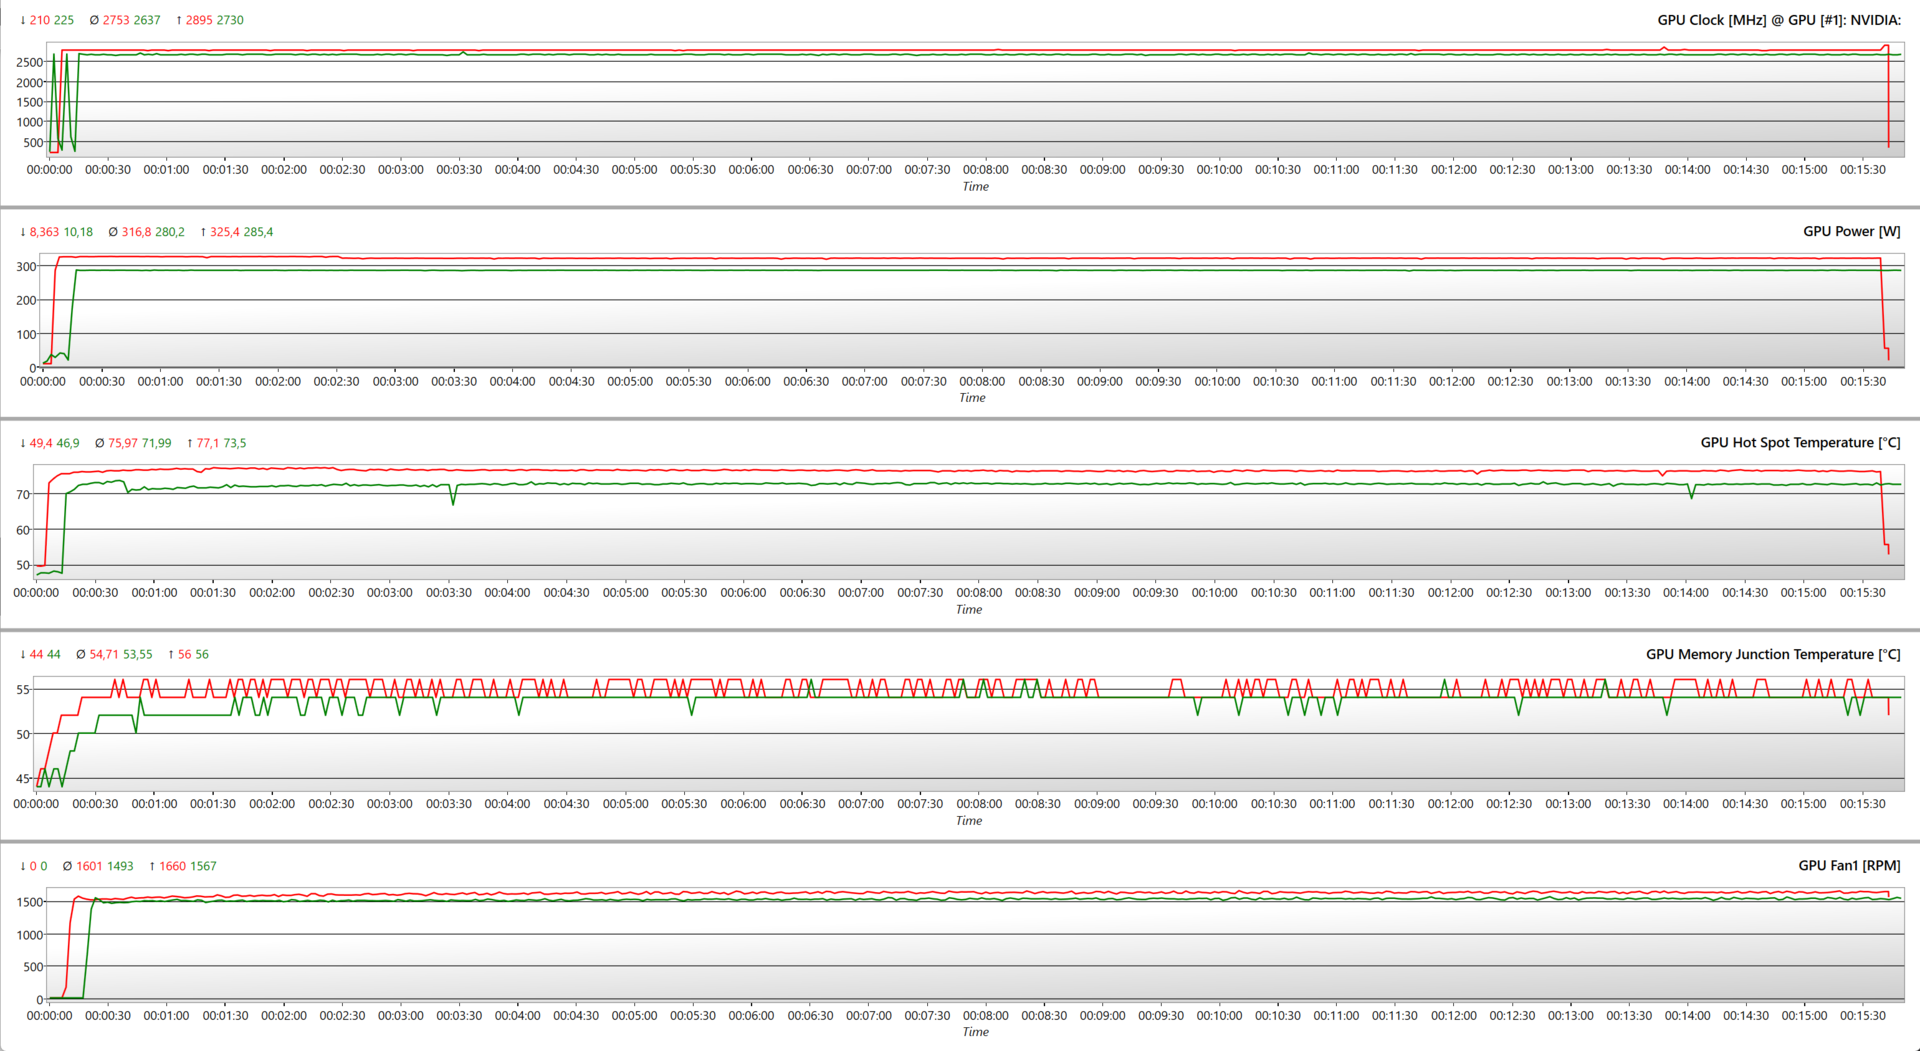
Testy warunków skrajnych

W programie FurMark w rozdzielczości 1280 x 720 bez AA w trybie OC BIOS-u Aorus GeForce RTX 4070 Ti Master osiągnął maksymalny wynik TGP przy 100% i 128% mocy. Zwiększenie mocy docelowej pozwala na 6% wzrost zegarów z 2,730 MHz do 2,895 MHz. Procesor graficzny jest w stanie utrzymać te wzrosty bardzo dobrze, bez widocznych oznak throttlingu, ze średnią temperaturą 72 °C i 76 °C, odpowiednio przy 100% i 128% wartości docelowej mocy.

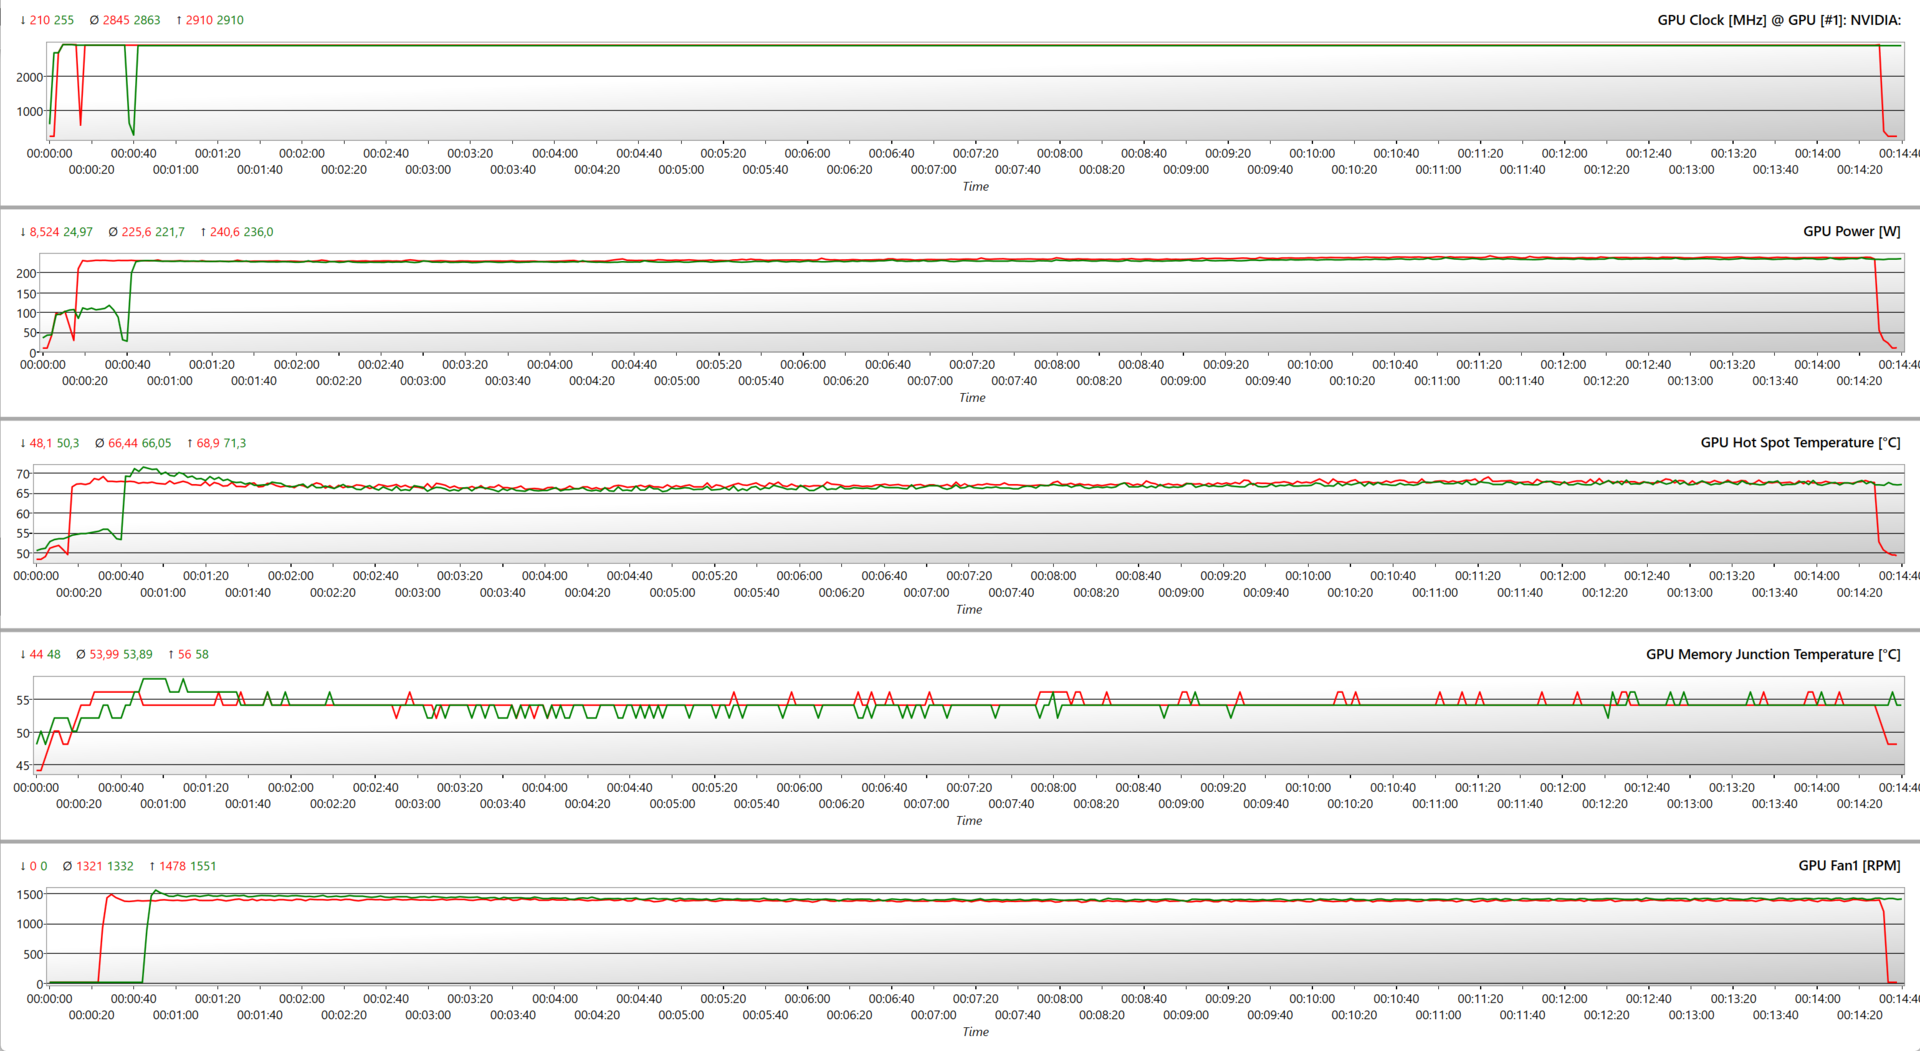
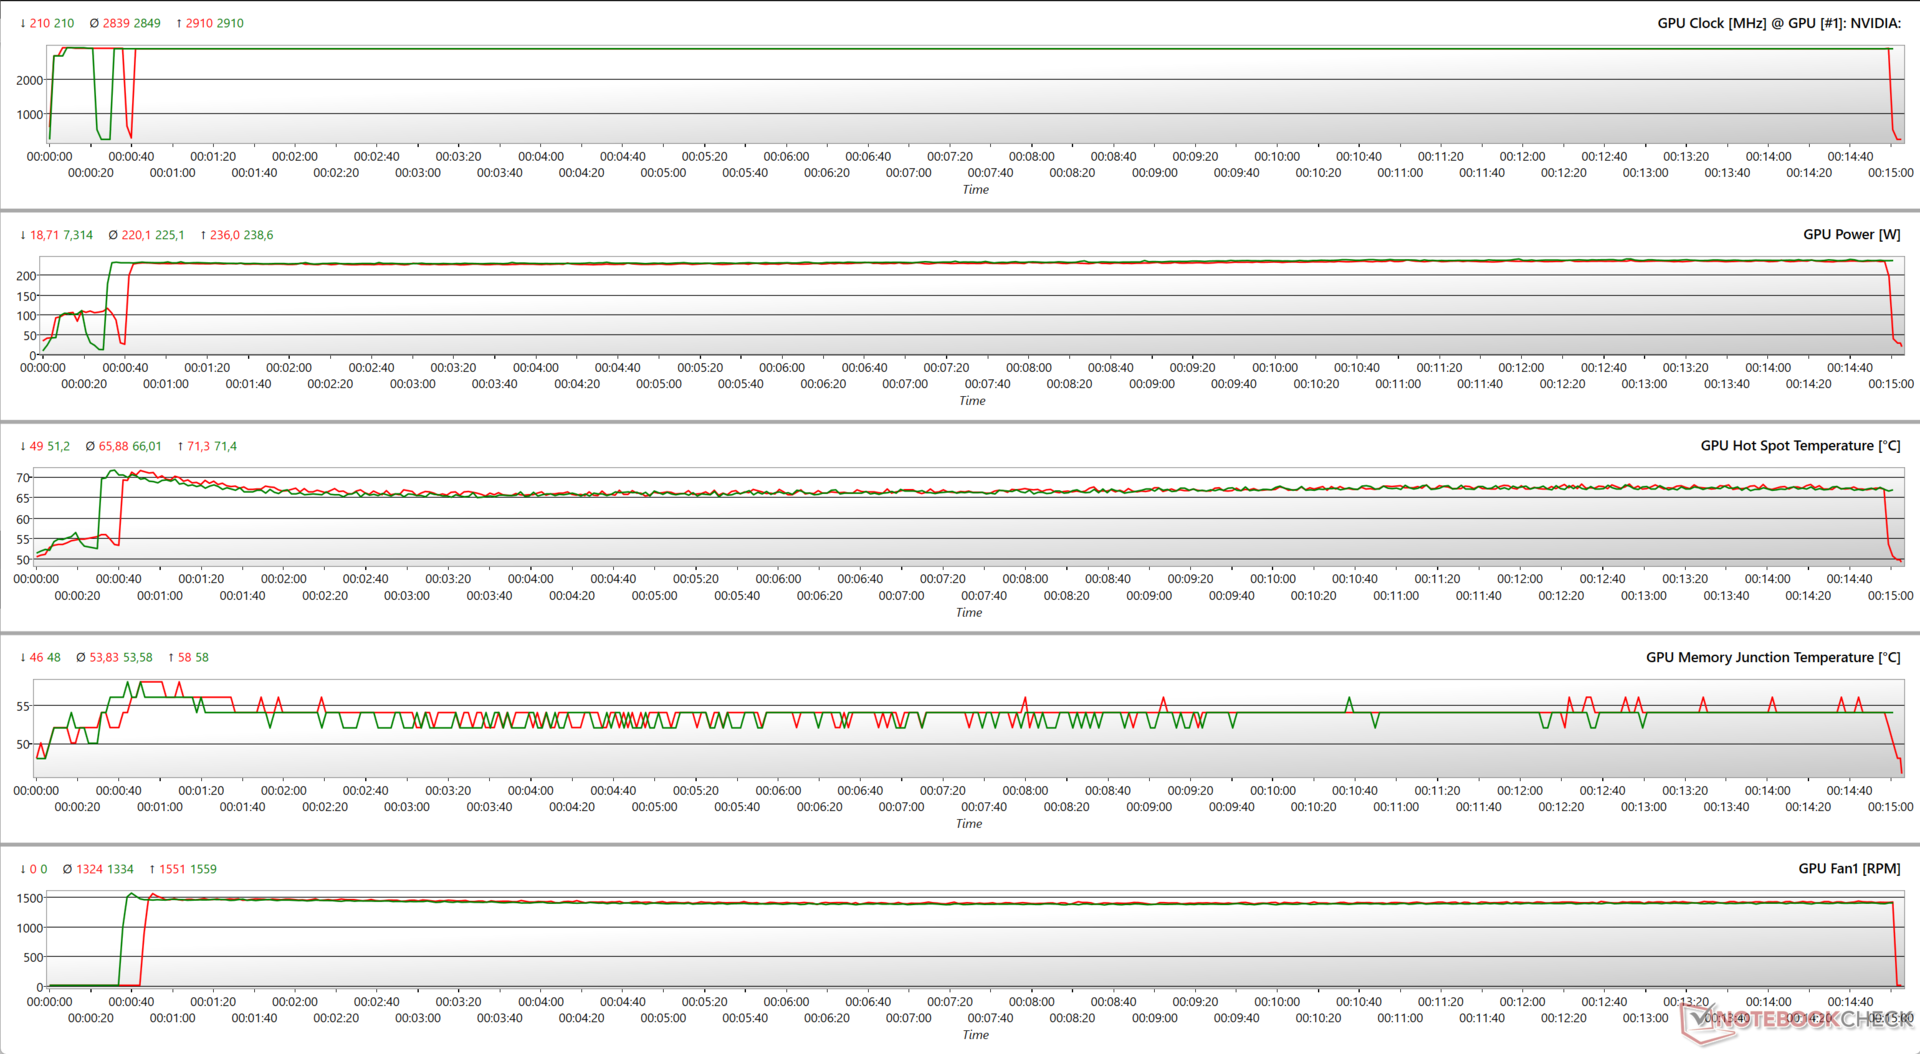
Na stronie Witcher 3 w rozdzielczości 1080p Ultra widzimy podobny schemat, ale zegary są tu maksymalizowane do 2910 MHz przy niższym 236 W TGP przy 100% wartości docelowej. Zwiększenie docelowego poboru mocy do 128% nie wydaje się mieć żadnych wymiernych korzyści pod względem zegarów czy średniej temperatury w gorących punktach. Uruchomienie gry w rozdzielczości 4K Ultra przy 100% mocy również zaowocowało zwiększeniem taktowania o 2 910 MHz, ale przy zwiększonym TGP o 246 W.

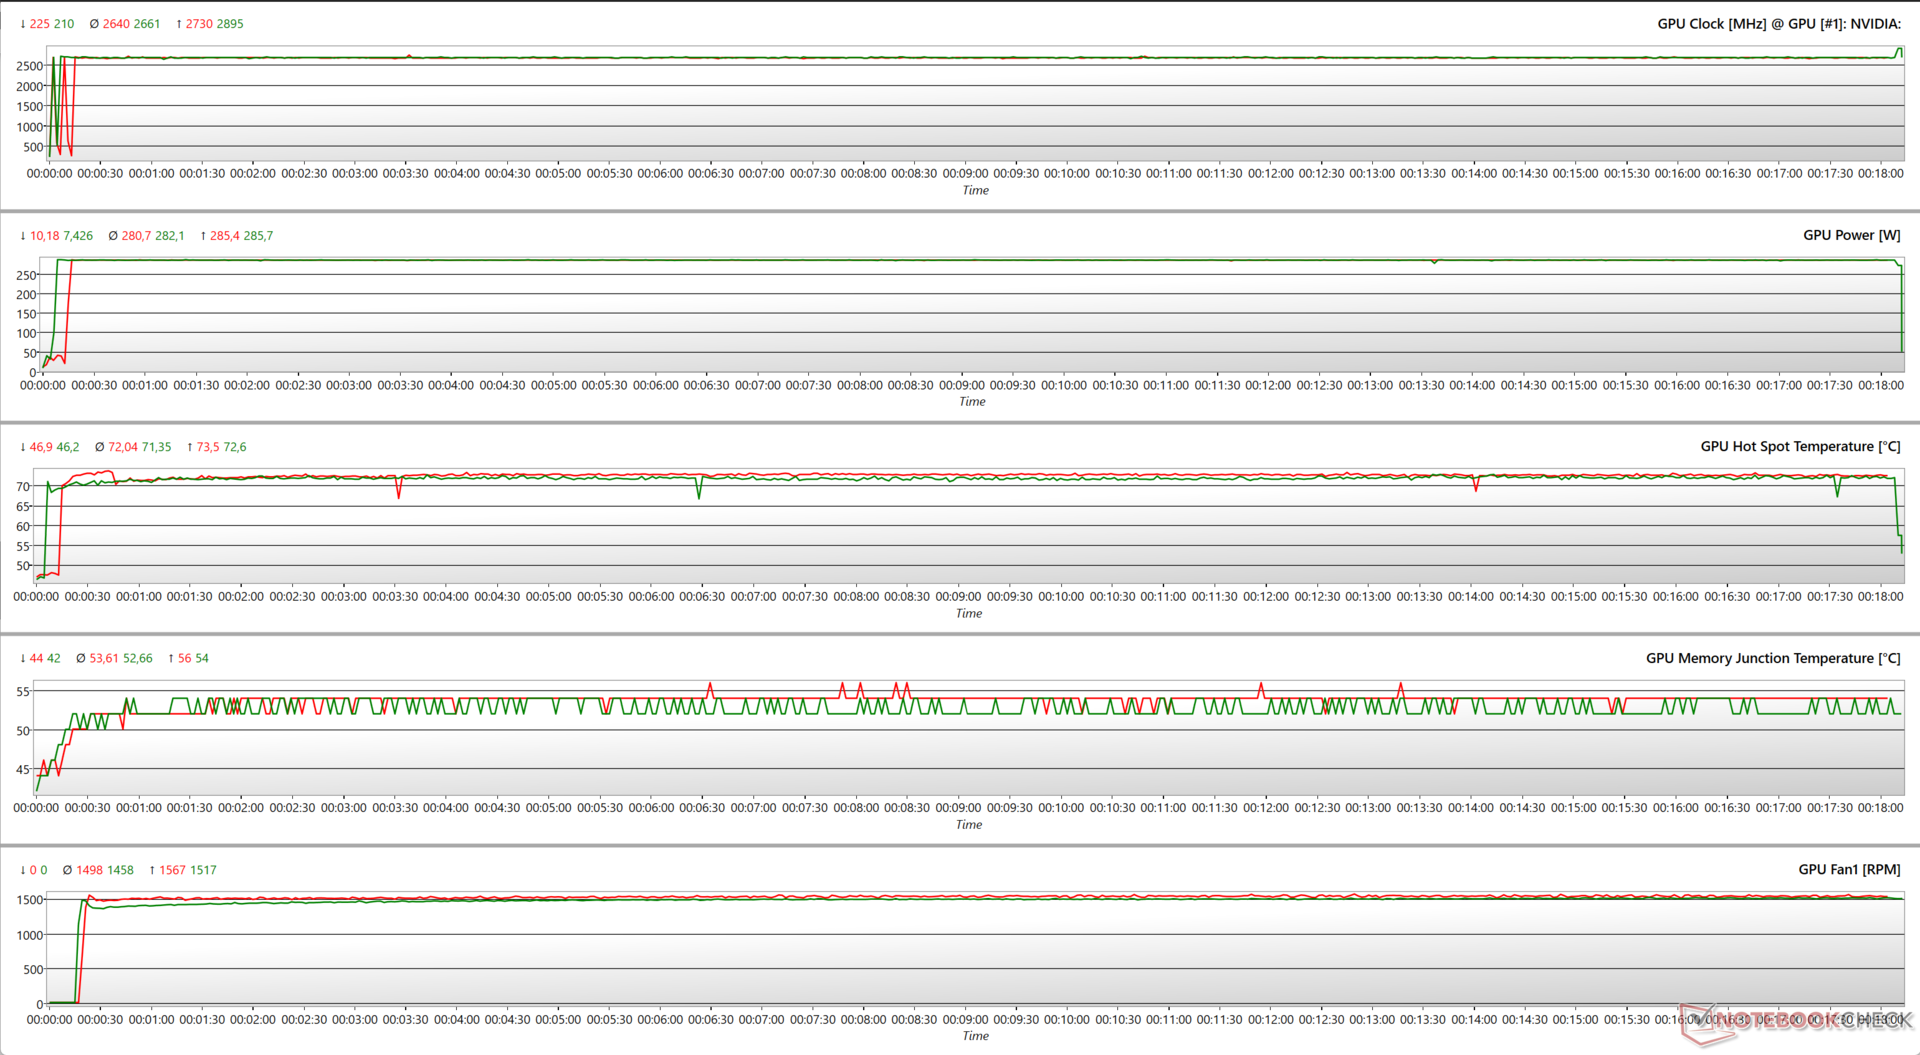
Przełączenie trybu BIOS-u na Silent nie ma praktycznie żadnego wpływu na pobór mocy w FurMarku. Co ciekawe, w trybie Silent można sobie nawet pozwolić na lekkie podniesienie zegarów boost, co było widać wcześniej, bez konieczności zwiększania docelowej mocy.

Parametry GPU w stresie The Witcher 3 przy użyciu Silent BIOS są mniej więcej podobne do tego, co widzimy przy OC BIOS przy 100% power target.

Parametry GPU podczas stresu FurMark (OC BIOS; zielony - 100% PT; czerwony - 128% PT)
Parametry GPU podczas stresu The Witcher 3 w rozdzielczości 1080p Ultra (OC BIOS; zielony - 100% PT; czerwony - 128% PT)
Parametry GPU podczas obciążenia FurMark (100% PT; zielony - Silent BIOS; czerwony - OC BIOS)
Parametry GPU podczas stresu The Witcher 3 (100% PT; zielony - Silent BIOS; czerwony - OC BIOS)

Wykres Witcher 3 FPS

Wydaje się, że Gigabyte wykonał dobrą robotę w dziale chłodzenia. Nie widzimy praktycznie żadnych spadków fps w The Witcher 3 w 1080p Ultra i 4K Ultra.

0153045607590105120135150165180195210225Tooltip
Gigabyte Aorus GeForce RTX 4070 Ti Master i9-13900K, NVIDIA GeForce RTX 4070 Ti; 1920x1080 Ultra Graphics & Postprocessing (HBAO+): Ø225 (220-230)
Gigabyte Aorus GeForce RTX 4070 Ti Master i9-13900K, NVIDIA GeForce RTX 4070 Ti; 3840x2160 Ultra Graphics & Postprocessing (HBAO+): Ø97.3 (95-99)

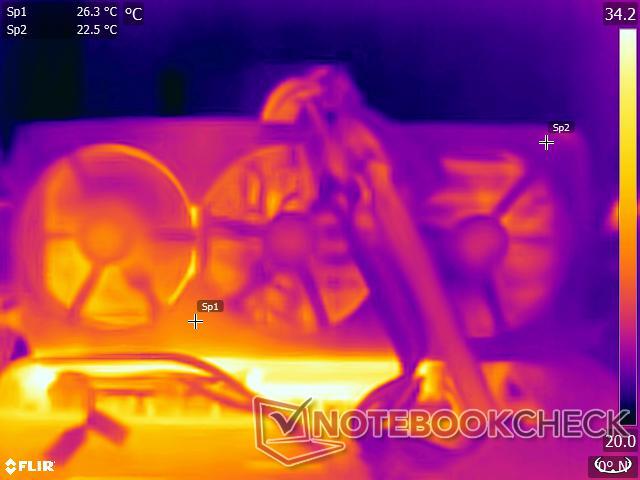
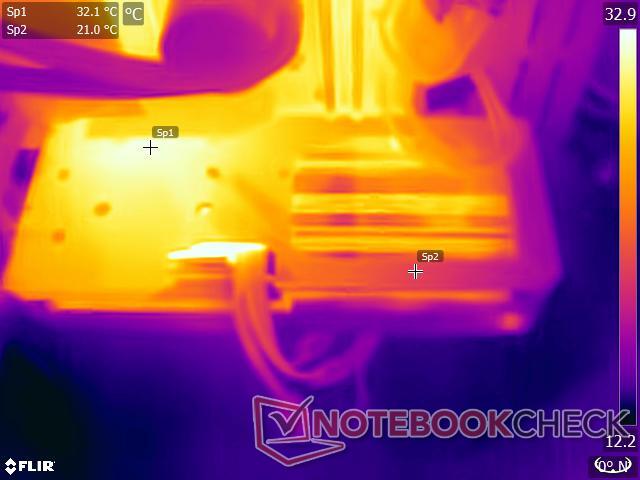
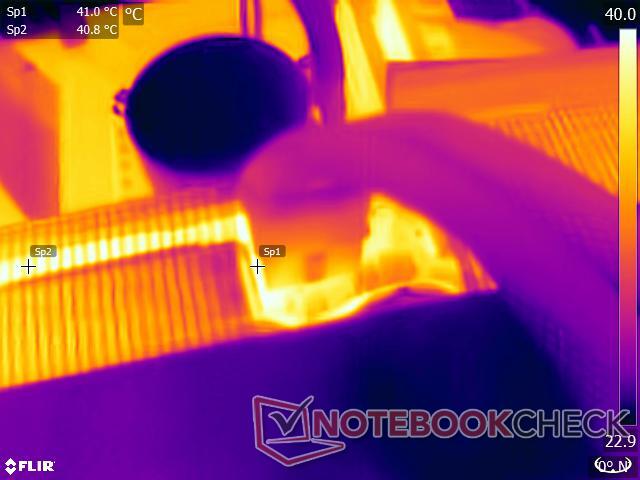
Temperatury powierzchniowe

Dobre chłodzenie przekłada się również na niższe temperatury powierzchni. Plastikowa przednia osłona karty utrzymuje się blisko temperatury otoczenia w pomieszczeniu, czyli 22°C.

Ponieważ karta Aorus nie odsłania mocowania GPU, metalowy backplate pomaga dość skutecznie wypromieniować temperatury.

W okolicy złącza 12VHPWR odnotowaliśmy około 41 °C, co jest normą.

Temperatury powierzchni - przód
Temperatury powierzchni - tył
Temperatury powierzchni - złącze 12VHPWR

Poziomy hałasu

Konstrukcja wentylatora inspirowana płetwą rekina na płycie Aorus GeForce RTX 4070 Ti Master

Gigabyte dużo mówi o swoim ulepszonym systemie chłodzenia Windforce w linii Aorus. Nowe łopatki wentylatora posiadają coś, co firma nazywa designem Bionic Shark, który naśladuje łuski na skórze rekina.

Najwyraźniej nowa konstrukcja łopatek wentylatora i ich tekstura przypominająca skórę rekina powinny pomóc w zwiększeniu ciśnienia statycznego o 30%, a jednocześnie spowodować zmniejszenie hałasu o 3 dB w porównaniu do konwencjonalnych wentylatorów przy 1800 RPM.

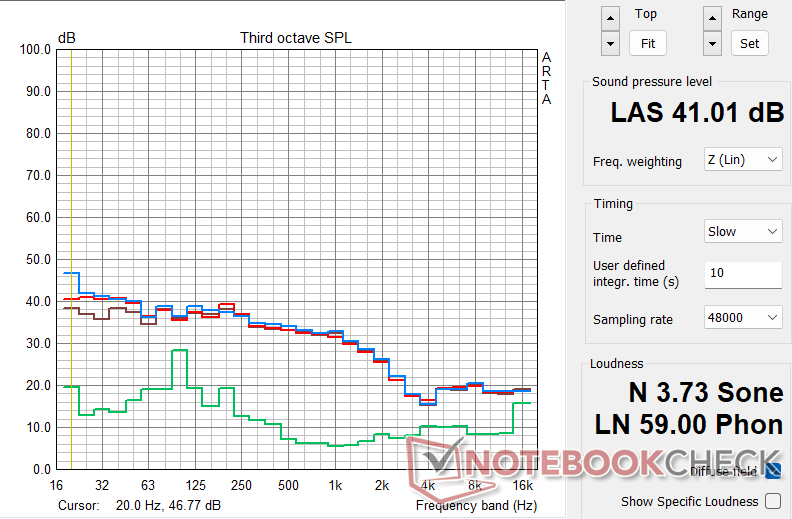
Gigabyte dostarczył nam zaktualizowane wersje BIOSu, które najwyraźniej pomagają w uzyskaniu lepszych krzywych wentylatorów i zmniejszeniu hałasu. Zaobserwowaliśmy, że nowe wersje BIOS-u rzeczywiście pomogły w redukcji hałasu wentylatorów w odczuwalnym stopniu. Dla przykładu, hałas wentylatorów w FurMark przy 100% mocy docelowej w trybie OC BIOS zmniejszył się z 44,10 dB(A) w starym BIOSie do 41,01 w nowej wersji.

W sprzedaży powinny być dostępne próbki z fabrycznie wgranymi nowymi BIOS-ami.

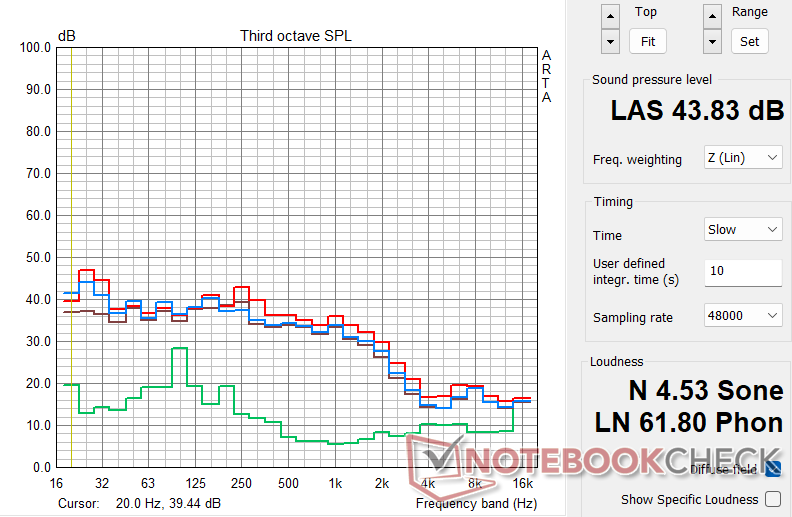
W związku z tym nie zaobserwowaliśmy żadnych szczególnych korzyści z wyboru jednego z trybów BIOS-u, podobnie jak w przypadku Asus TUF Gaming RTX 4070 Ti OC. Jak widać w poniższej tabeli, nie ma dużej różnicy w zmierzonym poziomie ciśnienia akustycznego (SPL) podczas testów obciążeniowych przeprowadzonych przy 100% mocy docelowej w obu trybach BIOS-u.

Zwiększenie docelowego poziomu zasilania do 128% ma wpływ na prędkość obrotową wentylatorów, a w konsekwencji na SPL w programie FurMark. Jednak w rzeczywistości wentylatory kręcą się z prędkością o 4% niższą podczas testu The Witcher 3 przy 128% poborze mocy, ponieważ procesor graficzny jest już w stanie utrzymać maksymalne taktowanie przez dłuższy czas bez dławienia.

Ambient Noise: 20.23 db(A); System Idle: 21.23 db(A)
Stress Test Tryb VBIOS / Power Target Max. Prędkość wentylatora (RPM) Hałas wentylatora dB(A)
FurMark 1280 x 720, bez AA OC BIOS / 100% 1,567 41.01
FurMark 1280 x 720, bez AA OC BIOS / 128% 1,660 43.83
FurMark 1280 x 720, bez AA Silent / 100% 1,517 41.40
The Witcher 3 1080p Ultra OC BIOS / 100% 1,551 40.55
The Witcher 3 1080p Ultra OC BIOS / 128% 1,478 40.41
The Witcher 3 1080p Ultra Silent / 100% 1,559 41.01
Aorus GeForce RTX 4070 Ti Master - Profil hałasu wentylatorów w stresie FurMark: Zielony - Ambient/Idle, Brązowy: OC BIOS 100% PT, Czerwony: OC BIOS: 128% PT, Niebieski: Silent BIOS 100% PT
Aorus GeForce RTX 4070 Ti Master - profil hałasu wentylatorów w stresie The Witcher 3: Zielony - Ambient/Idle, Brązowy: OC BIOS 100% PT, Czerwony: OC BIOS: 128% PT, Niebieski: Silent BIOS 100% PT

Wentylatory całkowicie zatrzymują się w bezczynności i zaczynają się kręcić dopiero wtedy, gdy temperatura rdzenia GPU przekroczy 52°C. Ogólnie rzecz biorąc, hałas wentylatorów Aorus GeForce RTX 4070 Ti Master jest do opanowania w zamkniętej obudowie.

Użytkownicy mogą jeszcze bardziej dostroić krzywe wentylatorów poprzez Gigabyte Control Center lub kompatybilne narzędzie innych firm.

Zarządzanie energią: Zasysa 32% mniej energii niż RTX 3090 Ti

Pobór mocy ze ściany jest na spodziewanych liniach dla karty AD104. Aorus GeForce RTX 4070 Ti Master zużywa o 32% mniej energii w porównaniu do Zotac Gaming GeForce RTX 3090 Ti AMP Extreme Holow FurMarku i 28% w The Witcher 3 w 1080p Ultra przy 100% docelowej mocy.

Pomiędzy samymi trzema kartami RTX 4070 Ti nie ma zbyt dużej różnicy pod względem zużycia energii. Przy celu 100% mocy, TUF Gaming RTX 4070 Ti OC zużywa około 4% więcej energii niż Aorus podczas uruchamiania The Witcher 3.

Power Consumption: External Monitor

0255075100125150175200225250275300325350375400425450Tooltip
Gigabyte Aorus GeForce RTX 4070 Ti Master; 1280x720 FurMark 1.19 GPU Stress Test (external Monitor); OC BIOS; 128% PT: Ø446 (436-452)
Gigabyte Aorus GeForce RTX 4070 Ti Master; 1280x720 FurMark 1.19 GPU Stress Test (external Monitor); OC BIOS; 100% PT: Ø405 (397-416)
Gigabyte Aorus GeForce RTX 4070 Ti Master; 1280x720 FurMark 1.19 GPU Stress Test (external Monitor); Silent BIOS; 100% PT: Ø404 (396-417)
Gigabyte Aorus GeForce RTX 4070 Ti Master; 1920x1080 The Witcher 3 ultra (external Monitor); Silent BIOS; 100% PT: Ø414 (406-432)
Gigabyte Aorus GeForce RTX 4070 Ti Master; 1920x1080 The Witcher 3 ultra (external Monitor); OC BIOS; 128% PT: Ø410 (401-435)
Gigabyte Aorus GeForce RTX 4070 Ti Master; 1920x1080 The Witcher 3 ultra (external Monitor); OC BIOS; 100% PT: Ø404 (397-427)
Gigabyte Aorus GeForce RTX 4070 Ti Master; Idle 1min (external Monitor): Ø75.5 (74.3-77.8)
Power Consumption
1280x720 FurMark 1.19 GPU Stress Test (external Monitor)
NVIDIA GeForce RTX 4090 Founders Edition
Intel Core i9-13900K, NVIDIA GeForce RTX 4090 (133% PT OC, Idle: 81.25 W)
704 (666min, 670P1 - 717max) Watt * -58%
NVIDIA GeForce RTX 4090 Founders Edition
Intel Core i9-13900K, NVIDIA GeForce RTX 4090 (100% PT, Idle: 81.25 W)
558 (551min, 553P1 - 566max) Watt * -25%
Zotac Gaming GeForce RTX 3090 Ti AMP Extreme Holo
AMD Ryzen 7 5800X3D, NVIDIA GeForce RTX 3090 Ti (110% PT, Idle: 102 W)
648 (629min, 637P1 - 658max) Watt * -45%
Zotac Gaming GeForce RTX 3090 Ti AMP Extreme Holo
AMD Ryzen 7 5800X3D, NVIDIA GeForce RTX 3090 Ti (100% PT; Quiet BIOS, Idle: 102 W)
599 (587min, 588P1 - 666max) Watt * -34%
Zotac Gaming GeForce RTX 3090 Ti AMP Extreme Holo
AMD Ryzen 7 5800X3D, NVIDIA GeForce RTX 3090 Ti (100% PT; Amplify BIOS, Idle: 102 W)
598 (584min, 595P1 - 608max) Watt * -34%
Sapphire AMD Radeon RX 6950 XT Nitro+ Pure
AMD Ryzen 9 5900X, AMD Radeon RX 6950 XT
564 (525min, 551P1 - 601max) Watt * -26%
AMD Radeon RX 7900 XTX
AMD Ryzen 9 7950X, AMD Radeon RX 7900 XTX (Idle: 86.5 W)
518 (501min, 502P1 - 525max) Watt * -16%
AMD Radeon RX 7900 XT
AMD Ryzen 9 7950X, AMD Radeon RX 7900 XT (Idle: 84.6 W)
513 (500min, 506P1 - 527max) Watt * -15%
Average NVIDIA GeForce RTX 3080
  (Idle: 492 - 505, n=2 W)
499 Watt * -12%
Average NVIDIA GeForce RTX 3090
  (Idle: 281 - 551, n=8 W)
469 Watt * -5%
NVIDIA GeForce RTX 4080 Founders Edition
Intel Core i9-13900K, NVIDIA GeForce RTX 4080 (110% PT, Idle: 78.45 W)
466 (461min, 462P1 - 488max) Watt * -4%
NVIDIA GeForce RTX 4080 Founders Edition
Intel Core i9-13900K, NVIDIA GeForce RTX 4080 (100% PT, Idle: 78.45 W)
429 (423min, 424P1 - 436max) Watt * +4%
Average NVIDIA GeForce RTX 3080 Ti
  (Idle: 427 - 513, n=3 W)
464 Watt * -4%
AMD Radeon RX 6900 XT
AMD Ryzen 9 5950X, AMD Radeon RX 6900 XT (Idle: 99.15 W)
456.8 (378.13min - 484.67max) Watt * -2%
AMD Radeon RX 6800 XT
AMD Ryzen 9 5950X, AMD Radeon RX 6800 XT (Idle: 99.5 W)
447.9 (413min - 484max) Watt * -0%
Aorus GeForce RTX 4070 Ti Master
Intel Core i9-13900K, NVIDIA GeForce RTX 4070 Ti (OC BIOS; 128% PT, Idle: 75.5 W)
446 (436min, 437P1 - 452max) Watt *
Aorus GeForce RTX 4070 Ti Master
Intel Core i9-13900K, NVIDIA GeForce RTX 4070 Ti (OC BIOS; 100% PT, Idle: 75.5 W)
405 (397min, 398P1 - 416max) Watt * +9%
Aorus GeForce RTX 4070 Ti Master
Intel Core i9-13900K, NVIDIA GeForce RTX 4070 Ti (Silent BIOS; 100% PT, Idle: 75.5 W)
404 (396min, 398P1 - 417max) Watt * +9%
Asus TUF Gaming GeForce RTX 4070 Ti
Intel Core i9-13900K, NVIDIA GeForce RTX 4070 Ti (Perf BIOS / 110% PT, Idle: 75.4 W)
443 (440min, 440P1 - 465max) Watt * +1%
Asus TUF Gaming GeForce RTX 4070 Ti
Intel Core i9-13900K, NVIDIA GeForce RTX 4070 Ti (Quiet BIOS / 100% PT, Idle: 75.4 W)
410 (408min, 409P1 - 415max) Watt * +8%
Asus TUF Gaming GeForce RTX 4070 Ti
Intel Core i9-13900K, NVIDIA GeForce RTX 4070 Ti (Perf BIOS / 100% PT, Idle: 75.4 W)
406 (401min, 402P1 - 430max) Watt * +9%
Average NVIDIA Titan RTX
  (Idle:  W)
419 Watt * +6%
KFA2 GeForce RTX 4070 Ti SG
AMD Ryzen 9 7950X, NVIDIA GeForce RTX 4070 Ti (Idle: 91.5 W)
410 (402min, 404P1 - 464max) Watt * +8%
Average of class
  (Idle: 8.15 - 704, n=1282 W)
128.5 Watt * +71%
1920x1080 The Witcher 3 ultra (external Monitor)
Sapphire AMD Radeon RX 6950 XT Nitro+ Pure
AMD Ryzen 9 5900X, AMD Radeon RX 6950 XT
589 (583min, 584P1 - 598max) Watt * -42%
Zotac Gaming GeForce RTX 3090 Ti AMP Extreme Holo
AMD Ryzen 7 5800X3D, NVIDIA GeForce RTX 3090 Ti (110% PT, Idle: 102 W)
569 (555min, 557P1 - 580max) Watt * -37%
Zotac Gaming GeForce RTX 3090 Ti AMP Extreme Holo
AMD Ryzen 7 5800X3D, NVIDIA GeForce RTX 3090 Ti (100% PT, Idle: 102 W)
561 (533min, 542P1 - 582max) Watt * -36%
NVIDIA GeForce RTX 4090 Founders Edition
Intel Core i9-13900K, NVIDIA GeForce RTX 4090 (133% PT OC, Idle: 81.25 W)
552 (541min, 545P1 - 569max) Watt * -33%
NVIDIA GeForce RTX 4090 Founders Edition
Intel Core i9-13900K, NVIDIA GeForce RTX 4090 (100% PT, Idle: 81.25 W)
499 (493min, 494P1 - 519max) Watt * -21%
AMD Radeon RX 7900 XTX
AMD Ryzen 9 7950X, AMD Radeon RX 7900 XTX (Idle: 86.5 W)
540 (527min, 530P1 - 564max) Watt * -30%
Intel Core i9-13900K
Intel Core i9-13900K, NVIDIA GeForce RTX 3090
533 (520min, 525P1 - 568max) Watt * -29%
Average NVIDIA GeForce RTX 3090
  (Idle: 464 - 597, n=17 W)
524 Watt * -27%
Average NVIDIA GeForce RTX 3080 Ti
  (Idle: 490 - 528, n=3 W)
506 Watt * -22%
AMD Radeon RX 6800 XT
AMD Ryzen 9 5950X, AMD Radeon RX 6800 XT (Idle: 99.5 W)
505 (389min - 543max) Watt * -22%
Average NVIDIA GeForce RTX 3080
  (Idle: 498 - 505, n=2 W)
502 Watt * -21%
AMD Radeon RX 6900 XT
AMD Ryzen 9 5950X, AMD Radeon RX 6900 XT (Idle: 99.15 W)
488.3 (459.99min - 512.79max) Watt * -18%
NVIDIA GeForce RTX 4080 Founders Edition
Intel Core i9-13900K, NVIDIA GeForce RTX 4080 (110% PT, Idle: 78.45 W)
463 (451min, 453P1 - 481max) Watt * -12%
NVIDIA GeForce RTX 4080 Founders Edition
Intel Core i9-13900K, NVIDIA GeForce RTX 4080 (100% PT, Idle: 78.45 W)
420 (410min, 411P1 - 448max) Watt * -1%
AMD Radeon RX 7900 XT
AMD Ryzen 9 7950X, AMD Radeon RX 7900 XT (Idle: 84.6 W)
459 (451min, 453P1 - 488max) Watt * -11%
Asus TUF Gaming GeForce RTX 4070 Ti
Intel Core i9-13900K, NVIDIA GeForce RTX 4070 Ti (Perf BIOS / 110% PT, Idle: 75.4 W)
422 (412min, 413P1 - 452max) Watt * -2%
Asus TUF Gaming GeForce RTX 4070 Ti
Intel Core i9-13900K, NVIDIA GeForce RTX 4070 Ti (Perf BIOS / 100% PT, Idle: 75.4 W)
419 (414min, 415P1 - 438max) Watt * -1%
Asus TUF Gaming GeForce RTX 4070 Ti
Intel Core i9-13900K, NVIDIA GeForce RTX 4070 Ti (Quiet BIOS / 100% PT, Idle: 75.4 W)
418 (411min, 412P1 - 433max) Watt * -1%
Aorus GeForce RTX 4070 Ti Master
Intel Core i9-13900K, NVIDIA GeForce RTX 4070 Ti (Silent BIOS; 100% PT, Idle: 75.5 W)
414 (406min, 407P1 - 432max) Watt *
Aorus GeForce RTX 4070 Ti Master
Intel Core i9-13900K, NVIDIA GeForce RTX 4070 Ti (OC BIOS; 128% PT, Idle: 75.5 W)
410 (401min, 403P1 - 435max) Watt * +1%
Aorus GeForce RTX 4070 Ti Master
Intel Core i9-13900K, NVIDIA GeForce RTX 4070 Ti (OC BIOS; 100% PT, Idle: 75.5 W)
404 (397min, 398P1 - 427max) Watt * +2%
KFA2 GeForce RTX 4070 Ti SG
AMD Ryzen 9 7950X, NVIDIA GeForce RTX 4070 Ti (Idle: 91.5 W)
409 (397min, 399P1 - 433max) Watt * +1%
Average NVIDIA Titan RTX
  (Idle: 371 - 463, n=27 W)
408 Watt * +1%
Average of class
  (Idle: 10.1 - 716, n=1259 W)
149.1 Watt * +64%

* ... im mniej tym lepiej

Za

+ Solidna jakość wykonania
+ Przydatny panel widokowy LCD
+ Solidny system chłodzenia z całkowitym zatrzymaniem wentylatora w stanie bezczynności
+ Wydajność na równi lub lekko przed RTX 3090 Ti
+ Tolerowane emisje dzięki nowemu BIOS-owi

Przeciw

- Brak zauważalnej różnicy akustycznej pomiędzy trybami OC i Silent BIOS-u
- Błędne i prawie nieużyteczne oprogramowanie Gigabyte Control Center
- Drogo jak na kartę klasy 70

Werdykt: Doskonała wydajność przy bezdusznej cenie

Aorus GeForce RTX 4070 Ti Master 12G. Jednostka recenzencka dzięki uprzejmości Gigabyte India i Nvidia India.

W związku z tym, że Nvidia nie zdecydowała się na wprowadzenie na rynek karty RTX 4070 Ti Founders Edition, Aorus GeForce RTX 4070 Ti Master 12G dołącza do listy kilkudziesięciu kart AiB opartych na nowym GPU AD104. Aorus ma jednak kilka własnych sztuczek, dzięki którym RTX 4070 Ti Master 12G będzie wyróżniać się z tłumu.

Aorus GeForce RTX 4070 Ti Master 12G nie rzuca szczególnych niespodzianek na froncie wydajnościowym - zachowuje się dokładnie tak, jak np Asus TUF Gaming GeForce RTX 4070 Ti OC i KFA2 GeForce RTX 4070 Ti SG w niemal każdym benchmarku i grze, którą testowaliśmy.

Oznacza to, że karta osiąga takie same lub nawet lepsze wyniki niż RTX 3090 Ti i często znacząco wyprzedza RTX 3090. Wsparcie dla nowych usprawnień architektonicznych, w tym generowania klatek DLSS 3.0 i nowych potoków ray tracingu, oznacza, że RTX 4070 Ti wytrzyma jeszcze przez dłuższy czas i bez większych problemów będzie w stanie rozbawić sporą liczbę obecnych i nadchodzących tytułów w QHD Ultra, a nawet w 4K.

Aorus stara się wyróżnić na tle konkurencji pod względem estetycznym. Konstrukcja jest przede wszystkim plastikowa, ale metalowy backplate dodaje zarówno formy, jak i funkcji pomagając w efektywnym odprowadzaniu ciepła.

Aorus RTX 4070 Ti Master posiada widoczne logo RGB z przodu i z tyłu, potrójny pierścień RGB Halo na wentylatorach, a nawet oferuje panel LCD do wyświetlania statystyk systemu i własnych informacji. Podczas gdy te funkcje działają świetnie po wyjęciu z pudełka, aplikacja Control Center firmy Gigabyte w obecnym stanie jest prawdziwym wrzodem na tyłku.

Aorus GeForce RTX 4070 Ti Master 12G to doskonała karta do gier w rozdzielczości QHD Ultra z trzycyfrową liczbą klatek na sekundę i 4K, która może pokonać RTX 3090 Ti. Jednak cena wywoławcza 1000 USD za kartę z serii 70 wzbudzi kilka zastrzeżeń.

Gigabyte wyposażył kartę w znakomite rozwiązanie chłodzące, którego skuteczność widać w naszych testach obciążeniowych. Dzięki najnowszym BIOS-om, Aorus RTX 4070 Ti Master stara się utrzymać niską głośność. Jednak TUF Gaming RTX 4070 Ti i KFA2 RTX 4070 Ti SG są jeszcze nieco cichsze w stresie.

Wydajność i emisja karty nie powinny się znacznie różnić niezależnie od używanego BIOS-u. Pobór mocy przy docelowym obciążeniu 100% jest podobny do innych kart RTX 4070 Ti, które do tej pory testowaliśmy.

Czy zatem Aorus GeForce RTX 4070 Ti Master 12G powinien znaleźć się wysoko na Twojej liście zakupów dla graczy? Jeśli chodzi o czystą wydajność, to odpowiedź jest twierdząca. Jednak jest w tym coś więcej niż się wydaje.

Jasne, otrzymujesz wydajność klasy RTX 3090 Ti, ale jest to wyłącznie przewaga architektoniczna. RTX 3090 Ti, a nawet RTX 3090, wciąż oferują lepszy podsystem pamięci, który może się przydać nie tylko w grach z dużą ilością tekstur, ale także w wymagających przepływach pracy twórczej.

A RTX 3090 Ti, który kiedyś był kolosalnym wydatkiem bez powodu, teraz spadł do 1 099 USD (powodzenia w znalezieniu zapasów w tej cenie jednak).

Po stronie AMD, Radeon RX 7900 XT jest pod względem cenowym niewypałem Team Red, odpowiednikiem 4070 Ti. Jego cena jest wyższa wyłącznie dlatego, że Nvidia zawyżyła swoją, wyczuwając, że klienci w końcu zapłacą.

Pamiętaj, że płacisz dodatkowo za branding Aorus i takie rzeczy jak wymyślne ekrany LCD. Gigabyte RTX 4070 Tis jest dostępny w okolicach 850 dolarów i działa równie dobrze.

Jednak karta Radeon RX 7900 XTX Made by AMD (MBA) w cenie MSRP wynoszącej 999 USD jest znacznie lepszym rozwiązaniem niż Aorus RTX 4070 Ti Master, jeśli nie masz nic przeciwko utracie DLSS 3 i wszelkich przepływów pracy zależnych od CUDA.

Sam w sobie, Aorus GeForce RTX 4070 Ti Master 12G to świetny procesor graficzny do gier, który wygląda świetnie, jest w miarę cichy, energooszczędny i oferuje flagową wydajność Ampere bez większych problemów

.

Jeśli masz czas, sugerujemy poczekać na dalszy spadek cen i bacznie obserwować dobre oferty na RTX 4080 i RX 7900 XTX.

W przeciwnym razie zdecyduj się na RTX 4070 Ti w okolicach 799 USD.

Cena i dostępność

Aorus GeForce RTX 4070 Ti Master 12G jest dostępny w Amazon US i Best Buy w cenie 999,99 USD.

W Indiach Aorus GeForce RTX 4070 Ti Master 12G jest wyceniony na oficjalną cenę MRP w wysokości ₹94,127 z niewielkimi różnicami między sprzedawcami. Tym samym jest on tańszy od Asus TUF Gaming RTX 4070 Ti OC, który kosztuje ₹101 999 MRP.

Pricecompare

Please share our article, every link counts!
> laptopy testy i recenzje notebooki > Laptopy > Recenzja Gigabyte Aorus GeForce RTX 4070 Ti Master 12G: RTX 3090 Ti z dodatkowym blingiem za 1000 USD
Vaidyanathan Subramaniam, 2023-02-27 (Update: 2023-02-27)