Recenzja laptopa MSI Pulse GL76: grafika 105 W TGP GeForce RTX 3070
Pulse GL76 to średniej klasy laptop gamingowy MSI znajdujący się pomiędzy tańszą serią Katana lub Sword a droższymi seriami GE Raider lub GT Titan. Jest to w zasadzie 17,3-calowa wersja mniejszego 15,6-calowego Pulse GL66. Modele 2021 i 2022 GL76 mają identyczne obudowy.
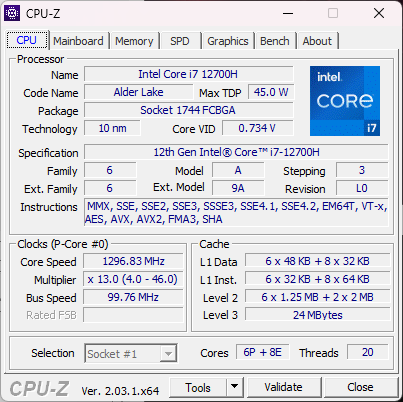
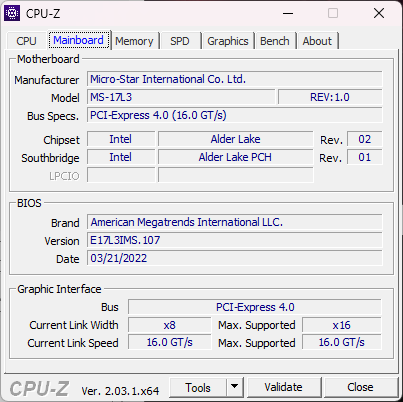
Nasz egzemplarz to konfiguracja z wyższej półki z procesorem Core i7-12700H 12. generacji, procesorem graficznym 105 W GeForce RTX 3070 i wyświetlaczem IPS 360 Hz 1080p w cenie około 1300 USD. Inne jednostki SKU są dostępne z wolniejszymi częstotliwościami odświeżania wyświetlacza, procesorami graficznymi GeForce RTX 3050/3050 Ti/3060 lub zamiast nich procesorem Core i5-12500H.
Konkurencję dla Pulse GL76 stanowią inne średniej klasy 17,3-calowe laptopy do gier, np Acer Nitro 5, , Asus "Seria TUF, HP Victus, lub Dell G series.
Więcej recenzji MSI:
Potencjalni konkurenci w porównaniu
Ocena | Data | Model | Waga | Wysokość | Rozmiar | Rezolucja | Cena |
|---|---|---|---|---|---|---|---|
| 83.2 % v7 (old) | 01/2023 | MSI Pulse GL76 12UGK i7-12700H, GeForce RTX 3070 Laptop GPU | 2.6 kg | 24.2 mm | 17.30" | 1920x1080 | |
| 86.1 % v7 (old) | 01/2023 | Alienware m17 R5 (R9 6900HX, RX 6850M XT) R9 6900HX, Radeon RX 6850M XT | 3.4 kg | 26.7 mm | 17.00" | 3840x2160 | |
| 86.9 % v7 (old) | 11/2022 | Asus ROG Strix Scar 17 SE G733CX-LL014W i9-12950HX, GeForce RTX 3080 Ti Laptop GPU | 2.9 kg | 28.3 mm | 17.30" | 2560x1440 | |
| 86.5 % v7 (old) | 11/2022 | Acer Predator Helios 300 (i7-12700H, RTX 3070 Ti) i7-12700H, GeForce RTX 3070 Ti Laptop GPU | 3 kg | 27.65 mm | 17.30" | 2560x1440 | |
| 89.9 % v7 (old) | Razer Blade 17 Early 2022 i9-12900H, GeForce RTX 3080 Ti Laptop GPU | 2.8 kg | 19.9 mm | 17.30" | 3840x2160 | ||
| 86.7 % v7 (old) | MSI Vector GP76 12UGS-434 i7-12700H, GeForce RTX 3070 Ti Laptop GPU | 2.9 kg | 25.9 mm | 17.30" | 1920x1080 |
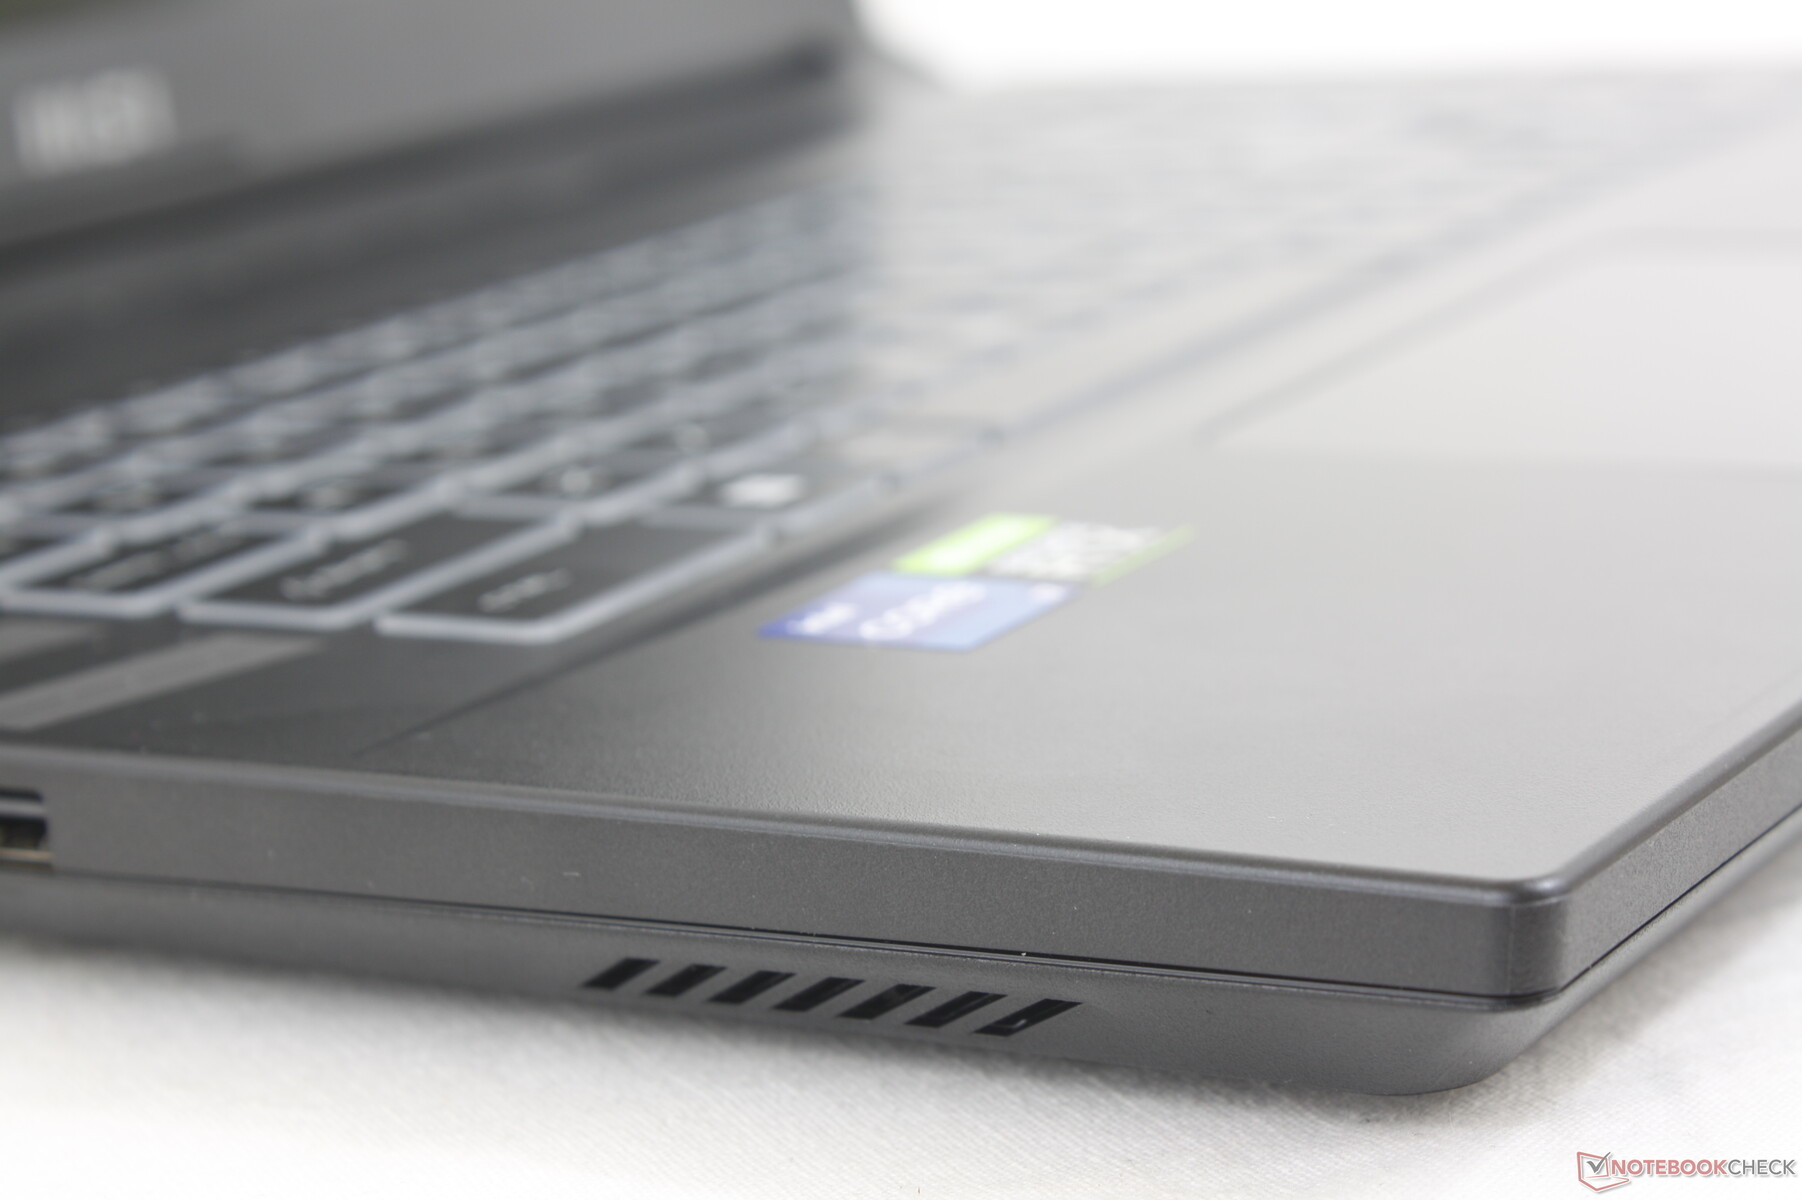
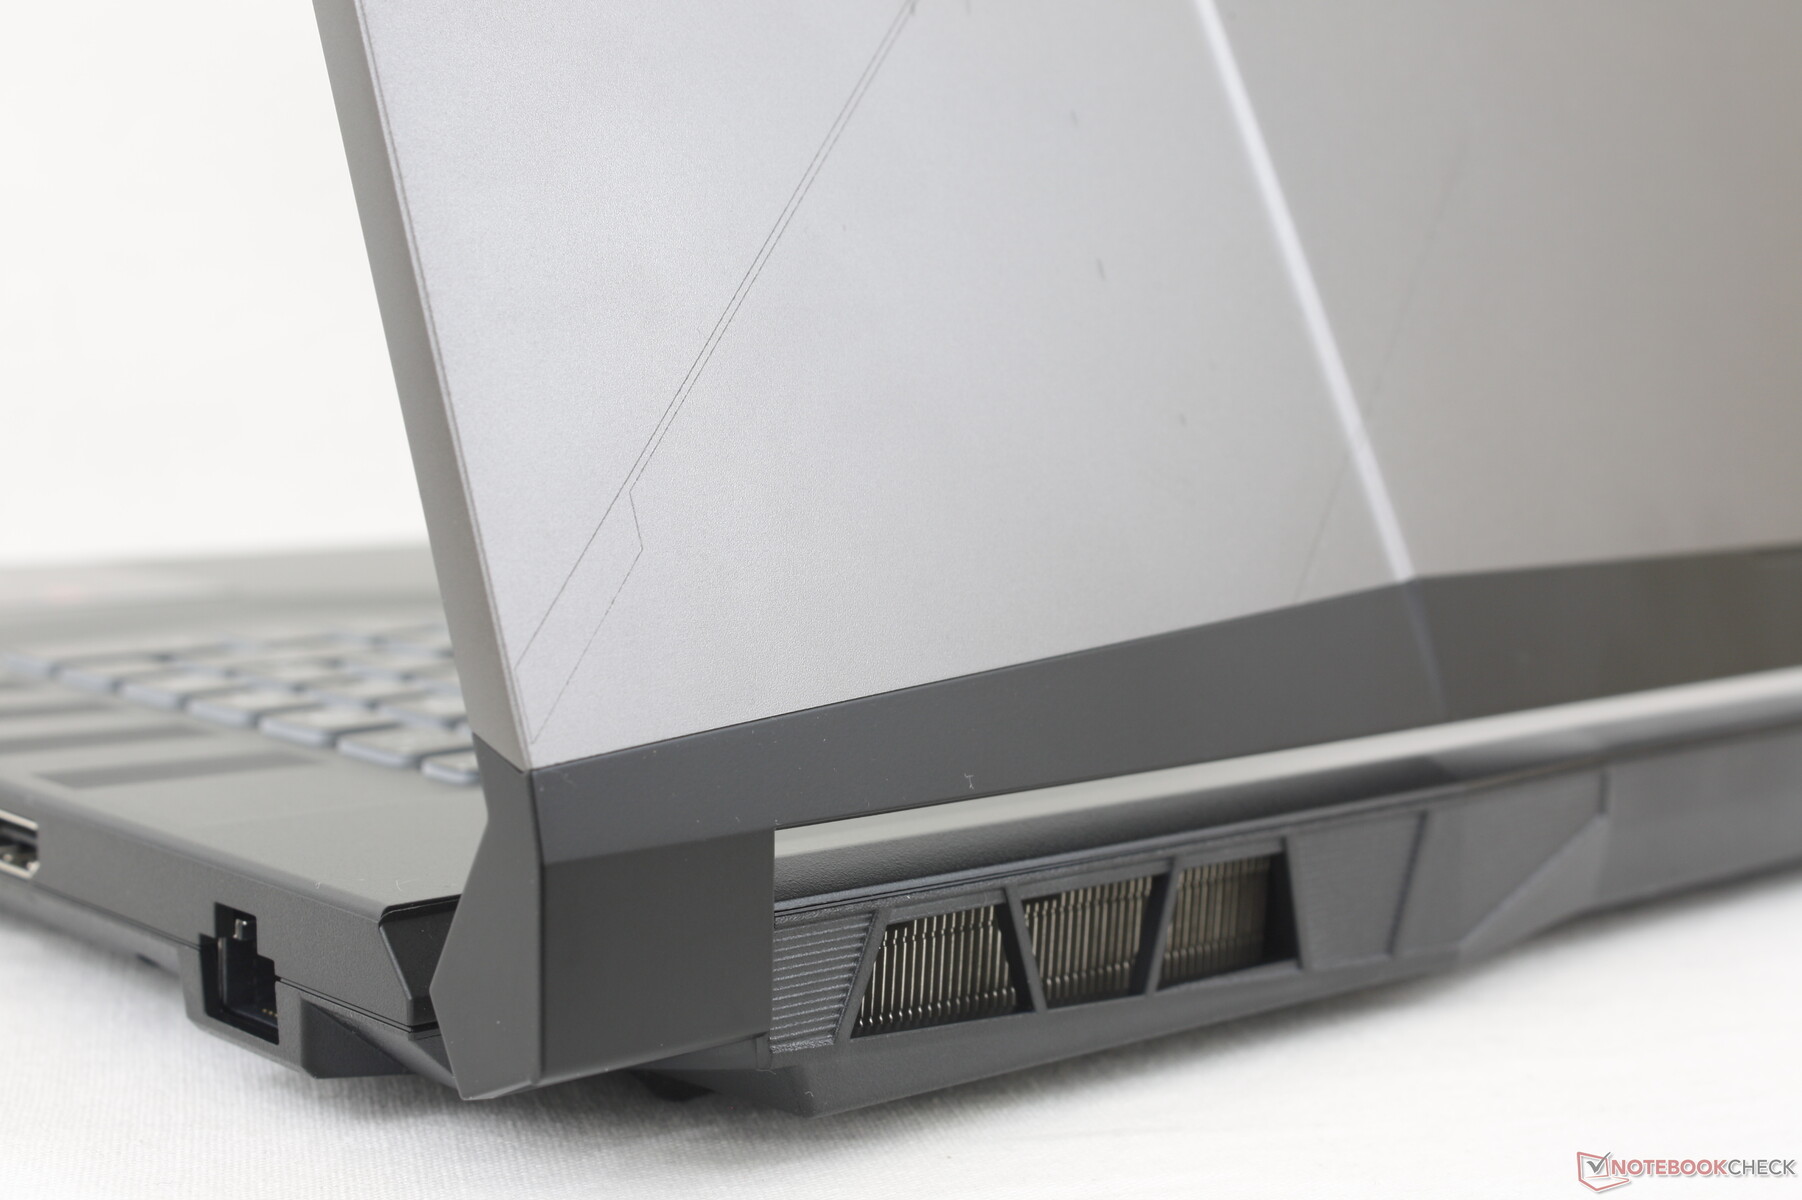
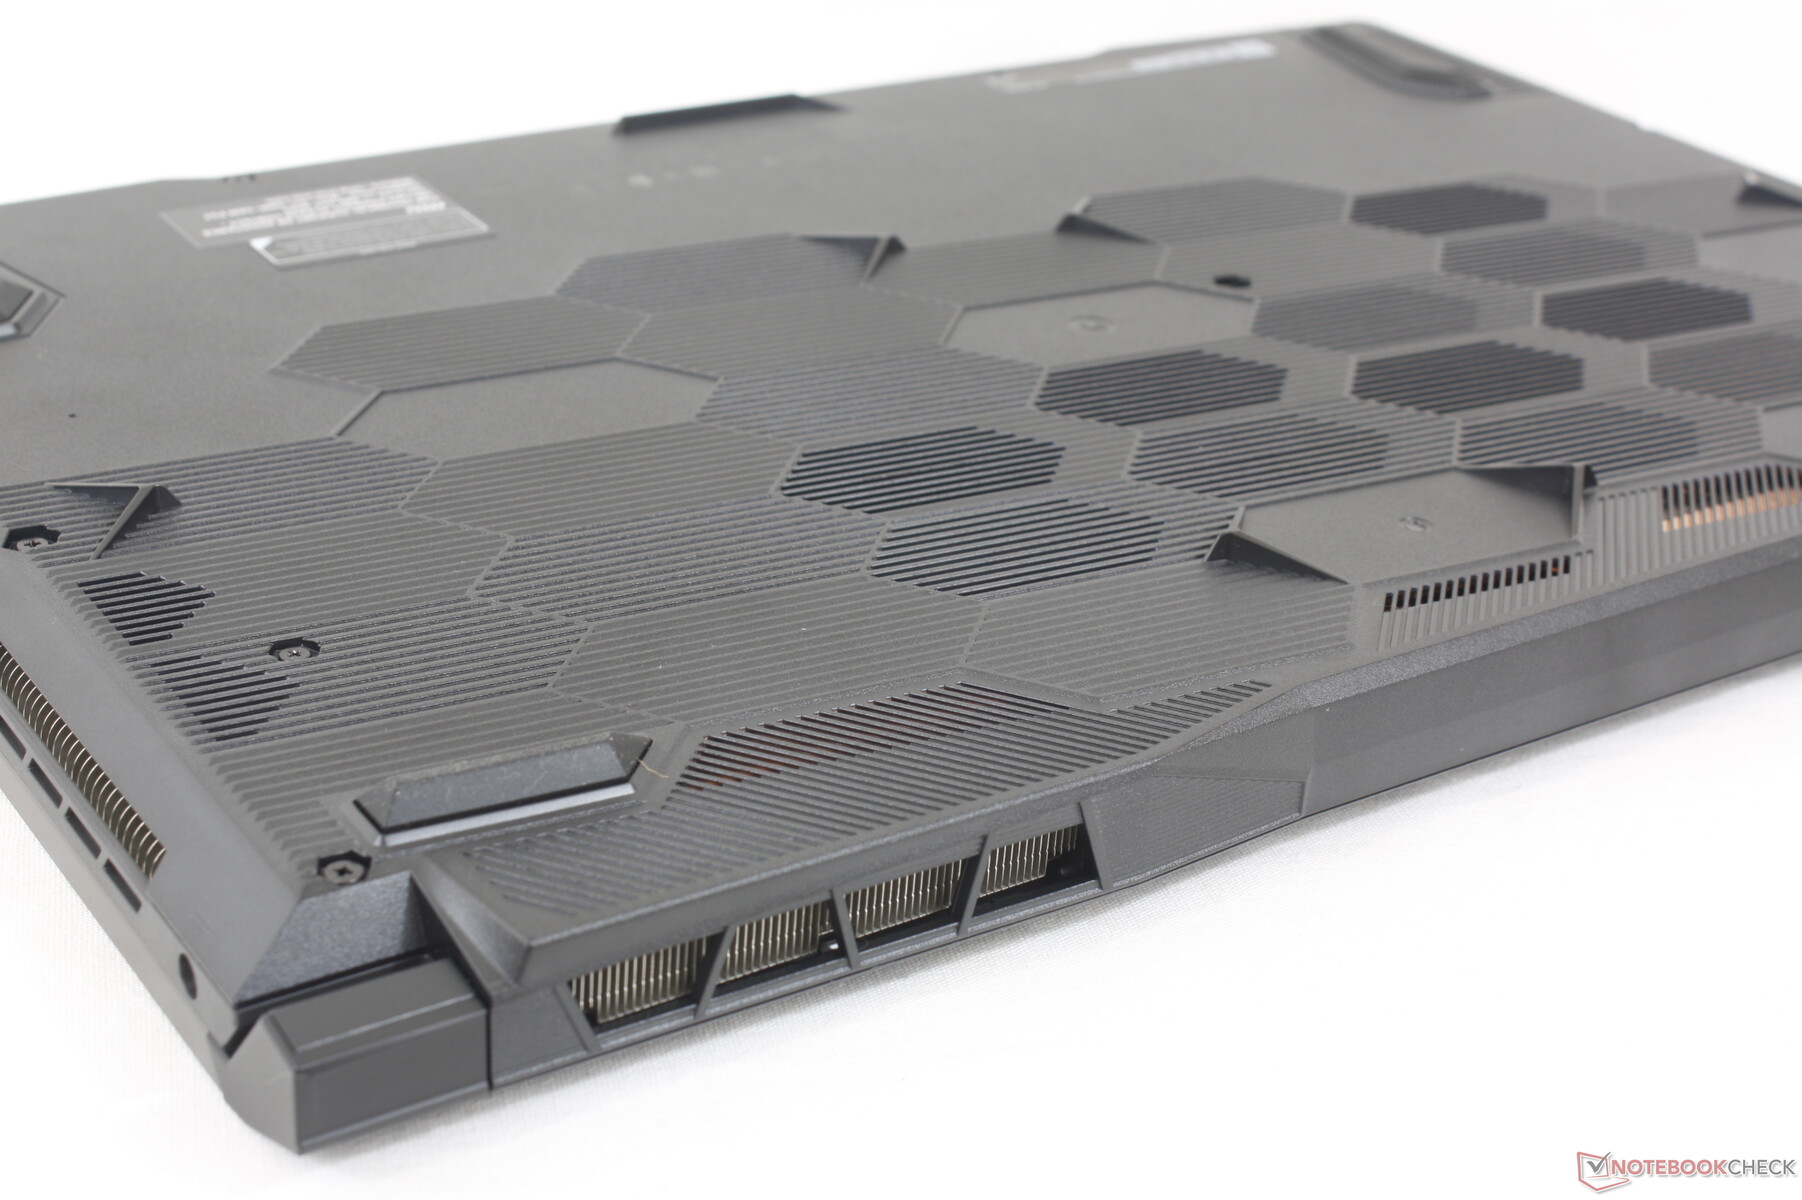
Obudowa - bez wymyślnych kolorów i diod LED
Obudowa jest w większości plastikowa, podobnie jak w przypadku wszystkich budżetowych i średniej klasy laptopów do gier od MSI. Brakuje w niej luksusowych akcentów, krzykliwych diod LED i gładszych odczuć w przypadku modeli z wyższej półki, takich jak MSI GE77 lub Razer Blade 17 co daje bardziej mdłe wrażenie. To nie powinno być zaskakujące, ponieważ wygląd jest jedną z pierwszych rzeczy, które dostają topór podczas cięcia kosztów na budżetowych i średnich modeli gier.
Sztywność obudowy na szczęście nie jest zagrożona. Plastikowe powierzchnie są tańsze w dotyku niż w modelach GE, GS czy GT, ale mimo to są dość solidne i odporne na skręcenia czy wgłębienia, nawet w przypadku środka klawiatury czy zewnętrznej pokrywy. Nie ma też większych problemów ze skrzypieniem. Zawiasy mogłyby być jednak sztywniejsze pod szerszymi kątami, by dać lepsze poczucie długowieczności.
System jest lżejszy niż się spodziewano, zwłaszcza jak na 17,3-calowy laptop do gier. Przy wadze 2,6 kg jest lżejszy od Razera Blade 17, Asusa ROG Strix Scar 17 i m.in.Acer Predator Helios 300 o kilkaset gramów każdy. Przewaga wagowa wynika prawdopodobnie z zauważalnie mniejszej długości konstrukcji obudowy GL76. Jest ona jednak nieco szersza, ale oszczędność wagi rekompensuje nieco dłuższą stopę.
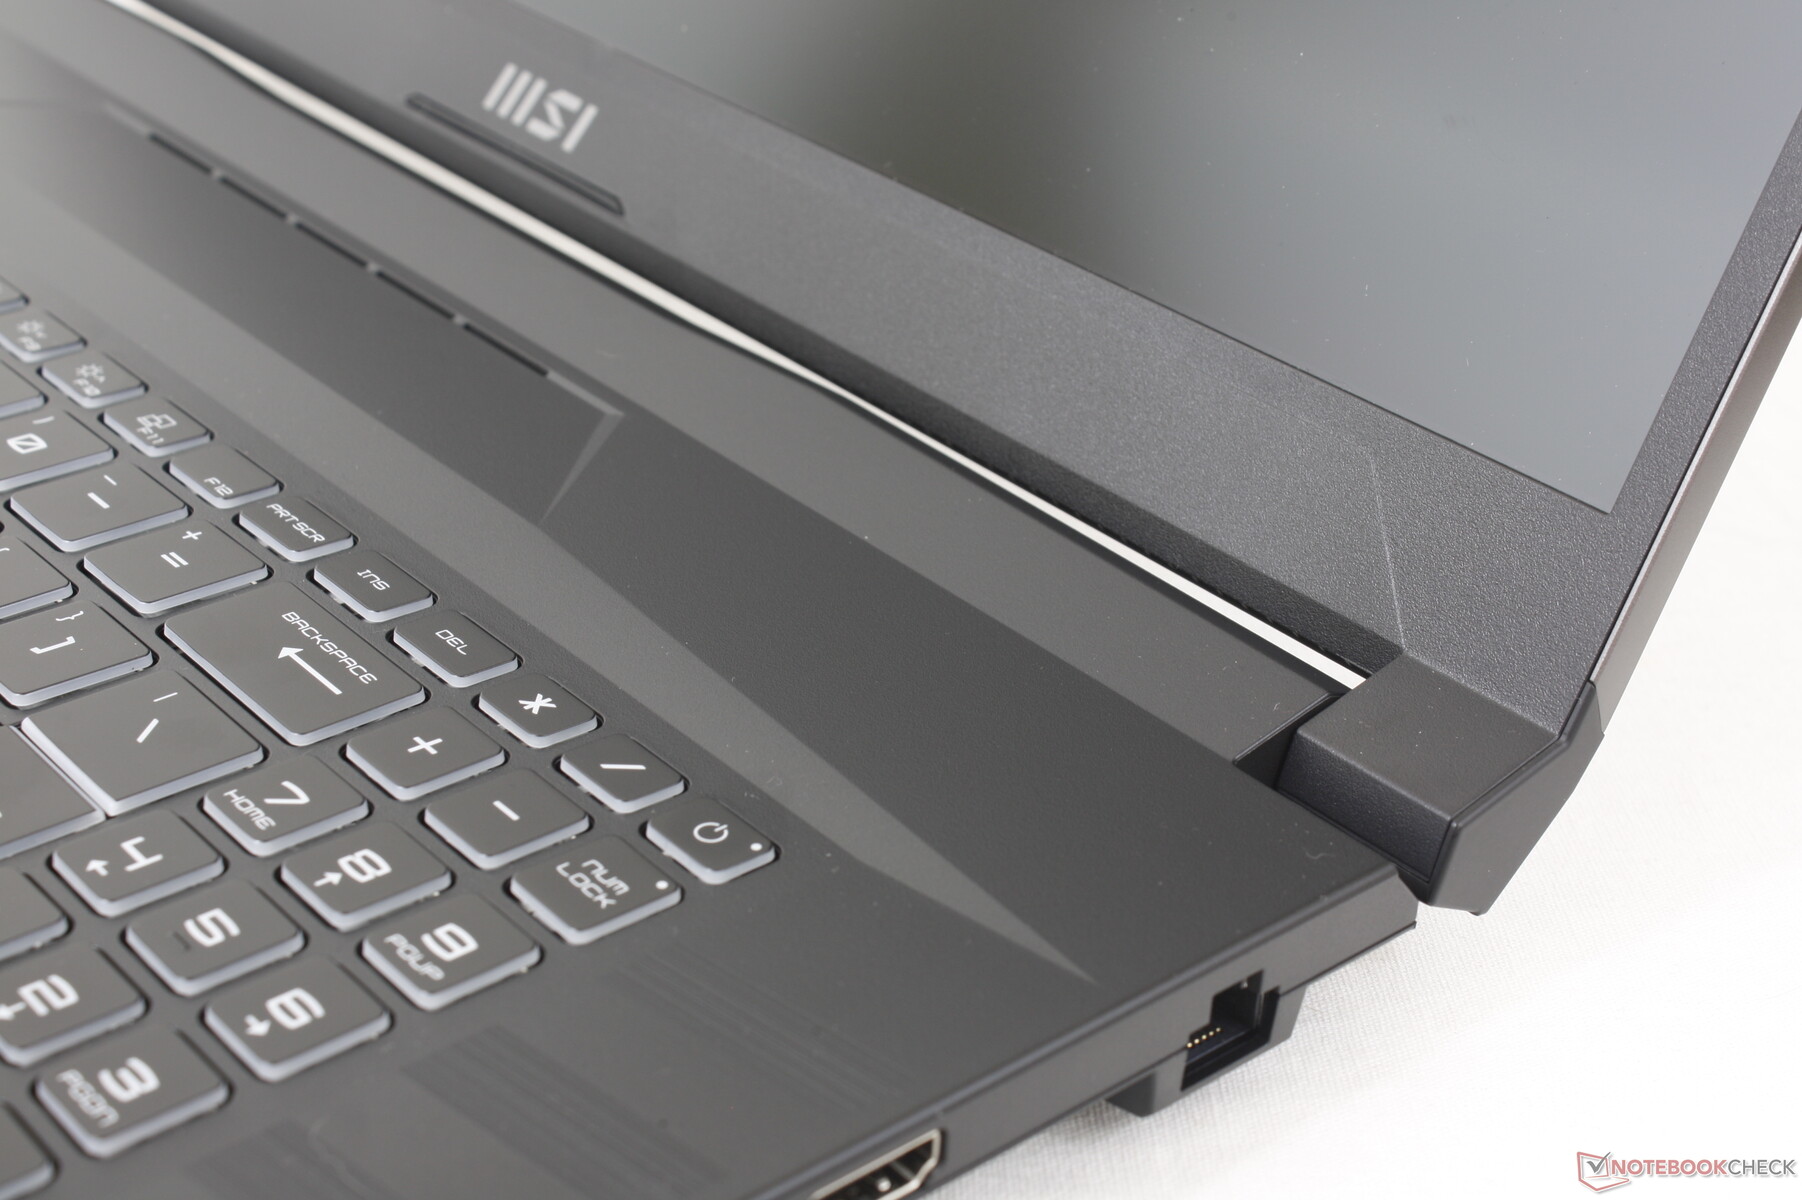
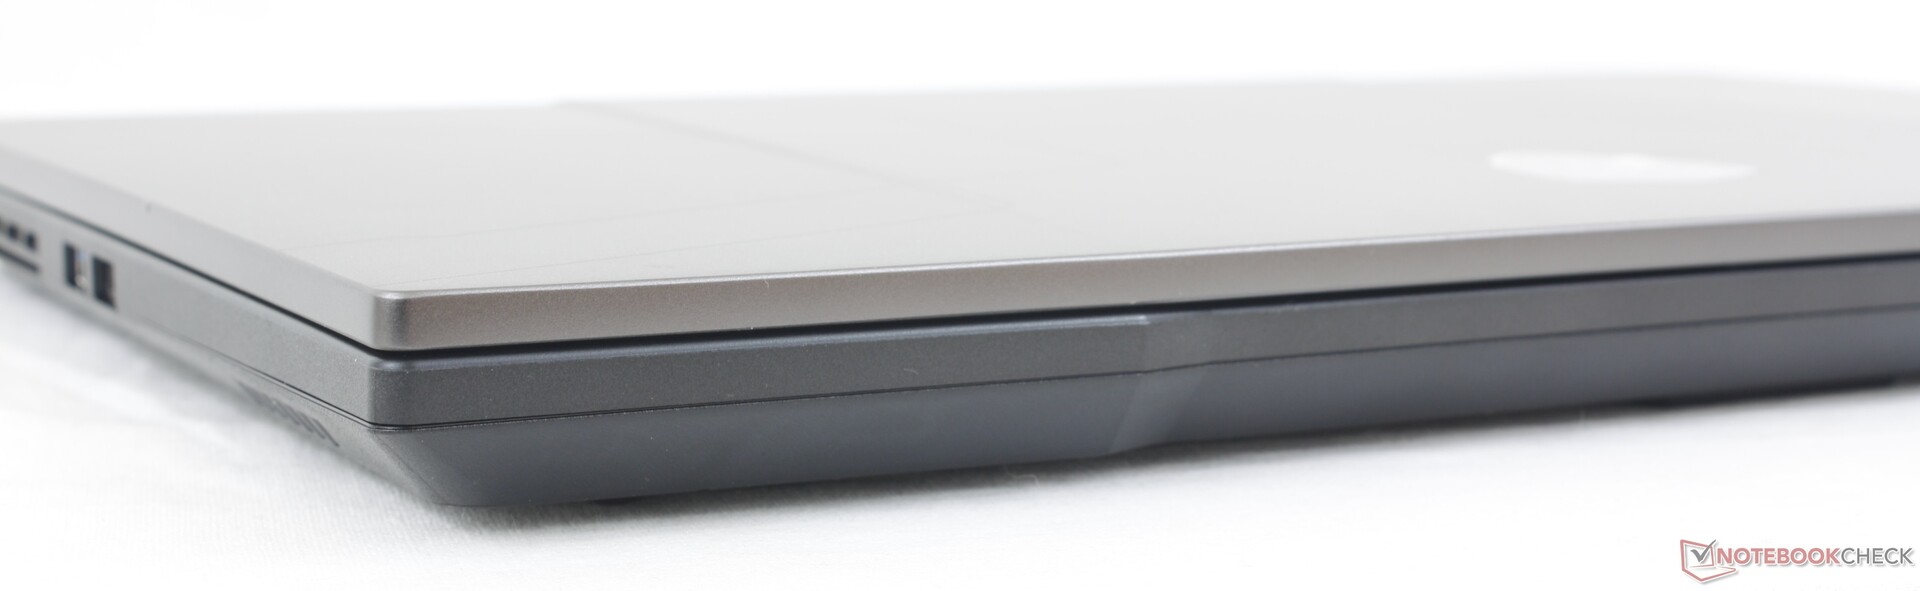
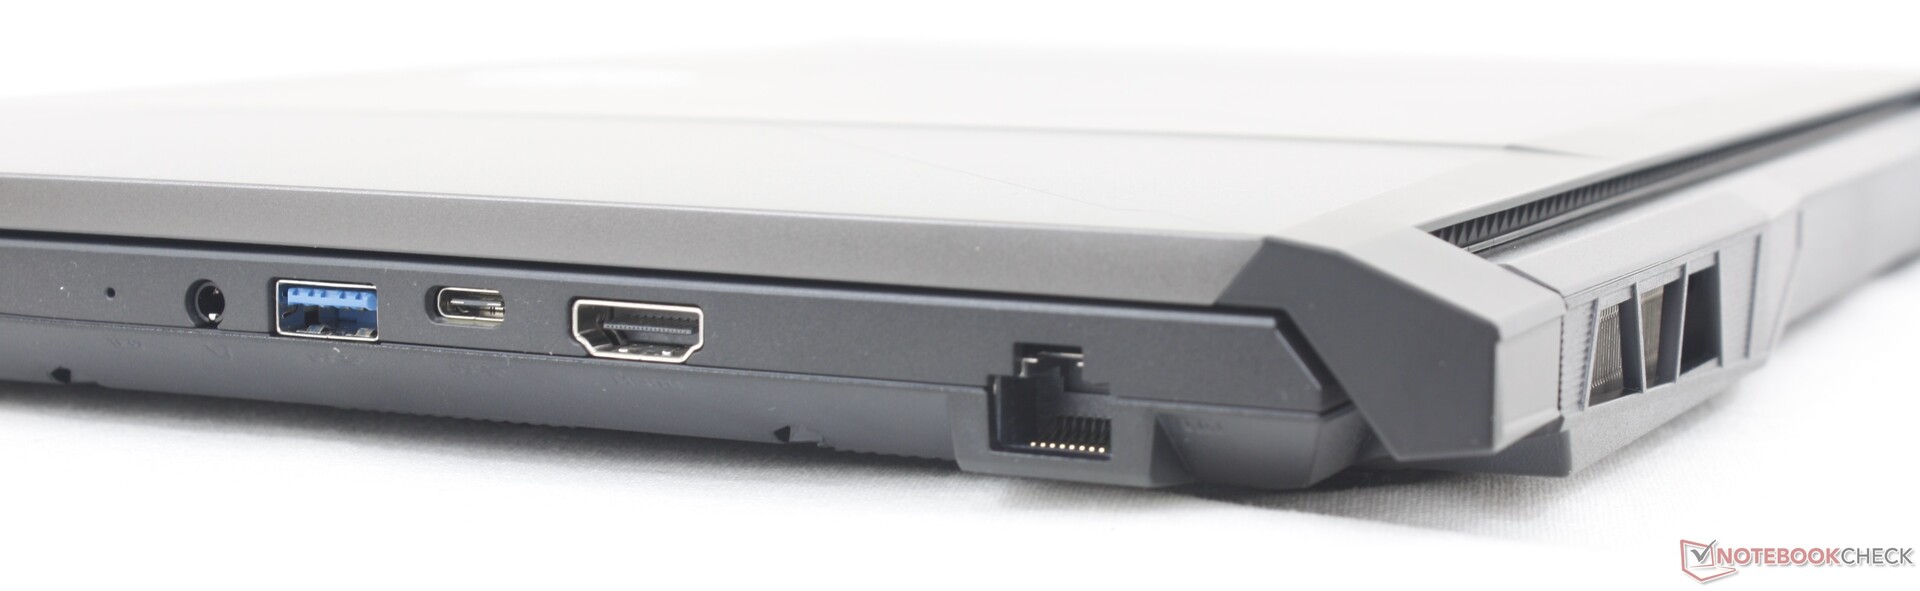
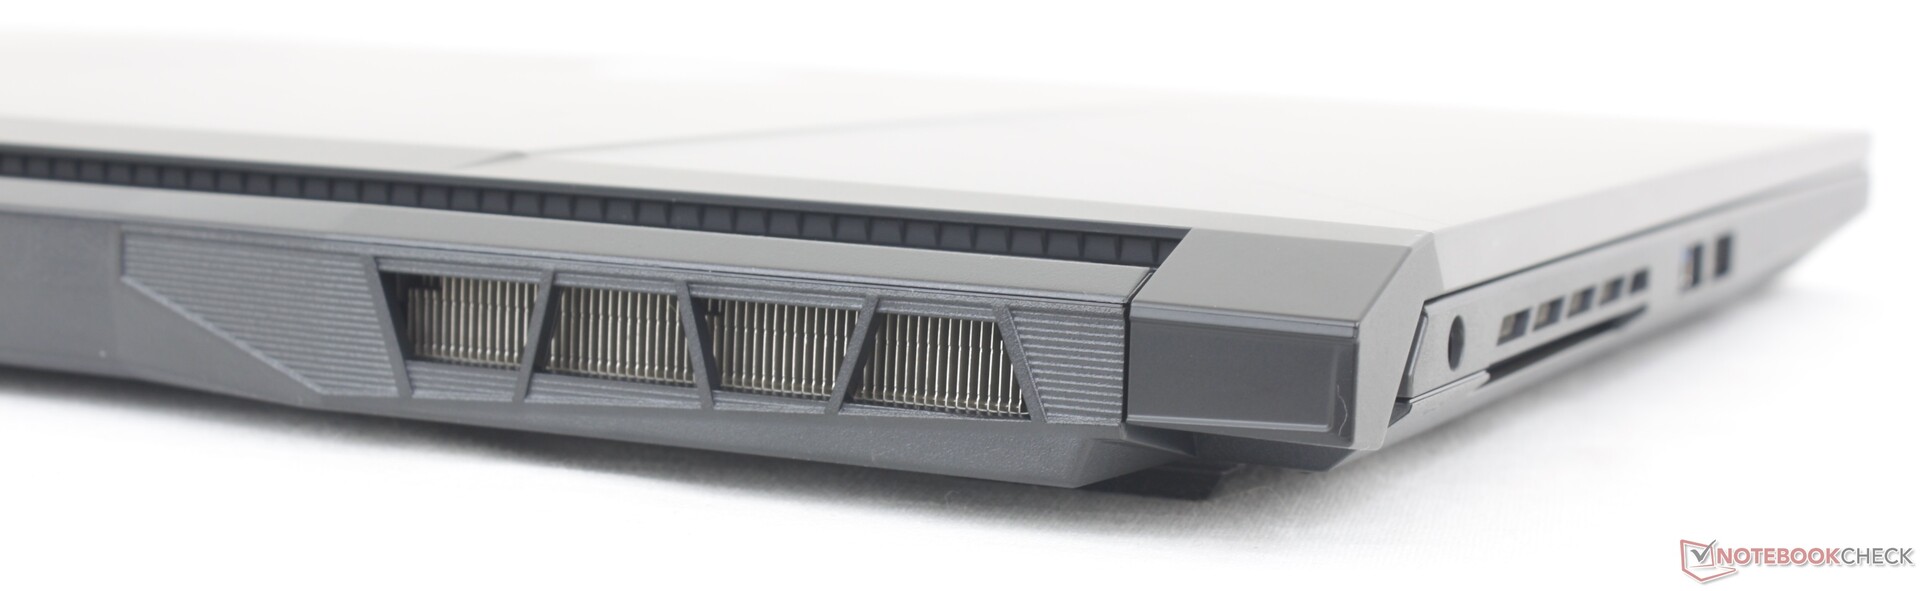
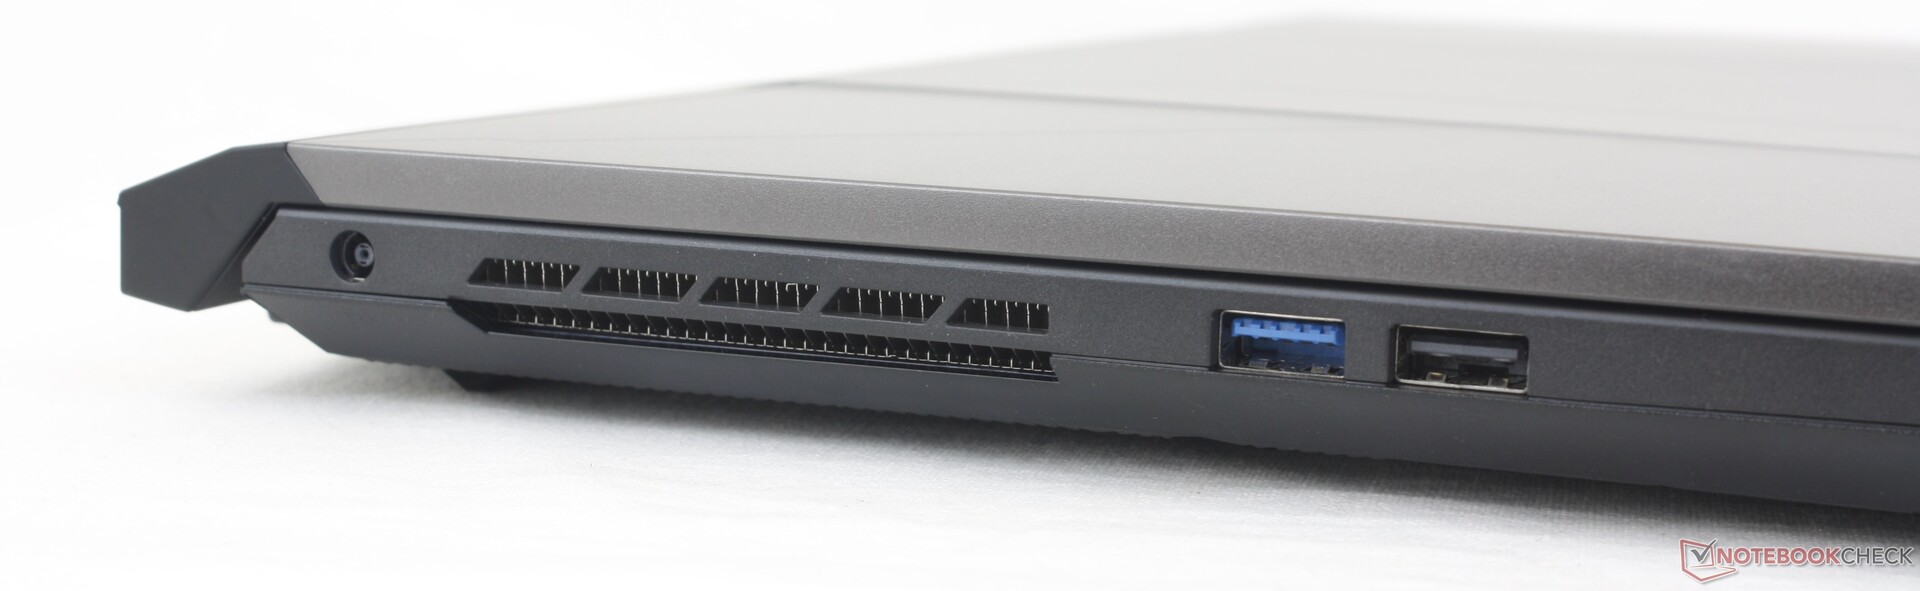
Łączność - ograniczona jak na swój rozmiar
Opcje portów są bardziej ograniczone w porównaniu z innymi laptopami do gier ze średniej półki, np Dell G16, Acer Nitro 5 czy Asus TUF G17. Najważniejszym pominięciem jest brak obsługi Thunderbolt, podczas gdy wszystkie trzy wyżej wymienione alternatywy ją posiadają. Jest to prawdopodobnie świadomy wysiłek MSI, aby zachęcić użytkowników do rozważenia wyższej klasy serii GE, GS lub GT zamiast.
DisplayPort-over-USB nie jest obsługiwany. Nasz testowy egzemplarz nie rozpoznał żadnego z naszych zewnętrznych monitorów przez USB-C.
Komunikacja
Intel AX201 standardowo zapewnia łączność Wi-Fi 6 i Bluetooth 5.2. Wi-Fi 6E nie jest dołączone, prawdopodobnie w celu zaoszczędzenia kosztów, ale aktualizacja dla użytkownika końcowego jest mimo wszystko prosta. Wydajność jest nadal stabilna i nie ma żadnych problemów po sparowaniu z naszym routerem Asus AXE11000.
| Networking | |
| iperf3 transmit AX12 | |
| MSI Vector GP76 12UGS-434 | |
| iperf3 receive AX12 | |
| MSI Vector GP76 12UGS-434 | |
| iperf3 receive AXE11000 6GHz | |
| Asus ROG Strix Scar 17 SE G733CX-LL014W | |
| Acer Predator Helios 300 (i7-12700H, RTX 3070 Ti) | |
| iperf3 receive AXE11000 | |
| Razer Blade 17 Early 2022 | |
| MSI Pulse GL76 12UGK | |
| Alienware m17 R5 (R9 6900HX, RX 6850M XT) | |
| iperf3 transmit AXE11000 | |
| MSI Pulse GL76 12UGK | |
| Alienware m17 R5 (R9 6900HX, RX 6850M XT) | |
| iperf3 transmit AXE11000 6GHz | |
| Asus ROG Strix Scar 17 SE G733CX-LL014W | |
| Acer Predator Helios 300 (i7-12700H, RTX 3070 Ti) | |
Kamera internetowa
Zintegrowana kamera internetowa 720p daje mętne obrazy o słabych kolorach. Alternatywą dla niegrających jest np HP Spectre jeśli jakość kamery jest ważna.
Wyłącznik aparatu cyfrowego jest powiązany z klawiszem F7, a funkcja Windows Hello nie jest obsługiwana.


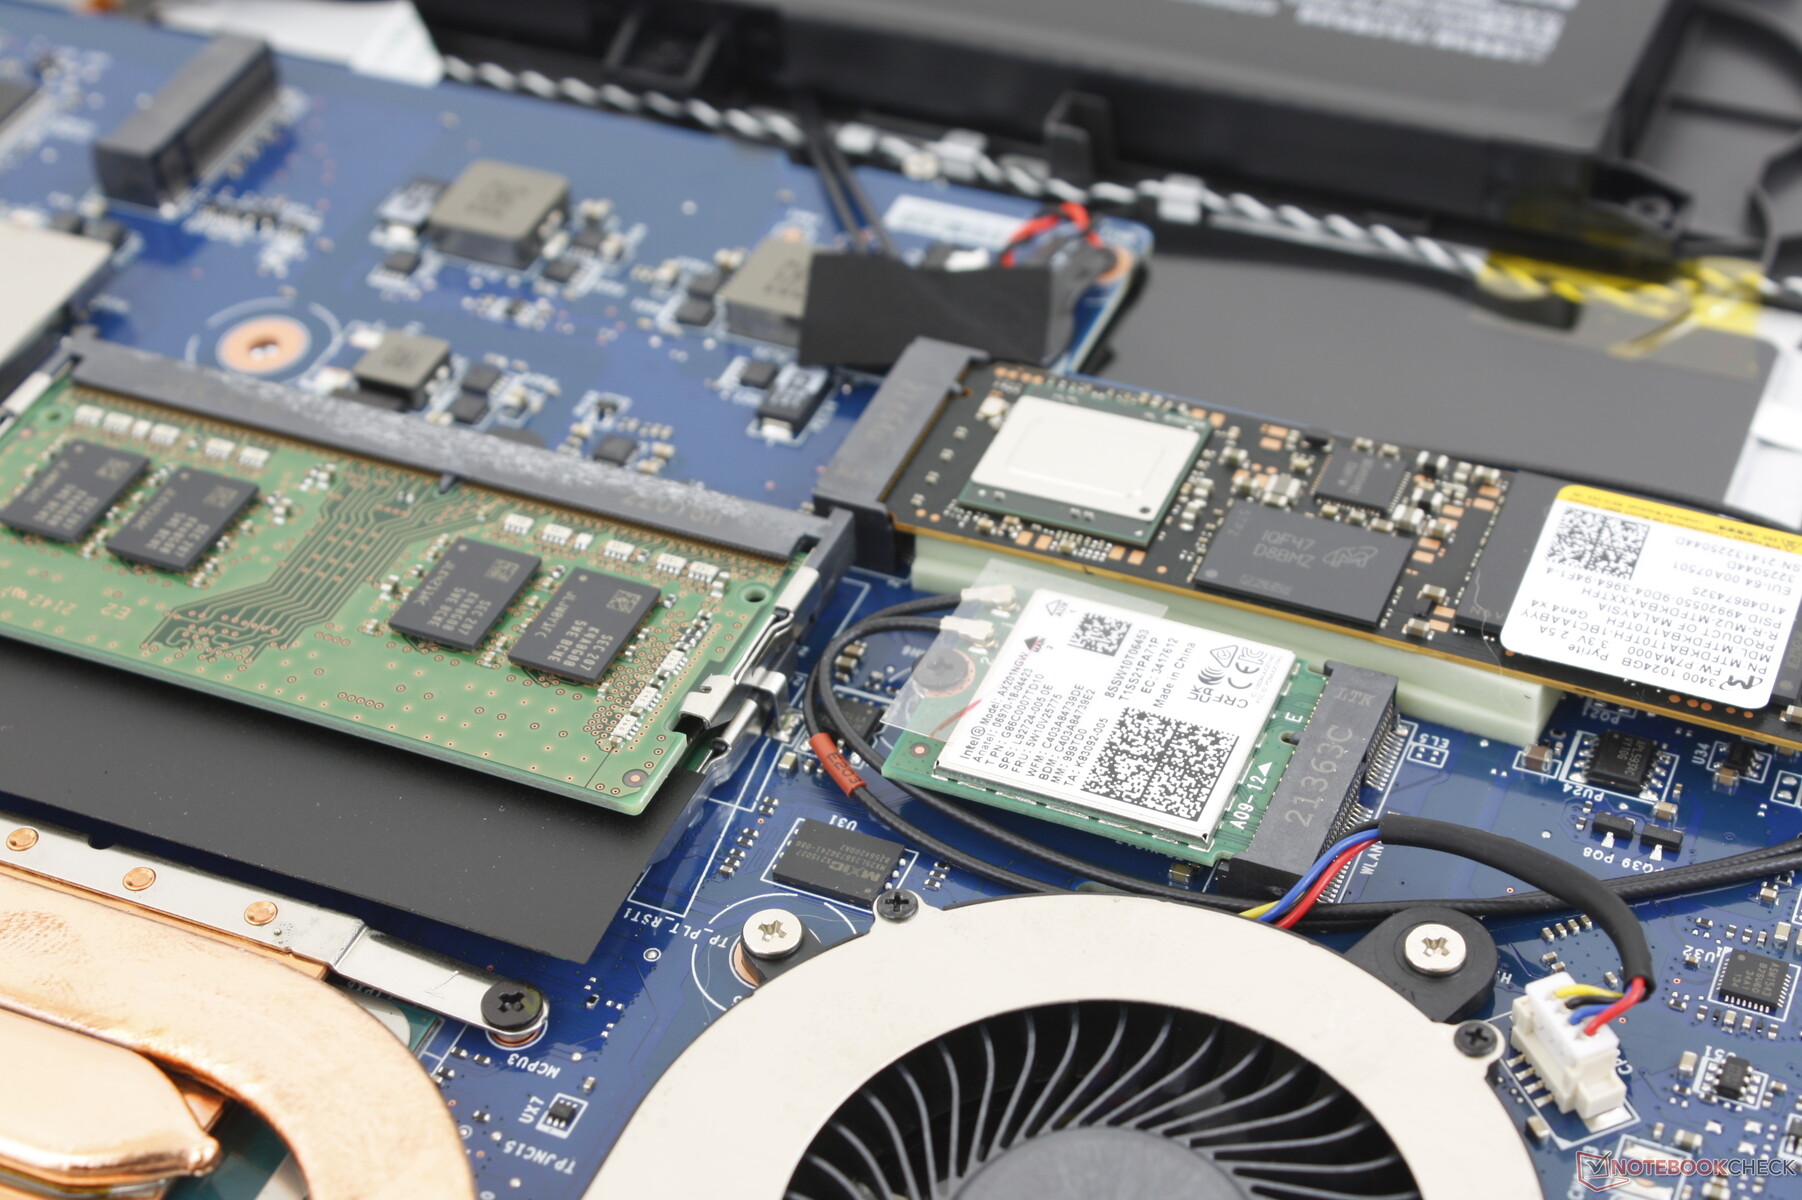
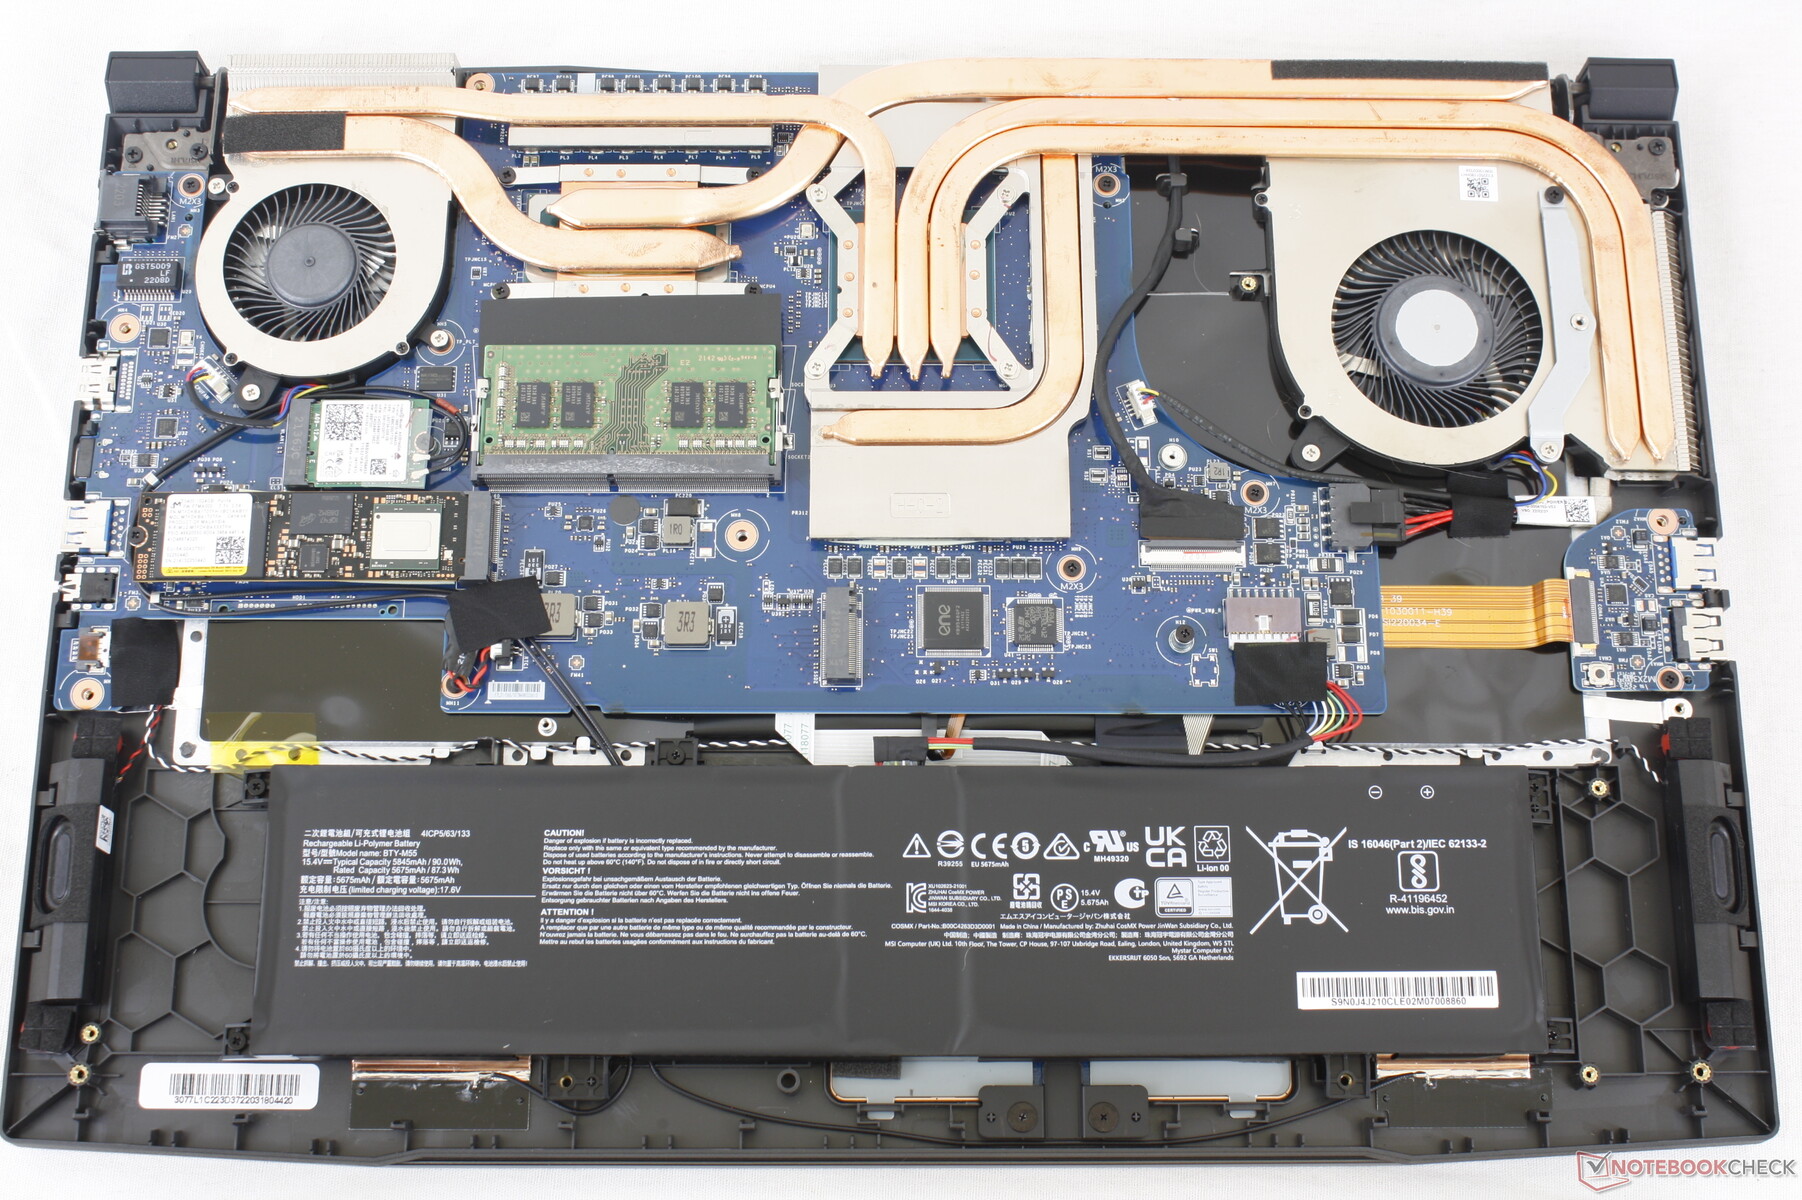
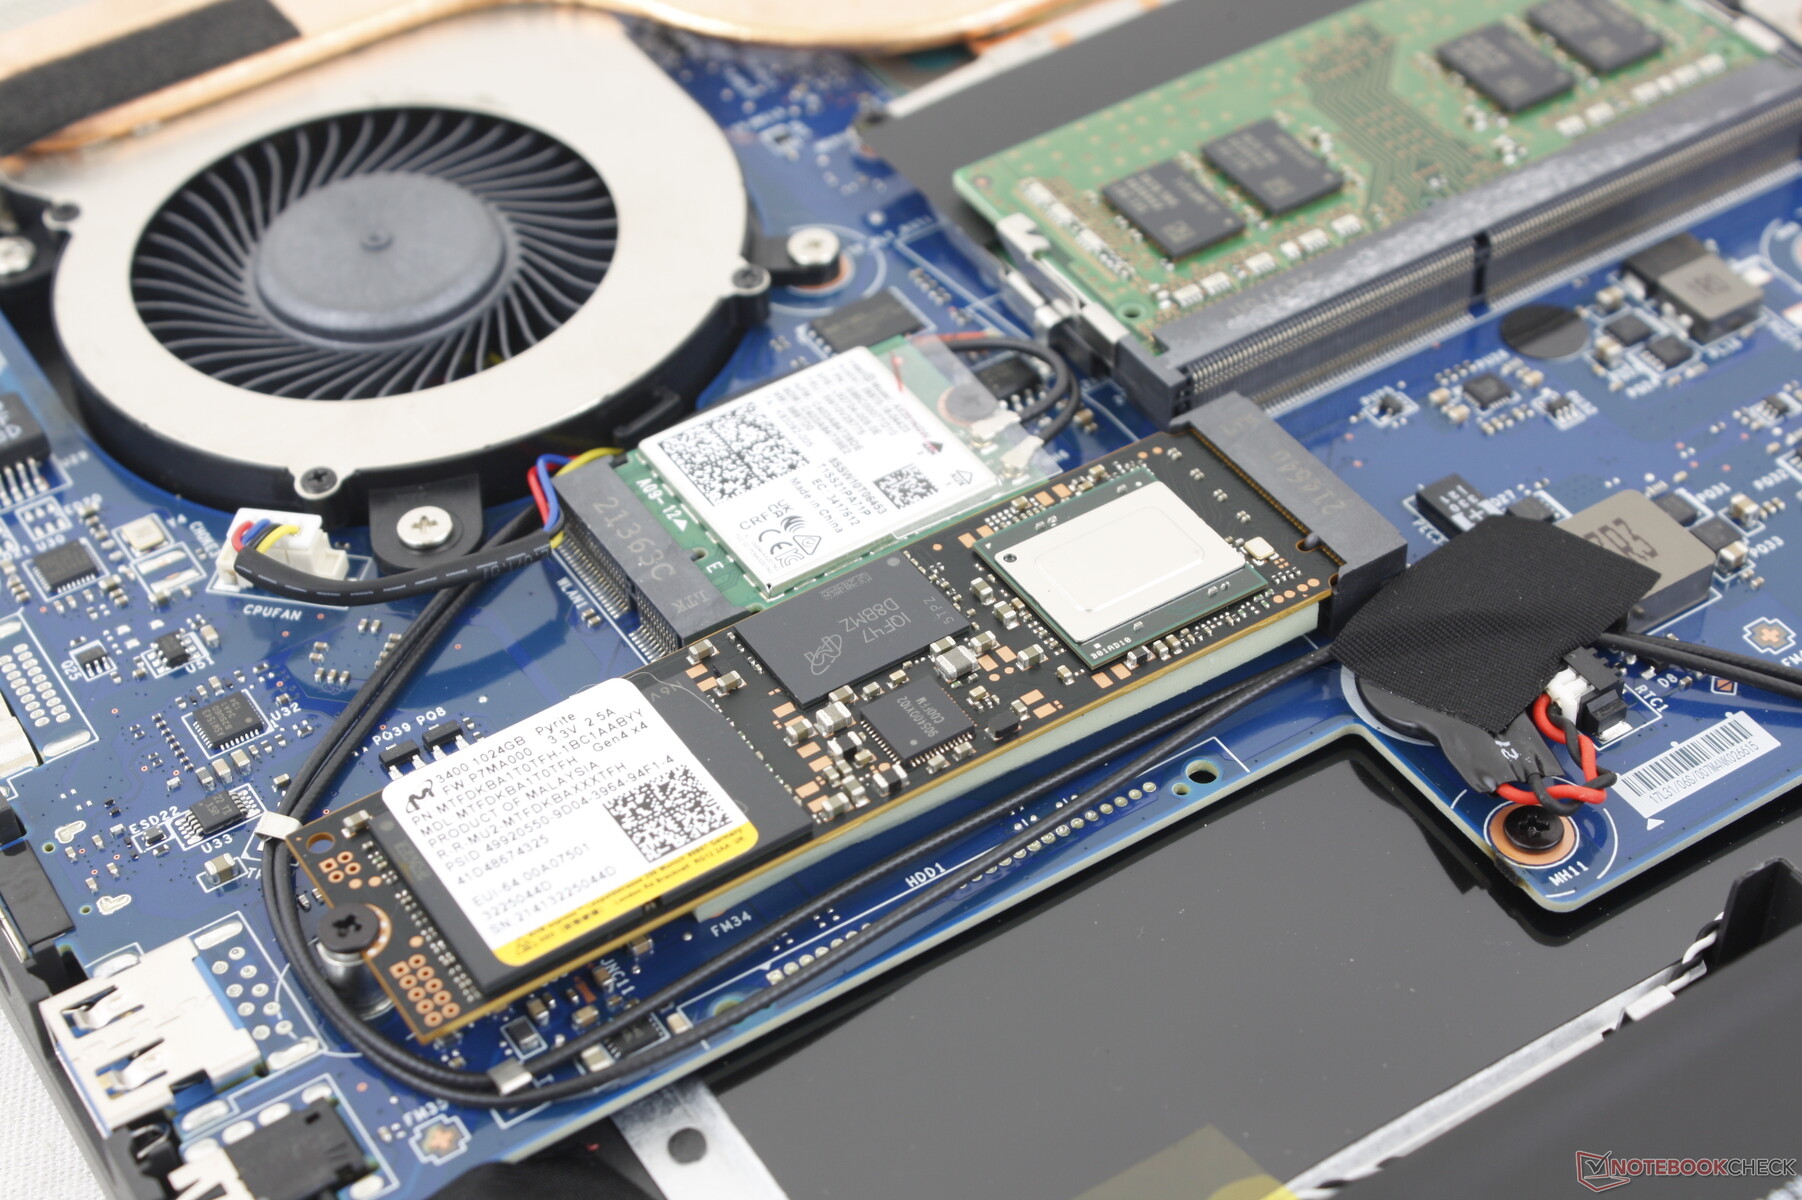
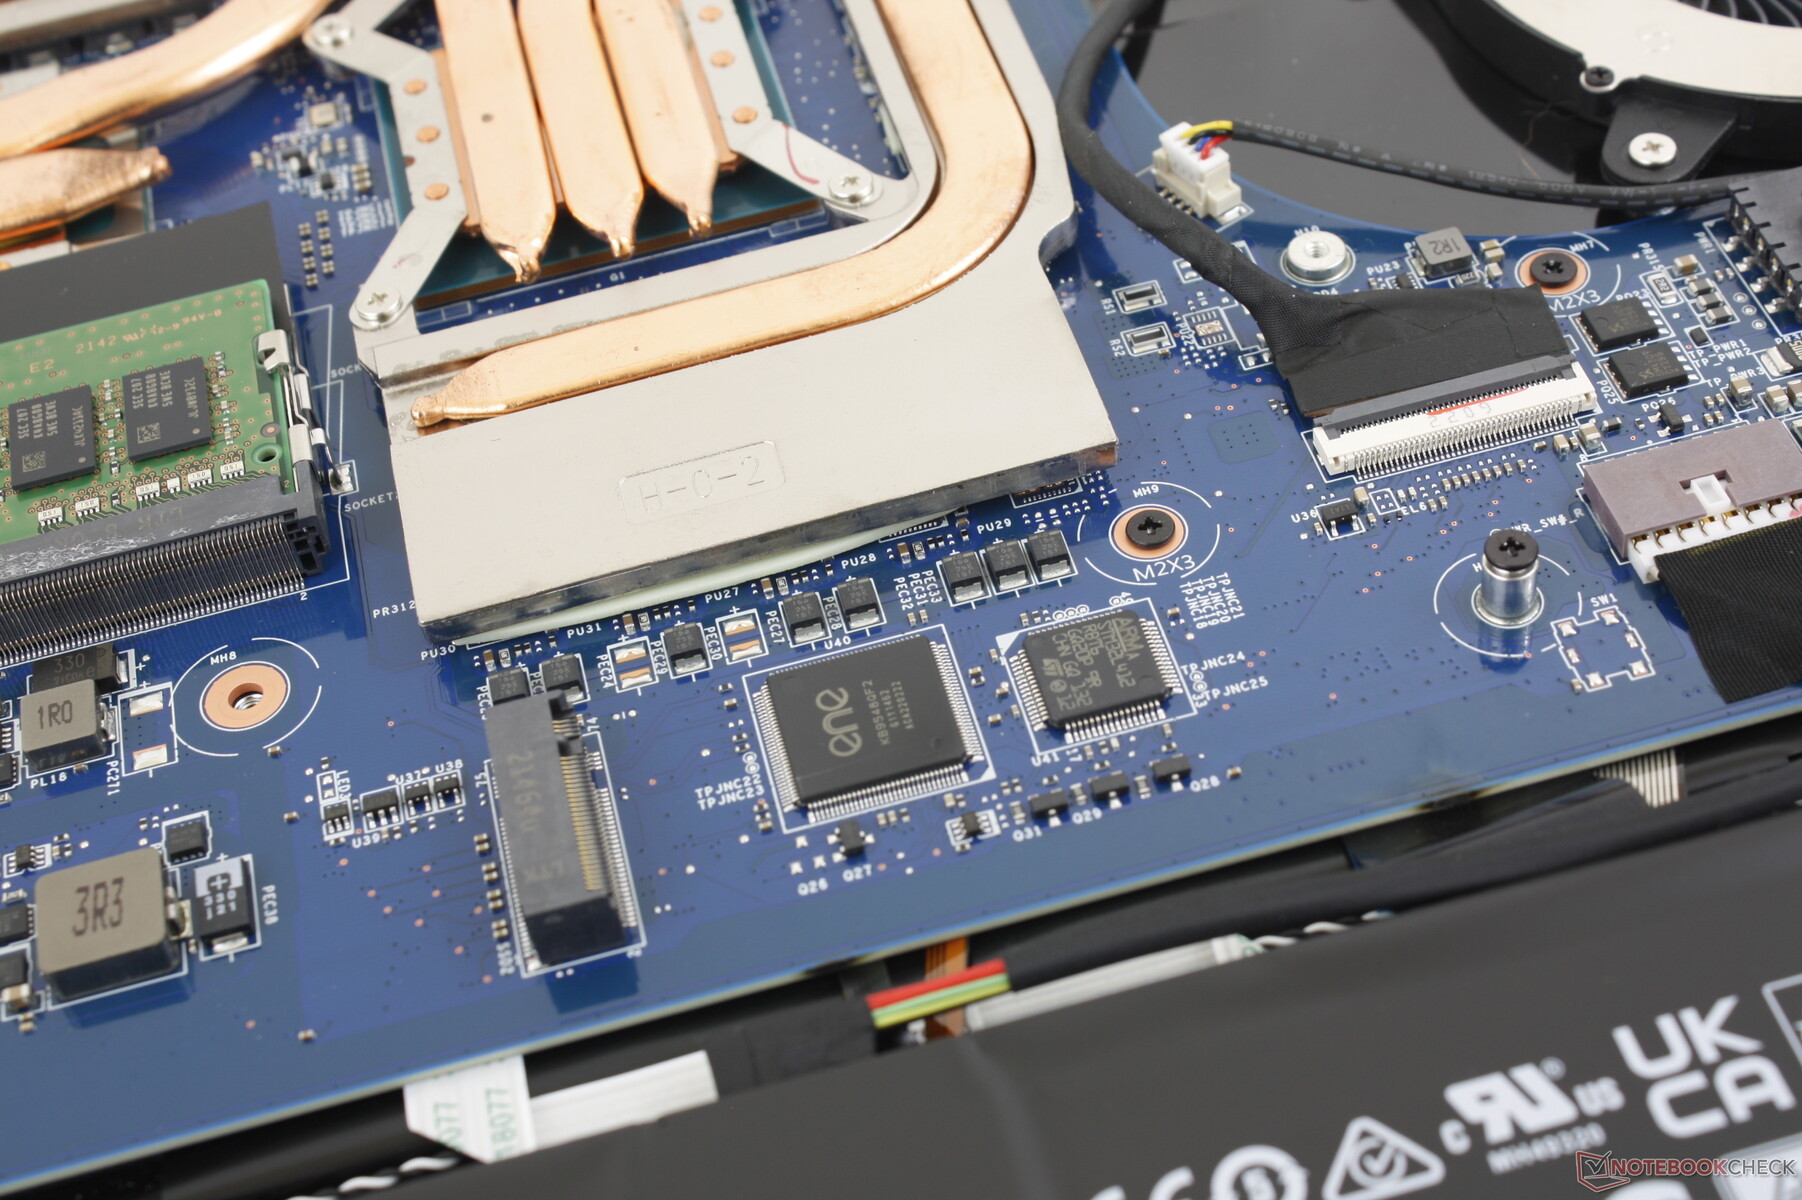
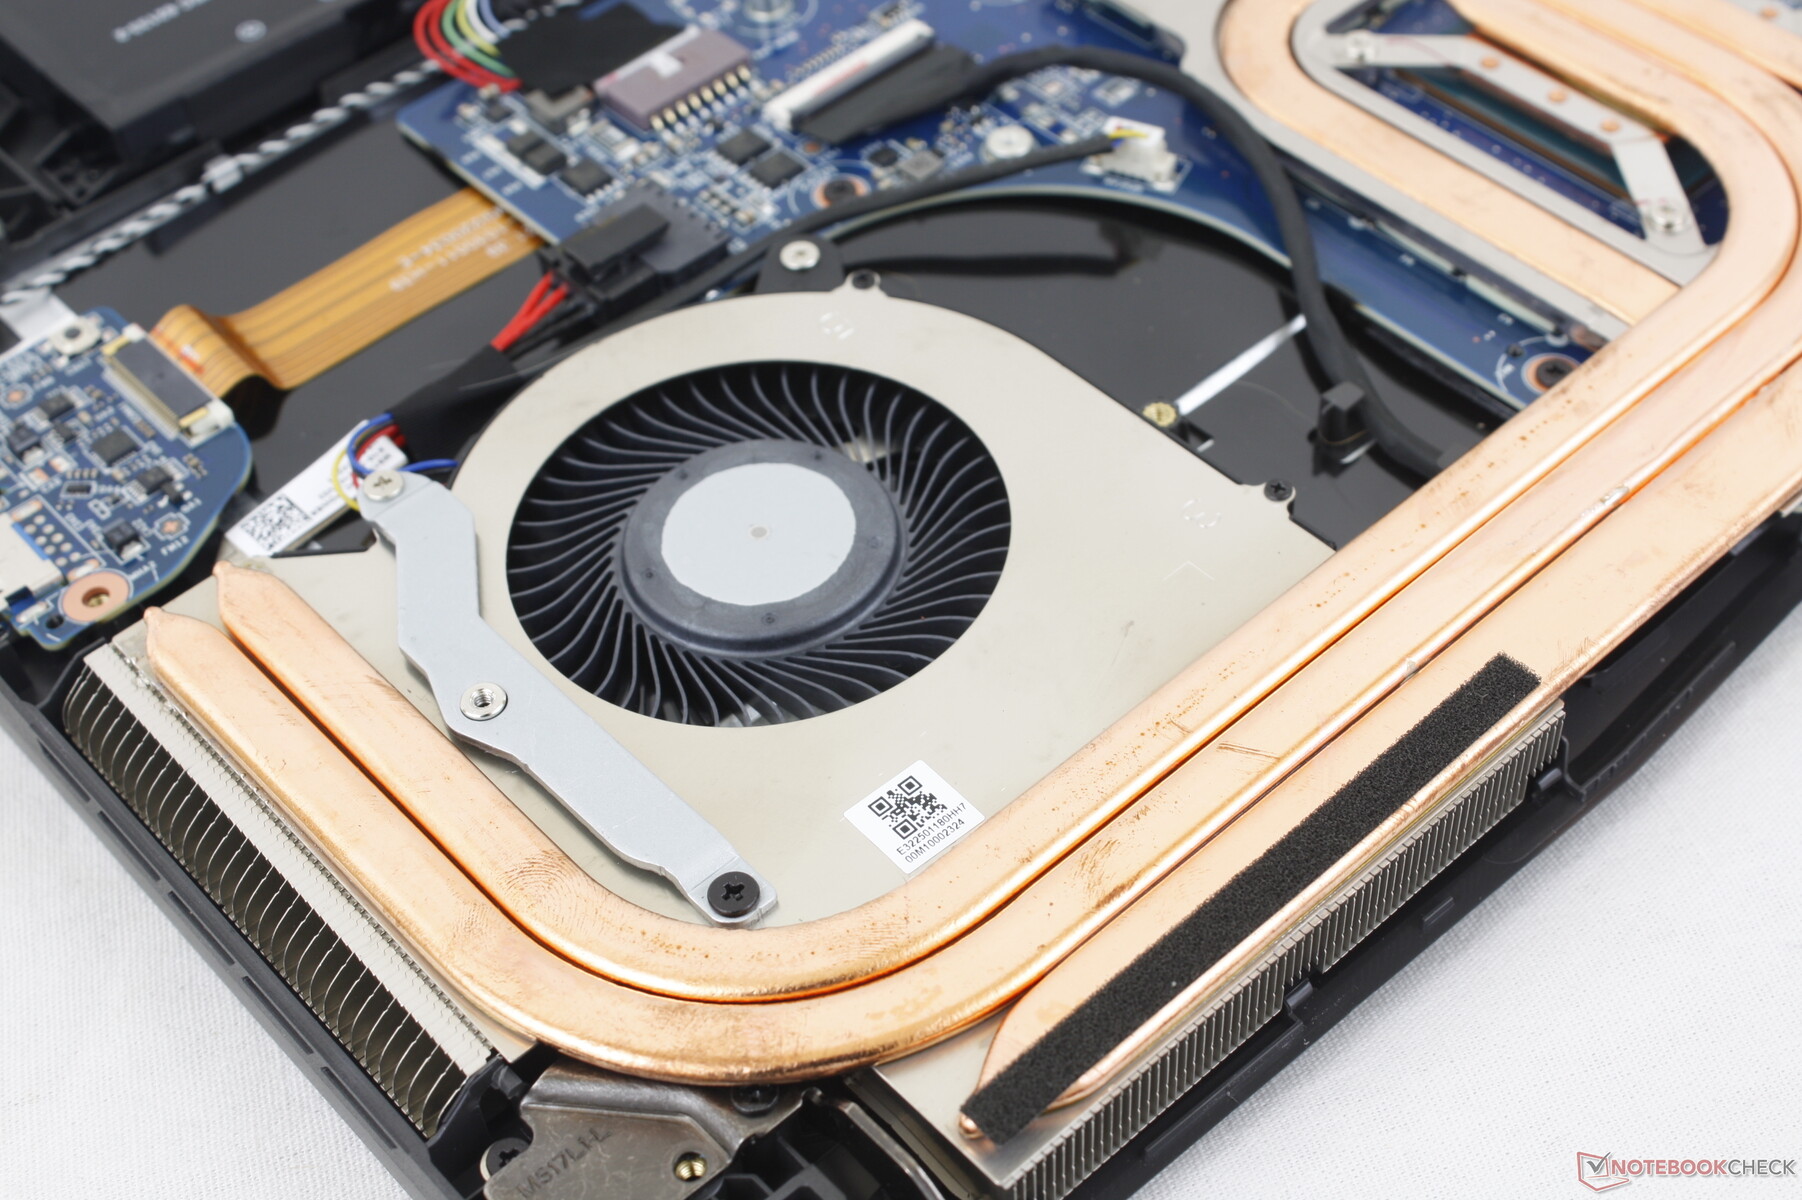
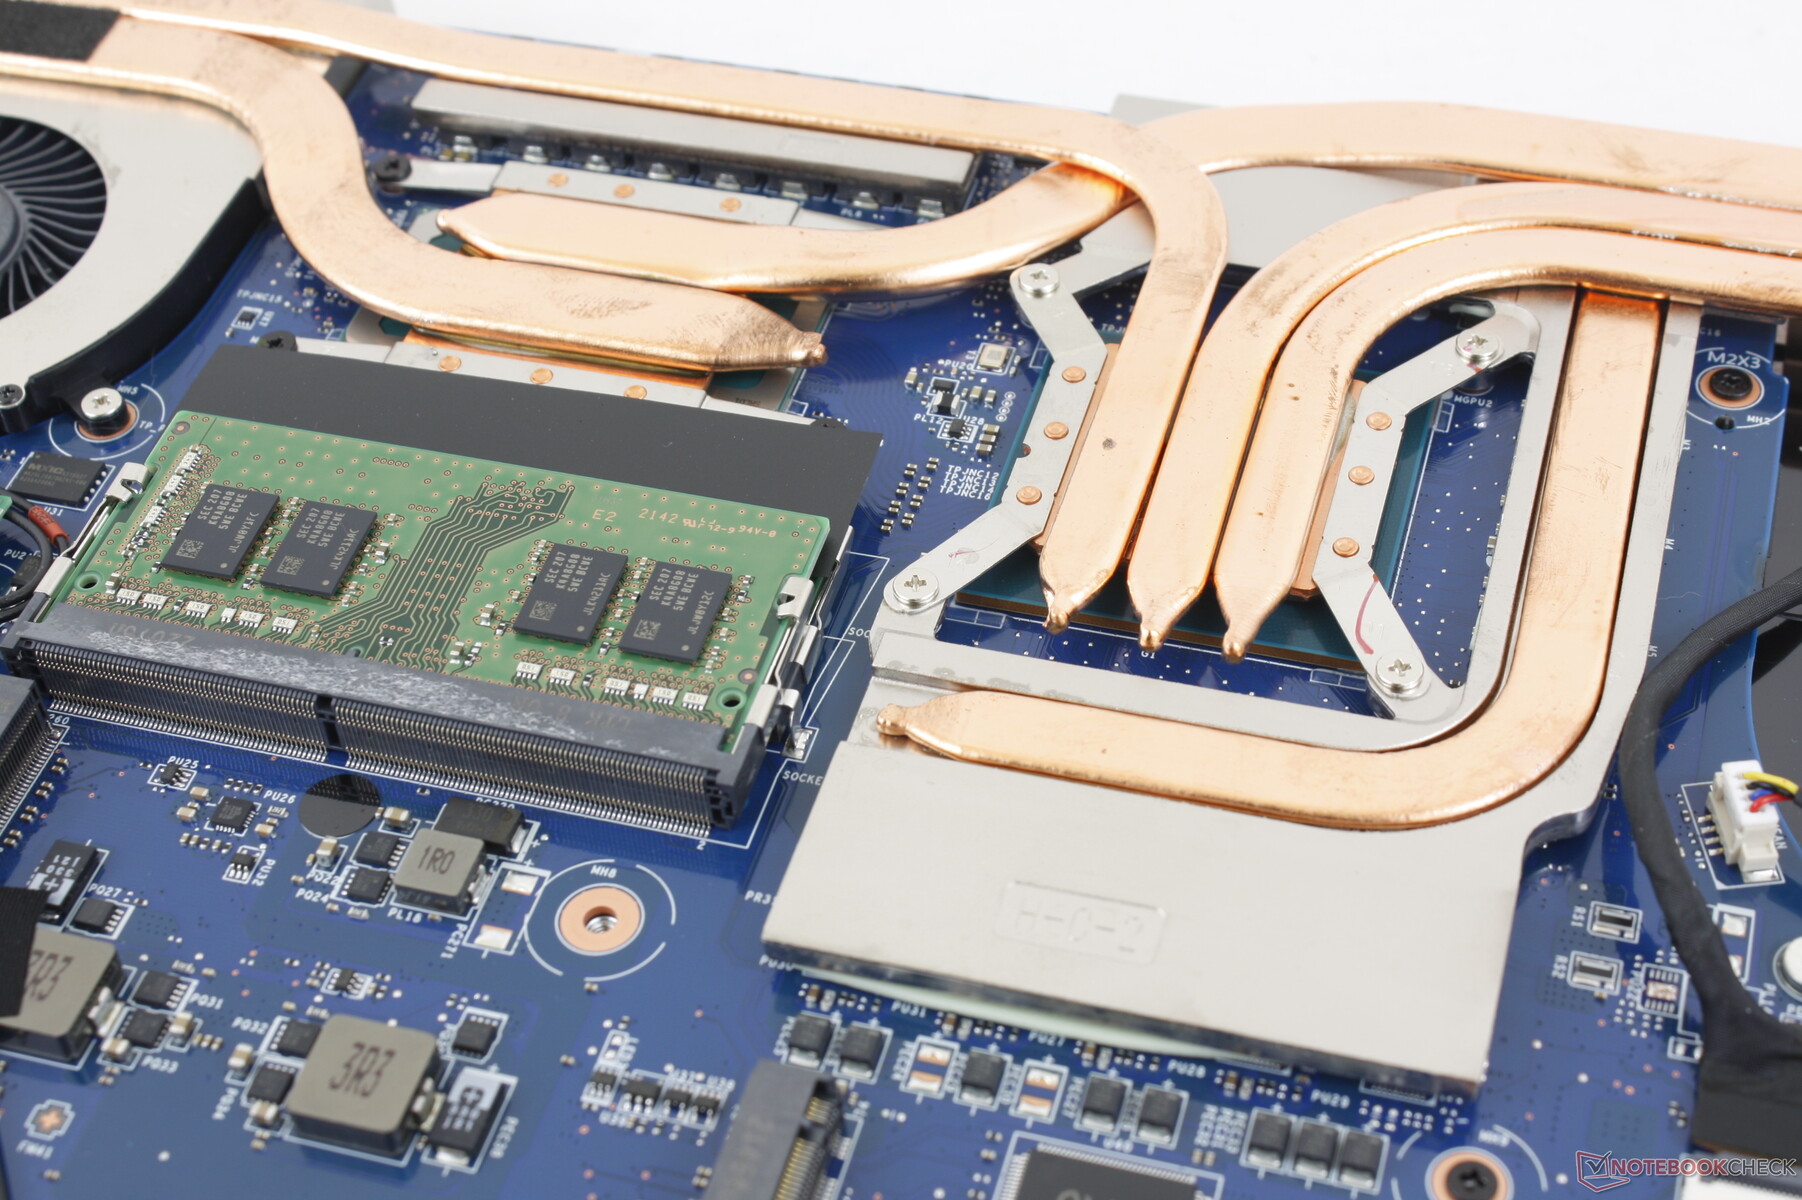
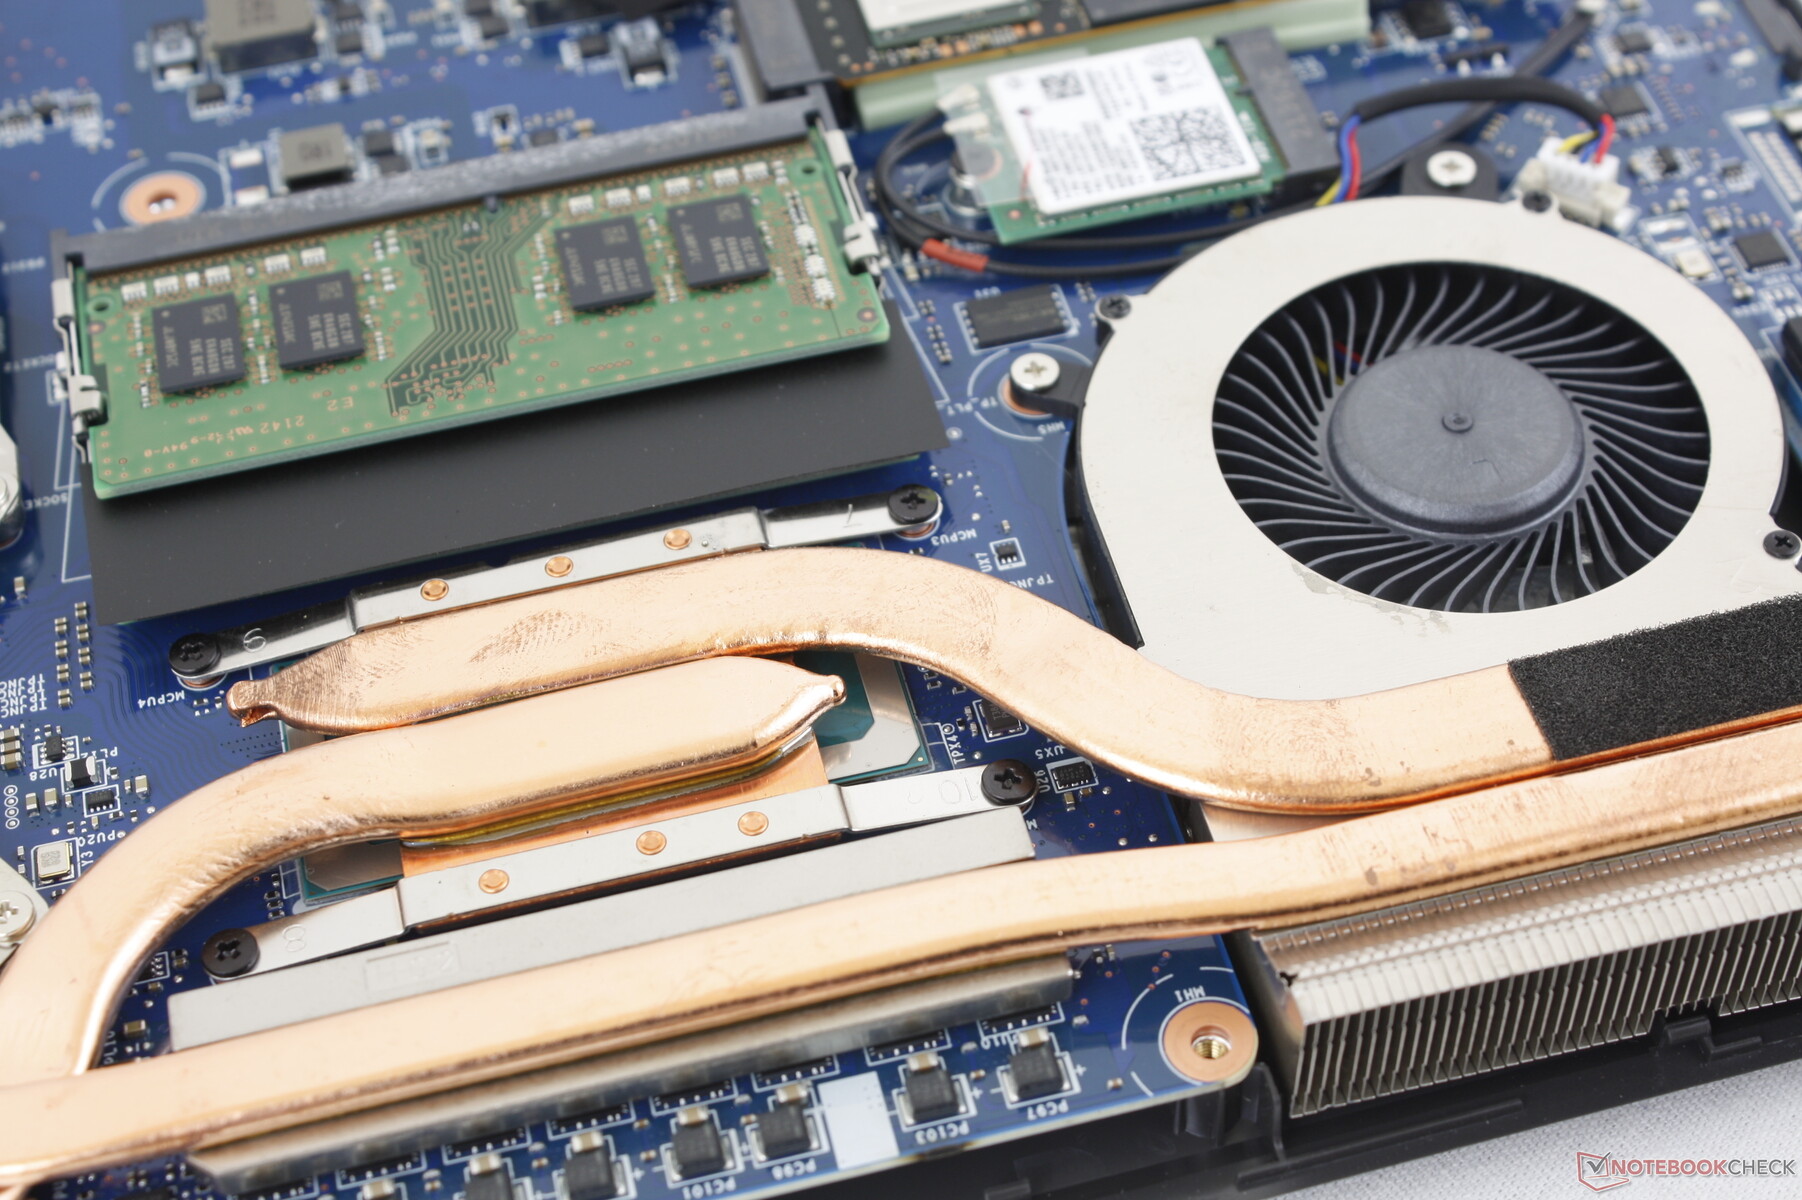
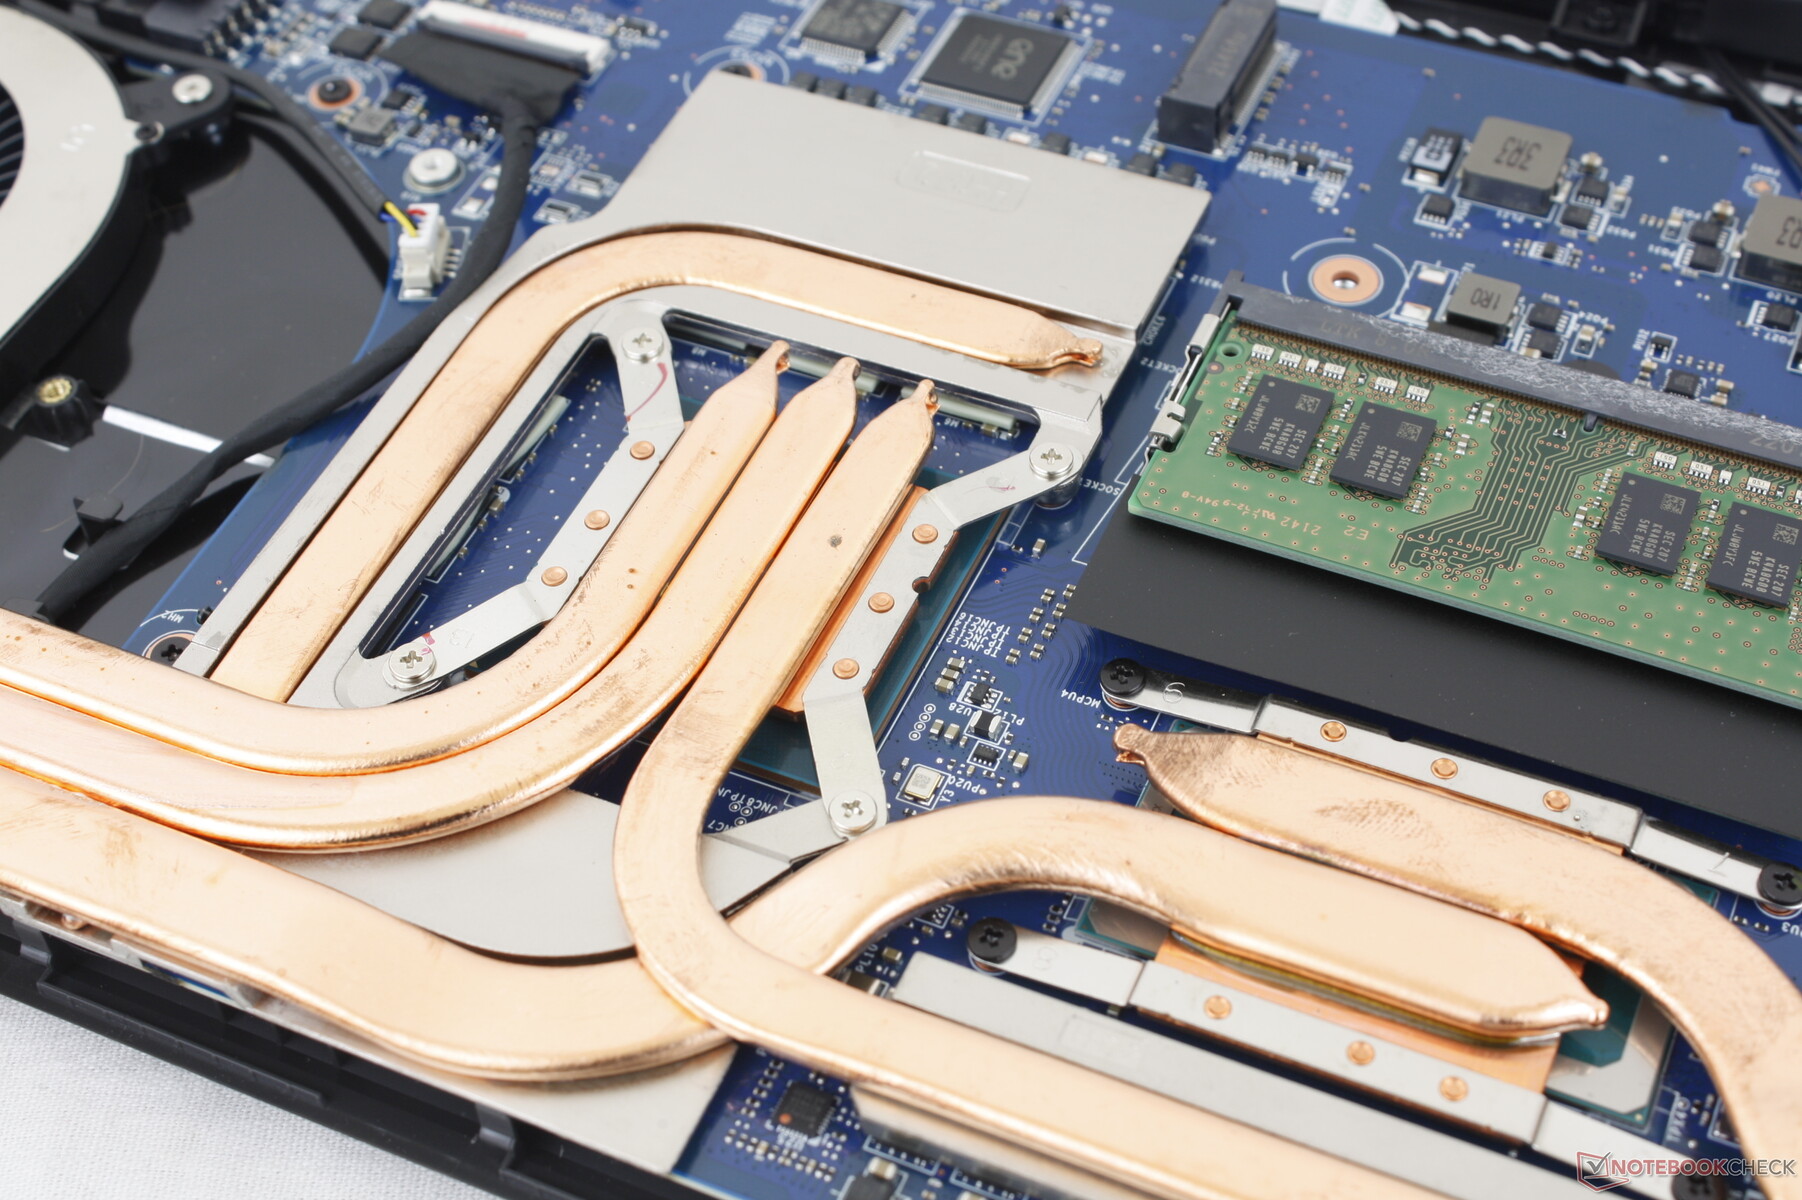
Konserwacja
Dolny panel jest zabezpieczony 13 łatwymi do odkręcenia śrubami Philips. Należy jednak pamiętać, że w tym celu należy zerwać fabryczną naklejkę plombową. MSI jest jednym z niewielu głównych producentów, którzy stosują fabryczne naklejki zabezpieczające nawet w przypadku prostych modernizacji, takich jak RAM czy pamięć masowa.
W środku użytkownicy będą mieli bezpośredni dostęp do 2x slotów PCIe4 SSD, 2x slotów SODIMM, modułu WLAN, baterii oraz chłodzenia.
Akcesoria i gwarancja
W pudełku nie ma żadnych dodatków poza zasilaczem sieciowym i dokumentacją. W przypadku zakupu w USA obowiązuje standardowa roczna ograniczona gwarancja.
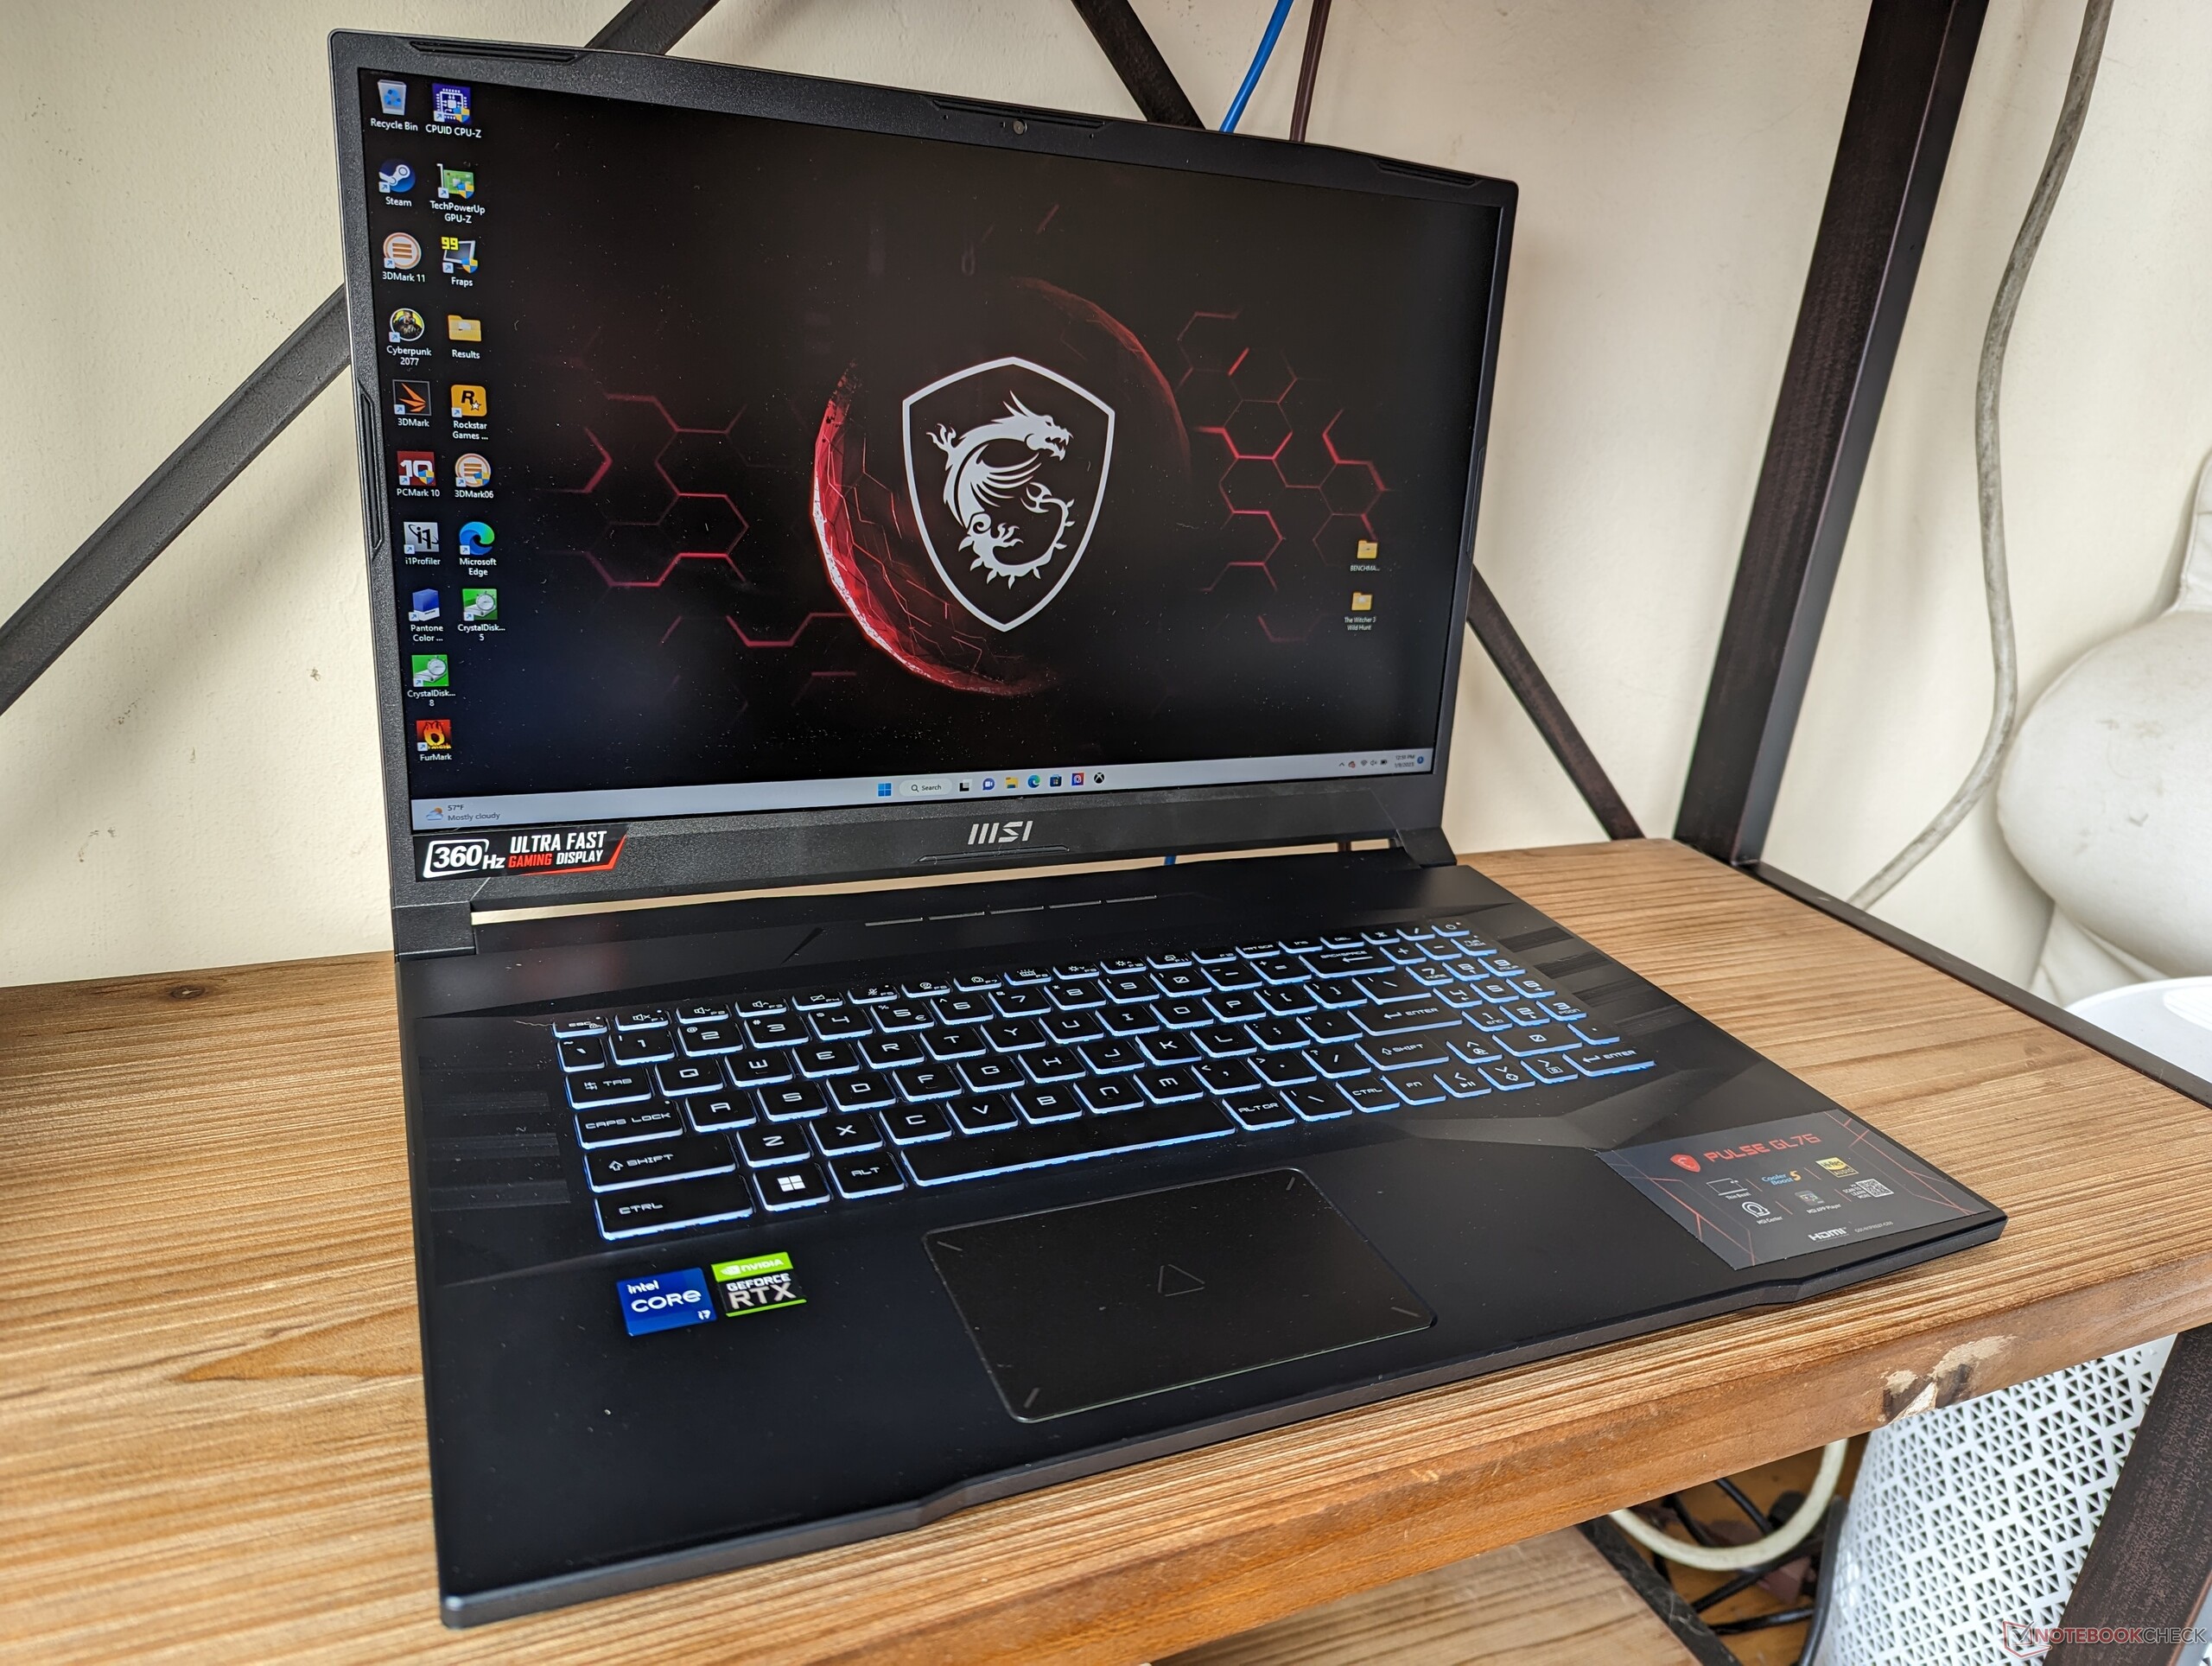
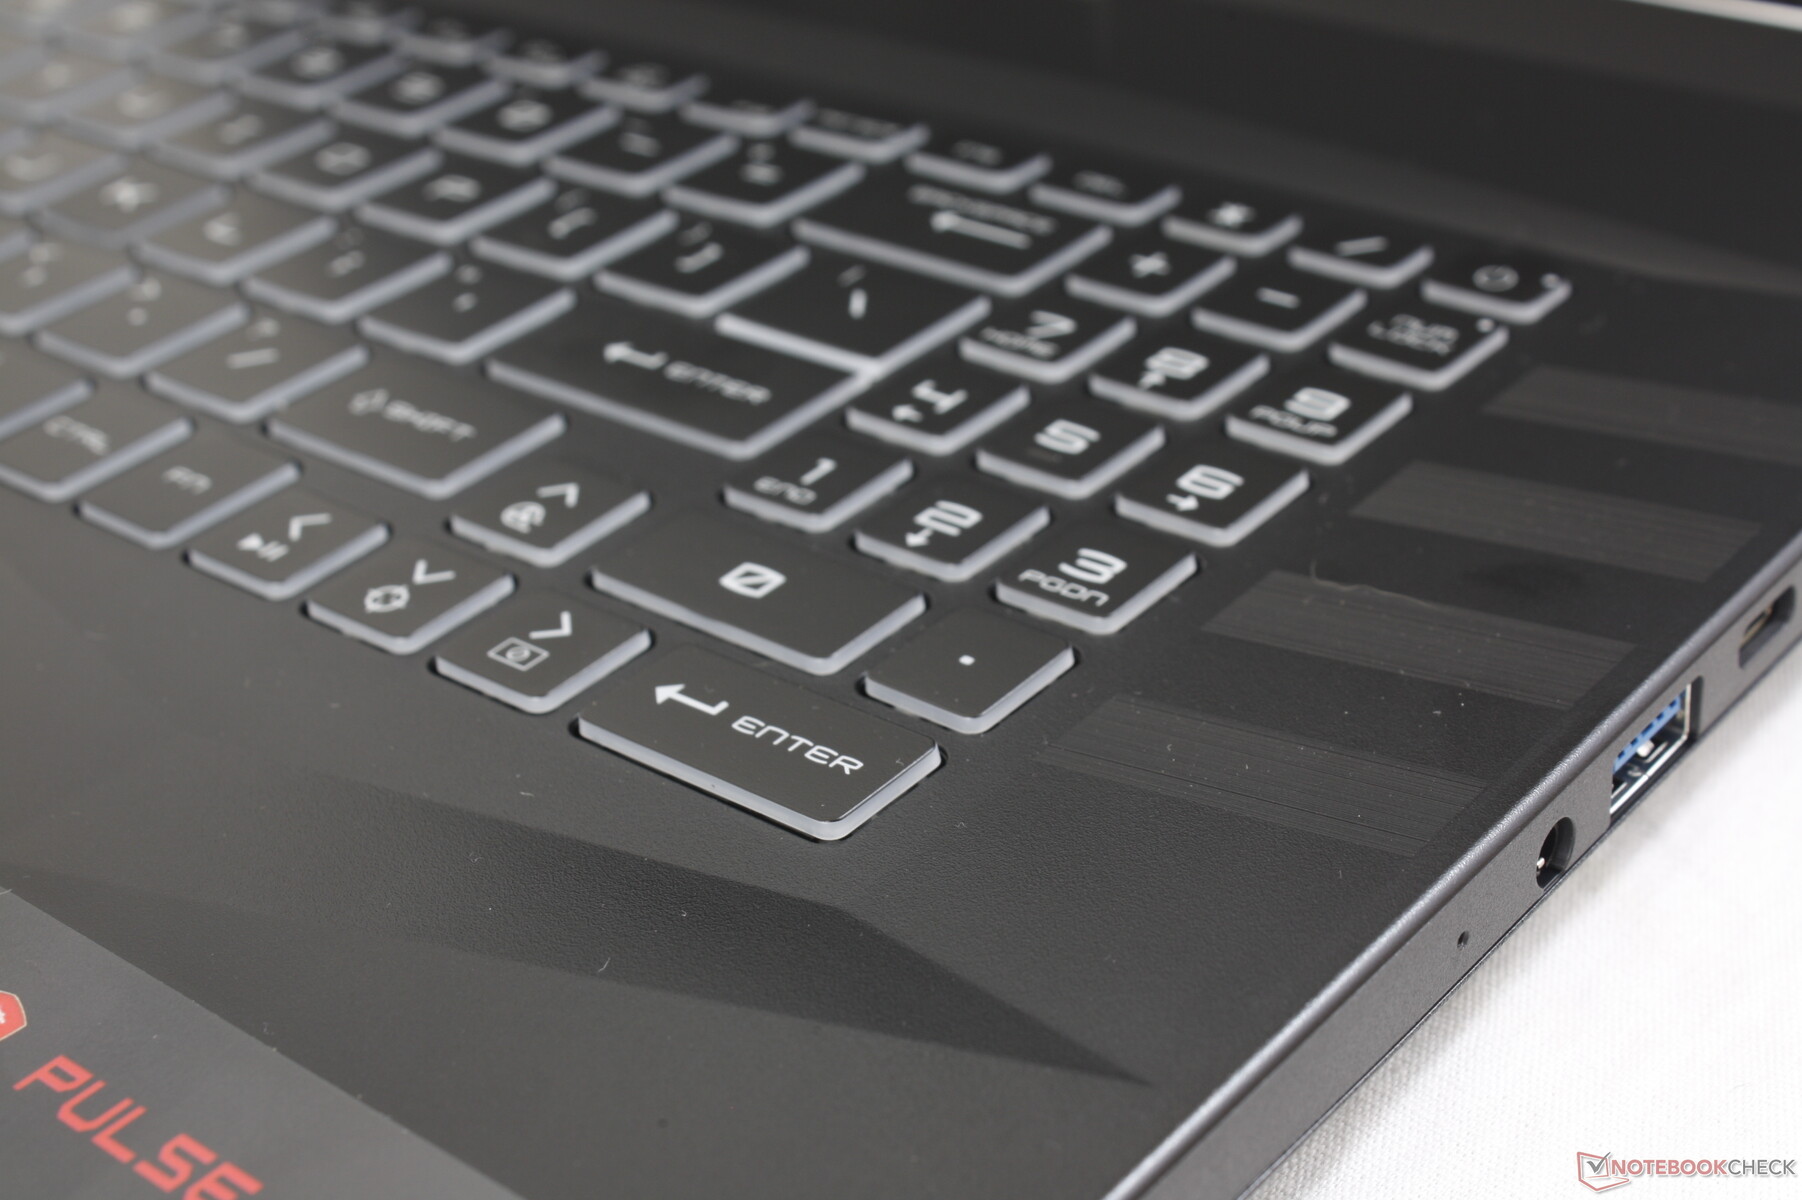
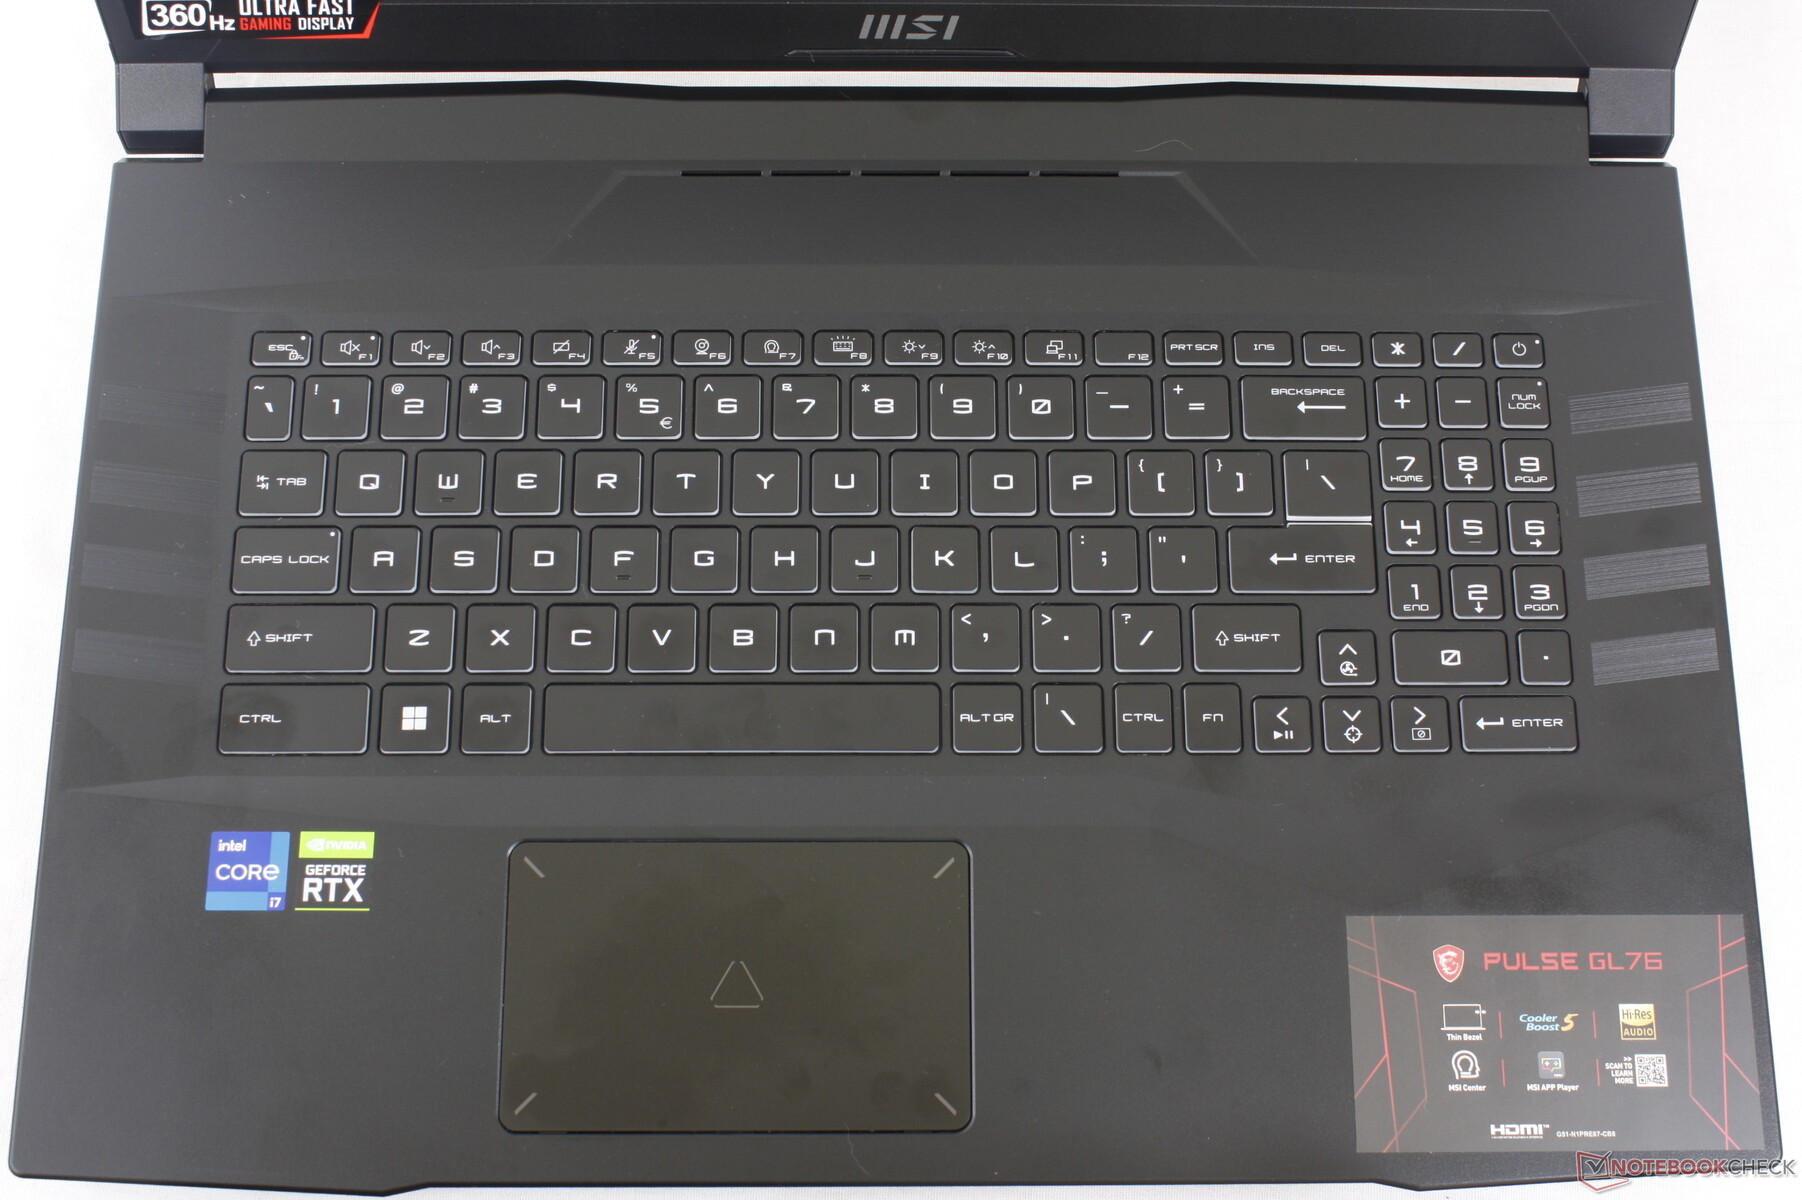
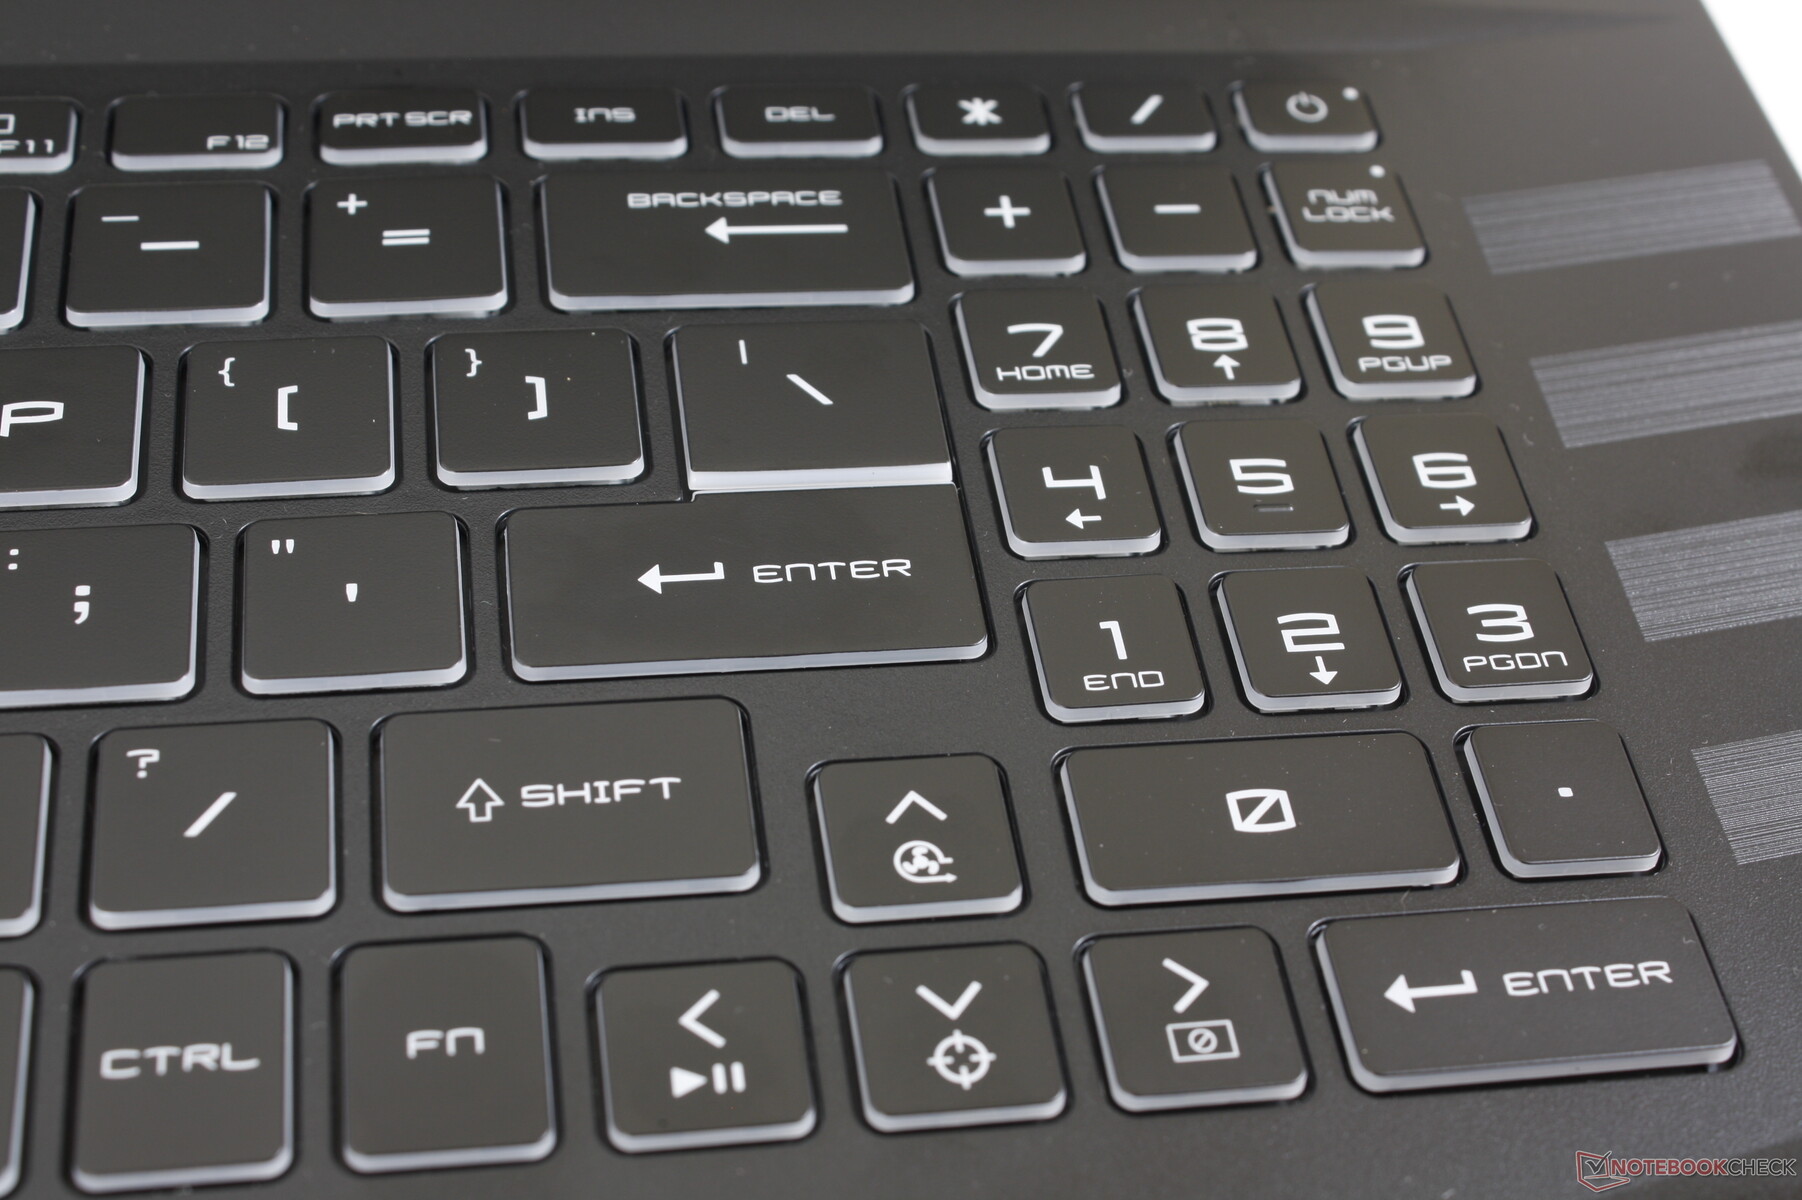
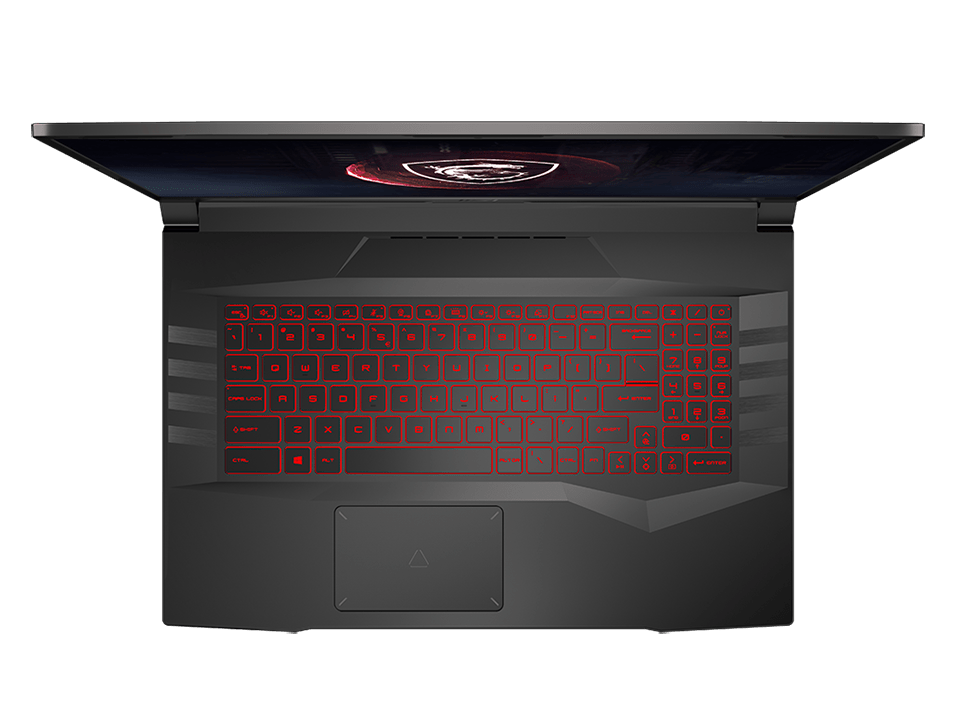
Urządzenia wejściowe - klawiatura OK, gąbczasty clickpad
Klawiatura
GL76 posiada taką samą klawiaturę i możliwość pisania jak w modelu GL66 pomimo różnic w budowie. Krótki skok klawiszy i dobre sprzężenie zwrotne w GL66 mają zastosowanie również w GL76. Szkoda, że MSI nie wykorzystało lepiej większego rozmiaru 17,3-calowej obudowy, zwiększając rozmiar numpada i klawiszy strzałek, ponieważ są one mniejsze, bardziej gąbczaste i ciasne w porównaniu z większymi klawiszami QWERTY. Ta cecha jest wspólna z Asus TUF Gaming F17.
W standardzie jest jednostrefowe podświetlenie RGB bez opcji RGB dla poszczególnych klawiszy. Wszystkie klawisze i symbole są podświetlane.
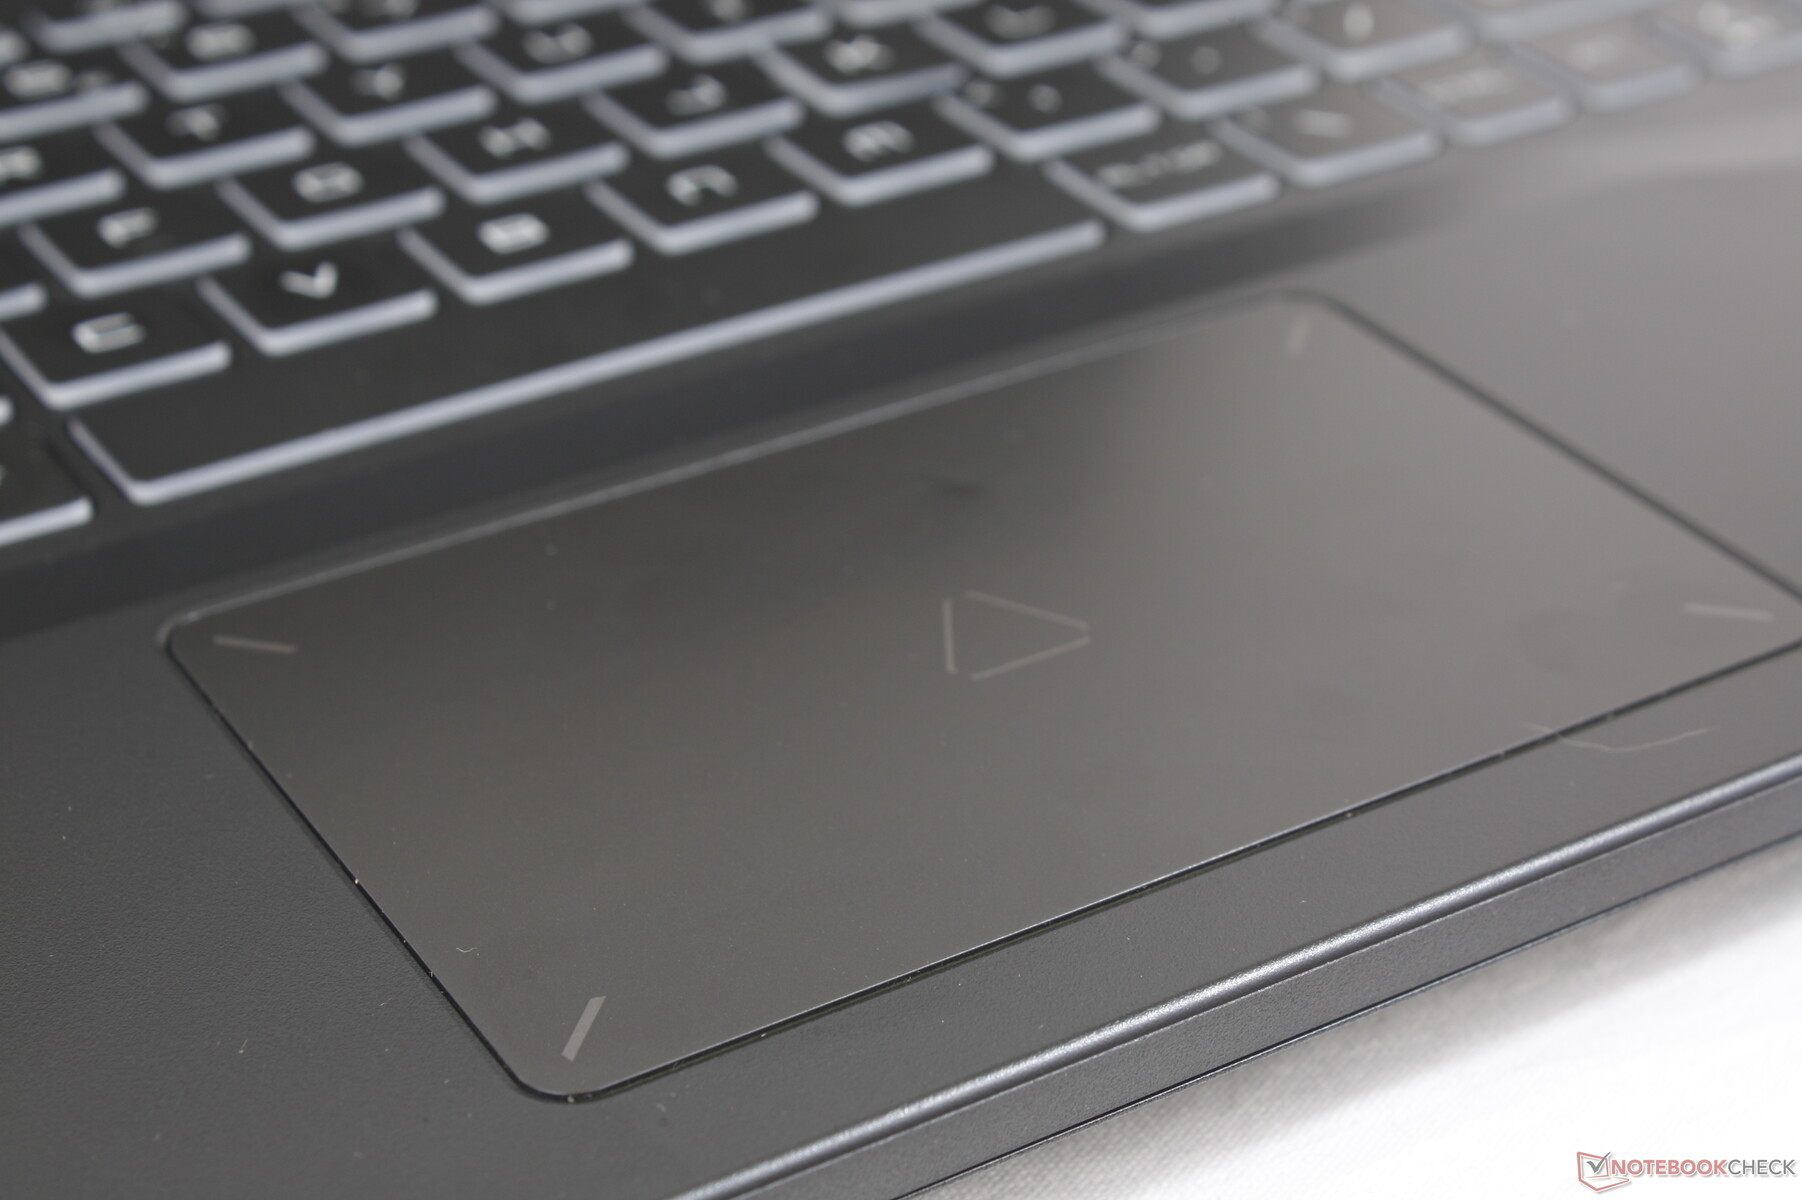
Touchpad
Klawiatura jest stosunkowo mała - 10,5 x 6,7 cm, ale jest przynajmniej nieco większa niż klawiatura o wymiarach 10,5 x 6 cm w modelu Dell G16. Jego plastikowa powierzchnia ma tendencję do przywierania podczas ślizgania się ze średnimi lub wolnymi prędkościami, co może sprawić, że sterowanie kursorem będzie czasem nieco wyboiste. Ponadto sprzężenie zwrotne podczas klikania na powierzchni jest gąbczaste, co daje bardzo niezadowalające odczucia. Zdecydowanie warto mieć pod ręką odpowiednią mysz zewnętrzną, gdy tylko będzie to możliwe.

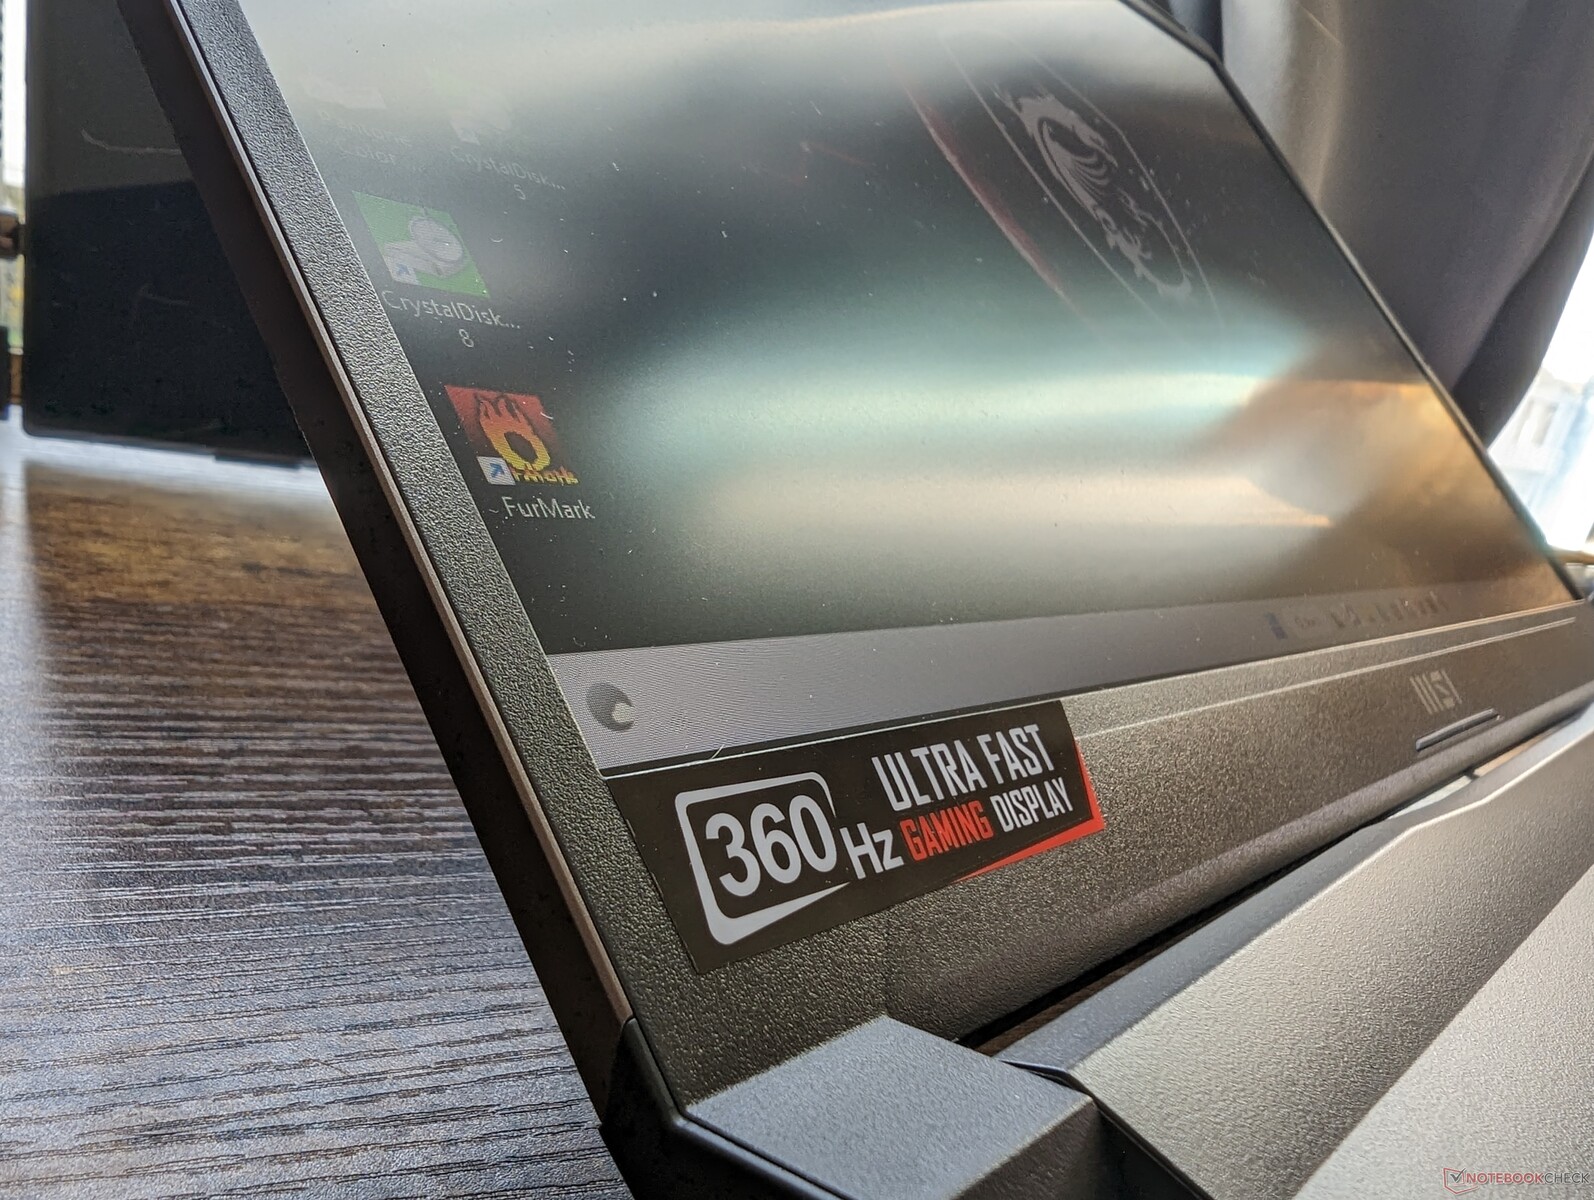
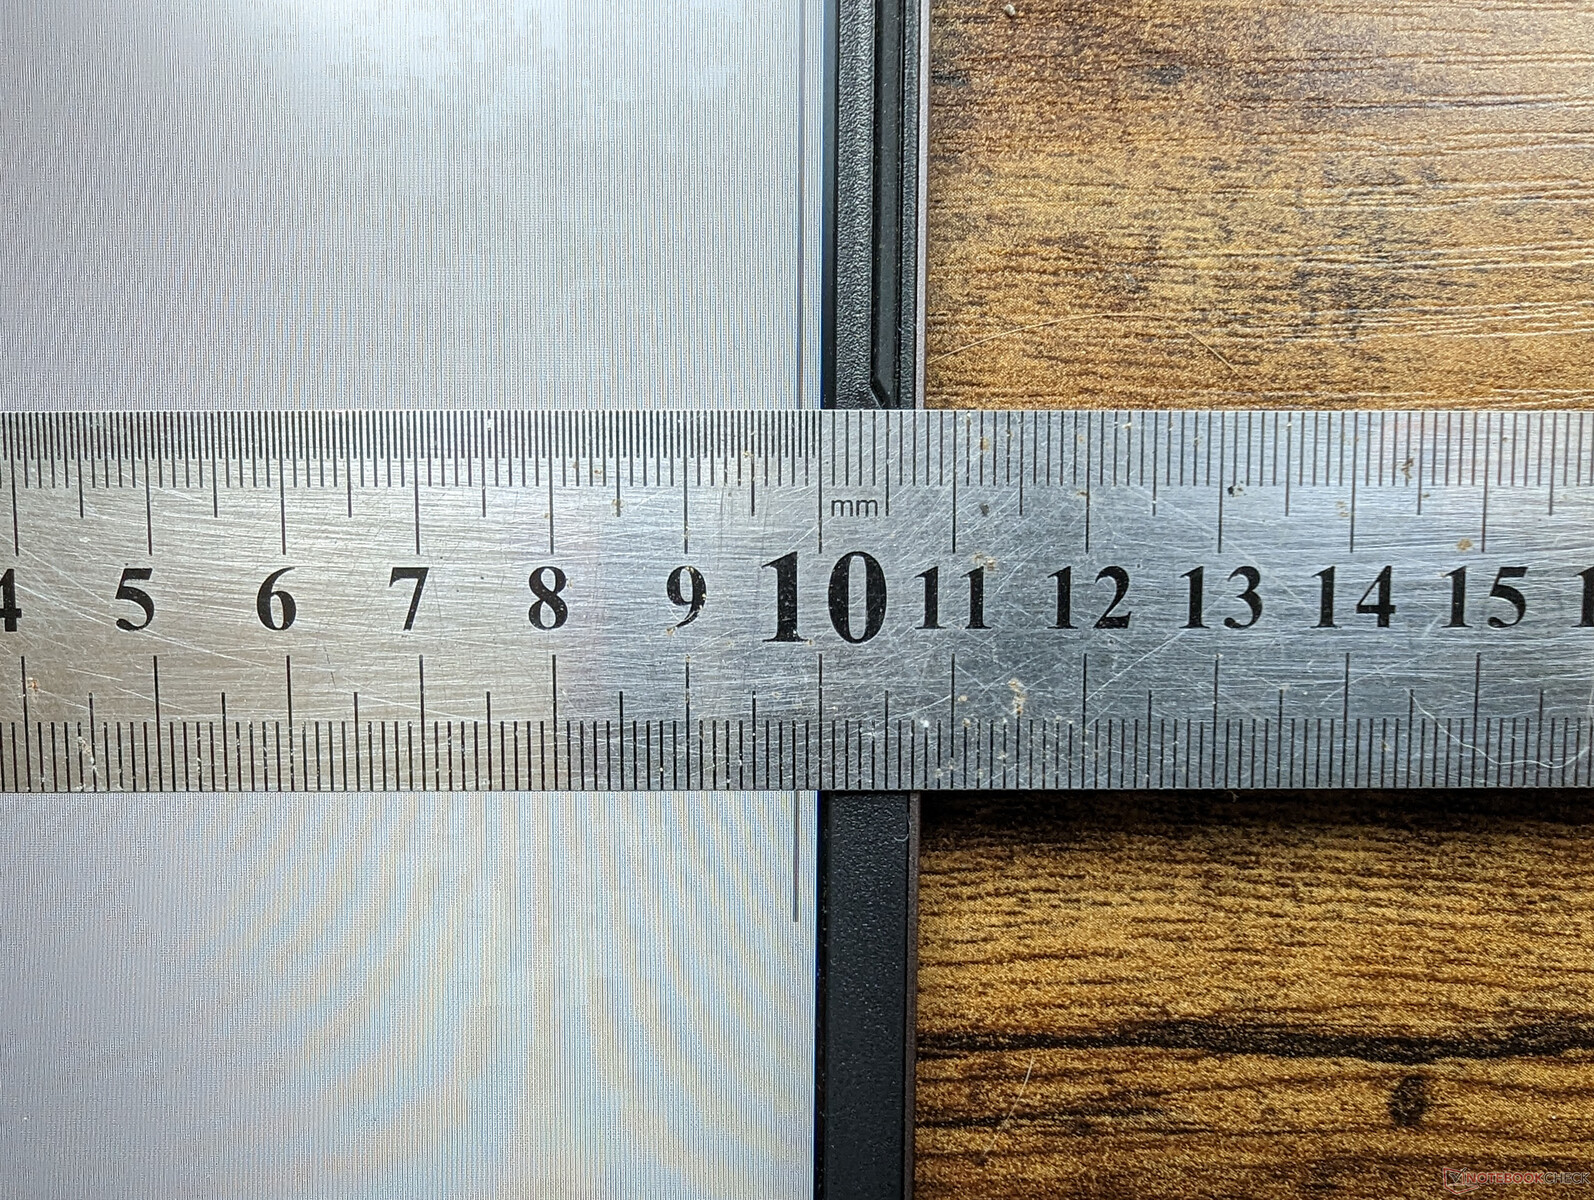
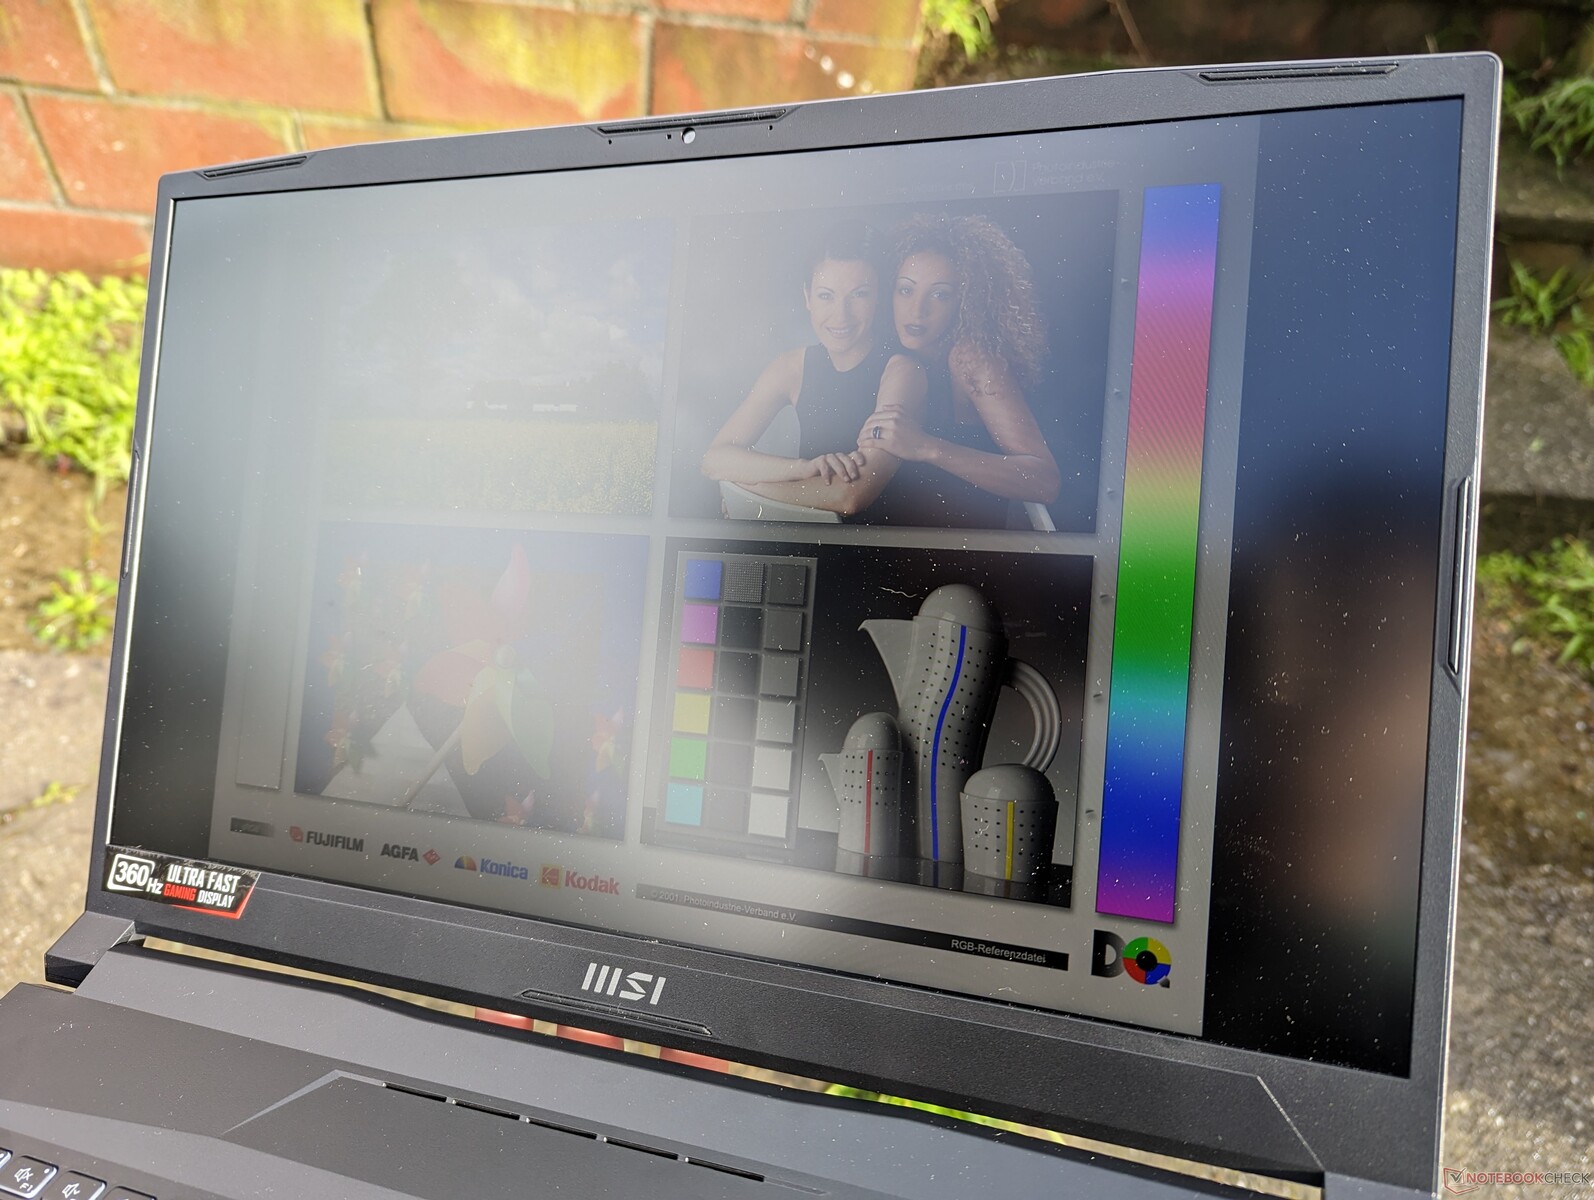
Wyświetlacz - tylko 1080p
Istnieją tylko dwie opcje panelu dla 2022 GL76, jak wymieniono poniżej. 1080p to na razie jedyna opcja rozdzielczości, podczas gdy model 2021 miał SKU QHD.
- 144 Hz, 1080p, 60% sRGB, IPS
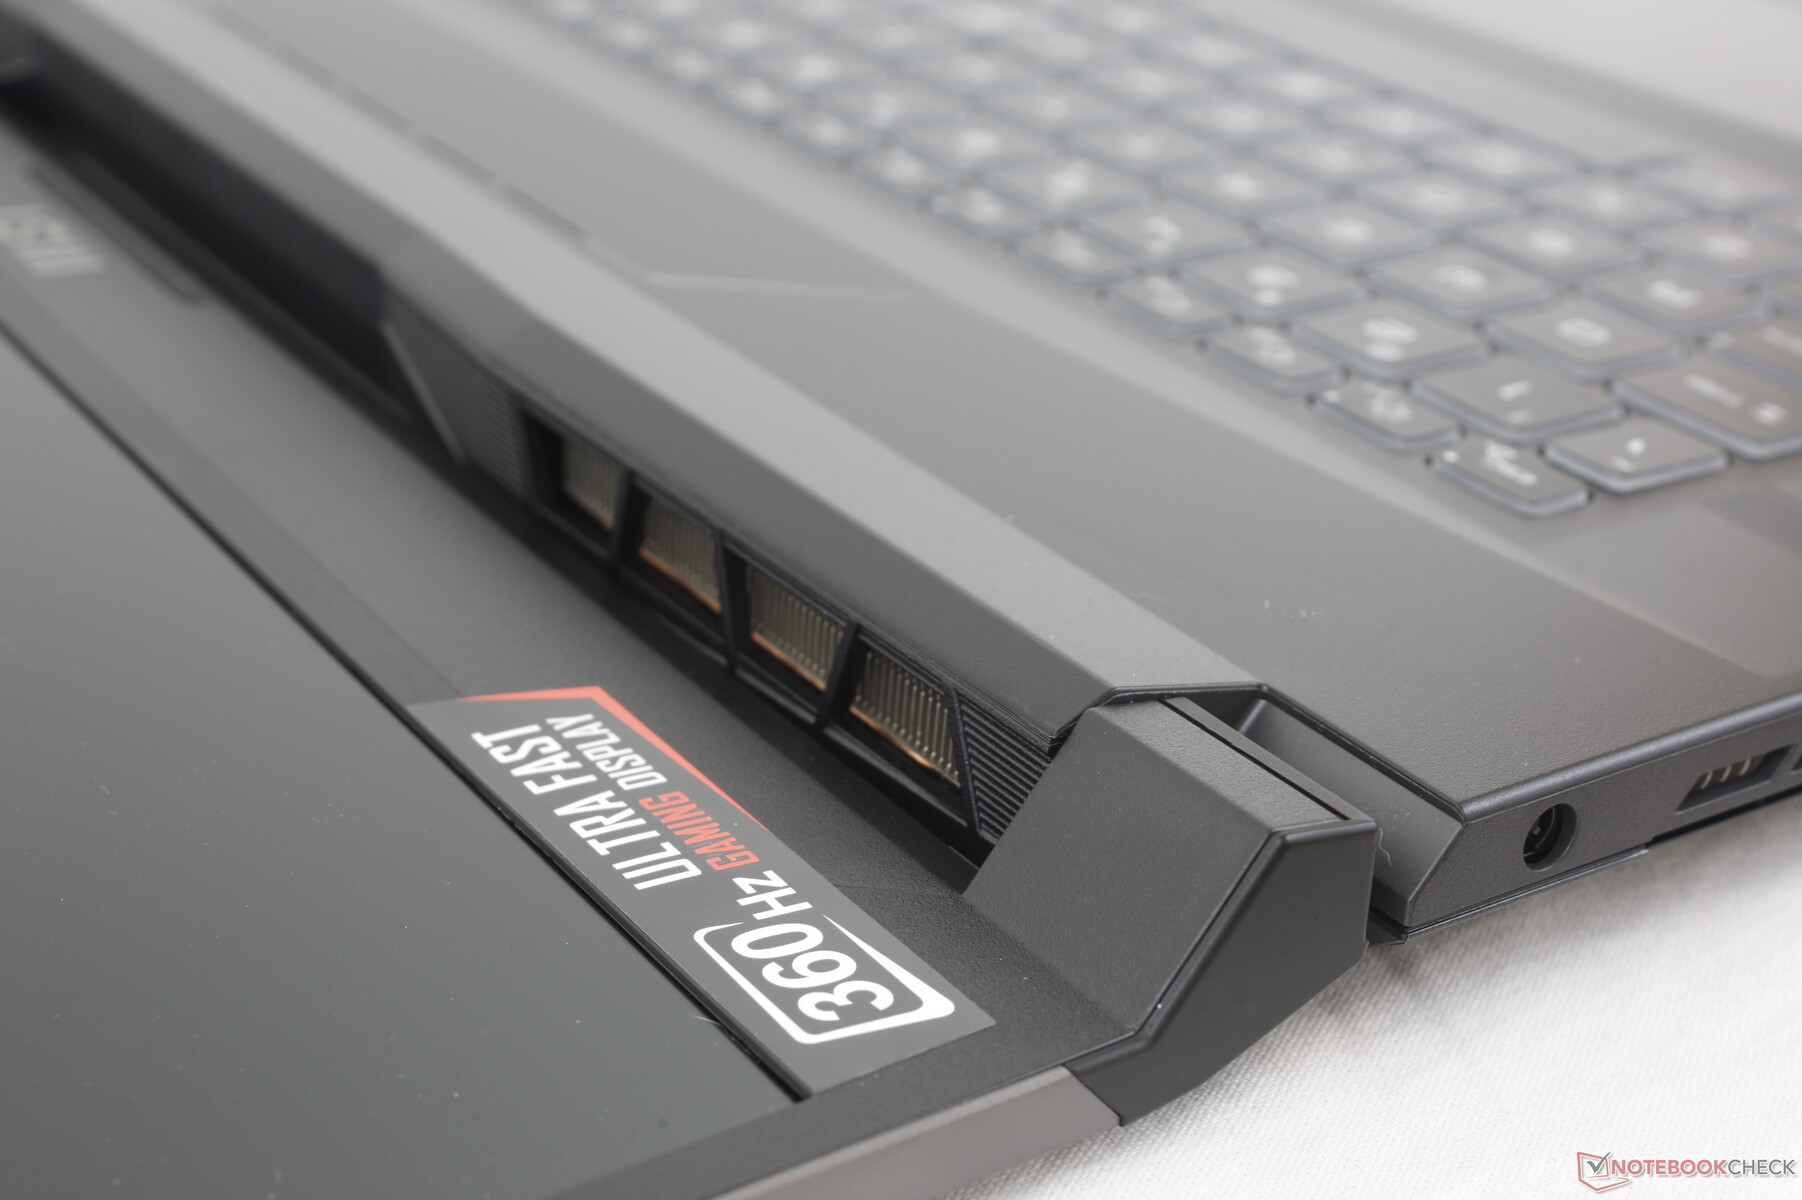
- 360 Hz, 1080p, 100% sRGB, IPS
Panel 360 Hz ma znacznie szybsze czasy reakcji czerni i bieli niż panel 144 Hz. Jest to również ten sam panel IPS Sharp LQ173M1JW08, który MSI wykorzystuje również w swoim flagowym modelu Titan GT77. Zalecamy unikanie opcji 144 Hz, ponieważ jej ograniczona przestrzeń kolorów jest dobrym wskaźnikiem bardzo taniego panelu.
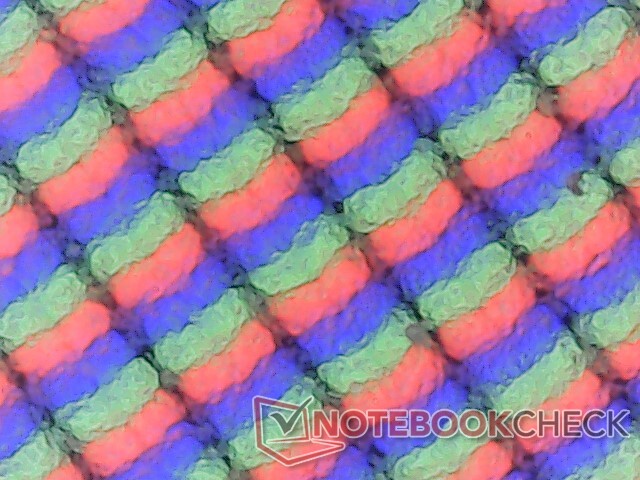
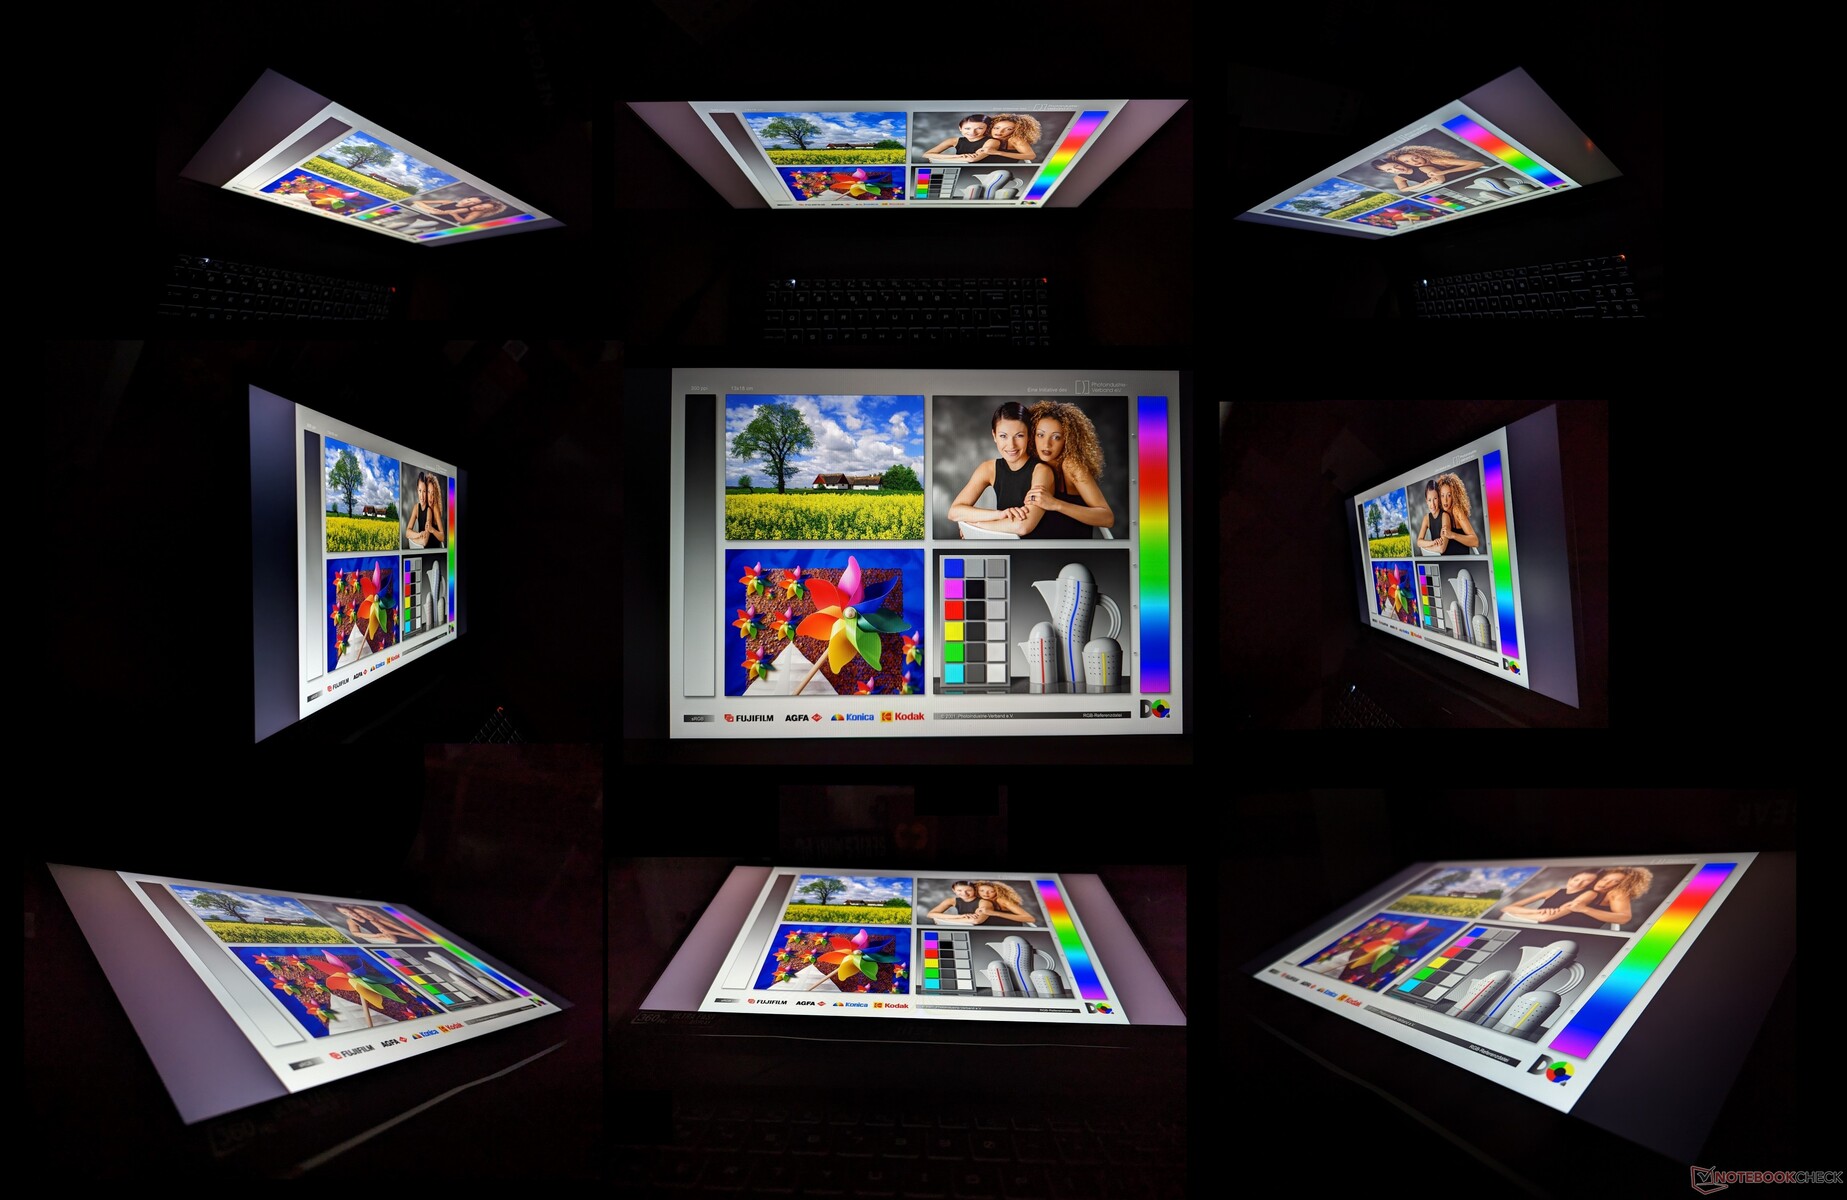
Jakość obrazu jest doskonała i maślanie gładka ze względu na szalenie szybką częstotliwość odświeżania. Należy pamiętać, że nie jest on tak ostry jak w większości ultrabooków lub mniejszych 15,6-calowych laptopów do gier ze względu na stosunkowo niskie PPI. Ten konkretny panel przedkłada responsywność i liczbę klatek na sekundę nad rozdzielczość.
| |||||||||||||||||||||||||
rozświetlenie: 82 %
na akumulatorze: 337.7 cd/m²
kontrast: 1089:1 (czerń: 0.31 cd/m²)
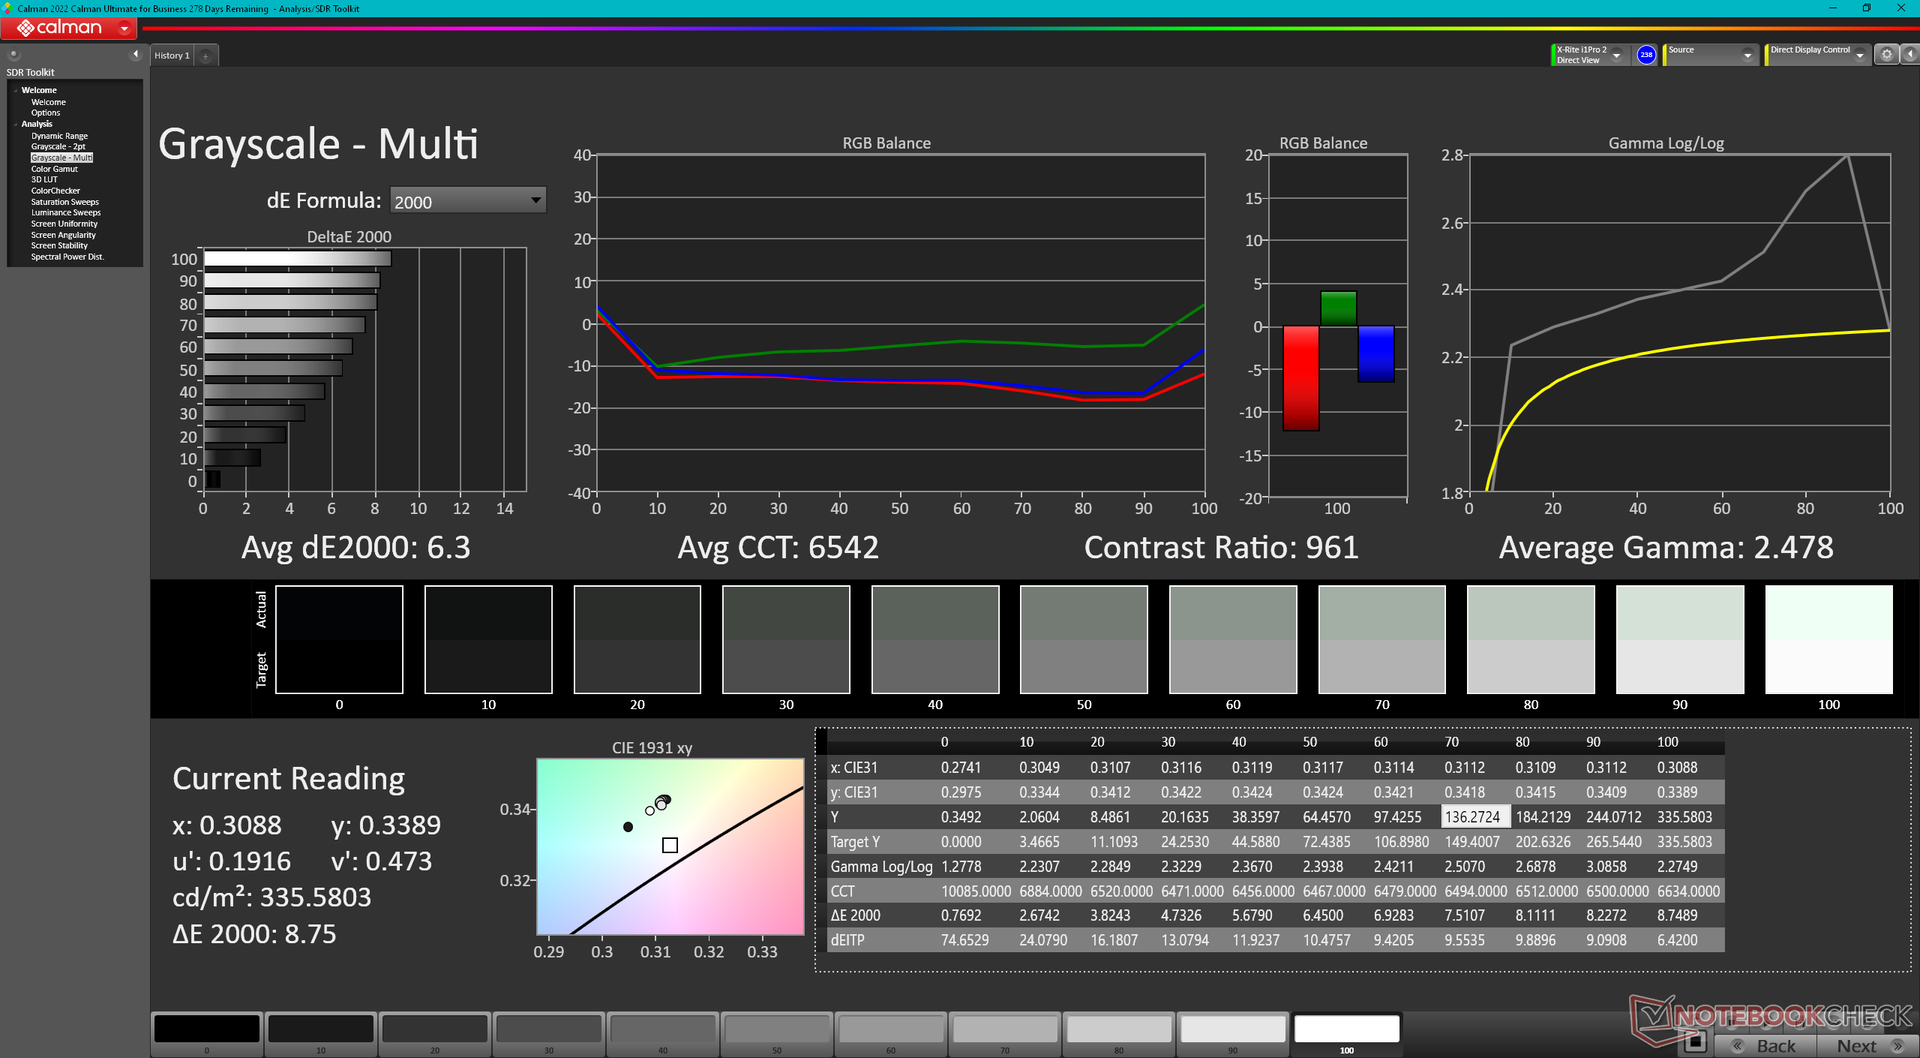
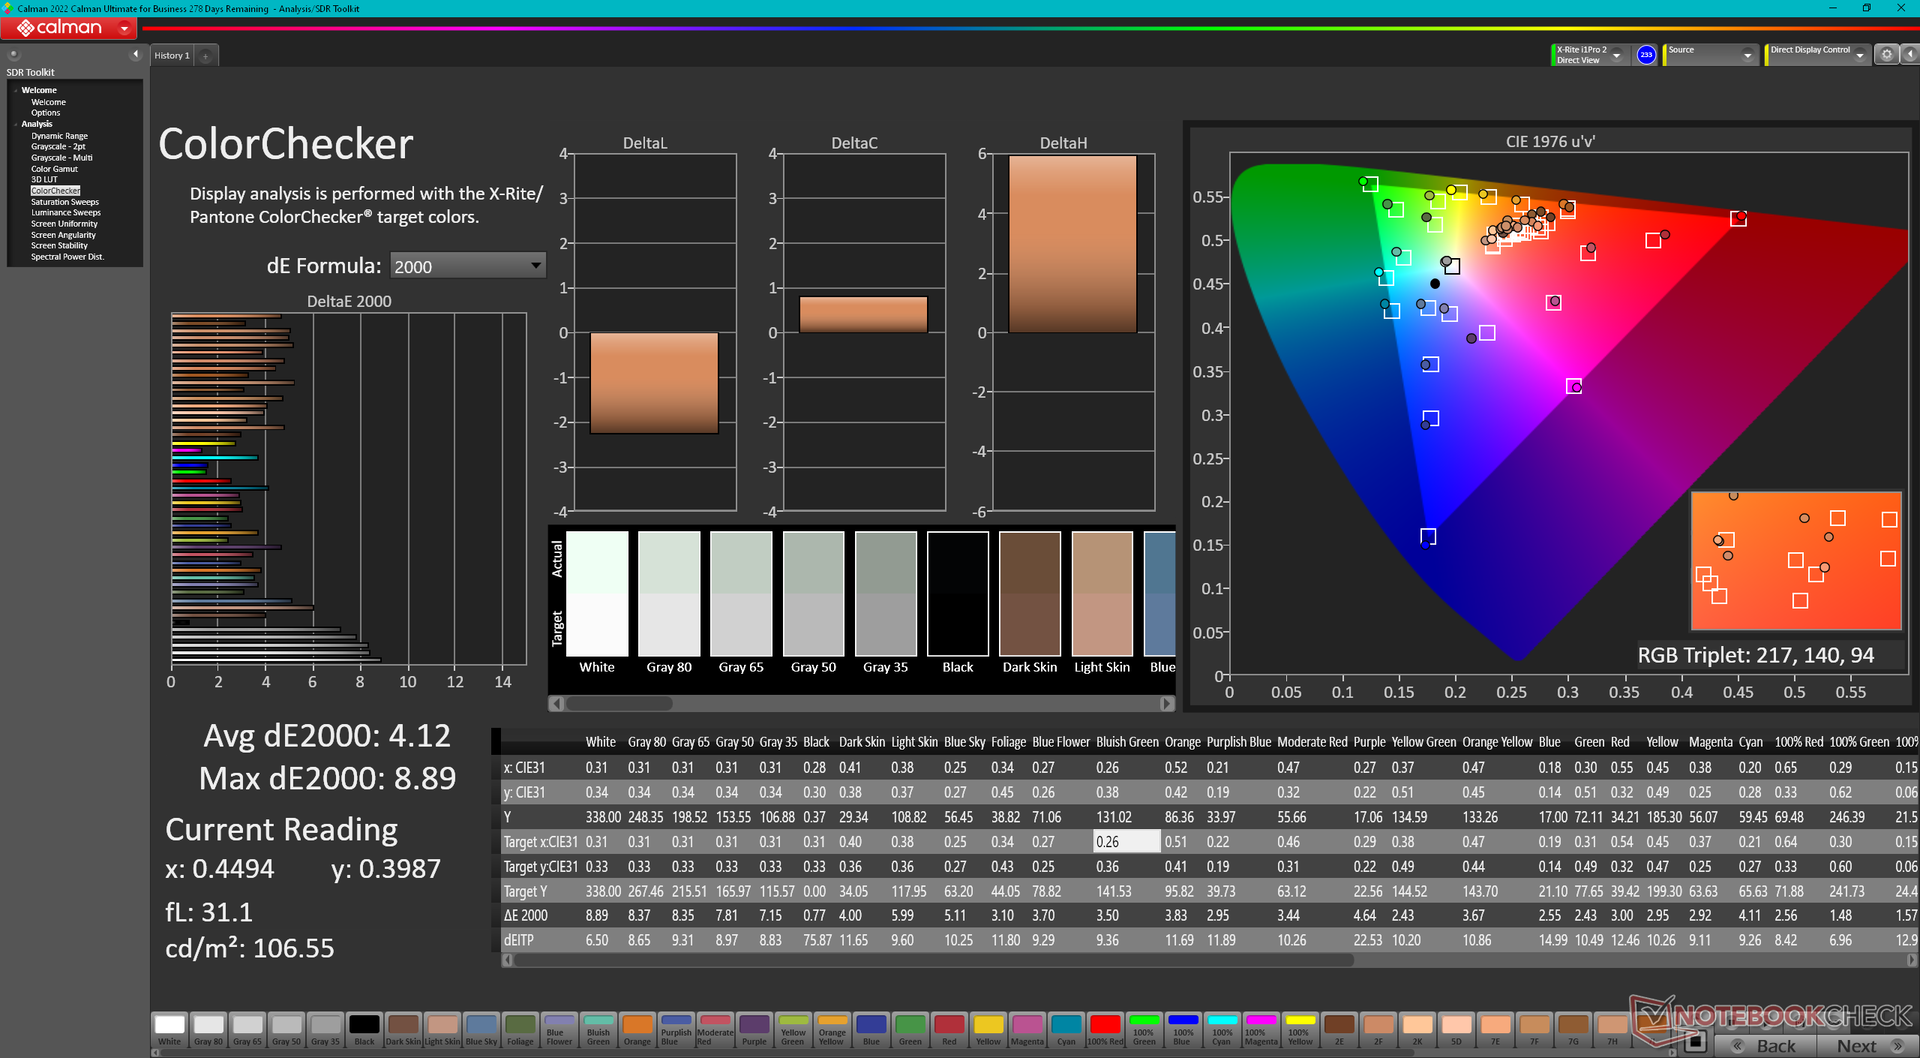
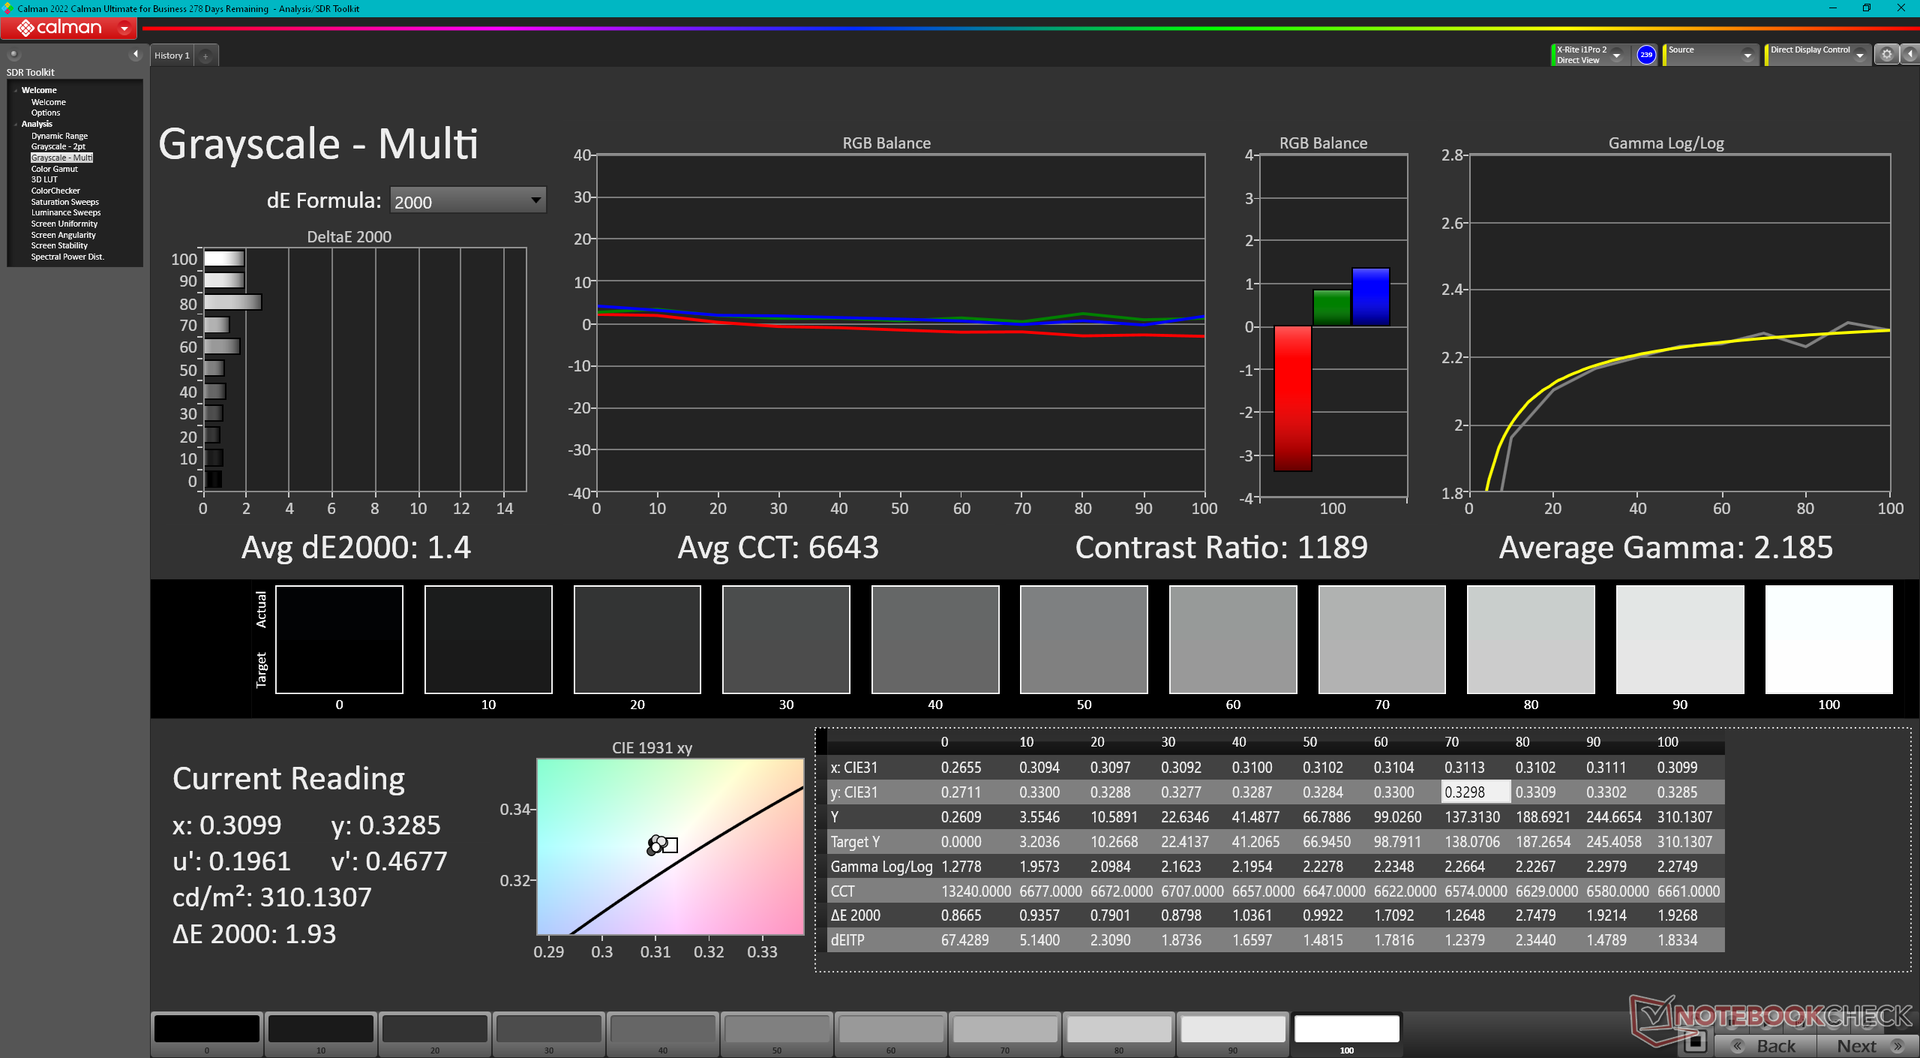
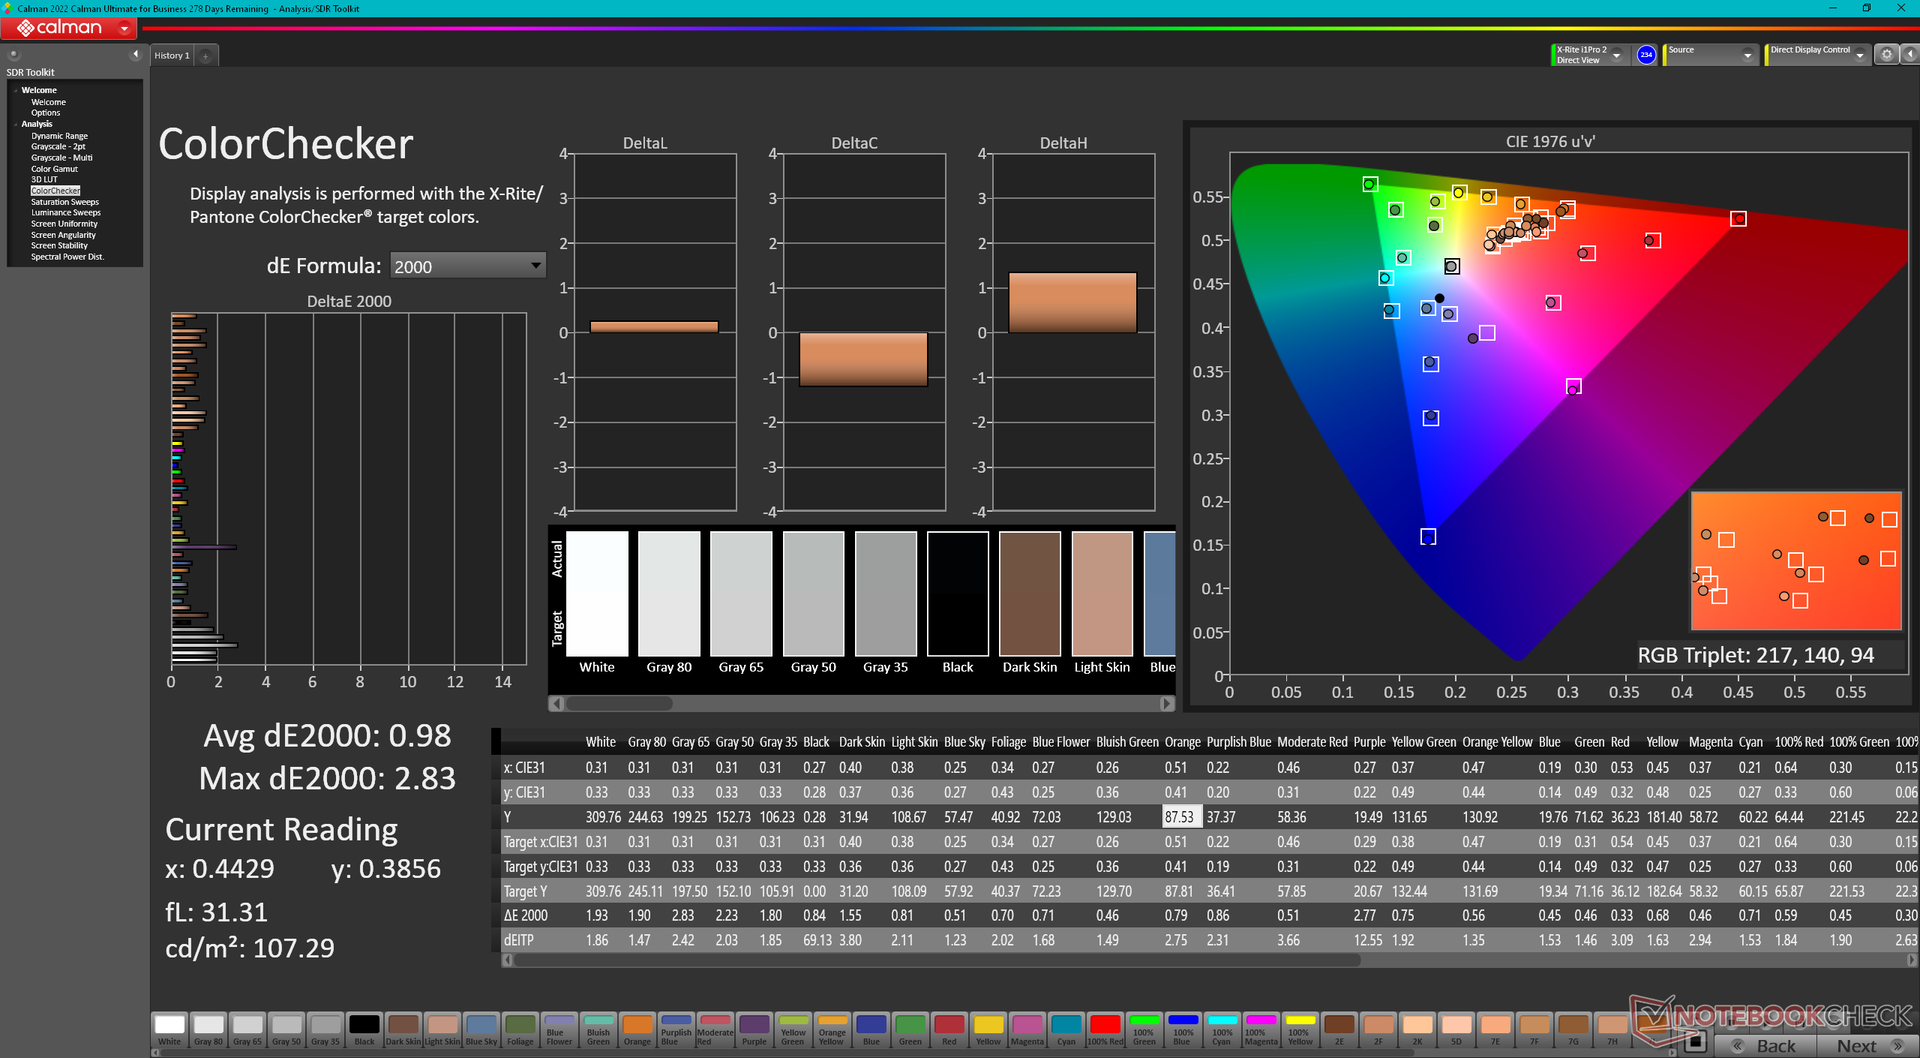
ΔE ColorChecker Calman: 4.12 | ∀{0.5-29.43 Ø4.72}
calibrated: 0.98
ΔE Greyscale Calman: 6.3 | ∀{0.09-98 Ø4.97}
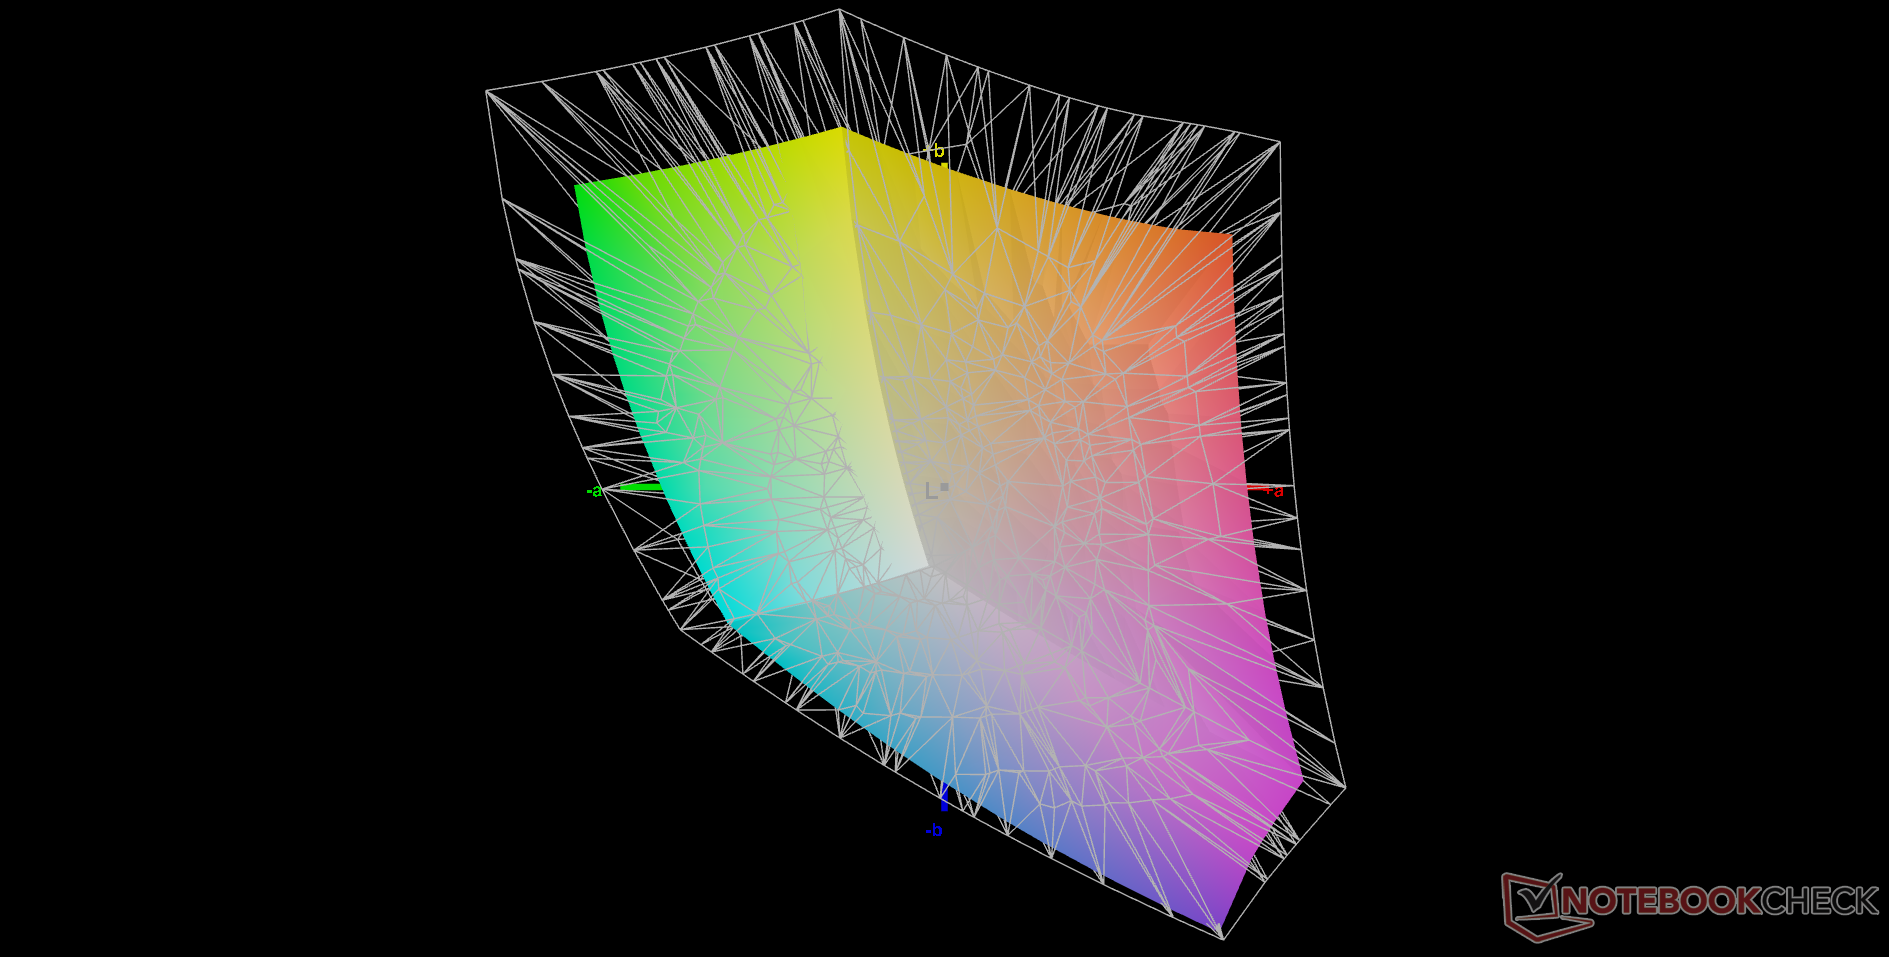
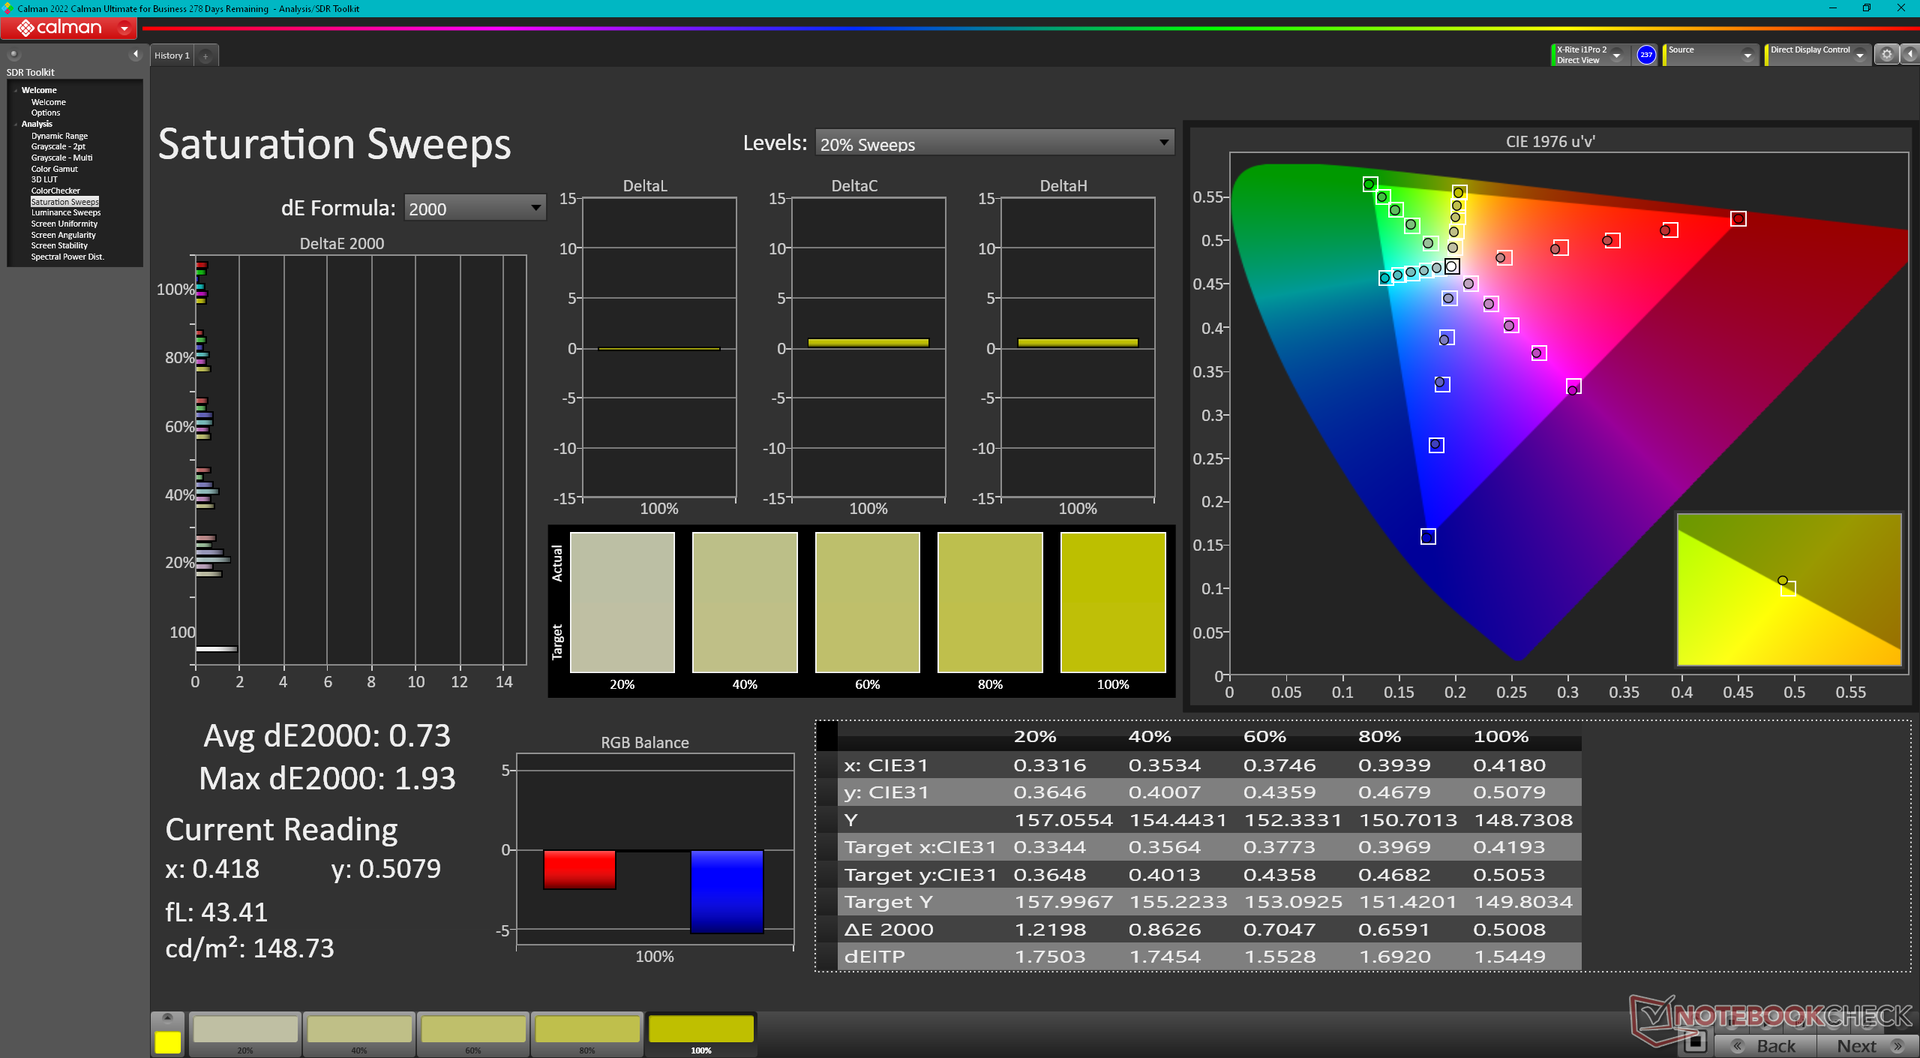
73.7% AdobeRGB 1998 (Argyll 3D)
99.9% sRGB (Argyll 3D)
71.9% Display P3 (Argyll 3D)
Gamma: 2.48
CCT: 6542 K
| MSI Pulse GL76 12UGK Sharp LQ173M1JW08, IPS, 1920x1080, 17.3" | Alienware m17 R5 (R9 6900HX, RX 6850M XT) AU Optronics AUODBA3, IPS, 3840x2160, 17" | Asus ROG Strix Scar 17 SE G733CX-LL014W NE173QHM-NZ2, IPS, 2560x1440, 17.3" | Acer Predator Helios 300 (i7-12700H, RTX 3070 Ti) BOE0A1A, IPS, 2560x1440, 17.3" | Razer Blade 17 Early 2022 AU Optronics B173ZAN06.9, IPS, 3840x2160, 17.3" | MSI Vector GP76 12UGS-434 AUO B173HAN05.4, IPS, 1920x1080, 17.3" | |
|---|---|---|---|---|---|---|
| Display | 18% | 17% | 17% | 19% | -3% | |
| Display P3 Coverage (%) | 71.9 | 97.2 35% | 97.1 35% | 96.8 35% | 99.4 38% | 70.09 -3% |
| sRGB Coverage (%) | 99.9 | 99.6 0% | 99.9 0% | 99.9 0% | 100 0% | 98.98 -1% |
| AdobeRGB 1998 Coverage (%) | 73.7 | 88.4 20% | 84.8 15% | 84.8 15% | 87.3 18% | 70.91 -4% |
| Response Times | -131% | -7% | -129% | -7% | 21% | |
| Response Time Grey 50% / Grey 80% * (ms) | 4.6 ? | 16.4 ? -257% | 5.7 ? -24% | 16.4 ? -257% | 7.5 ? -63% | 4 ? 13% |
| Response Time Black / White * (ms) | 11.2 ? | 11.6 ? -4% | 10.1 ? 10% | 11.2 ? -0% | 5.6 ? 50% | 8 ? 29% |
| PWM Frequency (Hz) | ||||||
| Screen | -43% | 28% | -12% | 34% | 11% | |
| Brightness middle (cd/m²) | 337.7 | 484 43% | 320 -5% | 366 8% | 503 49% | 274 -19% |
| Brightness (cd/m²) | 331 | 449 36% | 303 -8% | 340 3% | 486 47% | 264 -20% |
| Brightness Distribution (%) | 82 | 87 6% | 87 6% | 85 4% | 84 2% | 87 6% |
| Black Level * (cd/m²) | 0.31 | 0.55 -77% | 0.3 3% | 0.31 -0% | 0.44 -42% | 0.25 19% |
| Contrast (:1) | 1089 | 880 -19% | 1067 -2% | 1181 8% | 1143 5% | 1096 1% |
| Colorchecker dE 2000 * | 4.12 | 4.8 -17% | 1.1 73% | 3.56 14% | 1.08 74% | 2.53 39% |
| Colorchecker dE 2000 max. * | 8.89 | 7.48 16% | 2.7 70% | 5.66 36% | 4.54 49% | 6.76 24% |
| Colorchecker dE 2000 calibrated * | 0.98 | 4.74 -384% | 3.31 -238% | 0.6 39% | 0.98 -0% | |
| Greyscale dE 2000 * | 6.3 | 5.5 13% | 1.1 83% | 2.84 55% | 1.3 79% | 3.49 45% |
| Gamma | 2.48 89% | 2.42 91% | 2.13 103% | 2.29 96% | 2.151 102% | 2.31 95% |
| CCT | 6542 99% | 6148 106% | 6599 98% | 6835 95% | 6541 99% | 6714 97% |
| Całkowita średnia (program / ustawienia) | -52% /
-42% | 13% /
20% | -41% /
-23% | 15% /
25% | 10% /
9% |
* ... im mniej tym lepiej
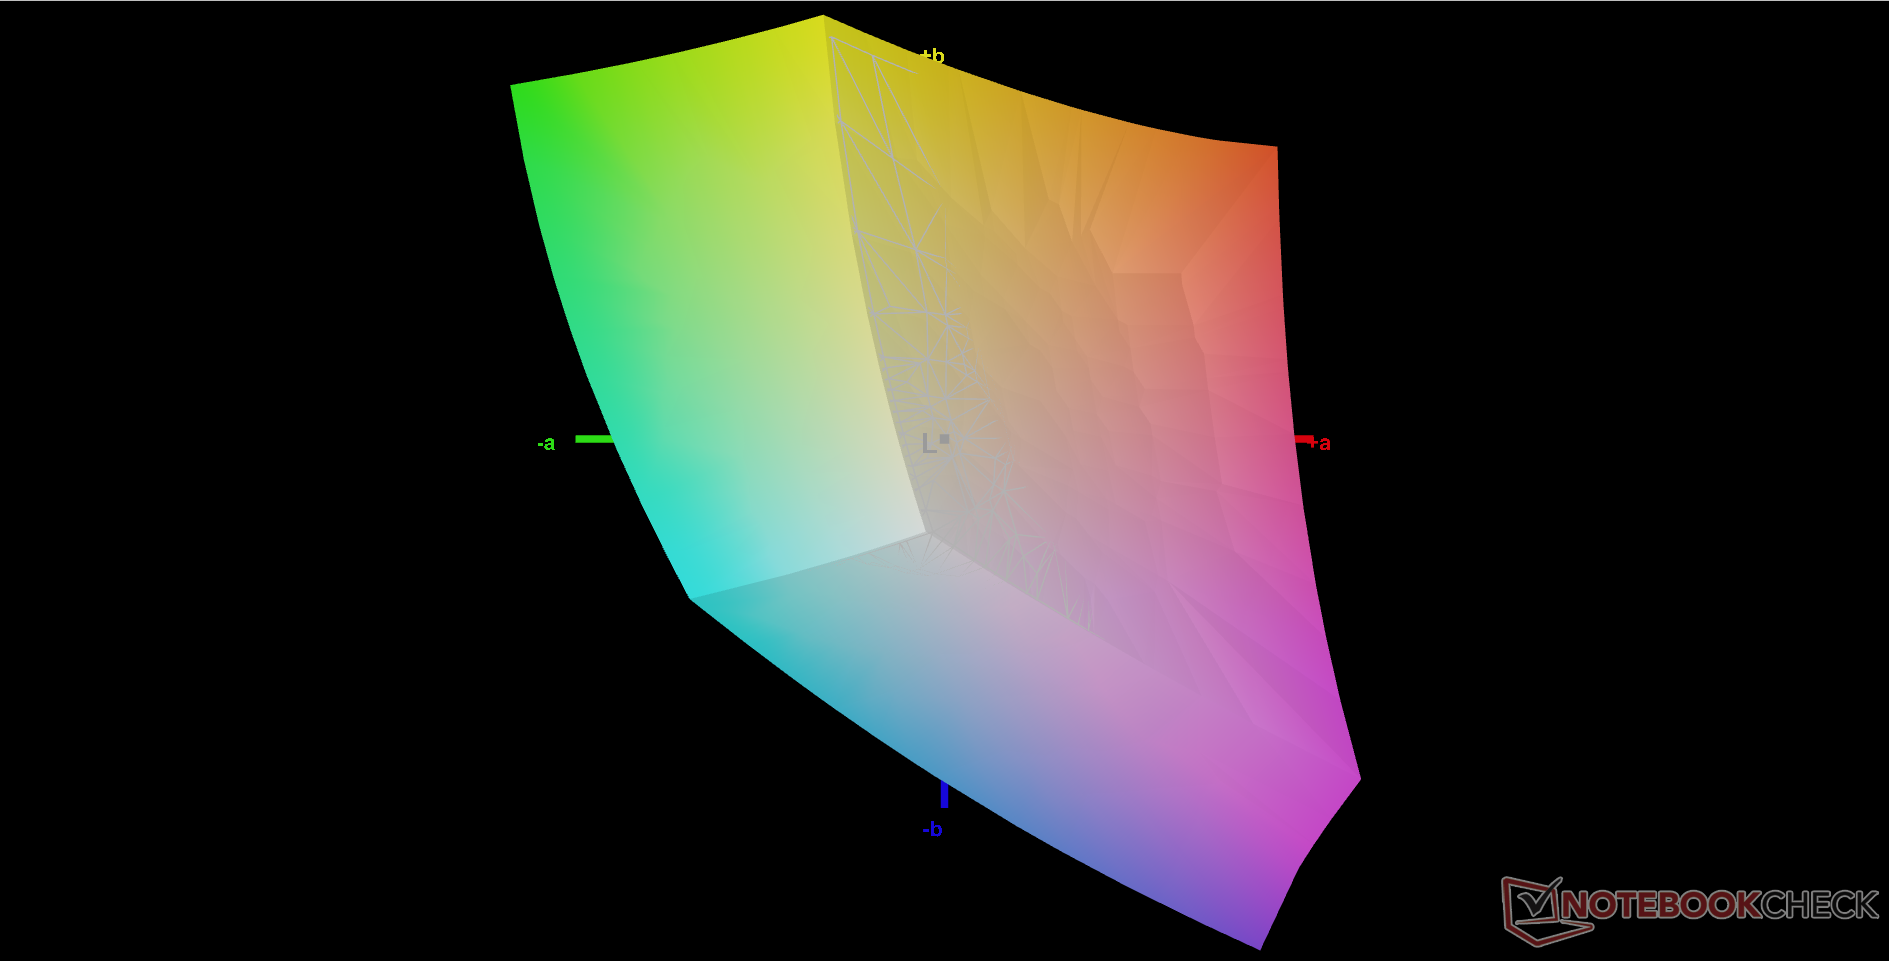
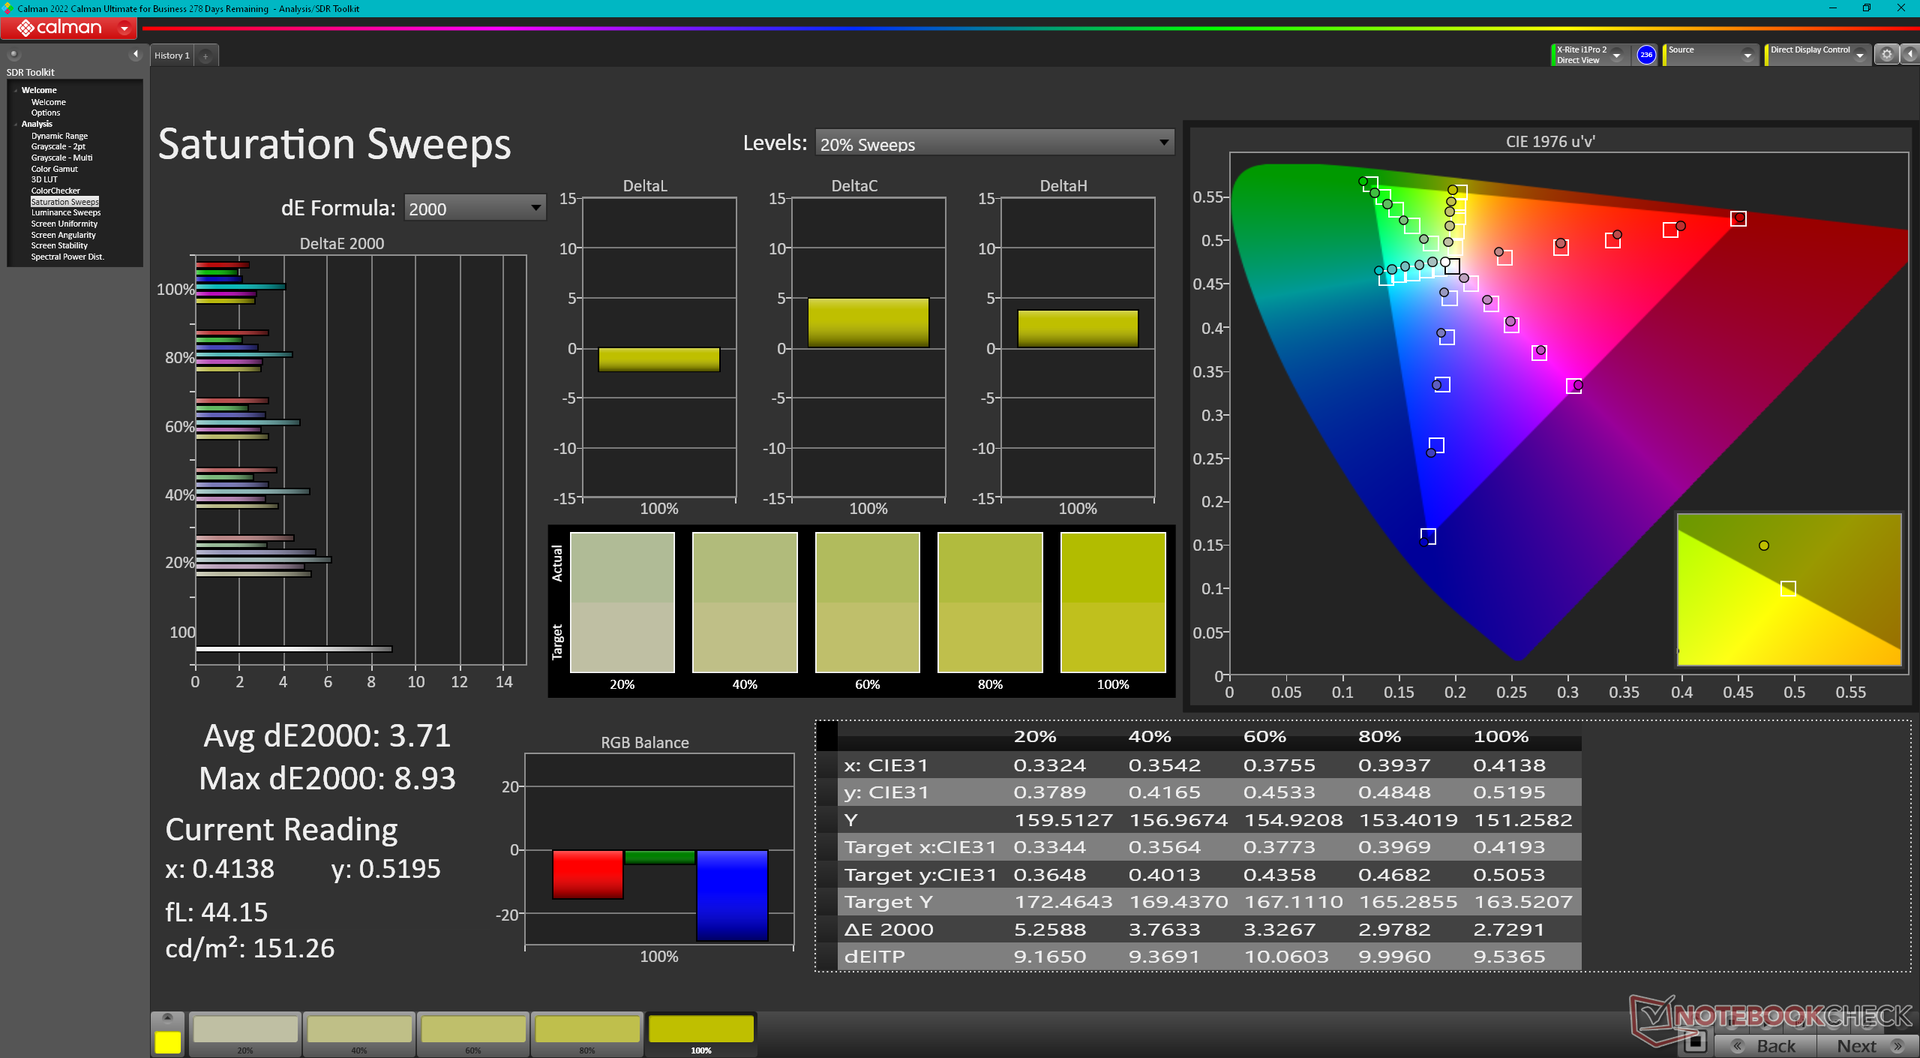
Wyświetlacz nie jest skalibrowany po wyjęciu z pudełka. Średnie wartości DeltaE w skali szarości i kolorze poprawiłyby się znacząco z 6,3 i 4,12 do zaledwie 1,4 i 0,98, odpowiednio, po odpowiedniej kalibracji kolorymetrem X-Rite. Zalecamy zastosowanie naszego powyższego profilu ICM, aby lepiej wykorzystać pełne pokrycie sRGB panelu.
Wyświetl czasy reakcji
| ↔ Czas reakcji od czerni do bieli | ||
|---|---|---|
| 11.2 ms ... wzrost ↗ i spadek ↘ łącznie | ↗ 6.8 ms wzrost | 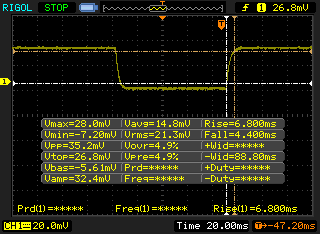 |
| ↘ 4.4 ms upadek | ||
| W naszych testach ekran wykazuje dobry współczynnik reakcji, ale może być zbyt wolny dla graczy rywalizujących ze sobą. Dla porównania, wszystkie testowane urządzenia wahają się od 0.1 (minimum) do 240 (maksimum) ms. » 30 % wszystkich urządzeń jest lepszych. Oznacza to, że zmierzony czas reakcji jest lepszy od średniej wszystkich testowanych urządzeń (19.8 ms). | ||
| ↔ Czas reakcji 50% szarości do 80% szarości | ||
| 4.6 ms ... wzrost ↗ i spadek ↘ łącznie | ↗ 2.2 ms wzrost | 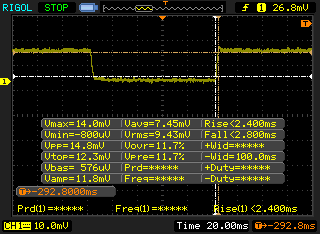 |
| ↘ 2.4 ms upadek | ||
| W naszych testach ekran wykazuje bardzo szybką reakcję i powinien bardzo dobrze nadawać się do szybkich gier. Dla porównania, wszystkie testowane urządzenia wahają się od 0.165 (minimum) do 636 (maksimum) ms. » 16 % wszystkich urządzeń jest lepszych. Oznacza to, że zmierzony czas reakcji jest lepszy od średniej wszystkich testowanych urządzeń (31 ms). | ||
Migotanie ekranu / PWM (modulacja szerokości impulsu)
| Migotanie ekranu/nie wykryto PWM | 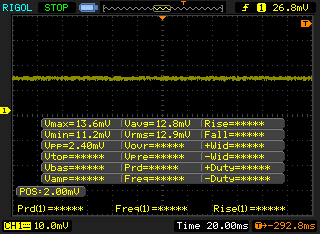 | ||
Dla porównania: 52 % wszystkich testowanych urządzeń nie używa PWM do przyciemniania wyświetlacza. Jeśli wykryto PWM, zmierzono średnio 7781 (minimum: 5 - maksimum: 343500) Hz. | |||
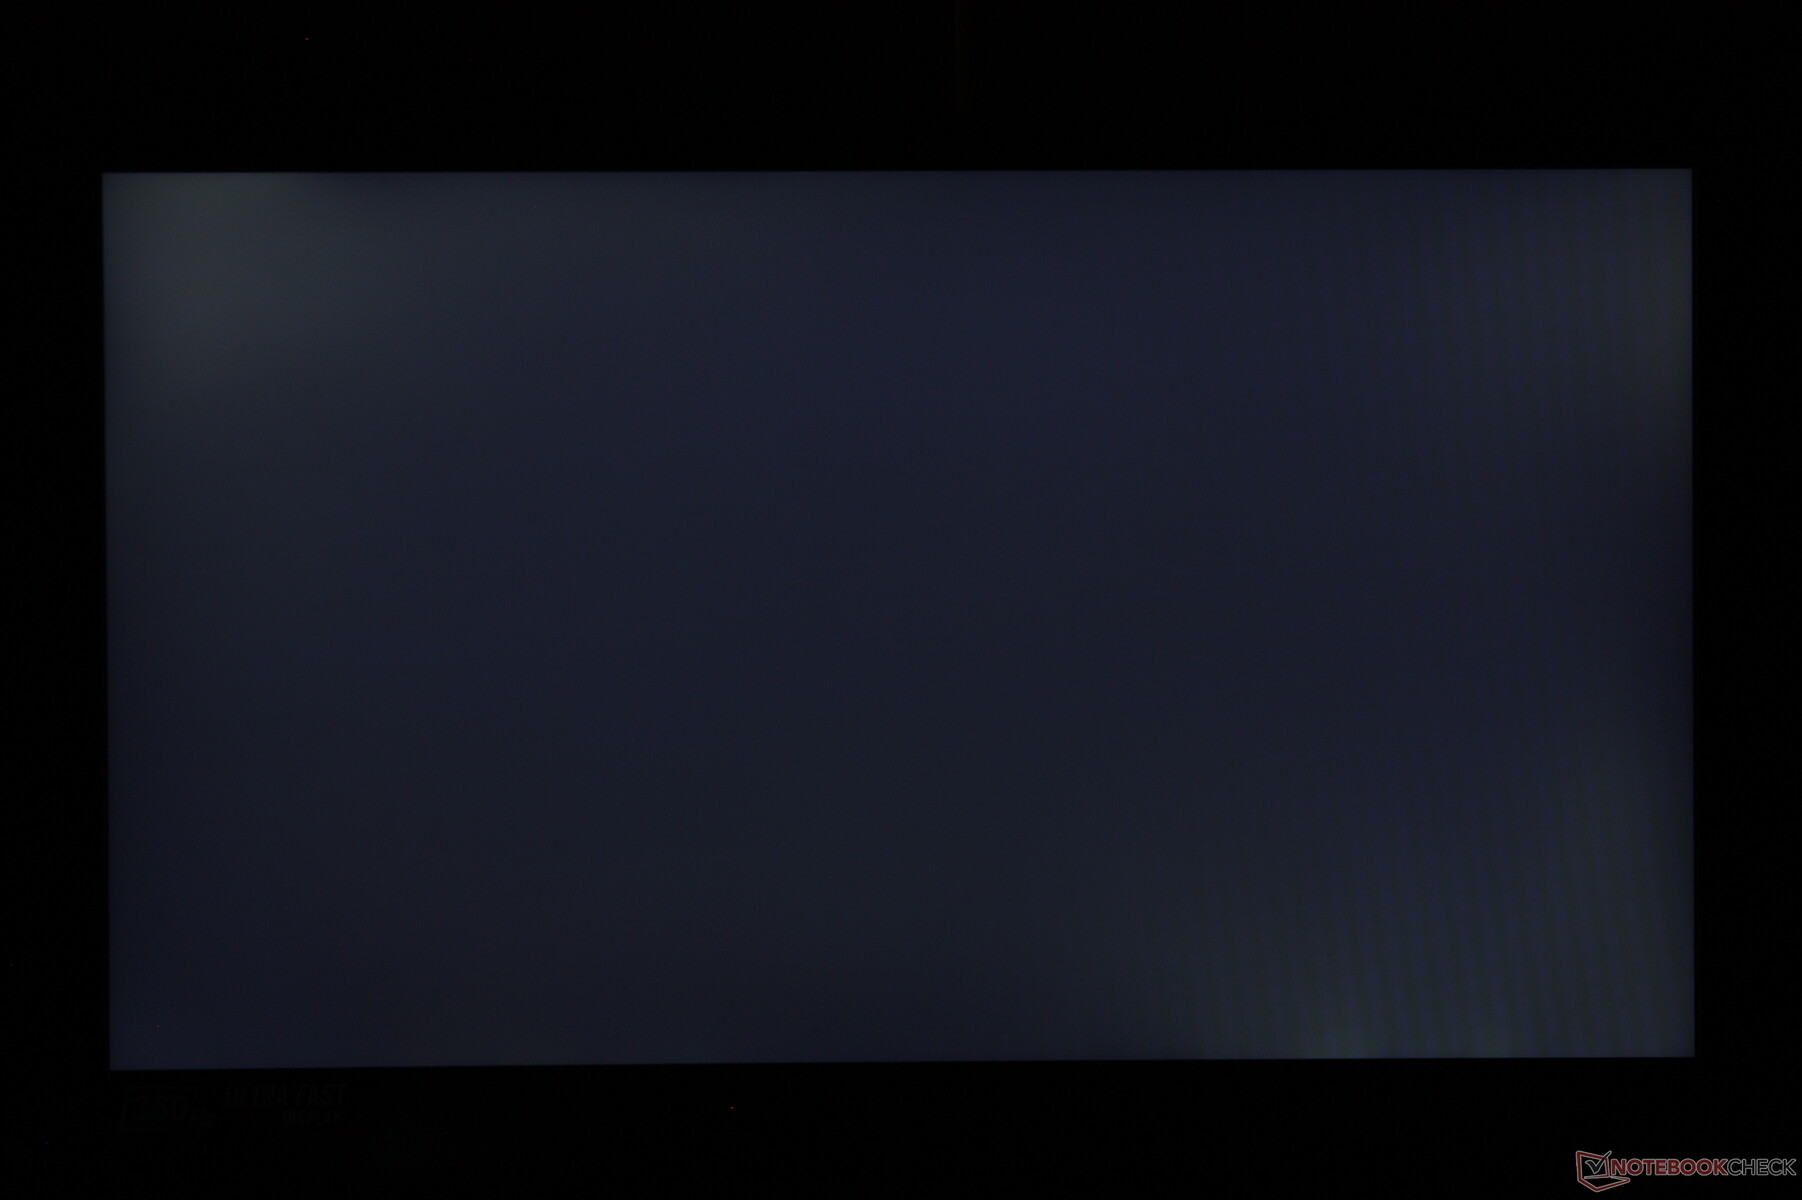
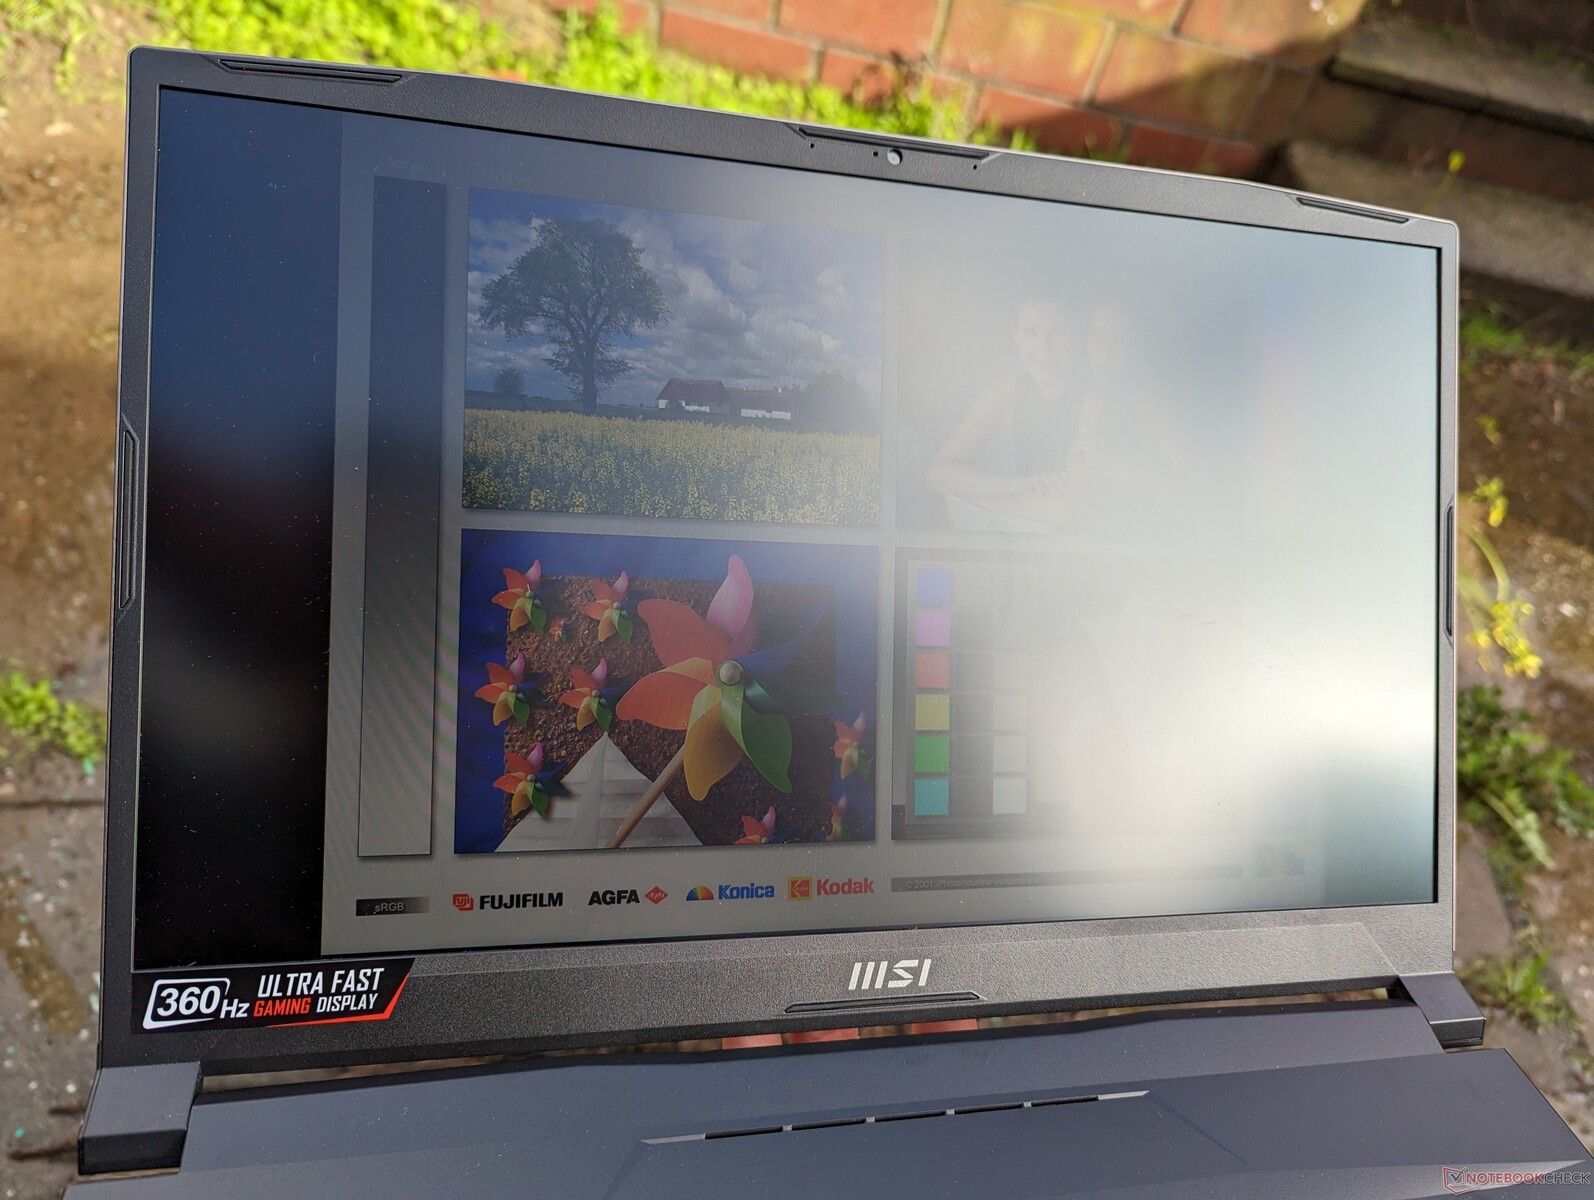
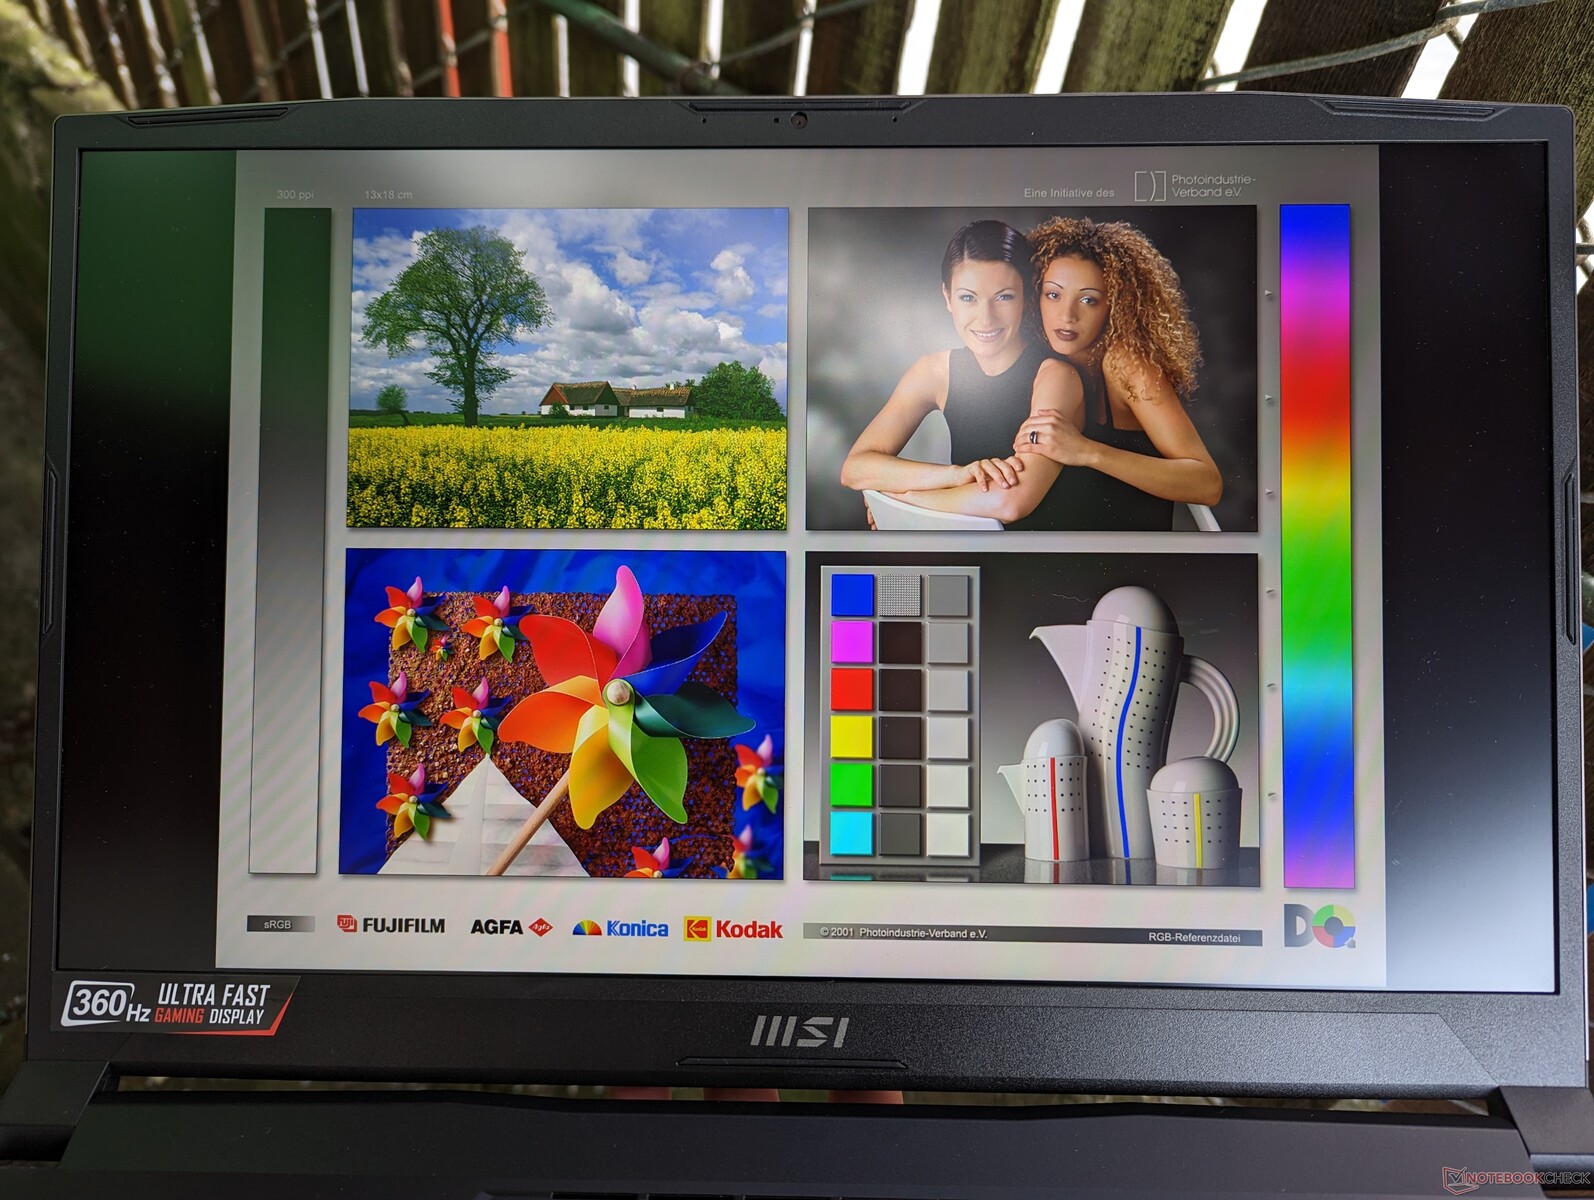
Matowy wyświetlacz jest wystarczająco jasny, by można go było używać pod cieniem, ale poza tym nie jest przeznaczony do pracy w jaśniejszych warunkach zewnętrznych. Kilka laptopów do gier, jak np Razer Blade 17 OLEDma jaśniejsze, 500-nitowe wyświetlacze ułatwiające czytanie na zewnątrz.
Wydajność - Intel 12th Gen Alder Lake-H
Warunki badania
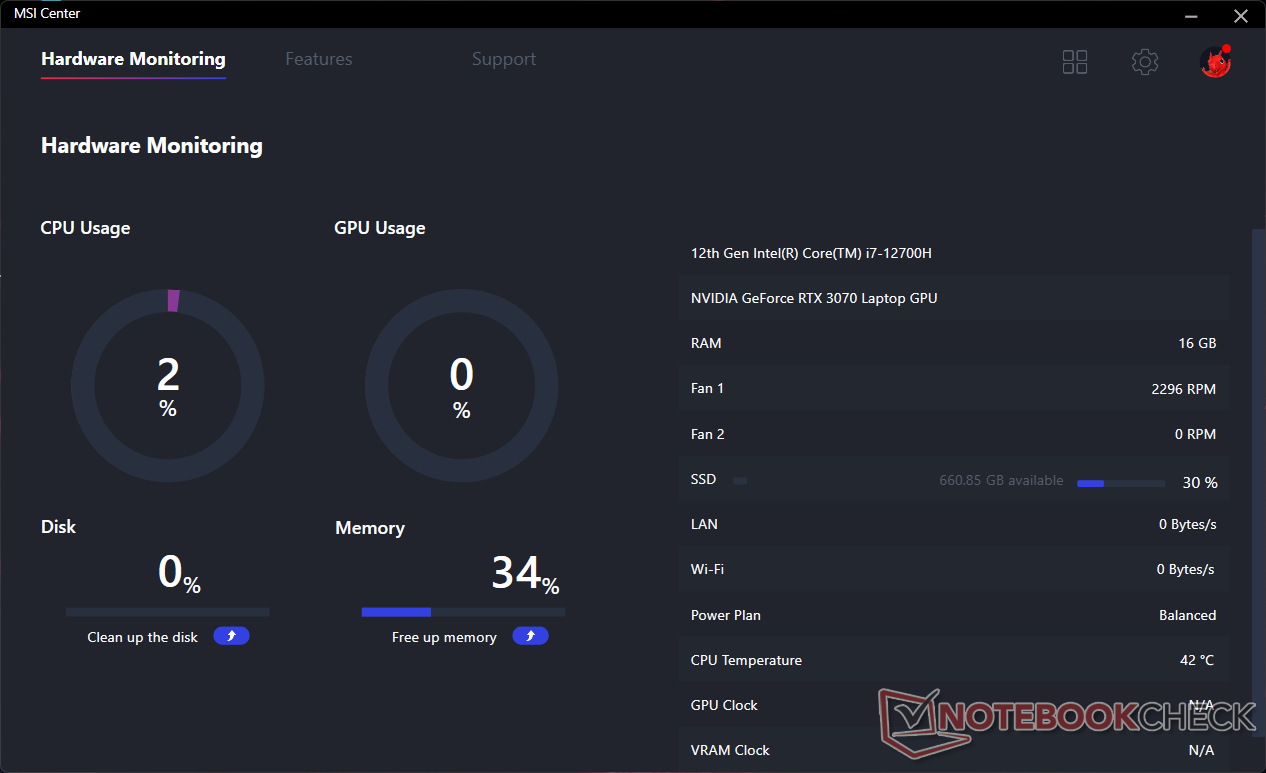
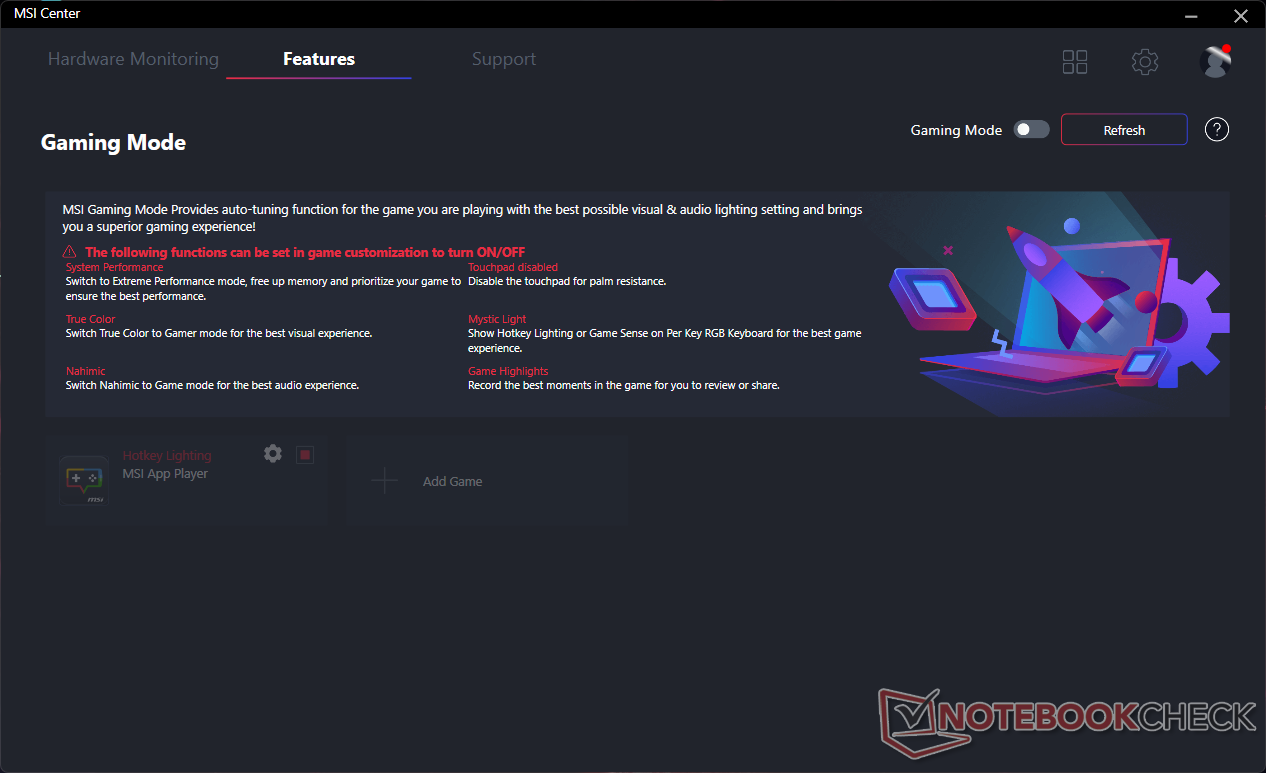
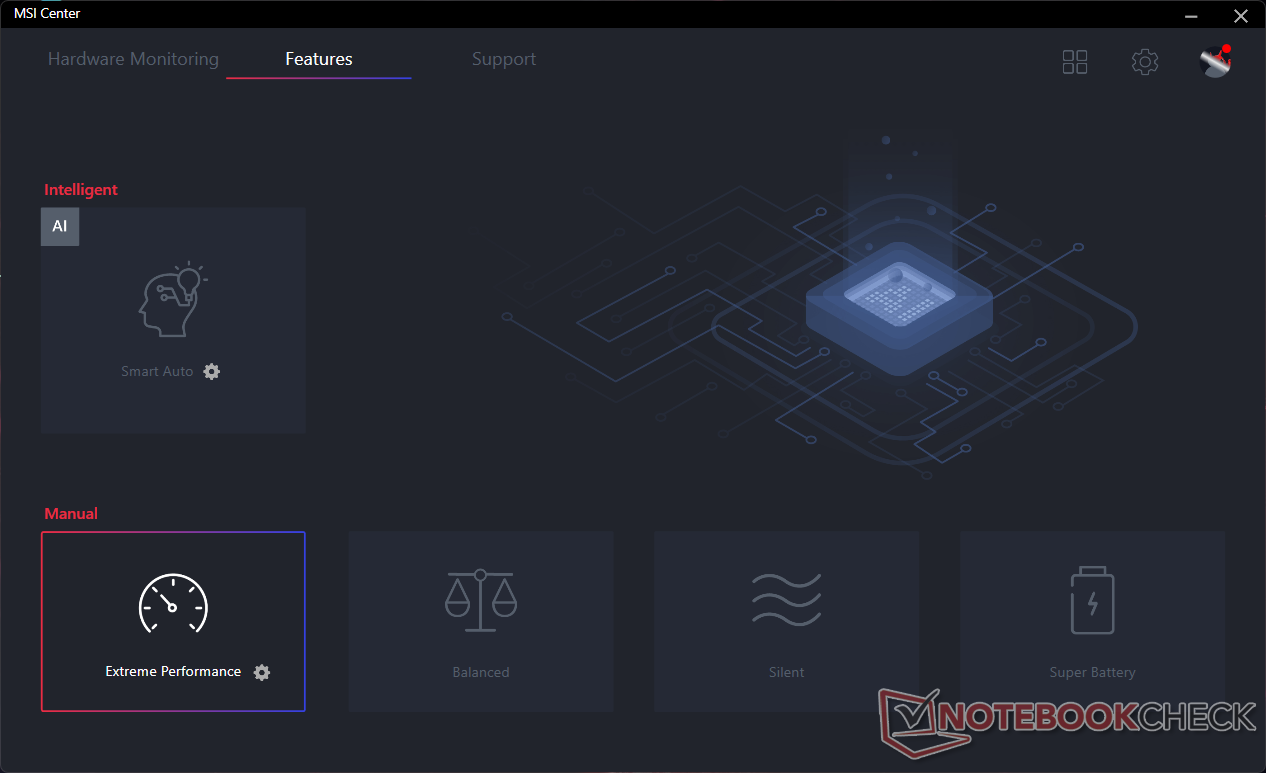
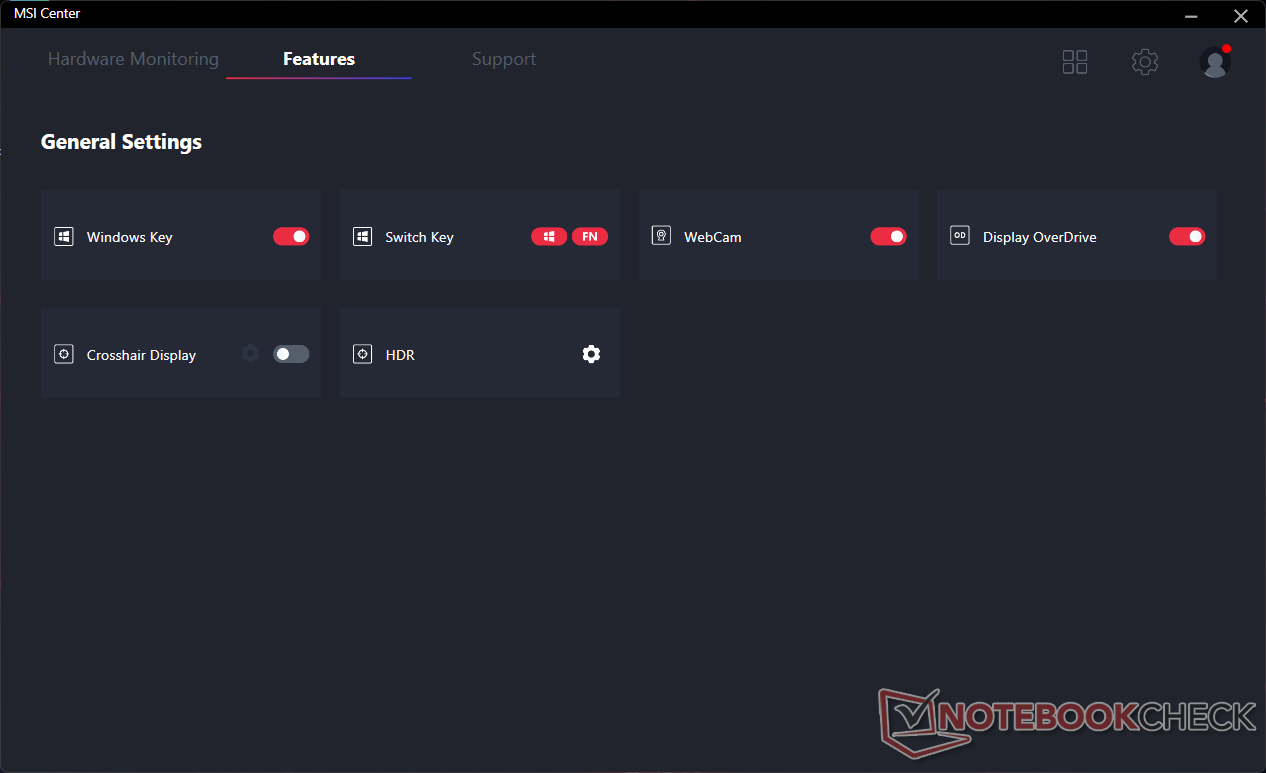
Przed uruchomieniem poniższych benchmarków ustawiliśmy nasz komputer w trybie Performance poprzez Windows i Extreme Performance poprzez MSI Center z aktywnym dGPU. Tryb wentylatora był również ustawiony na Auto. Użytkownicy powinni zapoznać się z MSI Center, ponieważ jest to centrum sterowania aktualizacjami MSI, profilami wydajności, monitorowaniem sprzętu i innymi elementami, jak widać na poniższych zrzutach ekranu.
W serii GL76 nie ma obsługi Advanced Optimus ani MUX.
Procesor
Wydajność procesora jest doskonała, a wyniki wielowątkowe są o około 10 procent szybsze niż w przypadku przeciętnego laptopa z naszej bazy danych wyposażonego w ten sam Core i7-12700H CPU. W ogólnym rozrachunku jest on o kilka punktów procentowych szybszy od Core i9-12900H w dużo droższym Alienware x15 R2.
Decydując się na niższą półkę Core i5-12500H zamiast naszego Core i7, spowodowałoby spadek wydajności wielowątkowej o około 15 procent.
Cinebench R15 Multi Loop
Cinebench R20: CPU (Multi Core) | CPU (Single Core)
Cinebench R23: Multi Core | Single Core
Cinebench R15: CPU Multi 64Bit | CPU Single 64Bit
Blender: v2.79 BMW27 CPU
7-Zip 18.03: 7z b 4 | 7z b 4 -mmt1
Geekbench 5.5: Multi-Core | Single-Core
HWBOT x265 Benchmark v2.2: 4k Preset
LibreOffice : 20 Documents To PDF
R Benchmark 2.5: Overall mean
| CPU Performance rating | |
| Asus ROG Strix Scar 17 SE G733CX-LL014W | |
| MSI GE67 HX 12UGS | |
| Alienware x15 R2 P111F | |
| MSI Pulse GL76 12UGK | |
| Przeciętny Intel Core i7-12700H | |
| Razer Blade 15 2022 | |
| Alienware m17 R5 (R9 6900HX, RX 6850M XT) | |
| Lenovo IdeaPad Gaming 3 15IAH7 | |
| HP Omen 16-n0033dx | |
| Schenker XMG Apex 15 Max | |
| MSI GE76 Raider 10UH | |
| MSI Creator 15 -3! | |
| Cinebench R20 / CPU (Multi Core) | |
| MSI GE67 HX 12UGS | |
| Asus ROG Strix Scar 17 SE G733CX-LL014W | |
| Alienware x15 R2 P111F | |
| MSI Pulse GL76 12UGK | |
| Przeciętny Intel Core i7-12700H (1576 - 7407, n=64) | |
| Razer Blade 15 2022 | |
| Lenovo IdeaPad Gaming 3 15IAH7 | |
| Alienware m17 R5 (R9 6900HX, RX 6850M XT) | |
| HP Omen 16-n0033dx | |
| MSI Creator 15 | |
| MSI Creator 15 | |
| Schenker XMG Apex 15 Max | |
| MSI GE76 Raider 10UH | |
| Cinebench R20 / CPU (Single Core) | |
| Asus ROG Strix Scar 17 SE G733CX-LL014W | |
| Alienware x15 R2 P111F | |
| Razer Blade 15 2022 | |
| Przeciętny Intel Core i7-12700H (300 - 704, n=64) | |
| MSI GE67 HX 12UGS | |
| MSI Pulse GL76 12UGK | |
| Lenovo IdeaPad Gaming 3 15IAH7 | |
| Alienware m17 R5 (R9 6900HX, RX 6850M XT) | |
| HP Omen 16-n0033dx | |
| Schenker XMG Apex 15 Max | |
| MSI Creator 15 | |
| MSI Creator 15 | |
| MSI GE76 Raider 10UH | |
| Cinebench R23 / Multi Core | |
| MSI GE67 HX 12UGS | |
| Asus ROG Strix Scar 17 SE G733CX-LL014W | |
| MSI Pulse GL76 12UGK | |
| Alienware x15 R2 P111F | |
| Przeciętny Intel Core i7-12700H (4032 - 19330, n=64) | |
| Razer Blade 15 2022 | |
| Lenovo IdeaPad Gaming 3 15IAH7 | |
| Alienware m17 R5 (R9 6900HX, RX 6850M XT) | |
| HP Omen 16-n0033dx | |
| Schenker XMG Apex 15 Max | |
| MSI GE76 Raider 10UH | |
| Cinebench R23 / Single Core | |
| Asus ROG Strix Scar 17 SE G733CX-LL014W | |
| Alienware x15 R2 P111F | |
| MSI GE67 HX 12UGS | |
| Razer Blade 15 2022 | |
| Przeciętny Intel Core i7-12700H (778 - 1826, n=63) | |
| MSI Pulse GL76 12UGK | |
| Lenovo IdeaPad Gaming 3 15IAH7 | |
| Alienware m17 R5 (R9 6900HX, RX 6850M XT) | |
| HP Omen 16-n0033dx | |
| Schenker XMG Apex 15 Max | |
| MSI GE76 Raider 10UH | |
| Cinebench R15 / CPU Multi 64Bit | |
| MSI GE67 HX 12UGS | |
| Asus ROG Strix Scar 17 SE G733CX-LL014W | |
| Alienware x15 R2 P111F | |
| MSI Pulse GL76 12UGK | |
| Przeciętny Intel Core i7-12700H (1379 - 2916, n=70) | |
| Alienware m17 R5 (R9 6900HX, RX 6850M XT) | |
| Lenovo IdeaPad Gaming 3 15IAH7 | |
| Razer Blade 15 2022 | |
| HP Omen 16-n0033dx | |
| MSI Creator 15 | |
| Schenker XMG Apex 15 Max | |
| MSI GE76 Raider 10UH | |
| Cinebench R15 / CPU Single 64Bit | |
| Alienware x15 R2 P111F | |
| Asus ROG Strix Scar 17 SE G733CX-LL014W | |
| MSI GE67 HX 12UGS | |
| Razer Blade 15 2022 | |
| MSI Pulse GL76 12UGK | |
| Przeciętny Intel Core i7-12700H (113 - 263, n=65) | |
| Alienware m17 R5 (R9 6900HX, RX 6850M XT) | |
| Lenovo IdeaPad Gaming 3 15IAH7 | |
| HP Omen 16-n0033dx | |
| Schenker XMG Apex 15 Max | |
| MSI Creator 15 | |
| MSI GE76 Raider 10UH | |
| Blender / v2.79 BMW27 CPU | |
| MSI Creator 15 | |
| MSI Creator 15 | |
| Schenker XMG Apex 15 Max | |
| MSI GE76 Raider 10UH | |
| HP Omen 16-n0033dx | |
| Razer Blade 15 2022 | |
| Przeciętny Intel Core i7-12700H (168 - 732, n=63) | |
| Lenovo IdeaPad Gaming 3 15IAH7 | |
| Alienware m17 R5 (R9 6900HX, RX 6850M XT) | |
| MSI Pulse GL76 12UGK | |
| Alienware x15 R2 P111F | |
| Asus ROG Strix Scar 17 SE G733CX-LL014W | |
| MSI GE67 HX 12UGS | |
| 7-Zip 18.03 / 7z b 4 | |
| Asus ROG Strix Scar 17 SE G733CX-LL014W | |
| MSI GE67 HX 12UGS | |
| Alienware x15 R2 P111F | |
| MSI Pulse GL76 12UGK | |
| Schenker XMG Apex 15 Max | |
| Alienware m17 R5 (R9 6900HX, RX 6850M XT) | |
| Razer Blade 15 2022 | |
| Przeciętny Intel Core i7-12700H (22844 - 73067, n=63) | |
| HP Omen 16-n0033dx | |
| MSI Creator 15 | |
| MSI Creator 15 | |
| MSI GE76 Raider 10UH | |
| Lenovo IdeaPad Gaming 3 15IAH7 | |
| 7-Zip 18.03 / 7z b 4 -mmt1 | |
| Schenker XMG Apex 15 Max | |
| Asus ROG Strix Scar 17 SE G733CX-LL014W | |
| Alienware x15 R2 P111F | |
| Alienware m17 R5 (R9 6900HX, RX 6850M XT) | |
| Razer Blade 15 2022 | |
| MSI Pulse GL76 12UGK | |
| HP Omen 16-n0033dx | |
| Przeciętny Intel Core i7-12700H (2743 - 5972, n=63) | |
| MSI GE67 HX 12UGS | |
| Lenovo IdeaPad Gaming 3 15IAH7 | |
| MSI Creator 15 | |
| MSI Creator 15 | |
| MSI GE76 Raider 10UH | |
| Geekbench 5.5 / Multi-Core | |
| Asus ROG Strix Scar 17 SE G733CX-LL014W | |
| MSI GE67 HX 12UGS | |
| Alienware x15 R2 P111F | |
| Razer Blade 15 2022 | |
| MSI Pulse GL76 12UGK | |
| Przeciętny Intel Core i7-12700H (5144 - 13745, n=64) | |
| Alienware m17 R5 (R9 6900HX, RX 6850M XT) | |
| HP Omen 16-n0033dx | |
| Schenker XMG Apex 15 Max | |
| MSI Creator 15 | |
| Lenovo IdeaPad Gaming 3 15IAH7 | |
| MSI GE76 Raider 10UH | |
| Geekbench 5.5 / Single-Core | |
| Asus ROG Strix Scar 17 SE G733CX-LL014W | |
| Alienware x15 R2 P111F | |
| MSI GE67 HX 12UGS | |
| Razer Blade 15 2022 | |
| Przeciętny Intel Core i7-12700H (803 - 1851, n=64) | |
| MSI Pulse GL76 12UGK | |
| Lenovo IdeaPad Gaming 3 15IAH7 | |
| Alienware m17 R5 (R9 6900HX, RX 6850M XT) | |
| Schenker XMG Apex 15 Max | |
| HP Omen 16-n0033dx | |
| MSI Creator 15 | |
| MSI GE76 Raider 10UH | |
| HWBOT x265 Benchmark v2.2 / 4k Preset | |
| MSI GE67 HX 12UGS | |
| Asus ROG Strix Scar 17 SE G733CX-LL014W | |
| Alienware x15 R2 P111F | |
| MSI Pulse GL76 12UGK | |
| Razer Blade 15 2022 | |
| Alienware m17 R5 (R9 6900HX, RX 6850M XT) | |
| Przeciętny Intel Core i7-12700H (4.67 - 21.8, n=64) | |
| HP Omen 16-n0033dx | |
| Lenovo IdeaPad Gaming 3 15IAH7 | |
| MSI GE76 Raider 10UH | |
| Schenker XMG Apex 15 Max | |
| LibreOffice / 20 Documents To PDF | |
| HP Omen 16-n0033dx | |
| Alienware m17 R5 (R9 6900HX, RX 6850M XT) | |
| MSI Creator 15 | |
| MSI Creator 15 | |
| Razer Blade 15 2022 | |
| Schenker XMG Apex 15 Max | |
| Lenovo IdeaPad Gaming 3 15IAH7 | |
| MSI GE76 Raider 10UH | |
| Alienware x15 R2 P111F | |
| Przeciętny Intel Core i7-12700H (34.2 - 95.3, n=63) | |
| MSI Pulse GL76 12UGK | |
| MSI GE67 HX 12UGS | |
| Asus ROG Strix Scar 17 SE G733CX-LL014W | |
| R Benchmark 2.5 / Overall mean | |
| MSI Creator 15 | |
| MSI Creator 15 | |
| MSI GE76 Raider 10UH | |
| Schenker XMG Apex 15 Max | |
| Lenovo IdeaPad Gaming 3 15IAH7 | |
| HP Omen 16-n0033dx | |
| Alienware m17 R5 (R9 6900HX, RX 6850M XT) | |
| MSI Pulse GL76 12UGK | |
| Przeciętny Intel Core i7-12700H (0.4441 - 1.052, n=63) | |
| Razer Blade 15 2022 | |
| MSI GE67 HX 12UGS | |
| Alienware x15 R2 P111F | |
| Asus ROG Strix Scar 17 SE G733CX-LL014W | |
* ... im mniej tym lepiej
AIDA64: FP32 Ray-Trace | FPU Julia | CPU SHA3 | CPU Queen | FPU SinJulia | FPU Mandel | CPU AES | CPU ZLib | FP64 Ray-Trace | CPU PhotoWorxx
| Performance rating | |
| Asus ROG Strix Scar 17 SE G733CX-LL014W | |
| Acer Predator Helios 300 (i7-12700H, RTX 3070 Ti) | |
| Alienware m17 R5 (R9 6900HX, RX 6850M XT) | |
| MSI Pulse GL76 12UGK | |
| Przeciętny Intel Core i7-12700H | |
| MSI Vector GP76 12UGS-434 | |
| Razer Blade 17 Early 2022 | |
| AIDA64 / FP32 Ray-Trace | |
| Asus ROG Strix Scar 17 SE G733CX-LL014W | |
| Acer Predator Helios 300 (i7-12700H, RTX 3070 Ti) | |
| MSI Pulse GL76 12UGK | |
| Alienware m17 R5 (R9 6900HX, RX 6850M XT) | |
| Przeciętny Intel Core i7-12700H (2585 - 17957, n=64) | |
| MSI Vector GP76 12UGS-434 | |
| Razer Blade 17 Early 2022 | |
| AIDA64 / FPU Julia | |
| Alienware m17 R5 (R9 6900HX, RX 6850M XT) | |
| Acer Predator Helios 300 (i7-12700H, RTX 3070 Ti) | |
| Asus ROG Strix Scar 17 SE G733CX-LL014W | |
| MSI Pulse GL76 12UGK | |
| Przeciętny Intel Core i7-12700H (12439 - 90760, n=64) | |
| MSI Vector GP76 12UGS-434 | |
| Razer Blade 17 Early 2022 | |
| AIDA64 / CPU SHA3 | |
| Asus ROG Strix Scar 17 SE G733CX-LL014W | |
| Acer Predator Helios 300 (i7-12700H, RTX 3070 Ti) | |
| MSI Pulse GL76 12UGK | |
| Alienware m17 R5 (R9 6900HX, RX 6850M XT) | |
| MSI Vector GP76 12UGS-434 | |
| Przeciętny Intel Core i7-12700H (833 - 4242, n=64) | |
| Razer Blade 17 Early 2022 | |
| AIDA64 / CPU Queen | |
| Alienware m17 R5 (R9 6900HX, RX 6850M XT) | |
| Asus ROG Strix Scar 17 SE G733CX-LL014W | |
| MSI Pulse GL76 12UGK | |
| Acer Predator Helios 300 (i7-12700H, RTX 3070 Ti) | |
| Przeciętny Intel Core i7-12700H (57923 - 103202, n=63) | |
| MSI Vector GP76 12UGS-434 | |
| Razer Blade 17 Early 2022 | |
| AIDA64 / FPU SinJulia | |
| Alienware m17 R5 (R9 6900HX, RX 6850M XT) | |
| Asus ROG Strix Scar 17 SE G733CX-LL014W | |
| Acer Predator Helios 300 (i7-12700H, RTX 3070 Ti) | |
| MSI Vector GP76 12UGS-434 | |
| MSI Pulse GL76 12UGK | |
| Przeciętny Intel Core i7-12700H (3249 - 9939, n=64) | |
| Razer Blade 17 Early 2022 | |
| AIDA64 / FPU Mandel | |
| Alienware m17 R5 (R9 6900HX, RX 6850M XT) | |
| Acer Predator Helios 300 (i7-12700H, RTX 3070 Ti) | |
| Asus ROG Strix Scar 17 SE G733CX-LL014W | |
| MSI Pulse GL76 12UGK | |
| Przeciętny Intel Core i7-12700H (7135 - 44760, n=64) | |
| MSI Vector GP76 12UGS-434 | |
| Razer Blade 17 Early 2022 | |
| AIDA64 / CPU AES | |
| Asus ROG Strix Scar 17 SE G733CX-LL014W | |
| MSI Pulse GL76 12UGK | |
| MSI Vector GP76 12UGS-434 | |
| Przeciętny Intel Core i7-12700H (31839 - 144360, n=64) | |
| Acer Predator Helios 300 (i7-12700H, RTX 3070 Ti) | |
| Alienware m17 R5 (R9 6900HX, RX 6850M XT) | |
| Razer Blade 17 Early 2022 | |
| AIDA64 / CPU ZLib | |
| Asus ROG Strix Scar 17 SE G733CX-LL014W | |
| Acer Predator Helios 300 (i7-12700H, RTX 3070 Ti) | |
| MSI Vector GP76 12UGS-434 | |
| MSI Pulse GL76 12UGK | |
| Przeciętny Intel Core i7-12700H (305 - 1171, n=64) | |
| Alienware m17 R5 (R9 6900HX, RX 6850M XT) | |
| Razer Blade 17 Early 2022 | |
| AIDA64 / FP64 Ray-Trace | |
| Acer Predator Helios 300 (i7-12700H, RTX 3070 Ti) | |
| Asus ROG Strix Scar 17 SE G733CX-LL014W | |
| MSI Pulse GL76 12UGK | |
| Alienware m17 R5 (R9 6900HX, RX 6850M XT) | |
| Przeciętny Intel Core i7-12700H (1437 - 9692, n=64) | |
| MSI Vector GP76 12UGS-434 | |
| Razer Blade 17 Early 2022 | |
| AIDA64 / CPU PhotoWorxx | |
| Asus ROG Strix Scar 17 SE G733CX-LL014W | |
| Acer Predator Helios 300 (i7-12700H, RTX 3070 Ti) | |
| Razer Blade 17 Early 2022 | |
| Przeciętny Intel Core i7-12700H (12863 - 52207, n=64) | |
| Alienware m17 R5 (R9 6900HX, RX 6850M XT) | |
| MSI Pulse GL76 12UGK | |
| MSI Vector GP76 12UGS-434 | |
Wydajność systemu
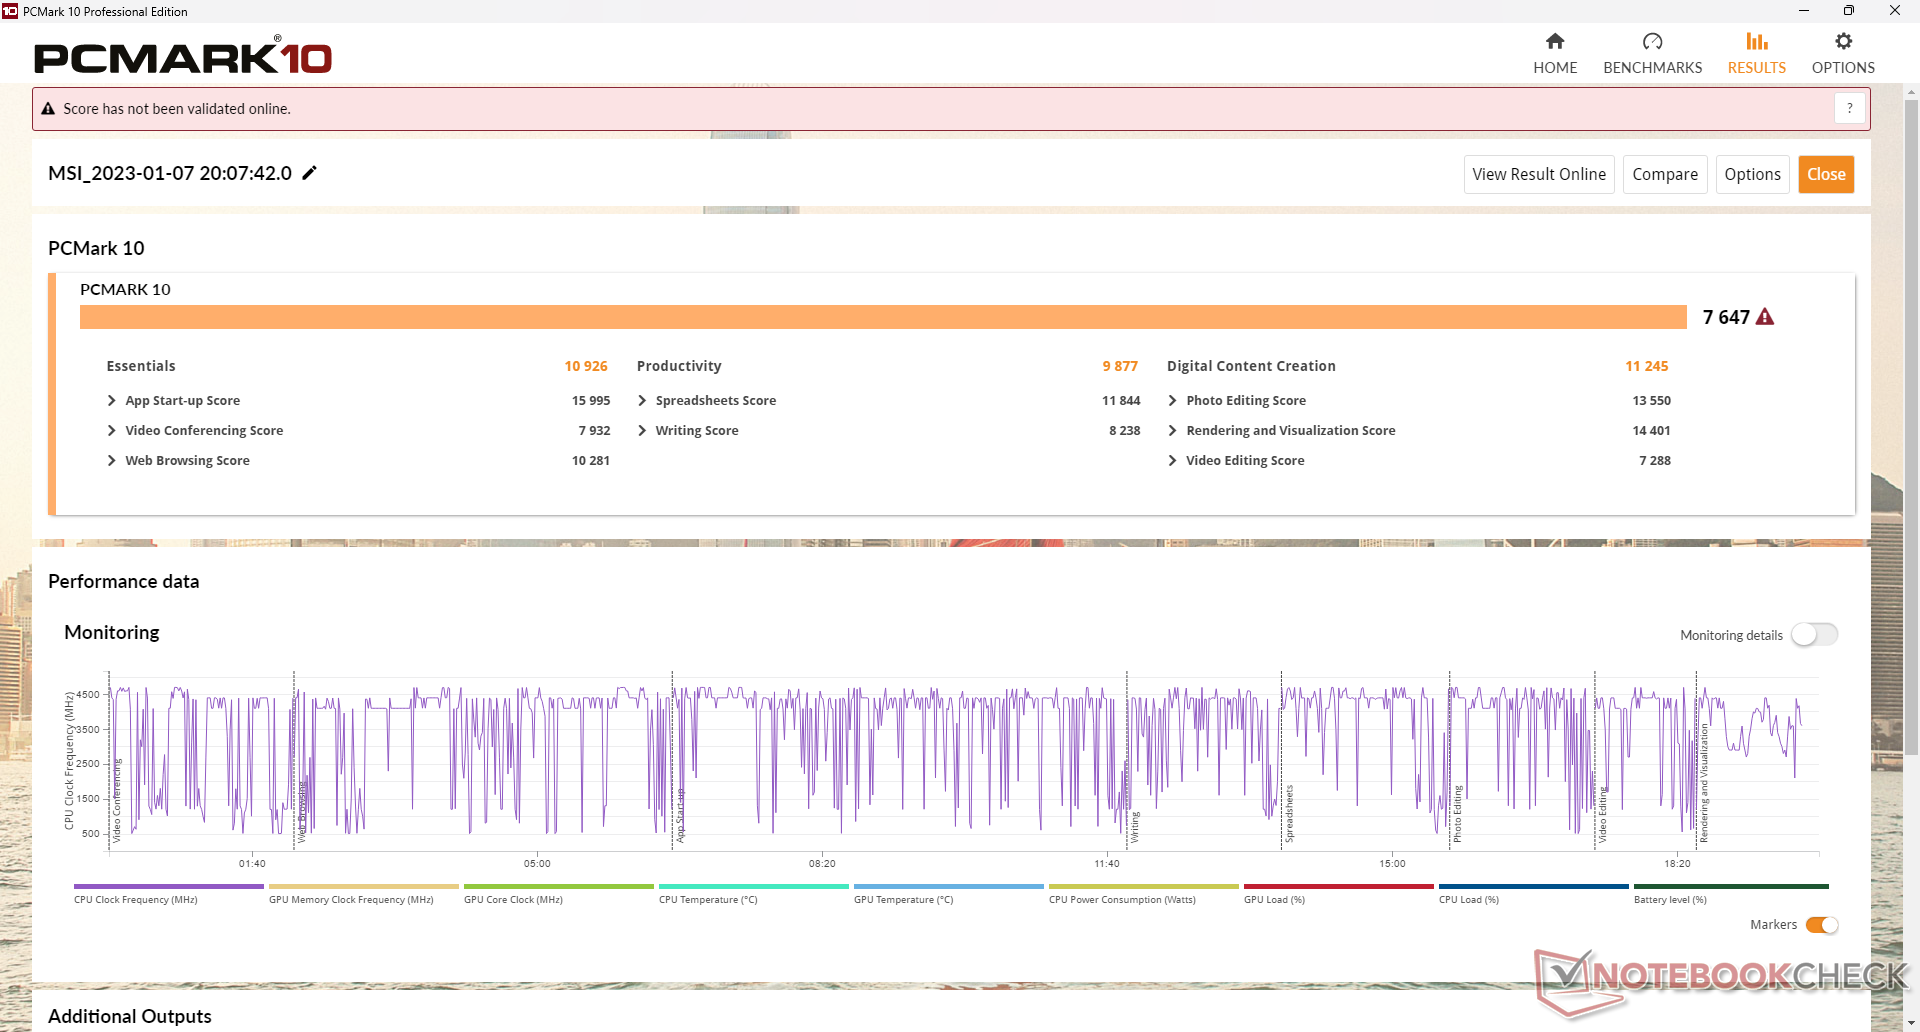
Wyniki PCMark są doskonałe i porównywalne z wyższymi laptopami do gier, np.Asus ROG Strix Scar 17. Innymi słowy, GL76 może zaoferować niemal taką samą wydajność jak flagowa alternatywa, ale za znacznie mniejsze pieniądze.
CrossMark: Overall | Productivity | Creativity | Responsiveness
| PCMark 10 / Score | |
| MSI Vector GP76 12UGS-434 | |
| Acer Predator Helios 300 (i7-12700H, RTX 3070 Ti) | |
| MSI Pulse GL76 12UGK | |
| Przeciętny Intel Core i7-12700H, NVIDIA GeForce RTX 3070 Laptop GPU (7082 - 7647, n=2) | |
| Alienware m17 R5 (R9 6900HX, RX 6850M XT) | |
| Asus ROG Strix Scar 17 SE G733CX-LL014W | |
| Razer Blade 17 Early 2022 | |
| PCMark 10 / Essentials | |
| MSI Pulse GL76 12UGK | |
| Acer Predator Helios 300 (i7-12700H, RTX 3070 Ti) | |
| MSI Vector GP76 12UGS-434 | |
| Przeciętny Intel Core i7-12700H, NVIDIA GeForce RTX 3070 Laptop GPU (10076 - 10926, n=2) | |
| Asus ROG Strix Scar 17 SE G733CX-LL014W | |
| Razer Blade 17 Early 2022 | |
| Alienware m17 R5 (R9 6900HX, RX 6850M XT) | |
| PCMark 10 / Productivity | |
| MSI Vector GP76 12UGS-434 | |
| Acer Predator Helios 300 (i7-12700H, RTX 3070 Ti) | |
| MSI Pulse GL76 12UGK | |
| Asus ROG Strix Scar 17 SE G733CX-LL014W | |
| Przeciętny Intel Core i7-12700H, NVIDIA GeForce RTX 3070 Laptop GPU (9460 - 9877, n=2) | |
| Razer Blade 17 Early 2022 | |
| Alienware m17 R5 (R9 6900HX, RX 6850M XT) | |
| PCMark 10 / Digital Content Creation | |
| Acer Predator Helios 300 (i7-12700H, RTX 3070 Ti) | |
| MSI Vector GP76 12UGS-434 | |
| Alienware m17 R5 (R9 6900HX, RX 6850M XT) | |
| MSI Pulse GL76 12UGK | |
| Przeciętny Intel Core i7-12700H, NVIDIA GeForce RTX 3070 Laptop GPU (10113 - 11245, n=2) | |
| Razer Blade 17 Early 2022 | |
| Asus ROG Strix Scar 17 SE G733CX-LL014W | |
| CrossMark / Overall | |
| Asus ROG Strix Scar 17 SE G733CX-LL014W | |
| MSI Vector GP76 12UGS-434 | |
| Przeciętny Intel Core i7-12700H, NVIDIA GeForce RTX 3070 Laptop GPU (1844 - 2003, n=2) | |
| Acer Predator Helios 300 (i7-12700H, RTX 3070 Ti) | |
| MSI Pulse GL76 12UGK | |
| Razer Blade 17 Early 2022 | |
| Alienware m17 R5 (R9 6900HX, RX 6850M XT) | |
| CrossMark / Productivity | |
| Asus ROG Strix Scar 17 SE G733CX-LL014W | |
| MSI Vector GP76 12UGS-434 | |
| Przeciętny Intel Core i7-12700H, NVIDIA GeForce RTX 3070 Laptop GPU (1785 - 1971, n=2) | |
| MSI Pulse GL76 12UGK | |
| Acer Predator Helios 300 (i7-12700H, RTX 3070 Ti) | |
| Razer Blade 17 Early 2022 | |
| Alienware m17 R5 (R9 6900HX, RX 6850M XT) | |
| CrossMark / Creativity | |
| Asus ROG Strix Scar 17 SE G733CX-LL014W | |
| Acer Predator Helios 300 (i7-12700H, RTX 3070 Ti) | |
| Przeciętny Intel Core i7-12700H, NVIDIA GeForce RTX 3070 Laptop GPU (1912 - 1979, n=2) | |
| MSI Vector GP76 12UGS-434 | |
| MSI Pulse GL76 12UGK | |
| Razer Blade 17 Early 2022 | |
| Alienware m17 R5 (R9 6900HX, RX 6850M XT) | |
| CrossMark / Responsiveness | |
| MSI Vector GP76 12UGS-434 | |
| Przeciętny Intel Core i7-12700H, NVIDIA GeForce RTX 3070 Laptop GPU (1824 - 2182, n=2) | |
| Asus ROG Strix Scar 17 SE G733CX-LL014W | |
| MSI Pulse GL76 12UGK | |
| Acer Predator Helios 300 (i7-12700H, RTX 3070 Ti) | |
| Razer Blade 17 Early 2022 | |
| Alienware m17 R5 (R9 6900HX, RX 6850M XT) | |
| PCMark 10 Score | 7647 pkt. | |
Pomoc | ||
| AIDA64 / Memory Copy | |
| Asus ROG Strix Scar 17 SE G733CX-LL014W | |
| Razer Blade 17 Early 2022 | |
| Acer Predator Helios 300 (i7-12700H, RTX 3070 Ti) | |
| Przeciętny Intel Core i7-12700H (25615 - 80511, n=64) | |
| Alienware m17 R5 (R9 6900HX, RX 6850M XT) | |
| MSI Pulse GL76 12UGK | |
| MSI Vector GP76 12UGS-434 | |
| AIDA64 / Memory Read | |
| Asus ROG Strix Scar 17 SE G733CX-LL014W | |
| Razer Blade 17 Early 2022 | |
| Acer Predator Helios 300 (i7-12700H, RTX 3070 Ti) | |
| Przeciętny Intel Core i7-12700H (25586 - 79442, n=64) | |
| Alienware m17 R5 (R9 6900HX, RX 6850M XT) | |
| MSI Pulse GL76 12UGK | |
| MSI Vector GP76 12UGS-434 | |
| AIDA64 / Memory Write | |
| Asus ROG Strix Scar 17 SE G733CX-LL014W | |
| Razer Blade 17 Early 2022 | |
| Acer Predator Helios 300 (i7-12700H, RTX 3070 Ti) | |
| Alienware m17 R5 (R9 6900HX, RX 6850M XT) | |
| Przeciętny Intel Core i7-12700H (23679 - 88660, n=64) | |
| MSI Vector GP76 12UGS-434 | |
| MSI Pulse GL76 12UGK | |
| AIDA64 / Memory Latency | |
| Alienware m17 R5 (R9 6900HX, RX 6850M XT) | |
| MSI Pulse GL76 12UGK | |
| MSI Vector GP76 12UGS-434 | |
| Acer Predator Helios 300 (i7-12700H, RTX 3070 Ti) | |
| Asus ROG Strix Scar 17 SE G733CX-LL014W | |
| Przeciętny Intel Core i7-12700H (76.2 - 133.9, n=62) | |
* ... im mniej tym lepiej
Opóźnienie DPC
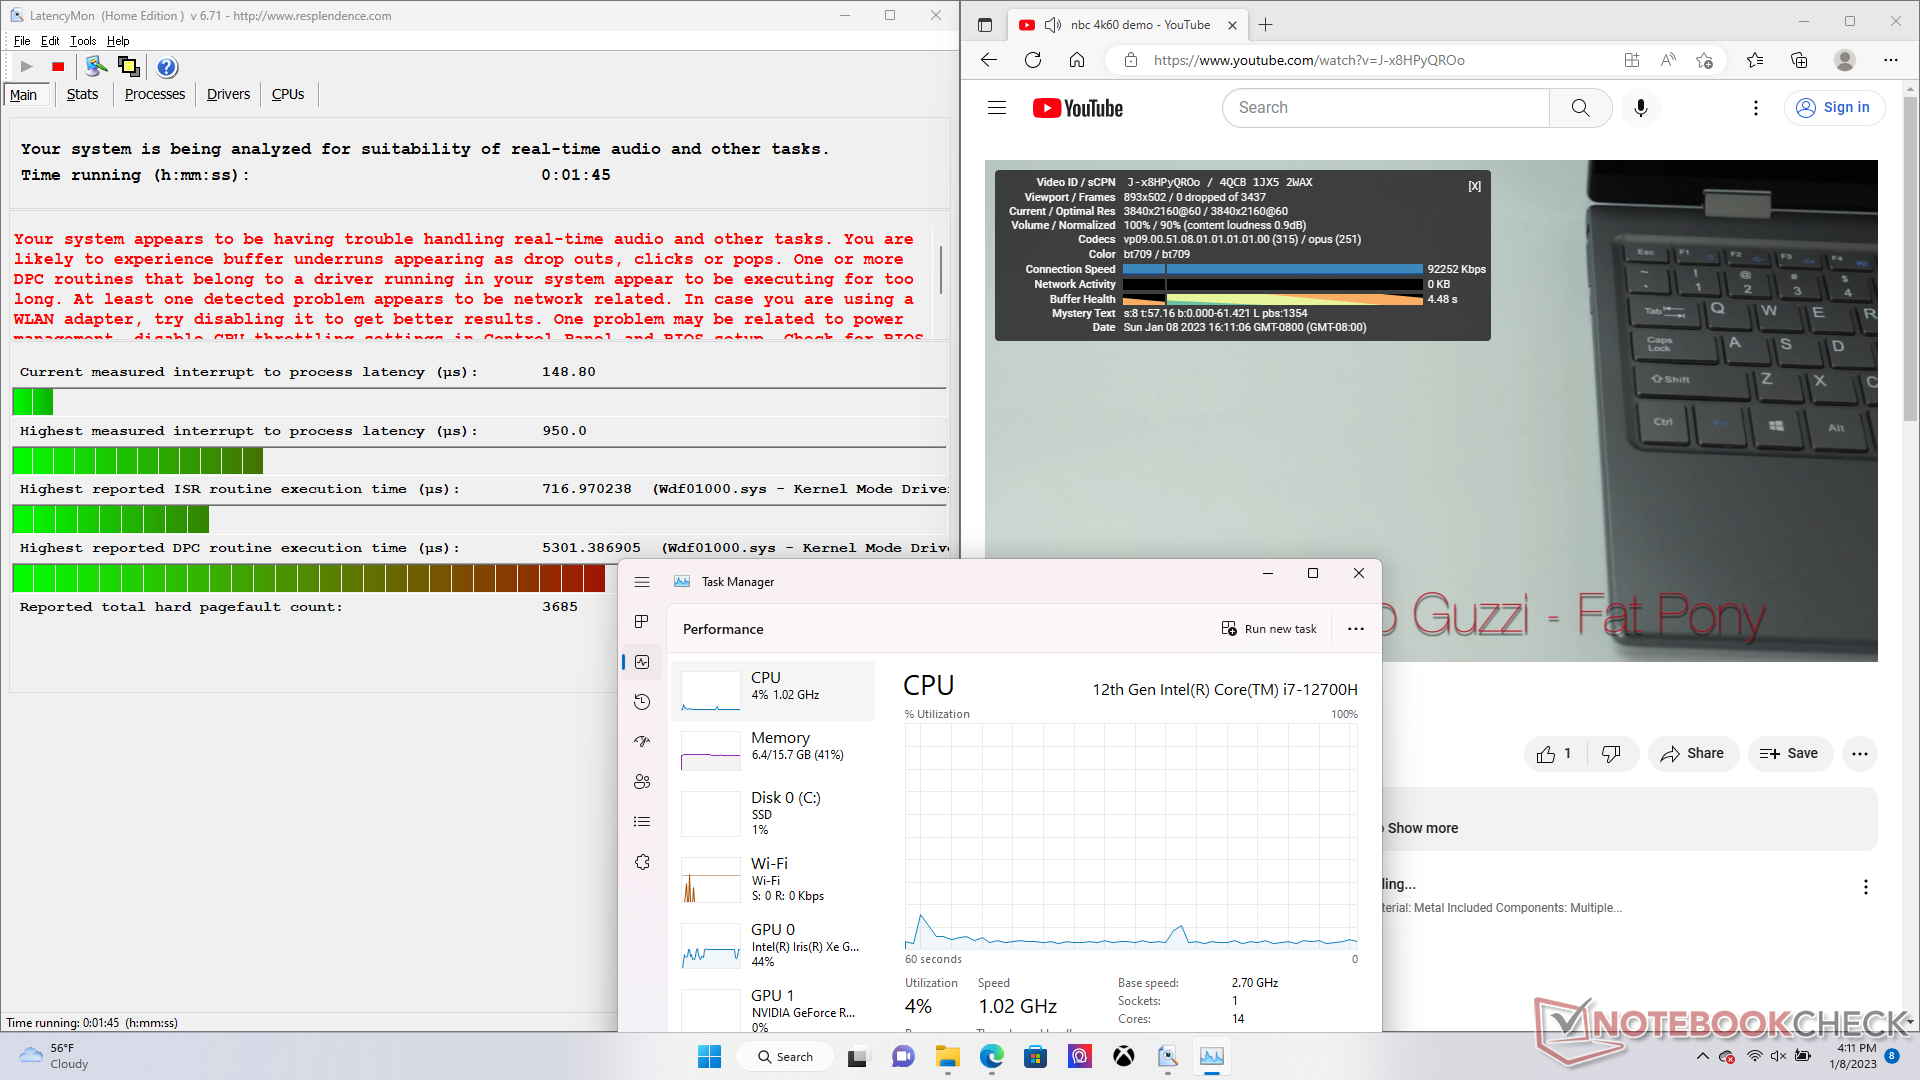
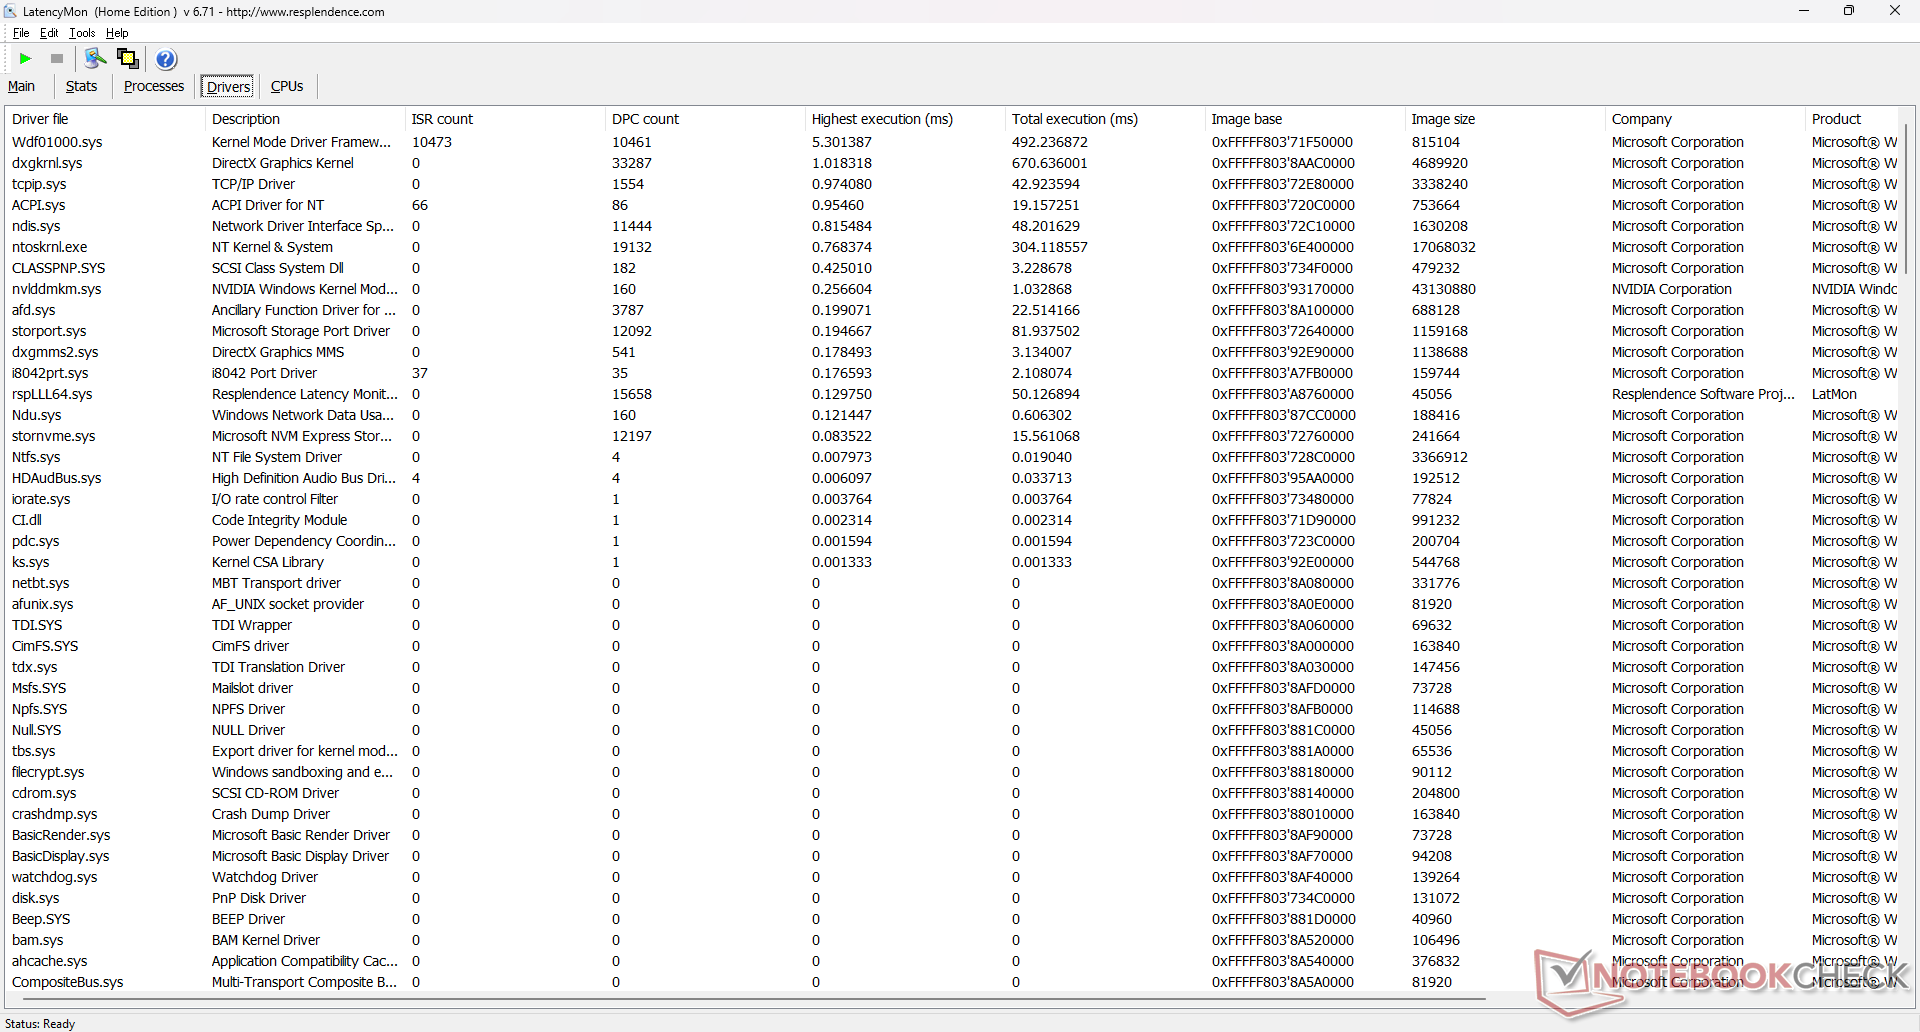
LatencyMon nie ujawnia żadnych problemów z DPC podczas otwierania wielu kart przeglądarki na naszej stronie głównej. odtwarzanie wideo w rozdzielczości 4K przy 60 FPS jest również bez zarzutu i nie ma mowy o jakichkolwiek spadkach klatek.
| DPC Latencies / LatencyMon - interrupt to process latency (max), Web, Youtube, Prime95 | |
| Asus ROG Strix Scar 17 SE G733CX-LL014W | |
| MSI Vector GP76 12UGS-434 | |
| Acer Predator Helios 300 (i7-12700H, RTX 3070 Ti) | |
| Alienware m17 R5 (R9 6900HX, RX 6850M XT) | |
| MSI Pulse GL76 12UGK | |
| Razer Blade 17 Early 2022 | |
* ... im mniej tym lepiej
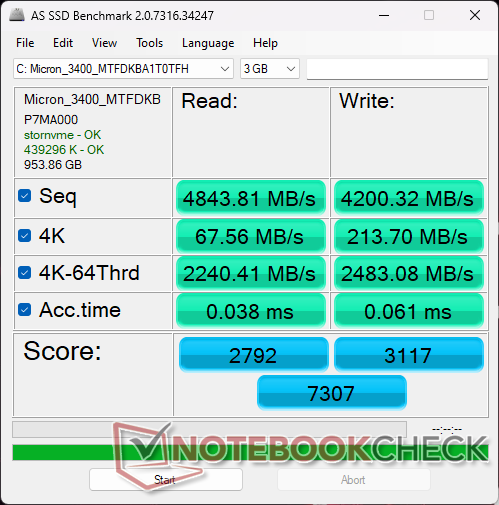
Urządzenia pamięci masowej - do dwóch dysków SSD NVMe
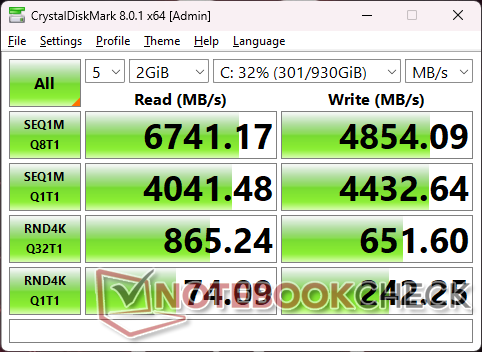
Nasze urządzenie jest dostarczane z 1 TB Micron 3400 PCIe4 x4 NVMe SSD zamiast bardziej popularnego 1 TB Samsunga PM9A1, prawdopodobnie w celu zaoszczędzenia kosztów. Szybkość transferu jest tylko nieznacznie wolniejsza - średnio o około 10 procent. Bardziej imponuje nam zdolność dysku do utrzymania bardzo wysokich transferów na poziomie ponad 6400 MB/s przez dłuższy czas bez rozpraszacza ciepła.

| Drive Performance rating - Percent | |
| Asus ROG Strix Scar 17 SE G733CX-LL014W | |
| Acer Predator Helios 300 (i7-12700H, RTX 3070 Ti) | |
| Razer Blade 17 Early 2022 | |
| MSI Pulse GL76 12UGK | |
| MSI Vector GP76 12UGS-434 | |
| Alienware m17 R5 (R9 6900HX, RX 6850M XT) | |
* ... im mniej tym lepiej
Disk Throttling: DiskSpd Read Loop, Queue Depth 8
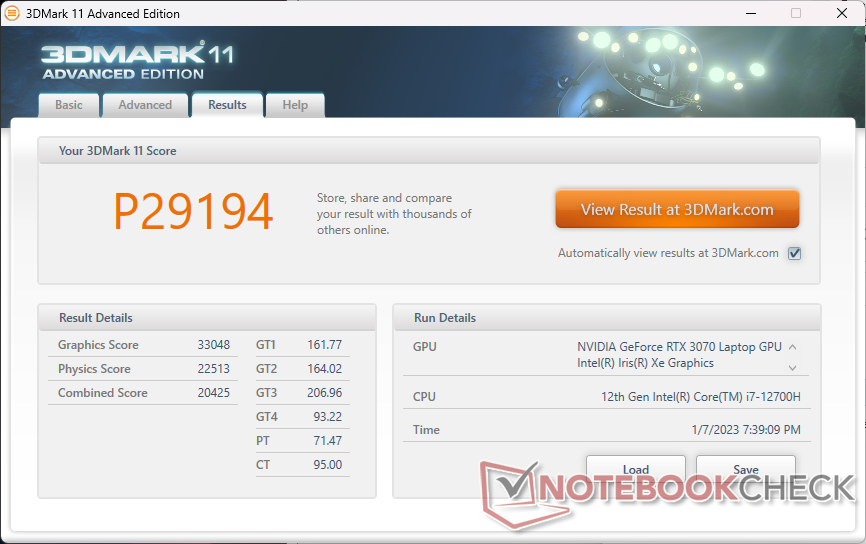
Wydajność GPU - 105 W TGP Graphics
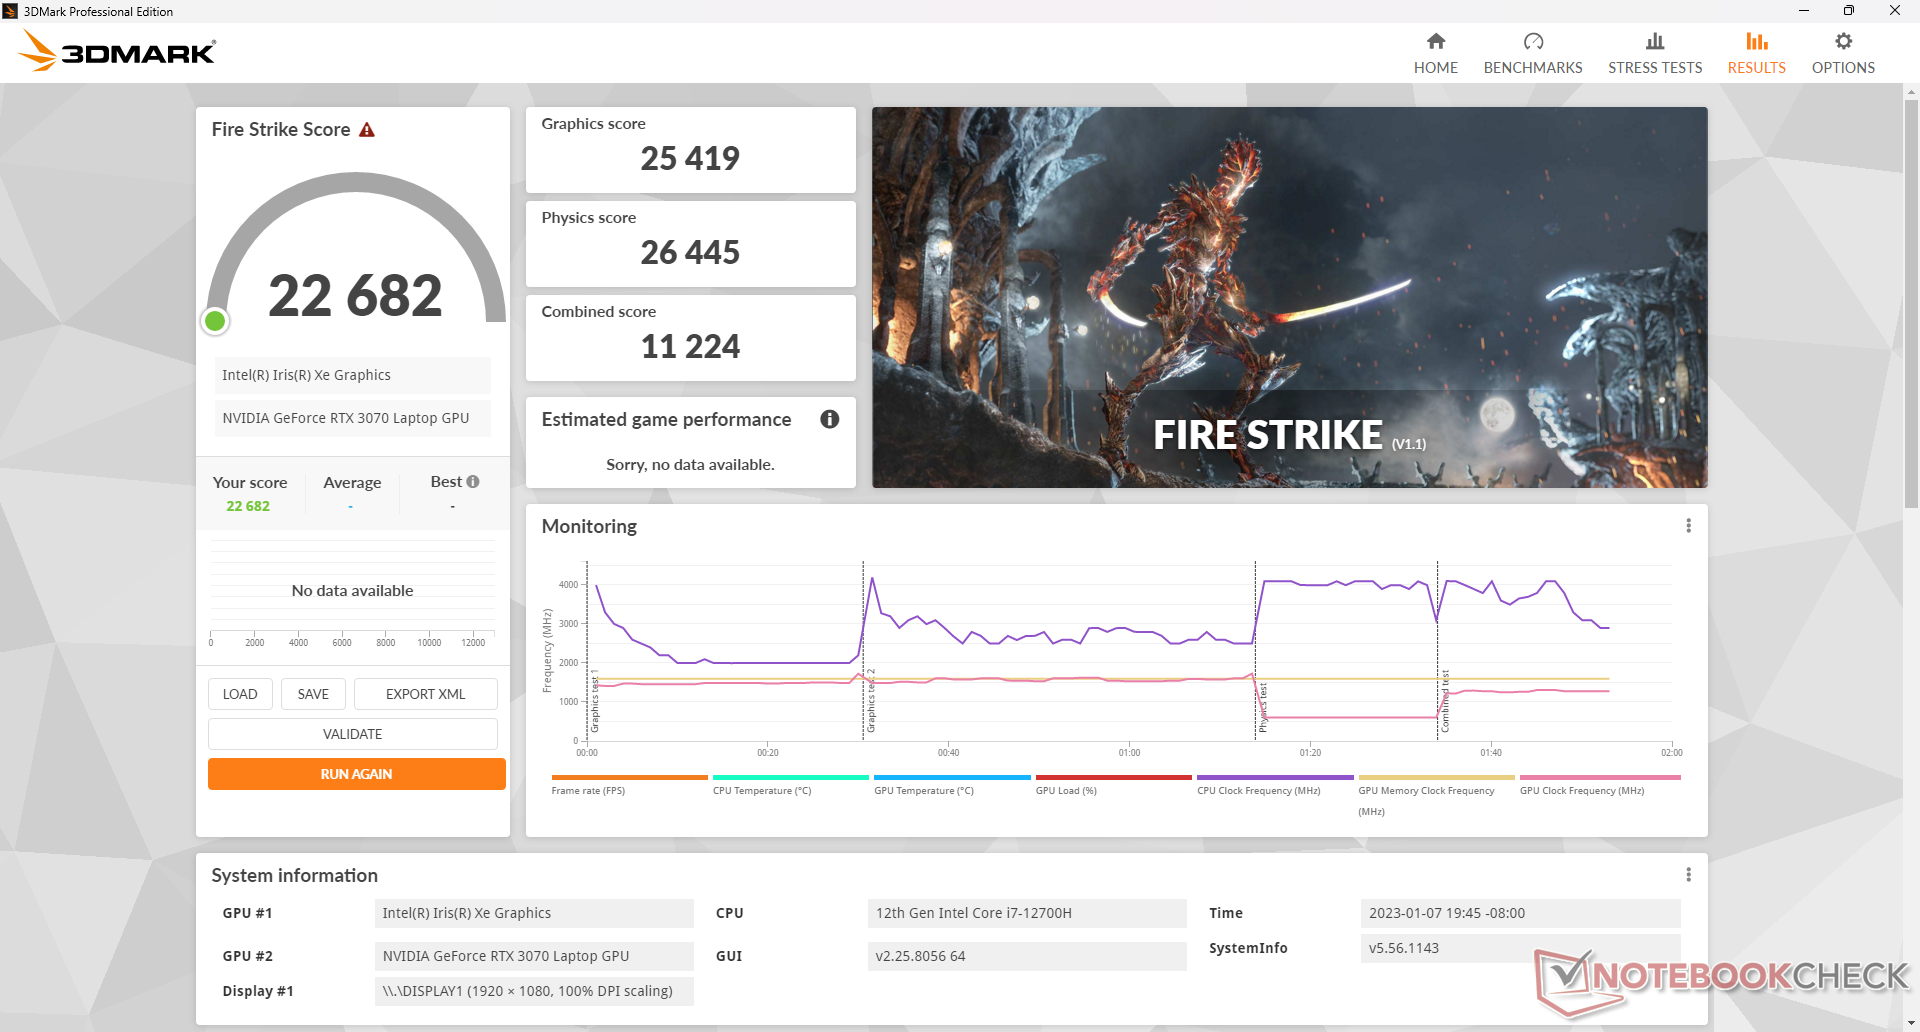
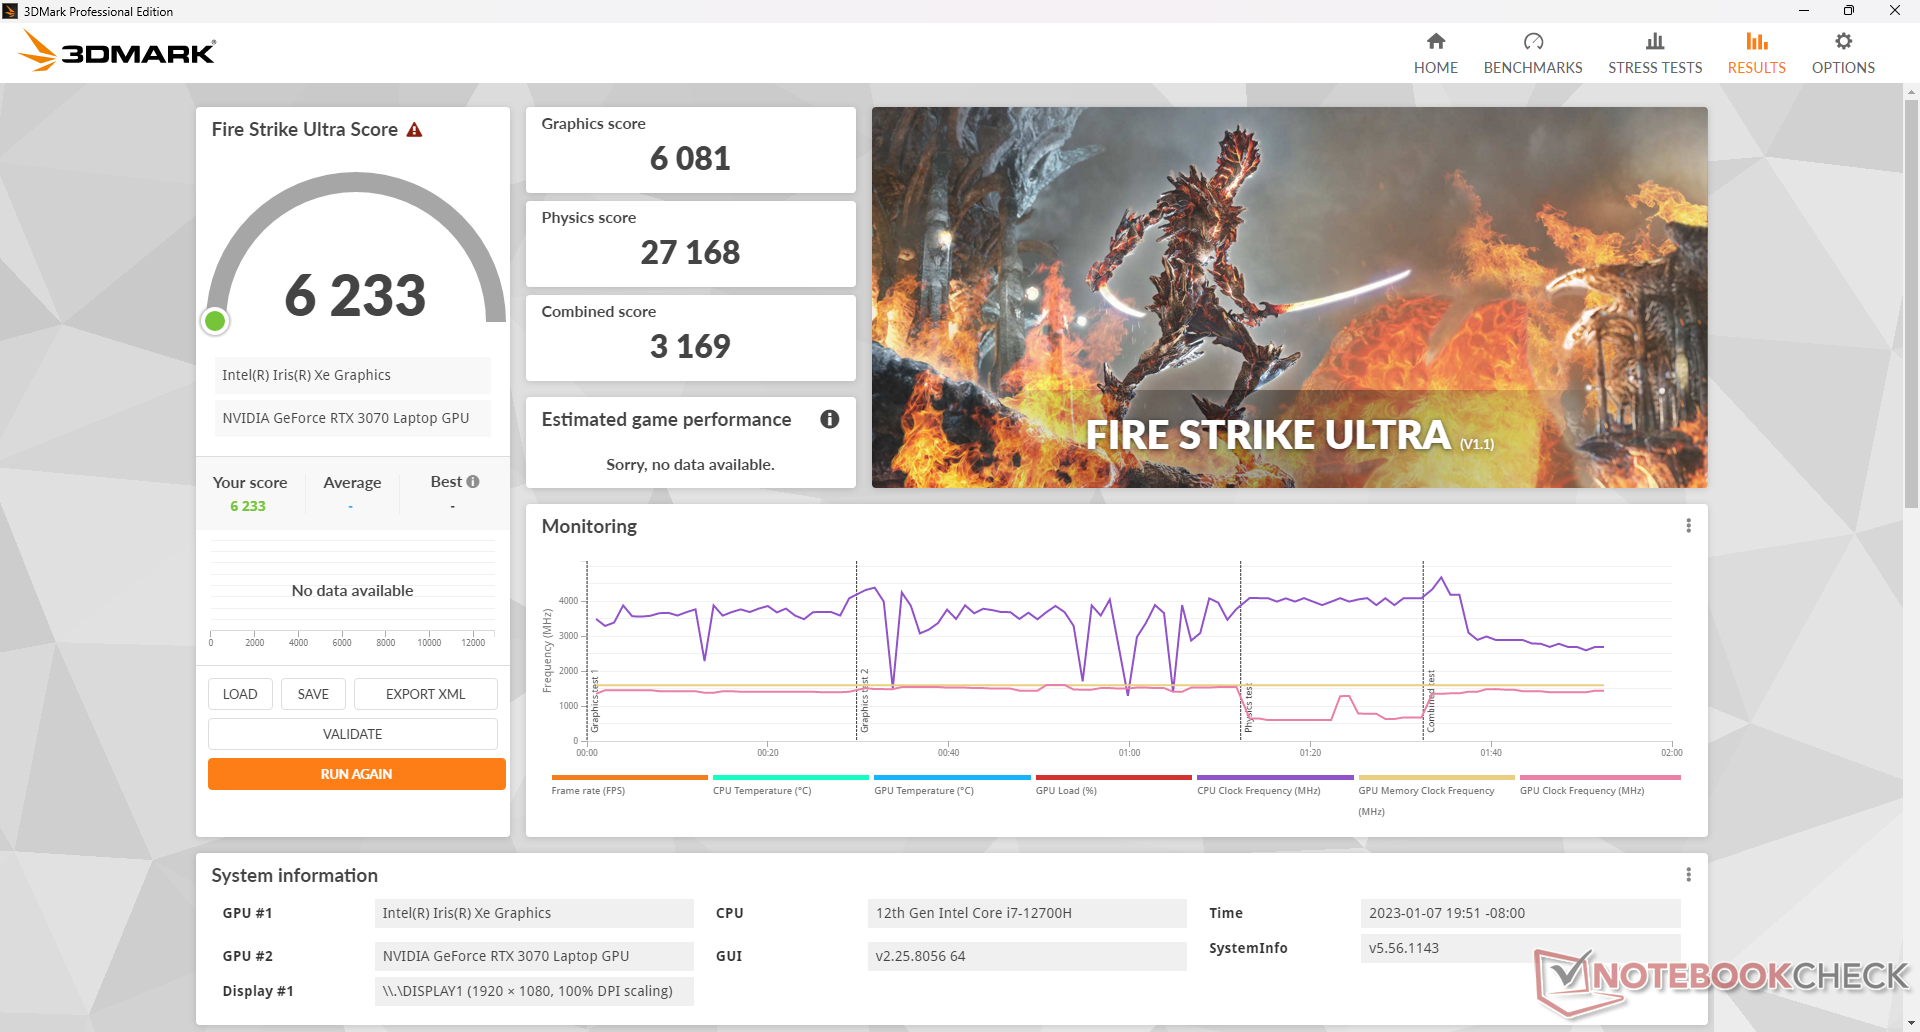
Surowa wydajność graficzna jest o około 25 procent wolniejsza niż w przypadku naszej GeForce RTX 3070 desktop reference. W porównaniu do 115 WGeForce RTX 3070 w Schenker XMG Apex 15, nasza wersja 105 W jest tylko około 5 procent za. Zmniejszenie mocy do RTX 3060 lub RTX 3050 wpłynie na wydajność grafiki odpowiednio o około 10-15 procent i 40-45 procent.
Wszystkie obecne tytuły są grywalne w natywnej rozdzielczości 1080p przy maksymalnych ustawieniach. Aby lepiej wykorzystać szybką, natywną częstotliwość odświeżania 360 Hz, możesz jednak rozważyć obniżenie ustawień do średnich lub niższych, zwłaszcza w grach konkurencyjnych, takich jak CS:GO czy Overwatch.
| 3DMark Performance rating - Percent | |
| Acer Predator Orion 3000 PO3-640 | |
| Asus ROG Strix Scar 17 SE G733CX-LL014W | |
| MSI GE76 Raider 10UH | |
| Alienware m17 R5 (R9 6900HX, RX 6850M XT) | |
| MSI GE67 HX 12UGS | |
| Schenker XMG Apex 15 Max | |
| MSI Pulse GL76 12UGK | |
| Przeciętny NVIDIA GeForce RTX 3070 Laptop GPU | |
| HP Omen 16-n0033dx | |
| Asus TUF Gaming F17 FX707Z-HX011W | |
| MSI Creator 15 -2! | |
| Lenovo IdeaPad Gaming 3 15IAH7 | |
| 3DMark 11 - 1280x720 Performance GPU | |
| Acer Predator Orion 3000 PO3-640 | |
| Asus ROG Strix Scar 17 SE G733CX-LL014W | |
| MSI GE76 Raider 10UH | |
| MSI GE67 HX 12UGS | |
| Alienware m17 R5 (R9 6900HX, RX 6850M XT) | |
| Schenker XMG Apex 15 Max | |
| MSI Pulse GL76 12UGK | |
| HP Omen 16-n0033dx | |
| Przeciętny NVIDIA GeForce RTX 3070 Laptop GPU (12535 - 38275, n=54) | |
| Asus TUF Gaming F17 FX707Z-HX011W | |
| MSI Creator 15 | |
| Lenovo IdeaPad Gaming 3 15IAH7 | |
| 3DMark | |
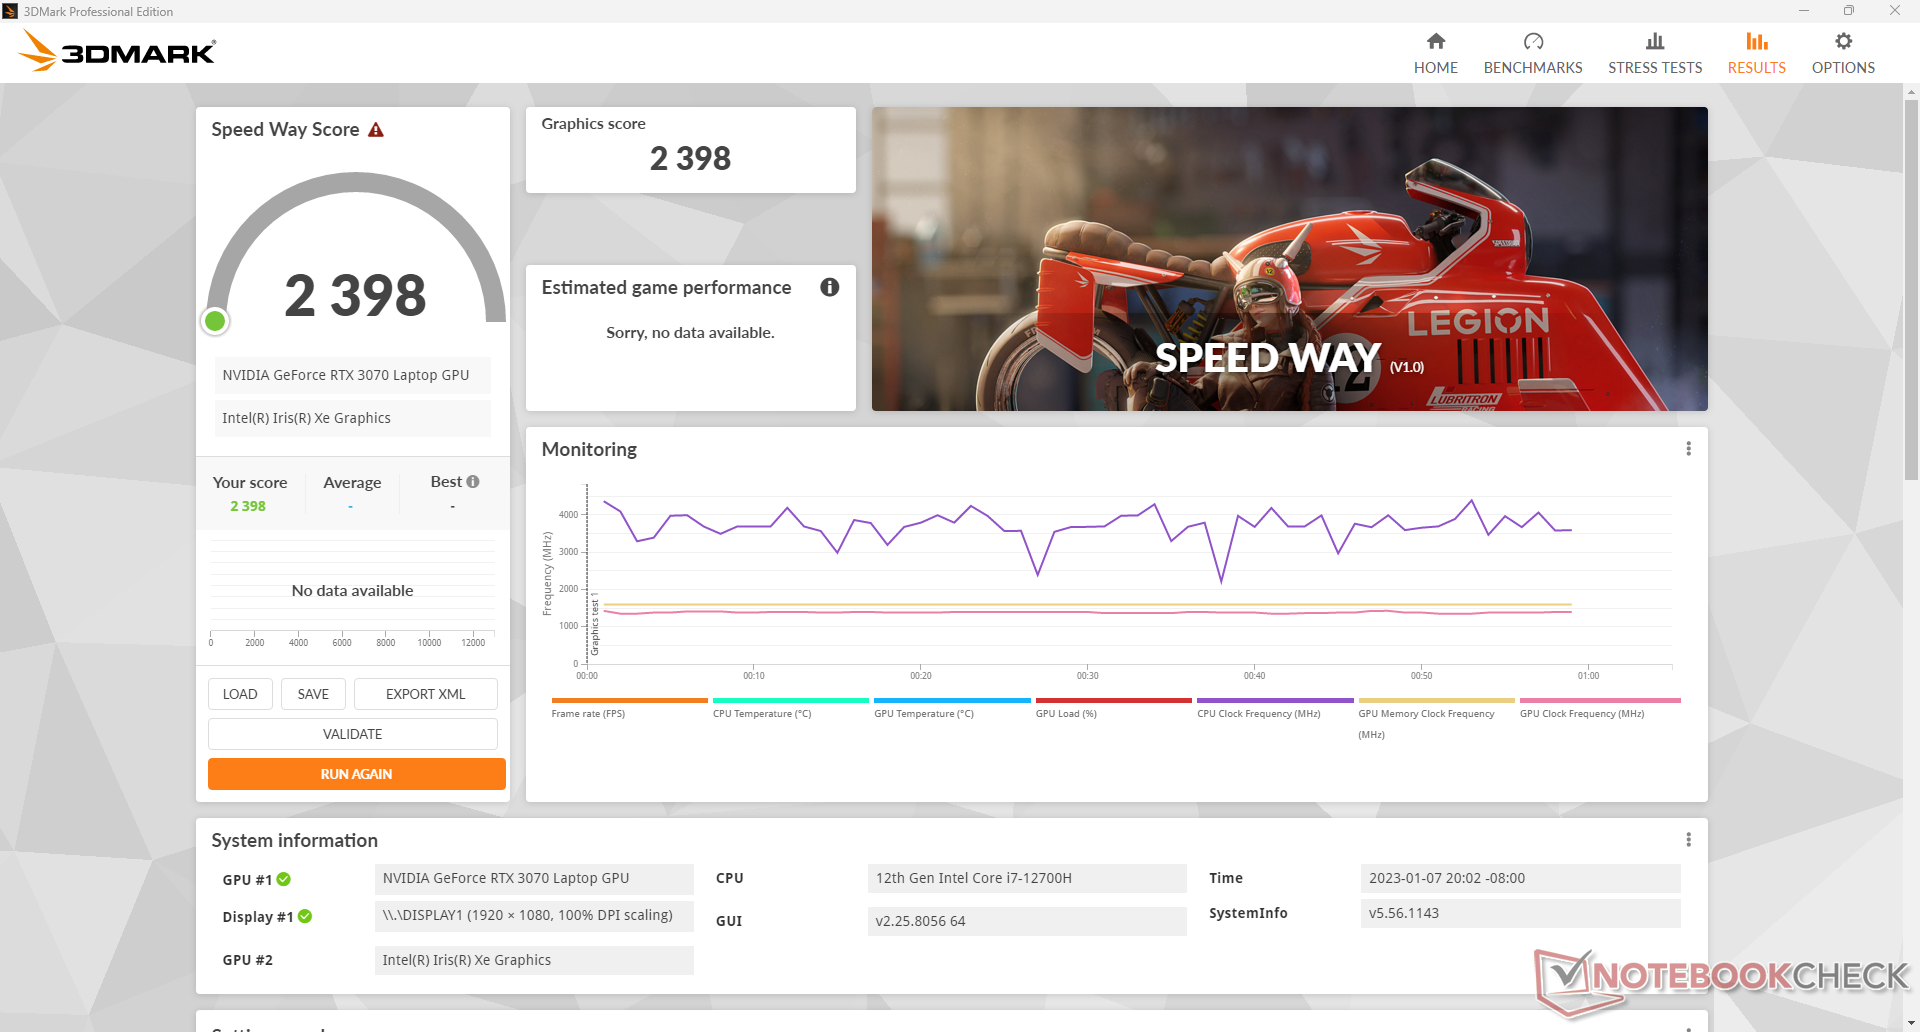
| 2560x1440 Speed Way Score | |
| Asus ROG Strix Scar 17 SE G733CX-LL014W | |
| Przeciętny NVIDIA GeForce RTX 3070 Laptop GPU (2398 - 2646, n=2) | |
| MSI Pulse GL76 12UGK | |
| HP Omen 16-n0033dx | |
| 2560x1440 Port Royal Graphics | |
| Asus ROG Strix Scar 17 SE G733CX-LL014W | |
| MSI GE76 Raider 10UH | |
| Schenker XMG Apex 15 Max | |
| Przeciętny NVIDIA GeForce RTX 3070 Laptop GPU (1640 - 6542, n=39) | |
| MSI Pulse GL76 12UGK | |
| HP Omen 16-n0033dx | |
| 3DMark 11 Performance | 29194 pkt. | |
| 3DMark Fire Strike Score | 22682 pkt. | |
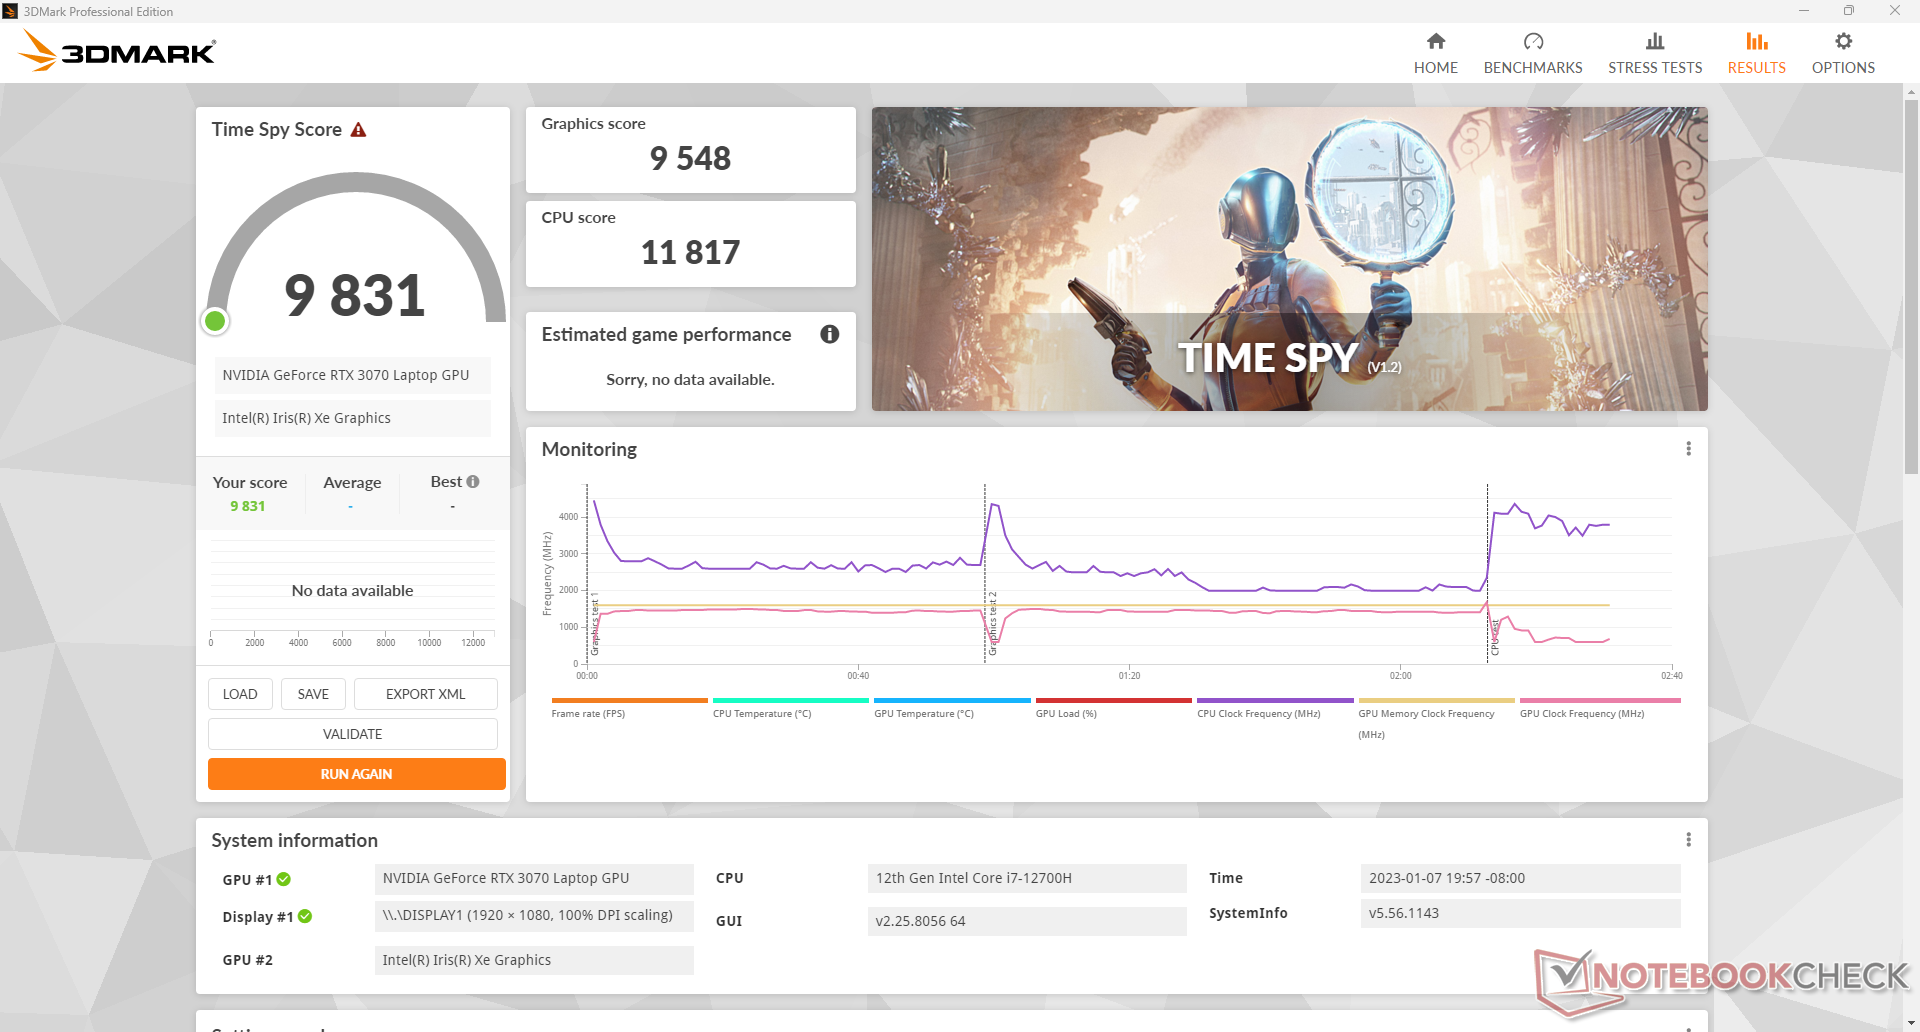
| 3DMark Time Spy Score | 9831 pkt. | |
Pomoc | ||
* ... im mniej tym lepiej
| Cyberpunk 2077 1.6 | |
| 1920x1080 Low Preset | |
| MSI GE67 HX 12UGS | |
| HP Omen 16-n0033dx | |
| Przeciętny NVIDIA GeForce RTX 3070 Laptop GPU (97.9 - 145.6, n=7) | |
| MSI Pulse GL76 12UGK | |
| Asus ROG Strix Scar 17 SE G733CX-LL014W | |
| Asus TUF Gaming F17 FX707Z-HX011W | |
| 1920x1080 Medium Preset | |
| MSI GE67 HX 12UGS | |
| Przeciętny NVIDIA GeForce RTX 3070 Laptop GPU (76.5 - 129.2, n=8) | |
| HP Omen 16-n0033dx | |
| MSI Pulse GL76 12UGK | |
| Asus ROG Strix Scar 17 SE G733CX-LL014W | |
| Asus TUF Gaming F17 FX707Z-HX011W | |
| 1920x1080 High Preset | |
| MSI GE67 HX 12UGS | |
| Asus ROG Strix Scar 17 SE G733CX-LL014W | |
| Przeciętny NVIDIA GeForce RTX 3070 Laptop GPU (66.6 - 113.9, n=8) | |
| MSI Pulse GL76 12UGK | |
| Asus TUF Gaming F17 FX707Z-HX011W | |
| HP Omen 16-n0033dx | |
| 1920x1080 Ultra Preset | |
| MSI GE67 HX 12UGS | |
| Asus ROG Strix Scar 17 SE G733CX-LL014W | |
| Asus TUF Gaming F17 FX707Z-HX011W | |
| Przeciętny NVIDIA GeForce RTX 3070 Laptop GPU (61.5 - 93, n=8) | |
| MSI Pulse GL76 12UGK | |
| HP Omen 16-n0033dx | |
| Final Fantasy XV Benchmark | |
| 1280x720 Lite Quality | |
| Schenker XMG Apex 15 Max | |
| MSI GE67 HX 12UGS | |
| MSI Pulse GL76 12UGK | |
| Asus ROG Strix Scar 17 SE G733CX-LL014W | |
| Asus TUF Gaming F17 FX707Z-HX011W | |
| MSI GE76 Raider 10UH | |
| HP Omen 16-n0033dx | |
| Przeciętny NVIDIA GeForce RTX 3070 Laptop GPU (137 - 207, n=30) | |
| 1920x1080 Standard Quality | |
| MSI GE67 HX 12UGS | |
| Asus ROG Strix Scar 17 SE G733CX-LL014W | |
| MSI GE76 Raider 10UH | |
| Schenker XMG Apex 15 Max | |
| MSI Pulse GL76 12UGK | |
| Przeciętny NVIDIA GeForce RTX 3070 Laptop GPU (67 - 144, n=32) | |
| HP Omen 16-n0033dx | |
| Asus TUF Gaming F17 FX707Z-HX011W | |
| Lenovo IdeaPad Gaming 3 15IAH7 | |
| 1920x1080 High Quality | |
| MSI GE67 HX 12UGS | |
| Asus ROG Strix Scar 17 SE G733CX-LL014W | |
| MSI GE76 Raider 10UH | |
| Alienware m17 R5 (R9 6900HX, RX 6850M XT) | |
| Schenker XMG Apex 15 Max | |
| MSI Pulse GL76 12UGK | |
| Przeciętny NVIDIA GeForce RTX 3070 Laptop GPU (27.9 - 107, n=49) | |
| HP Omen 16-n0033dx | |
| Asus TUF Gaming F17 FX707Z-HX011W | |
| MSI Creator 15 | |
| Lenovo IdeaPad Gaming 3 15IAH7 | |
Witcher 3 FPS Chart
| low | med. | high | ultra | |
|---|---|---|---|---|
| GTA V (2015) | 185.7 | 182.3 | 175.5 | 108.1 |
| The Witcher 3 (2015) | 377.1 | 252.8 | 170.5 | 92.8 |
| Dota 2 Reborn (2015) | 168.1 | 152.1 | 141.2 | 132.8 |
| Final Fantasy XV Benchmark (2018) | 186.3 | 118.5 | 89.7 | |
| X-Plane 11.11 (2018) | 139.9 | 122.9 | 97.7 | |
| Strange Brigade (2018) | 414 | 224 | 186.6 | 164.5 |
| Cyberpunk 2077 1.6 (2022) | 118.8 | 102.4 | 83.2 | 69.8 |
Emisje - nie za głośno
Szum systemu
Wentylatory nigdy nie próżnują, nawet gdy są ustawione w trybie "Silent". Udało nam się zarejestrować minimalnie 26,9 dB(A) na tle 24,1 dB(A), co w większości scenariuszy jest ledwo słyszalne. Zamiast tego tryb "Silent" znakomicie zapobiega pulsowaniu wewnętrznych wentylatorów w odpowiedzi na zmieniające się obciążenie ekranu. Na przykład podczas oglądania filmów lub przeglądania stron internetowych tryb Silent jest zalecany zamiast trybu Balanced, w którym wentylatory będą często pulsować w zakresie od 27 do 43,8 dB(A).
Szum wentylatora podczas pracy Witcher 3 stabilizuje się na poziomie nieco poniżej 45 dB(A) i jest cichszy od wielu konkurentów, co pokazuje poniższa tabela. Po włączeniu Cooler Boost (czyli trybu maksymalnego wentylatora) hałas wentylatora skoczy do 58 dB(A). Ten tryb służy raczej do obniżenia temperatury niż zwiększenia wydajności, więc nie jest konieczny w większości scenariuszy gier.
Hałas
| luz |
| 26.9 / 26.9 / 27 dB |
| obciążenie |
| 43.8 / 58.3 dB |
 | ||
30 dB cichy 40 dB(A) słyszalny 50 dB(A) irytujący |
||
min: | ||
| MSI Pulse GL76 12UGK GeForce RTX 3070 Laptop GPU, i7-12700H, Micron 3400 1TB MTFDKBA1T0TFH | Alienware m17 R5 (R9 6900HX, RX 6850M XT) Radeon RX 6850M XT, R9 6900HX, SSSTC CA6-8D1024 | Asus ROG Strix Scar 17 SE G733CX-LL014W GeForce RTX 3080 Ti Laptop GPU, i9-12950HX, Samsung PM9A1 MZVL22T0HBLB | Acer Predator Helios 300 (i7-12700H, RTX 3070 Ti) GeForce RTX 3070 Ti Laptop GPU, i7-12700H, Samsung PM9A1 MZVL21T0HCLR | Razer Blade 17 Early 2022 GeForce RTX 3080 Ti Laptop GPU, i9-12900H, Samsung PM9A1 MZVL21T0HCLR | MSI Vector GP76 12UGS-434 GeForce RTX 3070 Ti Laptop GPU, i7-12700H, Micron 2450 1TB MTFDKBA1T0TFK | |
|---|---|---|---|---|---|---|
| Noise | 6% | 13% | -10% | -6% | -6% | |
| wyłączone / środowisko * (dB) | 24.1 | 23 5% | 23.9 1% | 23 5% | 26 -8% | 25.6 -6% |
| Idle Minimum * (dB) | 26.9 | 23 14% | 23.9 11% | 23 14% | 26 3% | 27 -0% |
| Idle Average * (dB) | 26.9 | 28.11 -4% | 23.9 11% | 25.92 4% | 27 -0% | 27 -0% |
| Idle Maximum * (dB) | 27 | 28.11 -4% | 23.9 11% | 40.67 -51% | 32 -19% | 30.1 -11% |
| Load Average * (dB) | 43.8 | 30.62 30% | 34.3 22% | 42.7 3% | 50 -14% | 54.4 -24% |
| Witcher 3 ultra * (dB) | 44.7 | 49.75 -11% | 62.48 -40% | 51 -14% | ||
| Load Maximum * (dB) | 58.3 | 50.17 14% | 45.9 21% | 62.67 -7% | 51 13% | 56.2 4% |
* ... im mniej tym lepiej
Temperatura
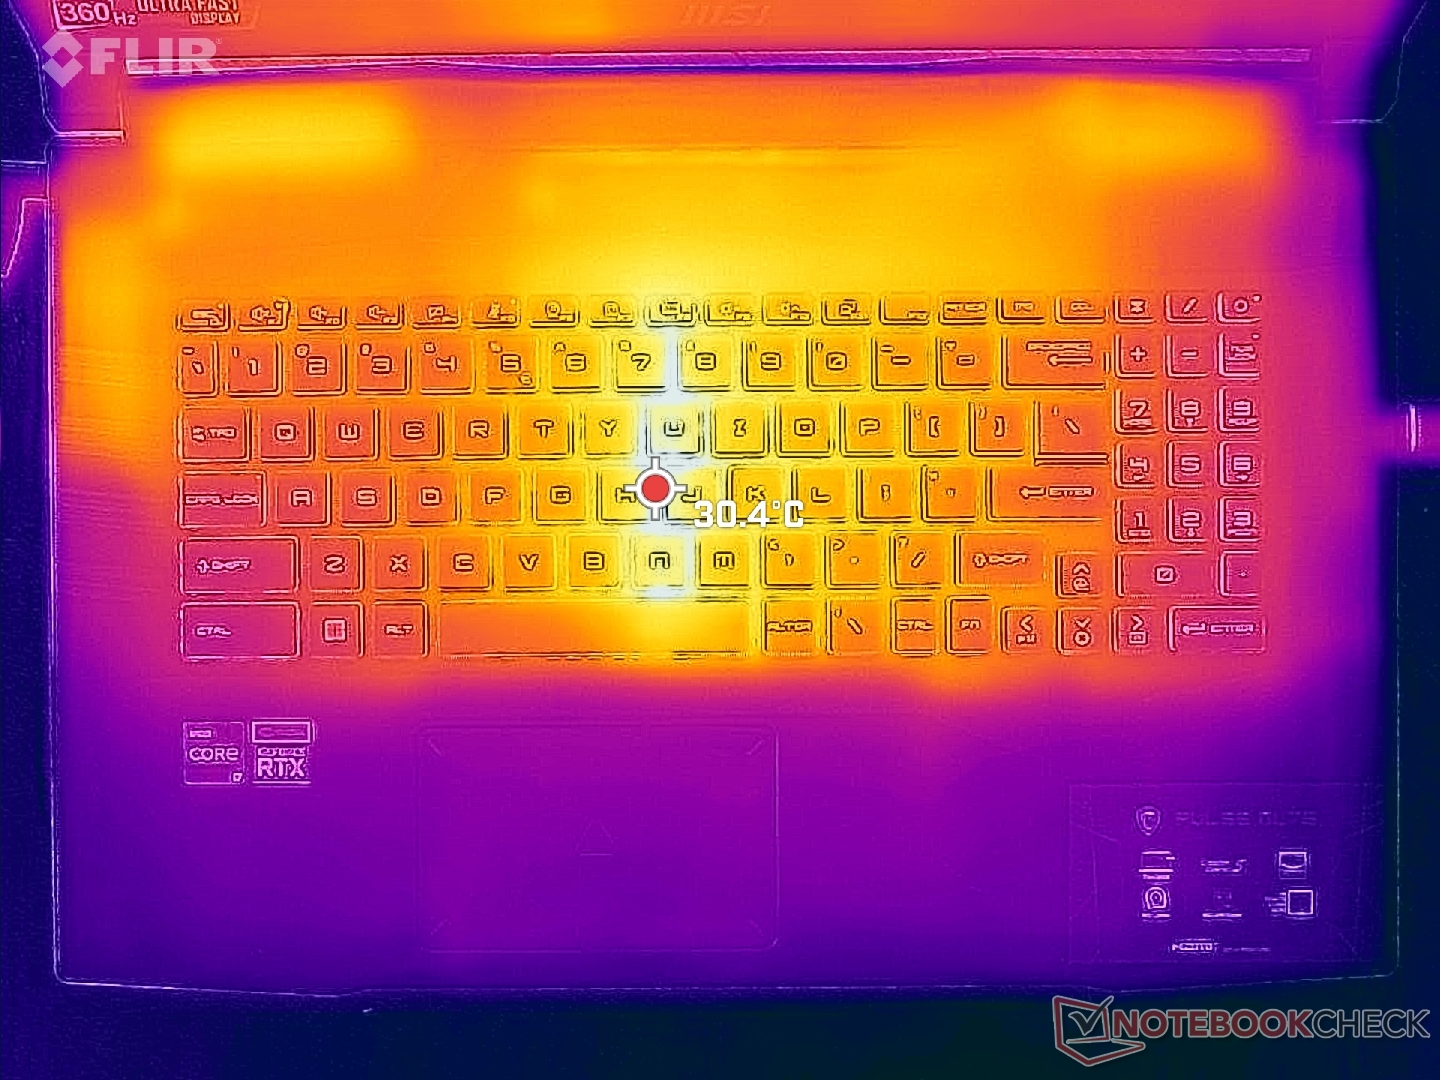
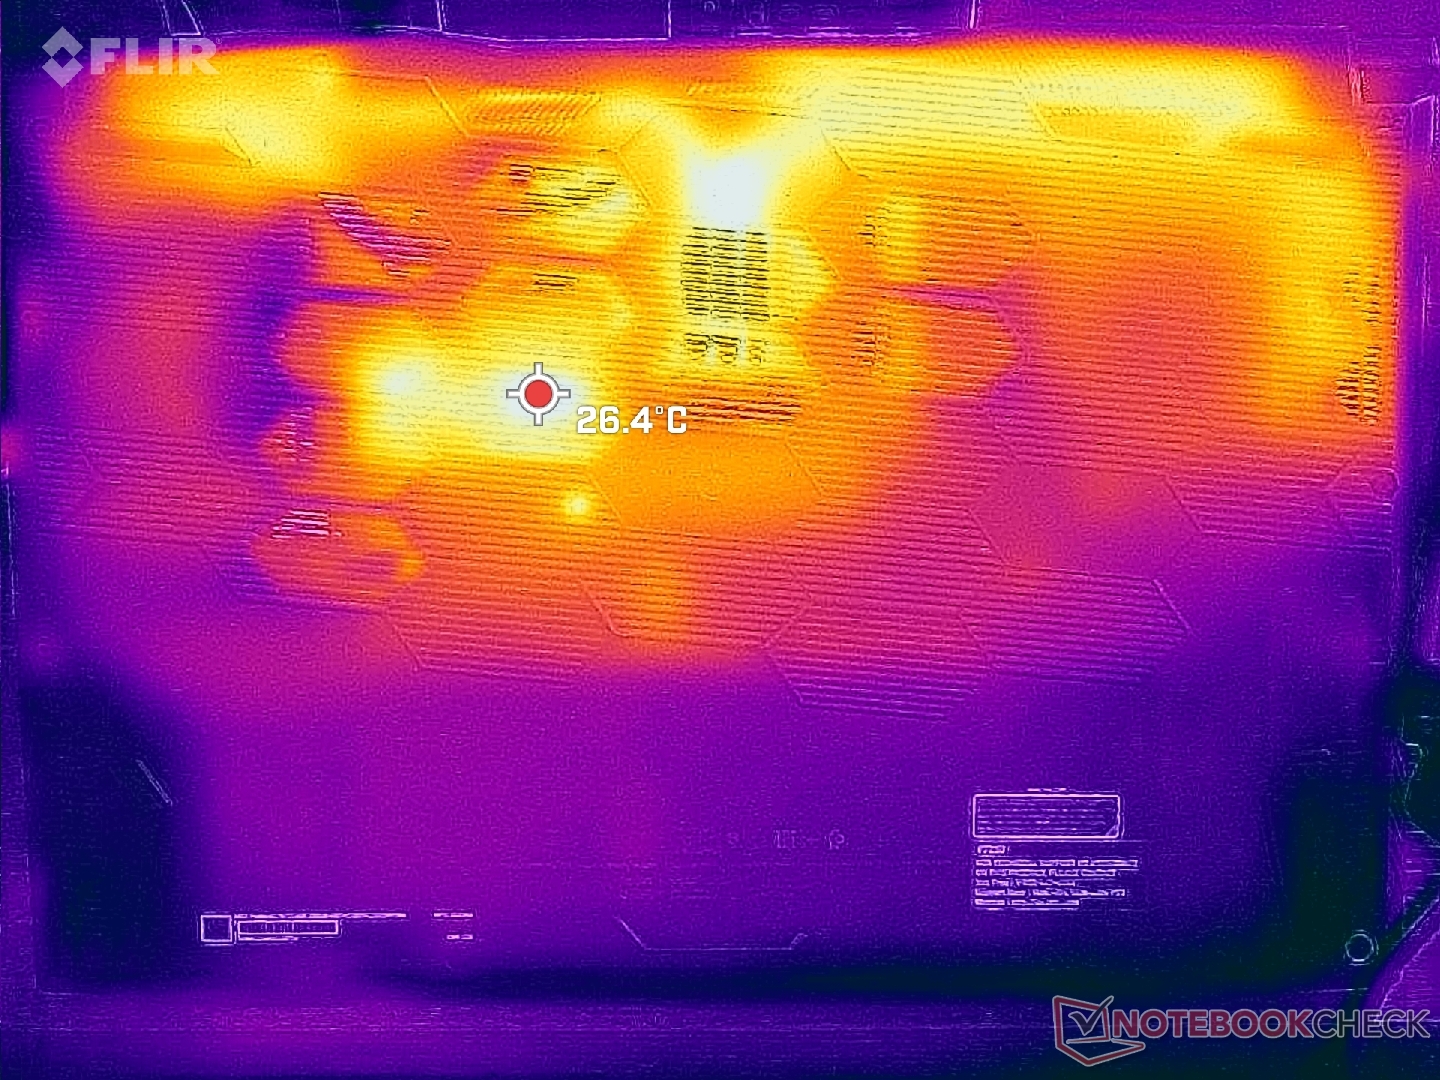
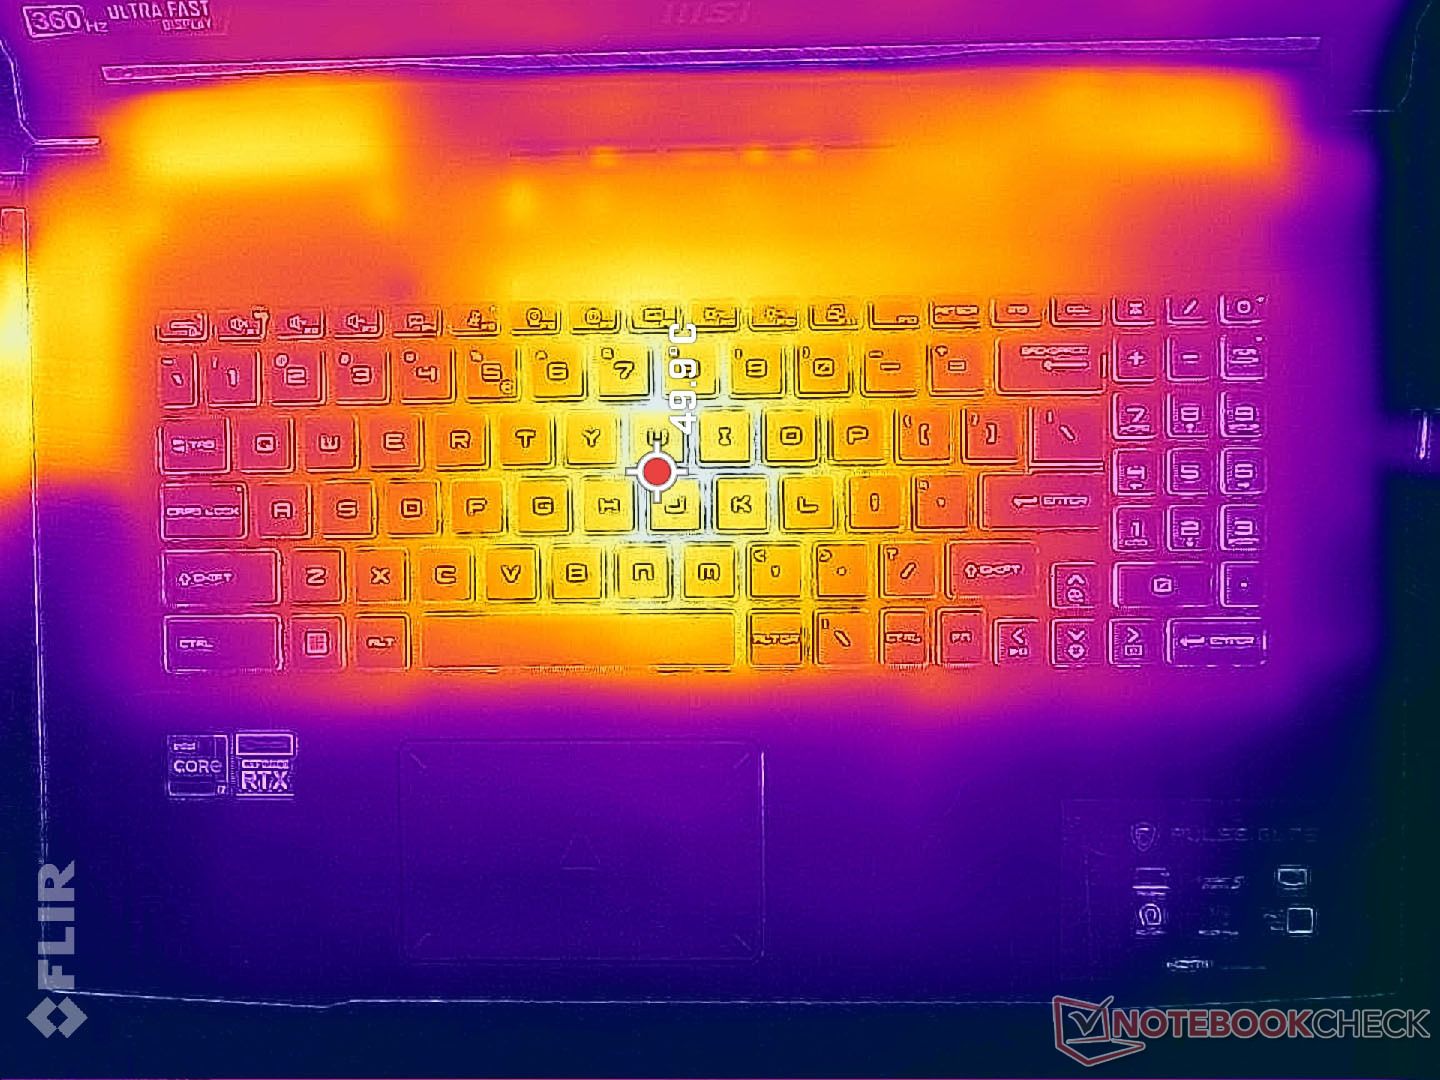
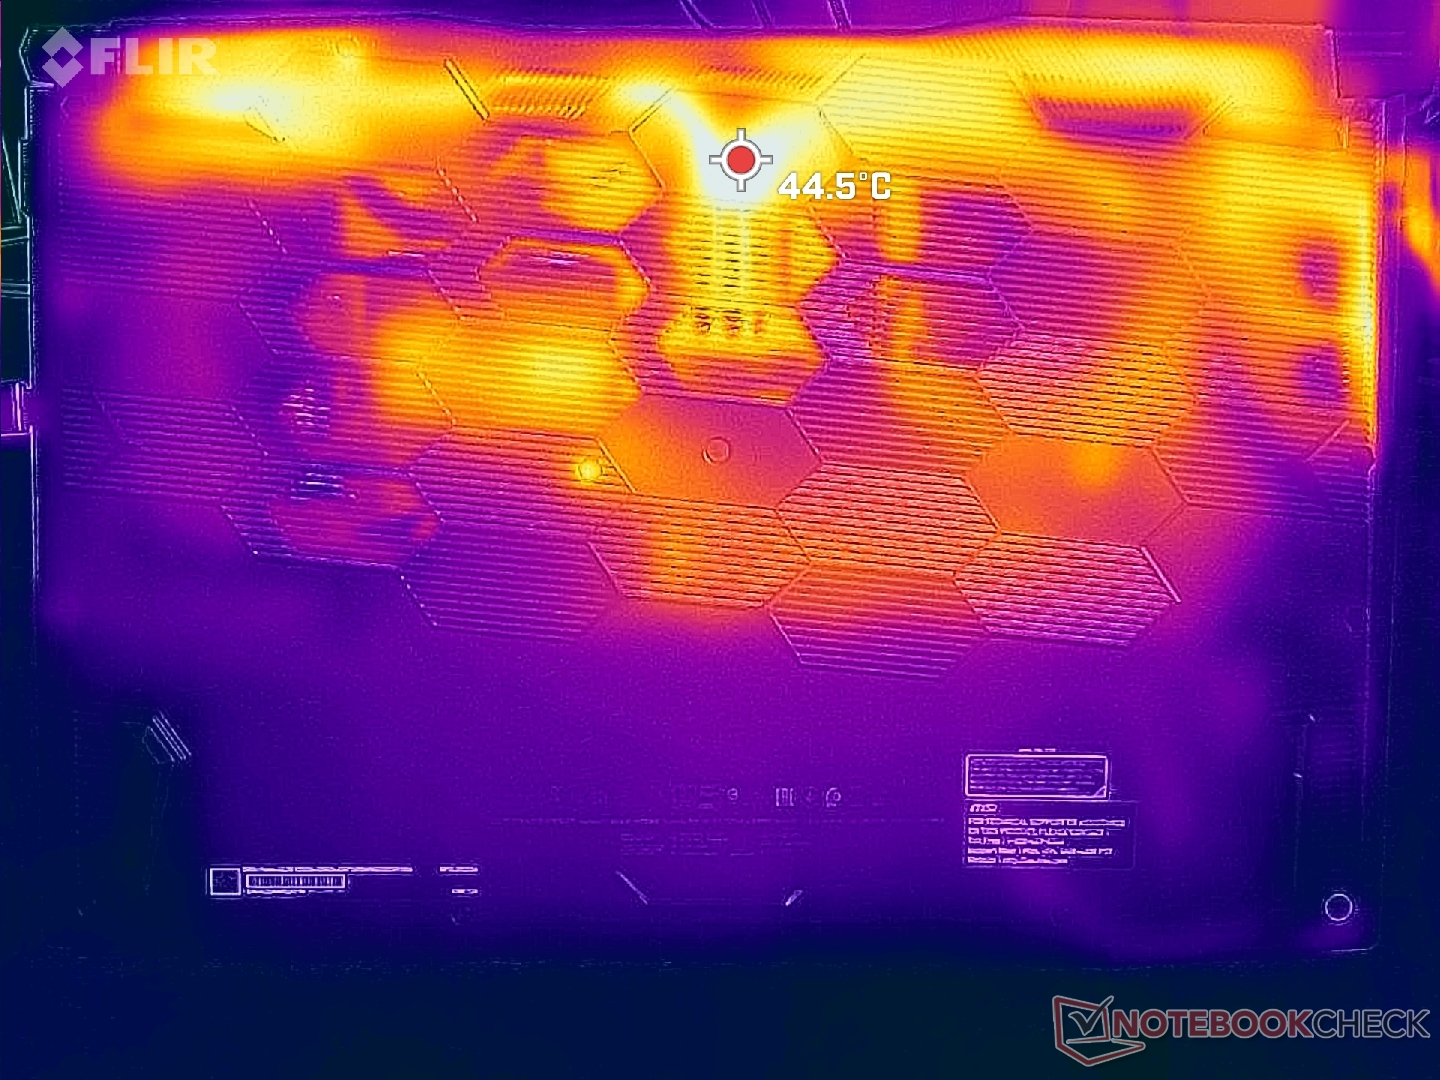
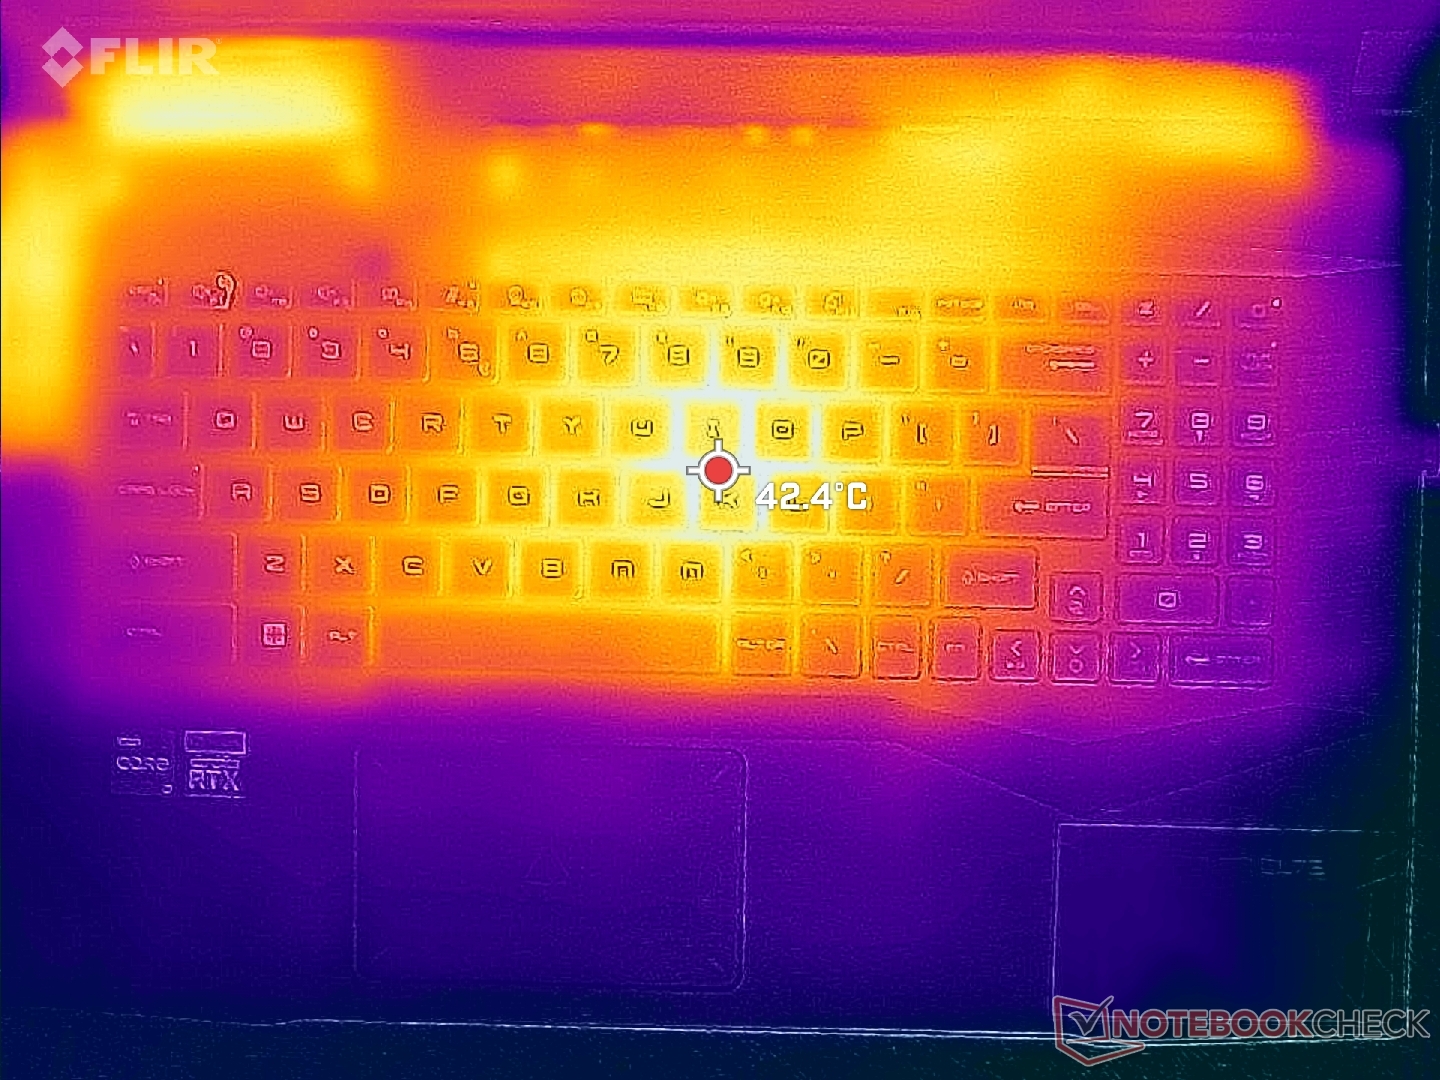
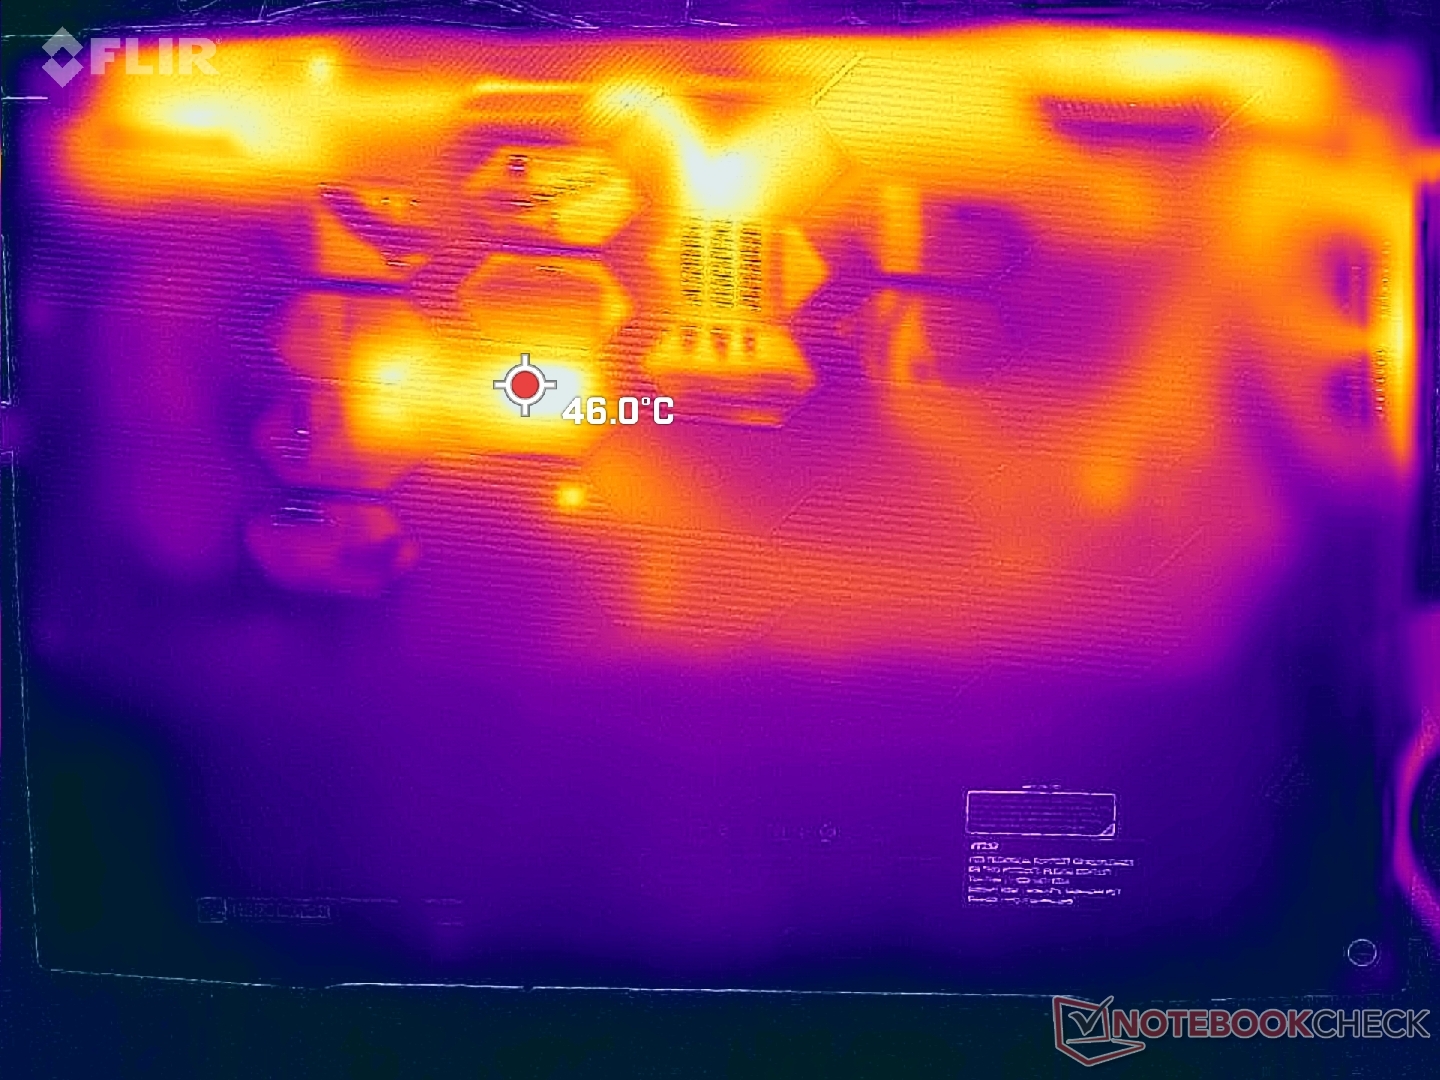
Średnie temperatury powierzchni nie są nieprzyjemnie ciepłe, a wszelkie gorące punkty są bardzo izolowane dzięki dużej 17,3-calowej obudowie i w większości plastikowej. Na przykład środek klawiatury osiąga podczas gry temperaturę prawie 50°C, podczas gdy podpórki pod nadgarstki i boki klawiatury są znacznie chłodniejsze, odpowiednio w zakresie 20 i 30°C. Gorące punkty na górze i na dole są rzadko zauważalne podczas gry, ponieważ kontakt skóry z tymi obszarami jest rzadki.
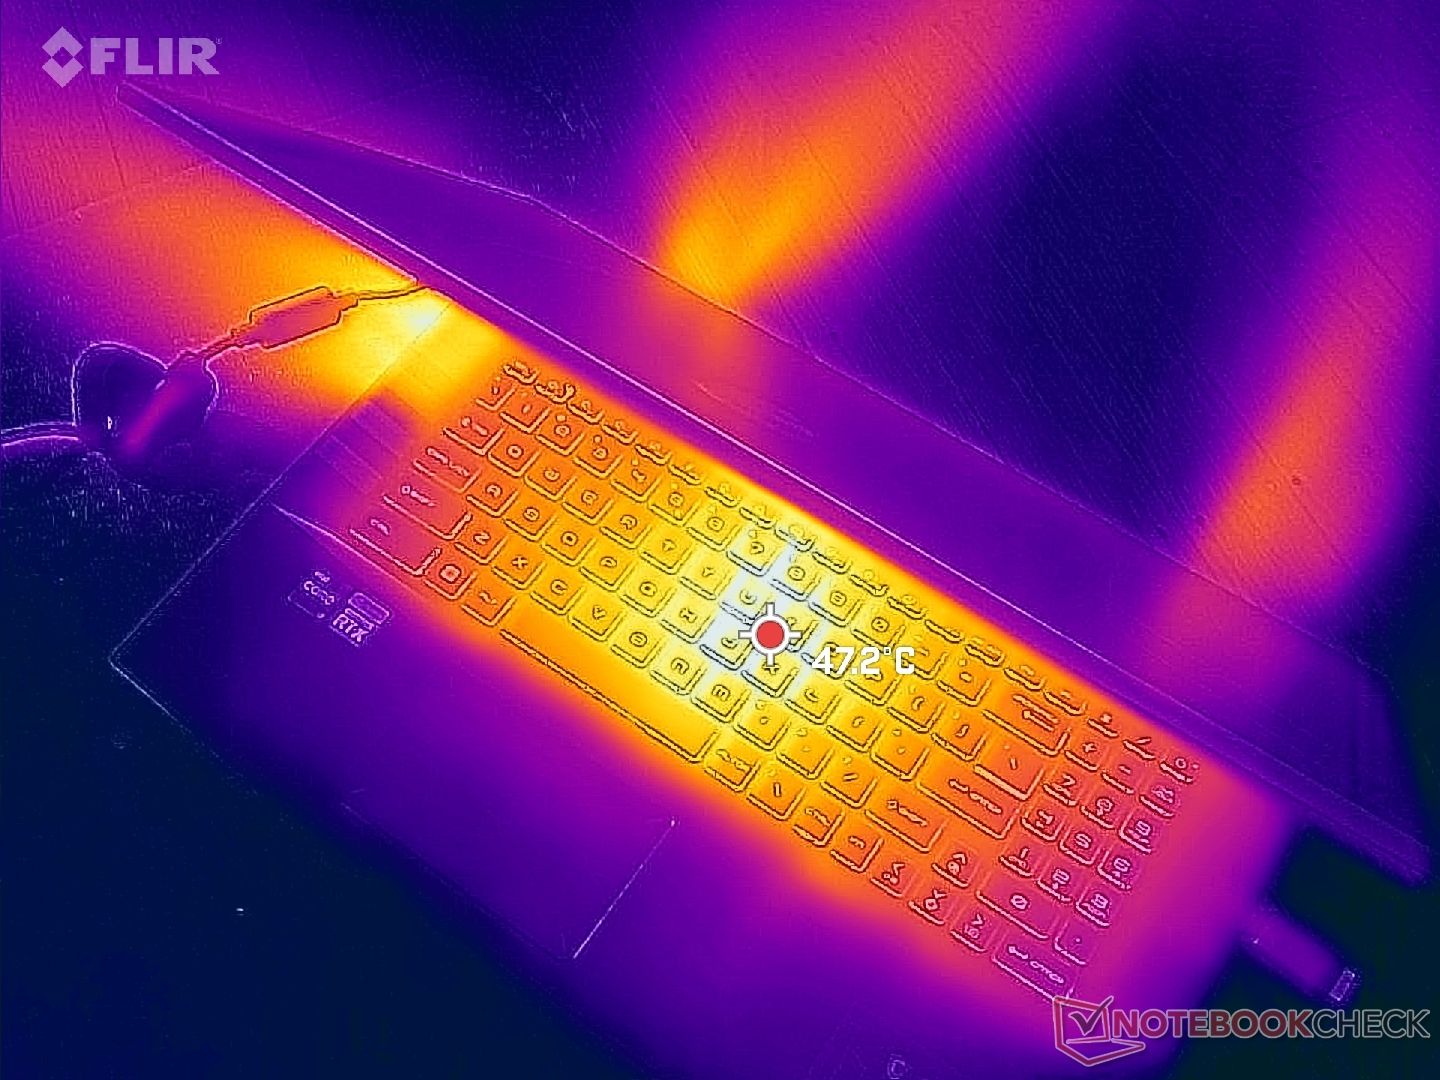
(±) Maksymalna temperatura w górnej części wynosi 44.2 °C / 112 F, w porównaniu do średniej 40.4 °C / 105 F , począwszy od 21.2 do 68.8 °C dla klasy Gaming.
(-) Dno nagrzewa się maksymalnie do 45.2 °C / 113 F, w porównaniu do średniej 43.2 °C / 110 F
(+) W stanie bezczynności średnia temperatura górnej części wynosi 27.7 °C / 82 F, w porównaniu ze średnią temperaturą urządzenia wynoszącą 33.9 °C / ### class_avg_f### F.
(±) Podczas gry w Wiedźmina 3 średnia temperatura górnej części wynosi 35.1 °C / 95 F, w porównaniu do średniej temperatury urządzenia wynoszącej 33.9 °C / ## #class_avg_f### F.
(+) Podpórki pod nadgarstki i touchpad są chłodniejsze niż temperatura skóry i maksymalnie 25.4 °C / 77.7 F i dlatego są chłodne w dotyku.
(+) Średnia temperatura obszaru podparcia dłoni w podobnych urządzeniach wynosiła 28.8 °C / 83.8 F (+3.4 °C / 6.1 F).
| MSI Pulse GL76 12UGK Intel Core i7-12700H, NVIDIA GeForce RTX 3070 Laptop GPU | Alienware m17 R5 (R9 6900HX, RX 6850M XT) AMD Ryzen 9 6900HX, AMD Radeon RX 6850M XT | Asus ROG Strix Scar 17 SE G733CX-LL014W Intel Core i9-12950HX, NVIDIA GeForce RTX 3080 Ti Laptop GPU | Acer Predator Helios 300 (i7-12700H, RTX 3070 Ti) Intel Core i7-12700H, NVIDIA GeForce RTX 3070 Ti Laptop GPU | Razer Blade 17 Early 2022 Intel Core i9-12900H, NVIDIA GeForce RTX 3080 Ti Laptop GPU | MSI Vector GP76 12UGS-434 Intel Core i7-12700H, NVIDIA GeForce RTX 3070 Ti Laptop GPU | |
|---|---|---|---|---|---|---|
| Heat | -3% | -2% | 6% | -12% | -3% | |
| Maximum Upper Side * (°C) | 44.2 | 53 -20% | 48.8 -10% | 35 21% | 50 -13% | 46.3 -5% |
| Maximum Bottom * (°C) | 45.2 | 56 -24% | 52.4 -16% | 53 -17% | 56 -24% | 45 -0% |
| Idle Upper Side * (°C) | 35.4 | 30 15% | 30.4 14% | 29 18% | 36 -2% | 34.2 3% |
| Idle Bottom * (°C) | 35 | 29 17% | 34.1 3% | 34 3% | 38 -9% | 38.3 -9% |
* ... im mniej tym lepiej
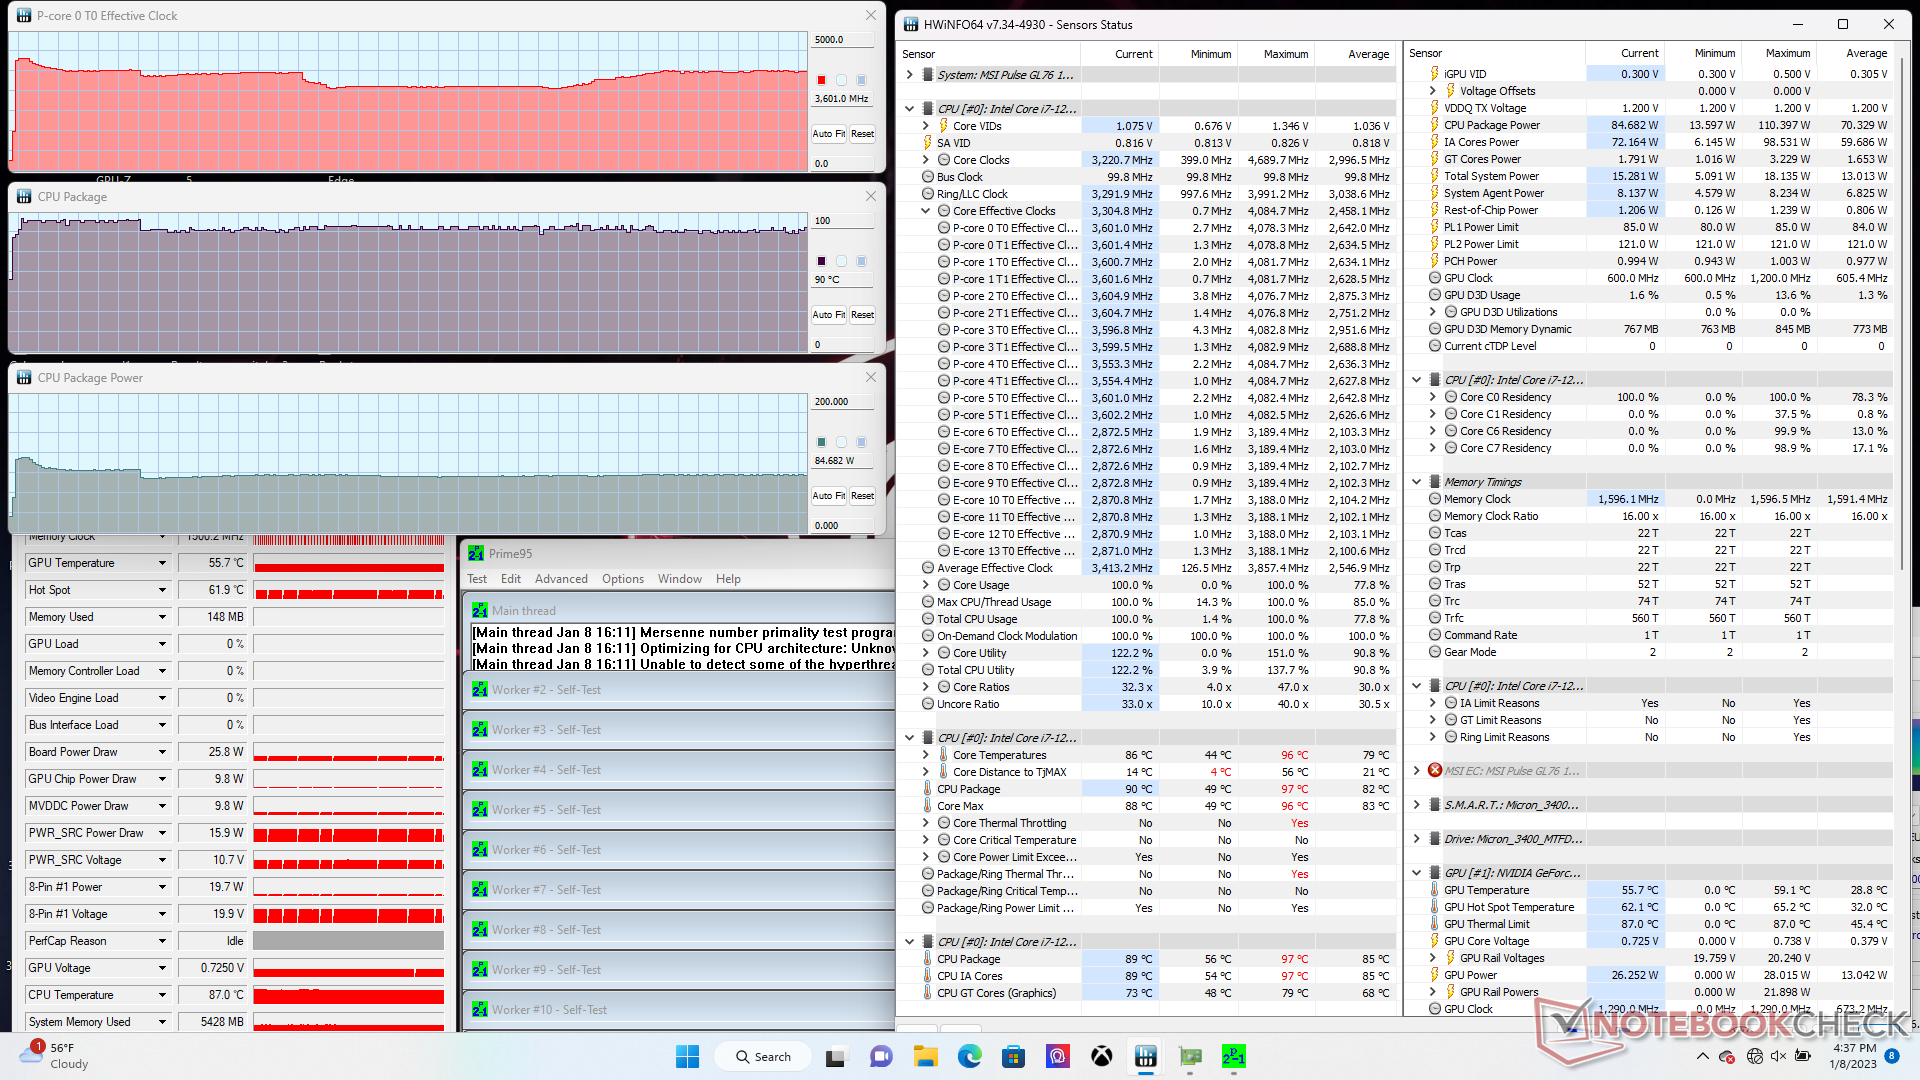
Stress Test
Podczas pracy z Prime95 częstotliwość taktowania CPU i pobór mocy na płycie wzrosłyby odpowiednio do 4,1 GHz i 110 W, utrzymując się przez kilka sekund lub do momentu, gdy temperatura rdzenia osiągnie 95 C. Następnie częstotliwość taktowania i pobór mocy na płycie spadłyby do 3,6 GHz i 92 W, by ostatecznie ustabilizować się na poziomie odpowiednio 3,1 do 3,6 GHz i 85 W. Temperatura rdzenia również ustabilizowała się na poziomie 90 C, co wskazuje, że rozwiązanie chłodzące jest na granicy swoich możliwości.
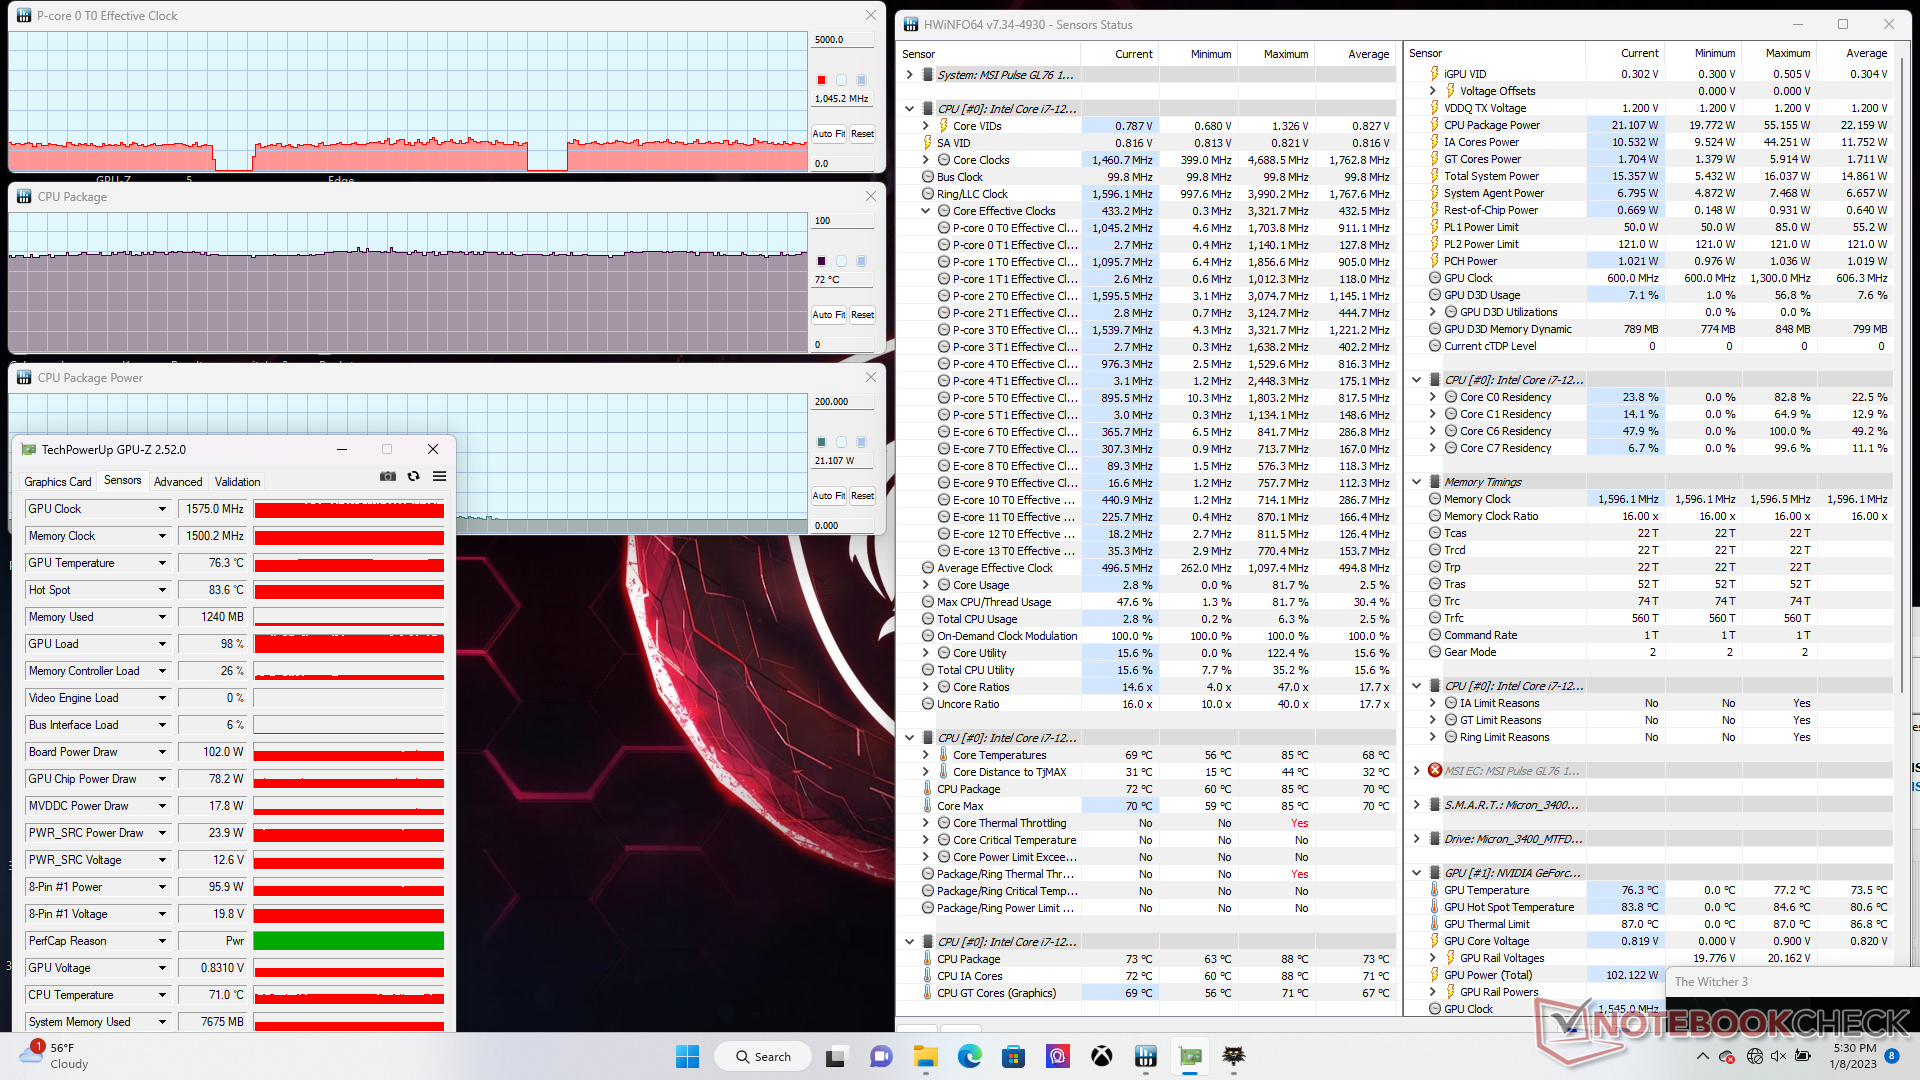
Procesor graficzny Nvidii ustabilizowałby się na poziomie 1575 MHz i 76 C podczas pracy pod adresem Witcher 3 w porównaniu do 1725 MHz i 72 C w Razer Blade 17 wyposażonym w wyższy 130 W TGP GeForce RTX 3070. GPU-Z w naszym urządzeniu testowym MSI wskazałby również pobór mocy karty graficznej na poziomie 102 W, co jest bardzo bliskie reklamowanemu celowi 105 W.
Praca na zasilaniu akumulatorowym ogranicza wydajność. Test 3DMark 11 przeprowadzony na baterii przyniósłby wyniki w zakresie fizyki i grafiki na poziomie odpowiednio 9089 i 11291 punktów, w porównaniu do 22513 i 33048 punktów przy zasilaniu z sieci.
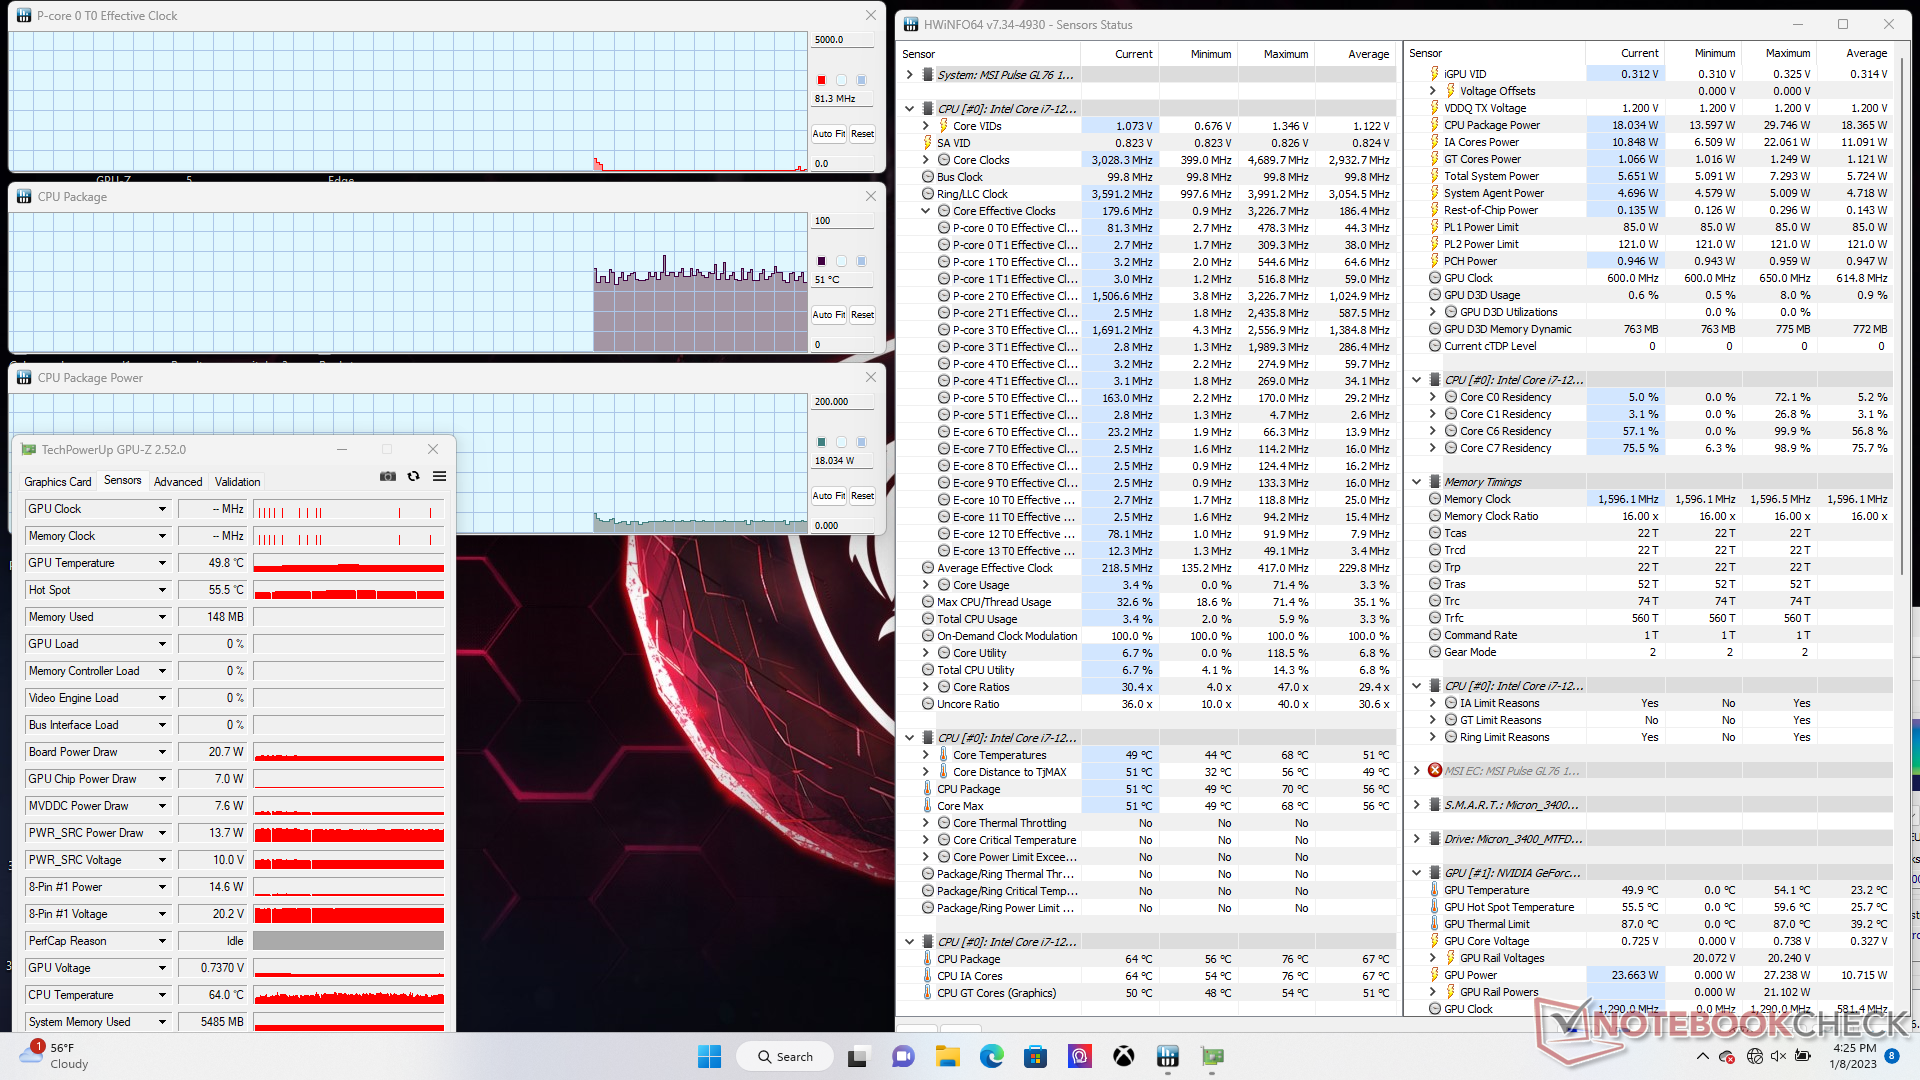
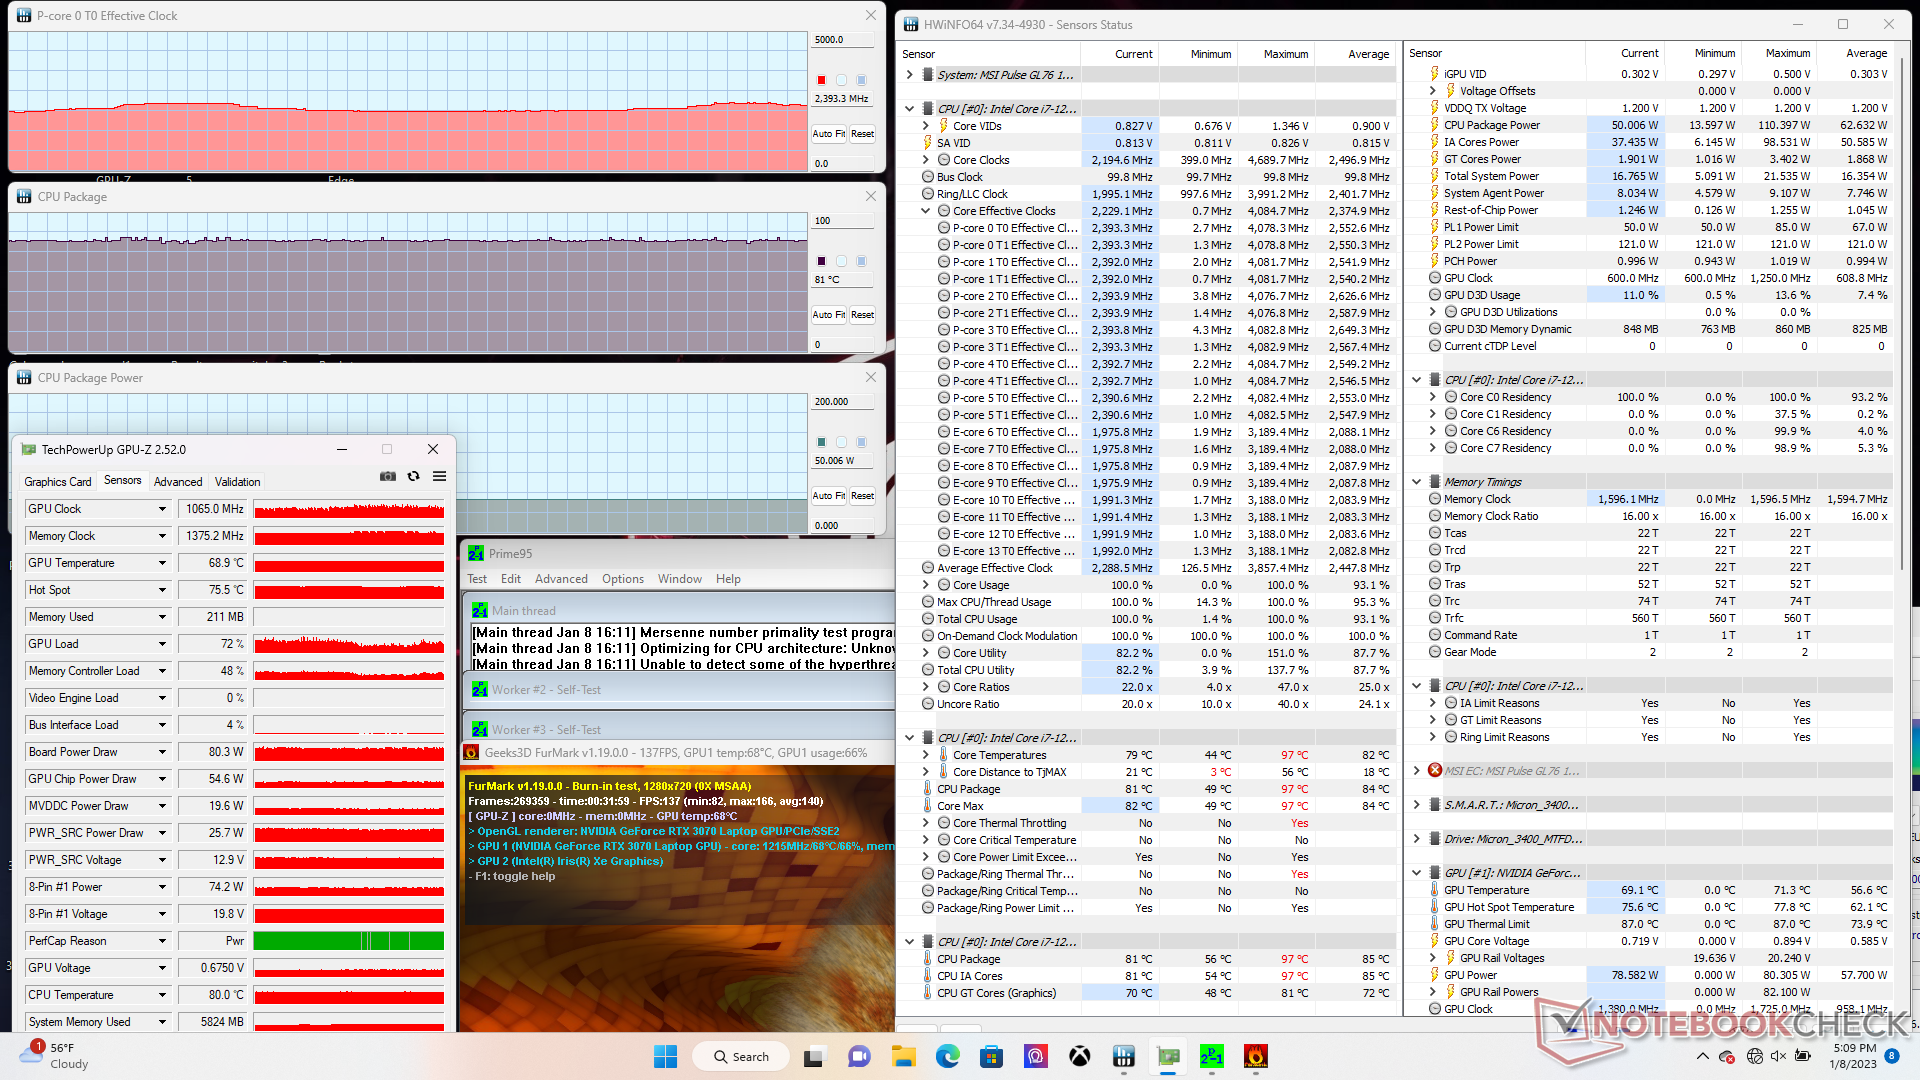
| ZegarCPU (GHz) | Zegar GPU (MHz) | Średnia temperatura CPU (°C) | Średnia temperatura GPU (°C) | |
| System w stanie bezczynności | -- | -- | 51 | 50 |
| Prime95 Stress | 3.4 - 3.6 | -- | 90 | 56 |
| Prime95 + FurMark Stress | 2,3 - 2,4 | 1065 | 81 | 69 |
| Witcher 3 Stress | ~1.1 | 1575 | 72 | 76 |
Mówcy
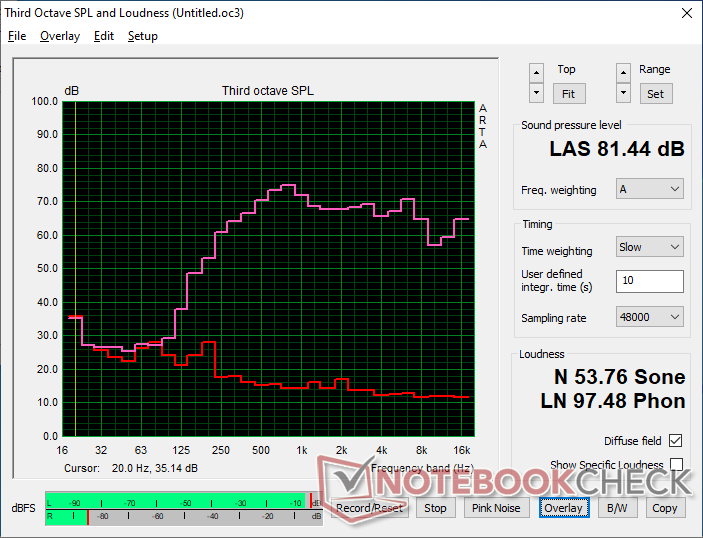
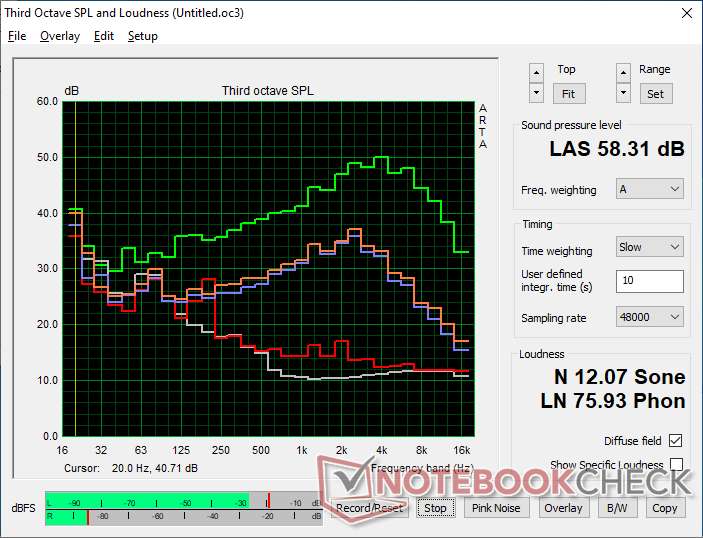
MSI Pulse GL76 12UGK analiza dźwięku
(±) | głośność głośnika jest średnia, ale dobra (81.4 dB)
Bas 100 - 315 Hz
(-) | prawie brak basu - średnio 17.5% niższa od mediany
(±) | liniowość basu jest średnia (11.8% delta do poprzedniej częstotliwości)
Średnie 400 - 2000 Hz
(+) | zbalansowane środki średnie - tylko 3.7% od mediany
(+) | średnie są liniowe (4.3% delta do poprzedniej częstotliwości)
Wysokie 2–16 kHz
(+) | zrównoważone maksima - tylko 3.1% od mediany
(+) | wzloty są liniowe (6.6% delta do poprzedniej częstotliwości)
Ogólnie 100 - 16.000 Hz
(+) | ogólny dźwięk jest liniowy (14.8% różnicy w stosunku do mediany)
W porównaniu do tej samej klasy
» 29% wszystkich testowanych urządzeń w tej klasie było lepszych, 7% podobnych, 64% gorszych
» Najlepszy miał deltę 6%, średnia wynosiła ###średnia###%, najgorsza wynosiła 132%
W porównaniu do wszystkich testowanych urządzeń
» 20% wszystkich testowanych urządzeń było lepszych, 4% podobnych, 76% gorszych
» Najlepszy miał deltę 4%, średnia wynosiła ###średnia###%, najgorsza wynosiła 134%
Apple MacBook Pro 16 2021 M1 Pro analiza dźwięku
(+) | głośniki mogą odtwarzać stosunkowo głośno (84.7 dB)
Bas 100 - 315 Hz
(+) | dobry bas - tylko 3.8% od mediany
(+) | bas jest liniowy (5.2% delta do poprzedniej częstotliwości)
Średnie 400 - 2000 Hz
(+) | zbalansowane środki średnie - tylko 1.3% od mediany
(+) | średnie są liniowe (2.1% delta do poprzedniej częstotliwości)
Wysokie 2–16 kHz
(+) | zrównoważone maksima - tylko 1.9% od mediany
(+) | wzloty są liniowe (2.7% delta do poprzedniej częstotliwości)
Ogólnie 100 - 16.000 Hz
(+) | ogólny dźwięk jest liniowy (4.6% różnicy w stosunku do mediany)
W porównaniu do tej samej klasy
» 0% wszystkich testowanych urządzeń w tej klasie było lepszych, 0% podobnych, 100% gorszych
» Najlepszy miał deltę 5%, średnia wynosiła ###średnia###%, najgorsza wynosiła 45%
W porównaniu do wszystkich testowanych urządzeń
» 0% wszystkich testowanych urządzeń było lepszych, 0% podobnych, 100% gorszych
» Najlepszy miał deltę 4%, średnia wynosiła ###średnia###%, najgorsza wynosiła 134%
Zarządzanie energią - większa wydajność energetyczna niż się spodziewano
Pobór mocy
Praca na biegu jałowym na pulpicie zużywa zaledwie 12 W w profilu Power Saver z aktywnym procesorem iGPU i jasnością ustawioną na minimum. Z kolei w trybie Ekstremalnej wydajności z jasnością ustawioną na maksimum, bezczynność na pulpicie może pochłonąć nieco ponad 25 W. Przełączanie pomiędzy trybami zasilania jest więc ważnym czynnikiem przedłużającym żywotność baterii.
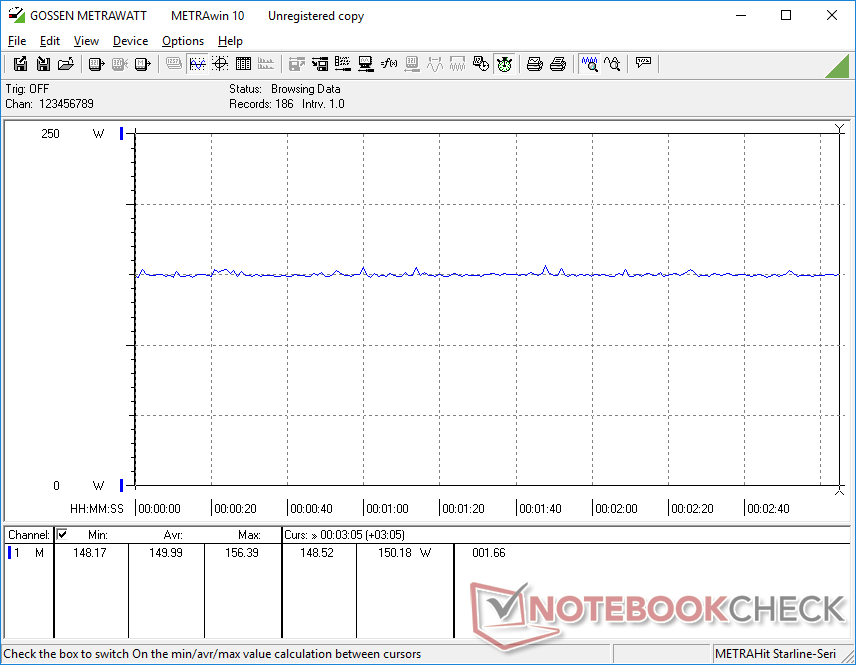
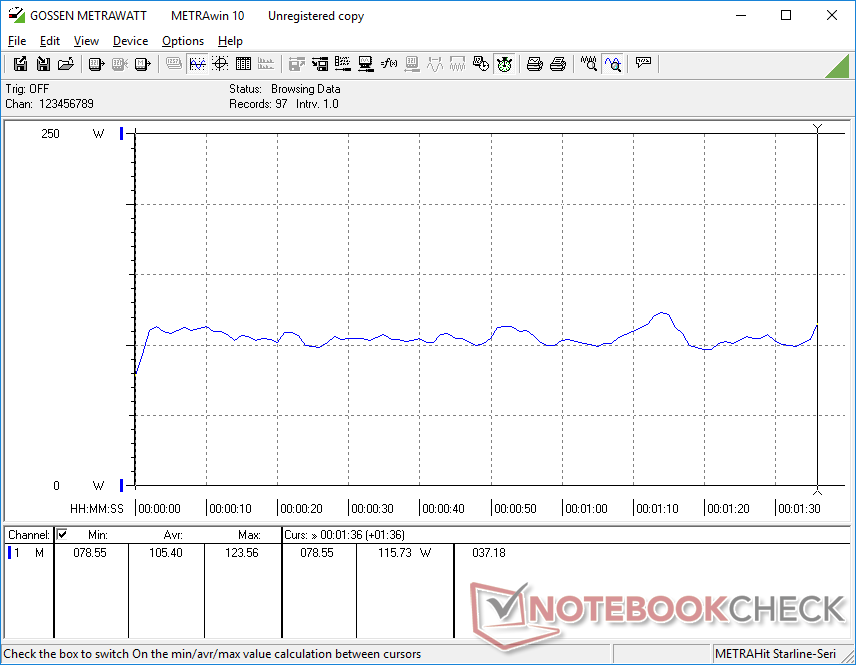
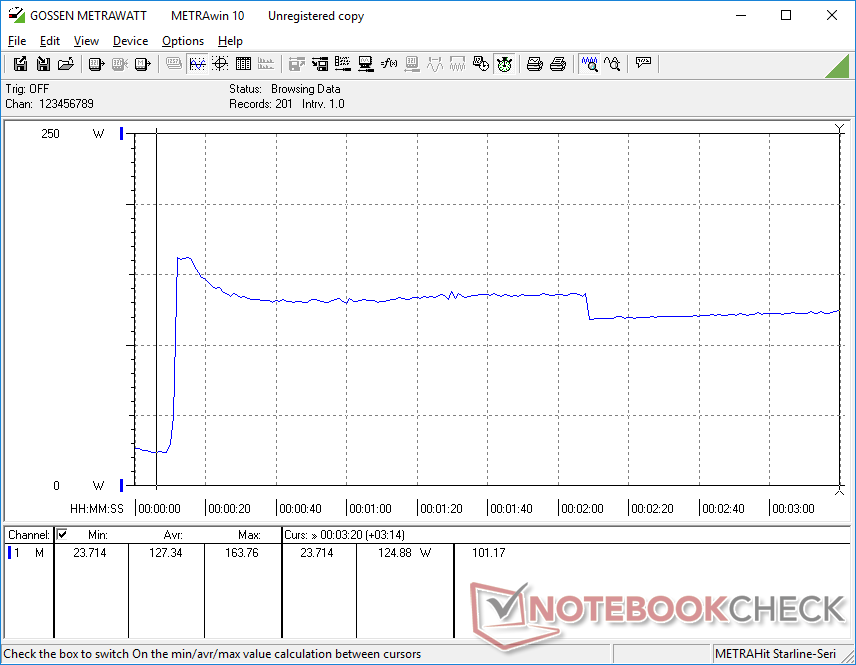
Ogólne zużycie energii jest niższe niż w większości innych 17,3-calowych laptopów do gier. Na przykład uruchomienie strony Witcher 3 spowodowałoby zużycie zaledwie 150 W w porównaniu z 199 W i 231 W w MSI Vector GP76 i Acer Predator Helios 300, odpowiednio w każdym z nich z procesorem graficznym RTX 3070 Ti. Zużycie jest też znacznie niższe niż w zasilanym Radeonem RX 6850M XT komputerze Alienware m17 R5, który oferuje niemal taką samą wydajność graficzną.
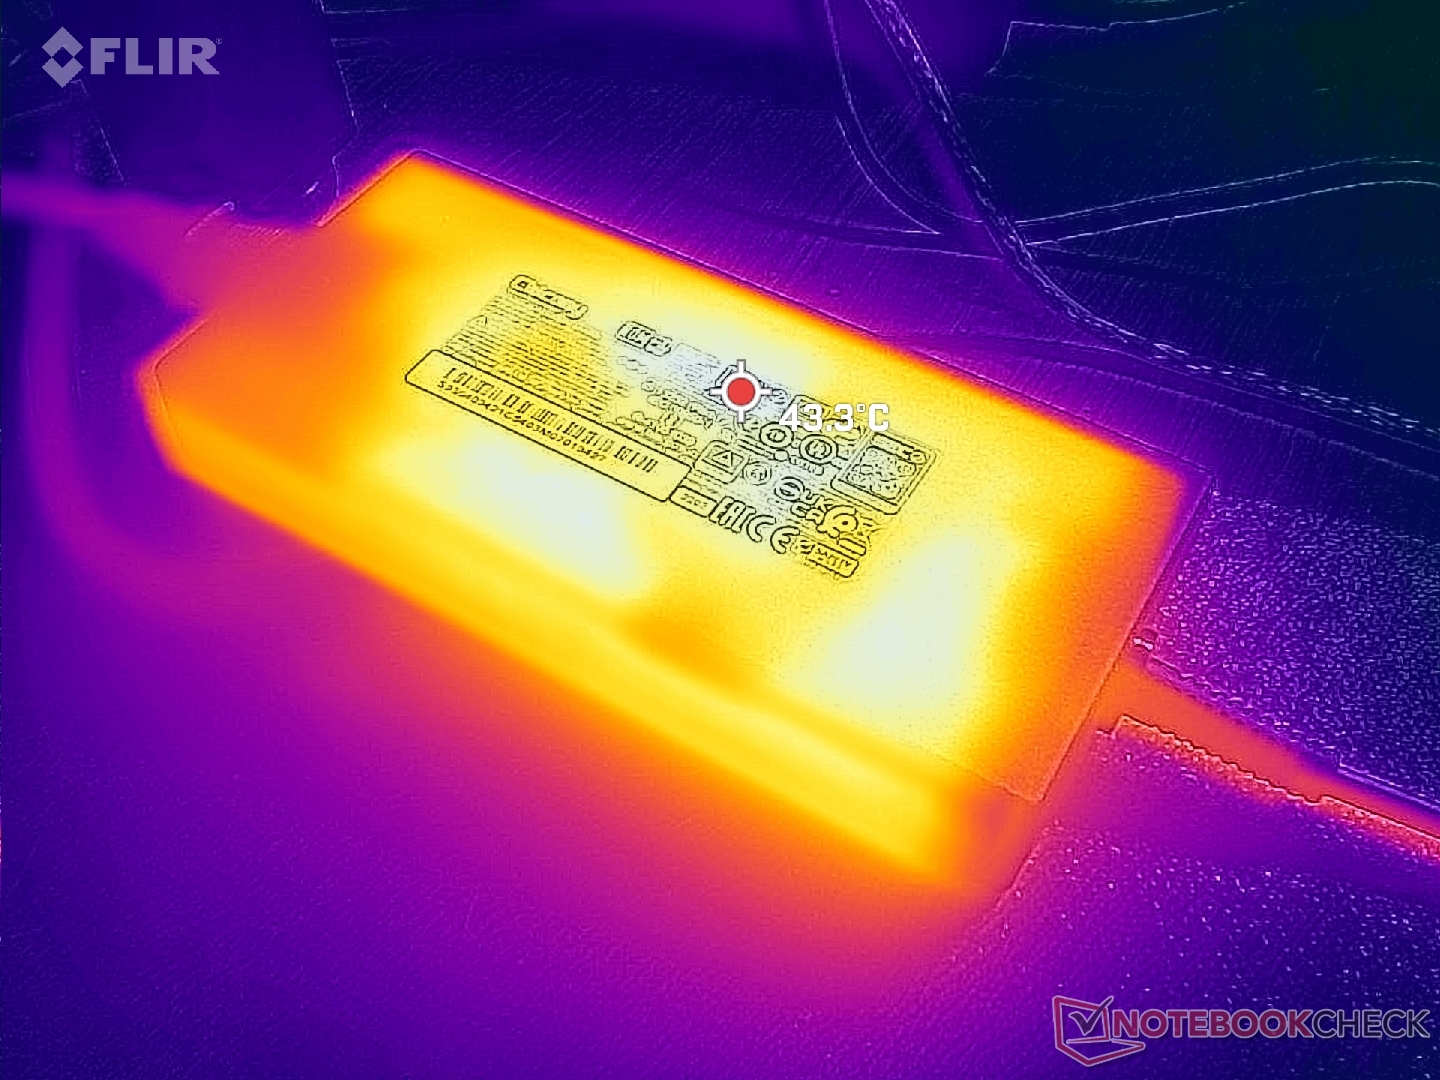
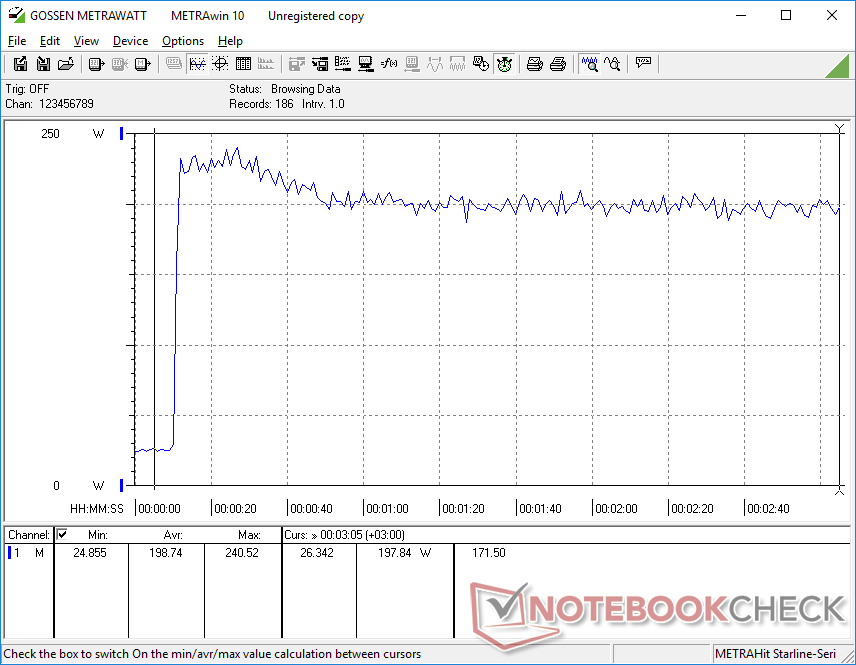
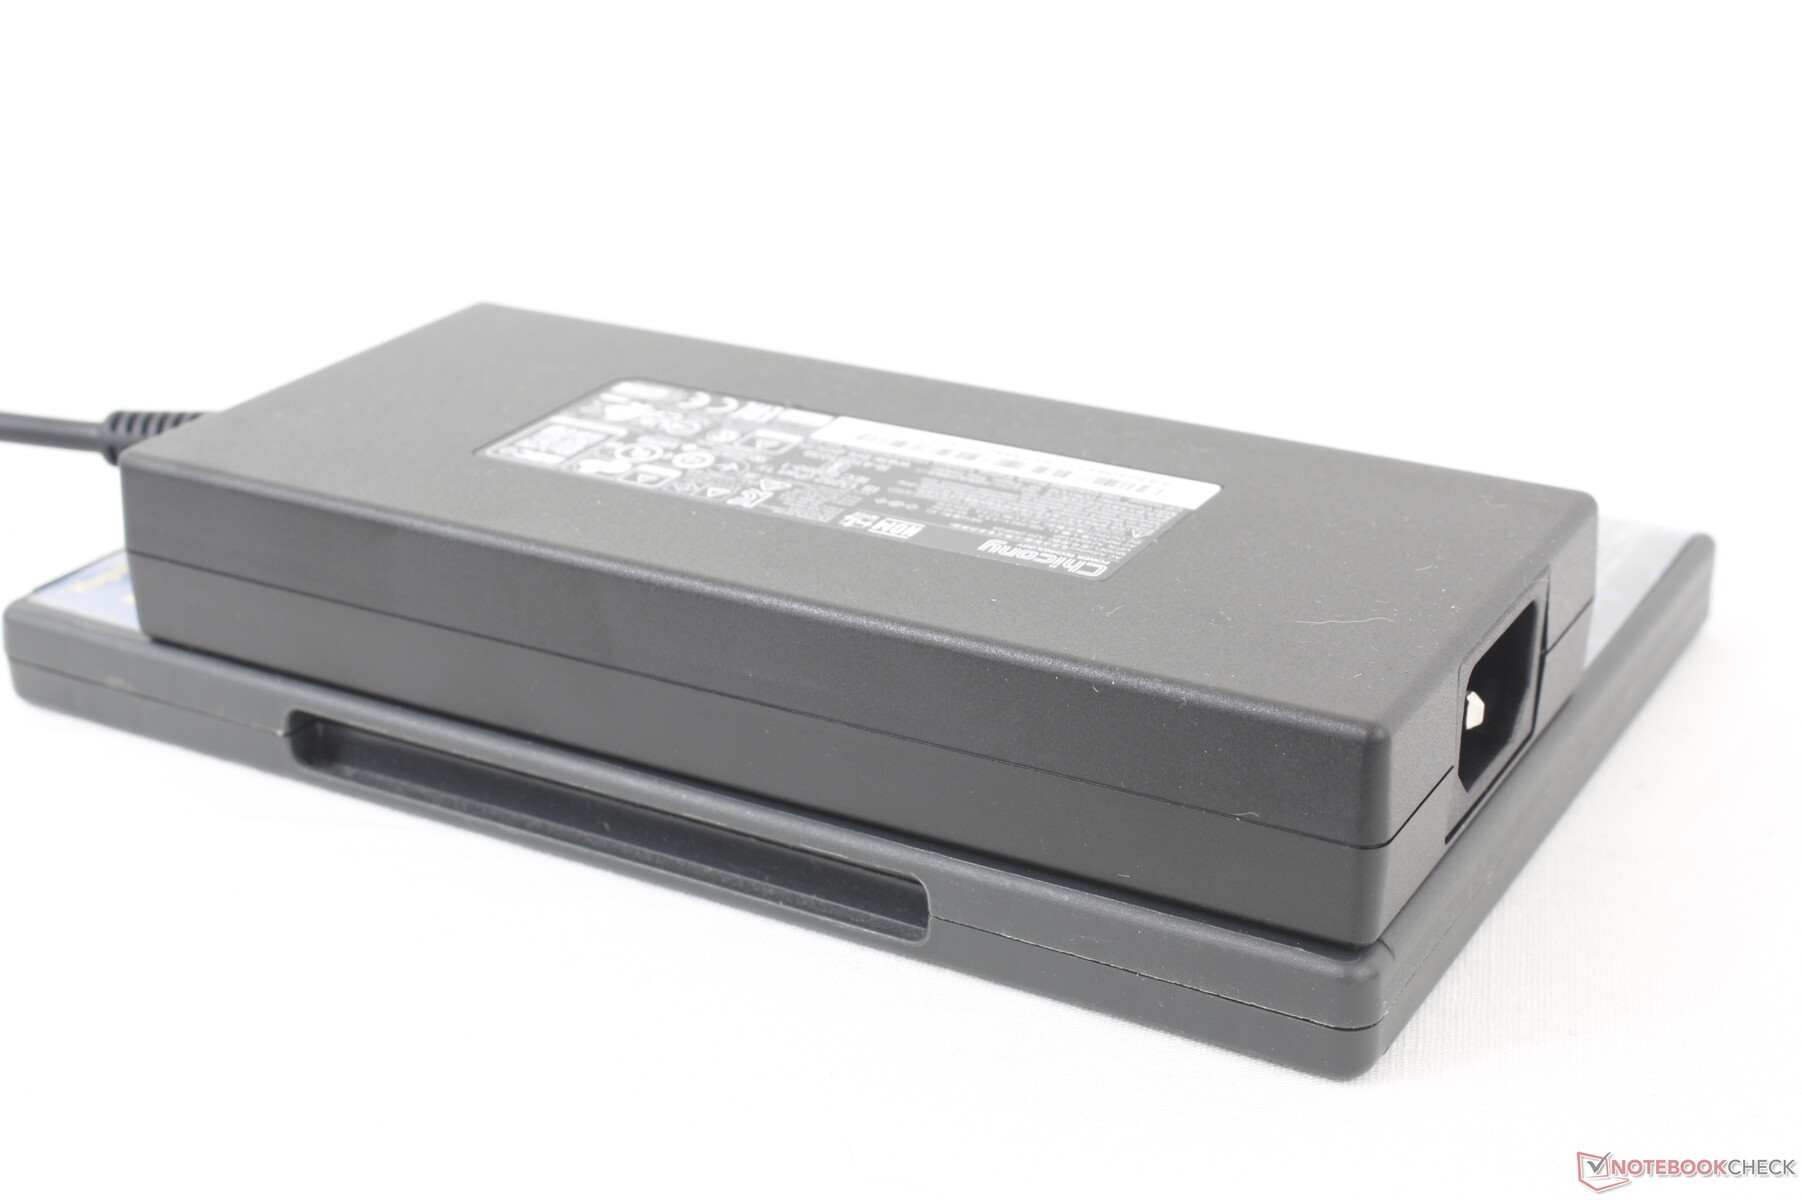
Udało nam się zmierzyć maksymalny pobór 241 W ze średniej wielkości (~16,4 x 7,4 x 2,5 cm) zasilacza sieciowego 240 W, gdy procesor i karta graficzna są wykorzystywane w 100 procentach. Ten wskaźnik jest tylko chwilowy, jak pokazują poniższe zrzuty ekranu, ze względu na ograniczony potencjał Turbo Boost procesora. Akumulator może nadal ładować się w przyzwoitym tempie podczas pracy pod dużym obciążeniem, np. w grach.
| wyłączony / stan wstrzymania | |
| luz | |
| obciążenie |
|
Legenda:
min: | |
| MSI Pulse GL76 12UGK i7-12700H, GeForce RTX 3070 Laptop GPU, Micron 3400 1TB MTFDKBA1T0TFH, IPS, 1920x1080, 17.3" | Alienware m17 R5 (R9 6900HX, RX 6850M XT) R9 6900HX, Radeon RX 6850M XT, SSSTC CA6-8D1024, IPS, 3840x2160, 17" | Asus ROG Strix Scar 17 SE G733CX-LL014W i9-12950HX, GeForce RTX 3080 Ti Laptop GPU, Samsung PM9A1 MZVL22T0HBLB, IPS, 2560x1440, 17.3" | Acer Predator Helios 300 (i7-12700H, RTX 3070 Ti) i7-12700H, GeForce RTX 3070 Ti Laptop GPU, Samsung PM9A1 MZVL21T0HCLR, IPS, 2560x1440, 17.3" | Razer Blade 17 Early 2022 i9-12900H, GeForce RTX 3080 Ti Laptop GPU, Samsung PM9A1 MZVL21T0HCLR, IPS, 3840x2160, 17.3" | MSI Vector GP76 12UGS-434 i7-12700H, GeForce RTX 3070 Ti Laptop GPU, Micron 2450 1TB MTFDKBA1T0TFK, IPS, 1920x1080, 17.3" | |
|---|---|---|---|---|---|---|
| Power Consumption | -8% | -46% | -27% | -36% | -27% | |
| Idle Minimum * (Watt) | 12.4 | 13 -5% | 19.3 -56% | 15 -21% | 17 -37% | 13.5 -9% |
| Idle Average * (Watt) | 13.1 | 16.5 -26% | 26.5 -102% | 20 -53% | 23 -76% | 15.6 -19% |
| Idle Maximum * (Watt) | 25.3 | 17 33% | 27.1 -7% | 22.3 12% | 34 -34% | 20.6 19% |
| Load Average * (Watt) | 105.4 | 93 12% | 141 -34% | 133 -26% | 120 -14% | 198 -88% |
| Witcher 3 ultra * (Watt) | 150 | 239 -59% | 225 -50% | 231 -54% | 229 -53% | 199 -33% |
| Load Maximum * (Watt) | 240.5 | 251 -4% | 307.9 -28% | 290 -21% | 243 -1% | 319 -33% |
* ... im mniej tym lepiej
Power Consumption Witcher 3 / Stresstest
Power Consumption external Monitor
Żywotność baterii - 99 Wh Li-Ion Pack
Co ciekawe, oficjalna specyfikacja MSI https://us.msi.com/Laptop/Pulse-GL76-12UX/Specification twierdzi, że akumulator w GL76 ma pojemność 53 Wh, podczas gdy bliższe spojrzenie na HWiNFO i fizyczny akumulator naszego testowego egzemplarza wskazuje na pojemność 90 Wh. Rozbieżność jest prawdopodobnie błędem ze strony producenta. Niemniej jednak czasy pracy na baterii są dobre jak na laptop do gier. Udało nam się odnotować czas pracy w sieci WLAN na poziomie nieco poniżej 6 godzin, co jest wynikiem o mniej więcej 2 godziny dłuższym, niż w Razer Blade 17 czy Asusie ROG Strix Scar 17.
Ładowanie od pustego do pełnego trwa nieco ponad 2 godziny. USB-PD nie jest obsługiwane, więc system można ładować tylko za pomocą dołączonego beczkowozu.
| MSI Pulse GL76 12UGK i7-12700H, GeForce RTX 3070 Laptop GPU, 90 Wh | Alienware m17 R5 (R9 6900HX, RX 6850M XT) R9 6900HX, Radeon RX 6850M XT, 97 Wh | Asus ROG Strix Scar 17 SE G733CX-LL014W i9-12950HX, GeForce RTX 3080 Ti Laptop GPU, 90 Wh | Acer Predator Helios 300 (i7-12700H, RTX 3070 Ti) i7-12700H, GeForce RTX 3070 Ti Laptop GPU, 90 Wh | Razer Blade 17 Early 2022 i9-12900H, GeForce RTX 3080 Ti Laptop GPU, 82 Wh | MSI Vector GP76 12UGS-434 i7-12700H, GeForce RTX 3070 Ti Laptop GPU, 65 Wh | |
|---|---|---|---|---|---|---|
| Czasy pracy | -17% | -29% | -6% | -19% | -11% | |
| Reader / Idle (h) | 7.3 | 7.1 -3% | 7.3 0% | |||
| WiFi v1.3 (h) | 5.9 | 4.8 -19% | 4.2 -29% | 6 2% | 3.8 -36% | 5.1 -14% |
| Load (h) | 2.1 | 1.8 -14% | 1.8 -14% | 1.7 -19% | 1.7 -19% | |
| H.264 (h) | 4.9 | 5.9 | 4.8 |
Za
Przeciw
Werdykt - Dużo mocy, ale brakuje kilku kluczowych funkcji
Pulse GL76 spełnia wszystkie oczekiwania, jeśli chodzi o cenę, wydajność i wyświetlacz. Procesor Core i7-12700H dobrze współpracuje z kartą GeForce RTX 3070, a panel 360 Hz 1080p to ten sam panel, którego MSI używa w swoich znacznie droższych modelach GT77 Titan. Za 1400 USD lub nawet 1200 USD, jeśli jest w sprzedaży, trudno byłoby znaleźć inny 17,3-calowy laptop do gier z lepszym procesorem, GPU i wyświetlaczem niż nasz GL76.
Po spojrzeniu poza procesory i wyświetlacz, jednak, cięcia narożniki zaczynają pokazać. Brak obsługi G-Sync, MUX, Advanced Optimus i Thunderbolt w szczególności naprawdę stawia pod znakiem zapytania ten skądinąd potężny system. Alternatywy takie jak Asus TUF Gaming F17 lub Acer Predator Helios 300 niosą wiele z tych brakujących funkcji, które zaawansowani użytkownicy lub gracze mogą docenić. Nie oczekujemy, że budżetowe laptopy do gier będą posiadały tak nowoczesne funkcje, ale GL76 kosztuje znacznie ponad 1000 USD, więc zasługuje na co najmniej kilka z nich.
MSI Pulse GL76 priorytetowo traktuje surową wydajność Intela i Nvidii wraz z wysokiej jakości wyświetlaczem IPS 360 Hz. Brakuje kilku zaawansowanych funkcji, które prawdopodobnie pozwoliłyby utrzymać koszty w ryzach.
Inne minusy, takie jak gąbczasty clickpad, błotnista kamera internetowa, przeciętne zawiasy, głównie plastikowa konstrukcja i brak podświetlenia RGB per-key są w większości typowe dla laptopów do gier klasy średniej i nie są to czynniki łamiące zasady. Gracze, którzy chcą zmaksymalizować wydajność i jakość wyświetlania bez rozbijania banku, powinni rozważyć GL76.
Cena i dostępność
Pulse GL76 w takiej konfiguracji jest obecnie dostępny na stronie Costco w cenie od 1200 do 1400 USD. Model ten jest również dostępny w Amazon za 1650 USD, Newegg za 1750 USD, lub Best Buy za 1700 USD.
MSI Pulse GL76 12UGK
- 11/01/2023 v7 (old)
Allen Ngo
Price comparison

