Recenzja laptopa HP Pavilion Gaming 17: Dobry wyświetlacz w budżetowej cenie
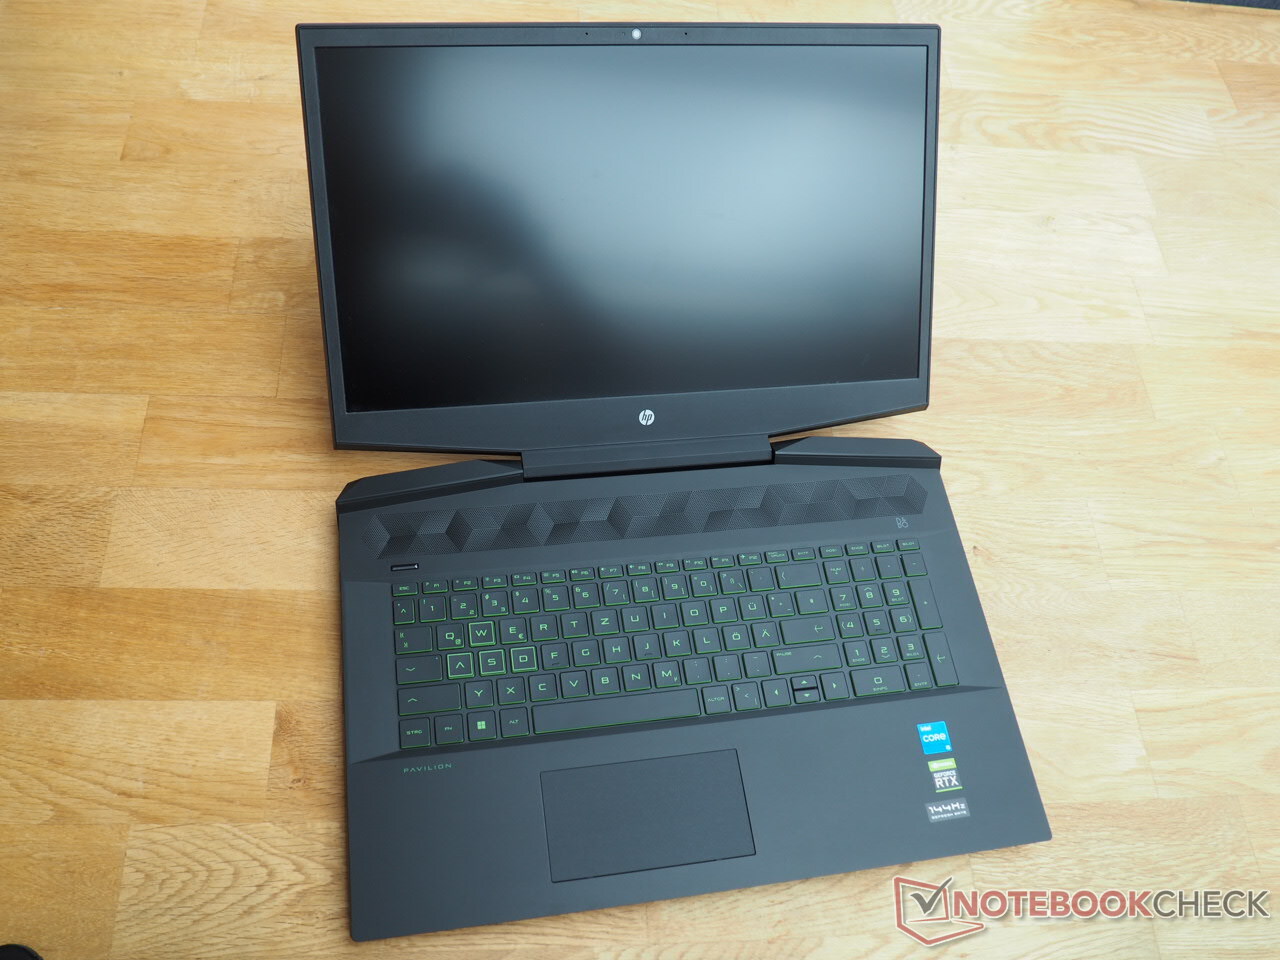
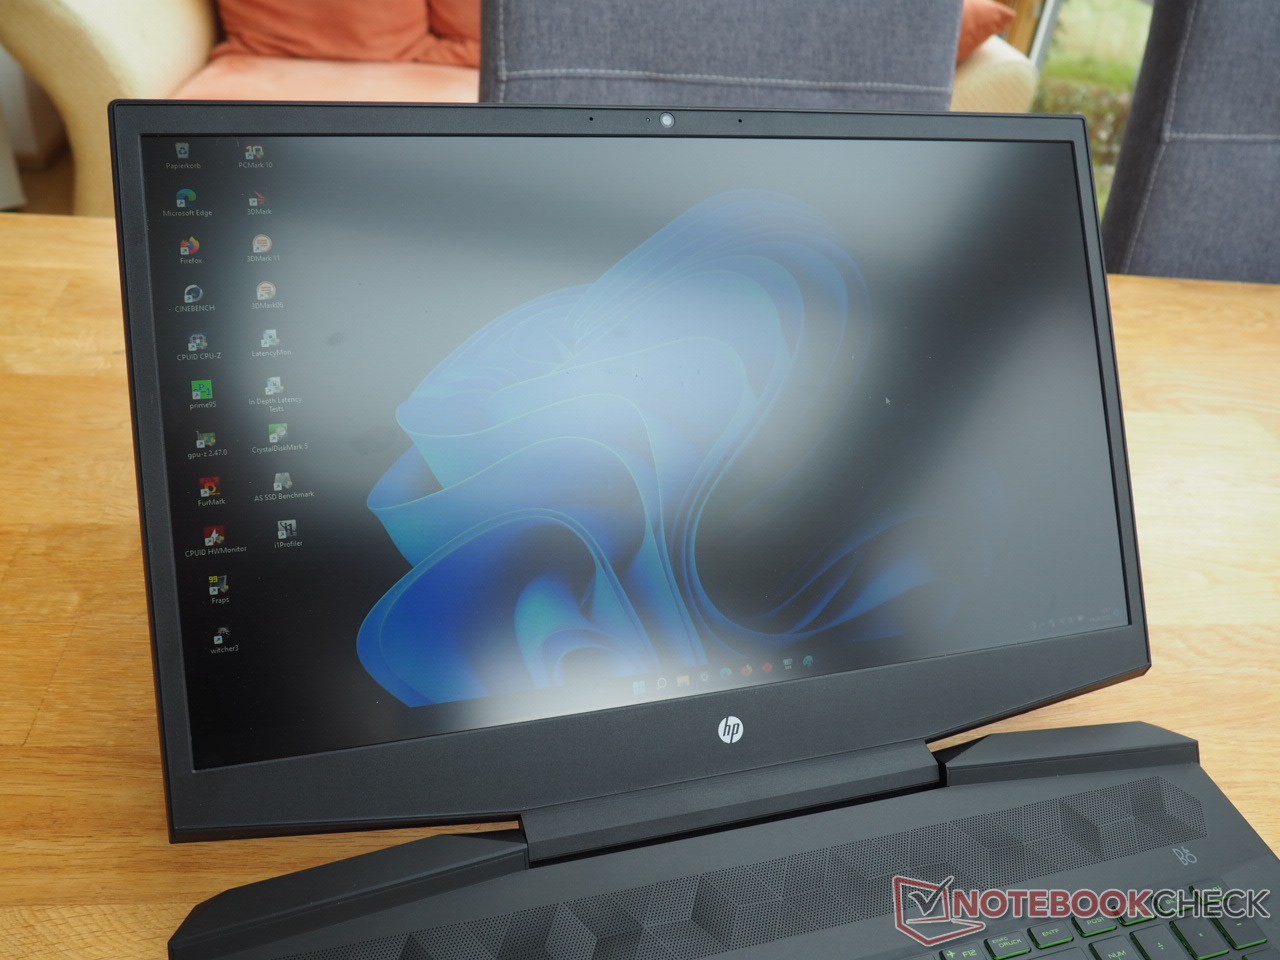
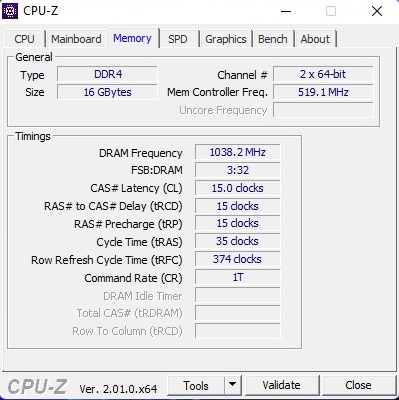
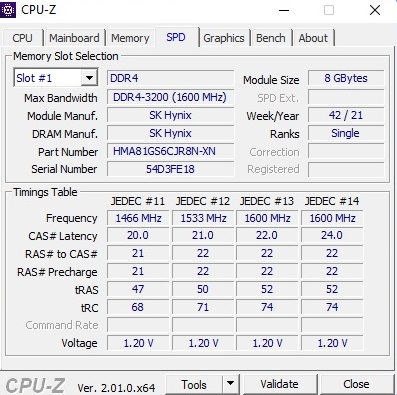
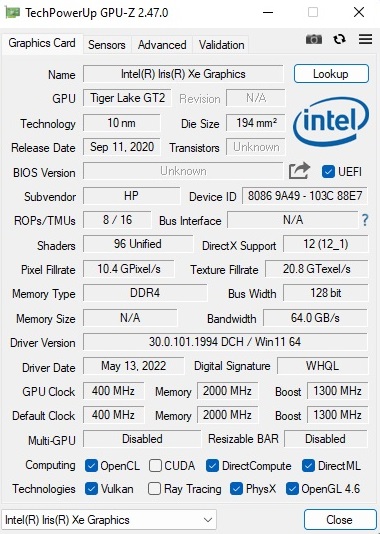
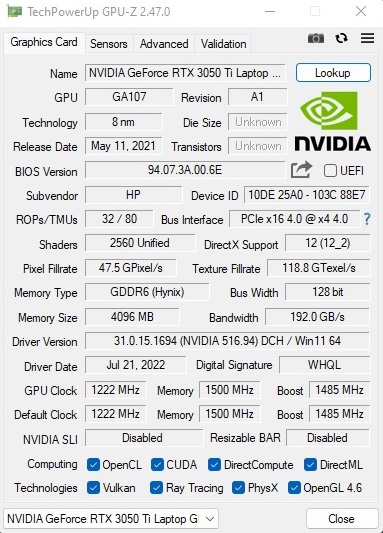
Użytkownicy szukający gamingowego laptopa za mniej niż 1000 euro (~1 002 USD) mogli już natknąć się na Pavilion Gaming 17. Recenzowany przez nas model cd2146ng wyposażony jest w dobrze zbalansowane komponenty klasy średniej, tj.Core i5-11300H i aGeForce RTX 3050 Ti wraz z 4 GB pamięci VRAM. 16 GB pamięci RAM DDR4 (2x 8 GB w dual-channel) i dysk SSD NVMe o pojemności 512 GB to również przyzwoite parametry w tym przedziale cenowym. Wyświetlacz jest więcej niż zadowalający: Matowy wyświetlacz IPS o rozdzielczości Full HD obsługuje 144 Hz i według HP ma osiągać około 300 nitów. Za chwilę przeanalizujemy, czy to twierdzenie jest prawdziwe. Tymczasem trochę szkoda, że w naszym modelu recenzenckim brakuje "prawdziwego" systemu operacyjnego (na pokładzie jest tylko FreeDOS). Kompatybilne licencje Windows - takie jak ta na wersję 11 Pro, którą później zainstalowaliśmy - można jednak bardzo tanio kupić w sieci
Do głównych konkurentów Pavilion Gaming 17 należą inne budżetowe laptopy o przekątnej od 15 do 17 cali wyposażone w GeForce RTX 3050 Ti, np Dell G15 5510, Lenovo IdeaPad Gaming 3 15IHUoraz własny HP Victus 16. Każdy z tych ostatnich laptopów pojawia się w tabelach jako urządzenia porównawcze
Potencjalni konkurenci w porównaniu
Ocena | Data | Model | Waga | Wysokość | Rozmiar | Rezolucja | Cena |
|---|---|---|---|---|---|---|---|
| 82.7 % v7 (old) | 10/2022 | HP Pavilion Gaming 17-cd2146ng i5-11300H, GeForce RTX 3050 Ti Laptop GPU | 2.8 kg | 25 mm | 17.30" | 1920x1080 | |
| 79.1 % v7 (old) | Dell G15 5510-43NHT i5-10200H, GeForce RTX 3050 Ti Laptop GPU | 2.5 kg | 23.33 mm | 15.60" | 1920x1080 | ||
| 79.7 % v7 (old) | Lenovo Ideapad Gaming 3 15IHU-82K1002RGE i5-11300H, GeForce RTX 3050 Ti Laptop GPU | 2 kg | 24.2 mm | 15.60" | 1920x1080 | ||
| 82.3 % v7 (old) | 03/2025 | HP Victus 16-e0145ng R5 5600H, GeForce RTX 3050 Ti Laptop GPU | 2.4 kg | 23.5 mm | 16.10" | 1920x1080 | |
| 81.6 % v7 (old) | HP Pavilion Gaming 17-cd0085cl i7-9750H, GeForce GTX 1660 Ti Max-Q | 2.8 kg | 25 mm | 17.30" | 1920x1080 |
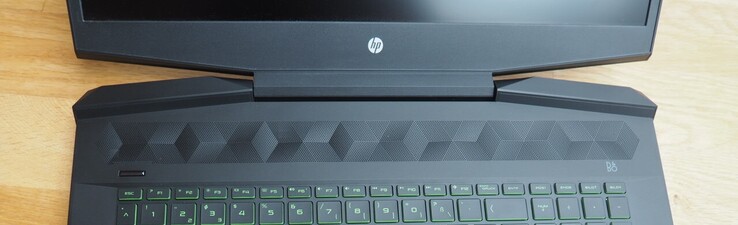
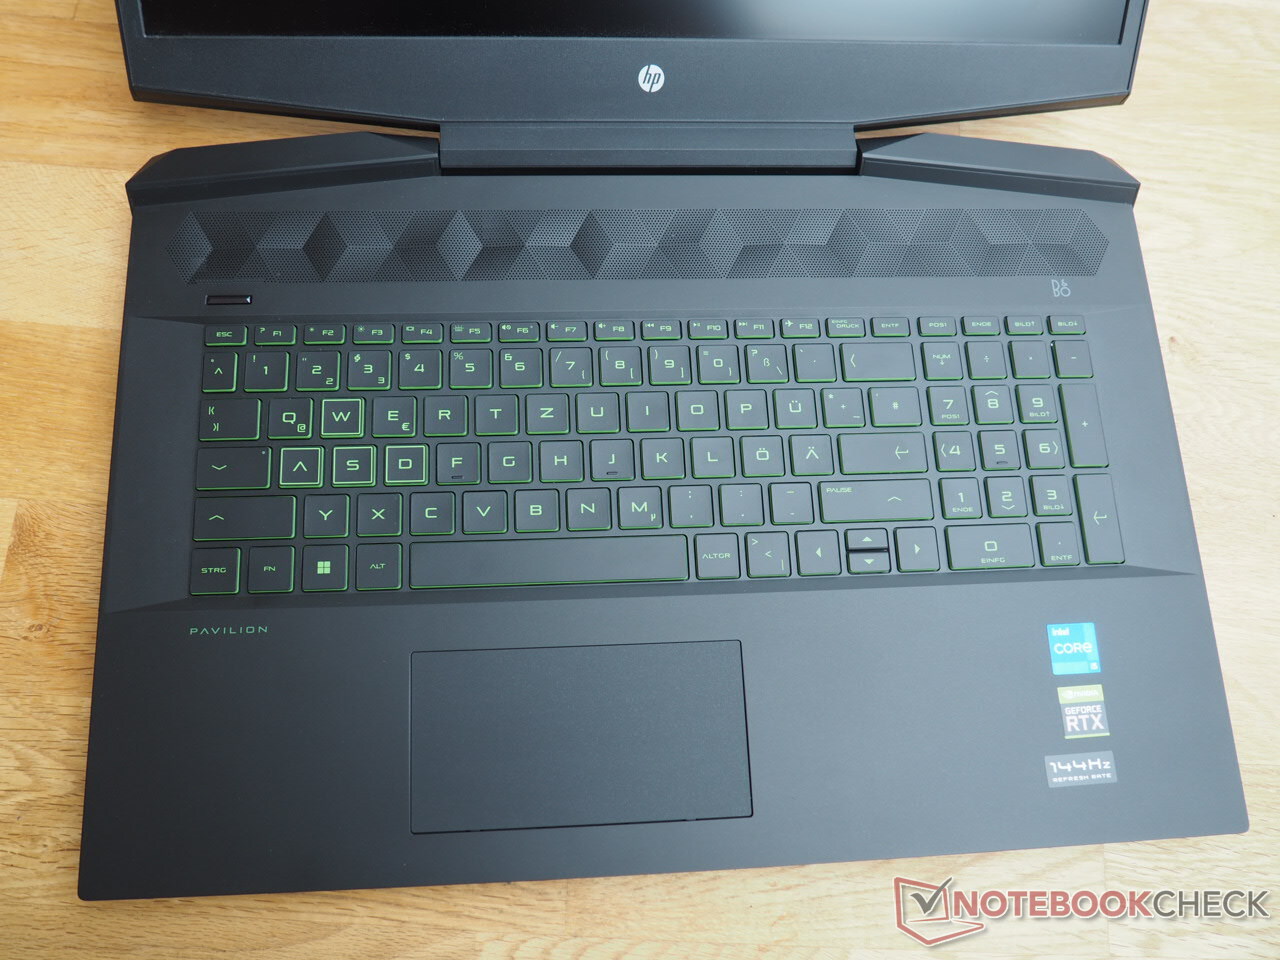
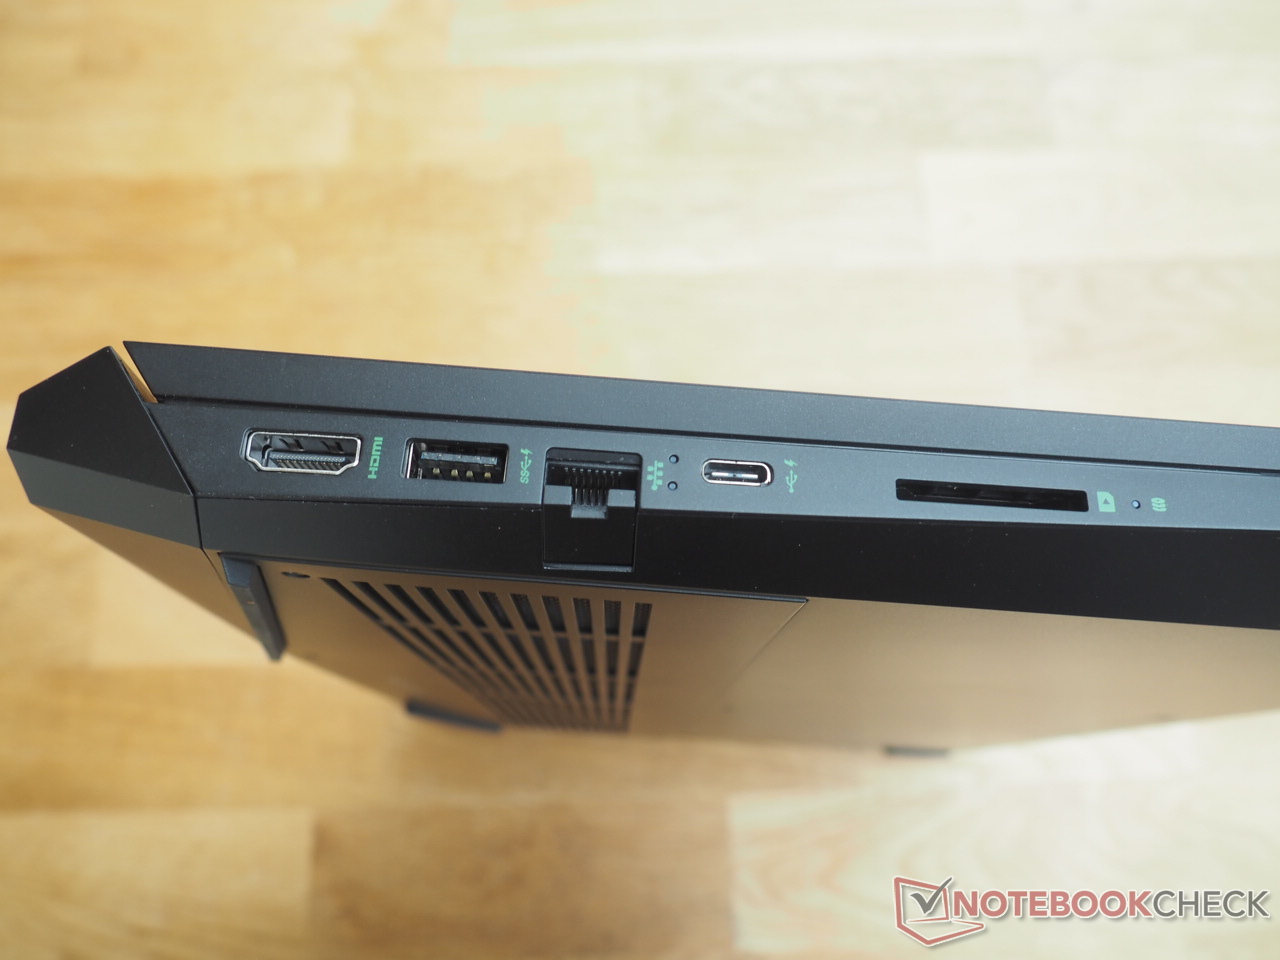
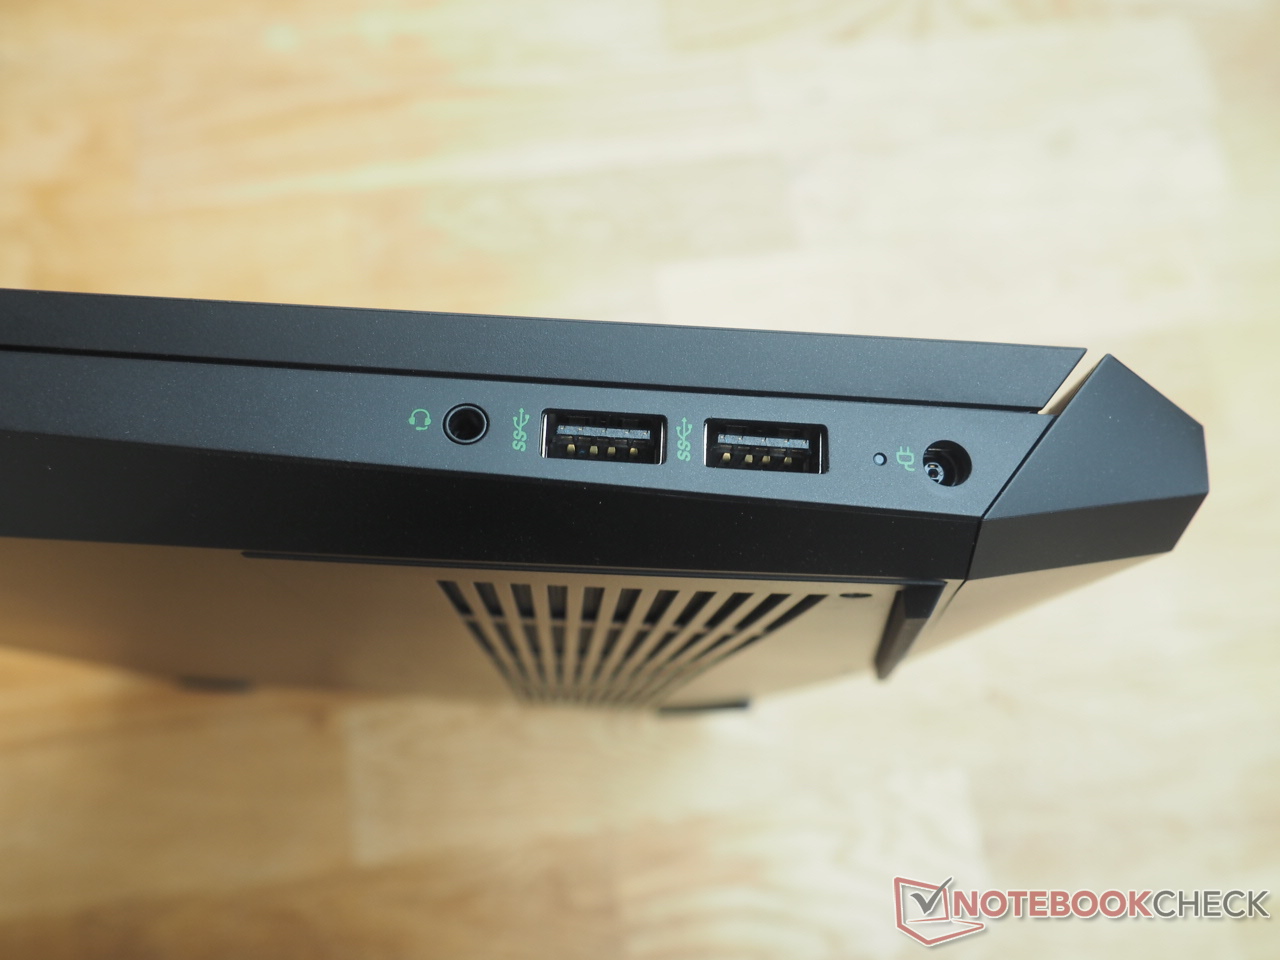
Jako że obudowa jest zewnętrznie identyczna jak u (przed)poprzednika, nie będziemy w tym artykule ponownie zagłębiać się w sprawę, urządzenia wejściowe i łączność. Odpowiednie informacje można znaleźć w naszej recenzji modelu Pavilion Gaming 17-cd0085cl
Czytnik kart SD
| SD Card Reader - average JPG Copy Test (av. of 3 runs) | |
| Średnia w klasie Gaming (20.9 - 210, n=54, ostatnie 2 lata) | |
| HP Pavilion Gaming 17-cd0085cl (Toshiba Exceria Pro SDXC 64 GB UHS-II) | |
| HP Victus 16-e0145ng (AV PRO microSD 128 GB V60) | |
| HP Pavilion Gaming 17-cd2146ng (AV PRO microSD 128 GB V60) | |
Komunikacja
| Networking - iperf3 receive AXE11000 | |
| Średnia w klasie Gaming (680 - 1745, n=95, ostatnie 2 lata) | |
| HP Pavilion Gaming 17-cd2146ng | |
| Przeciętny Realtek RTL8852AE (n=1) | |
| HP Victus 16-e0145ng | |
Kamera internetowa


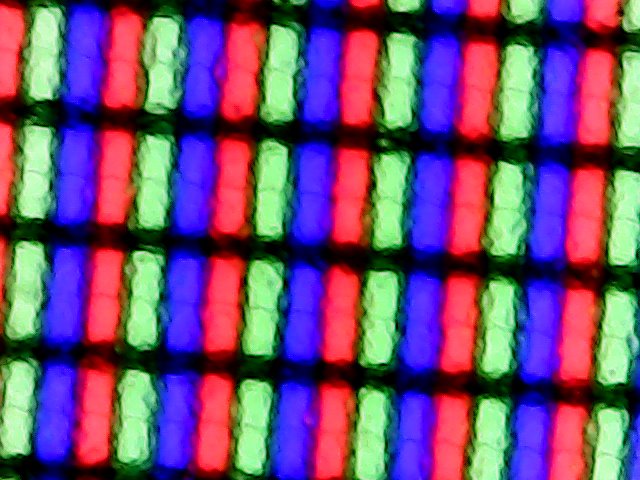
Wyświetl
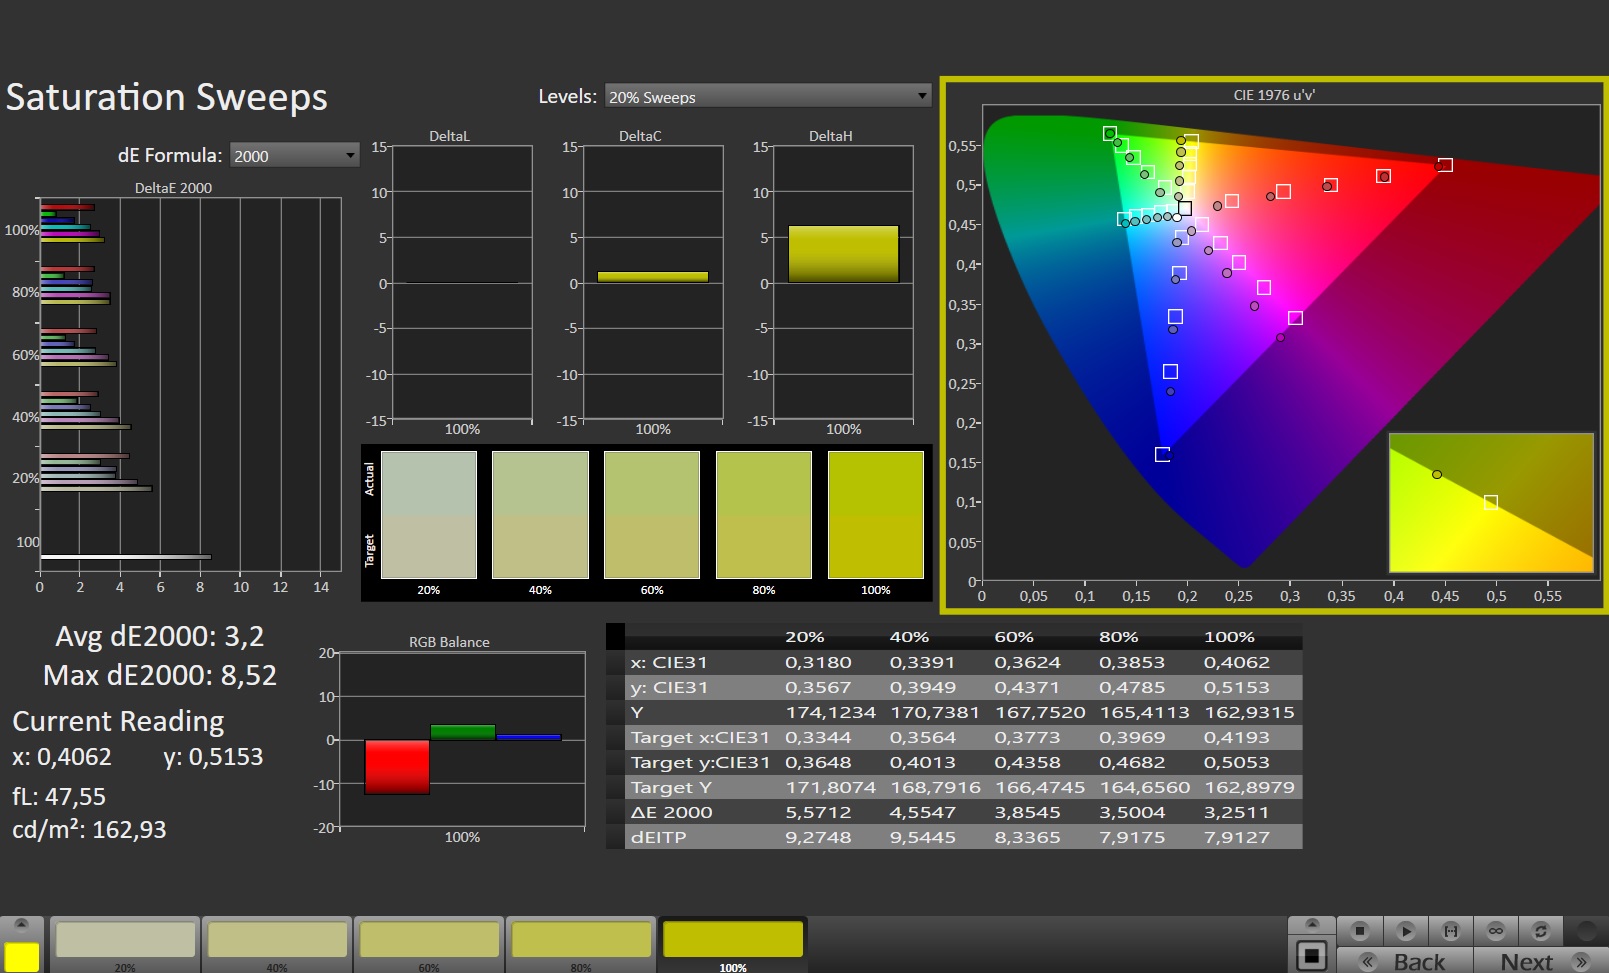
Jak już wspomniałem, raczej nieczęsto można znaleźć dobre wyświetlacze w tańszych laptopach gamingowych. Na szczęście Pavilion Gaming 17 jest jednym z nielicznych wyjątków
| |||||||||||||||||||||||||
rozświetlenie: 94 %
na akumulatorze: 328 cd/m²
kontrast: 1426:1 (czerń: 0.23 cd/m²)
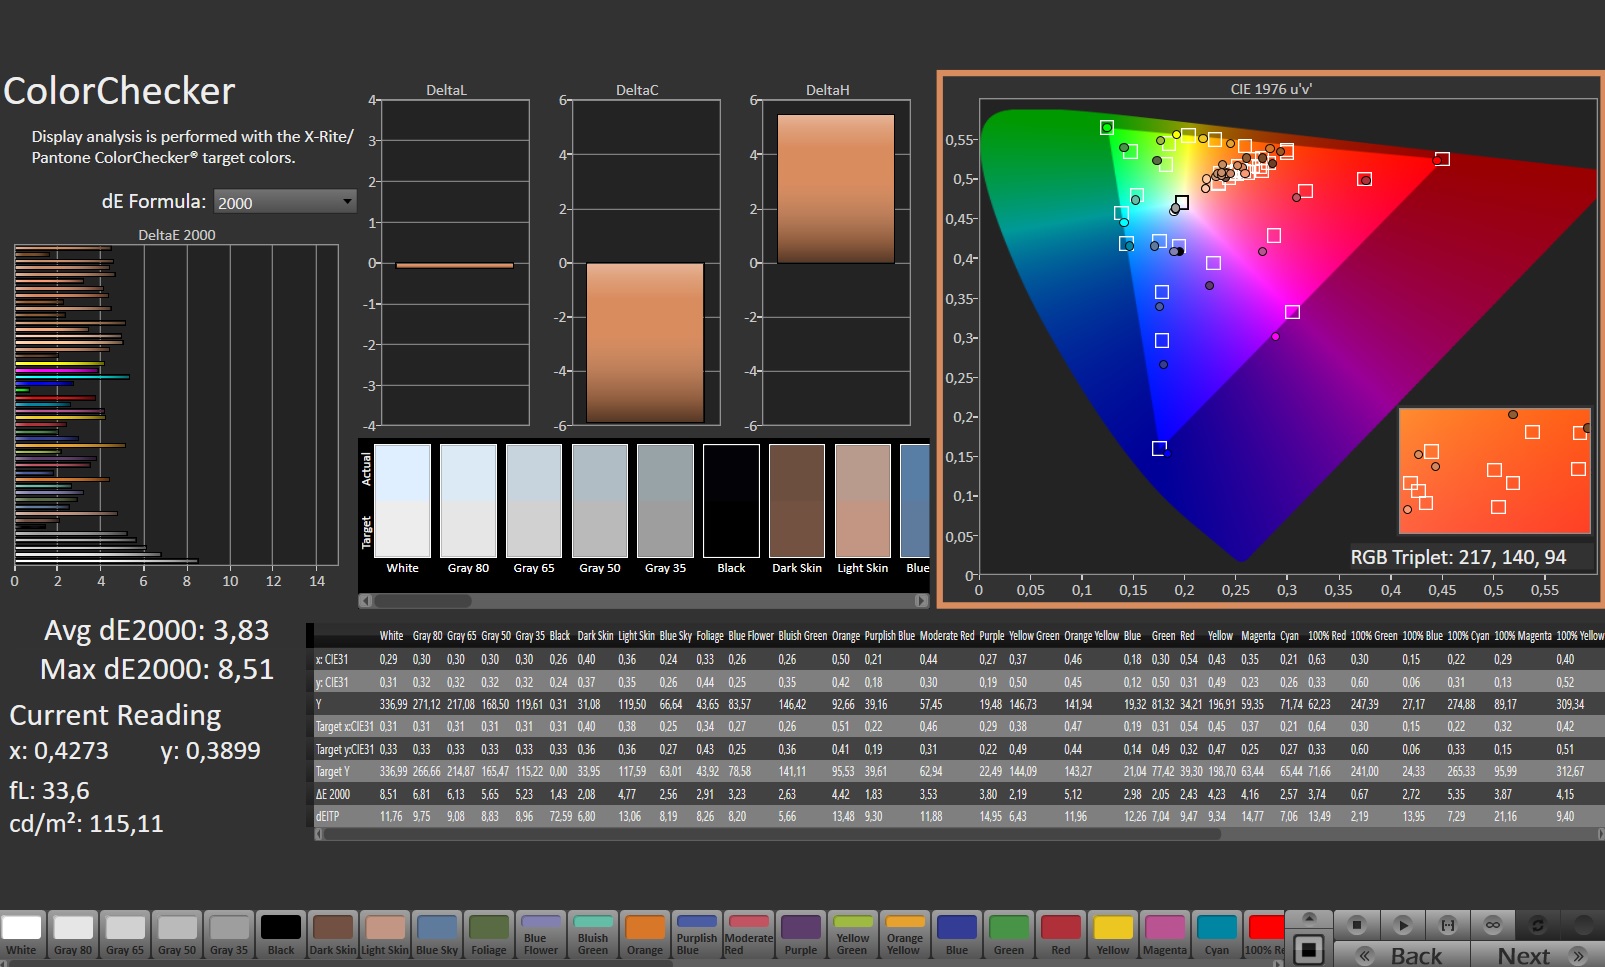
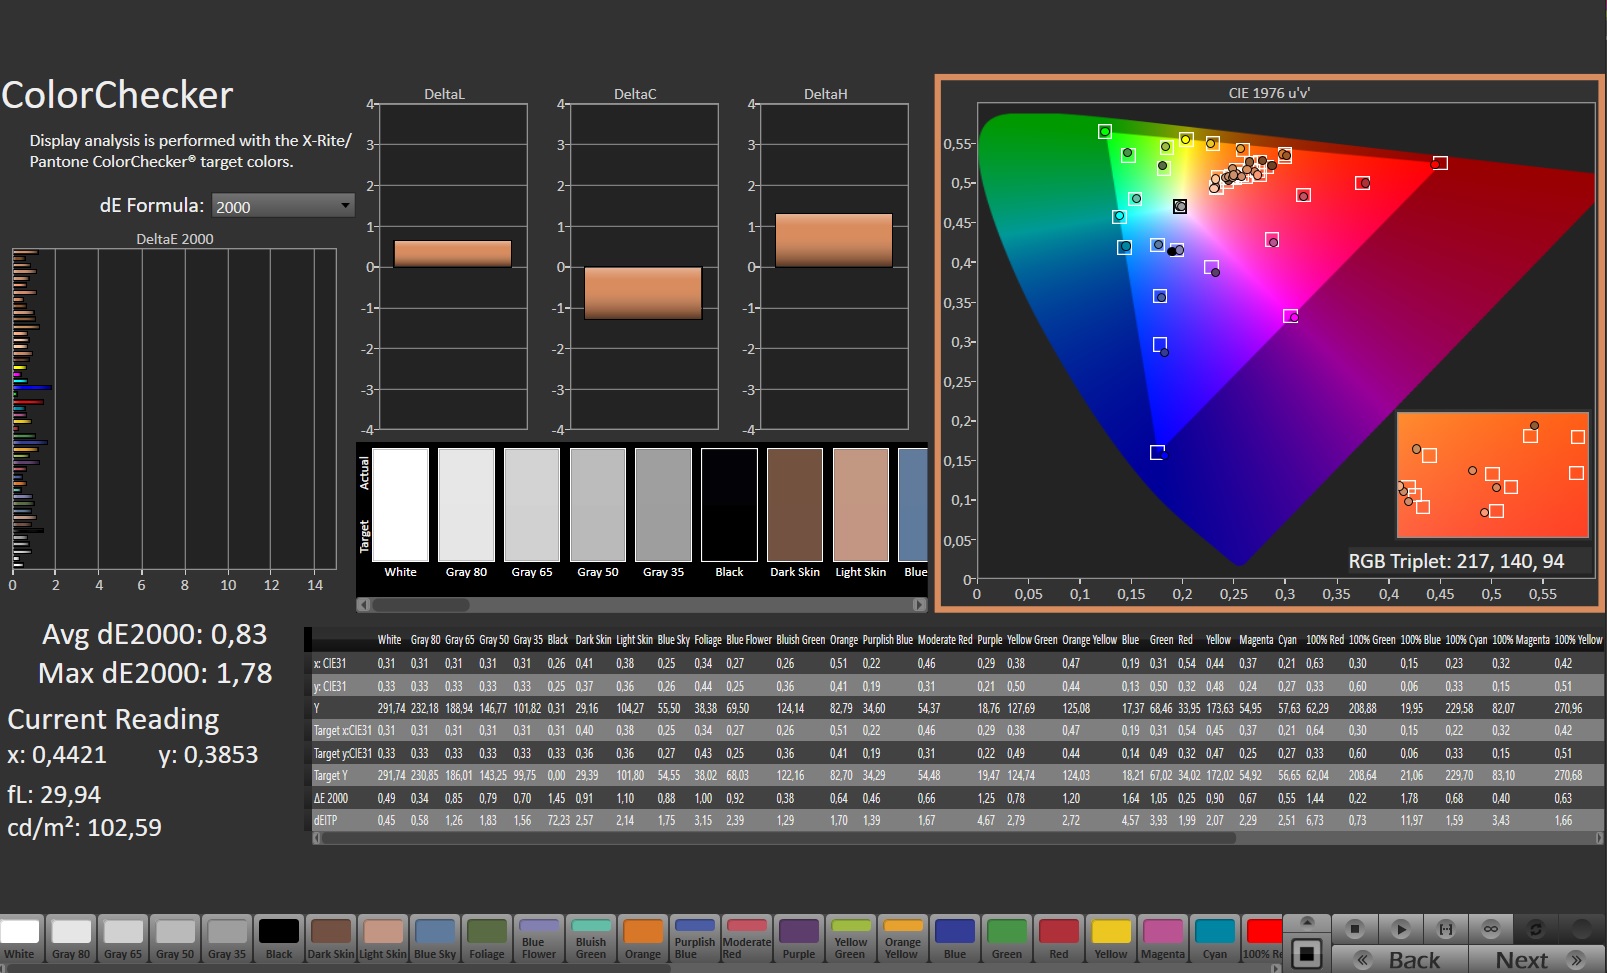
ΔE ColorChecker Calman: 3.83 | ∀{0.5-29.43 Ø4.73}
calibrated: 0.83
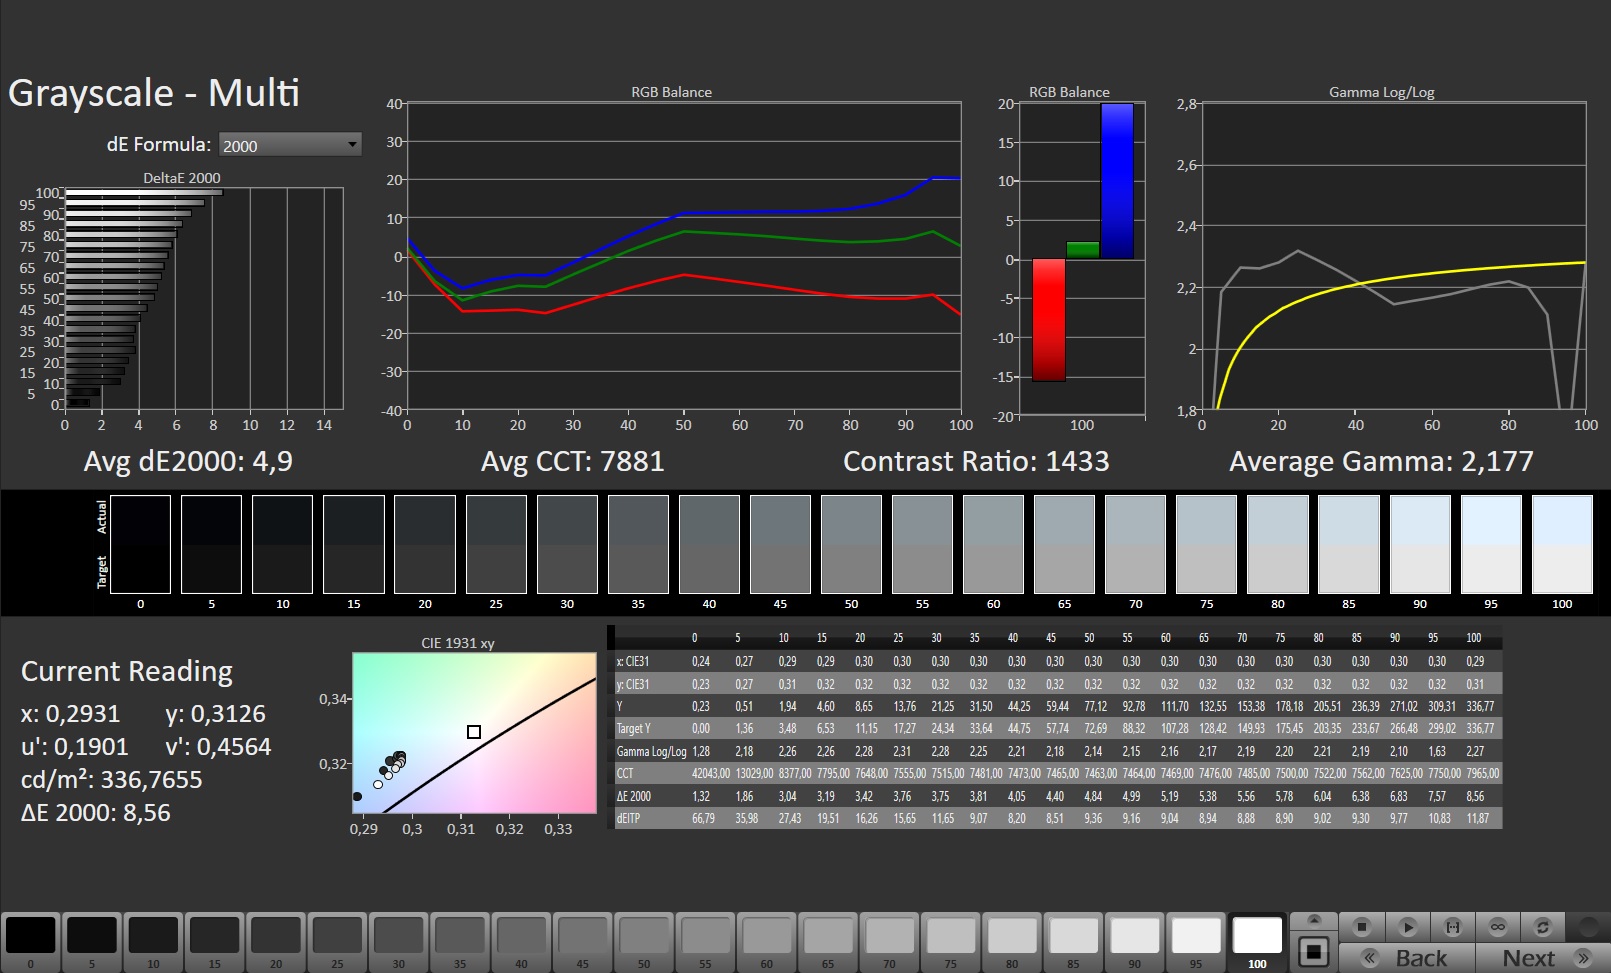
ΔE Greyscale Calman: 4.9 | ∀{0.09-98 Ø4.97}
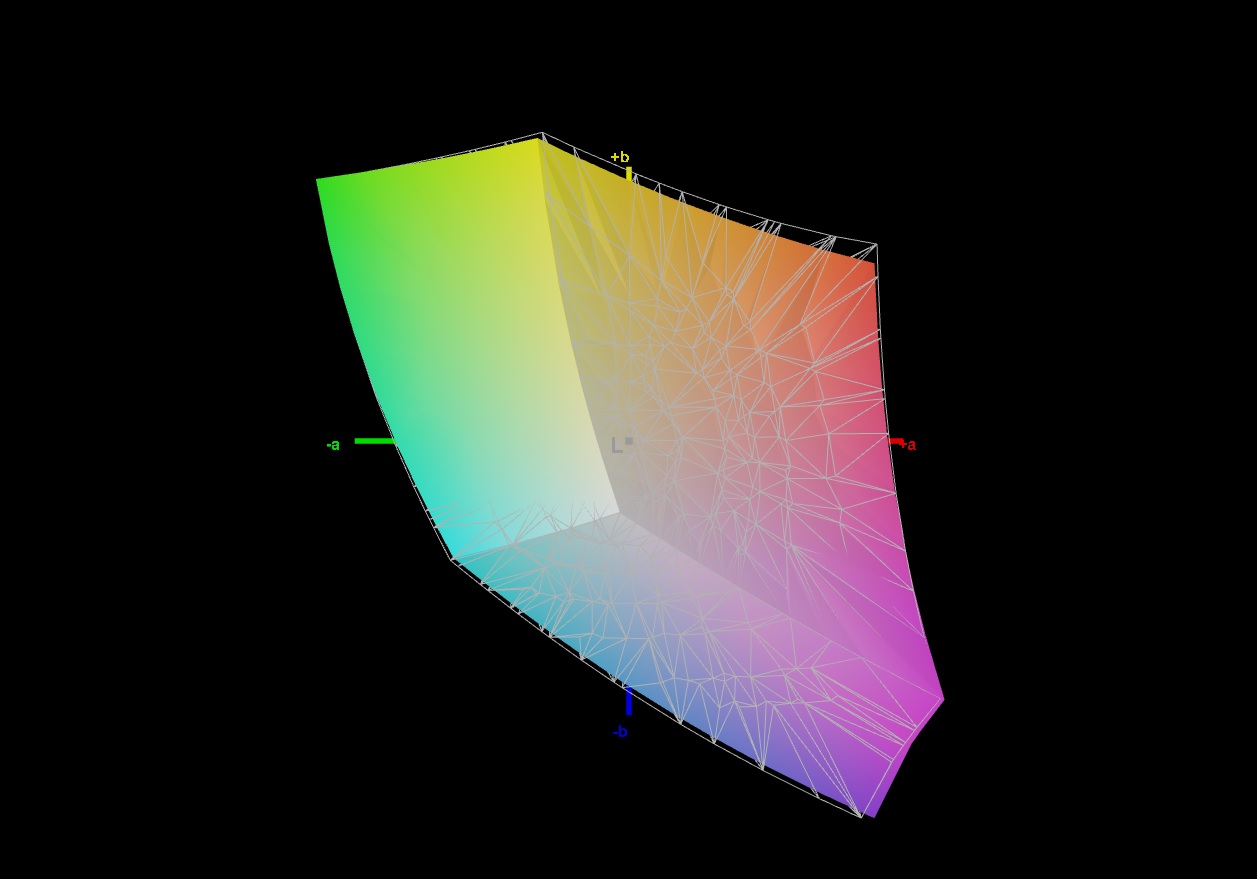
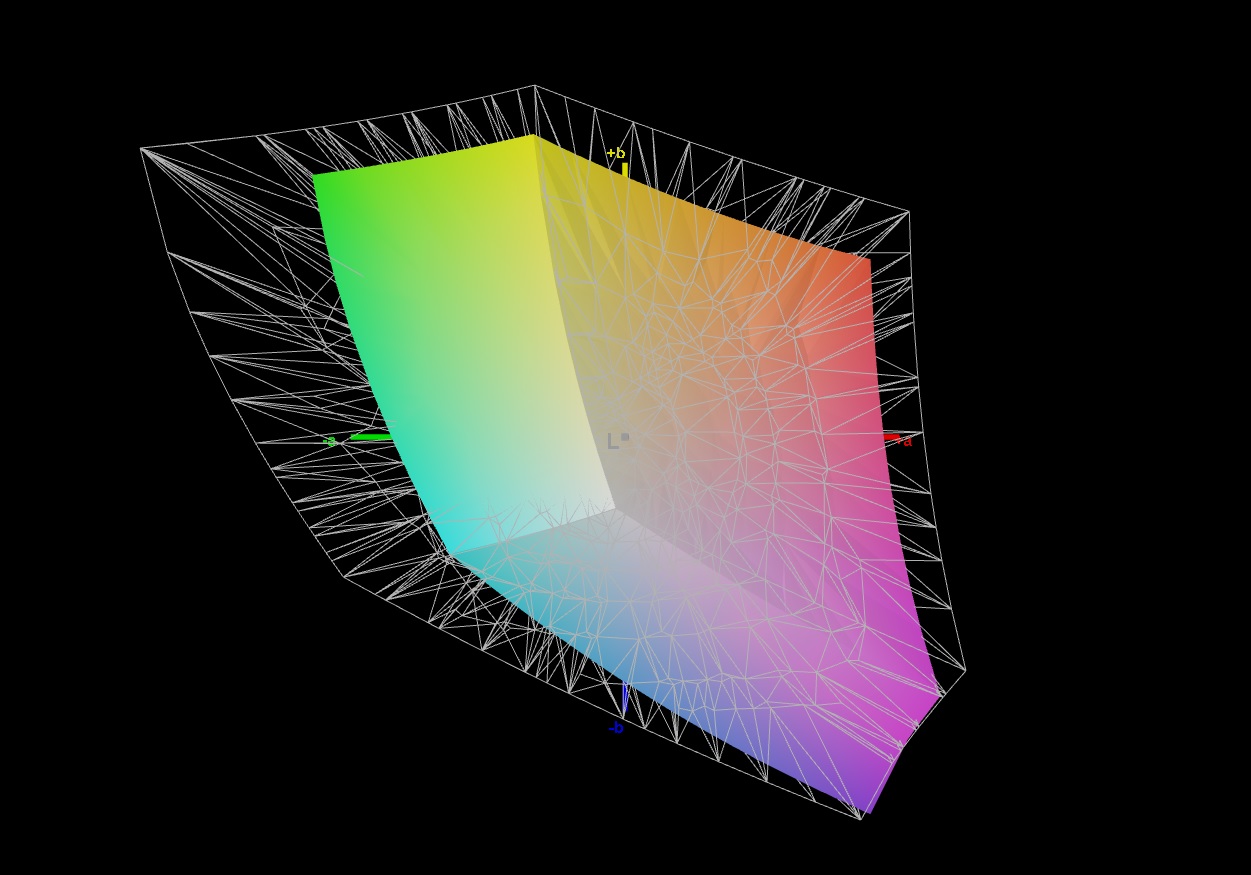
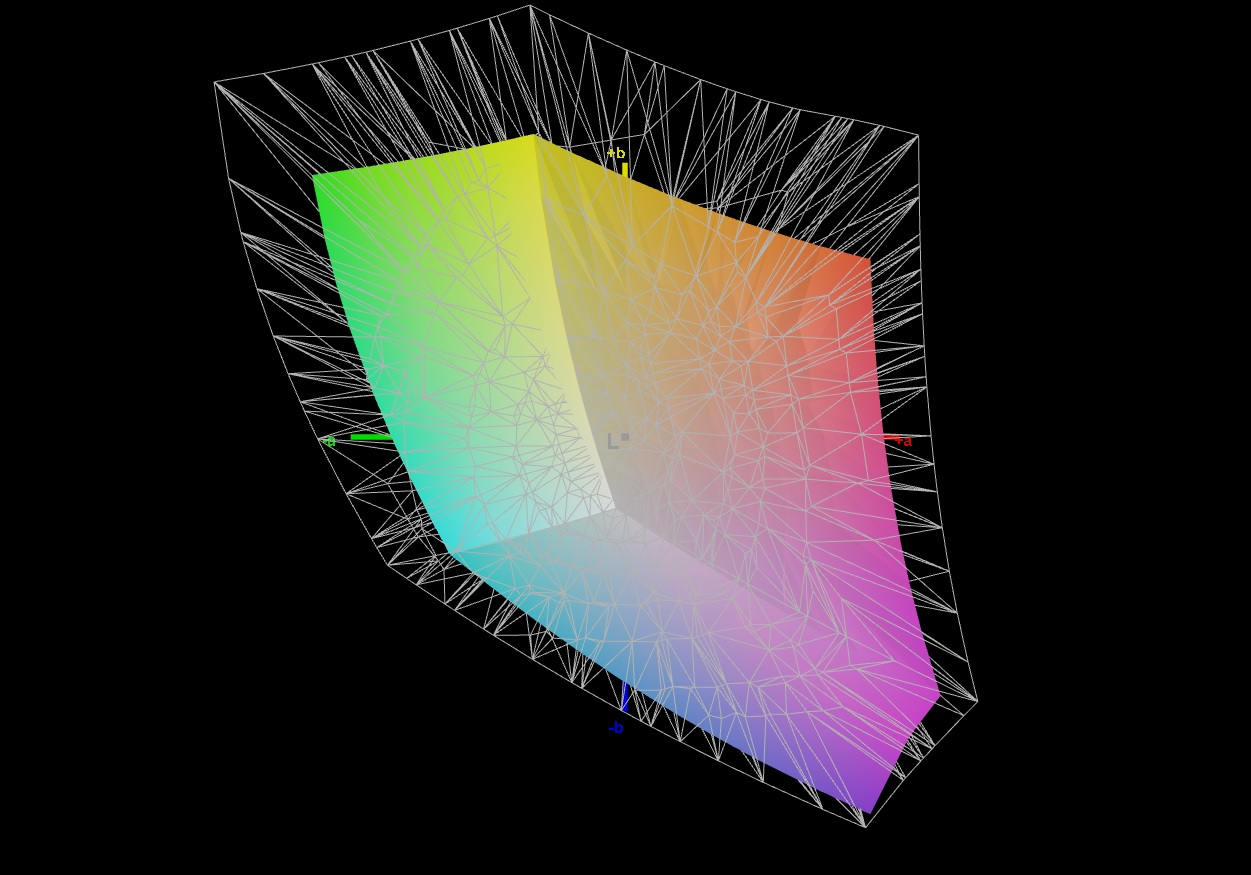
66.5% AdobeRGB 1998 (Argyll 3D)
96.8% sRGB (Argyll 3D)
64.8% Display P3 (Argyll 3D)
Gamma: 2.177
CCT: 7881 K
| HP Pavilion Gaming 17-cd2146ng LGD0611, IPS, 1920x1080, 17.3" | Dell G15 5510-43NHT Dell 156GL05, IPS, 1920x1080, 15.6" | Lenovo Ideapad Gaming 3 15IHU-82K1002RGE LEN156FHD, IPS, 1920x1080, 15.6" | HP Victus 16-e0145ng CMN1609, IPS, 1920x1080, 16.1" | HP Pavilion Gaming 17-cd0085cl BOE0825, IPS, 1920x1080, 17.3" | |
|---|---|---|---|---|---|
| Display | -37% | -38% | -36% | -4% | |
| Display P3 Coverage (%) | 64.8 | 40.8 -37% | 39.7 -39% | 41.6 -36% | 63.3 -2% |
| sRGB Coverage (%) | 96.8 | 61.4 -37% | 59.6 -38% | 61.9 -36% | 90.2 -7% |
| AdobeRGB 1998 Coverage (%) | 66.5 | 42.2 -37% | 41.1 -38% | 43 -35% | 64.3 -3% |
| Response Times | -193% | -285% | -128% | -137% | |
| Response Time Grey 50% / Grey 80% * (ms) | 12.7 ? | 35 ? -176% | 46.4 ? -265% | 29.6 ? -133% | 31.6 ? -149% |
| Response Time Black / White * (ms) | 8.7 ? | 27 ? -210% | 35.2 ? -305% | 19.4 ? -123% | 19.6 ? -125% |
| PWM Frequency (Hz) | |||||
| Screen | -117% | -77% | -80% | -40% | |
| Brightness middle (cd/m²) | 328 | 290 -12% | 307 -6% | 257 -22% | 299.6 -9% |
| Brightness (cd/m²) | 317 | 267 -16% | 292 -8% | 239 -25% | 285 -10% |
| Brightness Distribution (%) | 94 | 87 -7% | 88 -6% | 88 -6% | 86 -9% |
| Black Level * (cd/m²) | 0.23 | 1.085 -372% | 0.21 9% | 0.25 -9% | 0.33 -43% |
| Contrast (:1) | 1426 | 267 -81% | 1462 3% | 1028 -28% | 908 -36% |
| Colorchecker dE 2000 * | 3.83 | 6.5 -70% | 5.9 -54% | 6.91 -80% | 3.68 4% |
| Colorchecker dE 2000 max. * | 8.51 | 16.96 -99% | 21.6 -154% | 22.27 -162% | 8.05 5% |
| Colorchecker dE 2000 calibrated * | 0.83 | 4.11 -395% | 4.8 -478% | 3.61 -335% | 3.15 -280% |
| Greyscale dE 2000 * | 4.9 | 4.85 1% | 4.9 -0% | 7.5 -53% | 3.8 22% |
| Gamma | 2.177 101% | 2.22 99% | 2.26 97% | 2.125 104% | 2.12 104% |
| CCT | 7881 82% | 7401 88% | 6504 100% | 6025 108% | 7240 90% |
| Color Space (Percent of AdobeRGB 1998) (%) | 58.1 | ||||
| Color Space (Percent of sRGB) (%) | 89.8 | ||||
| Całkowita średnia (program / ustawienia) | -116% /
-111% | -133% /
-99% | -81% /
-77% | -60% /
-46% |
* ... im mniej tym lepiej
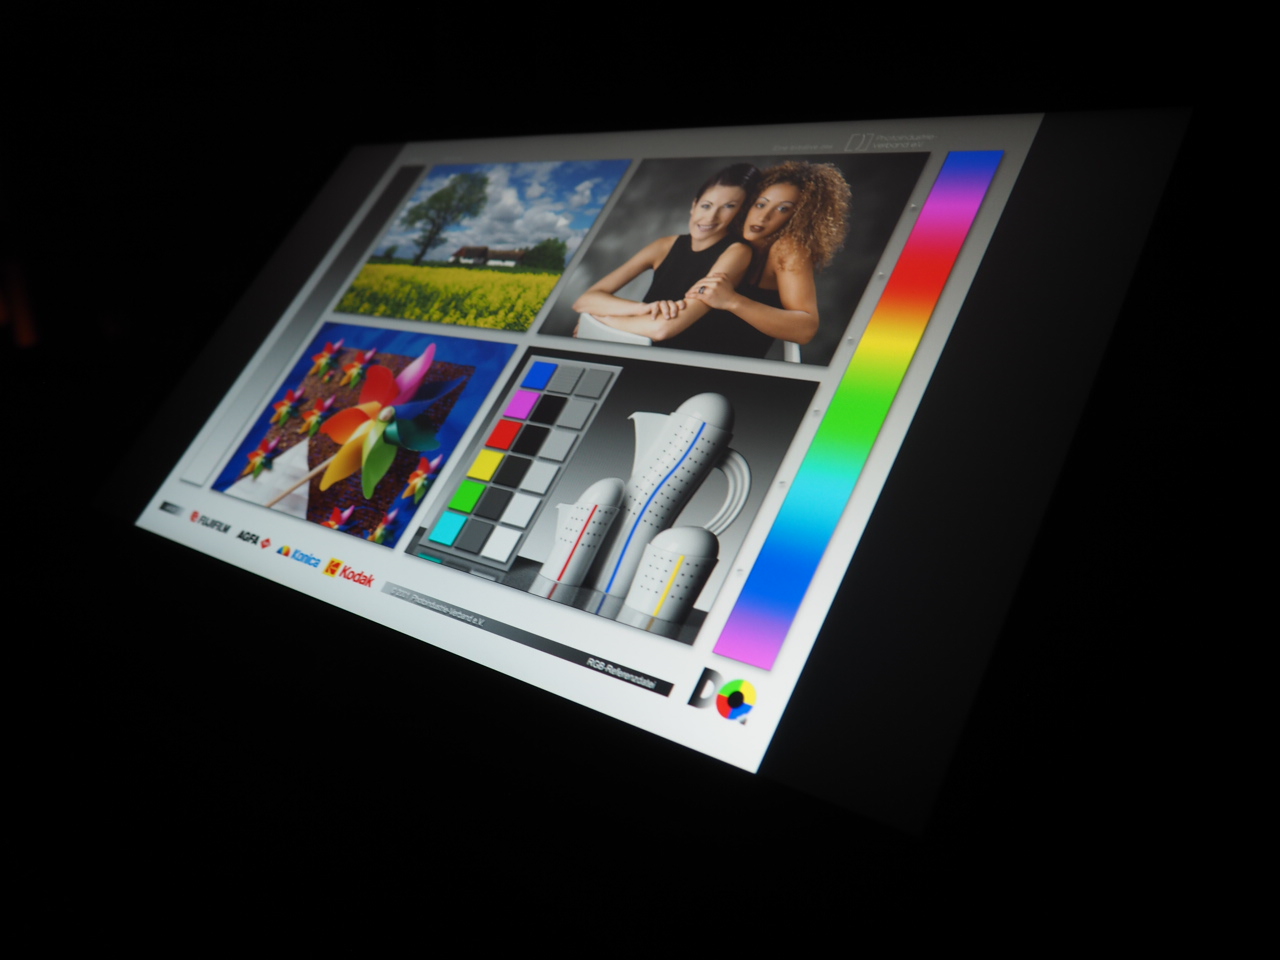
Dzięki zarejestrowanemu pokryciu sRGB na poziomie 97%, które jest bliskie specyfikacji producenta, laptop HP wyprzedza konkurencję o wiele kroków. Zarówno Dell G15, jak i Lenovo IdeaPad Gaming 3 osiągają tylko około 60%, co skutkuje znacznie bledszym obrazem niezależnie od kontrastu, który nadaje się tylko do pracy biurowej i przeglądania internetu, ale nie do konsumpcji mediów (filmów, gier itp.). W przeciwieństwie do tego, Pavilion 17 w każdym zastosowaniu wycina piękną figurę
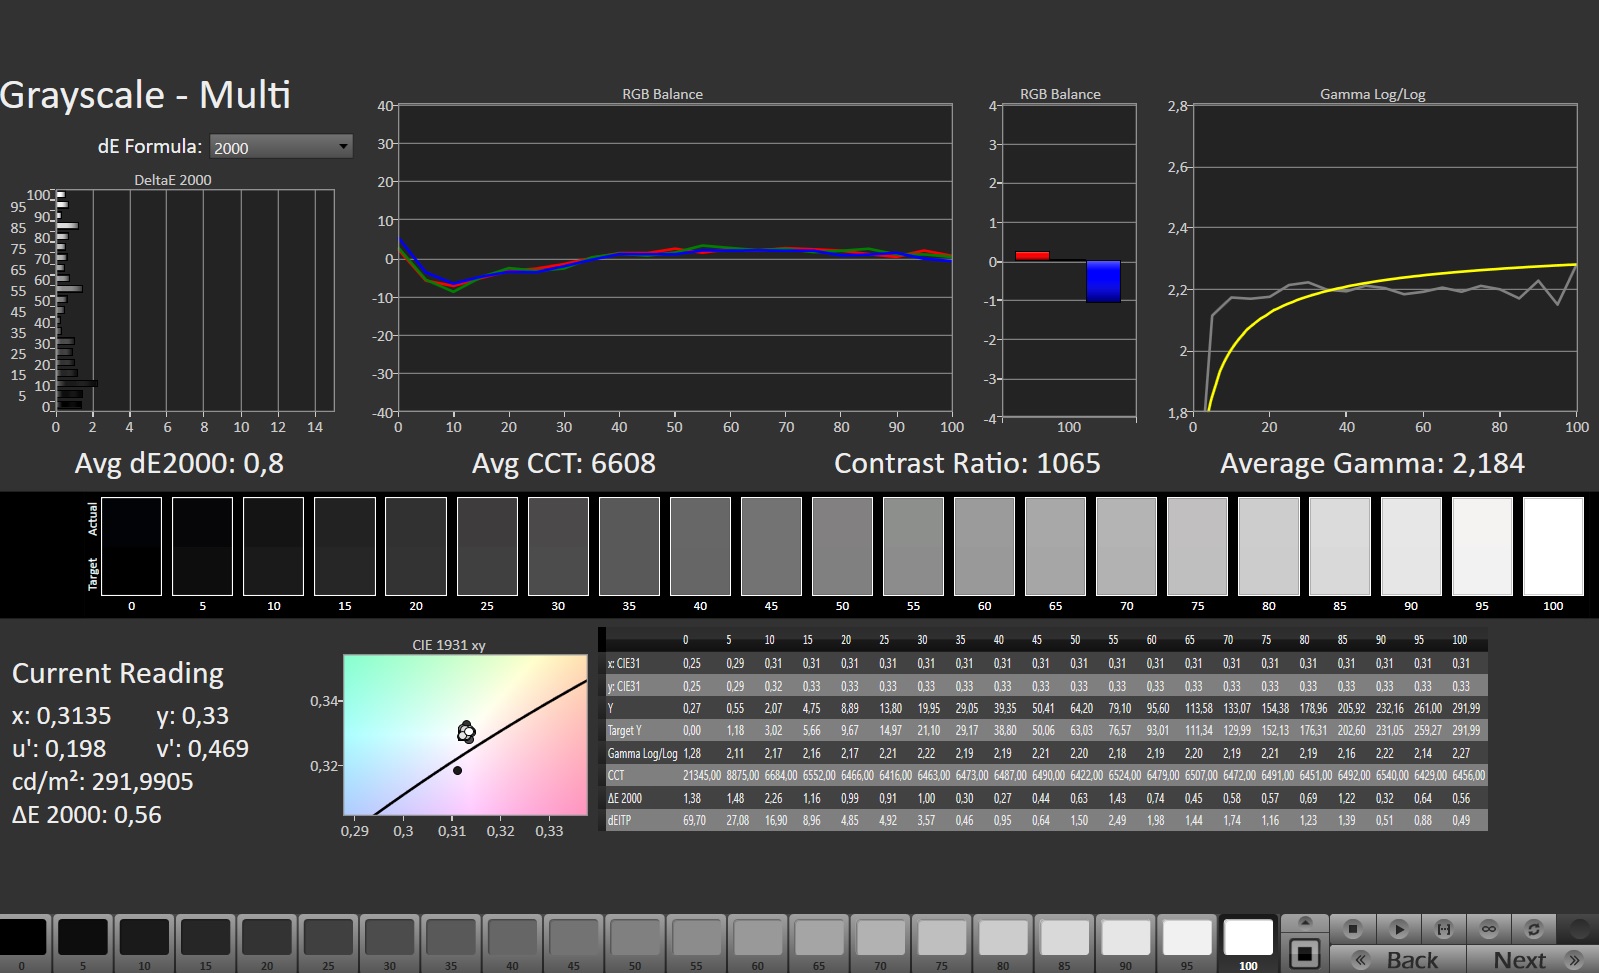
Pod względem kontrastu również nie ma na co narzekać. 1,426:1 to bardzo wysoki wynik jak na standardy IPS, a wartość tę dopiero przebija laptop Lenovo. Jeśli chodzi o jasność, to Pavilion po raz kolejny zajmuje czołowe miejsce. Średnia 317 cd/m² nie jest najwyższym wskaźnikiem, ale powinna być wystarczająca dla większości potrzeb, o ile unikamy szczególnie jasnych lub słonecznych miejsc. Dla porównania: Konkurencja utrzymuje się średnio poniżej 300 cd/m²
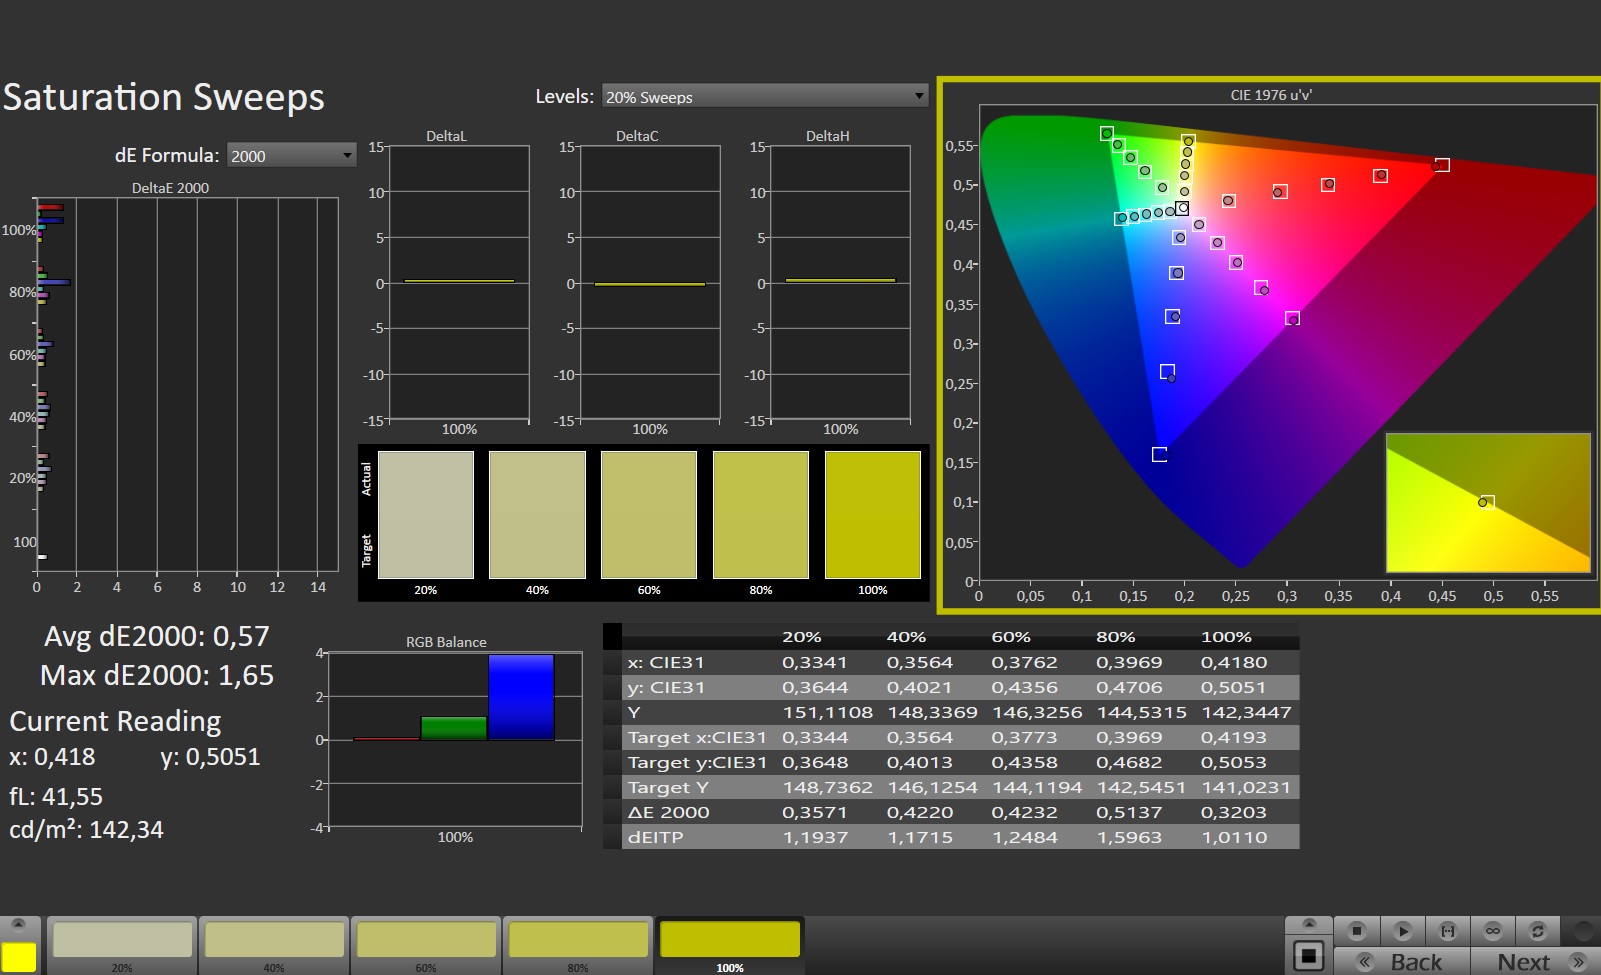
Laptop HP zdobywa jeszcze więcej punktów za szybki czas reakcji, z którym nie może się równać żaden konkurent. Producentowi przydałoby się jednak trochę poprawić w kwestii dokładności kolorów. Panel wykazuje po wyjęciu z pudełka lekki niebieski odcień, który można skorygować poprzez kalibrację (w prawym górnym rogu obok wykresu rozkładu jasności znajduje się link do naszego pliku ICC). Kąty widzenia są zgodne z typowymi standardami IPS. W 17-calowym urządzeniu nie występują nadmierne krwawienie czy migotanie ekranu
Wyświetl czasy reakcji
| ↔ Czas reakcji od czerni do bieli | ||
|---|---|---|
| 8.7 ms ... wzrost ↗ i spadek ↘ łącznie | ↗ 4.4 ms wzrost | 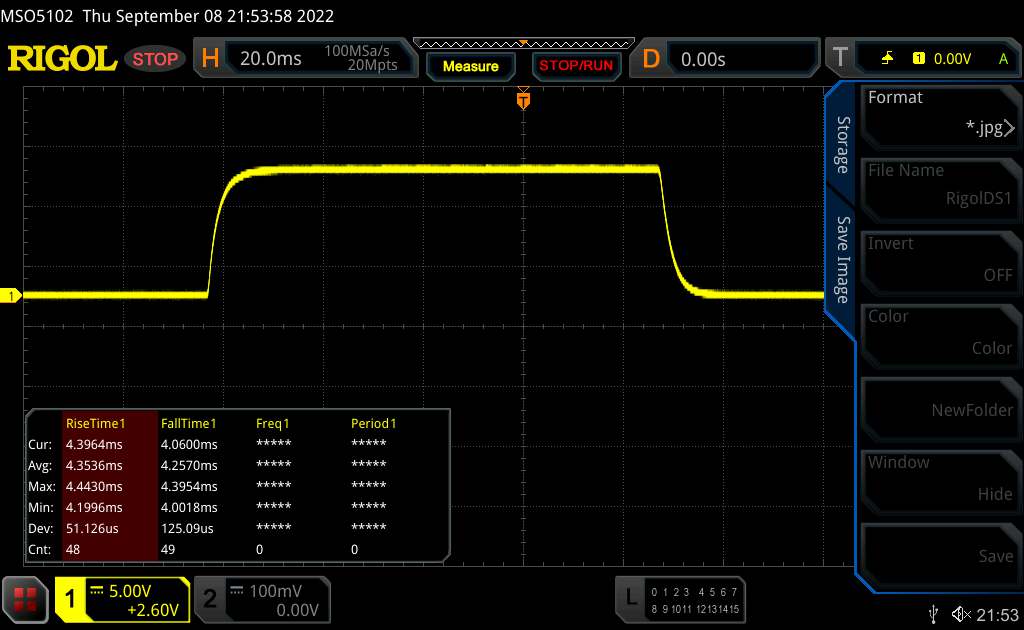 |
| ↘ 4.3 ms upadek | ||
| W naszych testach ekran wykazuje szybki czas reakcji i powinien nadawać się do gier. Dla porównania, wszystkie testowane urządzenia wahają się od 0.1 (minimum) do 240 (maksimum) ms. » 24 % wszystkich urządzeń jest lepszych. Oznacza to, że zmierzony czas reakcji jest lepszy od średniej wszystkich testowanych urządzeń (19.9 ms). | ||
| ↔ Czas reakcji 50% szarości do 80% szarości | ||
| 12.7 ms ... wzrost ↗ i spadek ↘ łącznie | ↗ 6.1 ms wzrost |  |
| ↘ 6.6 ms upadek | ||
| W naszych testach ekran wykazuje dobry współczynnik reakcji, ale może być zbyt wolny dla graczy rywalizujących ze sobą. Dla porównania, wszystkie testowane urządzenia wahają się od 0.165 (minimum) do 636 (maksimum) ms. » 26 % wszystkich urządzeń jest lepszych. Oznacza to, że zmierzony czas reakcji jest lepszy od średniej wszystkich testowanych urządzeń (31.1 ms). | ||
Migotanie ekranu / PWM (modulacja szerokości impulsu)
| Migotanie ekranu/nie wykryto PWM |  | ||
Dla porównania: 52 % wszystkich testowanych urządzeń nie używa PWM do przyciemniania wyświetlacza. Jeśli wykryto PWM, zmierzono średnio 7797 (minimum: 5 - maksimum: 343500) Hz. | |||
Wydajność
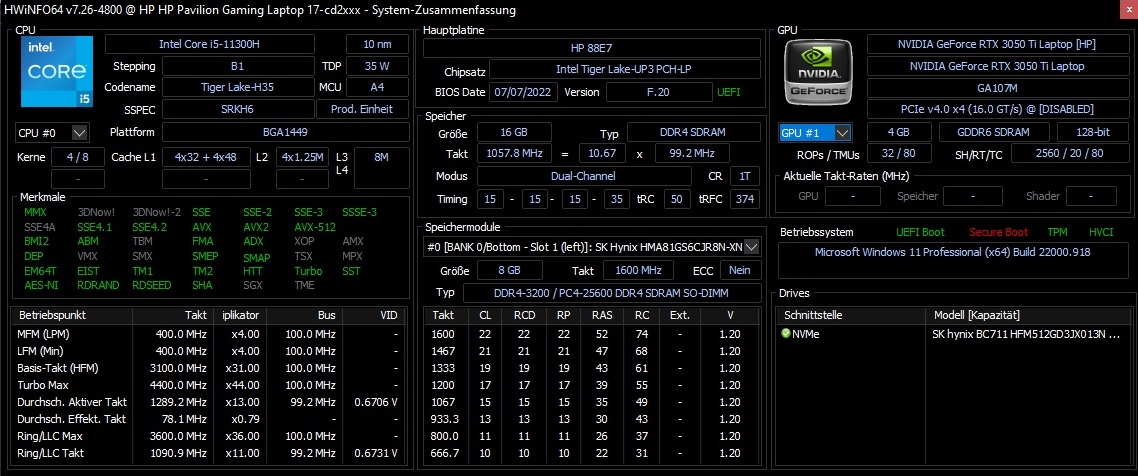
Dzięki czterordzeniowemu procesorowi i 4 GB GPU, Pavilion Gaming 17 jest pozycjonowany w segmencie średnim. 16 GB pamięci RAM powinno wystarczyć na najbliższe lata. Z dyskiem SSD może zrobić się ciasno, gdy zainstalowanych jest kilka (dużych) gier. Mimo to pamięć masową i RAM można bez problemu wymieniać
Warunki badania
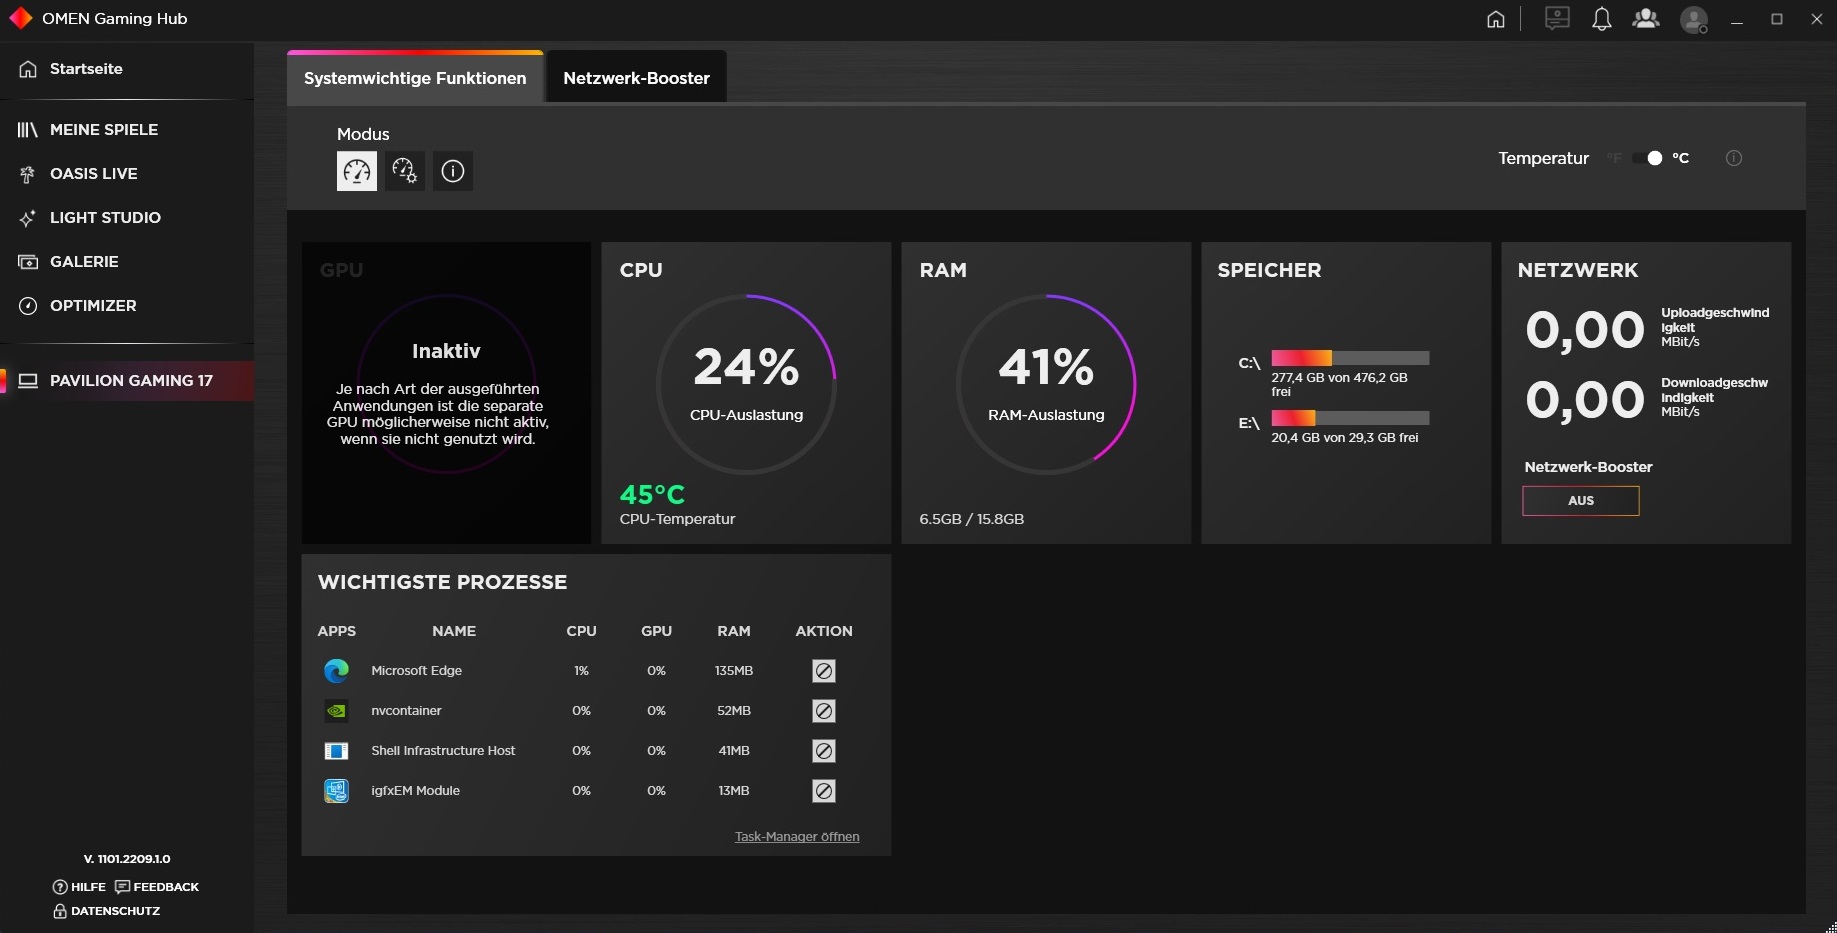
Oprócz sterowników i aktualizacji, które są automatycznie instalowane przez system Windows, zainstalowaliśmy na urządzeniu jedynie Omen Gaming Hub. W przypadku Pavilion Gaming 17 nie były tam jednak dostępne różne tryby wydajności, jak to skądinąd bywa w przypadku innych laptopów
Procesor
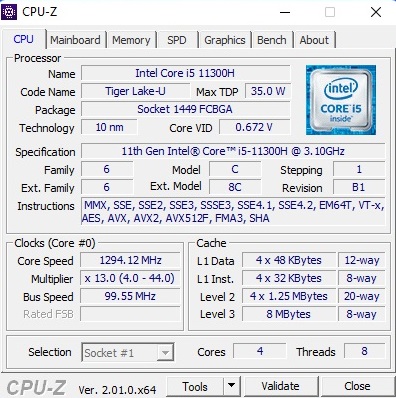
Core i5-11300H to wydajny, czterordzeniowy procesor należący do generacji Tiger-Lake firmy Intel, która nie jest już tak całkiem nowa jak kiedyś. 10 nm układ oferuje 8 MB pamięci podręcznej L3 oraz do 8 wątków, które mogą być przetwarzane równolegle dzięki Hyper-Threading. W naszym kursie benchmarkowym procesor zachowywał się bez zarzutu. Jego wydajność jest podobna do tej z Lenovo IdeaPad Gaming 3, który również wyposażony jest w i5-11300H. Jeśli jednak chodzi o aplikacje wielordzeniowe, procesor nie ma szans ze starymCore i7-9750H iRyzen 5 5600H (po 6 rdzeni) w szczególności. Niemniej jednak i5-11300H to dobry model uniwersalny
Cinebench R15 Multi endurance test
| CPU Performance rating - Percent | |
| Średnia w klasie Gaming | |
| HP Victus 16-e0145ng | |
| HP Pavilion Gaming 17-cd0085cl -12! | |
| Lenovo Ideapad Gaming 3 15IHU-82K1002RGE | |
| HP Pavilion Gaming 17-cd2146ng | |
| Przeciętny Intel Core i5-11300H | |
| Dell G15 5510-43NHT | |
| Cinebench R23 | |
| Multi Core | |
| Średnia w klasie Gaming (10488 - 40970, n=112, ostatnie 2 lata) | |
| HP Victus 16-e0145ng | |
| HP Pavilion Gaming 17-cd2146ng | |
| Lenovo Ideapad Gaming 3 15IHU-82K1002RGE | |
| Przeciętny Intel Core i5-11300H (3313 - 6581, n=10) | |
| Dell G15 5510-43NHT | |
| Single Core | |
| Średnia w klasie Gaming (1166 - 2356, n=112, ostatnie 2 lata) | |
| HP Victus 16-e0145ng | |
| Przeciętny Intel Core i5-11300H (1218 - 1431, n=11) | |
| HP Pavilion Gaming 17-cd2146ng | |
| Lenovo Ideapad Gaming 3 15IHU-82K1002RGE | |
| Dell G15 5510-43NHT | |
| Cinebench R20 | |
| CPU (Multi Core) | |
| Średnia w klasie Gaming (4029 - 16108, n=111, ostatnie 2 lata) | |
| HP Victus 16-e0145ng | |
| HP Pavilion Gaming 17-cd2146ng | |
| Lenovo Ideapad Gaming 3 15IHU-82K1002RGE | |
| Przeciętny Intel Core i5-11300H (1300 - 2533, n=10) | |
| Dell G15 5510-43NHT | |
| CPU (Single Core) | |
| Średnia w klasie Gaming (442 - 895, n=111, ostatnie 2 lata) | |
| HP Victus 16-e0145ng | |
| HP Pavilion Gaming 17-cd2146ng | |
| Przeciętny Intel Core i5-11300H (431 - 548, n=11) | |
| Lenovo Ideapad Gaming 3 15IHU-82K1002RGE | |
| Dell G15 5510-43NHT | |
| Cinebench R15 | |
| CPU Multi 64Bit | |
| Średnia w klasie Gaming (1578 - 6271, n=111, ostatnie 2 lata) | |
| HP Victus 16-e0145ng | |
| HP Pavilion Gaming 17-cd0085cl | |
| HP Pavilion Gaming 17-cd2146ng | |
| Lenovo Ideapad Gaming 3 15IHU-82K1002RGE | |
| Przeciętny Intel Core i5-11300H (632 - 990, n=11) | |
| Dell G15 5510-43NHT | |
| CPU Single 64Bit | |
| Średnia w klasie Gaming (188.8 - 343, n=111, ostatnie 2 lata) | |
| HP Victus 16-e0145ng | |
| Lenovo Ideapad Gaming 3 15IHU-82K1002RGE | |
| HP Pavilion Gaming 17-cd2146ng | |
| HP Pavilion Gaming 17-cd0085cl | |
| Przeciętny Intel Core i5-11300H (123 - 211, n=8) | |
| Dell G15 5510-43NHT | |
| Blender - v2.79 BMW27 CPU | |
| Przeciętny Intel Core i5-11300H (466 - 862, n=10) | |
| HP Pavilion Gaming 17-cd2146ng | |
| Dell G15 5510-43NHT | |
| Lenovo Ideapad Gaming 3 15IHU-82K1002RGE | |
| HP Victus 16-e0145ng | |
| Średnia w klasie Gaming (80 - 330, n=109, ostatnie 2 lata) | |
| 7-Zip 18.03 | |
| 7z b 4 | |
| Średnia w klasie Gaming (33491 - 148086, n=110, ostatnie 2 lata) | |
| HP Victus 16-e0145ng | |
| Lenovo Ideapad Gaming 3 15IHU-82K1002RGE | |
| HP Pavilion Gaming 17-cd2146ng | |
| Przeciętny Intel Core i5-11300H (17573 - 26001, n=10) | |
| Dell G15 5510-43NHT | |
| 7z b 4 -mmt1 | |
| Średnia w klasie Gaming (4199 - 7436, n=110, ostatnie 2 lata) | |
| HP Victus 16-e0145ng | |
| Przeciętny Intel Core i5-11300H (4603 - 4969, n=10) | |
| Lenovo Ideapad Gaming 3 15IHU-82K1002RGE | |
| HP Pavilion Gaming 17-cd2146ng | |
| Dell G15 5510-43NHT | |
| Geekbench 5.5 | |
| Multi-Core | |
| Średnia w klasie Gaming (6460 - 27010, n=110, ostatnie 2 lata) | |
| HP Victus 16-e0145ng | |
| HP Pavilion Gaming 17-cd2146ng | |
| Przeciętny Intel Core i5-11300H (3631 - 5499, n=10) | |
| Lenovo Ideapad Gaming 3 15IHU-82K1002RGE | |
| Dell G15 5510-43NHT | |
| Single-Core | |
| Średnia w klasie Gaming (986 - 2474, n=110, ostatnie 2 lata) | |
| HP Victus 16-e0145ng | |
| Przeciętny Intel Core i5-11300H (1342 - 1462, n=10) | |
| HP Pavilion Gaming 17-cd2146ng | |
| Lenovo Ideapad Gaming 3 15IHU-82K1002RGE | |
| Dell G15 5510-43NHT | |
| HWBOT x265 Benchmark v2.2 - 4k Preset | |
| Średnia w klasie Gaming (11.5 - 44.3, n=110, ostatnie 2 lata) | |
| HP Victus 16-e0145ng | |
| Lenovo Ideapad Gaming 3 15IHU-82K1002RGE | |
| HP Pavilion Gaming 17-cd2146ng | |
| Przeciętny Intel Core i5-11300H (4.32 - 8.38, n=10) | |
| Dell G15 5510-43NHT | |
| LibreOffice - 20 Documents To PDF | |
| HP Victus 16-e0145ng | |
| Dell G15 5510-43NHT | |
| HP Pavilion Gaming 17-cd2146ng | |
| Lenovo Ideapad Gaming 3 15IHU-82K1002RGE | |
| Przeciętny Intel Core i5-11300H (43.6 - 59.4, n=10) | |
| Średnia w klasie Gaming (19 - 88.8, n=110, ostatnie 2 lata) | |
| R Benchmark 2.5 - Overall mean | |
| Dell G15 5510-43NHT | |
| HP Pavilion Gaming 17-cd2146ng | |
| Przeciętny Intel Core i5-11300H (0.6 - 0.644, n=10) | |
| Lenovo Ideapad Gaming 3 15IHU-82K1002RGE | |
| HP Victus 16-e0145ng | |
| Średnia w klasie Gaming (0.3439 - 0.759, n=111, ostatnie 2 lata) | |
* ... im mniej tym lepiej
AIDA64: FP32 Ray-Trace | FPU Julia | CPU SHA3 | CPU Queen | FPU SinJulia | FPU Mandel | CPU AES | CPU ZLib | FP64 Ray-Trace | CPU PhotoWorxx
| Performance rating | |
| Średnia w klasie Gaming | |
| HP Victus 16-e0145ng | |
| Lenovo Ideapad Gaming 3 15IHU-82K1002RGE | |
| Przeciętny Intel Core i5-11300H | |
| HP Pavilion Gaming 17-cd2146ng | |
| Dell G15 5510-43NHT | |
| AIDA64 / FP32 Ray-Trace | |
| Średnia w klasie Gaming (10227 - 85542, n=109, ostatnie 2 lata) | |
| HP Victus 16-e0145ng | |
| Lenovo Ideapad Gaming 3 15IHU-82K1002RGE | |
| Przeciętny Intel Core i5-11300H (6128 - 8440, n=9) | |
| HP Pavilion Gaming 17-cd2146ng | |
| Dell G15 5510-43NHT | |
| AIDA64 / FPU Julia | |
| Średnia w klasie Gaming (51376 - 238426, n=109, ostatnie 2 lata) | |
| HP Victus 16-e0145ng | |
| Lenovo Ideapad Gaming 3 15IHU-82K1002RGE | |
| Dell G15 5510-43NHT | |
| Przeciętny Intel Core i5-11300H (25739 - 33986, n=9) | |
| HP Pavilion Gaming 17-cd2146ng | |
| AIDA64 / CPU SHA3 | |
| Średnia w klasie Gaming (2180 - 9817, n=109, ostatnie 2 lata) | |
| HP Victus 16-e0145ng | |
| Lenovo Ideapad Gaming 3 15IHU-82K1002RGE | |
| Przeciętny Intel Core i5-11300H (1773 - 2286, n=9) | |
| HP Pavilion Gaming 17-cd2146ng | |
| Dell G15 5510-43NHT | |
| AIDA64 / CPU Queen | |
| Średnia w klasie Gaming (49785 - 173351, n=100, ostatnie 2 lata) | |
| HP Victus 16-e0145ng | |
| Lenovo Ideapad Gaming 3 15IHU-82K1002RGE | |
| Przeciętny Intel Core i5-11300H (41257 - 49312, n=9) | |
| Dell G15 5510-43NHT | |
| HP Pavilion Gaming 17-cd2146ng | |
| AIDA64 / FPU SinJulia | |
| Średnia w klasie Gaming (4424 - 33636, n=109, ostatnie 2 lata) | |
| HP Victus 16-e0145ng | |
| Dell G15 5510-43NHT | |
| Lenovo Ideapad Gaming 3 15IHU-82K1002RGE | |
| Przeciętny Intel Core i5-11300H (3925 - 4677, n=9) | |
| HP Pavilion Gaming 17-cd2146ng | |
| AIDA64 / FPU Mandel | |
| Średnia w klasie Gaming (25115 - 128721, n=109, ostatnie 2 lata) | |
| HP Victus 16-e0145ng | |
| Lenovo Ideapad Gaming 3 15IHU-82K1002RGE | |
| Przeciętny Intel Core i5-11300H (15820 - 20669, n=9) | |
| HP Pavilion Gaming 17-cd2146ng | |
| Dell G15 5510-43NHT | |
| AIDA64 / CPU AES | |
| Średnia w klasie Gaming (39258 - 247074, n=109, ostatnie 2 lata) | |
| Lenovo Ideapad Gaming 3 15IHU-82K1002RGE | |
| Przeciętny Intel Core i5-11300H (37694 - 71519, n=9) | |
| HP Victus 16-e0145ng | |
| HP Pavilion Gaming 17-cd2146ng | |
| Dell G15 5510-43NHT | |
| AIDA64 / CPU ZLib | |
| Średnia w klasie Gaming (574 - 2531, n=109, ostatnie 2 lata) | |
| HP Victus 16-e0145ng | |
| Lenovo Ideapad Gaming 3 15IHU-82K1002RGE | |
| Przeciętny Intel Core i5-11300H (269 - 390, n=9) | |
| Dell G15 5510-43NHT | |
| HP Pavilion Gaming 17-cd2146ng | |
| AIDA64 / FP64 Ray-Trace | |
| Średnia w klasie Gaming (5509 - 45446, n=109, ostatnie 2 lata) | |
| HP Victus 16-e0145ng | |
| Lenovo Ideapad Gaming 3 15IHU-82K1002RGE | |
| Przeciętny Intel Core i5-11300H (3322 - 4613, n=9) | |
| HP Pavilion Gaming 17-cd2146ng | |
| Dell G15 5510-43NHT | |
| AIDA64 / CPU PhotoWorxx | |
| Średnia w klasie Gaming (12271 - 89891, n=109, ostatnie 2 lata) | |
| HP Pavilion Gaming 17-cd2146ng | |
| Przeciętny Intel Core i5-11300H (9705 - 38002, n=9) | |
| HP Victus 16-e0145ng | |
| Lenovo Ideapad Gaming 3 15IHU-82K1002RGE | |
| Dell G15 5510-43NHT | |
Wydajność systemu
Pod względem wydajności systemowej 17-calowy laptop plasuje się wygodnie pośrodku konkurencji. 5 442 pkt. w PCMarku 10 to solidny wynik i absolutnie adekwatny do szacowanej ceny
CrossMark: Overall | Productivity | Creativity | Responsiveness
| PCMark 10 / Score | |
| Średnia w klasie Gaming (5828 - 11574, n=95, ostatnie 2 lata) | |
| HP Victus 16-e0145ng | |
| Lenovo Ideapad Gaming 3 15IHU-82K1002RGE | |
| Przeciętny Intel Core i5-11300H, NVIDIA GeForce RTX 3050 Ti Laptop GPU (5442 - 5641, n=2) | |
| HP Pavilion Gaming 17-cd2146ng | |
| HP Pavilion Gaming 17-cd0085cl | |
| Dell G15 5510-43NHT | |
| PCMark 10 / Essentials | |
| Średnia w klasie Gaming (8810 - 12600, n=99, ostatnie 2 lata) | |
| HP Victus 16-e0145ng | |
| HP Pavilion Gaming 17-cd0085cl | |
| HP Pavilion Gaming 17-cd2146ng | |
| Przeciętny Intel Core i5-11300H, NVIDIA GeForce RTX 3050 Ti Laptop GPU (8524 - 8829, n=2) | |
| Lenovo Ideapad Gaming 3 15IHU-82K1002RGE | |
| Dell G15 5510-43NHT | |
| PCMark 10 / Productivity | |
| Średnia w klasie Gaming (6845 - 18766, n=97, ostatnie 2 lata) | |
| Lenovo Ideapad Gaming 3 15IHU-82K1002RGE | |
| Przeciętny Intel Core i5-11300H, NVIDIA GeForce RTX 3050 Ti Laptop GPU (7664 - 9112, n=2) | |
| HP Victus 16-e0145ng | |
| HP Pavilion Gaming 17-cd2146ng | |
| HP Pavilion Gaming 17-cd0085cl | |
| Dell G15 5510-43NHT | |
| PCMark 10 / Digital Content Creation | |
| Średnia w klasie Gaming (7602 - 19657, n=97, ostatnie 2 lata) | |
| HP Victus 16-e0145ng | |
| HP Pavilion Gaming 17-cd0085cl | |
| HP Pavilion Gaming 17-cd2146ng | |
| Przeciętny Intel Core i5-11300H, NVIDIA GeForce RTX 3050 Ti Laptop GPU (6271 - 6462, n=2) | |
| Lenovo Ideapad Gaming 3 15IHU-82K1002RGE | |
| Dell G15 5510-43NHT | |
| CrossMark / Overall | |
| Średnia w klasie Gaming (1366 - 2409, n=97, ostatnie 2 lata) | |
| Lenovo Ideapad Gaming 3 15IHU-82K1002RGE | |
| Przeciętny Intel Core i5-11300H, NVIDIA GeForce RTX 3050 Ti Laptop GPU (n=1) | |
| CrossMark / Productivity | |
| Średnia w klasie Gaming (1386 - 2254, n=97, ostatnie 2 lata) | |
| Lenovo Ideapad Gaming 3 15IHU-82K1002RGE | |
| Przeciętny Intel Core i5-11300H, NVIDIA GeForce RTX 3050 Ti Laptop GPU (n=1) | |
| CrossMark / Creativity | |
| Średnia w klasie Gaming (1343 - 2729, n=97, ostatnie 2 lata) | |
| Lenovo Ideapad Gaming 3 15IHU-82K1002RGE | |
| Przeciętny Intel Core i5-11300H, NVIDIA GeForce RTX 3050 Ti Laptop GPU (n=1) | |
| CrossMark / Responsiveness | |
| Średnia w klasie Gaming (1226 - 2334, n=97, ostatnie 2 lata) | |
| Lenovo Ideapad Gaming 3 15IHU-82K1002RGE | |
| Przeciętny Intel Core i5-11300H, NVIDIA GeForce RTX 3050 Ti Laptop GPU (n=1) | |
| PCMark 10 Score | 5442 pkt. | |
Pomoc | ||
| AIDA64 / Memory Copy | |
| Średnia w klasie Gaming (21750 - 129946, n=109, ostatnie 2 lata) | |
| HP Victus 16-e0145ng | |
| Przeciętny Intel Core i5-11300H (19947 - 60141, n=9) | |
| HP Pavilion Gaming 17-cd2146ng | |
| Lenovo Ideapad Gaming 3 15IHU-82K1002RGE | |
| Dell G15 5510-43NHT | |
| AIDA64 / Memory Read | |
| Średnia w klasie Gaming (22956 - 118858, n=109, ostatnie 2 lata) | |
| HP Victus 16-e0145ng | |
| Przeciętny Intel Core i5-11300H (22688 - 62684, n=9) | |
| HP Pavilion Gaming 17-cd2146ng | |
| Lenovo Ideapad Gaming 3 15IHU-82K1002RGE | |
| Dell G15 5510-43NHT | |
| AIDA64 / Memory Write | |
| Średnia w klasie Gaming (22297 - 135096, n=109, ostatnie 2 lata) | |
| HP Victus 16-e0145ng | |
| Przeciętny Intel Core i5-11300H (20959 - 65245, n=9) | |
| HP Pavilion Gaming 17-cd2146ng | |
| Lenovo Ideapad Gaming 3 15IHU-82K1002RGE | |
| Dell G15 5510-43NHT | |
| AIDA64 / Memory Latency | |
| Średnia w klasie Gaming (75.3 - 259, n=109, ostatnie 2 lata) | |
| Lenovo Ideapad Gaming 3 15IHU-82K1002RGE | |
| HP Pavilion Gaming 17-cd2146ng | |
| Przeciętny Intel Core i5-11300H (76.3 - 93.6, n=9) | |
| HP Victus 16-e0145ng | |
| Dell G15 5510-43NHT | |
* ... im mniej tym lepiej
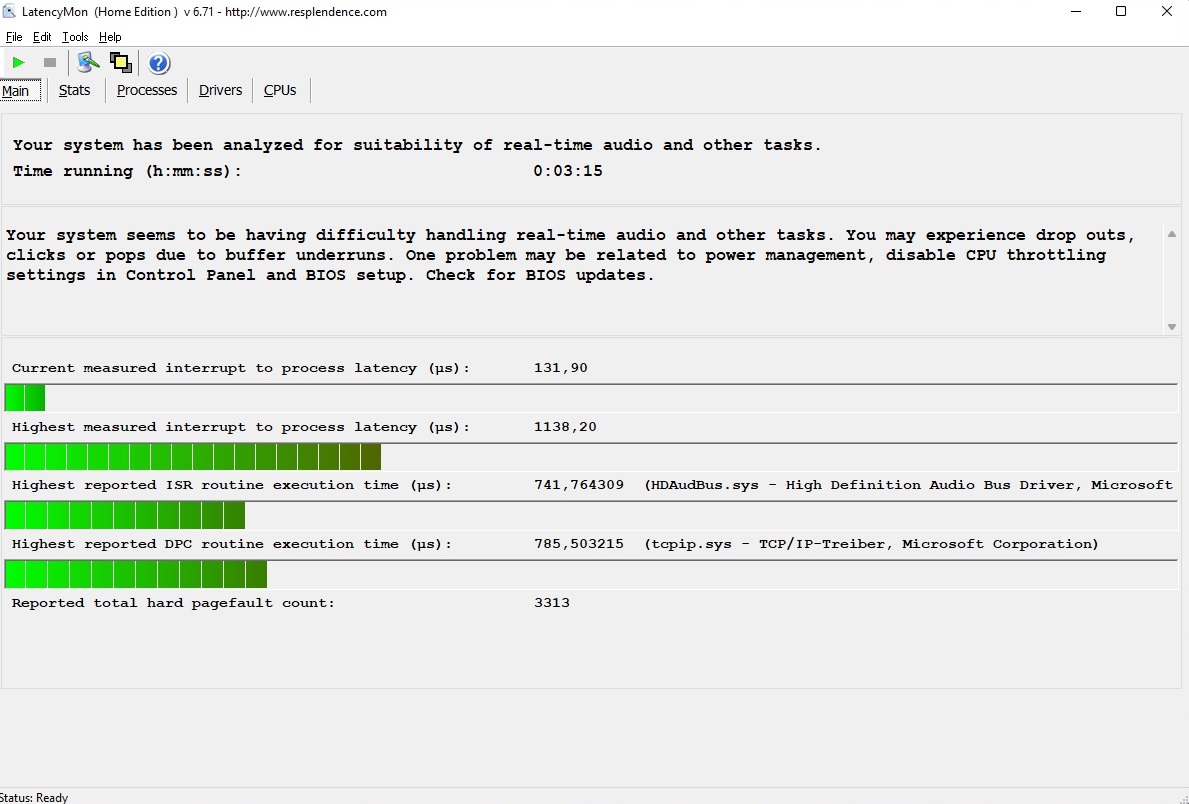
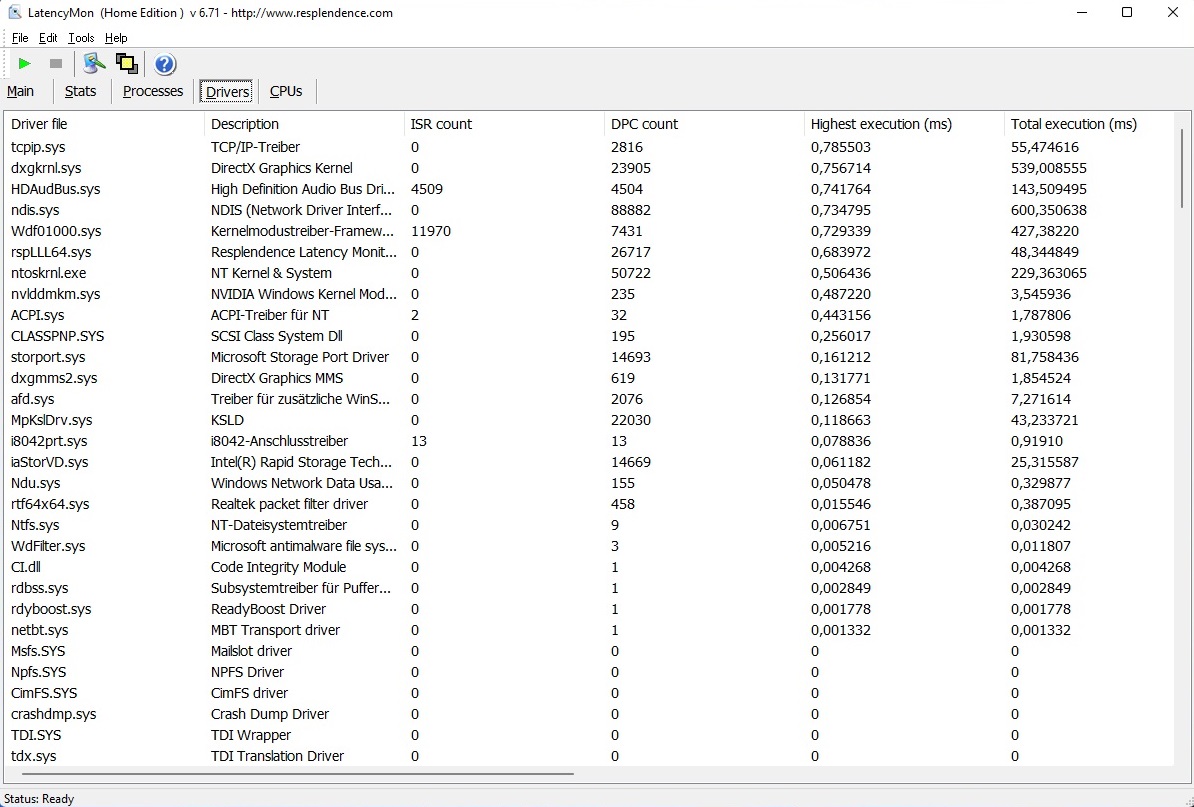
Opóźnienia DPC
Jeśli chodzi o opóźnienia, sytuacja nie jest całkowicie optymalna. Podobnie jak wiele innych laptopów, Pavilion Gaming 17 nie nadaje się szczególnie do edycji audio i wideo w czasie rzeczywistym według narzędzia LatencyMon
| DPC Latencies / LatencyMon - interrupt to process latency (max), Web, Youtube, Prime95 | |
| Dell G15 5510-43NHT | |
| HP Pavilion Gaming 17-cd2146ng | |
| Lenovo Ideapad Gaming 3 15IHU-82K1002RGE | |
| HP Victus 16-e0145ng | |
* ... im mniej tym lepiej
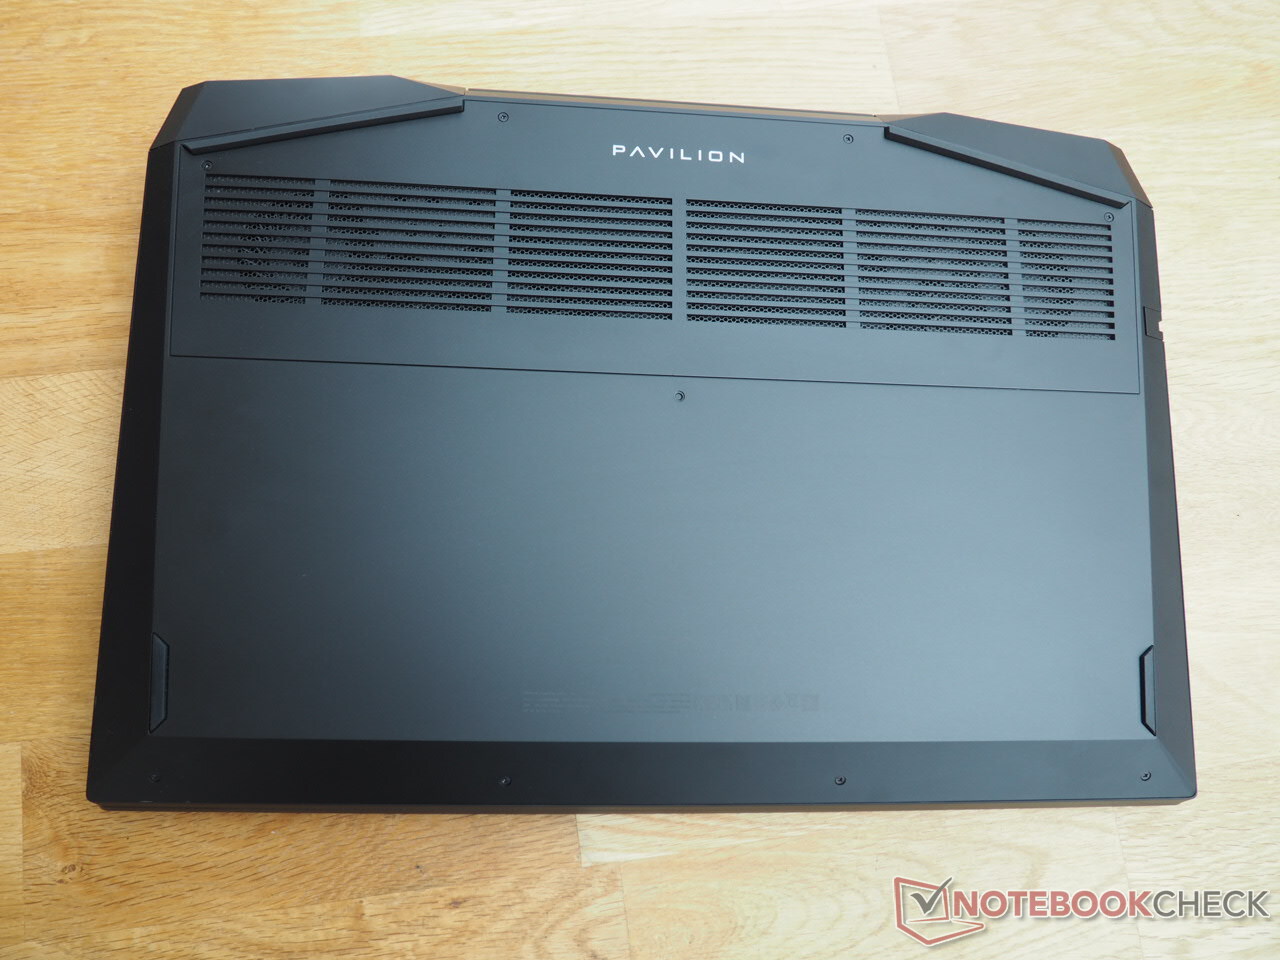
Przechowywanie
Pozytywnie należy podkreślić szybkie urządzenie magazynujące. HP wyposażył nasz model recenzencki w dysk PCIe o pojemności 512 GB (M.2 2280) firmy SK Hynix (BC711), który osiąga prędkości sekwencyjnego odczytu i zapisu na poziomie ponad 2500 MB/s, czyli coś, co może osiągnąć tylko HP Victus 16. Irytujące: Niestety nie można wykorzystać istniejącego gniazda 2,5 cala, w którym znajduje się "atrapa dysku twardego", gdyż nie ma zintegrowanego odpowiedniego kabla

| Drive Performance rating - Percent | |
| Średnia w klasie Gaming | |
| HP Pavilion Gaming 17-cd2146ng | |
| HP Victus 16-e0145ng | |
| Przeciętny SK Hynix BC711 512GB HFM512GD3GX013N | |
| HP Pavilion Gaming 17-cd0085cl -8! | |
| Lenovo Ideapad Gaming 3 15IHU-82K1002RGE | |
| Dell G15 5510-43NHT | |
* ... im mniej tym lepiej
Continuous load read: DiskSpd Read Loop, Queue Depth 8
Karta graficzna
GeForce RTX 3050 Ti od Nvidii to idealna karta graficzna dla casualowych graczy, którzy niekoniecznie chcą grać w każdy nowy tytuł na maksymalnych detalach. 8 nm model bazuje na najnowszej architekturze Ampere i jest wyposażony w 2560 jednostek cieniujących. Wydajność układów Nvidii w dużej mierze zależy od określonego TGP, które producenci laptopów mogą dowolnie dobierać w pewnym zakresie. W tym przypadku HP zdecydowało się na 60 W, co odpowiada średniemu poziomowi dla RTX 3050 Ti. Mimo to Pavilion Gaming 17 wypada nieco lepiej w układzie GPU w porównaniu ze średniakiem 3050 Ti
| 3DMark Performance rating - Percent | |
| Średnia w klasie Gaming | |
| HP Pavilion Gaming 17-cd2146ng | |
| HP Victus 16-e0145ng | |
| HP Pavilion Gaming 17-cd0085cl | |
| Lenovo Ideapad Gaming 3 15IHU-82K1002RGE | |
| Dell G15 5510-43NHT | |
| Przeciętny NVIDIA GeForce RTX 3050 Ti Laptop GPU | |
| 3DMark 11 - 1280x720 Performance GPU | |
| Średnia w klasie Gaming (21841 - 80022, n=108, ostatnie 2 lata) | |
| Dell G15 5510-43NHT | |
| Lenovo Ideapad Gaming 3 15IHU-82K1002RGE | |
| HP Victus 16-e0145ng | |
| HP Pavilion Gaming 17-cd2146ng | |
| Przeciętny NVIDIA GeForce RTX 3050 Ti Laptop GPU (7952 - 20905, n=27) | |
| HP Pavilion Gaming 17-cd0085cl | |
| 3DMark | |
| 1280x720 Cloud Gate Standard Graphics | |
| Średnia w klasie Gaming (86886 - 223650, n=61, ostatnie 2 lata) | |
| HP Pavilion Gaming 17-cd0085cl | |
| HP Pavilion Gaming 17-cd2146ng | |
| HP Victus 16-e0145ng | |
| Przeciętny NVIDIA GeForce RTX 3050 Ti Laptop GPU (30158 - 102432, n=23) | |
| Lenovo Ideapad Gaming 3 15IHU-82K1002RGE | |
| Dell G15 5510-43NHT | |
| 1920x1080 Fire Strike Graphics | |
| Średnia w klasie Gaming (12242 - 62849, n=120, ostatnie 2 lata) | |
| Dell G15 5510-43NHT | |
| HP Victus 16-e0145ng | |
| Lenovo Ideapad Gaming 3 15IHU-82K1002RGE | |
| HP Pavilion Gaming 17-cd2146ng | |
| HP Pavilion Gaming 17-cd0085cl | |
| Przeciętny NVIDIA GeForce RTX 3050 Ti Laptop GPU (7917 - 15611, n=26) | |
| 2560x1440 Time Spy Graphics | |
| Średnia w klasie Gaming (5012 - 26212, n=119, ostatnie 2 lata) | |
| Dell G15 5510-43NHT | |
| HP Victus 16-e0145ng | |
| Lenovo Ideapad Gaming 3 15IHU-82K1002RGE | |
| Przeciętny NVIDIA GeForce RTX 3050 Ti Laptop GPU (3744 - 6122, n=27) | |
| HP Pavilion Gaming 17-cd2146ng | |
| HP Pavilion Gaming 17-cd0085cl | |
| 3DMark 11 Performance | 15245 pkt. | |
| 3DMark Ice Storm Standard Score | 98555 pkt. | |
| 3DMark Cloud Gate Standard Score | 26005 pkt. | |
| 3DMark Fire Strike Score | 11649 pkt. | |
| 3DMark Time Spy Score | 5155 pkt. | |
Pomoc | ||
Wydajność w grach
Tak długo, jak trzymasz się natywnego 1920x1080 pikseli i nie podłączasz zewnętrznego wyświetlacza o wysokiej rozdzielczości, RTX 3050 Ti oferuje solidną wydajność 3D. Pomijając bardzo wymagające lub umiarkowanie zoptymalizowane gry, jak np God of War, większość obecnych tytułów działa płynnie, nawet na maksymalnych ustawieniach, choć odświeżanie 144 Hz jest często dalekie od pełnego wykorzystania. GPU ujawnia słabości zwłaszcza w ray tracingu, co pokazuje m.in F1 22. 4 GB VRAM też nie jest optymalne na dłuższą metę. Jeśli szukasz pewnego stopnia zabezpieczenia na przyszłość, powinieneś kupić kartę graficzną z co najmniej 6, a najlepiej 8 GB VRAM
| The Witcher 3 | |
| 1920x1080 High Graphics & Postprocessing (Nvidia HairWorks Off) | |
| Średnia w klasie Gaming (181 - 341, n=3, ostatnie 2 lata) | |
| HP Victus 16-e0145ng | |
| HP Pavilion Gaming 17-cd2146ng | |
| HP Pavilion Gaming 17-cd0085cl | |
| Lenovo Ideapad Gaming 3 15IHU-82K1002RGE | |
| Przeciętny NVIDIA GeForce RTX 3050 Ti Laptop GPU (30 - 110, n=26) | |
| Dell G15 5510-43NHT | |
| 1920x1080 Ultra Graphics & Postprocessing (HBAO+) | |
| Średnia w klasie Gaming (95 - 240, n=8, ostatnie 2 lata) | |
| HP Victus 16-e0145ng | |
| Dell G15 5510-43NHT | |
| HP Pavilion Gaming 17-cd2146ng | |
| HP Pavilion Gaming 17-cd0085cl | |
| Przeciętny NVIDIA GeForce RTX 3050 Ti Laptop GPU (19 - 58.5, n=29) | |
| Lenovo Ideapad Gaming 3 15IHU-82K1002RGE | |
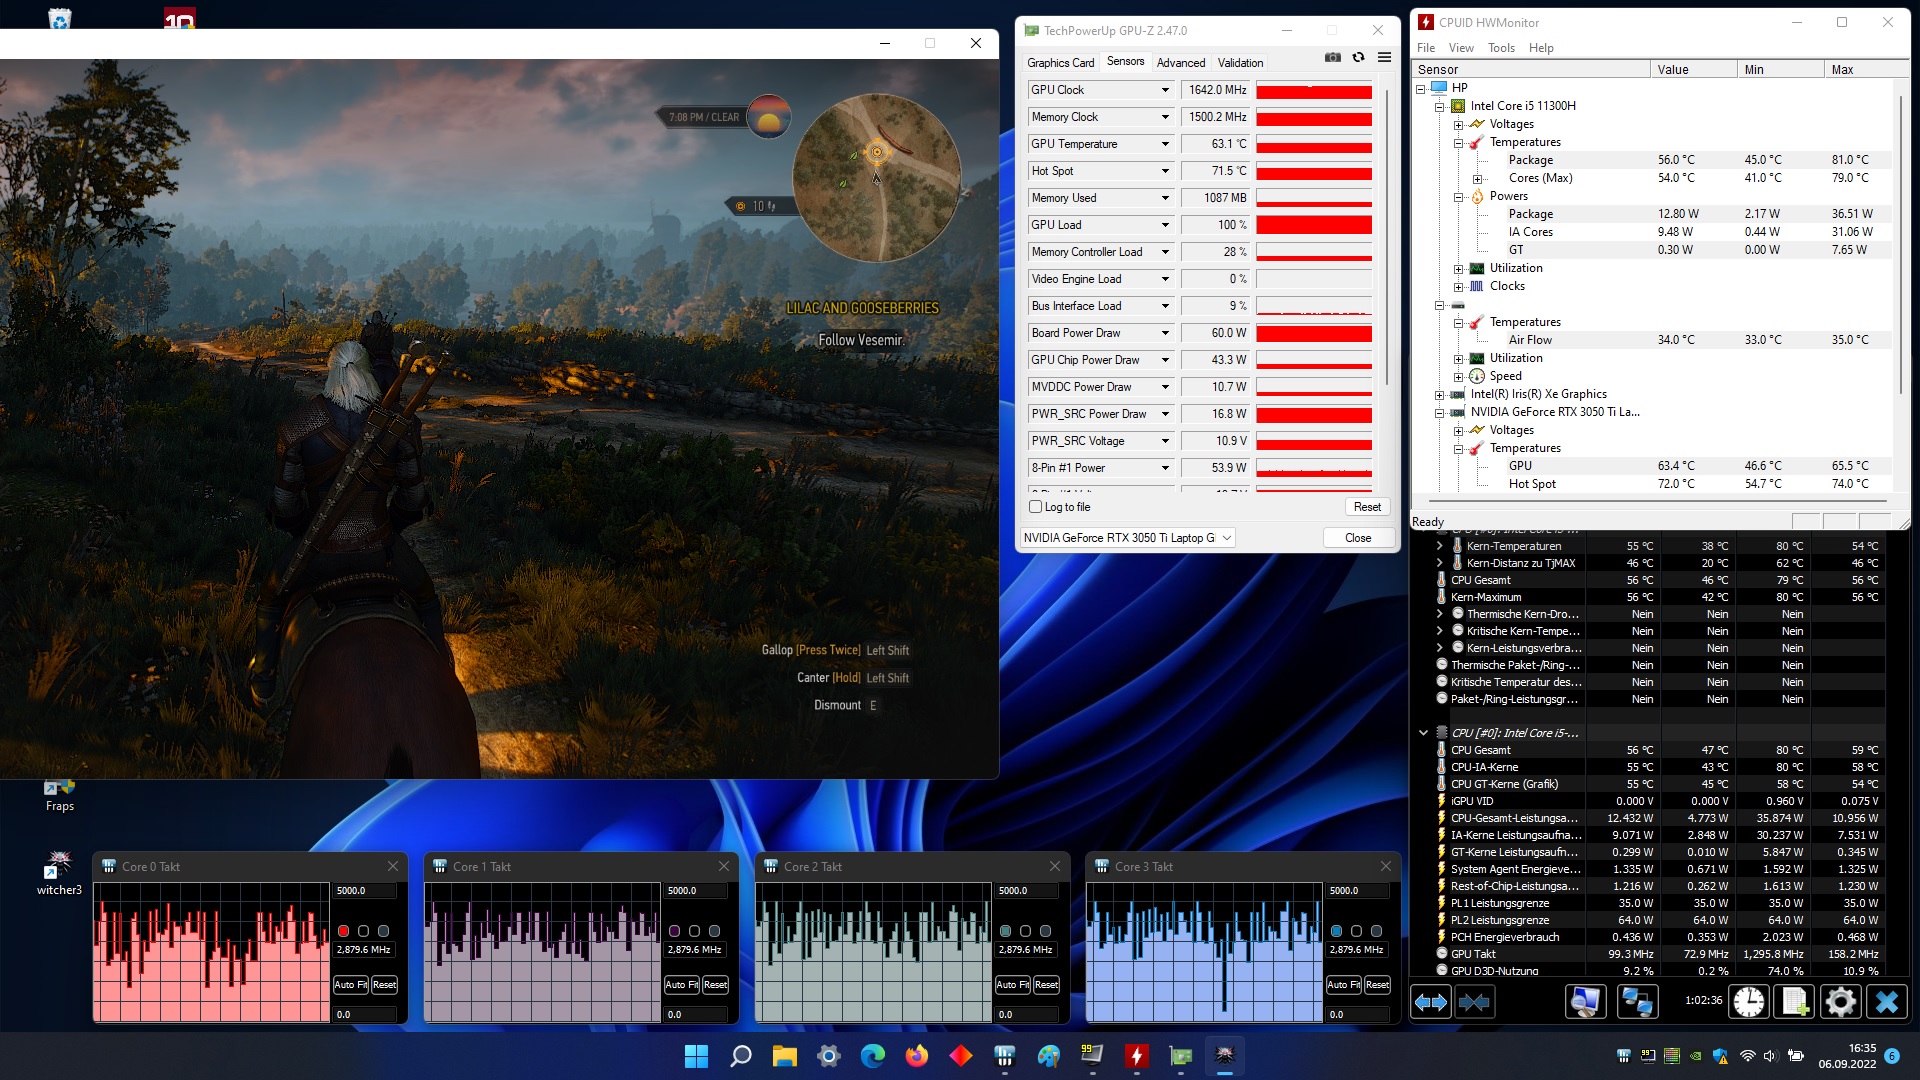
W naszym teście wytrzymałościowym nie było żadnych nieprawidłowości (godzina The Witcher 3). Liczba klatek na sekundę pozostawała dość stała przez cały okres czasu
The Witcher 3 FPS diagram
| low | med. | high | ultra | |
|---|---|---|---|---|
| GTA V (2015) | 156.1 | 119.9 | 66.9 | |
| The Witcher 3 (2015) | 170 | 94.4 | 51.4 | |
| Dota 2 Reborn (2015) | 119.7 | 108.5 | 104.8 | 100.7 |
| Final Fantasy XV Benchmark (2018) | 76 | 53.3 | ||
| X-Plane 11.11 (2018) | 87.5 | 75.3 | 64.3 | |
| Strange Brigade (2018) | 132.8 | 105.8 | 90.3 | |
| God of War (2022) | 60.7 | 48.6 | 30.6 | |
| Rainbow Six Extraction (2022) | 112 | 108 | 83 | |
| Dying Light 2 (2022) | 46.7 | 38.8 | ||
| Elden Ring (2022) | 55.4 | 53.8 | 52.7 | |
| Elex 2 (2022) | 52.2 | 50.9 | 46.1 | |
| F1 22 (2022) | 132 | 93 | 28 | |
| The Quarry (2022) | 63.1 | 51.5 | 39.7 |
Emisje
Emisja hałasu
Patrząc na poprzednika z Core i7-9750H i np GeForce GTX 1660 Ti Max-Q, chwaliliśmy przede wszystkim niższy poziom rozwoju hałasu. Podczas gdy nowy Pavilion Gaming 17 jest nadal jednym z cichszych laptopów do gier, 17-calowiec nie jest już naprawdę cichy. Zamiast 34 do 44 dB(A), zmierzyliśmy 39 do 46 dB(A) pod obciążeniem, co jest wyraźnie słyszalne, ale nie irytujące. Z drugiej strony, urządzenie jest przyjemnie ciche z 27 do 30 dB(A) w bezczynności, choć wentylatory nigdy nie wyłączają się całkowicie. To ostatnie można jednak zmienić w BIOS-ie, wyłączając opcję "always on". Powoduje to, że wentylatory są czasem wyłączane podczas wykonywania prostych zadań.
Hałas
| luz |
| 27 / 28 / 30 dB |
| obciążenie |
| 39 / 46 dB |
 | ||
30 dB cichy 40 dB(A) słyszalny 50 dB(A) irytujący |
||
min: | ||
| HP Pavilion Gaming 17-cd2146ng i5-11300H, GeForce RTX 3050 Ti Laptop GPU | Dell G15 5510-43NHT i5-10200H, GeForce RTX 3050 Ti Laptop GPU | Lenovo Ideapad Gaming 3 15IHU-82K1002RGE i5-11300H, GeForce RTX 3050 Ti Laptop GPU | HP Victus 16-e0145ng R5 5600H, GeForce RTX 3050 Ti Laptop GPU | HP Pavilion Gaming 17-cd0085cl i7-9750H, GeForce GTX 1660 Ti Max-Q | |
|---|---|---|---|---|---|
| Noise | -2% | 1% | -7% | 1% | |
| wyłączone / środowisko * (dB) | 25 | 25 -0% | 23.9 4% | 26 -4% | 28.2 -13% |
| Idle Minimum * (dB) | 27 | 25 7% | 23.9 11% | 26 4% | 30.1 -11% |
| Idle Average * (dB) | 28 | 25 11% | 26.8 4% | 28 -0% | 30.1 -8% |
| Idle Maximum * (dB) | 30 | 25 17% | 26.8 11% | 34 -13% | 30.1 -0% |
| Load Average * (dB) | 39 | 52.2 -34% | 43.5 -12% | 44 -13% | 34.2 12% |
| Witcher 3 ultra * (dB) | 44 | 43.5 1% | 48 -9% | 34.2 22% | |
| Load Maximum * (dB) | 46 | 52.2 -13% | 53.1 -15% | 53 -15% | 43.8 5% |
* ... im mniej tym lepiej
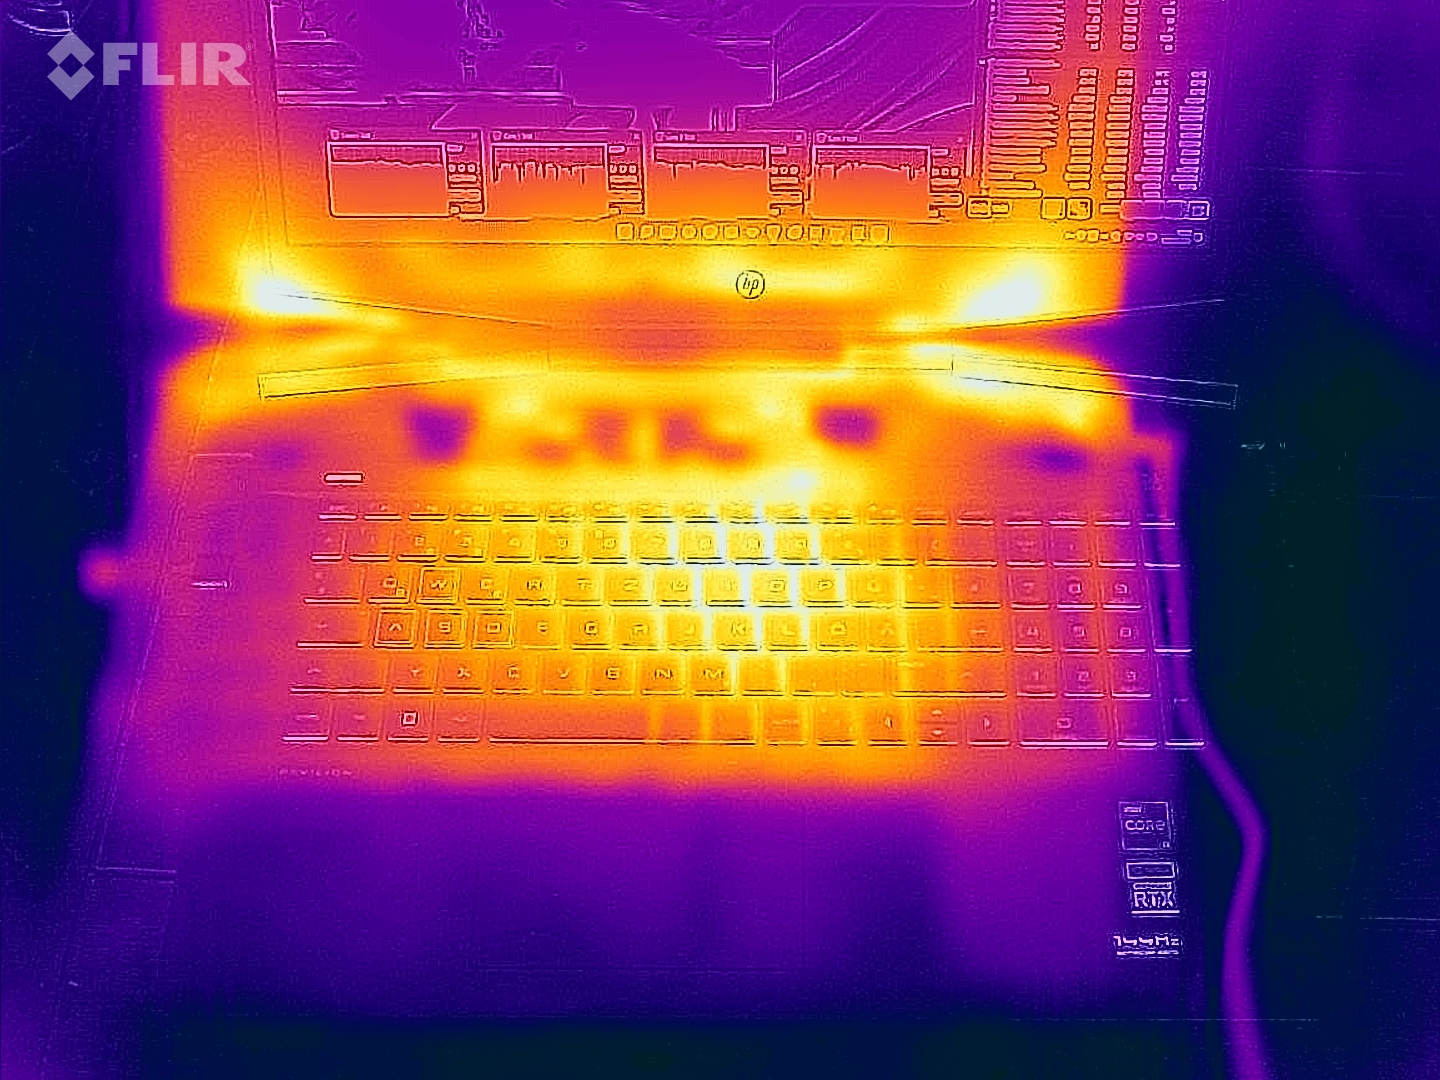
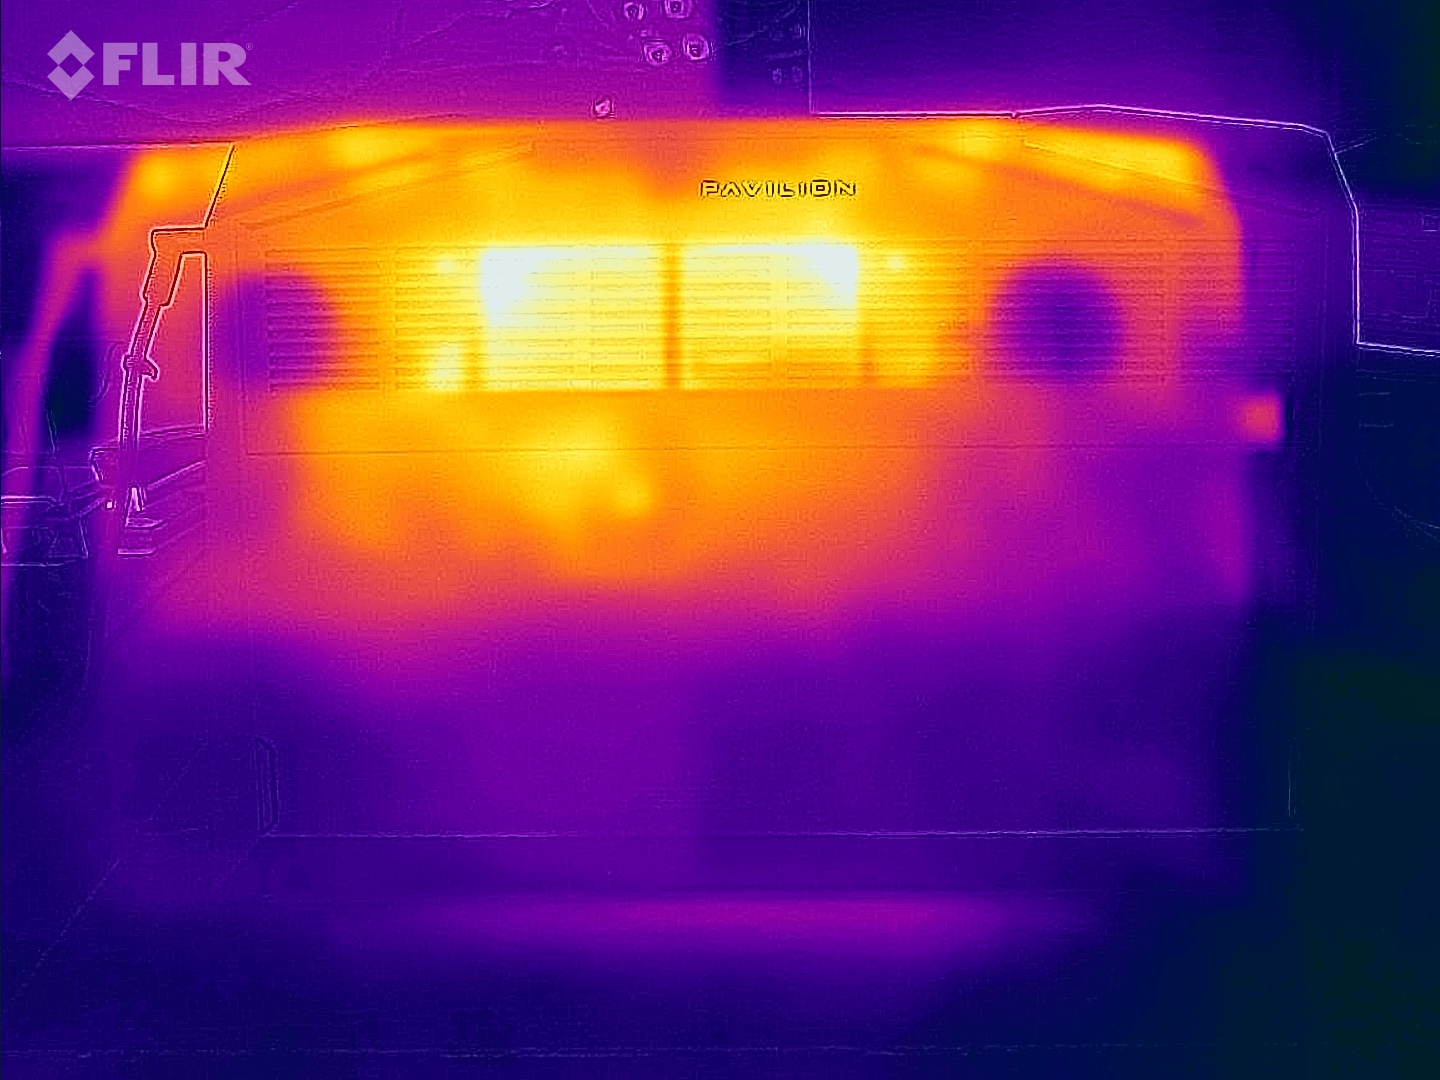
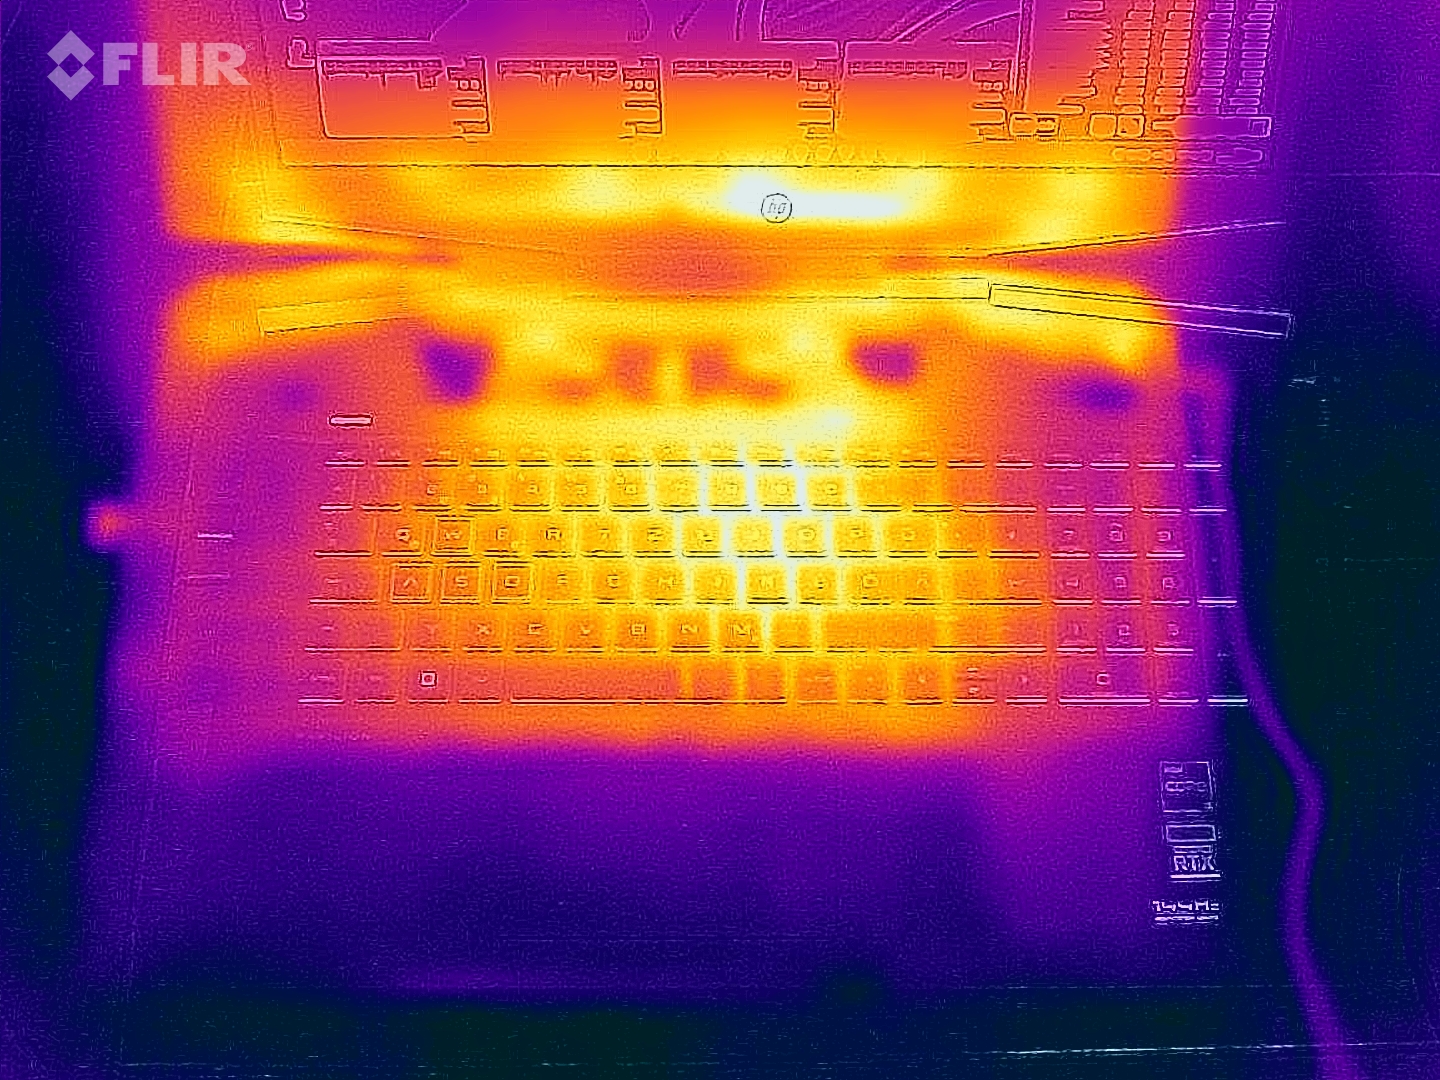
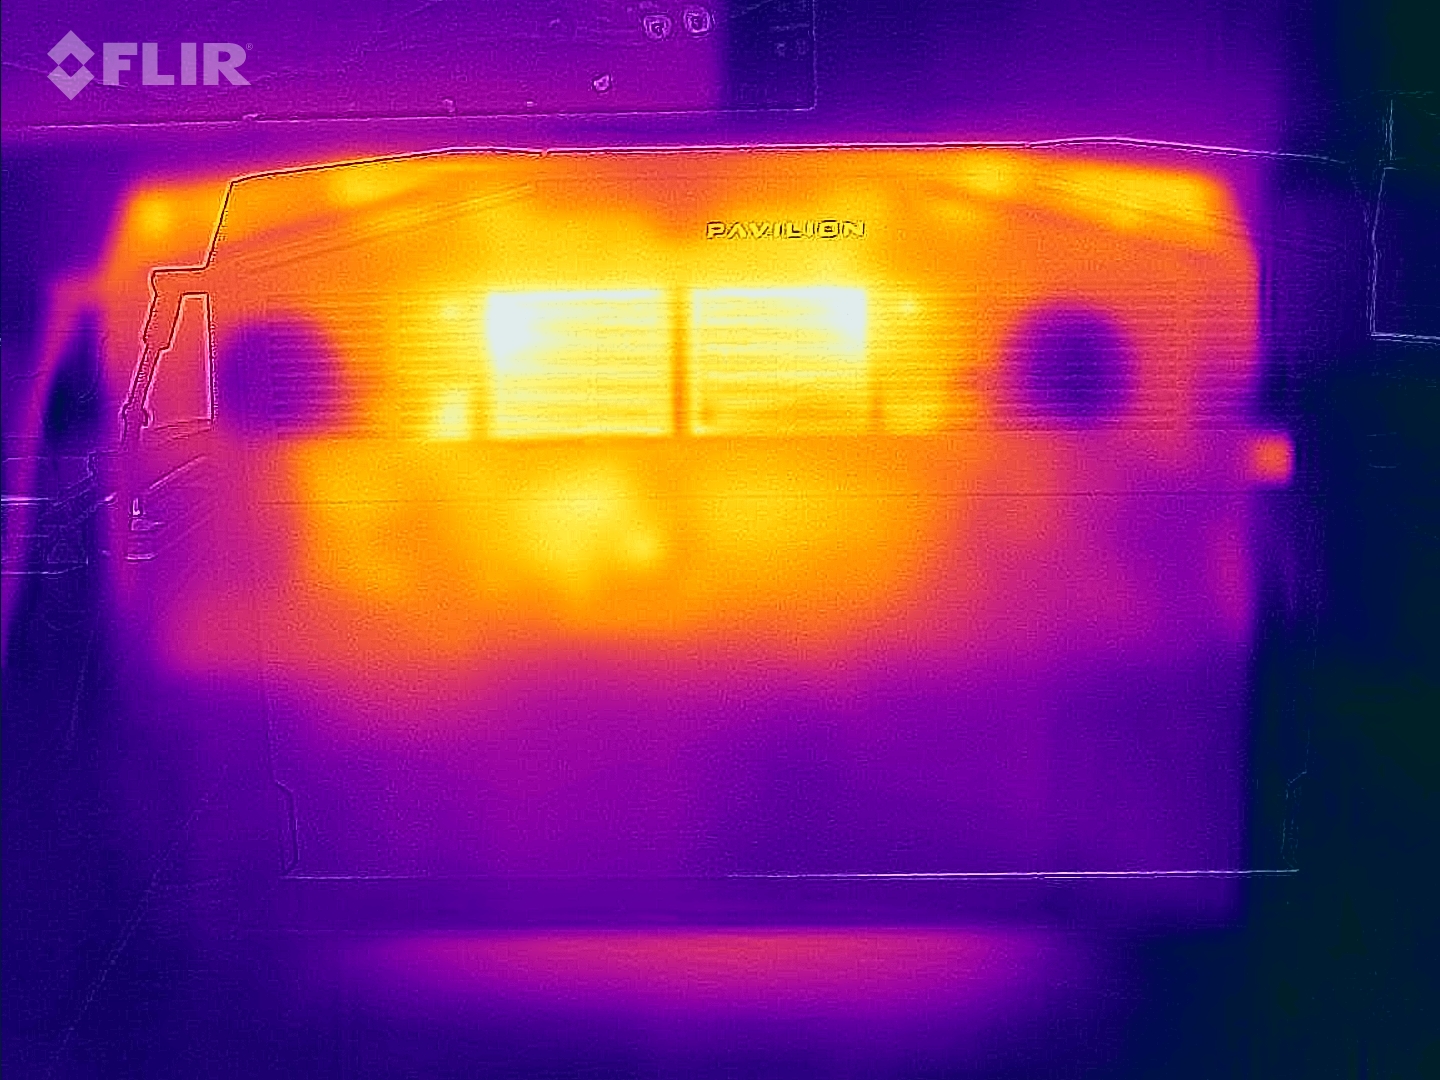
Temperatura
Rozwój cieplny Pavilion Gaming 17 również nie wykazuje niczego nadzwyczajnego. Maksymalnie 44 °C (~111 °F) na górze i 48 °C (~115 °F) na dole po 60 minutach testów w stresie za pomocą narzędzi FurMark i Prime95 są typowe dla wbudowanego sprzętu. W stanie spoczynku cała obudowa pozostaje poniżej granicy 30°C, co sprawia, że jest przyjemnie chłodna
(±) Maksymalna temperatura w górnej części wynosi 44 °C / 111 F, w porównaniu do średniej 40.4 °C / 105 F , począwszy od 21.2 do 68.8 °C dla klasy Gaming.
(-) Dno nagrzewa się maksymalnie do 48 °C / 118 F, w porównaniu do średniej 43.2 °C / 110 F
(+) W stanie bezczynności średnia temperatura górnej części wynosi 26.6 °C / 80 F, w porównaniu ze średnią temperaturą urządzenia wynoszącą 33.9 °C / ### class_avg_f### F.
(±) Podczas gry w Wiedźmina 3 średnia temperatura górnej części wynosi 36.2 °C / 97 F, w porównaniu do średniej temperatury urządzenia wynoszącej 33.9 °C / ## #class_avg_f### F.
(+) Podparcia dłoni i touchpad osiągają maksymalną temperaturę skóry (34 °C / 93.2 F) i dlatego nie są gorące.
(-) Średnia temperatura obszaru podparcia dłoni w podobnych urządzeniach wynosiła 28.8 °C / 83.8 F (-5.2 °C / -9.4 F).
| HP Pavilion Gaming 17-cd2146ng i5-11300H, GeForce RTX 3050 Ti Laptop GPU | Dell G15 5510-43NHT i5-10200H, GeForce RTX 3050 Ti Laptop GPU | Lenovo Ideapad Gaming 3 15IHU-82K1002RGE i5-11300H, GeForce RTX 3050 Ti Laptop GPU | HP Victus 16-e0145ng R5 5600H, GeForce RTX 3050 Ti Laptop GPU | HP Pavilion Gaming 17-cd0085cl i7-9750H, GeForce GTX 1660 Ti Max-Q | |
|---|---|---|---|---|---|
| Heat | -9% | 3% | -22% | -18% | |
| Maximum Upper Side * (°C) | 44 | 45.9 -4% | 43.2 2% | 54 -23% | 42.6 3% |
| Maximum Bottom * (°C) | 48 | 51.9 -8% | 47.9 -0% | 47 2% | 49 -2% |
| Idle Upper Side * (°C) | 27 | 30.1 -11% | 24.9 8% | 41 -52% | 34 -26% |
| Idle Bottom * (°C) | 27 | 30.1 -11% | 27 -0% | 31 -15% | 39.4 -46% |
* ... im mniej tym lepiej
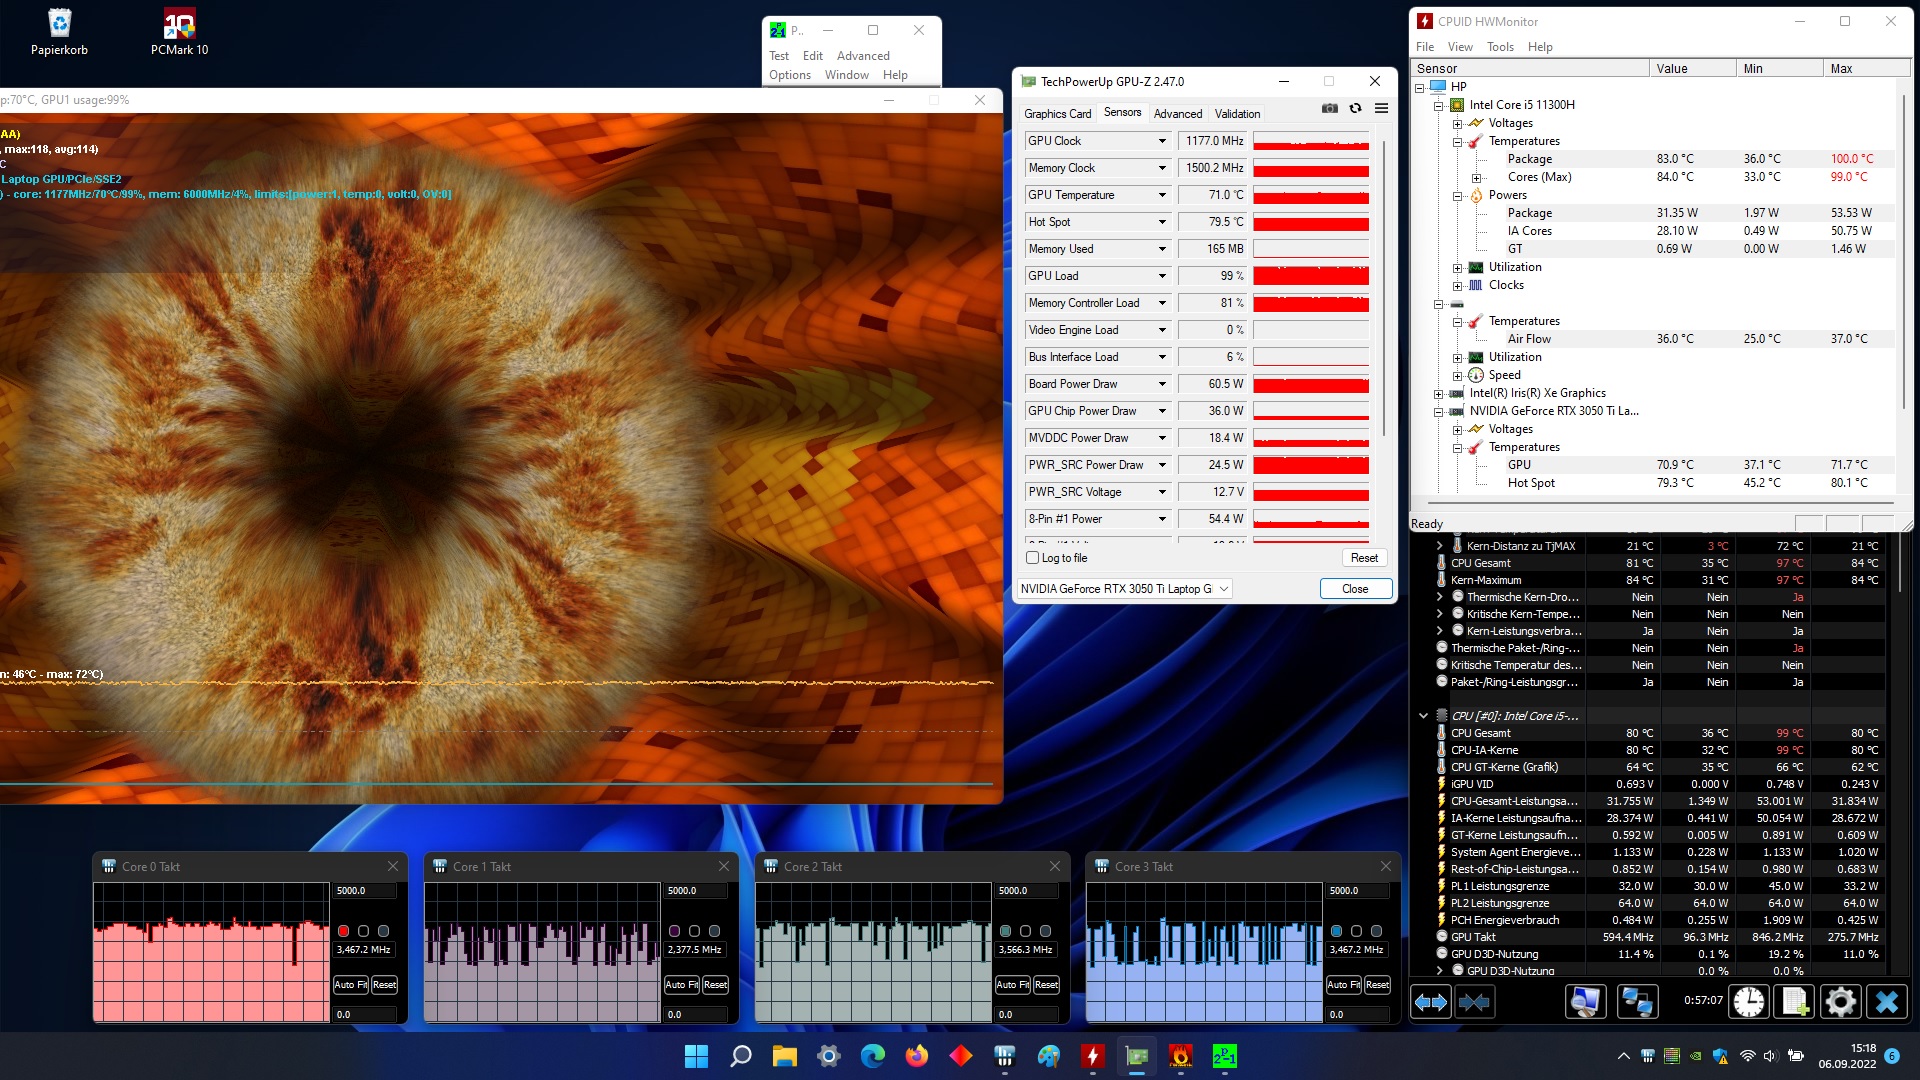
Test na stres
Podzespoły nie cierpią też z powodu przegrzania. Co prawda Core i5-11300H osiąga na krótko 100 °C (~212 °F) pod pełnym obciążeniem (według narzędzia HWMonitor), ale po chwili (przy przyzwoitej częstotliwości taktowania) temperatura osiada do akceptowalnych 83 °C (~181 °F). GeForce RTX 3050 Ti osiąga średnią temperaturę 71 °C (~160 °F), co również jest akceptowalną i nieszkodliwą wartością
Mówcy
HP Pavilion Gaming 17-cd2146ng analiza dźwięku
(±) | głośność głośnika jest średnia, ale dobra (80 dB)
Bas 100 - 315 Hz
(-) | prawie brak basu - średnio 19.5% niższa od mediany
(±) | liniowość basu jest średnia (11.5% delta do poprzedniej częstotliwości)
Średnie 400 - 2000 Hz
(+) | zbalansowane środki średnie - tylko 3.2% od mediany
(+) | średnie są liniowe (3.8% delta do poprzedniej częstotliwości)
Wysokie 2–16 kHz
(±) | wyższe maksima - średnio 8.6% wyższe od mediany
(±) | liniowość wysokich wartości jest średnia (8% delta do poprzedniej częstotliwości)
Ogólnie 100 - 16.000 Hz
(±) | liniowość ogólnego dźwięku jest średnia (20.5% różnicy w stosunku do mediany)
W porównaniu do tej samej klasy
» 73% wszystkich testowanych urządzeń w tej klasie było lepszych, 5% podobnych, 22% gorszych
» Najlepszy miał deltę 6%, średnia wynosiła ###średnia###%, najgorsza wynosiła 132%
W porównaniu do wszystkich testowanych urządzeń
» 54% wszystkich testowanych urządzeń było lepszych, 8% podobnych, 38% gorszych
» Najlepszy miał deltę 4%, średnia wynosiła ###średnia###%, najgorsza wynosiła 134%
HP Victus 16-e0145ng analiza dźwięku
(±) | głośność głośnika jest średnia, ale dobra (79 dB)
Bas 100 - 315 Hz
(-) | prawie brak basu - średnio 21% niższa od mediany
(±) | liniowość basu jest średnia (12.6% delta do poprzedniej częstotliwości)
Średnie 400 - 2000 Hz
(+) | zbalansowane środki średnie - tylko 1.1% od mediany
(+) | średnie są liniowe (3.6% delta do poprzedniej częstotliwości)
Wysokie 2–16 kHz
(+) | zrównoważone maksima - tylko 4.2% od mediany
(+) | wzloty są liniowe (5.3% delta do poprzedniej częstotliwości)
Ogólnie 100 - 16.000 Hz
(±) | liniowość ogólnego dźwięku jest średnia (16.2% różnicy w stosunku do mediany)
W porównaniu do tej samej klasy
» 40% wszystkich testowanych urządzeń w tej klasie było lepszych, 7% podobnych, 54% gorszych
» Najlepszy miał deltę 6%, średnia wynosiła ###średnia###%, najgorsza wynosiła 132%
W porównaniu do wszystkich testowanych urządzeń
» 26% wszystkich testowanych urządzeń było lepszych, 6% podobnych, 68% gorszych
» Najlepszy miał deltę 4%, średnia wynosiła ###średnia###%, najgorsza wynosiła 134%
Zarządzanie energią
| wyłączony / stan wstrzymania | |
| luz | |
| obciążenie |
|
Legenda:
min: | |
| HP Pavilion Gaming 17-cd2146ng i5-11300H, GeForce RTX 3050 Ti Laptop GPU | Dell G15 5510-43NHT i5-10200H, GeForce RTX 3050 Ti Laptop GPU | Lenovo Ideapad Gaming 3 15IHU-82K1002RGE i5-11300H, GeForce RTX 3050 Ti Laptop GPU | HP Victus 16-e0145ng R5 5600H, GeForce RTX 3050 Ti Laptop GPU | HP Pavilion Gaming 17-cd0085cl i7-9750H, GeForce GTX 1660 Ti Max-Q | Średnia w klasie Gaming | |
|---|---|---|---|---|---|---|
| Power Consumption | -13% | -4% | -28% | -12% | -111% | |
| Idle Minimum * (Watt) | 3 | 4.6 -53% | 4.9 -63% | 7 -133% | 5.4 -80% | 13.2 ? -340% |
| Idle Average * (Watt) | 8 | 6.5 19% | 8.3 -4% | 9 -13% | 9.2 -15% | 18.9 ? -136% |
| Idle Maximum * (Watt) | 28 | 10.1 64% | 8.9 68% | 15 46% | 13 54% | 24.3 ? 13% |
| Load Average * (Watt) | 88 | 129 -47% | 81 8% | 93 -6% | 85.9 2% | 108 ? -23% |
| Witcher 3 ultra * (Watt) | 98.2 | 129 -31% | 119 -21% | 134.5 -37% | 107.9 -10% | |
| Load Maximum * (Watt) | 152 | 195 -28% | 172 -13% | 185 -22% | 182.2 -20% | 254 ? -67% |
* ... im mniej tym lepiej
Energy consumption during The Witcher 3 / stress test
Energy consumption with an external monitor
Żywotność baterii
Nie do końca rozumiemy decyzję HP o zamontowaniu 2,5-calowego gniazda zamiast większej baterii. 52.5 Wh to raczej skromny wynik, co staje się również zauważalne w czasach pracy na baterii. Niecałe 5 godzin przeglądania internetu przez Wi-Fi przy średniej jasności nie jest już w dzisiejszych czasach powodem do świętowania. Konkurencja jest tu nieco do przodu
| HP Pavilion Gaming 17-cd2146ng i5-11300H, GeForce RTX 3050 Ti Laptop GPU, 52.5 Wh | Dell G15 5510-43NHT i5-10200H, GeForce RTX 3050 Ti Laptop GPU, 56 Wh | Lenovo Ideapad Gaming 3 15IHU-82K1002RGE i5-11300H, GeForce RTX 3050 Ti Laptop GPU, 45 Wh | HP Victus 16-e0145ng R5 5600H, GeForce RTX 3050 Ti Laptop GPU, 70 Wh | HP Pavilion Gaming 17-cd0085cl i7-9750H, GeForce GTX 1660 Ti Max-Q, 52.5 Wh | Średnia w klasie Gaming | |
|---|---|---|---|---|---|---|
| Czasy pracy | 26% | 32% | 42% | 14% | 40% | |
| WiFi v1.3 (h) | 5 | 6.3 26% | 6.6 32% | 7.1 42% | 5.7 14% | 7.02 ? 40% |
| H.264 (h) | 8.6 | 7.7 | 8.26 ? | |||
| Load (h) | 1.1 | 1.1 | 1 | 1.47 ? | ||
| Reader / Idle (h) | 11.6 | 8.71 ? |
Za
Przeciw
Werdykt
HP oferuje dobry budżetowy laptop do gier o nazwie Pavilion Gaming 17-cd2146ng.
W przeciwieństwie do większości konkurentów 17-calowy laptop ma zaskakująco dobry wyświetlacz, któremu nie brakuje kontrastu ani przestrzeni barwnej. Jasność i czasy reakcji są również stosunkowo dobre.
17-calowiec nie wyróżnia się pozytywnie ani negatywnie z tłumu w pozostałych kategoriach - niezależnie od tego, czy chodzi o urządzenia wejściowe, obudowę, porty, emisję czy jakość dźwięku.
W związku z tym trudno się pomylić, kupując Pavilion Gaming 17. Poniżej 1000 euro (~$1,002), urządzenie jest bardzo atrakcyjną i wskazaną opcją dla świadomych ceny graczy.
Cena i dostępność
W chwili pisania naszej recenzji konfiguracja nie wydaje się być dostępna w Stanach Zjednoczonych. Niemniej jednak, możecie mieć oko na Amazon i zobaczyć, czy urządzenie pojawi się tutaj.
HP Pavilion Gaming 17-cd2146ng
- 10/09/2022 v7 (old)
Florian Glaser
Price comparison

