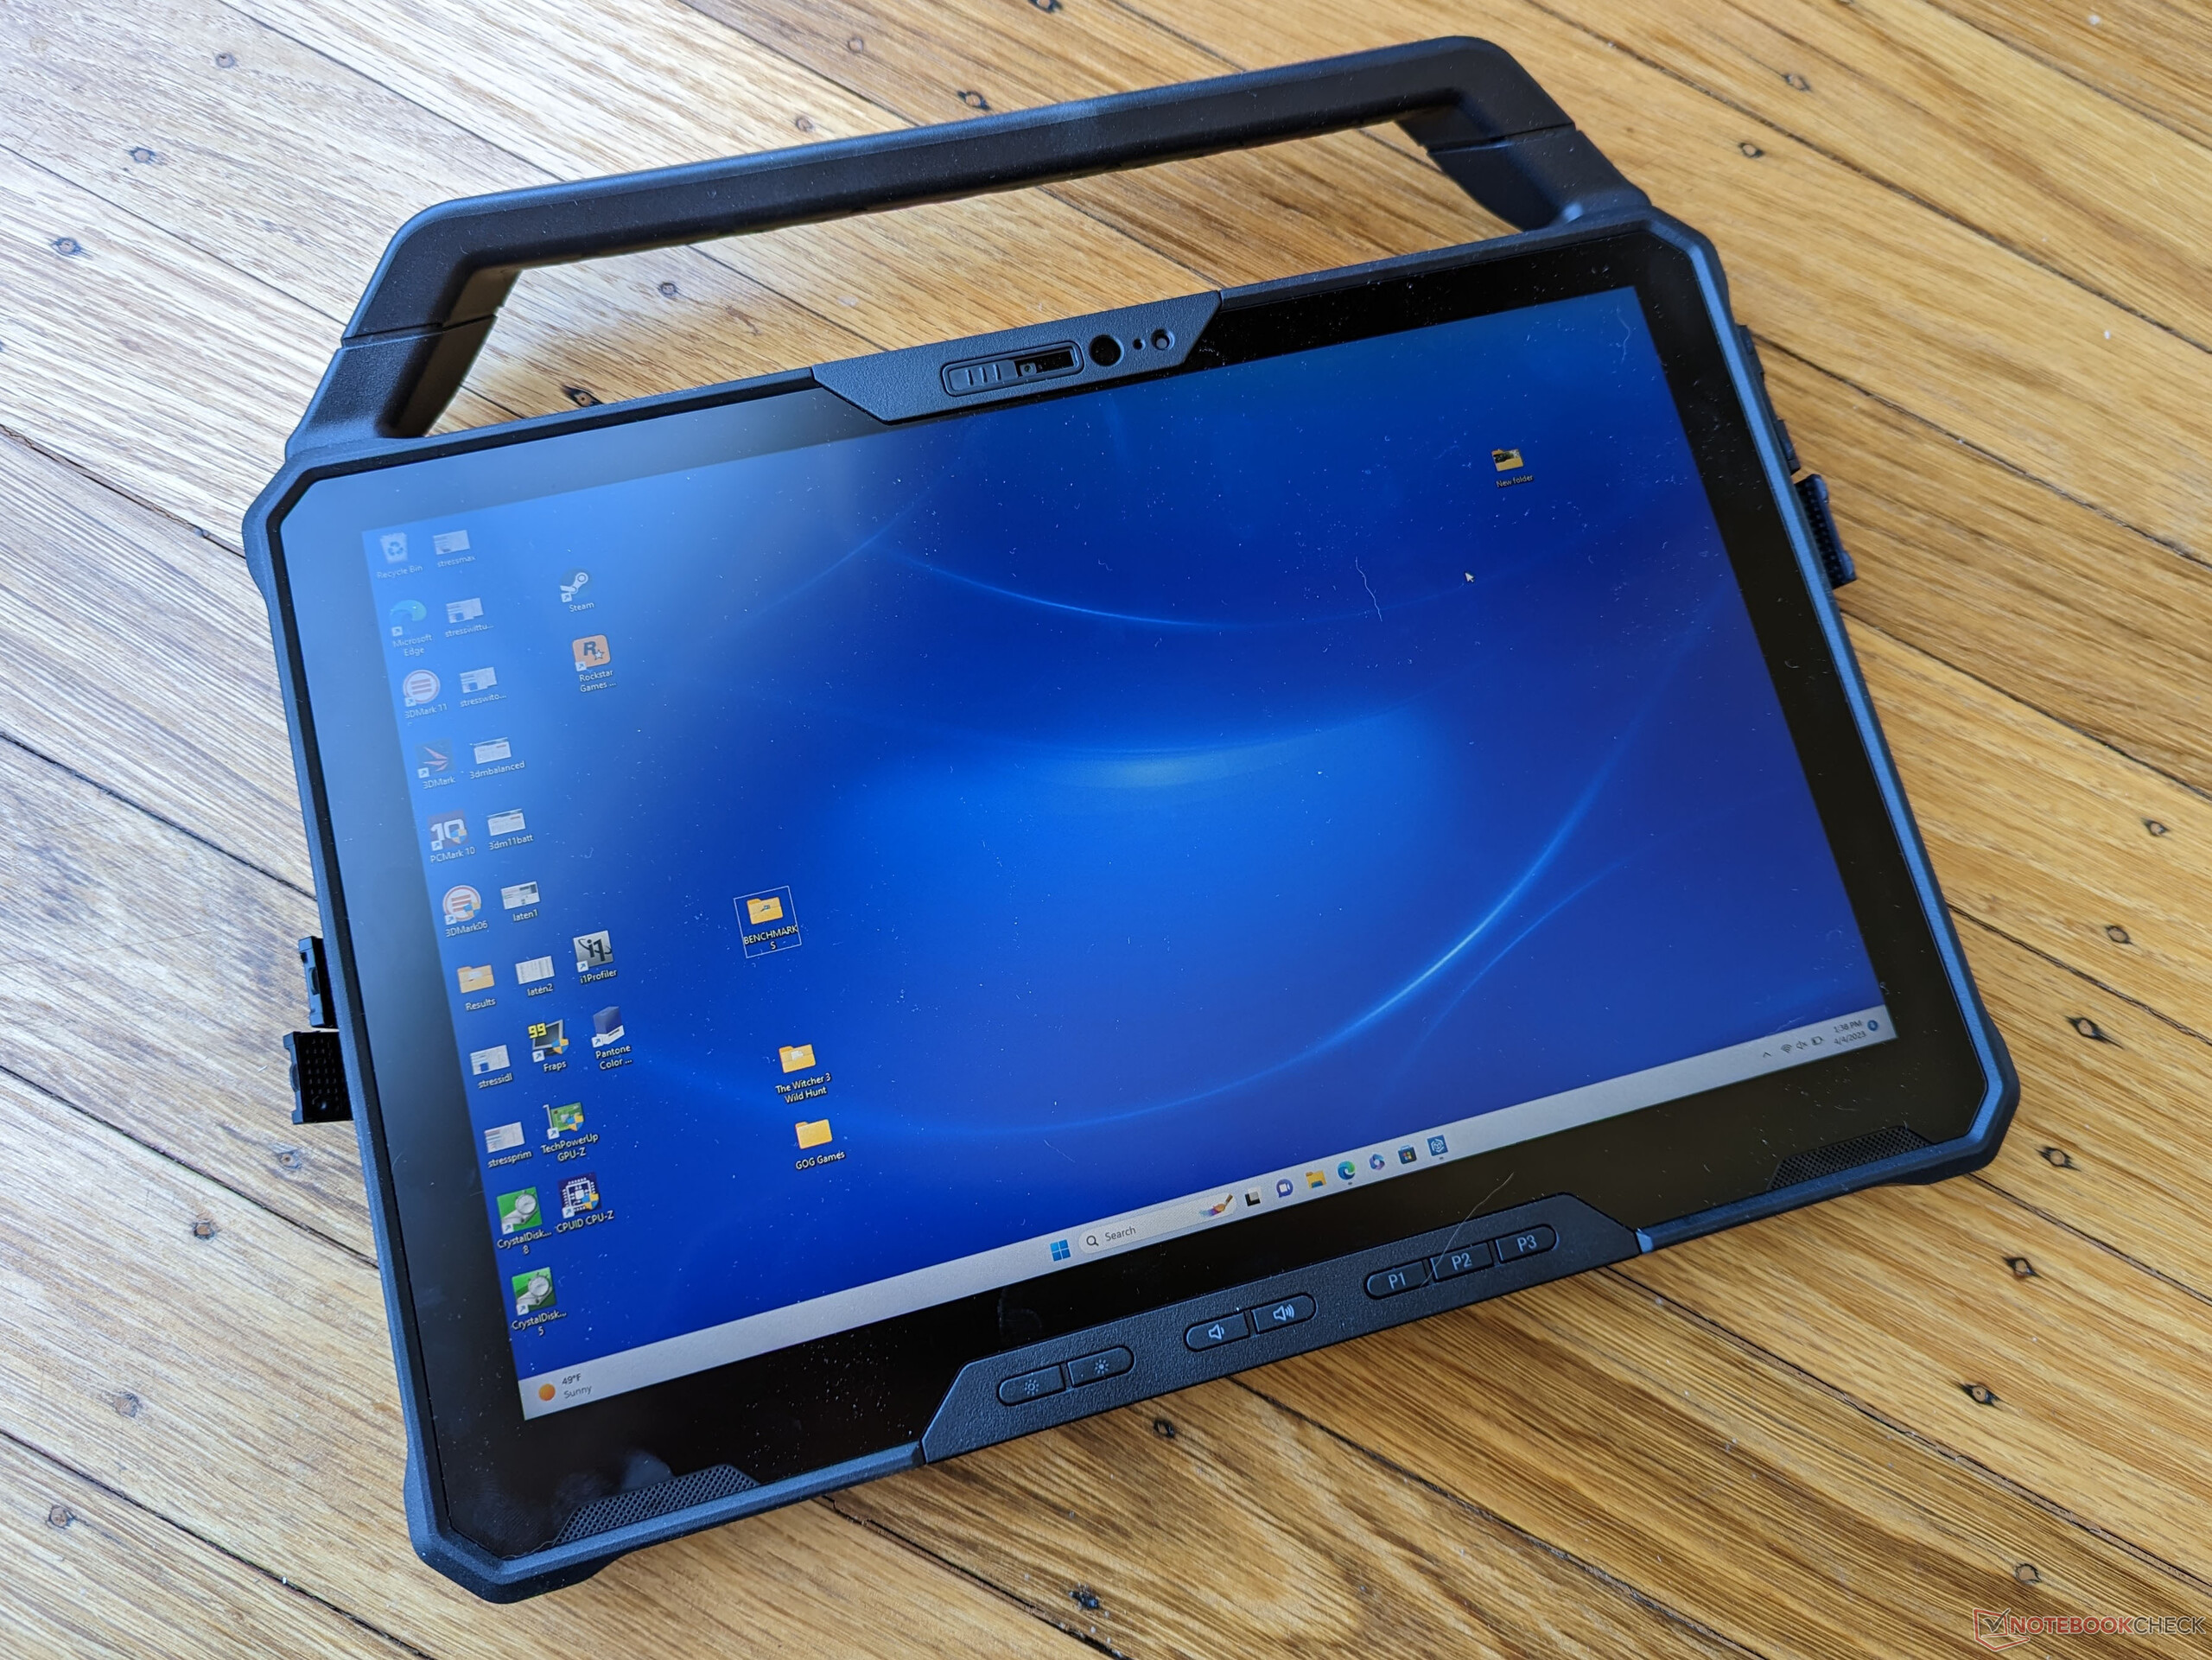
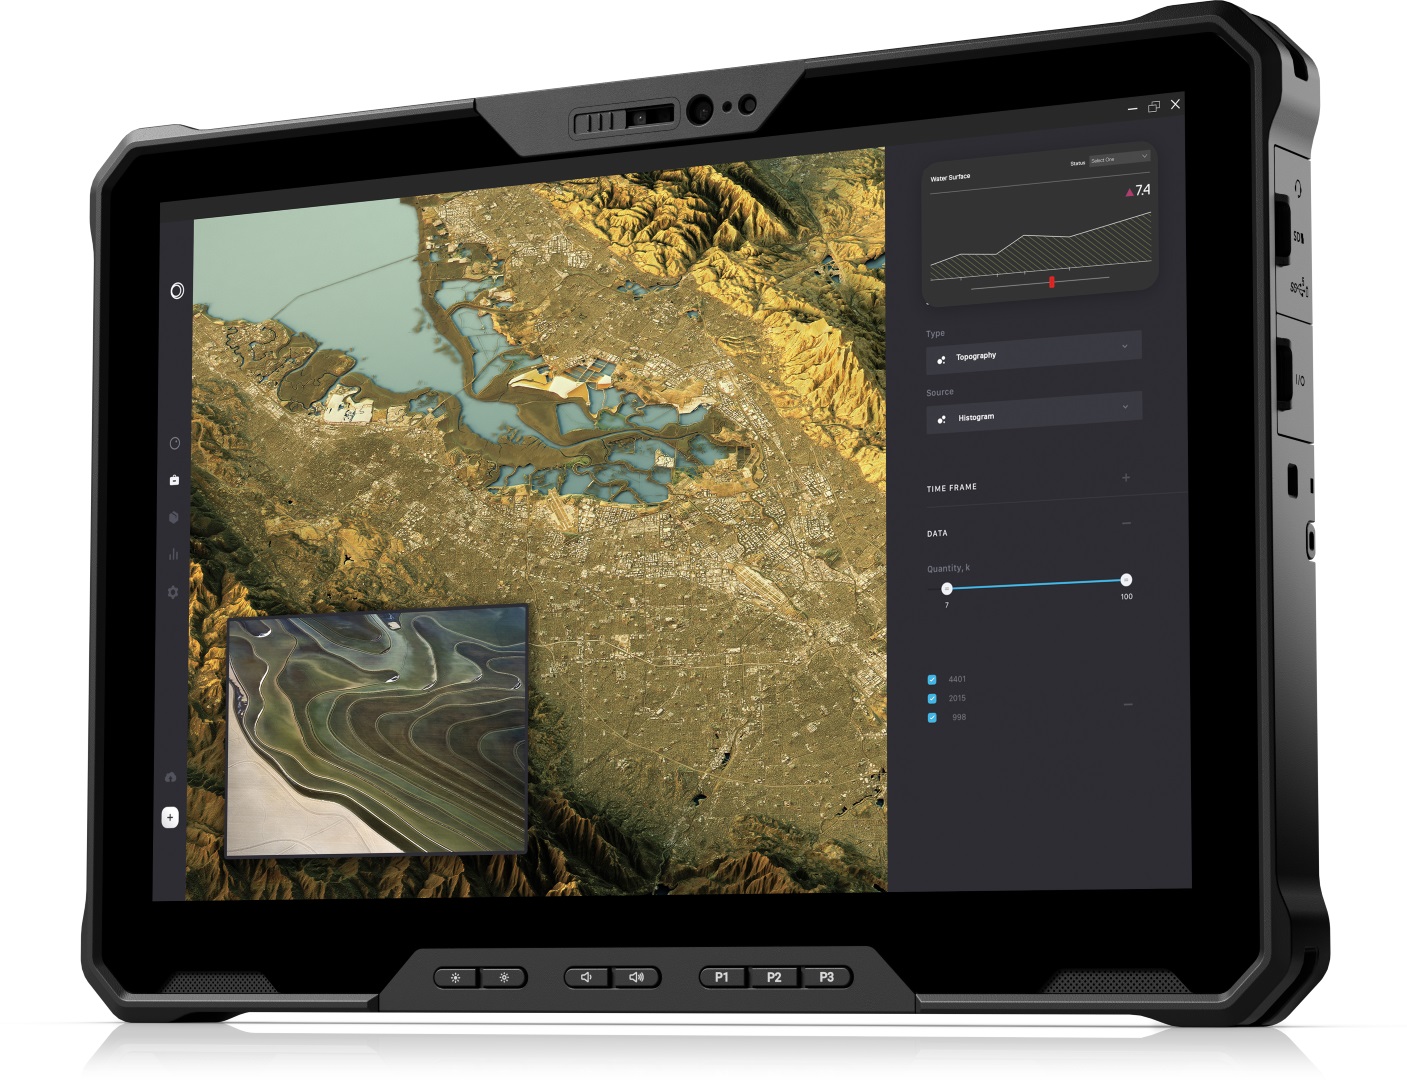
Recenzja tabletu Dell Latitude 7230 Rugged Extreme: Jeden z najlepszych wyświetlaczy w swojej kategorii

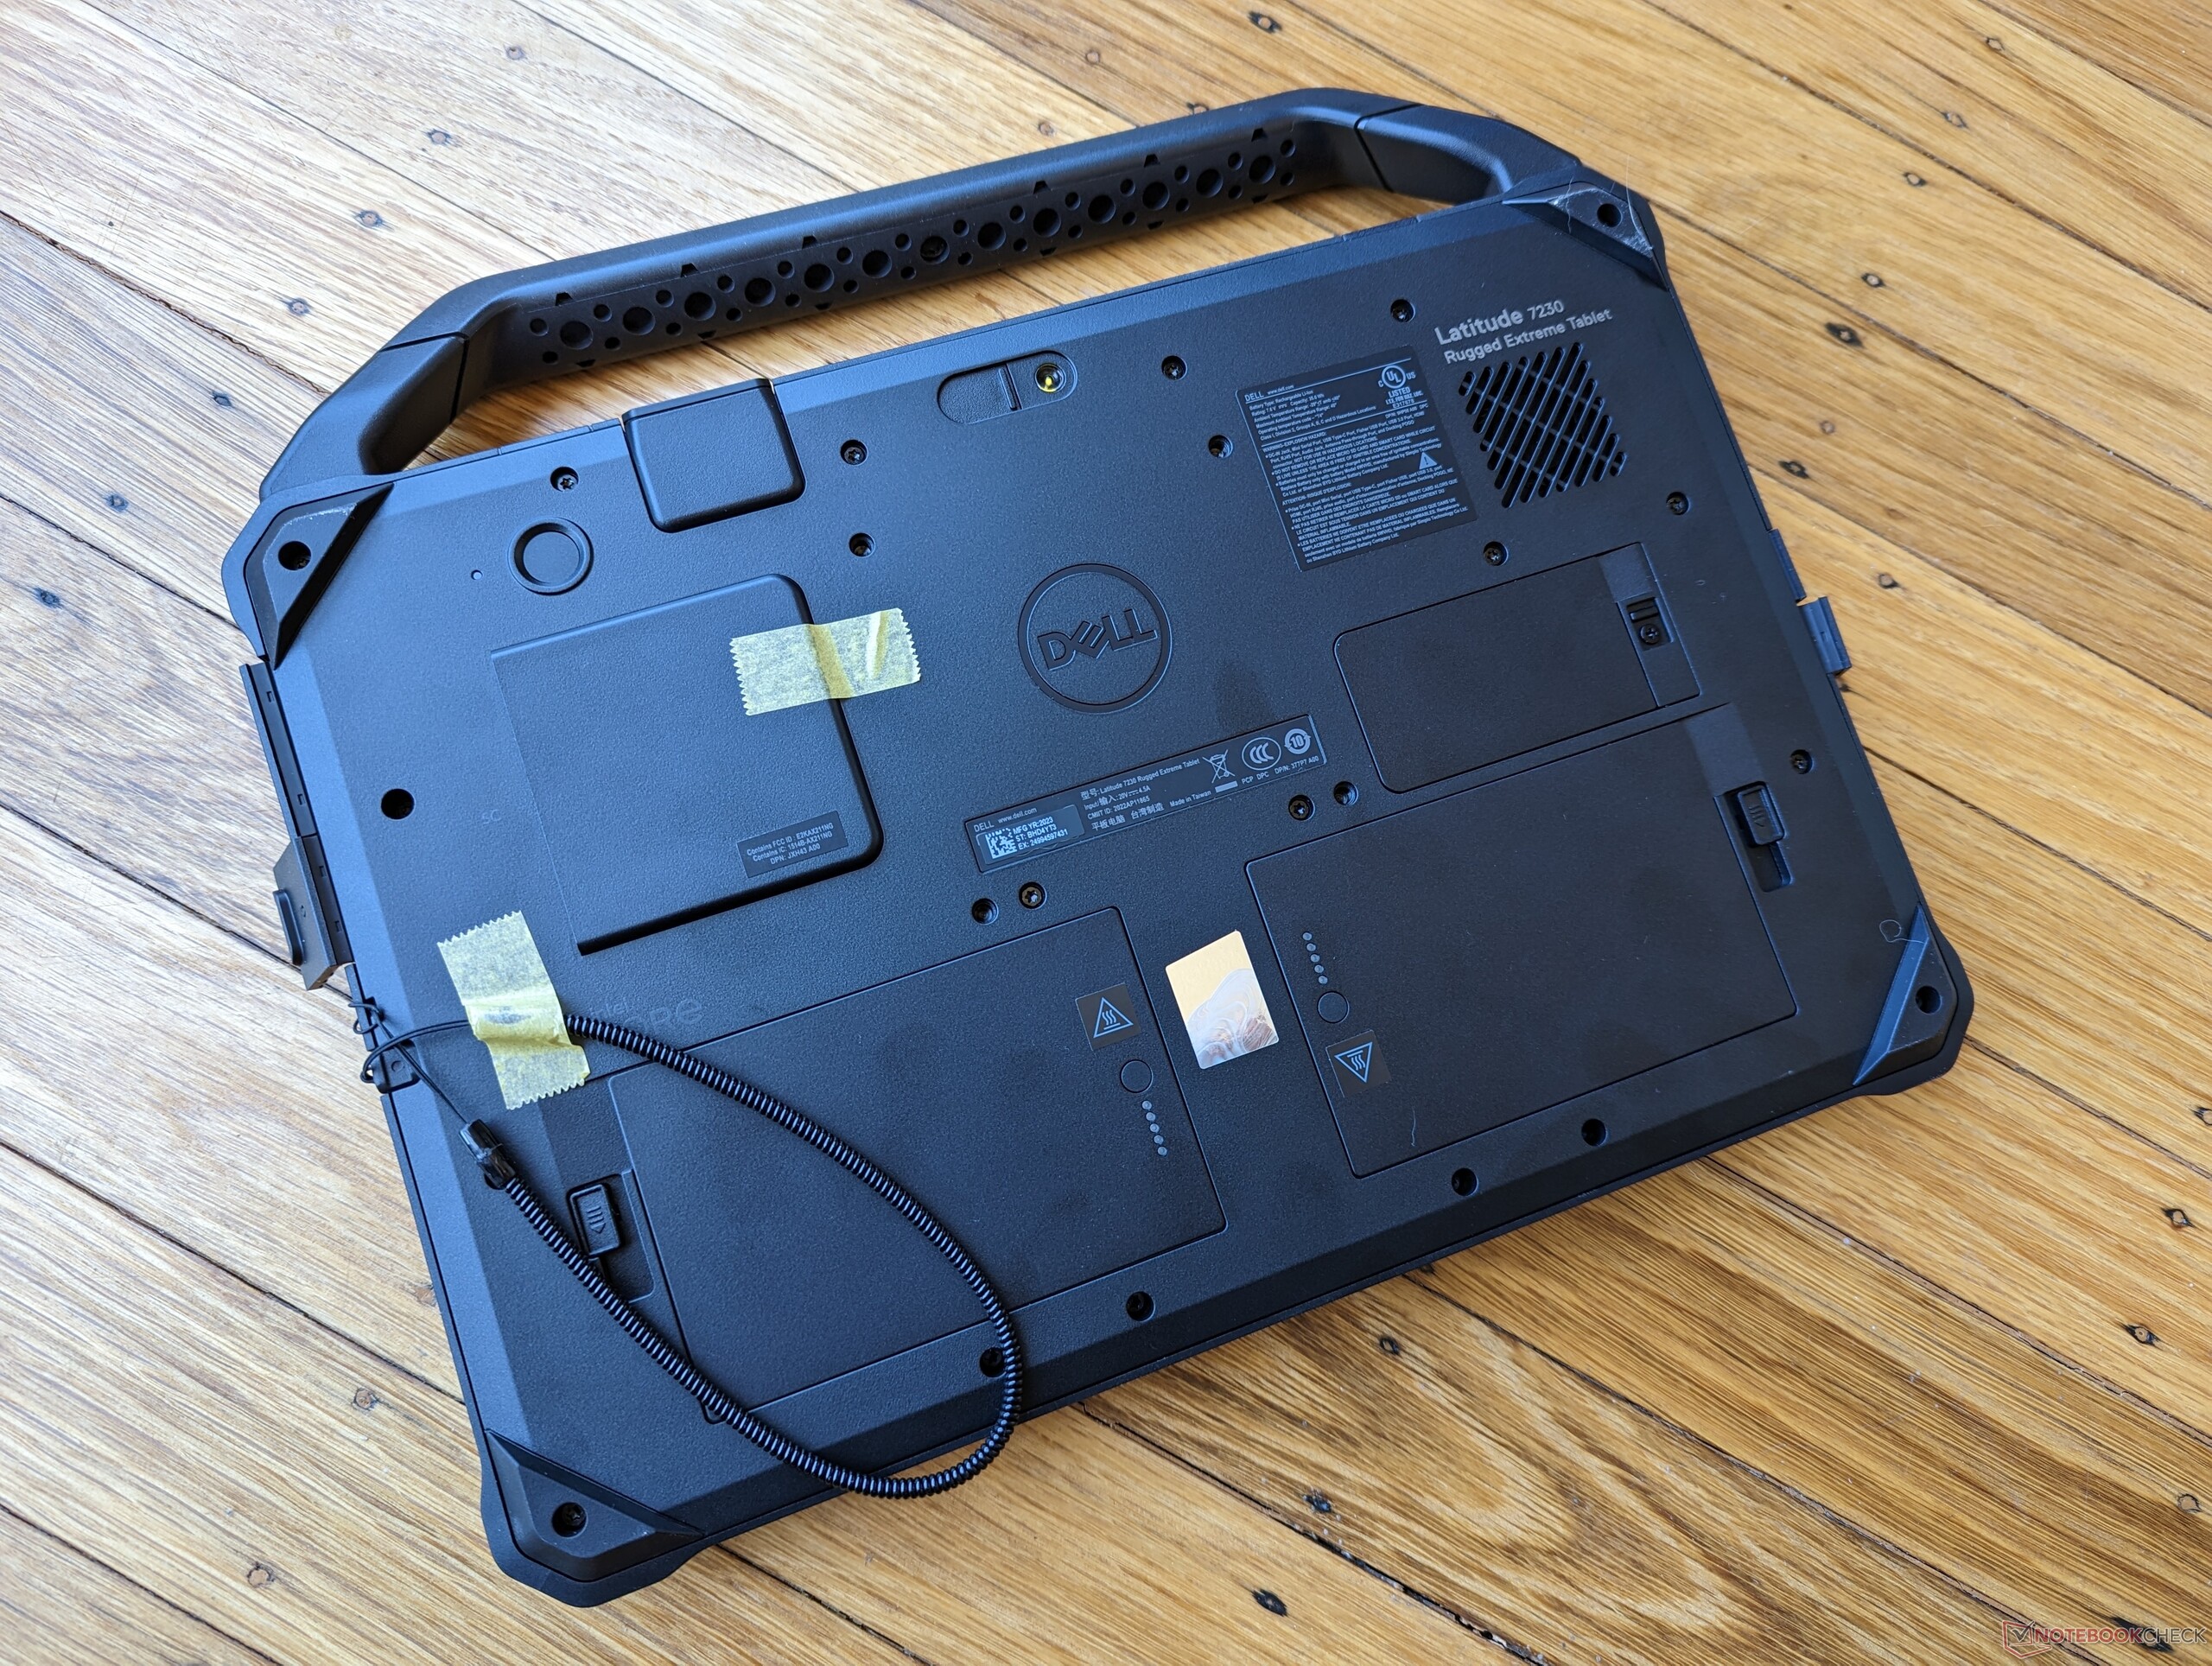
Model Latitude 7230 Rugged Extreme został zapowiedziany w Październiku ubiegłego roku jako następca modelu Latitude 7220 Rugged Extreme. Wprowadza zaktualizowaną obudowę z większym rozmiarem ekranu (11,6 cala do 12 cali), szybsze opcje procesorów Intel (8 gen. do 12 gen.) i szybsze opcje łączności (Wi-Fi 6 do 6E, 5G).
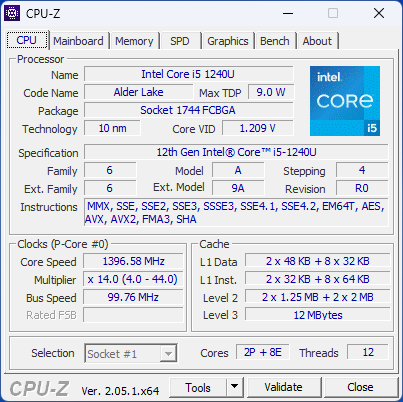
Nasz egzemplarz w recenzji w SKU midrange z Core i5-1240U, 16 GB RAM i 512 GB NVMe SSD za około 3200 USD. Inne jednostki SKU są dostępne z wolniejszym Core i3-1210U, szybszym i7-1260U, większą ilością RAM lub pamięci masowej oraz innymi rozszerzeniami. Wszystkie konfiguracje są wyposażone w ten sam ekran dotykowy IPS o rozdzielczości 1920 x 1200 1200 nitów. Pełna specyfikacja modelu Latitude 7230 Rugged Extreme jest publicznie dostępna na stronie Dell tutaj.
Alternatywne rozwiązania to m.in Acer Enduro T1, Samsung Galaxy Tab Activelub Panasonic Toughbook FZ-G2.
Więcej recenzji Della:
Potencjalni konkurenci w porównaniu
Ocena | Data | Model | Waga | Wysokość | Rozmiar | Rezolucja | Cena |
|---|---|---|---|---|---|---|---|
| 83.9 % v7 (old) | 04/2023 | Dell Latitude 7230 Rugged Extreme i5-1240U, Iris Xe G7 80EUs | 1.6 kg | 23.9 mm | 12.00" | 1920x1200 | |
v (old) | Dell Latitude 7330 Rugged Extreme i7-1185G7, Iris Xe G7 96EUs | 2.7 kg | 36.5 mm | 13.30" | 1920x1080 | ||
v (old) | 10/2024 | Panasonic Toughbook 40 i7-1185G7, Iris Xe G7 96EUs | 3.9 kg | 53.4 mm | 14.00" | 1920x1080 | |
| 83.8 % v7 (old) | Getac B360 i7-10710U, UHD Graphics 620 | 2.4 kg | 34.9 mm | 13.30" | 1920x1080 | ||
| 82.4 % v7 (old) | Acer Enduro Urban N3 EUN314 i7-1165G7, Iris Xe G7 96EUs | 1.8 kg | 21.95 mm | 14.00" | 1920x1080 | ||
v (old) | Durabook S14I i7-1165G7, Iris Xe G7 96EUs | 3 kg | 38.1 mm | 14.00" | 1920x1080 |
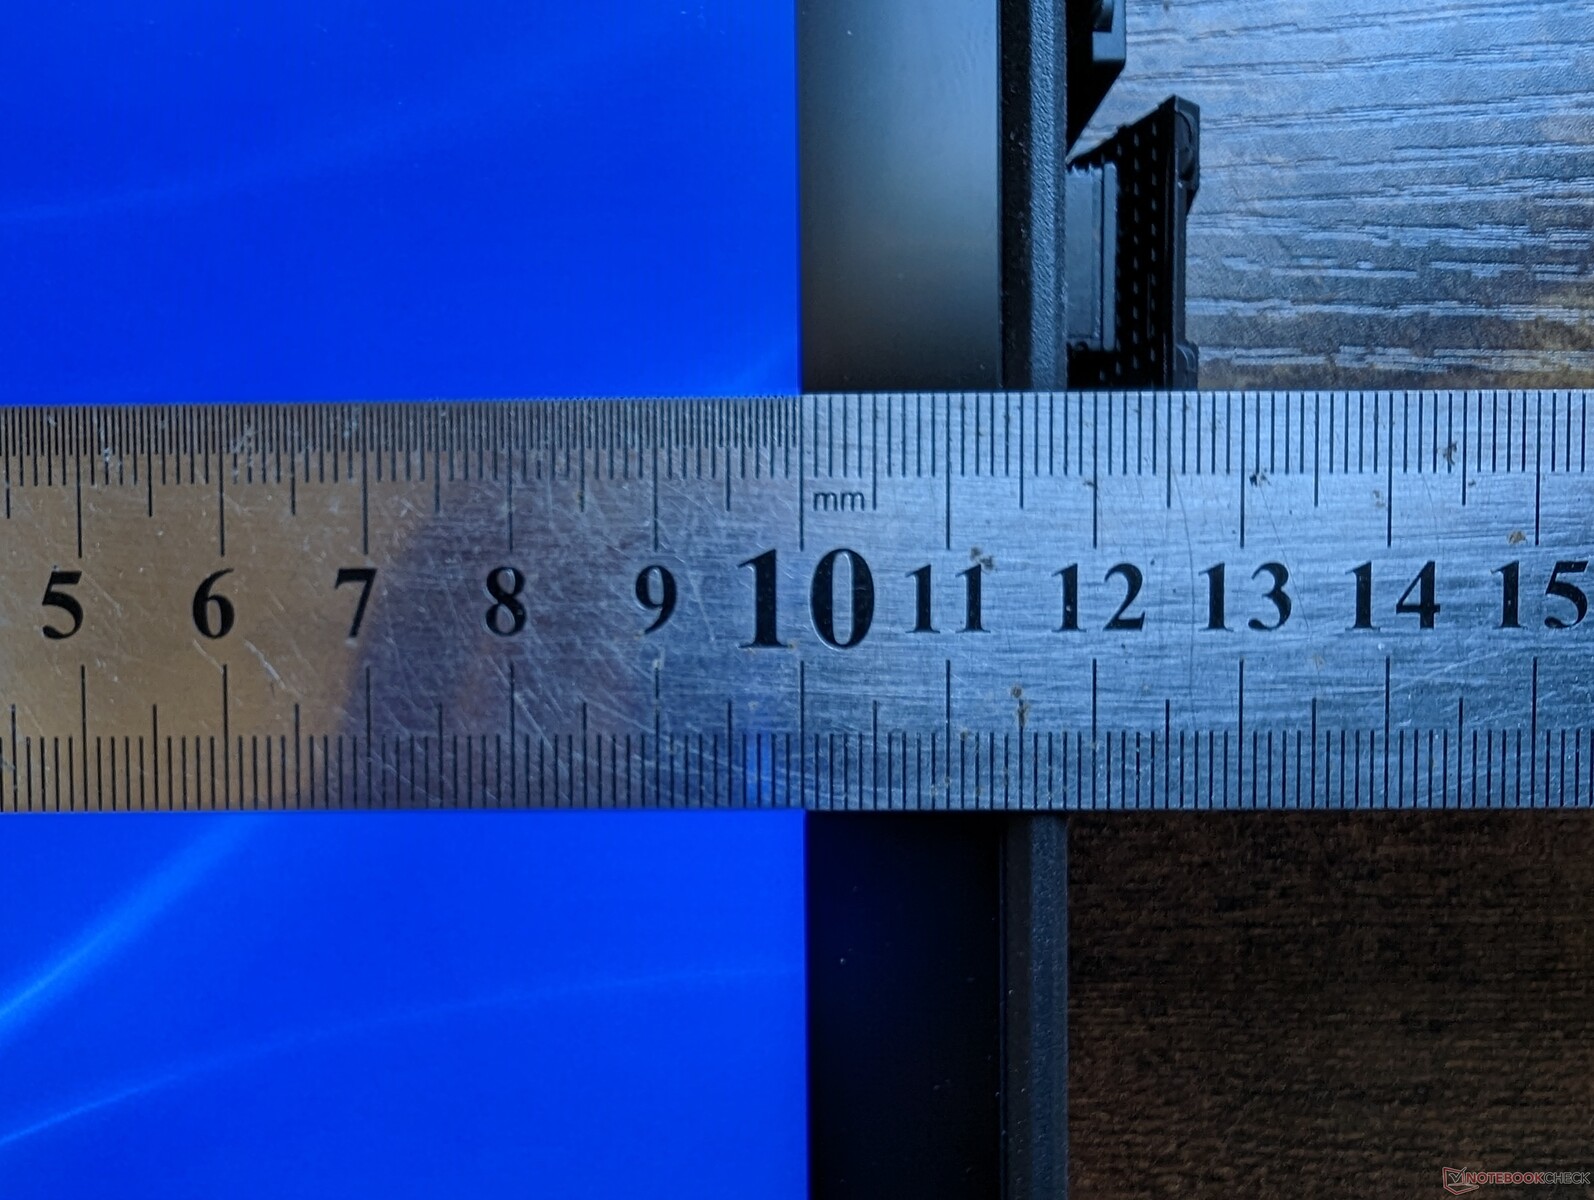
Obudowa - gruba, ze stosunkowo wąskimi ramkami
Obudowa jest solidna pod każdym kątem, zwłaszcza wzdłuż gumowanych krawędzi i narożników. Jego najsłabszym punktem jest bezpośrednio na środku ekranu dotykowego, gdzie wypaczenie jest zauważalne przy mocnym naciśnięciu palcem. To nie jest wielki problem, czy coś, ale każdy wypaczenia jest warte wspomnienia mimo wszystko.
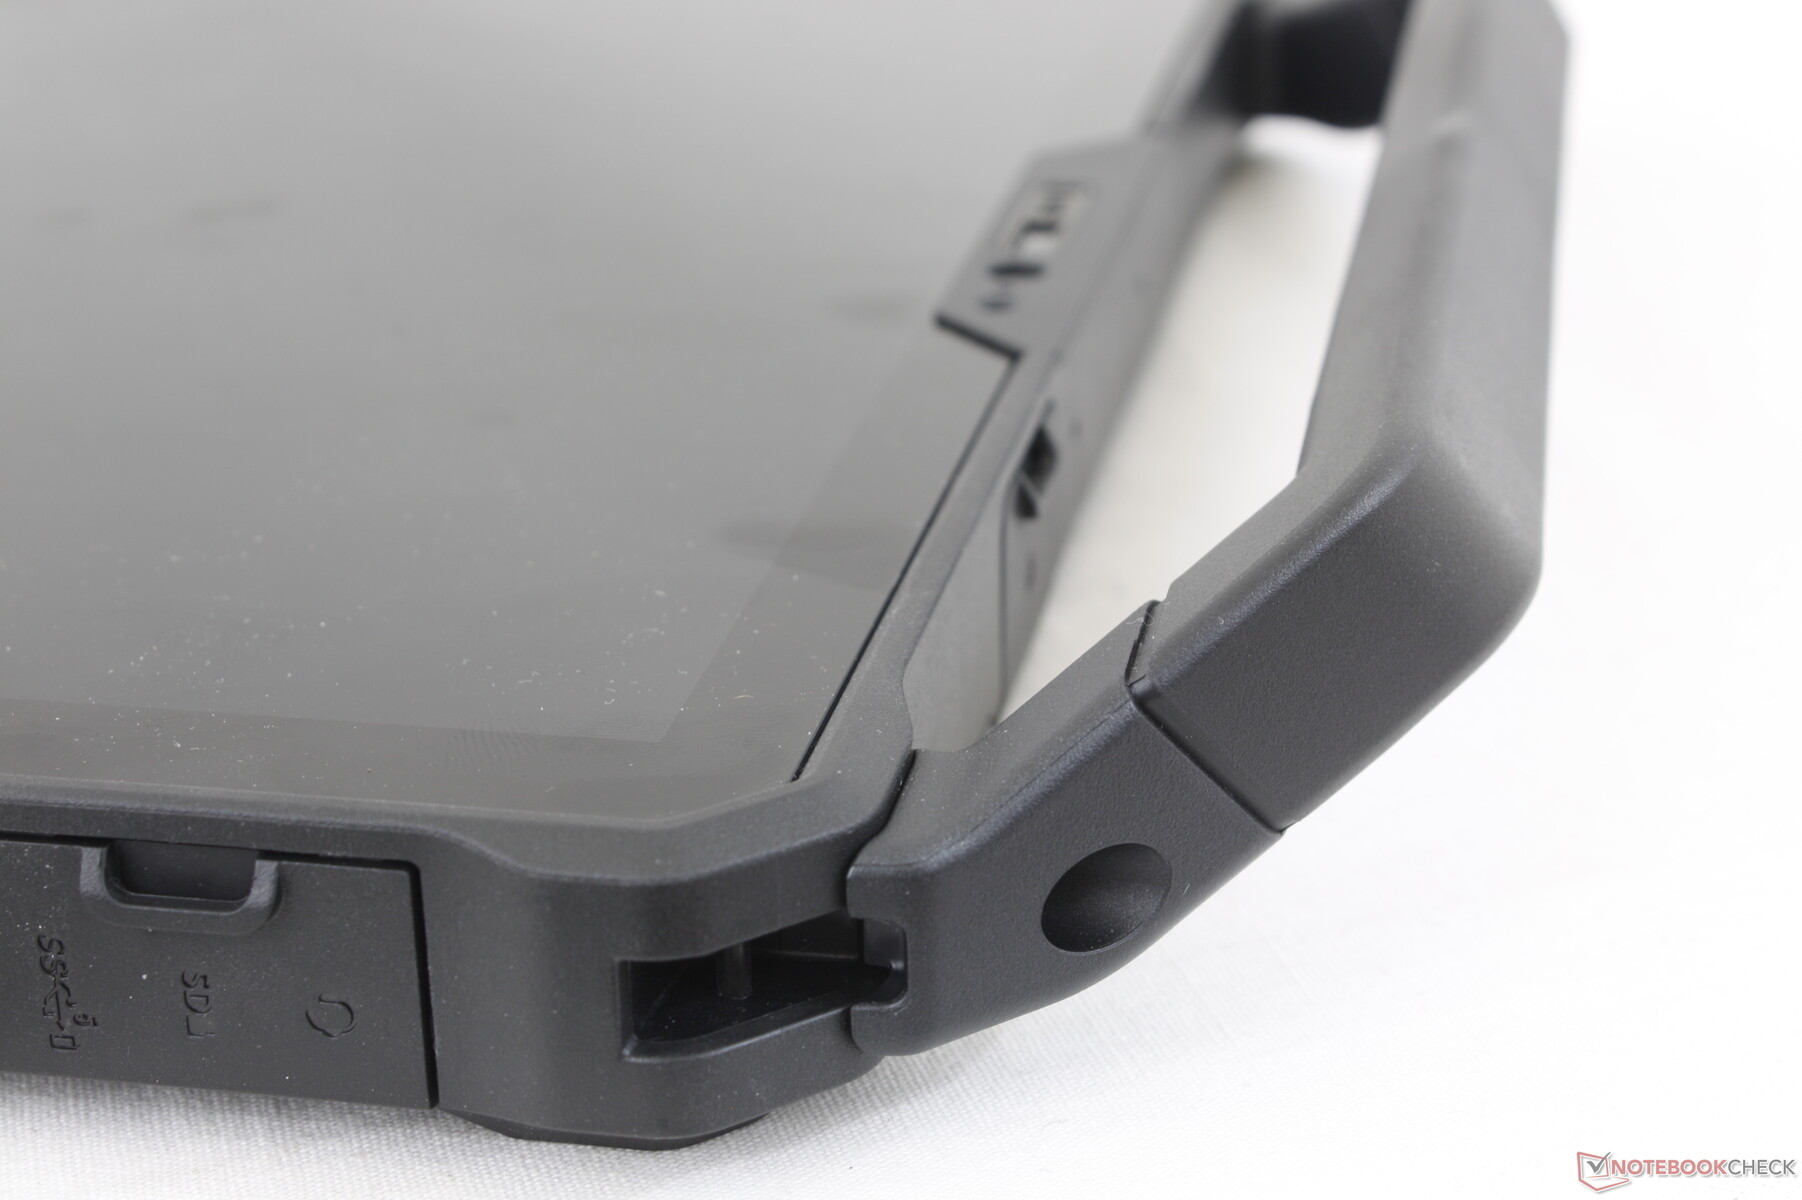
Niektóre irytujące aspekty obudowy obejmują nieprzewidywalne osłony portów i gąbczaste przyciski frontowe. Pokrywy portów są trudne do uchwycenia, a skróty przycisków mogłyby być nieco bardziej podatne na naciskanie. Konkurencyjny Toughbook FZ-G2 radzi sobie pod tym względem nieco lepiej.
Ważąc około 1,6 kg wraz z dwoma wymiennymi bateriami, urządzenie jest jednym z lżejszych tabletów w swojej kategorii. Długość i szerokość są wygodnie bardzo zbliżone do standardu DIN A4, nie biorąc pod uwagę zdejmowanego uchwytu do przenoszenia.
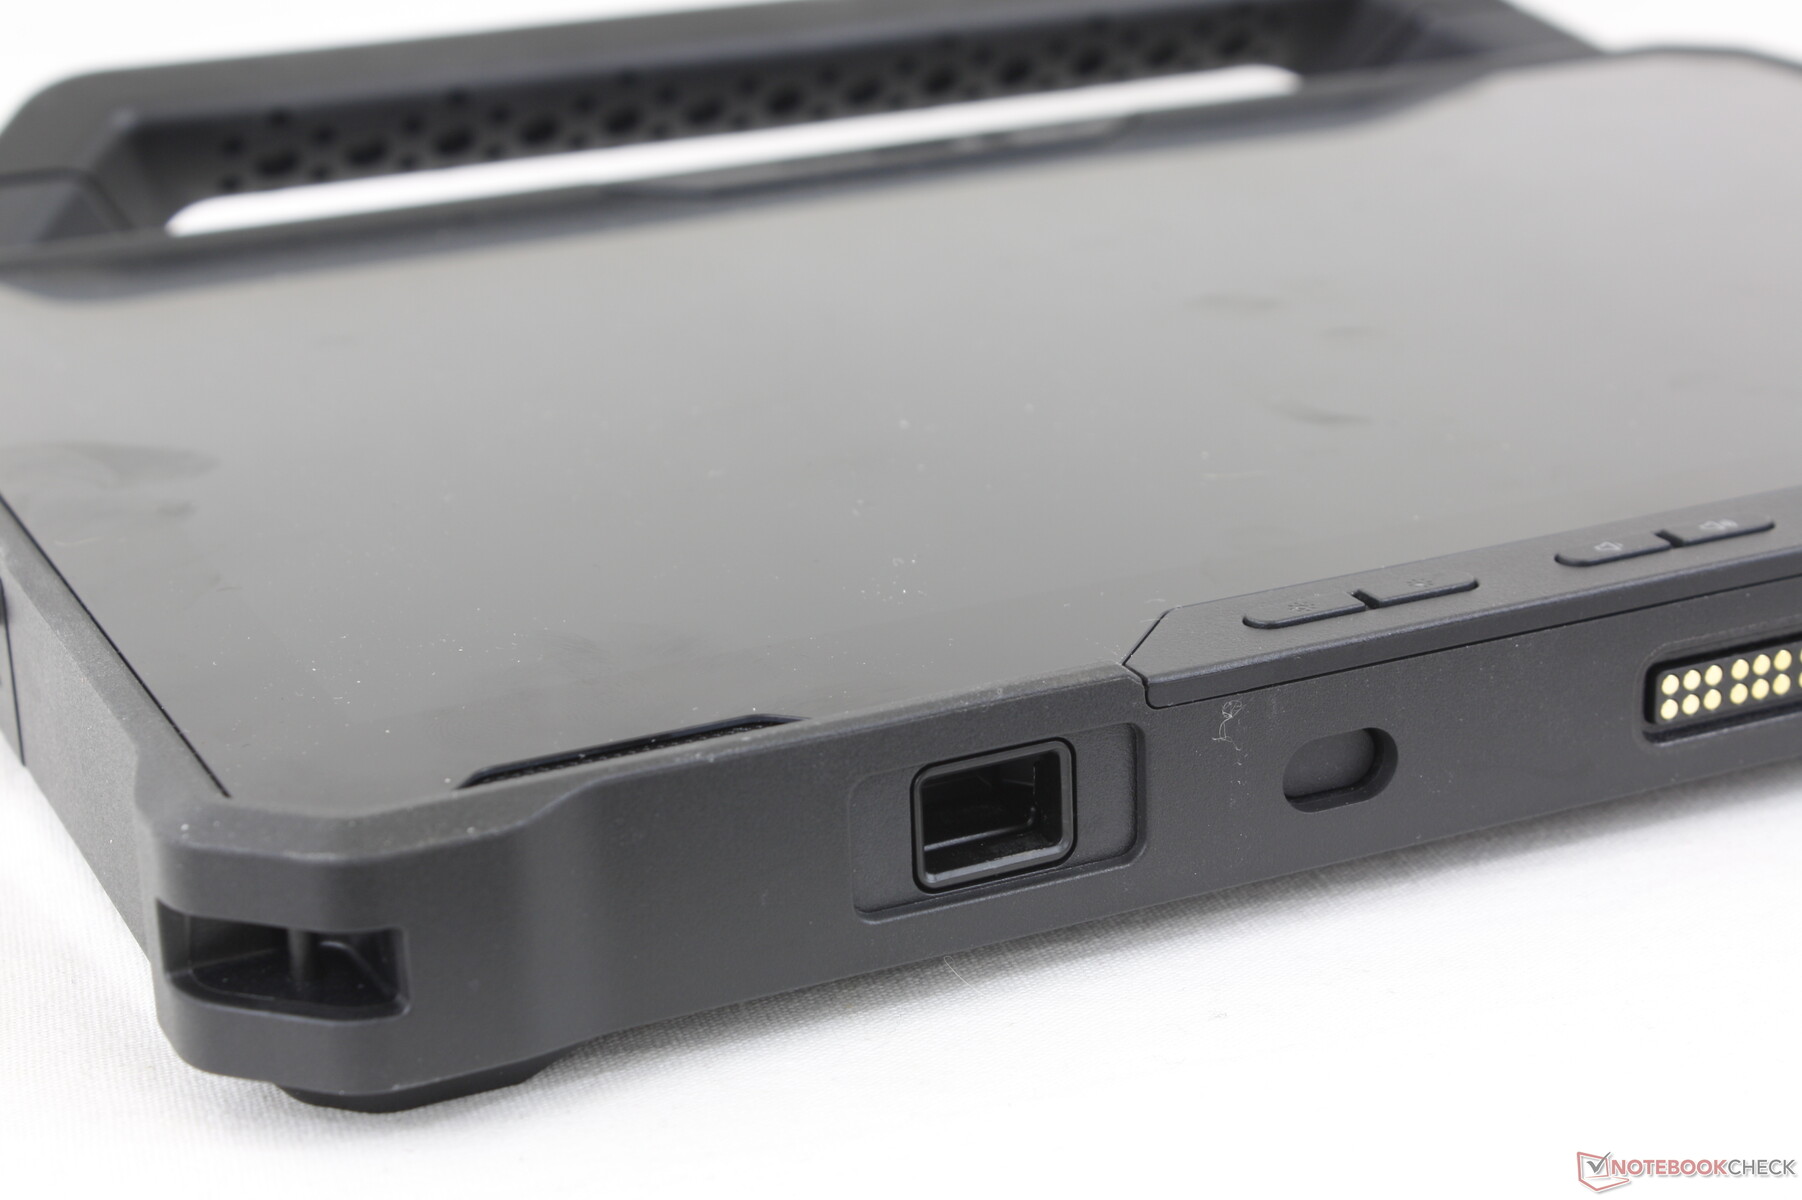
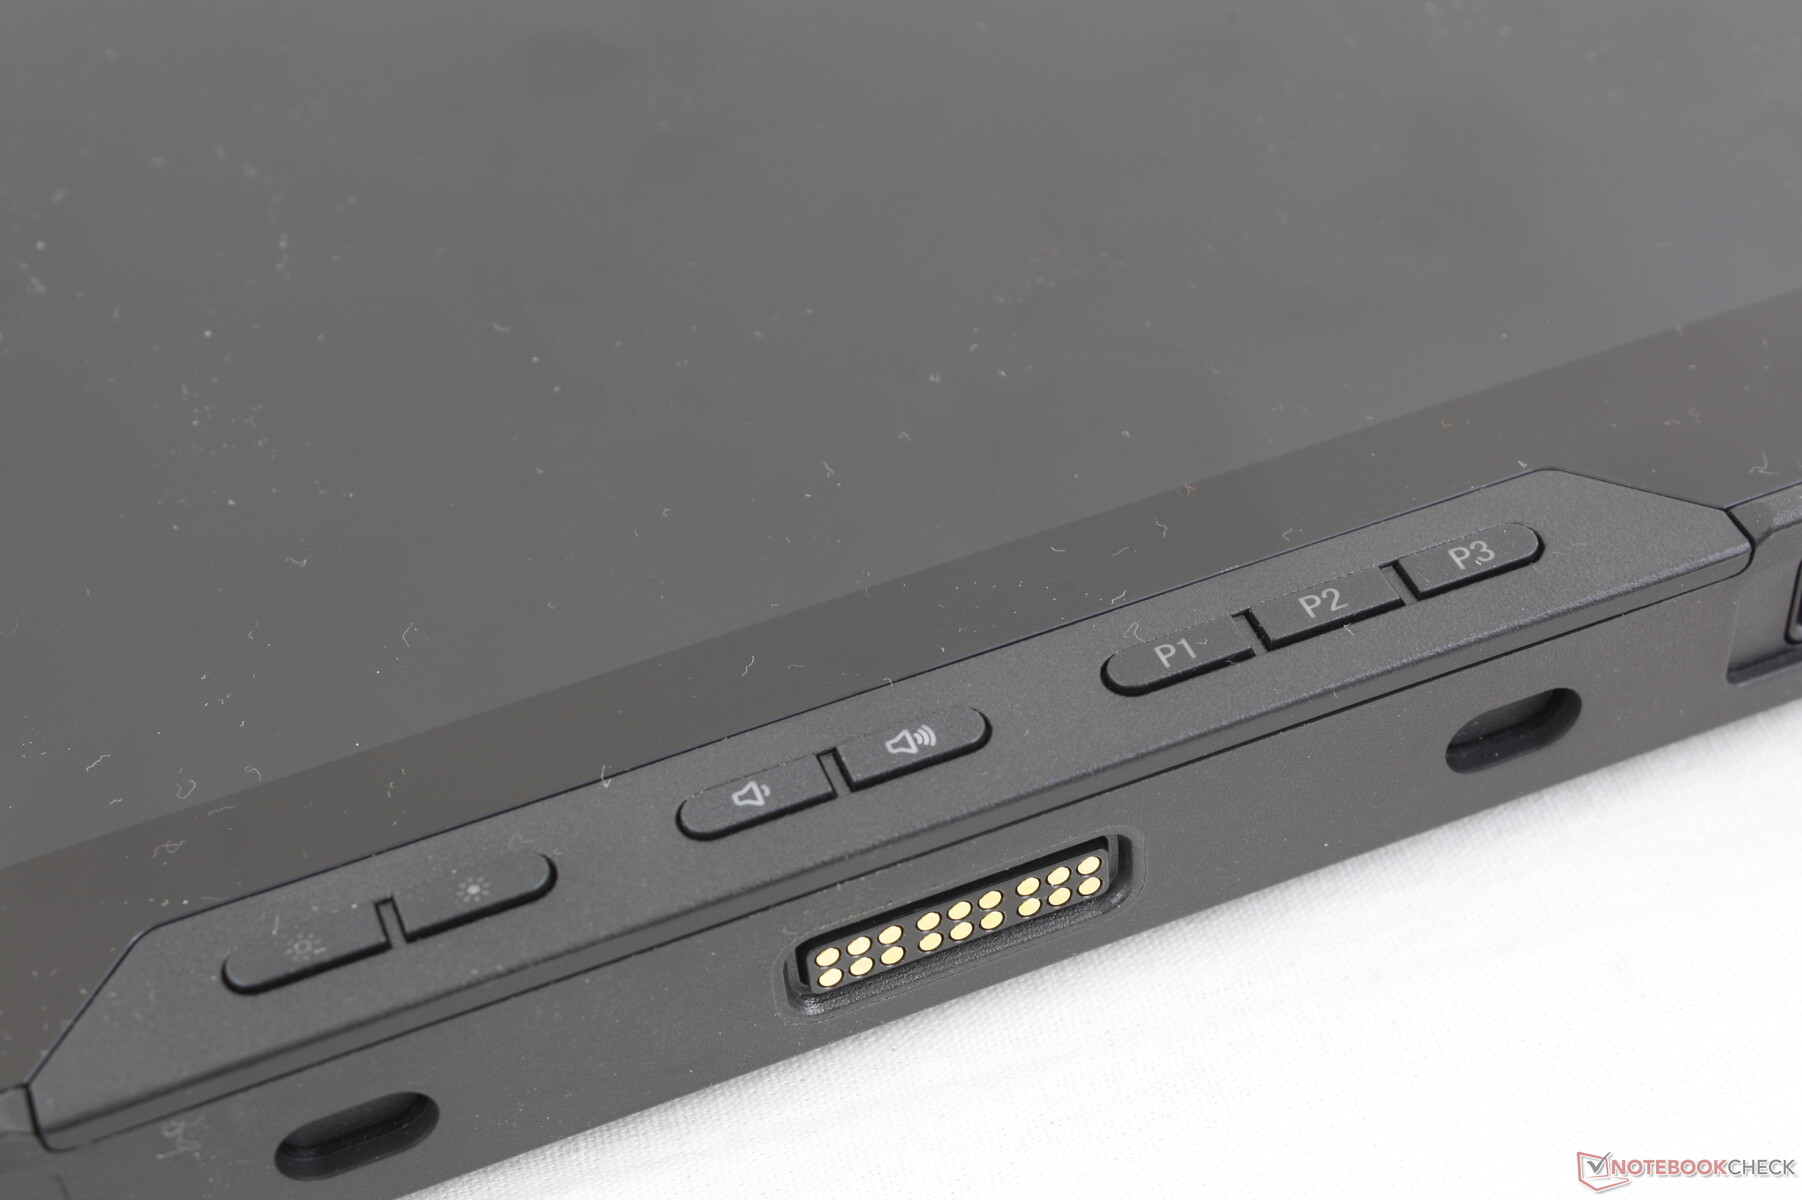
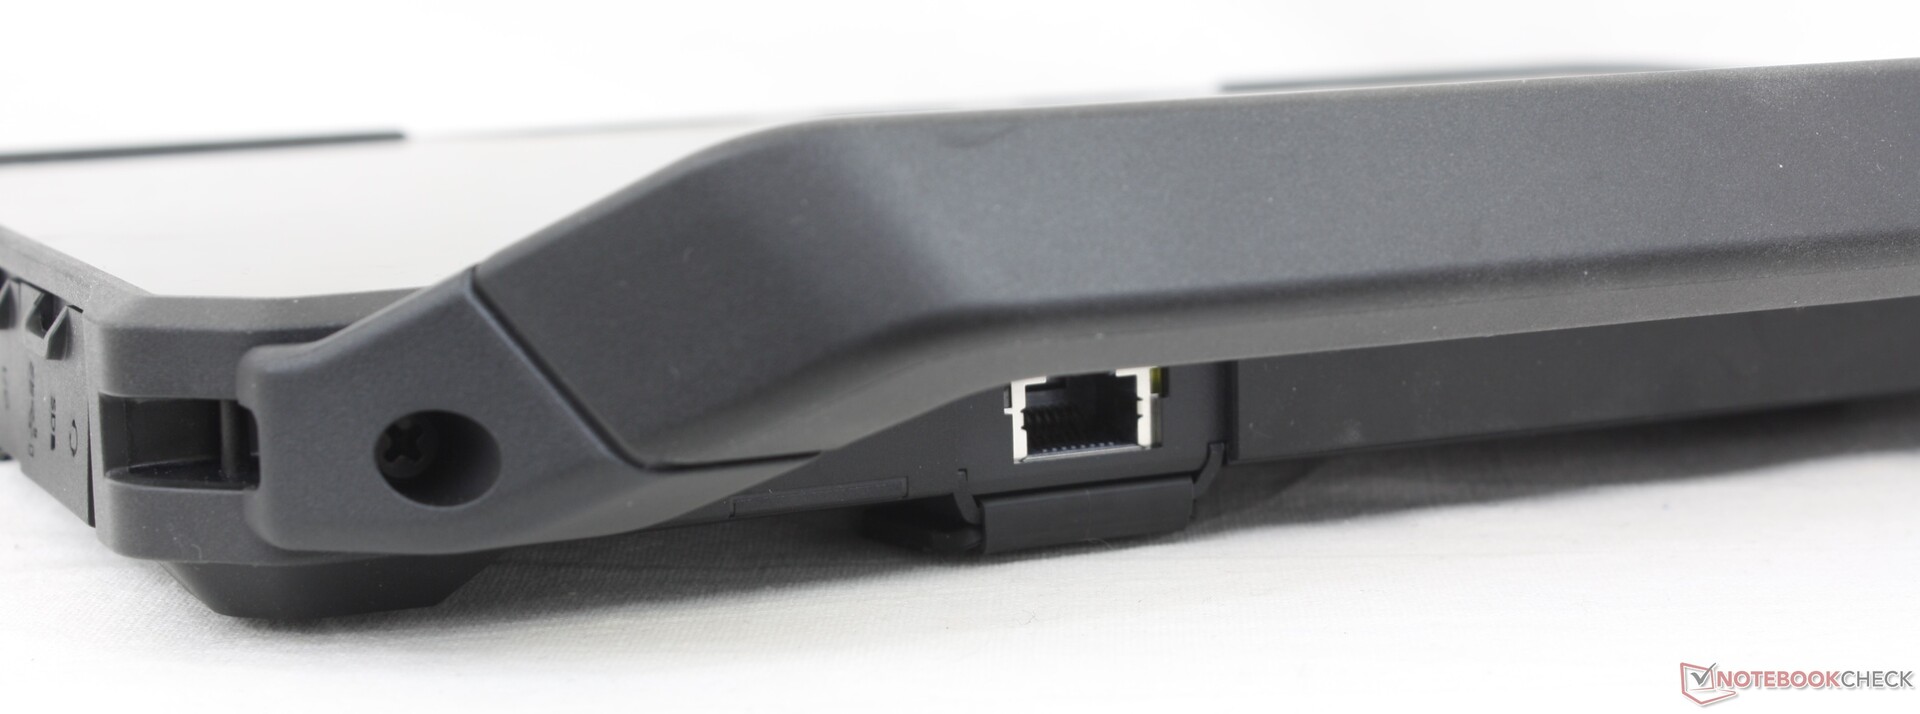
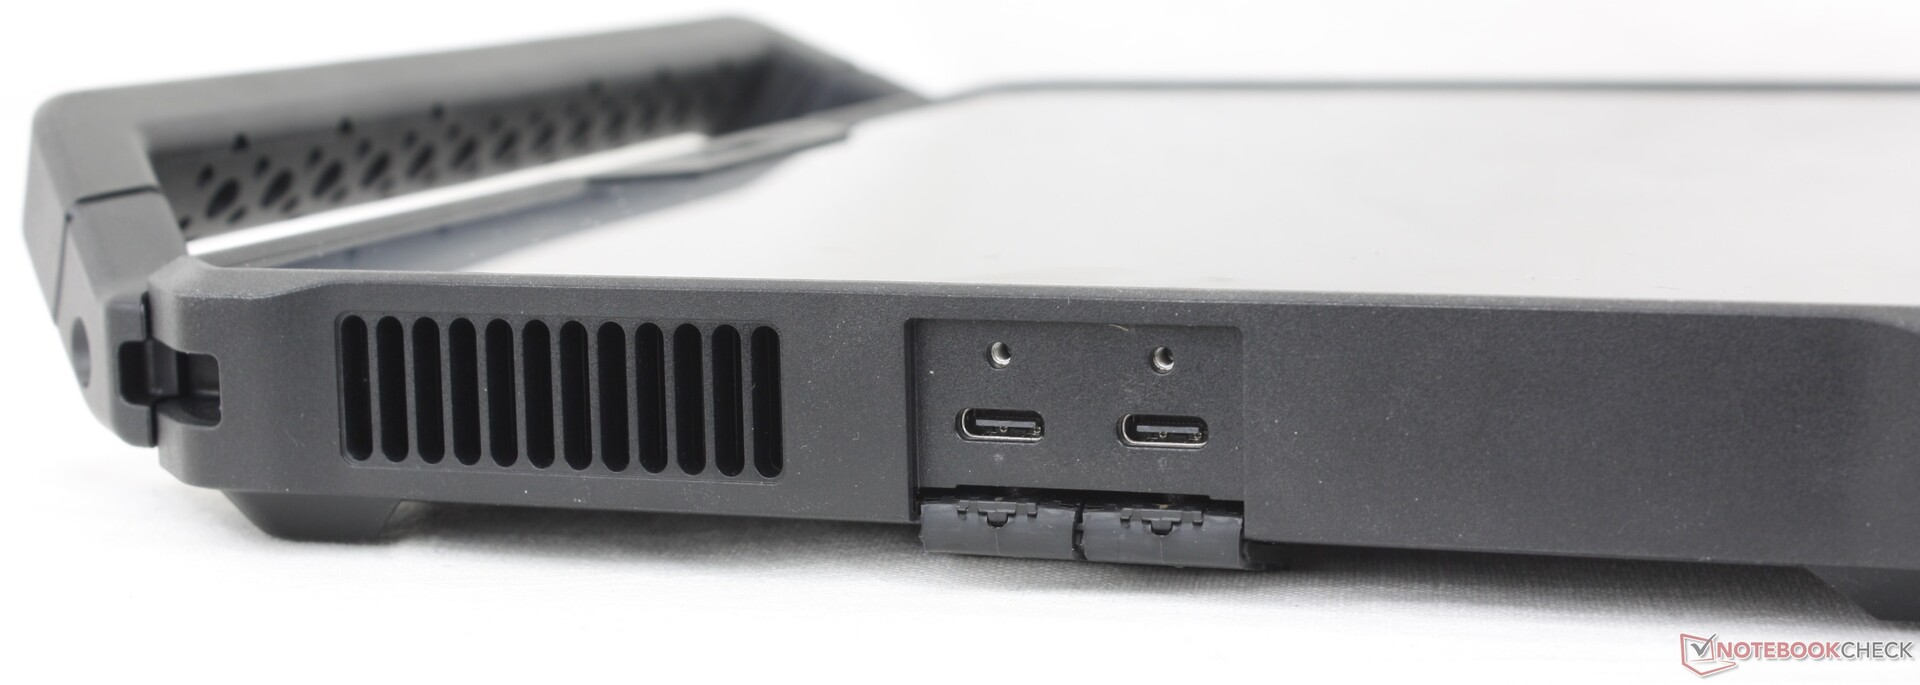
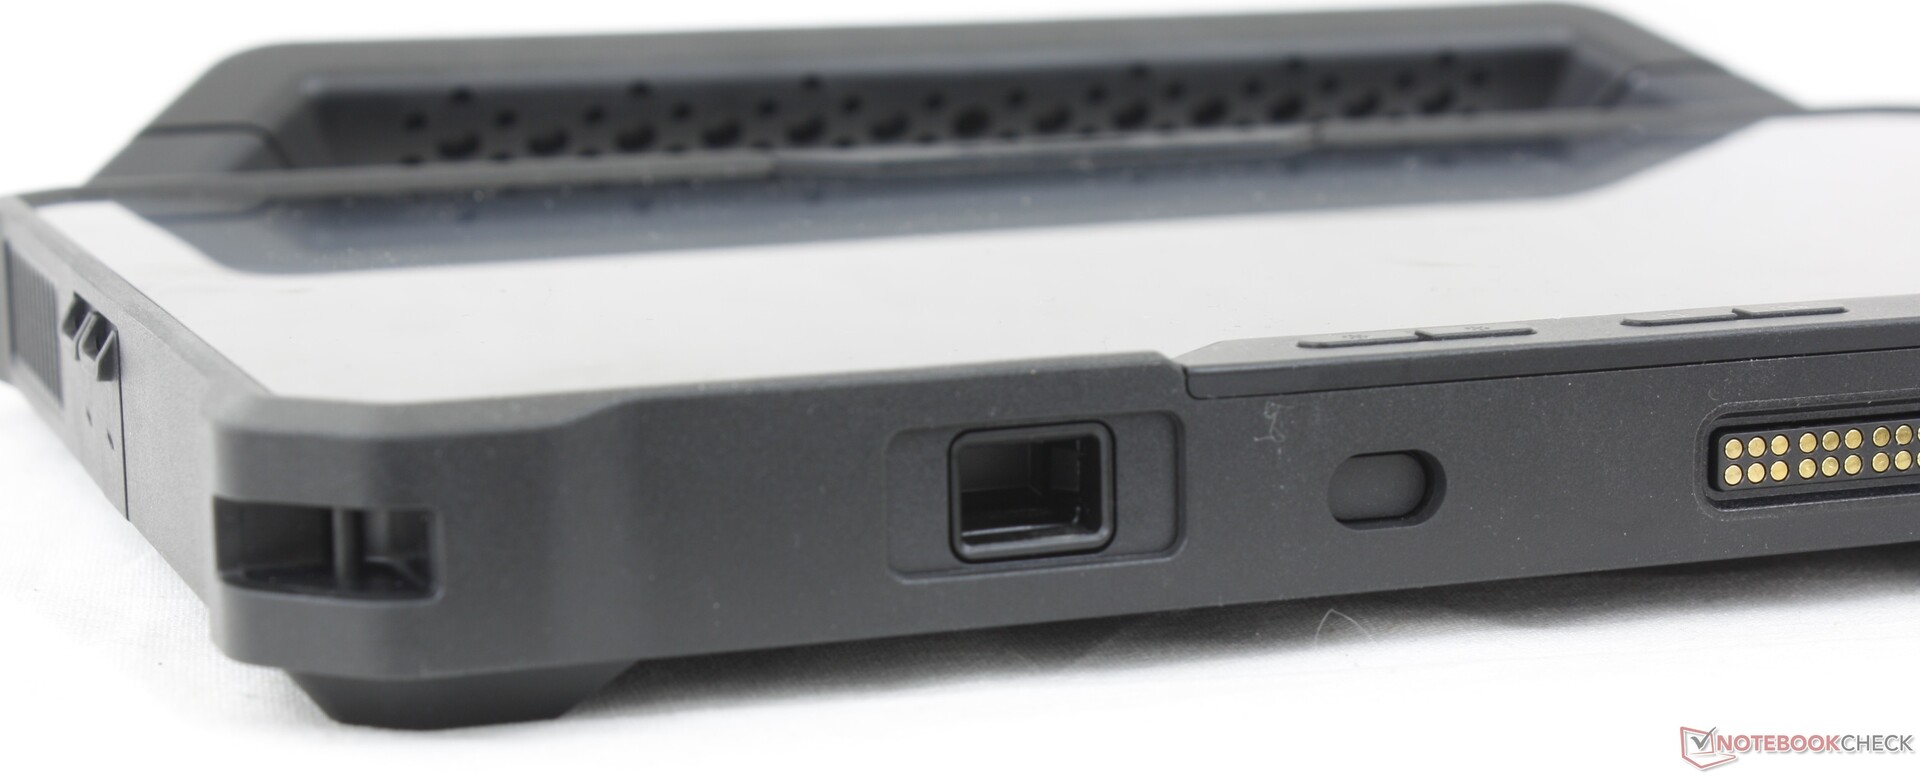
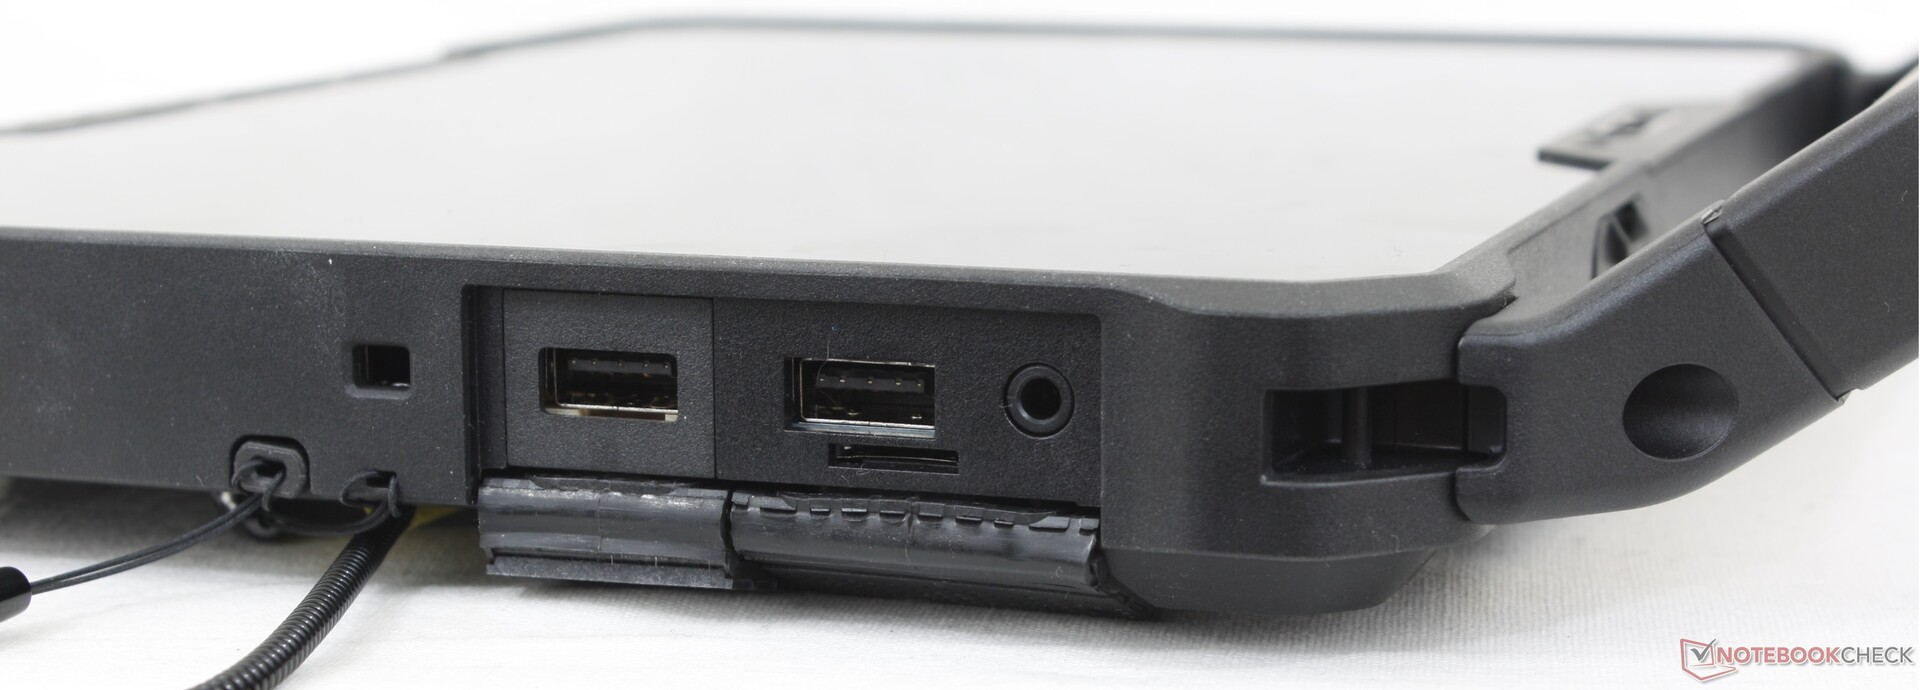
Łączność - Obsługa 2x Thunderbolt 4
Do wyboru jest wiele zintegrowanych portów. Na uwagę zasługują zwłaszcza dwa porty Thunderbolt 4, które umożliwiają takie same możliwości dokowania i obsługę monitorów zewnętrznych, jak w nowoczesnych ultrabookach konsumenckich. Należy jednak pamiętać, że jeden z nich będzie zawsze zajęty na potrzeby ładowania.
Większość pozostałych portów jest opcjonalna i można je skonfigurować przy kasie, w tym HDMI 2.0, USB-A, RJ-45, RS-232 czy skaner kodów kreskowych.
Czytnik kart SD
| SD Card Reader | |
| average JPG Copy Test (av. of 3 runs) | |
| Dell Latitude 7330 Rugged Extreme (AV Pro V60) | |
| Dell Latitude 7230 Rugged Extreme (AV Pro V60) | |
| Panasonic Toughbook 40 (AV Pro V60) | |
| Acer Enduro Urban N3 EUN314 (AV Pro V60) | |
| Durabook S14I (Angelbird 128GB AV Pro UHS-II) | |
| maximum AS SSD Seq Read Test (1GB) | |
| Dell Latitude 7330 Rugged Extreme (AV Pro V60) | |
| Dell Latitude 7230 Rugged Extreme (AV Pro V60) | |
| Panasonic Toughbook 40 (AV Pro V60) | |
| Durabook S14I (Angelbird 128GB AV Pro UHS-II) | |
| Acer Enduro Urban N3 EUN314 (AV Pro V60) | |
Komunikacja
Intel AX211 działa niezawodnie po sparowaniu z naszym routerem testowym Asus AXE11000 z obsługą Wi-Fi 6E. Model ten można skonfigurować bez Wi-Fi, ale zalecamy ostrożny wybór, gdyż instalacja dla użytkownika końcowego w modelu Latitude 7230 Rugged Extreme jest znacznie bardziej skomplikowana niż w przypadku typowego ultrabooka.
| Networking | |
| iperf3 transmit AX12 | |
| Acer Enduro Urban N3 EUN314 | |
| Durabook S14I | |
| Dell Latitude 7330 Rugged Extreme | |
| Getac B360 | |
| iperf3 receive AX12 | |
| Durabook S14I | |
| Acer Enduro Urban N3 EUN314 | |
| Getac B360 | |
| Dell Latitude 7330 Rugged Extreme | |
| iperf3 transmit AXE11000 | |
| Panasonic Toughbook 40 | |
| Dell Latitude 7230 Rugged Extreme | |
| iperf3 receive AXE11000 | |
| Panasonic Toughbook 40 | |
| Dell Latitude 7230 Rugged Extreme | |
| iperf3 transmit AXE11000 6GHz | |
| Dell Latitude 7230 Rugged Extreme | |
| iperf3 receive AXE11000 6GHz | |
| Dell Latitude 7230 Rugged Extreme | |
Kamera internetowa
Tylna kamera internetowa 11 MP i nawet 5 MP przednia kamera internetowa są ostrzejsze niż cokolwiek, co można znaleźć w konsumenckim laptopie typu clamshell. Każda z kamer ma swój własny suwak prywatności, a tylna kamera ma wbudowaną lampę błyskową.
Przednia kamera obsługuje funkcję Windows Hello.


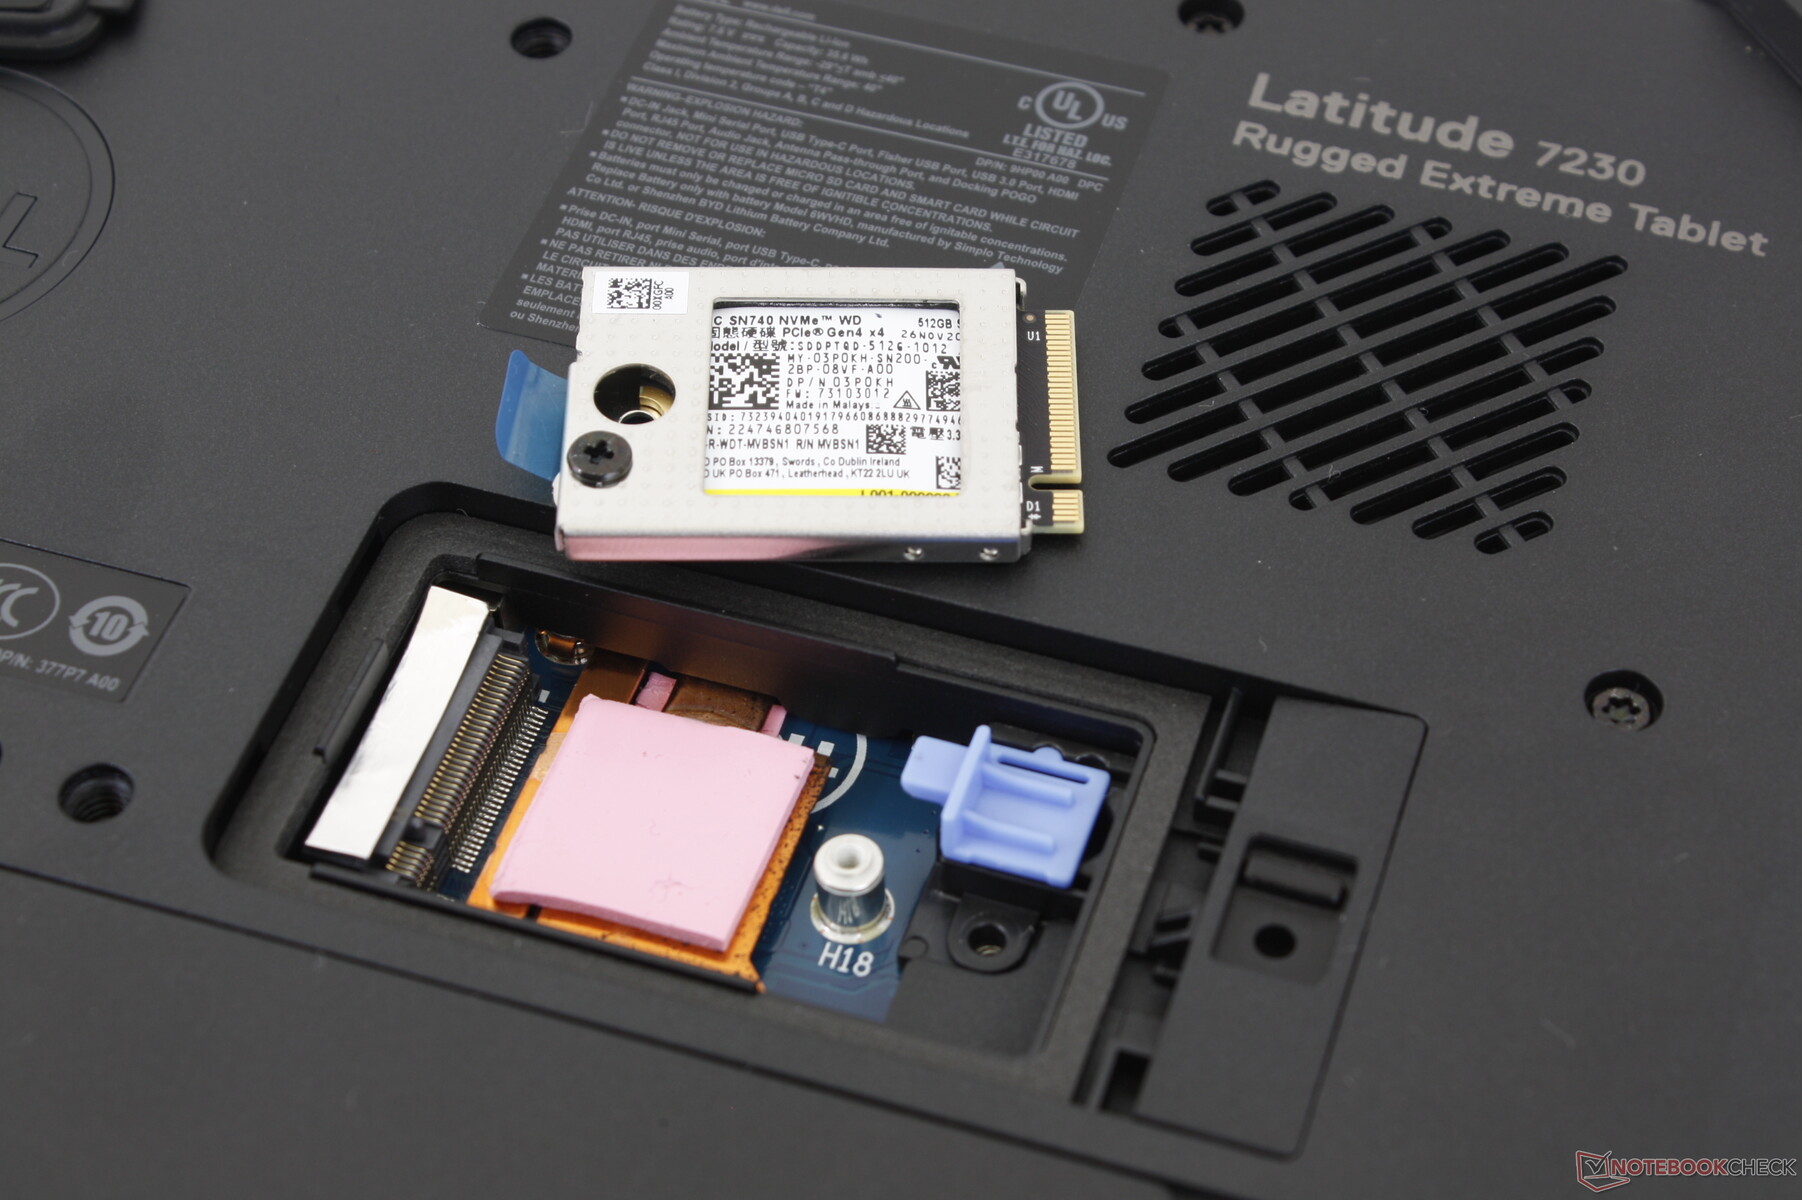
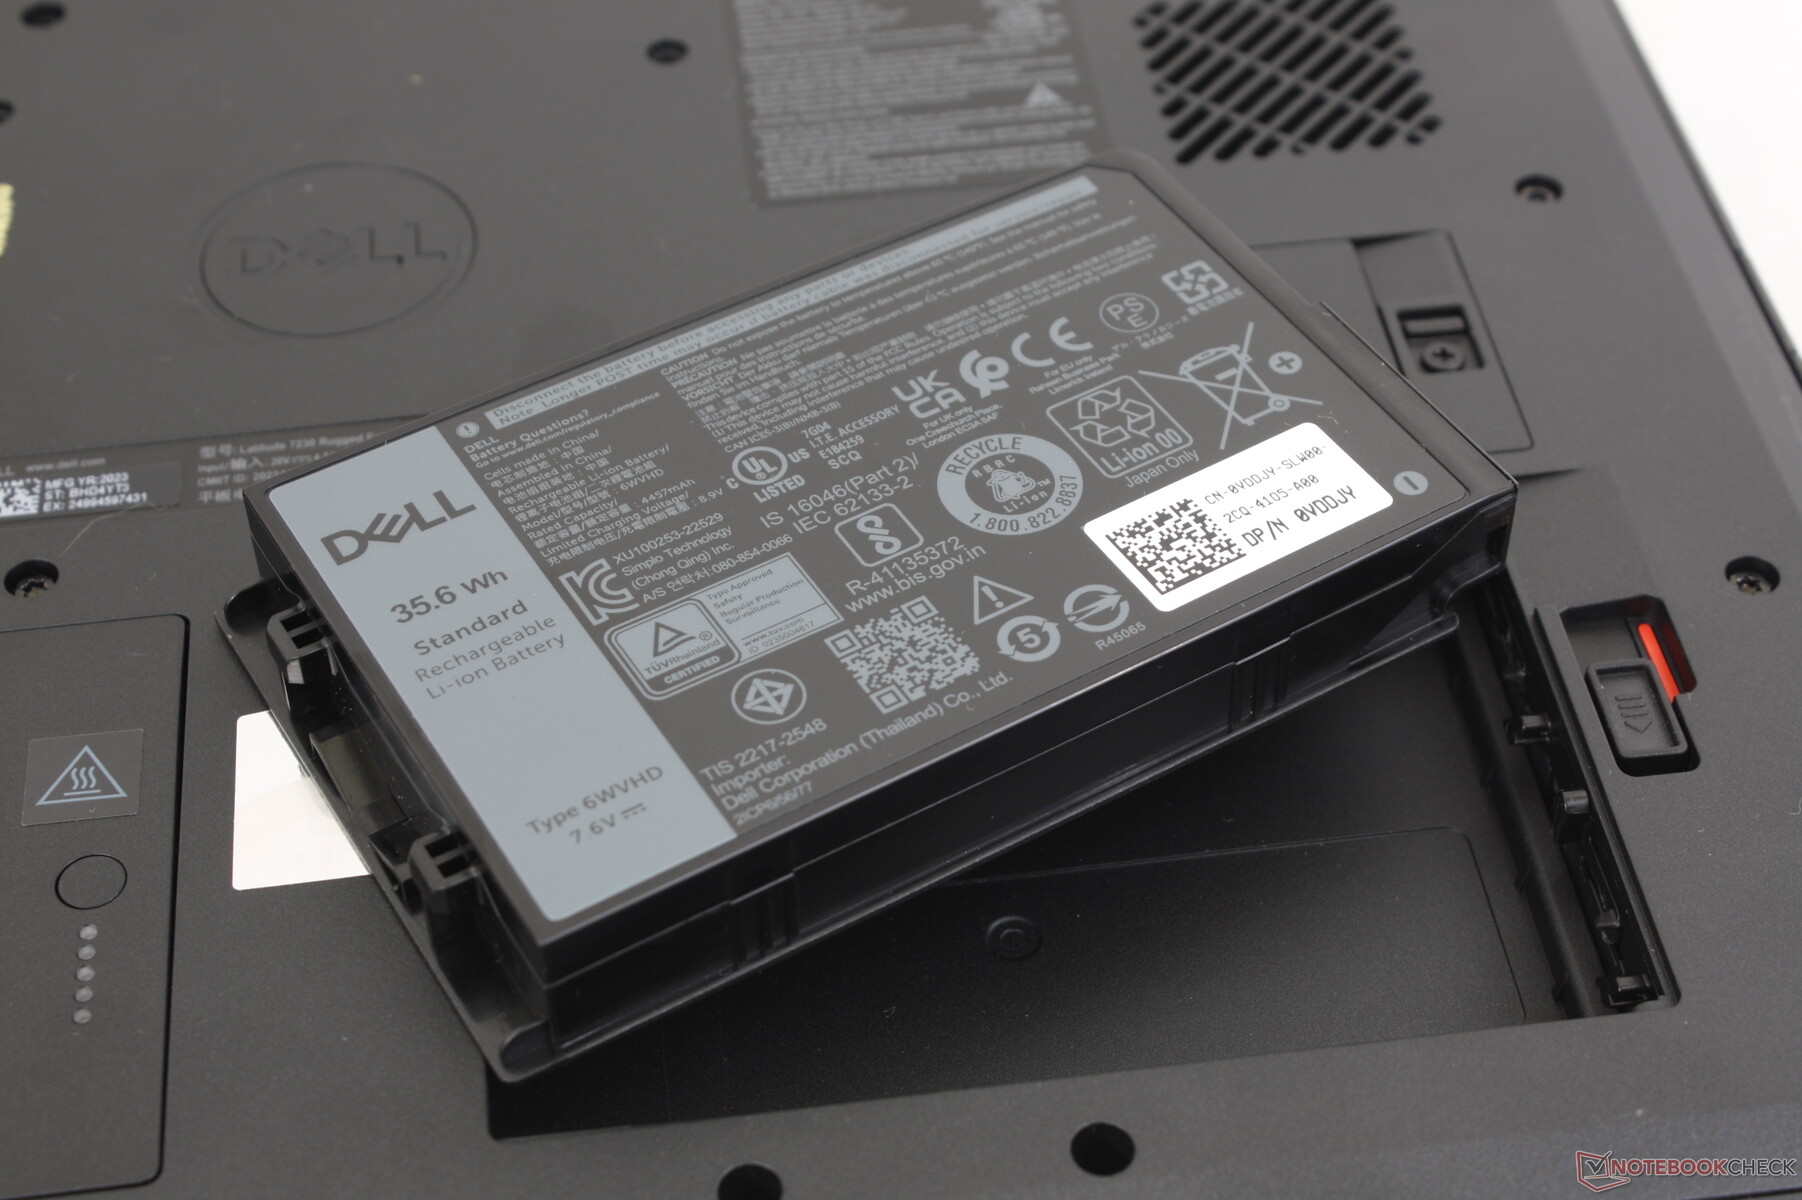
Konserwacja
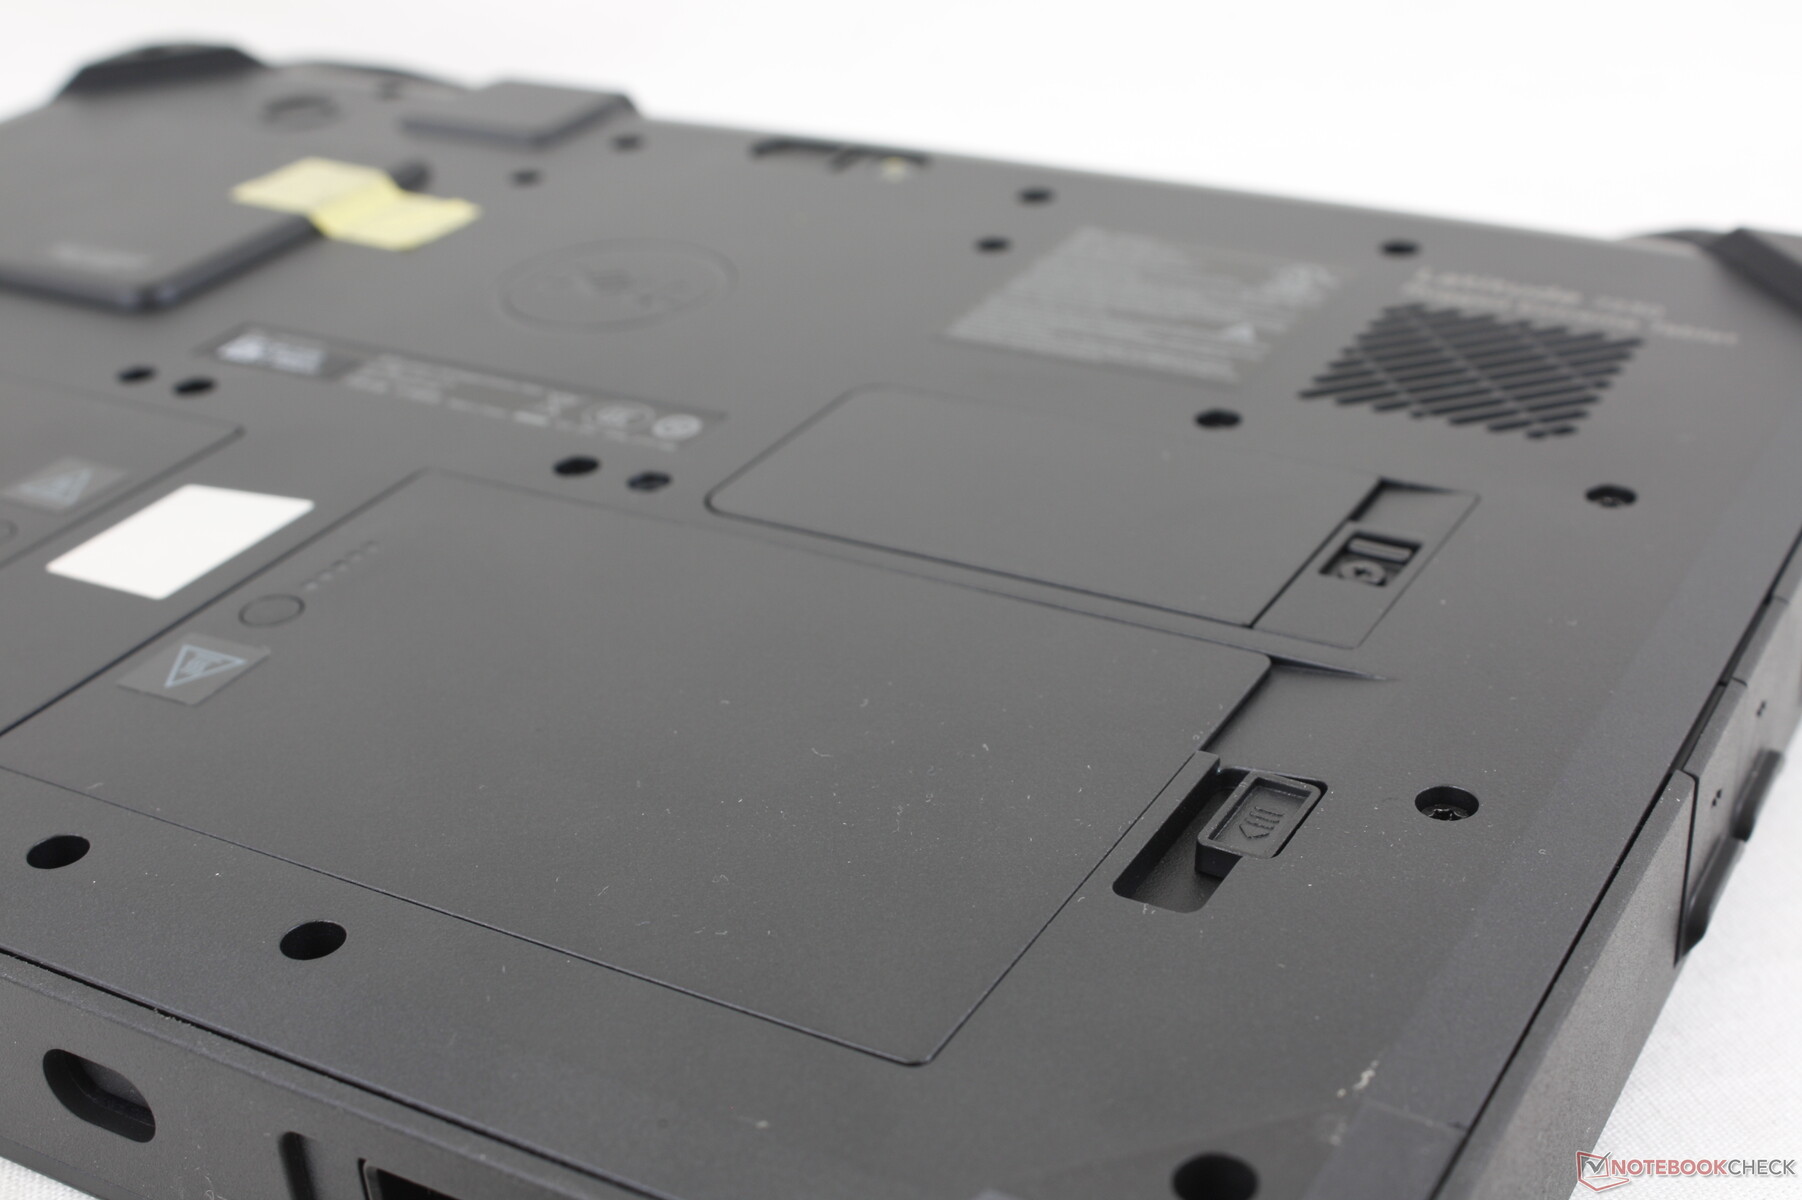
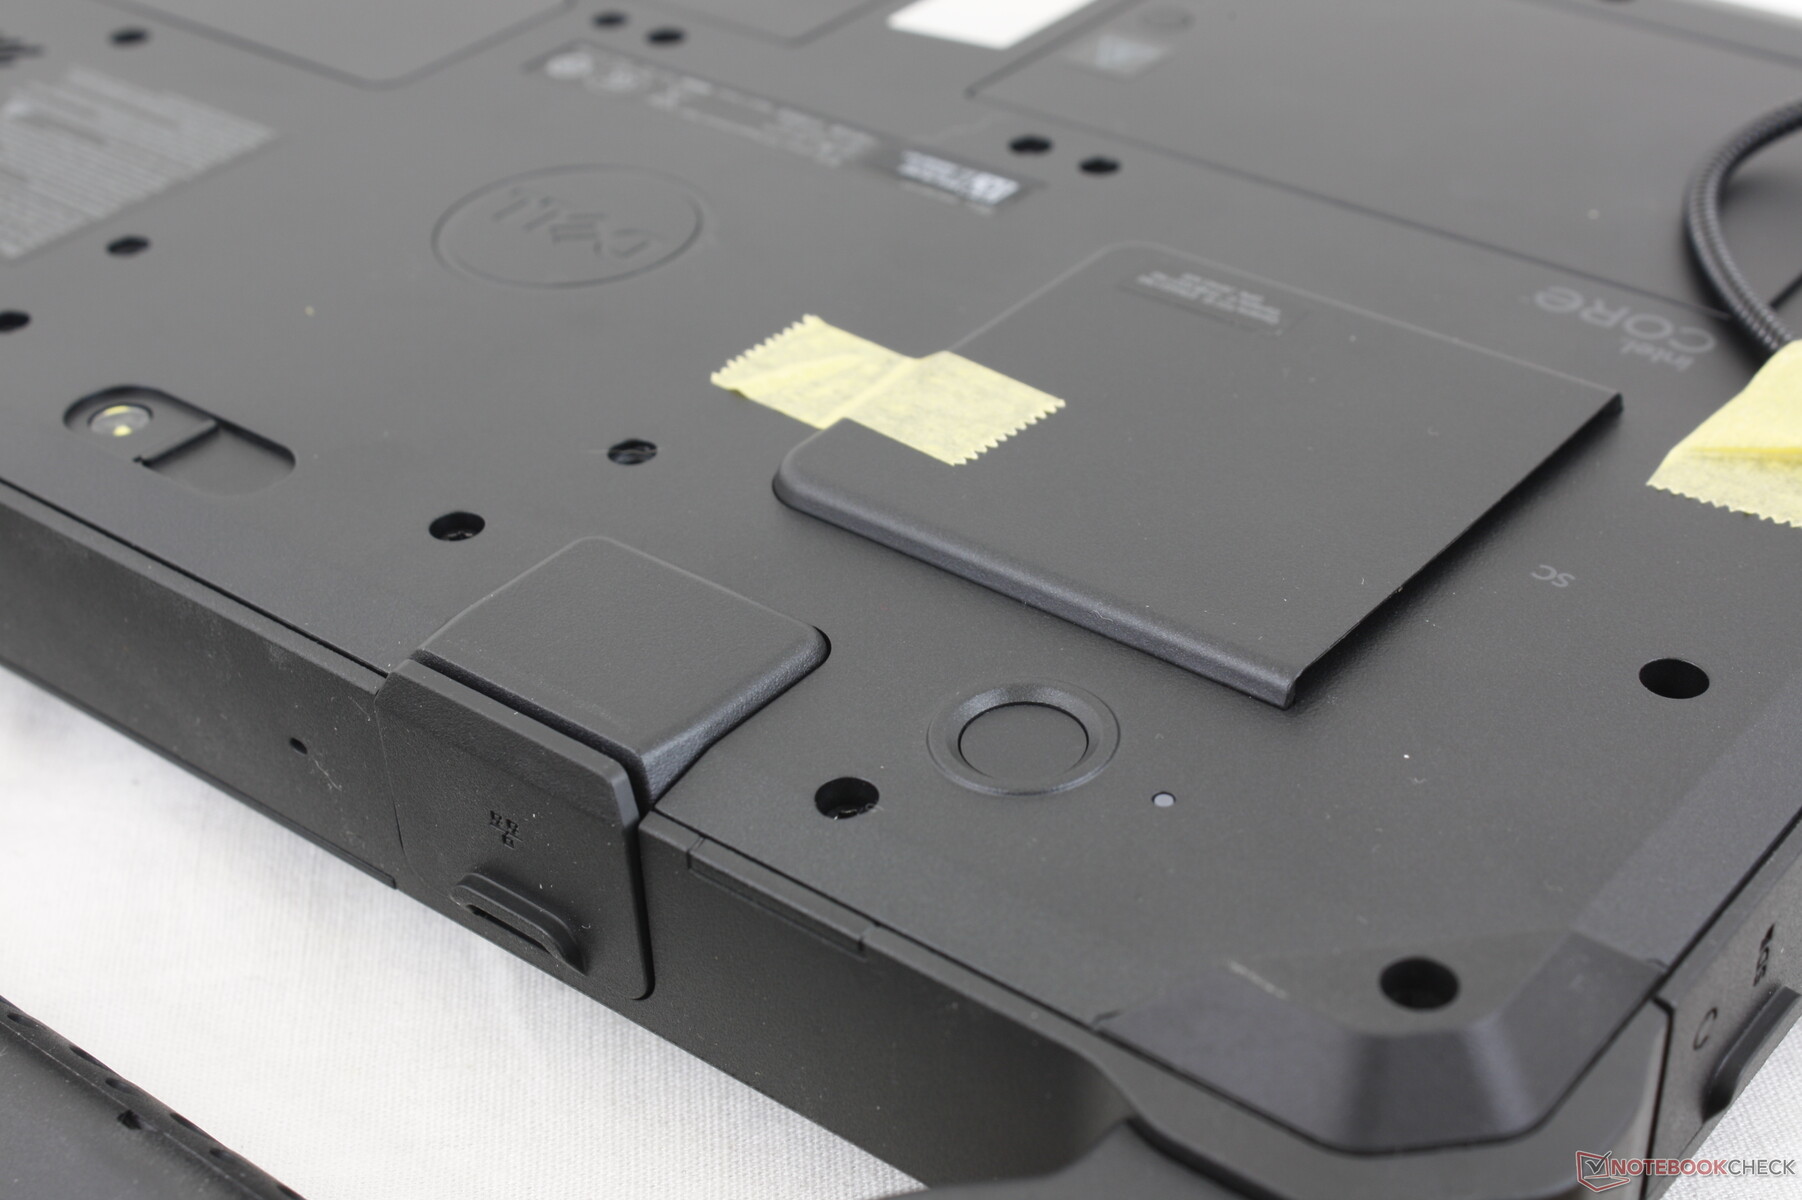
Tylny panel jest zabezpieczony przez nie mniej niż dwa tuziny śrubek Torx. Na szczęście dwa akumulatory i pojedyncze gniazdo M.2 SSD są łatwiej dostępne. Pamięć RAM jest wlutowana i konfigurowalna tylko przy kasie.
Oficjalny podręcznik serwisowy https://dl.dell.com/content/manual25603516-latitude-7230-rugged-extreme-tablet-service-manual.pdf?language=en-us jest dostępna bezpośrednio od Della, jeśli wymagany jest dalszy demontaż.
Akcesoria i gwarancja
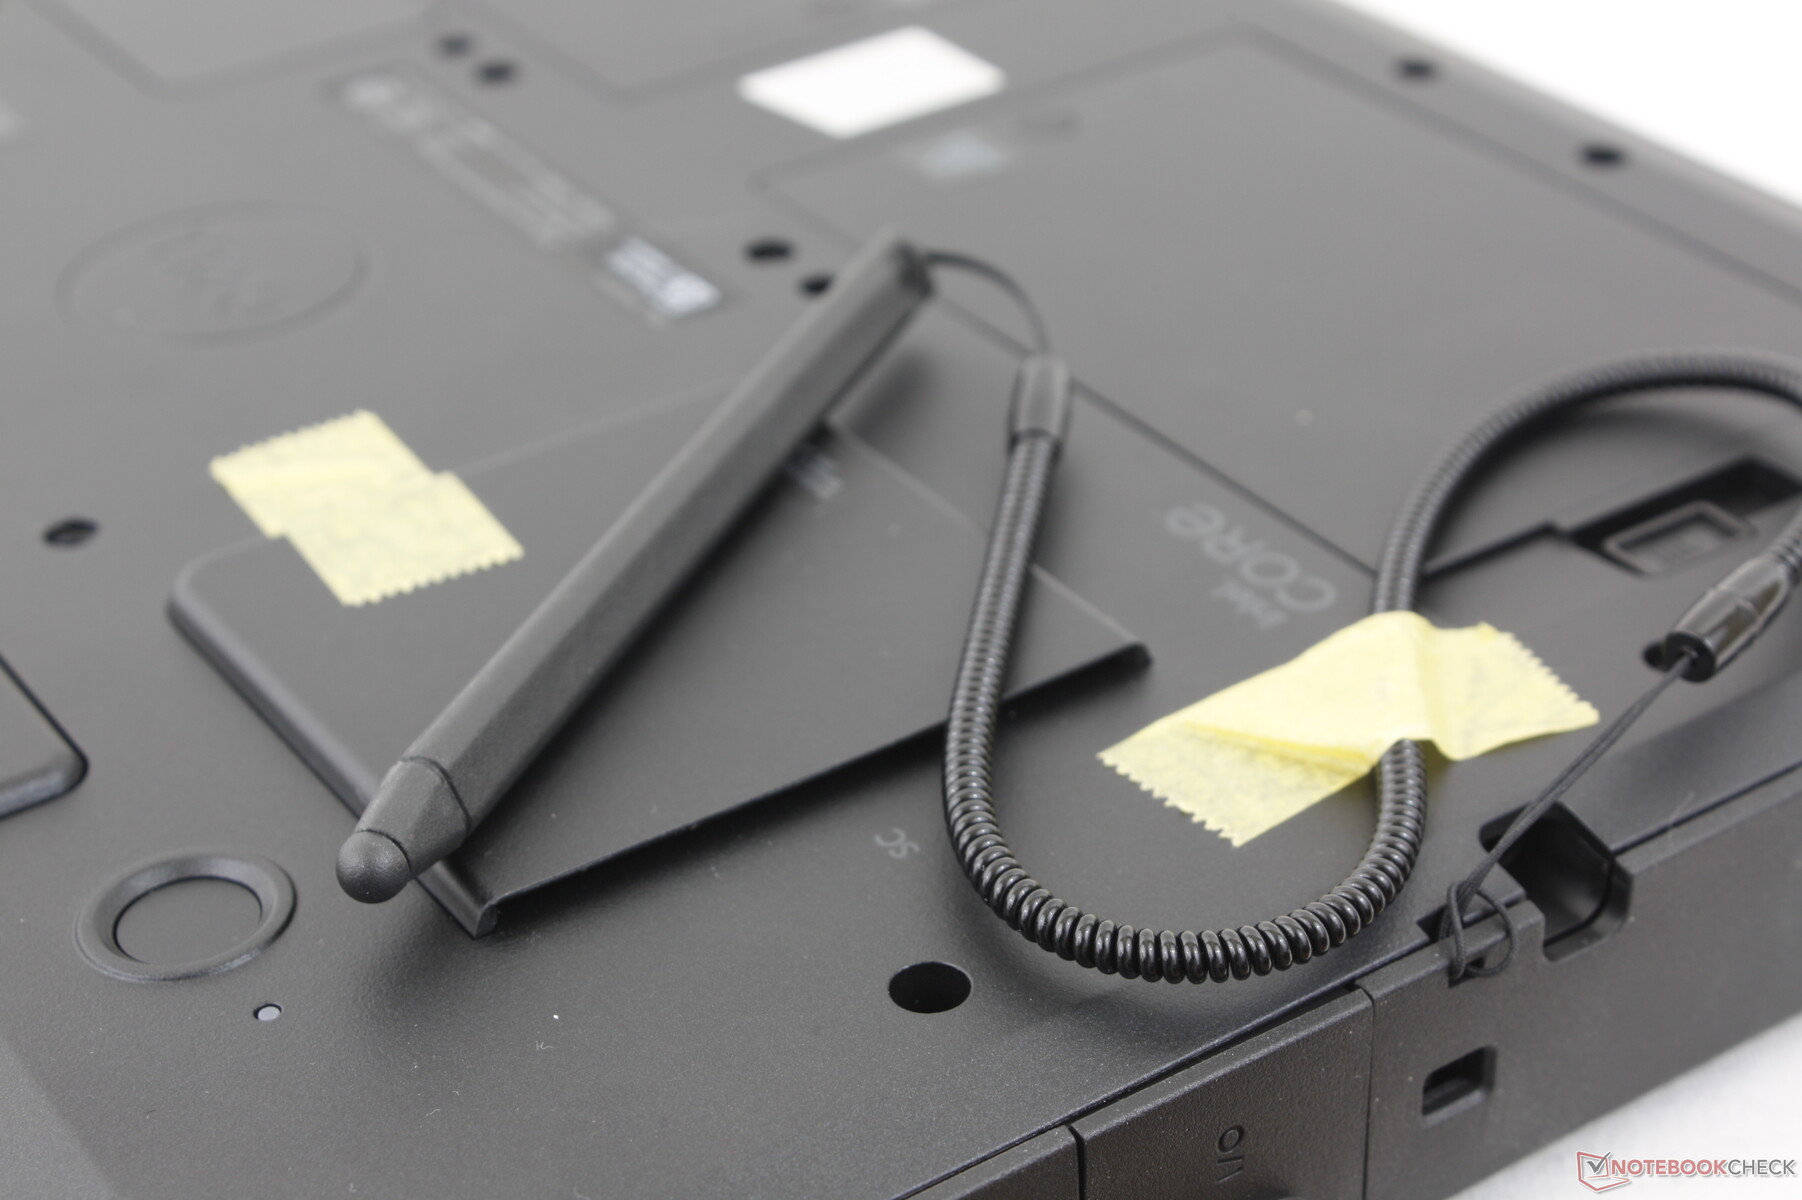
Opcjonalne akcesoria obejmują klawiaturę premium, pasek na rękę, aktywne pióro i wiele innych. W pudełku detalicznym znajduje się pasywne pióro i sztywny uchwyt do przenoszenia, który jest już dołączony. W przypadku zakupu w USA obowiązuje trzyletnia ograniczona gwarancja.
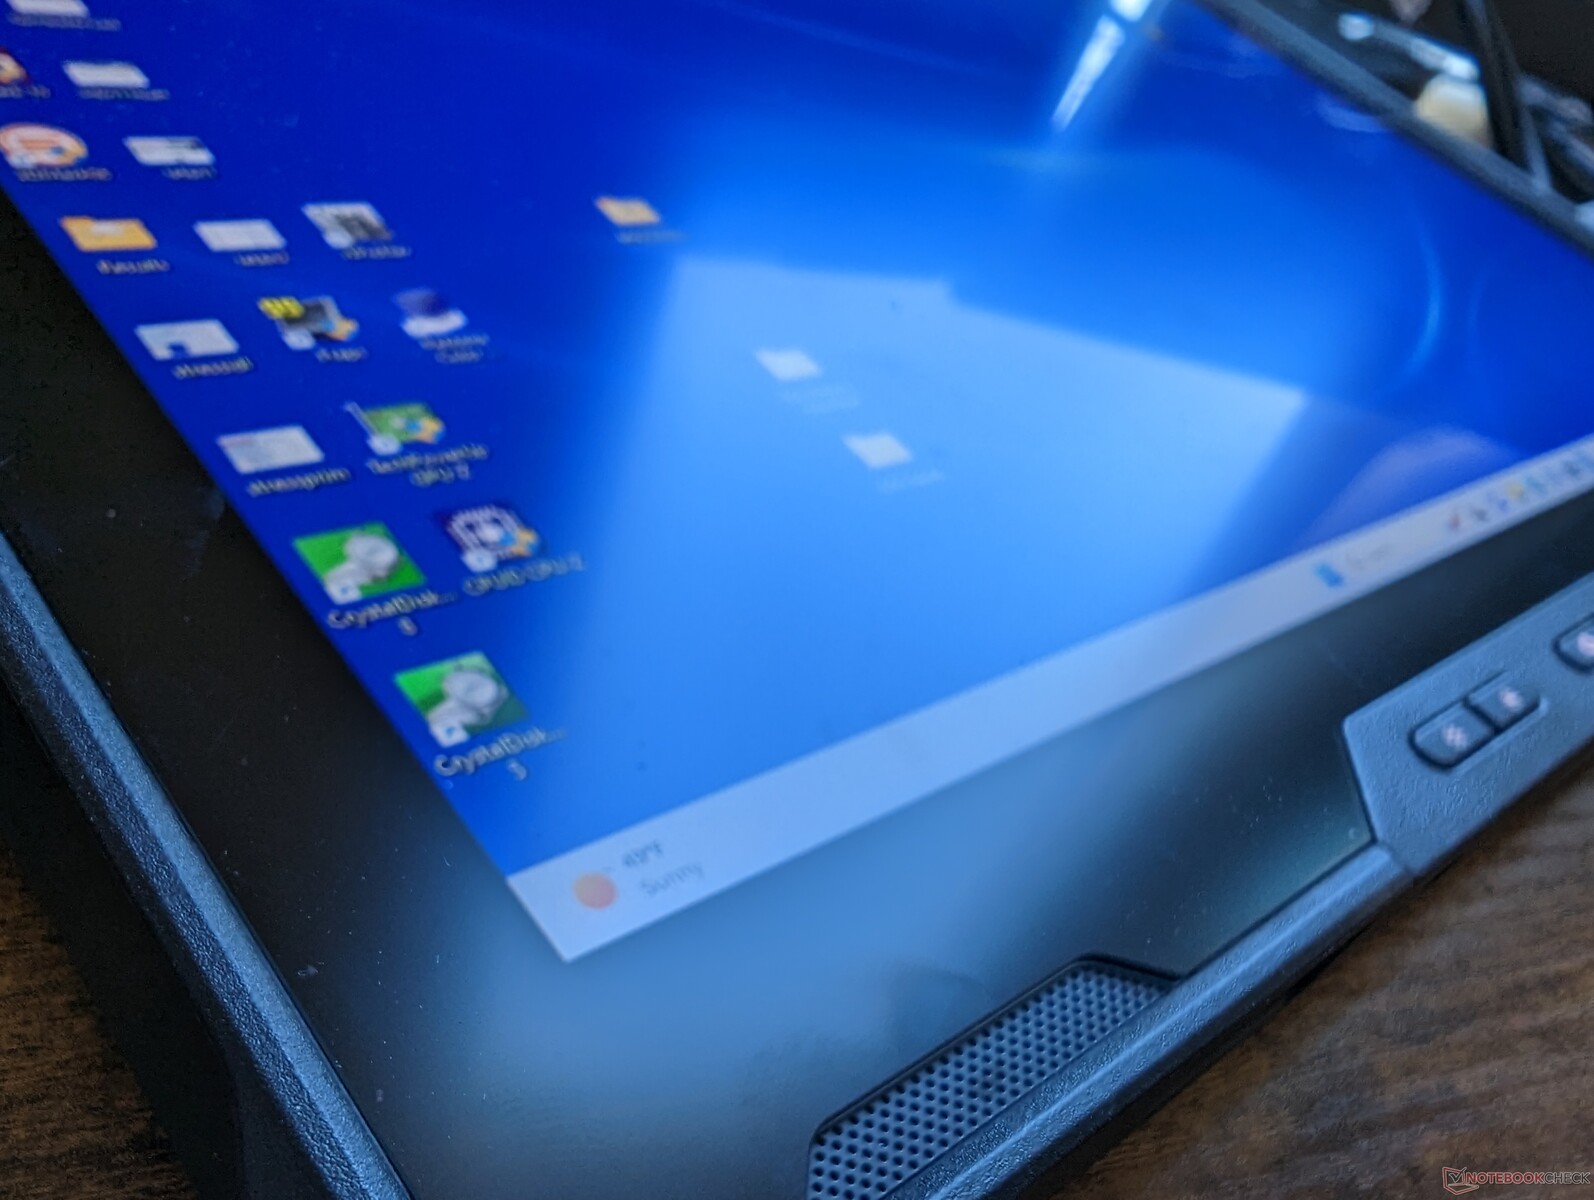
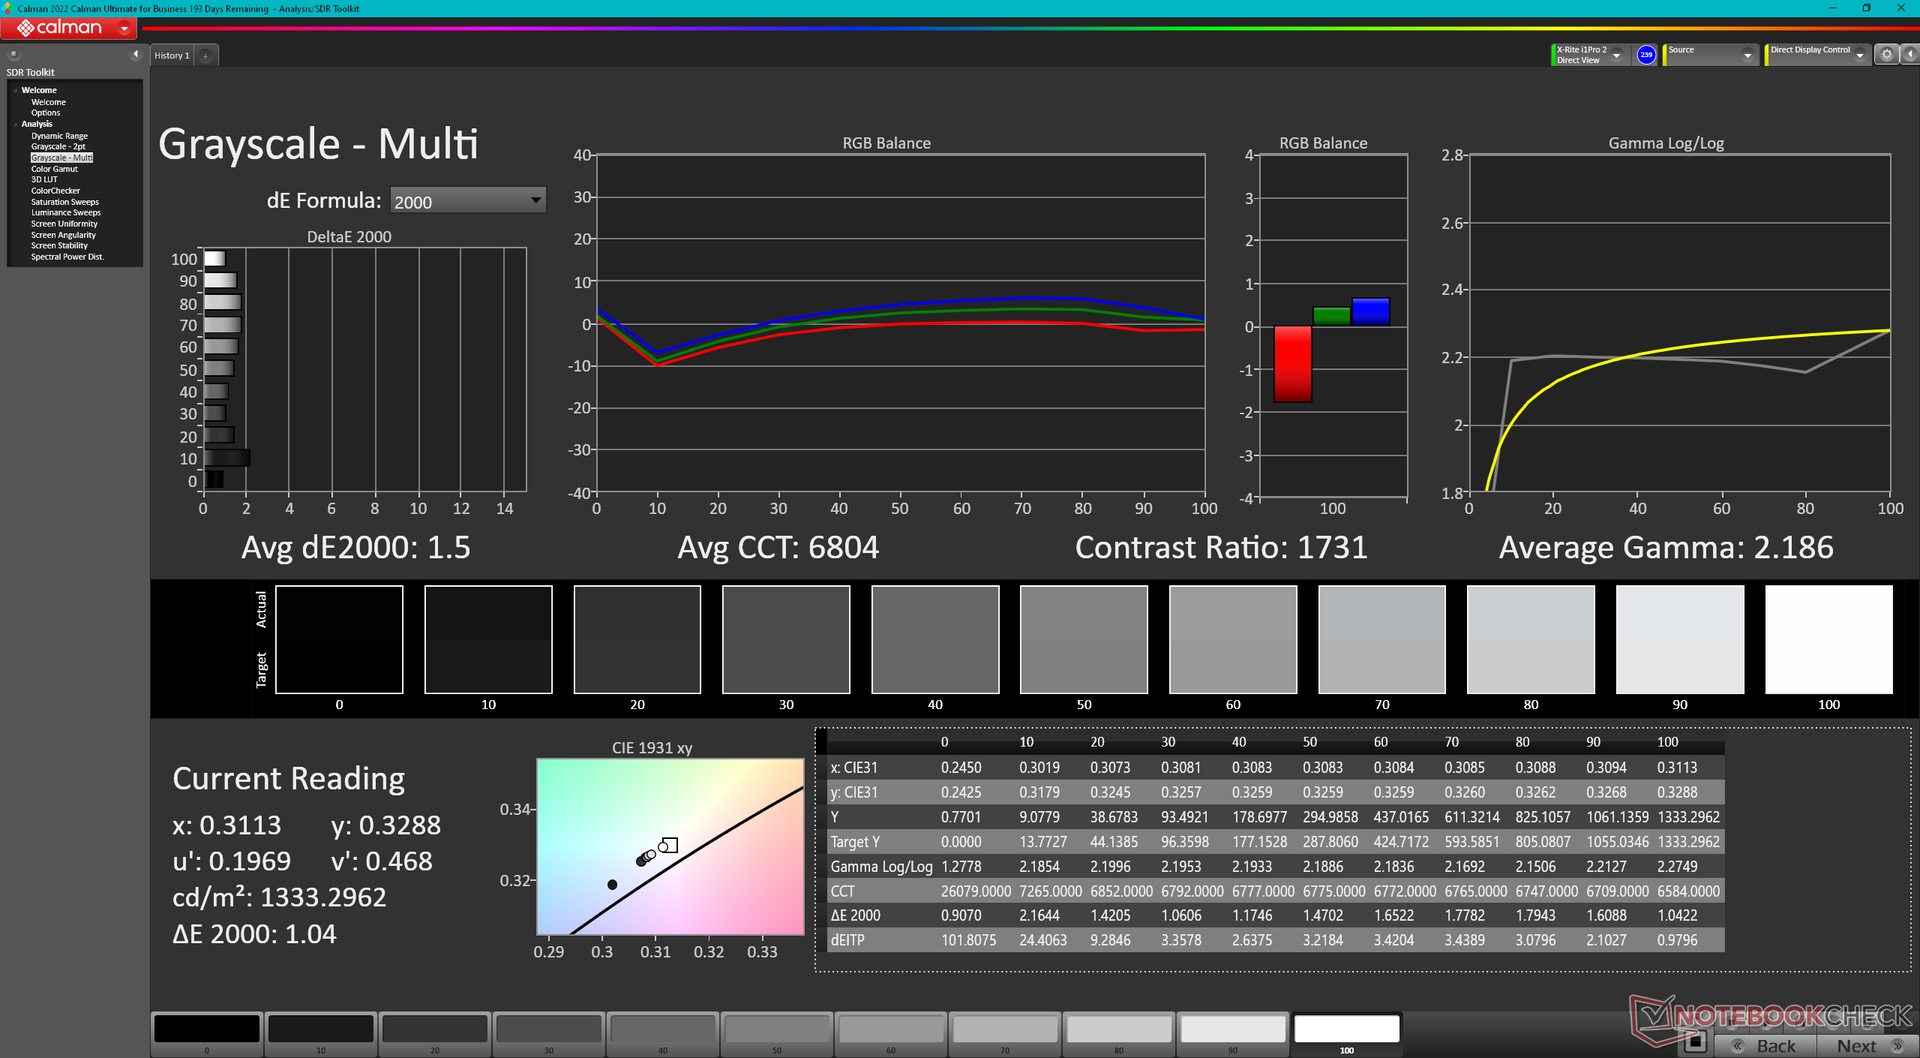
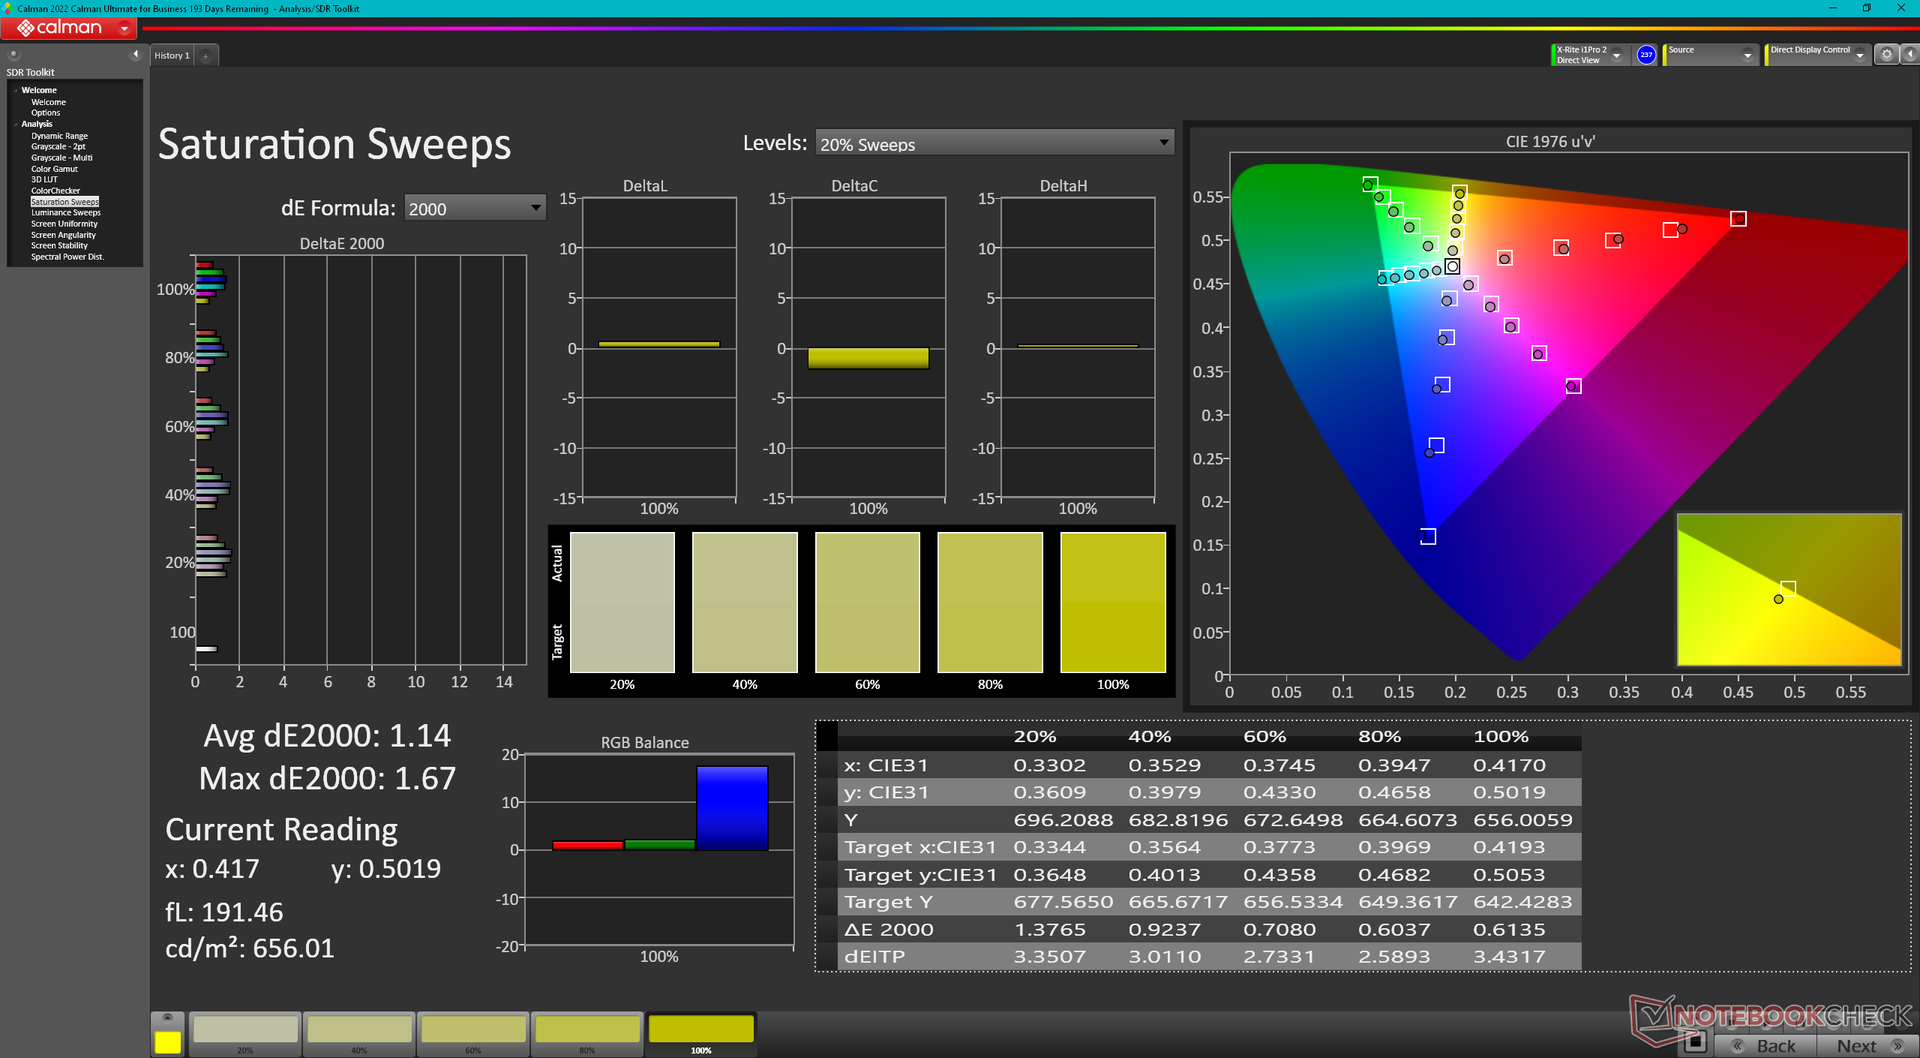
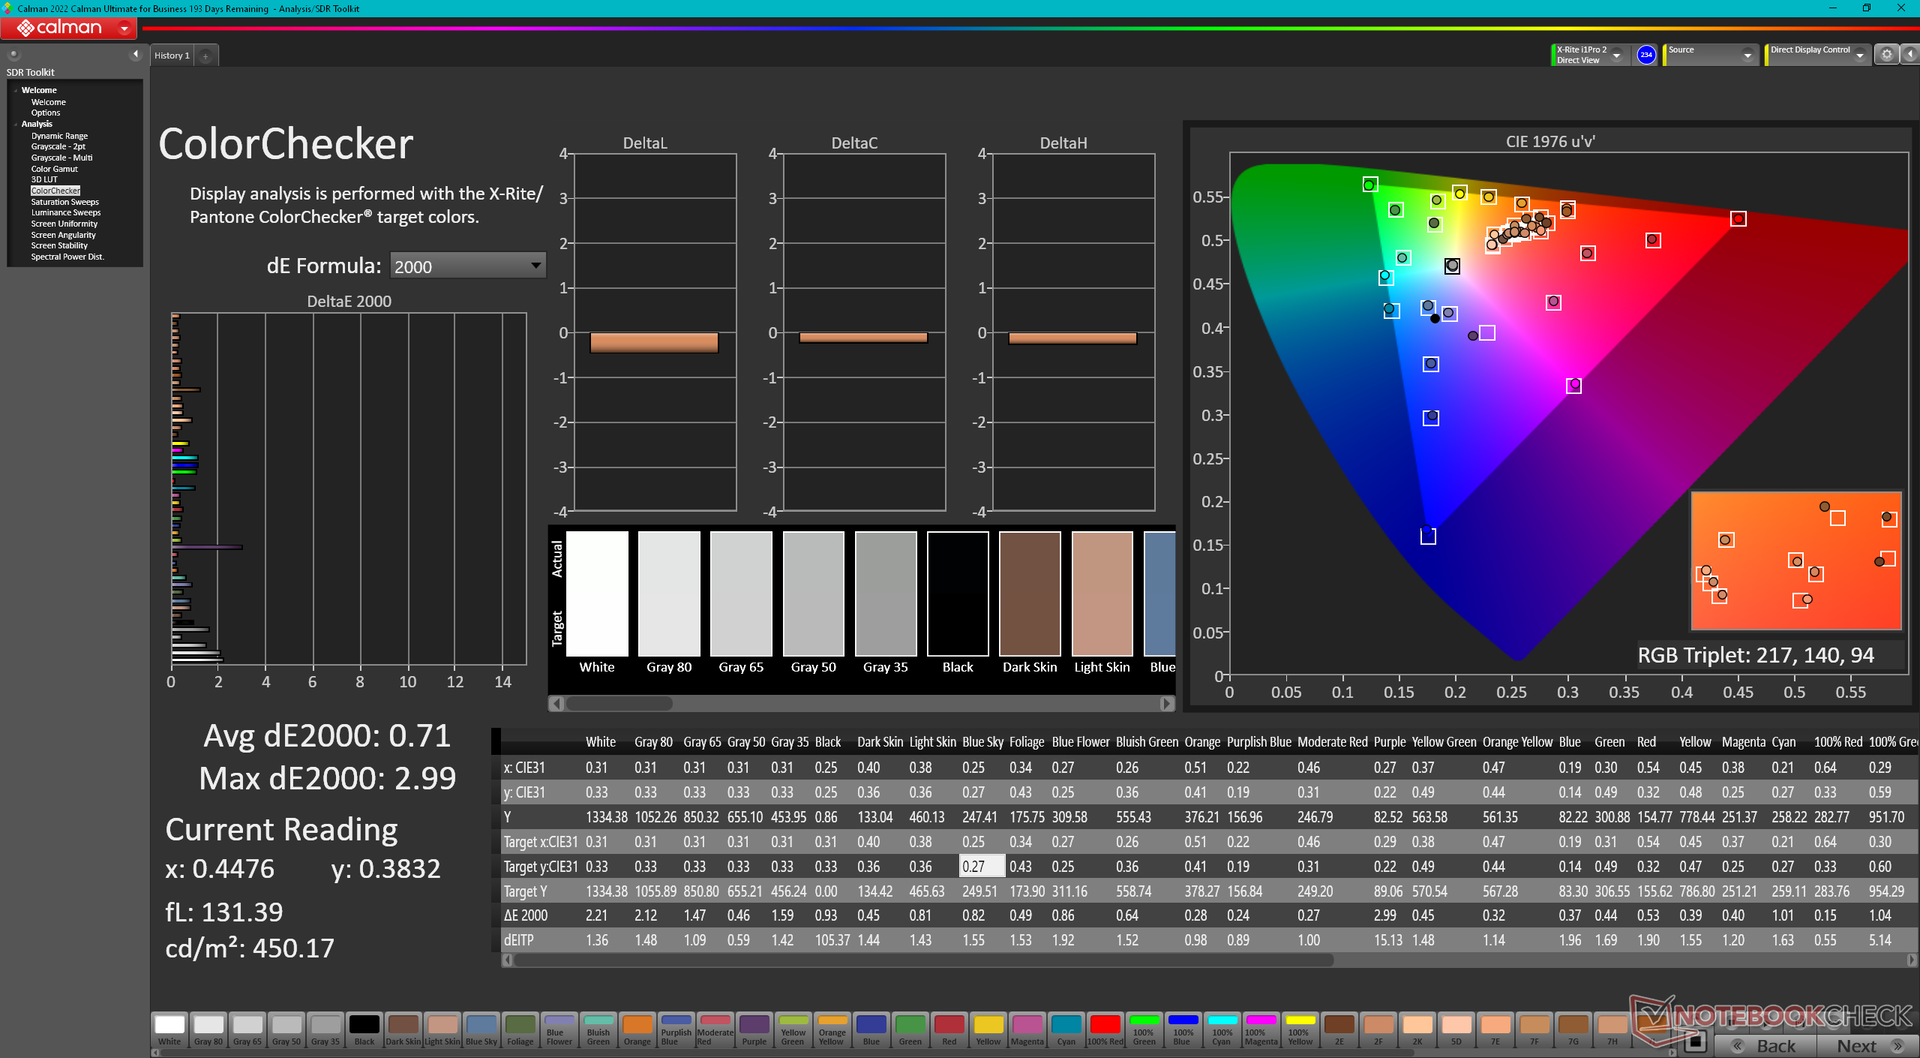
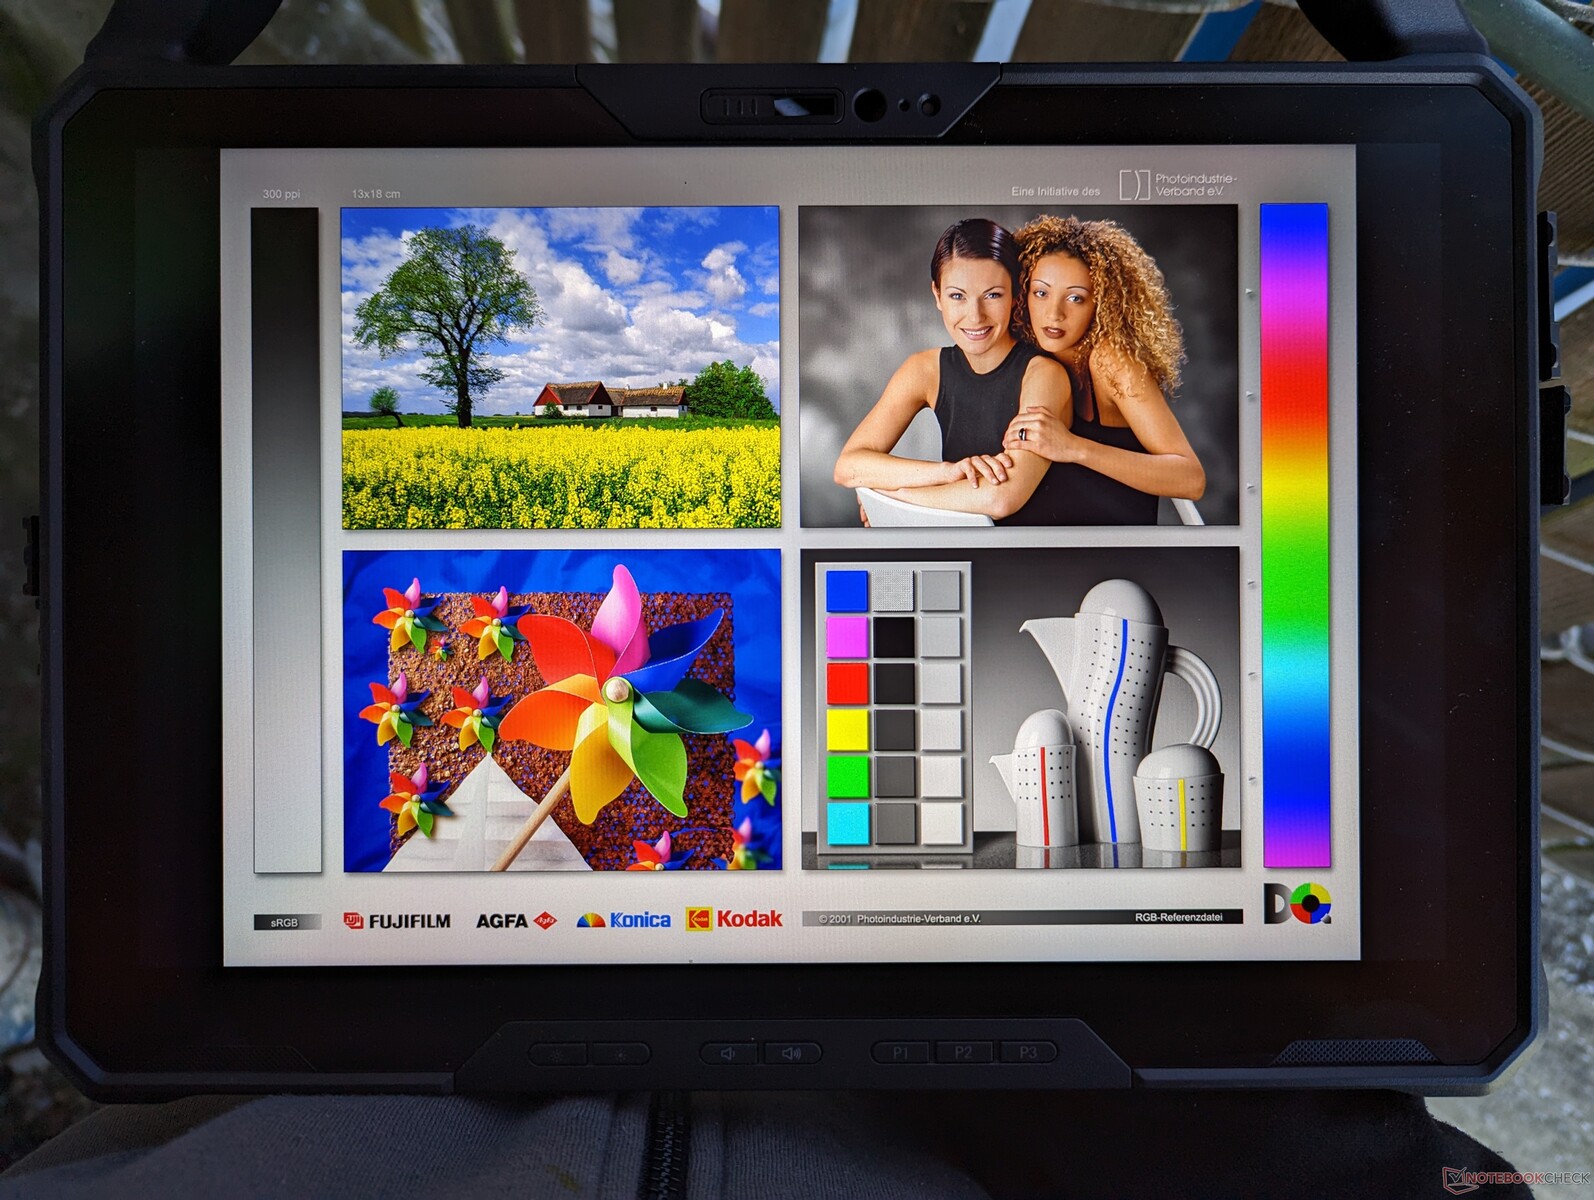
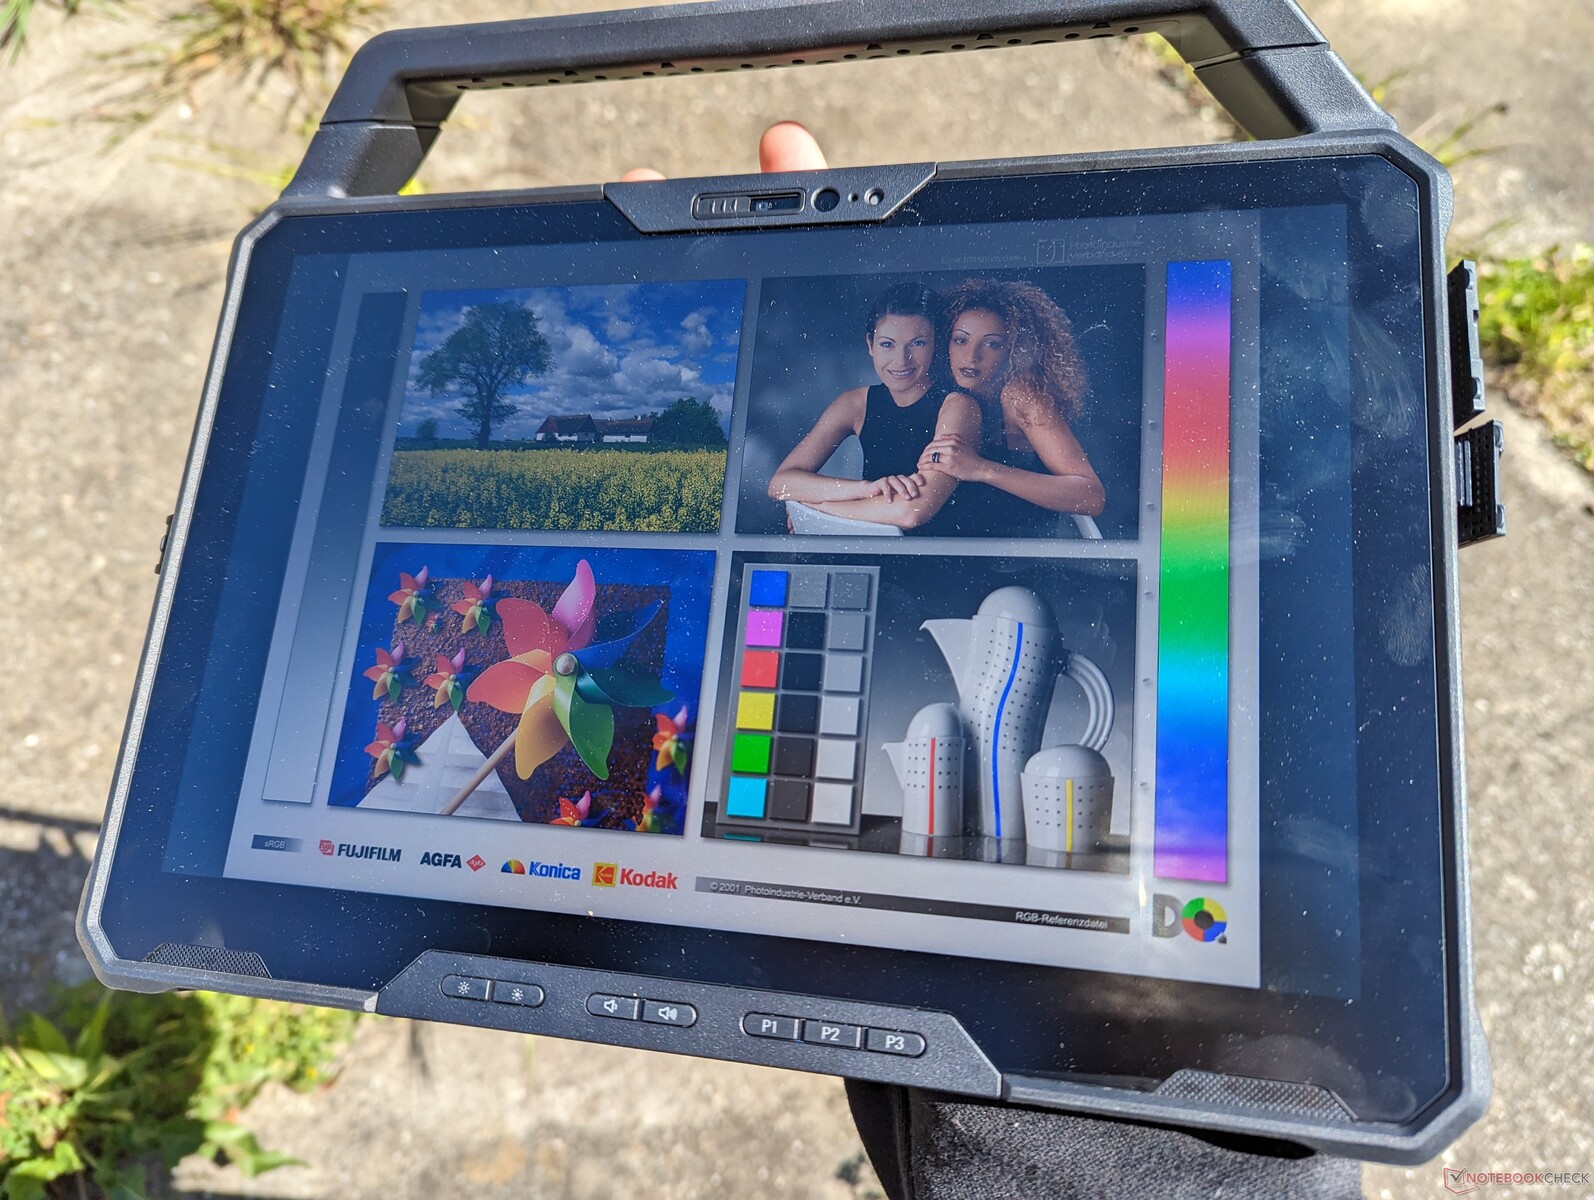
Wyświetlacz - 1200 nitów i pełne pokrycie sRGB
Monitor Latitude 7230 Rugged jest jednym z niewielu urządzeń w swojej kategorii i rozmiarze, które oferuje >95 procent sRGB dla dokładniejszych i żywszych kolorów. Czasy reakcji czerni i bieli oraz szarości są również dość szybkie, co zapewnia mniej zauważalne smużenie. Nie ma modulacji szerokości impulsu do kontroli jasności, co oznacza, że można używać tabletu przy bardzo niskich poziomach jasności bez zmęczenia oczu lub zauważalnego migotania. Jest to jeden z najlepszych wyświetlaczy, jakie widzieliśmy w wytrzymałych tabletach.
Największą wadą wyświetlacza jest jego ziarnistość, pomimo doskonałych kolorów i jasnego podświetlenia. W porównaniu z ostrzejszymi ekranami w tabletach konsumenckich lub laptopach, ekran dotykowy w tablecie Latitude 7230 Rugged znajduje się pod grubszą warstwą szkła i ochrony, co ostatecznie wpływa na jakość obrazu. Dla grupy docelowej super ostre obrazy nie są jednak zazwyczaj priorytetem.


| |||||||||||||||||||||||||
rozświetlenie: 82 %
na akumulatorze: 1326.7 cd/m²
kontrast: 1561:1 (czerń: 0.85 cd/m²)
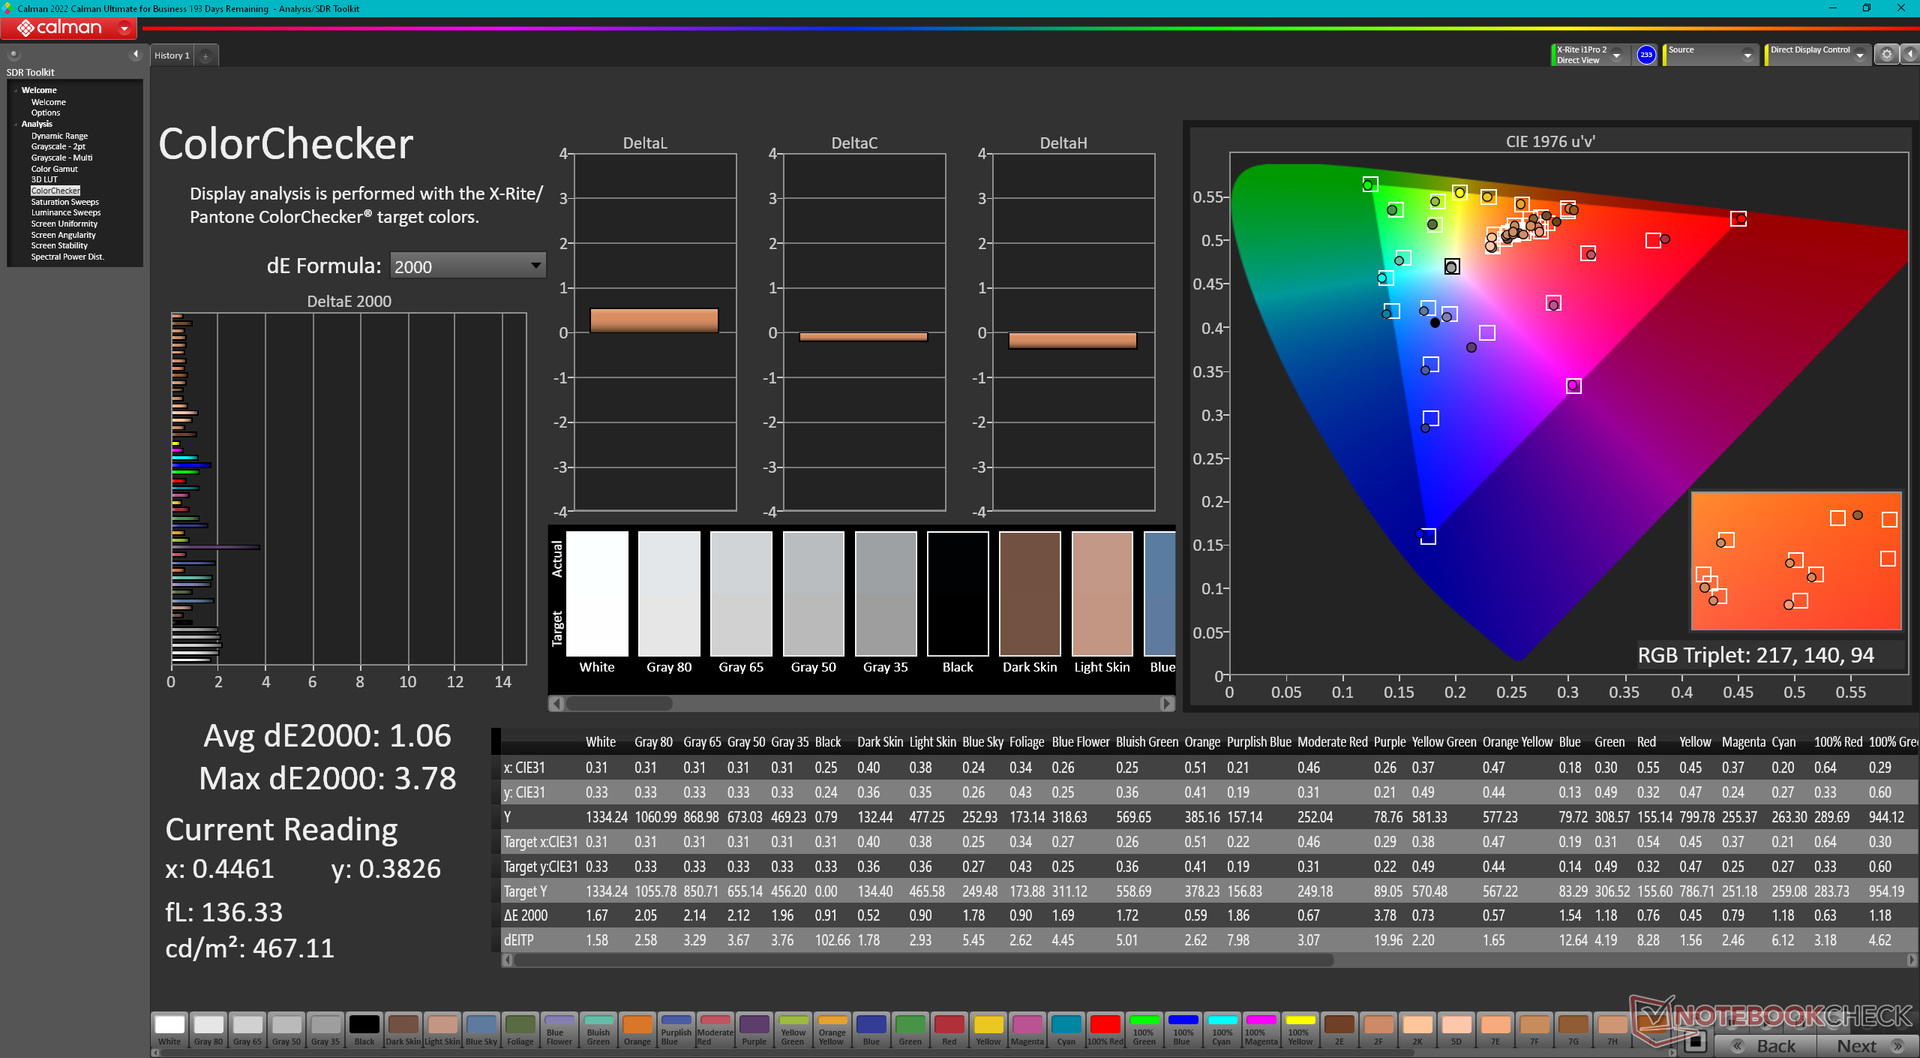
ΔE ColorChecker Calman: 1.06 | ∀{0.5-29.43 Ø4.71}
calibrated: 0.71
ΔE Greyscale Calman: 1.5 | ∀{0.09-98 Ø4.96}
68.4% AdobeRGB 1998 (Argyll 3D)
96.1% sRGB (Argyll 3D)
66.2% Display P3 (Argyll 3D)
Gamma: 2.19
CCT: 6804 K
| Dell Latitude 7230 Rugged Extreme Sharp LQ120N1, IPS, 1920x1200, 12" | Dell Latitude 7330 Rugged Extreme Sharp LQ133M1, IPS, 1920x1080, 13.3" | Panasonic Toughbook 40 InfoVision M140NWF5 R3, IPS, 1920x1080, 14" | Getac B360 AU Optronics AUO572D, IPS, 1920x1080, 13.3" | Acer Enduro Urban N3 EUN314 XR140EA6T, IPS, 1920x1080, 14" | Durabook S14I KD140N0730A01, TN, 1920x1080, 14" | |
|---|---|---|---|---|---|---|
| Display | 1% | -45% | -24% | -4% | -33% | |
| Display P3 Coverage (%) | 66.2 | 67.1 1% | 35.8 -46% | 51.3 -23% | 63.5 -4% | 43.55 -34% |
| sRGB Coverage (%) | 96.1 | 98.2 2% | 53.8 -44% | 72 -25% | 91.9 -4% | 65.4 -32% |
| AdobeRGB 1998 Coverage (%) | 68.4 | 69 1% | 37 -46% | 52.2 -24% | 65.5 -4% | 45 -34% |
| Response Times | -141% | -60% | -58% | -89% | 16% | |
| Response Time Grey 50% / Grey 80% * (ms) | 28.4 ? | 74.4 ? -162% | 50.4 ? -77% | 33 ? -16% | 56 ? -97% | 30.4 ? -7% |
| Response Time Black / White * (ms) | 19.4 ? | 42.4 ? -119% | 27.6 ? -42% | 38.8 ? -100% | 35.2 ? -81% | 11.8 ? 39% |
| PWM Frequency (Hz) | 694.4 ? | 870 ? | 1000 ? | 304.9 ? | ||
| Screen | -16% | -118% | -216% | -154% | -348% | |
| Brightness middle (cd/m²) | 1326.7 | 1414.1 7% | 1284.3 -3% | 1505.6 13% | 487.8 -63% | 1180.7 -11% |
| Brightness (cd/m²) | 1193 | 1282 7% | 1289 8% | 1383 16% | 464 -61% | 1102 -8% |
| Brightness Distribution (%) | 82 | 84 2% | 82 0% | 86 5% | 89 9% | 89 9% |
| Black Level * (cd/m²) | 0.85 | 0.83 2% | 0.89 -5% | 0.95 -12% | 0.48 44% | 1.91 -125% |
| Contrast (:1) | 1561 | 1704 9% | 1443 -8% | 1585 2% | 1016 -35% | 618 -60% |
| Colorchecker dE 2000 * | 1.06 | 1.99 -88% | 4.67 -341% | 9.81 -825% | 6.51 -514% | 13.45 -1169% |
| Colorchecker dE 2000 max. * | 3.78 | 3.75 1% | 19.85 -425% | 16.64 -340% | 11.36 -201% | 22.52 -496% |
| Colorchecker dE 2000 calibrated * | 0.71 | 0.72 -1% | 2.21 -211% | 1.44 -103% | 1.77 -149% | 3.19 -349% |
| Greyscale dE 2000 * | 1.5 | 2.8 -87% | 2.7 -80% | 12 -700% | 7.8 -420% | 15.4 -927% |
| Gamma | 2.19 100% | 2.06 107% | 1.97 112% | 1.98 111% | 2.28 96% | 1.97 112% |
| CCT | 6804 96% | 6775 96% | 6222 104% | 4838 134% | 8102 80% | 21134 31% |
| Color Space (Percent of AdobeRGB 1998) (%) | 41.6 | |||||
| Color Space (Percent of sRGB) (%) | 65.5 | |||||
| Całkowita średnia (program / ustawienia) | -52% /
-30% | -74% /
-94% | -99% /
-152% | -82% /
-113% | -122% /
-229% |
* ... im mniej tym lepiej
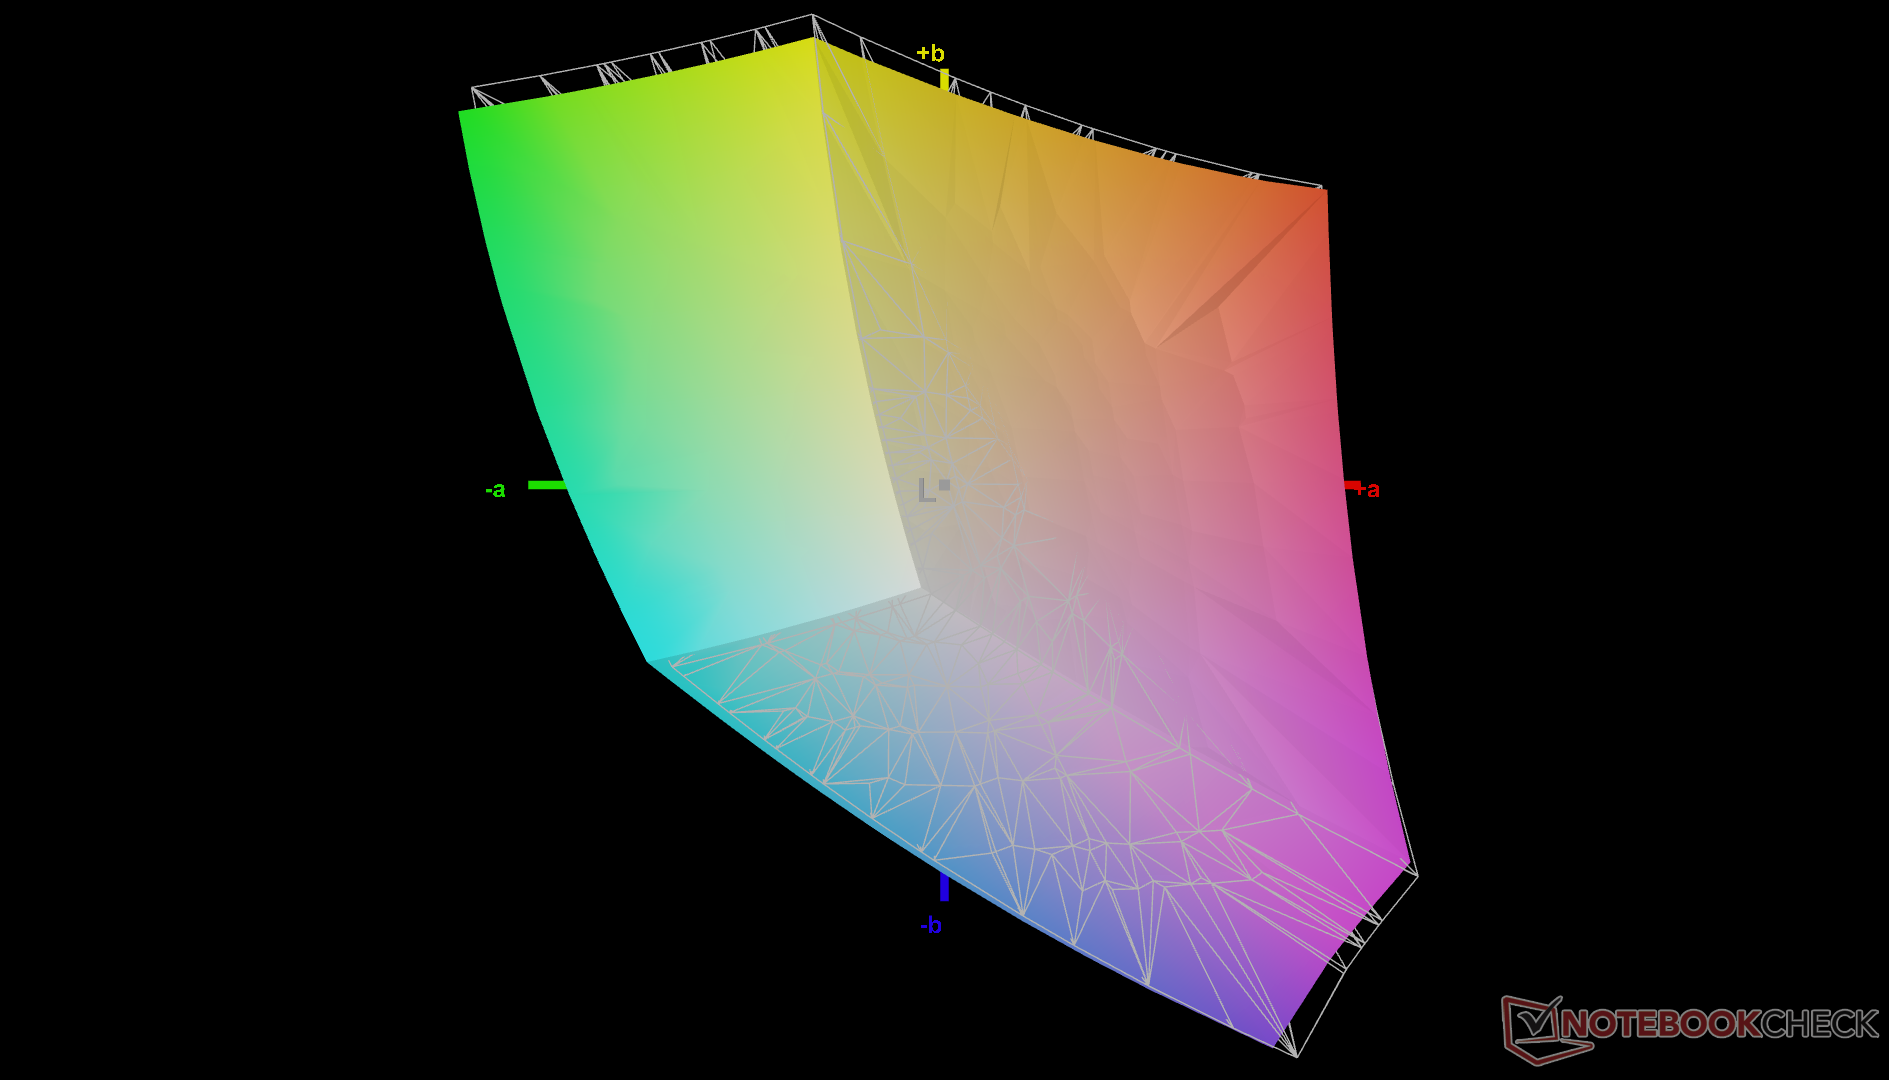
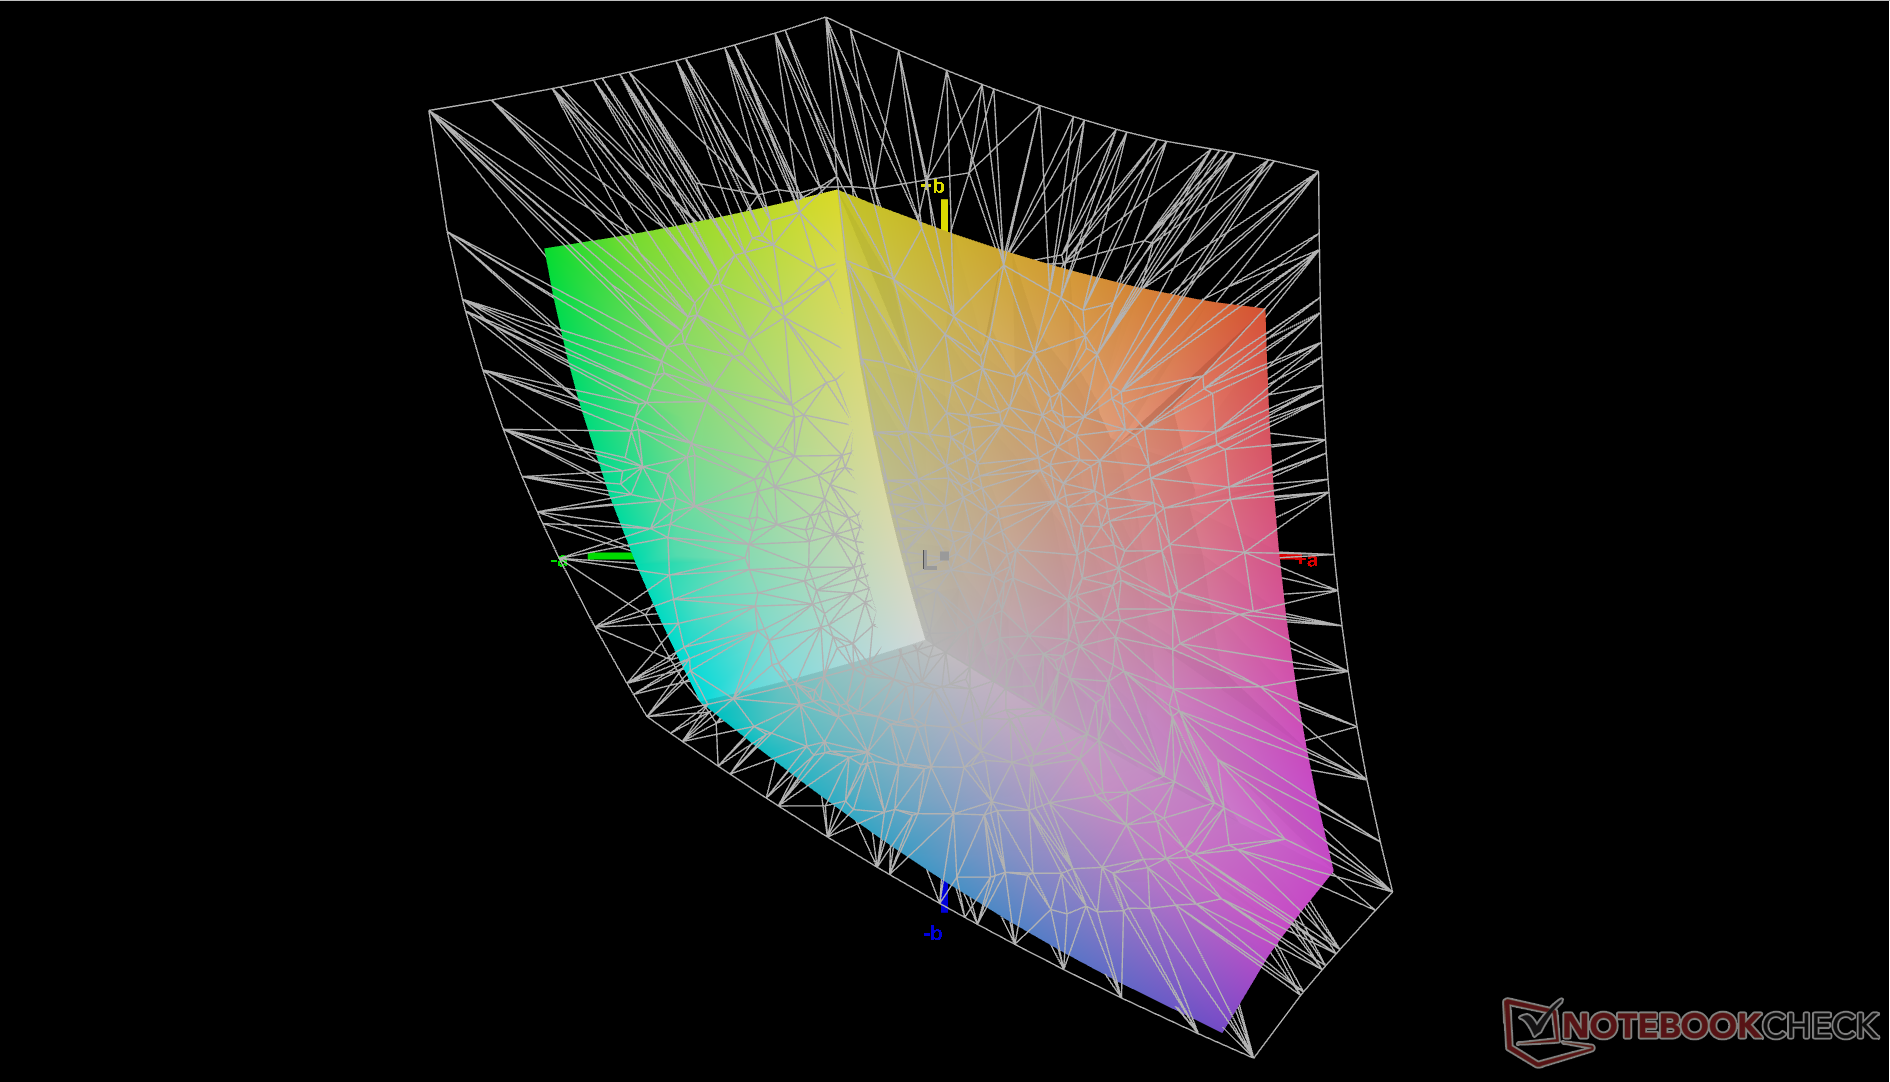
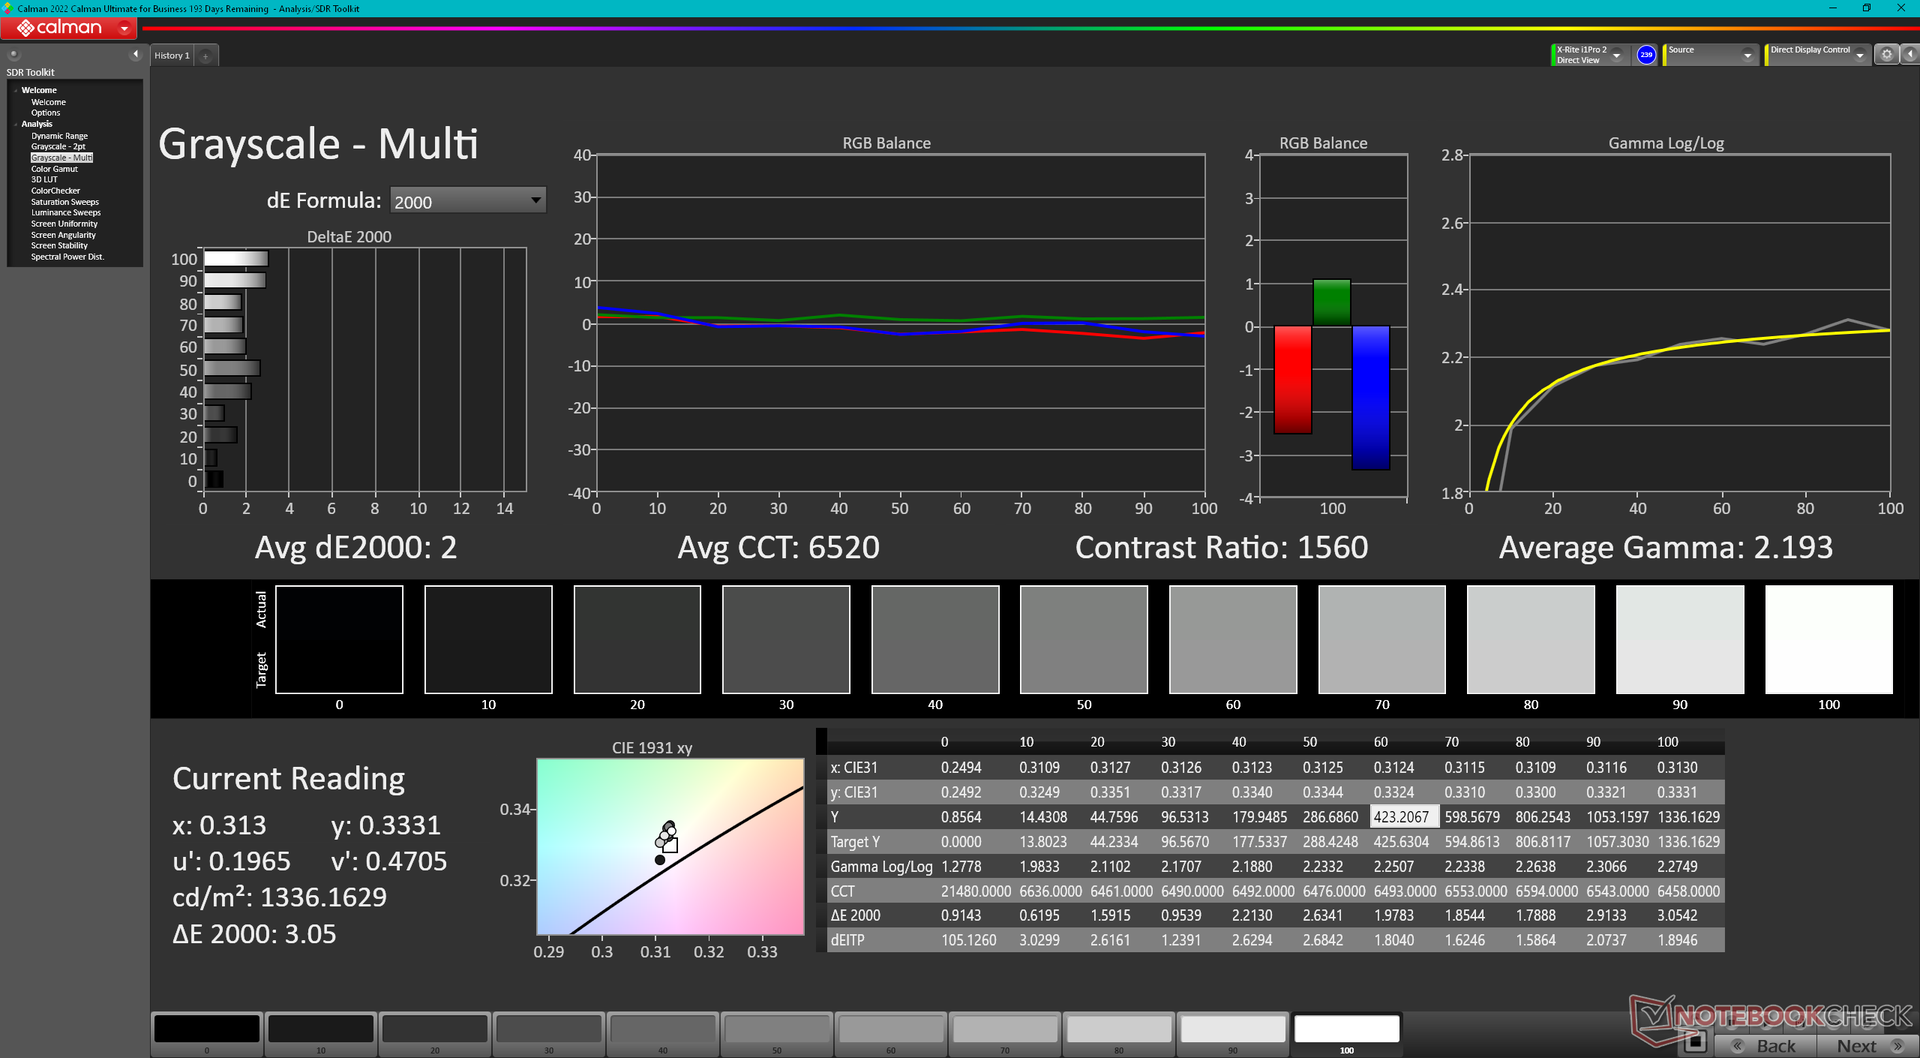
Wyświetlacz jest dobrze skalibrowany po wyjęciu z pudełka, a średnie wartości deltaE w skali szarości i kolorze wynoszą odpowiednio 1,5 i 1,06. Próba dalszej kalibracji z użyciem kolorymetru X-Rite nie poprawiłaby znacząco dokładności, więc kalibracja dla użytkownika końcowego nie jest konieczna.

Wyświetl czasy reakcji
| ↔ Czas reakcji od czerni do bieli | ||
|---|---|---|
| 19.4 ms ... wzrost ↗ i spadek ↘ łącznie | ↗ 9.7 ms wzrost | 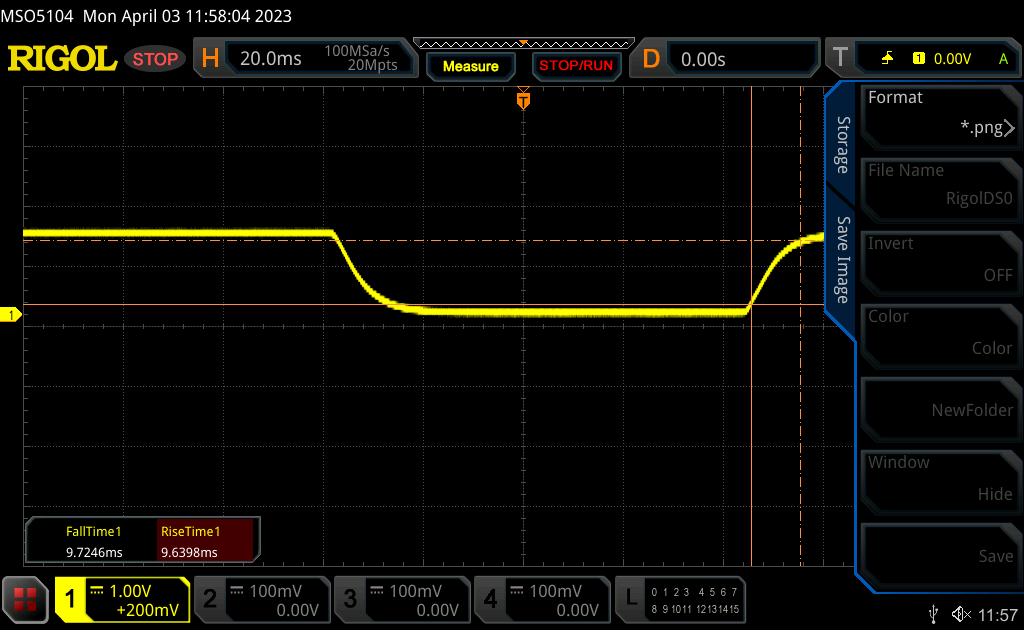 |
| ↘ 9.7 ms upadek | ||
| W naszych testach ekran wykazuje dobry współczynnik reakcji, ale może być zbyt wolny dla graczy rywalizujących ze sobą. Dla porównania, wszystkie testowane urządzenia wahają się od 0.1 (minimum) do 240 (maksimum) ms. » 43 % wszystkich urządzeń jest lepszych. Oznacza to, że zmierzony czas reakcji jest zbliżony do średniej wszystkich testowanych urządzeń (19.8 ms). | ||
| ↔ Czas reakcji 50% szarości do 80% szarości | ||
| 28.4 ms ... wzrost ↗ i spadek ↘ łącznie | ↗ 13.8 ms wzrost |  |
| ↘ 14.6 ms upadek | ||
| W naszych testach ekran wykazuje stosunkowo powolne tempo reakcji i może być zbyt wolny dla graczy. Dla porównania, wszystkie testowane urządzenia wahają się od 0.165 (minimum) do 636 (maksimum) ms. » 38 % wszystkich urządzeń jest lepszych. Oznacza to, że zmierzony czas reakcji jest zbliżony do średniej wszystkich testowanych urządzeń (30.9 ms). | ||
Migotanie ekranu / PWM (modulacja szerokości impulsu)
| Migotanie ekranu/nie wykryto PWM | 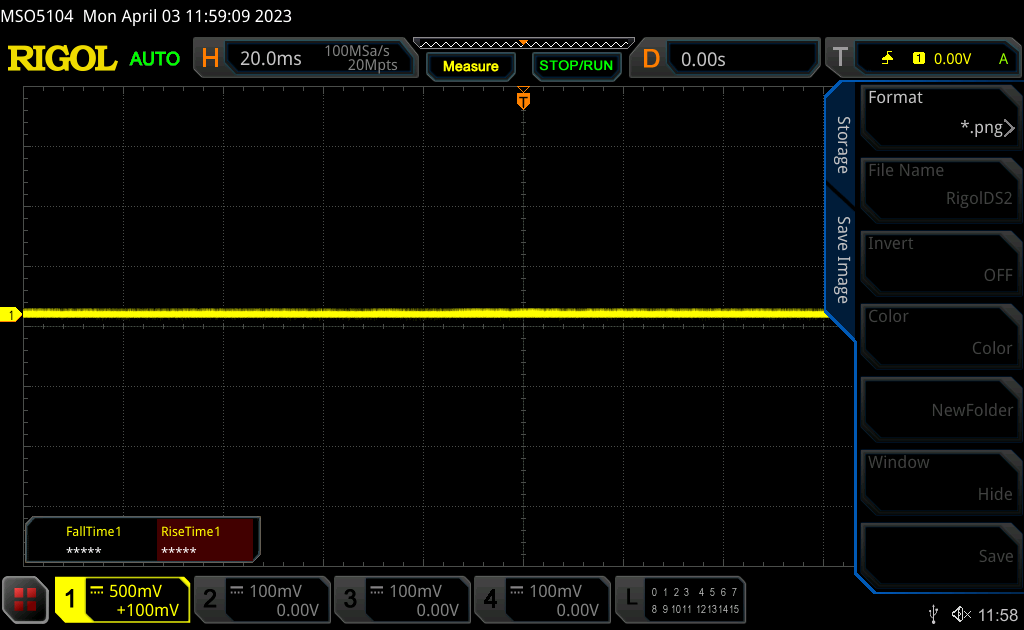 | ||
Dla porównania: 52 % wszystkich testowanych urządzeń nie używa PWM do przyciemniania wyświetlacza. Jeśli wykryto PWM, zmierzono średnio 7741 (minimum: 5 - maksimum: 343500) Hz. | |||
Widoczność na zewnątrz jest doskonała, ponieważ wyświetlacz ma ponad 1000 nitów lub jest ponad dwa razy jaśniejszy niż typowy konsumencki tablet lub laptop. Niektóre odblaski i wyprane kolory nadal występują, jednak, więc bezpośrednie światło słoneczne powinno być unikane, gdy tylko jest to możliwe, aby zmaksymalizować jakość obrazu.


Wydajność
Warunki badania
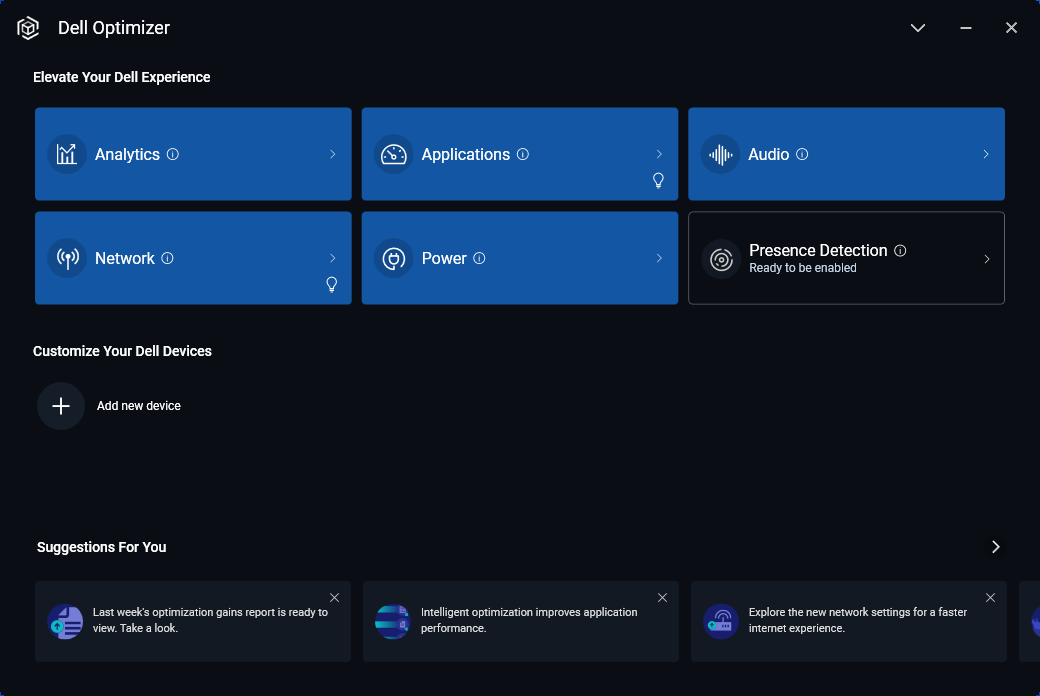
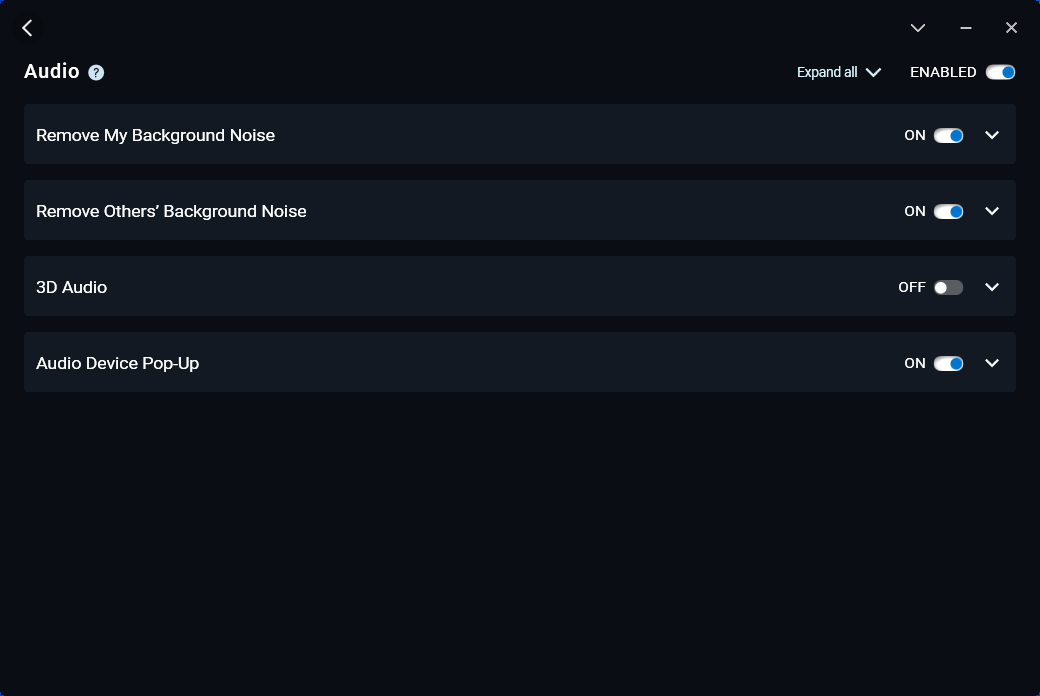
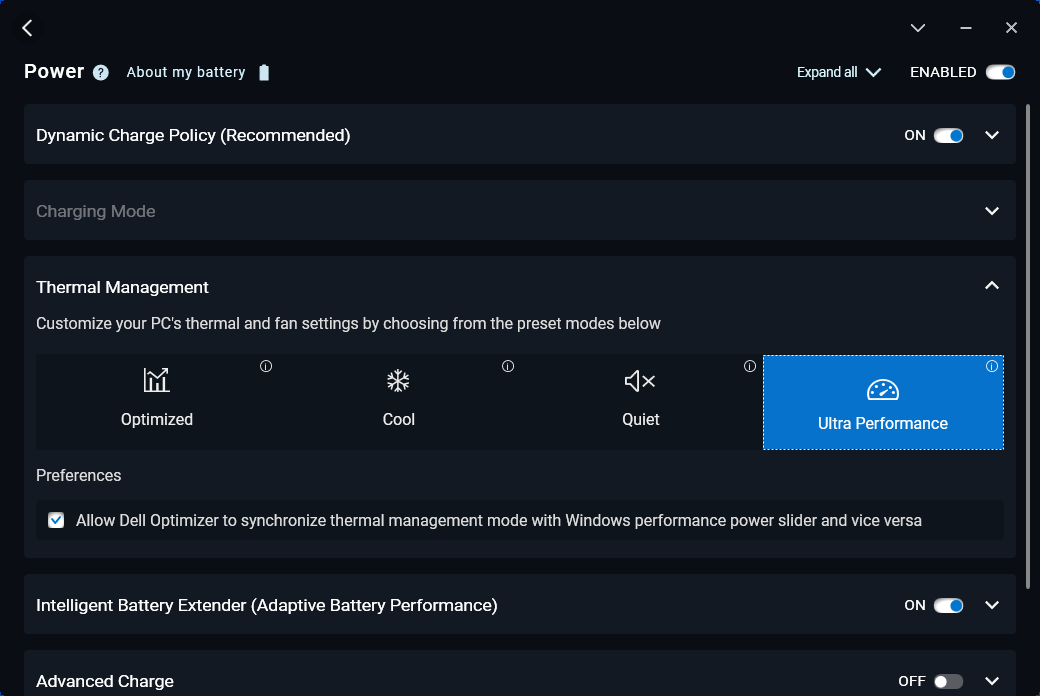
Przed przeprowadzeniem poniższych benchmarków ustawiliśmy nasze urządzenie w trybie Ultra Performance za pomocą preinstalowanego oprogramowania Dell Optimizer. Użytkownicy powinni przyzwyczaić się do Optimizera, ponieważ kontroluje on kluczowe aspekty modelu, w tym profile zasilania, dźwięk, mikrofon i łączność bezprzewodową.
Model ten nie obsługuje funkcji Dell Presence Detection.
Procesor - tak szybki jak Core i7-1260U
Wydajność procesora jest doskonała, zwłaszcza po tym, jak w zeszłym roku nie udało się znaleźć Core i7-1260U którego doświadczyliśmy w Latitude 7330. Wydajność wielowątkowa jest znacznie szybsza od popularnego Core i7-1165G7 lub i7-1185G7 które zasilały większość Ultrabooków i urządzeń typu rugged z dawnych lat.
Być może najważniejszym aspektem, o którym należy pamiętać przy wyborze pomiędzy Core i5-1240U lub Core i7-1260U jest fakt, że wydajność procesorów jest niemal identyczna. Zamiast tego, różnią się głównie wydajnością zintegrowanej grafiki. Jeśli potrzebujesz dodatkowej mocy GPU, wtedy najlepszy będzie wariant Core i7. W przeciwnym razie, oba procesory są jak równy z równym, jeśli chodzi o jedno- i wielowątkowe obciążenia CPU.
Cinebench R15 Multi Loop
Cinebench R23: Multi Core | Single Core
Cinebench R20: CPU (Multi Core) | CPU (Single Core)
Cinebench R15: CPU Multi 64Bit | CPU Single 64Bit
Blender: v2.79 BMW27 CPU
7-Zip 18.03: 7z b 4 | 7z b 4 -mmt1
Geekbench 5.5: Multi-Core | Single-Core
HWBOT x265 Benchmark v2.2: 4k Preset
LibreOffice : 20 Documents To PDF
R Benchmark 2.5: Overall mean
| CPU Performance rating | |
| HP EliteBook 840 G9 | |
| Asus ExpertBook B5 Flip B5602FBN | |
| Lenovo ThinkPad P14s G3 AMD 21J6S05000 | |
| HP ZBook Firefly 14 G9-6B8A2EA | |
| Lenovo ThinkBook 13s G3 20YA0005GE | |
| HP ProBook 440 G9-5Y3Z3EA | |
| Dell Latitude 7230 Rugged Extreme | |
| Przeciętny Intel Core i5-1240U | |
| Dell Latitude 9330 | |
| Dell Latitude 7330 Rugged Extreme | |
| Acer Enduro Urban N3 EUN314 | |
| Panasonic Toughbook 40 | |
| Durabook S14I | |
| Getac B360 -1! | |
| Cinebench R23 / Multi Core | |
| Asus ExpertBook B5 Flip B5602FBN | |
| Lenovo ThinkPad P14s G3 AMD 21J6S05000 | |
| HP EliteBook 840 G9 | |
| HP ZBook Firefly 14 G9-6B8A2EA | |
| Lenovo ThinkBook 13s G3 20YA0005GE | |
| Dell Latitude 7230 Rugged Extreme | |
| Przeciętny Intel Core i5-1240U (n=1) | |
| HP ProBook 440 G9-5Y3Z3EA | |
| Dell Latitude 9330 | |
| Dell Latitude 7330 Rugged Extreme | |
| Acer Enduro Urban N3 EUN314 | |
| Panasonic Toughbook 40 | |
| Getac B360 | |
| Durabook S14I | |
| Cinebench R23 / Single Core | |
| Asus ExpertBook B5 Flip B5602FBN | |
| HP ZBook Firefly 14 G9-6B8A2EA | |
| HP EliteBook 840 G9 | |
| HP ProBook 440 G9-5Y3Z3EA | |
| Dell Latitude 7230 Rugged Extreme | |
| Przeciętny Intel Core i5-1240U (n=1) | |
| Dell Latitude 9330 | |
| Dell Latitude 7330 Rugged Extreme | |
| Lenovo ThinkPad P14s G3 AMD 21J6S05000 | |
| Lenovo ThinkBook 13s G3 20YA0005GE | |
| Acer Enduro Urban N3 EUN314 | |
| Panasonic Toughbook 40 | |
| Durabook S14I | |
| Getac B360 | |
| Cinebench R20 / CPU (Multi Core) | |
| Lenovo ThinkPad P14s G3 AMD 21J6S05000 | |
| HP EliteBook 840 G9 | |
| Asus ExpertBook B5 Flip B5602FBN | |
| HP ZBook Firefly 14 G9-6B8A2EA | |
| Lenovo ThinkBook 13s G3 20YA0005GE | |
| Dell Latitude 7230 Rugged Extreme | |
| Przeciętny Intel Core i5-1240U (n=1) | |
| HP ProBook 440 G9-5Y3Z3EA | |
| Dell Latitude 9330 | |
| Dell Latitude 7330 Rugged Extreme | |
| Acer Enduro Urban N3 EUN314 | |
| Panasonic Toughbook 40 | |
| Getac B360 | |
| Durabook S14I | |
| Cinebench R20 / CPU (Single Core) | |
| Asus ExpertBook B5 Flip B5602FBN | |
| HP ZBook Firefly 14 G9-6B8A2EA | |
| HP ProBook 440 G9-5Y3Z3EA | |
| HP EliteBook 840 G9 | |
| Lenovo ThinkPad P14s G3 AMD 21J6S05000 | |
| Dell Latitude 7230 Rugged Extreme | |
| Przeciętny Intel Core i5-1240U (n=1) | |
| Dell Latitude 7330 Rugged Extreme | |
| Dell Latitude 9330 | |
| Lenovo ThinkBook 13s G3 20YA0005GE | |
| Acer Enduro Urban N3 EUN314 | |
| Durabook S14I | |
| Panasonic Toughbook 40 | |
| Getac B360 | |
| Cinebench R15 / CPU Multi 64Bit | |
| Asus ExpertBook B5 Flip B5602FBN | |
| HP EliteBook 840 G9 | |
| Lenovo ThinkBook 13s G3 20YA0005GE | |
| Lenovo ThinkBook 13s G3 20YA0005GE | |
| Lenovo ThinkPad P14s G3 AMD 21J6S05000 | |
| HP ZBook Firefly 14 G9-6B8A2EA | |
| HP ProBook 440 G9-5Y3Z3EA | |
| Dell Latitude 7230 Rugged Extreme | |
| Przeciętny Intel Core i5-1240U (n=1) | |
| Dell Latitude 9330 | |
| Acer Enduro Urban N3 EUN314 | |
| Dell Latitude 7330 Rugged Extreme | |
| Panasonic Toughbook 40 | |
| Getac B360 | |
| Durabook S14I | |
| Cinebench R15 / CPU Single 64Bit | |
| HP EliteBook 840 G9 | |
| HP ZBook Firefly 14 G9-6B8A2EA | |
| Asus ExpertBook B5 Flip B5602FBN | |
| HP ProBook 440 G9-5Y3Z3EA | |
| HP ProBook 440 G9-5Y3Z3EA | |
| Lenovo ThinkPad P14s G3 AMD 21J6S05000 | |
| Lenovo ThinkBook 13s G3 20YA0005GE | |
| Dell Latitude 7330 Rugged Extreme | |
| Dell Latitude 7230 Rugged Extreme | |
| Przeciętny Intel Core i5-1240U (n=1) | |
| Dell Latitude 9330 | |
| Acer Enduro Urban N3 EUN314 | |
| Durabook S14I | |
| Panasonic Toughbook 40 | |
| Getac B360 | |
| Blender / v2.79 BMW27 CPU | |
| Durabook S14I | |
| Getac B360 | |
| Panasonic Toughbook 40 | |
| Acer Enduro Urban N3 EUN314 | |
| Dell Latitude 7330 Rugged Extreme | |
| Dell Latitude 9330 | |
| HP ZBook Firefly 14 G9-6B8A2EA | |
| HP ProBook 440 G9-5Y3Z3EA | |
| Dell Latitude 7230 Rugged Extreme | |
| Przeciętny Intel Core i5-1240U (n=1) | |
| Lenovo ThinkBook 13s G3 20YA0005GE | |
| Lenovo ThinkPad P14s G3 AMD 21J6S05000 | |
| Asus ExpertBook B5 Flip B5602FBN | |
| HP EliteBook 840 G9 | |
| 7-Zip 18.03 / 7z b 4 | |
| HP EliteBook 840 G9 | |
| Lenovo ThinkPad P14s G3 AMD 21J6S05000 | |
| Asus ExpertBook B5 Flip B5602FBN | |
| Lenovo ThinkBook 13s G3 20YA0005GE | |
| HP ZBook Firefly 14 G9-6B8A2EA | |
| Dell Latitude 9330 | |
| Dell Latitude 7230 Rugged Extreme | |
| Przeciętny Intel Core i5-1240U (n=1) | |
| HP ProBook 440 G9-5Y3Z3EA | |
| Acer Enduro Urban N3 EUN314 | |
| Dell Latitude 7330 Rugged Extreme | |
| Getac B360 | |
| Panasonic Toughbook 40 | |
| Durabook S14I | |
| 7-Zip 18.03 / 7z b 4 -mmt1 | |
| HP EliteBook 840 G9 | |
| HP ZBook Firefly 14 G9-6B8A2EA | |
| Asus ExpertBook B5 Flip B5602FBN | |
| Dell Latitude 7330 Rugged Extreme | |
| Acer Enduro Urban N3 EUN314 | |
| Lenovo ThinkBook 13s G3 20YA0005GE | |
| Durabook S14I | |
| HP ProBook 440 G9-5Y3Z3EA | |
| Lenovo ThinkPad P14s G3 AMD 21J6S05000 | |
| Panasonic Toughbook 40 | |
| Dell Latitude 9330 | |
| Getac B360 | |
| Dell Latitude 7230 Rugged Extreme | |
| Przeciętny Intel Core i5-1240U (n=1) | |
| Geekbench 5.5 / Multi-Core | |
| HP EliteBook 840 G9 | |
| Asus ExpertBook B5 Flip B5602FBN | |
| HP ZBook Firefly 14 G9-6B8A2EA | |
| Lenovo ThinkPad P14s G3 AMD 21J6S05000 | |
| Dell Latitude 9330 | |
| Dell Latitude 7230 Rugged Extreme | |
| Przeciętny Intel Core i5-1240U (n=1) | |
| Lenovo ThinkBook 13s G3 20YA0005GE | |
| HP ProBook 440 G9-5Y3Z3EA | |
| Dell Latitude 7330 Rugged Extreme | |
| Acer Enduro Urban N3 EUN314 | |
| Panasonic Toughbook 40 | |
| Getac B360 | |
| Durabook S14I | |
| Geekbench 5.5 / Single-Core | |
| HP EliteBook 840 G9 | |
| HP ZBook Firefly 14 G9-6B8A2EA | |
| Dell Latitude 7230 Rugged Extreme | |
| Przeciętny Intel Core i5-1240U (n=1) | |
| HP ProBook 440 G9-5Y3Z3EA | |
| Dell Latitude 9330 | |
| Dell Latitude 7330 Rugged Extreme | |
| Acer Enduro Urban N3 EUN314 | |
| Asus ExpertBook B5 Flip B5602FBN | |
| Durabook S14I | |
| Lenovo ThinkPad P14s G3 AMD 21J6S05000 | |
| Panasonic Toughbook 40 | |
| Lenovo ThinkBook 13s G3 20YA0005GE | |
| Getac B360 | |
| HWBOT x265 Benchmark v2.2 / 4k Preset | |
| Lenovo ThinkPad P14s G3 AMD 21J6S05000 | |
| HP EliteBook 840 G9 | |
| Asus ExpertBook B5 Flip B5602FBN | |
| Lenovo ThinkBook 13s G3 20YA0005GE | |
| HP ZBook Firefly 14 G9-6B8A2EA | |
| Dell Latitude 7230 Rugged Extreme | |
| Przeciętny Intel Core i5-1240U (n=1) | |
| HP ProBook 440 G9-5Y3Z3EA | |
| Dell Latitude 9330 | |
| Dell Latitude 7330 Rugged Extreme | |
| Acer Enduro Urban N3 EUN314 | |
| Panasonic Toughbook 40 | |
| Getac B360 | |
| Durabook S14I | |
| LibreOffice / 20 Documents To PDF | |
| Acer Enduro Urban N3 EUN314 | |
| Lenovo ThinkPad P14s G3 AMD 21J6S05000 | |
| Panasonic Toughbook 40 | |
| Dell Latitude 7230 Rugged Extreme | |
| Przeciętny Intel Core i5-1240U (n=1) | |
| HP ProBook 440 G9-5Y3Z3EA | |
| Dell Latitude 9330 | |
| Lenovo ThinkBook 13s G3 20YA0005GE | |
| Dell Latitude 7330 Rugged Extreme | |
| Asus ExpertBook B5 Flip B5602FBN | |
| Durabook S14I | |
| HP EliteBook 840 G9 | |
| HP ZBook Firefly 14 G9-6B8A2EA | |
| R Benchmark 2.5 / Overall mean | |
| Getac B360 | |
| Panasonic Toughbook 40 | |
| Durabook S14I | |
| Acer Enduro Urban N3 EUN314 | |
| Dell Latitude 7330 Rugged Extreme | |
| Lenovo ThinkBook 13s G3 20YA0005GE | |
| Lenovo ThinkPad P14s G3 AMD 21J6S05000 | |
| Dell Latitude 7230 Rugged Extreme | |
| Przeciętny Intel Core i5-1240U (n=1) | |
| Dell Latitude 9330 | |
| HP ProBook 440 G9-5Y3Z3EA | |
| Asus ExpertBook B5 Flip B5602FBN | |
| HP ZBook Firefly 14 G9-6B8A2EA | |
| HP EliteBook 840 G9 | |
Cinebench R23: Multi Core | Single Core
Cinebench R20: CPU (Multi Core) | CPU (Single Core)
Cinebench R15: CPU Multi 64Bit | CPU Single 64Bit
Blender: v2.79 BMW27 CPU
7-Zip 18.03: 7z b 4 | 7z b 4 -mmt1
Geekbench 5.5: Multi-Core | Single-Core
HWBOT x265 Benchmark v2.2: 4k Preset
LibreOffice : 20 Documents To PDF
R Benchmark 2.5: Overall mean
* ... im mniej tym lepiej
| Blender | |
| v3.3 Classroom HIP/AMD | |
| Lenovo ThinkPad P14s G3 AMD 21J6S05000 | |
| Lenovo ThinkPad P14s G3 AMD 21J6S05000 | |
| v3.3 Classroom OPTIX/RTX | |
| HP ZBook Firefly 14 G9-6B8A2EA | |
| v3.3 Classroom CUDA | |
| HP ZBook Firefly 14 G9-6B8A2EA | |
| v3.3 Classroom CPU | |
| Dell Latitude 7230 Rugged Extreme | |
| HP ProBook 440 G9-5Y3Z3EA | |
| HP ZBook Firefly 14 G9-6B8A2EA | |
| HP EliteBook 840 G9 | |
| Asus ExpertBook B5 Flip B5602FBN | |
| Lenovo ThinkPad P14s G3 AMD 21J6S05000 | |
* ... im mniej tym lepiej
AIDA64: FP32 Ray-Trace | FPU Julia | CPU SHA3 | CPU Queen | FPU SinJulia | FPU Mandel | CPU AES | CPU ZLib | FP64 Ray-Trace | CPU PhotoWorxx
| Performance rating | |
| Dell Latitude 7330 Rugged Extreme | |
| Acer Enduro Urban N3 EUN314 | |
| Dell Latitude 7230 Rugged Extreme | |
| Przeciętny Intel Core i5-1240U | |
| Panasonic Toughbook 40 | |
| Getac B360 | |
| Durabook S14I | |
| AIDA64 / FP32 Ray-Trace | |
| Dell Latitude 7330 Rugged Extreme | |
| Acer Enduro Urban N3 EUN314 | |
| Dell Latitude 7230 Rugged Extreme | |
| Przeciętny Intel Core i5-1240U (n=1) | |
| Panasonic Toughbook 40 | |
| Durabook S14I | |
| Getac B360 | |
| AIDA64 / FPU Julia | |
| Dell Latitude 7230 Rugged Extreme | |
| Przeciętny Intel Core i5-1240U (n=1) | |
| Dell Latitude 7330 Rugged Extreme | |
| Acer Enduro Urban N3 EUN314 | |
| Getac B360 | |
| Panasonic Toughbook 40 | |
| Durabook S14I | |
| AIDA64 / CPU SHA3 | |
| Dell Latitude 7330 Rugged Extreme | |
| Acer Enduro Urban N3 EUN314 | |
| Dell Latitude 7230 Rugged Extreme | |
| Przeciętny Intel Core i5-1240U (n=1) | |
| Panasonic Toughbook 40 | |
| Durabook S14I | |
| Getac B360 | |
| AIDA64 / CPU Queen | |
| Getac B360 | |
| Dell Latitude 7330 Rugged Extreme | |
| Acer Enduro Urban N3 EUN314 | |
| Durabook S14I | |
| Dell Latitude 7230 Rugged Extreme | |
| Przeciętny Intel Core i5-1240U (n=1) | |
| Panasonic Toughbook 40 | |
| AIDA64 / FPU SinJulia | |
| Dell Latitude 7330 Rugged Extreme | |
| Acer Enduro Urban N3 EUN314 | |
| Getac B360 | |
| Panasonic Toughbook 40 | |
| Dell Latitude 7230 Rugged Extreme | |
| Przeciętny Intel Core i5-1240U (n=1) | |
| Durabook S14I | |
| AIDA64 / FPU Mandel | |
| Dell Latitude 7330 Rugged Extreme | |
| Acer Enduro Urban N3 EUN314 | |
| Dell Latitude 7230 Rugged Extreme | |
| Przeciętny Intel Core i5-1240U (n=1) | |
| Panasonic Toughbook 40 | |
| Durabook S14I | |
| Getac B360 | |
| AIDA64 / CPU AES | |
| Dell Latitude 7330 Rugged Extreme | |
| Acer Enduro Urban N3 EUN314 | |
| Durabook S14I | |
| Dell Latitude 7230 Rugged Extreme | |
| Przeciętny Intel Core i5-1240U (n=1) | |
| Panasonic Toughbook 40 | |
| Getac B360 | |
| AIDA64 / CPU ZLib | |
| Dell Latitude 7230 Rugged Extreme | |
| Przeciętny Intel Core i5-1240U (n=1) | |
| Dell Latitude 7330 Rugged Extreme | |
| Acer Enduro Urban N3 EUN314 | |
| Panasonic Toughbook 40 | |
| Getac B360 | |
| Durabook S14I | |
| AIDA64 / FP64 Ray-Trace | |
| Dell Latitude 7330 Rugged Extreme | |
| Acer Enduro Urban N3 EUN314 | |
| Dell Latitude 7230 Rugged Extreme | |
| Przeciętny Intel Core i5-1240U (n=1) | |
| Panasonic Toughbook 40 | |
| Durabook S14I | |
| Getac B360 | |
| AIDA64 / CPU PhotoWorxx | |
| Dell Latitude 7330 Rugged Extreme | |
| Dell Latitude 7230 Rugged Extreme | |
| Przeciętny Intel Core i5-1240U (n=1) | |
| Acer Enduro Urban N3 EUN314 | |
| Panasonic Toughbook 40 | |
| Getac B360 | |
| Durabook S14I | |
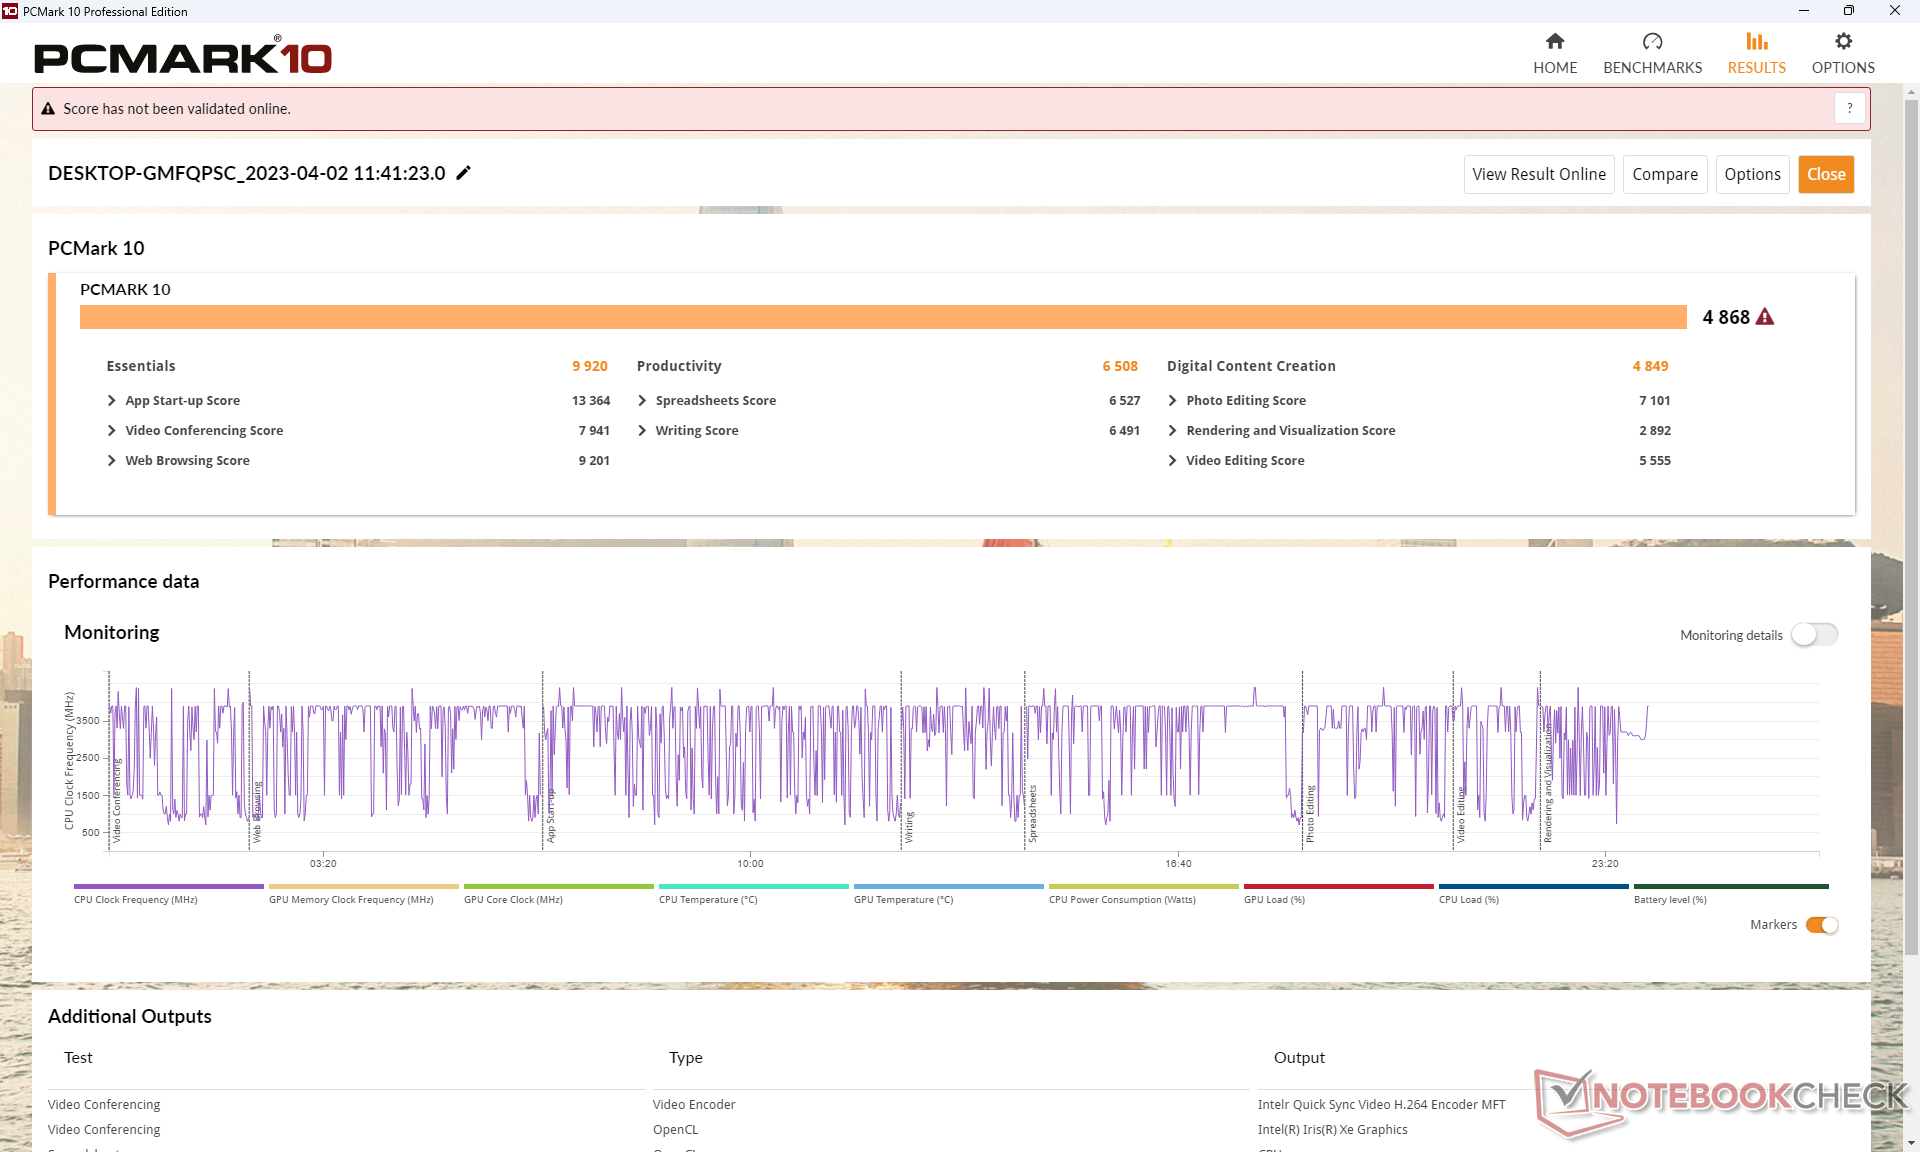
Wydajność systemu
CrossMark: Overall | Productivity | Creativity | Responsiveness
| PCMark 10 / Score | |
| Dell Latitude 7330 Rugged Extreme | |
| Panasonic Toughbook 40 | |
| Dell Latitude 7230 Rugged Extreme | |
| Przeciętny Intel Core i5-1240U, Intel Iris Xe Graphics G7 80EUs (n=1) | |
| Durabook S14I | |
| Acer Enduro Urban N3 EUN314 | |
| Getac B360 | |
| PCMark 10 / Essentials | |
| Dell Latitude 7330 Rugged Extreme | |
| Durabook S14I | |
| Dell Latitude 7230 Rugged Extreme | |
| Przeciętny Intel Core i5-1240U, Intel Iris Xe Graphics G7 80EUs (n=1) | |
| Panasonic Toughbook 40 | |
| Acer Enduro Urban N3 EUN314 | |
| Getac B360 | |
| PCMark 10 / Productivity | |
| Getac B360 | |
| Durabook S14I | |
| Dell Latitude 7330 Rugged Extreme | |
| Panasonic Toughbook 40 | |
| Dell Latitude 7230 Rugged Extreme | |
| Przeciętny Intel Core i5-1240U, Intel Iris Xe Graphics G7 80EUs (n=1) | |
| Acer Enduro Urban N3 EUN314 | |
| PCMark 10 / Digital Content Creation | |
| Dell Latitude 7330 Rugged Extreme | |
| Panasonic Toughbook 40 | |
| Acer Enduro Urban N3 EUN314 | |
| Dell Latitude 7230 Rugged Extreme | |
| Przeciętny Intel Core i5-1240U, Intel Iris Xe Graphics G7 80EUs (n=1) | |
| Durabook S14I | |
| Getac B360 | |
| CrossMark / Overall | |
| Dell Latitude 7230 Rugged Extreme | |
| Przeciętny Intel Core i5-1240U, Intel Iris Xe Graphics G7 80EUs (n=1) | |
| Panasonic Toughbook 40 | |
| CrossMark / Productivity | |
| Dell Latitude 7230 Rugged Extreme | |
| Przeciętny Intel Core i5-1240U, Intel Iris Xe Graphics G7 80EUs (n=1) | |
| Panasonic Toughbook 40 | |
| CrossMark / Creativity | |
| Dell Latitude 7230 Rugged Extreme | |
| Przeciętny Intel Core i5-1240U, Intel Iris Xe Graphics G7 80EUs (n=1) | |
| Panasonic Toughbook 40 | |
| CrossMark / Responsiveness | |
| Dell Latitude 7230 Rugged Extreme | |
| Przeciętny Intel Core i5-1240U, Intel Iris Xe Graphics G7 80EUs (n=1) | |
| Panasonic Toughbook 40 | |
| PCMark 10 Score | 4868 pkt. | |
Pomoc | ||
| AIDA64 / Memory Copy | |
| Dell Latitude 7230 Rugged Extreme | |
| Przeciętny Intel Core i5-1240U (n=1) | |
| Dell Latitude 7330 Rugged Extreme | |
| Acer Enduro Urban N3 EUN314 | |
| Panasonic Toughbook 40 | |
| Getac B360 | |
| Durabook S14I | |
| AIDA64 / Memory Read | |
| Dell Latitude 7330 Rugged Extreme | |
| Dell Latitude 7230 Rugged Extreme | |
| Przeciętny Intel Core i5-1240U (n=1) | |
| Acer Enduro Urban N3 EUN314 | |
| Panasonic Toughbook 40 | |
| Getac B360 | |
| Durabook S14I | |
| AIDA64 / Memory Write | |
| Dell Latitude 7330 Rugged Extreme | |
| Dell Latitude 7230 Rugged Extreme | |
| Przeciętny Intel Core i5-1240U (n=1) | |
| Acer Enduro Urban N3 EUN314 | |
| Getac B360 | |
| Panasonic Toughbook 40 | |
| Durabook S14I | |
| AIDA64 / Memory Latency | |
| Dell Latitude 7230 Rugged Extreme | |
| Przeciętny Intel Core i5-1240U (n=1) | |
| Panasonic Toughbook 40 | |
| Dell Latitude 7330 Rugged Extreme | |
| Acer Enduro Urban N3 EUN314 | |
| Durabook S14I | |
| Getac B360 | |
* ... im mniej tym lepiej
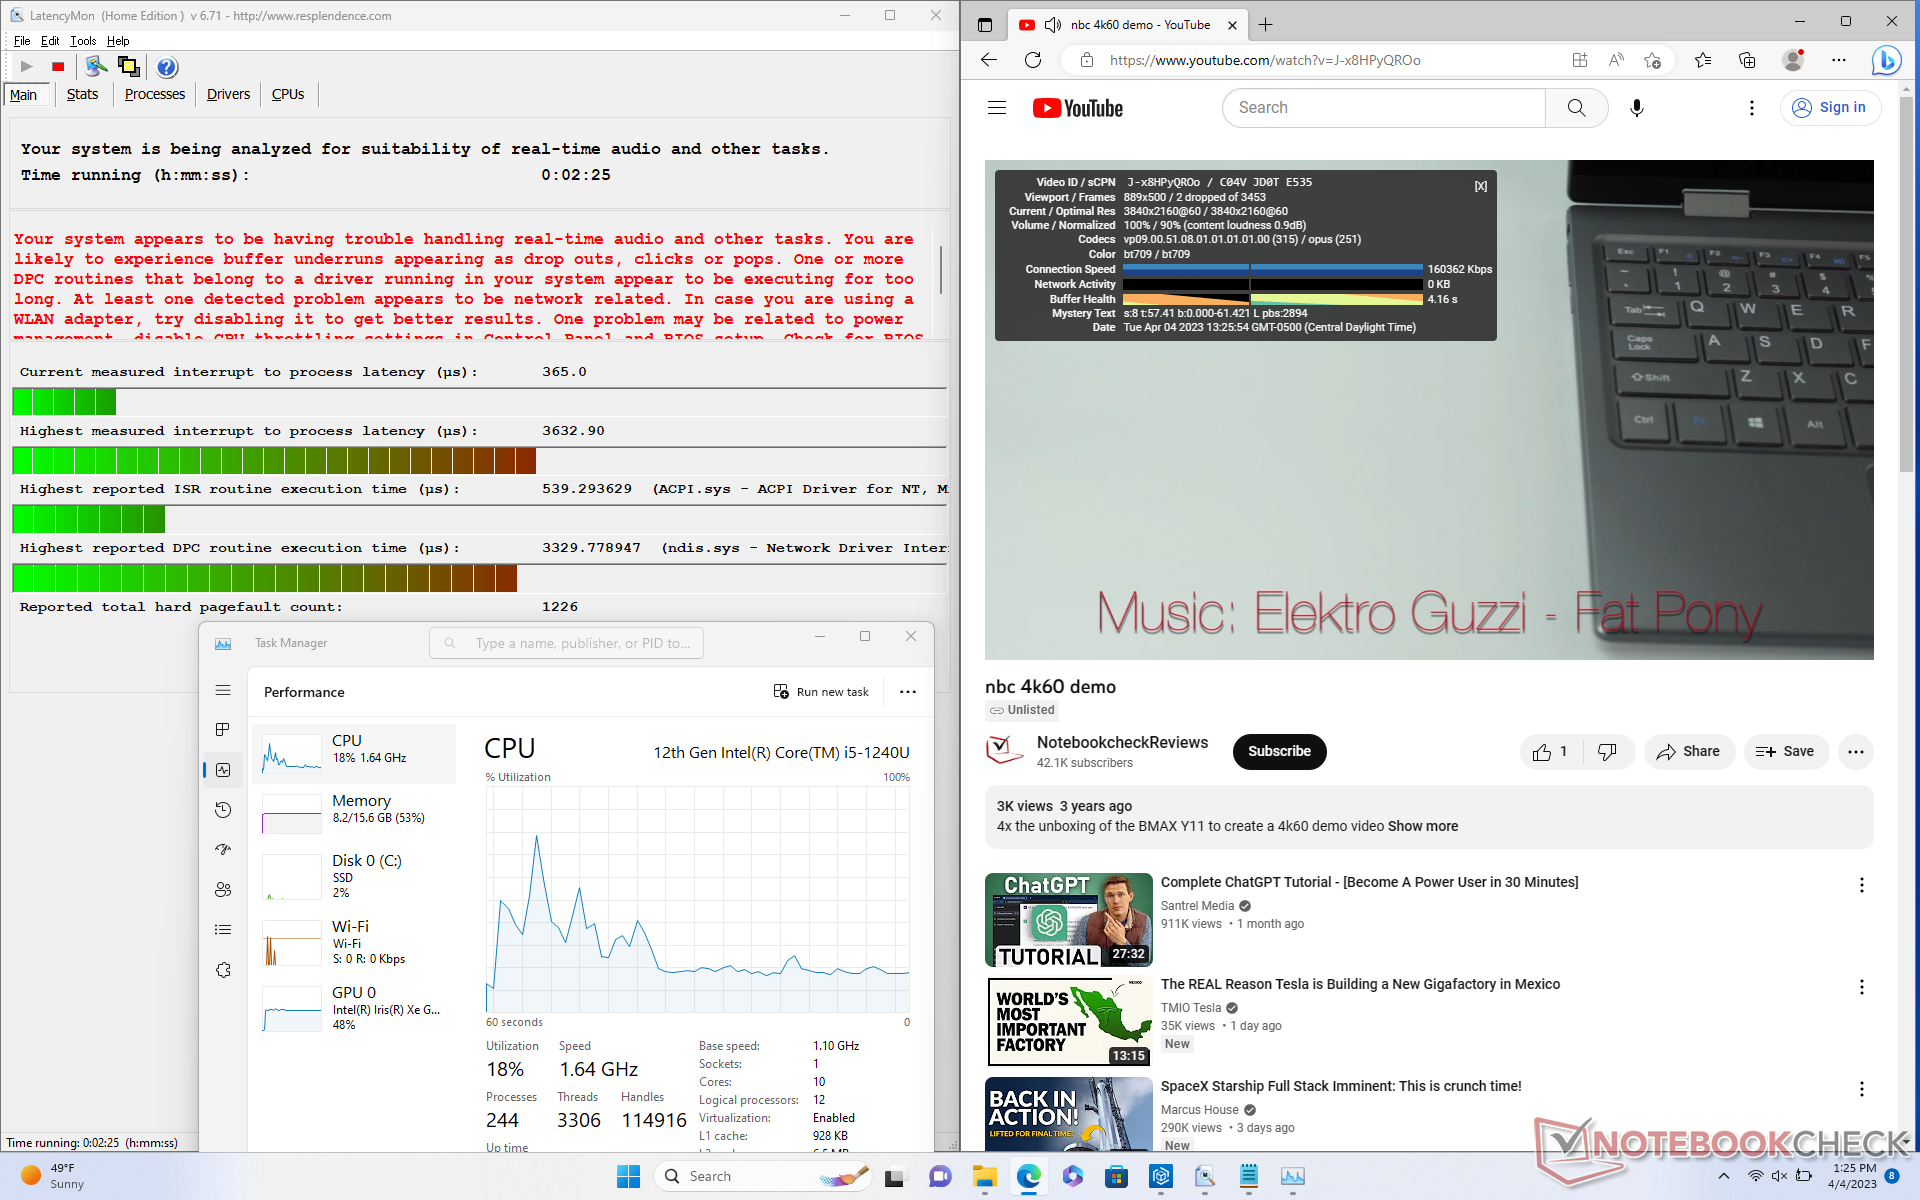
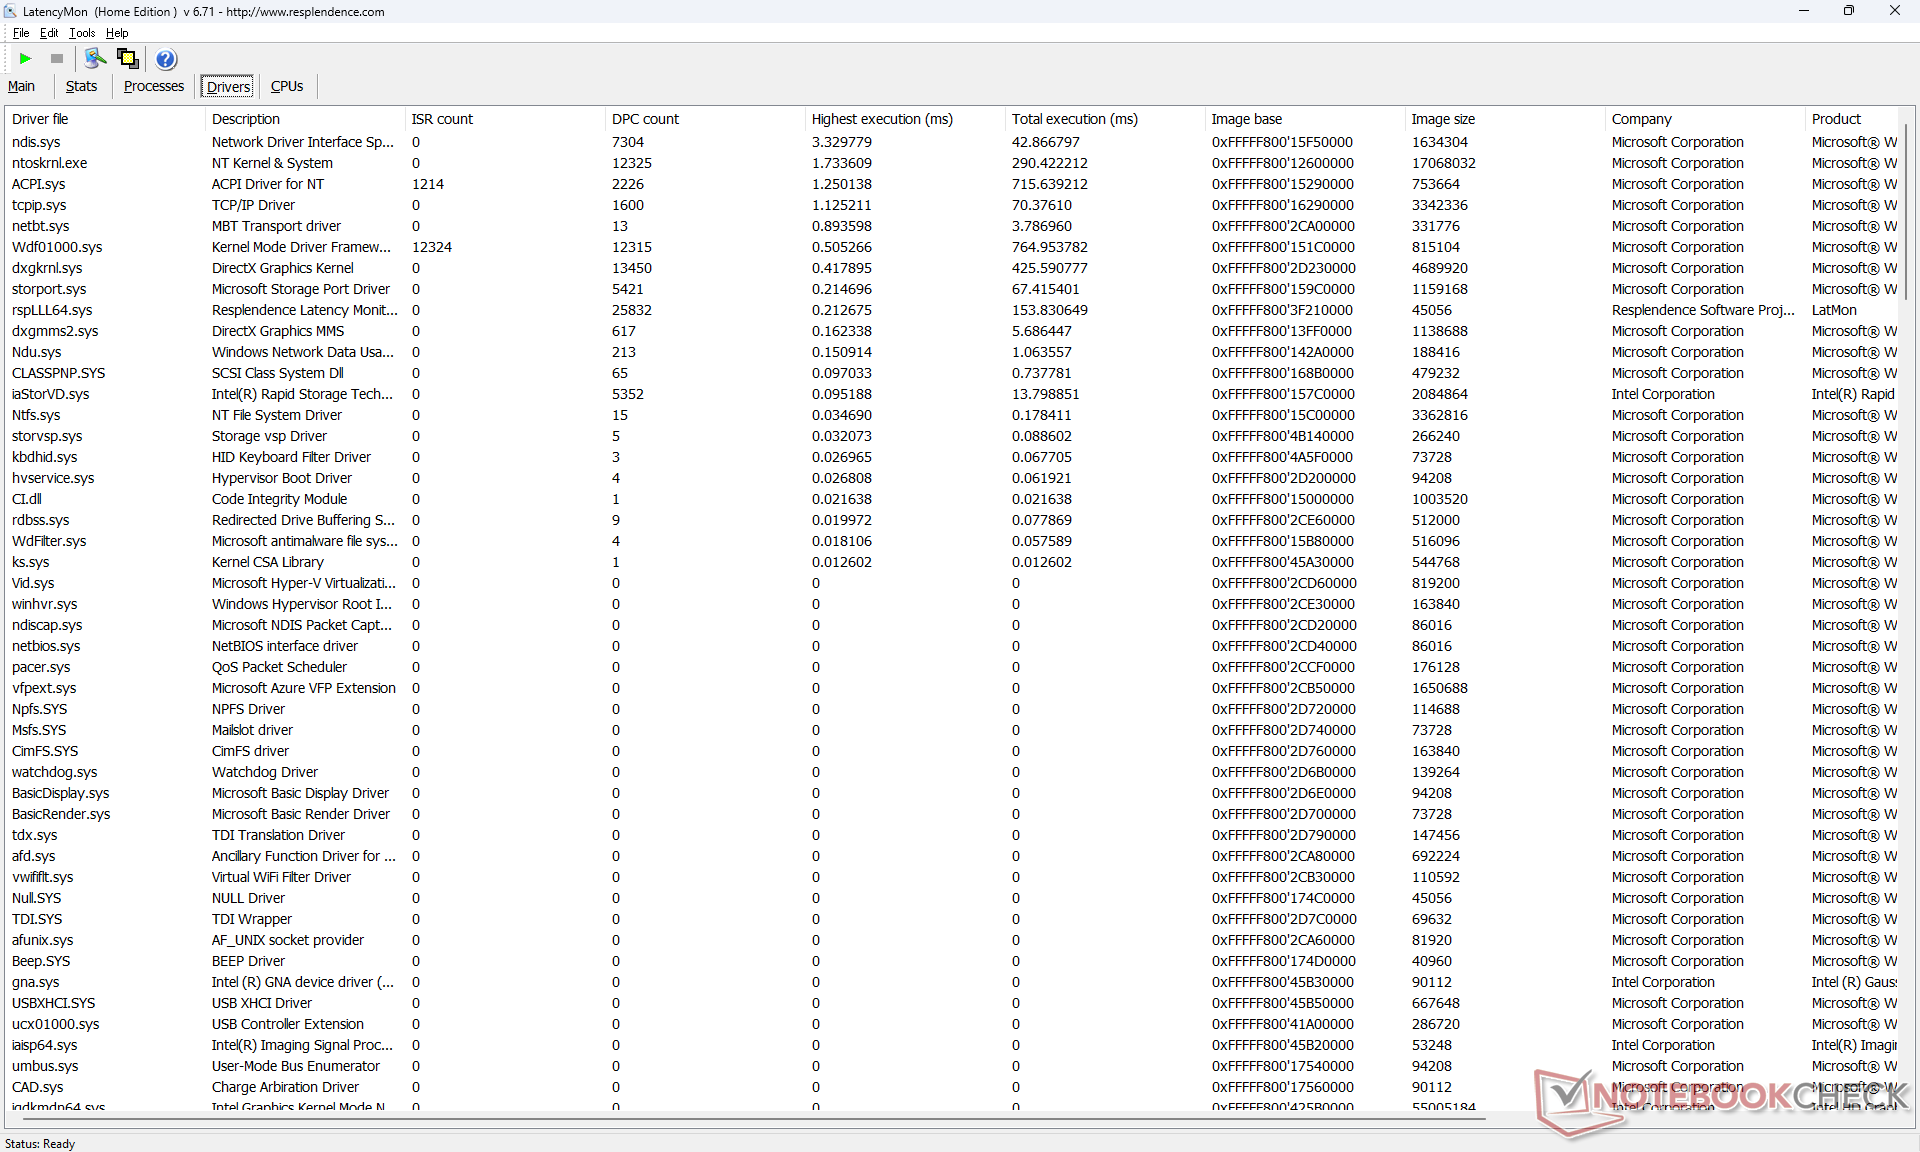
Opóźnienie DPC
LatencyMon ujawnia problemy DPC podczas otwierania wielu kart przeglądarki na naszej stronie głównej, co jest rozczarowujące w przypadku wytrzymałego urządzenia, w którym stabilność wydajności jest najważniejsza. odtwarzanie wideo 4K przy 60 FPS jest również niedoskonałe - podczas naszego minutowego filmu testowego wystąpiły 2 klatki.
| DPC Latencies / LatencyMon - interrupt to process latency (max), Web, Youtube, Prime95 | |
| Acer Enduro Urban N3 EUN314 | |
| Dell Latitude 7230 Rugged Extreme | |
| Durabook S14I | |
| Panasonic Toughbook 40 | |
| Getac B360 | |
| Dell Latitude 7330 Rugged Extreme | |
* ... im mniej tym lepiej
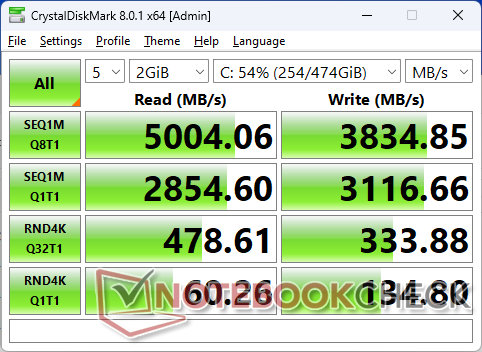
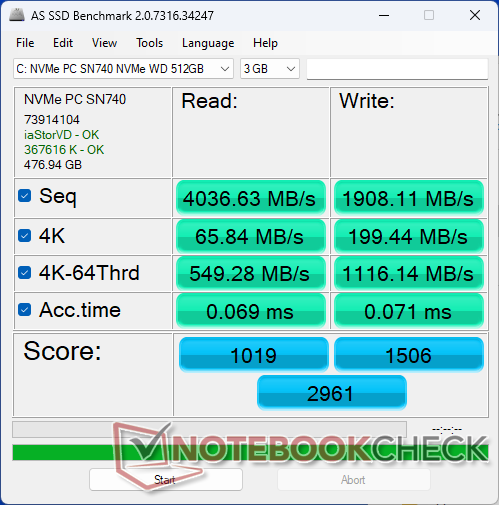
Urządzenia do przechowywania danych
Nasz testowy egzemplarz został wyposażony w wymienny WD PC SN740 PCIe4 x4 NVMe SSD zapewniający sekwencyjny transfer do 4800 MB/s. Maksymalna wydajność nie jest jednak trwała, gdyż po kilku minutach transfery spadały do poziomu 2300 MB/s, jak pokazuje poniższy wykres.

| Drive Performance rating - Percent | |
| Dell Latitude 7330 Rugged Extreme | |
| Dell Latitude 7230 Rugged Extreme | |
| Acer Enduro Urban N3 EUN314 | |
| Getac B360 | |
| Durabook S14I | |
| Panasonic Toughbook 40 | |
| DiskSpd | |
| seq read | |
| Dell Latitude 7230 Rugged Extreme | |
| Dell Latitude 7330 Rugged Extreme | |
| Getac B360 | |
| Panasonic Toughbook 40 | |
| Acer Enduro Urban N3 EUN314 | |
| Durabook S14I | |
| seq write | |
| Dell Latitude 7230 Rugged Extreme | |
| Getac B360 | |
| Dell Latitude 7330 Rugged Extreme | |
| Durabook S14I | |
| Panasonic Toughbook 40 | |
| Acer Enduro Urban N3 EUN314 | |
| seq q8 t1 read | |
| Dell Latitude 7230 Rugged Extreme | |
| Dell Latitude 7330 Rugged Extreme | |
| Panasonic Toughbook 40 | |
| Getac B360 | |
| Acer Enduro Urban N3 EUN314 | |
| Durabook S14I | |
| seq q8 t1 write | |
| Dell Latitude 7230 Rugged Extreme | |
| Dell Latitude 7330 Rugged Extreme | |
| Getac B360 | |
| Durabook S14I | |
| Panasonic Toughbook 40 | |
| Acer Enduro Urban N3 EUN314 | |
| 4k q1 t1 read | |
| Dell Latitude 7330 Rugged Extreme | |
| Dell Latitude 7230 Rugged Extreme | |
| Getac B360 | |
| Panasonic Toughbook 40 | |
| Durabook S14I | |
| Acer Enduro Urban N3 EUN314 | |
| 4k q1 t1 write | |
| Durabook S14I | |
| Acer Enduro Urban N3 EUN314 | |
| Dell Latitude 7330 Rugged Extreme | |
| Dell Latitude 7230 Rugged Extreme | |
| Getac B360 | |
| Panasonic Toughbook 40 | |
| 4k q32 t16 read | |
| Getac B360 | |
| Acer Enduro Urban N3 EUN314 | |
| Panasonic Toughbook 40 | |
| Dell Latitude 7330 Rugged Extreme | |
| Durabook S14I | |
| Dell Latitude 7230 Rugged Extreme | |
| 4k q32 t16 write | |
| Durabook S14I | |
| Getac B360 | |
| Acer Enduro Urban N3 EUN314 | |
| Dell Latitude 7330 Rugged Extreme | |
| Panasonic Toughbook 40 | |
| Dell Latitude 7230 Rugged Extreme | |
| AS SSD | |
| Score Total | |
| Dell Latitude 7330 Rugged Extreme | |
| Acer Enduro Urban N3 EUN314 | |
| Dell Latitude 7230 Rugged Extreme | |
| Panasonic Toughbook 40 | |
| Getac B360 | |
| Durabook S14I | |
| Score Read | |
| Dell Latitude 7330 Rugged Extreme | |
| Acer Enduro Urban N3 EUN314 | |
| Getac B360 | |
| Panasonic Toughbook 40 | |
| Dell Latitude 7230 Rugged Extreme | |
| Durabook S14I | |
| Score Write | |
| Dell Latitude 7330 Rugged Extreme | |
| Dell Latitude 7230 Rugged Extreme | |
| Durabook S14I | |
| Acer Enduro Urban N3 EUN314 | |
| Panasonic Toughbook 40 | |
| Getac B360 | |
| Seq Read | |
| Dell Latitude 7230 Rugged Extreme | |
| Getac B360 | |
| Dell Latitude 7330 Rugged Extreme | |
| Panasonic Toughbook 40 | |
| Durabook S14I | |
| Acer Enduro Urban N3 EUN314 | |
| Seq Write | |
| Dell Latitude 7230 Rugged Extreme | |
| Acer Enduro Urban N3 EUN314 | |
| Durabook S14I | |
| Getac B360 | |
| Dell Latitude 7330 Rugged Extreme | |
| Panasonic Toughbook 40 | |
| 4K Read | |
| Dell Latitude 7330 Rugged Extreme | |
| Dell Latitude 7230 Rugged Extreme | |
| Panasonic Toughbook 40 | |
| Getac B360 | |
| Acer Enduro Urban N3 EUN314 | |
| Durabook S14I | |
| 4K Write | |
| Durabook S14I | |
| Dell Latitude 7230 Rugged Extreme | |
| Dell Latitude 7330 Rugged Extreme | |
| Acer Enduro Urban N3 EUN314 | |
| Panasonic Toughbook 40 | |
| Getac B360 | |
| 4K-64 Read | |
| Acer Enduro Urban N3 EUN314 | |
| Dell Latitude 7330 Rugged Extreme | |
| Panasonic Toughbook 40 | |
| Getac B360 | |
| Dell Latitude 7230 Rugged Extreme | |
| Durabook S14I | |
| 4K-64 Write | |
| Dell Latitude 7330 Rugged Extreme | |
| Dell Latitude 7230 Rugged Extreme | |
| Durabook S14I | |
| Panasonic Toughbook 40 | |
| Acer Enduro Urban N3 EUN314 | |
| Getac B360 | |
| Access Time Read | |
| Acer Enduro Urban N3 EUN314 | |
| Panasonic Toughbook 40 | |
| Dell Latitude 7230 Rugged Extreme | |
| Getac B360 | |
| Durabook S14I | |
| Dell Latitude 7330 Rugged Extreme | |
| Access Time Write | |
| Getac B360 | |
| Durabook S14I | |
| Panasonic Toughbook 40 | |
| Dell Latitude 7230 Rugged Extreme | |
| Acer Enduro Urban N3 EUN314 | |
| Dell Latitude 7330 Rugged Extreme | |
* ... im mniej tym lepiej
Disk Throttling: DiskSpd Read Loop, Queue Depth 8
Wydajność GPU - średnia Iris Xe 80 EUs
Wydajność grafiki jest niższa o około 5 do 15 procent w porównaniu do przeciętnego komputera z naszej bazy danych wyposażonego w ten sam zintegrowany układ Iris Xe 80 EUs GPU. Spodziewaj się, że ogólna wydajność będzie o około 30 do 40 procent wolniejsza niż w przypadku popularnego Iris Xe 96 EUs. Na szczęście model ten może być skonfigurowany z Core i7-1260U, który jest wyposażony w szybszy Iris Xe 96 EUs dla tych, którzy potrzebują go jak wspomniano wcześniej.
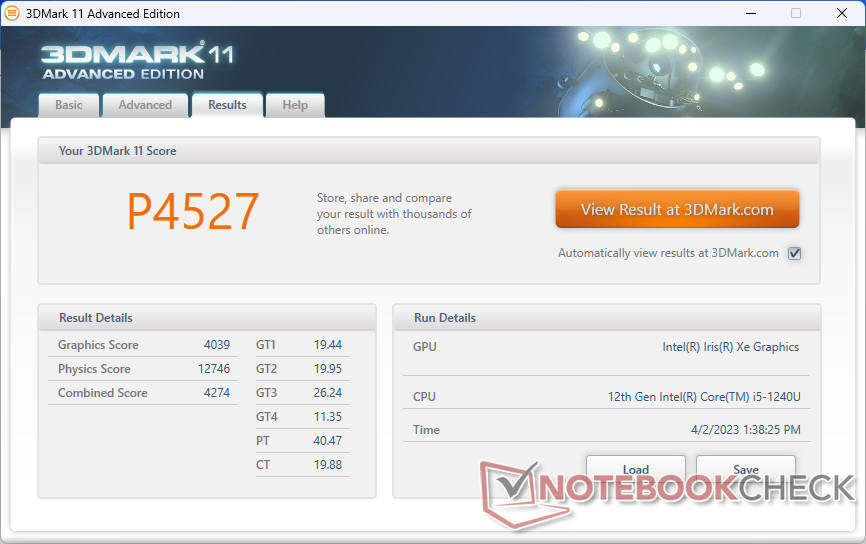
Wydajność systemu wydaje się być identyczna pomiędzy profilami zasilania Optimized i Ultra. Test 3DMark 11 w obu trybach zasilania przyniósłby niemal identyczne wyniki końcowe.
| 3DMark | |
| 1920x1080 Fire Strike Graphics | |
| Lenovo ThinkPad P14s G3 AMD 21J6S05000 | |
| Asus ExpertBook B5 Flip B5602FBN | |
| HP EliteBook 840 G9 | |
| HP ZBook Firefly 14 G9-6B8A2EA | |
| Dell Latitude 7330 Rugged Extreme | |
| Acer Enduro Urban N3 EUN314 | |
| Panasonic Toughbook 40 | |
| Przeciętny Intel Iris Xe Graphics G7 80EUs (1560 - 5398, n=114) | |
| Dell Latitude 7230 Rugged Extreme | |
| Lenovo ThinkBook 13s G3 20YA0005GE | |
| Durabook S14I | |
| HP ProBook 440 G9-5Y3Z3EA | |
| Getac B360 | |
| 2560x1440 Time Spy Graphics | |
| Asus ExpertBook B5 Flip B5602FBN | |
| Lenovo ThinkPad P14s G3 AMD 21J6S05000 | |
| HP ZBook Firefly 14 G9-6B8A2EA | |
| HP EliteBook 840 G9 | |
| Dell Latitude 7330 Rugged Extreme | |
| Acer Enduro Urban N3 EUN314 | |
| Panasonic Toughbook 40 | |
| HP ProBook 440 G9-5Y3Z3EA | |
| Przeciętny Intel Iris Xe Graphics G7 80EUs (561 - 1576, n=111) | |
| Lenovo ThinkBook 13s G3 20YA0005GE | |
| Durabook S14I | |
| Dell Latitude 7230 Rugged Extreme | |
| Getac B360 | |
| 3DMark 11 - 1280x720 Performance GPU | |
| Lenovo ThinkPad P14s G3 AMD 21J6S05000 | |
| Asus ExpertBook B5 Flip B5602FBN | |
| HP ZBook Firefly 14 G9-6B8A2EA | |
| HP EliteBook 840 G9 | |
| Acer Enduro Urban N3 EUN314 | |
| Dell Latitude 7330 Rugged Extreme | |
| Panasonic Toughbook 40 | |
| Lenovo ThinkBook 13s G3 20YA0005GE | |
| Przeciętny Intel Iris Xe Graphics G7 80EUs (2246 - 6579, n=112) | |
| Durabook S14I | |
| HP ProBook 440 G9-5Y3Z3EA | |
| Dell Latitude 7230 Rugged Extreme | |
| Getac B360 | |
| 3DMark 11 Performance | 4527 pkt. | |
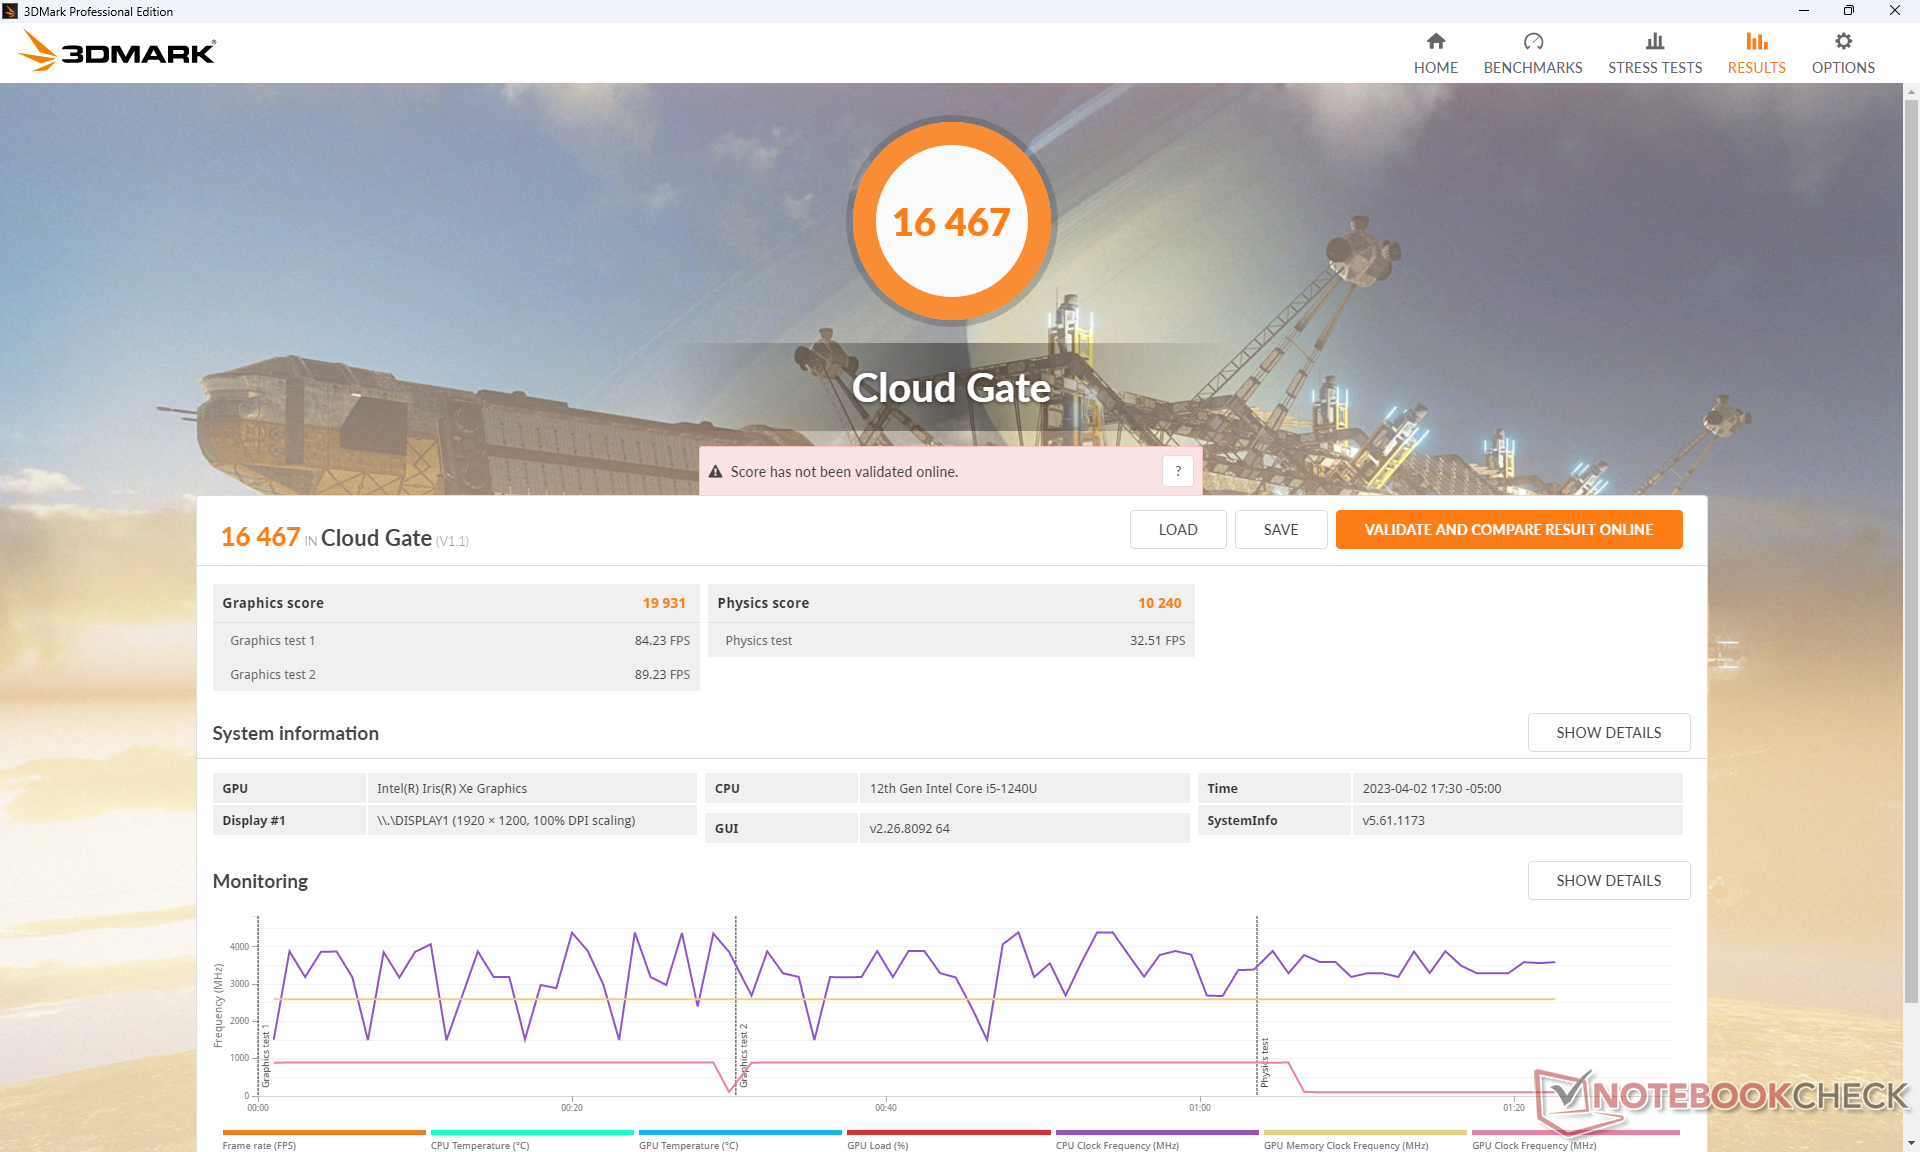
| 3DMark Cloud Gate Standard Score | 16467 pkt. | |
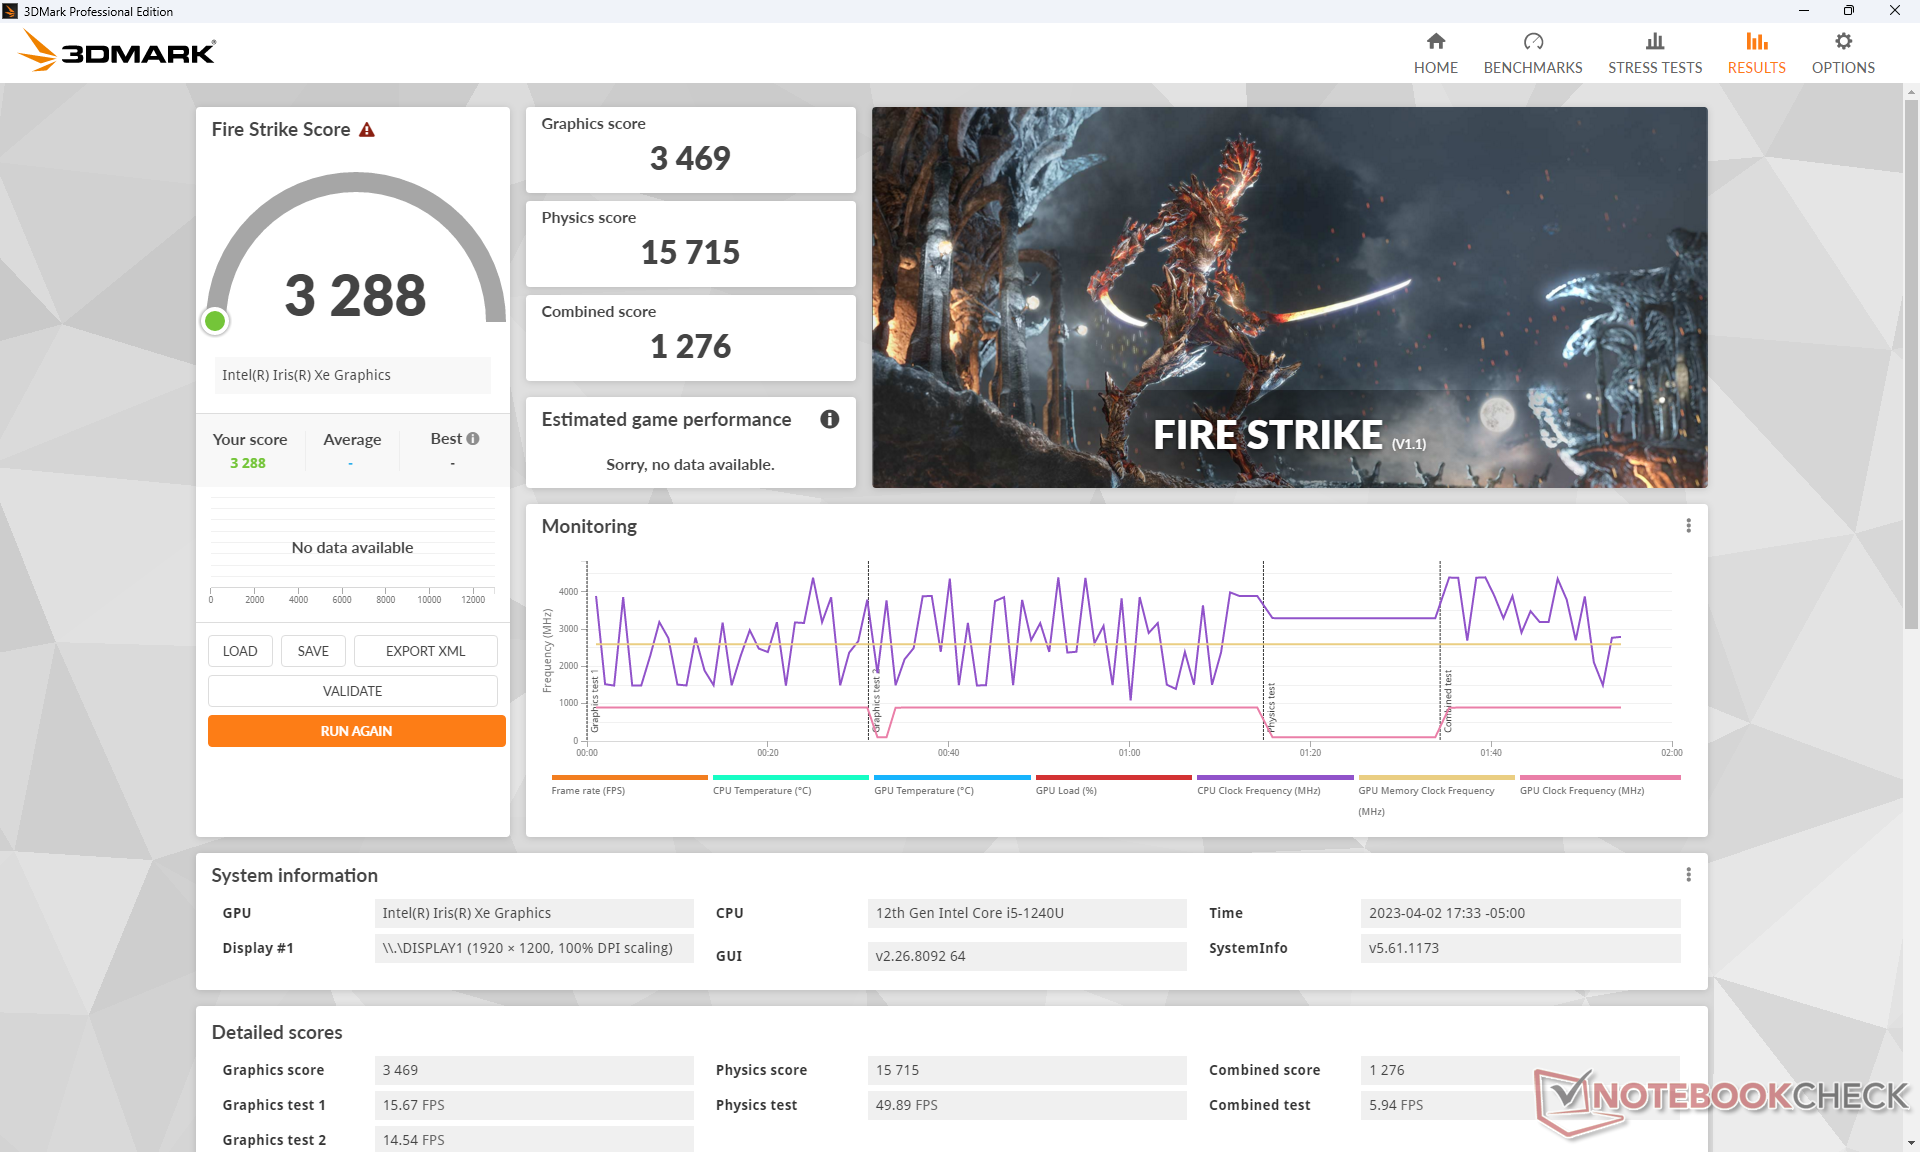
| 3DMark Fire Strike Score | 3288 pkt. | |
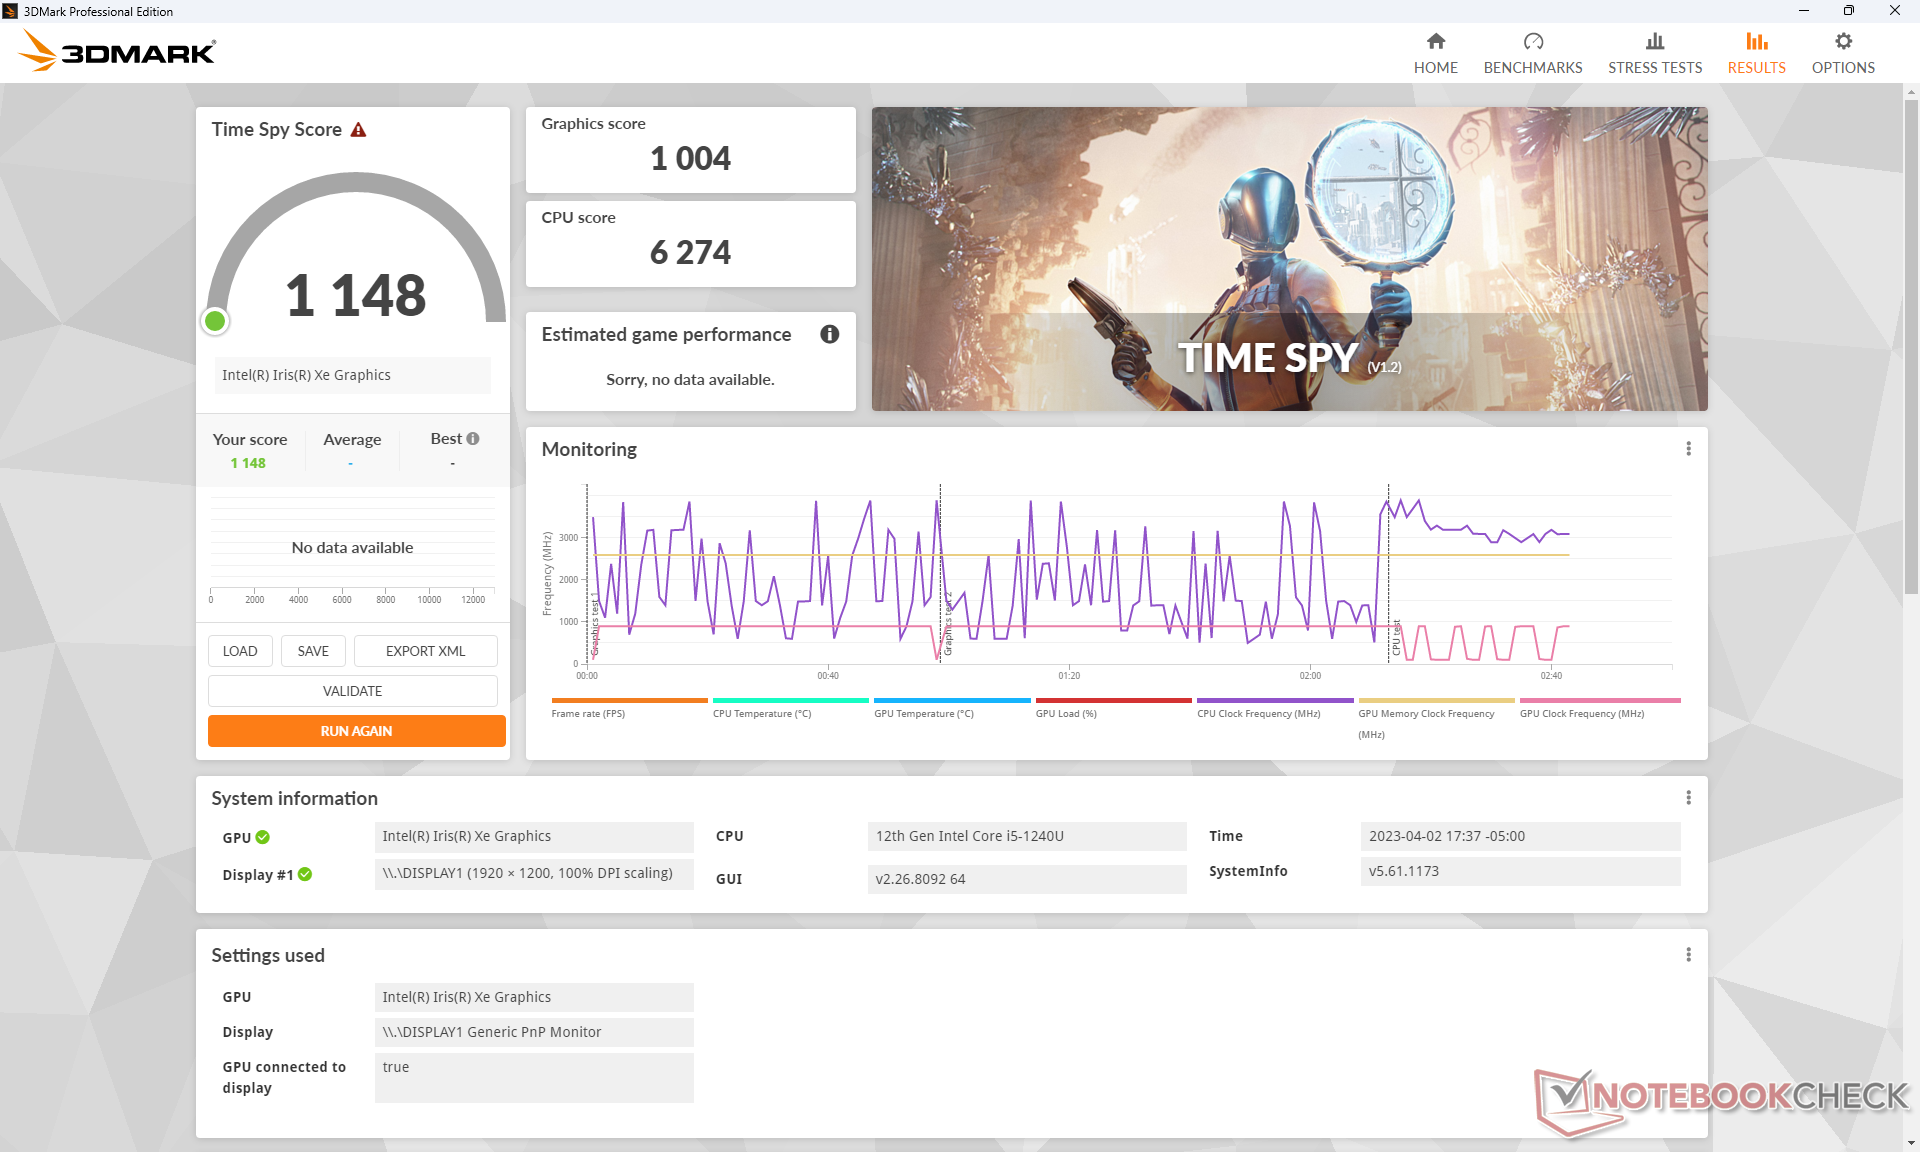
| 3DMark Time Spy Score | 1148 pkt. | |
Pomoc | ||
| Performance rating - Percent | |
| HP ZBook Firefly 14 G9-6B8A2EA | |
| Lenovo ThinkPad P14s G3 AMD 21J6S05000 | |
| Asus ExpertBook B5 Flip B5602FBN | |
| Dell Latitude 7330 Rugged Extreme -2! | |
| HP EliteBook 840 G9 | |
| Panasonic Toughbook 40 -2! | |
| Lenovo ThinkBook 13s G3 20YA0005GE -2! | |
| Acer Enduro Urban N3 EUN314 | |
| HP ProBook 440 G9-5Y3Z3EA -2! | |
| Durabook S14I -3! | |
| Dell Latitude 7230 Rugged Extreme | |
| Getac B360 -2! | |
| The Witcher 3 - 1920x1080 Ultra Graphics & Postprocessing (HBAO+) | |
| Lenovo ThinkPad P14s G3 AMD 21J6S05000 | |
| HP ZBook Firefly 14 G9-6B8A2EA | |
| Asus ExpertBook B5 Flip B5602FBN | |
| HP EliteBook 840 G9 | |
| Dell Latitude 7330 Rugged Extreme | |
| Panasonic Toughbook 40 | |
| Lenovo ThinkBook 13s G3 20YA0005GE | |
| Acer Enduro Urban N3 EUN314 | |
| Dell Latitude 7230 Rugged Extreme | |
| HP ProBook 440 G9-5Y3Z3EA | |
| Getac B360 | |
| GTA V - 1920x1080 Highest AA:4xMSAA + FX AF:16x | |
| HP ZBook Firefly 14 G9-6B8A2EA | |
| Lenovo ThinkPad P14s G3 AMD 21J6S05000 | |
| Asus ExpertBook B5 Flip B5602FBN | |
| HP EliteBook 840 G9 | |
| Acer Enduro Urban N3 EUN314 | |
| Dell Latitude 7230 Rugged Extreme | |
| Final Fantasy XV Benchmark - 1920x1080 High Quality | |
| Dell Latitude 7330 Rugged Extreme | |
| Lenovo ThinkPad P14s G3 AMD 21J6S05000 | |
| HP ZBook Firefly 14 G9-6B8A2EA | |
| HP EliteBook 840 G9 | |
| Asus ExpertBook B5 Flip B5602FBN | |
| Acer Enduro Urban N3 EUN314 | |
| Panasonic Toughbook 40 | |
| Lenovo ThinkBook 13s G3 20YA0005GE | |
| Dell Latitude 7230 Rugged Extreme | |
| HP ProBook 440 G9-5Y3Z3EA | |
| Durabook S14I | |
| Getac B360 | |
| Strange Brigade - 1920x1080 ultra AA:ultra AF:16 | |
| Asus ExpertBook B5 Flip B5602FBN | |
| HP ZBook Firefly 14 G9-6B8A2EA | |
| Lenovo ThinkPad P14s G3 AMD 21J6S05000 | |
| HP EliteBook 840 G9 | |
| Acer Enduro Urban N3 EUN314 | |
| Dell Latitude 7230 Rugged Extreme | |
| Dota 2 Reborn - 1920x1080 ultra (3/3) best looking | |
| HP ZBook Firefly 14 G9-6B8A2EA | |
| HP EliteBook 840 G9 | |
| Lenovo ThinkPad P14s G3 AMD 21J6S05000 | |
| Dell Latitude 7330 Rugged Extreme | |
| Asus ExpertBook B5 Flip B5602FBN | |
| Panasonic Toughbook 40 | |
| Lenovo ThinkBook 13s G3 20YA0005GE | |
| Dell Latitude 7230 Rugged Extreme | |
| Acer Enduro Urban N3 EUN314 | |
| Durabook S14I | |
| HP ProBook 440 G9-5Y3Z3EA | |
| Getac B360 | |
| X-Plane 11.11 - 1920x1080 high (fps_test=3) | |
| HP ZBook Firefly 14 G9-6B8A2EA | |
| Acer Enduro Urban N3 EUN314 | |
| HP EliteBook 840 G9 | |
| Lenovo ThinkPad P14s G3 AMD 21J6S05000 | |
| HP ProBook 440 G9-5Y3Z3EA | |
| Lenovo ThinkBook 13s G3 20YA0005GE | |
| Asus ExpertBook B5 Flip B5602FBN | |
| Durabook S14I | |
| Panasonic Toughbook 40 | |
| Dell Latitude 7330 Rugged Extreme | |
| Dell Latitude 7230 Rugged Extreme | |
| Getac B360 | |
Witcher 3 FPS Chart
| low | med. | high | ultra | |
|---|---|---|---|---|
| GTA V (2015) | 103.3 | 93.3 | 18.5 | 7.79 |
| The Witcher 3 (2015) | 67.3 | 40.9 | 24.1 | 10.6 |
| Dota 2 Reborn (2015) | 98.9 | 77.8 | 50.7 | 45.7 |
| Final Fantasy XV Benchmark (2018) | 31 | 17.3 | 11.8 | |
| X-Plane 11.11 (2018) | 32.6 | 22.6 | 20.6 | |
| Strange Brigade (2018) | 60.2 | 27.4 | 21.4 | 17.9 |
Emisje - cicho, póki nie jest głośno
Szum systemu
Szum wentylatora jest cichy i w zasadzie niesłyszalny podczas niskich i średnich obciążeń. Uruchomienie pierwszej sceny benchmarku 3DMark 06 nie wywołało na przykład do końca szumu wentylatora.
Wentylator o małej średnicy jest niestety bardziej głośny niż w większości laptopów. W przypadku uruchamiania bardzo wymagających aplikacji, takich jak gry czy Prime95, szum wentylatora może wynosić nawet 43 dB(A) i jest to jeden z najgłośniejszych tabletów typu rugged, jakie testowaliśmy. Trzeba jednak naprawdę mocno forsować tablet, by osiągnąć tak wysoki poziom hałasu.
Hałas
| luz |
| 22.9 / 22.9 / 22.9 dB |
| obciążenie |
| 24.5 / 43.2 dB |
 | ||
30 dB cichy 40 dB(A) słyszalny 50 dB(A) irytujący |
||
min: | ||
| Dell Latitude 7230 Rugged Extreme Iris Xe G7 80EUs, i5-1240U, WD PC SN740 512GB SDDPMQD-512G-1101 | Dell Latitude 7330 Rugged Extreme Iris Xe G7 96EUs, i7-1185G7 | Panasonic Toughbook 40 Iris Xe G7 96EUs, i7-1185G7, Samsung PM991 MZVLQ1T0HALB | Getac B360 UHD Graphics 620, i7-10710U, Lite-On CA5-8D512 | Acer Enduro Urban N3 EUN314 Iris Xe G7 96EUs, i7-1165G7, Samsung PM991 MZVLQ1T0HALB | Durabook S14I Iris Xe G7 96EUs, i7-1165G7, UDinfo M2P M2P80DE512GBAEP | |
|---|---|---|---|---|---|---|
| Noise | 2% | -13% | 0% | -3% | -18% | |
| wyłączone / środowisko * (dB) | 22.8 | 22.9 -0% | 22.8 -0% | 24.3 -7% | 23.8 -4% | 25.2 -11% |
| Idle Minimum * (dB) | 22.9 | 23.1 -1% | 26 -14% | 24.5 -7% | 24.1 -5% | 25.2 -10% |
| Idle Average * (dB) | 22.9 | 23.1 -1% | 26 -14% | 24.5 -7% | 24.1 -5% | 25.2 -10% |
| Idle Maximum * (dB) | 22.9 | 23.1 -1% | 26 -14% | 24.6 -7% | 24.1 -5% | 34.5 -51% |
| Load Average * (dB) | 24.5 | 28 -14% | 37.6 -53% | 29.8 -22% | 27.9 -14% | 34.5 -41% |
| Witcher 3 ultra * (dB) | 36 | 31.2 13% | 37.8 -5% | 27.3 24% | 35.7 1% | |
| Load Maximum * (dB) | 43.2 | 36.2 16% | 40.3 7% | 30.8 29% | 38.6 11% | 36.2 16% |
* ... im mniej tym lepiej
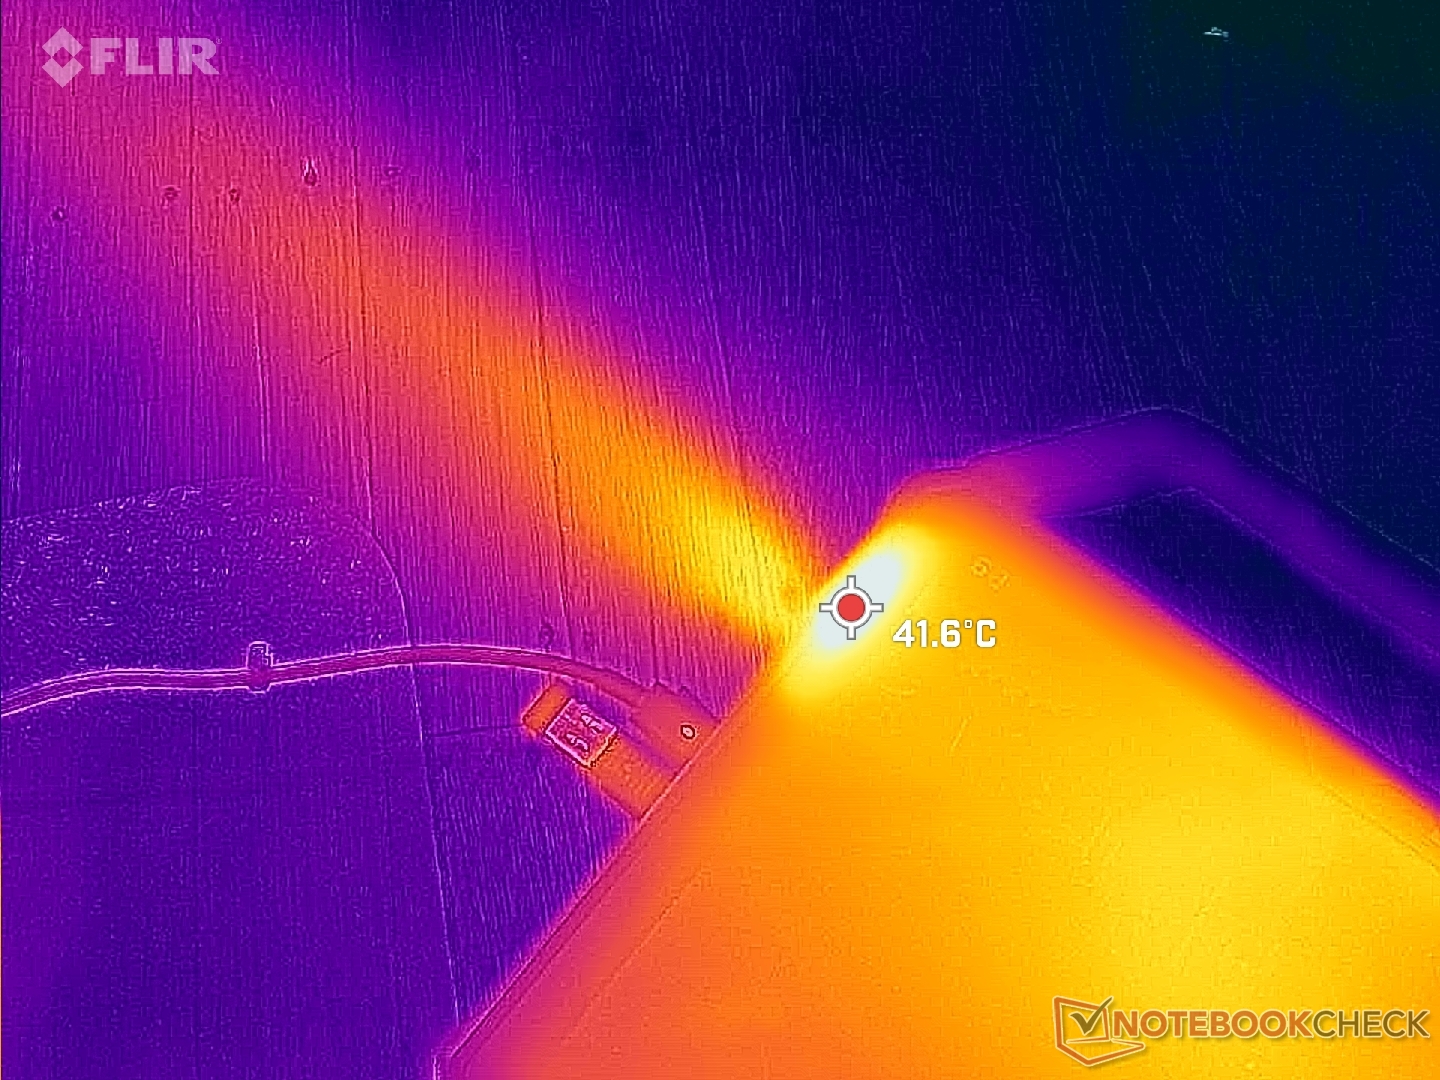
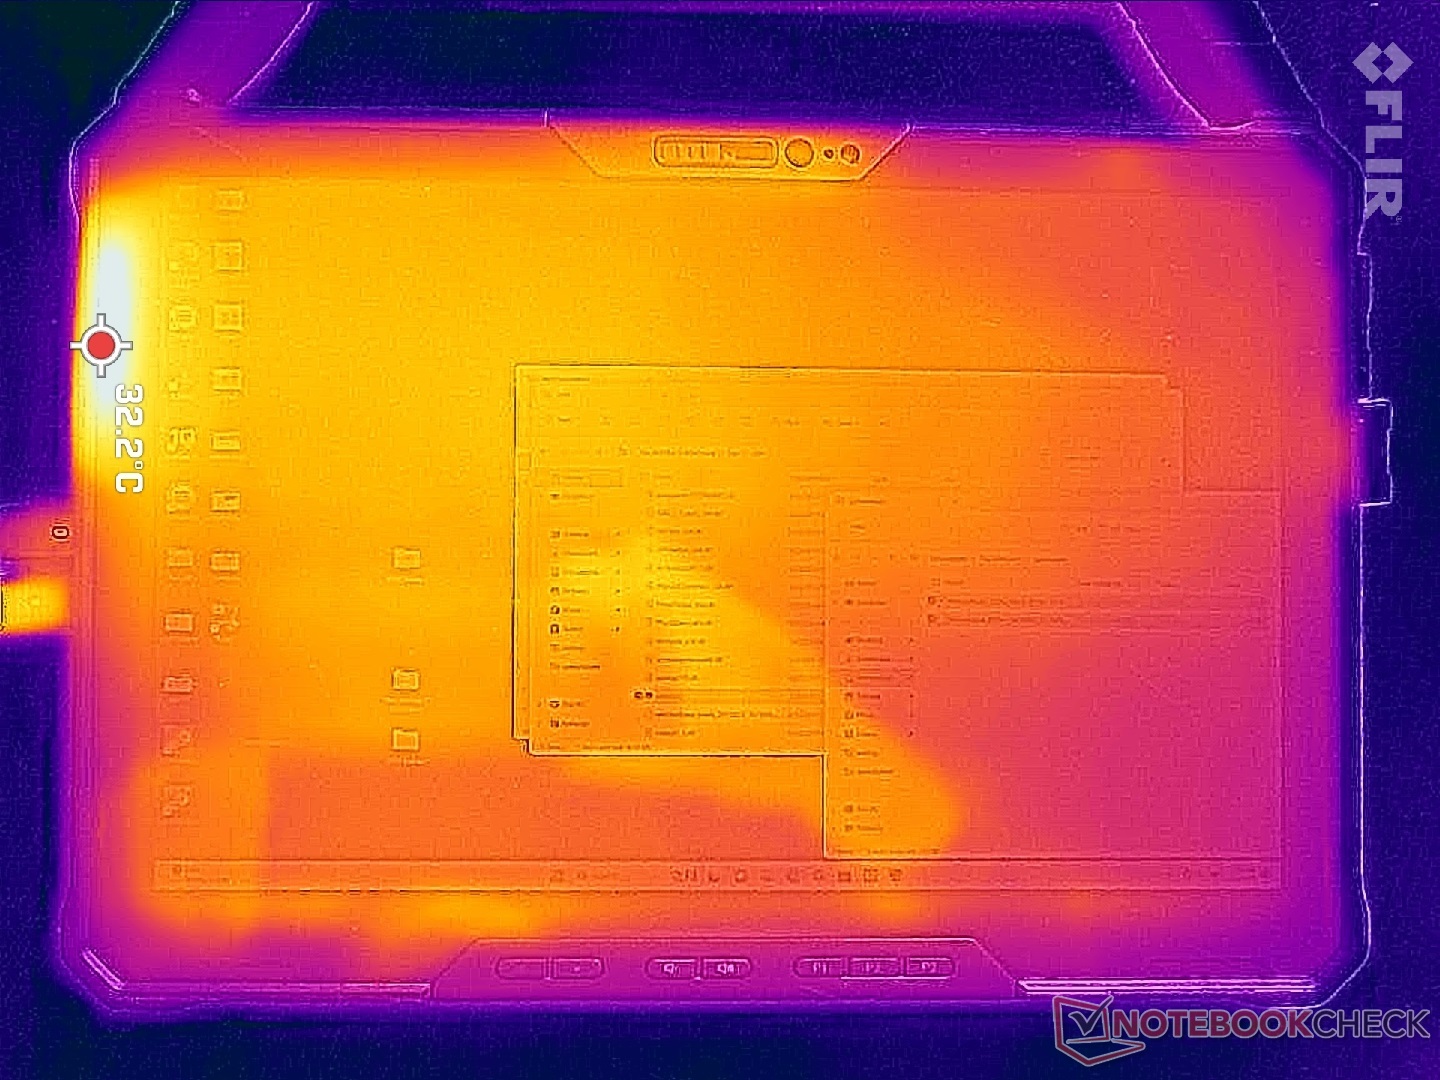
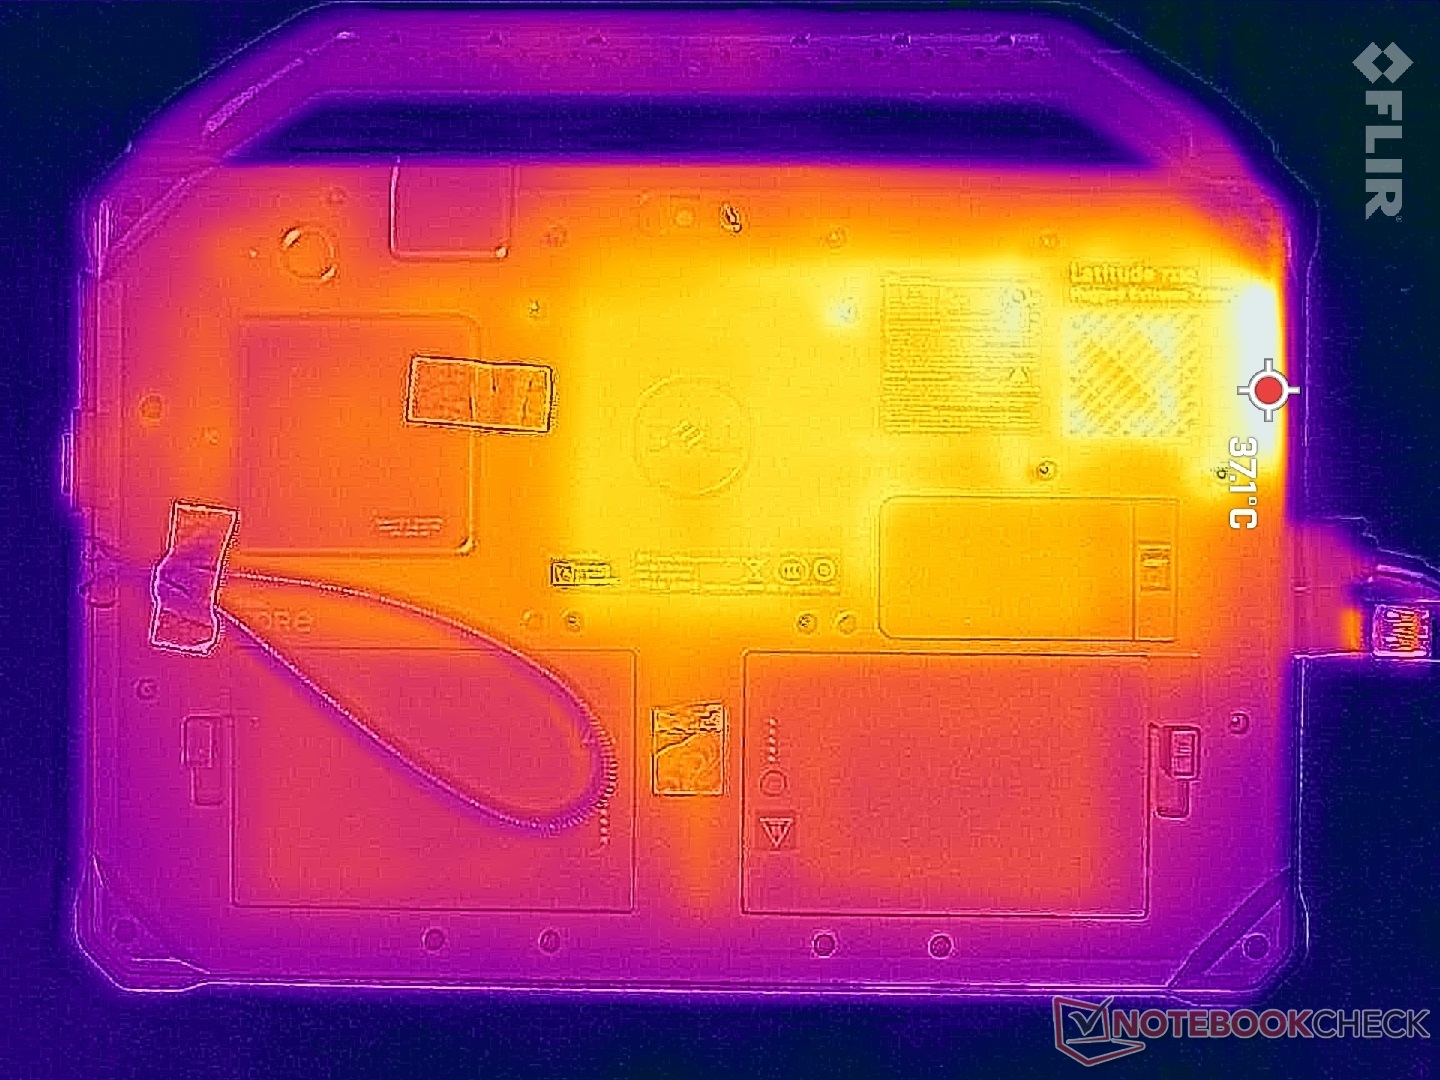
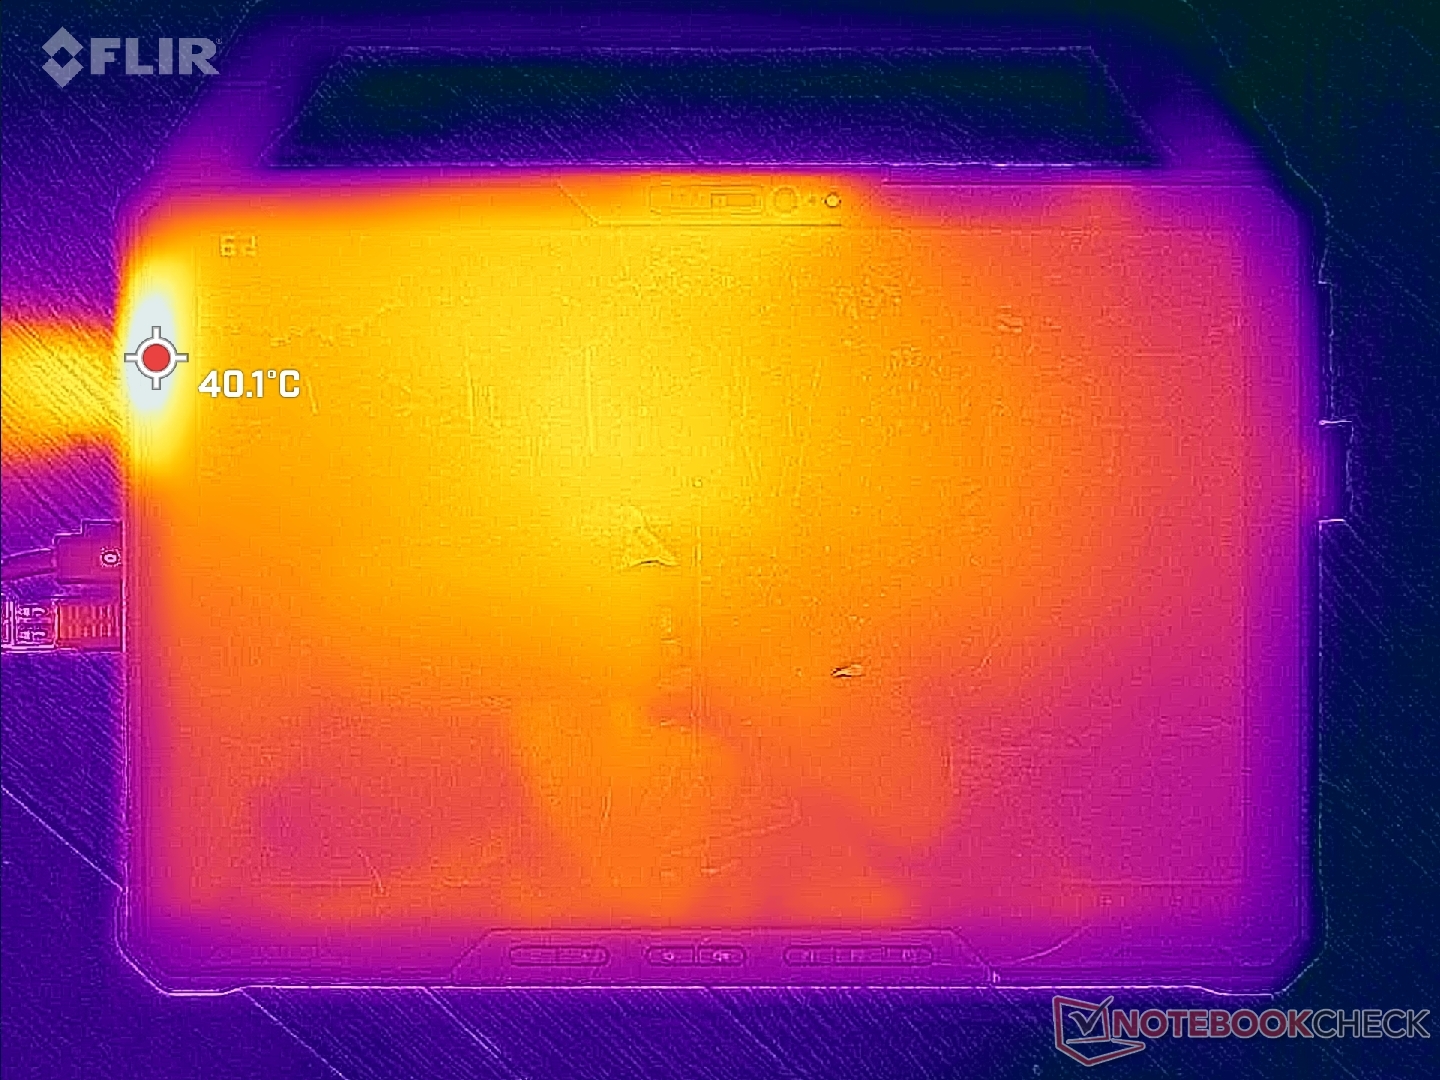
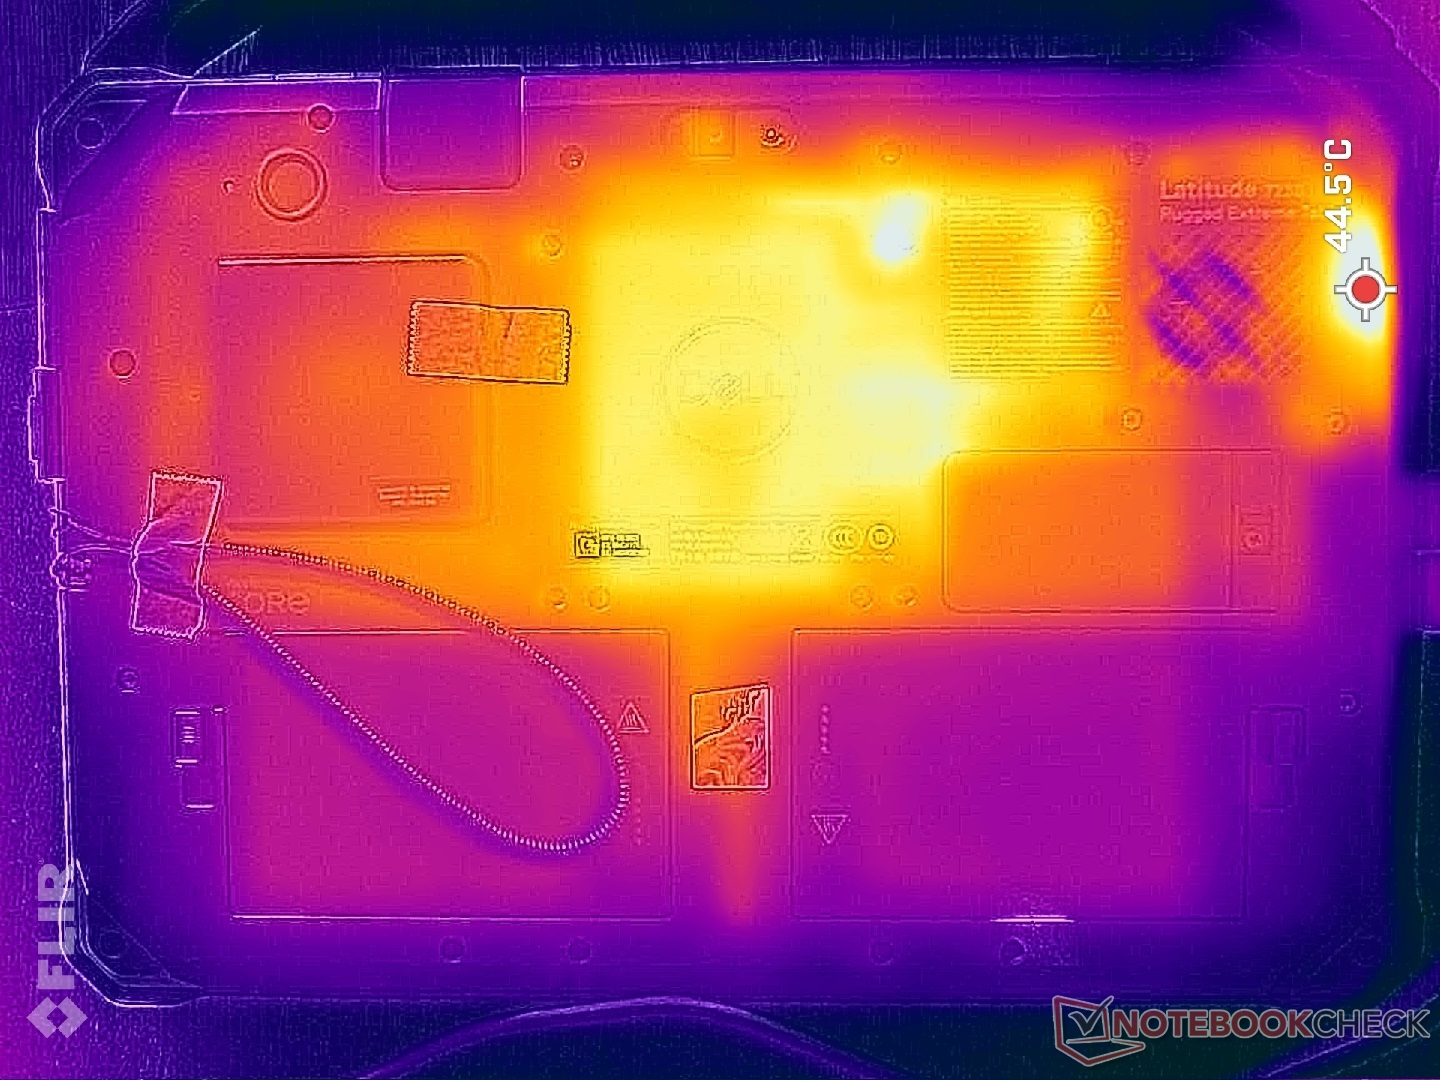
Temperatura
Temperatury powierzchni nie stanowią problemu ze względu na gruby profil, podobnie jak w większości innych urządzeń typu rugged. W najgorszym wypadku udało nam się odnotować 40 stopni C wzdłuż samej krawędzi urządzenia, najbliżej kratek wentylacyjnych, kiedy procesor jest wykorzystywany w 100 procentach.
(+) Maksymalna temperatura w górnej części wynosi 32.6 °C / 91 F, w porównaniu do średniej 33.7 °C / 93 F , począwszy od 20.7 do 53.2 °C dla klasy Tablet.
(±) Dno nagrzewa się maksymalnie do 40.2 °C / 104 F, w porównaniu do średniej 33.2 °C / 92 F
(+) W stanie bezczynności średnia temperatura górnej części wynosi 29 °C / 84 F, w porównaniu ze średnią temperaturą urządzenia wynoszącą 30 °C / ### class_avg_f### F.
| Dell Latitude 7230 Rugged Extreme Intel Core i5-1240U, Intel Iris Xe Graphics G7 80EUs | Dell Latitude 7330 Rugged Extreme Intel Core i7-1185G7, Intel Iris Xe Graphics G7 96EUs | Panasonic Toughbook 40 Intel Core i7-1185G7, Intel Iris Xe Graphics G7 96EUs | Getac B360 Intel Core i7-10710U, Intel UHD Graphics 620 | Acer Enduro Urban N3 EUN314 Intel Core i7-1165G7, Intel Iris Xe Graphics G7 96EUs | Durabook S14I Intel Core i7-1165G7, Intel Iris Xe Graphics G7 96EUs | |
|---|---|---|---|---|---|---|
| Heat | 13% | 4% | 10% | -1% | -3% | |
| Maximum Upper Side * (°C) | 32.6 | 34.6 -6% | 35.6 -9% | 33.4 -2% | 37.8 -16% | 36.4 -12% |
| Maximum Bottom * (°C) | 40.2 | 36.6 9% | 40 -0% | 42.6 -6% | 45.8 -14% | 38.6 4% |
| Idle Upper Side * (°C) | 30.6 | 24.8 19% | 28.6 7% | 24.2 21% | 26.4 14% | 32.6 -7% |
| Idle Bottom * (°C) | 35 | 25.2 28% | 29.4 16% | 26.2 25% | 30.2 14% | 33.8 3% |
* ... im mniej tym lepiej
Stress Test
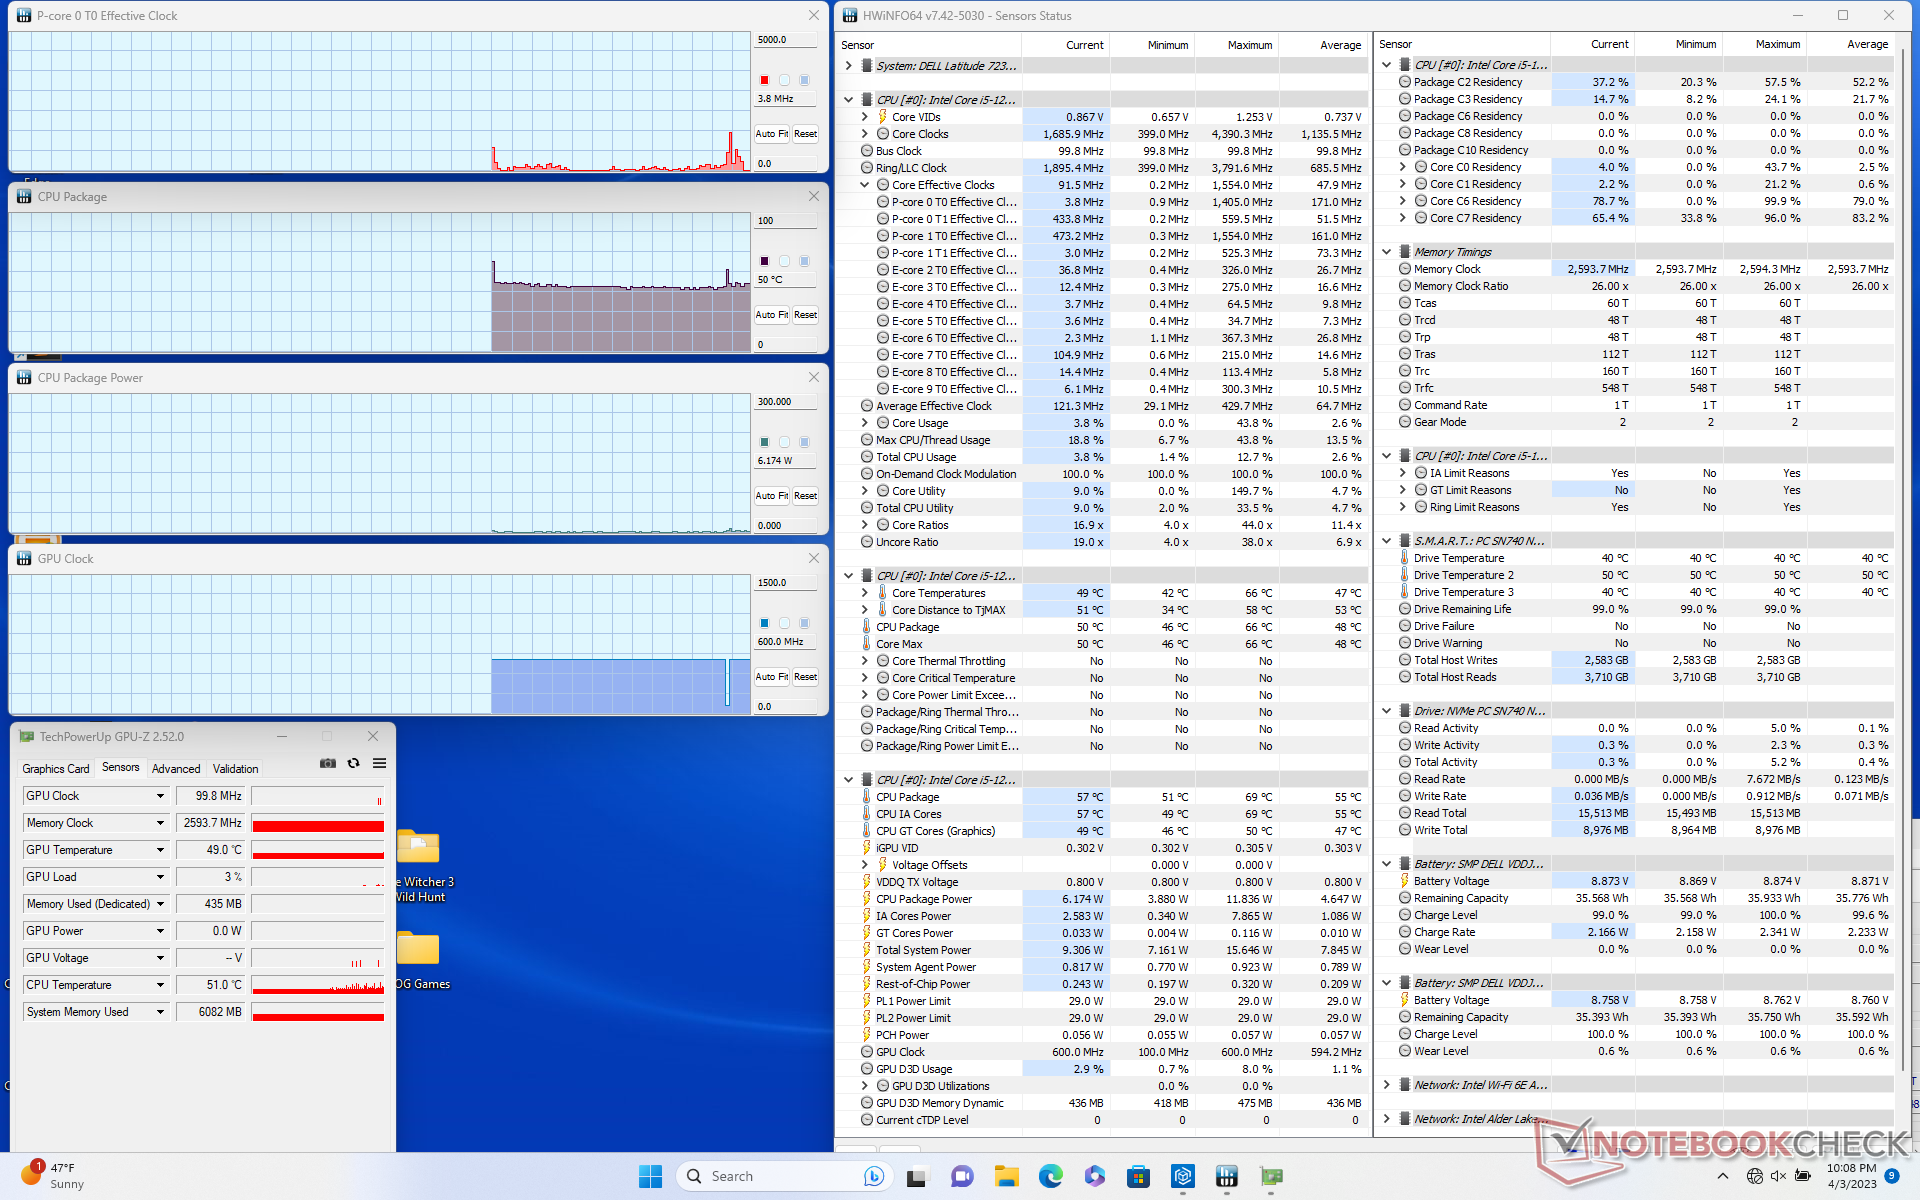
Po uruchomieniu Prime95, aby obciążyć procesor, częstotliwość taktowania i pobór mocy na płycie wzrosły odpowiednio do 2,6 GHz i 30 W, po czym kilka sekund później spadły do 2,5 GHz i 26 W. Temperatura rdzenia ustabilizowała się na bardzo wysokim poziomie 97 C, czyli cieplej niż byśmy chcieli. Powtórzenie tego testu na większym Dellu Latitude 7330 Rugged dałoby znacznie niższą temperaturę rdzenia, wynoszącą zaledwie 68 C.
Praca na zasilaniu akumulatorowym ma niewielki wpływ na wydajność procesora. W teście 3DMark 11 na akumulatorze wyniki fizyki i grafiki wyniosłyby odpowiednio 10743 i 4041 pkt. w porównaniu z 12765 i 4053 pkt. na zasilaniu sieciowym.
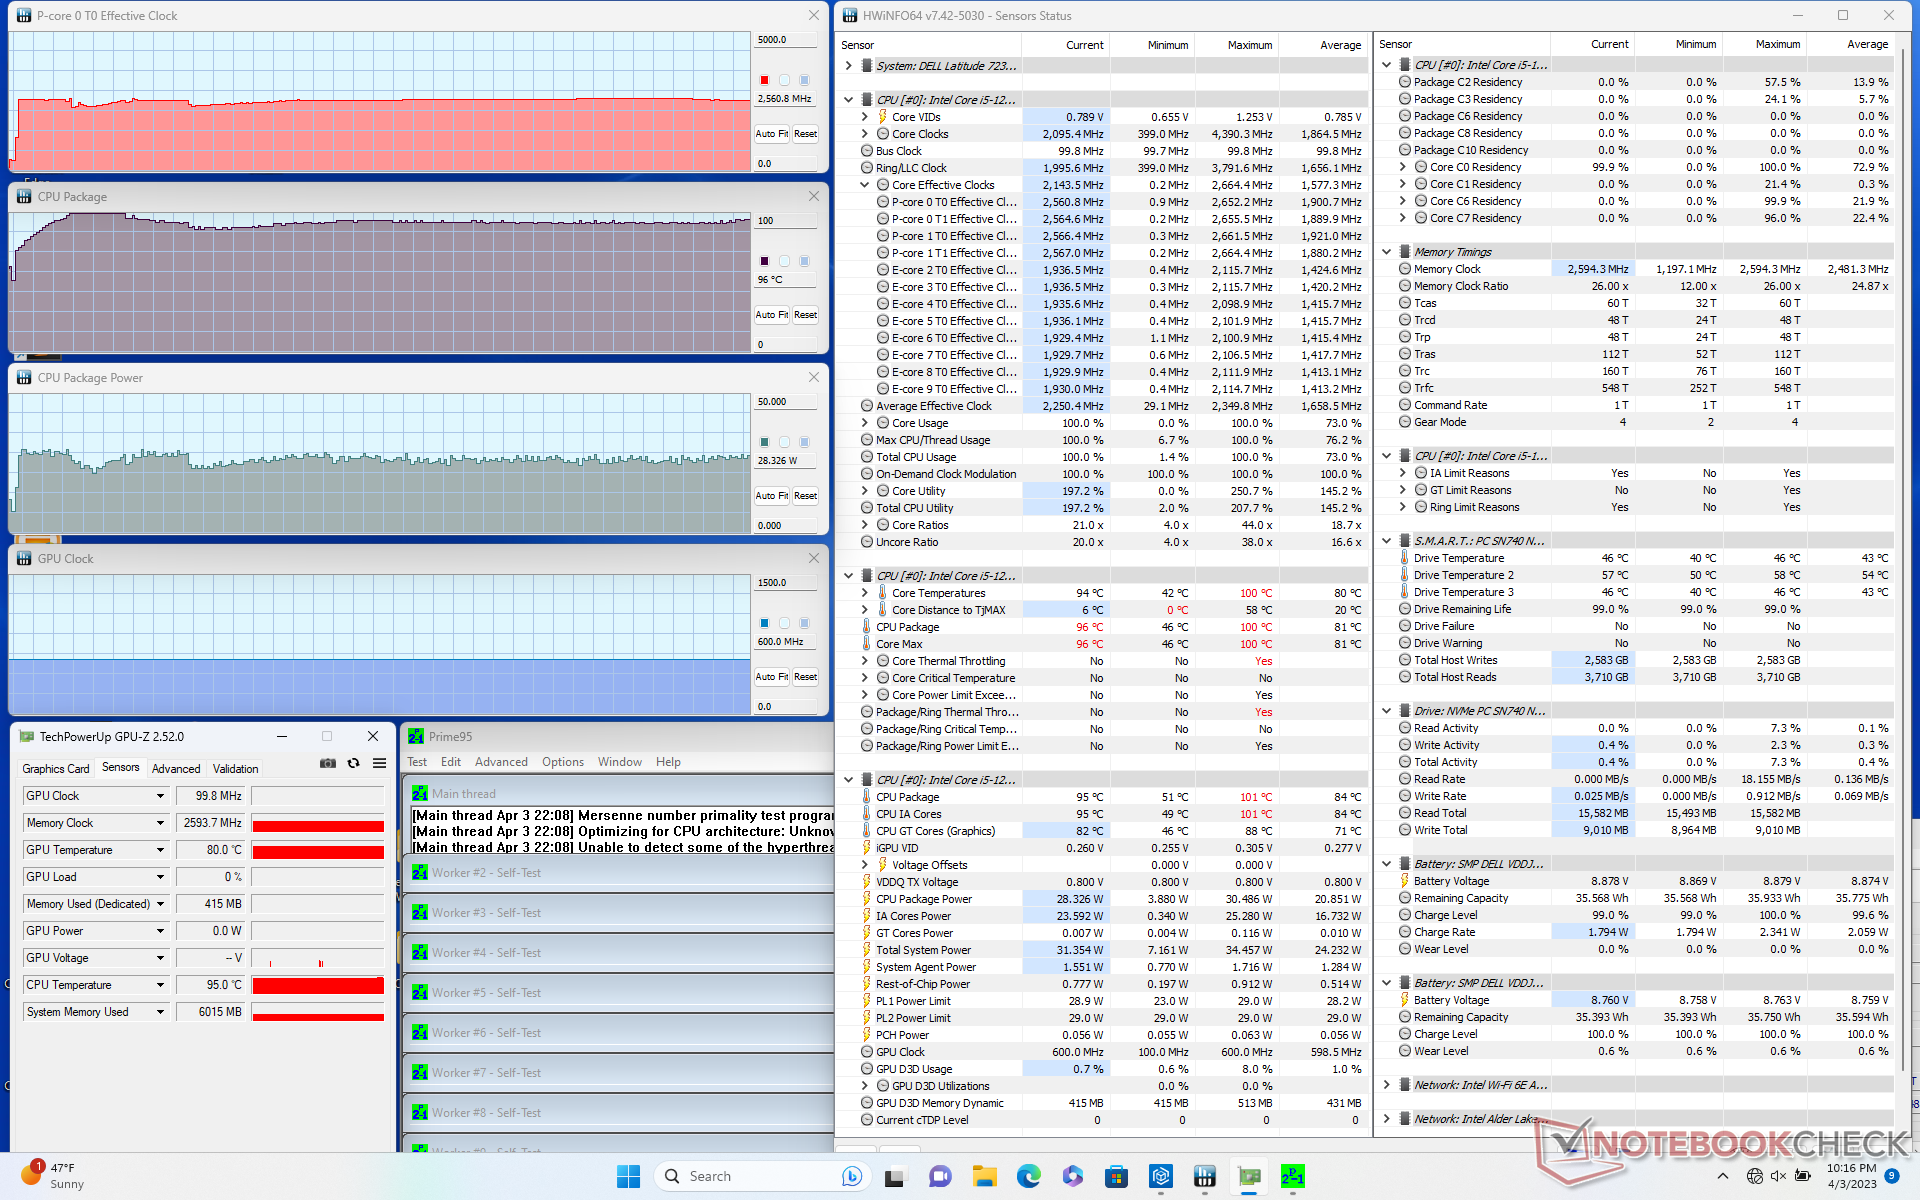
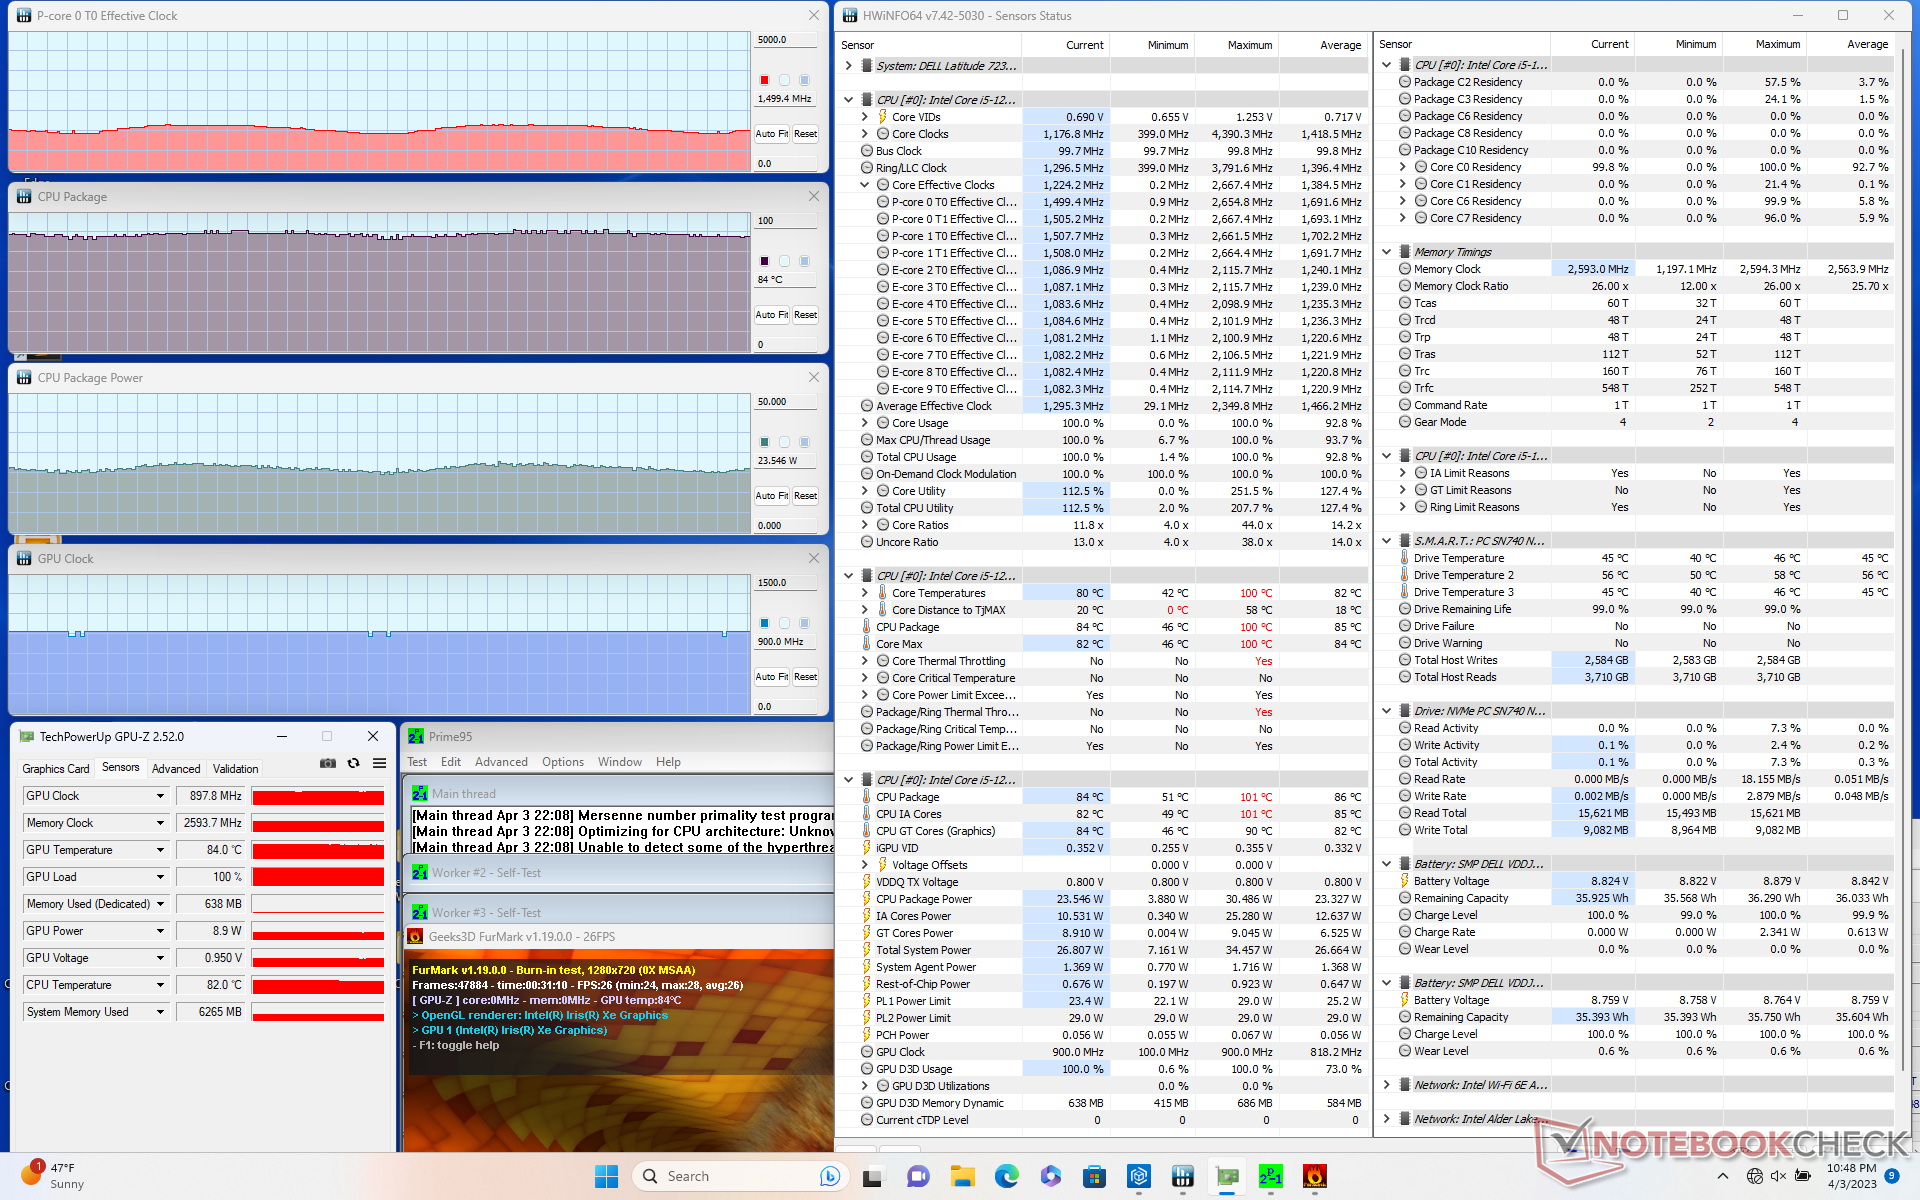

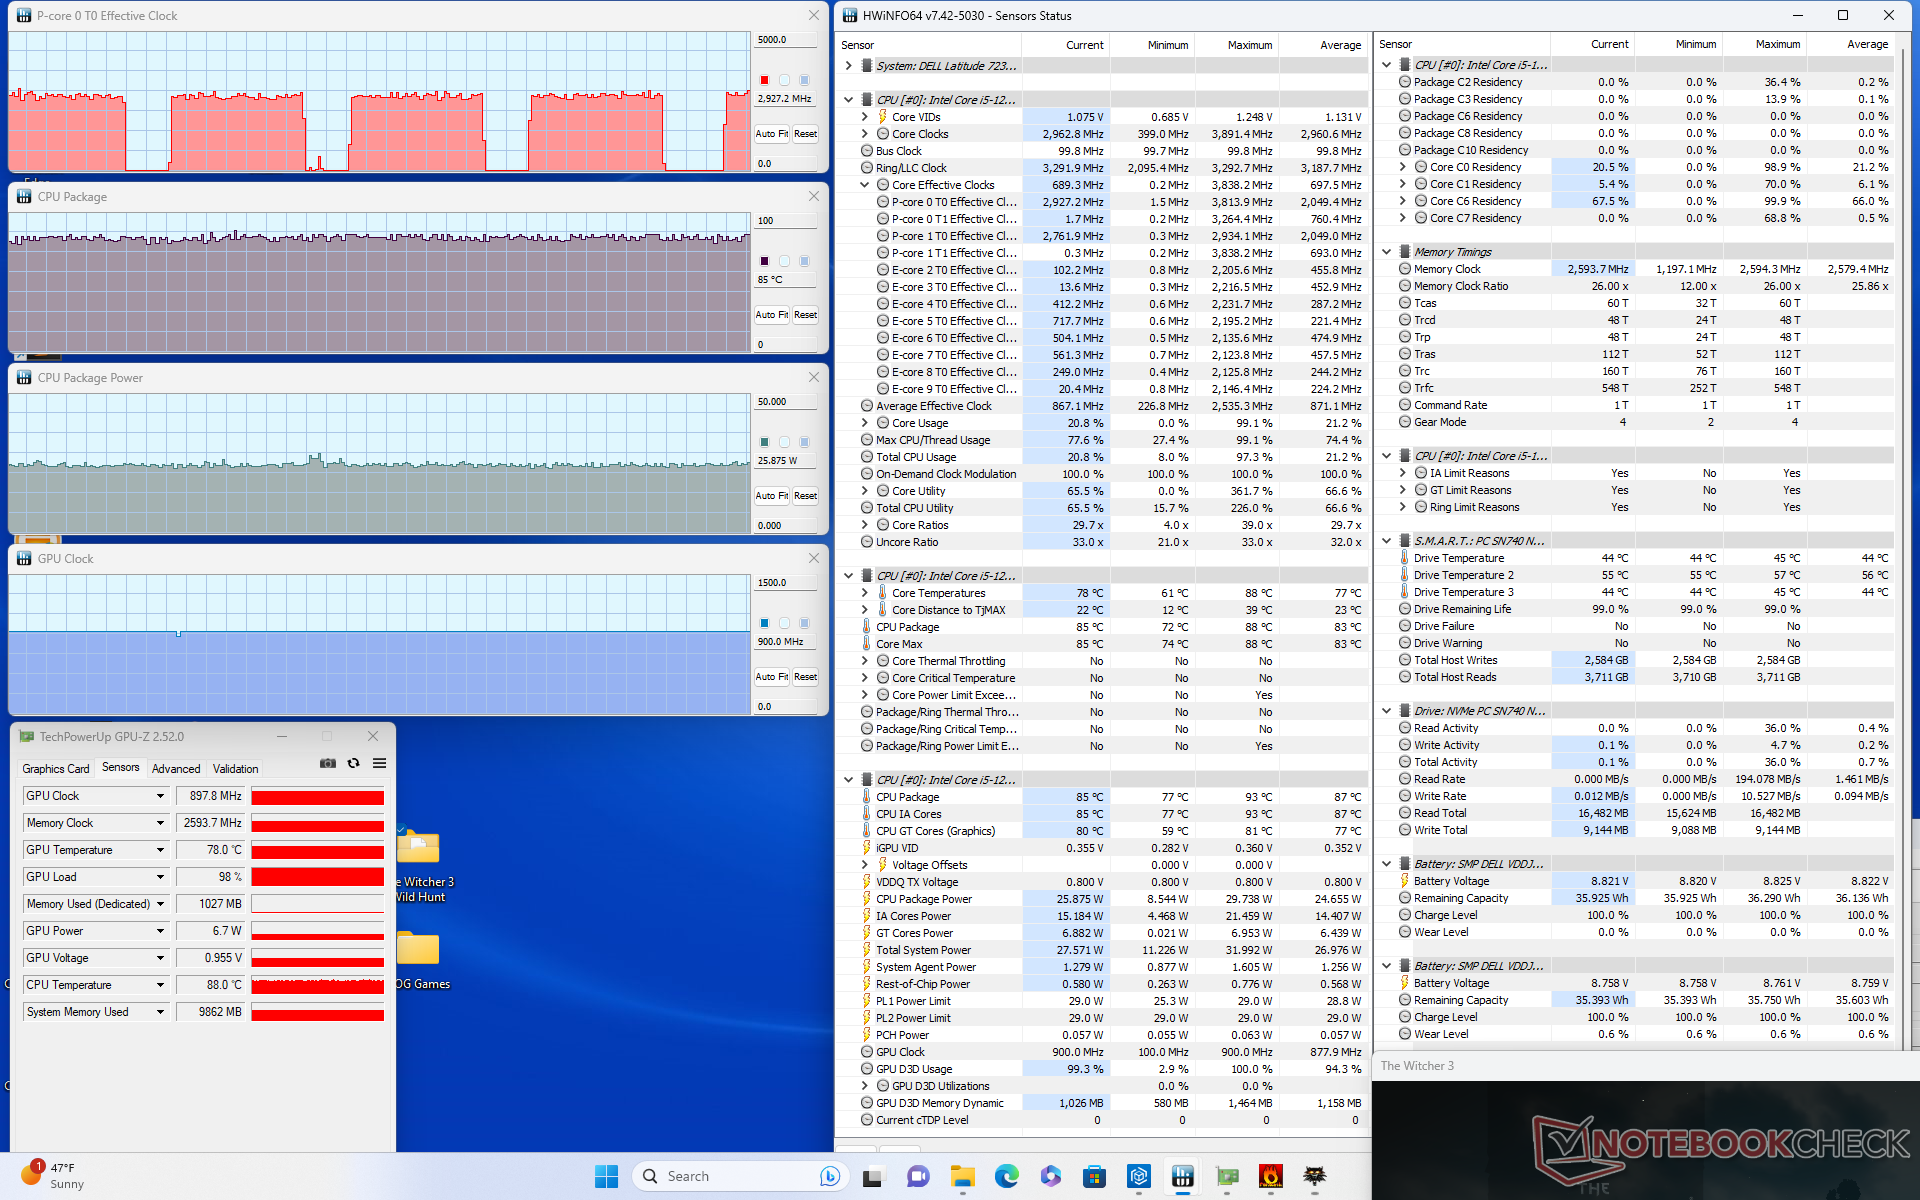
| ZegarCPU (GHz) | Zegar GPU (MHz) | Średnia temperatura CPU (°C) | |
| System w stanie bezczynności | -- | -- | 50 |
| Prime95 Stress | 2.6 | -- | 96 |
| Prime95 + FurMark Stress | 1,4 - 1,6 | 898 | 84 |
| Witcher 3 Stress (tryb Ultra) | ~3.0 | 898 | 85 |
| Witcher 3 Stres(tryb zoptymalizowany) | ~1,7 | 898 | 83 |
Mówcy
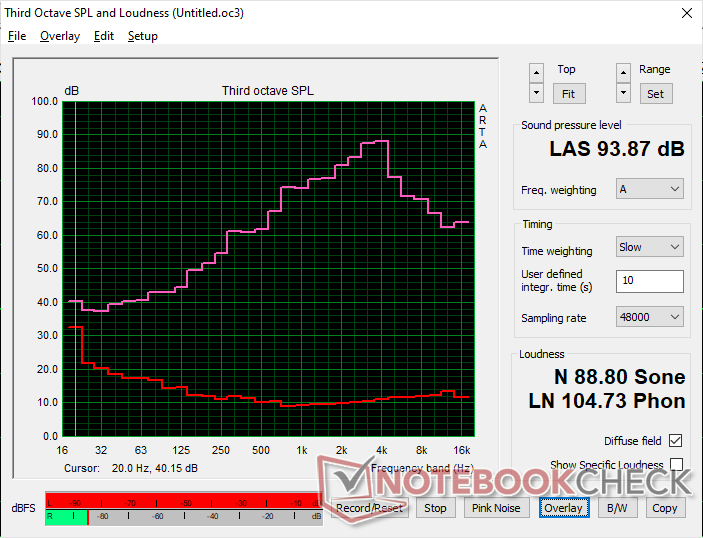
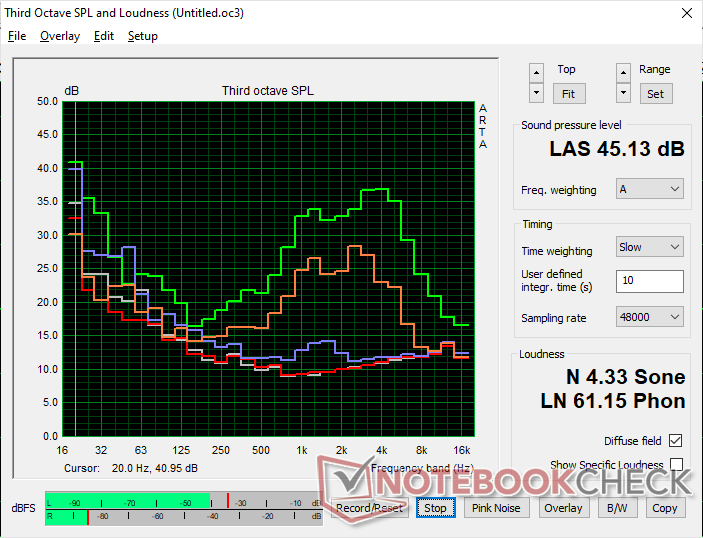
Dell Latitude 7230 Rugged Extreme analiza dźwięku
(+) | głośniki mogą odtwarzać stosunkowo głośno (93.9 dB)
Bas 100 - 315 Hz
(-) | prawie brak basu - średnio 19.9% niższa od mediany
(+) | bas jest liniowy (5.2% delta do poprzedniej częstotliwości)
Średnie 400 - 2000 Hz
(±) | wyższe średnie - średnio 6.5% wyższe niż mediana
(+) | średnie są liniowe (4.5% delta do poprzedniej częstotliwości)
Wysokie 2–16 kHz
(±) | wyższe maksima - średnio 8.4% wyższe od mediany
(±) | liniowość wysokich wartości jest średnia (7% delta do poprzedniej częstotliwości)
Ogólnie 100 - 16.000 Hz
(±) | liniowość ogólnego dźwięku jest średnia (19.4% różnicy w stosunku do mediany)
W porównaniu do tej samej klasy
» 54% wszystkich testowanych urządzeń w tej klasie było lepszych, 7% podobnych, 39% gorszych
» Najlepszy miał deltę 7%, średnia wynosiła ###średnia###%, najgorsza wynosiła 129%
W porównaniu do wszystkich testowanych urządzeń
» 48% wszystkich testowanych urządzeń było lepszych, 7% podobnych, 45% gorszych
» Najlepszy miał deltę 4%, średnia wynosiła ###średnia###%, najgorsza wynosiła 134%
Apple MacBook Pro 16 2021 M1 Pro analiza dźwięku
(+) | głośniki mogą odtwarzać stosunkowo głośno (84.7 dB)
Bas 100 - 315 Hz
(+) | dobry bas - tylko 3.8% od mediany
(+) | bas jest liniowy (5.2% delta do poprzedniej częstotliwości)
Średnie 400 - 2000 Hz
(+) | zbalansowane środki średnie - tylko 1.3% od mediany
(+) | średnie są liniowe (2.1% delta do poprzedniej częstotliwości)
Wysokie 2–16 kHz
(+) | zrównoważone maksima - tylko 1.9% od mediany
(+) | wzloty są liniowe (2.7% delta do poprzedniej częstotliwości)
Ogólnie 100 - 16.000 Hz
(+) | ogólny dźwięk jest liniowy (4.6% różnicy w stosunku do mediany)
W porównaniu do tej samej klasy
» 0% wszystkich testowanych urządzeń w tej klasie było lepszych, 0% podobnych, 100% gorszych
» Najlepszy miał deltę 5%, średnia wynosiła ###średnia###%, najgorsza wynosiła 45%
W porównaniu do wszystkich testowanych urządzeń
» 0% wszystkich testowanych urządzeń było lepszych, 0% podobnych, 100% gorszych
» Najlepszy miał deltę 4%, średnia wynosiła ###średnia###%, najgorsza wynosiła 134%
Zarządzanie energią
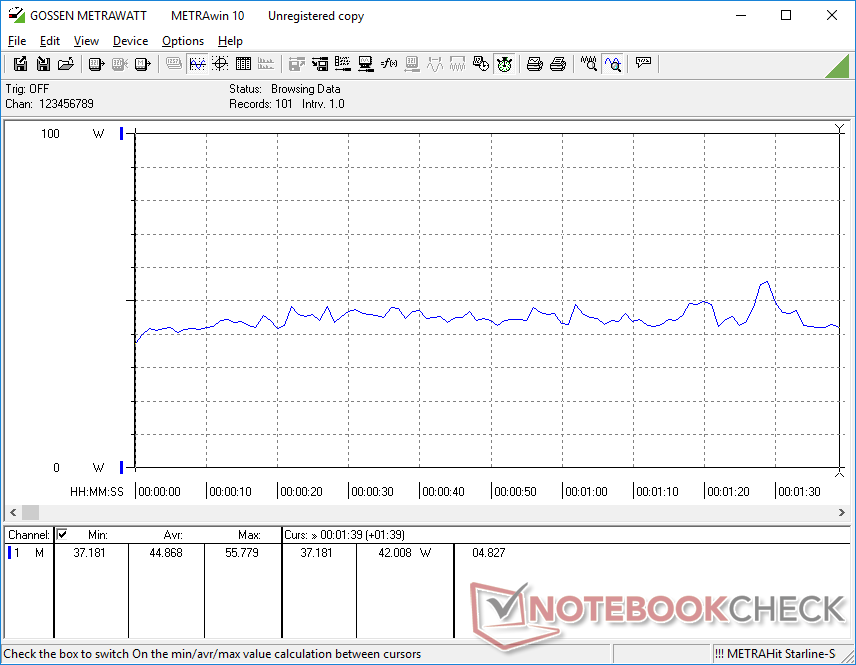
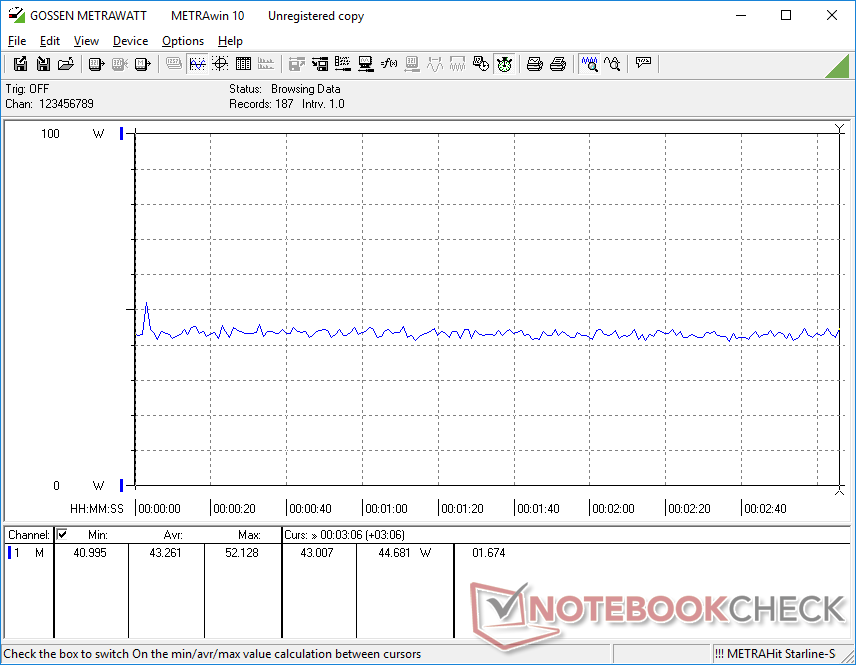
Pobór mocy
Pobór mocy jest w większości przypadków podobny do innych urządzeń typu rugged pracujących na starszych procesorach 11. generacji, takich jak Dell Latitude 7330 Rugged Extreme czy Panasonic Toughbook 40. Wydajność w przeliczeniu na wat może być jednak bardzo różna. Dokładniej mówiąc, nasz Latitude 7230 Rugged może zaoferować o 40 do 50 procent większą wydajność procesora niż Core i7-1185G7 wDell Latitude 7330 Rugged bez konieczności zużywania większej ilości energii. Z drugiej strony wydajność GPU jest o 30 do 40 procent wolniejsza.
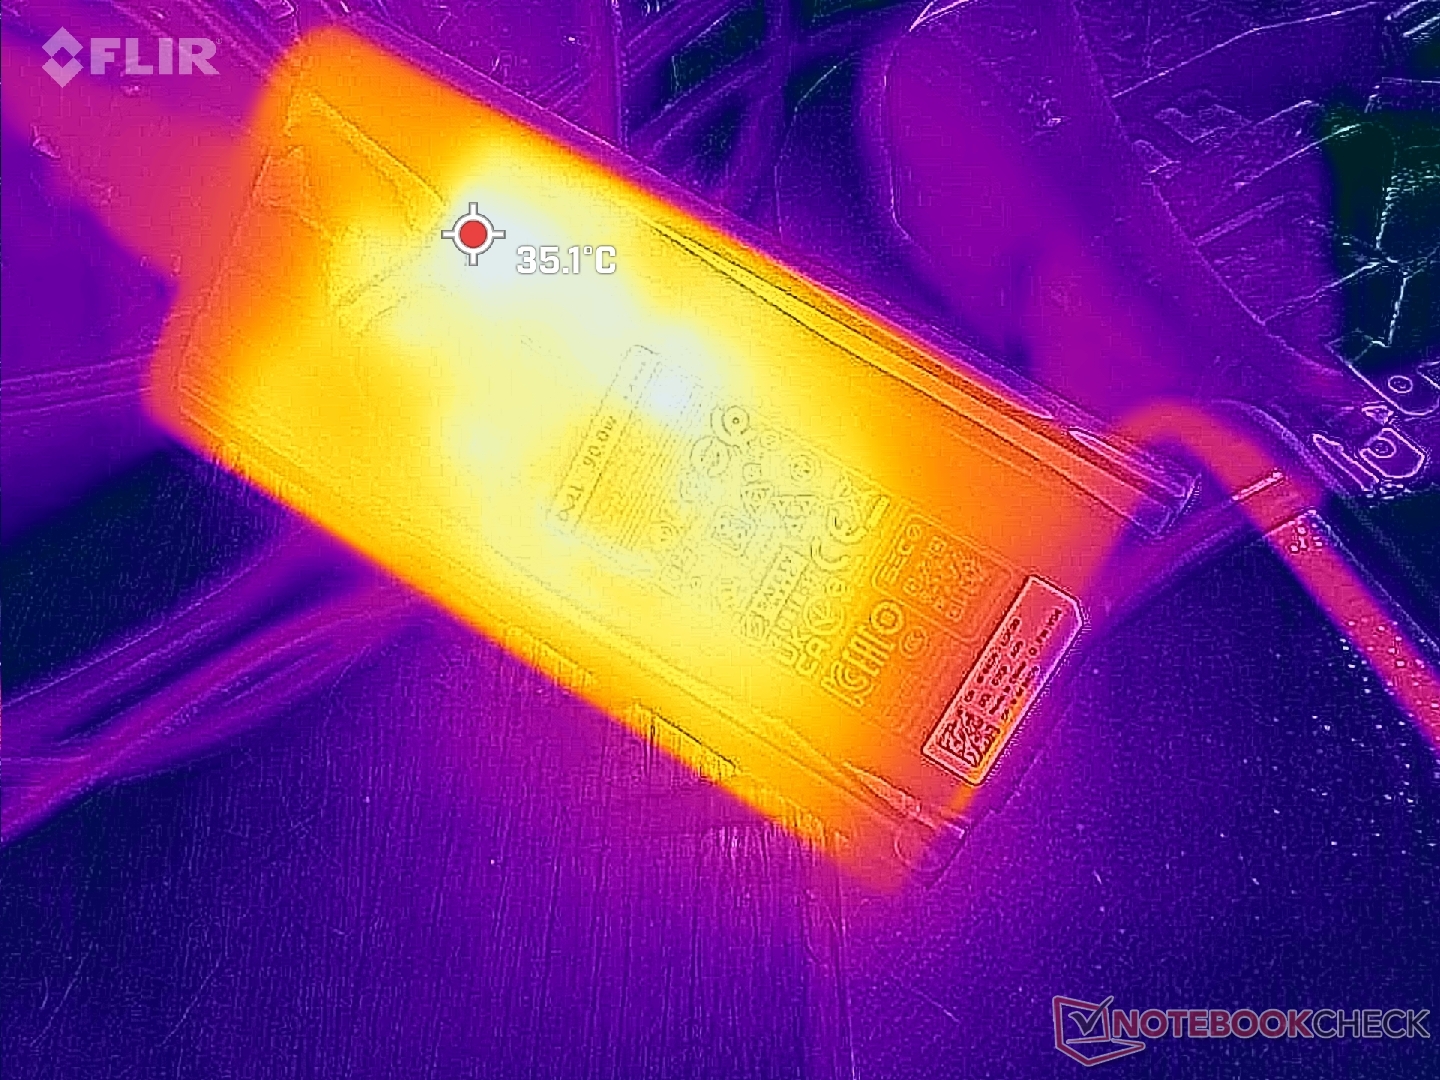
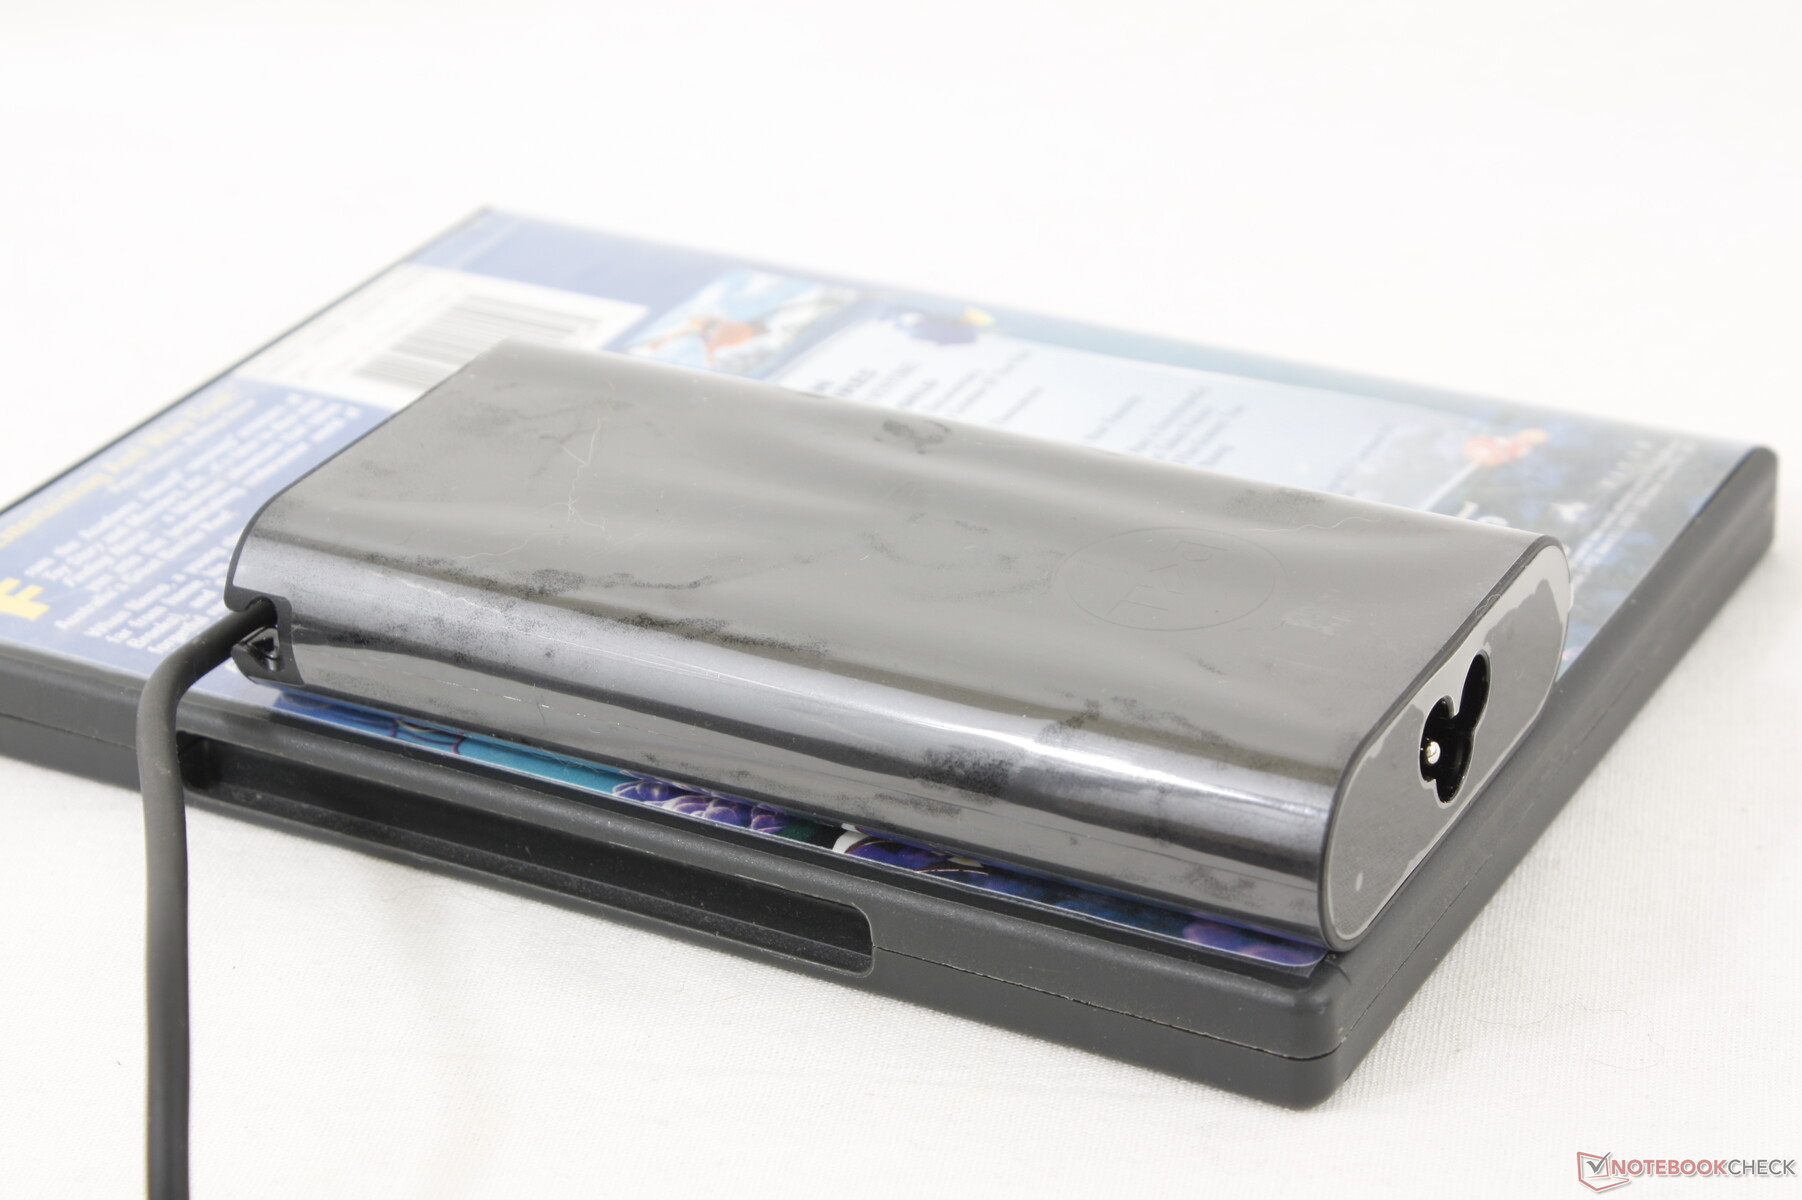
Jesteśmy w stanie zarejestrować maksymalny pobór 55 W z małego-średniego (~13 x 6,5 x 2,3 cm) adaptera USB-C AC o mocy 90 W. Ten maksymalny odczyt jest stosunkowo niski w porównaniu z wieloma alternatywami Core i7, ponieważ nasz Core i5 ma niższy limit Turbo Boost. Zauważ, że model ten jest wyposażony w ten sam adapter AC, który można znaleźć w niektórych laptopach XPS.
| wyłączony / stan wstrzymania | |
| luz | |
| obciążenie |
|
Legenda:
min: | |
| Dell Latitude 7230 Rugged Extreme i5-1240U, Iris Xe G7 80EUs, WD PC SN740 512GB SDDPMQD-512G-1101, IPS, 1920x1200, 12" | Dell Latitude 7330 Rugged Extreme i7-1185G7, Iris Xe G7 96EUs, , IPS, 1920x1080, 13.3" | Panasonic Toughbook 40 i7-1185G7, Iris Xe G7 96EUs, Samsung PM991 MZVLQ1T0HALB, IPS, 1920x1080, 14" | Getac B360 i7-10710U, UHD Graphics 620, Lite-On CA5-8D512, IPS, 1920x1080, 13.3" | Acer Enduro Urban N3 EUN314 i7-1165G7, Iris Xe G7 96EUs, Samsung PM991 MZVLQ1T0HALB, IPS, 1920x1080, 14" | Durabook S14I i7-1165G7, Iris Xe G7 96EUs, UDinfo M2P M2P80DE512GBAEP, TN, 1920x1080, 14" | |
|---|---|---|---|---|---|---|
| Power Consumption | -9% | -15% | -5% | 25% | -25% | |
| Idle Minimum * (Watt) | 6.5 | 4.1 37% | 4.9 25% | 5.4 17% | 3.8 42% | 6.8 -5% |
| Idle Average * (Watt) | 8.9 | 11.7 -31% | 12.3 -38% | 12.2 -37% | 8 10% | 16.4 -84% |
| Idle Maximum * (Watt) | 14.3 | 11.8 17% | 14 2% | 12.6 12% | 8.7 39% | 16.9 -18% |
| Load Average * (Watt) | 44.9 | 48.5 -8% | 54 -20% | 39.1 13% | 34.6 23% | 39.2 13% |
| Witcher 3 ultra * (Watt) | 43.2 | 44.3 -3% | 46.3 -7% | 36.5 16% | 35.4 18% | |
| Load Maximum * (Watt) | 54.8 | 91 -66% | 83.6 -53% | 81.8 -49% | 45.4 17% | 73.1 -33% |
* ... im mniej tym lepiej
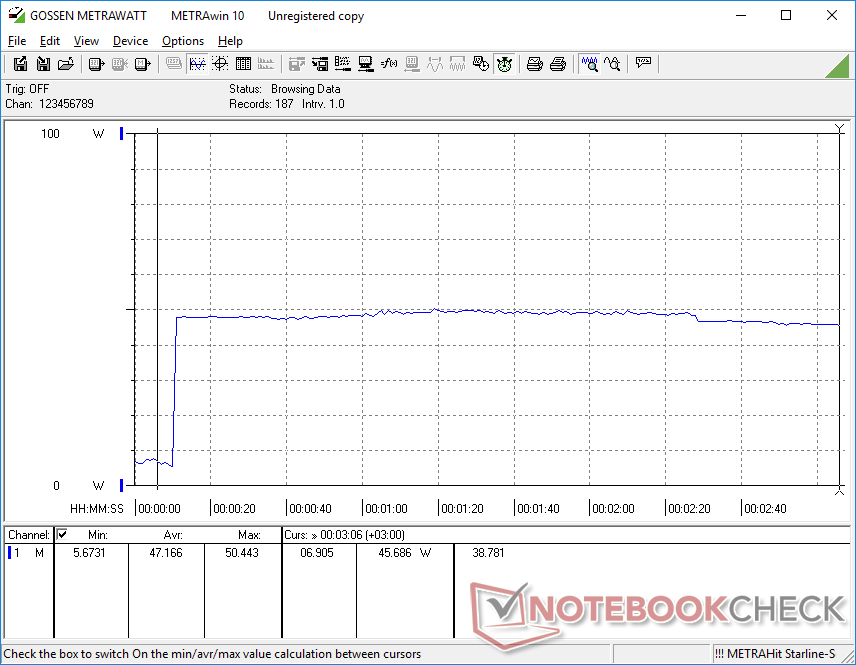
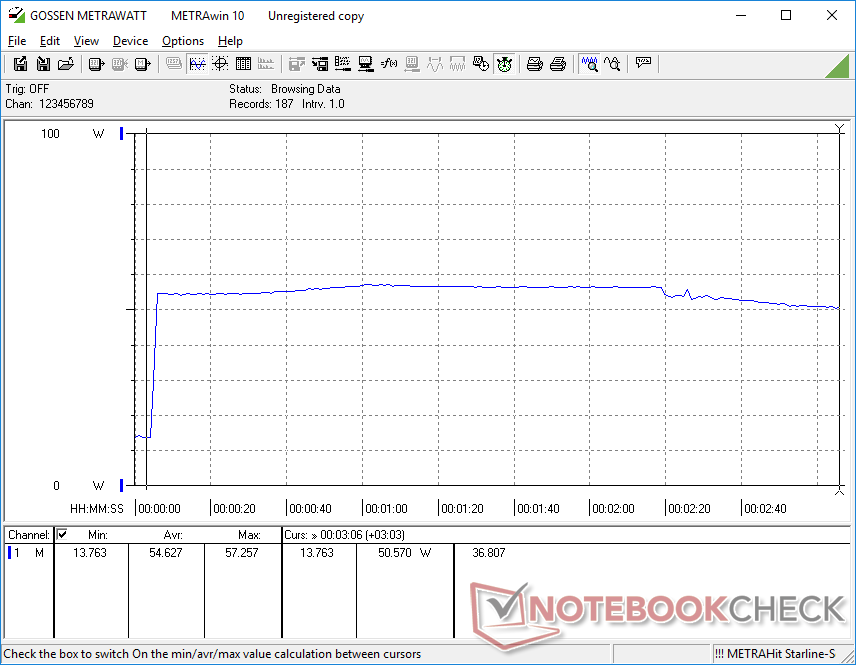
Power Consumption Witcher 3 / Stresstest
Power Consumption external Monitor
Żywotność baterii - 3,5 godziny przy ekstremalnym użytkowaniu
Obsługiwane są maksymalnie dwa wymienne akumulatory. Czas pracy w sieci WLAN wynosi prawie 13 godzin przy zainstalowanych obu akumulatorach (36 Wh x2). Z kolei uruchomienie wymagających obciążeń na maksymalnym poziomie jasności powinno wystarczyć na około 3,5 godziny.
Ładowanie obu akumulatorów od pustego do pełnego jest niestety dość wolne i wynosi 4 do 5 godzin w porównaniu z 1,5 do 2 godzin w większości ultrabooków.
| Dell Latitude 7230 Rugged Extreme i5-1240U, Iris Xe G7 80EUs, 72 Wh | Dell Latitude 7330 Rugged Extreme i7-1185G7, Iris Xe G7 96EUs, 107 Wh | Panasonic Toughbook 40 i7-1185G7, Iris Xe G7 96EUs, 136 Wh | Getac B360 i7-10710U, UHD Graphics 620, 46 Wh | Acer Enduro Urban N3 EUN314 i7-1165G7, Iris Xe G7 96EUs, 50.3 Wh | Durabook S14I i7-1165G7, Iris Xe G7 96EUs, 50 Wh | |
|---|---|---|---|---|---|---|
| Czasy pracy | 38% | 46% | -38% | -51% | -58% | |
| WiFi v1.3 (h) | 13 | 18 38% | 19 46% | 8.1 -38% | 6.4 -51% | 5.5 -58% |
| Load (h) | 3.6 |
Za
Przeciw
Werdykt - W większości przypadków to home run
Cechami wyróżniającymi Latitude 7230 Rugged Extreme są pełne pokrycie palety sRGB, szybka wydajność procesora oraz niewielka waga w stosunku do innych tabletów typu rugged. Większość alternatywnych rozwiązań ma w porównaniu gorsze kolory i grubsze ramki.
Chcielibyśmy zobaczyć ulepszenia w pokrywach portów i przednich przyciskach, które są odpowiednio zbyt śliskie i małe. Stają się one jeszcze trudniejsze do obsługi, jeśli zdarza się, że nosisz rękawiczki.
Doskonała żywotność baterii, super jasny wyświetlacz i pełne pokrycie sRGB w Latitude 7230 Rugged Extreme wyznaczają standardy dla przyszłych tabletów typu rugged.
Potencjalni nabywcy będą chcieli pamiętać, że tańszy Core i5-1240U pod względem wydajności procesora działa podobnie do Core i7-1260U. W związku z tym użytkownicy powinni wybrać ten ostatni tylko wtedy, gdy potrzebna jest szybsza wydajność grafiki. Jeśli planujesz uruchomić na tym modelu bardziej wymagające zadania, spodziewaj się, że szum wentylatora będzie głośniejszy niż zwykle.
Cena i dostępność
Dell sprzedaje obecnie model Latitude 7230 Rugged Extreme w cenie od 2700 USD za podstawową konfigurację do ponad 5000 USD za pełną konfigurację. Nasz egzemplarz recenzencki kosztuje około 3200 USD.
Dell Latitude 7230 Rugged Extreme
- 07/04/2023 v7 (old)
Allen Ngo
Przezroczystość
Wyboru urządzeń do recenzji dokonuje nasza redakcja. Próbka testowa została udostępniona autorowi jako pożyczka od producenta lub sprzedawcy detalicznego na potrzeby tej recenzji. Pożyczkodawca nie miał wpływu na tę recenzję, producent nie otrzymał też kopii tej recenzji przed publikacją. Nie było obowiązku publikowania tej recenzji. Jako niezależna firma medialna, Notebookcheck nie podlega władzy producentów, sprzedawców detalicznych ani wydawców.
Tak testuje Notebookcheck
Każdego roku Notebookcheck niezależnie sprawdza setki laptopów i smartfonów, stosując standardowe procedury, aby zapewnić porównywalność wszystkich wyników. Od około 20 lat stale rozwijamy nasze metody badawcze, ustanawiając przy tym standardy branżowe. W naszych laboratoriach testowych doświadczeni technicy i redaktorzy korzystają z wysokiej jakości sprzętu pomiarowego. Testy te obejmują wieloetapowy proces walidacji. Nasz kompleksowy system ocen opiera się na setkach uzasadnionych pomiarów i benchmarków, co pozwala zachować obiektywizm.Price comparison

