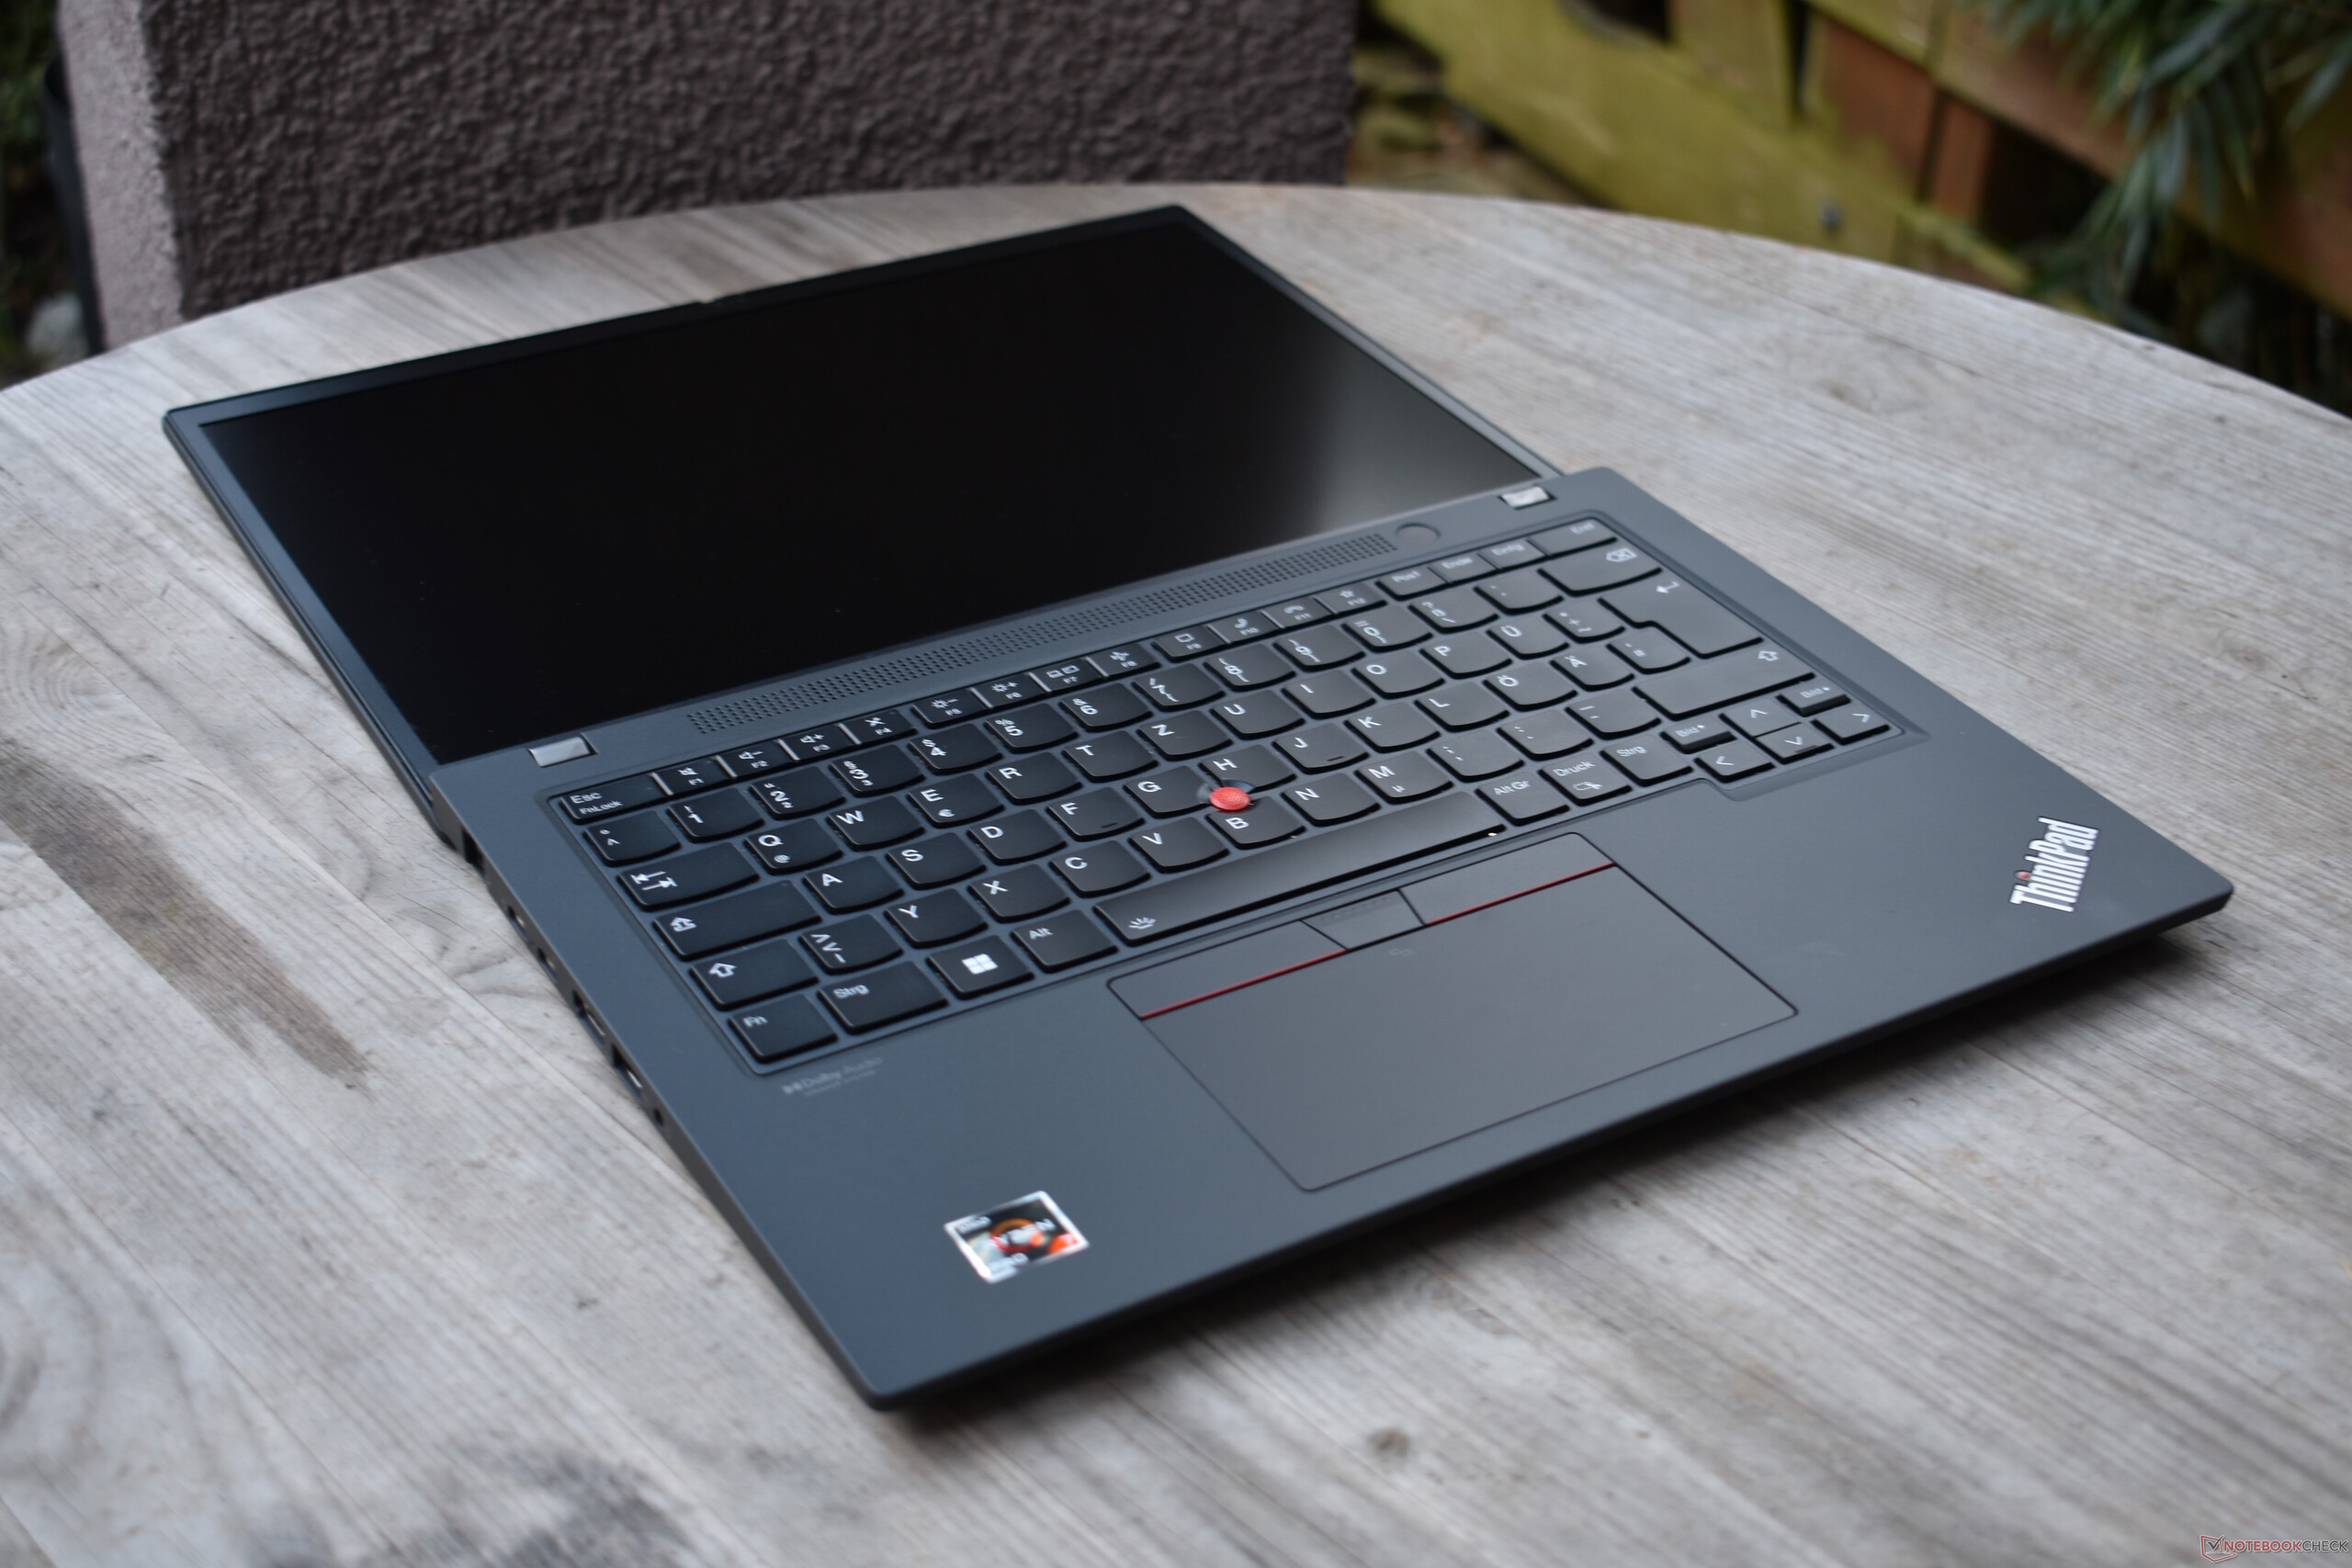
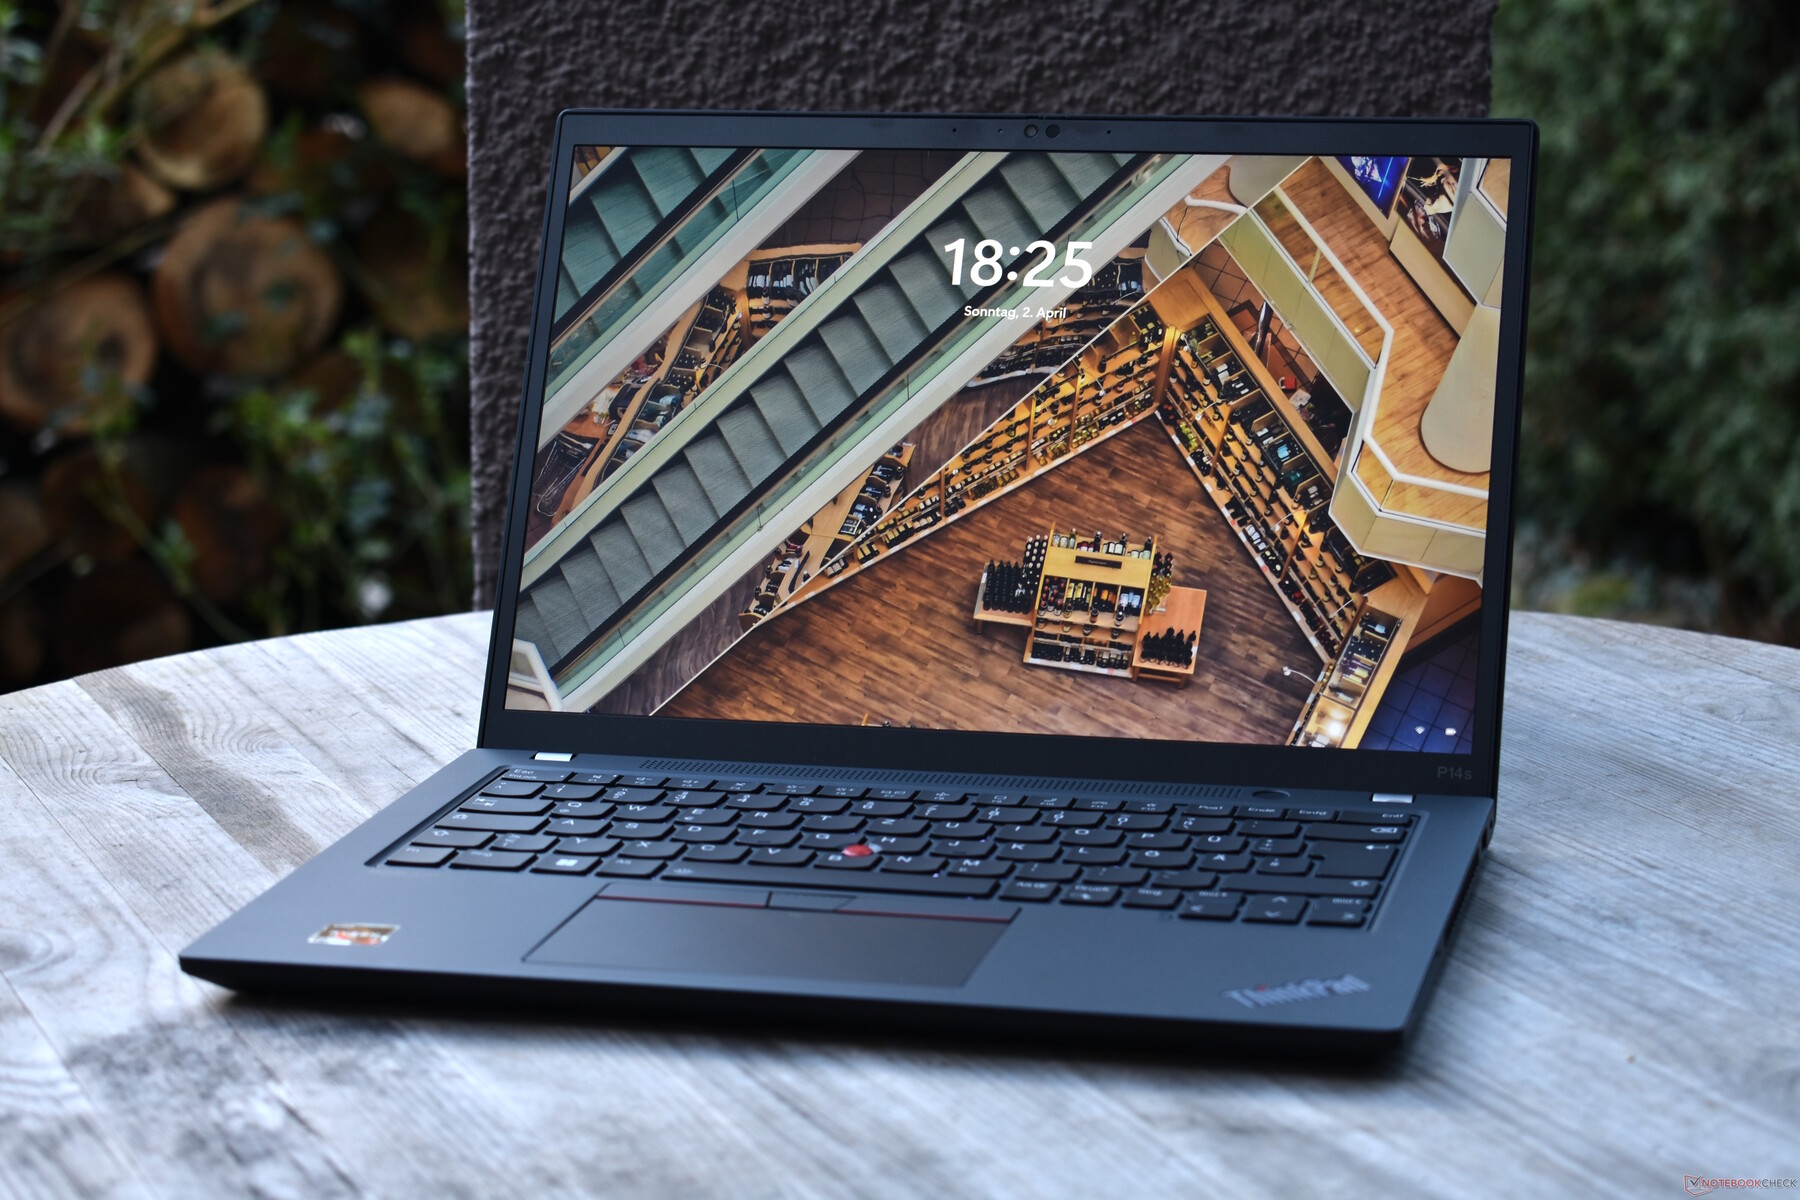
Recenzja laptopa Lenovo ThinkPad P14s G3 AMD: Lekka stacja robocza bez dGPU
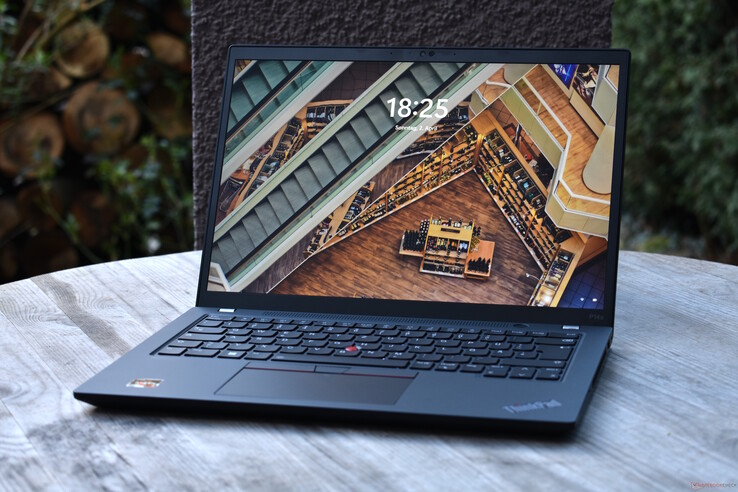
Mobilne stacje robocze tradycyjnie mają stosunkowo duże ekrany - co oznacza 15 cali i większe - natomiast 14-calowe stacje robocze są dość rzadkie. Lenovo ThinkPad P14s G3 jest jednym z tych ostatnich modeli. Ta seria produktów może nie jest nowa, ale warianty P14s z AMD są w porównaniu z nimi całkiem nowe. Jeden z nich będziemy dziś testować.
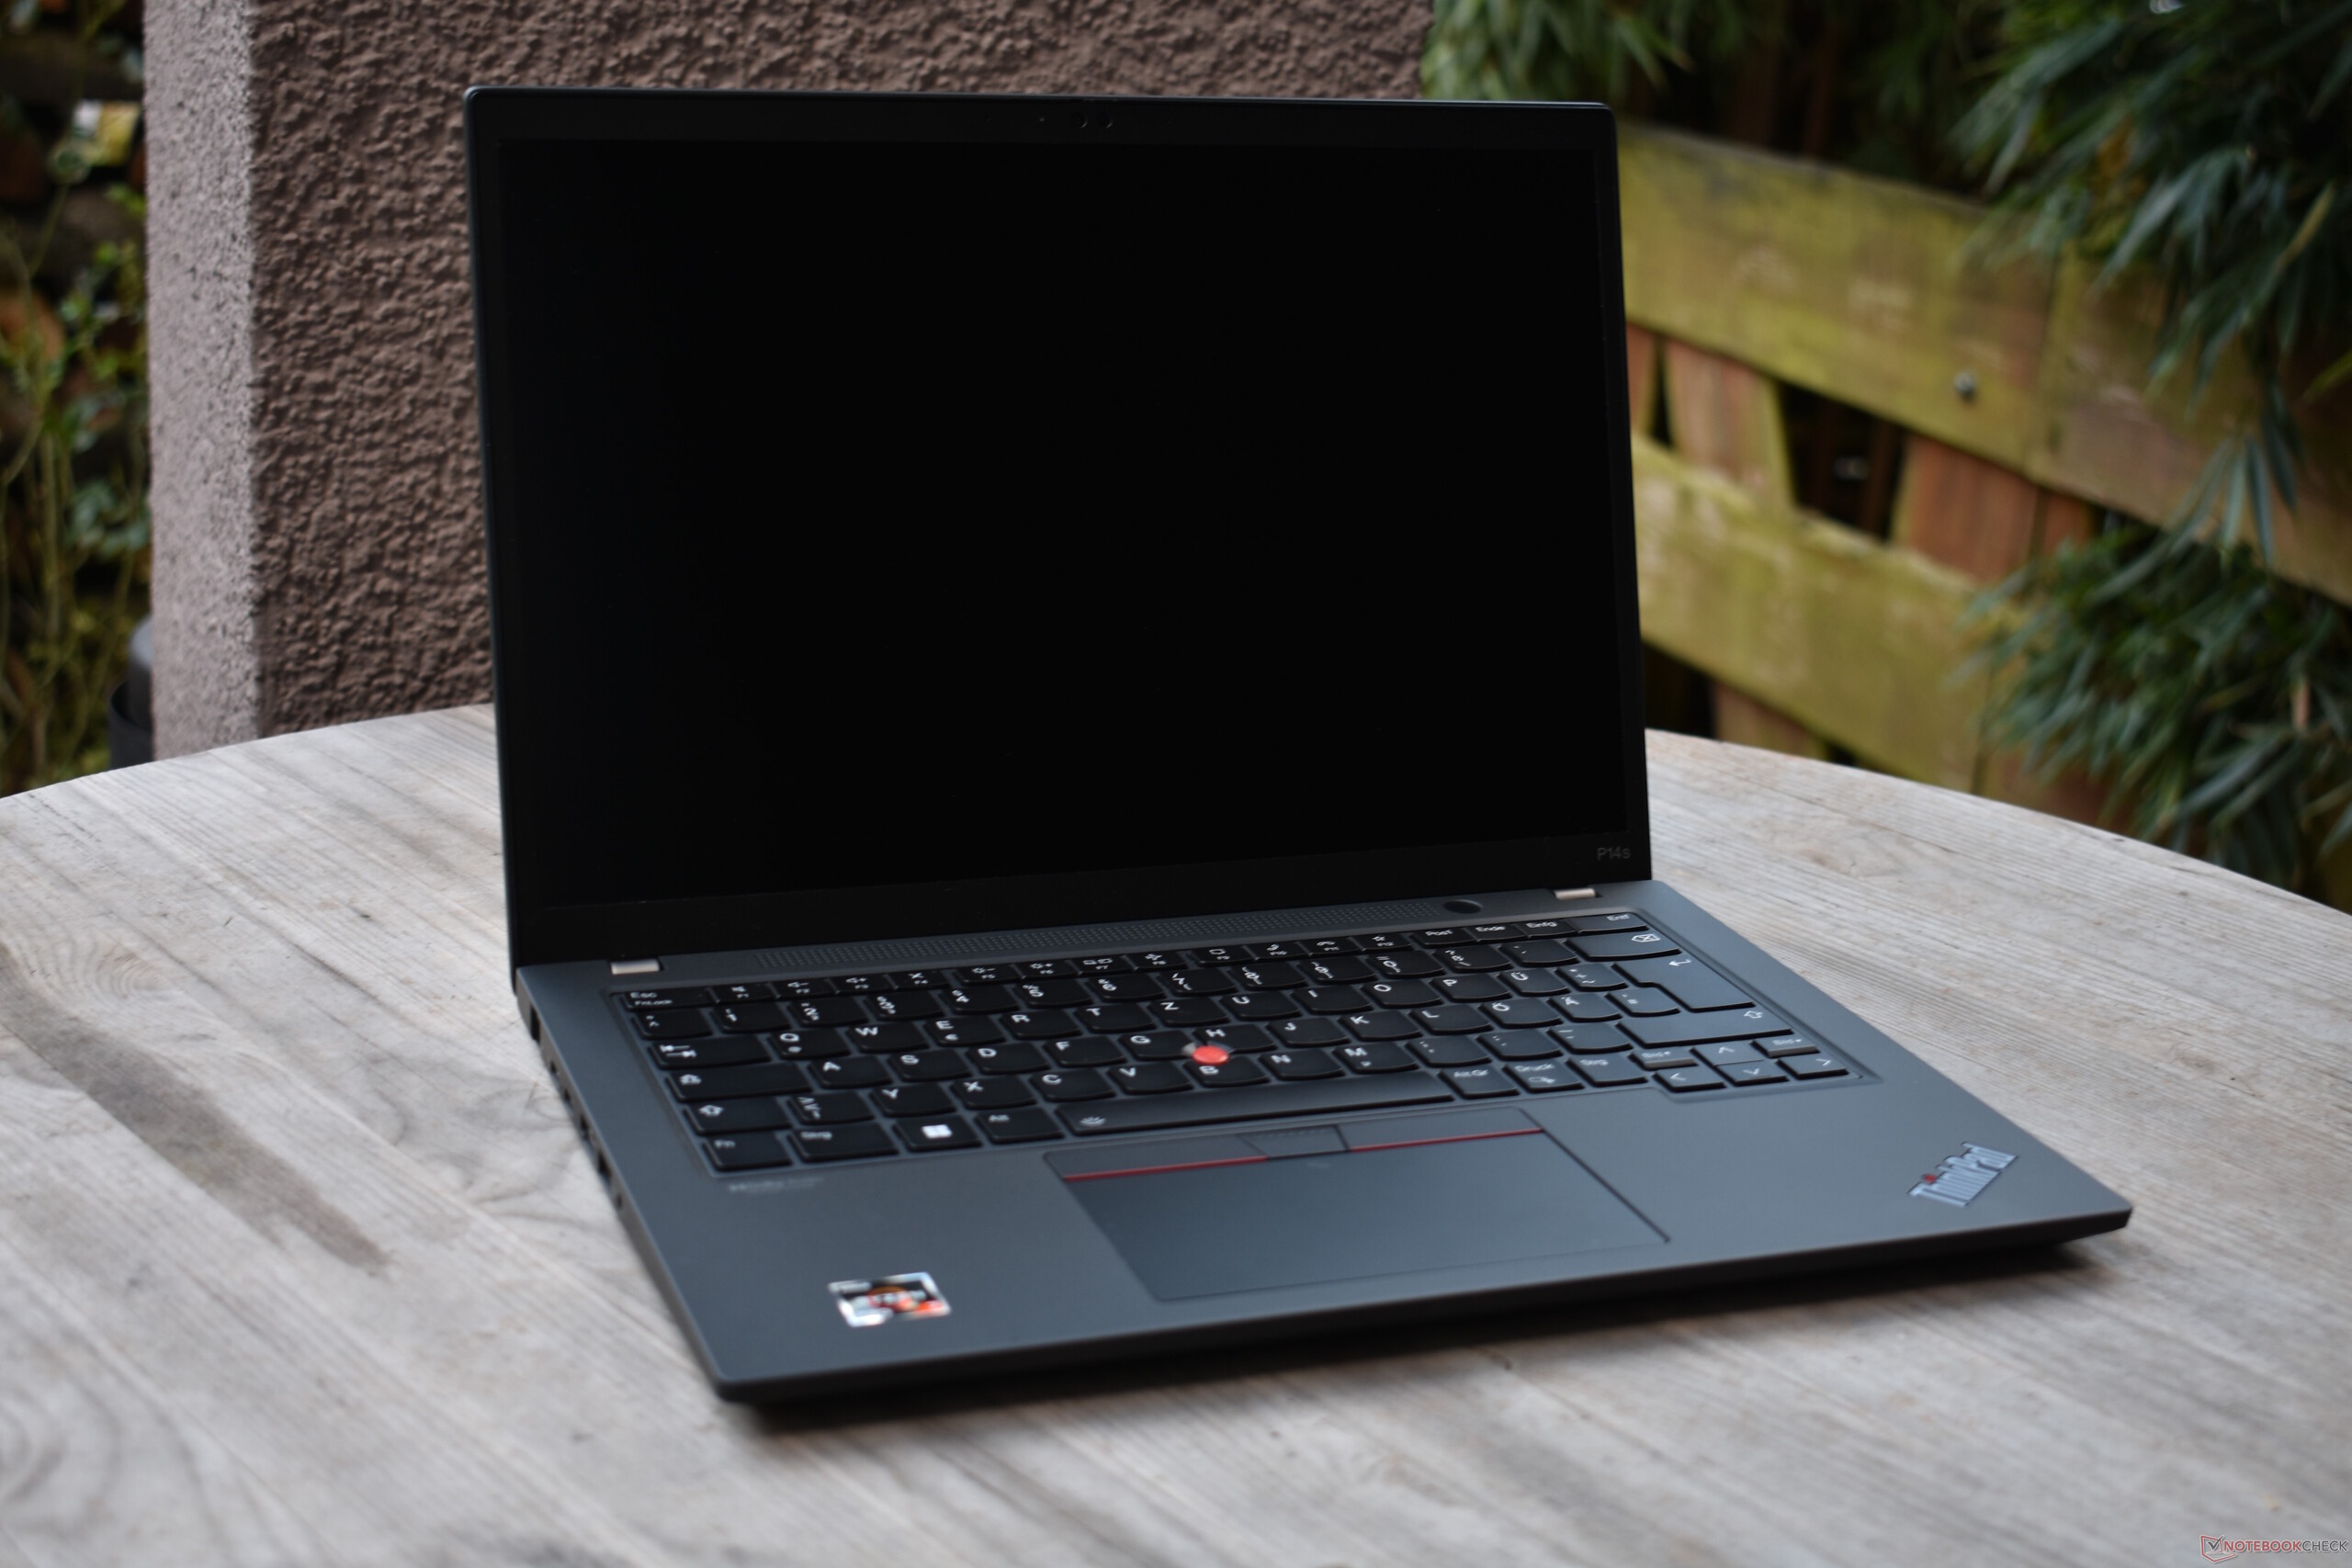
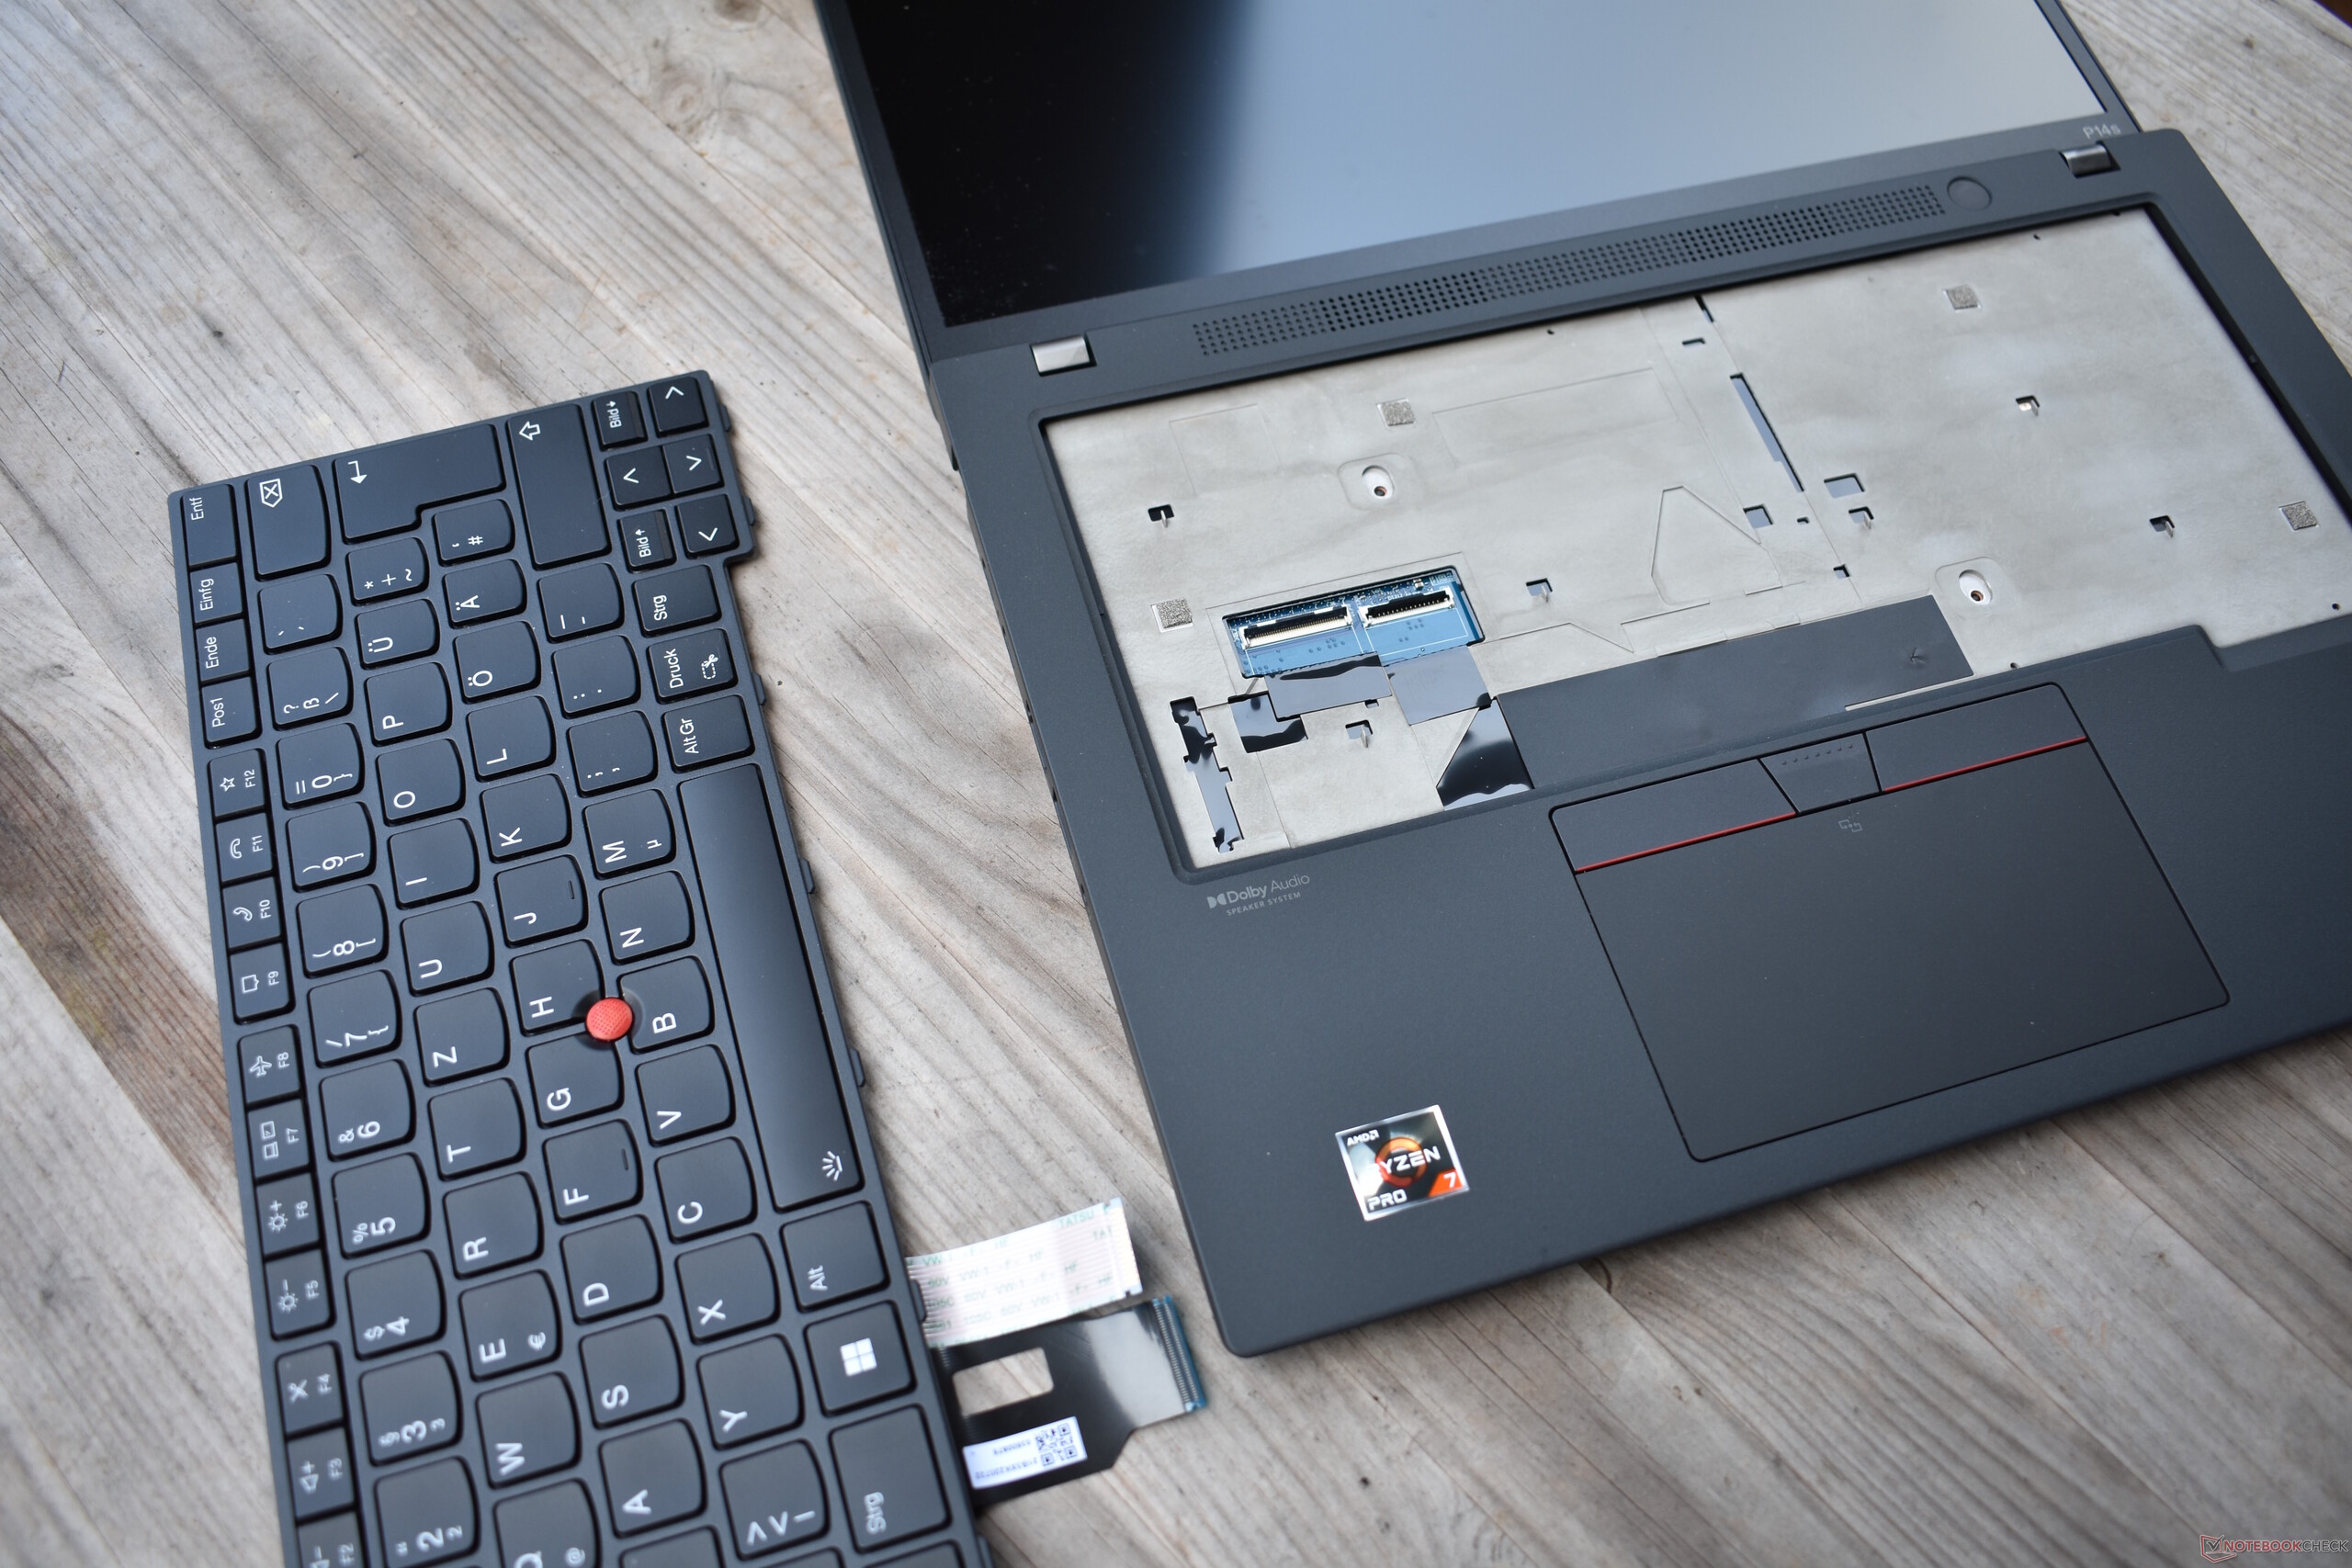
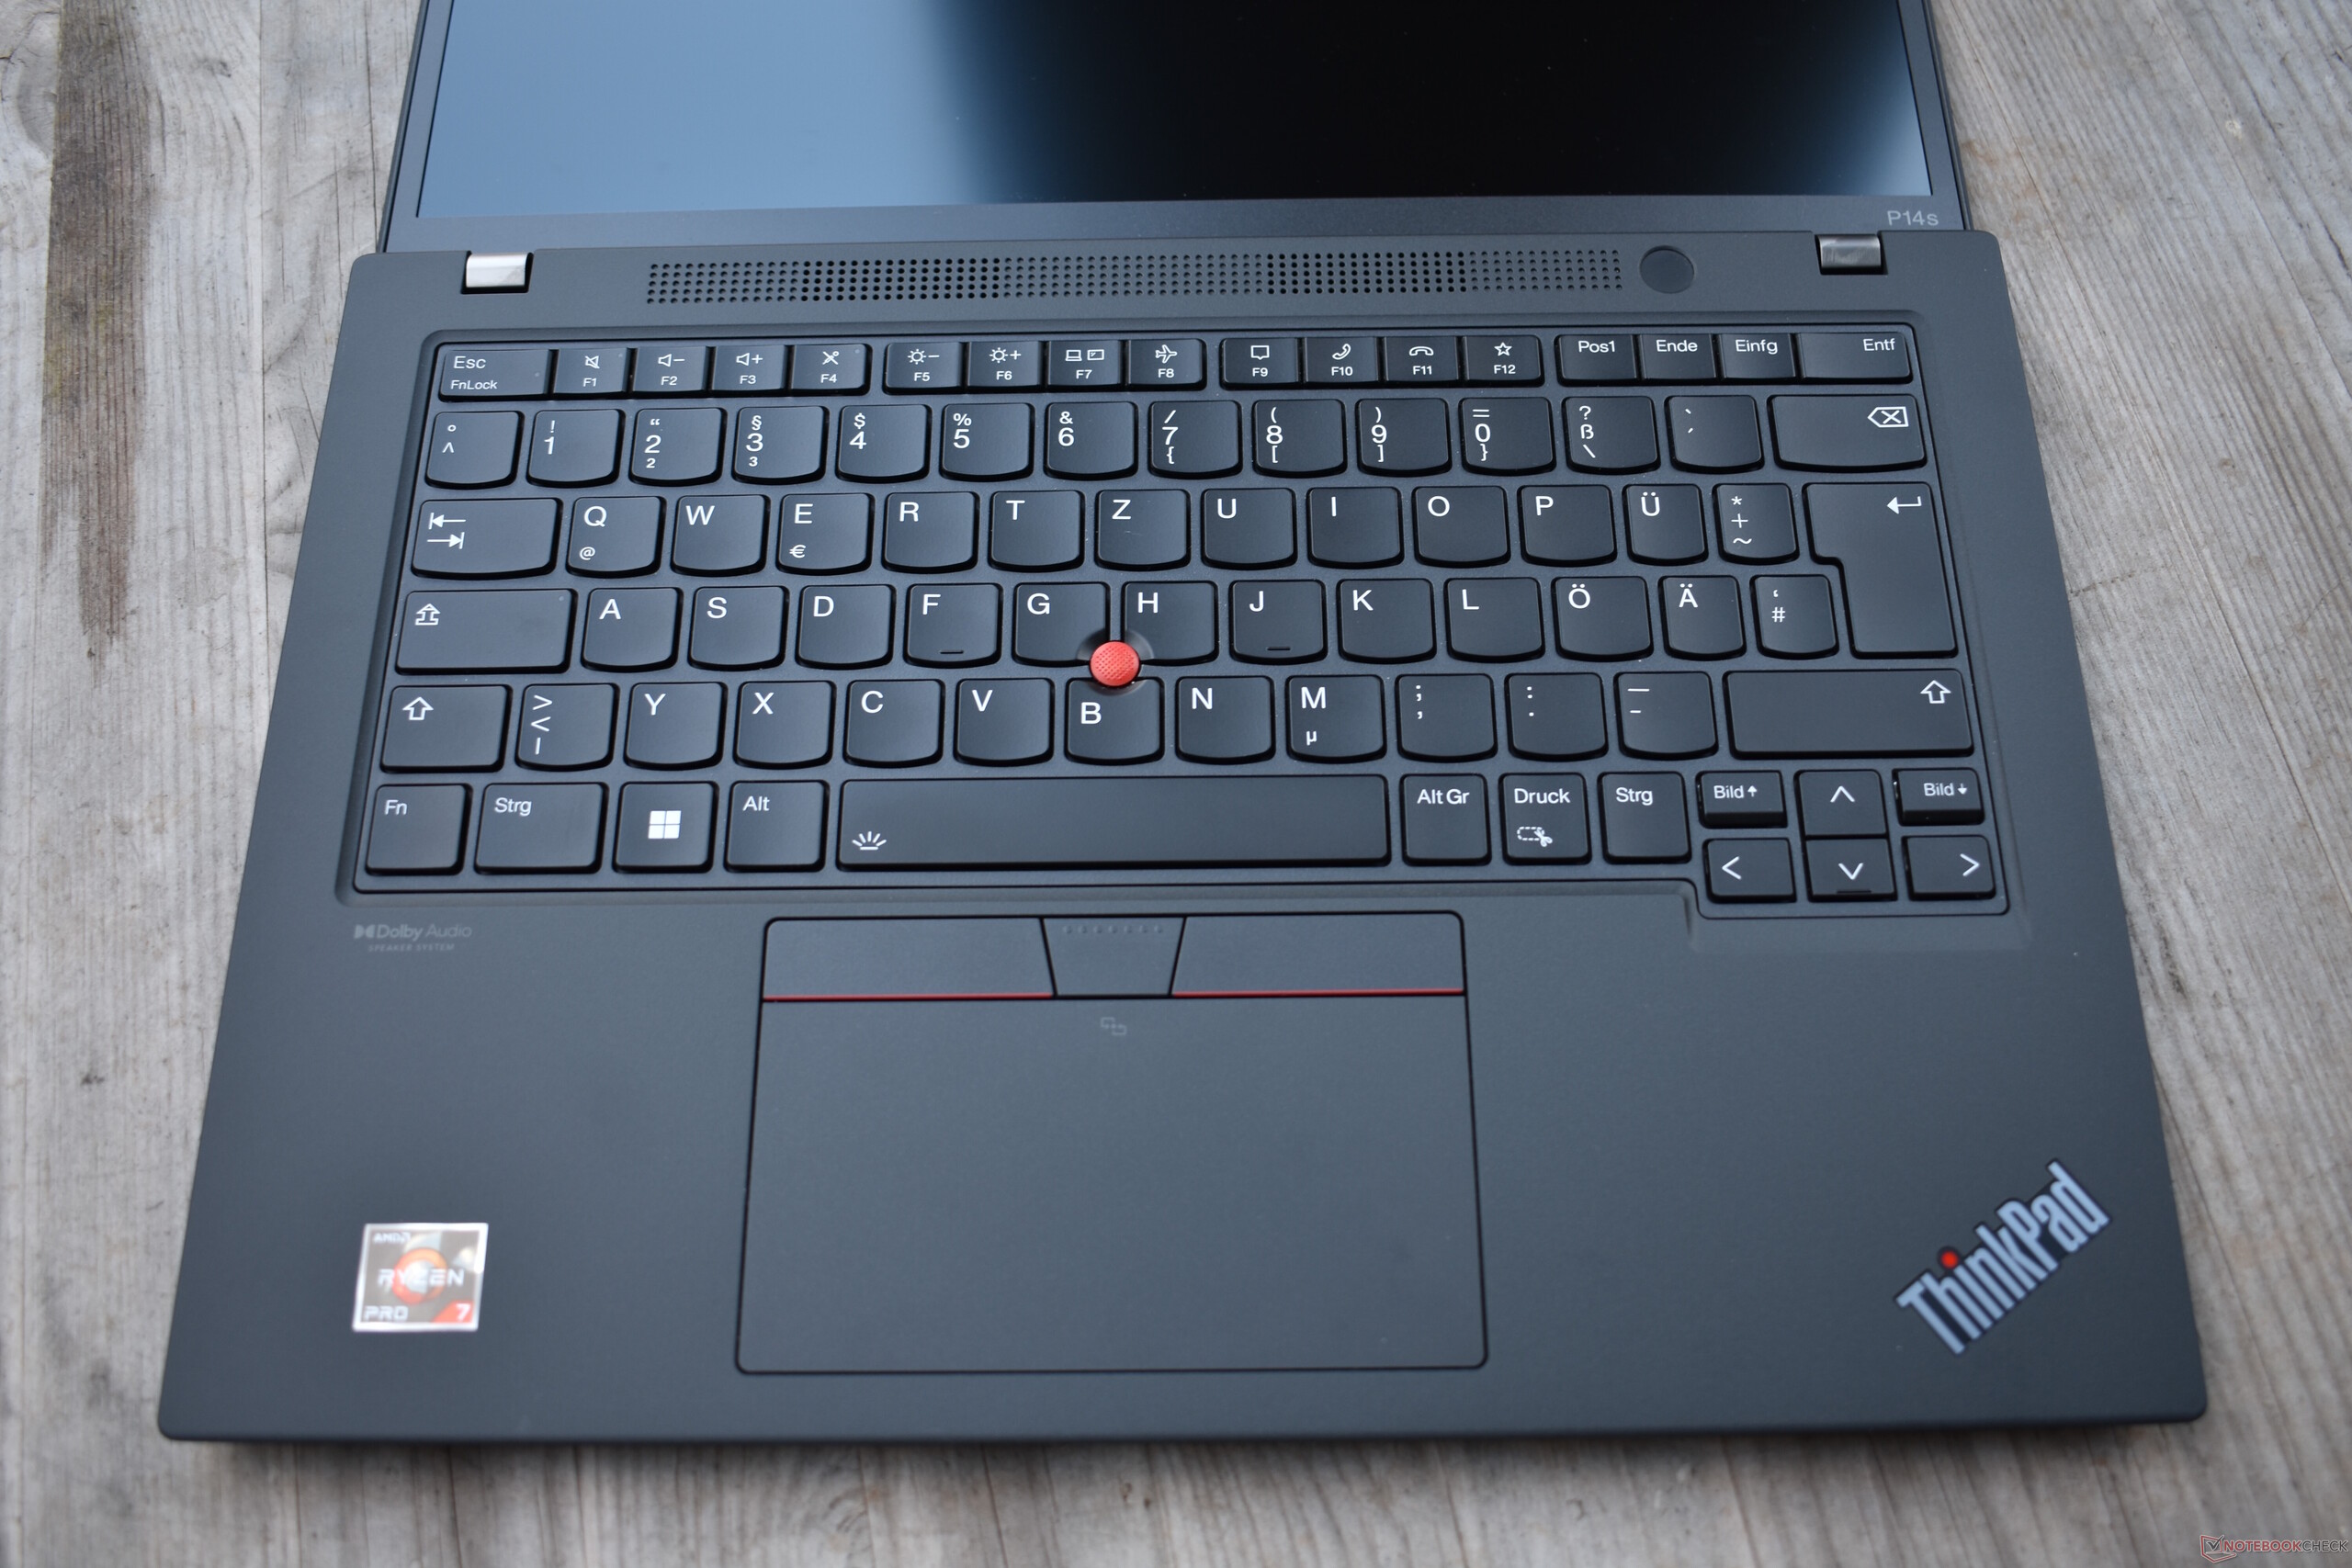
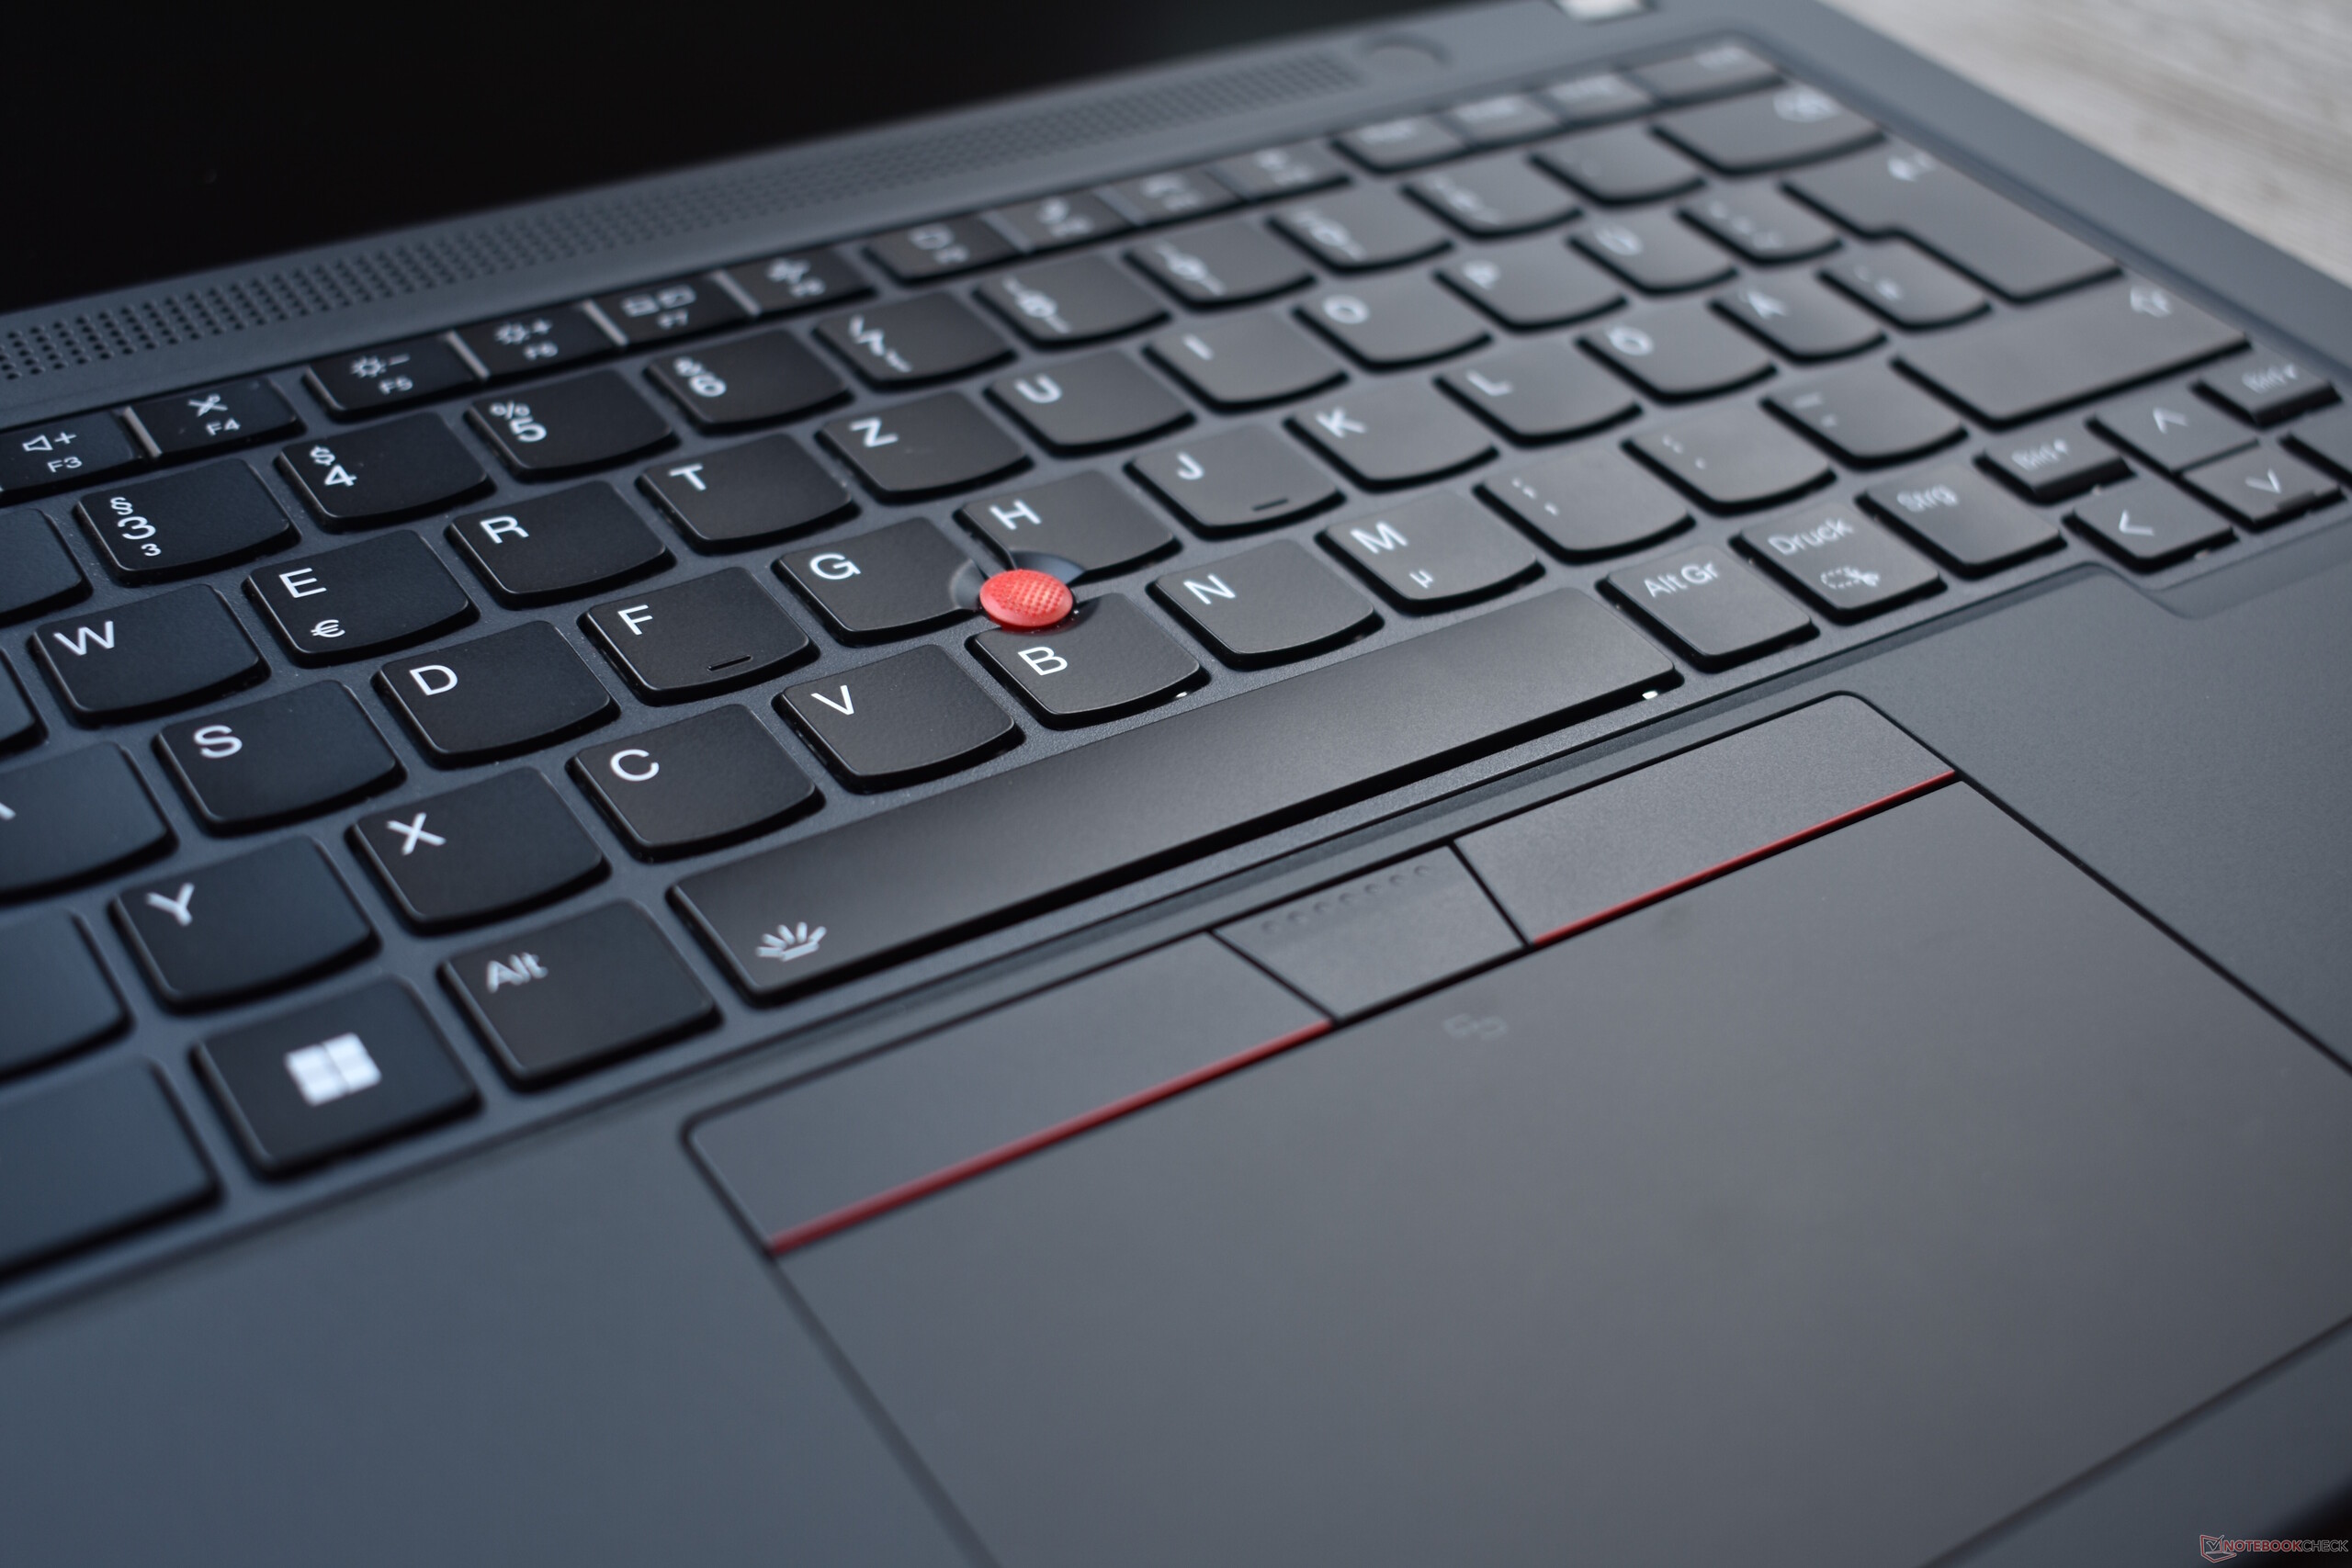
ThinkPad P14s to siostrzany model ThinkPada T14 firmy Lenovo. Zewnętrznie oba wyglądają dokładnie tak samo, co oznacza, że możecie sprawdzić naszą recenzjęLenovo's ThinkPad T14 Gen 3 jeśli jesteś zainteresowany przeczytaniem o jego konstrukcji, funkcjach i urządzeniach wejściowych.
Potencjalni konkurenci w porównaniu
Ocena | Data | Model | Waga | Wysokość | Rozmiar | Rezolucja | Cena |
|---|---|---|---|---|---|---|---|
| 86.9 % v7 (old) | 04/2023 | Lenovo ThinkPad P14s G3 AMD 21J6S05000 R7 PRO 6850U, Radeon 680M | 1.5 kg | 17.9 mm | 14.00" | 1920x1200 | |
| 85.1 % v7 (old) | Lenovo ThinkPad P14s Gen2-20VX000GGE i7-1185G7, T500 Laptop GPU | 1.5 kg | 18 mm | 14.00" | 1920x1080 | ||
| 88.8 % v7 (old) | 09/2022 | Lenovo ThinkPad T14 G3-21CF004NGE R7 PRO 6850U, Radeon 680M | 1.4 kg | 17.9 mm | 14.00" | 1920x1200 | |
| 87.6 % v7 (old) | 10/2022 | Dell Precision 5000 5470 i9-12900H, RTX A1000 Laptop GPU | 1.6 kg | 18.95 mm | 14.00" | 2560x1600 | |
| 83.6 % v7 (old) | 10/2022 | HP ZBook Firefly 14 G9-6B8A2EA i7-1265U, T550 Laptop GPU | 1.5 kg | 19.9 mm | 14.00" | 1920x1200 |
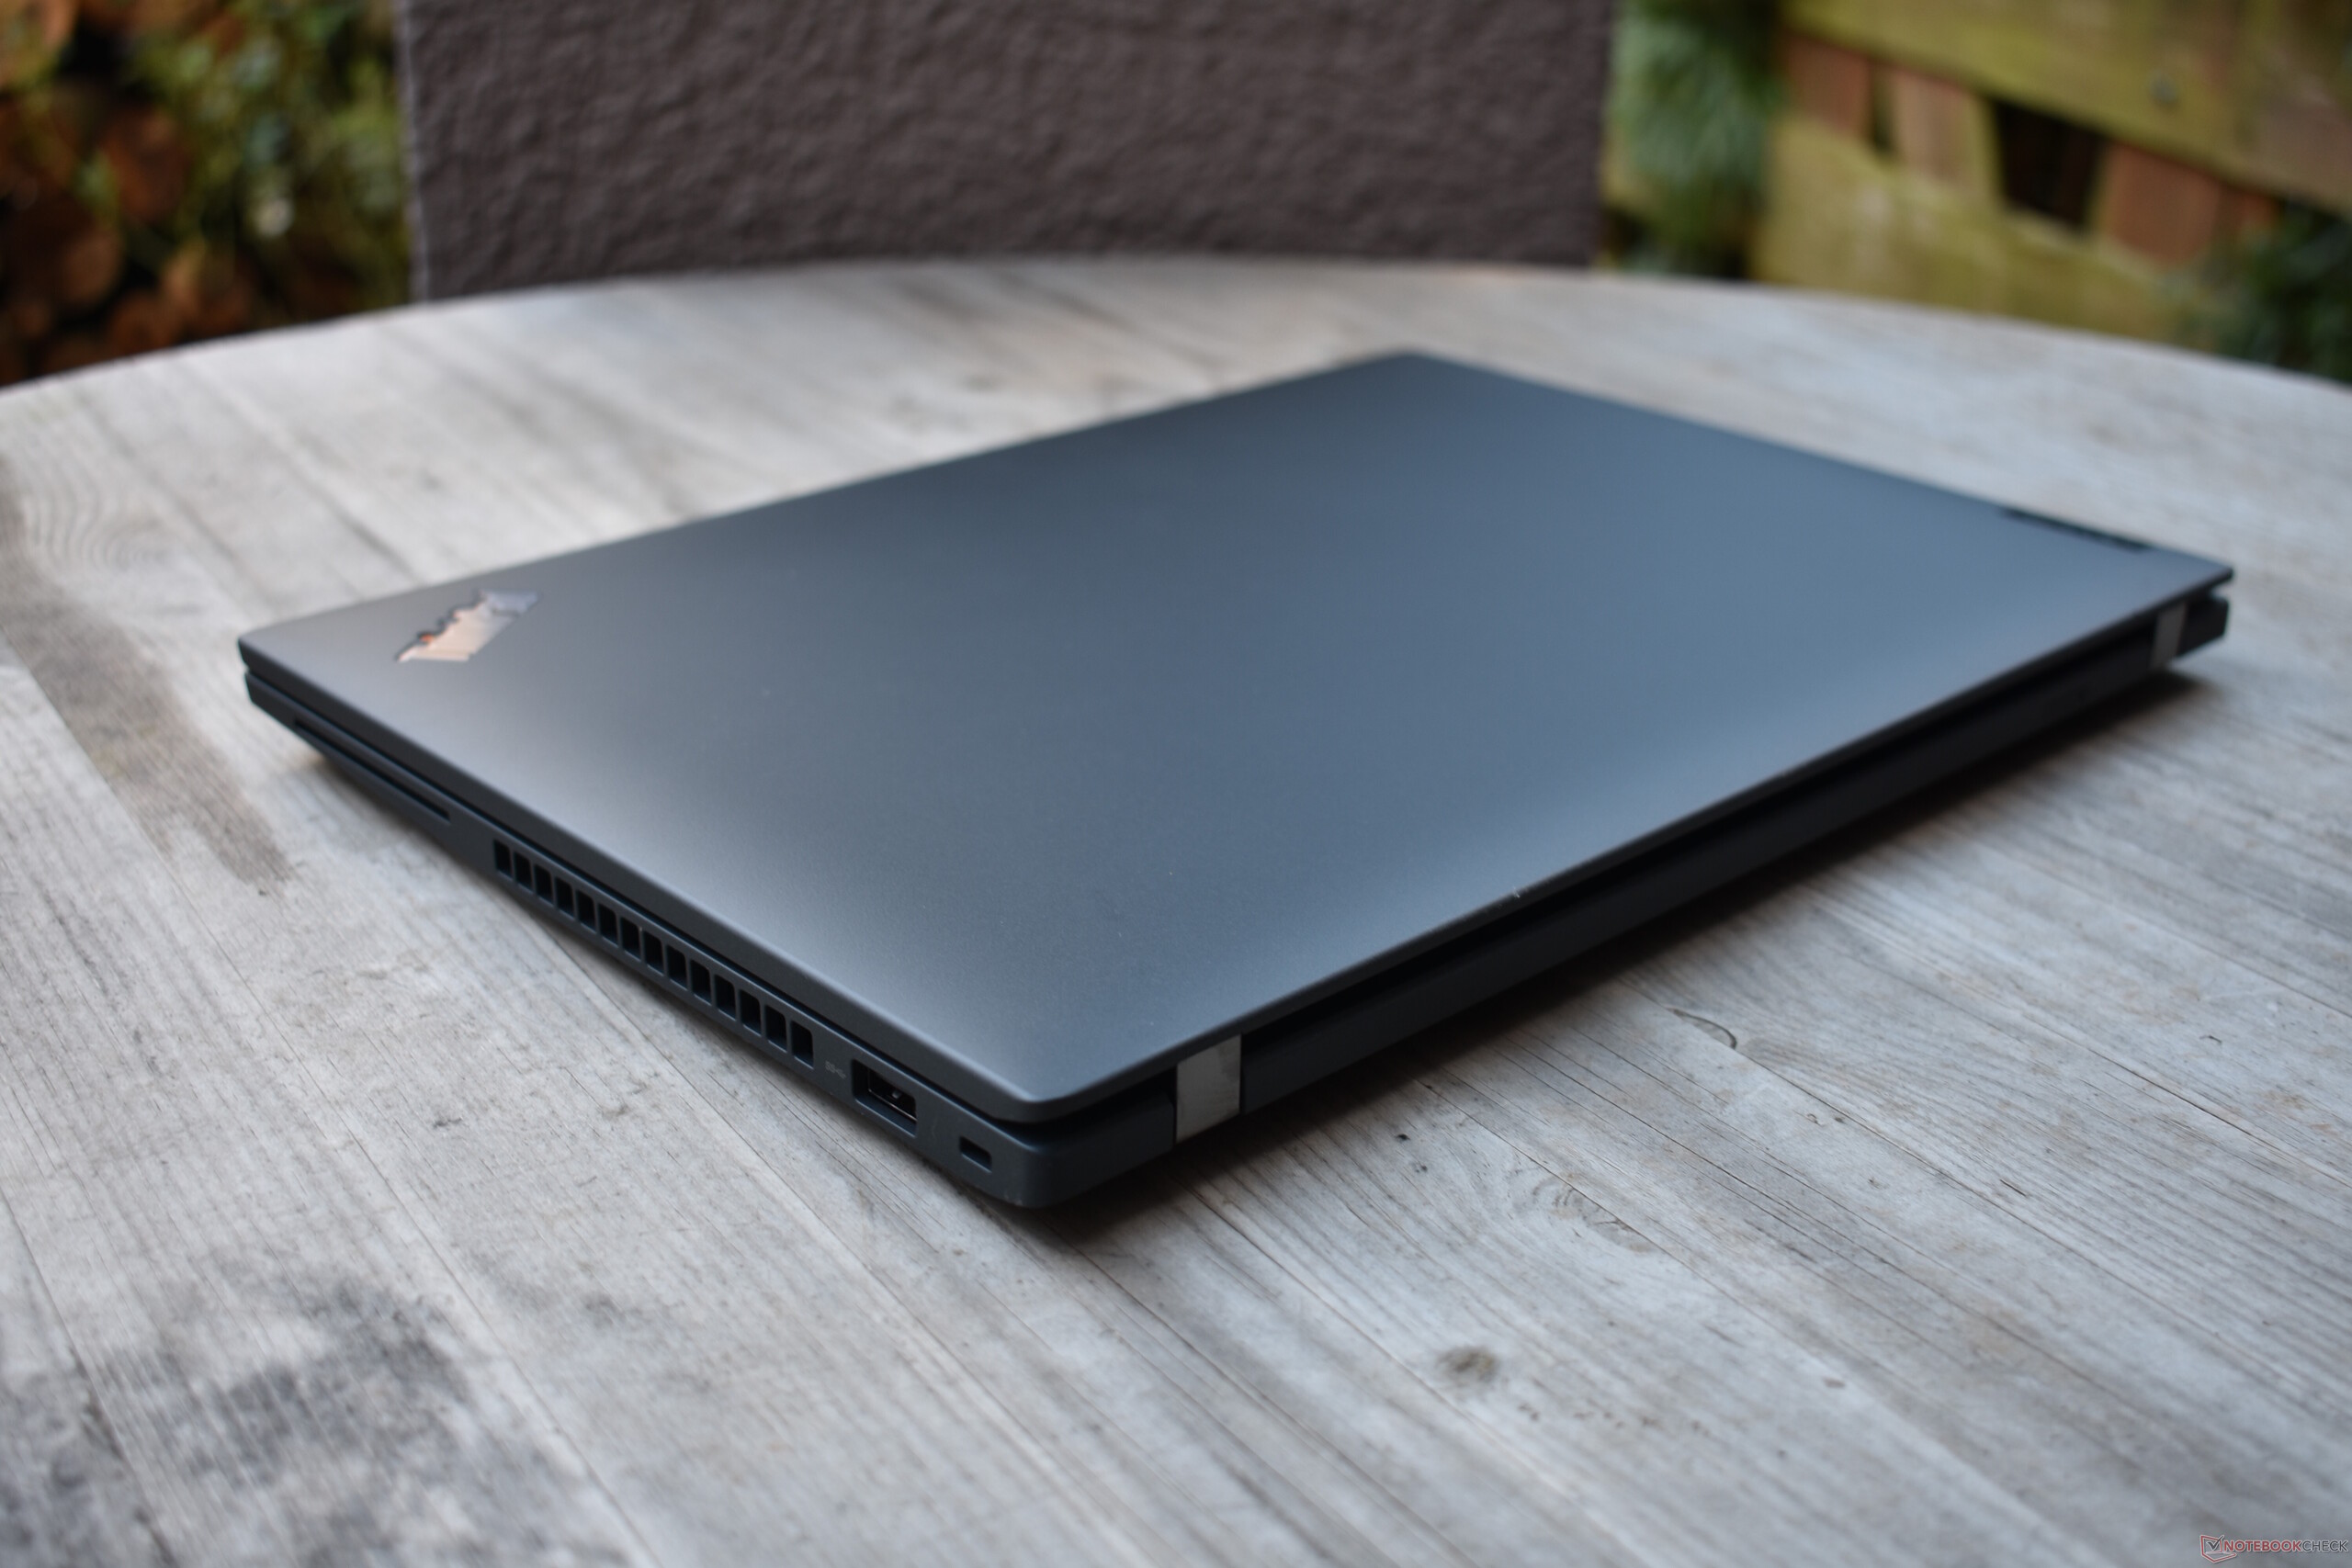
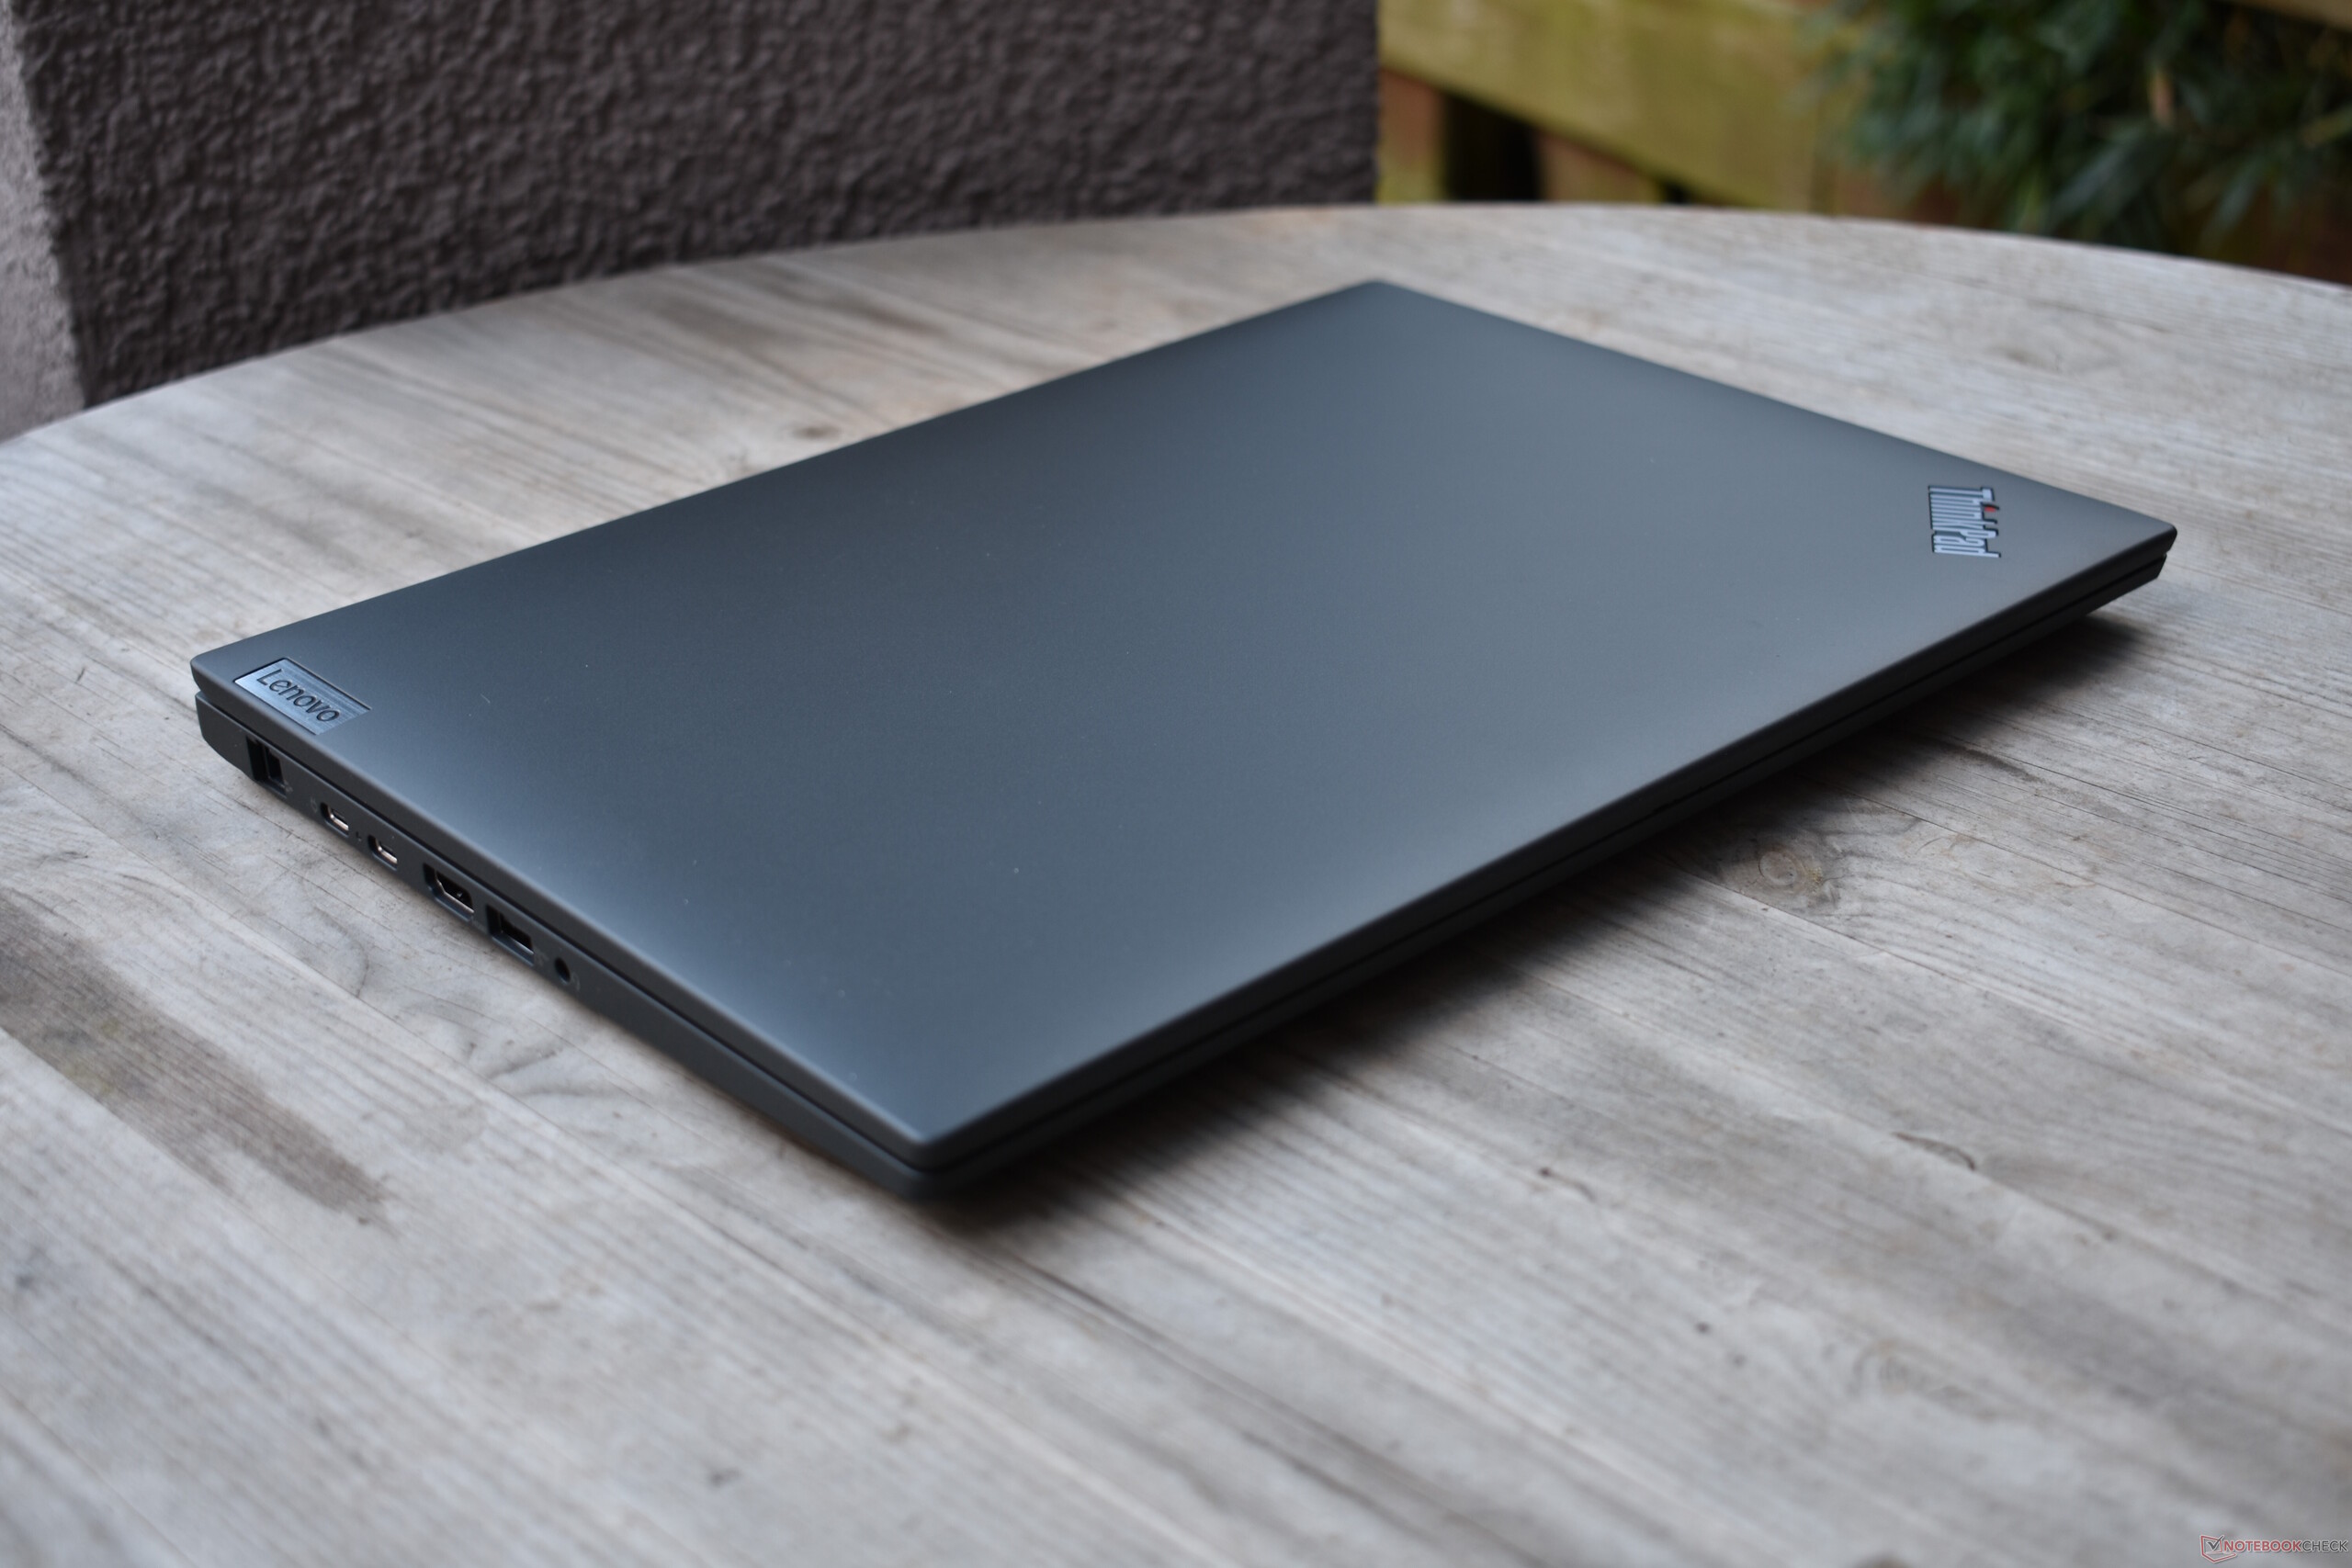
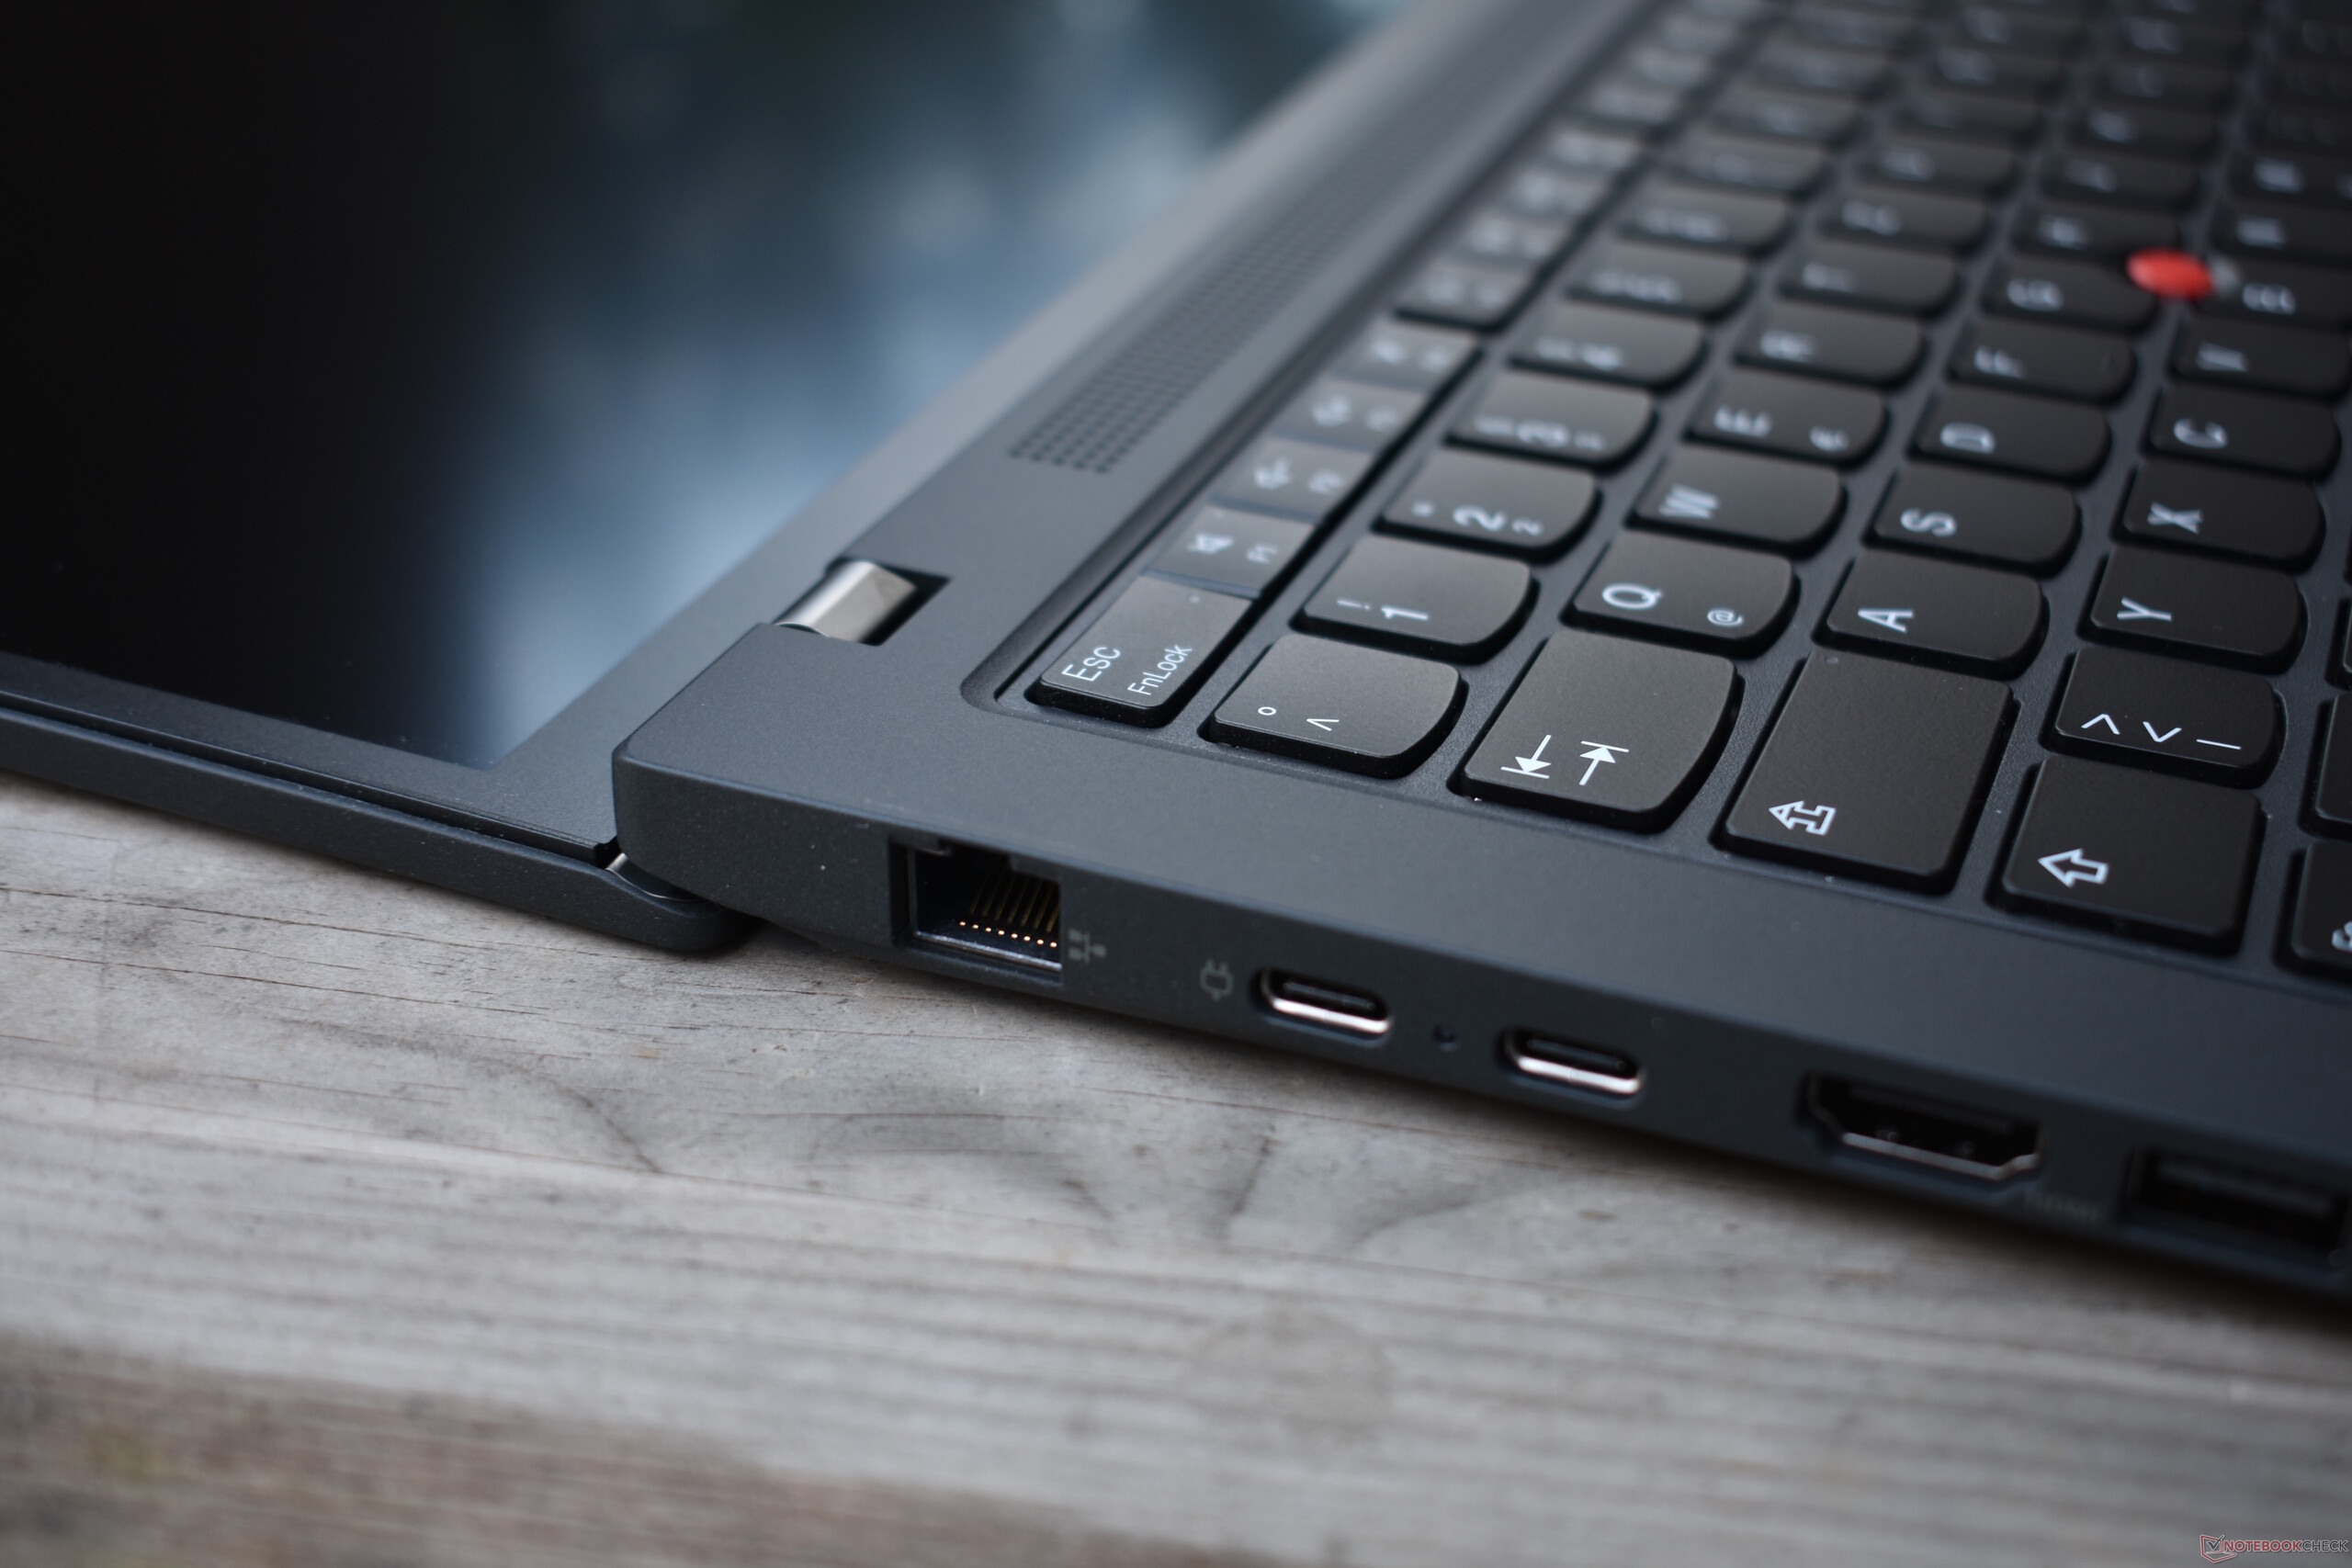
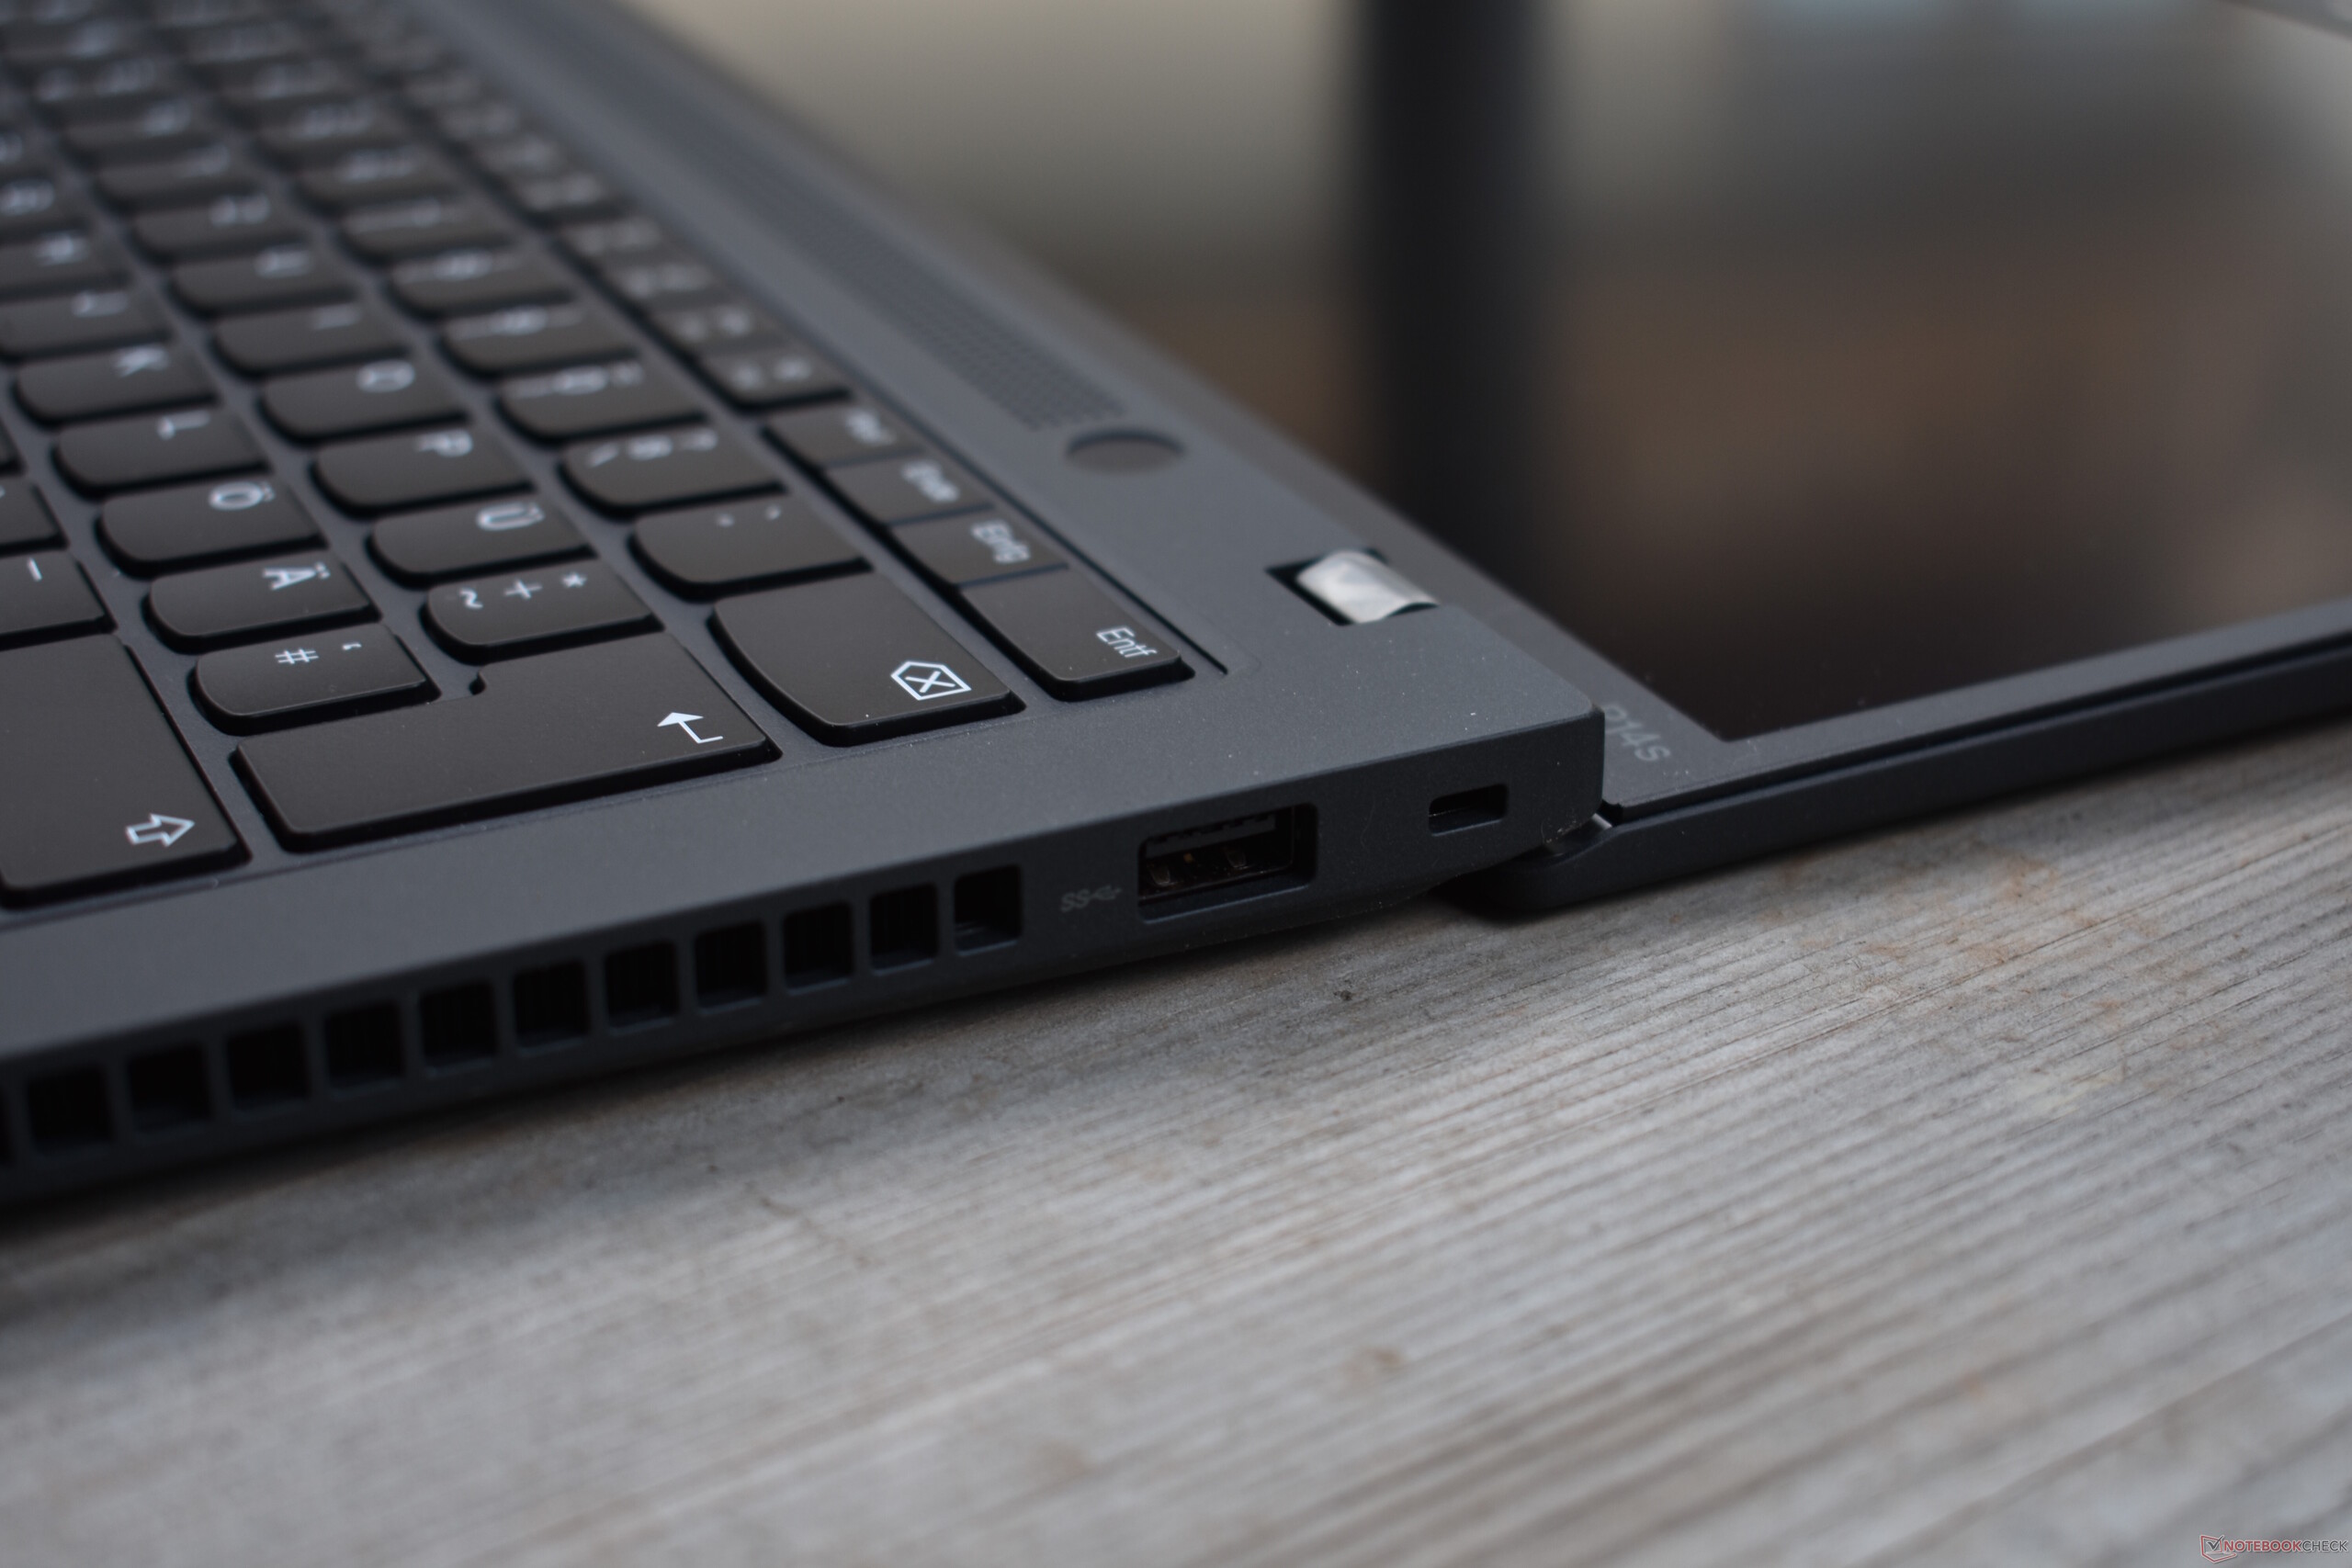
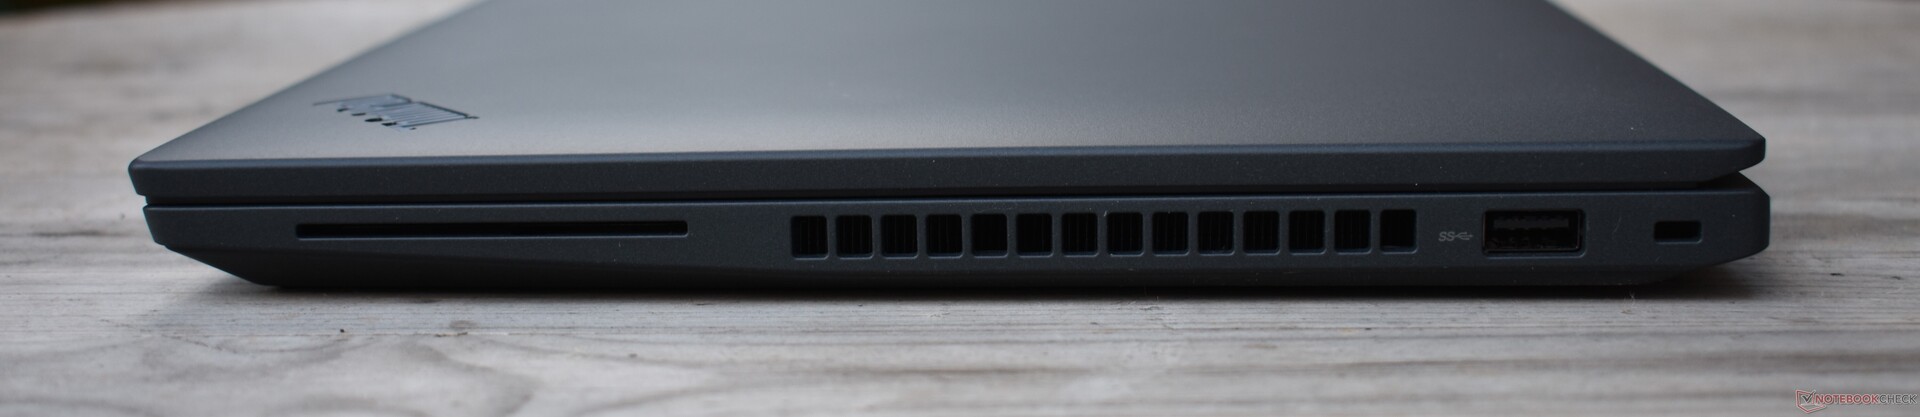
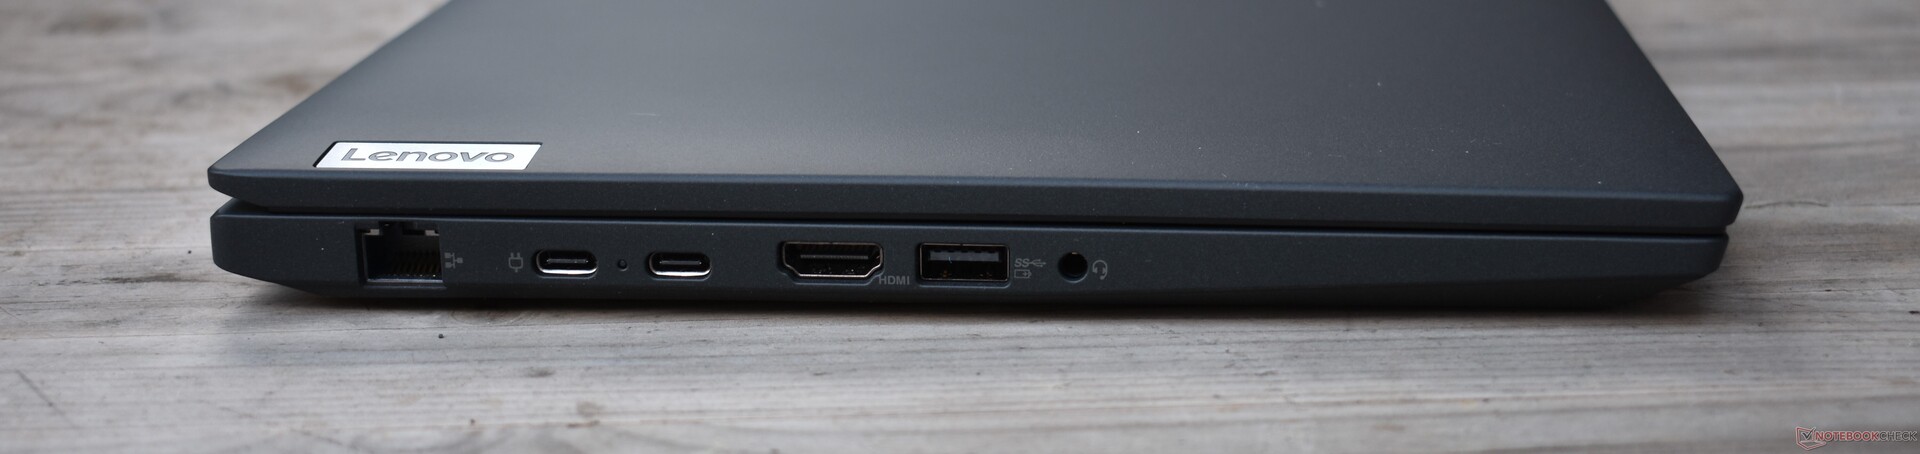
Porty
Jego szerokie opcje łączności są identyczne jak w ThinkPadzie T14 Gen 3. Rozczarowuje brak USB4 i w efekcie Thunderbolt. W zamian Lenovo ThinkPad P14s G3 posiada RJ45 Ethernet - 14-calowe stacje robocze Della i HP nie mają tego portu. Idealnie byłoby jednak, gdyby w tego typu laptopie znalazł się slot kart SD lub przynajmniej microSD.
Łączność
Podobnie jak wszystkie inne obecne ThinkPady z AMD, Lenovo ThinkPad P14s Gen 3 opiera się na rozwiązaniu Wi-Fi od Qualcomm. Dzięki temu można osiągnąć wysokie prędkości transferu, ale podczas wysyłania danych połączenie nie było zbyt stabilne.


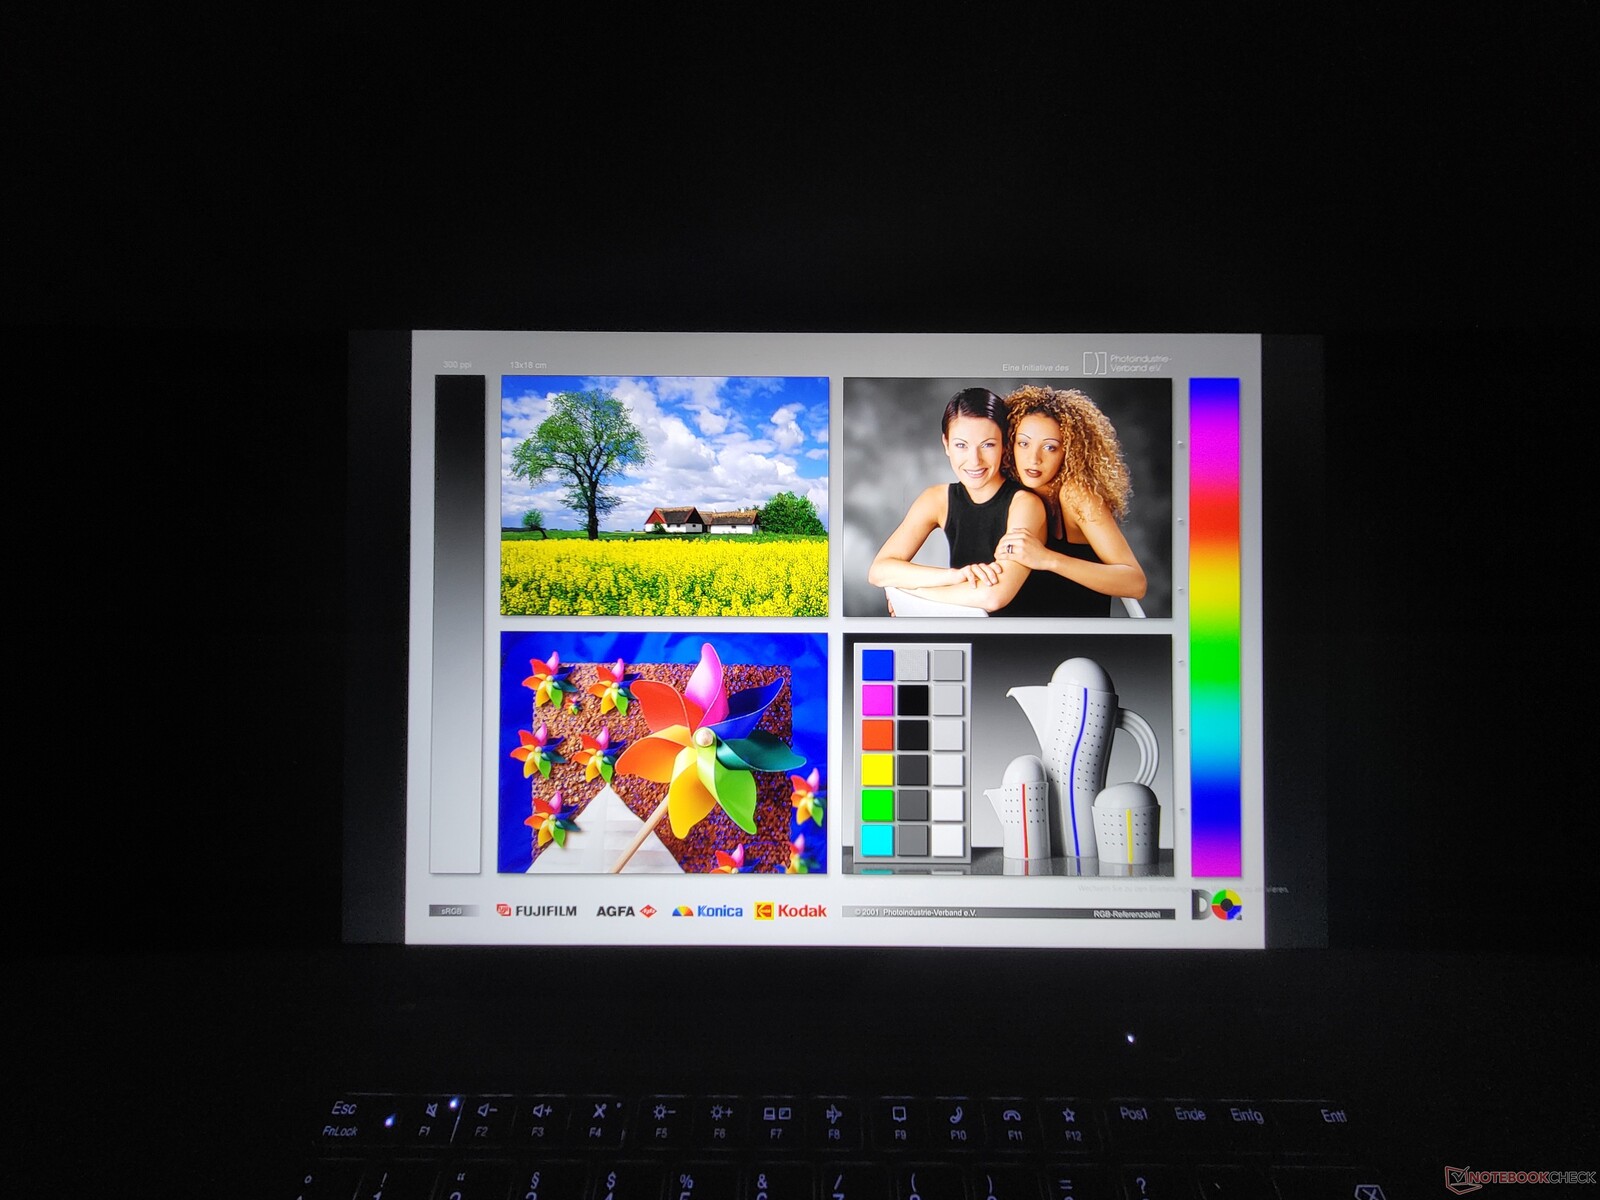
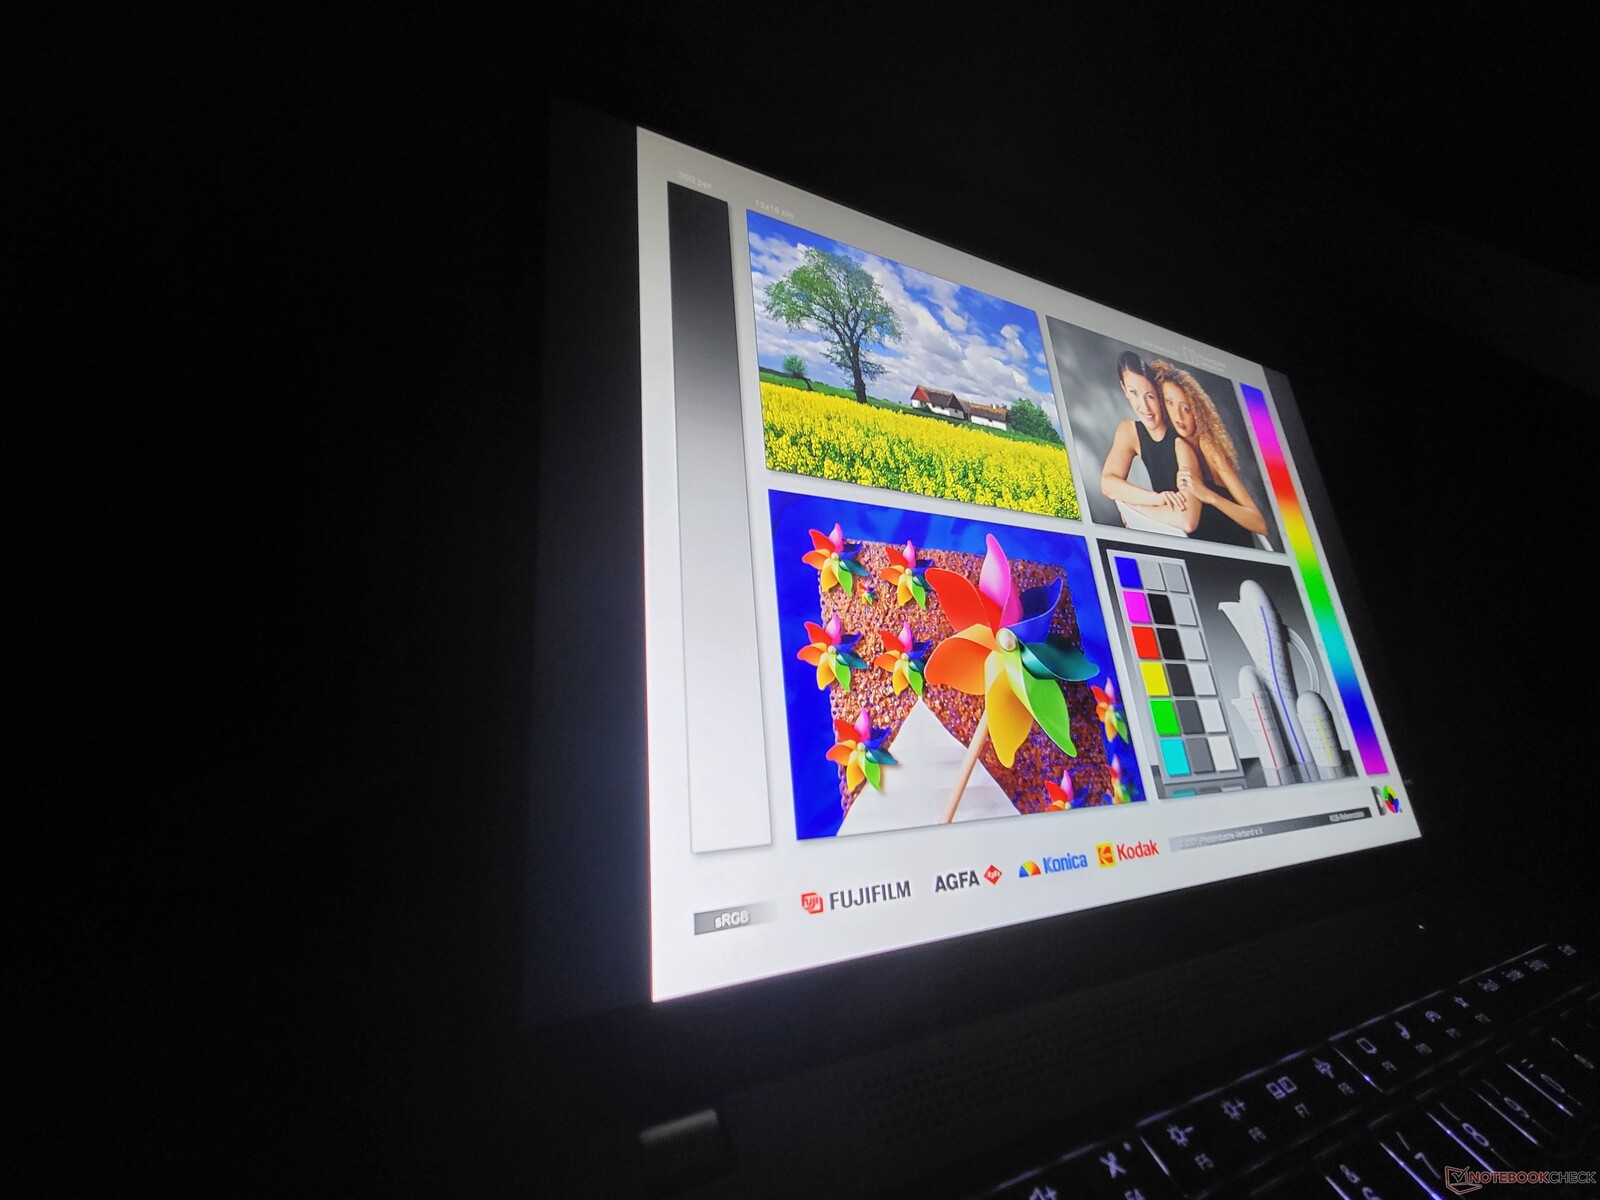
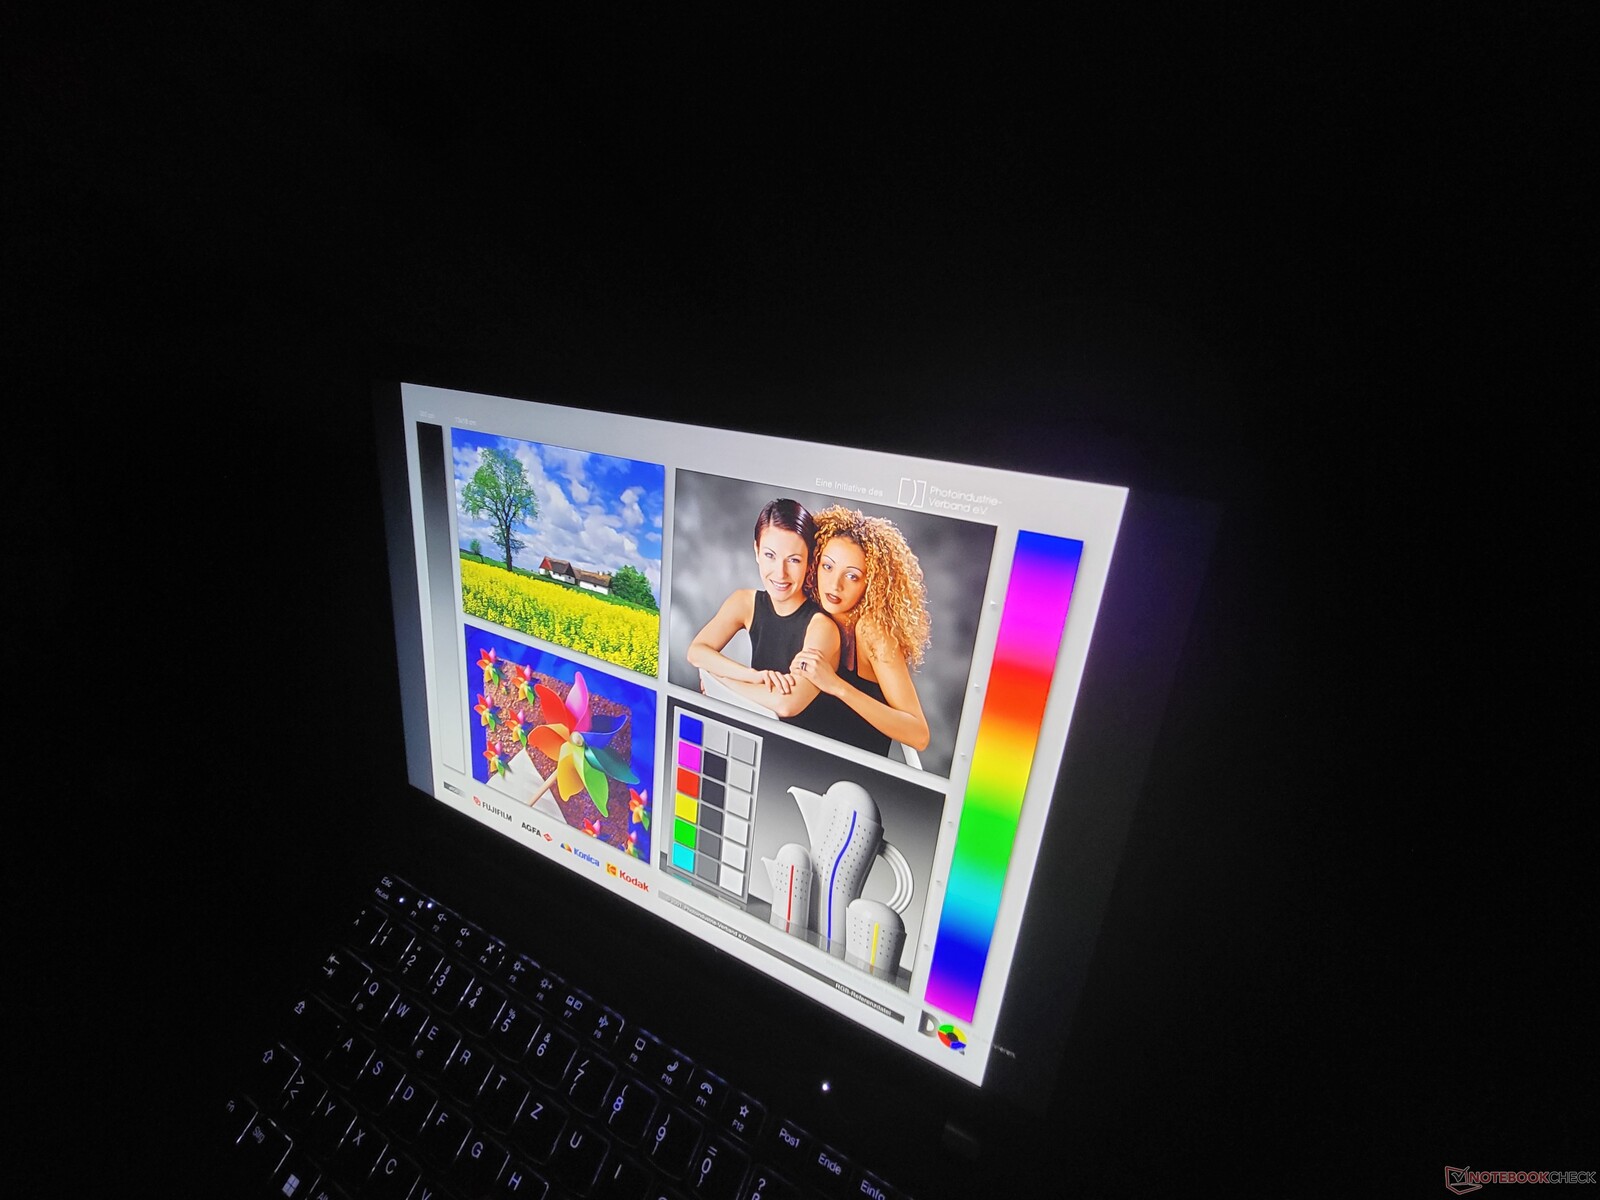
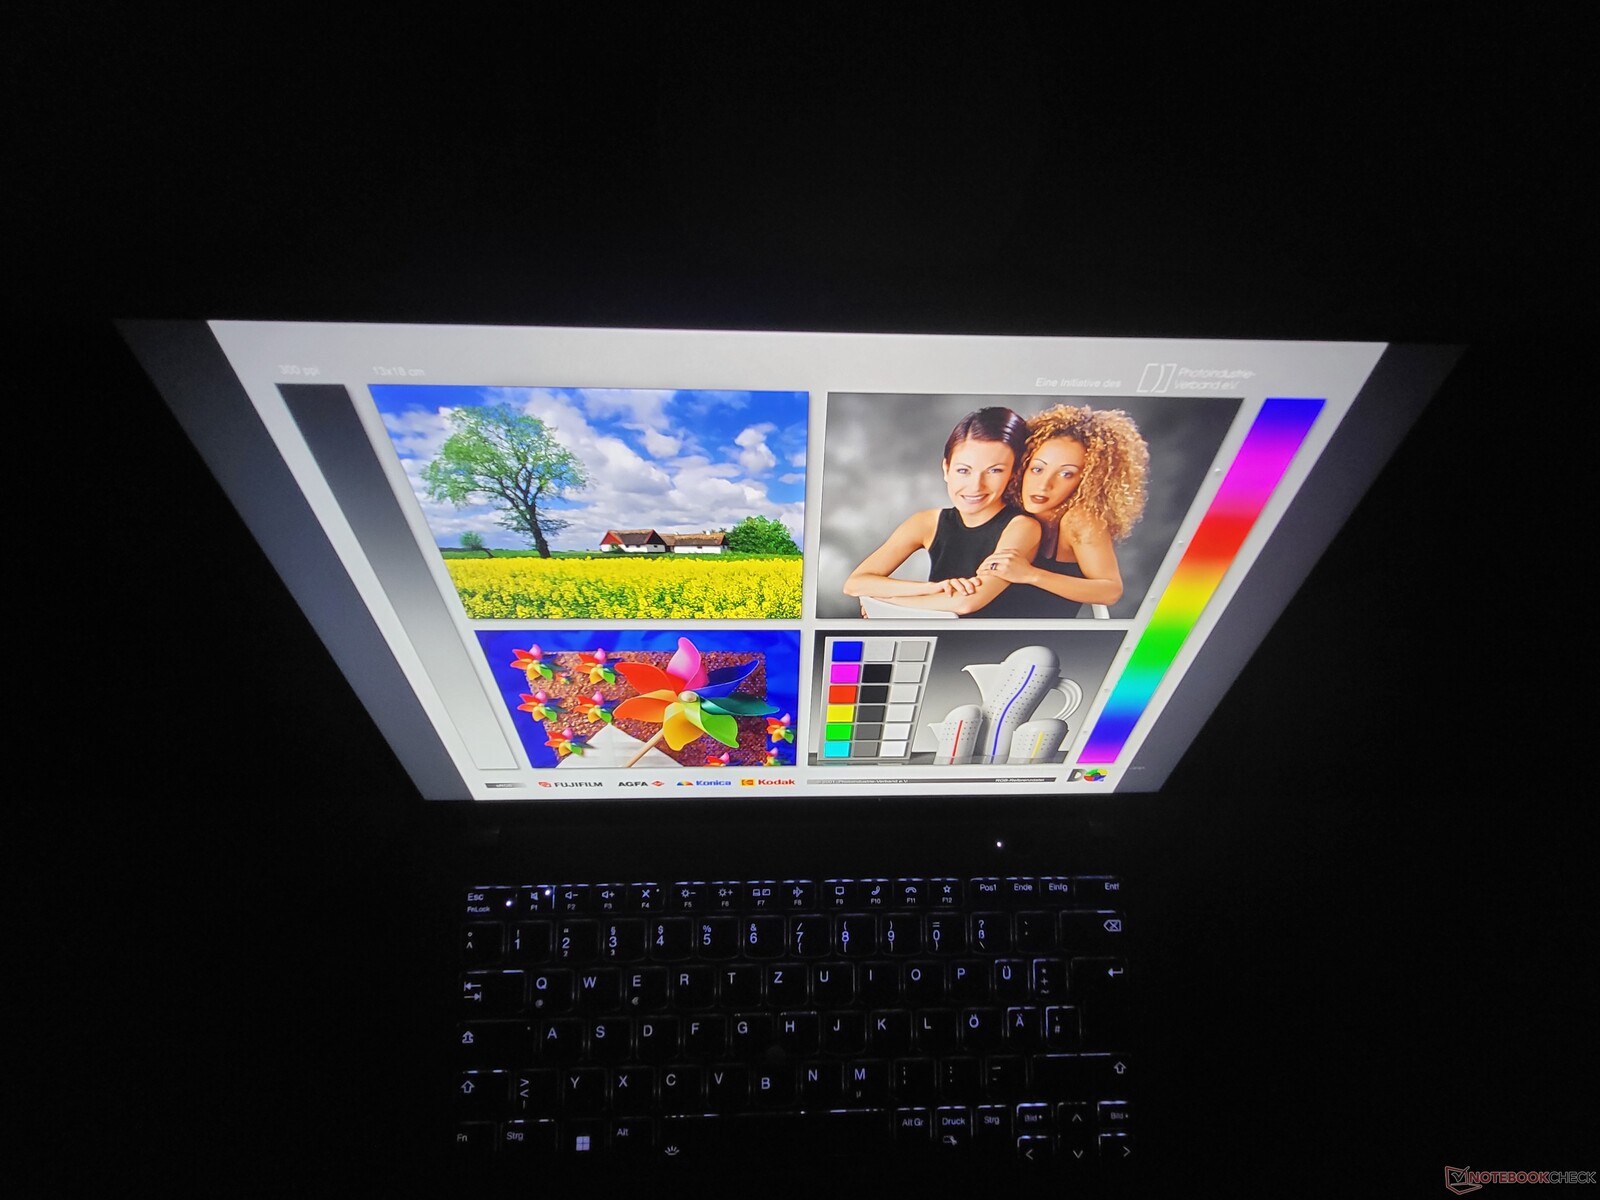
Wyświetlacz: Matowy panel ThinkPada o niskim zużyciu energii
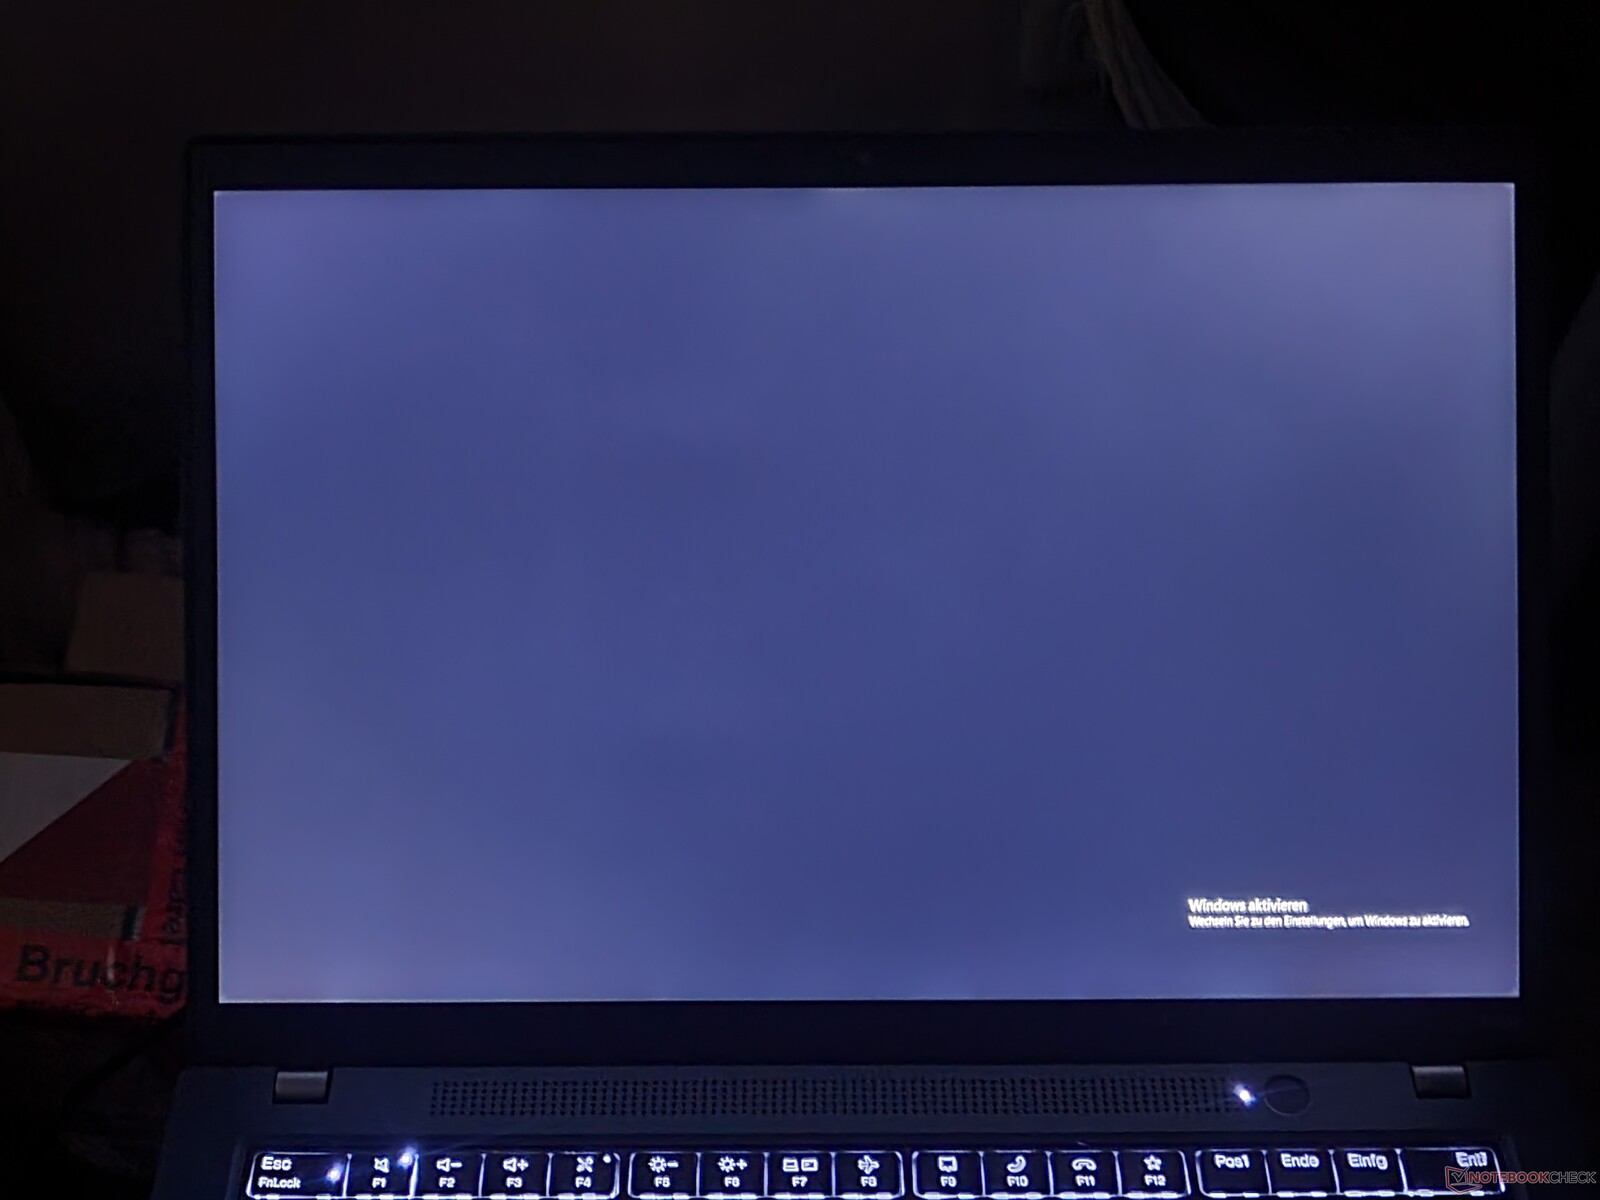
Jak to często bywa w przypadku laptopów Lenovo ThinkPad i ogólnie laptopów biznesowych, ThinkPad P14s Gen 3 również posiada kilka opcji wyświetlacza. Cechy wspólne tych ekranów to: ich 14-calowa przekątna, format 16:10, a także technologia IPS-LCD:
- WUXGA (1.920 x 1.200), 300 cd/m², 45% NTSC, Anti-Glare
- WUXGA (1.920 x 1.200), 400 cd/m², 100 % sRGB, antyrefleks, Low Power
- WUXGA (1.920 x 1.200), 300 cd/m², 45 % NTSC, antyodblaskowy, On-Cell-Multitouch
- WQUXGA (3.840 x 2.400), 500 cd/m², 100% DCI-P3, antyrefleks, Add-On-Film-Multitouch
Wyświetlacz LG o niskim poborze mocy testowaliśmy już w modelu ThinkPad T14 Gen 3. Przekroczył on deklarowaną wartość jasności 400 cd/m² - jego średnia jasność wyniosła 422 cd/m² . Nie jest to jedyny panel, który Lenovo sprzedaje jako "low-power display" - na przykład w ThinkPadzie T14s Gen 3 testowaliśmy panel CSOT, który zapewniał nieco mniejszą jasność. Taka "loteria wyświetlaczy" ma miejsce również w ThinkPadzie P14s G3.
| |||||||||||||||||||||||||
rozświetlenie: 85 %
na akumulatorze: 448 cd/m²
kontrast: 1948:1 (czerń: 0.23 cd/m²)
ΔE ColorChecker Calman: 2.5 | ∀{0.5-29.43 Ø4.73}
calibrated: 1.3
ΔE Greyscale Calman: 2.9 | ∀{0.09-98 Ø4.97}
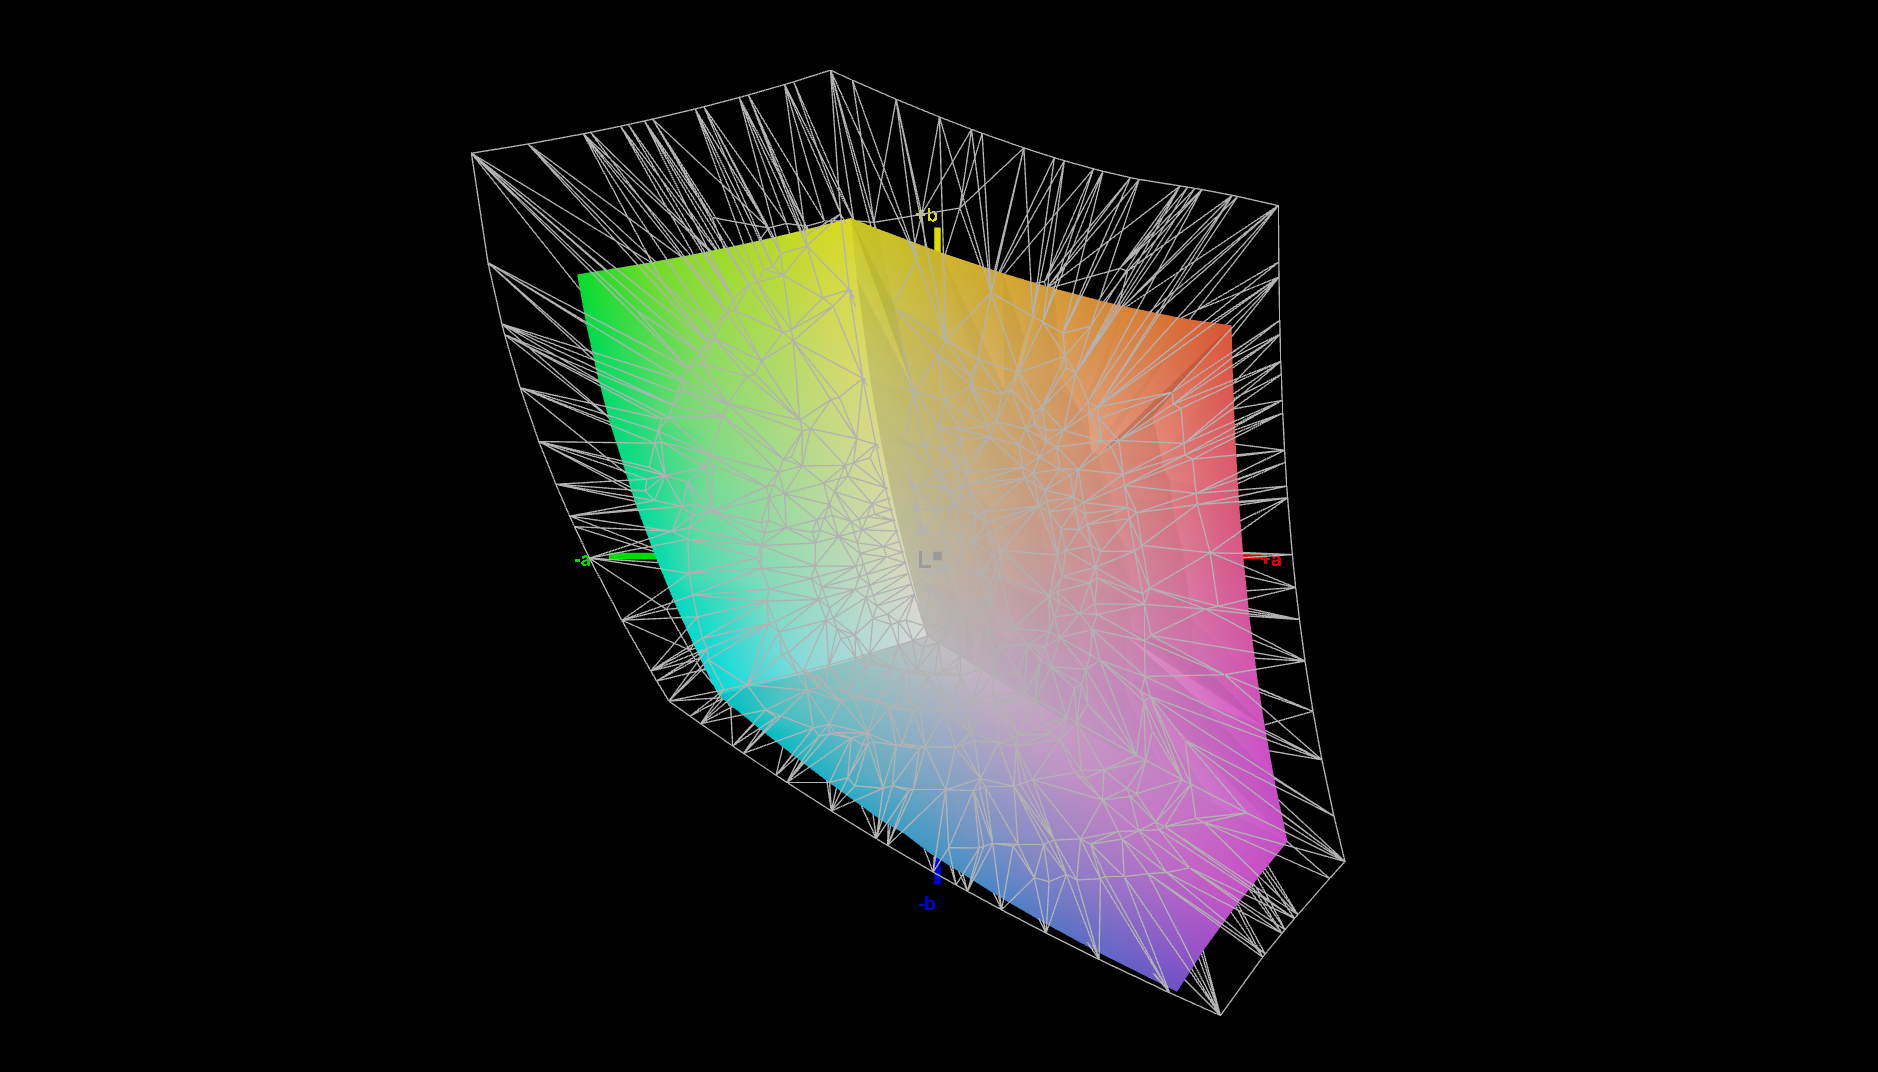
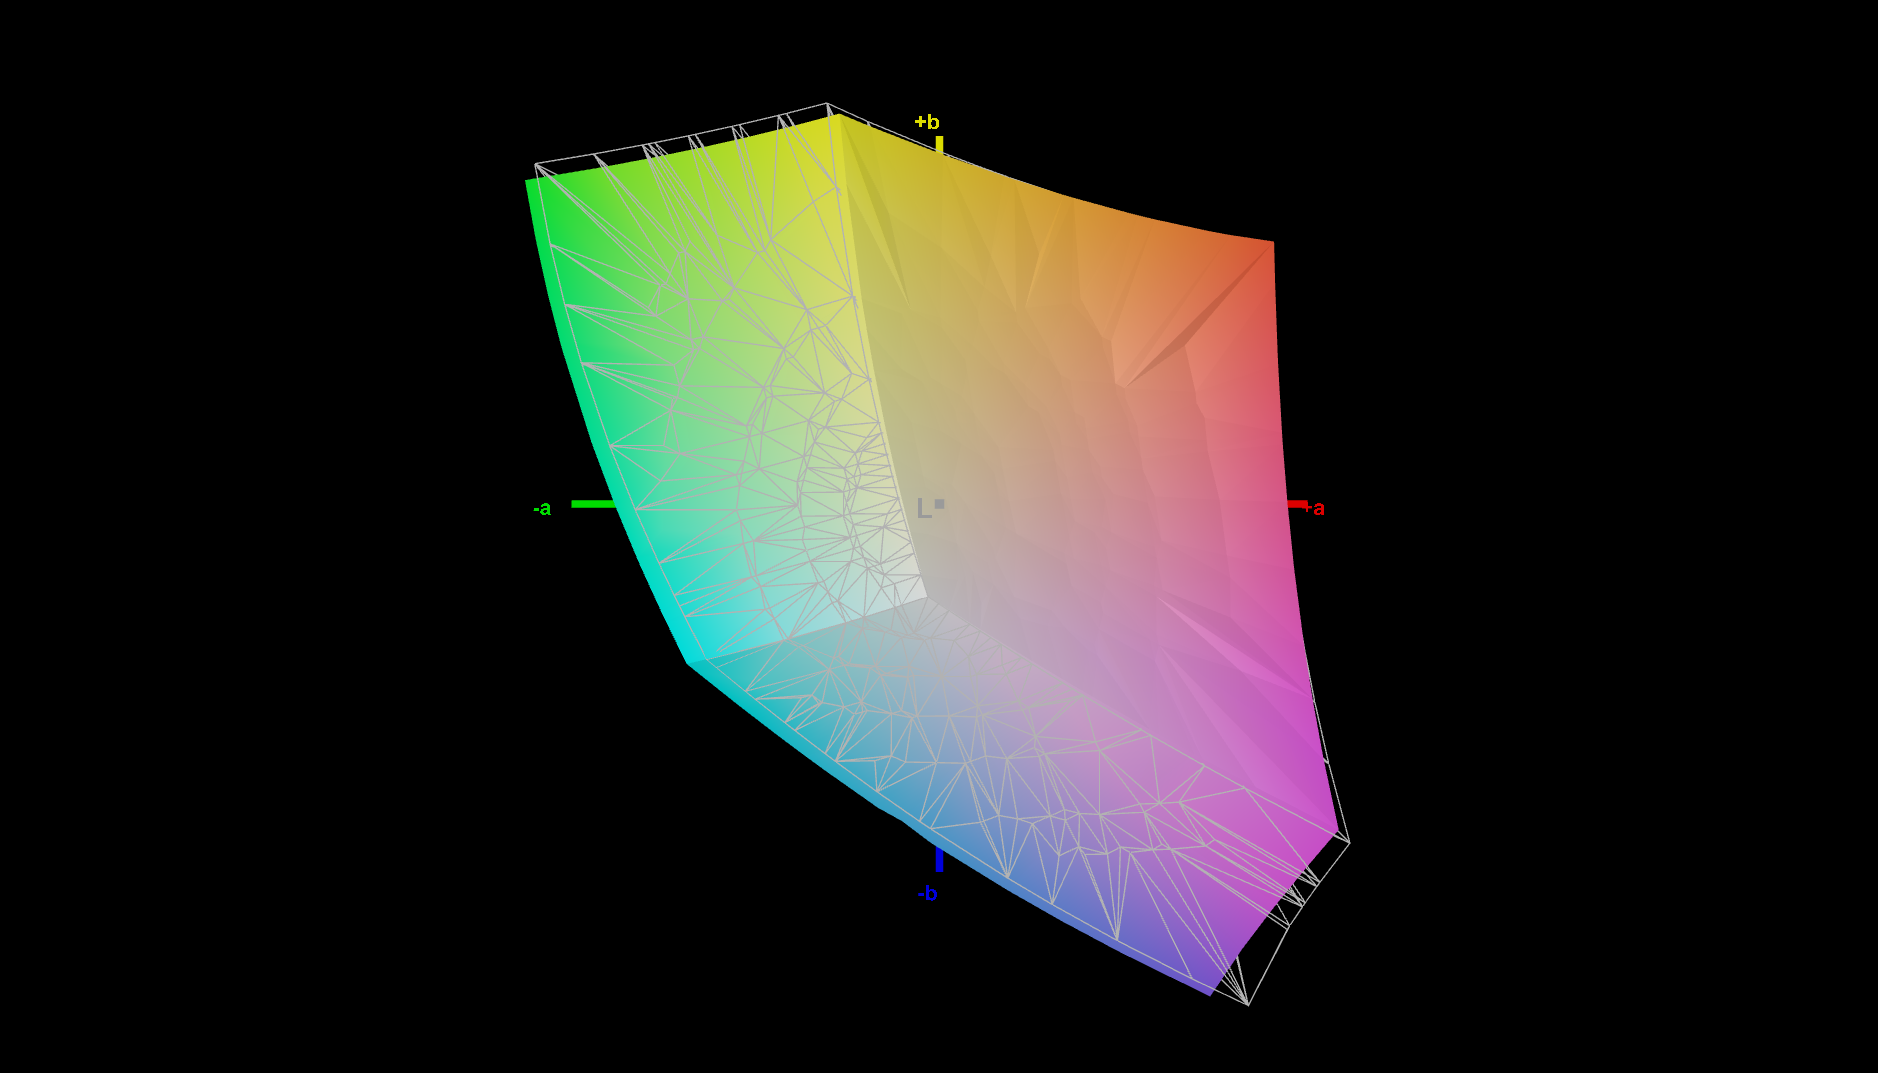
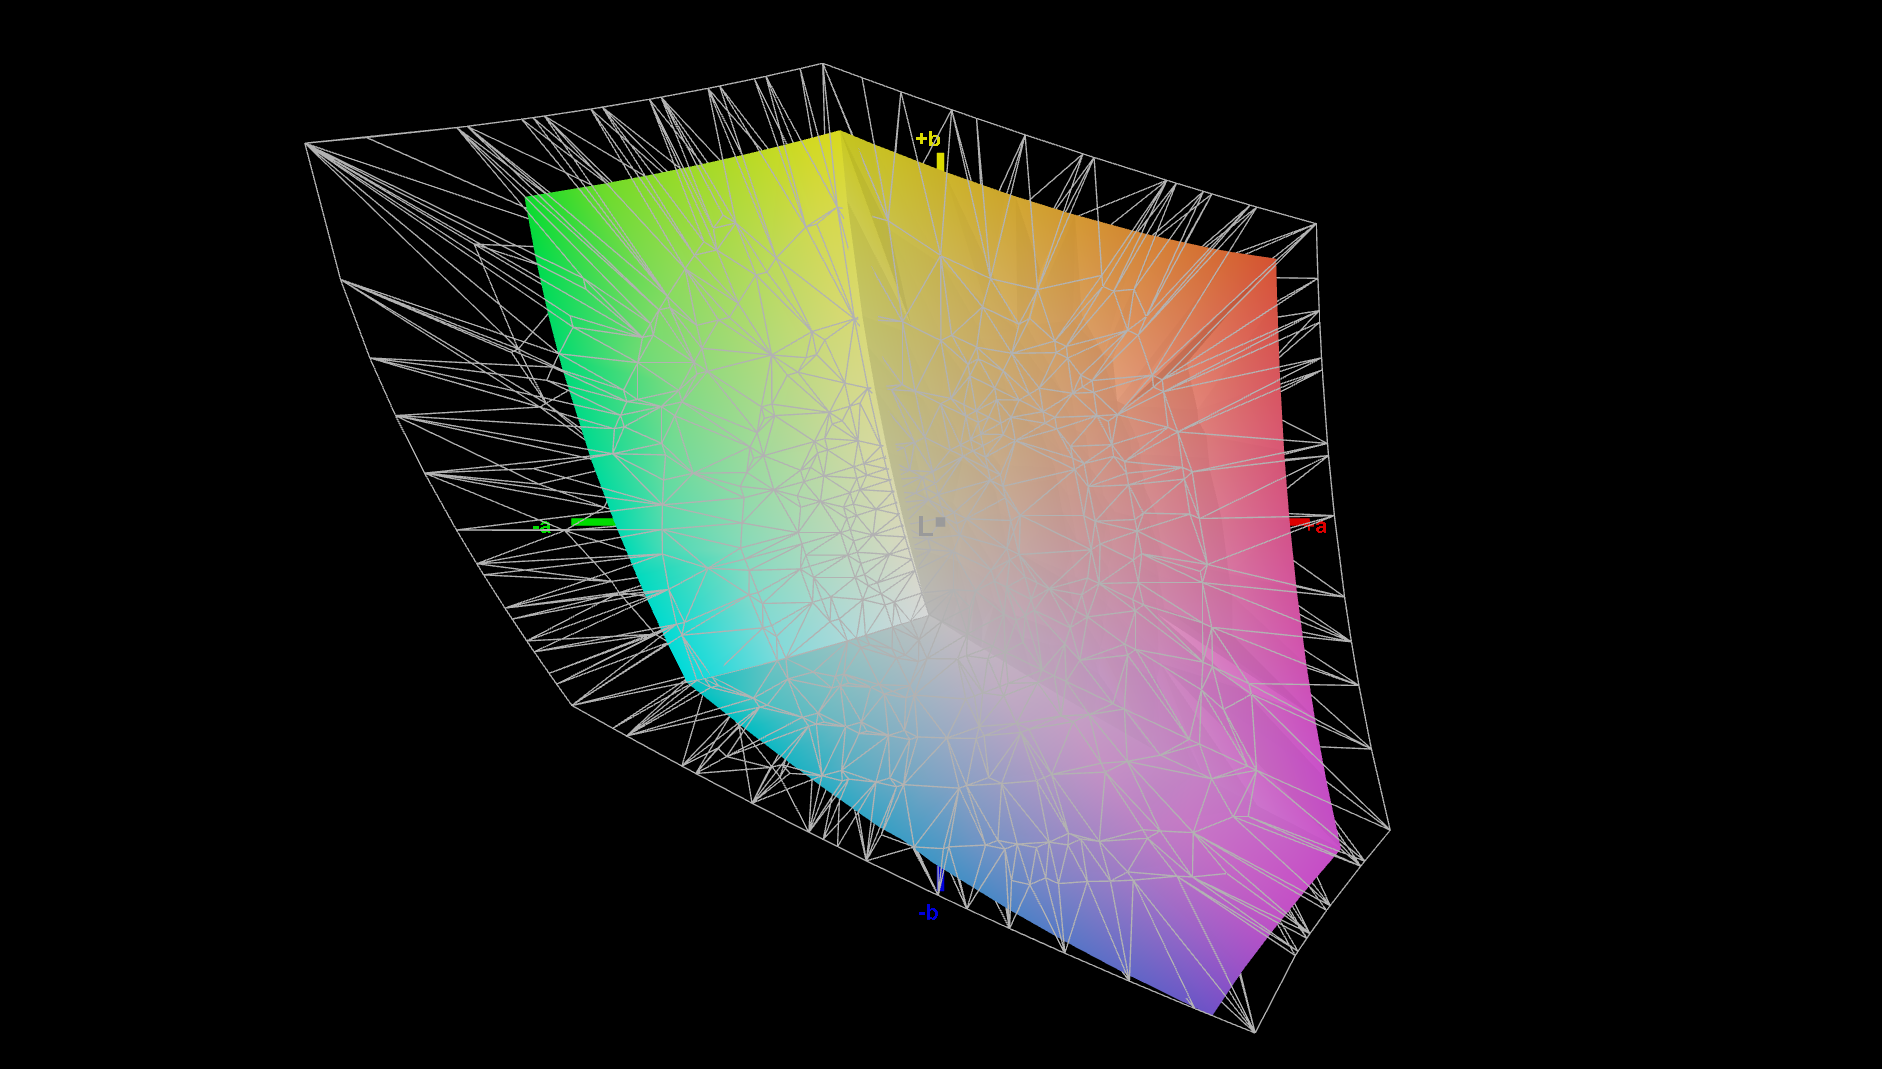
68.2% AdobeRGB 1998 (Argyll 3D)
94.3% sRGB (Argyll 3D)
65.9% Display P3 (Argyll 3D)
Gamma: 2.03
CCT: 6840 K
| Lenovo ThinkPad P14s G3 AMD 21J6S05000 LP140WU1-SPB2, IPS LED, 1920x1200, 14" | Lenovo ThinkPad P14s Gen2-20VX000GGE B140HAN05.7, IPS, 1920x1080, 14" | Lenovo ThinkPad T14 G3-21CF004NGE LP140WU1-SPB2, IPS, 1920x1200, 14" | Dell Precision 5000 5470 AU Optronics B140QAN, IPS, 2560x1600, 14" | HP ZBook Firefly 14 G9-6B8A2EA CMN1435, IPS, 1920x1200, 14" | Lenovo ThinkPad T14s G3 21CQ002LGE MNE007JA1-1, LTPS IPS LED, 1920x1200, 14" | |
|---|---|---|---|---|---|---|
| Display | -0% | 4% | 14% | 5% | 5% | |
| Display P3 Coverage (%) | 65.9 | 65.4 -1% | 69.2 5% | 79.3 20% | 69.6 6% | 69.4 5% |
| sRGB Coverage (%) | 94.3 | 96.6 2% | 97.4 3% | 100 6% | 99.9 6% | 99.8 6% |
| AdobeRGB 1998 Coverage (%) | 68.2 | 66.5 -2% | 71.5 5% | 78.7 15% | 71.1 4% | 71.4 5% |
| Response Times | -54% | -1% | -43% | -37% | -1% | |
| Response Time Grey 50% / Grey 80% * (ms) | 33.5 ? | 58.8 ? -76% | 41.4 ? -24% | 52.4 ? -56% | 56.3 ? -68% | 36.3 ? -8% |
| Response Time Black / White * (ms) | 24.9 ? | 32.8 ? -32% | 19.2 ? 23% | 32.4 ? -30% | 26.2 ? -5% | 23.1 ? 7% |
| PWM Frequency (Hz) | ||||||
| Screen | -24% | 1% | -2% | -15% | 13% | |
| Brightness middle (cd/m²) | 448 | 350 -22% | 451 1% | 537 20% | 432 -4% | 396 -12% |
| Brightness (cd/m²) | 422 | 348 -18% | 435 3% | 518 23% | 407 -4% | 379 -10% |
| Brightness Distribution (%) | 85 | 94 11% | 94 11% | 94 11% | 91 7% | 92 8% |
| Black Level * (cd/m²) | 0.23 | 0.14 39% | 0.21 9% | 0.33 -43% | 0.28 -22% | 0.26 -13% |
| Contrast (:1) | 1948 | 2500 28% | 2148 10% | 1627 -16% | 1543 -21% | 1523 -22% |
| Colorchecker dE 2000 * | 2.5 | 4.3 -72% | 2.4 4% | 2.97 -19% | 3.1 -24% | 1.3 48% |
| Colorchecker dE 2000 max. * | 3.7 | 6.7 -81% | 4.1 -11% | 5.33 -44% | 5.6 -51% | 2.7 27% |
| Colorchecker dE 2000 calibrated * | 1.3 | 1.5 -15% | 1.3 -0% | 0.88 32% | 0.8 38% | 0.7 46% |
| Greyscale dE 2000 * | 2.9 | 5.3 -83% | 3.3 -14% | 2.4 17% | 4.5 -55% | 1.6 45% |
| Gamma | 2.03 108% | 2.42 91% | 2.13 103% | 2.06 107% | 2 110% | 2.14 103% |
| CCT | 6840 95% | 7631 85% | 6848 95% | 6668 97% | 6528 100% | 6554 99% |
| Color Space (Percent of AdobeRGB 1998) (%) | 61.1 | |||||
| Color Space (Percent of sRGB) (%) | 96.4 | |||||
| Całkowita średnia (program / ustawienia) | -26% /
-23% | 1% /
2% | -10% /
-5% | -16% /
-14% | 6% /
9% |
* ... im mniej tym lepiej
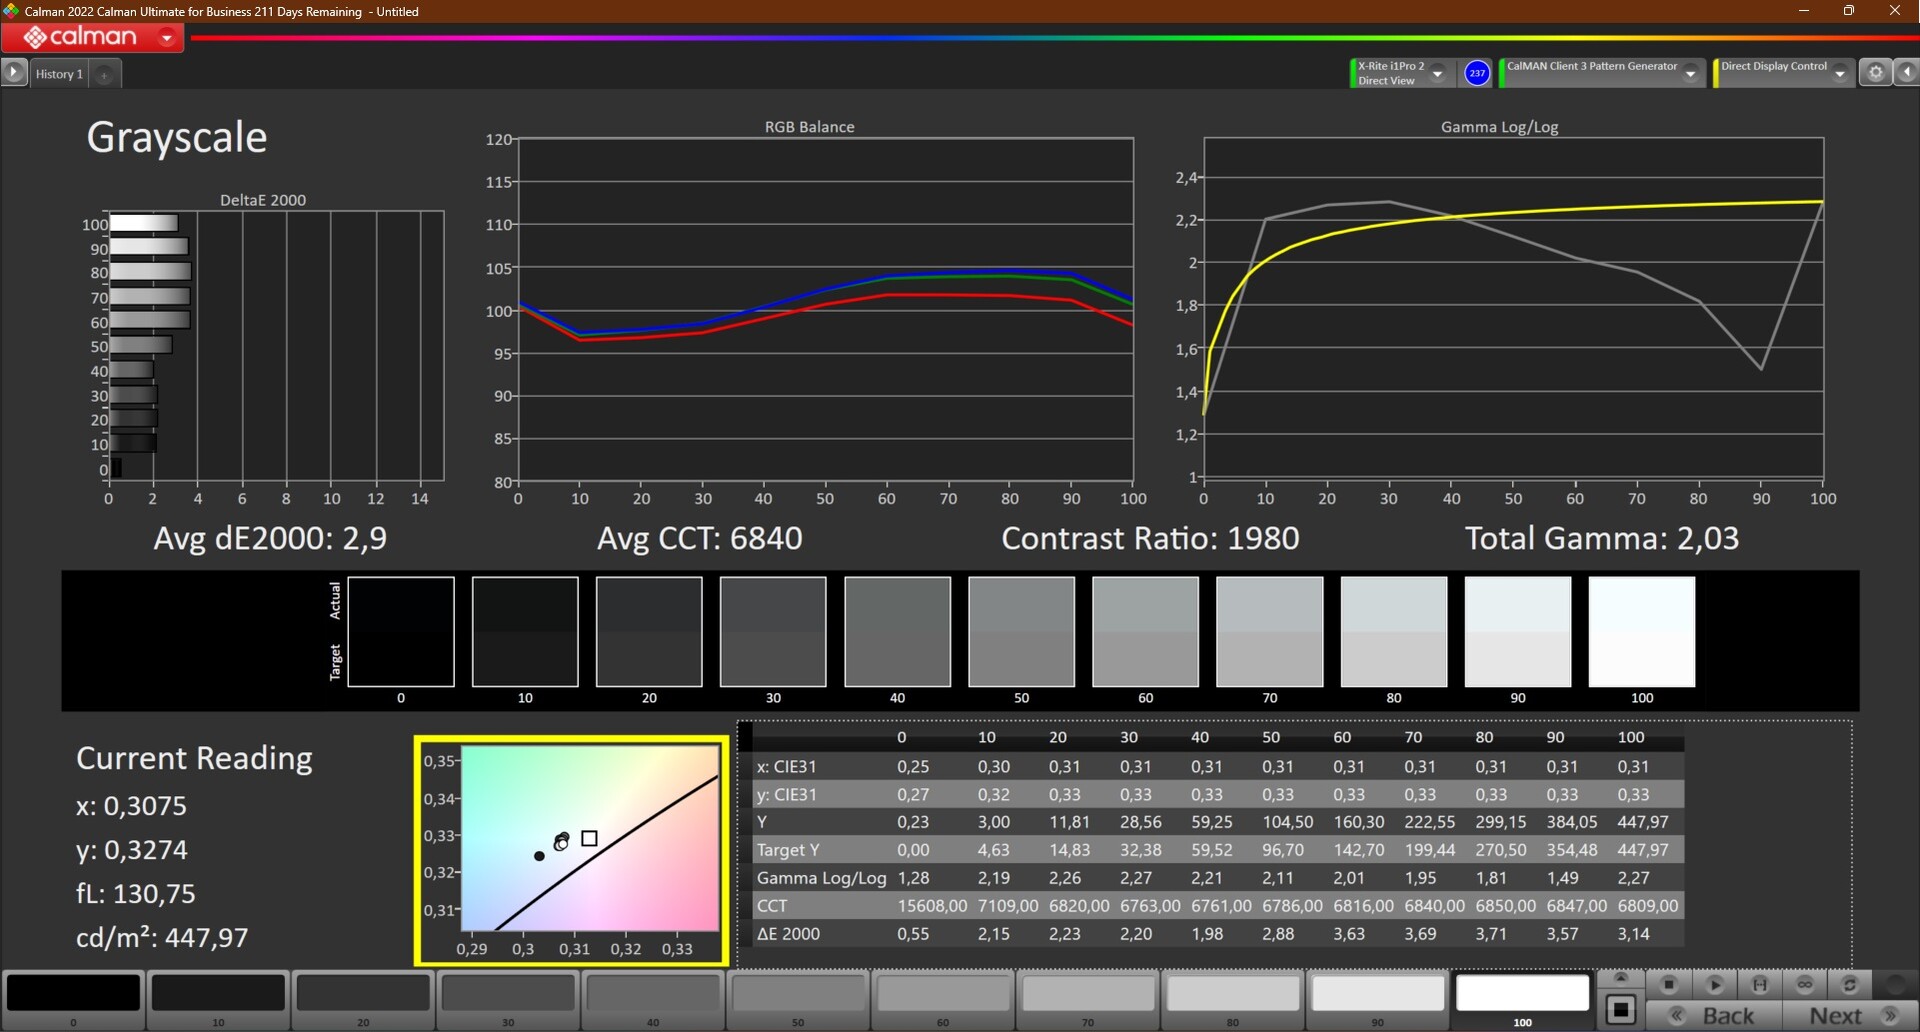
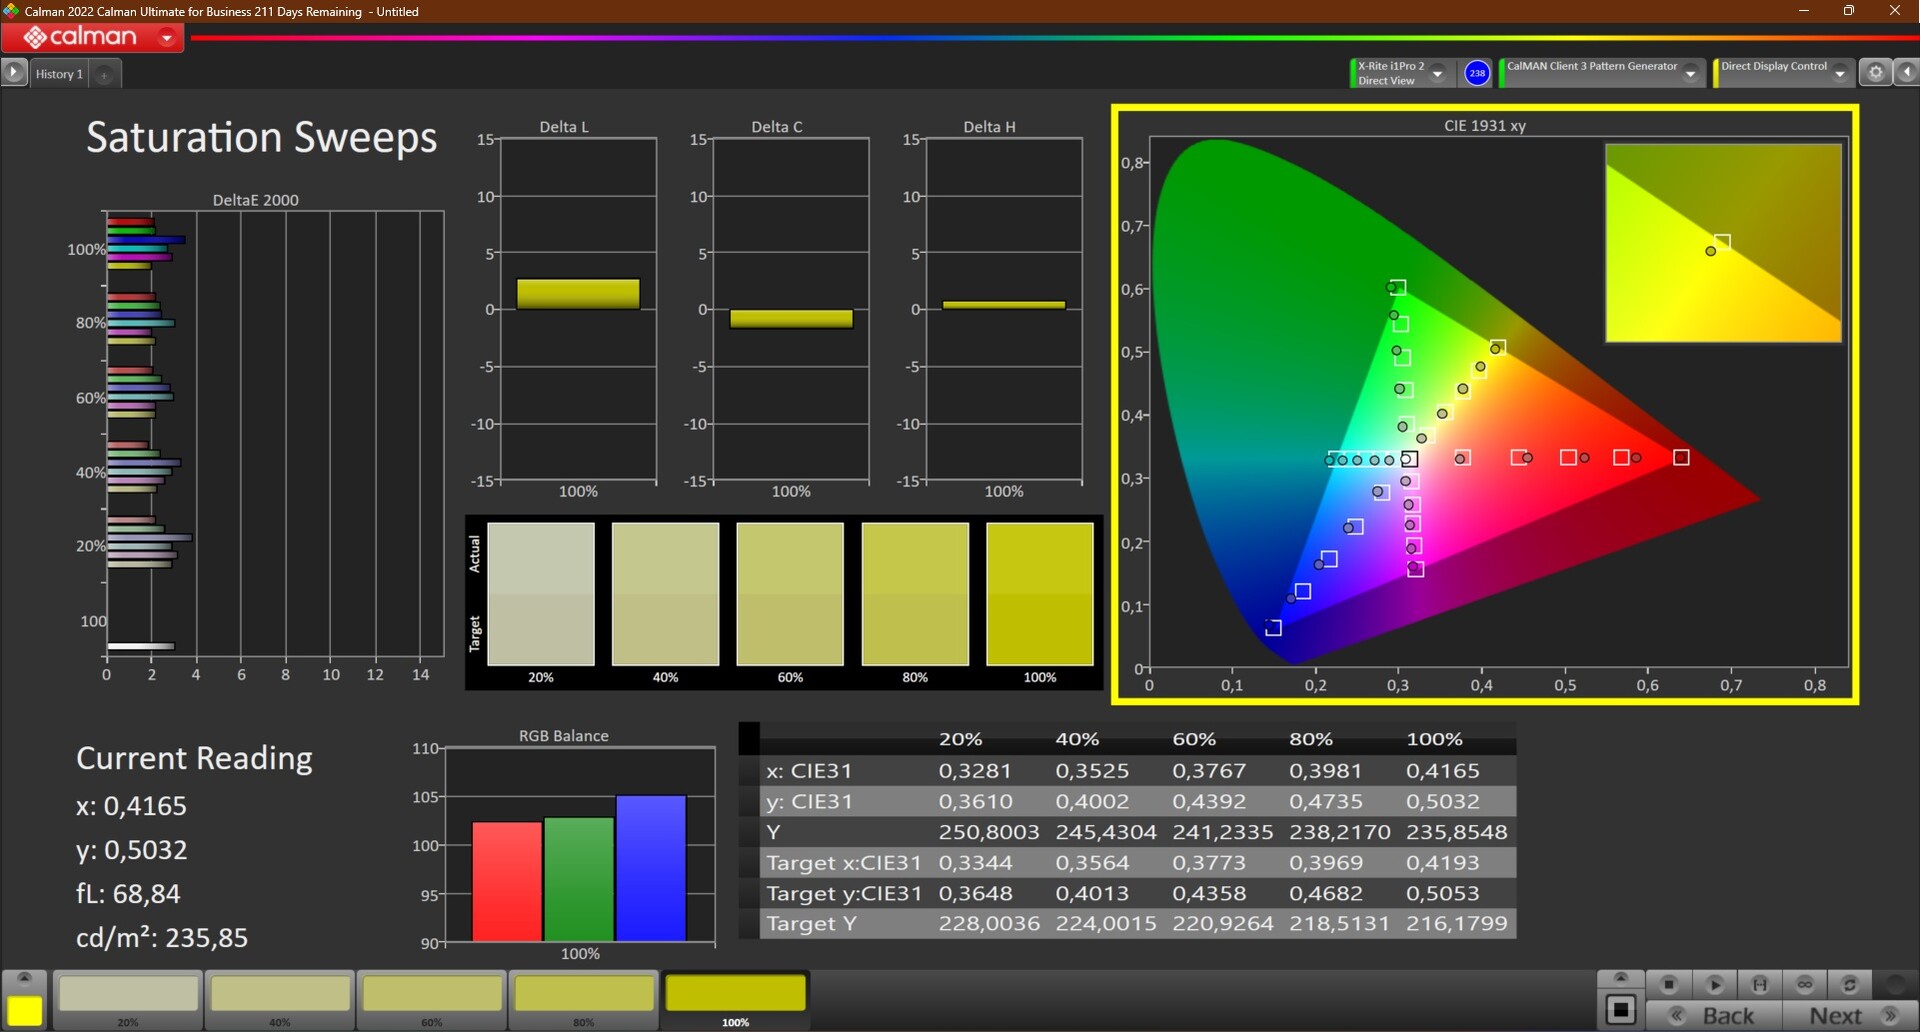
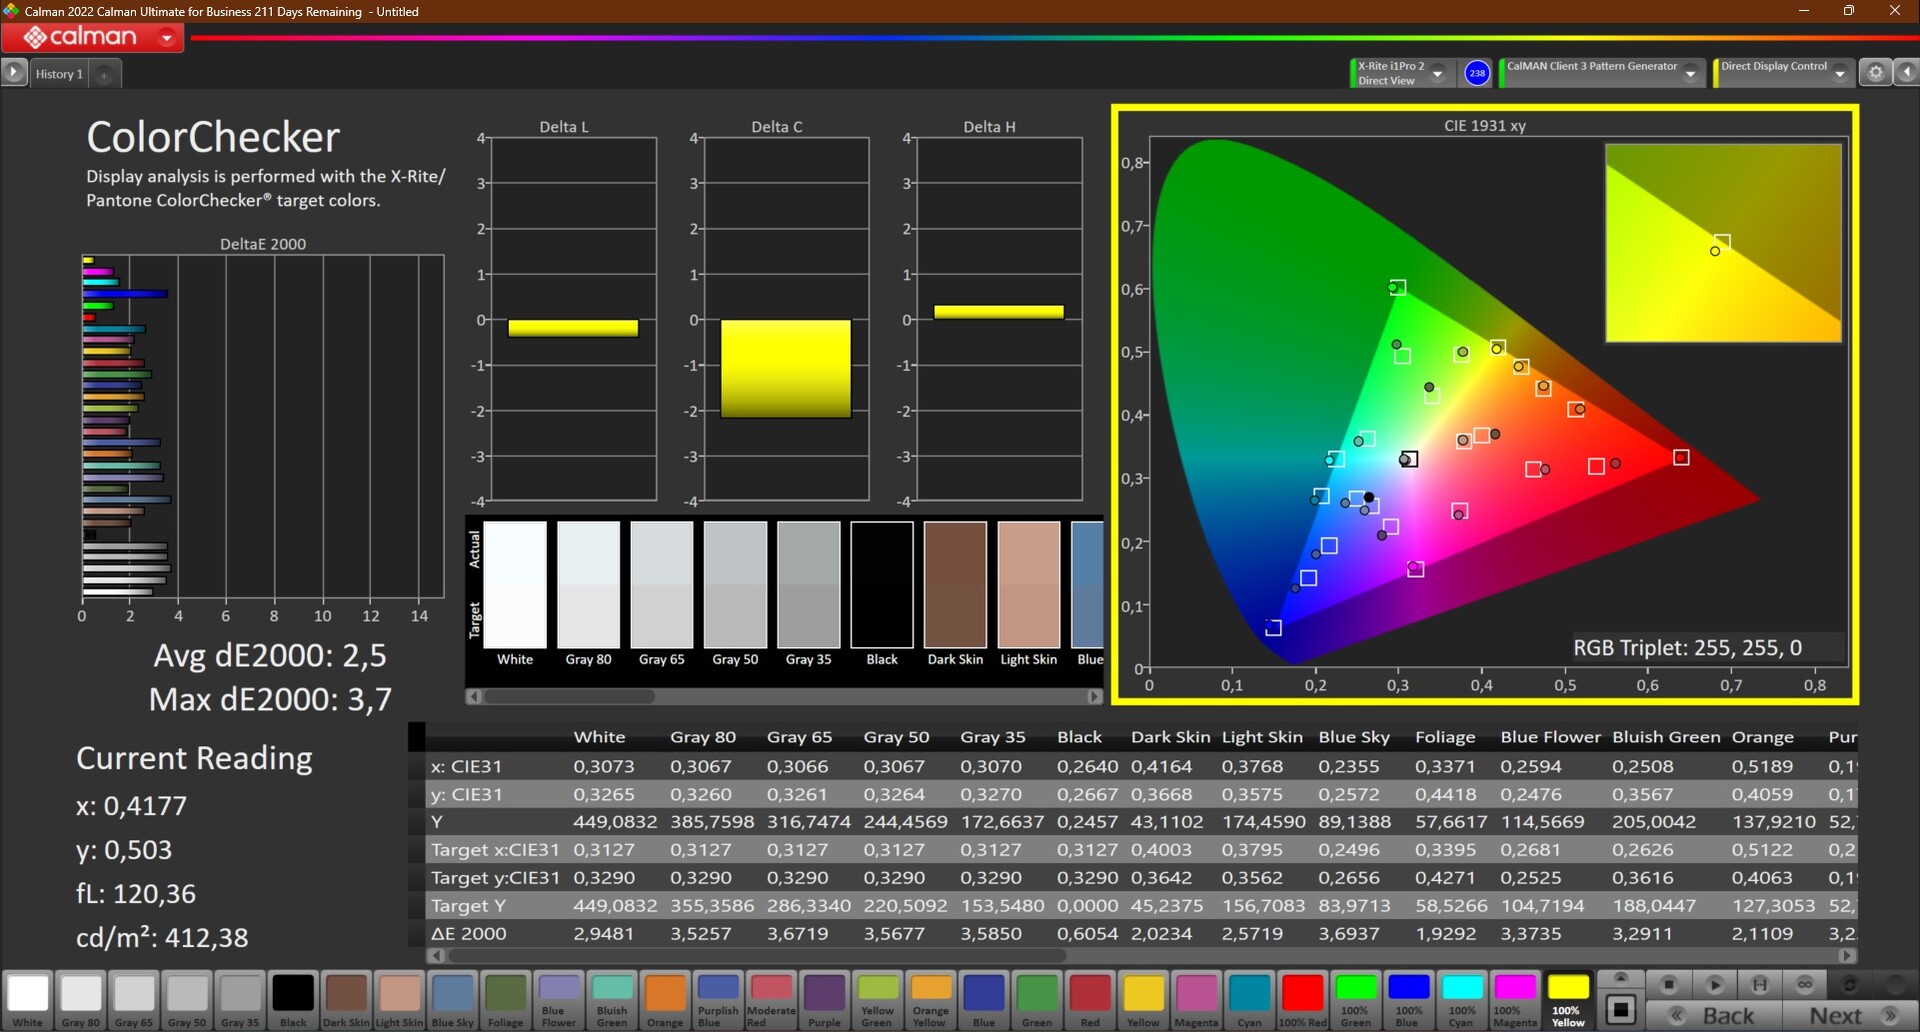
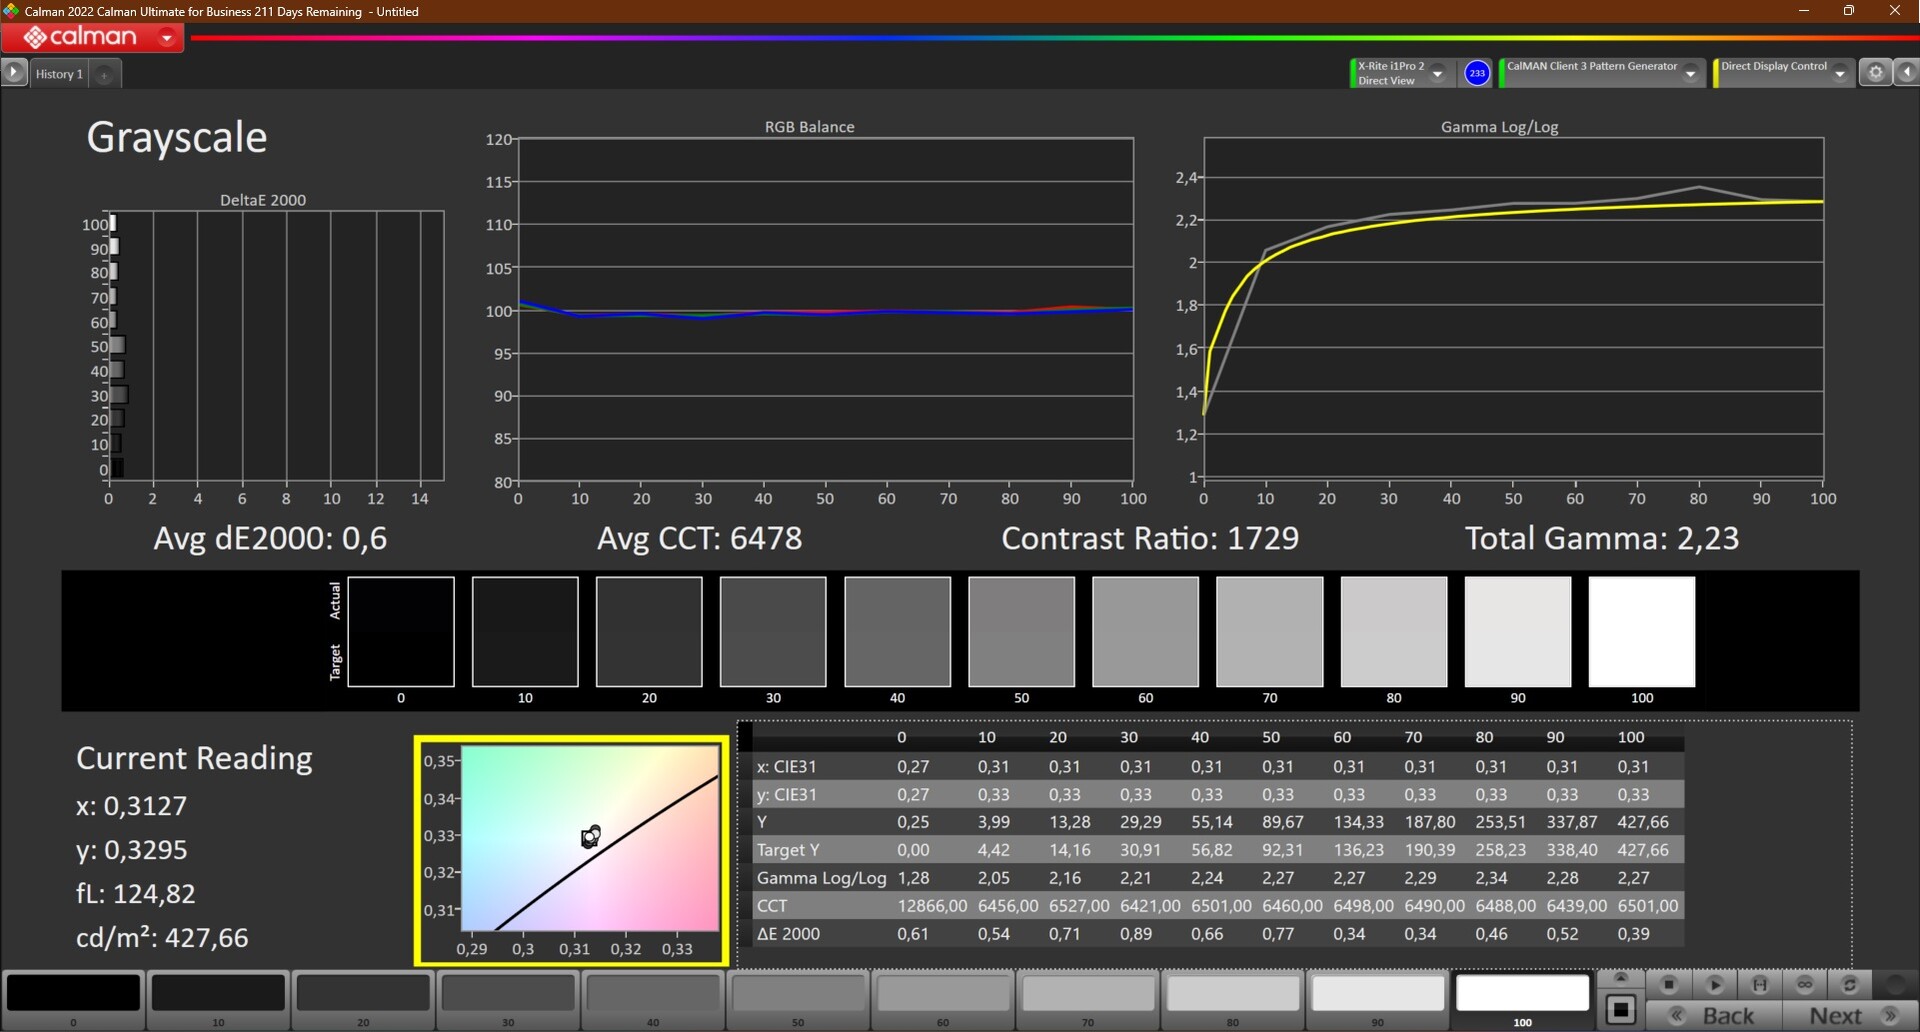
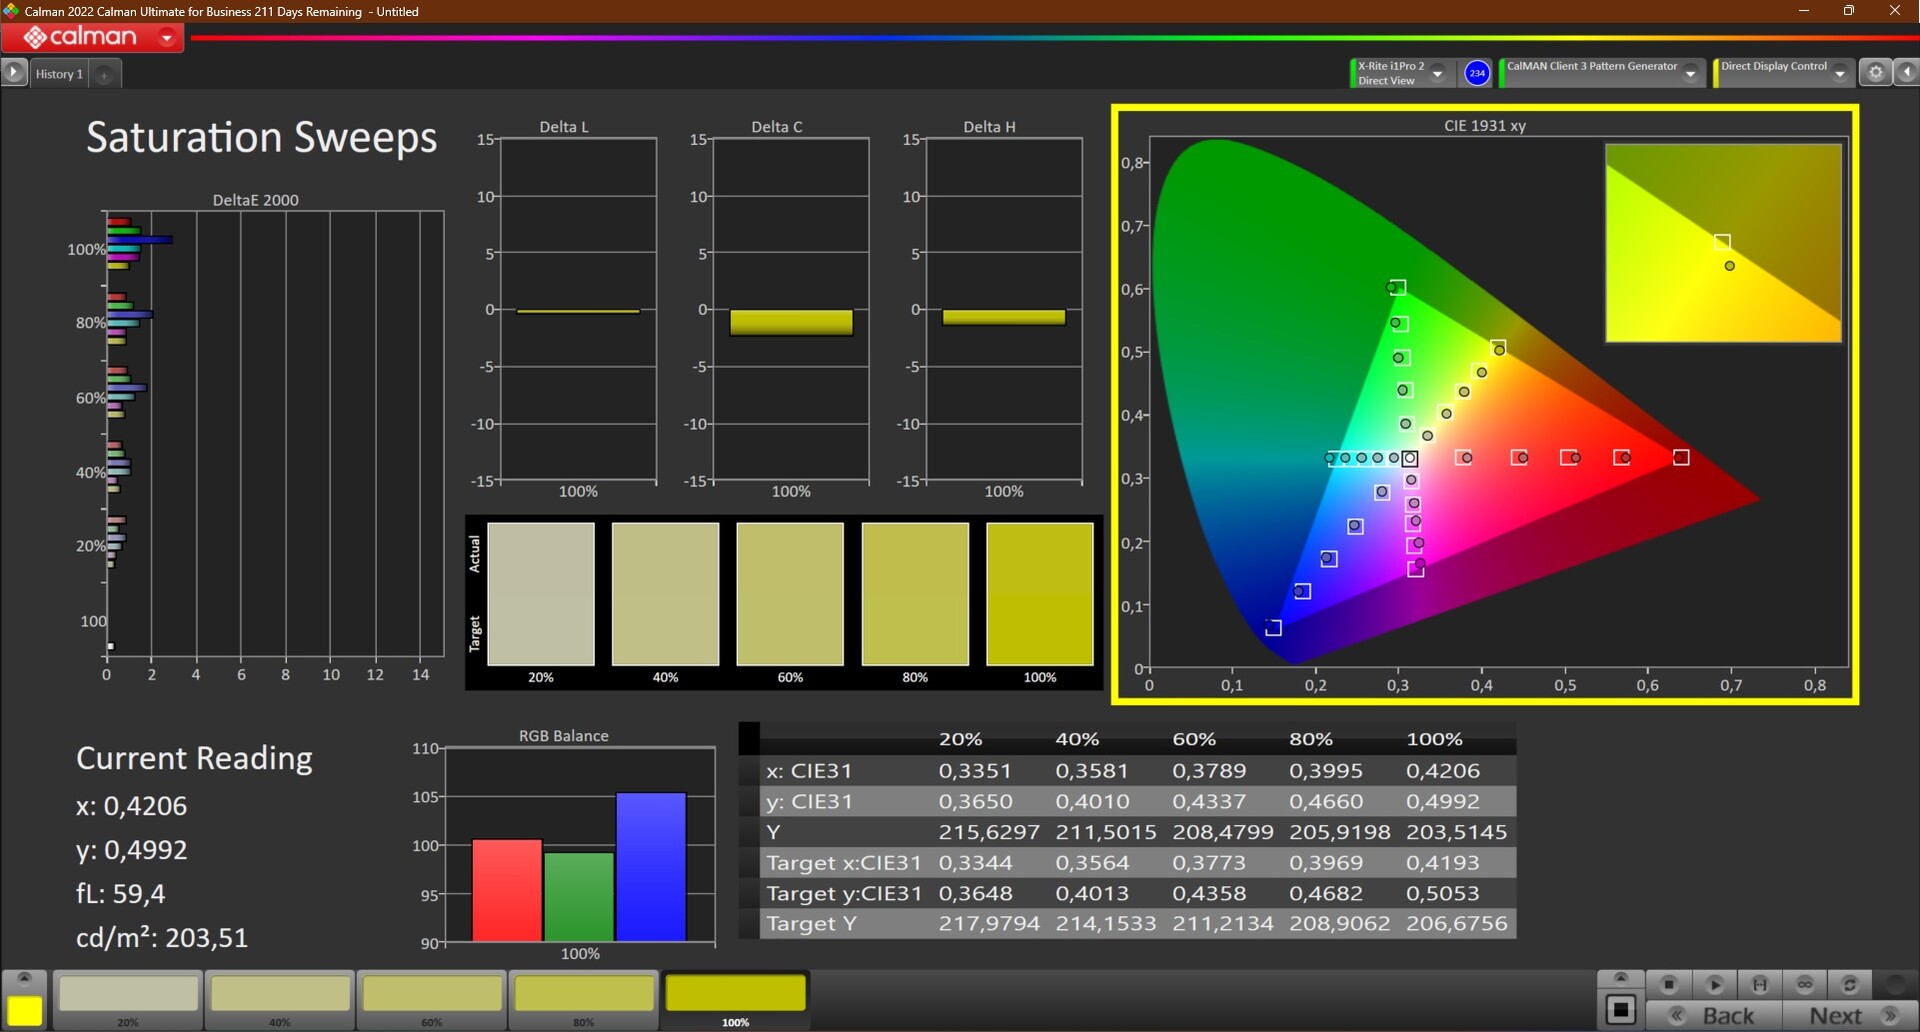
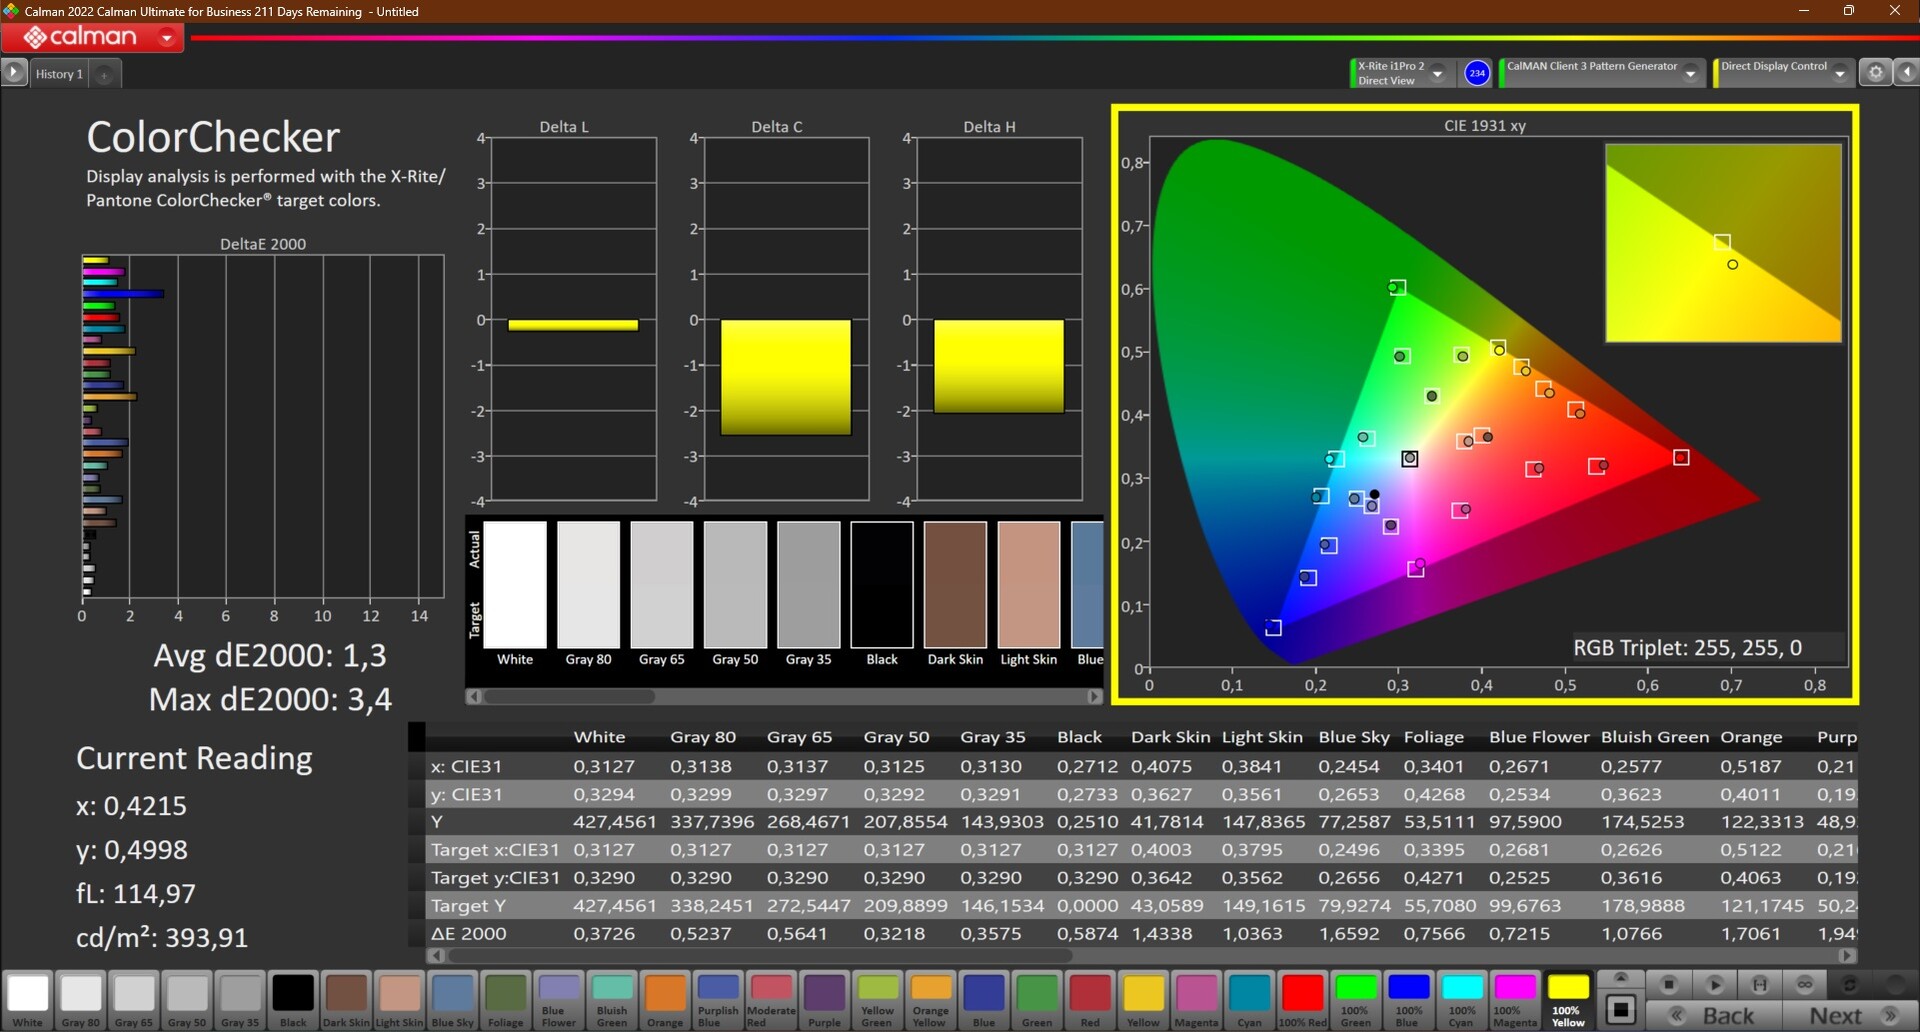
Kolory ekranu były nieco zimne zaraz po wyjęciu z pudełka, co zmierzyliśmy za pomocą oprogramowania Calman i kolorymetru X-Rite i1Pro 2. Kalibracja przy użyciu i1Profiler była w stanie skorygować tę nierównowagę kolorów. Jak zawsze, odpowiedni profil jest dostępny do pobrania za darmo w szarym polu ze zmierzonymi wartościami. Wartość deltaE--Colorchecker osiągnęła bardzo dobre 1,3 w stanie skalibrowanym.
Wyświetlacz LG nie był w stanie osiągnąć reklamowanej wartości 100% sRGB: przy 94,3% cel został po prostu przeoczony. W związku z tym panelu Lenovo ThinkPad P14s Gen 3 nie można polecić do edycji obrazu. Użytkownicy, którzy chcą to robić, będą w lepszej sytuacji, jeśli zdecydują się na ekran WQUXGA.
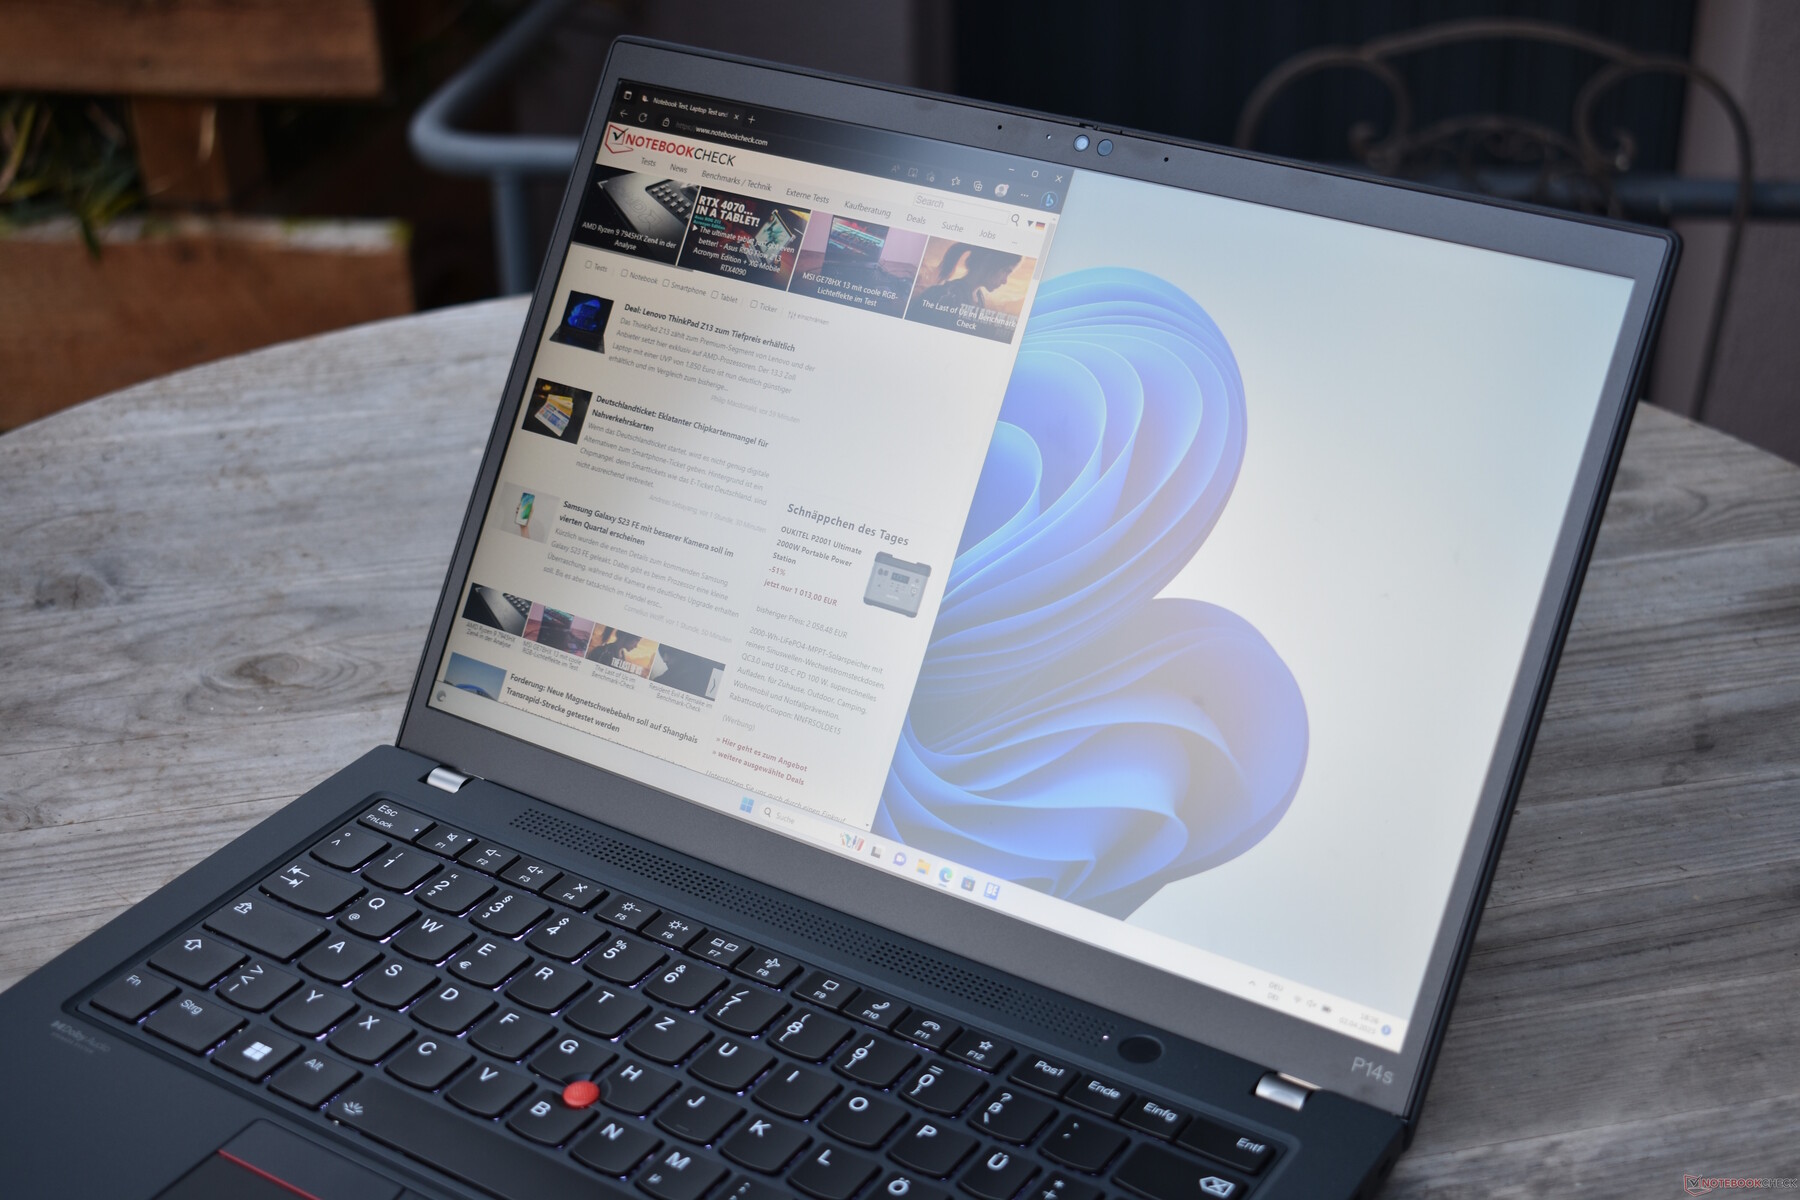
Laptop ThinkPad osiągał akceptowalne wyniki w pracy na dworze, co można przypisać połączeniu dobrej jasności wyświetlacza i jego matowej powierzchni (nazywanej przez Lenovo antyodblaskową).
Wyświetl czasy reakcji
| ↔ Czas reakcji od czerni do bieli | ||
|---|---|---|
| 24.9 ms ... wzrost ↗ i spadek ↘ łącznie | ↗ 11.6 ms wzrost | 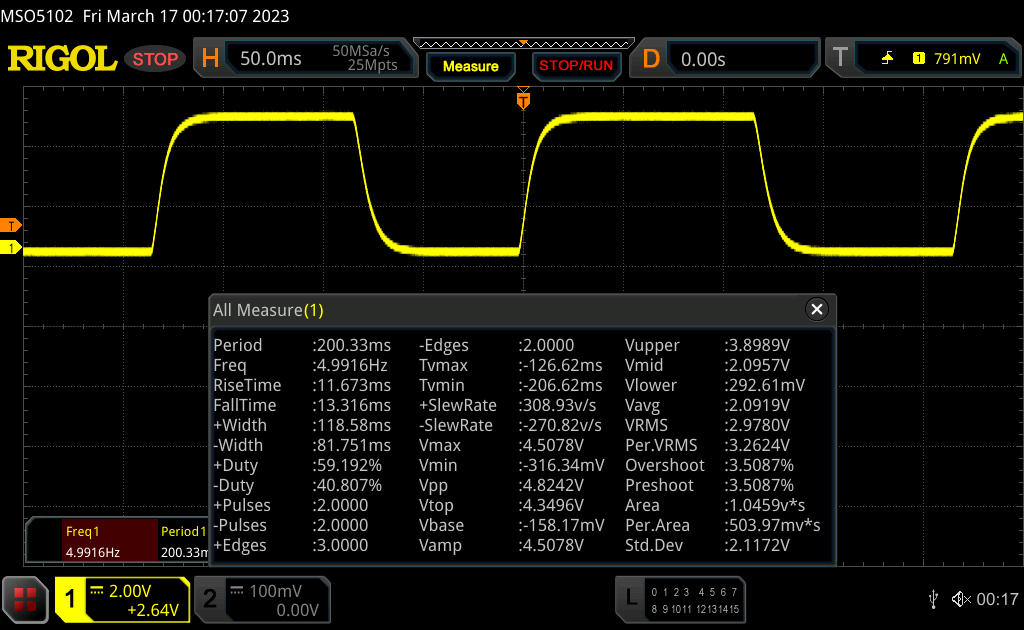 |
| ↘ 13.3 ms upadek | ||
| W naszych testach ekran wykazuje dobry współczynnik reakcji, ale może być zbyt wolny dla graczy rywalizujących ze sobą. Dla porównania, wszystkie testowane urządzenia wahają się od 0.1 (minimum) do 240 (maksimum) ms. » 59 % wszystkich urządzeń jest lepszych. Oznacza to, że zmierzony czas reakcji jest gorszy od średniej wszystkich testowanych urządzeń (19.9 ms). | ||
| ↔ Czas reakcji 50% szarości do 80% szarości | ||
| 33.5 ms ... wzrost ↗ i spadek ↘ łącznie | ↗ 14.9 ms wzrost |  |
| ↘ 18.6 ms upadek | ||
| W naszych testach ekran wykazuje powolne tempo reakcji, co będzie niezadowalające dla graczy. Dla porównania, wszystkie testowane urządzenia wahają się od 0.165 (minimum) do 636 (maksimum) ms. » 46 % wszystkich urządzeń jest lepszych. Oznacza to, że zmierzony czas reakcji jest zbliżony do średniej wszystkich testowanych urządzeń (31.1 ms). | ||
Migotanie ekranu / PWM (modulacja szerokości impulsu)
| Migotanie ekranu/nie wykryto PWM | 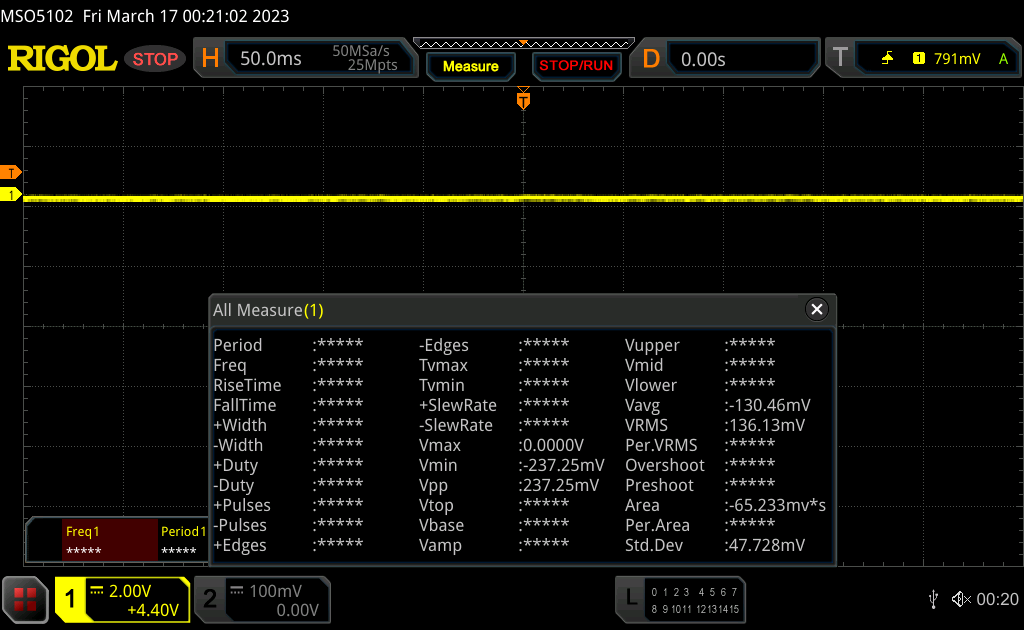 | ||
Dla porównania: 52 % wszystkich testowanych urządzeń nie używa PWM do przyciemniania wyświetlacza. Jeśli wykryto PWM, zmierzono średnio 7801 (minimum: 5 - maksimum: 343500) Hz. | |||
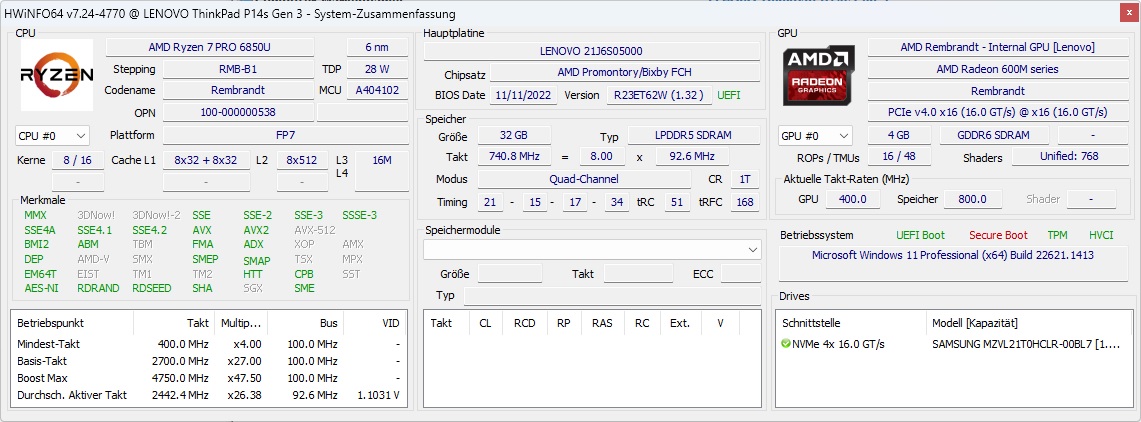
Wydajność: AMD Ryzen 6000U o świetnej wydajności
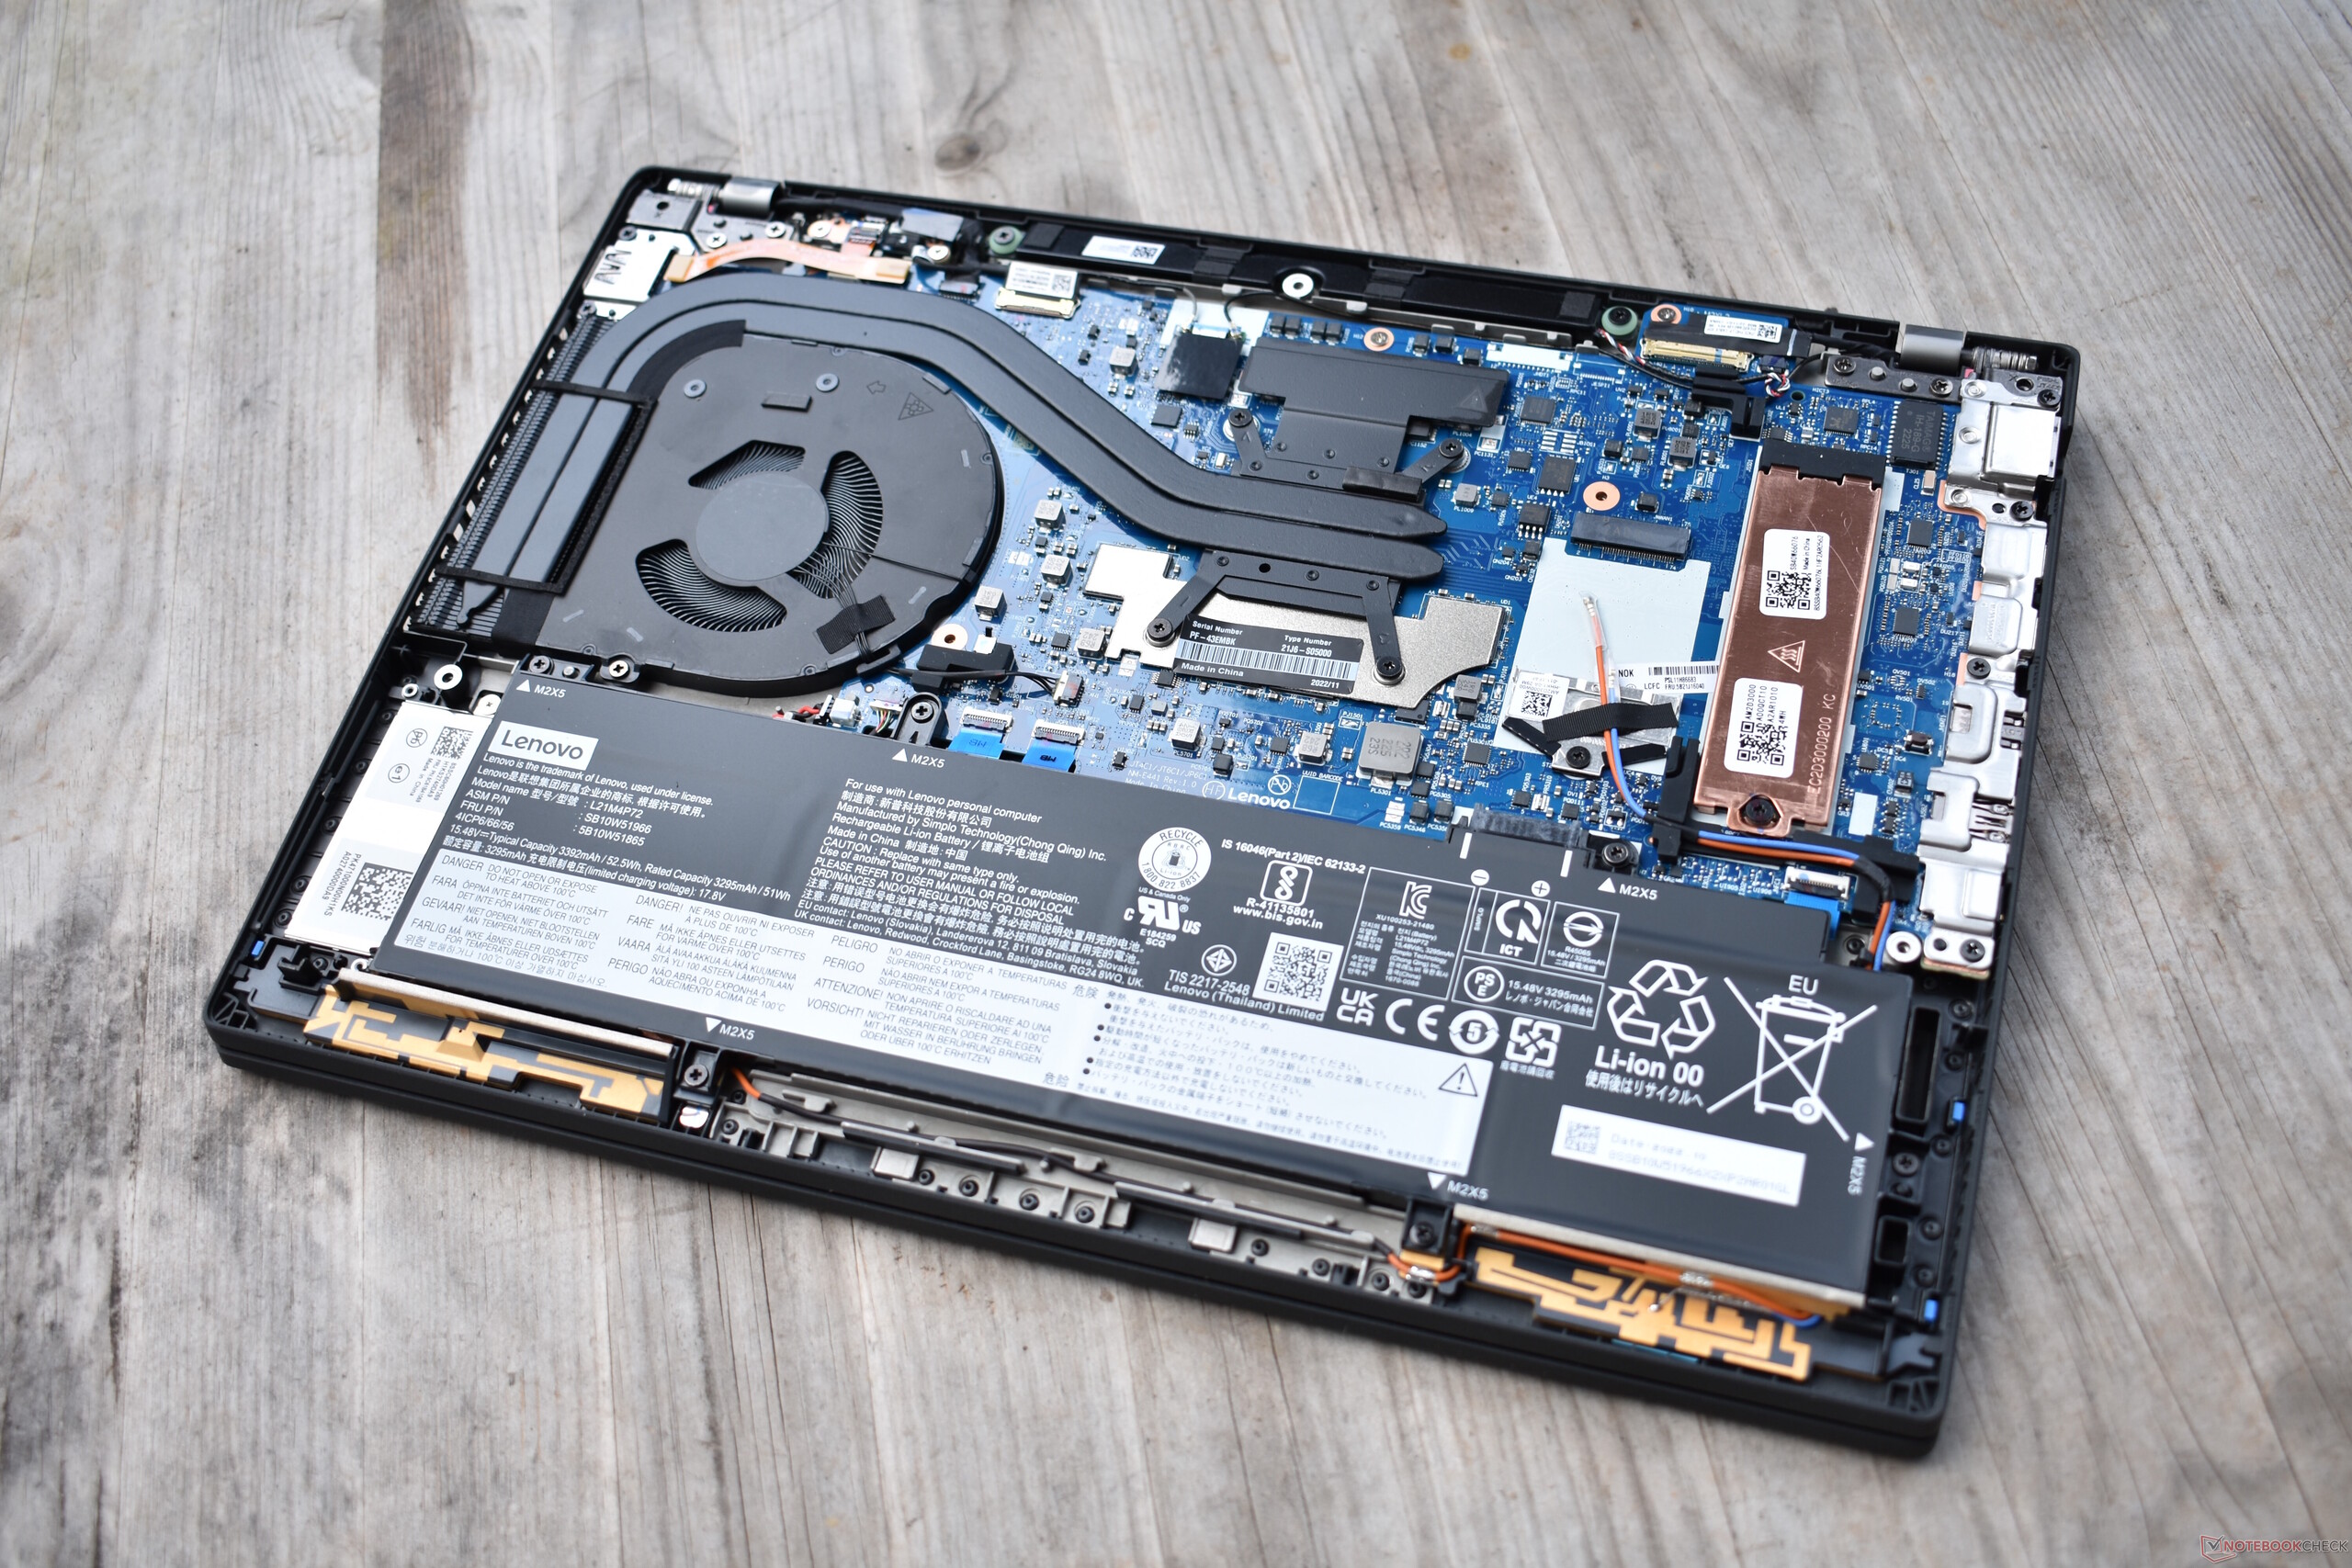
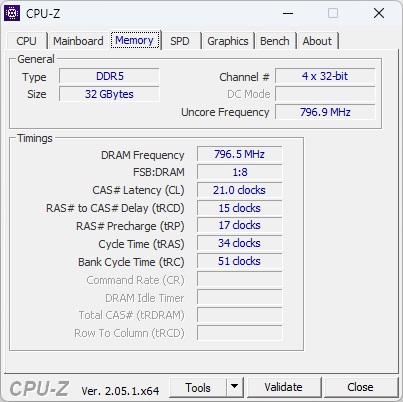
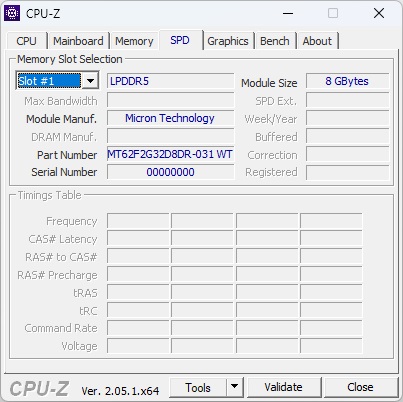
Lenovo ThinkPad P14s Gen 3 występuje w wielu różnych konfiguracjach. Wszystkie wykorzystują procesory Ryzen firmy AMD, przy czym Ryzen 5 Pro 6650U iRyzen 7 Pro 6850U są dostępne do wyboru. Ryzen 5 wyposażony jest w AMD Radeon 660M, a Ryzen 7 ma mocniejszy Radeon 680M. Pamięć RAM jest generalnie przylutowana do wersji AMD w P14s, przy czym Lenovo oferuje 16 lub 32 GB LPDDR5-6400. Rolę jego pamięci masowej pełni pojedynczy dysk SSD M.2-2280; ex-works Lenovo instaluje maksymalnie 2 TB.
Warunki badania
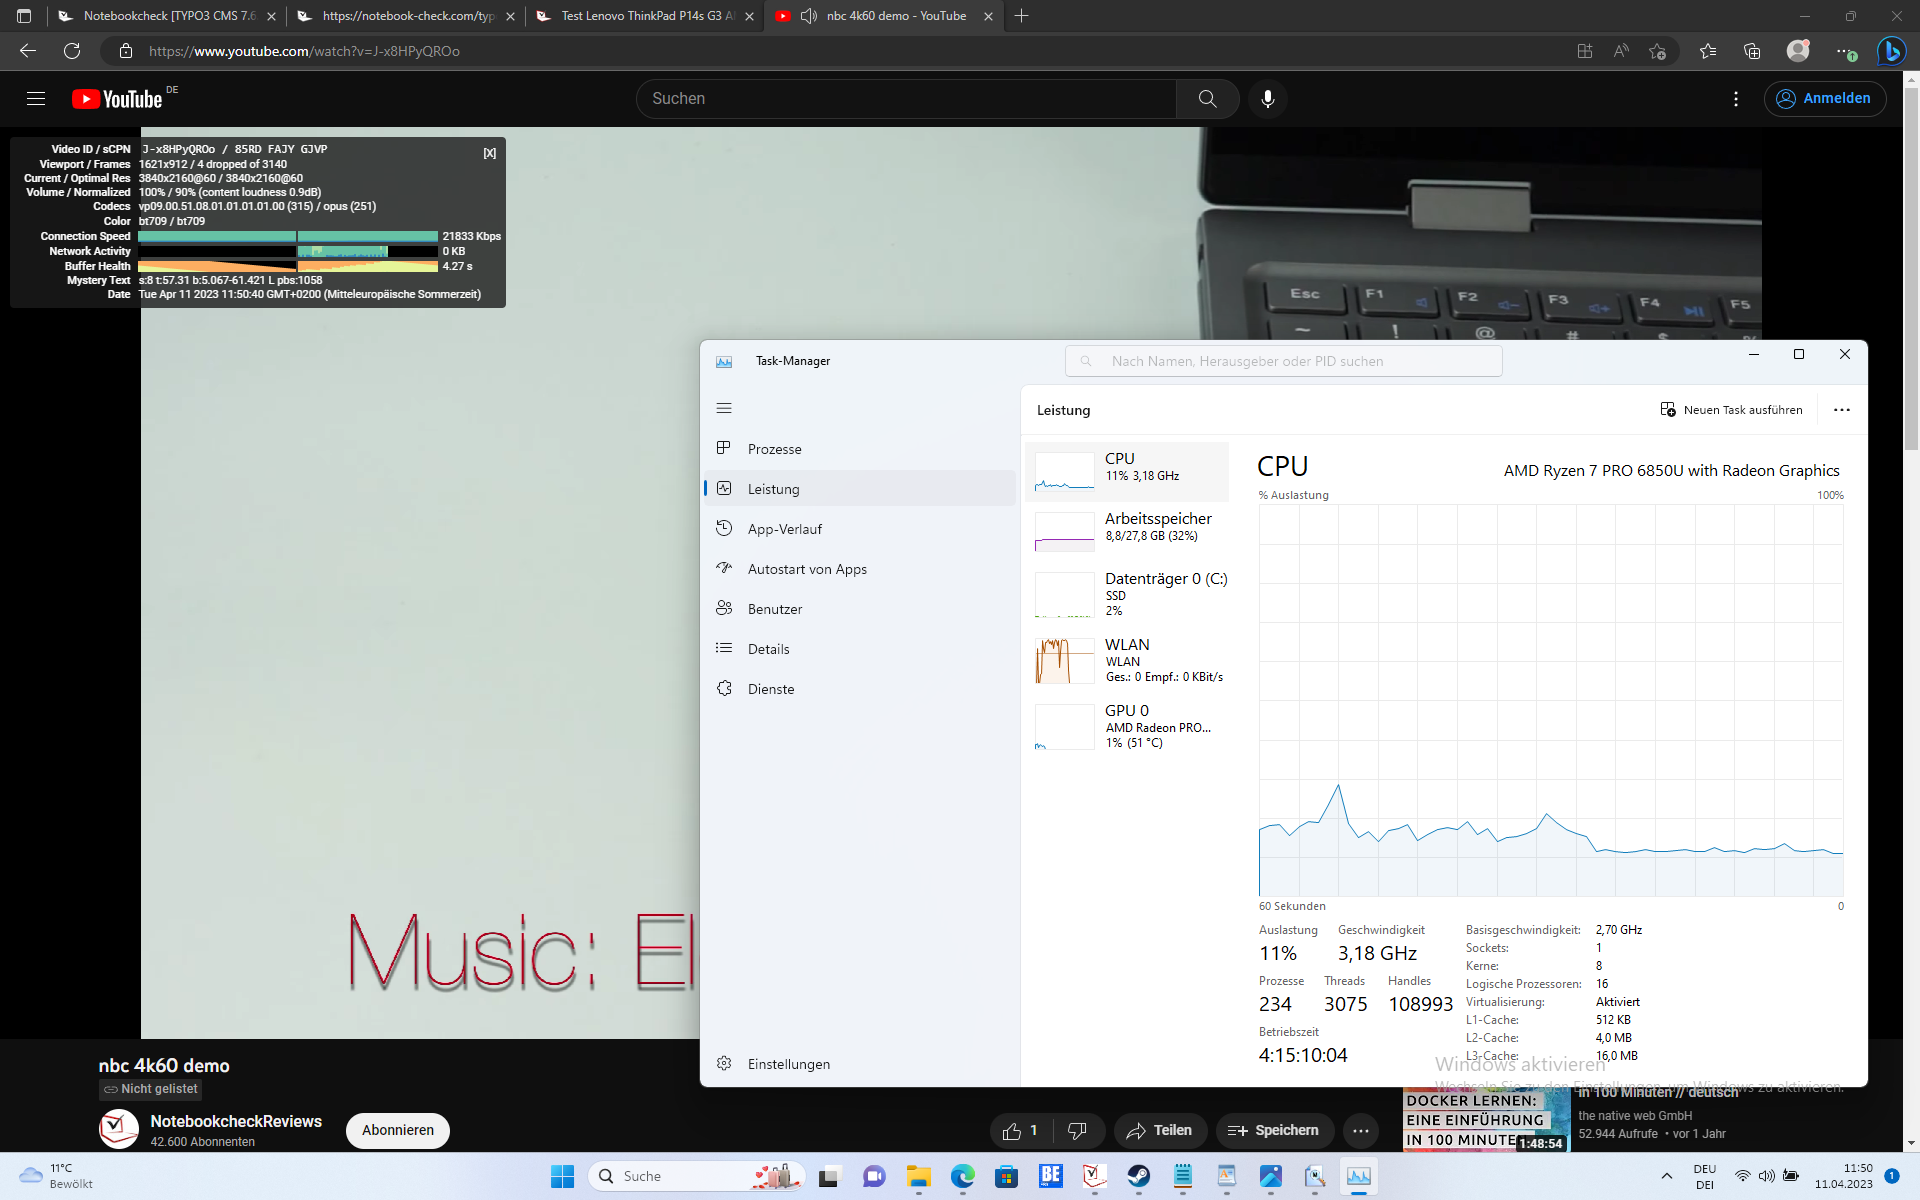
W swoich laptopach ThinkPad firma Lenovo splotła własne profile energetyczne z kontrolą energii systemu Windows. Dzięki temu w aplikacji ustawień systemu Windows można wybrać trzy różne profile, które wpływają na wydajność:
- Najlepsza oszczędność energii: 30 watów (krótkoterminowy limit mocy) / 25 watów (długoterminowy limit mocy).
- Zrównoważony: 36 watów (krótkoterminowy limit mocy) / 31 watów (długoterminowy limit mocy)
- Najlepsza moc: 40 watów (krótkoterminowy limit mocy) / 31 watów (długoterminowy limit mocy)
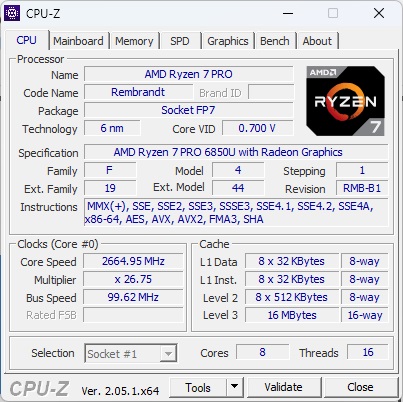
Procesor
Na stronie .AMD Ryzen 7 Pro 6850U to najszybszy procesor "U" z serii Ryzen 6000 (oprócz m.in 6860Z, który jest dostępny tylko w modelu ThinkPad Z13). Jako U-CPU jest zoptymalizowany do zużycia od 15 do 25 watów. Jego osiem rdzeni z 16 wątkami działa z częstotliwością od 2,7 do 4,7 GHz. Można zajrzeć do naszego Lista benchmarków CPU aby uzyskać szersze porównania z innymi procesorami.
W porównaniu z ThinkPadem T14 G3 z tym samym procesorem jego limity mocy są nieco wyższe. Można to było zaobserwować np. w pętli wielordzeniowej Cinebench R15, gdzie ThinkPad P14s uzyskał lepszy wynik od T14. Różnica ta nie była jednak duża. Porównując go z konkurentami, jego wydajność procesora budzi szacunek. ThinkPad P14s Gen 3 jest wyraźnie szybszy od m.in.ZBook Firefly 14 G9 i niedaleko za Dell Precision 5470, mimo nominalnie wyżej ocenianego procesora H45. Tylko w zakresie wydajności jednordzeniowej modele Intela mają przewagę.
Procesor z powodzeniem radzi sobie także na samym zasilaniu z akumulatora.
Cinebench R15 multi continuous test
Cinebench R23: Multi Core | Single Core
Cinebench R20: CPU (Multi Core) | CPU (Single Core)
Cinebench R15: CPU Multi 64Bit | CPU Single 64Bit
Blender: v2.79 BMW27 CPU
7-Zip 18.03: 7z b 4 | 7z b 4 -mmt1
Geekbench 5.5: Multi-Core | Single-Core
HWBOT x265 Benchmark v2.2: 4k Preset
LibreOffice : 20 Documents To PDF
R Benchmark 2.5: Overall mean
| CPU Performance rating | |
| Średnia w klasie Workstation | |
| Dell Precision 5000 5470 | |
| Lenovo ThinkPad T14 G3-21CF004NGE | |
| Przeciętny AMD Ryzen 7 PRO 6850U | |
| HP ZBook Firefly 14 G9-6B8A2EA | |
| Lenovo ThinkPad P14s G3 AMD 21J6S05000 | |
| Lenovo ThinkPad P14s Gen2-20VX000GGE | |
| Cinebench R23 / Multi Core | |
| Średnia w klasie Workstation (14055 - 38520, n=25, ostatnie 2 lata) | |
| Dell Precision 5000 5470 | |
| Lenovo ThinkPad P14s G3 AMD 21J6S05000 | |
| Przeciętny AMD Ryzen 7 PRO 6850U (9923 - 12945, n=7) | |
| Lenovo ThinkPad T14 G3-21CF004NGE | |
| HP ZBook Firefly 14 G9-6B8A2EA | |
| Lenovo ThinkPad P14s Gen2-20VX000GGE | |
| Cinebench R23 / Single Core | |
| Średnia w klasie Workstation (1712 - 2228, n=25, ostatnie 2 lata) | |
| Dell Precision 5000 5470 | |
| HP ZBook Firefly 14 G9-6B8A2EA | |
| Lenovo ThinkPad P14s G3 AMD 21J6S05000 | |
| Przeciętny AMD Ryzen 7 PRO 6850U (1409 - 1536, n=7) | |
| Lenovo ThinkPad P14s Gen2-20VX000GGE | |
| Lenovo ThinkPad T14 G3-21CF004NGE | |
| Cinebench R20 / CPU (Multi Core) | |
| Średnia w klasie Workstation (5471 - 15043, n=25, ostatnie 2 lata) | |
| Dell Precision 5000 5470 | |
| Lenovo ThinkPad P14s G3 AMD 21J6S05000 | |
| Przeciętny AMD Ryzen 7 PRO 6850U (3784 - 5022, n=7) | |
| Lenovo ThinkPad T14 G3-21CF004NGE | |
| HP ZBook Firefly 14 G9-6B8A2EA | |
| Lenovo ThinkPad P14s Gen2-20VX000GGE | |
| Cinebench R20 / CPU (Single Core) | |
| Średnia w klasie Workstation (671 - 857, n=25, ostatnie 2 lata) | |
| Dell Precision 5000 5470 | |
| HP ZBook Firefly 14 G9-6B8A2EA | |
| Lenovo ThinkPad P14s G3 AMD 21J6S05000 | |
| Przeciętny AMD Ryzen 7 PRO 6850U (587 - 596, n=7) | |
| Lenovo ThinkPad T14 G3-21CF004NGE | |
| Lenovo ThinkPad P14s Gen2-20VX000GGE | |
| Cinebench R15 / CPU Multi 64Bit | |
| Średnia w klasie Workstation (2489 - 5810, n=25, ostatnie 2 lata) | |
| Dell Precision 5000 5470 | |
| Lenovo ThinkPad P14s G3 AMD 21J6S05000 | |
| Przeciętny AMD Ryzen 7 PRO 6850U (1652 - 2092, n=7) | |
| Lenovo ThinkPad T14 G3-21CF004NGE | |
| HP ZBook Firefly 14 G9-6B8A2EA | |
| Lenovo ThinkPad P14s Gen2-20VX000GGE | |
| Cinebench R15 / CPU Single 64Bit | |
| Średnia w klasie Workstation (191.4 - 328, n=25, ostatnie 2 lata) | |
| HP ZBook Firefly 14 G9-6B8A2EA | |
| Dell Precision 5000 5470 | |
| Lenovo ThinkPad P14s G3 AMD 21J6S05000 | |
| Lenovo ThinkPad T14 G3-21CF004NGE | |
| Przeciętny AMD Ryzen 7 PRO 6850U (228 - 244, n=7) | |
| Lenovo ThinkPad P14s Gen2-20VX000GGE | |
| Blender / v2.79 BMW27 CPU | |
| Lenovo ThinkPad P14s Gen2-20VX000GGE | |
| HP ZBook Firefly 14 G9-6B8A2EA | |
| Lenovo ThinkPad T14 G3-21CF004NGE | |
| Lenovo ThinkPad P14s G3 AMD 21J6S05000 | |
| Przeciętny AMD Ryzen 7 PRO 6850U (241 - 307, n=7) | |
| Dell Precision 5000 5470 | |
| Średnia w klasie Workstation (91 - 261, n=25, ostatnie 2 lata) | |
| 7-Zip 18.03 / 7z b 4 | |
| Średnia w klasie Workstation (54741 - 116969, n=25, ostatnie 2 lata) | |
| Dell Precision 5000 5470 | |
| Lenovo ThinkPad T14 G3-21CF004NGE | |
| Przeciętny AMD Ryzen 7 PRO 6850U (44011 - 59045, n=7) | |
| Lenovo ThinkPad P14s G3 AMD 21J6S05000 | |
| HP ZBook Firefly 14 G9-6B8A2EA | |
| Lenovo ThinkPad P14s Gen2-20VX000GGE | |
| 7-Zip 18.03 / 7z b 4 -mmt1 | |
| Średnia w klasie Workstation (5126 - 6960, n=25, ostatnie 2 lata) | |
| HP ZBook Firefly 14 G9-6B8A2EA | |
| Lenovo ThinkPad P14s Gen2-20VX000GGE | |
| Dell Precision 5000 5470 | |
| Przeciętny AMD Ryzen 7 PRO 6850U (5057 - 5662, n=7) | |
| Lenovo ThinkPad T14 G3-21CF004NGE | |
| Lenovo ThinkPad P14s G3 AMD 21J6S05000 | |
| Geekbench 5.5 / Multi-Core | |
| Średnia w klasie Workstation (11542 - 25554, n=25, ostatnie 2 lata) | |
| Dell Precision 5000 5470 | |
| HP ZBook Firefly 14 G9-6B8A2EA | |
| Lenovo ThinkPad P14s G3 AMD 21J6S05000 | |
| Przeciętny AMD Ryzen 7 PRO 6850U (7044 - 9241, n=7) | |
| Lenovo ThinkPad T14 G3-21CF004NGE | |
| Lenovo ThinkPad P14s Gen2-20VX000GGE | |
| Geekbench 5.5 / Single-Core | |
| Średnia w klasie Workstation (1781 - 2183, n=25, ostatnie 2 lata) | |
| Dell Precision 5000 5470 | |
| HP ZBook Firefly 14 G9-6B8A2EA | |
| Lenovo ThinkPad P14s Gen2-20VX000GGE | |
| Lenovo ThinkPad T14 G3-21CF004NGE | |
| Lenovo ThinkPad P14s G3 AMD 21J6S05000 | |
| Przeciętny AMD Ryzen 7 PRO 6850U (1433 - 1533, n=7) | |
| HWBOT x265 Benchmark v2.2 / 4k Preset | |
| Średnia w klasie Workstation (14.4 - 40.5, n=25, ostatnie 2 lata) | |
| Dell Precision 5000 5470 | |
| Lenovo ThinkPad T14 G3-21CF004NGE | |
| Lenovo ThinkPad P14s G3 AMD 21J6S05000 | |
| Przeciętny AMD Ryzen 7 PRO 6850U (11.7 - 16.3, n=7) | |
| HP ZBook Firefly 14 G9-6B8A2EA | |
| Lenovo ThinkPad P14s Gen2-20VX000GGE | |
| LibreOffice / 20 Documents To PDF | |
| Lenovo ThinkPad P14s G3 AMD 21J6S05000 | |
| Przeciętny AMD Ryzen 7 PRO 6850U (46.3 - 74, n=7) | |
| Lenovo ThinkPad T14 G3-21CF004NGE | |
| Średnia w klasie Workstation (37.1 - 74.7, n=25, ostatnie 2 lata) | |
| Dell Precision 5000 5470 | |
| HP ZBook Firefly 14 G9-6B8A2EA | |
| Lenovo ThinkPad P14s Gen2-20VX000GGE | |
| R Benchmark 2.5 / Overall mean | |
| Lenovo ThinkPad P14s Gen2-20VX000GGE | |
| Lenovo ThinkPad P14s G3 AMD 21J6S05000 | |
| Lenovo ThinkPad T14 G3-21CF004NGE | |
| Przeciętny AMD Ryzen 7 PRO 6850U (0.4932 - 0.544, n=7) | |
| HP ZBook Firefly 14 G9-6B8A2EA | |
| Dell Precision 5000 5470 | |
| Średnia w klasie Workstation (0.3825 - 0.603, n=25, ostatnie 2 lata) | |
* ... im mniej tym lepiej
AIDA64: FP32 Ray-Trace | FPU Julia | CPU SHA3 | CPU Queen | FPU SinJulia | FPU Mandel | CPU AES | CPU ZLib | FP64 Ray-Trace | CPU PhotoWorxx
| Performance rating | |
| Średnia w klasie Workstation | |
| Przeciętny AMD Ryzen 7 PRO 6850U | |
| Lenovo ThinkPad P14s G3 AMD 21J6S05000 | |
| Dell Precision 5000 5470 | |
| Lenovo ThinkPad T14 G3-21CF004NGE | |
| HP ZBook Firefly 14 G9-6B8A2EA | |
| AIDA64 / FP32 Ray-Trace | |
| Średnia w klasie Workstation (10658 - 61611, n=25, ostatnie 2 lata) | |
| Dell Precision 5000 5470 | |
| Przeciętny AMD Ryzen 7 PRO 6850U (11272 - 14704, n=8) | |
| Lenovo ThinkPad P14s G3 AMD 21J6S05000 | |
| Lenovo ThinkPad T14 G3-21CF004NGE | |
| HP ZBook Firefly 14 G9-6B8A2EA | |
| AIDA64 / FPU Julia | |
| Średnia w klasie Workstation (56664 - 186971, n=25, ostatnie 2 lata) | |
| Przeciętny AMD Ryzen 7 PRO 6850U (72242 - 92957, n=8) | |
| Lenovo ThinkPad P14s G3 AMD 21J6S05000 | |
| Lenovo ThinkPad T14 G3-21CF004NGE | |
| Dell Precision 5000 5470 | |
| HP ZBook Firefly 14 G9-6B8A2EA | |
| AIDA64 / CPU SHA3 | |
| Średnia w klasie Workstation (2608 - 8975, n=25, ostatnie 2 lata) | |
| Dell Precision 5000 5470 | |
| Przeciętny AMD Ryzen 7 PRO 6850U (2419 - 3104, n=8) | |
| Lenovo ThinkPad P14s G3 AMD 21J6S05000 | |
| Lenovo ThinkPad T14 G3-21CF004NGE | |
| HP ZBook Firefly 14 G9-6B8A2EA | |
| AIDA64 / CPU Queen | |
| Dell Precision 5000 5470 | |
| Średnia w klasie Workstation (60778 - 144411, n=25, ostatnie 2 lata) | |
| Lenovo ThinkPad P14s G3 AMD 21J6S05000 | |
| Przeciętny AMD Ryzen 7 PRO 6850U (86644 - 96912, n=7) | |
| Lenovo ThinkPad T14 G3-21CF004NGE | |
| HP ZBook Firefly 14 G9-6B8A2EA | |
| AIDA64 / FPU SinJulia | |
| Średnia w klasie Workstation (8165 - 29343, n=25, ostatnie 2 lata) | |
| Lenovo ThinkPad P14s G3 AMD 21J6S05000 | |
| Przeciętny AMD Ryzen 7 PRO 6850U (10917 - 12571, n=8) | |
| Lenovo ThinkPad T14 G3-21CF004NGE | |
| Dell Precision 5000 5470 | |
| HP ZBook Firefly 14 G9-6B8A2EA | |
| AIDA64 / FPU Mandel | |
| Średnia w klasie Workstation (27301 - 98153, n=25, ostatnie 2 lata) | |
| Przeciętny AMD Ryzen 7 PRO 6850U (39609 - 51296, n=8) | |
| Lenovo ThinkPad P14s G3 AMD 21J6S05000 | |
| Lenovo ThinkPad T14 G3-21CF004NGE | |
| Dell Precision 5000 5470 | |
| HP ZBook Firefly 14 G9-6B8A2EA | |
| AIDA64 / CPU AES | |
| Średnia w klasie Workstation (56077 - 187841, n=25, ostatnie 2 lata) | |
| Przeciętny AMD Ryzen 7 PRO 6850U (45568 - 60867, n=8) | |
| Lenovo ThinkPad T14 G3-21CF004NGE | |
| Lenovo ThinkPad P14s G3 AMD 21J6S05000 | |
| HP ZBook Firefly 14 G9-6B8A2EA | |
| Dell Precision 5000 5470 | |
| AIDA64 / CPU ZLib | |
| Średnia w klasie Workstation (742 - 2148, n=25, ostatnie 2 lata) | |
| Lenovo ThinkPad P14s G3 AMD 21J6S05000 | |
| Przeciętny AMD Ryzen 7 PRO 6850U (641 - 805, n=8) | |
| Lenovo ThinkPad T14 G3-21CF004NGE | |
| HP ZBook Firefly 14 G9-6B8A2EA | |
| Dell Precision 5000 5470 | |
| AIDA64 / FP64 Ray-Trace | |
| Średnia w klasie Workstation (5580 - 32891, n=25, ostatnie 2 lata) | |
| Dell Precision 5000 5470 | |
| Przeciętny AMD Ryzen 7 PRO 6850U (5967 - 7821, n=8) | |
| Lenovo ThinkPad P14s G3 AMD 21J6S05000 | |
| Lenovo ThinkPad T14 G3-21CF004NGE | |
| HP ZBook Firefly 14 G9-6B8A2EA | |
| AIDA64 / CPU PhotoWorxx | |
| Średnia w klasie Workstation (37151 - 93684, n=25, ostatnie 2 lata) | |
| Dell Precision 5000 5470 | |
| HP ZBook Firefly 14 G9-6B8A2EA | |
| Przeciętny AMD Ryzen 7 PRO 6850U (19707 - 27840, n=8) | |
| Lenovo ThinkPad T14 G3-21CF004NGE | |
| Lenovo ThinkPad P14s G3 AMD 21J6S05000 | |
Wydajność systemu
Jego wydajność systemowa była nieco gorsza od bezpośrednich rywali, ale w codziennym użytkowaniu nie jest to aż tak zauważalne. Typową cechą dla obecnych układów AMD jest gorsza wydajność pamięci w porównaniu z modelami Intela.
CrossMark: Overall | Productivity | Creativity | Responsiveness
| PCMark 10 / Score | |
| Średnia w klasie Workstation (6436 - 10409, n=21, ostatnie 2 lata) | |
| Dell Precision 5000 5470 | |
| HP ZBook Firefly 14 G9-6B8A2EA | |
| Przeciętny AMD Ryzen 7 PRO 6850U, AMD Radeon 680M (5873 - 6311, n=7) | |
| Lenovo ThinkPad T14 G3-21CF004NGE | |
| Lenovo ThinkPad P14s G3 AMD 21J6S05000 | |
| Lenovo ThinkPad P14s Gen2-20VX000GGE | |
| PCMark 10 / Essentials | |
| Dell Precision 5000 5470 | |
| Średnia w klasie Workstation (9622 - 11157, n=21, ostatnie 2 lata) | |
| HP ZBook Firefly 14 G9-6B8A2EA | |
| Lenovo ThinkPad T14 G3-21CF004NGE | |
| Przeciętny AMD Ryzen 7 PRO 6850U, AMD Radeon 680M (9151 - 10263, n=7) | |
| Lenovo ThinkPad P14s Gen2-20VX000GGE | |
| Lenovo ThinkPad P14s G3 AMD 21J6S05000 | |
| PCMark 10 / Productivity | |
| Średnia w klasie Workstation (8789 - 20616, n=21, ostatnie 2 lata) | |
| HP ZBook Firefly 14 G9-6B8A2EA | |
| Lenovo ThinkPad P14s Gen2-20VX000GGE | |
| Przeciętny AMD Ryzen 7 PRO 6850U, AMD Radeon 680M (8435 - 8891, n=7) | |
| Lenovo ThinkPad T14 G3-21CF004NGE | |
| Dell Precision 5000 5470 | |
| Lenovo ThinkPad P14s G3 AMD 21J6S05000 | |
| PCMark 10 / Digital Content Creation | |
| Średnia w klasie Workstation (7744 - 15631, n=21, ostatnie 2 lata) | |
| Dell Precision 5000 5470 | |
| Lenovo ThinkPad P14s G3 AMD 21J6S05000 | |
| Przeciętny AMD Ryzen 7 PRO 6850U, AMD Radeon 680M (6796 - 8422, n=7) | |
| Lenovo ThinkPad T14 G3-21CF004NGE | |
| HP ZBook Firefly 14 G9-6B8A2EA | |
| Lenovo ThinkPad P14s Gen2-20VX000GGE | |
| CrossMark / Overall | |
| Średnia w klasie Workstation (1307 - 2267, n=24, ostatnie 2 lata) | |
| Dell Precision 5000 5470 | |
| HP ZBook Firefly 14 G9-6B8A2EA | |
| Lenovo ThinkPad T14 G3-21CF004NGE | |
| Przeciętny AMD Ryzen 7 PRO 6850U, AMD Radeon 680M (1154 - 1442, n=7) | |
| Lenovo ThinkPad P14s G3 AMD 21J6S05000 | |
| CrossMark / Productivity | |
| Średnia w klasie Workstation (1130 - 2122, n=24, ostatnie 2 lata) | |
| Dell Precision 5000 5470 | |
| HP ZBook Firefly 14 G9-6B8A2EA | |
| Lenovo ThinkPad T14 G3-21CF004NGE | |
| Przeciętny AMD Ryzen 7 PRO 6850U, AMD Radeon 680M (1188 - 1444, n=7) | |
| Lenovo ThinkPad P14s G3 AMD 21J6S05000 | |
| CrossMark / Creativity | |
| Średnia w klasie Workstation (1657 - 2725, n=24, ostatnie 2 lata) | |
| Dell Precision 5000 5470 | |
| HP ZBook Firefly 14 G9-6B8A2EA | |
| Lenovo ThinkPad T14 G3-21CF004NGE | |
| Przeciętny AMD Ryzen 7 PRO 6850U, AMD Radeon 680M (1180 - 1523, n=7) | |
| Lenovo ThinkPad P14s G3 AMD 21J6S05000 | |
| CrossMark / Responsiveness | |
| Średnia w klasie Workstation (993 - 2096, n=24, ostatnie 2 lata) | |
| Dell Precision 5000 5470 | |
| HP ZBook Firefly 14 G9-6B8A2EA | |
| Lenovo ThinkPad T14 G3-21CF004NGE | |
| Przeciętny AMD Ryzen 7 PRO 6850U, AMD Radeon 680M (990 - 1282, n=7) | |
| Lenovo ThinkPad P14s G3 AMD 21J6S05000 | |
| PCMark 10 Score | 5953 pkt. | |
Pomoc | ||
| AIDA64 / Memory Copy | |
| Średnia w klasie Workstation (56003 - 164795, n=25, ostatnie 2 lata) | |
| Dell Precision 5000 5470 | |
| HP ZBook Firefly 14 G9-6B8A2EA | |
| Lenovo ThinkPad T14 G3-21CF004NGE | |
| Lenovo ThinkPad P14s G3 AMD 21J6S05000 | |
| Przeciętny AMD Ryzen 7 PRO 6850U (31003 - 48605, n=8) | |
| AIDA64 / Memory Read | |
| Średnia w klasie Workstation (55795 - 121563, n=25, ostatnie 2 lata) | |
| Dell Precision 5000 5470 | |
| HP ZBook Firefly 14 G9-6B8A2EA | |
| Przeciętny AMD Ryzen 7 PRO 6850U (34682 - 45912, n=8) | |
| Lenovo ThinkPad T14 G3-21CF004NGE | |
| Lenovo ThinkPad P14s G3 AMD 21J6S05000 | |
| AIDA64 / Memory Write | |
| Średnia w klasie Workstation (55663 - 214520, n=25, ostatnie 2 lata) | |
| HP ZBook Firefly 14 G9-6B8A2EA | |
| Dell Precision 5000 5470 | |
| Lenovo ThinkPad P14s G3 AMD 21J6S05000 | |
| Lenovo ThinkPad T14 G3-21CF004NGE | |
| Przeciętny AMD Ryzen 7 PRO 6850U (34532 - 51096, n=8) | |
| AIDA64 / Memory Latency | |
| Średnia w klasie Workstation (84.5 - 165.2, n=25, ostatnie 2 lata) | |
| Lenovo ThinkPad P14s G3 AMD 21J6S05000 | |
| Lenovo ThinkPad T14 G3-21CF004NGE | |
| Dell Precision 5000 5470 | |
| Przeciętny AMD Ryzen 7 PRO 6850U (86.1 - 135.3, n=8) | |
| HP ZBook Firefly 14 G9-6B8A2EA | |
* ... im mniej tym lepiej
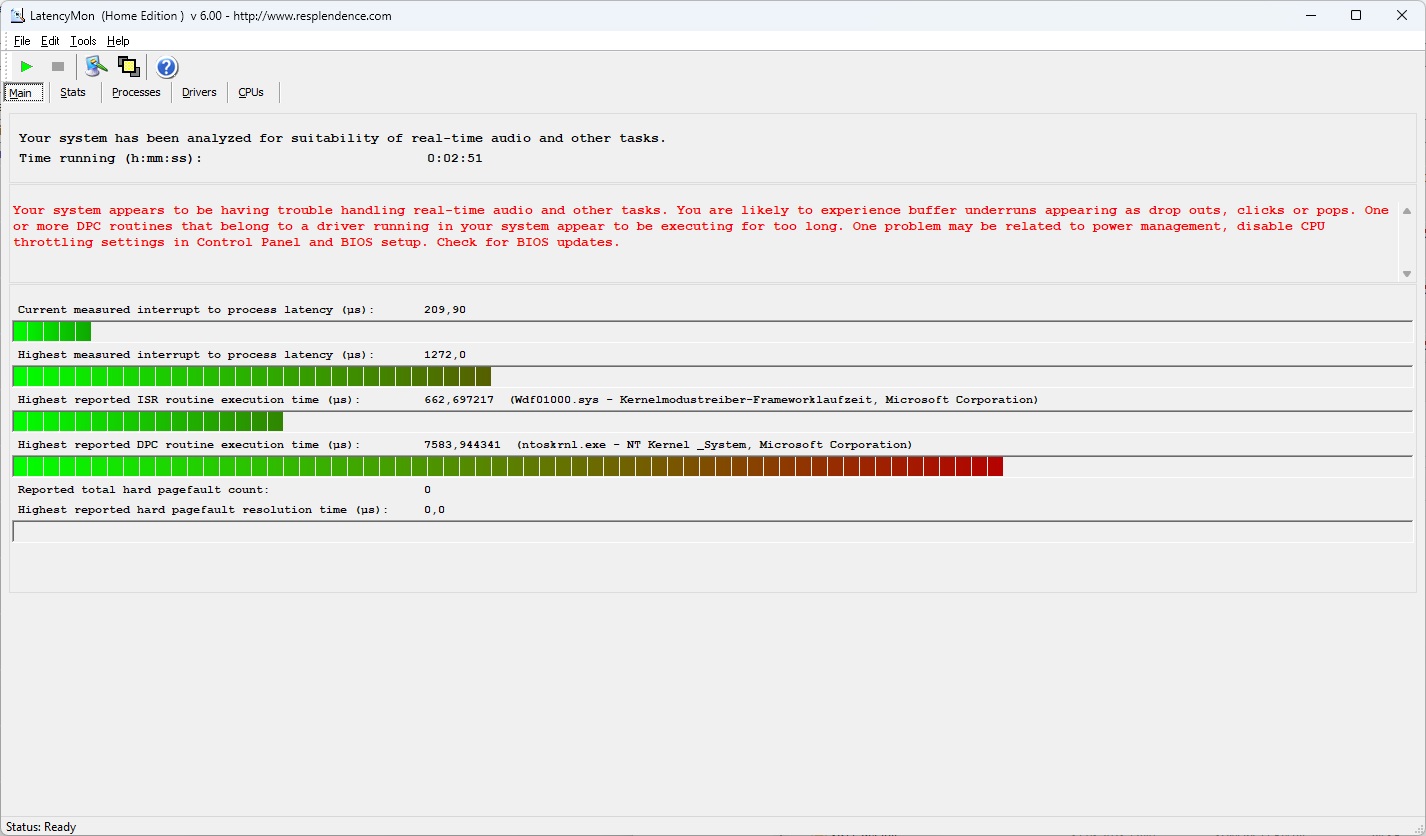
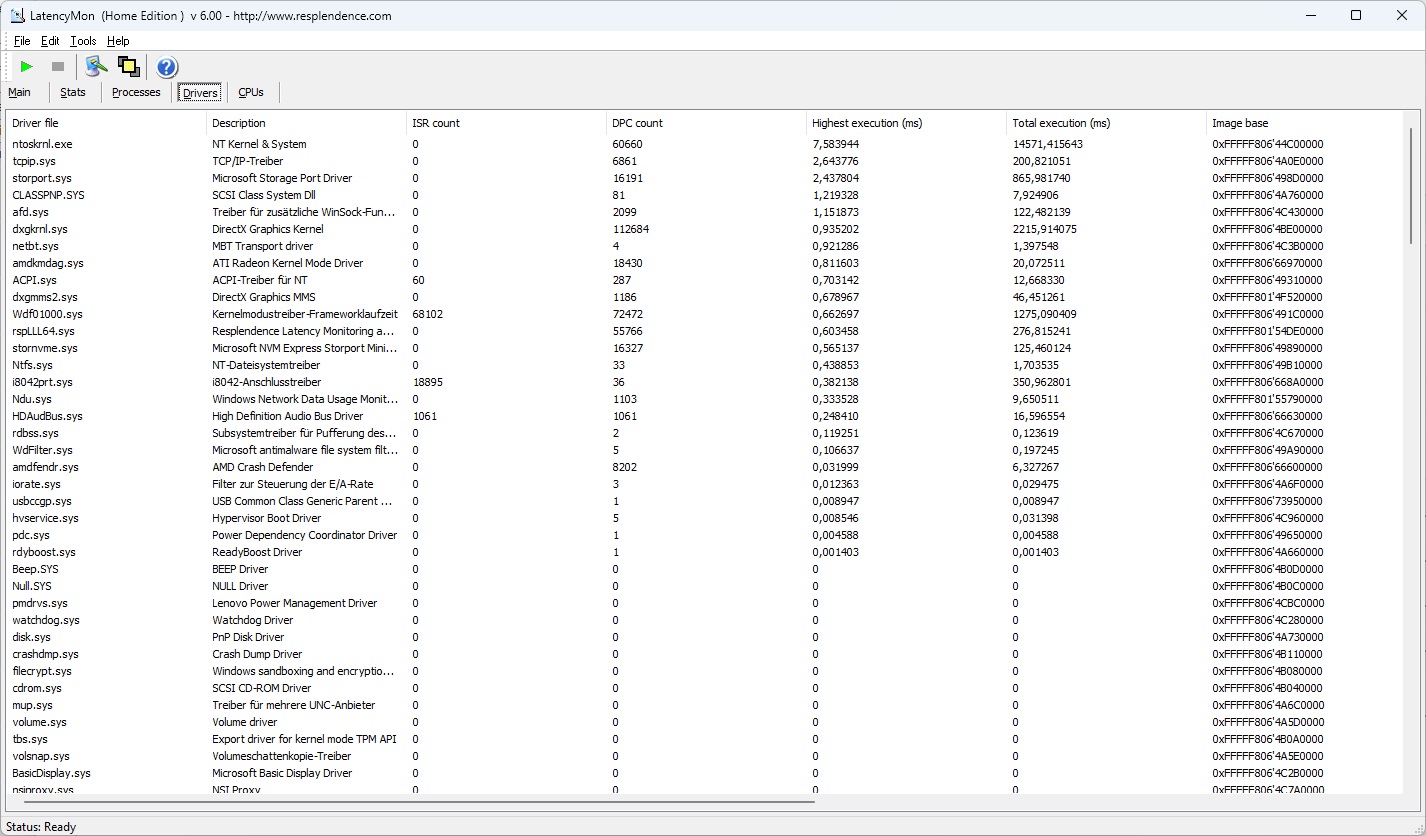
Opóźnienie DPC
ThinkPad P14s Gen 3 zmaga się z opóźnieniami DPC w prezentowanej konfiguracji. Może to być spowodowane problemem ze sterownikami i być może zostanie rozwiązane w przyszłej aktualizacji oprogramowania.
| DPC Latencies / LatencyMon - interrupt to process latency (max), Web, Youtube, Prime95 | |
| Dell Precision 5000 5470 | |
| Lenovo ThinkPad P14s G3 AMD 21J6S05000 | |
| Lenovo ThinkPad P14s Gen2-20VX000GGE | |
| HP ZBook Firefly 14 G9-6B8A2EA | |
| Lenovo ThinkPad T14 G3-21CF004NGE | |
* ... im mniej tym lepiej
Urządzenia pamięci masowej
Samsung PM9A1 w Lenovo ThinkPad P14s G3 zapewnia wysoką wydajność - typową dla dysku SSD PCIe 4.0. Jednostronny dysk SSD M.2-2280 działa również bardzo szybko pod ciągłym obciążeniem i bez throttlingu.

| Drive Performance rating - Percent | |
| Lenovo ThinkPad P14s G3 AMD 21J6S05000 | |
| Średnia w klasie Workstation | |
| Przeciętny Samsung PM9A1 MZVL21T0HCLR | |
| Dell Precision 5000 5470 | |
| HP ZBook Firefly 14 G9-6B8A2EA | |
| Lenovo ThinkPad P14s Gen2-20VX000GGE | |
| Lenovo ThinkPad T14 G3-21CF004NGE | |
* ... im mniej tym lepiej
Reading continuous performance: DiskSpd Read Loop, Queue Depth 8
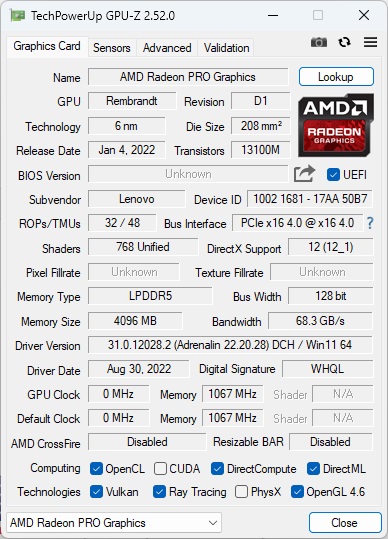
Karta graficzna
Cechą charakterystyczną mobilnych stacji roboczych jest to, że w przeciwieństwie do laptopów biurowych, ich grafika dobrze radzi sobie w programach CAD i innych zadaniach wymagających użycia GPU. W tym celu zazwyczaj instalowany byłby dedykowany procesor graficzny. Lenovo postanowiło jednak nie umieszczać go w ThinkPadzie P14s Gen 3. Zamiast tego laptop Lenovo polega wyłącznie na zintegrowanym AMD Radeon 680M.
Efektem jest słaba wydajność GPU jak na stację roboczą - znacznie poniżej średniej. Aby być sprawiedliwym, należy jednak zaznaczyć, że.Nvidia T550 wZBook Firefly 14 nie jest wcale lepsza. Tylko Nvidia RTX A1000 w DelluPrecision 5470 zaczyna wykazywać wyraźnie lepszą wydajność. Jedno powinno być jasne, jeśli zastanawiasz się nad zakupem P14: to model absolutnie podstawowy, który rezygnuje z wydajności GPU w imię mobilności.
Do gier P14s G3 nadaje się tak samo jak wszystkie inne obecne laptopy AMD z Radeonem 680M: Wiele gier działa dość płynnie w Full HD - ale przy obniżonych ustawieniach detali.
Podobnie jak w przypadku procesora, nie zauważyliśmy żadnych ograniczeń GPU w trybie akumulatorowym.
| 3DMark Performance rating - Percent | |
| Średnia w klasie Workstation | |
| Dell Precision 5000 5470 | |
| Lenovo ThinkPad P14s G3 AMD 21J6S05000 | |
| Lenovo ThinkPad T14 G3-21CF004NGE | |
| Przeciętny AMD Radeon 680M | |
| HP ZBook Firefly 14 G9-6B8A2EA -1! | |
| Lenovo ThinkPad P14s Gen2-20VX000GGE | |
| 3DMark 11 - 1280x720 Performance GPU | |
| Średnia w klasie Workstation (10888 - 69594, n=25, ostatnie 2 lata) | |
| Dell Precision 5000 5470 | |
| Lenovo ThinkPad P14s G3 AMD 21J6S05000 | |
| Lenovo ThinkPad T14 G3-21CF004NGE | |
| Przeciętny AMD Radeon 680M (6858 - 11755, n=39) | |
| HP ZBook Firefly 14 G9-6B8A2EA | |
| Lenovo ThinkPad P14s Gen2-20VX000GGE | |
| 3DMark | |
| 1280x720 Cloud Gate Standard Graphics | |
| Średnia w klasie Workstation (46927 - 152418, n=15, ostatnie 2 lata) | |
| Dell Precision 5000 5470 | |
| Lenovo ThinkPad T14 G3-21CF004NGE | |
| Lenovo ThinkPad P14s G3 AMD 21J6S05000 | |
| Przeciętny AMD Radeon 680M (24634 - 50120, n=31) | |
| Lenovo ThinkPad P14s Gen2-20VX000GGE | |
| 1920x1080 Fire Strike Graphics | |
| Średnia w klasie Workstation (7578 - 52560, n=25, ostatnie 2 lata) | |
| Dell Precision 5000 5470 | |
| Lenovo ThinkPad P14s G3 AMD 21J6S05000 | |
| Lenovo ThinkPad T14 G3-21CF004NGE | |
| Przeciętny AMD Radeon 680M (3791 - 7706, n=41) | |
| HP ZBook Firefly 14 G9-6B8A2EA | |
| Lenovo ThinkPad P14s Gen2-20VX000GGE | |
| 2560x1440 Time Spy Graphics | |
| Średnia w klasie Workstation (2725 - 24806, n=25, ostatnie 2 lata) | |
| Dell Precision 5000 5470 | |
| Lenovo ThinkPad P14s G3 AMD 21J6S05000 | |
| Lenovo ThinkPad T14 G3-21CF004NGE | |
| HP ZBook Firefly 14 G9-6B8A2EA | |
| Przeciętny AMD Radeon 680M (1359 - 2607, n=41) | |
| Lenovo ThinkPad P14s Gen2-20VX000GGE | |
| SPECviewperf Performance rating - Percent | |
| Średnia w klasie Workstation | |
| Dell Precision 5000 5470 | |
| HP ZBook Firefly 14 G9-6B8A2EA | |
| Lenovo ThinkPad P14s G3 AMD 21J6S05000 | |
| Przeciętny AMD Radeon 680M | |
| Lenovo ThinkPad T14 G3-21CF004NGE | |
| Lenovo ThinkPad P14s Gen2-20VX000GGE -1! | |
| 3DMark 11 Performance | 10377 pkt. | |
| 3DMark Cloud Gate Standard Score | 30226 pkt. | |
| 3DMark Fire Strike Score | 6722 pkt. | |
| 3DMark Time Spy Score | 2724 pkt. | |
Pomoc | ||
* ... im mniej tym lepiej
| Performance rating - Percent | |
| Średnia w klasie Workstation | |
| Dell Precision 5000 5470 | |
| HP ZBook Firefly 14 G9-6B8A2EA | |
| Lenovo ThinkPad P14s G3 AMD 21J6S05000 | |
| Lenovo ThinkPad T14 G3-21CF004NGE | |
| Lenovo ThinkPad P14s Gen2-20VX000GGE | |
| The Witcher 3 - 1920x1080 Ultra Graphics & Postprocessing (HBAO+) | |
| Średnia w klasie Workstation (26.3 - 91.7, n=3, ostatnie 2 lata) | |
| Dell Precision 5000 5470 | |
| Lenovo ThinkPad P14s G3 AMD 21J6S05000 | |
| Lenovo ThinkPad T14 G3-21CF004NGE | |
| HP ZBook Firefly 14 G9-6B8A2EA | |
| Lenovo ThinkPad P14s Gen2-20VX000GGE | |
| GTA V - 1920x1080 Highest AA:4xMSAA + FX AF:16x | |
| Średnia w klasie Workstation (18.1 - 156.1, n=24, ostatnie 2 lata) | |
| Dell Precision 5000 5470 | |
| HP ZBook Firefly 14 G9-6B8A2EA | |
| Lenovo ThinkPad P14s G3 AMD 21J6S05000 | |
| Lenovo ThinkPad T14 G3-21CF004NGE | |
| Lenovo ThinkPad P14s Gen2-20VX000GGE | |
| Final Fantasy XV Benchmark - 1920x1080 High Quality | |
| Średnia w klasie Workstation (26.4 - 197.6, n=25, ostatnie 2 lata) | |
| Dell Precision 5000 5470 | |
| Lenovo ThinkPad P14s G3 AMD 21J6S05000 | |
| Lenovo ThinkPad T14 G3-21CF004NGE | |
| HP ZBook Firefly 14 G9-6B8A2EA | |
| Lenovo ThinkPad P14s Gen2-20VX000GGE | |
| Strange Brigade - 1920x1080 ultra AA:ultra AF:16 | |
| Średnia w klasie Workstation (54.5 - 418, n=19, ostatnie 2 lata) | |
| Dell Precision 5000 5470 | |
| Lenovo ThinkPad T14 G3-21CF004NGE | |
| HP ZBook Firefly 14 G9-6B8A2EA | |
| Lenovo ThinkPad P14s G3 AMD 21J6S05000 | |
| Lenovo ThinkPad P14s Gen2-20VX000GGE | |
| Dota 2 Reborn - 1920x1080 ultra (3/3) best looking | |
| Dell Precision 5000 5470 | |
| Średnia w klasie Workstation (50.7 - 178.4, n=25, ostatnie 2 lata) | |
| HP ZBook Firefly 14 G9-6B8A2EA | |
| Lenovo ThinkPad P14s Gen2-20VX000GGE | |
| Lenovo ThinkPad T14 G3-21CF004NGE | |
| Lenovo ThinkPad P14s G3 AMD 21J6S05000 | |
| X-Plane 11.11 - 1920x1080 high (fps_test=3) | |
| Średnia w klasie Workstation (30.5 - 139.7, n=25, ostatnie 2 lata) | |
| Dell Precision 5000 5470 | |
| HP ZBook Firefly 14 G9-6B8A2EA | |
| Lenovo ThinkPad P14s Gen2-20VX000GGE | |
| Lenovo ThinkPad T14 G3-21CF004NGE | |
| Lenovo ThinkPad P14s G3 AMD 21J6S05000 | |
Witcher 3 fps diagram
| low | med. | high | ultra | |
|---|---|---|---|---|
| GTA V (2015) | 123.2 | 110.2 | 47.6 | 23.8 |
| The Witcher 3 (2015) | 111.1 | 42.6 | 26.8 | |
| Dota 2 Reborn (2015) | 90.2 | 84.7 | 67.4 | 57.8 |
| Final Fantasy XV Benchmark (2018) | 61.3 | 36.1 | 25.4 | |
| X-Plane 11.11 (2018) | 52 | 39.3 | 31.9 | |
| Far Cry 5 (2018) | 60 | 38 | 35 | 33 |
| Strange Brigade (2018) | 106.8 | 49.1 | 39.9 | 34.1 |
| F1 22 (2022) | 53.1 | 49.1 | 35.4 | 8.32 |
Emisje: Nieco głośniejszy niż ThinkPad T14 G3 AMD
Emisja hałasu
W porównaniu z ThinkPadem T14 Gen 3, ThinkPad P14s Gen 3 miał tendencję do bycia nieco głośniejszym - zwłaszcza w.. Witcher 3 teście. Choć ich maksymalne natężenie hałasu było porównywalne. Jego konkurenci z Della i HP mają dużo głośniejsze aktywne układy chłodzenia.
W P14s G3 nie udało nam się dostrzec żadnego wycie cewek - zaobserwowaliśmy jednak coś w rodzaju cichego trzeszczenia, które było prawdopodobnie tylko dyskiem SSD.
Hałas
| luz |
| 22.9 / 22.9 / 22.9 dB |
| obciążenie |
| 30.8 / 39.5 dB |
 | ||
30 dB cichy 40 dB(A) słyszalny 50 dB(A) irytujący |
||
min: | ||
| Lenovo ThinkPad P14s G3 AMD 21J6S05000 Radeon 680M, R7 PRO 6850U, Samsung PM9A1 MZVL21T0HCLR | Lenovo ThinkPad P14s Gen2-20VX000GGE T500 Laptop GPU, i7-1185G7, Toshiba XG6 KXG6AZNV1T02 | Lenovo ThinkPad T14 G3-21CF004NGE Radeon 680M, R7 PRO 6850U, Kioxia BG5 KBG5AZNV512G | Dell Precision 5000 5470 RTX A1000 Laptop GPU, i9-12900H, Samsung PM9A1 MZVL21T0HCLR | HP ZBook Firefly 14 G9-6B8A2EA T550 Laptop GPU, i7-1265U, Micron 3400 1TB MTFDKBA1T0TFH | |
|---|---|---|---|---|---|
| Noise | -9% | -3% | -16% | -9% | |
| wyłączone / środowisko * (dB) | 22.9 | 24.6 -7% | 24.2 -6% | 23 -0% | 23.6 -3% |
| Idle Minimum * (dB) | 22.9 | 24.6 -7% | 24.2 -6% | 23.3 -2% | 23.6 -3% |
| Idle Average * (dB) | 22.9 | 24.6 -7% | 24.2 -6% | 23.3 -2% | 23.6 -3% |
| Idle Maximum * (dB) | 22.9 | 24.6 -7% | 25.8 -13% | 23.3 -2% | 23.6 -3% |
| Load Average * (dB) | 30.8 | 38.9 -26% | 32.2 -5% | 48.5 -57% | 42.5 -38% |
| Witcher 3 ultra * (dB) | 39.4 | 34.1 13% | 48.6 -23% | 42.5 -8% | |
| Load Maximum * (dB) | 39.5 | 38.9 2% | 38.8 2% | 50.4 -28% | 42.5 -8% |
* ... im mniej tym lepiej
Temperatura
P14s G3 AMD jest stosunkowo chłodnym laptopem. Zwłaszcza oparty na Intelu poprzednik P14s Gen 2 działał znacznie goręcej. W P14s zmierzyliśmy maksymalnie 43,1 stopnia Celsjusza, czyli również poniżej maksymalnej temperatury T14 Gen 3 AMD - prawdopodobnie z powodu nieco bardziej aktywnego wentylatora.
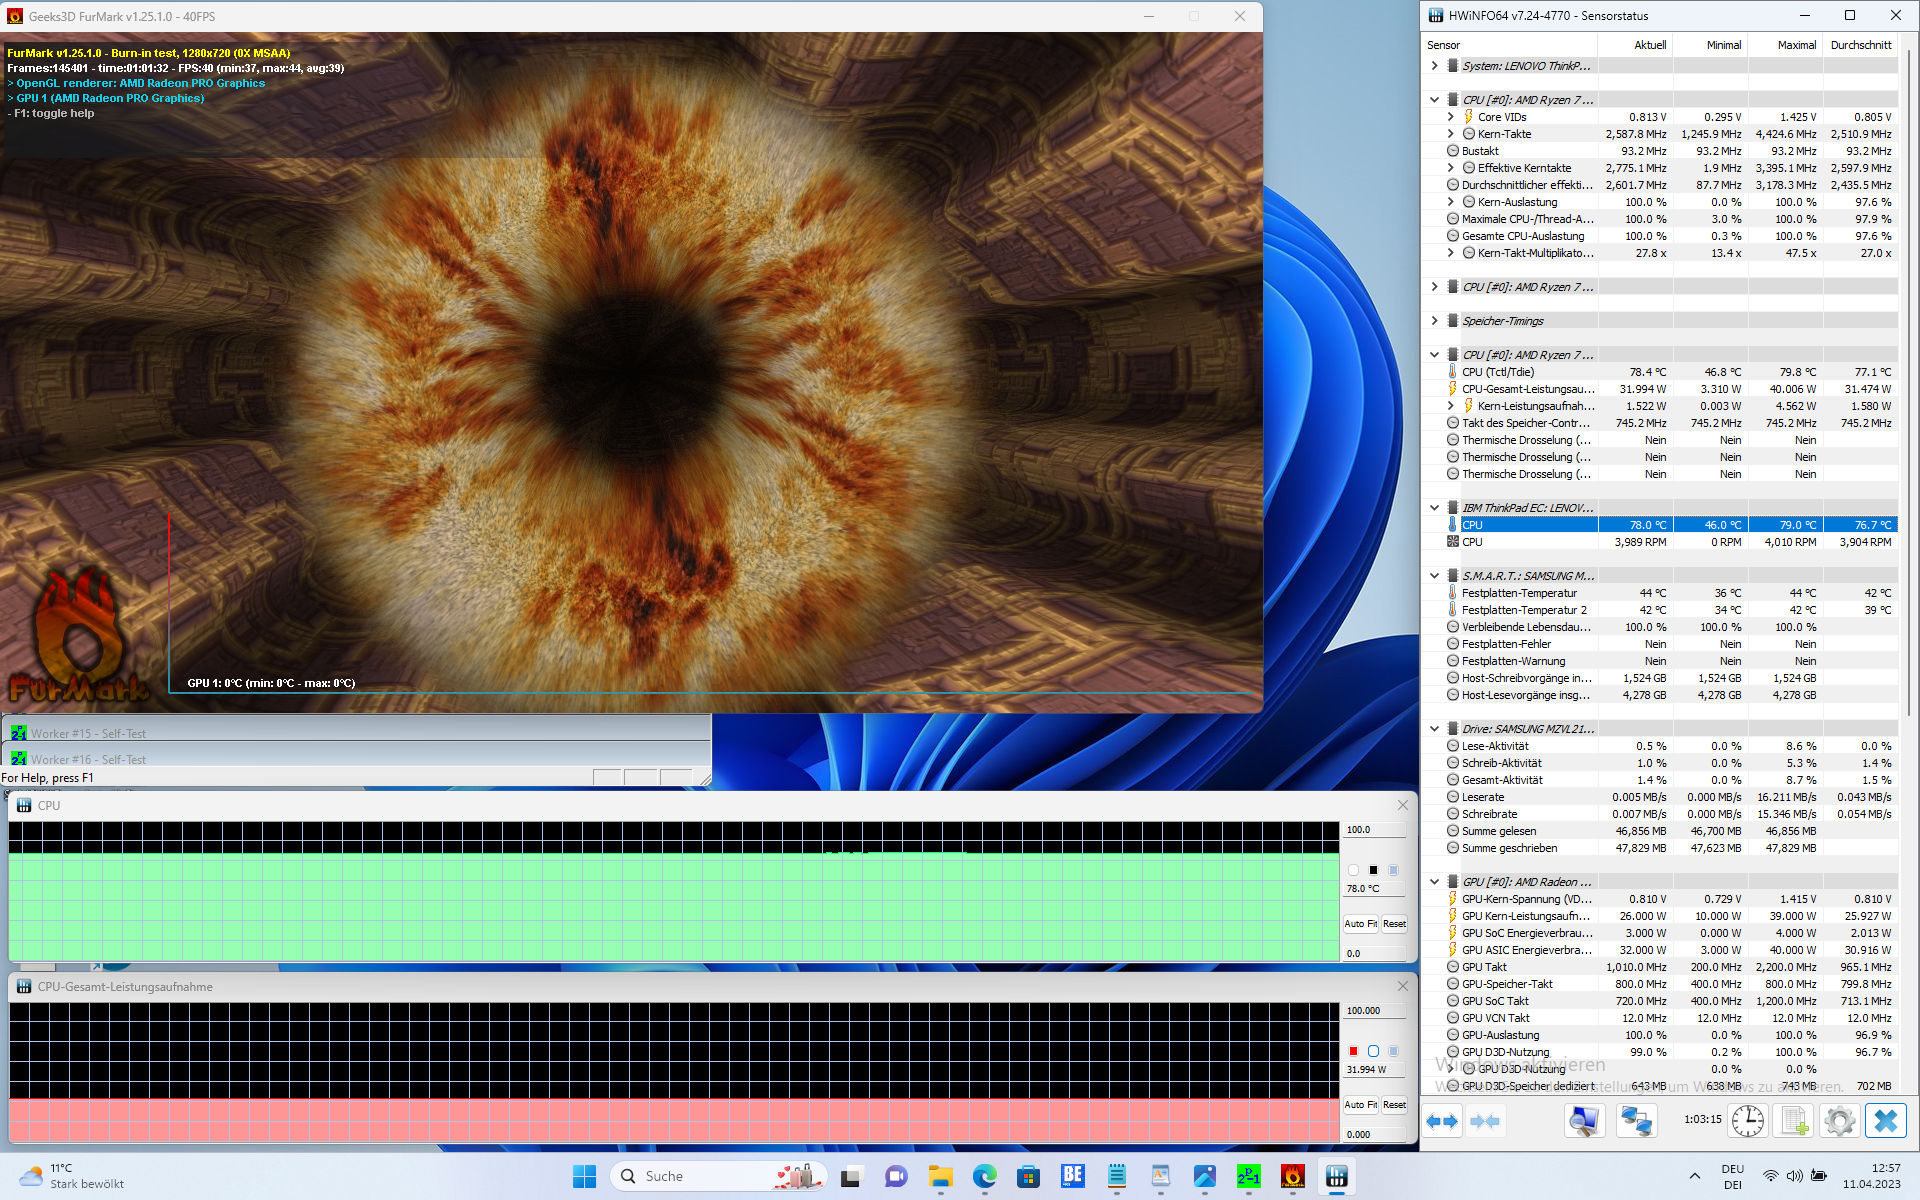
W stress teście nie było absolutnie żadnego throttlingu, jego procesor był w stanie utrzymać stabilną wydajność.
(±) Maksymalna temperatura w górnej części wynosi 42.7 °C / 109 F, w porównaniu do średniej 38.2 °C / 101 F , począwszy od 22.2 do 69.8 °C dla klasy Workstation.
(±) Dno nagrzewa się maksymalnie do 43.1 °C / 110 F, w porównaniu do średniej 41.1 °C / 106 F
(+) W stanie bezczynności średnia temperatura górnej części wynosi 24.6 °C / 76 F, w porównaniu ze średnią temperaturą urządzenia wynoszącą 32 °C / ### class_avg_f### F.
(±) Podczas gry w Wiedźmina 3 średnia temperatura górnej części wynosi 32.3 °C / 90 F, w porównaniu do średniej temperatury urządzenia wynoszącej 32 °C / ## #class_avg_f### F.
(+) Podpórki pod nadgarstki i touchpad są chłodniejsze niż temperatura skóry i maksymalnie 26.8 °C / 80.2 F i dlatego są chłodne w dotyku.
(±) Średnia temperatura obszaru podparcia dłoni w podobnych urządzeniach wynosiła 27.8 °C / 82 F (+1 °C / 1.8 F).
| Lenovo ThinkPad P14s G3 AMD 21J6S05000 AMD Ryzen 7 PRO 6850U, AMD Radeon 680M | Lenovo ThinkPad P14s Gen2-20VX000GGE Intel Core i7-1185G7, NVIDIA T500 Laptop GPU | Lenovo ThinkPad T14 G3-21CF004NGE AMD Ryzen 7 PRO 6850U, AMD Radeon 680M | Dell Precision 5000 5470 Intel Core i9-12900H, NVIDIA RTX A1000 Laptop GPU | HP ZBook Firefly 14 G9-6B8A2EA Intel Core i7-1265U, NVIDIA T550 Laptop GPU | |
|---|---|---|---|---|---|
| Heat | -16% | -6% | -11% | -3% | |
| Maximum Upper Side * (°C) | 42.7 | 52.4 -23% | 48.2 -13% | 41.8 2% | 41.2 4% |
| Maximum Bottom * (°C) | 43.1 | 63.7 -48% | 52.8 -23% | 36 16% | 47.9 -11% |
| Idle Upper Side * (°C) | 25.7 | 24.6 4% | 24.4 5% | 34.6 -35% | 26.5 -3% |
| Idle Bottom * (°C) | 26.4 | 26 2% | 24.5 7% | 33.6 -27% | 27 -2% |
* ... im mniej tym lepiej
Mówcy
Głośniki ThinkPada P14s Gen 3, które są umieszczone nad klawiaturą, nie są szczególnie dobre. Są one zbyt ciche i mało basowe. Do słuchania muzyki zdecydowanie zalecane jest rozwiązanie zewnętrzne.
Lenovo ThinkPad P14s G3 AMD 21J6S05000 analiza dźwięku
(-) | niezbyt głośne głośniki (###wartość### dB)
Bas 100 - 315 Hz
(-) | prawie brak basu - średnio 20.4% niższa od mediany
(-) | bas nie jest liniowy (15.1% delta do poprzedniej częstotliwości)
Średnie 400 - 2000 Hz
(+) | zbalansowane środki średnie - tylko 1.6% od mediany
(+) | średnie są liniowe (5.8% delta do poprzedniej częstotliwości)
Wysokie 2–16 kHz
(+) | zrównoważone maksima - tylko 2% od mediany
(+) | wzloty są liniowe (6.1% delta do poprzedniej częstotliwości)
Ogólnie 100 - 16.000 Hz
(±) | liniowość ogólnego dźwięku jest średnia (18.7% różnicy w stosunku do mediany)
W porównaniu do tej samej klasy
» 63% wszystkich testowanych urządzeń w tej klasie było lepszych, 8% podobnych, 29% gorszych
» Najlepszy miał deltę 7%, średnia wynosiła ###średnia###%, najgorsza wynosiła 35%
W porównaniu do wszystkich testowanych urządzeń
» 43% wszystkich testowanych urządzeń było lepszych, 8% podobnych, 50% gorszych
» Najlepszy miał deltę 4%, średnia wynosiła ###średnia###%, najgorsza wynosiła 134%
HP ZBook Firefly 14 G9-6B8A2EA analiza dźwięku
(+) | głośniki mogą odtwarzać stosunkowo głośno (84.5 dB)
Bas 100 - 315 Hz
(-) | prawie brak basu - średnio 19.6% niższa od mediany
(±) | liniowość basu jest średnia (13% delta do poprzedniej częstotliwości)
Średnie 400 - 2000 Hz
(+) | zbalansowane środki średnie - tylko 2.5% od mediany
(+) | średnie są liniowe (3.5% delta do poprzedniej częstotliwości)
Wysokie 2–16 kHz
(+) | zrównoważone maksima - tylko 1.9% od mediany
(+) | wzloty są liniowe (3.2% delta do poprzedniej częstotliwości)
Ogólnie 100 - 16.000 Hz
(+) | ogólny dźwięk jest liniowy (12.7% różnicy w stosunku do mediany)
W porównaniu do tej samej klasy
» 21% wszystkich testowanych urządzeń w tej klasie było lepszych, 4% podobnych, 74% gorszych
» Najlepszy miał deltę 7%, średnia wynosiła ###średnia###%, najgorsza wynosiła 35%
W porównaniu do wszystkich testowanych urządzeń
» 12% wszystkich testowanych urządzeń było lepszych, 3% podobnych, 86% gorszych
» Najlepszy miał deltę 4%, średnia wynosiła ###średnia###%, najgorsza wynosiła 134%
Zarządzanie energią: Wydajność AMD zapewnia dobre czasy pracy
Pobór mocy
Jego zużycie energii jest bardzo podobne do ThinkPada T14 G3 - z tą różnicą, że ThinkPad P14s G3 zużywa nieco więcej pod obciążeniem. Jego zużycie jest jednak nadal na tyle niskie, że 65-watowy zasilacz jest więcej niż wystarczający. Inaczej jest w przypadku jego konkurentów - Della i HP.
| wyłączony / stan wstrzymania | |
| luz | |
| obciążenie |
|
Legenda:
min: | |
| Lenovo ThinkPad P14s G3 AMD 21J6S05000 R7 PRO 6850U, Radeon 680M, Samsung PM9A1 MZVL21T0HCLR, IPS LED, 1920x1200, 14" | Lenovo ThinkPad P14s Gen2-20VX000GGE i7-1185G7, T500 Laptop GPU, Toshiba XG6 KXG6AZNV1T02, IPS, 1920x1080, 14" | Lenovo ThinkPad T14 G3-21CF004NGE R7 PRO 6850U, Radeon 680M, Kioxia BG5 KBG5AZNV512G, IPS, 1920x1200, 14" | Dell Precision 5000 5470 i9-12900H, RTX A1000 Laptop GPU, Samsung PM9A1 MZVL21T0HCLR, IPS, 2560x1600, 14" | HP ZBook Firefly 14 G9-6B8A2EA i7-1265U, T550 Laptop GPU, Micron 3400 1TB MTFDKBA1T0TFH, IPS, 1920x1200, 14" | Przeciętny AMD Radeon 680M | Średnia w klasie Workstation | |
|---|---|---|---|---|---|---|---|
| Power Consumption | -34% | 9% | -110% | -19% | -72% | -182% | |
| Idle Minimum * (Watt) | 2.6 | 4.5 -73% | 2.4 8% | 4.3 -65% | 4.2 -62% | 6.93 ? -167% | 8.94 ? -244% |
| Idle Average * (Watt) | 5 | 7.1 -42% | 5.3 -6% | 8.9 -78% | 6.5 -30% | 8.98 ? -80% | 13.8 ? -176% |
| Idle Maximum * (Watt) | 5.6 | 9.7 -73% | 5.6 -0% | 18.9 -238% | 7.2 -29% | 10.5 ? -88% | 17.5 ? -213% |
| Load Average * (Watt) | 49.7 | 37.8 24% | 39.7 20% | 94 -89% | 47.7 4% | 53.5 ? -8% | 95 ? -91% |
| Witcher 3 ultra * (Watt) | 50.6 | 42.8 15% | 83.2 -64% | 42.9 15% | |||
| Load Maximum * (Watt) | 61.1 | 64.7 -6% | 50.6 17% | 137.5 -125% | 68.2 -12% | 70.5 ? -15% | 175.2 ? -187% |
* ... im mniej tym lepiej
Power consumption Witcher 3 / stress test
Power consumption with external monitor
Żywotność baterii
Podobnie jak w ThinkPadzie T14 Gen 3 Lenovo, ThinkPad P14s G3 potrafi wyciągnąć sporo ze swojego 52,5-watowego akumulatora. Dwanaście godzin w teście Wi-Fi (150 cd/m²) to wynik godny szacunku. Nawet przy maksymalnej jasności wyświetlacza laptop ThinkPad działał jeszcze przez prawie dziesięć godzin w teście Wi-Fi. Jego bazujący na Intelu rywale z Della i HP mogą o tym tylko pomarzyć.
| Lenovo ThinkPad P14s G3 AMD 21J6S05000 R7 PRO 6850U, Radeon 680M, 52.5 Wh | Lenovo ThinkPad P14s Gen2-20VX000GGE i7-1185G7, T500 Laptop GPU, 50 Wh | Lenovo ThinkPad T14 G3-21CF004NGE R7 PRO 6850U, Radeon 680M, 52.5 Wh | Dell Precision 5000 5470 i9-12900H, RTX A1000 Laptop GPU, 72 Wh | HP ZBook Firefly 14 G9-6B8A2EA i7-1265U, T550 Laptop GPU, 51 Wh | Średnia w klasie Workstation | |
|---|---|---|---|---|---|---|
| Czasy pracy | -25% | 20% | -11% | -28% | -7% | |
| H.264 (h) | 12 | 16.4 37% | 9.51 ? -21% | |||
| WiFi v1.3 (h) | 12.2 | 9.2 -25% | 12.9 6% | 9.6 -21% | 8.8 -28% | 8.53 ? -30% |
| Load (h) | 1.1 | 1.3 18% | 1.1 0% | 1.429 ? 30% |
Za
Przeciw
Werdykt: Lenovo ThinkPad P14s G3 AMD to świetna stacja robocza klasy podstawowej

Mobilna stacja robocza, która przez wiele godzin renderuje rozbudowane projekty CAD lub która może być wykorzystywana do tworzenia gier - tym właśnie nie jest Lenovo ThinkPad P14s Gen 3 AMD. Jest to raczej model klasy podstawowej, który przede wszystkim oferuje dobrą wydajność CPU, ale pod względem wydajności GPU pozostaje daleko w tyle za większymi laptopami typu workstation. Laptop Lenovo nadrabia tę niższą wydajność bardzo dobrą mobilnością.
To też powinno dać do zrozumienia, że nie ma on zastąpić "dużych" stacji roboczych, takich jak ThinkPad P16. Jest to wariant ThinkPada T14 G3 - laptopa biurowego, który jest sprzedawany również dla klientów stacji roboczych. Logicznie rzecz biorąc, dzieli on podobne mocne i słabe strony z m.in ThinkPad T14 G3 AMD. Jego brak gniazda kart SD jest jedną z tych słabości, podobnie jak nieobsługiwany standard USB4. Wlutowana pamięć RAM jest jeszcze bardziej uciążliwa w urządzeniu dla stacji roboczej, a klawiatura nie jest na tym samym poziomie w porównaniu z P14s Gen 2, choć nadal jest bardzo dobra. Jego obecność w sieci Ethernet i łatwo wymienialna klawiatura to również pozytywy.
Dobra wydajność CPU i czas pracy na baterii, niska wydajność GPU jak na stację roboczą: Lenovo ThinkPad P14s Gen 3 AMD
Lenovo ThinkPad P14s Gen 3 AMD to doskonała mobilna stacja robocza do zadań wymagających wydajności procesora. Jej główni konkurenci to HP ZBook Firefly 14 G9, który oferuje Thunderbolt, ale ma gorszą wydajność wielordzeniową i krótszy czas pracy na baterii dzięki bardziej niewydajnemu procesorowi Intela. Inną alternatywą jest Dell Precision 5470, który charakteryzuje się przede wszystkim znacznie lepszą wydajnością GPU - ale ponosi duże ofiary w zakresie portów (poza obecnością Thunderbolt i czytnika kart SD).
Cena i dostępność
Testowany przez nas model z procesorem Ryzen 7, wyświetlaczem WUXGA, 32 GB RAM i 1 TB SSD o numerze modelu 21J6S05000 to model specjalny, który jest dostępny tylko w programie Lenovo Campus dla uprawnionych nabywców. Kosztuje on około 1 640 dolarów i jest dostarczany bez systemu operacyjnego. Dla wszystkich innych klientów model ten z systemem Windows 11 Pro(21J5002FGE) jest dostępny za około 1900 dolarów. Amazon ma w ofercie ThinkPad P14s Gen 3 AMD z ekranem o wyższej rozdzielczości WQUXGA za około 1 661 dolarów.
Lenovo ThinkPad P14s G3 AMD 21J6S05000
- 17/04/2023 v7 (old)
Benjamin Herzig
Przezroczystość
Wyboru urządzeń do recenzji dokonuje nasza redakcja. Próbka testowa została udostępniona autorowi jako pożyczka od producenta lub sprzedawcy detalicznego na potrzeby tej recenzji. Pożyczkodawca nie miał wpływu na tę recenzję, producent nie otrzymał też kopii tej recenzji przed publikacją. Nie było obowiązku publikowania tej recenzji. Jako niezależna firma medialna, Notebookcheck nie podlega władzy producentów, sprzedawców detalicznych ani wydawców.
Tak testuje Notebookcheck
Każdego roku Notebookcheck niezależnie sprawdza setki laptopów i smartfonów, stosując standardowe procedury, aby zapewnić porównywalność wszystkich wyników. Od około 20 lat stale rozwijamy nasze metody badawcze, ustanawiając przy tym standardy branżowe. W naszych laboratoriach testowych doświadczeni technicy i redaktorzy korzystają z wysokiej jakości sprzętu pomiarowego. Testy te obejmują wieloetapowy proces walidacji. Nasz kompleksowy system ocen opiera się na setkach uzasadnionych pomiarów i benchmarków, co pozwala zachować obiektywizm.Price comparison

