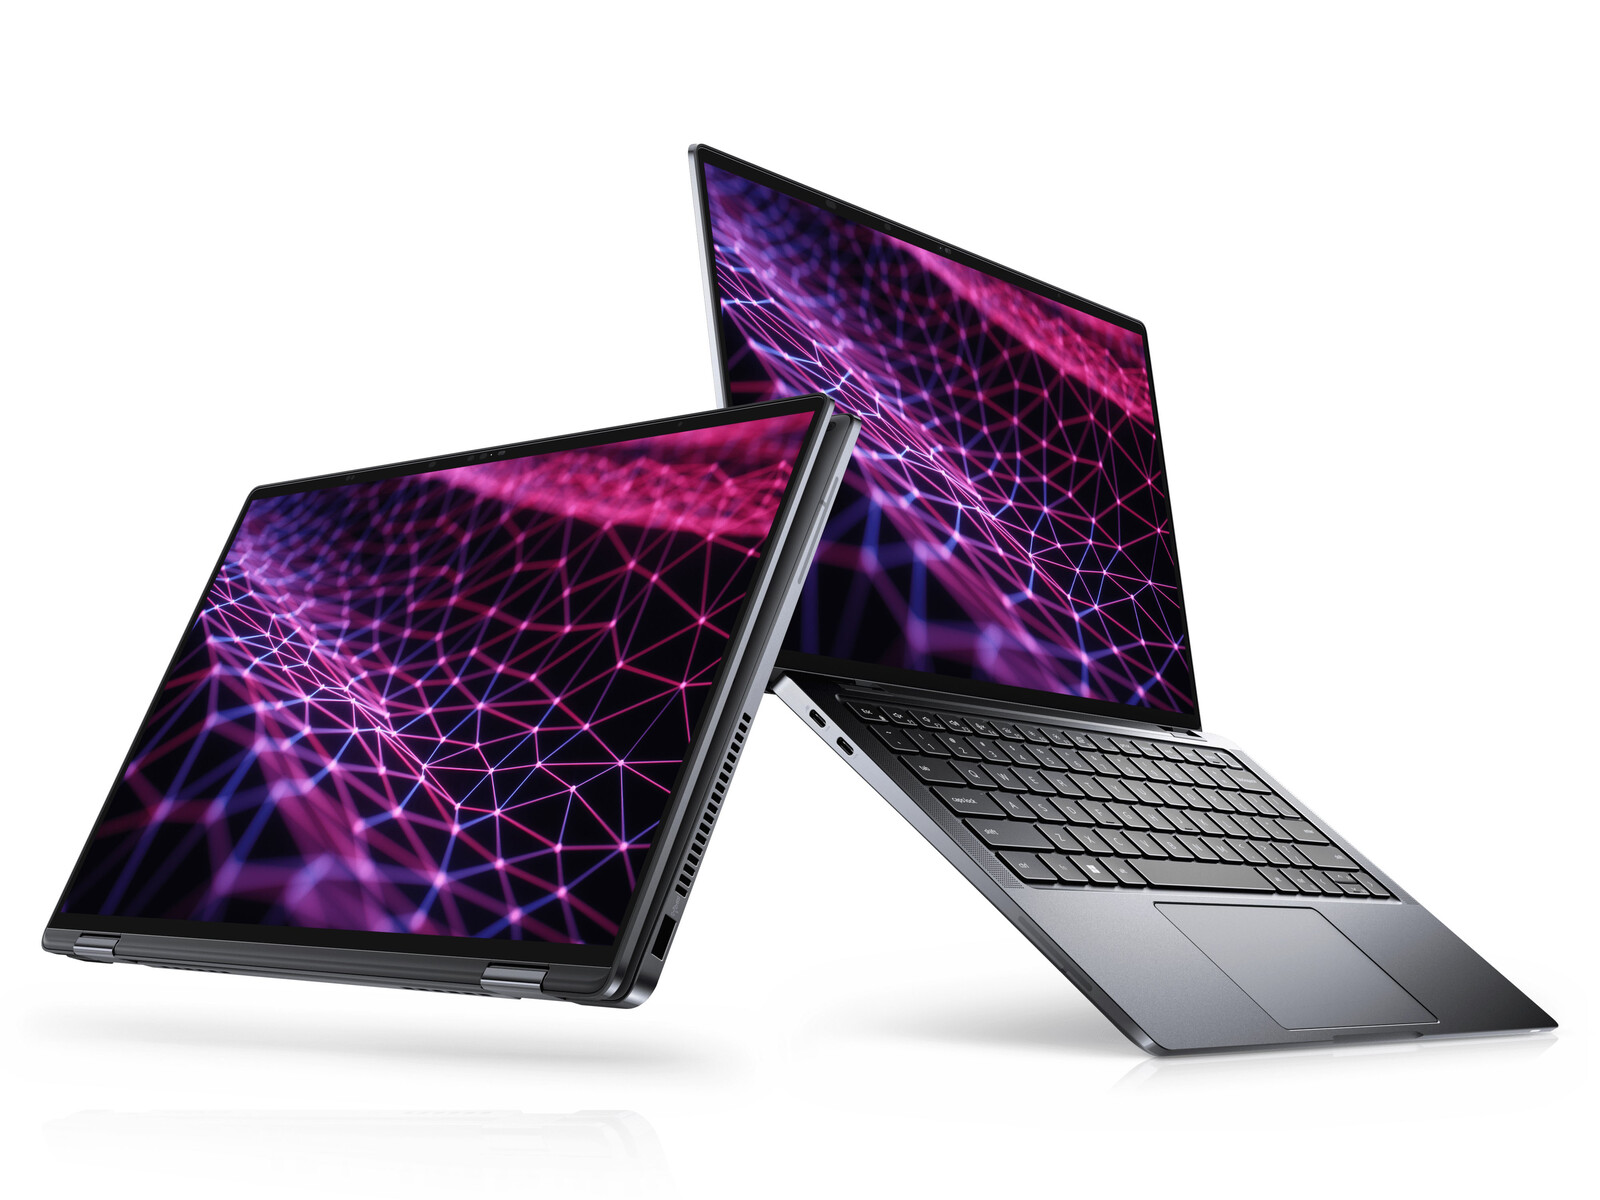
Debiut Core i7-1260U: Recenzja kabrioletu Dell Latitude 13 9330 2-w-1
W serii Latitude 9000 znajdują się flagowe laptopy biznesowe Dell, które stanowią kontrast dla wyższej klasy średniej Latitude 7000 seria 7000, średnia Latitude 5000 i niskiej klasy Latitude 3000 seria 3000. Nasz model w recenzji to Latitude 9330, który jest pierwszym 13,3-calowym kabrioletem w rodzinie Latitude 9000
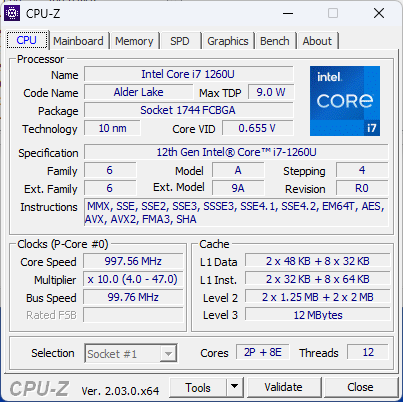
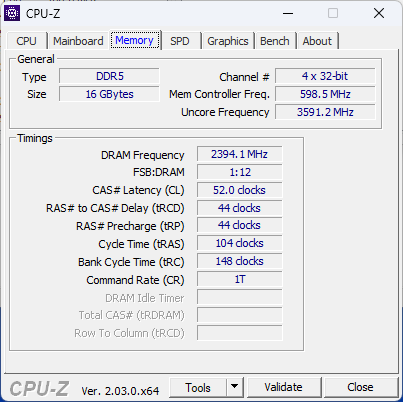
Nasza konkretna konfiguracja to najwyższy SKU z procesorem Core i7-1260U 12. generacji, 32 GB LPDDR5 RAM i 512 GB NVMe SSD za około 2700 USD. Inne SKU z wolniejszym procesorem Core i5-1240U i połową pamięci RAM i pamięci masowej są również dostępne od 2000 USD, ale wszystkie opcje inaczej są wyposażone tylko w zintegrowaną grafikę i ten sam ekran dotykowy IPS o rozdzielczości 2560 x 1600
Konkurencję dla Latitude 9330 stanowią inne wysokiej klasy 13-calowe biznesowe komputery konwertowalne, np Lenovo ThinkPad X1 Yoga G1, MSI Summit E13 "Flip, czy HP Elite Dragonfly Max.
Więcej recenzji Della
Potencjalni konkurenci w porównaniu
Ocena | Data | Model | Waga | Wysokość | Rozmiar | Rezolucja | Cena |
|---|---|---|---|---|---|---|---|
| 89 % v7 (old) | 11/2022 | Dell Latitude 9330 i7-1260U, Iris Xe G7 96EUs | 1.2 kg | 14.1 mm | 13.30" | 2560x1600 | |
| 88.5 % v7 (old) | Lenovo ThinkPad X1 Titanium Yoga G1 20QB0016GE i5-1140G7, Iris Xe G7 80EUs | 1.2 kg | 11.5 mm | 13.50" | 2256x1504 | ||
| 86.9 % v7 (old) | MSI Summit E13 Flip Evo A11MT i7-1185G7, Iris Xe G7 96EUs | 1.4 kg | 14.9 mm | 13.40" | 1920x1200 | ||
| 90 % v7 (old) | HP EliteBook x360 1030 G7 i7-10810U, UHD Graphics 620 | 1.2 kg | 16 mm | 13.30" | 1920x1080 | ||
| 90.8 % v7 (old) | HP Elite Dragonfly Max i7-1185G7, Iris Xe G7 96EUs | 1.2 kg | 16 mm | 13.30" | 1920x1080 | ||
| 87.2 % v7 (old) | Dell Latitude 5310-23VP6 i5-10310U, UHD Graphics 620 | 1.3 kg | 19.7 mm | 13.30" | 1920x1080 |
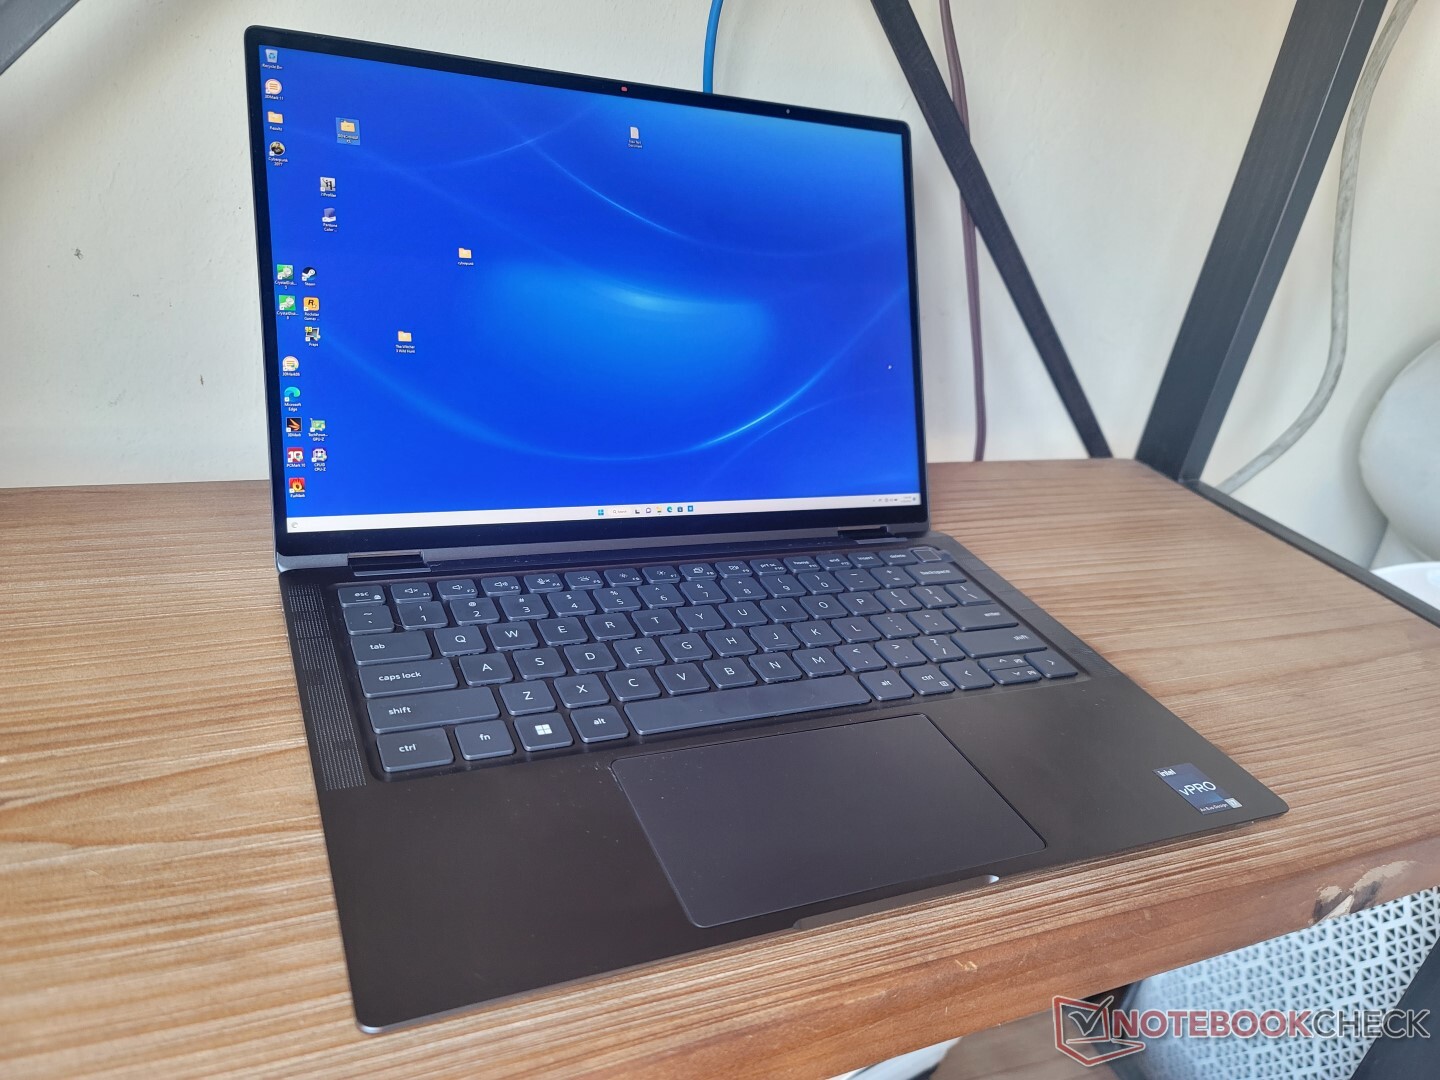
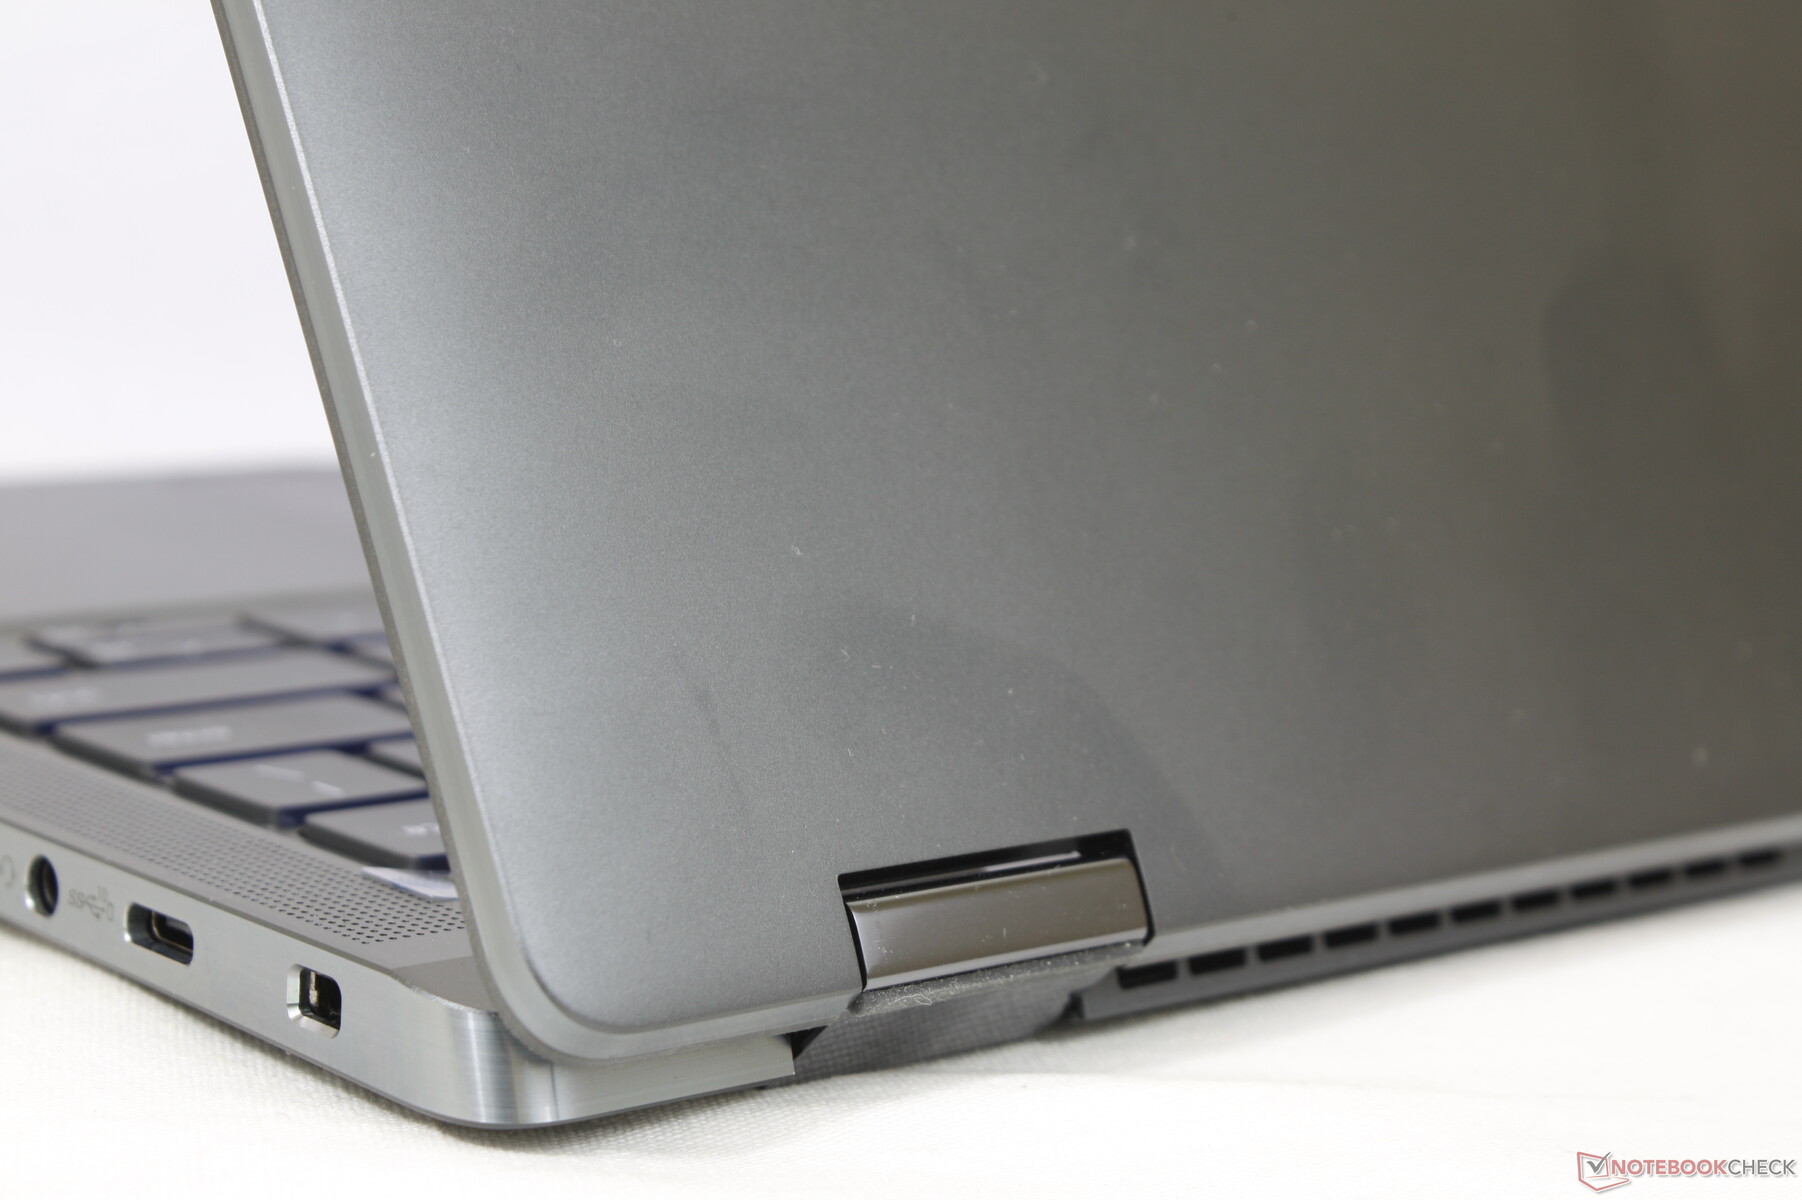
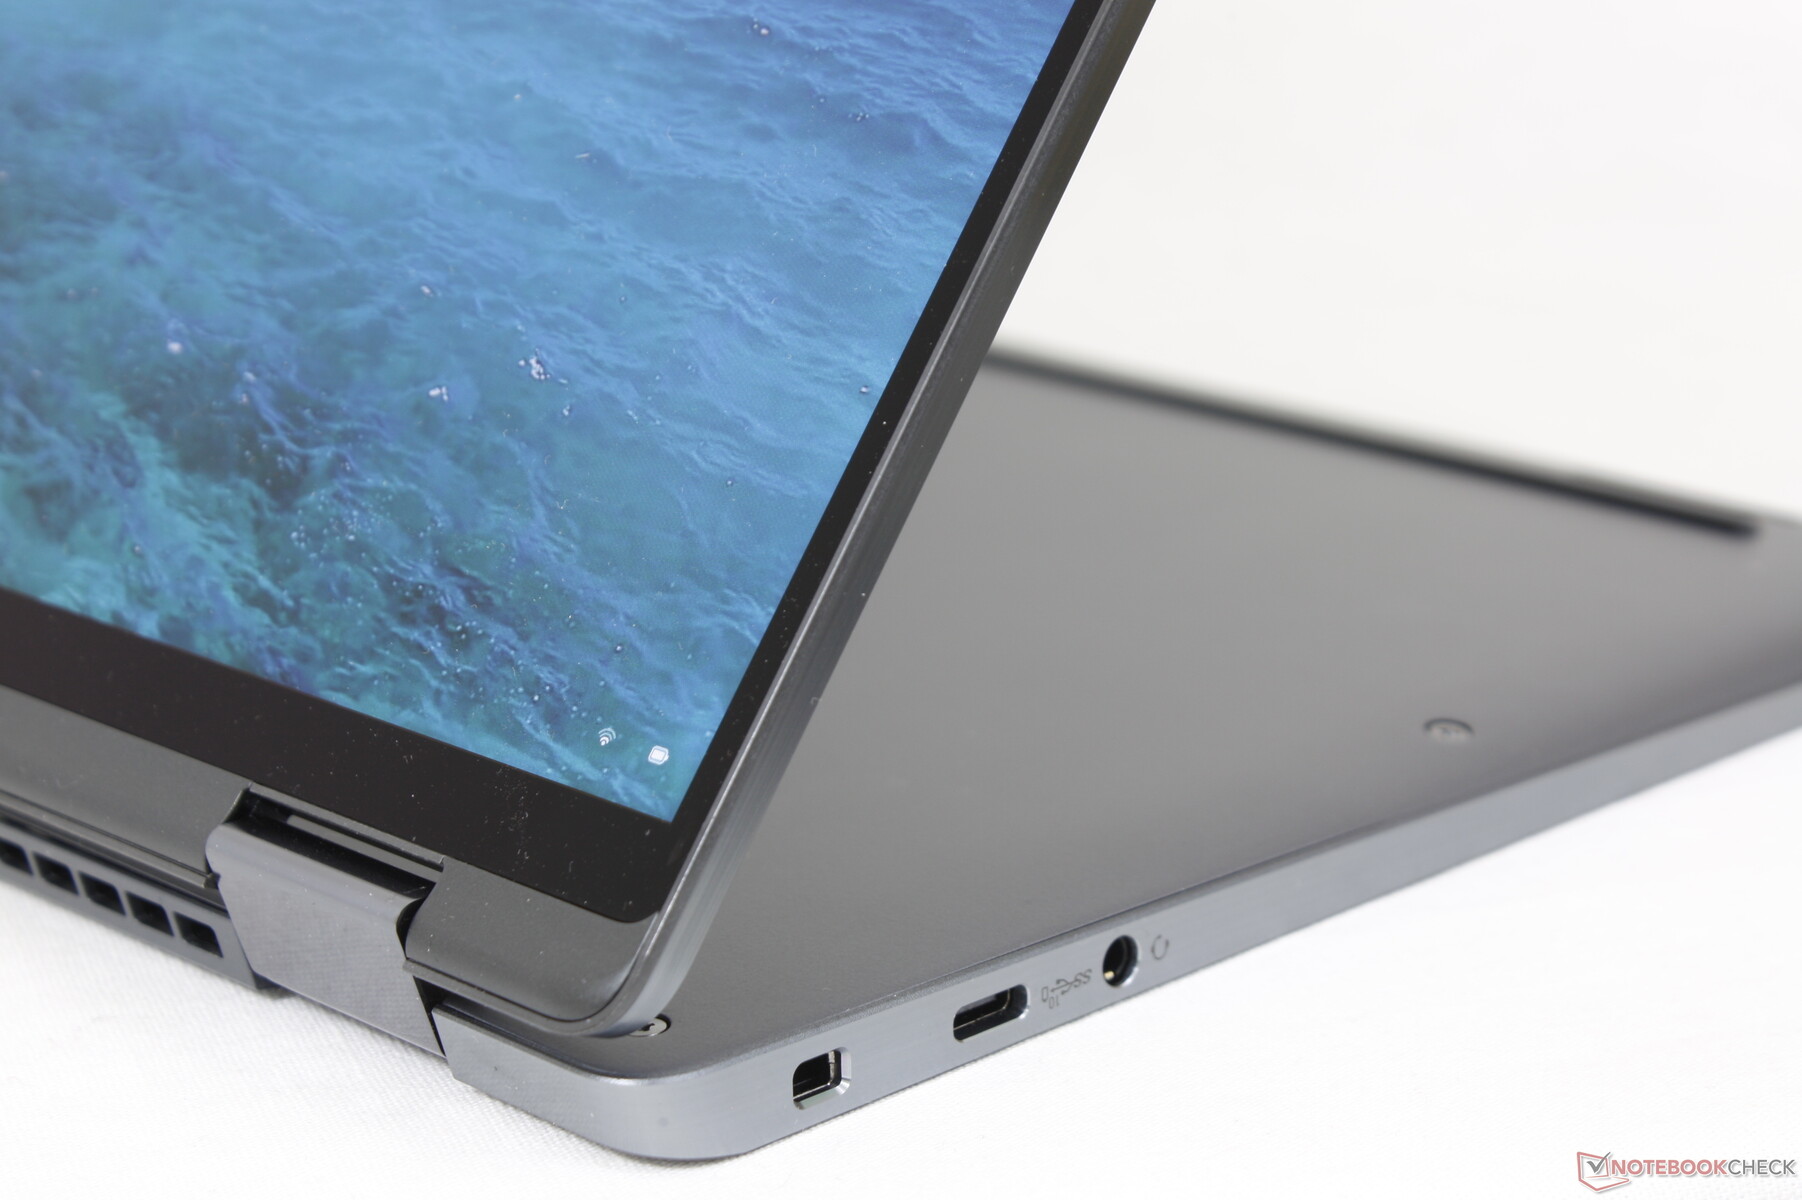
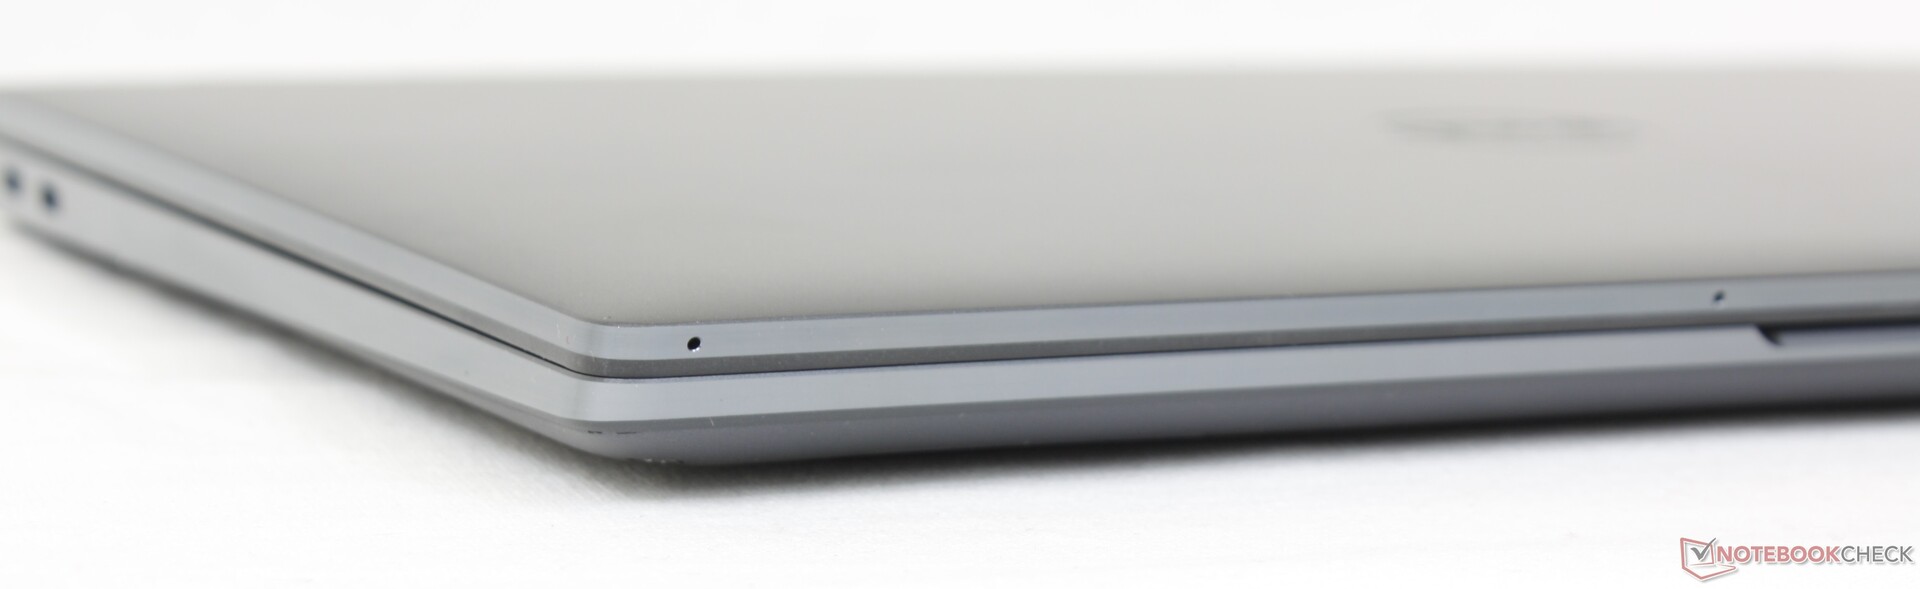
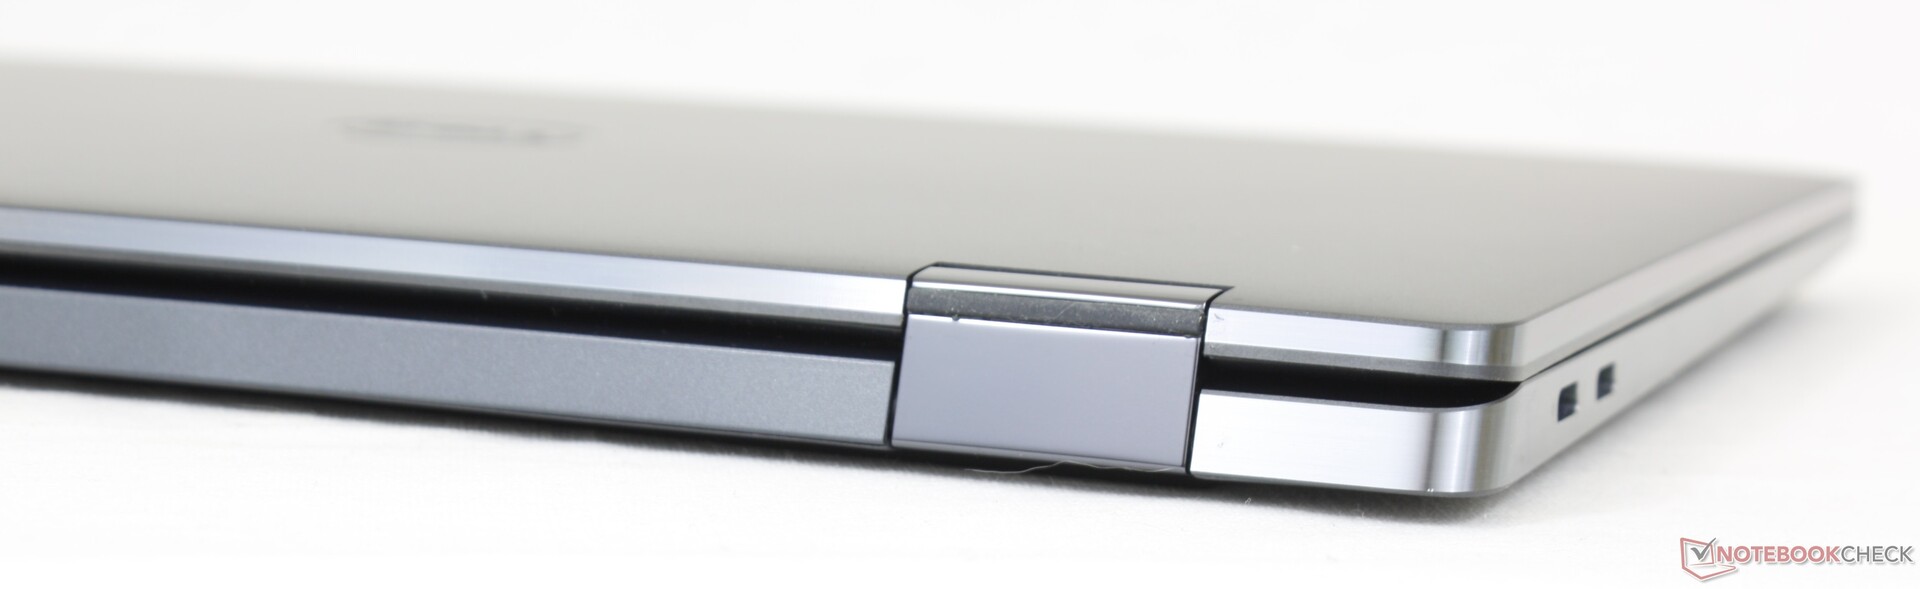
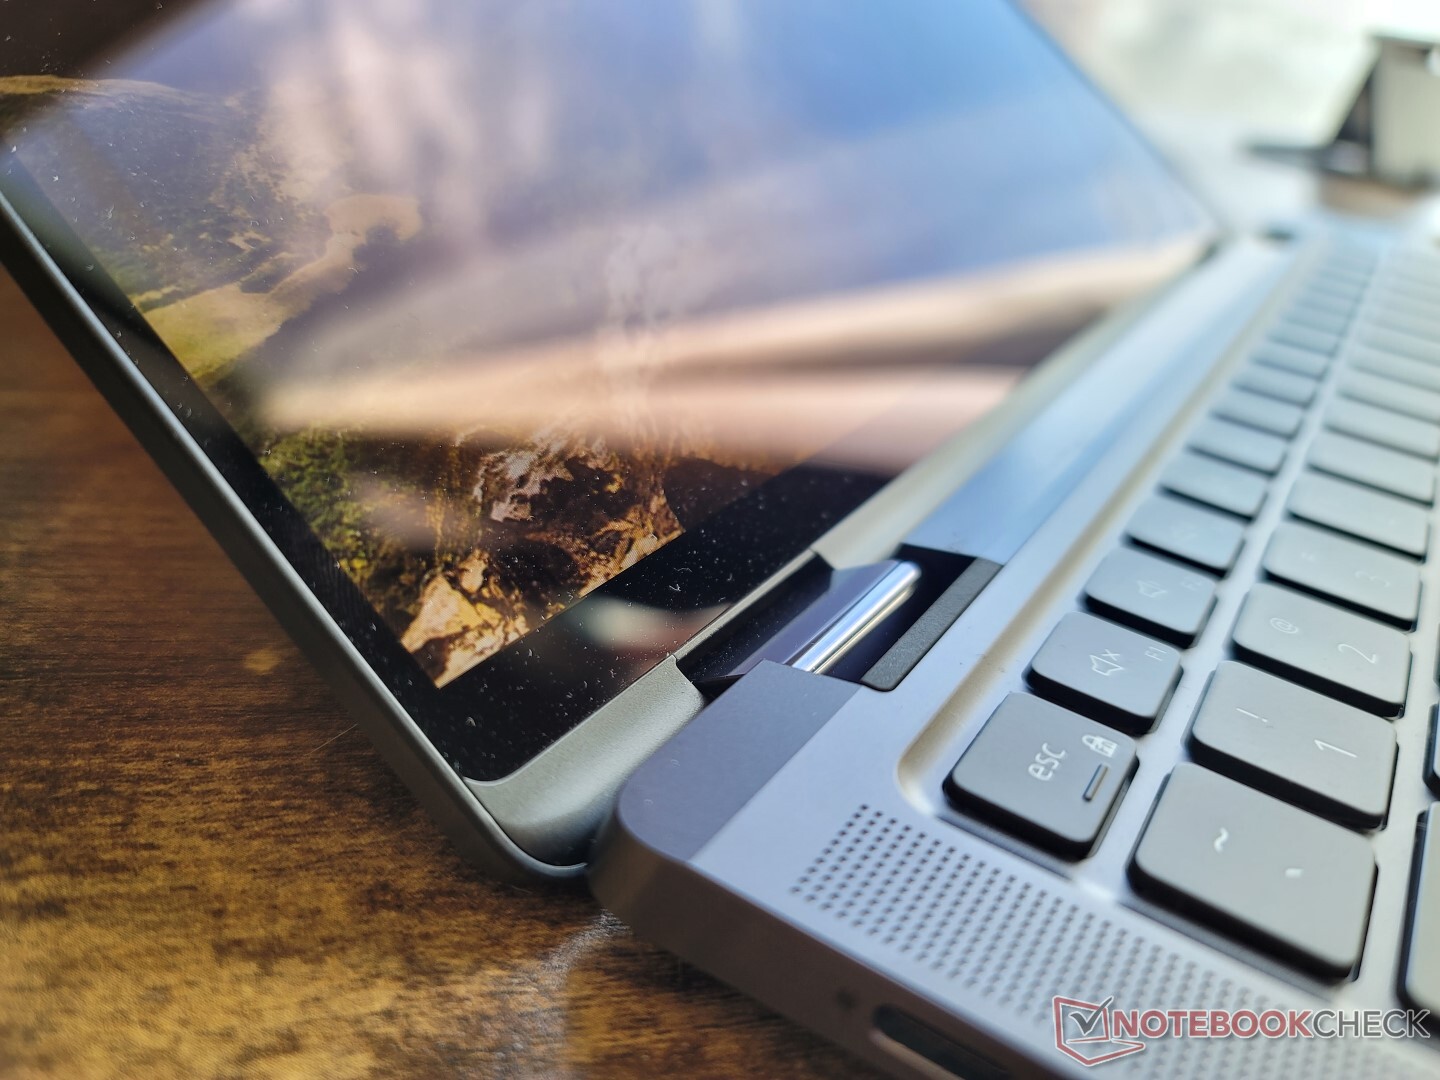
Obudowa - nudny wygląd, mocna konstrukcja
Szary metalowy szkielet może nie wyglądać zbyt dobrze, zwłaszcza w porównaniu z krzykliwymi złotymi konstrukcjami MSI Summit E13 Flip czy HP Spectre ale jest równie mocny, jeśli nie bardziej. Próba wykręcenia podstawy po bokach lub w dół od środka klawiatury skutkuje tylko minimalnym odkształceniem, co zapewnia doskonałe pierwsze wrażenie. Nawet wyświetlacz jest odporny na skręcanie i wyginanie. Ogólna sztywność jest jedną z najlepszych, jakie widzieliśmy w jakimkolwiek ultracienkim subnotebooku konwertowalnym.
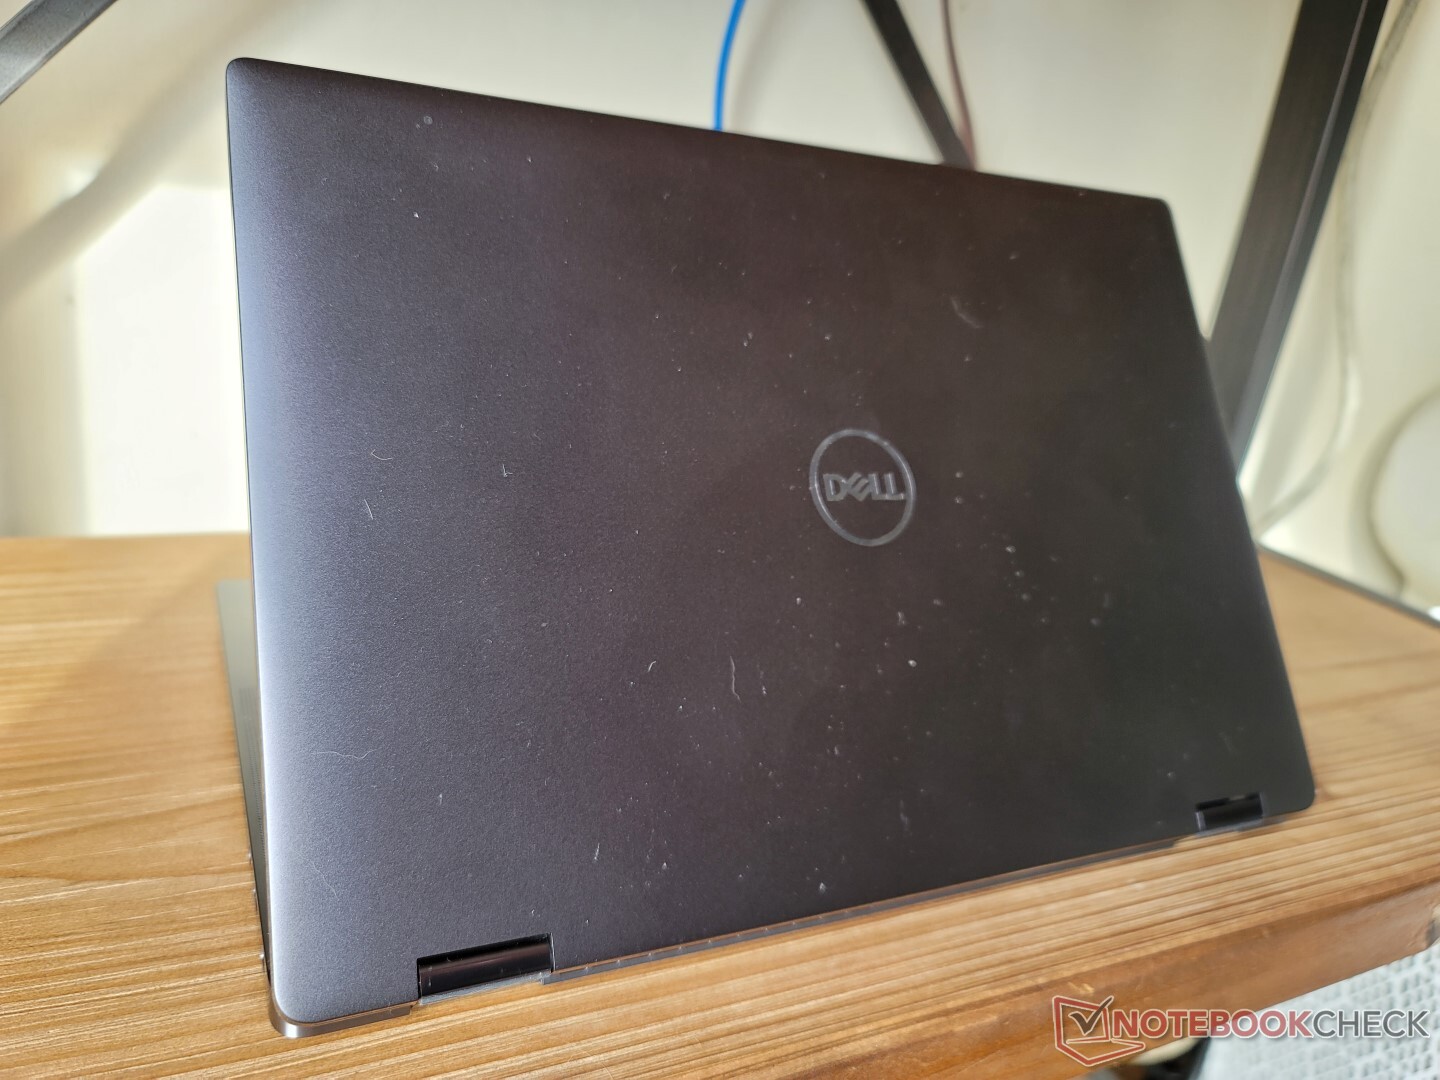
Wymiary i waga są zbliżone do Elite Dragonfly Max. Model Della jest nieco dłuższy ze względu na wyższe proporcje 16:10 vs. 16:9 HP, ale konstrukcja Della nadrabia to węższymi ramkami bocznymi i cieńszym profilem. Tymczasem Summit E13 Flip to jeszcze większy i cięższy 13-calowy kabriolet.
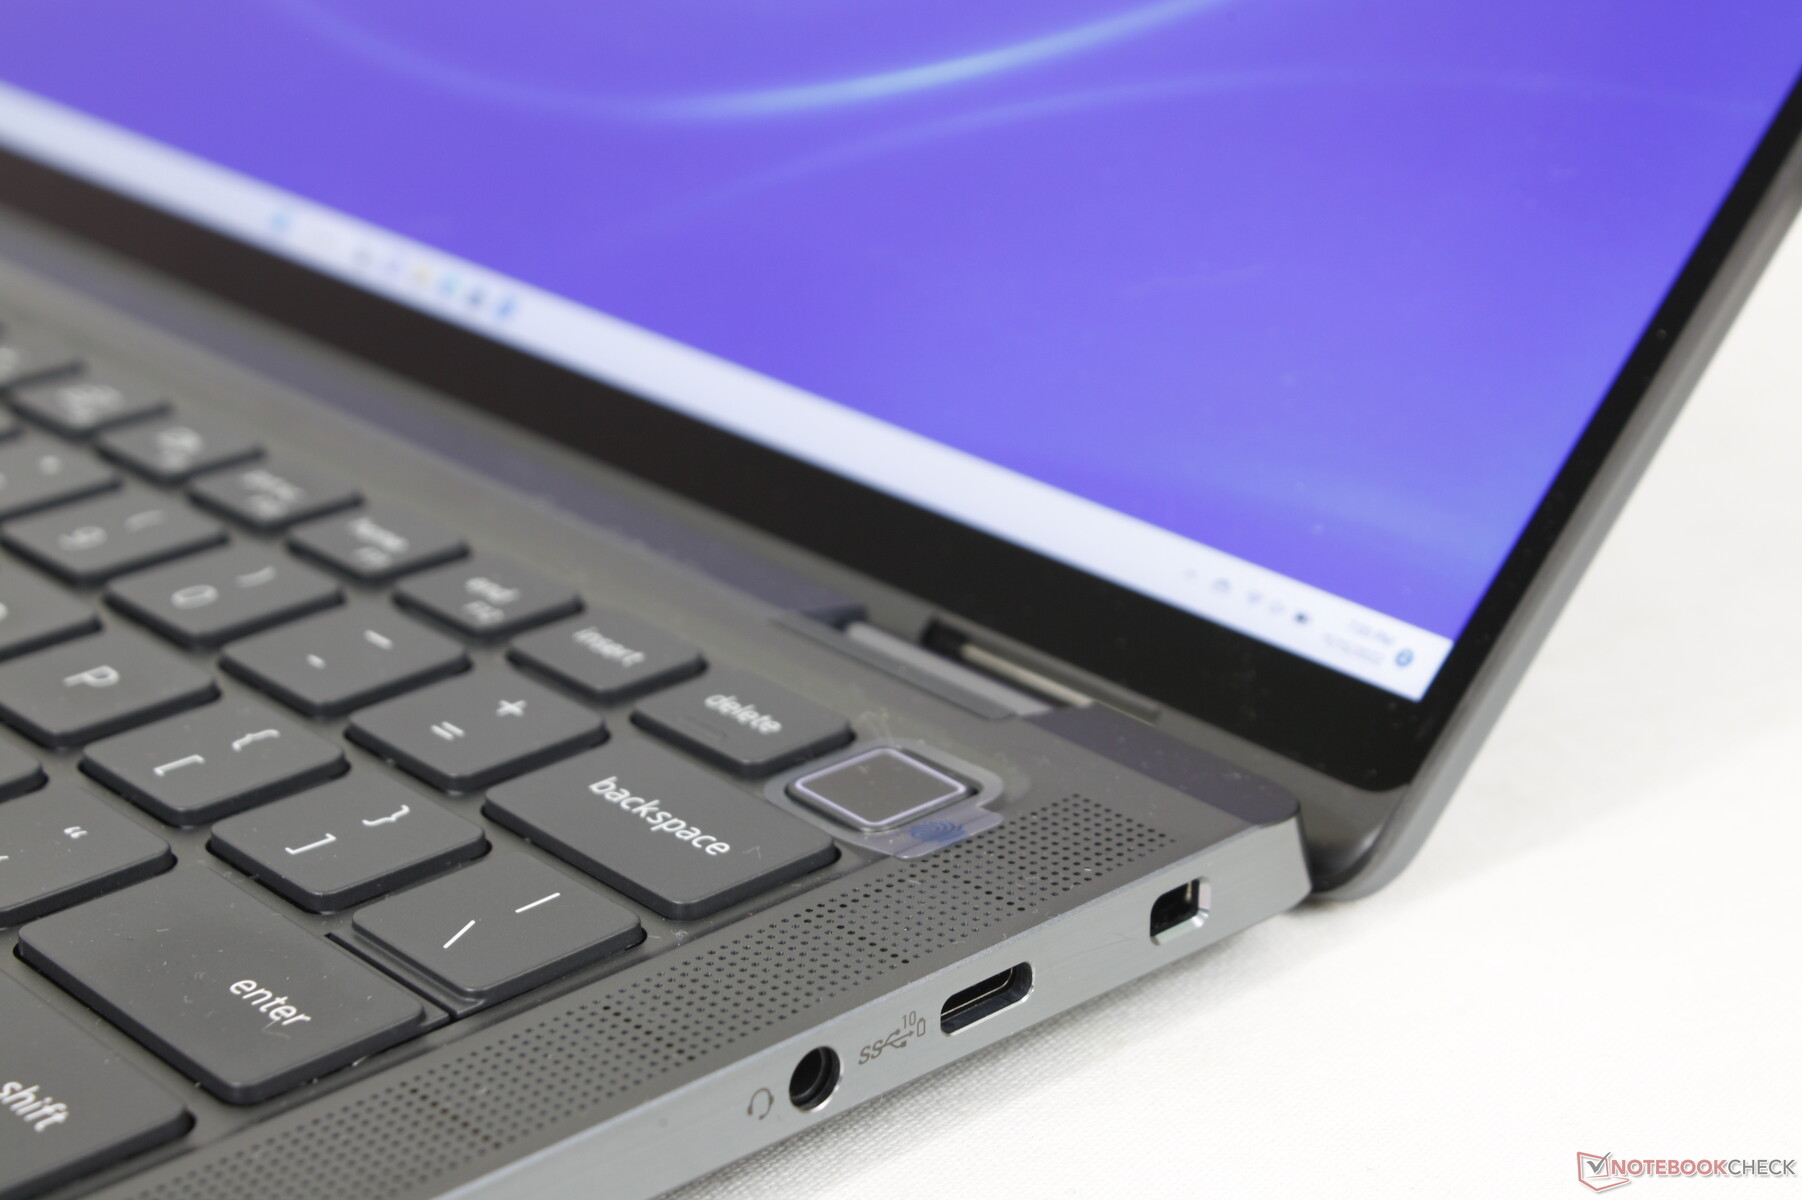
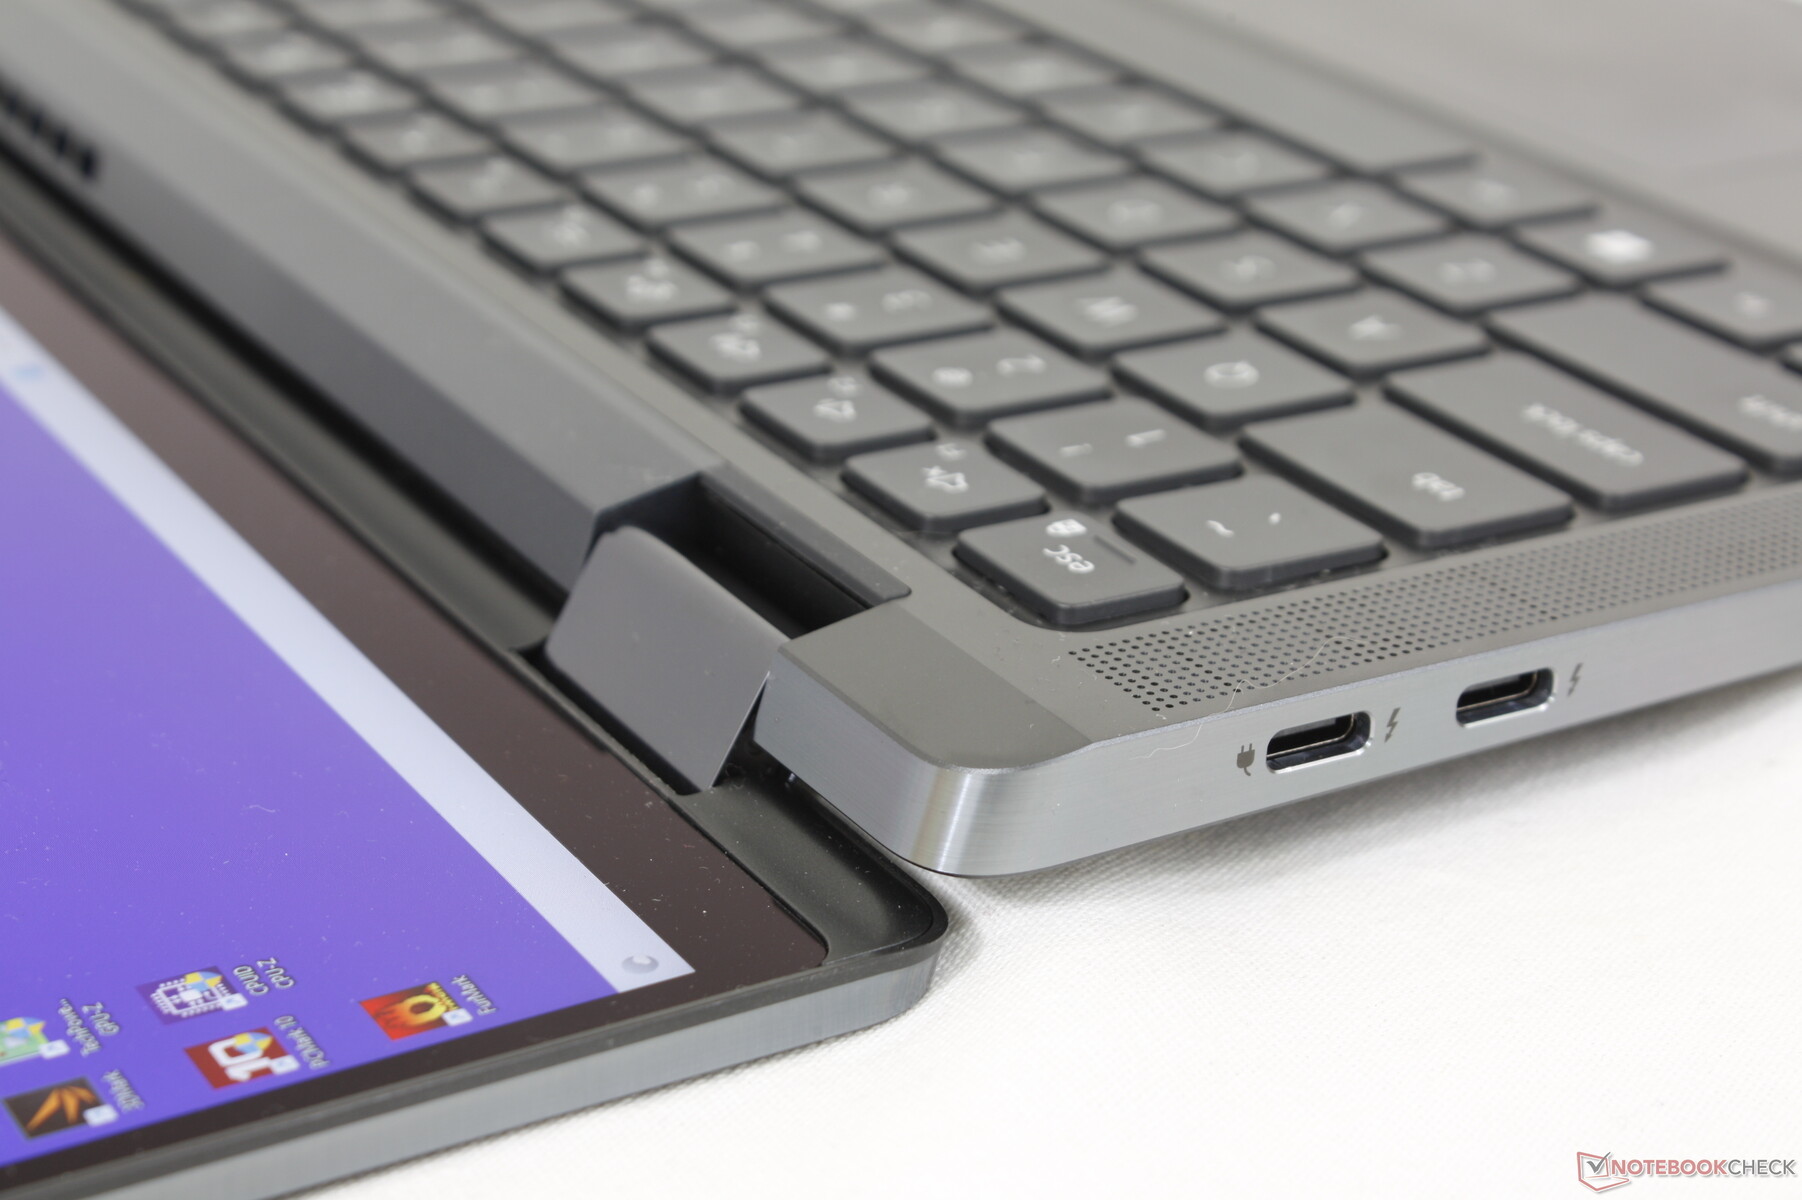
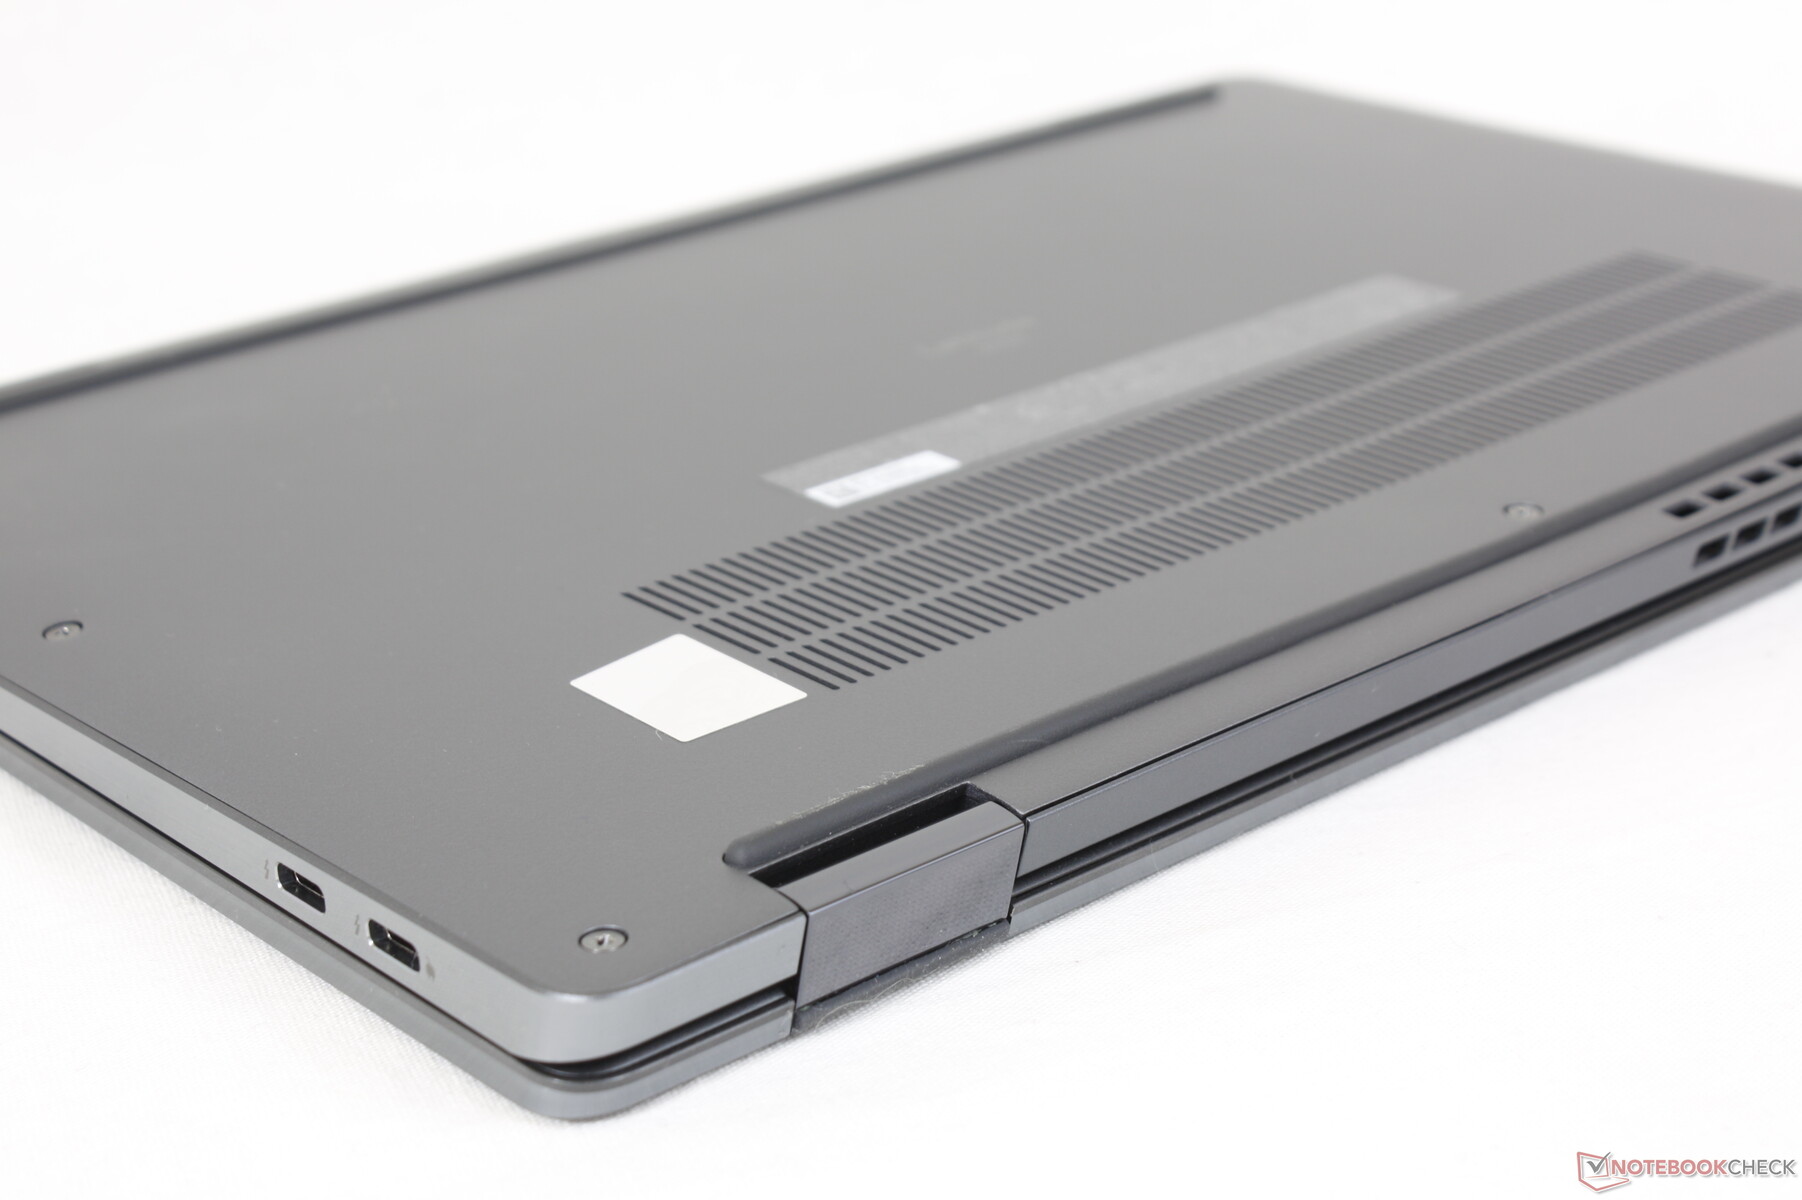
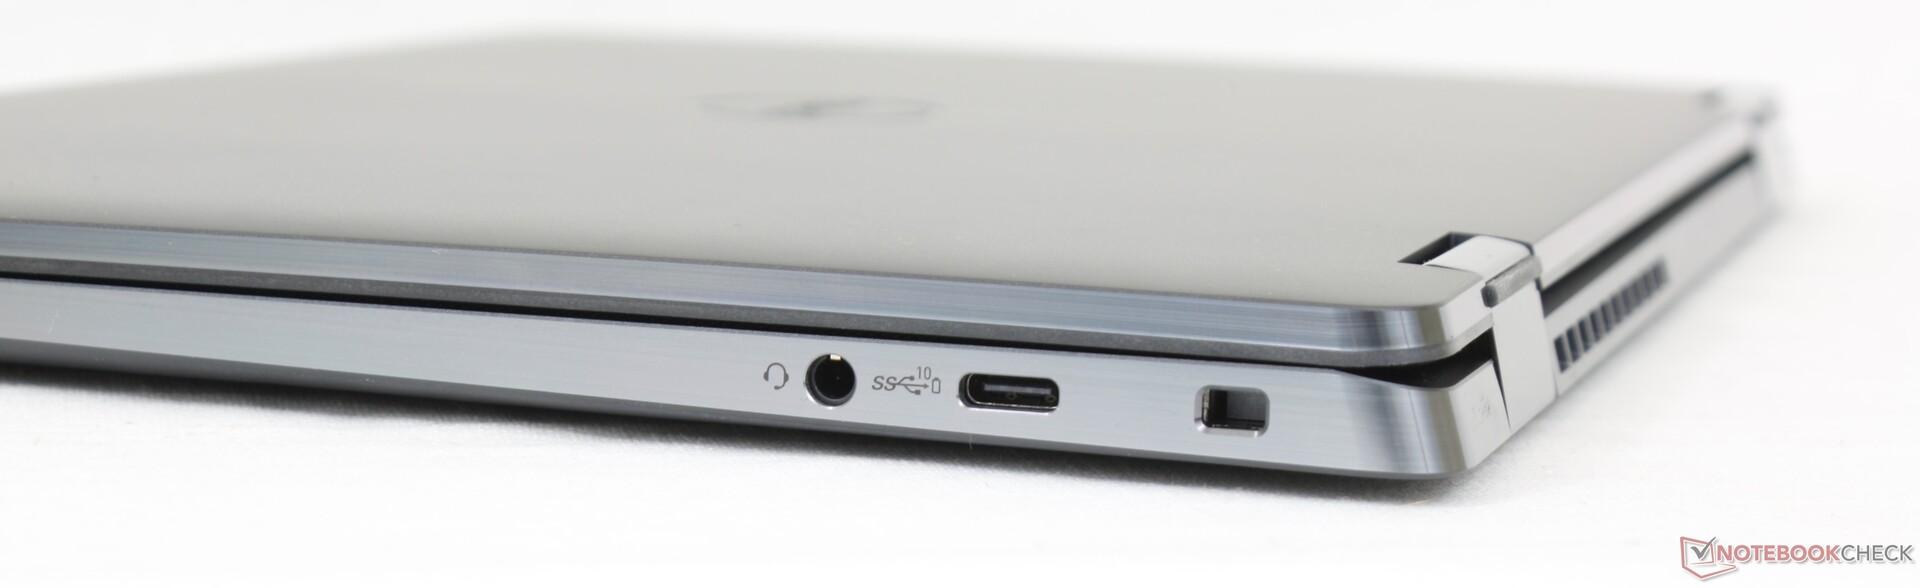
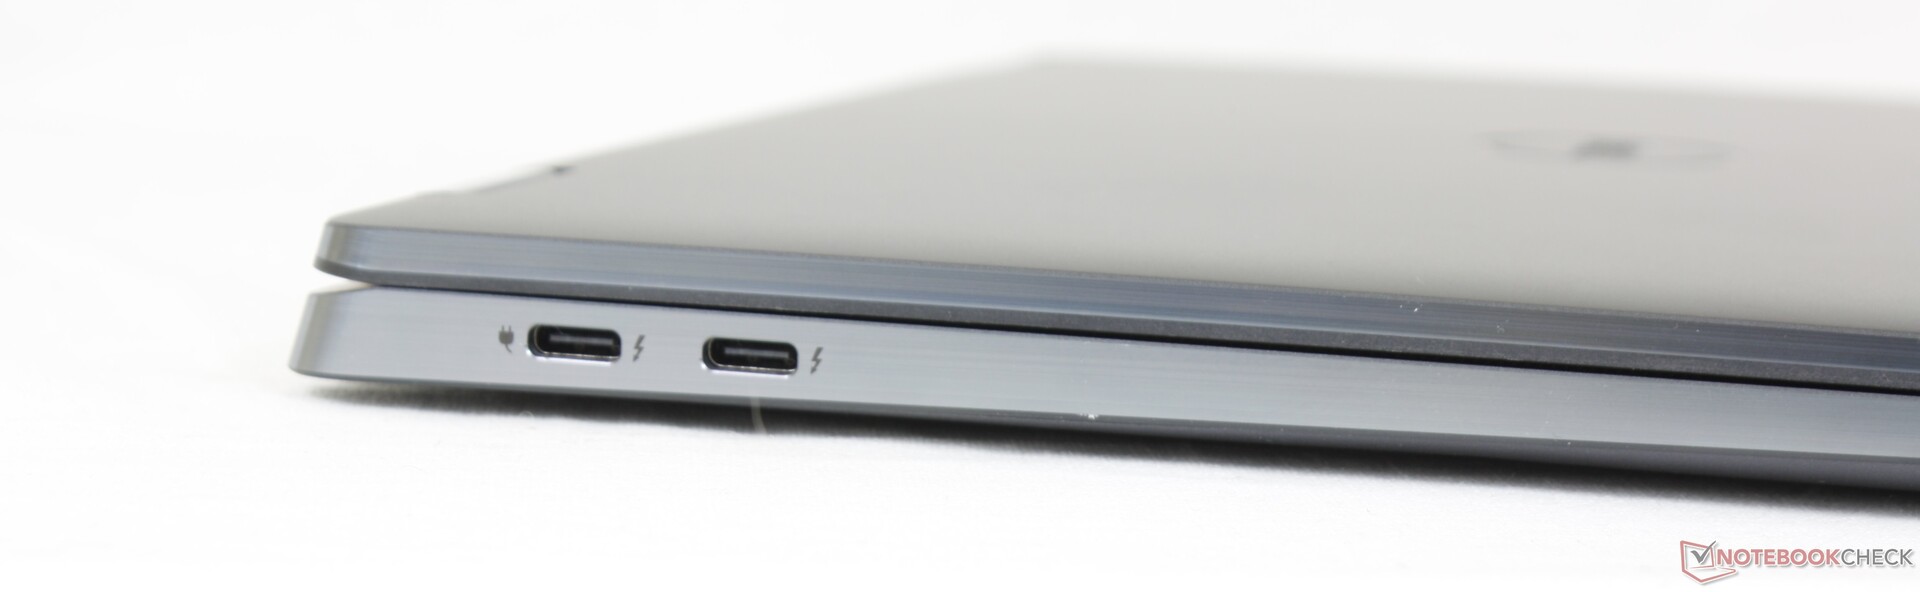
Łączność - Tylko USB-C
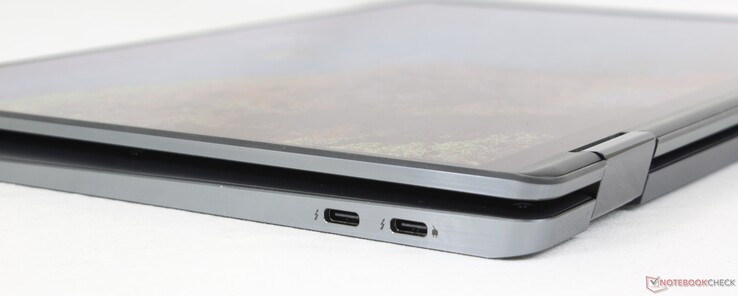
Bądź przygotowany na noszenie adapterów USB-C wszędzie, gdzie idziesz, ponieważ model ten integruje się bez portów USB-A i HDMI. Jeśli takie porty są niezbędne, to możesz rozważyć zamiast nich Dragonfly Max lub nawet Summit E13 Flip.
Należy pamiętać, że tylko dwa lewe porty USB-C obsługują urządzenia Thunderbolt 4. Każdy z trzech portów USB-C może w przeciwnym razie zostać wykorzystany do zewnętrznych monitorów i celów ładowania.
Trochę rozczarowuje fakt, że w modelu tym nie ma czytnika kart SD, biorąc pod uwagę, że tańszy modelLatitude 5310 2-in-1 zawiera taki czytnik.
Komunikacja
Za łączność Wi-Fi 6E i Bluetooth 5.2 standardowo odpowiada układ Intel AX211. Szybkość transferu jest nieco szybsza na 6 GHz w porównaniu do 5 GHz, ale różnica nie jest tak duża, jak wielu by się spodziewało
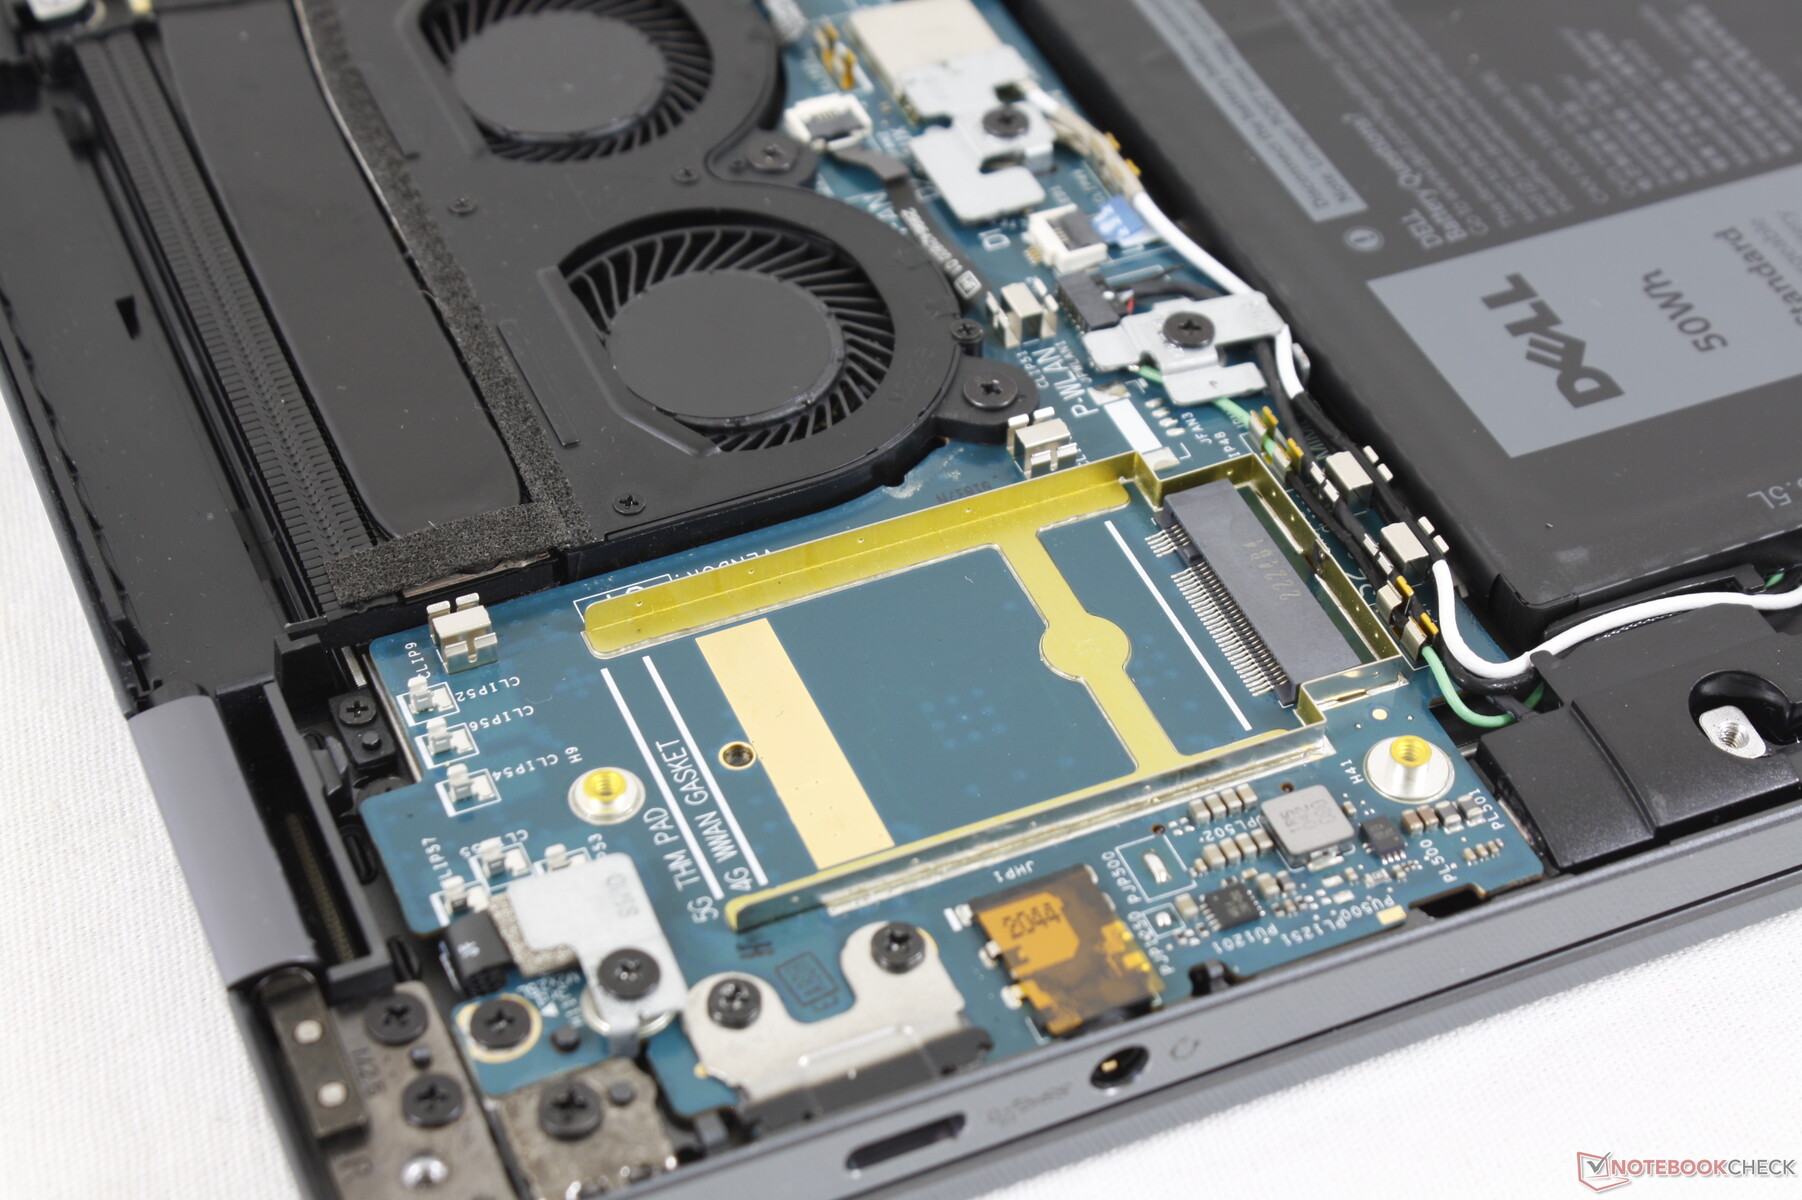
Snapdragon X20 LTE-A lub Intel 5000 5G są opcjonalne dla łączności WWAN uSIM. Niestety, nie można kupić SKU non-WAN tylko po to, aby dodać moduł WAN później, ponieważ antena nie są zawarte w konfiguracjach non-WAN.
| Networking | |
| iperf3 transmit AX12 | |
| Dell Latitude 5310-23VP6 | |
| HP Elite Dragonfly Max | |
| HP EliteBook x360 1030 G7 | |
| MSI Summit E13 Flip Evo A11MT | |
| iperf3 receive AX12 | |
| HP EliteBook x360 1030 G7 | |
| HP Elite Dragonfly Max | |
| MSI Summit E13 Flip Evo A11MT | |
| Dell Latitude 5310-23VP6 | |
| iperf3 receive AXE11000 6GHz | |
| Dell Latitude 9330 | |
| iperf3 receive AXE11000 | |
| Dell Latitude 9330 | |
| iperf3 transmit AXE11000 | |
| Dell Latitude 9330 | |
| iperf3 transmit AXE11000 6GHz | |
| Dell Latitude 9330 | |
Kamera internetowa
Kamera internetowa o rozdzielczości 2 MP z podczerwienią jest standardowym wyposażeniem do obsługi funkcji Windows Hello. Dla porównania, laptopy HP Elite i Spectre są wyposażone w 5 MP czujniki zapewniające ostrzejszą jakość obrazu. Wszystkie kamery internetowe w laptopach Dell Latitude i Lenovo ThinkPad są jak dotąd ograniczone do 2 MP.


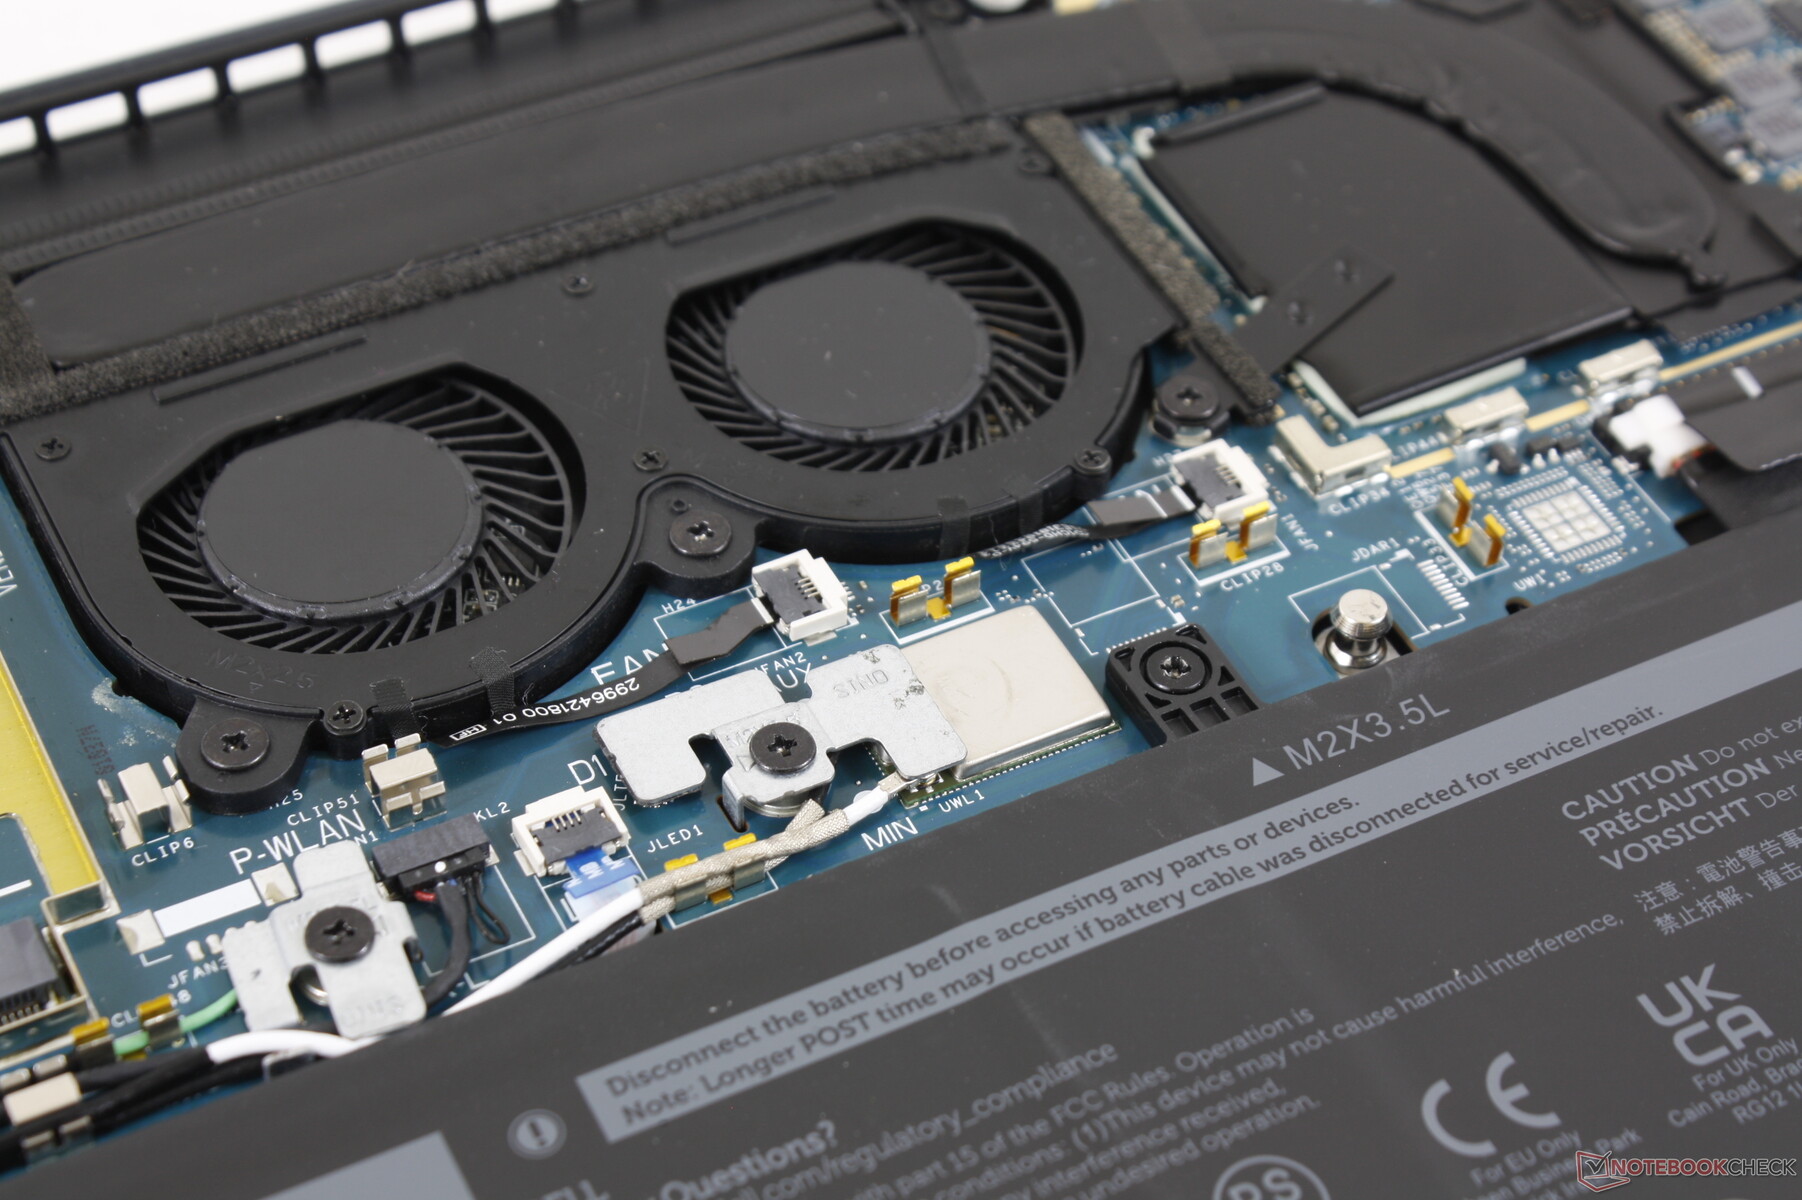
Konserwacja
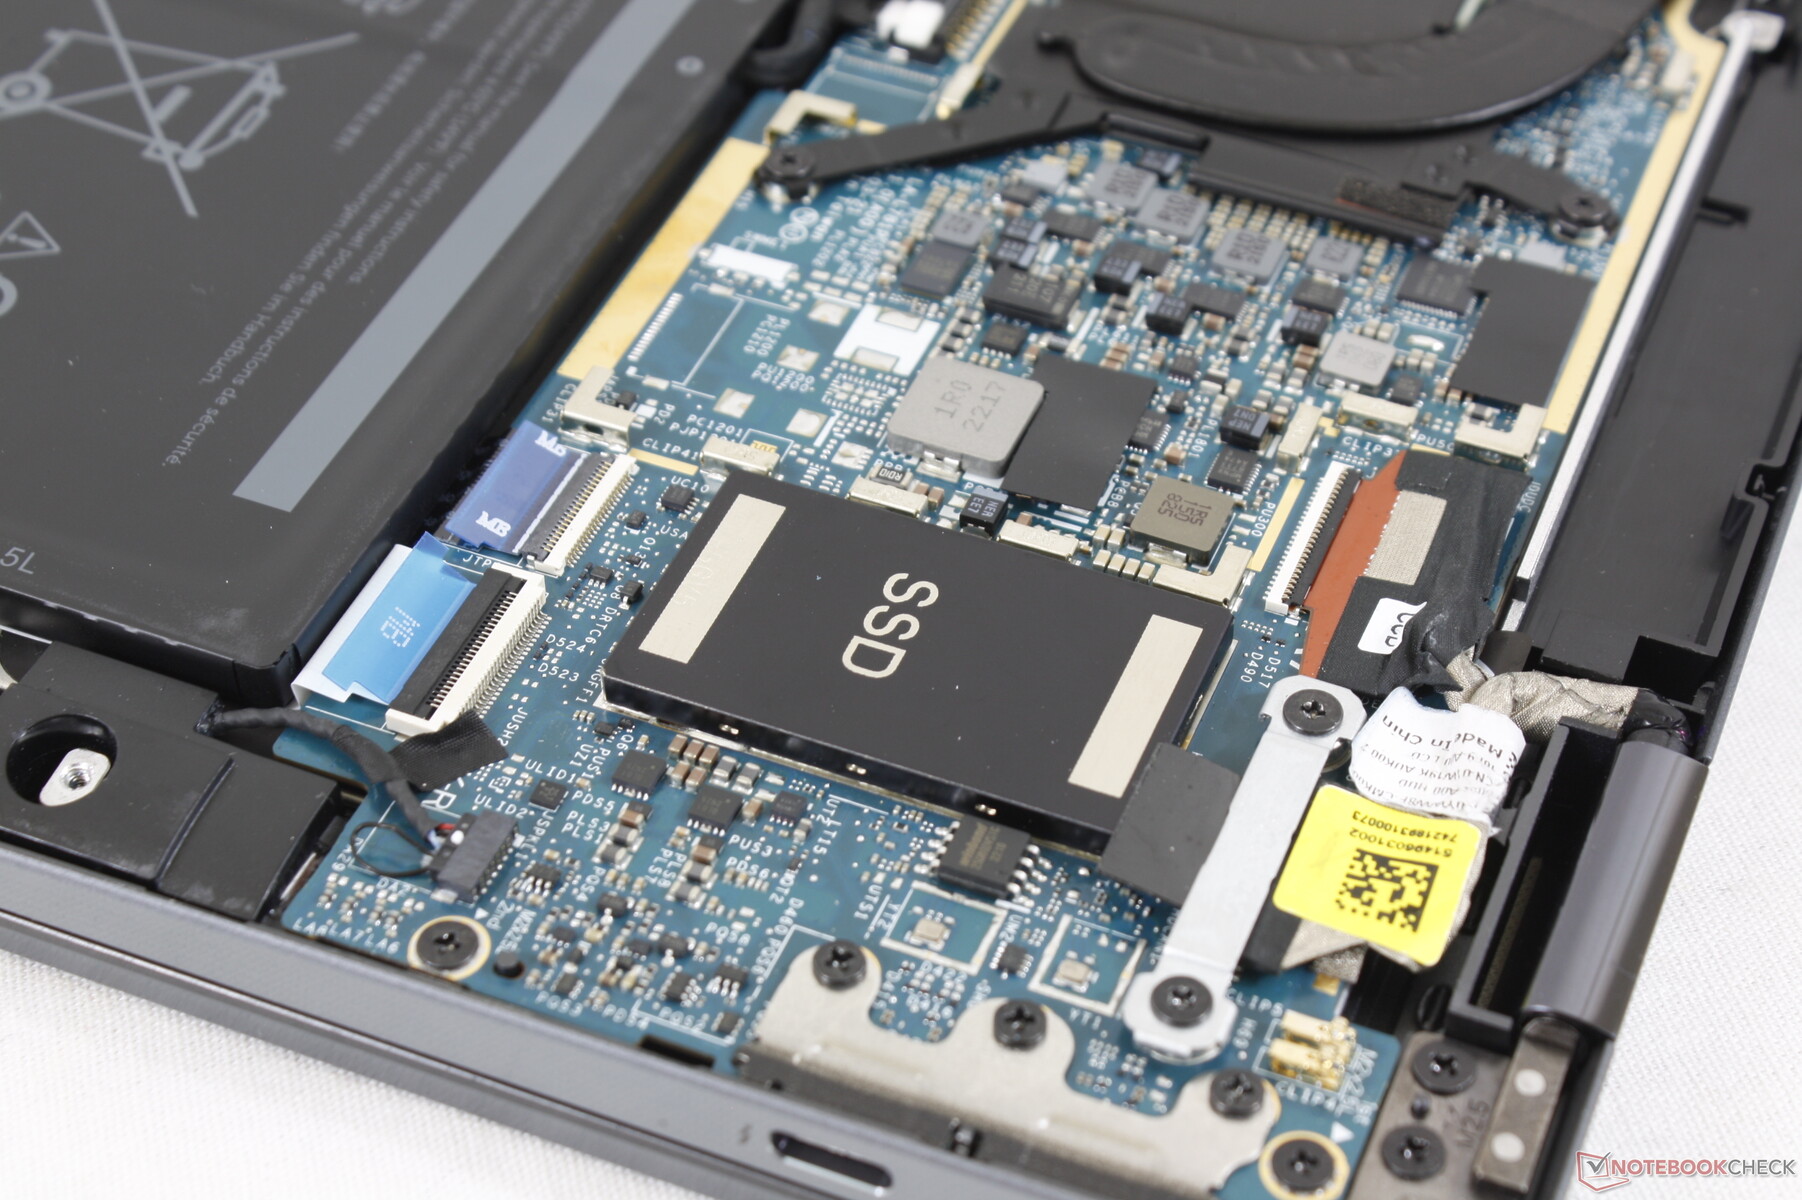
Dolny panel jest zabezpieczony tylko 6 śrubkami Philipsa, co ułatwia serwisowanie. Użytkownicy mogą wyjąć baterię, moduł WAN i SSD, podczas gdy moduły WLAN i RAM są lutowane. Brak możliwości rozbudowy sieci WLAN i pamięci RAM jest powszechny w 13-calowych subnotebookach.
Akcesoria i gwarancja
W pudełku detalicznym znajduje się przejściówka z USB-C na USB-A, aby złagodzić fakt, że w Latitude 9330 nie ma portów USB-A. Trzyletnia ograniczona gwarancja producenta jest standardem, co jest powszechną praktyką w przypadku wysokiej klasy komputerów biznesowych firmy Dell lub HP.
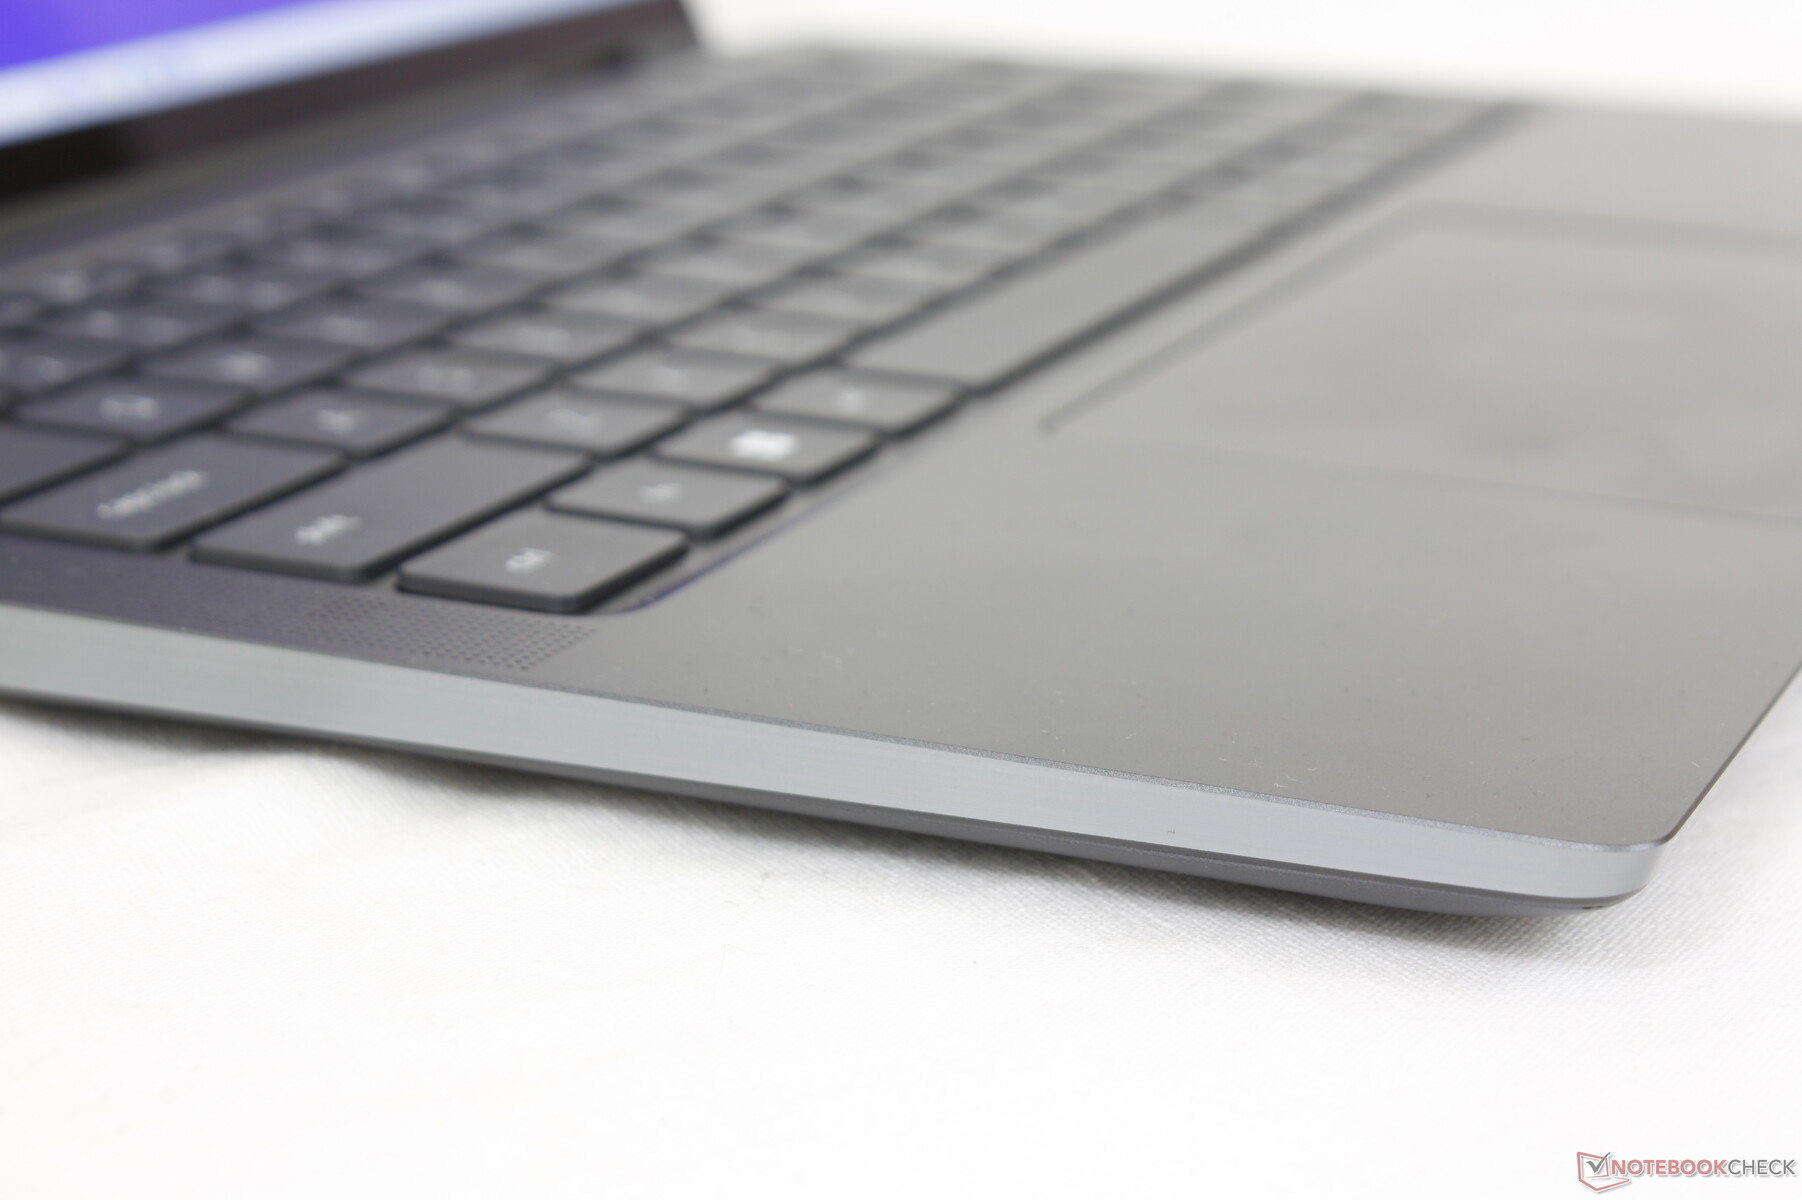
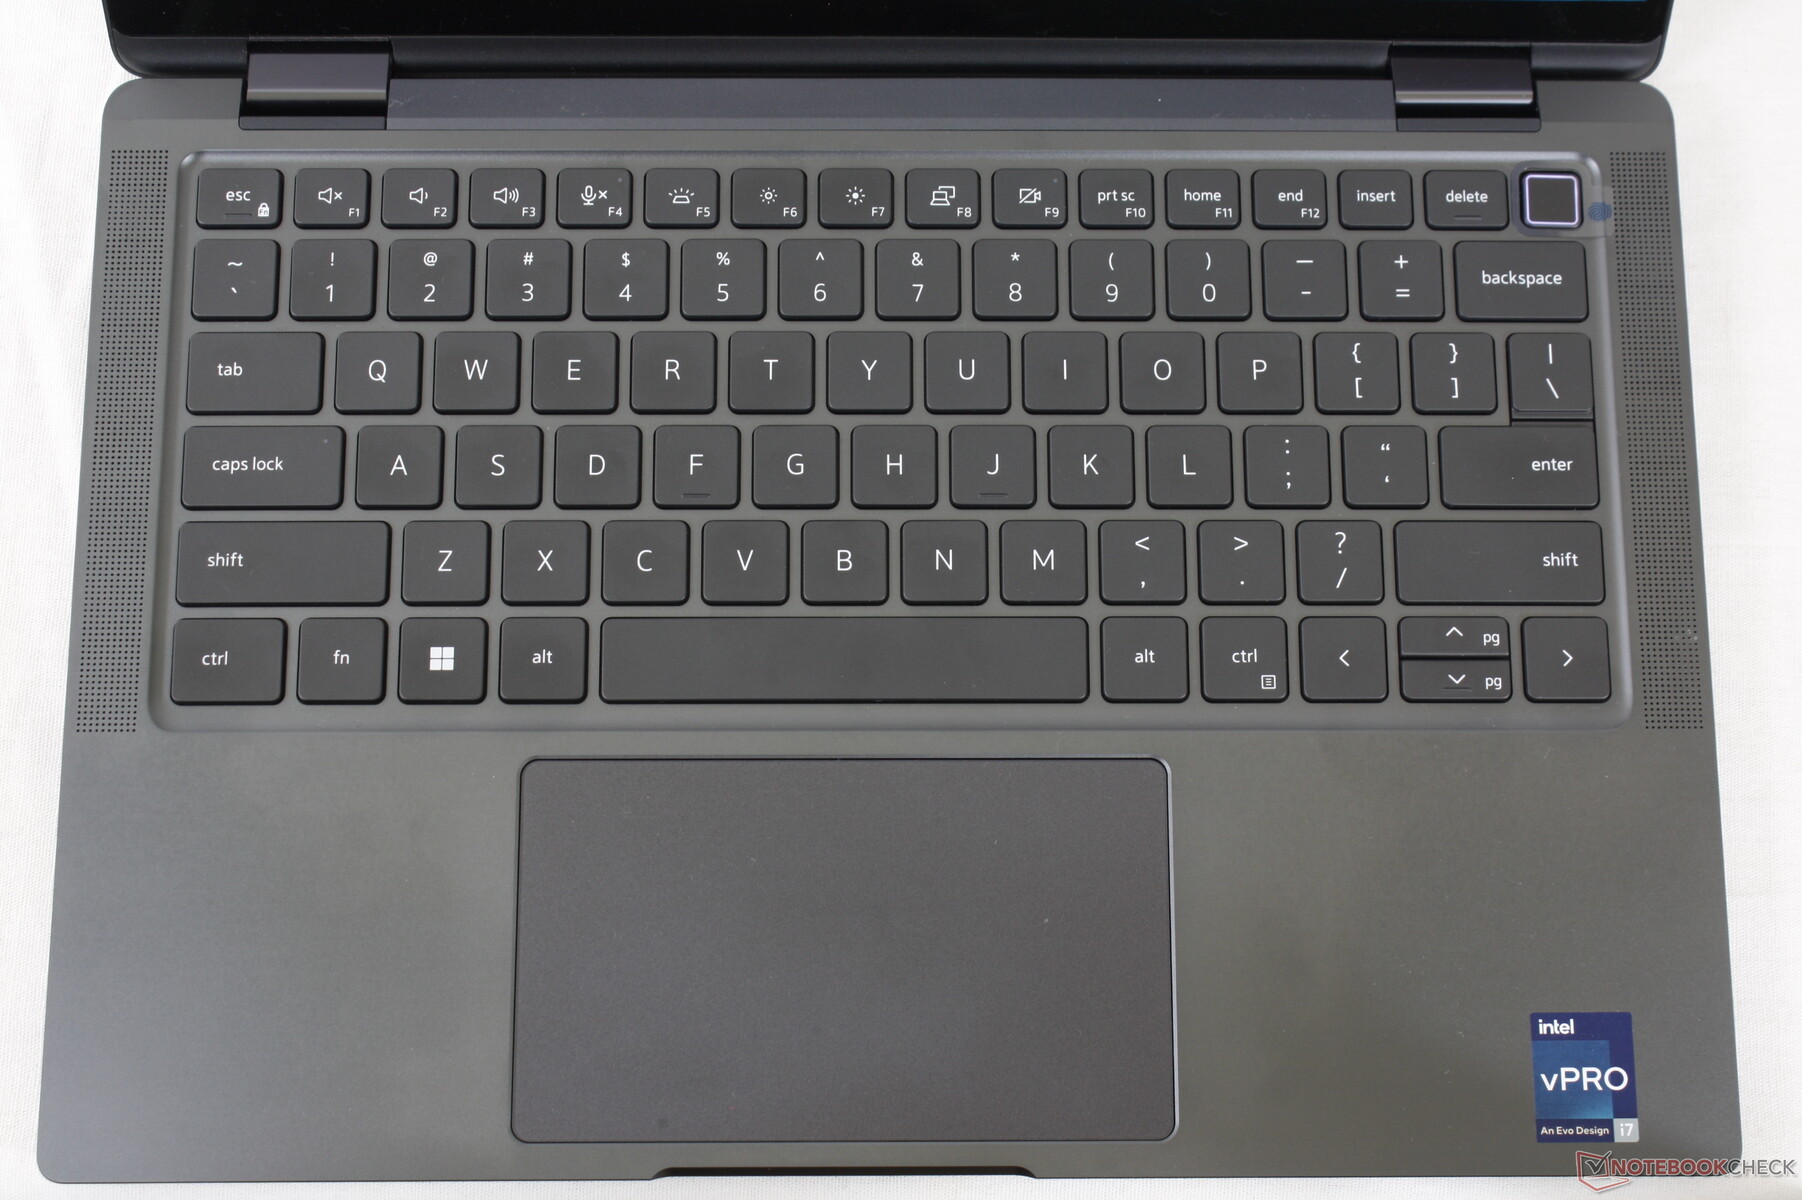
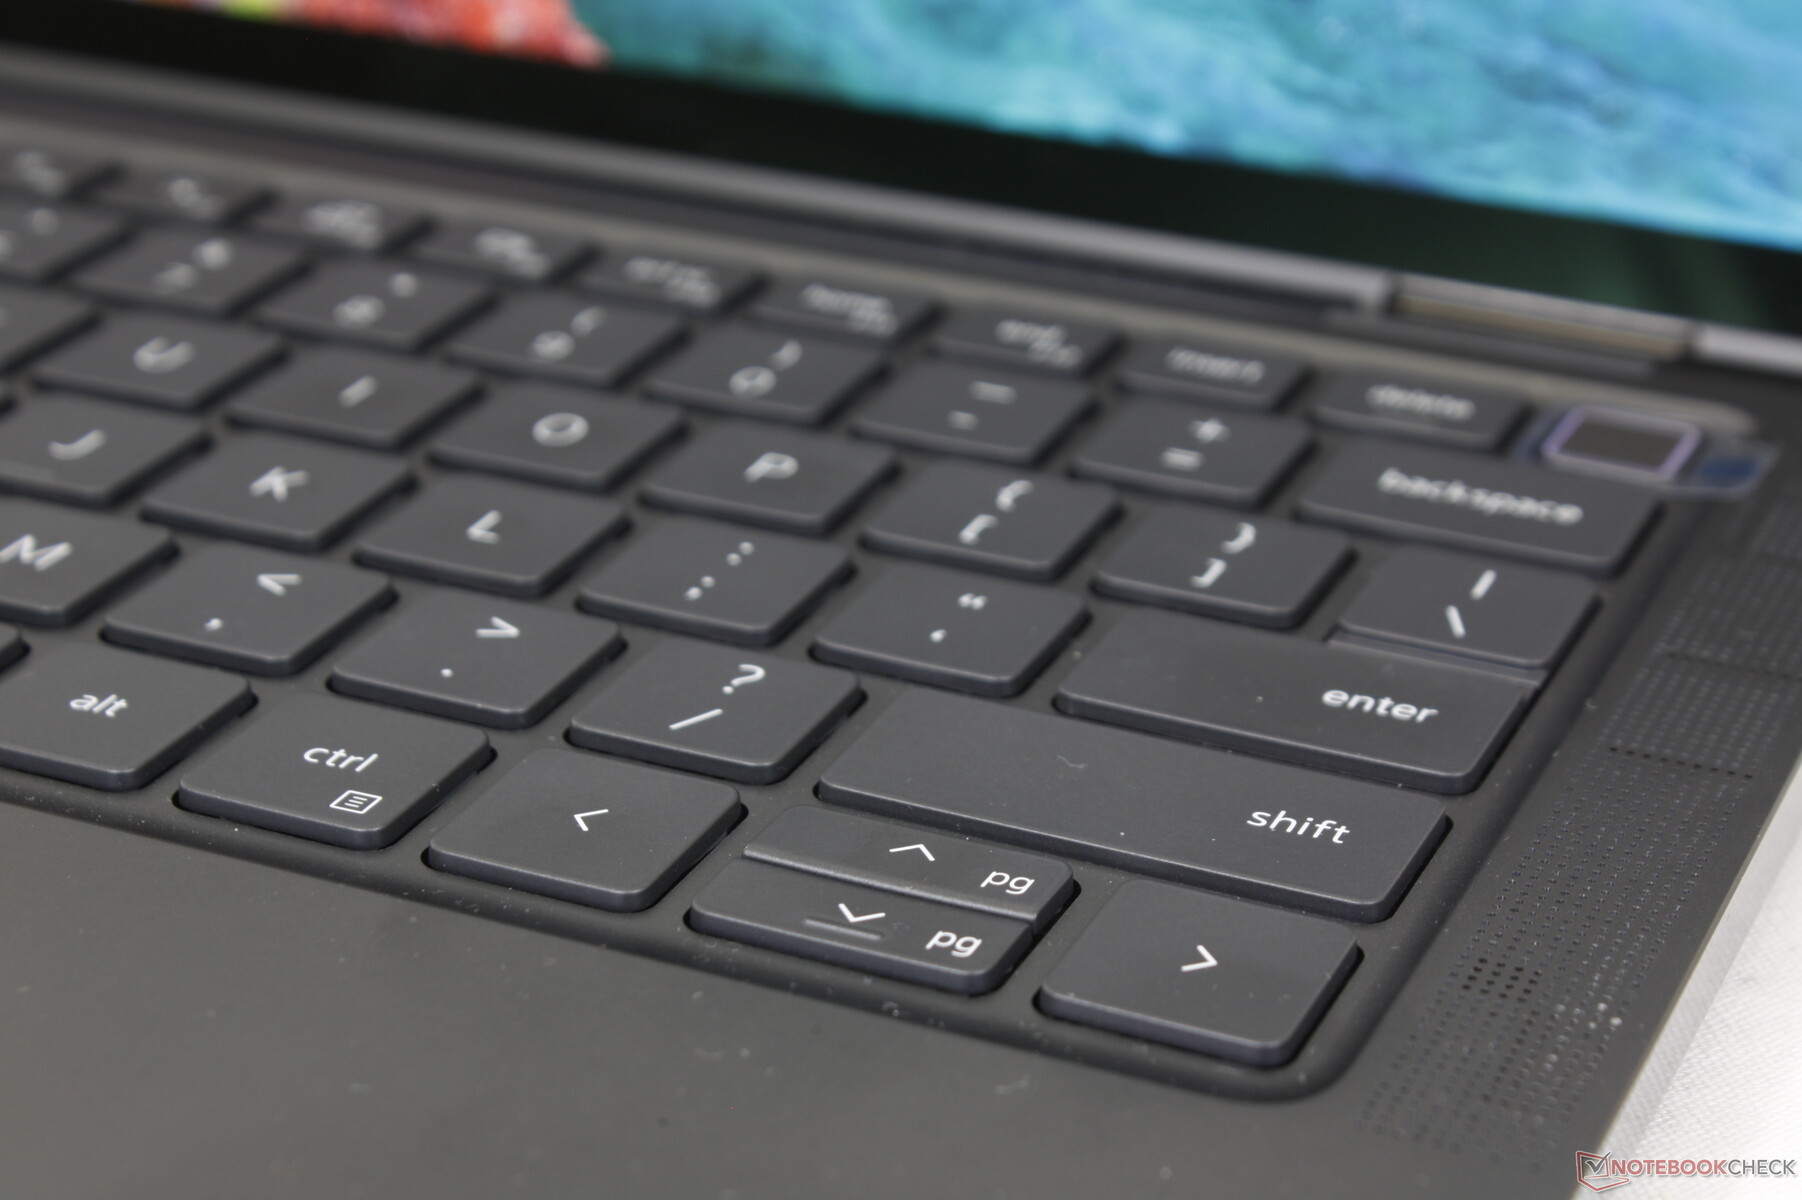
Urządzenia wejściowe - wygodna klawiatura i gąbczasty clickpad
Klawiatura
Klawisze w modelu Latitude 9330 są twardsze i mają silniejsze sprzężenie zwrotne niż klawisze w XPS 13 9315 co zapewnia wygodniejsze pisanie. Są one bardziej porównywalne z klawiszami w serii Spectre lub EliteBook w przeciwieństwie do klawiszy w tańszych subnotebookach konsumenckich. Klekot jest jednak umiarkowanie głośny, co jest konsekwencją ostrzejszego sprzężenia zwrotnego.
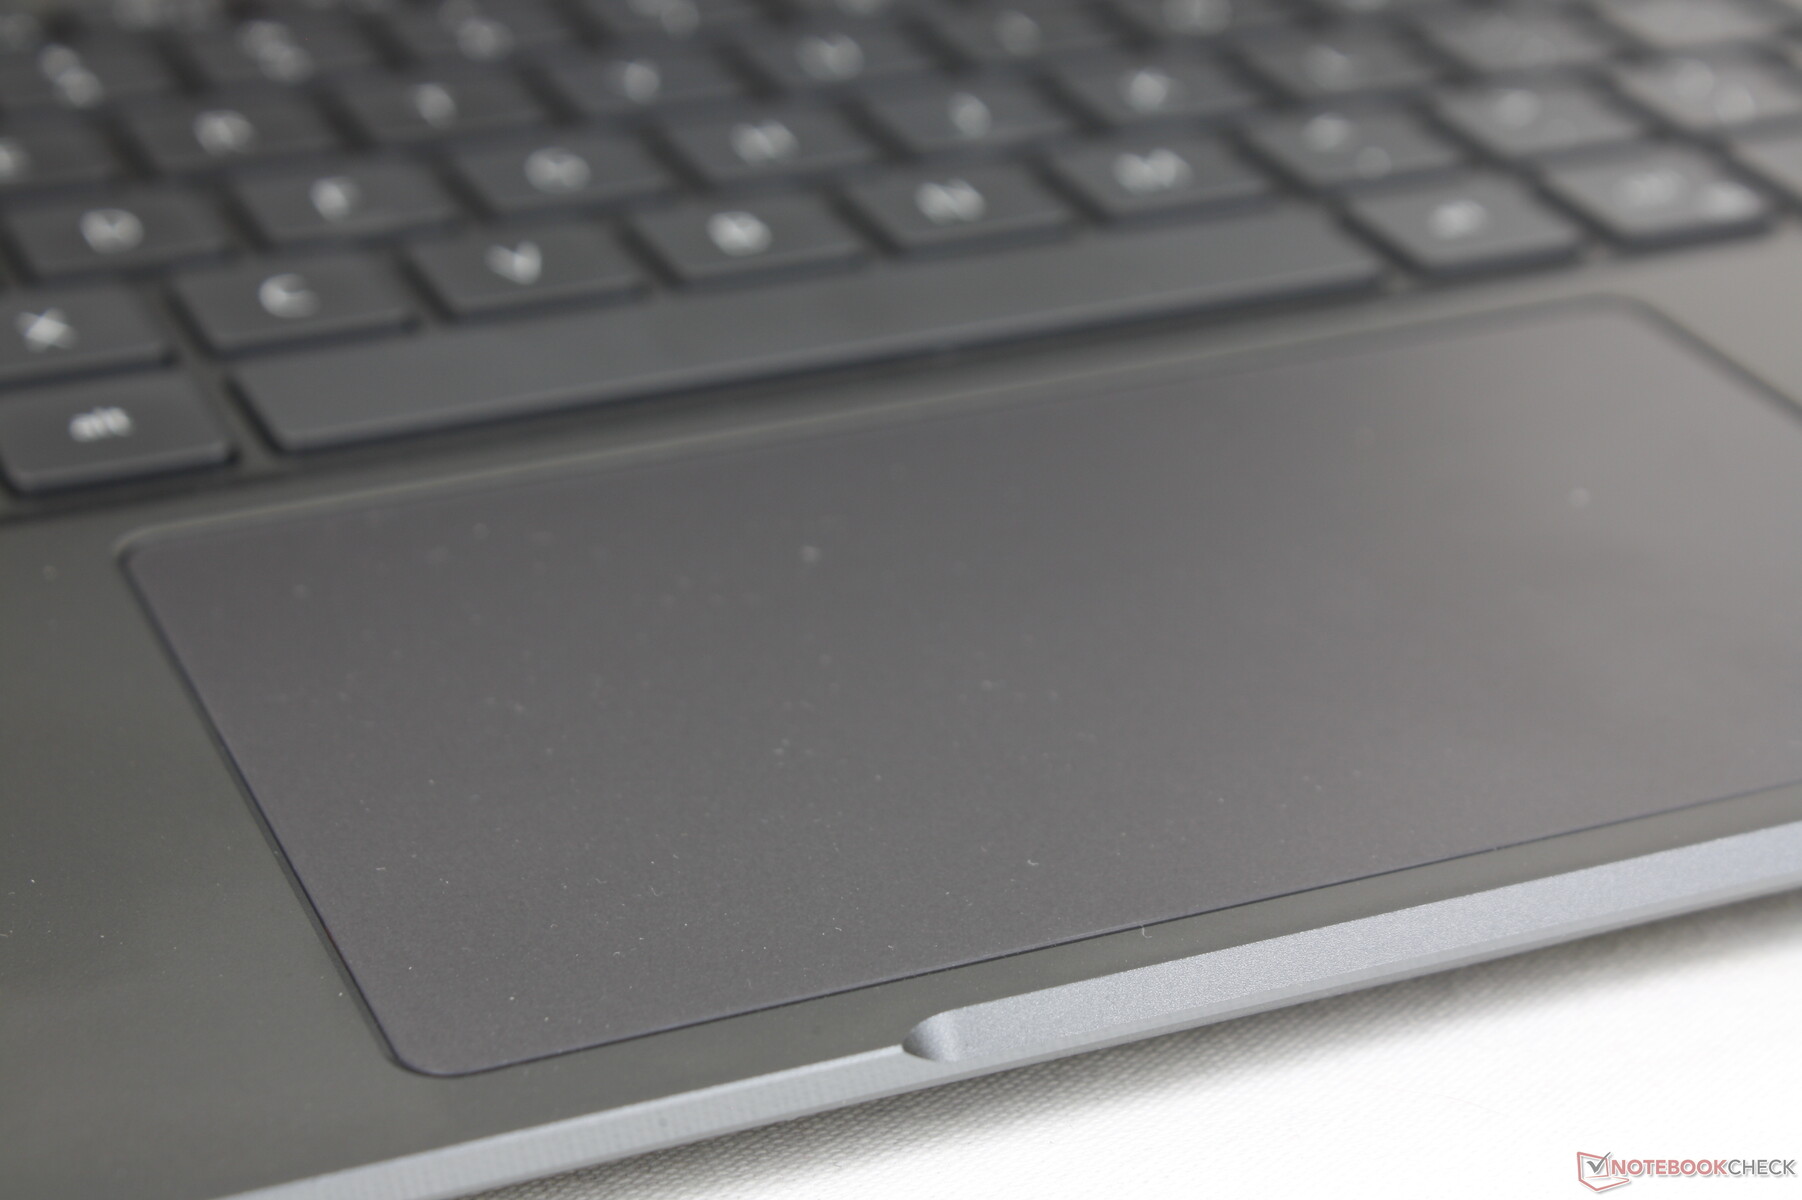
Touchpad
Klawiatura jest większa niż ta w modelu ThinkPad X1 Titanium Yoga (11,5 x 6,8 cm vs. 9 x 6,5 cm), by ułatwić wprowadzanie wielodotyku mimo niewielkiej, 13-calowej obudowy. Z drugiej strony nie ma dedykowanych przycisków myszy, więc działania typu "przeciągnij i upuść" są trudniejsze do wykonania. Jej powierzchnia jest całkowicie gładka, z niewielkim tylko zacięciem przy wolniejszych prędkościach, co pozwala na dokładniejsze kliknięcia.
Sprzężenie zwrotne podczas klikania na klawiaturze jest bardziej miękkie i cichsze niż w większości innych laptopów. Choć niektórzy mogą docenić brak głośnego "kliknięcia" przy naciskaniu, gąbczaste sprzężenie zwrotne nie jest zbyt satysfakcjonujące.

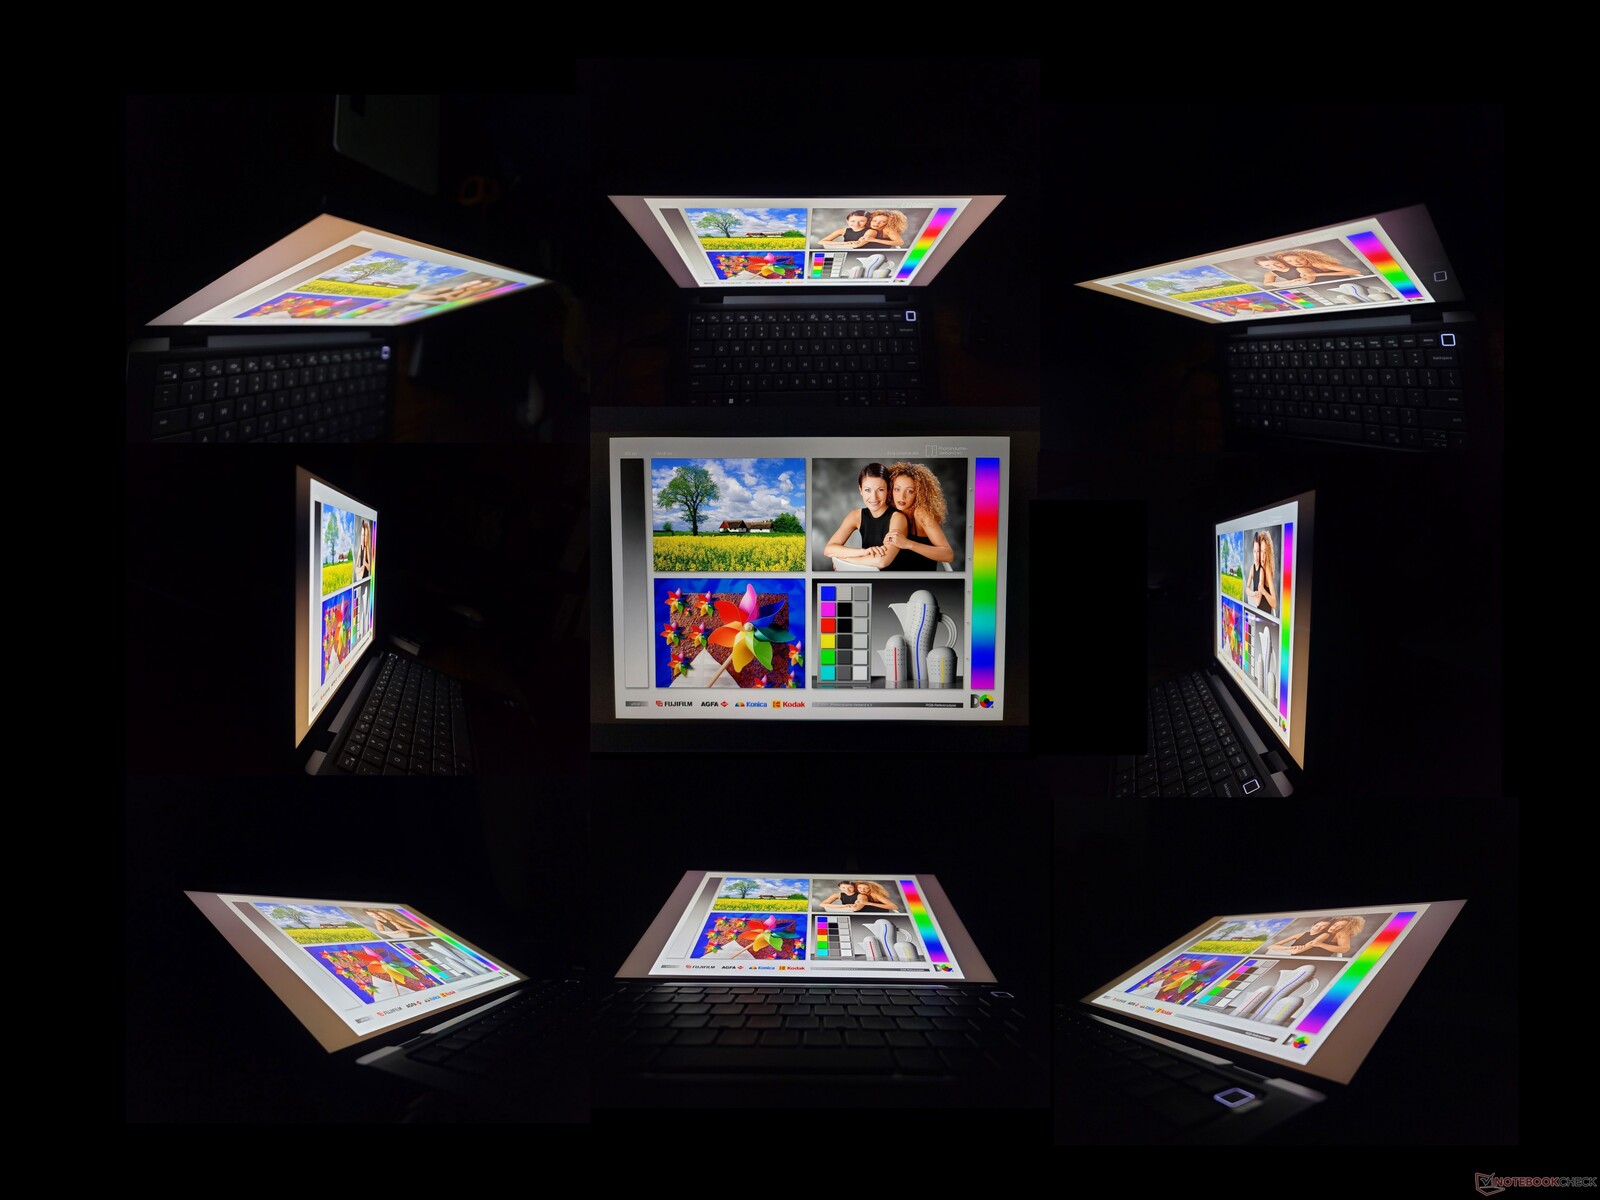
Wyświetlacz - 100% sRGB, 500-nitowy ekran dotykowy IPS
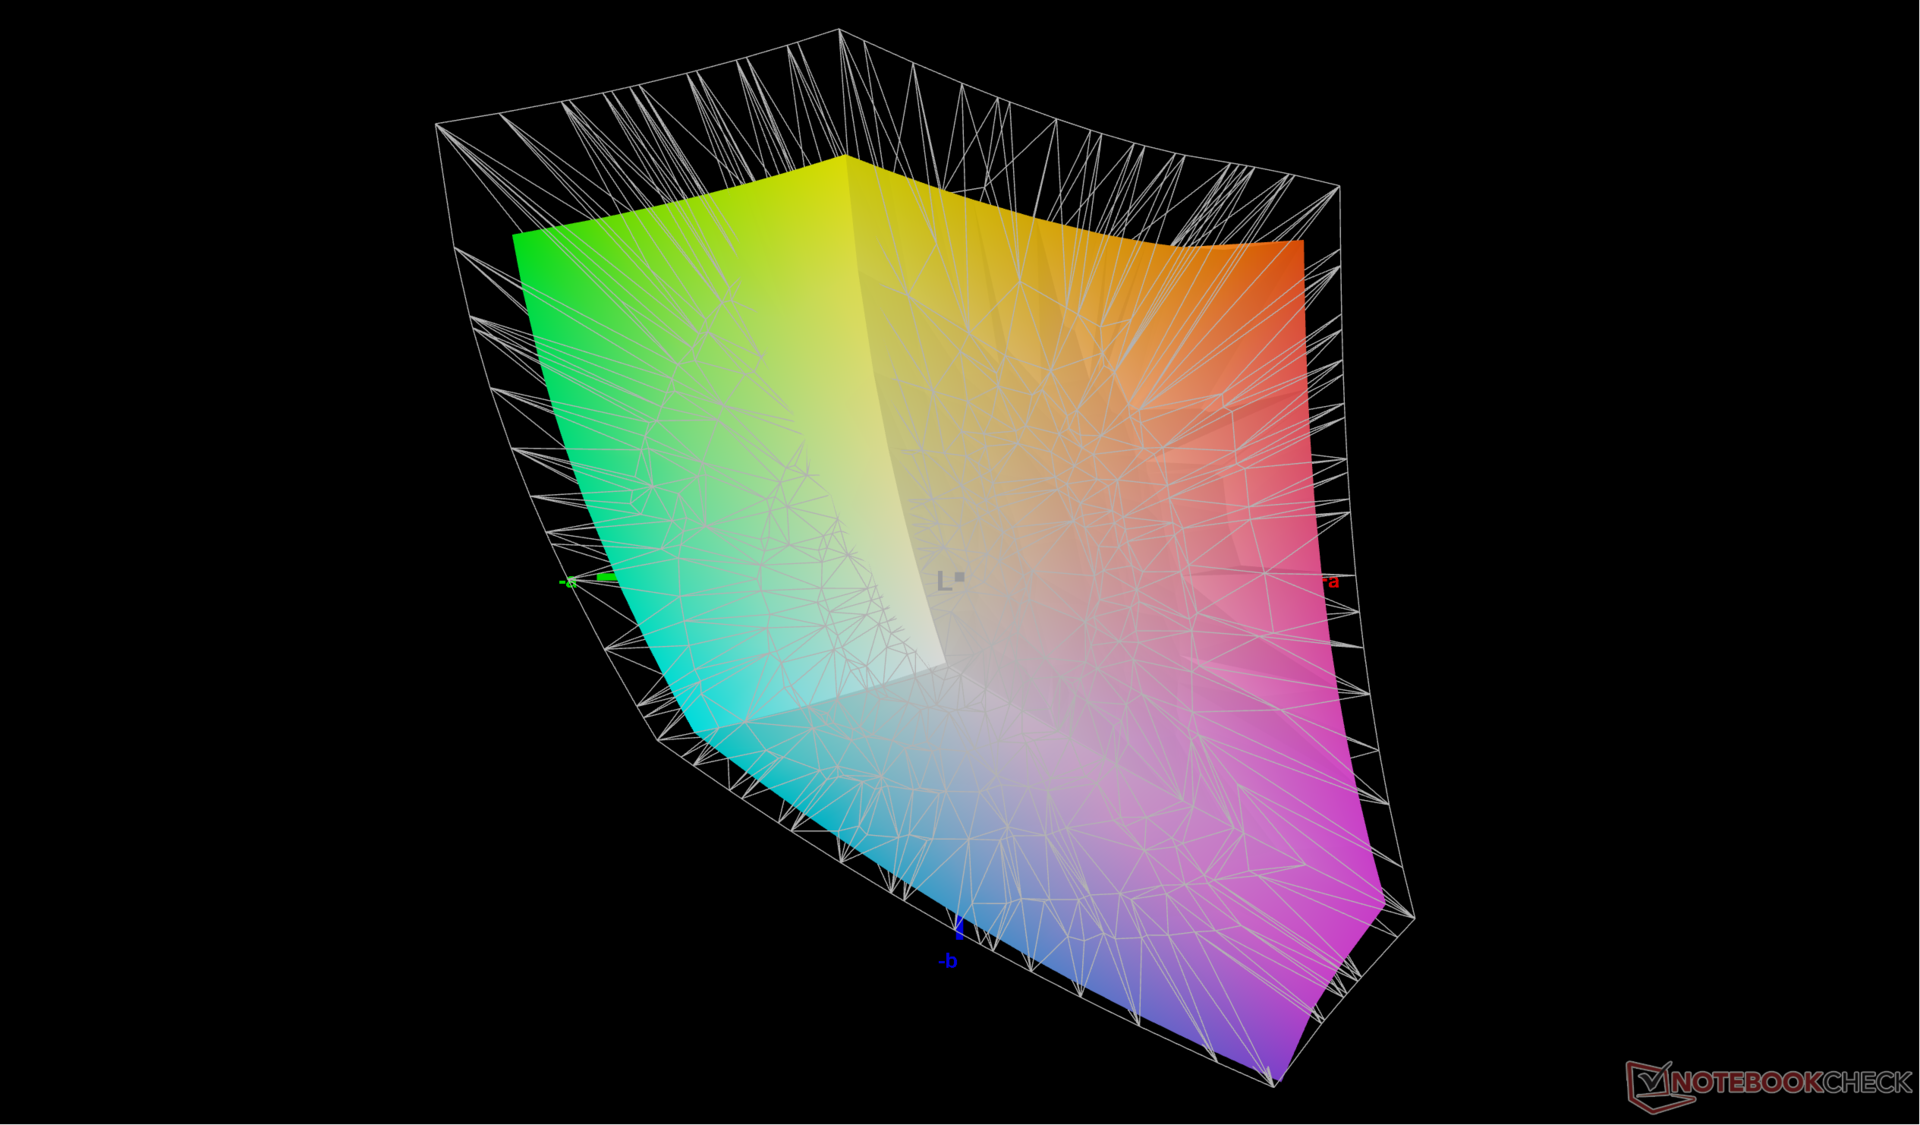
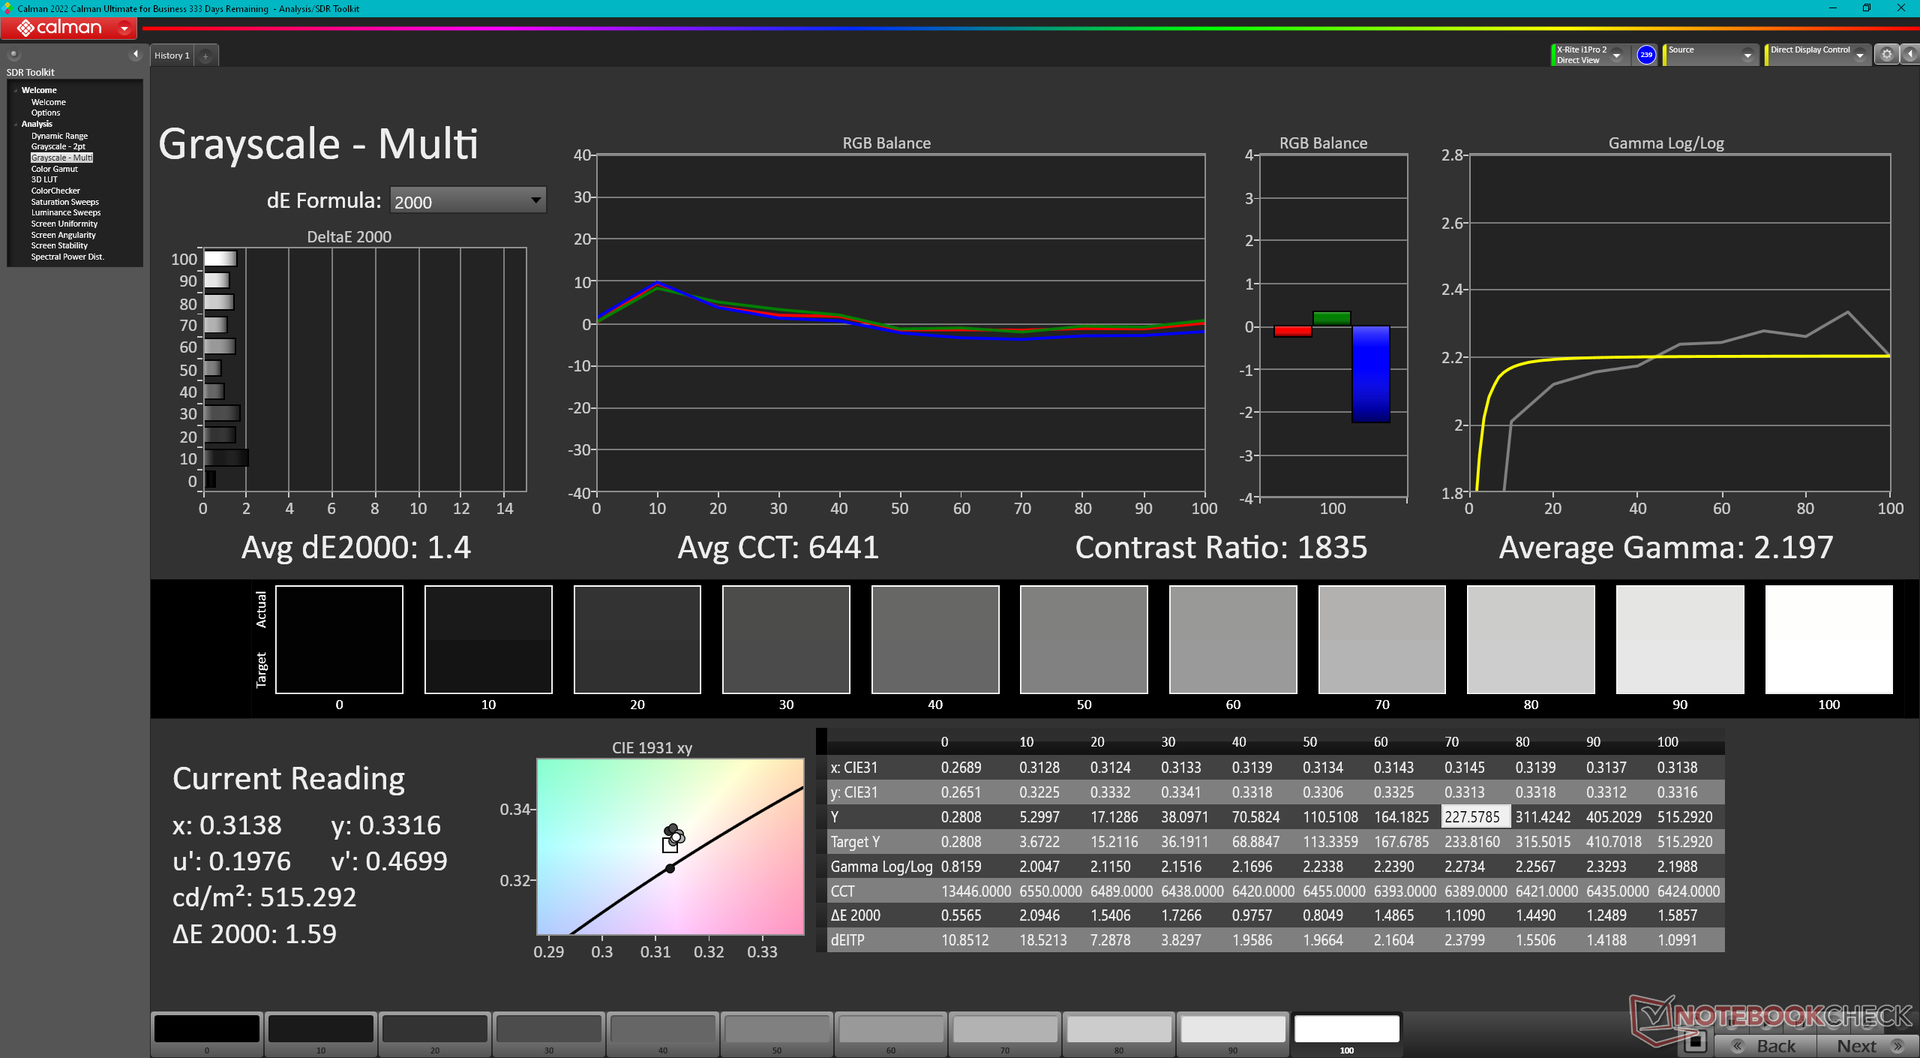
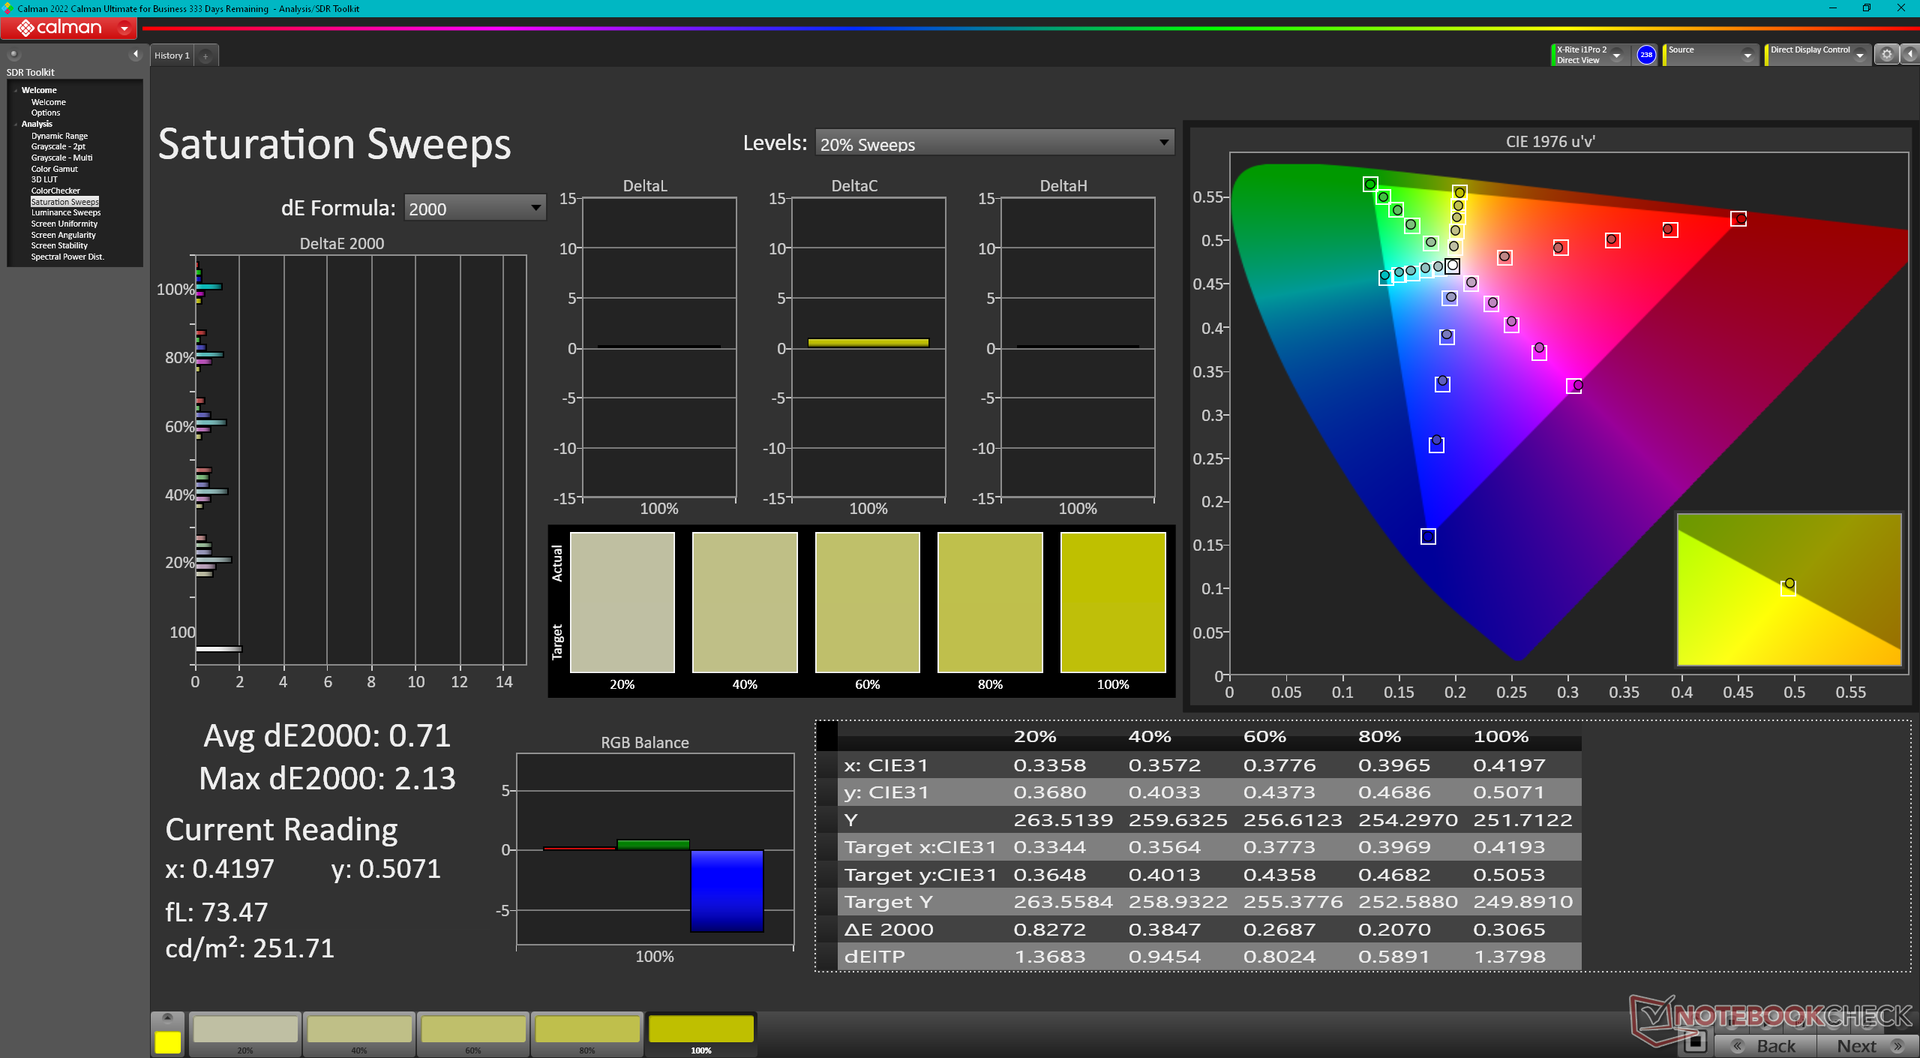
Dell reklamuje 500-nitowy ekran dotykowy o pełnym pokryciu sRGB, co możemy potwierdzić naszymi niezależnymi pomiarami. Jest to wysokiej klasy wyświetlacz o podobnym poziomie jasności i kontrastu jak wyświetlacz w MSI Summit E13 Flip.
Dwie największe wady wyświetlacza to bardzo wolne czasy reakcji w czerni i bieli oraz ograniczona częstotliwość odświeżania 60 Hz. Choć nie jest to maszyna do gier, smużenie jest trudne do przeoczenia nawet podczas przeglądania stron internetowych, a częstotliwość odświeżania 60 Hz zaczyna pokazywać swój wiek. Wyższa częstotliwość odświeżania poprawiłaby również reakcję ekranu dotykowego.
Nie ma opcji, by wybrać coś jaśniejszego lub z szerszymi kolorami P3, ponieważ wszystkie jednostki Latitude 9330 są obecnie wyposażone w dokładnie ten sam panel AU Optronics.
| |||||||||||||||||||||||||
rozświetlenie: 85 %
na akumulatorze: 542.3 cd/m²
kontrast: 1427:1 (czerń: 0.38 cd/m²)
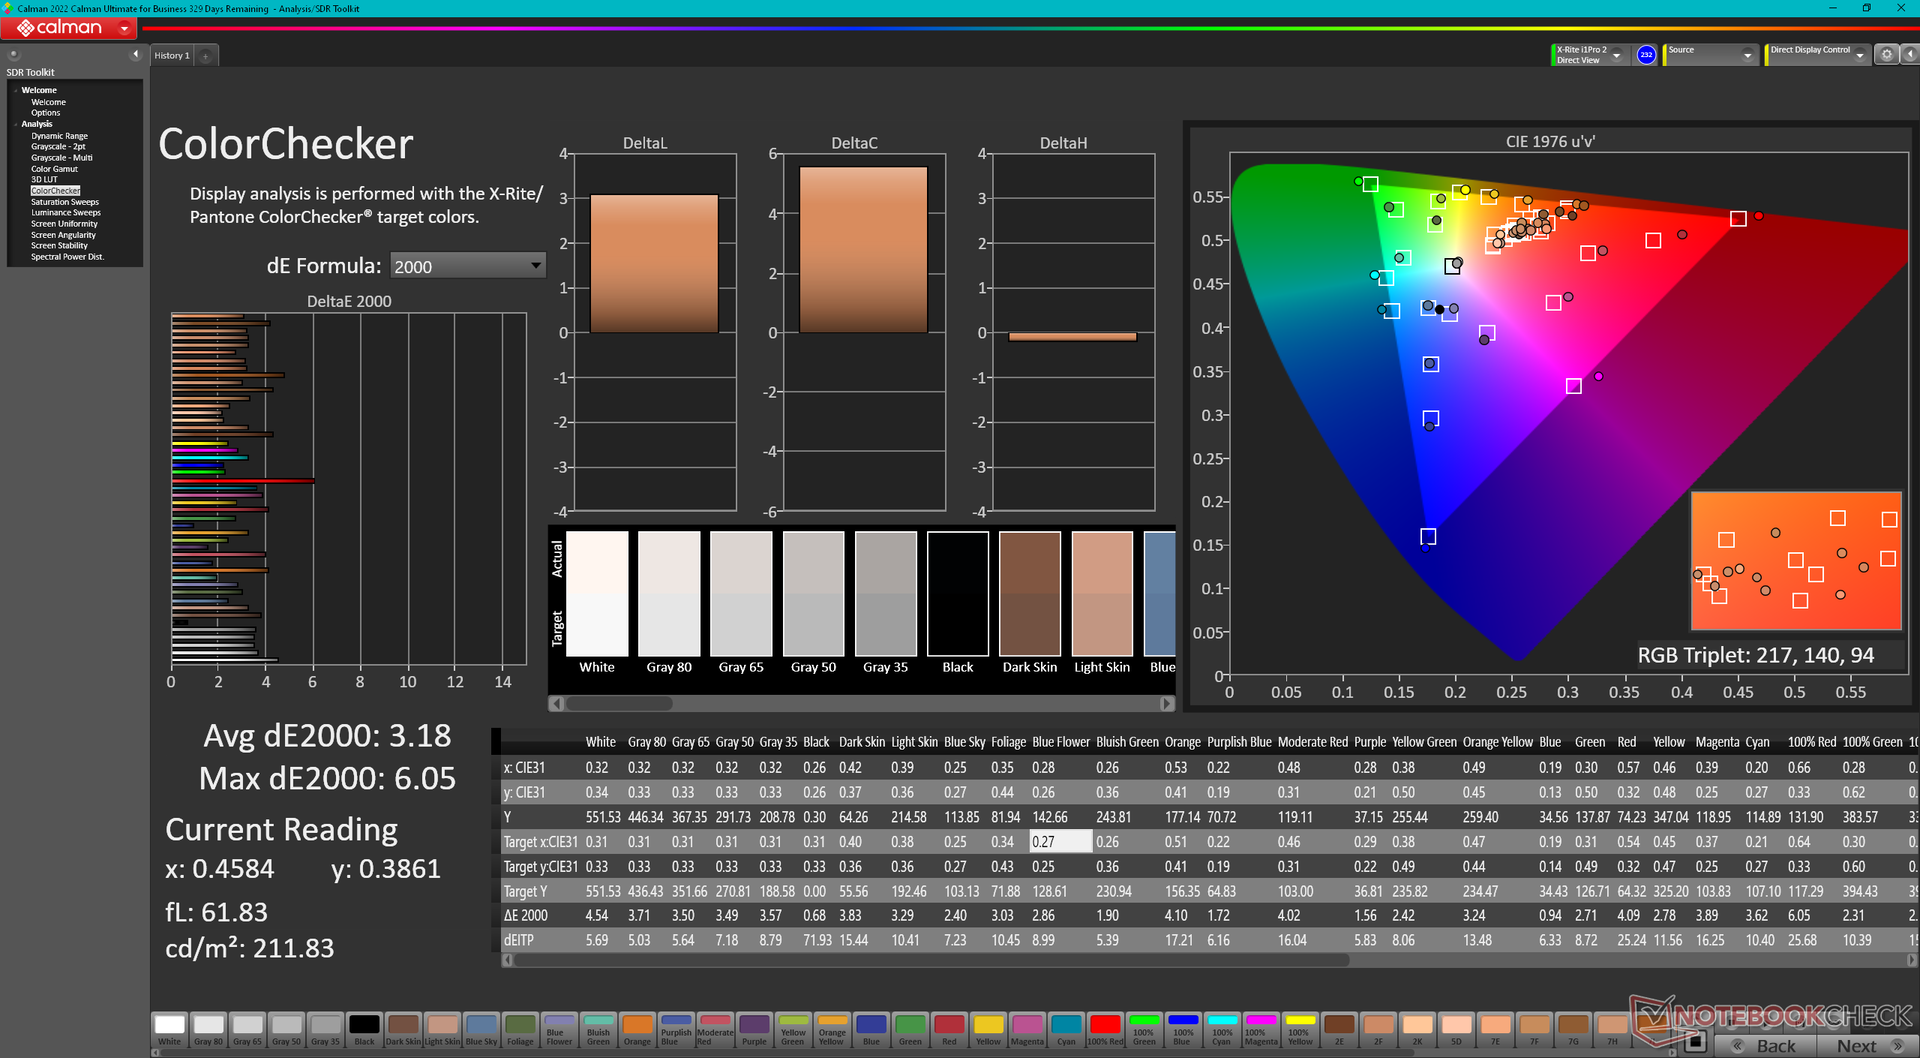
ΔE ColorChecker Calman: 3.18 | ∀{0.5-29.43 Ø4.71}
calibrated: 0.67
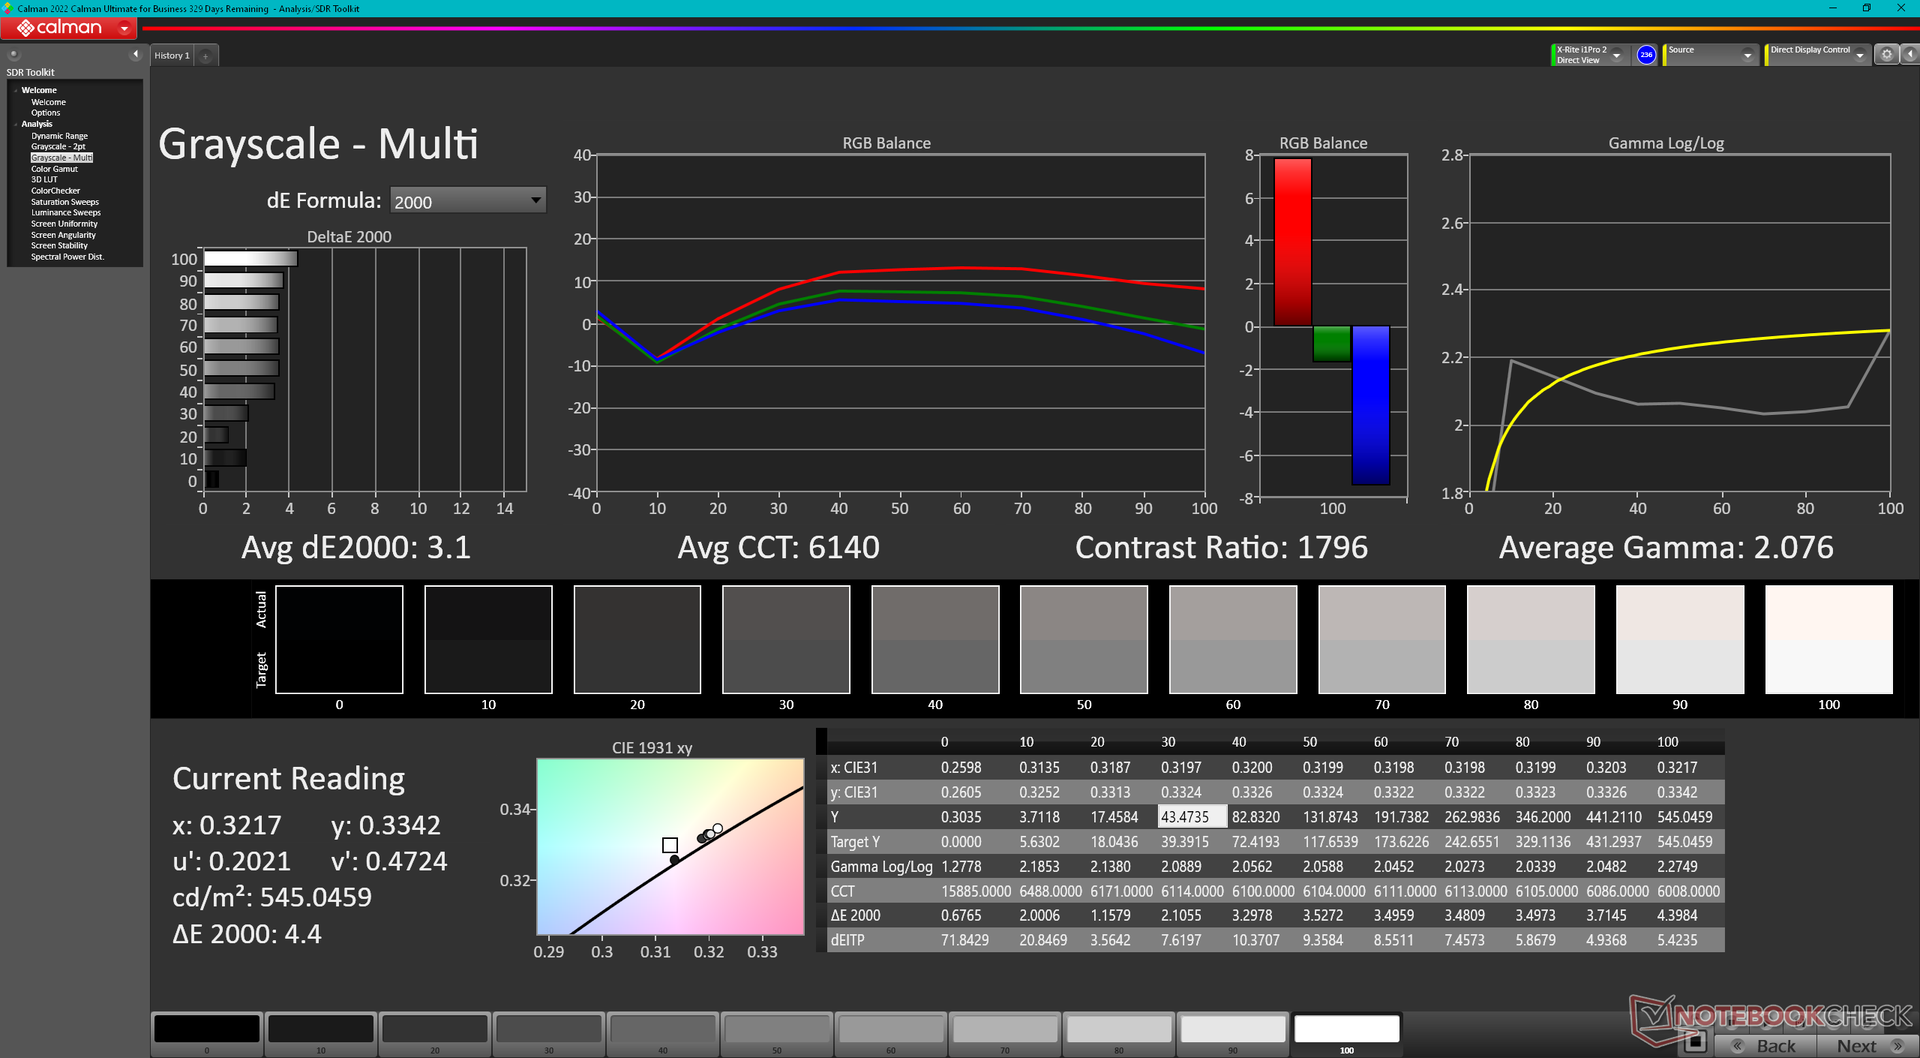
ΔE Greyscale Calman: 3.1 | ∀{0.09-98 Ø4.96}
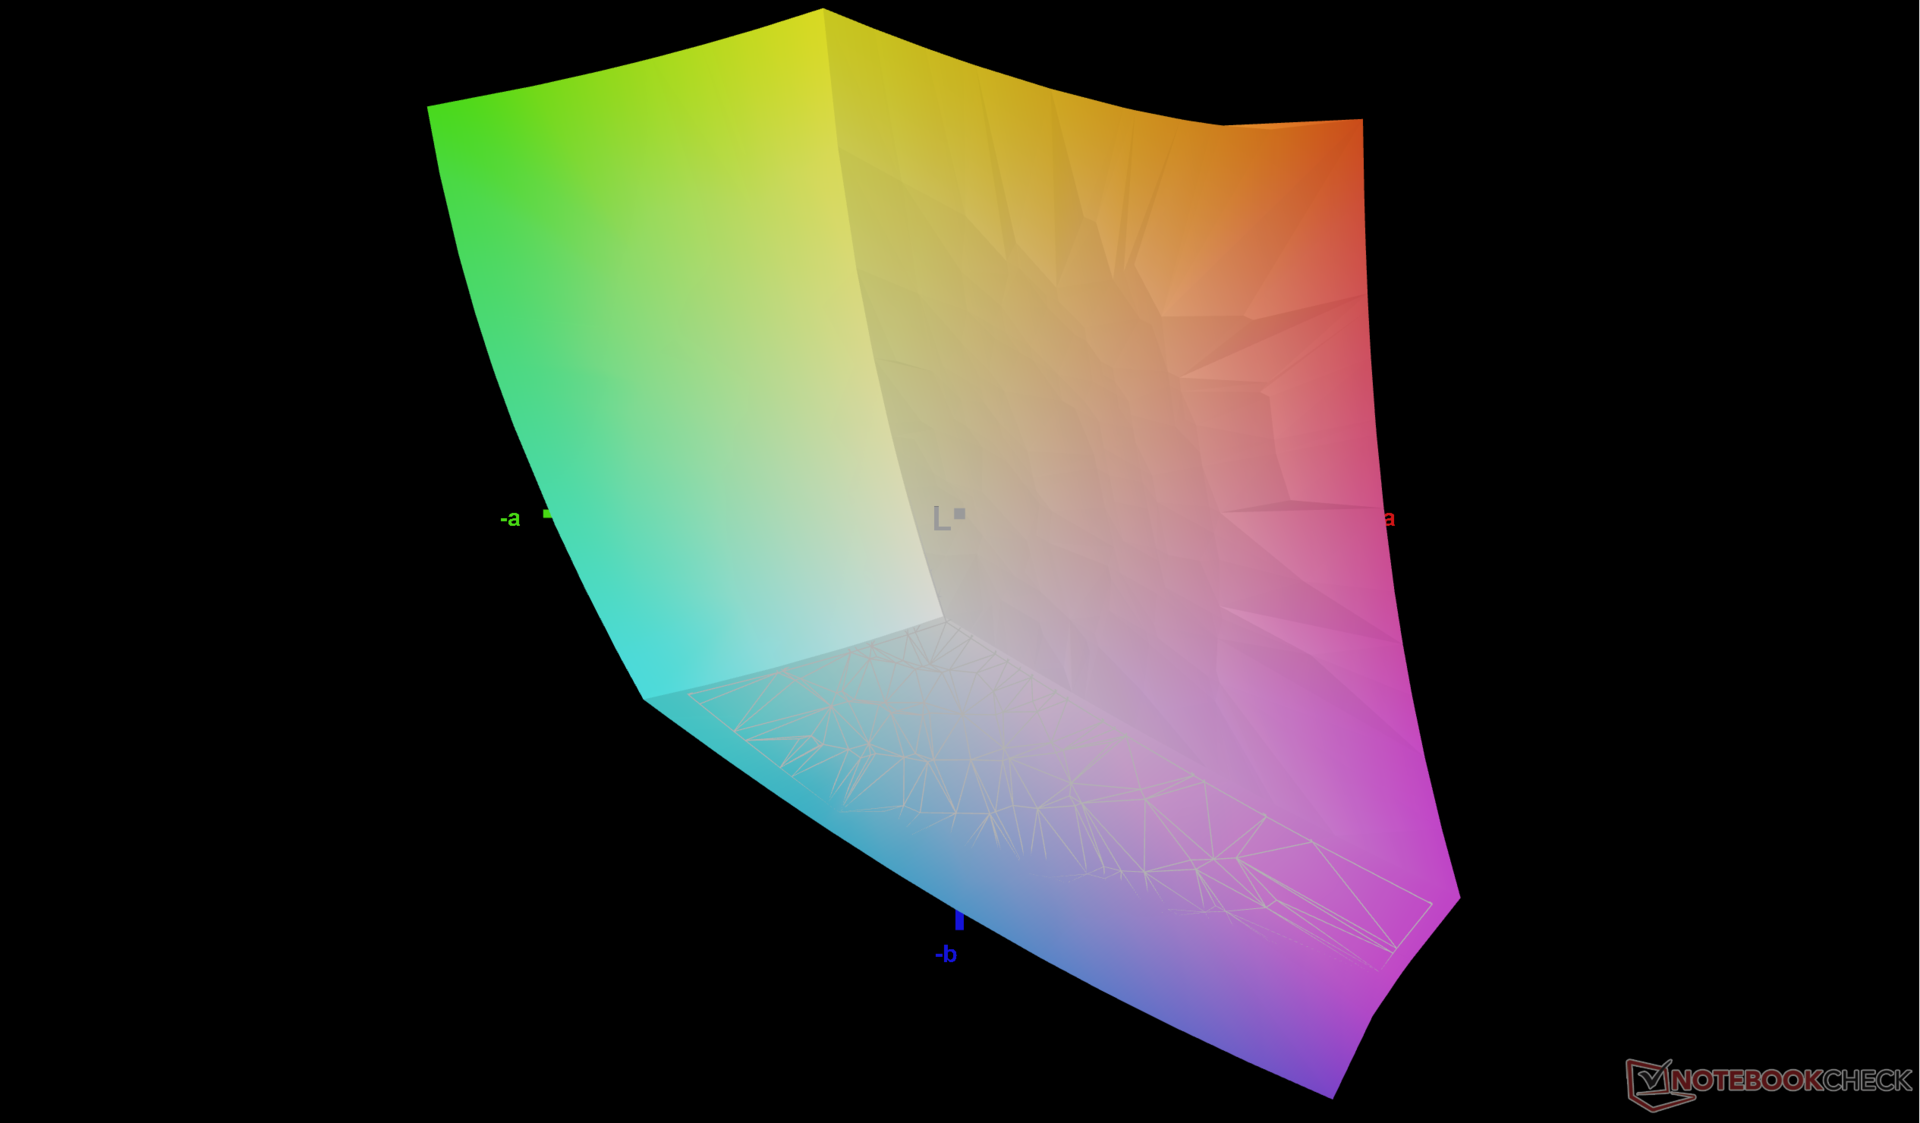
77.5% AdobeRGB 1998 (Argyll 3D)
99.9% sRGB (Argyll 3D)
77.8% Display P3 (Argyll 3D)
Gamma: 2.08
CCT: 6140 K
| Dell Latitude 9330 AU Optronics B133QAA, IPS, 2560x1600, 13.3" | Lenovo ThinkPad X1 Titanium Yoga G1 20QB0016GE LPM135M467, IPS LED, 2256x1504, 13.5" | MSI Summit E13 Flip Evo A11MT Sharp LQ134N1JW53, IPS, 1920x1200, 13.4" | HP EliteBook x360 1030 G7 Chi Mei CMN13A9, IPS, 1920x1080, 13.3" | HP Elite Dragonfly Max InfoVision X133NVFL R0, IPS, 1920x1080, 13.3" | Dell Latitude 5310-23VP6 Chi Mei CMN1382, IPS, 1920x1080, 13.3" | |
|---|---|---|---|---|---|---|
| Display | -9% | -7% | -10% | -8% | ||
| Display P3 Coverage (%) | 77.8 | 66.8 -14% | 69.8 -10% | 66.1 -15% | 67.5 -13% | |
| sRGB Coverage (%) | 99.9 | 98 -2% | 98.8 -1% | 97 -3% | 99 -1% | |
| AdobeRGB 1998 Coverage (%) | 77.5 | 68.6 -11% | 70.6 -9% | 67.7 -13% | 69.2 -11% | |
| Response Times | 9% | 9% | 25% | 36% | 50% | |
| Response Time Grey 50% / Grey 80% * (ms) | 67.6 ? | 64 ? 5% | 64 ? 5% | 56.4 ? 17% | 44.8 ? 34% | 36 ? 47% |
| Response Time Black / White * (ms) | 50.4 ? | 44 ? 13% | 44 ? 13% | 34.4 ? 32% | 32 ? 37% | 24 ? 52% |
| PWM Frequency (Hz) | 26040 ? | 2500 ? | ||||
| Screen | 9% | 3% | -25% | 10% | 2% | |
| Brightness middle (cd/m²) | 542.3 | 465 -14% | 551.3 2% | 425.4 -22% | 777.5 43% | 383 -29% |
| Brightness (cd/m²) | 516 | 451 -13% | 517 0% | 407 -21% | 727 41% | 364 -29% |
| Brightness Distribution (%) | 85 | 92 8% | 91 7% | 89 5% | 75 -12% | 84 -1% |
| Black Level * (cd/m²) | 0.38 | 0.28 26% | 0.37 3% | 0.28 26% | 0.44 -16% | 0.34 11% |
| Contrast (:1) | 1427 | 1661 16% | 1490 4% | 1519 6% | 1767 24% | 1126 -21% |
| Colorchecker dE 2000 * | 3.18 | 2 37% | 1.45 54% | 4.39 -38% | 1.62 49% | 2.24 30% |
| Colorchecker dE 2000 max. * | 6.05 | 4.7 22% | 2.86 53% | 6.73 -11% | 5.26 13% | 3.32 45% |
| Colorchecker dE 2000 calibrated * | 0.67 | 0.7 -4% | 1.7 -154% | 1.65 -146% | 1.32 -97% | 0.72 -7% |
| Greyscale dE 2000 * | 3.1 | 2.9 6% | 1.3 58% | 3.9 -26% | 1.6 48% | 2.42 22% |
| Gamma | 2.08 106% | 2.09 105% | 2.14 103% | 1.87 118% | 2.2 100% | 2.65 83% |
| CCT | 6140 106% | 6181 105% | 6580 99% | 6758 96% | 6538 99% | 6776 96% |
| Color Space (Percent of AdobeRGB 1998) (%) | 65 | 61.7 | 72.3 | 56 | ||
| Color Space (Percent of sRGB) (%) | 99 | 96.6 | 94.8 | 99 | ||
| Całkowita średnia (program / ustawienia) | 3% /
5% | 2% /
2% | -3% /
-15% | 23% /
15% | 15% /
7% |
* ... im mniej tym lepiej
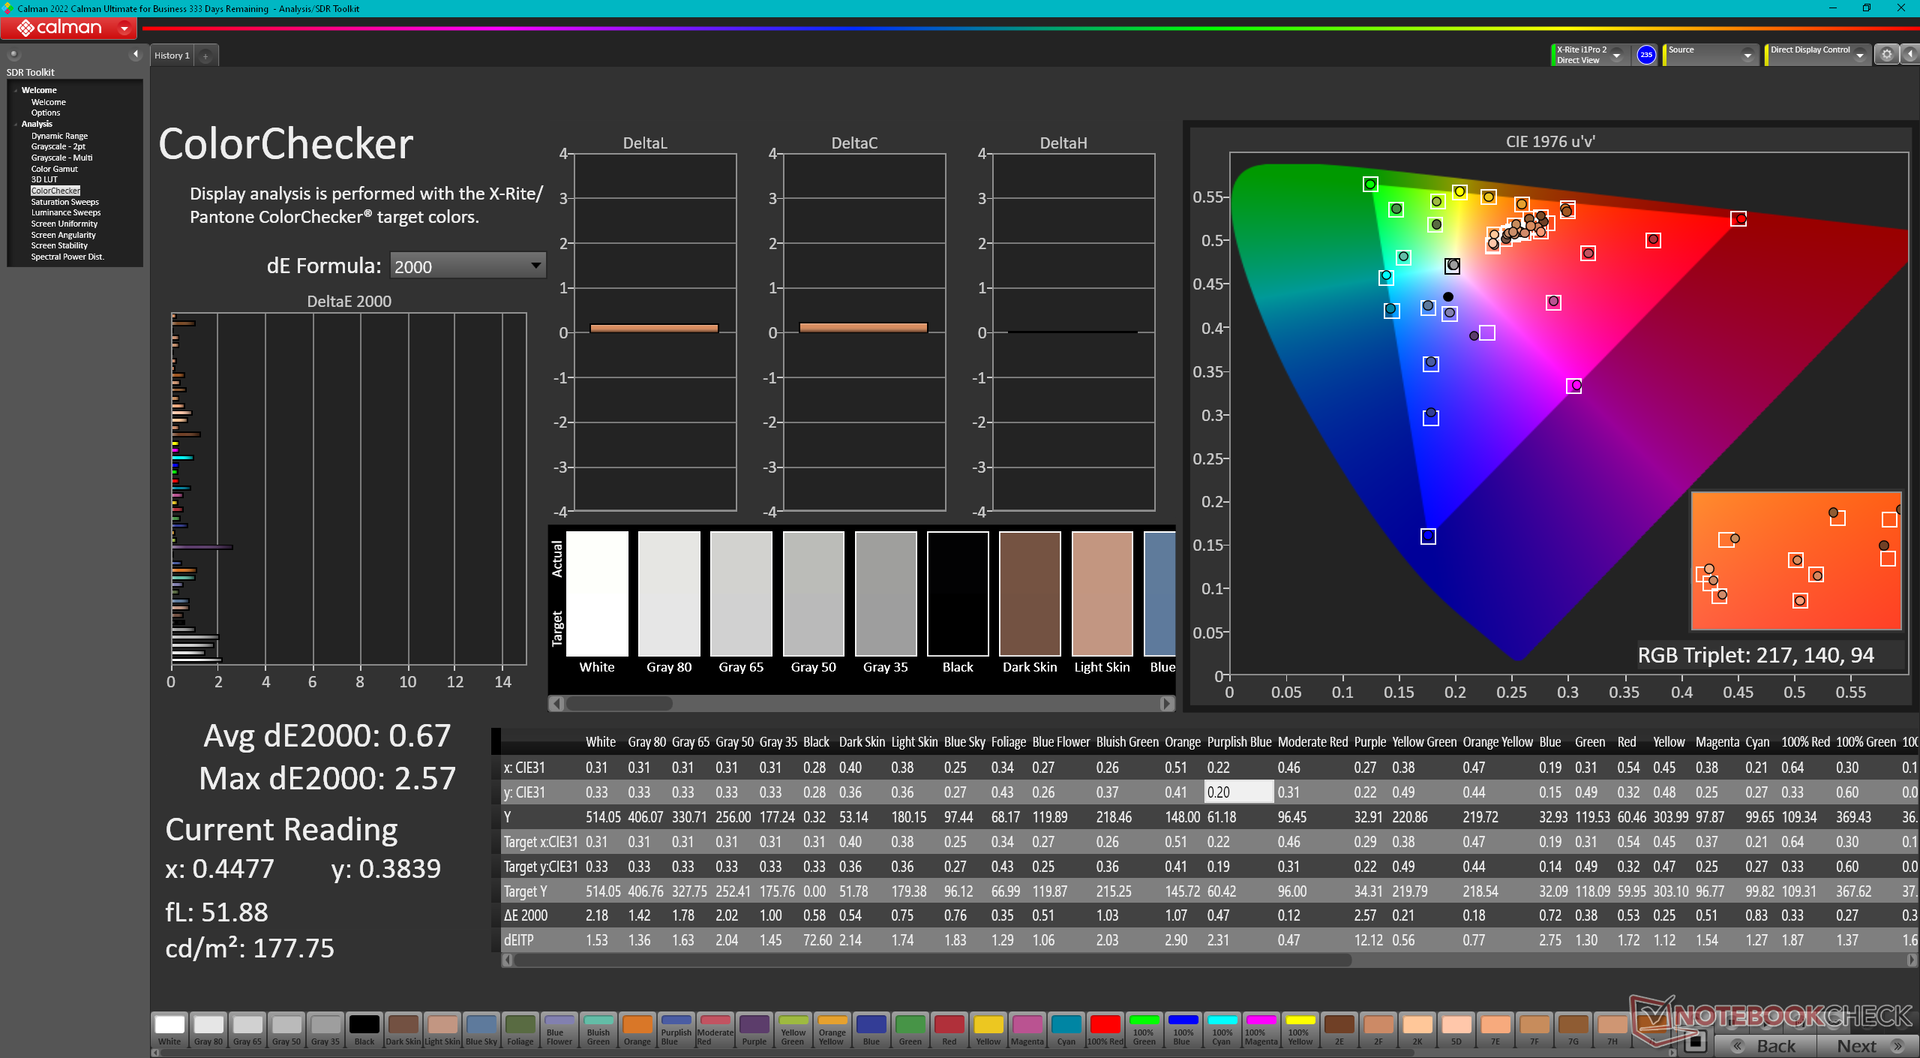
Wyświetlacz nie jest fabrycznie skalibrowany, co jest rozczarowujące w przypadku laptopa sprzedającego się za ponad 2000 USD. Kalibracja panelu przy pomocy kolorymetru X-Rite poprawiłaby średnie wartości DeltaE w skali szarości i kolorze z 3,1 i 3,18 do odpowiednio 1,4 i 0,67. Użytkownicy mogą zastosować nasz powyższy profil ICM, aby lepiej wykorzystać pełną kolorystykę sRGB wyświetlacza.
Wyświetl czasy reakcji
| ↔ Czas reakcji od czerni do bieli | ||
|---|---|---|
| 50.4 ms ... wzrost ↗ i spadek ↘ łącznie | ↗ 26.8 ms wzrost | 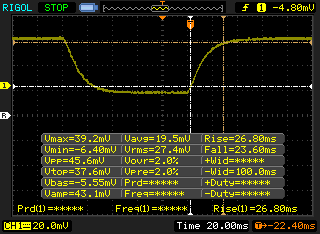 |
| ↘ 23.6 ms upadek | ||
| W naszych testach ekran wykazuje powolne tempo reakcji, co będzie niezadowalające dla graczy. Dla porównania, wszystkie testowane urządzenia wahają się od 0.1 (minimum) do 240 (maksimum) ms. » 99 % wszystkich urządzeń jest lepszych. Oznacza to, że zmierzony czas reakcji jest gorszy od średniej wszystkich testowanych urządzeń (19.8 ms). | ||
| ↔ Czas reakcji 50% szarości do 80% szarości | ||
| 67.6 ms ... wzrost ↗ i spadek ↘ łącznie | ↗ 34.8 ms wzrost | 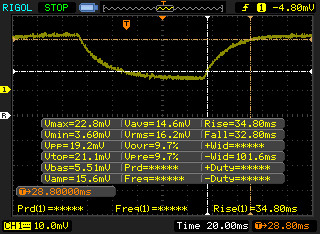 |
| ↘ 32.8 ms upadek | ||
| W naszych testach ekran wykazuje powolne tempo reakcji, co będzie niezadowalające dla graczy. Dla porównania, wszystkie testowane urządzenia wahają się od 0.165 (minimum) do 636 (maksimum) ms. » 98 % wszystkich urządzeń jest lepszych. Oznacza to, że zmierzony czas reakcji jest gorszy od średniej wszystkich testowanych urządzeń (30.9 ms). | ||
Migotanie ekranu / PWM (modulacja szerokości impulsu)
| Migotanie ekranu/nie wykryto PWM | 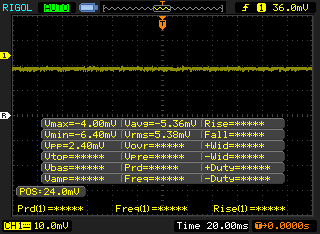 | ||
Dla porównania: 52 % wszystkich testowanych urządzeń nie używa PWM do przyciemniania wyświetlacza. Jeśli wykryto PWM, zmierzono średnio 7741 (minimum: 5 - maksimum: 343500) Hz. | |||
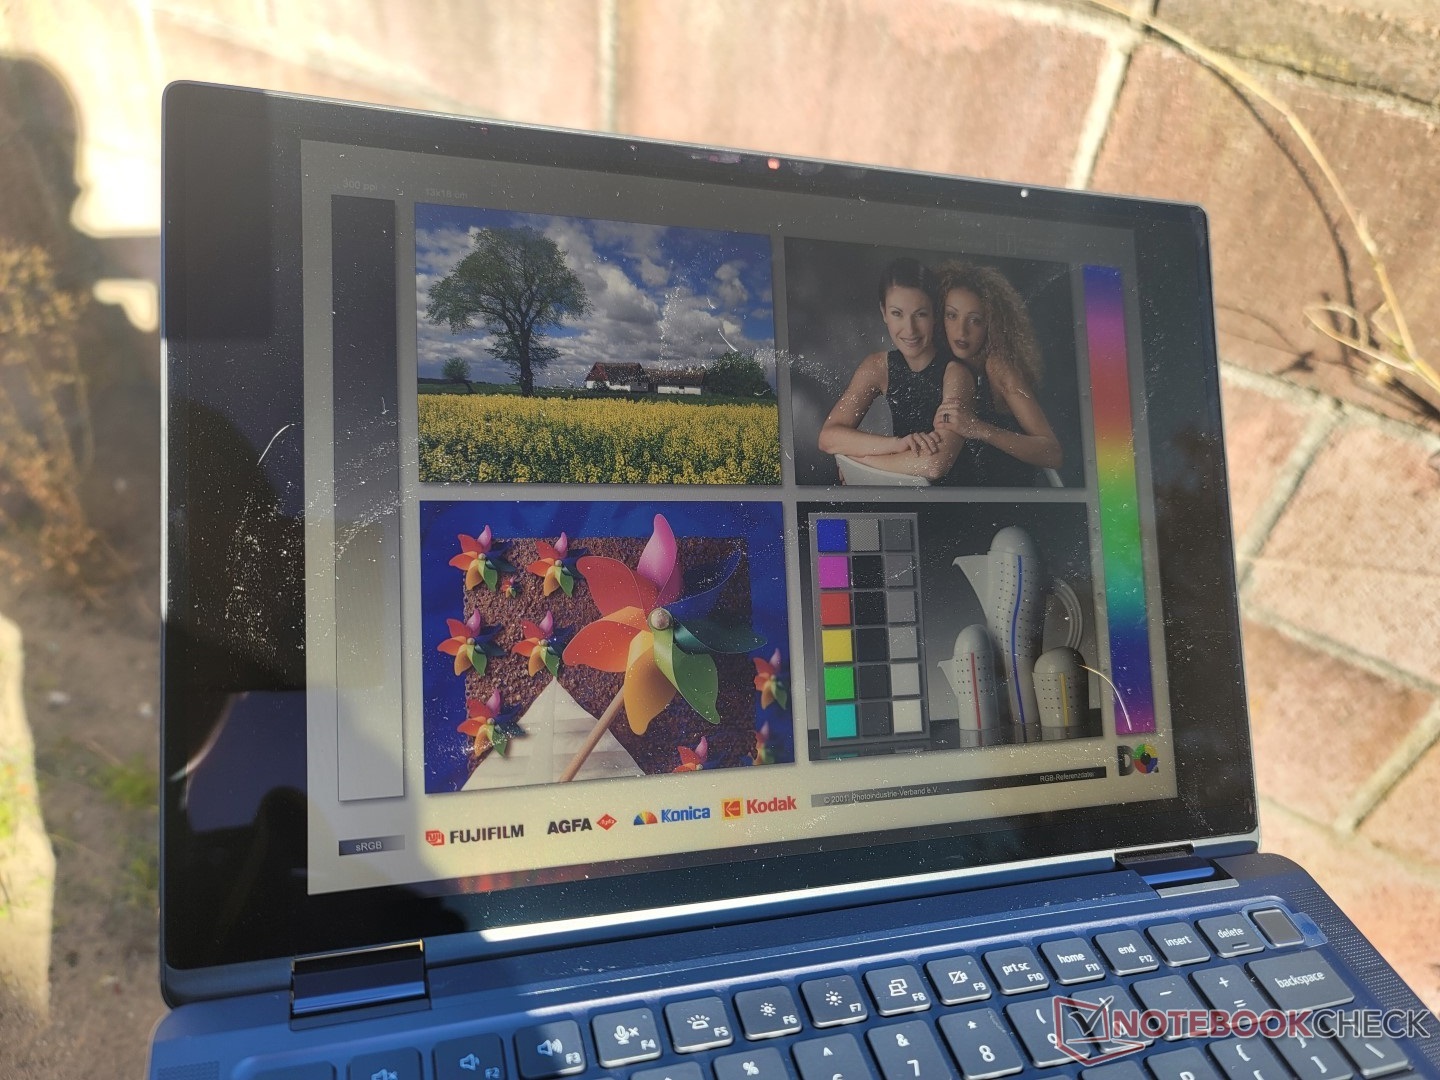
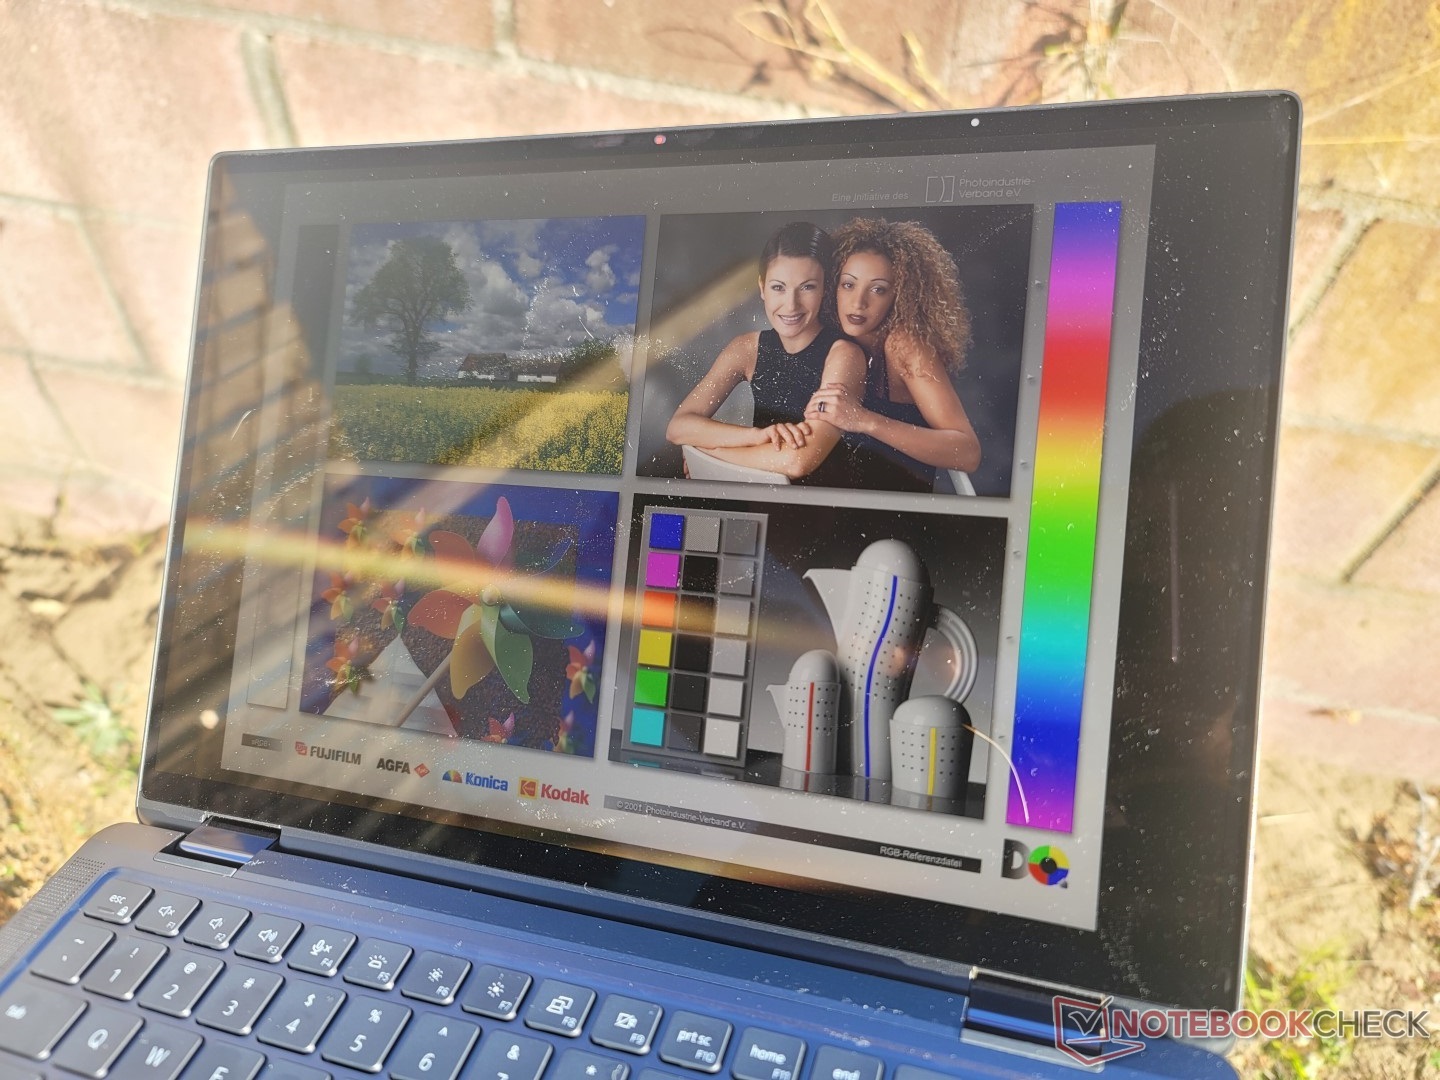
Widoczność na zewnątrz jest dobra w cieniu, ponieważ wyświetlacz jest wystarczająco jasny, aby pokonać niewielkie lub umiarkowane odblaski. Mimo to należy unikać bezpośredniego światła słonecznego, jeśli to tylko możliwe, aby zoptymalizować wrażenia z oglądania. Konkurencja Dragonfly Max oferuje jeszcze jaśniejsze opcje wyświetlania niż Latitude 9330, co zapewnia bardziej komfortowe oglądanie na zewnątrz.

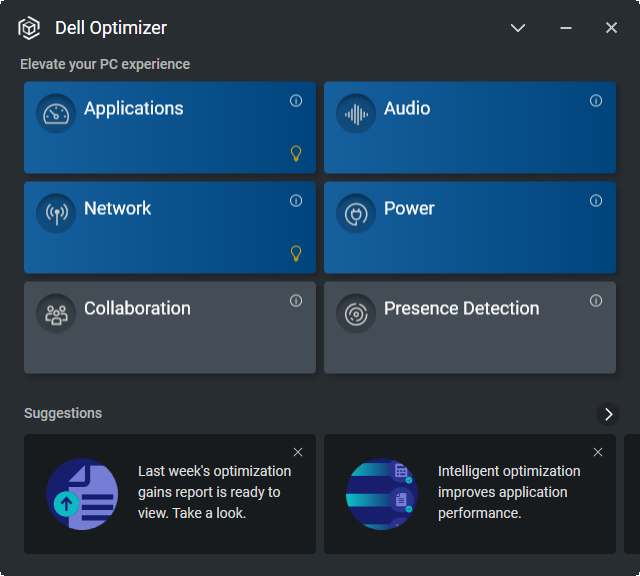
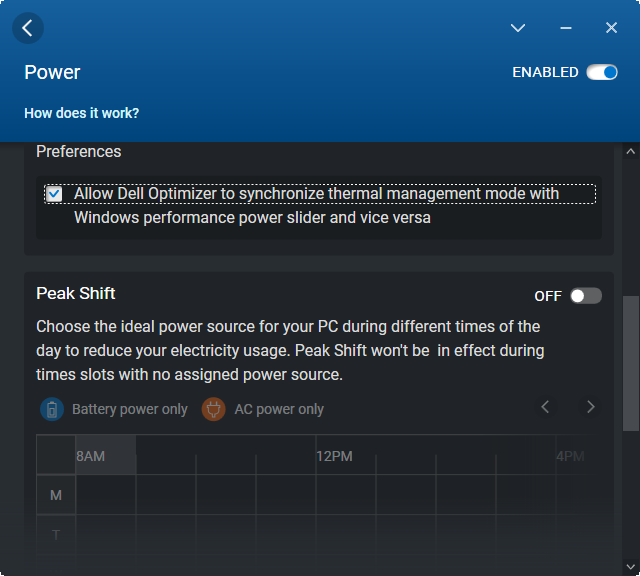
Wykonanie - 12. gen. Alder Lake-U
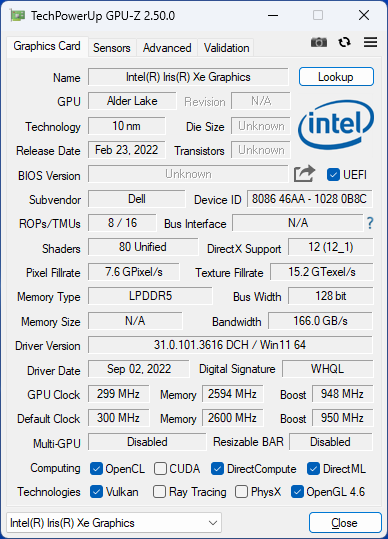
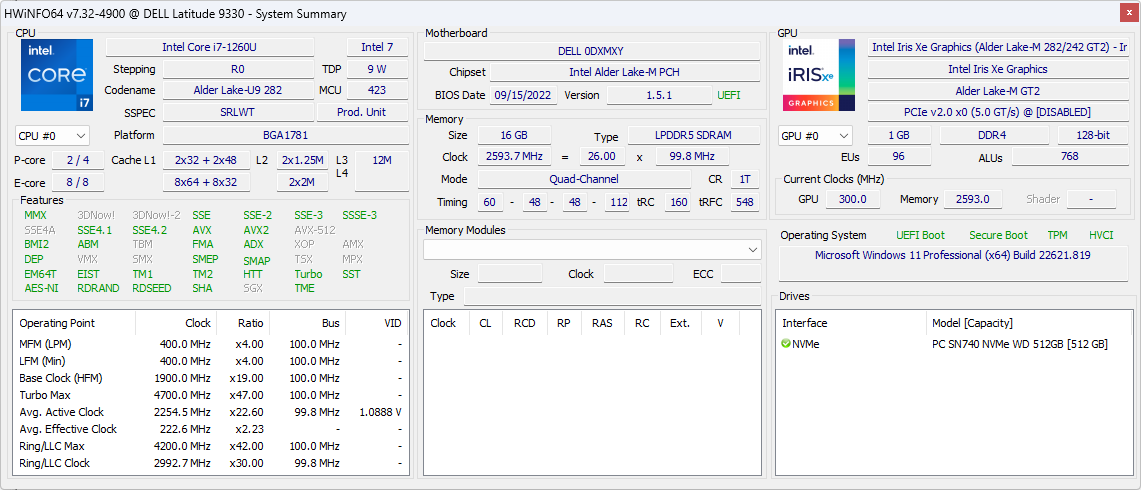
Warunki badania
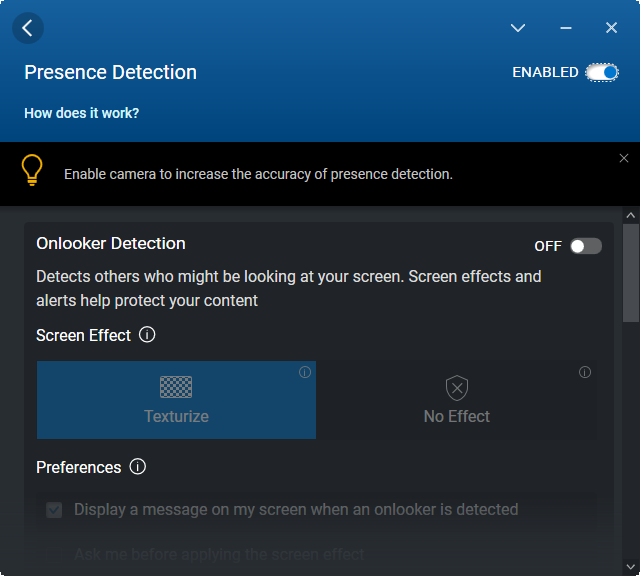
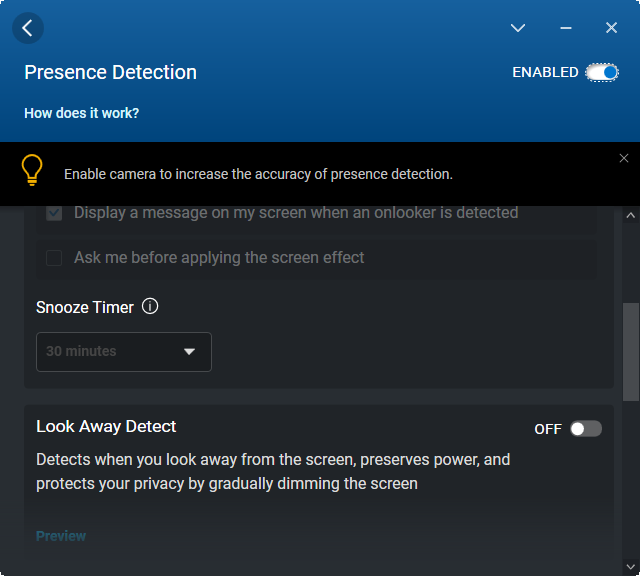
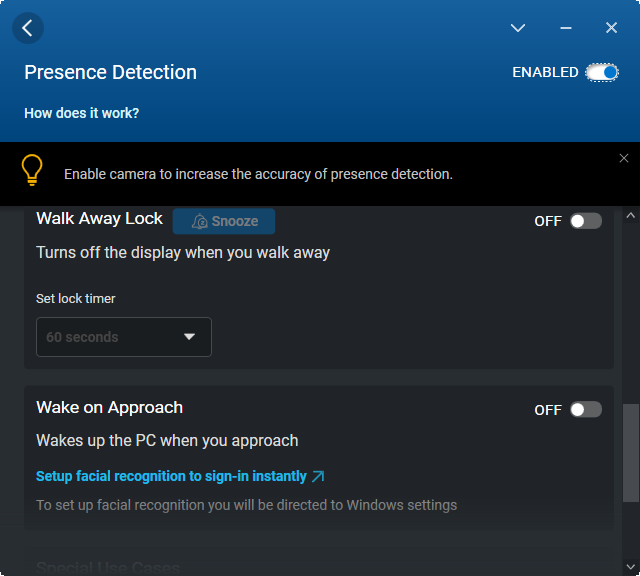
Nasze urządzenie zostało ustawione w trybie Ultra Performance zarówno przez system Windows, jak i oprogramowanie Dell Optimizer. Zaleca się, aby właściciele zapoznali się z programem Optimizer, ponieważ jest to centrum umożliwiające przełączanie funkcji specyficznych dla Latitude, takich jak wykrywanie obecności do logowania bez użycia rąk lub włączanie dodatkowych przycisków dotykowych. W oprogramowaniu można również znaleźć profile wydajności, co pokazują poniższe zrzuty ekranu.

Procesor
Wydajność procesora jest ogólnie doskonała, ale nie robi on wystarczająco dużo, aby odróżnić się od Core i5-1235U. Na przykład wyniki benchmarków są o 5 do 10 procent lepsze od tańszego Core i5-1235U w modelu IdeaPad Flex 5i. Tymczasem Core i7-1255U jest szybszy o około 10-15% z powodu wyższego TDP niż nasz Core i7-1260U. Przewaga wydajności wielowątkowej nad ustępującym 11. gen Core i7-1165G7 jest nadal znacząca i wynosi około 35%, pomimo mniejszych różnic pomiędzy procesorami 12 generacji i5-1235U i i7-1255U
Zrównoważenie wydajności jest dobre i znacznie lepsze od tego, co zaobserwowaliśmy w konkurencyjnym ThinkPad X1 Nano Gen 2 co pokazuje poniższy wykres porównawczy. Układ Della jest w stanie osiągnąć to poprzez bardzo wysokie temperatury rdzenia, co zilustruje nasza sekcja Stress Test.
Cinebench R15 Multi Loop
Cinebench R23: Multi Core | Single Core
Cinebench R15: CPU Multi 64Bit | CPU Single 64Bit
Blender: v2.79 BMW27 CPU
7-Zip 18.03: 7z b 4 | 7z b 4 -mmt1
Geekbench 5.5: Multi-Core | Single-Core
HWBOT x265 Benchmark v2.2: 4k Preset
LibreOffice : 20 Documents To PDF
R Benchmark 2.5: Overall mean
| Cinebench R20 / CPU (Multi Core) | |
| Asus Zenbook S 13 OLED | |
| Lenovo ThinkPad X1 Nano Gen 2 Core i7-1280P | |
| HP Spectre x360 13.5 14t-ef000 | |
| Przeciętny Intel Core i7-1260U (2838 - 3165, n=2) | |
| Lenovo ThinkBook 13s G3 20YA0005GE | |
| Lenovo Yoga 6 13ALC6 | |
| Dell Latitude 9330 | |
| Lenovo IdeaPad Flex 5i 14IAU7 | |
| Samsung Galaxy Book2 Pro 13 NP930XED-KA1DE | |
| Framework Laptop 13.5 | |
| MSI Summit E13 Flip Evo A11MT | |
| HP EliteBook x360 1030 G7 | |
| HP Elite Dragonfly Max | |
| Dell Latitude 5310-23VP6 | |
| Lenovo ThinkPad X1 Titanium Yoga G1 20QB0016GE | |
| Cinebench R20 / CPU (Single Core) | |
| HP Spectre x360 13.5 14t-ef000 | |
| Lenovo IdeaPad Flex 5i 14IAU7 | |
| Lenovo ThinkPad X1 Nano Gen 2 Core i7-1280P | |
| Dell Latitude 9330 | |
| Framework Laptop 13.5 | |
| Przeciętny Intel Core i7-1260U (566 - 588, n=2) | |
| Asus Zenbook S 13 OLED | |
| Lenovo ThinkBook 13s G3 20YA0005GE | |
| MSI Summit E13 Flip Evo A11MT | |
| HP Elite Dragonfly Max | |
| Lenovo Yoga 6 13ALC6 | |
| HP EliteBook x360 1030 G7 | |
| Lenovo ThinkPad X1 Titanium Yoga G1 20QB0016GE | |
| Dell Latitude 5310-23VP6 | |
| Samsung Galaxy Book2 Pro 13 NP930XED-KA1DE | |
| Cinebench R23 / Multi Core | |
| Asus Zenbook S 13 OLED | |
| Lenovo ThinkPad X1 Nano Gen 2 Core i7-1280P | |
| HP Spectre x360 13.5 14t-ef000 | |
| Lenovo IdeaPad Flex 5i 14IAU7 | |
| Lenovo ThinkBook 13s G3 20YA0005GE | |
| Przeciętny Intel Core i7-1260U (7444 - 8381, n=2) | |
| Lenovo Yoga 6 13ALC6 | |
| Dell Latitude 9330 | |
| Samsung Galaxy Book2 Pro 13 NP930XED-KA1DE | |
| MSI Summit E13 Flip Evo A11MT | |
| Framework Laptop 13.5 | |
| HP Elite Dragonfly Max | |
| Lenovo ThinkPad X1 Titanium Yoga G1 20QB0016GE | |
| Cinebench R23 / Single Core | |
| HP Spectre x360 13.5 14t-ef000 | |
| Lenovo ThinkPad X1 Nano Gen 2 Core i7-1280P | |
| Lenovo IdeaPad Flex 5i 14IAU7 | |
| Przeciętny Intel Core i7-1260U (1538 - 1664, n=2) | |
| Dell Latitude 9330 | |
| Framework Laptop 13.5 | |
| Asus Zenbook S 13 OLED | |
| MSI Summit E13 Flip Evo A11MT | |
| Lenovo ThinkBook 13s G3 20YA0005GE | |
| HP Elite Dragonfly Max | |
| Lenovo Yoga 6 13ALC6 | |
| Lenovo ThinkPad X1 Titanium Yoga G1 20QB0016GE | |
| Samsung Galaxy Book2 Pro 13 NP930XED-KA1DE | |
| Cinebench R15 / CPU Multi 64Bit | |
| Lenovo ThinkPad X1 Nano Gen 2 Core i7-1280P | |
| Lenovo ThinkBook 13s G3 20YA0005GE | |
| Lenovo ThinkBook 13s G3 20YA0005GE | |
| Asus Zenbook S 13 OLED | |
| HP Spectre x360 13.5 14t-ef000 | |
| Lenovo IdeaPad Flex 5i 14IAU7 | |
| Przeciętny Intel Core i7-1260U (1117 - 1289, n=2) | |
| Lenovo Yoga 6 13ALC6 | |
| Dell Latitude 9330 | |
| Samsung Galaxy Book2 Pro 13 NP930XED-KA1DE | |
| MSI Summit E13 Flip Evo A11MT | |
| Framework Laptop 13.5 | |
| HP EliteBook x360 1030 G7 | |
| Lenovo ThinkPad X1 Titanium Yoga G1 20QB0016GE | |
| HP Elite Dragonfly Max | |
| Dell Latitude 5310-23VP6 | |
| Cinebench R15 / CPU Single 64Bit | |
| HP Spectre x360 13.5 14t-ef000 | |
| Lenovo IdeaPad Flex 5i 14IAU7 | |
| Lenovo ThinkPad X1 Nano Gen 2 Core i7-1280P | |
| Asus Zenbook S 13 OLED | |
| Lenovo ThinkBook 13s G3 20YA0005GE | |
| Framework Laptop 13.5 | |
| Dell Latitude 9330 | |
| Przeciętny Intel Core i7-1260U (217 - 222, n=2) | |
| MSI Summit E13 Flip Evo A11MT | |
| Lenovo Yoga 6 13ALC6 | |
| HP EliteBook x360 1030 G7 | |
| Lenovo ThinkPad X1 Titanium Yoga G1 20QB0016GE | |
| HP Elite Dragonfly Max | |
| Dell Latitude 5310-23VP6 | |
| Samsung Galaxy Book2 Pro 13 NP930XED-KA1DE | |
| Blender / v2.79 BMW27 CPU | |
| Lenovo ThinkPad X1 Titanium Yoga G1 20QB0016GE | |
| Dell Latitude 5310-23VP6 | |
| HP Elite Dragonfly Max | |
| HP EliteBook x360 1030 G7 | |
| Samsung Galaxy Book2 Pro 13 NP930XED-KA1DE | |
| MSI Summit E13 Flip Evo A11MT | |
| Framework Laptop 13.5 | |
| Dell Latitude 9330 | |
| Przeciętny Intel Core i7-1260U (393 - 431, n=2) | |
| Lenovo IdeaPad Flex 5i 14IAU7 | |
| Lenovo ThinkBook 13s G3 20YA0005GE | |
| HP Spectre x360 13.5 14t-ef000 | |
| Lenovo Yoga 6 13ALC6 | |
| Asus Zenbook S 13 OLED | |
| Lenovo ThinkPad X1 Nano Gen 2 Core i7-1280P | |
| 7-Zip 18.03 / 7z b 4 | |
| Asus Zenbook S 13 OLED | |
| Lenovo ThinkPad X1 Nano Gen 2 Core i7-1280P | |
| Lenovo ThinkBook 13s G3 20YA0005GE | |
| Lenovo Yoga 6 13ALC6 | |
| HP Spectre x360 13.5 14t-ef000 | |
| Przeciętny Intel Core i7-1260U (32008 - 36480, n=2) | |
| Dell Latitude 9330 | |
| Lenovo IdeaPad Flex 5i 14IAU7 | |
| MSI Summit E13 Flip Evo A11MT | |
| Framework Laptop 13.5 | |
| Samsung Galaxy Book2 Pro 13 NP930XED-KA1DE | |
| HP EliteBook x360 1030 G7 | |
| HP Elite Dragonfly Max | |
| Dell Latitude 5310-23VP6 | |
| Lenovo ThinkPad X1 Titanium Yoga G1 20QB0016GE | |
| 7-Zip 18.03 / 7z b 4 -mmt1 | |
| Lenovo ThinkPad X1 Nano Gen 2 Core i7-1280P | |
| HP Spectre x360 13.5 14t-ef000 | |
| Asus Zenbook S 13 OLED | |
| Framework Laptop 13.5 | |
| Lenovo ThinkBook 13s G3 20YA0005GE | |
| MSI Summit E13 Flip Evo A11MT | |
| HP Elite Dragonfly Max | |
| Lenovo IdeaPad Flex 5i 14IAU7 | |
| Przeciętny Intel Core i7-1260U (4746 - 5047, n=2) | |
| Dell Latitude 9330 | |
| Lenovo Yoga 6 13ALC6 | |
| HP EliteBook x360 1030 G7 | |
| Dell Latitude 5310-23VP6 | |
| Lenovo ThinkPad X1 Titanium Yoga G1 20QB0016GE | |
| Samsung Galaxy Book2 Pro 13 NP930XED-KA1DE | |
| Geekbench 5.5 / Multi-Core | |
| Lenovo ThinkPad X1 Nano Gen 2 Core i7-1280P | |
| Lenovo IdeaPad Flex 5i 14IAU7 | |
| HP Spectre x360 13.5 14t-ef000 | |
| Asus Zenbook S 13 OLED | |
| Przeciętny Intel Core i7-1260U (7072 - 7444, n=2) | |
| Dell Latitude 9330 | |
| Lenovo ThinkBook 13s G3 20YA0005GE | |
| MSI Summit E13 Flip Evo A11MT | |
| HP Elite Dragonfly Max | |
| HP EliteBook x360 1030 G7 | |
| Samsung Galaxy Book2 Pro 13 NP930XED-KA1DE | |
| Lenovo ThinkPad X1 Titanium Yoga G1 20QB0016GE | |
| Dell Latitude 5310-23VP6 | |
| Geekbench 5.5 / Single-Core | |
| Lenovo ThinkPad X1 Nano Gen 2 Core i7-1280P | |
| HP Spectre x360 13.5 14t-ef000 | |
| Lenovo IdeaPad Flex 5i 14IAU7 | |
| Przeciętny Intel Core i7-1260U (1560 - 1662, n=2) | |
| Dell Latitude 9330 | |
| HP Elite Dragonfly Max | |
| Asus Zenbook S 13 OLED | |
| MSI Summit E13 Flip Evo A11MT | |
| Lenovo ThinkBook 13s G3 20YA0005GE | |
| Lenovo ThinkPad X1 Titanium Yoga G1 20QB0016GE | |
| HP EliteBook x360 1030 G7 | |
| Dell Latitude 5310-23VP6 | |
| Samsung Galaxy Book2 Pro 13 NP930XED-KA1DE | |
| HWBOT x265 Benchmark v2.2 / 4k Preset | |
| Asus Zenbook S 13 OLED | |
| HP Spectre x360 13.5 14t-ef000 | |
| Lenovo ThinkBook 13s G3 20YA0005GE | |
| Lenovo ThinkPad X1 Nano Gen 2 Core i7-1280P | |
| Lenovo IdeaPad Flex 5i 14IAU7 | |
| Lenovo Yoga 6 13ALC6 | |
| Przeciętny Intel Core i7-1260U (8.54 - 9.58, n=2) | |
| Dell Latitude 9330 | |
| MSI Summit E13 Flip Evo A11MT | |
| Framework Laptop 13.5 | |
| Samsung Galaxy Book2 Pro 13 NP930XED-KA1DE | |
| HP EliteBook x360 1030 G7 | |
| HP Elite Dragonfly Max | |
| Dell Latitude 5310-23VP6 | |
| Lenovo ThinkPad X1 Titanium Yoga G1 20QB0016GE | |
| LibreOffice / 20 Documents To PDF | |
| Samsung Galaxy Book2 Pro 13 NP930XED-KA1DE | |
| HP EliteBook x360 1030 G7 | |
| Dell Latitude 5310-23VP6 | |
| Lenovo Yoga 6 13ALC6 | |
| Asus Zenbook S 13 OLED | |
| Dell Latitude 9330 | |
| Lenovo ThinkPad X1 Titanium Yoga G1 20QB0016GE | |
| Lenovo ThinkBook 13s G3 20YA0005GE | |
| Lenovo IdeaPad Flex 5i 14IAU7 | |
| Przeciętny Intel Core i7-1260U (45.9 - 51.4, n=2) | |
| MSI Summit E13 Flip Evo A11MT | |
| HP Elite Dragonfly Max | |
| Lenovo ThinkPad X1 Nano Gen 2 Core i7-1280P | |
| Framework Laptop 13.5 | |
| HP Spectre x360 13.5 14t-ef000 | |
| R Benchmark 2.5 / Overall mean | |
| Samsung Galaxy Book2 Pro 13 NP930XED-KA1DE | |
| Lenovo ThinkPad X1 Titanium Yoga G1 20QB0016GE | |
| Dell Latitude 5310-23VP6 | |
| HP EliteBook x360 1030 G7 | |
| HP Elite Dragonfly Max | |
| MSI Summit E13 Flip Evo A11MT | |
| Lenovo Yoga 6 13ALC6 | |
| Framework Laptop 13.5 | |
| Lenovo ThinkBook 13s G3 20YA0005GE | |
| Dell Latitude 9330 | |
| Asus Zenbook S 13 OLED | |
| Przeciętny Intel Core i7-1260U (0.494 - 0.53, n=2) | |
| Lenovo IdeaPad Flex 5i 14IAU7 | |
| HP Spectre x360 13.5 14t-ef000 | |
| Lenovo ThinkPad X1 Nano Gen 2 Core i7-1280P | |
Cinebench R23: Multi Core | Single Core
Cinebench R15: CPU Multi 64Bit | CPU Single 64Bit
Blender: v2.79 BMW27 CPU
7-Zip 18.03: 7z b 4 | 7z b 4 -mmt1
Geekbench 5.5: Multi-Core | Single-Core
HWBOT x265 Benchmark v2.2: 4k Preset
LibreOffice : 20 Documents To PDF
R Benchmark 2.5: Overall mean
* ... im mniej tym lepiej
AIDA64: FP32 Ray-Trace | FPU Julia | CPU SHA3 | CPU Queen | FPU SinJulia | FPU Mandel | CPU AES | CPU ZLib | FP64 Ray-Trace | CPU PhotoWorxx
| Performance rating | |
| MSI Summit E13 Flip Evo A11MT | |
| Przeciętny Intel Core i7-1260U | |
| Dell Latitude 9330 | |
| HP Elite Dragonfly Max | |
| Lenovo ThinkPad X1 Titanium Yoga G1 20QB0016GE | |
| Dell Latitude 5310-23VP6 | |
| AIDA64 / FP32 Ray-Trace | |
| MSI Summit E13 Flip Evo A11MT | |
| Przeciętny Intel Core i7-1260U (6694 - 7261, n=2) | |
| Dell Latitude 9330 | |
| HP Elite Dragonfly Max | |
| Dell Latitude 5310-23VP6 | |
| Lenovo ThinkPad X1 Titanium Yoga G1 20QB0016GE | |
| AIDA64 / FPU Julia | |
| Przeciętny Intel Core i7-1260U (33823 - 37371, n=2) | |
| Dell Latitude 9330 | |
| MSI Summit E13 Flip Evo A11MT | |
| Dell Latitude 5310-23VP6 | |
| HP Elite Dragonfly Max | |
| Lenovo ThinkPad X1 Titanium Yoga G1 20QB0016GE | |
| AIDA64 / CPU SHA3 | |
| MSI Summit E13 Flip Evo A11MT | |
| Przeciętny Intel Core i7-1260U (1816 - 1949, n=2) | |
| Dell Latitude 9330 | |
| HP Elite Dragonfly Max | |
| Lenovo ThinkPad X1 Titanium Yoga G1 20QB0016GE | |
| Dell Latitude 5310-23VP6 | |
| AIDA64 / CPU Queen | |
| MSI Summit E13 Flip Evo A11MT | |
| Przeciętny Intel Core i7-1260U (50854 - 53090, n=2) | |
| Dell Latitude 9330 | |
| HP Elite Dragonfly Max | |
| Dell Latitude 5310-23VP6 | |
| Lenovo ThinkPad X1 Titanium Yoga G1 20QB0016GE | |
| AIDA64 / FPU SinJulia | |
| MSI Summit E13 Flip Evo A11MT | |
| Dell Latitude 5310-23VP6 | |
| Przeciętny Intel Core i7-1260U (4067 - 4155, n=2) | |
| Dell Latitude 9330 | |
| HP Elite Dragonfly Max | |
| Lenovo ThinkPad X1 Titanium Yoga G1 20QB0016GE | |
| AIDA64 / FPU Mandel | |
| MSI Summit E13 Flip Evo A11MT | |
| Przeciętny Intel Core i7-1260U (16988 - 17918, n=2) | |
| Dell Latitude 9330 | |
| HP Elite Dragonfly Max | |
| Dell Latitude 5310-23VP6 | |
| Lenovo ThinkPad X1 Titanium Yoga G1 20QB0016GE | |
| AIDA64 / CPU AES | |
| MSI Summit E13 Flip Evo A11MT | |
| HP Elite Dragonfly Max | |
| Lenovo ThinkPad X1 Titanium Yoga G1 20QB0016GE | |
| Przeciętny Intel Core i7-1260U (33289 - 35061, n=2) | |
| Dell Latitude 9330 | |
| Dell Latitude 5310-23VP6 | |
| AIDA64 / CPU ZLib | |
| Przeciętny Intel Core i7-1260U (506 - 586, n=2) | |
| Dell Latitude 9330 | |
| MSI Summit E13 Flip Evo A11MT | |
| Dell Latitude 5310-23VP6 | |
| HP Elite Dragonfly Max | |
| Lenovo ThinkPad X1 Titanium Yoga G1 20QB0016GE | |
| AIDA64 / FP64 Ray-Trace | |
| MSI Summit E13 Flip Evo A11MT | |
| Przeciętny Intel Core i7-1260U (3666 - 3854, n=2) | |
| Dell Latitude 9330 | |
| HP Elite Dragonfly Max | |
| Dell Latitude 5310-23VP6 | |
| Lenovo ThinkPad X1 Titanium Yoga G1 20QB0016GE | |
| AIDA64 / CPU PhotoWorxx | |
| MSI Summit E13 Flip Evo A11MT | |
| HP Elite Dragonfly Max | |
| Przeciętny Intel Core i7-1260U (37448 - 37790, n=2) | |
| Dell Latitude 9330 | |
| Lenovo ThinkPad X1 Titanium Yoga G1 20QB0016GE | |
| Dell Latitude 5310-23VP6 | |
Wydajność systemu
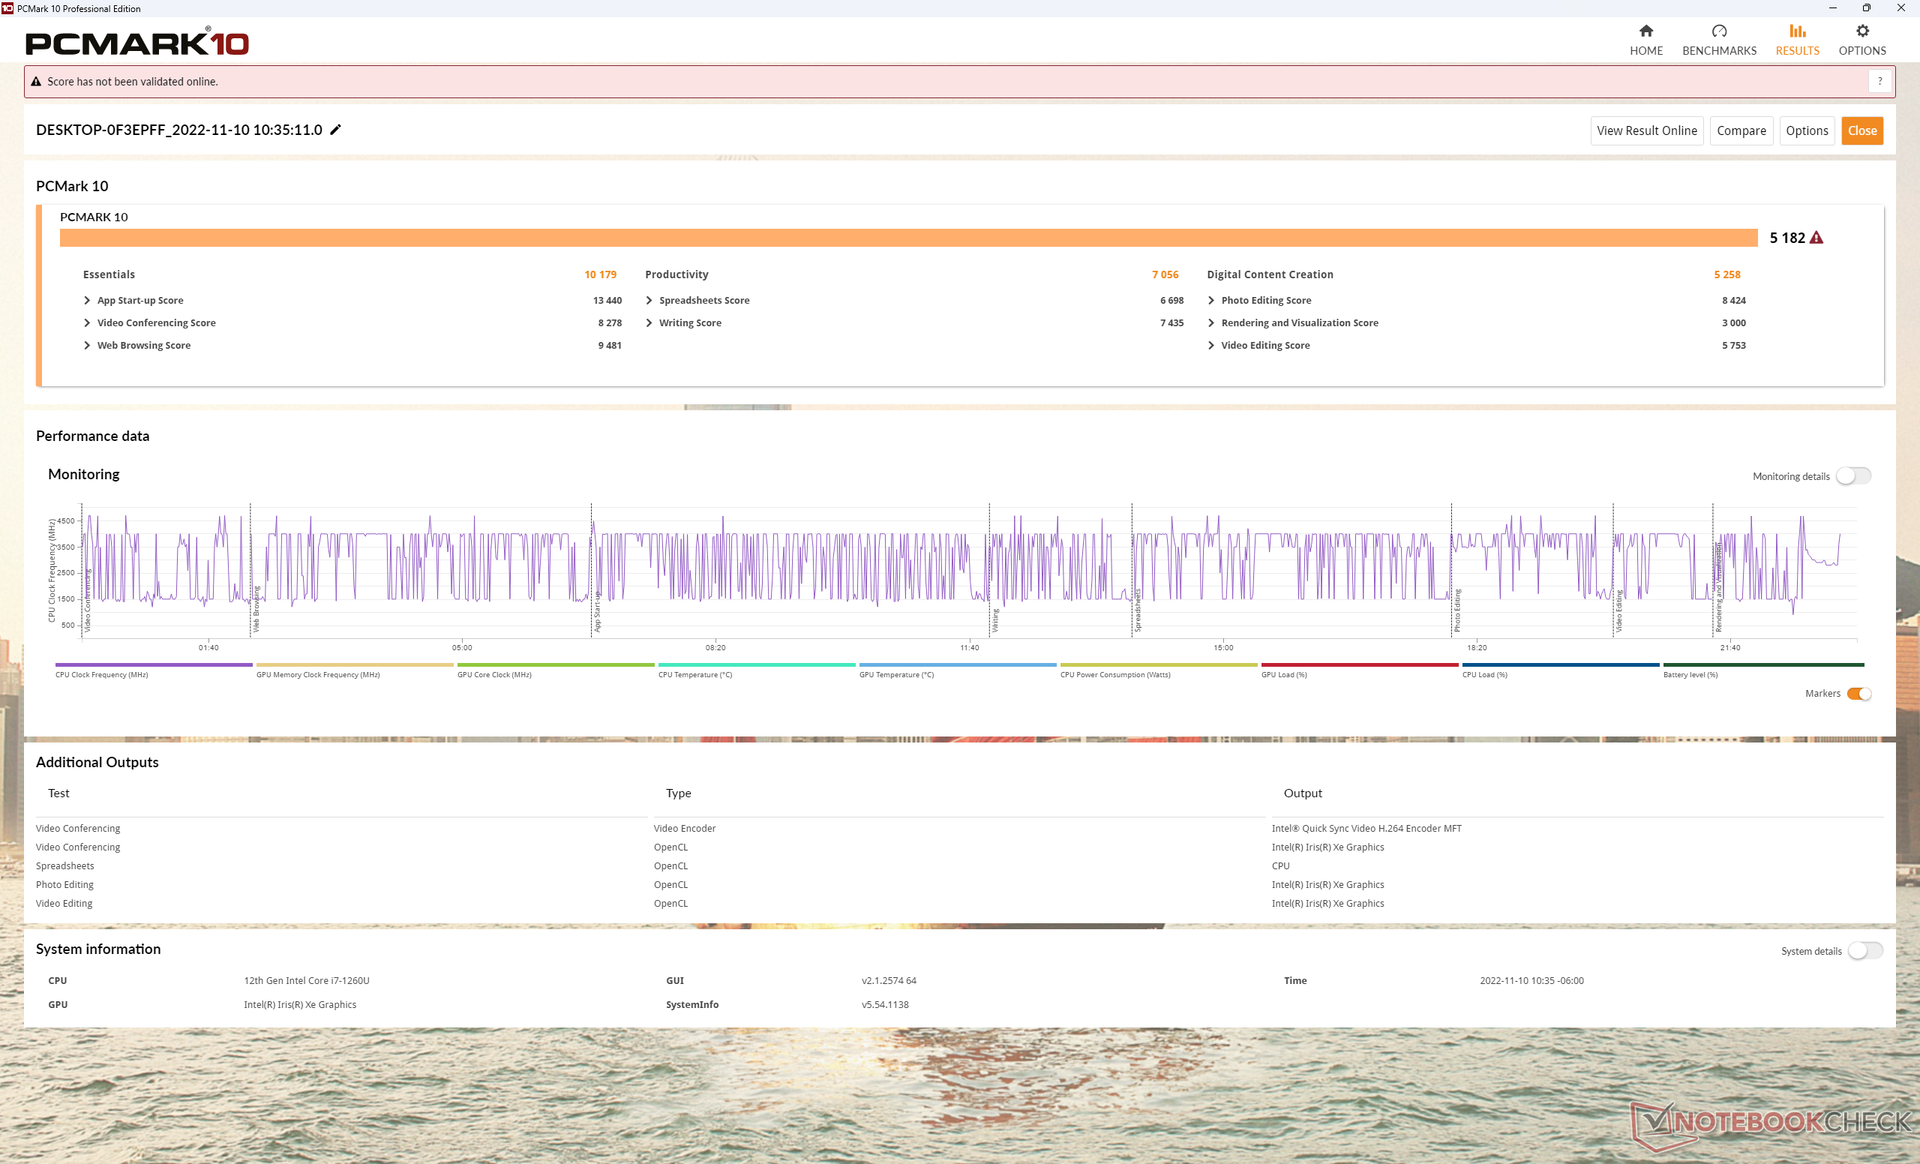
Wyniki PCMark 10 są wyższe, niż w większości innych 13-calowych subnotebooków, dzięki czemu są jednymi z najszybszych w tej kategorii. Wiele modeli w tej klasie wielkości ma tendencję do działania na procesorach o niższych docelowych TDP, jak np ThinkPad X1 Yoga G1 dla ostatecznie wolniejszej wydajności.
| PCMark 10 / Score | |
| Przeciętny Intel Core i7-1260U, Intel Iris Xe Graphics G7 96EUs (5182 - 5300, n=2) | |
| Dell Latitude 9330 | |
| HP Elite Dragonfly Max | |
| MSI Summit E13 Flip Evo A11MT | |
| Lenovo ThinkPad X1 Titanium Yoga G1 20QB0016GE | |
| HP EliteBook x360 1030 G7 | |
| Dell Latitude 5310-23VP6 | |
| PCMark 10 / Essentials | |
| HP Elite Dragonfly Max | |
| Dell Latitude 9330 | |
| Przeciętny Intel Core i7-1260U, Intel Iris Xe Graphics G7 96EUs (9929 - 10179, n=2) | |
| Lenovo ThinkPad X1 Titanium Yoga G1 20QB0016GE | |
| HP EliteBook x360 1030 G7 | |
| Dell Latitude 5310-23VP6 | |
| MSI Summit E13 Flip Evo A11MT | |
| PCMark 10 / Productivity | |
| Przeciętny Intel Core i7-1260U, Intel Iris Xe Graphics G7 96EUs (7056 - 7287, n=2) | |
| Dell Latitude 9330 | |
| MSI Summit E13 Flip Evo A11MT | |
| HP Elite Dragonfly Max | |
| Dell Latitude 5310-23VP6 | |
| HP EliteBook x360 1030 G7 | |
| Lenovo ThinkPad X1 Titanium Yoga G1 20QB0016GE | |
| PCMark 10 / Digital Content Creation | |
| Przeciętny Intel Core i7-1260U, Intel Iris Xe Graphics G7 96EUs (5258 - 5584, n=2) | |
| Dell Latitude 9330 | |
| MSI Summit E13 Flip Evo A11MT | |
| HP Elite Dragonfly Max | |
| Lenovo ThinkPad X1 Titanium Yoga G1 20QB0016GE | |
| HP EliteBook x360 1030 G7 | |
| Dell Latitude 5310-23VP6 | |
| PCMark 10 Score | 5182 pkt. | |
Pomoc | ||
| AIDA64 / Memory Copy | |
| Dell Latitude 9330 | |
| Przeciętny Intel Core i7-1260U (68849 - 69994, n=2) | |
| HP Elite Dragonfly Max | |
| MSI Summit E13 Flip Evo A11MT | |
| Lenovo ThinkPad X1 Titanium Yoga G1 20QB0016GE | |
| Dell Latitude 5310-23VP6 | |
| AIDA64 / Memory Read | |
| HP Elite Dragonfly Max | |
| Dell Latitude 9330 | |
| Przeciętny Intel Core i7-1260U (59219 - 60804, n=2) | |
| MSI Summit E13 Flip Evo A11MT | |
| Lenovo ThinkPad X1 Titanium Yoga G1 20QB0016GE | |
| Dell Latitude 5310-23VP6 | |
| AIDA64 / Memory Write | |
| HP Elite Dragonfly Max | |
| Dell Latitude 9330 | |
| Przeciętny Intel Core i7-1260U (62367 - 63786, n=2) | |
| Lenovo ThinkPad X1 Titanium Yoga G1 20QB0016GE | |
| MSI Summit E13 Flip Evo A11MT | |
| Dell Latitude 5310-23VP6 | |
| AIDA64 / Memory Latency | |
| Dell Latitude 9330 | |
| Przeciętny Intel Core i7-1260U (107.2 - 107.7, n=2) | |
| HP Elite Dragonfly Max | |
| Dell Latitude 5310-23VP6 | |
| MSI Summit E13 Flip Evo A11MT | |
| Lenovo ThinkPad X1 Titanium Yoga G1 20QB0016GE | |
* ... im mniej tym lepiej
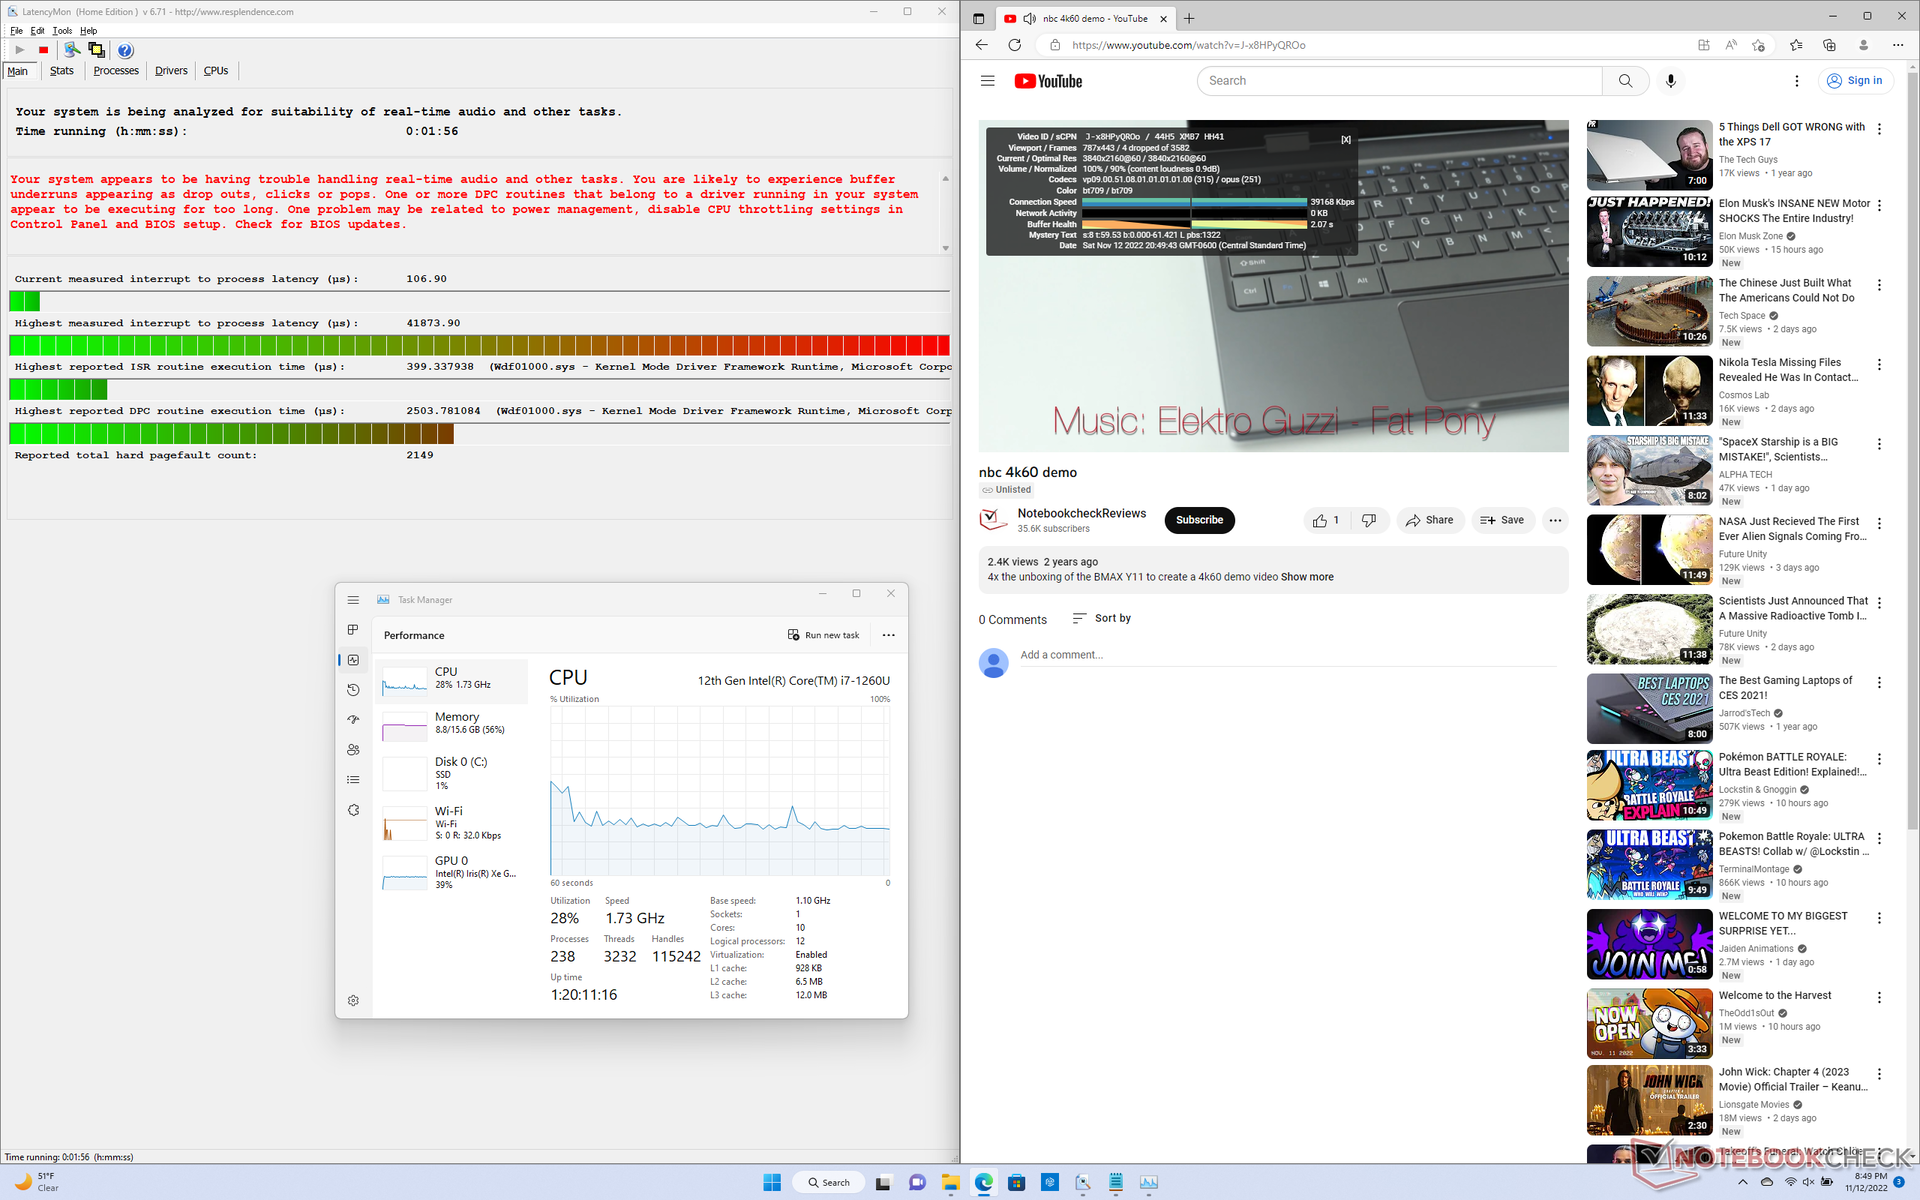
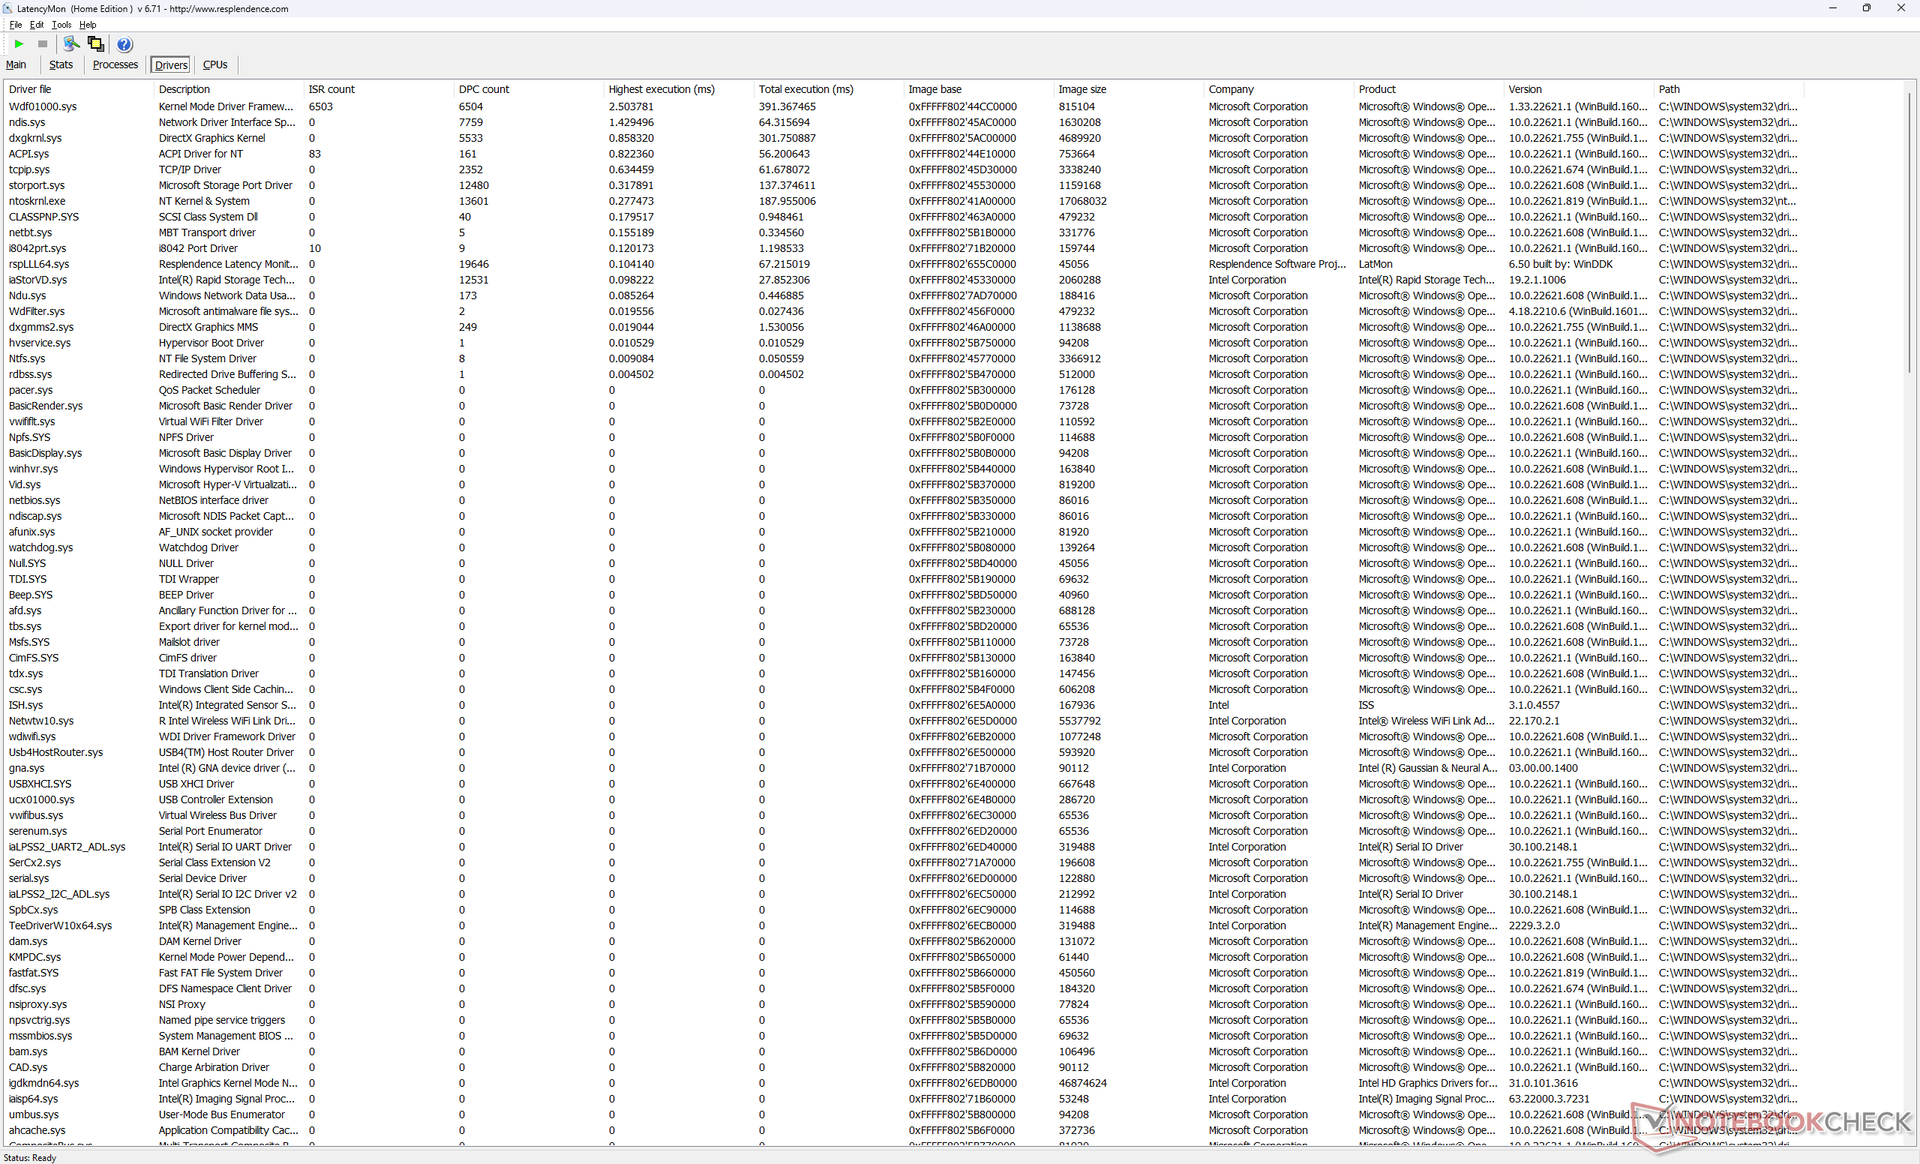
Opóźnienie DPC
Nasz egzemplarz wykazywał poważne problemy z DPC podczas otwierania wielu kart przeglądarki na stronie głównej, nawet po wielokrotnych testach. odtwarzanie wideo 4K przy 60 FPS jest również niedoskonałe z 4 opuszczonymi klatkami podczas minutowego filmu testowego. Wyniki te są rozczarowujące w przypadku biznesowego laptopa z wyższej półki, w którym ważna jest stała wydajność.
| DPC Latencies / LatencyMon - interrupt to process latency (max), Web, Youtube, Prime95 | |
| Dell Latitude 9330 | |
| HP EliteBook x360 1030 G7 | |
| HP Elite Dragonfly Max | |
| MSI Summit E13 Flip Evo A11MT | |
| Lenovo ThinkPad X1 Titanium Yoga G1 20QB0016GE | |
| Dell Latitude 5310-23VP6 | |
* ... im mniej tym lepiej
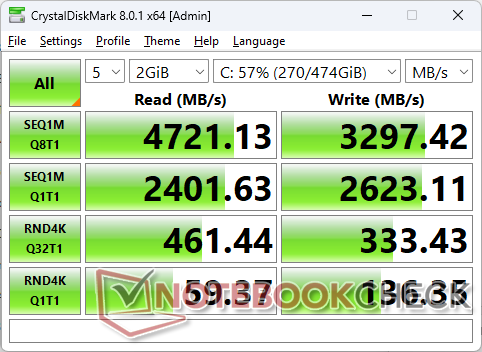
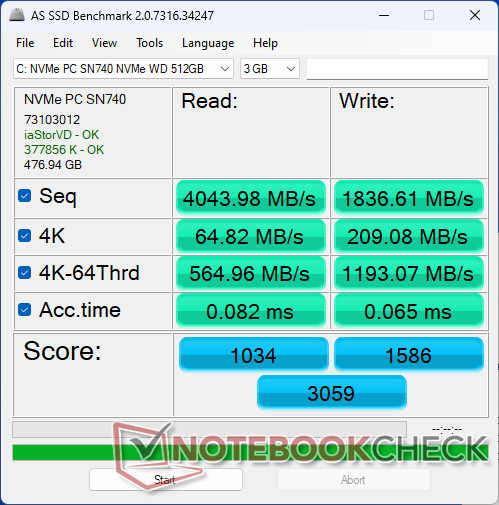
Urządzenia pamięci masowej - tylko PCIe4 x4 2230
Nasz egzemplarz testowy jest dostarczany z dyskiem 512 GB WD SN740 PCIe4 x4 NVMe SSD oferujący stały odczyt i zapis sekwencyjny na poziomie odpowiednio 4700 MB/s i 3300 MB/s. Jest to dysk ze średniej półki, biorąc pod uwagę, że najnowsze dyski PCIe4 x4 od Samsunga mogą osiągać ponad 7000 MB/s. System może obsługiwać tylko jeden dysk wewnętrzny bez opcji dodatkowych.

| Drive Performance rating - Percent | |
| MSI Summit E13 Flip Evo A11MT | |
| Dell Latitude 9330 | |
| HP EliteBook x360 1030 G7 | |
| HP Elite Dragonfly Max | |
| Lenovo ThinkPad X1 Titanium Yoga G1 20QB0016GE | |
| Dell Latitude 5310-23VP6 | |
| DiskSpd | |
| seq read | |
| Dell Latitude 9330 | |
| HP EliteBook x360 1030 G7 | |
| MSI Summit E13 Flip Evo A11MT | |
| HP Elite Dragonfly Max | |
| Lenovo ThinkPad X1 Titanium Yoga G1 20QB0016GE | |
| Dell Latitude 5310-23VP6 | |
| seq write | |
| Dell Latitude 9330 | |
| MSI Summit E13 Flip Evo A11MT | |
| HP EliteBook x360 1030 G7 | |
| HP Elite Dragonfly Max | |
| Lenovo ThinkPad X1 Titanium Yoga G1 20QB0016GE | |
| Dell Latitude 5310-23VP6 | |
| seq q8 t1 read | |
| MSI Summit E13 Flip Evo A11MT | |
| Dell Latitude 9330 | |
| HP EliteBook x360 1030 G7 | |
| HP Elite Dragonfly Max | |
| Dell Latitude 5310-23VP6 | |
| Lenovo ThinkPad X1 Titanium Yoga G1 20QB0016GE | |
| seq q8 t1 write | |
| Dell Latitude 9330 | |
| HP EliteBook x360 1030 G7 | |
| HP Elite Dragonfly Max | |
| MSI Summit E13 Flip Evo A11MT | |
| Dell Latitude 5310-23VP6 | |
| Lenovo ThinkPad X1 Titanium Yoga G1 20QB0016GE | |
| 4k q1 t1 read | |
| Dell Latitude 9330 | |
| Lenovo ThinkPad X1 Titanium Yoga G1 20QB0016GE | |
| MSI Summit E13 Flip Evo A11MT | |
| HP Elite Dragonfly Max | |
| HP EliteBook x360 1030 G7 | |
| Dell Latitude 5310-23VP6 | |
| 4k q1 t1 write | |
| MSI Summit E13 Flip Evo A11MT | |
| Lenovo ThinkPad X1 Titanium Yoga G1 20QB0016GE | |
| Dell Latitude 9330 | |
| HP Elite Dragonfly Max | |
| HP EliteBook x360 1030 G7 | |
| Dell Latitude 5310-23VP6 | |
| 4k q32 t16 read | |
| MSI Summit E13 Flip Evo A11MT | |
| HP Elite Dragonfly Max | |
| HP EliteBook x360 1030 G7 | |
| Dell Latitude 5310-23VP6 | |
| Lenovo ThinkPad X1 Titanium Yoga G1 20QB0016GE | |
| Dell Latitude 9330 | |
| 4k q32 t16 write | |
| MSI Summit E13 Flip Evo A11MT | |
| Lenovo ThinkPad X1 Titanium Yoga G1 20QB0016GE | |
| HP Elite Dragonfly Max | |
| HP EliteBook x360 1030 G7 | |
| Dell Latitude 5310-23VP6 | |
| Dell Latitude 9330 | |
| AS SSD | |
| Score Total | |
| MSI Summit E13 Flip Evo A11MT | |
| HP Elite Dragonfly Max | |
| HP EliteBook x360 1030 G7 | |
| Dell Latitude 9330 | |
| Dell Latitude 5310-23VP6 | |
| Lenovo ThinkPad X1 Titanium Yoga G1 20QB0016GE | |
| Score Read | |
| MSI Summit E13 Flip Evo A11MT | |
| HP Elite Dragonfly Max | |
| Dell Latitude 9330 | |
| Dell Latitude 5310-23VP6 | |
| HP EliteBook x360 1030 G7 | |
| Lenovo ThinkPad X1 Titanium Yoga G1 20QB0016GE | |
| Score Write | |
| MSI Summit E13 Flip Evo A11MT | |
| HP EliteBook x360 1030 G7 | |
| Dell Latitude 9330 | |
| HP Elite Dragonfly Max | |
| Lenovo ThinkPad X1 Titanium Yoga G1 20QB0016GE | |
| Dell Latitude 5310-23VP6 | |
| Seq Read | |
| Dell Latitude 9330 | |
| MSI Summit E13 Flip Evo A11MT | |
| HP Elite Dragonfly Max | |
| HP EliteBook x360 1030 G7 | |
| Lenovo ThinkPad X1 Titanium Yoga G1 20QB0016GE | |
| Dell Latitude 5310-23VP6 | |
| Seq Write | |
| MSI Summit E13 Flip Evo A11MT | |
| Dell Latitude 9330 | |
| HP Elite Dragonfly Max | |
| HP EliteBook x360 1030 G7 | |
| Lenovo ThinkPad X1 Titanium Yoga G1 20QB0016GE | |
| Dell Latitude 5310-23VP6 | |
| 4K Read | |
| Dell Latitude 9330 | |
| Lenovo ThinkPad X1 Titanium Yoga G1 20QB0016GE | |
| MSI Summit E13 Flip Evo A11MT | |
| HP EliteBook x360 1030 G7 | |
| HP Elite Dragonfly Max | |
| Dell Latitude 5310-23VP6 | |
| 4K Write | |
| Lenovo ThinkPad X1 Titanium Yoga G1 20QB0016GE | |
| Dell Latitude 9330 | |
| HP Elite Dragonfly Max | |
| Dell Latitude 5310-23VP6 | |
| HP EliteBook x360 1030 G7 | |
| MSI Summit E13 Flip Evo A11MT | |
| 4K-64 Read | |
| MSI Summit E13 Flip Evo A11MT | |
| HP Elite Dragonfly Max | |
| Dell Latitude 5310-23VP6 | |
| HP EliteBook x360 1030 G7 | |
| Dell Latitude 9330 | |
| Lenovo ThinkPad X1 Titanium Yoga G1 20QB0016GE | |
| 4K-64 Write | |
| MSI Summit E13 Flip Evo A11MT | |
| HP EliteBook x360 1030 G7 | |
| HP Elite Dragonfly Max | |
| Dell Latitude 9330 | |
| Dell Latitude 5310-23VP6 | |
| Lenovo ThinkPad X1 Titanium Yoga G1 20QB0016GE | |
| Access Time Read | |
| Dell Latitude 9330 | |
| HP Elite Dragonfly Max | |
| Lenovo ThinkPad X1 Titanium Yoga G1 20QB0016GE | |
| MSI Summit E13 Flip Evo A11MT | |
| HP EliteBook x360 1030 G7 | |
| Dell Latitude 5310-23VP6 | |
| Access Time Write | |
| HP Elite Dragonfly Max | |
| HP EliteBook x360 1030 G7 | |
| Dell Latitude 9330 | |
| MSI Summit E13 Flip Evo A11MT | |
| Dell Latitude 5310-23VP6 | |
| Lenovo ThinkPad X1 Titanium Yoga G1 20QB0016GE | |
* ... im mniej tym lepiej
Disk Throttling: DiskSpd Read Loop, Queue Depth 8
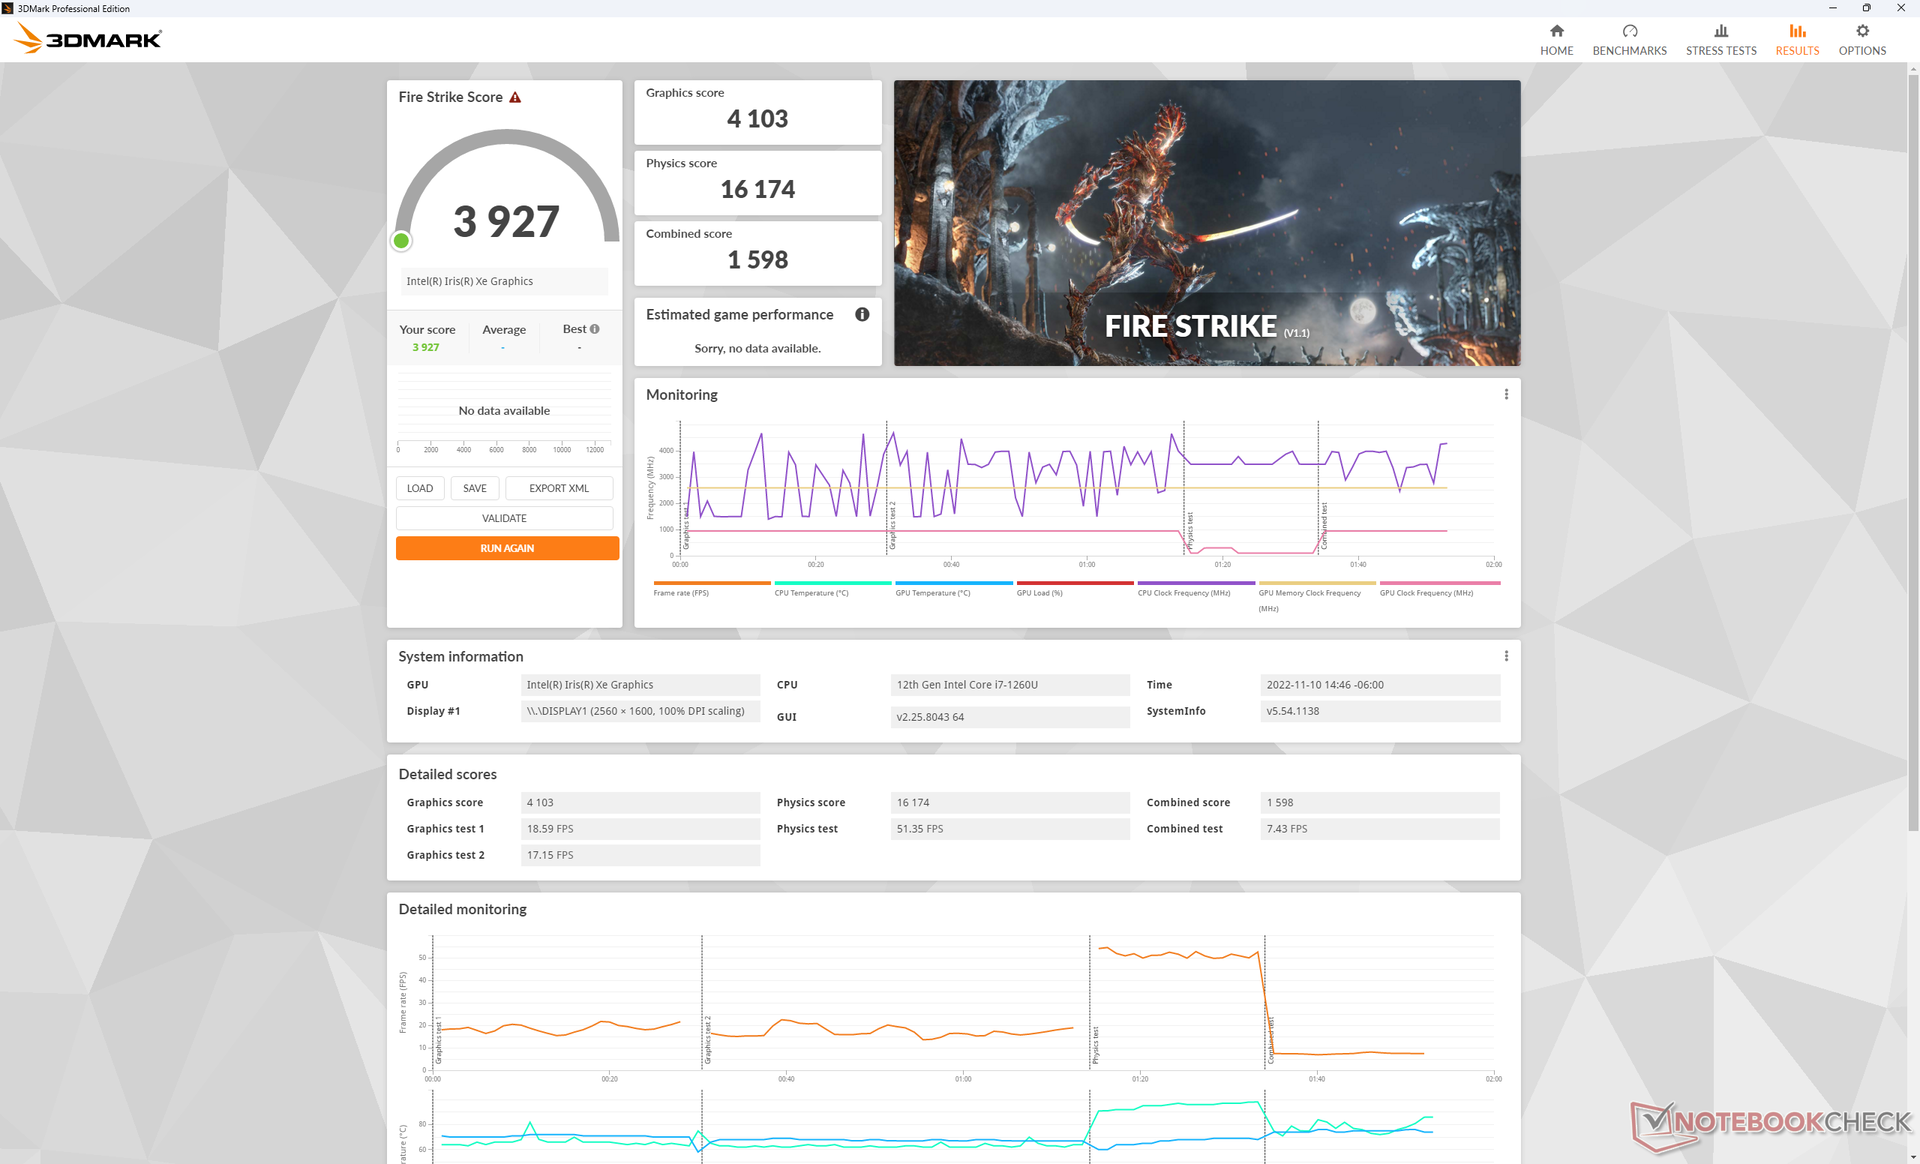
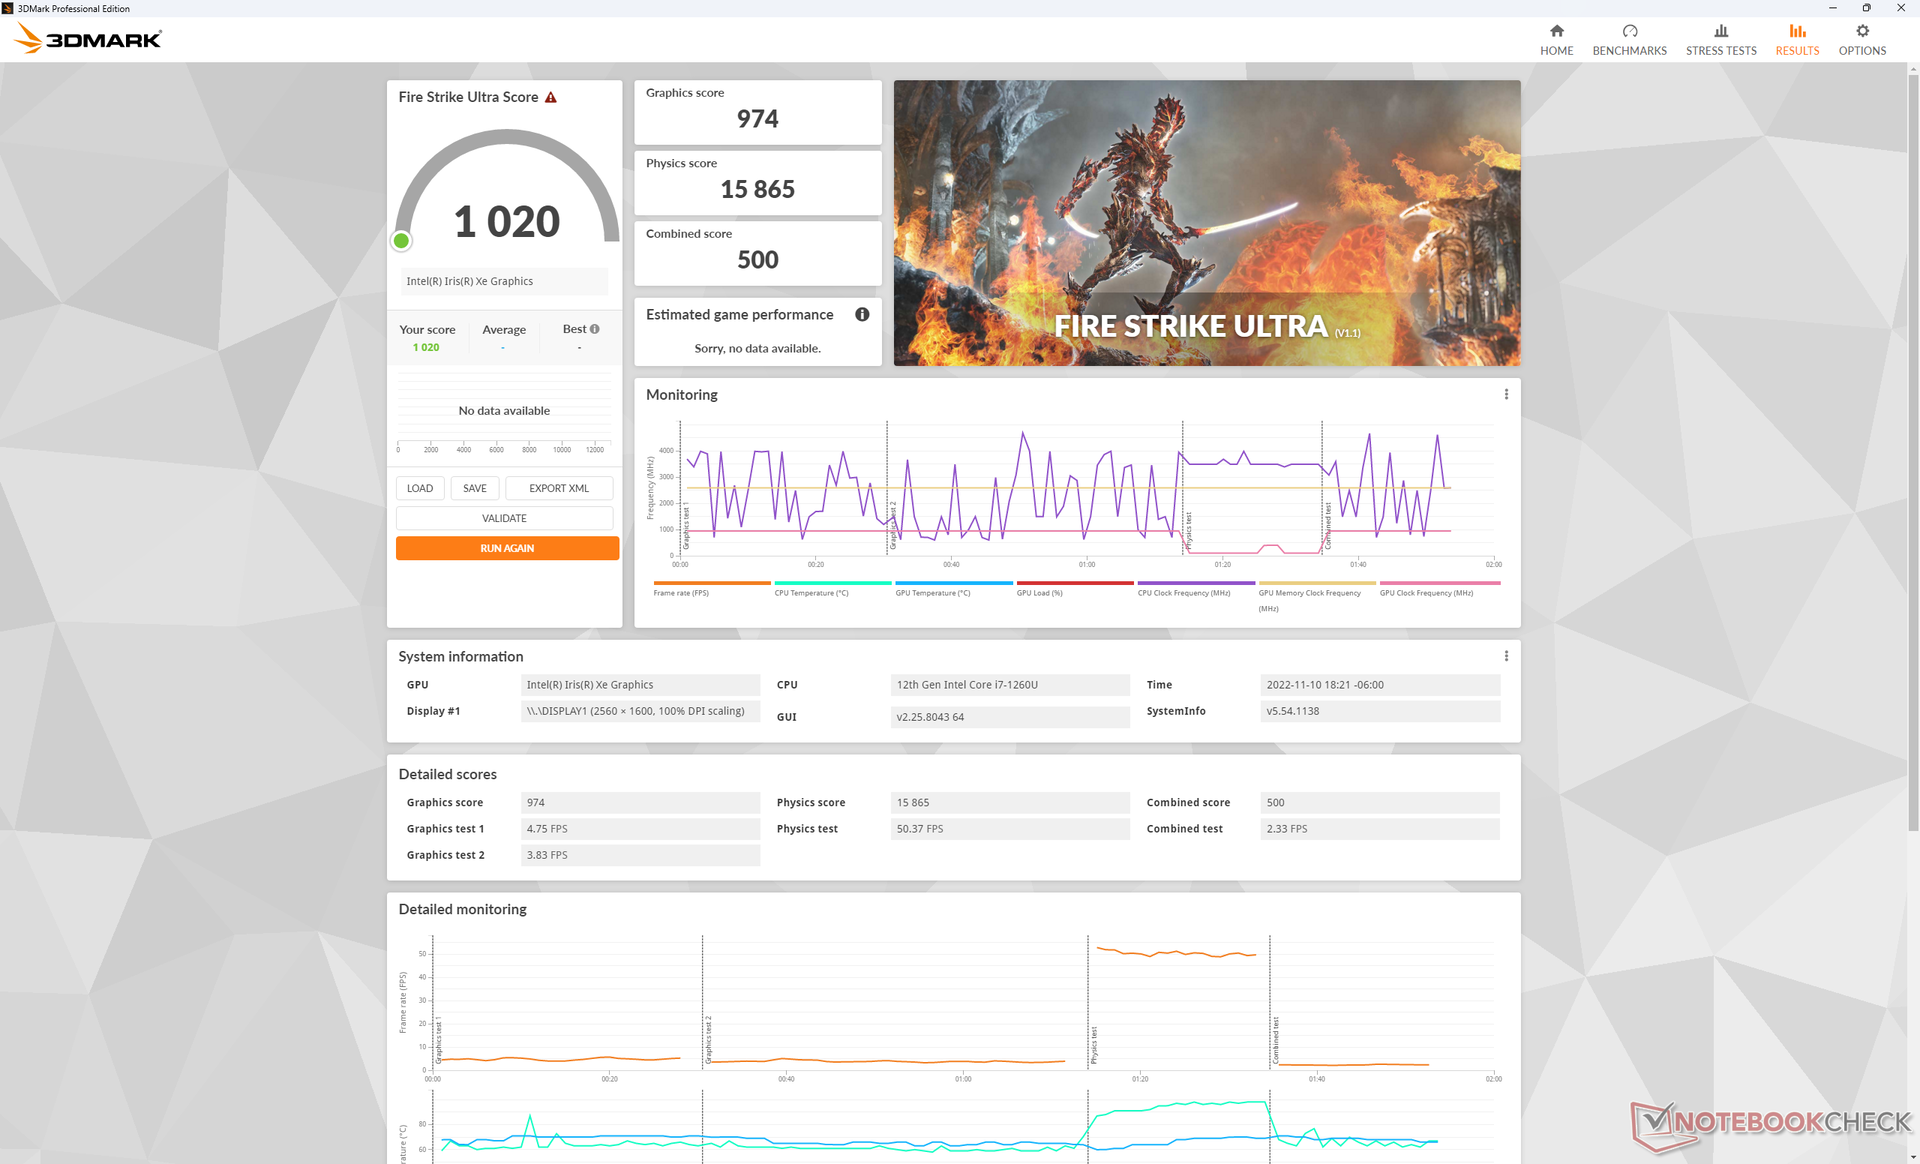
Wydajność układu GPU - dobra, ale nie rewelacyjna
Wydajność grafiki jest o 15 procent wolniejsza niż w przeciętnym laptopie z naszej bazy danych z tym samym zintegrowanym Iris Xe 96 EUs GPU mimo pojemnych 32 GB pamięci RAM LPDDR5-5200. Seria Latitude nie jest przeznaczona do gier, więc ten deficyt nie jest dużym problemem. Ogólna wydajność jest zbliżona do Iris Xe 80 EUs jakie można znaleźć w wielu procesorach Core i5
Większość gier jest wciąż grywalna na Latitude 9330, aczkolwiek tylko na niskich ustawieniach.
| 3DMark | |
| 1920x1080 Fire Strike Graphics | |
| Asus Zenbook S 13 OLED | |
| MSI Summit E13 Flip Evo A11MT | |
| Lenovo ThinkPad X1 Nano Gen 2 Core i7-1280P | |
| HP Spectre x360 13.5 14t-ef000 | |
| Przeciętny Intel Iris Xe Graphics G7 96EUs (2286 - 6624, n=222) | |
| Lenovo IdeaPad Flex 5i 14IAU7 | |
| Samsung Galaxy Book2 Pro 13 NP930XED-KA1DE | |
| Dell Latitude 9330 | |
| HP Elite Dragonfly Max | |
| Lenovo Yoga 6 13ALC6 | |
| Lenovo ThinkBook 13s G3 20YA0005GE | |
| Lenovo ThinkPad X1 Titanium Yoga G1 20QB0016GE | |
| HP EliteBook x360 1030 G7 | |
| Dell Latitude 5310-23VP6 | |
| 2560x1440 Time Spy Graphics | |
| Asus Zenbook S 13 OLED | |
| Lenovo ThinkPad X1 Nano Gen 2 Core i7-1280P | |
| HP Spectre x360 13.5 14t-ef000 | |
| MSI Summit E13 Flip Evo A11MT | |
| Przeciętny Intel Iris Xe Graphics G7 96EUs (707 - 1890, n=218) | |
| Lenovo IdeaPad Flex 5i 14IAU7 | |
| Samsung Galaxy Book2 Pro 13 NP930XED-KA1DE | |
| Dell Latitude 9330 | |
| HP Elite Dragonfly Max | |
| Lenovo Yoga 6 13ALC6 | |
| Lenovo ThinkBook 13s G3 20YA0005GE | |
| Lenovo ThinkPad X1 Titanium Yoga G1 20QB0016GE | |
| HP EliteBook x360 1030 G7 | |
| 2560x1440 Time Spy Score | |
| Asus Zenbook S 13 OLED | |
| Lenovo ThinkPad X1 Nano Gen 2 Core i7-1280P | |
| HP Spectre x360 13.5 14t-ef000 | |
| MSI Summit E13 Flip Evo A11MT | |
| Przeciętny Intel Iris Xe Graphics G7 96EUs (789 - 2159, n=215) | |
| Lenovo IdeaPad Flex 5i 14IAU7 | |
| Samsung Galaxy Book2 Pro 13 NP930XED-KA1DE | |
| Dell Latitude 9330 | |
| Lenovo Yoga 6 13ALC6 | |
| HP Elite Dragonfly Max | |
| Lenovo ThinkBook 13s G3 20YA0005GE | |
| Lenovo ThinkPad X1 Titanium Yoga G1 20QB0016GE | |
| HP EliteBook x360 1030 G7 | |
| 3DMark 11 - 1280x720 Performance GPU | |
| Asus Zenbook S 13 OLED | |
| MSI Summit E13 Flip Evo A11MT | |
| Lenovo ThinkPad X1 Nano Gen 2 Core i7-1280P | |
| Przeciętny Intel Iris Xe Graphics G7 96EUs (2867 - 7676, n=209) | |
| HP Spectre x360 13.5 14t-ef000 | |
| Lenovo ThinkBook 13s G3 20YA0005GE | |
| Lenovo Yoga 6 13ALC6 | |
| Lenovo IdeaPad Flex 5i 14IAU7 | |
| Samsung Galaxy Book2 Pro 13 NP930XED-KA1DE | |
| HP Elite Dragonfly Max | |
| Dell Latitude 9330 | |
| Lenovo ThinkPad X1 Titanium Yoga G1 20QB0016GE | |
| HP EliteBook x360 1030 G7 | |
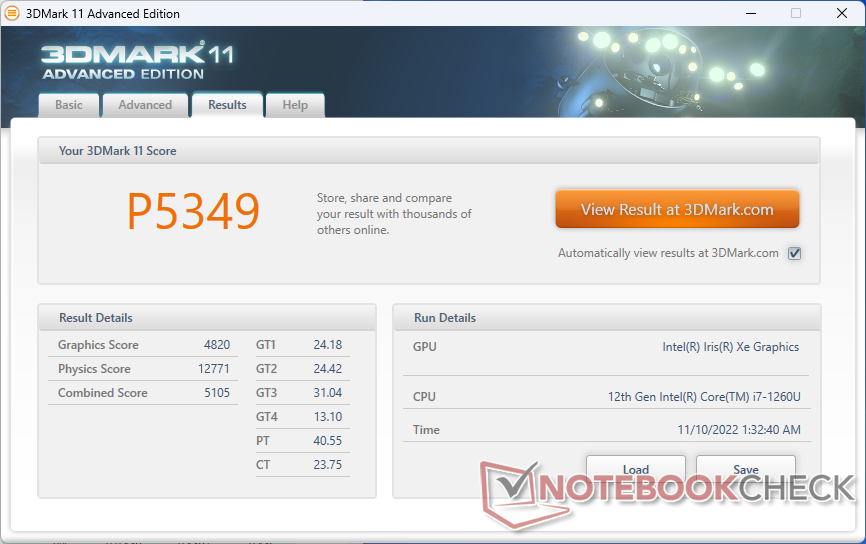
| 3DMark 11 Performance | 5349 pkt. | |
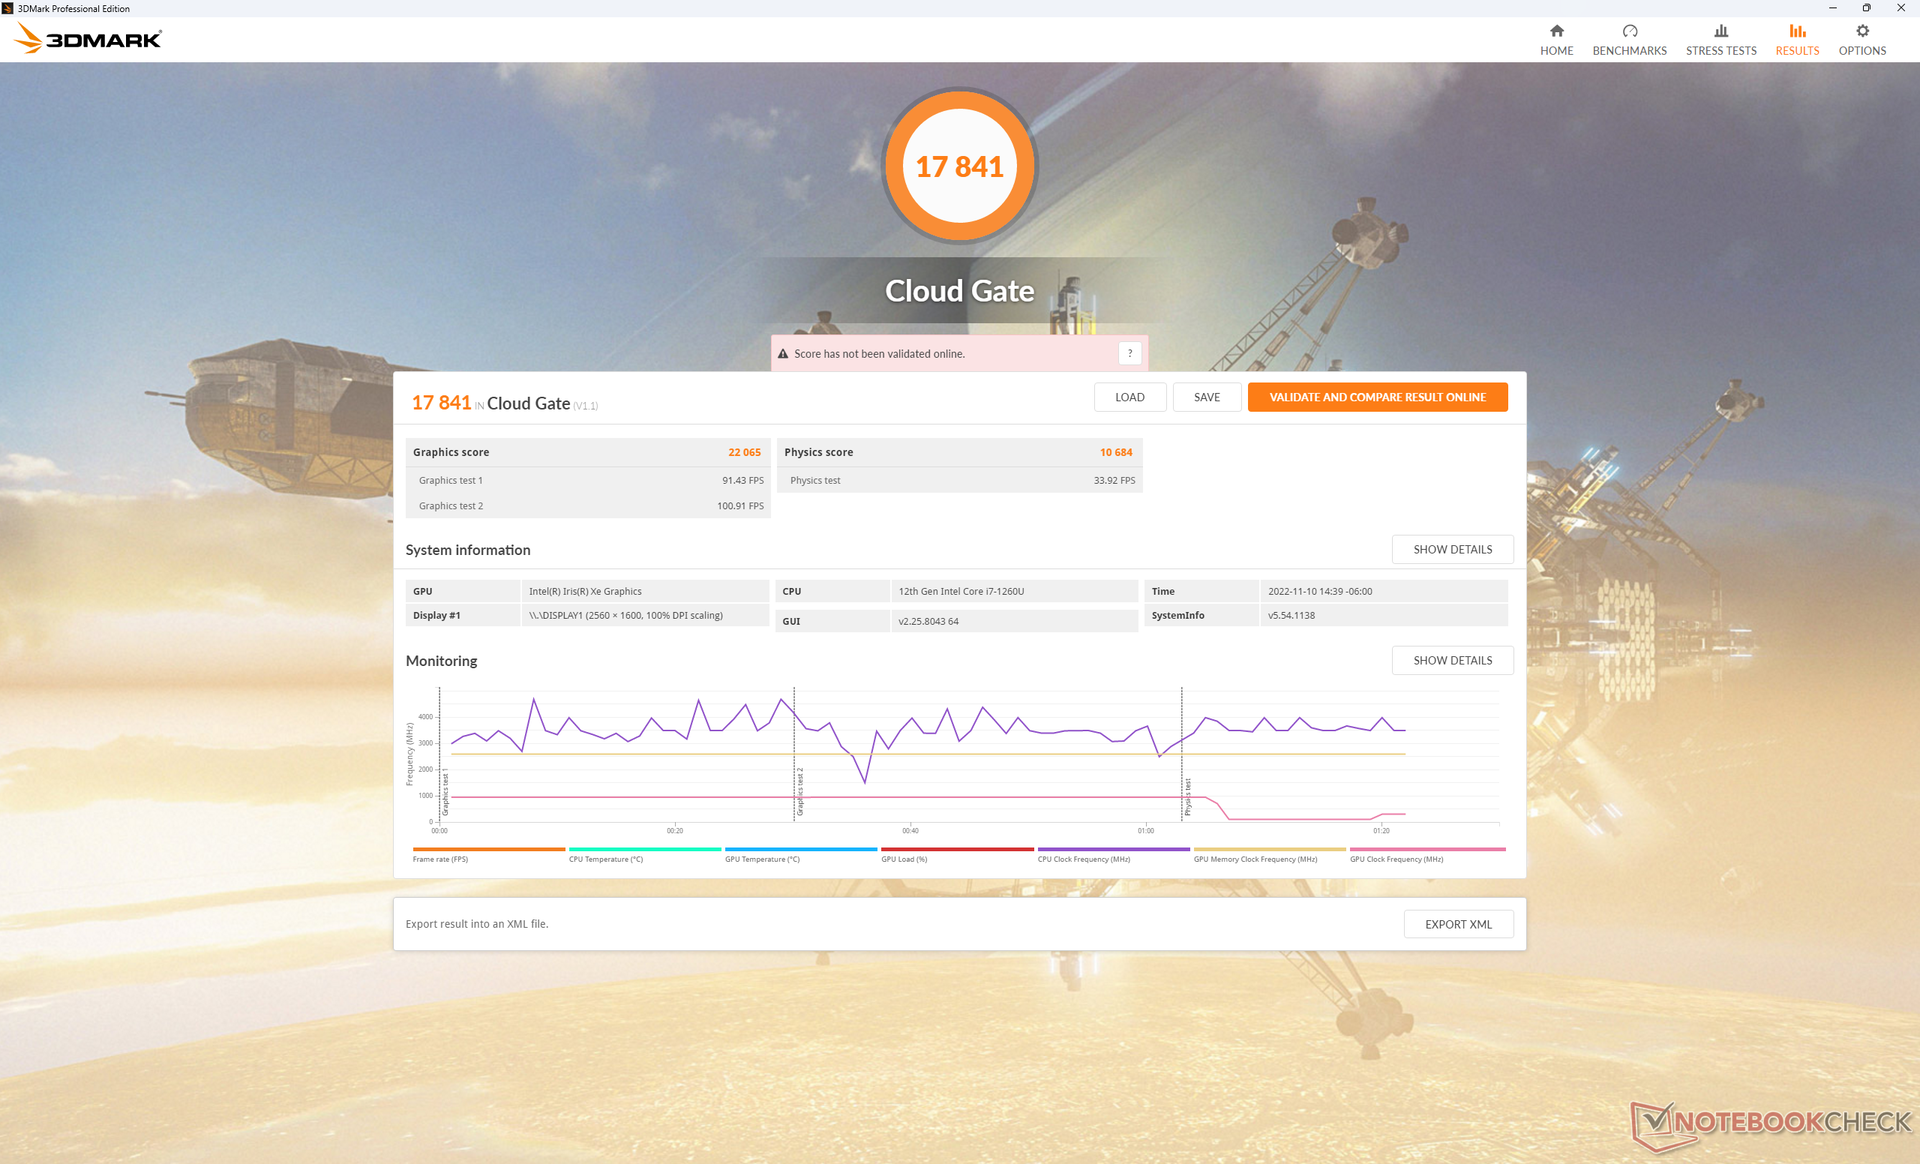
| 3DMark Cloud Gate Standard Score | 17841 pkt. | |
| 3DMark Fire Strike Score | 3927 pkt. | |
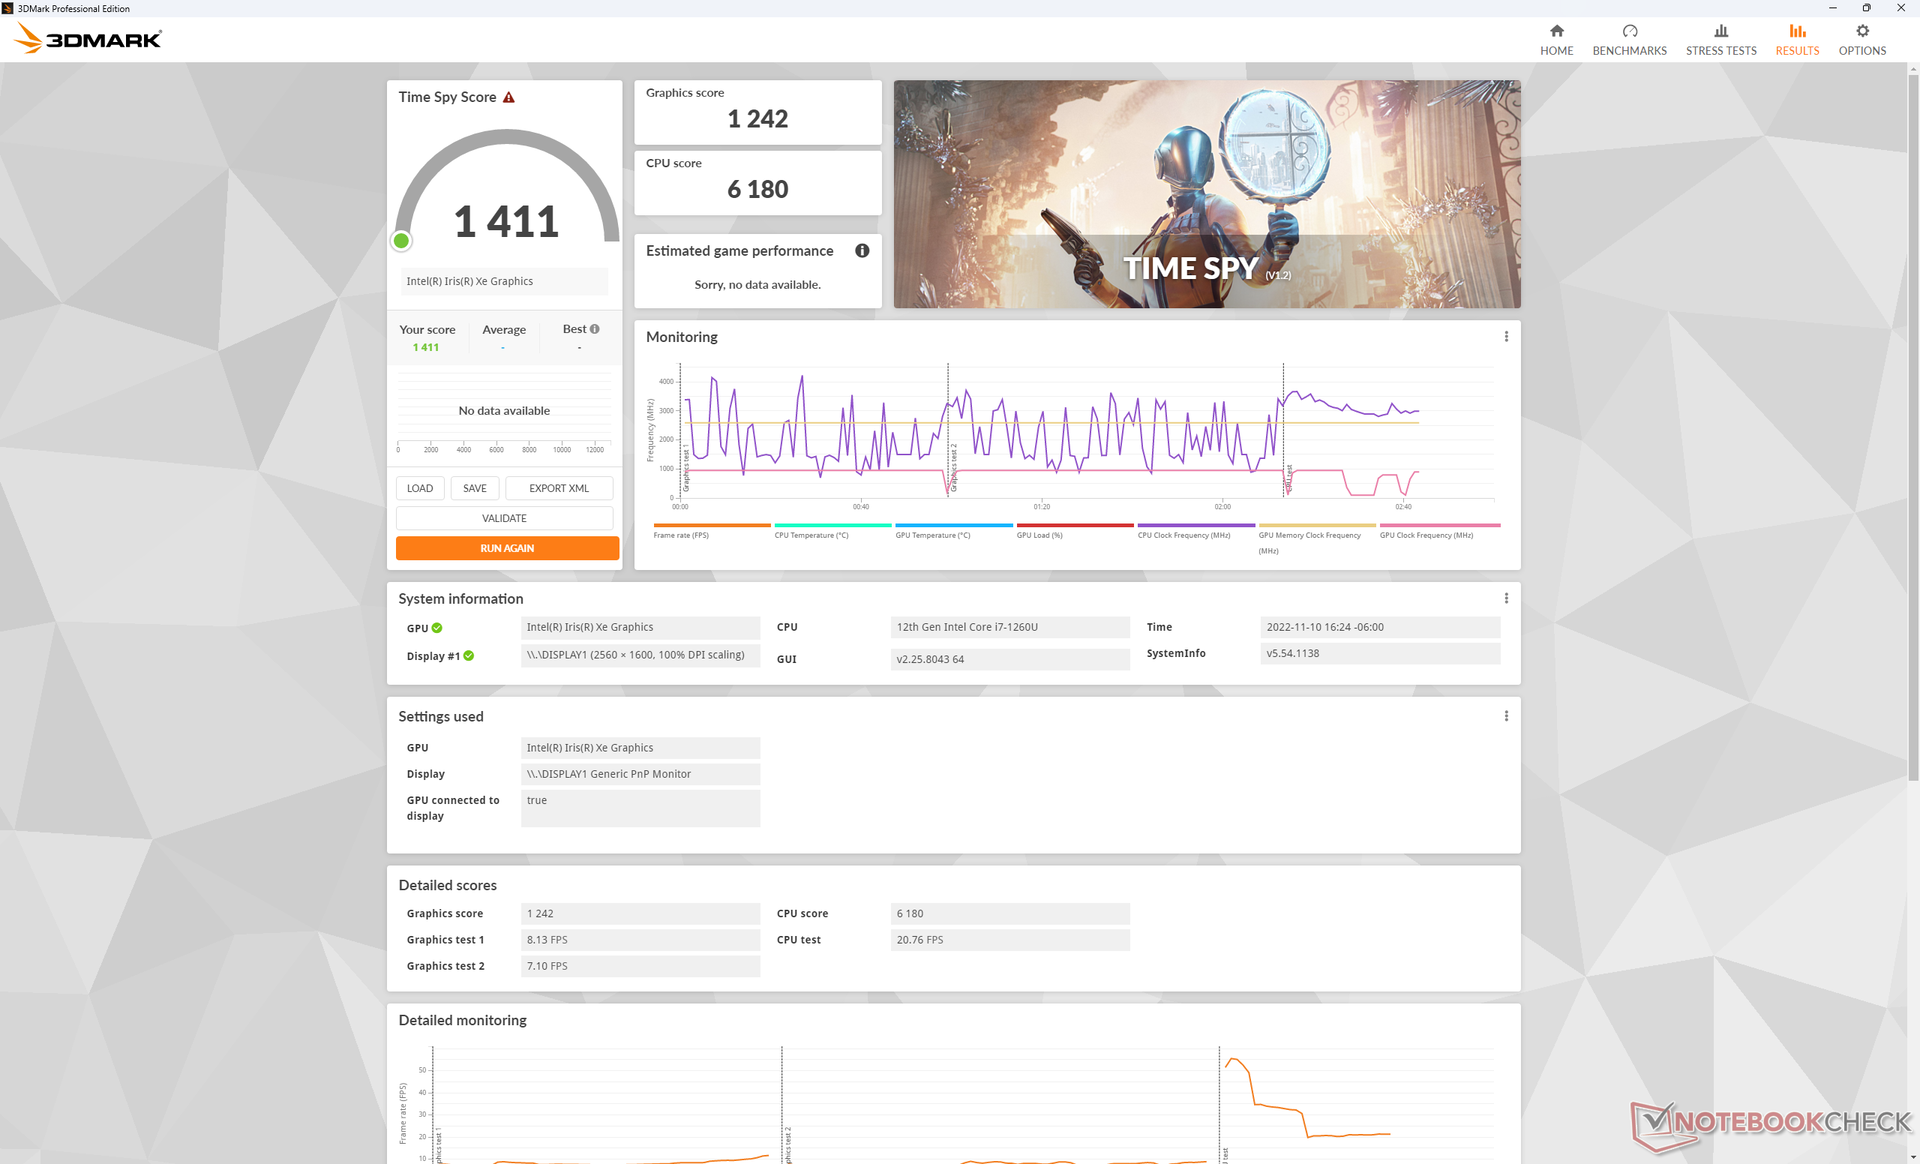
| 3DMark Time Spy Score | 1411 pkt. | |
Pomoc | ||
| Blender - v3.3 Classroom CPU | |
| Dell Latitude 9330 | |
| Przeciętny Intel Iris Xe Graphics G7 96EUs (336 - 1259, n=109) | |
* ... im mniej tym lepiej
| Performance rating - Percent | |
| MSI Summit E13 Flip Evo A11MT | |
| Dell Latitude 9330 | |
| HP Elite Dragonfly Max -1! | |
| Lenovo ThinkPad X1 Titanium Yoga G1 20QB0016GE -3! | |
| HP EliteBook x360 1030 G7 -3! | |
| Dell Latitude 5310-23VP6 -4! | |
| The Witcher 3 - 1920x1080 Ultra Graphics & Postprocessing (HBAO+) | |
| MSI Summit E13 Flip Evo A11MT | |
| HP Elite Dragonfly Max | |
| Dell Latitude 9330 | |
| Lenovo ThinkPad X1 Titanium Yoga G1 20QB0016GE | |
| GTA V - 1920x1080 Highest AA:4xMSAA + FX AF:16x | |
| MSI Summit E13 Flip Evo A11MT | |
| Dell Latitude 9330 | |
| Final Fantasy XV Benchmark - 1920x1080 High Quality | |
| MSI Summit E13 Flip Evo A11MT | |
| Dell Latitude 9330 | |
| HP Elite Dragonfly Max | |
| HP EliteBook x360 1030 G7 | |
| Strange Brigade - 1920x1080 ultra AA:ultra AF:16 | |
| MSI Summit E13 Flip Evo A11MT | |
| Dell Latitude 9330 | |
| HP Elite Dragonfly Max | |
| Dota 2 Reborn - 1920x1080 ultra (3/3) best looking | |
| Dell Latitude 9330 | |
| MSI Summit E13 Flip Evo A11MT | |
| Lenovo ThinkPad X1 Titanium Yoga G1 20QB0016GE | |
| HP Elite Dragonfly Max | |
| HP EliteBook x360 1030 G7 | |
| Dell Latitude 5310-23VP6 | |
| X-Plane 11.11 - 1920x1080 high (fps_test=3) | |
| MSI Summit E13 Flip Evo A11MT | |
| Dell Latitude 9330 | |
| HP Elite Dragonfly Max | |
| Lenovo ThinkPad X1 Titanium Yoga G1 20QB0016GE | |
| HP EliteBook x360 1030 G7 | |
| Dell Latitude 5310-23VP6 | |
| GTA V | |
| 1024x768 Lowest Settings possible | |
| Asus Zenbook S 13 OLED | |
| HP Spectre x360 13.5 14t-ef000 | |
| Dell Latitude 9330 | |
| Przeciętny Intel Iris Xe Graphics G7 96EUs (52 - 166.4, n=168) | |
| Lenovo ThinkPad X1 Nano Gen 2 Core i7-1280P | |
| Lenovo IdeaPad Flex 5i 14IAU7 | |
| MSI Summit E13 Flip Evo A11MT | |
| Lenovo Yoga 6 13ALC6 | |
| Samsung Galaxy Book2 Pro 13 NP930XED-KA1DE | |
| 1366x768 Normal/Off AF:4x | |
| Asus Zenbook S 13 OLED | |
| HP Spectre x360 13.5 14t-ef000 | |
| Dell Latitude 9330 | |
| Przeciętny Intel Iris Xe Graphics G7 96EUs (24.1 - 152.7, n=169) | |
| Lenovo ThinkPad X1 Nano Gen 2 Core i7-1280P | |
| Lenovo IdeaPad Flex 5i 14IAU7 | |
| MSI Summit E13 Flip Evo A11MT | |
| Samsung Galaxy Book2 Pro 13 NP930XED-KA1DE | |
| 1920x1080 Normal/Off AF:4x | |
| HP Spectre x360 13.5 14t-ef000 | |
| Dell Latitude 9330 | |
| Lenovo IdeaPad Flex 5i 14IAU7 | |
| Przeciętny Intel Iris Xe Graphics G7 96EUs (20 - 119.3, n=142) | |
| Lenovo ThinkPad X1 Nano Gen 2 Core i7-1280P | |
| MSI Summit E13 Flip Evo A11MT | |
| Lenovo Yoga 6 13ALC6 | |
| 1920x1080 High/On (Advanced Graphics Off) AA:2xMSAA + FX AF:8x | |
| Asus Zenbook S 13 OLED | |
| Lenovo Yoga 6 13ALC6 | |
| HP Spectre x360 13.5 14t-ef000 | |
| MSI Summit E13 Flip Evo A11MT | |
| Przeciętny Intel Iris Xe Graphics G7 96EUs (9.39 - 51.6, n=162) | |
| Lenovo ThinkPad X1 Nano Gen 2 Core i7-1280P | |
| Dell Latitude 9330 | |
| Lenovo IdeaPad Flex 5i 14IAU7 | |
| Samsung Galaxy Book2 Pro 13 NP930XED-KA1DE | |
| 1920x1080 Highest AA:4xMSAA + FX AF:16x | |
| Asus Zenbook S 13 OLED | |
| MSI Summit E13 Flip Evo A11MT | |
| HP Spectre x360 13.5 14t-ef000 | |
| Lenovo ThinkPad X1 Nano Gen 2 Core i7-1280P | |
| Lenovo Yoga 6 13ALC6 | |
| Przeciętny Intel Iris Xe Graphics G7 96EUs (4.13 - 22.9, n=156) | |
| Dell Latitude 9330 | |
| Lenovo IdeaPad Flex 5i 14IAU7 | |
| Samsung Galaxy Book2 Pro 13 NP930XED-KA1DE | |
| Final Fantasy XV Benchmark | |
| 1280x720 Lite Quality | |
| Asus Zenbook S 13 OLED | |
| MSI Summit E13 Flip Evo A11MT | |
| HP Spectre x360 13.5 14t-ef000 | |
| Przeciętny Intel Iris Xe Graphics G7 96EUs (14.9 - 56.5, n=189) | |
| Lenovo ThinkBook 13s G3 20YA0005GE | |
| Lenovo IdeaPad Flex 5i 14IAU7 | |
| Dell Latitude 9330 | |
| Lenovo ThinkPad X1 Nano Gen 2 Core i7-1280P | |
| Lenovo Yoga 6 13ALC6 | |
| HP Elite Dragonfly Max | |
| HP EliteBook x360 1030 G7 | |
| 1920x1080 Standard Quality | |
| Asus Zenbook S 13 OLED | |
| MSI Summit E13 Flip Evo A11MT | |
| HP Spectre x360 13.5 14t-ef000 | |
| Przeciętny Intel Iris Xe Graphics G7 96EUs (10.5 - 31.2, n=185) | |
| Dell Latitude 9330 | |
| Lenovo IdeaPad Flex 5i 14IAU7 | |
| Lenovo ThinkPad X1 Nano Gen 2 Core i7-1280P | |
| Lenovo ThinkBook 13s G3 20YA0005GE | |
| Lenovo Yoga 6 13ALC6 | |
| HP Elite Dragonfly Max | |
| HP EliteBook x360 1030 G7 | |
| 1920x1080 High Quality | |
| Asus Zenbook S 13 OLED | |
| Lenovo IdeaPad Flex 5i 14IAU7 | |
| Lenovo ThinkPad X1 Nano Gen 2 Core i7-1280P | |
| MSI Summit E13 Flip Evo A11MT | |
| Przeciętny Intel Iris Xe Graphics G7 96EUs (8.15 - 27.8, n=178) | |
| HP Spectre x360 13.5 14t-ef000 | |
| Dell Latitude 9330 | |
| Lenovo ThinkBook 13s G3 20YA0005GE | |
| HP Elite Dragonfly Max | |
| Lenovo Yoga 6 13ALC6 | |
| HP EliteBook x360 1030 G7 | |
| The Witcher 3 | |
| 1024x768 Low Graphics & Postprocessing | |
| Asus Zenbook S 13 OLED | |
| Lenovo ThinkPad X1 Nano Gen 2 Core i7-1280P | |
| MSI Summit E13 Flip Evo A11MT | |
| HP Spectre x360 13.5 14t-ef000 | |
| Przeciętny Intel Iris Xe Graphics G7 96EUs (28.9 - 117.2, n=188) | |
| Dell Latitude 9330 | |
| Lenovo ThinkBook 13s G3 20YA0005GE | |
| HP Elite Dragonfly Max | |
| Lenovo IdeaPad Flex 5i 14IAU7 | |
| Lenovo Yoga 6 13ALC6 | |
| Lenovo ThinkPad X1 Titanium Yoga G1 20QB0016GE | |
| Samsung Galaxy Book2 Pro 13 NP930XED-KA1DE | |
| Dell Latitude 5310-23VP6 | |
| 1366x768 Medium Graphics & Postprocessing | |
| Lenovo ThinkPad X1 Nano Gen 2 Core i7-1280P | |
| MSI Summit E13 Flip Evo A11MT | |
| Przeciętny Intel Iris Xe Graphics G7 96EUs (21.4 - 77.8, n=185) | |
| HP Spectre x360 13.5 14t-ef000 | |
| HP Elite Dragonfly Max | |
| Lenovo IdeaPad Flex 5i 14IAU7 | |
| Dell Latitude 9330 | |
| Lenovo ThinkPad X1 Titanium Yoga G1 20QB0016GE | |
| Samsung Galaxy Book2 Pro 13 NP930XED-KA1DE | |
| Lenovo Yoga 6 13ALC6 | |
| Dell Latitude 5310-23VP6 | |
| 1920x1080 High Graphics & Postprocessing (Nvidia HairWorks Off) | |
| Asus Zenbook S 13 OLED | |
| Lenovo ThinkPad X1 Nano Gen 2 Core i7-1280P | |
| HP Spectre x360 13.5 14t-ef000 | |
| MSI Summit E13 Flip Evo A11MT | |
| HP Elite Dragonfly Max | |
| Przeciętny Intel Iris Xe Graphics G7 96EUs (10.6 - 45.9, n=191) | |
| Lenovo IdeaPad Flex 5i 14IAU7 | |
| Dell Latitude 9330 | |
| Lenovo ThinkBook 13s G3 20YA0005GE | |
| Lenovo ThinkPad X1 Titanium Yoga G1 20QB0016GE | |
| Samsung Galaxy Book2 Pro 13 NP930XED-KA1DE | |
| 1920x1080 Ultra Graphics & Postprocessing (HBAO+) | |
| Asus Zenbook S 13 OLED | |
| Lenovo Yoga 6 13ALC6 | |
| Lenovo ThinkPad X1 Nano Gen 2 Core i7-1280P | |
| HP Spectre x360 13.5 14t-ef000 | |
| MSI Summit E13 Flip Evo A11MT | |
| Lenovo ThinkBook 13s G3 20YA0005GE | |
| Przeciętny Intel Iris Xe Graphics G7 96EUs (8.79 - 20.1, n=181) | |
| HP Elite Dragonfly Max | |
| Lenovo IdeaPad Flex 5i 14IAU7 | |
| Dell Latitude 9330 | |
| Samsung Galaxy Book2 Pro 13 NP930XED-KA1DE | |
| Lenovo ThinkPad X1 Titanium Yoga G1 20QB0016GE | |
| X-Plane 11.11 | |
| 1280x720 low (fps_test=1) | |
| Asus Zenbook S 13 OLED | |
| Lenovo ThinkBook 13s G3 20YA0005GE | |
| Przeciętny Intel Iris Xe Graphics G7 96EUs (13.4 - 88.4, n=213) | |
| HP Spectre x360 13.5 14t-ef000 | |
| Lenovo ThinkPad X1 Nano Gen 2 Core i7-1280P | |
| Lenovo Yoga 6 13ALC6 | |
| Dell Latitude 9330 | |
| Lenovo IdeaPad Flex 5i 14IAU7 | |
| Samsung Galaxy Book2 Pro 13 NP930XED-KA1DE | |
| MSI Summit E13 Flip Evo A11MT | |
| HP Elite Dragonfly Max | |
| Lenovo ThinkPad X1 Titanium Yoga G1 20QB0016GE | |
| HP EliteBook x360 1030 G7 | |
| Dell Latitude 5310-23VP6 | |
| 1920x1080 med (fps_test=2) | |
| HP Spectre x360 13.5 14t-ef000 | |
| Lenovo ThinkPad X1 Nano Gen 2 Core i7-1280P | |
| Asus Zenbook S 13 OLED | |
| MSI Summit E13 Flip Evo A11MT | |
| Przeciętny Intel Iris Xe Graphics G7 96EUs (11.6 - 69.5, n=214) | |
| Dell Latitude 9330 | |
| Lenovo ThinkBook 13s G3 20YA0005GE | |
| Lenovo Yoga 6 13ALC6 | |
| HP Elite Dragonfly Max | |
| Lenovo IdeaPad Flex 5i 14IAU7 | |
| Samsung Galaxy Book2 Pro 13 NP930XED-KA1DE | |
| HP EliteBook x360 1030 G7 | |
| Lenovo ThinkPad X1 Titanium Yoga G1 20QB0016GE | |
| Dell Latitude 5310-23VP6 | |
| 1920x1080 high (fps_test=3) | |
| HP Spectre x360 13.5 14t-ef000 | |
| Lenovo ThinkPad X1 Nano Gen 2 Core i7-1280P | |
| Asus Zenbook S 13 OLED | |
| MSI Summit E13 Flip Evo A11MT | |
| Przeciętny Intel Iris Xe Graphics G7 96EUs (11.1 - 59.8, n=213) | |
| Dell Latitude 9330 | |
| Lenovo ThinkBook 13s G3 20YA0005GE | |
| Lenovo Yoga 6 13ALC6 | |
| HP Elite Dragonfly Max | |
| Lenovo IdeaPad Flex 5i 14IAU7 | |
| Samsung Galaxy Book2 Pro 13 NP930XED-KA1DE | |
| Lenovo ThinkPad X1 Titanium Yoga G1 20QB0016GE | |
| HP EliteBook x360 1030 G7 | |
| Dell Latitude 5310-23VP6 | |
| Strange Brigade | |
| 1280x720 lowest AF:1 | |
| Asus Zenbook S 13 OLED | |
| MSI Summit E13 Flip Evo A11MT | |
| HP Spectre x360 13.5 14t-ef000 | |
| Lenovo ThinkPad X1 Nano Gen 2 Core i7-1280P | |
| Przeciętny Intel Iris Xe Graphics G7 96EUs (48.5 - 115.1, n=172) | |
| HP Elite Dragonfly Max | |
| Lenovo Yoga 6 13ALC6 | |
| Lenovo IdeaPad Flex 5i 14IAU7 | |
| Dell Latitude 9330 | |
| Samsung Galaxy Book2 Pro 13 NP930XED-KA1DE | |
| Dell Latitude 5310-23VP6 | |
| 1920x1080 medium AA:medium AF:4 | |
| Asus Zenbook S 13 OLED | |
| Lenovo ThinkPad X1 Nano Gen 2 Core i7-1280P | |
| HP Spectre x360 13.5 14t-ef000 | |
| MSI Summit E13 Flip Evo A11MT | |
| Przeciętny Intel Iris Xe Graphics G7 96EUs (18.2 - 51.4, n=170) | |
| Dell Latitude 9330 | |
| Lenovo IdeaPad Flex 5i 14IAU7 | |
| Lenovo Yoga 6 13ALC6 | |
| HP Elite Dragonfly Max | |
| Samsung Galaxy Book2 Pro 13 NP930XED-KA1DE | |
| Dell Latitude 5310-23VP6 | |
| 1920x1080 high AA:high AF:8 | |
| Asus Zenbook S 13 OLED | |
| HP Spectre x360 13.5 14t-ef000 | |
| Lenovo ThinkPad X1 Nano Gen 2 Core i7-1280P | |
| MSI Summit E13 Flip Evo A11MT | |
| Przeciętny Intel Iris Xe Graphics G7 96EUs (15.4 - 39.8, n=169) | |
| Dell Latitude 9330 | |
| Lenovo Yoga 6 13ALC6 | |
| Lenovo IdeaPad Flex 5i 14IAU7 | |
| HP Elite Dragonfly Max | |
| Samsung Galaxy Book2 Pro 13 NP930XED-KA1DE | |
| 1920x1080 ultra AA:ultra AF:16 | |
| Asus Zenbook S 13 OLED | |
| HP Spectre x360 13.5 14t-ef000 | |
| MSI Summit E13 Flip Evo A11MT | |
| Lenovo ThinkPad X1 Nano Gen 2 Core i7-1280P | |
| Przeciętny Intel Iris Xe Graphics G7 96EUs (13.2 - 31.7, n=167) | |
| Lenovo Yoga 6 13ALC6 | |
| Dell Latitude 9330 | |
| Lenovo IdeaPad Flex 5i 14IAU7 | |
| HP Elite Dragonfly Max | |
| Cyberpunk 2077 1.6 | |
| 1920x1080 Low Preset | |
| Asus Zenbook S 13 OLED | |
| HP Spectre x360 13.5 14t-ef000 | |
| Przeciętny Intel Iris Xe Graphics G7 96EUs (13 - 25.9, n=42) | |
| Lenovo ThinkPad X1 Nano Gen 2 Core i7-1280P | |
| Dell Latitude 9330 | |
| Lenovo IdeaPad Flex 5i 14IAU7 | |
| 1920x1080 Medium Preset | |
| Asus Zenbook S 13 OLED | |
| HP Spectre x360 13.5 14t-ef000 | |
| Lenovo ThinkPad X1 Nano Gen 2 Core i7-1280P | |
| Przeciętny Intel Iris Xe Graphics G7 96EUs (10.8 - 21.7, n=37) | |
| Dell Latitude 9330 | |
| Lenovo IdeaPad Flex 5i 14IAU7 | |
| 1920x1080 High Preset | |
| Asus Zenbook S 13 OLED | |
| HP Spectre x360 13.5 14t-ef000 | |
| Przeciętny Intel Iris Xe Graphics G7 96EUs (9.8 - 16.9, n=34) | |
| Lenovo ThinkPad X1 Nano Gen 2 Core i7-1280P | |
| Dell Latitude 9330 | |
| Lenovo IdeaPad Flex 5i 14IAU7 | |
| 1920x1080 Ultra Preset | |
| Asus Zenbook S 13 OLED | |
| HP Spectre x360 13.5 14t-ef000 | |
| Przeciętny Intel Iris Xe Graphics G7 96EUs (7.4 - 16.8, n=32) | |
| Lenovo ThinkPad X1 Nano Gen 2 Core i7-1280P | |
| Dell Latitude 9330 | |
| Lenovo IdeaPad Flex 5i 14IAU7 | |
| Dota 2 Reborn | |
| 1280x720 min (0/3) fastest | |
| HP Spectre x360 13.5 14t-ef000 | |
| Lenovo ThinkBook 13s G3 20YA0005GE | |
| Asus Zenbook S 13 OLED | |
| Lenovo IdeaPad Flex 5i 14IAU7 | |
| Lenovo ThinkPad X1 Nano Gen 2 Core i7-1280P | |
| Przeciętny Intel Iris Xe Graphics G7 96EUs (36 - 148, n=221) | |
| Dell Latitude 9330 | |
| Lenovo Yoga 6 13ALC6 | |
| Lenovo ThinkPad X1 Titanium Yoga G1 20QB0016GE | |
| HP EliteBook x360 1030 G7 | |
| MSI Summit E13 Flip Evo A11MT | |
| Samsung Galaxy Book2 Pro 13 NP930XED-KA1DE | |
| HP Elite Dragonfly Max | |
| Dell Latitude 5310-23VP6 | |
| 1366x768 med (1/3) | |
| Asus Zenbook S 13 OLED | |
| HP Spectre x360 13.5 14t-ef000 | |
| Lenovo ThinkBook 13s G3 20YA0005GE | |
| Lenovo IdeaPad Flex 5i 14IAU7 | |
| Dell Latitude 9330 | |
| Lenovo ThinkPad X1 Nano Gen 2 Core i7-1280P | |
| Przeciętny Intel Iris Xe Graphics G7 96EUs (31.6 - 108.5, n=221) | |
| Lenovo Yoga 6 13ALC6 | |
| MSI Summit E13 Flip Evo A11MT | |
| Lenovo ThinkPad X1 Titanium Yoga G1 20QB0016GE | |
| HP EliteBook x360 1030 G7 | |
| Samsung Galaxy Book2 Pro 13 NP930XED-KA1DE | |
| HP Elite Dragonfly Max | |
| Dell Latitude 5310-23VP6 | |
| 1920x1080 high (2/3) | |
| Asus Zenbook S 13 OLED | |
| HP Spectre x360 13.5 14t-ef000 | |
| Dell Latitude 9330 | |
| Lenovo ThinkPad X1 Nano Gen 2 Core i7-1280P | |
| Przeciętny Intel Iris Xe Graphics G7 96EUs (23.2 - 88.1, n=221) | |
| Lenovo ThinkBook 13s G3 20YA0005GE | |
| MSI Summit E13 Flip Evo A11MT | |
| Lenovo IdeaPad Flex 5i 14IAU7 | |
| Lenovo Yoga 6 13ALC6 | |
| Samsung Galaxy Book2 Pro 13 NP930XED-KA1DE | |
| Lenovo ThinkPad X1 Titanium Yoga G1 20QB0016GE | |
| HP Elite Dragonfly Max | |
| HP EliteBook x360 1030 G7 | |
| Dell Latitude 5310-23VP6 | |
| 1920x1080 ultra (3/3) best looking | |
| Asus Zenbook S 13 OLED | |
| HP Spectre x360 13.5 14t-ef000 | |
| Dell Latitude 9330 | |
| Przeciętny Intel Iris Xe Graphics G7 96EUs (20.6 - 78.5, n=221) | |
| Lenovo ThinkPad X1 Nano Gen 2 Core i7-1280P | |
| Lenovo ThinkBook 13s G3 20YA0005GE | |
| MSI Summit E13 Flip Evo A11MT | |
| Lenovo IdeaPad Flex 5i 14IAU7 | |
| Lenovo Yoga 6 13ALC6 | |
| Samsung Galaxy Book2 Pro 13 NP930XED-KA1DE | |
| Lenovo ThinkPad X1 Titanium Yoga G1 20QB0016GE | |
| HP Elite Dragonfly Max | |
| HP EliteBook x360 1030 G7 | |
| Dell Latitude 5310-23VP6 | |
Witcher 3 FPS Chart
| low | med. | high | ultra | |
|---|---|---|---|---|
| GTA V (2015) | 102.1 | 91.1 | 21.7 | 8.94 |
| The Witcher 3 (2015) | 75.8 | 47.2 | 25.9 | 11.4 |
| Dota 2 Reborn (2015) | 100.3 | 80.1 | 58.6 | 53.4 |
| Final Fantasy XV Benchmark (2018) | 37.3 | 21 | 14.6 | |
| X-Plane 11.11 (2018) | 37.1 | 34.4 | 30.8 | |
| Strange Brigade (2018) | 69.1 | 32.4 | 25 | 20.4 |
| Cyberpunk 2077 1.6 (2022) | 17.5 | 14.5 | 11.2 | 8.9 |
Emisje
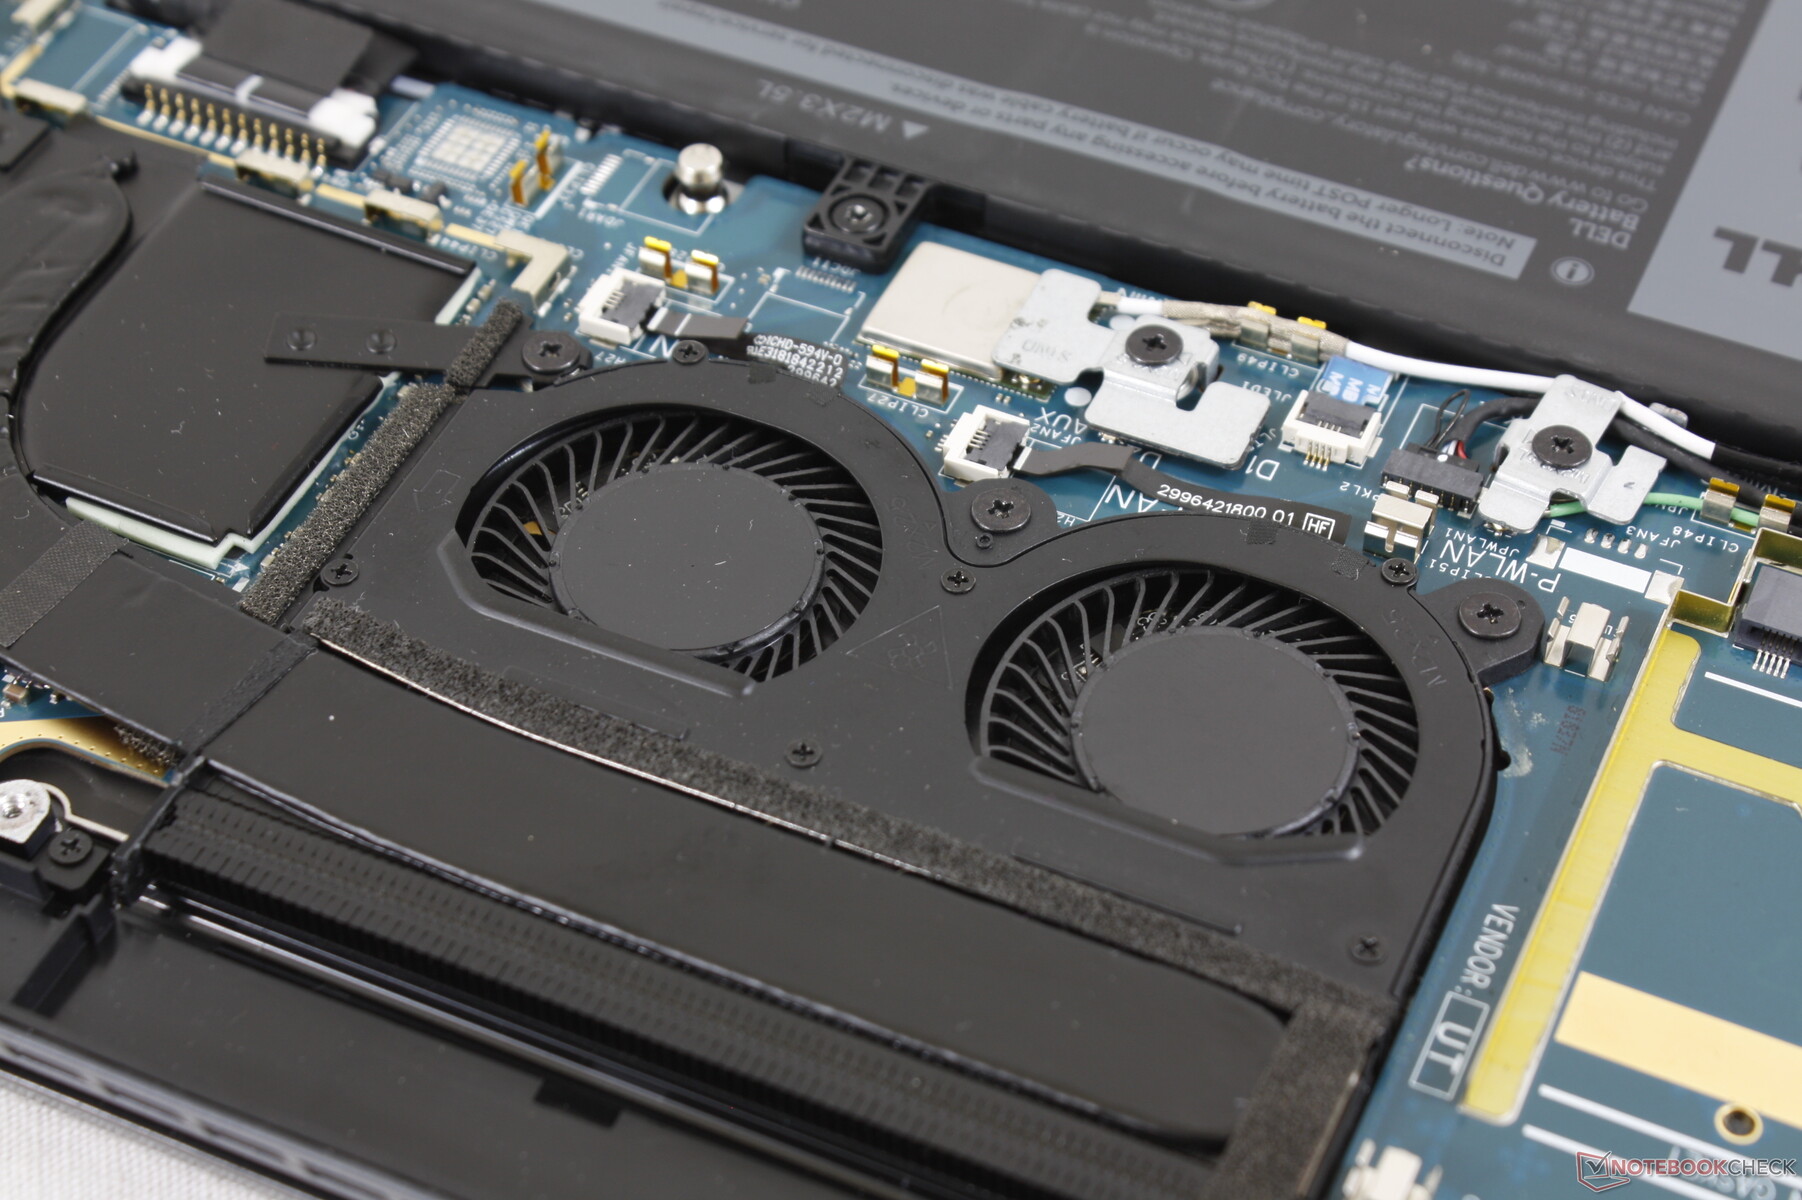
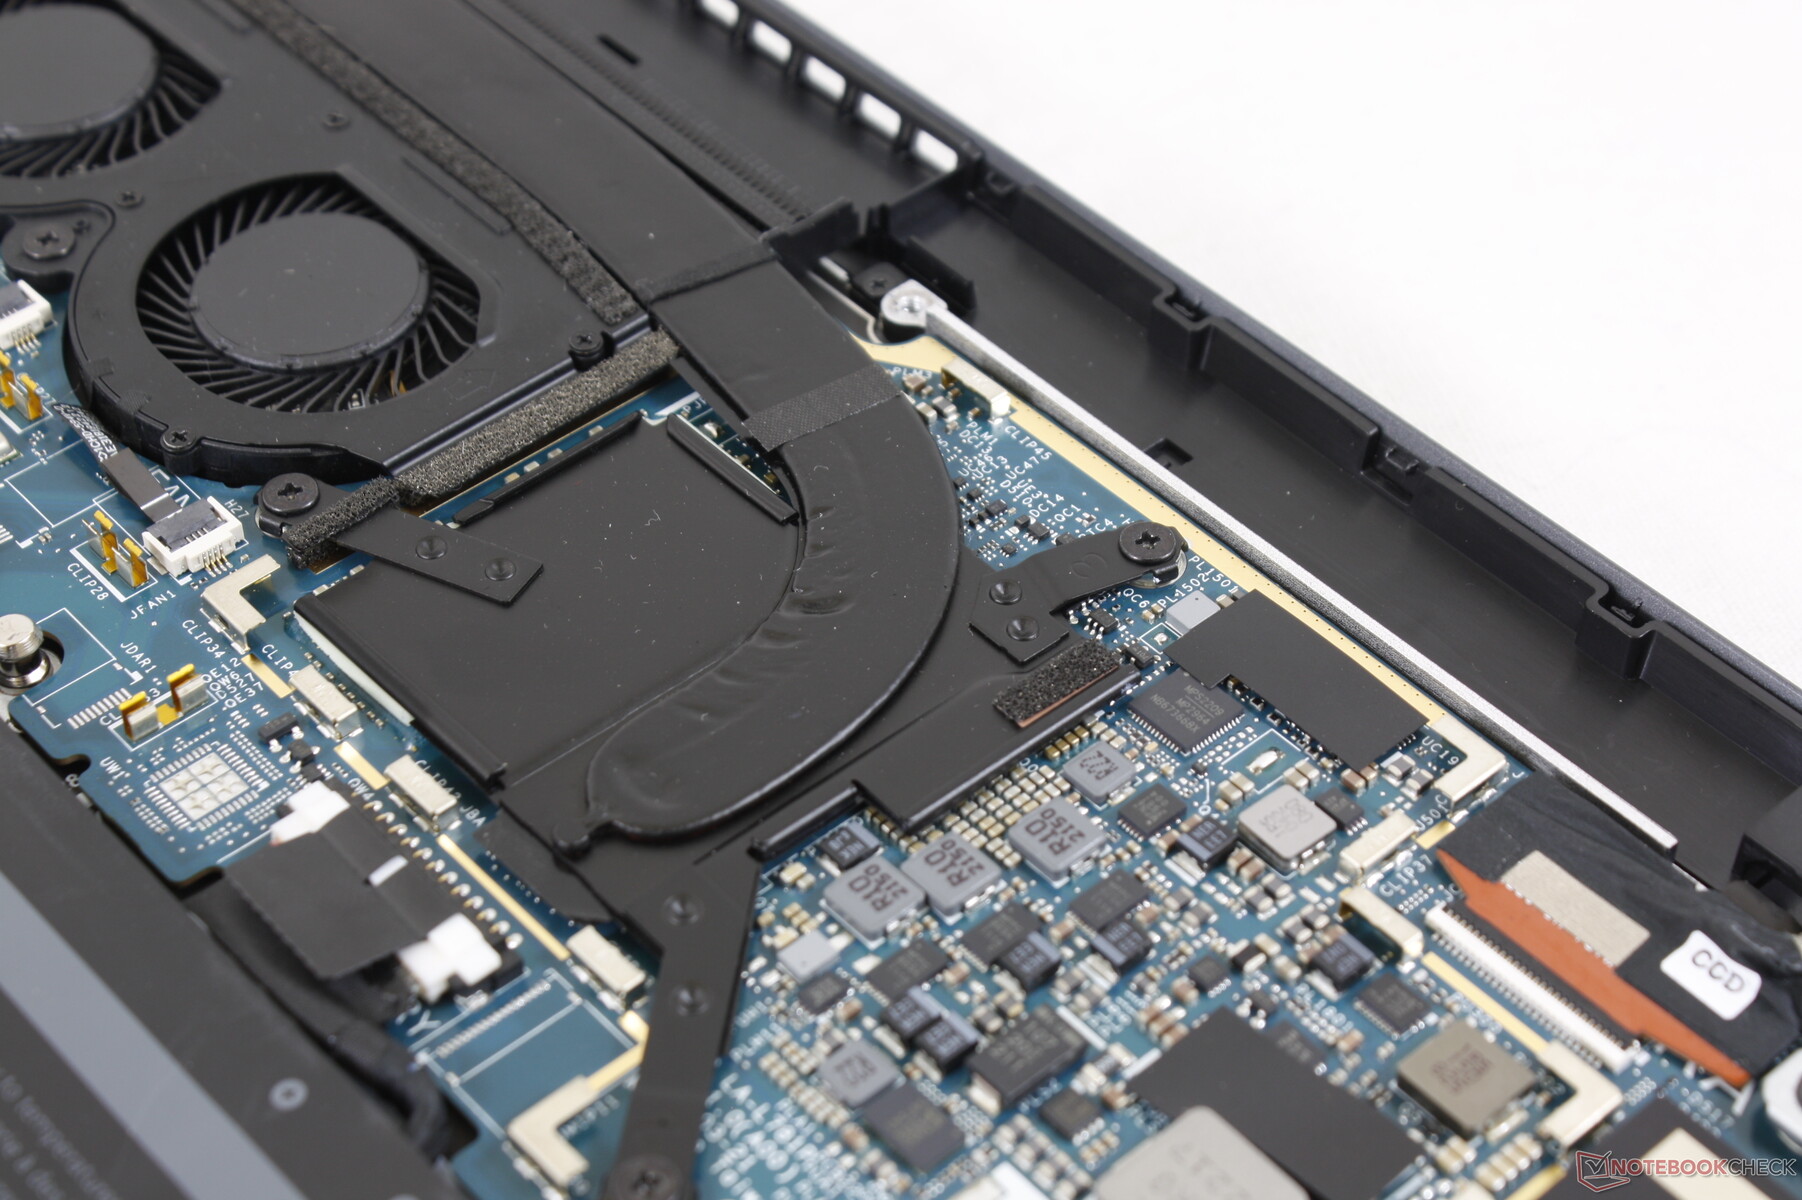
Hałas systemu - wentylatory o dużym skoku
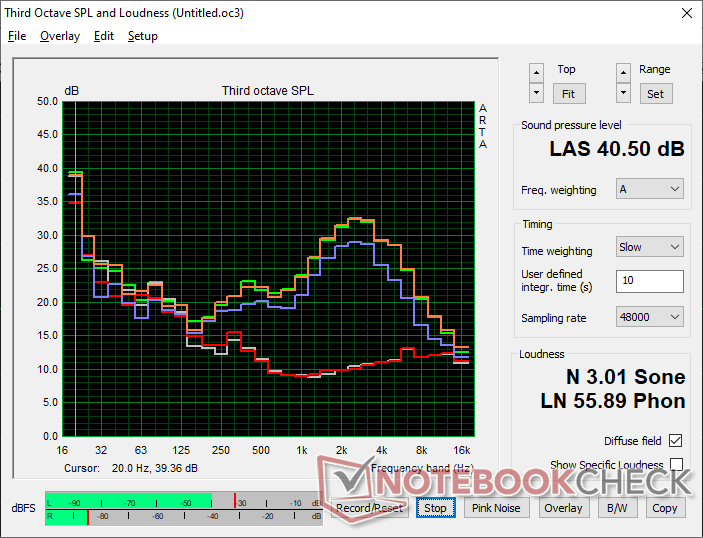
Dwa wewnętrzne wentylatory są dość małe - każdy ma tylko 30 mm średnicy, w porównaniu z 40 mm lub więcej w większości innych laptopów. Główną wadą mniejszych wentylatorów jest to, że generalnie mają wyższy poziom hałasu, niż większe, więc są bardziej zauważalne, kiedy są aktywne. Nasze pomiary mikrofonowe poniżej potwierdzają wyższy poziom hałasu z relatywnie ostrym szczytem około 3k Hz w porównaniu z szerszymi szczytami w innych 13-calowych subnotebookach, jak np XPS 13 Plus 9320. Innymi słowy, wentylatory w Latitude 9330 mogą być bardziej rozpraszające podczas przeglądania stron internetowych lub strumieniowania wideo.
Podczas uruchamiania programu 3DMark 06 szum wentylatorów gwałtownie wzrastał z ciszy do 37 dB(A) mniej więcej w połowie pierwszej sceny benchmarku. Dell jest znacznie głośniejszy od tego, co zarejestrowaliśmy naHP Dragonfly Max a jednocześnie jest na równi z Summit E13 Flip. Zalecamy uruchomienie systemu w trybie Quiet lub Balanced, aby utrzymać pulsowanie wentylatora na minimalnym poziomie.
Hałas
| luz |
| 23 / 23.1 / 23.1 dB |
| obciążenie |
| 37.1 / 40.5 dB |
 | ||
30 dB cichy 40 dB(A) słyszalny 50 dB(A) irytujący |
||
min: | ||
| Dell Latitude 9330 Iris Xe G7 96EUs, i7-1260U | Lenovo ThinkPad X1 Titanium Yoga G1 20QB0016GE Iris Xe G7 80EUs, i5-1140G7, Lenovo UMIS RPJTJ256MEE1OWX | MSI Summit E13 Flip Evo A11MT Iris Xe G7 96EUs, i7-1185G7, Phison 1TB SM2801T24GKBB4S-E162 | HP EliteBook x360 1030 G7 UHD Graphics 620, i7-10810U, Samsung SSD PM981a MZVLB512HBJQ | HP Elite Dragonfly Max Iris Xe G7 96EUs, i7-1185G7, Toshiba XG6 KXG60ZNV512G | Dell Latitude 5310-23VP6 UHD Graphics 620, i5-10310U, SK hynix BC511 HFM512GDHTNI-87A0B | |
|---|---|---|---|---|---|---|
| Noise | -9% | -8% | -13% | 5% | 1% | |
| wyłączone / środowisko * (dB) | 23 | 25.61 -11% | 24.5 -7% | 28.1 -22% | 24.9 -8% | 24.9 -8% |
| Idle Minimum * (dB) | 23 | 25.61 -11% | 24.7 -7% | 28.1 -22% | 24.9 -8% | 24.9 -8% |
| Idle Average * (dB) | 23.1 | 25.61 -11% | 24.7 -7% | 28.1 -22% | 24.9 -8% | 24.9 -8% |
| Idle Maximum * (dB) | 23.1 | 25.61 -11% | 26.4 -14% | 28.1 -22% | 24.9 -8% | 24.9 -8% |
| Load Average * (dB) | 37.1 | 40.14 -8% | 37.8 -2% | 35.1 5% | 29.7 20% | 30 19% |
| Witcher 3 ultra * (dB) | 40.6 | 41.4 -2% | 31.3 23% | 36 11% | ||
| Load Maximum * (dB) | 40.5 | 40.14 1% | 48.8 -20% | 37.6 7% | 31.3 23% | 36.3 10% |
* ... im mniej tym lepiej
Temperatura
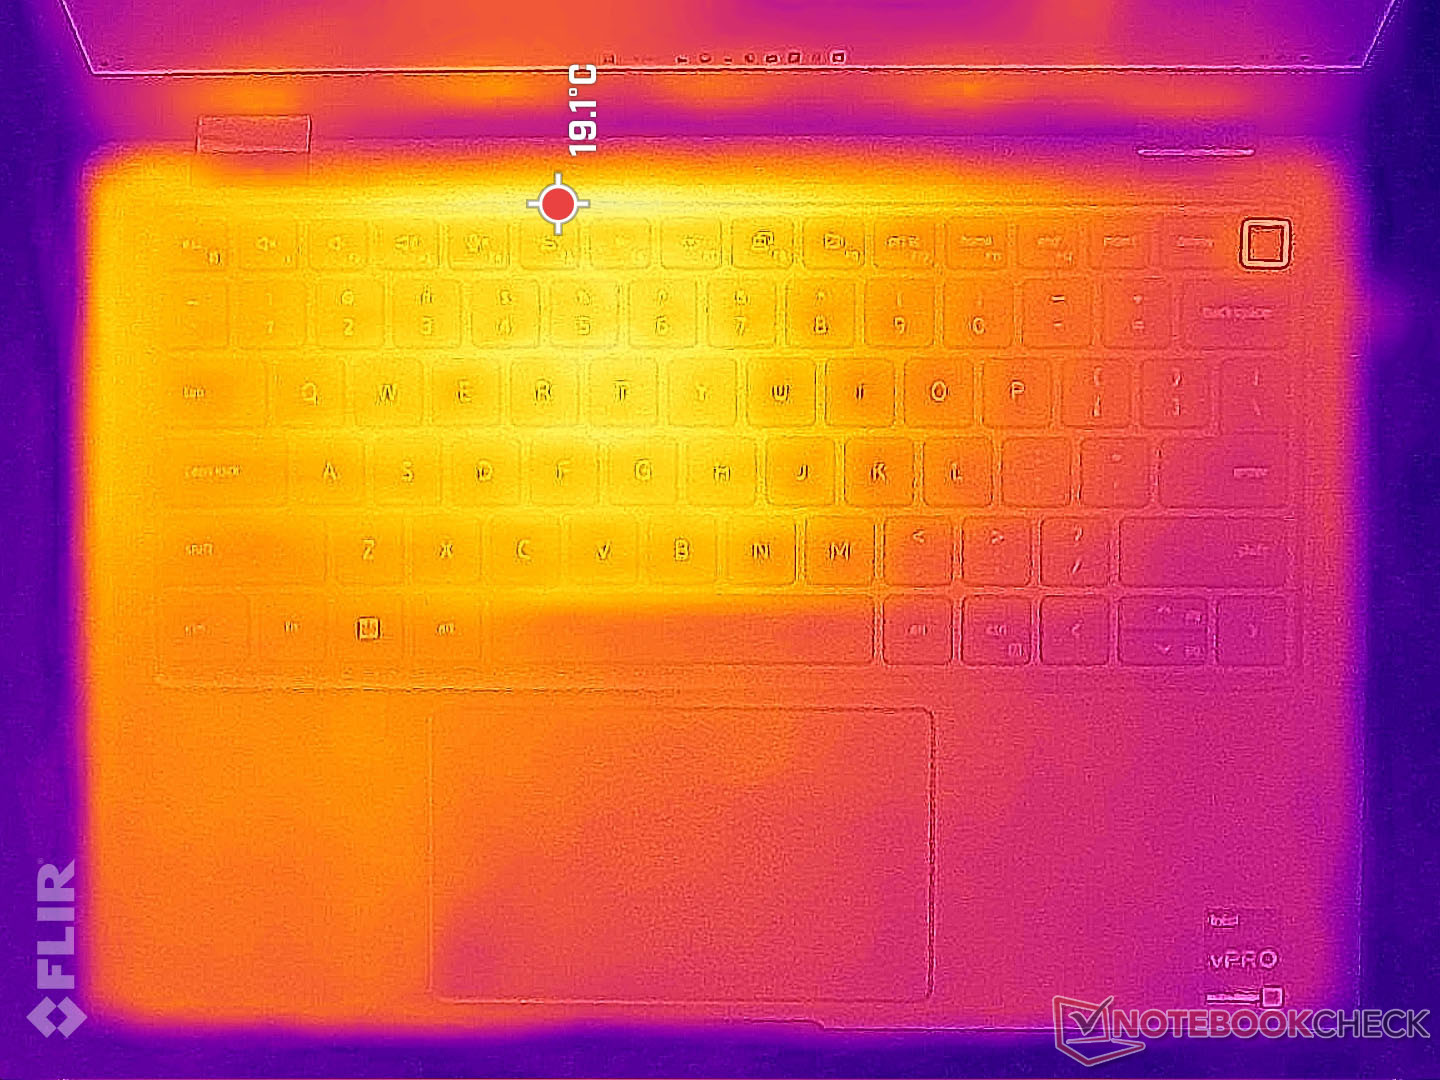
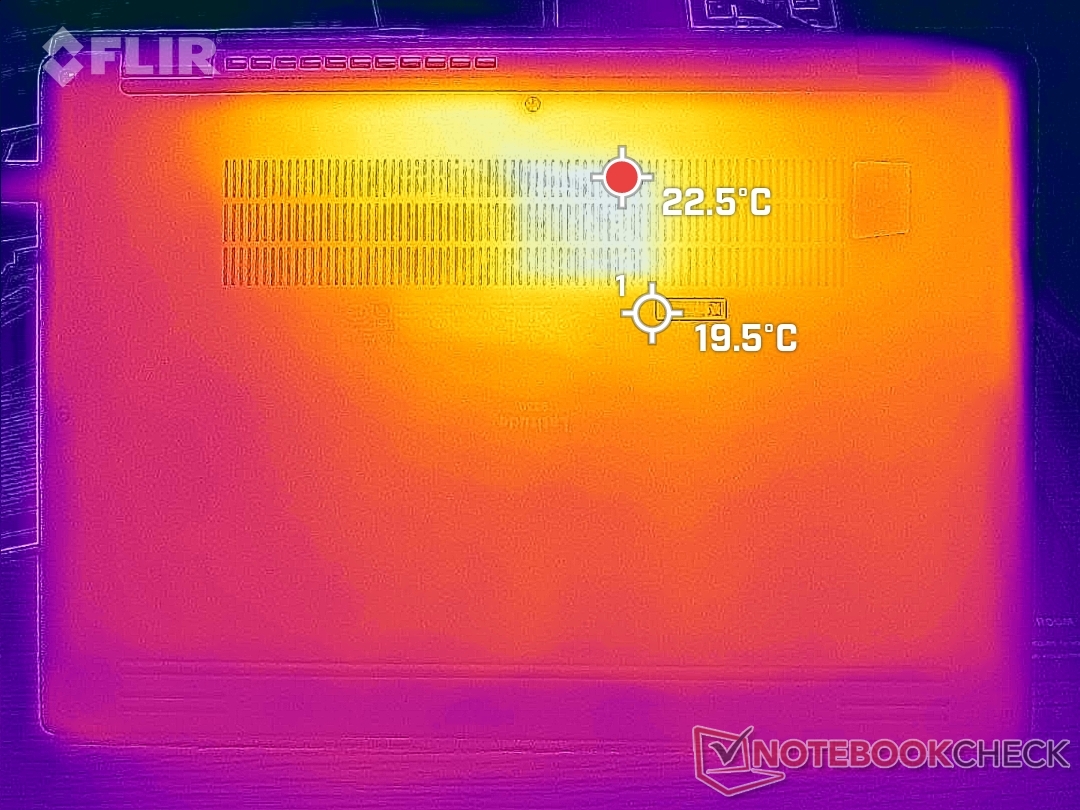
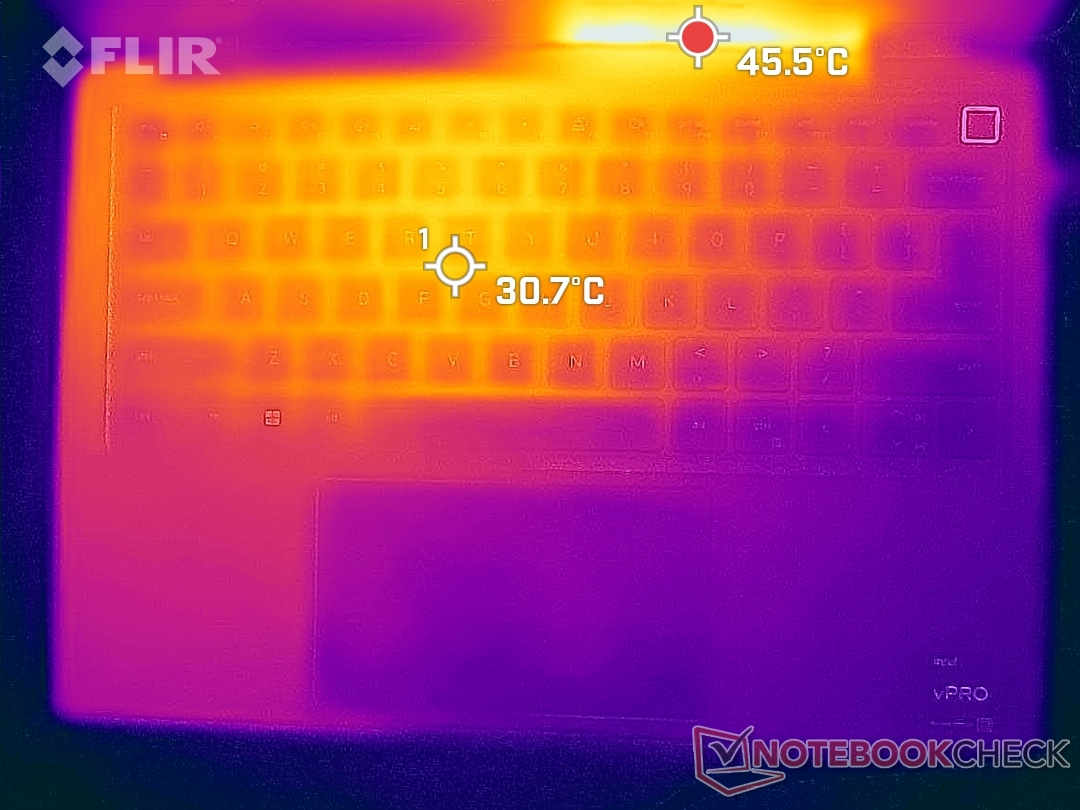
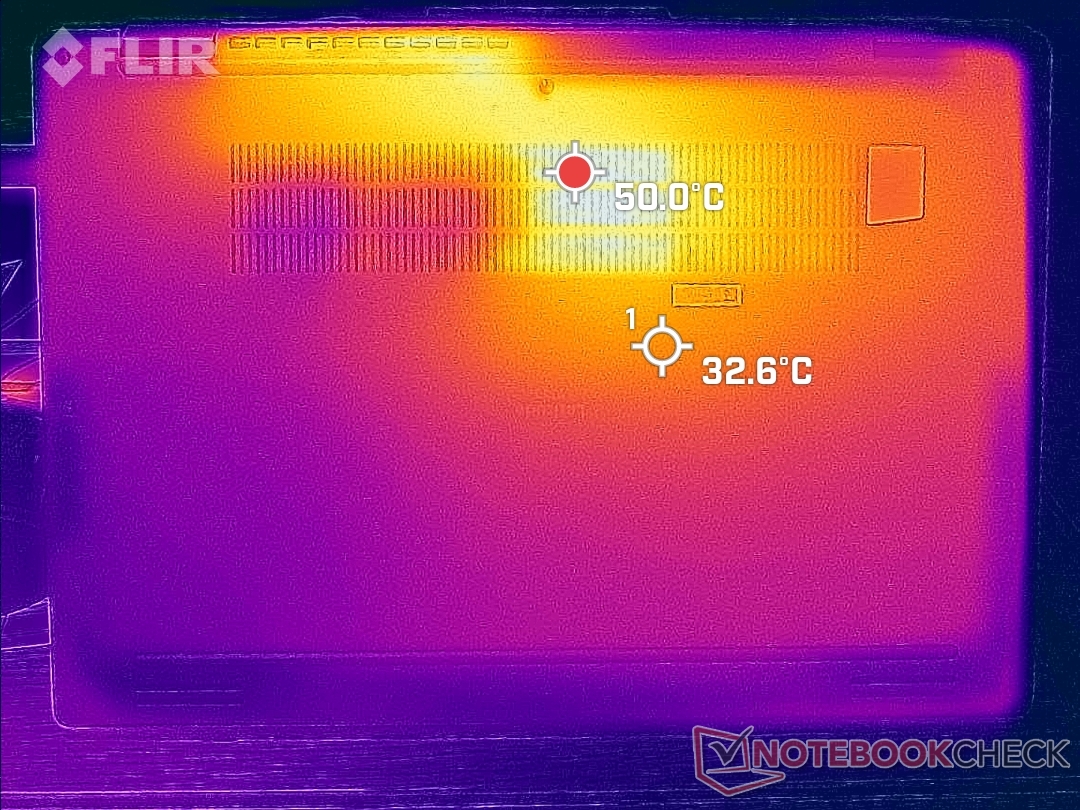
Podczas niewielkich obciążeń temperatury powierzchni są bardzo chłodne, ponieważ większość obudowy jest metalowa. Przy większym obciążeniu gorące punkty mogą jednak osiągnąć do 41 C i 50 C odpowiednio na wierzchu i spodzie. Gorące punkty znajdują się w tylnej części obudowy, więc klawiatura i podpórki pod nadgarstki pozostają chłodniejsze, co zapewnia komfortowe pisanie. Konkurencyjny Dragonfly Max osiąga podobne maksima, a Summit E13 Flip może być jeszcze cieplejszy - do 57 C.
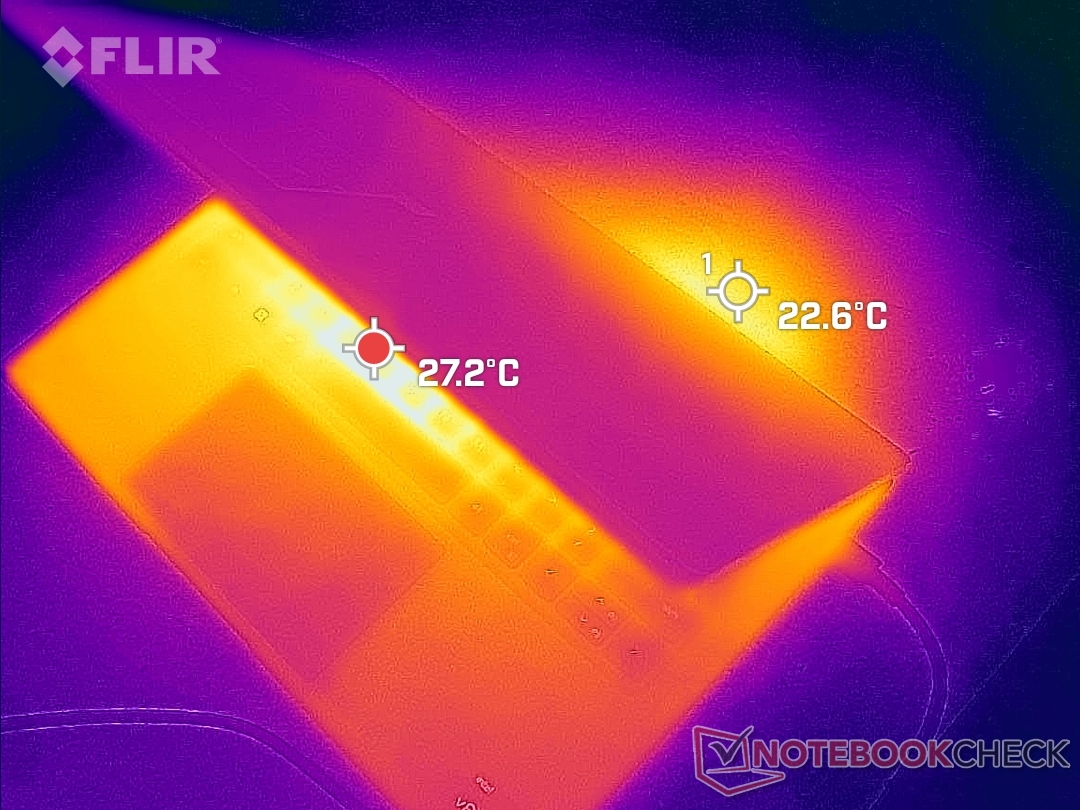
(±) Maksymalna temperatura w górnej części wynosi 40.6 °C / 105 F, w porównaniu do średniej 35.4 °C / 96 F , począwszy od 19.6 do 60 °C dla klasy Convertible.
(-) Dno nagrzewa się maksymalnie do 50.2 °C / 122 F, w porównaniu do średniej 36.9 °C / 98 F
(+) W stanie bezczynności średnia temperatura górnej części wynosi 23.5 °C / 74 F, w porównaniu ze średnią temperaturą urządzenia wynoszącą 30.3 °C / ### class_avg_f### F.
(+) Podpórki pod nadgarstki i touchpad są chłodniejsze niż temperatura skóry i maksymalnie 28 °C / 82.4 F i dlatego są chłodne w dotyku.
(±) Średnia temperatura obszaru podparcia dłoni w podobnych urządzeniach wynosiła 28 °C / 82.4 F (0 °C / 0 F).
| Dell Latitude 9330 Intel Core i7-1260U, Intel Iris Xe Graphics G7 96EUs | Lenovo ThinkPad X1 Titanium Yoga G1 20QB0016GE Intel Core i5-1140G7, Intel Iris Xe Graphics G7 80EUs | MSI Summit E13 Flip Evo A11MT Intel Core i7-1185G7, Intel Iris Xe Graphics G7 96EUs | HP EliteBook x360 1030 G7 Intel Core i7-10810U, Intel UHD Graphics 620 | HP Elite Dragonfly Max Intel Core i7-1185G7, Intel Iris Xe Graphics G7 96EUs | Dell Latitude 5310-23VP6 Intel Core i5-10310U, Intel UHD Graphics 620 | |
|---|---|---|---|---|---|---|
| Heat | -3% | -22% | -2% | -11% | 6% | |
| Maximum Upper Side * (°C) | 40.6 | 46.3 -14% | 52 -28% | 37 9% | 39.4 3% | 39 4% |
| Maximum Bottom * (°C) | 50.2 | 43.3 14% | 57.4 -14% | 47.2 6% | 50 -0% | 44.8 11% |
| Idle Upper Side * (°C) | 25 | 26.8 -7% | 30.4 -22% | 25.8 -3% | 31.6 -26% | 24.3 3% |
| Idle Bottom * (°C) | 27.6 | 28.3 -3% | 34.2 -24% | 32.6 -18% | 33.4 -21% | 25.6 7% |
* ... im mniej tym lepiej
Stress Test
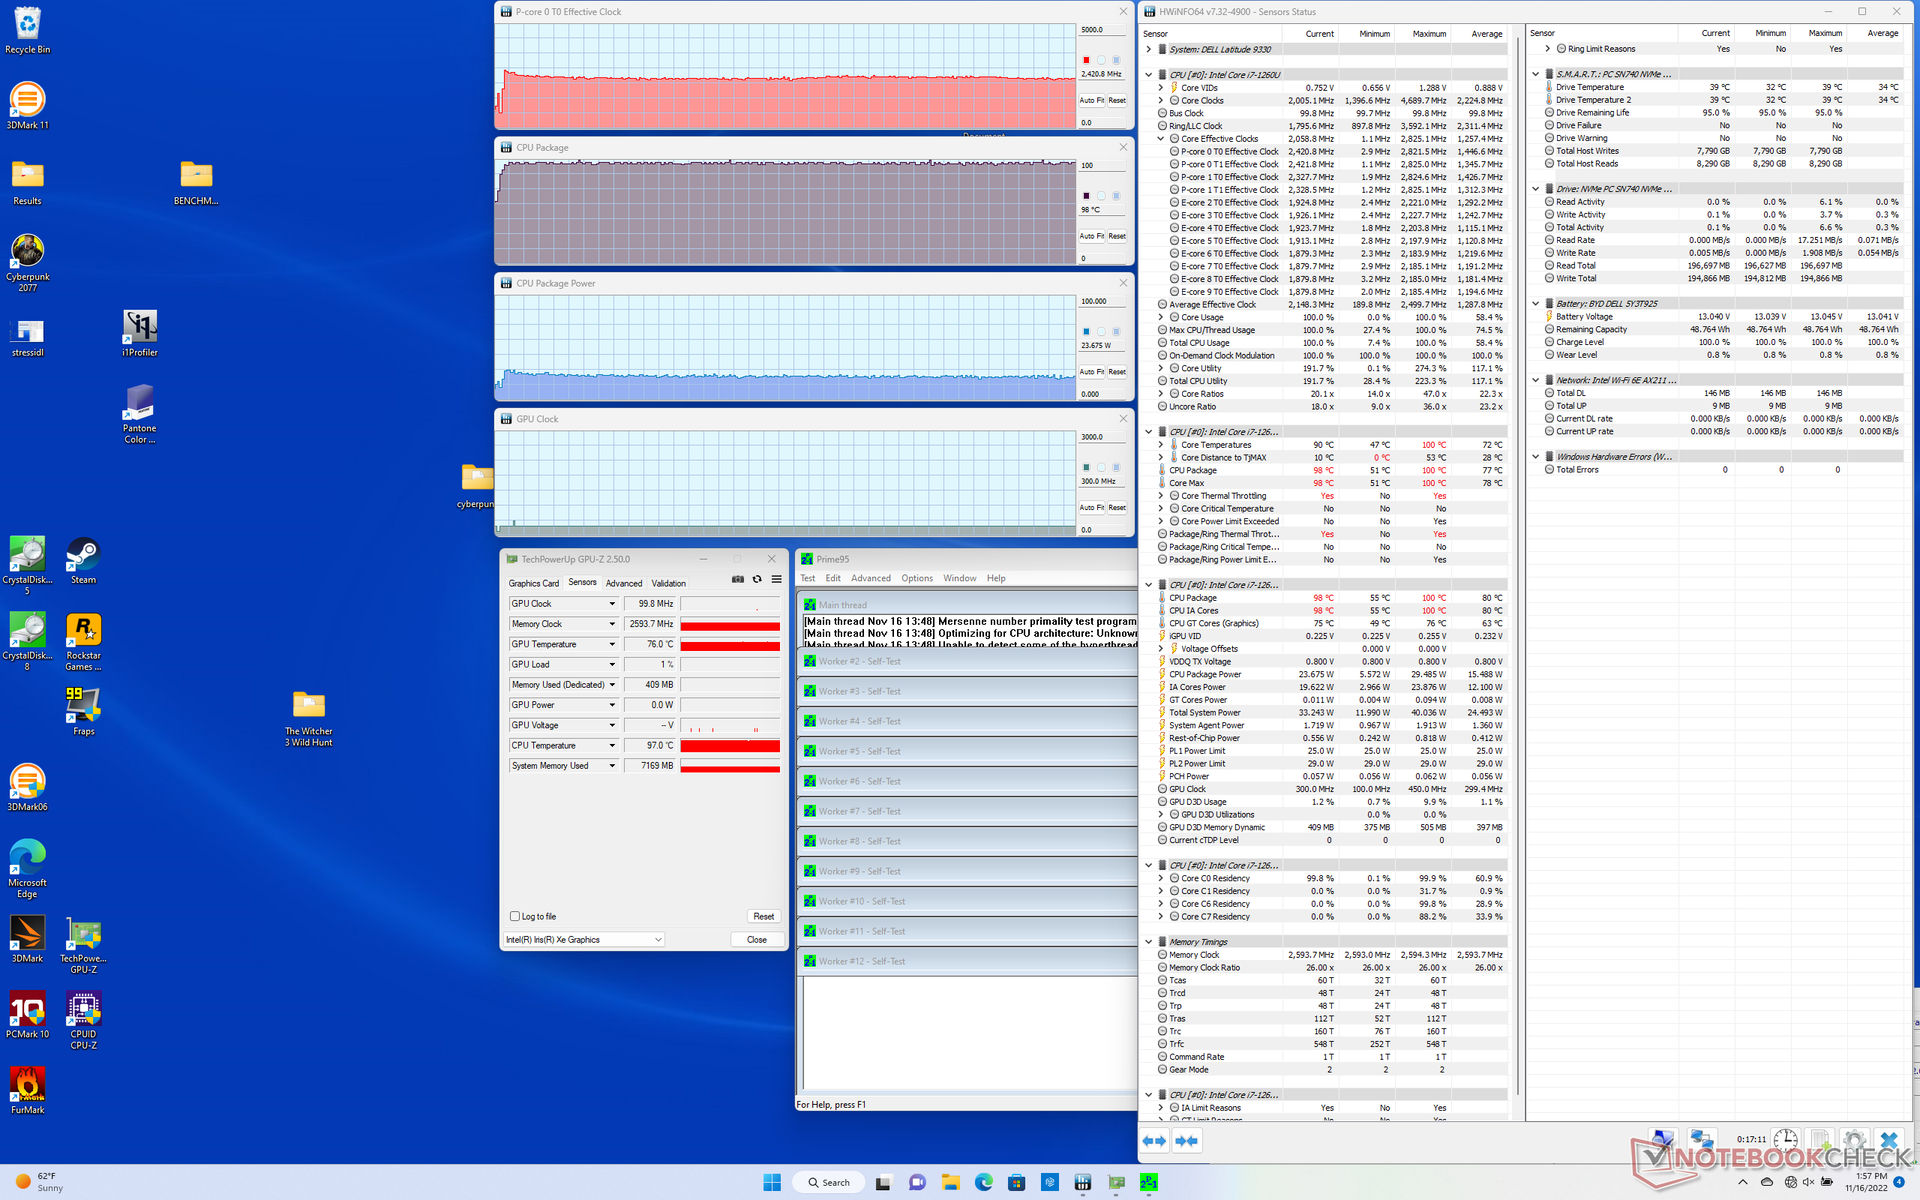
Temperatura procesora regularnie osiąga 90 C lub więcej podczas pracy pod dużym obciążeniem. Na przykład podczas uruchomienia Prime95 temperatura procesora niemal natychmiast wzrosła do 99 C, 2,8 GHz i 29 W, po czym szybko spadła i ustabilizowała się na poziomie 2,4 GHz i 25 W, by utrzymać temperaturę rdzenia na poziomie ~98 C. Przeprowadzenie tego samego testu w modelu Dragonfly Max z procesorem Core i7-1185G7 spowodowałoby znacznie wolniejsze taktowanie i niższą temperaturę rdzenia, wynoszącą odpowiednio 1,5 GHz i 71 C. Dell nie boi się uruchamiać procesora w cieplejszej temperaturze niż w większości innych modeli, by zaoferować szybszą wydajność.
Częstotliwość taktowania GPU i temperatura podczas pracy Witcher 3 przy wymagającym obciążeniu graficznym ustabilizowały się na poziomie 948 MHz i 91 stopni Celsjusza, w porównaniu z 700 MHz i 61 stopniami Celsjusza we wspomnianym HP.
Praca na zasilaniu akumulatorowym ogranicza wydajność. Test 3DMark 11 na akumulatorze przyniósłby wyniki z fizyki i grafiki na poziomie odpowiednio 7531 i 4193 pkt. w porównaniu z 12771 i 4820 pkt. na zasilaniu sieciowym.
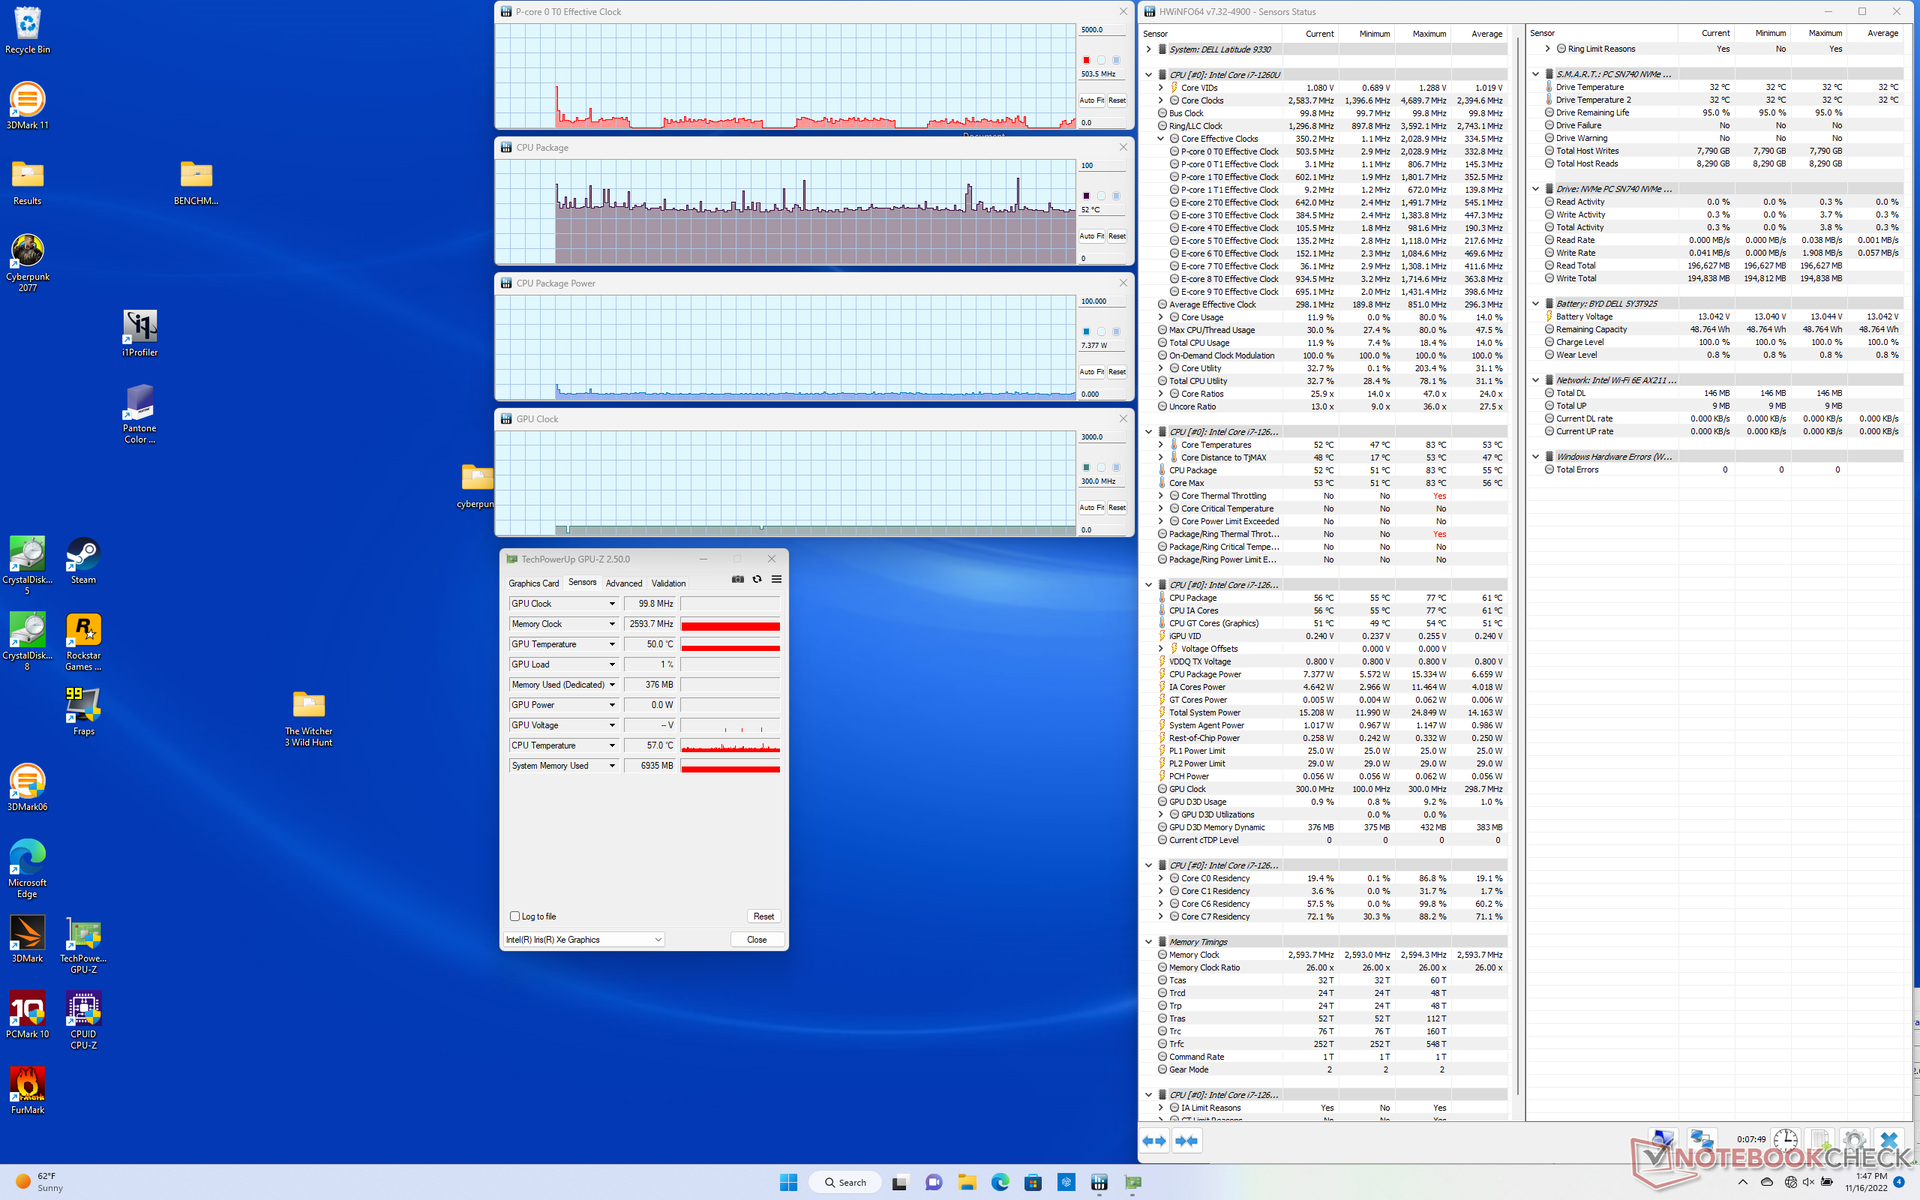
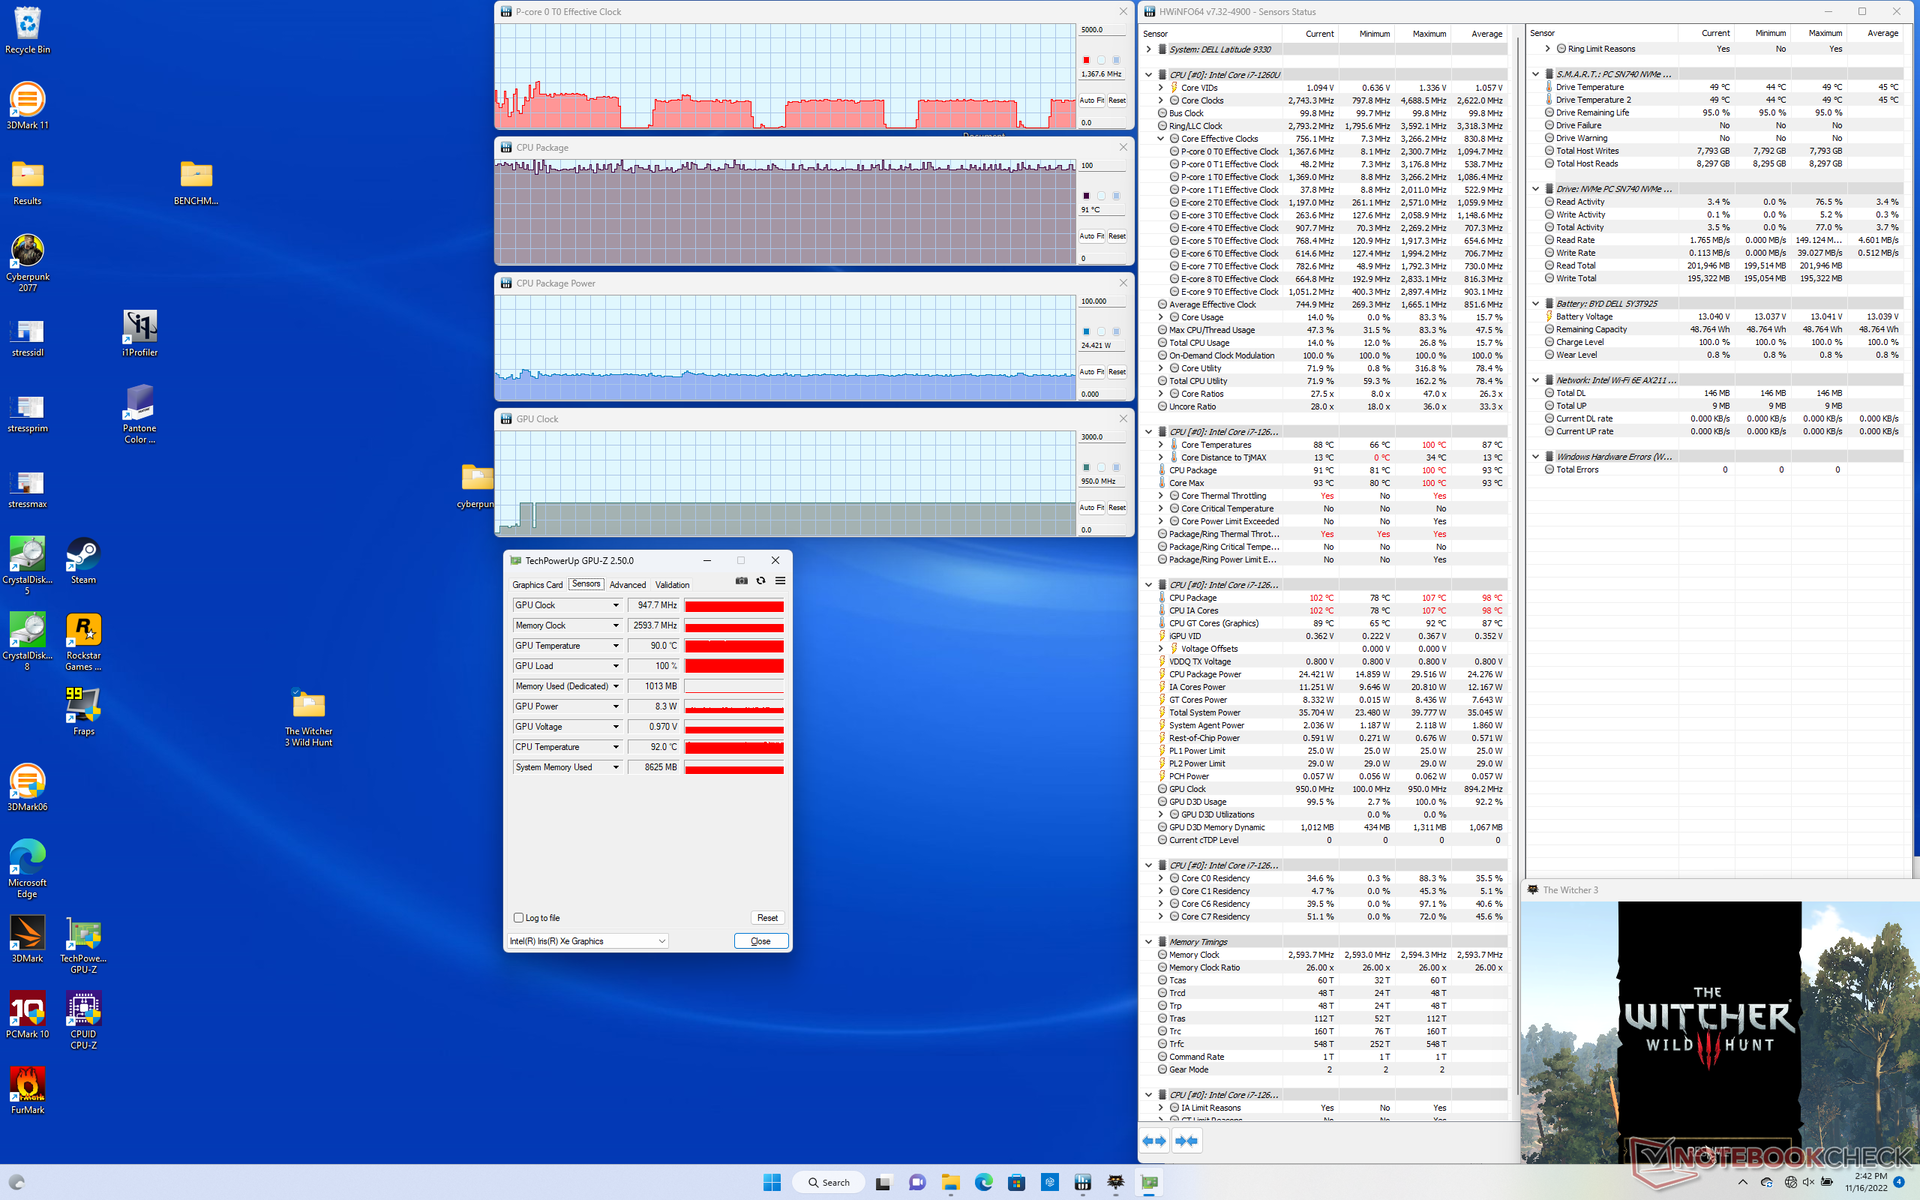
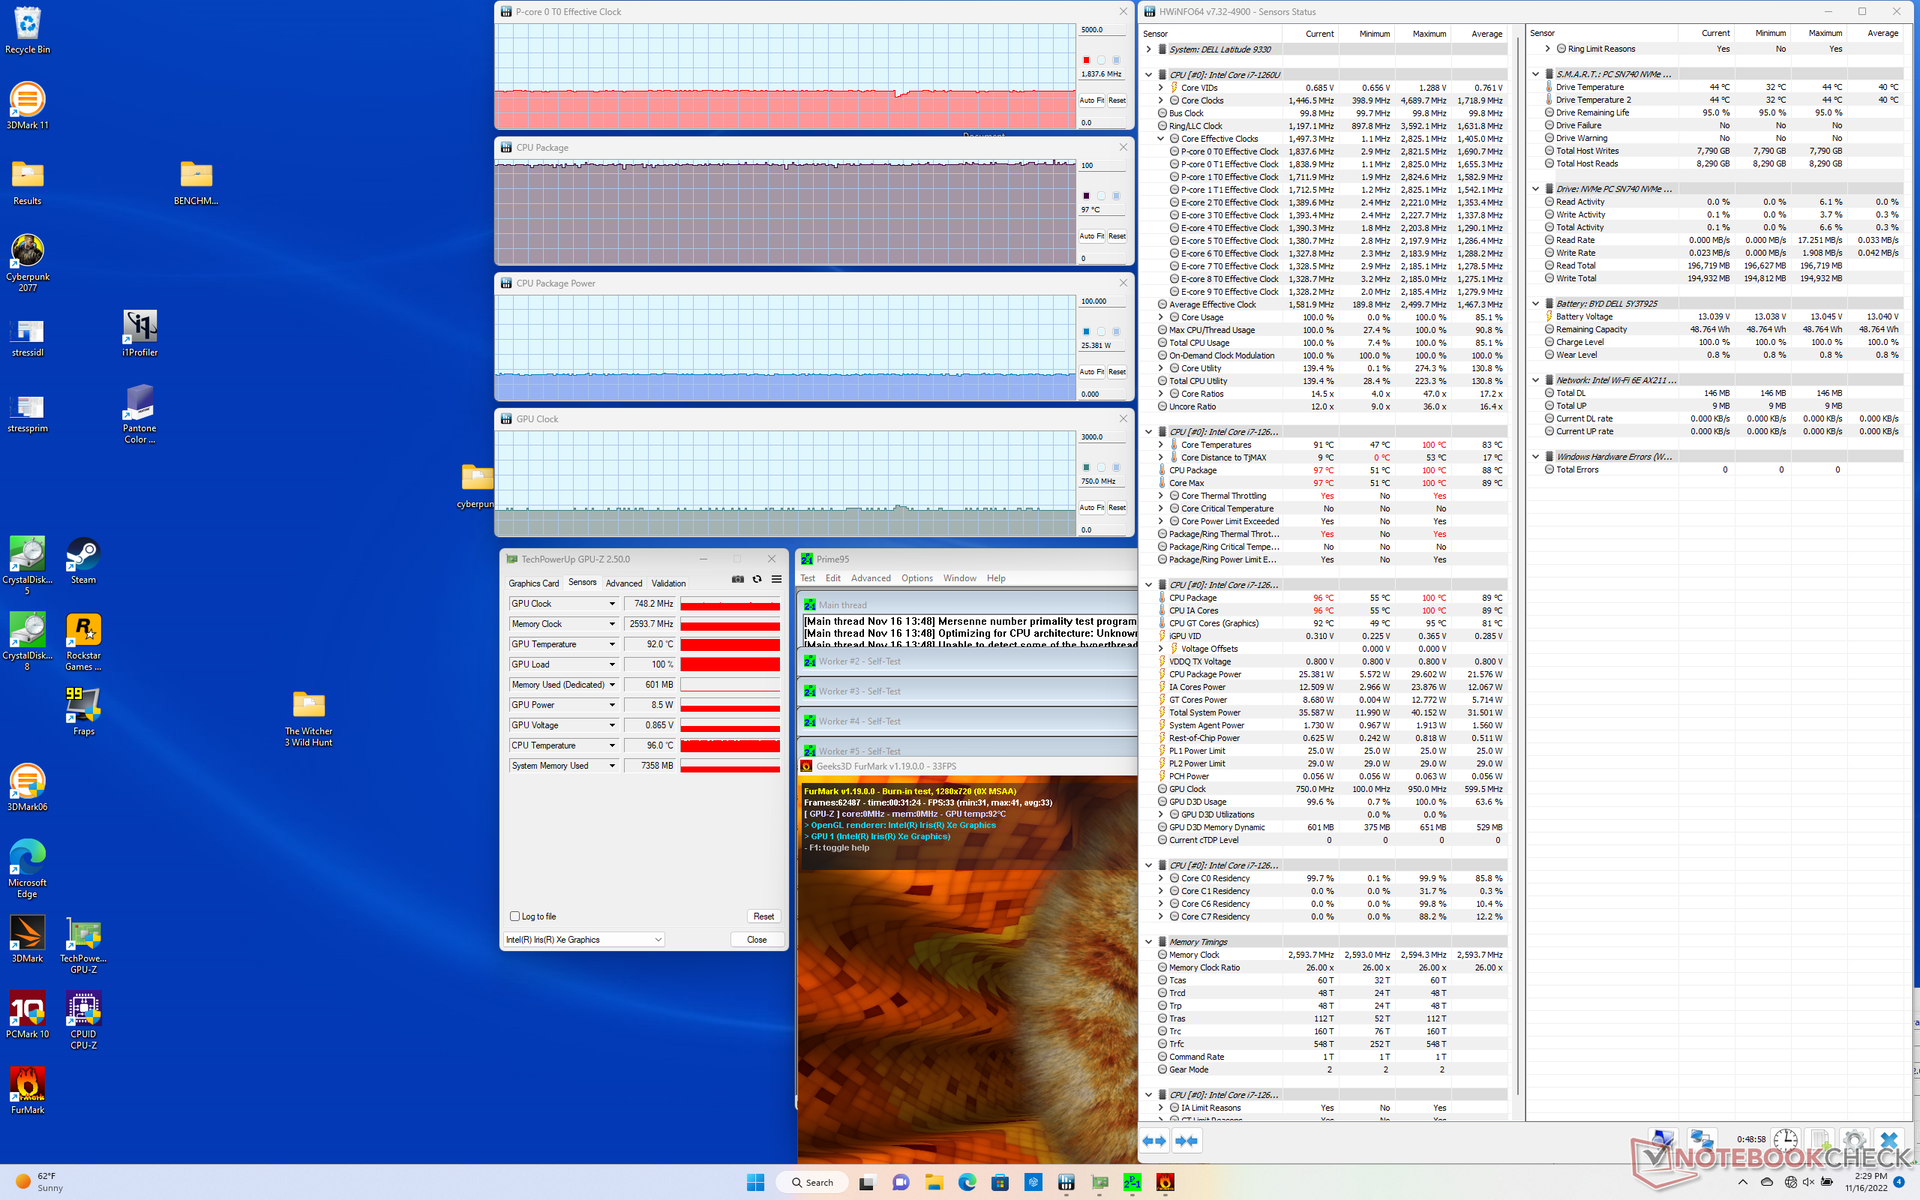
| ZegarCPU (GHz) | Zegar GPU (MHz) | Średnia temperatura CPU (°C) | |
| System w stanie bezczynności | -- | -- | 52 |
| Prime95 Stress | 2.4 | -- | 98 |
| Prime95 + FurMark Stress | 1.8 | 748 | 97 |
| Witcher 3 Stress | 1.4 | 948 | 91 |
Mówcy
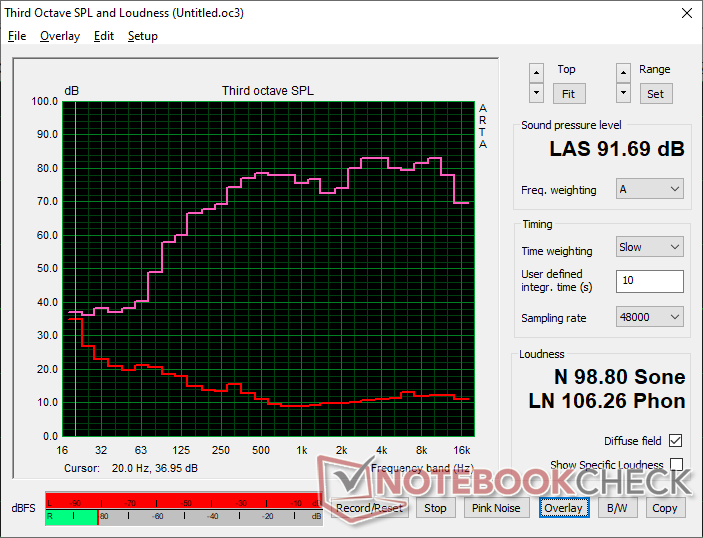
Dellowi udało się wcisnąć cztery indywidualne głośniki o doskonałej reprodukcji dźwięku mimo niewielkiej obudowy. Maksymalna głośność jest głośna i wyraźna, bez zauważalnych zakłóceń. Widać, że wewnętrzne głośniki zostały zoptymalizowane pod kątem konferencji audio lub wideo.
Dell Latitude 9330 analiza dźwięku
(+) | głośniki mogą odtwarzać stosunkowo głośno (91.7 dB)
Bas 100 - 315 Hz
(±) | zredukowany bas - średnio 11.9% niższy od mediany
(+) | bas jest liniowy (6.3% delta do poprzedniej częstotliwości)
Średnie 400 - 2000 Hz
(+) | zbalansowane środki średnie - tylko 1.9% od mediany
(+) | średnie są liniowe (2.7% delta do poprzedniej częstotliwości)
Wysokie 2–16 kHz
(+) | zrównoważone maksima - tylko 3.4% od mediany
(+) | wzloty są liniowe (3.5% delta do poprzedniej częstotliwości)
Ogólnie 100 - 16.000 Hz
(+) | ogólny dźwięk jest liniowy (9.2% różnicy w stosunku do mediany)
W porównaniu do tej samej klasy
» 4% wszystkich testowanych urządzeń w tej klasie było lepszych, 1% podobnych, 95% gorszych
» Najlepszy miał deltę 6%, średnia wynosiła ###średnia###%, najgorsza wynosiła 57%
W porównaniu do wszystkich testowanych urządzeń
» 3% wszystkich testowanych urządzeń było lepszych, 1% podobnych, 96% gorszych
» Najlepszy miał deltę 4%, średnia wynosiła ###średnia###%, najgorsza wynosiła 134%
Apple MacBook Pro 16 2021 M1 Pro analiza dźwięku
(+) | głośniki mogą odtwarzać stosunkowo głośno (84.7 dB)
Bas 100 - 315 Hz
(+) | dobry bas - tylko 3.8% od mediany
(+) | bas jest liniowy (5.2% delta do poprzedniej częstotliwości)
Średnie 400 - 2000 Hz
(+) | zbalansowane środki średnie - tylko 1.3% od mediany
(+) | średnie są liniowe (2.1% delta do poprzedniej częstotliwości)
Wysokie 2–16 kHz
(+) | zrównoważone maksima - tylko 1.9% od mediany
(+) | wzloty są liniowe (2.7% delta do poprzedniej częstotliwości)
Ogólnie 100 - 16.000 Hz
(+) | ogólny dźwięk jest liniowy (4.6% różnicy w stosunku do mediany)
W porównaniu do tej samej klasy
» 0% wszystkich testowanych urządzeń w tej klasie było lepszych, 0% podobnych, 100% gorszych
» Najlepszy miał deltę 5%, średnia wynosiła ###średnia###%, najgorsza wynosiła 45%
W porównaniu do wszystkich testowanych urządzeń
» 0% wszystkich testowanych urządzeń było lepszych, 0% podobnych, 100% gorszych
» Najlepszy miał deltę 4%, średnia wynosiła ###średnia###%, najgorsza wynosiła 134%
Zarządzanie energią
Zużycie energii - wysoka wydajność na wat
System jest bardzo energooszczędny, jak można by się spodziewać po laptopie napędzanym przez procesor z serii Core U. Najbardziej godny uwagi jest fakt, że nasz Latitude 9330 zużyłby około 23 procent mniej energii niż starszyLatitude 5310 podczas uruchamiania aplikacji intensywnie wykorzystujących GPU, oferując przy tym od 2 do 3 razy wyższą wydajność graficzną. Użytkownicy przesiadający się z 10. generacji lub starszych procesorów Intel zauważą znaczny wzrost wydajności na wat.
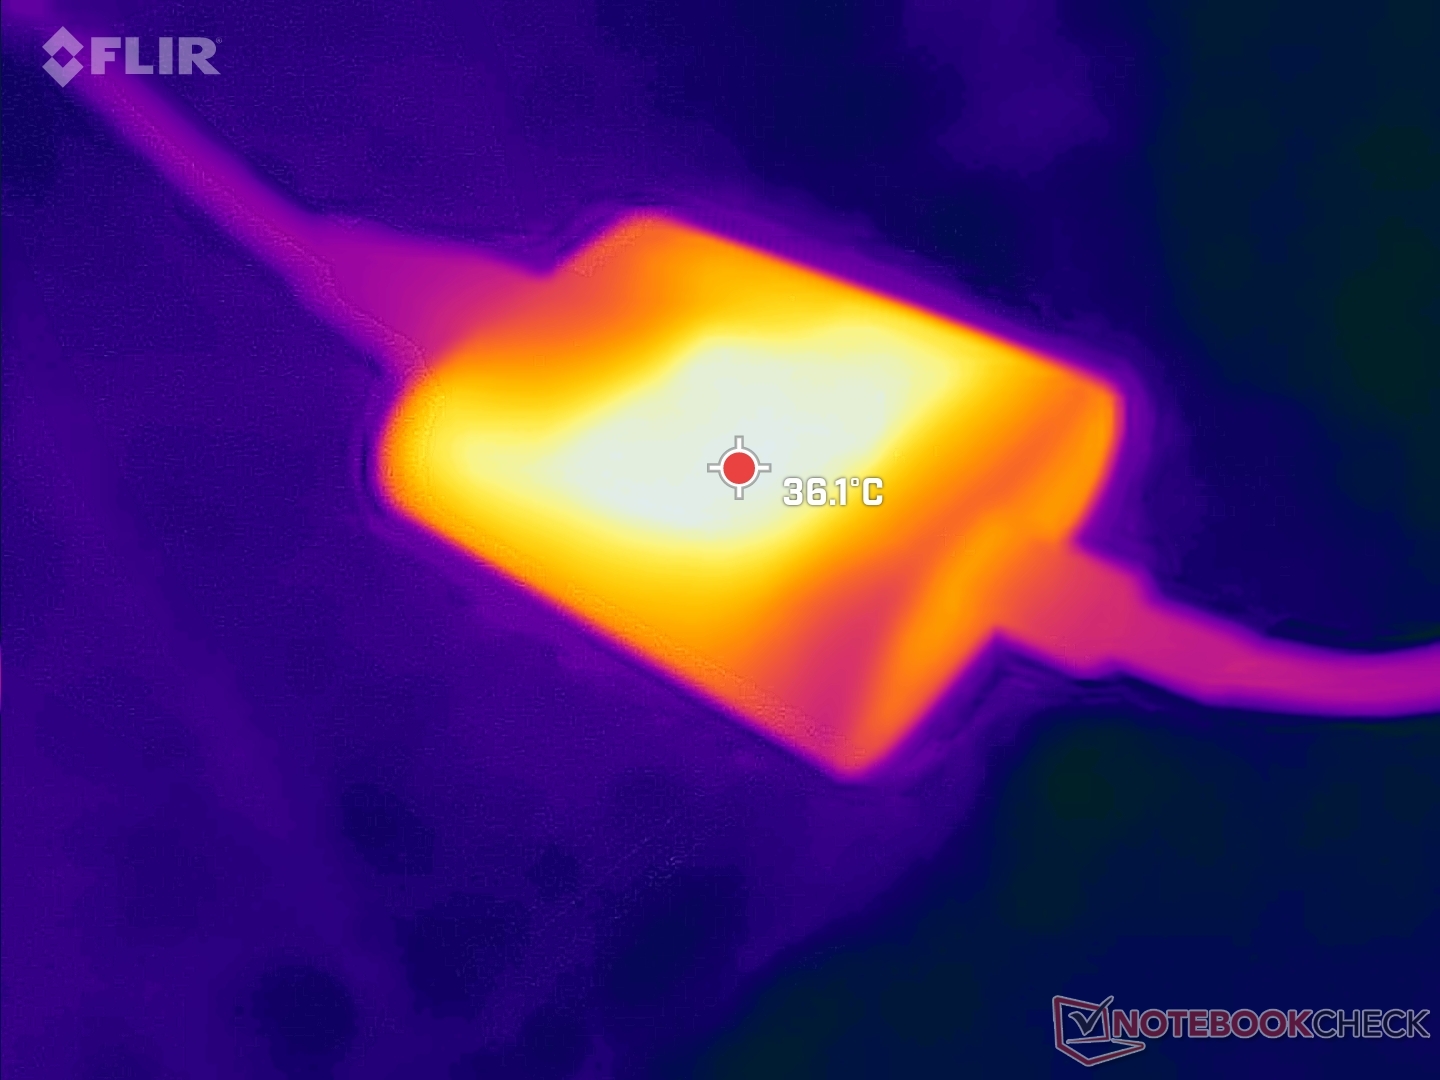
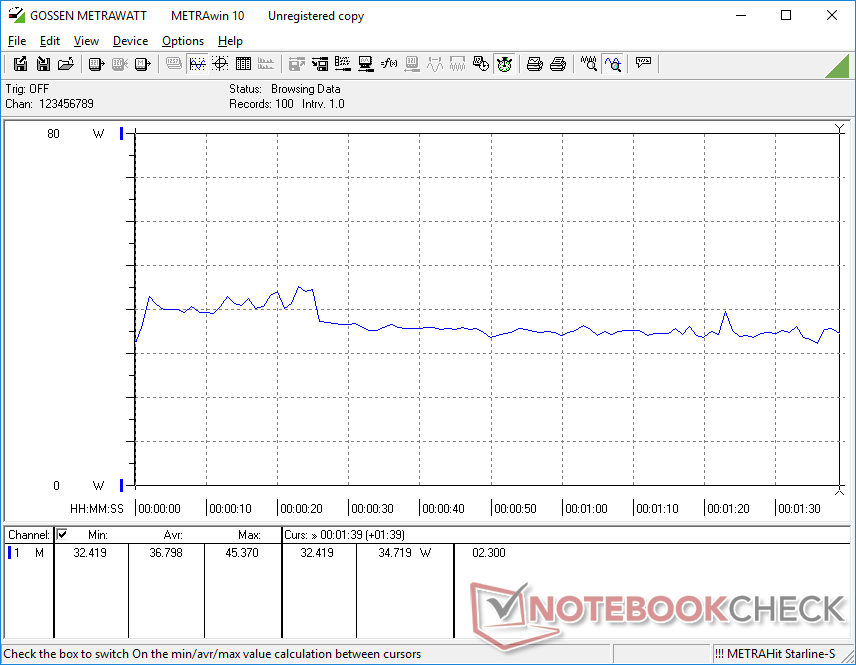
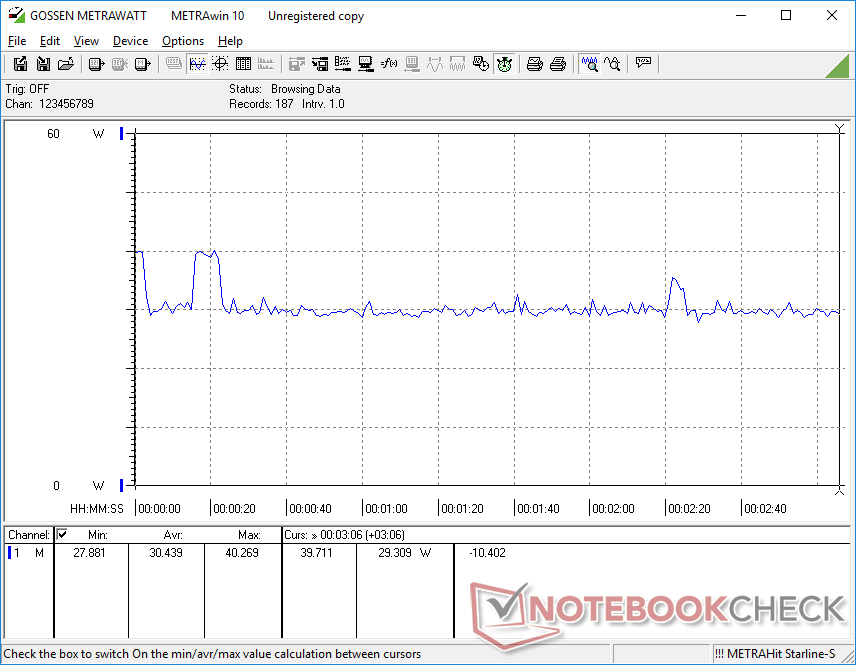
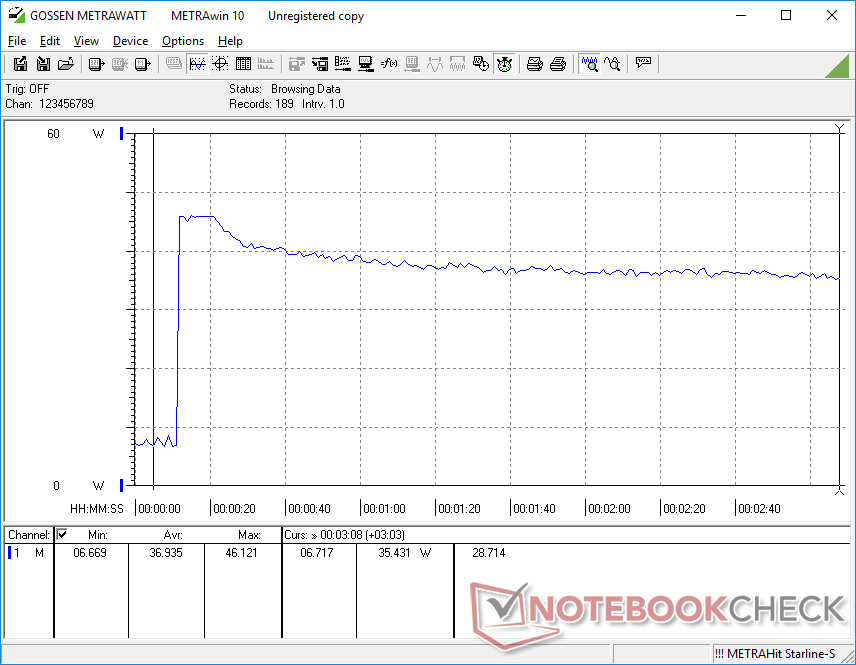
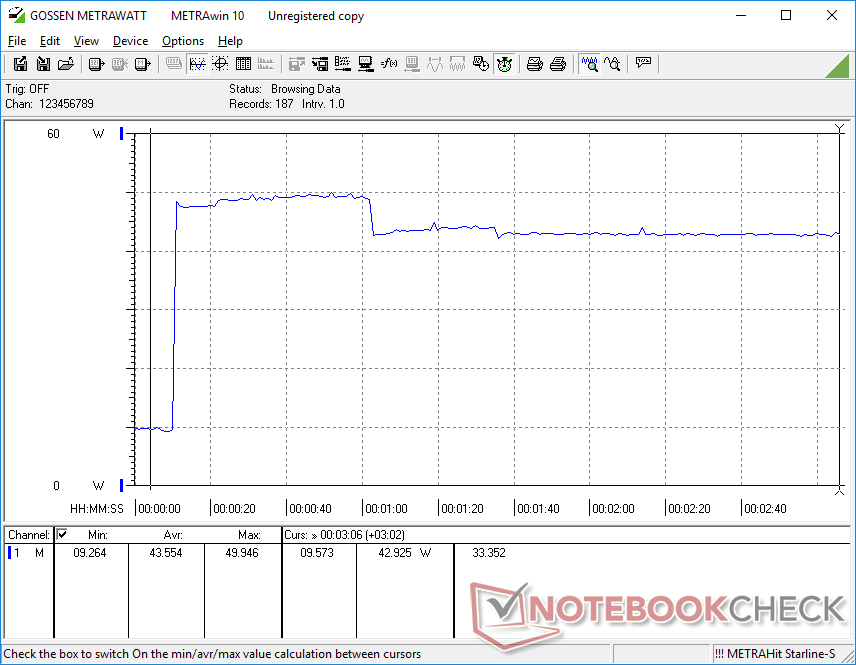
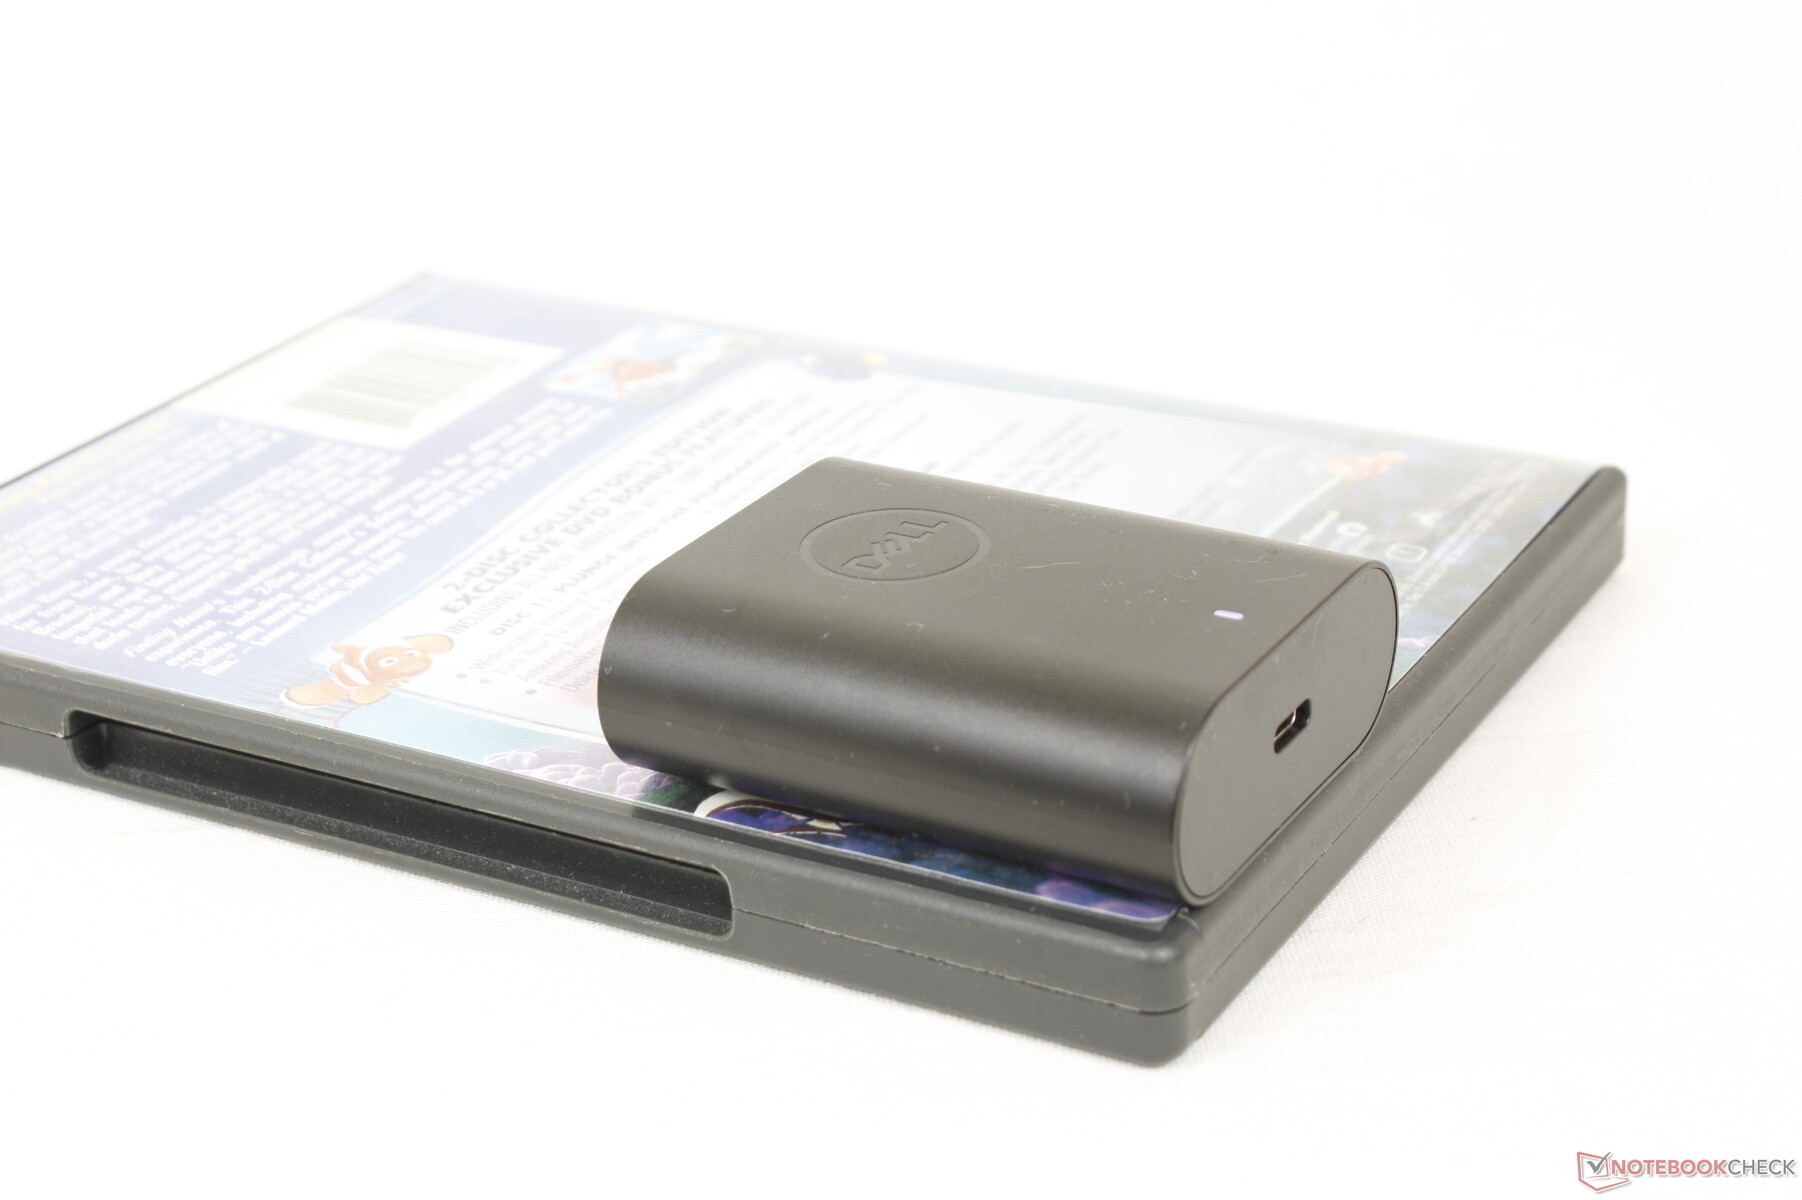
Pobór mocy jest o 27 procent mniejszy niż w przypadku Core i7-1255U Spectre x360 13.5 w stresie Prime95. Udało nam się zmierzyć chwilowy maksymalny pobór mocy 50 W z małego (~6,7 x 5,3 x 2,3 cm) zasilacza USB-C o mocy 60 W, gdy procesor jest wykorzystywany w 100 procentach. Pobór mocy spada z czasem, co pokazują nasze wykresy poniżej, ponieważ maksymalna wydajność Turbo Boost nie jest nieograniczona.
| wyłączony / stan wstrzymania | |
| luz | |
| obciążenie |
|
Legenda:
min: | |
| Dell Latitude 9330 i7-1260U, Iris Xe G7 96EUs, , IPS, 2560x1600, 13.3" | Lenovo ThinkPad X1 Titanium Yoga G1 20QB0016GE i5-1140G7, Iris Xe G7 80EUs, Lenovo UMIS RPJTJ256MEE1OWX, IPS LED, 2256x1504, 13.5" | MSI Summit E13 Flip Evo A11MT i7-1185G7, Iris Xe G7 96EUs, Phison 1TB SM2801T24GKBB4S-E162, IPS, 1920x1200, 13.4" | HP Elite Dragonfly Max i7-1185G7, Iris Xe G7 96EUs, Toshiba XG6 KXG60ZNV512G, IPS, 1920x1080, 13.3" | Dell Latitude 5310-23VP6 i5-10310U, UHD Graphics 620, SK hynix BC511 HFM512GDHTNI-87A0B, IPS, 1920x1080, 13.3" | Lenovo Yoga Slim 9 14IAP7 i7-1280P, Iris Xe G7 96EUs, Samsung PM9B1 1024GB MZAL41T0HBLB, OLED, 2880x1800, 14" | |
|---|---|---|---|---|---|---|
| Power Consumption | 11% | -23% | -5% | 5% | -98% | |
| Idle Minimum * (Watt) | 4.7 | 3.75 20% | 4.8 -2% | 2.9 38% | 2.9 38% | 11.8 -151% |
| Idle Average * (Watt) | 8.2 | 7.75 5% | 8.4 -2% | 9.9 -21% | 5.9 28% | 17.4 -112% |
| Idle Maximum * (Watt) | 8.4 | 8.69 -3% | 8.6 -2% | 10.4 -24% | 6.7 20% | 22.4 -167% |
| Load Average * (Watt) | 36.8 | 33.12 10% | 47.1 -28% | 37.1 -1% | 42 -14% | 53 -44% |
| Witcher 3 ultra * (Watt) | 30.4 | 28.7 6% | 51.6 -70% | 31.5 -4% | 43 -41% | 52.6 -73% |
| Load Maximum * (Watt) | 49.9 | 35.19 29% | 65.9 -32% | 58.8 -18% | 50 -0% | 71 -42% |
* ... im mniej tym lepiej
Power Consumption Witcher 3 / Stresstest
Power Consumption external Monitor
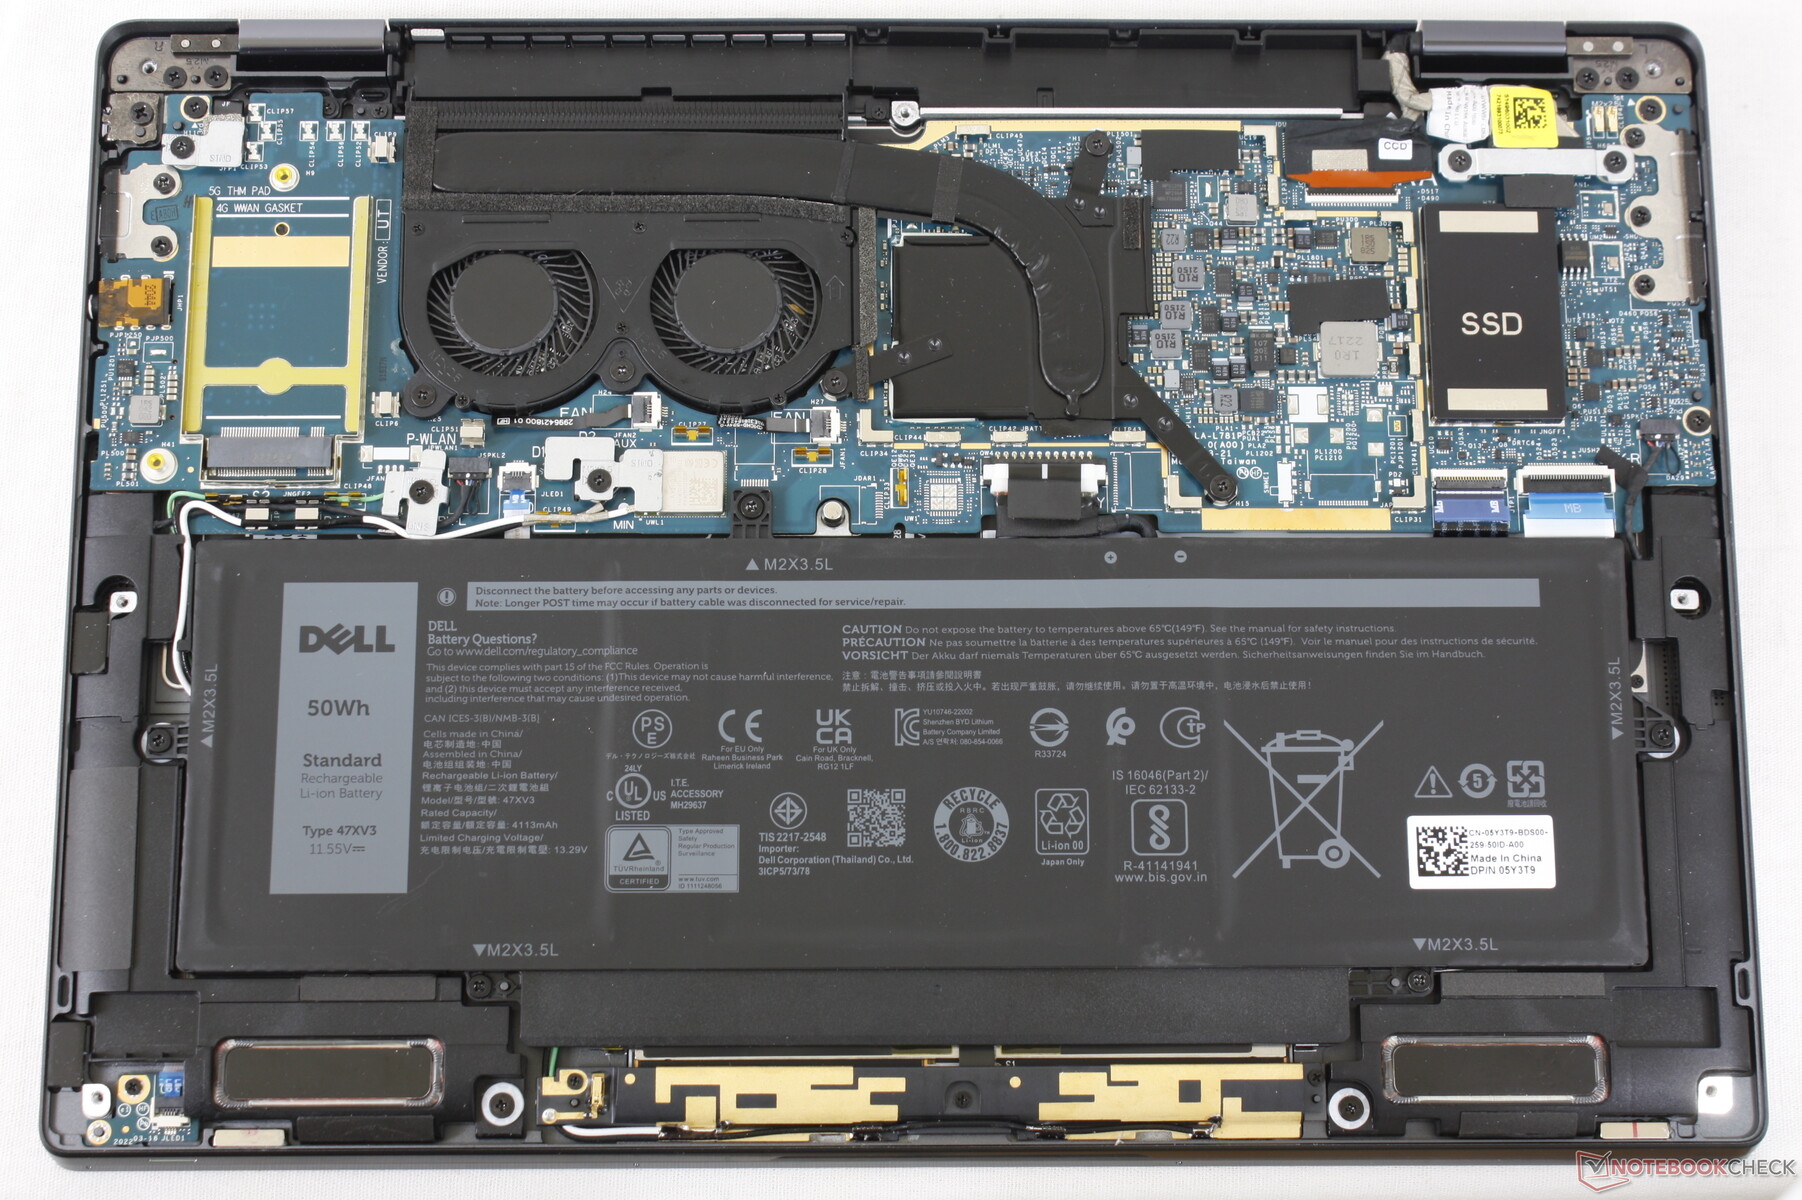
Czas pracy na baterii - dobry na dzień pracy
Pojemność akumulatora jest przeciętna jak na subnotebook i wynosi 50 Wh. Czasy pracy są mimo to dobre i wynoszą prawie 9,5 h w czasie rzeczywistego korzystania z sieci WLAN, a więc są tylko nieco krótsze, niż w HP Dragonfly Max czy MSI Summit E13 Flip.
Ładowanie od stanu pustego do pełnego trwa około 90 minut.
| Dell Latitude 9330 i7-1260U, Iris Xe G7 96EUs, 50 Wh | Lenovo ThinkPad X1 Titanium Yoga G1 20QA001RGE i7-1160G7, Iris Xe G7 96EUs, 44.5 Wh | MSI Summit E13 Flip Evo A11MT i7-1185G7, Iris Xe G7 96EUs, 70 Wh | HP EliteBook x360 1030 G7 i7-10810U, UHD Graphics 620, 54 Wh | HP Elite Dragonfly Max i7-1185G7, Iris Xe G7 96EUs, 56 Wh | Dell Latitude 5310-23VP6 i5-10310U, UHD Graphics 620, 60 Wh | |
|---|---|---|---|---|---|---|
| Czasy pracy | -14% | 11% | 37% | 43% | 18% | |
| Reader / Idle (h) | 15.4 | 21.1 37% | 30.9 101% | 28.7 86% | ||
| WiFi v1.3 (h) | 9.4 | 8.4 -11% | 11.2 19% | 10.3 10% | 11 17% | 11.1 18% |
| Load (h) | 2.3 | 1.9 -17% | 1.8 -22% | 2.3 0% | 2.9 26% | |
| H.264 (h) | 11.4 |
Za
Przeciw
Werdykt - Doskonały tam, gdzie ma to znaczenie
Komputer Latitude 9330 2-w-1 jest wysoce zoptymalizowany pod kątem środowisk biurowych i posiada funkcje niedostępne w większości modeli zorientowanych na konsumenta, w tym w modelu XPS 13. Jakość wykonania i sztywność są jednymi z najlepszych, jakie widzieliśmy w przypadku ultracienkiego, 13-calowego komputera konwertowalnego, co daje nam większą pewność co do długowieczności i niezawodności tego modelu. Jeśli zdecydujesz się zainwestować w Latitude 9330, to najprawdopodobniej posłuży Ci on przez kilka lat
.
Choć system Della jest dobry do doskonałego w większości obszarów, to w kilku innych zaczyna pozostawać w tyle Konkurencyjne modele od HP dostarczają opcje wyświetlaczy 1000 nitów i kamer 5 MP, podczas gdy Latitude 9330 utknął na 500 nitach i 2 MP. Brak portów USB-A i HDMI prawdopodobnie również zirytuje wielu użytkowników. Przygotuj się na zauważalnie głośniejszy hałas wentylatora, jeśli zamierzasz uruchomić wymagające obciążenia na Dellu.
Pomijając kilka przeciętnych specyfikacji, Dell Latitude 9330 2-w-1 jest naszym najlepszym biznesowym komputerem konwertowalnym, który polecamy, jeśli chcesz czegoś, co przetrwa kilka lat.
Inne wady, takie jak gorsza wydajność grafiki, cieplejsze temperatury rdzenia i brak obsługi dysków SSD M.2 2280, są stosunkowo niewielkie, biorąc pod uwagę docelową grupę użytkowników biznesowych lub korporacyjnych. Chętnie zobaczylibyśmy w przyszłości opcje wyświetlaczy o wyższej częstotliwości odświeżania z szybszym czasem reakcji w trybie czarno-białym, ponieważ płynniejsze odświeżanie znacznie poprawiłoby wrażenia z użytkowania ekranu dotykowego.
Cena i dostępność
Dellprowadzi obecnie sprzedaż modelu Latitude 9330 2-in-1 w cenie od 2065 USD do ponad 2700 USD w przypadku pełnej konfiguracji.
Dell Latitude 9330
- 18/11/2022 v7 (old)
Allen Ngo
Price comparison

