Recenzja laptopa HP EliteBook 840 G9: Alternatywa dla Lenovo ThinkPad X1 Carbon
EliteBook 840 G9 to intelowska wersja EliteBooka 845 G9, którego niedawno recenzowaliśmy w dwóch różnych konfiguracjach. Na tej stronie skupimy się na wydajności EliteBooka 840 G9 w konfiguracji z procesorem i7-1280P, gdyż szczegóły dotyczące obudowy, klawiatury, możliwości serwisowania i innych atrybutów fizycznych można znaleźć na naszej stronie internetowej istniejący AMD strony z recenzjami
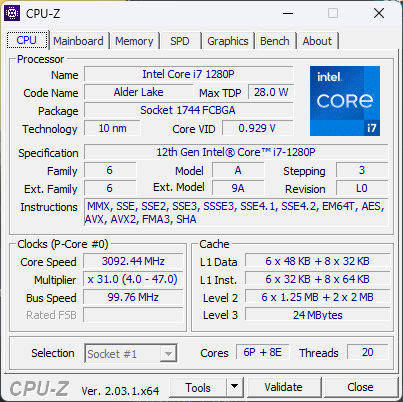
Wybór jednostek SKU jest znacznie szerszy niż w większości laptopów konsumenckich, ponieważ EliteBook integruje wiele więcej funkcji opcjonalnych. Procesory od Core i5-1250P do Core i7-1280P, wyświetlacze od 250-nit do 1000-nit oraz 8 do 64 GB pamięci RAM wśród innych opcji pomocniczych jak pokazano tutaj. Nasz egzemplarz recenzencki jest wyposażony w procesor Core i7-1280P z najwyższej półki, ale z panelem 400-nitowym i 16 GB pamięci RAM w cenie poniżej 3000 USD
Alternatywą dla EliteBook 840 G9 są inne flagowe 14-calowe subnotebooki biznesowe, takie jak Lenovo ThinkPad X1 Carbon Gen 10 lub Dell Latitude 9430 lub Latitude 7420
Więcej recenzji HP:
Potencjalni konkurenci w porównaniu
Ocena | Data | Model | Waga | Wysokość | Rozmiar | Rezolucja | Cena |
|---|---|---|---|---|---|---|---|
| 88.7 % v7 (old) | 12/2022 | HP EliteBook 840 G9 i7-1280P, Iris Xe G7 96EUs | 1.5 kg | 19 mm | 14.00" | 1920x1200 | |
| 88.6 % v7 (old) | HP EliteBook 845 G9 6F6H6EA R9 PRO 6950HS, Radeon 680M | 1.5 kg | 19.3 mm | 14.00" | 1920x1200 | ||
| 89.8 % v7 (old) | HP EliteBook 840 Aero G8 3E4Q6AA i7-1185G7, Iris Xe G7 96EUs | 1.2 kg | 17.9 mm | 14.00" | 1920x1080 | ||
| 90.2 % v7 (old) | 12/2022 | Lenovo ThinkPad X1 Carbon G10 Core i7-1265U i7-1265U, Iris Xe G7 96EUs | 1.2 kg | 15.36 mm | 14.00" | 1920x1200 | |
| 86.6 % v7 (old) | 10/2022 | LG Gram 14Z90Q i5-1240P, Iris Xe G7 80EUs | 980 g | 16.8 mm | 14.00" | 1920x1200 | |
| 90.1 % v7 (old) | Dell Latitude 7420 JW6MH i5-1145G7, Iris Xe G7 80EUs | 1.3 kg | 17.3 mm | 14.00" | 1920x1080 |
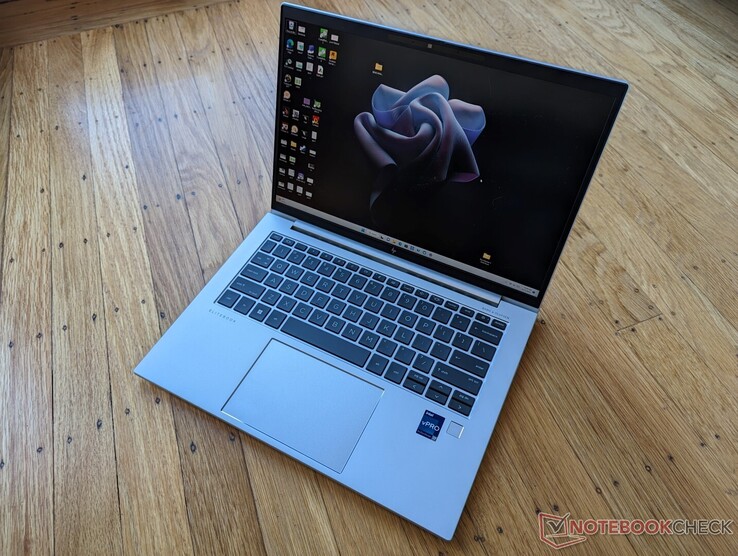
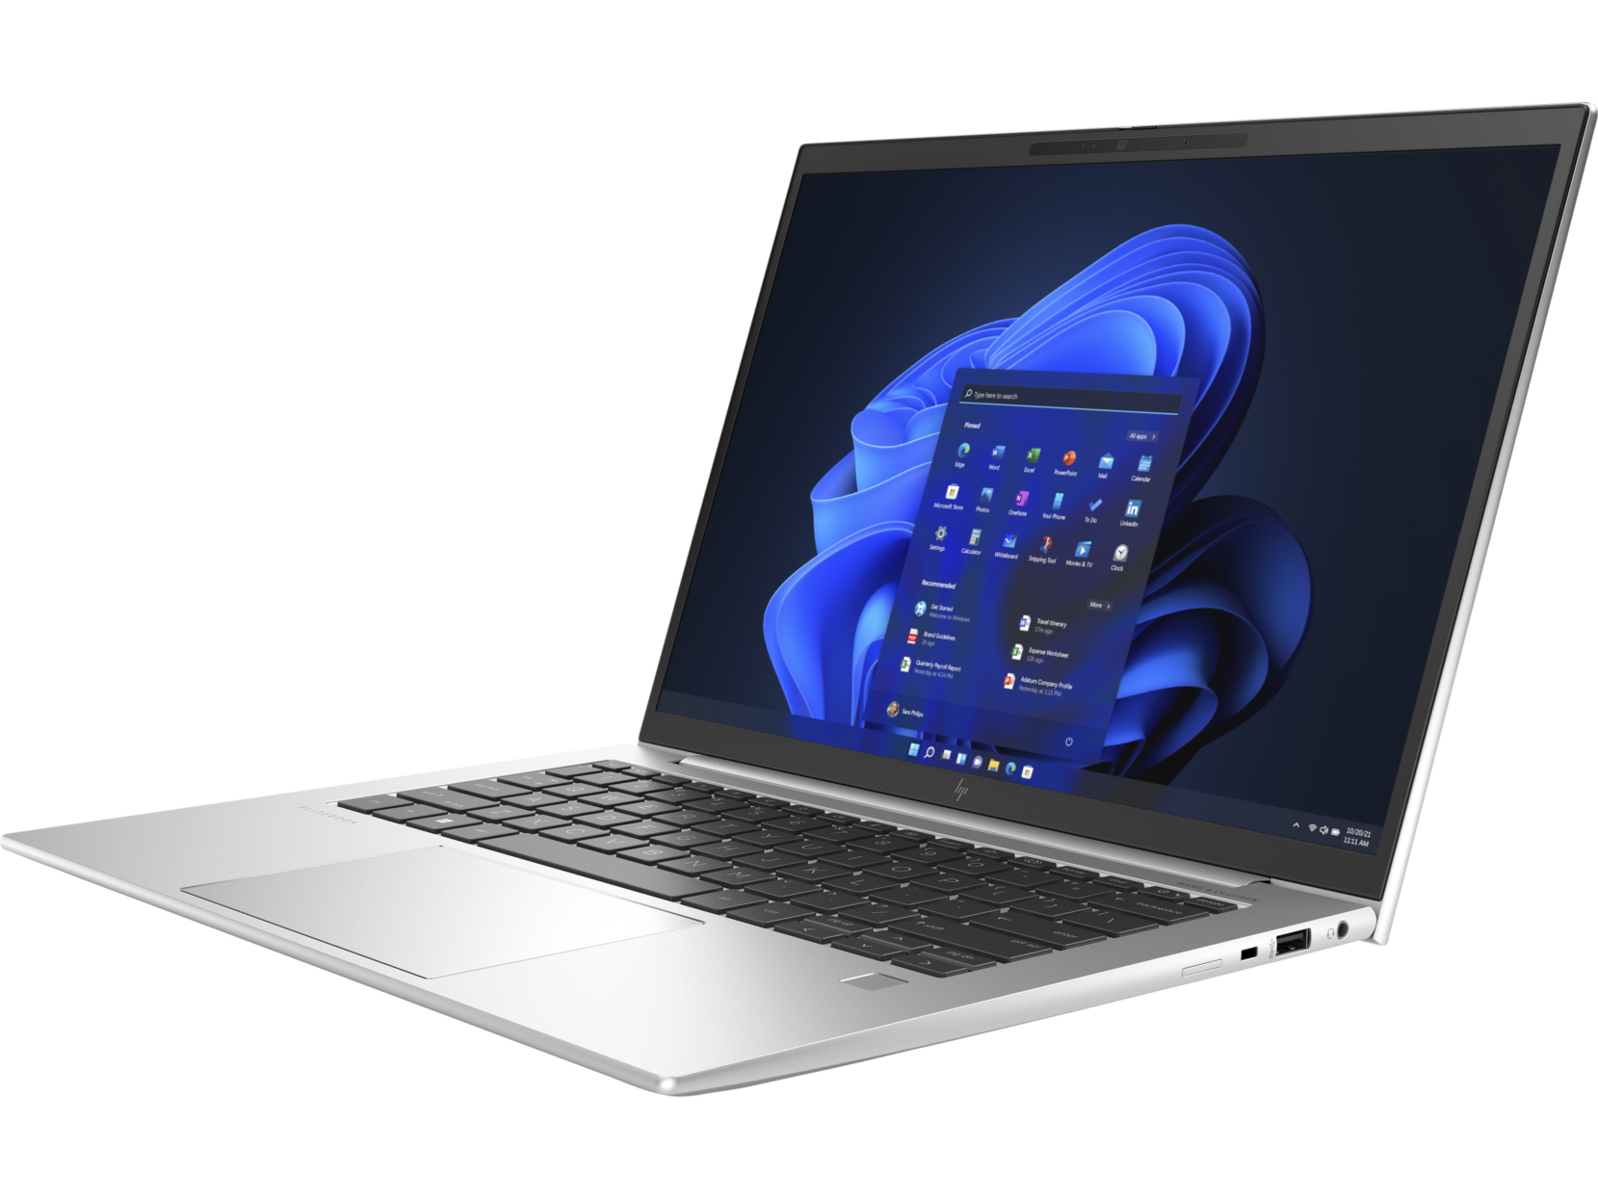
Obudowa - taka sama jak w EliteBook 845 G9
Choć obudowa jest wizualnie identyczna jak w EliteBooku 845 G9, szybkie spojrzenie na porty USB-C wzdłuż lewej krawędzi pozwoli łatwo odróżnić oba modele. 840 G9 będzie miał etykietę Thunderbolt obok portów, podczas gdy zasilany przez AMD 845 G9 całkowicie pomija etykietę ze względu na brak wsparcia.
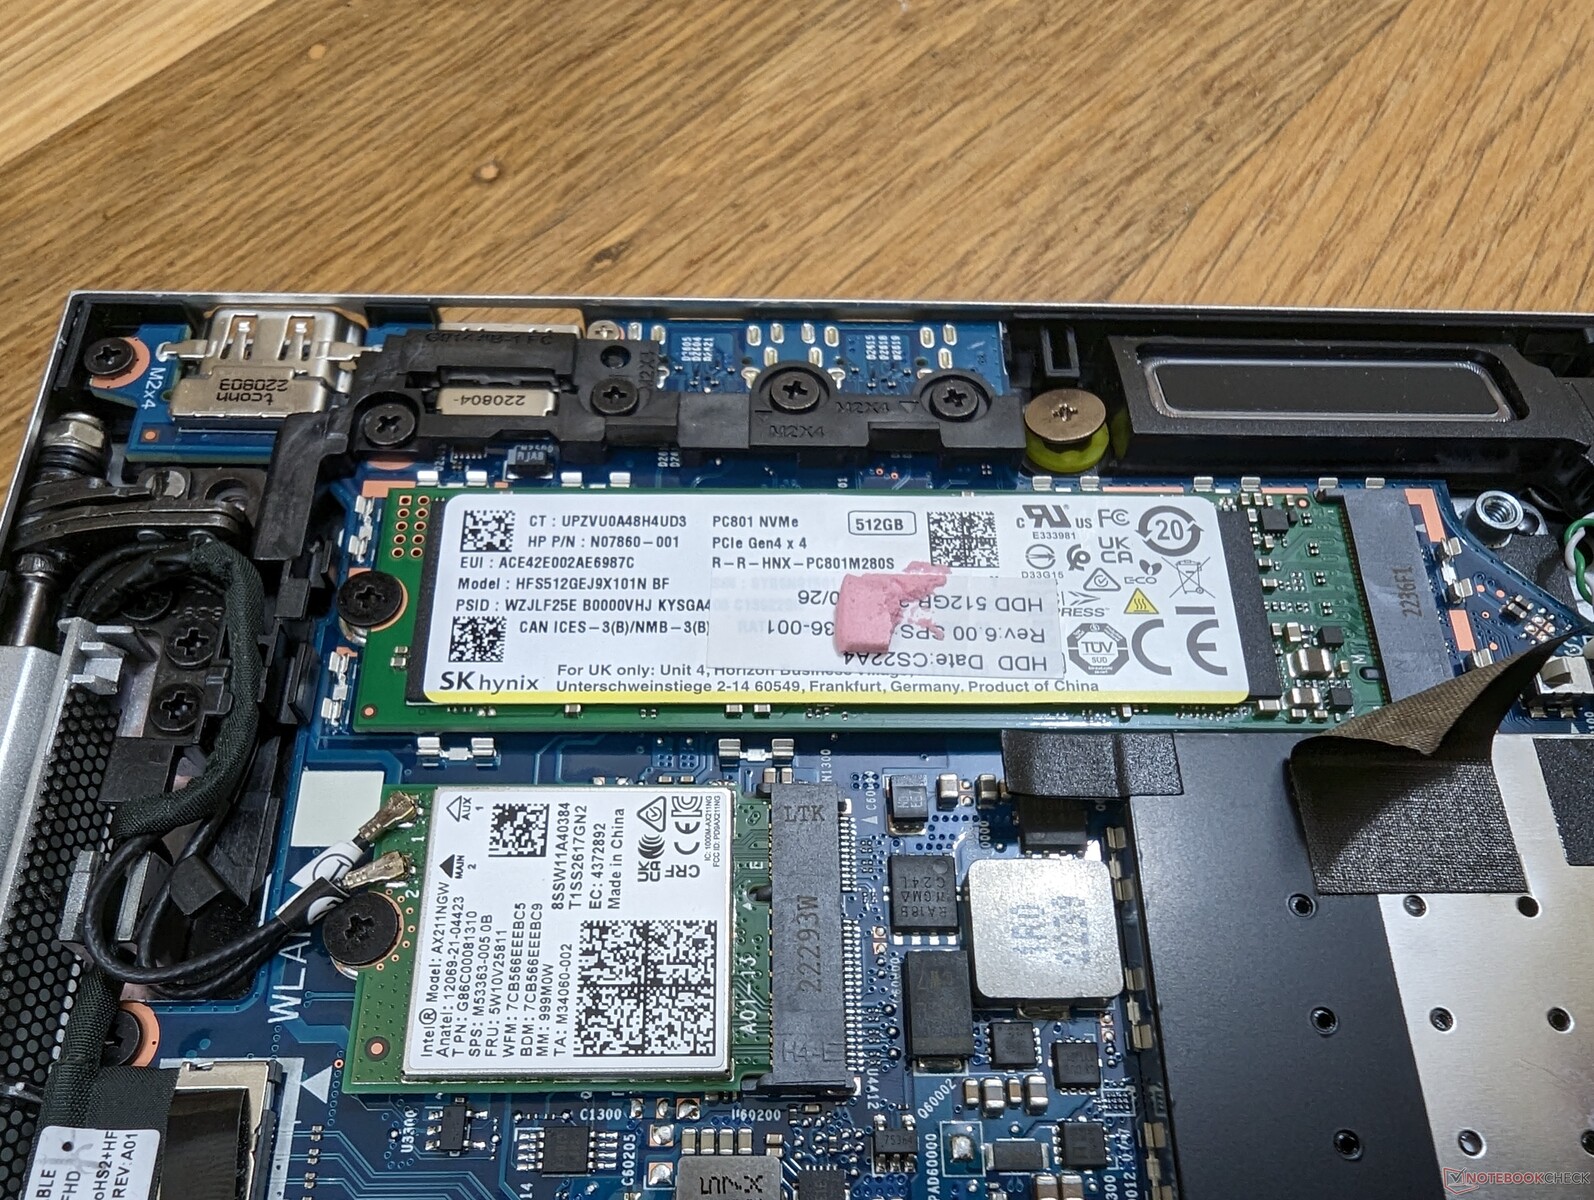
W przypadku serwisowania, HP ma cały przewodnik wideo od początku do końca, jak wymontować i wymienić każdy ważniejszy element modelu. Jest to praktyka, którą mamy nadzieję, że inni główni producenci będą mogli naśladować w przyszłości, aby pozbawić użytkowników końcowych wszelkich domysłów.
Komunikacja
Intel AX211 jest standardem w większości konfiguracji 840 G9, bo to w końcu seria napędzana przez Intela. Z kolei 845 G9 napędzany przez AMD wykorzystuje Qualcomm Fast Connect 6900, by zapewnić tę samą funkcjonalność Wi-Fi 6E. Na podstawie naszych testów z routerem Asus AXE11000 ogólna wydajność jest porównywalna.
Sieć WAN jest opcjonalna i można wybrać Intel XMM 7560 R+ LTE lub 5000 5G.
| Networking | |
| iperf3 transmit AX12 | |
| Dell Latitude 7420 JW6MH | |
| HP EliteBook 840 Aero G8 3E4Q6AA | |
| iperf3 receive AX12 | |
| Dell Latitude 7420 JW6MH | |
| HP EliteBook 840 Aero G8 3E4Q6AA | |
| iperf3 receive AXE11000 6GHz | |
| LG Gram 14Z90Q | |
| HP EliteBook 845 G9 6F6H6EA | |
| HP EliteBook 840 G9 | |
| Lenovo ThinkPad X1 Carbon G10 Core i7-1265U | |
| iperf3 receive AXE11000 | |
| HP EliteBook 840 G9 | |
| Lenovo ThinkPad X1 Carbon G10 Core i7-1265U | |
| iperf3 transmit AXE11000 | |
| Lenovo ThinkPad X1 Carbon G10 Core i7-1265U | |
| HP EliteBook 840 G9 | |
| iperf3 transmit AXE11000 6GHz | |
| HP EliteBook 845 G9 6F6H6EA | |
| Lenovo ThinkPad X1 Carbon G10 Core i7-1265U | |
| HP EliteBook 840 G9 | |
Kamera internetowa
Kamera internetowa 5 MP może nie być tak ostra jak 8 MP w ostatnim Dragonfly Folio G3ale i tak jest znacznie lepsza od kamer 1 MP lub 2 MP w większości innych laptopów. HP jest pod tym względem daleko przed konkurencją
Przesuwana migawka kamery internetowej jest standardem dla zwiększenia prywatności, natomiast czujnik podczerwieni do obsługi funkcji Hello jest opcjonalny.


Akcesoria i gwarancja
W pudełku nie ma żadnych dodatków poza zasilaczem i papierami. Standardowe okno gwarancyjne wynosi rozczarowująco tylko rok w porównaniu z trzema latami w większości konkurencyjnych modeli Dell Latitude.
Wyświetlacz - świetne kolory, wolny czas reakcji
HP oferuje siedem różnych opcji paneli:
- 250 nitów, bez WWAN
- 250 nitów, WWAN
- 400 nitów, słabe światło niebieskie, bez WWAN
- 400 nitów, słabe światło niebieskie, WWAN
- 250 nitów, ekran dotykowy, bez WWAN
- 1000 nitów, niskie natężenie światła niebieskiego, Sure View, WWAN
- 250 nitów, ekran dotykowy, WWAN
- 1000 nitów, niskie natężenie światła niebieskiego, Sure View, bez WWAN
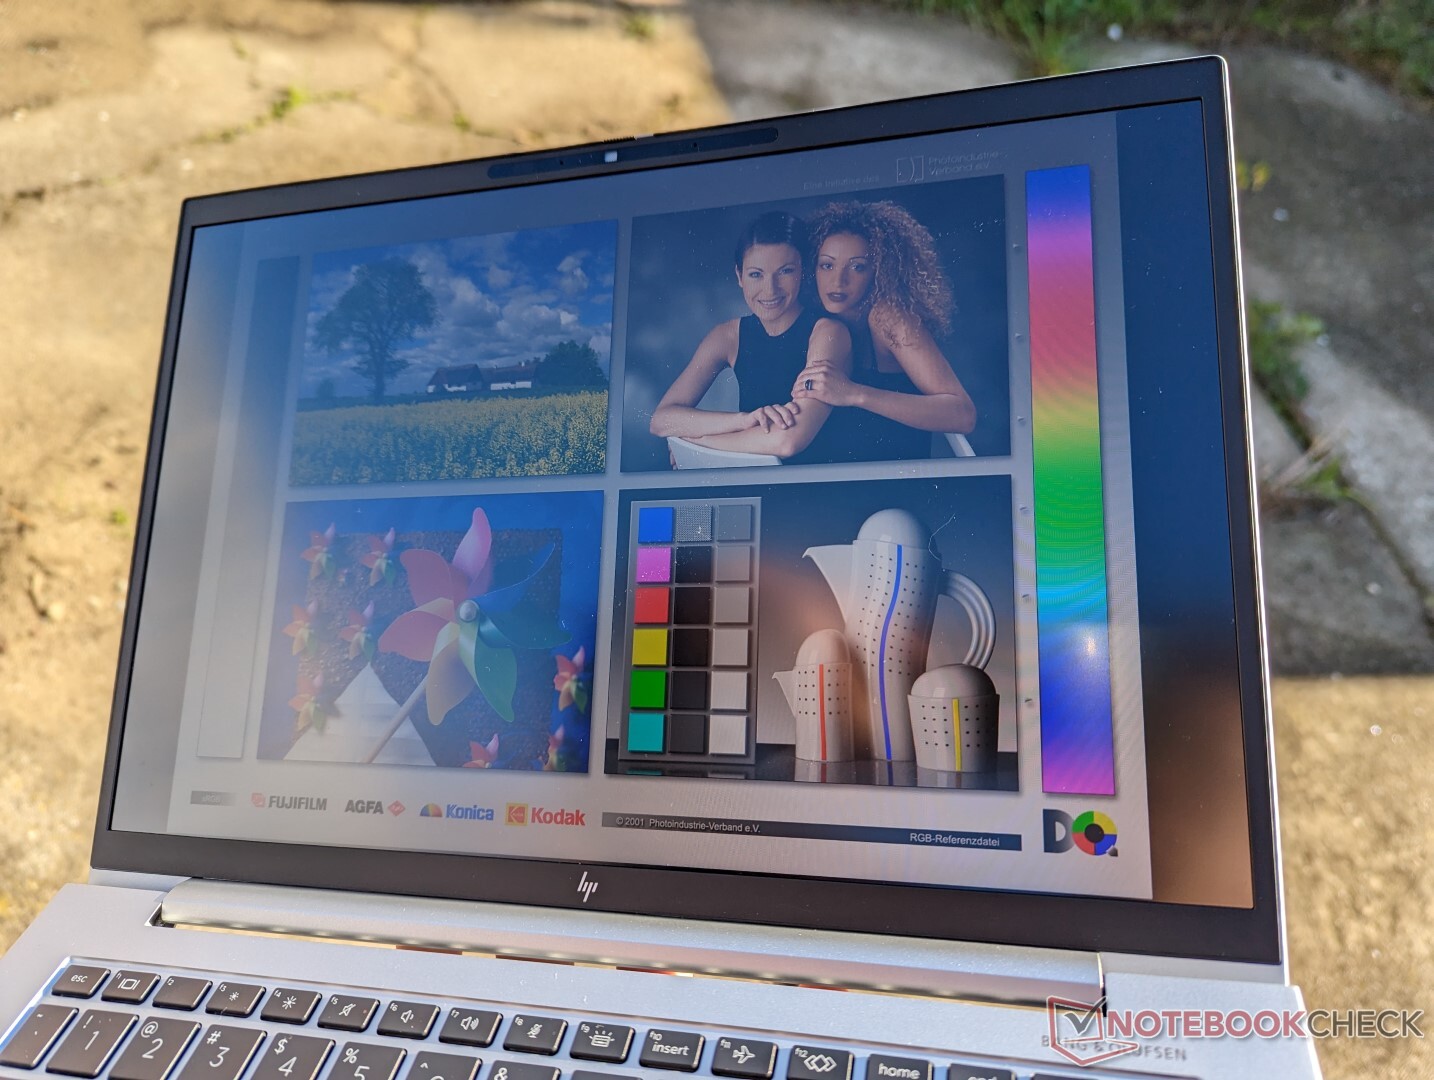
Nasze pomiary poniżej odzwierciedlają tylko pogrubioną opcję powyżej. Warto zauważyć, że wszystkie są 1920 x 1200 matowe IPS 60 Hz bez opcji OLED. Niestety, Sure View jest związany z opcją 1000-nitowego panelu, czy to się użytkownikom podoba czy nie
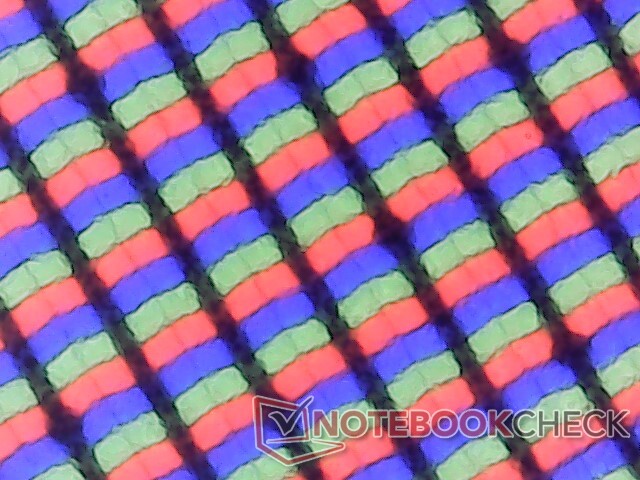
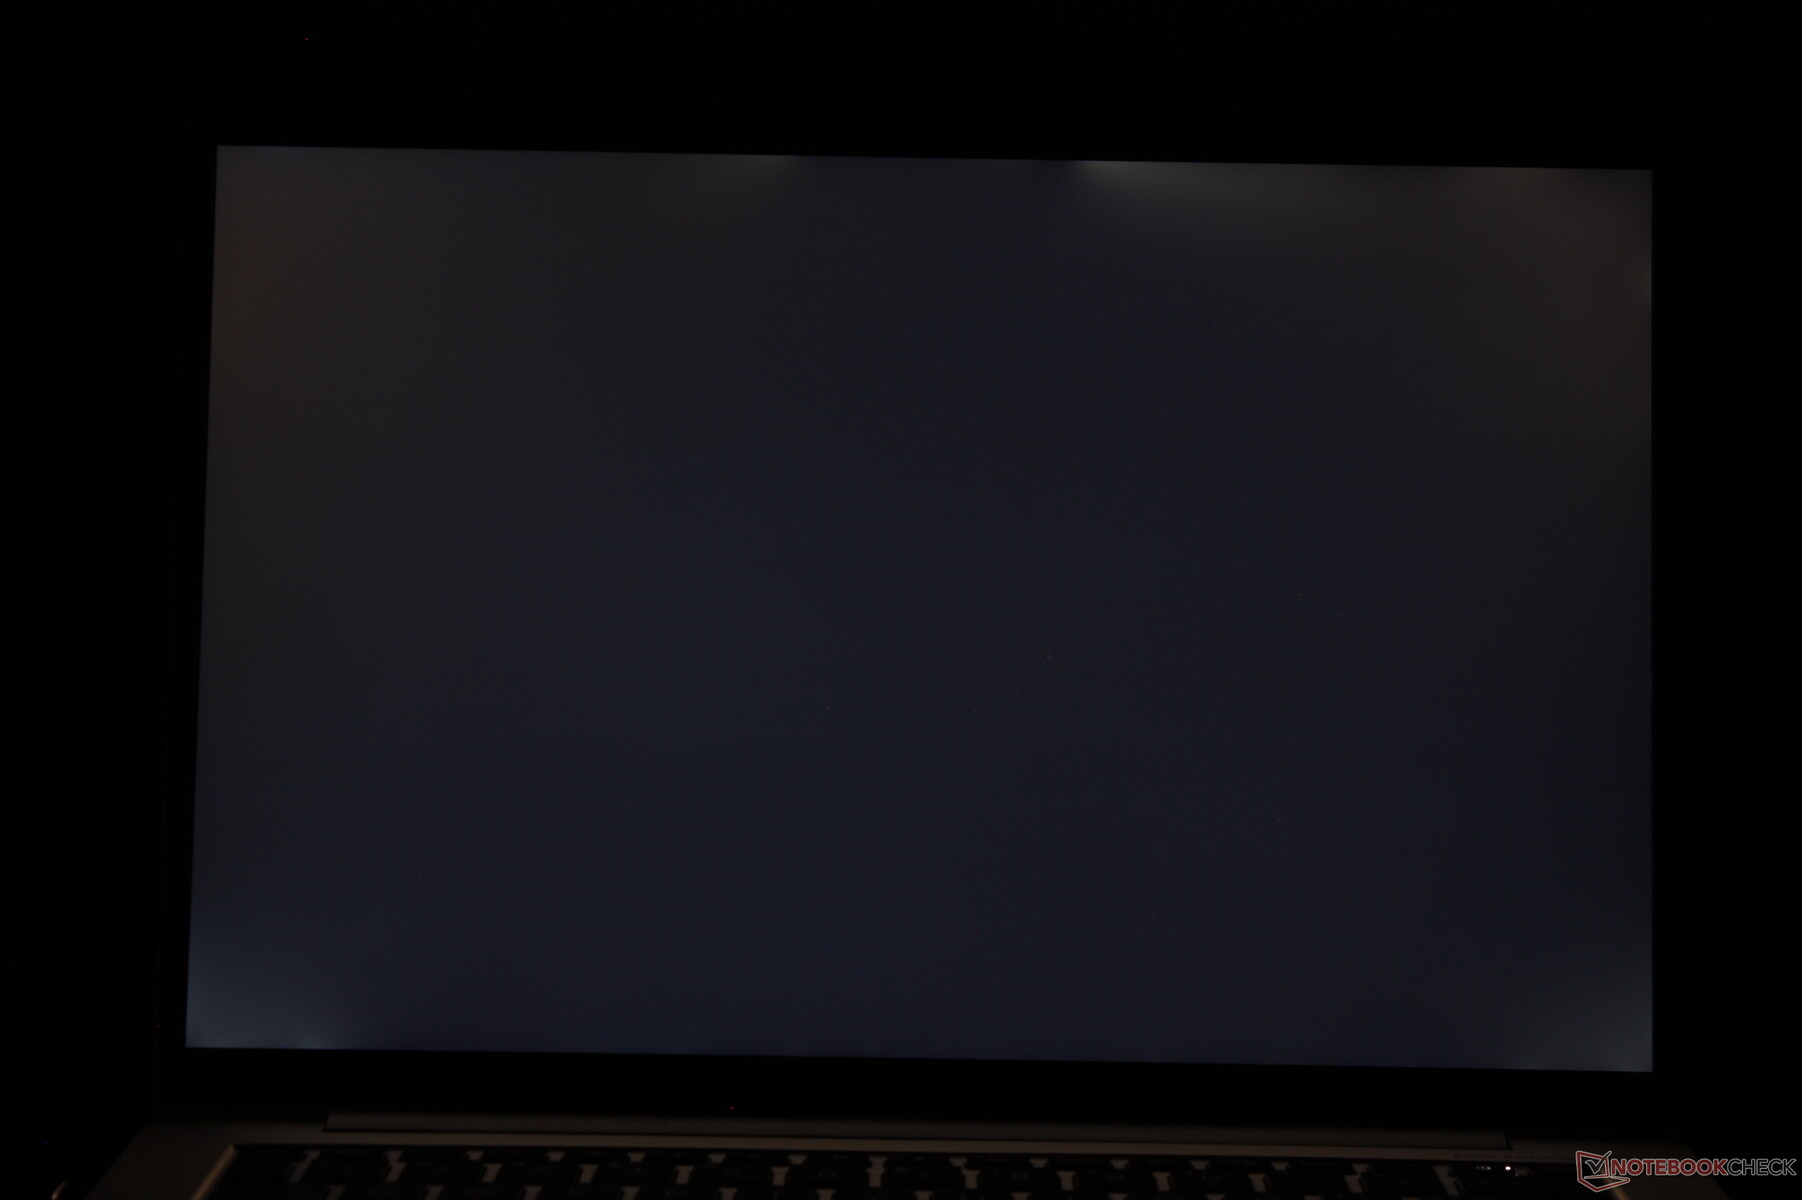
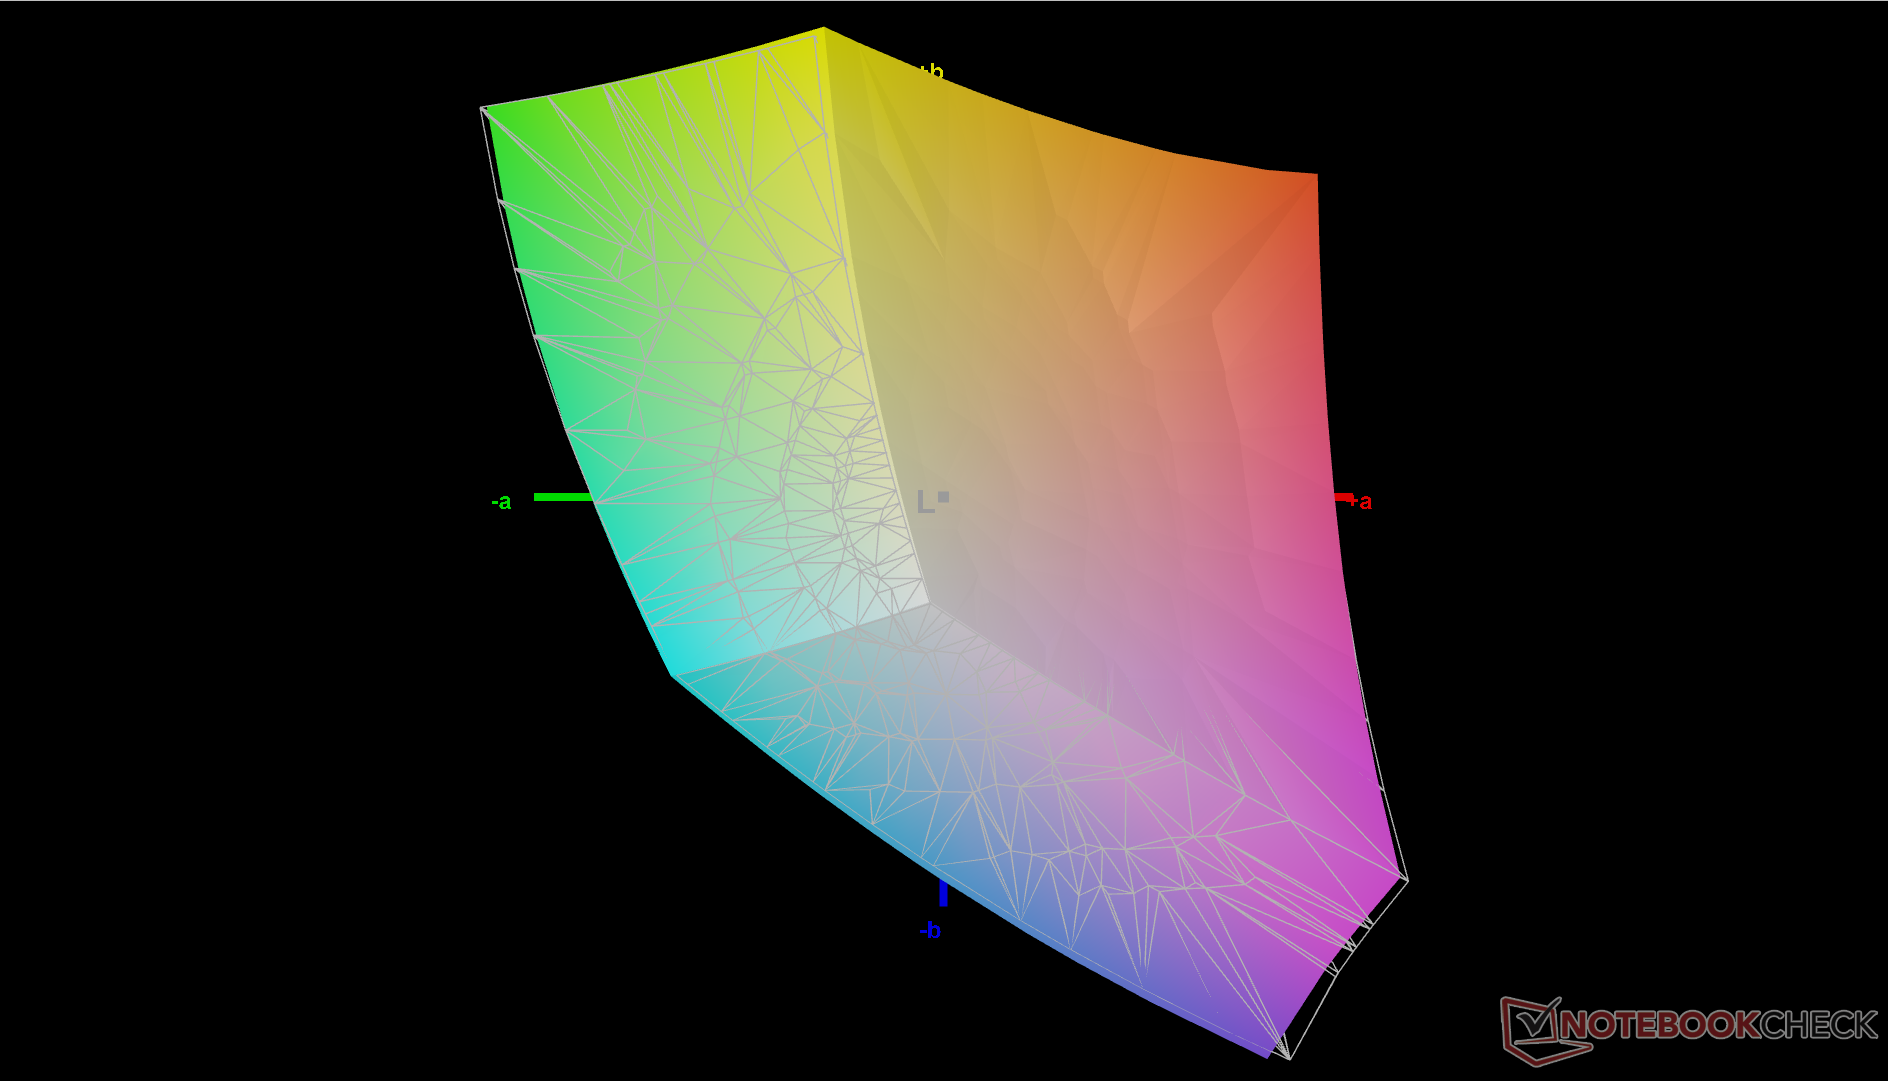
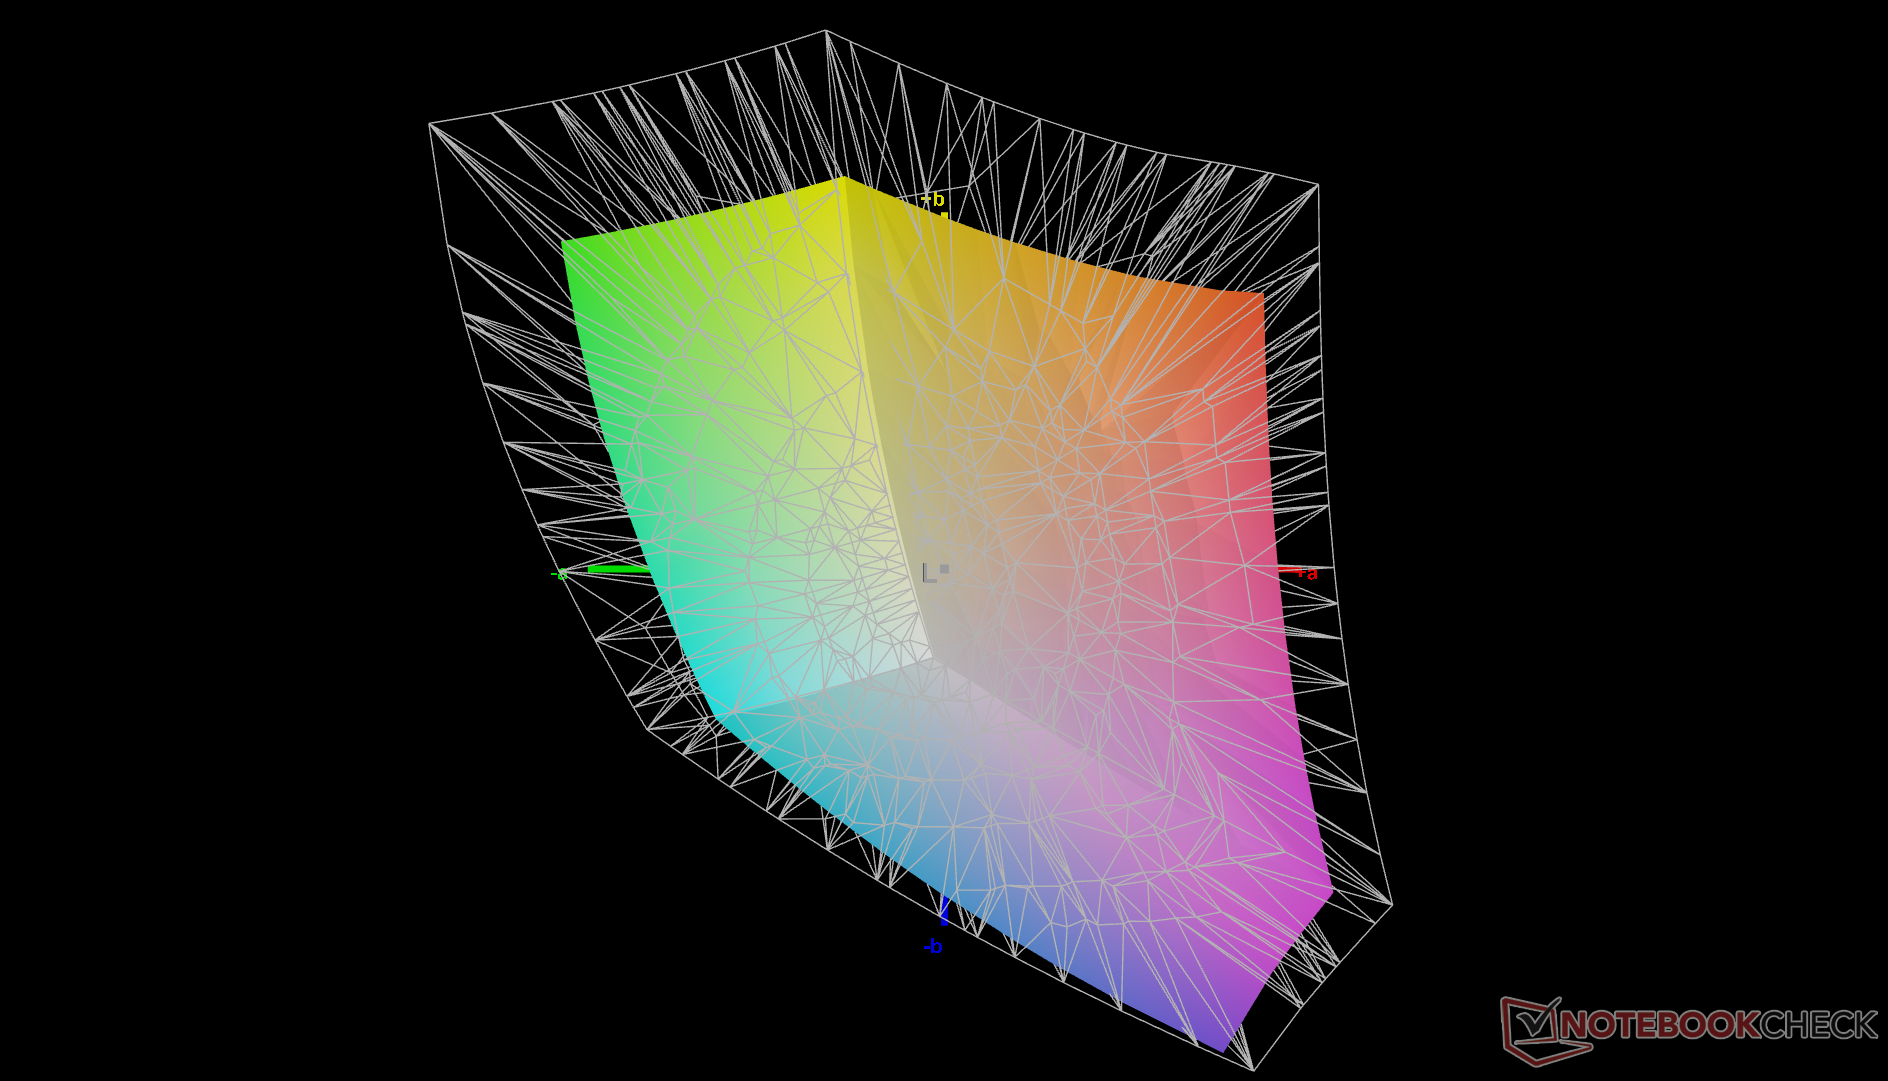
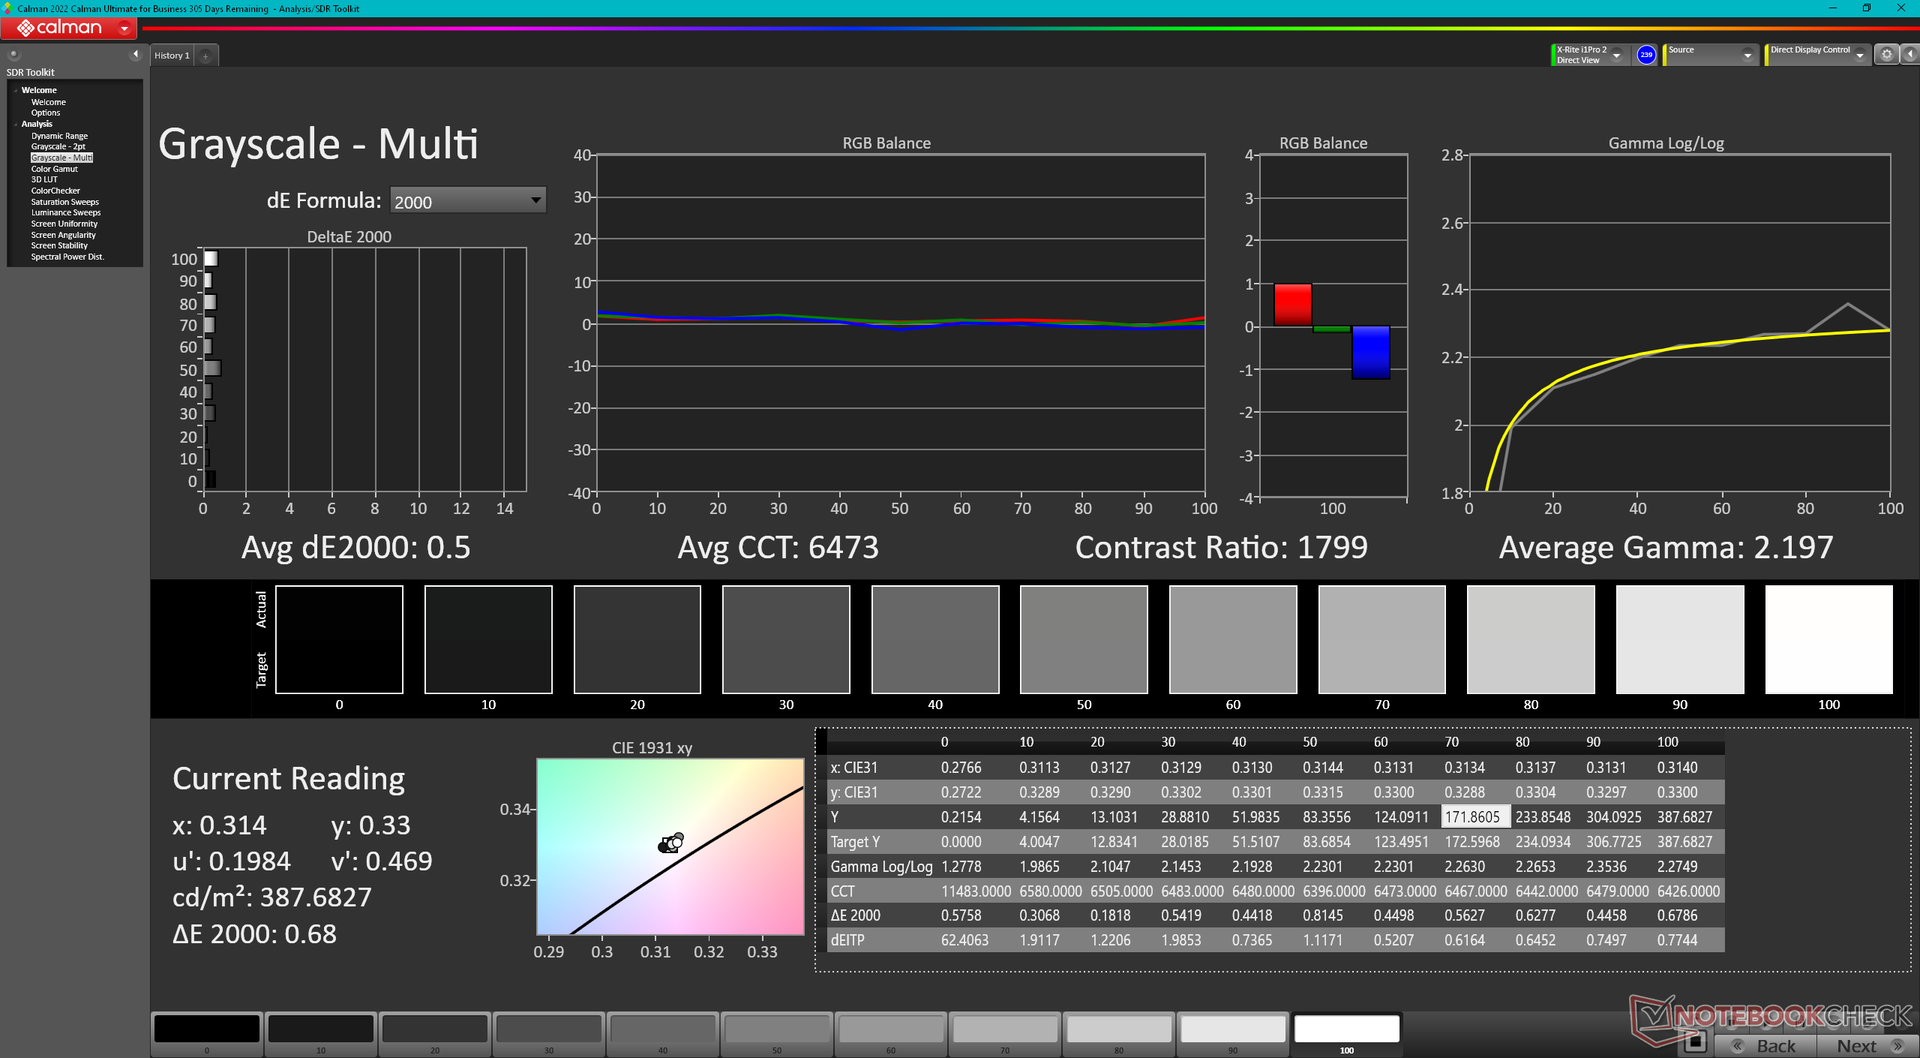
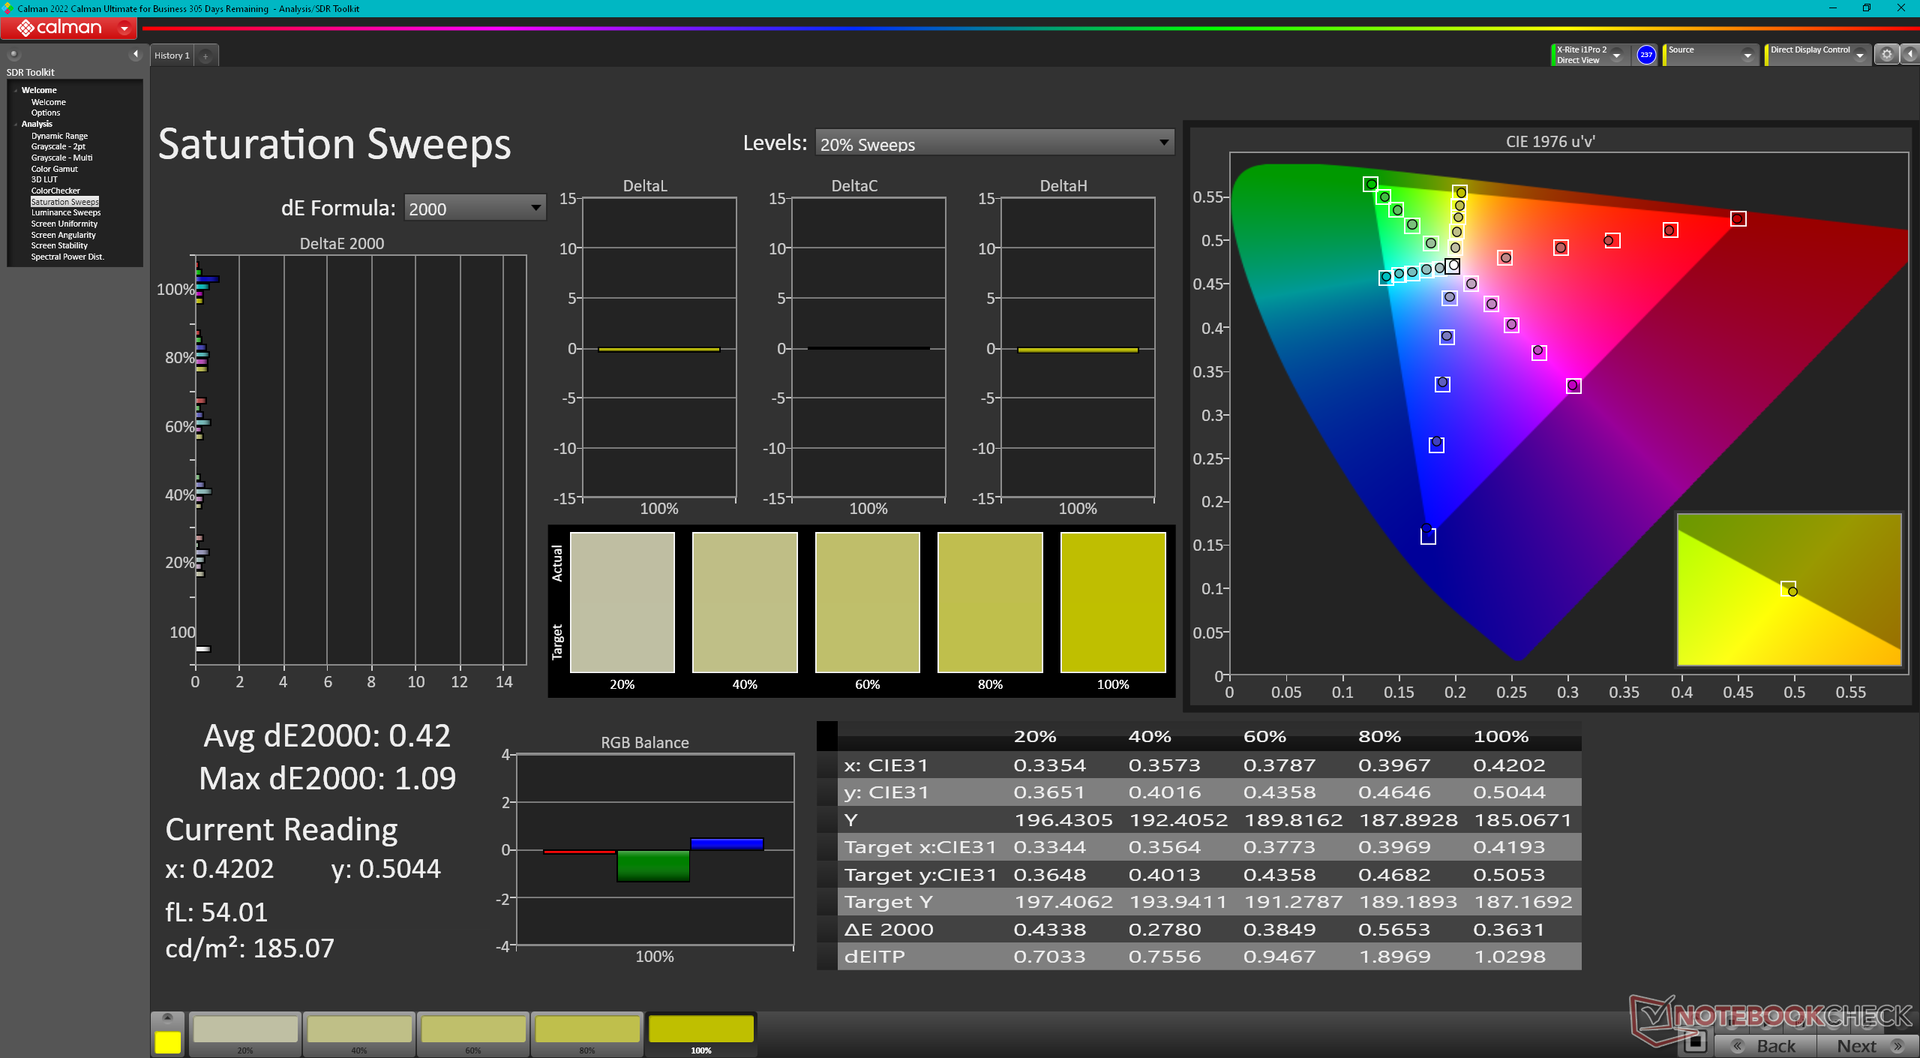
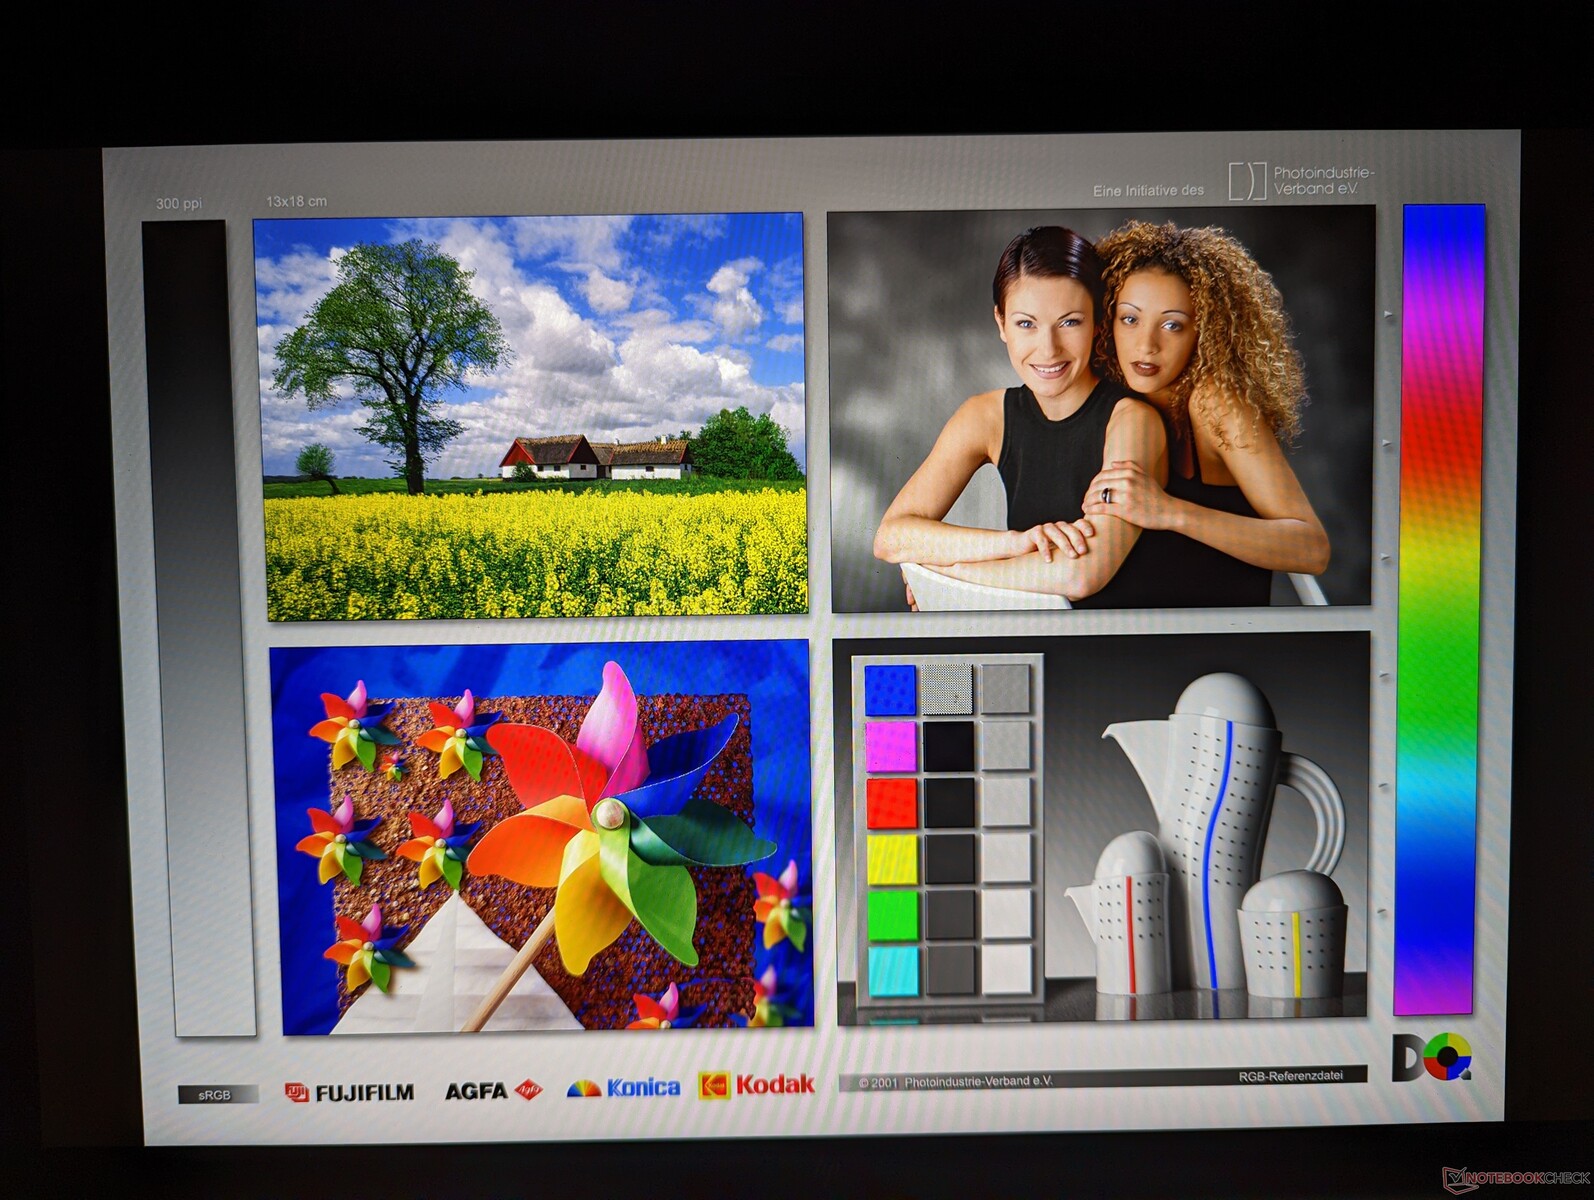
Poza powyższymi ograniczeniami, panel Chi Mei w naszym urządzeniu jest wysokiej jakości pod względem pokrycia kolorów i kontrastu. Jego największą wadą jest bardzo powolny czas reakcji w czerni i bieli oraz szarości, co powoduje zauważalny ghosting. Choć nie jest to rzadkość w laptopach biurowych lub biznesowych, tutaj są one bardzo powolne, co rozprasza podczas przeglądania stron internetowych lub strumieniowania wideo.
| |||||||||||||||||||||||||
rozświetlenie: 86 %
na akumulatorze: 391.3 cd/m²
kontrast: 1223:1 (czerń: 0.32 cd/m²)
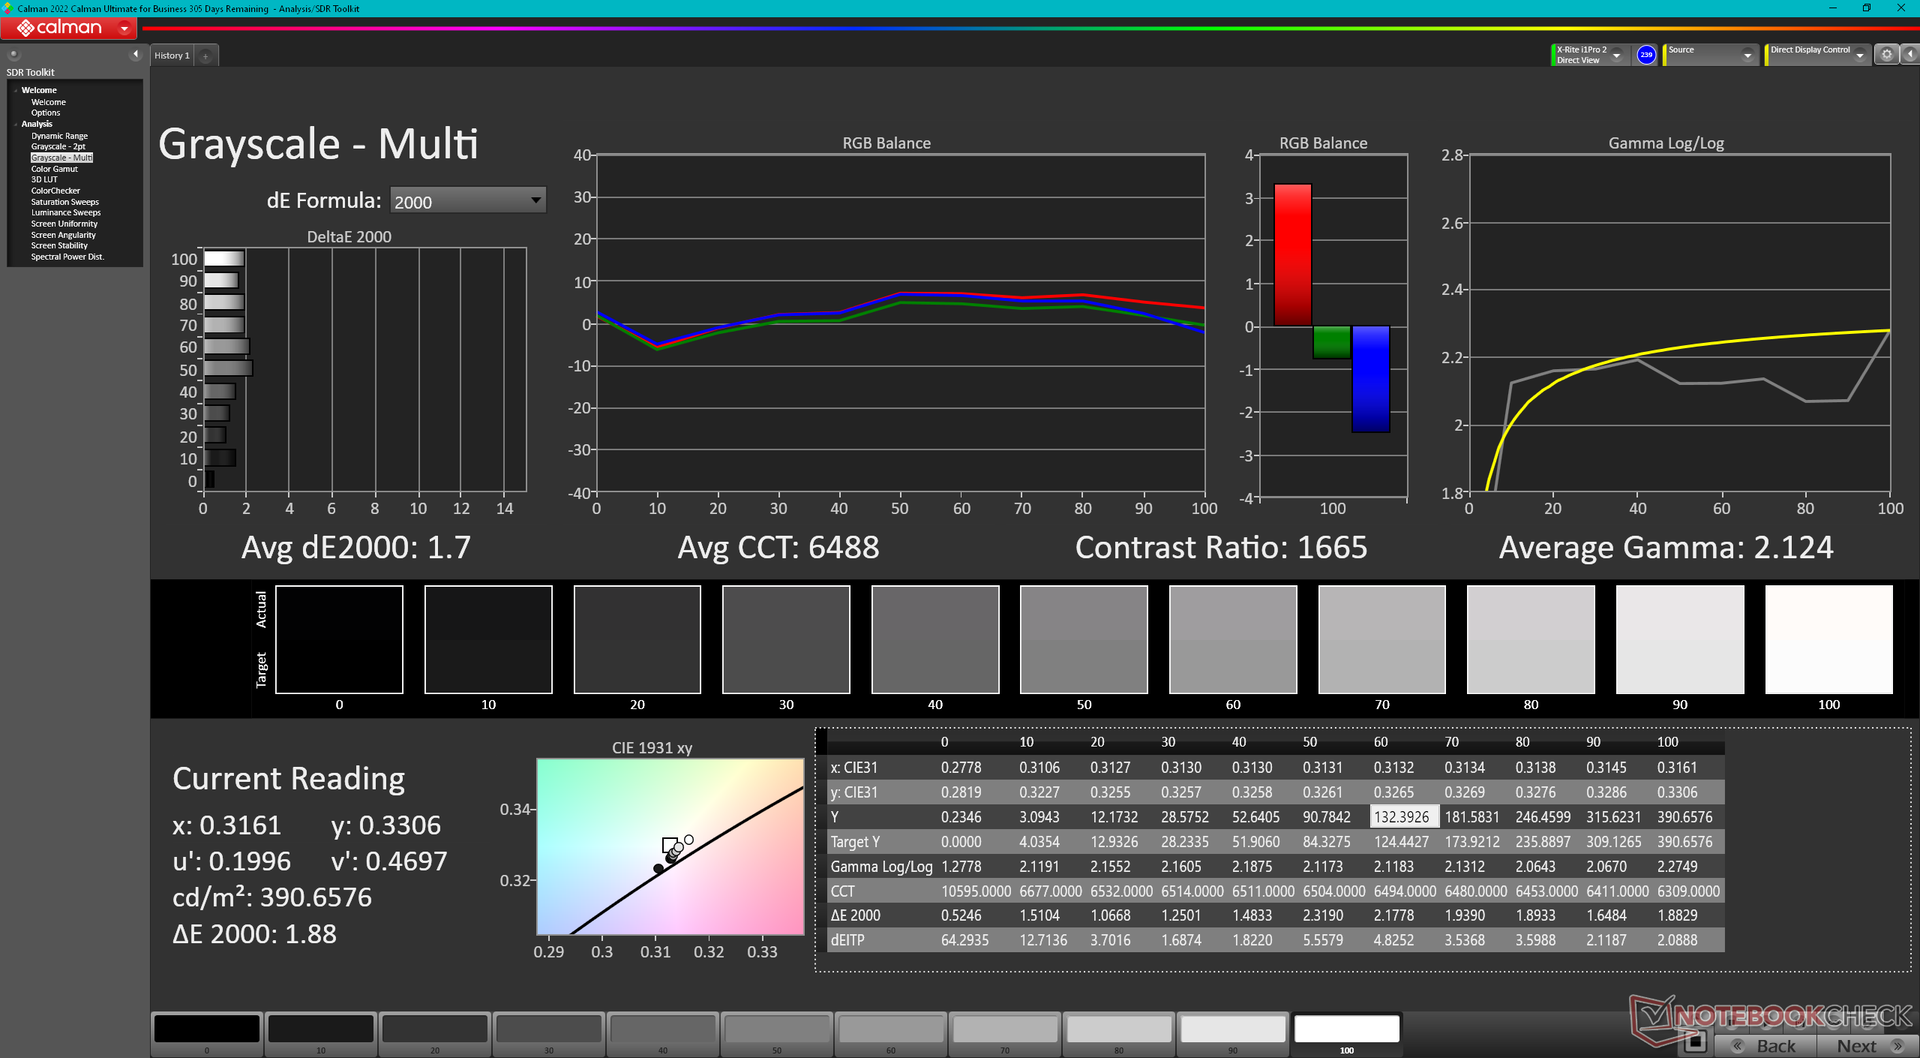
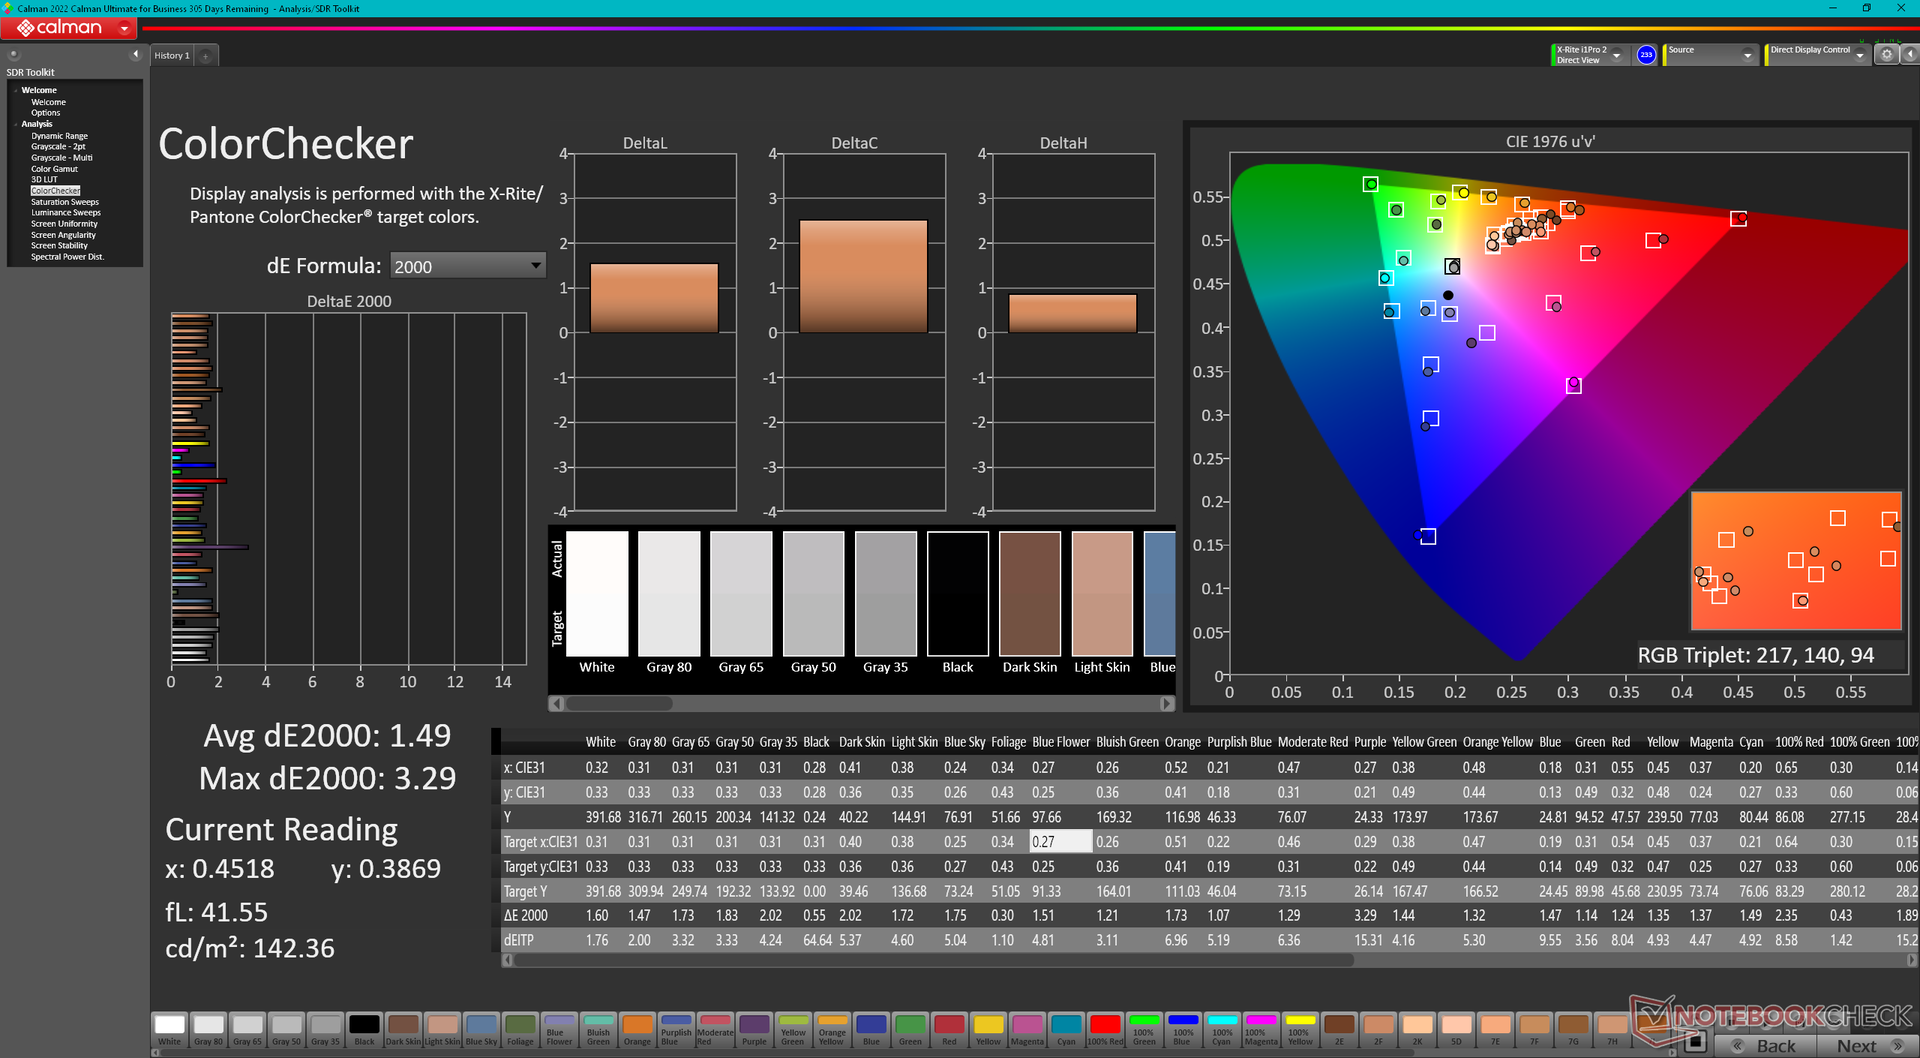
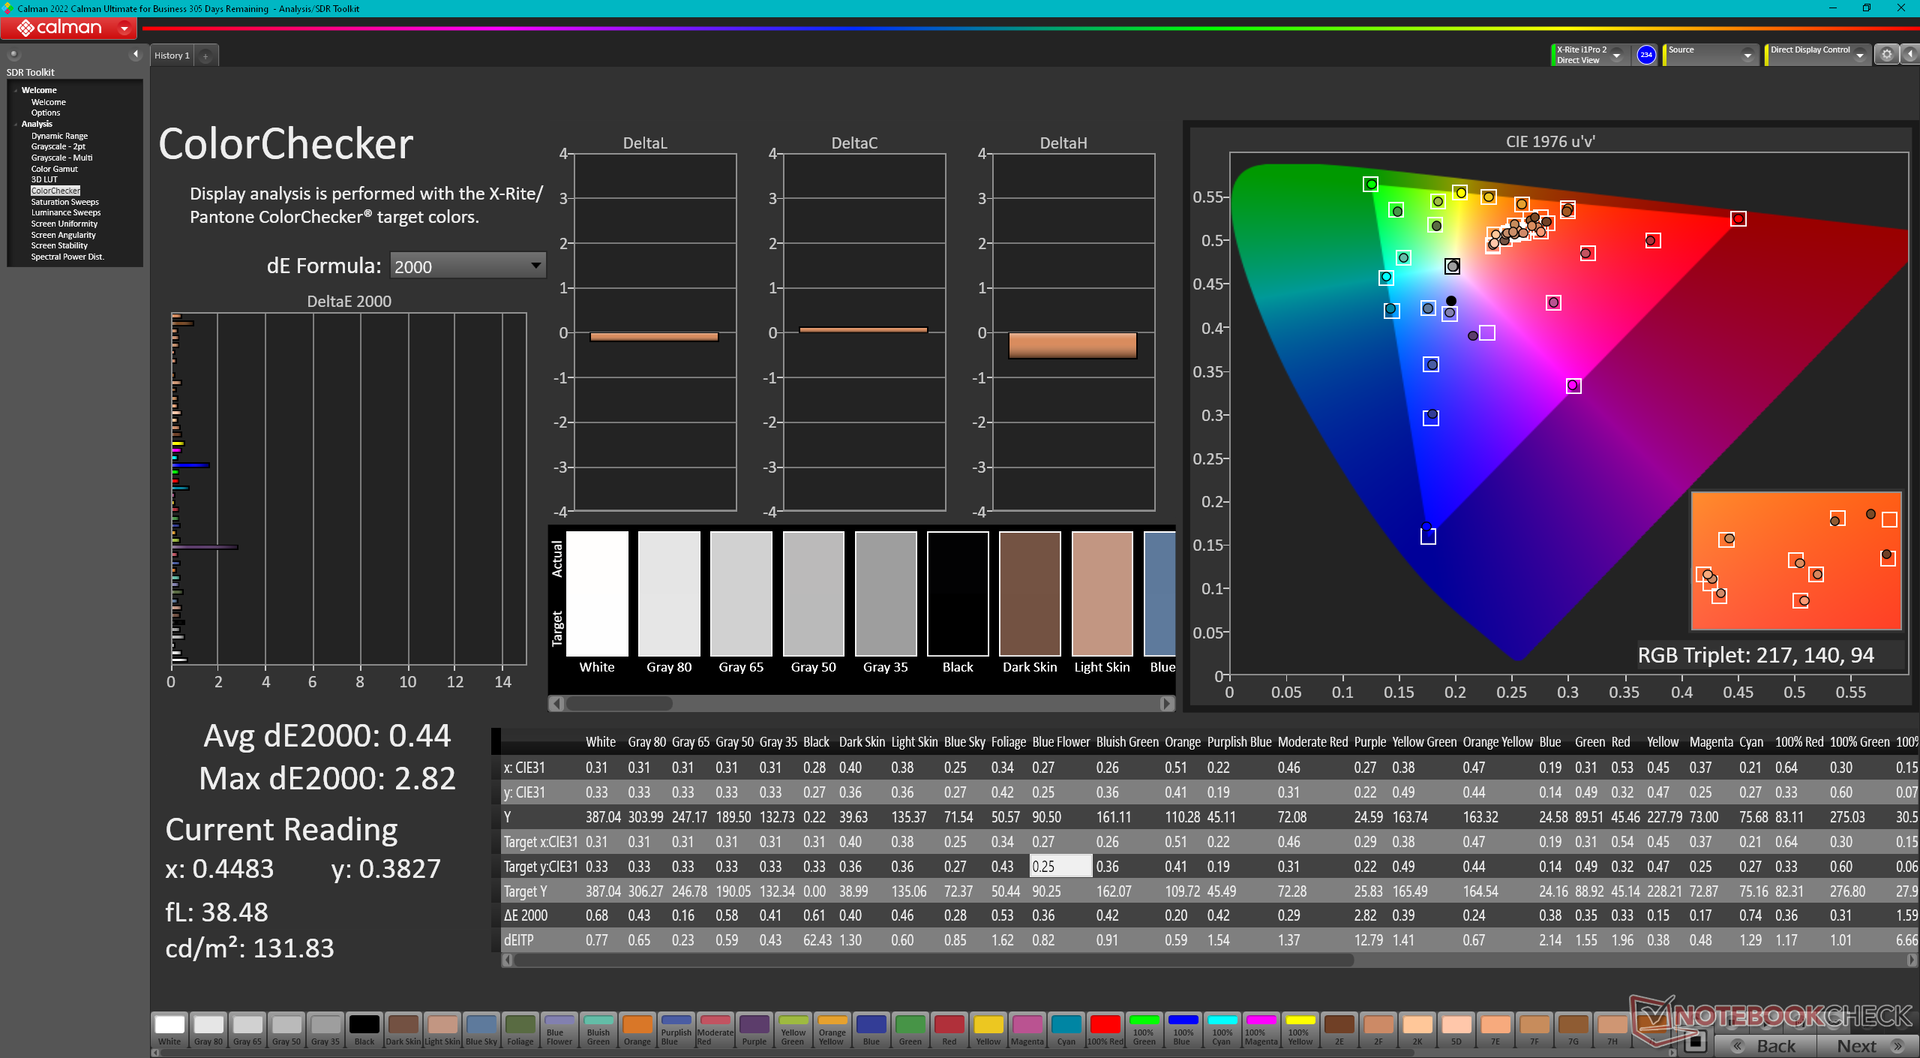
ΔE ColorChecker Calman: 1.49 | ∀{0.5-29.43 Ø4.71}
calibrated: 0.44
ΔE Greyscale Calman: 1.7 | ∀{0.09-98 Ø4.96}
69.7% AdobeRGB 1998 (Argyll 3D)
98.7% sRGB (Argyll 3D)
67.6% Display P3 (Argyll 3D)
Gamma: 2.12
CCT: 6488 K
| HP EliteBook 840 G9 Chi Mei CMN1435, IPS, 1920x1200, 14" | HP EliteBook 845 G9 6F6H6EA InfoVision X140NV4J, IPS, 1920x1200, 14" | HP EliteBook 840 Aero G8 3E4Q6AA AU Optronics AUO068B, IPS, 1920x1080, 14" | Lenovo ThinkPad X1 Carbon G10 Core i7-1265U R140NW4D R0, IPS, 1920x1200, 14" | LG Gram 14Z90Q LG LP140WU1-SPF1, IPS, 1920x1200, 14" | Dell Latitude 7420 JW6MH Chi Mei CMN1416 CHF07 140HCG, IPS, 1920x1080, 14" | |
|---|---|---|---|---|---|---|
| Display | 1% | -0% | 1% | 23% | 0% | |
| Display P3 Coverage (%) | 67.6 | 69 2% | 68 1% | 68.7 2% | 98.4 46% | 68 1% |
| sRGB Coverage (%) | 98.7 | 99 0% | 97.6 -1% | 99.5 1% | 99.9 1% | 99 0% |
| AdobeRGB 1998 Coverage (%) | 69.7 | 70 0% | 69.3 -1% | 70.2 1% | 85.9 23% | 70 0% |
| Response Times | 54% | 33% | 12% | 38% | 31% | |
| Response Time Grey 50% / Grey 80% * (ms) | 66 ? | 31 ? 53% | 48 ? 27% | 55.2 ? 16% | 47.5 ? 28% | 55 ? 17% |
| Response Time Black / White * (ms) | 46.4 ? | 21 ? 55% | 28.8 ? 38% | 43.2 ? 7% | 24.5 ? 47% | 26 ? 44% |
| PWM Frequency (Hz) | ||||||
| Screen | -41% | -69% | -5% | -63% | -6% | |
| Brightness middle (cd/m²) | 391.3 | 678 73% | 466.4 19% | 421.9 8% | 341 -13% | 408 4% |
| Brightness (cd/m²) | 368 | 745 102% | 426 16% | 420 14% | 305 -17% | 378 3% |
| Brightness Distribution (%) | 86 | 69 -20% | 84 -2% | 87 1% | 87 1% | 86 0% |
| Black Level * (cd/m²) | 0.32 | 0.33 -3% | 0.32 -0% | 0.29 9% | 0.26 19% | 0.22 31% |
| Contrast (:1) | 1223 | 2055 68% | 1458 19% | 1455 19% | 1312 7% | 1855 52% |
| Colorchecker dE 2000 * | 1.49 | 3.56 -139% | 2.84 -91% | 1.69 -13% | 3.11 -109% | 1.54 -3% |
| Colorchecker dE 2000 max. * | 3.29 | 7.23 -120% | 4.73 -44% | 3.55 -8% | 8.29 -152% | 2.72 17% |
| Colorchecker dE 2000 calibrated * | 0.44 | 1.05 -139% | 2.27 -416% | 0.5 -14% | 0.83 -89% | 1.08 -145% |
| Greyscale dE 2000 * | 1.7 | 4.93 -190% | 3.7 -118% | 2.8 -65% | 5.3 -212% | 1.95 -15% |
| Gamma | 2.12 104% | 2.63 84% | 2.13 103% | 2.13 103% | 2.037 108% | 2.33 94% |
| CCT | 6488 100% | 7114 91% | 6886 94% | 6442 101% | 7571 86% | 6806 96% |
| Całkowita średnia (program / ustawienia) | 5% /
-18% | -12% /
-40% | 3% /
-2% | -1% /
-30% | 8% /
0% |
* ... im mniej tym lepiej
Wyświetlacz jest już dobrze skalibrowany po wyjęciu z pudełka, a średnie wartości deltaE w skali szarości i kolorze wynoszą odpowiednio 1,7 i 1,49. Kalibracja panelu za pomocą kolorymetru X-Rite pozwoliłaby jeszcze bardziej poprawić te wartości, co pokazują poniższe zrzuty ekranu, ale dla większości użytkowników nie będzie to konieczne. Nasz skalibrowany profil ICM jest dostępny powyżej, jeśli posiadacze chcą spróbować go zastosować.

Wyświetl czasy reakcji
| ↔ Czas reakcji od czerni do bieli | ||
|---|---|---|
| 46.4 ms ... wzrost ↗ i spadek ↘ łącznie | ↗ 24.4 ms wzrost | 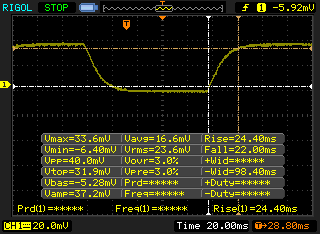 |
| ↘ 22 ms upadek | ||
| W naszych testach ekran wykazuje powolne tempo reakcji, co będzie niezadowalające dla graczy. Dla porównania, wszystkie testowane urządzenia wahają się od 0.1 (minimum) do 240 (maksimum) ms. » 99 % wszystkich urządzeń jest lepszych. Oznacza to, że zmierzony czas reakcji jest gorszy od średniej wszystkich testowanych urządzeń (19.8 ms). | ||
| ↔ Czas reakcji 50% szarości do 80% szarości | ||
| 66 ms ... wzrost ↗ i spadek ↘ łącznie | ↗ 35.2 ms wzrost | 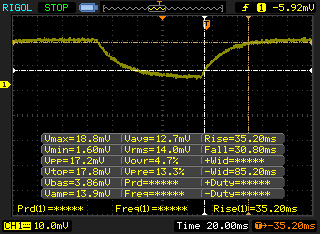 |
| ↘ 30.8 ms upadek | ||
| W naszych testach ekran wykazuje powolne tempo reakcji, co będzie niezadowalające dla graczy. Dla porównania, wszystkie testowane urządzenia wahają się od 0.165 (minimum) do 636 (maksimum) ms. » 98 % wszystkich urządzeń jest lepszych. Oznacza to, że zmierzony czas reakcji jest gorszy od średniej wszystkich testowanych urządzeń (31 ms). | ||
Migotanie ekranu / PWM (modulacja szerokości impulsu)
| Migotanie ekranu/nie wykryto PWM | 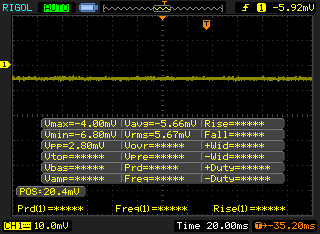 | ||
Dla porównania: 52 % wszystkich testowanych urządzeń nie używa PWM do przyciemniania wyświetlacza. Jeśli wykryto PWM, zmierzono średnio 7747 (minimum: 5 - maksimum: 343500) Hz. | |||
Wydajność - najszybszy Core i7 z serii P
Warunki badania
Przed przeprowadzeniem poniższych benchmarków, ustawiliśmy nasze urządzenie w trybie "Best performance" za pośrednictwem systemu Windows. Co ciekawe, preinstalowana aplikacja Power Manager nie zawiera żadnych dodatkowych ustawień zasilania, w przeciwieństwie do tego, co zaobserwowaliśmy w ostatnim modelu Dragonfly Folio G3.
Procesor
Wydajność procesora jest mieszana ze względu na ograniczony potencjał Turbo Boost systemu. Na przykład podczas uruchamiania programu CineBench R15 xT w pętli początkowy wynik 1992 punktów spadł zauważalnie do 1458 punktów po jednym przebiegu, co oznacza spadek wydajności o 27%. Spadek ten jest większy, niż w większości innych laptopów, w tym nawet w wielu modelach z serii Core U. Dla porównania.Ryzen 9 PRO 6950HS w EliteBooku 845 G9 osiągał stałe wyniki w całym teście obciążeniowym.
Wiele innych laptopów z tym samym Core i7-1280P CPU jest w stanie zaoferować szybsze osiągi od naszego HP dzięki mocniejszym rozwiązaniom chłodzącym. Większy MSI Summit E16 Flipmoże na przykład zaoferować od 25 do 50 procent szybszą wydajność wielowątkową niż nasz EliteBook 840 G9.
Cinebench R15 Multi Loop
Cinebench R23: Multi Core | Single Core
Cinebench R15: CPU Multi 64Bit | CPU Single 64Bit
Blender: v2.79 BMW27 CPU
7-Zip 18.03: 7z b 4 | 7z b 4 -mmt1
Geekbench 5.5: Multi-Core | Single-Core
HWBOT x265 Benchmark v2.2: 4k Preset
LibreOffice : 20 Documents To PDF
R Benchmark 2.5: Overall mean
| Cinebench R20 / CPU (Multi Core) | |
| Przeciętny Intel Core i7-1280P (3283 - 5415, n=8) | |
| HP EliteBook 845 G9 6F6H6EA | |
| HP EliteBook 840 G9 | |
| MSI Summit E14 Flip Evo A12MT | |
| Lenovo ThinkPad X1 Carbon G10 Core i7-1265U | |
| Dell Inspiron 14 7420 2-in-1 | |
| Lenovo ThinkPad X1 Carbon G10 21CC001RGE | |
| Asus ExpertBook B3 Flip B3402FEA | |
| HP EliteBook 840 Aero G8 3E4Q6AA | |
| Dell Latitude 7420 JW6MH | |
| Infinix INBook X2 | |
| LG Gram 14Z90Q | |
| Cinebench R20 / CPU (Single Core) | |
| Dell Inspiron 14 7420 2-in-1 | |
| MSI Summit E14 Flip Evo A12MT | |
| Przeciętny Intel Core i7-1280P (615 - 701, n=8) | |
| Lenovo ThinkPad X1 Carbon G10 Core i7-1265U | |
| HP EliteBook 840 G9 | |
| HP EliteBook 845 G9 6F6H6EA | |
| Asus ExpertBook B3 Flip B3402FEA | |
| Lenovo ThinkPad X1 Carbon G10 21CC001RGE | |
| Dell Latitude 7420 JW6MH | |
| HP EliteBook 840 Aero G8 3E4Q6AA | |
| LG Gram 14Z90Q | |
| Infinix INBook X2 | |
| Cinebench R23 / Multi Core | |
| Przeciętny Intel Core i7-1280P (8632 - 14803, n=8) | |
| HP EliteBook 845 G9 6F6H6EA | |
| HP EliteBook 840 G9 | |
| MSI Summit E14 Flip Evo A12MT | |
| Lenovo ThinkPad X1 Carbon G10 Core i7-1265U | |
| Dell Inspiron 14 7420 2-in-1 | |
| Lenovo ThinkPad X1 Carbon G10 21CC001RGE | |
| Asus ExpertBook B3 Flip B3402FEA | |
| Dell Latitude 7420 JW6MH | |
| HP EliteBook 840 Aero G8 3E4Q6AA | |
| Infinix INBook X2 | |
| LG Gram 14Z90Q | |
| Cinebench R23 / Single Core | |
| Dell Inspiron 14 7420 2-in-1 | |
| MSI Summit E14 Flip Evo A12MT | |
| HP EliteBook 840 G9 | |
| Przeciętny Intel Core i7-1280P (1609 - 1787, n=7) | |
| Lenovo ThinkPad X1 Carbon G10 Core i7-1265U | |
| Lenovo ThinkPad X1 Carbon G10 21CC001RGE | |
| HP EliteBook 845 G9 6F6H6EA | |
| Asus ExpertBook B3 Flip B3402FEA | |
| HP EliteBook 840 Aero G8 3E4Q6AA | |
| Dell Latitude 7420 JW6MH | |
| Infinix INBook X2 | |
| LG Gram 14Z90Q | |
| Cinebench R15 / CPU Multi 64Bit | |
| Przeciętny Intel Core i7-1280P (1905 - 2332, n=7) | |
| HP EliteBook 840 G9 | |
| HP EliteBook 845 G9 6F6H6EA | |
| Lenovo ThinkPad X1 Carbon G10 21CC001RGE | |
| Lenovo ThinkPad X1 Carbon G10 Core i7-1265U | |
| MSI Summit E14 Flip Evo A12MT | |
| Dell Inspiron 14 7420 2-in-1 | |
| LG Gram 14Z90Q | |
| Asus ExpertBook B3 Flip B3402FEA | |
| Dell Latitude 7420 JW6MH | |
| HP EliteBook 840 Aero G8 3E4Q6AA | |
| Infinix INBook X2 | |
| Cinebench R15 / CPU Single 64Bit | |
| HP EliteBook 840 G9 | |
| Dell Inspiron 14 7420 2-in-1 | |
| MSI Summit E14 Flip Evo A12MT | |
| HP EliteBook 845 G9 6F6H6EA | |
| Lenovo ThinkPad X1 Carbon G10 Core i7-1265U | |
| Przeciętny Intel Core i7-1280P (203 - 258, n=7) | |
| HP EliteBook 840 Aero G8 3E4Q6AA | |
| Dell Latitude 7420 JW6MH | |
| LG Gram 14Z90Q | |
| Lenovo ThinkPad X1 Carbon G10 21CC001RGE | |
| Asus ExpertBook B3 Flip B3402FEA | |
| Infinix INBook X2 | |
| Blender / v2.79 BMW27 CPU | |
| Infinix INBook X2 | |
| Dell Latitude 7420 JW6MH | |
| HP EliteBook 840 Aero G8 3E4Q6AA | |
| Asus ExpertBook B3 Flip B3402FEA | |
| LG Gram 14Z90Q | |
| Lenovo ThinkPad X1 Carbon G10 21CC001RGE | |
| Dell Inspiron 14 7420 2-in-1 | |
| Lenovo ThinkPad X1 Carbon G10 Core i7-1265U | |
| MSI Summit E14 Flip Evo A12MT | |
| HP EliteBook 840 G9 | |
| Przeciętny Intel Core i7-1280P (259 - 309, n=7) | |
| HP EliteBook 845 G9 6F6H6EA | |
| 7-Zip 18.03 / 7z b 4 | |
| Przeciętny Intel Core i7-1280P (45292 - 53710, n=7) | |
| HP EliteBook 845 G9 6F6H6EA | |
| HP EliteBook 840 G9 | |
| MSI Summit E14 Flip Evo A12MT | |
| Lenovo ThinkPad X1 Carbon G10 Core i7-1265U | |
| Dell Inspiron 14 7420 2-in-1 | |
| LG Gram 14Z90Q | |
| Lenovo ThinkPad X1 Carbon G10 21CC001RGE | |
| Asus ExpertBook B3 Flip B3402FEA | |
| HP EliteBook 840 Aero G8 3E4Q6AA | |
| Dell Latitude 7420 JW6MH | |
| Infinix INBook X2 | |
| 7-Zip 18.03 / 7z b 4 -mmt1 | |
| HP EliteBook 840 G9 | |
| Dell Inspiron 14 7420 2-in-1 | |
| HP EliteBook 845 G9 6F6H6EA | |
| Przeciętny Intel Core i7-1280P (4995 - 5874, n=7) | |
| Lenovo ThinkPad X1 Carbon G10 Core i7-1265U | |
| MSI Summit E14 Flip Evo A12MT | |
| HP EliteBook 840 Aero G8 3E4Q6AA | |
| Asus ExpertBook B3 Flip B3402FEA | |
| Dell Latitude 7420 JW6MH | |
| LG Gram 14Z90Q | |
| Lenovo ThinkPad X1 Carbon G10 21CC001RGE | |
| Infinix INBook X2 | |
| Geekbench 5.5 / Multi-Core | |
| HP EliteBook 840 G9 | |
| Przeciętny Intel Core i7-1280P (9623 - 11811, n=7) | |
| MSI Summit E14 Flip Evo A12MT | |
| Lenovo ThinkPad X1 Carbon G10 Core i7-1265U | |
| LG Gram 14Z90Q | |
| Lenovo ThinkPad X1 Carbon G10 21CC001RGE | |
| HP EliteBook 845 G9 6F6H6EA | |
| Dell Inspiron 14 7420 2-in-1 | |
| Dell Latitude 7420 JW6MH | |
| Asus ExpertBook B3 Flip B3402FEA | |
| Infinix INBook X2 | |
| Geekbench 5.5 / Single-Core | |
| HP EliteBook 840 G9 | |
| Lenovo ThinkPad X1 Carbon G10 Core i7-1265U | |
| MSI Summit E14 Flip Evo A12MT | |
| Przeciętny Intel Core i7-1280P (1571 - 1802, n=7) | |
| Dell Inspiron 14 7420 2-in-1 | |
| Lenovo ThinkPad X1 Carbon G10 21CC001RGE | |
| LG Gram 14Z90Q | |
| HP EliteBook 845 G9 6F6H6EA | |
| Asus ExpertBook B3 Flip B3402FEA | |
| Dell Latitude 7420 JW6MH | |
| Infinix INBook X2 | |
| HWBOT x265 Benchmark v2.2 / 4k Preset | |
| MSI Summit E14 Flip Evo A12MT | |
| HP EliteBook 840 G9 | |
| HP EliteBook 845 G9 6F6H6EA | |
| Przeciętny Intel Core i7-1280P (9.62 - 14.5, n=5) | |
| Lenovo ThinkPad X1 Carbon G10 Core i7-1265U | |
| Dell Inspiron 14 7420 2-in-1 | |
| LG Gram 14Z90Q | |
| Lenovo ThinkPad X1 Carbon G10 21CC001RGE | |
| HP EliteBook 840 Aero G8 3E4Q6AA | |
| Asus ExpertBook B3 Flip B3402FEA | |
| Dell Latitude 7420 JW6MH | |
| Infinix INBook X2 | |
| LibreOffice / 20 Documents To PDF | |
| Infinix INBook X2 | |
| HP EliteBook 845 G9 6F6H6EA | |
| HP EliteBook 840 Aero G8 3E4Q6AA | |
| Lenovo ThinkPad X1 Carbon G10 21CC001RGE | |
| Dell Latitude 7420 JW6MH | |
| LG Gram 14Z90Q | |
| Przeciętny Intel Core i7-1280P (41 - 61.6, n=8) | |
| Dell Inspiron 14 7420 2-in-1 | |
| MSI Summit E14 Flip Evo A12MT | |
| Asus ExpertBook B3 Flip B3402FEA | |
| Lenovo ThinkPad X1 Carbon G10 Core i7-1265U | |
| HP EliteBook 840 G9 | |
| R Benchmark 2.5 / Overall mean | |
| Infinix INBook X2 | |
| Dell Latitude 7420 JW6MH | |
| Lenovo ThinkPad X1 Carbon G10 21CC001RGE | |
| HP EliteBook 840 Aero G8 3E4Q6AA | |
| Asus ExpertBook B3 Flip B3402FEA | |
| LG Gram 14Z90Q | |
| HP EliteBook 845 G9 6F6H6EA | |
| Lenovo ThinkPad X1 Carbon G10 Core i7-1265U | |
| MSI Summit E14 Flip Evo A12MT | |
| Przeciętny Intel Core i7-1280P (0.4505 - 0.512, n=7) | |
| Dell Inspiron 14 7420 2-in-1 | |
| HP EliteBook 840 G9 | |
* ... im mniej tym lepiej
| Blender - v3.3 Classroom CPU | |
| LG Gram 14Z90Q | |
| Lenovo ThinkPad X1 Carbon G10 Core i7-1265U | |
| Przeciętny Intel Iris Xe Graphics G7 96EUs (336 - 1259, n=109) | |
| HP EliteBook 840 G9 | |
* ... im mniej tym lepiej
AIDA64: FP32 Ray-Trace | FPU Julia | CPU SHA3 | CPU Queen | FPU SinJulia | FPU Mandel | CPU AES | CPU ZLib | FP64 Ray-Trace | CPU PhotoWorxx
| Performance rating | |
| HP EliteBook 845 G9 6F6H6EA | |
| Przeciętny Intel Core i7-1280P | |
| HP EliteBook 840 G9 | |
| Lenovo ThinkPad X1 Carbon G10 Core i7-1265U | |
| Dell Latitude 7420 JW6MH | |
| HP EliteBook 840 Aero G8 3E4Q6AA | |
| LG Gram 14Z90Q | |
| AIDA64 / FP32 Ray-Trace | |
| HP EliteBook 845 G9 6F6H6EA | |
| Przeciętny Intel Core i7-1280P (7466 - 13068, n=6) | |
| HP EliteBook 840 G9 | |
| Lenovo ThinkPad X1 Carbon G10 Core i7-1265U | |
| Dell Latitude 7420 JW6MH | |
| HP EliteBook 840 Aero G8 3E4Q6AA | |
| LG Gram 14Z90Q | |
| AIDA64 / FPU Julia | |
| HP EliteBook 845 G9 6F6H6EA | |
| Przeciętny Intel Core i7-1280P (38904 - 66081, n=6) | |
| HP EliteBook 840 G9 | |
| Lenovo ThinkPad X1 Carbon G10 Core i7-1265U | |
| Dell Latitude 7420 JW6MH | |
| HP EliteBook 840 Aero G8 3E4Q6AA | |
| LG Gram 14Z90Q | |
| AIDA64 / CPU SHA3 | |
| HP EliteBook 845 G9 6F6H6EA | |
| Przeciętny Intel Core i7-1280P (1826 - 2992, n=6) | |
| HP EliteBook 840 G9 | |
| Dell Latitude 7420 JW6MH | |
| Lenovo ThinkPad X1 Carbon G10 Core i7-1265U | |
| HP EliteBook 840 Aero G8 3E4Q6AA | |
| LG Gram 14Z90Q | |
| AIDA64 / CPU Queen | |
| HP EliteBook 845 G9 6F6H6EA | |
| HP EliteBook 840 G9 | |
| Przeciętny Intel Core i7-1280P (80180 - 100358, n=6) | |
| LG Gram 14Z90Q | |
| Lenovo ThinkPad X1 Carbon G10 Core i7-1265U | |
| HP EliteBook 840 Aero G8 3E4Q6AA | |
| Dell Latitude 7420 JW6MH | |
| AIDA64 / FPU SinJulia | |
| HP EliteBook 845 G9 6F6H6EA | |
| Przeciętny Intel Core i7-1280P (5880 - 8571, n=6) | |
| HP EliteBook 840 G9 | |
| Dell Latitude 7420 JW6MH | |
| Lenovo ThinkPad X1 Carbon G10 Core i7-1265U | |
| HP EliteBook 840 Aero G8 3E4Q6AA | |
| LG Gram 14Z90Q | |
| AIDA64 / FPU Mandel | |
| HP EliteBook 845 G9 6F6H6EA | |
| Przeciętny Intel Core i7-1280P (18907 - 32766, n=6) | |
| HP EliteBook 840 G9 | |
| Dell Latitude 7420 JW6MH | |
| Lenovo ThinkPad X1 Carbon G10 Core i7-1265U | |
| HP EliteBook 840 Aero G8 3E4Q6AA | |
| LG Gram 14Z90Q | |
| AIDA64 / CPU AES | |
| Dell Latitude 7420 JW6MH | |
| HP EliteBook 840 Aero G8 3E4Q6AA | |
| Przeciętny Intel Core i7-1280P (40691 - 99367, n=6) | |
| HP EliteBook 845 G9 6F6H6EA | |
| HP EliteBook 840 G9 | |
| Lenovo ThinkPad X1 Carbon G10 Core i7-1265U | |
| LG Gram 14Z90Q | |
| AIDA64 / CPU ZLib | |
| HP EliteBook 845 G9 6F6H6EA | |
| Przeciętny Intel Core i7-1280P (540 - 880, n=6) | |
| HP EliteBook 840 G9 | |
| Lenovo ThinkPad X1 Carbon G10 Core i7-1265U | |
| Dell Latitude 7420 JW6MH | |
| HP EliteBook 840 Aero G8 3E4Q6AA | |
| LG Gram 14Z90Q | |
| AIDA64 / FP64 Ray-Trace | |
| HP EliteBook 845 G9 6F6H6EA | |
| Przeciętny Intel Core i7-1280P (4006 - 7184, n=6) | |
| HP EliteBook 840 G9 | |
| Lenovo ThinkPad X1 Carbon G10 Core i7-1265U | |
| Dell Latitude 7420 JW6MH | |
| HP EliteBook 840 Aero G8 3E4Q6AA | |
| LG Gram 14Z90Q | |
| AIDA64 / CPU PhotoWorxx | |
| Przeciętny Intel Core i7-1280P (36663 - 48416, n=6) | |
| Lenovo ThinkPad X1 Carbon G10 Core i7-1265U | |
| HP EliteBook 840 G9 | |
| Dell Latitude 7420 JW6MH | |
| HP EliteBook 840 Aero G8 3E4Q6AA | |
| LG Gram 14Z90Q | |
| HP EliteBook 845 G9 6F6H6EA | |
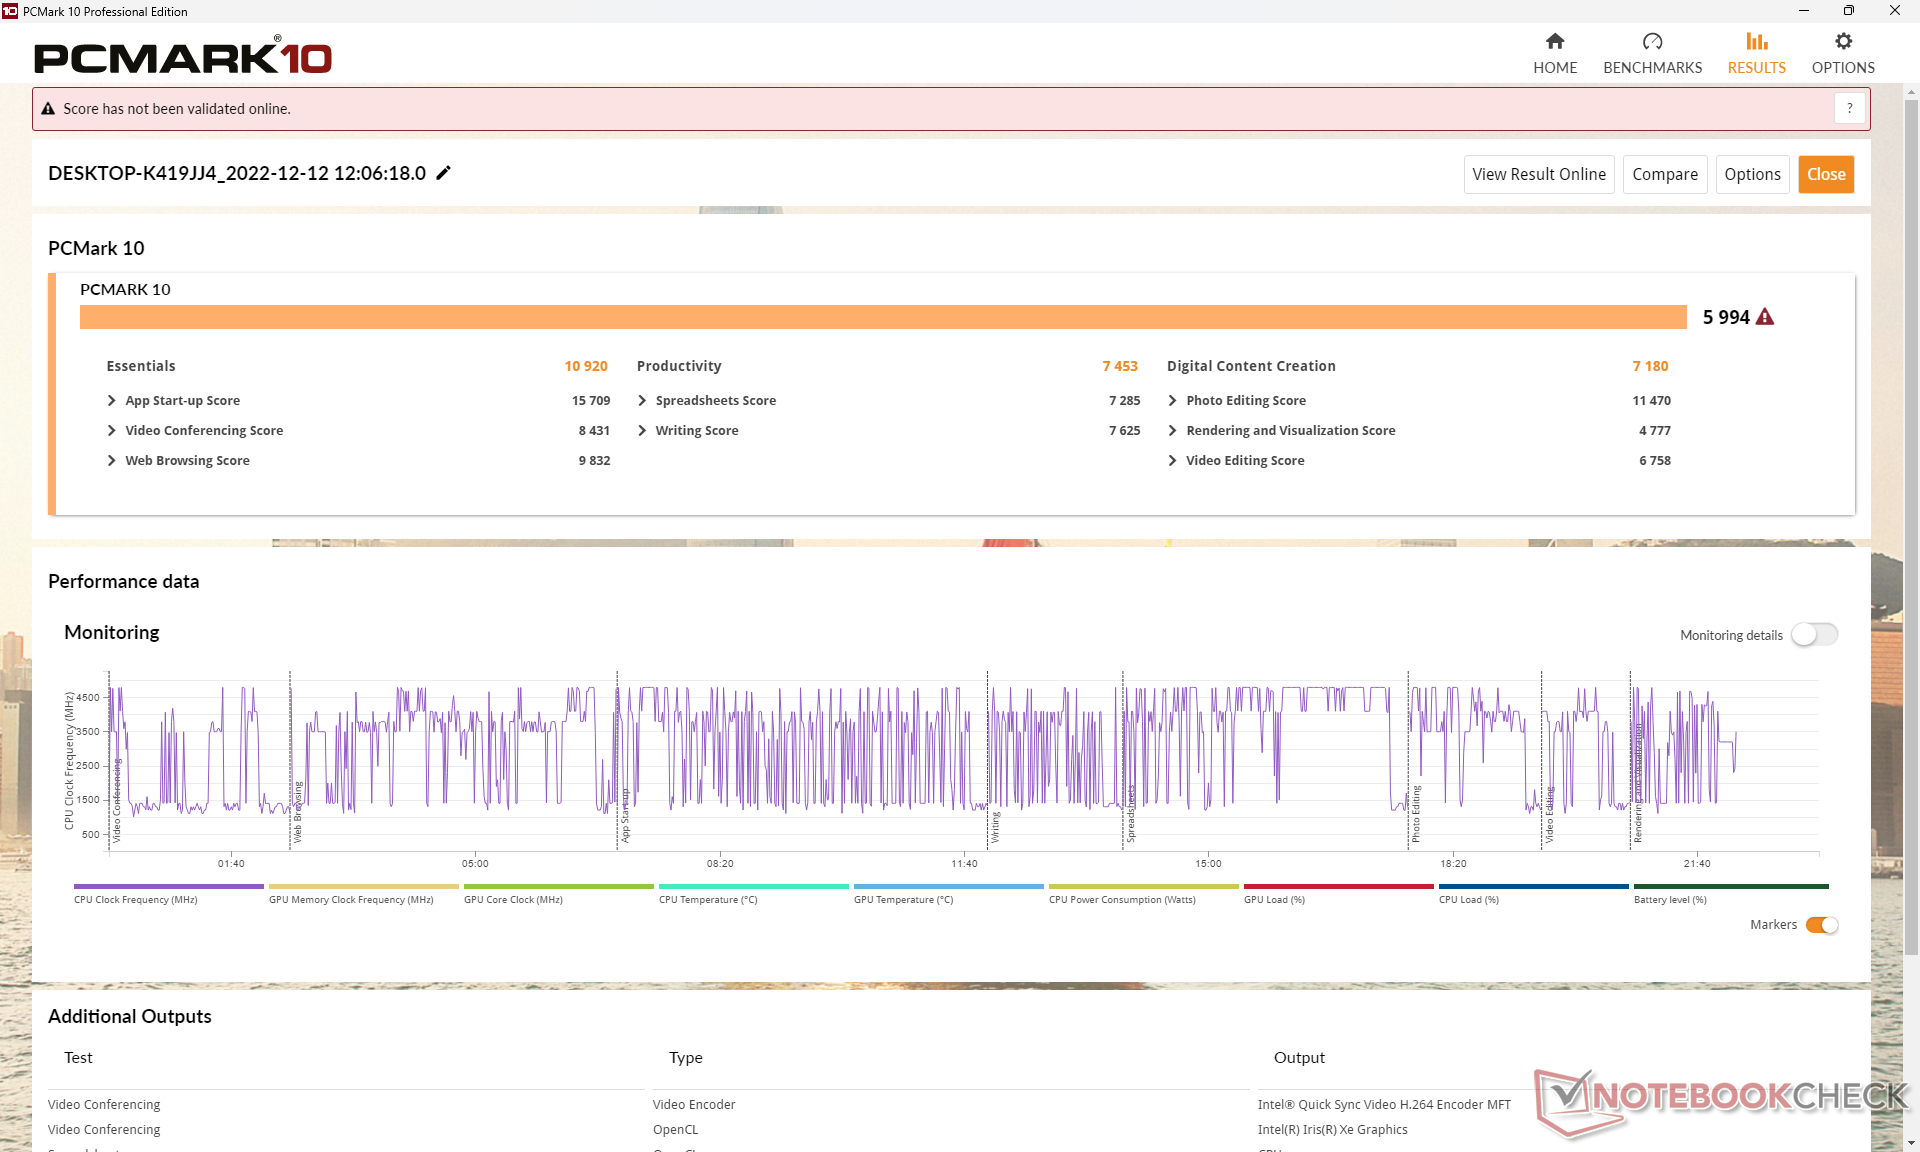
Wydajność systemu
Wyniki PCMark są porównywalne z wersją AMD z wyjątkiem podtestu Productivity prawdopodobnie dlatego, że Ryzen 9 PRO 6950HS oferuje szybszą surową wydajność wielowątkową, co pokazują powyższe benchmarki.
CrossMark: Overall | Productivity | Creativity | Responsiveness
| PCMark 10 / Score | |
| HP EliteBook 840 G9 | |
| HP EliteBook 845 G9 6F6H6EA | |
| Przeciętny Intel Core i7-1280P, Intel Iris Xe Graphics G7 96EUs (5410 - 5994, n=4) | |
| Lenovo ThinkPad X1 Carbon G10 Core i7-1265U | |
| LG Gram 14Z90Q | |
| Dell Latitude 7420 JW6MH | |
| HP EliteBook 840 Aero G8 3E4Q6AA | |
| PCMark 10 / Essentials | |
| HP EliteBook 840 G9 | |
| Lenovo ThinkPad X1 Carbon G10 Core i7-1265U | |
| Przeciętny Intel Core i7-1280P, Intel Iris Xe Graphics G7 96EUs (9719 - 10920, n=4) | |
| Dell Latitude 7420 JW6MH | |
| LG Gram 14Z90Q | |
| HP EliteBook 840 Aero G8 3E4Q6AA | |
| HP EliteBook 845 G9 6F6H6EA | |
| PCMark 10 / Productivity | |
| HP EliteBook 845 G9 6F6H6EA | |
| HP EliteBook 840 G9 | |
| Lenovo ThinkPad X1 Carbon G10 Core i7-1265U | |
| Przeciętny Intel Core i7-1280P, Intel Iris Xe Graphics G7 96EUs (6301 - 7453, n=4) | |
| HP EliteBook 840 Aero G8 3E4Q6AA | |
| Dell Latitude 7420 JW6MH | |
| LG Gram 14Z90Q | |
| PCMark 10 / Digital Content Creation | |
| HP EliteBook 845 G9 6F6H6EA | |
| HP EliteBook 840 G9 | |
| Przeciętny Intel Core i7-1280P, Intel Iris Xe Graphics G7 96EUs (6450 - 7180, n=4) | |
| Lenovo ThinkPad X1 Carbon G10 Core i7-1265U | |
| LG Gram 14Z90Q | |
| Dell Latitude 7420 JW6MH | |
| HP EliteBook 840 Aero G8 3E4Q6AA | |
| CrossMark / Overall | |
| HP EliteBook 840 G9 | |
| Przeciętny Intel Core i7-1280P, Intel Iris Xe Graphics G7 96EUs (1677 - 1773, n=4) | |
| Lenovo ThinkPad X1 Carbon G10 Core i7-1265U | |
| HP EliteBook 845 G9 6F6H6EA | |
| Dell Latitude 7420 JW6MH | |
| CrossMark / Productivity | |
| HP EliteBook 840 G9 | |
| Przeciętny Intel Core i7-1280P, Intel Iris Xe Graphics G7 96EUs (1585 - 1709, n=4) | |
| Lenovo ThinkPad X1 Carbon G10 Core i7-1265U | |
| HP EliteBook 845 G9 6F6H6EA | |
| Dell Latitude 7420 JW6MH | |
| CrossMark / Creativity | |
| Przeciętny Intel Core i7-1280P, Intel Iris Xe Graphics G7 96EUs (1849 - 1928, n=4) | |
| HP EliteBook 840 G9 | |
| Lenovo ThinkPad X1 Carbon G10 Core i7-1265U | |
| HP EliteBook 845 G9 6F6H6EA | |
| Dell Latitude 7420 JW6MH | |
| CrossMark / Responsiveness | |
| HP EliteBook 840 G9 | |
| Przeciętny Intel Core i7-1280P, Intel Iris Xe Graphics G7 96EUs (1394 - 1746, n=4) | |
| Lenovo ThinkPad X1 Carbon G10 Core i7-1265U | |
| Dell Latitude 7420 JW6MH | |
| HP EliteBook 845 G9 6F6H6EA | |
| PCMark 10 Score | 5994 pkt. | |
Pomoc | ||
| AIDA64 / Memory Copy | |
| Przeciętny Intel Core i7-1280P (56337 - 73486, n=6) | |
| Lenovo ThinkPad X1 Carbon G10 Core i7-1265U | |
| Dell Latitude 7420 JW6MH | |
| HP EliteBook 840 G9 | |
| LG Gram 14Z90Q | |
| HP EliteBook 840 Aero G8 3E4Q6AA | |
| HP EliteBook 845 G9 6F6H6EA | |
| AIDA64 / Memory Read | |
| LG Gram 14Z90Q | |
| Lenovo ThinkPad X1 Carbon G10 Core i7-1265U | |
| Przeciętny Intel Core i7-1280P (63221 - 73719, n=6) | |
| HP EliteBook 840 G9 | |
| Dell Latitude 7420 JW6MH | |
| HP EliteBook 840 Aero G8 3E4Q6AA | |
| HP EliteBook 845 G9 6F6H6EA | |
| AIDA64 / Memory Write | |
| Przeciętny Intel Core i7-1280P (58729 - 68247, n=6) | |
| Lenovo ThinkPad X1 Carbon G10 Core i7-1265U | |
| LG Gram 14Z90Q | |
| HP EliteBook 840 G9 | |
| Dell Latitude 7420 JW6MH | |
| HP EliteBook 840 Aero G8 3E4Q6AA | |
| HP EliteBook 845 G9 6F6H6EA | |
| AIDA64 / Memory Latency | |
| LG Gram 14Z90Q | |
| Przeciętny Intel Core i7-1280P (93.1 - 153.3, n=6) | |
| HP EliteBook 845 G9 6F6H6EA | |
| Dell Latitude 7420 JW6MH | |
| HP EliteBook 840 G9 | |
| Lenovo ThinkPad X1 Carbon G10 Core i7-1265U | |
| HP EliteBook 840 Aero G8 3E4Q6AA | |
* ... im mniej tym lepiej
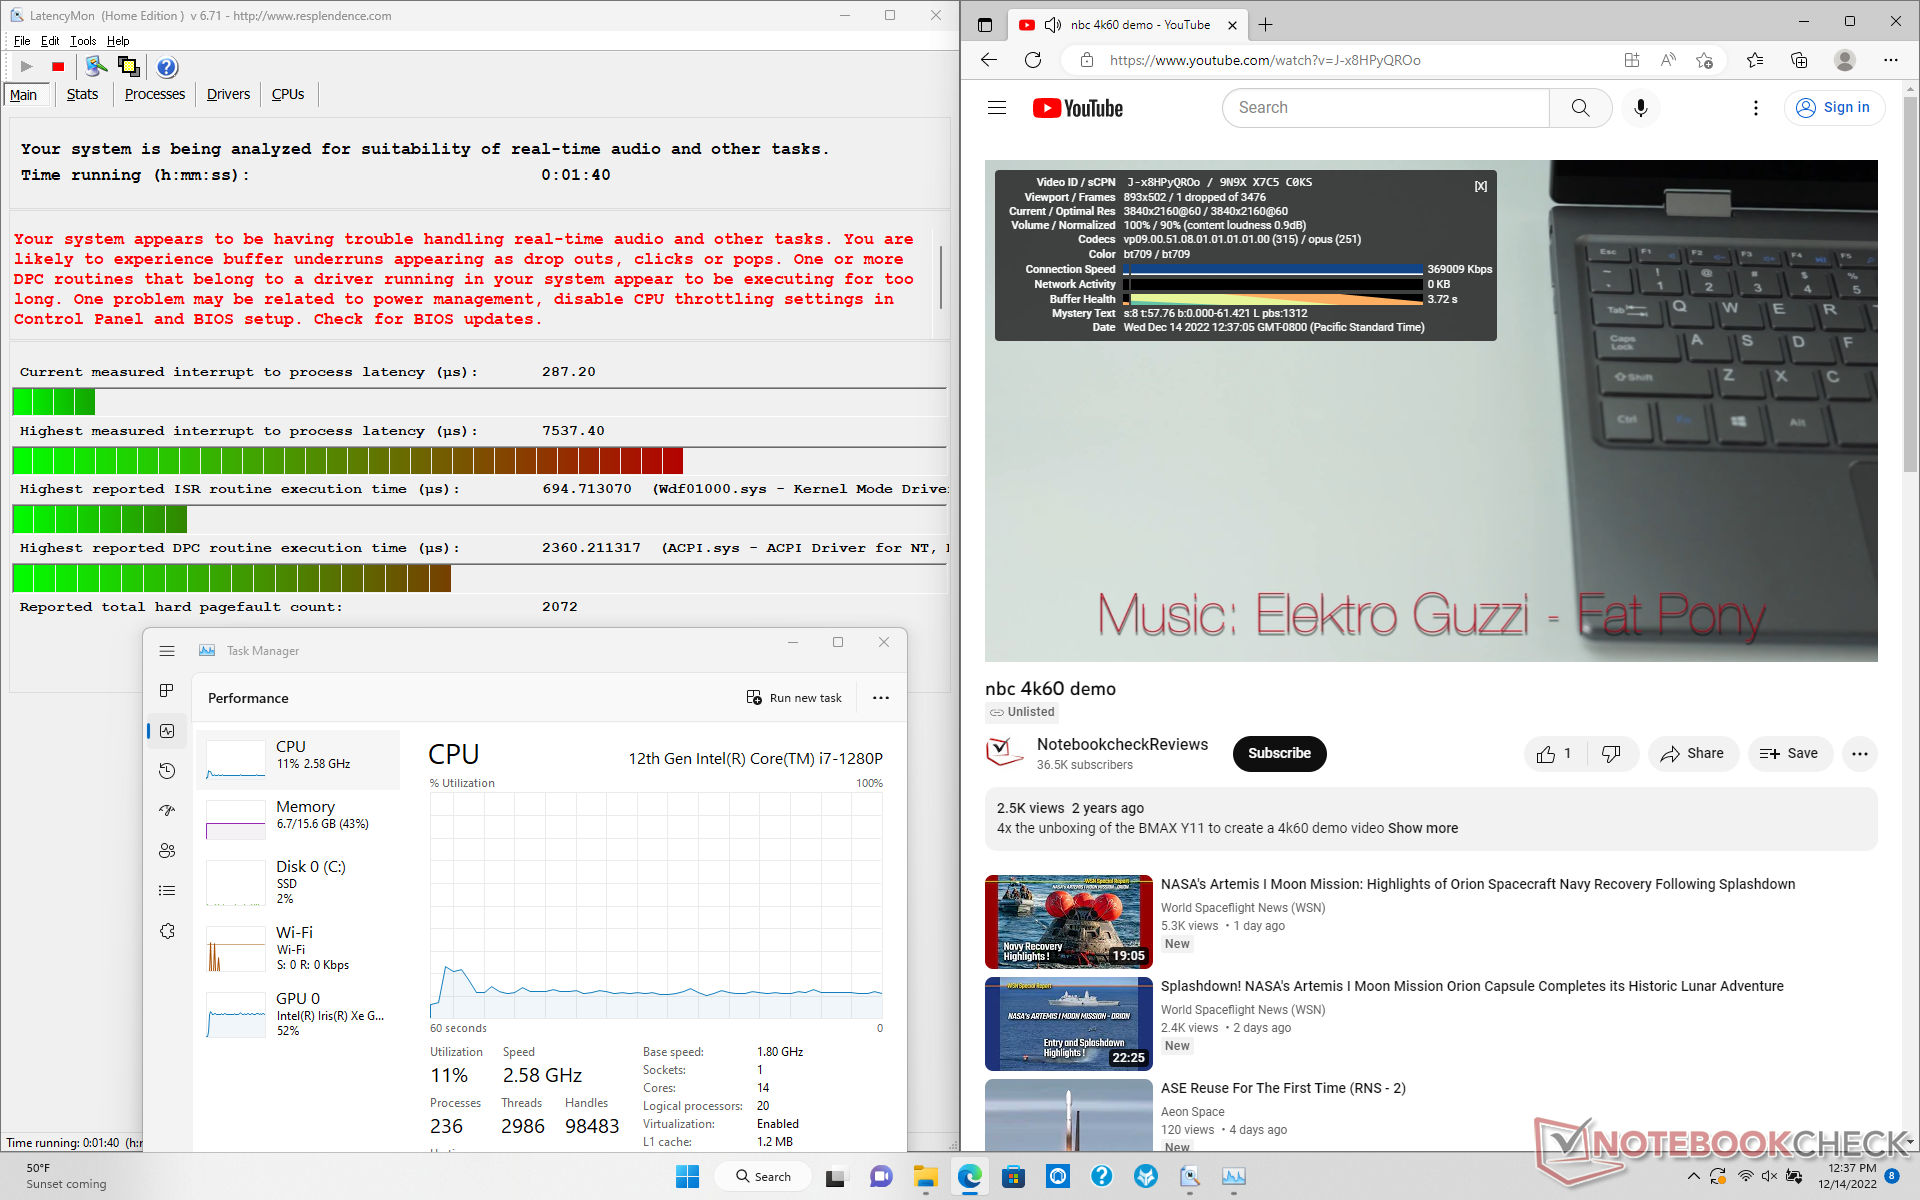
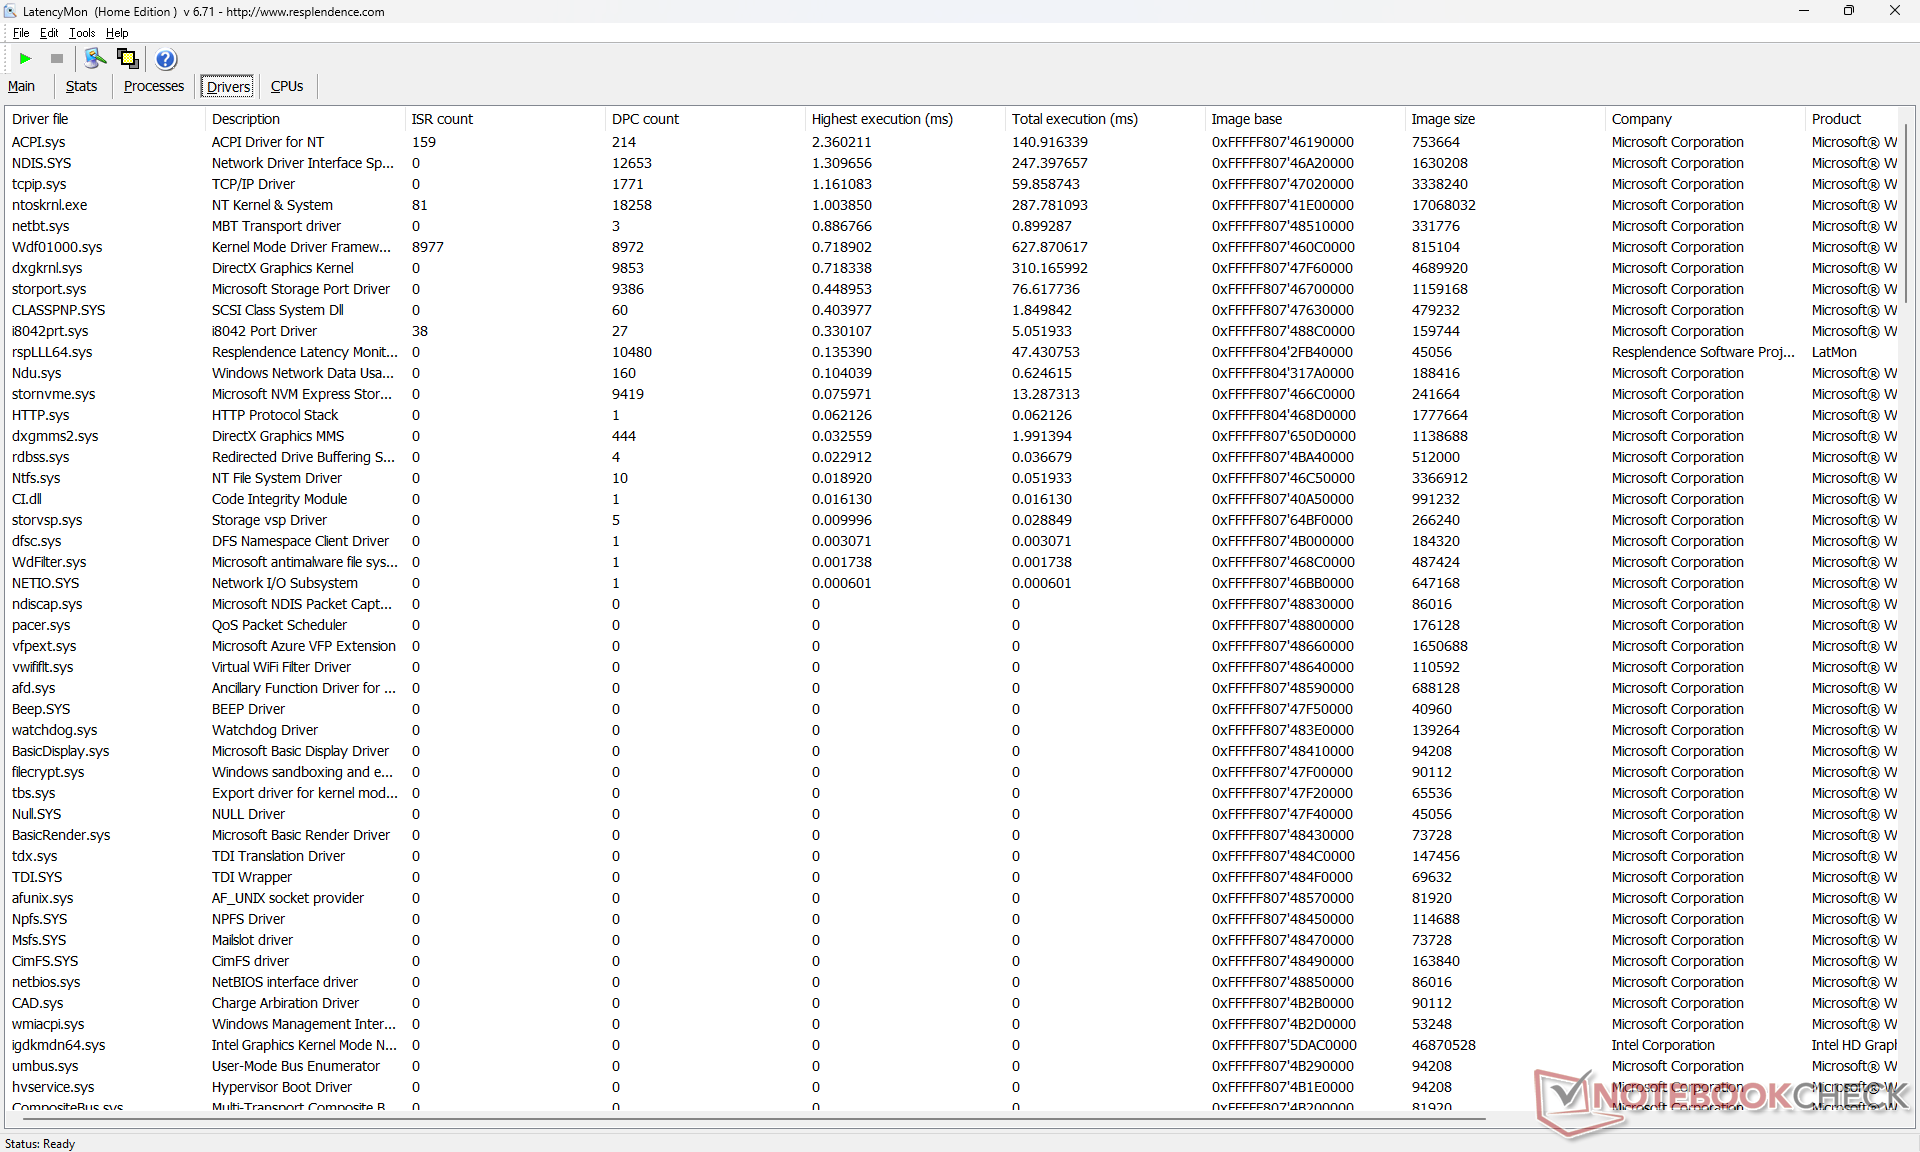
Opóźnienie DPC
LatencyMon ujawnia problemy z DPC podczas otwierania wielu kart przeglądarki na naszej stronie głównej. odtwarzanie wideo 4K przy 60 FPS jest poza tym niemal perfekcyjne - na początku naszego testu pojawiła się tylko jedna klatka.
| DPC Latencies / LatencyMon - interrupt to process latency (max), Web, Youtube, Prime95 | |
| HP EliteBook 840 G9 | |
| HP EliteBook 840 Aero G8 3E4Q6AA | |
| Lenovo ThinkPad X1 Carbon G10 Core i7-1265U | |
| HP EliteBook 845 G9 6F6H6EA | |
| LG Gram 14Z90Q | |
| Dell Latitude 7420 JW6MH | |
* ... im mniej tym lepiej
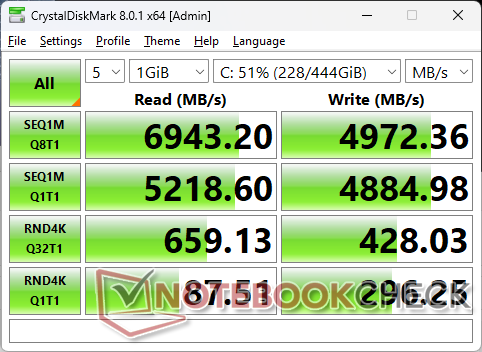
Urządzenia do przechowywania danych
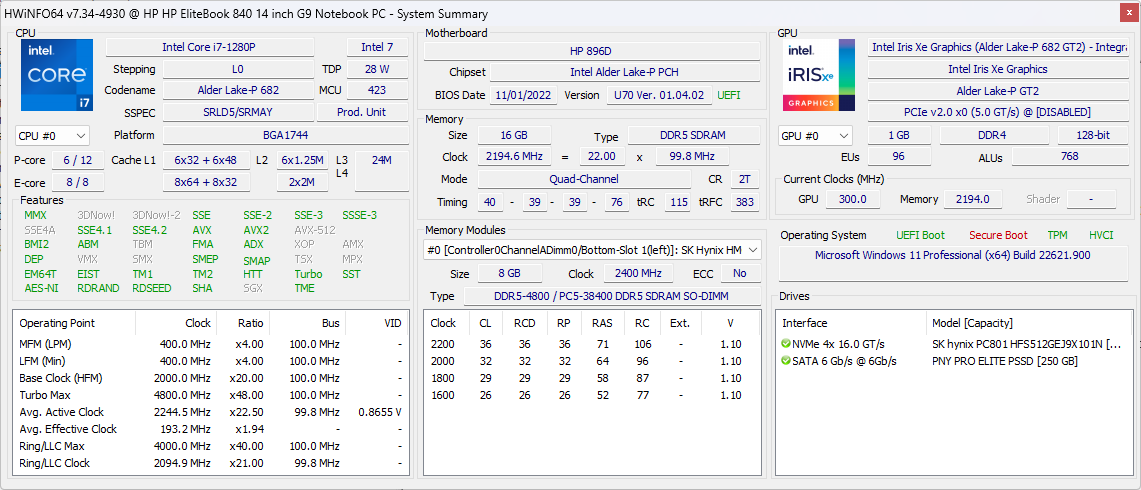
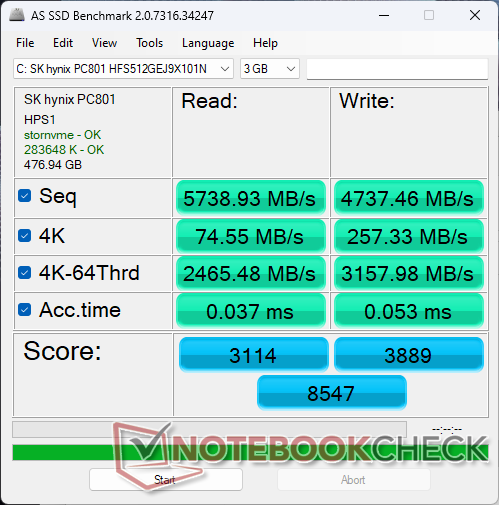
Nasze urządzenie jest dostarczane z 512 GB SK hynix PC801 PCIe4 x4 NVMe SSD, który umożliwia sekwencyjny odczyt i zapis z prędkością odpowiednio 7000 MB/s i 5000 MB/s. Trwały odczyt jest jednak nieco wolniejszy i wynosi 5800 MB/s, co prawdopodobnie wynika z ograniczeń temperaturowych.

| Drive Performance rating - Percent | |
| HP EliteBook 840 G9 | |
| LG Gram 14Z90Q | |
| HP EliteBook 845 G9 6F6H6EA | |
| Lenovo ThinkPad X1 Carbon G10 Core i7-1265U | |
| HP EliteBook 840 Aero G8 3E4Q6AA | |
| Dell Latitude 7420 JW6MH | |
| DiskSpd | |
| seq read | |
| LG Gram 14Z90Q | |
| HP EliteBook 845 G9 6F6H6EA | |
| HP EliteBook 840 G9 | |
| Dell Latitude 7420 JW6MH | |
| Lenovo ThinkPad X1 Carbon G10 Core i7-1265U | |
| HP EliteBook 840 Aero G8 3E4Q6AA | |
| seq write | |
| HP EliteBook 840 G9 | |
| LG Gram 14Z90Q | |
| HP EliteBook 845 G9 6F6H6EA | |
| Lenovo ThinkPad X1 Carbon G10 Core i7-1265U | |
| HP EliteBook 840 Aero G8 3E4Q6AA | |
| Dell Latitude 7420 JW6MH | |
| seq q8 t1 read | |
| HP EliteBook 845 G9 6F6H6EA | |
| LG Gram 14Z90Q | |
| HP EliteBook 840 G9 | |
| HP EliteBook 840 Aero G8 3E4Q6AA | |
| Dell Latitude 7420 JW6MH | |
| Lenovo ThinkPad X1 Carbon G10 Core i7-1265U | |
| seq q8 t1 write | |
| HP EliteBook 845 G9 6F6H6EA | |
| HP EliteBook 840 G9 | |
| LG Gram 14Z90Q | |
| HP EliteBook 840 Aero G8 3E4Q6AA | |
| Lenovo ThinkPad X1 Carbon G10 Core i7-1265U | |
| Dell Latitude 7420 JW6MH | |
| 4k q1 t1 read | |
| LG Gram 14Z90Q | |
| Lenovo ThinkPad X1 Carbon G10 Core i7-1265U | |
| HP EliteBook 840 G9 | |
| Dell Latitude 7420 JW6MH | |
| HP EliteBook 840 Aero G8 3E4Q6AA | |
| HP EliteBook 845 G9 6F6H6EA | |
| 4k q1 t1 write | |
| HP EliteBook 840 G9 | |
| Lenovo ThinkPad X1 Carbon G10 Core i7-1265U | |
| LG Gram 14Z90Q | |
| Dell Latitude 7420 JW6MH | |
| HP EliteBook 840 Aero G8 3E4Q6AA | |
| HP EliteBook 845 G9 6F6H6EA | |
| 4k q32 t16 read | |
| HP EliteBook 840 G9 | |
| LG Gram 14Z90Q | |
| Lenovo ThinkPad X1 Carbon G10 Core i7-1265U | |
| HP EliteBook 840 Aero G8 3E4Q6AA | |
| HP EliteBook 845 G9 6F6H6EA | |
| Dell Latitude 7420 JW6MH | |
| 4k q32 t16 write | |
| HP EliteBook 840 G9 | |
| LG Gram 14Z90Q | |
| Lenovo ThinkPad X1 Carbon G10 Core i7-1265U | |
| HP EliteBook 840 Aero G8 3E4Q6AA | |
| Dell Latitude 7420 JW6MH | |
| HP EliteBook 845 G9 6F6H6EA | |
| AS SSD | |
| Score Total | |
| HP EliteBook 840 G9 | |
| HP EliteBook 845 G9 6F6H6EA | |
| Lenovo ThinkPad X1 Carbon G10 Core i7-1265U | |
| HP EliteBook 840 Aero G8 3E4Q6AA | |
| LG Gram 14Z90Q | |
| Dell Latitude 7420 JW6MH | |
| Score Read | |
| HP EliteBook 840 G9 | |
| Lenovo ThinkPad X1 Carbon G10 Core i7-1265U | |
| HP EliteBook 840 Aero G8 3E4Q6AA | |
| HP EliteBook 845 G9 6F6H6EA | |
| Dell Latitude 7420 JW6MH | |
| LG Gram 14Z90Q | |
| Score Write | |
| HP EliteBook 840 G9 | |
| HP EliteBook 845 G9 6F6H6EA | |
| LG Gram 14Z90Q | |
| HP EliteBook 840 Aero G8 3E4Q6AA | |
| Dell Latitude 7420 JW6MH | |
| Lenovo ThinkPad X1 Carbon G10 Core i7-1265U | |
| Seq Read | |
| HP EliteBook 840 G9 | |
| LG Gram 14Z90Q | |
| HP EliteBook 845 G9 6F6H6EA | |
| HP EliteBook 840 Aero G8 3E4Q6AA | |
| Dell Latitude 7420 JW6MH | |
| Lenovo ThinkPad X1 Carbon G10 Core i7-1265U | |
| Seq Write | |
| HP EliteBook 840 G9 | |
| LG Gram 14Z90Q | |
| Lenovo ThinkPad X1 Carbon G10 Core i7-1265U | |
| HP EliteBook 845 G9 6F6H6EA | |
| HP EliteBook 840 Aero G8 3E4Q6AA | |
| Dell Latitude 7420 JW6MH | |
| 4K Read | |
| HP EliteBook 840 G9 | |
| Dell Latitude 7420 JW6MH | |
| LG Gram 14Z90Q | |
| Lenovo ThinkPad X1 Carbon G10 Core i7-1265U | |
| HP EliteBook 840 Aero G8 3E4Q6AA | |
| HP EliteBook 845 G9 6F6H6EA | |
| 4K Write | |
| HP EliteBook 840 G9 | |
| Lenovo ThinkPad X1 Carbon G10 Core i7-1265U | |
| Dell Latitude 7420 JW6MH | |
| LG Gram 14Z90Q | |
| HP EliteBook 845 G9 6F6H6EA | |
| HP EliteBook 840 Aero G8 3E4Q6AA | |
| 4K-64 Read | |
| HP EliteBook 840 G9 | |
| Lenovo ThinkPad X1 Carbon G10 Core i7-1265U | |
| HP EliteBook 840 Aero G8 3E4Q6AA | |
| Dell Latitude 7420 JW6MH | |
| HP EliteBook 845 G9 6F6H6EA | |
| LG Gram 14Z90Q | |
| 4K-64 Write | |
| HP EliteBook 840 G9 | |
| HP EliteBook 845 G9 6F6H6EA | |
| LG Gram 14Z90Q | |
| HP EliteBook 840 Aero G8 3E4Q6AA | |
| Dell Latitude 7420 JW6MH | |
| Lenovo ThinkPad X1 Carbon G10 Core i7-1265U | |
| Access Time Read | |
| Dell Latitude 7420 JW6MH | |
| HP EliteBook 845 G9 6F6H6EA | |
| Lenovo ThinkPad X1 Carbon G10 Core i7-1265U | |
| LG Gram 14Z90Q | |
| HP EliteBook 840 G9 | |
| HP EliteBook 840 Aero G8 3E4Q6AA | |
| Access Time Write | |
| HP EliteBook 840 Aero G8 3E4Q6AA | |
| Lenovo ThinkPad X1 Carbon G10 Core i7-1265U | |
| HP EliteBook 840 G9 | |
| Dell Latitude 7420 JW6MH | |
| LG Gram 14Z90Q | |
| HP EliteBook 845 G9 6F6H6EA | |
* ... im mniej tym lepiej
Disk Throttling: DiskSpd Read Loop, Queue Depth 8
Wydajność GPU - powyżej średniej Iris Xe 96 EUs
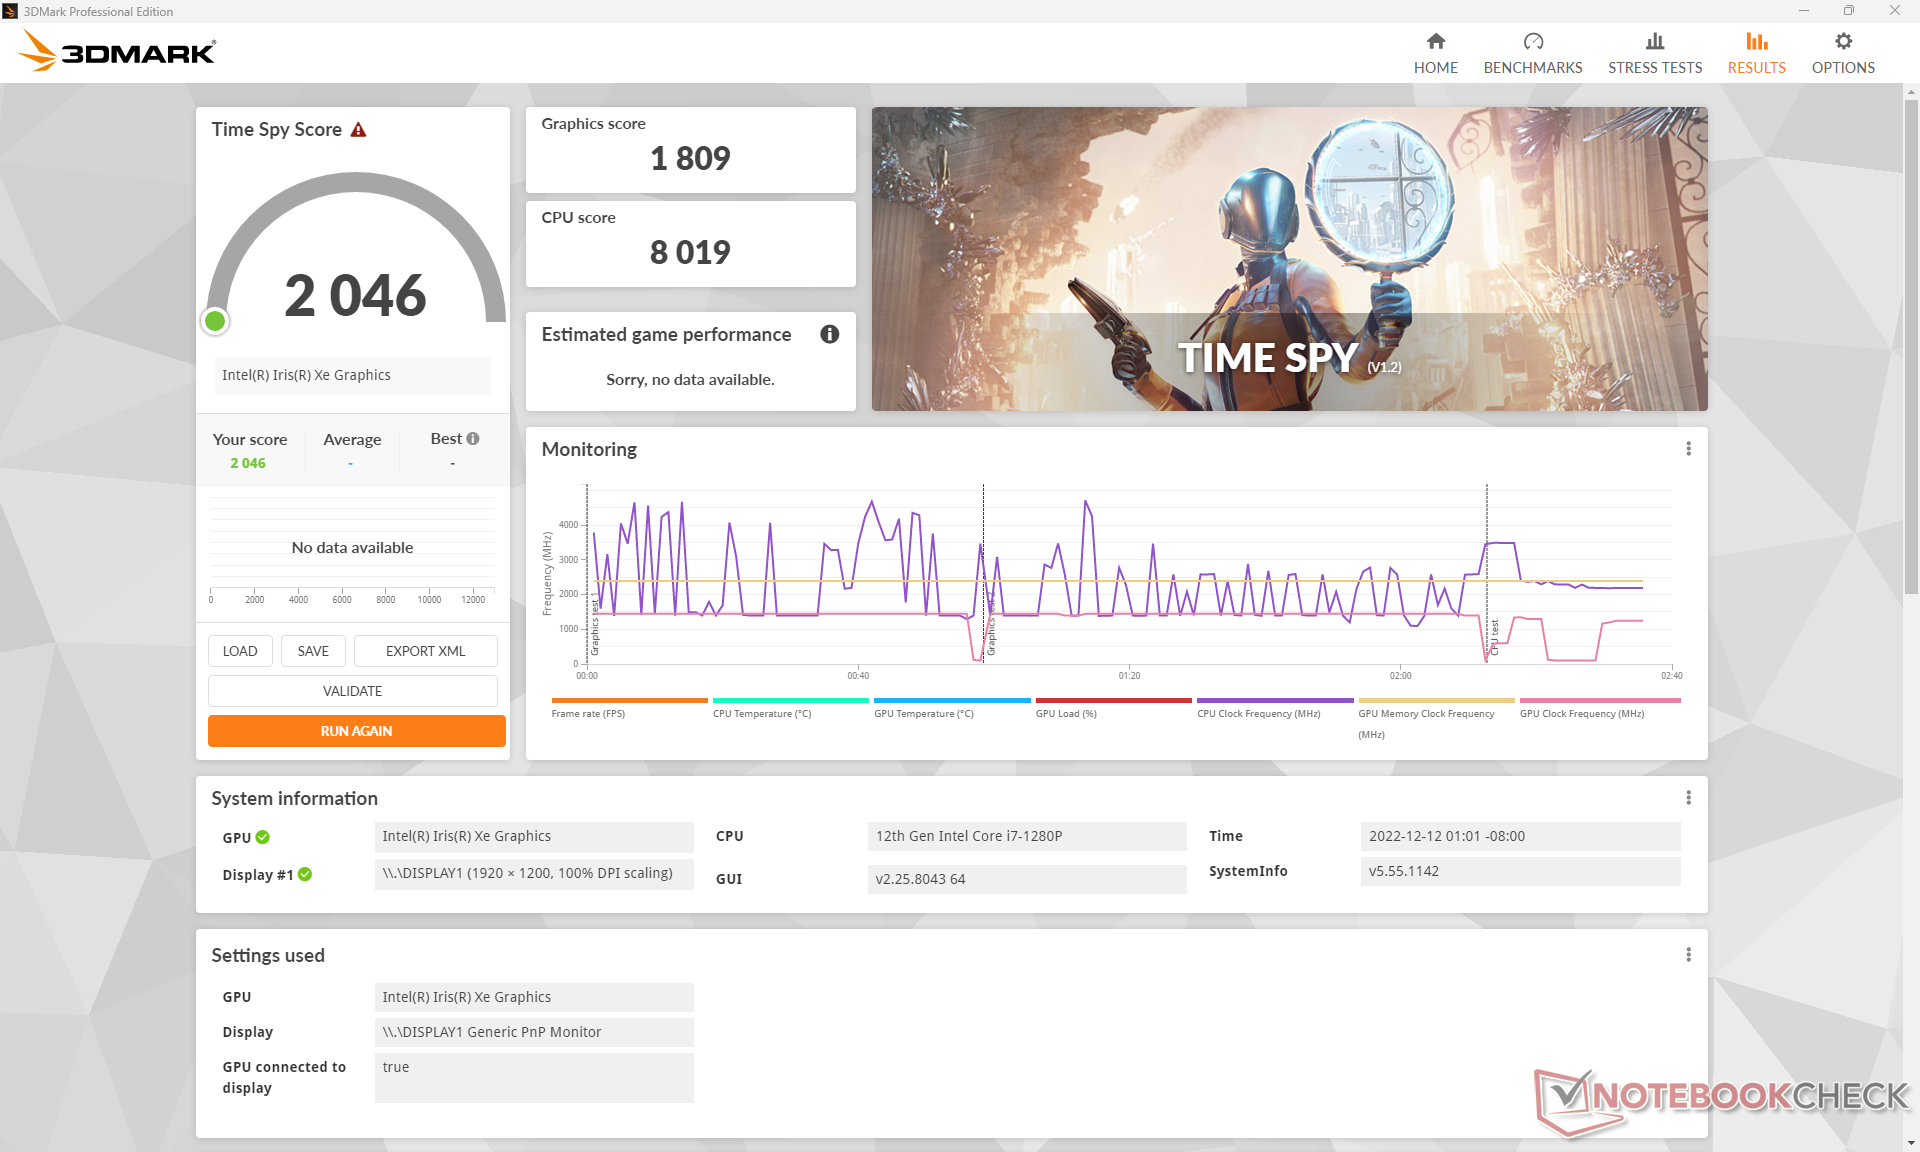
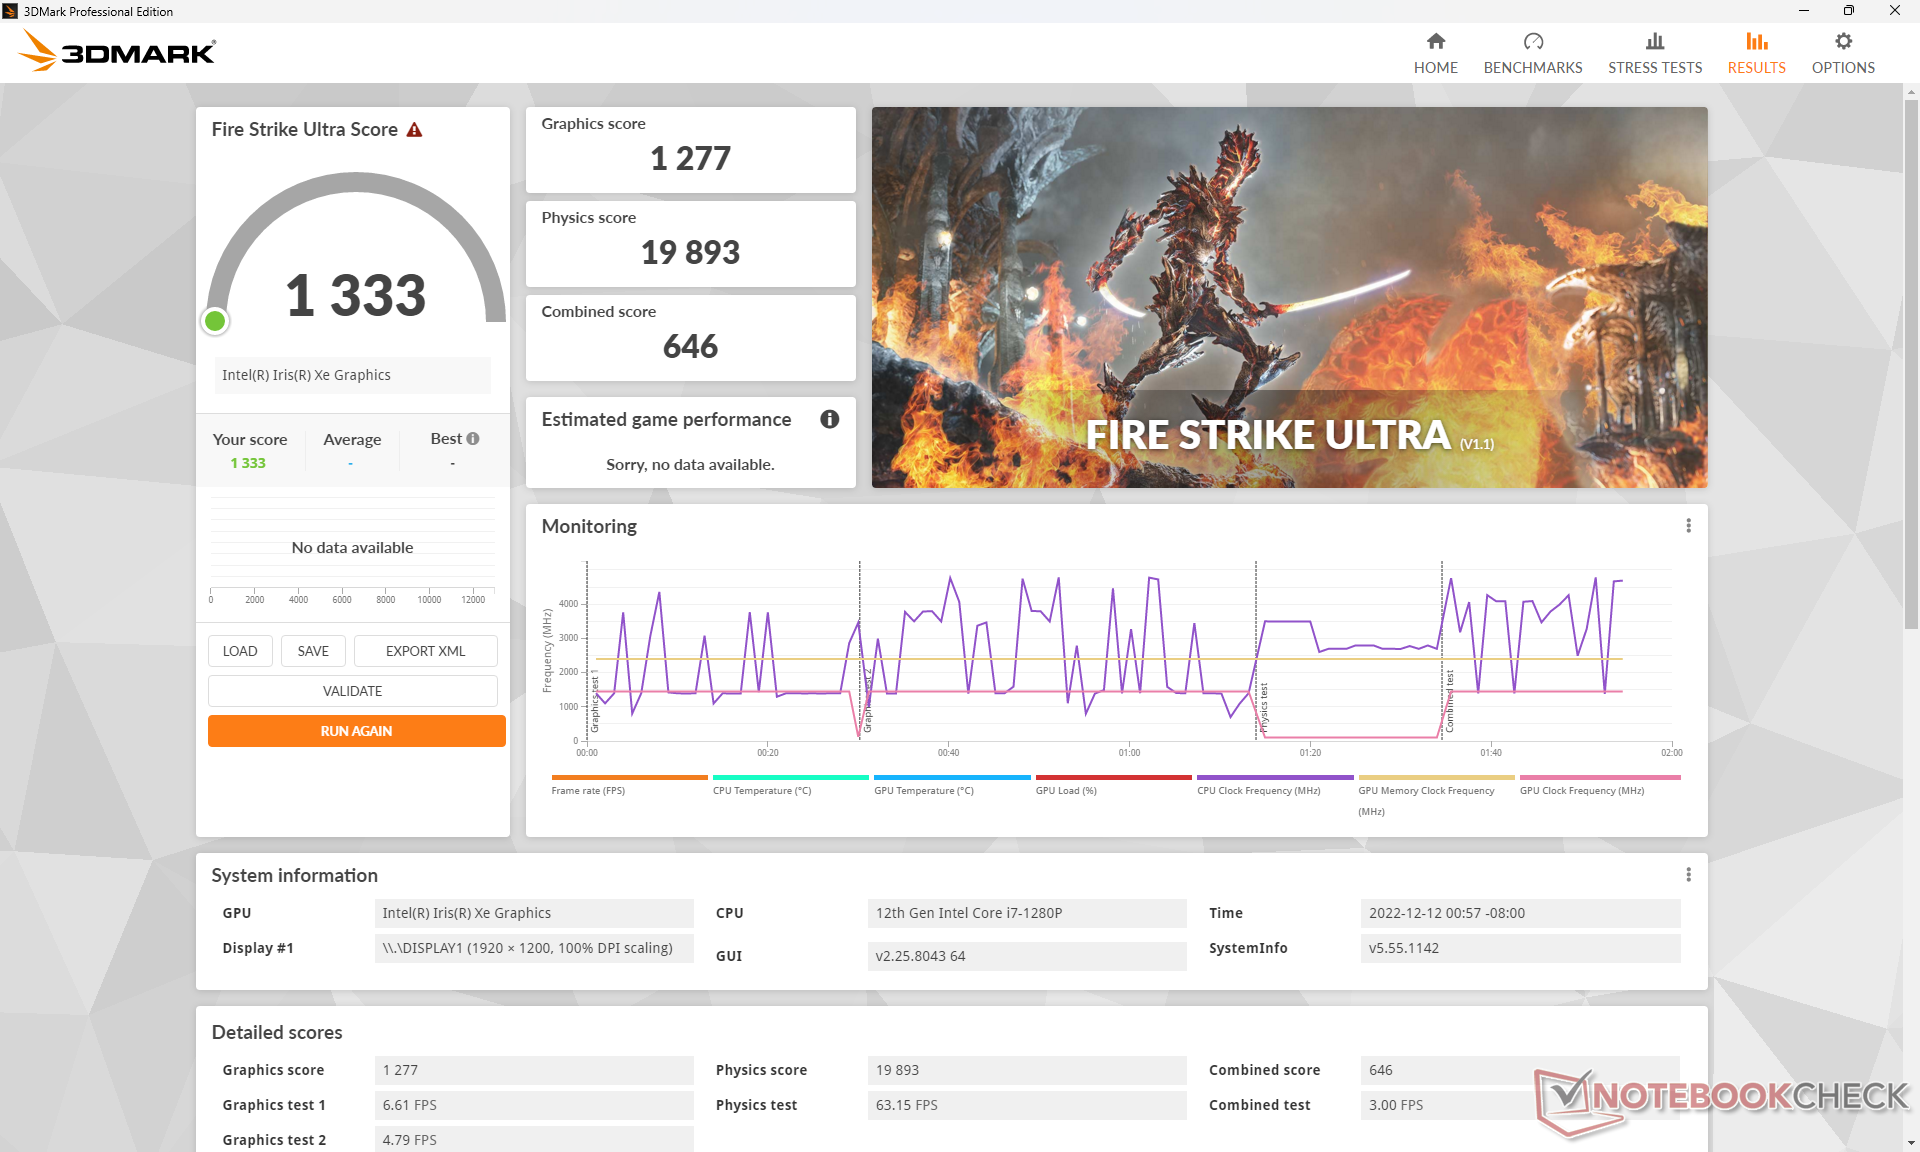
Chociaż Core i7-1280P wykorzystuje ten sam zintegrowany Iris Xe 96 EUs Jak w modelach Core i7-1165G7 lub Core i7-1265U, wydajność grafiki jest w HP nieco wyższa, gdyż procesor Core-P ma wyższą obudowę termiczną. Użytkownicy mogą w związku z tym oczekiwać od 15 do 25 procent szybszego wyświetlania klatek w porównaniu z przeciętnym laptopem napędzanym przez Iris Xe 96 EU. Zmniejszenie wydajności do konfiguracji z procesorem Core i5 z Iris Xe 80 EU spowoduje spadek wydajności graficznej o 20 do 30 procent.
Co ciekawe, nasz procesor graficzny Intela przewyższa konkurencyjnego Radeon 680M w EliteBooku 845 G9, mimo że Radeon 680M może działać szybciej w innych laptopach, np.Lenovo Yoga 7 14. Widać wyraźnie, że zintegrowany procesor graficzny Radeon w EliteBooku osiąga gorsze wyniki.

| 3DMark | |
| 1920x1080 Fire Strike Graphics | |
| HP EliteBook 840 G9 | |
| MSI Summit E14 Flip Evo A12MT | |
| Lenovo ThinkPad X1 Carbon G10 Core i7-1265U | |
| HP EliteBook 840 Aero G8 3E4Q6AA | |
| Przeciętny Intel Iris Xe Graphics G7 96EUs (2286 - 6624, n=222) | |
| Dell Latitude 7420 JW6MH | |
| Lenovo ThinkPad X1 Carbon G10 21CC001RGE | |
| Dell Inspiron 14 7420 2-in-1 | |
| HP EliteBook 845 G9 6F6H6EA | |
| LG Gram 14Z90Q | |
| Asus ExpertBook B3 Flip B3402FEA | |
| Infinix INBook X2 | |
| 2560x1440 Time Spy Graphics | |
| HP EliteBook 840 G9 | |
| MSI Summit E14 Flip Evo A12MT | |
| Lenovo ThinkPad X1 Carbon G10 Core i7-1265U | |
| Przeciętny Intel Iris Xe Graphics G7 96EUs (707 - 1890, n=218) | |
| HP EliteBook 840 Aero G8 3E4Q6AA | |
| LG Gram 14Z90Q | |
| Dell Latitude 7420 JW6MH | |
| HP EliteBook 845 G9 6F6H6EA | |
| Dell Inspiron 14 7420 2-in-1 | |
| Lenovo ThinkPad X1 Carbon G10 21CC001RGE | |
| Asus ExpertBook B3 Flip B3402FEA | |
| Infinix INBook X2 | |
| 2560x1440 Time Spy Score | |
| HP EliteBook 840 G9 | |
| MSI Summit E14 Flip Evo A12MT | |
| Lenovo ThinkPad X1 Carbon G10 Core i7-1265U | |
| Przeciętny Intel Iris Xe Graphics G7 96EUs (789 - 2159, n=215) | |
| HP EliteBook 840 Aero G8 3E4Q6AA | |
| HP EliteBook 845 G9 6F6H6EA | |
| LG Gram 14Z90Q | |
| Dell Latitude 7420 JW6MH | |
| Dell Inspiron 14 7420 2-in-1 | |
| Lenovo ThinkPad X1 Carbon G10 21CC001RGE | |
| Asus ExpertBook B3 Flip B3402FEA | |
| Infinix INBook X2 | |
| 3DMark 11 - 1280x720 Performance GPU | |
| HP EliteBook 845 G9 6F6H6EA | |
| HP EliteBook 840 G9 | |
| HP EliteBook 840 Aero G8 3E4Q6AA | |
| Przeciętny Intel Iris Xe Graphics G7 96EUs (2867 - 7676, n=209) | |
| MSI Summit E14 Flip Evo A12MT | |
| Lenovo ThinkPad X1 Carbon G10 Core i7-1265U | |
| Dell Inspiron 14 7420 2-in-1 | |
| Dell Latitude 7420 JW6MH | |
| Lenovo ThinkPad X1 Carbon G10 21CC001RGE | |
| Asus ExpertBook B3 Flip B3402FEA | |
| LG Gram 14Z90Q | |
| Infinix INBook X2 | |
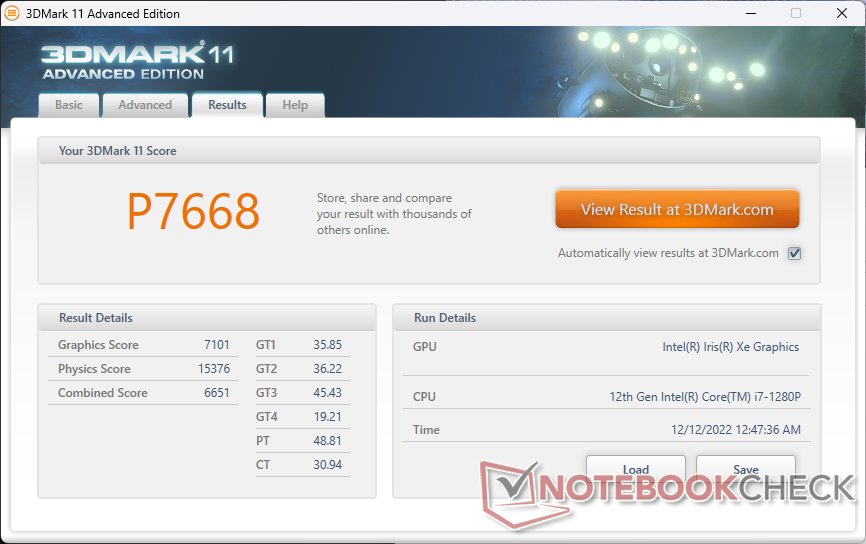
| 3DMark 11 Performance | 7668 pkt. | |
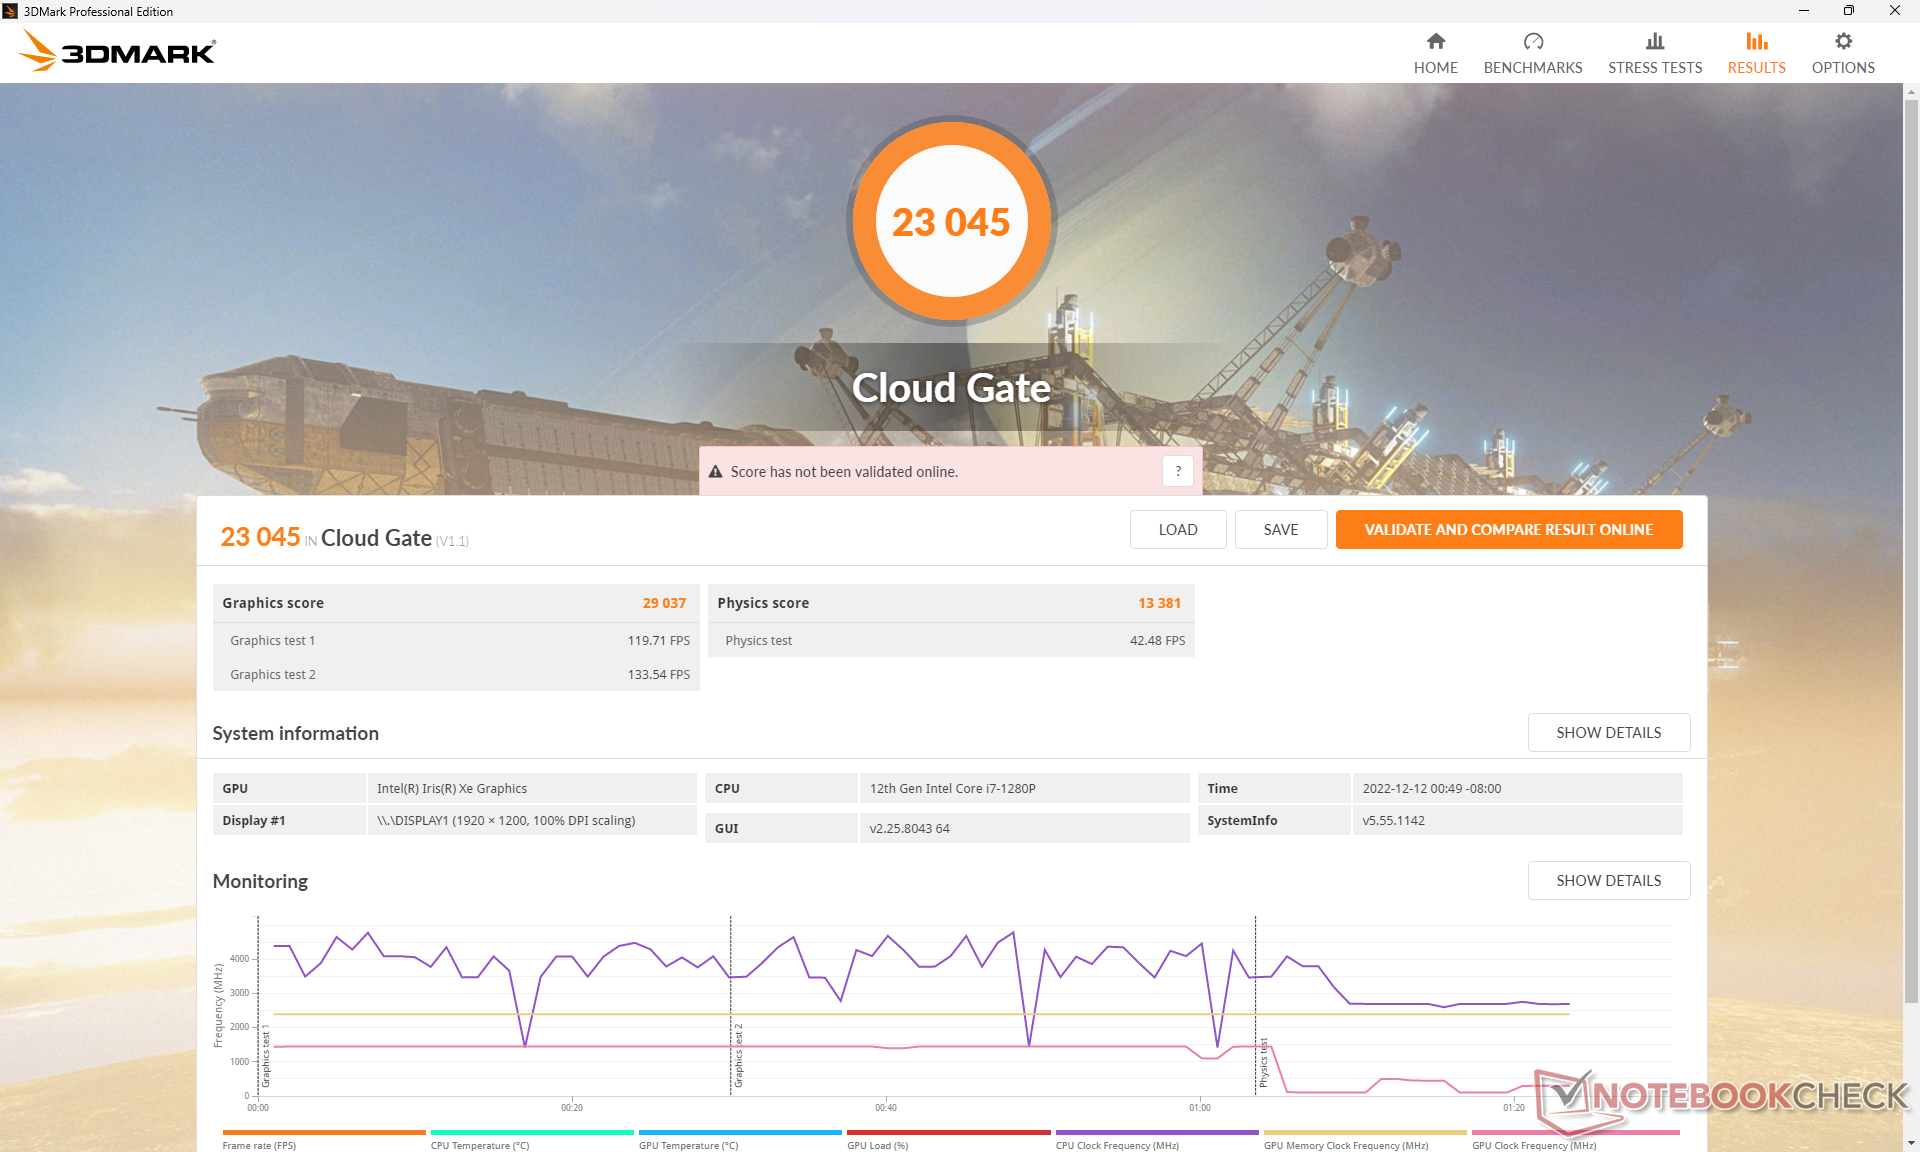
| 3DMark Cloud Gate Standard Score | 23045 pkt. | |
| 3DMark Fire Strike Score | 5252 pkt. | |
| 3DMark Time Spy Score | 2046 pkt. | |
Pomoc | ||
| The Witcher 3 | |
| 1024x768 Low Graphics & Postprocessing | |
| HP EliteBook 840 G9 | |
| MSI Summit E14 Flip Evo A12MT | |
| Lenovo ThinkPad X1 Carbon G10 Core i7-1265U | |
| HP EliteBook 840 Aero G8 3E4Q6AA | |
| Przeciętny Intel Iris Xe Graphics G7 96EUs (28.9 - 117.2, n=188) | |
| Dell Inspiron 14 7420 2-in-1 | |
| Lenovo ThinkPad X1 Carbon G10 21CC001RGE | |
| Asus ExpertBook B3 Flip B3402FEA | |
| Infinix INBook X2 | |
| LG Gram 14Z90Q | |
| 1366x768 Medium Graphics & Postprocessing | |
| MSI Summit E14 Flip Evo A12MT | |
| Lenovo ThinkPad X1 Carbon G10 Core i7-1265U | |
| HP EliteBook 840 G9 | |
| Przeciętny Intel Iris Xe Graphics G7 96EUs (21.4 - 77.8, n=185) | |
| HP EliteBook 840 Aero G8 3E4Q6AA | |
| Dell Inspiron 14 7420 2-in-1 | |
| Lenovo ThinkPad X1 Carbon G10 21CC001RGE | |
| HP EliteBook 845 G9 6F6H6EA | |
| Dell Latitude 7420 JW6MH | |
| Asus ExpertBook B3 Flip B3402FEA | |
| Infinix INBook X2 | |
| LG Gram 14Z90Q | |
| 1920x1080 High Graphics & Postprocessing (Nvidia HairWorks Off) | |
| HP EliteBook 840 G9 | |
| MSI Summit E14 Flip Evo A12MT | |
| Lenovo ThinkPad X1 Carbon G10 Core i7-1265U | |
| Przeciętny Intel Iris Xe Graphics G7 96EUs (10.6 - 45.9, n=191) | |
| HP EliteBook 840 Aero G8 3E4Q6AA | |
| Dell Inspiron 14 7420 2-in-1 | |
| LG Gram 14Z90Q | |
| Lenovo ThinkPad X1 Carbon G10 21CC001RGE | |
| HP EliteBook 845 G9 6F6H6EA | |
| Infinix INBook X2 | |
| Asus ExpertBook B3 Flip B3402FEA | |
| Dell Latitude 7420 JW6MH | |
| 1920x1080 Ultra Graphics & Postprocessing (HBAO+) | |
| HP EliteBook 840 G9 | |
| MSI Summit E14 Flip Evo A12MT | |
| Lenovo ThinkPad X1 Carbon G10 Core i7-1265U | |
| HP EliteBook 845 G9 6F6H6EA | |
| Przeciętny Intel Iris Xe Graphics G7 96EUs (8.79 - 20.1, n=181) | |
| HP EliteBook 840 Aero G8 3E4Q6AA | |
| LG Gram 14Z90Q | |
| Dell Inspiron 14 7420 2-in-1 | |
| Dell Latitude 7420 JW6MH | |
| Lenovo ThinkPad X1 Carbon G10 21CC001RGE | |
| Asus ExpertBook B3 Flip B3402FEA | |
| Infinix INBook X2 | |
| Dota 2 Reborn | |
| 1280x720 min (0/3) fastest | |
| MSI Summit E14 Flip Evo A12MT | |
| Dell Latitude 7420 JW6MH | |
| HP EliteBook 845 G9 6F6H6EA | |
| Dell Inspiron 14 7420 2-in-1 | |
| HP EliteBook 840 G9 | |
| Lenovo ThinkPad X1 Carbon G10 Core i7-1265U | |
| LG Gram 14Z90Q | |
| Przeciętny Intel Iris Xe Graphics G7 96EUs (36 - 148, n=221) | |
| Asus ExpertBook B3 Flip B3402FEA | |
| Infinix INBook X2 | |
| Lenovo ThinkPad X1 Carbon G10 21CC001RGE | |
| HP EliteBook 840 Aero G8 3E4Q6AA | |
| 1366x768 med (1/3) | |
| Dell Latitude 7420 JW6MH | |
| MSI Summit E14 Flip Evo A12MT | |
| HP EliteBook 840 G9 | |
| HP EliteBook 845 G9 6F6H6EA | |
| Lenovo ThinkPad X1 Carbon G10 Core i7-1265U | |
| Dell Inspiron 14 7420 2-in-1 | |
| Przeciętny Intel Iris Xe Graphics G7 96EUs (31.6 - 108.5, n=221) | |
| LG Gram 14Z90Q | |
| HP EliteBook 840 Aero G8 3E4Q6AA | |
| Lenovo ThinkPad X1 Carbon G10 21CC001RGE | |
| Infinix INBook X2 | |
| Asus ExpertBook B3 Flip B3402FEA | |
| 1920x1080 high (2/3) | |
| HP EliteBook 840 G9 | |
| MSI Summit E14 Flip Evo A12MT | |
| Lenovo ThinkPad X1 Carbon G10 Core i7-1265U | |
| Dell Latitude 7420 JW6MH | |
| HP EliteBook 845 G9 6F6H6EA | |
| Przeciętny Intel Iris Xe Graphics G7 96EUs (23.2 - 88.1, n=221) | |
| Dell Inspiron 14 7420 2-in-1 | |
| HP EliteBook 840 Aero G8 3E4Q6AA | |
| Lenovo ThinkPad X1 Carbon G10 21CC001RGE | |
| Asus ExpertBook B3 Flip B3402FEA | |
| LG Gram 14Z90Q | |
| Infinix INBook X2 | |
| 1920x1080 ultra (3/3) best looking | |
| HP EliteBook 840 G9 | |
| MSI Summit E14 Flip Evo A12MT | |
| Lenovo ThinkPad X1 Carbon G10 Core i7-1265U | |
| Dell Latitude 7420 JW6MH | |
| Przeciętny Intel Iris Xe Graphics G7 96EUs (20.6 - 78.5, n=221) | |
| HP EliteBook 845 G9 6F6H6EA | |
| Dell Inspiron 14 7420 2-in-1 | |
| HP EliteBook 840 Aero G8 3E4Q6AA | |
| Asus ExpertBook B3 Flip B3402FEA | |
| Lenovo ThinkPad X1 Carbon G10 21CC001RGE | |
| LG Gram 14Z90Q | |
| Infinix INBook X2 | |
| X-Plane 11.11 | |
| 1280x720 low (fps_test=1) | |
| Dell Inspiron 14 7420 2-in-1 | |
| MSI Summit E14 Flip Evo A12MT | |
| HP EliteBook 840 G9 | |
| Przeciętny Intel Iris Xe Graphics G7 96EUs (13.4 - 88.4, n=213) | |
| Lenovo ThinkPad X1 Carbon G10 Core i7-1265U | |
| HP EliteBook 845 G9 6F6H6EA | |
| LG Gram 14Z90Q | |
| Lenovo ThinkPad X1 Carbon G10 21CC001RGE | |
| Asus ExpertBook B3 Flip B3402FEA | |
| HP EliteBook 840 Aero G8 3E4Q6AA | |
| Infinix INBook X2 | |
| Dell Latitude 7420 JW6MH | |
| 1920x1080 med (fps_test=2) | |
| Dell Inspiron 14 7420 2-in-1 | |
| Przeciętny Intel Iris Xe Graphics G7 96EUs (11.6 - 69.5, n=214) | |
| Lenovo ThinkPad X1 Carbon G10 Core i7-1265U | |
| MSI Summit E14 Flip Evo A12MT | |
| HP EliteBook 840 G9 | |
| HP EliteBook 840 Aero G8 3E4Q6AA | |
| HP EliteBook 845 G9 6F6H6EA | |
| Lenovo ThinkPad X1 Carbon G10 21CC001RGE | |
| Dell Latitude 7420 JW6MH | |
| LG Gram 14Z90Q | |
| Infinix INBook X2 | |
| Asus ExpertBook B3 Flip B3402FEA | |
| 1920x1080 high (fps_test=3) | |
| Dell Inspiron 14 7420 2-in-1 | |
| HP EliteBook 840 G9 | |
| MSI Summit E14 Flip Evo A12MT | |
| Przeciętny Intel Iris Xe Graphics G7 96EUs (11.1 - 59.8, n=213) | |
| Lenovo ThinkPad X1 Carbon G10 Core i7-1265U | |
| HP EliteBook 840 Aero G8 3E4Q6AA | |
| HP EliteBook 845 G9 6F6H6EA | |
| LG Gram 14Z90Q | |
| Lenovo ThinkPad X1 Carbon G10 21CC001RGE | |
| Asus ExpertBook B3 Flip B3402FEA | |
| Infinix INBook X2 | |
| Dell Latitude 7420 JW6MH | |
| Final Fantasy XV Benchmark | |
| 1280x720 Lite Quality | |
| HP EliteBook 840 G9 | |
| MSI Summit E14 Flip Evo A12MT | |
| Lenovo ThinkPad X1 Carbon G10 Core i7-1265U | |
| Przeciętny Intel Iris Xe Graphics G7 96EUs (14.9 - 56.5, n=189) | |
| HP EliteBook 840 Aero G8 3E4Q6AA | |
| HP EliteBook 845 G9 6F6H6EA | |
| Dell Inspiron 14 7420 2-in-1 | |
| LG Gram 14Z90Q | |
| Lenovo ThinkPad X1 Carbon G10 21CC001RGE | |
| Dell Latitude 7420 JW6MH | |
| Asus ExpertBook B3 Flip B3402FEA | |
| Infinix INBook X2 | |
| 1920x1080 Standard Quality | |
| HP EliteBook 840 G9 | |
| MSI Summit E14 Flip Evo A12MT | |
| Lenovo ThinkPad X1 Carbon G10 Core i7-1265U | |
| Przeciętny Intel Iris Xe Graphics G7 96EUs (10.5 - 31.2, n=185) | |
| HP EliteBook 840 Aero G8 3E4Q6AA | |
| HP EliteBook 845 G9 6F6H6EA | |
| Dell Latitude 7420 JW6MH | |
| Dell Inspiron 14 7420 2-in-1 | |
| LG Gram 14Z90Q | |
| Lenovo ThinkPad X1 Carbon G10 21CC001RGE | |
| Asus ExpertBook B3 Flip B3402FEA | |
| Infinix INBook X2 | |
| 1920x1080 High Quality | |
| MSI Summit E14 Flip Evo A12MT | |
| HP EliteBook 840 G9 | |
| Przeciętny Intel Iris Xe Graphics G7 96EUs (8.15 - 27.8, n=178) | |
| Lenovo ThinkPad X1 Carbon G10 Core i7-1265U | |
| LG Gram 14Z90Q | |
| HP EliteBook 840 Aero G8 3E4Q6AA | |
| HP EliteBook 845 G9 6F6H6EA | |
| Dell Inspiron 14 7420 2-in-1 | |
| Asus ExpertBook B3 Flip B3402FEA | |
| Infinix INBook X2 | |
| Lenovo ThinkPad X1 Carbon G10 21CC001RGE | |
| Strange Brigade | |
| 1280x720 lowest AF:1 | |
| MSI Summit E14 Flip Evo A12MT | |
| HP EliteBook 840 G9 | |
| Lenovo ThinkPad X1 Carbon G10 Core i7-1265U | |
| Przeciętny Intel Iris Xe Graphics G7 96EUs (48.5 - 115.1, n=172) | |
| HP EliteBook 840 Aero G8 3E4Q6AA | |
| HP EliteBook 845 G9 6F6H6EA | |
| Dell Inspiron 14 7420 2-in-1 | |
| LG Gram 14Z90Q | |
| Dell Latitude 7420 JW6MH | |
| Asus ExpertBook B3 Flip B3402FEA | |
| Infinix INBook X2 | |
| 1920x1080 medium AA:medium AF:4 | |
| MSI Summit E14 Flip Evo A12MT | |
| HP EliteBook 840 G9 | |
| Lenovo ThinkPad X1 Carbon G10 Core i7-1265U | |
| Przeciętny Intel Iris Xe Graphics G7 96EUs (18.2 - 51.4, n=170) | |
| HP EliteBook 840 Aero G8 3E4Q6AA | |
| HP EliteBook 845 G9 6F6H6EA | |
| Dell Latitude 7420 JW6MH | |
| Dell Inspiron 14 7420 2-in-1 | |
| LG Gram 14Z90Q | |
| Infinix INBook X2 | |
| Asus ExpertBook B3 Flip B3402FEA | |
| 1920x1080 high AA:high AF:8 | |
| HP EliteBook 840 G9 | |
| MSI Summit E14 Flip Evo A12MT | |
| Lenovo ThinkPad X1 Carbon G10 Core i7-1265U | |
| Przeciętny Intel Iris Xe Graphics G7 96EUs (15.4 - 39.8, n=169) | |
| HP EliteBook 840 Aero G8 3E4Q6AA | |
| HP EliteBook 845 G9 6F6H6EA | |
| Dell Inspiron 14 7420 2-in-1 | |
| Dell Latitude 7420 JW6MH | |
| LG Gram 14Z90Q | |
| Asus ExpertBook B3 Flip B3402FEA | |
| Infinix INBook X2 | |
| 1920x1080 ultra AA:ultra AF:16 | |
| MSI Summit E14 Flip Evo A12MT | |
| HP EliteBook 840 G9 | |
| Lenovo ThinkPad X1 Carbon G10 Core i7-1265U | |
| Przeciętny Intel Iris Xe Graphics G7 96EUs (13.2 - 31.7, n=167) | |
| HP EliteBook 840 Aero G8 3E4Q6AA | |
| HP EliteBook 845 G9 6F6H6EA | |
| Dell Inspiron 14 7420 2-in-1 | |
| Dell Latitude 7420 JW6MH | |
| Asus ExpertBook B3 Flip B3402FEA | |
| Cyberpunk 2077 1.6 | |
| 1920x1080 Low Preset | |
| MSI Summit E14 Flip Evo A12MT | |
| Lenovo ThinkPad X1 Carbon G10 Core i7-1265U | |
| HP EliteBook 840 G9 | |
| Przeciętny Intel Iris Xe Graphics G7 96EUs (13 - 25.9, n=42) | |
| Dell Inspiron 14 7420 2-in-1 | |
| 1920x1080 Medium Preset | |
| MSI Summit E14 Flip Evo A12MT | |
| Lenovo ThinkPad X1 Carbon G10 Core i7-1265U | |
| HP EliteBook 840 G9 | |
| Przeciętny Intel Iris Xe Graphics G7 96EUs (10.8 - 21.7, n=37) | |
| Dell Inspiron 14 7420 2-in-1 | |
| 1920x1080 High Preset | |
| MSI Summit E14 Flip Evo A12MT | |
| Lenovo ThinkPad X1 Carbon G10 Core i7-1265U | |
| HP EliteBook 840 G9 | |
| Przeciętny Intel Iris Xe Graphics G7 96EUs (9.8 - 16.9, n=34) | |
| Dell Inspiron 14 7420 2-in-1 | |
| 1920x1080 Ultra Preset | |
| MSI Summit E14 Flip Evo A12MT | |
| Lenovo ThinkPad X1 Carbon G10 Core i7-1265U | |
| HP EliteBook 840 G9 | |
| Przeciętny Intel Iris Xe Graphics G7 96EUs (7.4 - 16.8, n=32) | |
| Dell Inspiron 14 7420 2-in-1 | |
| GTA V | |
| 1024x768 Lowest Settings possible | |
| MSI Summit E14 Flip Evo A12MT | |
| HP EliteBook 840 G9 | |
| Lenovo ThinkPad X1 Carbon G10 Core i7-1265U | |
| Dell Latitude 7420 JW6MH | |
| Przeciętny Intel Iris Xe Graphics G7 96EUs (52 - 166.4, n=168) | |
| Dell Inspiron 14 7420 2-in-1 | |
| HP EliteBook 840 Aero G8 3E4Q6AA | |
| LG Gram 14Z90Q | |
| Asus ExpertBook B3 Flip B3402FEA | |
| 1920x1080 Lowest Settings possible | |
| MSI Summit E14 Flip Evo A12MT | |
| HP EliteBook 840 G9 | |
| Lenovo ThinkPad X1 Carbon G10 Core i7-1265U | |
| Przeciętny Intel Iris Xe Graphics G7 96EUs (34.7 - 132.1, n=141) | |
| HP EliteBook 840 Aero G8 3E4Q6AA | |
| Dell Inspiron 14 7420 2-in-1 | |
| LG Gram 14Z90Q | |
| Asus ExpertBook B3 Flip B3402FEA | |
| 1366x768 Normal/Off AF:4x | |
| MSI Summit E14 Flip Evo A12MT | |
| HP EliteBook 840 G9 | |
| Lenovo ThinkPad X1 Carbon G10 Core i7-1265U | |
| Dell Latitude 7420 JW6MH | |
| Przeciętny Intel Iris Xe Graphics G7 96EUs (24.1 - 152.7, n=169) | |
| Dell Inspiron 14 7420 2-in-1 | |
| HP EliteBook 840 Aero G8 3E4Q6AA | |
| LG Gram 14Z90Q | |
| Asus ExpertBook B3 Flip B3402FEA | |
| 1920x1080 Normal/Off AF:4x | |
| MSI Summit E14 Flip Evo A12MT | |
| HP EliteBook 840 G9 | |
| Lenovo ThinkPad X1 Carbon G10 Core i7-1265U | |
| Przeciętny Intel Iris Xe Graphics G7 96EUs (20 - 119.3, n=142) | |
| HP EliteBook 840 Aero G8 3E4Q6AA | |
| LG Gram 14Z90Q | |
| Dell Inspiron 14 7420 2-in-1 | |
| Asus ExpertBook B3 Flip B3402FEA | |
| 1920x1080 High/On (Advanced Graphics Off) AA:2xMSAA + FX AF:8x | |
| HP EliteBook 845 G9 6F6H6EA | |
| Dell Latitude 7420 JW6MH | |
| HP EliteBook 840 G9 | |
| Przeciętny Intel Iris Xe Graphics G7 96EUs (9.39 - 51.6, n=162) | |
| Lenovo ThinkPad X1 Carbon G10 Core i7-1265U | |
| HP EliteBook 840 Aero G8 3E4Q6AA | |
| MSI Summit E14 Flip Evo A12MT | |
| LG Gram 14Z90Q | |
| Dell Inspiron 14 7420 2-in-1 | |
| Asus ExpertBook B3 Flip B3402FEA | |
| 1920x1080 Highest AA:4xMSAA + FX AF:16x | |
| HP EliteBook 845 G9 6F6H6EA | |
| HP EliteBook 840 G9 | |
| Dell Latitude 7420 JW6MH | |
| MSI Summit E14 Flip Evo A12MT | |
| Lenovo ThinkPad X1 Carbon G10 Core i7-1265U | |
| Przeciętny Intel Iris Xe Graphics G7 96EUs (4.13 - 22.9, n=156) | |
| HP EliteBook 840 Aero G8 3E4Q6AA | |
| Dell Inspiron 14 7420 2-in-1 | |
| Asus ExpertBook B3 Flip B3402FEA | |
Witcher 3 FPS Chart
| low | med. | high | ultra | |
|---|---|---|---|---|
| GTA V (2015) | 108.6 | 97.3 | 23.4 | 10.2 |
| The Witcher 3 (2015) | 100.1 | 59.3 | 35 | 16.4 |
| Dota 2 Reborn (2015) | 108.3 | 84.9 | 68.8 | 61.8 |
| Final Fantasy XV Benchmark (2018) | 46.9 | 26.1 | 18.4 | |
| X-Plane 11.11 (2018) | 46.1 | 34.5 | 33.7 | |
| Strange Brigade (2018) | 95.1 | 43.4 | 35.9 | 27.4 |
| Cyberpunk 2077 1.6 (2022) | 19.6 | 16.8 | 13 | 10.8 |
Emisje - chłodno i cicho
Szum systemu
Szum wentylatora i jego zachowanie są podobne do tego, co zarejestrowaliśmy w modelu w wersji AMD. Wewnętrzny wentylator doskonale radzi sobie z utrzymywaniem jak najdłużej stanu spoczynku przy większych obciążeniach. Przykładowo, jednokrotne uruchomienie pierwszej sceny benchmarku 3DMark 06 spowodowało, że szum wentylatora wyniósł zaledwie 32 dB(A) na tle cichego tła o wartości 24 dB(A). Po kilkukrotnym uruchomieniu wentylator ustabilizował się na poziomie około 39 dB(A), przy czym jedynie chwilowo występowały impulsy o natężeniu do 45 dB(A). Ogólny hałas wentylatora jest głośniejszy od tego, co odnotowaliśmy w ubiegłorocznym EliteBook 840 Aero G8 który wykorzystuje wolniejszy procesor 11. generacji z serii Core U.
Hałas
| luz |
| 24.5 / 24.5 / 26 dB |
| obciążenie |
| 32.3 / 44.7 dB |
 | ||
30 dB cichy 40 dB(A) słyszalny 50 dB(A) irytujący |
||
min: | ||
| HP EliteBook 840 G9 Iris Xe G7 96EUs, i7-1280P, SK hynix PC801 HFS512GEJ9X101N BF | HP EliteBook 845 G9 6F6H6EA Radeon 680M, R9 PRO 6950HS, WDC PC SN810 1TB | HP EliteBook 840 Aero G8 3E4Q6AA Iris Xe G7 96EUs, i7-1185G7, SK Hynix PC711 512GB HFS512GDE9X073N | Lenovo ThinkPad X1 Carbon G10 Core i7-1265U Iris Xe G7 96EUs, i7-1265U, Kioxia BG5 KBG5AZNV1T02 | LG Gram 14Z90Q Iris Xe G7 80EUs, i5-1240P, Samsung PM9A1 MZVL2512HCJQ | Dell Latitude 7420 JW6MH Iris Xe G7 80EUs, i5-1145G7, SK Hynix BC711 HFM512GD3HX015N | |
|---|---|---|---|---|---|---|
| Noise | -5% | 13% | 3% | -1% | -8% | |
| wyłączone / środowisko * (dB) | 24.3 | 25.5 -5% | 24.1 1% | 23.2 5% | 25 -3% | 25.3 -4% |
| Idle Minimum * (dB) | 24.5 | 25.5 -4% | 24.2 1% | 23.2 5% | 26 -6% | 25.3 -3% |
| Idle Average * (dB) | 24.5 | 25.5 -4% | 24.2 1% | 23.2 5% | 27 -10% | 25.3 -3% |
| Idle Maximum * (dB) | 26 | 25.5 2% | 24.2 7% | 23.2 11% | 28 -8% | 25.3 3% |
| Load Average * (dB) | 32.3 | 38.1 -18% | 26.9 17% | 38.6 -20% | 35 -8% | 44.9 -39% |
| Witcher 3 ultra * (dB) | 39 | 27.9 28% | 38.5 1% | 36 8% | ||
| Load Maximum * (dB) | 44.7 | 44 2% | 29.9 33% | 38.3 14% | 36 19% | 44.9 -0% |
* ... im mniej tym lepiej
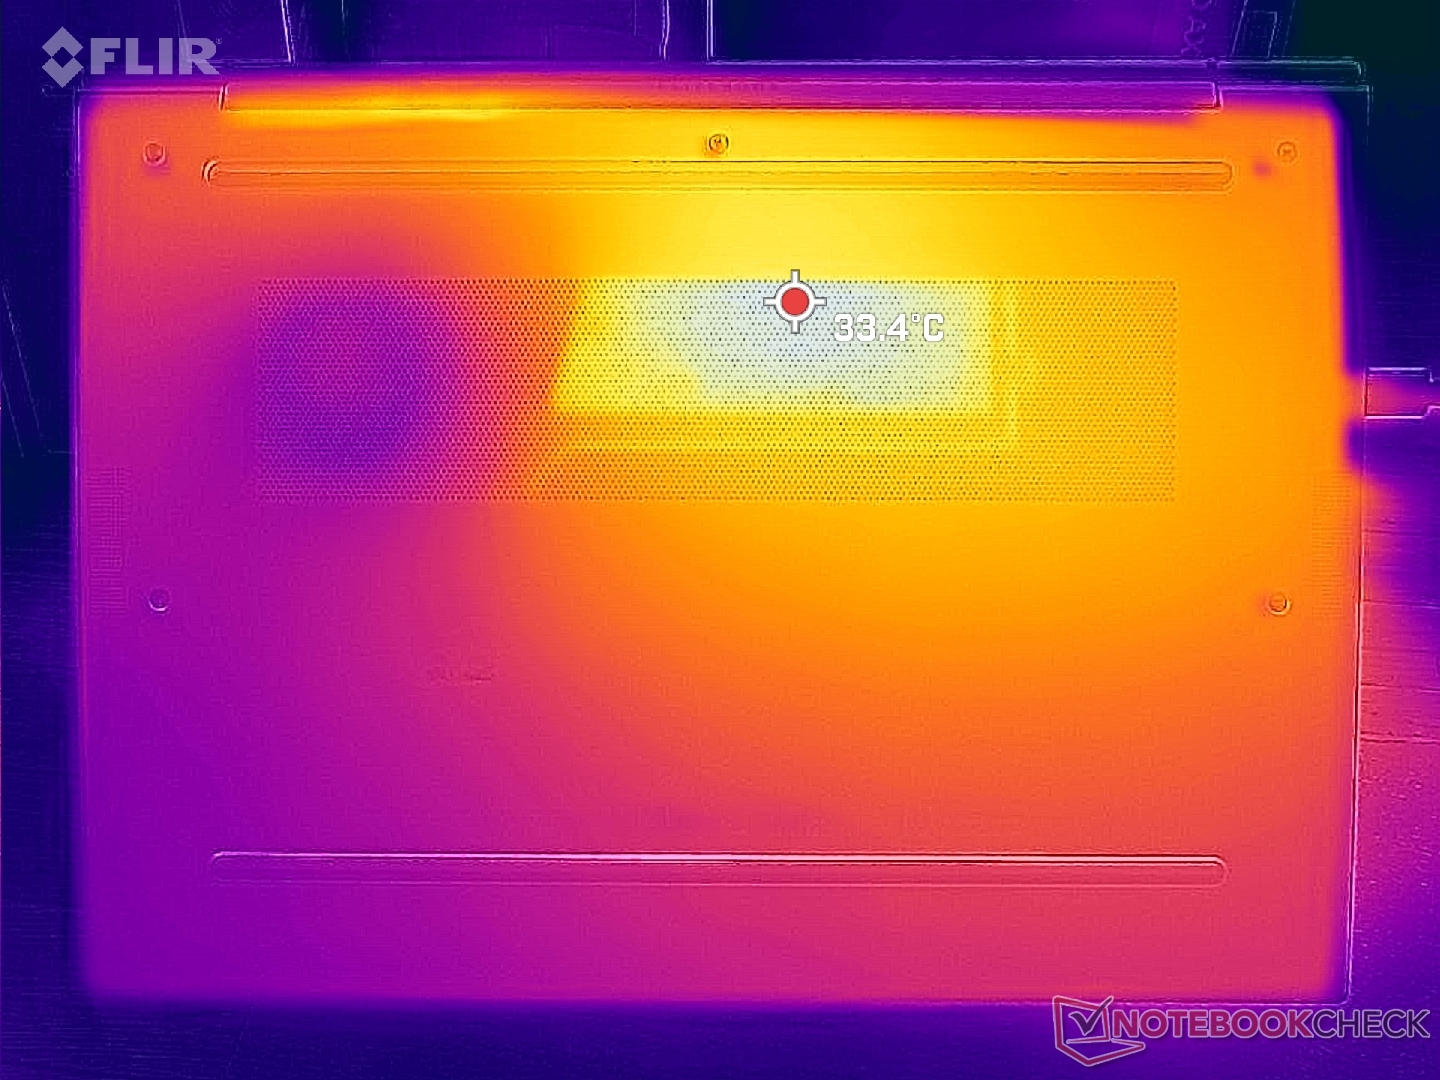
Temperatura
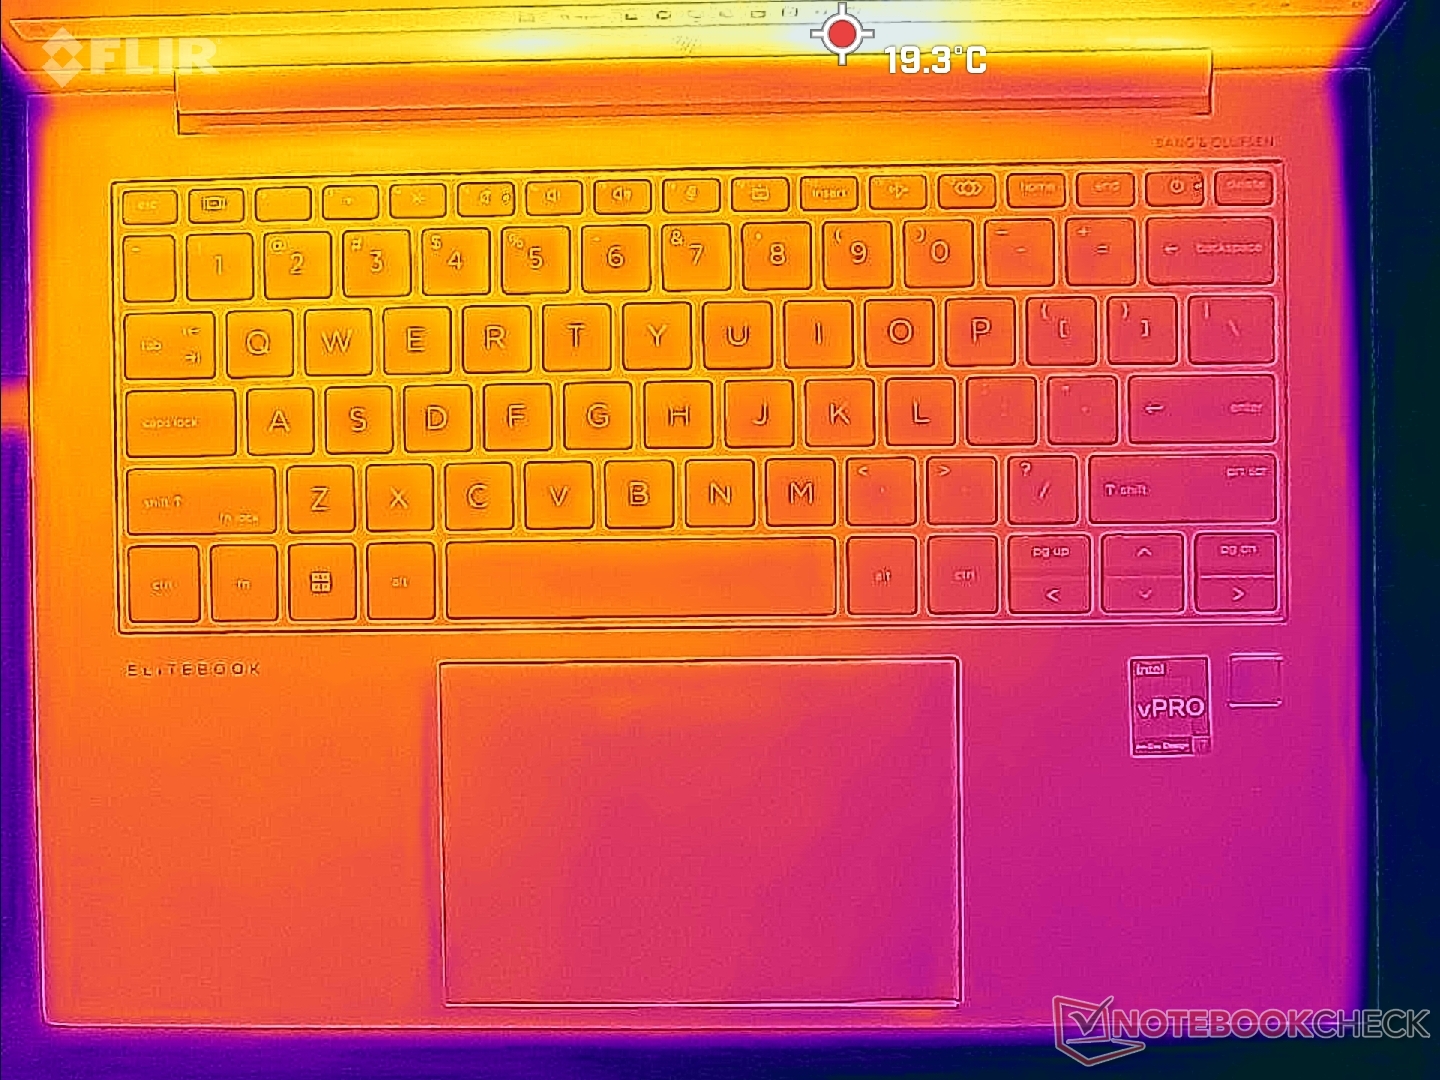
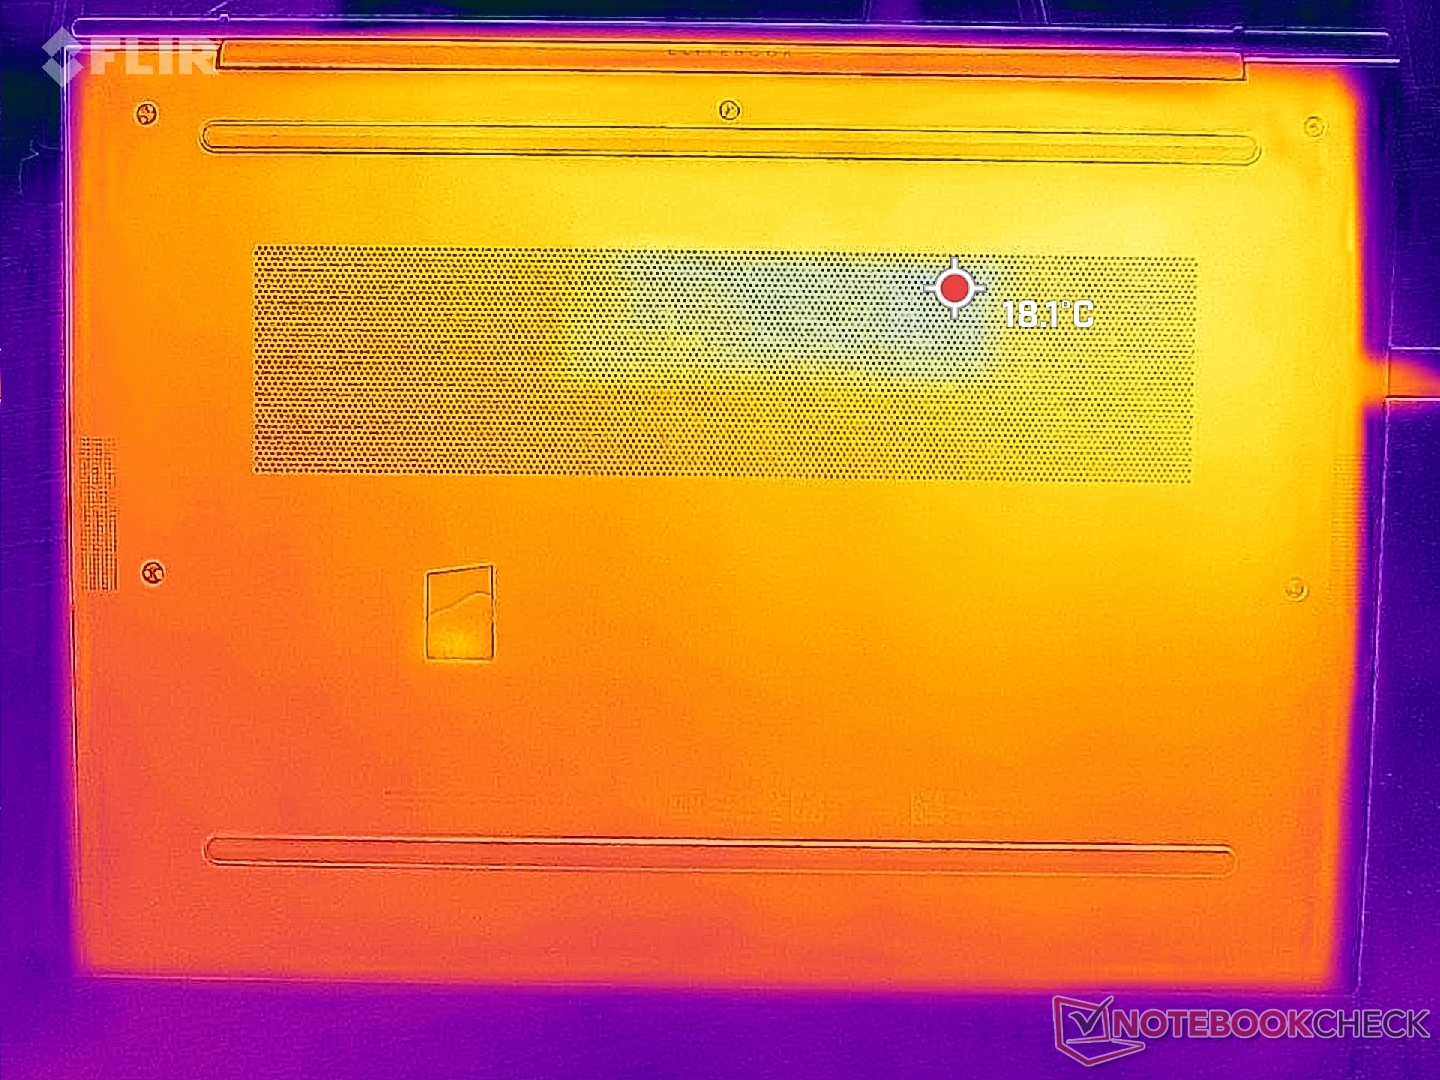
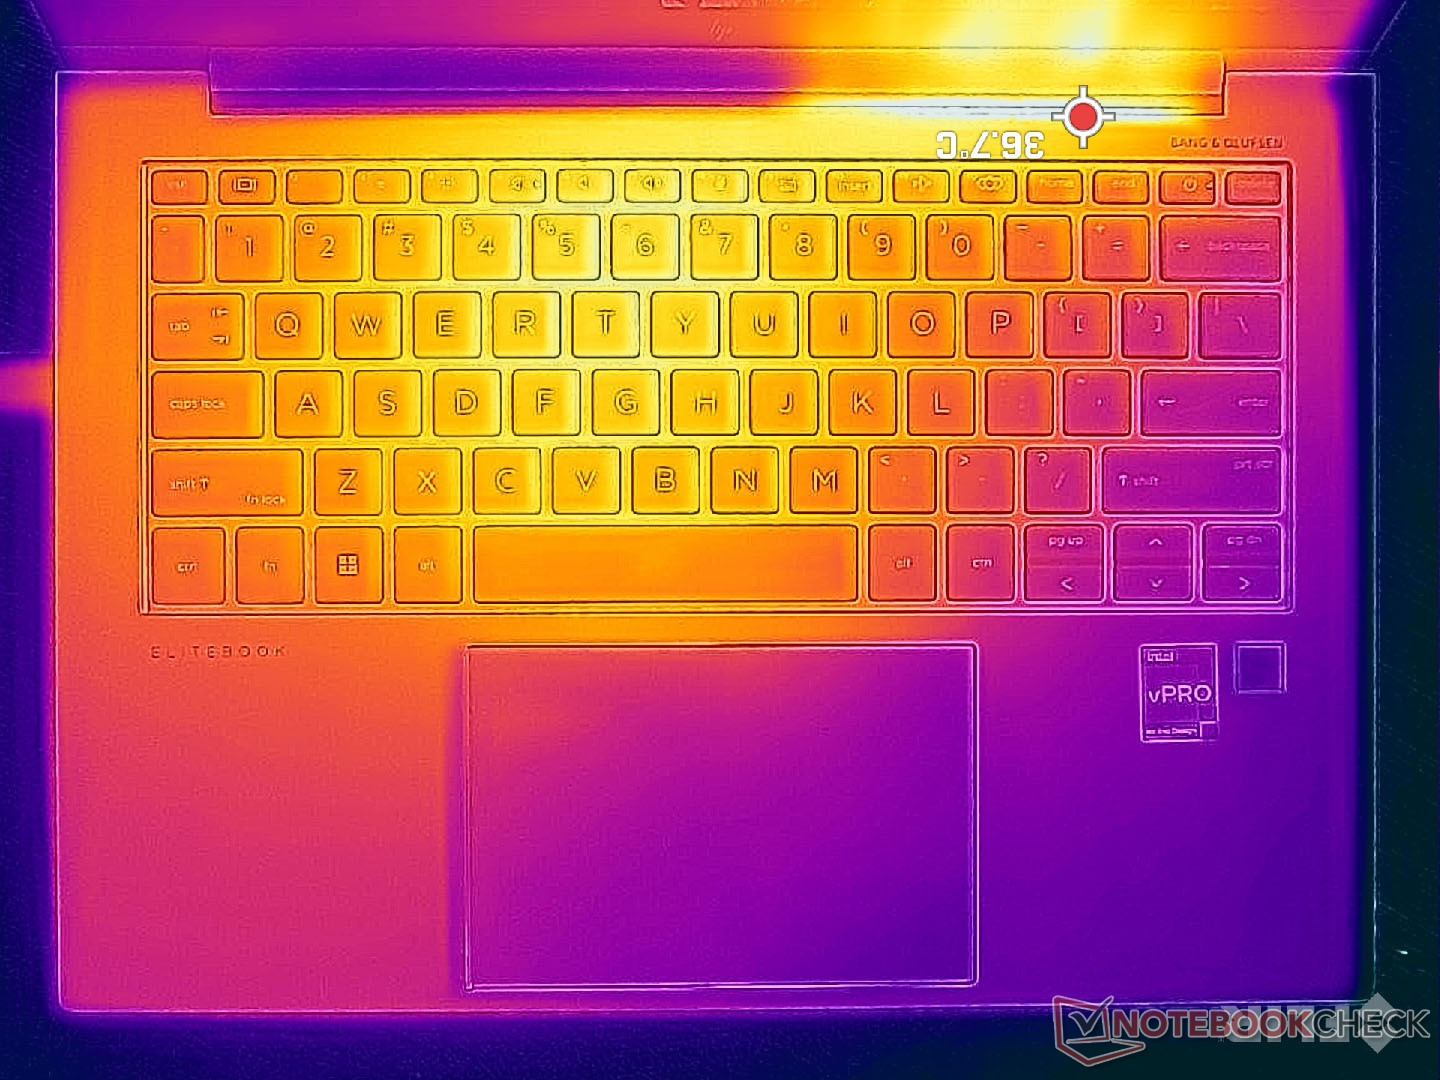
Temperatury powierzchni są najcieplejsze w kierunku środka, gdzie gorące punkty na klawiaturze i spodzie mogą osiągnąć odpowiednio około 33 C i 36 C, w porównaniu z nieco ponad 40 C w ThinkPadzie X1 Carbon Gen 10. System nigdy nie staje się niekomfortowo ciepły na skórze.
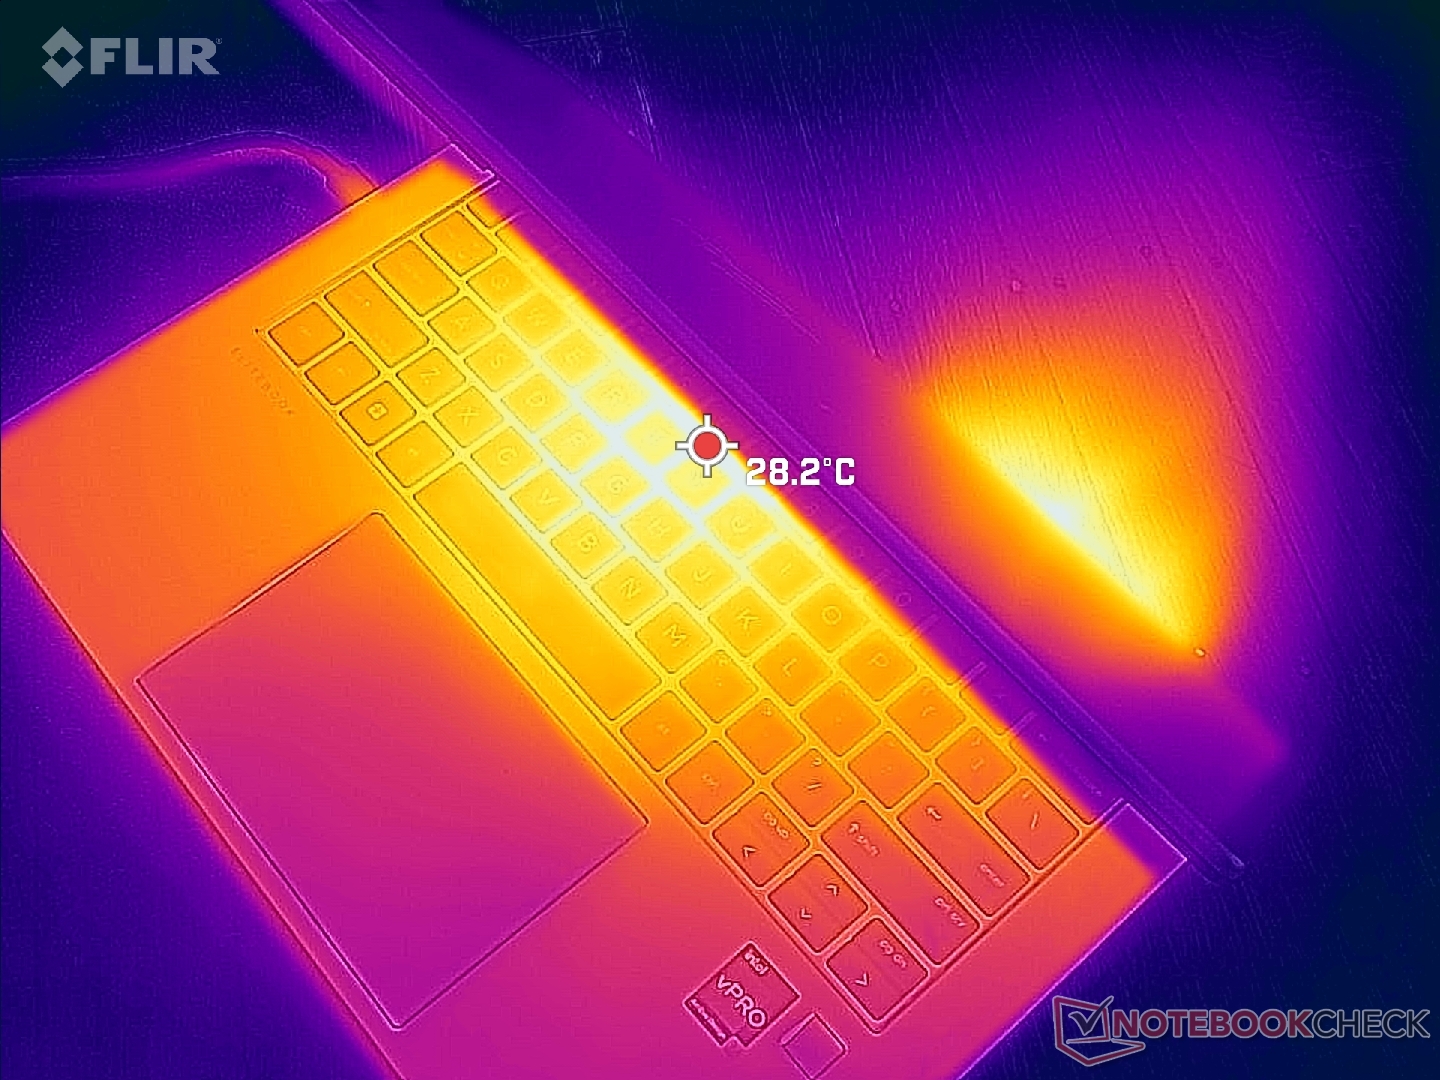
(+) Maksymalna temperatura w górnej części wynosi 32.8 °C / 91 F, w porównaniu do średniej 34.3 °C / 94 F , począwszy od 21.2 do 62.5 °C dla klasy Office.
(+) Dno nagrzewa się maksymalnie do 36.6 °C / 98 F, w porównaniu do średniej 36.8 °C / 98 F
(+) W stanie bezczynności średnia temperatura górnej części wynosi 20.7 °C / 69 F, w porównaniu ze średnią temperaturą urządzenia wynoszącą 29.5 °C / ### class_avg_f### F.
(+) Podpórki pod nadgarstki i touchpad są chłodniejsze niż temperatura skóry i maksymalnie 23.2 °C / 73.8 F i dlatego są chłodne w dotyku.
(+) Średnia temperatura obszaru podparcia dłoni w podobnych urządzeniach wynosiła 27.5 °C / 81.5 F (+4.3 °C / 7.7 F).
| HP EliteBook 840 G9 Intel Core i7-1280P, Intel Iris Xe Graphics G7 96EUs | HP EliteBook 845 G9 6F6H6EA AMD Ryzen 9 PRO 6950HS, AMD Radeon 680M | HP EliteBook 840 Aero G8 3E4Q6AA Intel Core i7-1185G7, Intel Iris Xe Graphics G7 96EUs | Lenovo ThinkPad X1 Carbon G10 Core i7-1265U Intel Core i7-1265U, Intel Iris Xe Graphics G7 96EUs | LG Gram 14Z90Q Intel Core i5-1240P, Intel Iris Xe Graphics G7 80EUs | Dell Latitude 7420 JW6MH Intel Core i5-1145G7, Intel Iris Xe Graphics G7 80EUs | |
|---|---|---|---|---|---|---|
| Heat | -42% | -42% | -13% | -26% | -18% | |
| Maximum Upper Side * (°C) | 32.8 | 49.4 -51% | 39.2 -20% | 41.2 -26% | 43 -31% | 37.1 -13% |
| Maximum Bottom * (°C) | 36.6 | 48 -31% | 51.2 -40% | 41 -12% | 45 -23% | 38.7 -6% |
| Idle Upper Side * (°C) | 21.6 | 30.8 -43% | 33 -53% | 23.2 -7% | 27 -25% | 27.3 -26% |
| Idle Bottom * (°C) | 22.2 | 31.4 -41% | 34 -53% | 23.4 -5% | 28 -26% | 28.1 -27% |
* ... im mniej tym lepiej
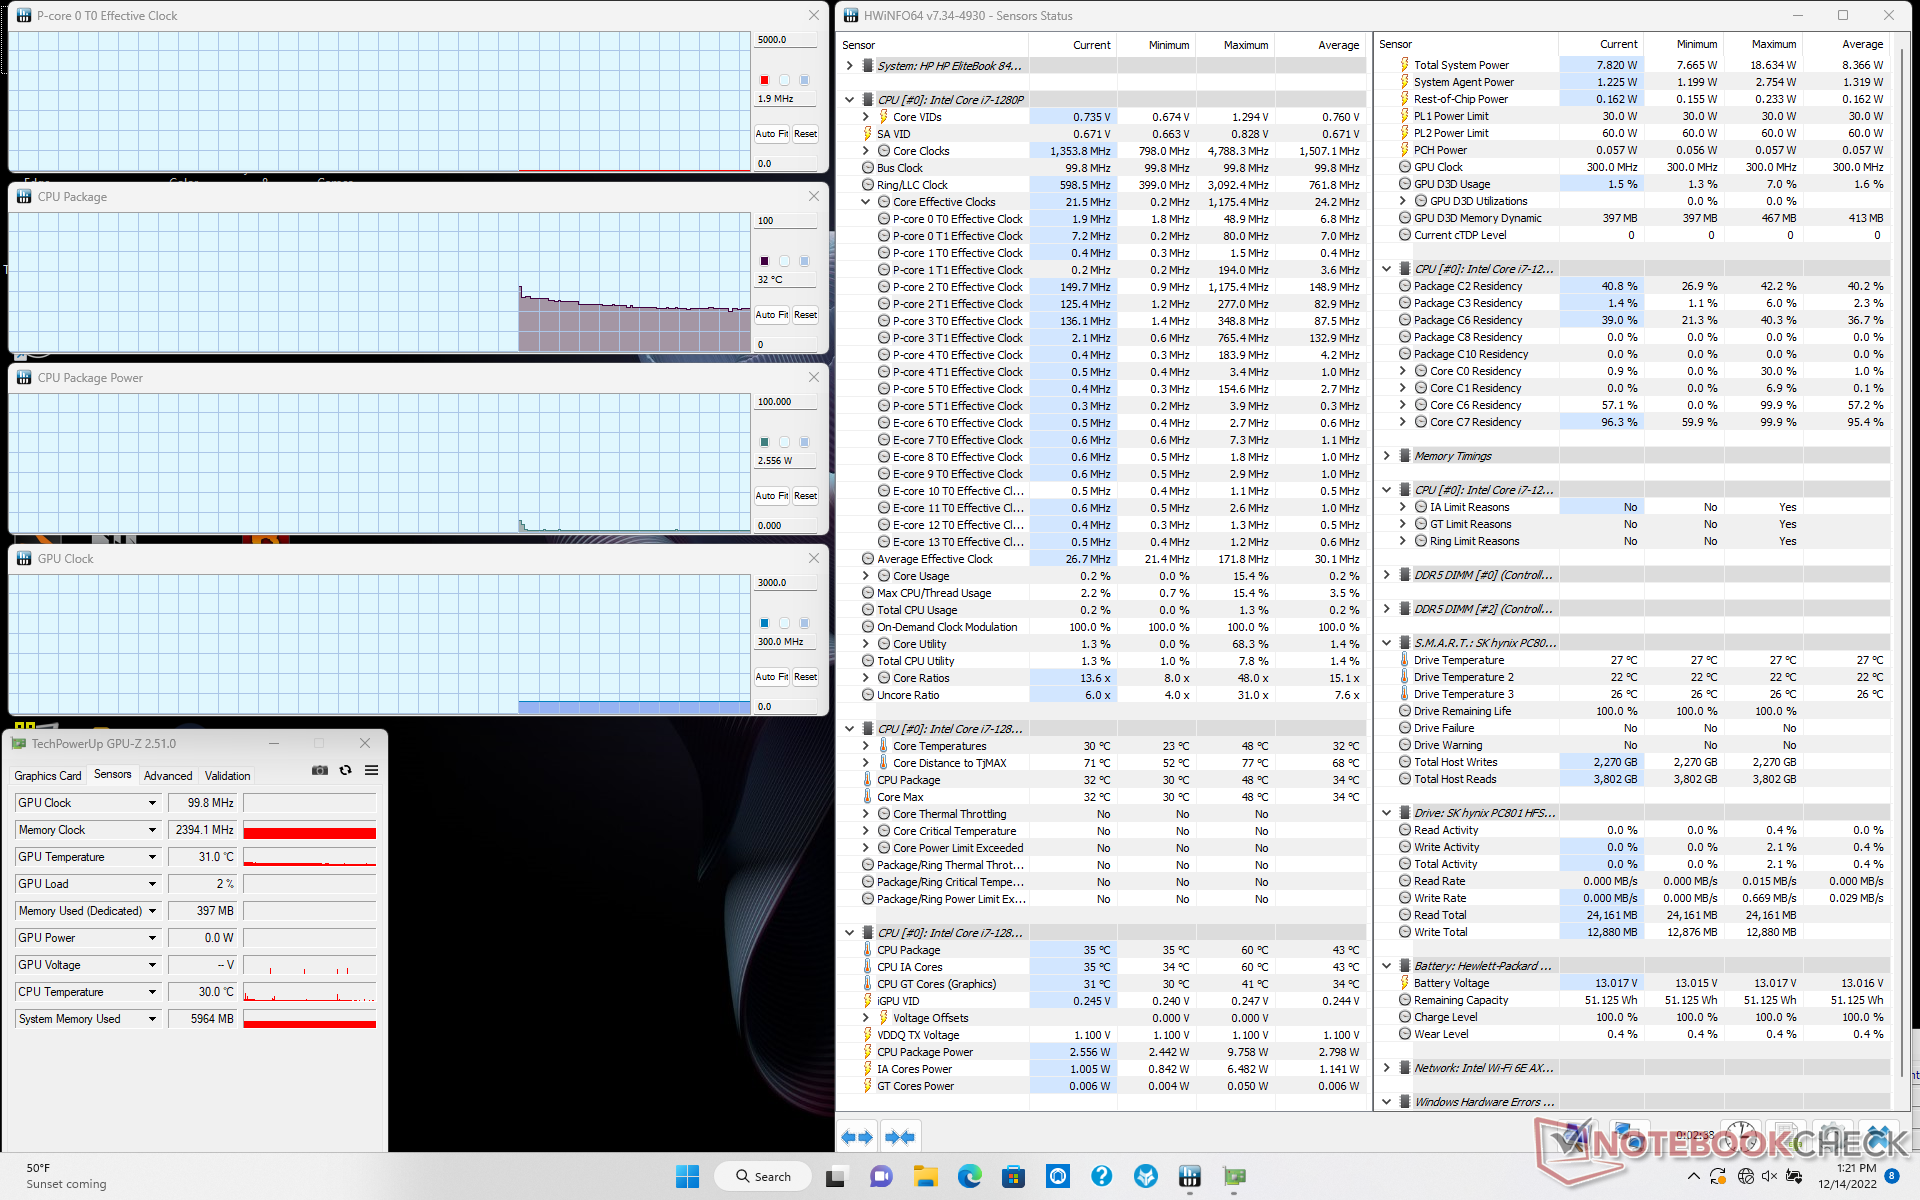
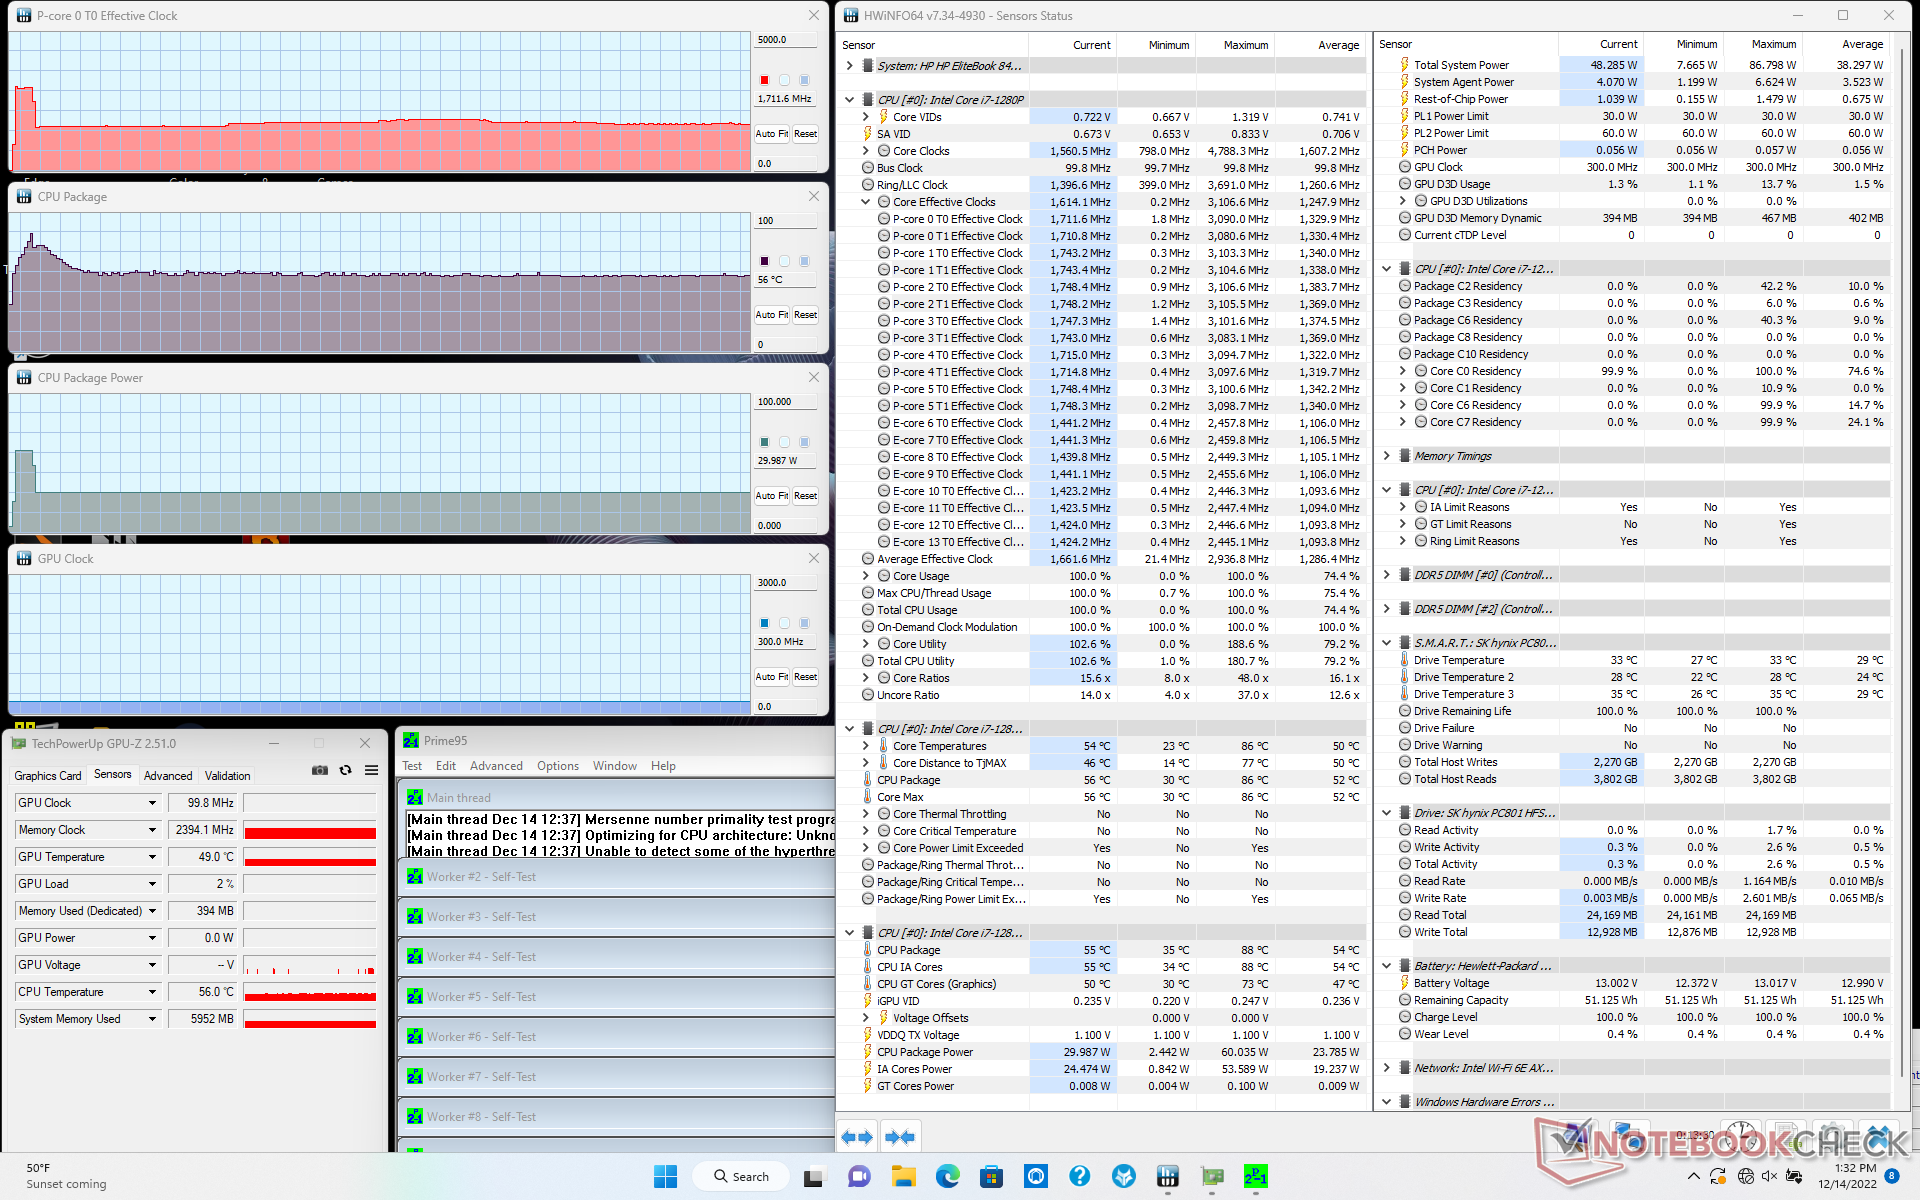
Stress Test
Podczas uruchamiania Prime95 procesor zwiększałby częstotliwość taktowania do 3 GHz i 60 W przez około 20 sekund lub do momentu, kiedy temperatura rdzenia osiągnie 86 C. Następnie spadałby do zaledwie 1,6 GHz i 30 W, by utrzymać chłodniejszą temperaturę rdzenia na poziomie 65 C. Szkoda, że nie ma opcji podniesienia pułapu temperatury dla wyższych stałych częstotliwości taktowania, gdyż procesor jest tutaj słabo wydajny w porównaniu z większością innych laptopów z tym samym procesorem Core i7-1280P.
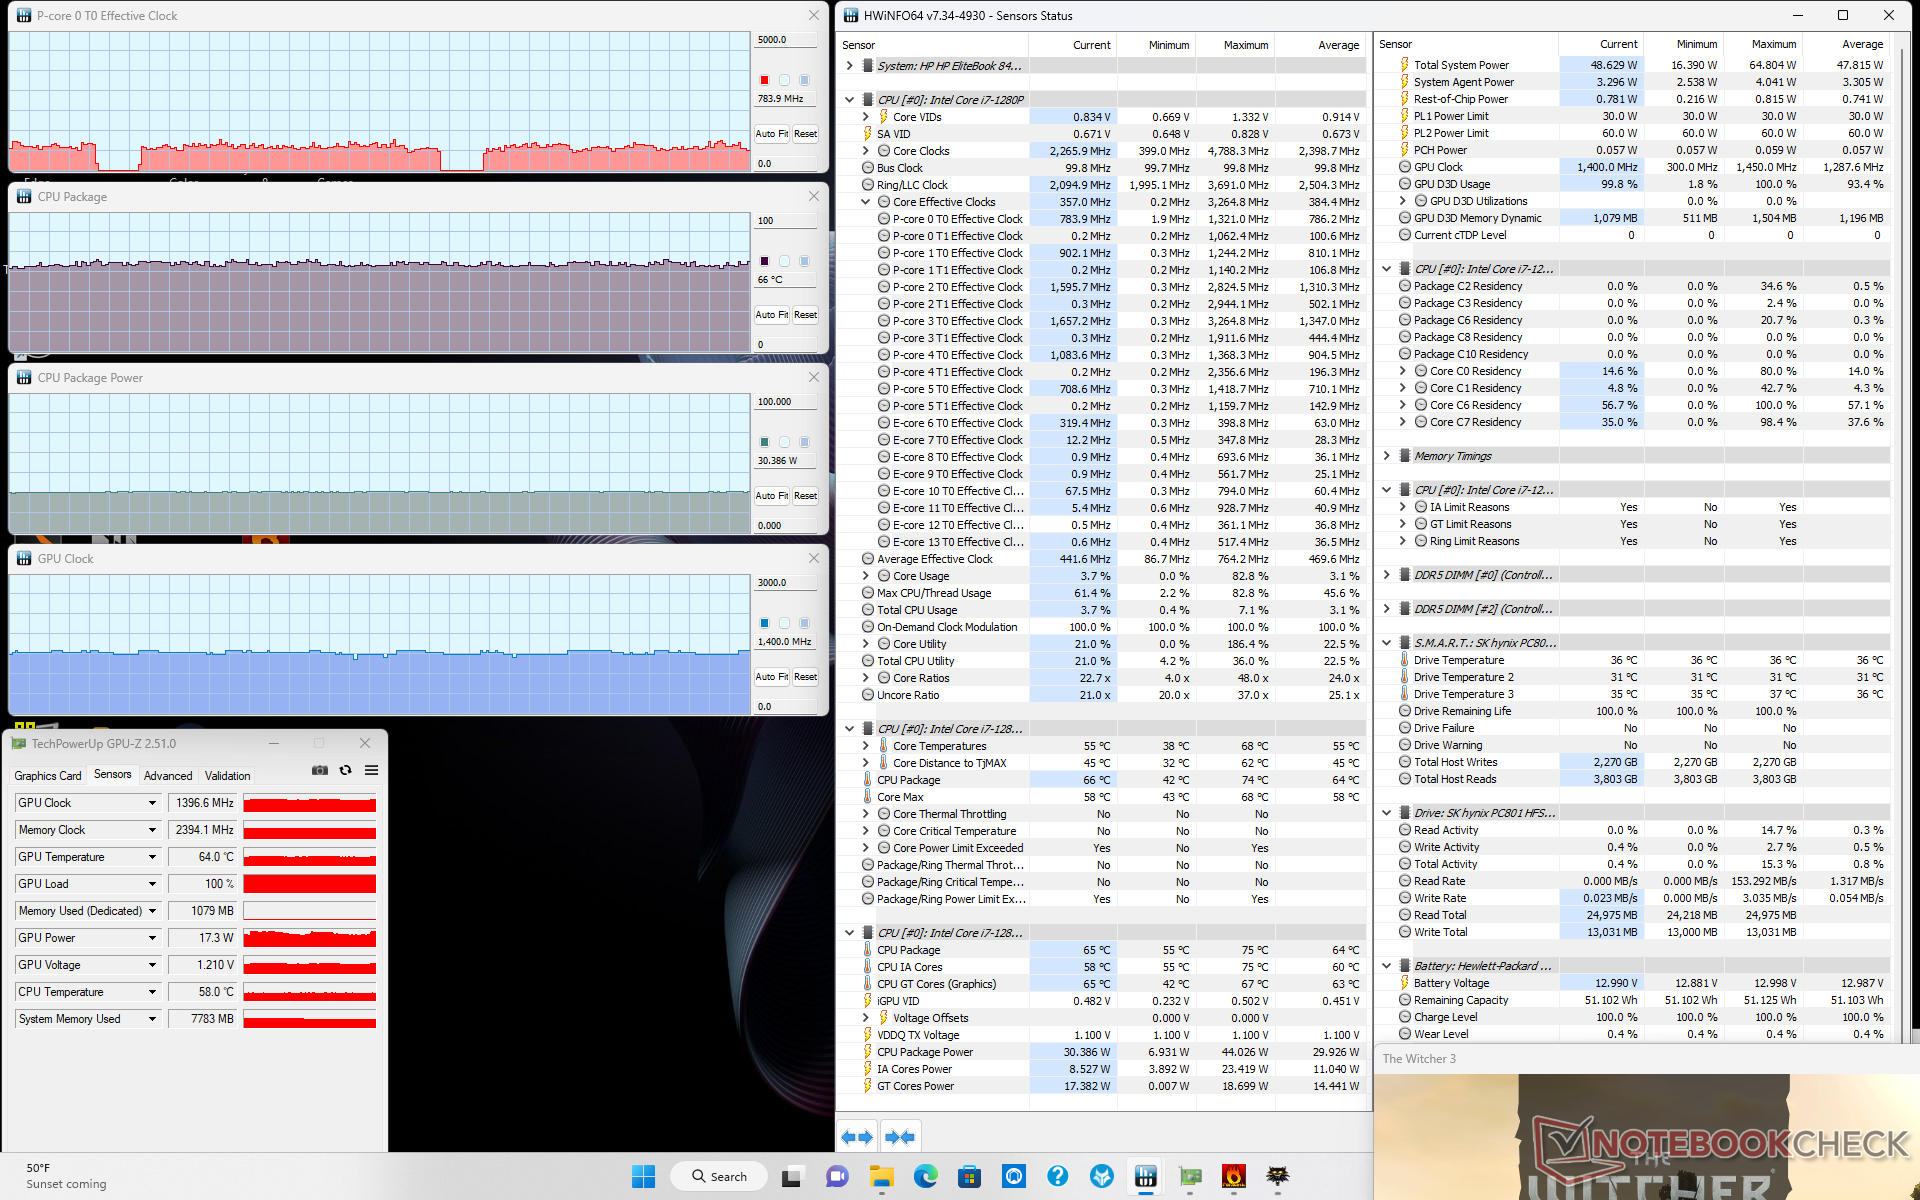
Częstotliwości taktowania GPU i temperatura podczas pracy Witcher 3 ustabilizowały się na poziomie odpowiednio 1397 MHz i 66 C, w porównaniu z 1097 MHz i 65 C w modelu Dragonfly Folio G3 Dragonfly Folio G3 wyposażonym w ten sam zintegrowany procesor graficzny. Wyższe częstotliwości taktowania pomagają EliteBookowi wybić się ponad większość laptopów z procesorem Core U pod względem wydajności grafiki.
Praca na zasilaniu akumulatorowym obniża nieco wydajność. Test 3DMark 11 na zasilaniu akumulatorowym przyniósłby wyniki z dziedziny fizyki i grafiki na poziomie odpowiednio 13157 i 6717 pkt. wobec 15376 i 7101 pkt. na zasilaniu z sieci.
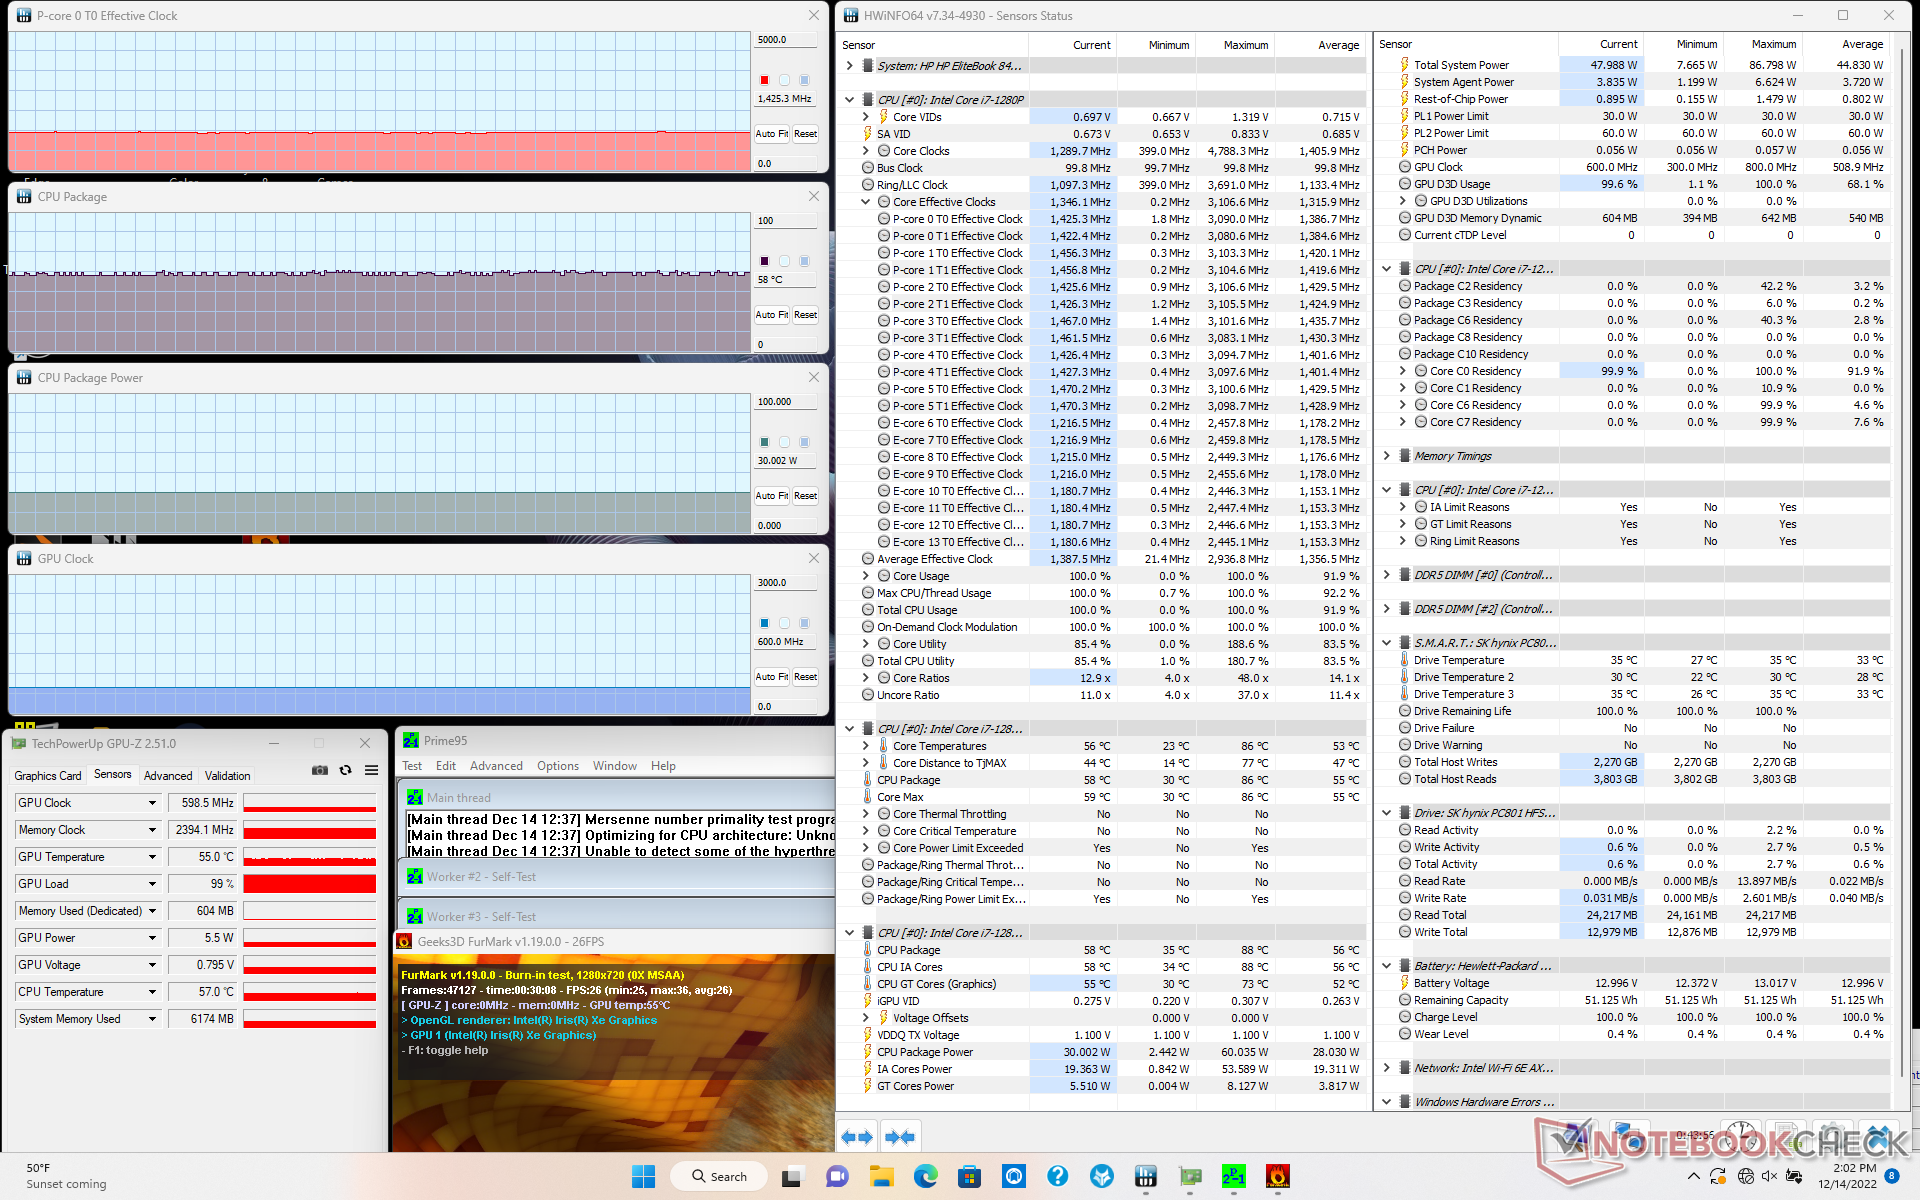
| ZegarCPU (GHz) | Zegar GPU (MHz) | Średnia temperatura CPU (°C) | |
| System w stanie bezczynności | -- | -- | 32 |
| Prime95 Stress | 1.7 | -- | 56 |
| Prime95+ FurMark Stress | 1.4 | 599 | 58 |
| Witcher 3 Stress | ~0,8 | 1397 | 66 |
Mówcy
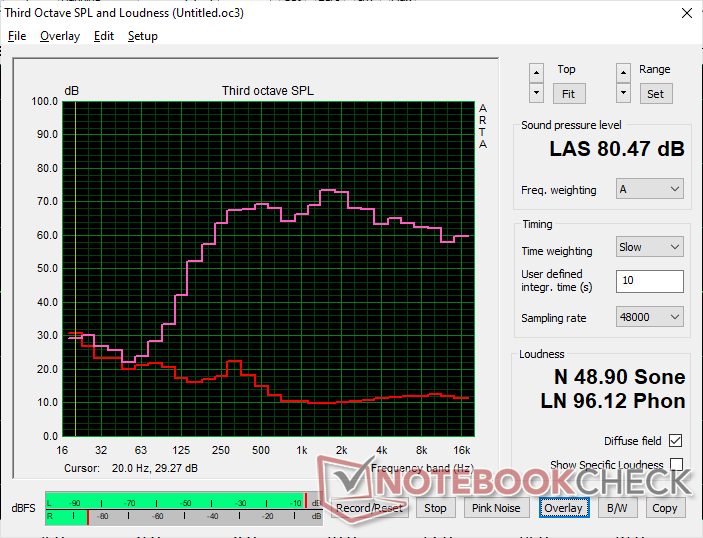
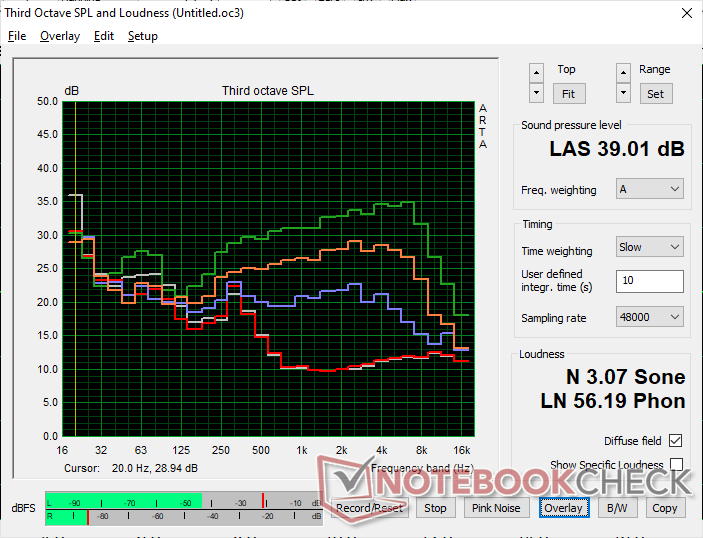
HP EliteBook 840 G9 analiza dźwięku
(±) | głośność głośnika jest średnia, ale dobra (80.5 dB)
Bas 100 - 315 Hz
(±) | zredukowany bas - średnio 12.6% niższy od mediany
(±) | liniowość basu jest średnia (12.4% delta do poprzedniej częstotliwości)
Średnie 400 - 2000 Hz
(+) | zbalansowane środki średnie - tylko 4.6% od mediany
(+) | średnie są liniowe (3.9% delta do poprzedniej częstotliwości)
Wysokie 2–16 kHz
(+) | zrównoważone maksima - tylko 2% od mediany
(+) | wzloty są liniowe (3.9% delta do poprzedniej częstotliwości)
Ogólnie 100 - 16.000 Hz
(+) | ogólny dźwięk jest liniowy (12.9% różnicy w stosunku do mediany)
W porównaniu do tej samej klasy
» 6% wszystkich testowanych urządzeń w tej klasie było lepszych, 2% podobnych, 92% gorszych
» Najlepszy miał deltę 7%, średnia wynosiła ###średnia###%, najgorsza wynosiła 53%
W porównaniu do wszystkich testowanych urządzeń
» 12% wszystkich testowanych urządzeń było lepszych, 3% podobnych, 85% gorszych
» Najlepszy miał deltę 4%, średnia wynosiła ###średnia###%, najgorsza wynosiła 134%
Apple MacBook Pro 16 2021 M1 Pro analiza dźwięku
(+) | głośniki mogą odtwarzać stosunkowo głośno (84.7 dB)
Bas 100 - 315 Hz
(+) | dobry bas - tylko 3.8% od mediany
(+) | bas jest liniowy (5.2% delta do poprzedniej częstotliwości)
Średnie 400 - 2000 Hz
(+) | zbalansowane środki średnie - tylko 1.3% od mediany
(+) | średnie są liniowe (2.1% delta do poprzedniej częstotliwości)
Wysokie 2–16 kHz
(+) | zrównoważone maksima - tylko 1.9% od mediany
(+) | wzloty są liniowe (2.7% delta do poprzedniej częstotliwości)
Ogólnie 100 - 16.000 Hz
(+) | ogólny dźwięk jest liniowy (4.6% różnicy w stosunku do mediany)
W porównaniu do tej samej klasy
» 0% wszystkich testowanych urządzeń w tej klasie było lepszych, 0% podobnych, 100% gorszych
» Najlepszy miał deltę 5%, średnia wynosiła ###średnia###%, najgorsza wynosiła 45%
W porównaniu do wszystkich testowanych urządzeń
» 0% wszystkich testowanych urządzeń było lepszych, 0% podobnych, 100% gorszych
» Najlepszy miał deltę 4%, średnia wynosiła ###średnia###%, najgorsza wynosiła 134%
Zarządzanie energią
Pobór mocy
Nasza tabela porównawcza poniżej pokazuje, że wersja AMD jest bardziej wymagająca niż nasz egzemplarz Intela. Rozbieżność jest jednak w dużej mierze przypisana 1000-nitowemu panelowi w naszej wersji AMD, podczas gdy nasza wersja Intela wykorzystuje mniej wymagający 400-nitowy panel. Praca na biegu jałowym na maksymalnym ustawieniu jasności zużyłaby około 9 W i 18 W odpowiednio na jednostkach Intela i AMD. Biorąc to pod uwagę, ogólne różnice w poborze mocy pomiędzy dwoma modelami stają się bardziej niewielkie, pomimo wszystkich różnic w ich wydajności.
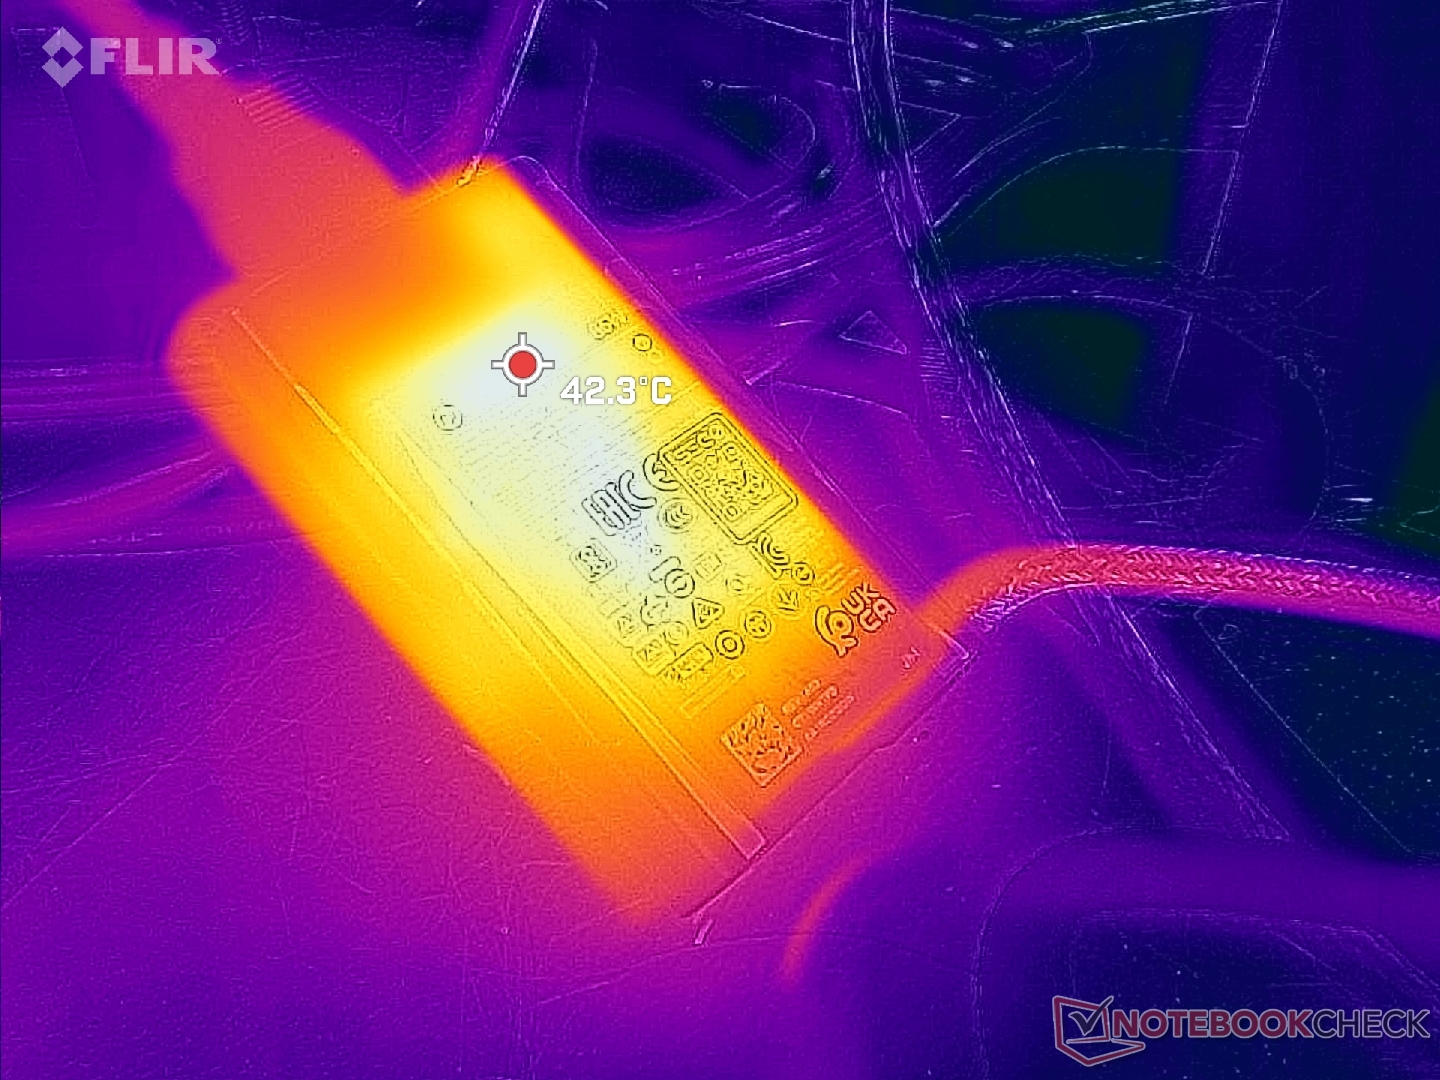
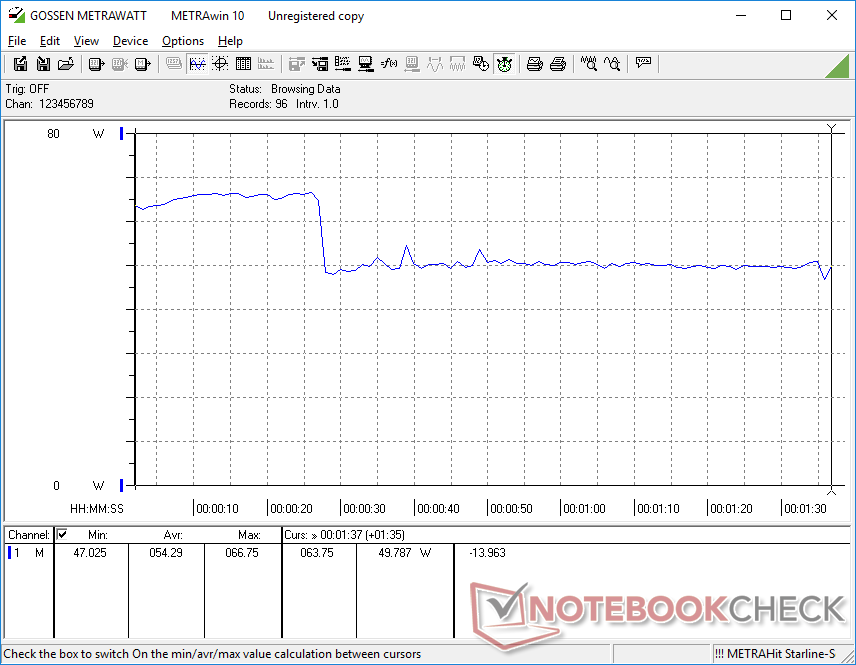
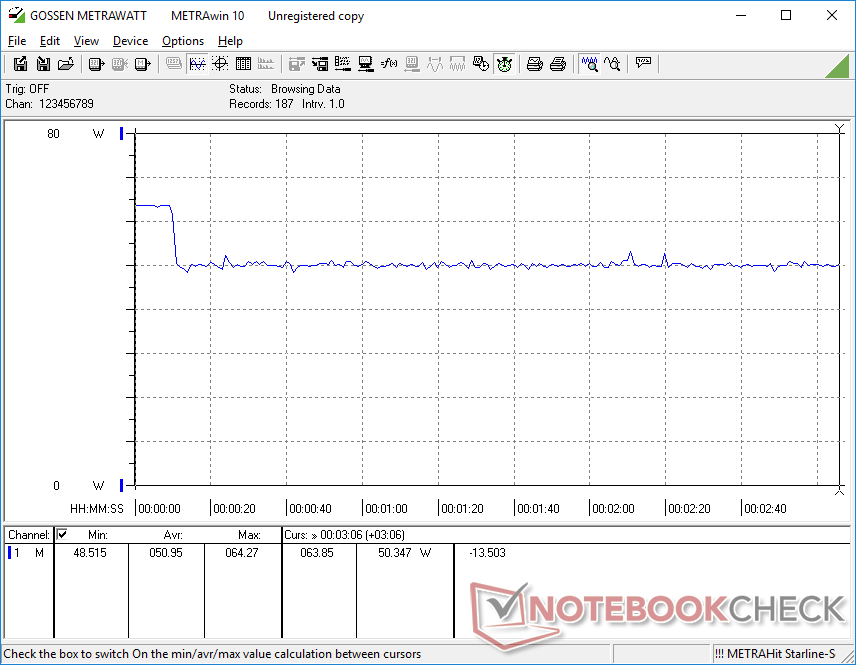
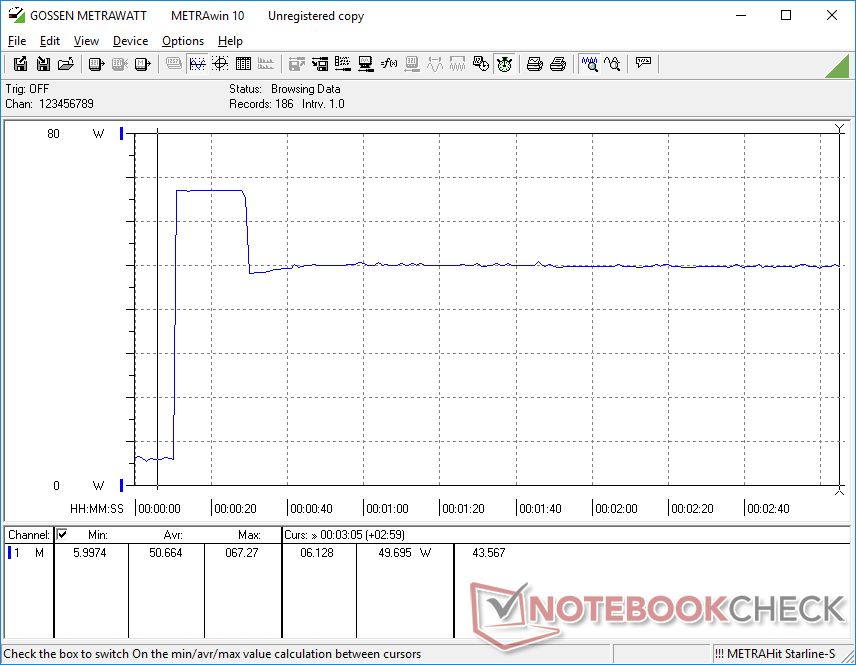
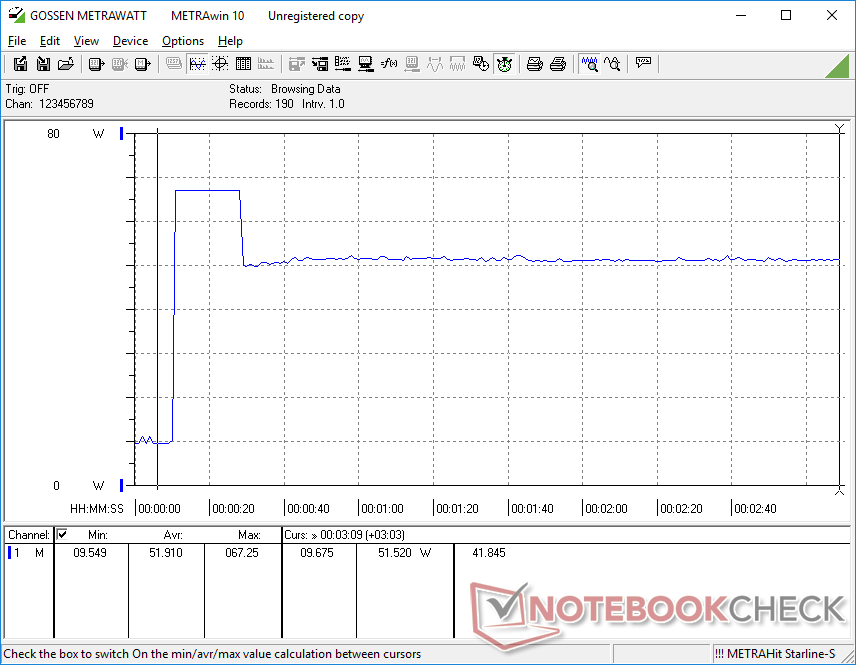
Z niewielkiego (~8,8 x 5,3 x 2,1 cm) zasilacza 65 W jesteśmy w stanie odnotować maksymalny pobór 68 W podczas pracy w stresie Prime95. Ten wskaźnik jest tylko chwilowy, jak pokazują poniższe wykresy, ze względu na ograniczenia termiczne.
| wyłączony / stan wstrzymania | |
| luz | |
| obciążenie |
|
Legenda:
min: | |
| HP EliteBook 840 G9 i7-1280P, Iris Xe G7 96EUs, SK hynix PC801 HFS512GEJ9X101N BF, IPS, 1920x1200, 14" | HP EliteBook 845 G9 6F6H6EA R9 PRO 6950HS, Radeon 680M, WDC PC SN810 1TB, IPS, 1920x1200, 14" | HP EliteBook 840 Aero G8 3E4Q6AA i7-1185G7, Iris Xe G7 96EUs, SK Hynix PC711 512GB HFS512GDE9X073N, IPS, 1920x1080, 14" | Lenovo ThinkPad X1 Carbon G10 Core i7-1265U i7-1265U, Iris Xe G7 96EUs, Kioxia BG5 KBG5AZNV1T02, IPS, 1920x1200, 14" | LG Gram 14Z90Q i5-1240P, Iris Xe G7 80EUs, Samsung PM9A1 MZVL2512HCJQ, IPS, 1920x1200, 14" | Dell Latitude 7420 JW6MH i5-1145G7, Iris Xe G7 80EUs, SK Hynix BC711 HFM512GD3HX015N, IPS, 1920x1080, 14" | |
|---|---|---|---|---|---|---|
| Power Consumption | -80% | 5% | -8% | -5% | 8% | |
| Idle Minimum * (Watt) | 2.2 | 6.4 -191% | 3.2 -45% | 2.8 -27% | 3 -36% | 2.7 -23% |
| Idle Average * (Watt) | 5.3 | 12.4 -134% | 5.4 -2% | 6 -13% | 6 -13% | 6 -13% |
| Idle Maximum * (Watt) | 8.5 | 18 -112% | 6.9 19% | 10.9 -28% | 12 -41% | 7.6 11% |
| Load Average * (Watt) | 54.3 | 63 -16% | 38.9 28% | 51.8 5% | 40 26% | 37 32% |
| Witcher 3 ultra * (Watt) | 51 | 63.6 -25% | 37 27% | 51.6 -1% | 36.5 28% | 33.2 35% |
| Load Maximum * (Watt) | 67.3 | 68 -1% | 66.5 1% | 55.6 17% | 63 6% | 65 3% |
* ... im mniej tym lepiej
Power Consumption Witcher 3 / Stresstest
Power Consumption external Monitor
Czas pracy na baterii - nieco krótszy niż u AMD
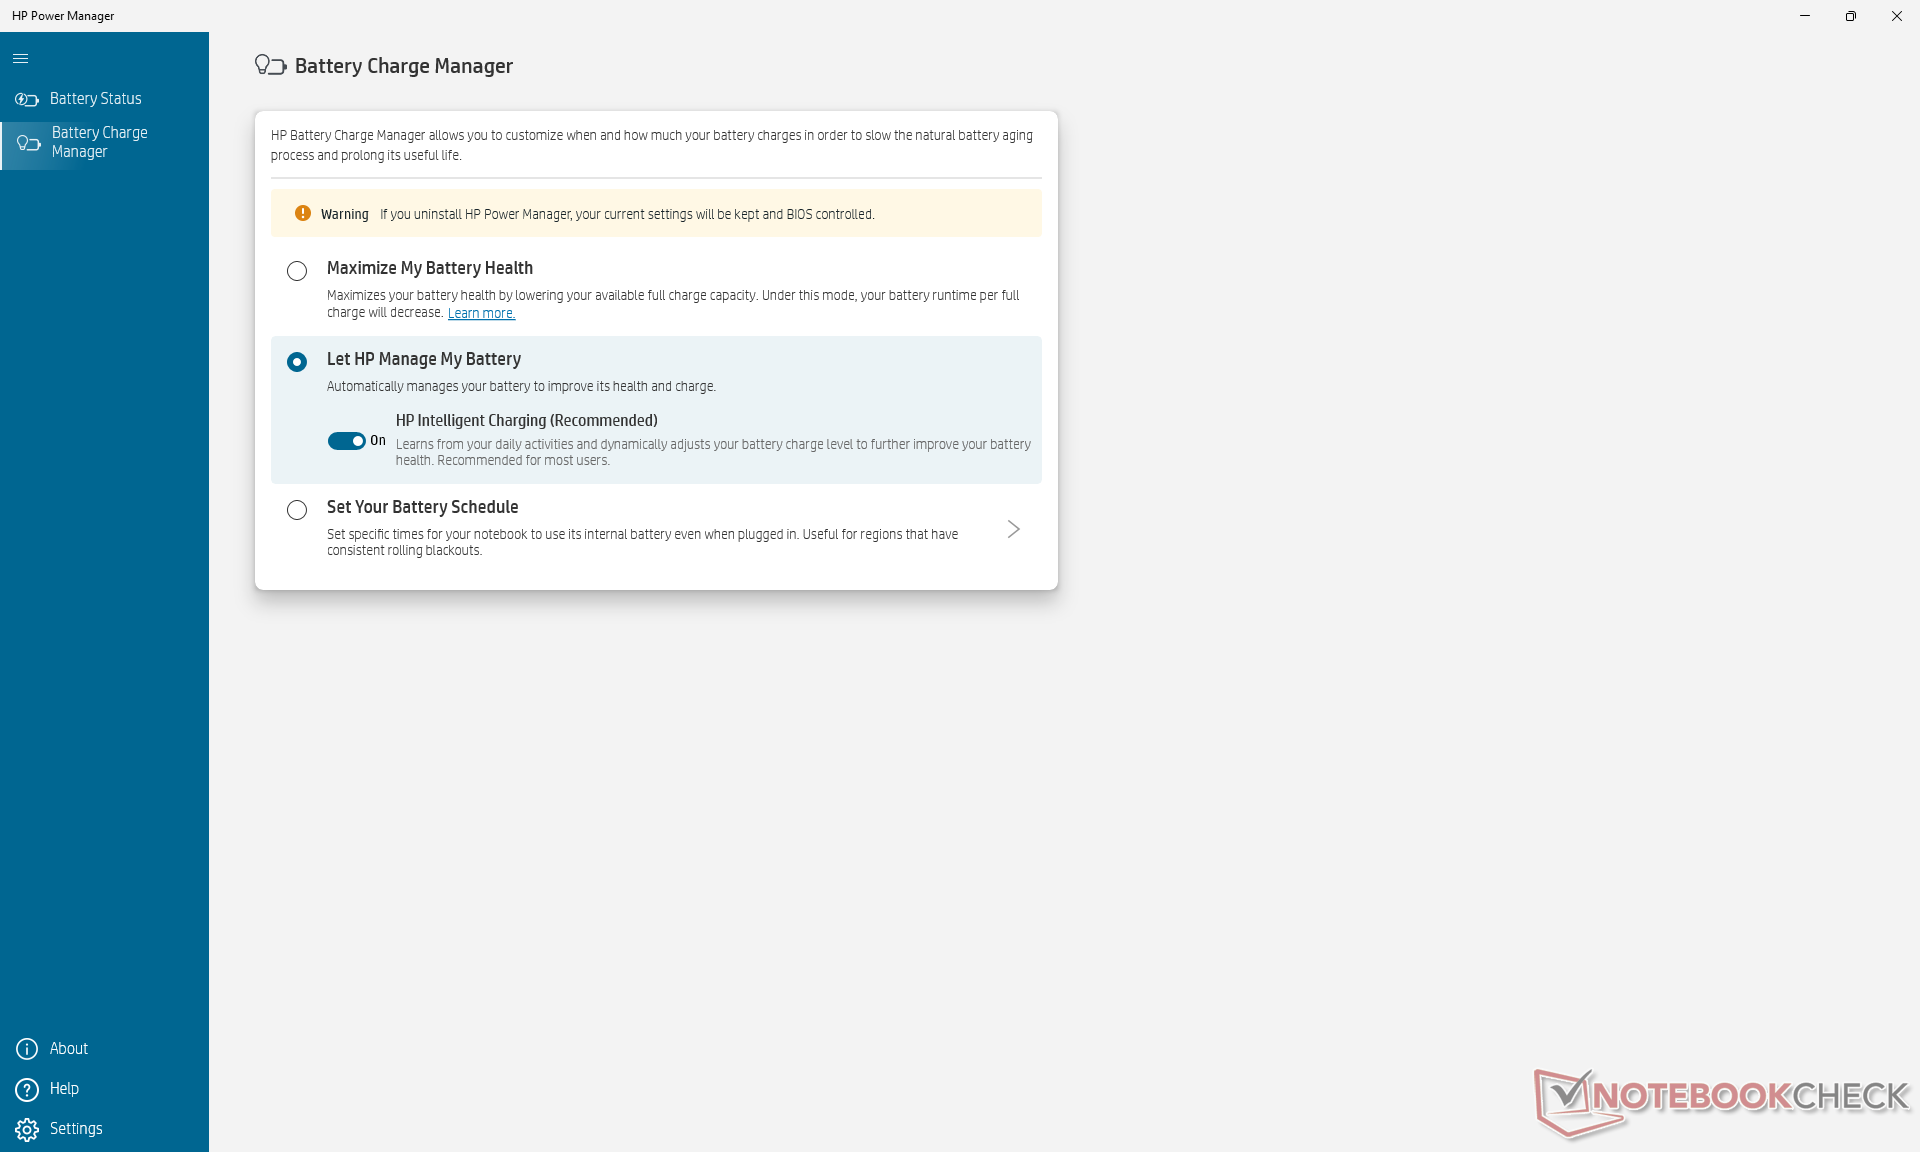
Czas pracy w sieci WLAN jest o prawie dwie godziny krótszy od tego, co zarejestrowaliśmy na zasilanym przez AMD EliteBooku 845 G9 przy ustawieniu w obu przypadkach jasności 150 nitów i profilu zasilania Balanced. Mimo to 7,5 godziny ciągłego przeglądania stron powinno być zadowalające dla większości użytkowników.
Ładowanie od pustego do pełnego jest szybkie i trwa około 90 minut. Ładowarki USB-C innych firm są technicznie obsługiwane, ale wiele z nich nie gwarantuje działania, jeśli ich poziomy wyjściowe nie odpowiadają dołączonej ładowarce HP (20V/3,25A).
| HP EliteBook 840 G9 i7-1280P, Iris Xe G7 96EUs, 51 Wh | HP EliteBook 845 G9 6F6H6EA R9 PRO 6950HS, Radeon 680M, 51 Wh | HP EliteBook 840 Aero G8 3E4Q6AA i7-1185G7, Iris Xe G7 96EUs, 53 Wh | Lenovo ThinkPad X1 Carbon G10 Core i7-1265U i7-1265U, Iris Xe G7 96EUs, 57 Wh | LG Gram 14Z90Q i5-1240P, Iris Xe G7 80EUs, 72 Wh | Dell Latitude 7420 JW6MH i5-1145G7, Iris Xe G7 80EUs, 63 Wh | |
|---|---|---|---|---|---|---|
| Czasy pracy | 22% | 50% | -13% | 57% | 86% | |
| WiFi v1.3 (h) | 7.6 | 9.3 22% | 11.4 50% | 6.6 -13% | 11.9 57% | 14.1 86% |
| Load (h) | 1.3 | 2.5 | 2.8 | 2.6 | ||
| Reader / Idle (h) | 24.8 | 28.9 | 23.5 |
Za
Przeciw
Werdykt - Korzyści i wady
Czy EliteBook 840 G9 z procesorem Core i7-1280P wytrzyma w starciu z Ryzenem 9 Pro 6950HS? EliteBook 845 G9? Jeśli chodzi o potencjał procesora, model AMD jest lepszym rozwiązaniem, gdyż jego wydajność nie dławi się tak bardzo jak w przypadku modelu Intela. Jeśli chodzi o wydajność graficzną, Radeon 680M w modelu AMD wydaje się być jednak słabszy do tego stopnia, że ustępuje Iris Xe 96 EUs. Wybór lepszej opcji będzie więc zależał od tego, jak intensywne mogą być obciążenia CPU lub GPU.
Poza różnicami w procesorze, czas pracy na baterii jest dłuższy w modelu AMD, podczas gdy model Intela korzysta z obsługi Thunderbolt. Szkoda, że funkcja Sure View jest wymuszona na wszystkich 1000-nitowych panelach, ponieważ niektórzy użytkownicy mogą nie chcieć tej funkcji prywatności ze względu na jej wpływ na jakość obrazu nawet po wyłączeniu. W przyszłych modelach chętnie zobaczylibyśmy panele z szybszym czasem reakcji, by zredukować ghosting i być może wyższy pułap temperatury rdzenia, by wycisnąć z procesora Intel więcej wydajności Turbo Boost.
Cena i dostępność
HP wysyła już eliteBooka 840 G9 w cenie od 2200 USD za konfigurację podstawową lub około 3000 USD za naszą konkretną konfigurację recenzencką. Ceny na stronie mogą jednak zaczynać się znacznie niżej w przypadku wstępnie skonfigurowanych jednostek SKU bez możliwości dostosowania do potrzeb użytkownika.
HP EliteBook 840 G9
- 17/12/2022 v7 (old)
Allen Ngo
Price comparison

