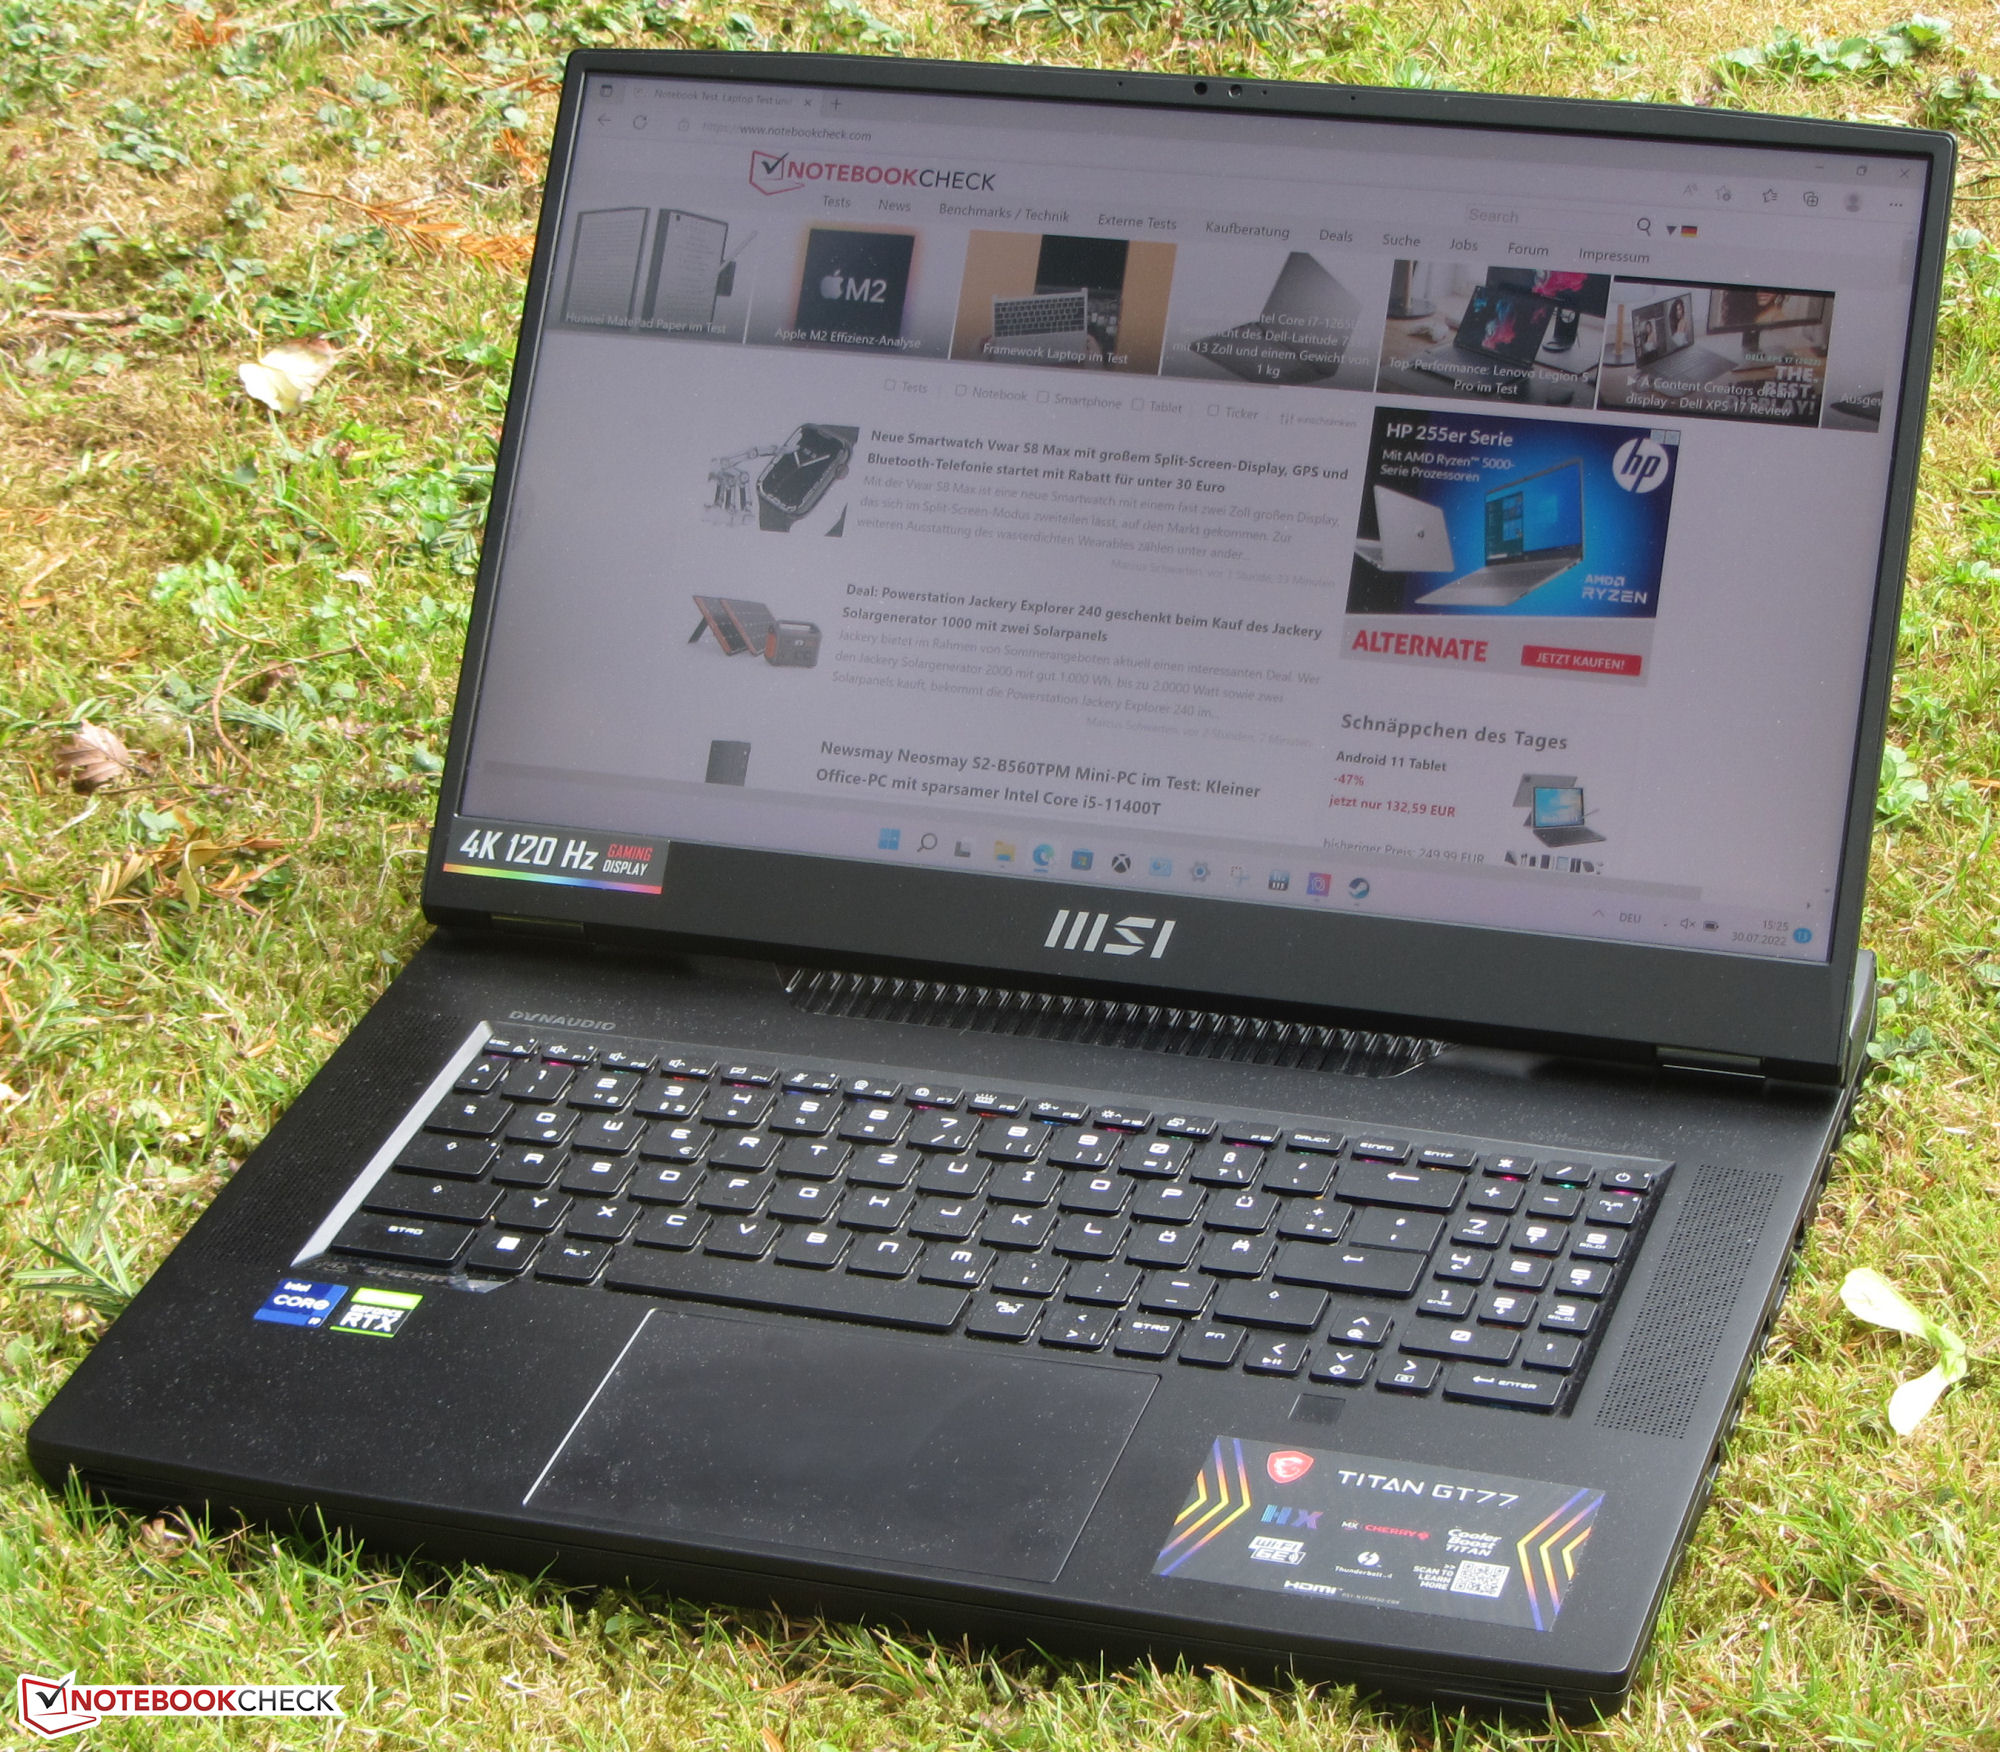
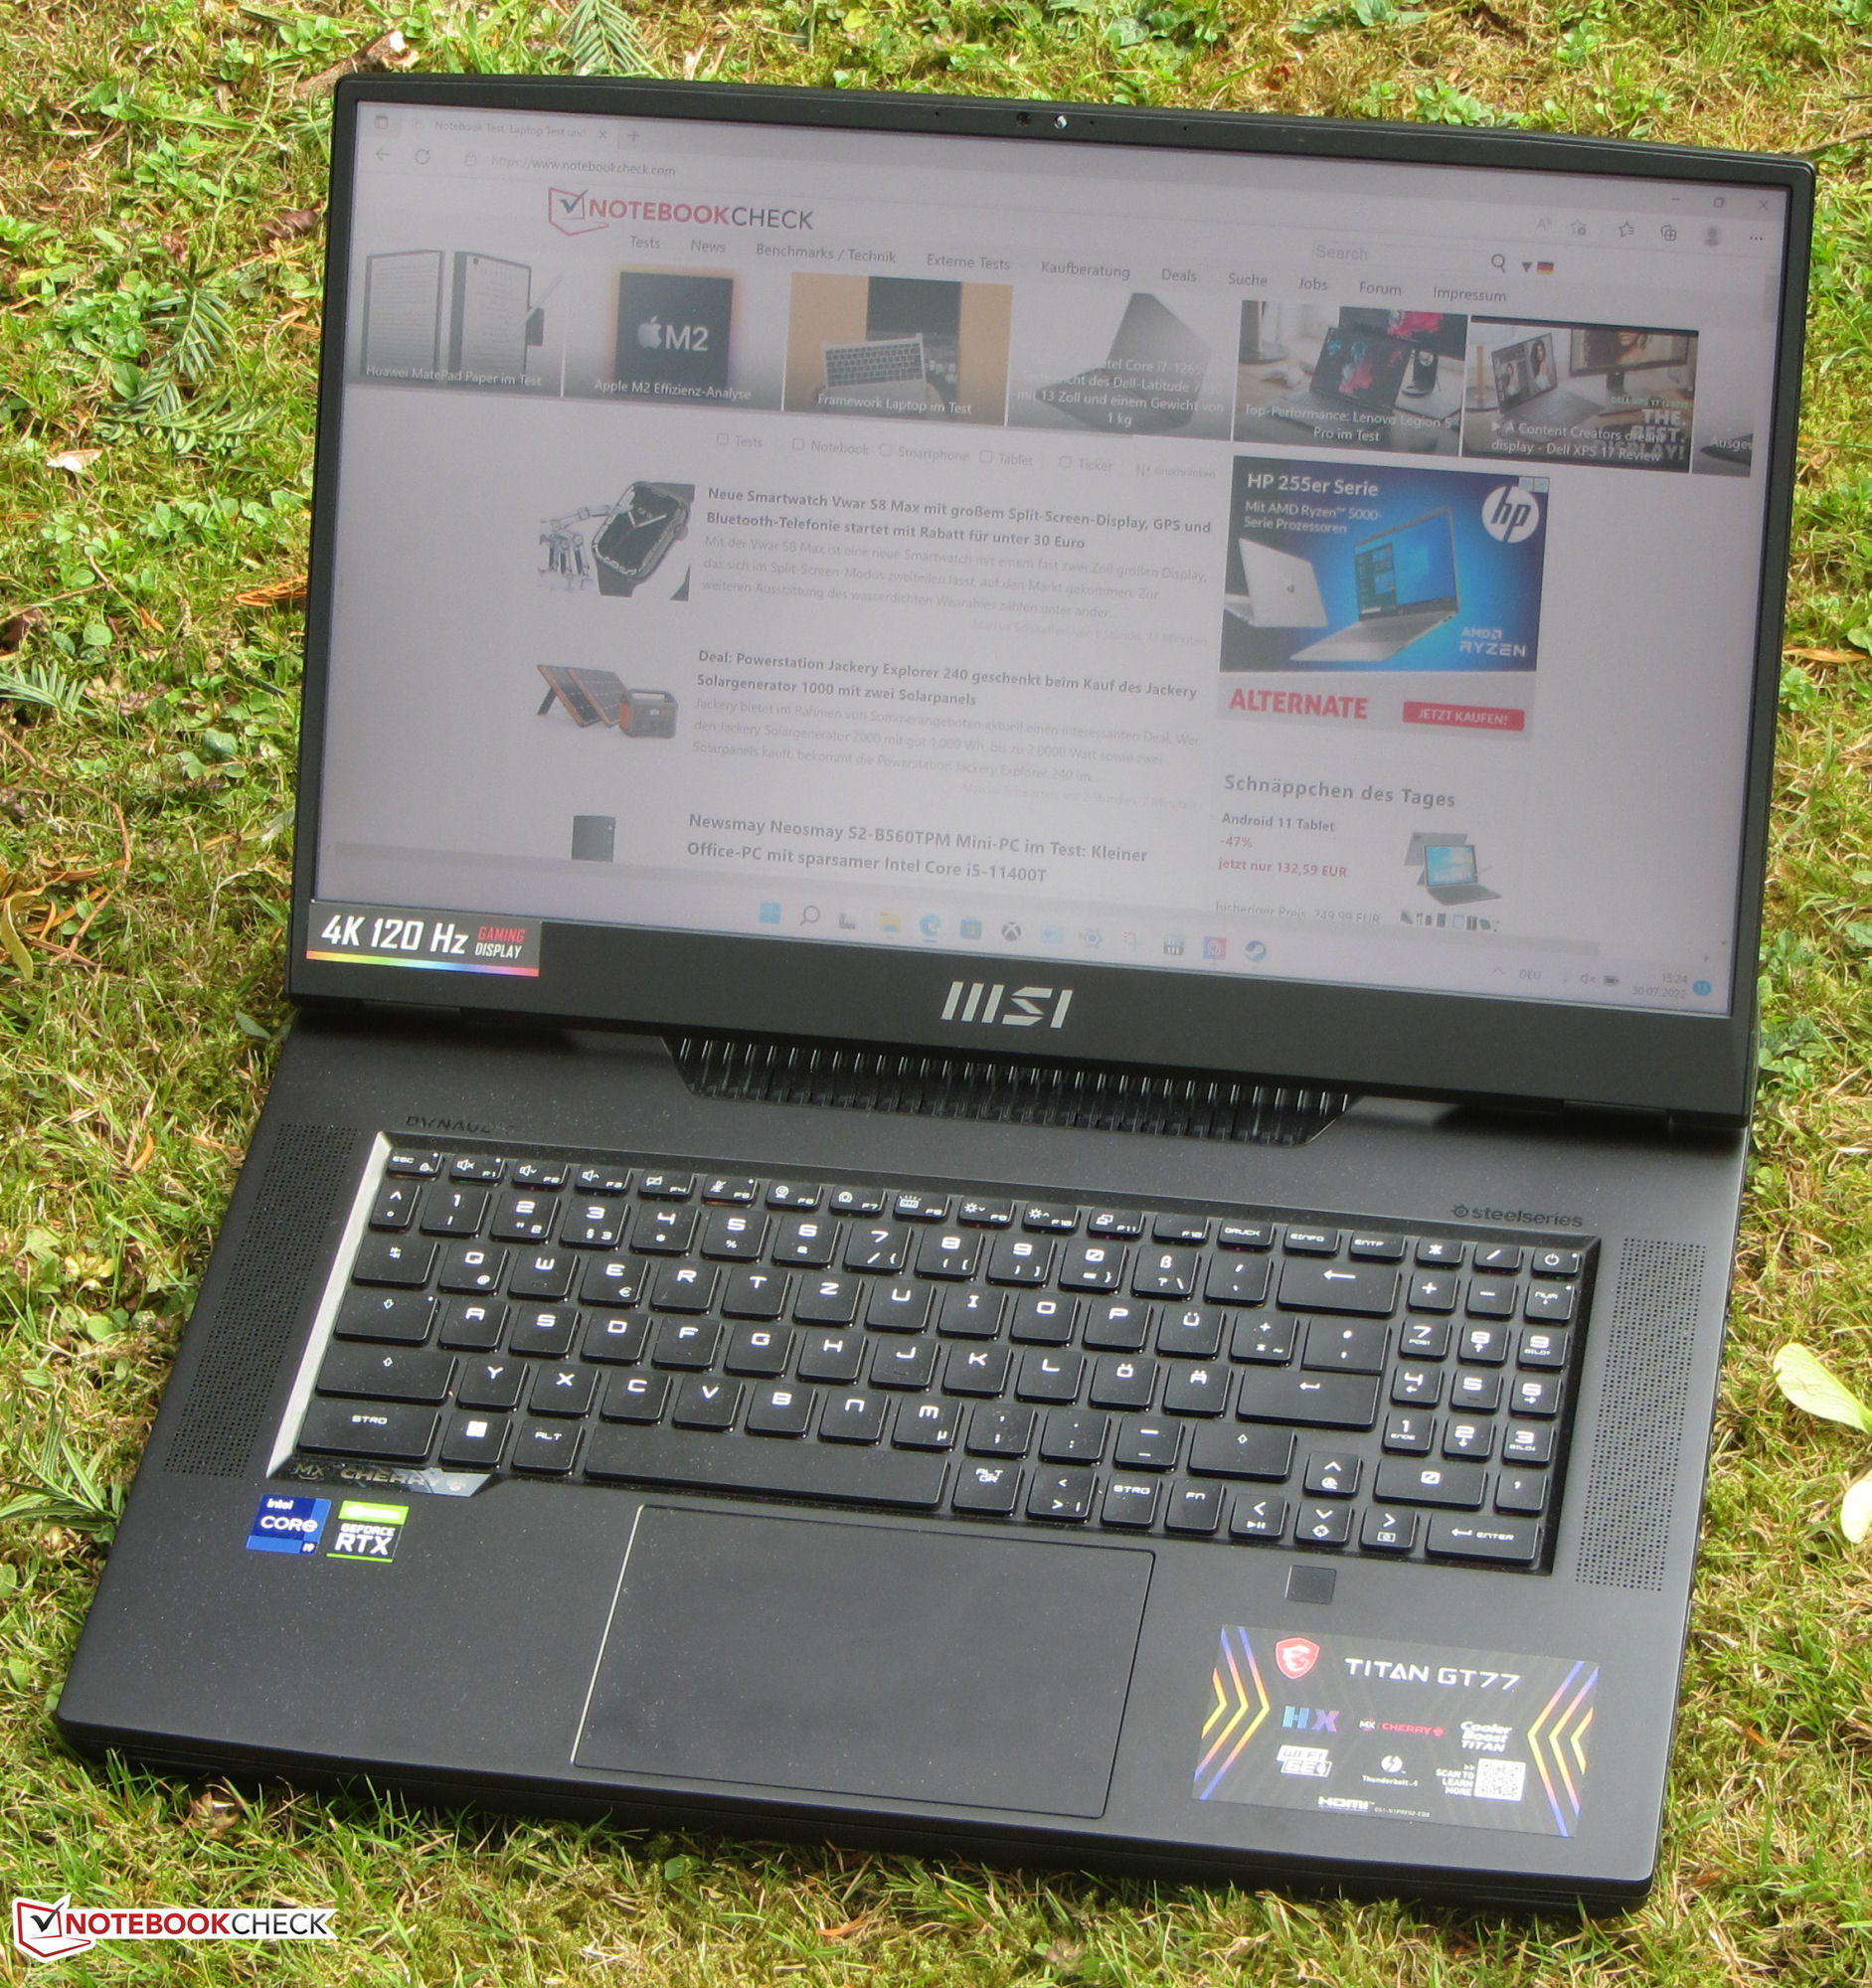
Recenzja MSI Titan GT77 12UHS 4K: Elita wśród laptopów UHD DTR
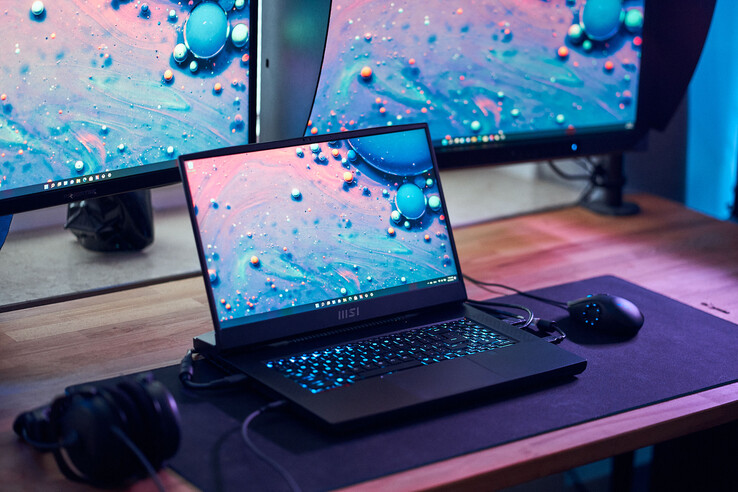
Gracze i twórcy są zarówno częścią grupy docelowej MSI Titan GT77 12UHS - laptopa zastępującego komputer stacjonarny (DTR). Wysokiej klasy specyfikacja (Core i9-12900HX, GeForce RTX 3080 Ti Laptop i 64 GB pamięci RAM) wypycha cenę laptopa do około 5 600 euro (5 980 dolarów). Wyświetlacz to główna różnica między tym urządzeniem a jego Modelu rodzeństwa FHDktóry niedawno recenzowaliśmy: obecny egzemplarz recenzencki ma na pokładzie panel 4K. Niektórzy z jego konkurentów to m.in Schenker XMG Ultra 17, Razer Blade 17 oraz Alienware x17 R2.
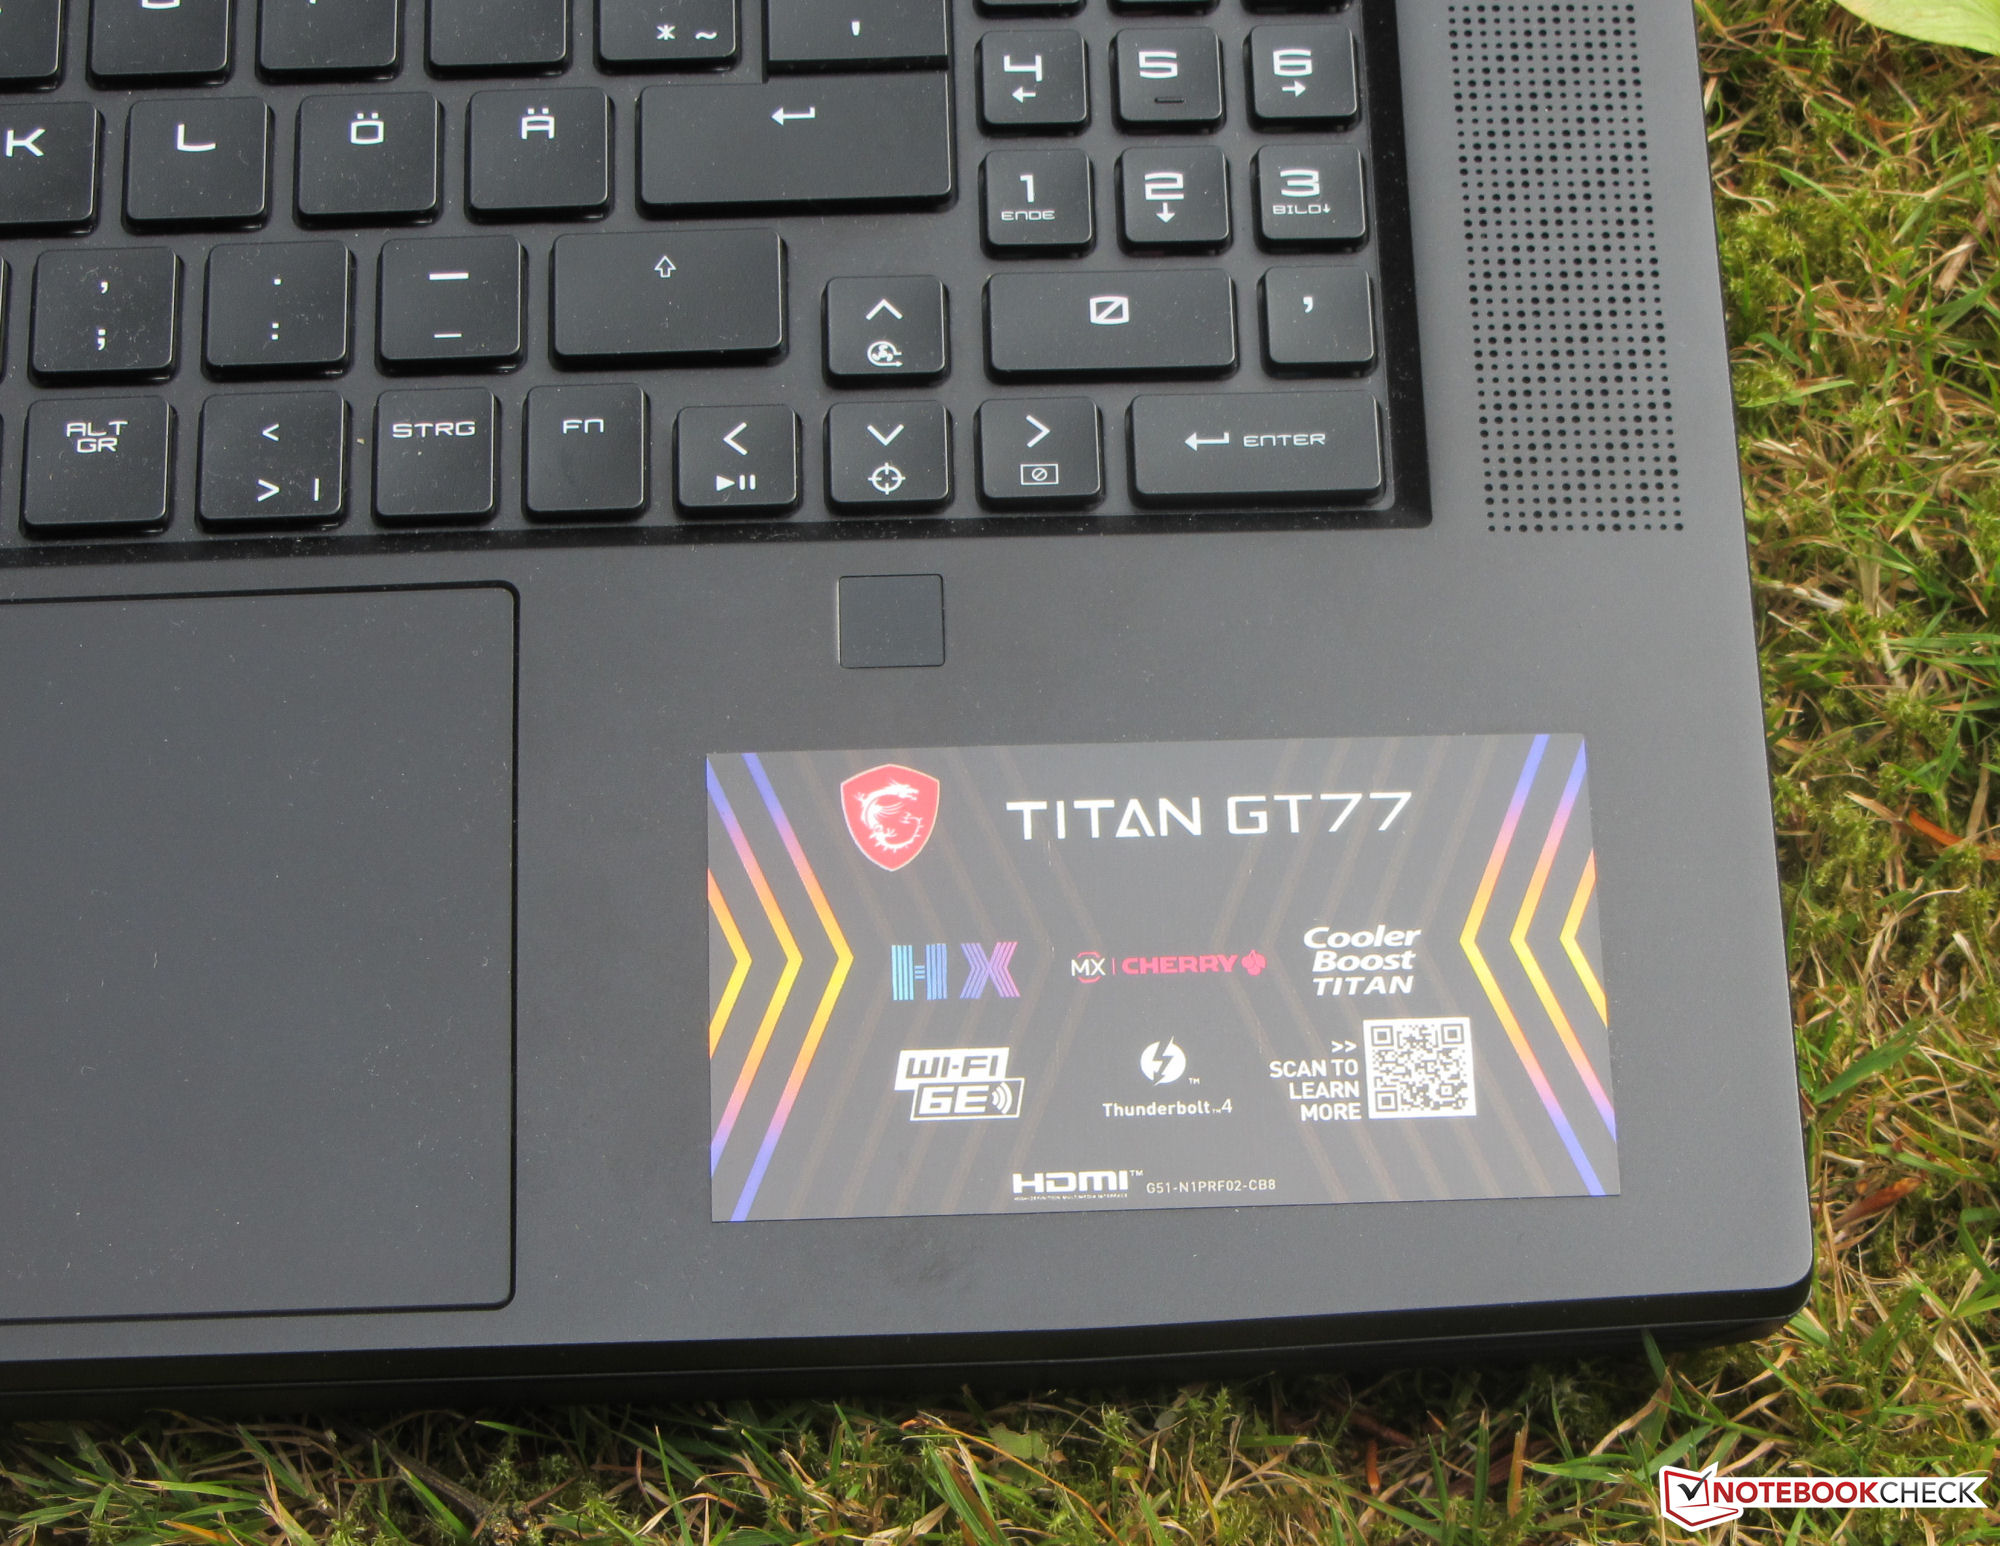
Ponieważ to urządzenie i jego odpowiednik FHD są zbudowane identycznie, możecie przeczytać naszą recenzję dot MSI Titan GT77 12UHS (Core i9, FHD), by uzyskać więcej informacji na temat obudowy, urządzeń wejściowych i głośników.
Potencjalni konkurenci w porównaniu
Ocena | Data | Model | Waga | Wysokość | Rozmiar | Rezolucja | Cena |
|---|---|---|---|---|---|---|---|
| 87.8 % v7 (old) | 09/2022 | MSI Titan GT77 12UHS i9-12900HX, GeForce RTX 3080 Ti Laptop GPU | 3.4 kg | 23 mm | 17.30" | 3840x2160 | |
| 89.9 % v7 (old) | Razer Blade 17 Early 2022 i9-12900H, GeForce RTX 3080 Ti Laptop GPU | 2.8 kg | 19.9 mm | 17.30" | 3840x2160 | ||
| 89.2 % v7 (old) | Alienware x17 R2 P48E i9-12900HK, GeForce RTX 3080 Ti Laptop GPU | 3.1 kg | 20.9 mm | 17.30" | 1920x1080 | ||
| 84.9 % v7 (old) | Schenker XMG Ultra 17 Rocket Lake i9-11900K, GeForce RTX 3080 Laptop GPU | 4.7 kg | 43.5 mm | 17.30" | 1920x1080 |


| SD Card Reader - average JPG Copy Test (av. of 3 runs) | |
| Schenker XMG Ultra 17 Rocket Lake | |
| Alienware x17 R2 P48E (AV Pro V60) | |
| Razer Blade 17 Early 2022 (AV PRO microSD 128 GB V60) | |
| Średnia w klasie Gaming (20.9 - 210, n=55, ostatnie 2 lata) | |
| MSI Titan GT77 12UHS (AV PRO microSD 128 GB V60) | |
| MSI Titan GT77 12UHS 4k (AV PRO microSD 128 GB V60) | |
| Networking | |
| iperf3 receive AXE11000 | |
| MSI Titan GT77 12UHS | |
| MSI Titan GT77 12UHS 4k | |
| Razer Blade 17 Early 2022 | |
| Przeciętny Killer Wi-Fi 6E AX1675i 160MHz Wireless Network Adapter (872 - 1714, n=29) | |
| Średnia w klasie Gaming (680 - 1745, n=96, ostatnie 2 lata) | |
| iperf3 transmit AXE11000 | |
| MSI Titan GT77 12UHS | |
| Przeciętny Killer Wi-Fi 6E AX1675i 160MHz Wireless Network Adapter (797 - 1622, n=27) | |
| MSI Titan GT77 12UHS 4k | |
| Średnia w klasie Gaming (560 - 1862, n=96, ostatnie 2 lata) | |
| iperf3 receive AX12 | |
| Schenker XMG Ultra 17 Rocket Lake | |
| Alienware x17 R2 P48E | |
| Przeciętny Killer Wi-Fi 6E AX1675i 160MHz Wireless Network Adapter (1137 - 1270, n=2) | |
| iperf3 transmit AX12 | |
| Schenker XMG Ultra 17 Rocket Lake | |
| Alienware x17 R2 P48E | |
| Przeciętny Killer Wi-Fi 6E AX1675i 160MHz Wireless Network Adapter (986 - 1257, n=2) | |


Wyświetlacz - Jasny panel o wysokim pokryciu DCI-P3
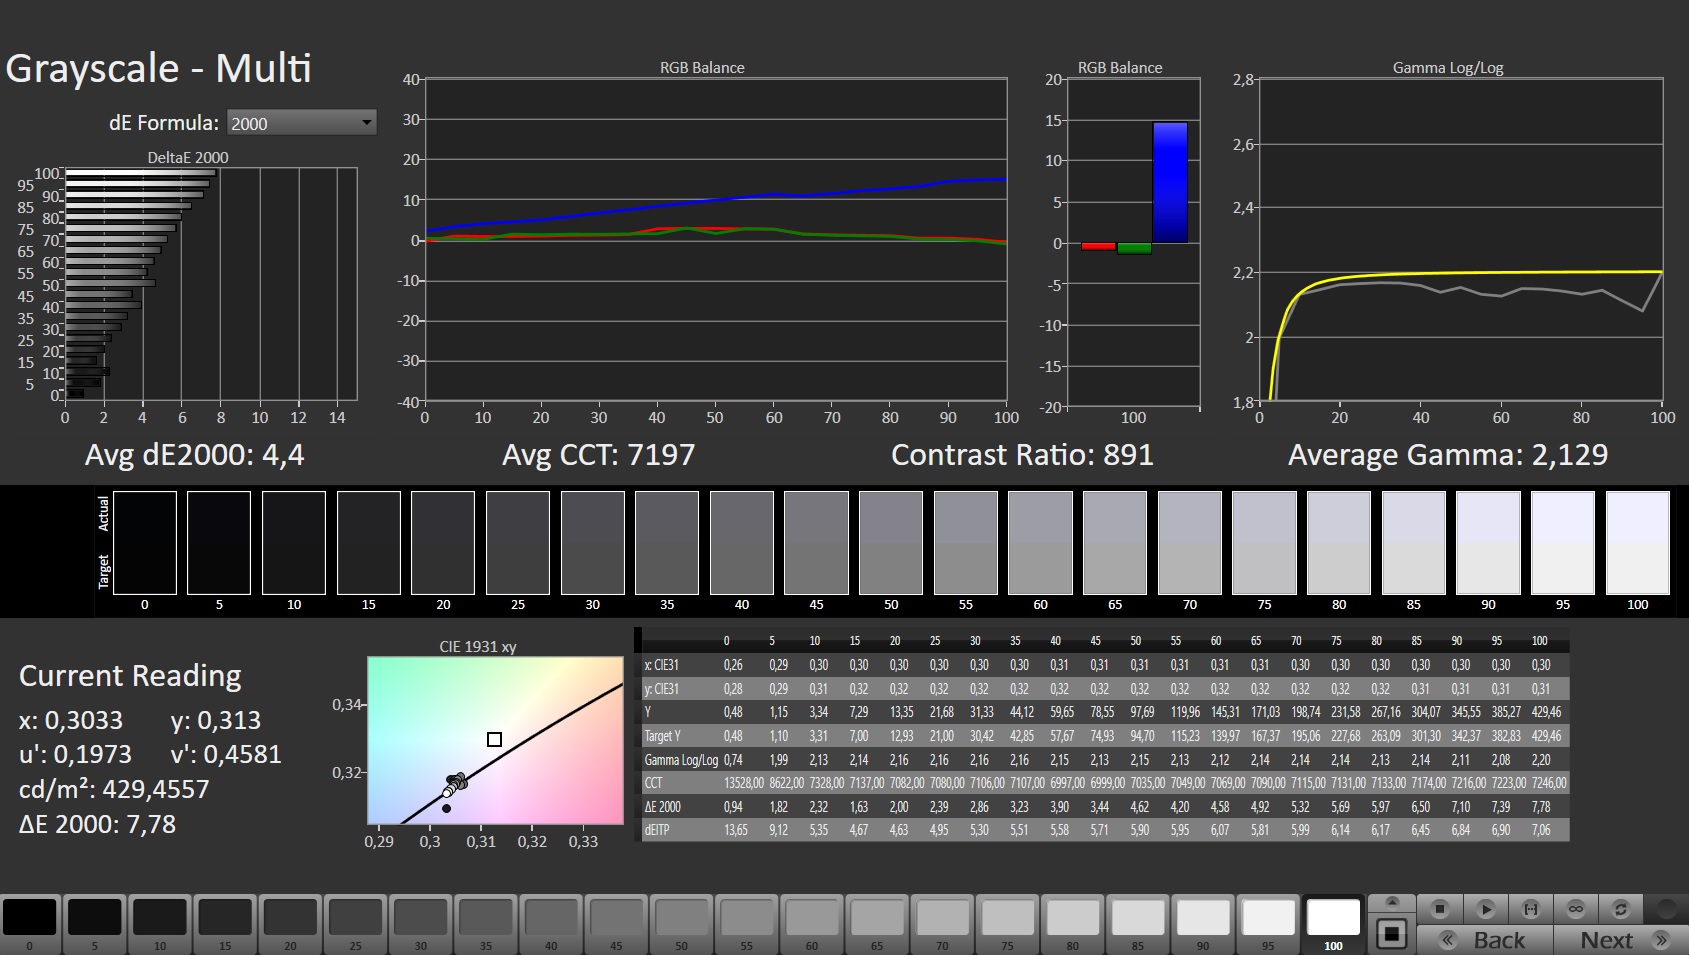
Matowy panel 4K (3 840 x 2 160 pikseli) w recenzowanym egzemplarzu zapewnia znacznie wyższą jasność szczytową niż wyświetlacz FHD w jego rodzeństwa (401 cd/m² vs. 275,1 cd/m²).
Niemniej jednak można jeszcze poprawić kontrast (871:1 vs. 700:1): oba wyświetlacze nie osiągają wartości, które uważamy za dobre (> 1000:1). Choć oba panele są bardzo responsywne, model FHD oferuje znacznie wyższą częstotliwość odświeżania (120 Hz vs. 360 Hz). Podczas naszych pomiarów nie zaobserwowaliśmy żadnego migotania PWM.
| |||||||||||||||||||||||||
rozświetlenie: 91 %
na akumulatorze: 418 cd/m²
kontrast: 871:1 (czerń: 0.48 cd/m²)
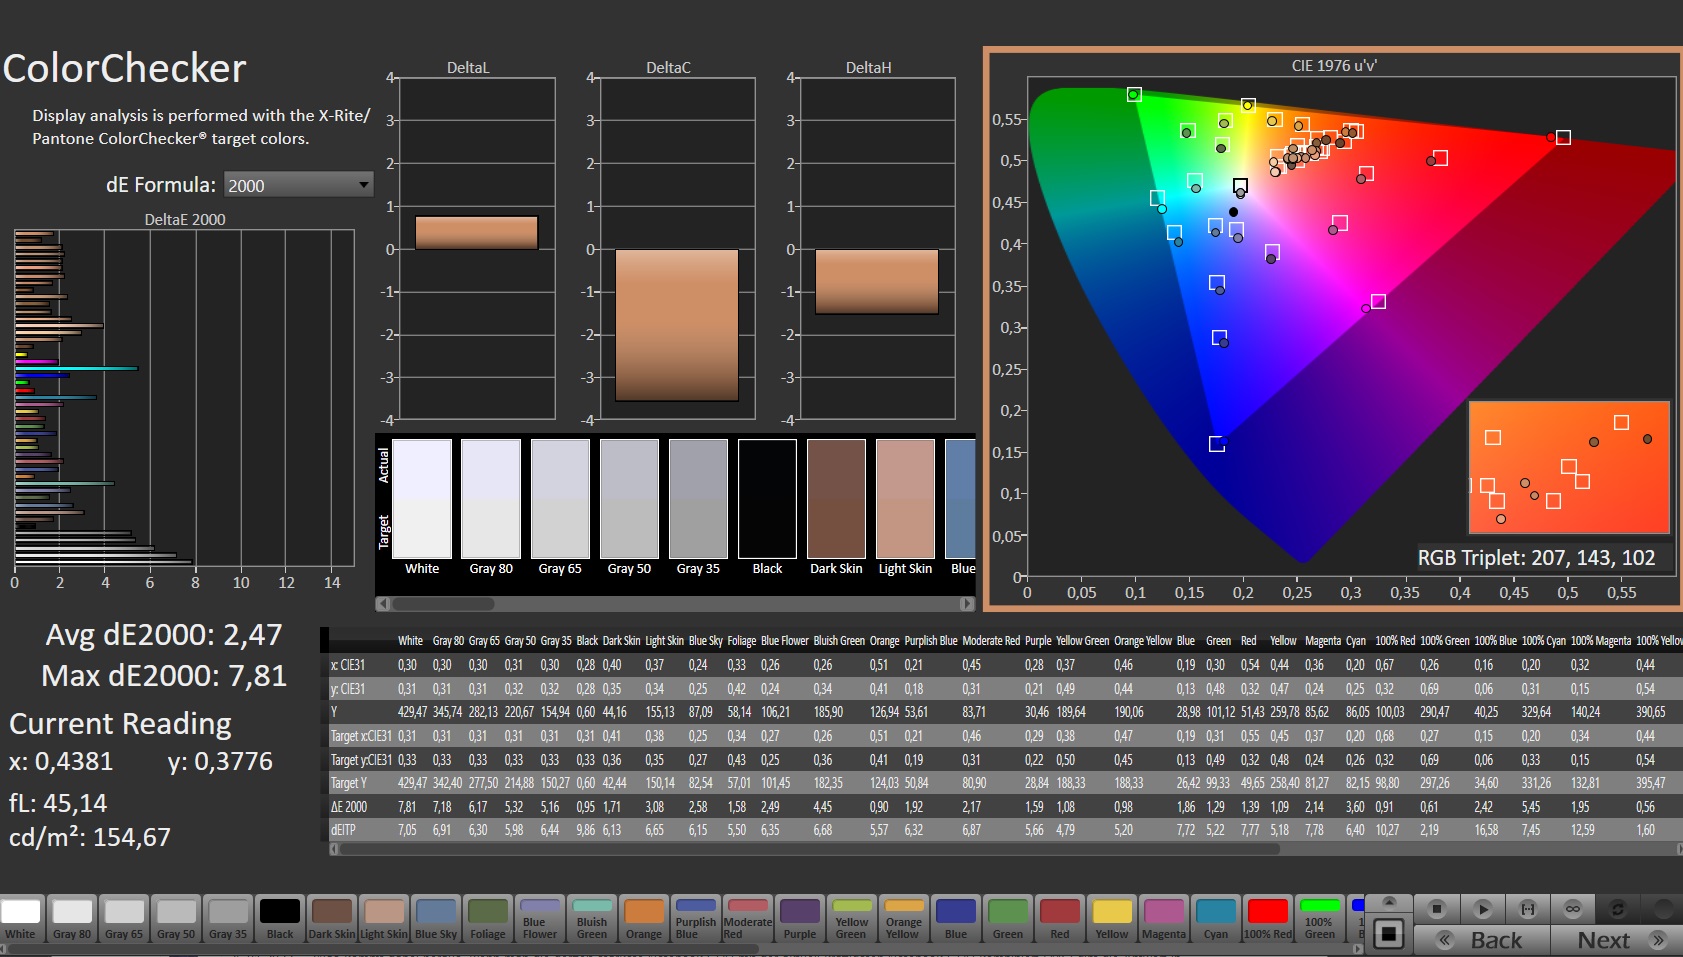
ΔE ColorChecker Calman: 2.47 | ∀{0.5-29.43 Ø4.73}
calibrated: 0.66
ΔE Greyscale Calman: 4.4 | ∀{0.09-98 Ø4.97}
86.2% AdobeRGB 1998 (Argyll 3D)
99.8% sRGB (Argyll 3D)
97% Display P3 (Argyll 3D)
Gamma: 2.129
CCT: 7197 K
| MSI Titan GT77 12UHS 4k AU Optronics B173ZAN06.1, IPS, 3840x2160, 17.3" | Razer Blade 17 Early 2022 AU Optronics B173ZAN06.9, IPS, 3840x2160, 17.3" | Alienware x17 R2 P48E AU Optronics B173HAN, IPS, 1920x1080, 17.3" | Schenker XMG Ultra 17 Rocket Lake AU Optronics B173HAN05.1, IPS, 1920x1080, 17.3" | MSI Titan GT77 12UHS Sharp SHP1544 LQ173M1JW08, IPS-Level, 1920x1080, 17.3" | |
|---|---|---|---|---|---|
| Display | 1% | -9% | -16% | -14% | |
| Display P3 Coverage (%) | 97 | 99.4 2% | 79.2 -18% | 69.8 -28% | 70.8 -27% |
| sRGB Coverage (%) | 99.8 | 100 0% | 99.8 0% | 97.2 -3% | 98.9 -1% |
| AdobeRGB 1998 Coverage (%) | 86.2 | 87.3 1% | 79.6 -8% | 72 -16% | 73 -15% |
| Response Times | -27% | -109% | -44% | 19% | |
| Response Time Grey 50% / Grey 80% * (ms) | 5.2 ? | 7.5 ? -44% | 12.4 ? -138% | 5.6 ? -8% | 3.03 ? 42% |
| Response Time Black / White * (ms) | 5.1 ? | 5.6 ? -10% | 9.2 ? -80% | 9.2 ? -80% | 5.28 ? -4% |
| PWM Frequency (Hz) | |||||
| Screen | 28% | 3% | 9% | -17% | |
| Brightness middle (cd/m²) | 418 | 503 20% | 365.4 -13% | 306 -27% | 280 -33% |
| Brightness (cd/m²) | 401 | 486 21% | 344 -14% | 299 -25% | 275 -31% |
| Brightness Distribution (%) | 91 | 84 -8% | 85 -7% | 93 2% | 79 -13% |
| Black Level * (cd/m²) | 0.48 | 0.44 8% | 0.29 40% | 0.22 54% | 0.4 17% |
| Contrast (:1) | 871 | 1143 31% | 1260 45% | 1391 60% | 700 -20% |
| Colorchecker dE 2000 * | 2.47 | 1.08 56% | 3.17 -28% | 1.92 22% | 2.1 15% |
| Colorchecker dE 2000 max. * | 7.81 | 4.54 42% | 7.69 2% | 4.78 39% | 5.83 25% |
| Colorchecker dE 2000 calibrated * | 0.66 | 0.6 9% | 0.51 23% | 1.34 -103% | 1.58 -139% |
| Greyscale dE 2000 * | 4.4 | 1.3 70% | 5.3 -20% | 2 55% | 3.3 25% |
| Gamma | 2.129 103% | 2.151 102% | 2.18 101% | 2.153 102% | 2.13 103% |
| CCT | 7197 90% | 6541 99% | 5879 111% | 6738 96% | 7060 92% |
| Color Space (Percent of AdobeRGB 1998) (%) | 72 | ||||
| Color Space (Percent of sRGB) (%) | 93 | ||||
| Całkowita średnia (program / ustawienia) | 1% /
14% | -38% /
-15% | -17% /
-4% | -4% /
-11% |
* ... im mniej tym lepiej
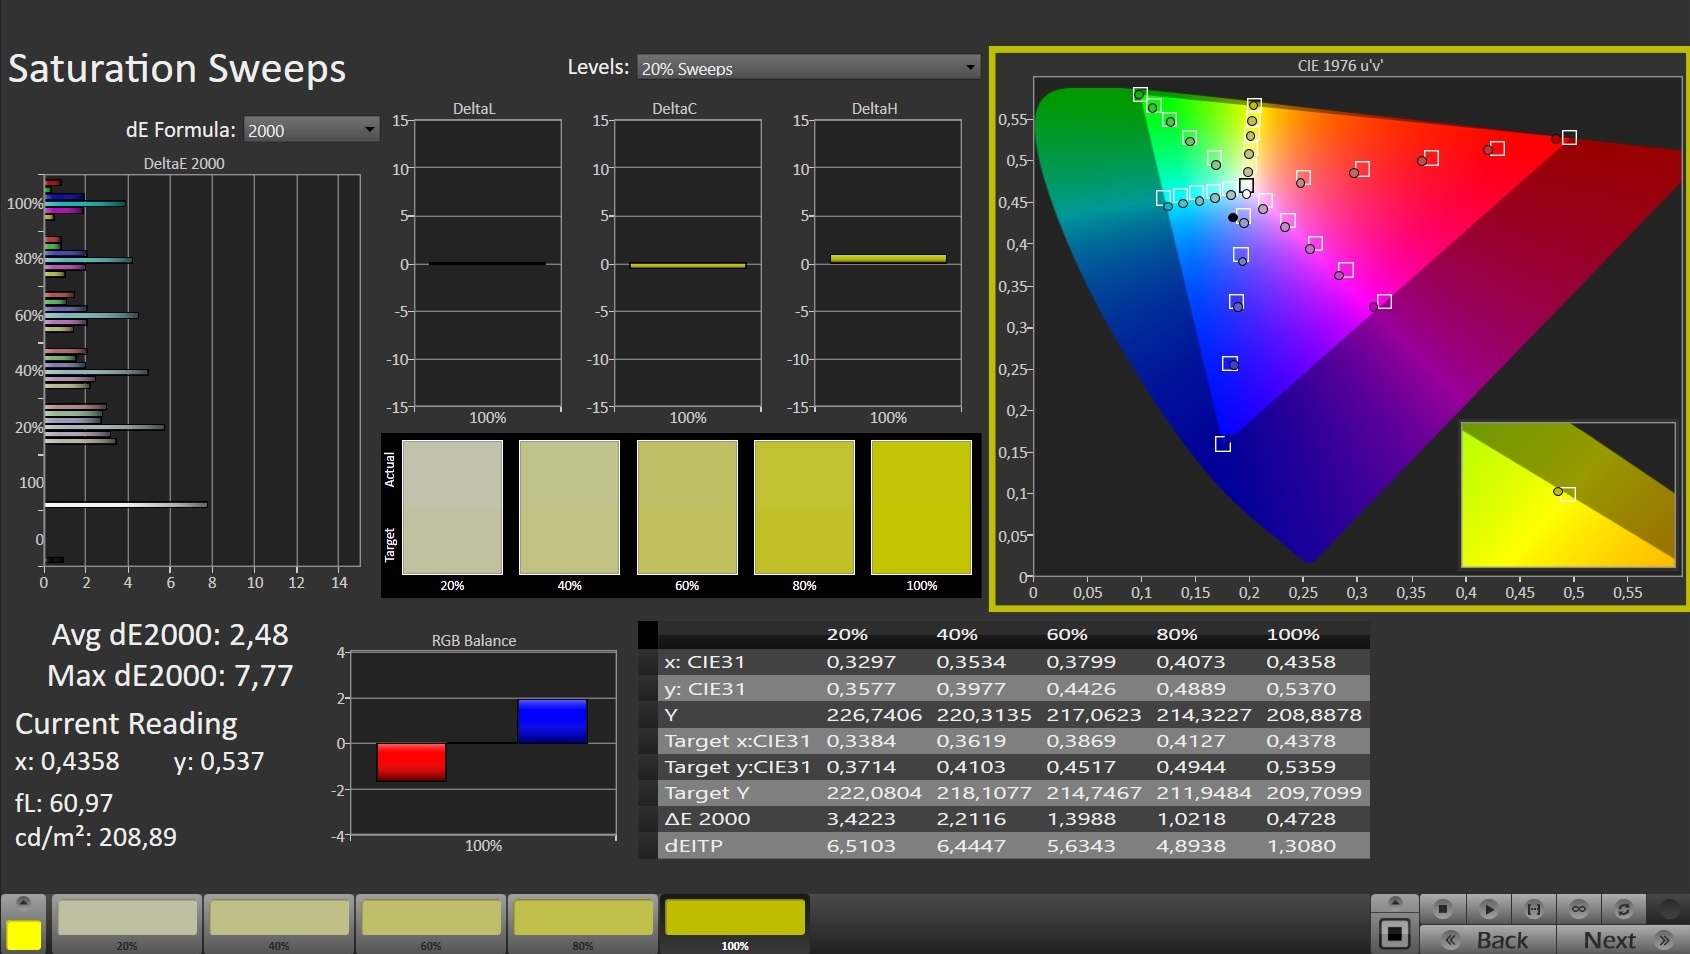
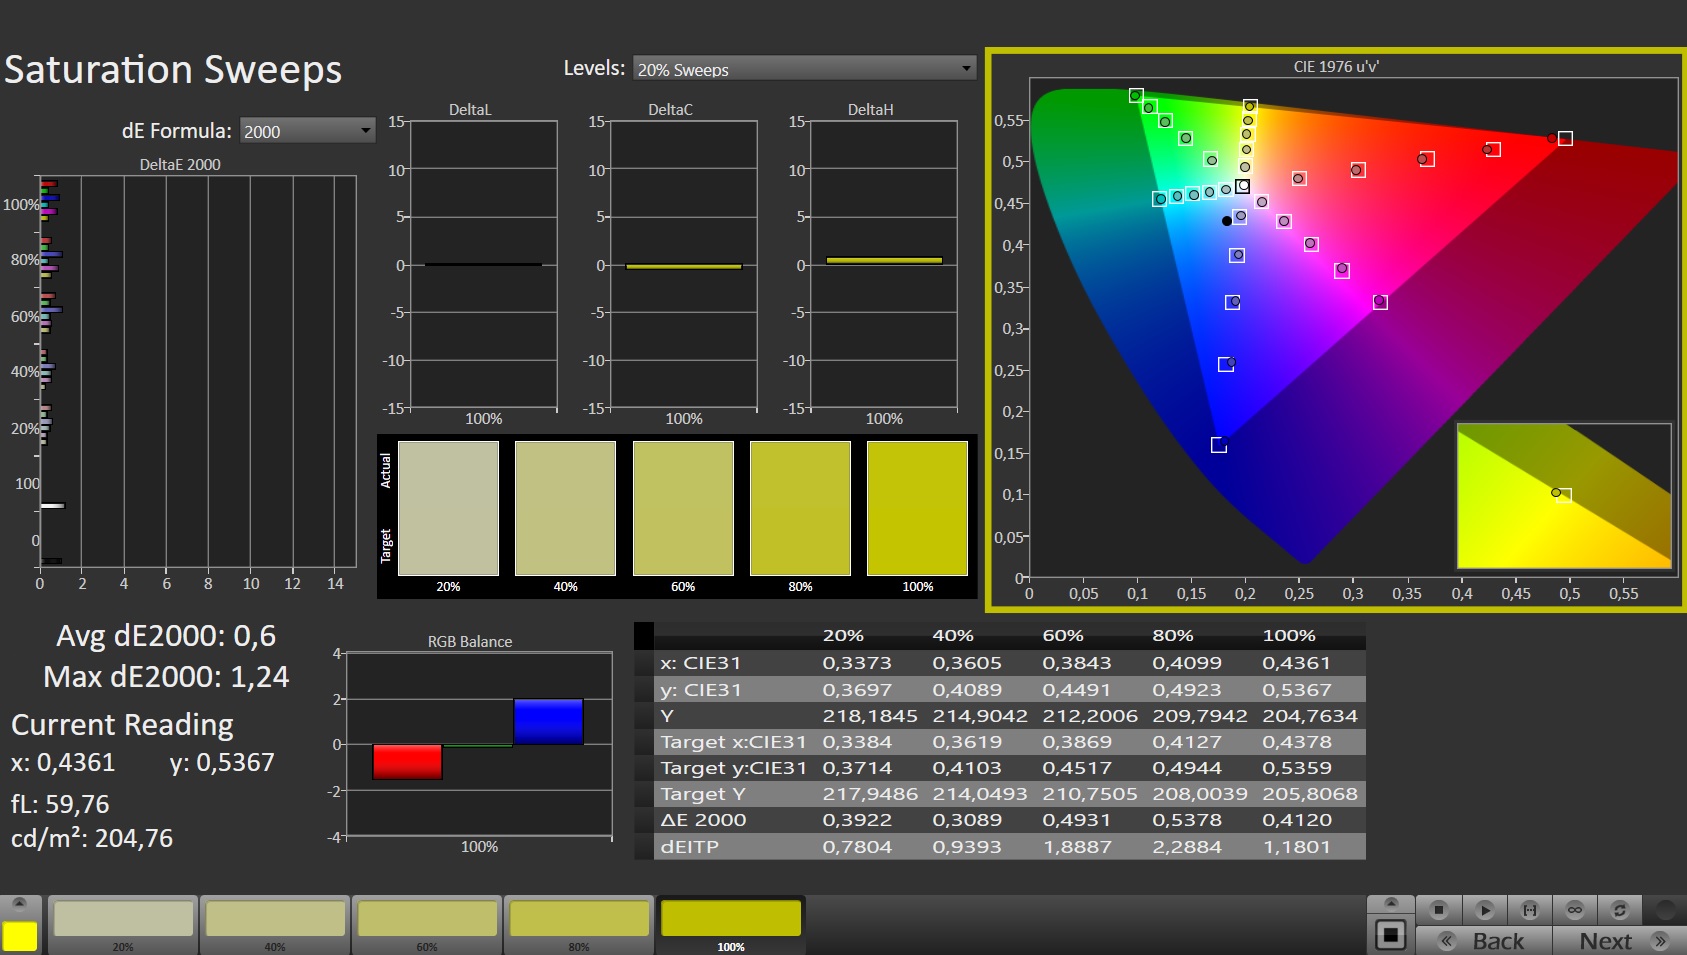
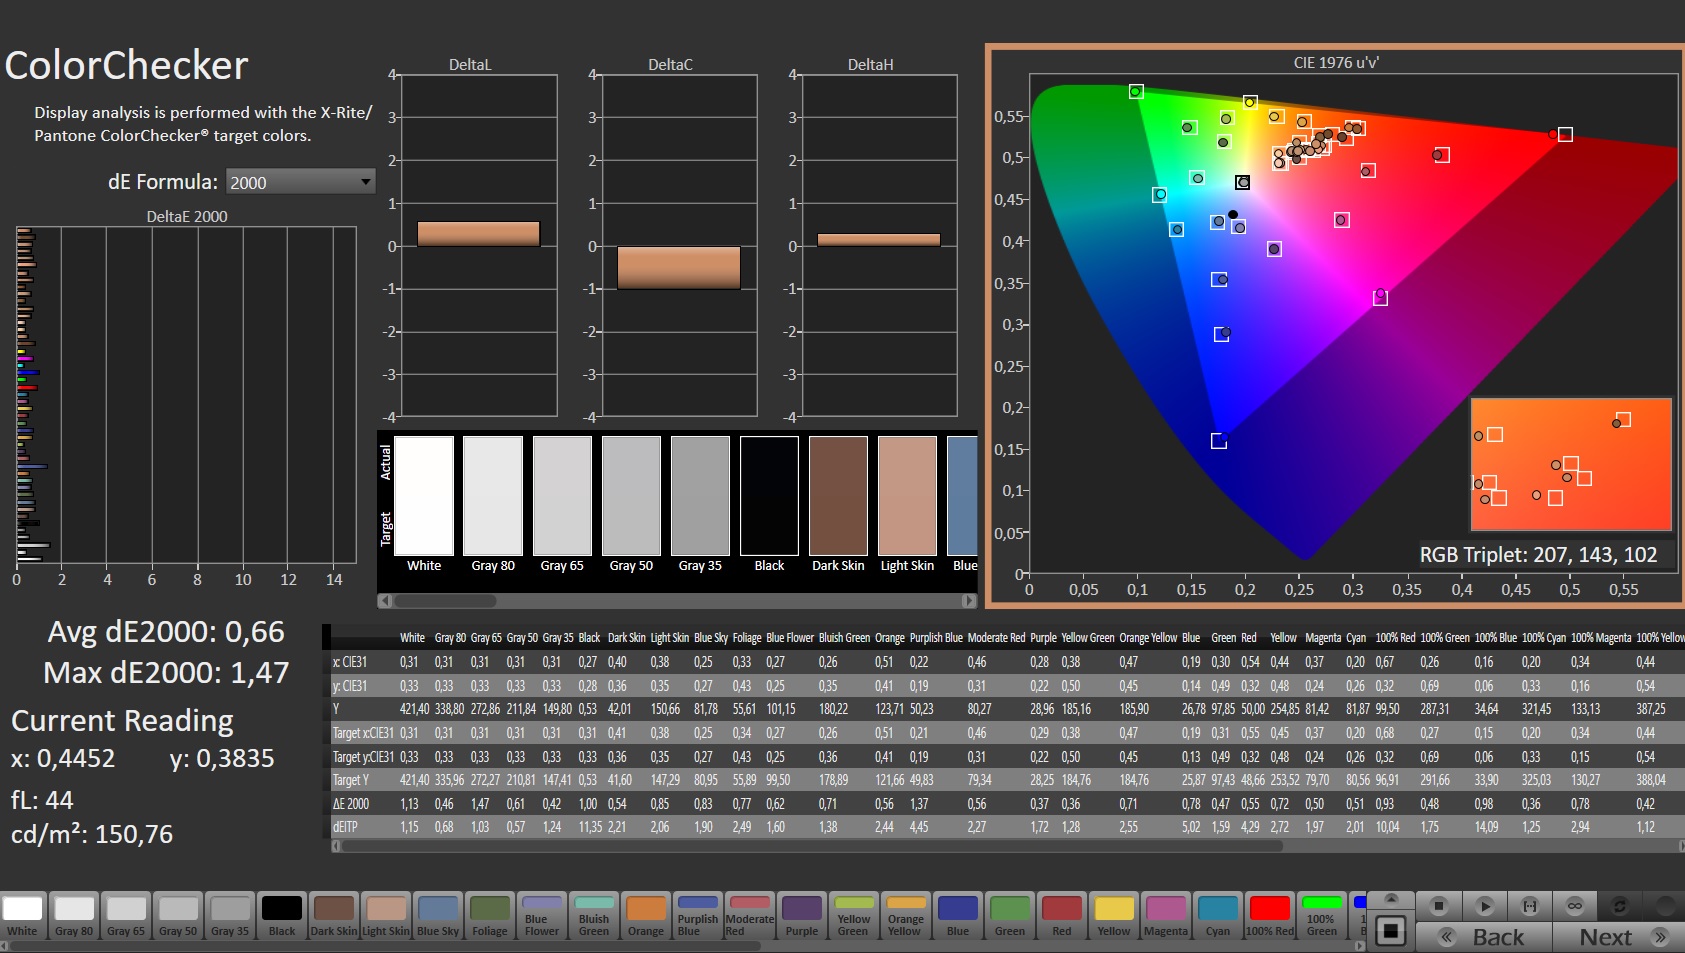
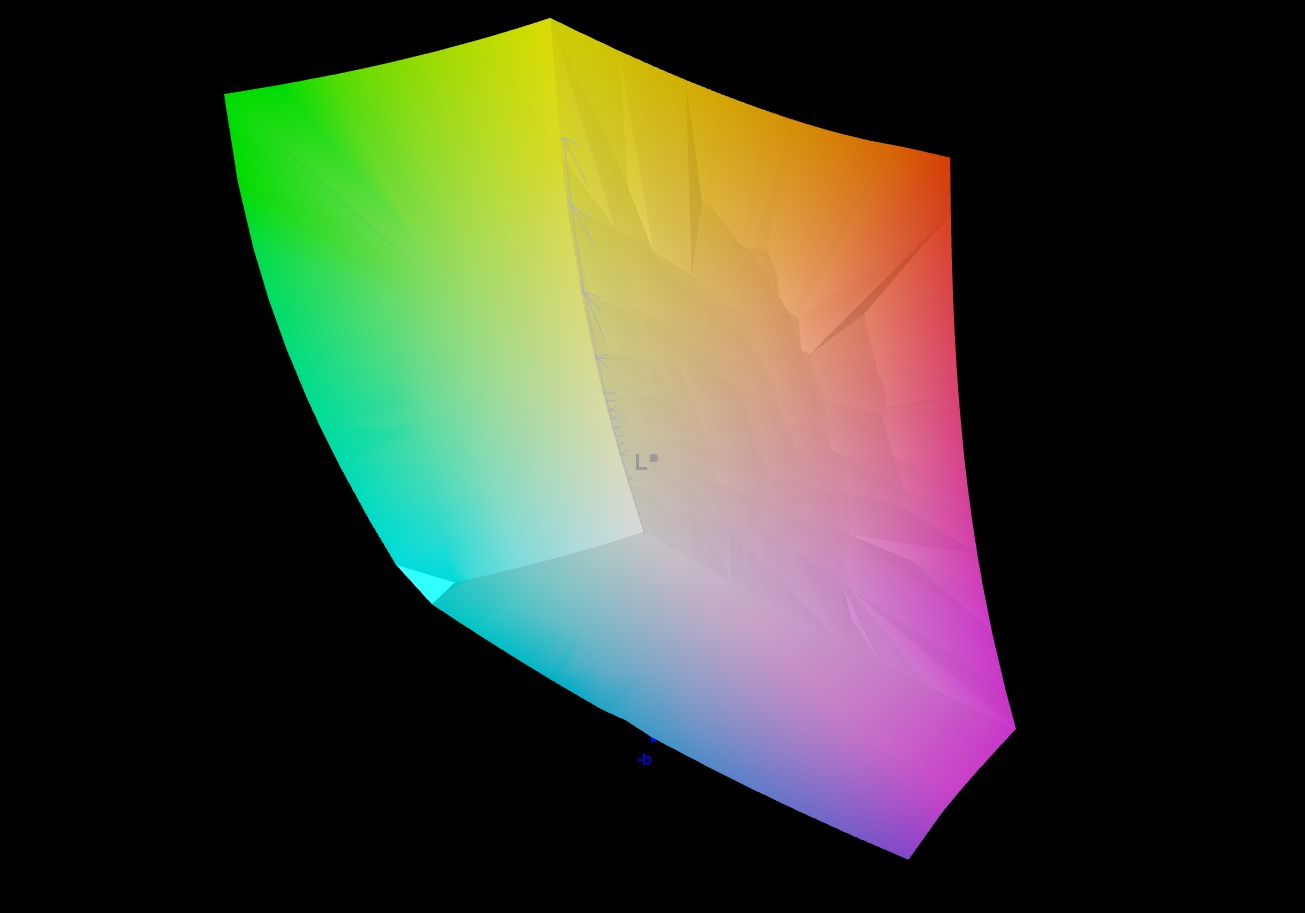
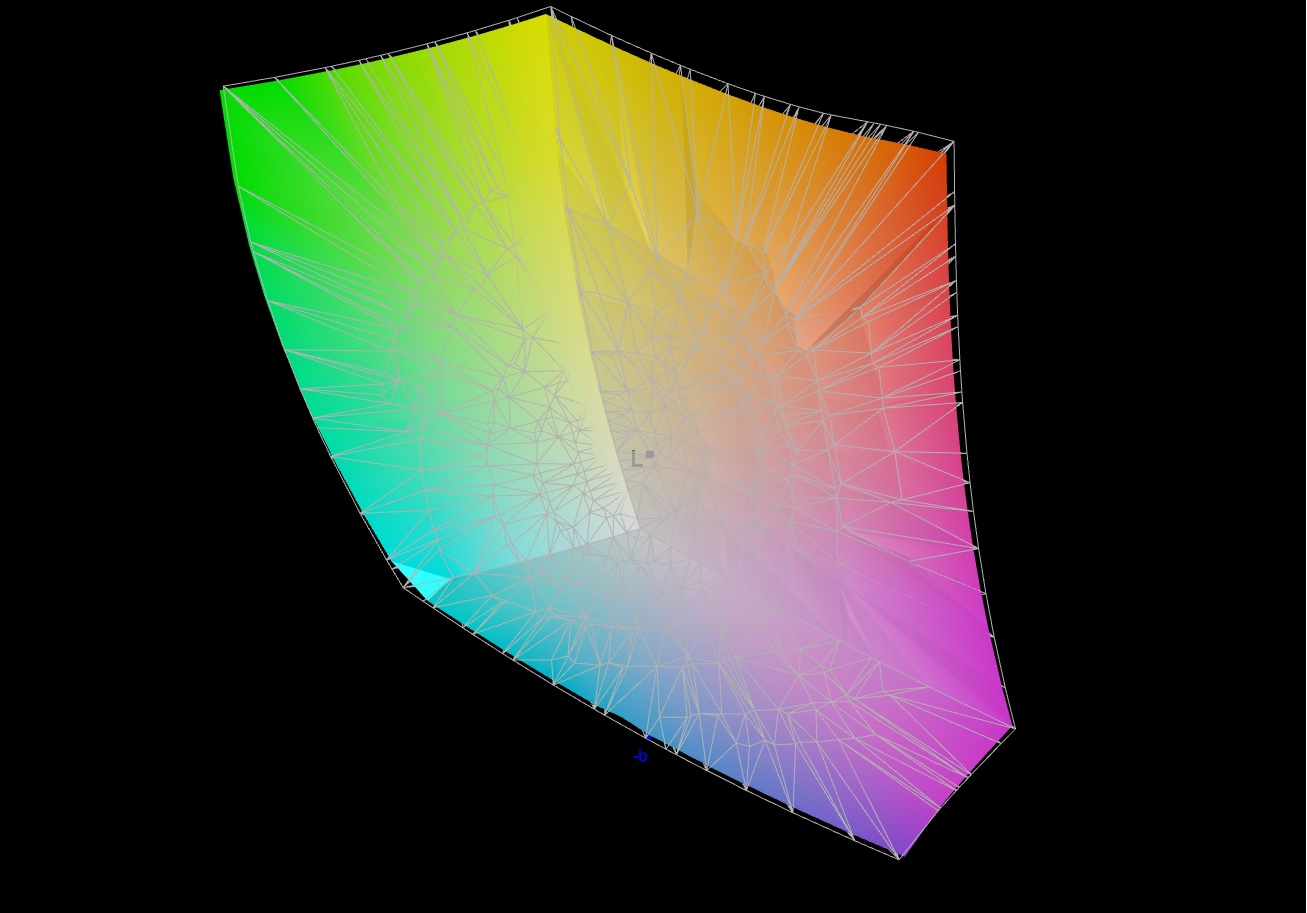
Wyświetlacz 4K pokrywa niemal całą przestrzeń barw sRGB (99,8%) i DCI-P3 (97%) oraz do 86% AdobeRGB. Panel FHD w modelu rodzeństwa nie jest w stanie dotrzymać kroku pod tym względem (sRGB: 97%, AdobeRGB: 73%, DCI-P3: 71%). Oznacza to, że panel 4K jest najlepszym rozwiązaniem, jeśli dokładność kolorów jest dla Ciebie ważna
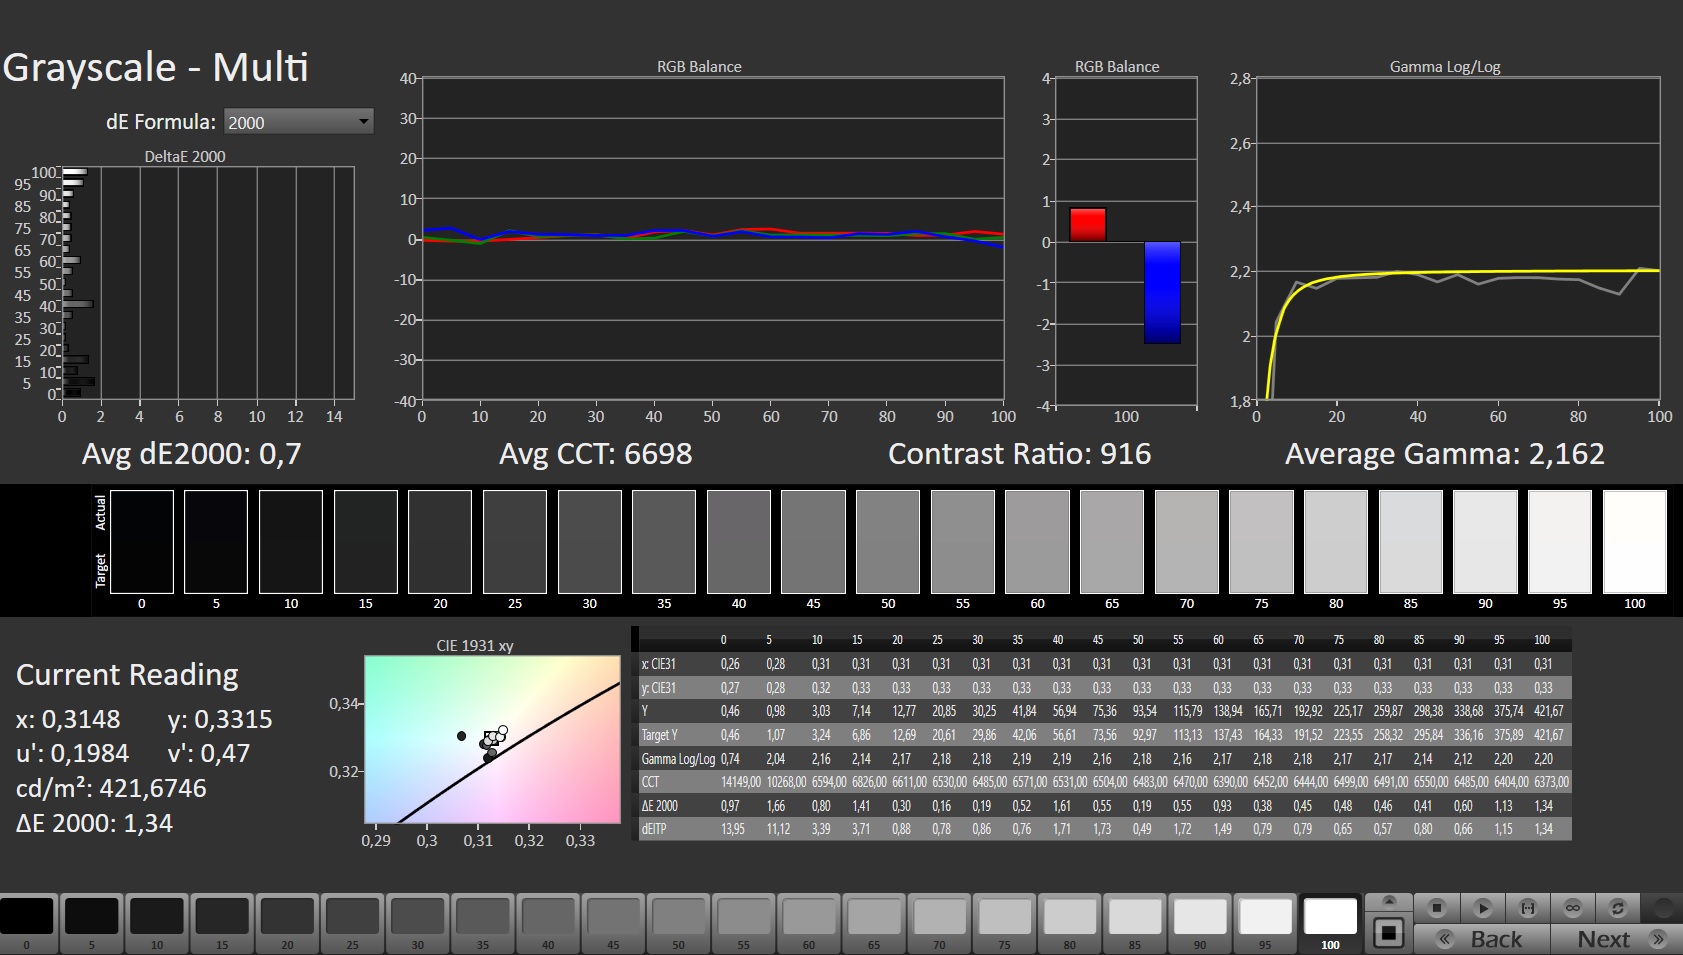
Ekrany mają już dobre odwzorowanie kolorów zaraz po wyjęciu z pudełka: wyświetlacze UHD i FHD spełniają pożądaną wartość (Delta E < 3) przy swoich niezauważalnych różnicach kolorów wynoszących odpowiednio 2,47 i 2,1. Kalibracja ekranów sprawiła, że ich reprodukcja w skali szarości stała się bardziej zrównoważona, a różnice kolorów zmniejszyły się odpowiednio do 0,66 i 1,58. W infoboxie każdego monitora można znaleźć link do pobrania stworzonych przez nas profili barwnych za darmo.
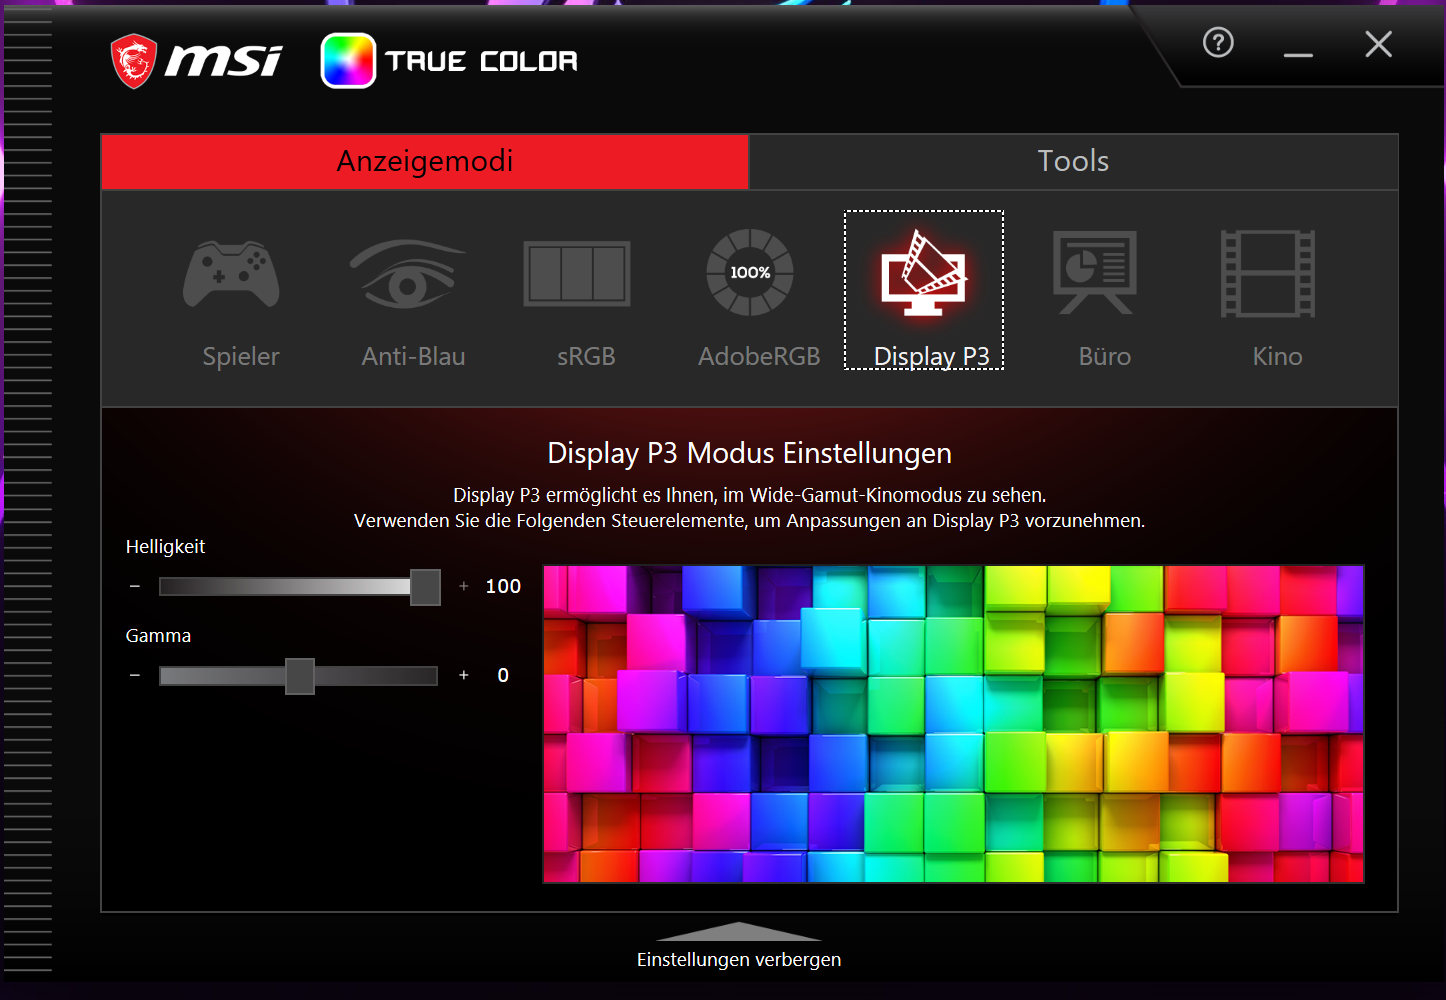
Uwaga: Oprogramowanie MSI True Color pozwala na dostosowanie kolorów do lepszego dopasowania do palety barw lub zdefiniowanego scenariusza użytkowania. My wybraliśmy ustawienie wstępne "Display P3".

Wyświetl czasy reakcji
| ↔ Czas reakcji od czerni do bieli | ||
|---|---|---|
| 5.1 ms ... wzrost ↗ i spadek ↘ łącznie | ↗ 1.5 ms wzrost | 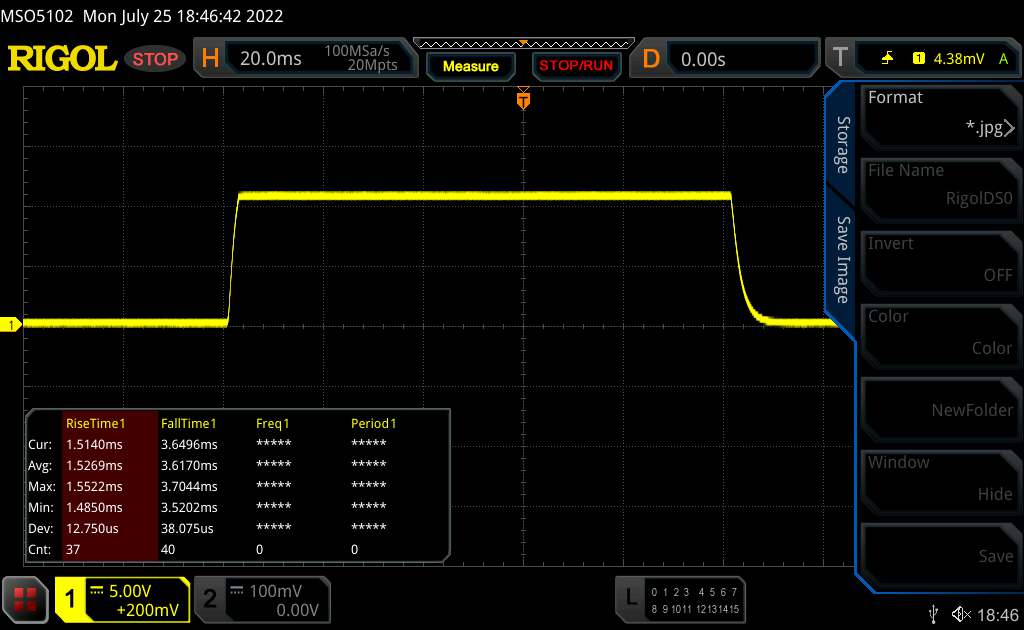 |
| ↘ 3.6 ms upadek | ||
| W naszych testach ekran wykazuje bardzo szybką reakcję i powinien bardzo dobrze nadawać się do szybkich gier. Dla porównania, wszystkie testowane urządzenia wahają się od 0.1 (minimum) do 240 (maksimum) ms. » 18 % wszystkich urządzeń jest lepszych. Oznacza to, że zmierzony czas reakcji jest lepszy od średniej wszystkich testowanych urządzeń (19.9 ms). | ||
| ↔ Czas reakcji 50% szarości do 80% szarości | ||
| 5.2 ms ... wzrost ↗ i spadek ↘ łącznie | ↗ 1.2 ms wzrost | 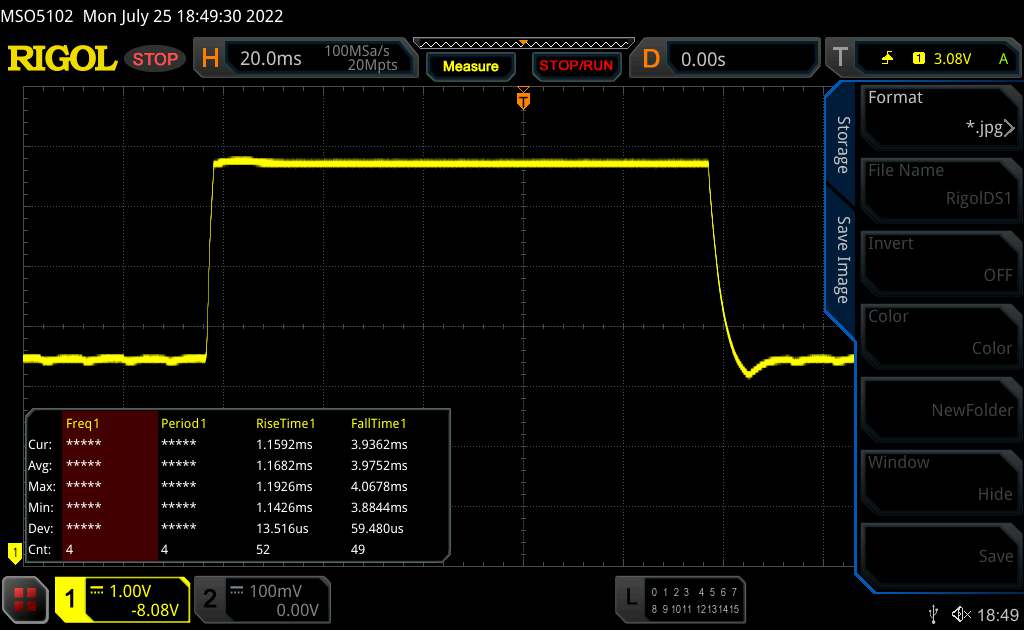 |
| ↘ 4 ms upadek | ||
| W naszych testach ekran wykazuje bardzo szybką reakcję i powinien bardzo dobrze nadawać się do szybkich gier. Dla porównania, wszystkie testowane urządzenia wahają się od 0.165 (minimum) do 636 (maksimum) ms. » 17 % wszystkich urządzeń jest lepszych. Oznacza to, że zmierzony czas reakcji jest lepszy od średniej wszystkich testowanych urządzeń (31.1 ms). | ||
Migotanie ekranu / PWM (modulacja szerokości impulsu)
| Migotanie ekranu/nie wykryto PWM |  | ||
Dla porównania: 52 % wszystkich testowanych urządzeń nie używa PWM do przyciemniania wyświetlacza. Jeśli wykryto PWM, zmierzono średnio 7798 (minimum: 5 - maksimum: 343500) Hz. | |||
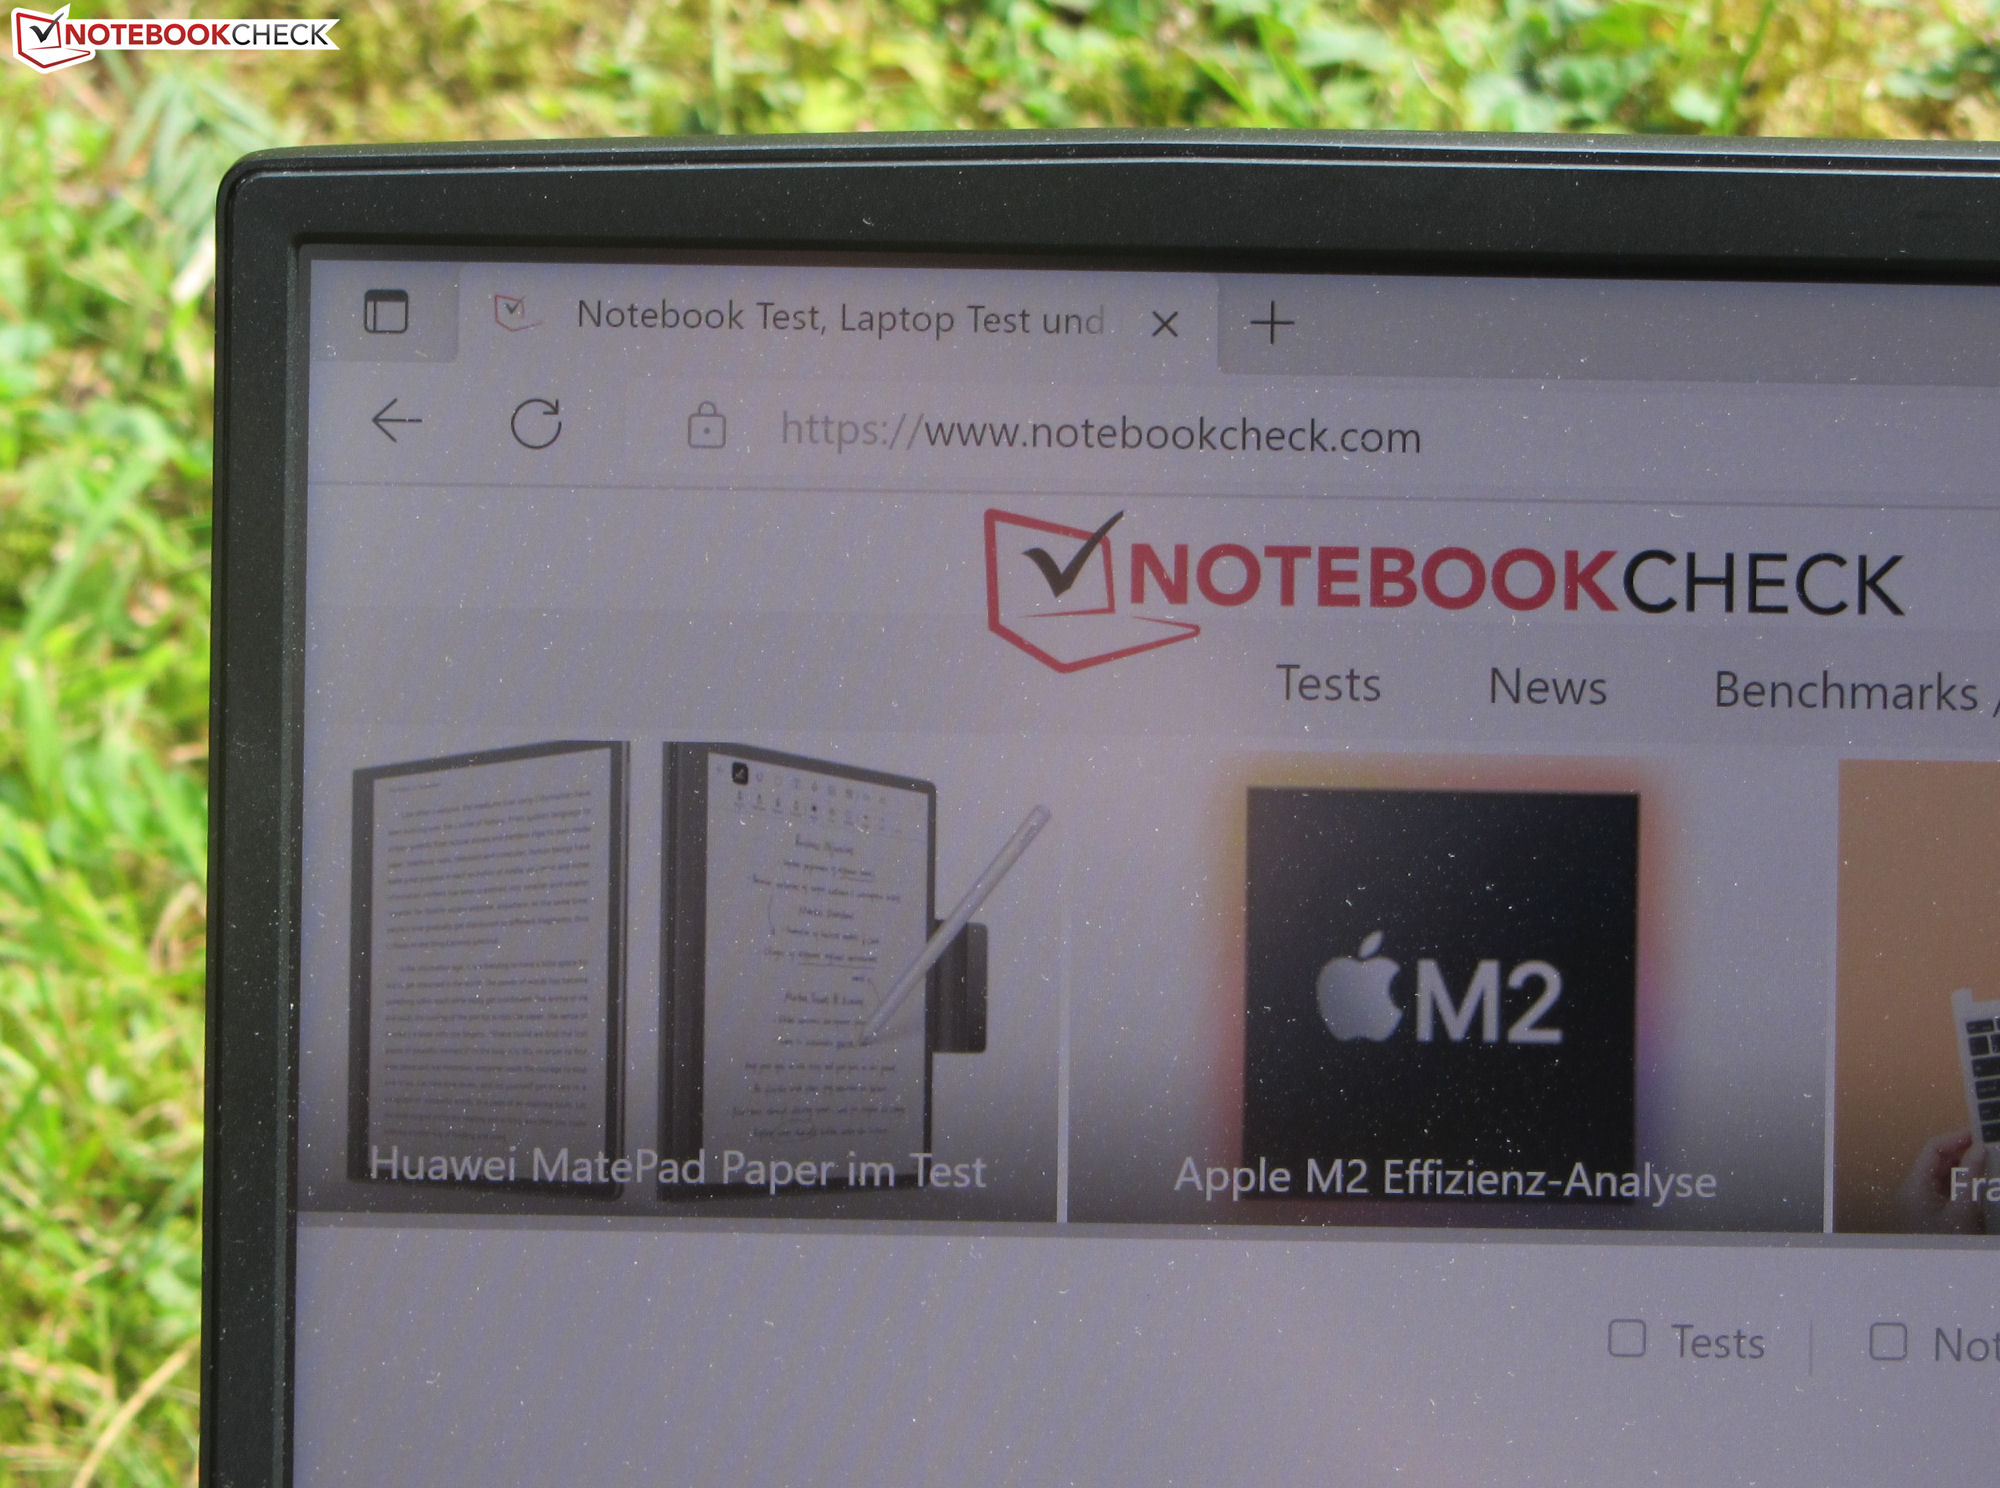
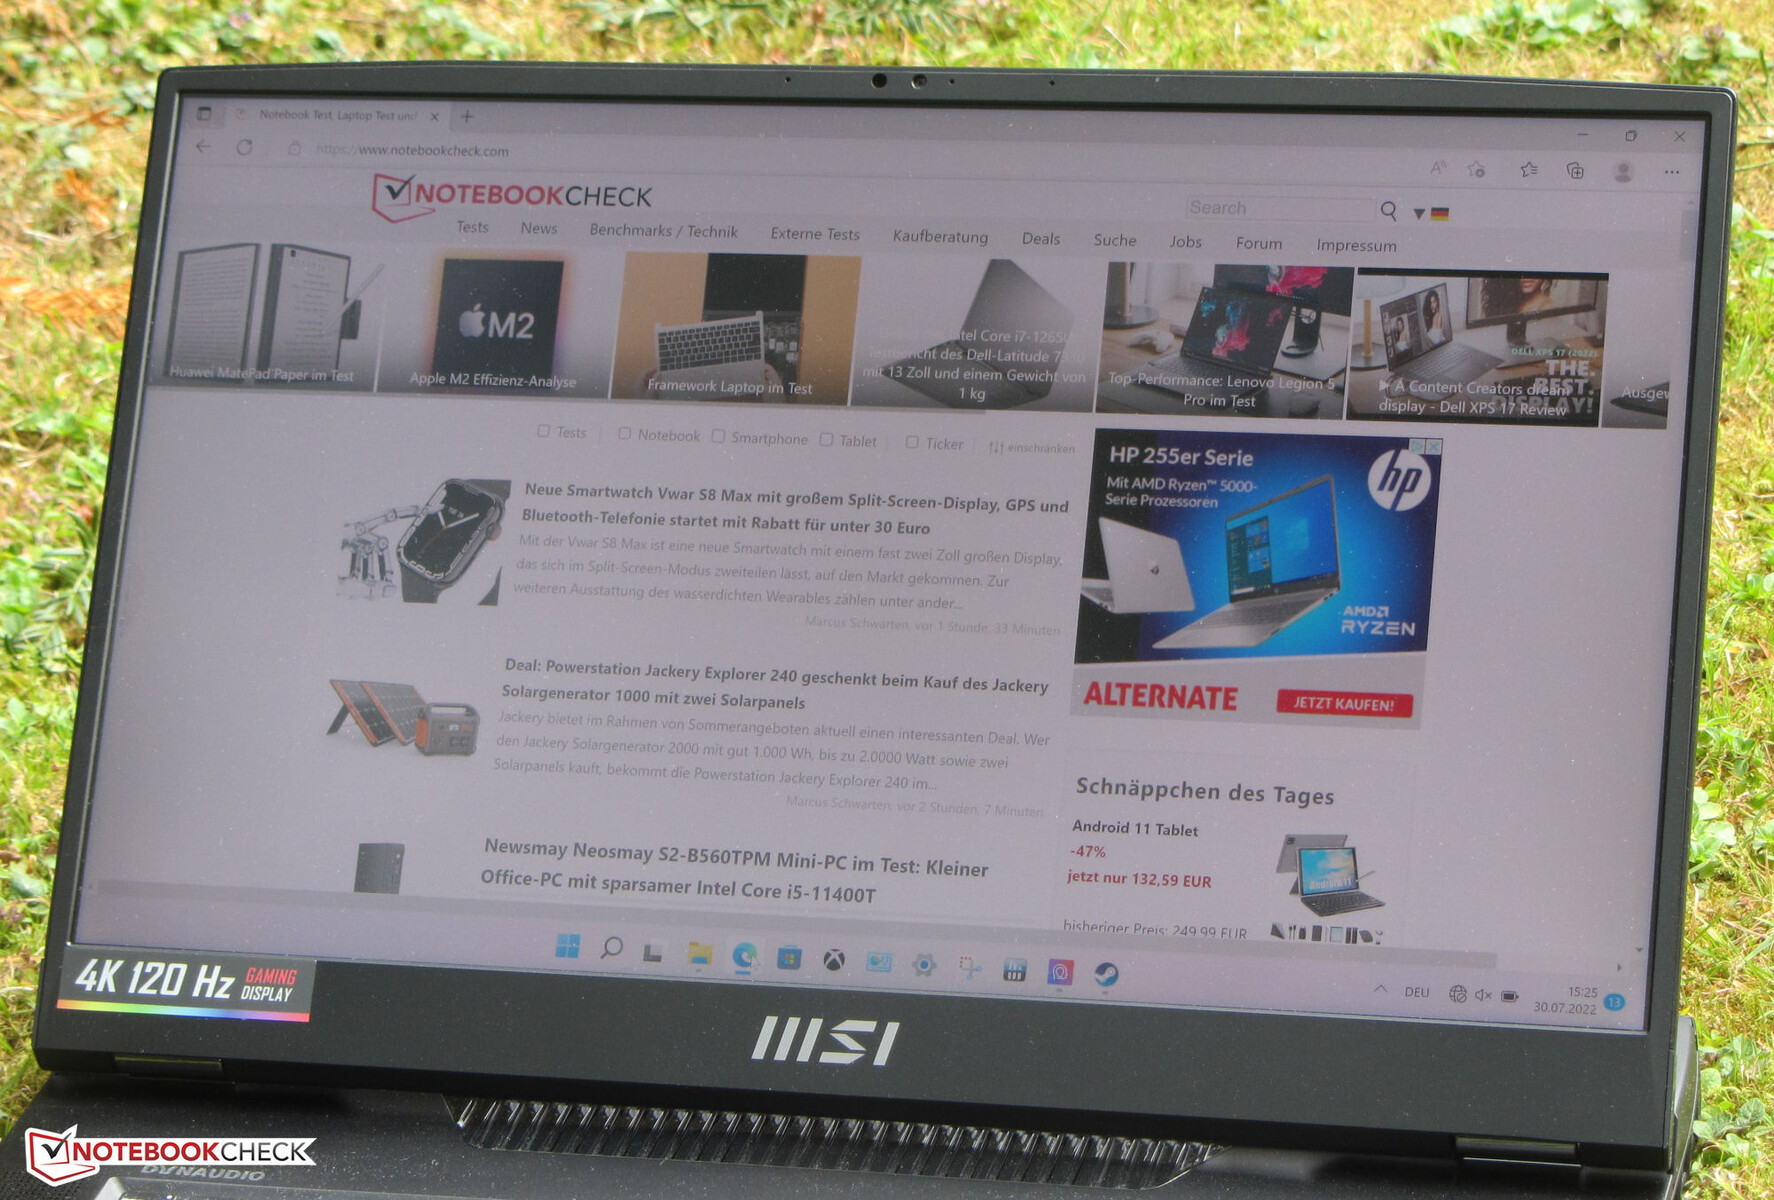
Panel IPS oferuje stabilne kąty widzenia, dzięki czemu można go bez problemu oglądać z każdej pozycji. Wyświetlacz jest również bardzo czytelny na zewnątrz.

Niedokładne odwzorowanie kolorów z powodu problemów z oprogramowaniem
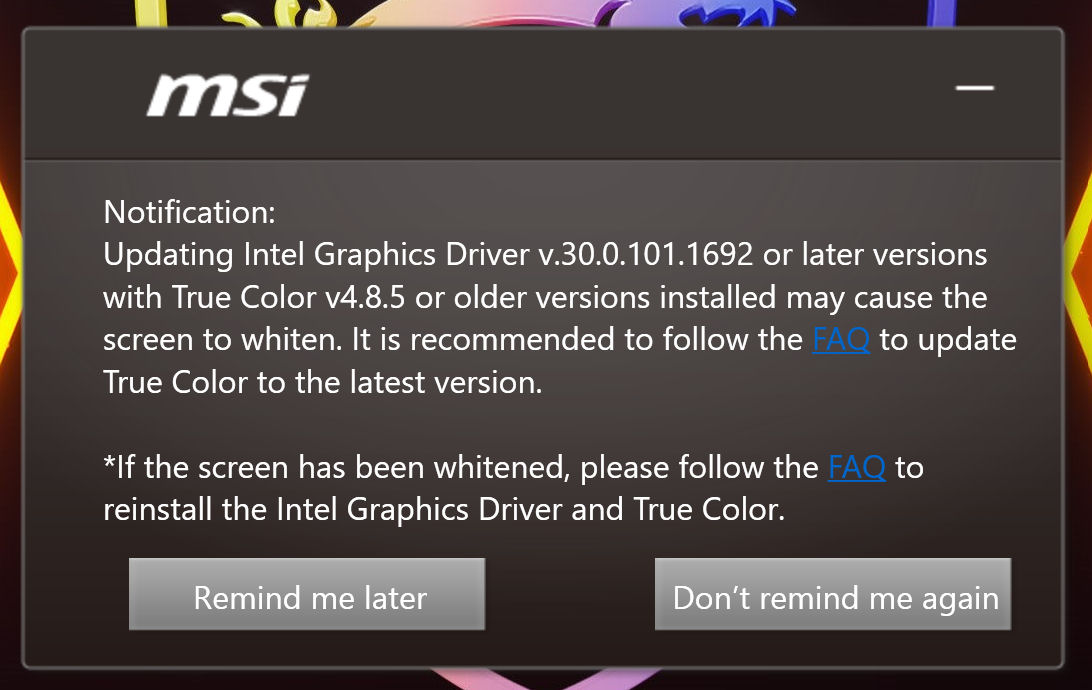
Niektóre kombinacje oprogramowania True Color i sterownika iGPU mogą prowadzić do niedokładnej reprodukcji obrazów. Gdy tak się stanie, wszystkie wyświetlane kolory będą wydawać się zniekształcone i wybielone. MSI zaleca pełną deinstalację, a następnie ponowną instalację obu komponentów. Po wypróbowaniu stwierdziliśmy, że ta metoda rozwiązuje problem.
Wydajność - Ampere i Alder Lake zapewniają dużo oomph.
Dzięki modelowi Titan GT77 12UHS, MSI ma w swojej ofercie bardzo wydajny 17,3-calowy laptop, który sprawdza się w każdym wymagającym scenariuszu użytkowania.
Warunki badania
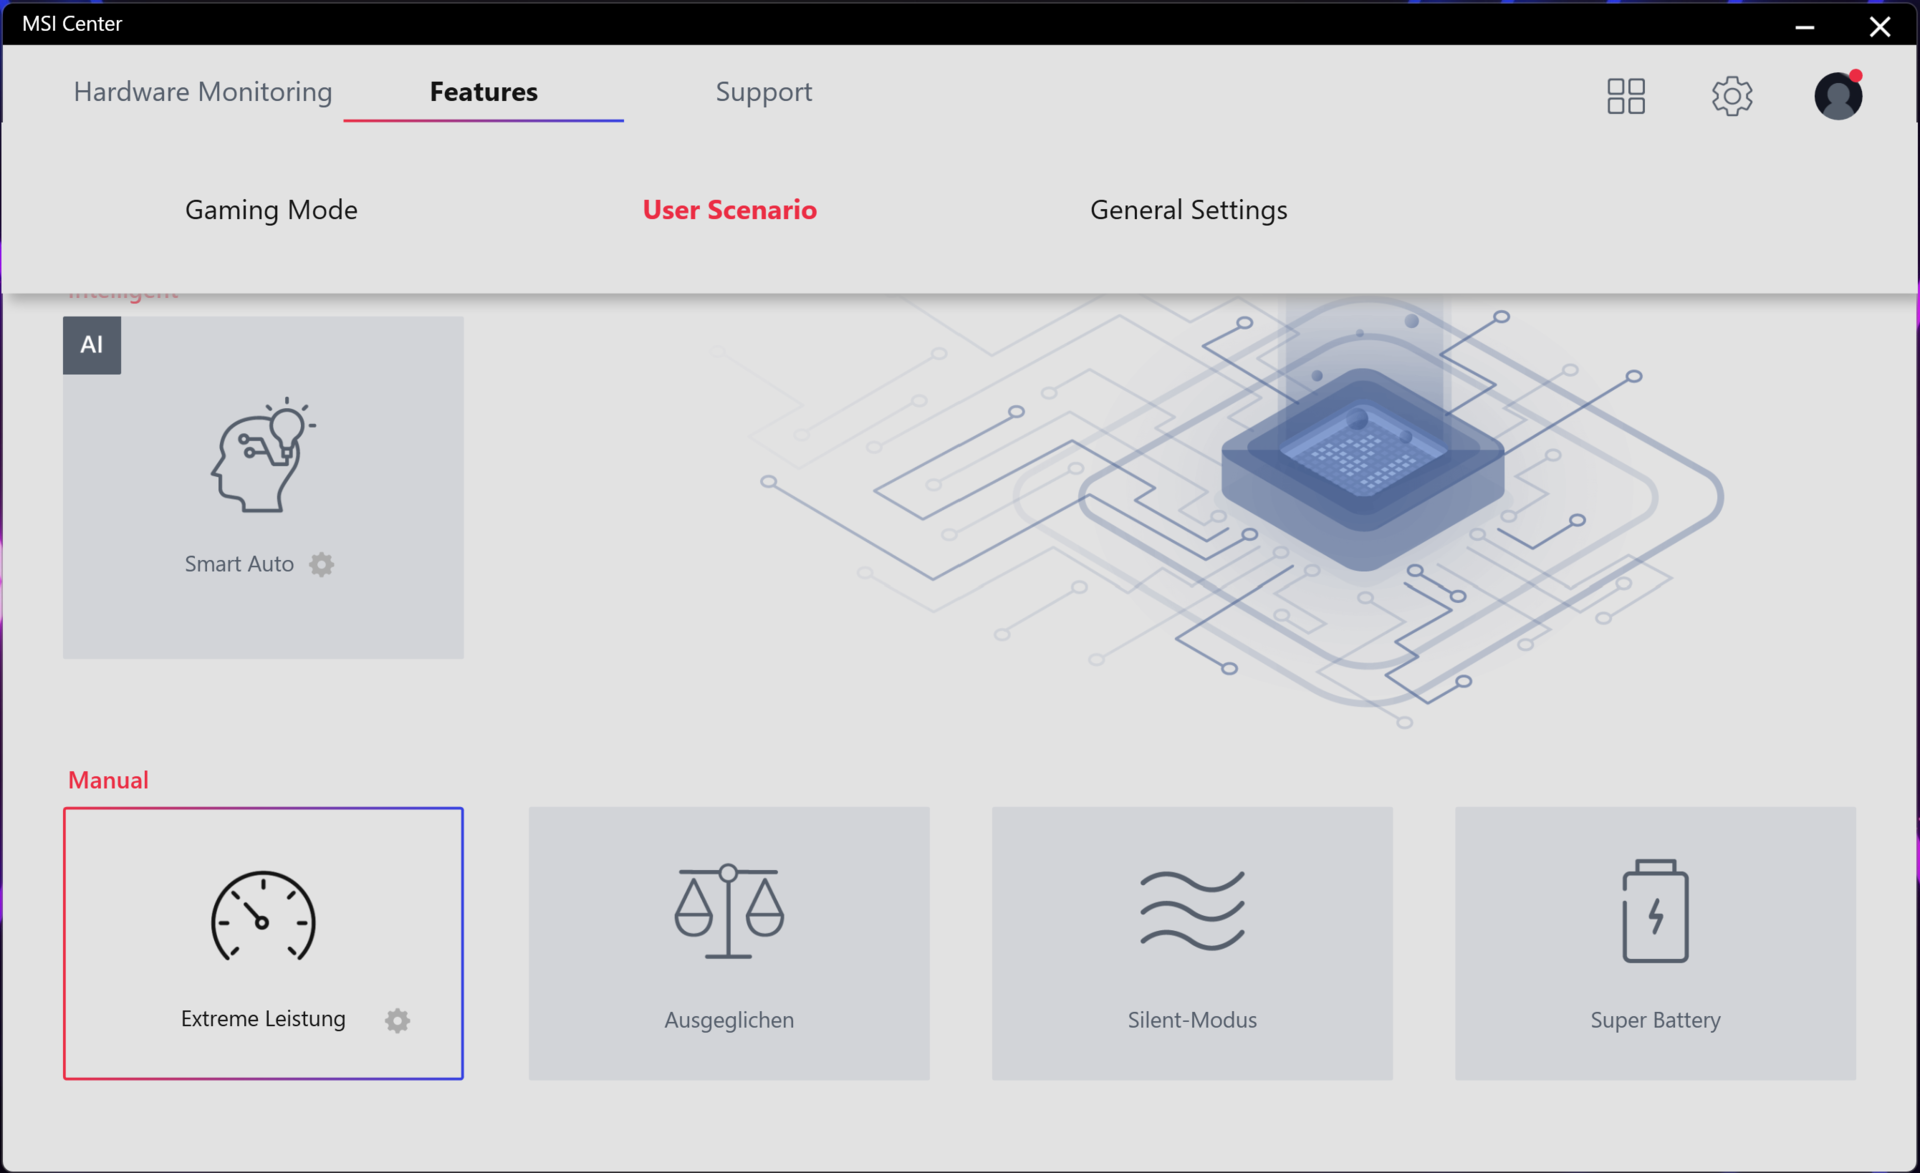
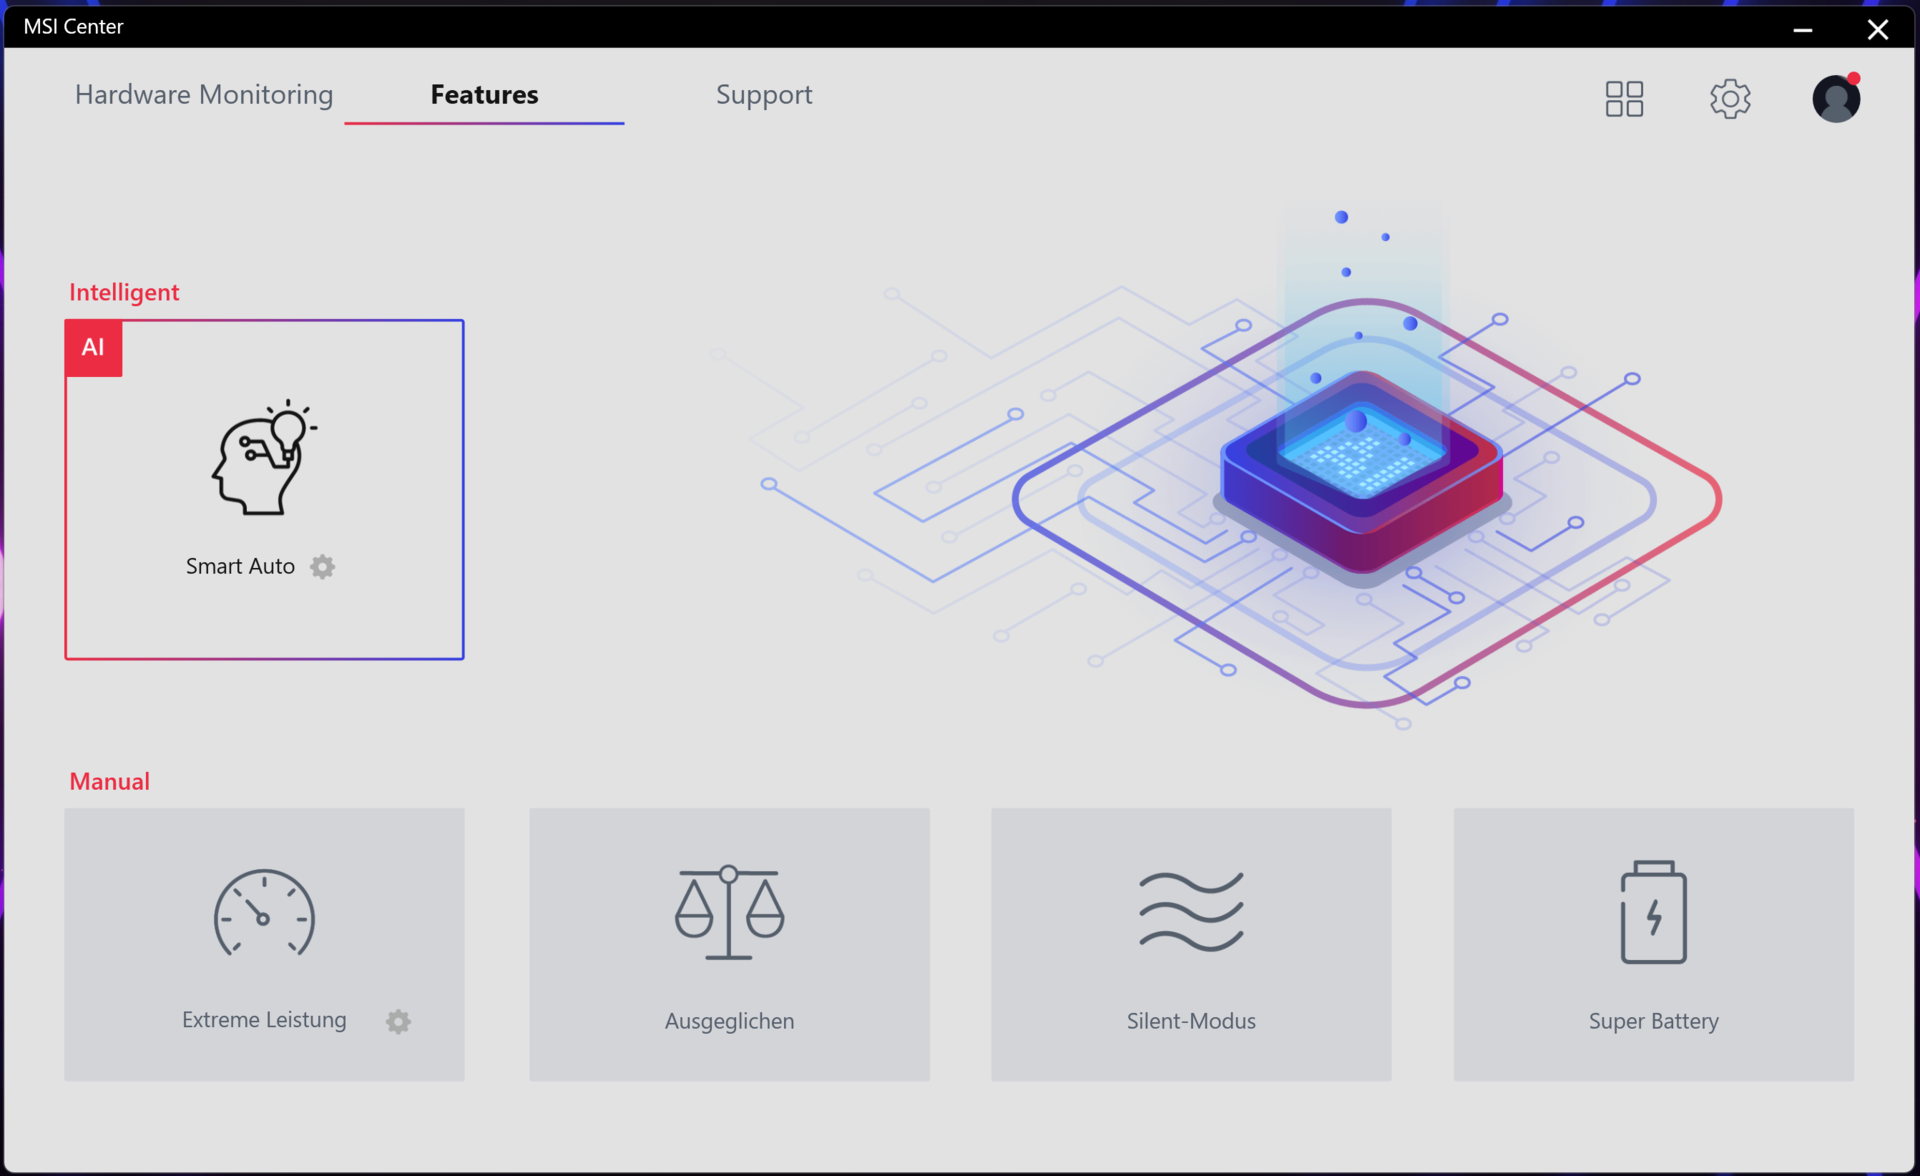
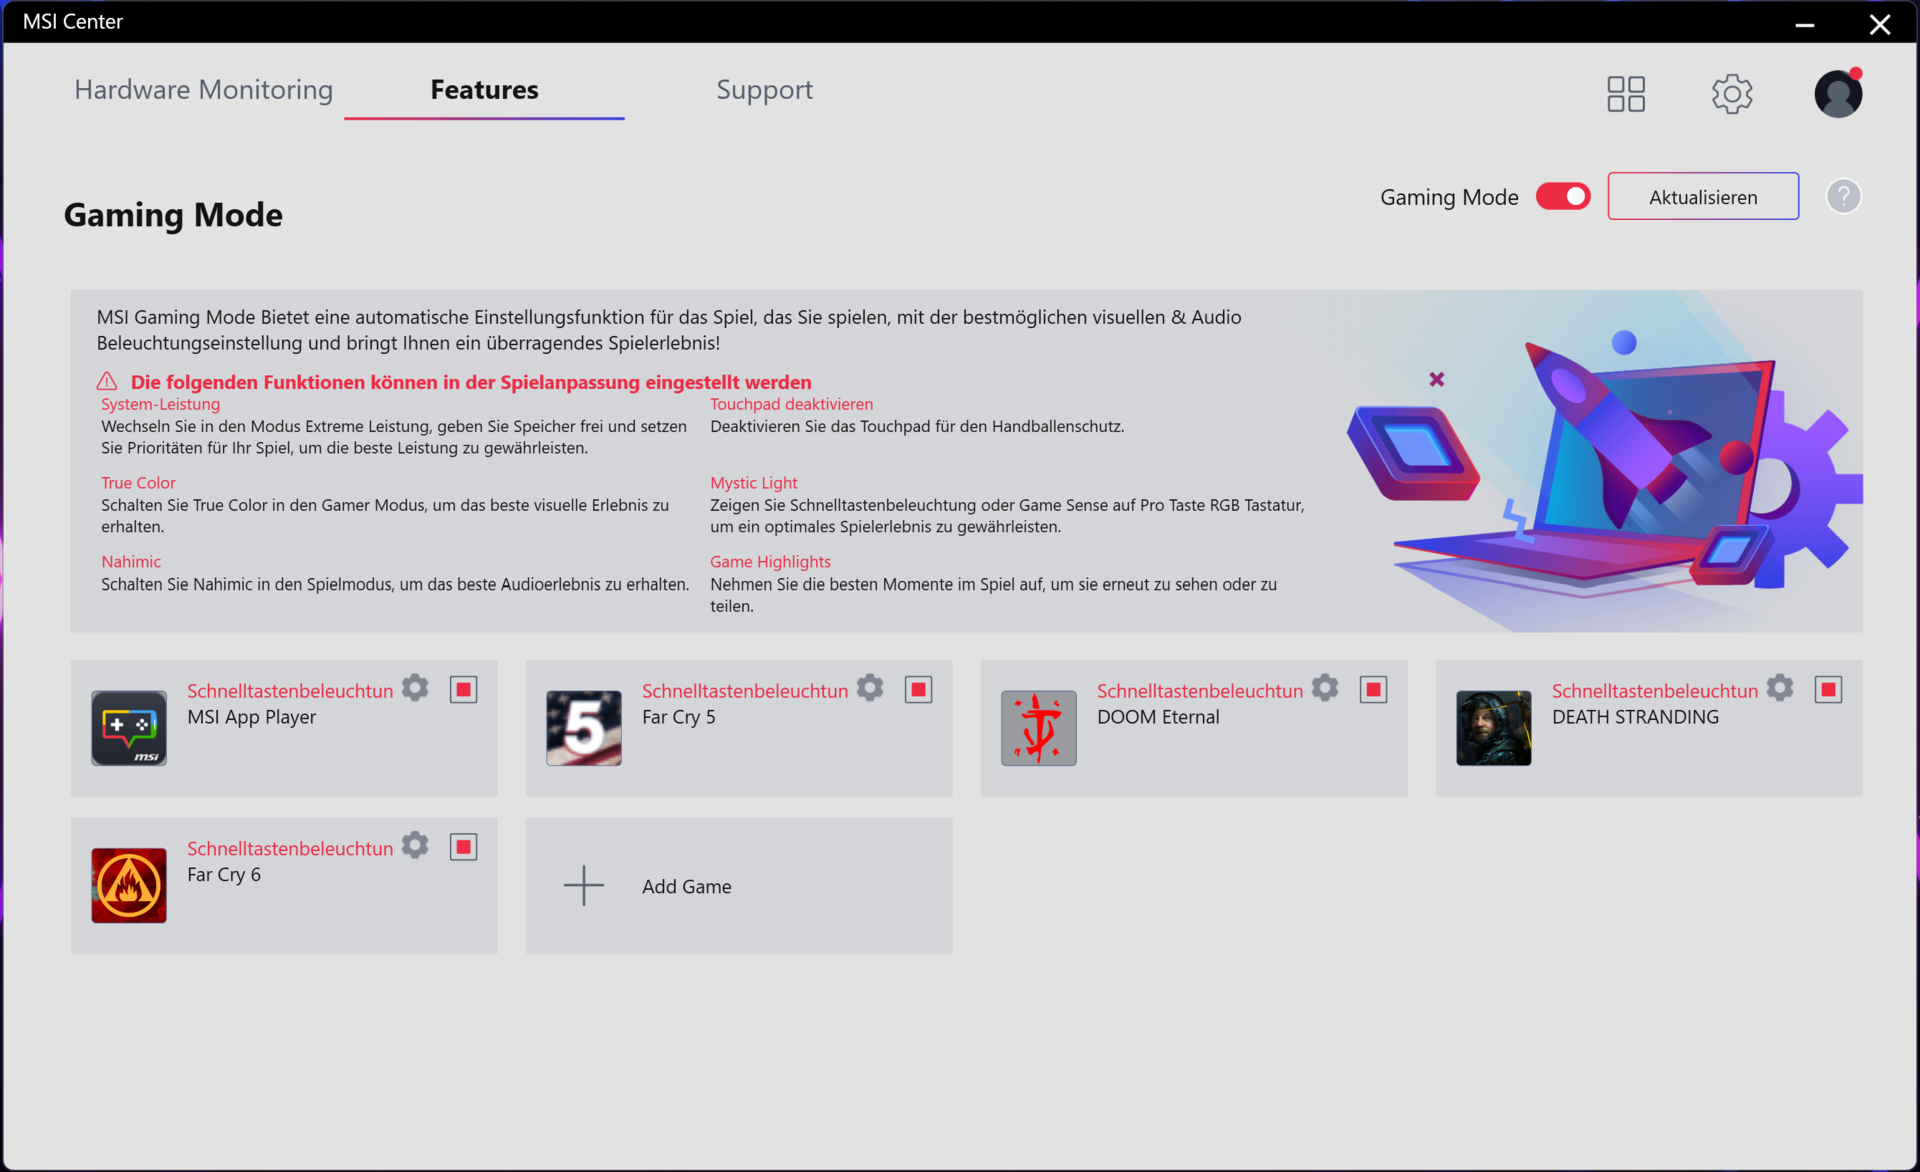
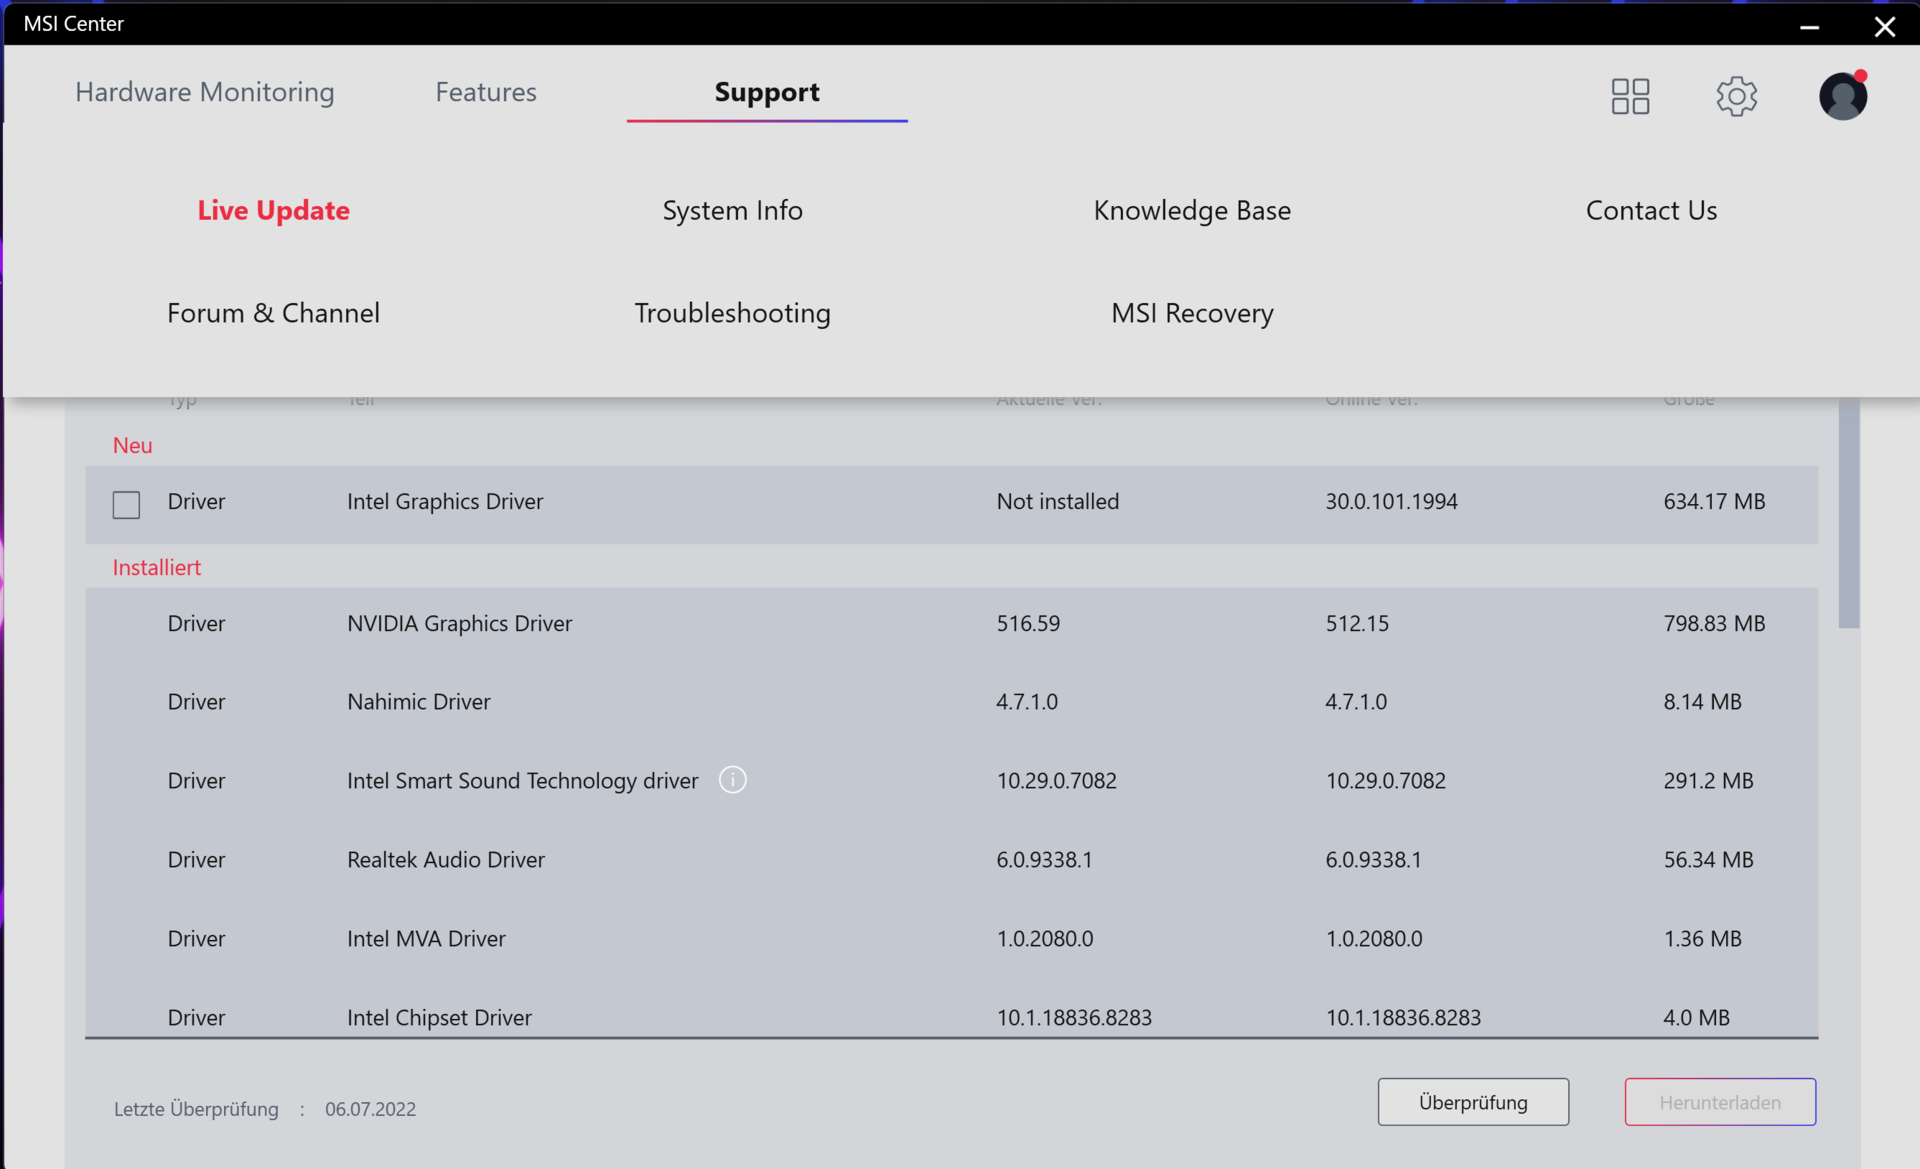
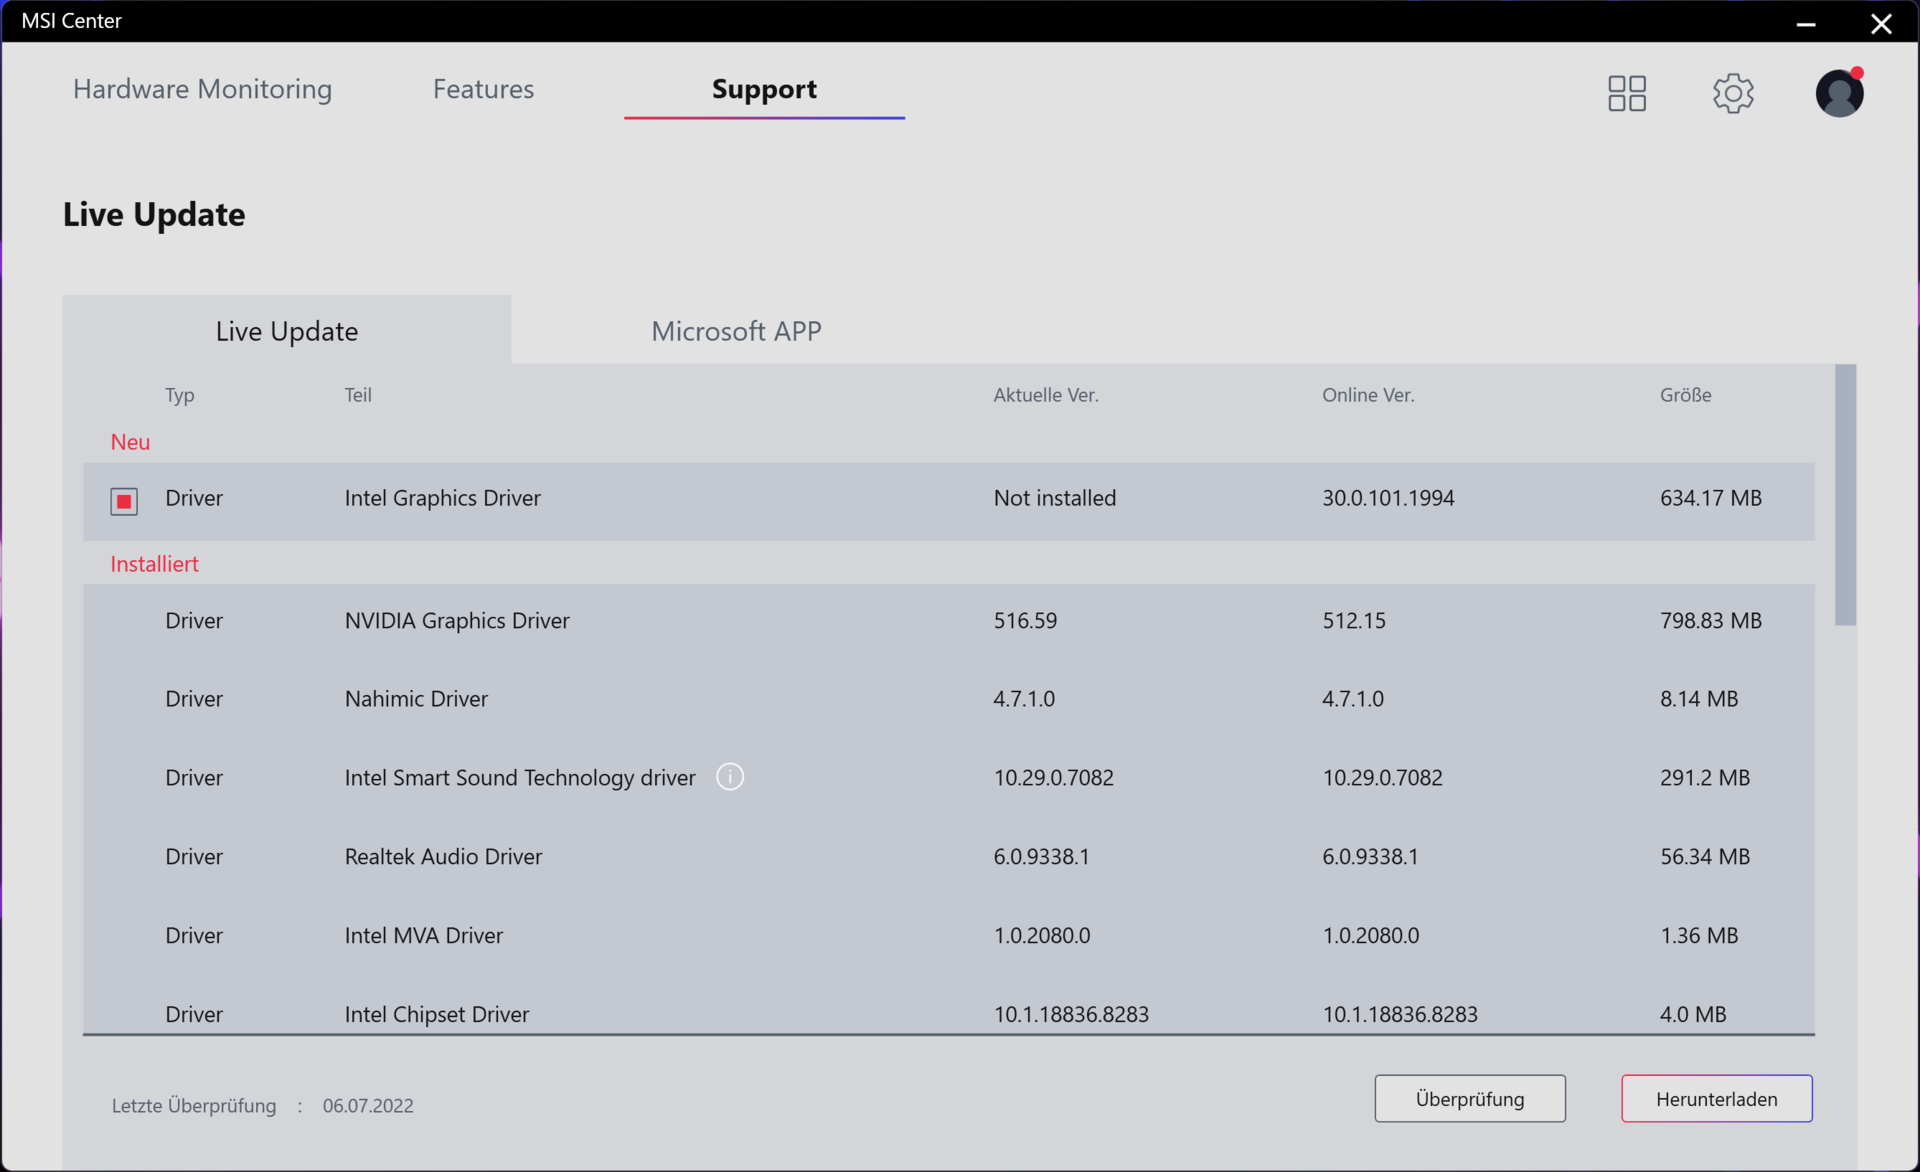
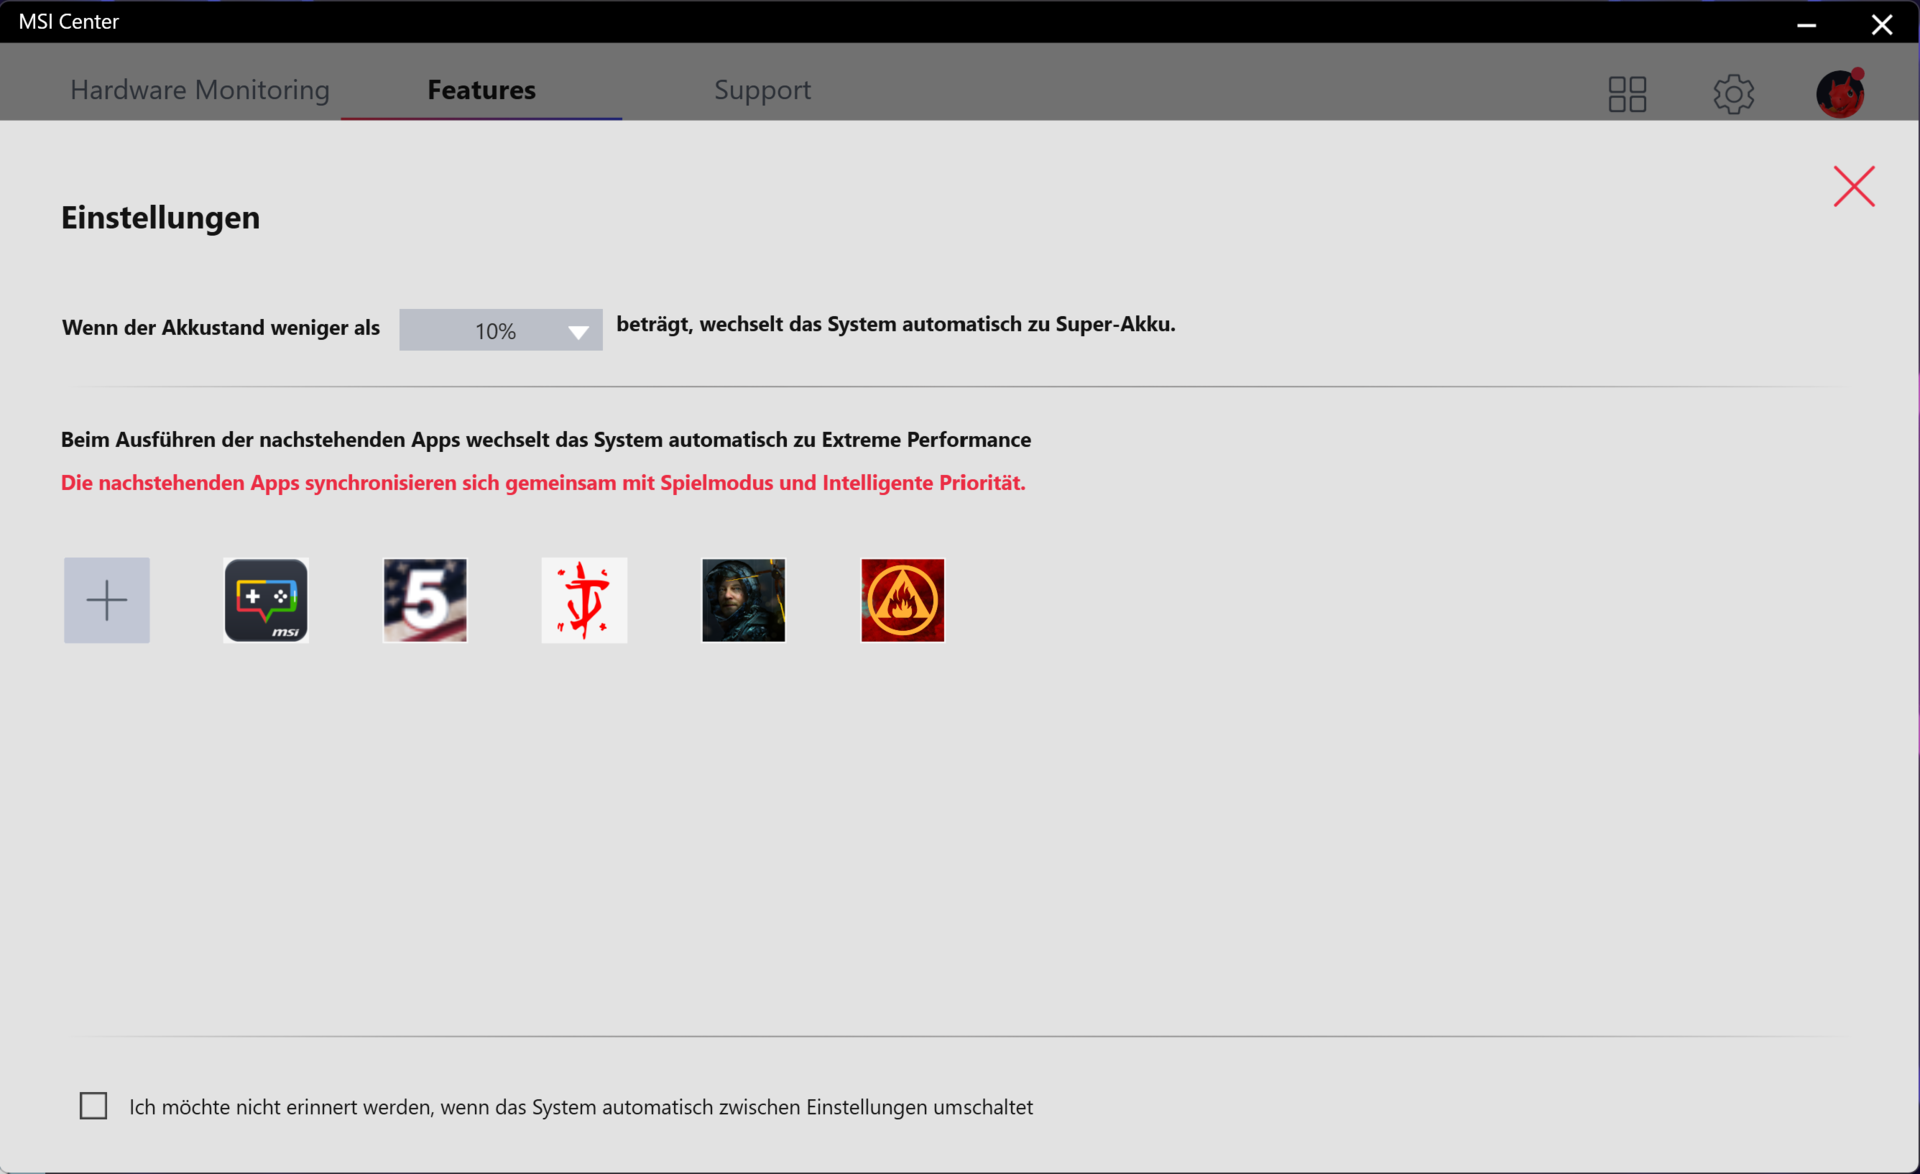
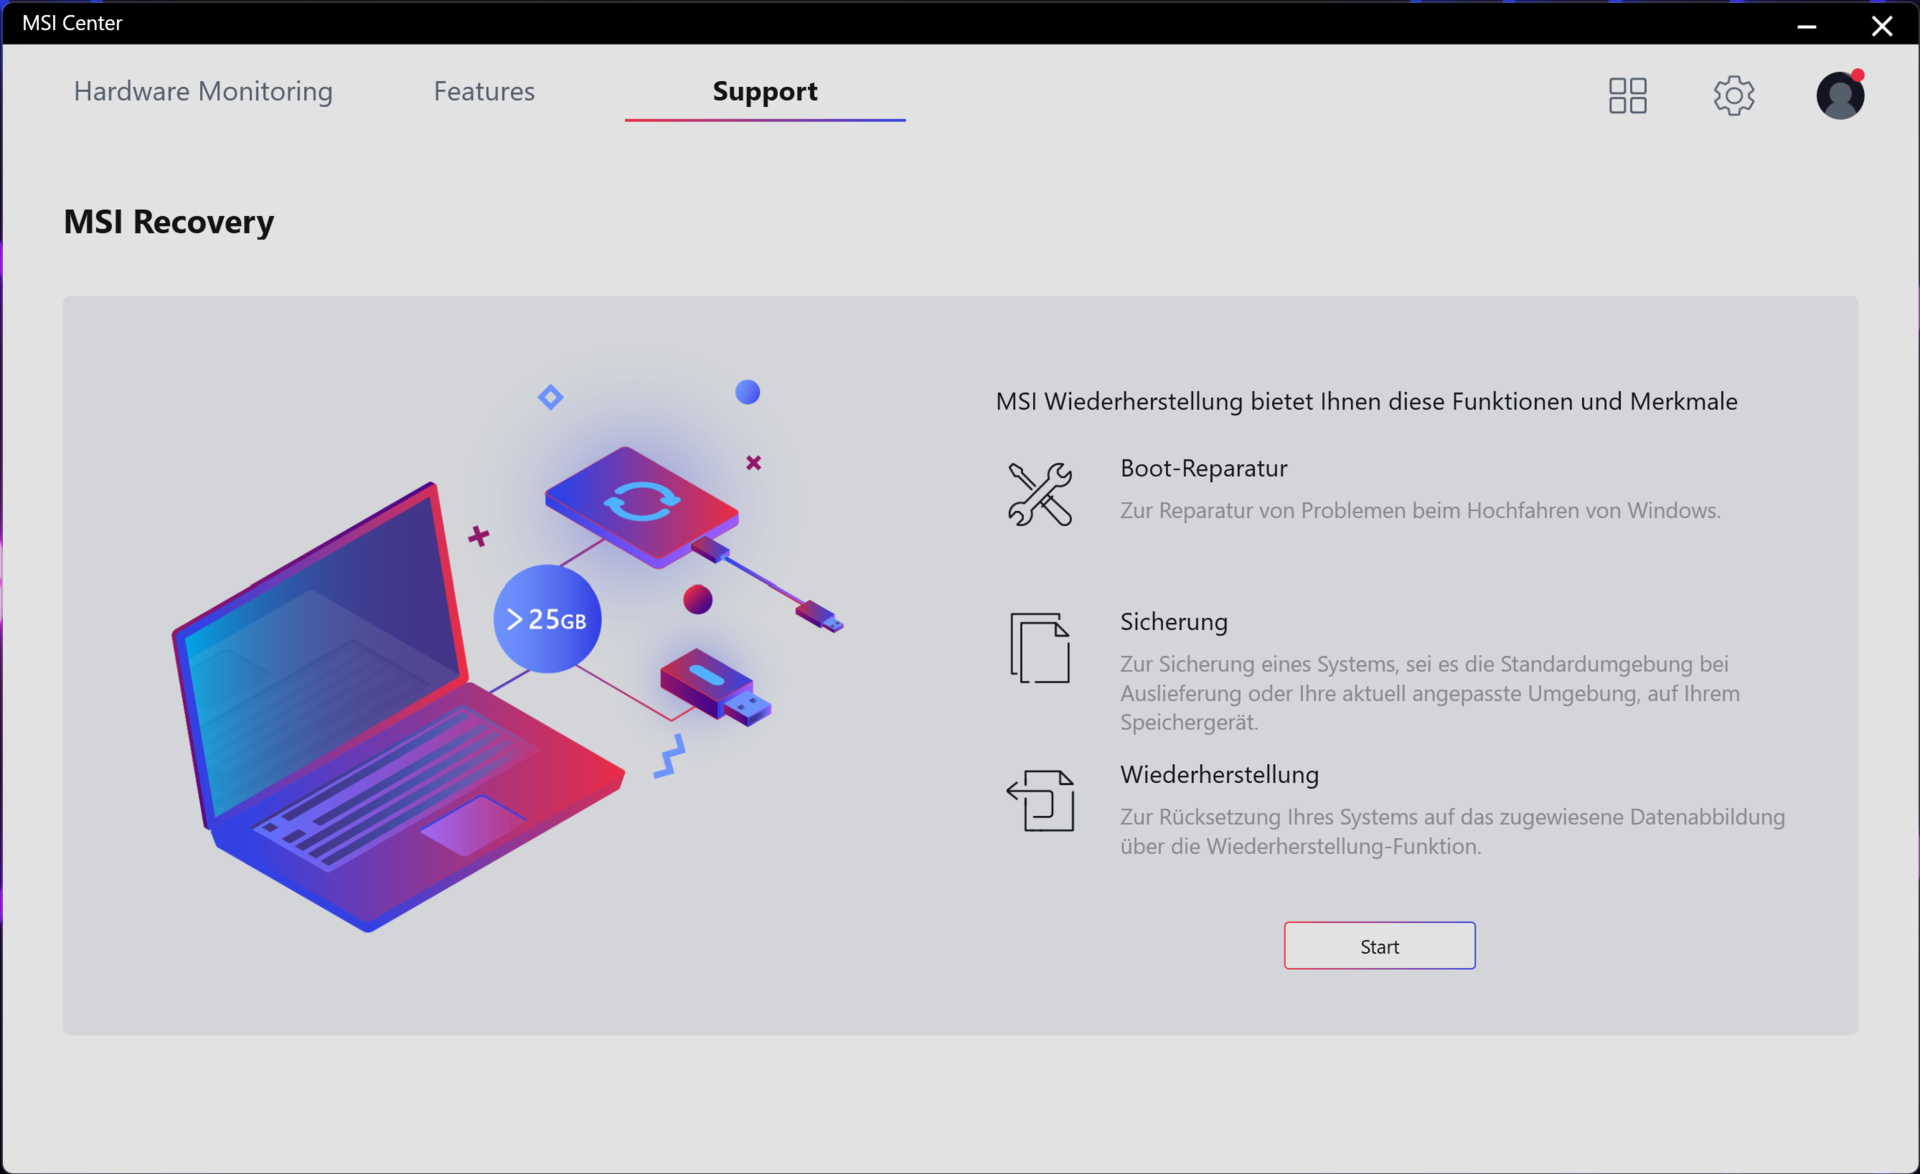
Pomiędzy czterema profilami wydajności można przełączać się za pomocą preinstalowanego MSI Center (patrz zdjęcia) lub poprzez naciśnięcie kombinacji klawiszy Fn+F7. Jeśli aktywowana jest wyższa, oparta na AI funkcja "Smart Auto" (tak jak w naszym przypadku), MSI Center automatycznie dobierze odpowiedni profil do aktualnej sytuacji.
Testowaliśmy model FHD z aktywnym trybem dGPU. Z kolei Nvidia Optimus była włączona podczas naszej recenzji obecnego urządzenia. Dlatego wyniki pomiarów nie zawsze mogą być bezpośrednio porównywalne.
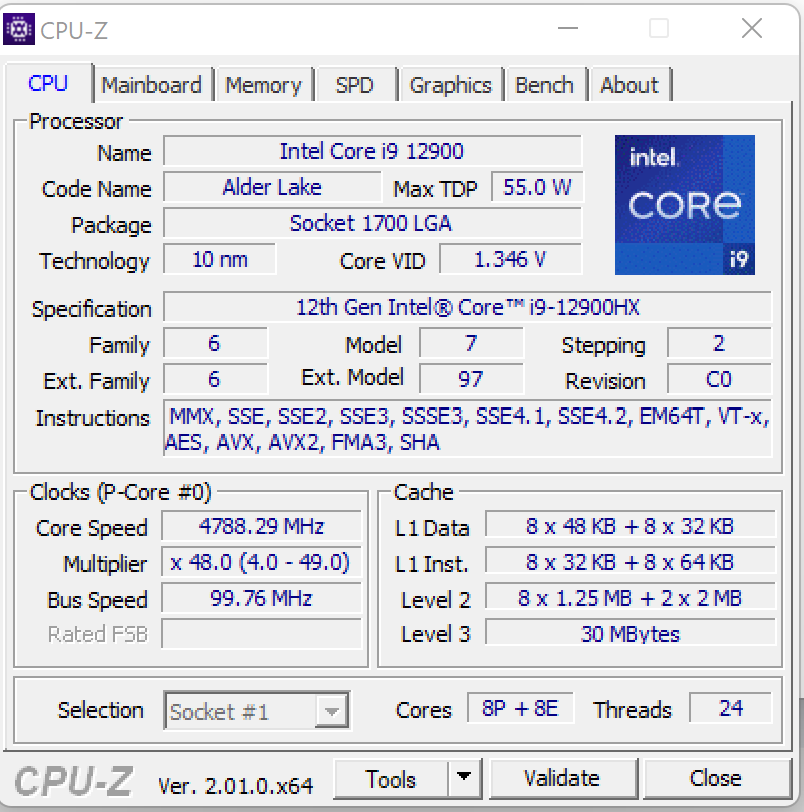
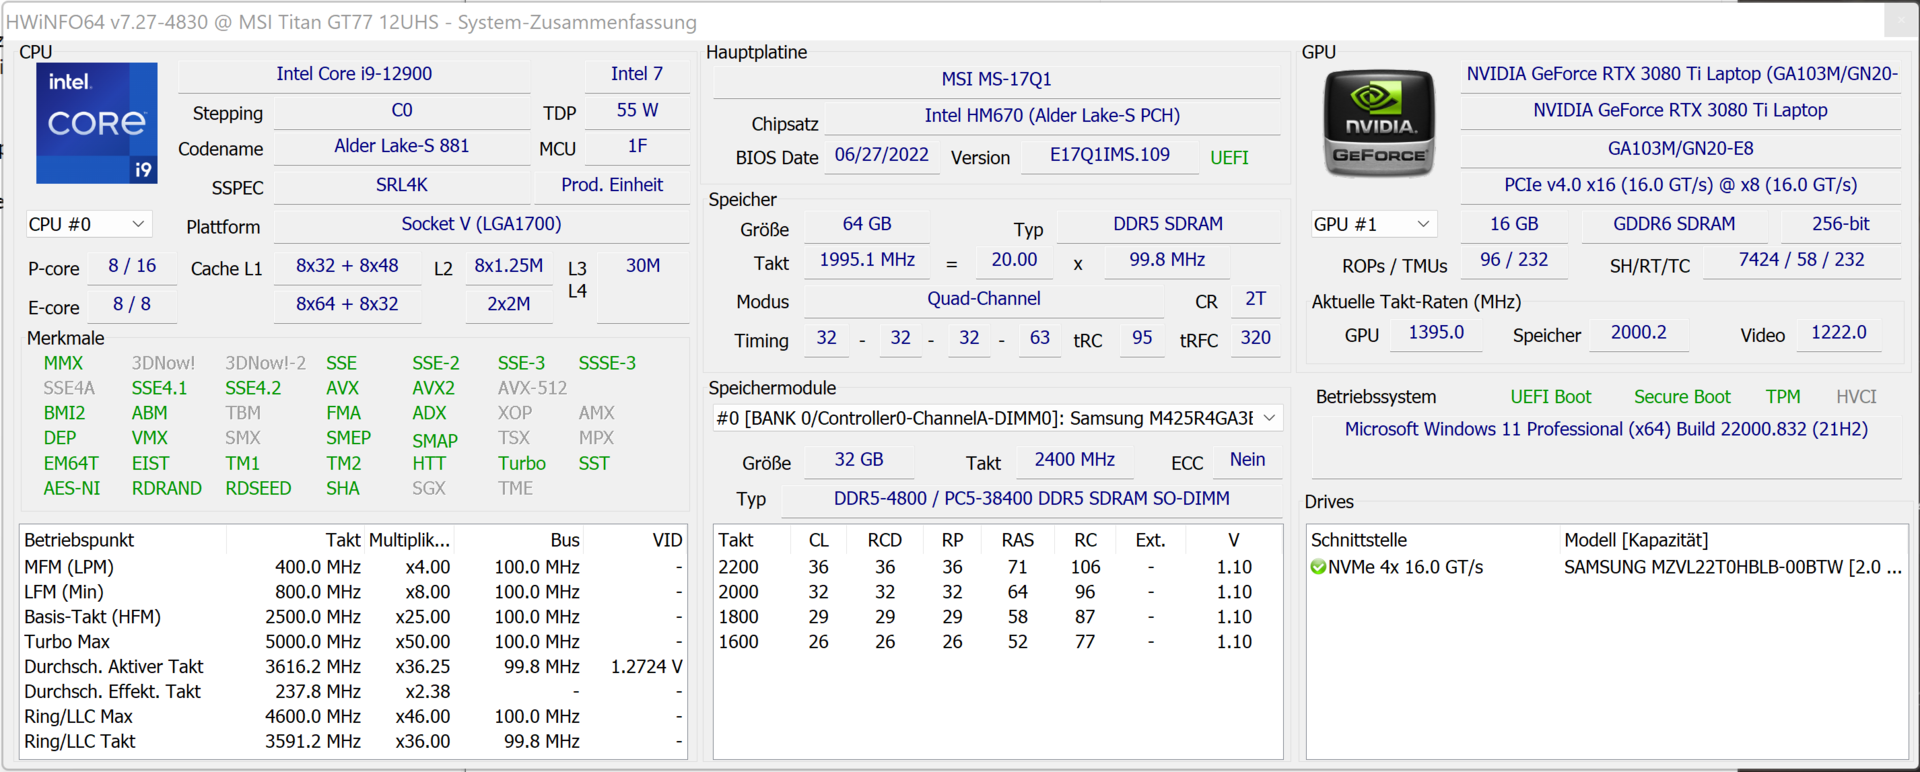
Procesor
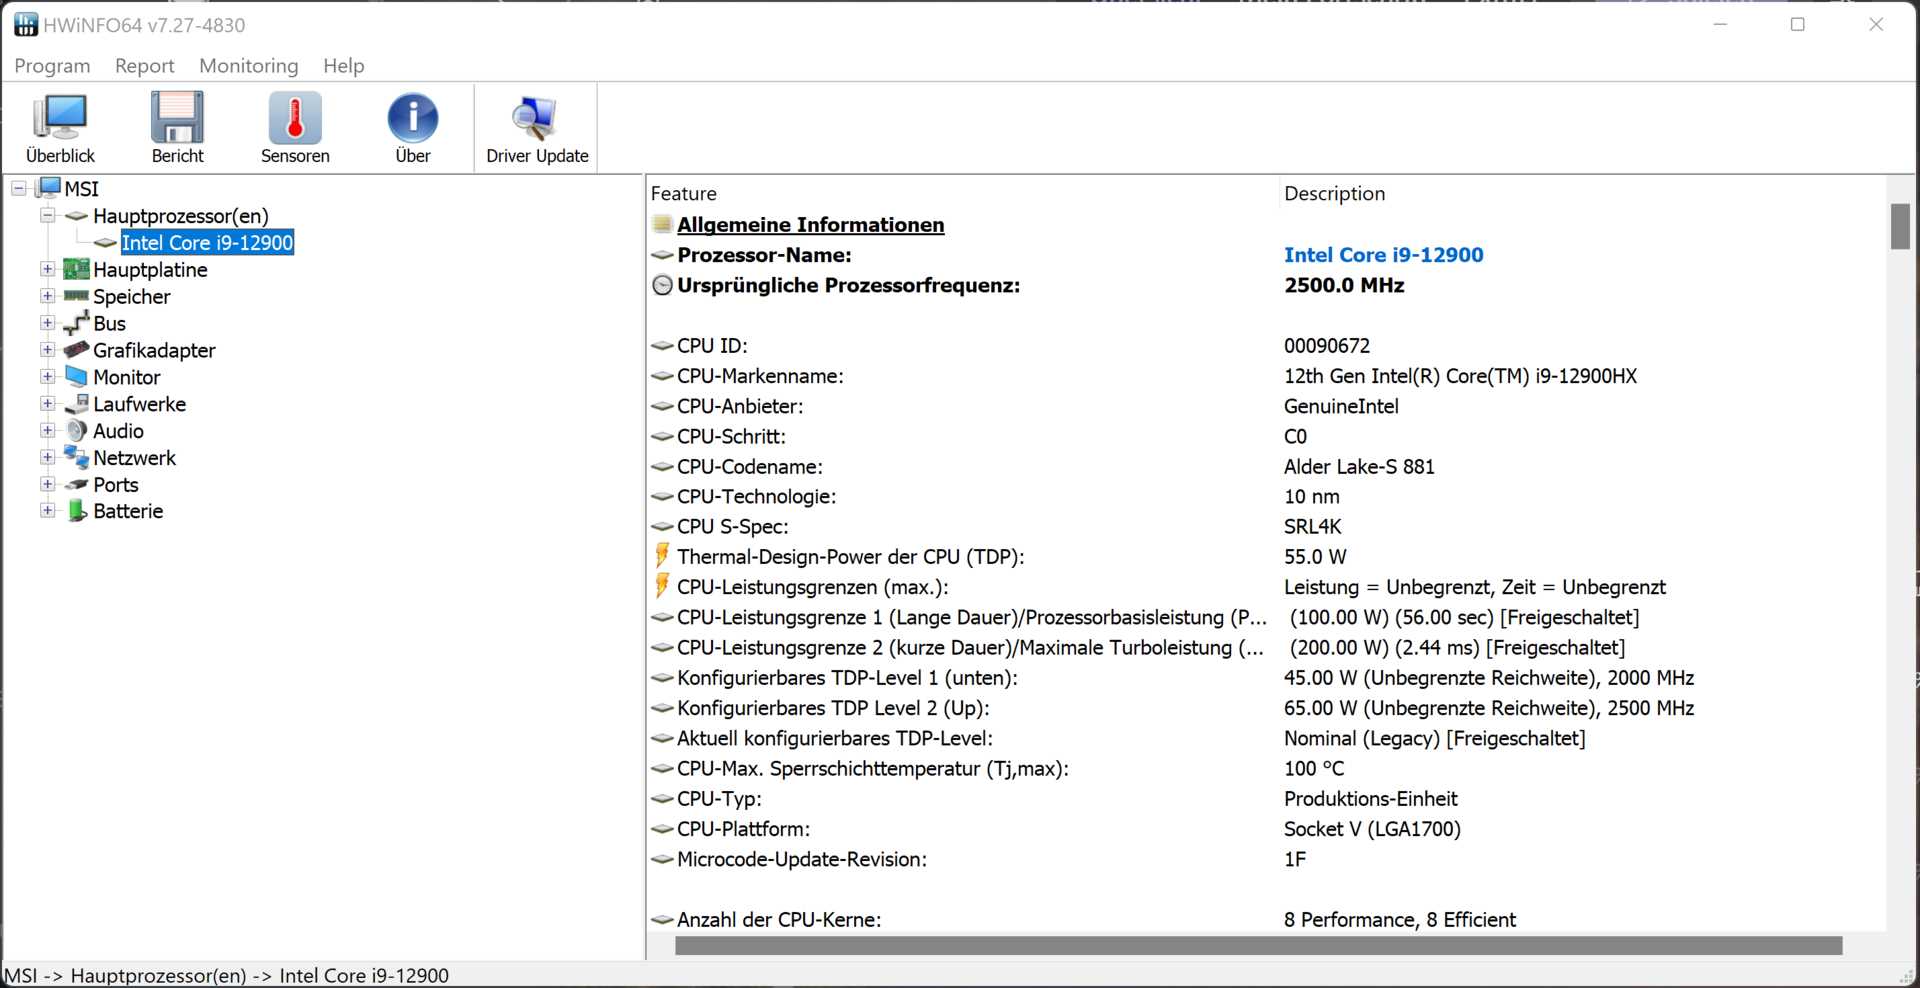
Procesor Core i9-12900HX (Alder Lake) składa się z ośmiu rdzeni wydajnościowych (Hyper-Threading, 2,3 do 5 GHz) i ośmiu rdzeni efektywnościowych (bez Hyper-Threading, 1,7 do 3,6 GHz), co daje łącznie 24 wątki.
W Cinebench R15 procesor ukończył zarówno test wielowątkowy (P-cores: 4,4 GHz, E-cores: 3,3 GHz), jak i test jednowątkowy (P-cores: 500 MHz do 5 GHz, E-cores: 400 MHz do 3,6 GHz) przy wysokim taktowaniu. Na zasilaniu akumulatorowym wypadał on nieco wolniej.
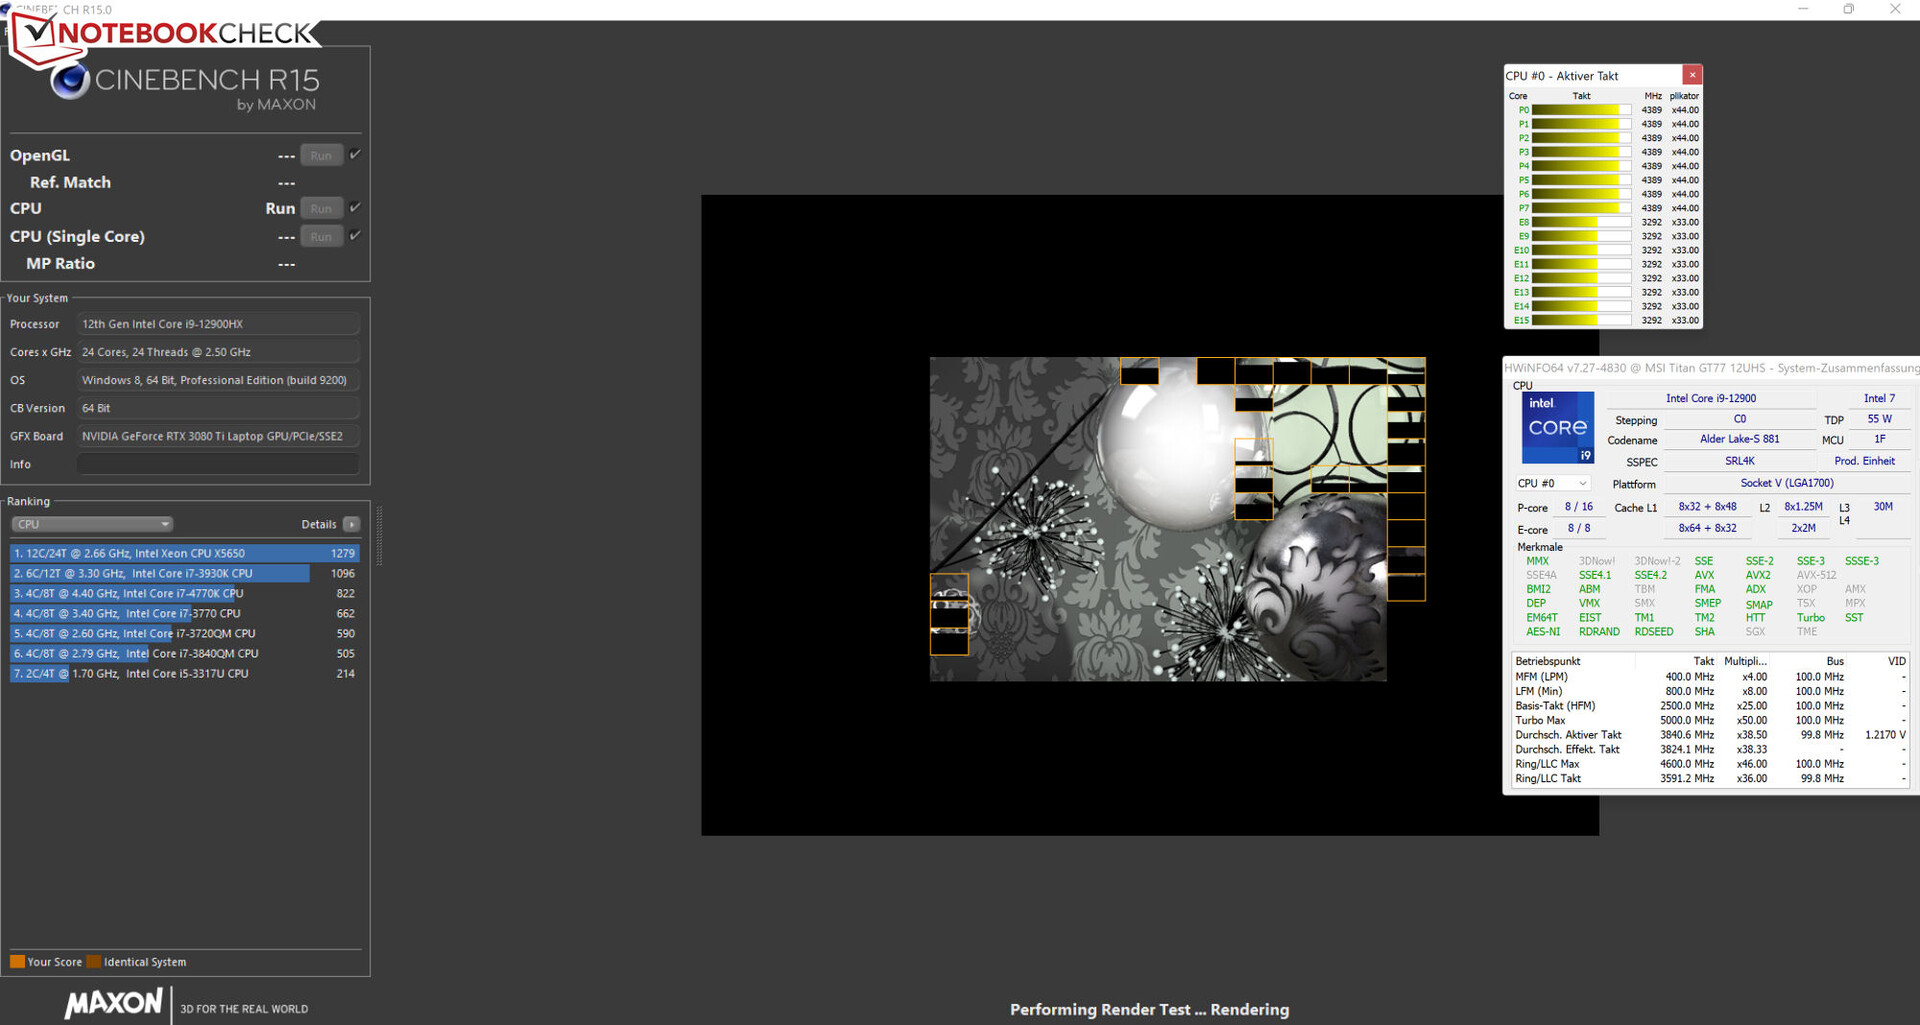
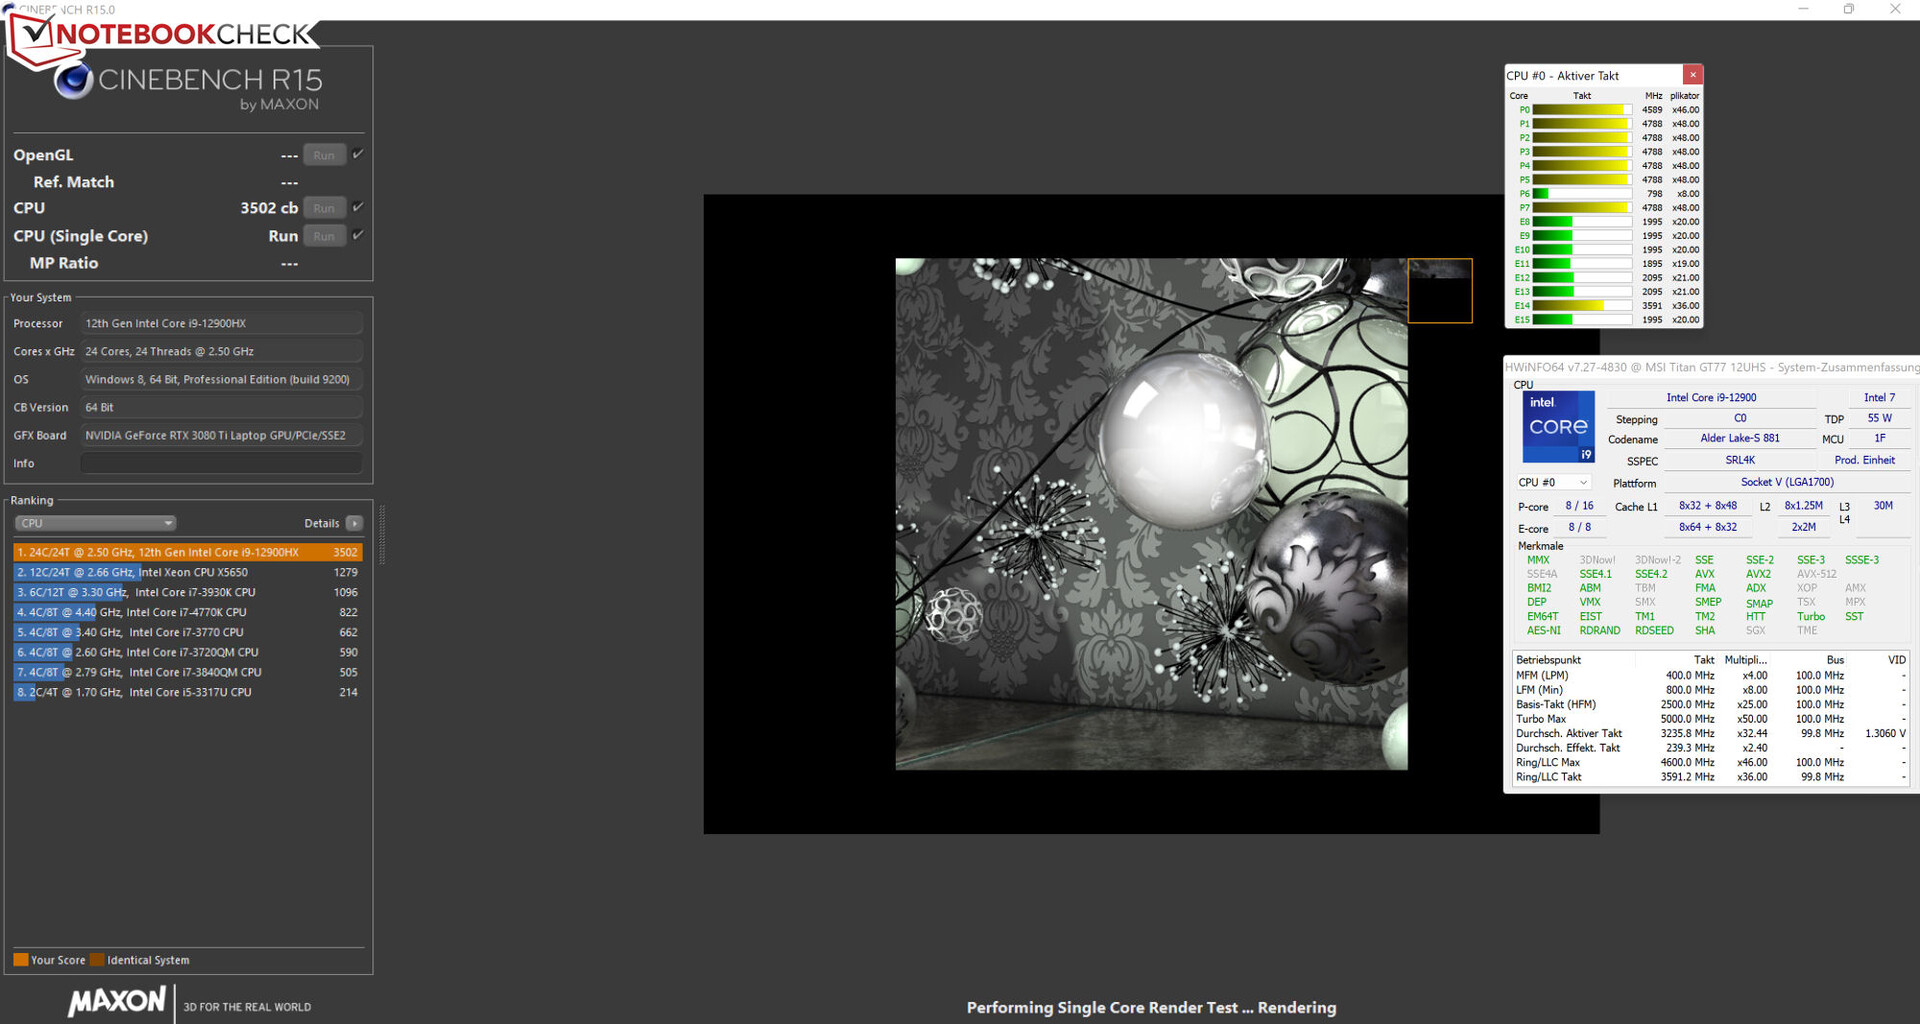
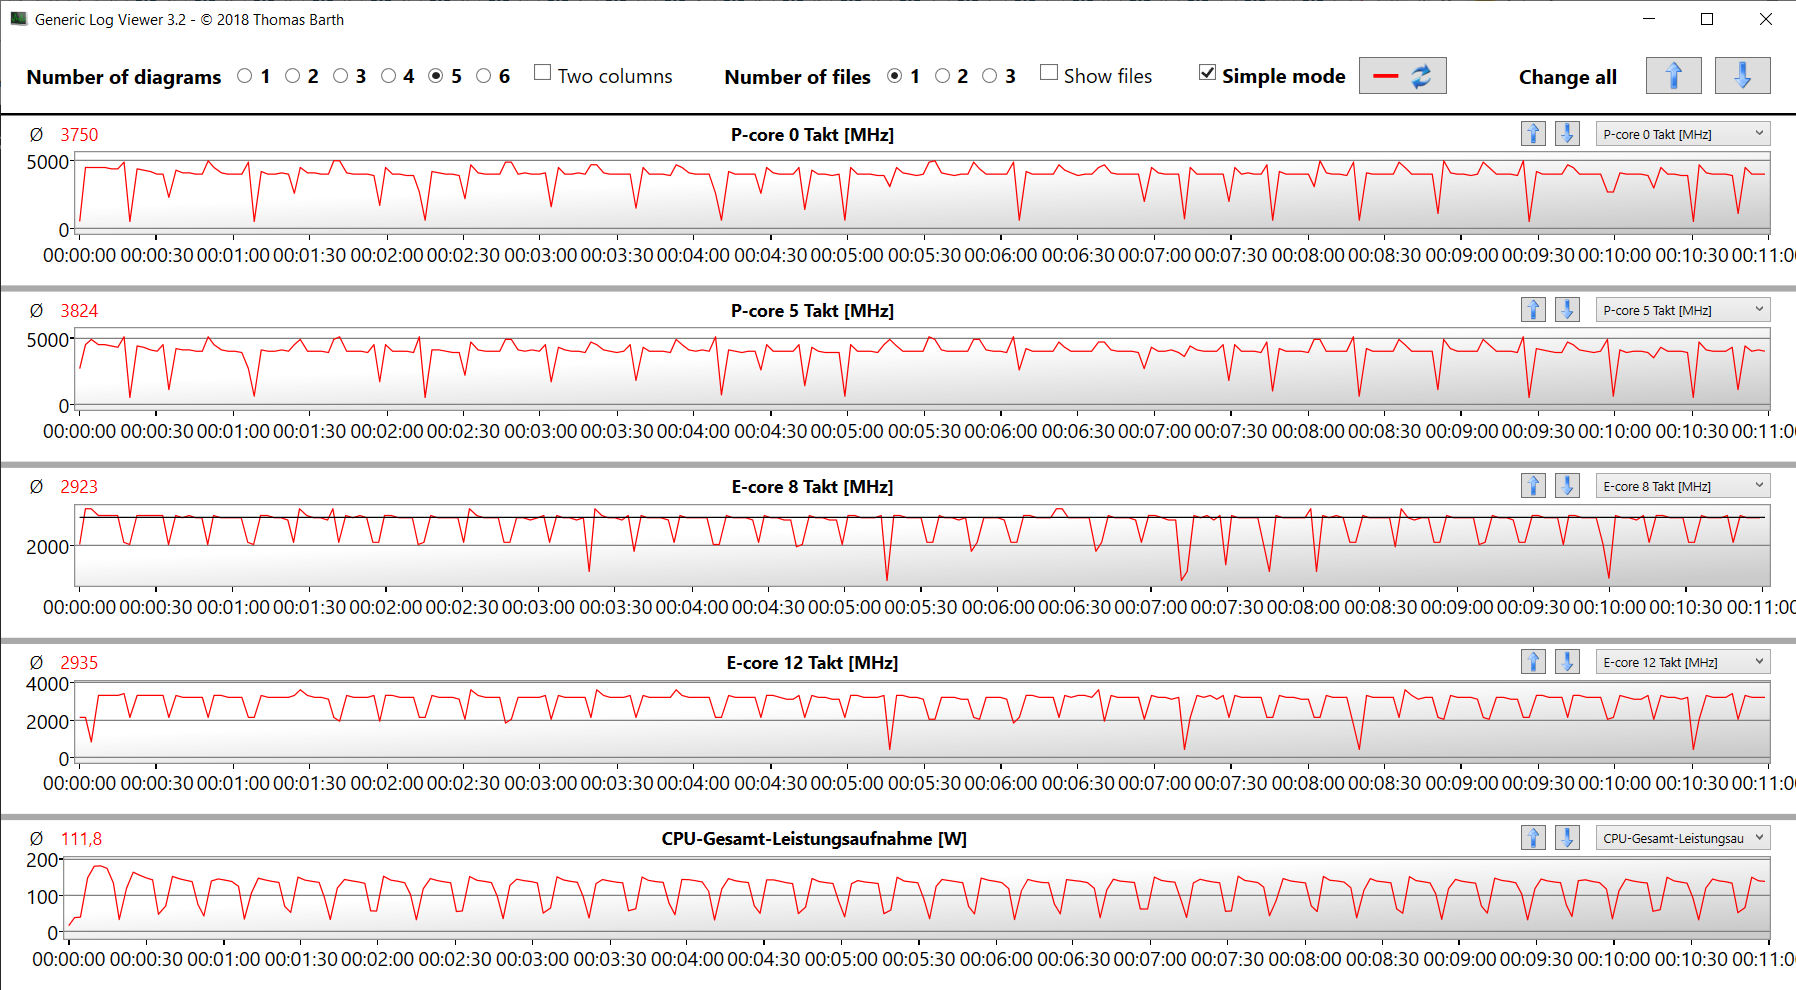
Test pętli Cinebench 15 wykazał, że procesor jest w stanie pracować nieprzerwanie z wysokim taktowaniem. Zastosowanie profilu "Extreme Performance" spowodowało, że wydajność była marginalnie bardziej stabilna.
Cinebench R15 Multi continuous test
| CPU Performance rating - Percent | |
| Średnia w klasie Gaming | |
| MSI Titan GT77 12UHS 4k | |
| MSI Titan GT77 12UHS | |
| MSI Titan GT77 12UHS | |
| Przeciętny Intel Core i9-12900HX | |
| Alienware x17 R2 P48E | |
| Schenker XMG Ultra 17 Rocket Lake | |
| Razer Blade 17 Early 2022 | |
| Cinebench R23 | |
| Multi Core | |
| Średnia w klasie Gaming (10488 - 40970, n=113, ostatnie 2 lata) | |
| MSI Titan GT77 12UHS 4k | |
| MSI Titan GT77 12UHS (4k, Extreme Leistung, Cooler Boost) | |
| MSI Titan GT77 12UHS | |
| Przeciętny Intel Core i9-12900HX (18337 - 23482, n=8) | |
| Alienware x17 R2 P48E | |
| Schenker XMG Ultra 17 Rocket Lake | |
| Razer Blade 17 Early 2022 | |
| Single Core | |
| Średnia w klasie Gaming (1166 - 2356, n=113, ostatnie 2 lata) | |
| MSI Titan GT77 12UHS 4k | |
| Przeciętny Intel Core i9-12900HX (1897 - 1936, n=8) | |
| MSI Titan GT77 12UHS | |
| MSI Titan GT77 12UHS (4k, Extreme Leistung, Cooler Boost) | |
| Razer Blade 17 Early 2022 | |
| Alienware x17 R2 P48E | |
| Schenker XMG Ultra 17 Rocket Lake | |
| Cinebench R20 | |
| CPU (Multi Core) | |
| Średnia w klasie Gaming (4029 - 16108, n=112, ostatnie 2 lata) | |
| MSI Titan GT77 12UHS 4k | |
| MSI Titan GT77 12UHS (4k, Extreme Leistung, Cooler Boost) | |
| MSI Titan GT77 12UHS | |
| Przeciętny Intel Core i9-12900HX (7037 - 9042, n=8) | |
| Alienware x17 R2 P48E | |
| Schenker XMG Ultra 17 Rocket Lake | |
| Razer Blade 17 Early 2022 | |
| CPU (Single Core) | |
| Średnia w klasie Gaming (442 - 895, n=112, ostatnie 2 lata) | |
| MSI Titan GT77 12UHS 4k | |
| MSI Titan GT77 12UHS | |
| Przeciętny Intel Core i9-12900HX (728 - 745, n=8) | |
| MSI Titan GT77 12UHS (4k, Extreme Leistung, Cooler Boost) | |
| Alienware x17 R2 P48E | |
| Razer Blade 17 Early 2022 | |
| Schenker XMG Ultra 17 Rocket Lake | |
| Cinebench R15 | |
| CPU Multi 64Bit | |
| Średnia w klasie Gaming (1578 - 6271, n=113, ostatnie 2 lata) | |
| MSI Titan GT77 12UHS 4k | |
| MSI Titan GT77 12UHS (4k, Extreme Leistung, Cooler Boost) | |
| MSI Titan GT77 12UHS | |
| Przeciętny Intel Core i9-12900HX (2830 - 3652, n=8) | |
| Alienware x17 R2 P48E | |
| Schenker XMG Ultra 17 Rocket Lake | |
| Razer Blade 17 Early 2022 | |
| CPU Single 64Bit | |
| Średnia w klasie Gaming (188.8 - 343, n=112, ostatnie 2 lata) | |
| MSI Titan GT77 12UHS 4k | |
| MSI Titan GT77 12UHS | |
| MSI Titan GT77 12UHS (4k, Extreme Leistung, Cooler Boost) | |
| Przeciętny Intel Core i9-12900HX (274 - 282, n=8) | |
| Alienware x17 R2 P48E | |
| Razer Blade 17 Early 2022 | |
| Schenker XMG Ultra 17 Rocket Lake | |
| Blender - v2.79 BMW27 CPU | |
| Razer Blade 17 Early 2022 | |
| Schenker XMG Ultra 17 Rocket Lake | |
| Alienware x17 R2 P48E | |
| Przeciętny Intel Core i9-12900HX (144 - 201, n=8) | |
| Średnia w klasie Gaming (80 - 330, n=110, ostatnie 2 lata) | |
| MSI Titan GT77 12UHS 4k | |
| MSI Titan GT77 12UHS | |
| MSI Titan GT77 12UHS (4k, Extreme Leistung, Cooler Boost) | |
| 7-Zip 18.03 | |
| 7z b 4 | |
| Średnia w klasie Gaming (33491 - 148086, n=111, ostatnie 2 lata) | |
| MSI Titan GT77 12UHS 4k | |
| MSI Titan GT77 12UHS (4k, Extreme Leistung, Cooler Boost) | |
| MSI Titan GT77 12UHS | |
| Przeciętny Intel Core i9-12900HX (69778 - 88128, n=7) | |
| Alienware x17 R2 P48E | |
| Schenker XMG Ultra 17 Rocket Lake | |
| Razer Blade 17 Early 2022 | |
| 7z b 4 -mmt1 | |
| Średnia w klasie Gaming (4199 - 7436, n=111, ostatnie 2 lata) | |
| MSI Titan GT77 12UHS 4k | |
| Przeciętny Intel Core i9-12900HX (6165 - 6358, n=7) | |
| MSI Titan GT77 12UHS | |
| MSI Titan GT77 12UHS | |
| Schenker XMG Ultra 17 Rocket Lake | |
| Razer Blade 17 Early 2022 | |
| Alienware x17 R2 P48E | |
| Geekbench 5.5 | |
| Multi-Core | |
| Średnia w klasie Gaming (6460 - 27010, n=111, ostatnie 2 lata) | |
| MSI Titan GT77 12UHS 4k | |
| MSI Titan GT77 12UHS (4k, Extreme Leistung, Cooler Boost) | |
| MSI Titan GT77 12UHS | |
| Przeciętny Intel Core i9-12900HX (15116 - 16925, n=8) | |
| Alienware x17 R2 P48E | |
| Schenker XMG Ultra 17 Rocket Lake | |
| Razer Blade 17 Early 2022 | |
| Single-Core | |
| Średnia w klasie Gaming (986 - 2474, n=111, ostatnie 2 lata) | |
| MSI Titan GT77 12UHS | |
| MSI Titan GT77 12UHS 4k | |
| MSI Titan GT77 12UHS (4k, Extreme Leistung, Cooler Boost) | |
| Przeciętny Intel Core i9-12900HX (1874 - 1949, n=8) | |
| Alienware x17 R2 P48E | |
| Razer Blade 17 Early 2022 | |
| Schenker XMG Ultra 17 Rocket Lake | |
| HWBOT x265 Benchmark v2.2 - 4k Preset | |
| Średnia w klasie Gaming (11.5 - 44.3, n=111, ostatnie 2 lata) | |
| MSI Titan GT77 12UHS 4k | |
| MSI Titan GT77 12UHS (4k, Extreme Leistung, Cooler Boost) | |
| MSI Titan GT77 12UHS | |
| Przeciętny Intel Core i9-12900HX (19.6 - 26.6, n=7) | |
| Alienware x17 R2 P48E | |
| Schenker XMG Ultra 17 Rocket Lake | |
| Razer Blade 17 Early 2022 | |
| LibreOffice - 20 Documents To PDF | |
| Średnia w klasie Gaming (19 - 88.8, n=111, ostatnie 2 lata) | |
| Alienware x17 R2 P48E | |
| Schenker XMG Ultra 17 Rocket Lake | |
| Razer Blade 17 Early 2022 | |
| MSI Titan GT77 12UHS | |
| MSI Titan GT77 12UHS 4k | |
| Przeciętny Intel Core i9-12900HX (33.6 - 42.4, n=7) | |
| MSI Titan GT77 12UHS (4k, Extreme Leistung, Cooler Boost) | |
| R Benchmark 2.5 - Overall mean | |
| Schenker XMG Ultra 17 Rocket Lake | |
| Razer Blade 17 Early 2022 | |
| Alienware x17 R2 P48E | |
| Średnia w klasie Gaming (0.3439 - 0.759, n=112, ostatnie 2 lata) | |
| MSI Titan GT77 12UHS 4k | |
| MSI Titan GT77 12UHS (4k, Extreme Leistung, Cooler Boost) | |
| Przeciętny Intel Core i9-12900HX (0.4159 - 0.4242, n=7) | |
| MSI Titan GT77 12UHS | |
* ... im mniej tym lepiej
AIDA64: FP32 Ray-Trace | FPU Julia | CPU SHA3 | CPU Queen | FPU SinJulia | FPU Mandel | CPU AES | CPU ZLib | FP64 Ray-Trace | CPU PhotoWorxx
| Performance rating | |
| Średnia w klasie Gaming | |
| MSI Titan GT77 12UHS 4k | |
| MSI Titan GT77 12UHS | |
| MSI Titan GT77 12UHS | |
| Przeciętny Intel Core i9-12900HX | |
| Schenker XMG Ultra 17 Rocket Lake | |
| Alienware x17 R2 P48E | |
| Razer Blade 17 Early 2022 | |
| AIDA64 / FP32 Ray-Trace | |
| Średnia w klasie Gaming (10227 - 85542, n=110, ostatnie 2 lata) | |
| MSI Titan GT77 12UHS 4k (v6.70.6000) | |
| MSI Titan GT77 12UHS (v6.70.6000, 4k, Extreme Leistung, Cooler Boost) | |
| MSI Titan GT77 12UHS (v6.70.6000) | |
| Przeciętny Intel Core i9-12900HX (11535 - 22183, n=7) | |
| Schenker XMG Ultra 17 Rocket Lake (v6.32.5600) | |
| Alienware x17 R2 P48E (v6.50.5800) | |
| Razer Blade 17 Early 2022 (v6.50.5800) | |
| AIDA64 / FPU Julia | |
| Średnia w klasie Gaming (51376 - 238426, n=110, ostatnie 2 lata) | |
| MSI Titan GT77 12UHS 4k (v6.70.6000) | |
| MSI Titan GT77 12UHS (v6.70.6000) | |
| MSI Titan GT77 12UHS (v6.70.6000, 4k, Extreme Leistung, Cooler Boost) | |
| Przeciętny Intel Core i9-12900HX (52916 - 110093, n=7) | |
| Schenker XMG Ultra 17 Rocket Lake (v6.32.5600) | |
| Alienware x17 R2 P48E (v6.50.5800) | |
| Razer Blade 17 Early 2022 (v6.50.5800) | |
| AIDA64 / CPU SHA3 | |
| Średnia w klasie Gaming (2180 - 9817, n=110, ostatnie 2 lata) | |
| MSI Titan GT77 12UHS 4k (v6.70.6000) | |
| MSI Titan GT77 12UHS (v6.70.6000, 4k, Extreme Leistung, Cooler Boost) | |
| MSI Titan GT77 12UHS (v6.70.6000) | |
| Schenker XMG Ultra 17 Rocket Lake (v6.32.5600) | |
| Przeciętny Intel Core i9-12900HX (3559 - 5123, n=7) | |
| Alienware x17 R2 P48E (v6.50.5800) | |
| Razer Blade 17 Early 2022 (v6.50.5800) | |
| AIDA64 / CPU Queen | |
| Średnia w klasie Gaming (49785 - 173351, n=101, ostatnie 2 lata) | |
| Alienware x17 R2 P48E (v6.50.5800) | |
| Schenker XMG Ultra 17 Rocket Lake (v6.32.5600) | |
| MSI Titan GT77 12UHS (v6.70.6000) | |
| MSI Titan GT77 12UHS 4k (v6.70.6000) | |
| MSI Titan GT77 12UHS (v6.70.6000, 4k, Extreme Leistung, Cooler Boost) | |
| Przeciętny Intel Core i9-12900HX (101029 - 104457, n=7) | |
| Razer Blade 17 Early 2022 (v6.50.5800) | |
| AIDA64 / FPU SinJulia | |
| Średnia w klasie Gaming (4424 - 33636, n=110, ostatnie 2 lata) | |
| MSI Titan GT77 12UHS 4k (v6.70.6000) | |
| MSI Titan GT77 12UHS (v6.70.6000, 4k, Extreme Leistung, Cooler Boost) | |
| MSI Titan GT77 12UHS (v6.70.6000) | |
| Przeciętny Intel Core i9-12900HX (10475 - 13062, n=7) | |
| Schenker XMG Ultra 17 Rocket Lake (v6.32.5600) | |
| Alienware x17 R2 P48E (v6.50.5800) | |
| Razer Blade 17 Early 2022 (v6.50.5800) | |
| AIDA64 / FPU Mandel | |
| Średnia w klasie Gaming (25115 - 128721, n=110, ostatnie 2 lata) | |
| MSI Titan GT77 12UHS 4k (v6.70.6000) | |
| MSI Titan GT77 12UHS (v6.70.6000, 4k, Extreme Leistung, Cooler Boost) | |
| MSI Titan GT77 12UHS (v6.70.6000) | |
| Przeciętny Intel Core i9-12900HX (31779 - 53628, n=7) | |
| Schenker XMG Ultra 17 Rocket Lake (v6.32.5600) | |
| Alienware x17 R2 P48E (v6.50.5800) | |
| Razer Blade 17 Early 2022 (v6.50.5800) | |
| AIDA64 / CPU AES | |
| MSI Titan GT77 12UHS (v6.70.6000, 4k, Extreme Leistung, Cooler Boost) | |
| MSI Titan GT77 12UHS | |
| MSI Titan GT77 12UHS 4k (v6.70.6000) | |
| Przeciętny Intel Core i9-12900HX (125268 - 183146, n=7) | |
| Schenker XMG Ultra 17 Rocket Lake (v6.32.5600) | |
| Alienware x17 R2 P48E (v6.50.5800) | |
| Średnia w klasie Gaming (39258 - 247074, n=110, ostatnie 2 lata) | |
| Razer Blade 17 Early 2022 (v6.50.5800) | |
| AIDA64 / CPU ZLib | |
| Średnia w klasie Gaming (574 - 2531, n=110, ostatnie 2 lata) | |
| MSI Titan GT77 12UHS 4k (v6.70.6000) | |
| MSI Titan GT77 12UHS (v6.70.6000, 4k, Extreme Leistung, Cooler Boost) | |
| MSI Titan GT77 12UHS (v6.70.6000) | |
| Przeciętny Intel Core i9-12900HX (990 - 1408, n=7) | |
| Alienware x17 R2 P48E (v6.50.5800) | |
| Schenker XMG Ultra 17 Rocket Lake (v6.32.5600) | |
| Razer Blade 17 Early 2022 (v6.50.5800) | |
| AIDA64 / FP64 Ray-Trace | |
| Średnia w klasie Gaming (5509 - 45446, n=110, ostatnie 2 lata) | |
| MSI Titan GT77 12UHS 4k (v6.70.6000) | |
| MSI Titan GT77 12UHS (v6.70.6000, 4k, Extreme Leistung, Cooler Boost) | |
| MSI Titan GT77 12UHS (v6.70.6000) | |
| Przeciętny Intel Core i9-12900HX (6663 - 11913, n=7) | |
| Schenker XMG Ultra 17 Rocket Lake (v6.32.5600) | |
| Alienware x17 R2 P48E (v6.50.5800) | |
| Razer Blade 17 Early 2022 (v6.50.5800) | |
| AIDA64 / CPU PhotoWorxx | |
| Średnia w klasie Gaming (12271 - 89891, n=110, ostatnie 2 lata) | |
| Przeciętny Intel Core i9-12900HX (40239 - 47710, n=7) | |
| MSI Titan GT77 12UHS (v6.70.6000) | |
| MSI Titan GT77 12UHS 4k (v6.70.6000) | |
| MSI Titan GT77 12UHS (v6.70.6000, 4k, Extreme Leistung, Cooler Boost) | |
| Razer Blade 17 Early 2022 (v6.50.5800) | |
| Alienware x17 R2 P48E (v6.50.5800) | |
| Schenker XMG Ultra 17 Rocket Lake (v6.32.5600) | |
Wydajność systemu
GT77 nie brakuje mocy obliczeniowej - widać to od razu po spojrzeniu na jego specyfikację. 17-calowy laptop bez problemu radzi sobie z grami, renderowaniem i wieloma innymi czynnościami. Szybkość transferu pamięci RAM odpowiada zwykłemu poziomowi wydajności pamięci DDR4-4800. System uzyskał również dobre wyniki w programie PCMark.
CrossMark: Overall | Productivity | Creativity | Responsiveness
| PCMark 10 / Score | |
| MSI Titan GT77 12UHS (dGPU, Extreme Leistung) | |
| Średnia w klasie Gaming (5828 - 11574, n=96, ostatnie 2 lata) | |
| MSI Titan GT77 12UHS | |
| Alienware x17 R2 P48E | |
| Przeciętny Intel Core i9-12900HX, NVIDIA GeForce RTX 3080 Ti Laptop GPU (6812 - 8636, n=6) | |
| Schenker XMG Ultra 17 Rocket Lake | |
| Razer Blade 17 Early 2022 | |
| MSI Titan GT77 12UHS 4k | |
| PCMark 10 / Essentials | |
| Alienware x17 R2 P48E | |
| MSI Titan GT77 12UHS (dGPU, Extreme Leistung) | |
| MSI Titan GT77 12UHS | |
| Schenker XMG Ultra 17 Rocket Lake | |
| Średnia w klasie Gaming (8810 - 12600, n=100, ostatnie 2 lata) | |
| Przeciętny Intel Core i9-12900HX, NVIDIA GeForce RTX 3080 Ti Laptop GPU (9598 - 11192, n=6) | |
| Razer Blade 17 Early 2022 | |
| MSI Titan GT77 12UHS 4k | |
| PCMark 10 / Productivity | |
| MSI Titan GT77 12UHS (dGPU, Extreme Leistung) | |
| Średnia w klasie Gaming (6845 - 18766, n=98, ostatnie 2 lata) | |
| Przeciętny Intel Core i9-12900HX, NVIDIA GeForce RTX 3080 Ti Laptop GPU (9365 - 10932, n=6) | |
| MSI Titan GT77 12UHS | |
| Alienware x17 R2 P48E | |
| Schenker XMG Ultra 17 Rocket Lake | |
| MSI Titan GT77 12UHS 4k | |
| Razer Blade 17 Early 2022 | |
| PCMark 10 / Digital Content Creation | |
| Średnia w klasie Gaming (7602 - 19657, n=98, ostatnie 2 lata) | |
| MSI Titan GT77 12UHS (dGPU, Extreme Leistung) | |
| MSI Titan GT77 12UHS | |
| Alienware x17 R2 P48E | |
| Przeciętny Intel Core i9-12900HX, NVIDIA GeForce RTX 3080 Ti Laptop GPU (9543 - 14291, n=6) | |
| Schenker XMG Ultra 17 Rocket Lake | |
| Razer Blade 17 Early 2022 | |
| MSI Titan GT77 12UHS 4k | |
| CrossMark / Overall | |
| MSI Titan GT77 12UHS 4k | |
| Przeciętny Intel Core i9-12900HX, NVIDIA GeForce RTX 3080 Ti Laptop GPU (2108 - 2170, n=5) | |
| MSI Titan GT77 12UHS | |
| Średnia w klasie Gaming (1366 - 2409, n=98, ostatnie 2 lata) | |
| Alienware x17 R2 P48E | |
| Razer Blade 17 Early 2022 | |
| CrossMark / Productivity | |
| MSI Titan GT77 12UHS 4k | |
| Przeciętny Intel Core i9-12900HX, NVIDIA GeForce RTX 3080 Ti Laptop GPU (1978 - 2047, n=5) | |
| MSI Titan GT77 12UHS | |
| Średnia w klasie Gaming (1386 - 2254, n=98, ostatnie 2 lata) | |
| Alienware x17 R2 P48E | |
| Razer Blade 17 Early 2022 | |
| CrossMark / Creativity | |
| MSI Titan GT77 12UHS 4k | |
| Przeciętny Intel Core i9-12900HX, NVIDIA GeForce RTX 3080 Ti Laptop GPU (2288 - 2366, n=5) | |
| MSI Titan GT77 12UHS | |
| Średnia w klasie Gaming (1343 - 2729, n=98, ostatnie 2 lata) | |
| Alienware x17 R2 P48E | |
| Razer Blade 17 Early 2022 | |
| CrossMark / Responsiveness | |
| MSI Titan GT77 12UHS 4k | |
| Przeciętny Intel Core i9-12900HX, NVIDIA GeForce RTX 3080 Ti Laptop GPU (1991 - 2090, n=5) | |
| MSI Titan GT77 12UHS | |
| Średnia w klasie Gaming (1226 - 2334, n=98, ostatnie 2 lata) | |
| Alienware x17 R2 P48E | |
| Razer Blade 17 Early 2022 | |
| PCMark 8 Home Score Accelerated v2 | 4166 pkt. | |
| PCMark 8 Creative Score Accelerated v2 | 6677 pkt. | |
| PCMark 8 Work Score Accelerated v2 | 5165 pkt. | |
| PCMark 10 Score | 6812 pkt. | |
Pomoc | ||
| AIDA64 / Memory Copy | |
| Średnia w klasie Gaming (21750 - 129946, n=110, ostatnie 2 lata) | |
| Przeciętny Intel Core i9-12900HX (62852 - 70863, n=7) | |
| MSI Titan GT77 12UHS | |
| MSI Titan GT77 12UHS 4k | |
| Razer Blade 17 Early 2022 | |
| Alienware x17 R2 P48E | |
| Schenker XMG Ultra 17 Rocket Lake | |
| AIDA64 / Memory Read | |
| Średnia w klasie Gaming (22956 - 118858, n=110, ostatnie 2 lata) | |
| Przeciętny Intel Core i9-12900HX (62140 - 72930, n=7) | |
| MSI Titan GT77 12UHS 4k | |
| Razer Blade 17 Early 2022 | |
| MSI Titan GT77 12UHS | |
| Alienware x17 R2 P48E | |
| Schenker XMG Ultra 17 Rocket Lake | |
| AIDA64 / Memory Write | |
| Średnia w klasie Gaming (22297 - 135096, n=110, ostatnie 2 lata) | |
| Przeciętny Intel Core i9-12900HX (60001 - 68782, n=7) | |
| MSI Titan GT77 12UHS 4k | |
| MSI Titan GT77 12UHS | |
| Razer Blade 17 Early 2022 | |
| Alienware x17 R2 P48E | |
| Schenker XMG Ultra 17 Rocket Lake | |
| AIDA64 / Memory Latency | |
| Średnia w klasie Gaming (75.3 - 259, n=110, ostatnie 2 lata) | |
| Alienware x17 R2 P48E | |
| MSI Titan GT77 12UHS 4k | |
| MSI Titan GT77 12UHS | |
| Przeciętny Intel Core i9-12900HX (83.9 - 93.4, n=7) | |
| Schenker XMG Ultra 17 Rocket Lake | |
* ... im mniej tym lepiej
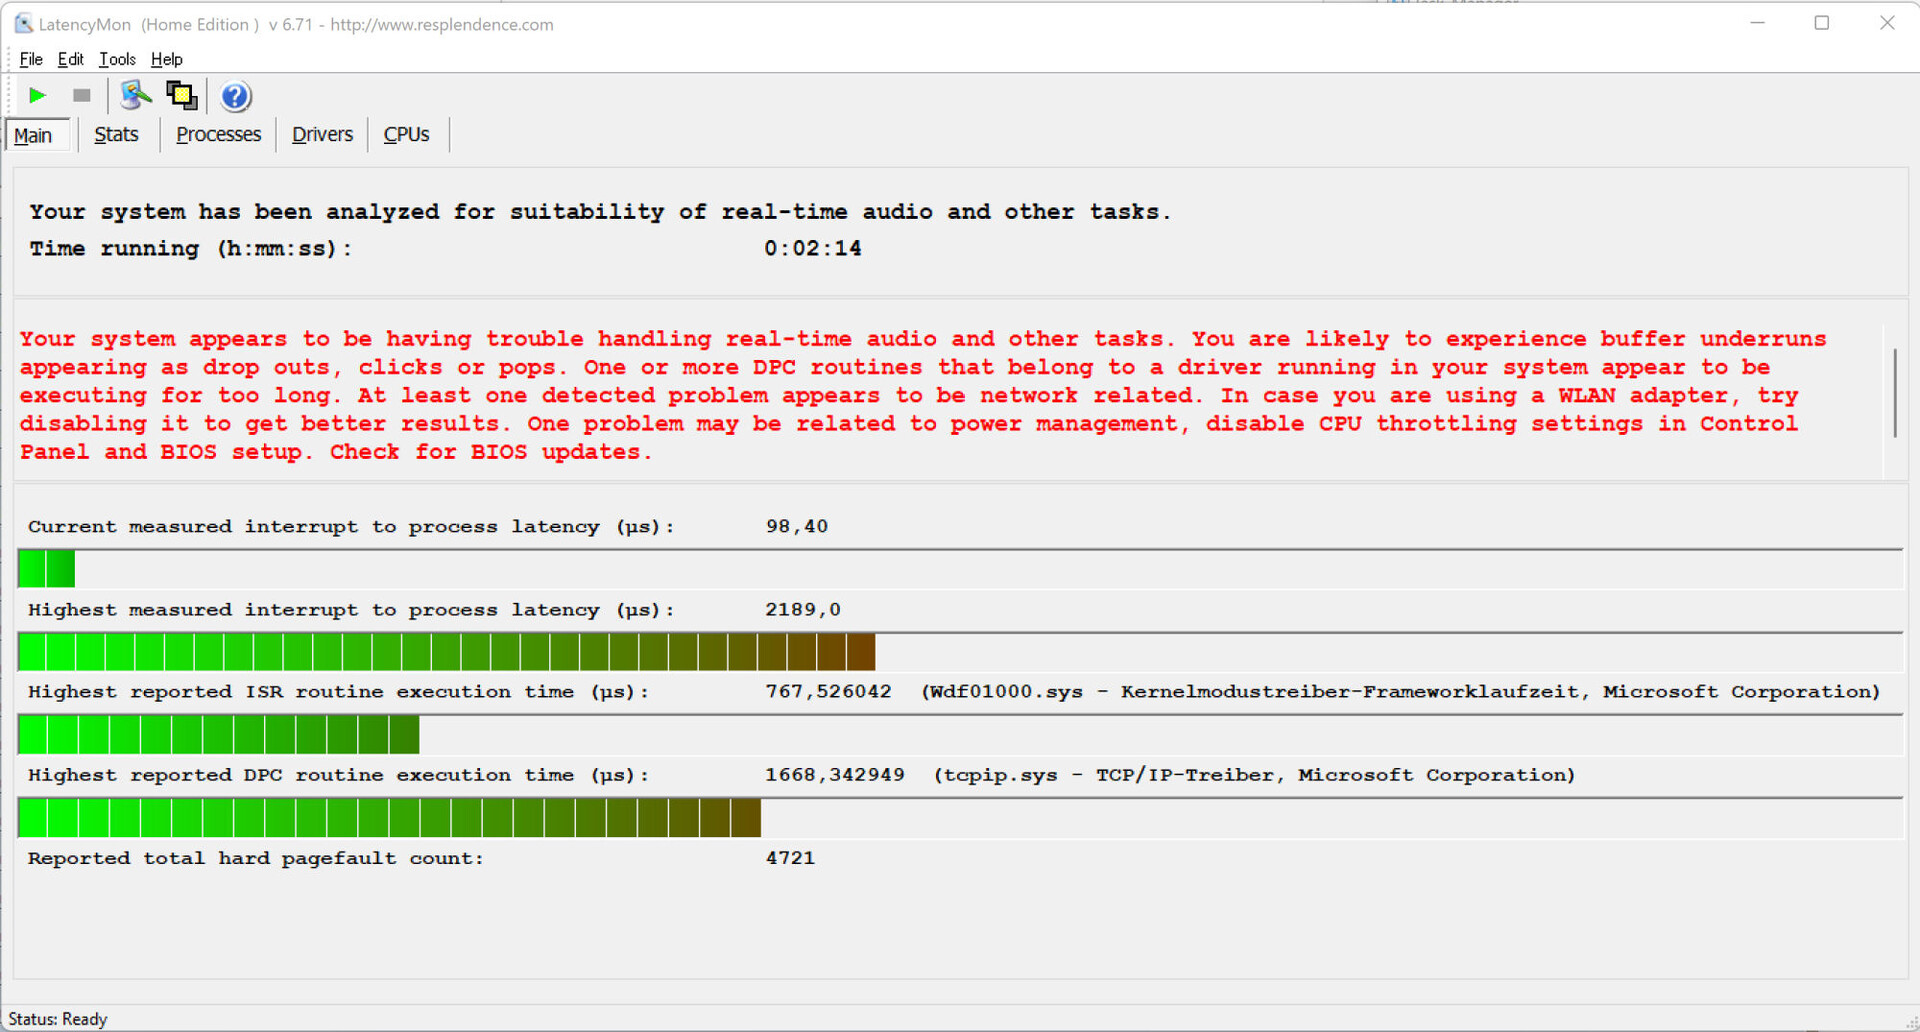
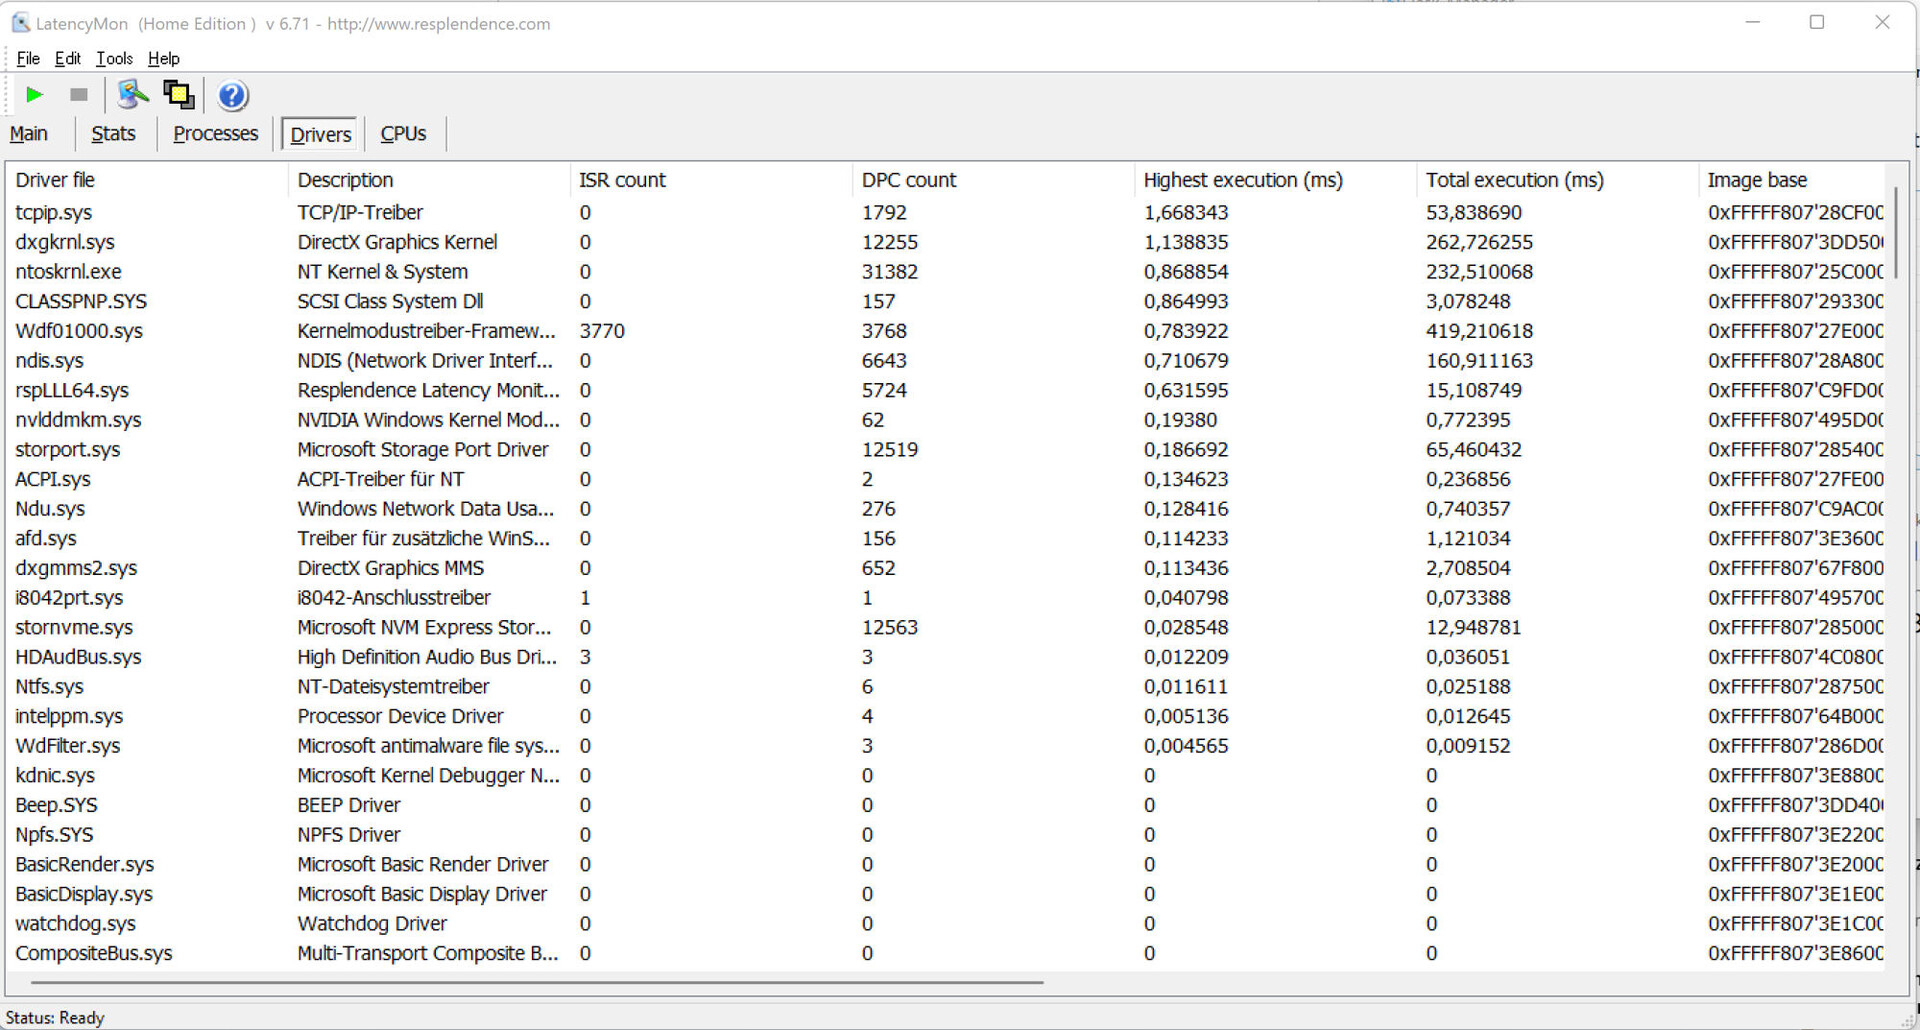
Opóźnienie DPC
Nasz standardowy test monitorowania latencji (przeglądanie internetu, odtwarzanie wideo 4K, wysokie obciążenie Prime95) ujawnił pewne problemy z latencją DPC. System nie wydaje się być dobrze przystosowany do przetwarzania wideo i audio w czasie rzeczywistym. Przyszłe aktualizacje oprogramowania mogą poprawić lub nawet pogorszyć ten problem.
| DPC Latencies / LatencyMon - interrupt to process latency (max), Web, Youtube, Prime95 | |
| MSI Titan GT77 12UHS | |
| MSI Titan GT77 12UHS | |
| MSI Titan GT77 12UHS 4k | |
| Alienware x17 R2 P48E | |
| Schenker XMG Ultra 17 Rocket Lake | |
| Razer Blade 17 Early 2022 | |
* ... im mniej tym lepiej
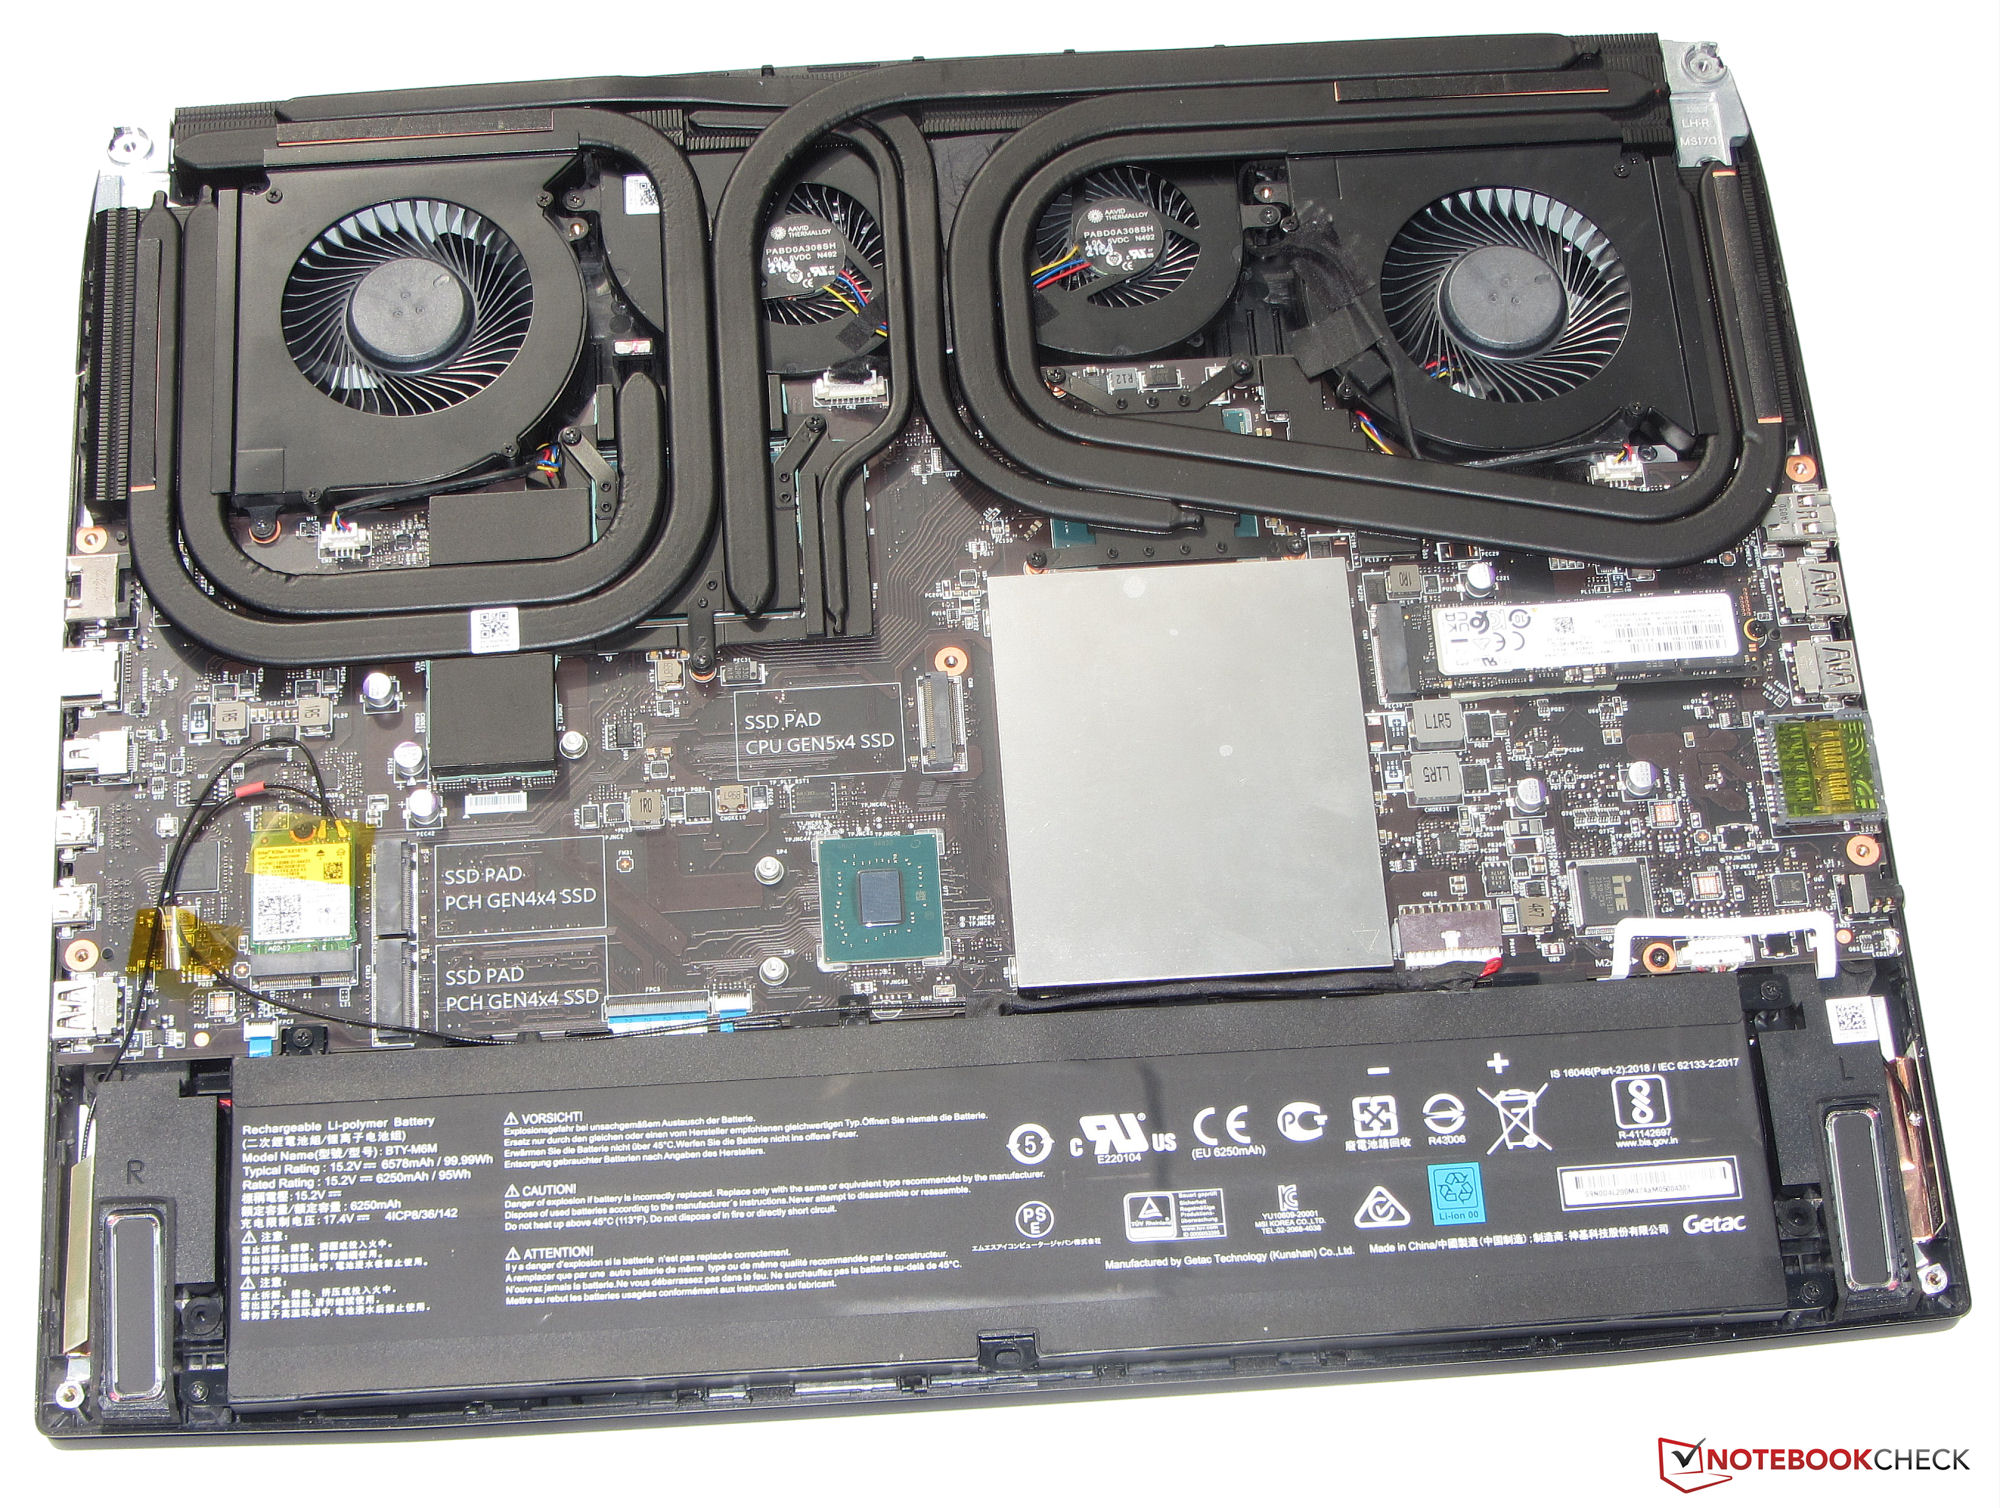
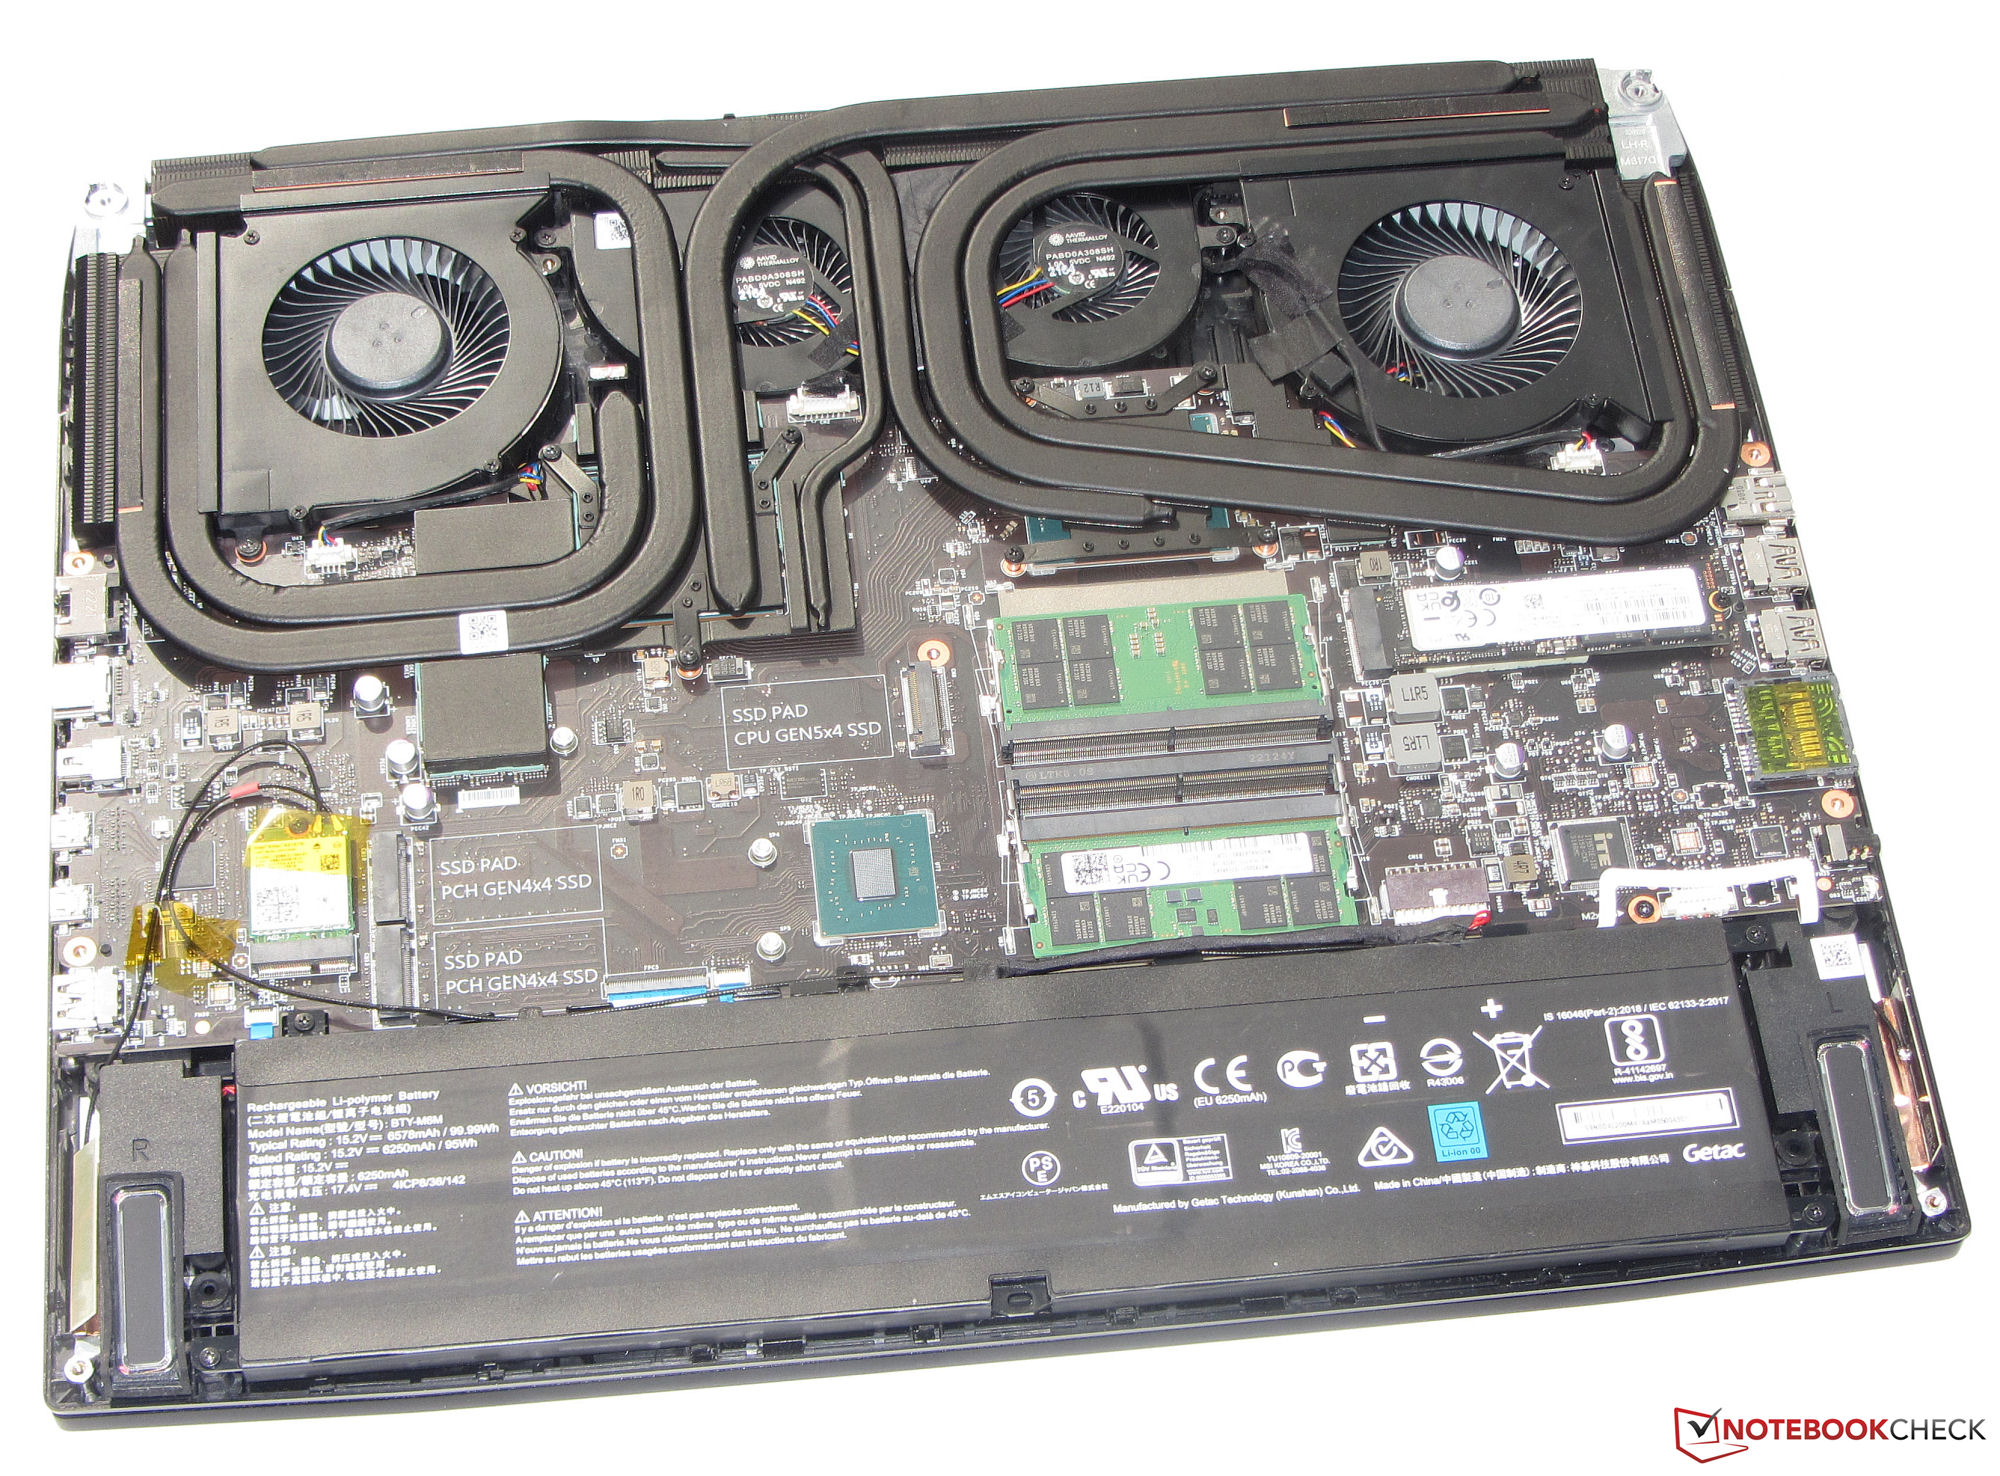
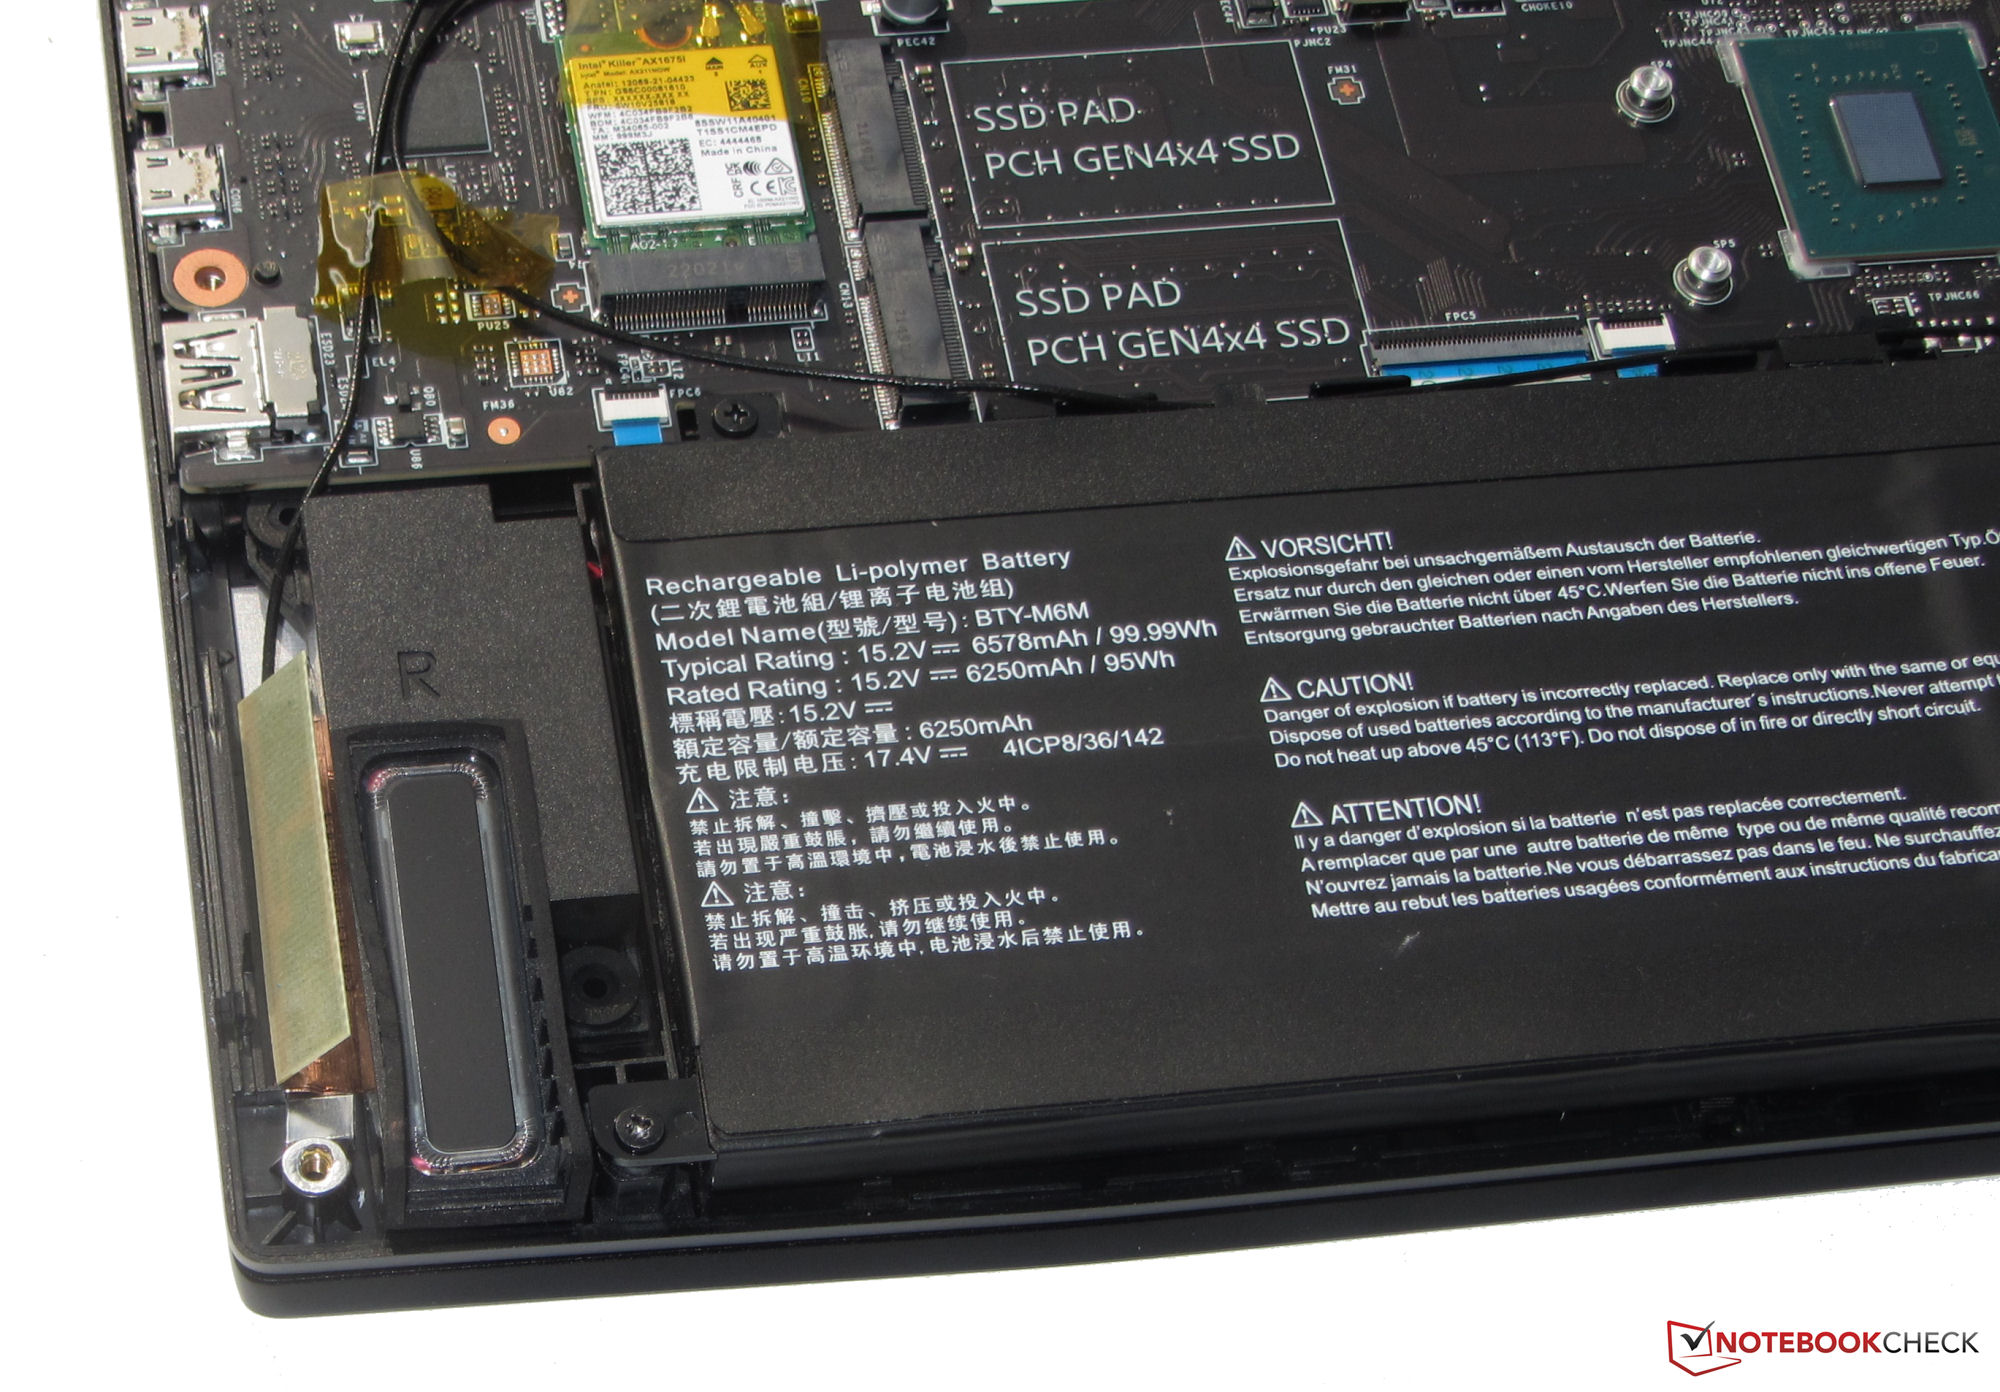
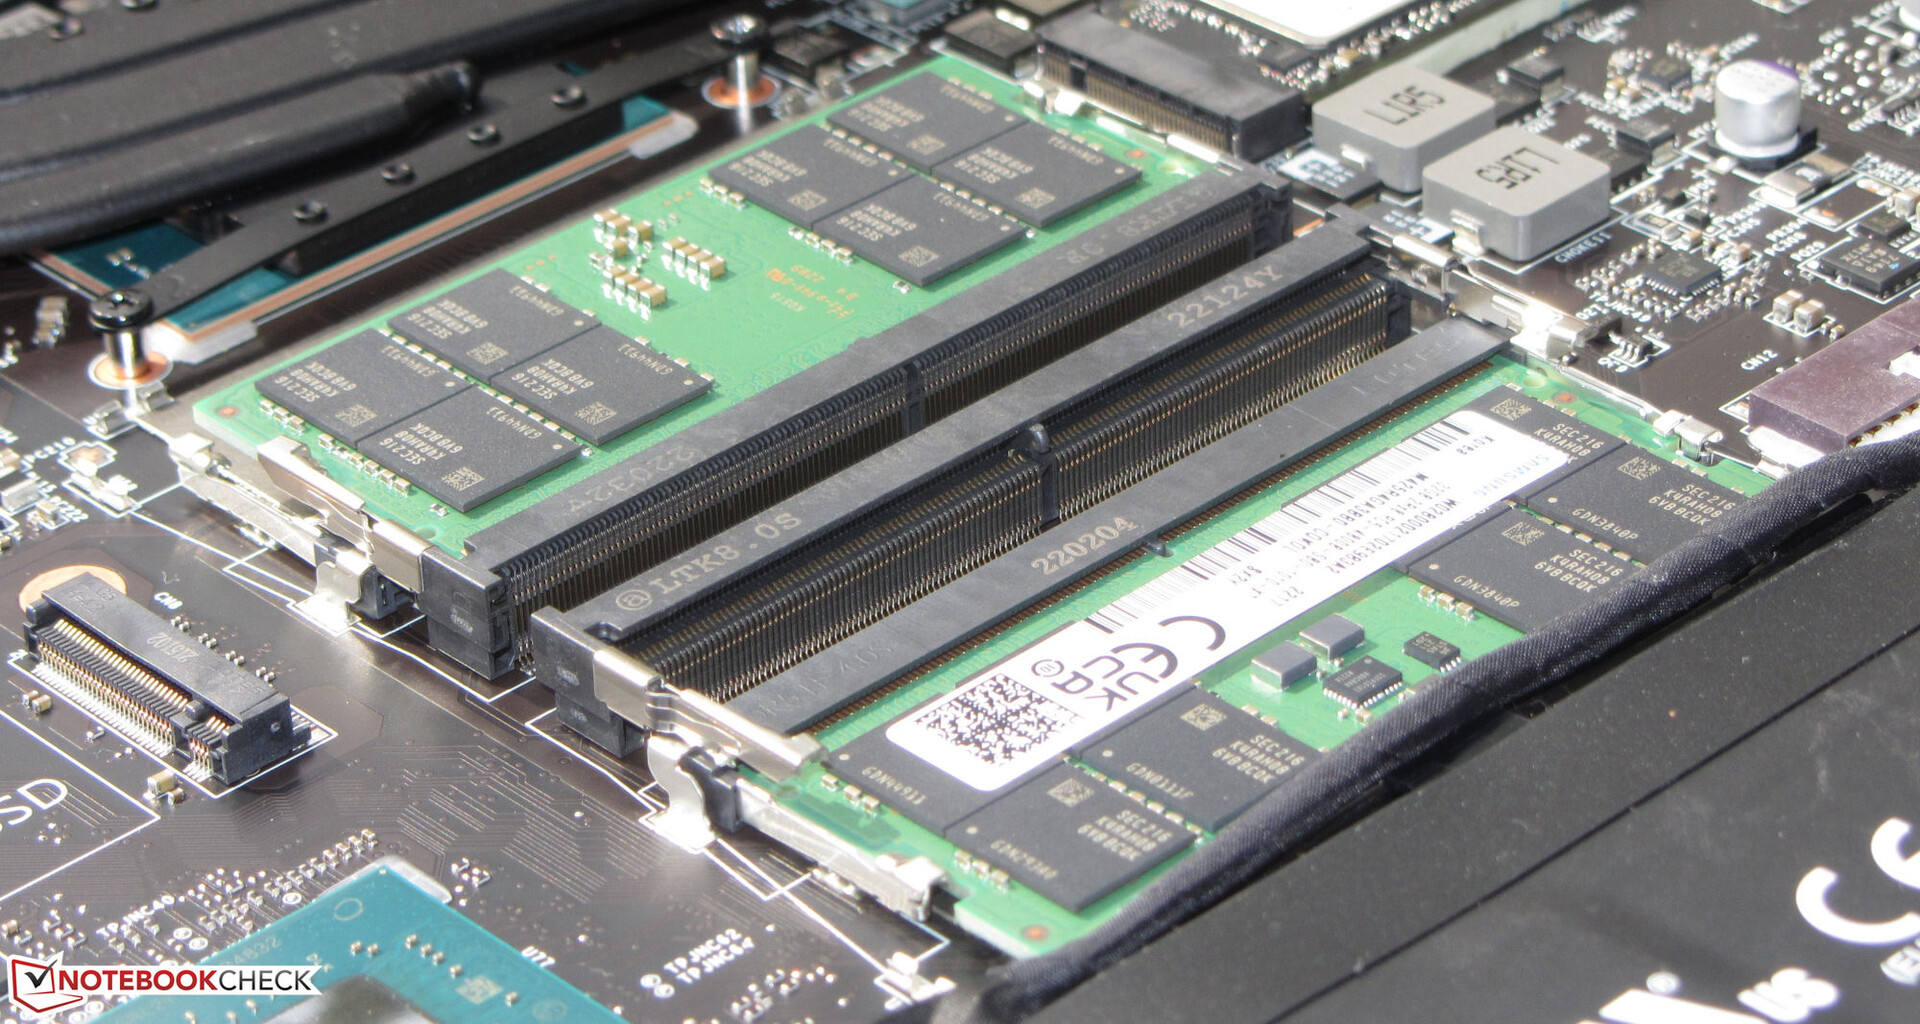
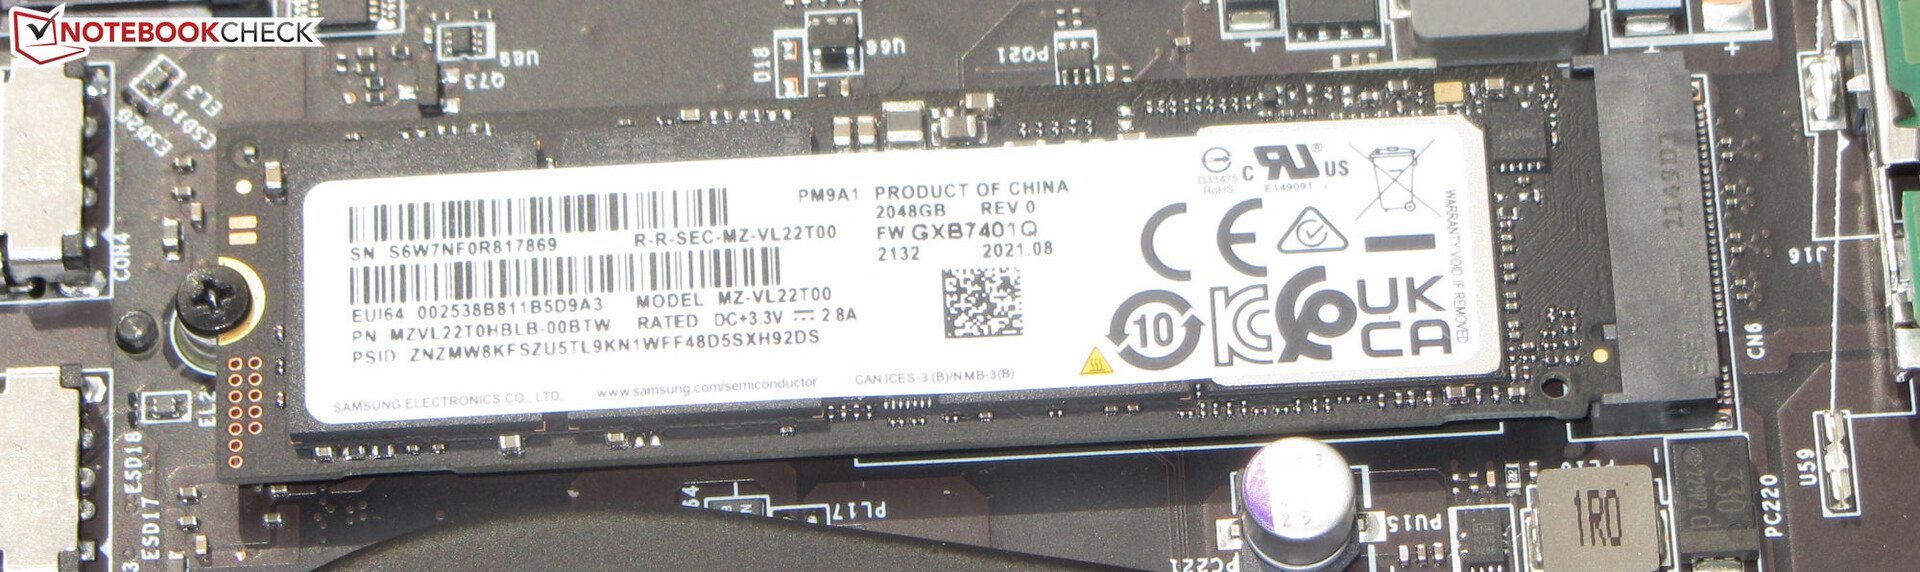
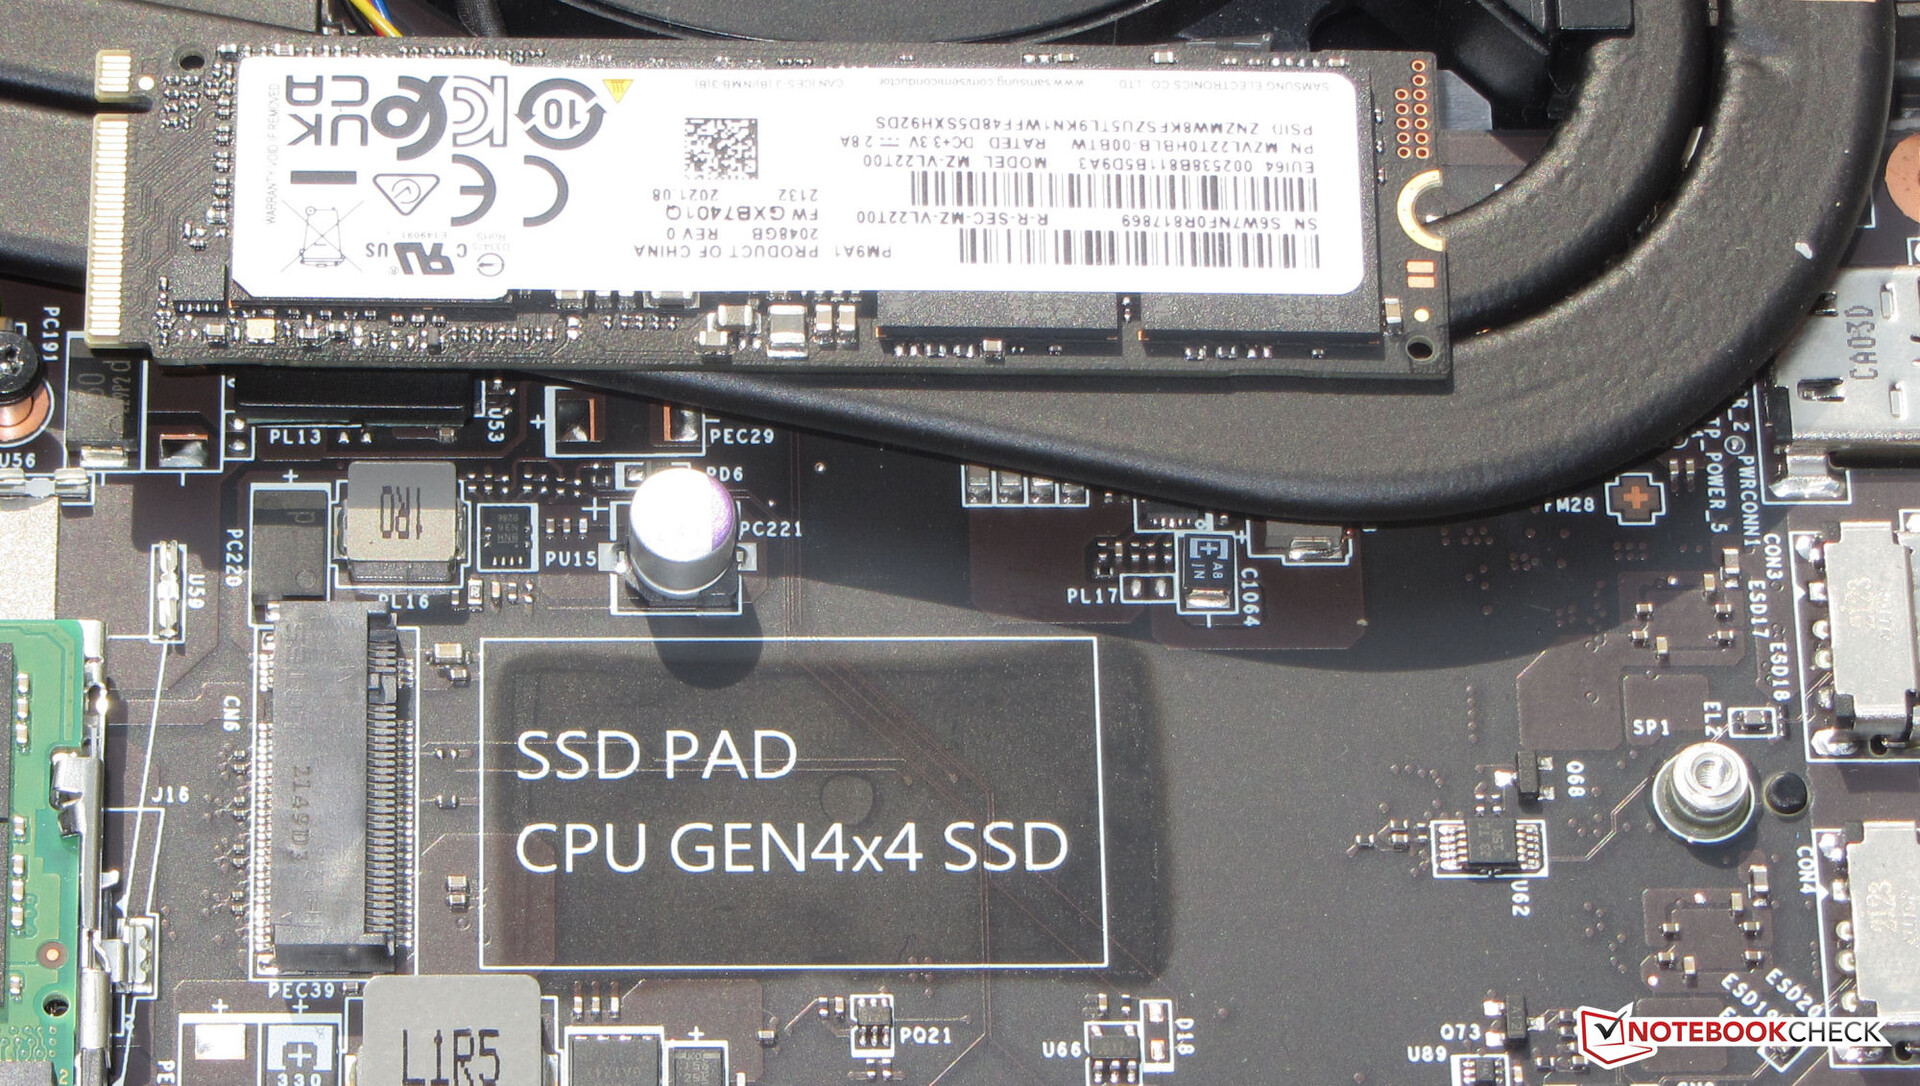
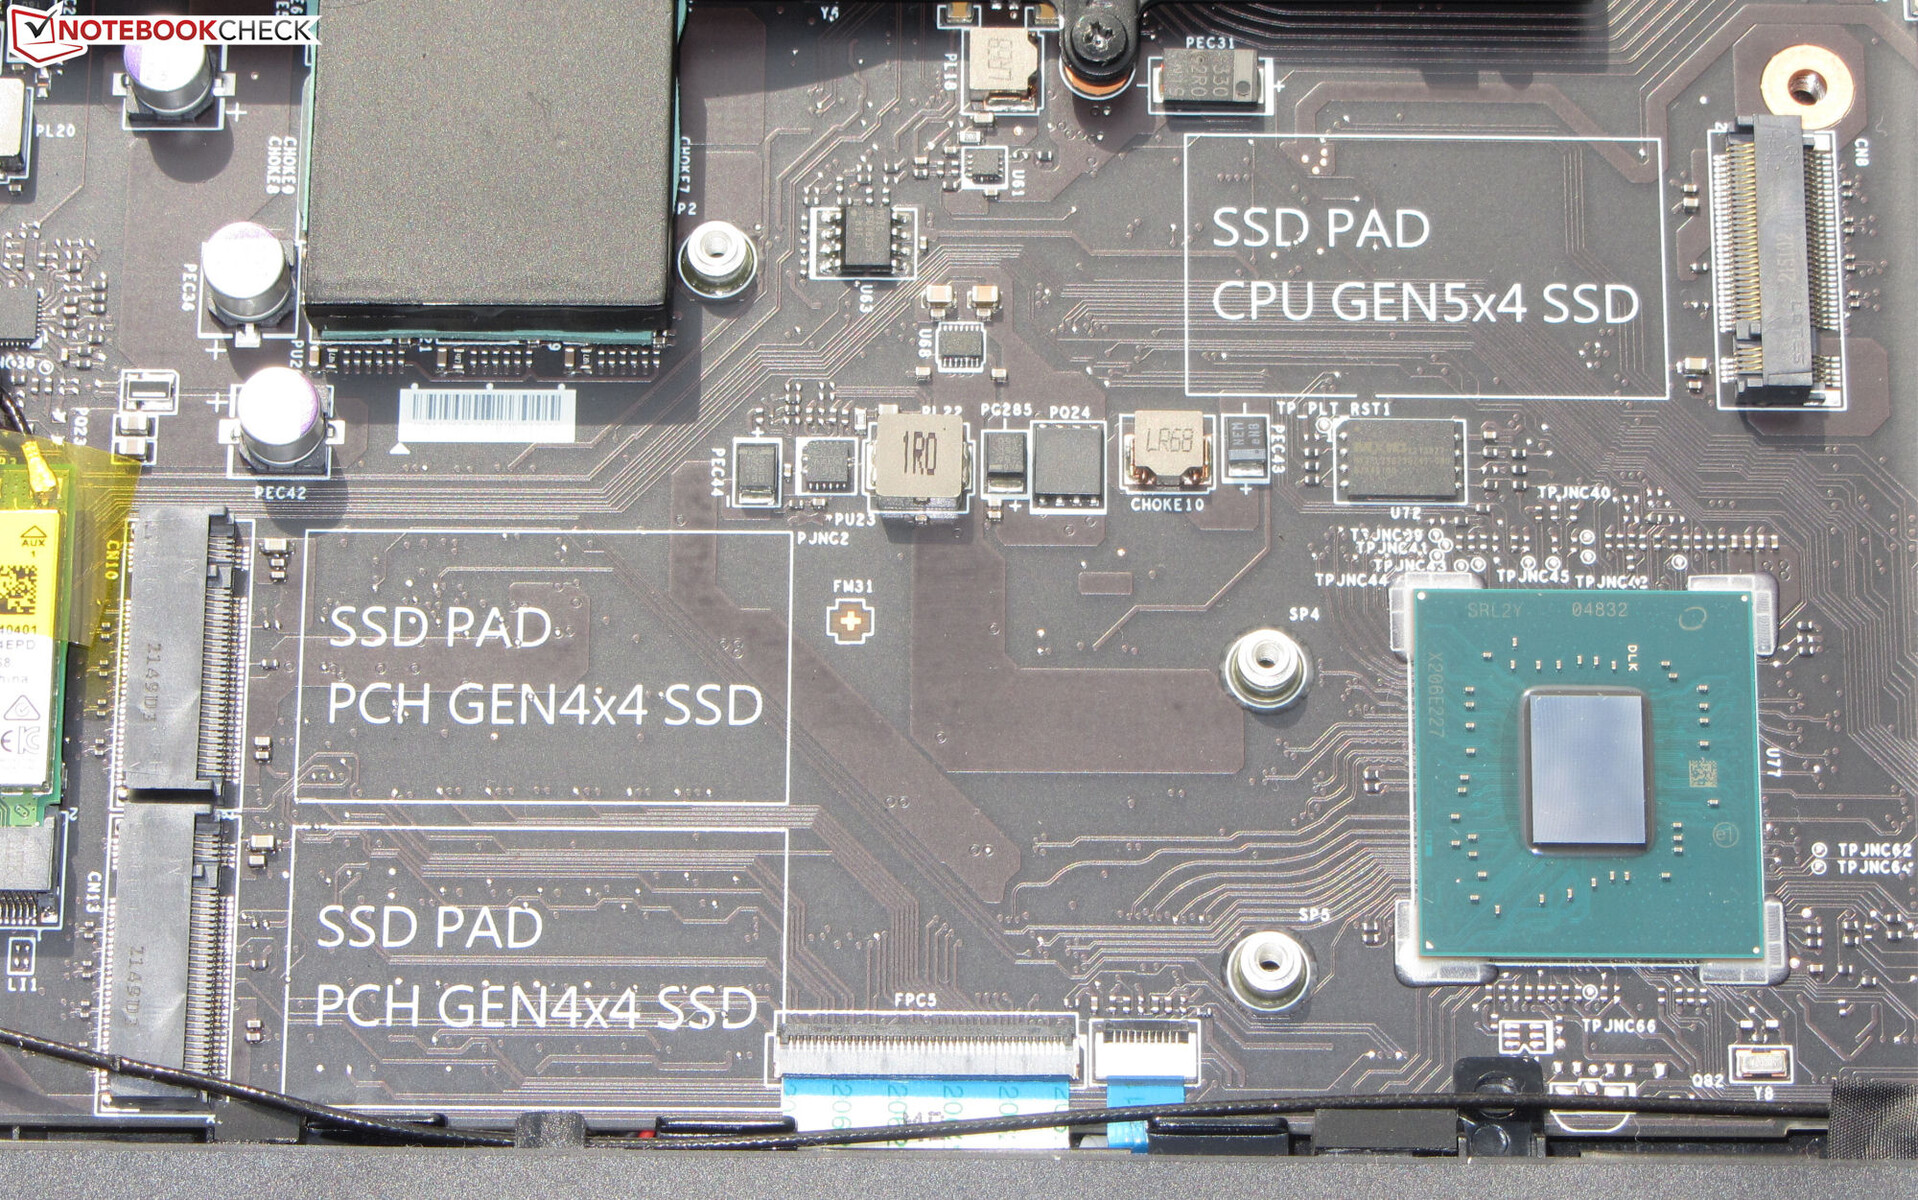
Pamięć masowa
Titan może pomieścić do czterech dysków SSD M.2 2280 (3x PCIe 4, 1x PCIe 5). Dołączony do zestawu dysk SSD Samsunga o pojemności 2 TB (PCIe 4) jest w stanie zapewnić doskonałe prędkości transferu
WModelu "FHD, dysk SSD z systemem operacyjnym (również produkcji Samsunga) cierpi na spadki wydajności z powodu throttlingu termicznego. Być może trzy inne dyski SSD zainstalowane w laptopie uniemożliwiają optymalny przepływ powietrza. Dysk SSD w naszym aktualnym egzemplarzu testowym nie wykazuje spadków wydajności.

| Drive Performance rating - Percent | |
| MSI Titan GT77 12UHS 4k | |
| MSI Titan GT77 12UHS | |
| Razer Blade 17 Early 2022 | |
| Schenker XMG Ultra 17 Rocket Lake | |
| Przeciętny Samsung PM9A1 MZVL22T0HBLB | |
| Średnia w klasie Gaming | |
| Alienware x17 R2 P48E | |
* ... im mniej tym lepiej
Continuous read: DiskSpd Read Loop, Queue Depth 8
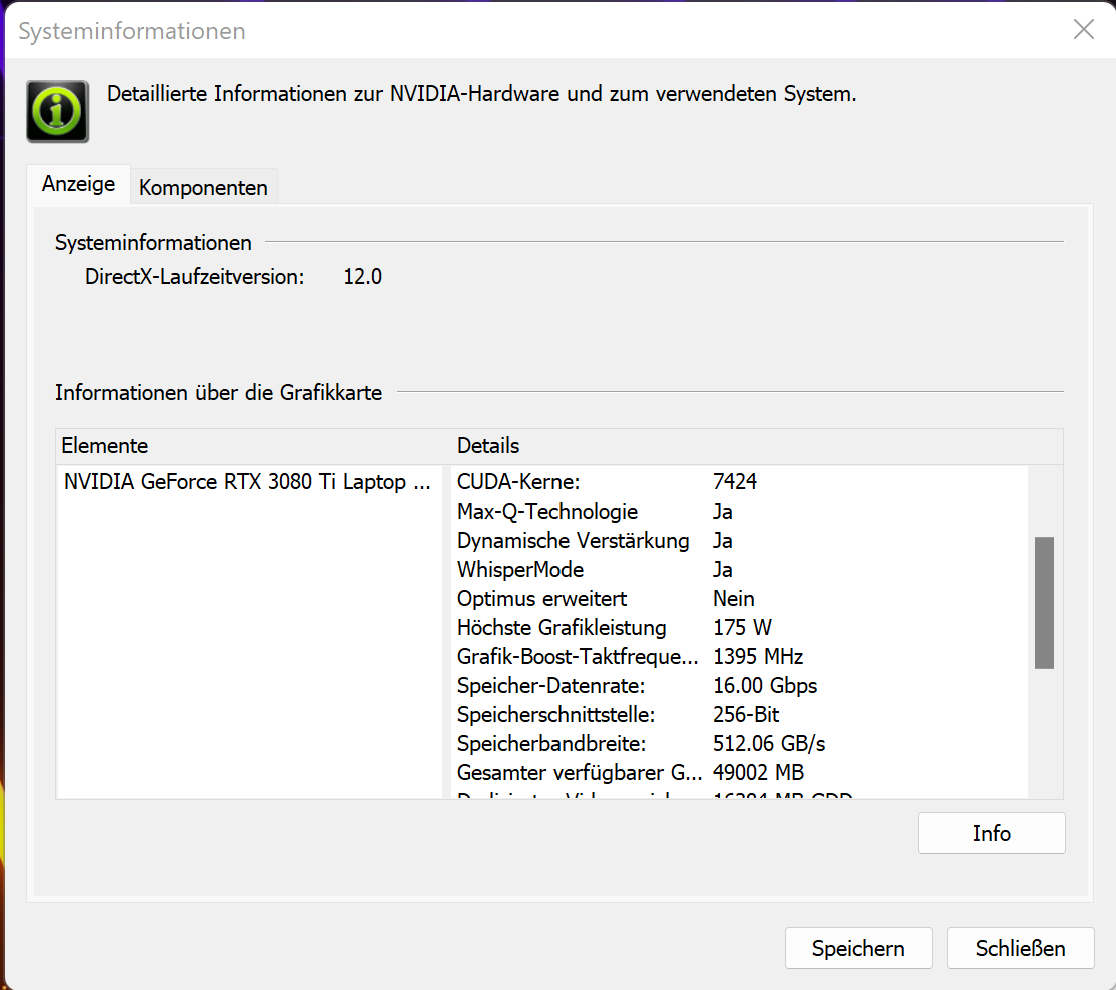
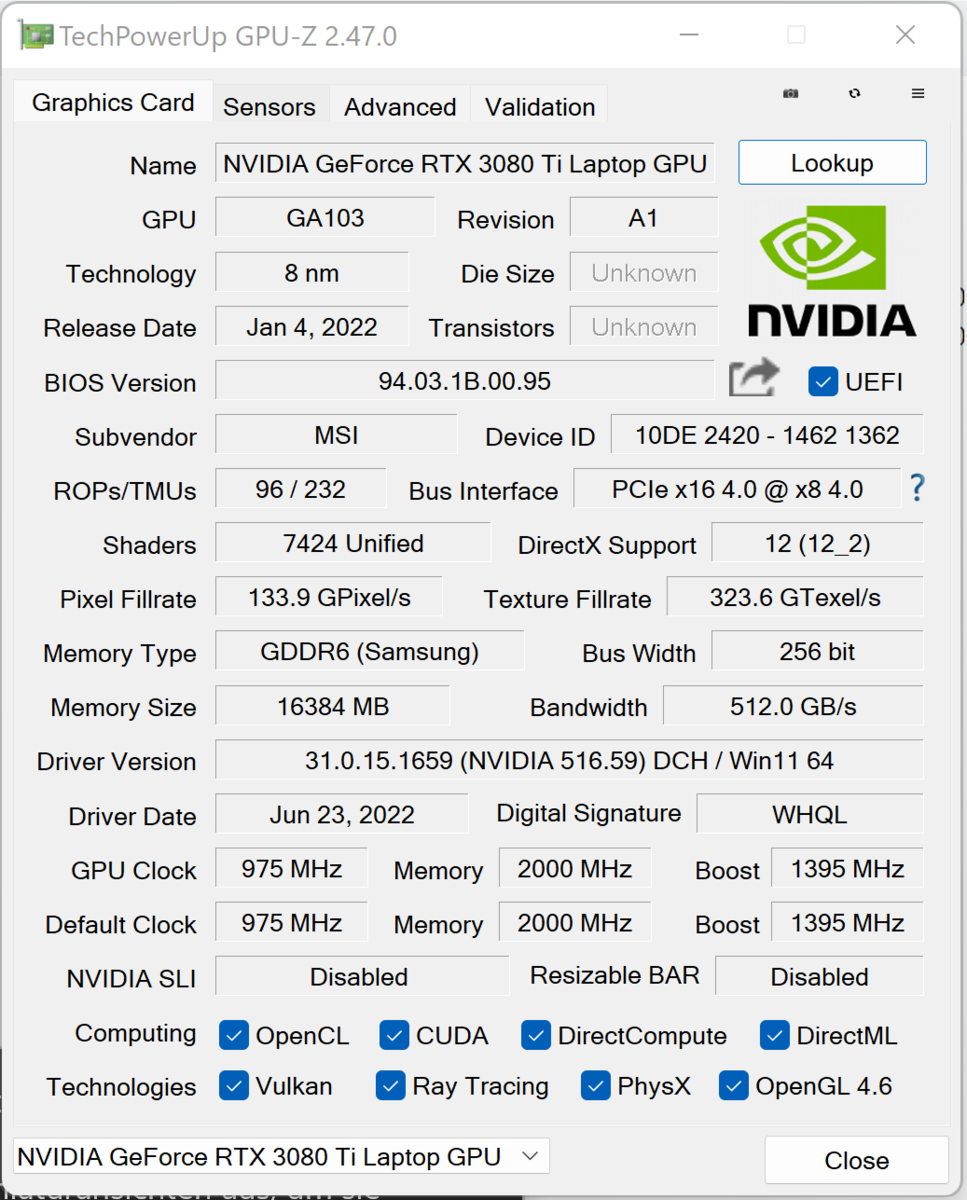
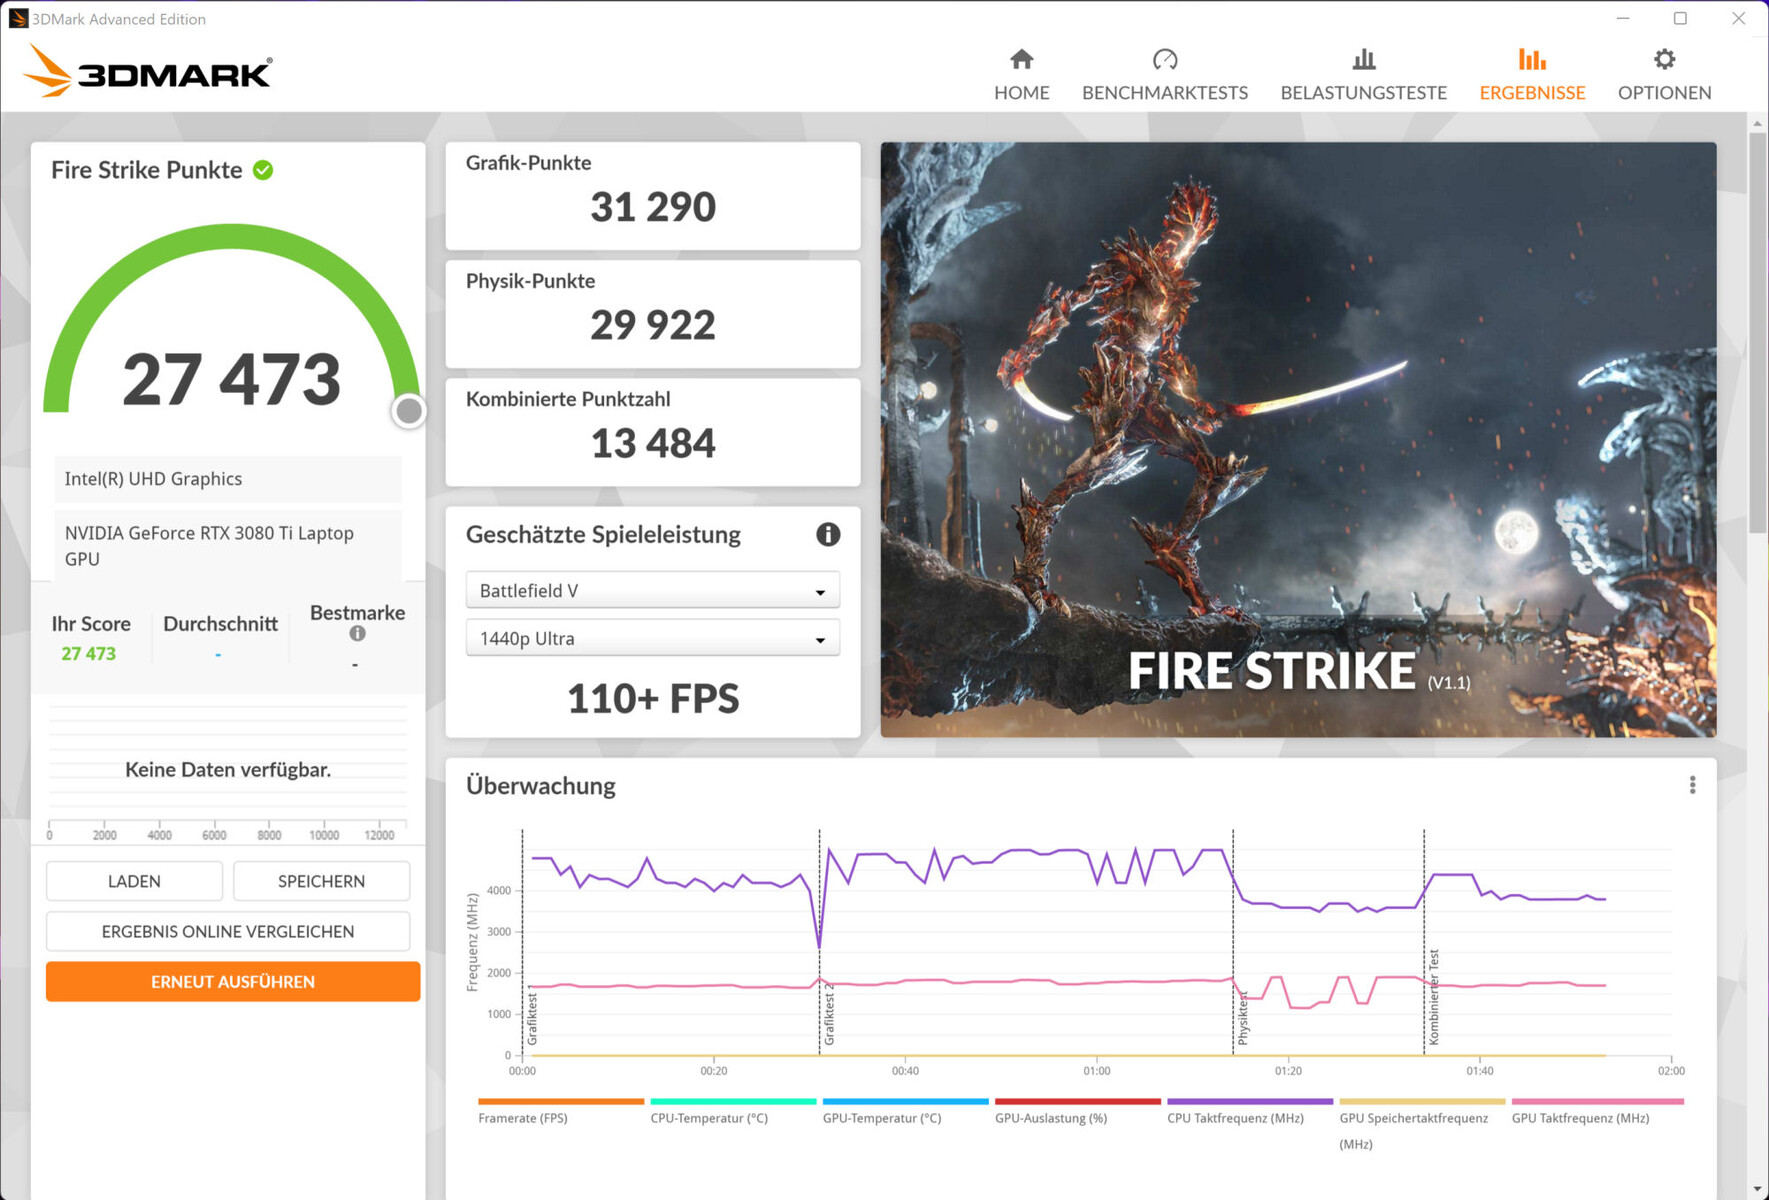
Karta graficzna
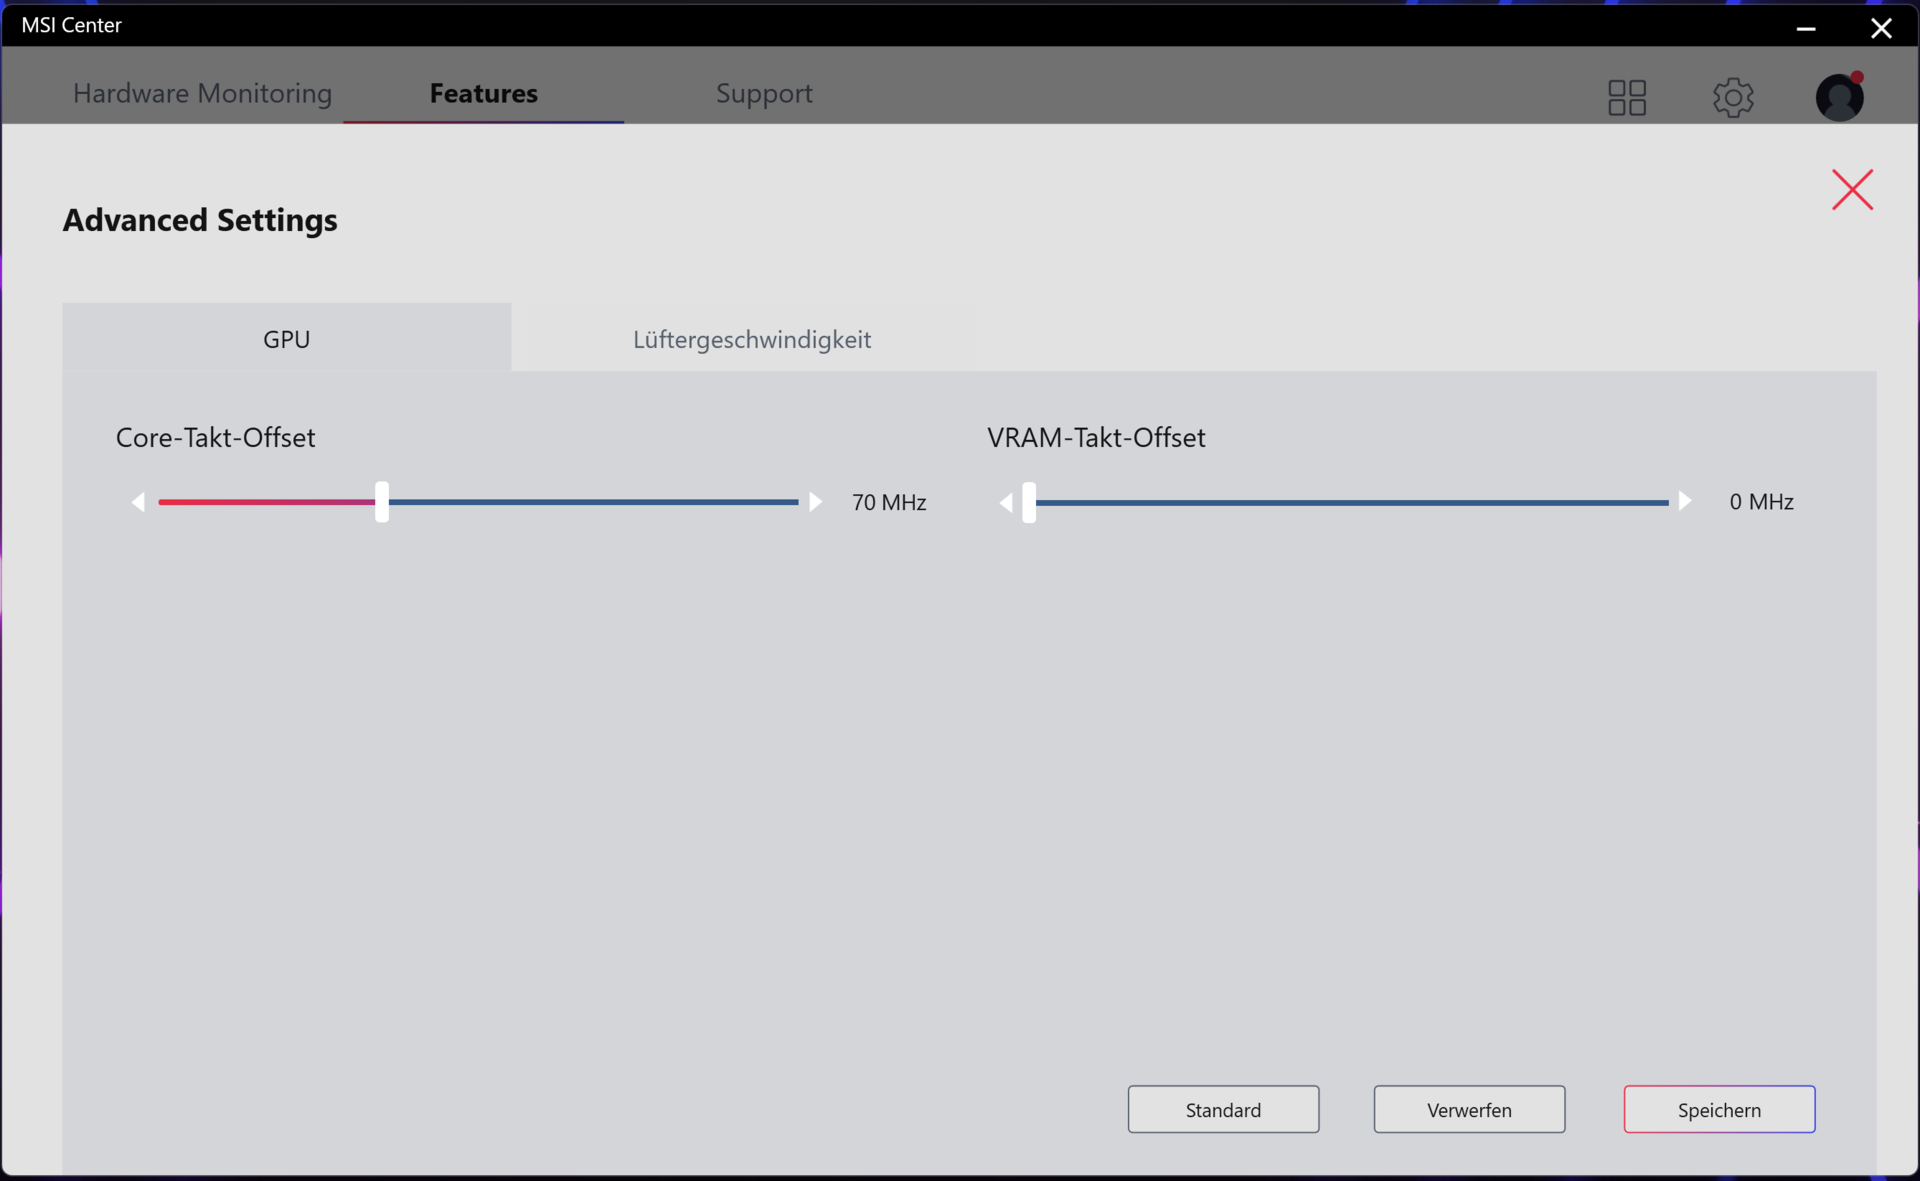
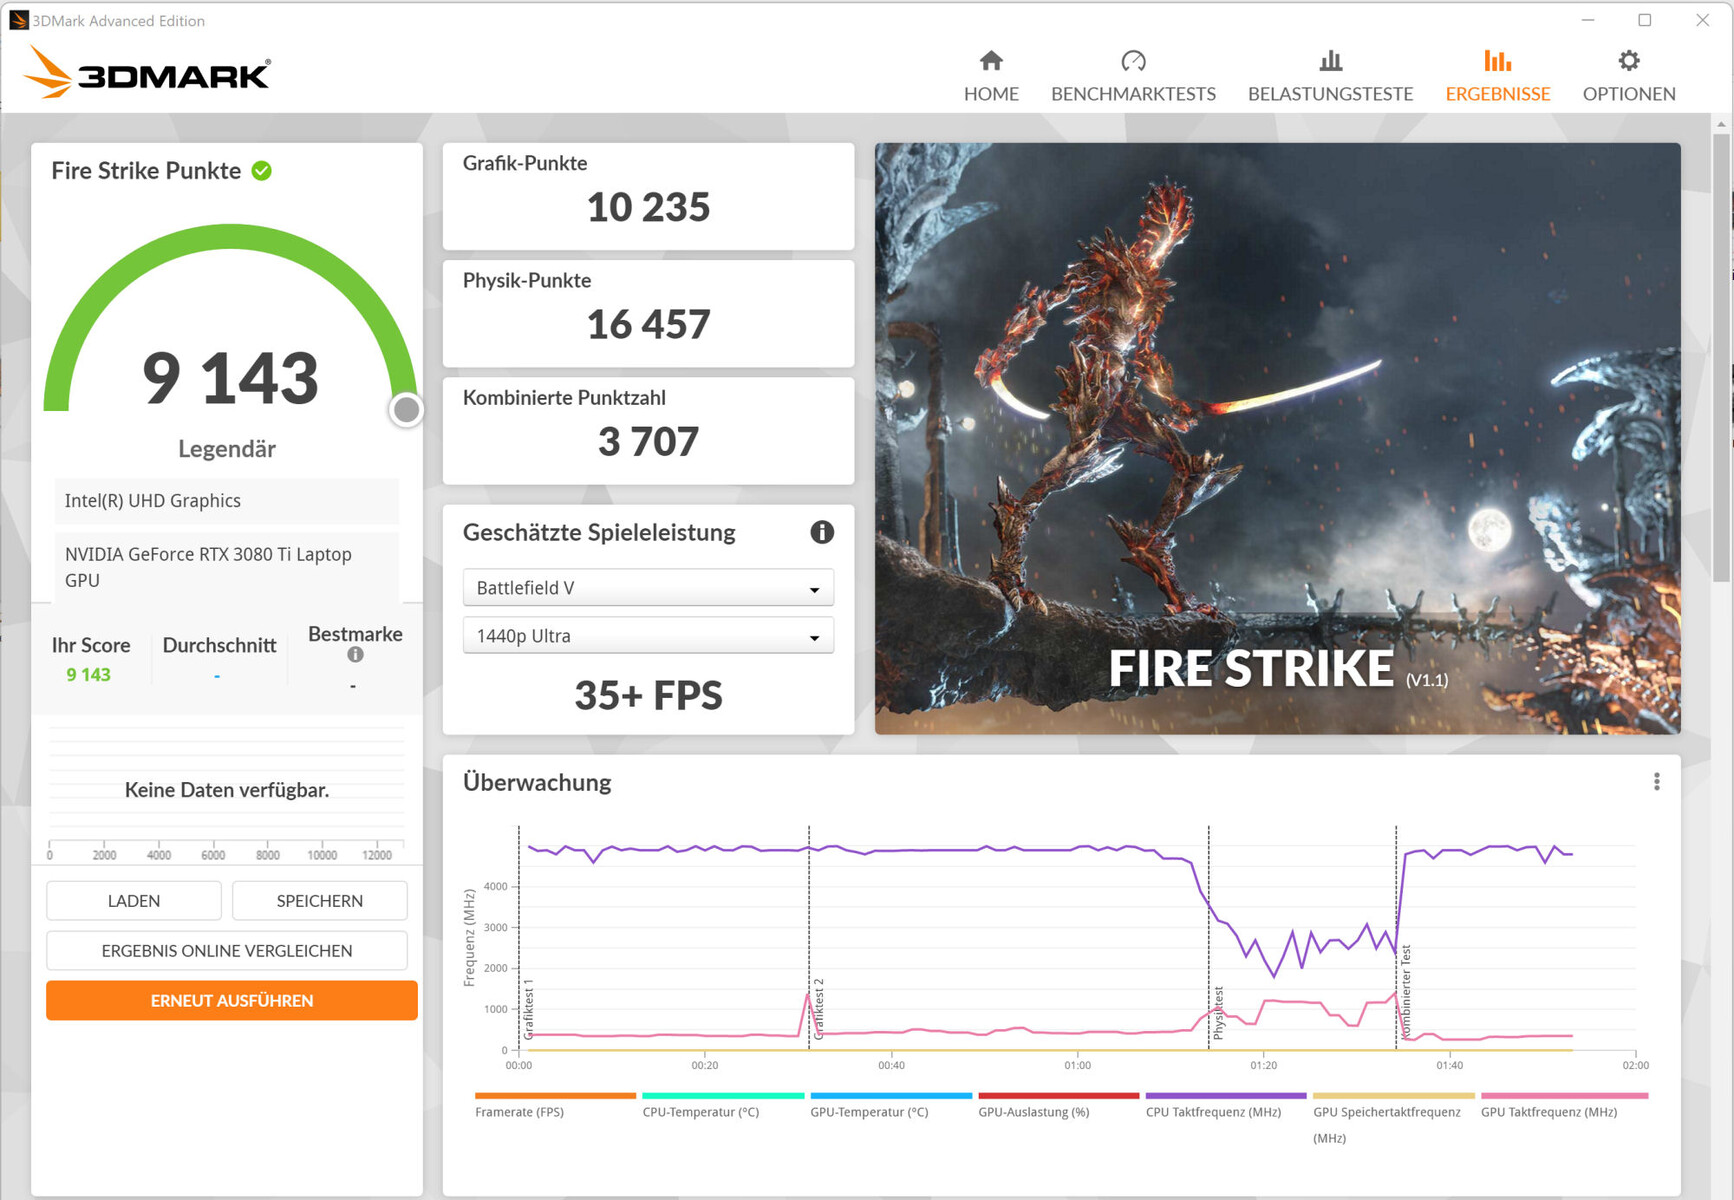
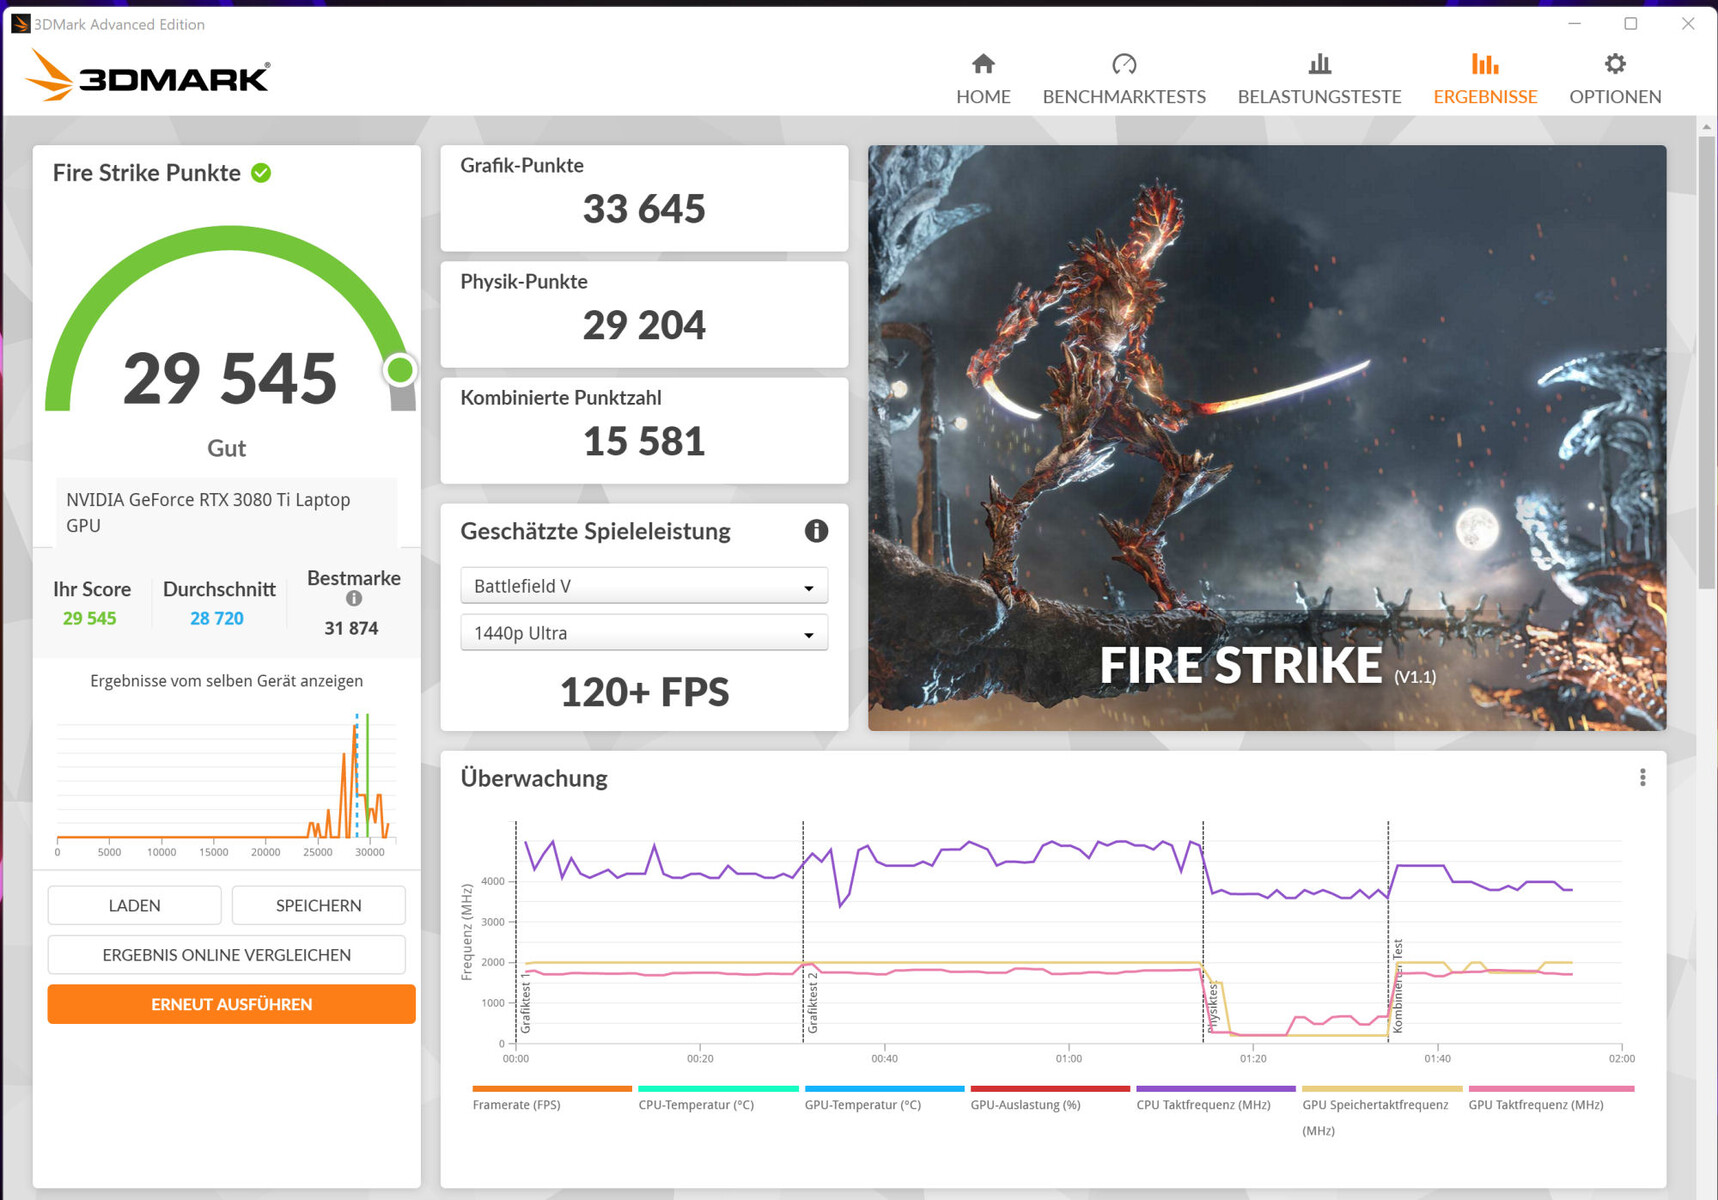
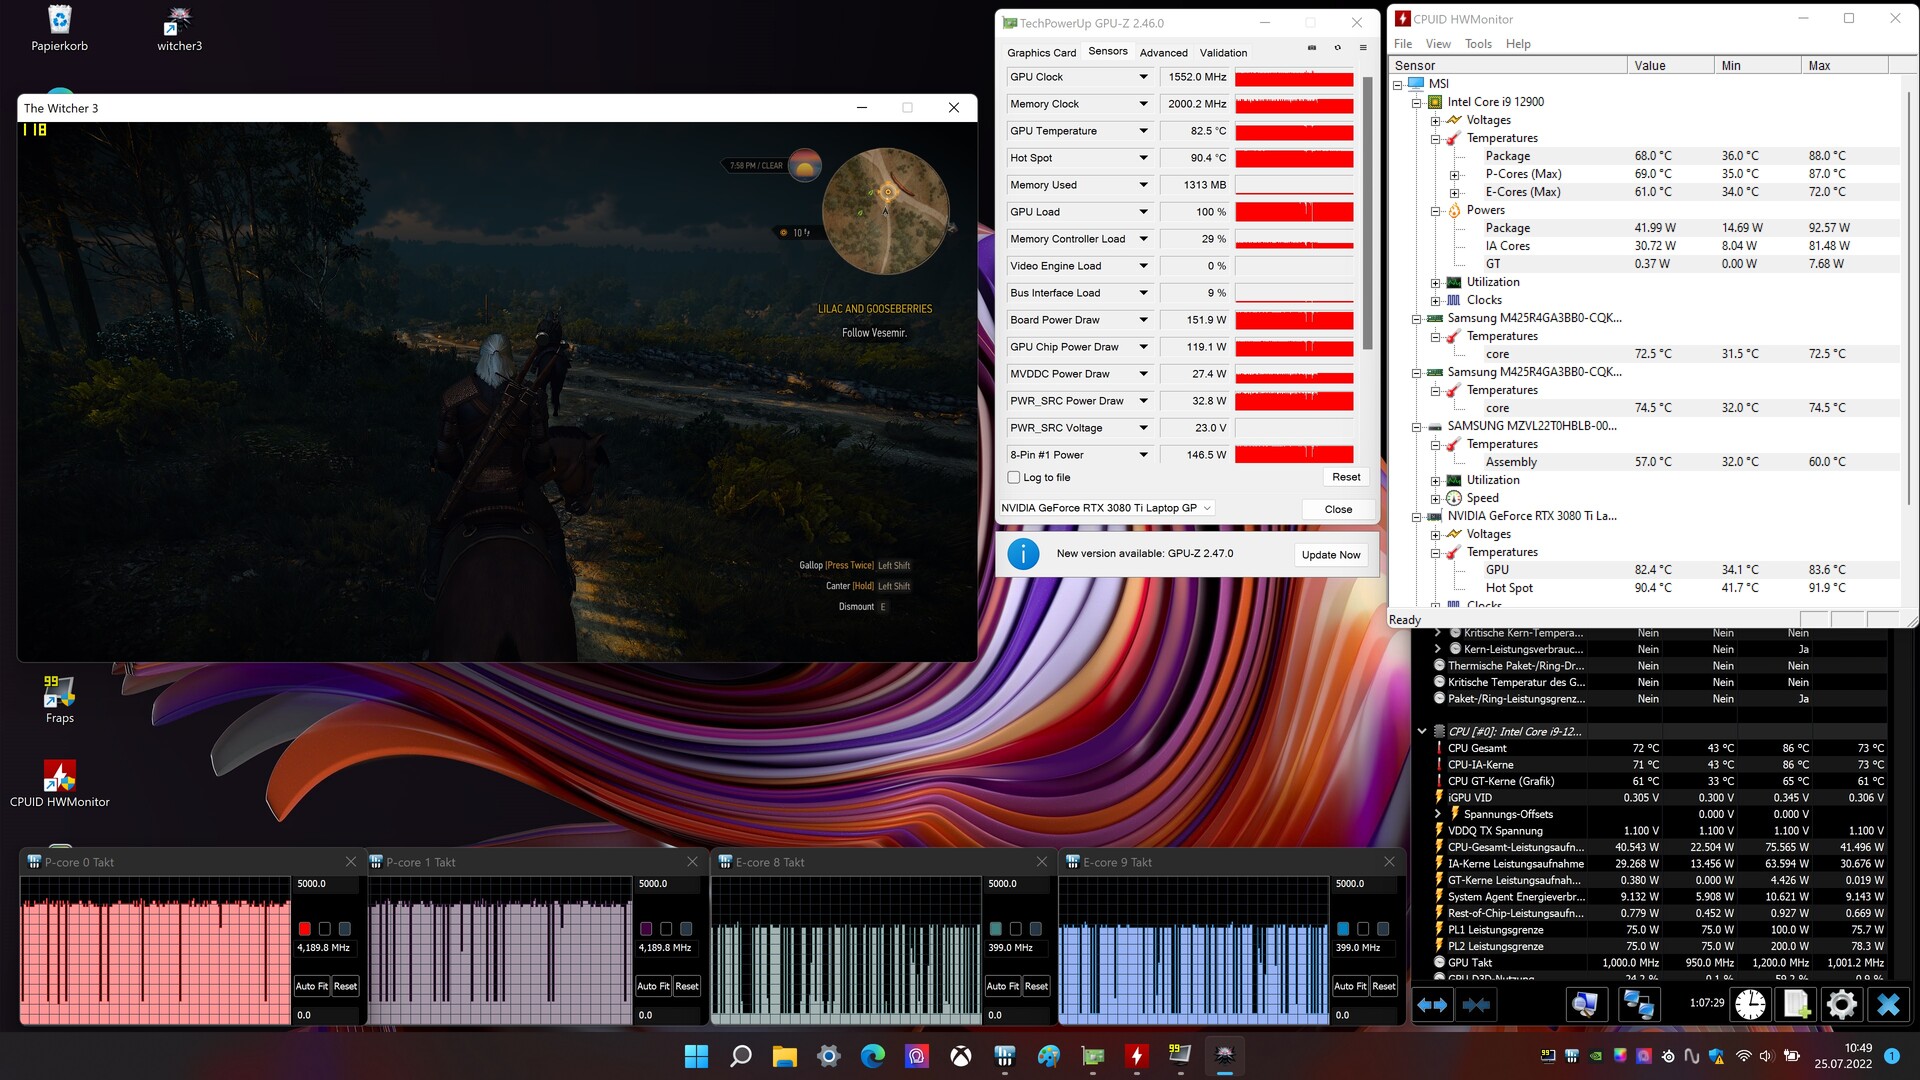
Na stronie GeForce RTX 3080 Ti Laptop (TGP: 175 W, 16 GB pamięci VRAM GDDR6) w MSI Titan GT77 uzyskał jedne z najlepszych wyników, jakie do tej pory widzieliśmy z tego GPU. TGP nie jest jednak w pełni wykorzystywany, co pokazuje test Witcher 3. Profil "Extreme Performance" oferuje opcje podkręcania GPU i pamięci graficznej. Zaawansowany Optimus nie jest obsługiwany. Przełączanie między dGPU a Optimusem zawsze wymaga ponownego uruchomienia komputera
| 3DMark Performance rating - Percent | |
| Średnia w klasie Gaming | |
| MSI Titan GT77 12UHS | |
| Alienware x17 R2 P48E | |
| MSI Titan GT77 12UHS 4k -1! | |
| MSI Titan GT77 12UHS | |
| Razer Blade 17 Early 2022 | |
| Schenker XMG Ultra 17 Rocket Lake | |
| Przeciętny NVIDIA GeForce RTX 3080 Ti Laptop GPU | |
| 3DMark 11 - 1280x720 Performance GPU | |
| Średnia w klasie Gaming (21841 - 80022, n=109, ostatnie 2 lata) | |
| MSI Titan GT77 12UHS | |
| Alienware x17 R2 P48E | |
| MSI Titan GT77 12UHS 4k | |
| Razer Blade 17 Early 2022 | |
| MSI Titan GT77 12UHS (dGPU, Extreme Leistung) | |
| Schenker XMG Ultra 17 Rocket Lake | |
| Przeciętny NVIDIA GeForce RTX 3080 Ti Laptop GPU (13920 - 45841, n=45) | |
| 3DMark | |
| 1920x1080 Fire Strike Graphics | |
| Średnia w klasie Gaming (12242 - 62849, n=121, ostatnie 2 lata) | |
| MSI Titan GT77 12UHS | |
| MSI Titan GT77 12UHS (dGPU, Extreme Leistung) | |
| Alienware x17 R2 P48E | |
| MSI Titan GT77 12UHS 4k | |
| Razer Blade 17 Early 2022 | |
| Schenker XMG Ultra 17 Rocket Lake | |
| Przeciętny NVIDIA GeForce RTX 3080 Ti Laptop GPU (6928 - 34439, n=43) | |
| 2560x1440 Time Spy Graphics | |
| Średnia w klasie Gaming (5012 - 26212, n=120, ostatnie 2 lata) | |
| MSI Titan GT77 12UHS | |
| Alienware x17 R2 P48E | |
| MSI Titan GT77 12UHS (dGPU, Extreme Leistung) | |
| Schenker XMG Ultra 17 Rocket Lake | |
| MSI Titan GT77 12UHS 4k | |
| Razer Blade 17 Early 2022 | |
| Przeciętny NVIDIA GeForce RTX 3080 Ti Laptop GPU (4921 - 13835, n=43) | |
| 2560x1440 Port Royal Graphics | |
| Średnia w klasie Gaming (4395 - 17286, n=70, ostatnie 2 lata) | |
| Alienware x17 R2 P48E | |
| MSI Titan GT77 12UHS | |
| MSI Titan GT77 12UHS (dGPU, Extreme Leistung) | |
| Razer Blade 17 Early 2022 | |
| Schenker XMG Ultra 17 Rocket Lake | |
| Przeciętny NVIDIA GeForce RTX 3080 Ti Laptop GPU (6423 - 8462, n=28) | |
| Geekbench 5.5 - OpenCL Score | |
| Średnia w klasie Gaming (80702 - 277970, n=108, ostatnie 2 lata) | |
| Alienware x17 R2 P48E | |
| MSI Titan GT77 12UHS (dGPU, Extreme Leistung) | |
| MSI Titan GT77 12UHS 4k | |
| Asus ROG Zephyrus Duo 16 GX650RX | |
| Schenker XMG Ultra 17 Rocket Lake | |
| Przeciętny NVIDIA GeForce RTX 3080 Ti Laptop GPU (88580 - 151633, n=41) | |
| MSI Titan GT77 12UHS | |
| Razer Blade 17 Early 2022 | |
| Gigabyte Aero 16 YE5 | |
| V-Ray 5 Benchmark | |
| GPU RTX | |
| Średnia w klasie Gaming (1146 - 4363, n=38, ostatnie 2 lata) | |
| MSI Titan GT77 12UHS 4k (5.0.1) | |
| MSI Titan GT77 12UHS (5.0.1, dGPU, Extreme Leistung) | |
| Razer Blade 17 Early 2022 (5.0.1) | |
| Asus ROG Zephyrus Duo 16 GX650RX (5.0.1) | |
| Przeciętny NVIDIA GeForce RTX 3080 Ti Laptop GPU (1225 - 1915, n=19) | |
| Gigabyte Aero 16 YE5 (5.0.1) | |
| Schenker XMG Ultra 17 Rocket Lake (5.0.1) | |
| GPU CUDA | |
| Średnia w klasie Gaming (887 - 3288, n=38, ostatnie 2 lata) | |
| Razer Blade 17 Early 2022 (5.0.1) | |
| MSI Titan GT77 12UHS (5.0.1, dGPU, Extreme Leistung) | |
| MSI Titan GT77 12UHS 4k (5.0.1) | |
| Asus ROG Zephyrus Duo 16 GX650RX (5.0.1) | |
| Przeciętny NVIDIA GeForce RTX 3080 Ti Laptop GPU (846 - 1384, n=20) | |
| Gigabyte Aero 16 YE5 (5.0.1) | |
| CPU | |
| Średnia w klasie Gaming (5864 - 30302, n=37, ostatnie 2 lata) | |
| MSI Titan GT77 12UHS 4k (5.0.1) | |
| MSI Titan GT77 12UHS (5.0.1, dGPU, Extreme Leistung) | |
| Alienware x17 R2 P48E (5.0.1) | |
| Przeciętny NVIDIA GeForce RTX 3080 Ti Laptop GPU (3692 - 15811, n=25) | |
| Gigabyte Aero 16 YE5 (5.0.1) | |
| Schenker XMG Ultra 17 Rocket Lake (5.0.1) | |
| Asus ROG Zephyrus Duo 16 GX650RX (5.0.1) | |
| Razer Blade 17 Early 2022 (5.0.1) | |
| V-Ray Benchmark Next 4.10 | |
| GPU | |
| Średnia w klasie Gaming (427 - 1333, n=106, ostatnie 2 lata) | |
| MSI Titan GT77 12UHS (v4.10.07, dGPU, Extreme Leistung) | |
| MSI Titan GT77 12UHS (v4.10.07 ) | |
| Asus ROG Zephyrus Duo 16 GX650RX (v4.10.07 ) | |
| MSI Titan GT77 12UHS 4k (v4.10.07 ) | |
| Przeciętny NVIDIA GeForce RTX 3080 Ti Laptop GPU (311 - 552, n=35) | |
| Razer Blade 17 Early 2022 (v4.10.07 ) | |
| Gigabyte Aero 16 YE5 (v4.10.07 ) | |
| Schenker XMG Ultra 17 Rocket Lake (v4.10.07 ) | |
| CPU | |
| Średnia w klasie Gaming (10048 - 45327, n=105, ostatnie 2 lata) | |
| MSI Titan GT77 12UHS 4k (v4.10.07 ) | |
| MSI Titan GT77 12UHS (v4.10.07, dGPU, Extreme Leistung) | |
| MSI Titan GT77 12UHS (v4.10.07 ) | |
| Przeciętny NVIDIA GeForce RTX 3080 Ti Laptop GPU (5564 - 23947, n=35) | |
| Gigabyte Aero 16 YE5 (v4.10.07 ) | |
| Schenker XMG Ultra 17 Rocket Lake (v4.10.07 ) | |
| Asus ROG Zephyrus Duo 16 GX650RX (v4.10.07 ) | |
| Razer Blade 17 Early 2022 (v4.10.07 ) | |
| Blender | |
| v3.3 Classroom CUDA | |
| MSI Titan GT77 12UHS 4k | |
| MSI Titan GT77 12UHS (dGPU, Extreme Leistung) | |
| Przeciętny NVIDIA GeForce RTX 3080 Ti Laptop GPU (32 - 41, n=13) | |
| Średnia w klasie Gaming (15 - 228, n=112, ostatnie 2 lata) | |
| MSI Titan GT77 12UHS | |
| v3.3 Classroom OPTIX/RTX | |
| MSI Titan GT77 12UHS 4k | |
| Przeciętny NVIDIA GeForce RTX 3080 Ti Laptop GPU (20 - 28, n=13) | |
| MSI Titan GT77 12UHS | |
| MSI Titan GT77 12UHS (dGPU, Extreme Leistung) | |
| Średnia w klasie Gaming (9 - 32, n=112, ostatnie 2 lata) | |
| SPECviewperf 13 | |
| Solidworks (sw-04) | |
| MSI Titan GT77 12UHS (dGPU, Extreme Leistung) | |
| Przeciętny NVIDIA GeForce RTX 3080 Ti Laptop GPU (62.9 - 133.4, n=8) | |
| Asus ROG Zephyrus Duo 16 GX650RX | |
| Gigabyte Aero 16 YE5 | |
| Średnia w klasie Gaming (n=1ostatnie 2 lata) | |
| Siemens NX (snx-03) | |
| MSI Titan GT77 12UHS (dGPU, Extreme Leistung) | |
| Przeciętny NVIDIA GeForce RTX 3080 Ti Laptop GPU (18.3 - 25.3, n=8) | |
| Gigabyte Aero 16 YE5 | |
| Asus ROG Zephyrus Duo 16 GX650RX | |
| Średnia w klasie Gaming (n=1ostatnie 2 lata) | |
| Showcase (showcase-02) | |
| MSI Titan GT77 12UHS (dGPU, Extreme Leistung) | |
| Asus ROG Zephyrus Duo 16 GX650RX | |
| Przeciętny NVIDIA GeForce RTX 3080 Ti Laptop GPU (110 - 175, n=8) | |
| Gigabyte Aero 16 YE5 | |
| Średnia w klasie Gaming (n=1ostatnie 2 lata) | |
| Medical (medical-02) | |
| MSI Titan GT77 12UHS (dGPU, Extreme Leistung) | |
| Asus ROG Zephyrus Duo 16 GX650RX | |
| Przeciętny NVIDIA GeForce RTX 3080 Ti Laptop GPU (65.3 - 79.1, n=8) | |
| Gigabyte Aero 16 YE5 | |
| Średnia w klasie Gaming (n=1ostatnie 2 lata) | |
| Maya (maya-05) | |
| MSI Titan GT77 12UHS (dGPU, Extreme Leistung) | |
| Przeciętny NVIDIA GeForce RTX 3080 Ti Laptop GPU (212 - 430, n=8) | |
| Asus ROG Zephyrus Duo 16 GX650RX | |
| Gigabyte Aero 16 YE5 | |
| Średnia w klasie Gaming (n=1ostatnie 2 lata) | |
| Energy (energy-02) | |
| MSI Titan GT77 12UHS (dGPU, Extreme Leistung) | |
| Asus ROG Zephyrus Duo 16 GX650RX | |
| Przeciętny NVIDIA GeForce RTX 3080 Ti Laptop GPU (19.3 - 27.3, n=8) | |
| Średnia w klasie Gaming (n=1ostatnie 2 lata) | |
| Gigabyte Aero 16 YE5 | |
| Creo (creo-02) | |
| MSI Titan GT77 12UHS (dGPU, Extreme Leistung) | |
| Przeciętny NVIDIA GeForce RTX 3080 Ti Laptop GPU (177.4 - 311, n=8) | |
| Asus ROG Zephyrus Duo 16 GX650RX | |
| Gigabyte Aero 16 YE5 | |
| Średnia w klasie Gaming (n=1ostatnie 2 lata) | |
| Catia (catia-05) | |
| MSI Titan GT77 12UHS (dGPU, Extreme Leistung) | |
| Asus ROG Zephyrus Duo 16 GX650RX | |
| Przeciętny NVIDIA GeForce RTX 3080 Ti Laptop GPU (130.4 - 190.3, n=8) | |
| Gigabyte Aero 16 YE5 | |
| Średnia w klasie Gaming (n=1ostatnie 2 lata) | |
| 3ds Max (3dsmax-06) | |
| MSI Titan GT77 12UHS (dGPU, Extreme Leistung) | |
| Przeciętny NVIDIA GeForce RTX 3080 Ti Laptop GPU (161 - 260, n=8) | |
| Gigabyte Aero 16 YE5 | |
| Asus ROG Zephyrus Duo 16 GX650RX | |
| Średnia w klasie Gaming (n=1ostatnie 2 lata) | |
| SPECviewperf 2020 | |
| 1920x1080 Siemens NX (snx-04) | |
| Średnia w klasie Gaming (n=1ostatnie 2 lata) | |
| MSI Titan GT77 12UHS (dGPU, Extreme Leistung) | |
| Przeciętny NVIDIA GeForce RTX 3080 Ti Laptop GPU (18.1 - 25, n=6) | |
| Gigabyte Aero 16 YE5 | |
| Asus ROG Zephyrus Duo 16 GX650RX | |
| 1920x1080 Medical (medical-03) | |
| Średnia w klasie Gaming (n=1ostatnie 2 lata) | |
| MSI Titan GT77 12UHS (dGPU, Extreme Leistung) | |
| Asus ROG Zephyrus Duo 16 GX650RX | |
| Przeciętny NVIDIA GeForce RTX 3080 Ti Laptop GPU (33 - 40.2, n=6) | |
| Gigabyte Aero 16 YE5 | |
| 1920x1080 Maya (maya-06) | |
| Średnia w klasie Gaming (n=1ostatnie 2 lata) | |
| MSI Titan GT77 12UHS (dGPU, Extreme Leistung) | |
| Przeciętny NVIDIA GeForce RTX 3080 Ti Laptop GPU (248 - 456, n=6) | |
| Asus ROG Zephyrus Duo 16 GX650RX | |
| Gigabyte Aero 16 YE5 | |
| 1920x1080 Energy (energy-03) | |
| MSI Titan GT77 12UHS (dGPU, Extreme Leistung) | |
| Asus ROG Zephyrus Duo 16 GX650RX | |
| Średnia w klasie Gaming (n=1ostatnie 2 lata) | |
| Przeciętny NVIDIA GeForce RTX 3080 Ti Laptop GPU (19.6 - 27, n=6) | |
| Gigabyte Aero 16 YE5 | |
| 1920x1080 Creo (creo-03) | |
| MSI Titan GT77 12UHS (dGPU, Extreme Leistung) | |
| Przeciętny NVIDIA GeForce RTX 3080 Ti Laptop GPU (55.3 - 114.7, n=6) | |
| Gigabyte Aero 16 YE5 | |
| Asus ROG Zephyrus Duo 16 GX650RX | |
| Średnia w klasie Gaming (n=1ostatnie 2 lata) | |
| 1920x1080 CATIA (catia-06) | |
| MSI Titan GT77 12UHS (dGPU, Extreme Leistung) | |
| Przeciętny NVIDIA GeForce RTX 3080 Ti Laptop GPU (51.8 - 78.7, n=6) | |
| Asus ROG Zephyrus Duo 16 GX650RX | |
| Gigabyte Aero 16 YE5 | |
| Średnia w klasie Gaming (n=1ostatnie 2 lata) | |
| 1920x1080 3ds Max (3dsmax-07) | |
| MSI Titan GT77 12UHS (dGPU, Extreme Leistung) | |
| Asus ROG Zephyrus Duo 16 GX650RX | |
| Przeciętny NVIDIA GeForce RTX 3080 Ti Laptop GPU (99.2 - 153, n=6) | |
| Gigabyte Aero 16 YE5 | |
| Średnia w klasie Gaming (n=1ostatnie 2 lata) | |
| 3840x2160 Siemens NX (snx-04) | |
| Średnia w klasie Gaming (27.2 - 33.3, n=2, ostatnie 2 lata) | |
| MSI Titan GT77 12UHS | |
| Przeciętny NVIDIA GeForce RTX 3080 Ti Laptop GPU (15.5 - 21.1, n=7) | |
| Gigabyte Aero 16 YE5 | |
| Asus ROG Zephyrus Duo 16 GX650RX | |
| 3840x2160 Medical (medical-03) | |
| Średnia w klasie Gaming (20.4 - 27.4, n=2, ostatnie 2 lata) | |
| Przeciętny NVIDIA GeForce RTX 3080 Ti Laptop GPU (13.2 - 34.3, n=7) | |
| MSI Titan GT77 12UHS (dGPU, Extreme Leistung) | |
| Asus ROG Zephyrus Duo 16 GX650RX | |
| Gigabyte Aero 16 YE5 | |
| 3840x2160 Maya (maya-06) | |
| Średnia w klasie Gaming (331 - 422, n=2, ostatnie 2 lata) | |
| MSI Titan GT77 12UHS (dGPU, Extreme Leistung) | |
| Przeciętny NVIDIA GeForce RTX 3080 Ti Laptop GPU (137.4 - 345, n=7) | |
| Asus ROG Zephyrus Duo 16 GX650RX | |
| Gigabyte Aero 16 YE5 | |
| 3840x2160 Energy (energy-03) | |
| Asus ROG Zephyrus Duo 16 GX650RX | |
| Przeciętny NVIDIA GeForce RTX 3080 Ti Laptop GPU (27.7 - 118.7, n=7) | |
| Gigabyte Aero 16 YE5 | |
| MSI Titan GT77 12UHS (dGPU, Extreme Leistung) | |
| Średnia w klasie Gaming (37.9 - 56.4, n=2, ostatnie 2 lata) | |
| 3840x2160 Creo (creo-03) | |
| Średnia w klasie Gaming (105 - 108, n=2, ostatnie 2 lata) | |
| MSI Titan GT77 12UHS (dGPU, Extreme Leistung) | |
| Przeciętny NVIDIA GeForce RTX 3080 Ti Laptop GPU (49 - 93.3, n=7) | |
| Asus ROG Zephyrus Duo 16 GX650RX | |
| Gigabyte Aero 16 YE5 | |
| 3840x2160 CATIA (catia-06) | |
| Średnia w klasie Gaming (53.5 - 65.2, n=2, ostatnie 2 lata) | |
| MSI Titan GT77 12UHS (dGPU, Extreme Leistung) | |
| Przeciętny NVIDIA GeForce RTX 3080 Ti Laptop GPU (30.3 - 69.6, n=7) | |
| Asus ROG Zephyrus Duo 16 GX650RX | |
| Gigabyte Aero 16 YE5 | |
| 3840x2160 3ds Max (3dsmax-07) | |
| Średnia w klasie Gaming (115 - 160, n=2, ostatnie 2 lata) | |
| MSI Titan GT77 12UHS (dGPU, Extreme Leistung) | |
| Przeciętny NVIDIA GeForce RTX 3080 Ti Laptop GPU (69.5 - 144, n=7) | |
| Asus ROG Zephyrus Duo 16 GX650RX | |
| Gigabyte Aero 16 YE5 | |
* ... im mniej tym lepiej
| 3DMark 11 Performance | 35867 pkt. | |
| 3DMark Cloud Gate Standard Score | 53629 pkt. | |
| 3DMark Fire Strike Score | 27273 pkt. | |
| 3DMark Fire Strike Extreme Score | 15613 pkt. | |
| 3DMark Time Spy Score | 12865 pkt. | |
Pomoc | ||
Wydajność w grach
Sprzęt jest przeznaczony do grania w 4K przy ustawieniach wysokich do maksymalnych. Liczba klatek na sekundę przekracza to, do czego średnio zdolny jest RTX 3080 Ti. Gdy GPU GeForce napędzało wyświetlacz bezpośrednio, często generowało najlepsze liczby klatek na sekundę, jakie widzieliśmy do tej pory z RTX 3080 Ti. W każdym razie, jak wykazał test Witcher 3, laptop zapewnia dobre i stabilne wyniki.
| The Witcher 3 | |
| 1920x1080 Ultra Graphics & Postprocessing (HBAO+) | |
| Średnia w klasie Gaming (95 - 240, n=8, ostatnie 2 lata) | |
| MSI Titan GT77 12UHS (dGPU, Extreme Leistung) | |
| MSI Titan GT77 12UHS | |
| Alienware x17 R2 P48E | |
| MSI Titan GT77 12UHS 4k | |
| Schenker XMG Ultra 17 Rocket Lake | |
| Razer Blade 17 Early 2022 | |
| Przeciętny NVIDIA GeForce RTX 3080 Ti Laptop GPU (30 - 130.6, n=43) | |
| 3840x2160 Ultra Graphics & Postprocessing (HBAO+) | |
| Średnia w klasie Gaming (48.4 - 112.4, n=2, ostatnie 2 lata) | |
| MSI Titan GT77 12UHS (dGPU, Extreme Leistung) | |
| MSI Titan GT77 12UHS 4k | |
| Razer Blade 17 Early 2022 | |
| Przeciętny NVIDIA GeForce RTX 3080 Ti Laptop GPU (44.8 - 62.7, n=5) | |
| Dota 2 Reborn | |
| 1920x1080 ultra (3/3) best looking | |
| MSI Titan GT77 12UHS | |
| MSI Titan GT77 12UHS (dGPU, Extreme Leistung) | |
| MSI Titan GT77 12UHS 4k | |
| Alienware x17 R2 P48E | |
| Schenker XMG Ultra 17 Rocket Lake | |
| Średnia w klasie Gaming (84.8 - 248, n=113, ostatnie 2 lata) | |
| Przeciętny NVIDIA GeForce RTX 3080 Ti Laptop GPU (29.9 - 170.5, n=45) | |
| Razer Blade 17 Early 2022 | |
| 3840x2160 ultra (3/3) best looking | |
| Średnia w klasie Gaming (105.2 - 199.2, n=33, ostatnie 2 lata) | |
| MSI Titan GT77 12UHS (dGPU, Extreme Leistung) | |
| MSI Titan GT77 12UHS 4k | |
| Przeciętny NVIDIA GeForce RTX 3080 Ti Laptop GPU (70.8 - 155.6, n=19) | |
| Razer Blade 17 Early 2022 | |
| X-Plane 11.11 | |
| 3840x2160 high (fps_test=3) | |
| MSI Titan GT77 12UHS (dGPU, Extreme Leistung) | |
| MSI Titan GT77 12UHS 4k | |
| Średnia w klasie Gaming (60 - 124.1, n=33, ostatnie 2 lata) | |
| Przeciętny NVIDIA GeForce RTX 3080 Ti Laptop GPU (32.9 - 109.5, n=20) | |
| Razer Blade 17 Early 2022 | |
| 1920x1080 high (fps_test=3) | |
| MSI Titan GT77 12UHS | |
| MSI Titan GT77 12UHS (dGPU, Extreme Leistung) | |
| MSI Titan GT77 12UHS 4k | |
| Schenker XMG Ultra 17 Rocket Lake | |
| Alienware x17 R2 P48E | |
| Przeciętny NVIDIA GeForce RTX 3080 Ti Laptop GPU (32.6 - 127, n=45) | |
| Średnia w klasie Gaming (52.1 - 143.5, n=116, ostatnie 2 lata) | |
| Razer Blade 17 Early 2022 | |
| Final Fantasy XV Benchmark | |
| 3840x2160 High Quality | |
| Średnia w klasie Gaming (45 - 111.8, n=34, ostatnie 2 lata) | |
| MSI Titan GT77 12UHS (1.3, dGPU, Extreme Leistung) | |
| MSI Titan GT77 12UHS 4k (1.3) | |
| Razer Blade 17 Early 2022 (1.3) | |
| Przeciętny NVIDIA GeForce RTX 3080 Ti Laptop GPU (35.1 - 61.2, n=18) | |
| 1920x1080 High Quality | |
| Średnia w klasie Gaming (41 - 215, n=104, ostatnie 2 lata) | |
| MSI Titan GT77 12UHS (1.3, dGPU, Extreme Leistung) | |
| MSI Titan GT77 12UHS (1.3) | |
| MSI Titan GT77 12UHS 4k (1.3) | |
| Alienware x17 R2 P48E (1.3) | |
| Przeciętny NVIDIA GeForce RTX 3080 Ti Laptop GPU (30.7 - 140.6, n=42) | |
| Razer Blade 17 Early 2022 (1.3) | |
| GTA V | |
| 3840x2160 Highest AA:4xMSAA + FX AF:16x | |
| Średnia w klasie Gaming (40.5 - 116.7, n=25, ostatnie 2 lata) | |
| MSI Titan GT77 12UHS (dGPU, Extreme Leistung) | |
| MSI Titan GT77 12UHS 4k | |
| Razer Blade 17 Early 2022 | |
| Przeciętny NVIDIA GeForce RTX 3080 Ti Laptop GPU (37.7 - 67.2, n=14) | |
| 1920x1080 Highest AA:4xMSAA + FX AF:16x | |
| MSI Titan GT77 12UHS 4k | |
| MSI Titan GT77 12UHS (dGPU, Extreme Leistung) | |
| MSI Titan GT77 12UHS | |
| Średnia w klasie Gaming (48.3 - 186.9, n=103, ostatnie 2 lata) | |
| Alienware x17 R2 P48E | |
| Przeciętny NVIDIA GeForce RTX 3080 Ti Laptop GPU (30 - 139.2, n=42) | |
| Razer Blade 17 Early 2022 | |
| Strange Brigade | |
| 3840x2160 ultra AA:ultra AF:16 | |
| Średnia w klasie Gaming (66.7 - 187.2, n=34, ostatnie 2 lata) | |
| MSI Titan GT77 12UHS (1.47.22.14 D3D12, dGPU, Extreme Leistung) | |
| MSI Titan GT77 12UHS 4k (1.47.22.14 D3D12) | |
| Razer Blade 17 Early 2022 (1.47.22.14 D3D12) | |
| Przeciętny NVIDIA GeForce RTX 3080 Ti Laptop GPU (61.7 - 100.7, n=15) | |
| 1920x1080 ultra AA:ultra AF:16 | |
| Średnia w klasie Gaming (76.3 - 456, n=94, ostatnie 2 lata) | |
| MSI Titan GT77 12UHS (1.47.22.14 D3D12) | |
| MSI Titan GT77 12UHS (1.47.22.14 D3D12, dGPU, Extreme Leistung) | |
| Alienware x17 R2 P48E (1.47.22.14 D3D12) | |
| MSI Titan GT77 12UHS 4k (1.47.22.14 D3D12) | |
| Razer Blade 17 Early 2022 (1.47.22.14 D3D12) | |
| Przeciętny NVIDIA GeForce RTX 3080 Ti Laptop GPU (42.3 - 224, n=41) | |
| F1 2021 | |
| 3840x2160 Ultra High Preset + Raytracing AA:T AF:16x | |
| MSI Titan GT77 12UHS (874931, dGPU, Extreme Leistung) | |
| MSI Titan GT77 12UHS 4k (874931) | |
| Razer Blade 17 Early 2022 (874931) | |
| Przeciętny NVIDIA GeForce RTX 3080 Ti Laptop GPU (41.1 - 70.2, n=18) | |
| 1920x1080 Ultra High Preset + Raytracing AA:T AF:16x | |
| MSI Titan GT77 12UHS (874931) | |
| MSI Titan GT77 12UHS (874931, dGPU, Extreme Leistung) | |
| Razer Blade 17 Early 2022 (874931) | |
| MSI Titan GT77 12UHS 4k (874931) | |
| Przeciętny NVIDIA GeForce RTX 3080 Ti Laptop GPU (30.2 - 160.6, n=30) | |
| Far Cry 5 | |
| 3840x2160 Ultra Preset AA:T | |
| Średnia w klasie Gaming (61 - 96, n=2, ostatnie 2 lata) | |
| MSI Titan GT77 12UHS 4k | |
| MSI Titan GT77 12UHS (dGPU, Extreme Leistung) | |
| Razer Blade 17 Early 2022 | |
| Przeciętny NVIDIA GeForce RTX 3080 Ti Laptop GPU (45 - 76, n=9) | |
| 1920x1080 Ultra Preset AA:T | |
| MSI Titan GT77 12UHS (dGPU, Extreme Leistung) | |
| MSI Titan GT77 12UHS | |
| MSI Titan GT77 12UHS 4k | |
| Schenker XMG Ultra 17 Rocket Lake | |
| Przeciętny NVIDIA GeForce RTX 3080 Ti Laptop GPU (111 - 162, n=24) | |
| Średnia w klasie Gaming (70 - 151, n=10, ostatnie 2 lata) | |
| Razer Blade 17 Early 2022 | |
Witcher 3 FPS graph
| low | med. | high | ultra | QHD | 4K | |
|---|---|---|---|---|---|---|
| GTA V (2015) | 187.3 | 186.6 | 182.3 | 134.4 | 117.8 | 121.7 |
| The Witcher 3 (2015) | 480 | 379 | 240 | 123.7 | 91.9 | |
| Dota 2 Reborn (2015) | 199.9 | 180.7 | 169.7 | 162.7 | 139.9 | |
| Final Fantasy XV Benchmark (2018) | 220 | 174.1 | 131 | 100.3 | 58.3 | |
| X-Plane 11.11 (2018) | 170.8 | 150.8 | 118.3 | 100.9 | ||
| Far Cry 5 (2018) | 199 | 169 | 161 | 151 | 134 | 76 |
| Strange Brigade (2018) | 519 | 286 | 233 | 206 | 156.2 | 93.7 |
| F1 2021 (2021) | 348 | 237 | 205 | 130.4 | 103.4 | 62.8 |
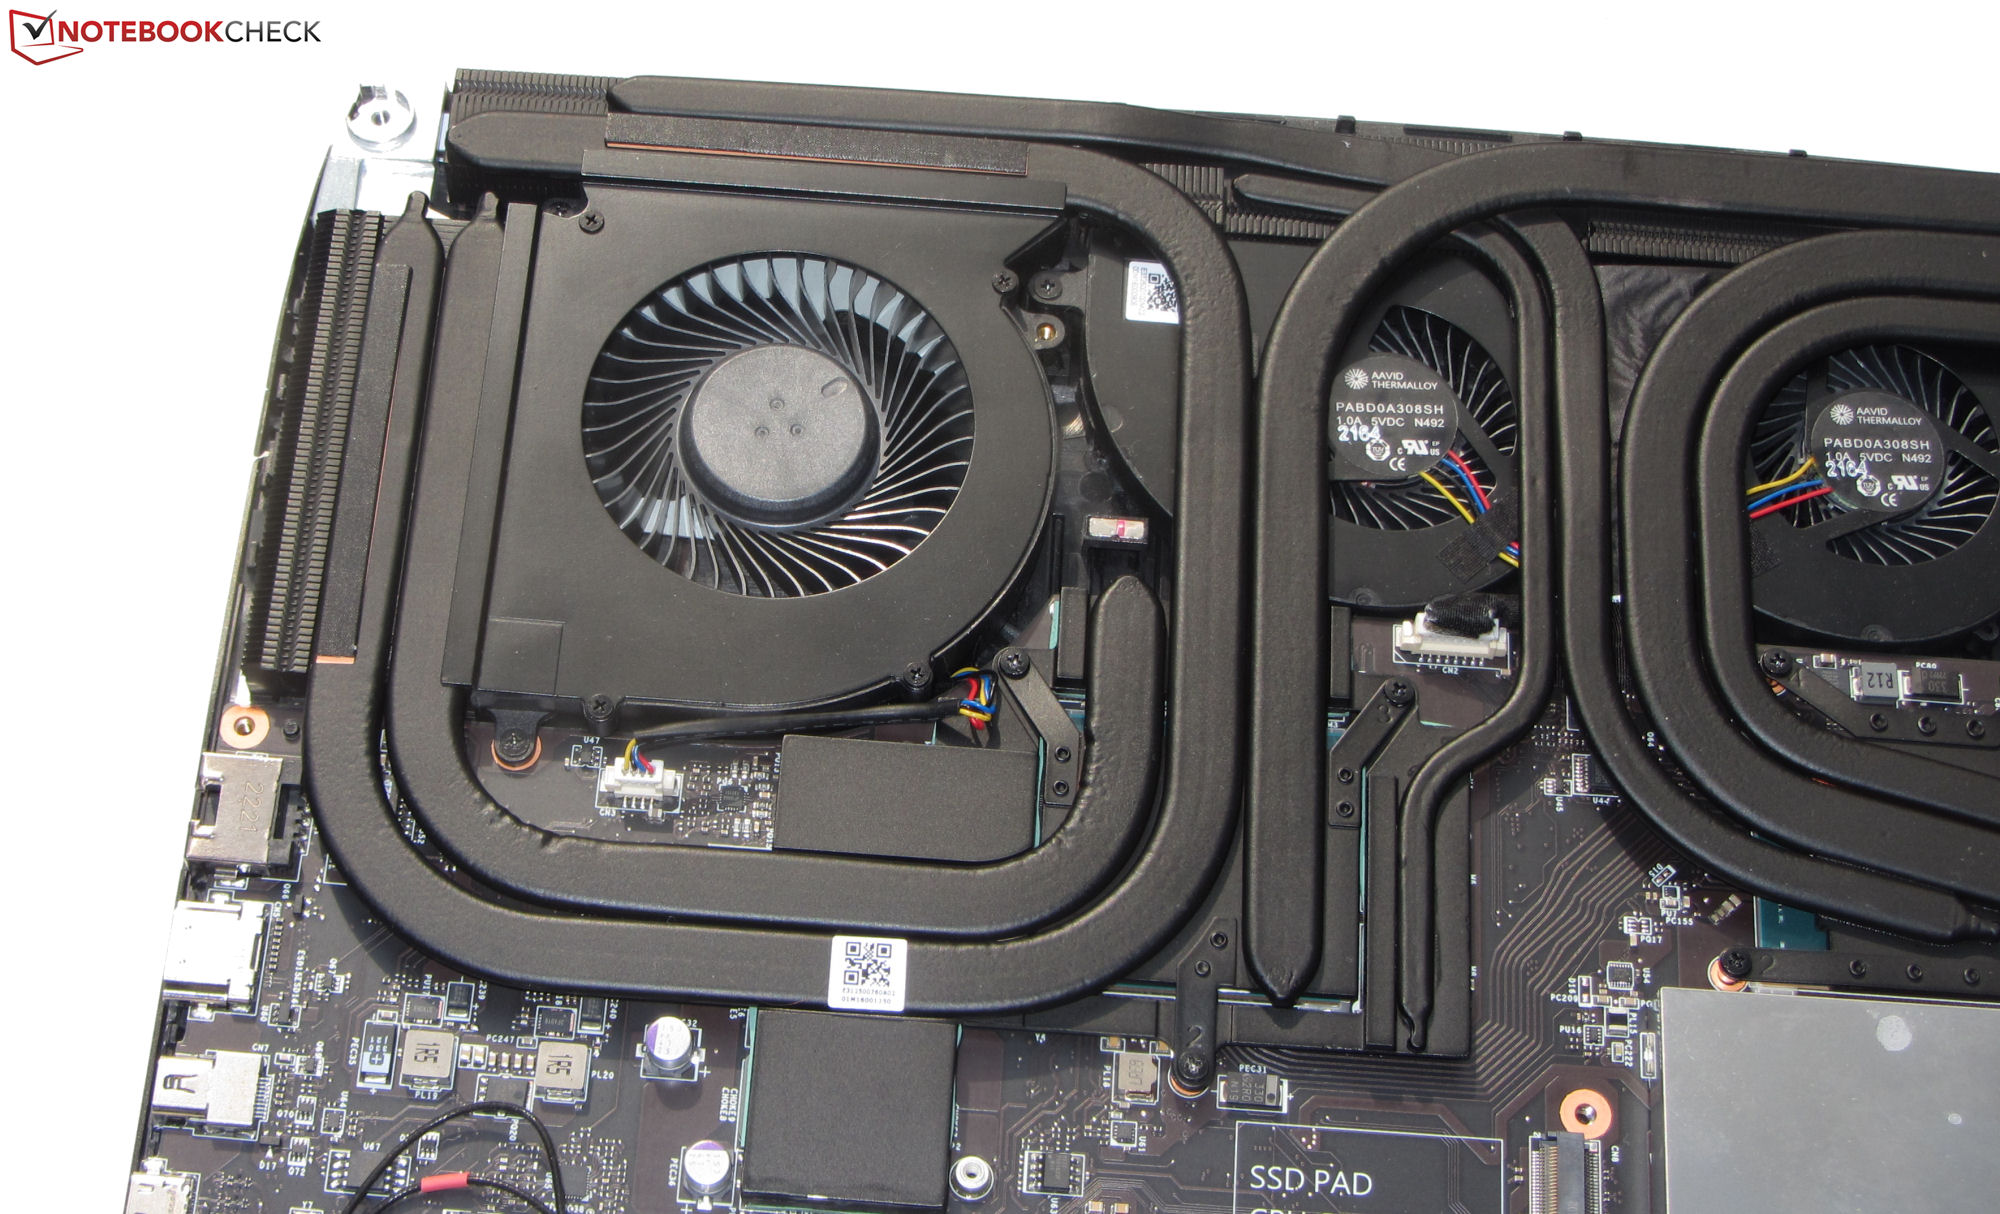
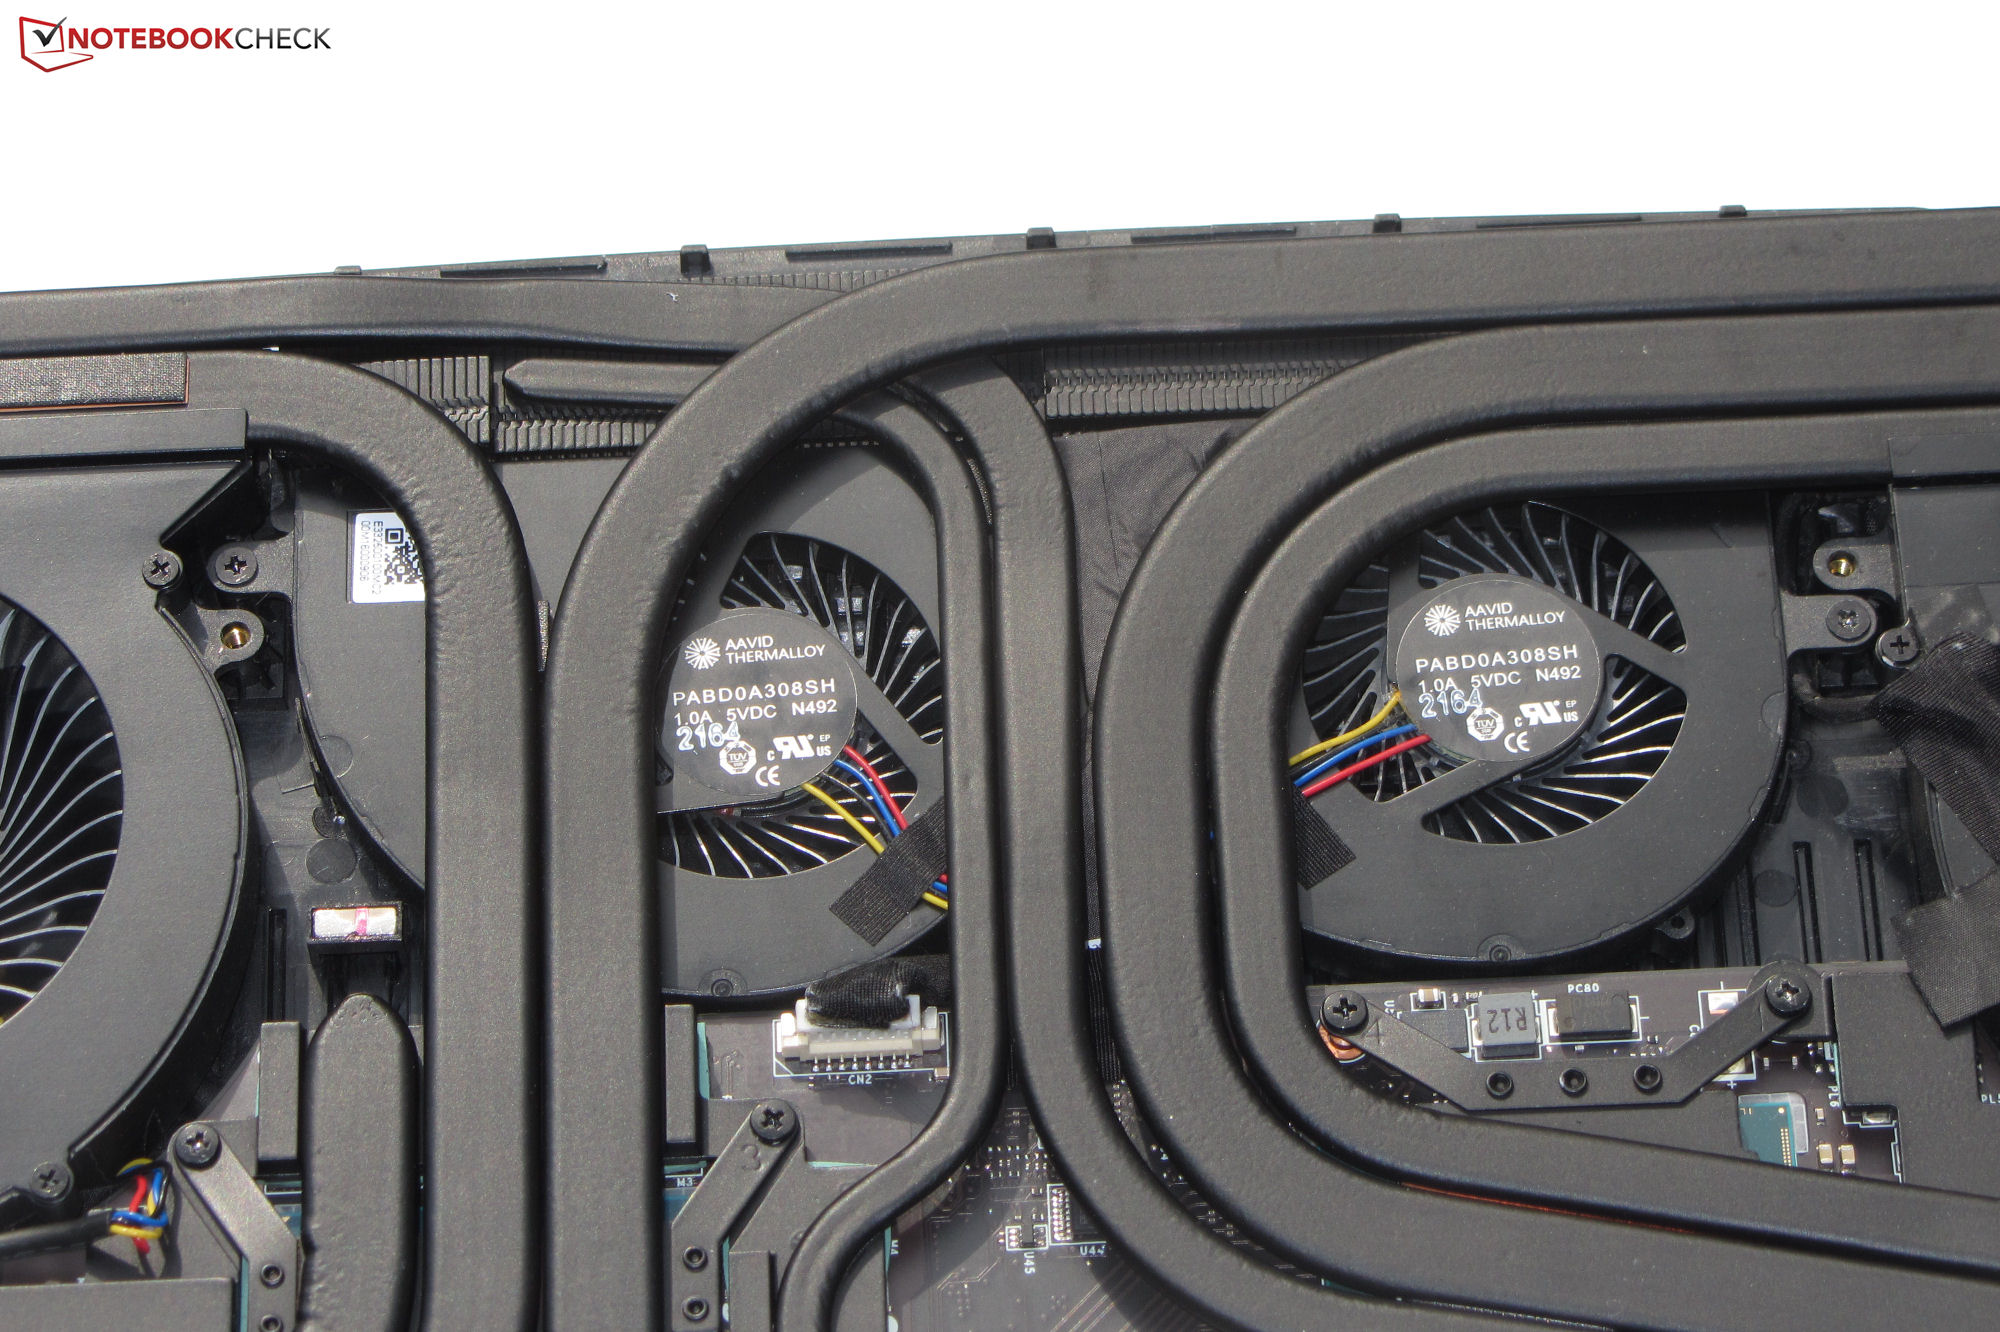
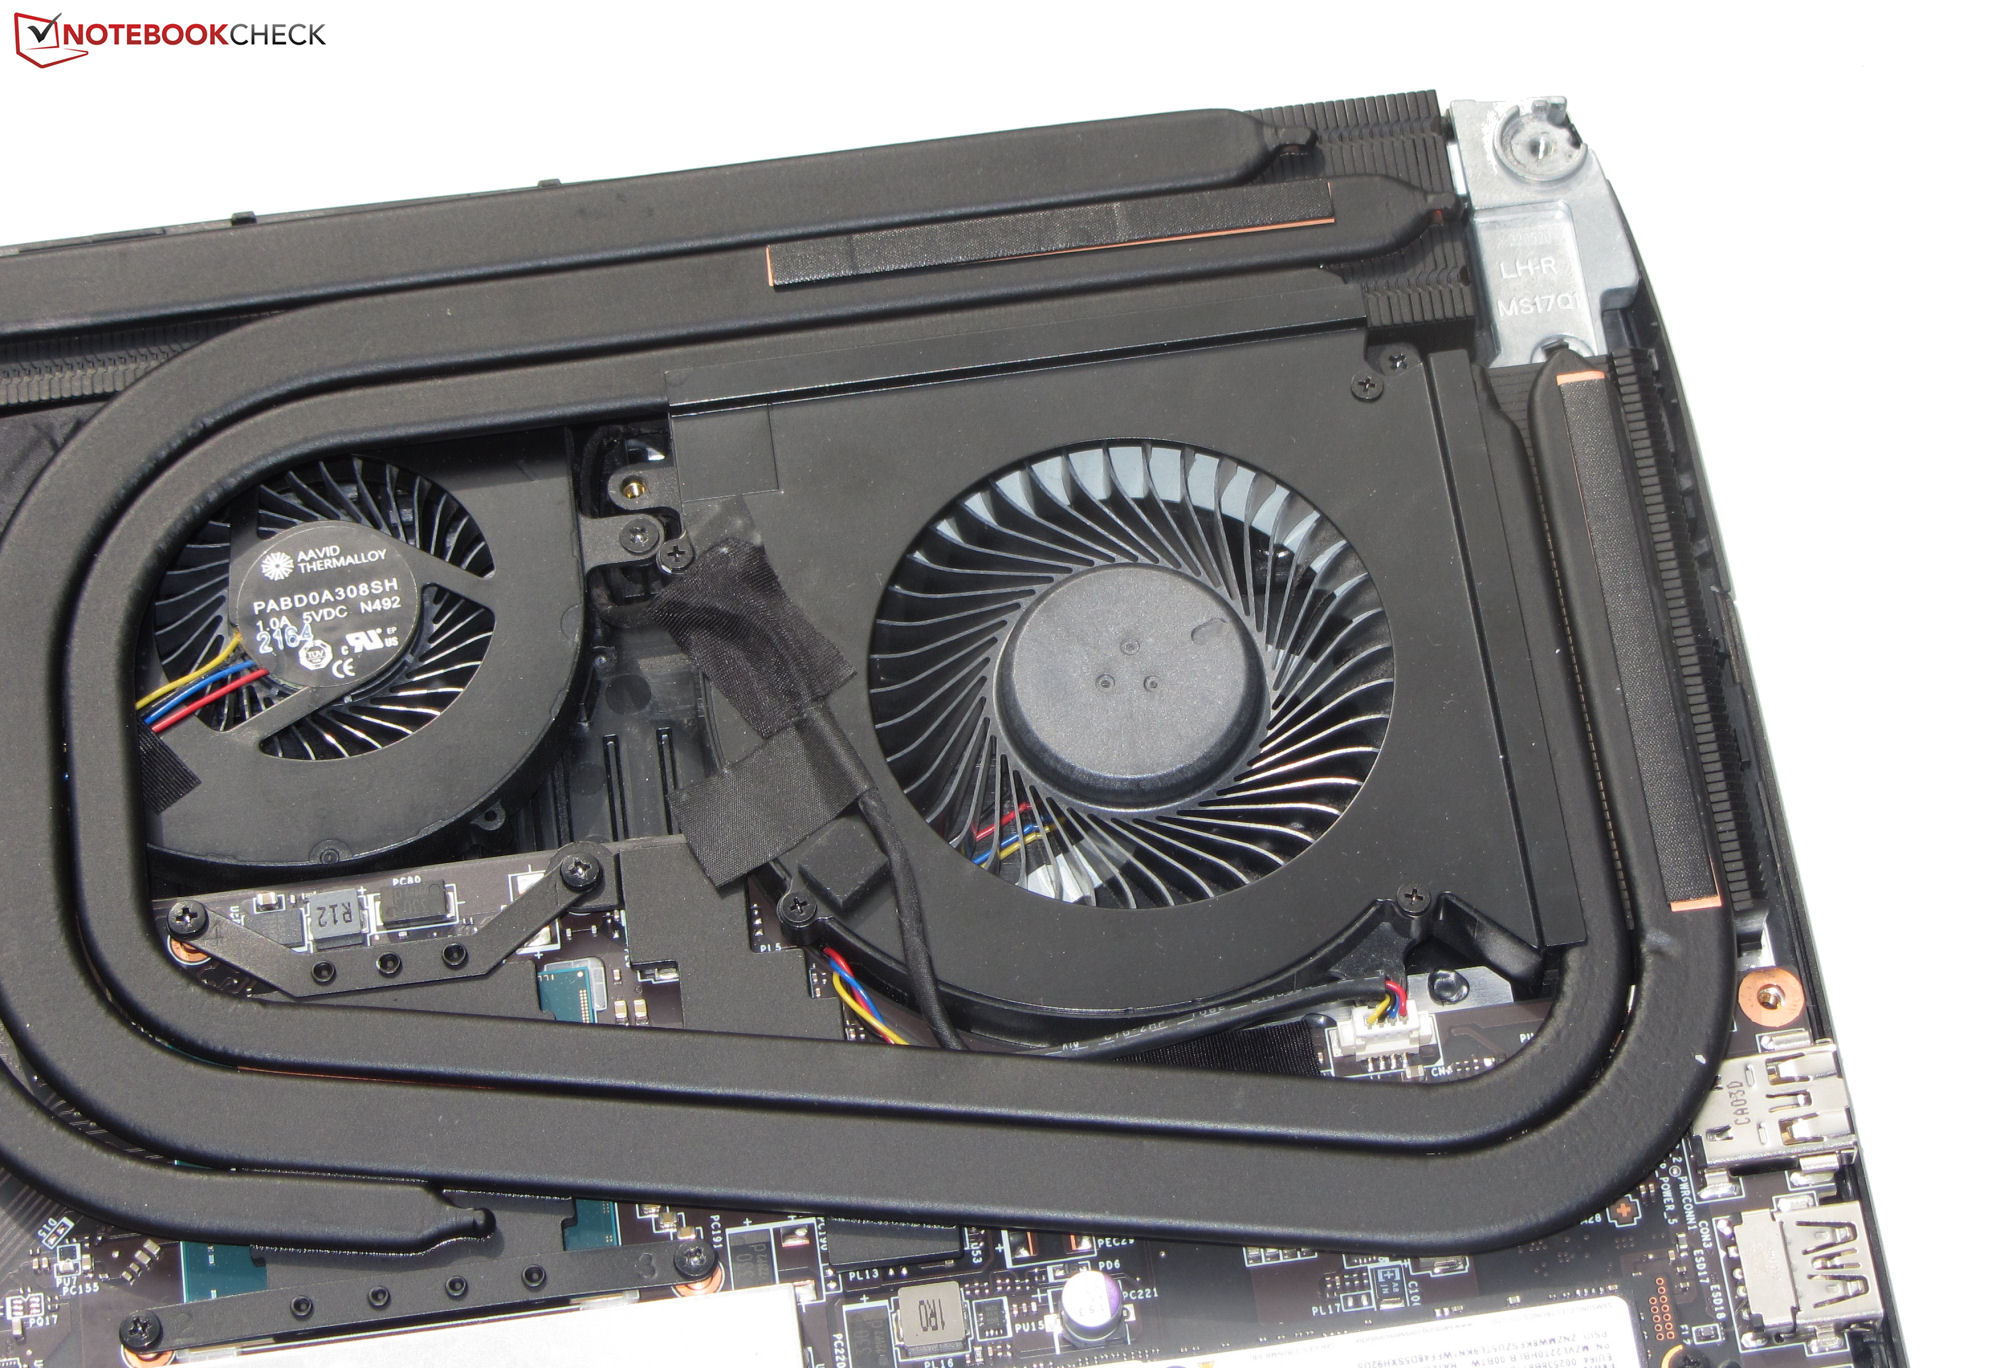
Emisja - MSI GT77 posiada cztery wentylatory
Emisja hałasu
Cztery wentylatory mogą generować dość duży hałas: pod obciążeniem natężenie hałasu osiągnęło 53 dB(A) w teście Witcher 3 i 56 dB(A) w teście obciążeniowym. W stanie bezczynności lub pod niewielkim obciążeniem kręci się zwykle przynajmniej jeden z wentylatorów, a szum wentylatorów może dochodzić do 42 dB(A). W przypadku FHD Titan nie ma jednak tego wpływu. Jednym z możliwych wyjaśnień jest to, że sterowanie wentylatorami w modelu 4K może być nieco bardziej upierdliwe ze względu na aktywną funkcję "Smart Auto". Profil "Silent Mode" pomaga zmniejszyć ilość hałasu podczas pracy systemu - kosztem mocy obliczeniowej
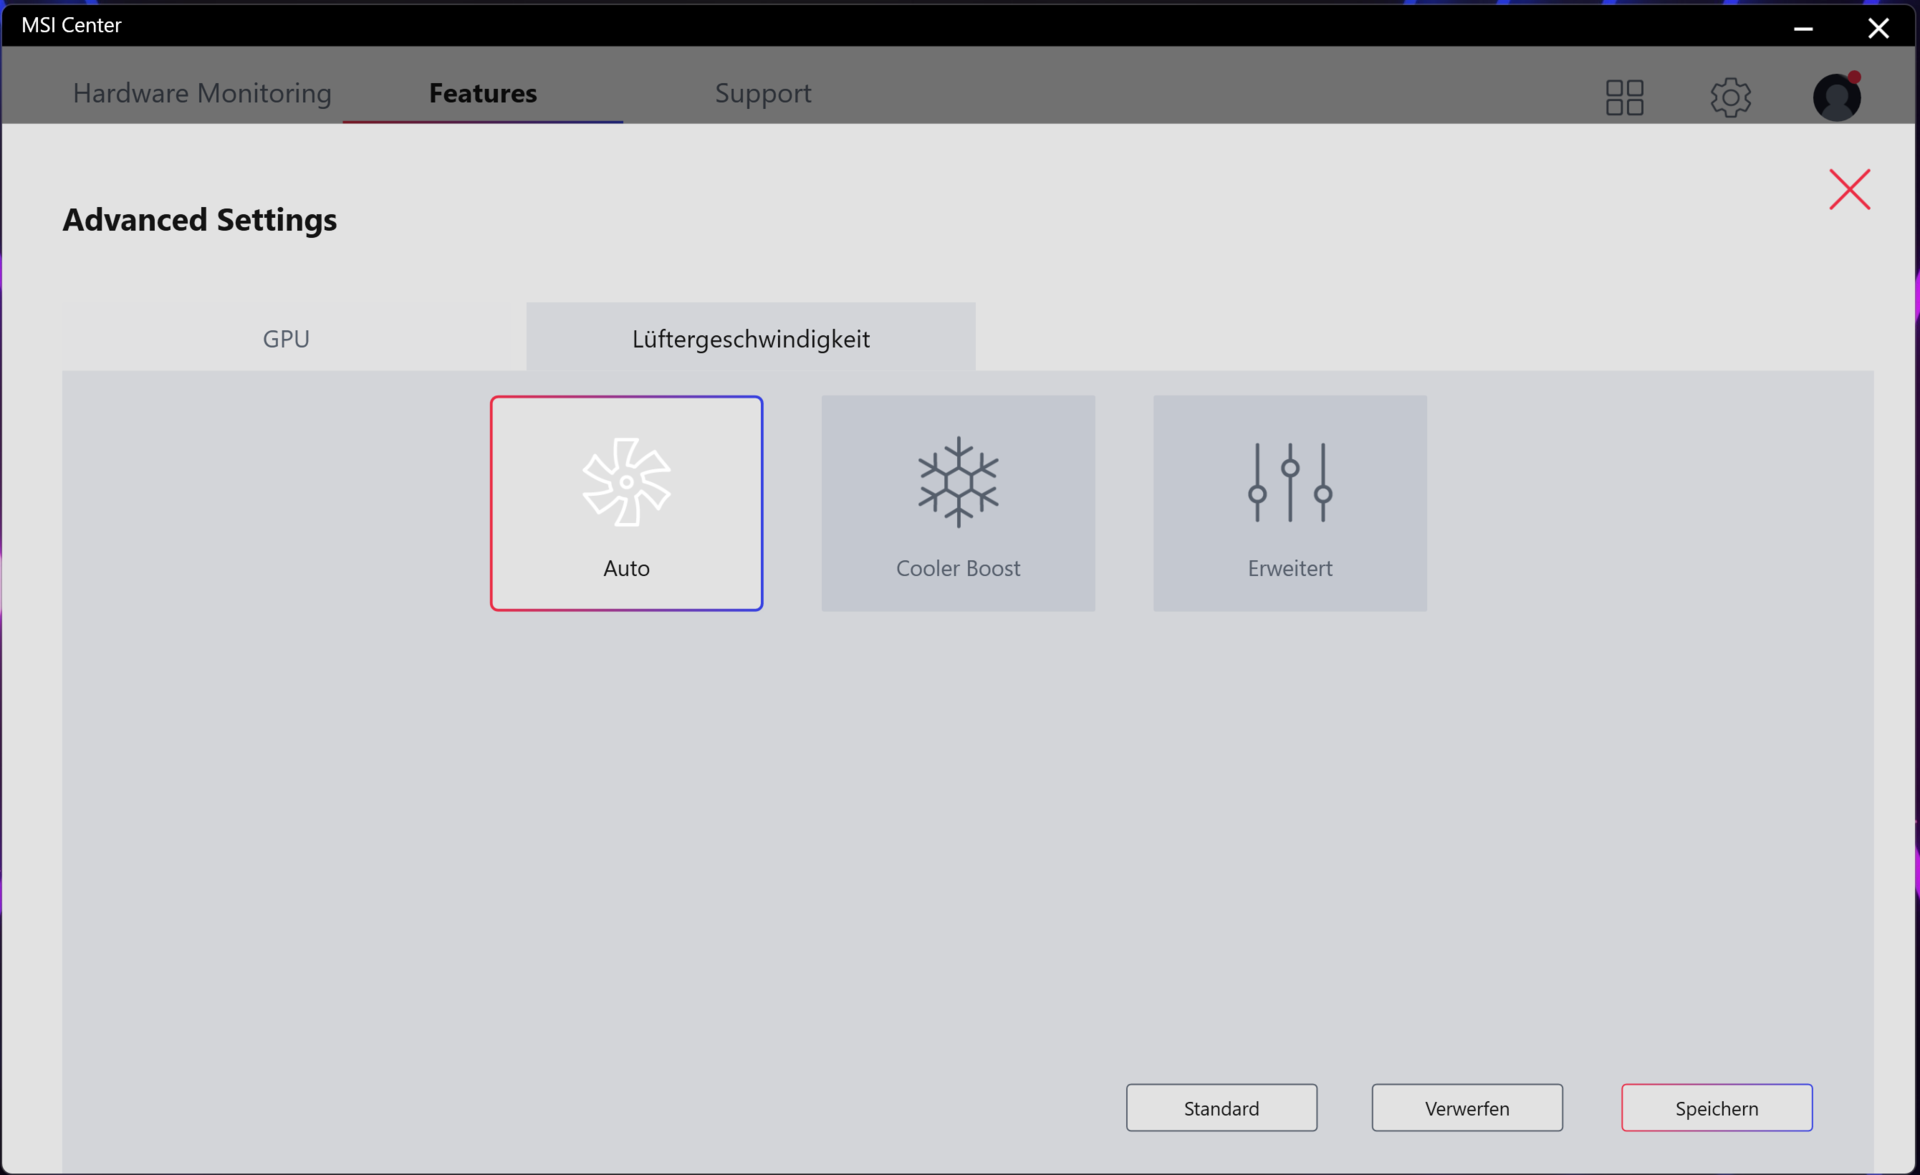
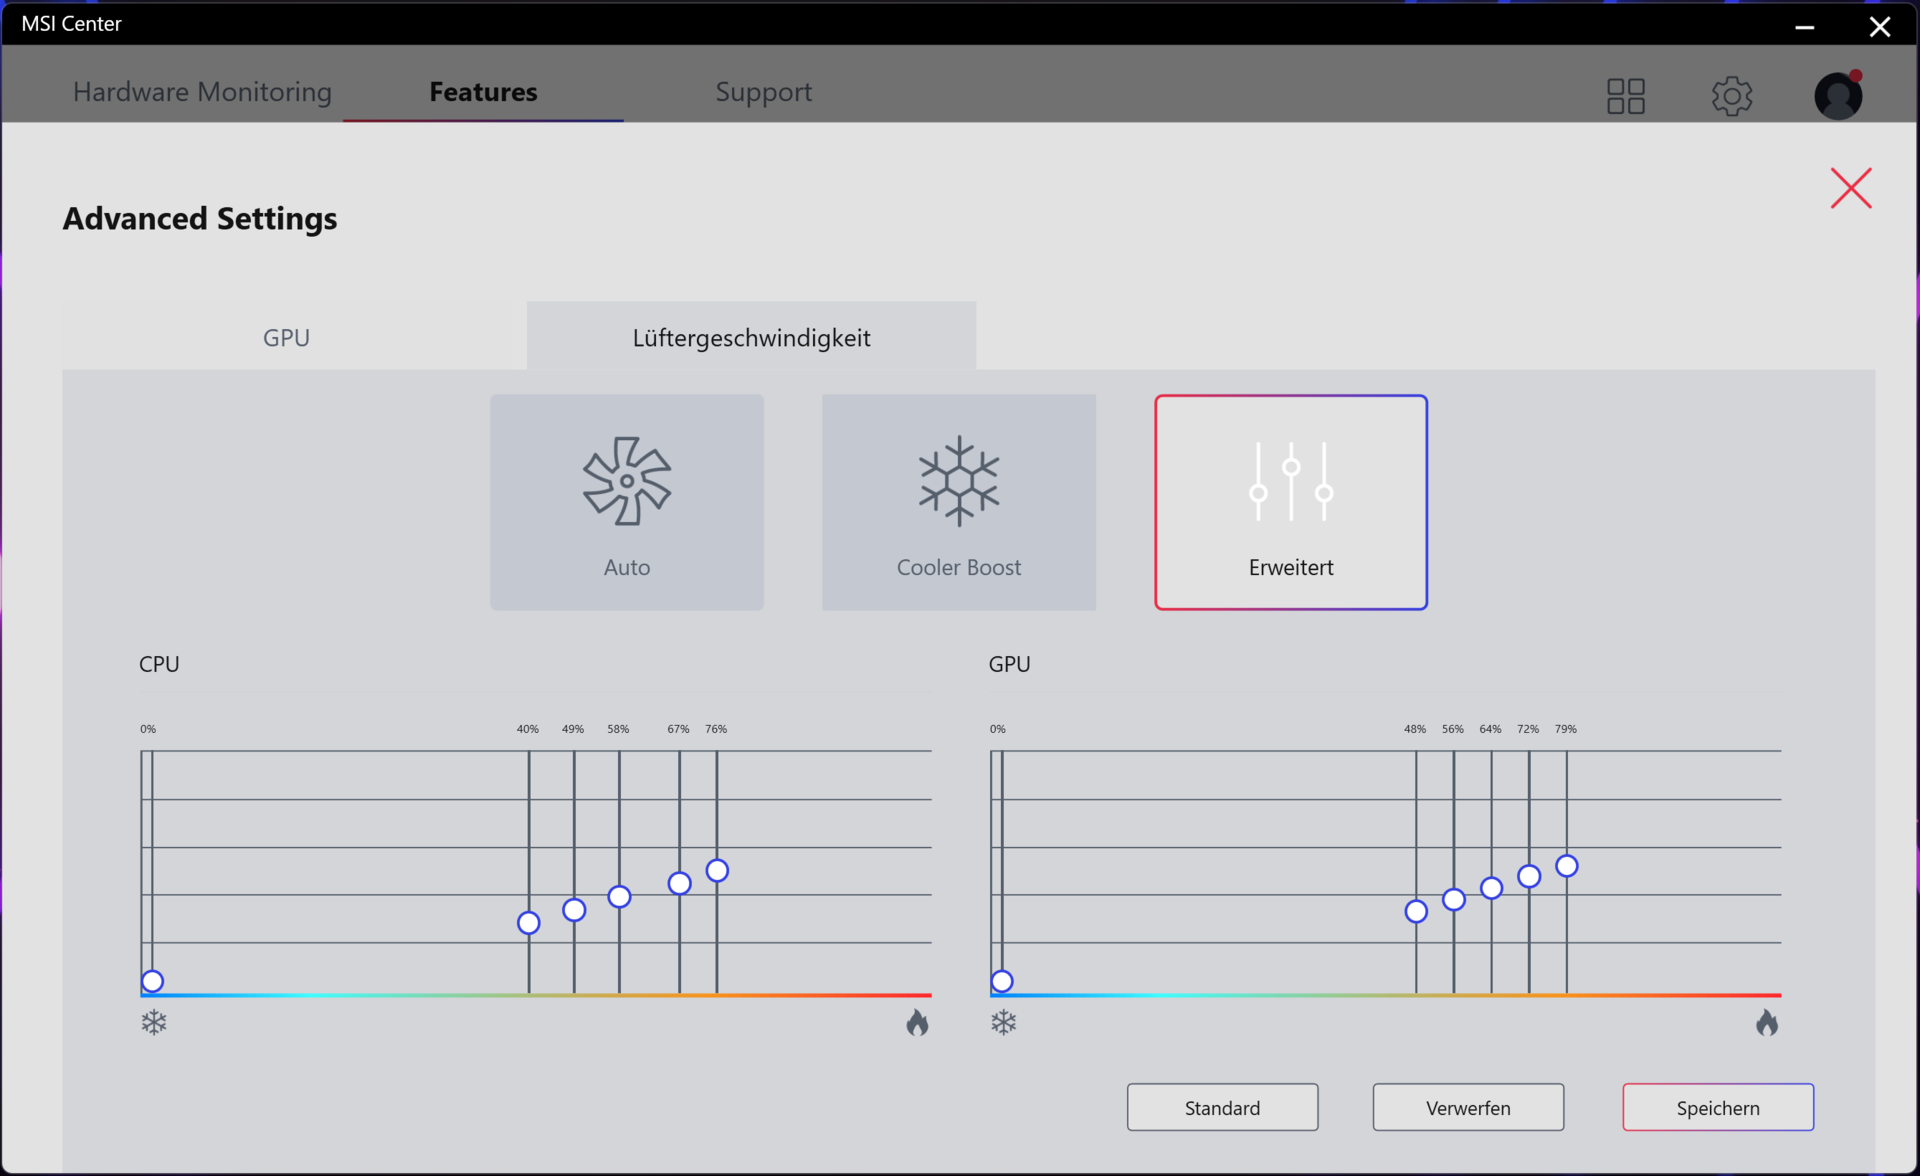
Profil "Extreme Performance" pozwala na modyfikację sterowania wentylatorem. Dostępne opcje to "Auto", "Cooler Boost" (wentylatory pracują z maksymalną prędkością) oraz "Advanced" (dostosowanie krzywych wentylatorów).
Hałas
| luz |
| 29 / 30 / 42 dB |
| obciążenie |
| 54 / 56 dB |
 | ||
30 dB cichy 40 dB(A) słyszalny 50 dB(A) irytujący |
||
min: | ||
| MSI Titan GT77 12UHS 4k i9-12900HX, GeForce RTX 3080 Ti Laptop GPU | Razer Blade 17 Early 2022 i9-12900H, GeForce RTX 3080 Ti Laptop GPU | Alienware x17 R2 P48E i9-12900HK, GeForce RTX 3080 Ti Laptop GPU | Schenker XMG Ultra 17 Rocket Lake i9-11900K, GeForce RTX 3080 Laptop GPU | MSI Titan GT77 12UHS i9-12900HX, GeForce RTX 3080 Ti Laptop GPU | |
|---|---|---|---|---|---|
| Noise | 9% | 21% | -12% | 14% | |
| wyłączone / środowisko * (dB) | 26 | 26 -0% | 22.7 13% | 24 8% | 21.9 16% |
| Idle Minimum * (dB) | 29 | 26 10% | 23.1 20% | 30 -3% | 24.53 15% |
| Idle Average * (dB) | 30 | 27 10% | 23.1 23% | 31 -3% | 24.53 18% |
| Idle Maximum * (dB) | 42 | 32 24% | 23.1 45% | 57 -36% | 24.53 42% |
| Load Average * (dB) | 54 | 50 7% | 31.9 41% | 63 -17% | 46.25 14% |
| Witcher 3 ultra * (dB) | 52 | 51 2% | 52.5 -1% | 61 -17% | 56.86 -9% |
| Load Maximum * (dB) | 56 | 51 9% | 52.5 6% | 63 -13% | 54.25 3% |
* ... im mniej tym lepiej
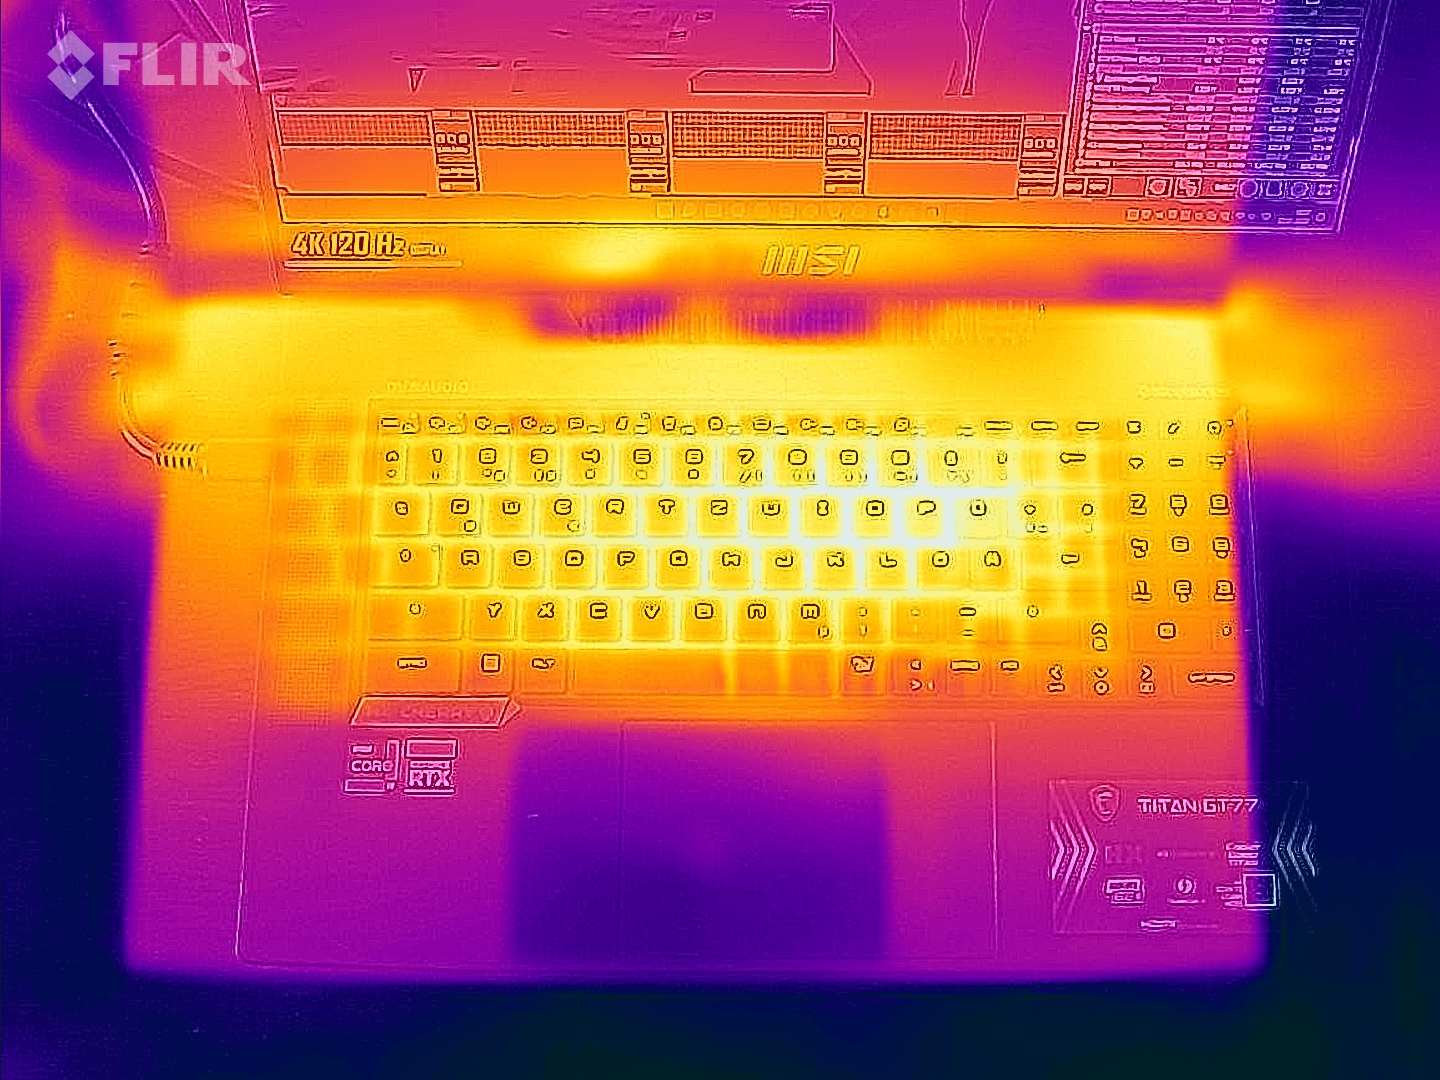
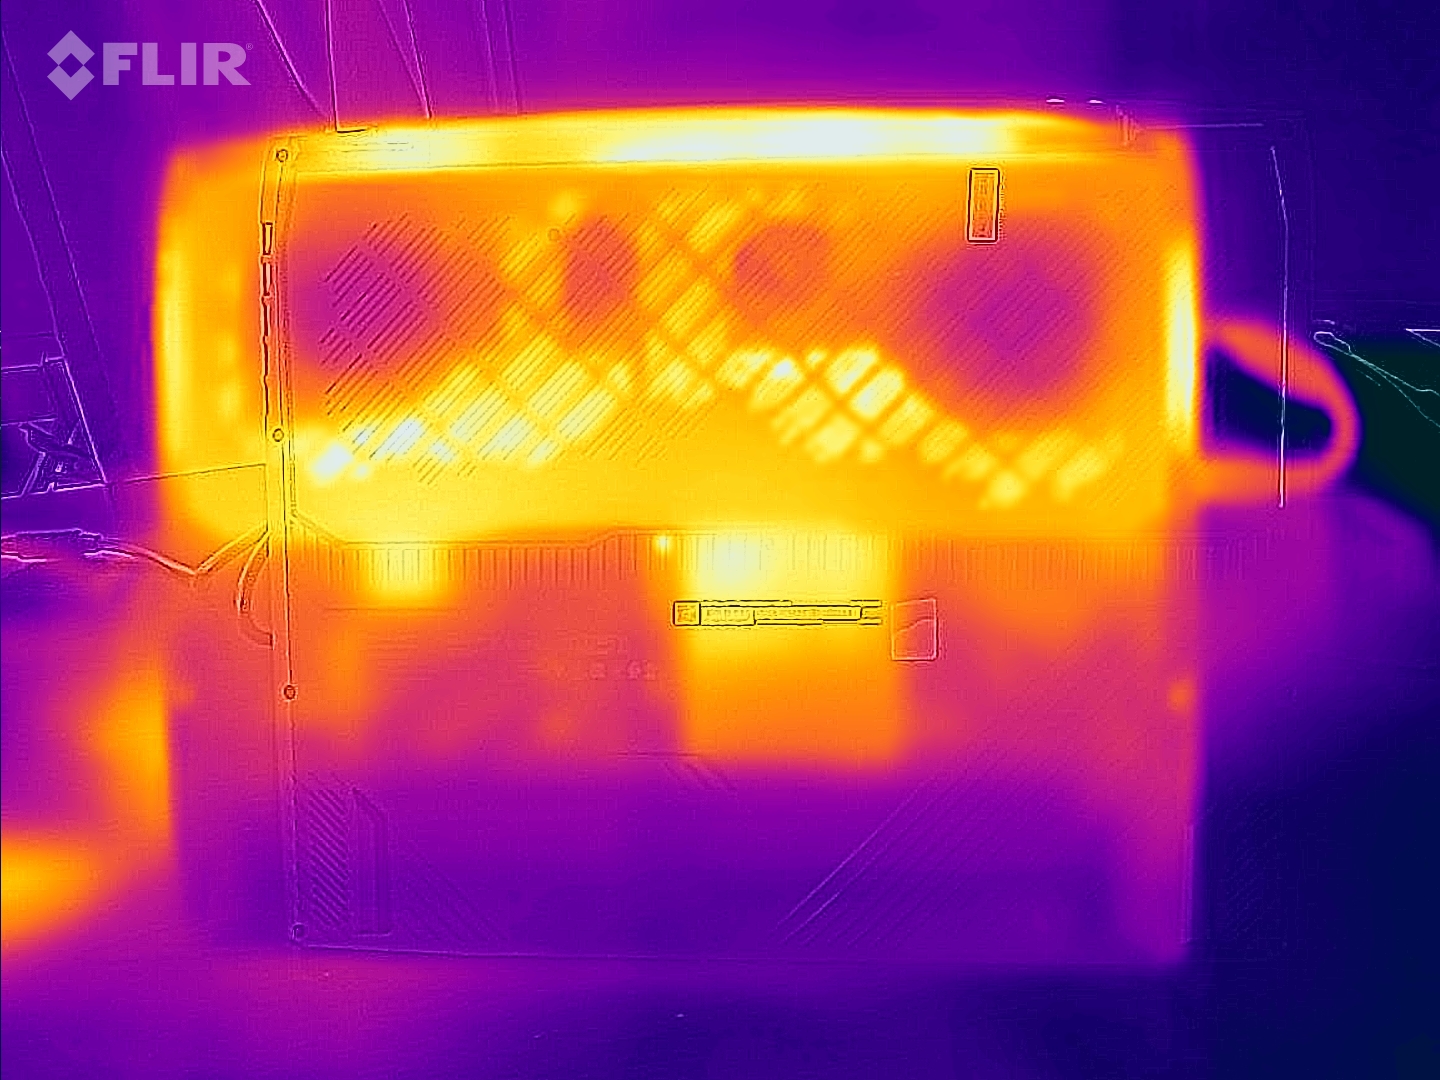
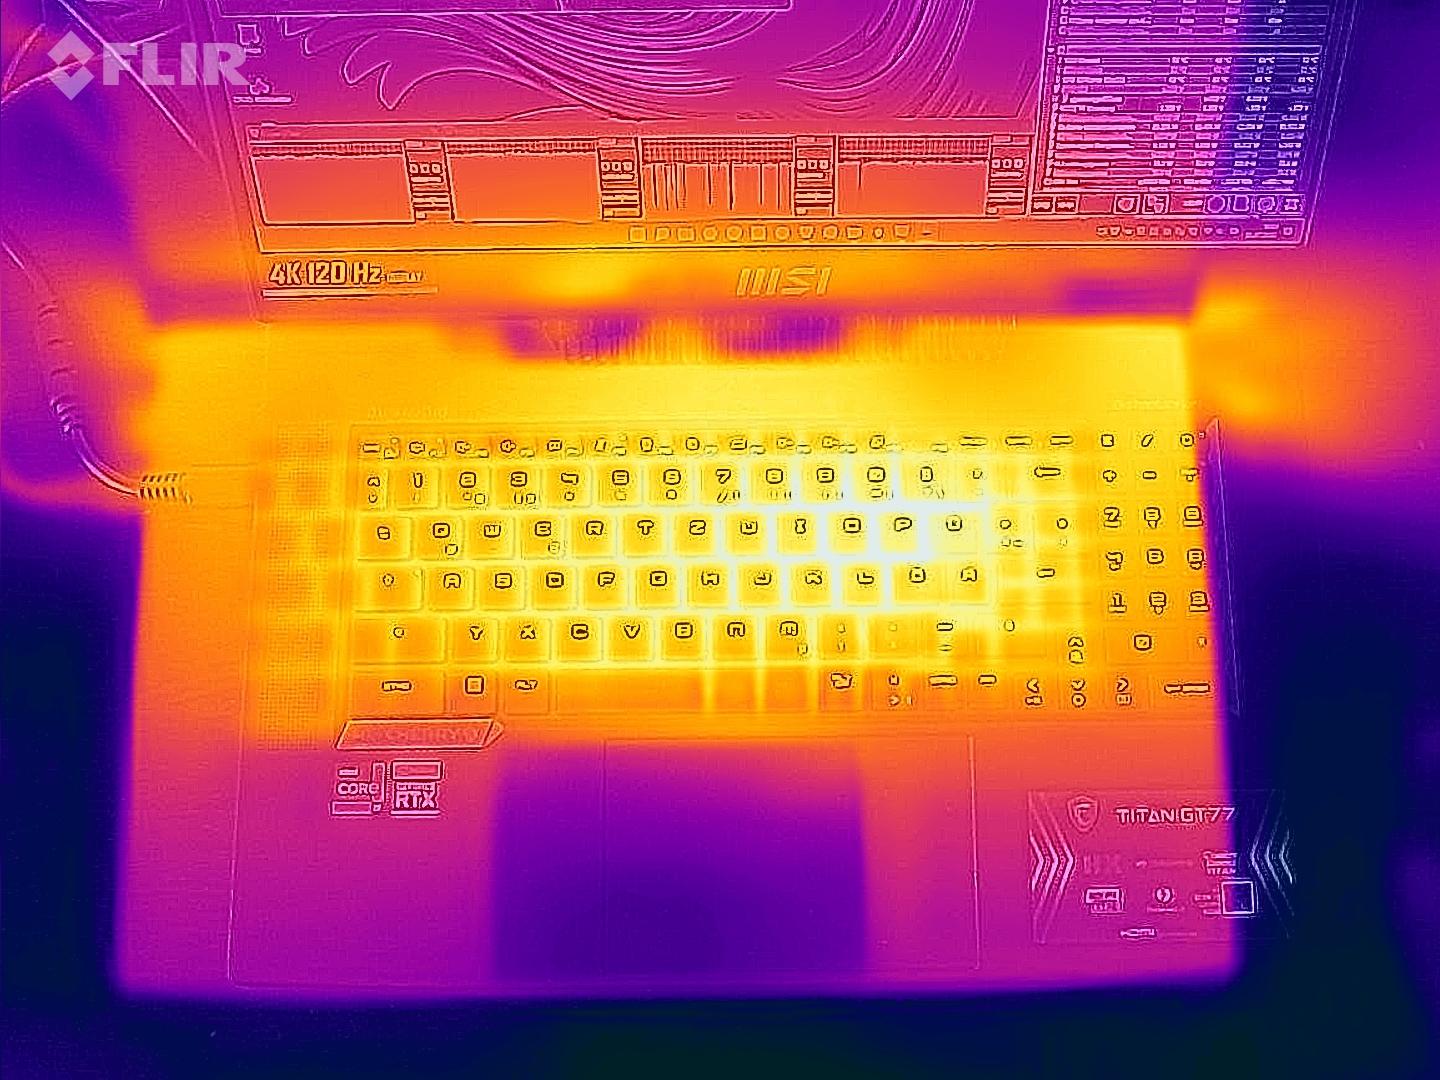
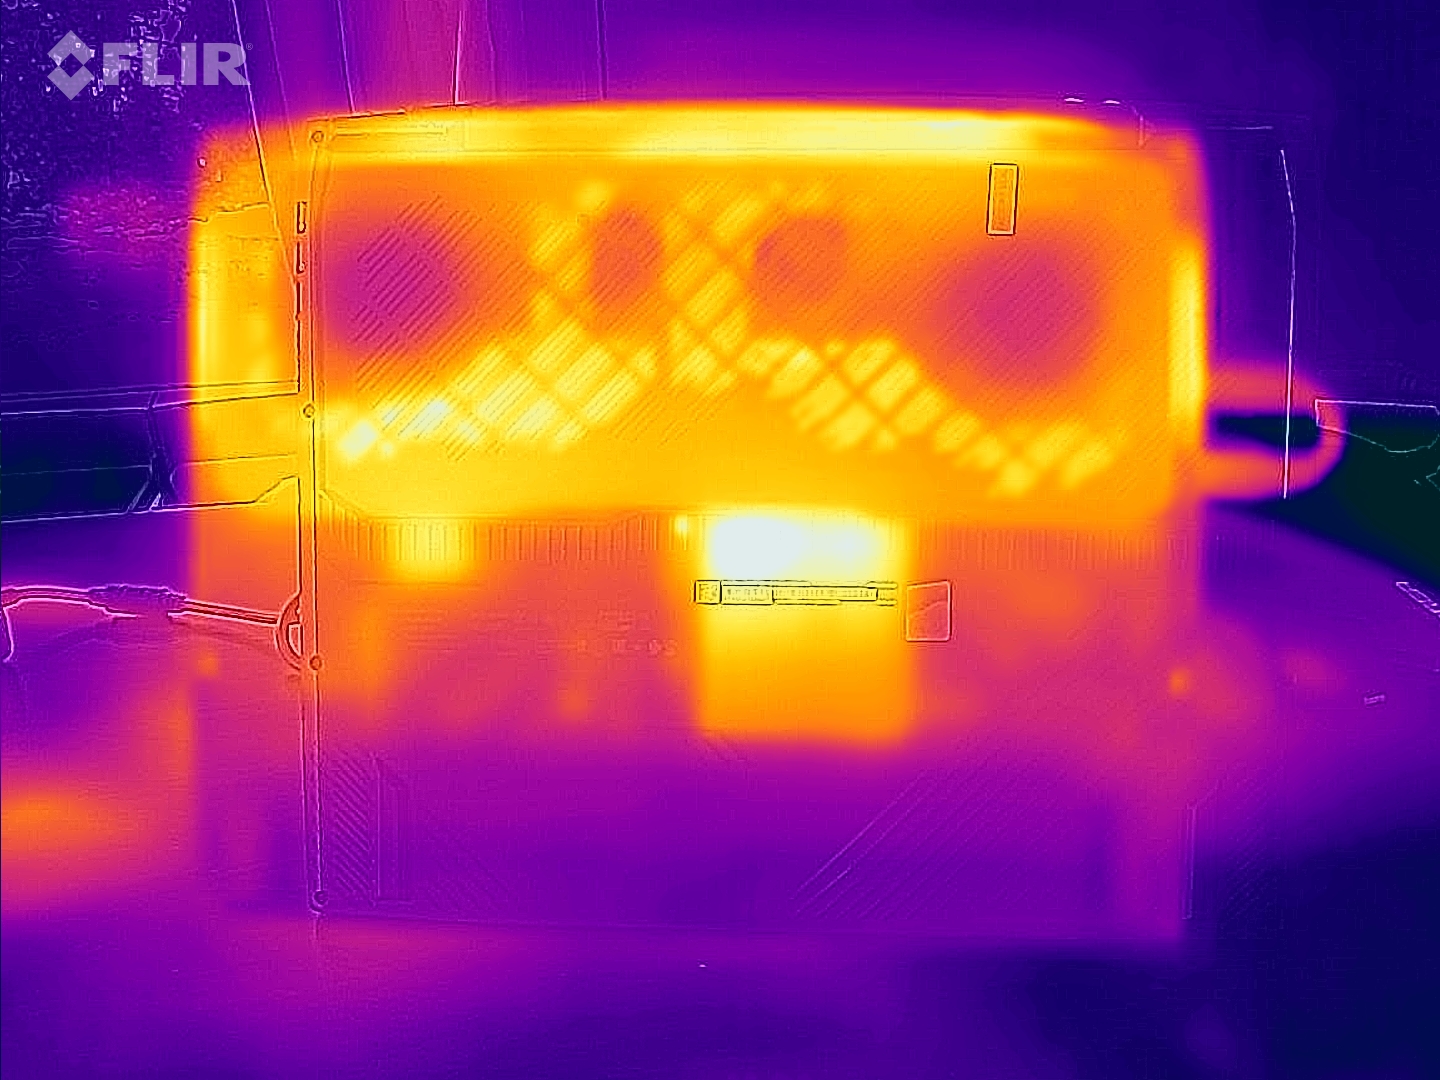
Temperatura
W codziennym użytkowaniu (praca biurowa, przeglądanie internetu) temperatury obudowy utrzymywały się w akceptowalnym zakresie. Pod obciążeniem (stress test, Witcher 3 test) laptop stał się wyraźnie cieplejszy, ale nie za gorący. Jeżeli chodzi o temperatury procesora, nie ma powodów do niepokoju.
(-) Maksymalna temperatura w górnej części wynosi 49 °C / 120 F, w porównaniu do średniej 40.4 °C / 105 F , począwszy od 21.2 do 68.8 °C dla klasy Gaming.
(-) Dno nagrzewa się maksymalnie do 50 °C / 122 F, w porównaniu do średniej 43.2 °C / 110 F
(±) W stanie bezczynności średnia temperatura górnej części wynosi 33.2 °C / 92 F, w porównaniu ze średnią temperaturą urządzenia wynoszącą 33.9 °C / ### class_avg_f### F.
(-) Podczas gry w Wiedźmina 3 średnia temperatura górnej części wynosi 48.1 °C / 119 F, w porównaniu do średniej temperatury urządzenia wynoszącej 33.9 °C / ## #class_avg_f### F.
(-) Podpórki pod nadgarstki i touchpad mogą się bardzo nagrzać w dotyku, maksymalnie do 43 °C / 109.4 F.
(-) Średnia temperatura obszaru podparcia dłoni w podobnych urządzeniach wynosiła 28.8 °C / 83.8 F (-14.2 °C / -25.6 F).
| MSI Titan GT77 12UHS 4k Intel Core i9-12900HX, NVIDIA GeForce RTX 3080 Ti Laptop GPU | Razer Blade 17 Early 2022 Intel Core i9-12900H, NVIDIA GeForce RTX 3080 Ti Laptop GPU | Alienware x17 R2 P48E Intel Core i9-12900HK, NVIDIA GeForce RTX 3080 Ti Laptop GPU | Schenker XMG Ultra 17 Rocket Lake Intel Core i9-11900K, NVIDIA GeForce RTX 3080 Laptop GPU | MSI Titan GT77 12UHS Intel Core i9-12900HX, NVIDIA GeForce RTX 3080 Ti Laptop GPU | |
|---|---|---|---|---|---|
| Heat | -5% | 11% | 8% | 2% | |
| Maximum Upper Side * (°C) | 49 | 50 -2% | 49.6 -1% | 34 31% | 40.8 17% |
| Maximum Bottom * (°C) | 50 | 56 -12% | 42.4 15% | 43 14% | 52.4 -5% |
| Idle Upper Side * (°C) | 34 | 36 -6% | 29.2 14% | 38 -12% | 34.6 -2% |
| Idle Bottom * (°C) | 38 | 38 -0% | 32 16% | 39 -3% | 38.4 -1% |
* ... im mniej tym lepiej
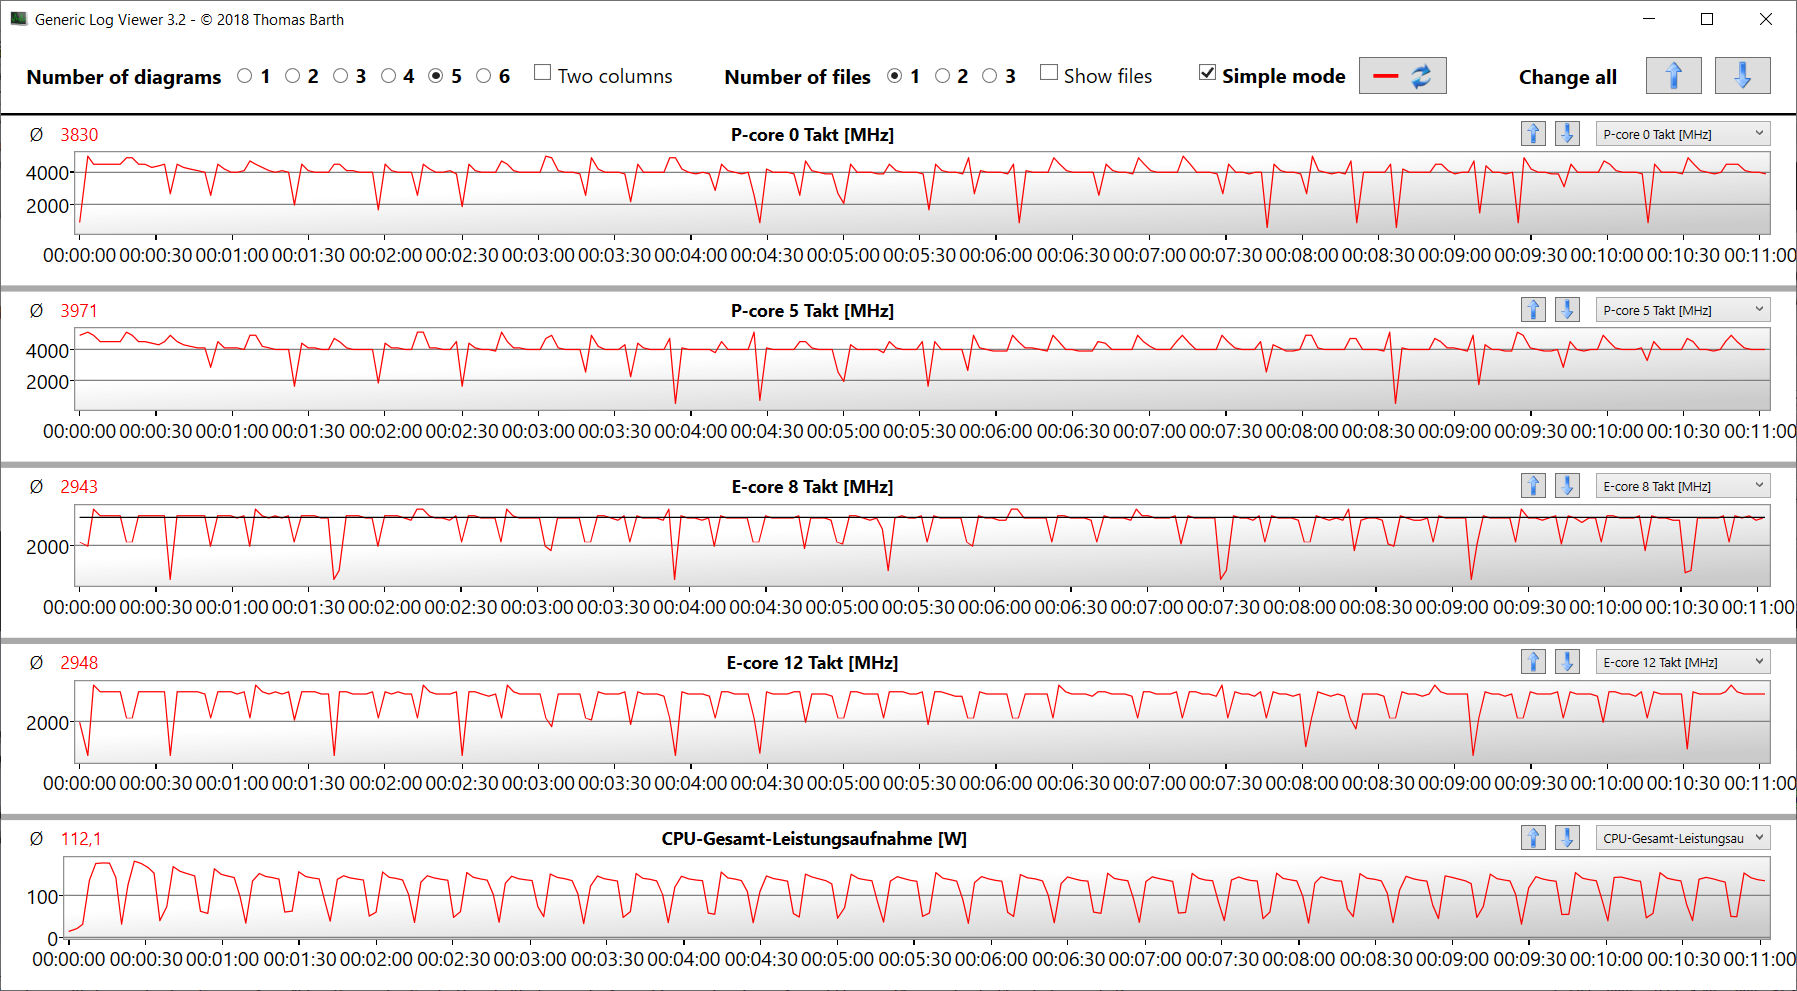
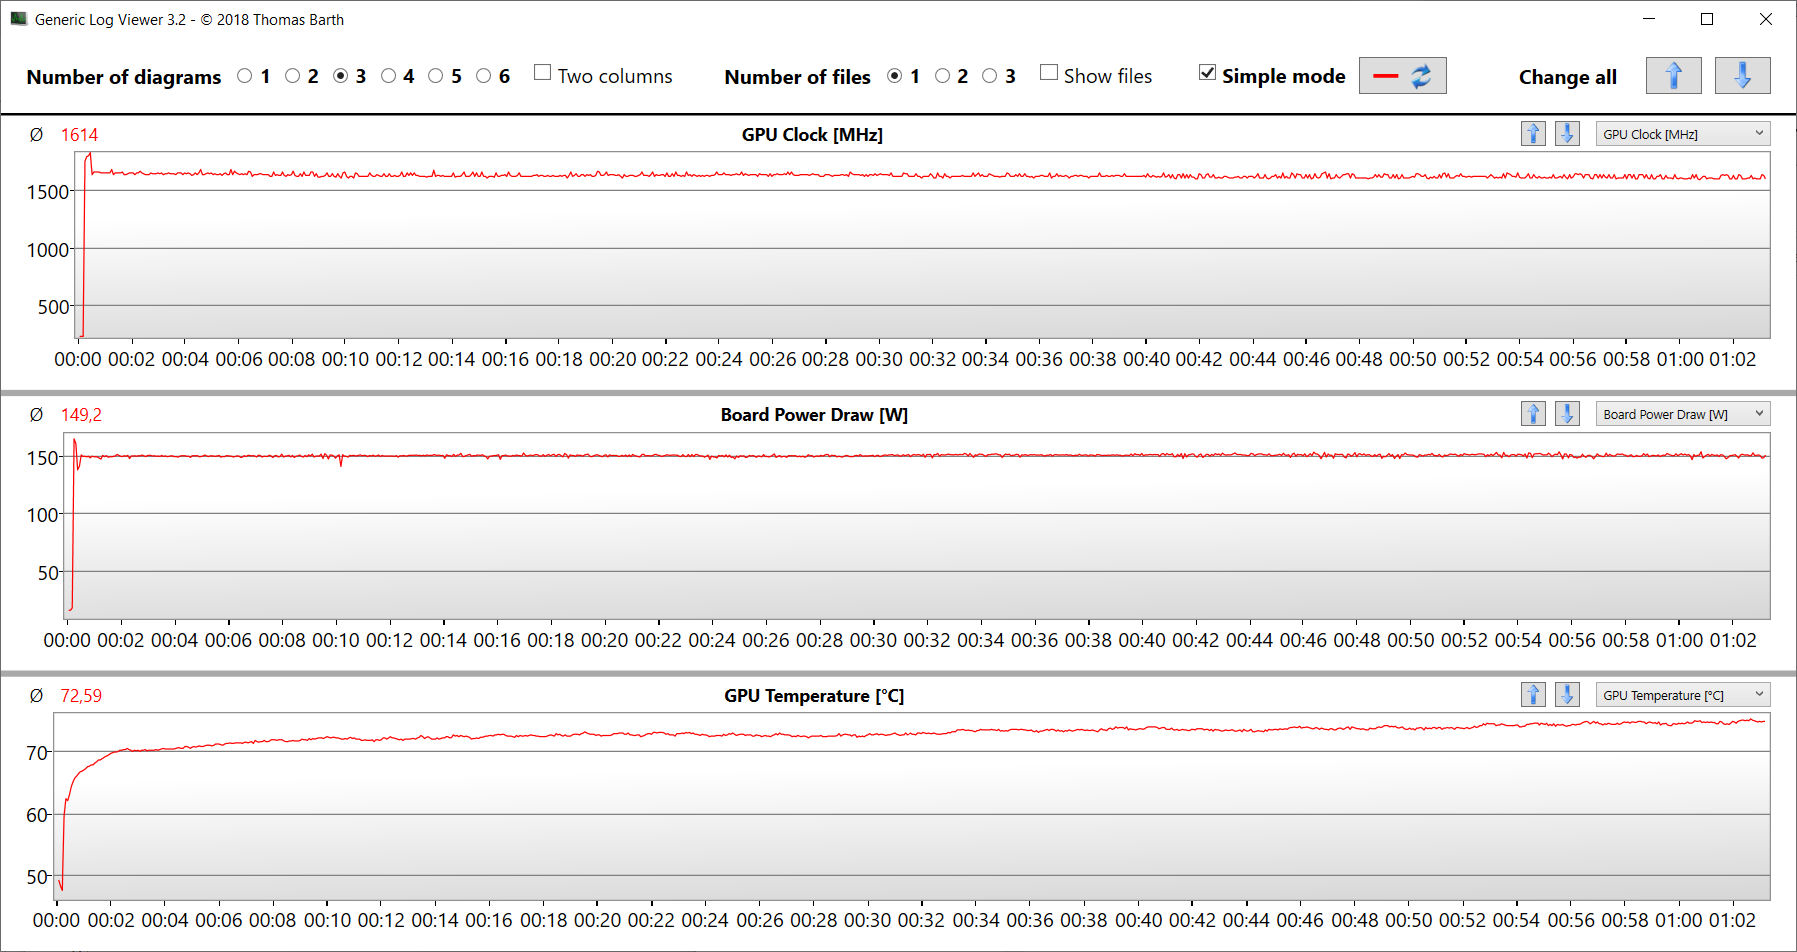
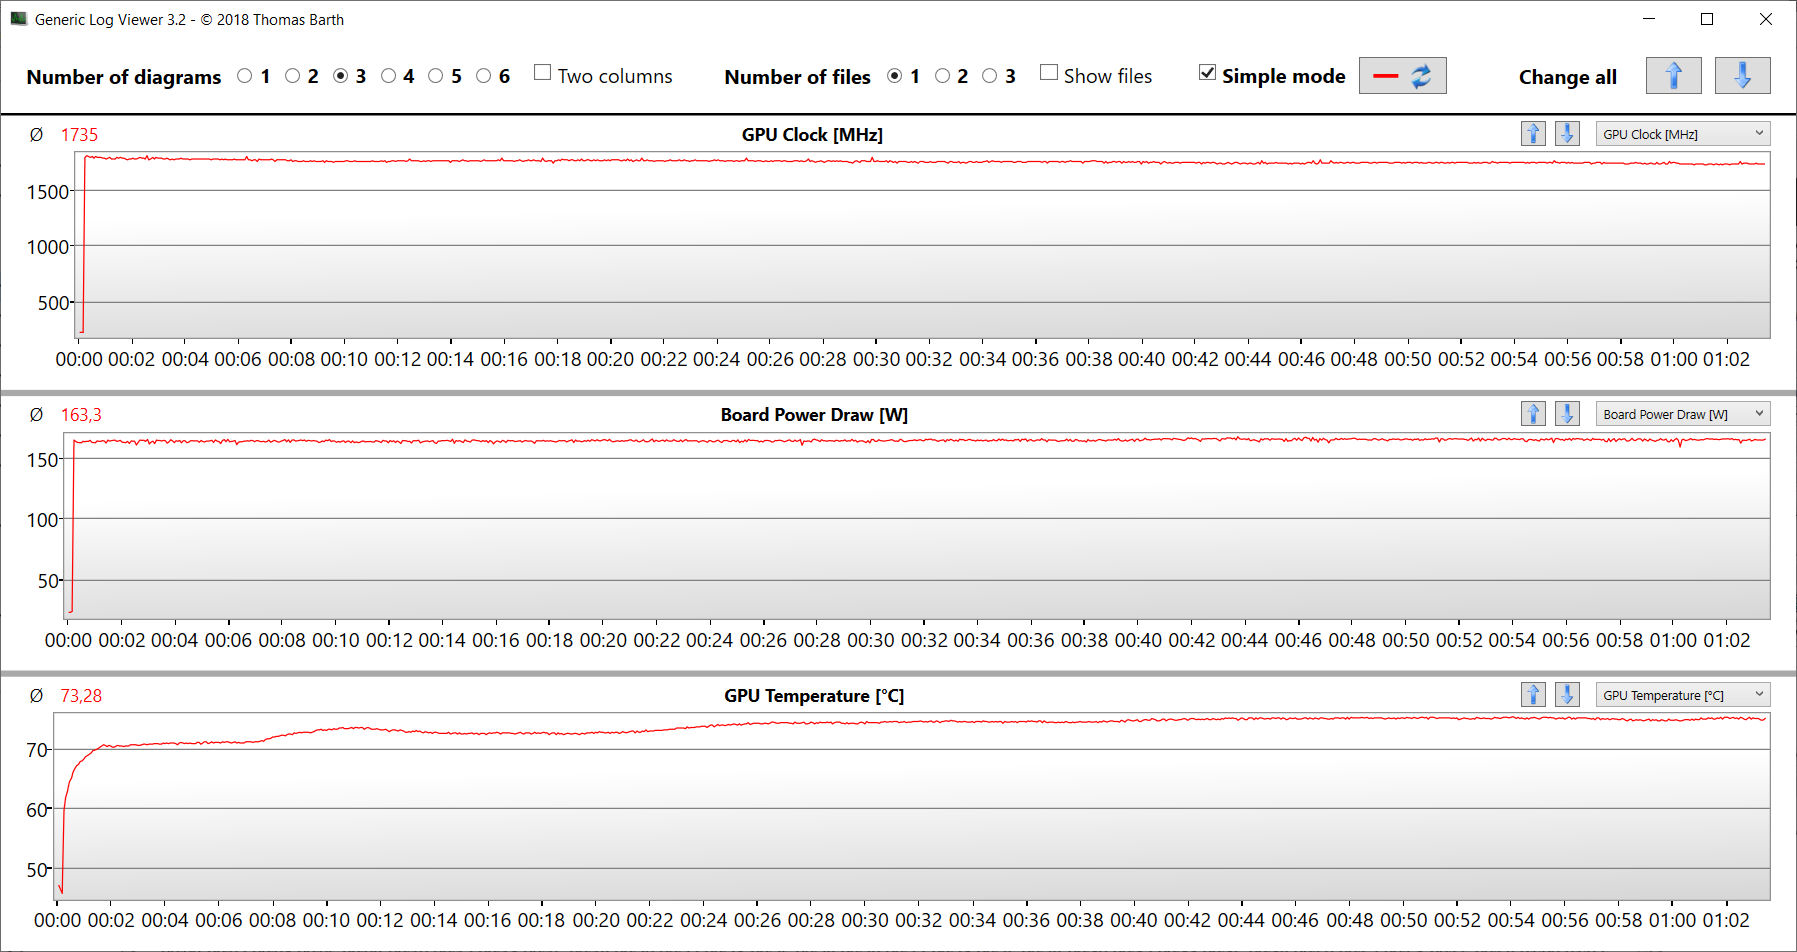
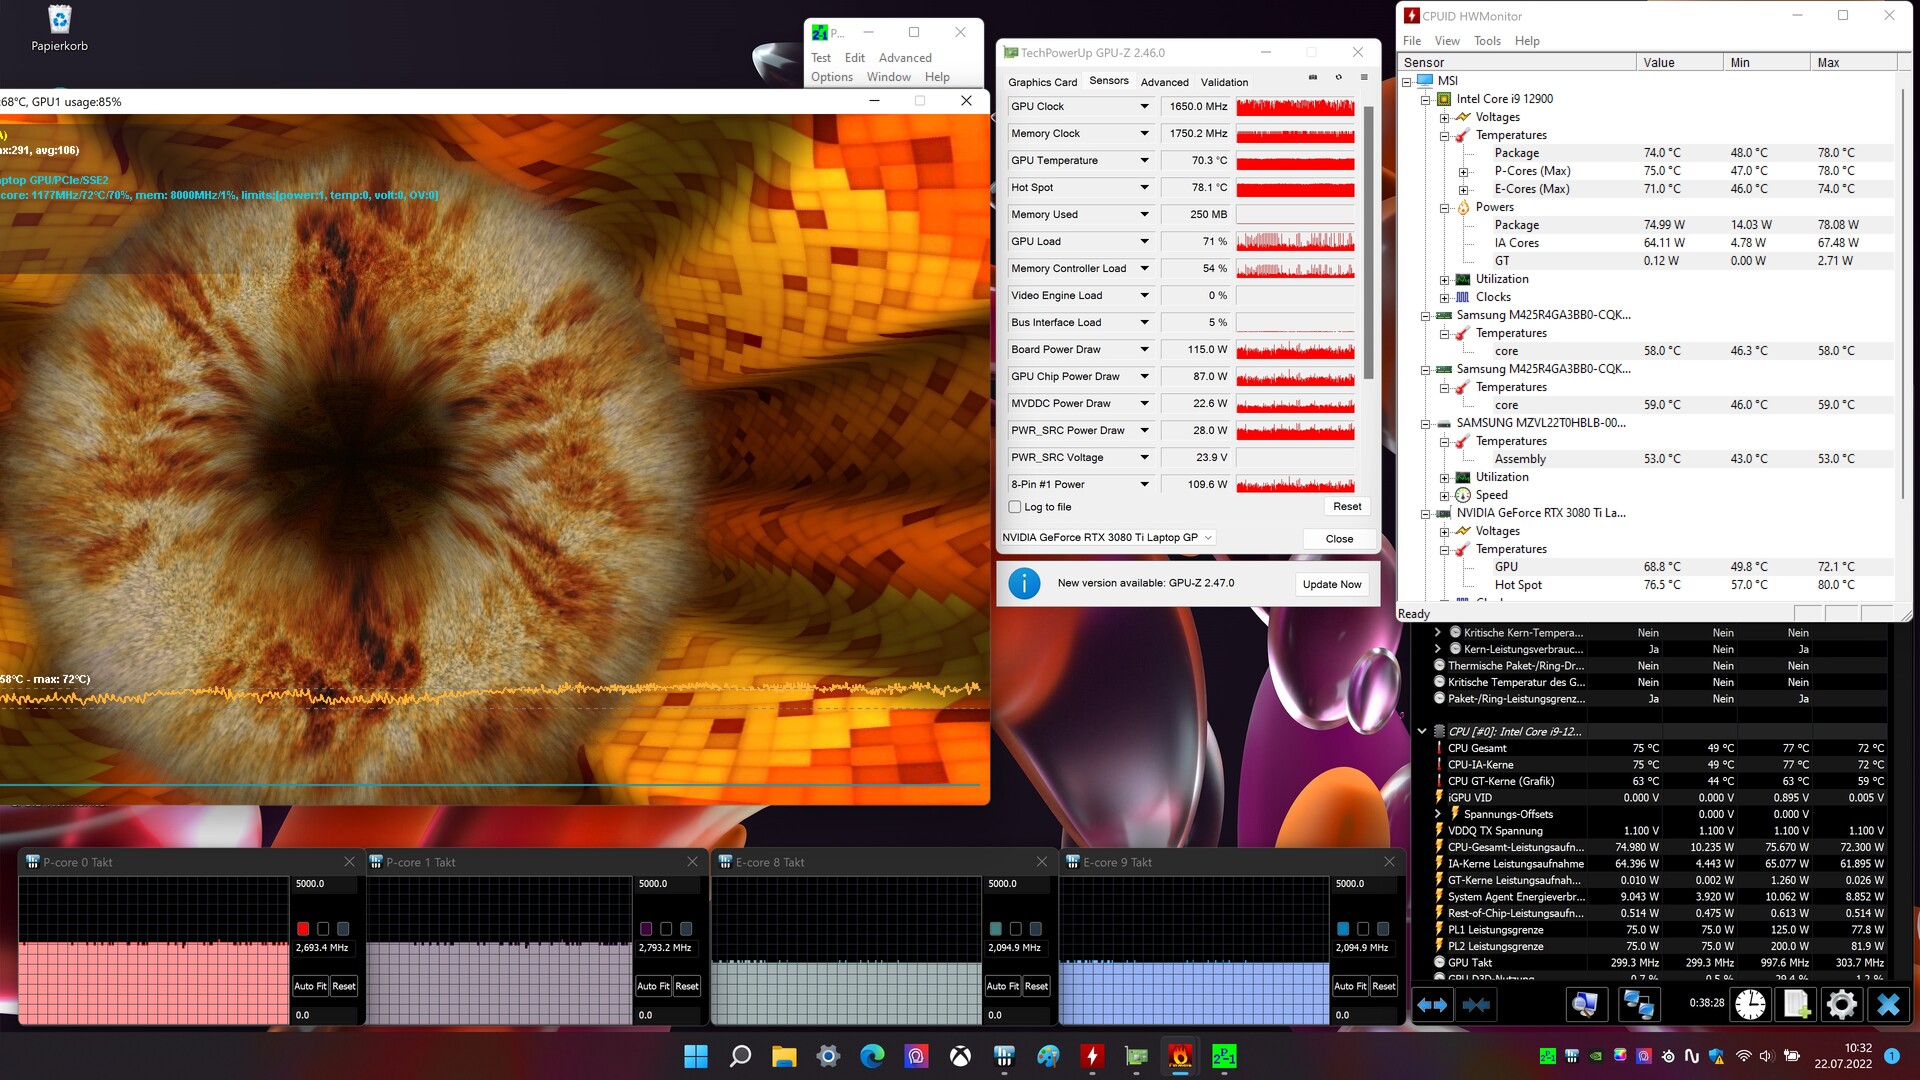
Test na stres
Procesor ukończył test obciążeniowy (uruchamiając Prime95 i FurMark przez co najmniej godzinę) ze średnią prędkością przetwarzania, podczas gdy GPU był w stanie osiągnąć maksymalne taktowanie. Test warunków skrajnych reprezentuje sytuację ekstremalną. Przeprowadzamy ten test, aby sprawdzić, czy system jest stabilny podczas pracy pod pełnym obciążeniem.
Mówcy
MSI Titan GT77 12UHS analiza dźwięku
(+) | głośniki mogą odtwarzać stosunkowo głośno (91 dB)
Bas 100 - 315 Hz
(±) | zredukowany bas - średnio 13.9% niższy od mediany
(±) | liniowość basu jest średnia (9.7% delta do poprzedniej częstotliwości)
Średnie 400 - 2000 Hz
(+) | zbalansowane środki średnie - tylko 4% od mediany
(+) | średnie są liniowe (3.6% delta do poprzedniej częstotliwości)
Wysokie 2–16 kHz
(+) | zrównoważone maksima - tylko 1.8% od mediany
(+) | wzloty są liniowe (3.9% delta do poprzedniej częstotliwości)
Ogólnie 100 - 16.000 Hz
(+) | ogólny dźwięk jest liniowy (11.4% różnicy w stosunku do mediany)
W porównaniu do tej samej klasy
» 9% wszystkich testowanych urządzeń w tej klasie było lepszych, 3% podobnych, 88% gorszych
» Najlepszy miał deltę 6%, średnia wynosiła ###średnia###%, najgorsza wynosiła 132%
W porównaniu do wszystkich testowanych urządzeń
» 7% wszystkich testowanych urządzeń było lepszych, 2% podobnych, 91% gorszych
» Najlepszy miał deltę 4%, średnia wynosiła ###średnia###%, najgorsza wynosiła 134%
Alienware x17 R2 P48E analiza dźwięku
(+) | głośniki mogą odtwarzać stosunkowo głośno (84.3 dB)
Bas 100 - 315 Hz
(±) | zredukowany bas - średnio 9.7% niższy od mediany
(+) | bas jest liniowy (5.5% delta do poprzedniej częstotliwości)
Średnie 400 - 2000 Hz
(+) | zbalansowane środki średnie - tylko 1.6% od mediany
(+) | średnie są liniowe (3% delta do poprzedniej częstotliwości)
Wysokie 2–16 kHz
(±) | wyższe maksima - średnio 5% wyższe od mediany
(±) | liniowość wysokich wartości jest średnia (7.6% delta do poprzedniej częstotliwości)
Ogólnie 100 - 16.000 Hz
(+) | ogólny dźwięk jest liniowy (9.3% różnicy w stosunku do mediany)
W porównaniu do tej samej klasy
» 3% wszystkich testowanych urządzeń w tej klasie było lepszych, 2% podobnych, 95% gorszych
» Najlepszy miał deltę 6%, średnia wynosiła ###średnia###%, najgorsza wynosiła 132%
W porównaniu do wszystkich testowanych urządzeń
» 3% wszystkich testowanych urządzeń było lepszych, 1% podobnych, 96% gorszych
» Najlepszy miał deltę 4%, średnia wynosiła ###średnia###%, najgorsza wynosiła 134%
Zarządzanie energią - laptop MSI zapewnia przyzwoity czas pracy na baterii
Pobór mocy
Pobór mocy laptopa mieści się w normalnym zakresie dla znajdującego się w nim sprzętu. Podczas testu Witcher 3 i stress testu jego pobór mocy wzrósł do średnio 236 W i szczytowo do 309 W. Podczas obu testów urządzenie zużywało stałą ilość energii
Uwaga: Model Model FHDbył testowany z aktywnym trybem dGPU. To wyjaśnia, dlaczego w stanie bezczynności zużywał więcej energii.
| wyłączony / stan wstrzymania | |
| luz | |
| obciążenie |
|
Legenda:
min: | |
| MSI Titan GT77 12UHS i9-12900HX, GeForce RTX 3080 Ti Laptop GPU | Razer Blade 17 Early 2022 i9-12900H, GeForce RTX 3080 Ti Laptop GPU | Alienware x17 R2 P48E i9-12900HK, GeForce RTX 3080 Ti Laptop GPU | Schenker XMG Ultra 17 Rocket Lake i9-11900K, GeForce RTX 3080 Laptop GPU | MSI Titan GT77 12UHS i9-12900HX, GeForce RTX 3080 Ti Laptop GPU | Przeciętny NVIDIA GeForce RTX 3080 Ti Laptop GPU | Średnia w klasie Gaming | |
|---|---|---|---|---|---|---|---|
| Power Consumption | -7% | -44% | -146% | -41% | -10% | 8% | |
| Idle Minimum * (Watt) | 12 | 17 -42% | 24.1 -101% | 62 -417% | 30.21 -152% | 17.2 ? -43% | 13.3 ? -11% |
| Idle Average * (Watt) | 18 | 23 -28% | 28.5 -58% | 64 -256% | 32.42 -80% | 23.3 ? -29% | 19 ? -6% |
| Idle Maximum * (Watt) | 30 | 34 -13% | 60 -100% | 69 -130% | 33.7 -12% | 30.8 ? -3% | 24.5 ? 18% |
| Load Average * (Watt) | 141 | 120 15% | 128.7 9% | 183 -30% | 125.09 11% | 121.2 ? 14% | 108.1 ? 23% |
| Witcher 3 ultra * (Watt) | 236 | 229 3% | 254 -8% | 297 -26% | 256 -8% | ||
| Load Maximum * (Watt) | 309 | 243 21% | 323 -5% | 368 -19% | 321.88 -4% | 276 ? 11% | 254 ? 18% |
* ... im mniej tym lepiej
Power consumption Witcher 3 / stress test
Power consumption with external monitor
Żywotność baterii
W przypadku naszego testu Wi-Fi (odwiedzanie stron internetowych automatycznie z użyciem skryptu) i testu wideo (odtwarzanie w pętli krótkiego filmu Big Buck Bunny (kodowanie H.264, FHD)) 17,3-calowy laptop zdołał działać odpowiednio przez 5:52 h i 6:50 h. Na stronie Model rodzeństwa FHDwytrzymywał nieco dłużej ze względu na niższą rozdzielczość ekranu.
| MSI Titan GT77 12UHS 4k i9-12900HX, GeForce RTX 3080 Ti Laptop GPU, 99.99 Wh | Razer Blade 17 Early 2022 i9-12900H, GeForce RTX 3080 Ti Laptop GPU, 82 Wh | Alienware x17 R2 P48E i9-12900HK, GeForce RTX 3080 Ti Laptop GPU, 87 Wh | Schenker XMG Ultra 17 Rocket Lake i9-11900K, GeForce RTX 3080 Laptop GPU, 97 Wh | MSI Titan GT77 12UHS i9-12900HX, GeForce RTX 3080 Ti Laptop GPU, 99.9 Wh | Średnia w klasie Gaming | |
|---|---|---|---|---|---|---|
| Czasy pracy | -16% | -55% | -58% | 5% | 11% | |
| Reader / Idle (h) | 8.2 | 7.1 -13% | 3.9 -52% | 3 -63% | 8.71 ? 6% | |
| H.264 (h) | 6.8 | 4.8 -29% | 1.9 -72% | 7.2 6% | 8.26 ? 21% | |
| WiFi v1.3 (h) | 5.9 | 3.8 -36% | 2 -66% | 1.8 -69% | 6.9 17% | 7.01 ? 19% |
| Load (h) | 1.5 | 1.7 13% | 0.8 -47% | 1.1 -27% | 1.4 -7% | 1.47 ? -2% |
| Witcher 3 ultra (h) | 1.5 |
Za
Przeciw
Werdykt - Jeszcze lepiej z wyświetlaczem 4K
Wraz z Titanem GT77, MSI dostarcza jeden z najbardziej wydajnych laptopów DTR w tej chwili. Został on zaprojektowany z myślą o scenariuszach użytkowania, które wymagają intensywnej mocy obliczeniowej i dużej ilości pamięci RAM, takich jak renderowanie i gry.
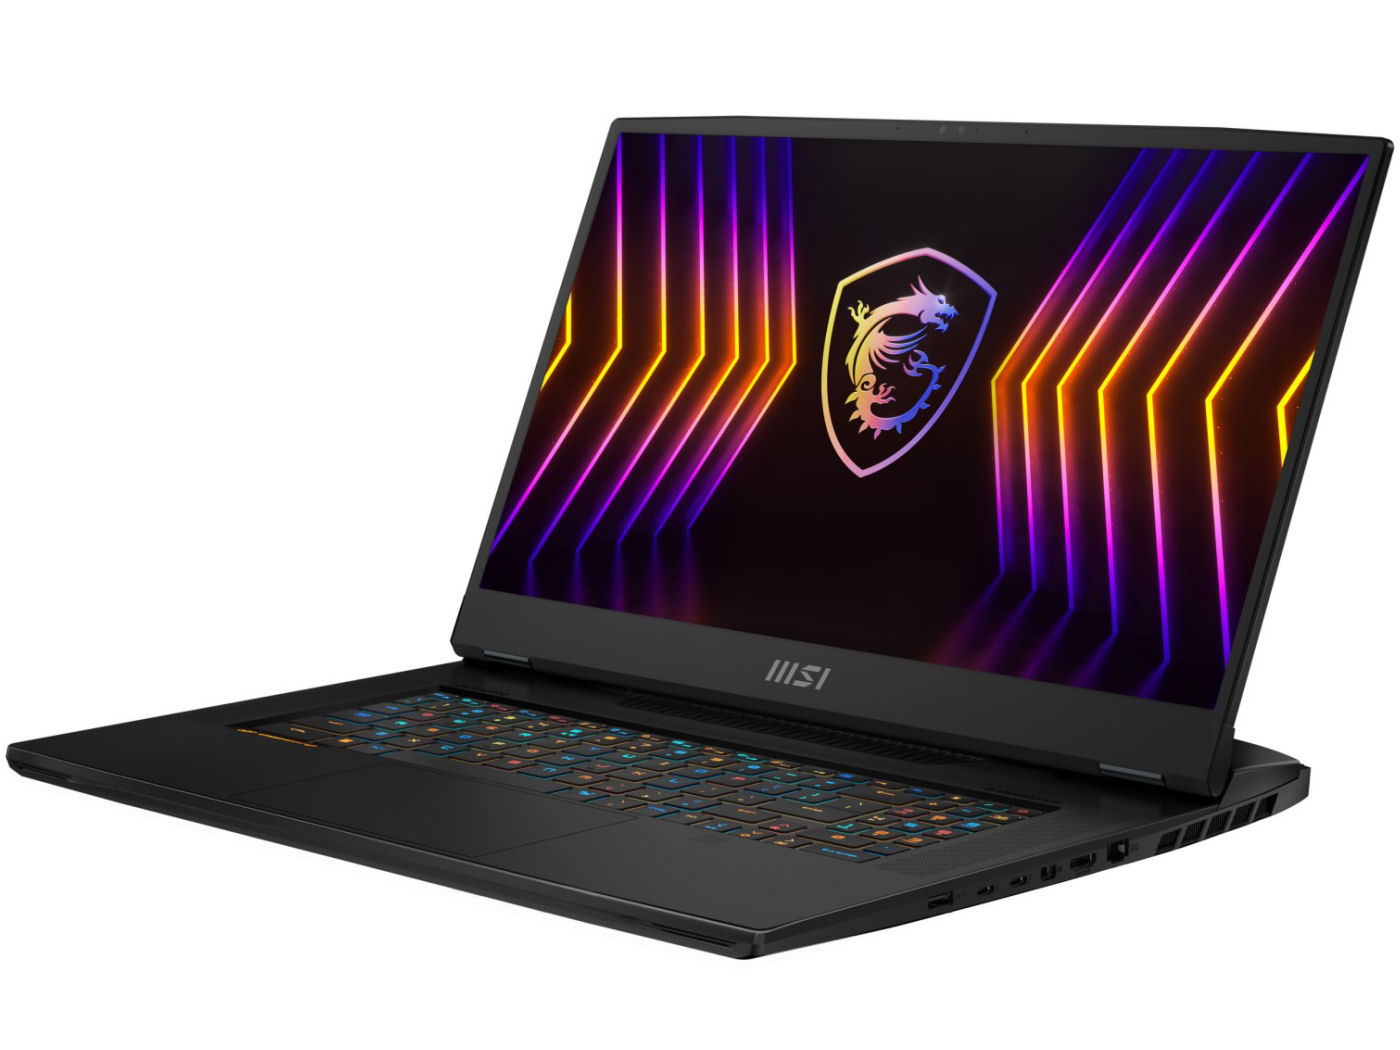
MSI Titan GT77 - jeden z najbardziej wydajnych laptopów w tej chwili
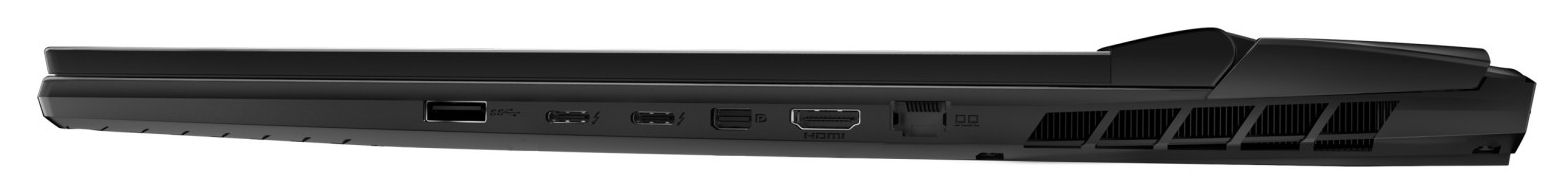
Na stronie Core i9-12900HX oraz GeForce RTX 3080 Ti Laptop (175 W TGP, 16 GB VRAM) są w stanie pracować konsekwentnie przy wysokich taktowaniach. Laptop generuje dość dużo ciepła i hałasu, co jest typowe dla tej klasy sprzętu. Dwa porty Thunderbolt 4 zapewniają opcje rozbudowy (np. zewnętrzne GPU, rozwiązania dokujące). Ponadto laptop ten posiada dobrze zaprojektowaną klawiaturę mechaniczną i bardzo przyzwoite czasy pracy na akumulatorze. To wszystko rzeczy, które obecny wariant dzieli ze swoim modelem rodzeństwa który wcześniej recenzowaliśmy.
Wyświetlacz to główna różnica między dwoma modelami Titana: panel 4K (120 Hz) w obecnym egzemplarzu recenzenckim przewyższa panel FHD (360 Hz) w drugim modelu pod względem rozdzielczości, jasności szczytowej i pokrycia kolorów (prawie 100% DCI-P3). Jest to więc najlepsza opcja, jeśli dokładność odwzorowania kolorów jest dla Ciebie ważna. Z kolei wyświetlacz FHD oferuje bardzo wysoką częstotliwość odświeżania i powinien uszczęśliwić niejednego gracza. Niestety, obu wyświetlaczom brakuje kontrastu.
Alienware x17 R2 jest godną alternatywą dla Titana, jeśli chodzi o wydajność. Oferuje jednak mniej opcji rozbudowy i zapewnia gorszy czas pracy na baterii.
Cena i dostępność
Płyta główna MSI Titan GT77 12UHS jest dostępna u takich sprzedawców jak Amazon.com. Recenzowana przez nas konfiguracja jest wyceniona na około 5 600 euro (5 980 dolarów).
MSI Titan GT77 12UHS
- 28/08/2022 v7 (old)
Sascha Mölck
Price comparison

