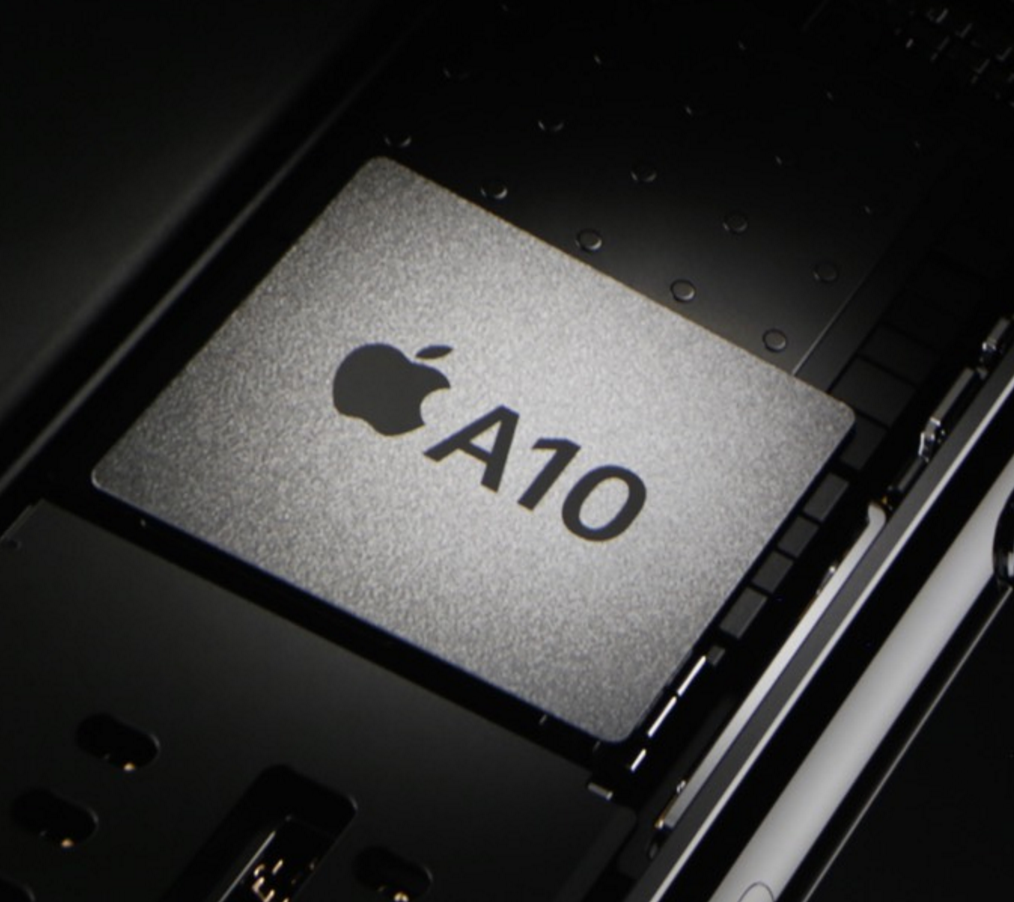
Apple A10 Fusion
-
| Nazwa robocza | APL1021 Hurricane / Zephyr |
| Seria | Apple Apple A-Series |
| Taktowanie | 2340 MHz |
| Liczba rdzeni / wątków | 4 / 2 |
| Liczba tranzystorów | 3300 mln |
| Technologia wytwarzania | 16 nm |
| Cechy | ARMv8 Instruction Set |
| GPU | Apple A10 Fusion GPU / PowerVR (900 MHz) |
| 64-bity | obsługa 64-bitów |
| Architecture | ARM |
| Data premiery | 08/09/2016 |
Testy
3DMark - 3DMark Ice Storm Unlimited Physics
min: 9189 przeciętny: 14249 mediana: 15479 (12%) maks: 15626 Points

3DMark - 3DMark Sling Shot Extreme (ES 3.1) Unlimited Physics
min: 1252 przeciętny: 1437 mediana: 1434.5 (13%) maks: 1627 Points
3DMark - 3DMark Sling Shot (ES 3.0) Unlimited Physics
min: 1408 przeciętny: 1525 mediana: 1518 (17%) maks: 1690 Points
Geekbench 6.7 - Geekbench 6.7.1 Single-Core
870 pkt. (20%)
Geekbench 6.7 - Geekbench 6.7.1 Multi-Core
1390 pkt. (5%)
...
HiSilicon Kirin 710A
Mediatek MT8183
Mediatek Helio G88
Mediatek MT8788
Mediatek Helio G81
Unisoc T7200 (T606)
Mediatek Helio G80
Apple A10 Fusion
Mediatek Helio G85
Unisoc T7250 (T615)
Unisoc T7255 (T616)
Qualcomm Snapdragon 732G
...
Apple M5 10-Core
max:
Apple M5 Max
0%
100%
Geekbench 5.5 - Geekbench 5.1 - 5.5 64 Bit Single-Core
min: 766 przeciętny: 773 mediana: 777 (26%) maks: 777 pkt.
...
Qualcomm Snapdragon 860
HiSilicon Kirin 990
HiSilicon Kirin 990 5G
Apple A10 Fusion
...
Apple M5 10-Core
0%
100%
Geekbench 5.5 - Geekbench 5.1 - 5.5 64 Bit Multi-Core
min: 1361 przeciętny: 1403 mediana: 1421 (3%) maks: 1426 pkt.
...
Mediatek Helio G85
UNISOC T618
HiSilicon Kirin 710
Unisoc T7250 (T615)
Mediatek MT8788
Apple A10 Fusion
Unisoc T7255 (T616)
Qualcomm Snapdragon 710
UNISOC T619
Mediatek Helio P90
...
Apple M5 10-Core
max:
0%
100%
Geekbench 5.0 - Geekbench 5.0 64 Bit Single-Core
min: 767 przeciętny: 771 mediana: 771 (3%) maks: 775 pkt.
Geekbench 5.0 - Geekbench 5.0 64 Bit Multi-Core
min: 1426 przeciętny: 1429 mediana: 1429 (5%) maks: 1432 pkt.
Geekbench 4.4 - Geekbench 4.1 - 4.4 64 Bit Single-Core
min: 2672 przeciętny: 3233 mediana: 3499 (32%) maks: 3527 pkt.
Geekbench 4.4 - Geekbench 4.1 - 4.4 64 Bit Multi-Core
min: 4508 przeciętny: 5461 mediana: 5922 (6%) maks: 5952 pkt.
Geekbench 4.0 - Geekbench 4.0 64 Bit Single-Core
min: 3476 przeciętny: 3483 mediana: 3483 (38%) maks: 3490 pkt.
Geekbench 4.0 - Geekbench 4.0 64 Bit Multi-Core
min: 5585 przeciętny: 5608 mediana: 5607.5 (7%) maks: 5630 pkt.
Mozilla Kraken 1.1 - Kraken 1.1 Total Score *
min: 1026 przeciętny: 1178 mediana: 1113 (1%) maks: 1531 ms
Octane V2 - Octane V2 Total Score
min: 19783 przeciętny: 25316 mediana: 26053 (17%) maks: 27967 Points
WebXPRT 3 - WebXPRT 3 Score
min: 79 przeciętny: 95 mediana: 95 (16%) maks: 111 Points
AnTuTu v6 - AnTuTu v6 Total Score
min: 142532 przeciętny: 153966 mediana: 153966 (52%) maks: 165399 Points
AnTuTu v7 - AnTuTu v7 MEM
min: 6141 przeciętny: 9979 mediana: 10439 (32%) maks: 12895 Points
AnTuTu v7 - AnTuTu v7 UX
min: 32746 przeciętny: 45782 mediana: 47936.5 (59%) maks: 54510 Points
AnTuTu v7 - AnTuTu v7 GPU
min: 45772 przeciętny: 54850 mediana: 52519 (16%) maks: 68591 Points
AnTuTu v7 - AnTuTu v7 CPU
min: 50770 przeciętny: 65083 mediana: 60084.5 (37%) maks: 89394 Points
AnTuTu v7 - AnTuTu v7 Total Score
min: 160578 przeciętny: 175694 mediana: 165802 (29%) maks: 210596 Points
PassMark PerformanceTest Mobile V1 - PerformanceTest Mobile V1 CPU Tests
min: 49294 przeciętny: 49329 mediana: 49329 (6%) maks: 49364 Points
- Zakres wyników testów referencyjnych dla tej karty graficznej
 - Średnia wartość wyników testów referencyjnych dla tej karty graficzne
* Mniejsze liczby oznaczają wyższą wydajność
* Mniejsze liczby oznaczają wyższą wydajność
v1.35
Testy dla Apple A10 Fusion procesor
Apple iPad 7 2019: Apple A10 Fusion GPU / PowerVR, 10.20", 0.5 kg
Zewnętrzna recenzja » Apple iPad 7 2019