
Recenzja Acer Chromebook 13 CB5-311
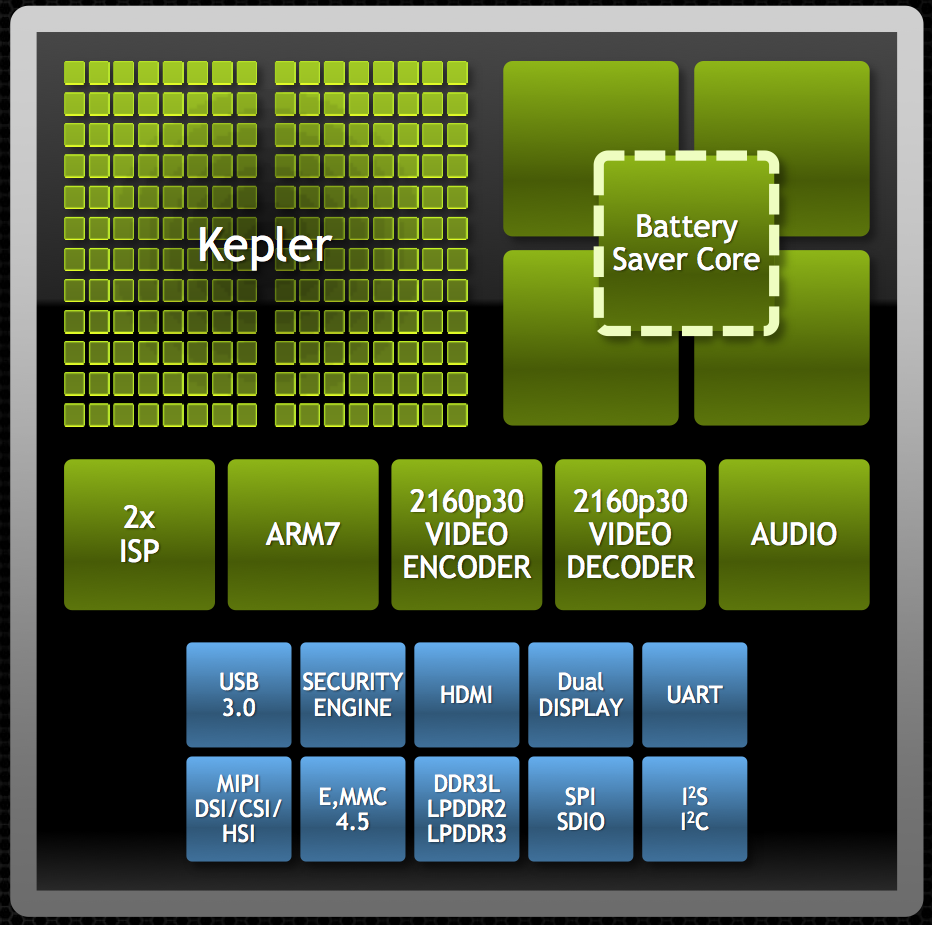
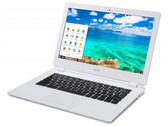
Chromebook to, jak wiadomo, mały laptop służący do korzystania z internetu, posiadający oparty na Linuksie system operacyjny Chrome OS. Model Acer Chromebook 13 CB5-311 ma 13-calową matrycę Full HD. Niestety ten wyświetlacz odznacza się wąskimi kątami widzenia. Testowany model miał także procesor Tegra K1 i pamięć eMMC o pojemności 16 GB.
Nvidia Tegra K1, 13.3", 1.5 kg