
Werdykt - Dużo miejsca na ulepszenia, słaby tryb wydajności
Po włączeniu "Trybu wydajności" laptop do gier nie spełnia oczekiwań pod względem wydajności. Z drugiej strony jest nieco cichszy niż niektórzy jego konkurenci, a jeśli potrzebujesz więcej mocy, nadal możesz przełączyć się na bardzo głośny "tryb Turbo". Chcielibyśmy jednak mieć tryb pomiędzy tymi dwoma. Pozytywnie wyróżniają się również duże możliwości rozbudowy i dobre wyposażenie: 4 sloty RAM i 3 sloty SSD, a do tego wysokiej jakości mini panel LED i szybkie Wi-Fi 7.
Poniżej Wi-Fi 6E szybkość transferu jest jednak szczególnie powolna w porównaniu. Nieco irytujące jest również to, że pokrywa wyświetlacza zamyka się zbyt szybko. Chociaż dysk SSD jest szybki, w pewnym momencie jest dławiony przy dłuższym obciążeniu.
Za
Przeciw
Cena i dostępność
W naszej konfiguracji testowej laptop do gier jest dostępny od około 3850 euro (około 4500 USD), na przykład na stronie notebooksbilliger.de.
- $2,797.09Acer Predator Helios Neo 18 AI Gaming Laptop | Intel Core Ultra 9 Processor 275HX | NVIDIA GeForce RTX 5070 Ti | 18" WQXGA 240Hz G-SYNC | 32GB DDR5 | 2TB Gen 4 SSD | Killer Wi-Fi 6E | PHN18-72-9474
- $3,379.99acer Predator Helios 18 AI Gaming Laptop 18" 250Hz 1000 nits Mini-LED WQXGA (Intel Ultra 9-275HX, GeForce RTX 5080 16GB, 32GB DDR5, 1TB SSD, 2 Thunderbolt 5, Win 11 Home) w/DKZ USB Port Expander
- $1,999.99Acer Predator Helios Neo 18 AI Gaming Laptop | Intel Core Ultra 9 Processor 275HX | NVIDIA GeForce RTX 5070 Ti | 18" WQXGA 240Hz G-SYNC | 16GB DDR5 | 1TB Gen 4 SSD | Killer Wi-Fi 6E | PHN18-72-92Y3
Spis treści
- Werdykt - Dużo miejsca na ulepszenia, słaby tryb wydajności
- Specyfikacje
- Obudowa i funkcje: Predator przyjazny dla modernizacji
- Urządzenia wejściowe - przycisk Predator i dużo RGB
- Wyświetlacz - 1,600p mini LED
- Wydajność - nieco poniżej średniej w trybie wydajności
- Emisje i energia - zasilacz 400 W!
- Ogólna ocena Notebookcheck
- Możliwe porównanie alternatyw
W zeszłym roku kupiliśmy Heliosa 18 z mini panelem LED, Core i9-14900HXi GeForce RTX 4090 jako "wszechstronny, beztroski pakiet" dla graczy. Nieco krytykowano sterowanie wentylatorem, zużycie energii i dławienie dysku SSD. Co Acer zrobił z tym w tym roku?
Specyfikacje
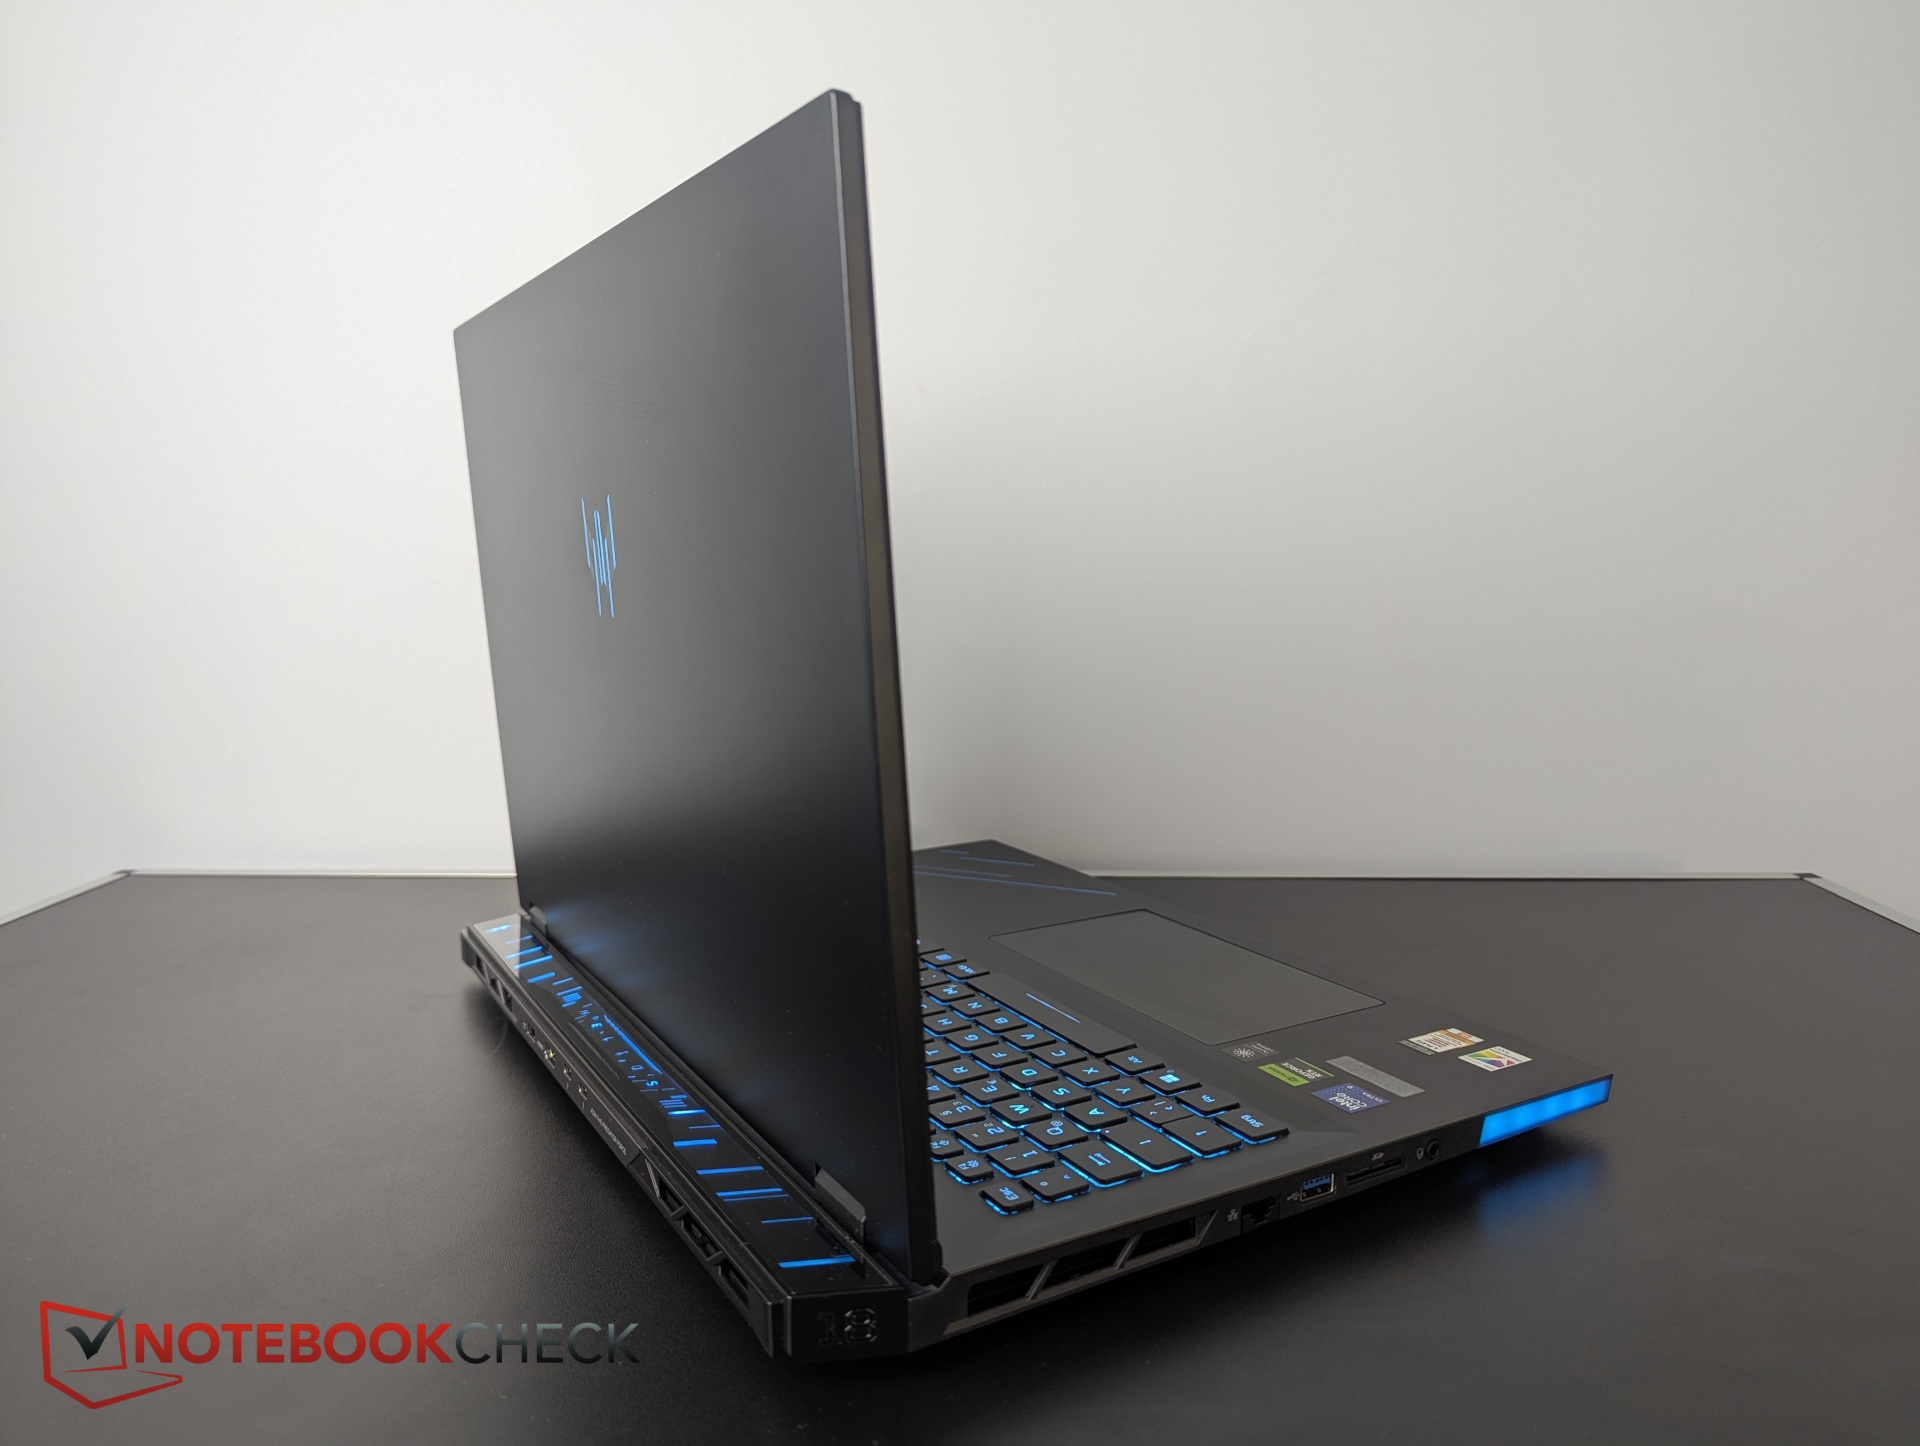
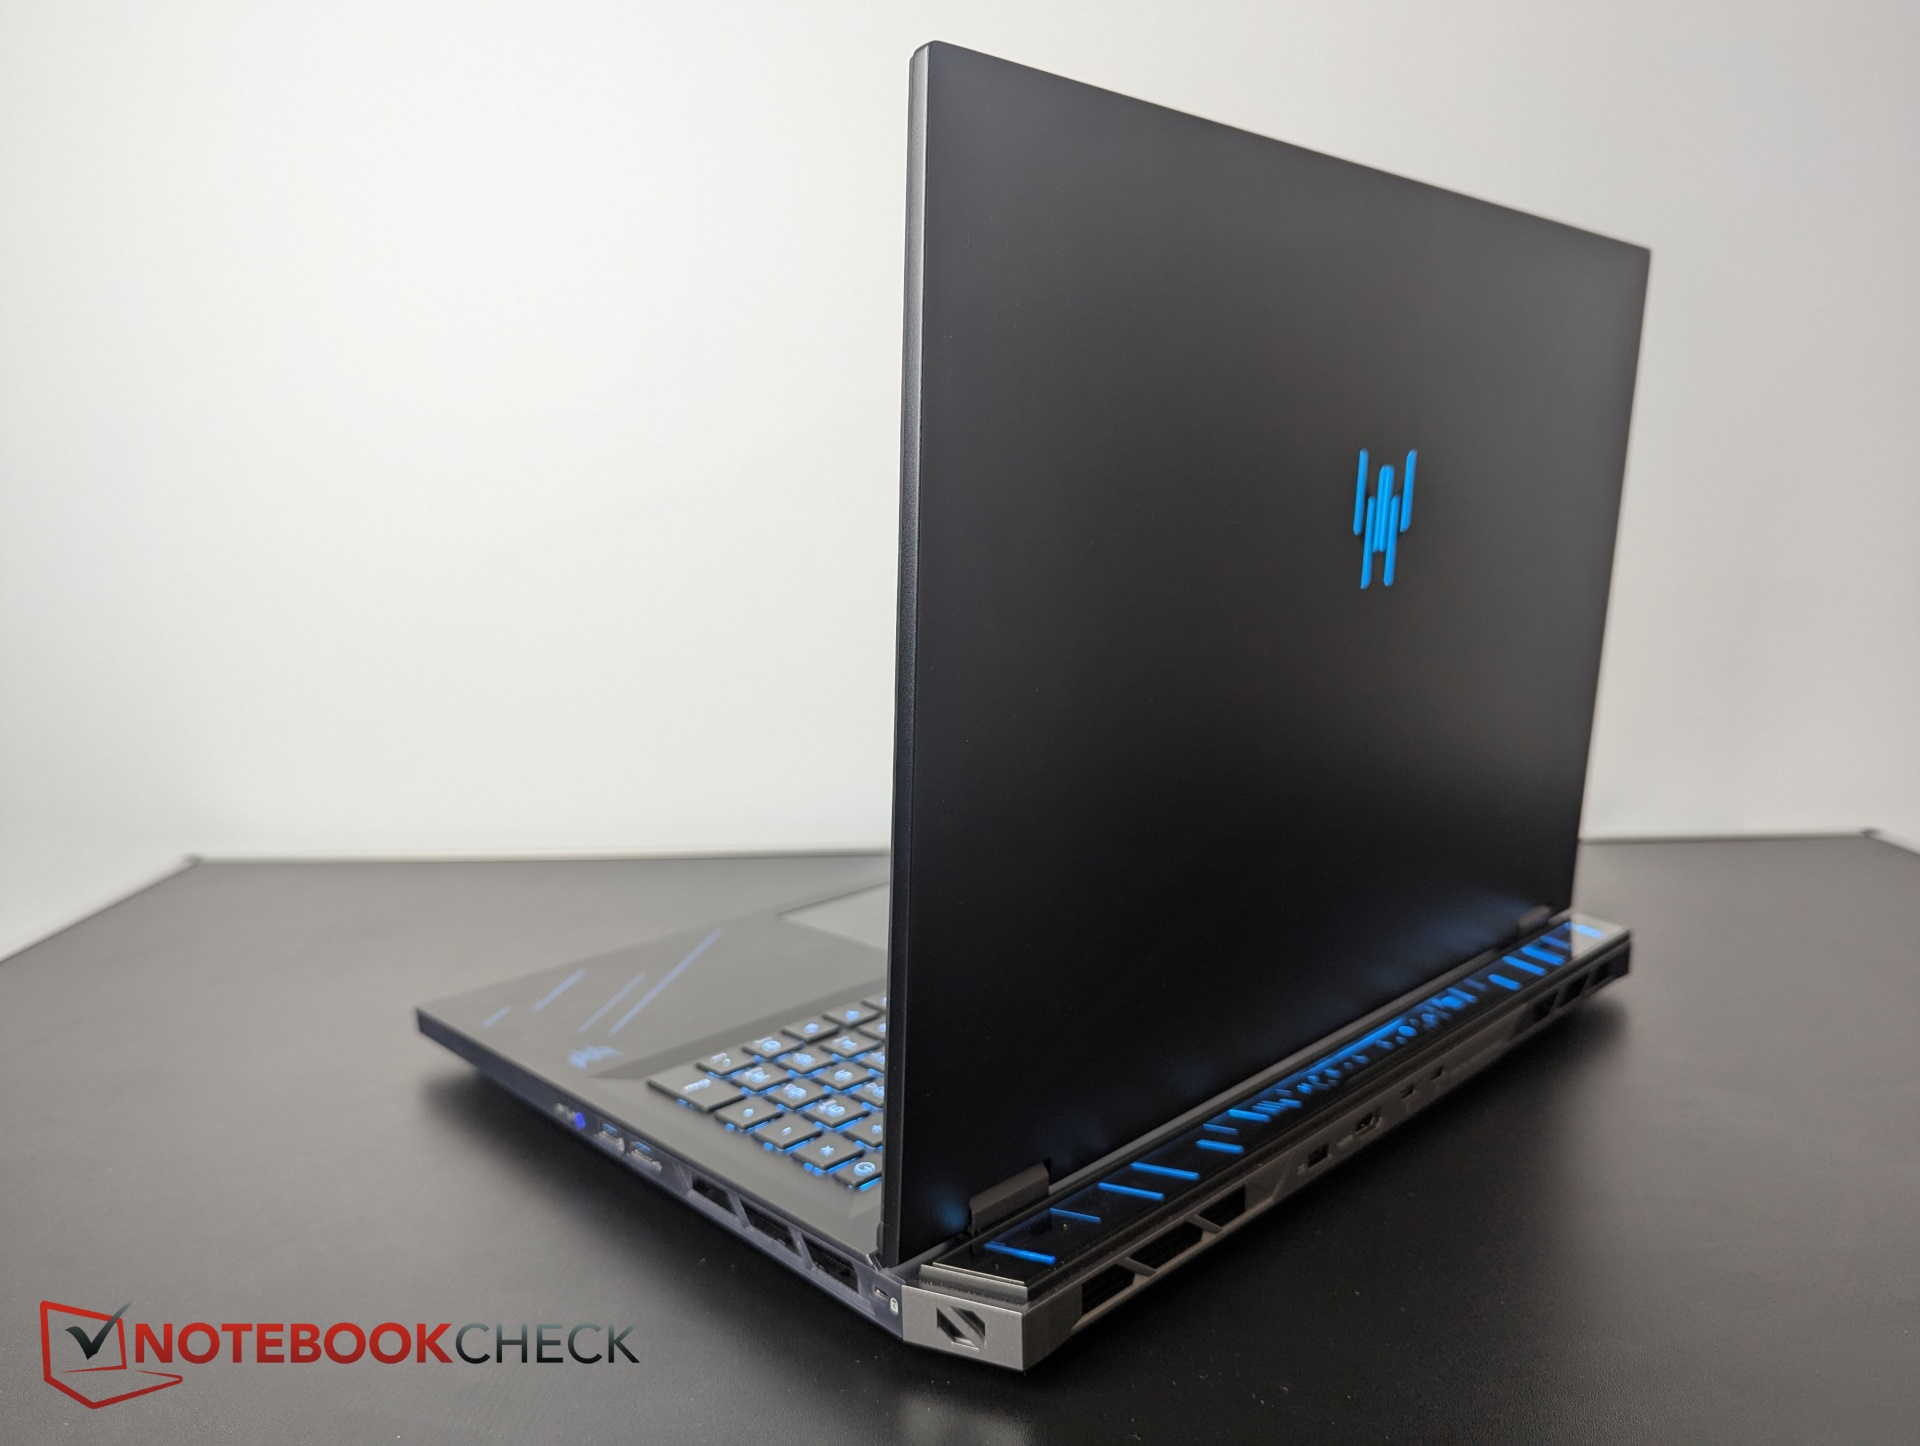
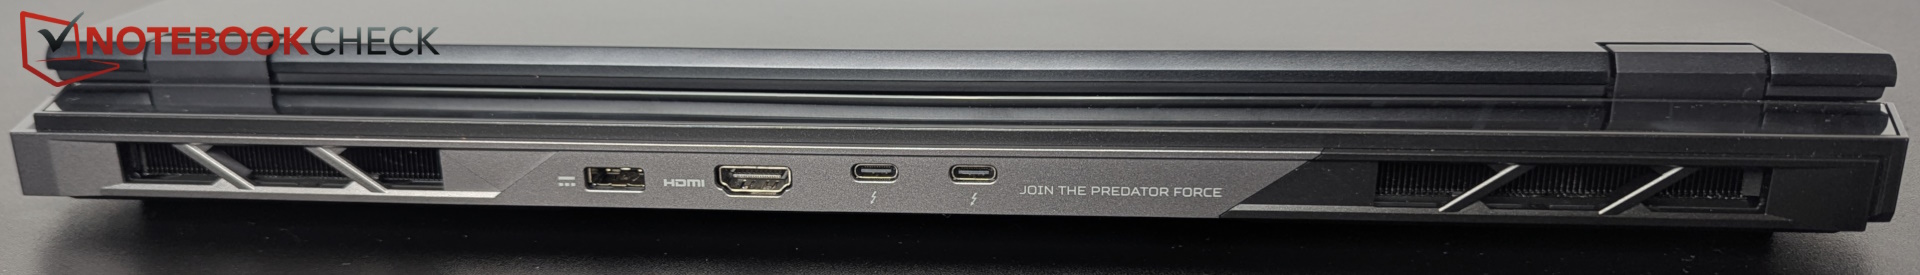
Obudowa i funkcje: Predator przyjazny dla modernizacji
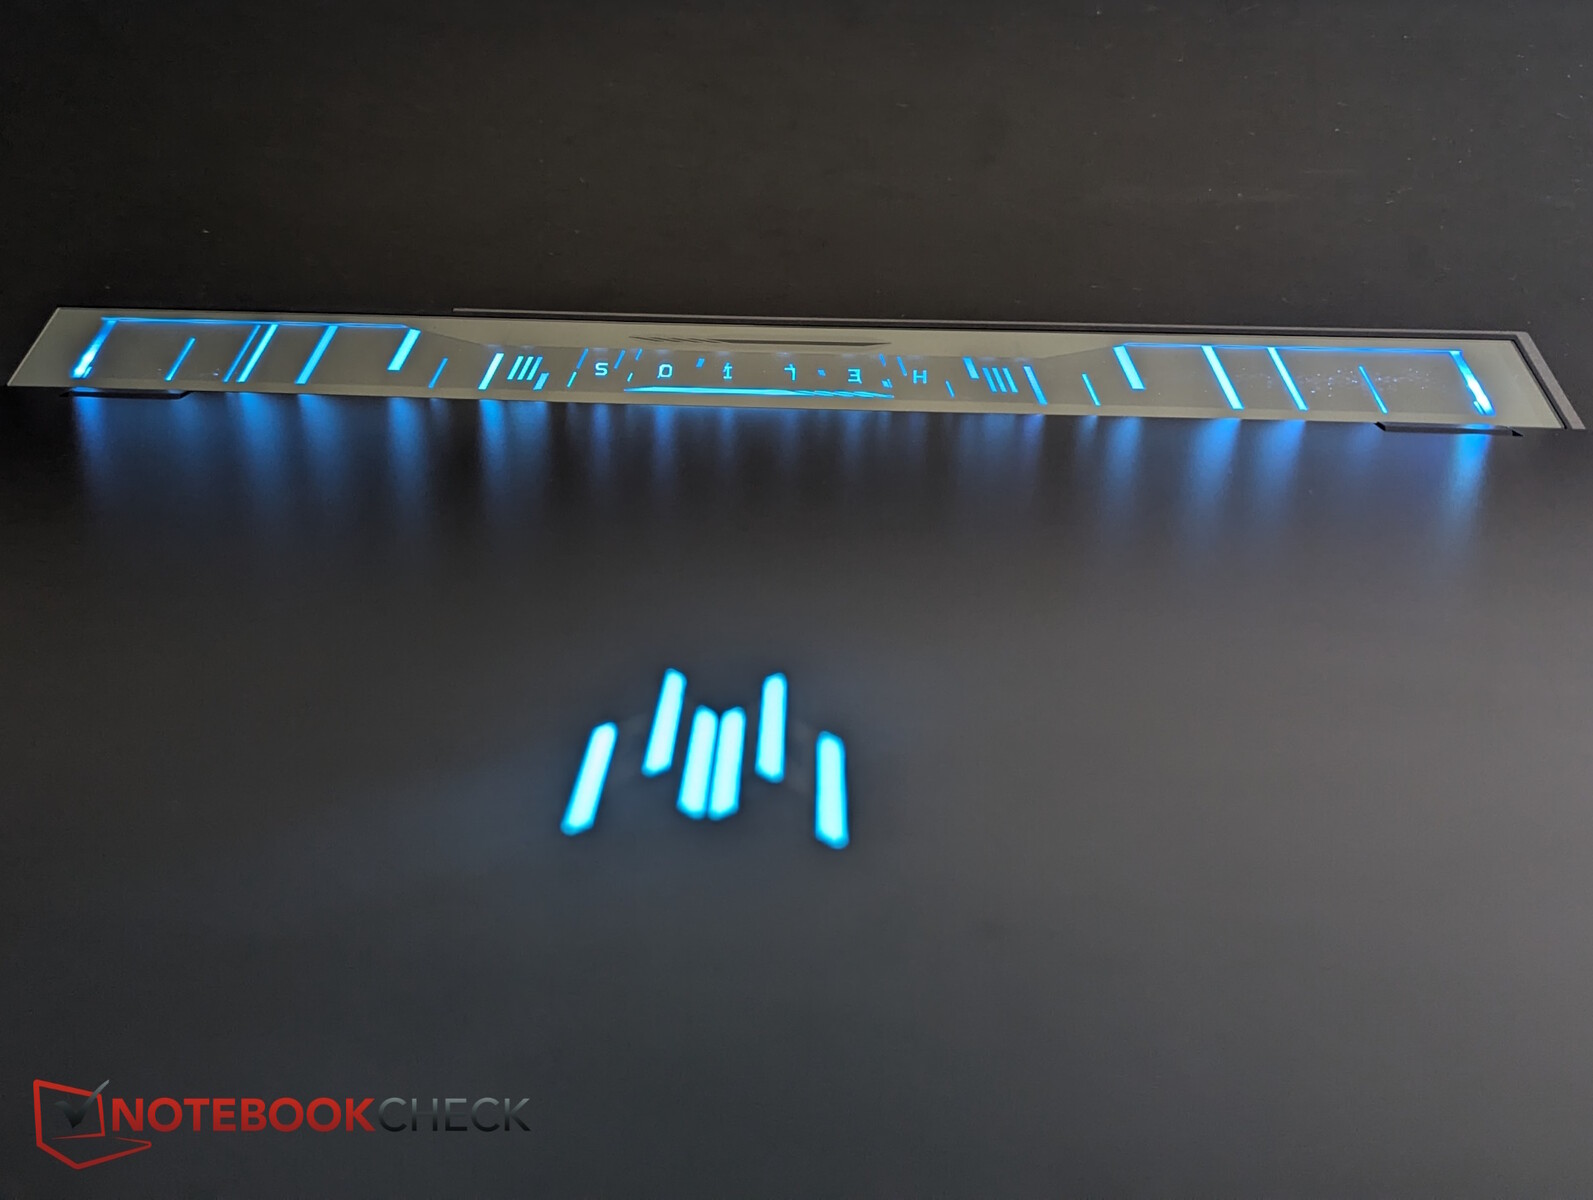
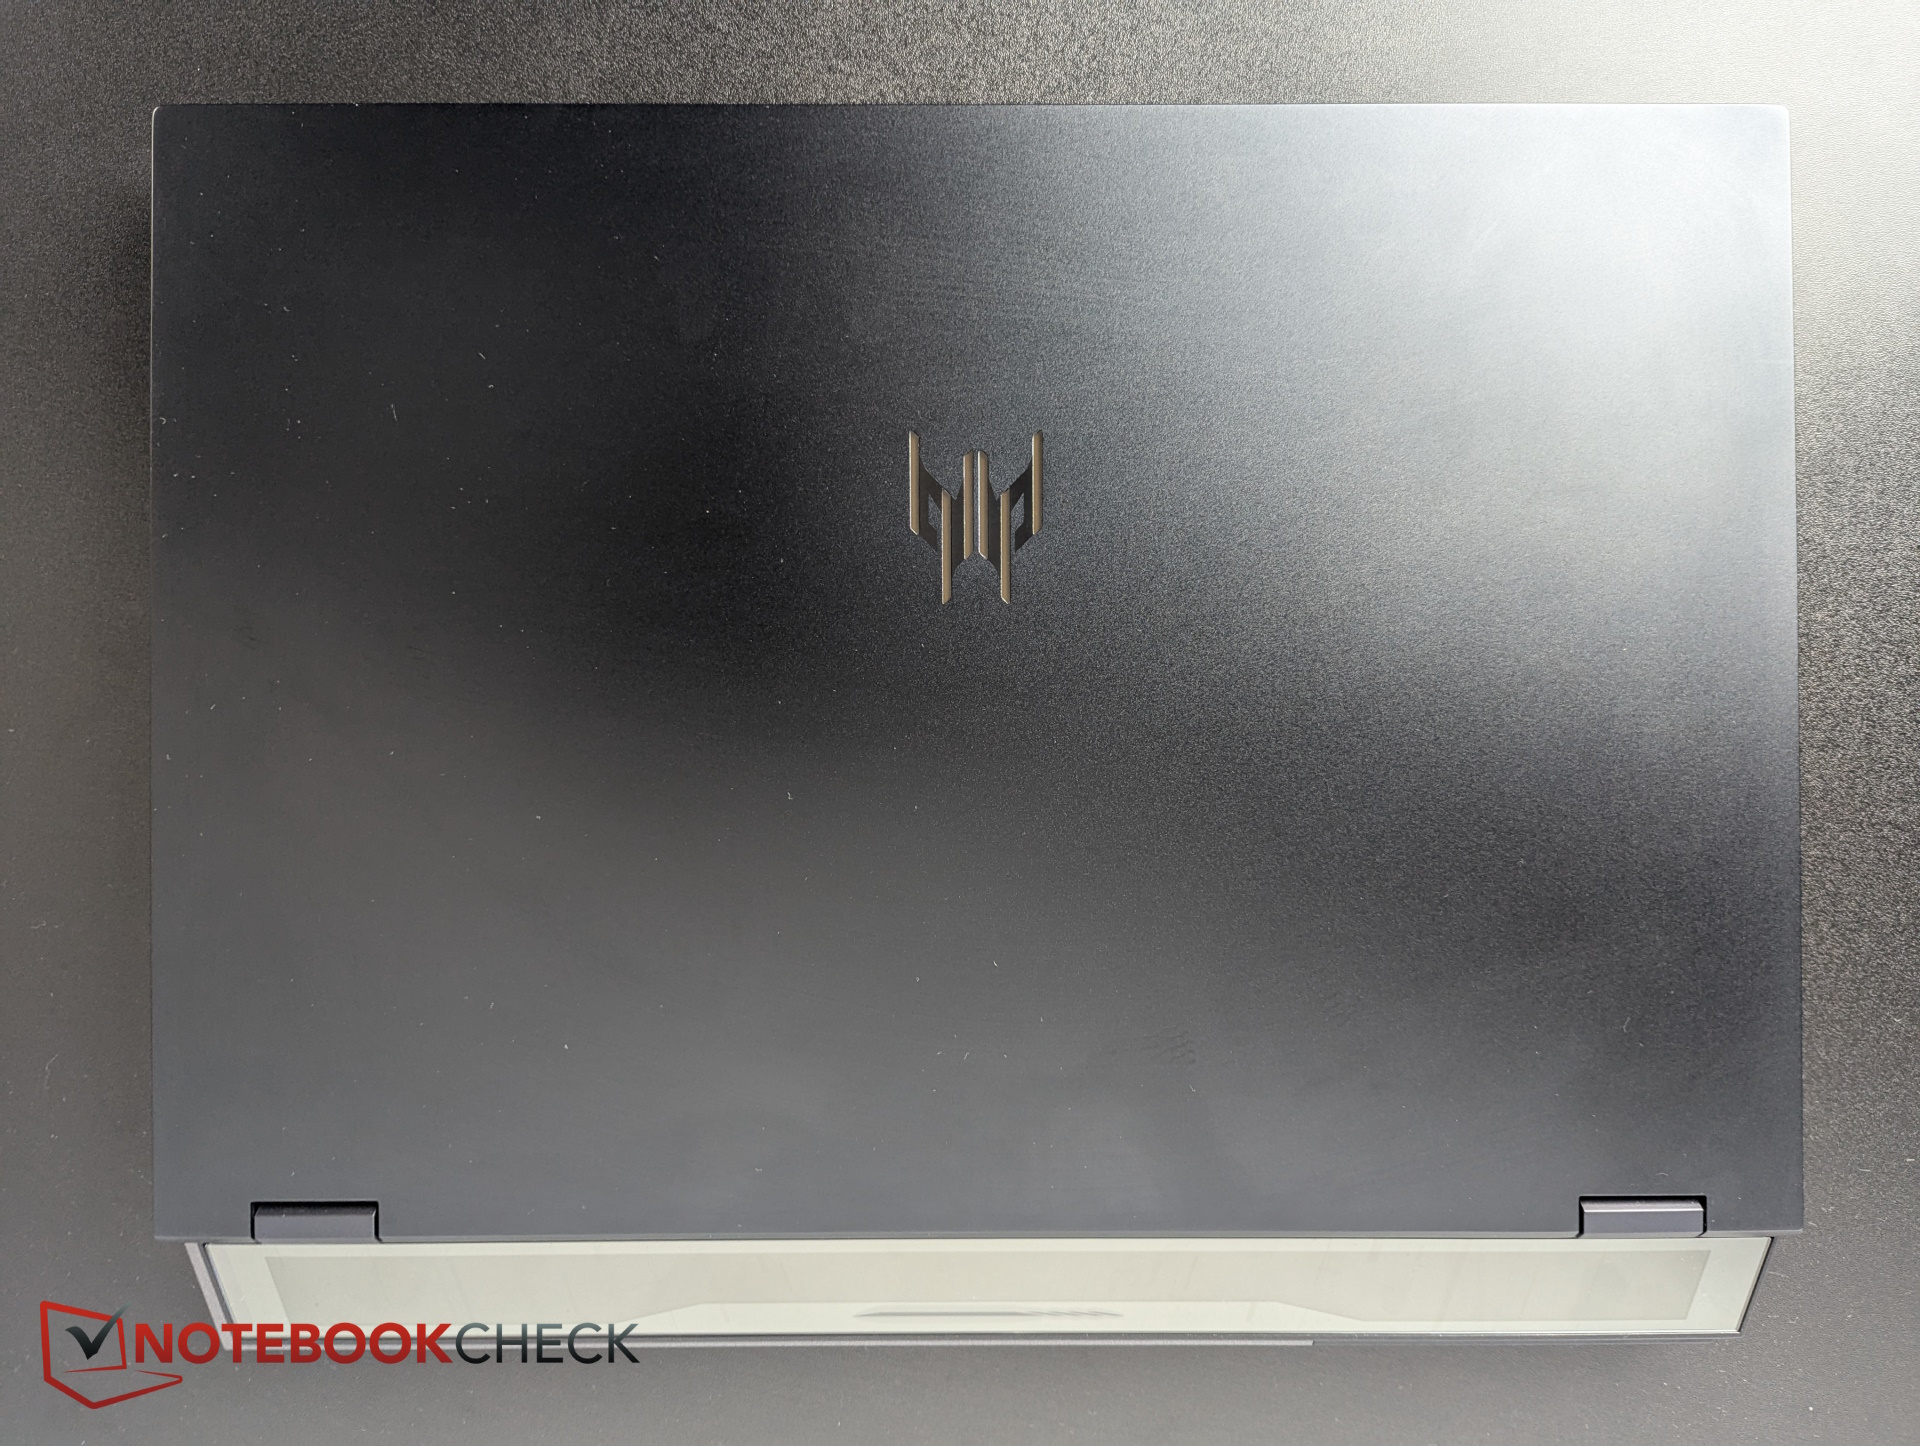
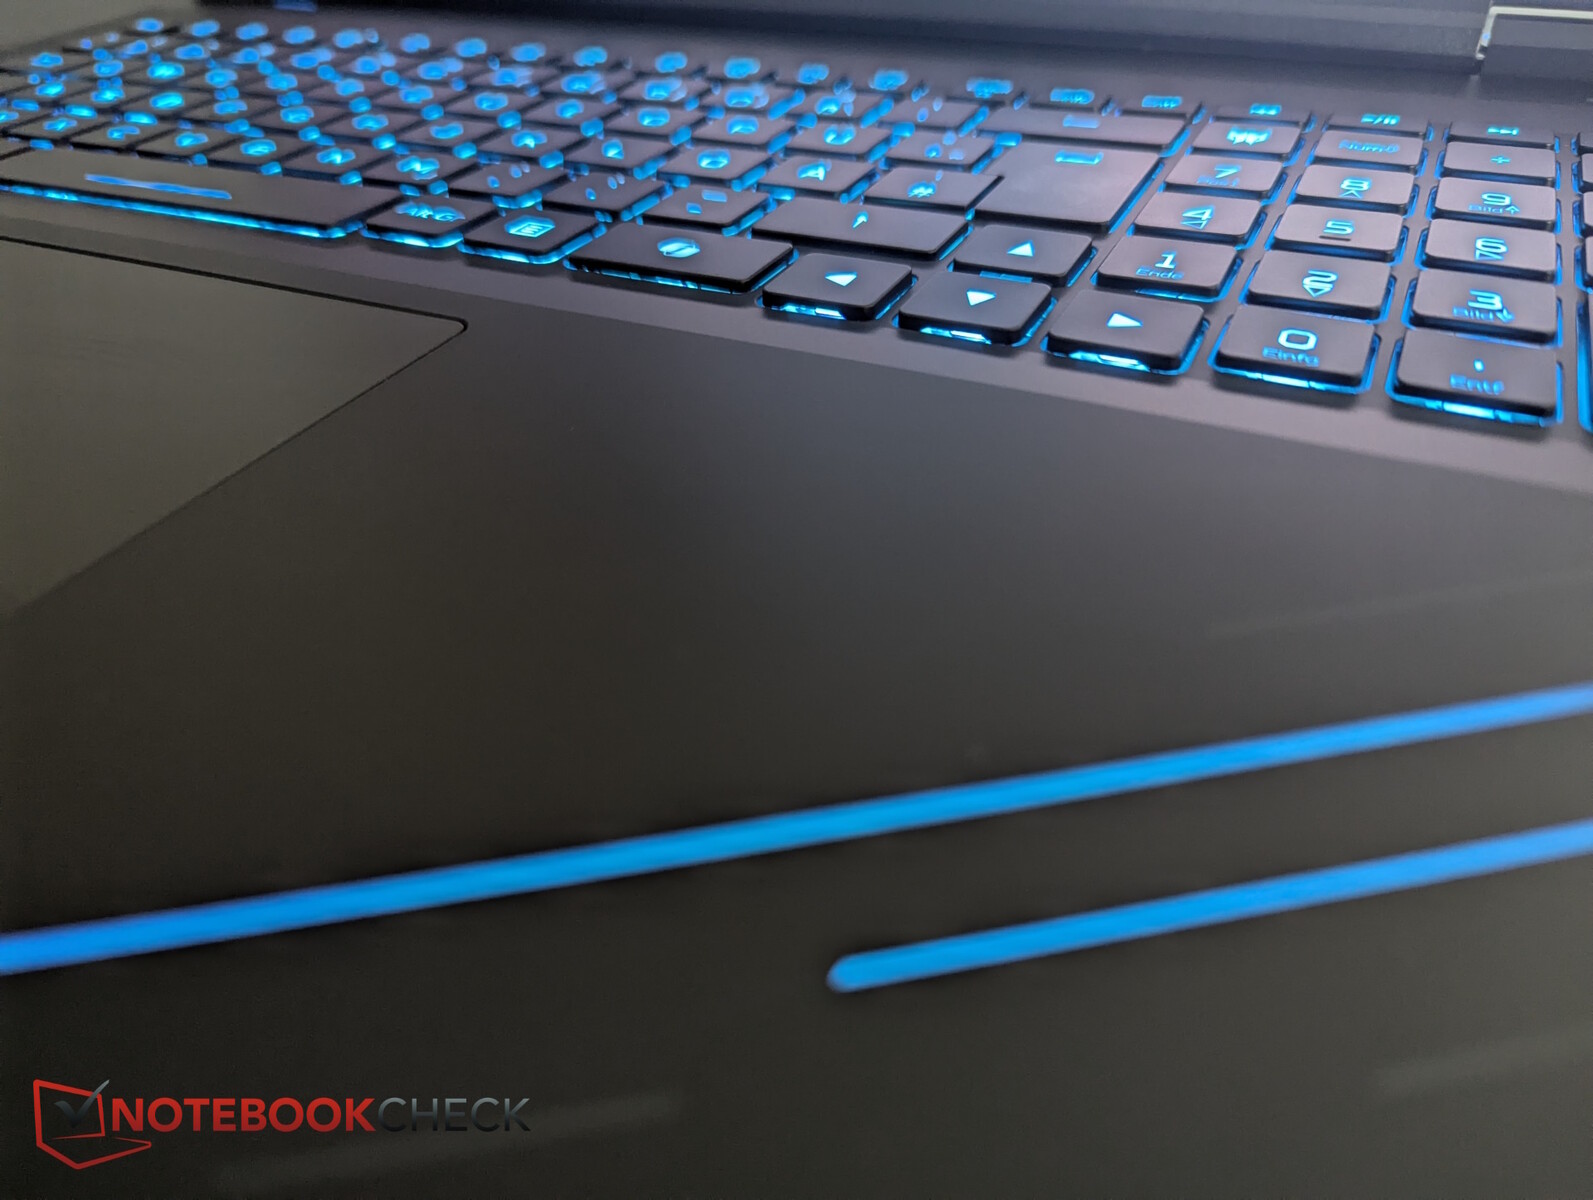
Na pierwszy rzut oka czarna obudowa z układem chłodzenia wystającym z tyłu nie wydaje się być zmieniona. Kiedy jednak zapalą się wszystkie światła, można dostrzec pewne różnice w stosunku do Poprzednika. Na przykład, jest teraz pasek LED, który owija się wokół przedniej lewej krawędzi. Podstawa, pokrywa i wylot powietrza są teraz również podświetlane.
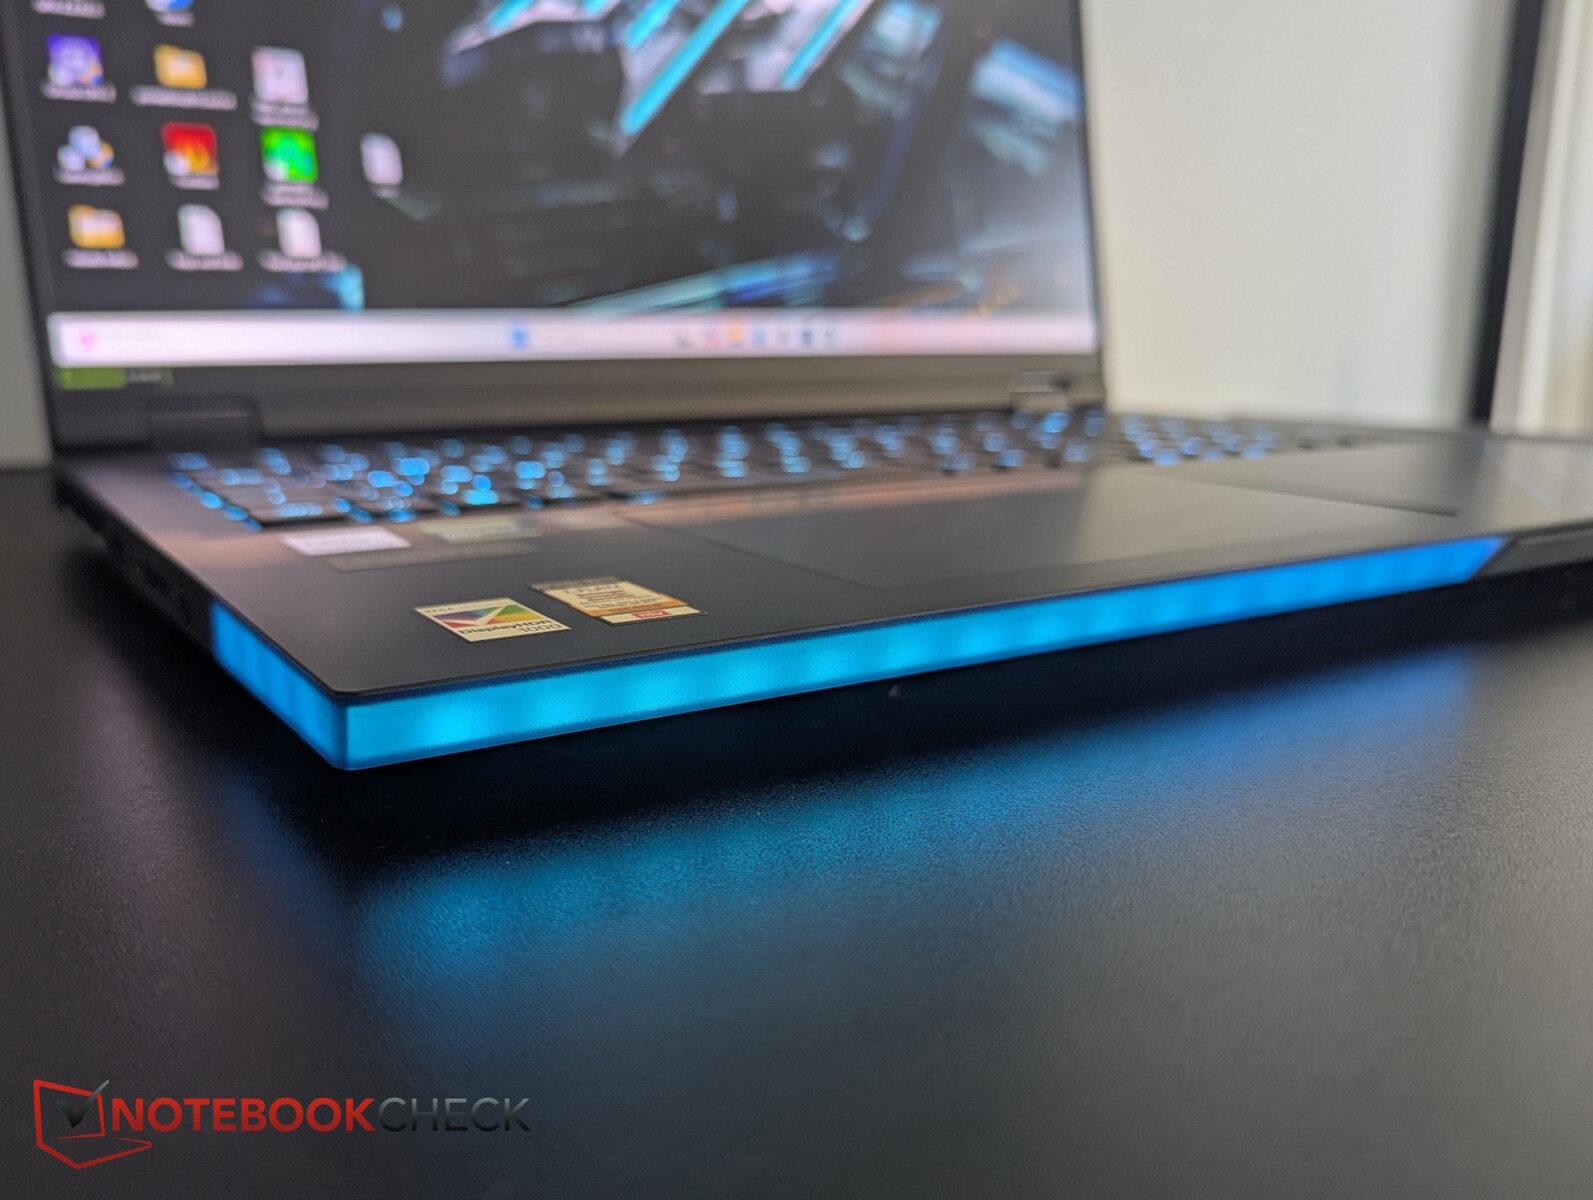

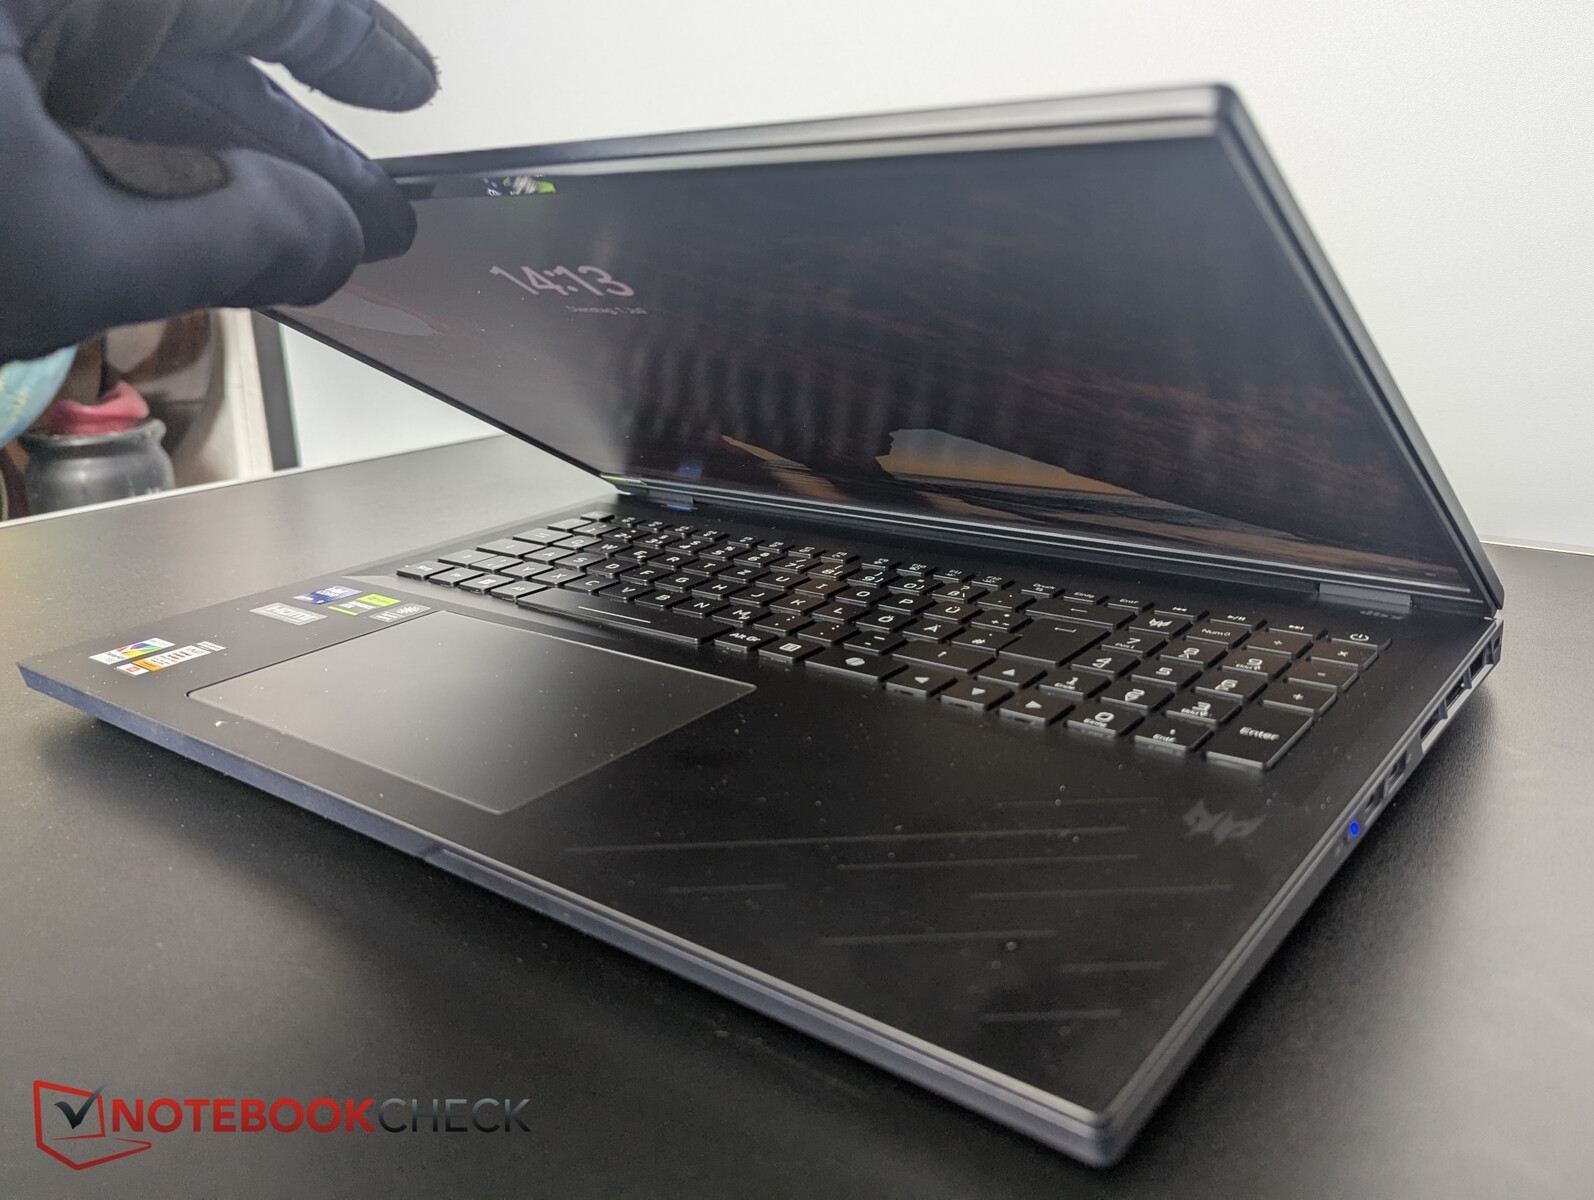
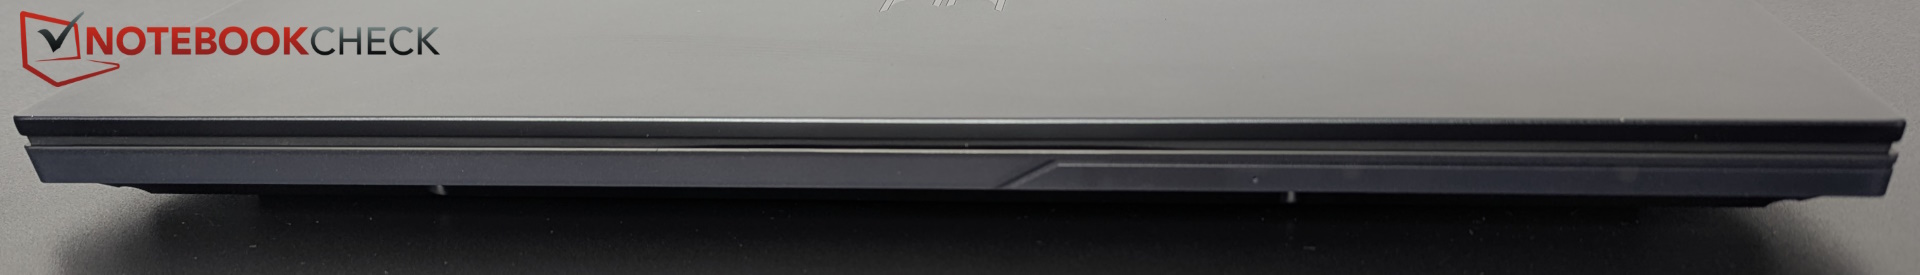
Pokrywa (otwiera się do około 160 stopni, ale zamyka się zbyt wcześnie) i podstawa są wykonane z aluminium, zapewniając dobrą stabilność. Spód i ramka wyświetlacza są wykonane z tworzywa sztucznego.
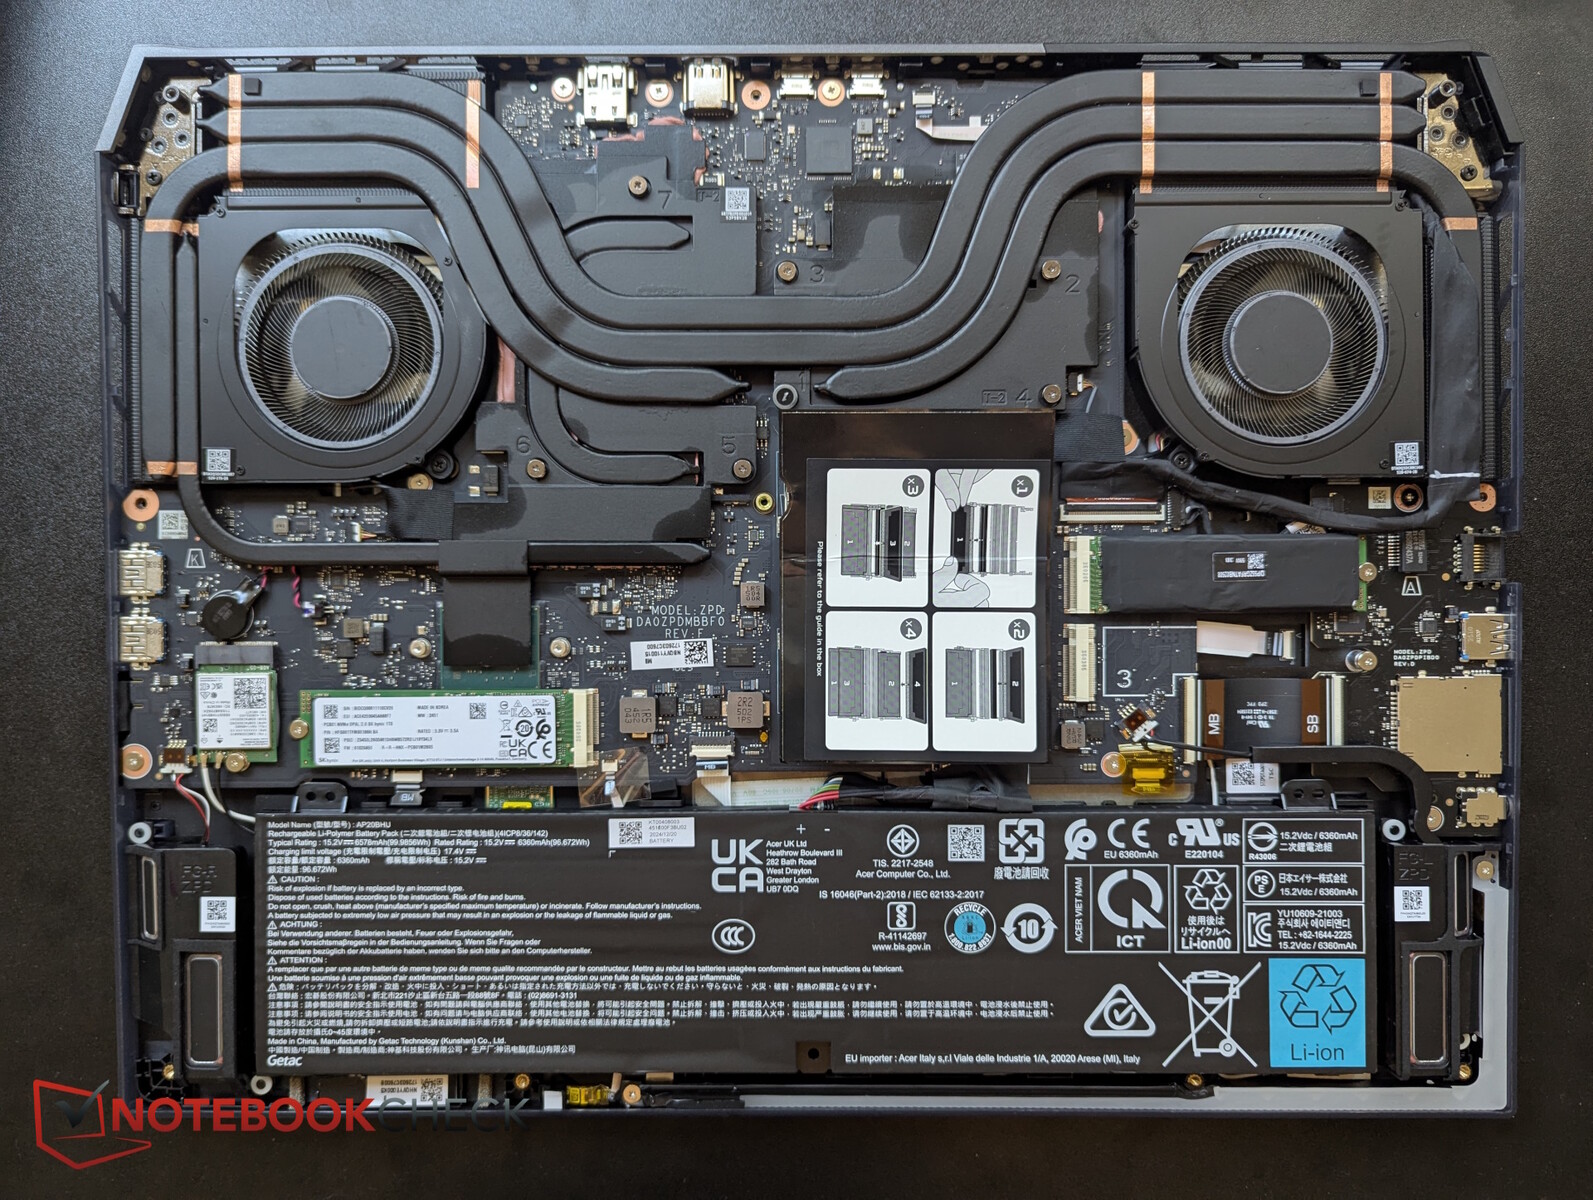
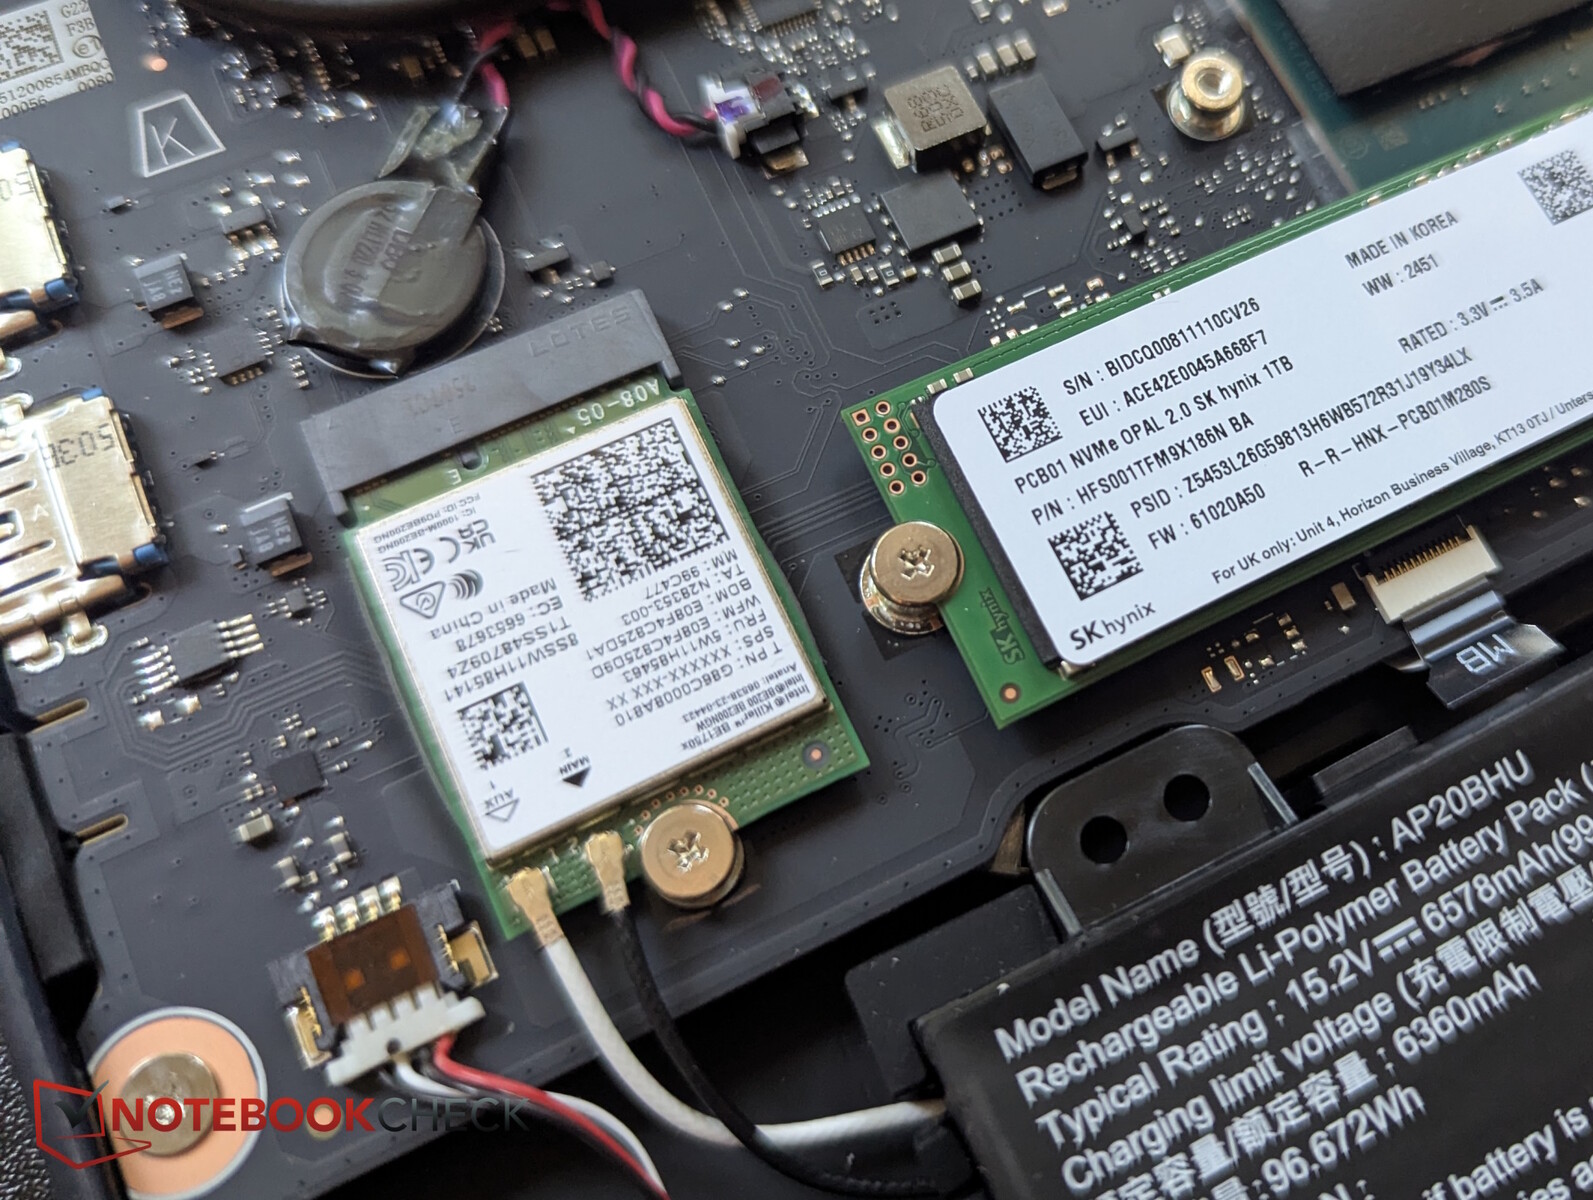
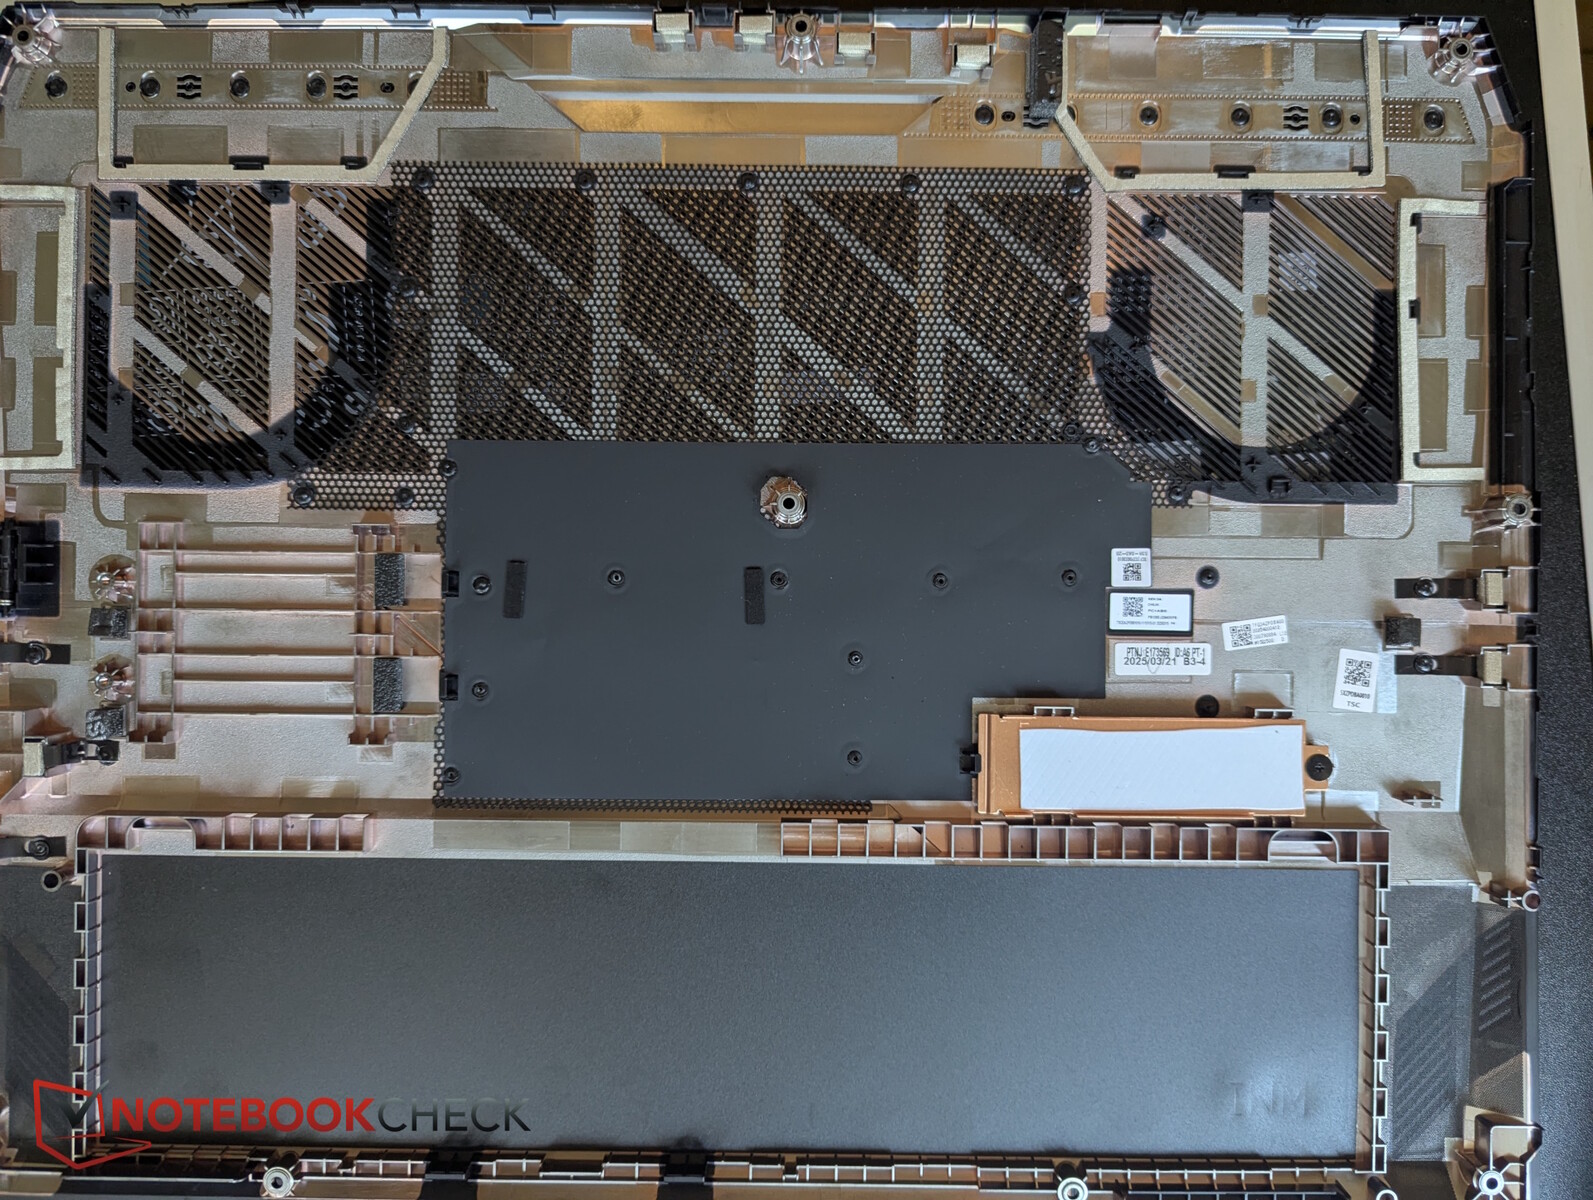
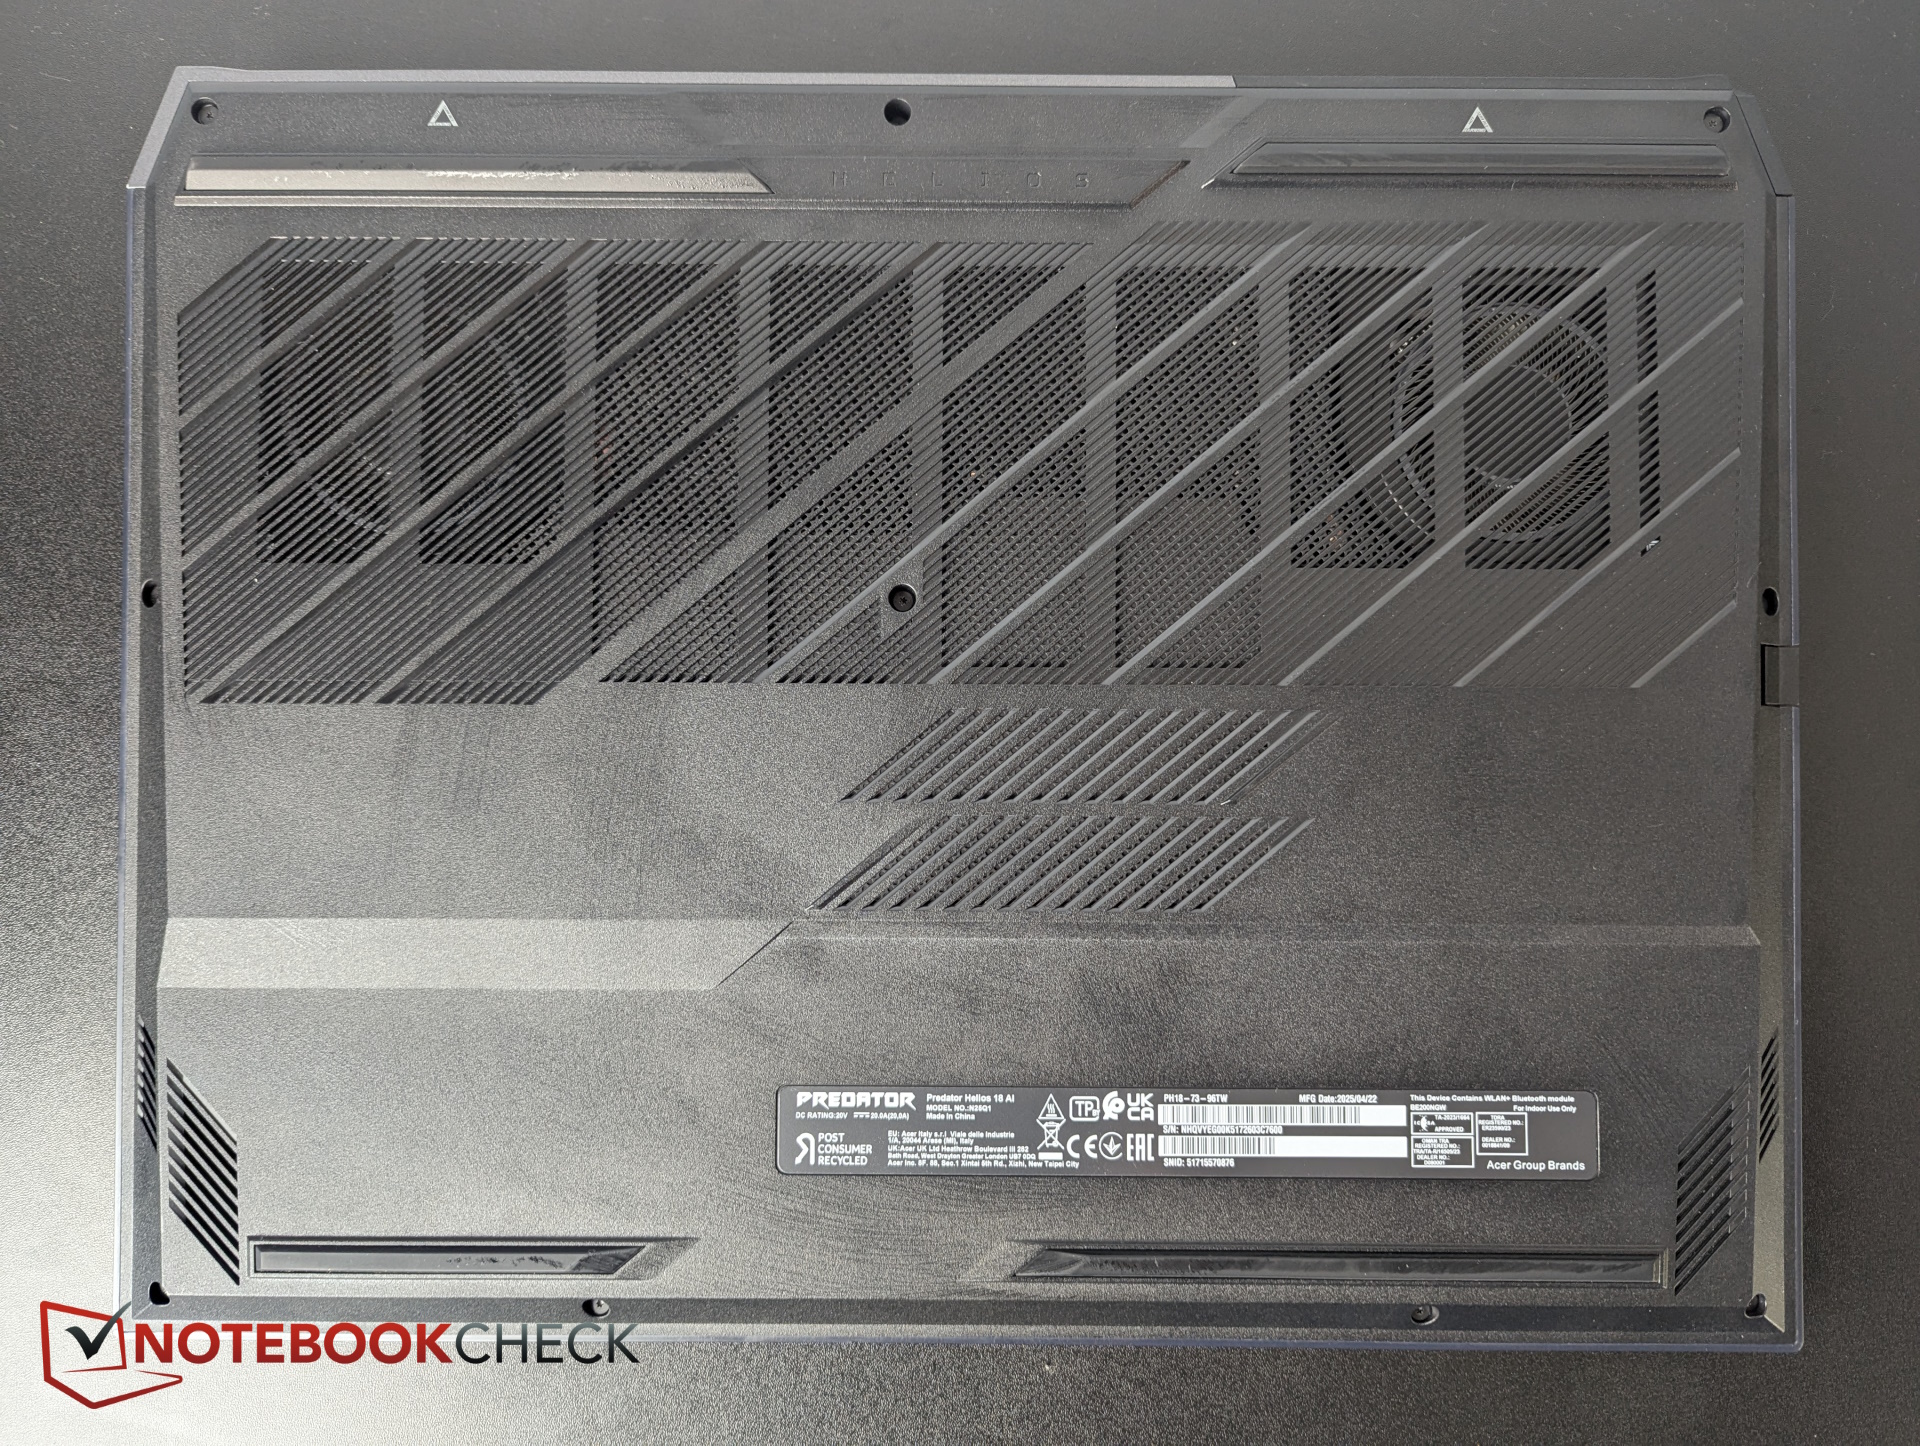
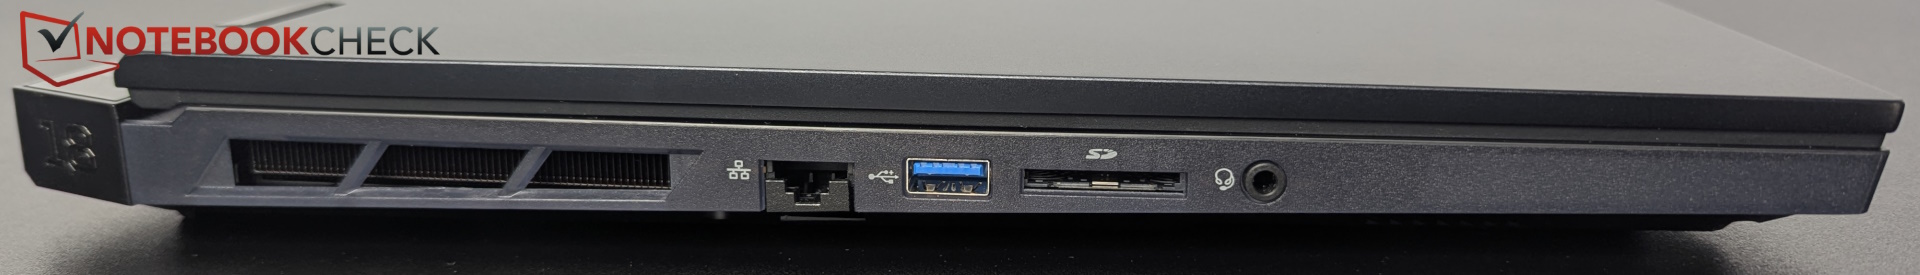
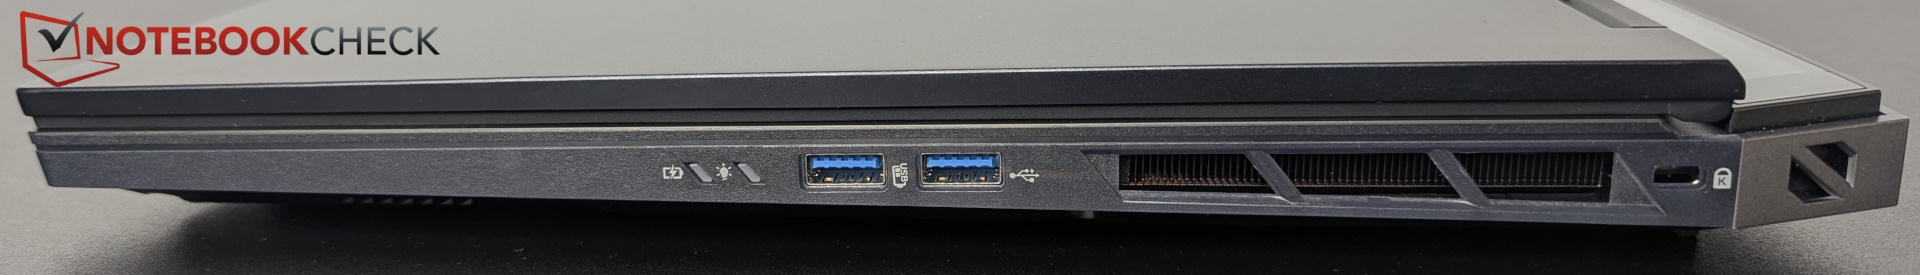
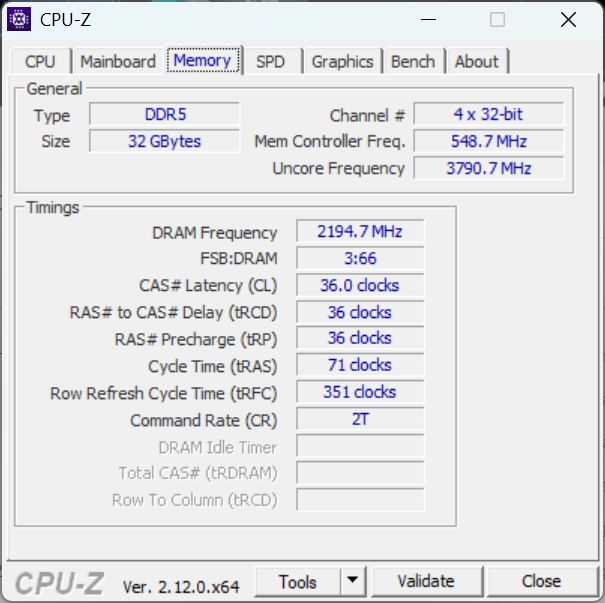
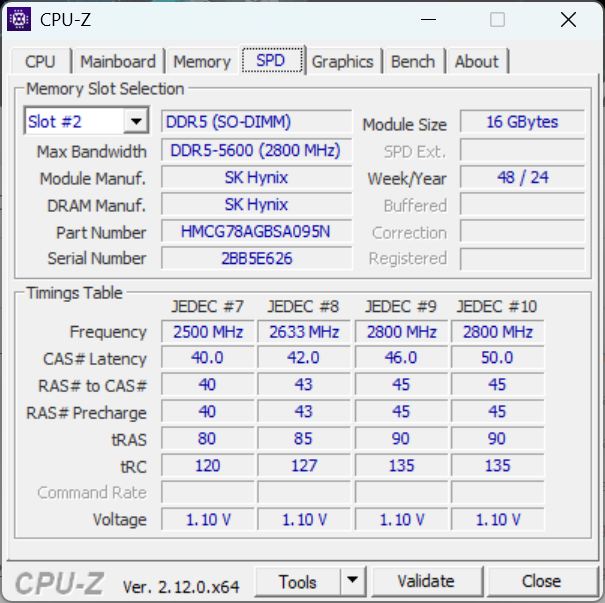
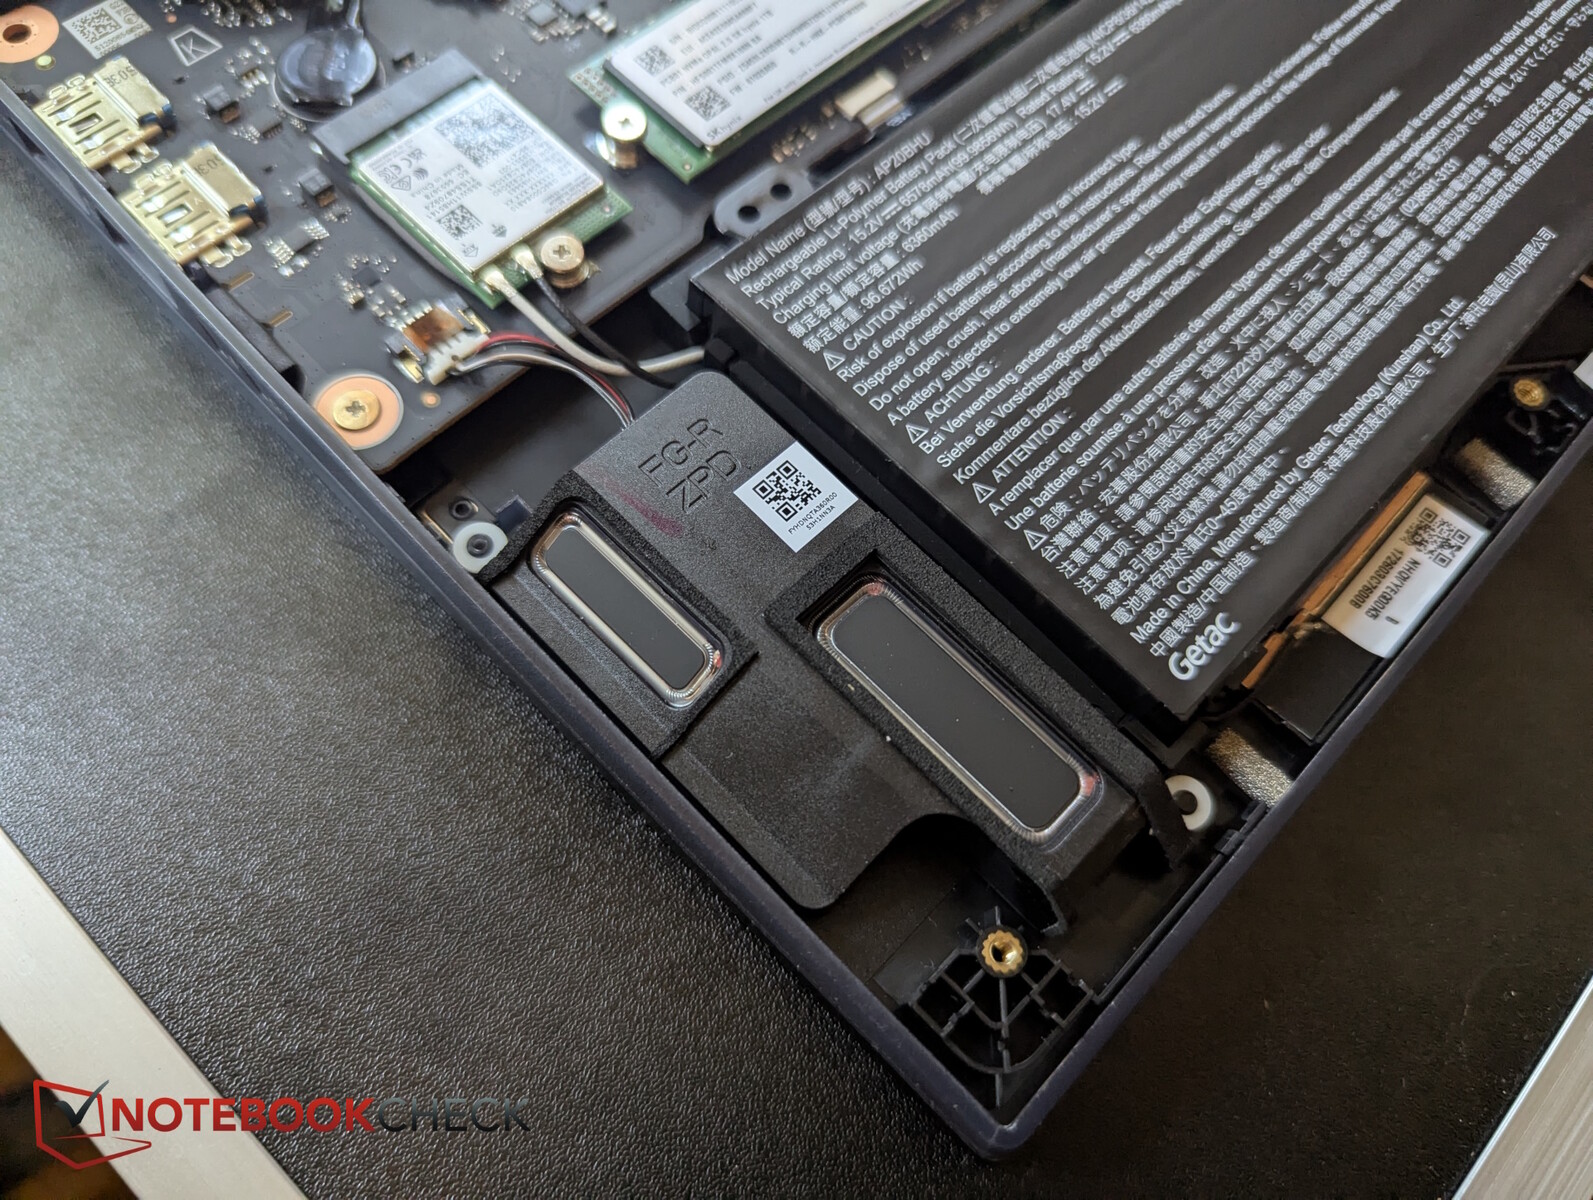
Spód jest przykręcony jedenastoma śrubami krzyżakowymi o jednakowej długości. Wewnątrz widzimy cztery sloty na pamięć RAM i trzy sloty na dyski SSD M.2. Wymienny jest również moduł Wi-Fi 7. Ten ostatni jest szybki w sieci 6 GHz, ale wolny w sieci 5 GHz.

Przy tej samej grubości, nowy Helios 18 jest teraz nieco krótszy na obu krawędziach, ale prawie 200 g cięższy. W końcu konkurencja jest podobnie duża, gruba i ciężka
Kamera internetowa Full HD nie jest już całkiem aktualna; obraz wydaje się mleczny, ostrość mogłaby być znacznie lepsza, ale odchylenia kolorów są akceptowalne.
| SD Card Reader | |
| average JPG Copy Test (av. of 3 runs) | |
| MSI Vector A18 HX A9W (Toshiba Exceria Pro SDXC 64 GB UHS-II) | |
| Medion Erazer Beast 18 X1 MD62731 (AV PRO microSD 128 GB V60) | |
| Średnia w klasie Gaming (20.9 - 210, n=54, ostatnie 2 lata) | |
| MSI Titan 18 HX AI A2XWJG (AV PRO microSD 128 GB V60) | |
| Acer Predator Helios 18 AI | |
| MSI Raider A18 HX A9WIG-080 | |
| maximum AS SSD Seq Read Test (1GB) | |
| MSI Vector A18 HX A9W (Toshiba Exceria Pro SDXC 64 GB UHS-II) | |
| MSI Raider A18 HX A9WIG-080 | |
| Medion Erazer Beast 18 X1 MD62731 (AV PRO microSD 128 GB V60) | |
| Średnia w klasie Gaming (25.5 - 261, n=51, ostatnie 2 lata) | |
| MSI Titan 18 HX AI A2XWJG (AV PRO microSD 128 GB V60) | |
| Acer Predator Helios 18 AI | |


Zrównoważony rozwój
Acer nie podaje żadnych informacji na temat emisjiCO2. Opakowanie składa się głównie z kartonu, który może nawet służyć jako podstawka pod słuchawki. Zasilacz został jednak owinięty w plastik, a pudełko transportowe Acer zawierało styropian.
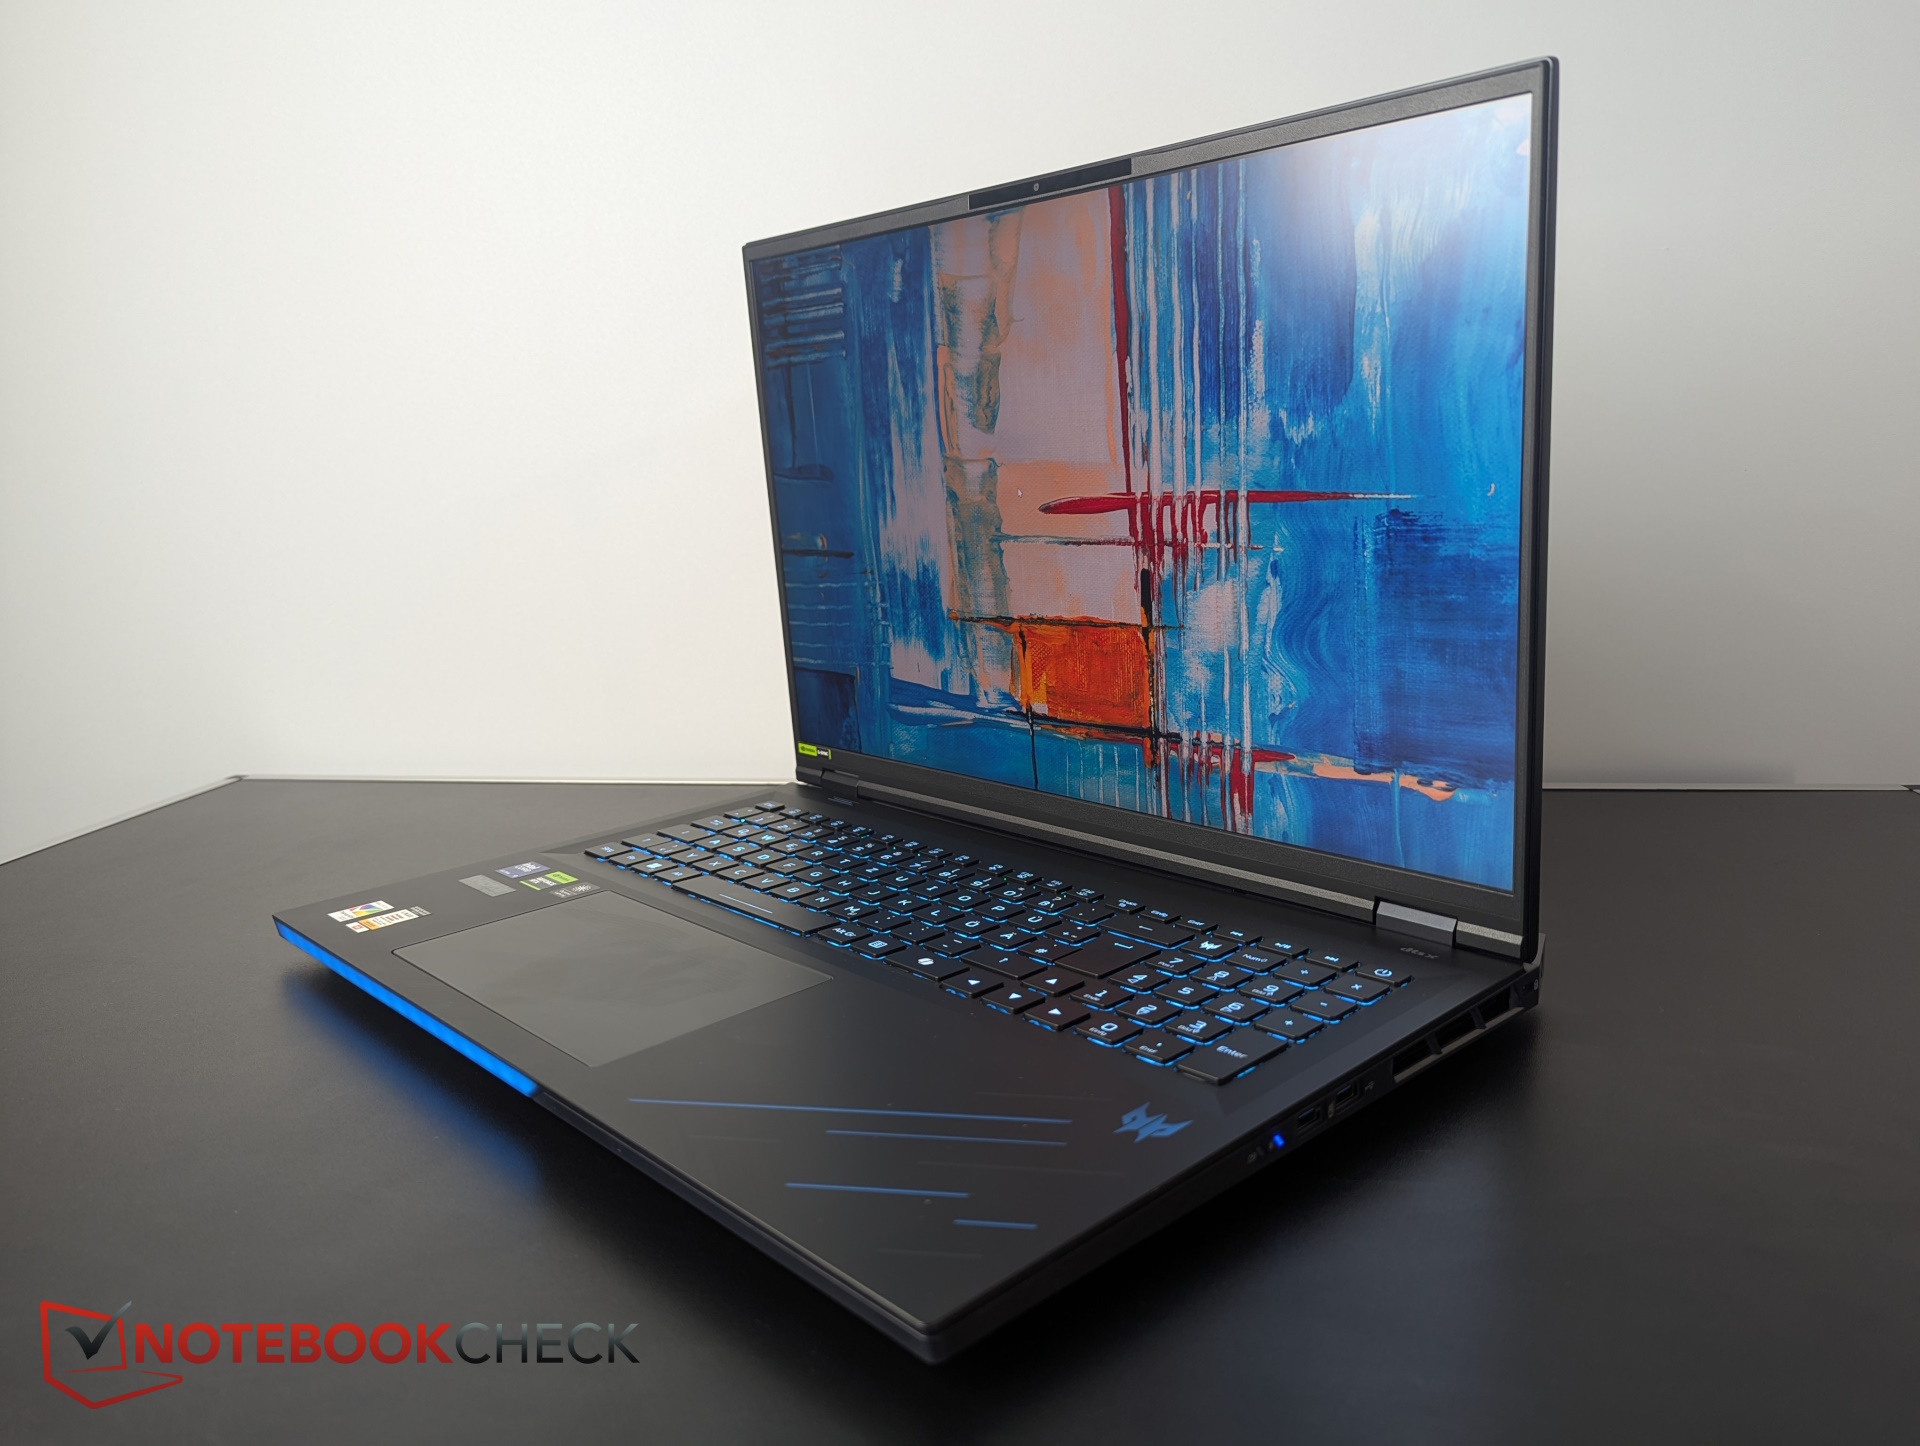
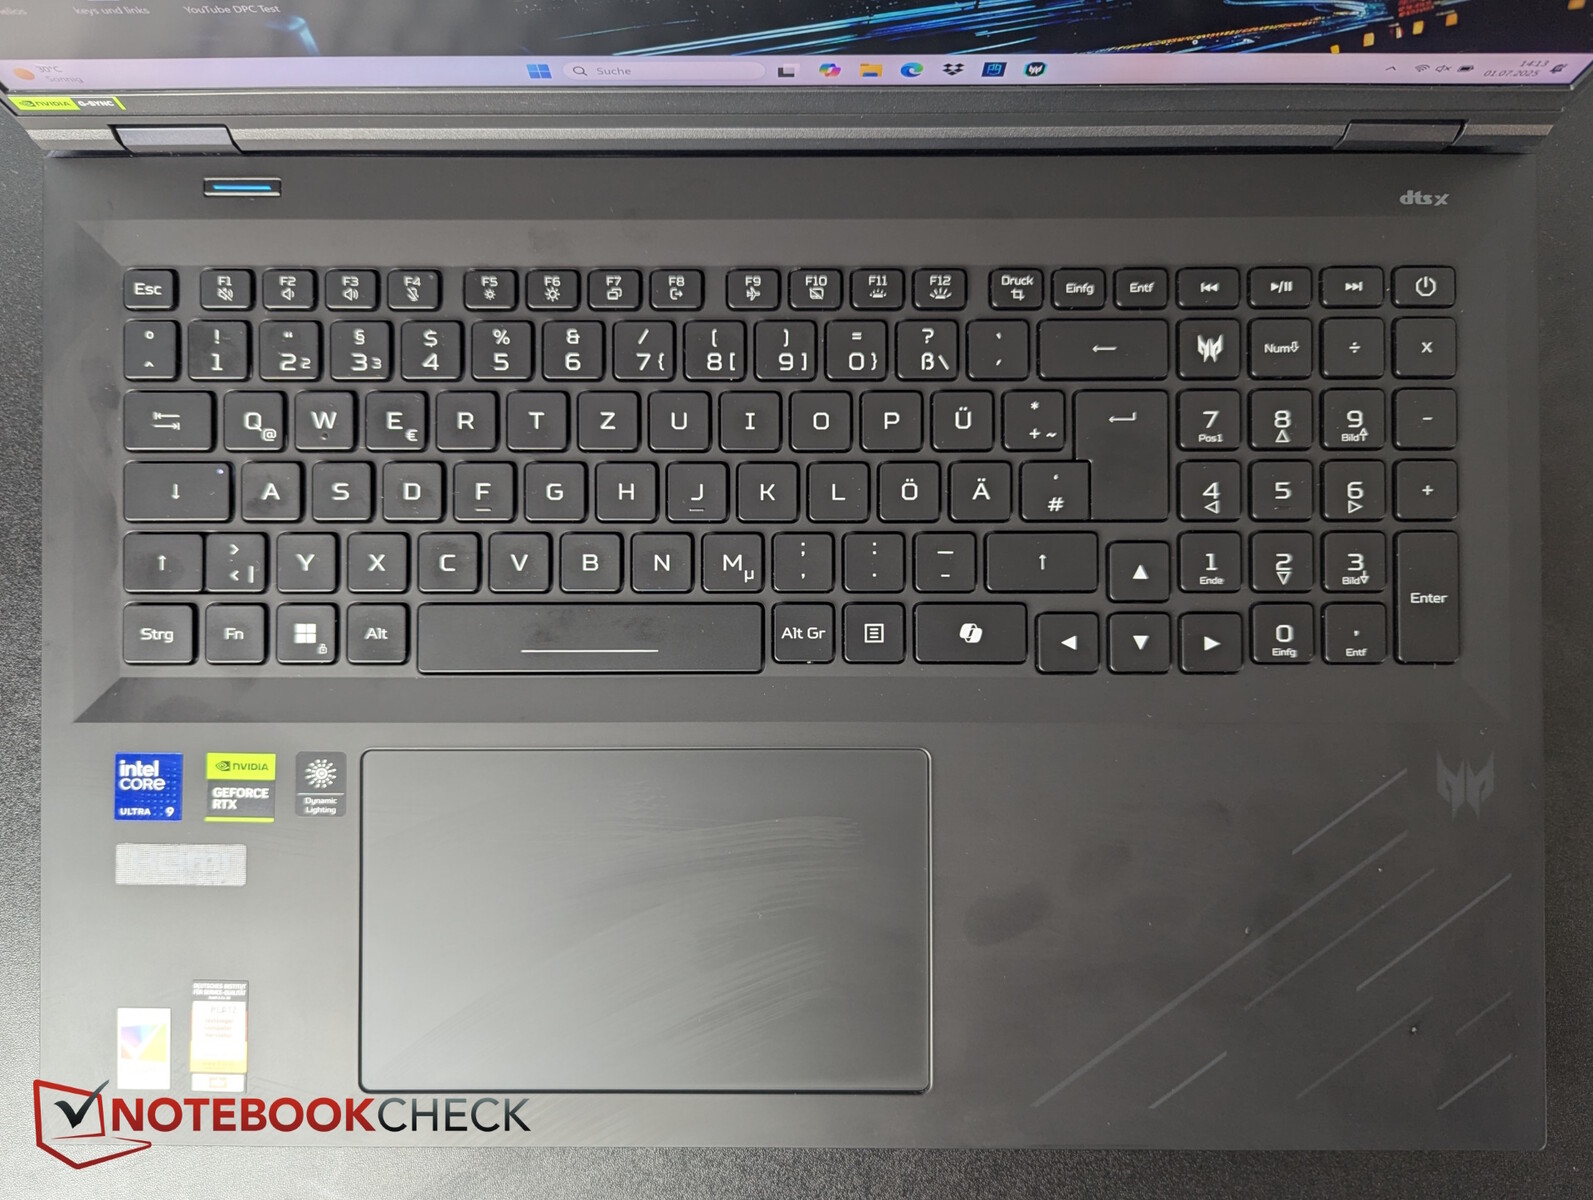
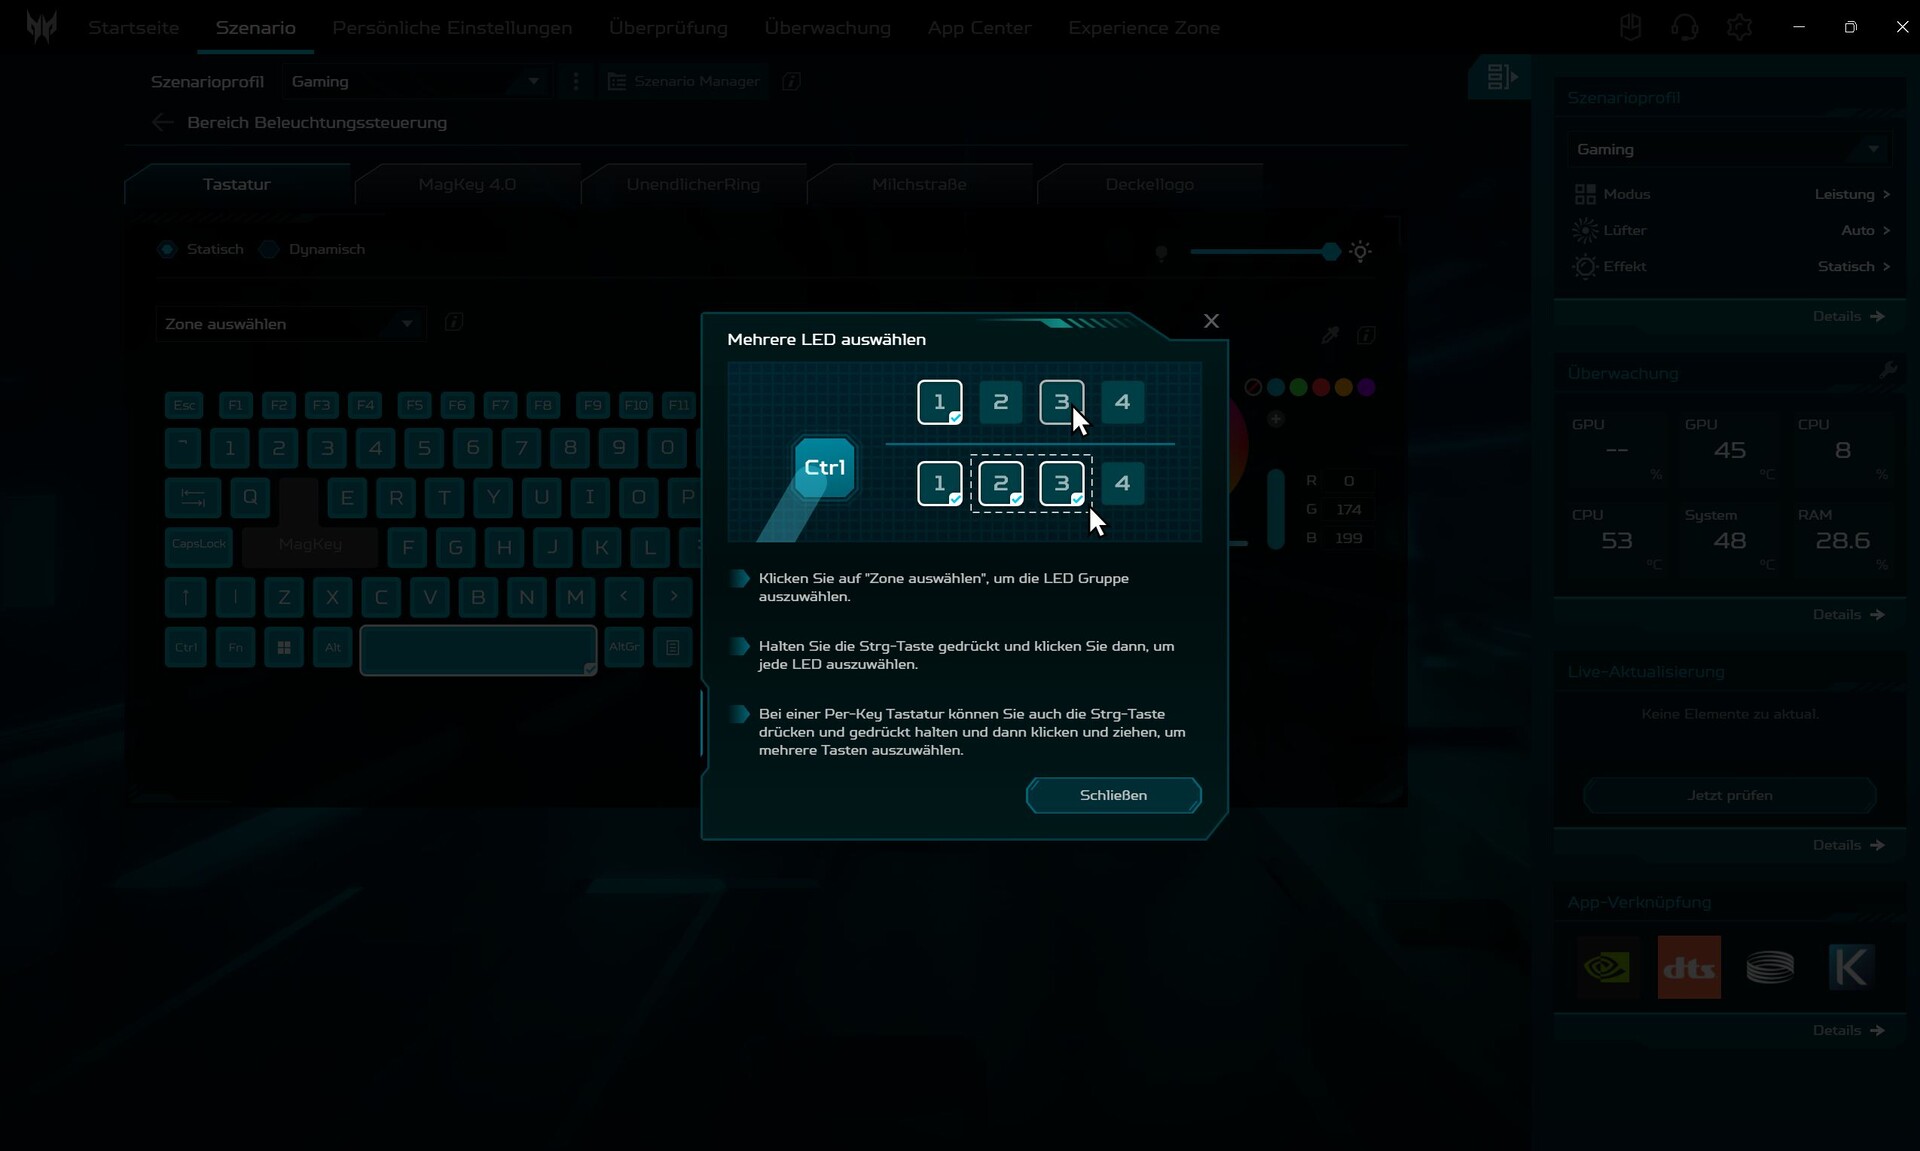
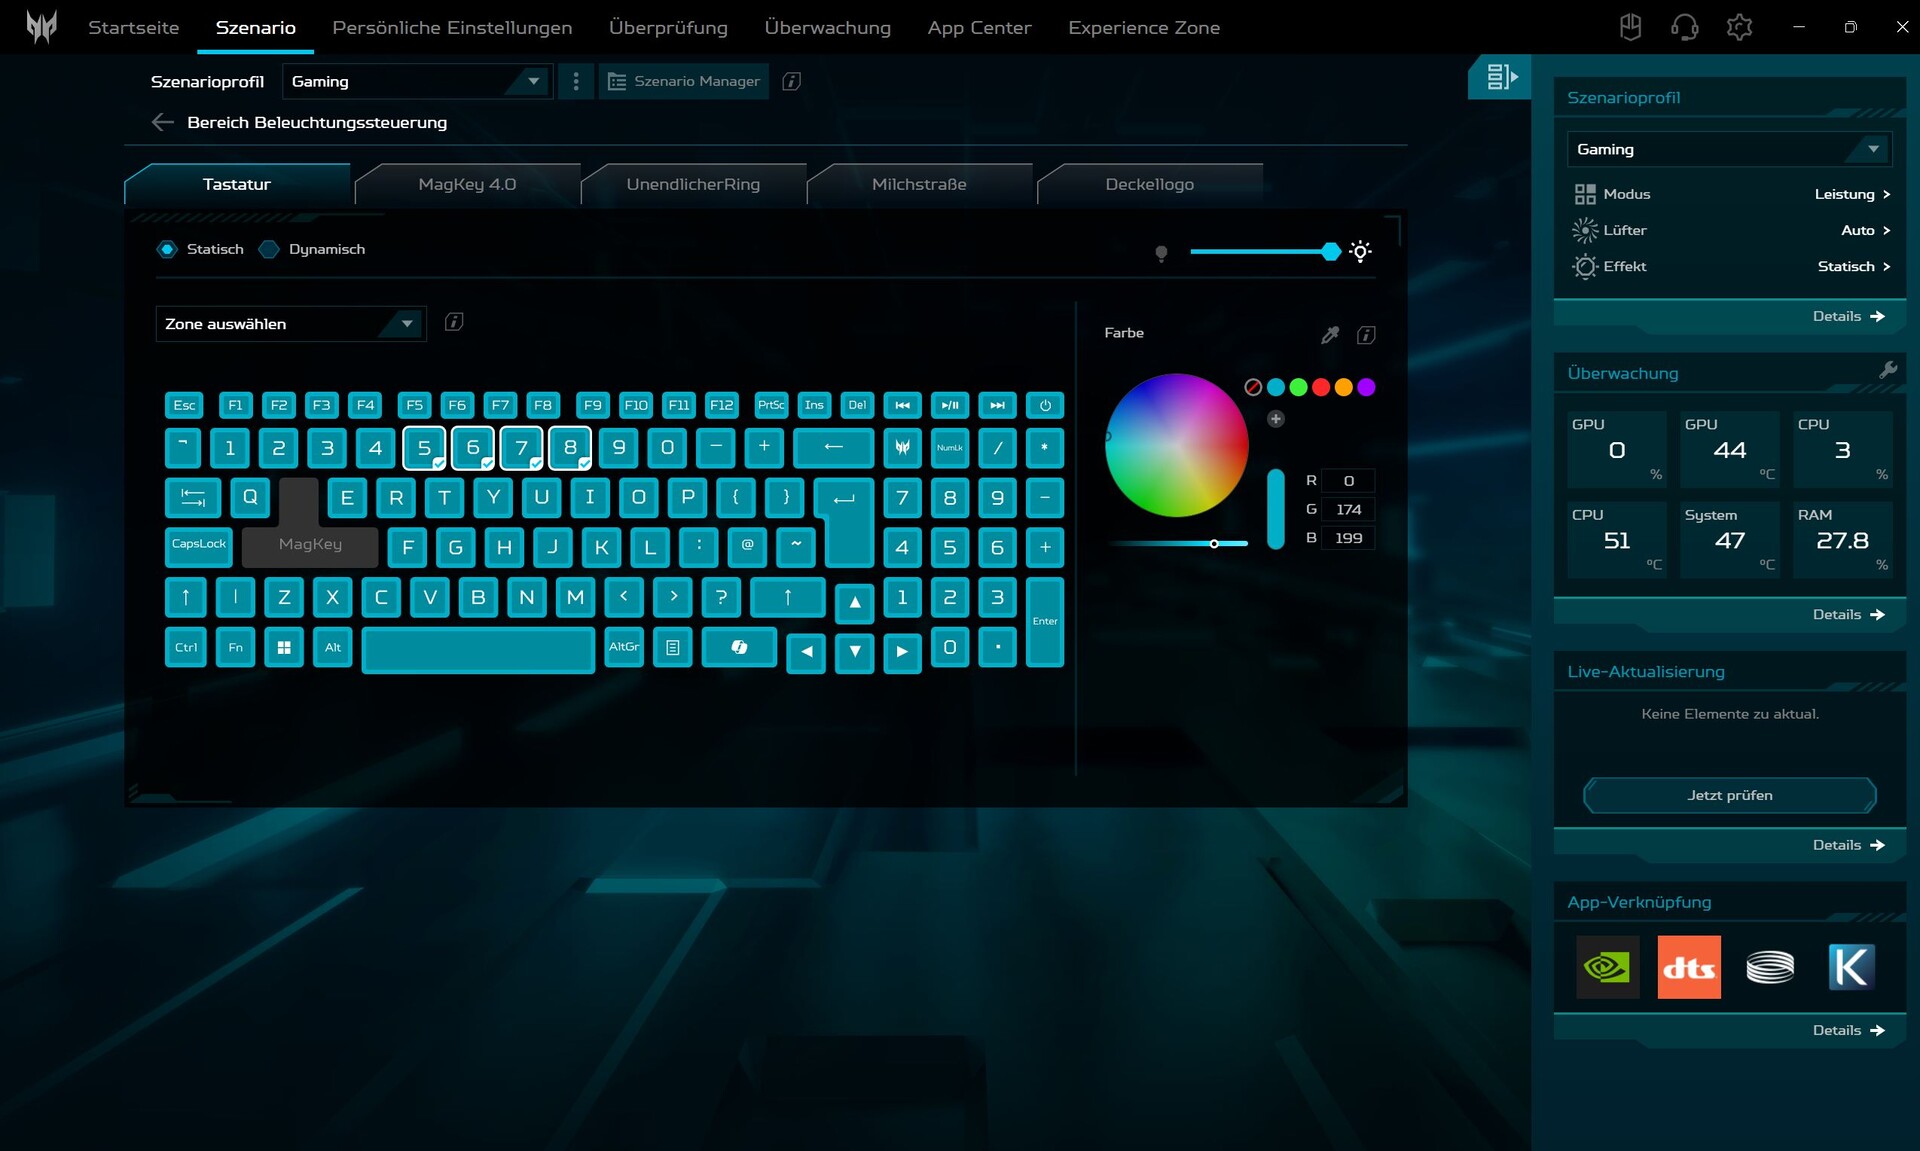
Urządzenia wejściowe - przycisk Predator i dużo RGB
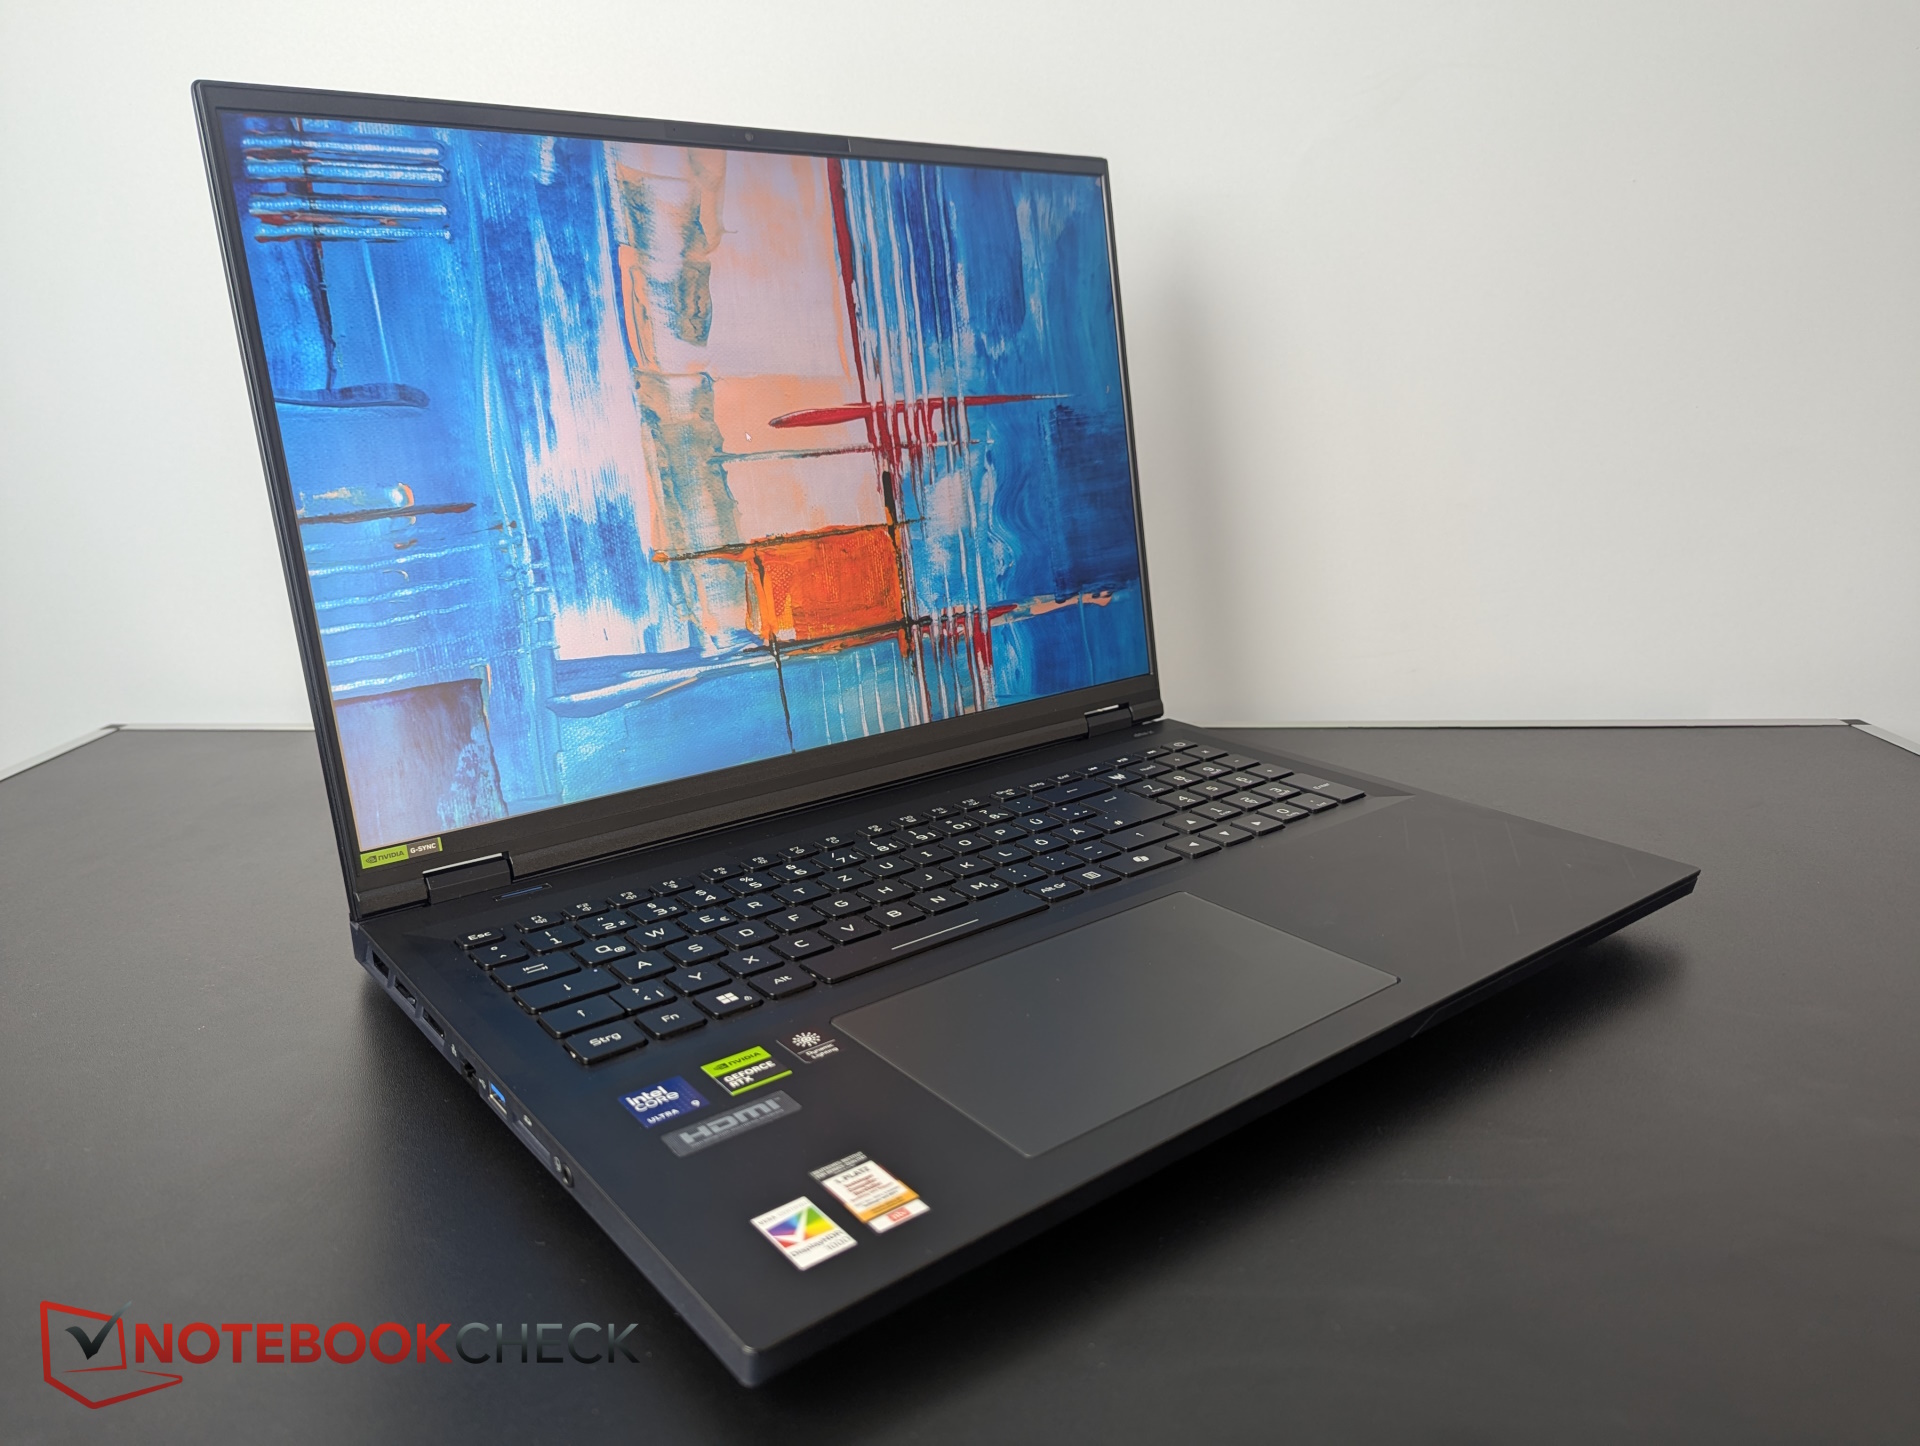
Dzięki 18-calowemu ekranowi po prawej stronie znajduje się również duży NumPad. Klawisze strzałek również mają standardowy rozmiar. Dodatkowy przycisk Predator uruchamia Centrum sterowania. Przełącznik trybu został zaprojektowany osobno w lewym górnym rogu.
Klawisze mają krótki lub średni skok z dobrym sprzężeniem zwrotnym. Odgłos naciskania klawiszy jest umiarkowany; jedynie spacja jest nieco głośniejsza.
Touchpad jest ogromny, ma około 15,2 x 9 cm i oferuje dobre właściwości ślizgowe, nawet przy powolnych ruchach. Zintegrowane klawisze są jednak nieco zbyt "sprężyste" podczas pisania i lekko grzechoczą. Kliknięcia wyzwalają się dość niezawodnie, ale stuknięcia nie zawsze są niezawodne.
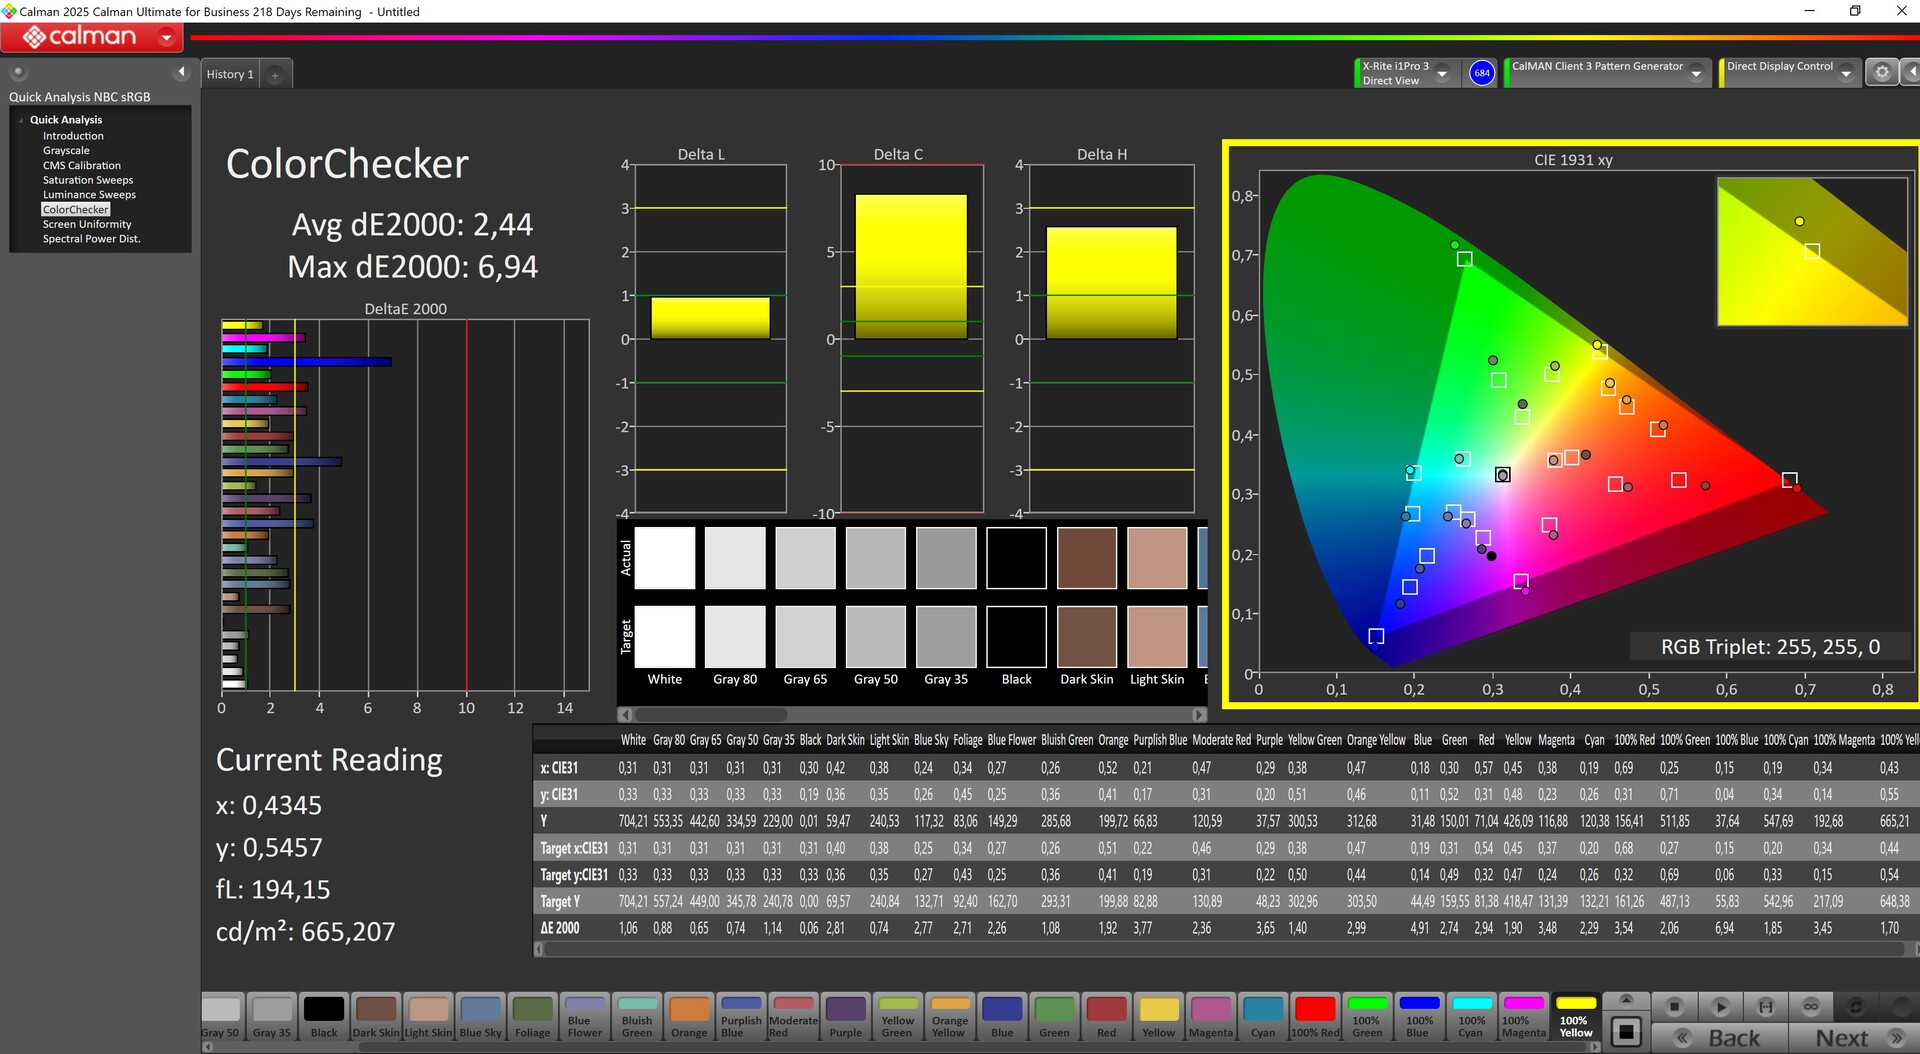
Wyświetlacz - 1,600p mini LED
W naszym przypadku Helios jest wyposażony w wyświetlacz mini-LED QHD o częstotliwości odświeżania 250 Hz, podczas gdy reklamowany przez Acer na stronie internetowej wyświetlacz 4K z dwoma trybami jest dostępny tylko z laptopem RTX 5090.
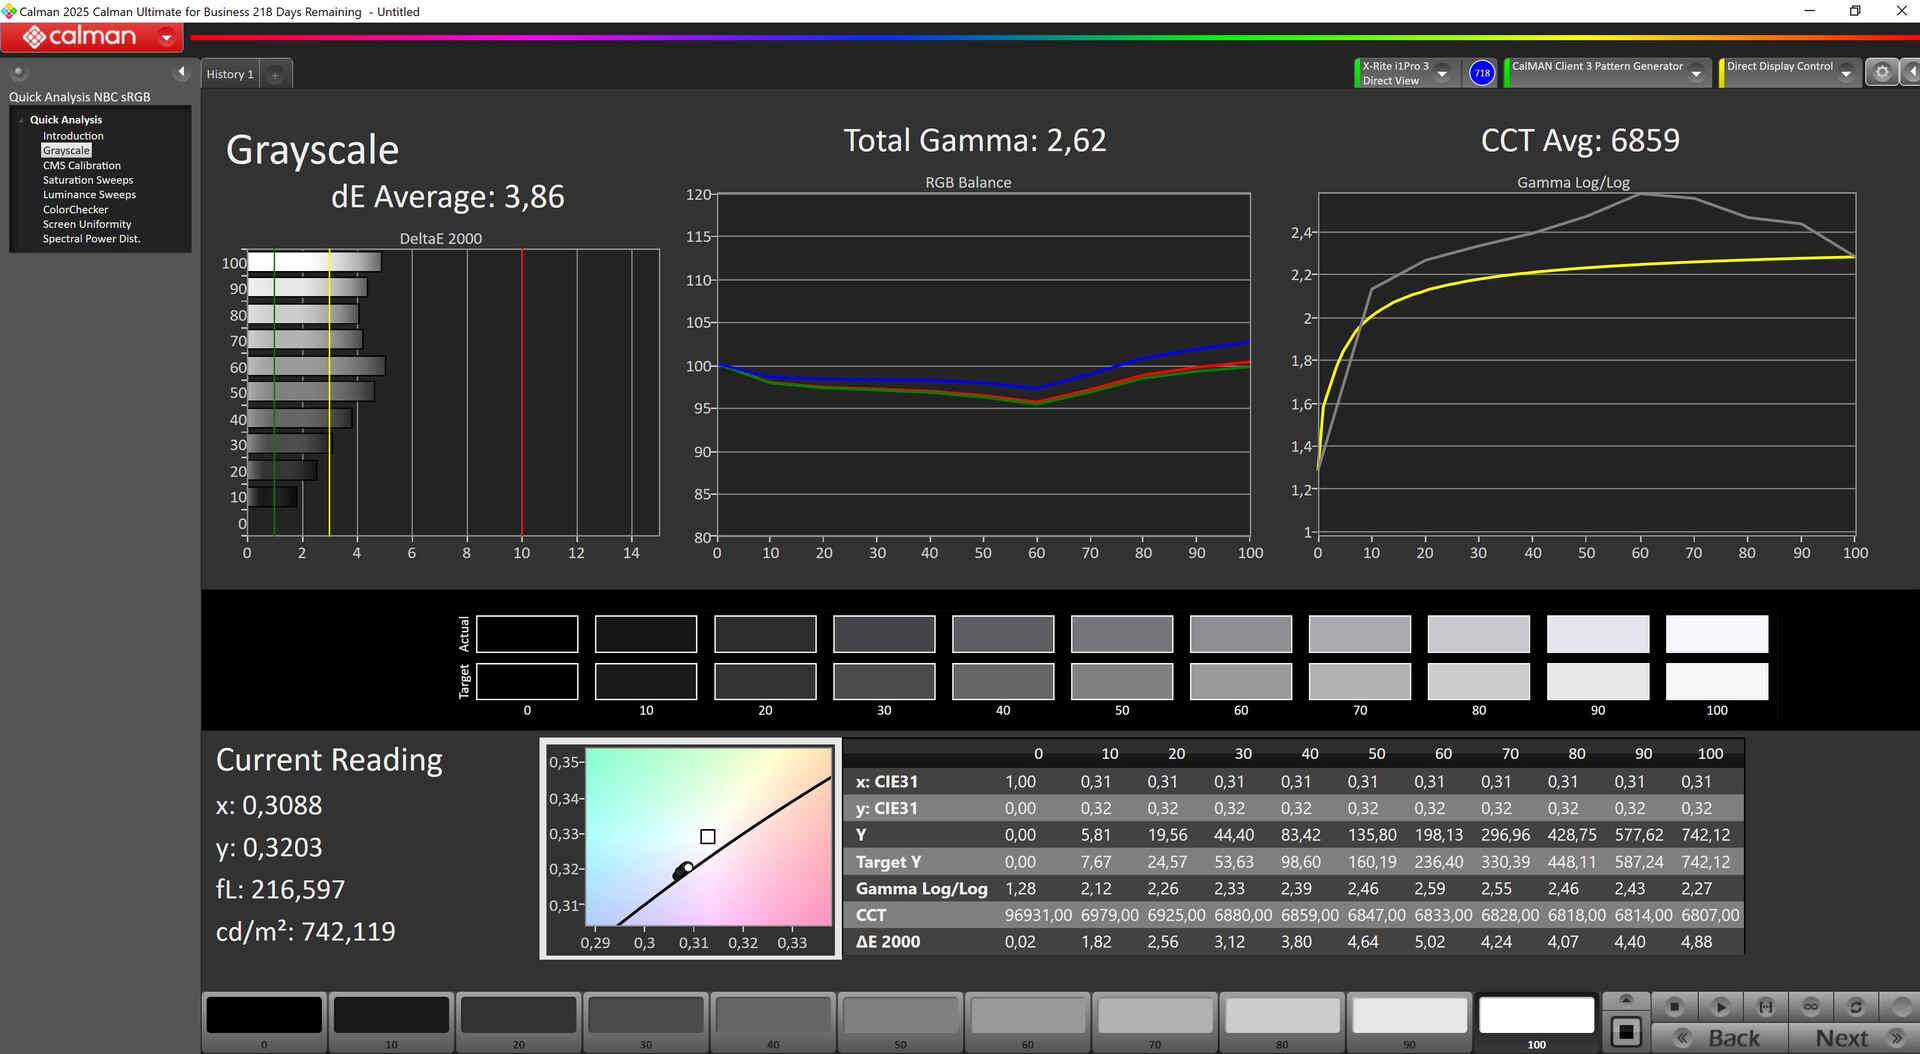
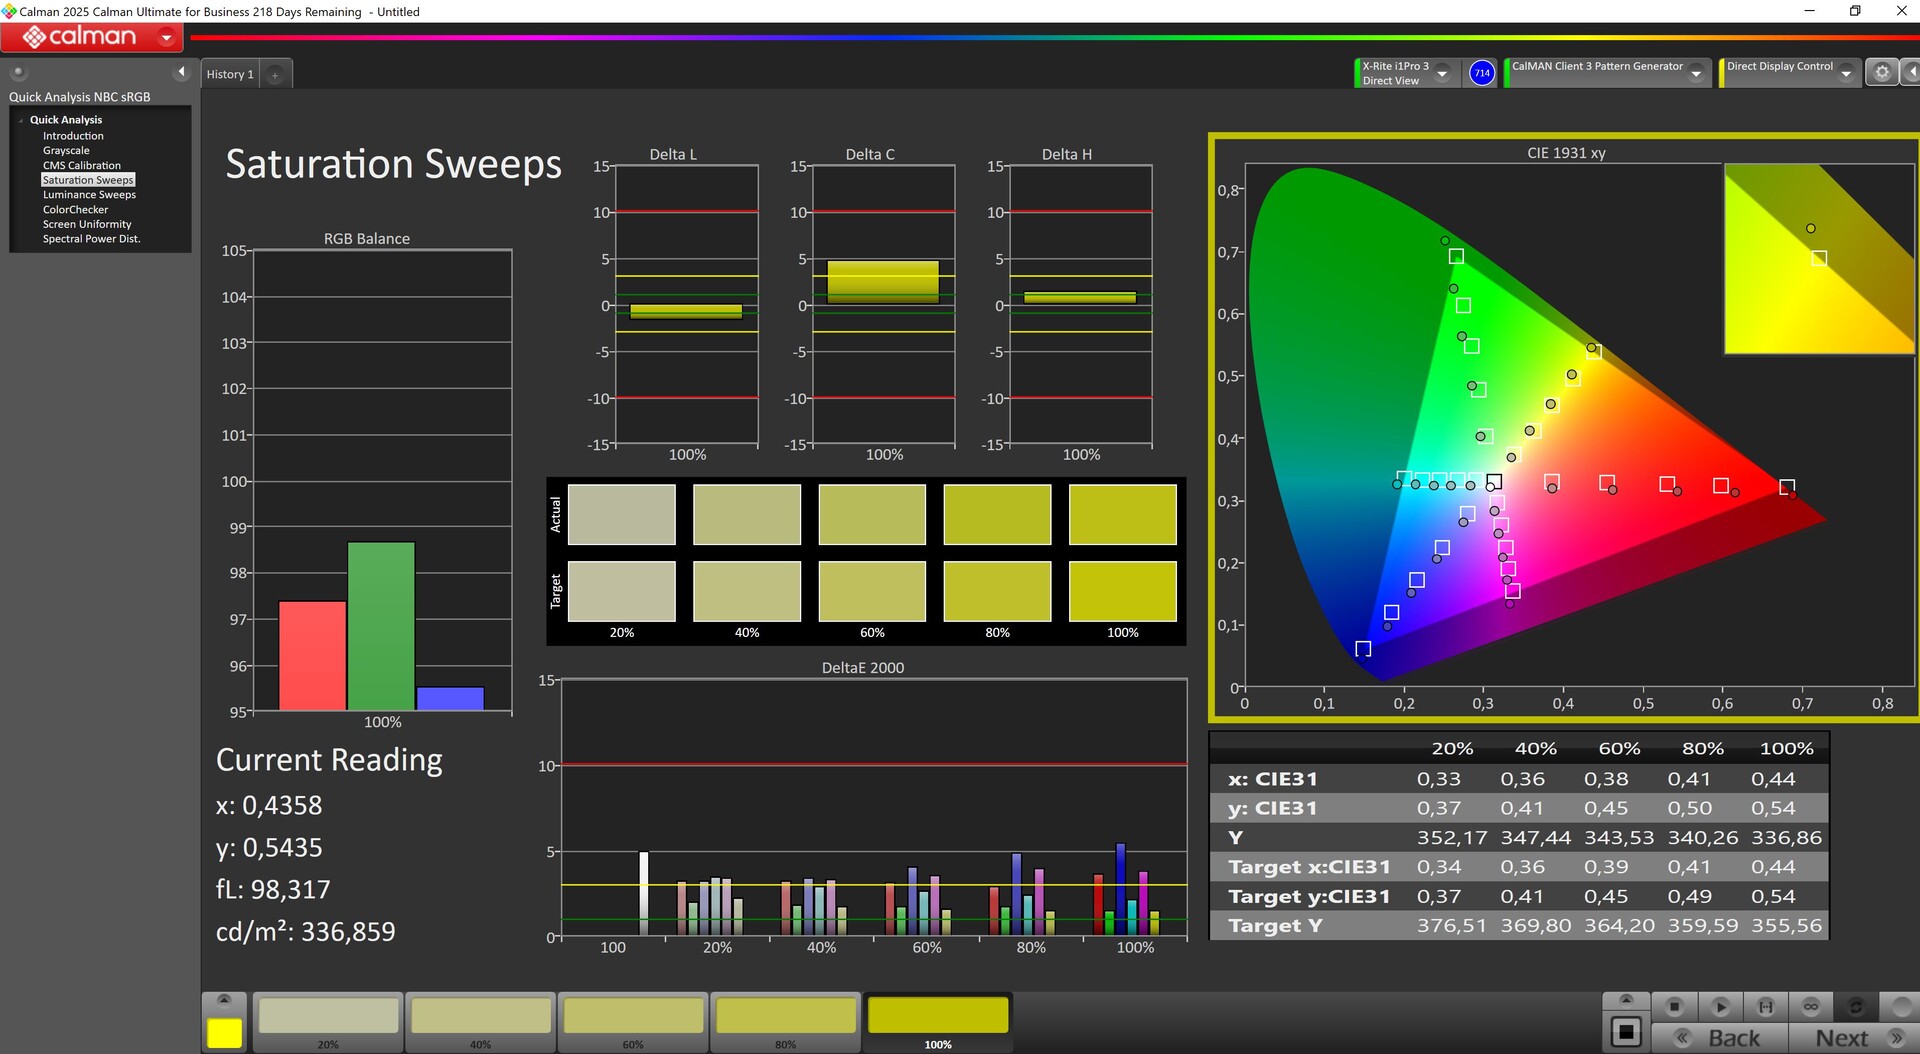
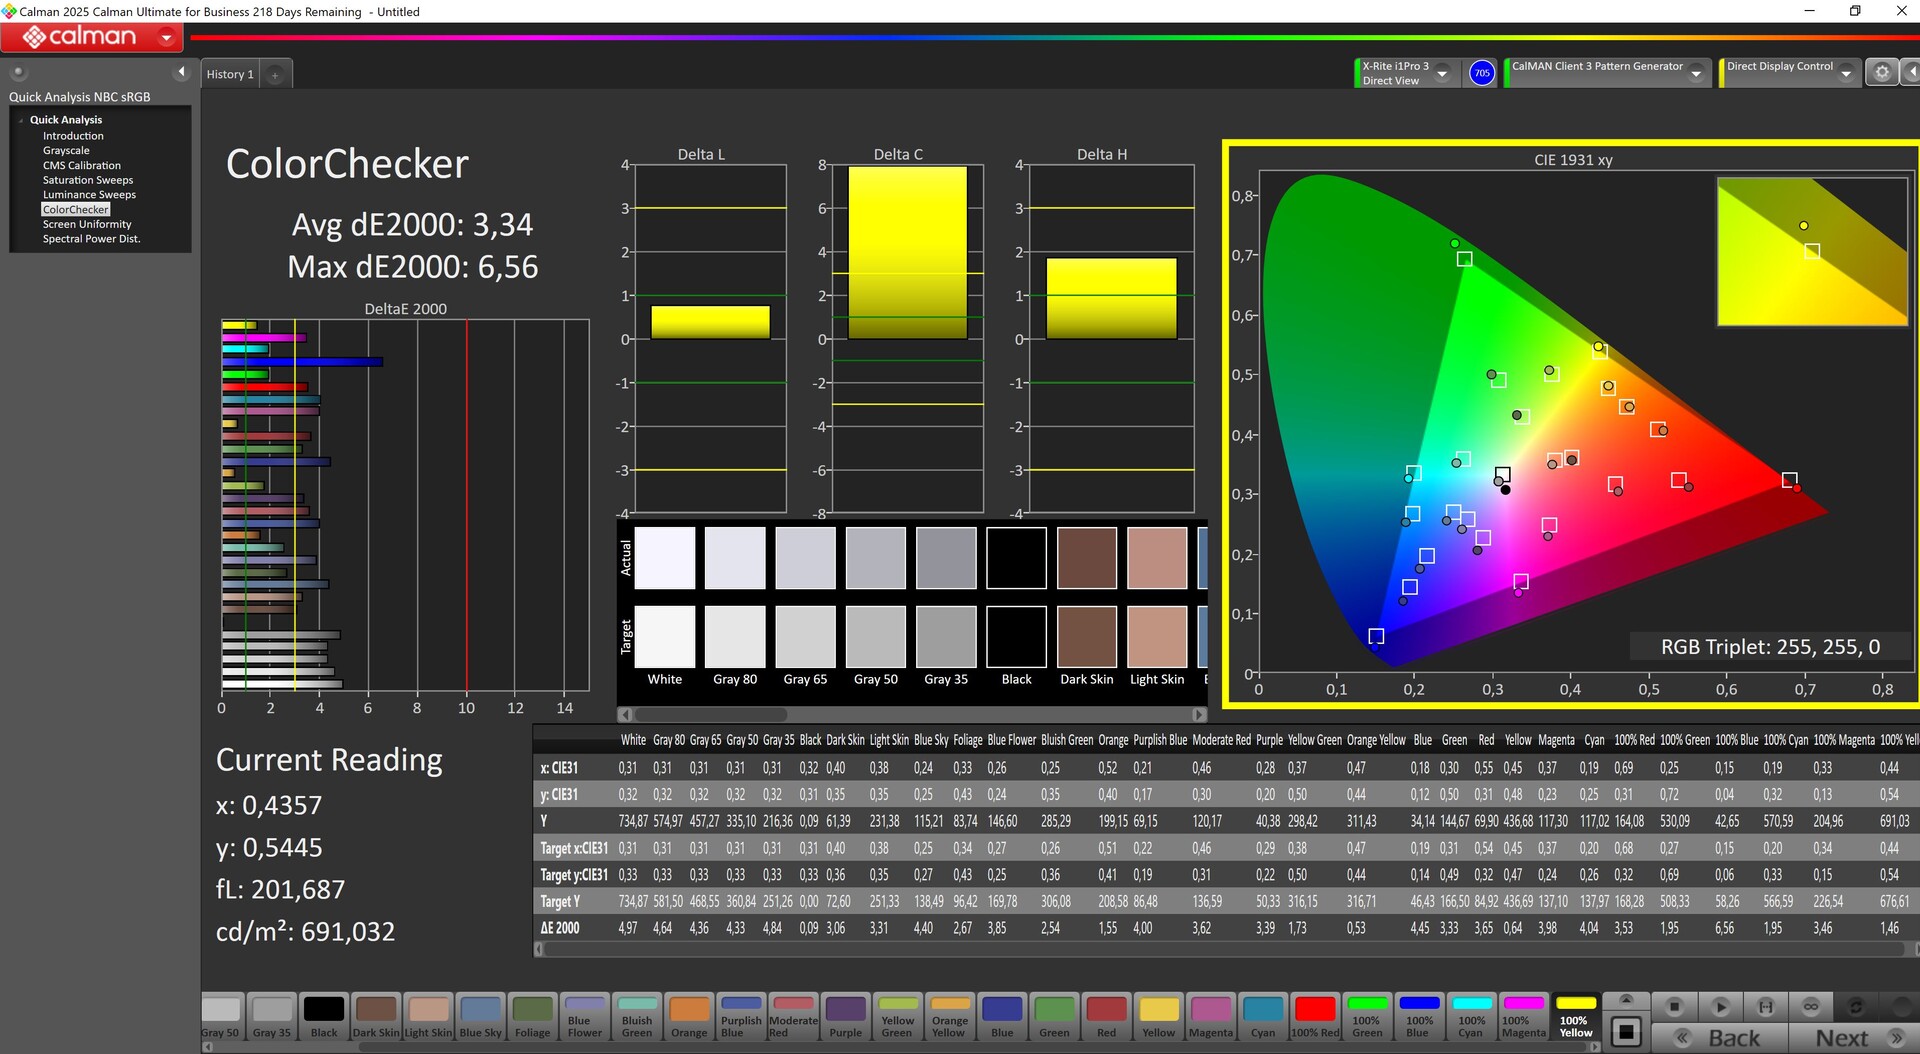
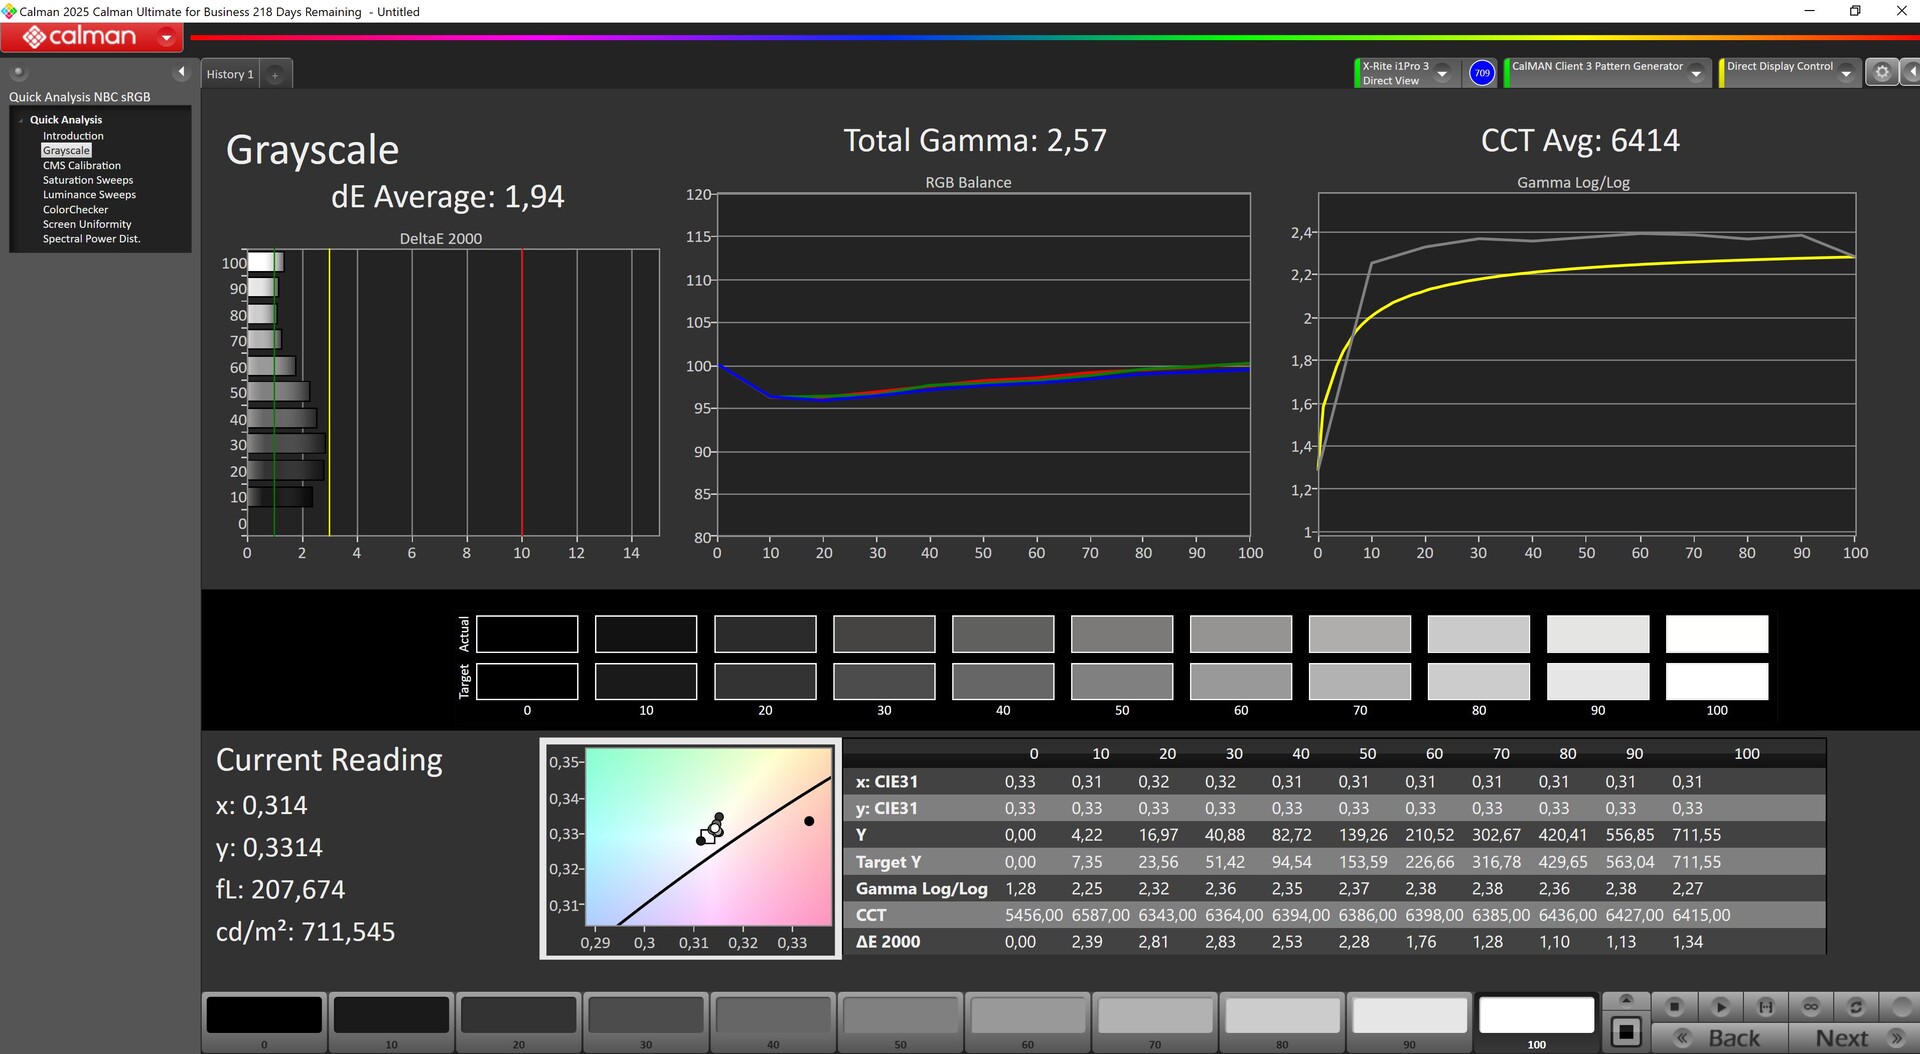
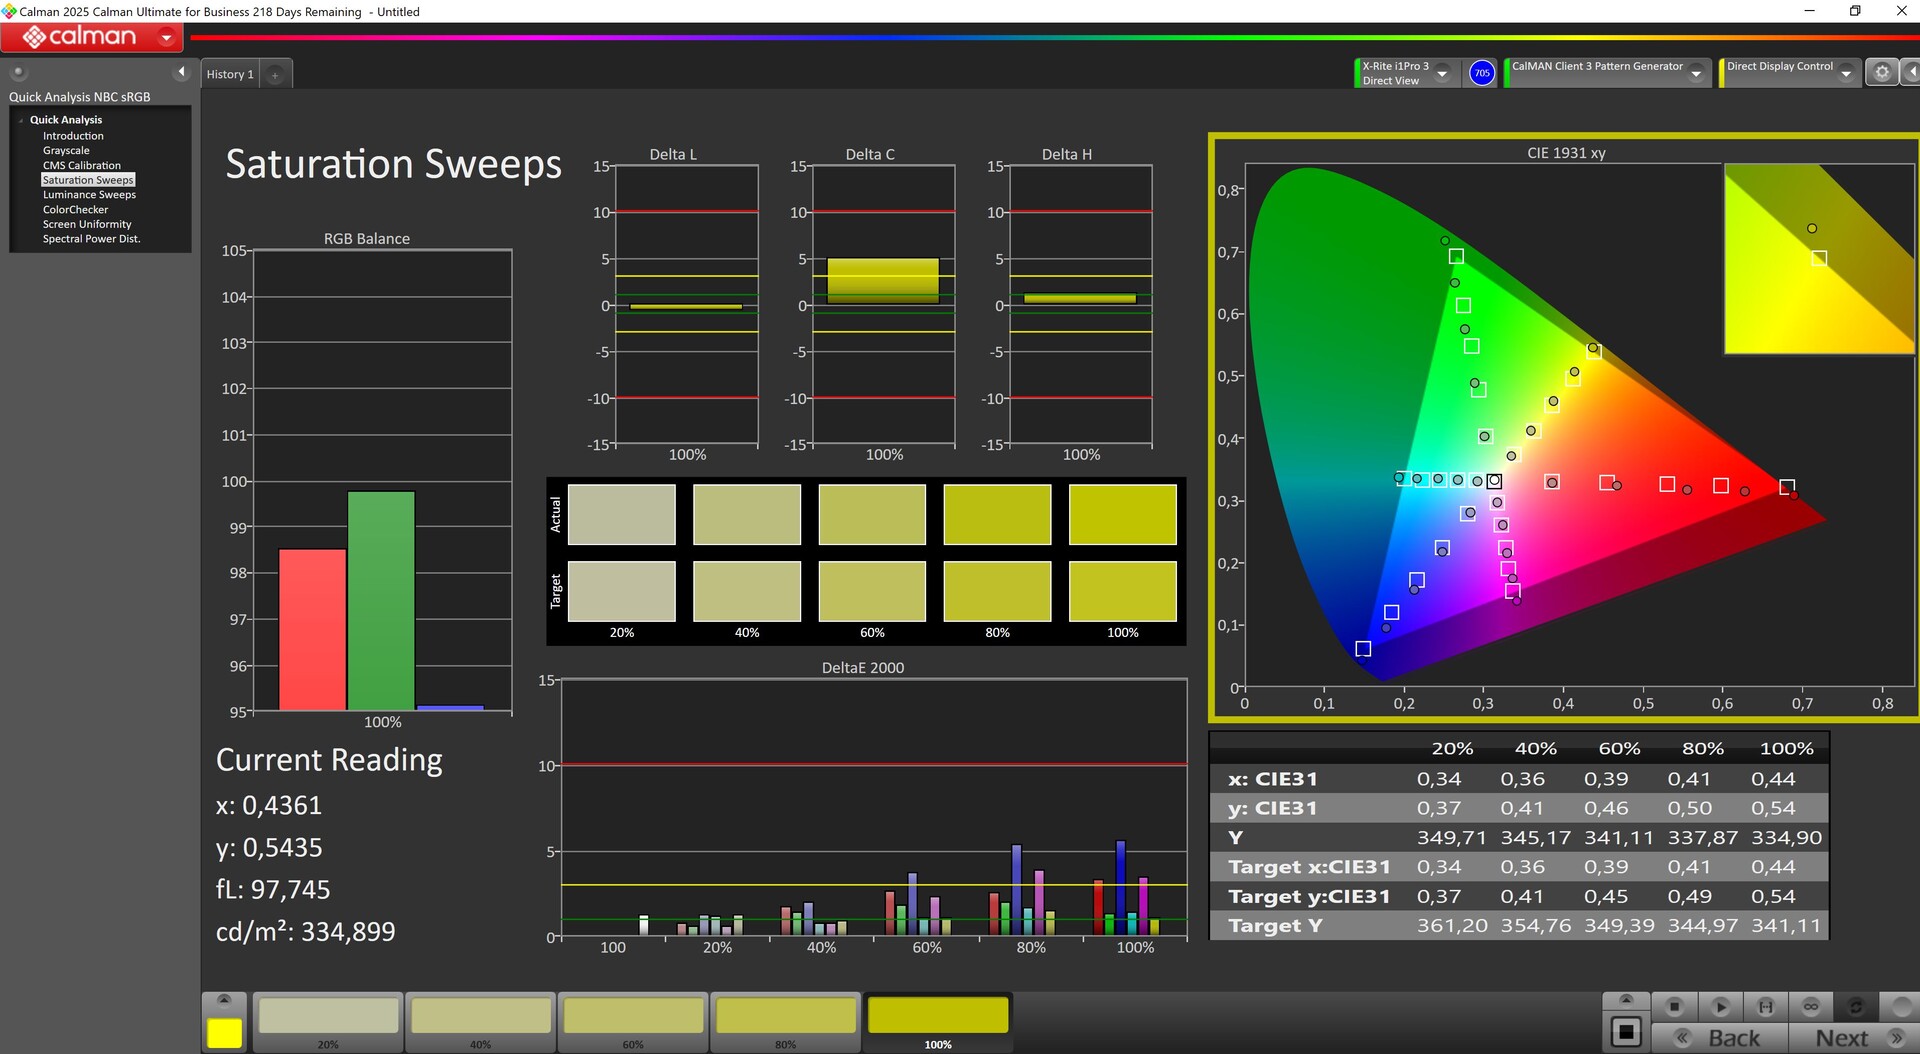
Panel urządzenia testowego jest jednak nadal wysokiej jakości, ponieważ zmierzyliśmy średnią jasność ponad 700 nitów. Podświetlenie jest bardzo dobre, bez aureoli, a poziom czerni jest wyjątkowo niski, co skutkuje bardzo wysokim kontrastem. Wyświetlacz migocze, ale w bardzo wysokim tempie, dzięki czemu nawet wrażliwe osoby nie powinny zauważyć PWM. Przestrzenie kolorów P3 i sRGB są w pełni pokryte.
| |||||||||||||||||||||||||
rozświetlenie: 96 %
na akumulatorze: 400 cd/m²
kontrast: 18250:1 (czerń: 0.04 cd/m²)
ΔE ColorChecker Calman: 3.34 | ∀{0.5-29.43 Ø4.72}
calibrated: 2.44
ΔE Greyscale Calman: 3.86 | ∀{0.09-98 Ø4.97}
90.1% AdobeRGB 1998 (Argyll 3D)
100% sRGB (Argyll 3D)
99.7% Display P3 (Argyll 3D)
Gamma: 2.62
CCT: 6859 K
| Acer Predator Helios 18 AI B180QAN01.2 (AUO45A8), IPS, 2560x1600, 18", 250 Hz | Acer Predator Helios 18 PH18-72-98MW B180QAN01.2 (AUO45A8), Mini-LED, 2560x1600, 18", 250 Hz | Medion Erazer Beast 18 X1 MD62731 BOEhydis NE180QDM-NZ2, IPS, 2560x1600, 18", 240 Hz | Asus Strix Scar 18 G835LX N180QDM-NM2, Mini-LED, 2560x1600, 18", 240 Hz | MSI Titan 18 HX AI A2XWJG AU Optronics B180ZAN01.0, Mini-LED, 3840x2160, 18", 120 Hz | MSI Vector A18 HX A9W AU Optronics B180QAN01.0, IPS, 2560x1600, 18", 240 Hz | |
|---|---|---|---|---|---|---|
| Display | 1% | -3% | -1% | 0% | -2% | |
| HDR Peak Brightness (cd/m²) | 1153 | |||||
| Display P3 Coverage (%) | 99.7 | 99.7 0% | 97.1 -3% | 99 -1% | 99.7 0% | 98.1 -2% |
| sRGB Coverage (%) | 100 | 100 0% | 99.9 0% | 100 0% | 99.9 0% | 99.9 0% |
| AdobeRGB 1998 Coverage (%) | 90.1 | 91.6 2% | 84.7 -6% | 87.2 -3% | 90.4 0% | 86.3 -4% |
| Response Times | -295% | -96% | -114% | -159% | -90% | |
| Response Time Grey 50% / Grey 80% * (ms) | 3.6 ? | 8 ? -122% | 5.6 ? -56% | 7.4 ? -106% | 8.8 ? -144% | 4.3 ? -19% |
| Response Time Black / White * (ms) | 3.1 ? | 17.6 ? -468% | 7.3 ? -135% | 10.4 ? -235% | 15 ? -384% | 8.1 ? -161% |
| PWM Frequency (Hz) | 2500 | 4832 ? | 20610 ? | 15430 ? | ||
| PWM Amplitude * (%) | 100 | 100 -0% | 50 50% | |||
| Screen | 5% | -122% | -3% | -10% | -153% | |
| Brightness middle (cd/m²) | 730 | 722 -1% | 478 -35% | 764 5% | 704 -4% | 543 -26% |
| Brightness (cd/m²) | 719 | 724 1% | 456 -37% | 747 4% | 680 -5% | 502 -30% |
| Brightness Distribution (%) | 96 | 93 -3% | 89 -7% | 93 -3% | 88 -8% | 86 -10% |
| Black Level * (cd/m²) | 0.04 | 0.04 -0% | 0.4 -900% | 0.1 -150% | 0.56 -1300% | |
| Contrast (:1) | 18250 | 18050 -1% | 1195 -93% | 7640 -58% | 970 -95% | |
| Colorchecker dE 2000 * | 3.34 | 3.4 -2% | 3.94 -18% | 1.2 64% | 4.11 -23% | 3.41 -2% |
| Colorchecker dE 2000 max. * | 6.56 | 5.32 19% | 8.6 -31% | 2.8 57% | 6.43 2% | 6.4 2% |
| Colorchecker dE 2000 calibrated * | 2.44 | 1.6 34% | 0.75 69% | 2.5 -2% | 0.66 73% | |
| Greyscale dE 2000 * | 3.86 | 3.8 2% | 5.5 -42% | 1.5 61% | 4.9 -27% | 3.4 12% |
| Gamma | 2.62 84% | 2.383 92% | 2.212 99% | 2.17 101% | 2.03 108% | 2.3 96% |
| CCT | 6859 95% | 7051 92% | 7059 92% | 6556 99% | 6331 103% | 6070 107% |
| Całkowita średnia (program / ustawienia) | -96% /
-39% | -74% /
-92% | -39% /
-26% | -56% /
-42% | -82% /
-112% |
* ... im mniej tym lepiej
Zmierzyliśmy średnie wartości DeltaE wynoszące 3,86 (skala szarości) i 3,34 (ColorChecker) przy natywnej jasności fabrycznej. Dzięki ręcznej kalibracji udało nam się zmniejszyć te wartości odpowiednio do 1,94 i 2,44.
Wyświetl czasy reakcji
| ↔ Czas reakcji od czerni do bieli | ||
|---|---|---|
| 3.1 ms ... wzrost ↗ i spadek ↘ łącznie | ↗ 2.7 ms wzrost | 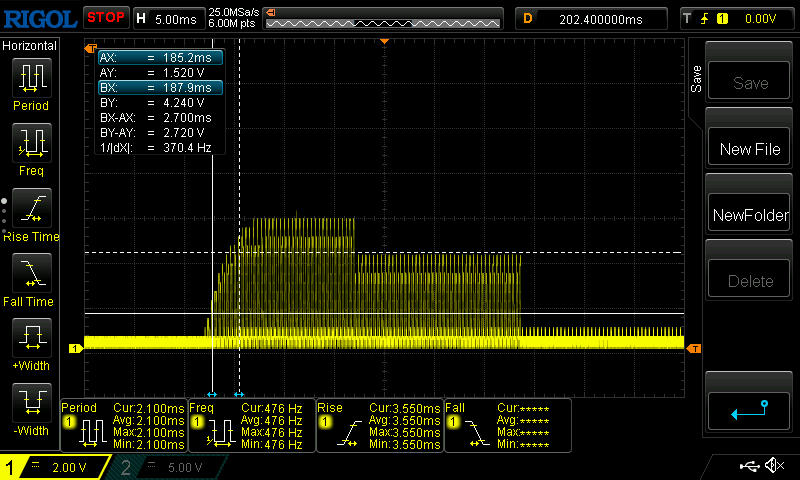 |
| ↘ 0.4 ms upadek | ||
| W naszych testach ekran wykazuje bardzo szybką reakcję i powinien bardzo dobrze nadawać się do szybkich gier. Dla porównania, wszystkie testowane urządzenia wahają się od 0.1 (minimum) do 240 (maksimum) ms. » 15 % wszystkich urządzeń jest lepszych. Oznacza to, że zmierzony czas reakcji jest lepszy od średniej wszystkich testowanych urządzeń (19.8 ms). | ||
| ↔ Czas reakcji 50% szarości do 80% szarości | ||
| 3.6 ms ... wzrost ↗ i spadek ↘ łącznie | ↗ 1.6 ms wzrost | 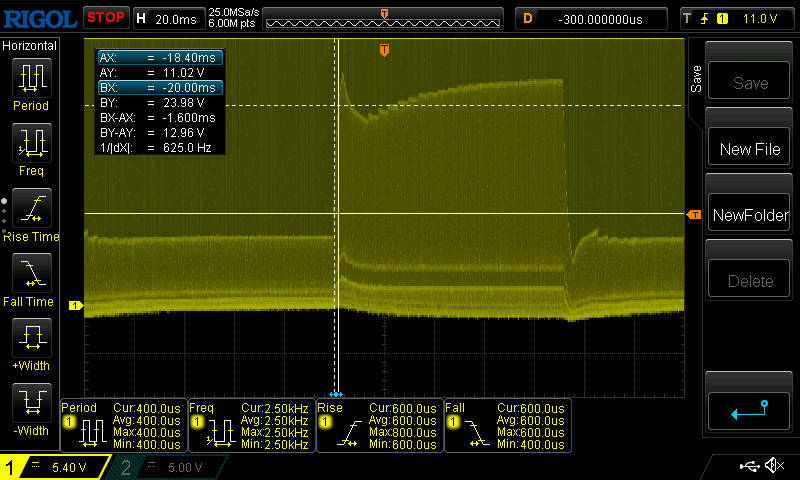 |
| ↘ 2 ms upadek | ||
| W naszych testach ekran wykazuje bardzo szybką reakcję i powinien bardzo dobrze nadawać się do szybkich gier. Dla porównania, wszystkie testowane urządzenia wahają się od 0.165 (minimum) do 636 (maksimum) ms. » 14 % wszystkich urządzeń jest lepszych. Oznacza to, że zmierzony czas reakcji jest lepszy od średniej wszystkich testowanych urządzeń (31 ms). | ||
Migotanie ekranu / PWM (modulacja szerokości impulsu)
| Wykryto migotanie ekranu/wykryto PWM | 2500 Hz Amplitude: 100 % |  | |
Podświetlenie wyświetlacza miga z częstotliwością 2500 Hz (najgorszy przypadek, np. przy użyciu PWM) . Częstotliwość 2500 Hz jest dość wysoka, więc większość użytkowników wrażliwych na PWM nie powinna zauważyć żadnego migotania. Dla porównania: 52 % wszystkich testowanych urządzeń nie używa PWM do przyciemniania wyświetlacza. Jeśli wykryto PWM, zmierzono średnio 7763 (minimum: 5 - maksimum: 343500) Hz. | |||
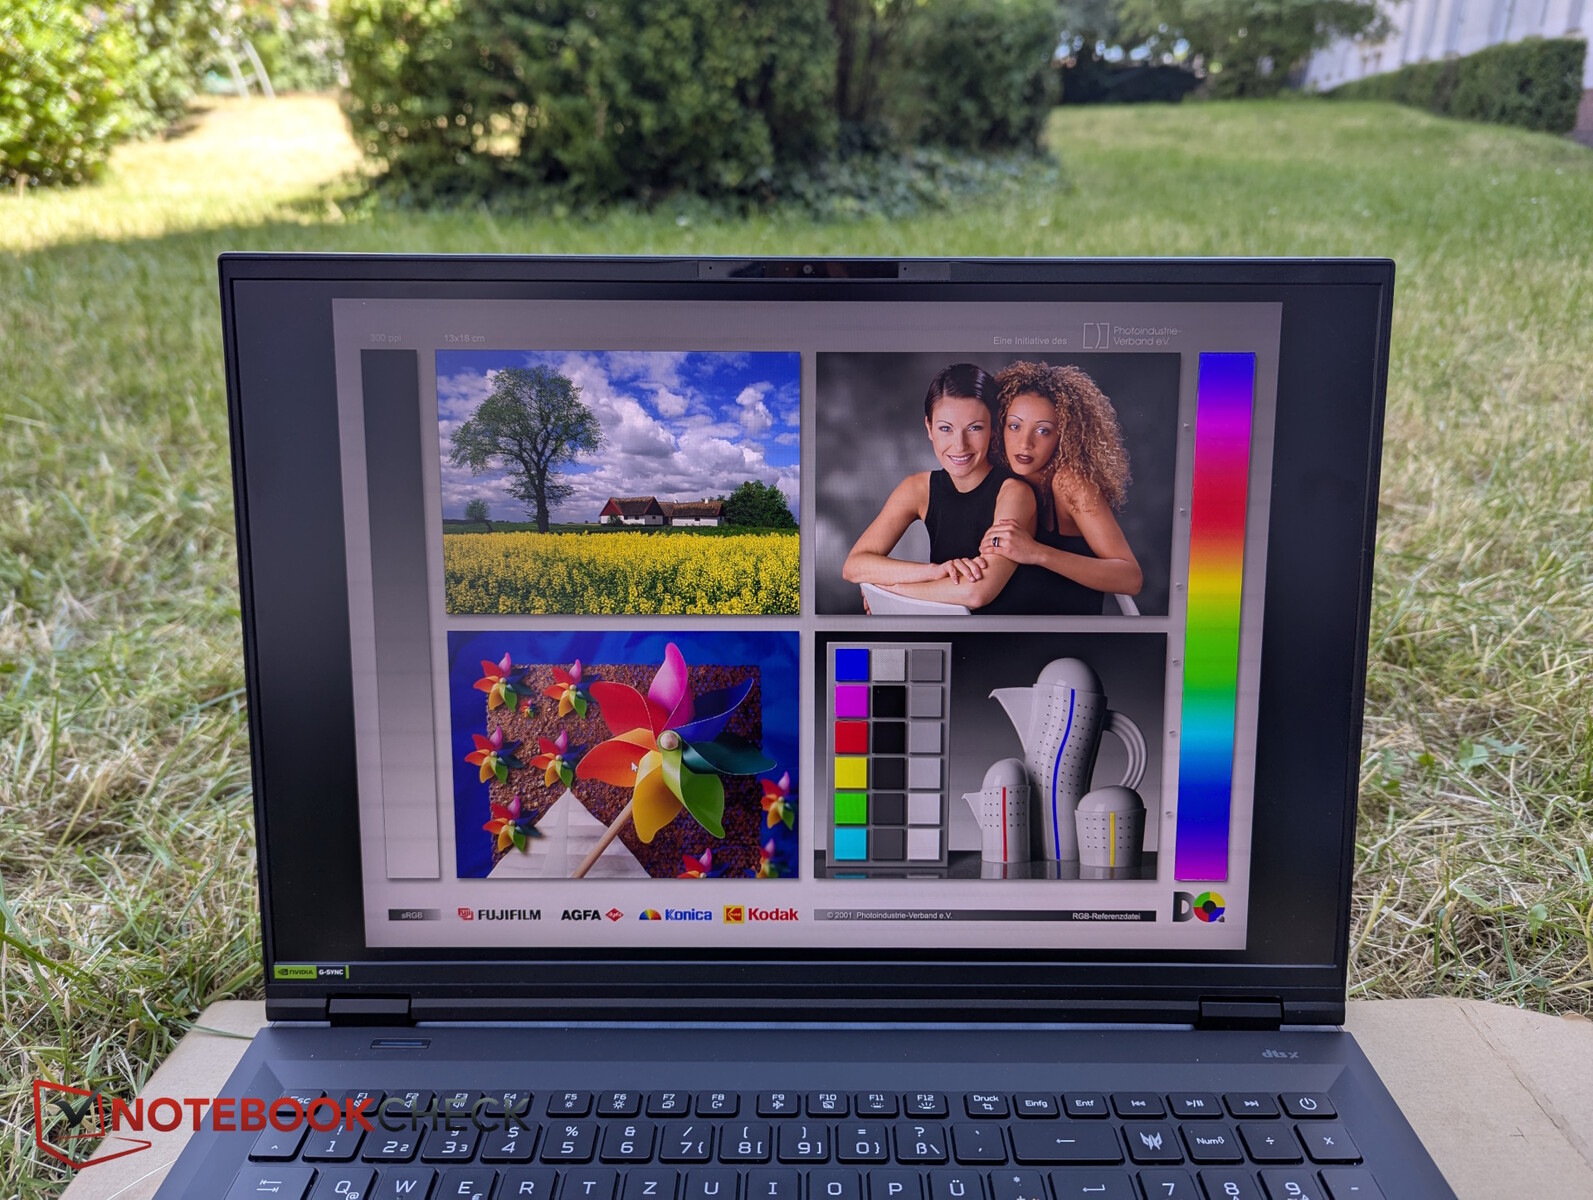
W trybie bateryjnym jasność jest "dławiona" z 700 do 400 nitów. Jest to jednak nadal wystarczające, aby umożliwić wyraźne oglądanie treści na zewnątrz w cieniu i podczas oglądania bezpośrednio z góry.

Wydajność - nieco poniżej średniej w trybie wydajności
Z jego Intel Core Ultra 9 275HX i Nvidia GeForce RTX 5080 laptopten duży 18-calowy laptop wyraźnie pozycjonuje się jako high-endowy gracz i zamiennik komputera stacjonarnego, również dzięki wielu opcjom aktualizacji.
Warunki testu
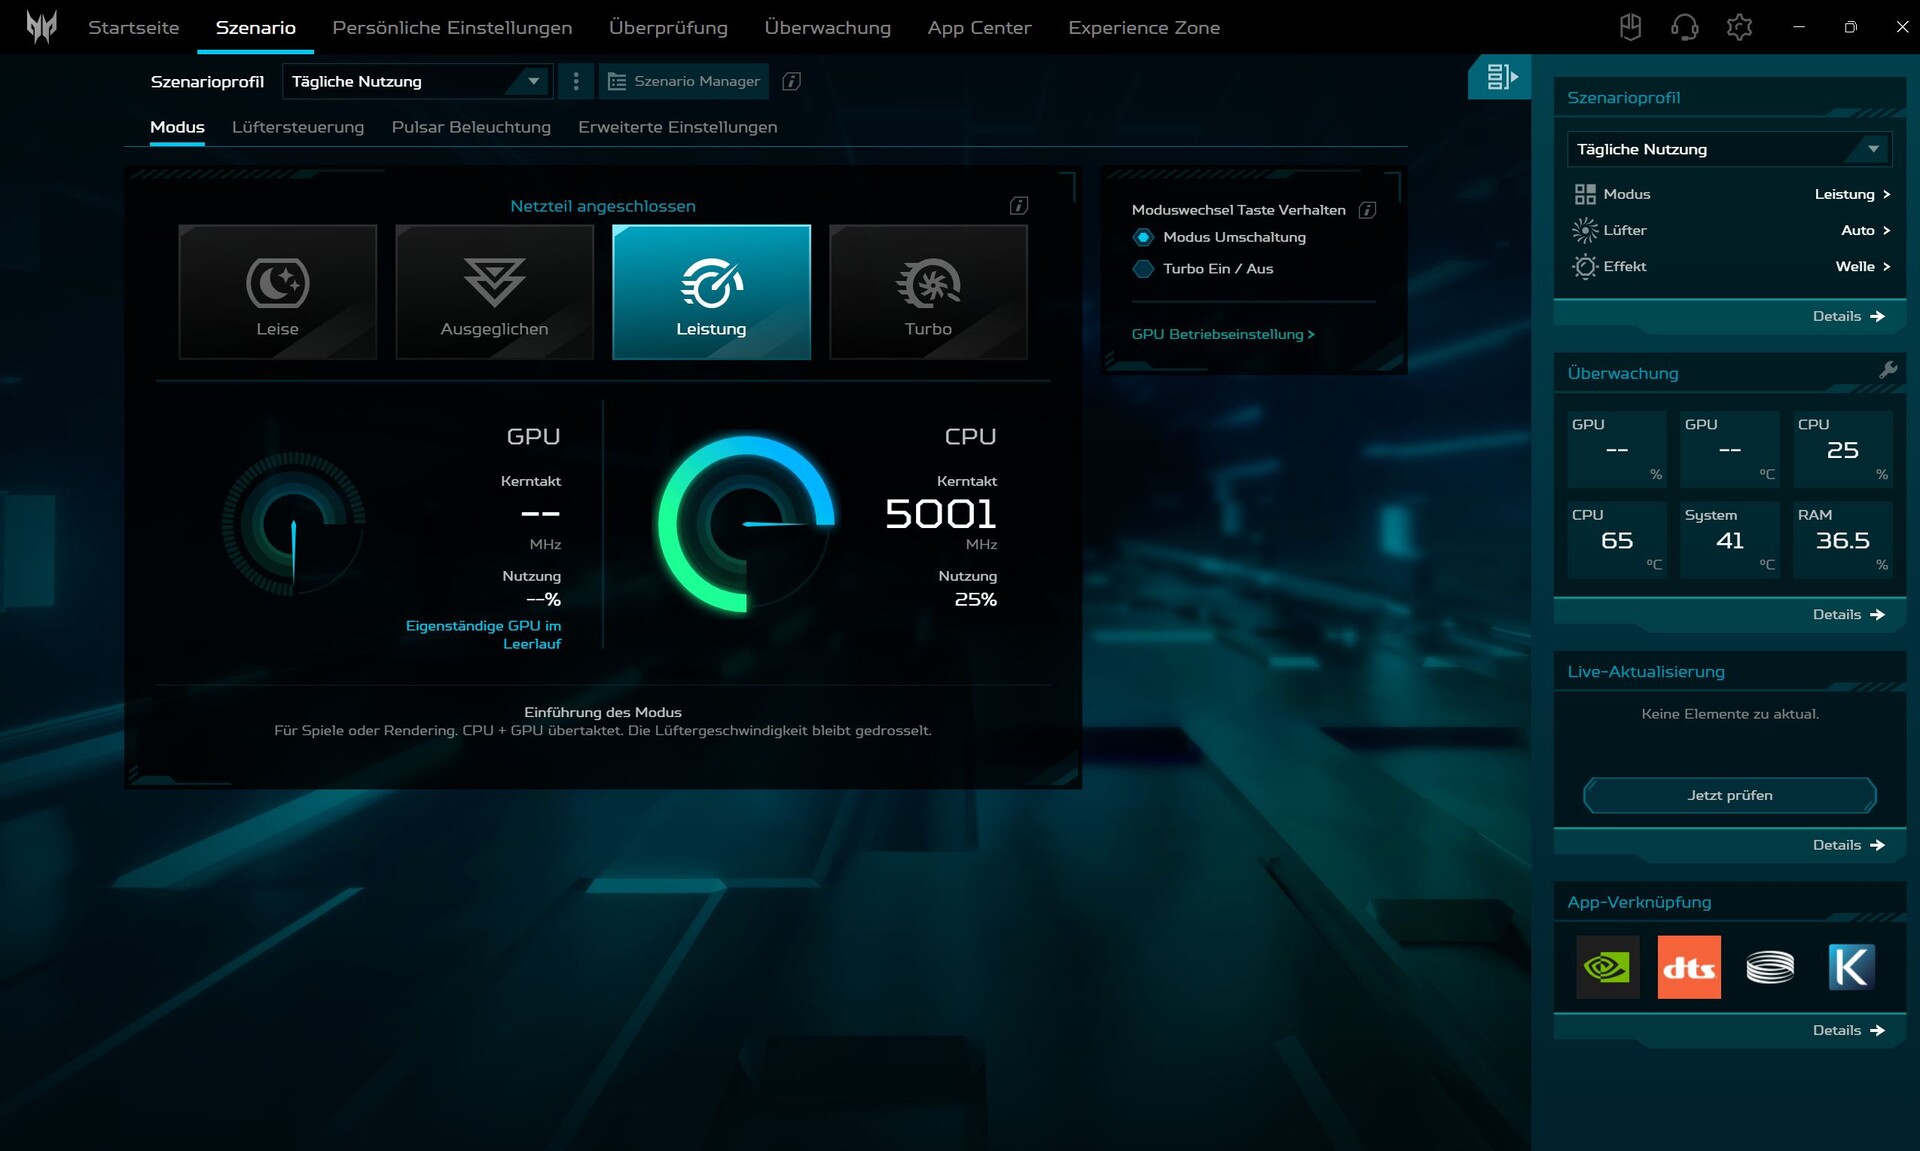
PredatorSense to centrum sterowania (nasza recenzja) gamingowych laptopów Acer. Program zawiera wiele ustawień, ale jest nieco zagmatwany, zawiły i przeładowany. Na przykład przełączanie grafiki jest dostępne za pośrednictwem łącza tekstowego ("Ustawienia operacyjne GPU") i łatwo je przeoczyć. Dostępne są 4 tryby wydajności (Cichy, Zrównoważony, Wydajność, Turbo); w naszych testach porównawczych korzystamy z trybu Wydajność.
Podczas uruchamiania systemu, dźwięk startowy jest zawsze odtwarzany tak głośno, że nie sposób się nie skrzywić. Na szczęście irytujący dźwięk uruchamiania można wyłączyć w PredatorSense (Ustawienia osobiste, Efekt uruchamiania systemu).
Irytujące jest również oprogramowanie "Acer Jump Start". Irytuje wyskakującym okienkiem Dropbox, w rzeczywistości jest mało przydatne i można je bezpiecznie odinstalować.


| Profil energetyczny | PL2/PL1 | CB 15 Multi | CP 2077 FHD Ultra | max. Głośność wentylatora |
|---|---|---|---|---|
| Cichy | 115/75 watów | 4,709 punktów | 111 fps | 27.5 dB(A) |
| Zrównoważony | 135/115 watów | 5,242 punktów | 121 fps | 39 dB(A) |
| Power | 160/135 watów | 5,379 punktów | 139.6 fps | 50.33 dB(A) |
| Turbo | 190/160 W | 5,894 punktów | 147 fps | 60 dB(A) |
| bateria (zbalansowana) | 135/115 watów | 3 319 punktów | 26,6 fps | 27,5 dB(A) |
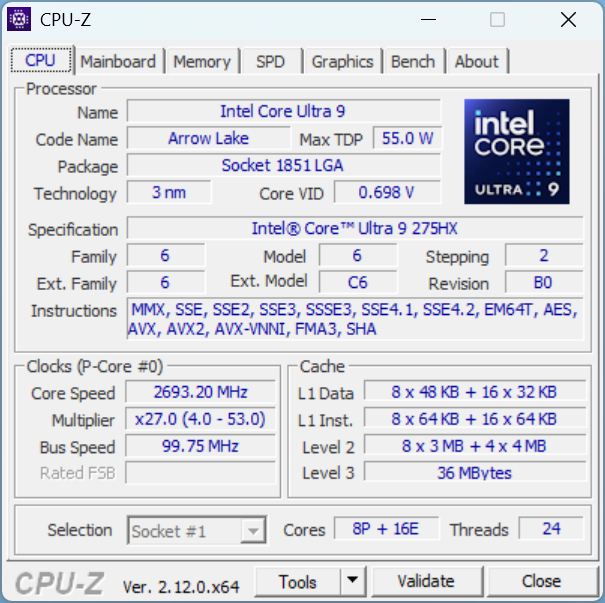
Procesor
Procesor Intel Core Ultra 9 275HX jest instalowany w wielu wysokiej klasy laptopach do gier, a jego 24 rdzenie (8 rdzeni P, 16 rdzeni E) taktują z częstotliwością do 4,6 do 5,4 GHz.
W ciągłej pętli Cinebench R15, nasz Helios 18 plasuje się pośrodku. Medion Erazer Beast 18 Medion Erazer Beast 18 X1 jest słabszy, a Asus Strix Scar 18 jest szybszy, oba z tym samym procesorem. We wszystkich testach CPU, przeciętny laptop z tym samym procesorem jest o 6 procent szybszy, a Asus Strix Scar jest nawet o 13 procent szybszy. W trybie Turbo wynik Cinebench R15 jest powyżej średniej, ale wciąż poniżej wielu konkurentów.
Z dala od gniazdka elektrycznego, Helios 18 traci około 38 procent wydajności procesora.
Cinebench R15 Multi loop
Cinebench R23: Multi Core | Single Core
Cinebench R20: CPU (Multi Core) | CPU (Single Core)
Cinebench R15: CPU Multi 64Bit | CPU Single 64Bit
Blender: v2.79 BMW27 CPU
7-Zip 18.03: 7z b 4 | 7z b 4 -mmt1
Geekbench 6.7: Multi-Core | Single-Core
Geekbench 5.5: Multi-Core | Single-Core
HWBOT x265 Benchmark v2.2: 4k Preset
LibreOffice : 20 Documents To PDF
R Benchmark 2.5: Overall mean
| CPU Performance rating | |
| MSI Raider A18 HX A9WIG-080 | |
| Asus Strix Scar 18 G835LX | |
| MSI Titan 18 HX AI A2XWJG | |
| MSI Vector A18 HX A9W | |
| Przeciętny Intel Core Ultra 9 275HX | |
| Acer Predator Helios 18 AI | |
| Medion Erazer Beast 18 X1 MD62731 | |
| Acer Predator Helios 18 PH18-72-98MW | |
| Średnia w klasie Gaming | |
| Cinebench R23 / Multi Core | |
| MSI Titan 18 HX AI A2XWJG | |
| MSI Vector A18 HX A9W | |
| Asus Strix Scar 18 G835LX | |
| MSI Raider A18 HX A9WIG-080 | |
| Przeciętny Intel Core Ultra 9 275HX (30712 - 40970, n=31) | |
| Acer Predator Helios 18 AI | |
| Medion Erazer Beast 18 X1 MD62731 | |
| Acer Predator Helios 18 PH18-72-98MW | |
| Średnia w klasie Gaming (10488 - 40970, n=110, ostatnie 2 lata) | |
| Cinebench R23 / Single Core | |
| Medion Erazer Beast 18 X1 MD62731 | |
| Asus Strix Scar 18 G835LX | |
| Przeciętny Intel Core Ultra 9 275HX (2009 - 2267, n=31) | |
| MSI Titan 18 HX AI A2XWJG | |
| Acer Predator Helios 18 PH18-72-98MW | |
| MSI Raider A18 HX A9WIG-080 | |
| Acer Predator Helios 18 AI | |
| Średnia w klasie Gaming (1166 - 2356, n=110, ostatnie 2 lata) | |
| MSI Vector A18 HX A9W | |
| Cinebench R20 / CPU (Multi Core) | |
| MSI Titan 18 HX AI A2XWJG | |
| MSI Vector A18 HX A9W | |
| Asus Strix Scar 18 G835LX | |
| MSI Raider A18 HX A9WIG-080 | |
| Przeciętny Intel Core Ultra 9 275HX (12026 - 16108, n=30) | |
| Acer Predator Helios 18 AI | |
| Medion Erazer Beast 18 X1 MD62731 | |
| Średnia w klasie Gaming (4029 - 16108, n=109, ostatnie 2 lata) | |
| Acer Predator Helios 18 PH18-72-98MW | |
| Cinebench R20 / CPU (Single Core) | |
| Asus Strix Scar 18 G835LX | |
| Medion Erazer Beast 18 X1 MD62731 | |
| MSI Raider A18 HX A9WIG-080 | |
| Przeciętny Intel Core Ultra 9 275HX (774 - 870, n=30) | |
| MSI Titan 18 HX AI A2XWJG | |
| Acer Predator Helios 18 PH18-72-98MW | |
| MSI Vector A18 HX A9W | |
| Acer Predator Helios 18 AI | |
| Średnia w klasie Gaming (442 - 895, n=109, ostatnie 2 lata) | |
| Cinebench R15 / CPU Multi 64Bit | |
| MSI Titan 18 HX AI A2XWJG | |
| MSI Vector A18 HX A9W | |
| Asus Strix Scar 18 G835LX | |
| MSI Raider A18 HX A9WIG-080 | |
| Przeciętny Intel Core Ultra 9 275HX (4737 - 6271, n=30) | |
| Acer Predator Helios 18 AI | |
| Medion Erazer Beast 18 X1 MD62731 | |
| Acer Predator Helios 18 PH18-72-98MW | |
| Średnia w klasie Gaming (1578 - 6271, n=108, ostatnie 2 lata) | |
| Cinebench R15 / CPU Single 64Bit | |
| Asus Strix Scar 18 G835LX | |
| Medion Erazer Beast 18 X1 MD62731 | |
| Przeciętny Intel Core Ultra 9 275HX (306 - 343, n=31) | |
| MSI Titan 18 HX AI A2XWJG | |
| MSI Raider A18 HX A9WIG-080 | |
| MSI Vector A18 HX A9W | |
| Acer Predator Helios 18 PH18-72-98MW | |
| Acer Predator Helios 18 AI | |
| Średnia w klasie Gaming (188.8 - 343, n=109, ostatnie 2 lata) | |
| Blender / v2.79 BMW27 CPU | |
| Średnia w klasie Gaming (80 - 330, n=107, ostatnie 2 lata) | |
| Acer Predator Helios 18 PH18-72-98MW | |
| Medion Erazer Beast 18 X1 MD62731 | |
| Acer Predator Helios 18 AI | |
| Przeciętny Intel Core Ultra 9 275HX (82 - 116, n=29) | |
| Asus Strix Scar 18 G835LX | |
| MSI Titan 18 HX AI A2XWJG | |
| MSI Vector A18 HX A9W | |
| MSI Raider A18 HX A9WIG-080 | |
| 7-Zip 18.03 / 7z b 4 | |
| MSI Raider A18 HX A9WIG-080 | |
| MSI Vector A18 HX A9W | |
| MSI Titan 18 HX AI A2XWJG | |
| Asus Strix Scar 18 G835LX | |
| Przeciętny Intel Core Ultra 9 275HX (98236 - 124155, n=30) | |
| Acer Predator Helios 18 PH18-72-98MW | |
| Acer Predator Helios 18 AI | |
| Medion Erazer Beast 18 X1 MD62731 | |
| Średnia w klasie Gaming (33491 - 148086, n=108, ostatnie 2 lata) | |
| 7-Zip 18.03 / 7z b 4 -mmt1 | |
| MSI Vector A18 HX A9W | |
| MSI Raider A18 HX A9WIG-080 | |
| Medion Erazer Beast 18 X1 MD62731 | |
| Asus Strix Scar 18 G835LX | |
| MSI Titan 18 HX AI A2XWJG | |
| Przeciętny Intel Core Ultra 9 275HX (6026 - 7149, n=30) | |
| Średnia w klasie Gaming (4199 - 7436, n=108, ostatnie 2 lata) | |
| Acer Predator Helios 18 PH18-72-98MW | |
| Acer Predator Helios 18 AI | |
| Geekbench 6.7 / Multi-Core | |
| MSI Titan 18 HX AI A2XWJG | |
| Asus Strix Scar 18 G835LX | |
| MSI Raider A18 HX A9WIG-080 | |
| Przeciętny Intel Core Ultra 9 275HX (16033 - 21668, n=33) | |
| Acer Predator Helios 18 AI | |
| Medion Erazer Beast 18 X1 MD62731 | |
| Acer Predator Helios 18 PH18-72-98MW | |
| MSI Vector A18 HX A9W | |
| Średnia w klasie Gaming (6625 - 22104, n=109, ostatnie 2 lata) | |
| Geekbench 6.7 / Single-Core | |
| MSI Vector A18 HX A9W | |
| Asus Strix Scar 18 G835LX | |
| MSI Raider A18 HX A9WIG-080 | |
| Medion Erazer Beast 18 X1 MD62731 | |
| MSI Titan 18 HX AI A2XWJG | |
| Przeciętny Intel Core Ultra 9 275HX (2843 - 3160, n=33) | |
| Acer Predator Helios 18 PH18-72-98MW | |
| Acer Predator Helios 18 AI | |
| Średnia w klasie Gaming (1490 - 3259, n=109, ostatnie 2 lata) | |
| Geekbench 5.5 / Multi-Core | |
| MSI Titan 18 HX AI A2XWJG | |
| Asus Strix Scar 18 G835LX | |
| MSI Raider A18 HX A9WIG-080 | |
| Przeciętny Intel Core Ultra 9 275HX (19105 - 25855, n=31) | |
| MSI Vector A18 HX A9W | |
| Acer Predator Helios 18 AI | |
| Acer Predator Helios 18 PH18-72-98MW | |
| Medion Erazer Beast 18 X1 MD62731 | |
| Średnia w klasie Gaming (6460 - 27010, n=108, ostatnie 2 lata) | |
| Geekbench 5.5 / Single-Core | |
| MSI Raider A18 HX A9WIG-080 | |
| MSI Vector A18 HX A9W | |
| Asus Strix Scar 18 G835LX | |
| Medion Erazer Beast 18 X1 MD62731 | |
| MSI Titan 18 HX AI A2XWJG | |
| Przeciętny Intel Core Ultra 9 275HX (2033 - 2292, n=31) | |
| Średnia w klasie Gaming (986 - 2474, n=108, ostatnie 2 lata) | |
| Acer Predator Helios 18 AI | |
| Acer Predator Helios 18 PH18-72-98MW | |
| HWBOT x265 Benchmark v2.2 / 4k Preset | |
| MSI Titan 18 HX AI A2XWJG | |
| MSI Vector A18 HX A9W | |
| MSI Raider A18 HX A9WIG-080 | |
| Asus Strix Scar 18 G835LX | |
| Przeciętny Intel Core Ultra 9 275HX (30.7 - 43.8, n=30) | |
| Acer Predator Helios 18 AI | |
| Medion Erazer Beast 18 X1 MD62731 | |
| Acer Predator Helios 18 PH18-72-98MW | |
| Średnia w klasie Gaming (11.5 - 44.3, n=108, ostatnie 2 lata) | |
| LibreOffice / 20 Documents To PDF | |
| Acer Predator Helios 18 PH18-72-98MW | |
| Średnia w klasie Gaming (19 - 88.8, n=108, ostatnie 2 lata) | |
| Medion Erazer Beast 18 X1 MD62731 | |
| MSI Titan 18 HX AI A2XWJG | |
| MSI Raider A18 HX A9WIG-080 | |
| MSI Vector A18 HX A9W | |
| Przeciętny Intel Core Ultra 9 275HX (33.2 - 62.1, n=30) | |
| Asus Strix Scar 18 G835LX | |
| Acer Predator Helios 18 AI | |
| R Benchmark 2.5 / Overall mean | |
| Acer Predator Helios 18 AI | |
| Średnia w klasie Gaming (0.3439 - 0.759, n=109, ostatnie 2 lata) | |
| Acer Predator Helios 18 PH18-72-98MW | |
| Przeciętny Intel Core Ultra 9 275HX (0.3943 - 0.4568, n=30) | |
| MSI Titan 18 HX AI A2XWJG | |
| Medion Erazer Beast 18 X1 MD62731 | |
| Asus Strix Scar 18 G835LX | |
| MSI Raider A18 HX A9WIG-080 | |
| MSI Vector A18 HX A9W | |
* ... im mniej tym lepiej
AIDA64: FP32 Ray-Trace | FPU Julia | CPU SHA3 | CPU Queen | FPU SinJulia | FPU Mandel | CPU AES | CPU ZLib | FP64 Ray-Trace | CPU PhotoWorxx
| Performance rating | |
| MSI Raider A18 HX A9WIG-080 | |
| MSI Vector A18 HX A9W | |
| MSI Titan 18 HX AI A2XWJG | |
| Asus Strix Scar 18 G835LX | |
| Przeciętny Intel Core Ultra 9 275HX | |
| Acer Predator Helios 18 AI | |
| Medion Erazer Beast 18 X1 MD62731 | |
| Średnia w klasie Gaming | |
| Acer Predator Helios 18 PH18-72-98MW | |
| AIDA64 / FP32 Ray-Trace | |
| MSI Vector A18 HX A9W | |
| MSI Raider A18 HX A9WIG-080 | |
| MSI Titan 18 HX AI A2XWJG | |
| Asus Strix Scar 18 G835LX | |
| Przeciętny Intel Core Ultra 9 275HX (28039 - 39895, n=30) | |
| Acer Predator Helios 18 AI | |
| Średnia w klasie Gaming (10227 - 85542, n=107, ostatnie 2 lata) | |
| Medion Erazer Beast 18 X1 MD62731 | |
| Acer Predator Helios 18 PH18-72-98MW | |
| AIDA64 / FPU Julia | |
| MSI Raider A18 HX A9WIG-080 | |
| MSI Vector A18 HX A9W | |
| MSI Titan 18 HX AI A2XWJG | |
| Asus Strix Scar 18 G835LX | |
| Przeciętny Intel Core Ultra 9 275HX (140254 - 200744, n=30) | |
| Acer Predator Helios 18 AI | |
| Medion Erazer Beast 18 X1 MD62731 | |
| Średnia w klasie Gaming (51376 - 238426, n=107, ostatnie 2 lata) | |
| Acer Predator Helios 18 PH18-72-98MW | |
| AIDA64 / CPU SHA3 | |
| MSI Titan 18 HX AI A2XWJG | |
| MSI Vector A18 HX A9W | |
| MSI Raider A18 HX A9WIG-080 | |
| Asus Strix Scar 18 G835LX | |
| Przeciętny Intel Core Ultra 9 275HX (6710 - 9817, n=30) | |
| Acer Predator Helios 18 AI | |
| Medion Erazer Beast 18 X1 MD62731 | |
| Średnia w klasie Gaming (2180 - 9817, n=107, ostatnie 2 lata) | |
| Acer Predator Helios 18 PH18-72-98MW | |
| AIDA64 / CPU Queen | |
| MSI Raider A18 HX A9WIG-080 | |
| MSI Vector A18 HX A9W | |
| MSI Titan 18 HX AI A2XWJG | |
| Asus Strix Scar 18 G835LX | |
| Acer Predator Helios 18 AI | |
| Acer Predator Helios 18 PH18-72-98MW | |
| Przeciętny Intel Core Ultra 9 275HX (113887 - 140937, n=30) | |
| Średnia w klasie Gaming (49785 - 173351, n=94, ostatnie 2 lata) | |
| Medion Erazer Beast 18 X1 MD62731 | |
| AIDA64 / FPU SinJulia | |
| MSI Raider A18 HX A9WIG-080 | |
| MSI Vector A18 HX A9W | |
| Acer Predator Helios 18 PH18-72-98MW | |
| Średnia w klasie Gaming (4424 - 33636, n=107, ostatnie 2 lata) | |
| MSI Titan 18 HX AI A2XWJG | |
| Asus Strix Scar 18 G835LX | |
| Acer Predator Helios 18 AI | |
| Przeciętny Intel Core Ultra 9 275HX (11172 - 14425, n=30) | |
| Medion Erazer Beast 18 X1 MD62731 | |
| AIDA64 / FPU Mandel | |
| MSI Vector A18 HX A9W | |
| MSI Raider A18 HX A9WIG-080 | |
| MSI Titan 18 HX AI A2XWJG | |
| Asus Strix Scar 18 G835LX | |
| Przeciętny Intel Core Ultra 9 275HX (72596 - 104508, n=30) | |
| Acer Predator Helios 18 AI | |
| Medion Erazer Beast 18 X1 MD62731 | |
| Średnia w klasie Gaming (25115 - 128721, n=107, ostatnie 2 lata) | |
| Acer Predator Helios 18 PH18-72-98MW | |
| AIDA64 / CPU AES | |
| MSI Raider A18 HX A9WIG-080 | |
| MSI Vector A18 HX A9W | |
| Asus Strix Scar 18 G835LX | |
| MSI Titan 18 HX AI A2XWJG | |
| Przeciętny Intel Core Ultra 9 275HX (105608 - 247074, n=30) | |
| Acer Predator Helios 18 AI | |
| Acer Predator Helios 18 PH18-72-98MW | |
| Medion Erazer Beast 18 X1 MD62731 | |
| Średnia w klasie Gaming (39258 - 247074, n=107, ostatnie 2 lata) | |
| AIDA64 / CPU ZLib | |
| MSI Vector A18 HX A9W | |
| MSI Raider A18 HX A9WIG-080 | |
| MSI Titan 18 HX AI A2XWJG | |
| Asus Strix Scar 18 G835LX | |
| Przeciętny Intel Core Ultra 9 275HX (1582 - 2263, n=30) | |
| Acer Predator Helios 18 AI | |
| Medion Erazer Beast 18 X1 MD62731 | |
| Acer Predator Helios 18 PH18-72-98MW | |
| Średnia w klasie Gaming (574 - 2531, n=107, ostatnie 2 lata) | |
| AIDA64 / FP64 Ray-Trace | |
| MSI Vector A18 HX A9W | |
| MSI Raider A18 HX A9WIG-080 | |
| MSI Titan 18 HX AI A2XWJG | |
| Asus Strix Scar 18 G835LX | |
| Przeciętny Intel Core Ultra 9 275HX (14847 - 21854, n=30) | |
| Acer Predator Helios 18 AI | |
| Średnia w klasie Gaming (5509 - 45446, n=107, ostatnie 2 lata) | |
| Medion Erazer Beast 18 X1 MD62731 | |
| Acer Predator Helios 18 PH18-72-98MW | |
| AIDA64 / CPU PhotoWorxx | |
| MSI Titan 18 HX AI A2XWJG | |
| Asus Strix Scar 18 G835LX | |
| Przeciętny Intel Core Ultra 9 275HX (37482 - 62916, n=30) | |
| Medion Erazer Beast 18 X1 MD62731 | |
| Acer Predator Helios 18 PH18-72-98MW | |
| Średnia w klasie Gaming (12271 - 89891, n=107, ostatnie 2 lata) | |
| MSI Vector A18 HX A9W | |
| Acer Predator Helios 18 AI | |
| MSI Raider A18 HX A9WIG-080 | |
Wydajność systemu

Jeśli chodzi o wydajność systemu, Helios 18 jest nieco poniżej średniej na poziomie 4 procent. Ale subiektywnie, otwieranie przeglądarek plików lub menu kontekstowych zawsze trwa nieco dłużej niż zwykle. Miejmy nadzieję, że przyszłe aktualizacje wyeliminują te krótkie czkawki.
PCMark 10: Score | Essentials | Productivity | Digital Content Creation
CrossMark: Overall | Productivity | Creativity | Responsiveness
WebXPRT 3: Overall
WebXPRT 4: Overall
Mozilla Kraken 1.1: Total
| Performance rating | |
| MSI Raider A18 HX A9WIG-080 | |
| MSI Vector A18 HX A9W | |
| MSI Titan 18 HX AI A2XWJG | |
| Asus Strix Scar 18 G835LX | |
| Przeciętny Intel Core Ultra 9 275HX, NVIDIA GeForce RTX 5080 Laptop | |
| Acer Predator Helios 18 AI | |
| Średnia w klasie Gaming | |
| Medion Erazer Beast 18 X1 MD62731 | |
| Acer Predator Helios 18 PH18-72-98MW -6! | |
| PCMark 10 / Score | |
| MSI Vector A18 HX A9W | |
| MSI Raider A18 HX A9WIG-080 | |
| MSI Titan 18 HX AI A2XWJG | |
| Przeciętny Intel Core Ultra 9 275HX, NVIDIA GeForce RTX 5080 Laptop (7805 - 10409, n=9) | |
| Asus Strix Scar 18 G835LX | |
| Acer Predator Helios 18 AI | |
| Medion Erazer Beast 18 X1 MD62731 | |
| Średnia w klasie Gaming (5828 - 11574, n=95, ostatnie 2 lata) | |
| Acer Predator Helios 18 PH18-72-98MW | |
| PCMark 10 / Essentials | |
| MSI Raider A18 HX A9WIG-080 | |
| MSI Vector A18 HX A9W | |
| Acer Predator Helios 18 PH18-72-98MW | |
| Asus Strix Scar 18 G835LX | |
| MSI Titan 18 HX AI A2XWJG | |
| Przeciętny Intel Core Ultra 9 275HX, NVIDIA GeForce RTX 5080 Laptop (10206 - 11472, n=9) | |
| Acer Predator Helios 18 AI | |
| Średnia w klasie Gaming (8810 - 12600, n=99, ostatnie 2 lata) | |
| Medion Erazer Beast 18 X1 MD62731 | |
| PCMark 10 / Productivity | |
| Średnia w klasie Gaming (6845 - 21327, n=97, ostatnie 2 lata) | |
| MSI Vector A18 HX A9W | |
| MSI Raider A18 HX A9WIG-080 | |
| Przeciętny Intel Core Ultra 9 275HX, NVIDIA GeForce RTX 5080 Laptop (8319 - 20616, n=9) | |
| Acer Predator Helios 18 PH18-72-98MW | |
| Acer Predator Helios 18 AI | |
| Medion Erazer Beast 18 X1 MD62731 | |
| MSI Titan 18 HX AI A2XWJG | |
| Asus Strix Scar 18 G835LX | |
| PCMark 10 / Digital Content Creation | |
| MSI Vector A18 HX A9W | |
| MSI Titan 18 HX AI A2XWJG | |
| Asus Strix Scar 18 G835LX | |
| Przeciętny Intel Core Ultra 9 275HX, NVIDIA GeForce RTX 5080 Laptop (10505 - 19351, n=9) | |
| Acer Predator Helios 18 AI | |
| Medion Erazer Beast 18 X1 MD62731 | |
| MSI Raider A18 HX A9WIG-080 | |
| Średnia w klasie Gaming (7602 - 19657, n=97, ostatnie 2 lata) | |
| Acer Predator Helios 18 PH18-72-98MW | |
| CrossMark / Overall | |
| MSI Raider A18 HX A9WIG-080 | |
| MSI Titan 18 HX AI A2XWJG | |
| Asus Strix Scar 18 G835LX | |
| MSI Vector A18 HX A9W | |
| Przeciętny Intel Core Ultra 9 275HX, NVIDIA GeForce RTX 5080 Laptop (1857 - 2244, n=9) | |
| Acer Predator Helios 18 AI | |
| Średnia w klasie Gaming (1366 - 2409, n=96, ostatnie 2 lata) | |
| Medion Erazer Beast 18 X1 MD62731 | |
| CrossMark / Productivity | |
| Asus Strix Scar 18 G835LX | |
| MSI Raider A18 HX A9WIG-080 | |
| MSI Titan 18 HX AI A2XWJG | |
| Przeciętny Intel Core Ultra 9 275HX, NVIDIA GeForce RTX 5080 Laptop (1764 - 2122, n=9) | |
| MSI Vector A18 HX A9W | |
| Acer Predator Helios 18 AI | |
| Średnia w klasie Gaming (1386 - 2254, n=96, ostatnie 2 lata) | |
| Medion Erazer Beast 18 X1 MD62731 | |
| CrossMark / Creativity | |
| MSI Raider A18 HX A9WIG-080 | |
| MSI Titan 18 HX AI A2XWJG | |
| MSI Vector A18 HX A9W | |
| Asus Strix Scar 18 G835LX | |
| Przeciętny Intel Core Ultra 9 275HX, NVIDIA GeForce RTX 5080 Laptop (2115 - 2498, n=9) | |
| Acer Predator Helios 18 AI | |
| Średnia w klasie Gaming (1343 - 2729, n=96, ostatnie 2 lata) | |
| Medion Erazer Beast 18 X1 MD62731 | |
| CrossMark / Responsiveness | |
| Przeciętny Intel Core Ultra 9 275HX, NVIDIA GeForce RTX 5080 Laptop (1466 - 2096, n=9) | |
| MSI Raider A18 HX A9WIG-080 | |
| Asus Strix Scar 18 G835LX | |
| Acer Predator Helios 18 AI | |
| MSI Titan 18 HX AI A2XWJG | |
| Średnia w klasie Gaming (1226 - 2334, n=96, ostatnie 2 lata) | |
| MSI Vector A18 HX A9W | |
| Medion Erazer Beast 18 X1 MD62731 | |
| WebXPRT 3 / Overall | |
| MSI Raider A18 HX A9WIG-080 | |
| MSI Titan 18 HX AI A2XWJG | |
| MSI Vector A18 HX A9W | |
| Asus Strix Scar 18 G835LX | |
| Przeciętny Intel Core Ultra 9 275HX, NVIDIA GeForce RTX 5080 Laptop (306 - 378, n=9) | |
| Medion Erazer Beast 18 X1 MD62731 | |
| Średnia w klasie Gaming (220 - 532, n=100, ostatnie 2 lata) | |
| Acer Predator Helios 18 AI | |
| WebXPRT 4 / Overall | |
| Asus Strix Scar 18 G835LX | |
| MSI Raider A18 HX A9WIG-080 | |
| Medion Erazer Beast 18 X1 MD62731 | |
| Przeciętny Intel Core Ultra 9 275HX, NVIDIA GeForce RTX 5080 Laptop (285 - 336, n=9) | |
| MSI Vector A18 HX A9W | |
| MSI Titan 18 HX AI A2XWJG | |
| Acer Predator Helios 18 AI | |
| Średnia w klasie Gaming (165 - 354, n=101, ostatnie 2 lata) | |
| Mozilla Kraken 1.1 / Total | |
| Średnia w klasie Gaming (391 - 590, n=104, ostatnie 2 lata) | |
| Acer Predator Helios 18 PH18-72-98MW | |
| Acer Predator Helios 18 AI | |
| Medion Erazer Beast 18 X1 MD62731 | |
| Przeciętny Intel Core Ultra 9 275HX, NVIDIA GeForce RTX 5080 Laptop (405 - 432, n=9) | |
| Asus Strix Scar 18 G835LX | |
| MSI Titan 18 HX AI A2XWJG | |
| MSI Vector A18 HX A9W | |
| MSI Raider A18 HX A9WIG-080 | |
* ... im mniej tym lepiej
| PCMark 10 Score | 8511 pkt. | |
Pomoc | ||
| AIDA64 / Memory Copy | |
| MSI Titan 18 HX AI A2XWJG | |
| Asus Strix Scar 18 G835LX | |
| Przeciętny Intel Core Ultra 9 275HX (56003 - 94460, n=30) | |
| Acer Predator Helios 18 PH18-72-98MW | |
| Medion Erazer Beast 18 X1 MD62731 | |
| Średnia w klasie Gaming (21750 - 129946, n=107, ostatnie 2 lata) | |
| Acer Predator Helios 18 AI | |
| MSI Vector A18 HX A9W | |
| MSI Raider A18 HX A9WIG-080 | |
| AIDA64 / Memory Read | |
| MSI Titan 18 HX AI A2XWJG | |
| Medion Erazer Beast 18 X1 MD62731 | |
| Asus Strix Scar 18 G835LX | |
| Acer Predator Helios 18 PH18-72-98MW | |
| Przeciętny Intel Core Ultra 9 275HX (55795 - 97151, n=30) | |
| Średnia w klasie Gaming (22956 - 118858, n=107, ostatnie 2 lata) | |
| Acer Predator Helios 18 AI | |
| MSI Vector A18 HX A9W | |
| MSI Raider A18 HX A9WIG-080 | |
| AIDA64 / Memory Write | |
| MSI Titan 18 HX AI A2XWJG | |
| Asus Strix Scar 18 G835LX | |
| Przeciętny Intel Core Ultra 9 275HX (55663 - 116129, n=30) | |
| Medion Erazer Beast 18 X1 MD62731 | |
| Średnia w klasie Gaming (22297 - 135096, n=107, ostatnie 2 lata) | |
| Acer Predator Helios 18 PH18-72-98MW | |
| MSI Vector A18 HX A9W | |
| Acer Predator Helios 18 AI | |
| MSI Raider A18 HX A9WIG-080 | |
| AIDA64 / Memory Latency | |
| Acer Predator Helios 18 AI | |
| Przeciętny Intel Core Ultra 9 275HX (105.8 - 161.6, n=30) | |
| Medion Erazer Beast 18 X1 MD62731 | |
| Asus Strix Scar 18 G835LX | |
| Średnia w klasie Gaming (75.3 - 259, n=107, ostatnie 2 lata) | |
| MSI Titan 18 HX AI A2XWJG | |
| MSI Vector A18 HX A9W | |
| MSI Raider A18 HX A9WIG-080 | |
| Acer Predator Helios 18 PH18-72-98MW | |
* ... im mniej tym lepiej
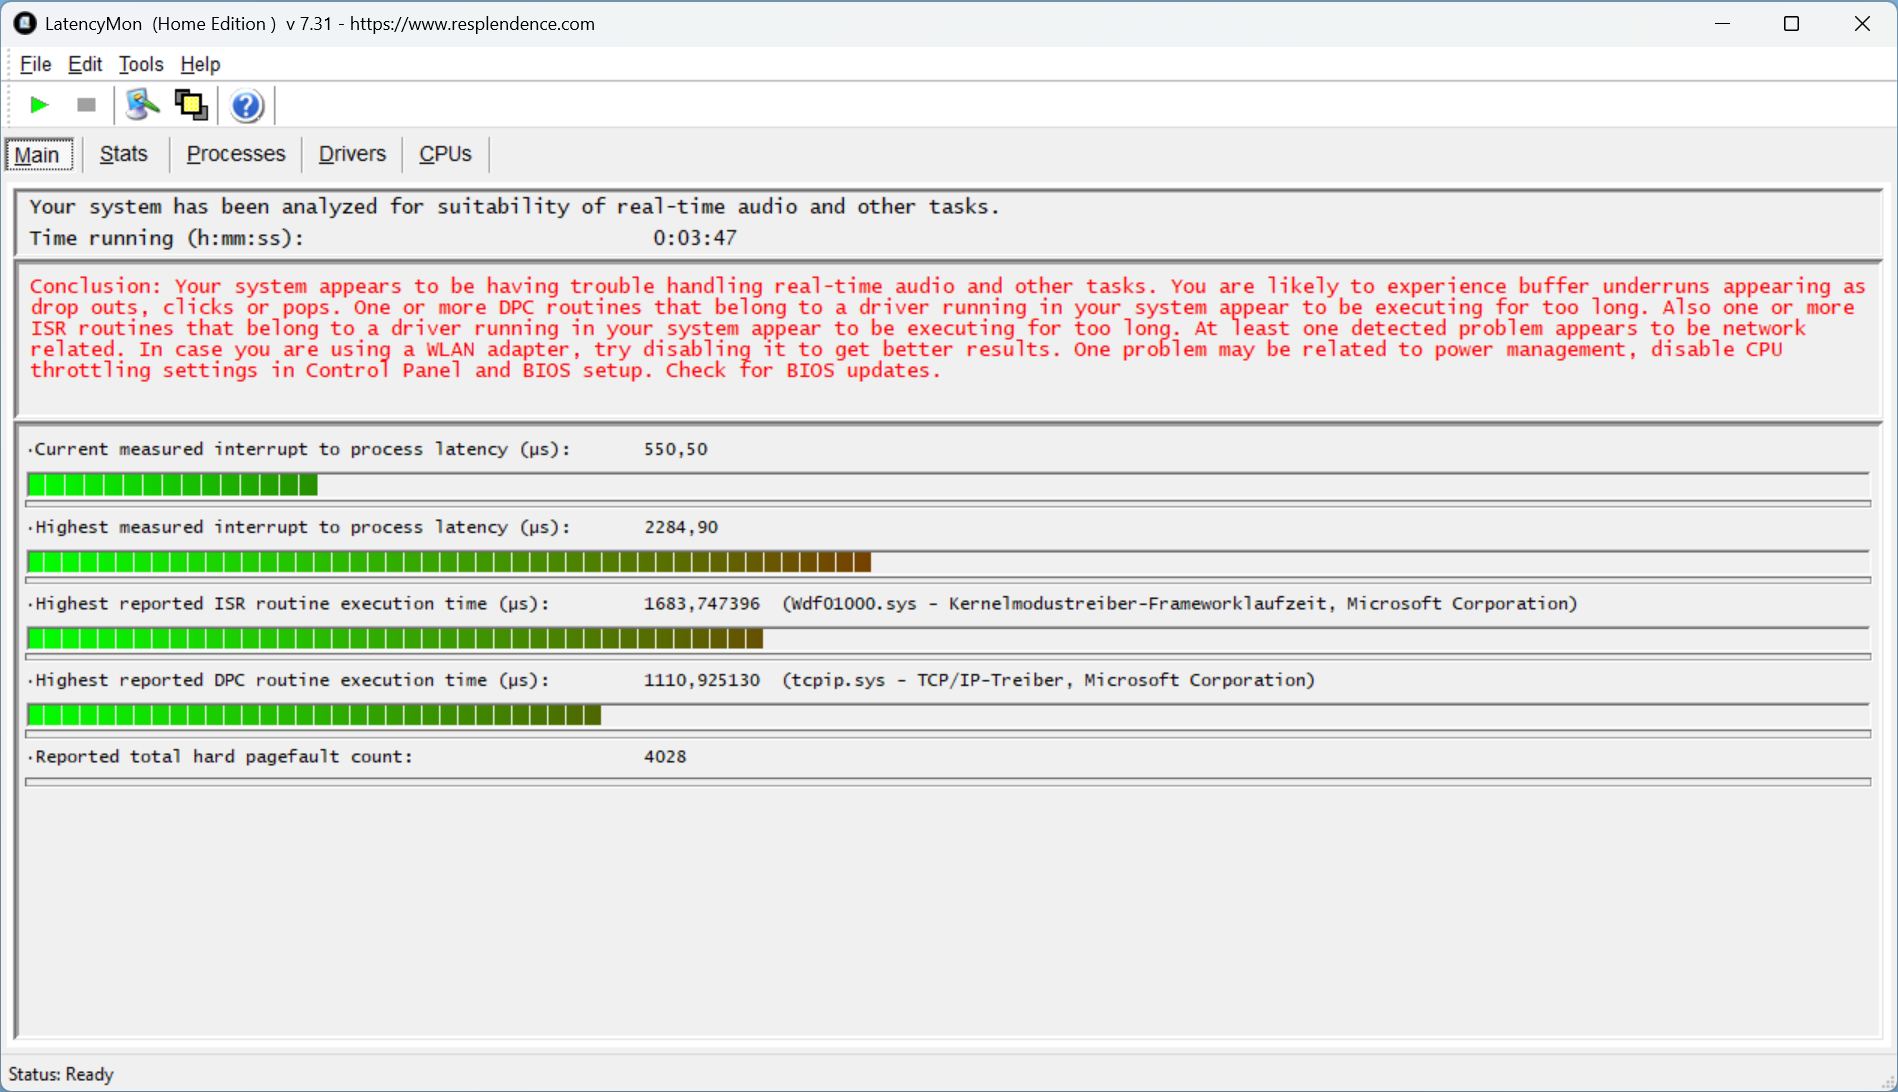
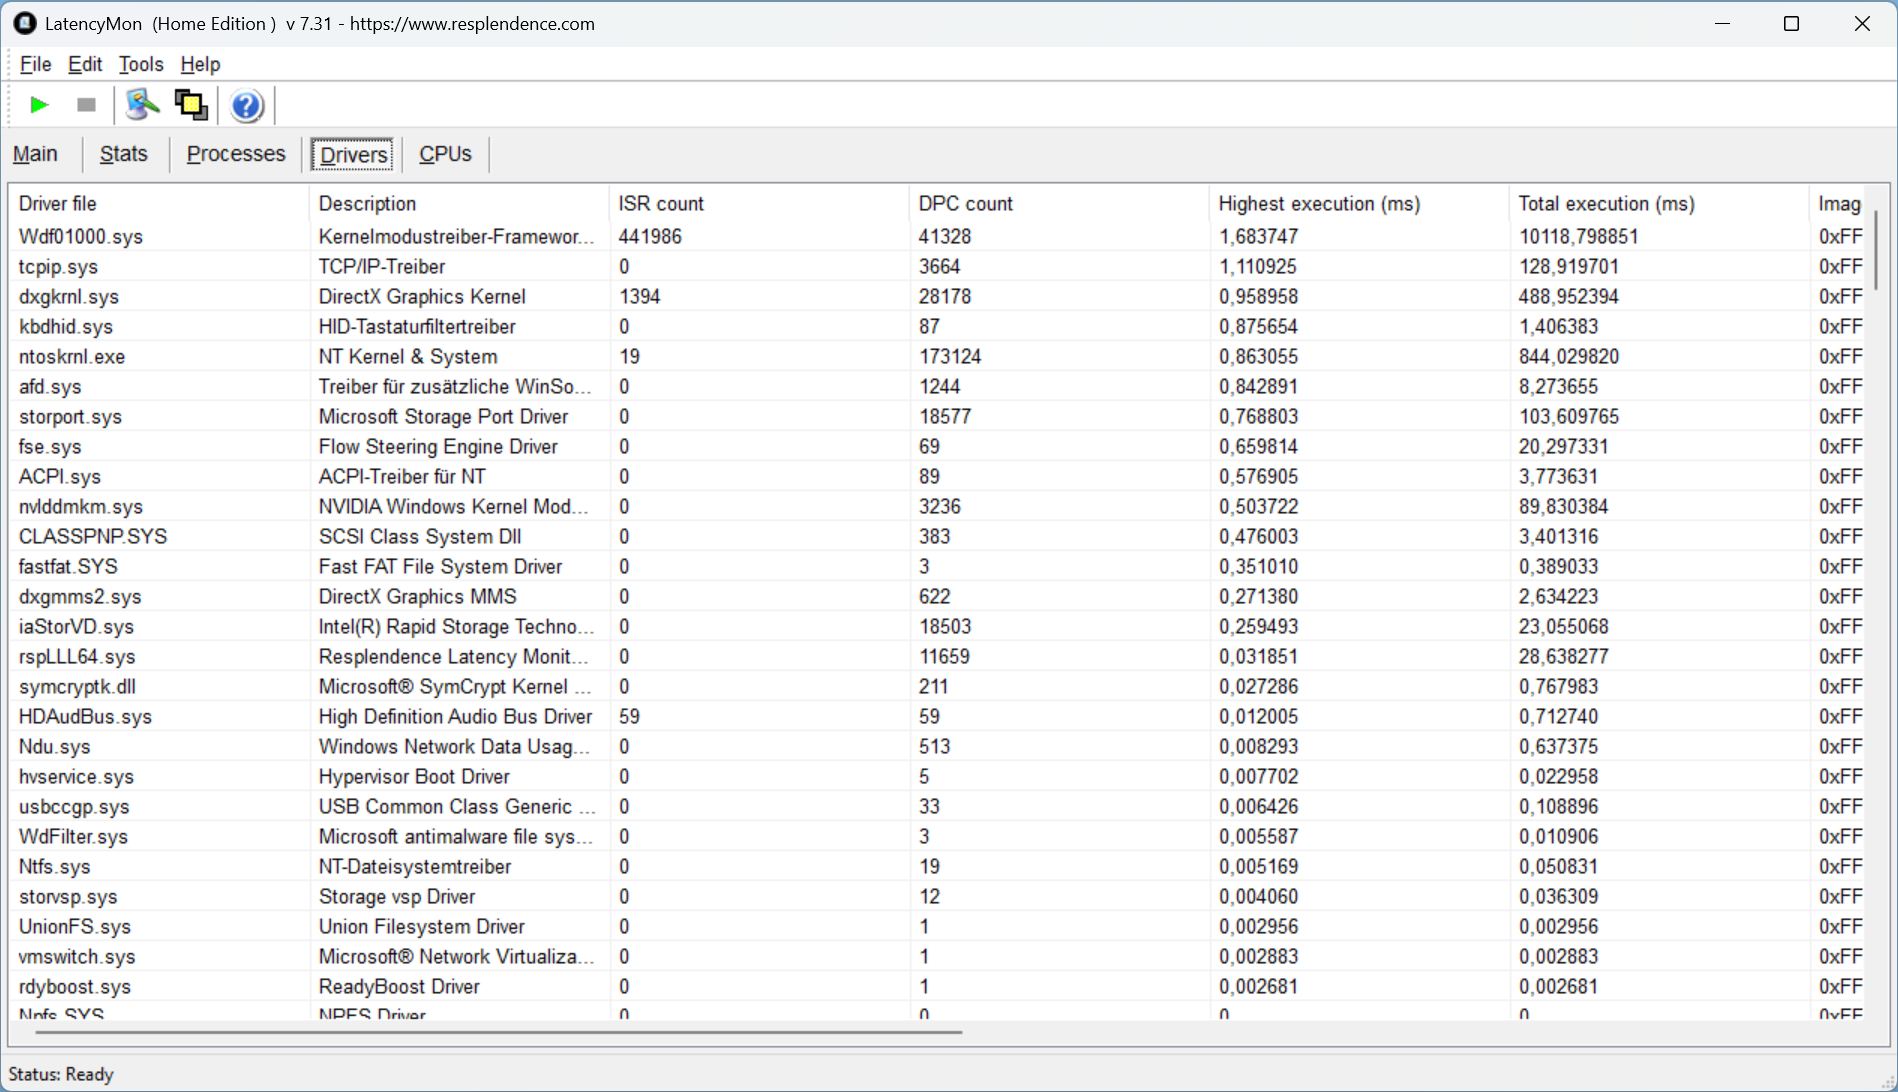
Opóźnienia DPC
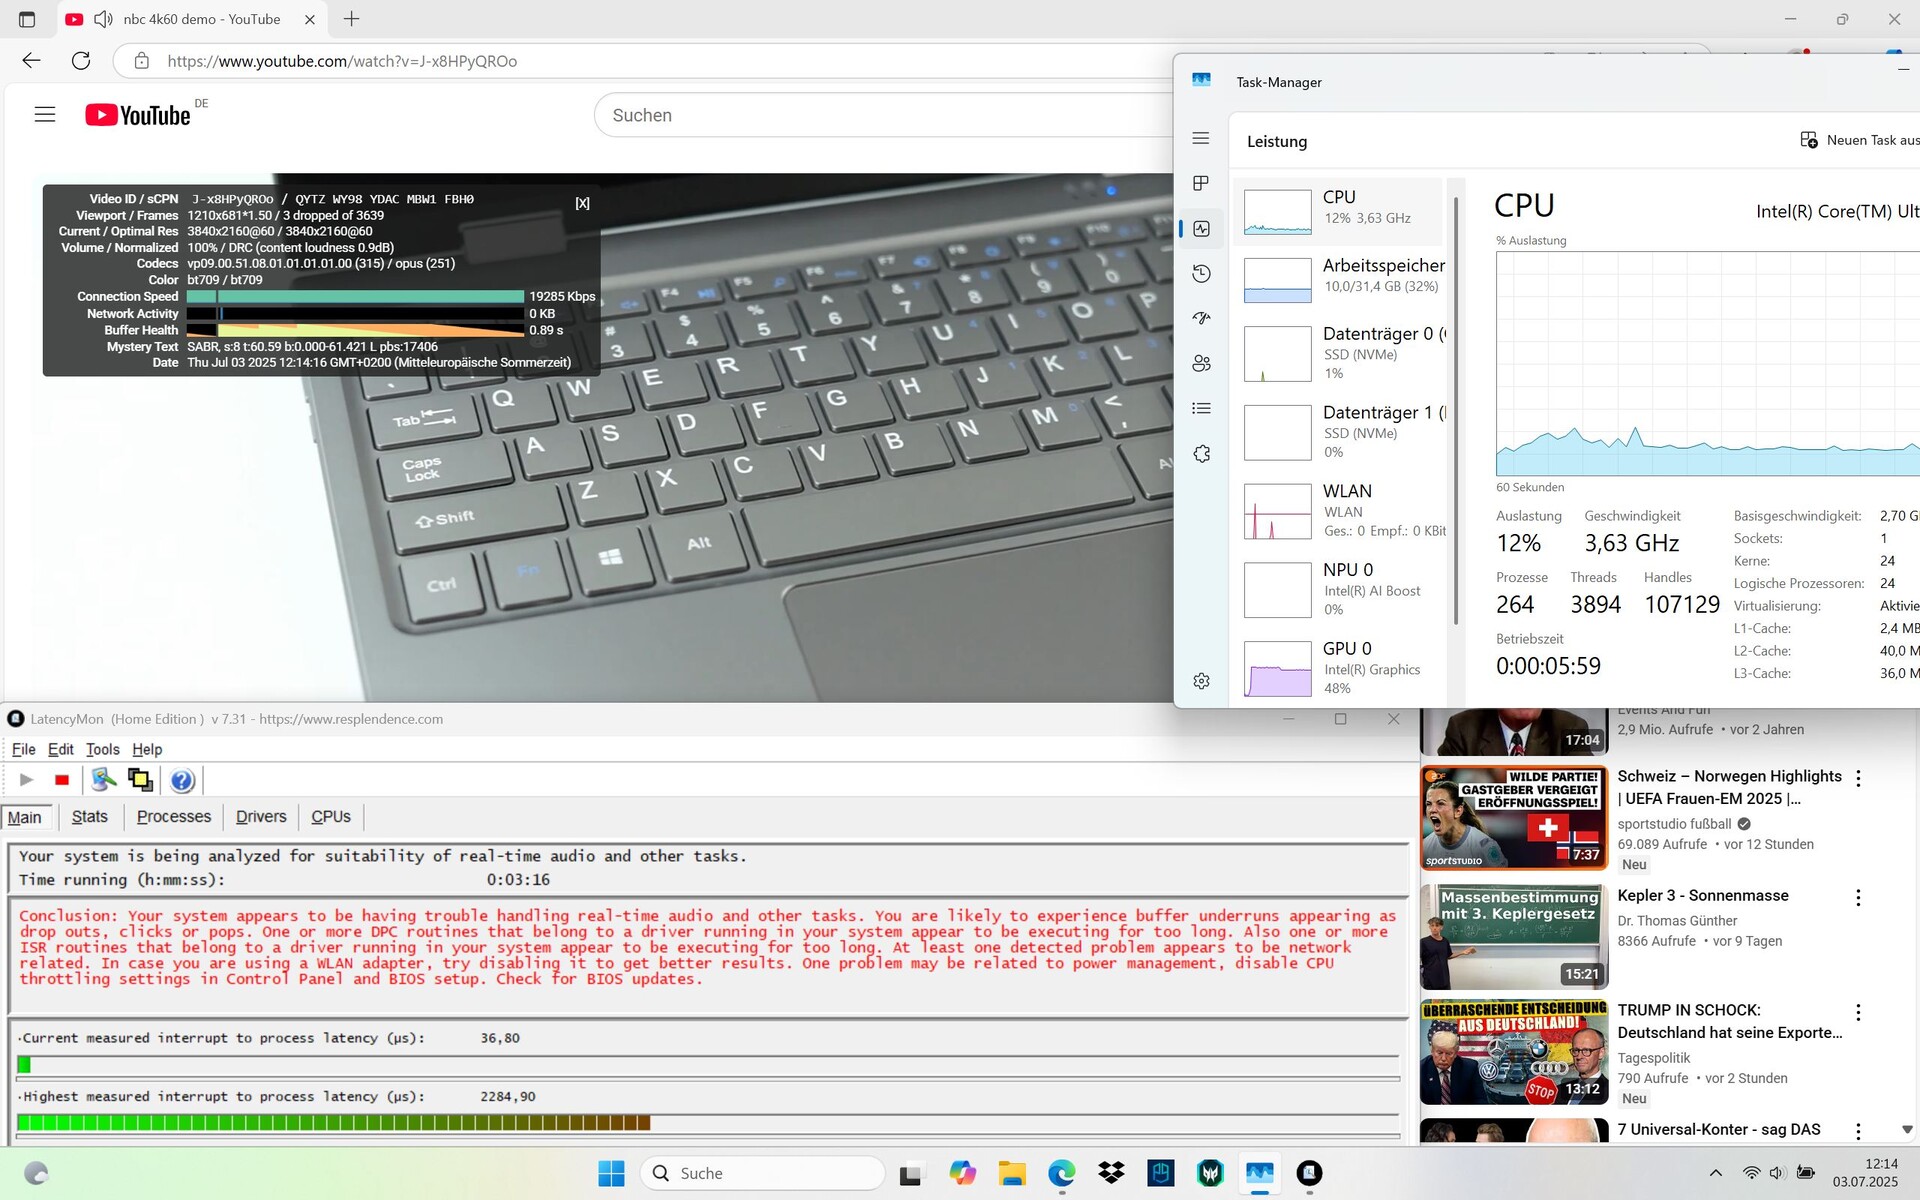
LatencyMon zaczyna od pierwszych opóźnień, które zwiększają się po otwarciu przeglądarki i innych kart. Nasz film 4K 60 fps z YouTube jest odtwarzany z 3 pominiętymi klatkami.
| DPC Latencies / LatencyMon - interrupt to process latency (max), Web, Youtube, Prime95 | |
| Medion Erazer Beast 18 X1 MD62731 | |
| Acer Predator Helios 18 PH18-72-98MW | |
| Acer Predator Helios 18 AI | |
| MSI Titan 18 HX AI A2XWJG | |
| MSI Raider A18 HX A9WIG-080 | |
| Asus Strix Scar 18 G835LX | |
| MSI Vector A18 HX A9W | |
* ... im mniej tym lepiej
Pamięć masowa
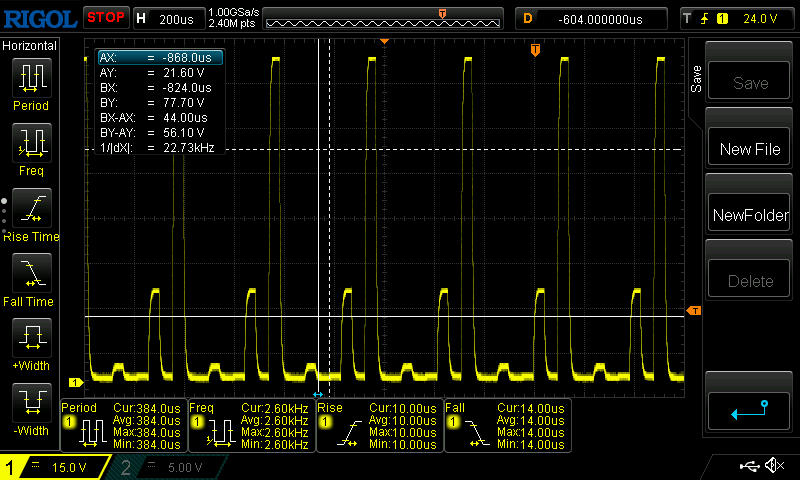
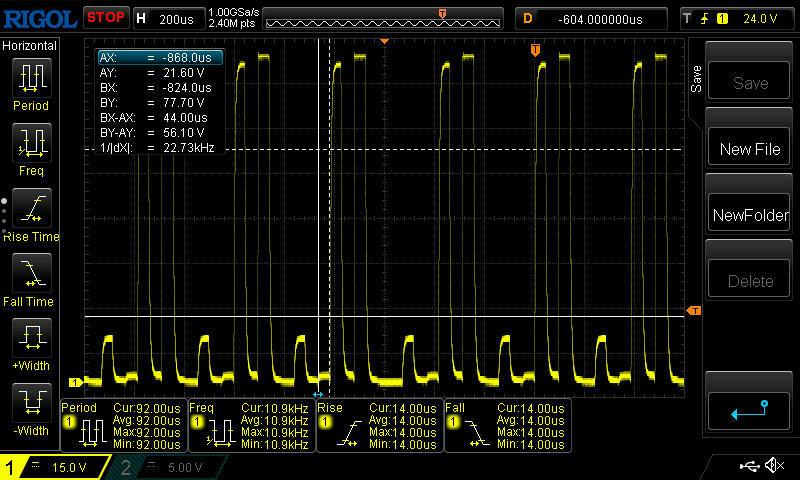
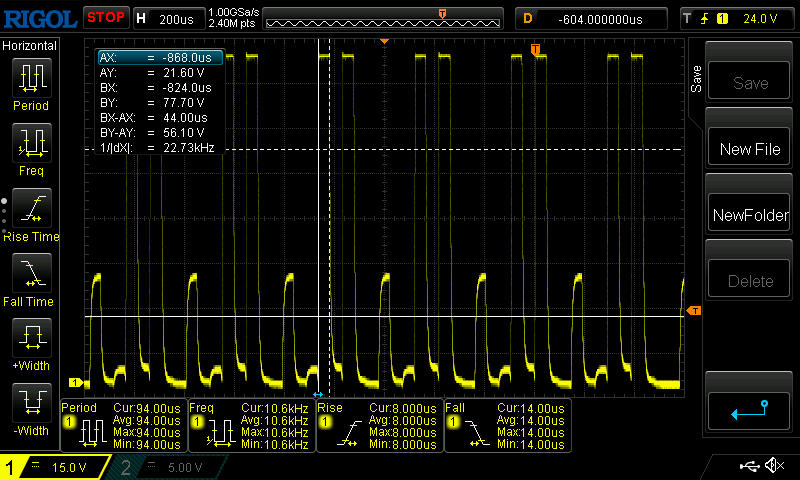
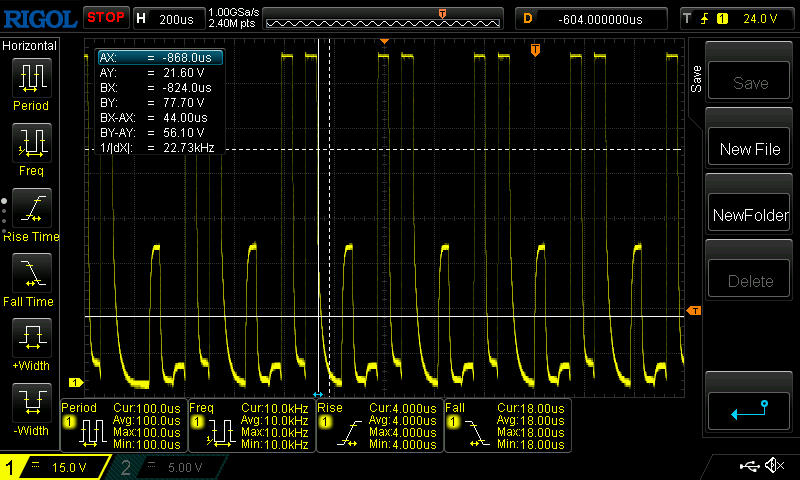
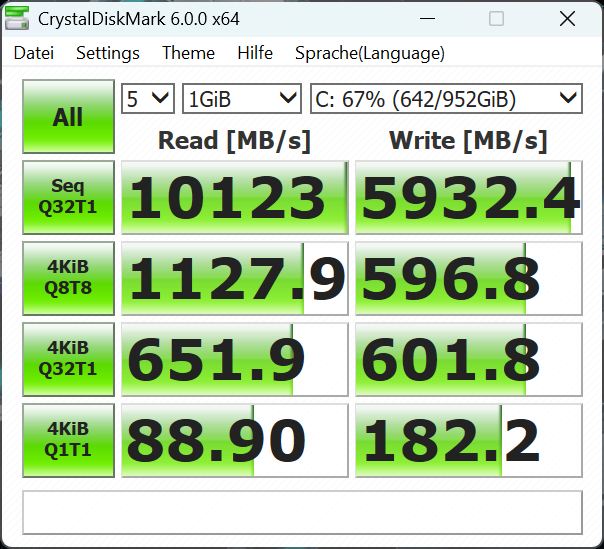
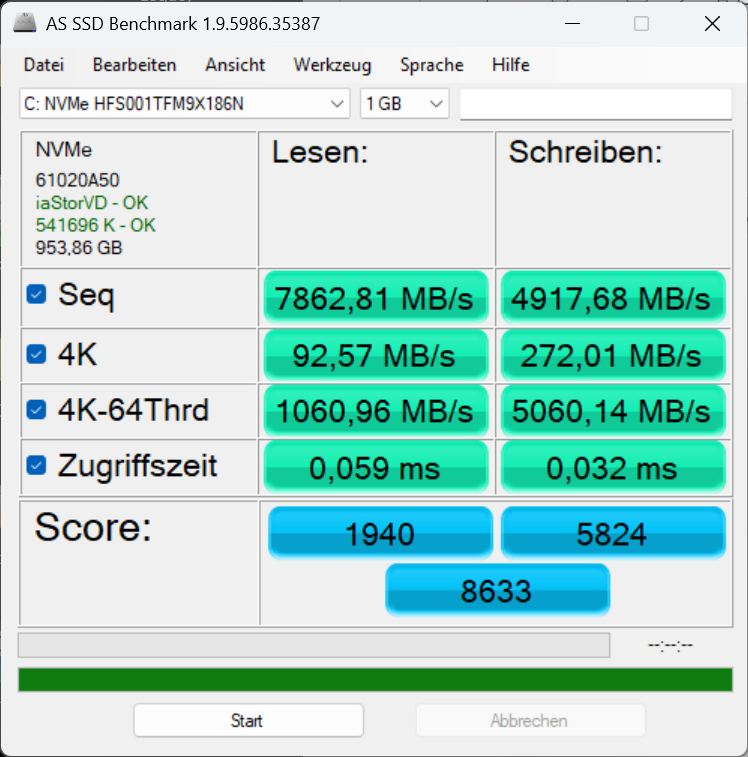
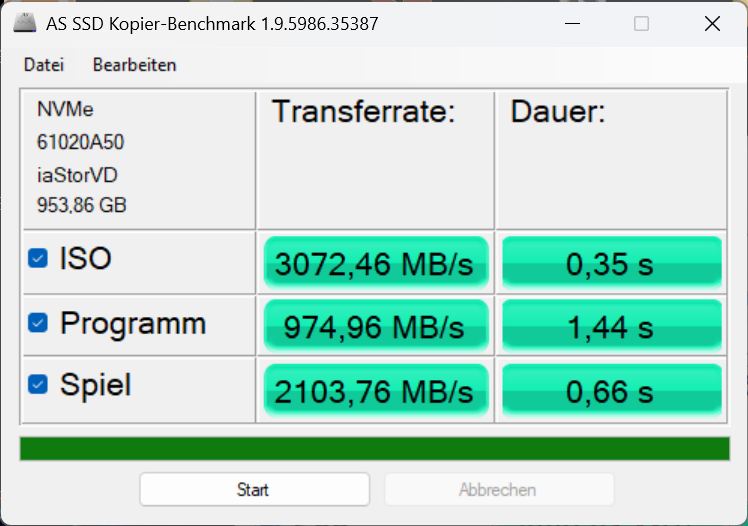
Nasza konfiguracja zawiera dwa dyski SSD od SK Hynix (różne modele), każdy z 1 TB przestrzeni dyskowej, które najwyraźniej nie są połączone w RAID. Systemowy dysk SSD jest bardzo szybki, ale jest dławiony po połowie czasu przy ciągłym obciążeniu.

* ... im mniej tym lepiej
Continuous read: DiskSpd Read Loop, Queue Depth 8
Wydajność GPU
W syntetycznych testach 3DMarks laptop GeForce RTX 5080 z naszym Heliosem 18 jest około 3 procent za średnią MSI Raider A18 z tym samym GPU jest o 8 procent szybszy. Aż 85 procent wydajności 3D jest tracone w trybie bateryjnym!
Sytuacja wygląda podobnie w testach gier: nasz Helios radzi sobie w Full HD na równi z Medion Erazer Beast 18 X1ale MSI Vector A18 HX z RTX 5070 Ti wyprzedza nawet o 8 do 9 procent dwóch graczy wyposażonych w RTX 5080! Poprzednik Helios 18 z RTX 4090 jest tylko o 4 procent wolniejszy we wszystkich grach. W rozdzielczości QHD różnice mogą być jeszcze większe.
Helios 18 czuje się szczególnie komfortowo w rozdzielczości Full HD i QHD. Baldur's Gate 3, na przykład, zawiesza się przy 7 fps w 4K, a niektóre inne tytuły, takie jak F1 25 lub Cyberpunk 2077, nie działają już płynnie w 4K. Nasz wykres Cyberpunk pokazuje z jednej strony, że kilka klatek jest traconych z czasem, a z drugiej strony, że MSI Vector 17 jest co najmniej tak samo szybki, pomimo posiadania faktycznie słabszego GPU.
Niektóre tytuły, takie jak F1 25 w rozdzielczości QHD, nadal można przyspieszyć za pomocą DLSS, jeśli nie działają już całkowicie płynnie natywnie.
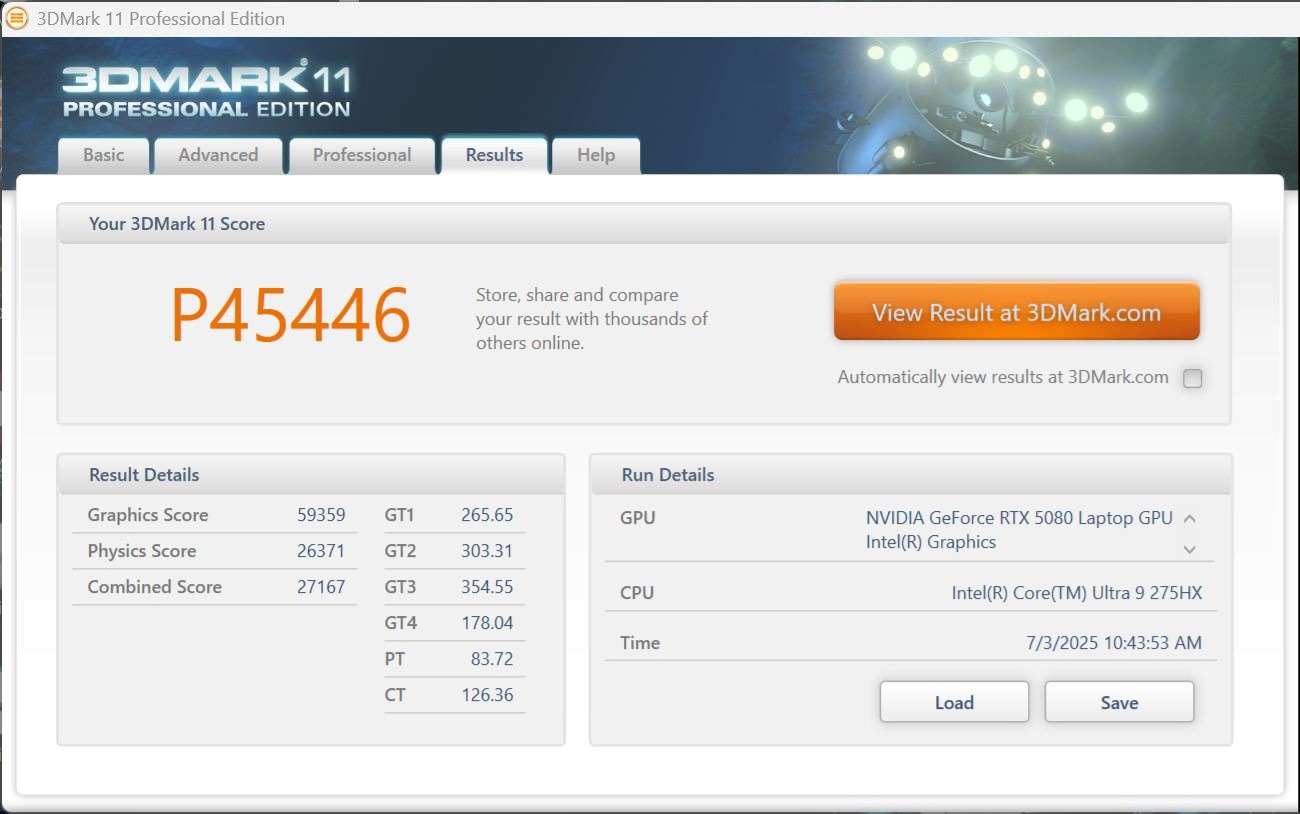
| 3DMark 11 Performance | 45446 pkt. | |
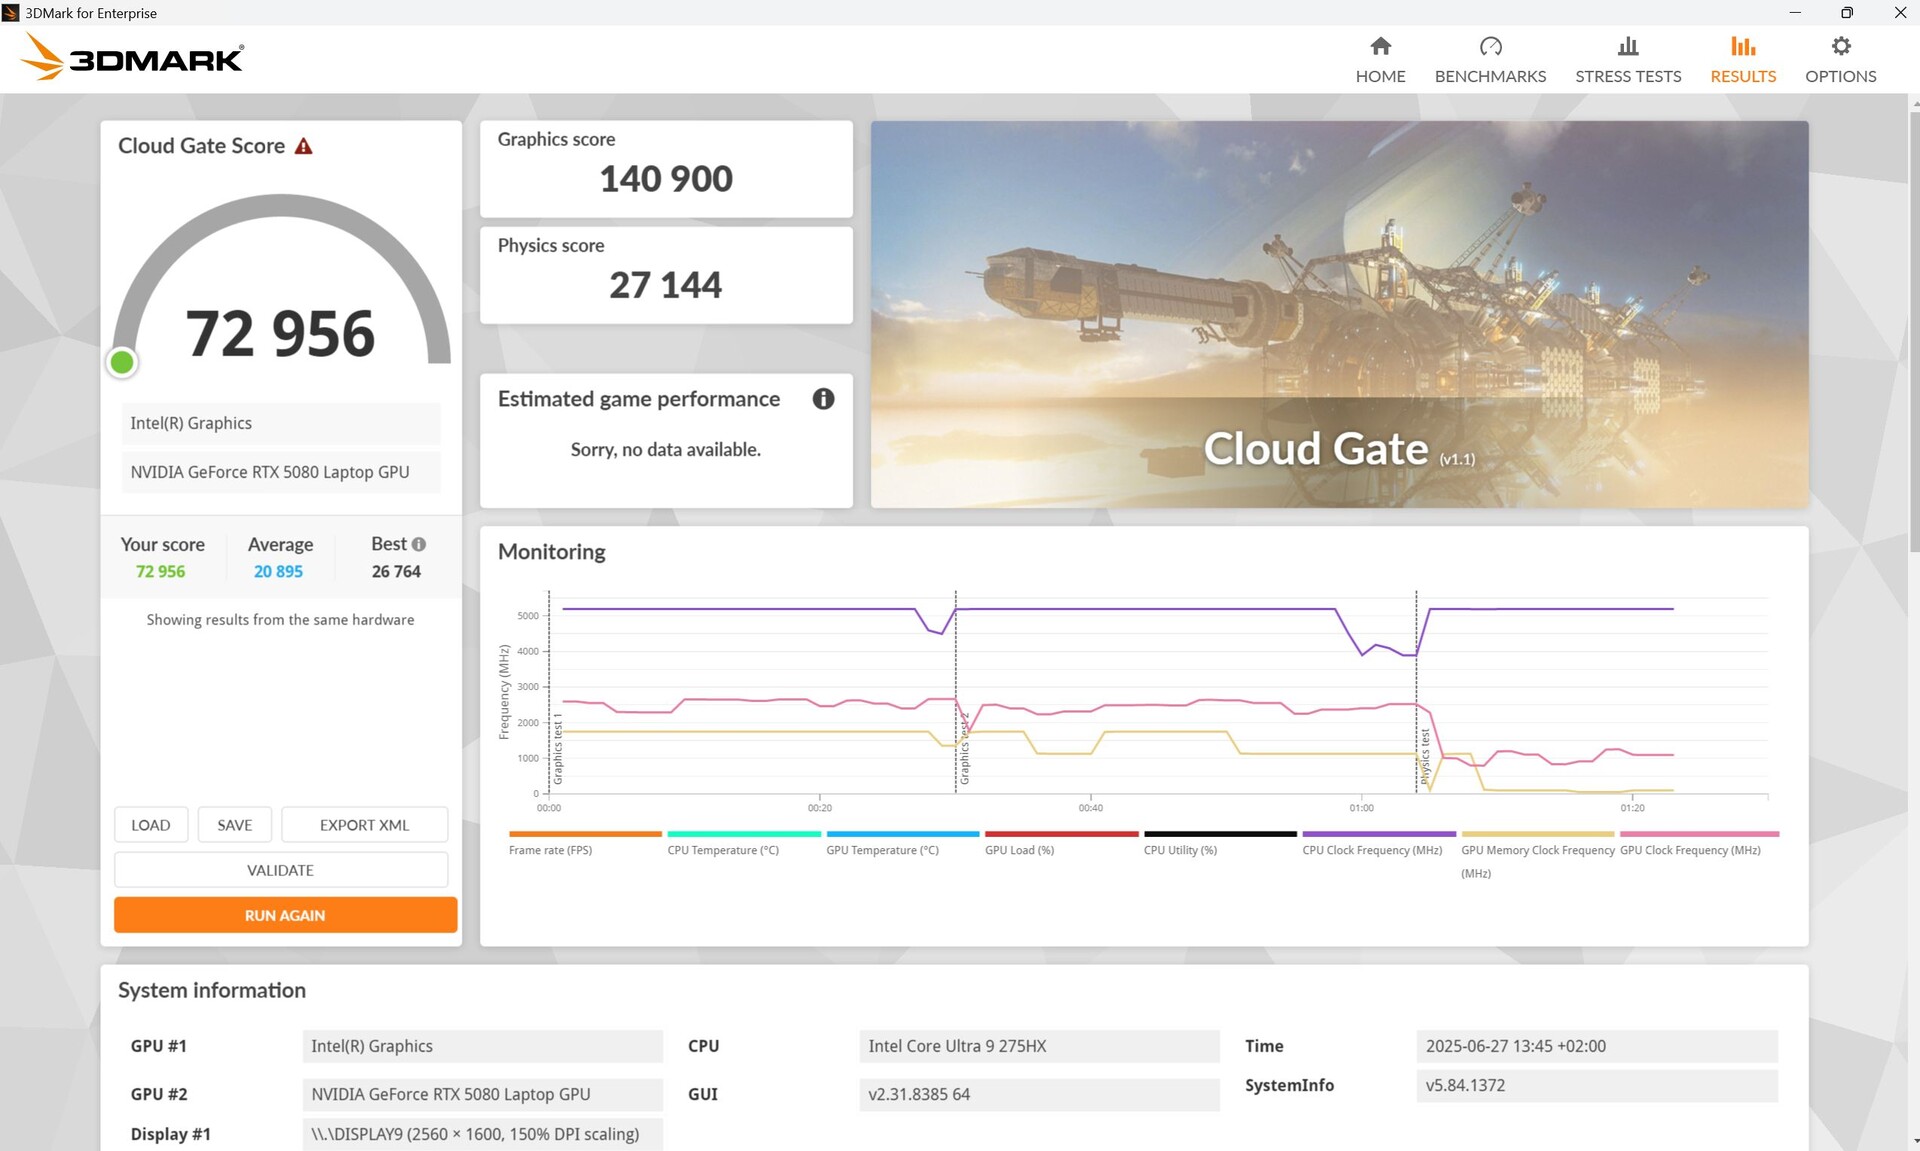
| 3DMark Cloud Gate Standard Score | 72956 pkt. | |
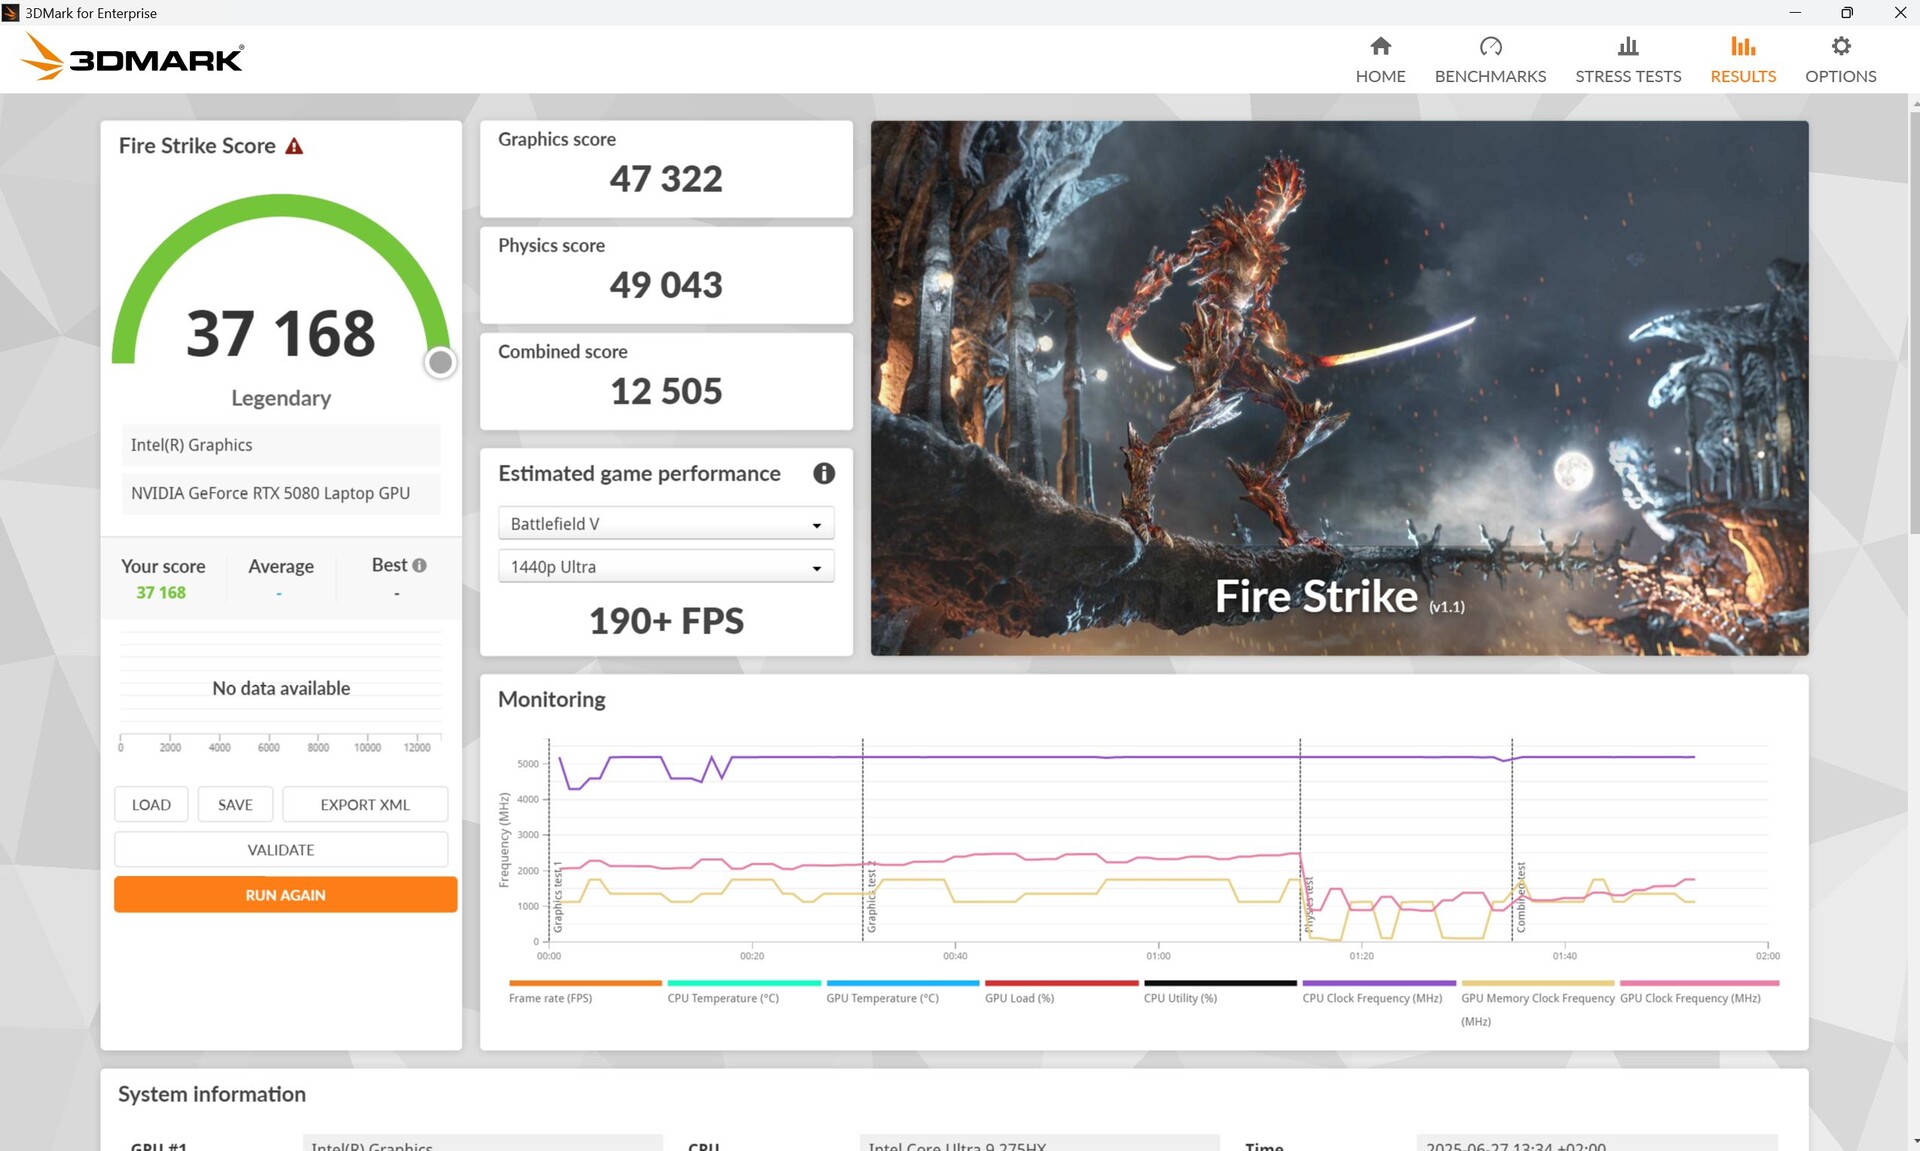
| 3DMark Fire Strike Score | 37168 pkt. | |
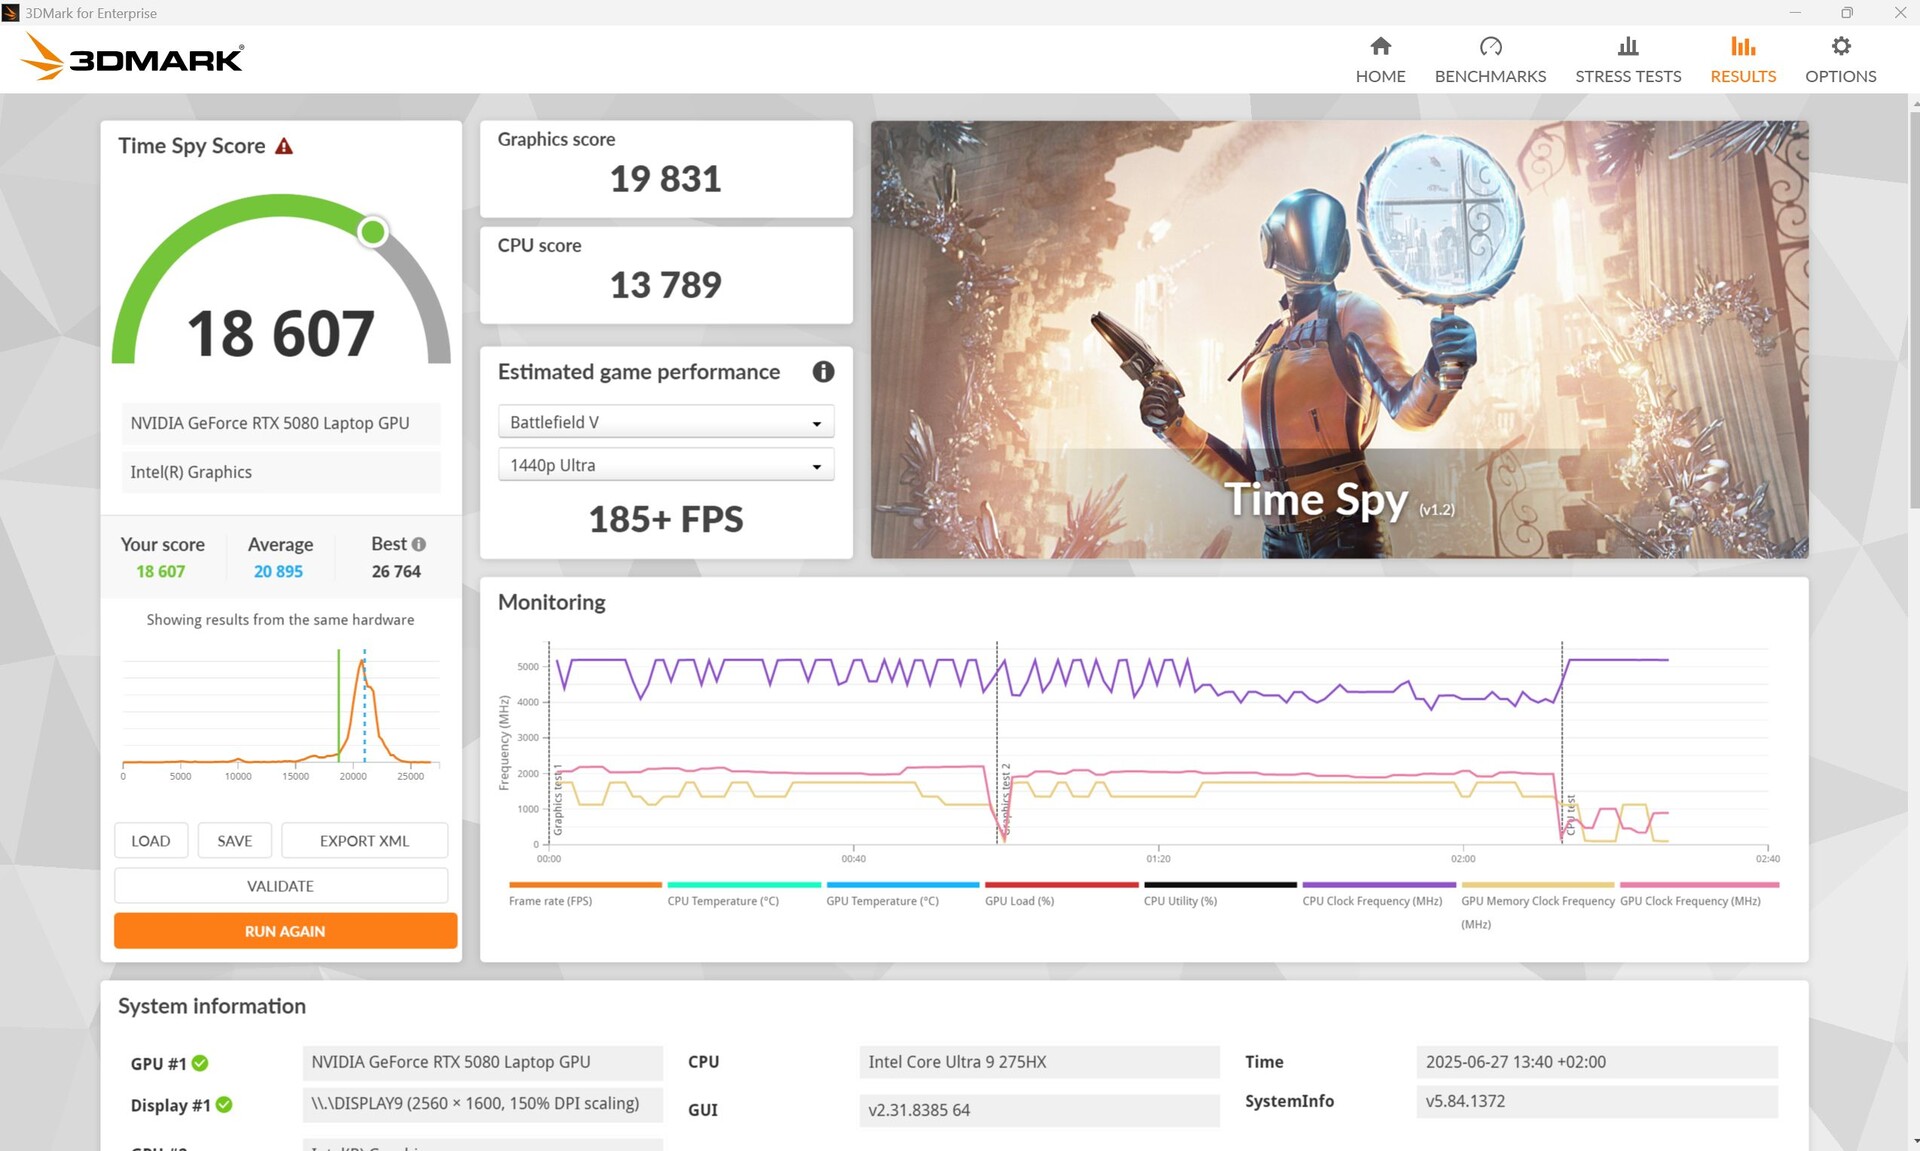
| 3DMark Time Spy Score | 18607 pkt. | |
Pomoc | ||
* ... im mniej tym lepiej
| Cyberpunk 2077 - 1920x1080 Ultra Preset (FSR off) | |
| MSI Raider A18 HX A9WIG-080 | |
| Medion Erazer Beast 18 X1 MD62731 | |
| Acer Predator Helios 18 AI | |
| MSI Vector 17 HX AI A2XWIG | |
| MSI Vector A18 HX A9W | |
| Alienware 16 Area-51 | |
| Średnia w klasie Gaming (17.7 - 169.9, n=118, ostatnie 2 lata) | |
Cyberpunk 2077 Ultra FPS chart
| low | med. | high | ultra | QHD DLSS | QHD | 4K DLSS | 4K | |
|---|---|---|---|---|---|---|---|---|
| GTA V (2015) | 185.9 | 184.6 | 181.3 | 146.1 | 143.9 | |||
| Dota 2 Reborn (2015) | 201 | 177.5 | 173.2 | 158.3 | 155.9 | |||
| Final Fantasy XV Benchmark (2018) | 233 | 220 | 176.3 | 144.5 | ||||
| X-Plane 11.11 (2018) | 145.8 | 131.1 | 105.1 | 90.8 | ||||
| Strange Brigade (2018) | 600 | 456 | 406 | 371 | 278 | 148.9 | ||
| Baldur's Gate 3 (2023) | 232 | 206 | 182.4 | 178 | 181 | 123 | 30.6 | |
| Cyberpunk 2077 (2023) | 176.3 | 170.3 | 150.4 | 139.6 | 103.8 | 94.6 | 42 | |
| F1 25 (2025) | 177.7 | 176.1 | 169.9 | 44.3 | 48.7 | 27.3 | 24.8 | 12.8 |
Emisje i energia - zasilacz 400 W!
Emisja hałasu
Wentylatory Heliosa są od czasu do czasu zauważalne podczas pracy na biegu jałowym, zarówno w trybie Turbo, jak i Performance.
Około 50 dB pod obciążeniem znajduje się na dolnym końcu skali porównawczej, więc są znacznie głośniejsi gracze. W trybie Turbo robi się ekstremalnie głośno, osiągając nawet 60 dB. Grając w cichszym trybie Balanced należy liczyć się ze spadkiem wydajności 3D o około 13 procent.
Hałas
| luz |
| 24 / 24 / 31.31 dB |
| obciążenie |
| 40.31 / 50.33 dB |
 | ||
30 dB cichy 40 dB(A) słyszalny 50 dB(A) irytujący |
||
min: | ||
| Acer Predator Helios 18 AI GeForce RTX 5080 Laptop, Ultra 9 275HX, SK hynix PCB01 HFS001TFM9X186N | MSI Raider A18 HX A9WIG-080 GeForce RTX 5080 Laptop, R9 9955HX3D, Samsung PM9E1 MZVLC2T0HBLD | Medion Erazer Beast 18 X1 MD62731 GeForce RTX 5080 Laptop, Ultra 9 275HX, Phison E31 2 TB | Asus Strix Scar 18 G835LX GeForce RTX 5090 Laptop, Ultra 9 275HX, WD PC SN8000S 2TB | MSI Titan 18 HX AI A2XWJG GeForce RTX 5090 Laptop, Ultra 9 285HX, 1x Samsung PM9E1 MZVLC2T0HBLD-00BT7 + 2x Samsung PM9A1 MZVL22T0HDLB-00BT7 (RAID 0) | MSI Vector A18 HX A9W GeForce RTX 5070 Ti Laptop, R9 9955HX | |
|---|---|---|---|---|---|---|
| Noise | -7% | -21% | -9% | -12% | -6% | |
| wyłączone / środowisko * (dB) | 24 | 25.1 -5% | 25 -4% | 23.3 3% | 25.56 -7% | 22.5 6% |
| Idle Minimum * (dB) | 24 | 28.6 -19% | 25 -4% | 29.8 -24% | 27.68 -15% | 26 -8% |
| Idle Average * (dB) | 24 | 28.9 -20% | 39 -63% | 29.8 -24% | 27.68 -15% | 26 -8% |
| Idle Maximum * (dB) | 31.31 | 29.2 7% | 42 -34% | 29.8 5% | 31.54 -1% | 32 -2% |
| Load Average * (dB) | 40.31 | 45.6 -13% | 52 -29% | 42.9 -6% | 44 -9% | 44.4 -10% |
| Cyberpunk 2077 ultra * (dB) | 50.33 | 55.6 -10% | 53 -5% | 53.7 -7% | 58.7 -17% | 49.8 1% |
| Load Maximum * (dB) | 50.33 | 45.8 9% | 55 -9% | 53.7 -7% | 58.9 -17% | 61.6 -22% |
* ... im mniej tym lepiej
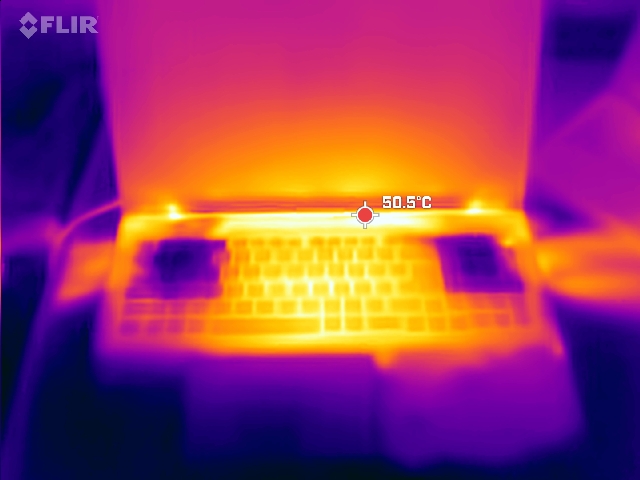
Temperatura
Pod pełnym obciążeniem robi się gorący, szczególnie na dole, centralnie w kierunku wyświetlacza (do 59 °C). Klawisze WASD pozostają umiarkowanie ciepłe (39 °C).
(-) Maksymalna temperatura w górnej części wynosi 48 °C / 118 F, w porównaniu do średniej 40.4 °C / 105 F , począwszy od 21.2 do 68.8 °C dla klasy Gaming.
(-) Dno nagrzewa się maksymalnie do 59 °C / 138 F, w porównaniu do średniej 43.2 °C / 110 F
(+) W stanie bezczynności średnia temperatura górnej części wynosi 30.3 °C / 87 F, w porównaniu ze średnią temperaturą urządzenia wynoszącą 33.9 °C / ### class_avg_f### F.
(-) 3: The average temperature for the upper side is 39.7 °C / 103 F, compared to the average of 33.9 °C / 93 F for the class Gaming.
(+) Podparcia dłoni i touchpad osiągają maksymalną temperaturę skóry (34 °C / 93.2 F) i dlatego nie są gorące.
(-) Średnia temperatura obszaru podparcia dłoni w podobnych urządzeniach wynosiła 28.8 °C / 83.8 F (-5.2 °C / -9.4 F).
| Acer Predator Helios 18 AI Intel Core Ultra 9 275HX, NVIDIA GeForce RTX 5080 Laptop | MSI Raider A18 HX A9WIG-080 AMD Ryzen 9 9955HX3D, NVIDIA GeForce RTX 5080 Laptop | Medion Erazer Beast 18 X1 MD62731 Intel Core Ultra 9 275HX, NVIDIA GeForce RTX 5080 Laptop | Asus Strix Scar 18 G835LX Intel Core Ultra 9 275HX, NVIDIA GeForce RTX 5090 Laptop | MSI Titan 18 HX AI A2XWJG Intel Core Ultra 9 285HX, NVIDIA GeForce RTX 5090 Laptop | MSI Vector A18 HX A9W AMD Ryzen 9 9955HX, NVIDIA GeForce RTX 5070 Ti Laptop | Acer Predator Helios 18 PH18-72-98MW Intel Core i9-14900HX, NVIDIA GeForce RTX 4090 Laptop GPU | |
|---|---|---|---|---|---|---|---|
| Heat | 1% | 8% | 13% | -7% | 11% | 3% | |
| Maximum Upper Side * (°C) | 48 | 49.3 -3% | 47 2% | 45.6 5% | 48.2 -0% | 46.6 3% | 43 10% |
| Maximum Bottom * (°C) | 59 | 50.9 14% | 48 19% | 46 22% | 53.6 9% | 45.6 23% | 59 -0% |
| Idle Upper Side * (°C) | 33 | 35.2 -7% | 29 12% | 28.9 12% | 37.2 -13% | 31.2 5% | 32 3% |
| Idle Bottom * (°C) | 33 | 33.5 -2% | 33 -0% | 29.2 12% | 40.4 -22% | 28.6 13% | 34 -3% |
* ... im mniej tym lepiej
Głośnik
System 6 głośników (według Acer) gra dość głośno, ma zrównoważone wysokie tony i przynajmniej nie ma fobii basowej, jak wielu kolegów.
Port słuchawkowy w formacie jack jest dostępny do podłączenia słuchawek i podobnych urządzeń.
Acer Predator Helios 18 AI analiza dźwięku
(+) | głośniki mogą odtwarzać stosunkowo głośno (87.6 dB)
Bas 100 - 315 Hz
(±) | zredukowany bas - średnio 9.5% niższy od mediany
(±) | liniowość basu jest średnia (8.6% delta do poprzedniej częstotliwości)
Średnie 400 - 2000 Hz
(±) | wyższe średnie - średnio 9.1% wyższe niż mediana
(±) | liniowość środka jest średnia (8.3% delta do poprzedniej częstotliwości)
Wysokie 2–16 kHz
(+) | zrównoważone maksima - tylko 1.9% od mediany
(+) | wzloty są liniowe (3.8% delta do poprzedniej częstotliwości)
Ogólnie 100 - 16.000 Hz
(+) | ogólny dźwięk jest liniowy (13.1% różnicy w stosunku do mediany)
W porównaniu do tej samej klasy
» 18% wszystkich testowanych urządzeń w tej klasie było lepszych, 4% podobnych, 78% gorszych
» Najlepszy miał deltę 6%, średnia wynosiła ###średnia###%, najgorsza wynosiła 132%
W porównaniu do wszystkich testowanych urządzeń
» 13% wszystkich testowanych urządzeń było lepszych, 3% podobnych, 84% gorszych
» Najlepszy miał deltę 4%, średnia wynosiła ###średnia###%, najgorsza wynosiła 134%
MSI Raider A18 HX A9WIG-080 analiza dźwięku
(+) | głośniki mogą odtwarzać stosunkowo głośno (85.9 dB)
Bas 100 - 315 Hz
(-) | prawie brak basu - średnio 17.1% niższa od mediany
(±) | liniowość basu jest średnia (8.5% delta do poprzedniej częstotliwości)
Średnie 400 - 2000 Hz
(±) | wyższe średnie - średnio 9.4% wyższe niż mediana
(±) | liniowość środka jest średnia (9.1% delta do poprzedniej częstotliwości)
Wysokie 2–16 kHz
(+) | zrównoważone maksima - tylko 3.8% od mediany
(+) | wzloty są liniowe (5.8% delta do poprzedniej częstotliwości)
Ogólnie 100 - 16.000 Hz
(±) | liniowość ogólnego dźwięku jest średnia (18.9% różnicy w stosunku do mediany)
W porównaniu do tej samej klasy
» 63% wszystkich testowanych urządzeń w tej klasie było lepszych, 8% podobnych, 29% gorszych
» Najlepszy miał deltę 6%, średnia wynosiła ###średnia###%, najgorsza wynosiła 132%
W porównaniu do wszystkich testowanych urządzeń
» 44% wszystkich testowanych urządzeń było lepszych, 8% podobnych, 48% gorszych
» Najlepszy miał deltę 4%, średnia wynosiła ###średnia###%, najgorsza wynosiła 134%
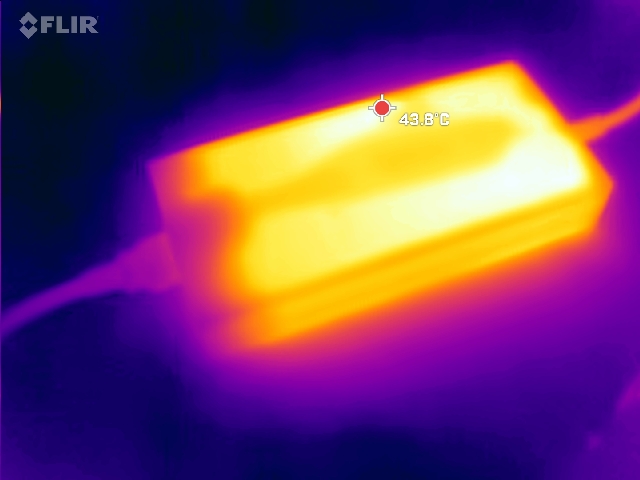
Zużycie energii
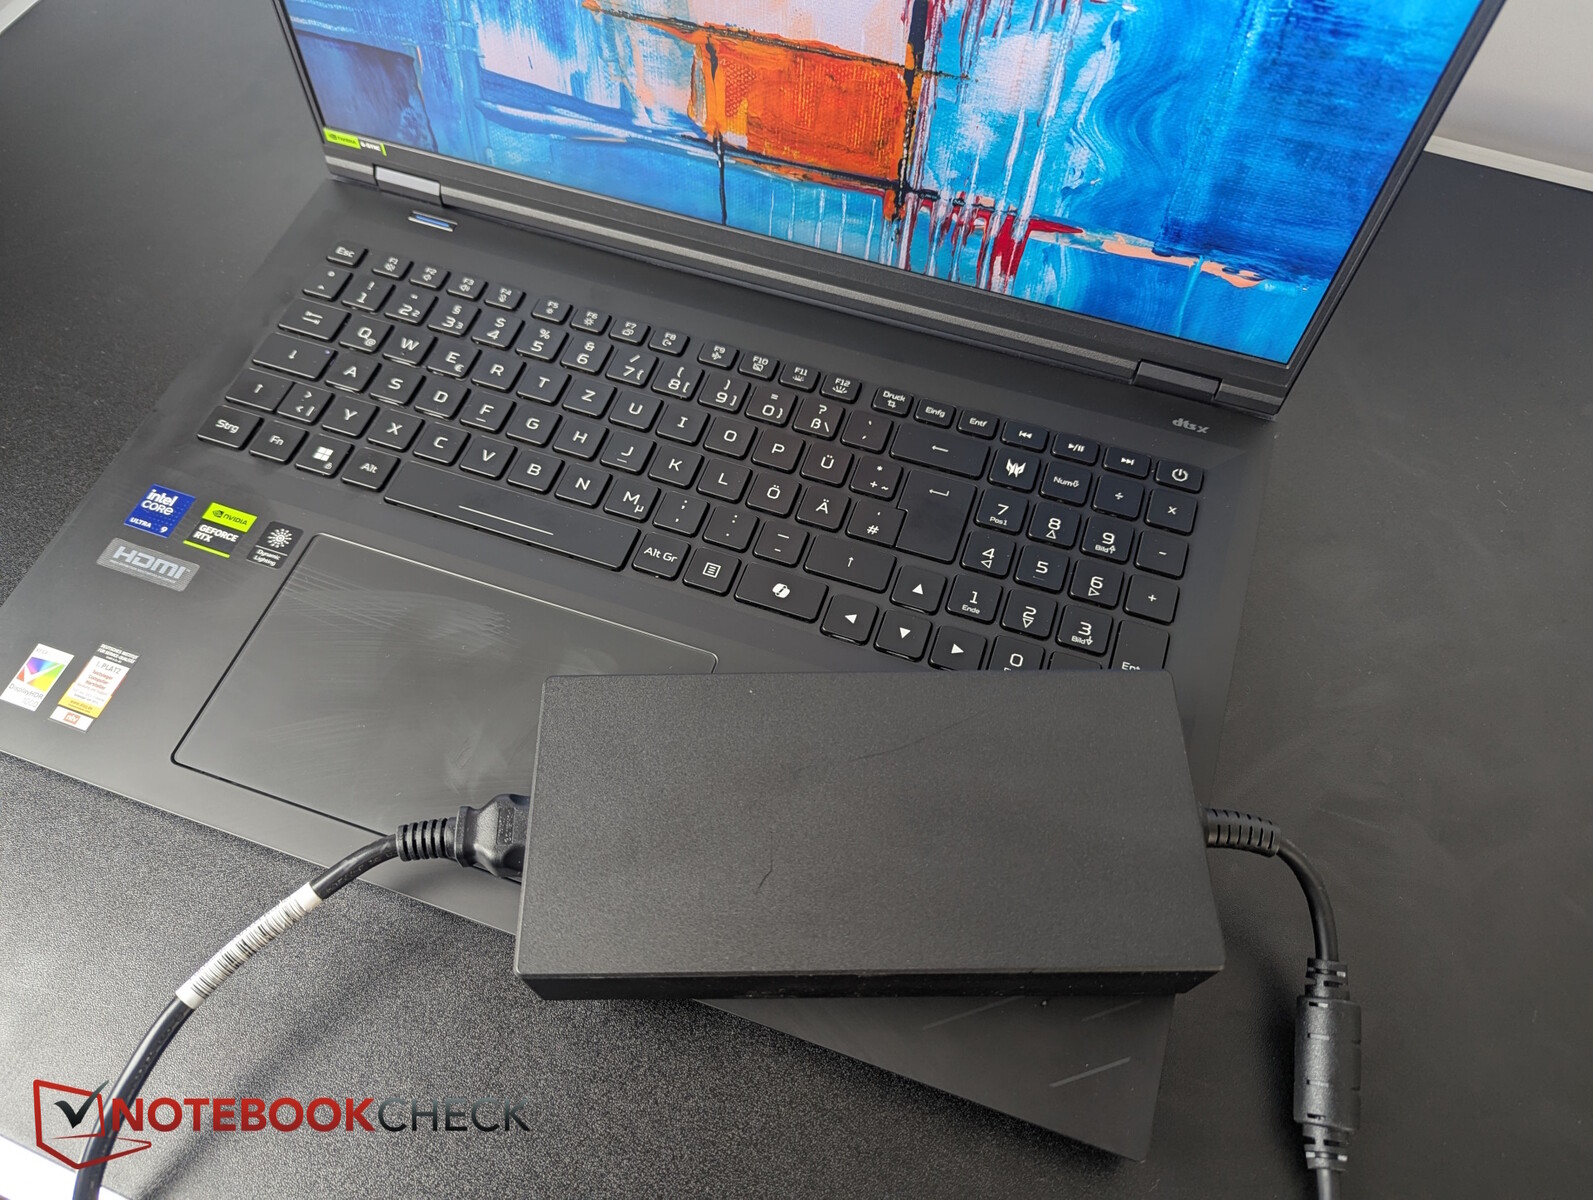
W grach zużycie 245 W jest dość umiarkowane w porównaniu, ale zdarzają się szczególnie wysokie, chwilowe skoki obciążenia do 375 W, z którymi poradzi sobie duży zasilacz 400 W.
Jednostka dGPU jest aktywna z zewnętrznym wyświetlaczem (TB).
| wyłączony / stan wstrzymania | |
| luz | |
| obciążenie |
|
Legenda:
min: | |
| Acer Predator Helios 18 AI Ultra 9 275HX, GeForce RTX 5080 Laptop, SK hynix PCB01 HFS001TFM9X186N, IPS, 2560x1600, 18" | MSI Raider A18 HX A9WIG-080 R9 9955HX3D, GeForce RTX 5080 Laptop, Samsung PM9E1 MZVLC2T0HBLD, MiniLED IPS, 3840x2400, 18" | Medion Erazer Beast 18 X1 MD62731 Ultra 9 275HX, GeForce RTX 5080 Laptop, Phison E31 2 TB, IPS, 2560x1600, 18" | Asus Strix Scar 18 G835LX Ultra 9 275HX, GeForce RTX 5090 Laptop, WD PC SN8000S 2TB, Mini-LED, 2560x1600, 18" | MSI Titan 18 HX AI A2XWJG Ultra 9 285HX, GeForce RTX 5090 Laptop, 1x Samsung PM9E1 MZVLC2T0HBLD-00BT7 + 2x Samsung PM9A1 MZVL22T0HDLB-00BT7 (RAID 0), Mini-LED, 3840x2160, 18" | MSI Vector A18 HX A9W R9 9955HX, GeForce RTX 5070 Ti Laptop, , IPS, 2560x1600, 18" | Przeciętny NVIDIA GeForce RTX 5080 Laptop | Średnia w klasie Gaming | |
|---|---|---|---|---|---|---|---|---|
| Power Consumption | -65% | 20% | -27% | -19% | -42% | -6% | 18% | |
| Idle Minimum * (Watt) | 17.3 | 41.5 -140% | 7.9 54% | 11.4 34% | 19.01 -10% | 20.8 -20% | 19.1 ? -10% | 13 ? 25% |
| Idle Average * (Watt) | 23 | 53.5 -133% | 11.5 50% | 39.2 -70% | 30.92 -34% | 52.8 -130% | 25.3 ? -10% | 18.7 ? 19% |
| Idle Maximum * (Watt) | 25.3 | 53.8 -113% | 16.6 34% | 40.2 -59% | 33.84 -34% | 54.5 -115% | 30.4 ? -20% | 24.3 ? 4% |
| Load Average * (Watt) | 123 | 168.5 -37% | 130 -6% | 161.2 -31% | 105.4 14% | 146.6 -19% | 128.5 ? -4% | 108.2 ? 12% |
| Cyberpunk 2077 ultra * (Watt) | 244 | 298 -22% | 253 -4% | 303 -24% | 343 -41% | 285 -17% | ||
| Cyberpunk 2077 ultra external monitor * (Watt) | 243 | 295 -21% | 245 -1% | 295 -21% | 330 -36% | 278 -14% | ||
| Load Maximum * (Watt) | 375 | 323.7 14% | 330 12% | 430.9 -15% | 354 6% | 297.3 21% | 314 ? 16% | 254 ? 32% |
* ... im mniej tym lepiej
Power consumption Cyberpunk / Stress test
Power consumption with the external monitor
Żywotność baterii
Pojemna bateria 99 Wh zapewnia około 4,5 do 5 godzin działania Wi-Fi i wideo przy wyłączonej jasności, co jest przeciętnym wynikiem w porównaniu.
| Acer Predator Helios 18 AI Ultra 9 275HX, GeForce RTX 5080 Laptop, 99 Wh | MSI Raider A18 HX A9WIG-080 R9 9955HX3D, GeForce RTX 5080 Laptop, 99 Wh | Medion Erazer Beast 18 X1 MD62731 Ultra 9 275HX, GeForce RTX 5080 Laptop, 99 Wh | Asus Strix Scar 18 G835LX Ultra 9 275HX, GeForce RTX 5090 Laptop, 90 Wh | MSI Titan 18 HX AI A2XWJG Ultra 9 285HX, GeForce RTX 5090 Laptop, 99 Wh | MSI Vector A18 HX A9W R9 9955HX, GeForce RTX 5070 Ti Laptop, 99 Wh | Acer Predator Helios 18 PH18-72-98MW i9-14900HX, GeForce RTX 4090 Laptop GPU, 90 Wh | Średnia w klasie Gaming | |
|---|---|---|---|---|---|---|---|---|
| Czasy pracy | -42% | 61% | 9% | -14% | -22% | -31% | 50% | |
| H.264 (h) | 4.3 | 5.8 35% | 3 -30% | 8.9 ? 107% | ||||
| WiFi v1.3 (h) | 4.9 | 2.1 -57% | 7.9 61% | 5.5 12% | 4.3 -12% | 3.8 -22% | 3.2 -35% | 7 ? 43% |
| Load (h) | 1.5 | 1.1 -27% | 1.2 -20% | 1.5 0% | 1.1 -27% | 1.51 ? 1% | ||
| Cyberpunk 2077 ultra 150cd (h) | 0.7 | 1.2 | ||||||
| Reader / Idle (h) | 7 | 8.71 ? |
Ogólna ocena Notebookcheck
Helios 18 AI to świetny gracz z dobrym wyświetlaczem, dobrymi funkcjami i dużym potencjałem rozbudowy.
Acer Predator Helios 18 AI
- 04/07/2025 v8
Christian Hintze
 Total Sustainability Score:
 Możliwe porównanie alternatyw
Obraz | Model / recenzja | Cena | Waga | Wysokość | Ekran |
|---|---|---|---|---|---|
1. 86.4%  | Acer Predator Helios 18 AI Intel Core Ultra 9 275HX ⎘ NVIDIA GeForce RTX 5080 Laptop ⎘ 31.6 GB Pamięć, SSD | Amazon: Cena katalogowa: 3999 Euro | 3.5 kg | 29.55 mm | 18.00" 2560x1600 168 PPI IPS |
2. 85.1%  | MSI Raider A18 HX A9WIG-080 AMD Ryzen 9 9955HX3D ⎘ NVIDIA GeForce RTX 5080 Laptop ⎘ 64 GB Pamięć, 2048 GB SSD | Amazon: Cena katalogowa: 4350 Euro | 3.6 kg | 34 mm | 18.00" 3840x2400 252 PPI MiniLED IPS |
3. 82.5%  | Medion Erazer Beast 18 X1 MD62731 Intel Core Ultra 9 275HX ⎘ NVIDIA GeForce RTX 5080 Laptop ⎘ 32 GB Pamięć, SSD | Amazon: Cena katalogowa: 3700 EUR | 3.6 kg | 30.4 mm | 18.00" 2560x1600 168 PPI IPS |
4. 88%  | Asus Strix Scar 18 G835LX Intel Core Ultra 9 275HX ⎘ NVIDIA GeForce RTX 5090 Laptop ⎘ 64 GB Pamięć, 2048 GB SSD | Amazon: Cena katalogowa: 5799€ | 3.3 kg | 32 mm | 18.00" 2560x1600 168 PPI Mini-LED |
5. 86.1%  | MSI Titan 18 HX AI A2XWJG Intel Core Ultra 9 285HX ⎘ NVIDIA GeForce RTX 5090 Laptop ⎘ 64 GB Pamięć, 6000 GB SSD | Amazon: Cena katalogowa: 6600 USD | 3.6 kg | 32.05 mm | 18.00" 3840x2160 245 PPI Mini-LED |
6. 84.8%  | MSI Vector A18 HX A9W AMD Ryzen 9 9955HX ⎘ NVIDIA GeForce RTX 5070 Ti Laptop ⎘ 32 GB Pamięć | Amazon: Cena katalogowa: 3200 USD | 3.5 kg | 32.05 mm | 18.00" 2560x1600 189 PPI IPS |
Przezroczystość
Wyboru urządzeń do recenzji dokonuje nasza redakcja. Próbka testowa została udostępniona autorowi jako pożyczka od producenta lub sprzedawcy detalicznego na potrzeby tej recenzji. Pożyczkodawca nie miał wpływu na tę recenzję, producent nie otrzymał też kopii tej recenzji przed publikacją. Nie było obowiązku publikowania tej recenzji. Jako niezależna firma medialna, Notebookcheck nie podlega władzy producentów, sprzedawców detalicznych ani wydawców.
Tak testuje Notebookcheck
Każdego roku Notebookcheck niezależnie sprawdza setki laptopów i smartfonów, stosując standardowe procedury, aby zapewnić porównywalność wszystkich wyników. Od około 20 lat stale rozwijamy nasze metody badawcze, ustanawiając przy tym standardy branżowe. W naszych laboratoriach testowych doświadczeni technicy i redaktorzy korzystają z wysokiej jakości sprzętu pomiarowego. Testy te obejmują wieloetapowy proces walidacji. Nasz kompleksowy system ocen opiera się na setkach uzasadnionych pomiarów i benchmarków, co pozwala zachować obiektywizm.