Werdykt - Beast 18 X1 jest dobry, ale ma miejsce na ulepszenia
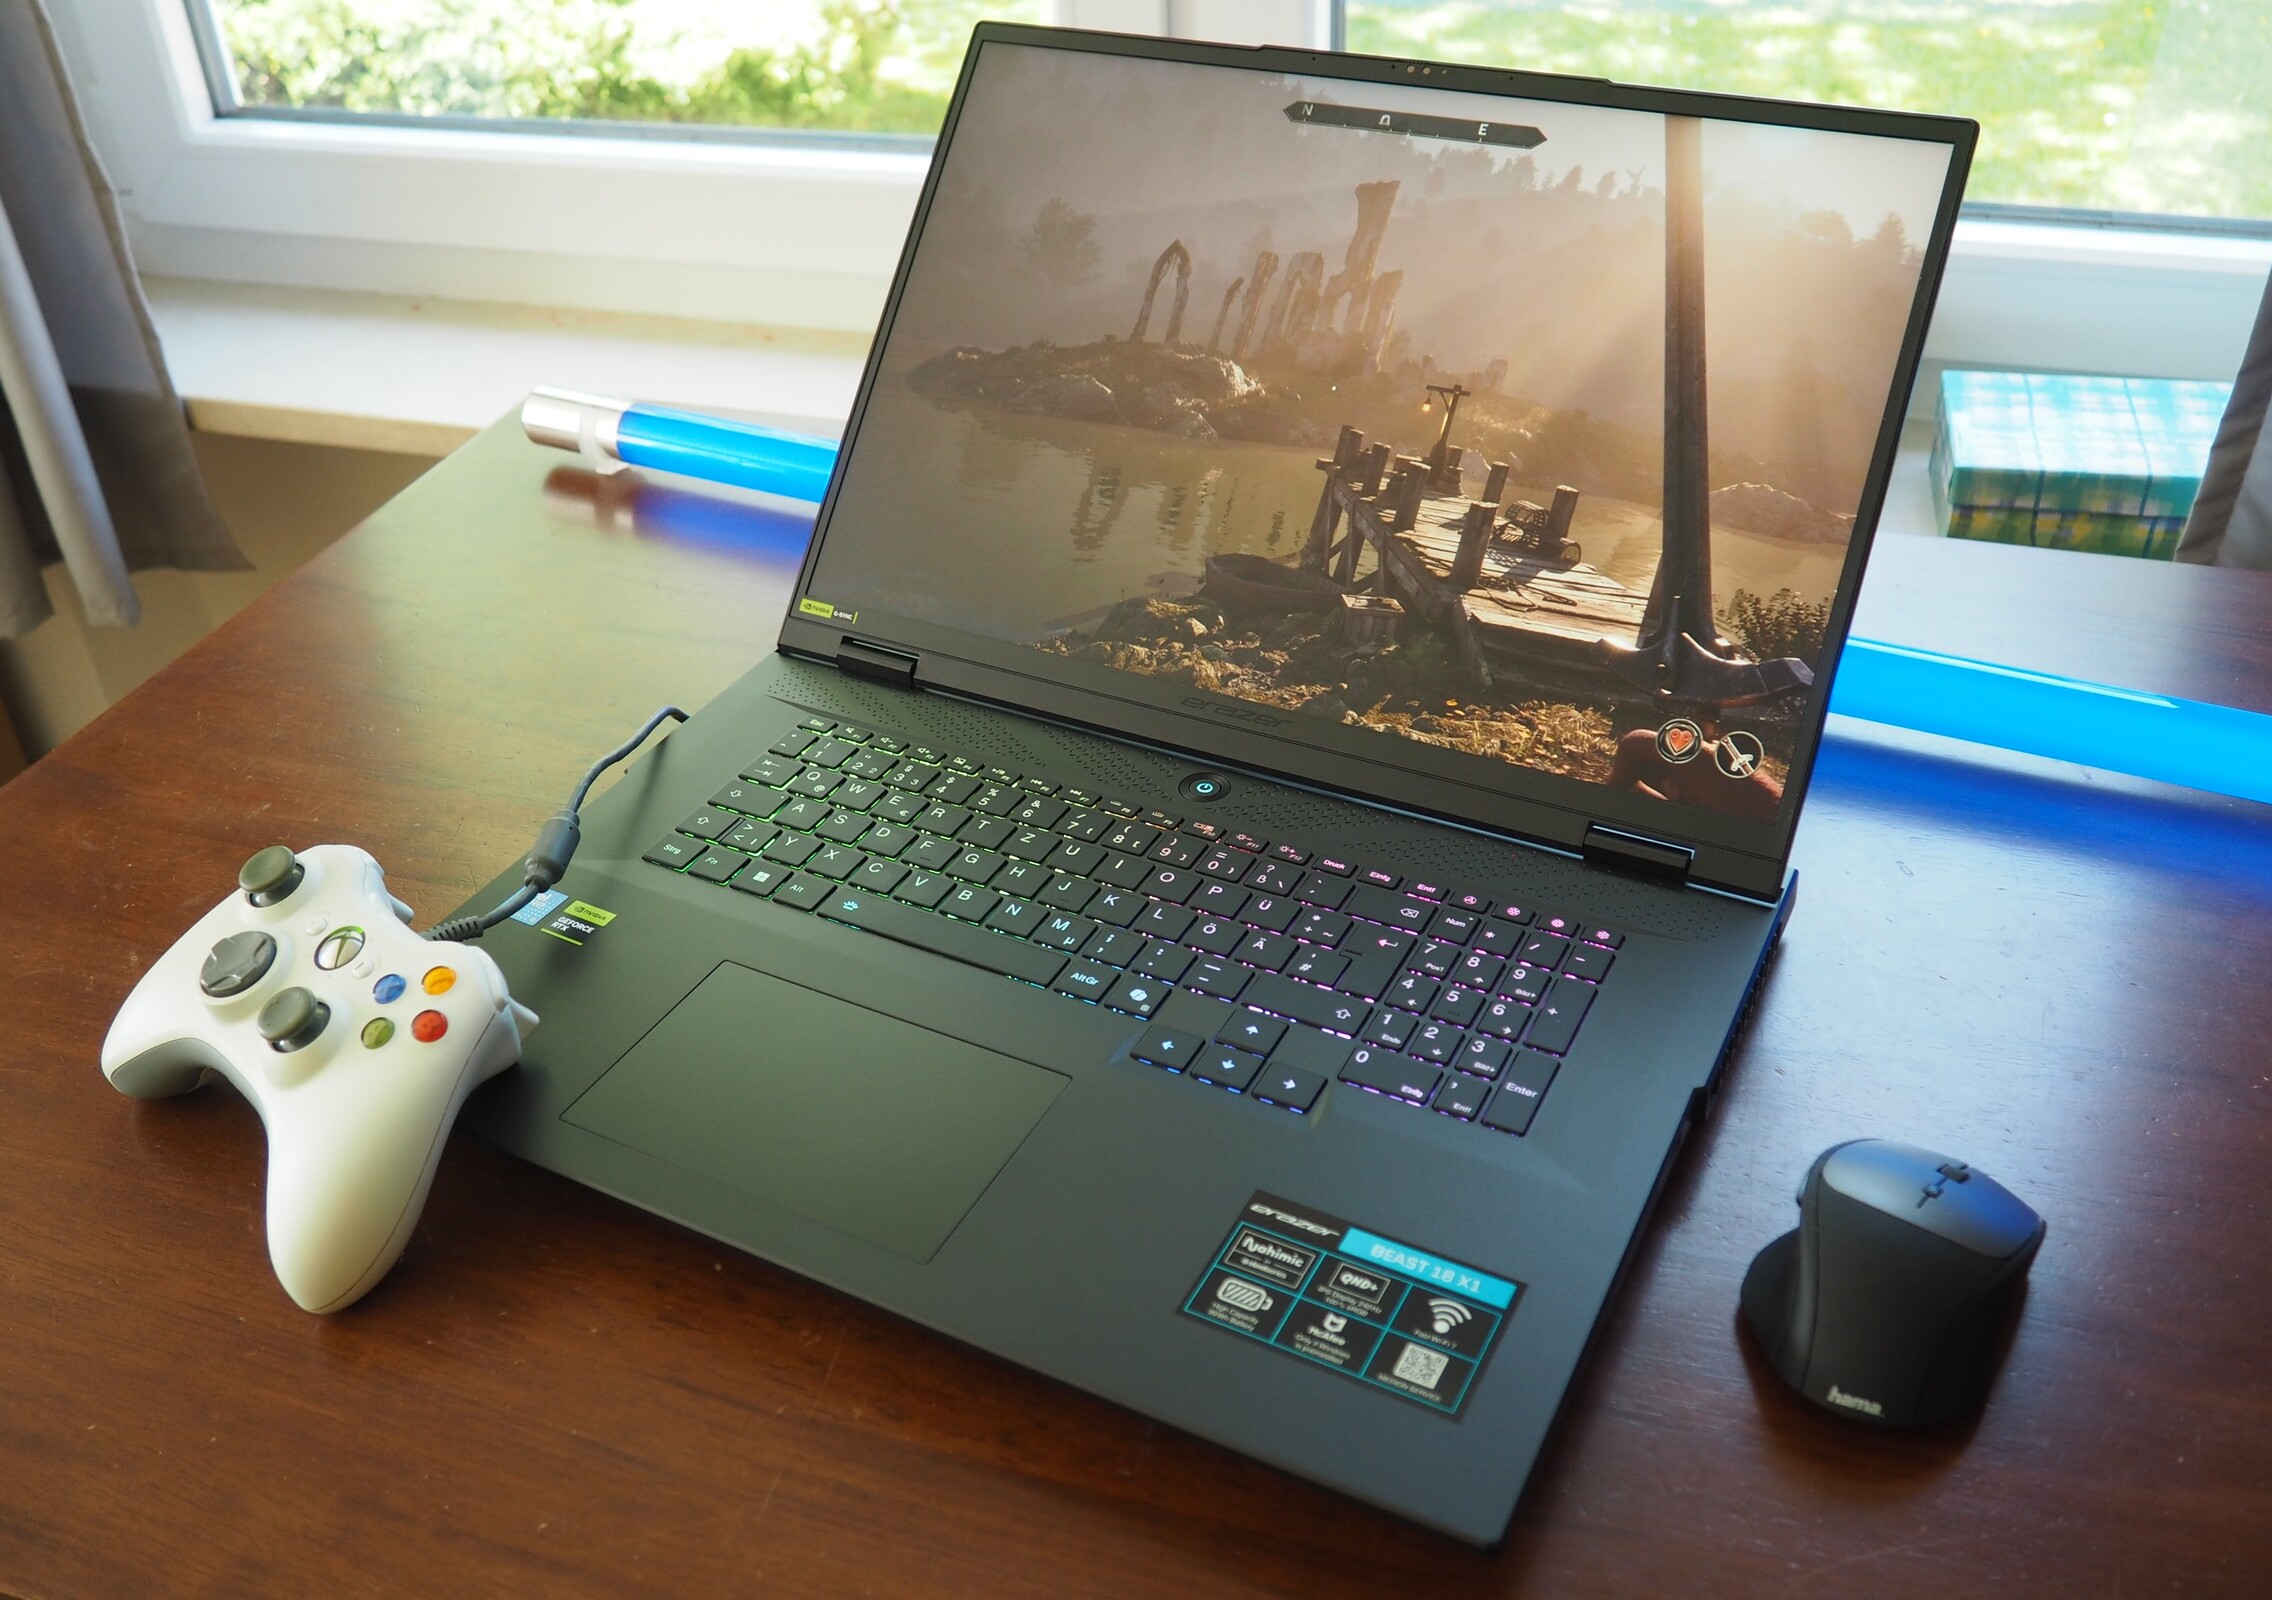
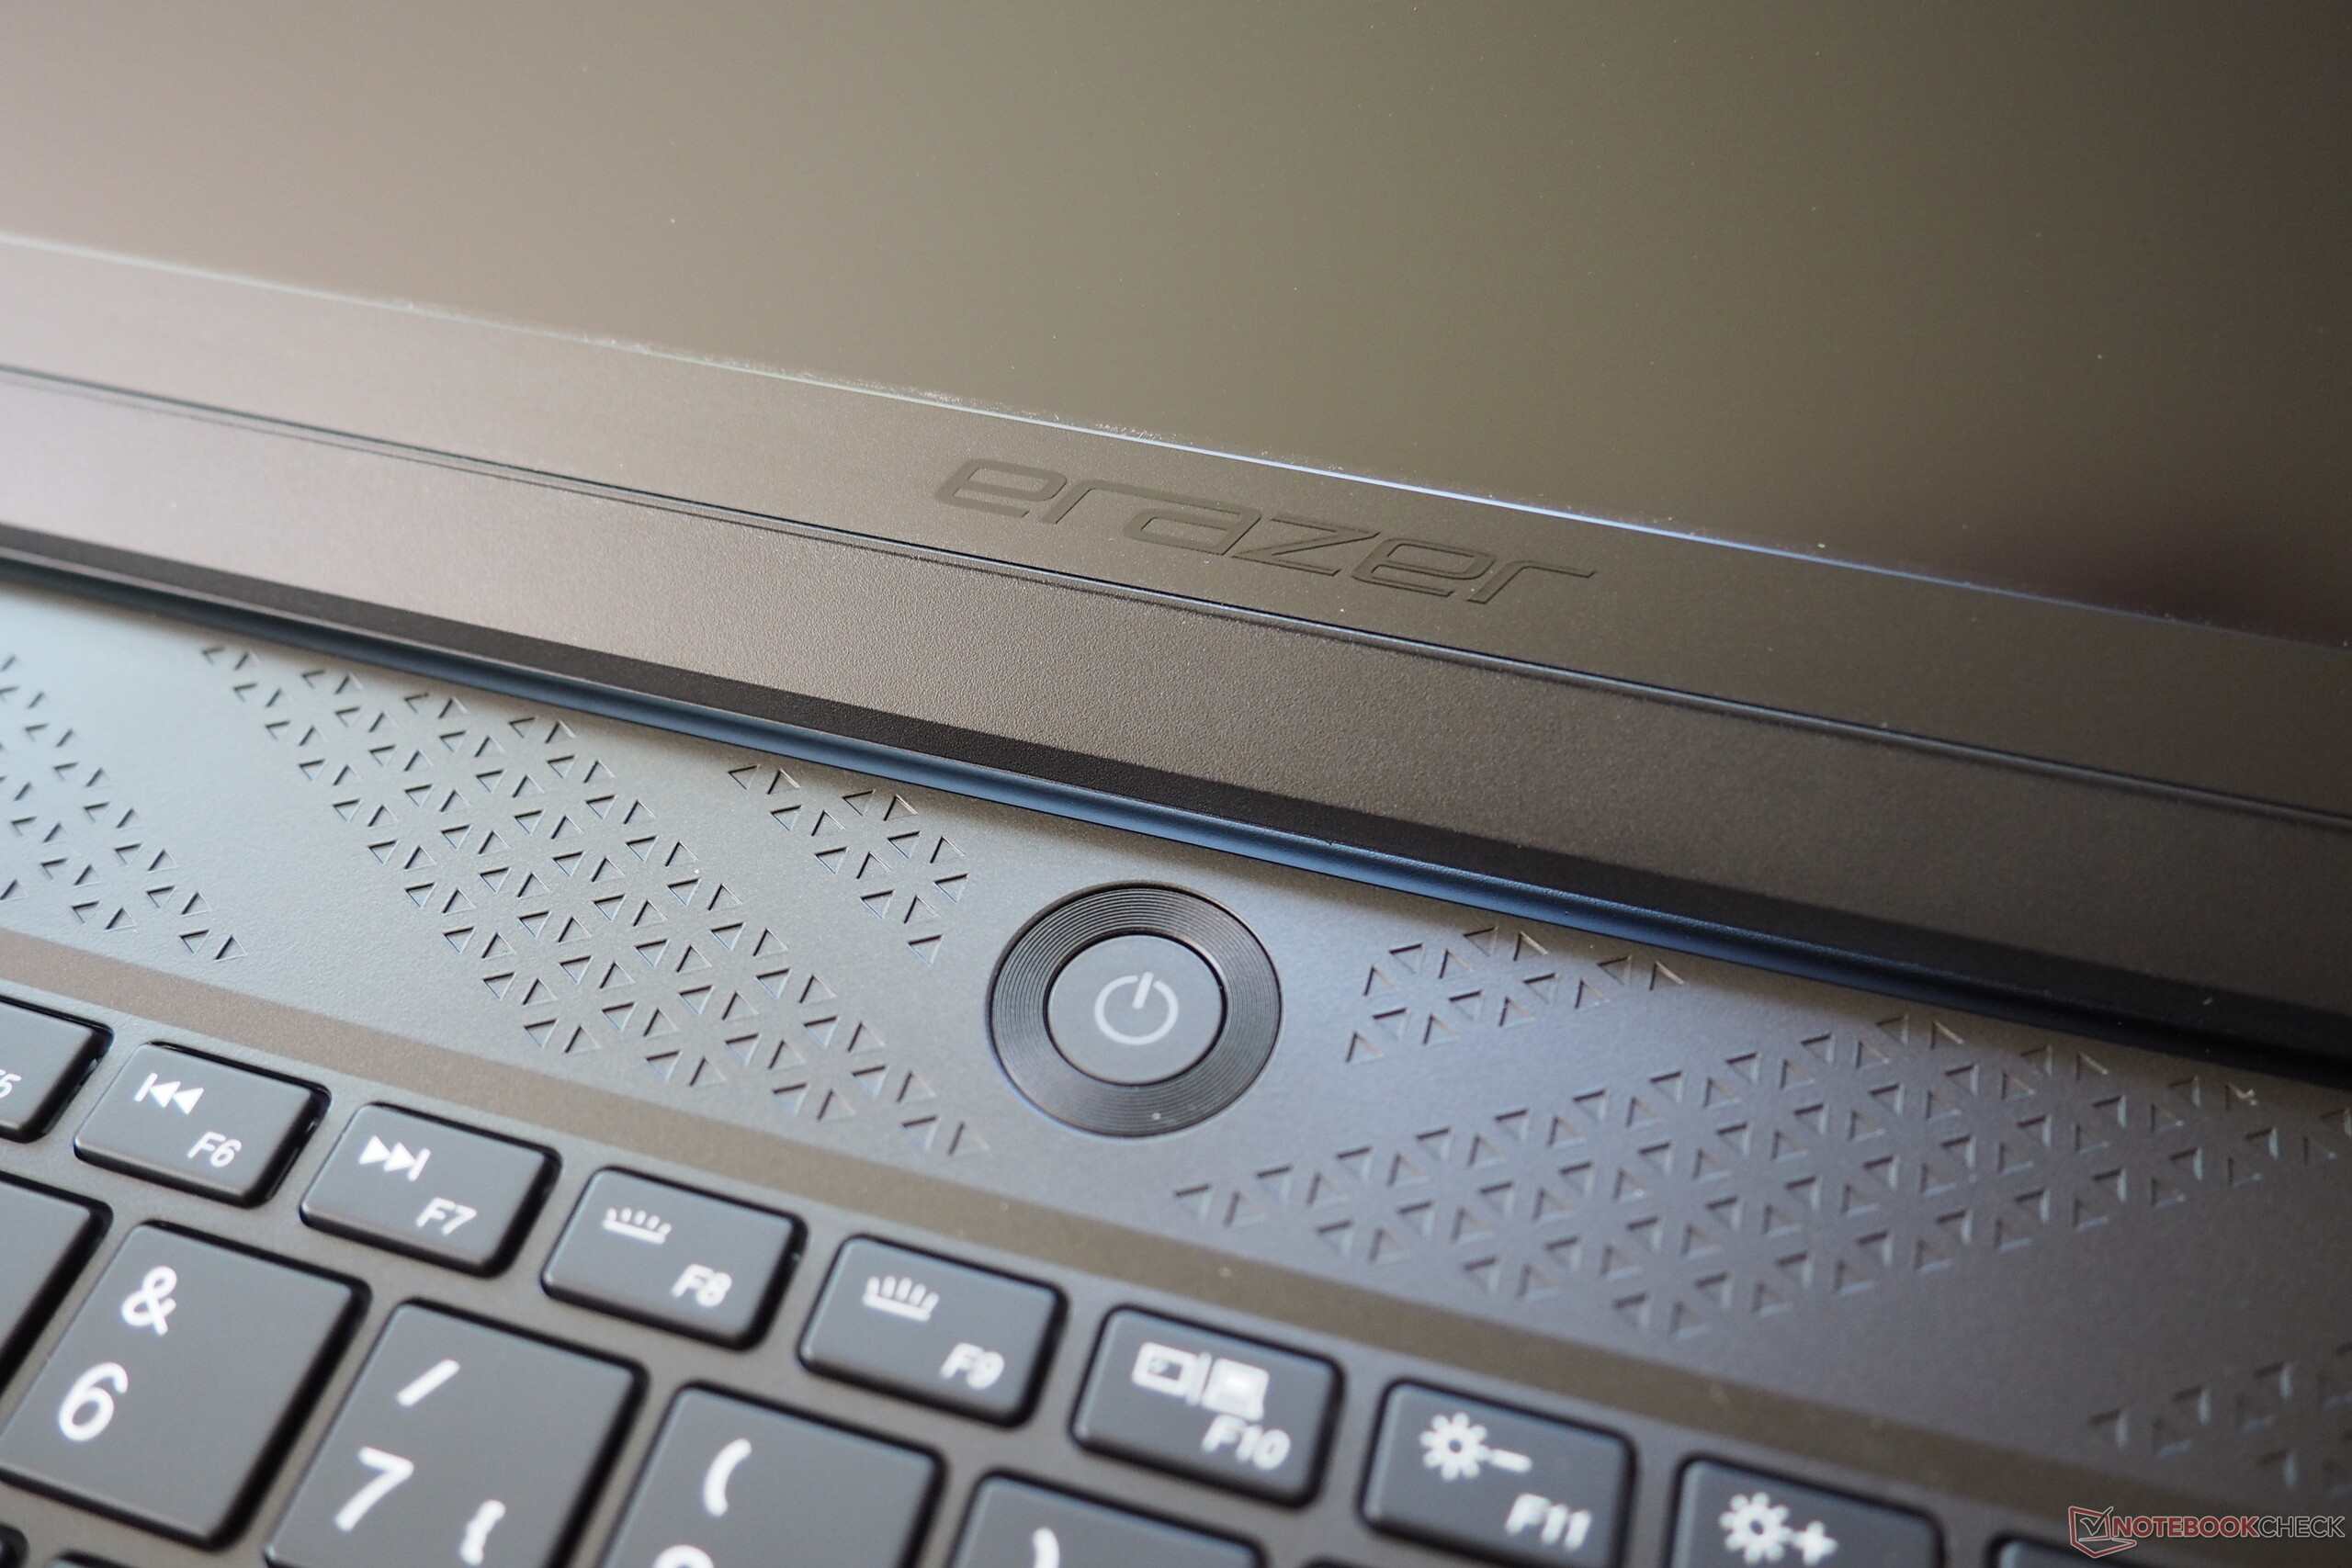
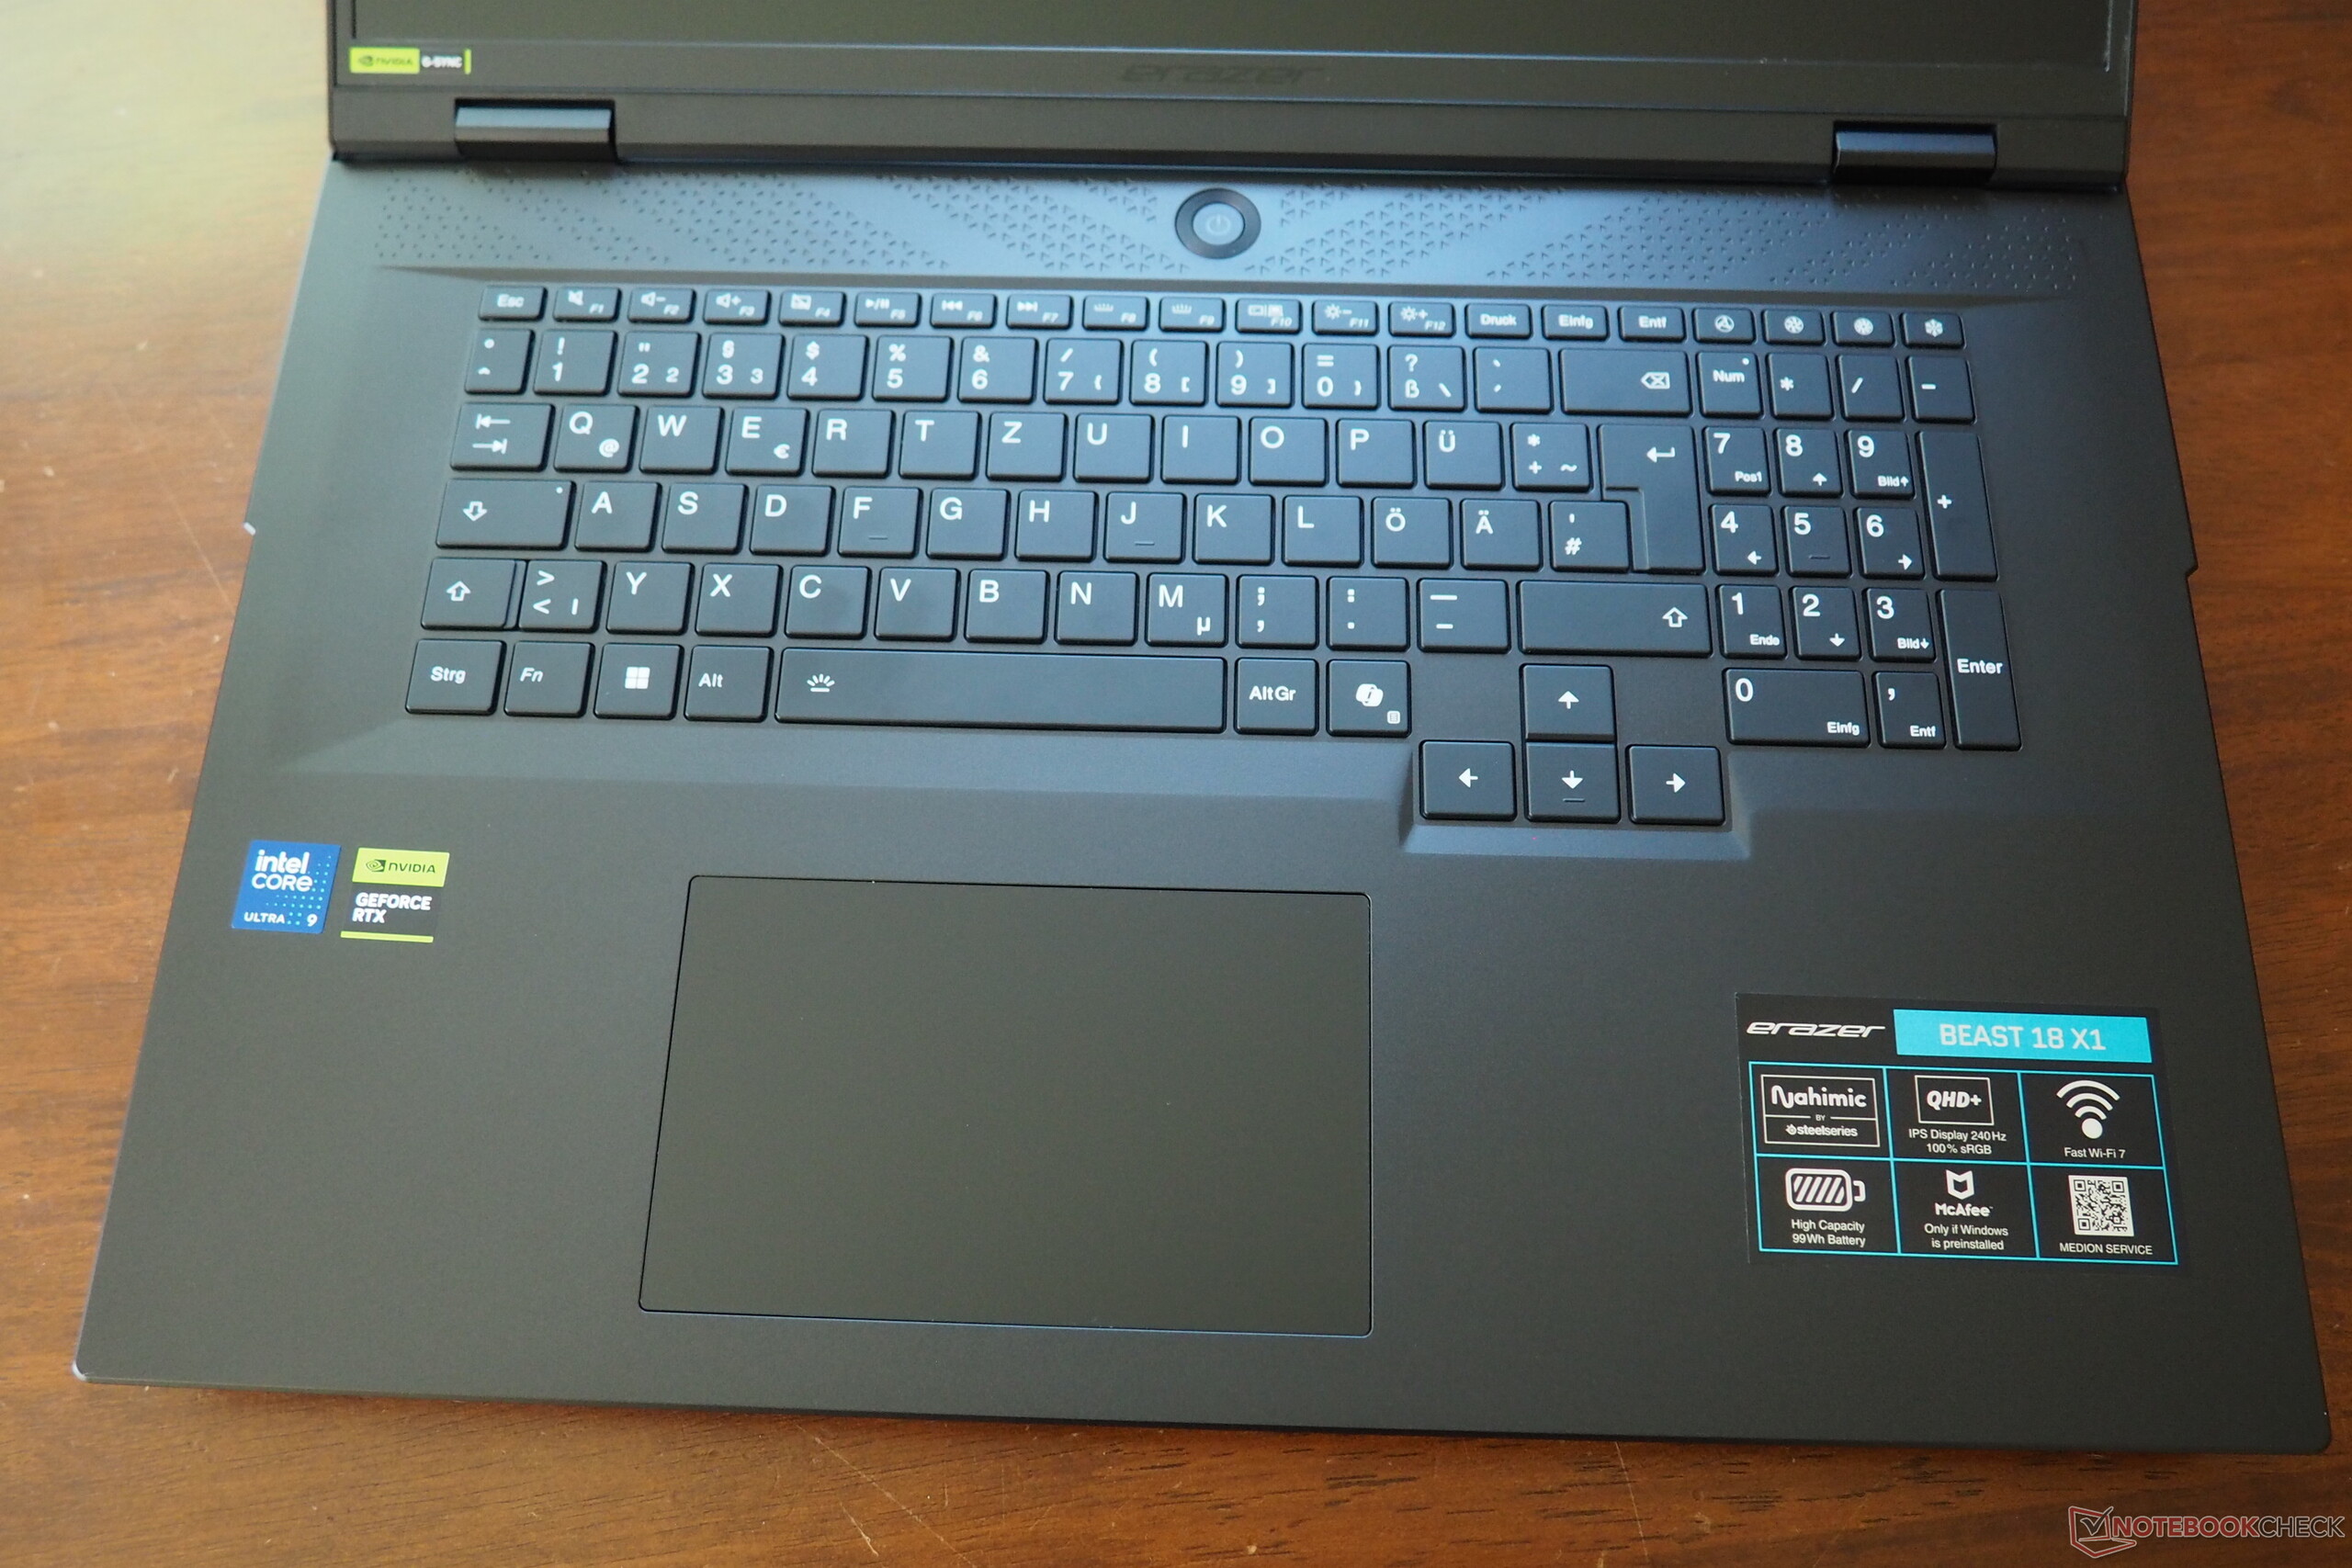
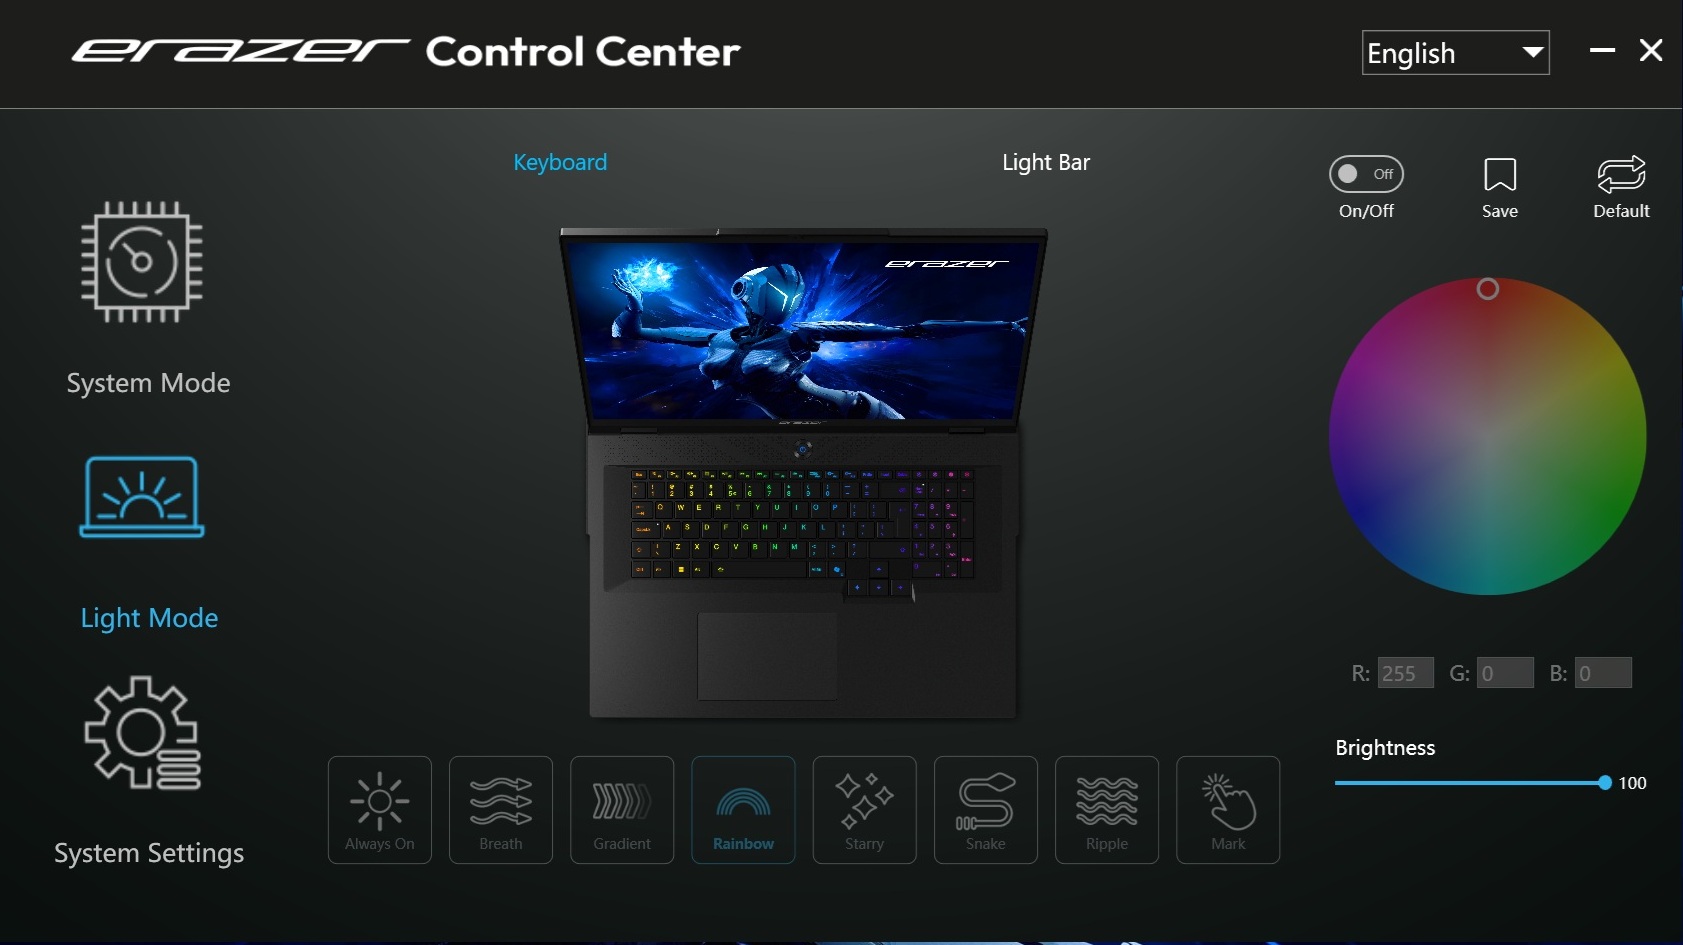
Jeśli zależy Państwu na wydajnym zamienniku komputera stacjonarnego, to Erazer Beast 18 X1 może przypaść Państwu do gustu. Choć 18-calowy laptop może być niezwykle głośny pod obciążeniem (nawet w trybie zrównoważonym), podobnie jak wiele innych laptopów do gier, użytkownicy, którzy nie są zbyt wrażliwi na hałas i/lub grają z zestawem słuchawkowym, będą w stanie znieść głośność. Masywne urządzenie ma solidną sylwetkę i zdobywa punkty dzięki dość bogatej łączności, w tym Thunderbolt 5, klawiaturze RGB i stylowym paskom świetlnym z boku i z tyłu (patrz zdjęcia). Urządzenia wejściowe są przyzwoite lub dobre, ale model naprawdę nie jest w stanie zaimponować.
Laptop Nvidii GeForce RTX 5080 działa w oczekiwanym zakresie, podczas gdy Intel Core Ultra 9 275HX traci nieco na wydajności przy dłuższym obciążeniu (więcej na ten temat za chwilę). Konkurencję stanowią między innymi Aorus Master 18 i Asus ROG Strix Scar 18które testowaliśmy z mocniejszym laptopem RTX 5090.
Za
Przeciw
Cena i dostępność
Medion Erazer Beast 18 X1 MD62731 jest wymieniony za około 3700 euro na stronie głównej Medion wymienione.
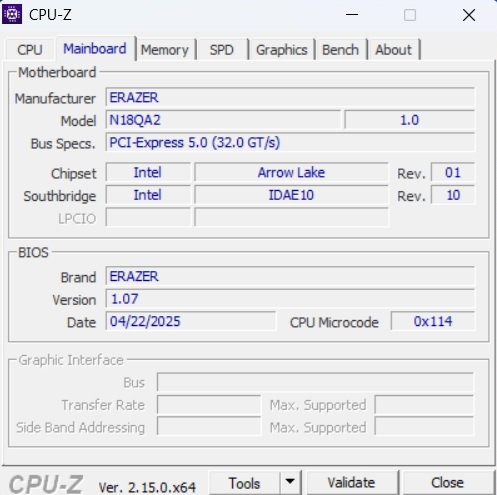
Specyfikacje
Przypadek
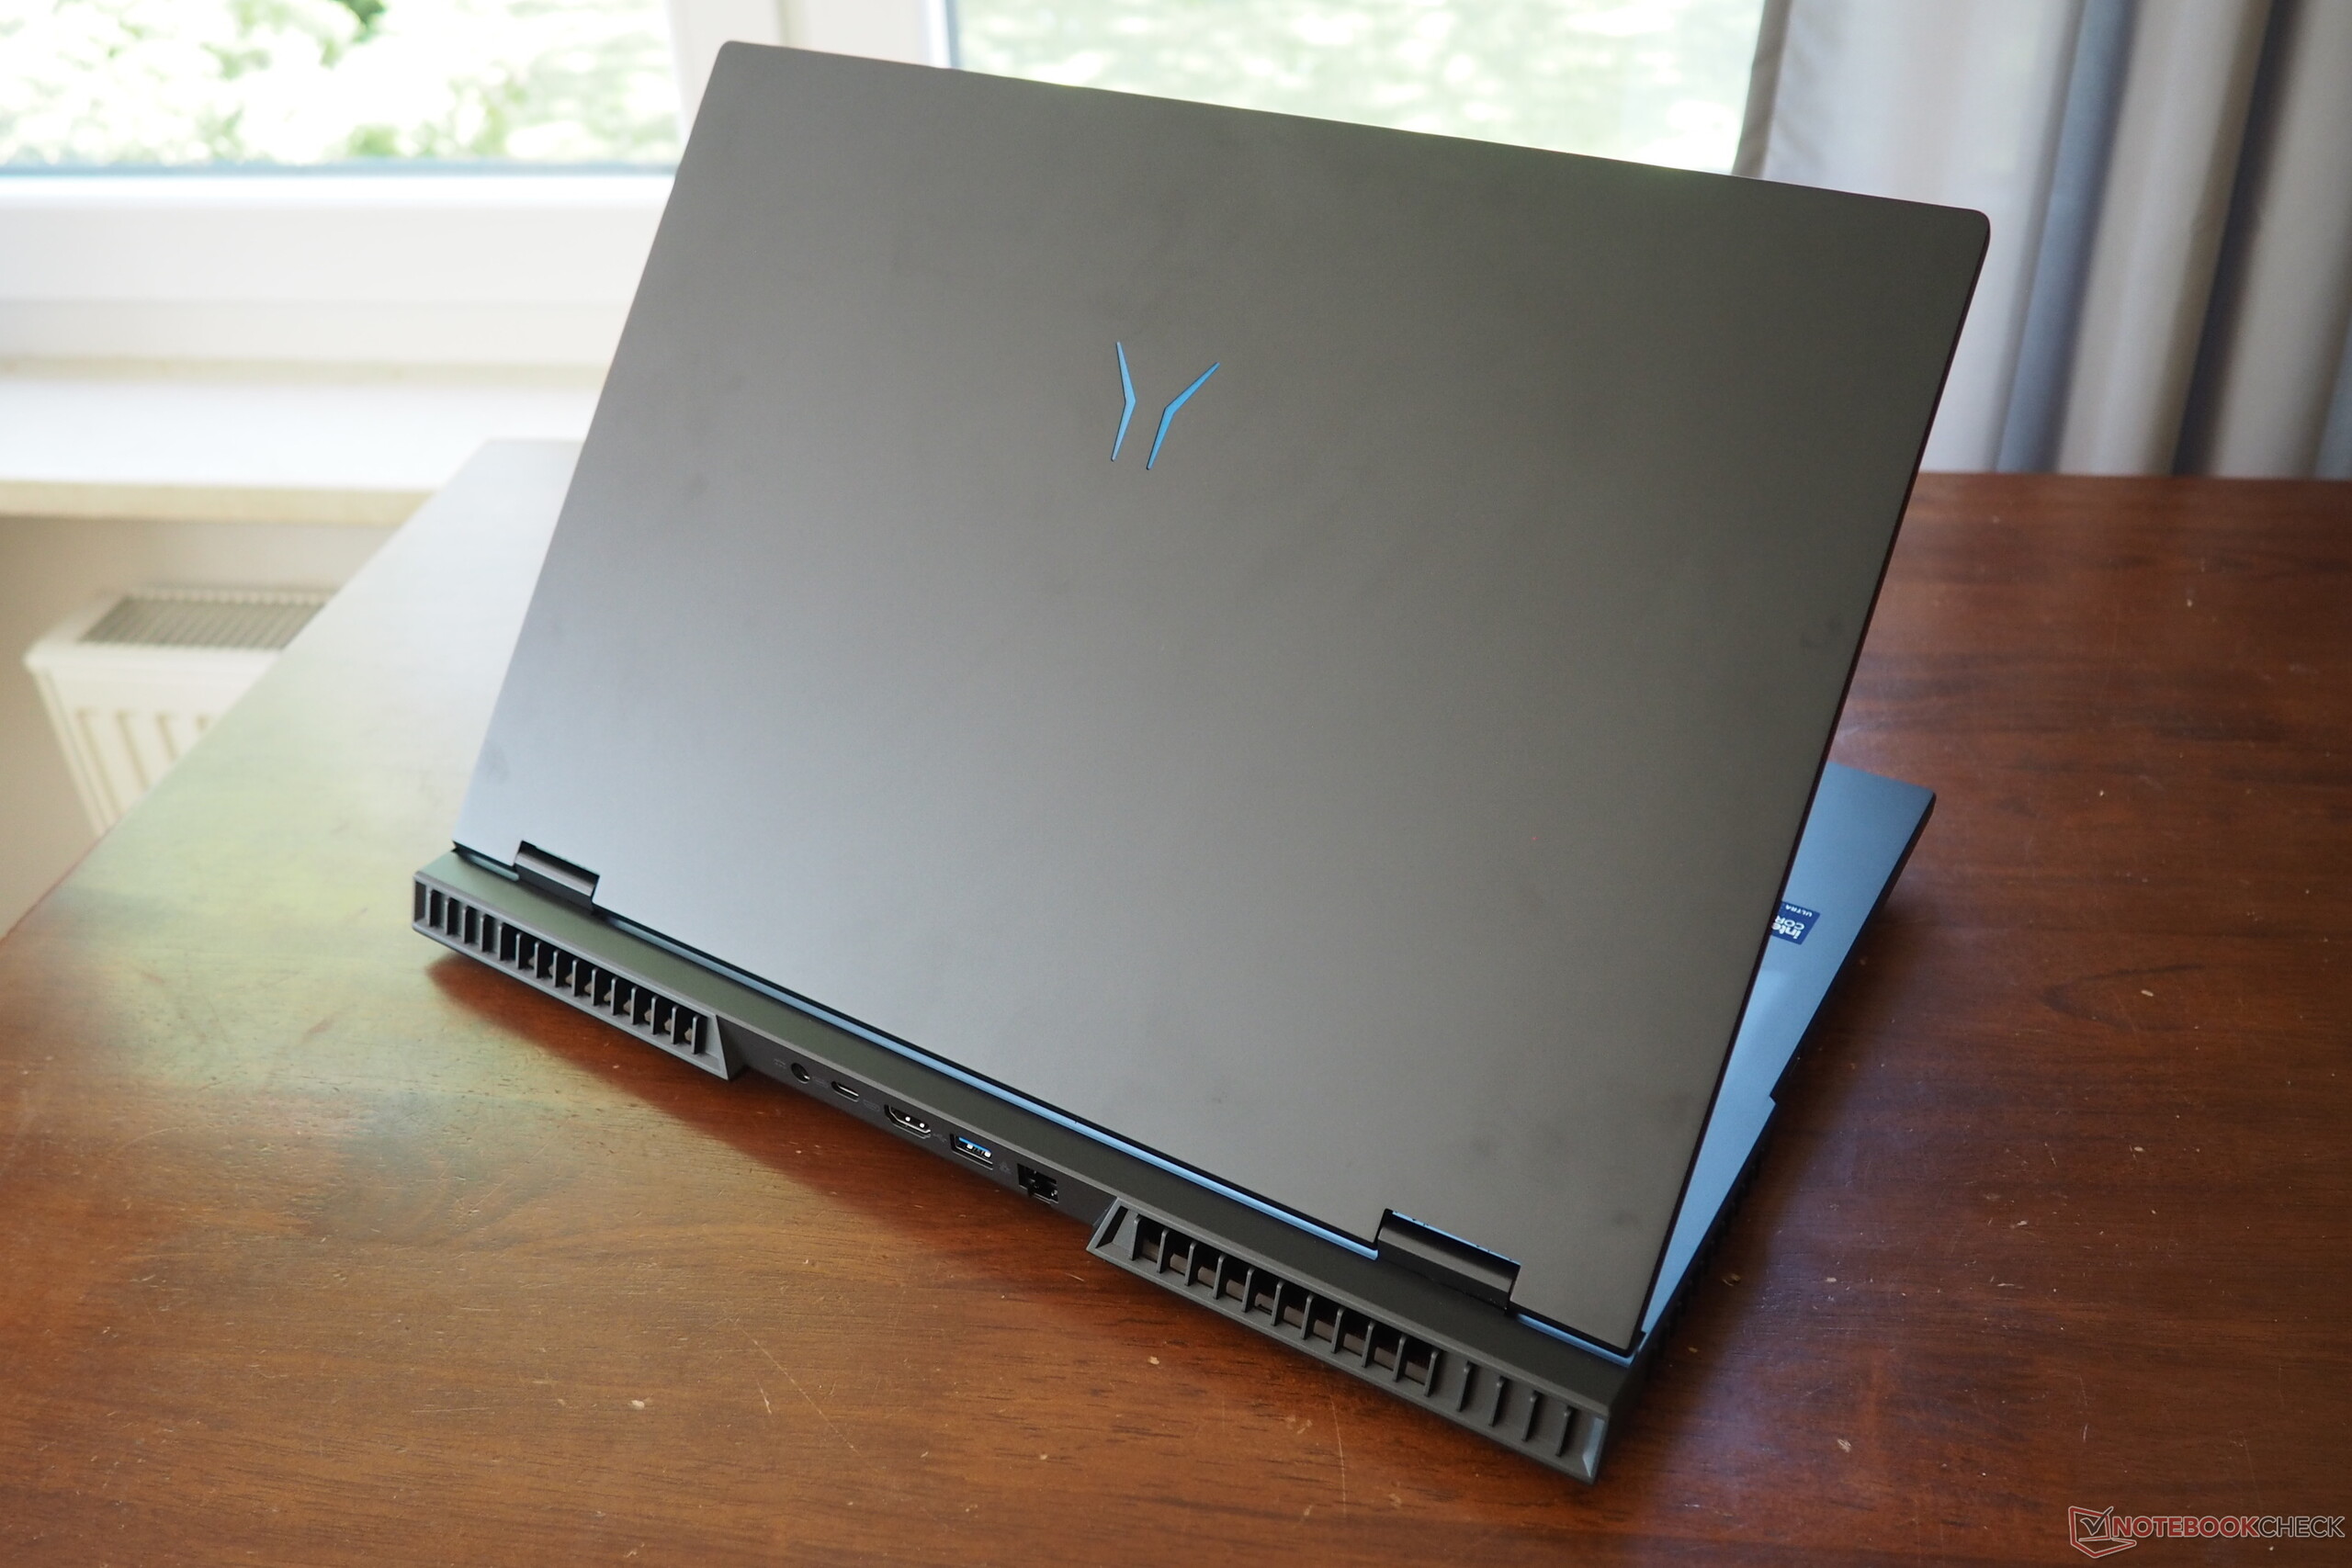
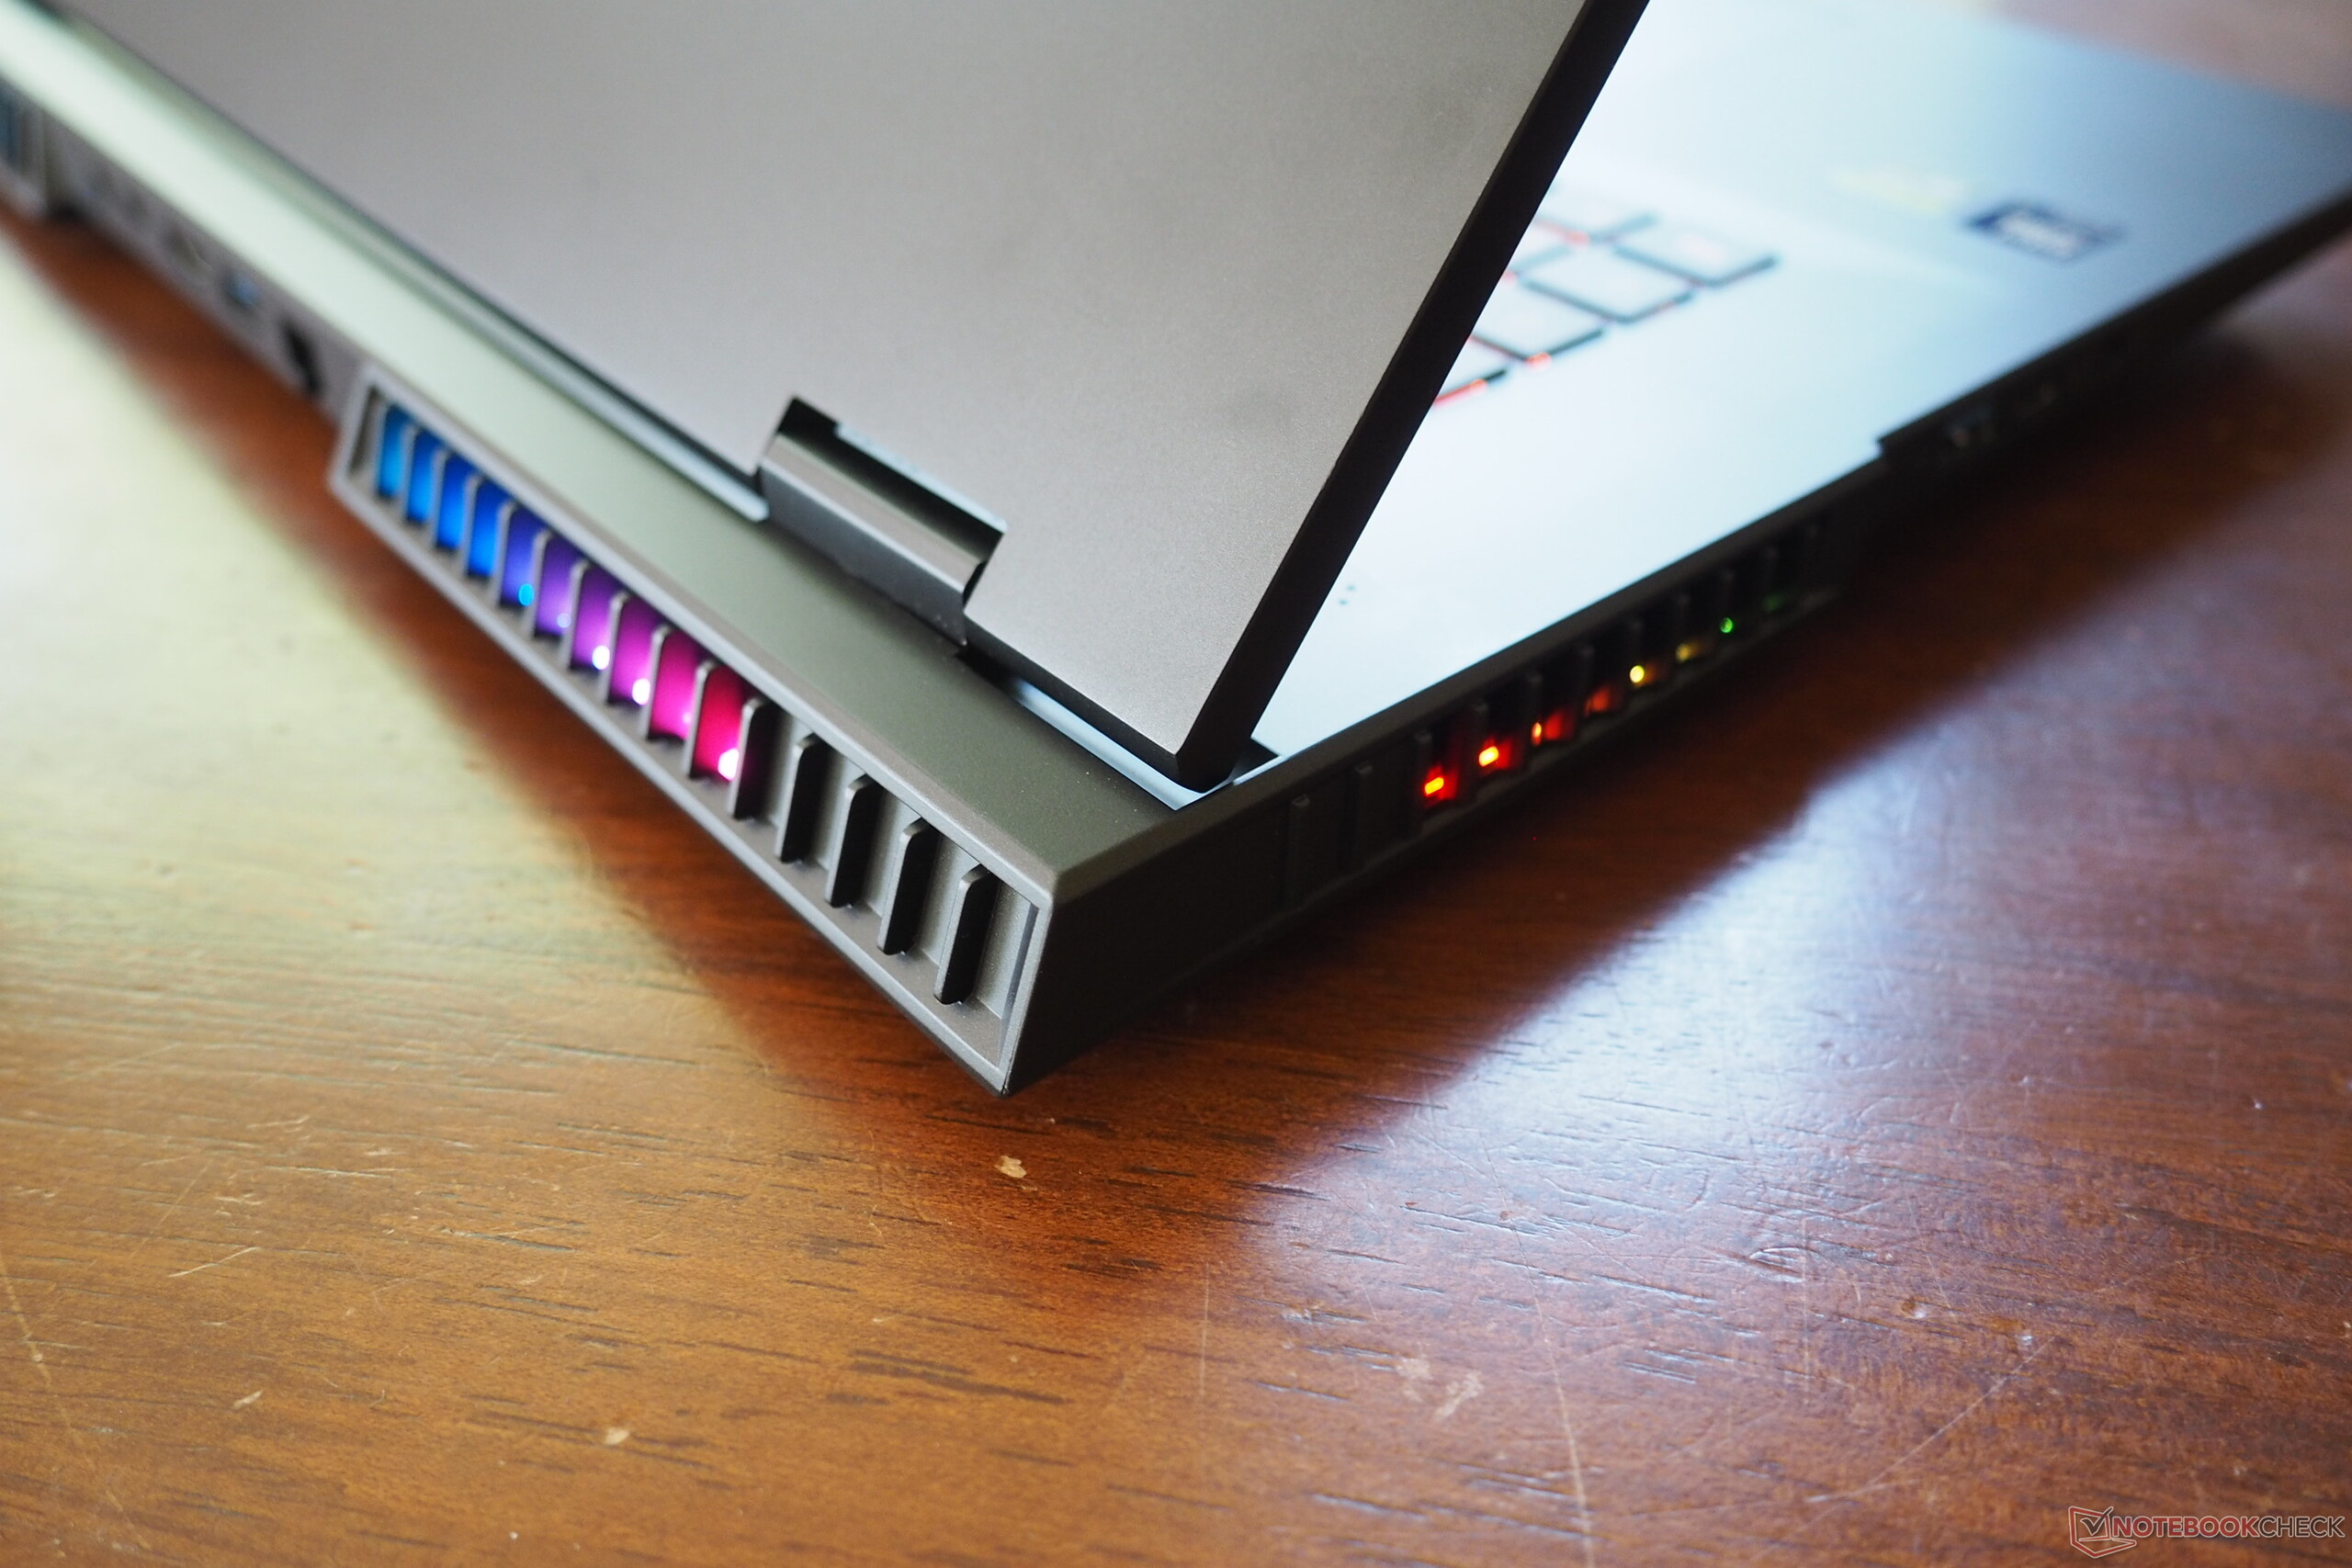
Jeśli chodzi o jakość wykonania, to Medion prezentuje przeciętny poziom. Podczas gdy pokrywa 18-calowca wykonana jest z aluminium, jednostka bazowa wykonana jest z tworzywa sztucznego. Pomimo relatywnie grubszej konstrukcji, ta ostatnia może być lekko wygięta w niektórych miejscach, ale dzieje się tak głównie przy zastosowaniu większego nacisku. Z drugiej strony, na pochwałę zasługuje duży kąt otwarcia wynoszący 150°, choć zawiasy mogłyby być nieco ciaśniejsze. Przy całkowitej wysokości wynoszącej niecałe 3 cm (bez nóżek obudowy), Beast 18 X1 dorównuje swoim odpowiednikom od Aorus i Asuschoć waga jest nieco wyższa i wynosi od 3,6 do 3,3-3,4 kg.

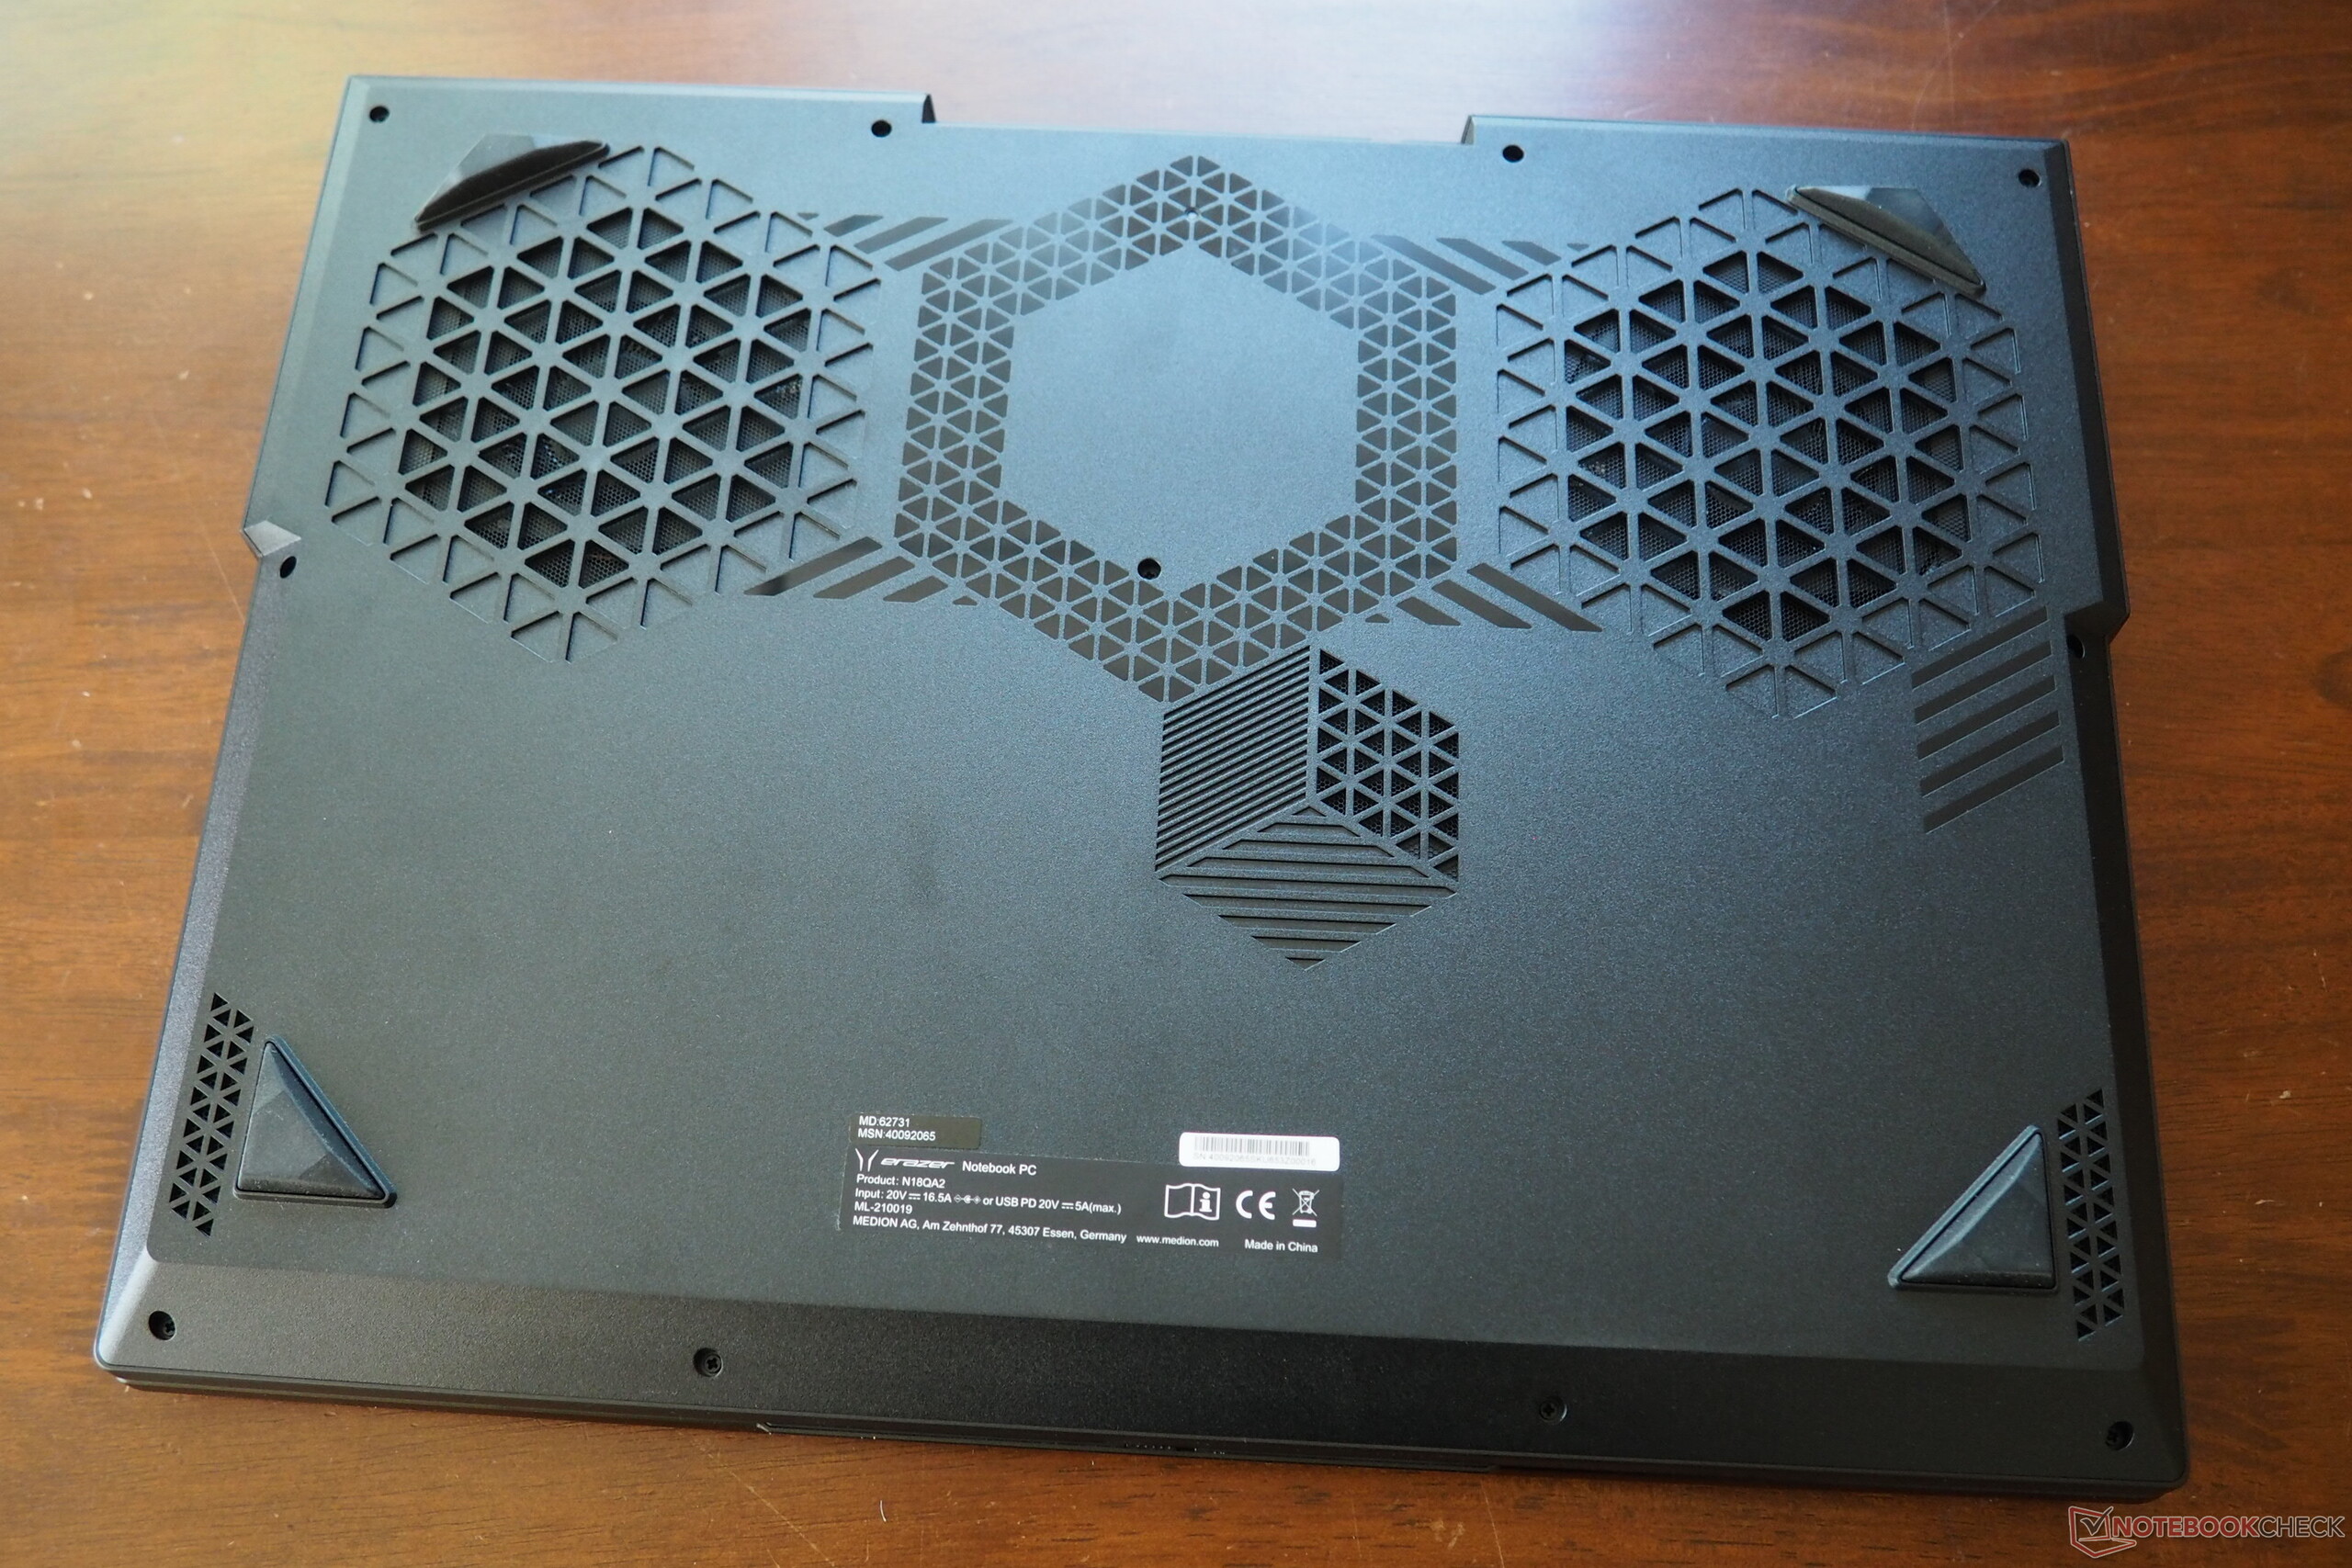
Sprzęt
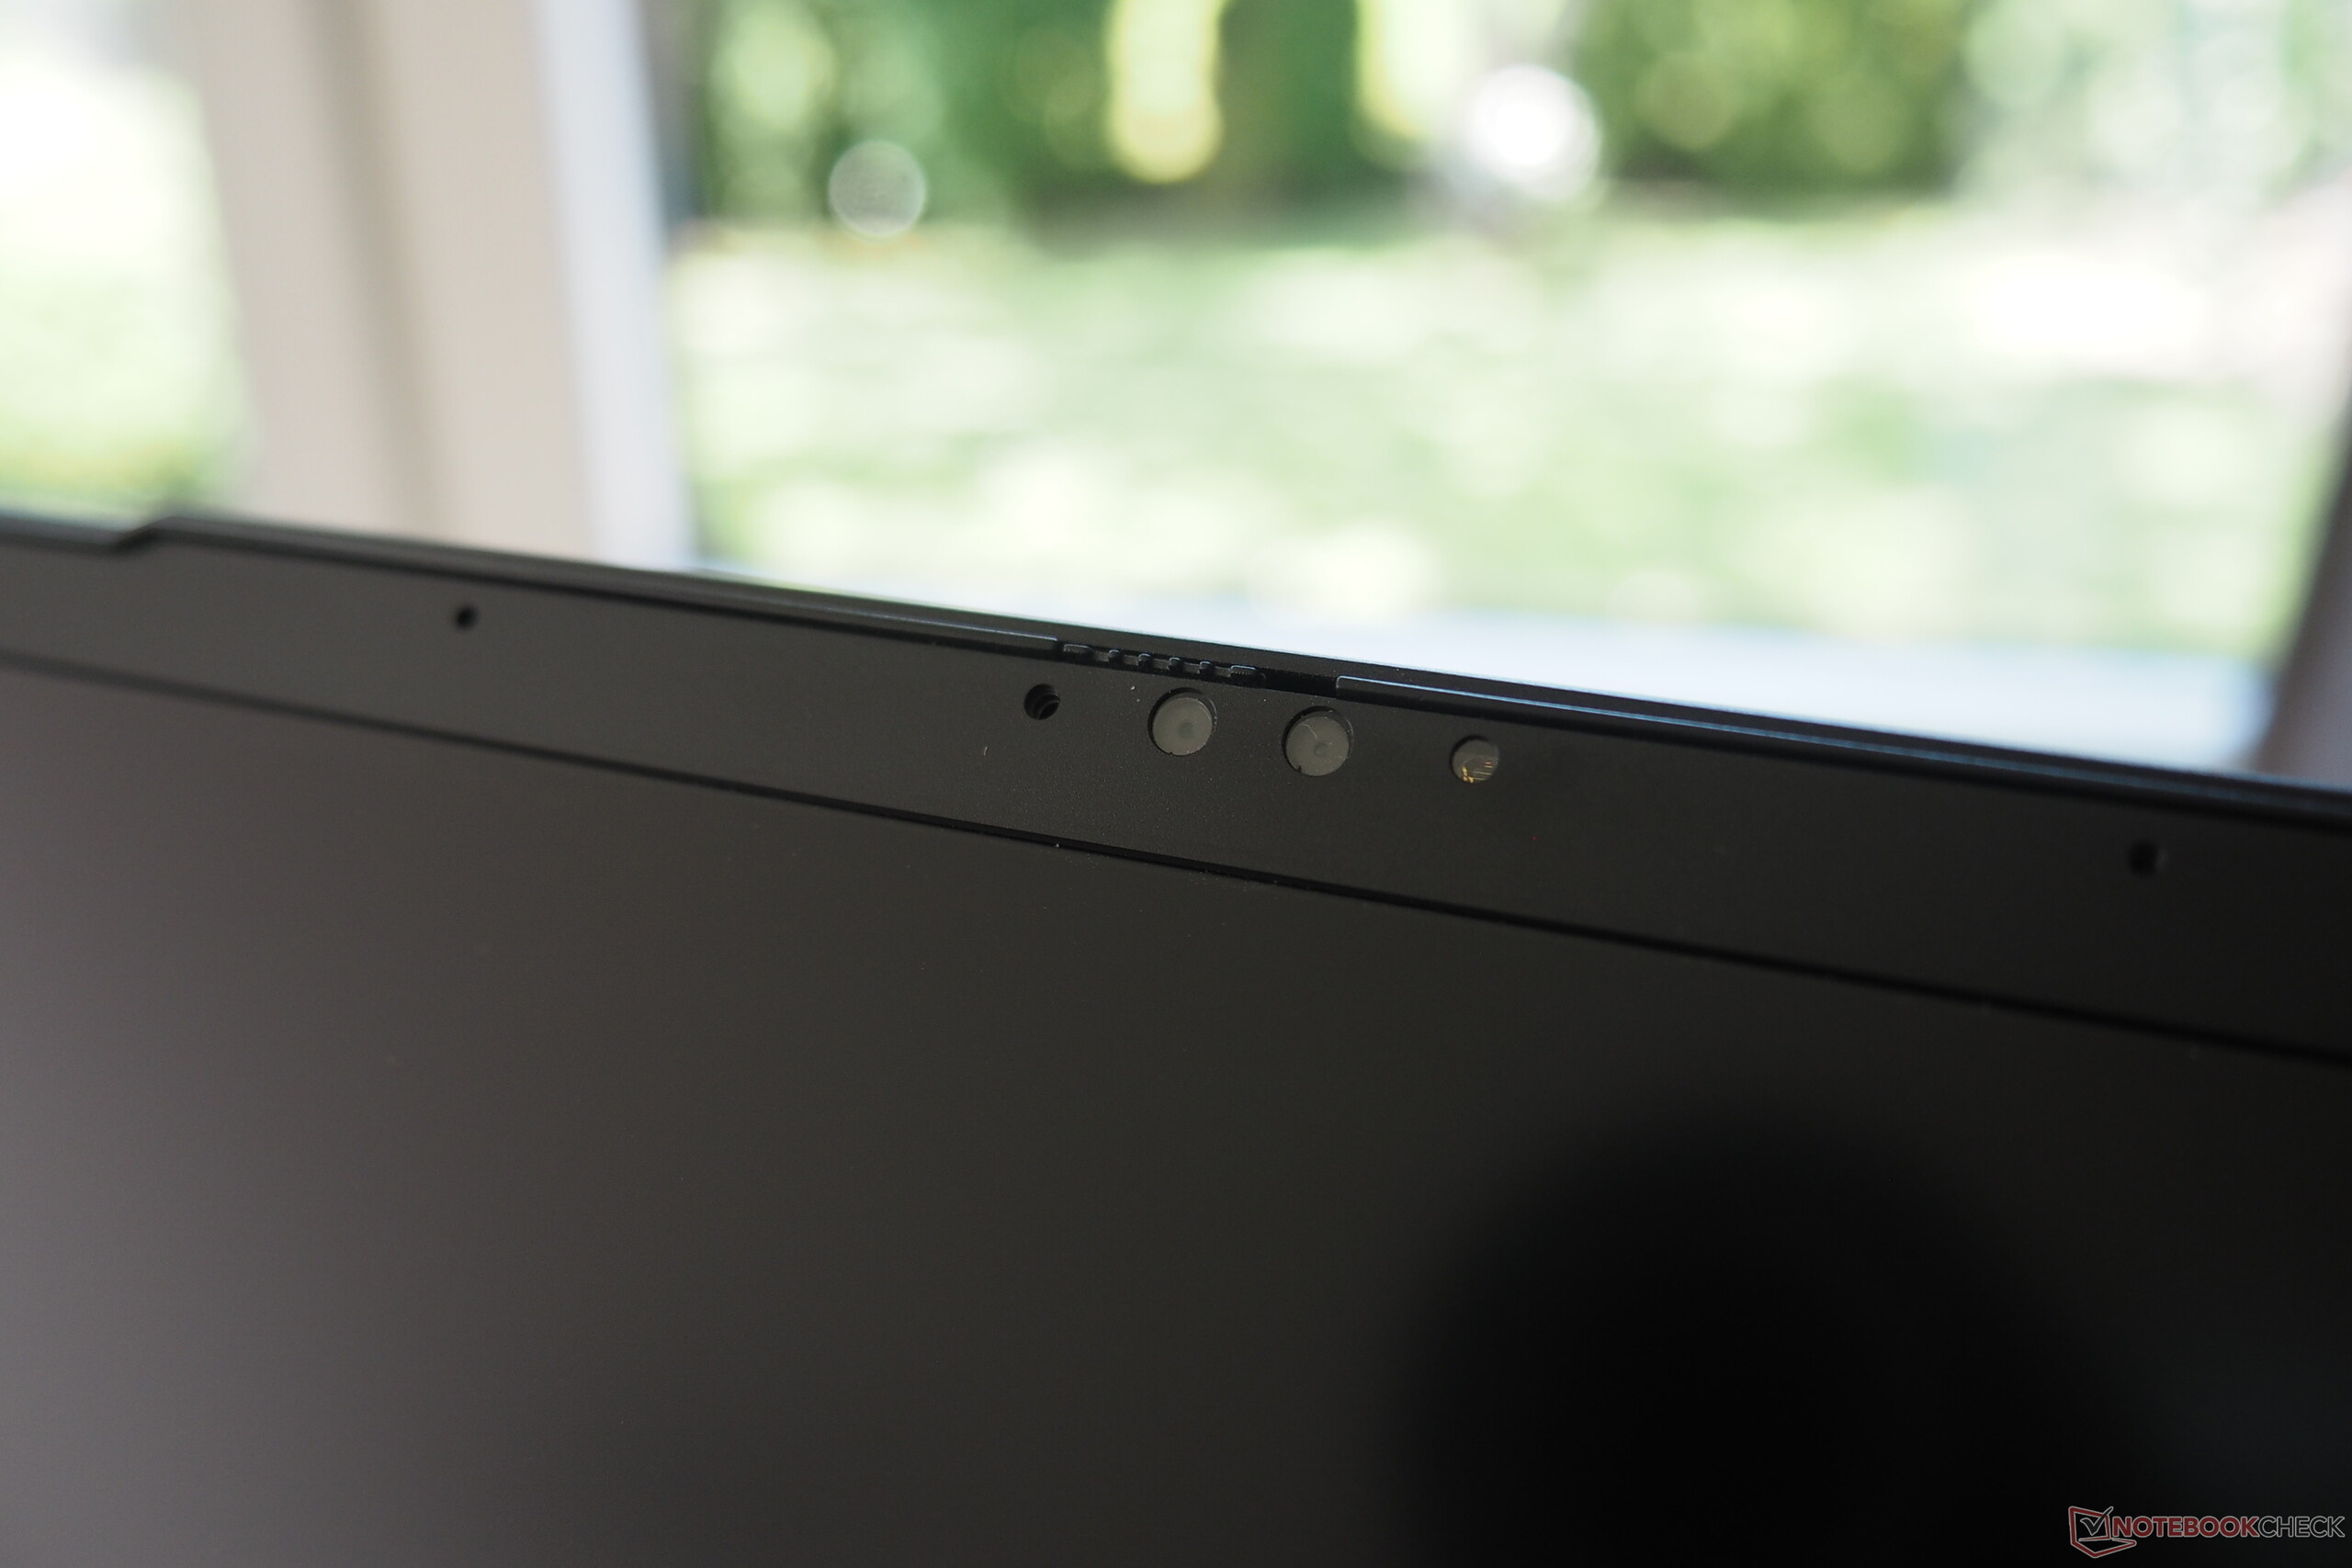
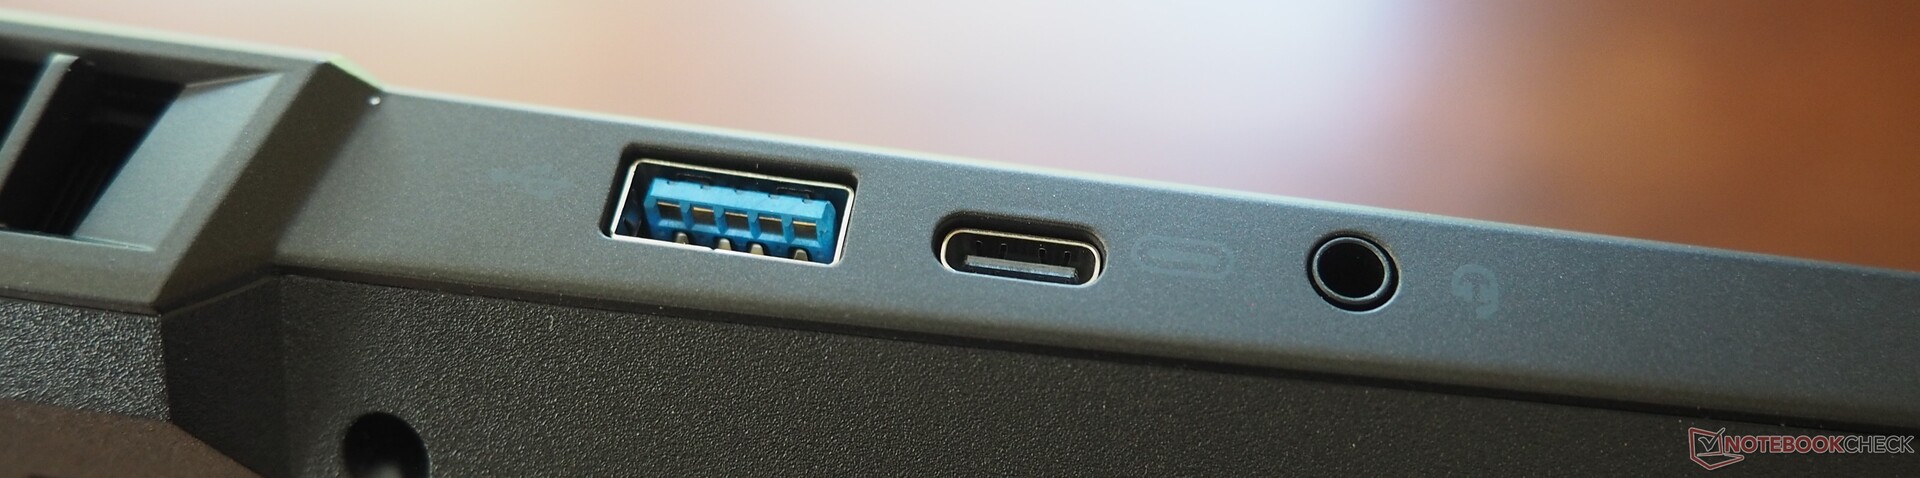
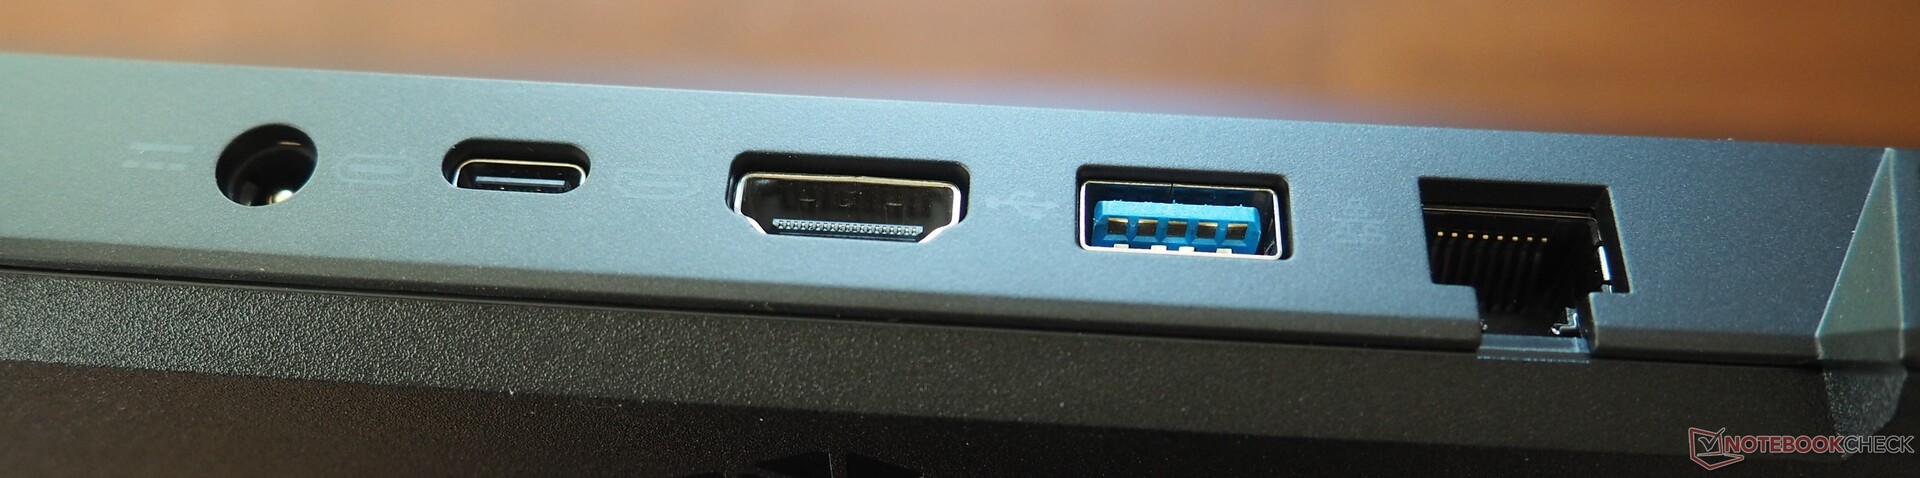
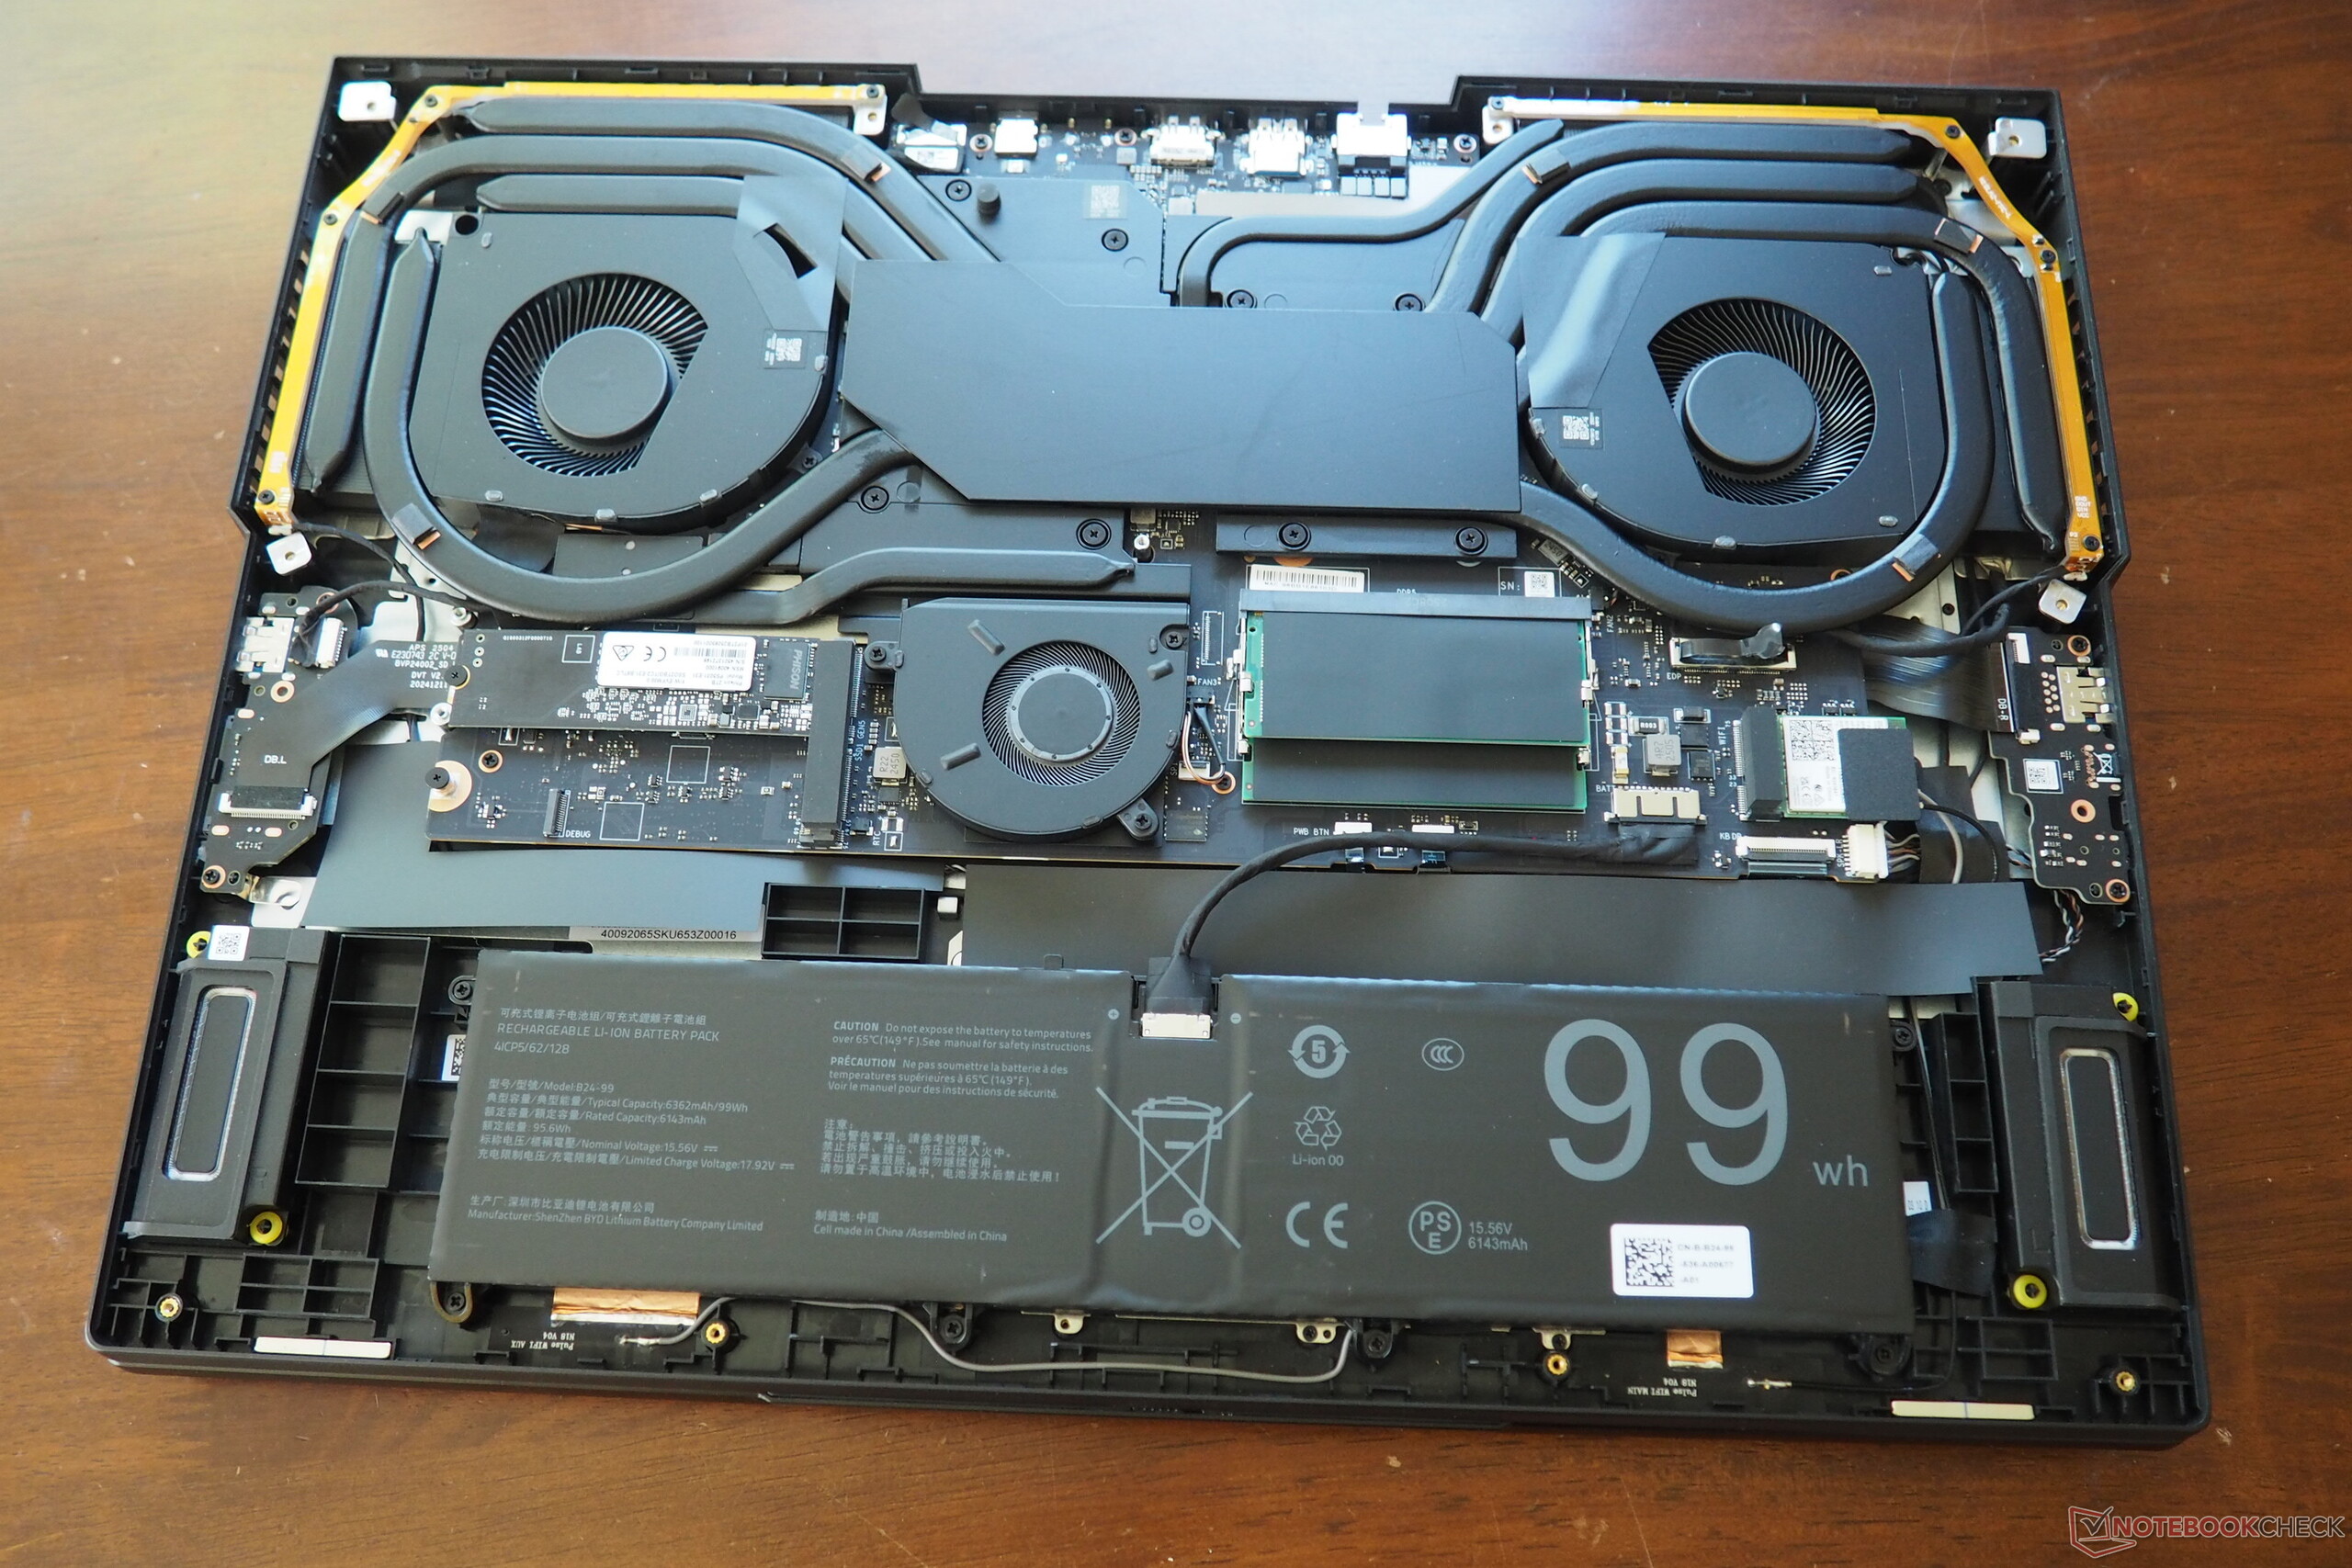
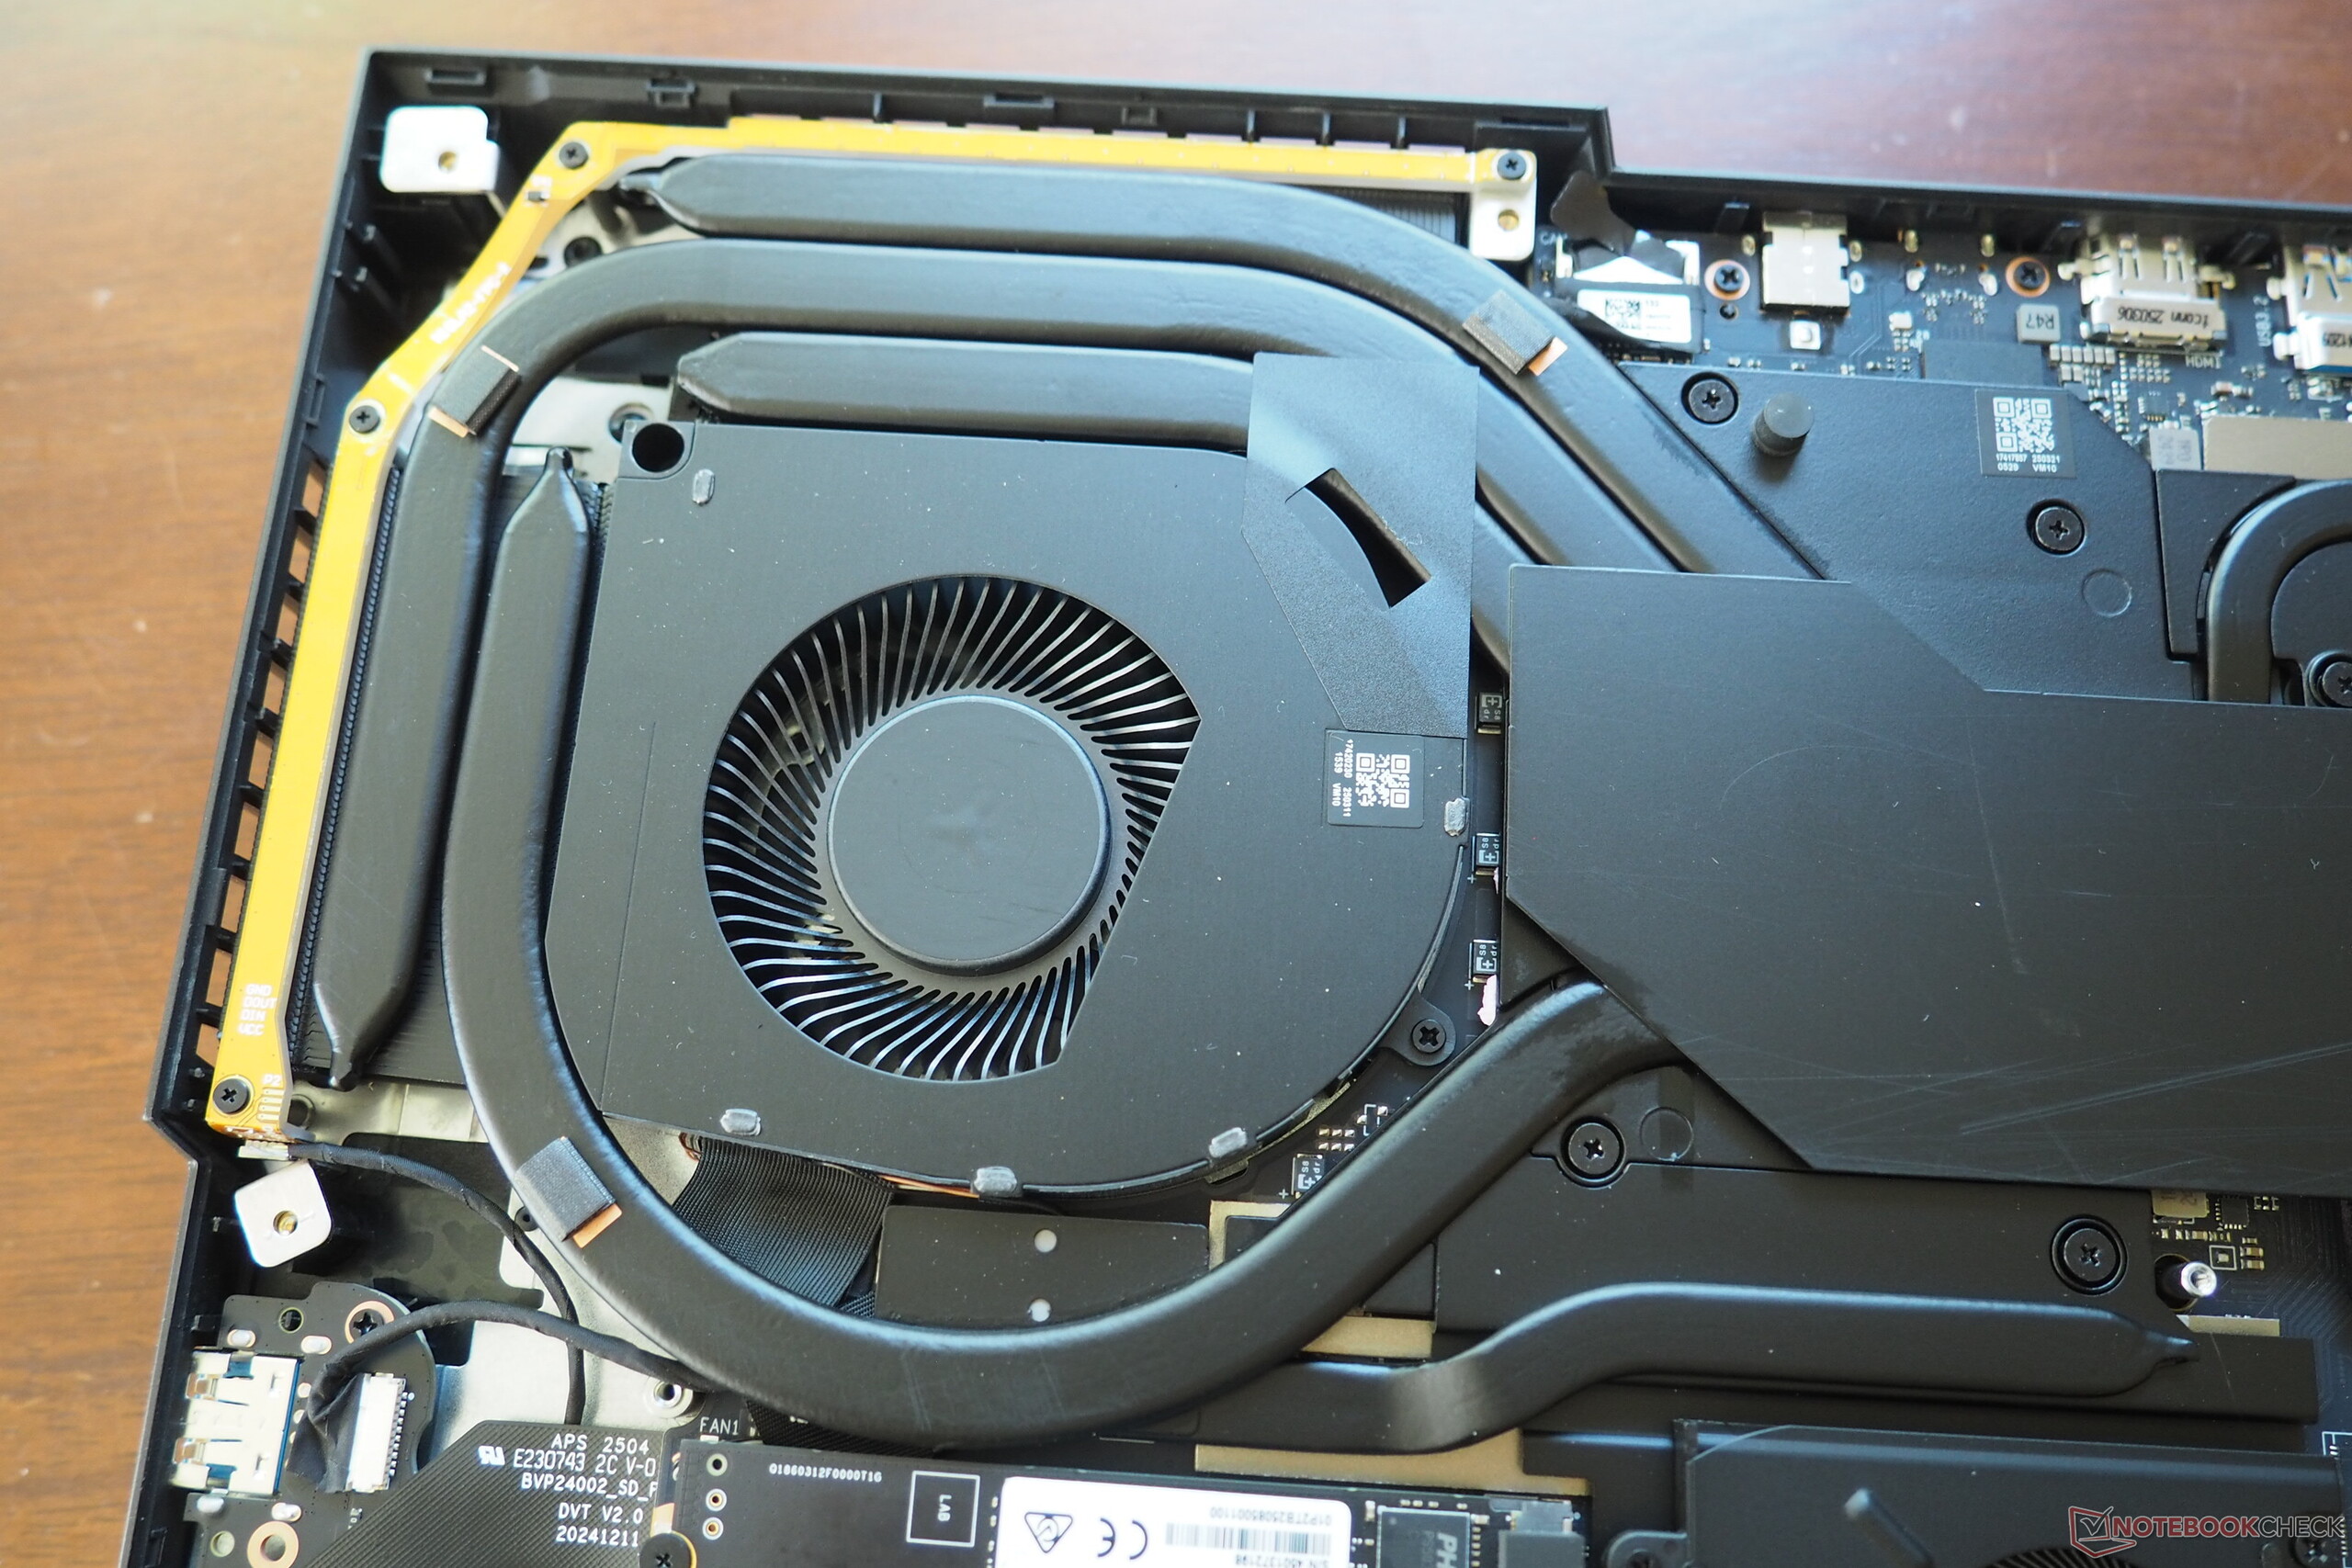
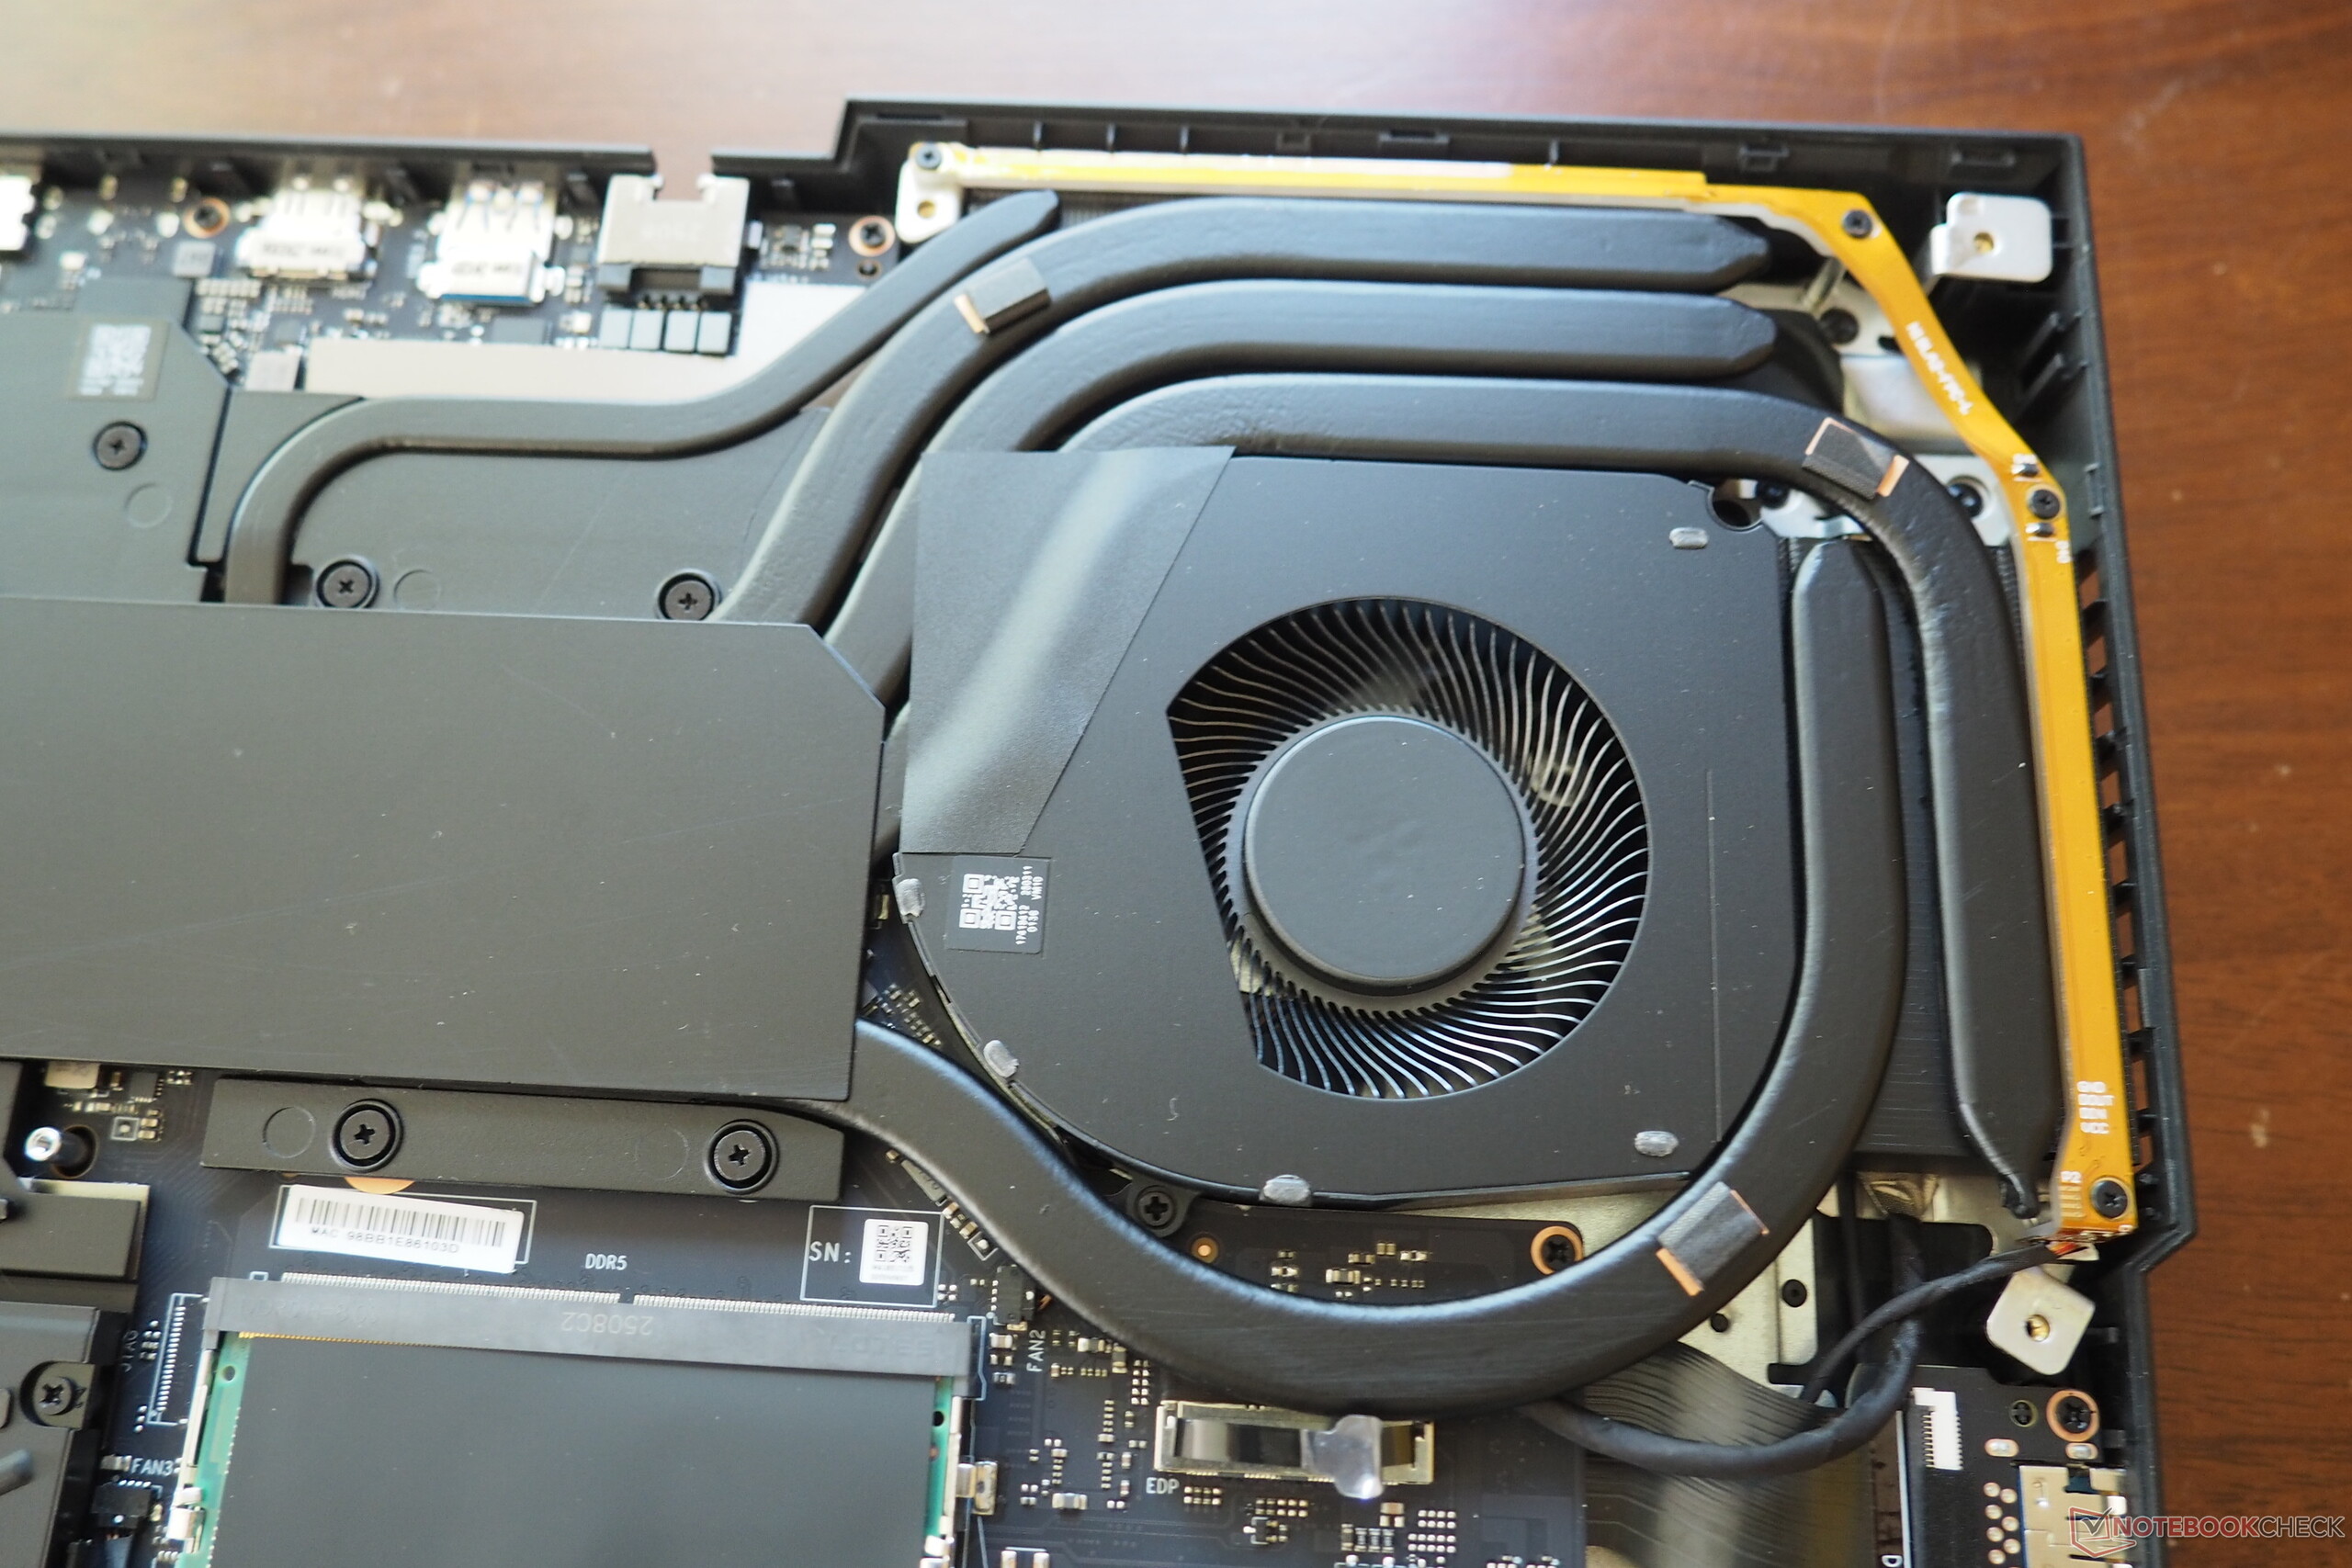
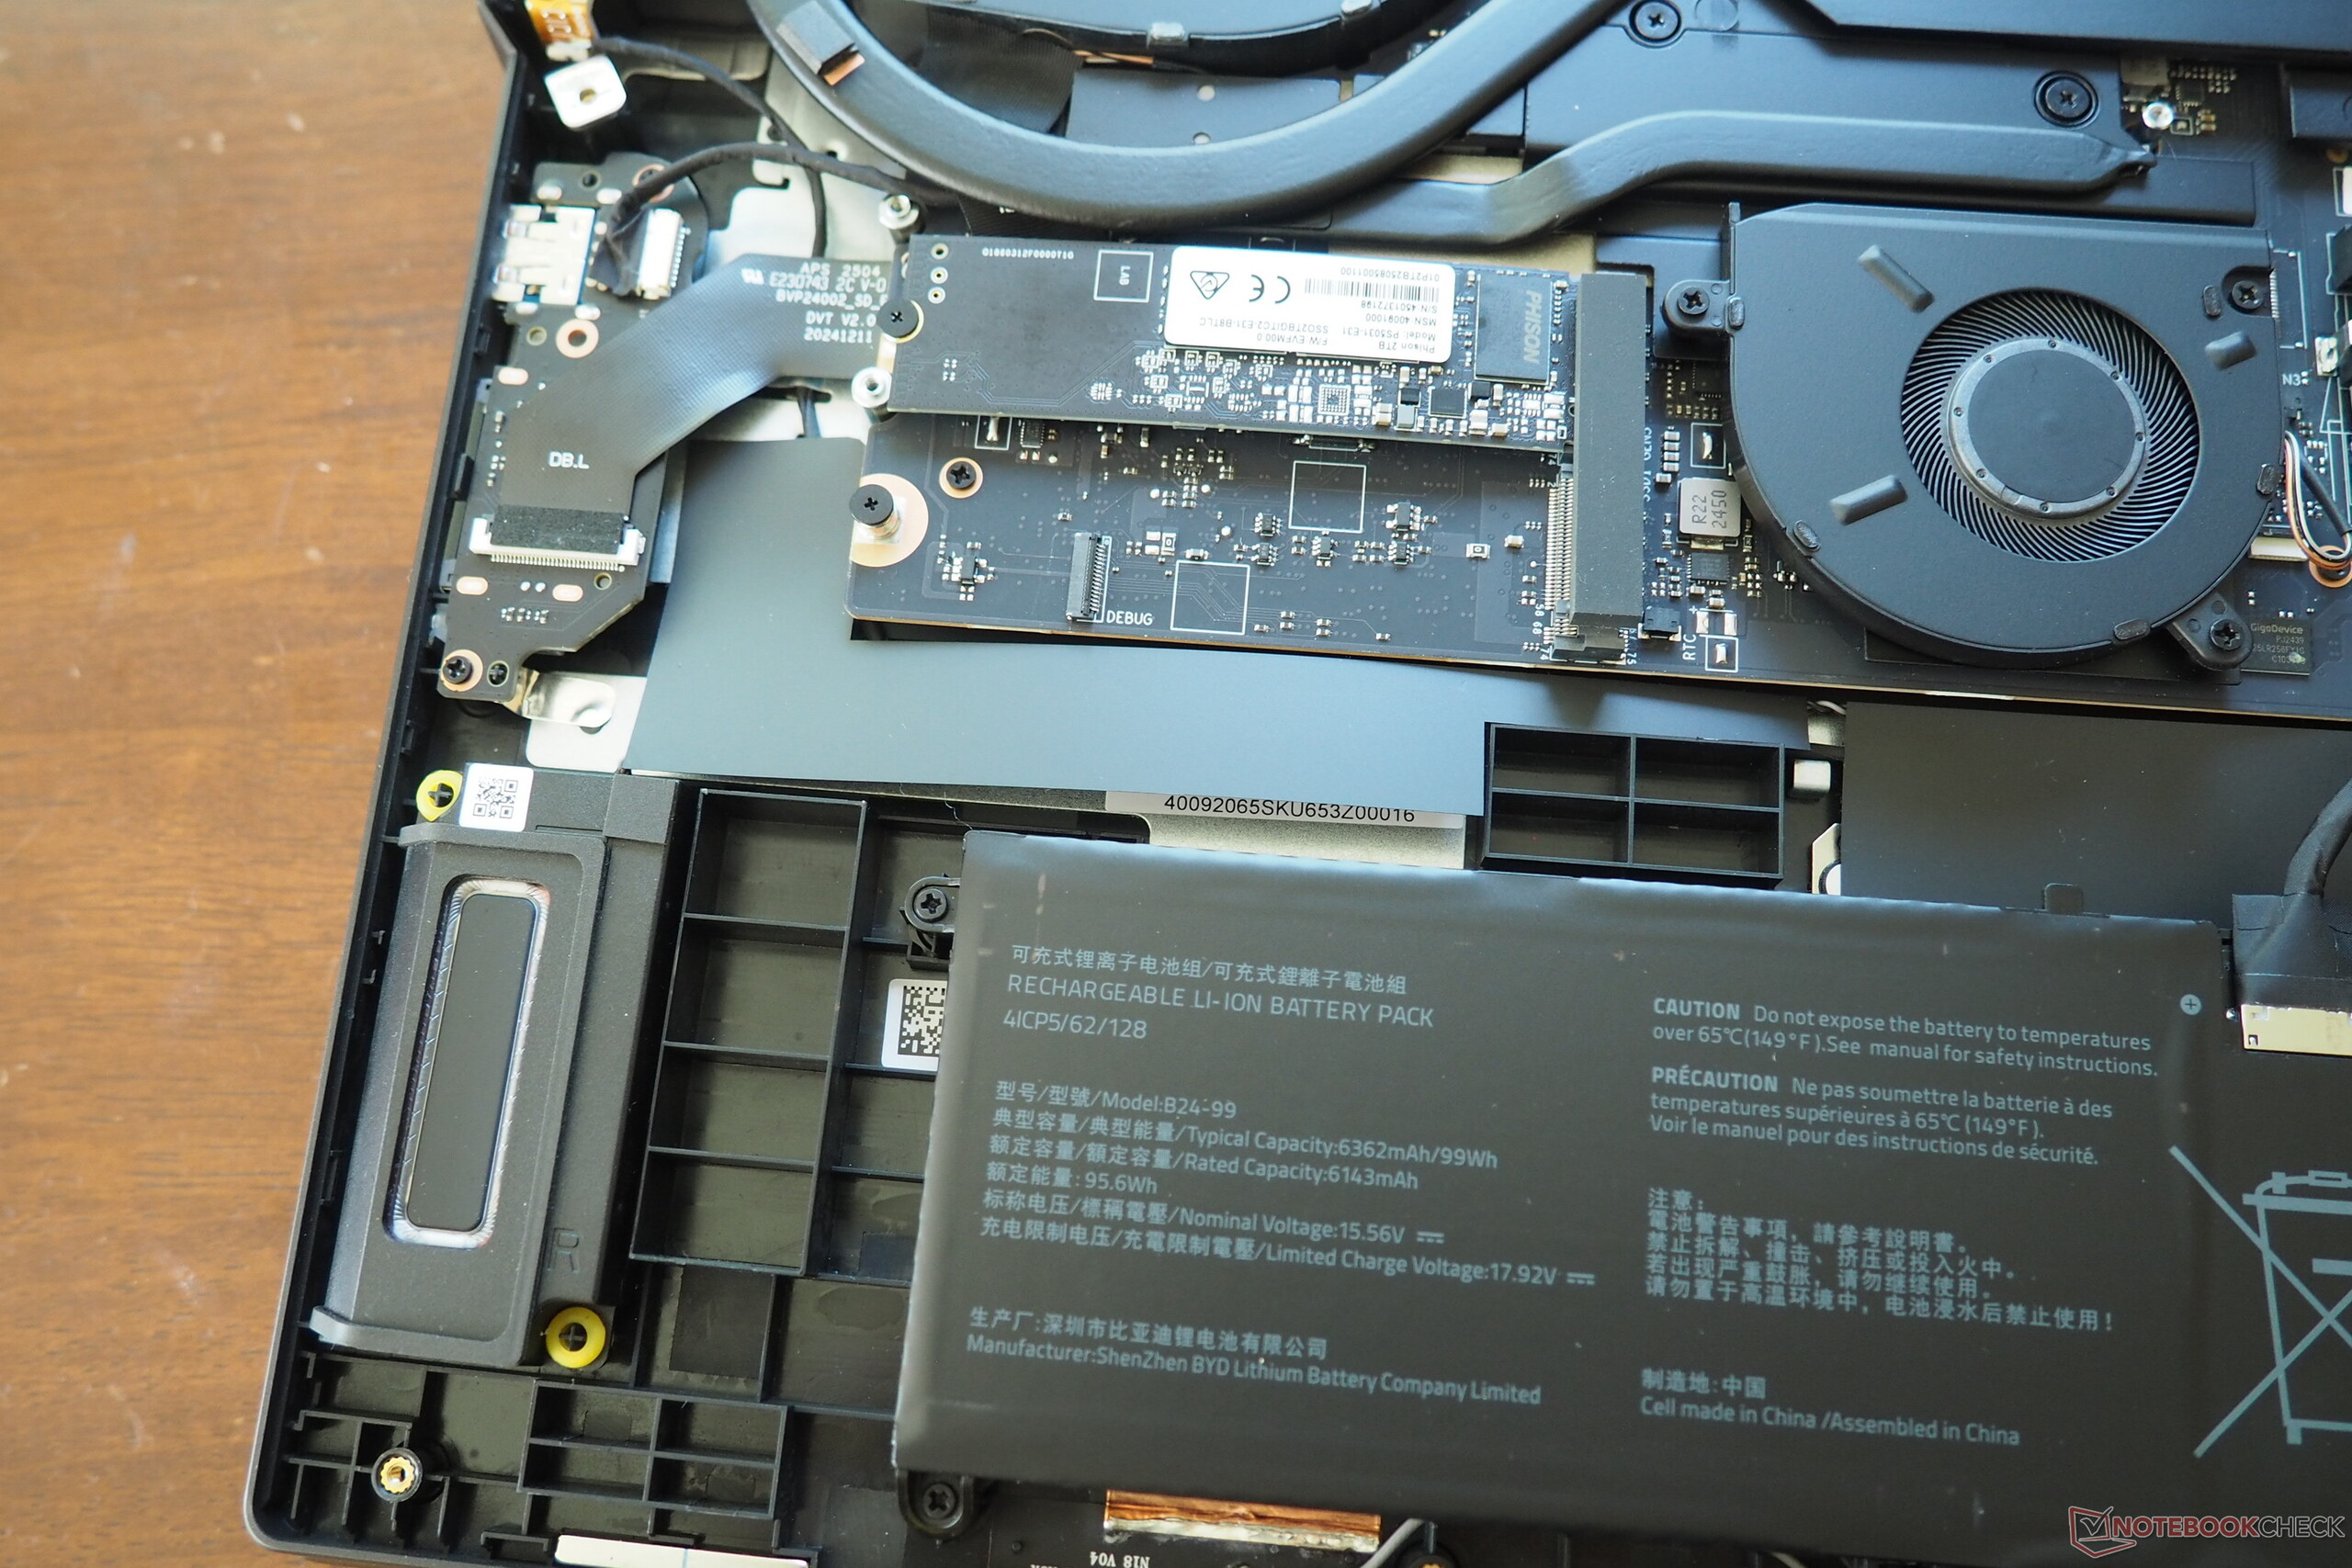
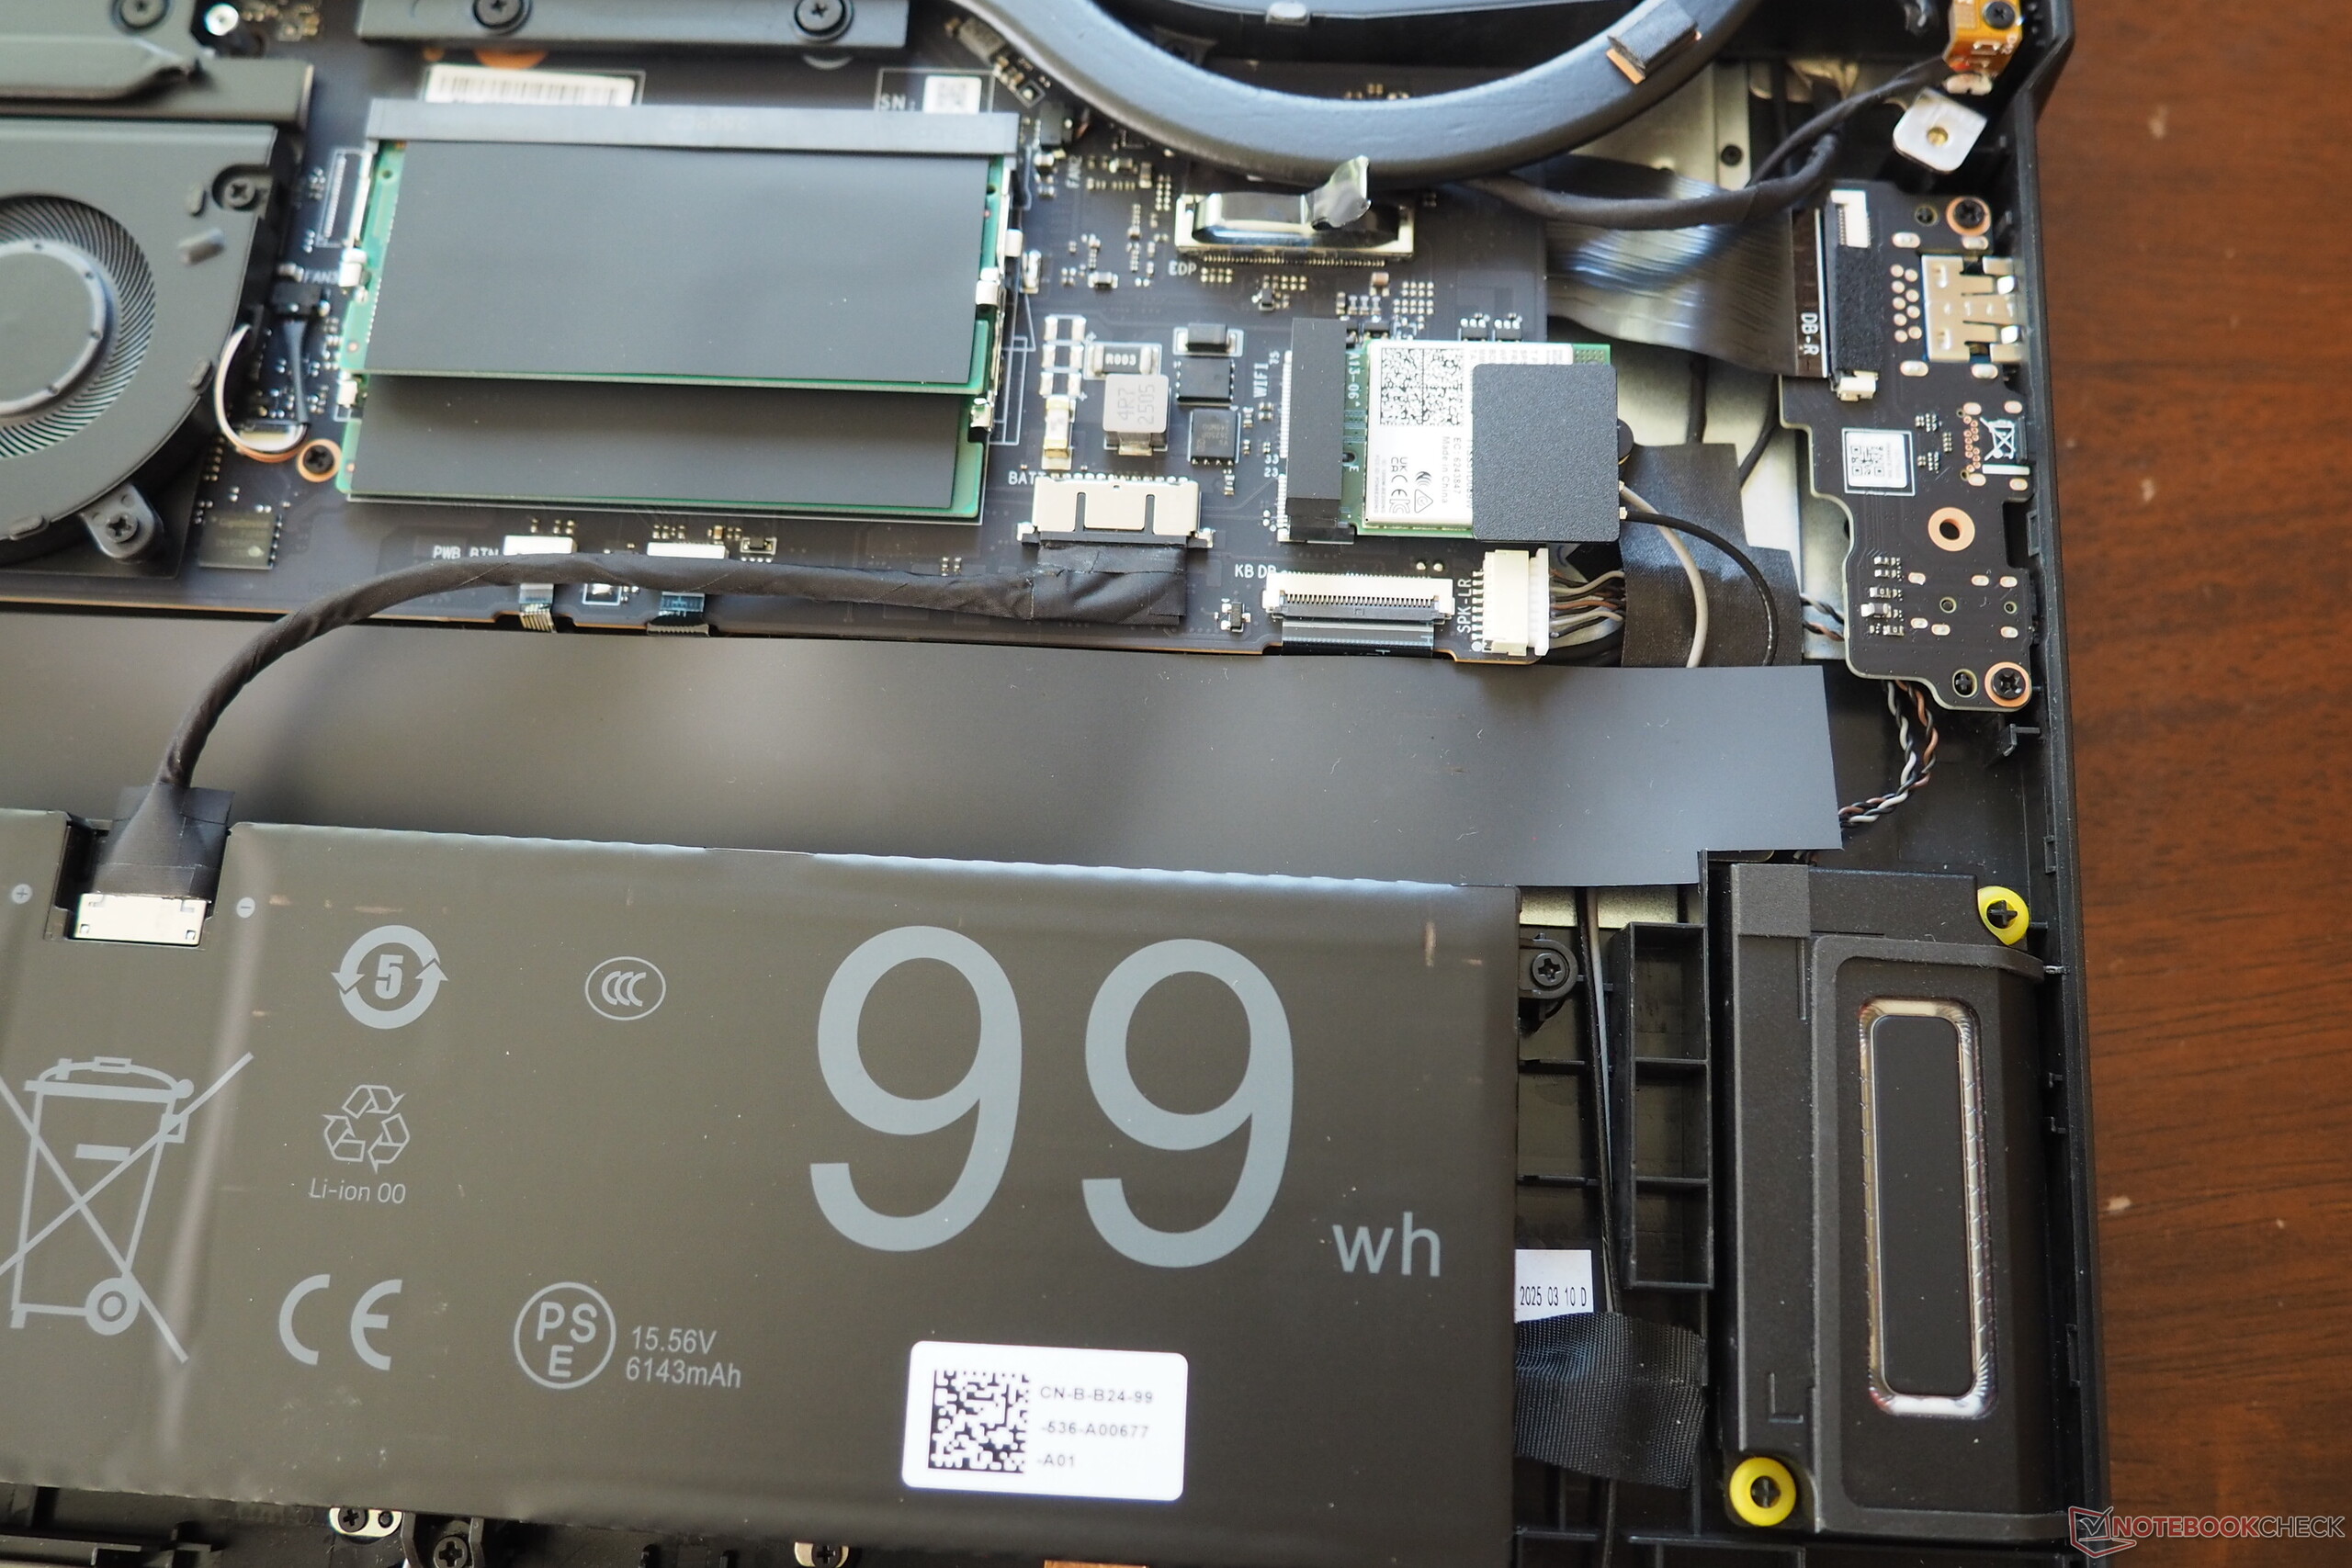
Wybór interfejsów jest imponujący, jak przystało na desktopowy zamiennik. Oprócz dwóch portów USB-A (3.2 Gen1), znajdziemy tu również dwa porty Type-C, z których jeden obsługuje interfejs Thunderbolt 5. Jest też gniazdo audio, wyjście HDMI 2.1, przyjemnie szybki czytnik kart pamięci i port sieciowy 2,5 Gbit. Połączenia bezprzewodowe obsługiwane są przez układ Intel Wi-Fi 7 (BE200), który w teście wypadł szczególnie dobrze pod względem szybkości. Tymczasem kamera internetowa FHD nie generuje żadnych okrzyków, ale oferuje fizyczny zasięg, co nie jest rzeczą oczywistą. Konserwacja Erazer Beast 18 X1 jest umiarkowanie łatwa lub trudna: Po odkręceniu 11 śrub krzyżakowych, płytę bazową można podważyć, odsłaniając układ chłodzenia z trzema wentylatorami. Oba gniazda pamięci RAM są zajęte, ale wciąż jest miejsce na gnieździe M.2.
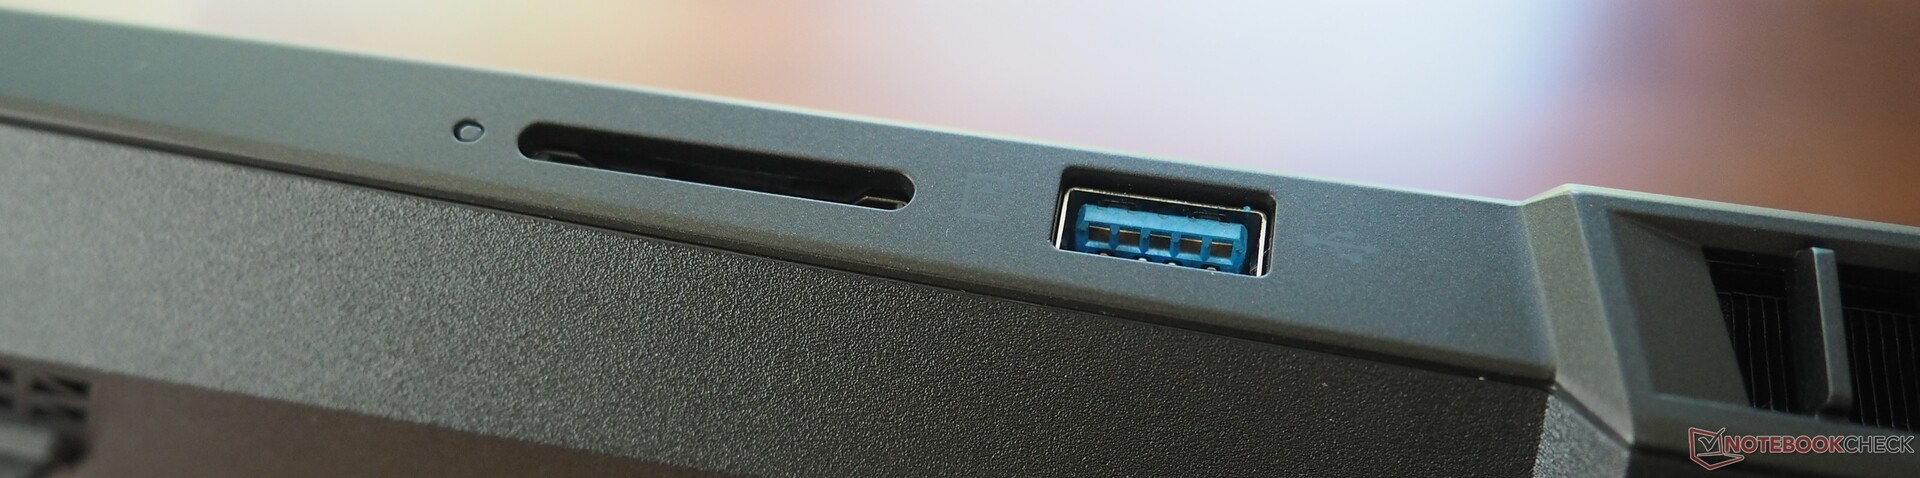
Czytnik kart SD
| SD Card Reader | |
| average JPG Copy Test (av. of 3 runs) | |
| Medion Erazer Beast 18 X1 MD62731 (AV PRO microSD 128 GB V60) | |
| Aorus Master 18 AM8H (AV PRO microSD 128 GB V60) | |
| Średnia w klasie Gaming (20.9 - 210, n=54, ostatnie 2 lata) | |
| Acer Predator Helios 18 N23Q2 | |
| MSI GE78HX 13VH-070US (Angelibird AV Pro V60) | |
| maximum AS SSD Seq Read Test (1GB) | |
| Aorus Master 18 AM8H (AV PRO microSD 128 GB V60) | |
| Medion Erazer Beast 18 X1 MD62731 (AV PRO microSD 128 GB V60) | |
| Średnia w klasie Gaming (25.5 - 261, n=51, ostatnie 2 lata) | |
| MSI GE78HX 13VH-070US (Angelibird AV Pro V60) | |
| Acer Predator Helios 18 N23Q2 | |
Komunikacja
Kamera internetowa


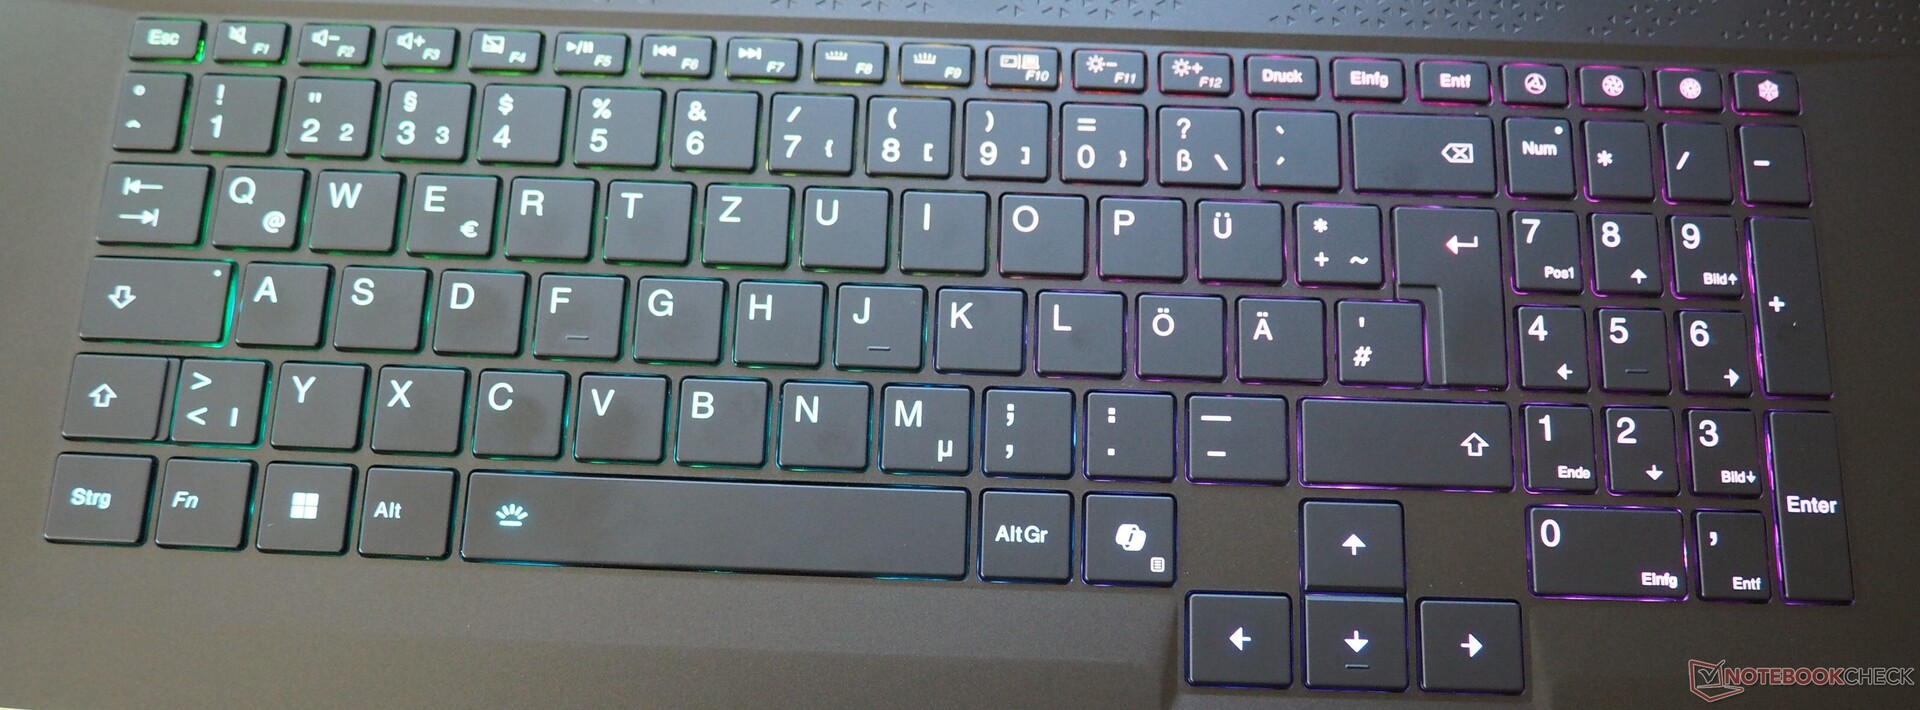
Urządzenia wejściowe
Klawiatura typu chiclet posiada dedykowany numpad i imponuje normalnej wielkości strzałkami kierunkowymi oraz (w prawym górnym rogu) praktycznymi klawiszami specjalnymi do sterowania wentylatorem. Sprzężenie zwrotne i wyczucie klawiszy wydają nam się akceptowalne; na przykład Aorus Master 18 radzi sobie tutaj jeszcze lepiej. Clickpad mógłby być bardziej stabilny tu i ówdzie, ale z rozmiarem około 13 x 8 cm, jest na odpowiedniej wielkości dla 18-calowego produktu.
Wyświetlacz
Medion nie wykorzystuje panelu OLED lub mini-LED, ale zamiast tego polega na klasycznym wyświetlaczu IPS, który mimo to zapewnia dobrą wydajność w większości dyscyplin.
| |||||||||||||||||||||||||
rozświetlenie: 89 %
na akumulatorze: 478 cd/m²
kontrast: 1195:1 (czerń: 0.4 cd/m²)
ΔE ColorChecker Calman: 3.94 | ∀{0.5-29.43 Ø4.72}
calibrated: 0.75
ΔE Greyscale Calman: 5.5 | ∀{0.09-98 Ø4.97}
84.7% AdobeRGB 1998 (Argyll 3D)
99.9% sRGB (Argyll 3D)
97.1% Display P3 (Argyll 3D)
Gamma: 2.212
CCT: 7059 K
| Medion Erazer Beast 18 X1 MD62731 BOEhydis NE180QDM-NZ2, IPS, 2560x1600, 18", 240 Hz | MSI GE78HX 13VH-070US AU Optronics B170QAN01.2, IPS, 2560x1600, 17", 240 Hz | Acer Predator Helios 18 N23Q2 AUO45A8 (B180QAN01.2), IPS, 2560x1600, 18", 250 Hz | Asus Strix Scar 18 G835LX N180QDM-NM2, Mini-LED, 2560x1600, 18", 240 Hz | Aorus Master 18 AM8H NE180QDM-NM1 (BOE0C58), Mini-LED, 2560x1600, 18", 240 Hz | Lenovo Legion Pro 7i 16 Gen 10 Samsung ATNA60HU01-0, OLED, 2560x1600, 16", 240 Hz | |
|---|---|---|---|---|---|---|
| Display | 1% | 4% | 2% | 2% | 4% | |
| Display P3 Coverage (%) | 97.1 | 97.6 1% | 99.8 3% | 99 2% | 99.9 3% | 99.5 2% |
| sRGB Coverage (%) | 99.9 | 99.9 0% | 100 0% | 100 0% | 100 0% | 100 0% |
| AdobeRGB 1998 Coverage (%) | 84.7 | 86.5 2% | 91.8 8% | 87.2 3% | 87.7 4% | 94.4 11% |
| Response Times | 19% | -90% | -37% | -102% | 95% | |
| Response Time Grey 50% / Grey 80% * (ms) | 5.6 ? | 4.2 ? 25% | 7.6 ? -36% | 7.4 ? -32% | 16.4 ? -193% | 0.28 ? 95% |
| Response Time Black / White * (ms) | 7.3 ? | 6.4 ? 12% | 17.8 ? -144% | 10.4 ? -42% | 8.1 ? -11% | 0.43 ? 94% |
| PWM Frequency (Hz) | 2509 | 20610 ? | 1398 ? | 1438 ? | ||
| PWM Amplitude * (%) | 100 | 100 | 29 | |||
| Screen | -15% | -14% | 119% | 53% | 20% | |
| Brightness middle (cd/m²) | 478 | 398.6 -17% | 360 -25% | 764 60% | 438 -8% | 490.4 3% |
| Brightness (cd/m²) | 456 | 384 -16% | 355 -22% | 747 64% | 451 -1% | 498 9% |
| Brightness Distribution (%) | 89 | 89 0% | 92 3% | 93 4% | 90 1% | 97 9% |
| Black Level * (cd/m²) | 0.4 | 0.46 -15% | 0.21 48% | 0.1 75% | 0.13 67% | |
| Contrast (:1) | 1195 | 867 -27% | 1714 43% | 7640 539% | 3369 182% | |
| Colorchecker dE 2000 * | 3.94 | 4.05 -3% | 3.82 3% | 1.2 70% | 1.25 68% | 3.2 19% |
| Colorchecker dE 2000 max. * | 8.6 | 8.68 -1% | 7.38 14% | 2.8 67% | 4.93 43% | 6.04 30% |
| Colorchecker dE 2000 calibrated * | 0.75 | 1.02 -36% | 2.24 -199% | 0.84 -12% | ||
| Greyscale dE 2000 * | 5.5 | 6.5 -18% | 5.06 8% | 1.5 73% | 1.7 69% | 1 82% |
| Gamma | 2.212 99% | 2.11 104% | 2.52 87% | 2.17 101% | 2.173 101% | 2.24 98% |
| CCT | 7059 92% | 7518 86% | 5657 115% | 6556 99% | 6518 100% | 6373 102% |
| Całkowita średnia (program / ustawienia) | 2% /
-7% | -33% /
-21% | 28% /
68% | -16% /
17% | 40% /
29% |
* ... im mniej tym lepiej
Zaczynając od przestrzeni barw, która pokrywa prawie 100% sRGB i DCI-P3 (AdobeRGB jest pokryty w 85%). Jasność również jest dobra, ze średnią 456 cd/m².
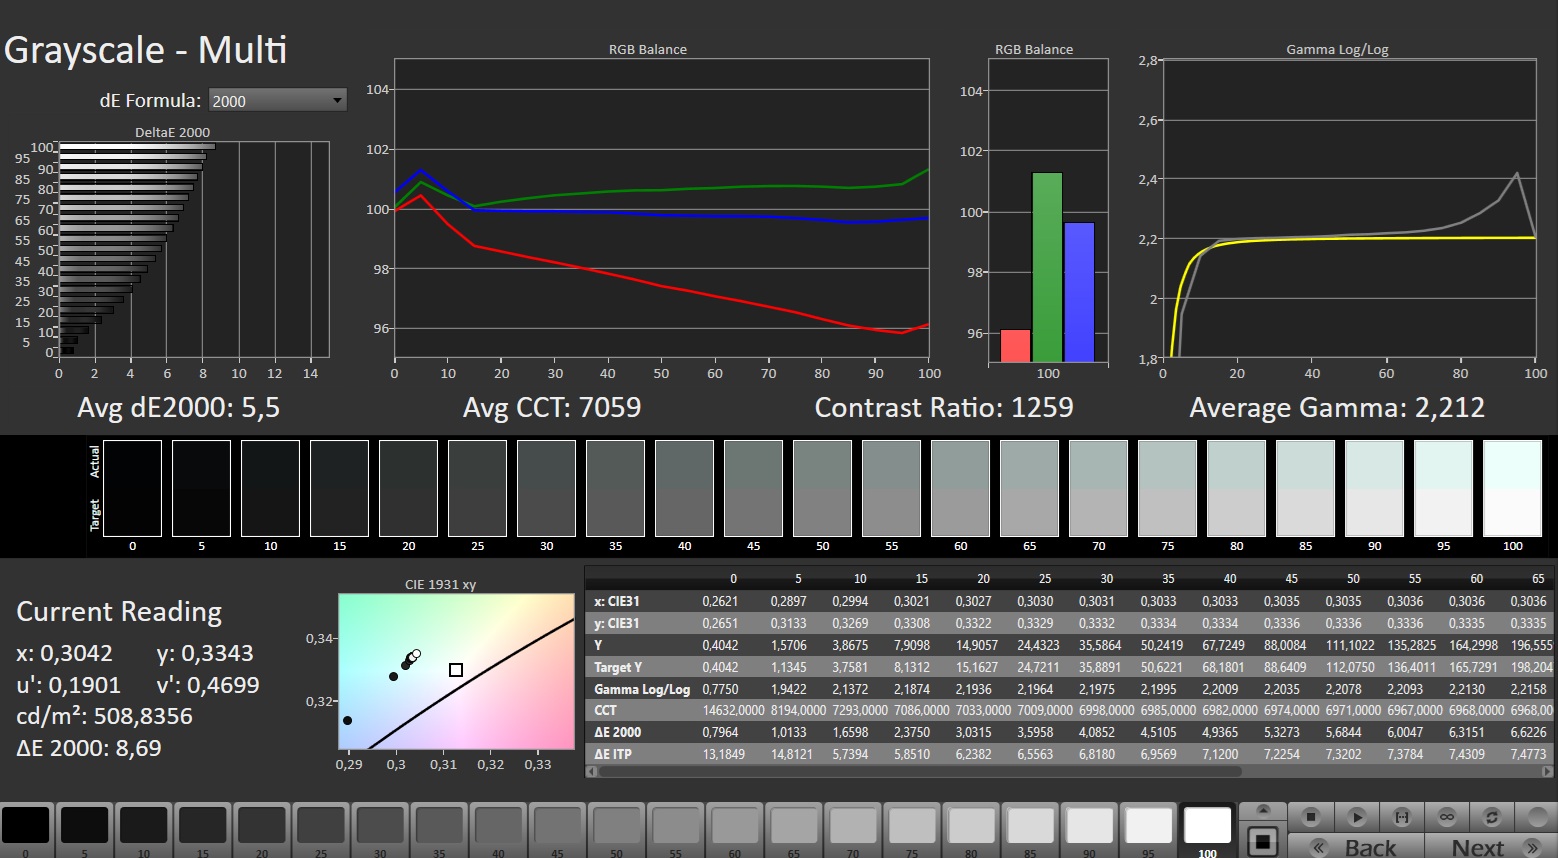
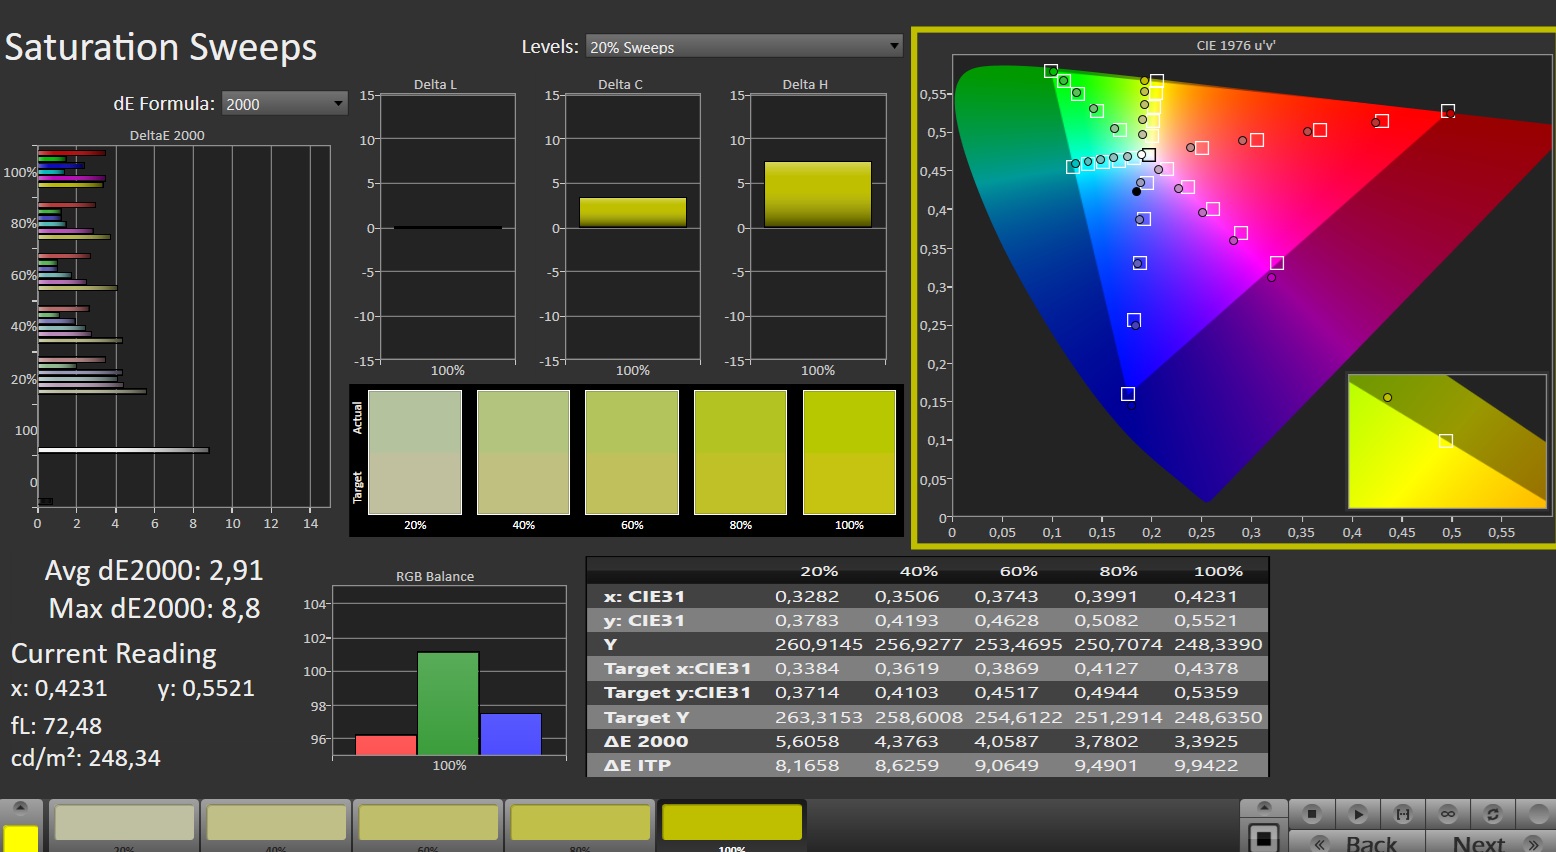
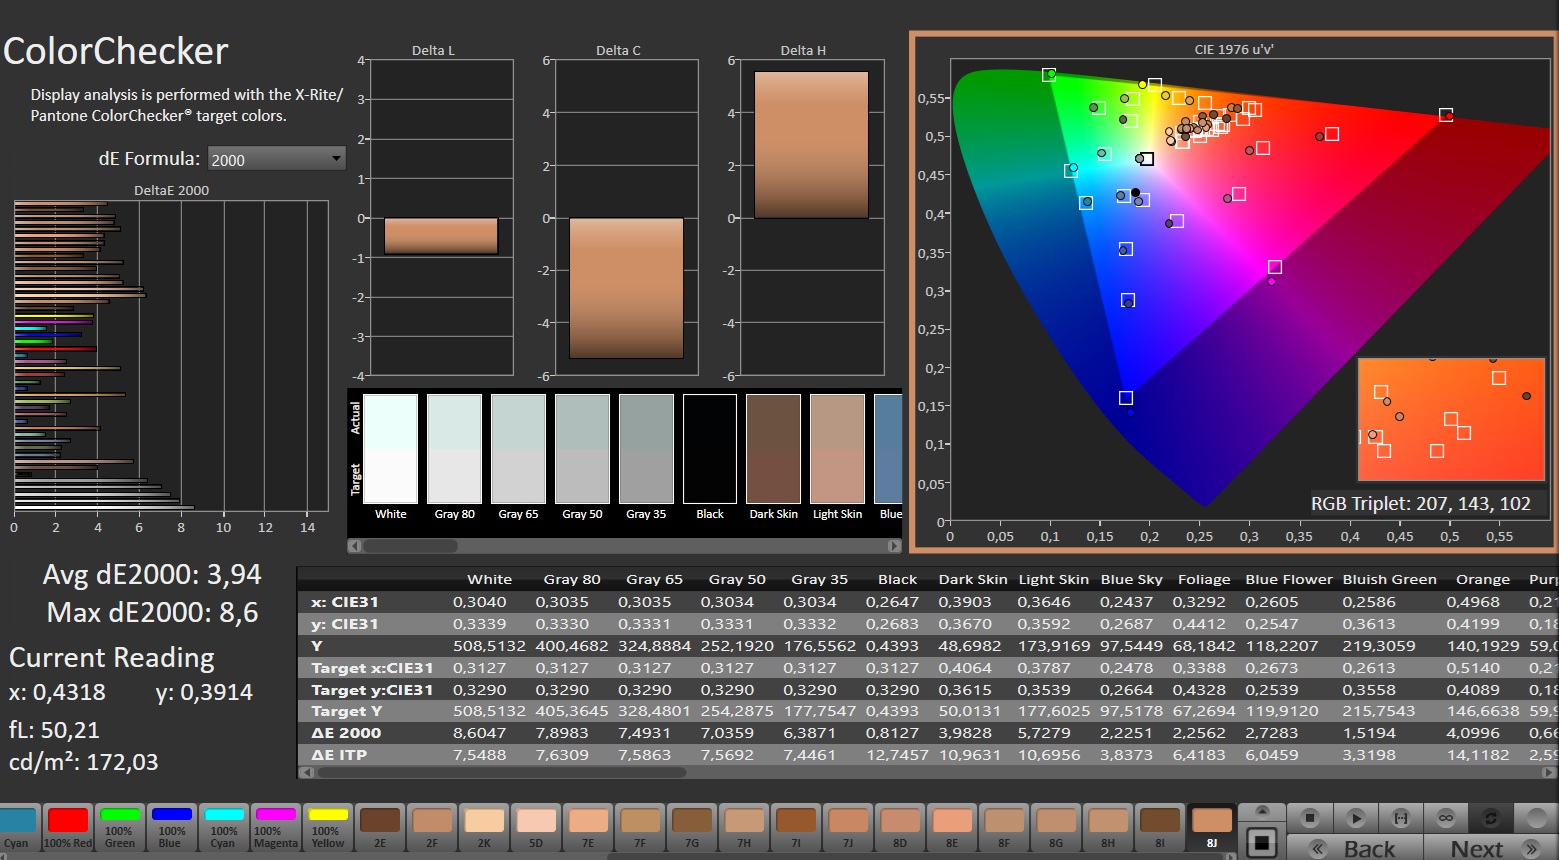
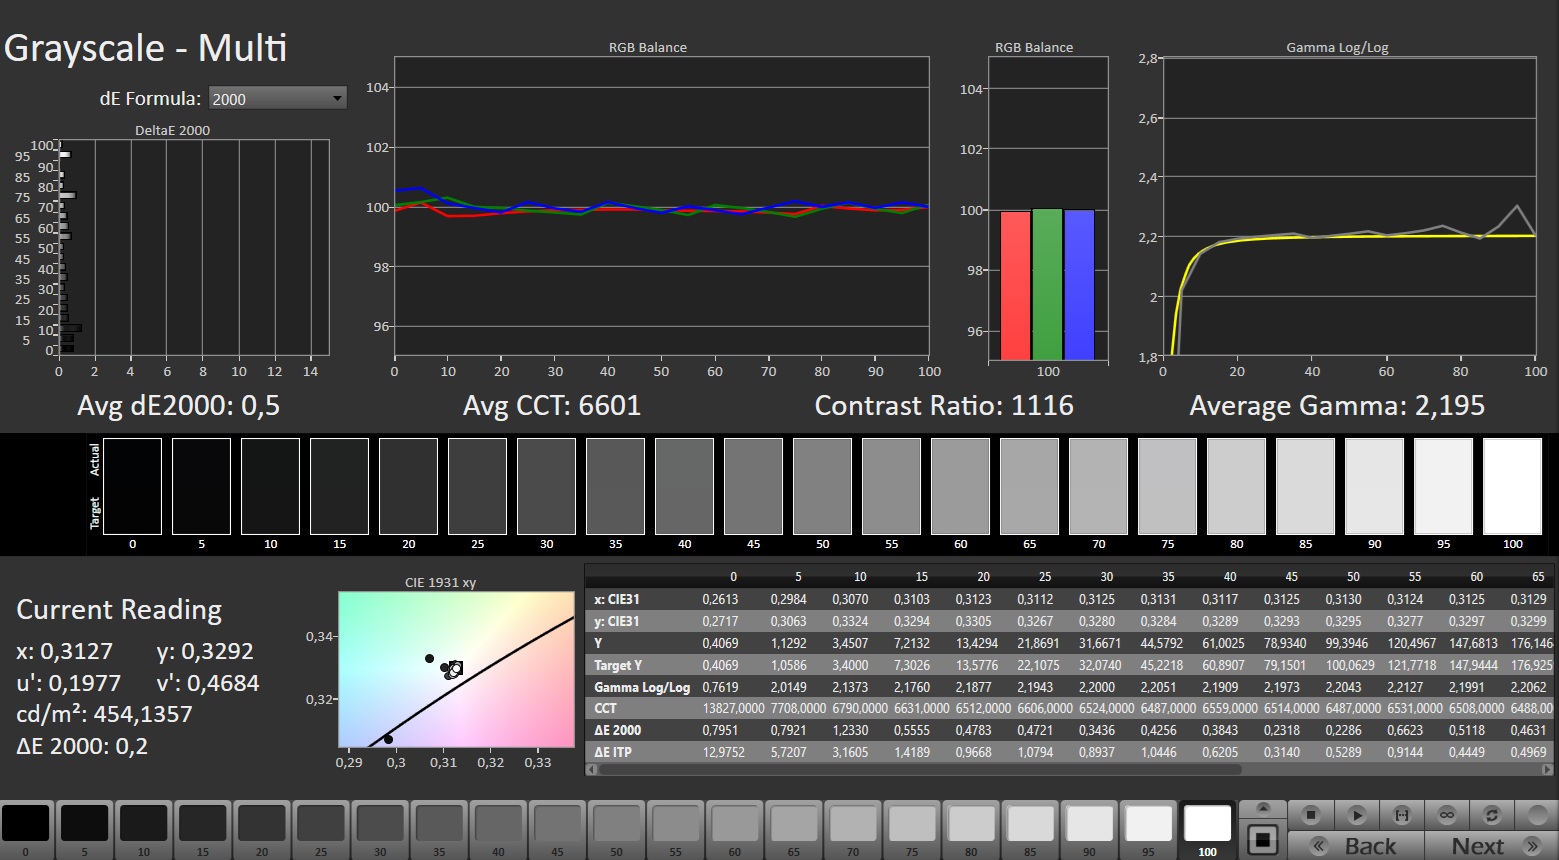
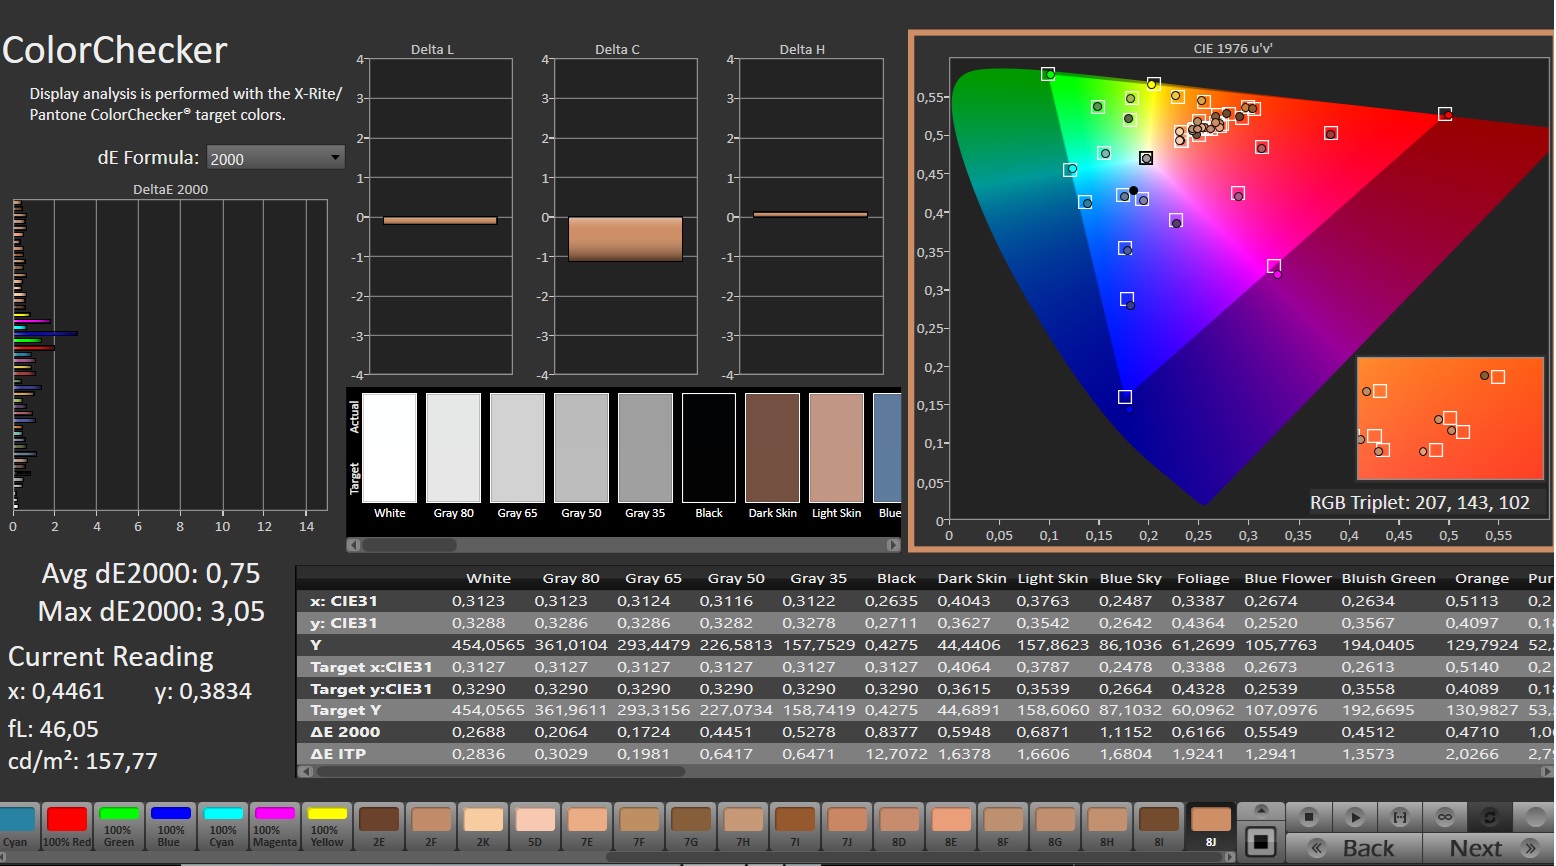
Kontrast jest tylko przyzwoity ze względu na mierną wartość czerni wynoszącą 0,4 cd/m², ale 195:1 nadal mieści się w zwykłym zakresie IPS. To samo dotyczy kątów widzenia i czasu reakcji, który według naszych pomiarów wynosi około 5 do 7 ms.
Zgodnie ze specyfikacją, 18-calowy ekran obsługuje również częstotliwość odświeżania 240 Hz. Ma on rozdzielczość 2560 x 1600 pikseli (format 16:10), która nie jest ani niska, ani szczególnie wysoka w stosunku do przekątnej ekranu.
Wyświetl czasy reakcji
| ↔ Czas reakcji od czerni do bieli | ||
|---|---|---|
| 7.3 ms ... wzrost ↗ i spadek ↘ łącznie | ↗ 2.2 ms wzrost | 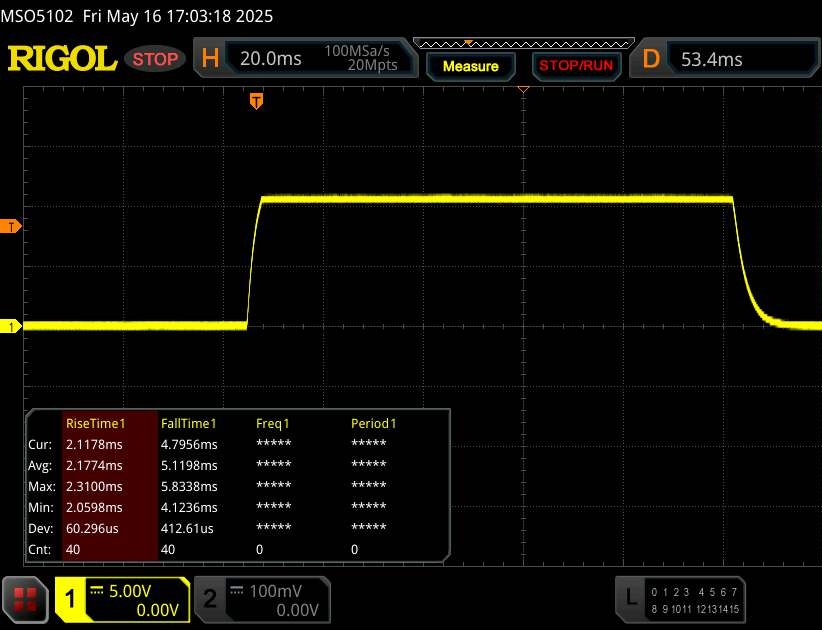 |
| ↘ 5.1 ms upadek | ||
| W naszych testach ekran wykazuje bardzo szybką reakcję i powinien bardzo dobrze nadawać się do szybkich gier. Dla porównania, wszystkie testowane urządzenia wahają się od 0.1 (minimum) do 240 (maksimum) ms. » 22 % wszystkich urządzeń jest lepszych. Oznacza to, że zmierzony czas reakcji jest lepszy od średniej wszystkich testowanych urządzeń (19.8 ms). | ||
| ↔ Czas reakcji 50% szarości do 80% szarości | ||
| 5.6 ms ... wzrost ↗ i spadek ↘ łącznie | ↗ 2.7 ms wzrost | 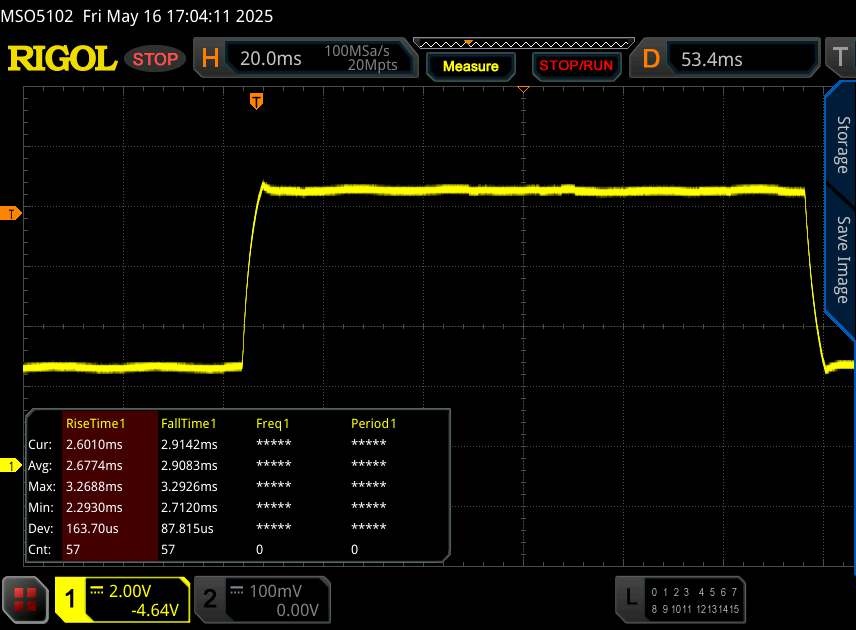 |
| ↘ 2.9 ms upadek | ||
| W naszych testach ekran wykazuje bardzo szybką reakcję i powinien bardzo dobrze nadawać się do szybkich gier. Dla porównania, wszystkie testowane urządzenia wahają się od 0.165 (minimum) do 636 (maksimum) ms. » 18 % wszystkich urządzeń jest lepszych. Oznacza to, że zmierzony czas reakcji jest lepszy od średniej wszystkich testowanych urządzeń (31 ms). | ||
Migotanie ekranu / PWM (modulacja szerokości impulsu)
| Migotanie ekranu/nie wykryto PWM | 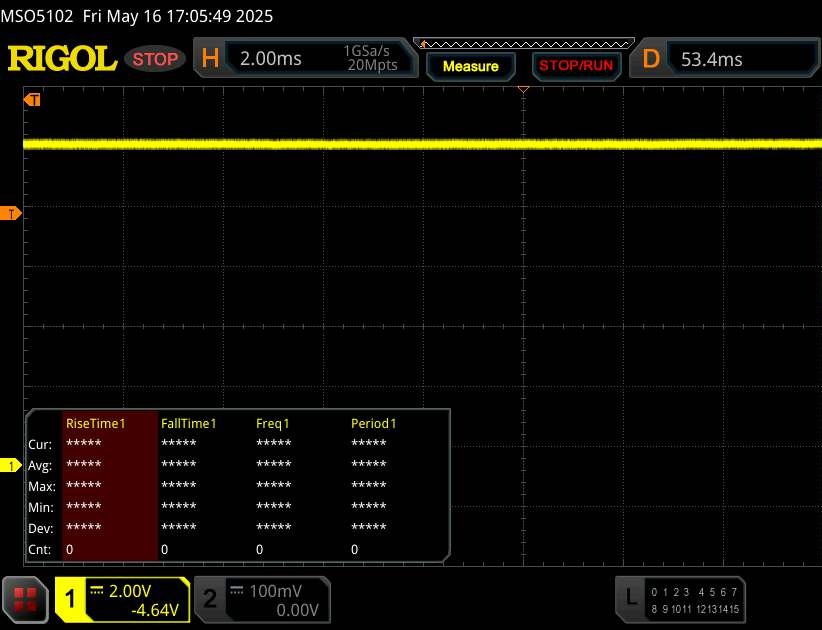 | ||
Dla porównania: 52 % wszystkich testowanych urządzeń nie używa PWM do przyciemniania wyświetlacza. Jeśli wykryto PWM, zmierzono średnio 7778 (minimum: 5 - maksimum: 343500) Hz. | |||

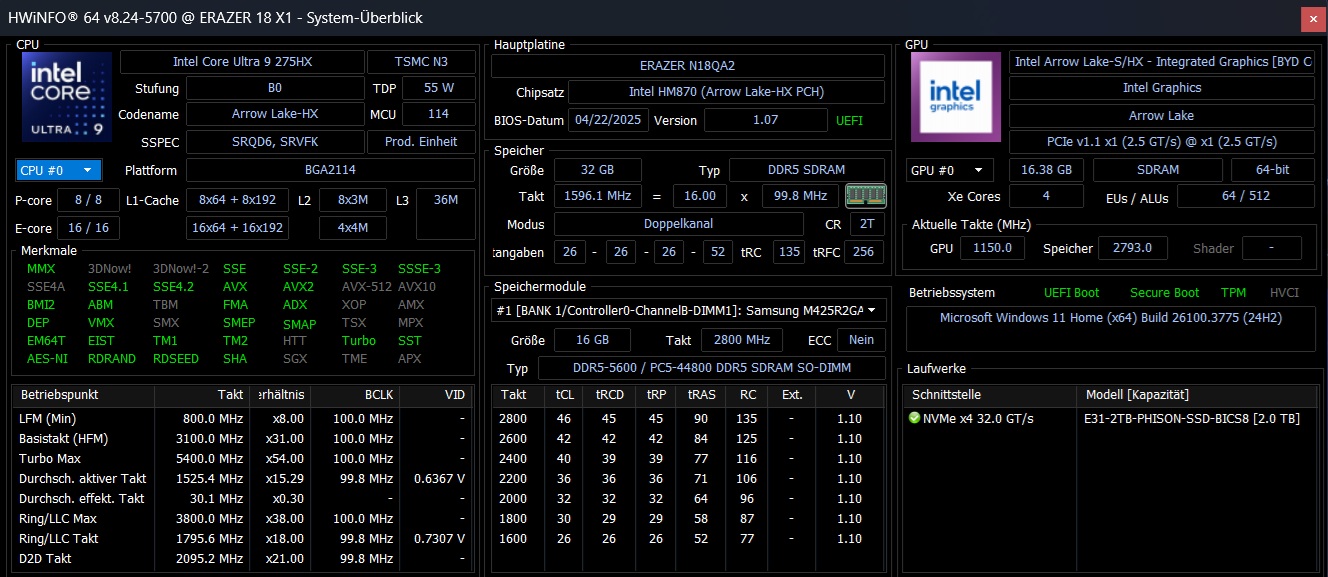
Wydajność
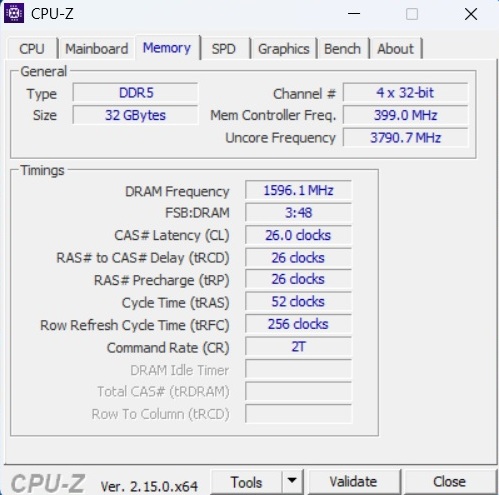
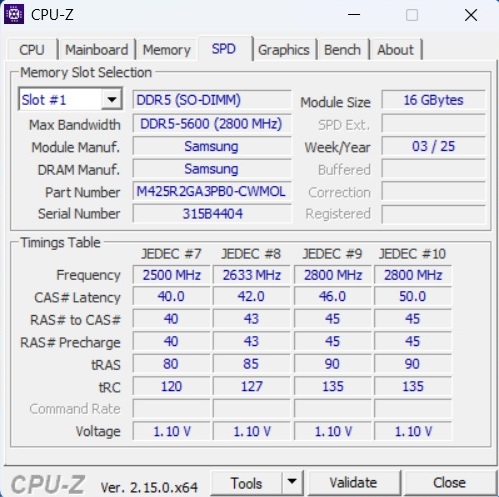
Beast 18 X1 należy do segmentu high-end nie tylko pod względem ceny, ale i wydajności. 32 GB pamięci RAM jest tak samo wystarczające w 2025 roku, jak dysk SSD o pojemności 2 TB, chociaż można by oczekiwać (nawet) więcej za ponad 4000 USD. Nawiasem mówiąc, Medion oferuje również Beast 18 X1 z mobilnym RTX 5090 za ~5 650 USD.
Warunki testu
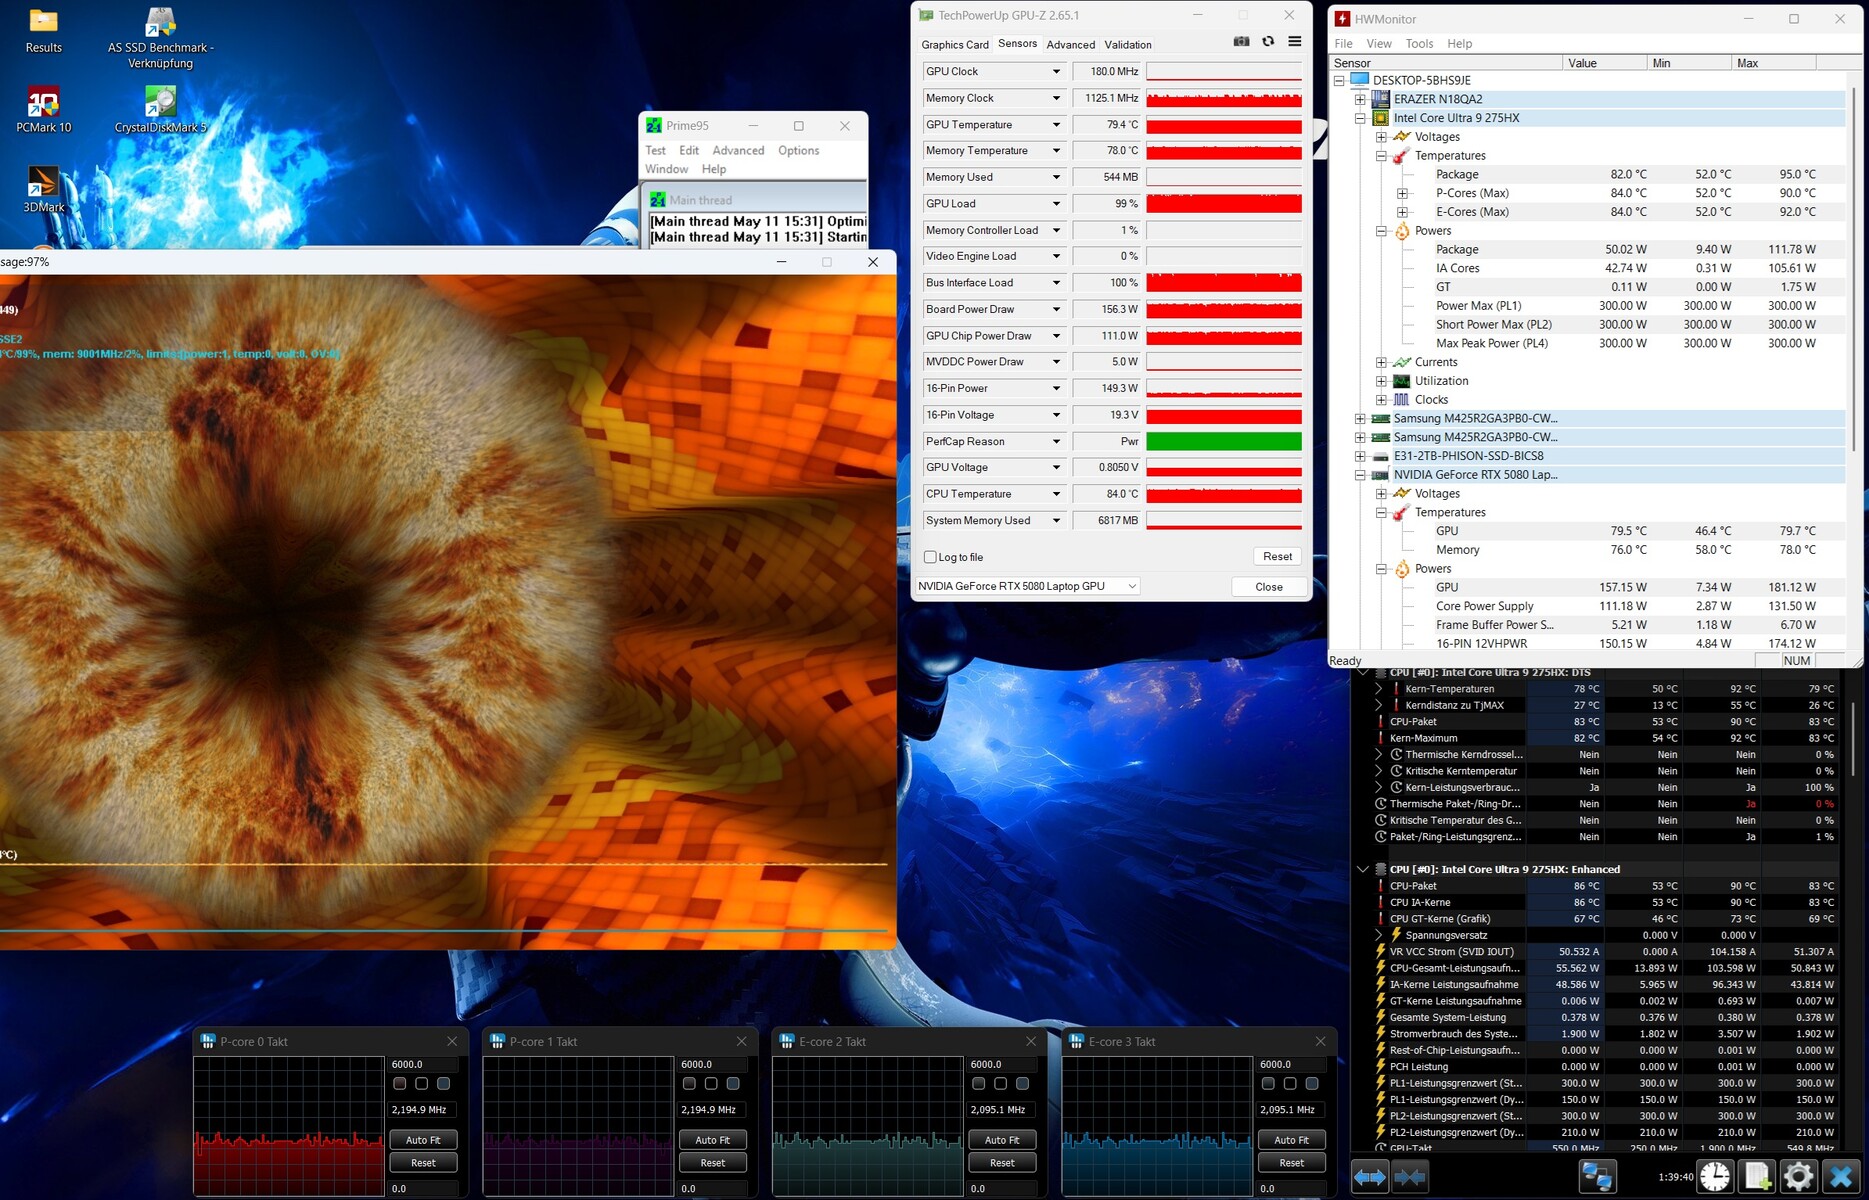
W Erazer Control Center dostępne są trzy tryby pracy, z których niektóre znacząco wpływają na emisję i prędkość. Ponieważ 18-calowiec jest niemal absurdalnie głośny w trybie Performance, osiągając miejscami ponad 60 dB(A), do pomiarów ograniczyliśmy się do równie słyszalnego trybu Balanced, który zużywa nieco więcej mocy CPU niż GPU (patrz tabela).
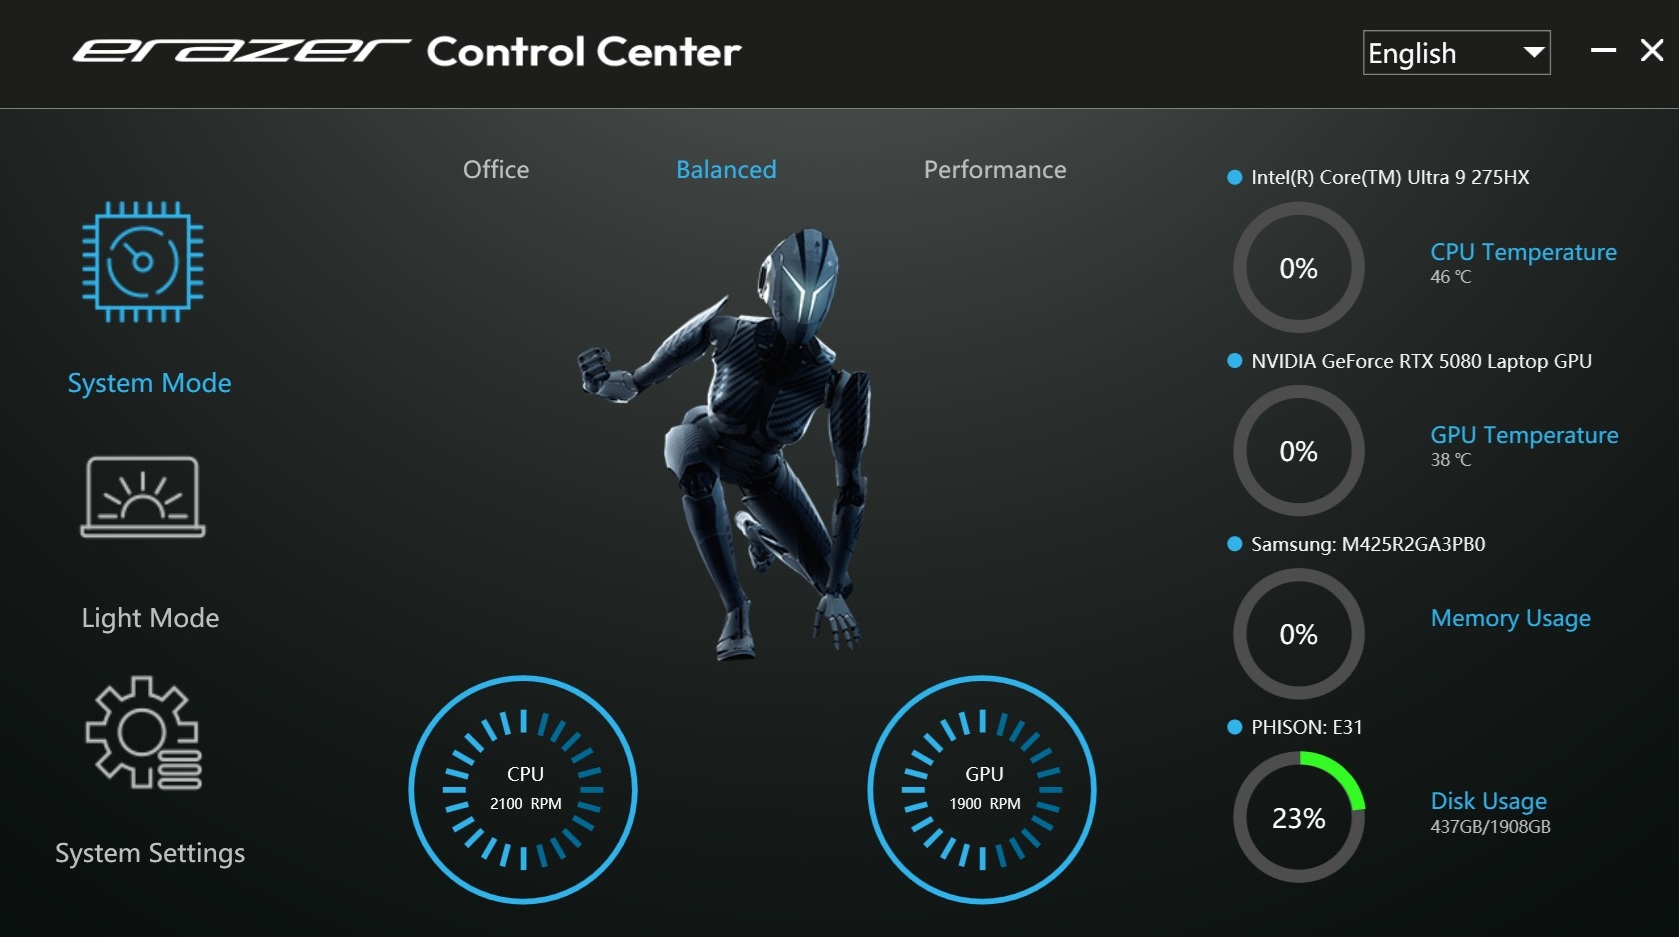
| Erazer Control Center Mode | Office | Balanced | Performance |
| Cyberpunk 2077 Hałas | maks. 46 dB(A) | maks. 53 dB(A) | maks. 61 dB(A) |
| Wydajność Cyberpunk 2077 (FHD/Ultra) | 78,8 fps | 139,8 fps | 146,5 fps |
| Cinebench R15 Multi Score | 3596 punktów | 4871 punktów | 6154 punktów |
Procesor
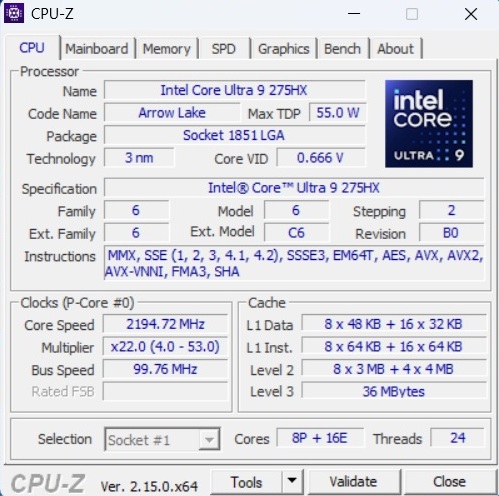
Jeśli przyjąć tryb zrównoważony jako podstawę, zainstalowany Core Ultra 9 275HXktóry zawiera 8 rdzeni wydajnościowych i 16 rdzeni wydajnościowych (każdy bez Hyper-Threading), osiąga wyniki nieco poniżej średniej wartości określonej do tej pory dla tego procesora i mniej więcej osiąga poziom Aorus Master 18 (również nie był testowany w trybie maksymalnym ze względu na duży hałas w tle). Szczególnie niefortunne jest to, że wyniki w pętli Cinebench z czasem spadają o kilka procent, co nie miało miejsca w przypadku konkurencyjnych urządzeń.
Cinebench R15 Multi loop
* ... im mniej tym lepiej
AIDA64: FP32 Ray-Trace | FPU Julia | CPU SHA3 | CPU Queen | FPU SinJulia | FPU Mandel | CPU AES | CPU ZLib | FP64 Ray-Trace | CPU PhotoWorxx
| Performance rating | |
| Asus Strix Scar 18 G835LX | |
| Lenovo Legion Pro 7i 16 Gen 10 | |
| Przeciętny Intel Core Ultra 9 275HX | |
| Acer Predator Helios 18 N23Q2 | |
| Aorus Master 18 AM8H | |
| MSI GE78HX 13VH-070US | |
| Średnia w klasie Gaming | |
| Medion Erazer Beast 18 X1 MD62731 | |
| AIDA64 / FP32 Ray-Trace | |
| Asus Strix Scar 18 G835LX | |
| Lenovo Legion Pro 7i 16 Gen 10 | |
| Przeciętny Intel Core Ultra 9 275HX (28039 - 39895, n=30) | |
| Aorus Master 18 AM8H | |
| Średnia w klasie Gaming (10227 - 85542, n=109, ostatnie 2 lata) | |
| Medion Erazer Beast 18 X1 MD62731 | |
| MSI GE78HX 13VH-070US | |
| Acer Predator Helios 18 N23Q2 | |
| AIDA64 / FPU Julia | |
| Asus Strix Scar 18 G835LX | |
| Lenovo Legion Pro 7i 16 Gen 10 | |
| Przeciętny Intel Core Ultra 9 275HX (140254 - 200744, n=30) | |
| Aorus Master 18 AM8H | |
| MSI GE78HX 13VH-070US | |
| Medion Erazer Beast 18 X1 MD62731 | |
| Acer Predator Helios 18 N23Q2 | |
| Średnia w klasie Gaming (51376 - 238426, n=109, ostatnie 2 lata) | |
| AIDA64 / CPU SHA3 | |
| Asus Strix Scar 18 G835LX | |
| Lenovo Legion Pro 7i 16 Gen 10 | |
| Przeciętny Intel Core Ultra 9 275HX (6710 - 9817, n=30) | |
| Aorus Master 18 AM8H | |
| Medion Erazer Beast 18 X1 MD62731 | |
| MSI GE78HX 13VH-070US | |
| Acer Predator Helios 18 N23Q2 | |
| Średnia w klasie Gaming (2180 - 9817, n=109, ostatnie 2 lata) | |
| AIDA64 / CPU Queen | |
| MSI GE78HX 13VH-070US | |
| Asus Strix Scar 18 G835LX | |
| Lenovo Legion Pro 7i 16 Gen 10 | |
| Acer Predator Helios 18 N23Q2 | |
| Przeciętny Intel Core Ultra 9 275HX (113887 - 140937, n=30) | |
| Aorus Master 18 AM8H | |
| Średnia w klasie Gaming (49785 - 173351, n=98, ostatnie 2 lata) | |
| Medion Erazer Beast 18 X1 MD62731 | |
| AIDA64 / FPU SinJulia | |
| MSI GE78HX 13VH-070US | |
| Acer Predator Helios 18 N23Q2 | |
| Średnia w klasie Gaming (4424 - 33636, n=109, ostatnie 2 lata) | |
| Asus Strix Scar 18 G835LX | |
| Lenovo Legion Pro 7i 16 Gen 10 | |
| Przeciętny Intel Core Ultra 9 275HX (11172 - 14425, n=30) | |
| Aorus Master 18 AM8H | |
| Medion Erazer Beast 18 X1 MD62731 | |
| AIDA64 / FPU Mandel | |
| Asus Strix Scar 18 G835LX | |
| Lenovo Legion Pro 7i 16 Gen 10 | |
| Przeciętny Intel Core Ultra 9 275HX (72596 - 104508, n=30) | |
| Aorus Master 18 AM8H | |
| Medion Erazer Beast 18 X1 MD62731 | |
| Średnia w klasie Gaming (25115 - 128721, n=109, ostatnie 2 lata) | |
| MSI GE78HX 13VH-070US | |
| Acer Predator Helios 18 N23Q2 | |
| AIDA64 / CPU AES | |
| Acer Predator Helios 18 N23Q2 | |
| Asus Strix Scar 18 G835LX | |
| MSI GE78HX 13VH-070US | |
| Lenovo Legion Pro 7i 16 Gen 10 | |
| Przeciętny Intel Core Ultra 9 275HX (105608 - 247074, n=30) | |
| Aorus Master 18 AM8H | |
| Medion Erazer Beast 18 X1 MD62731 | |
| Średnia w klasie Gaming (39258 - 247074, n=109, ostatnie 2 lata) | |
| AIDA64 / CPU ZLib | |
| Asus Strix Scar 18 G835LX | |
| MSI GE78HX 13VH-070US | |
| Lenovo Legion Pro 7i 16 Gen 10 | |
| Przeciętny Intel Core Ultra 9 275HX (1582 - 2263, n=30) | |
| Acer Predator Helios 18 N23Q2 | |
| Aorus Master 18 AM8H | |
| Medion Erazer Beast 18 X1 MD62731 | |
| Średnia w klasie Gaming (574 - 2531, n=109, ostatnie 2 lata) | |
| AIDA64 / FP64 Ray-Trace | |
| Asus Strix Scar 18 G835LX | |
| Lenovo Legion Pro 7i 16 Gen 10 | |
| Przeciętny Intel Core Ultra 9 275HX (14847 - 21854, n=30) | |
| Aorus Master 18 AM8H | |
| Średnia w klasie Gaming (5509 - 45446, n=109, ostatnie 2 lata) | |
| MSI GE78HX 13VH-070US | |
| Acer Predator Helios 18 N23Q2 | |
| Medion Erazer Beast 18 X1 MD62731 | |
| AIDA64 / CPU PhotoWorxx | |
| Asus Strix Scar 18 G835LX | |
| Lenovo Legion Pro 7i 16 Gen 10 | |
| Acer Predator Helios 18 N23Q2 | |
| MSI GE78HX 13VH-070US | |
| Przeciętny Intel Core Ultra 9 275HX (37482 - 62916, n=30) | |
| Aorus Master 18 AM8H | |
| Medion Erazer Beast 18 X1 MD62731 | |
| Średnia w klasie Gaming (12271 - 89891, n=109, ostatnie 2 lata) | |
Wydajność systemu
Jeśli chodzi o wydajność systemu, różnica między konkurentami jest ograniczona. Subiektywnie, czasami zauważamy zawieszanie się podczas otwierania programów, co, jak to często bywa, jest prawdopodobnie spowodowane przełączaniem grafiki. Generacja Blackwell Nvidii, czyli jej obecny sterownik, ma tutaj większy problem niż Ada Lovelace (to samo zauważyliśmy w przypadku Aorus Master 18).
PCMark 10: Score | Essentials | Productivity | Digital Content Creation
CrossMark: Overall | Productivity | Creativity | Responsiveness
WebXPRT 3: Overall
WebXPRT 4: Overall
Mozilla Kraken 1.1: Total
| Performance rating | |
| Aorus Master 18 AM8H | |
| Asus Strix Scar 18 G835LX | |
| Lenovo Legion Pro 7i 16 Gen 10 | |
| Przeciętny Intel Core Ultra 9 275HX, NVIDIA GeForce RTX 5080 Laptop | |
| Acer Predator Helios 18 N23Q2 -1! | |
| MSI GE78HX 13VH-070US | |
| Średnia w klasie Gaming | |
| Medion Erazer Beast 18 X1 MD62731 | |
| PCMark 10 / Score | |
| Lenovo Legion Pro 7i 16 Gen 10 | |
| MSI GE78HX 13VH-070US | |
| Przeciętny Intel Core Ultra 9 275HX, NVIDIA GeForce RTX 5080 Laptop (7805 - 10409, n=9) | |
| Asus Strix Scar 18 G835LX | |
| Aorus Master 18 AM8H | |
| Acer Predator Helios 18 N23Q2 | |
| Medion Erazer Beast 18 X1 MD62731 | |
| Średnia w klasie Gaming (5828 - 11574, n=96, ostatnie 2 lata) | |
| PCMark 10 / Essentials | |
| MSI GE78HX 13VH-070US | |
| Lenovo Legion Pro 7i 16 Gen 10 | |
| Aorus Master 18 AM8H | |
| Acer Predator Helios 18 N23Q2 | |
| Asus Strix Scar 18 G835LX | |
| Przeciętny Intel Core Ultra 9 275HX, NVIDIA GeForce RTX 5080 Laptop (10206 - 11472, n=9) | |
| Średnia w klasie Gaming (8810 - 12600, n=100, ostatnie 2 lata) | |
| Medion Erazer Beast 18 X1 MD62731 | |
| PCMark 10 / Productivity | |
| Średnia w klasie Gaming (6845 - 21327, n=98, ostatnie 2 lata) | |
| Przeciętny Intel Core Ultra 9 275HX, NVIDIA GeForce RTX 5080 Laptop (8319 - 20616, n=9) | |
| Acer Predator Helios 18 N23Q2 | |
| MSI GE78HX 13VH-070US | |
| Medion Erazer Beast 18 X1 MD62731 | |
| Lenovo Legion Pro 7i 16 Gen 10 | |
| Asus Strix Scar 18 G835LX | |
| Aorus Master 18 AM8H | |
| PCMark 10 / Digital Content Creation | |
| Lenovo Legion Pro 7i 16 Gen 10 | |
| Asus Strix Scar 18 G835LX | |
| Aorus Master 18 AM8H | |
| Przeciętny Intel Core Ultra 9 275HX, NVIDIA GeForce RTX 5080 Laptop (10505 - 19351, n=9) | |
| Medion Erazer Beast 18 X1 MD62731 | |
| MSI GE78HX 13VH-070US | |
| Acer Predator Helios 18 N23Q2 | |
| Średnia w klasie Gaming (7602 - 19657, n=98, ostatnie 2 lata) | |
| CrossMark / Overall | |
| Aorus Master 18 AM8H | |
| Asus Strix Scar 18 G835LX | |
| Acer Predator Helios 18 N23Q2 | |
| Przeciętny Intel Core Ultra 9 275HX, NVIDIA GeForce RTX 5080 Laptop (1857 - 2244, n=9) | |
| Lenovo Legion Pro 7i 16 Gen 10 | |
| Średnia w klasie Gaming (1366 - 2409, n=97, ostatnie 2 lata) | |
| MSI GE78HX 13VH-070US | |
| Medion Erazer Beast 18 X1 MD62731 | |
| CrossMark / Productivity | |
| Aorus Master 18 AM8H | |
| Acer Predator Helios 18 N23Q2 | |
| Asus Strix Scar 18 G835LX | |
| Przeciętny Intel Core Ultra 9 275HX, NVIDIA GeForce RTX 5080 Laptop (1764 - 2122, n=9) | |
| Lenovo Legion Pro 7i 16 Gen 10 | |
| Średnia w klasie Gaming (1386 - 2254, n=97, ostatnie 2 lata) | |
| MSI GE78HX 13VH-070US | |
| Medion Erazer Beast 18 X1 MD62731 | |
| CrossMark / Creativity | |
| Asus Strix Scar 18 G835LX | |
| Aorus Master 18 AM8H | |
| Acer Predator Helios 18 N23Q2 | |
| Przeciętny Intel Core Ultra 9 275HX, NVIDIA GeForce RTX 5080 Laptop (2115 - 2498, n=9) | |
| Lenovo Legion Pro 7i 16 Gen 10 | |
| Średnia w klasie Gaming (1343 - 2729, n=97, ostatnie 2 lata) | |
| Medion Erazer Beast 18 X1 MD62731 | |
| MSI GE78HX 13VH-070US | |
| CrossMark / Responsiveness | |
| Aorus Master 18 AM8H | |
| Acer Predator Helios 18 N23Q2 | |
| Przeciętny Intel Core Ultra 9 275HX, NVIDIA GeForce RTX 5080 Laptop (1466 - 2096, n=9) | |
| Asus Strix Scar 18 G835LX | |
| Średnia w klasie Gaming (1226 - 2334, n=97, ostatnie 2 lata) | |
| MSI GE78HX 13VH-070US | |
| Lenovo Legion Pro 7i 16 Gen 10 | |
| Medion Erazer Beast 18 X1 MD62731 | |
| WebXPRT 3 / Overall | |
| Lenovo Legion Pro 7i 16 Gen 10 | |
| Asus Strix Scar 18 G835LX | |
| Przeciętny Intel Core Ultra 9 275HX, NVIDIA GeForce RTX 5080 Laptop (306 - 378, n=9) | |
| Medion Erazer Beast 18 X1 MD62731 | |
| Acer Predator Helios 18 N23Q2 | |
| Średnia w klasie Gaming (242 - 532, n=101, ostatnie 2 lata) | |
| MSI GE78HX 13VH-070US | |
| Aorus Master 18 AM8H | |
| WebXPRT 4 / Overall | |
| Asus Strix Scar 18 G835LX | |
| Lenovo Legion Pro 7i 16 Gen 10 | |
| Medion Erazer Beast 18 X1 MD62731 | |
| Przeciętny Intel Core Ultra 9 275HX, NVIDIA GeForce RTX 5080 Laptop (285 - 336, n=9) | |
| Aorus Master 18 AM8H | |
| MSI GE78HX 13VH-070US | |
| Średnia w klasie Gaming (176.4 - 354, n=101, ostatnie 2 lata) | |
| Mozilla Kraken 1.1 / Total | |
| MSI GE78HX 13VH-070US | |
| Średnia w klasie Gaming (391 - 590, n=106, ostatnie 2 lata) | |
| Acer Predator Helios 18 N23Q2 | |
| Aorus Master 18 AM8H | |
| Medion Erazer Beast 18 X1 MD62731 | |
| Przeciętny Intel Core Ultra 9 275HX, NVIDIA GeForce RTX 5080 Laptop (405 - 432, n=9) | |
| Asus Strix Scar 18 G835LX | |
| Lenovo Legion Pro 7i 16 Gen 10 | |
* ... im mniej tym lepiej
| PCMark 10 Score | 8378 pkt. | |
Pomoc | ||
| AIDA64 / Memory Copy | |
| Lenovo Legion Pro 7i 16 Gen 10 | |
| Asus Strix Scar 18 G835LX | |
| Przeciętny Intel Core Ultra 9 275HX (56003 - 94460, n=30) | |
| Acer Predator Helios 18 N23Q2 | |
| Medion Erazer Beast 18 X1 MD62731 | |
| MSI GE78HX 13VH-070US | |
| Aorus Master 18 AM8H | |
| Średnia w klasie Gaming (21750 - 129946, n=109, ostatnie 2 lata) | |
| AIDA64 / Memory Read | |
| Lenovo Legion Pro 7i 16 Gen 10 | |
| Acer Predator Helios 18 N23Q2 | |
| Medion Erazer Beast 18 X1 MD62731 | |
| Asus Strix Scar 18 G835LX | |
| MSI GE78HX 13VH-070US | |
| Przeciętny Intel Core Ultra 9 275HX (55795 - 97151, n=30) | |
| Aorus Master 18 AM8H | |
| Średnia w klasie Gaming (22956 - 118858, n=109, ostatnie 2 lata) | |
| AIDA64 / Memory Write | |
| Lenovo Legion Pro 7i 16 Gen 10 | |
| Asus Strix Scar 18 G835LX | |
| Przeciętny Intel Core Ultra 9 275HX (55663 - 116129, n=30) | |
| Medion Erazer Beast 18 X1 MD62731 | |
| MSI GE78HX 13VH-070US | |
| Średnia w klasie Gaming (22297 - 135096, n=109, ostatnie 2 lata) | |
| Acer Predator Helios 18 N23Q2 | |
| Aorus Master 18 AM8H | |
| AIDA64 / Memory Latency | |
| Aorus Master 18 AM8H | |
| Przeciętny Intel Core Ultra 9 275HX (105.8 - 161.6, n=30) | |
| Medion Erazer Beast 18 X1 MD62731 | |
| Lenovo Legion Pro 7i 16 Gen 10 | |
| Asus Strix Scar 18 G835LX | |
| Średnia w klasie Gaming (75.3 - 259, n=109, ostatnie 2 lata) | |
| MSI GE78HX 13VH-070US | |
| Acer Predator Helios 18 N23Q2 | |
* ... im mniej tym lepiej
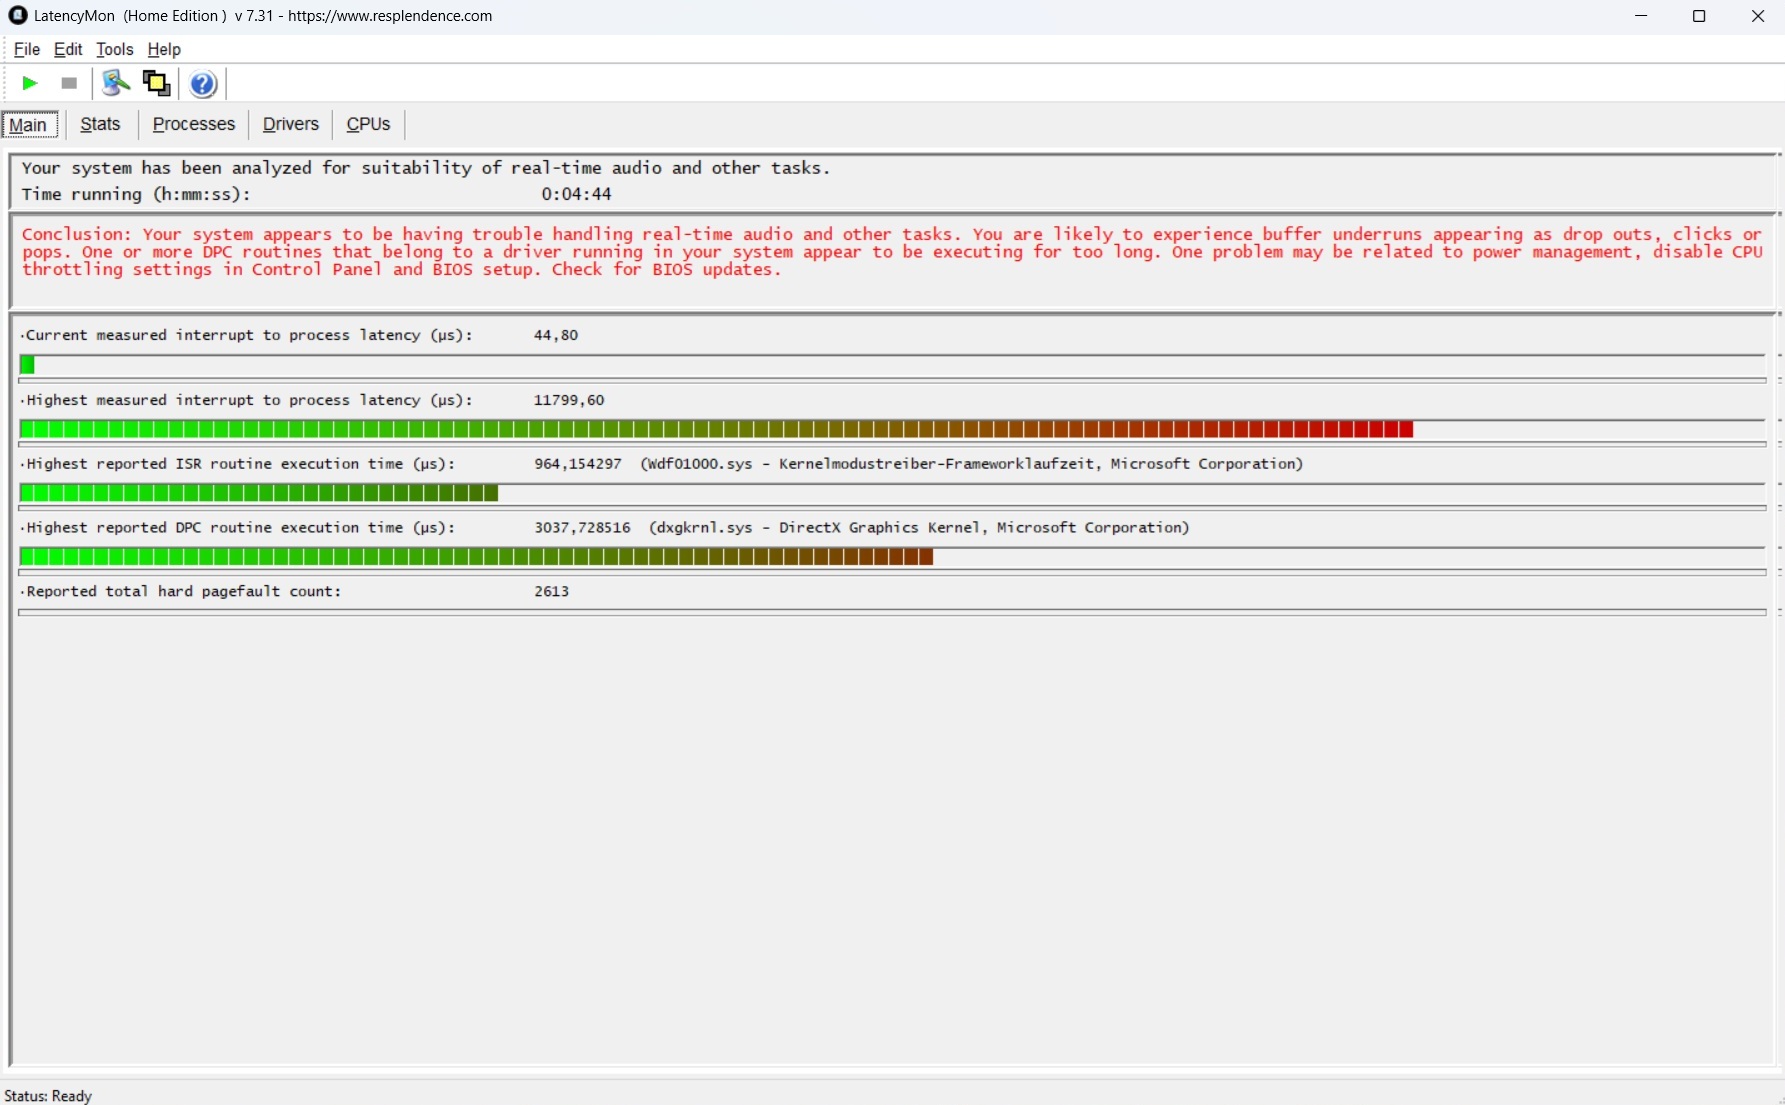
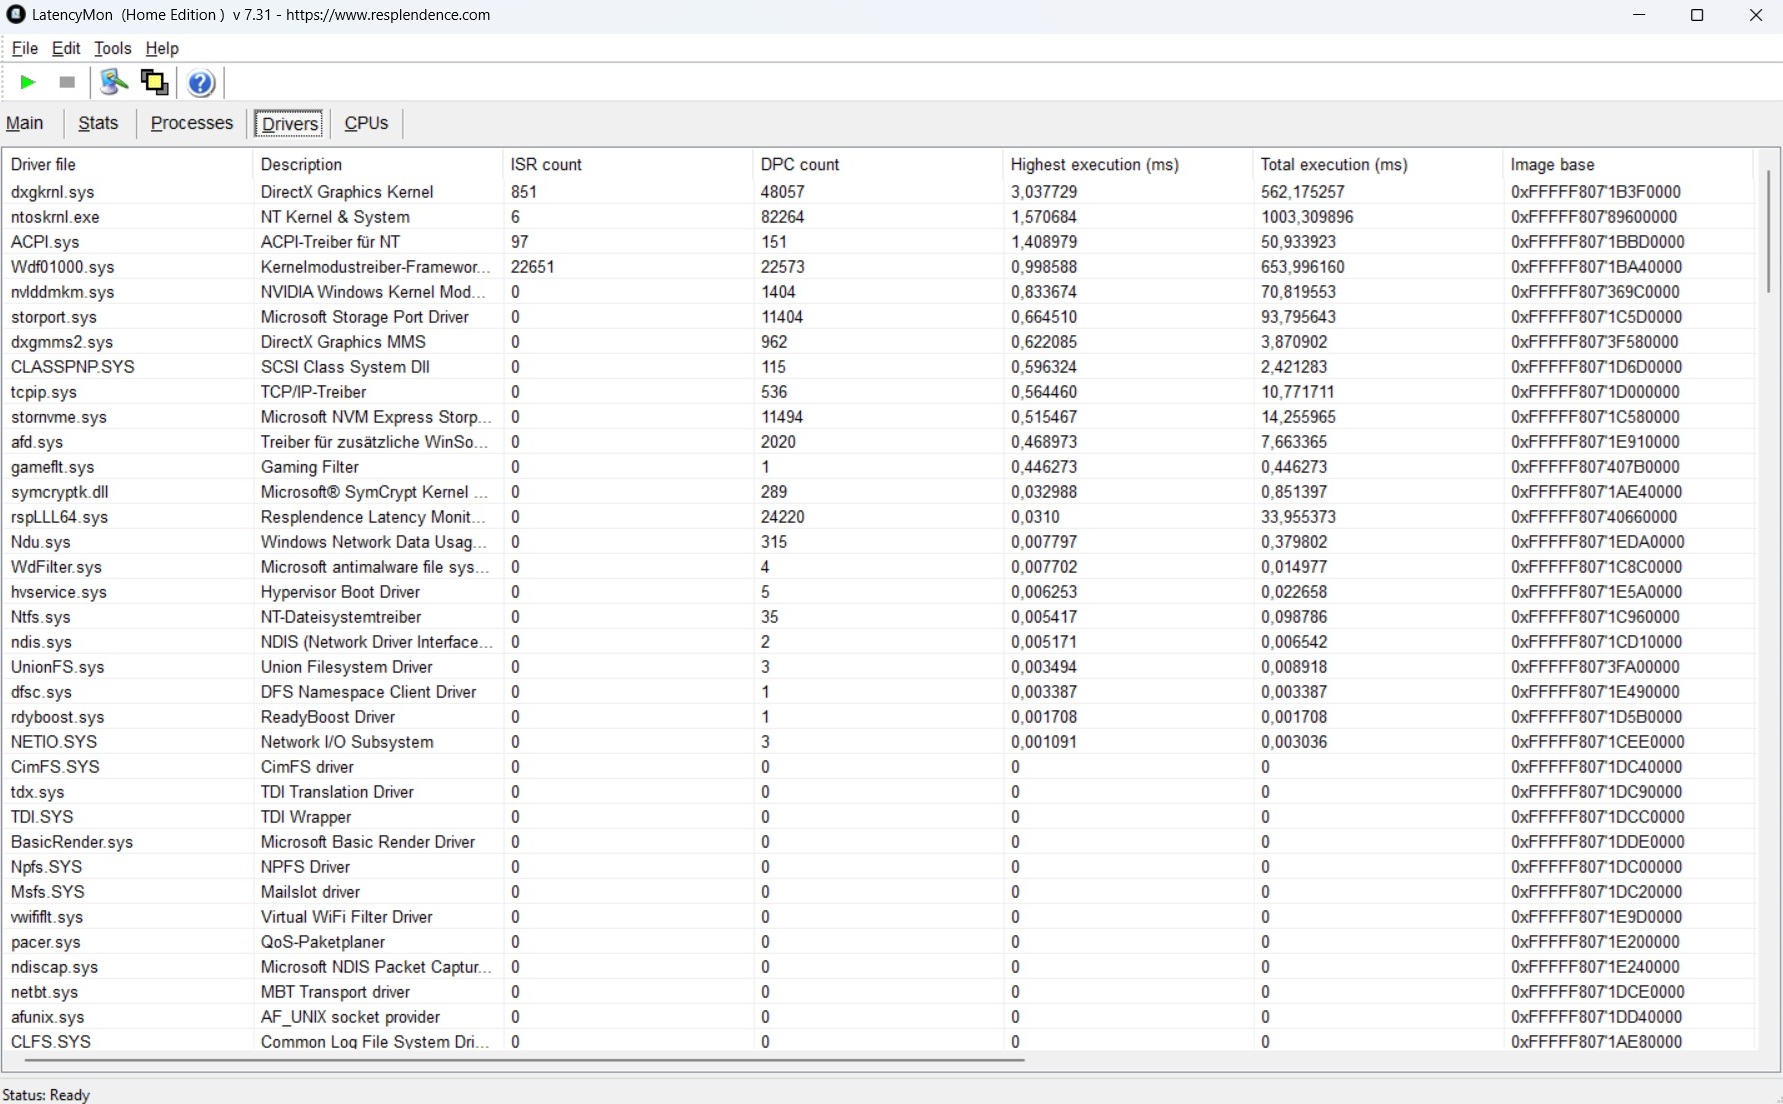
Opóźnienia DPC
Ogólnie biorąc, opóźnienia nie są główną zaletą Beast 18 X1: maksymalnie 11 799 µs jest nawet gorsze niż w Acer Predator Helios 18 X1 Acer Predator Helios 18 (8 290 µs).
| DPC Latencies / LatencyMon - interrupt to process latency (max), Web, Youtube, Prime95 | |
| Medion Erazer Beast 18 X1 MD62731 | |
| Acer Predator Helios 18 N23Q2 | |
| MSI GE78HX 13VH-070US | |
| Aorus Master 18 AM8H | |
| Asus Strix Scar 18 G835LX | |
| Lenovo Legion Pro 7i 16 Gen 10 | |
* ... im mniej tym lepiej
Pamięć masowa
Jednak szybki dysk SSD PCIe Gen. 5x4 zasługuje na szacunek. Dysk o pojemności 2 TB przekroczył próg 10 000 MB/s w testach sekwencyjnych, a nawet może działać bez dławienia w dłuższej perspektywie.

* ... im mniej tym lepiej
Continuous read: DiskSpd Read Loop, Queue Depth 8
Karta graficzna
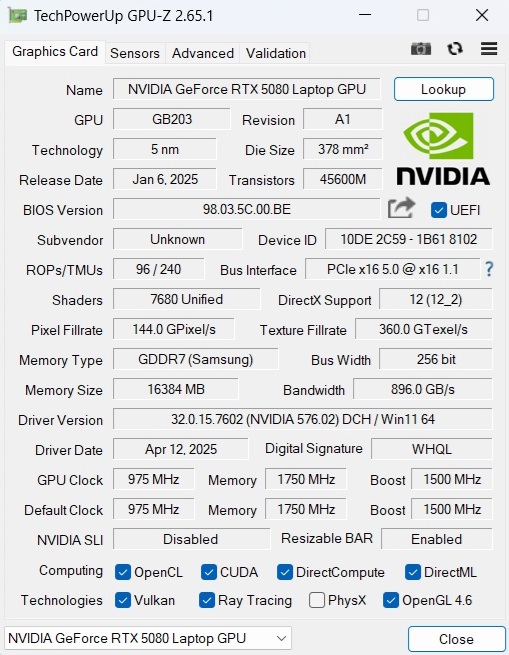
Laptop GeForce Laptop RTX 5080 jest obecnie drugim najpotężniejszym modelem notebooka Nvidii z serii Blackwell po laptopie RTX 5090. Jednak ten ostatni ma tylko ograniczoną przewagę w naszym kursie 3DMark, jeśli spojrzeć na konkurencję. I odwrotnie, RTX 5080 nie jest dużo szybszy niż stary laptop Laptop RTX 4080który przynajmniej dobrze radzi sobie w testach syntetycznych. Tymczasem 16 GB GDDR7 VRAM nie jest rewelacją w tym przedziale cenowym, ale wciąż jest lepsze niż 12 GB GDDR6X poprzednika. Poziom TGP może osiągnąć maksymalnie 175 watów.
| 3DMark 11 Performance | 44491 pkt. | |
| 3DMark Ice Storm Standard Score | 245418 pkt. | |
| 3DMark Cloud Gate Standard Score | 61468 pkt. | |
| 3DMark Fire Strike Score | 30780 pkt. | |
| 3DMark Time Spy Score | 20170 pkt. | |
Pomoc | ||
* ... im mniej tym lepiej
Wydajność w grach
W benchmarkach gamingowych luki pomiędzy konkurencyjnymi urządzeniami są nieco większe, ale w praktyce często nie zauważymy tego zbytnio. Zasadniczo, mobilny RTX 5080 jest wystarczająco szybki, by płynnie uruchomić większość współczesnych gier w maksymalnych detalach i naturalnej rozdzielczości QHD+. Sytuacja robi się napięta tylko w przypadku bardzo wymagających lub umiarkowanie zoptymalizowanych tytułów, takich jak The Elder Scrolls: Oblivion Remastered. W tym przypadku zalecane jest zastosowanie skalowania w górę (słowo kluczowe DLSS) i/lub generowania (wielu) klatek. Z Stalker 2liczba klatek na sekundę w rozdzielczości QHD podwaja się (patrz tabela).
| Stalker 2 | |
| 2560x1440 Epic Preset | |
| Aorus Master 18 AM8H | |
| Medion Erazer Beast 18 X1 MD62731 | |
| Przeciętny NVIDIA GeForce RTX 5080 Laptop (41.5 - 58.5, n=2) | |
| Średnia w klasie Gaming (29 - 110.7, n=13, ostatnie 2 lata) | |
| 2560x1440 Epic Preset + Quality DLSS + FG | |
| Aorus Master 18 AM8H | |
| Medion Erazer Beast 18 X1 MD62731 | |
| Przeciętny NVIDIA GeForce RTX 5080 Laptop (80.7 - 122.1, n=2) | |
| Średnia w klasie Gaming (58.3 - 134.6, n=12, ostatnie 2 lata) | |
| Horizon Forbidden West | |
| 2560x1440 Very High Preset AA:T | |
| Aorus Master 18 AM8H | |
| Medion Erazer Beast 18 X1 MD62731 | |
| Przeciętny NVIDIA GeForce RTX 5080 Laptop (n=1) | |
| Średnia w klasie Gaming (39.6 - 100.9, n=10, ostatnie 2 lata) | |
| 2560x1440 Very High Preset + DLSS Quality | |
| Aorus Master 18 AM8H | |
| Medion Erazer Beast 18 X1 MD62731 | |
| Przeciętny NVIDIA GeForce RTX 5080 Laptop (n=1) | |
| Średnia w klasie Gaming (58.4 - 116.6, n=8, ostatnie 2 lata) | |
| Ghost of Tsushima | |
| 2560x1440 Very High Preset AA:T | |
| Aorus Master 18 AM8H | |
| Medion Erazer Beast 18 X1 MD62731 | |
| Przeciętny NVIDIA GeForce RTX 5080 Laptop (n=1) | |
| Średnia w klasie Gaming (22.7 - 100.3, n=13, ostatnie 2 lata) | |
| 2560x1440 Very High Preset + Quality DLSS | |
| Aorus Master 18 AM8H | |
| Medion Erazer Beast 18 X1 MD62731 | |
| Przeciętny NVIDIA GeForce RTX 5080 Laptop (n=1) | |
| Średnia w klasie Gaming (55.2 - 105.2, n=10, ostatnie 2 lata) | |
| Senua's Saga Hellblade 2 | |
| 2560x1440 High Preset | |
| Aorus Master 18 AM8H | |
| Medion Erazer Beast 18 X1 MD62731 | |
| Przeciętny NVIDIA GeForce RTX 5080 Laptop (n=1) | |
| Średnia w klasie Gaming (24.2 - 63.1, n=11, ostatnie 2 lata) | |
| 2560x1440 High Preset + Quality DLSS | |
| Aorus Master 18 AM8H | |
| Medion Erazer Beast 18 X1 MD62731 | |
| Przeciętny NVIDIA GeForce RTX 5080 Laptop (n=1) | |
| Średnia w klasie Gaming (39.6 - 81.9, n=9, ostatnie 2 lata) | |
| Space Marine 2 | |
| 2560x1440 Ultra Preset AA:T | |
| Aorus Master 18 AM8H | |
| Medion Erazer Beast 18 X1 MD62731 | |
| Przeciętny NVIDIA GeForce RTX 5080 Laptop (n=1) | |
| Średnia w klasie Gaming (48.2 - 107.4, n=11, ostatnie 2 lata) | |
| 2560x1440 Ultra Preset + Quality DLSS | |
| Aorus Master 18 AM8H | |
| Medion Erazer Beast 18 X1 MD62731 | |
| Przeciętny NVIDIA GeForce RTX 5080 Laptop (n=1) | |
| Średnia w klasie Gaming (58.5 - 100.8, n=10, ostatnie 2 lata) | |
| Until Dawn | |
| 2560x1440 Ultra Preset | |
| Aorus Master 18 AM8H | |
| Medion Erazer Beast 18 X1 MD62731 | |
| Przeciętny NVIDIA GeForce RTX 5080 Laptop (n=1) | |
| Średnia w klasie Gaming (30.4 - 76.6, n=11, ostatnie 2 lata) | |
| 2560x1440 Ultra Preset + Quality DLSS + Ray Tracing | |
| Aorus Master 18 AM8H | |
| Medion Erazer Beast 18 X1 MD62731 | |
| Przeciętny NVIDIA GeForce RTX 5080 Laptop (n=1) | |
| Średnia w klasie Gaming (39.5 - 86.3, n=10, ostatnie 2 lata) | |
| Kingdom Come Deliverance 2 | |
| 2560x1440 Ultra Preset | |
| Aorus Master 18 AM8H | |
| Medion Erazer Beast 18 X1 MD62731 | |
| Przeciętny NVIDIA GeForce RTX 5080 Laptop (n=1) | |
| Średnia w klasie Gaming (36.8 - 97.2, n=13, ostatnie 2 lata) | |
| 2560x1440 Ultra Preset + Quality DLSS | |
| Medion Erazer Beast 18 X1 MD62731 | |
| Przeciętny NVIDIA GeForce RTX 5080 Laptop (n=1) | |
| Aorus Master 18 AM8H | |
| Średnia w klasie Gaming (50.3 - 115.5, n=13, ostatnie 2 lata) | |
| The Elder Scrolls IV Oblivion Remastered | |
| 2560x1440 Ultra Preset AA:T | |
| Medion Erazer Beast 18 X1 MD62731 | |
| Przeciętny NVIDIA GeForce RTX 5080 Laptop (17.9 - 36.6, n=3) | |
| Średnia w klasie Gaming (12.7 - 45.9, n=14, ostatnie 2 lata) | |
| 2560x1440 Ultra Preset + Quality DLSS | |
| Medion Erazer Beast 18 X1 MD62731 | |
| Przeciętny NVIDIA GeForce RTX 5080 Laptop (51 - 53.2, n=2) | |
| Średnia w klasie Gaming (25.3 - 59.7, n=12, ostatnie 2 lata) | |
| low | med. | high | ultra | QHD DLSS | QHD | |
|---|---|---|---|---|---|---|
| GTA V (2015) | 185.4 | 170.6 | 139.5 | 137.4 | ||
| Dota 2 Reborn (2015) | 211 | 186.4 | 175.1 | 162.3 | ||
| Final Fantasy XV Benchmark (2018) | 218 | 189.9 | 152.1 | |||
| X-Plane 11.11 (2018) | 143 | 132.2 | 108.9 | |||
| Strange Brigade (2018) | 434 | 403 | 371 | 281 | ||
| Baldur's Gate 3 (2023) | 202 | 181.6 | 179.6 | 130.5 | ||
| Cyberpunk 2077 (2023) | 157.8 | 148.1 | 139.8 | 96.4 | ||
| Counter-Strike 2 (2023) | 345 | 290 | 255 | 205 | ||
| Prince of Persia The Lost Crown (2024) | 356 | 356 | 356 | 356 | ||
| Helldivers 2 (2024) | 135.9 | 134.5 | 131.9 | 127.8 | ||
| Dragon's Dogma 2 (2024) | 84.8 | 82.3 | ||||
| Horizon Forbidden West (2024) | 148.2 | 117.7 | 115.5 | 110.6 | 90.7 | |
| Ghost of Tsushima (2024) | 110.7 | 105.7 | 97.5 | 96.1 | 76.7 | |
| Senua's Saga Hellblade 2 (2024) | 99.3 | 76 | 81 | 55.1 | ||
| Star Wars Outlaws (2024) | 79.8 | 72.7 | 67.8 | 64.8 | 51.4 | |
| Space Marine 2 (2024) | 90 | 89.7 | 88.7 | 86.9 | 86.2 | |
| Until Dawn (2024) | 92.9 | 91 | 81.6 | 74.4 | 59 | |
| Stalker 2 (2024) | 90.7 | 78.1 | 72.6 | 122.1 | 58.5 | |
| Kingdom Come Deliverance 2 (2025) | 173.8 | 145.6 | 101.6 | 98.9 | 74.5 | |
| Civilization 7 (2025) | 173.4 | 165.5 | 158 | |||
| The Elder Scrolls IV Oblivion Remastered (2025) | 106.3 | 94.1 | 50.6 | 53.2 | 36.6 | |
| Doom: The Dark Ages (2025) | 113 | 104 | 101 | 97 | 72 |
Przetestowaliśmy, jak wydajność 3D zachowuje się przez dłuższy czas z Cyberpunk 2077 przetestowane. W trakcie testu zdarzały się krótkie spadki liczby klatek na sekundę, ale były one subtelne i nie były duże.
Cyberpunk 2077 Ultra FPS chart
Emisje
Emisja hałasu
Jednym z największych zarzutów wobec Beast 18 X1 jest skromna kontrola wentylatorów. Nawet przy korzystaniu z trybu Zrównoważonego, układ chłodzenia czasami osiąga nieprzyjemny poziom 40 dB(A) lub nawet wyższy w trybie bezczynności, co na dłuższą metę może irytować wielu użytkowników. Pod obciążeniem wartości hałasu osiągane są już przy profilu Balanced, który niektórzy konkurenci generują tylko w trybie Performance (proszę porównać chociażby Strix Scar 18).
Hałas
| luz |
| 25 / 39 / 42 dB |
| obciążenie |
| 52 / 55 dB |
 | ||
30 dB cichy 40 dB(A) słyszalny 50 dB(A) irytujący |
||
min: | ||
| Medion Erazer Beast 18 X1 MD62731 Ultra 9 275HX, GeForce RTX 5080 Laptop | MSI GE78HX 13VH-070US i9-13950HX, GeForce RTX 4080 Laptop GPU | Acer Predator Helios 18 N23Q2 i9-13900HX, GeForce RTX 4080 Laptop GPU | Asus Strix Scar 18 G835LX Ultra 9 275HX, GeForce RTX 5090 Laptop | Aorus Master 18 AM8H Ultra 9 275HX, GeForce RTX 5090 Laptop | Lenovo Legion Pro 7i 16 Gen 10 Ultra 9 275HX, GeForce RTX 5080 Laptop | |
|---|---|---|---|---|---|---|
| Noise | 13% | 18% | 8% | 7% | 20% | |
| wyłączone / środowisko * (dB) | 25 | 23.4 6% | 23 8% | 23.3 7% | 25 -0% | 22.9 8% |
| Idle Minimum * (dB) | 25 | 24.2 3% | 23 8% | 29.8 -19% | 26 -4% | 22.9 8% |
| Idle Average * (dB) | 39 | 25.6 34% | 23 41% | 29.8 24% | 29 26% | 22.9 41% |
| Idle Maximum * (dB) | 42 | 31 26% | 23 45% | 29.8 29% | 34 19% | 26.3 37% |
| Load Average * (dB) | 52 | 43.3 17% | 45.26 13% | 42.9 17% | 50 4% | 27.8 47% |
| Cyberpunk 2077 ultra * (dB) | 53 | 53.7 -1% | 52 2% | 54.2 -2% | ||
| Load Maximum * (dB) | 55 | 59.1 -7% | 59.94 -9% | 53.7 2% | 53 4% | 53.9 2% |
| Witcher 3 ultra * (dB) | 56.3 | 59.82 |
* ... im mniej tym lepiej
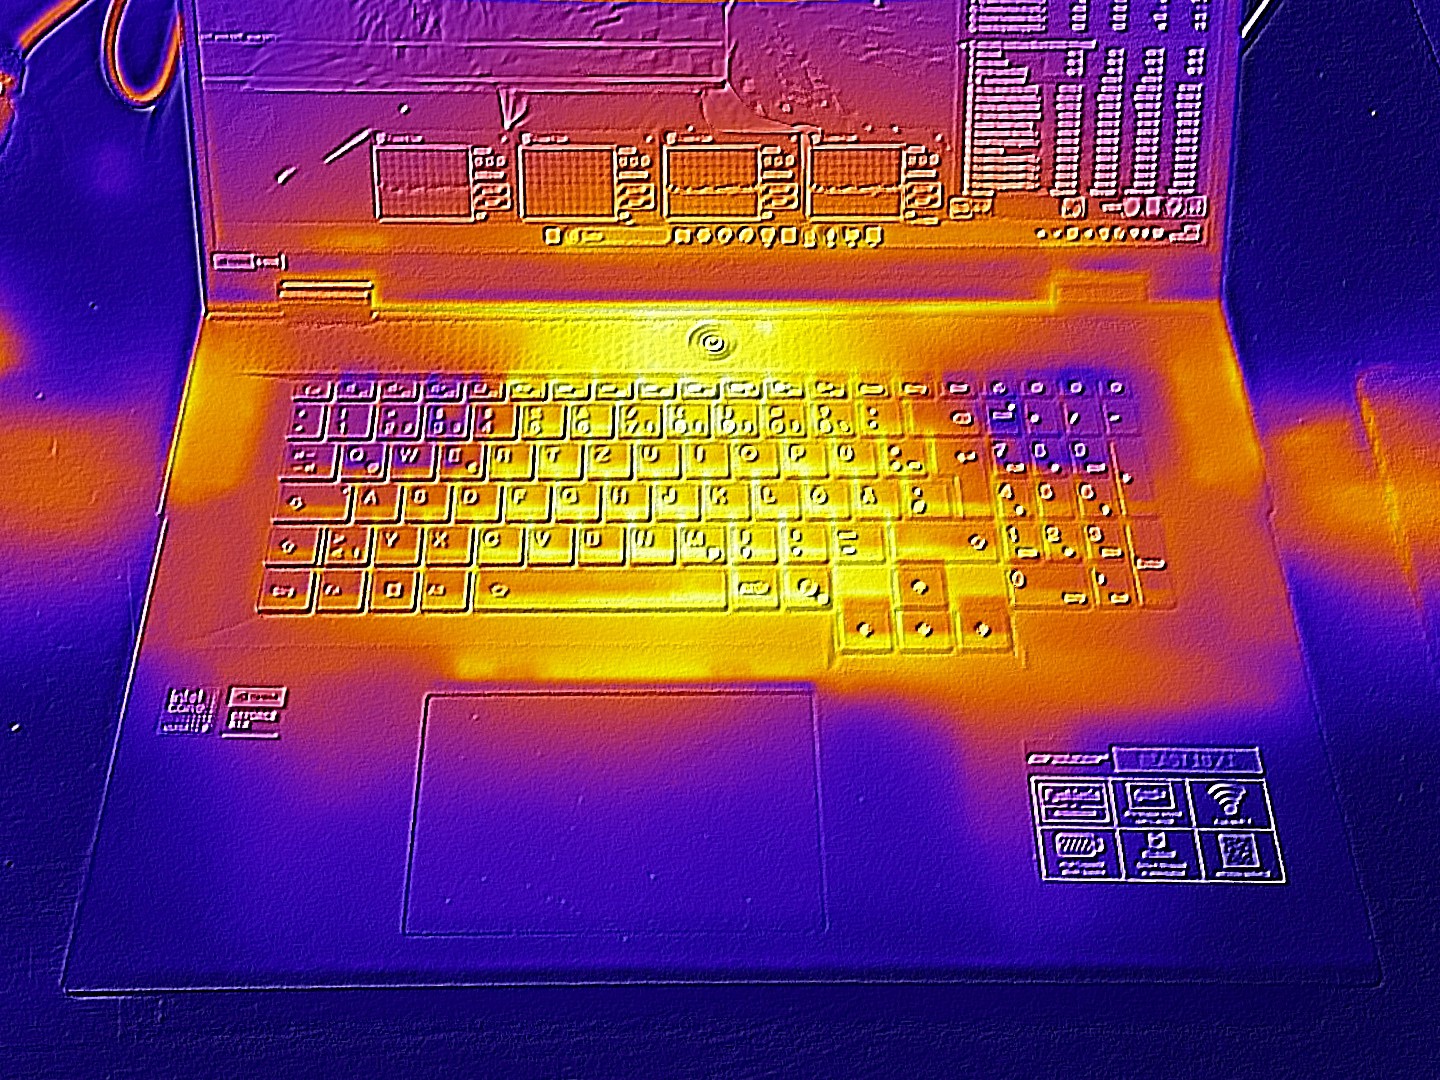
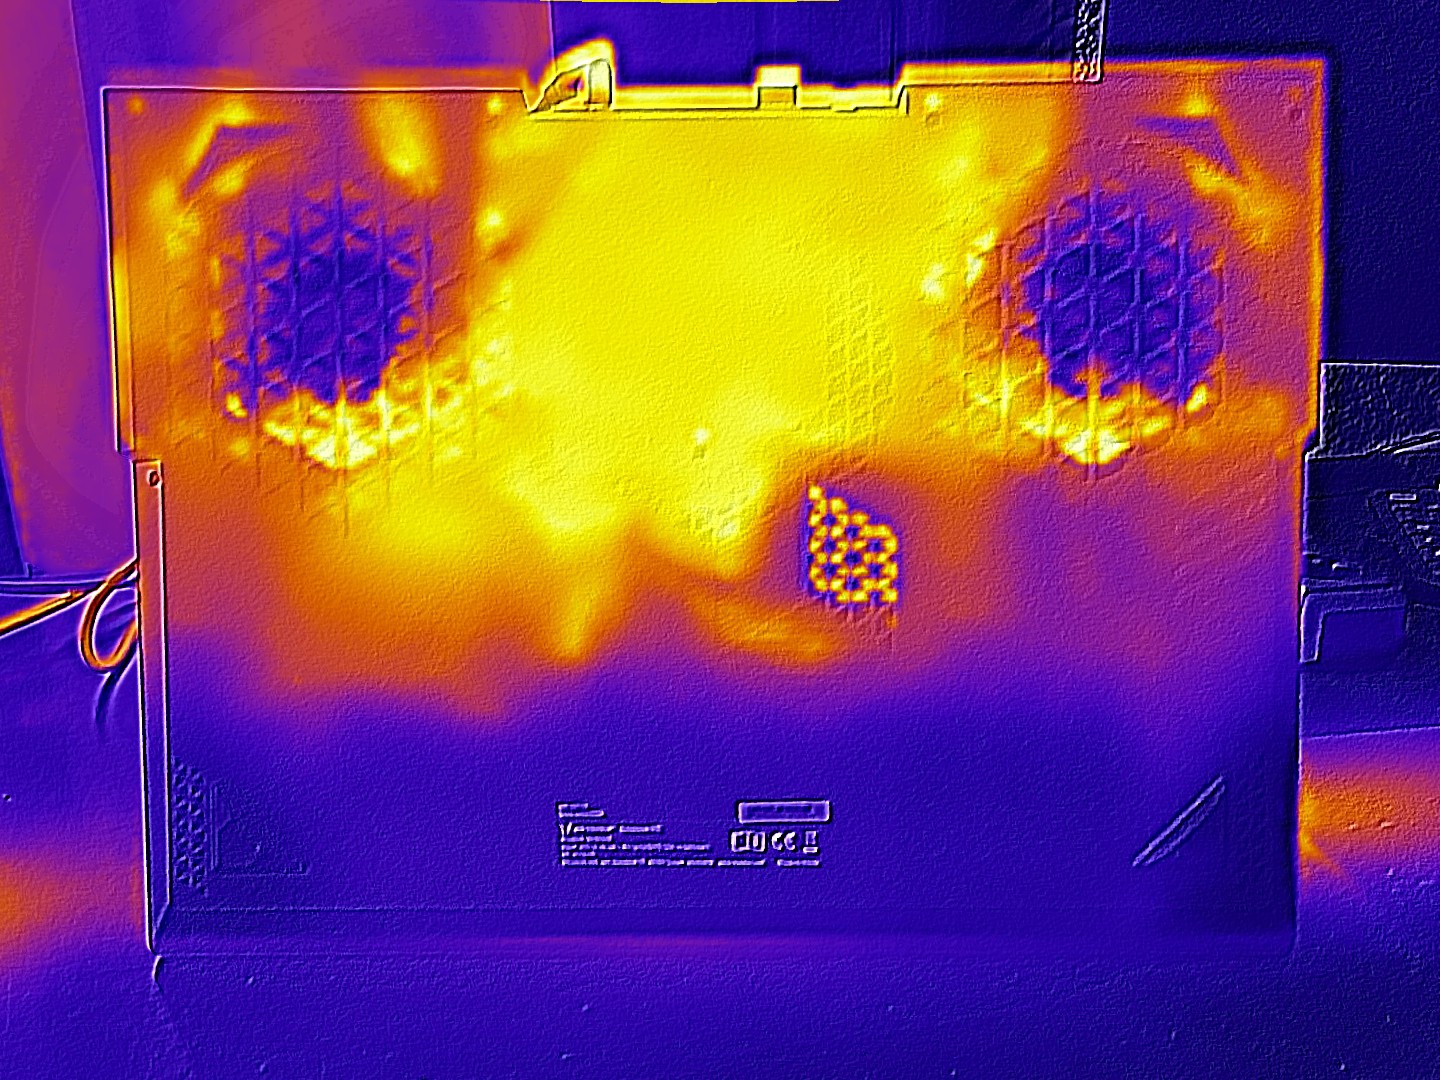
Temperatura
Temperatury obudowy są mniej niepokojące. Maksymalnie 47 °C na górze i 48 °C na dole to wartości typowe dla laptopów z wyższej półki. W trybie bezczynności powierzchnie w większości przypadków utrzymują się poniżej 30 °C, dzięki czemu są przyjemnie chłodne.
(-) Maksymalna temperatura w górnej części wynosi 47 °C / 117 F, w porównaniu do średniej 40.4 °C / 105 F , począwszy od 21.2 do 68.8 °C dla klasy Gaming.
(-) Dno nagrzewa się maksymalnie do 48 °C / 118 F, w porównaniu do średniej 43.2 °C / 110 F
(+) W stanie bezczynności średnia temperatura górnej części wynosi 27.9 °C / 82 F, w porównaniu ze średnią temperaturą urządzenia wynoszącą 33.9 °C / ### class_avg_f### F.
(-) 3: The average temperature for the upper side is 42 °C / 108 F, compared to the average of 33.9 °C / 93 F for the class Gaming.
(-) Podpórki pod nadgarstki i touchpad mogą się bardzo nagrzać w dotyku, maksymalnie do 41 °C / 105.8 F.
(-) Średnia temperatura obszaru podparcia dłoni w podobnych urządzeniach wynosiła 28.8 °C / 83.8 F (-12.2 °C / -22 F).
| Medion Erazer Beast 18 X1 MD62731 Ultra 9 275HX, GeForce RTX 5080 Laptop | MSI GE78HX 13VH-070US i9-13950HX, GeForce RTX 4080 Laptop GPU | Acer Predator Helios 18 N23Q2 i9-13900HX, GeForce RTX 4080 Laptop GPU | Asus Strix Scar 18 G835LX Ultra 9 275HX, GeForce RTX 5090 Laptop | Aorus Master 18 AM8H Ultra 9 275HX, GeForce RTX 5090 Laptop | Lenovo Legion Pro 7i 16 Gen 10 Ultra 9 275HX, GeForce RTX 5080 Laptop | |
|---|---|---|---|---|---|---|
| Heat | 6% | -7% | 5% | -8% | 3% | |
| Maximum Upper Side * (°C) | 47 | 37.4 20% | 35 26% | 45.6 3% | 50 -6% | 42.6 9% |
| Maximum Bottom * (°C) | 48 | 45 6% | 56 -17% | 46 4% | 46 4% | 41.2 14% |
| Idle Upper Side * (°C) | 29 | 29.8 -3% | 34 -17% | 28.9 -0% | 36 -24% | 32.6 -12% |
| Idle Bottom * (°C) | 33 | 32.4 2% | 39 -18% | 29.2 12% | 35 -6% | 32.4 2% |
* ... im mniej tym lepiej
Test warunków skrajnych
Nasz test obciążeniowy z Furmarkiem i Prime95 nie spowodował nadmiernego pocenia się podzespołów. Około 80 °C dla CPU i GPU jest akceptowalne.

Głośnik
System dźwiękowy może również wypełnić większe pomieszczenia z maksymalną głośnością 89 dB(A). Według analizy audio jakość dźwięku jest nieco niższa niż w przypadku Aorus Master 18, ale pozostaje stosunkowo dobra jak na notebooka, pomimo typowych słabości basów.
Medion Erazer Beast 18 X1 MD62731 analiza dźwięku
(+) | głośniki mogą odtwarzać stosunkowo głośno (89 dB)
Bas 100 - 315 Hz
(-) | prawie brak basu - średnio 18.6% niższa od mediany
(±) | liniowość basu jest średnia (13% delta do poprzedniej częstotliwości)
Średnie 400 - 2000 Hz
(+) | zbalansowane środki średnie - tylko 2.8% od mediany
(+) | średnie są liniowe (4.5% delta do poprzedniej częstotliwości)
Wysokie 2–16 kHz
(±) | wyższe maksima - średnio 5.3% wyższe od mediany
(+) | wzloty są liniowe (6.4% delta do poprzedniej częstotliwości)
Ogólnie 100 - 16.000 Hz
(+) | ogólny dźwięk jest liniowy (14.2% różnicy w stosunku do mediany)
W porównaniu do tej samej klasy
» 25% wszystkich testowanych urządzeń w tej klasie było lepszych, 7% podobnych, 68% gorszych
» Najlepszy miał deltę 6%, średnia wynosiła ###średnia###%, najgorsza wynosiła 132%
W porównaniu do wszystkich testowanych urządzeń
» 17% wszystkich testowanych urządzeń było lepszych, 4% podobnych, 79% gorszych
» Najlepszy miał deltę 4%, średnia wynosiła ###średnia###%, najgorsza wynosiła 134%
Aorus Master 18 AM8H analiza dźwięku
(±) | głośność głośnika jest średnia, ale dobra (77 dB)
Bas 100 - 315 Hz
(±) | zredukowany bas - średnio 8.7% niższy od mediany
(±) | liniowość basu jest średnia (10.3% delta do poprzedniej częstotliwości)
Średnie 400 - 2000 Hz
(+) | zbalansowane środki średnie - tylko 3% od mediany
(+) | średnie są liniowe (4.3% delta do poprzedniej częstotliwości)
Wysokie 2–16 kHz
(+) | zrównoważone maksima - tylko 2.8% od mediany
(+) | wzloty są liniowe (5.4% delta do poprzedniej częstotliwości)
Ogólnie 100 - 16.000 Hz
(+) | ogólny dźwięk jest liniowy (11.9% różnicy w stosunku do mediany)
W porównaniu do tej samej klasy
» 12% wszystkich testowanych urządzeń w tej klasie było lepszych, 4% podobnych, 84% gorszych
» Najlepszy miał deltę 6%, średnia wynosiła ###średnia###%, najgorsza wynosiła 132%
W porównaniu do wszystkich testowanych urządzeń
» 9% wszystkich testowanych urządzeń było lepszych, 2% podobnych, 89% gorszych
» Najlepszy miał deltę 4%, średnia wynosiła ###średnia###%, najgorsza wynosiła 134%
Zarządzanie energią
Zużycie energii
W stanie spoczynku pobór mocy waha się podobnie do poziomu hałasu. W idealnym przypadku wynosi on zaledwie od 7,9 do 16,6 W, co jest wynikiem lepszym od wszystkich urządzeń porównawczych (dGPU jest automatycznie aktywowane po podłączeniu zewnętrznego monitora). W trybie 3D pobór mocy wynosi 330 W, a dostarczony zasilacz również został określony na 330 W.
| wyłączony / stan wstrzymania | |
| luz | |
| obciążenie |
|
Legenda:
min: | |
| Medion Erazer Beast 18 X1 MD62731 Ultra 9 275HX, GeForce RTX 5080 Laptop | MSI GE78HX 13VH-070US i9-13950HX, GeForce RTX 4080 Laptop GPU | Acer Predator Helios 18 N23Q2 i9-13900HX, GeForce RTX 4080 Laptop GPU | Asus Strix Scar 18 G835LX Ultra 9 275HX, GeForce RTX 5090 Laptop | Aorus Master 18 AM8H Ultra 9 275HX, GeForce RTX 5090 Laptop | Lenovo Legion Pro 7i 16 Gen 10 Ultra 9 275HX, GeForce RTX 5080 Laptop | Średnia w klasie Gaming | |
|---|---|---|---|---|---|---|---|
| Power Consumption | -60% | -38% | -75% | -97% | -107% | -27% | |
| Idle Minimum * (Watt) | 7.9 | 16.1 -104% | 16 -103% | 11.4 -44% | 29 -267% | 28.5 -261% | 13.1 ? -66% |
| Idle Average * (Watt) | 11.5 | 24 -109% | 19 -65% | 39.2 -241% | 33 -187% | 38.8 -237% | 18.7 ? -63% |
| Idle Maximum * (Watt) | 16.6 | 34 -105% | 21.3 -28% | 40.2 -142% | 48 -189% | 45.6 -175% | 24.4 ? -47% |
| Load Average * (Watt) | 130 | 123.6 5% | 124 5% | 161.2 -24% | 141 -8% | 132.2 -2% | 108.1 ? 17% |
| Cyberpunk 2077 ultra * (Watt) | 253 | 303 -20% | 283 -12% | 318 -26% | |||
| Cyberpunk 2077 ultra external monitor * (Watt) | 245 | 295 -20% | 283 -16% | 319 -30% | |||
| Load Maximum * (Watt) | 330 | 285.7 13% | 319 3% | 430.9 -31% | 340 -3% | 384 -16% | 254 ? 23% |
| Witcher 3 ultra * (Watt) | 286 | 289 |
* ... im mniej tym lepiej
Power consumption Cyberpunk / Stress test
Power consumption with external monitor
Żywotność baterii
Dzięki umiarkowanemu zużyciu energii w trybie bezczynności, Erazer Beast 18 X1 zapewnia najdłuższy czas pracy na baterii spośród testowanych urządzeń. Około 8 godzin przeglądania Internetu z jasnością ustawioną na 150 cd/m² to więcej niż przyzwoity wynik.
| Medion Erazer Beast 18 X1 MD62731 Ultra 9 275HX, GeForce RTX 5080 Laptop, 99 Wh | MSI GE78HX 13VH-070US i9-13950HX, GeForce RTX 4080 Laptop GPU, 99 Wh | Acer Predator Helios 18 N23Q2 i9-13900HX, GeForce RTX 4080 Laptop GPU, 90 Wh | Asus Strix Scar 18 G835LX Ultra 9 275HX, GeForce RTX 5090 Laptop, 90 Wh | Aorus Master 18 AM8H Ultra 9 275HX, GeForce RTX 5090 Laptop, 99 Wh | Lenovo Legion Pro 7i 16 Gen 10 Ultra 9 275HX, GeForce RTX 5080 Laptop, 99 Wh | Średnia w klasie Gaming | |
|---|---|---|---|---|---|---|---|
| Czasy pracy | -23% | -44% | -30% | -38% | -32% | -11% | |
| WiFi v1.3 (h) | 7.9 | 6.1 -23% | 4.4 -44% | 5.5 -30% | 4.9 -38% | 5.4 -32% | 7.04 ? -11% |
| Reader / Idle (h) | 7.3 | 5.8 | 8.71 ? | ||||
| Load (h) | 1.5 | 1.7 | 1.2 | 1.9 | 0.8 | 1.47 ? | |
| H.264 (h) | 4.8 | 5.8 | 8.26 ? | ||||
| Cyberpunk 2077 ultra 150cd (h) | 0.7 |
Ogólna ocena Notebookcheck
Medion Erazer Beast 18 X1 wyróżnia się na tle 18-calowej konkurencji przyzwoitym czasem pracy na baterii, ale ma tendencję do bycia głośniejszym pod obciążeniem (w tym samym trybie wydajności) niż jego odpowiedniki.
Medion Erazer Beast 18 X1 MD62731
- 21/05/2025 v8
Florian Glaser
 Total Sustainability Score:
 Możliwe porównanie alternatyw
Obraz | Model / recenzja | Cena | Waga | Wysokość | Ekran |
|---|---|---|---|---|---|
1. 82.5%  | Medion Erazer Beast 18 X1 MD62731 Intel Core Ultra 9 275HX ⎘ NVIDIA GeForce RTX 5080 Laptop ⎘ 32 GB Pamięć, SSD | Amazon: Cena katalogowa: 3700 EUR | 3.6 kg | 30.4 mm | 18.00" 2560x1600 168 PPI IPS |
2. 88.3% v7 (old)  | MSI GE78HX 13VH-070US Intel Core i9-13950HX ⎘ NVIDIA GeForce RTX 4080 Laptop GPU ⎘ 32 GB Pamięć, 2048 GB SSD | Amazon: 1. $136.99 LCDOLED Compatible with MSI ... 2. $127.77 17.3" 240Hz Screen Replaceme... 3. $52.99 Replacement Backlit Keyboard... Cena katalogowa: 3600 USD | 3 kg | 23 mm | 17.00" 2560x1600 178 PPI IPS |
3. 88.3% v7 (old) 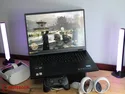 | Acer Predator Helios 18 N23Q2 Intel Core i9-13900HX ⎘ NVIDIA GeForce RTX 4080 Laptop GPU ⎘ 32 GB Pamięć, 2048 GB SSD | Amazon: 1. $2,770.36 Acer Predator Helios Neo 18 ... 2. $165.98 New KrystalPix LCD Display F... 3. $1,999.99 Acer Predator Helios Neo 18 ... Cena katalogowa: 3699 Euro | 3.2 kg | 29.15 mm | 18.00" 2560x1600 168 PPI IPS |
4. 88%  | Asus Strix Scar 18 G835LX Intel Core Ultra 9 275HX ⎘ NVIDIA GeForce RTX 5090 Laptop ⎘ 64 GB Pamięć, 2048 GB SSD | Amazon: Cena katalogowa: 5799€ | 3.3 kg | 32 mm | 18.00" 2560x1600 168 PPI Mini-LED |
5. 86.8%  | Aorus Master 18 AM8H Intel Core Ultra 9 275HX ⎘ NVIDIA GeForce RTX 5090 Laptop ⎘ 64 GB Pamięć, 2048 GB SSD | Amazon: Cena katalogowa: 5000 EUR | 3.4 kg | 31 mm | 18.00" 2560x1600 168 PPI Mini-LED |
6. 87.5%  | Lenovo Legion Pro 7i 16 Gen 10 Intel Core Ultra 9 275HX ⎘ NVIDIA GeForce RTX 5080 Laptop ⎘ 32 GB Pamięć, 1024 GB SSD | Amazon: Cena katalogowa: 4200 USD | 2.6 kg | 26.65 mm | 16.00" 2560x1600 189 PPI OLED |
Przezroczystość
Wyboru urządzeń do recenzji dokonuje nasza redakcja. Próbka testowa została udostępniona autorowi jako pożyczka od producenta lub sprzedawcy detalicznego na potrzeby tej recenzji. Pożyczkodawca nie miał wpływu na tę recenzję, producent nie otrzymał też kopii tej recenzji przed publikacją. Nie było obowiązku publikowania tej recenzji. Jako niezależna firma medialna, Notebookcheck nie podlega władzy producentów, sprzedawców detalicznych ani wydawców.
Tak testuje Notebookcheck
Każdego roku Notebookcheck niezależnie sprawdza setki laptopów i smartfonów, stosując standardowe procedury, aby zapewnić porównywalność wszystkich wyników. Od około 20 lat stale rozwijamy nasze metody badawcze, ustanawiając przy tym standardy branżowe. W naszych laboratoriach testowych doświadczeni technicy i redaktorzy korzystają z wysokiej jakości sprzętu pomiarowego. Testy te obejmują wieloetapowy proces walidacji. Nasz kompleksowy system ocen opiera się na setkach uzasadnionych pomiarów i benchmarków, co pozwala zachować obiektywizm.