Kolorowa recenzja EVOL X15 AT 23: Imponujący gracz QHD z Raptor Lake-HX i kilkoma nieuniknionymi dziwactwami

Bardziej popularna ze względu na swoją ofertę płyt głównych i procesorów graficznych do komputerów PC, firma Colorful zaczęła poszerzać swoje horyzonty o laptopy Intel 12. generacji Alder Lake. W tym roku chiński gigant technologiczny zaktualizował swoją ofertę, aby zaoferować kilka 13. generacji Raptor Lake.
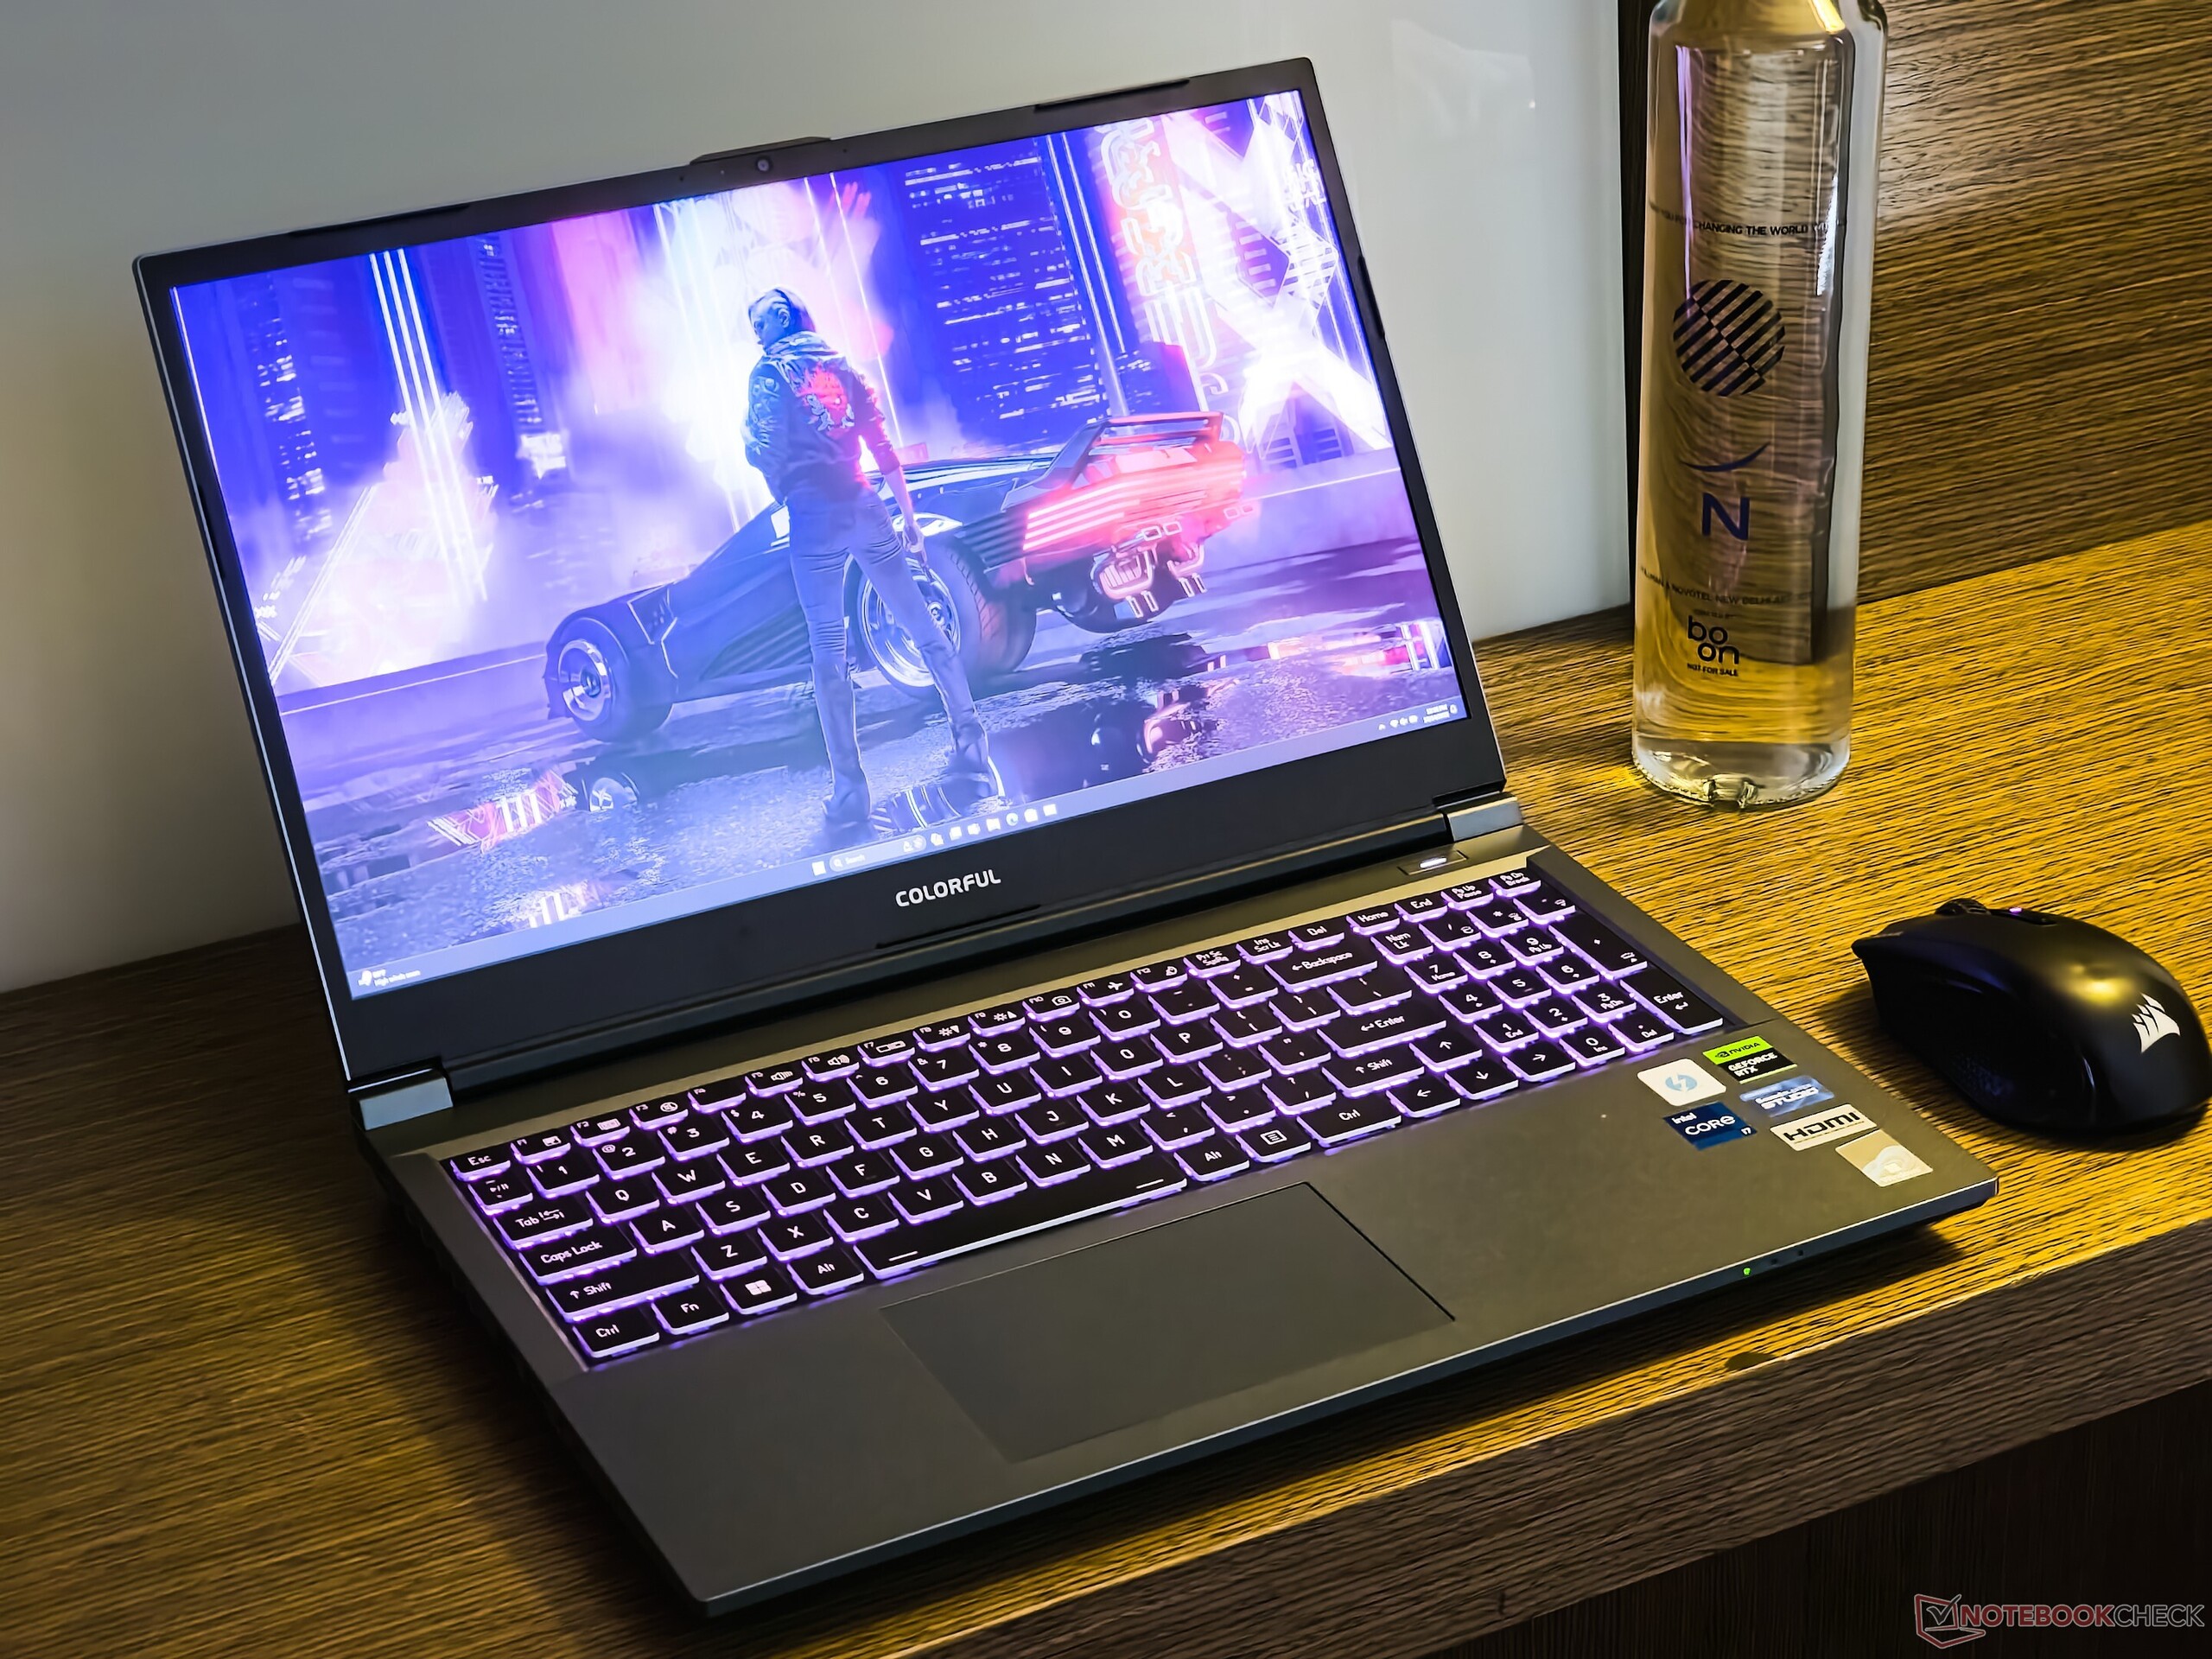
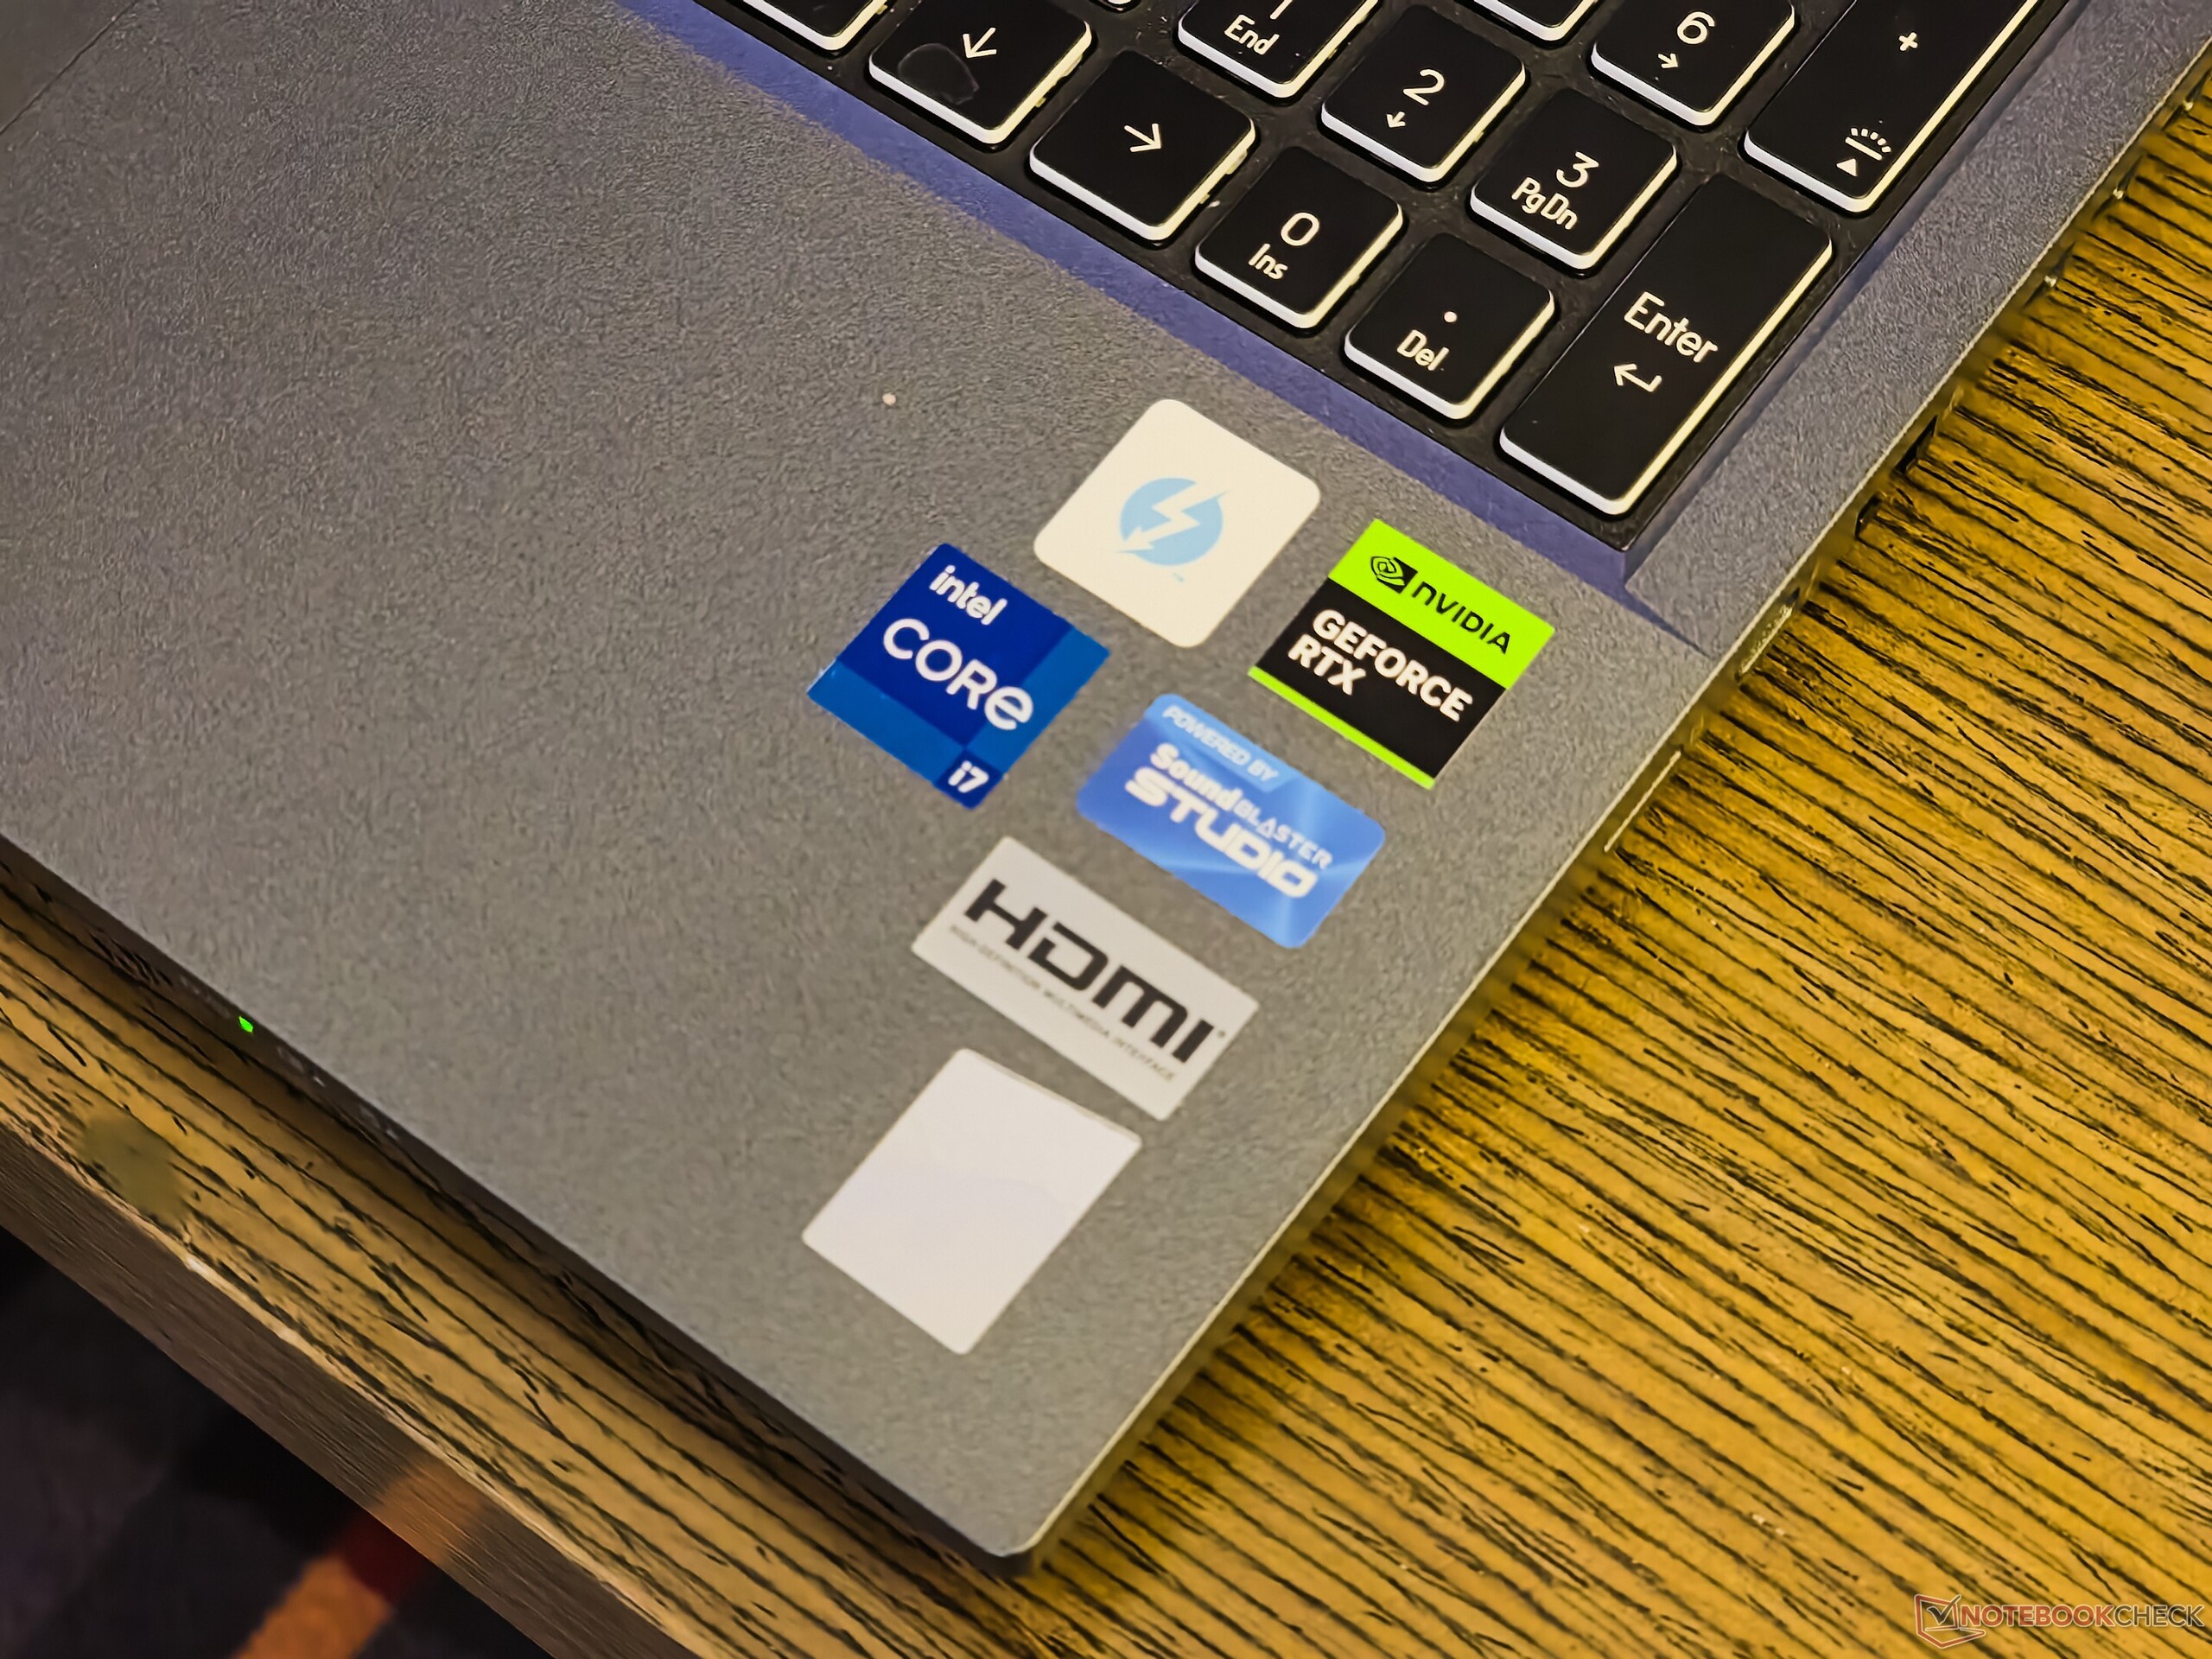
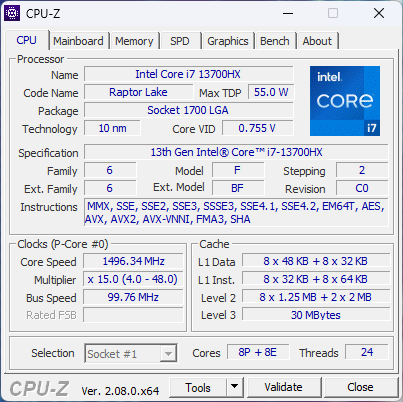
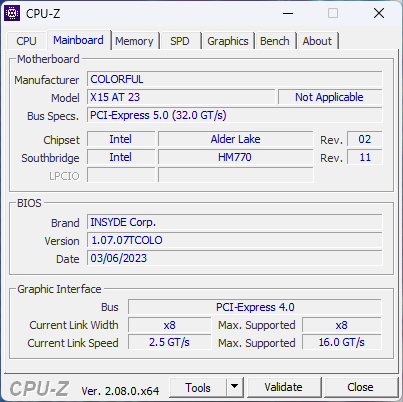
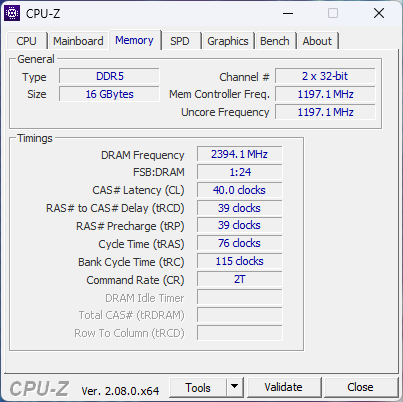
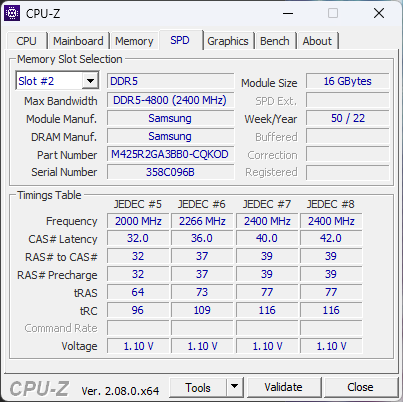
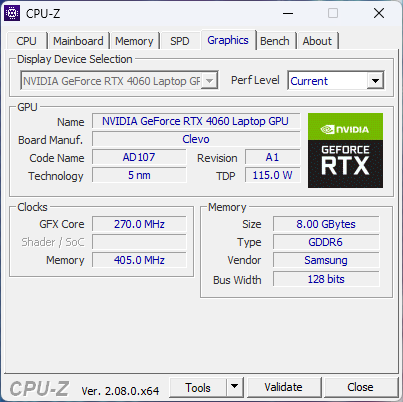
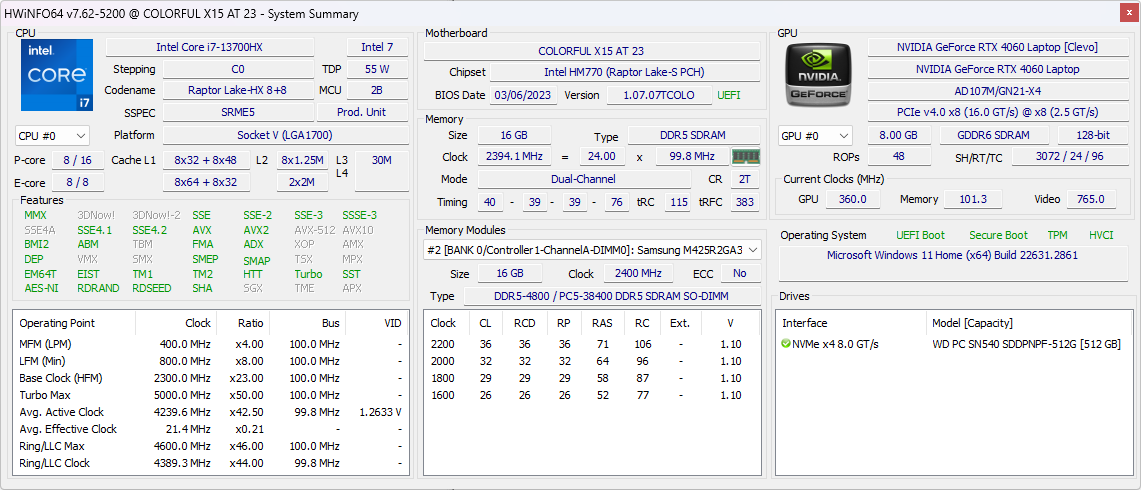
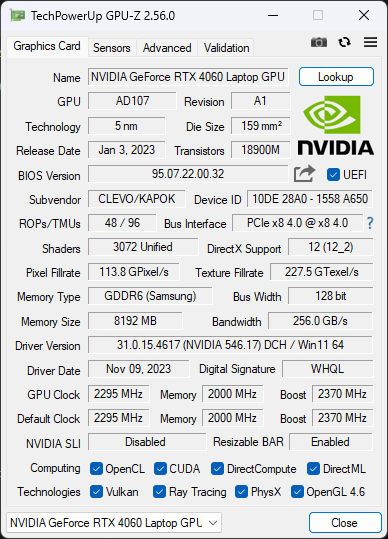
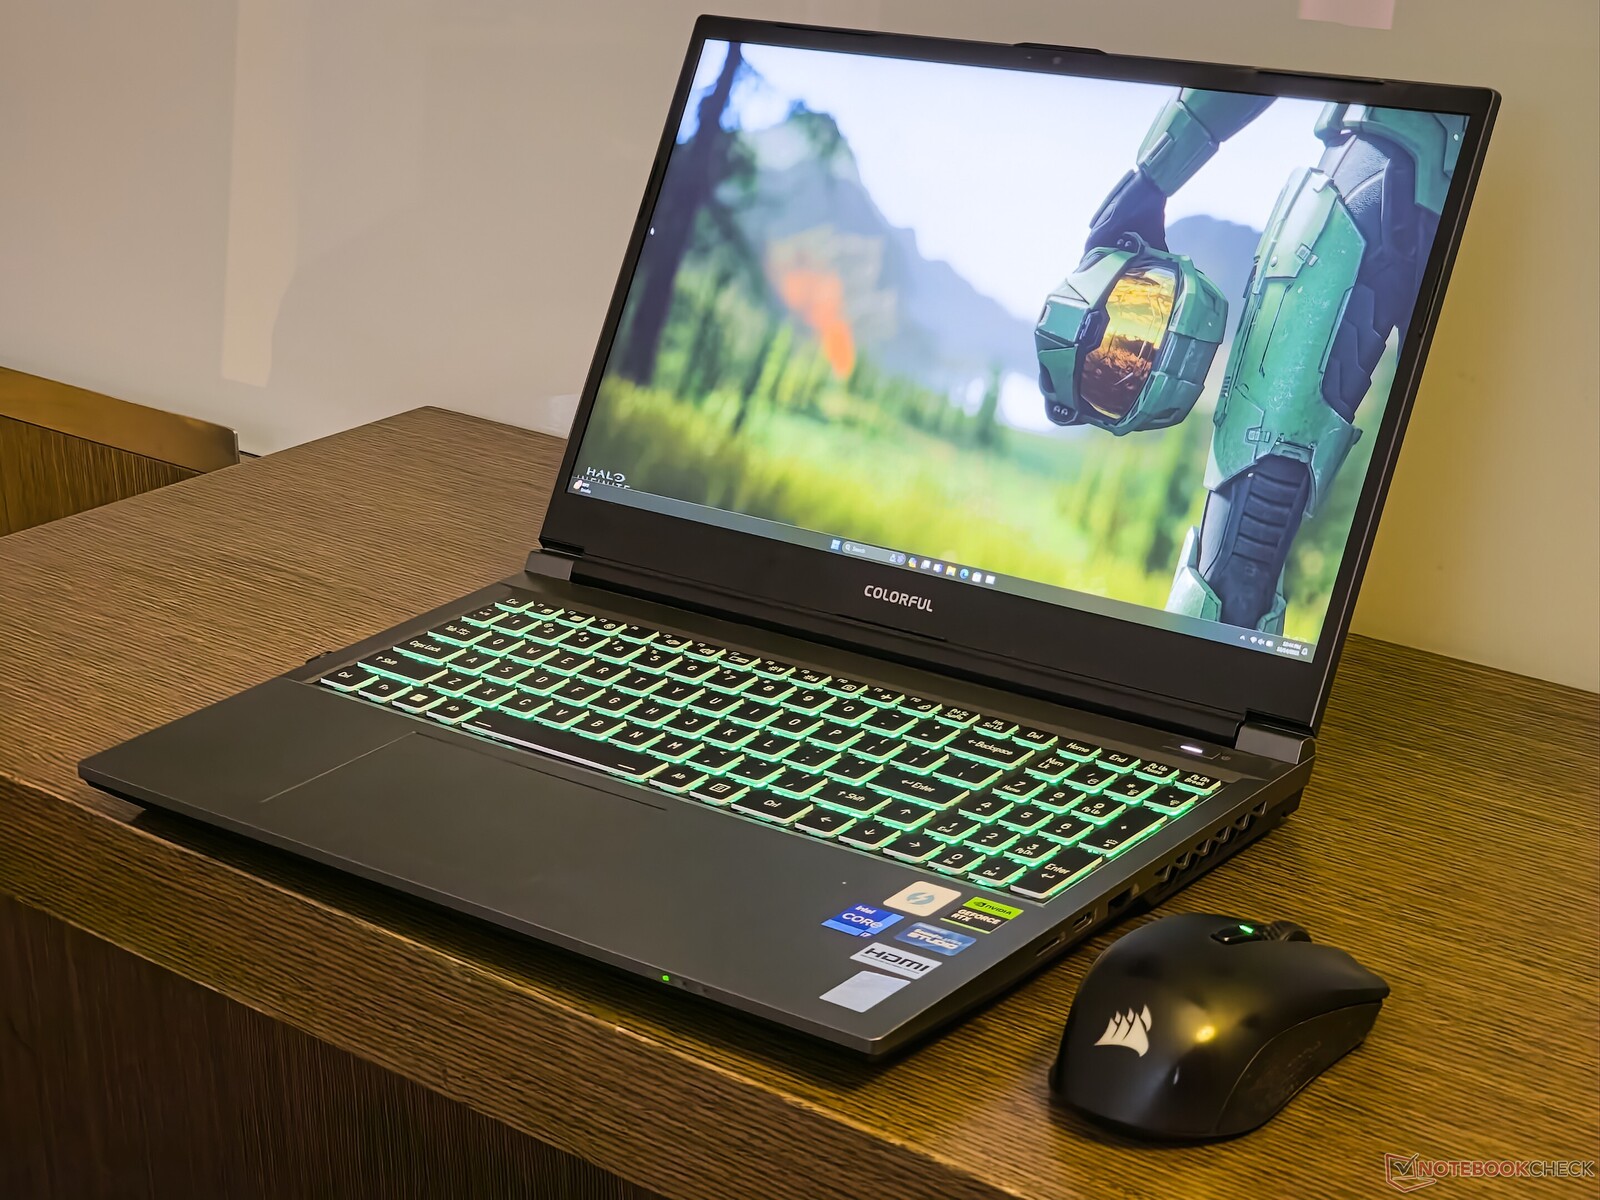
W związku z tym, nowy Colorful EVOL X15 AT 23 niedawno dotarł do naszych laboratoriów testowych. Nasz egzemplarz EVOL X15 AT jest napędzany przez procesor Intel Core i7-13700HX, Karta graficzna Nvidia GeForce RTX 4060 Laptop GPU, 16 GB pamięci DDR5-4800 (pojedyncza pamięć) i 512 GB NVMe SSD.
Urządzenie oferuje imponujące specyfikacje, w tym wyświetlacz QHD 165 Hz i baterię 73 WHr, i jest dostępne na wybranych rynkach azjatyckich, takich jak Chiny, Tajlandia, Malezja, Indonezja, Filipiny oraz w Rosji w Ozon za około 969 USD. Newegg sprzedaje ten SKU w Stanach Zjednoczonych z marżą 1 759 USD.
W tej recenzji przyjrzymy się nowemu Colorful EVOL X15 AT i sprawdzimy, czy może on stawić czoła niektórym z bardziej zakorzenionych konkurentów.
Potencjalni konkurenci w porównaniu
Ocena | Data | Model | Waga | Wysokość | Rozmiar | Rezolucja | Cena |
|---|---|---|---|---|---|---|---|
| 84.9 % v7 (old) | 12/2023 | Colorful EVOL X15 AT 23 i7-13700HX, GeForce RTX 4060 Laptop GPU | 2.3 kg | 26.9 mm | 15.60" | 2560x1440 | |
| 88.3 % v7 (old) | 09/2023 | Alienware m16 R1 Intel i7-13700HX, GeForce RTX 4060 Laptop GPU | 3 kg | 25.4 mm | 16.00" | 2560x1600 | |
| 87.4 % v7 (old) | 07/2023 | HP Omen 16-wf000 i7-13700HX, GeForce RTX 4080 Laptop GPU | 2.4 kg | 23.6 mm | 16.10" | 2560x1440 | |
| 89.5 % v7 (old) | 07/2023 | Acer Predator Helios 16 PH16-71-731Q i7-13700HX, GeForce RTX 4060 Laptop GPU | 2.6 kg | 26.9 mm | 16.00" | 2560x1600 | |
| 84.2 % v7 (old) | 06/2023 | Dell G15 5530 i7-13650HX, GeForce RTX 4060 Laptop GPU | 3 kg | 26.95 mm | 15.60" | 1920x1080 | |
| 86.2 % v7 (old) | 07/2023 | Schenker XMG Pro 15 (E23) i9-13900HX, GeForce RTX 4060 Laptop GPU | 2.4 kg | 24.9 mm | 15.60" | 2560x1440 | |
| 89.2 % v7 (old) | 08/2023 | Alienware m16 R1 AMD R9 7845HX, GeForce RTX 4080 Laptop GPU | 3.1 kg | 25.4 mm | 16.00" | 2560x1600 | |
| 88.2 % v7 (old) | 03/2023 | Uniwill GM6PX7X RTX 4070 i7-13700HX, GeForce RTX 4070 Laptop GPU | 2.2 kg | 22 mm | 16.00" | 2560x1600 |
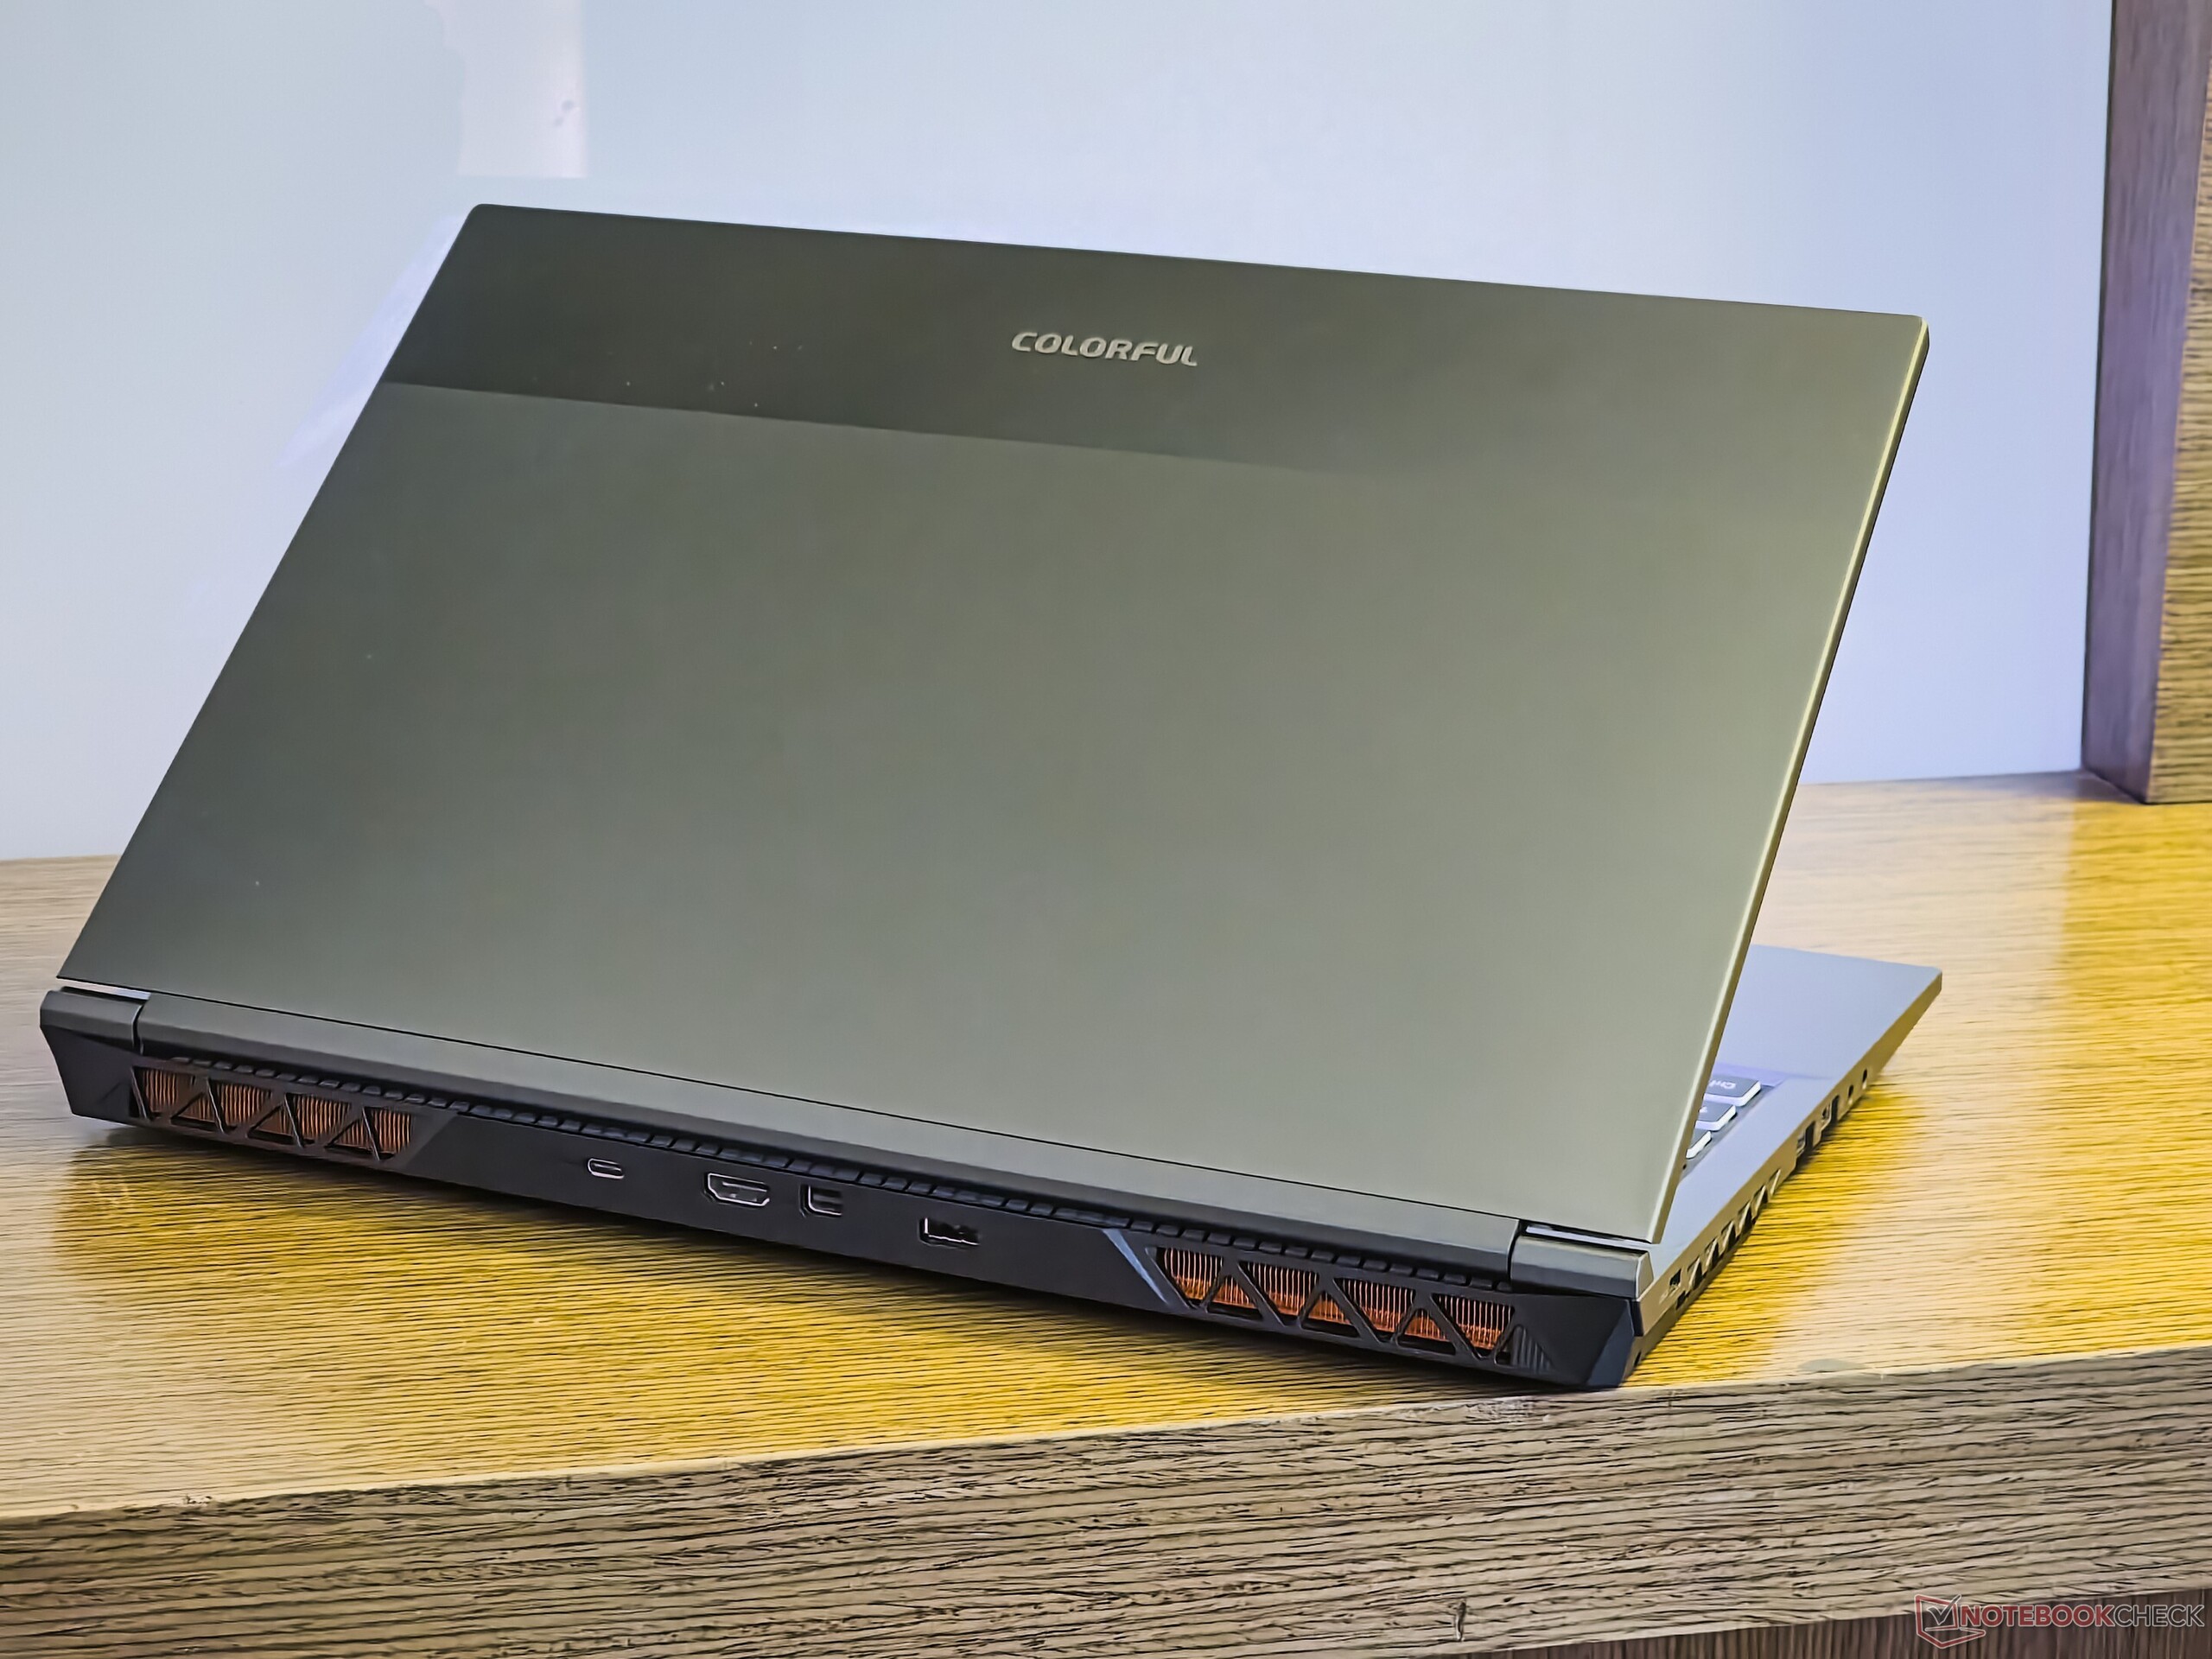
Podwozie: Funkcja ponad formą w plastikowej estetyce Clevo
Colorful oferuje EVOL X15 AT w trzech odcieniach - Grape Purple, Pine Blue i Mist Grey (nasza recenzja). Przy grubości 27,1 mm i wadze 2,3 kg, EVOL XT15 AT nie zdobędzie żadnych nagród za smukłość. Mimo to jest znacznie bardziej przenośny niż Dell G15 5530 i Alienware m16 R1.
EVOL X15 AT, jako konstrukcja Clevo, ma przede wszystkim solidną plastikową obudowę. Konstrukcja w dużej mierze przypomina Gigabyte G5 KE, który również jest rebrandingiem Clevo. Pomimo solidności konstrukcji, zaobserwowaliśmy znaczne ugięcie klawiatury.
Pokrywa wyświetlacza jest wykonana z metalu i nie chwieje się zbytnio. Zawiasy mają idealne naprężenie, pozwalając na otwarcie pokrywy jednym palcem bez powodowania ślizgania się podstawy
Ogólnie rzecz biorąc, EVOL X15 AT nie ma na celu przyciągnięcia uwagi użytkownika eleganckim językiem projektowania, ale jest wystarczająco utylitarny jako laptop do gier.

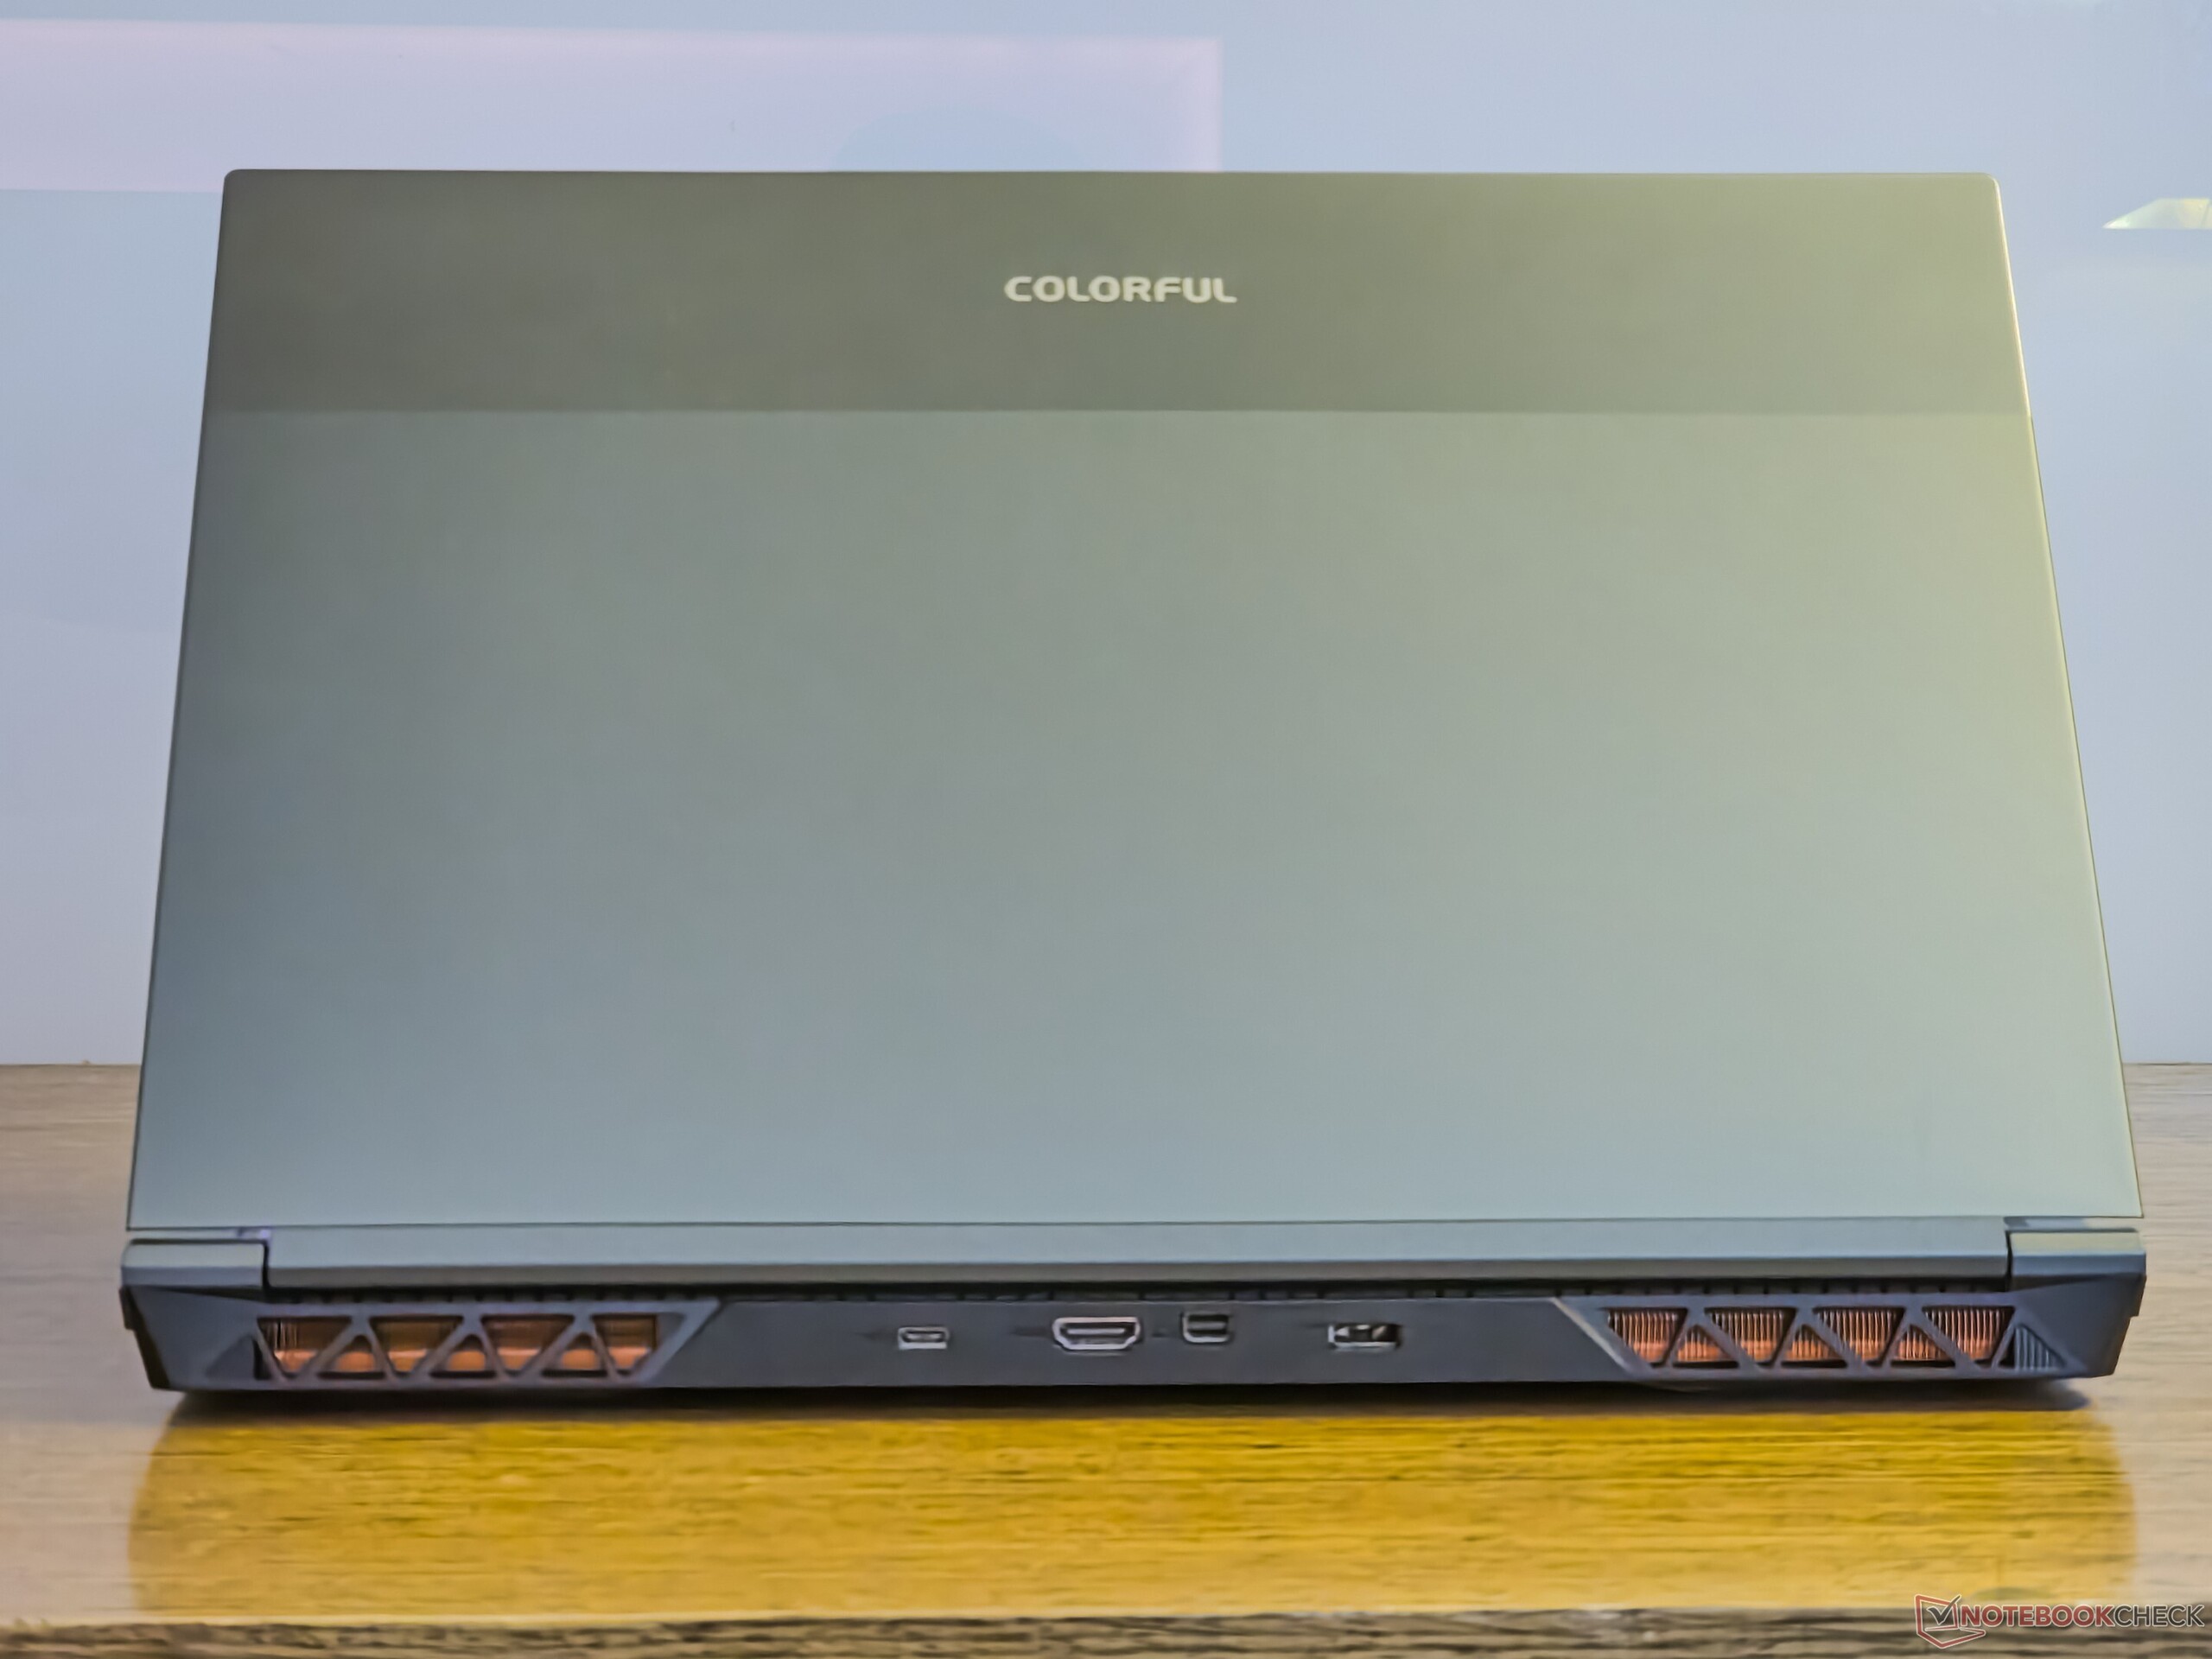
Łączność: Porty typu C bez wejścia zasilania
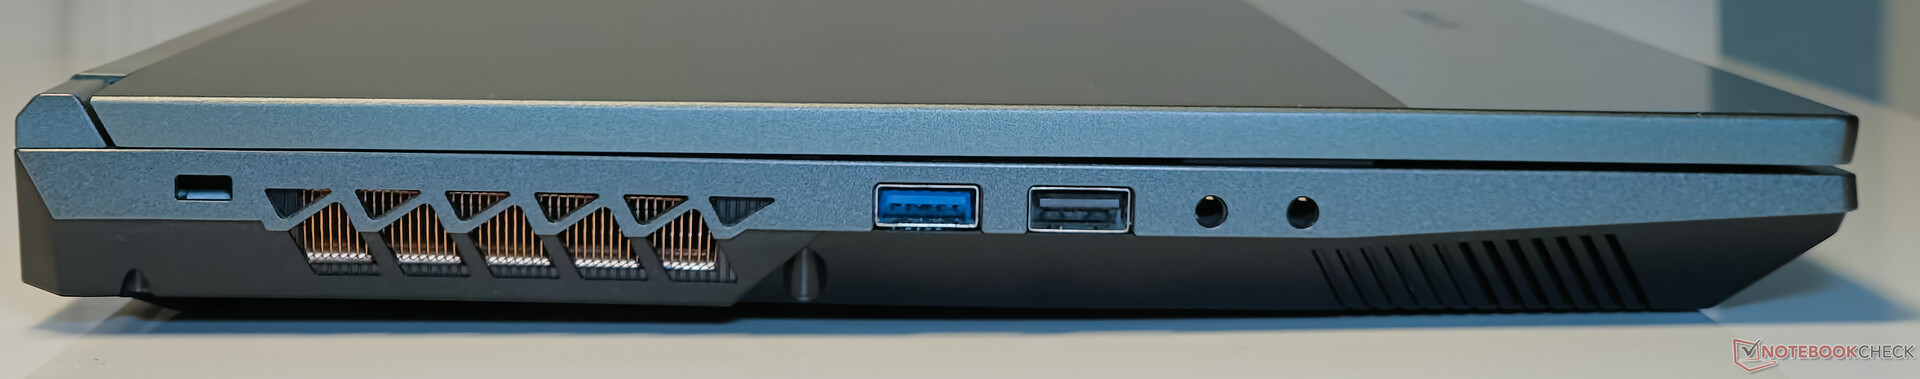
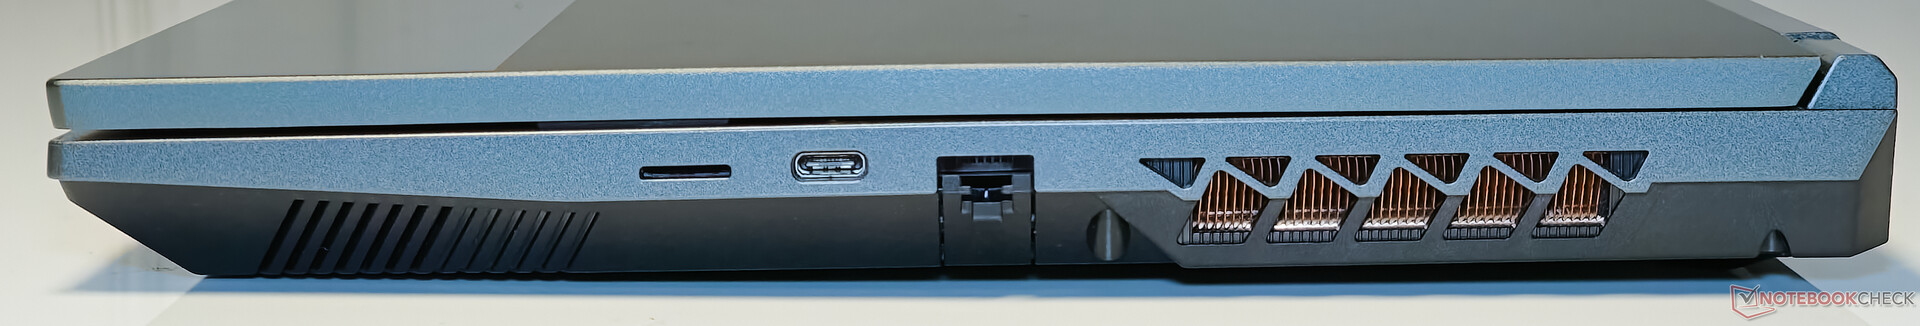
Colorful wyposażył EVOL X15 AT w całkiem przyzwoity wybór portów. Po lewej stronie znajdują się dwa porty USB-A (USB 2.0 i USB 3.2 Gen 1) oraz dedykowane gniazdo liniowe dla analogowego wejścia audio. Po prawej stronie znajduje się gniazdo microSD, Thunderbolt 4 i Gigabit LAN.
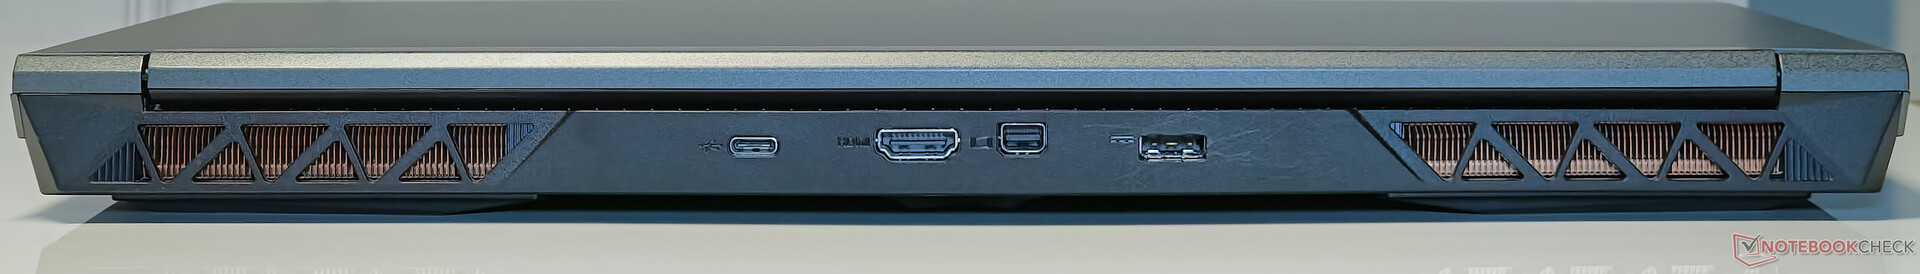
Po prawej stronie znajduje się czytnik kart microSD, Thunderbolt 4 i Gigabit LAN. Wreszcie, z tyłu znajduje się USB 3.2 Gen2 Type-C, wyjście mini-DisplayPort i wyjście HDMI.
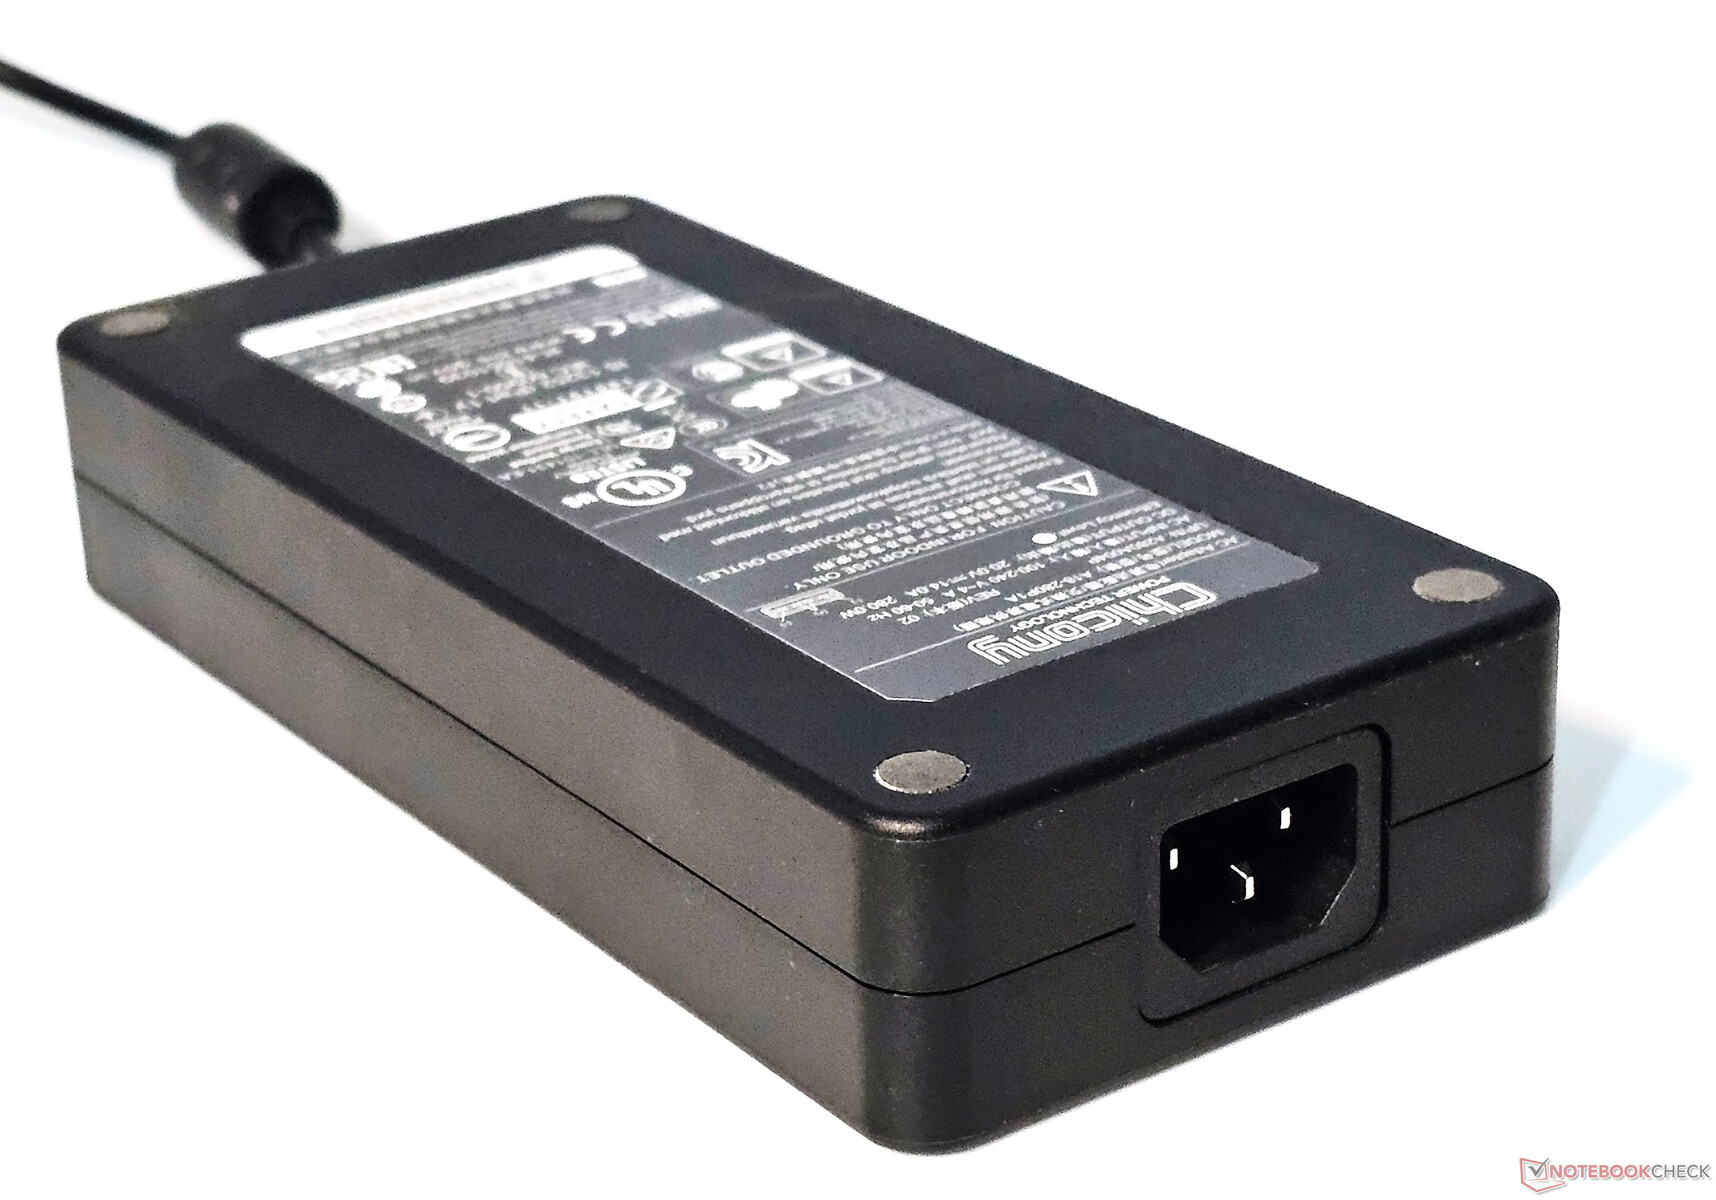
Porty typu C niestety obsługują tylko wyjście zasilania, więc nieuchronnie trzeba będzie wszędzie nosić ze sobą prawie 1-kilogramowy zasilacz, aby zapewnić zasilanie laptopa.
Czytnik kart SD
Czytnik kart microSD w EVOL X15 nie bije żadnych rekordów prędkości i jest o około 28% wolniejszy niż średnia w klasie w testach kopiowania JPG i sekwencyjnego odczytu AS SSD.
| SD Card Reader | |
| average JPG Copy Test (av. of 3 runs) | |
| Alienware m16 R1 AMD (Toshiba Exceria Pro SDXC 64 GB UHS-II) | |
| Alienware m16 R1 Intel (AV PRO microSD 128 GB V60) | |
| Średnia w klasie Gaming (20.9 - 210, n=54, ostatnie 2 lata) | |
| Schenker XMG Pro 15 (E23) | |
| Colorful EVOL X15 AT 23 (AV PRO microSD 128 GB V60) | |
| Acer Predator Helios 16 PH16-71-731Q | |
| Uniwill GM6PX7X RTX 4070 (AV PRO microSD 128 GB V60) | |
| maximum AS SSD Seq Read Test (1GB) | |
| Alienware m16 R1 AMD (Toshiba Exceria Pro SDXC 64 GB UHS-II) | |
| Alienware m16 R1 Intel (AV PRO microSD 128 GB V60) | |
| Średnia w klasie Gaming (25.5 - 261, n=51, ostatnie 2 lata) | |
| Schenker XMG Pro 15 (E23) | |
| Colorful EVOL X15 AT 23 (AV PRO microSD 128 GB V60) | |
| Uniwill GM6PX7X RTX 4070 (AV PRO microSD 128 GB V60) | |
| Acer Predator Helios 16 PH16-71-731Q | |
Komunikacja
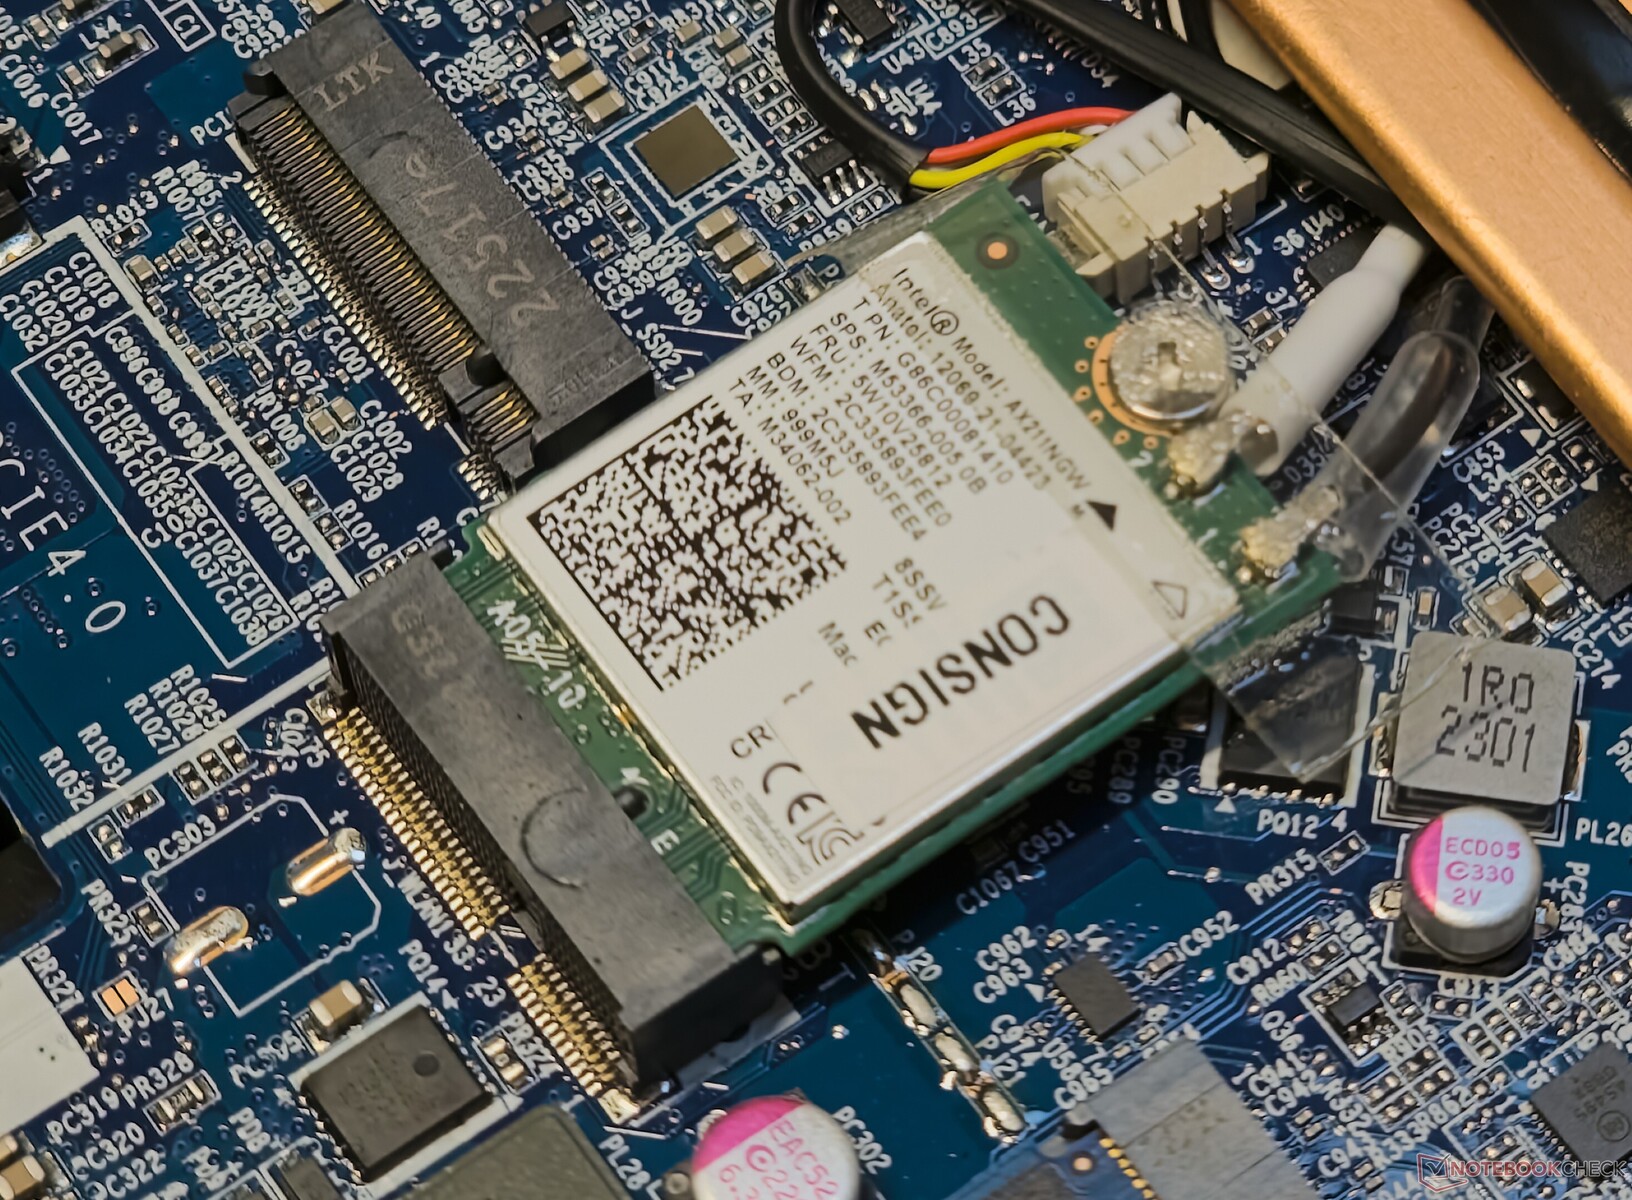
EVOL X15 AT posiada układ WLAN Intel Wi-Fi 6E AX211. Podczas testów z naszym referencyjnym routerem Asus ROG Rapture GT-AXE11000 prędkości transferu są dość spójne zarówno w paśmie 5 GHz, jak i 6 GHz.
Laptop oferuje doskonałą przepustowość nadawania i odbioru w paśmie 5 GHz. W paśmie 6 GHz EVOL X15 wypada gorzej niż Alienware m16 R1 AMD w testach nadawania iPerf3, ale nadrabia braki w testach odbioru ze szczytową przepustowością 1,7 Gb/s.
| Networking / iperf3 transmit AXE11000 | |
| Colorful EVOL X15 AT 23 | |
| Dell G15 5530 | |
| Alienware m16 R1 AMD | |
| Acer Predator Helios 16 PH16-71-731Q | |
| Alienware m16 R1 Intel | |
| Średnia w klasie Gaming (560 - 1862, n=95, ostatnie 2 lata) | |
| Przeciętny Intel Wi-Fi 6E AX211 (64 - 1921, n=276) | |
| Uniwill GM6PX7X RTX 4070 | |
| HP Omen 16-wf000 | |
| Schenker XMG Pro 15 (E23) | |
| Networking / iperf3 receive AXE11000 | |
| Colorful EVOL X15 AT 23 | |
| Alienware m16 R1 Intel | |
| Dell G15 5530 | |
| Średnia w klasie Gaming (680 - 1745, n=95, ostatnie 2 lata) | |
| Acer Predator Helios 16 PH16-71-731Q | |
| Alienware m16 R1 AMD | |
| Przeciętny Intel Wi-Fi 6E AX211 (582 - 1890, n=276) | |
| HP Omen 16-wf000 | |
| Uniwill GM6PX7X RTX 4070 | |
| Schenker XMG Pro 15 (E23) | |
| Networking / iperf3 transmit AXE11000 6GHz | |
| Alienware m16 R1 AMD | |
| Acer Predator Helios 16 PH16-71-731Q | |
| Schenker XMG Pro 15 (E23) | |
| Colorful EVOL X15 AT 23 | |
| Średnia w klasie Gaming (723 - 2355, n=38, ostatnie 2 lata) | |
| Przeciętny Intel Wi-Fi 6E AX211 (385 - 1851, n=226) | |
| HP Omen 16-wf000 | |
| Networking / iperf3 receive AXE11000 6GHz | |
| Colorful EVOL X15 AT 23 | |
| Schenker XMG Pro 15 (E23) | |
| Średnia w klasie Gaming (975 - 1775, n=37, ostatnie 2 lata) | |
| Alienware m16 R1 AMD | |
| Przeciętny Intel Wi-Fi 6E AX211 (700 - 1857, n=226) | |
| Acer Predator Helios 16 PH16-71-731Q | |
| HP Omen 16-wf000 | |
Kamera internetowa
Biorąc pod uwagę, że EVOL X15 koncentruje się głównie na grach, wystarczy konwencjonalna kamera internetowa 720p. Kamera internetowa jest odpowiednia do szybkich rozmów wideo, ale brakuje jej dokładności kolorów, reprodukcji szczegółów i ogólnej ostrości.


Bezpieczeństwo
Nie ma wbudowanych dedykowanych funkcji bezpieczeństwa, takich jak logowanie biometryczne. Moduł TPM 2.0 jest obecny, aby spełnić wymagania bezpieczeństwa systemu Windows 11.
Akcesoria i gwarancja
W pudełku nie ma żadnych oddzielnych akcesoriów oprócz adaptera 280 W i zwykłej dokumentacji. Colorful EVOL X15 AT jest objęty dwuletnią standardową gwarancją.
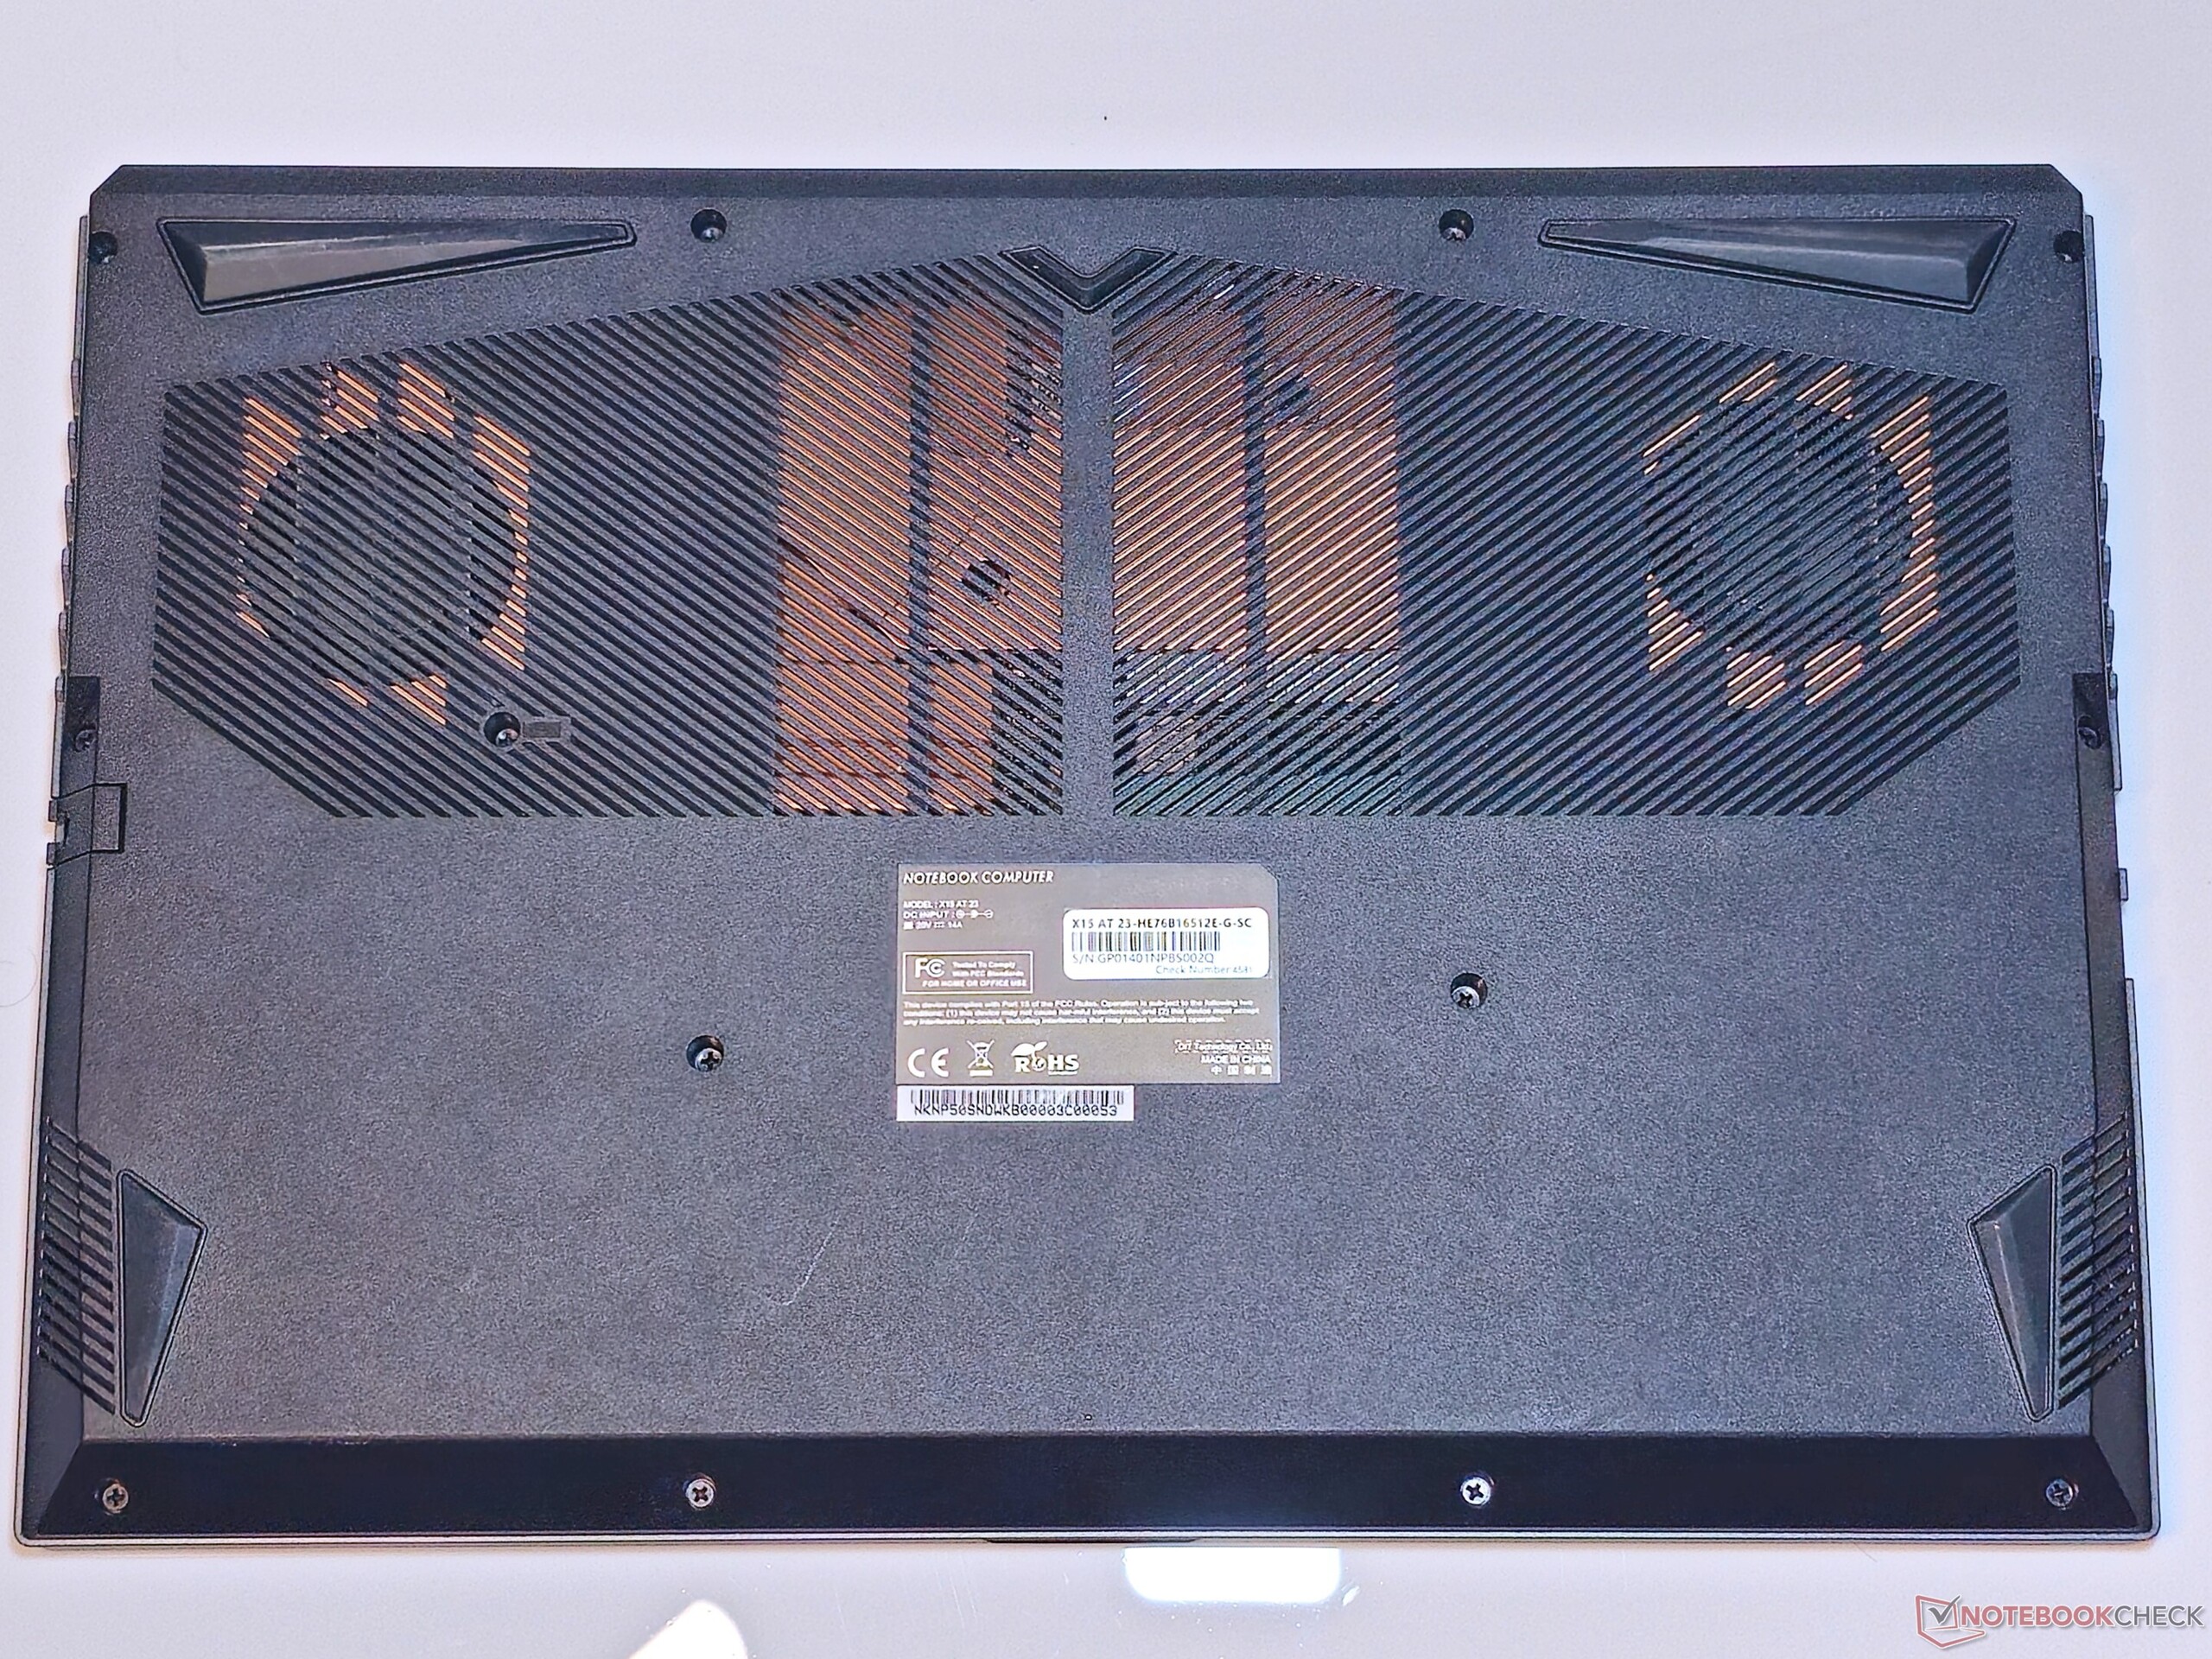
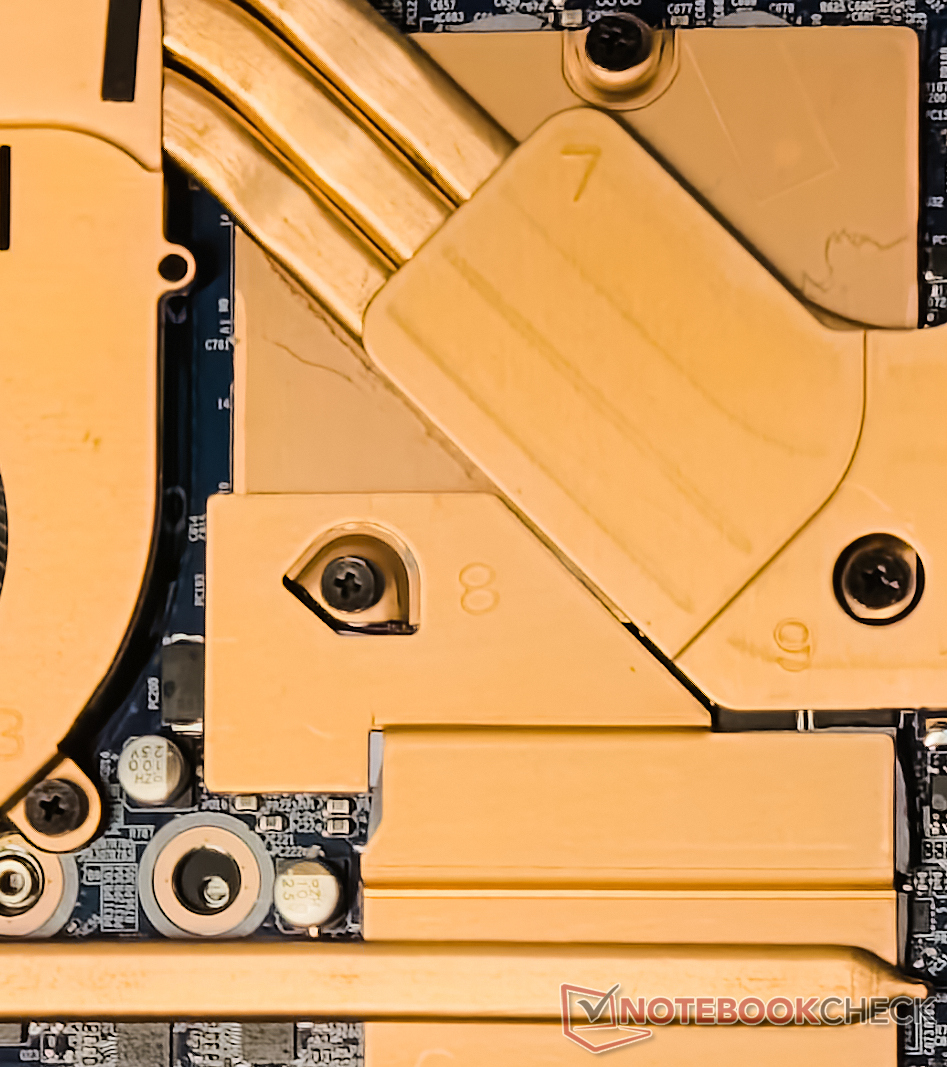
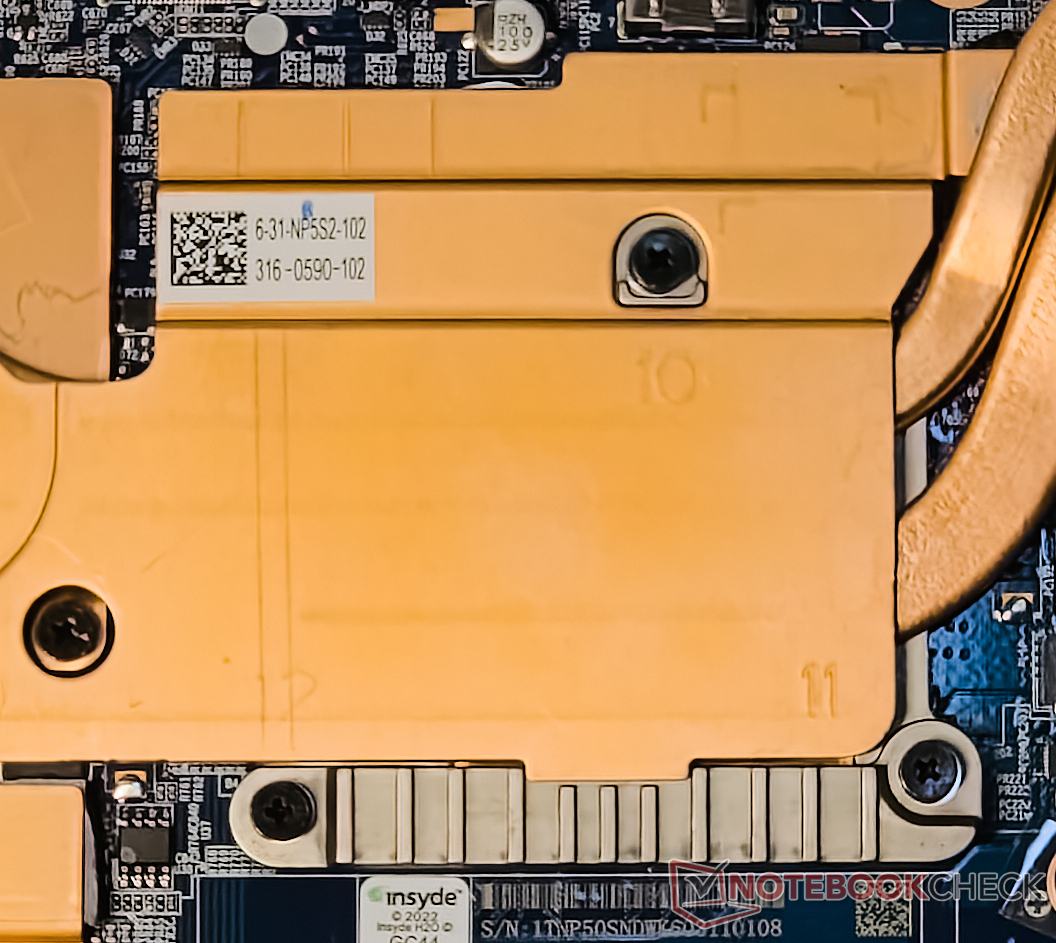
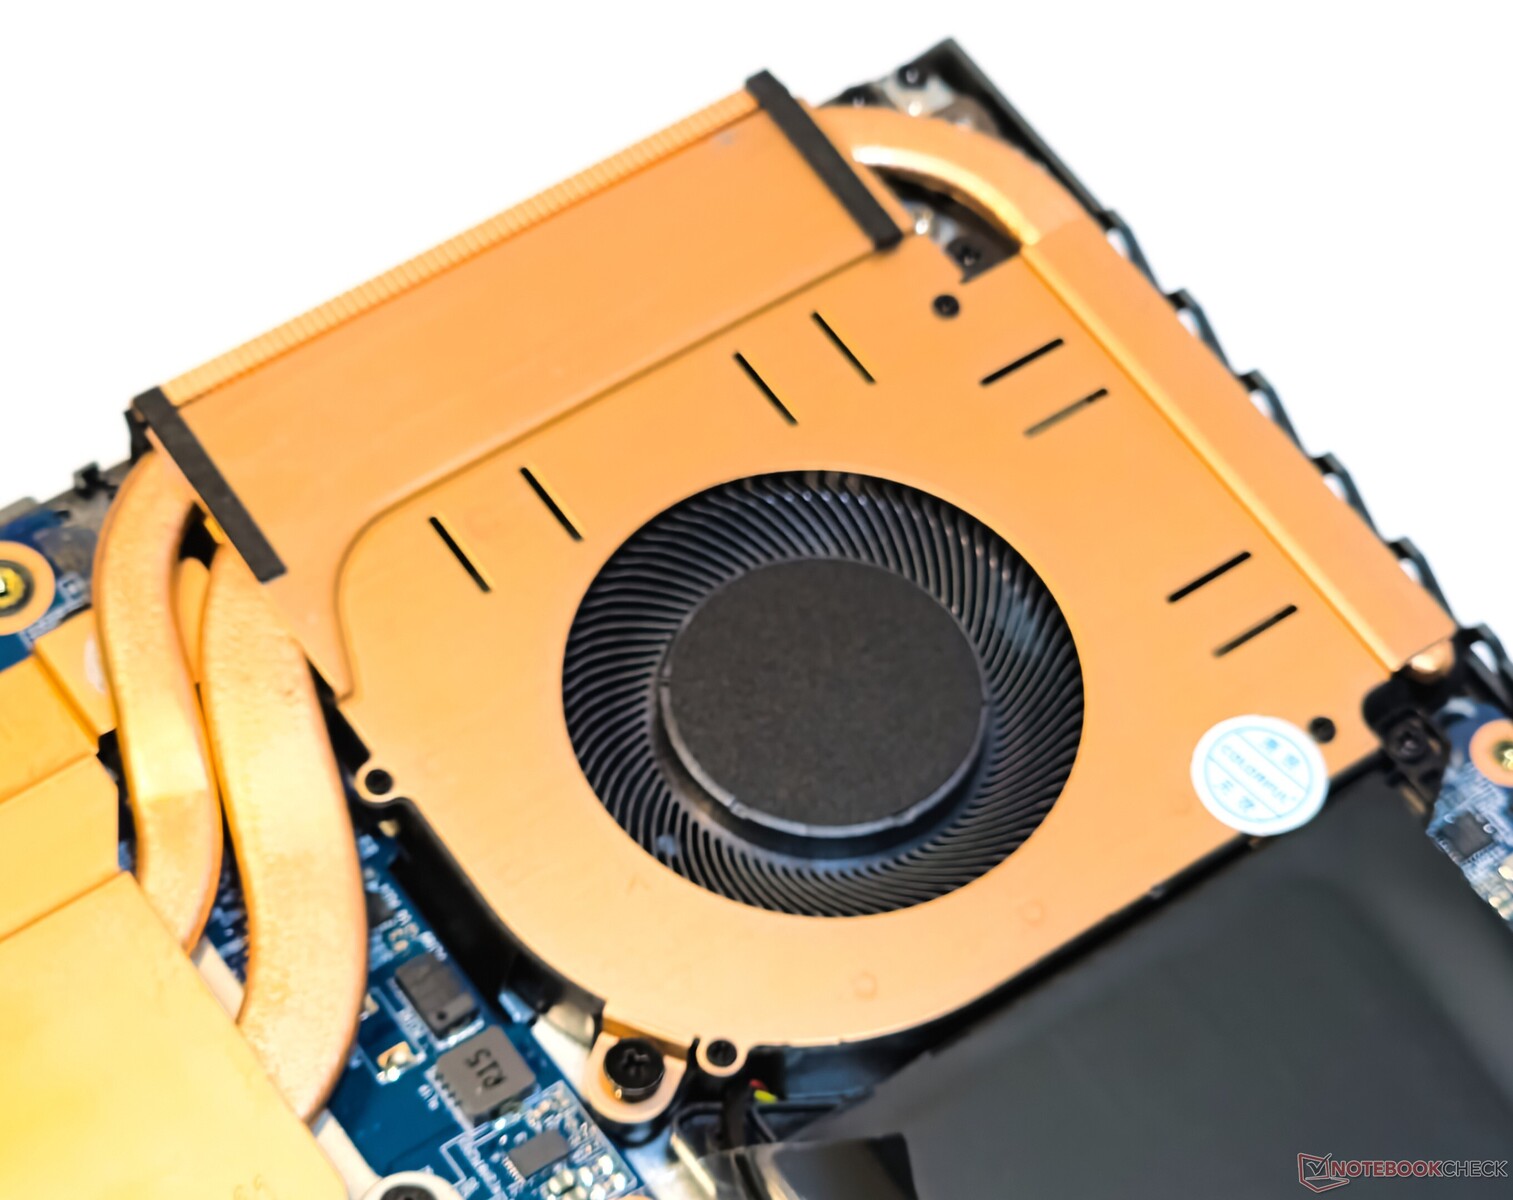
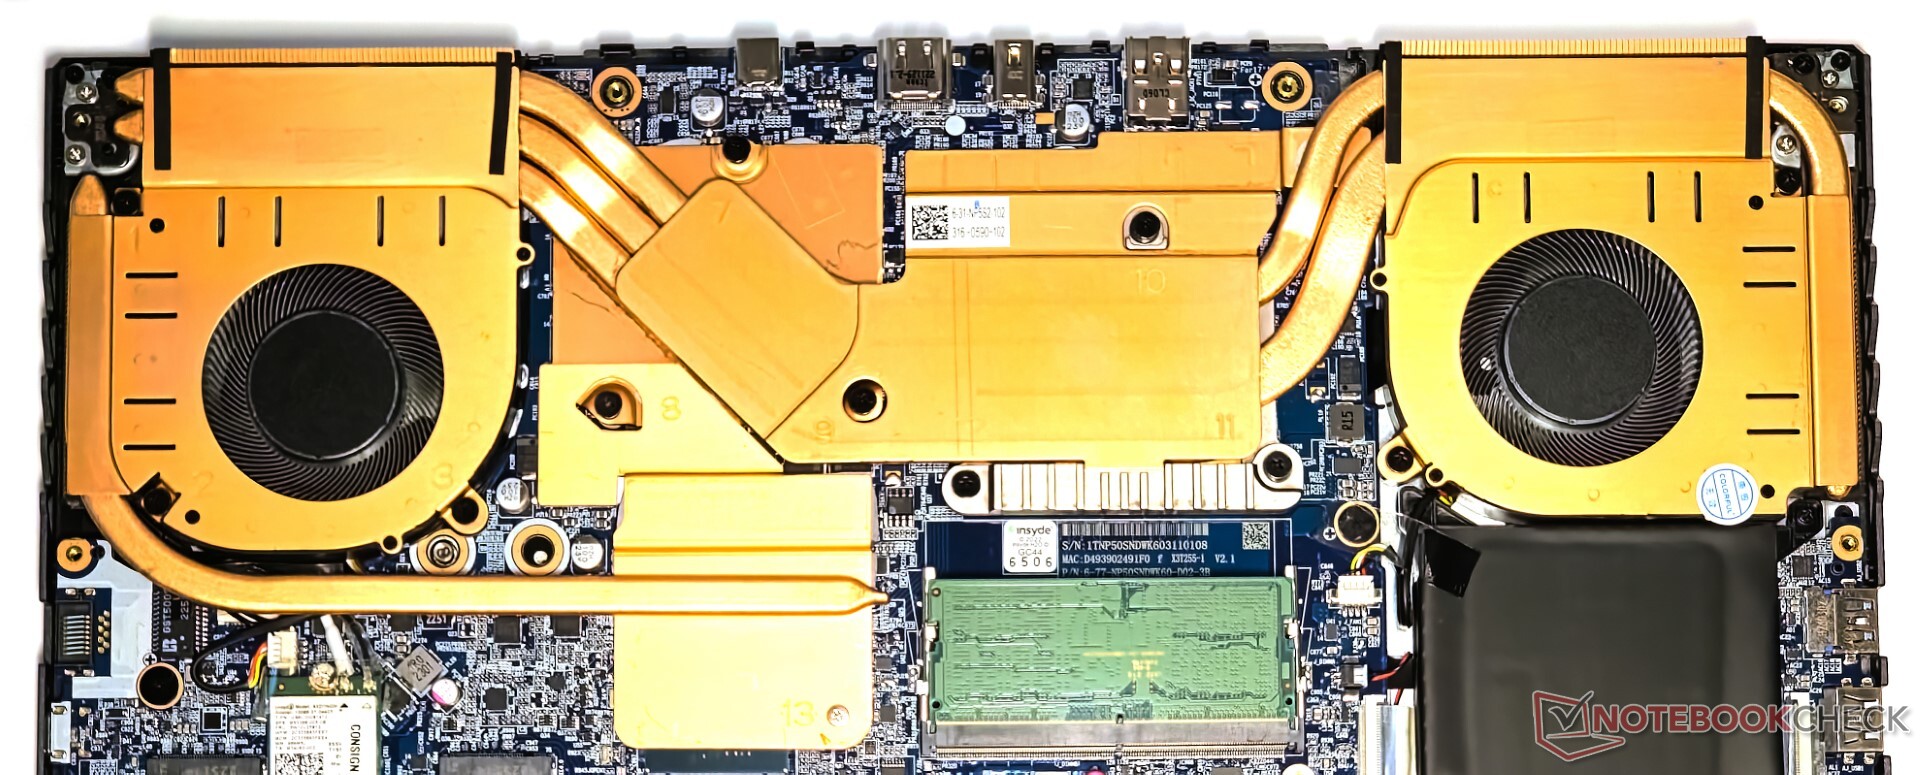
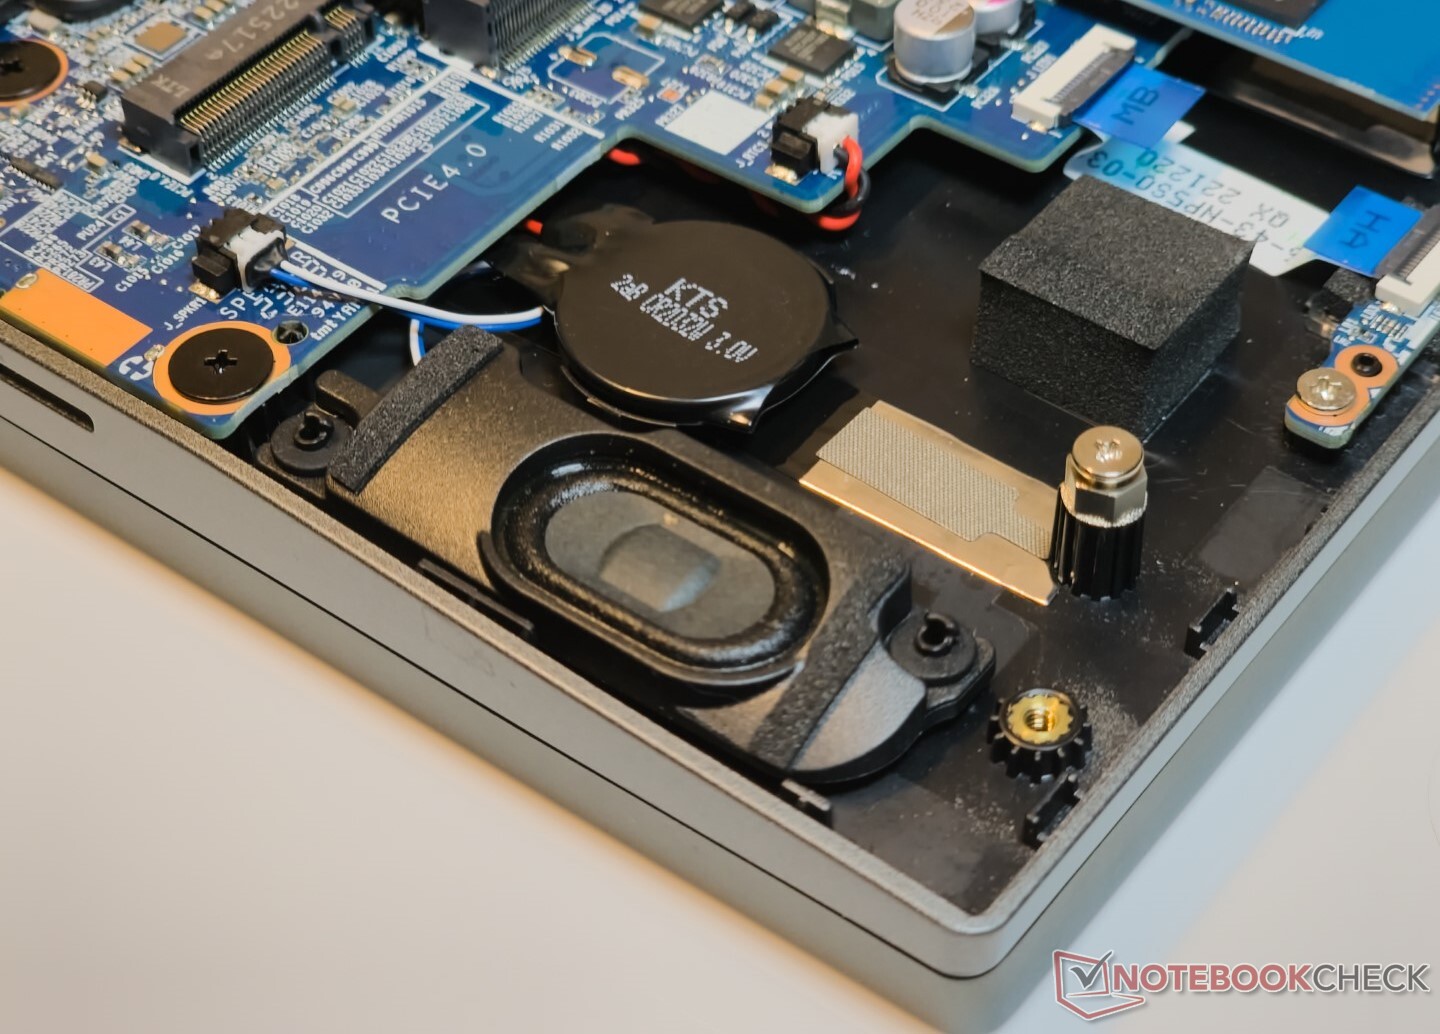
Konserwacja
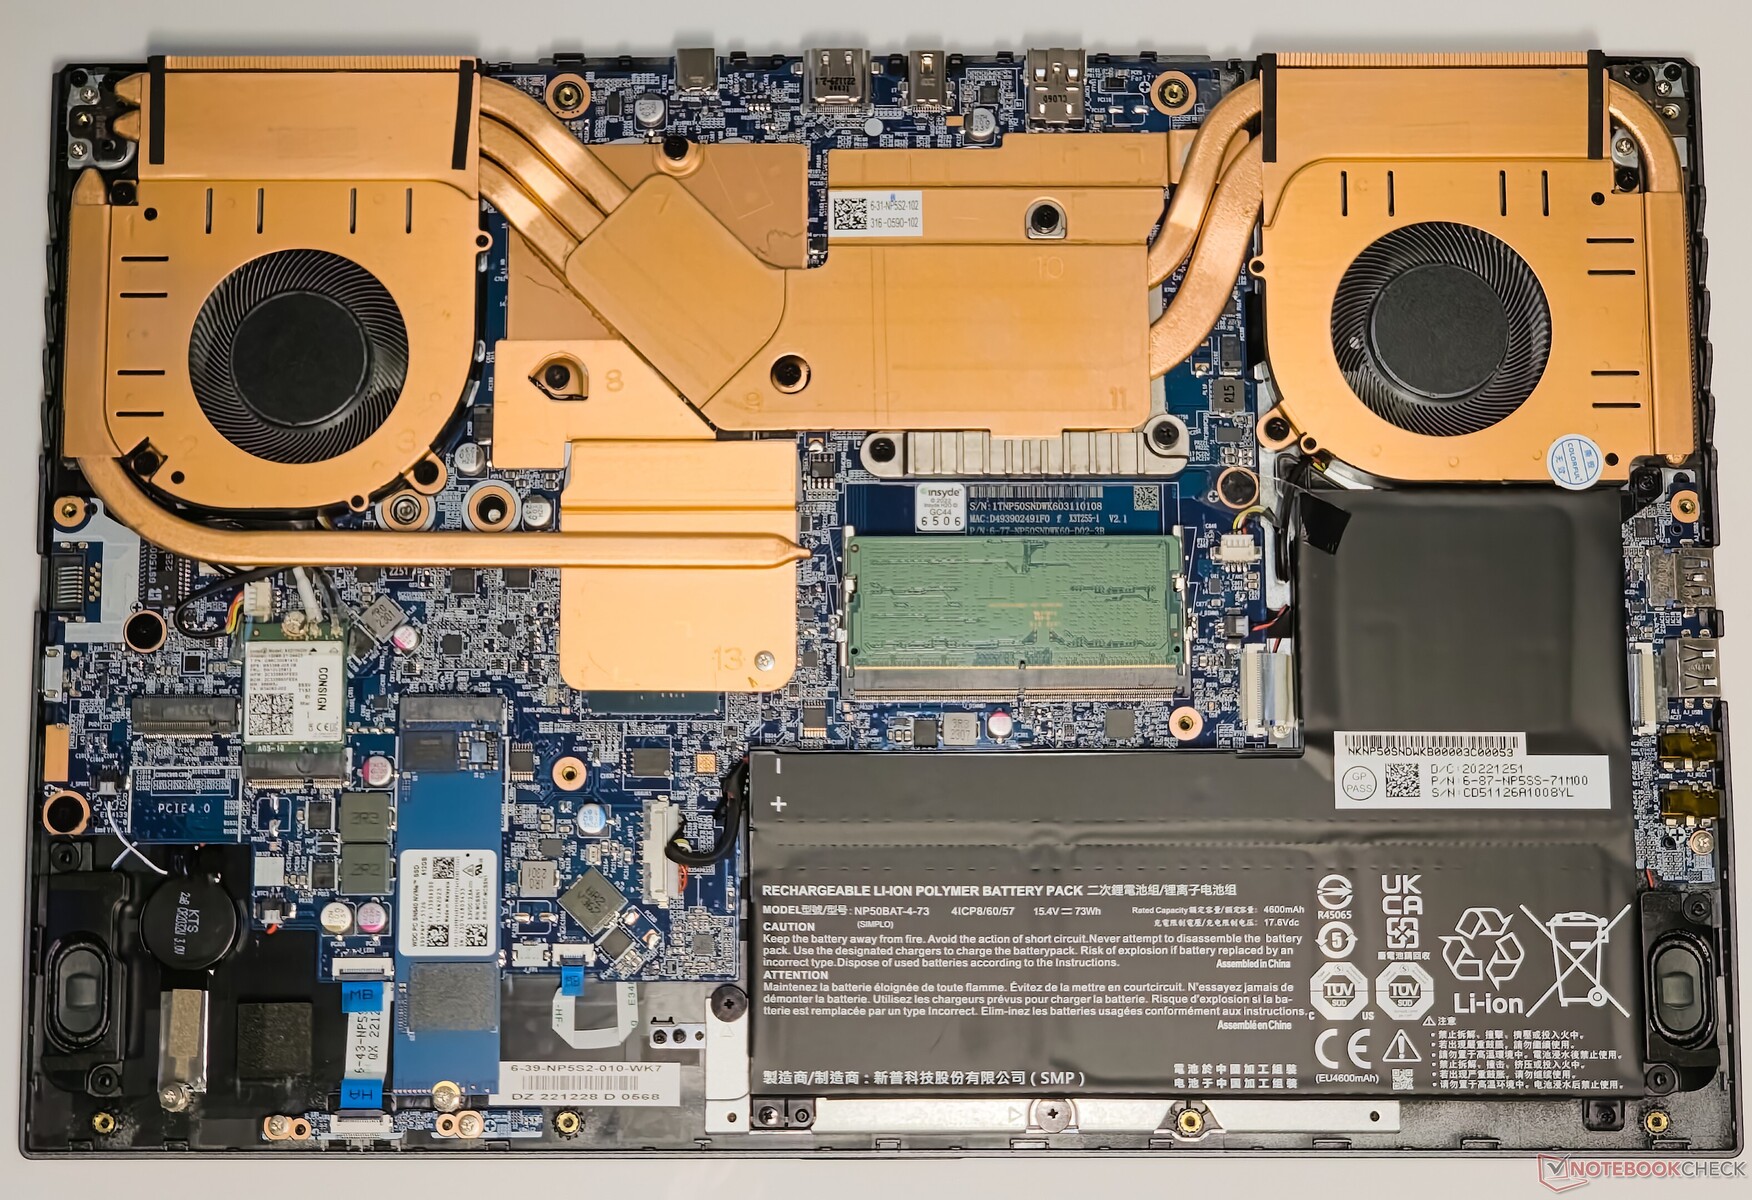
Tylny panel można łatwo zdjąć po odkręceniu 13 śrub PH0. EVOL X15 prezentuje bogaty układ wewnętrzny wraz z rozbudowanym, całkowicie miedzianym systemem chłodzenia dla CPU i GPU.
Nasz egzemplarz wyposażony był tylko w jedną pamięć 16 GB DDR5-4800 skonfigurowaną w trybie dwukanałowym. Kartę WLAN, pamięć RAM i dysk SSD NVMe można wymienić lub zmodernizować w razie potrzeby, a akumulator w kształcie litery L można odkręcić.
Urządzenia wejściowe: Miękkie klawisze z przyzwoitym wyczuciem
Klawiatura
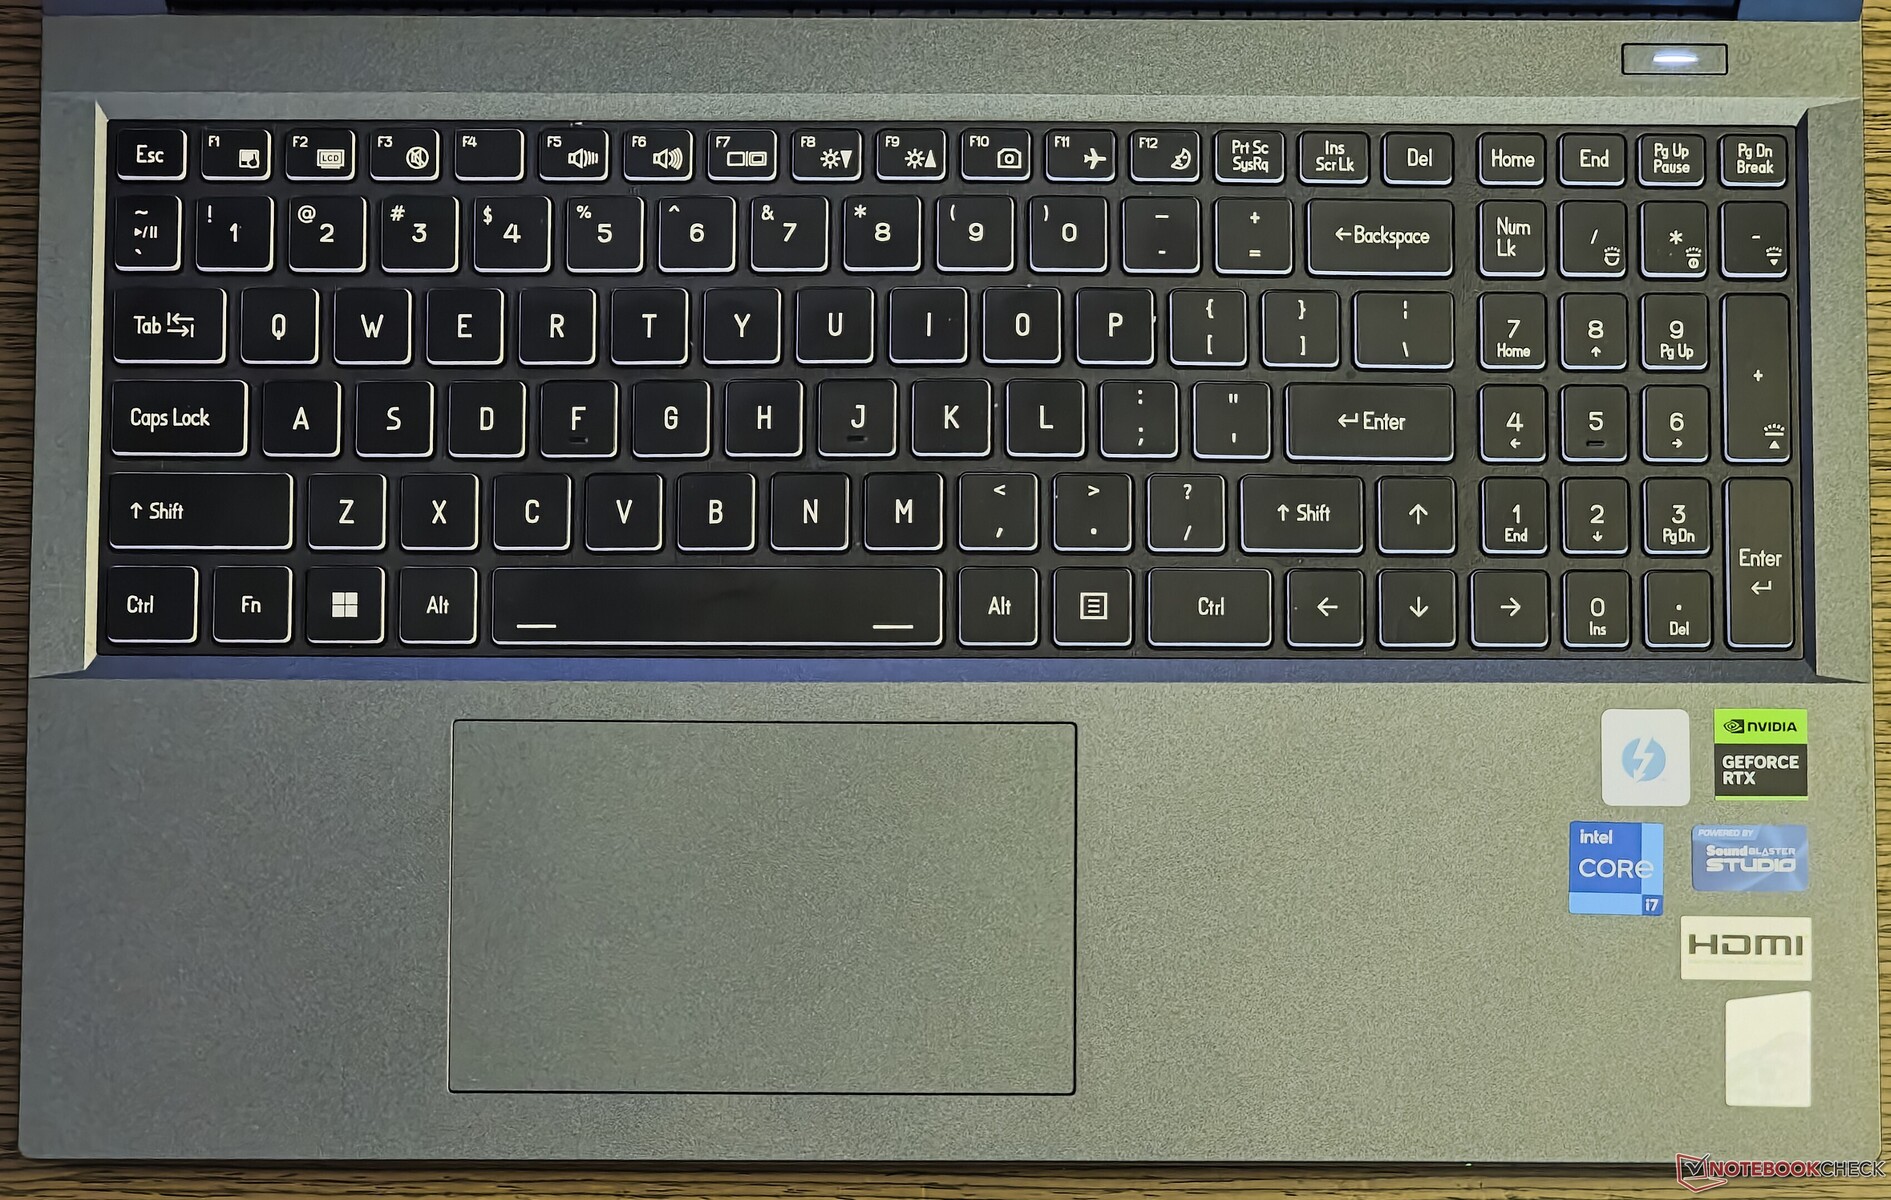
Pełnowymiarowa klawiatura EVOL X15 zawiera klawiaturę numeryczną i miejsce na odpowiedniej wielkości klawisze strzałek - jest to dobrodziejstwo dla tytułów wyścigowych. Jedną z wad tego układu jest skrócony prawy klawisz Shift, który może przeszkadzać użytkownikom przechodzącym z typowej klawiatury komputera stacjonarnego lub nawet laptopa.
Skok klawiszy początkowo wydaje się nieco miękki, ale jest wystarczający do grania i pisania. Aplikacja Colorful (czytaj Clevo) Control Center umożliwia nagrywanie makr klawiatury i myszy, co powinno przydać się graczom MMORPG i MOBA.
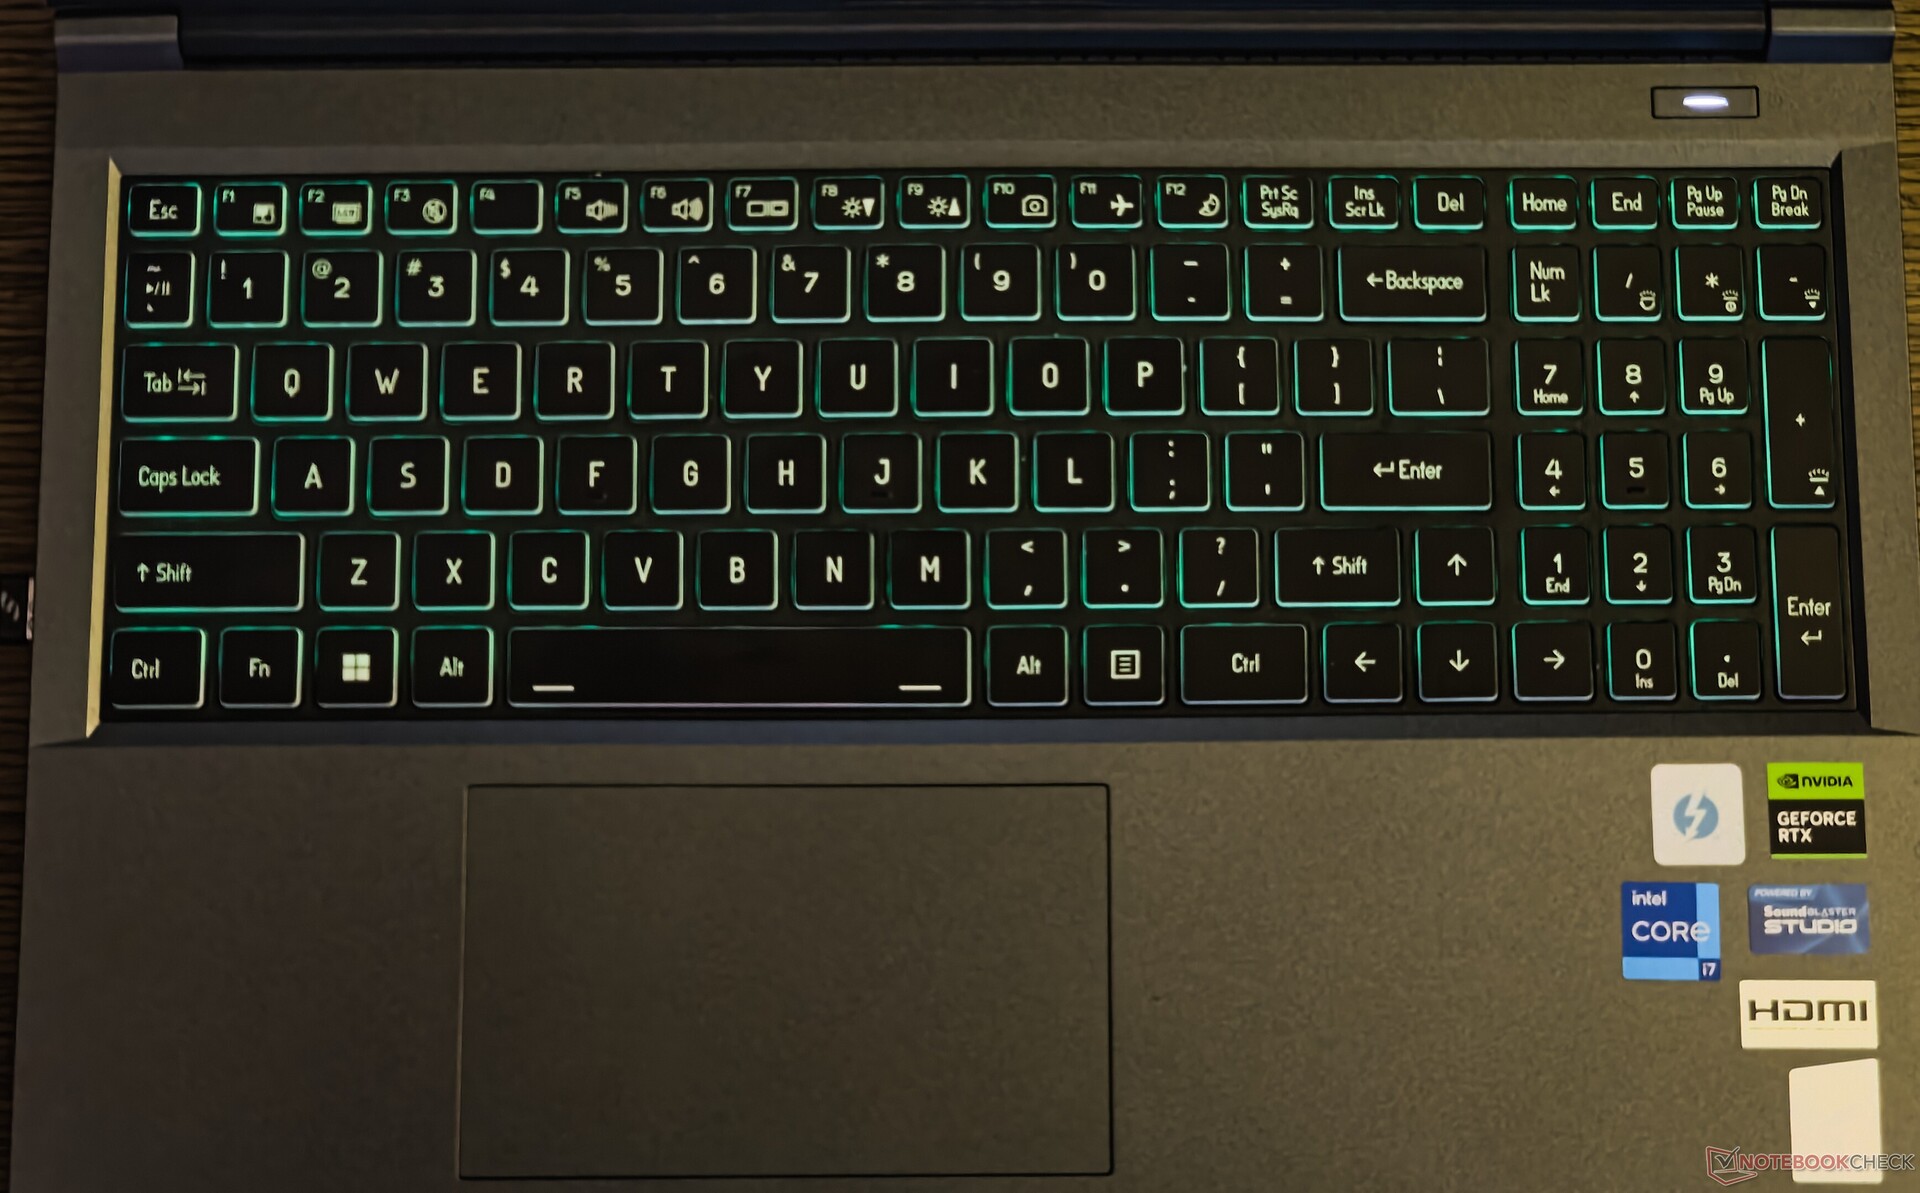
Klawiatura nie posiada wielostrefowego podświetlenia RGB, więc będą Państwo musieli zmagać się z ograniczoną paletą kolorów w aplikacji Control Center. Podświetlenie można regulować w czterech stopniach, ale klawisze odfiltrowują sporą ilość światła.
Panel dotykowy
Touchpad o wymiarach 12 cm x 7 cm nie jest największym, jaki widzieliśmy w laptopach do gier w tym roku, ale oferuje stosunkowo płynne przesuwanie i w pełni obsługuje gesty systemu Windows Precision.
Cała powierzchnia touchpada służy jako lewy przycisk myszy. Kliknięcia są jednak łatwiejsze i mniej hałaśliwe w środkowej i dolnej części touchpada w porównaniu do górnych rogów.
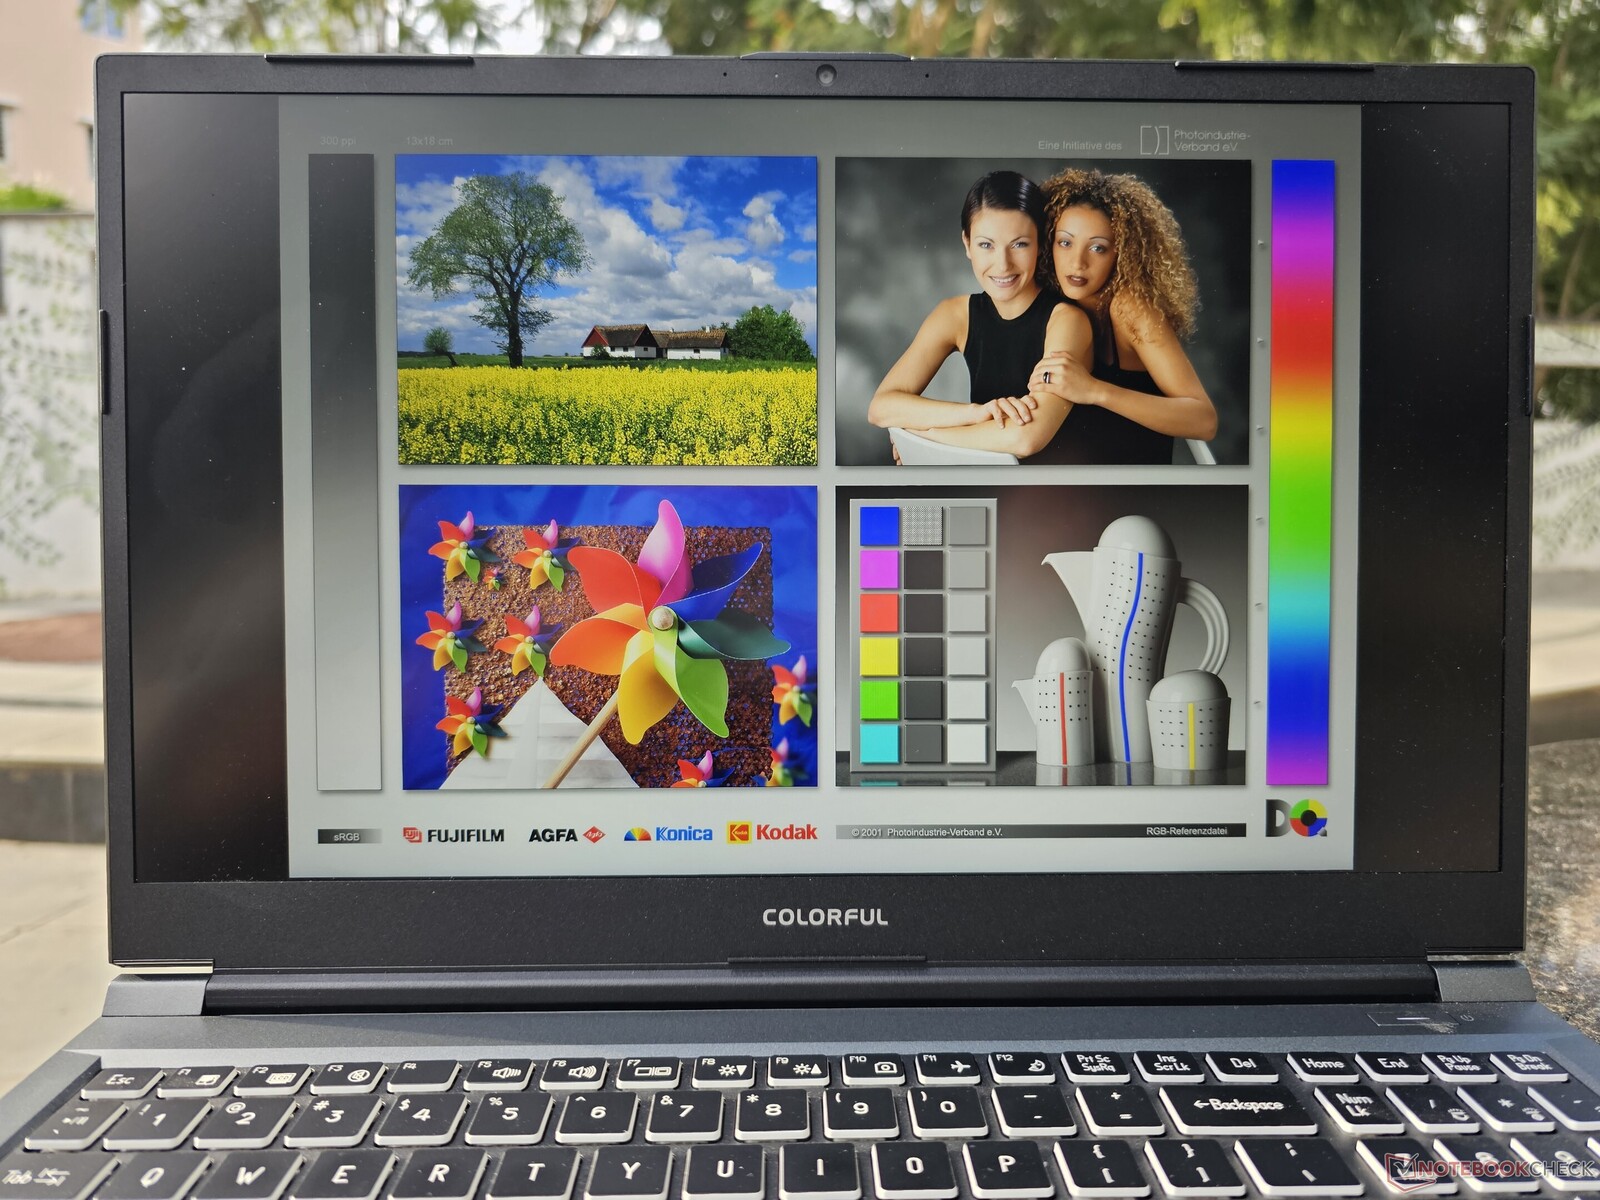
Wyświetlacz: panel QHD 165 Hz bez PWM
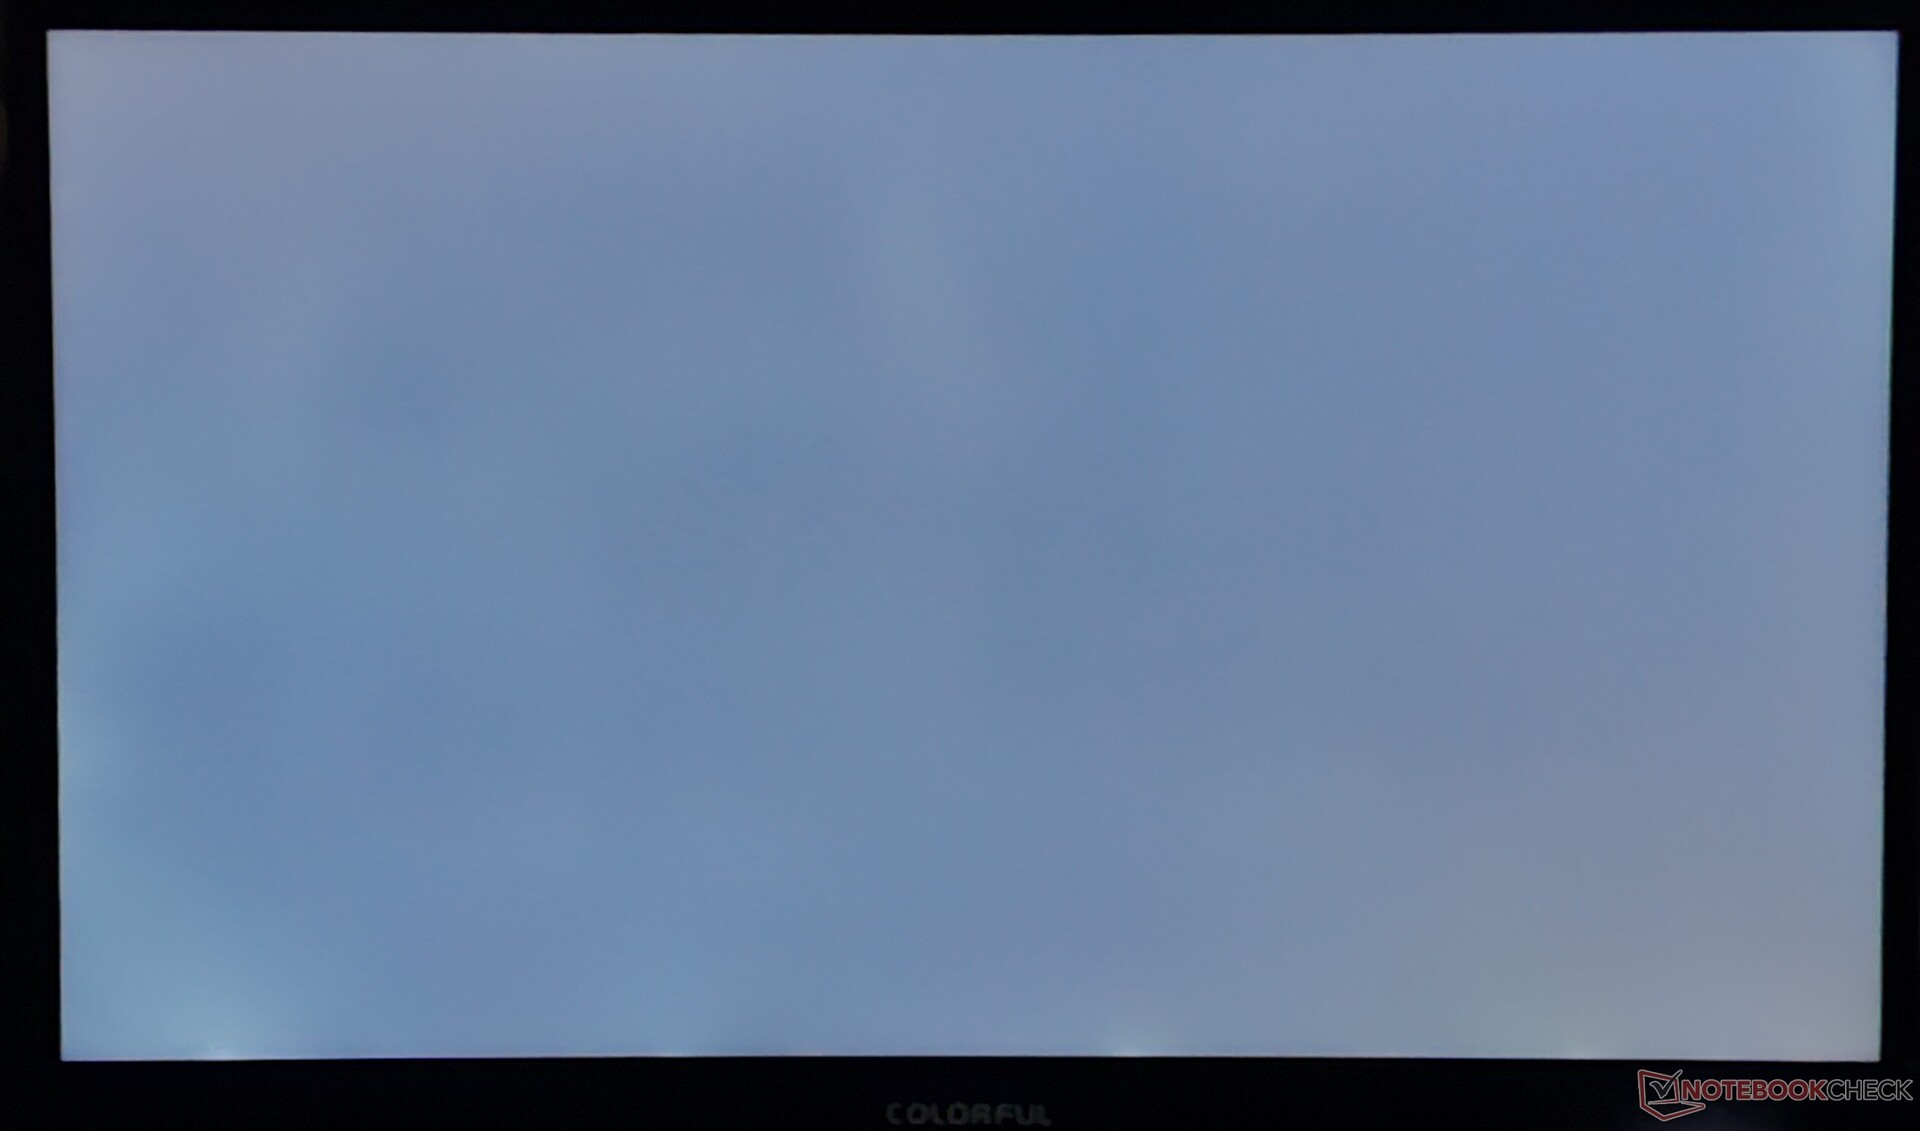
EVOL X15 AT jest wyposażony w 15,6-calowy panel BOE QHD 165 Hz. Wyświetlacz nie zachwyca szczytową luminancją na poziomie 345 nitów i średnią 318 nitów, ale jest na równi z większością laptopów do gier w tej cenie. W narożnikach zaobserwowano minimalne krwawienie podświetlenia.
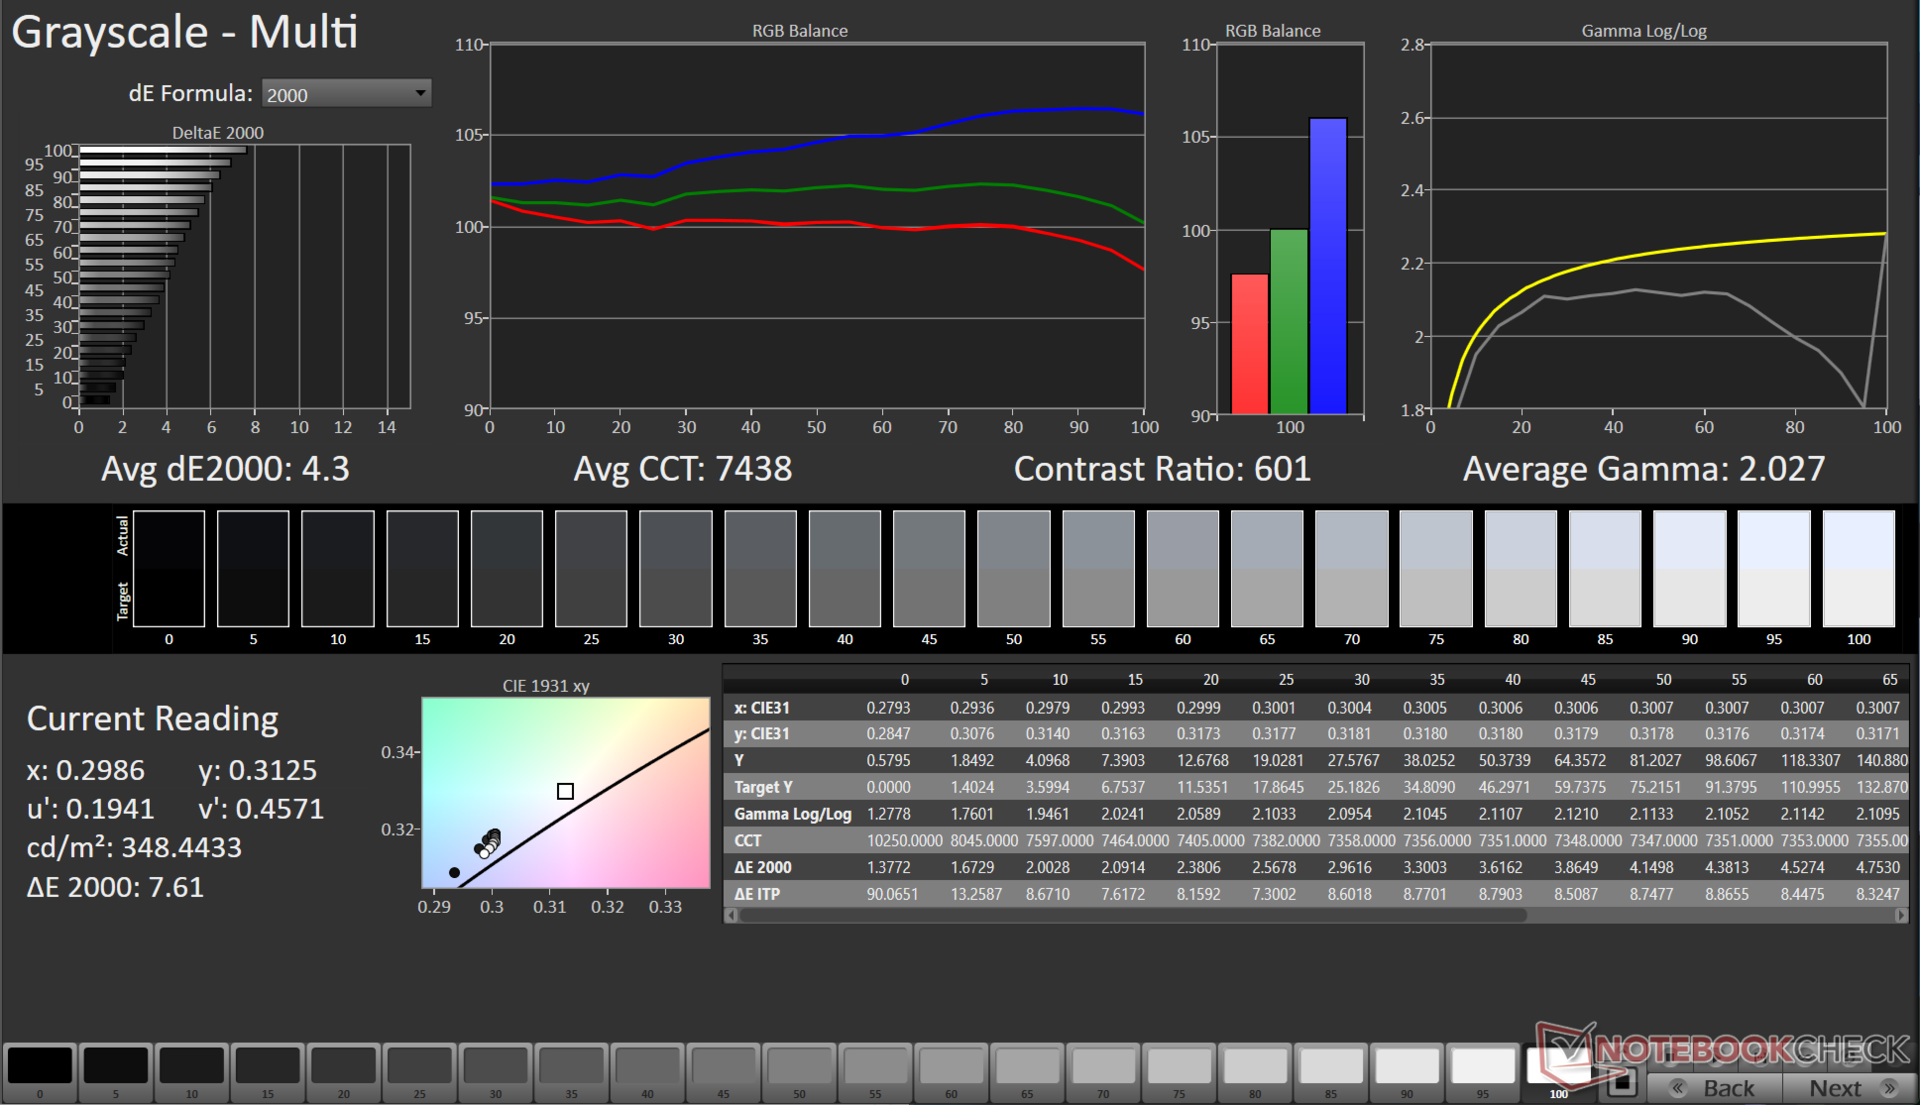
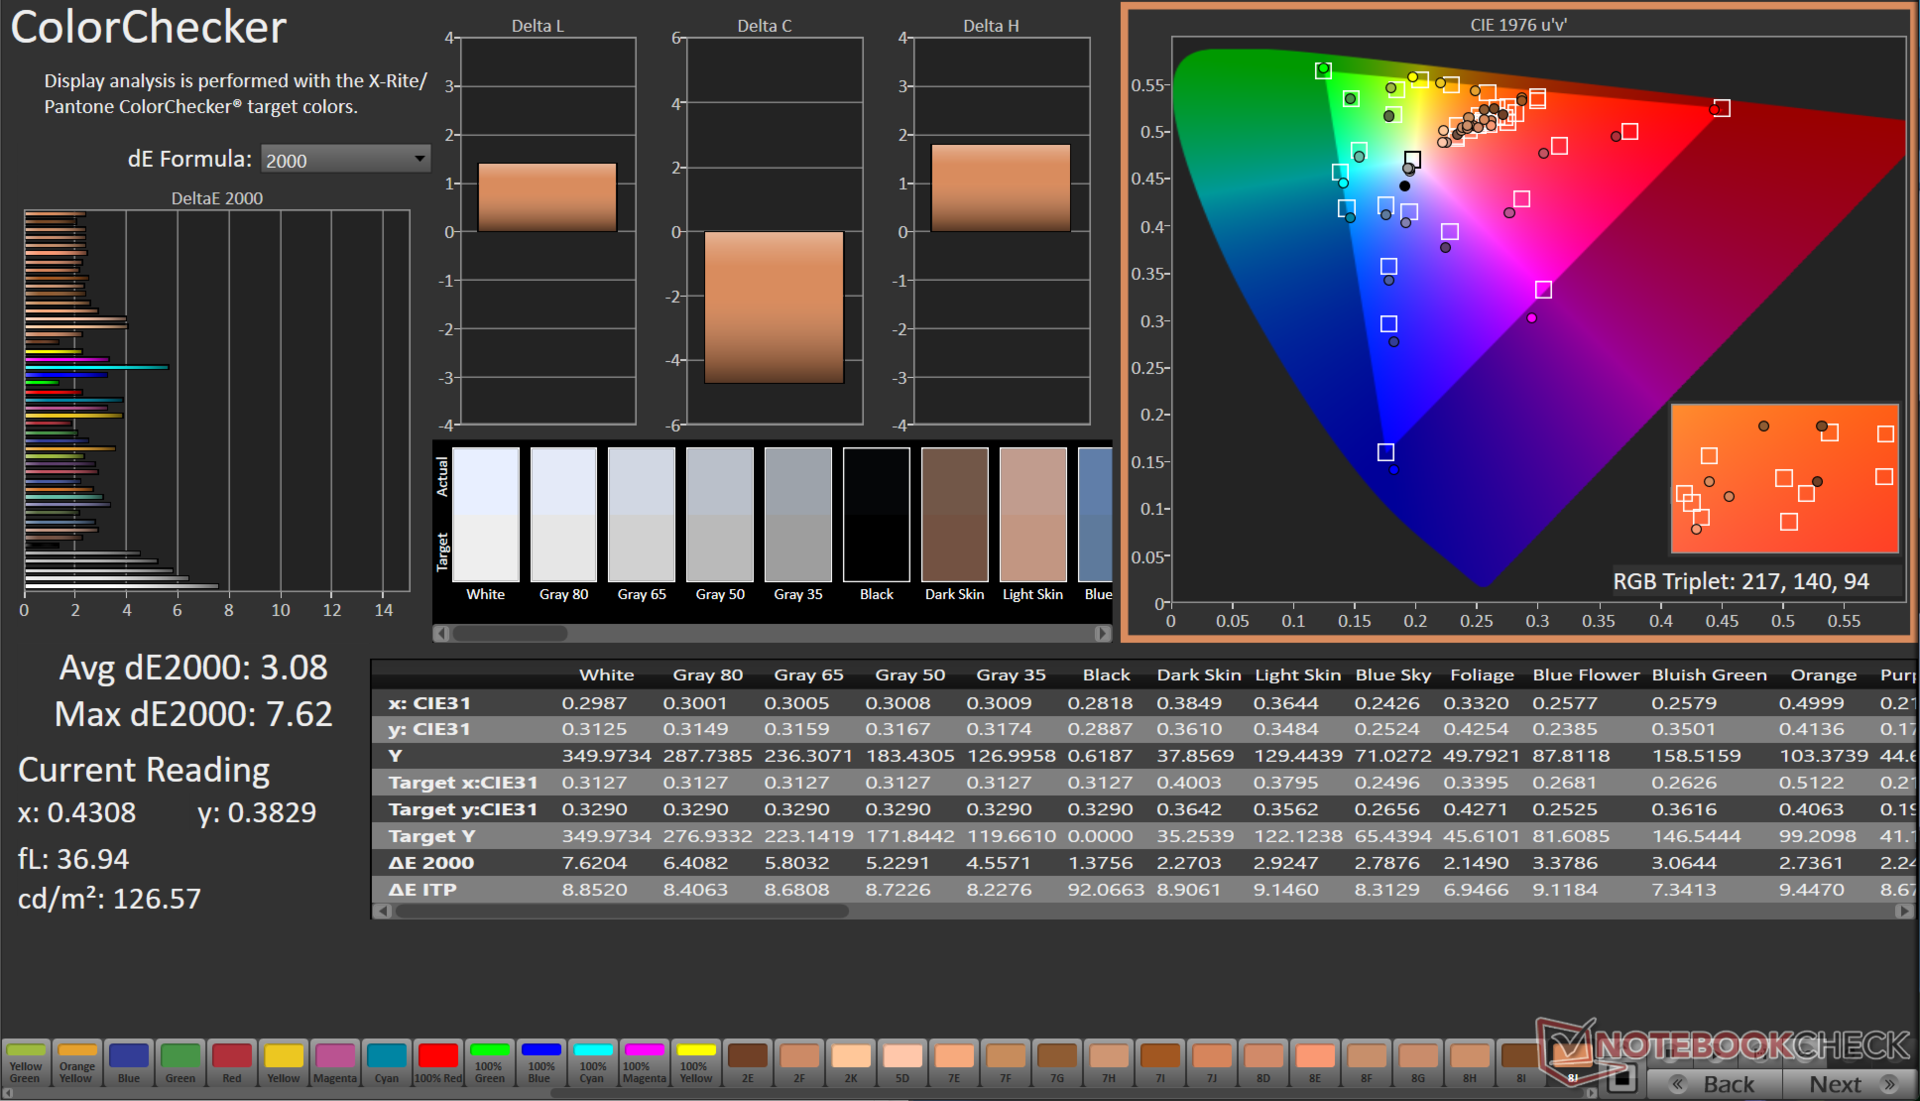
Panel wykazuje przyzwoity rozkład jasności 81%, ale zmierzony współczynnik kontrastu 607:1 znajduje się na niższym końcu, zwłaszcza w porównaniu z innymi panelami BOE w tym porównaniu.

| |||||||||||||||||||||||||
rozświetlenie: 81 %
na akumulatorze: 251 cd/m²
kontrast: 607:1 (czerń: 0.57 cd/m²)
ΔE ColorChecker Calman: 3.08 | ∀{0.5-29.43 Ø4.73}
calibrated: 1.12
ΔE Greyscale Calman: 4.3 | ∀{0.09-98 Ø4.97}
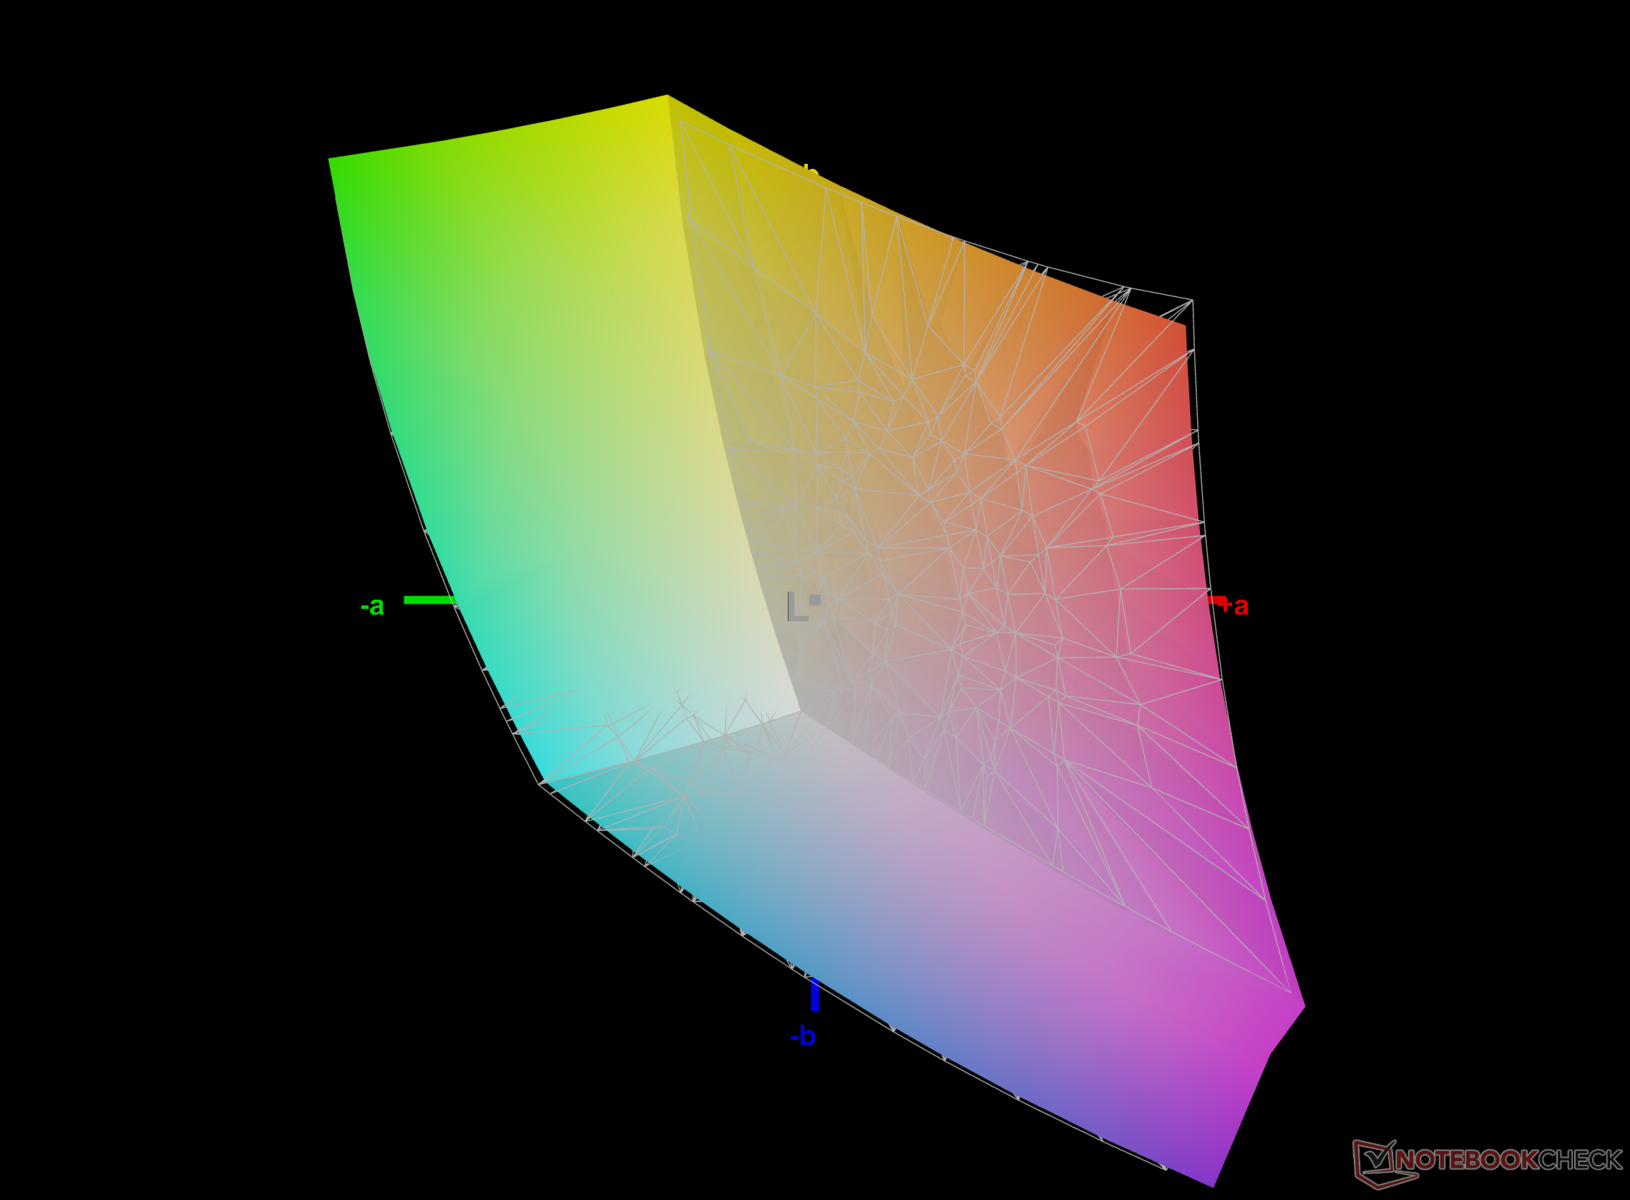
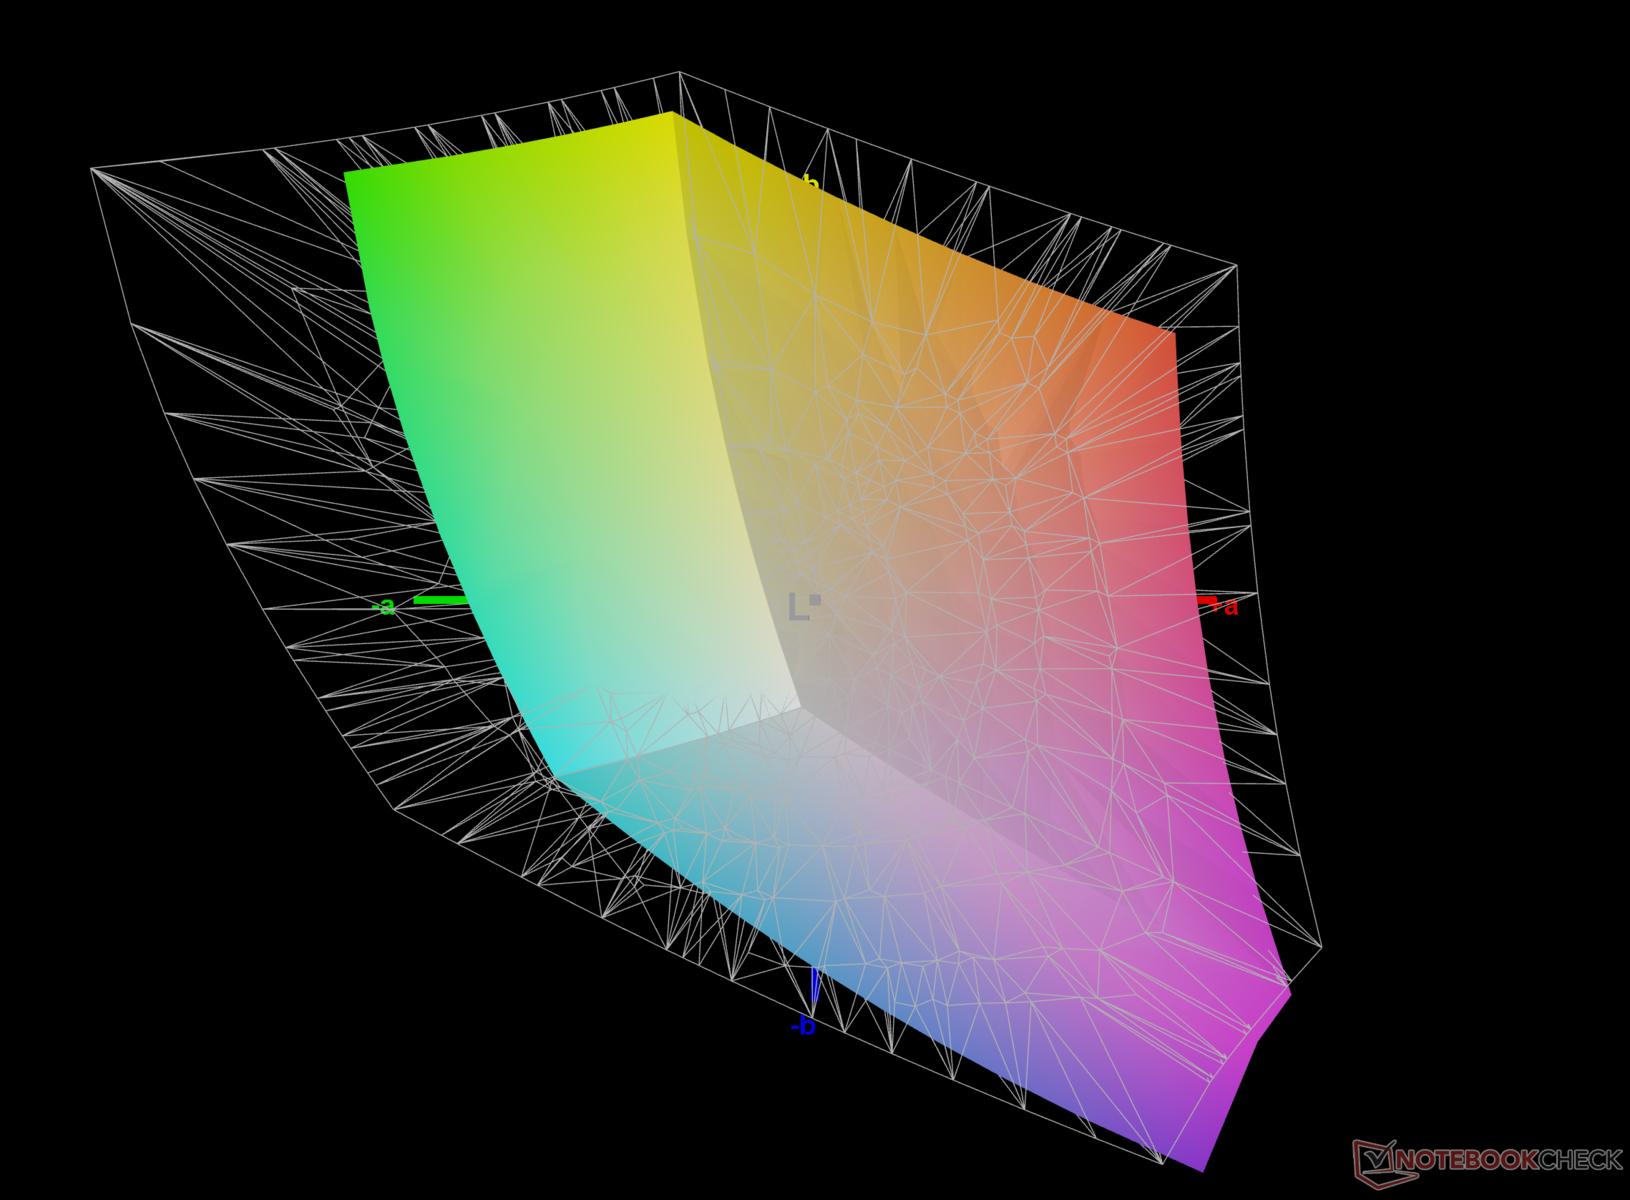
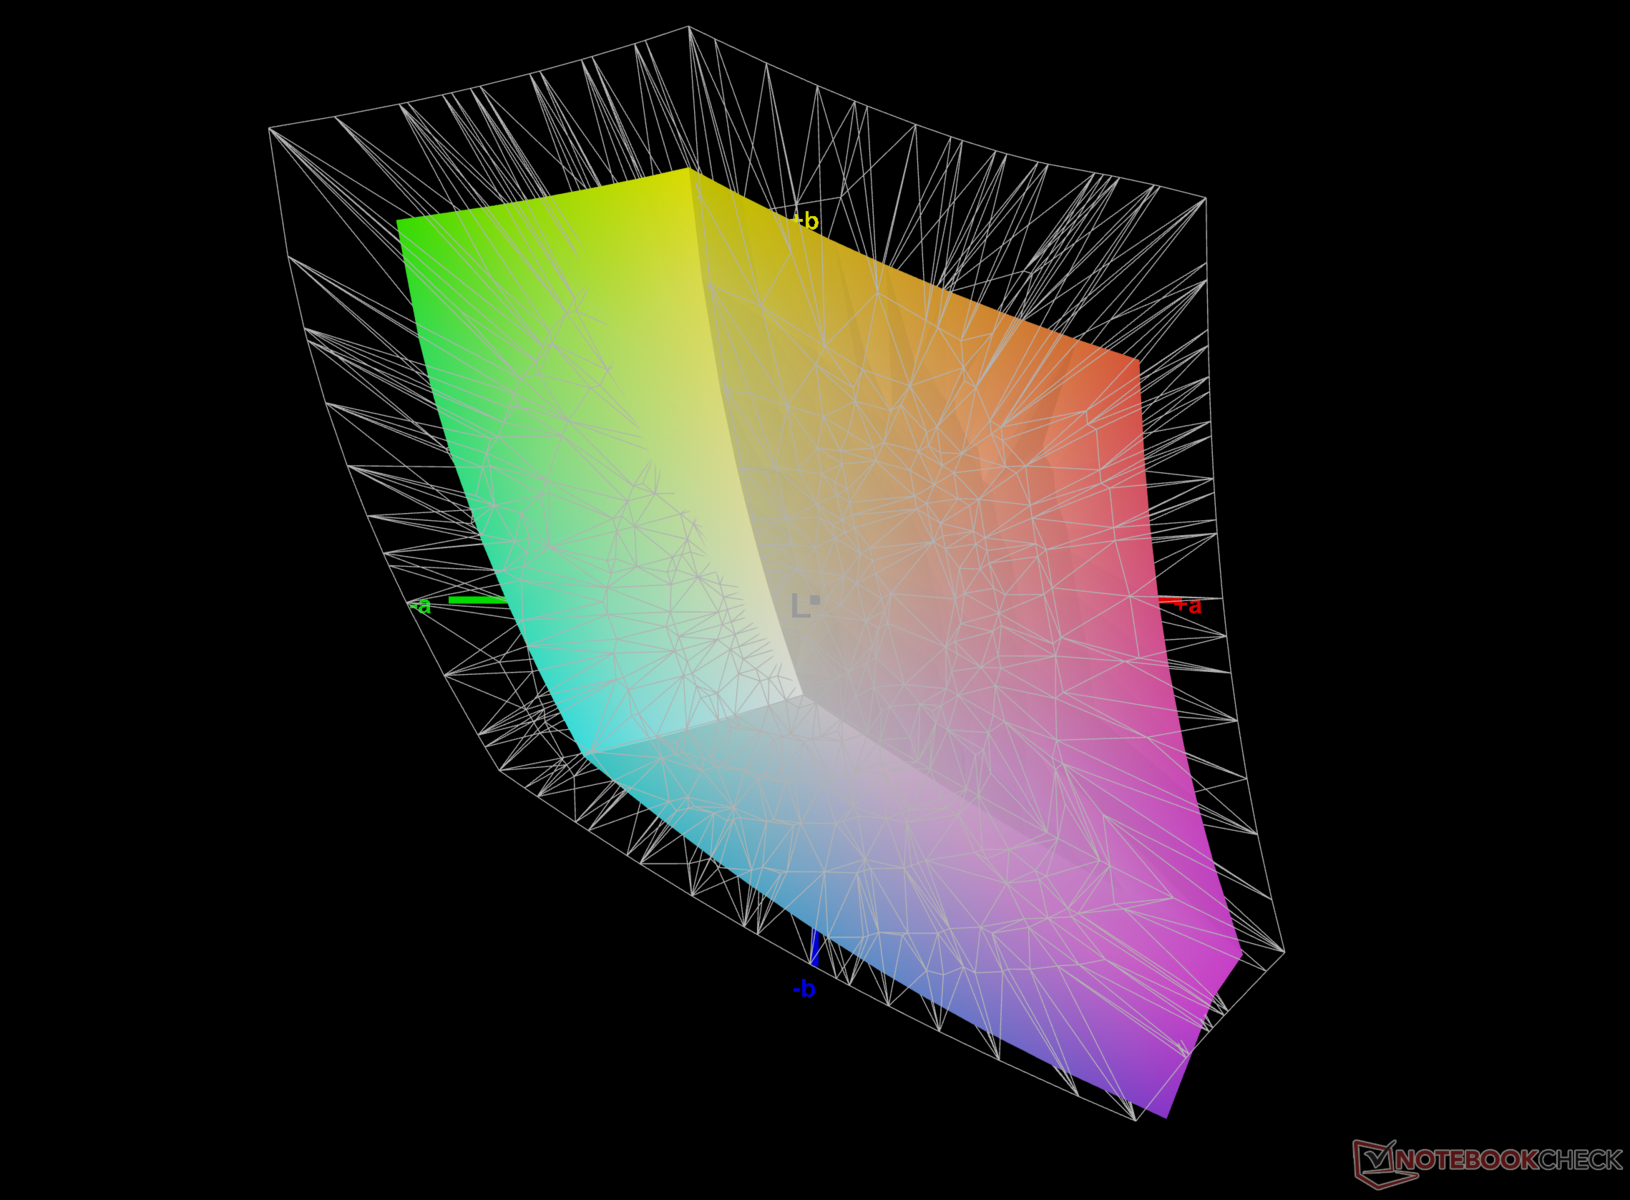
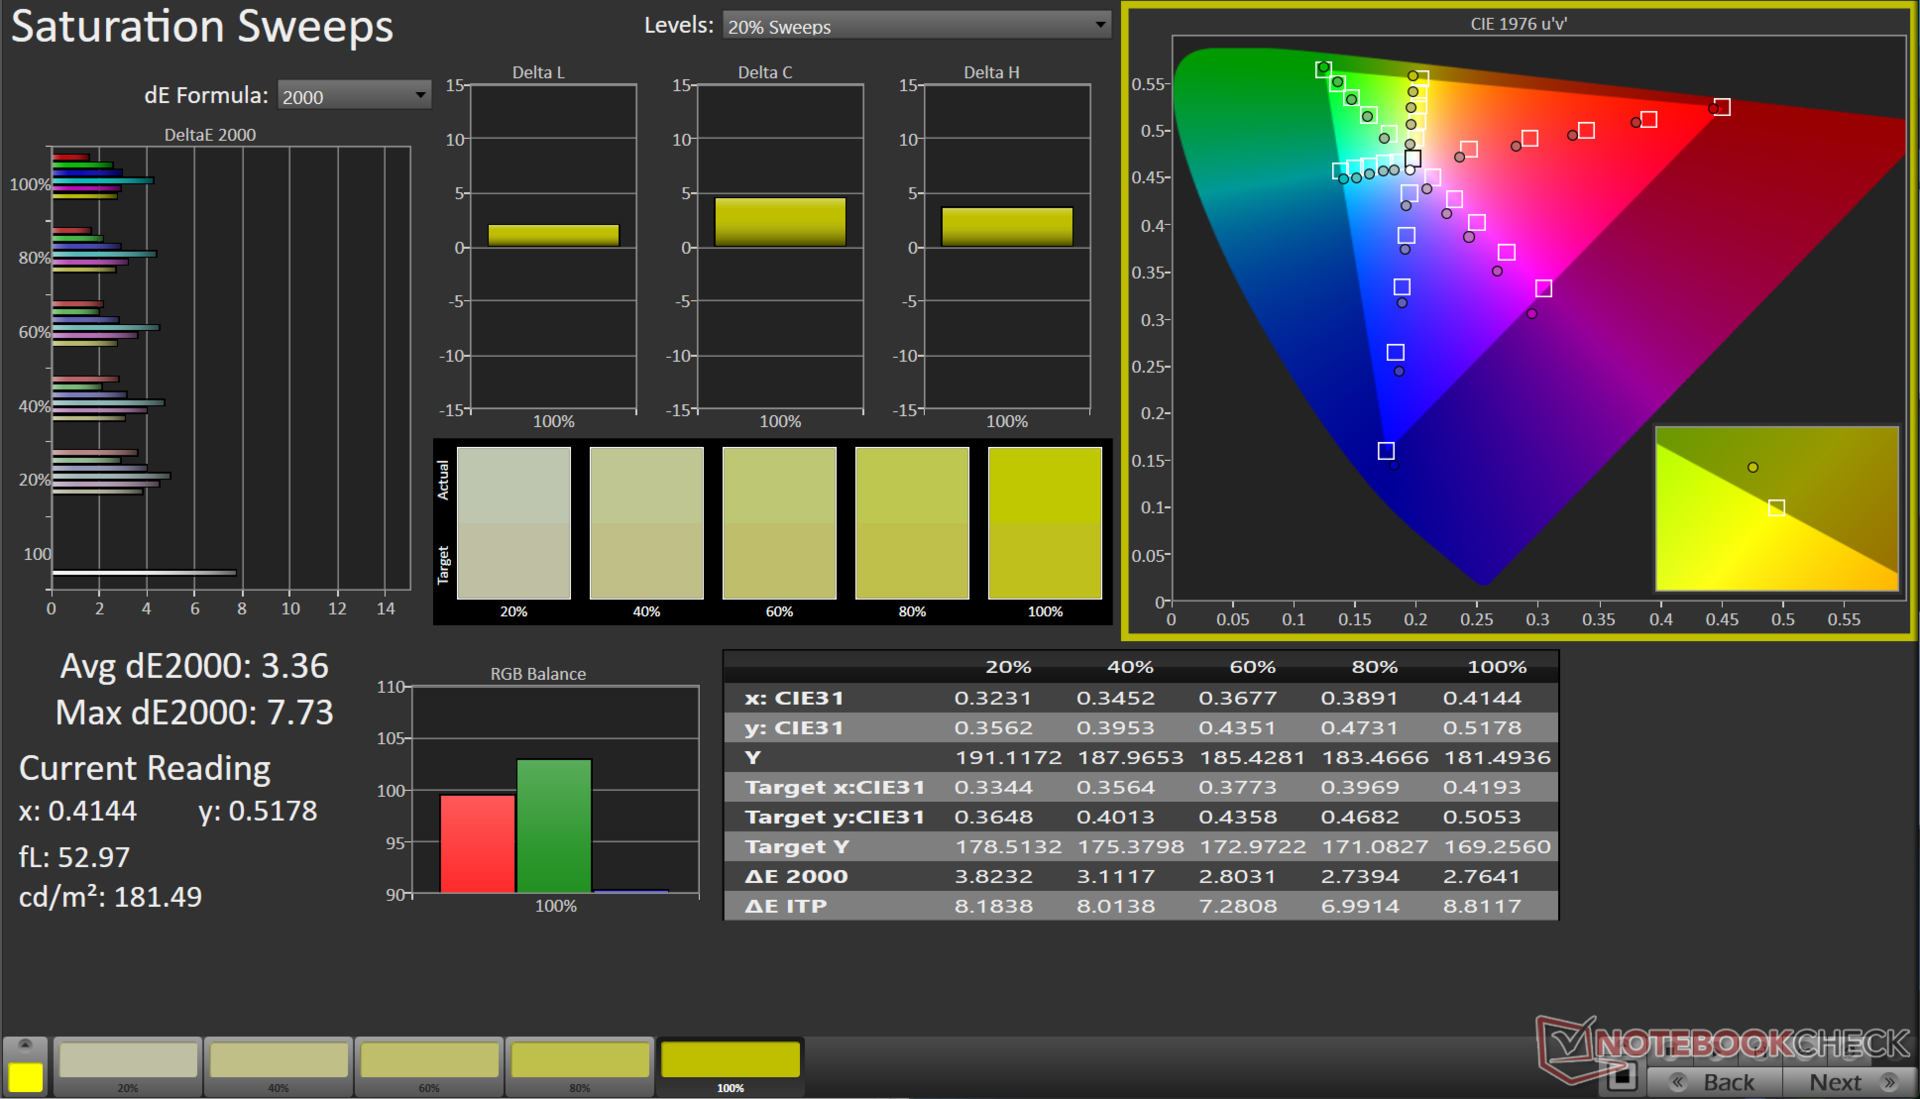
68.2% AdobeRGB 1998 (Argyll 3D)
97.4% sRGB (Argyll 3D)
66.9% Display P3 (Argyll 3D)
Gamma: 2.02
CCT: 7438 K
| Colorful EVOL X15 AT 23 BOE CQ NE156QHM-NY2, IPS, 2560x1440, 15.6" | Alienware m16 R1 Intel BOE NE16NYB, IPS, 2560x1600, 16" | HP Omen 16-wf000 BOE0B7D, IPS, 2560x1440, 16.1" | Acer Predator Helios 16 PH16-71-731Q BOE NE160QDM-NZ2, IPS-LED, 2560x1600, 16" | Dell G15 5530 AUO B156HAN, IPS, 1920x1080, 15.6" | Schenker XMG Pro 15 (E23) BOE0AD1, IPS, 2560x1440, 15.6" | Alienware m16 R1 AMD BOE NE16NZ4, IPS, 2560x1600, 16" | Uniwill GM6PX7X RTX 4070 BOE CQ NE160QDM-NZ1, IPS, 2560x1600, 16" | |
|---|---|---|---|---|---|---|---|---|
| Display | 1% | 3% | 24% | 6% | 25% | 27% | 0% | |
| Display P3 Coverage (%) | 66.9 | 67.7 1% | 69 3% | 97.1 45% | 73.1 9% | 97.8 46% | 98.6 47% | 67.5 1% |
| sRGB Coverage (%) | 97.4 | 97.2 0% | 99.2 2% | 100 3% | 98.4 1% | 99.9 3% | 99.9 3% | 96.4 -1% |
| AdobeRGB 1998 Coverage (%) | 68.2 | 70 3% | 71.2 4% | 84.7 24% | 74.4 9% | 85.4 25% | 88.9 30% | 68.6 1% |
| Response Times | 35% | 16% | -7% | 49% | -29% | 18% | -23% | |
| Response Time Grey 50% / Grey 80% * (ms) | 10.42 ? | 4 ? 62% | 4.6 ? 56% | 13.6 ? -31% | 3.39 ? 67% | 14 ? -34% | 5.1 ? 51% | 12.6 ? -21% |
| Response Time Black / White * (ms) | 7.81 ? | 7.3 ? 7% | 9.7 ? -24% | 6.4 ? 18% | 5.35 ? 31% | 9.6 ? -23% | 9 ? -15% | 9.8 ? -25% |
| PWM Frequency (Hz) | 21620 ? | |||||||
| Screen | 24% | 28% | 42% | 7% | 12% | 0% | 22% | |
| Brightness middle (cd/m²) | 346 | 306 -12% | 310.9 -10% | 511 48% | 320 -8% | 322 -7% | 329 -5% | 338.6 -2% |
| Brightness (cd/m²) | 318 | 302 -5% | 296 -7% | 498 57% | 316 -1% | 301 -5% | 317 0% | 328 3% |
| Brightness Distribution (%) | 81 | 89 10% | 91 12% | 94 16% | 94 16% | 85 5% | 89 10% | 89 10% |
| Black Level * (cd/m²) | 0.57 | 0.3 47% | 0.35 39% | 0.36 37% | 0.21 63% | 0.36 37% | 0.32 44% | 0.32 44% |
| Contrast (:1) | 607 | 1020 68% | 888 46% | 1419 134% | 1524 151% | 894 47% | 1028 69% | 1058 74% |
| Colorchecker dE 2000 * | 3.08 | 2.57 17% | 2.18 29% | 1.76 43% | 4.55 -48% | 1.98 36% | 3.71 -20% | 2.18 29% |
| Colorchecker dE 2000 max. * | 7.62 | 4.26 44% | 3.58 53% | 3.7 51% | 9.83 -29% | 5.24 31% | 7.23 5% | 7.14 6% |
| Colorchecker dE 2000 calibrated * | 1.12 | 0.85 24% | 0.52 54% | 1.56 -39% | 1.51 -35% | 1.98 -77% | 2.82 -152% | 0.93 17% |
| Greyscale dE 2000 * | 4.3 | 3.3 23% | 2.8 35% | 3 30% | 6.2 -44% | 2.44 43% | 2.2 49% | 3.7 14% |
| Gamma | 2.02 109% | 1.997 110% | 2.18 101% | 2.33 94% | 2.07 106% | 2.42 91% | 2.3 96% | 2.18 101% |
| CCT | 7438 87% | 6895 94% | 6002 108% | 6341 103% | 6479 100% | 6984 93% | 6270 104% | 7245 90% |
| Całkowita średnia (program / ustawienia) | 20% /
21% | 16% /
21% | 20% /
31% | 21% /
13% | 3% /
9% | 15% /
8% | -0% /
11% |
* ... im mniej tym lepiej
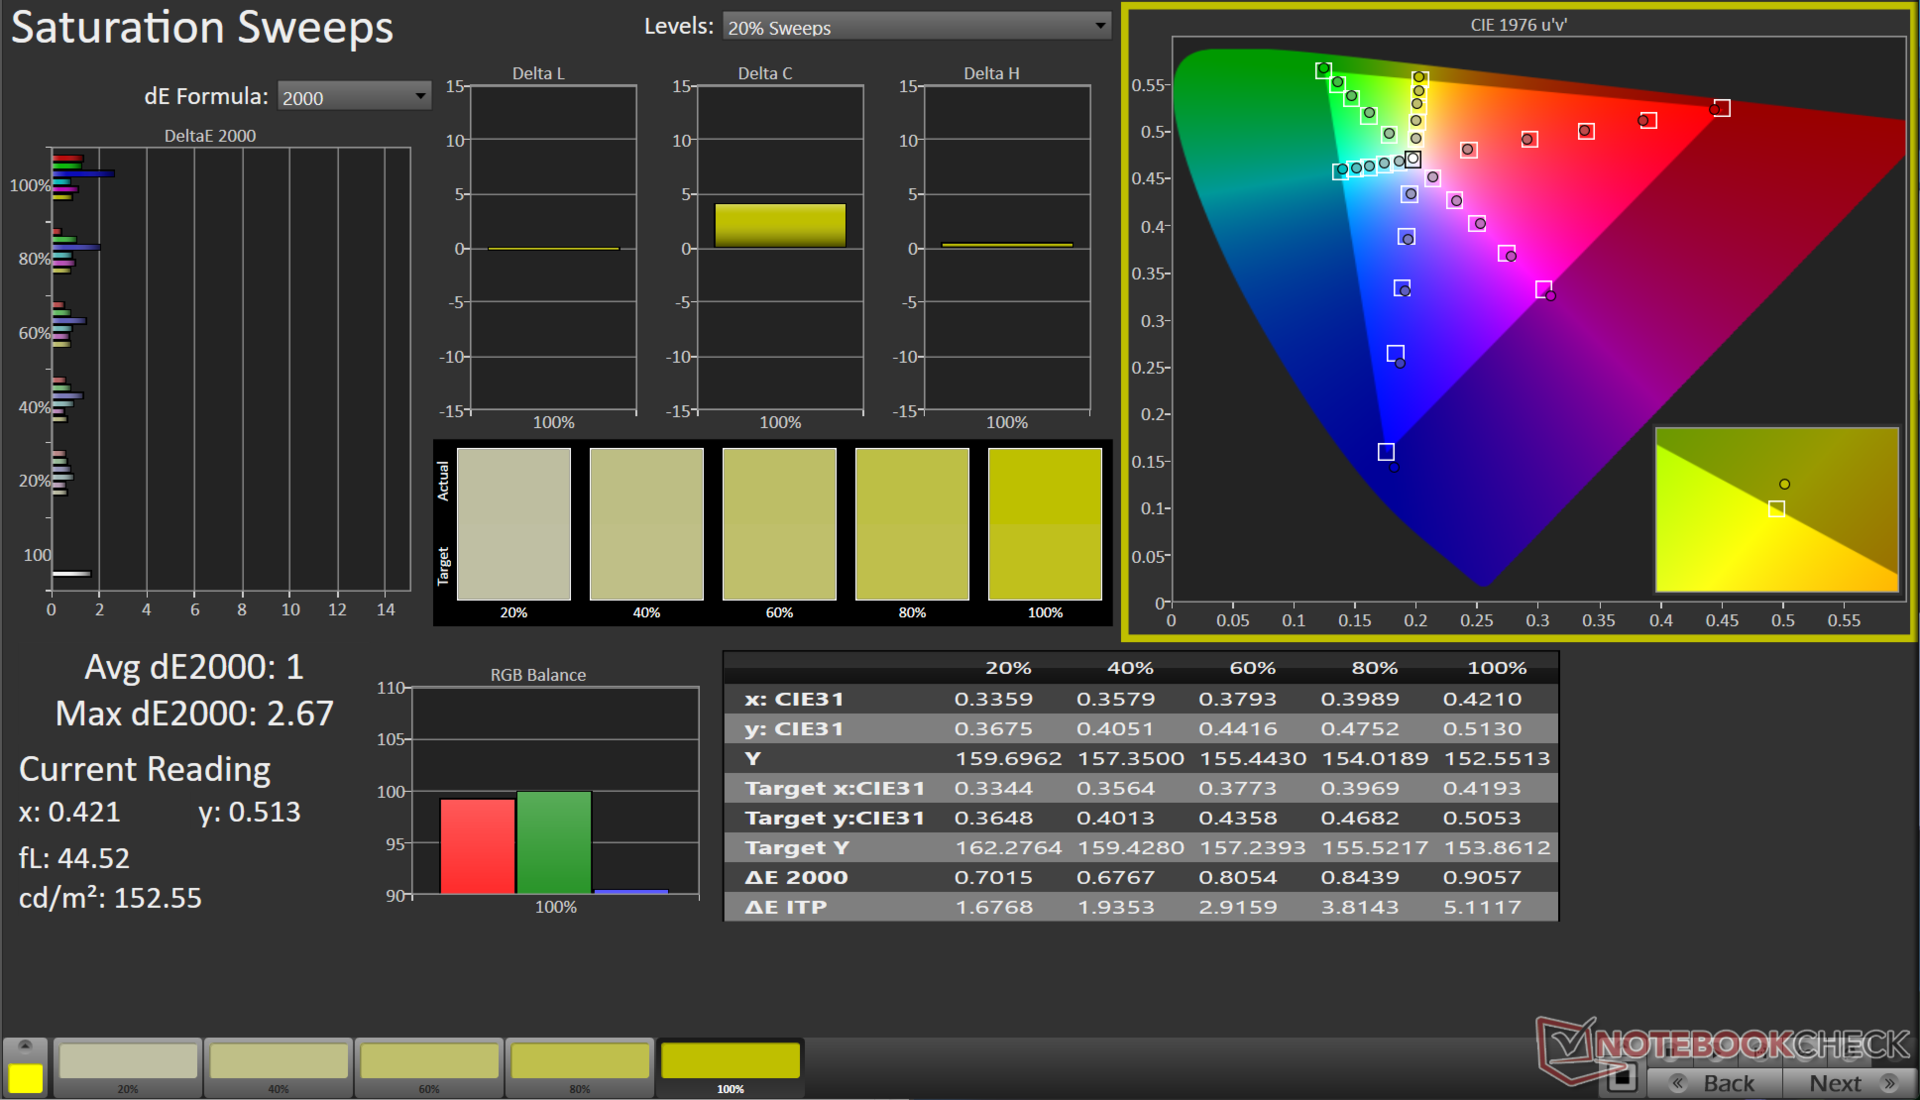
EVOL X15 nie jest przeznaczony dla twórców treści, ale 97% pokrycie palety sRGB dobrze wróży grom, stronom internetowym i podstawowym edycjom. Twórcy, którzy chcą wykorzystać możliwości sprzętowe EVOL X15, mogą użyć zewnętrznego wyświetlacza, aby zwiększyć wydajność kolorów.
Odwzorowanie kolorów wyświetlacza po wyjęciu z pudełka jest w większości sprawne, ze średnimi wartościami skali szarości i ColorChecker Delta E 2000 wynoszącymi odpowiednio 4,3 i 3,08.
Nasza procedura kalibracji, przy użyciu spektrofotometru X-Rite i1Basic Pro 3 i oprogramowania Portrait Display Calman Ultimate, znacznie poprawiła te odpowiednie wartości do 1 i 1,12.
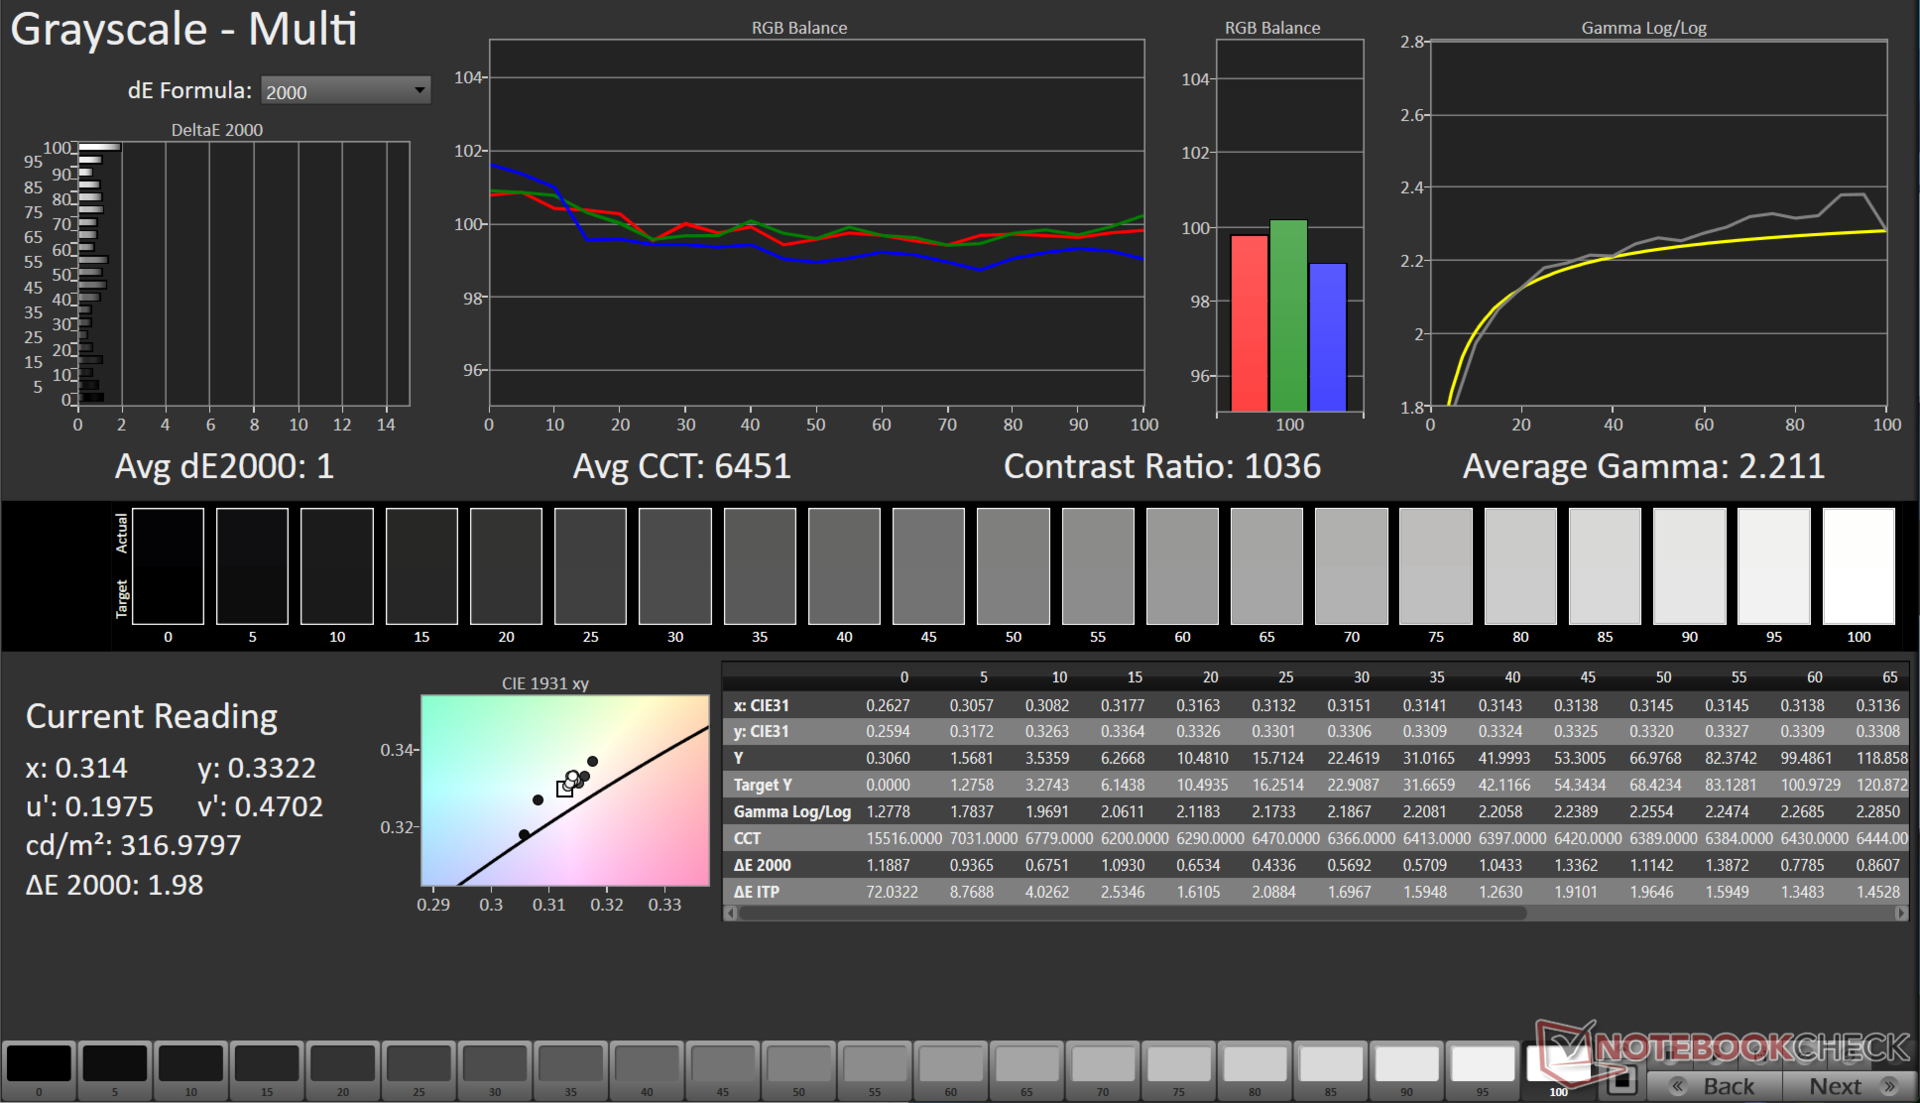
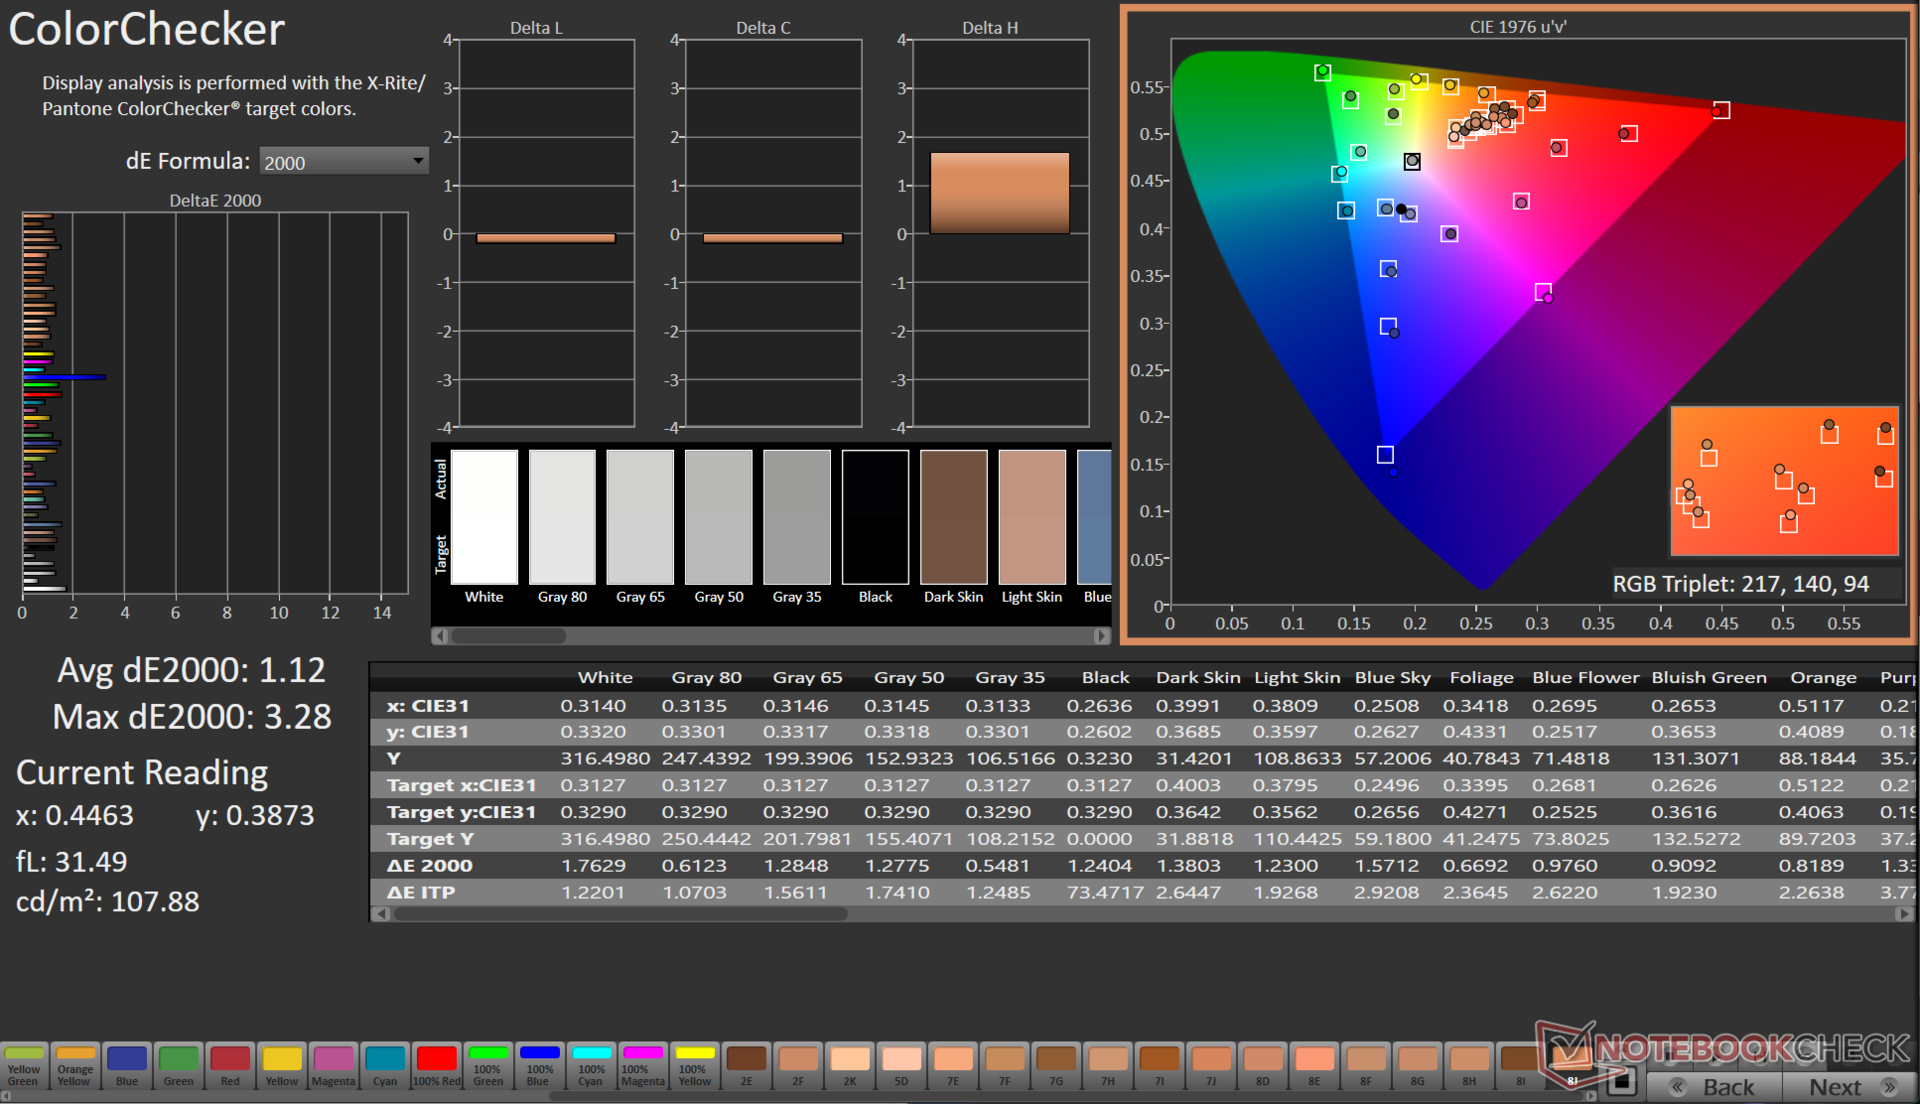
Skalibrowany plik ICC można pobrać z linku powyżej.
Wyświetl czasy reakcji
| ↔ Czas reakcji od czerni do bieli | ||
|---|---|---|
| 7.81 ms ... wzrost ↗ i spadek ↘ łącznie | ↗ 4.01 ms wzrost | 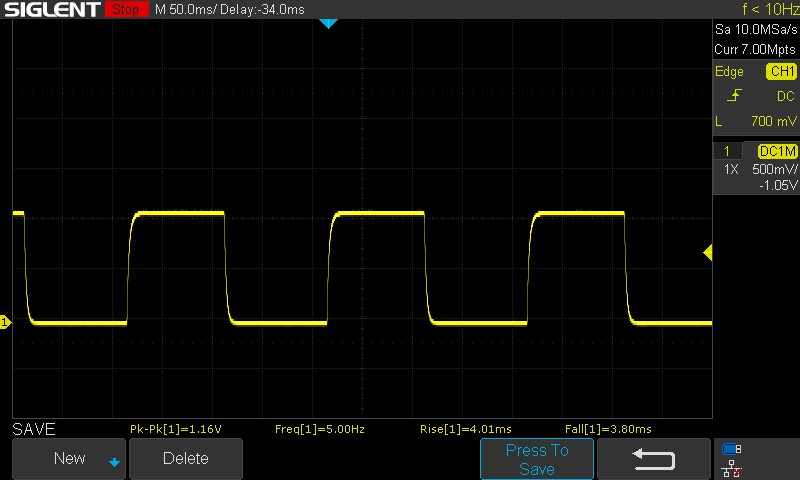 |
| ↘ 3.8 ms upadek | ||
| W naszych testach ekran wykazuje bardzo szybką reakcję i powinien bardzo dobrze nadawać się do szybkich gier. Dla porównania, wszystkie testowane urządzenia wahają się od 0.1 (minimum) do 240 (maksimum) ms. » 22 % wszystkich urządzeń jest lepszych. Oznacza to, że zmierzony czas reakcji jest lepszy od średniej wszystkich testowanych urządzeń (19.9 ms). | ||
| ↔ Czas reakcji 50% szarości do 80% szarości | ||
| 10.42 ms ... wzrost ↗ i spadek ↘ łącznie | ↗ 4.73 ms wzrost | 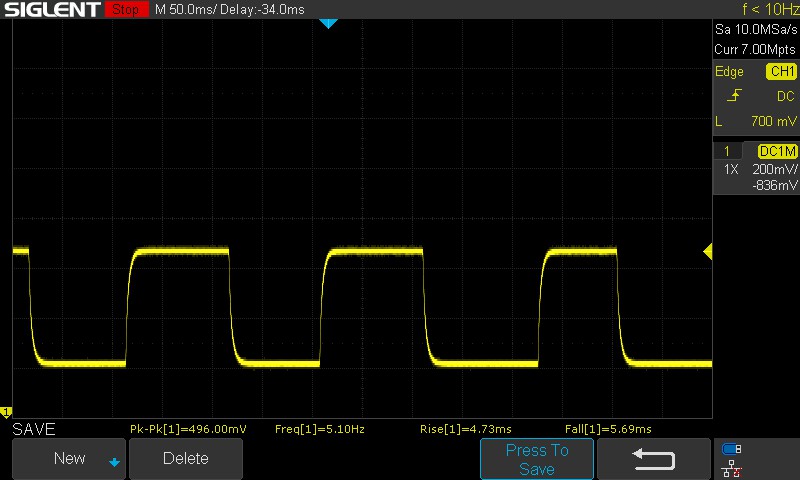 |
| ↘ 5.69 ms upadek | ||
| W naszych testach ekran wykazuje dobry współczynnik reakcji, ale może być zbyt wolny dla graczy rywalizujących ze sobą. Dla porównania, wszystkie testowane urządzenia wahają się od 0.165 (minimum) do 636 (maksimum) ms. » 24 % wszystkich urządzeń jest lepszych. Oznacza to, że zmierzony czas reakcji jest lepszy od średniej wszystkich testowanych urządzeń (31.1 ms). | ||
Czasy reakcji są przyzwoite dla większości gier. Panel EVOL X15 AT nie wykorzystuje funkcji overdrive i nie ma opcji jej włączenia, co pomogłoby jeszcze bardziej skrócić czas przejścia od 50% do 80% szarości.
Migotanie ekranu / PWM (modulacja szerokości impulsu)
| Migotanie ekranu/nie wykryto PWM | ≤ 100 % ustawienia jasności | 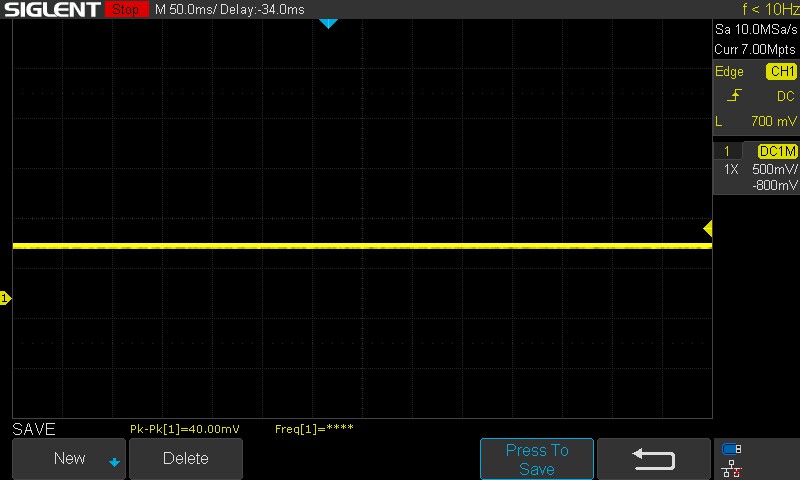 | |
Dla porównania: 52 % wszystkich testowanych urządzeń nie używa PWM do przyciemniania wyświetlacza. Jeśli wykryto PWM, zmierzono średnio 7798 (minimum: 5 - maksimum: 343500) Hz. | |||
Nie wykryliśmy PWM ani migotania na żadnym z testowanych poziomów jasności.
Więcej informacji znajdą Państwo w naszym artykule "Dlaczego PWM to taki ból głowy", a także w naszej Tabela rankingowa PWM.
Oglądanie na zewnątrz jest w porządku, ale jasność wyświetlacza może nie być odpowiednia do użytku w bezpośrednim ostrym świetle słonecznym. Kąty widzenia są stosunkowo stabilne, z niewielką utratą jasności w skrajnych przypadkach.


Wydajność: Core i7-13700HX i RTX 4060 dobrze wróżą grom AAA średniej klasy
Kolorowy EVOL X15 AT jest dostępny zarówno z Intel Core i5-13500HX i Core i7-13700HX, a odpowiadające im opcje GPU to GPU Nvidia GeForce RTX 4050 do laptopów i RTX 4060 Laptop GPU.
Warunki testowania
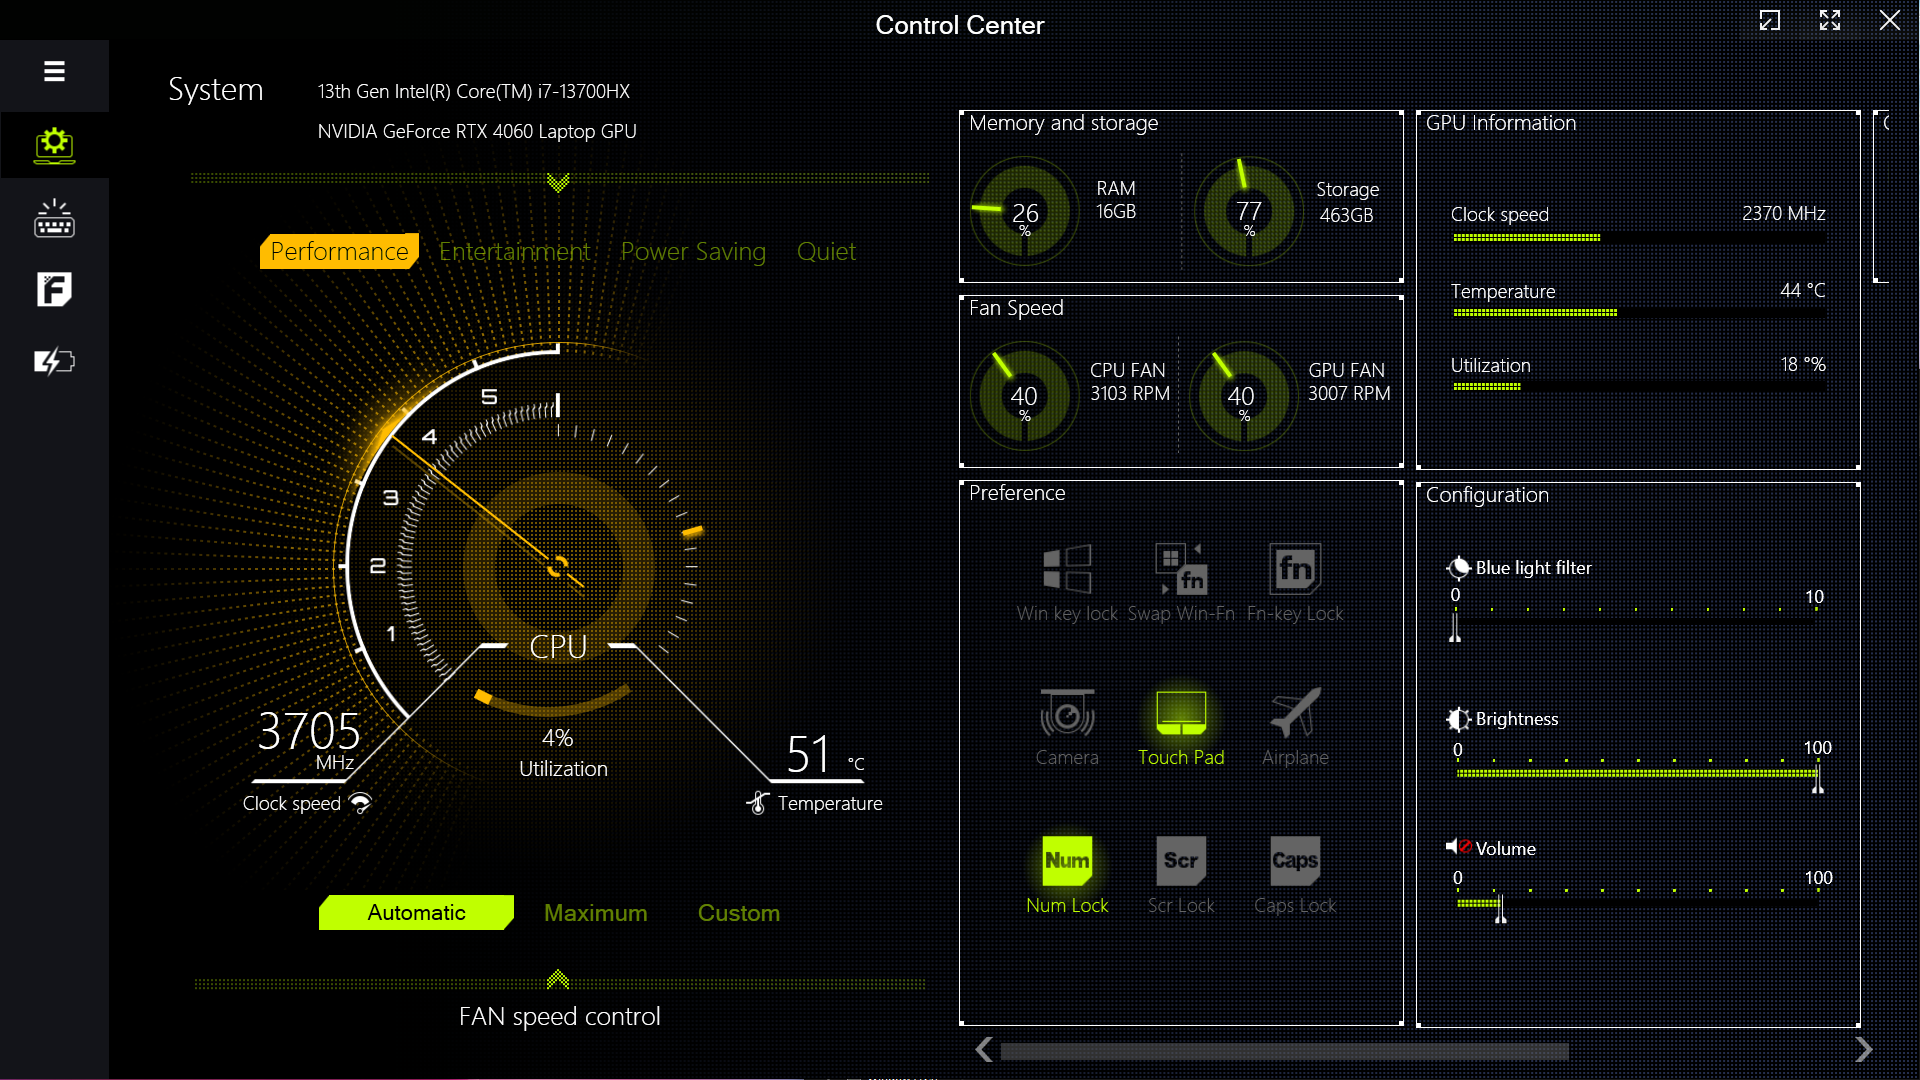
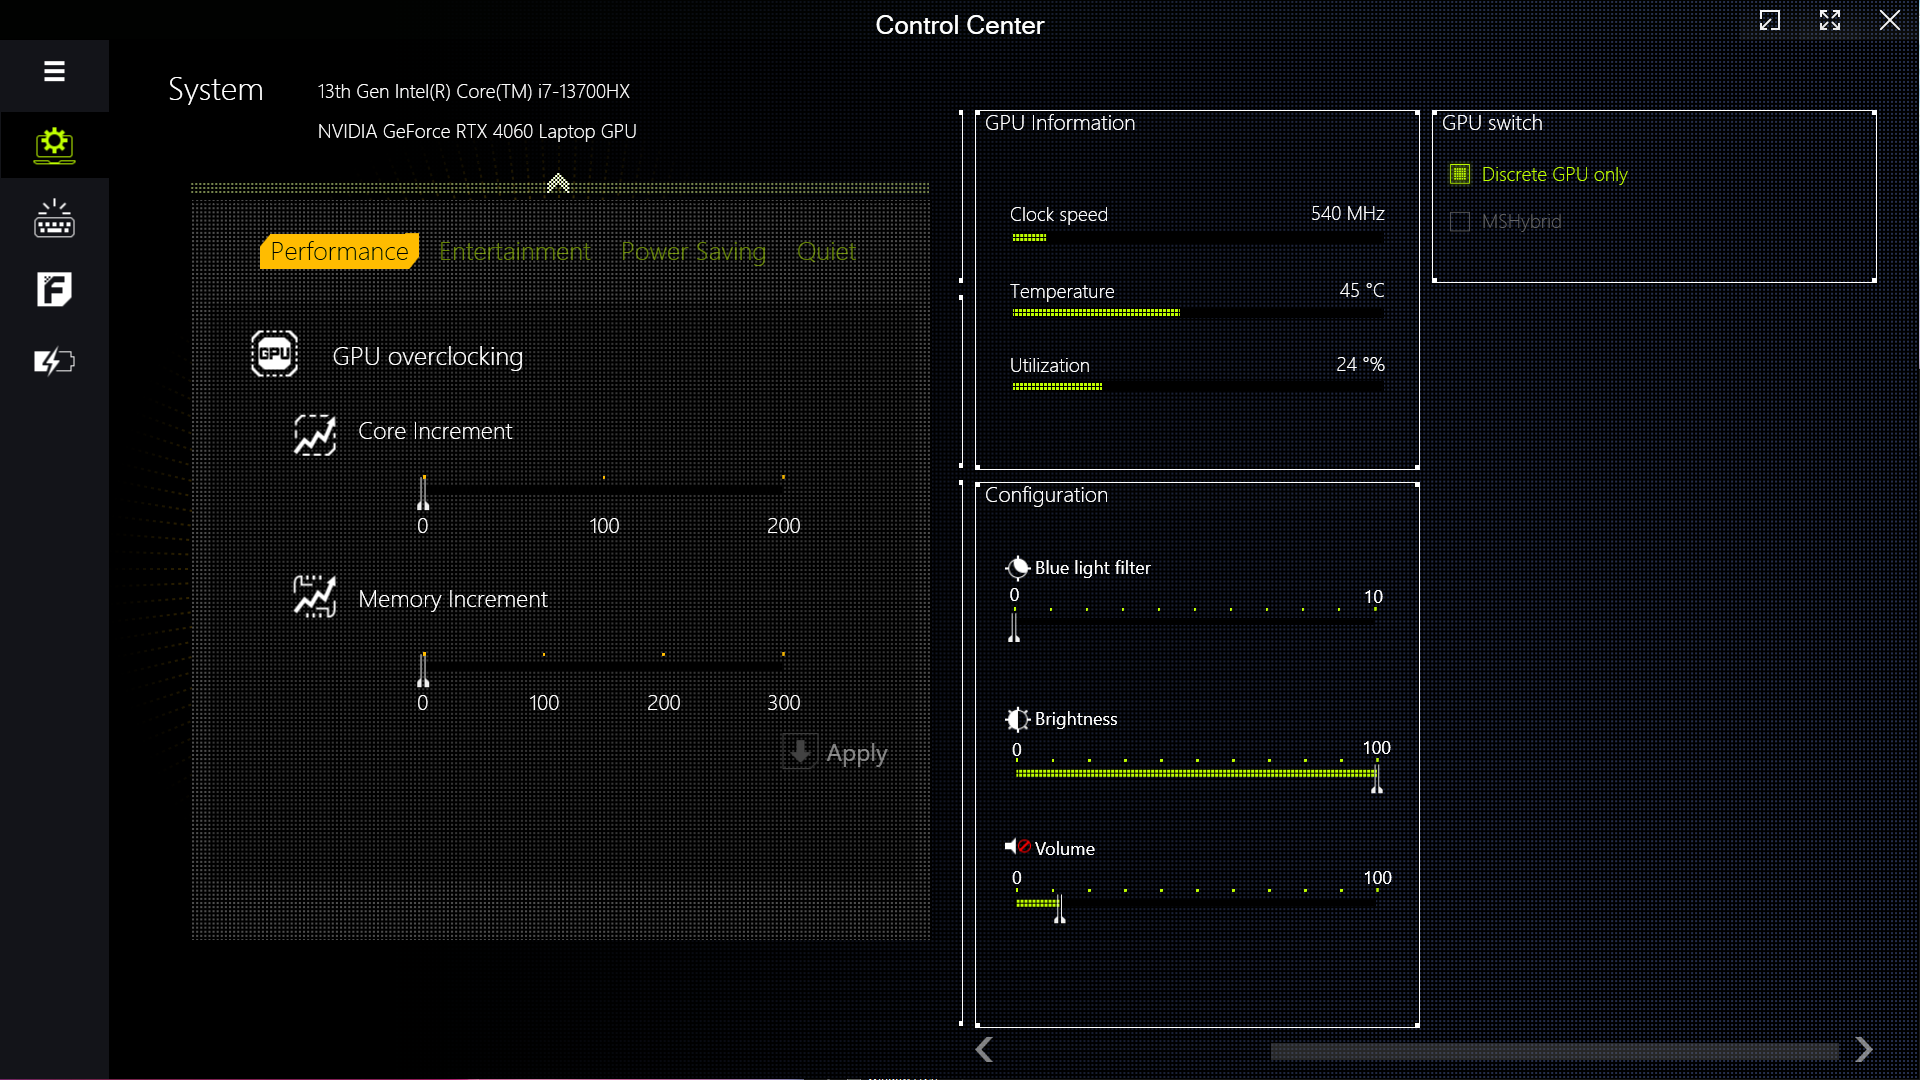
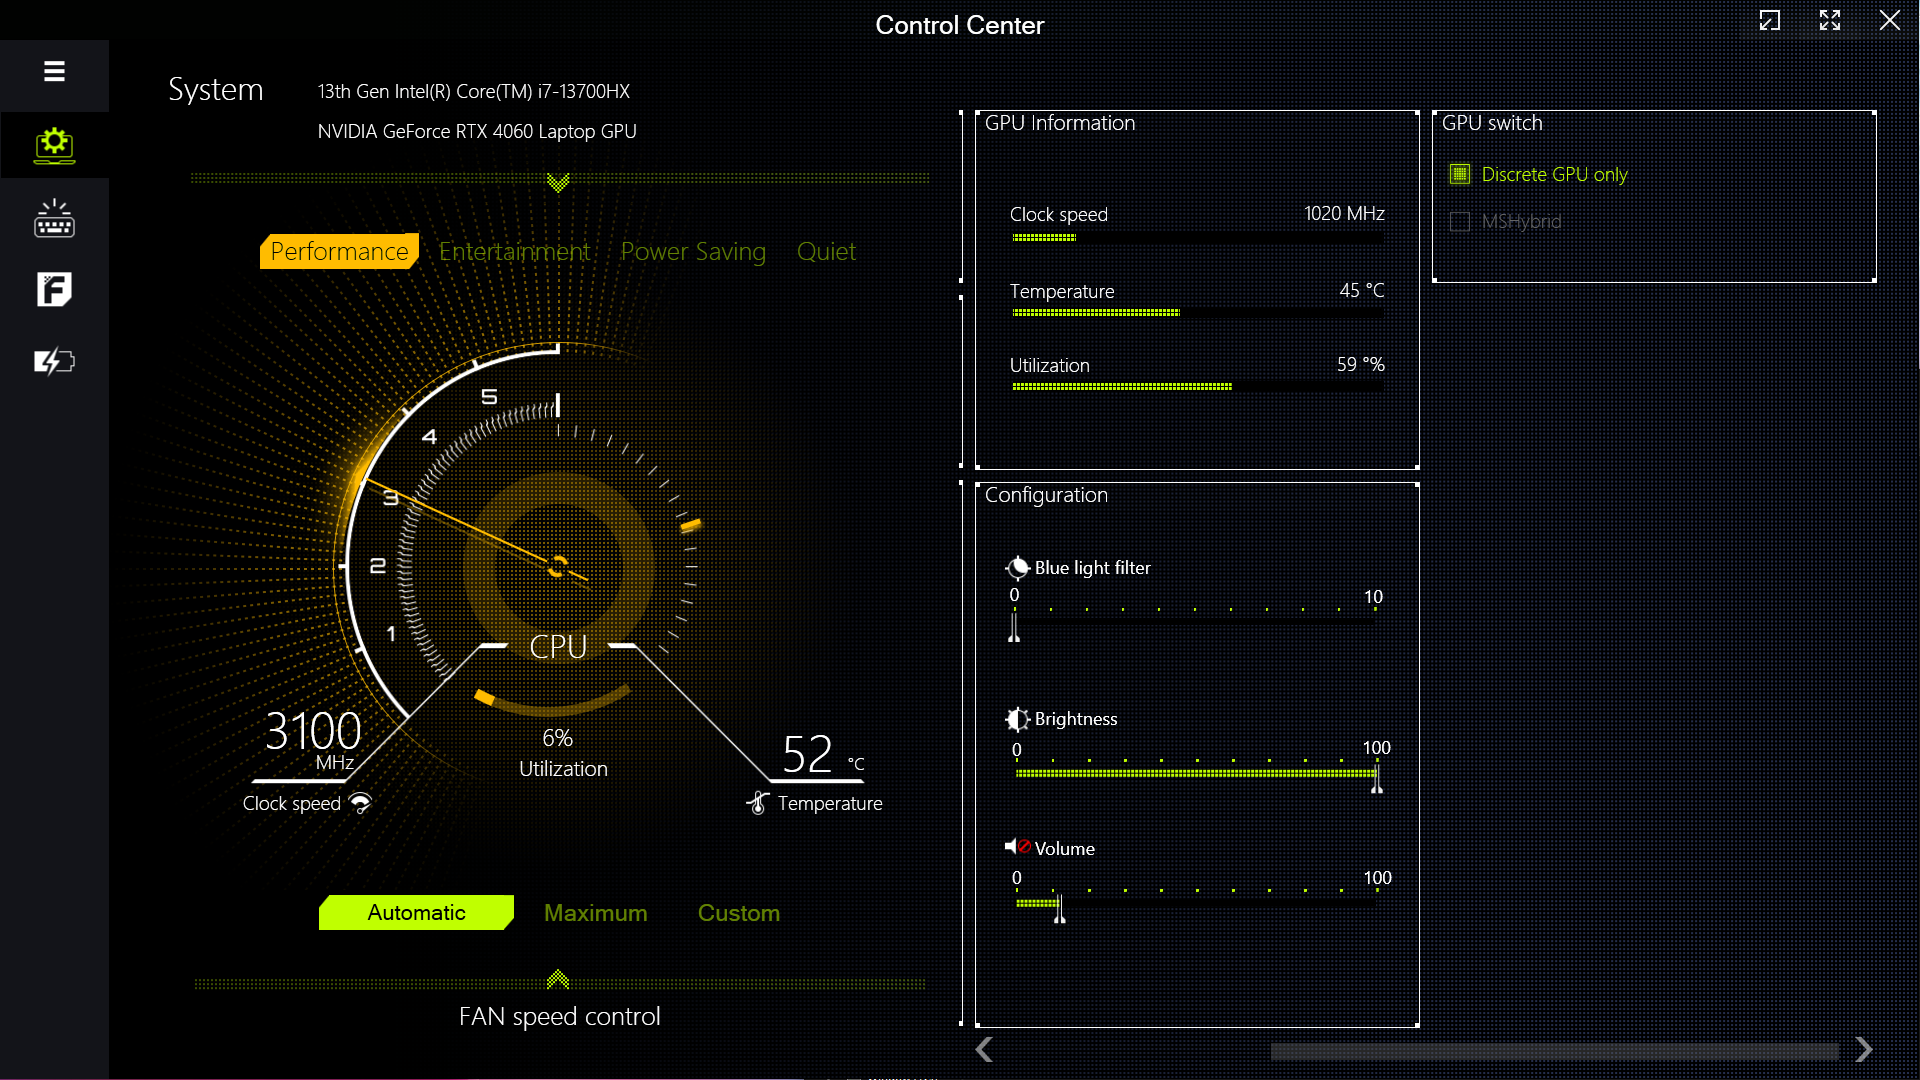
Colorful oferuje aplikację Clevo Control Center do dostrajania wydajności i dostosowywania różnych efektów RGB. Łącznie oferowane są cztery tryby wydajności.
Wszystkie testy porównawcze zostały przeprowadzone w trybie wydajności, który pozwala procesorowi Core i7-13700HX w pełni rozwinąć mięśnie. Do testów graficznych i gier wykorzystano tryb Discrete GPU.
Testy baterii przeprowadzono w profilu Quiet z włączoną funkcją MSHybrid.
Colorful ogranicza moc PL2 do 30 W w trybach Quiet i Power Saving, co stanowi znaczną redukcję mocy w porównaniu do innych trybów. Znajduje to odzwierciedlenie w drastycznym spadku wyników Cinebench R15, co ilustruje poniższa tabela.
| Tryb wydajności | PL1 (PBP) / Tau | PL2 (MTP) / Tau | Cinebench R15 Multi score | Cinebench R15 Multi score (30 pętli) |
|---|---|---|---|---|
| Cicha praca | 15 W / 8 s | 30 W / 2,44 ms | 567 (-83%) | 542 (-82,28%) |
| Oszczędzanie energii | 45 W / 8 s | 30 W / 2,44 ms | 557 (-84%) | 548 (-82,08%) |
| Rozrywka | 65 W / 56 s | 130 W / 2,44 ms | 2814 (-19,18%) | 2168 (-29,12%) |
| Wydajność | 135 W / 96 s | 162 W / 2,44 ms | 3482 (100%) | 3059 (100%) |
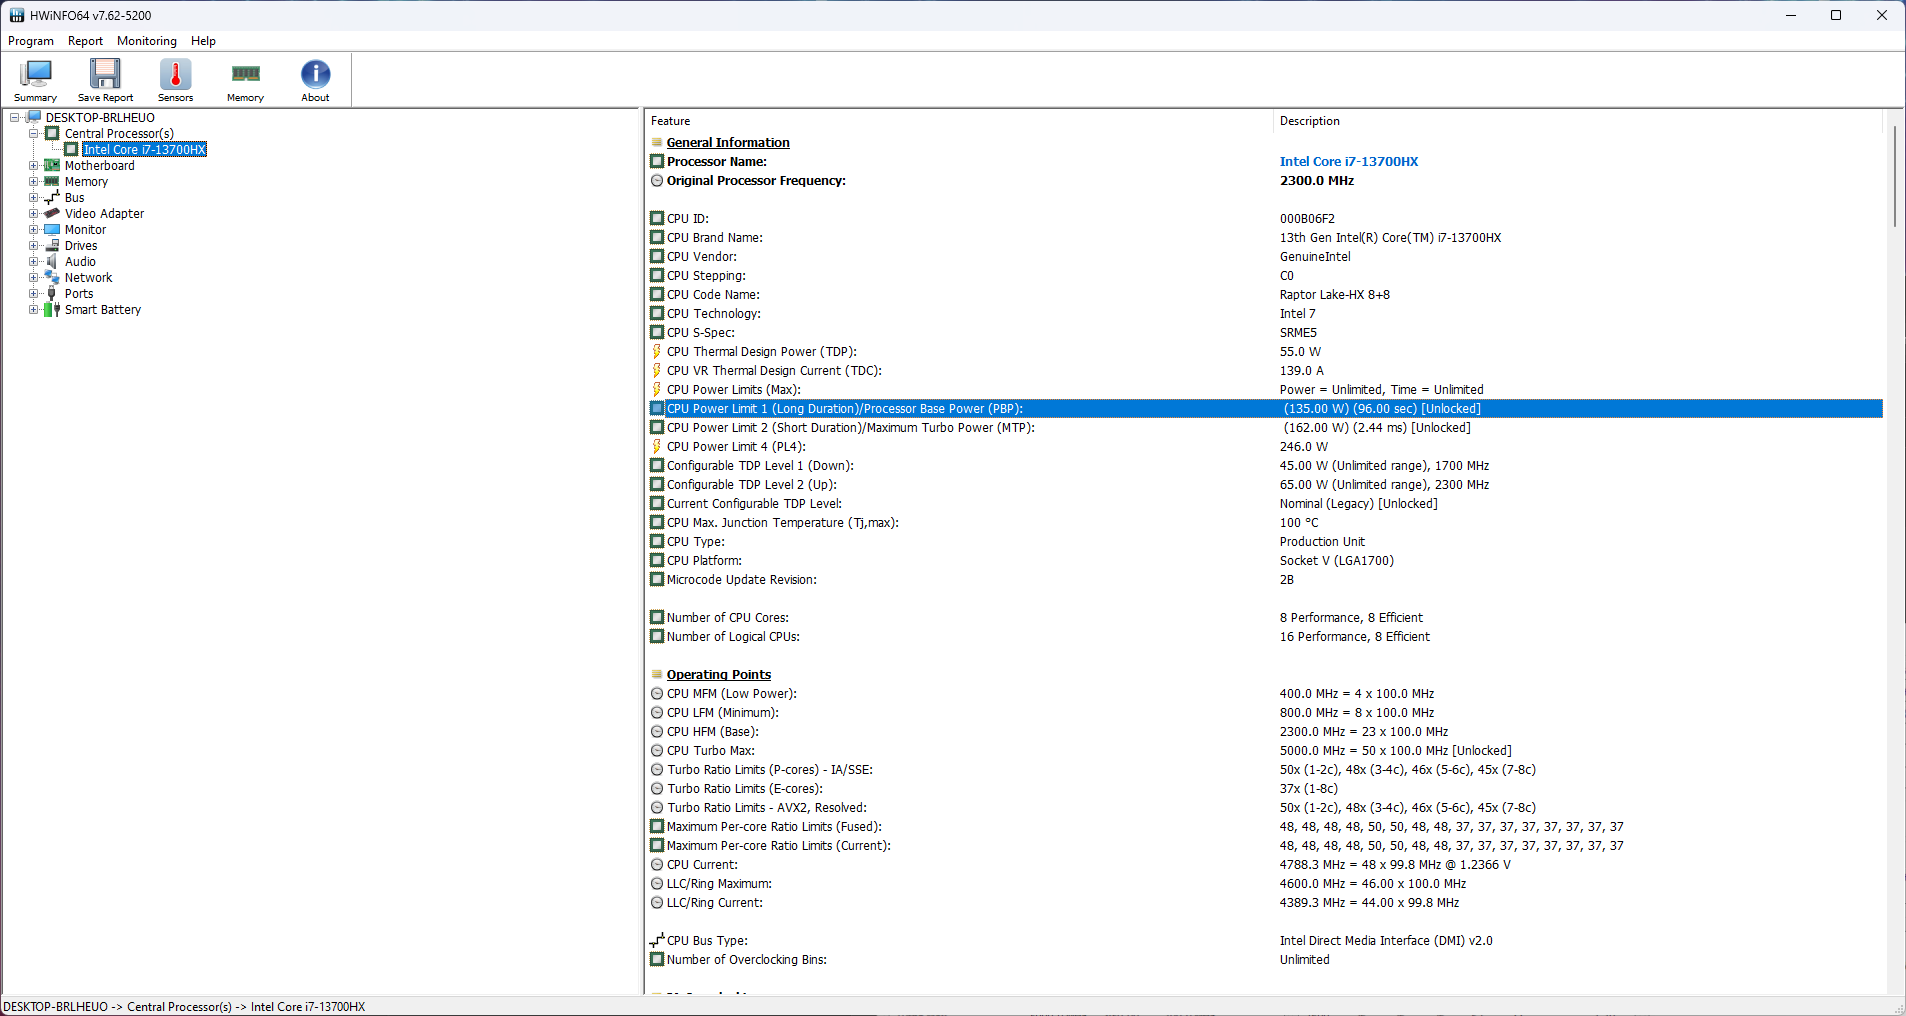
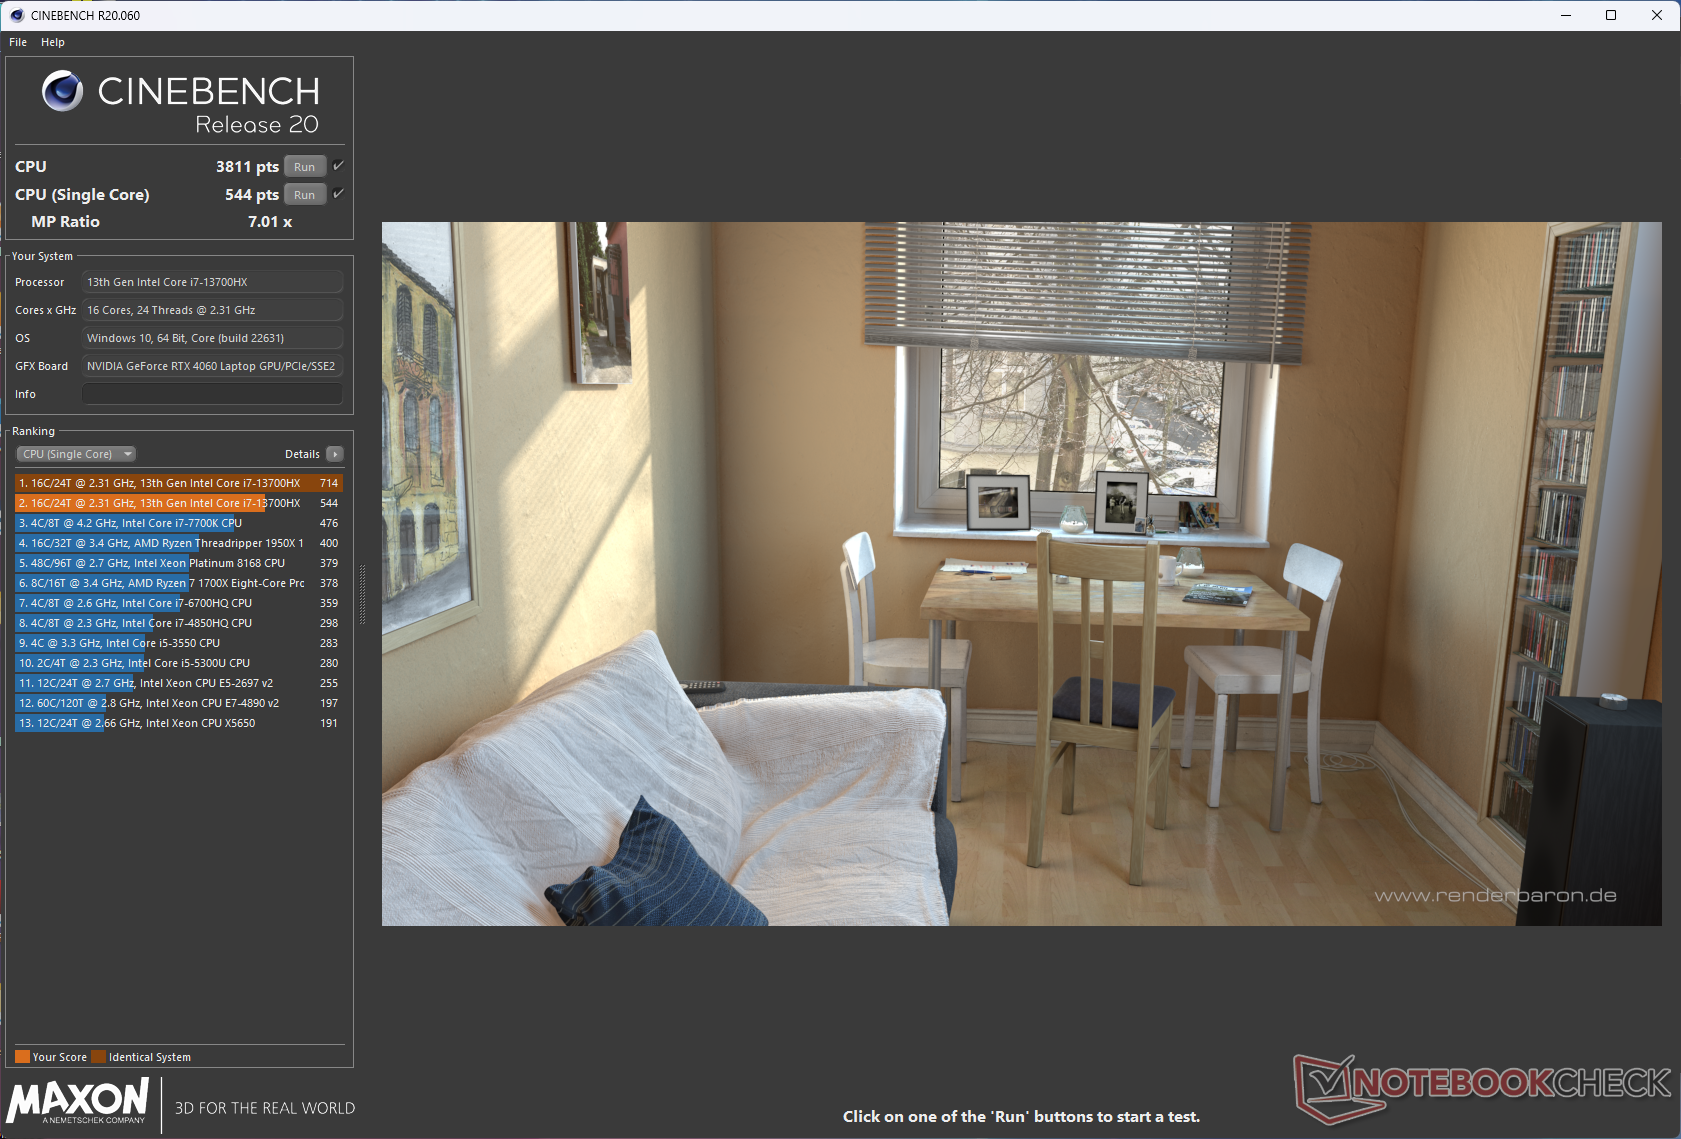
Procesor
Core i7-13700HX posiada 16 rdzeni i 24 wątki z zegarem boost do 5 GHz. Ten procesor w EVOL X15 AT generalnie działa na równi ze swoim odpowiednikiem w Alienware m16 R1 i ogólnie w innych laptopach. Pozostaje on jednak znacznie w tyle za 12-rdzeniowym, 24-wątkowym procesorem AMD Ryzen 9 7845HX w testach wielordzeniowych.
Choć Core i7-13700HX pobiera nominalnie 162 W, to w trybie wydajności może zużywać nawet 145 W. Niemniej jednak zapewnia to tylko minimalną przewagę w wydajności jednordzeniowej nad 115 W PL2 w HP Omen 16.
Pomijając początkowy stopniowy spadek wyników, podczas wielordzeniowego testu pętli Cinebench R15 nie występuje zauważalny throttling.
Cinebench R15 Multi Loop
Cinebench R23: Multi Core | Single Core
Cinebench R20: CPU (Multi Core) | CPU (Single Core)
Cinebench R15: CPU Multi 64Bit | CPU Single 64Bit
Blender: v2.79 BMW27 CPU
7-Zip 18.03: 7z b 4 | 7z b 4 -mmt1
Geekbench 5.5: Multi-Core | Single-Core
HWBOT x265 Benchmark v2.2: 4k Preset
LibreOffice : 20 Documents To PDF
R Benchmark 2.5: Overall mean
| CPU Performance rating | |
| Alienware m16 R1 AMD | |
| Średnia w klasie Gaming | |
| Schenker XMG Pro 15 (E23) | |
| Acer Predator Helios 16 PH16-71-731Q | |
| HP Omen 16-wf000 -1! | |
| Uniwill GM6PX7X RTX 4070 | |
| Alienware m16 R1 Intel | |
| Dell G15 5530 | |
| Colorful EVOL X15 AT 23 | |
| Przeciętny Intel Core i7-13700HX | |
| Cinebench R23 / Multi Core | |
| Alienware m16 R1 AMD | |
| Średnia w klasie Gaming (10488 - 40970, n=112, ostatnie 2 lata) | |
| Schenker XMG Pro 15 (E23) | |
| Acer Predator Helios 16 PH16-71-731Q | |
| Colorful EVOL X15 AT 23 | |
| Alienware m16 R1 Intel | |
| Uniwill GM6PX7X RTX 4070 | |
| Dell G15 5530 | |
| Przeciętny Intel Core i7-13700HX (15558 - 22598, n=11) | |
| HP Omen 16-wf000 | |
| Cinebench R23 / Single Core | |
| Średnia w klasie Gaming (1166 - 2356, n=112, ostatnie 2 lata) | |
| Alienware m16 R1 Intel | |
| Colorful EVOL X15 AT 23 | |
| Acer Predator Helios 16 PH16-71-731Q | |
| Schenker XMG Pro 15 (E23) | |
| HP Omen 16-wf000 | |
| Alienware m16 R1 AMD | |
| Dell G15 5530 | |
| Przeciętny Intel Core i7-13700HX (1666 - 1933, n=11) | |
| Uniwill GM6PX7X RTX 4070 | |
| Cinebench R20 / CPU (Multi Core) | |
| Alienware m16 R1 AMD | |
| Średnia w klasie Gaming (4029 - 16108, n=111, ostatnie 2 lata) | |
| Schenker XMG Pro 15 (E23) | |
| Acer Predator Helios 16 PH16-71-731Q | |
| Colorful EVOL X15 AT 23 | |
| Uniwill GM6PX7X RTX 4070 | |
| Alienware m16 R1 Intel | |
| Dell G15 5530 | |
| Przeciętny Intel Core i7-13700HX (6160 - 8610, n=11) | |
| HP Omen 16-wf000 | |
| Cinebench R20 / CPU (Single Core) | |
| Średnia w klasie Gaming (442 - 895, n=111, ostatnie 2 lata) | |
| Colorful EVOL X15 AT 23 | |
| Alienware m16 R1 Intel | |
| Acer Predator Helios 16 PH16-71-731Q | |
| Schenker XMG Pro 15 (E23) | |
| HP Omen 16-wf000 | |
| Alienware m16 R1 AMD | |
| Dell G15 5530 | |
| Uniwill GM6PX7X RTX 4070 | |
| Przeciętny Intel Core i7-13700HX (644 - 740, n=11) | |
| Cinebench R15 / CPU Multi 64Bit | |
| Alienware m16 R1 AMD | |
| Średnia w klasie Gaming (1578 - 6271, n=111, ostatnie 2 lata) | |
| Schenker XMG Pro 15 (E23) | |
| Colorful EVOL X15 AT 23 | |
| Acer Predator Helios 16 PH16-71-731Q | |
| Acer Predator Helios 16 PH16-71-731Q | |
| Uniwill GM6PX7X RTX 4070 | |
| Przeciętny Intel Core i7-13700HX (2548 - 3482, n=12) | |
| Alienware m16 R1 Intel | |
| Dell G15 5530 | |
| HP Omen 16-wf000 | |
| Cinebench R15 / CPU Single 64Bit | |
| Alienware m16 R1 AMD | |
| Średnia w klasie Gaming (188.8 - 343, n=111, ostatnie 2 lata) | |
| Alienware m16 R1 Intel | |
| Colorful EVOL X15 AT 23 | |
| Dell G15 5530 | |
| Acer Predator Helios 16 PH16-71-731Q | |
| Przeciętny Intel Core i7-13700HX (243 - 279, n=11) | |
| HP Omen 16-wf000 | |
| Uniwill GM6PX7X RTX 4070 | |
| Schenker XMG Pro 15 (E23) | |
| Blender / v2.79 BMW27 CPU | |
| Przeciętny Intel Core i7-13700HX (138 - 207, n=10) | |
| Dell G15 5530 | |
| Acer Predator Helios 16 PH16-71-731Q | |
| Alienware m16 R1 Intel | |
| Colorful EVOL X15 AT 23 | |
| Średnia w klasie Gaming (80 - 330, n=109, ostatnie 2 lata) | |
| Uniwill GM6PX7X RTX 4070 | |
| Schenker XMG Pro 15 (E23) | |
| Alienware m16 R1 AMD | |
| 7-Zip 18.03 / 7z b 4 | |
| Alienware m16 R1 AMD | |
| Schenker XMG Pro 15 (E23) | |
| Średnia w klasie Gaming (33491 - 148086, n=110, ostatnie 2 lata) | |
| Uniwill GM6PX7X RTX 4070 | |
| Alienware m16 R1 Intel | |
| Acer Predator Helios 16 PH16-71-731Q | |
| HP Omen 16-wf000 | |
| Dell G15 5530 | |
| Przeciętny Intel Core i7-13700HX (58912 - 89294, n=11) | |
| Colorful EVOL X15 AT 23 | |
| 7-Zip 18.03 / 7z b 4 -mmt1 | |
| Alienware m16 R1 AMD | |
| Alienware m16 R1 Intel | |
| Średnia w klasie Gaming (4199 - 7436, n=110, ostatnie 2 lata) | |
| Colorful EVOL X15 AT 23 | |
| Schenker XMG Pro 15 (E23) | |
| Acer Predator Helios 16 PH16-71-731Q | |
| Przeciętny Intel Core i7-13700HX (5552 - 6409, n=11) | |
| Uniwill GM6PX7X RTX 4070 | |
| HP Omen 16-wf000 | |
| Dell G15 5530 | |
| Geekbench 5.5 / Multi-Core | |
| Schenker XMG Pro 15 (E23) | |
| Średnia w klasie Gaming (6460 - 27010, n=110, ostatnie 2 lata) | |
| Acer Predator Helios 16 PH16-71-731Q | |
| Uniwill GM6PX7X RTX 4070 | |
| Alienware m16 R1 AMD | |
| HP Omen 16-wf000 | |
| Alienware m16 R1 Intel | |
| Dell G15 5530 | |
| Przeciętny Intel Core i7-13700HX (10156 - 15850, n=12) | |
| Colorful EVOL X15 AT 23 | |
| Geekbench 5.5 / Single-Core | |
| Średnia w klasie Gaming (986 - 2474, n=110, ostatnie 2 lata) | |
| Alienware m16 R1 AMD | |
| Acer Predator Helios 16 PH16-71-731Q | |
| HP Omen 16-wf000 | |
| Dell G15 5530 | |
| Alienware m16 R1 Intel | |
| Colorful EVOL X15 AT 23 | |
| Uniwill GM6PX7X RTX 4070 | |
| Schenker XMG Pro 15 (E23) | |
| Przeciętny Intel Core i7-13700HX (1666 - 1899, n=12) | |
| HWBOT x265 Benchmark v2.2 / 4k Preset | |
| Alienware m16 R1 AMD | |
| Średnia w klasie Gaming (11.5 - 44.3, n=110, ostatnie 2 lata) | |
| Uniwill GM6PX7X RTX 4070 | |
| Acer Predator Helios 16 PH16-71-731Q | |
| Schenker XMG Pro 15 (E23) | |
| Dell G15 5530 | |
| Alienware m16 R1 Intel | |
| Przeciętny Intel Core i7-13700HX (17.1 - 25.5, n=11) | |
| Colorful EVOL X15 AT 23 | |
| HP Omen 16-wf000 | |
| LibreOffice / 20 Documents To PDF | |
| Colorful EVOL X15 AT 23 | |
| Schenker XMG Pro 15 (E23) | |
| Średnia w klasie Gaming (19 - 88.8, n=110, ostatnie 2 lata) | |
| Dell G15 5530 | |
| HP Omen 16-wf000 | |
| Alienware m16 R1 Intel | |
| Przeciętny Intel Core i7-13700HX (36.5 - 52.9, n=11) | |
| Alienware m16 R1 AMD | |
| Uniwill GM6PX7X RTX 4070 | |
| Acer Predator Helios 16 PH16-71-731Q | |
| R Benchmark 2.5 / Overall mean | |
| Uniwill GM6PX7X RTX 4070 | |
| Przeciętny Intel Core i7-13700HX (0.4274 - 0.513, n=11) | |
| Schenker XMG Pro 15 (E23) | |
| HP Omen 16-wf000 | |
| Colorful EVOL X15 AT 23 | |
| Alienware m16 R1 Intel | |
| Średnia w klasie Gaming (0.3439 - 0.759, n=111, ostatnie 2 lata) | |
| Acer Predator Helios 16 PH16-71-731Q | |
| Dell G15 5530 | |
| Alienware m16 R1 AMD | |
* ... im mniej tym lepiej
Core i7-13700HX w EVOL X15 może zużywać maksymalnie 145 W z boostem do 4,2 GHz podczas wykonywania wielordzeniowej pętli Cinebench R15 w trybie Performance. W trybie Rozrywka, Core i7-13700HX nadal może osiągnąć 4,2 GHz przy 113 W, ale średnia moc spada do około 21 W podczas pracy.
W trybie cichym EVOL X15 osiąga szczytowe taktowanie 4 GHz, zużywając przy tym zaledwie 30 W. Średnie taktowanie spada jednak do nieco poniżej 1 GHz, zużywając przy tym 15 W.
Wyniki Cinebench R20 na baterii spadły odpowiednio o 26,5% i 54% w trybie jednordzeniowym i wielordzeniowym.
AIDA64: FP32 Ray-Trace | FPU Julia | CPU SHA3 | CPU Queen | FPU SinJulia | FPU Mandel | CPU AES | CPU ZLib | FP64 Ray-Trace | CPU PhotoWorxx
| Performance rating | |
| Alienware m16 R1 AMD | |
| Średnia w klasie Gaming | |
| Uniwill GM6PX7X RTX 4070 | |
| Alienware m16 R1 Intel | |
| Acer Predator Helios 16 PH16-71-731Q | |
| Schenker XMG Pro 15 (E23) | |
| Przeciętny Intel Core i7-13700HX | |
| HP Omen 16-wf000 | |
| Colorful EVOL X15 AT 23 | |
| Dell G15 5530 | |
| AIDA64 / FP32 Ray-Trace | |
| Alienware m16 R1 AMD | |
| Średnia w klasie Gaming (10227 - 85542, n=109, ostatnie 2 lata) | |
| Uniwill GM6PX7X RTX 4070 | |
| Alienware m16 R1 Intel | |
| Acer Predator Helios 16 PH16-71-731Q | |
| Colorful EVOL X15 AT 23 | |
| Przeciętny Intel Core i7-13700HX (14261 - 21999, n=11) | |
| HP Omen 16-wf000 | |
| Dell G15 5530 | |
| Schenker XMG Pro 15 (E23) | |
| AIDA64 / FPU Julia | |
| Alienware m16 R1 AMD | |
| Średnia w klasie Gaming (51376 - 238426, n=109, ostatnie 2 lata) | |
| Uniwill GM6PX7X RTX 4070 | |
| Alienware m16 R1 Intel | |
| Colorful EVOL X15 AT 23 | |
| Acer Predator Helios 16 PH16-71-731Q | |
| HP Omen 16-wf000 | |
| Przeciętny Intel Core i7-13700HX (74636 - 109364, n=11) | |
| Schenker XMG Pro 15 (E23) | |
| Dell G15 5530 | |
| AIDA64 / CPU SHA3 | |
| Alienware m16 R1 AMD | |
| Średnia w klasie Gaming (2180 - 9817, n=109, ostatnie 2 lata) | |
| Uniwill GM6PX7X RTX 4070 | |
| Alienware m16 R1 Intel | |
| Schenker XMG Pro 15 (E23) | |
| Colorful EVOL X15 AT 23 | |
| Acer Predator Helios 16 PH16-71-731Q | |
| Dell G15 5530 | |
| Przeciętny Intel Core i7-13700HX (3359 - 5053, n=11) | |
| HP Omen 16-wf000 | |
| AIDA64 / CPU Queen | |
| Alienware m16 R1 AMD | |
| Schenker XMG Pro 15 (E23) | |
| Średnia w klasie Gaming (49785 - 173351, n=100, ostatnie 2 lata) | |
| Alienware m16 R1 Intel | |
| Acer Predator Helios 16 PH16-71-731Q | |
| Colorful EVOL X15 AT 23 | |
| Uniwill GM6PX7X RTX 4070 | |
| Przeciętny Intel Core i7-13700HX (86532 - 114717, n=11) | |
| Dell G15 5530 | |
| HP Omen 16-wf000 | |
| AIDA64 / FPU SinJulia | |
| Alienware m16 R1 AMD | |
| Średnia w klasie Gaming (4424 - 33636, n=109, ostatnie 2 lata) | |
| Alienware m16 R1 Intel | |
| Uniwill GM6PX7X RTX 4070 | |
| Acer Predator Helios 16 PH16-71-731Q | |
| Colorful EVOL X15 AT 23 | |
| Schenker XMG Pro 15 (E23) | |
| Przeciętny Intel Core i7-13700HX (9290 - 13519, n=11) | |
| HP Omen 16-wf000 | |
| Dell G15 5530 | |
| AIDA64 / FPU Mandel | |
| Alienware m16 R1 AMD | |
| Średnia w klasie Gaming (25115 - 128721, n=109, ostatnie 2 lata) | |
| Uniwill GM6PX7X RTX 4070 | |
| Alienware m16 R1 Intel | |
| Acer Predator Helios 16 PH16-71-731Q | |
| Colorful EVOL X15 AT 23 | |
| HP Omen 16-wf000 | |
| Przeciętny Intel Core i7-13700HX (35751 - 53484, n=11) | |
| Schenker XMG Pro 15 (E23) | |
| Dell G15 5530 | |
| AIDA64 / CPU AES | |
| Uniwill GM6PX7X RTX 4070 | |
| Alienware m16 R1 Intel | |
| Acer Predator Helios 16 PH16-71-731Q | |
| Przeciętny Intel Core i7-13700HX (67846 - 182575, n=11) | |
| Alienware m16 R1 AMD | |
| Średnia w klasie Gaming (39258 - 247074, n=109, ostatnie 2 lata) | |
| Colorful EVOL X15 AT 23 | |
| Schenker XMG Pro 15 (E23) | |
| HP Omen 16-wf000 | |
| Dell G15 5530 | |
| AIDA64 / CPU ZLib | |
| Alienware m16 R1 AMD | |
| Średnia w klasie Gaming (574 - 2531, n=109, ostatnie 2 lata) | |
| Acer Predator Helios 16 PH16-71-731Q | |
| Schenker XMG Pro 15 (E23) | |
| Uniwill GM6PX7X RTX 4070 | |
| Alienware m16 R1 Intel | |
| HP Omen 16-wf000 | |
| Colorful EVOL X15 AT 23 | |
| Dell G15 5530 | |
| Przeciętny Intel Core i7-13700HX (981 - 1451, n=11) | |
| AIDA64 / FP64 Ray-Trace | |
| Alienware m16 R1 AMD | |
| Średnia w klasie Gaming (5509 - 45446, n=109, ostatnie 2 lata) | |
| Uniwill GM6PX7X RTX 4070 | |
| Alienware m16 R1 Intel | |
| Colorful EVOL X15 AT 23 | |
| Acer Predator Helios 16 PH16-71-731Q | |
| Przeciętny Intel Core i7-13700HX (7728 - 11837, n=11) | |
| HP Omen 16-wf000 | |
| Dell G15 5530 | |
| Schenker XMG Pro 15 (E23) | |
| AIDA64 / CPU PhotoWorxx | |
| Schenker XMG Pro 15 (E23) | |
| Średnia w klasie Gaming (12271 - 89891, n=109, ostatnie 2 lata) | |
| Uniwill GM6PX7X RTX 4070 | |
| HP Omen 16-wf000 | |
| Dell G15 5530 | |
| Alienware m16 R1 Intel | |
| Acer Predator Helios 16 PH16-71-731Q | |
| Przeciętny Intel Core i7-13700HX (19678 - 42415, n=11) | |
| Alienware m16 R1 AMD | |
| Colorful EVOL X15 AT 23 | |
Więcej informacji znajdą Państwo w naszym dedykowanym artykule Intel Core i7-13700HX strona.
Wydajność systemu
EVOL X15 AT osiąga lepsze wyniki w PCMark 10 w porównaniu do CrossMark. Wyniki pamięci AIDA64 są niższe ze względu na pojedynczą dwukanałową pamięć DDR5-4800 w EVOL X15 w porównaniu do podwójnej czterokanałowej implementacji u konkurentów.
To powiedziawszy, nie napotkaliśmy żadnych czkawek podczas używania EVOL X15 do rutynowych zadań związanych z produktywnością i przeglądaniem stron internetowych.
CrossMark: Overall | Productivity | Creativity | Responsiveness
AIDA64: Memory Copy | Memory Read | Memory Write | Memory Latency
| PCMark 10 / Score | |
| Alienware m16 R1 AMD | |
| Uniwill GM6PX7X RTX 4070 | |
| Średnia w klasie Gaming (5828 - 11574, n=95, ostatnie 2 lata) | |
| HP Omen 16-wf000 | |
| Acer Predator Helios 16 PH16-71-731Q | |
| Colorful EVOL X15 AT 23 | |
| Schenker XMG Pro 15 (E23) | |
| Przeciętny Intel Core i7-13700HX, NVIDIA GeForce RTX 4060 Laptop GPU (6909 - 7743, n=5) | |
| Alienware m16 R1 Intel | |
| Dell G15 5530 | |
| PCMark 10 / Essentials | |
| Uniwill GM6PX7X RTX 4070 | |
| Alienware m16 R1 AMD | |
| Schenker XMG Pro 15 (E23) | |
| Acer Predator Helios 16 PH16-71-731Q | |
| Dell G15 5530 | |
| Alienware m16 R1 Intel | |
| Przeciętny Intel Core i7-13700HX, NVIDIA GeForce RTX 4060 Laptop GPU (9760 - 11313, n=5) | |
| Średnia w klasie Gaming (8810 - 12600, n=99, ostatnie 2 lata) | |
| Colorful EVOL X15 AT 23 | |
| HP Omen 16-wf000 | |
| PCMark 10 / Productivity | |
| Acer Predator Helios 16 PH16-71-731Q | |
| Średnia w klasie Gaming (6845 - 18766, n=97, ostatnie 2 lata) | |
| Uniwill GM6PX7X RTX 4070 | |
| Schenker XMG Pro 15 (E23) | |
| Alienware m16 R1 AMD | |
| Dell G15 5530 | |
| Przeciętny Intel Core i7-13700HX, NVIDIA GeForce RTX 4060 Laptop GPU (9131 - 11018, n=5) | |
| Alienware m16 R1 Intel | |
| Colorful EVOL X15 AT 23 | |
| HP Omen 16-wf000 | |
| PCMark 10 / Digital Content Creation | |
| Alienware m16 R1 AMD | |
| Średnia w klasie Gaming (7602 - 19657, n=97, ostatnie 2 lata) | |
| Uniwill GM6PX7X RTX 4070 | |
| HP Omen 16-wf000 | |
| Colorful EVOL X15 AT 23 | |
| Przeciętny Intel Core i7-13700HX, NVIDIA GeForce RTX 4060 Laptop GPU (9393 - 12434, n=5) | |
| Acer Predator Helios 16 PH16-71-731Q | |
| Alienware m16 R1 Intel | |
| Schenker XMG Pro 15 (E23) | |
| Dell G15 5530 | |
| CrossMark / Overall | |
| Acer Predator Helios 16 PH16-71-731Q | |
| Alienware m16 R1 Intel | |
| Alienware m16 R1 AMD | |
| Średnia w klasie Gaming (1366 - 2409, n=97, ostatnie 2 lata) | |
| Uniwill GM6PX7X RTX 4070 | |
| Schenker XMG Pro 15 (E23) | |
| Przeciętny Intel Core i7-13700HX, NVIDIA GeForce RTX 4060 Laptop GPU (1663 - 2105, n=5) | |
| Dell G15 5530 | |
| Colorful EVOL X15 AT 23 | |
| HP Omen 16-wf000 | |
| CrossMark / Productivity | |
| Acer Predator Helios 16 PH16-71-731Q | |
| Alienware m16 R1 Intel | |
| Alienware m16 R1 AMD | |
| Średnia w klasie Gaming (1386 - 2254, n=97, ostatnie 2 lata) | |
| Uniwill GM6PX7X RTX 4070 | |
| Schenker XMG Pro 15 (E23) | |
| Przeciętny Intel Core i7-13700HX, NVIDIA GeForce RTX 4060 Laptop GPU (1618 - 1989, n=5) | |
| Dell G15 5530 | |
| Colorful EVOL X15 AT 23 | |
| HP Omen 16-wf000 | |
| CrossMark / Creativity | |
| Acer Predator Helios 16 PH16-71-731Q | |
| Alienware m16 R1 Intel | |
| Średnia w klasie Gaming (1343 - 2729, n=97, ostatnie 2 lata) | |
| Schenker XMG Pro 15 (E23) | |
| Alienware m16 R1 AMD | |
| Uniwill GM6PX7X RTX 4070 | |
| Dell G15 5530 | |
| Przeciętny Intel Core i7-13700HX, NVIDIA GeForce RTX 4060 Laptop GPU (1710 - 2274, n=5) | |
| HP Omen 16-wf000 | |
| Colorful EVOL X15 AT 23 | |
| CrossMark / Responsiveness | |
| Acer Predator Helios 16 PH16-71-731Q | |
| Alienware m16 R1 Intel | |
| Uniwill GM6PX7X RTX 4070 | |
| Schenker XMG Pro 15 (E23) | |
| Alienware m16 R1 AMD | |
| Średnia w klasie Gaming (1226 - 2334, n=97, ostatnie 2 lata) | |
| Przeciętny Intel Core i7-13700HX, NVIDIA GeForce RTX 4060 Laptop GPU (1269 - 1983, n=5) | |
| Dell G15 5530 | |
| HP Omen 16-wf000 | |
| Colorful EVOL X15 AT 23 | |
| AIDA64 / Memory Copy | |
| Schenker XMG Pro 15 (E23) | |
| Średnia w klasie Gaming (21750 - 129946, n=109, ostatnie 2 lata) | |
| Uniwill GM6PX7X RTX 4070 | |
| HP Omen 16-wf000 | |
| Dell G15 5530 | |
| Alienware m16 R1 Intel | |
| Acer Predator Helios 16 PH16-71-731Q | |
| Przeciętny Intel Core i7-13700HX, NVIDIA GeForce RTX 4060 Laptop GPU (36504 - 58458, n=5) | |
| Alienware m16 R1 AMD | |
| Colorful EVOL X15 AT 23 | |
| AIDA64 / Memory Read | |
| Schenker XMG Pro 15 (E23) | |
| Średnia w klasie Gaming (22956 - 118858, n=109, ostatnie 2 lata) | |
| Uniwill GM6PX7X RTX 4070 | |
| Dell G15 5530 | |
| Alienware m16 R1 Intel | |
| HP Omen 16-wf000 | |
| Acer Predator Helios 16 PH16-71-731Q | |
| Przeciętny Intel Core i7-13700HX, NVIDIA GeForce RTX 4060 Laptop GPU (36510 - 67644, n=5) | |
| Alienware m16 R1 AMD | |
| Colorful EVOL X15 AT 23 | |
| AIDA64 / Memory Write | |
| Acer Predator Helios 16 PH16-71-731Q | |
| Średnia w klasie Gaming (22297 - 135096, n=109, ostatnie 2 lata) | |
| Schenker XMG Pro 15 (E23) | |
| HP Omen 16-wf000 | |
| Uniwill GM6PX7X RTX 4070 | |
| Przeciętny Intel Core i7-13700HX, NVIDIA GeForce RTX 4060 Laptop GPU (33598 - 85675, n=5) | |
| Dell G15 5530 | |
| Alienware m16 R1 Intel | |
| Alienware m16 R1 AMD | |
| Colorful EVOL X15 AT 23 | |
| AIDA64 / Memory Latency | |
| Średnia w klasie Gaming (75.3 - 259, n=109, ostatnie 2 lata) | |
| Alienware m16 R1 AMD | |
| Dell G15 5530 | |
| Alienware m16 R1 Intel | |
| Uniwill GM6PX7X RTX 4070 | |
| HP Omen 16-wf000 | |
| Przeciętny Intel Core i7-13700HX, NVIDIA GeForce RTX 4060 Laptop GPU (81.9 - 93, n=5) | |
| Acer Predator Helios 16 PH16-71-731Q | |
| Schenker XMG Pro 15 (E23) | |
| Colorful EVOL X15 AT 23 | |
* ... im mniej tym lepiej
| PCMark 8 Home Score Accelerated v2 | 5769 pkt. | |
| PCMark 8 Work Score Accelerated v2 | 5995 pkt. | |
| PCMark 10 Score | 7655 pkt. | |
Pomoc | ||
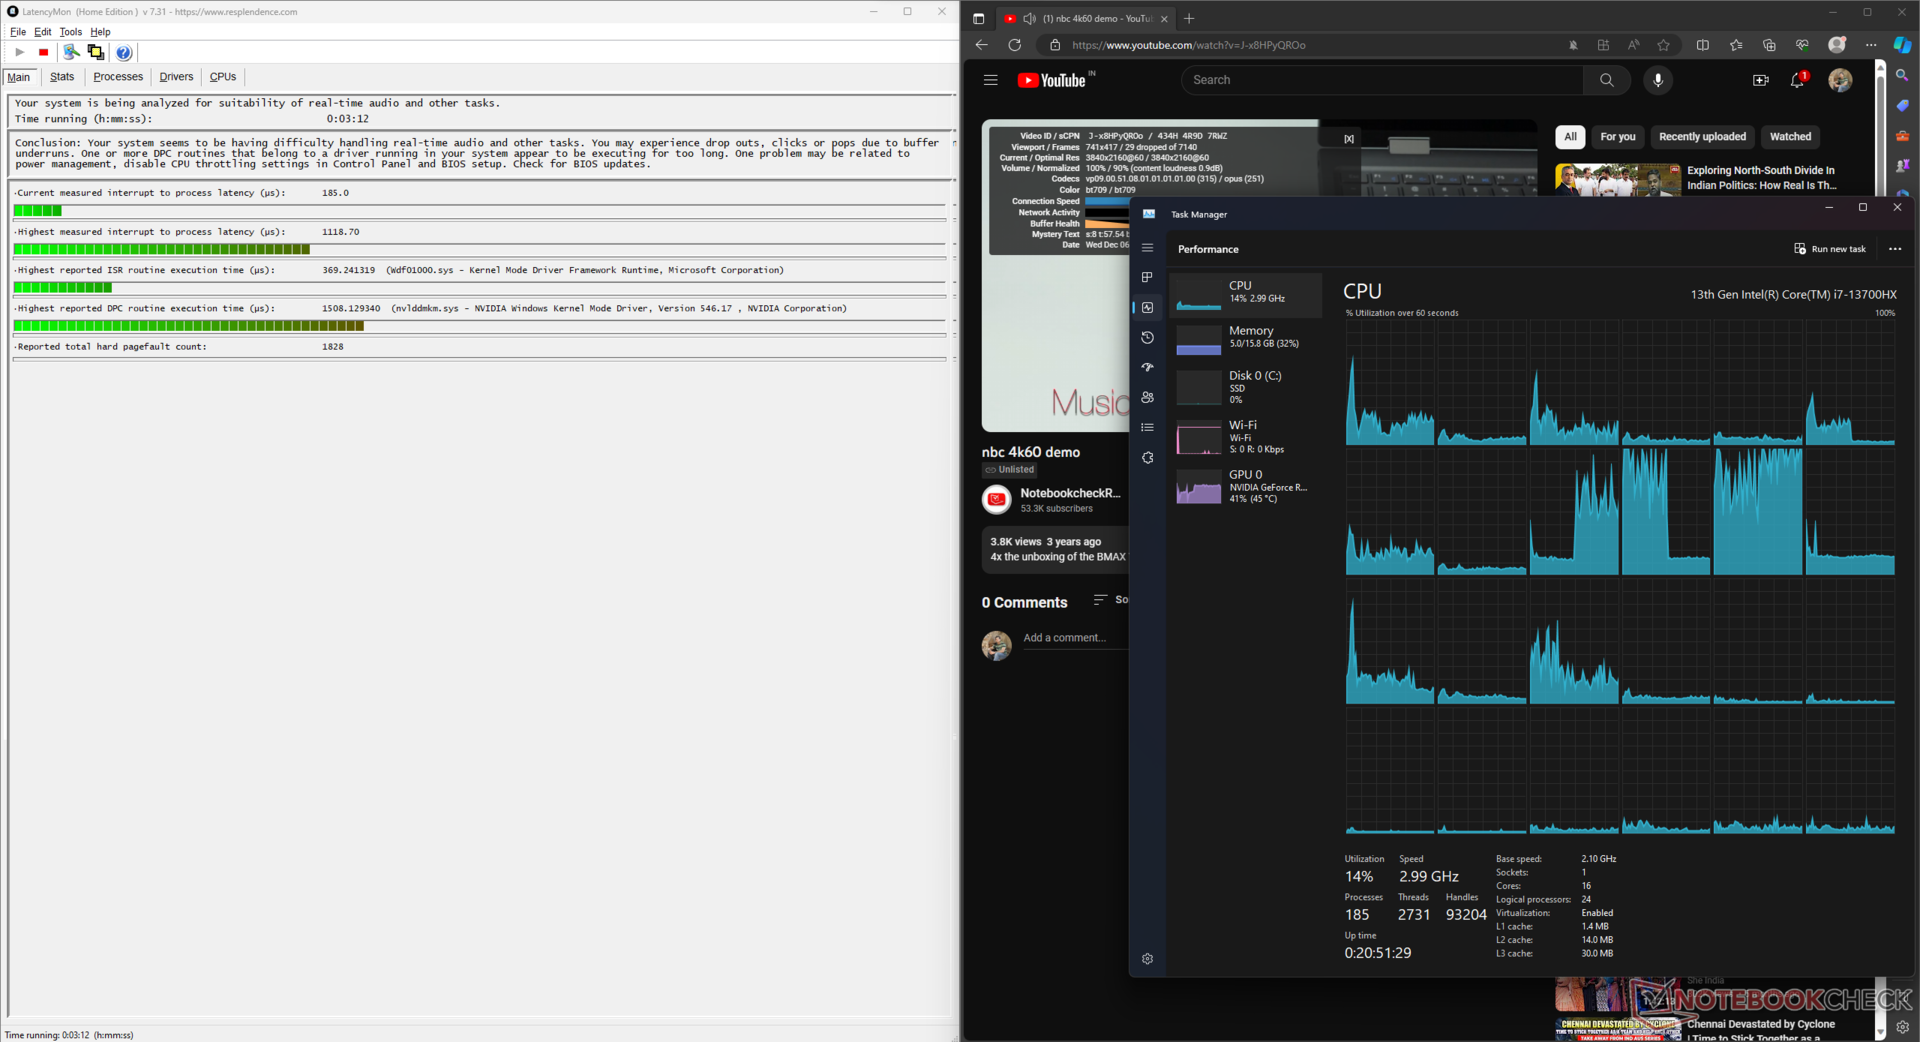
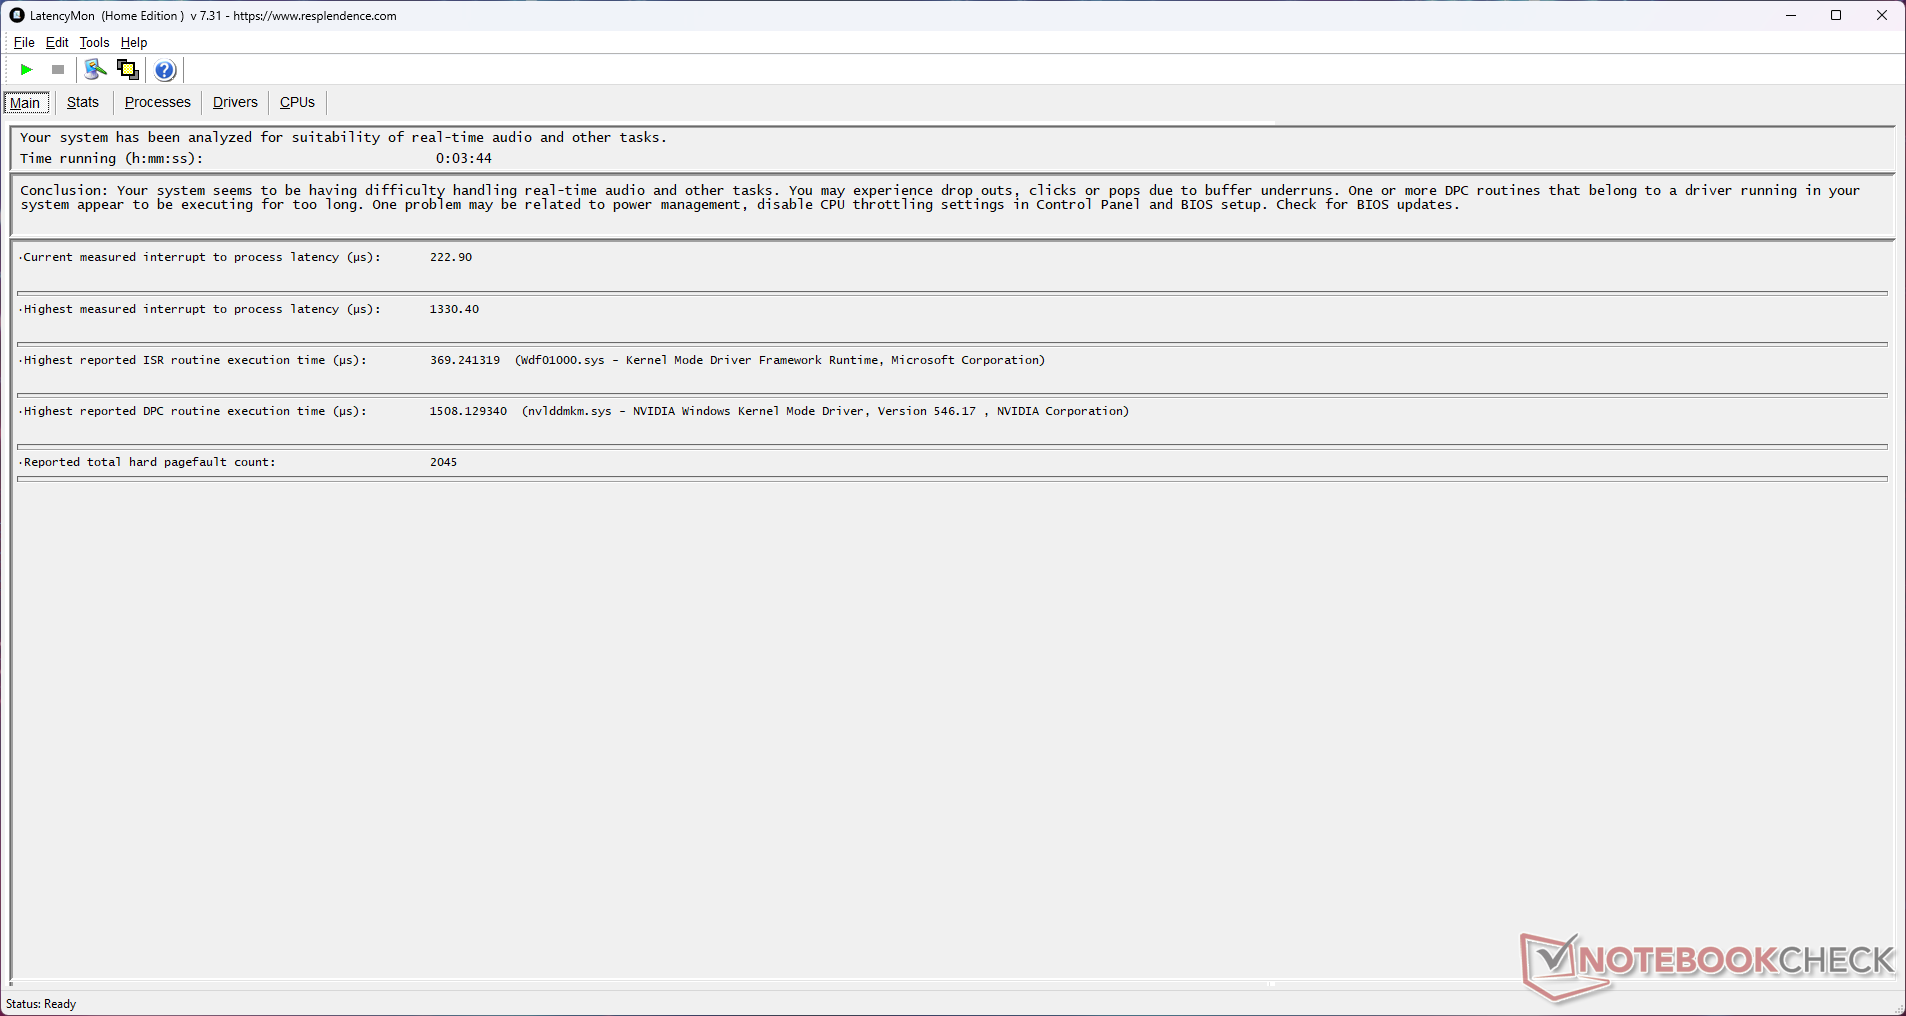
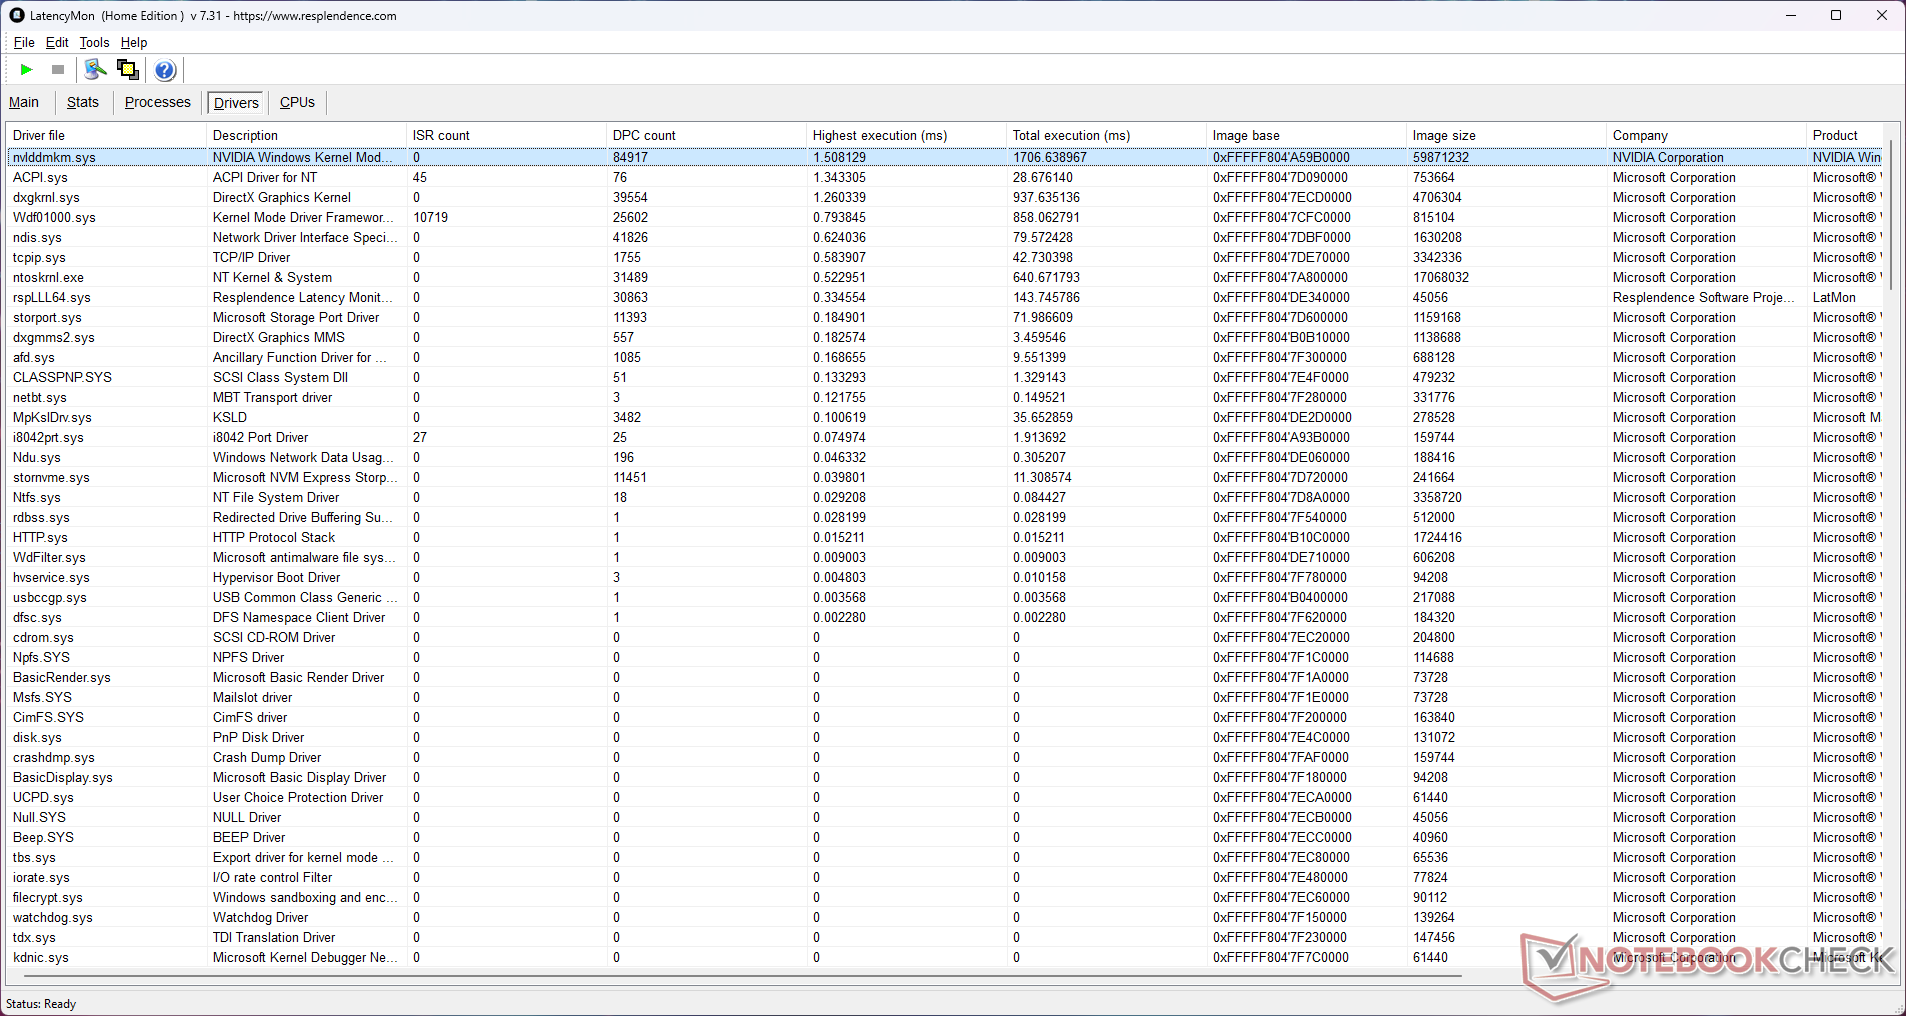
Opóźnienie DPC
Wysokie opóźnienia DPC to znany problem w laptopach z kartami Nvidii, a EVOL X15 nie jest wyjątkiem, choć wypada lepiej niż jego konkurenci.
Za pomocą LatencyMon zarejestrowaliśmy opóźnienie między przerwaniem a procesem wynoszące 1 330,4 µs, po przykładowym odtwarzaniu YouTube 4K60 i 10-sekundowym stresie Prime95. Do tak wysokich opóźnień przyczynia się Nvidia Windows Kernel Mode Driver Framework (nvlddmkm.sys).
| DPC Latencies / LatencyMon - interrupt to process latency (max), Web, Youtube, Prime95 | |
| Dell G15 5530 | |
| Alienware m16 R1 Intel | |
| HP Omen 16-wf000 | |
| Alienware m16 R1 AMD | |
| Acer Predator Helios 16 PH16-71-731Q | |
| Colorful EVOL X15 AT 23 | |
| Uniwill GM6PX7X RTX 4070 | |
| Schenker XMG Pro 15 (E23) | |
* ... im mniej tym lepiej
Nasz Ranking opóźnień DPC znajdą Państwo więcej porównań LatencyMon dla testowanych urządzeń.
Urządzenia pamięci masowej
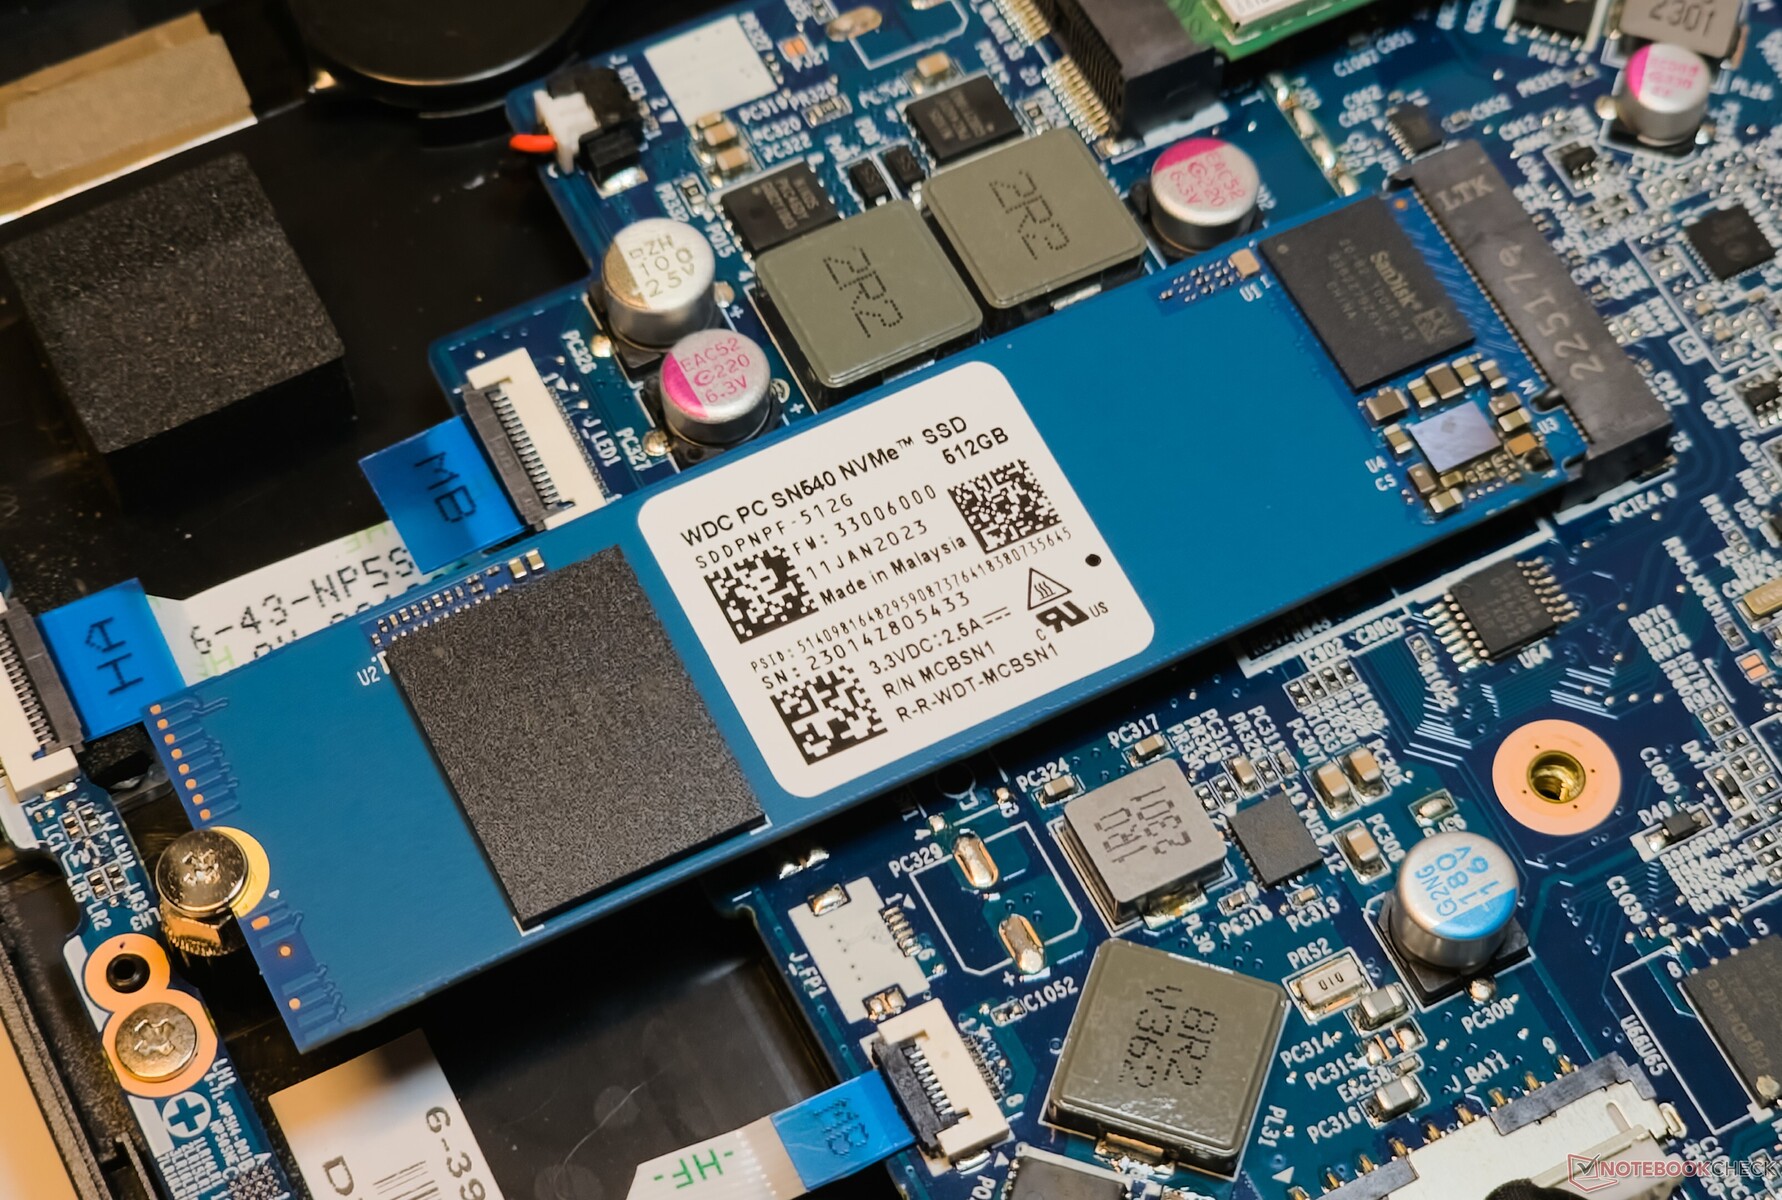
Dysk Western Digital SN540 NVMe SSD o pojemności 512 GB w EVOL X15 nie może się równać z dyskami Kioxia i SK Hynix używanymi przez konkurencję. Niemniej jednak, odczyty 4k q1 t1 i zapisy 4k q1 t1 przewyższają te z Kioxia XG8 w Alienware m16 R1 AMD.
Colorful umożliwia dodanie kolejnego dysku PCIe Gen4 NVMe. Nie ma jednak możliwości dodania 2,5-calowej pamięci masowej SATA.

* ... im mniej tym lepiej
Dławienie dysku: Pętla odczytu DiskSpd, głębokość kolejki 8
Dysk zaczyna dławić się po 17. pętli podczas testu DiskSpd Read Loop przy głębokości kolejki wynoszącej 8. Na dysku nie ma osłony termicznej ani wyściółki.
Wydajność GPU
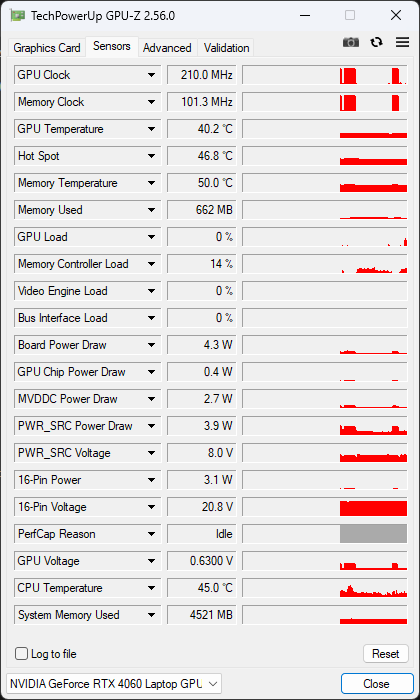
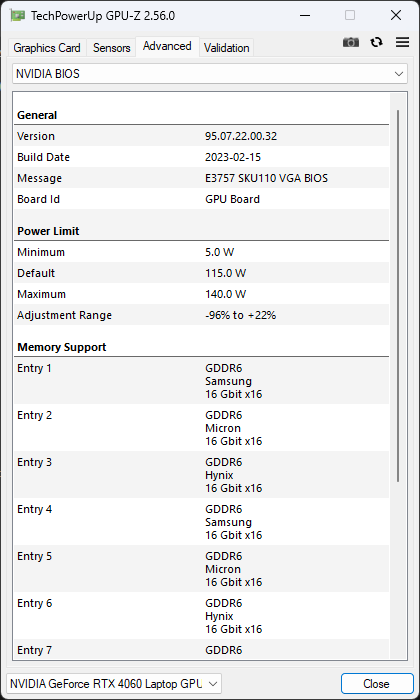
Procesor graficzny Nvidia GeForce RTX 4060 Laptop w EVOL X15 AT działa przy 140 W TGP. Jego ogólna wydajność w 3DMark jest porównywalna z innymi laptopami korzystającymi z tego samego GPU.
Widzimy również, że RTX 4060 jest w niewielkiej odległości od 140 W RTX 4070 Laptop GPU w laptopie Uniwill GM6PX7Xale wypada słabiej o 31% w porównaniu do 175 W RTX 4080 Laptop GPU który zasila Alienware m16 R1 AMD.
wyniki graficzne 3DMark Time Spy mogą spaść o prawie 54% na zasilaniu bateryjnym.
| 3DMark 11 Performance | 30245 pkt. | |
| 3DMark Ice Storm Standard Score | 278340 pkt. | |
| 3DMark Cloud Gate Standard Score | 63582 pkt. | |
| 3DMark Fire Strike Score | 24674 pkt. | |
| 3DMark Fire Strike Extreme Score | 12089 pkt. | |
| 3DMark Time Spy Score | 10590 pkt. | |
Pomoc | ||
| Blender / v3.3 Classroom OPTIX/RTX | |
| Schenker XMG Pro 15 (E23) | |
| Colorful EVOL X15 AT 23 | |
| Alienware m16 R1 Intel | |
| Przeciętny NVIDIA GeForce RTX 4060 Laptop GPU (19 - 28, n=53) | |
| Acer Predator Helios 16 PH16-71-731Q | |
| Dell G15 5530 | |
| Uniwill GM6PX7X RTX 4070 | |
| Średnia w klasie Gaming (9 - 32, n=111, ostatnie 2 lata) | |
| HP Omen 16-wf000 | |
| Alienware m16 R1 AMD | |
| Blender / v3.3 Classroom CUDA | |
| Schenker XMG Pro 15 (E23) | |
| Przeciętny NVIDIA GeForce RTX 4060 Laptop GPU (39 - 53, n=53) | |
| Colorful EVOL X15 AT 23 | |
| Acer Predator Helios 16 PH16-71-731Q | |
| Dell G15 5530 | |
| Alienware m16 R1 Intel | |
| Uniwill GM6PX7X RTX 4070 | |
| Średnia w klasie Gaming (15 - 228, n=111, ostatnie 2 lata) | |
| Alienware m16 R1 AMD | |
| HP Omen 16-wf000 | |
| Blender / v3.3 Classroom CPU | |
| Przeciętny NVIDIA GeForce RTX 4060 Laptop GPU (189 - 452, n=53) | |
| HP Omen 16-wf000 | |
| Dell G15 5530 | |
| Acer Predator Helios 16 PH16-71-731Q | |
| Colorful EVOL X15 AT 23 | |
| Schenker XMG Pro 15 (E23) | |
| Alienware m16 R1 Intel | |
| Średnia w klasie Gaming (122 - 565, n=107, ostatnie 2 lata) | |
| Uniwill GM6PX7X RTX 4070 | |
| Alienware m16 R1 AMD | |
* ... im mniej tym lepiej
Wydajność w grach
EVOL X15 ma niewielką przewagę nad konkurencyjnymi laptopami o podobnych specyfikacjach, w tym Acer Predator Helios 16 i Alienware m16 R1 Intel pod względem ogólnej wydajności w grach w rozdzielczości 1080p Ultra.
Rozgrywka w rozdzielczości QHD 60 klatek na sekundę jest osiągalna w wielu tytułach AAA, a istnieje potencjał, aby uzyskać jeszcze wyższą liczbę klatek na sekundę przy pomocy upscalerów, takich jak Nvidia DLSS, AMD FSR lub Intel XeSS.
| The Witcher 3 - 1920x1080 Ultra Graphics & Postprocessing (HBAO+) | |
| Średnia w klasie Gaming (95 - 240, n=8, ostatnie 2 lata) | |
| Alienware m16 R1 AMD | |
| HP Omen 16-wf000 | |
| Schenker XMG Pro 15 (E23) | |
| Uniwill GM6PX7X RTX 4070 | |
| Alienware m16 R1 Intel | |
| Dell G15 5530 | |
| Colorful EVOL X15 AT 23 | |
| Acer Predator Helios 16 PH16-71-731Q | |
| GTA V - 1920x1080 Highest AA:4xMSAA + FX AF:16x | |
| Średnia w klasie Gaming (48.3 - 186.9, n=102, ostatnie 2 lata) | |
| Uniwill GM6PX7X RTX 4070 | |
| Colorful EVOL X15 AT 23 | |
| HP Omen 16-wf000 | |
| Acer Predator Helios 16 PH16-71-731Q | |
| Dell G15 5530 | |
| Schenker XMG Pro 15 (E23) | |
| Final Fantasy XV Benchmark - 1920x1080 High Quality | |
| Alienware m16 R1 AMD | |
| HP Omen 16-wf000 | |
| Średnia w klasie Gaming (41 - 215, n=103, ostatnie 2 lata) | |
| Uniwill GM6PX7X RTX 4070 | |
| Alienware m16 R1 Intel | |
| Colorful EVOL X15 AT 23 | |
| Acer Predator Helios 16 PH16-71-731Q | |
| Dell G15 5530 | |
Wykres Witcher 3 FPS
Chłodzenie podsystemu graficznego EVOL X15 wydaje się być całkiem wydajne, o czym świadczy stabilna liczba klatek na sekundę zaobserwowana podczas obciążającej gry The Witcher 3 w rozdzielczości 1080p Ultra.
| low | med. | high | ultra | QHD | |
|---|---|---|---|---|---|
| GTA V (2015) | 185.6 | 182.3 | 177.3 | 114.6 | 85.6 |
| The Witcher 3 (2015) | 450 | 333 | 205 | 103.4 | 75.7 |
| Dota 2 Reborn (2015) | 192.2 | 169.7 | 164.6 | 153.1 | |
| Final Fantasy XV Benchmark (2018) | 206 | 143.9 | 101 | 74 | |
| X-Plane 11.11 (2018) | 176.1 | 155.9 | 116.4 | ||
| Far Cry 5 (2018) | 162 | 146 | 141 | 135 | 101 |
| Strange Brigade (2018) | 480 | 288 | 225 | 192 | 127.4 |
| F1 22 (2022) | 253 | 253 | 194.5 | 65.8 | 42.3 |
| F1 23 (2023) | 248 | 250 | 184.1 | 58.3 | 37 |
| Cyberpunk 2077 (2023) | 119.4 | 96.5 | 82.8 | 71.1 | 42.8 |
| Assassin's Creed Mirage (2023) | 137 | 125 | 116 | 89 | 65 |
| Call of Duty Modern Warfare 3 2023 (2023) | 128 | 114 | 86 | 65 | 56 |
| Avatar Frontiers of Pandora (2023) | 77.3 | 71.1 | 60.8 | 45.2 | 29.8 |
Proszę odnieść się do naszego dedykowanego Karta graficzna Nvidia GeForce RTX 4060 do laptopów aby uzyskać więcej informacji i porównać wydajność.
Emisje: Niskim temperaturom powierzchni towarzyszy wysoki hałas wentylatora
Hałas systemowy
Colorful ogranicza hałas wentylatora EVOL X15 AT do poniżej 30 db(A) w trybie cichym.
Jednak zarówno w trybach Rozrywka, jak i Wydajność poziom hałasu zbliża się do 55 db(A), nawet przy średnim obciążeniu 3DMark 06.
Dostarczone profile zasilania mają zauważalny wpływ na wydajność w grach. Przykładowo, obserwujemy spadek średniej liczby klatek na sekundę o 33% w grze The Witcher 3 w rozdzielczości 1080p Ultra po przełączeniu z trybu Wydajność na tryb Cichy.
Hałas
| luz |
| 33.16 / 33.16 / 33.16 dB |
| obciążenie |
| 54.62 / 54.53 dB |
 | ||
30 dB cichy 40 dB(A) słyszalny 50 dB(A) irytujący |
||
min: | ||
| Tryb wydajności | Bezczynność dB(A) | Średnie obciążenie dB(A) | Maksymalne obciążenie dB(A) | Witcher 3 1080p Ultra dB(A) |
|---|---|---|---|---|
| Cichy | 24,73 | 26,61 | 26,08 | 26,82 / 67 kl |
| Oszczędzanie energii | 24,85 | 26,02 | 41,05 | 46,10 / 75 kl |
| Rozrywka | 25.07 | 54.06 | 54.56 | 53.29 / 97 fps |
| Wydajność | 33.16 | 54.62 | 54.53 | 54.62 / 100 fps |
| Colorful EVOL X15 AT 23 i7-13700HX, GeForce RTX 4060 Laptop GPU | Alienware m16 R1 Intel i7-13700HX, GeForce RTX 4060 Laptop GPU | HP Omen 16-wf000 i7-13700HX, GeForce RTX 4080 Laptop GPU | Acer Predator Helios 16 PH16-71-731Q i7-13700HX, GeForce RTX 4060 Laptop GPU | Dell G15 5530 i7-13650HX, GeForce RTX 4060 Laptop GPU | Schenker XMG Pro 15 (E23) i9-13900HX, GeForce RTX 4060 Laptop GPU | Alienware m16 R1 AMD R9 7845HX, GeForce RTX 4080 Laptop GPU | Uniwill GM6PX7X RTX 4070 i7-13700HX, GeForce RTX 4070 Laptop GPU | |
|---|---|---|---|---|---|---|---|---|
| Noise | 9% | 7% | 14% | 19% | 11% | 13% | 13% | |
| wyłączone / środowisko * (dB) | 21.32 | 25 -17% | 23 -8% | 24 -13% | 20.41 4% | 24 -13% | 22.9 -7% | 22.4 -5% |
| Idle Minimum * (dB) | 33.16 | 25 25% | 29.6 11% | 24 28% | 26.85 19% | 24 28% | 22.9 31% | 22.9 31% |
| Idle Average * (dB) | 33.16 | 26 22% | 29.8 10% | 24 28% | 26.85 19% | 24 28% | 29.7 10% | 29 13% |
| Idle Maximum * (dB) | 33.16 | 27 19% | 30.4 8% | 32.32 3% | 26.85 19% | 24 28% | 29.7 10% | 29 13% |
| Load Average * (dB) | 54.62 | 52 5% | 33.8 38% | 36.66 33% | 27.65 49% | 53.65 2% | 29.8 45% | 40.2 26% |
| Witcher 3 ultra * (dB) | 54.6 | 51 7% | 57 -4% | 49.06 10% | 47.9 12% | 53.53 2% | 54.7 -0% | 48.7 11% |
| Load Maximum * (dB) | 54.53 | 53 3% | 58.3 -7% | 49.49 9% | 47.86 12% | 53.65 2% | 54.7 -0% | 55 -1% |
* ... im mniej tym lepiej
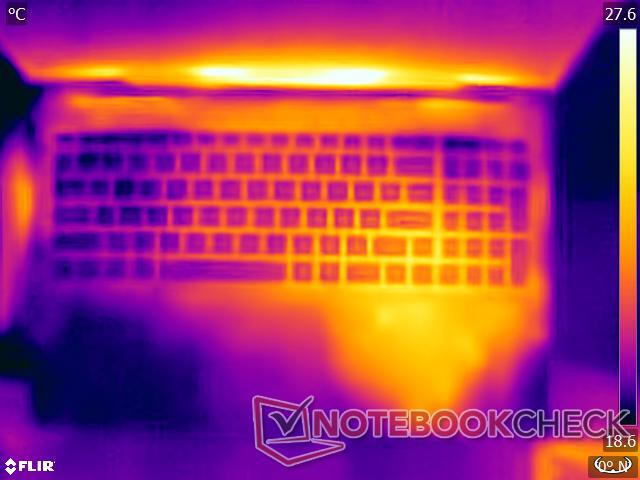
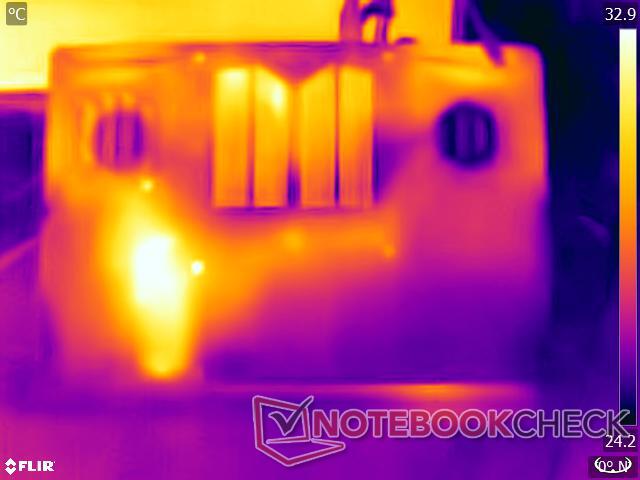
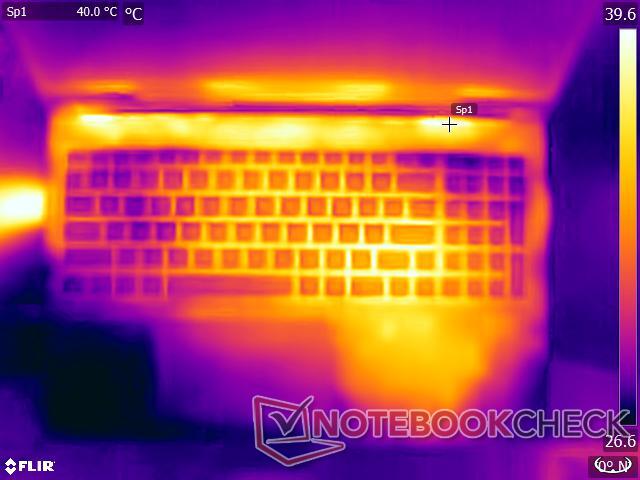
Temperatura
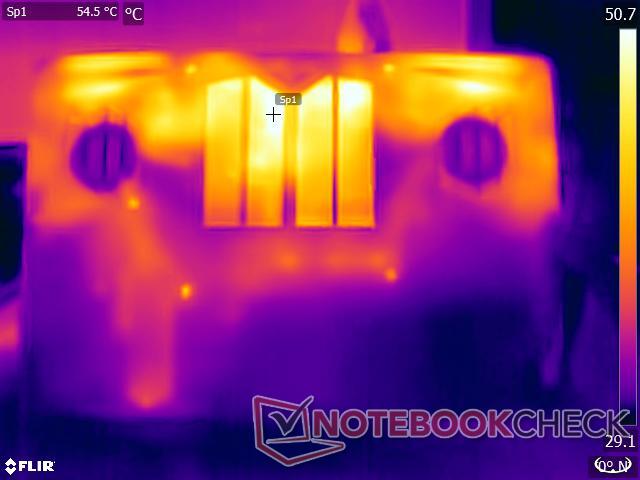
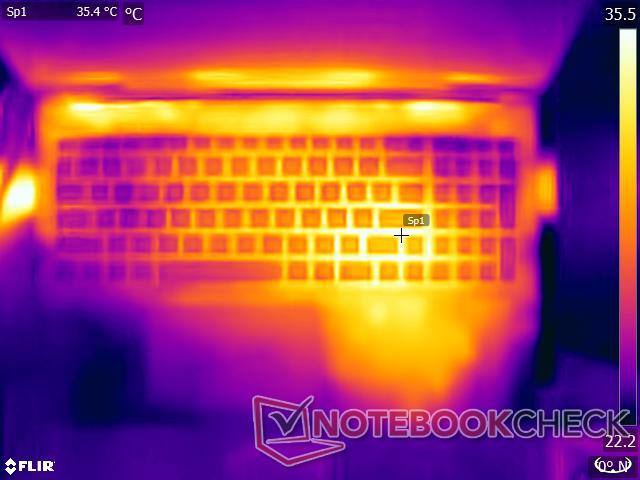
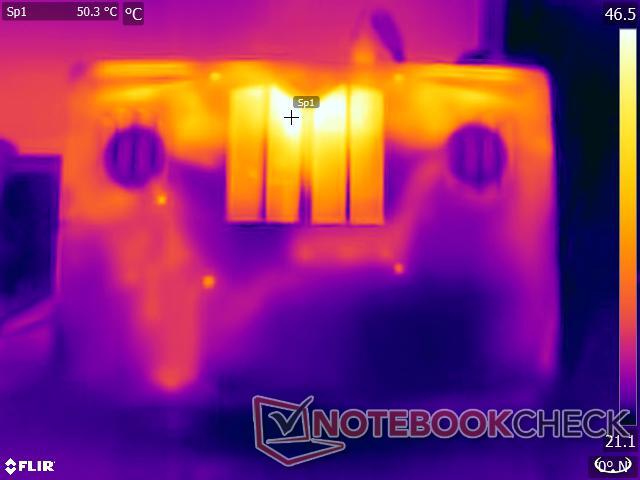
EVOL X15 posiada solidny system chłodzenia, który w pełni pokrywa CPU, GPU i chipset. Temperatury powierzchniowe są do opanowania pod dużym obciążeniem dzięki solidnej plastikowej konstrukcji i dużemu odstępowi tylnego panelu od płyty głównej. Tylko jeden hotspot na spodzie osiąga 51°C.
Pomimo swojej wagi, EVOL X15 może być używany na kolanach, o ile nie naciskamy go zbyt mocno. Touchpad i obszary podparcia dłoni pozostają stosunkowo chłodne, nagrzewając się nieznacznie tylko przy ekstremalnym obciążeniu.
(+) Maksymalna temperatura w górnej części wynosi 37 °C / 99 F, w porównaniu do średniej 40.4 °C / 105 F , począwszy od 21.2 do 68.8 °C dla klasy Gaming.
(-) Dno nagrzewa się maksymalnie do 51.2 °C / 124 F, w porównaniu do średniej 43.2 °C / 110 F
(+) W stanie bezczynności średnia temperatura górnej części wynosi 29.3 °C / 85 F, w porównaniu ze średnią temperaturą urządzenia wynoszącą 33.9 °C / ### class_avg_f### F.
(+) Podczas gry w Wiedźmina 3 średnia temperatura górnej części wynosi 31.7 °C / 89 F, w porównaniu do średniej temperatury urządzenia wynoszącej 33.9 °C / ## #class_avg_f### F.
(+) Podparcia dłoni i touchpad osiągają maksymalną temperaturę skóry (34.8 °C / 94.6 F) i dlatego nie są gorące.
(-) Średnia temperatura obszaru podparcia dłoni w podobnych urządzeniach wynosiła 28.8 °C / 83.8 F (-6 °C / -10.8 F).
| Colorful EVOL X15 AT 23 Intel Core i7-13700HX, NVIDIA GeForce RTX 4060 Laptop GPU | Alienware m16 R1 Intel Intel Core i7-13700HX, NVIDIA GeForce RTX 4060 Laptop GPU | HP Omen 16-wf000 Intel Core i7-13700HX, NVIDIA GeForce RTX 4080 Laptop GPU | Acer Predator Helios 16 PH16-71-731Q Intel Core i7-13700HX, NVIDIA GeForce RTX 4060 Laptop GPU | Dell G15 5530 Intel Core i7-13650HX, NVIDIA GeForce RTX 4060 Laptop GPU | Schenker XMG Pro 15 (E23) Intel Core i9-13900HX, NVIDIA GeForce RTX 4060 Laptop GPU | Alienware m16 R1 AMD AMD Ryzen 9 7845HX, NVIDIA GeForce RTX 4080 Laptop GPU | Uniwill GM6PX7X RTX 4070 Intel Core i7-13700HX, NVIDIA GeForce RTX 4070 Laptop GPU | |
|---|---|---|---|---|---|---|---|---|
| Heat | -18% | 0% | -17% | -19% | -9% | -9% | -5% | |
| Maximum Upper Side * (°C) | 37 | 49 -32% | 45 -22% | 41 -11% | 54 -46% | 50 -35% | 48 -30% | 38.2 -3% |
| Maximum Bottom * (°C) | 51.2 | 48 6% | 48.8 5% | 66 -29% | 62.2 -21% | 50 2% | 39 24% | 45 12% |
| Idle Upper Side * (°C) | 31.2 | 40 -28% | 29.2 6% | 36 -15% | 33.4 -7% | 33 -6% | 37 -19% | 33.6 -8% |
| Idle Bottom * (°C) | 32.8 | 39 -19% | 28.8 12% | 37 -13% | 33.4 -2% | 32 2% | 36.2 -10% | 39.6 -21% |
* ... im mniej tym lepiej
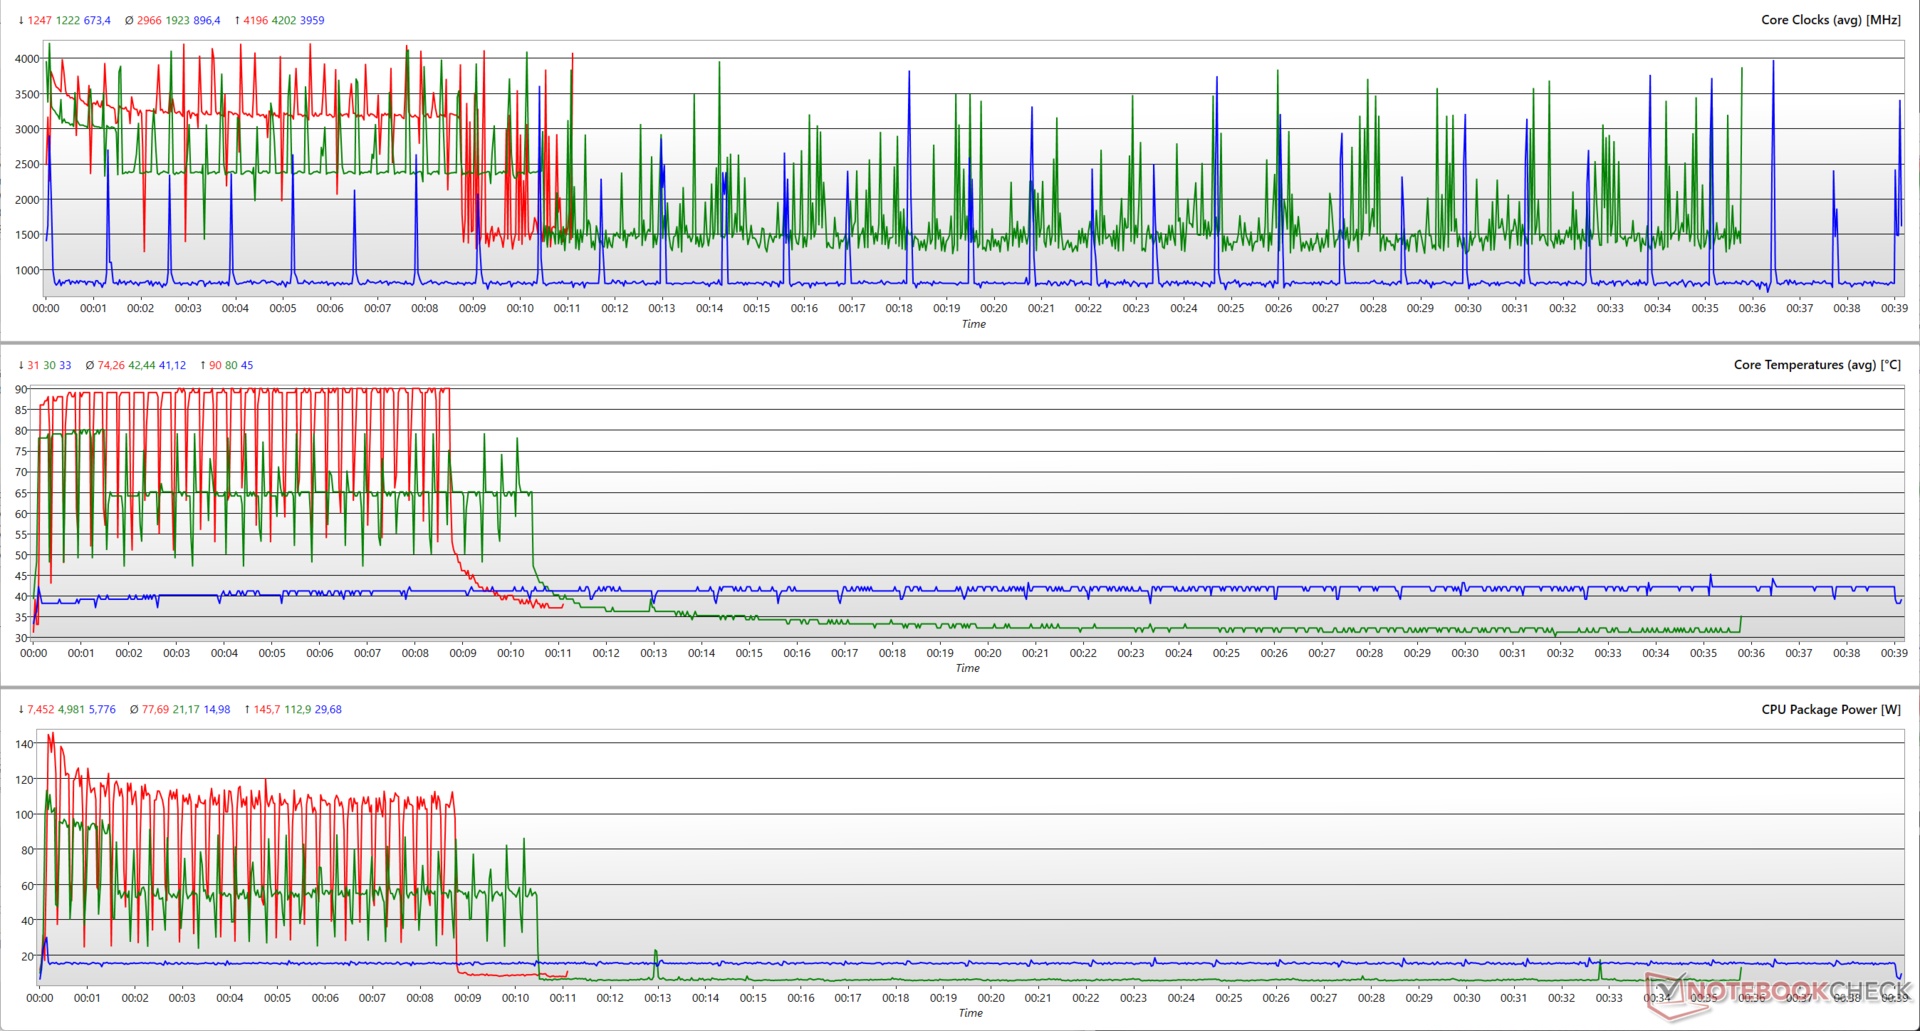
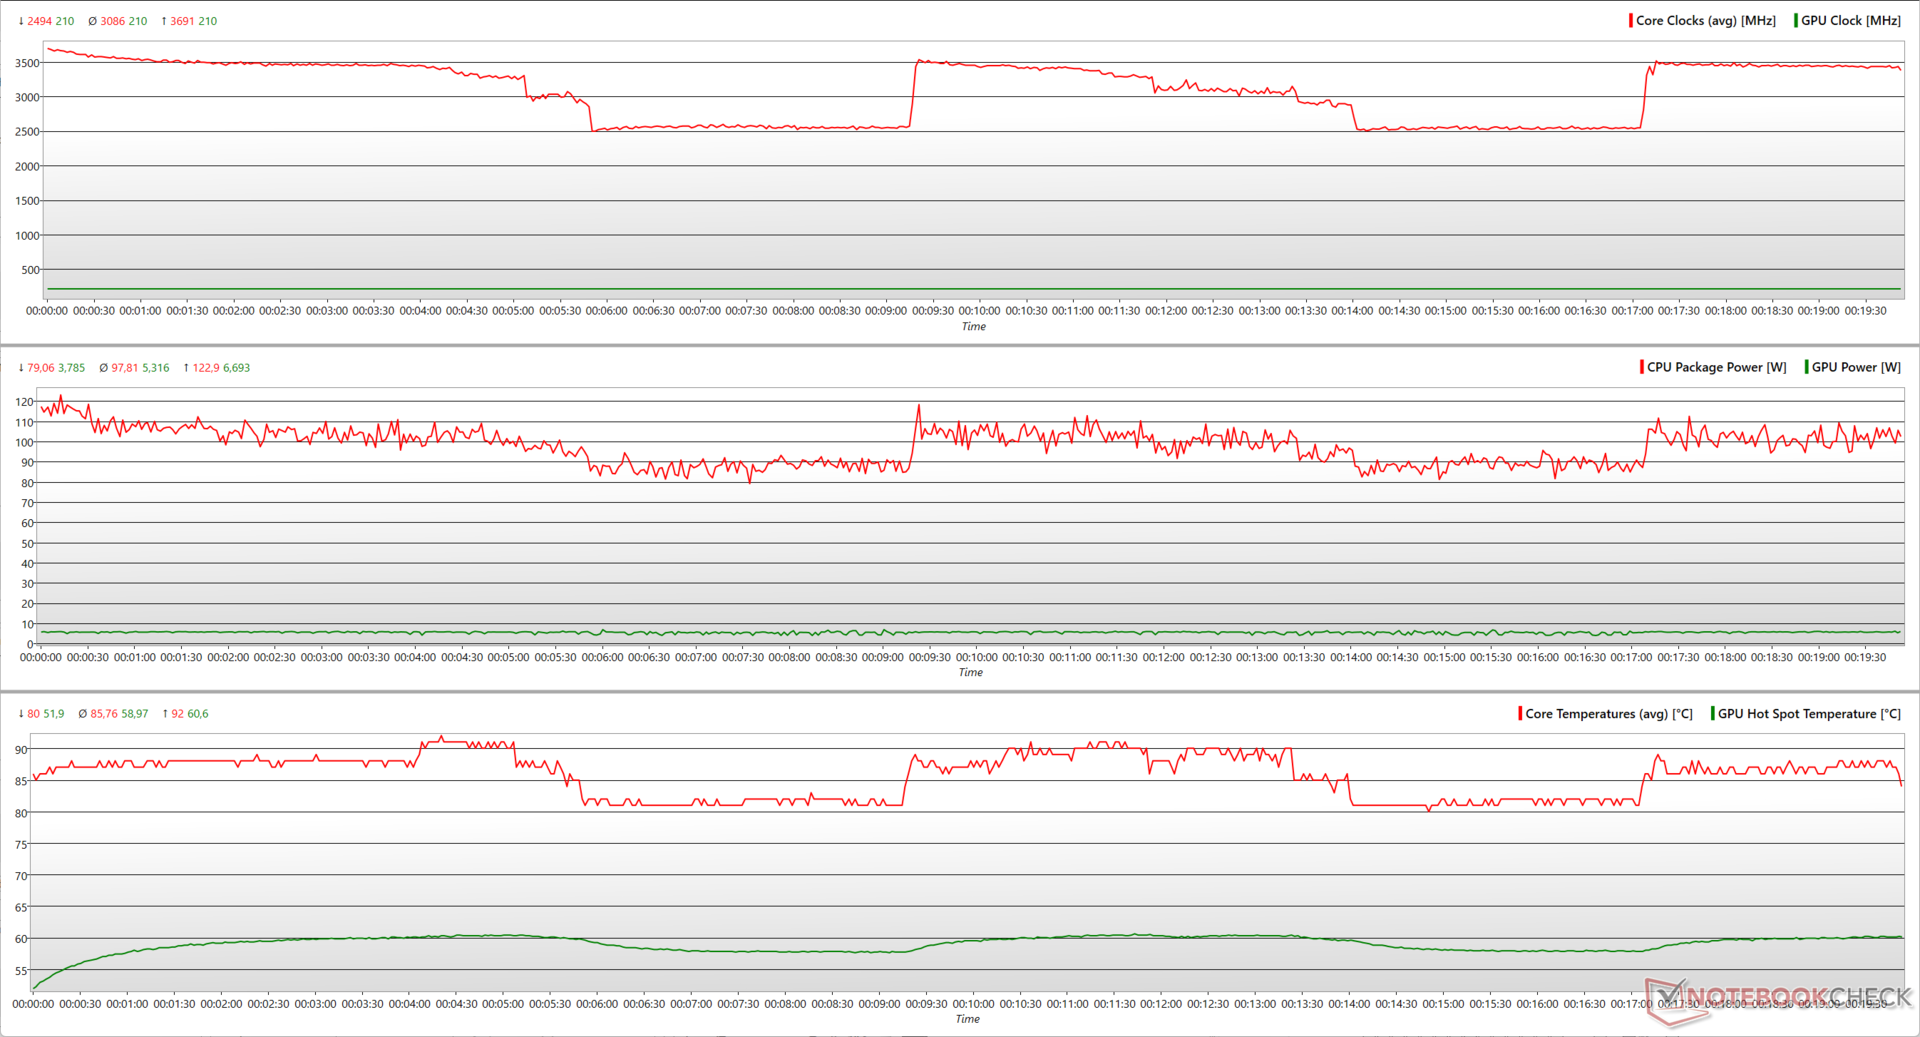
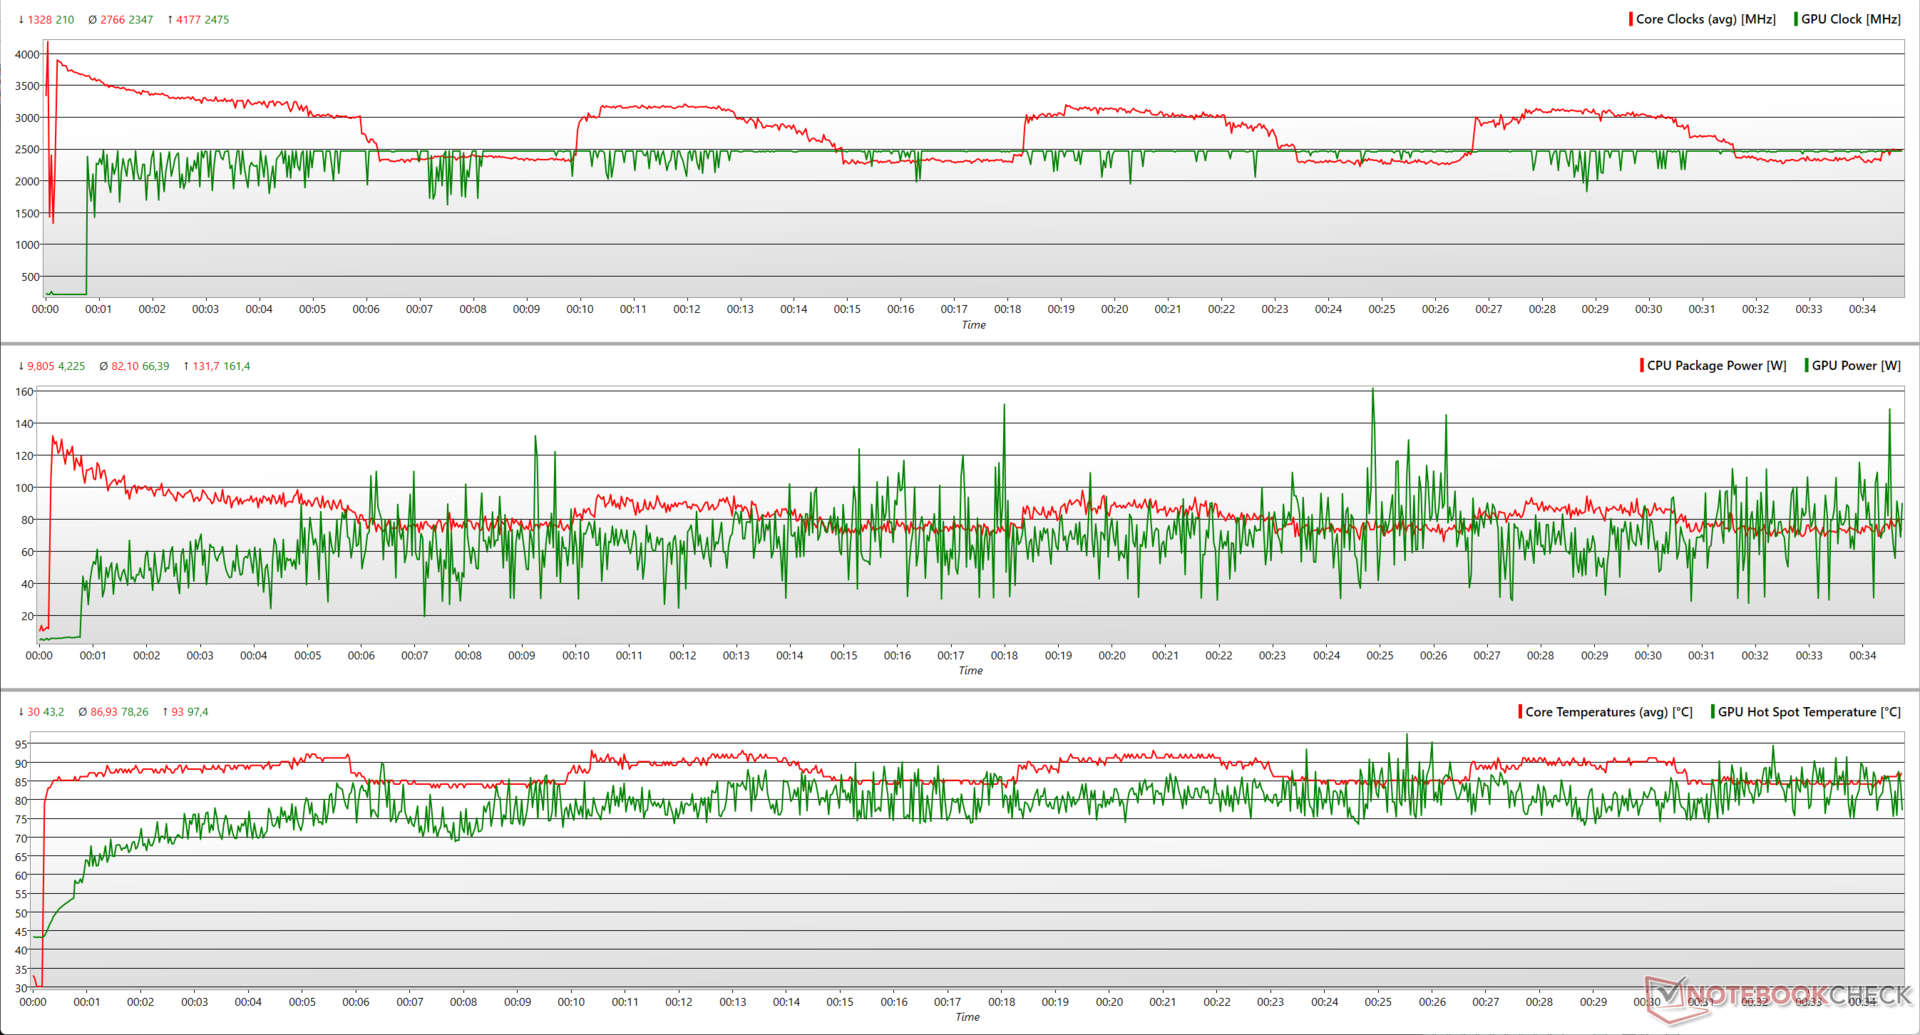
Test warunków skrajnych
Obciążając EVOL X15 za pomocą Prime95 in-place large FFTs, Core i7-13700HX osiąga szczytowe przyspieszenie do 3,7 GHz przy zużyciu 123 W. Pomimo kompleksowego chłodzenia, procesor okresowo spada do 2,5 GHz przy 80 W, po czym próbuje wznieść się z powrotem do 3,7 GHz.
Po dodaniu FurMark, Core i7-13700HX może teraz zużywać do 132 W, aby osiągnąć 4,2 GHz, ale nadal sporadycznie dławi się blisko poziomu 2,5 GHz. RTX 4060 może wykorzystać nadwyżkę mocy i osiągnąć 2475 MHz w szczycie, zużywając przy tym 161 W.
| Test obciążeniowy | Taktowanie CPU (GHz) | Taktowanie GPU (MHz) | Średnia temperatura CPU (°C) | Średnia temperatura GPU (°C) |
| System w stanie spoczynku | 1,42 | 210 | 31 | 37,1 |
| Prime95 | 3.42 | 210 | 85 | 50.8 |
| Prime95 + FurMark | 2.99 | 2,460 | 86 | 70.8 |
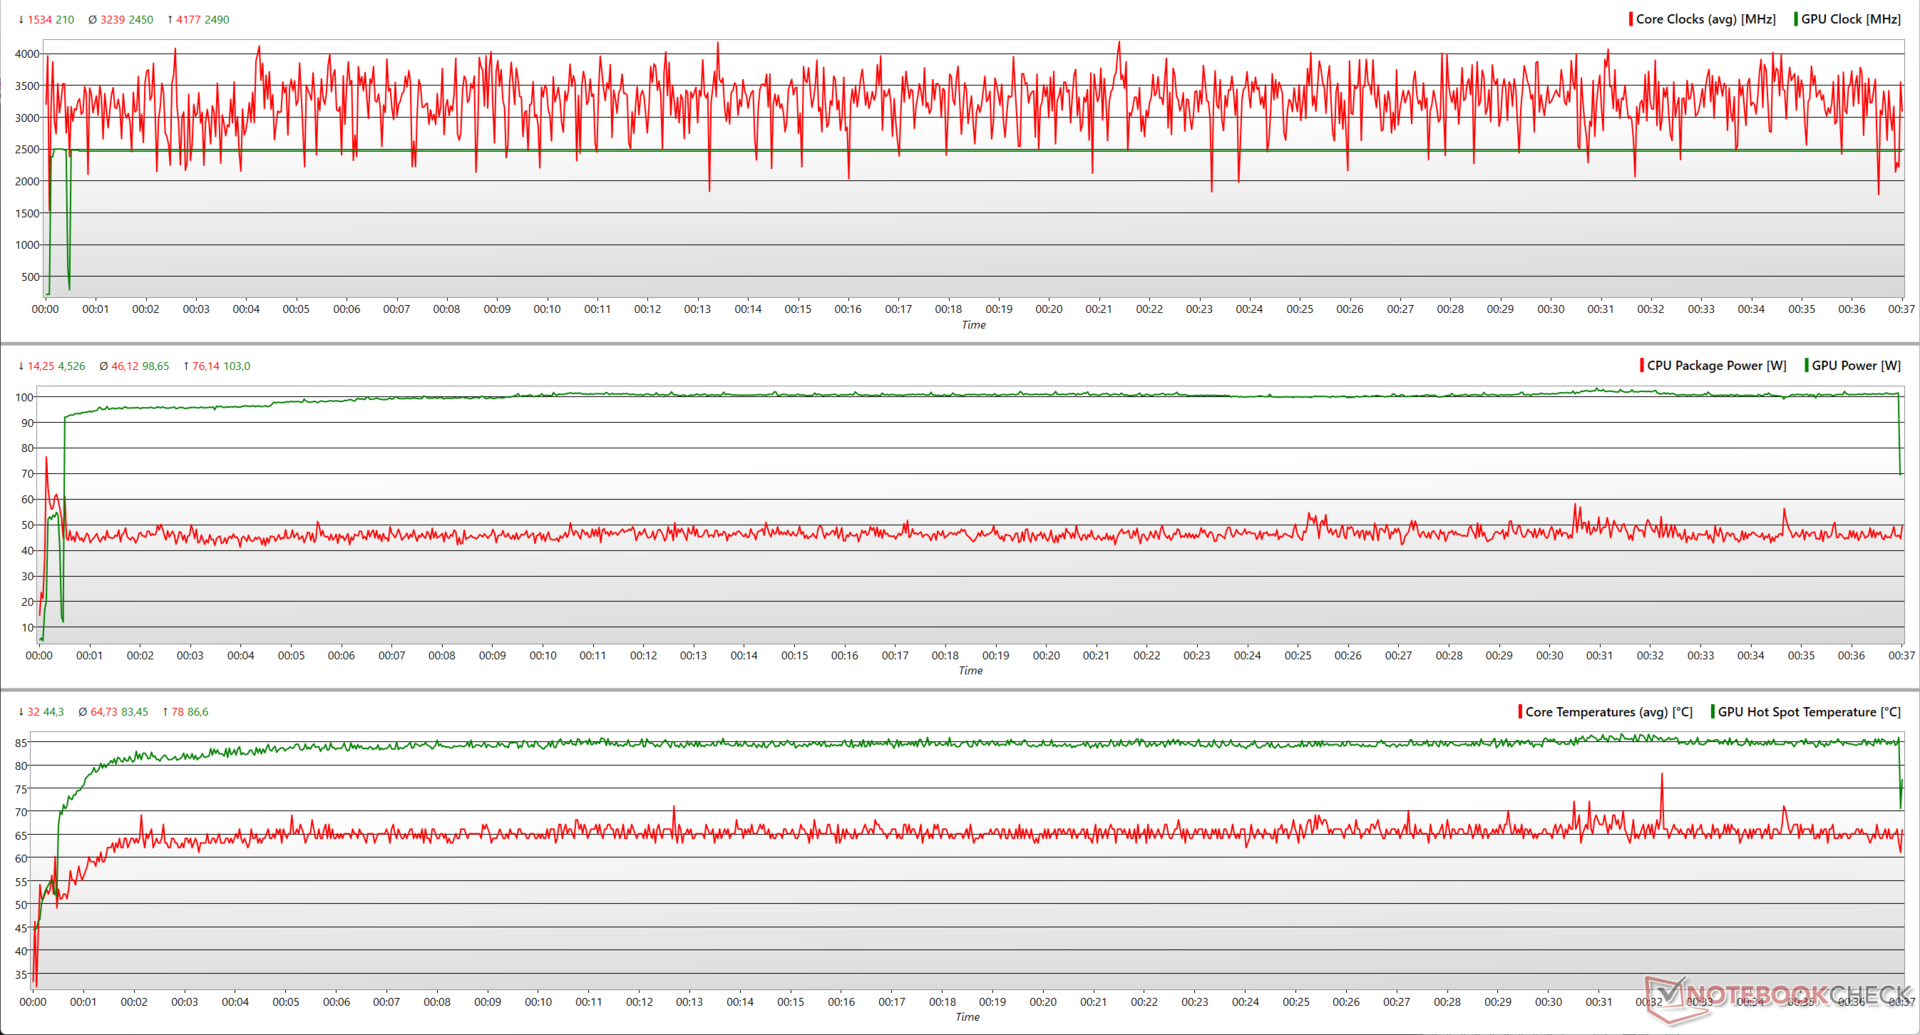
| The Witcher 3 1080p Ultra | 3.12 | 2,460 | 64 | 73.7 |
Z The Witcher 3 w rozdzielczości 1080p Ultra, Core i7-13700HX jest w stanie osiągnąć szczytowe taktowanie 4,2 GHz przy zużyciu zaledwie 76 W, jednocześnie utrzymując średnie zegary na poziomie 3,2 GHz przy 46 W. Daje to wystarczająco dużo miejsca dla RTX 4060, aby osiągnąć niemal stały wzrost do 2490 MHz przy 103 W.
Głośniki
Głośniki stereo EVOL X15 są wystarczająco głośne dla średniej wielkości pomieszczenia. Colorful reklamuje tuning Creative SoundBlaster Studio, ale dźwięk brzmi blado z powodu braku reakcji basów i przeciętnych średnich. Z drugiej strony, wyższe częstotliwości są odtwarzane dość dobrze.
Idealnie byłoby, gdyby Colorful mógł wykorzystać dużą obudowę i zastosować mocniejsze pasywne radiatory. Niemniej jednak, użytkownicy mogą uzyskać lepszą jakość dźwięku za pośrednictwem gniazda combo audio 3,5 mm lub Bluetooth 5.2.
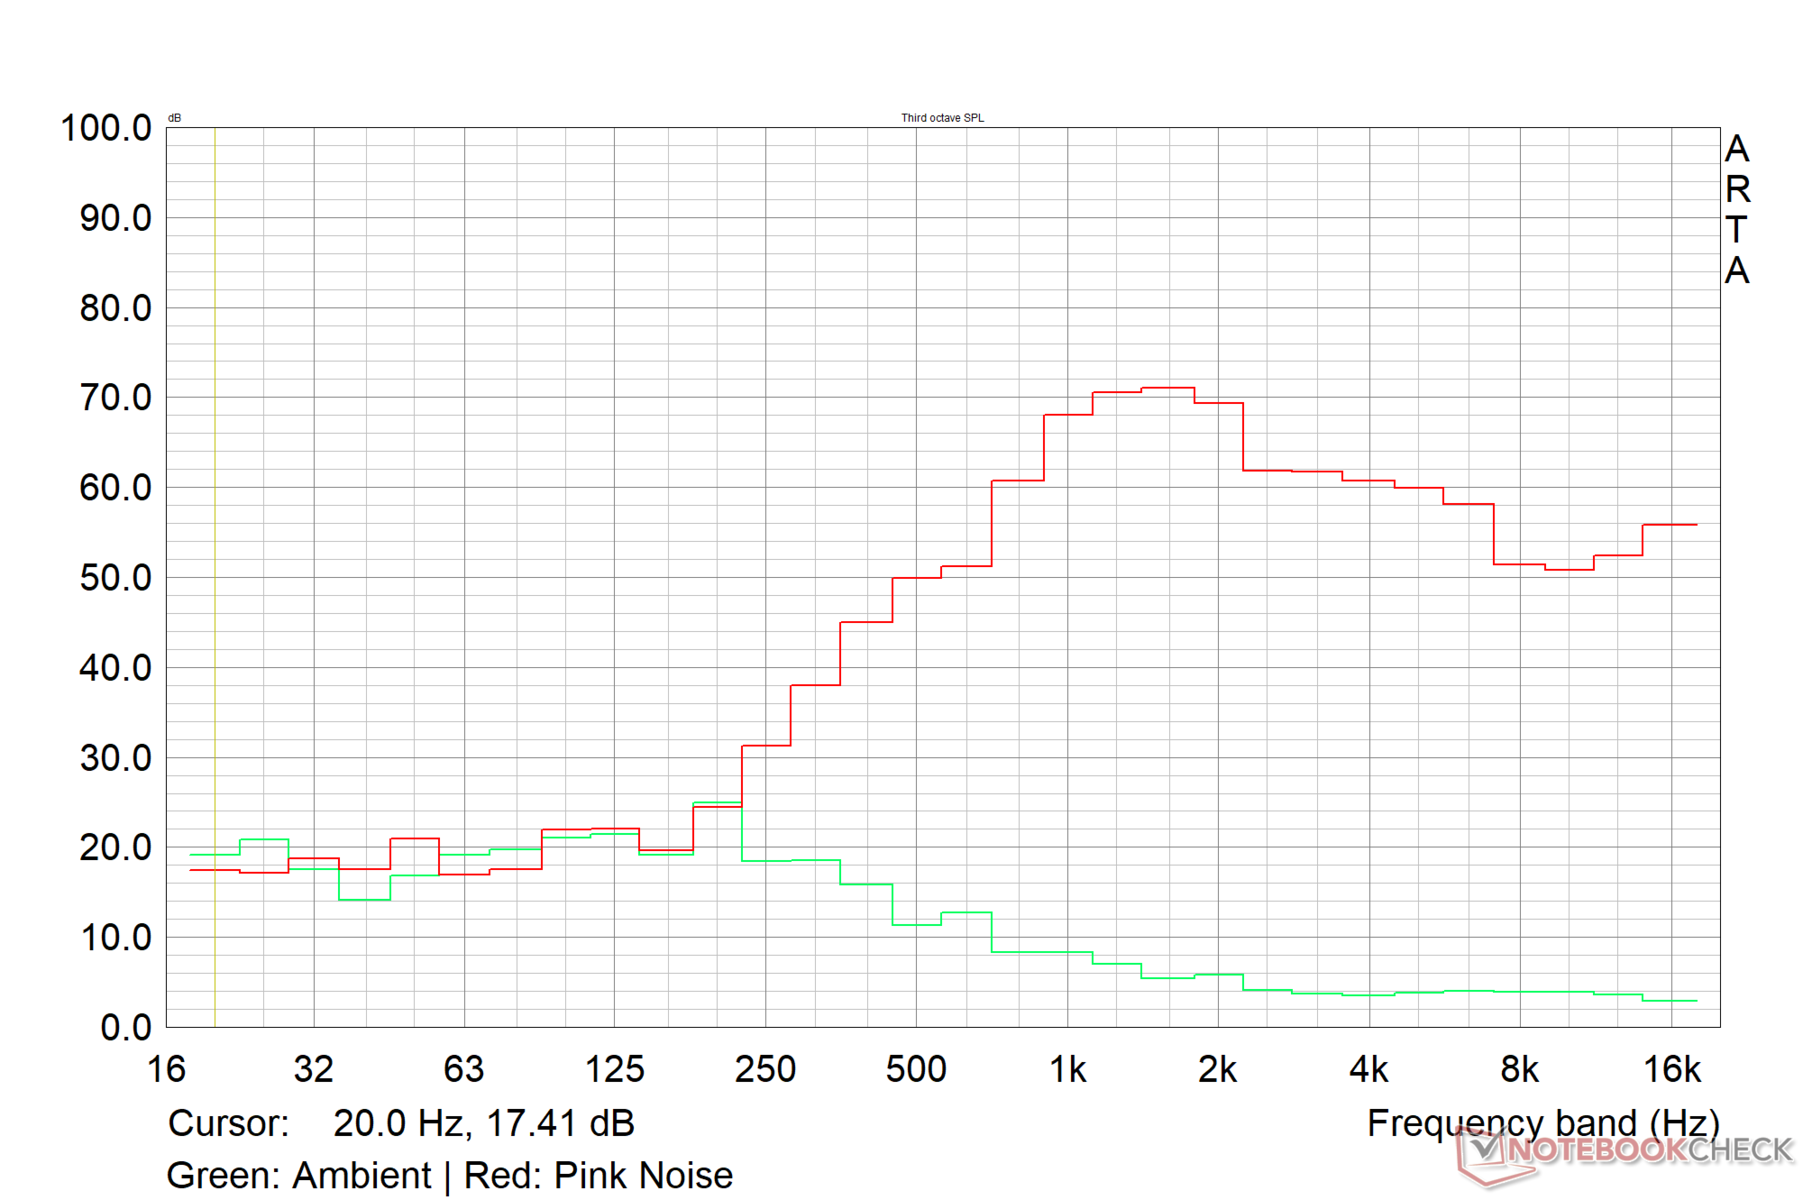
Colorful EVOL X15 AT 23 analiza dźwięku
(±) | głośność głośnika jest średnia, ale dobra (77.5 dB)
Bas 100 - 315 Hz
(-) | prawie brak basu - średnio 26.2% niższa od mediany
(±) | liniowość basu jest średnia (9.2% delta do poprzedniej częstotliwości)
Średnie 400 - 2000 Hz
(±) | wyższe średnie - średnio 11.1% wyższe niż mediana
(±) | liniowość środka jest średnia (9.6% delta do poprzedniej częstotliwości)
Wysokie 2–16 kHz
(±) | wyższe maksima - średnio 6.1% wyższe od mediany
(+) | wzloty są liniowe (5.8% delta do poprzedniej częstotliwości)
Ogólnie 100 - 16.000 Hz
(±) | liniowość ogólnego dźwięku jest średnia (29.7% różnicy w stosunku do mediany)
W porównaniu do tej samej klasy
» 95% wszystkich testowanych urządzeń w tej klasie było lepszych, 2% podobnych, 3% gorszych
» Najlepszy miał deltę 6%, średnia wynosiła ###średnia###%, najgorsza wynosiła 132%
W porównaniu do wszystkich testowanych urządzeń
» 88% wszystkich testowanych urządzeń było lepszych, 3% podobnych, 10% gorszych
» Najlepszy miał deltę 4%, średnia wynosiła ###średnia###%, najgorsza wynosiła 134%
Apple MacBook Pro 16 2021 M1 Pro analiza dźwięku
(+) | głośniki mogą odtwarzać stosunkowo głośno (84.7 dB)
Bas 100 - 315 Hz
(+) | dobry bas - tylko 3.8% od mediany
(+) | bas jest liniowy (5.2% delta do poprzedniej częstotliwości)
Średnie 400 - 2000 Hz
(+) | zbalansowane środki średnie - tylko 1.3% od mediany
(+) | średnie są liniowe (2.1% delta do poprzedniej częstotliwości)
Wysokie 2–16 kHz
(+) | zrównoważone maksima - tylko 1.9% od mediany
(+) | wzloty są liniowe (2.7% delta do poprzedniej częstotliwości)
Ogólnie 100 - 16.000 Hz
(+) | ogólny dźwięk jest liniowy (4.6% różnicy w stosunku do mediany)
W porównaniu do tej samej klasy
» 0% wszystkich testowanych urządzeń w tej klasie było lepszych, 0% podobnych, 100% gorszych
» Najlepszy miał deltę 5%, średnia wynosiła ###średnia###%, najgorsza wynosiła 45%
W porównaniu do wszystkich testowanych urządzeń
» 0% wszystkich testowanych urządzeń było lepszych, 0% podobnych, 100% gorszych
» Najlepszy miał deltę 4%, średnia wynosiła ###średnia###%, najgorsza wynosiła 134%
Zarządzanie energią: Oszczędność przy maksymalnym obciążeniu
Zużycie energii
Pobór mocy w trybie spoczynku EVOL X15 jest wyższy w porównaniu do konkurencji korzystającej z Core i7-13700HX i RTX 4060. Biorąc to pod uwagę, pobór mocy pod maksymalnym obciążeniem jest stosunkowo niższy i wynosi 224 W.
Uniwill GM6PX7X z RTX 4070 wykazuje o 33% wyższy pobór mocy pod maksymalnym obciążeniem, ale nadal jest o 16% bardziej ekonomiczny niż EVOL X15.
Dostarczony zasilacz o mocy 280 W może odpowiednio zasilić laptopa pod obciążeniem.
| wyłączony / stan wstrzymania | |
| luz | |
| obciążenie |
|
Legenda:
min: | |
| Colorful EVOL X15 AT 23 i7-13700HX, GeForce RTX 4060 Laptop GPU, IPS, 2560x1440, 15.6" | Alienware m16 R1 Intel i7-13700HX, GeForce RTX 4060 Laptop GPU, IPS, 2560x1600, 16" | HP Omen 16-wf000 i7-13700HX, GeForce RTX 4080 Laptop GPU, IPS, 2560x1440, 16.1" | Acer Predator Helios 16 PH16-71-731Q i7-13700HX, GeForce RTX 4060 Laptop GPU, IPS-LED, 2560x1600, 16" | Dell G15 5530 i7-13650HX, GeForce RTX 4060 Laptop GPU, IPS, 1920x1080, 15.6" | Schenker XMG Pro 15 (E23) i9-13900HX, GeForce RTX 4060 Laptop GPU, IPS, 2560x1440, 15.6" | Alienware m16 R1 AMD R9 7845HX, GeForce RTX 4080 Laptop GPU, IPS, 2560x1600, 16" | Uniwill GM6PX7X RTX 4070 i7-13700HX, GeForce RTX 4070 Laptop GPU, IPS, 2560x1600, 16" | Przeciętny NVIDIA GeForce RTX 4060 Laptop GPU | Średnia w klasie Gaming | |
|---|---|---|---|---|---|---|---|---|---|---|
| Power Consumption | 20% | 2% | 20% | 30% | -11% | -45% | 16% | 36% | 25% | |
| Idle Minimum * (Watt) | 28.3 | 10 65% | 21.8 23% | 15.9 44% | 8.4 70% | 21.6 24% | 39 -38% | 12.6 55% | 11.5 ? 59% | 13.2 ? 53% |
| Idle Average * (Watt) | 32.2 | 14 57% | 26 19% | 20.5 36% | 14.98 53% | 29 10% | 44.6 -39% | 17.7 45% | 16 ? 50% | 18.9 ? 41% |
| Idle Maximum * (Watt) | 36.5 | 21 42% | 36 1% | 20.9 43% | 15.56 57% | 42.7 -17% | 68.1 -87% | 31.8 13% | 20.3 ? 44% | 24.3 ? 33% |
| Load Average * (Watt) | 119 | 119 -0% | 115.5 3% | 106 11% | 96.8 19% | 190 -60% | 129.8 -9% | 101.4 15% | 92.9 ? 22% | 108 ? 9% |
| Witcher 3 ultra * (Watt) | 189.6 | 186.7 2% | 214 -13% | 175 8% | 186 2% | 189 -0% | 285 -50% | 185.3 2% | ||
| Load Maximum * (Watt) | 224.3 | 323 -44% | 269.7 -20% | 276 -23% | 271.42 -21% | 269 -20% | 327.3 -46% | 298 -33% | 210 ? 6% | 254 ? -13% |
* ... im mniej tym lepiej
Power Consumption: The Witcher 3 / Stress test
Power Consumption: External monitor
Żywotność baterii
Biorąc pod uwagę dość mocne podzespoły EVOL X15, bateria o pojemności 73 Whr może pozwolić sobie jedynie na przeciętne czasy pracy. Przy jasności 150 nitów, laptop może wytrzymać prawie 5,5 godziny w naszym standardowym teście przeglądania sieci Wi-Fi i około 6,5 godziny podczas odtwarzania wideo H.264 1080p.
| Colorful EVOL X15 AT 23 i7-13700HX, GeForce RTX 4060 Laptop GPU, 73 Wh | Alienware m16 R1 Intel i7-13700HX, GeForce RTX 4060 Laptop GPU, 86 Wh | HP Omen 16-wf000 i7-13700HX, GeForce RTX 4080 Laptop GPU, 83 Wh | Acer Predator Helios 16 PH16-71-731Q i7-13700HX, GeForce RTX 4060 Laptop GPU, 90 Wh | Dell G15 5530 i7-13650HX, GeForce RTX 4060 Laptop GPU, 86 Wh | Schenker XMG Pro 15 (E23) i9-13900HX, GeForce RTX 4060 Laptop GPU, 80 Wh | Alienware m16 R1 AMD R9 7845HX, GeForce RTX 4080 Laptop GPU, 86 Wh | Uniwill GM6PX7X RTX 4070 i7-13700HX, GeForce RTX 4070 Laptop GPU, 62 Wh | Średnia w klasie Gaming | |
|---|---|---|---|---|---|---|---|---|---|
| Czasy pracy | -15% | -11% | 5% | -11% | 26% | -35% | -26% | 25% | |
| H.264 (h) | 6.3 | 5.6 -11% | 4.8 -24% | 6.8 8% | 8.26 ? 31% | ||||
| WiFi v1.3 (h) | 5.4 | 4.8 -11% | 5.1 -6% | 5.6 4% | 6.5 20% | 5.7 6% | 3.7 -31% | 4 -26% | 7.02 ? 30% |
| Witcher 3 ultra (h) | 1.2 | 1.5 25% | 0.8 -33% | ||||||
| Load (h) | 1.3 | 1 -23% | 1.1 -15% | 1.5 15% | 0.8 -38% | 1.9 46% | 0.8 -38% | 1.47 ? 13% | |
| Reader / Idle (h) | 6.4 | 5.5 | 4 | 8.71 ? |
Za
Przeciw
Werdykt: Dobry wybór, jeśli można go kupić za mniej niż 1000 USD
Colorful ma na celu zaoferowanie wydajnego laptopa do gier QHD za mniej niż 1000 USD i w dużej mierze odnosi sukces dzięki EVOL X15 AT 23. Zbudowany głównie z plastikowej konstrukcji Clevo, występuje pewne ugięcie klawiatury; jednak EVOL X15 pozostaje ogólnie solidny strukturalnie.
EVOL X15 AT ma wiele zalet. Potencjalni nabywcy docenią przyzwoity wybór portów, szybkie prędkości Wi-Fi 6E i łatwy dostęp do wnętrza.
Połączenie procesora Intel Core i7-13700HX cPU klasy desktop i karty graficznej GPU Nvidia GeForce RTX 4060 do laptopów pozwala EVOL X15 AT skutecznie konkurować z droższymi modelami, takimi jak Alienware m16 R1 i Acer Predator Helios 16.
Colorful EVOL X15 AT może nie oferować wszystkich dzwonków i gwizdków, które można znaleźć w dobrze ugruntowanej konkurencji, ale w dużej mierze udaje mu się uzyskać podstawy bez zauważalnych ograniczeń wydajności "
To powiedziawszy, istnieje również kilka obszarów krytyki. Aspekty takie jak brak zasilania w portach typu C i nieco dłuższy czas reakcji wymagają rozwiązania. Colorful musi również skupić się na precyzyjnym dostrojeniu krzywych wentylatorów za pomocą domyślnych profili wydajności, a także popracować nad poprawą zużycia energii w trybie bezczynności.
Ogólnie rzecz biorąc, Colorful EVOL X15 AT jest godny rozważenia, pod warunkiem, że można go złapać za mniej niż 1000 USD i nie trzeba płacić marży.
Biorąc to pod uwagę, laptopy z kartą graficzną RTX 3070 Ti Laptop GPUlub nawet Radeon RX 6800Mmogą oferować lepszy ogólny pakiet w podobnych cenach, jeśli nie przeszkadza Państwu utrata generowania klatek DLSS 3 i wzrost wydajności dzięki Adzie Lovelace.
Cena i dostępność
Colorful EVOL X15 AT 23 jest dostępny bezpośrednio u lokalnych dystrybutorów produktów Colorful. Testowana konfiguracja EVOL X15 AT oficjalnie kosztuje 969 USD, ale obecnie można ją kupić na Newegg ze znacznie wyższą marżą wynoszącą 1 759 USD.
Alternatywnie, wariant QHD modelu Acer Nitro 5 z procesorem AMD Ryzen 7 6800H i kartą graficzną RTX 3070 Ti Laptop można nabyć w sklepie Amazon US za mniej niż 1200 USD.
Jeśli surowa wydajność procesora nie jest priorytetem, to Asus ROG Strix G15 wyposażony w procesor AMD Ryzen 9 5900HX i Radeon RX 6800M to dobry wybór za mniej niż 1300 USD na Amazon US i mniej niż 1200 USD w Best Buy US.
Colorful EVOL X15 AT 23
- 20/12/2023 v7 (old)
Vaidyanathan Subramaniam
Przezroczystość
Wyboru urządzeń do recenzji dokonuje nasza redakcja. Próbka testowa została udostępniona autorowi przez producenta bezpłatnie do celów recenzji. Na tę recenzję nie miały wpływu osoby trzecie, a producent nie otrzymał kopii tej recenzji przed publikacją. Nie było obowiązku publikowania tej recenzji. Jako niezależna firma medialna, Notebookcheck nie podlega władzy producentów, sprzedawców detalicznych ani wydawców.
Tak testuje Notebookcheck
Każdego roku Notebookcheck niezależnie sprawdza setki laptopów i smartfonów, stosując standardowe procedury, aby zapewnić porównywalność wszystkich wyników. Od około 20 lat stale rozwijamy nasze metody badawcze, ustanawiając przy tym standardy branżowe. W naszych laboratoriach testowych doświadczeni technicy i redaktorzy korzystają z wysokiej jakości sprzętu pomiarowego. Testy te obejmują wieloetapowy proces walidacji. Nasz kompleksowy system ocen opiera się na setkach uzasadnionych pomiarów i benchmarków, co pozwala zachować obiektywizm.Price comparison

