Recenzja Acer Nitro 5 AN515-46: mocny gaming FHD z USB 4
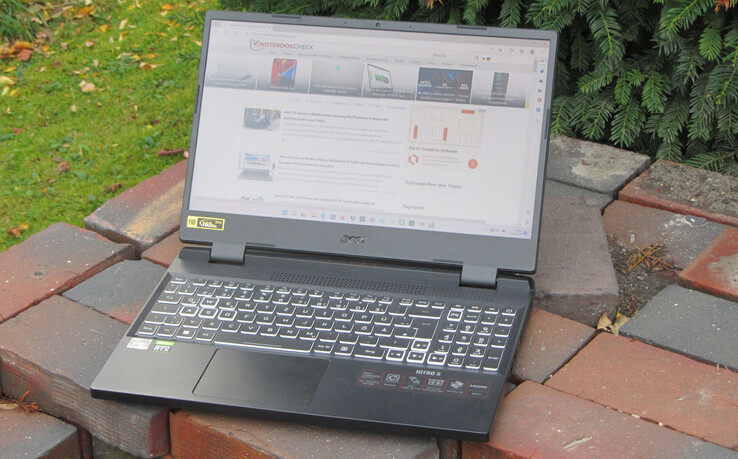
Seria Nitro 5 firmy Acer składa się z urządzeń dla graczy klasy podstawowej i średniej. Laptopy te są pozycjonowane poniżej serii Predator, a ich ceny sięgają nawet 2500 euro. Dzisiejszy egzemplarz testowy jest dostępny od 1750 euro. Acer połączył w tym modelu energooszczędny APU Ryzen 7-6800H z GPU GeForce RTX 3070-Ti (TGP o mocy 150 W). W teorii może to dać wydajny notebook, który charakteryzuje się niską emisją spalin i długim czasem pracy na baterii. Do konkurentów urządzenia należą m.in.Schenker XMG Fusion 15 (Mid 22), theMSI Katana GF66 12UGS, oraz.Asus TUF Dash F15 FX517ZR.
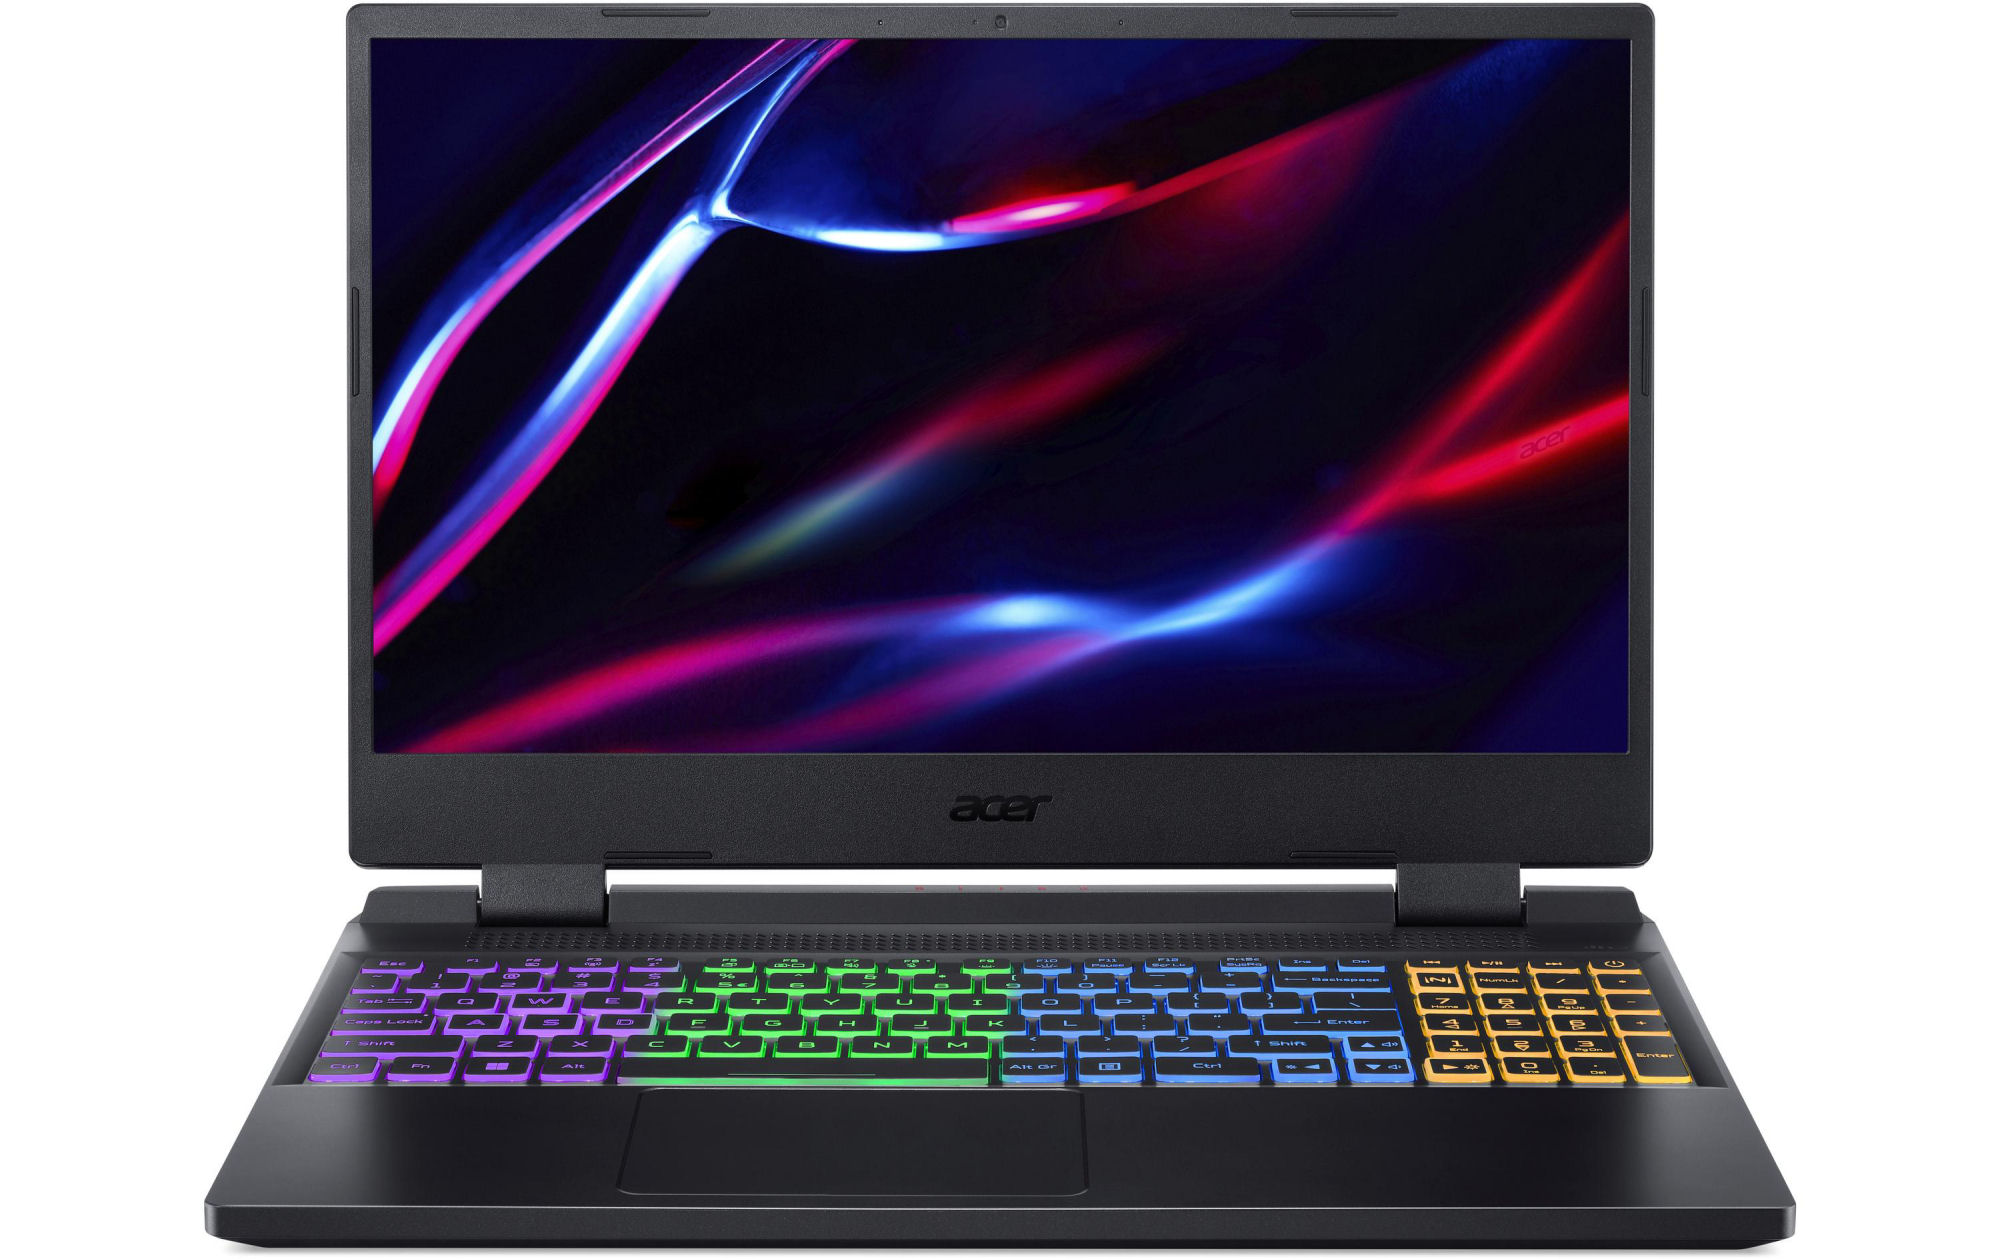
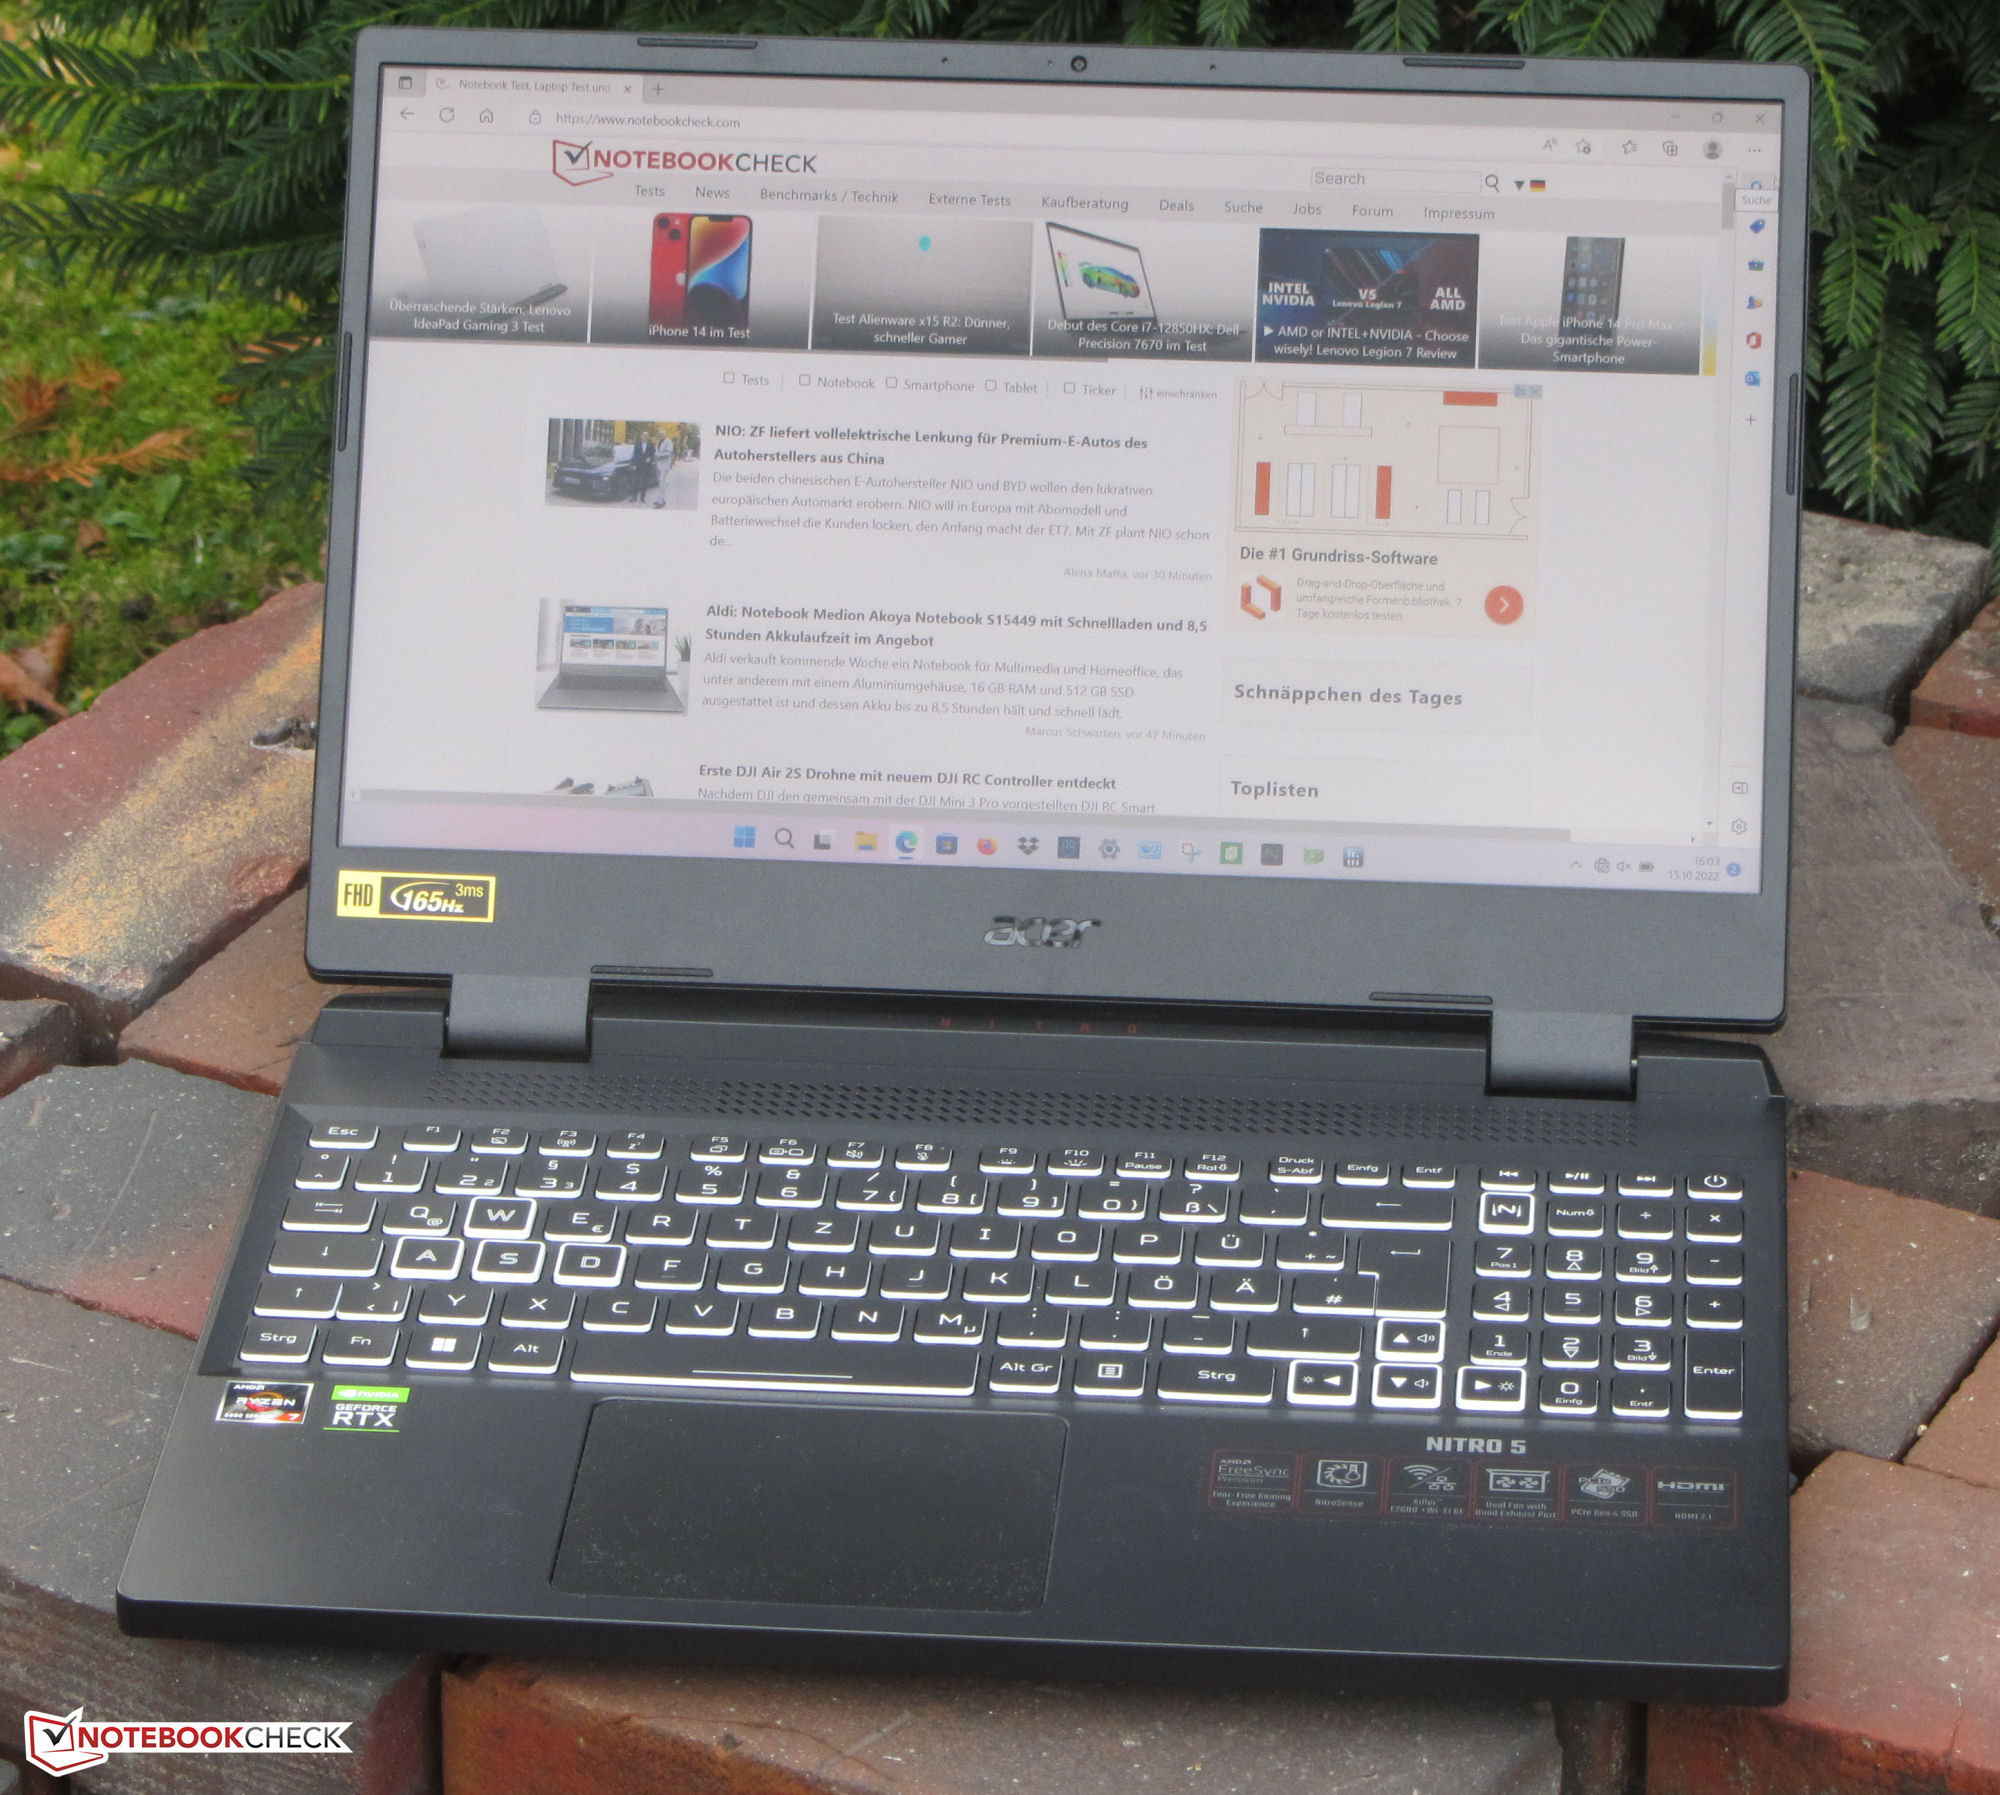
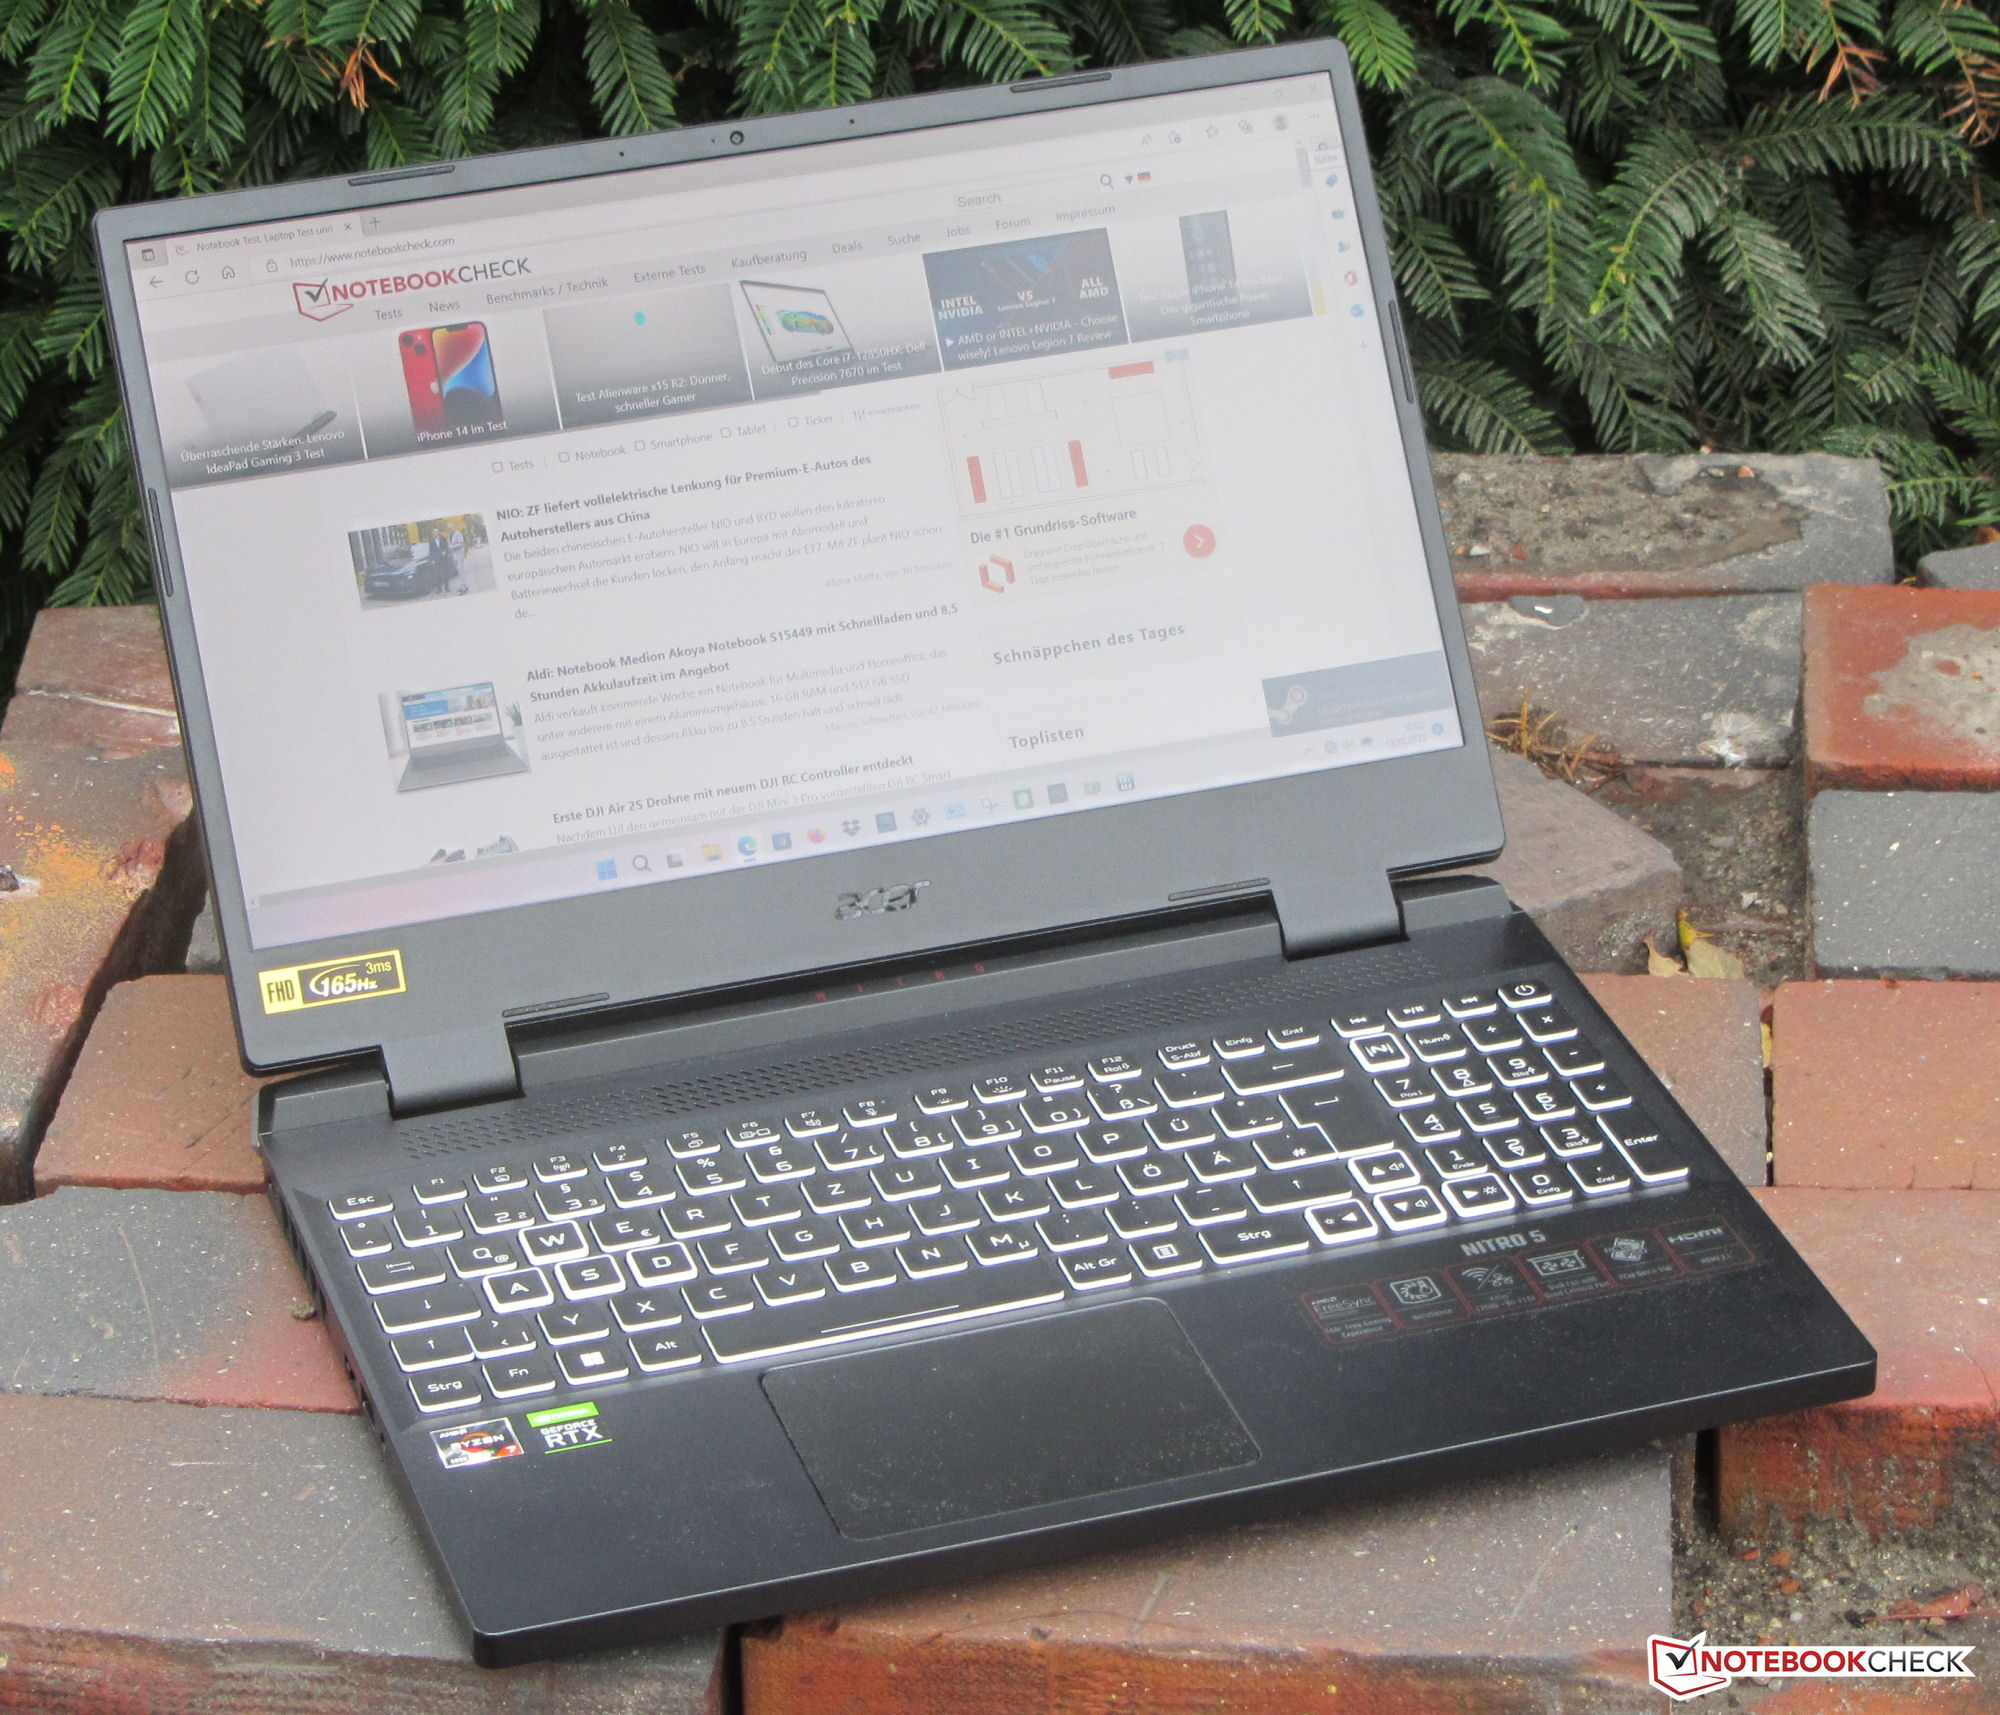
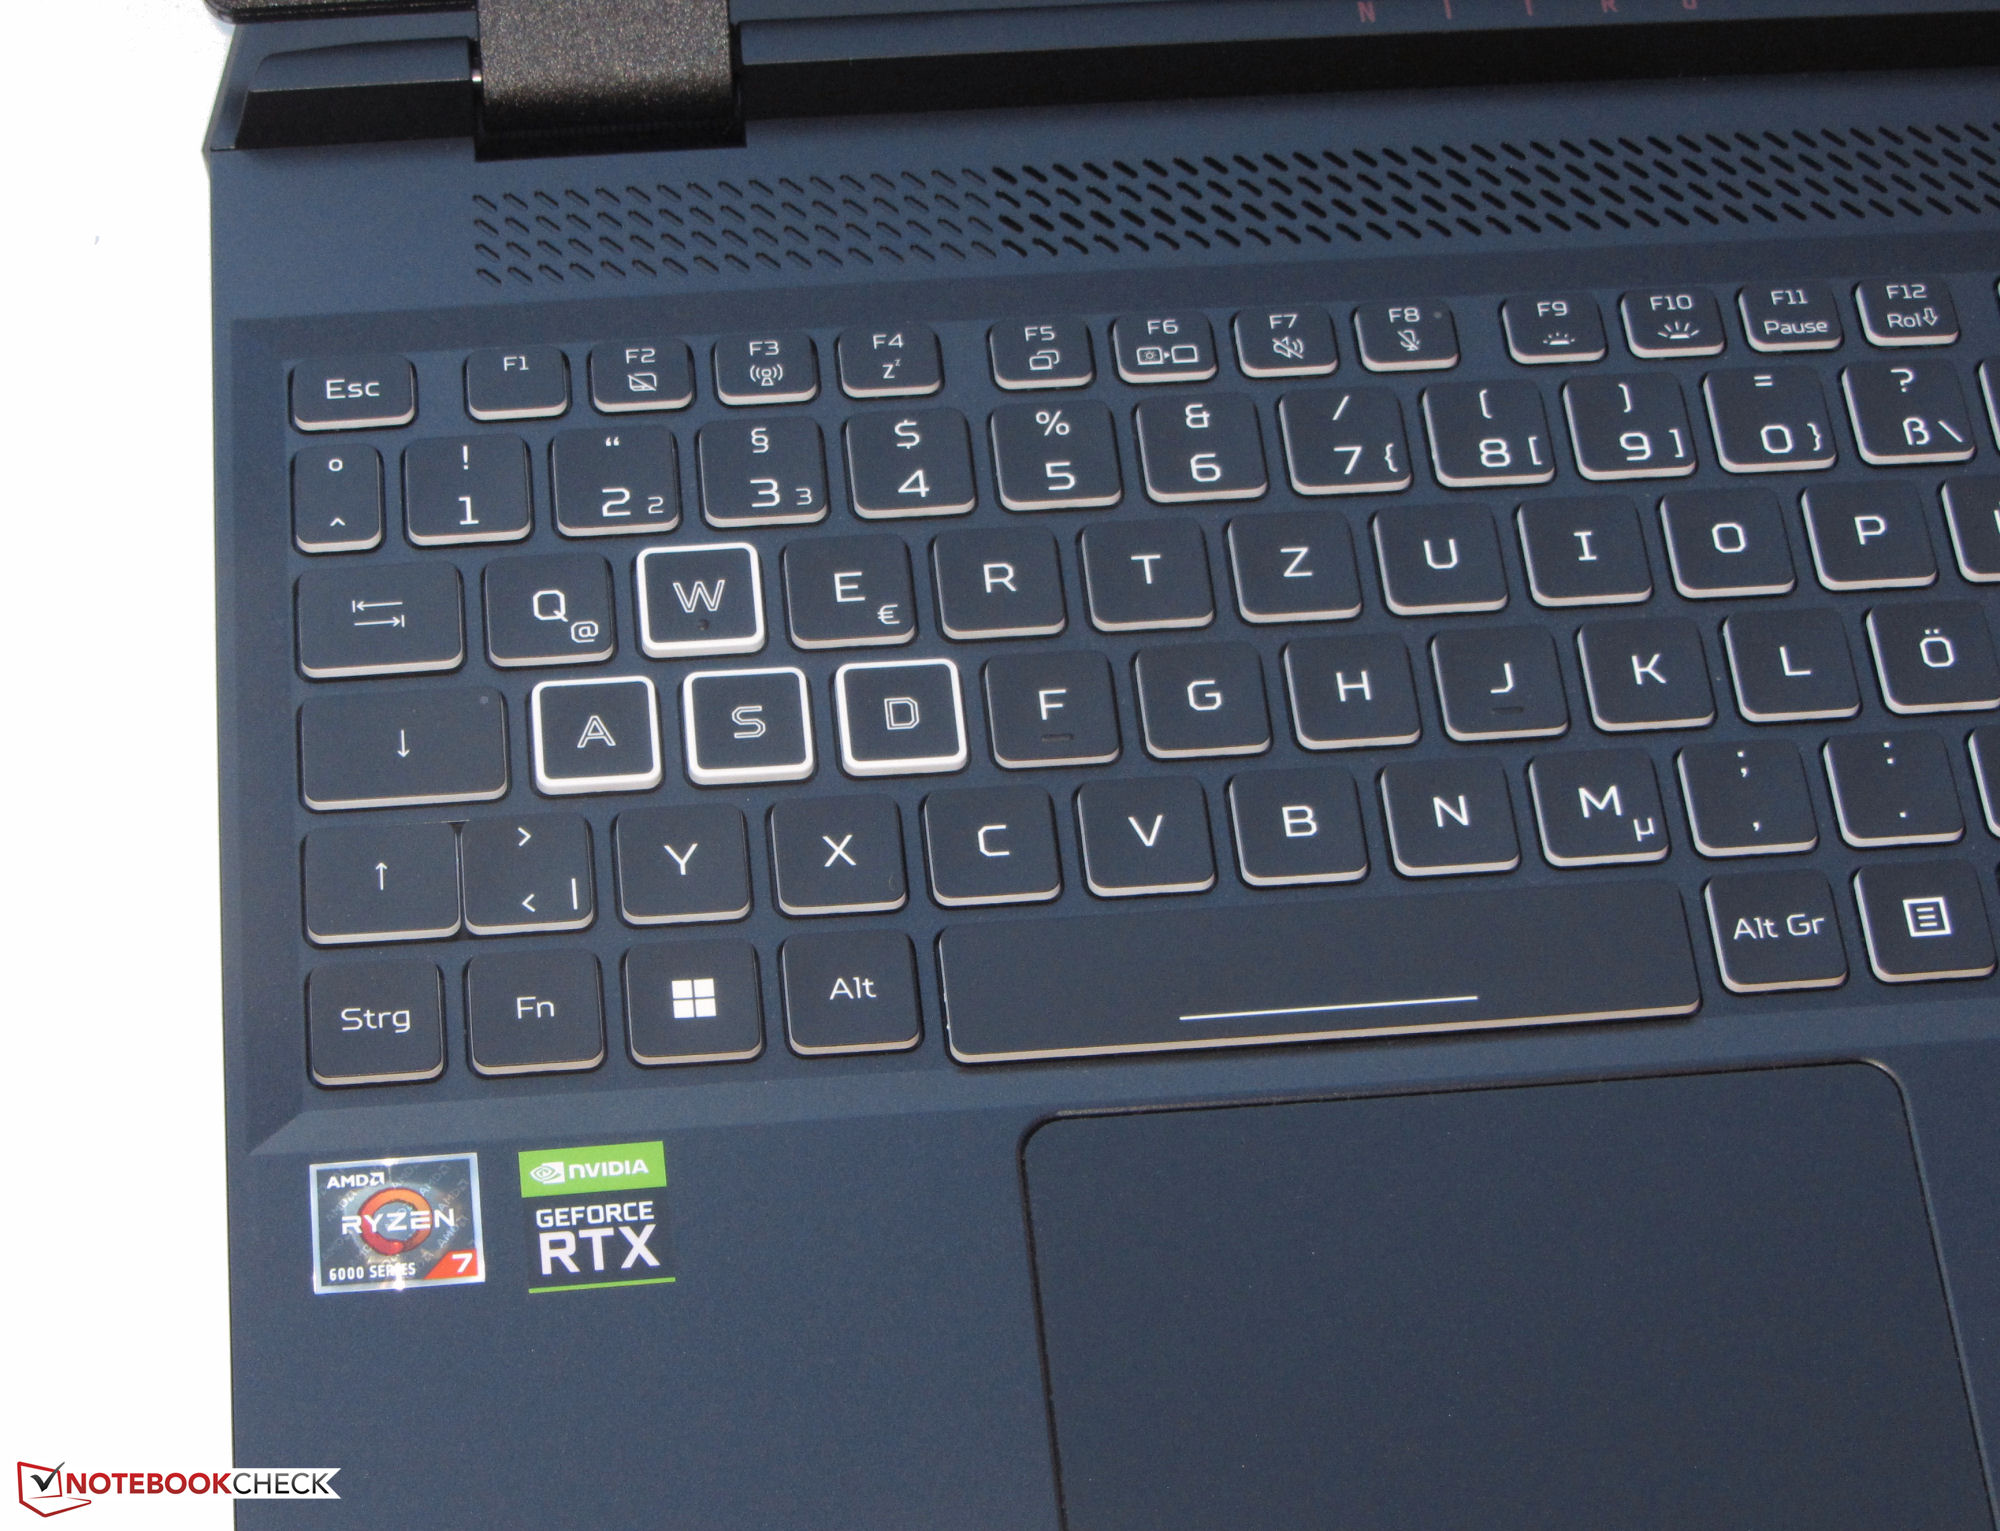
AN515-58 został zmieszczony w tej samej obudowie co jego rodzeństwo z procesorem Intela, które już testowaliśmy. Aby dowiedzieć się więcej o obudowie, łączności i urządzeniach wejściowych, zapraszamy do naszej recenzji dot.Nitro 5 AN515-58(Core i7, QHD).
Potencjalni konkurenci w porównaniu
Ocena | Data | Model | Waga | Wysokość | Rozmiar | Rezolucja | Cena |
|---|---|---|---|---|---|---|---|
| 83.9 % v7 (old) | 11/2022 | Acer Nitro 5 AN515-46-R1A1 R7 6800H, GeForce RTX 3070 Ti Laptop GPU | 2.5 kg | 26.8 mm | 15.60" | 1920x1080 | |
| 80.3 % v7 (old) | MSI Katana GF66 12UGS i7-12700H, GeForce RTX 3070 Ti Laptop GPU | 2.3 kg | 27.5 mm | 15.60" | 1920x1080 | ||
| 87.4 % v7 (old) | Schenker XMG Fusion 15 (Mid 22) i7-11800H, GeForce RTX 3070 Laptop GPU | 1.9 kg | 21.65 mm | 15.60" | 2560x1440 | ||
| 85.8 % v7 (old) | Asus TUF Dash F15 FX517ZR i7-12650H, GeForce RTX 3070 Laptop GPU | 2 kg | 20.7 mm | 15.60" | 2560x1440 |
| Networking | |
| iperf3 receive AXE11000 | |
| Acer Nitro 5 AN515-58-72QR | |
| MSI Katana GF66 12UGS | |
| Acer Nitro 5 AN515-46-R1A1 | |
| Asus TUF Dash F15 FX517ZR | |
| Schenker XMG Fusion 15 (Mid 22) | |
| Przeciętny Qualcomm WCN685x (852 - 1777, n=21) | |
| Średnia w klasie Gaming (680 - 1745, n=94, ostatnie 2 lata) | |
| iperf3 transmit AXE11000 | |
| Acer Nitro 5 AN515-58-72QR | |
| Acer Nitro 5 AN515-46-R1A1 | |
| MSI Katana GF66 12UGS | |
| Asus TUF Dash F15 FX517ZR | |
| Przeciętny Qualcomm WCN685x (521 - 1838, n=21) | |
| Średnia w klasie Gaming (560 - 1862, n=94, ostatnie 2 lata) | |
| Schenker XMG Fusion 15 (Mid 22) | |


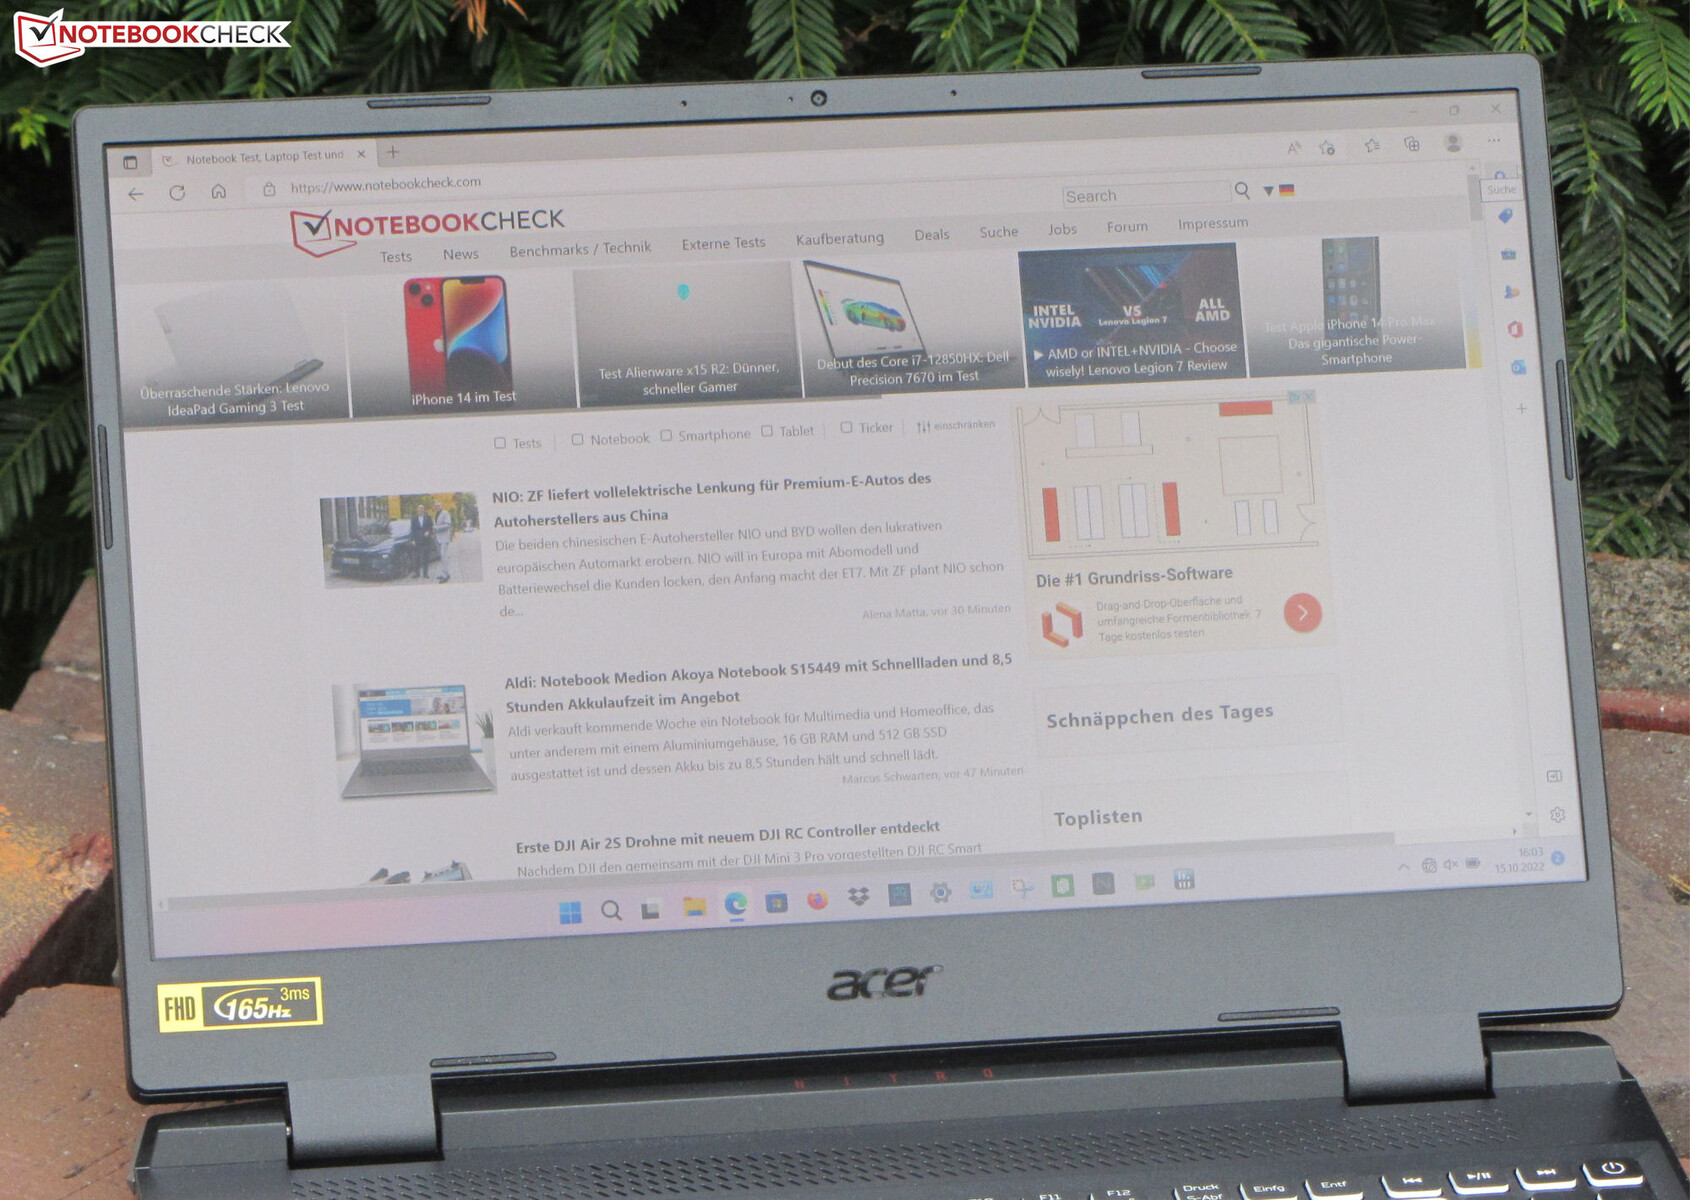
Wyświetlacz - notebook Acer z panelem o częstotliwości 165 Hz
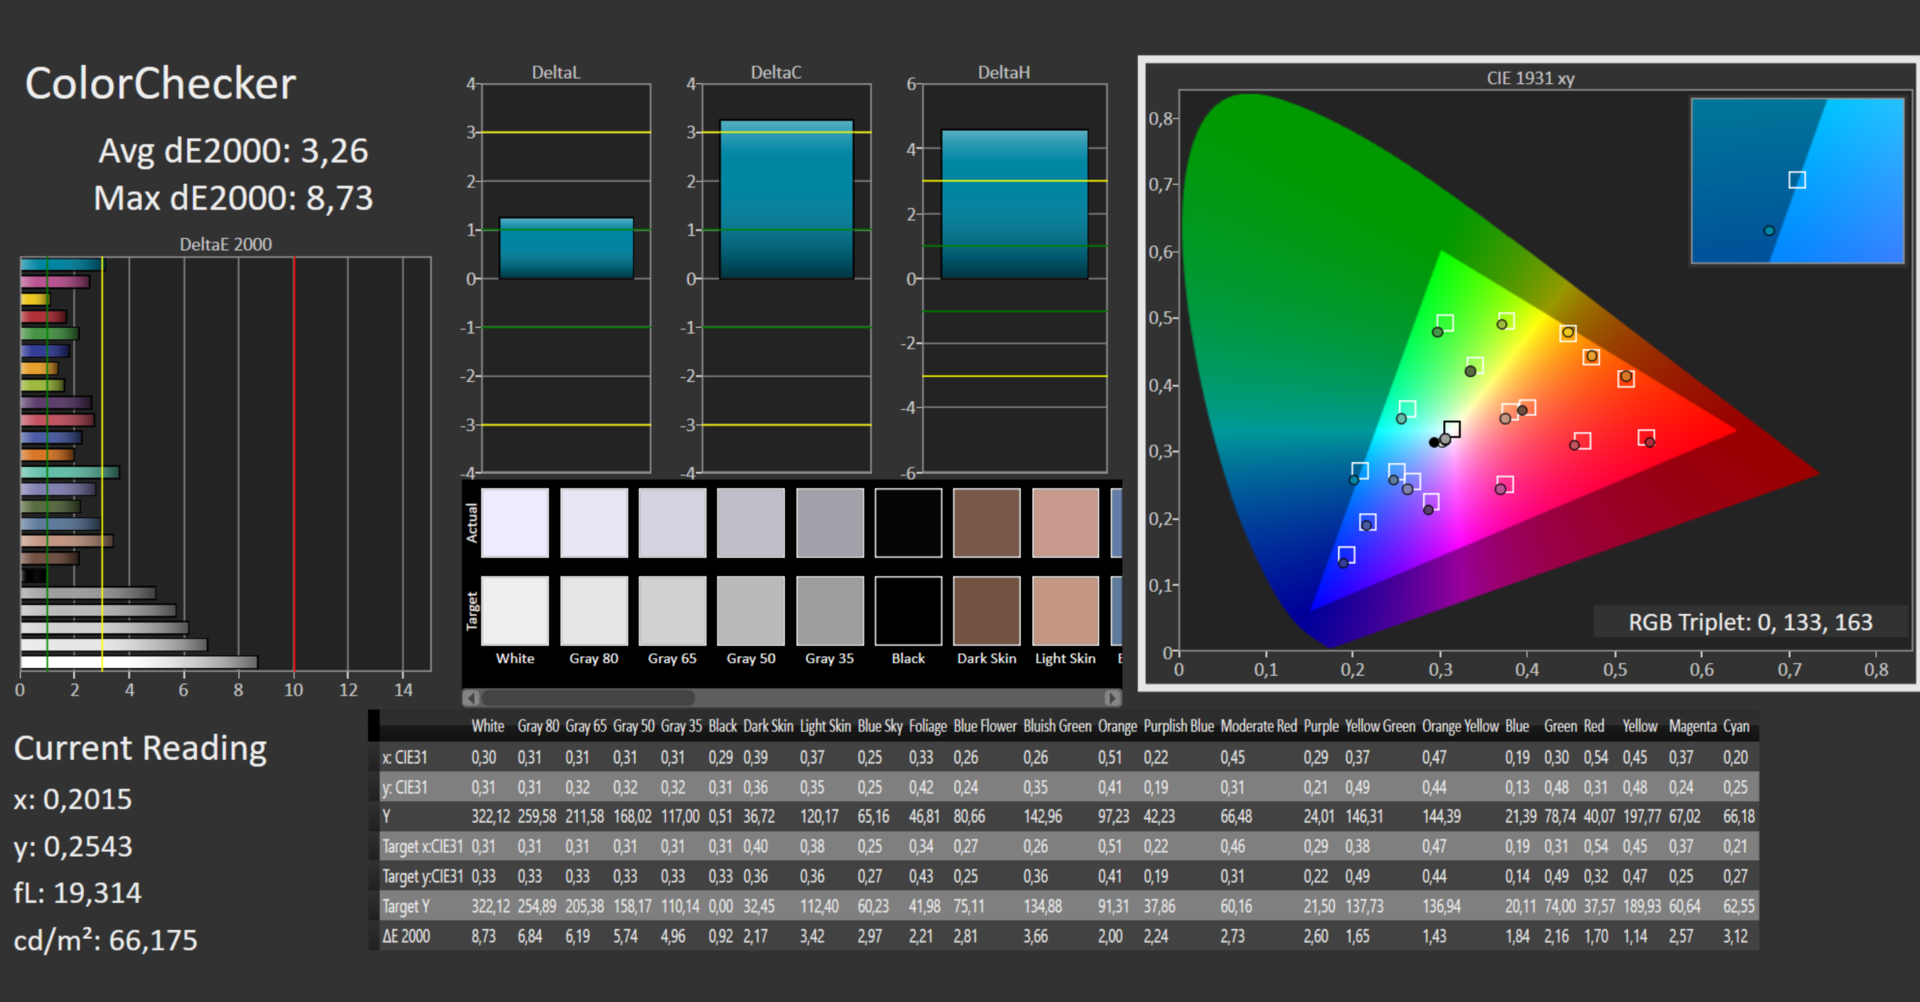
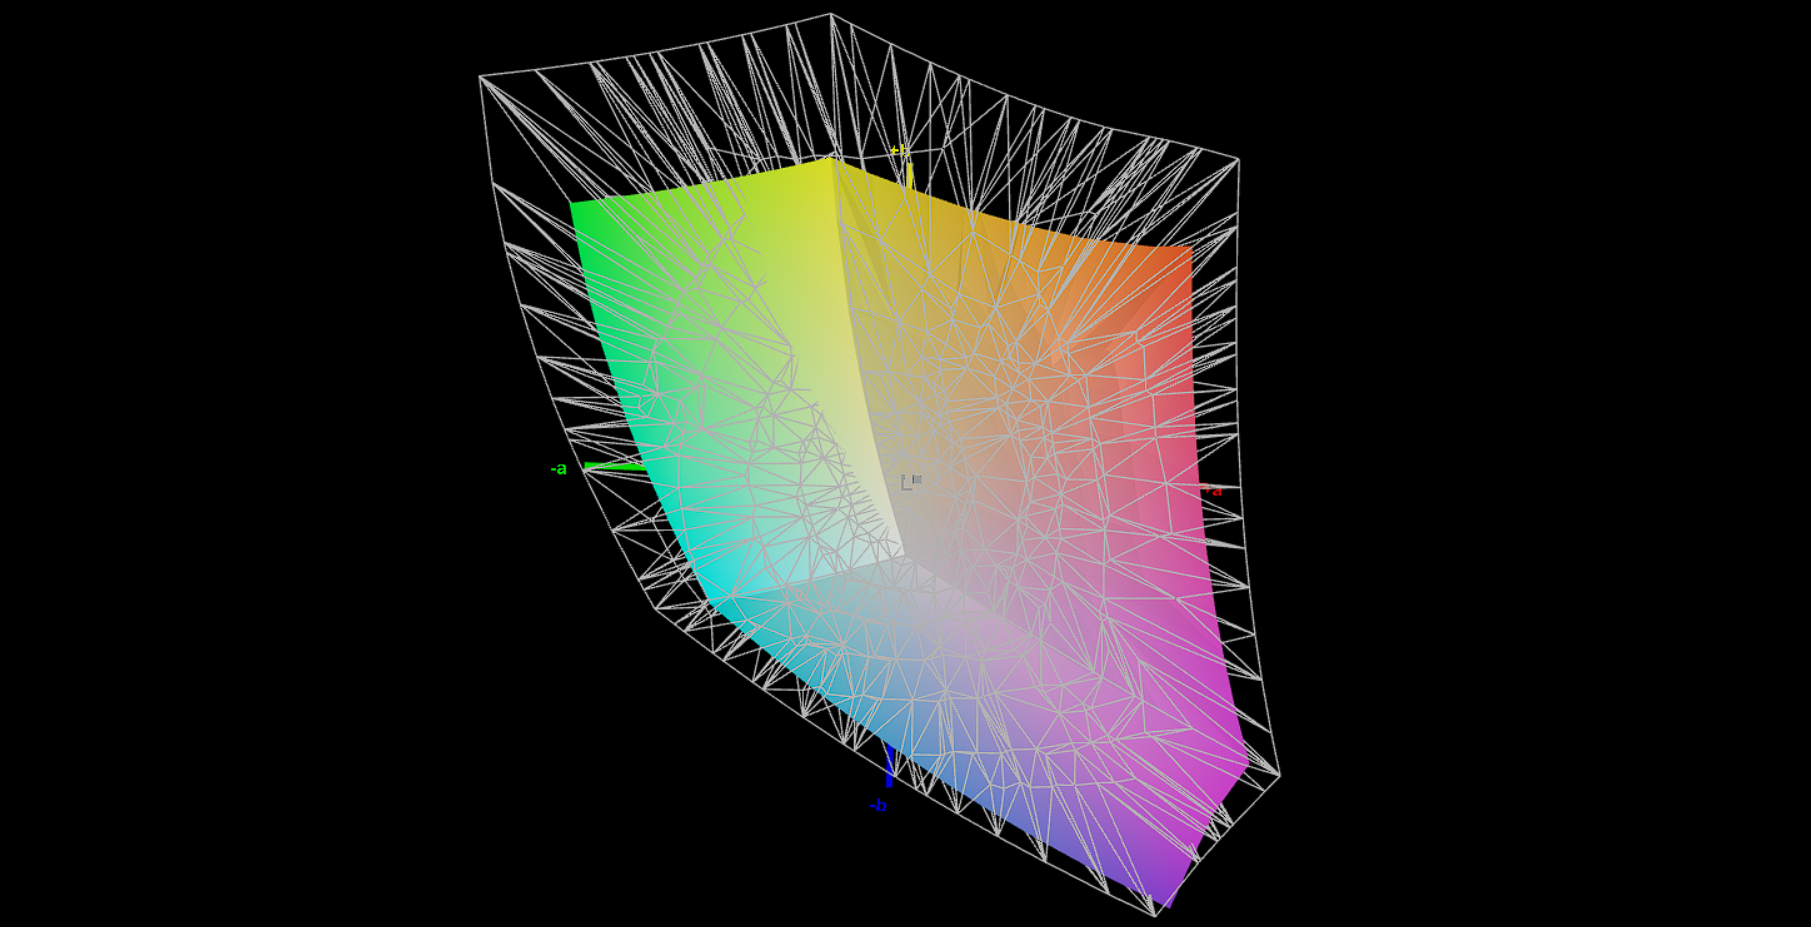
Jasność matowego 15,6-calowego (1 920 x 1 080 pikseli) wyświetlacza na poziomie 320,2 cd/m² spełnia nasze minimalne wymagania (> 300 cd/m²). Jego współczynnik kontrastu 1 363:1 jest więcej niż wystarczający i z łatwością pokonuje konkurencję. Panel 165 Hz ma krótkie czasy reakcji i nie wykorzystuje PWM na żadnym poziomie jasności.
Wyświetlacz obsługuje opracowaną przez AMD technologię FreeSync. Dzięki temu dynamicznie dopasowuje częstotliwość odświeżania wyświetlacza do GPU. Celem jest stworzenie jak najbardziej płynnego obrazu - zwłaszcza w grach komputerowych.
| |||||||||||||||||||||||||
rozświetlenie: 93 %
na akumulatorze: 334 cd/m²
kontrast: 1363:1 (czerń: 0.24 cd/m²)
ΔE ColorChecker Calman: 3.26 | ∀{0.5-29.43 Ø4.72}
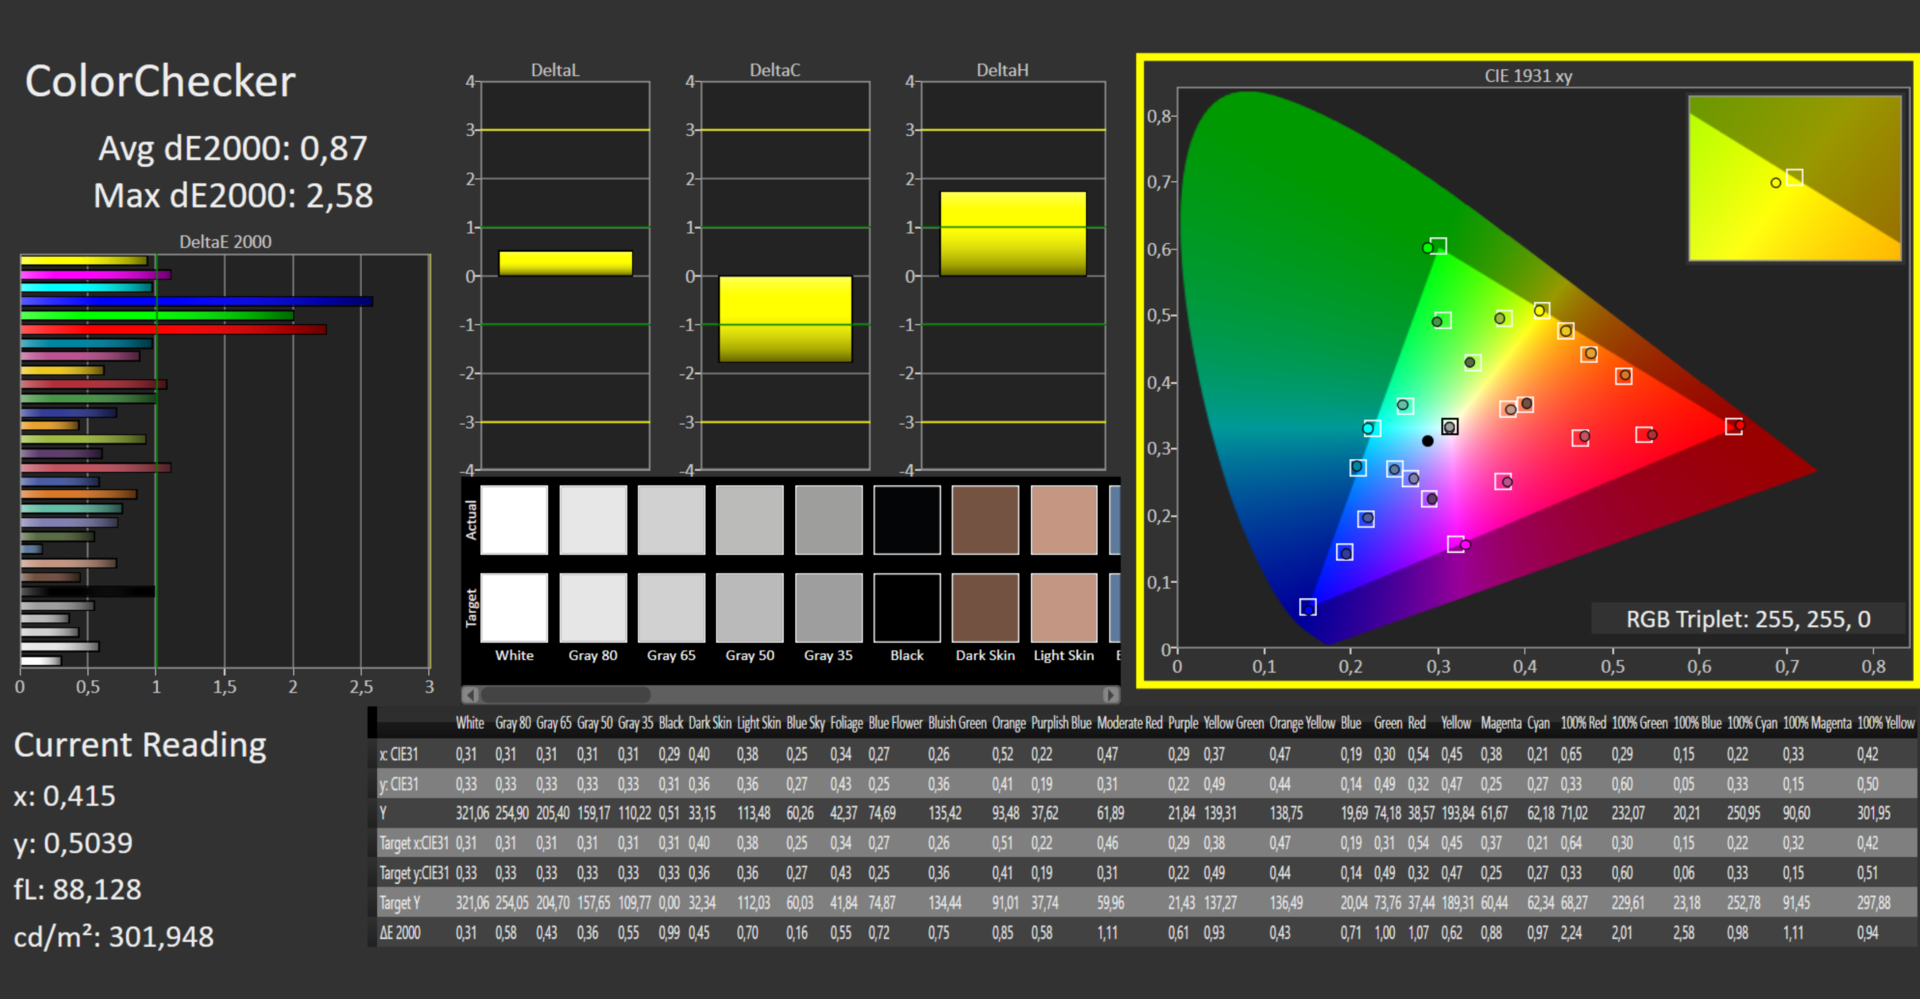
calibrated: 0.87
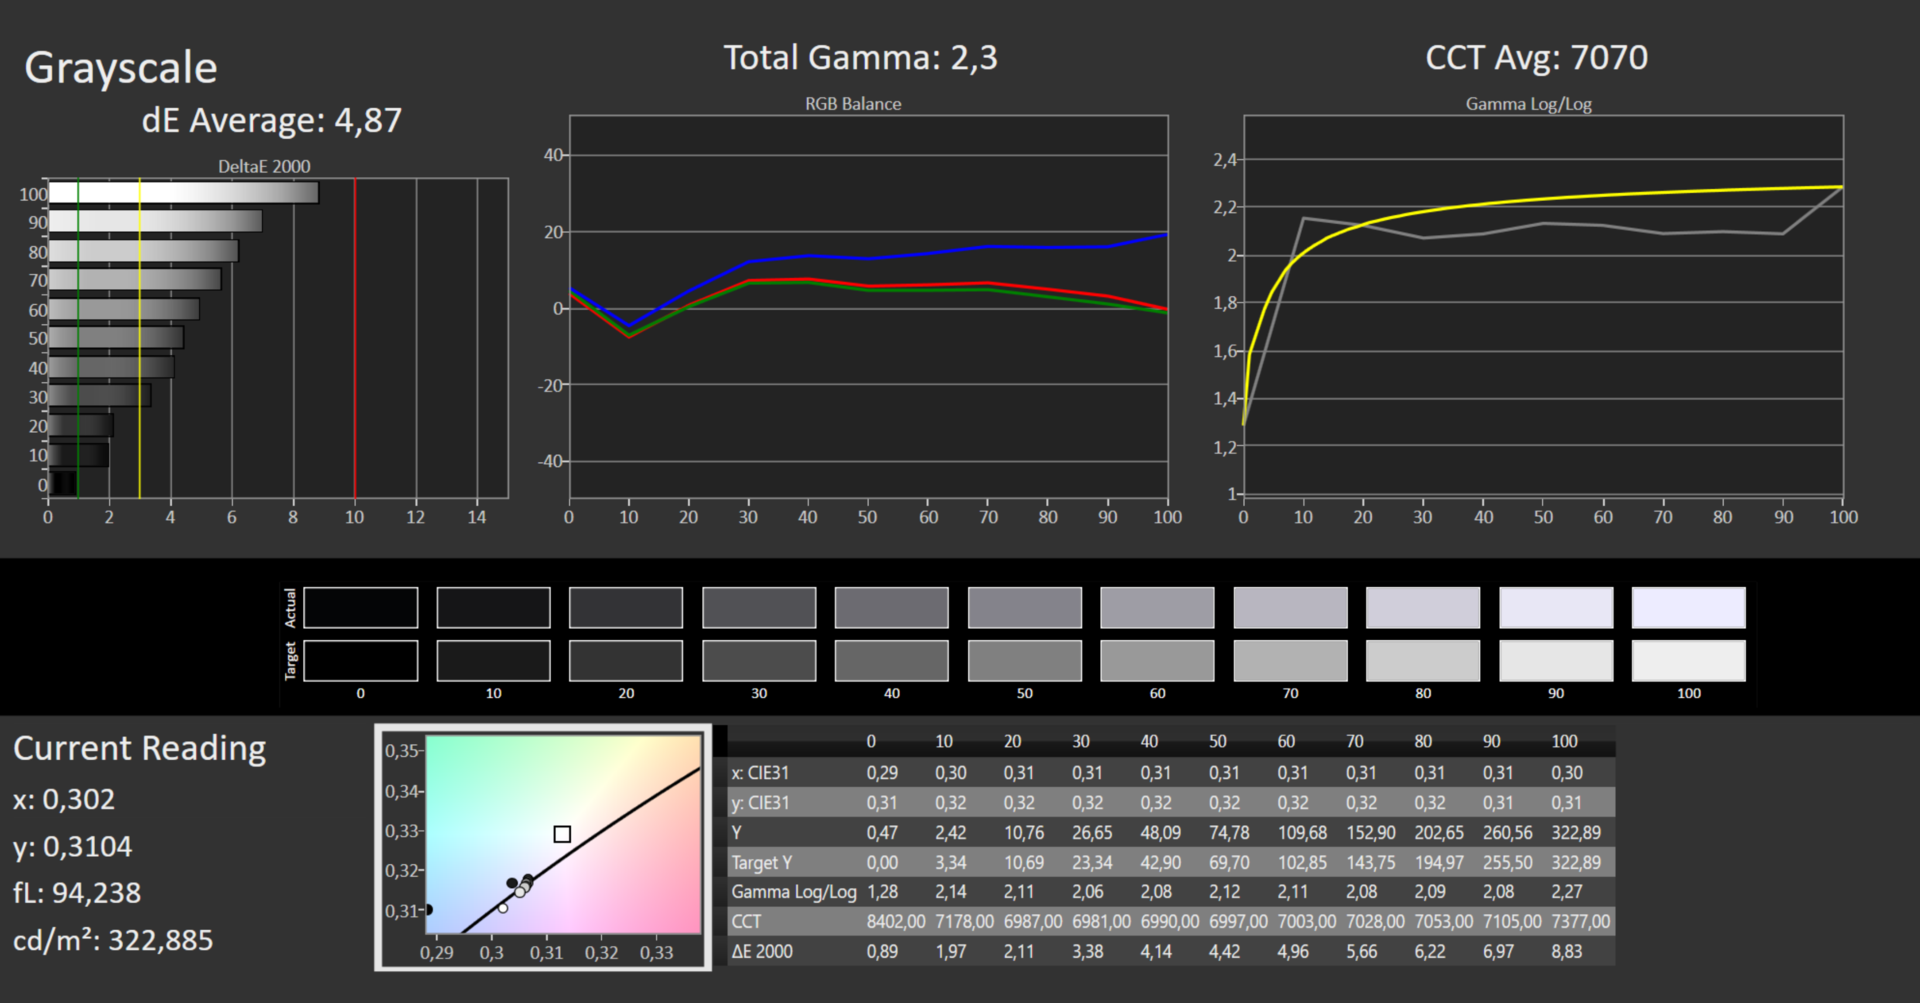
ΔE Greyscale Calman: 4.87 | ∀{0.09-98 Ø4.97}
69.7% AdobeRGB 1998 (Argyll 3D)
98.1% sRGB (Argyll 3D)
68.8% Display P3 (Argyll 3D)
Gamma: 2.3
CCT: 7070 K
| Acer Nitro 5 AN515-46-R1A1 AU Optronics B156HAN12.H, IPS, 1920x1080, 15.6" | MSI Katana GF66 12UGS AU Optronics AUOAF90, IPS, 1920x1080, 15.6" | Schenker XMG Fusion 15 (Mid 22) BOE CQ NE156QHM-NY2, IPS, 2560x1440, 15.6" | Asus TUF Dash F15 FX517ZR BOE CQ NE156QHM-NY1, IPS, 2560x1440, 15.6" | Acer Nitro 5 AN515-58-72QR Chi Mei N156KME-GNA, IPS, 2560x1440, 15.6" | |
|---|---|---|---|---|---|
| Display | -42% | -2% | 23% | 21% | |
| Display P3 Coverage (%) | 68.8 | 39.1 -43% | 67.3 -2% | 98.4 43% | 95.6 39% |
| sRGB Coverage (%) | 98.1 | 58.3 -41% | 96.7 -1% | 99.9 2% | 99.8 2% |
| AdobeRGB 1998 Coverage (%) | 69.7 | 40.4 -42% | 68.2 -2% | 85.9 23% | 85.2 22% |
| Response Times | -232% | 12% | 20% | -24% | |
| Response Time Grey 50% / Grey 80% * (ms) | 13 ? | 40 ? -208% | 11.6 ? 11% | 5.6 ? 57% | 15.7 ? -21% |
| Response Time Black / White * (ms) | 8 ? | 28.4 ? -255% | 7 ? 12% | 9.4 ? -18% | 10.2 ? -27% |
| PWM Frequency (Hz) | |||||
| Screen | -55% | -15% | 9% | -2% | |
| Brightness middle (cd/m²) | 327 | 227 -31% | 326 0% | 286 -13% | 332 2% |
| Brightness (cd/m²) | 320 | 225 -30% | 303 -5% | 266 -17% | 303 -5% |
| Brightness Distribution (%) | 93 | 90 -3% | 89 -4% | 87 -6% | 86 -8% |
| Black Level * (cd/m²) | 0.24 | 0.21 12% | 0.33 -38% | 0.25 -4% | 0.29 -21% |
| Contrast (:1) | 1363 | 1081 -21% | 988 -28% | 1144 -16% | 1145 -16% |
| Colorchecker dE 2000 * | 3.26 | 4.19 -29% | 2.73 16% | 2.14 34% | 3.61 -11% |
| Colorchecker dE 2000 max. * | 8.73 | 17.45 -100% | 9.54 -9% | 5.22 40% | 7.71 12% |
| Colorchecker dE 2000 calibrated * | 0.87 | 3.81 -338% | 1.36 -56% | 0.67 23% | 0.59 32% |
| Greyscale dE 2000 * | 4.87 | 2.7 45% | 5.2 -7% | 2.8 43% | 5.2 -7% |
| Gamma | 2.3 96% | 2.208 100% | 2.074 106% | 2.23 99% | 2.155 102% |
| CCT | 7070 92% | 6176 105% | 6911 94% | 7092 92% | 6724 97% |
| Całkowita średnia (program / ustawienia) | -110% /
-77% | -2% /
-8% | 17% /
14% | -2% /
-1% |
* ... im mniej tym lepiej
Ekran wyświetla kolory dość dobrze ex works. Zmierzyliśmy odchylenie kolorów na poziomie 3,26, czyli niewiele powyżej wartości idealnej (DeltaE < 3). Kalibracja wyświetlacza zmniejsza odchylenie do 0,87 i sprawia, że skale szarości wydają się bardziej równomierne. Panel potrafi wyświetlić prawie całą przestrzeń barw sRGB (98,1%) oraz pokrywa 70% AdobeRGB i 69% DCI-P3. Panel QHD siostrzanego modelu osiąga lepsze ogólne pokrycie przestrzeni barw.
Stworzony przez nas profil kolorów możecie pobrać i wykorzystać za darmo. Link znajduje się w polu informacyjnym powyżej.
Wyświetl czasy reakcji
| ↔ Czas reakcji od czerni do bieli | ||
|---|---|---|
| 8 ms ... wzrost ↗ i spadek ↘ łącznie | ↗ 4 ms wzrost |  |
| ↘ 4 ms upadek | ||
| W naszych testach ekran wykazuje szybki czas reakcji i powinien nadawać się do gier. Dla porównania, wszystkie testowane urządzenia wahają się od 0.1 (minimum) do 240 (maksimum) ms. » 22 % wszystkich urządzeń jest lepszych. Oznacza to, że zmierzony czas reakcji jest lepszy od średniej wszystkich testowanych urządzeń (19.9 ms). | ||
| ↔ Czas reakcji 50% szarości do 80% szarości | ||
| 13 ms ... wzrost ↗ i spadek ↘ łącznie | ↗ 6 ms wzrost |  |
| ↘ 7 ms upadek | ||
| W naszych testach ekran wykazuje dobry współczynnik reakcji, ale może być zbyt wolny dla graczy rywalizujących ze sobą. Dla porównania, wszystkie testowane urządzenia wahają się od 0.165 (minimum) do 636 (maksimum) ms. » 26 % wszystkich urządzeń jest lepszych. Oznacza to, że zmierzony czas reakcji jest lepszy od średniej wszystkich testowanych urządzeń (31.1 ms). | ||
Migotanie ekranu / PWM (modulacja szerokości impulsu)
| Migotanie ekranu/nie wykryto PWM |  | ||
Dla porównania: 52 % wszystkich testowanych urządzeń nie używa PWM do przyciemniania wyświetlacza. Jeśli wykryto PWM, zmierzono średnio 7784 (minimum: 5 - maksimum: 343500) Hz. | |||


Panel IPS ma stabilne kąty widzenia i można go czytać z każdej pozycji. Można go używać także na zewnątrz, pod warunkiem, że słońce nie jest zbyt silne.

Performance - notebook Nitro z Amperem i Rembrandtem
Acer Nitro 5 AN515 - 15,6-calowy notebook dla graczy - jest dostępny w całej gamie konfiguracji i może być wyposażony w procesor Intela lub AMD. Podstawowa konfiguracja jest obecnie dostępna za około 800 euro (Core i5-11400H, RTX 3050, 8 GB RAM, 512-GB SSD, bez systemu Windows). Najdroższy model (Ryzen 9 6900HX, RTX 3070 Ti, 32 GB RAM, 1-TB SSD) został wyceniony na 2400 euro.
Warunki badania
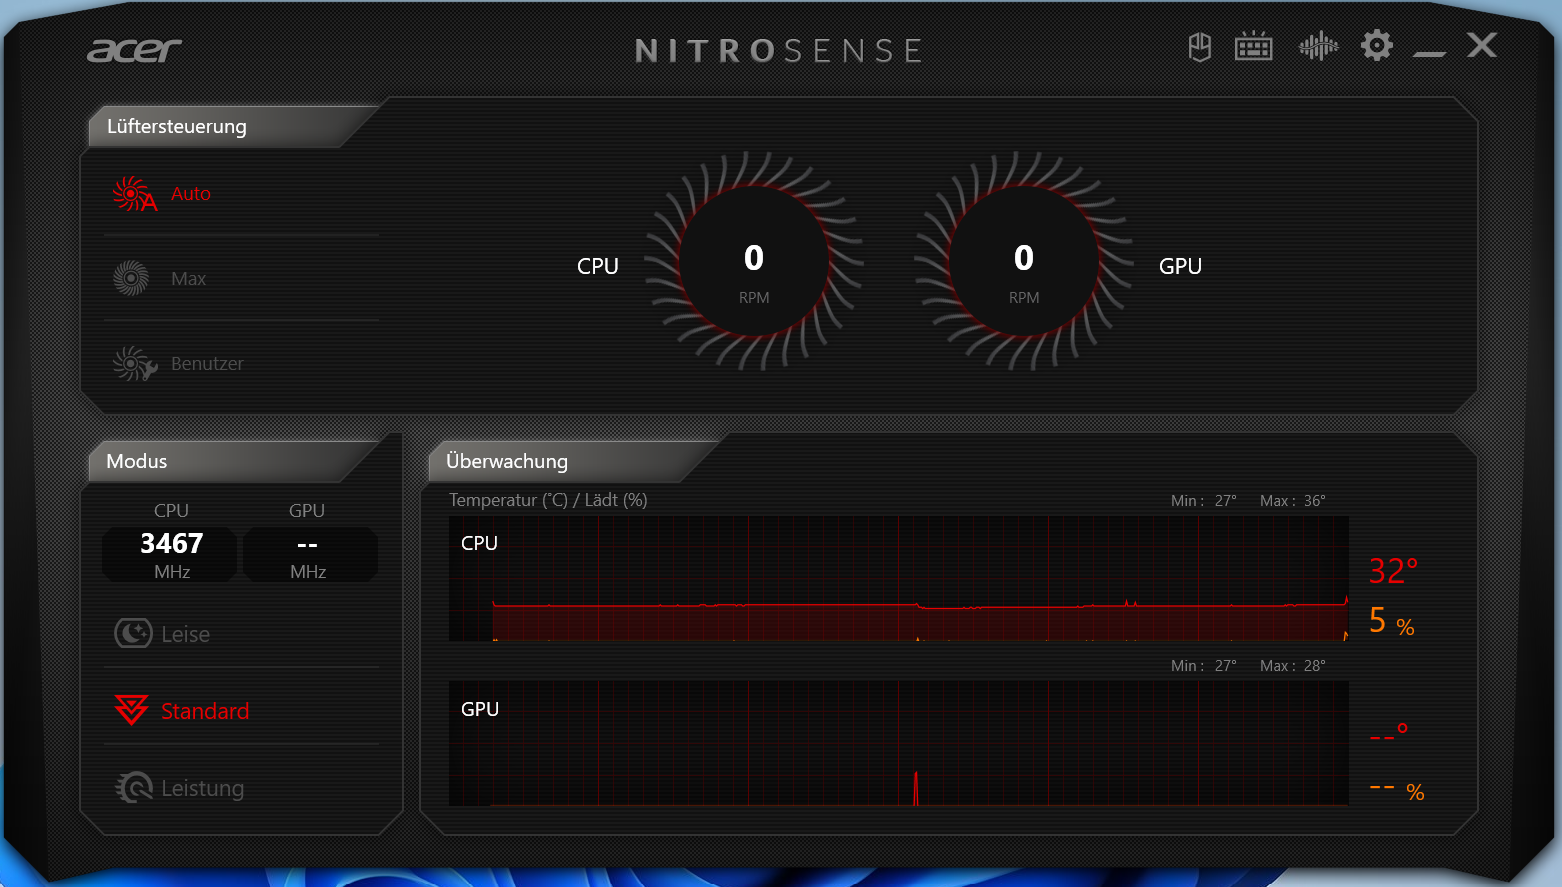
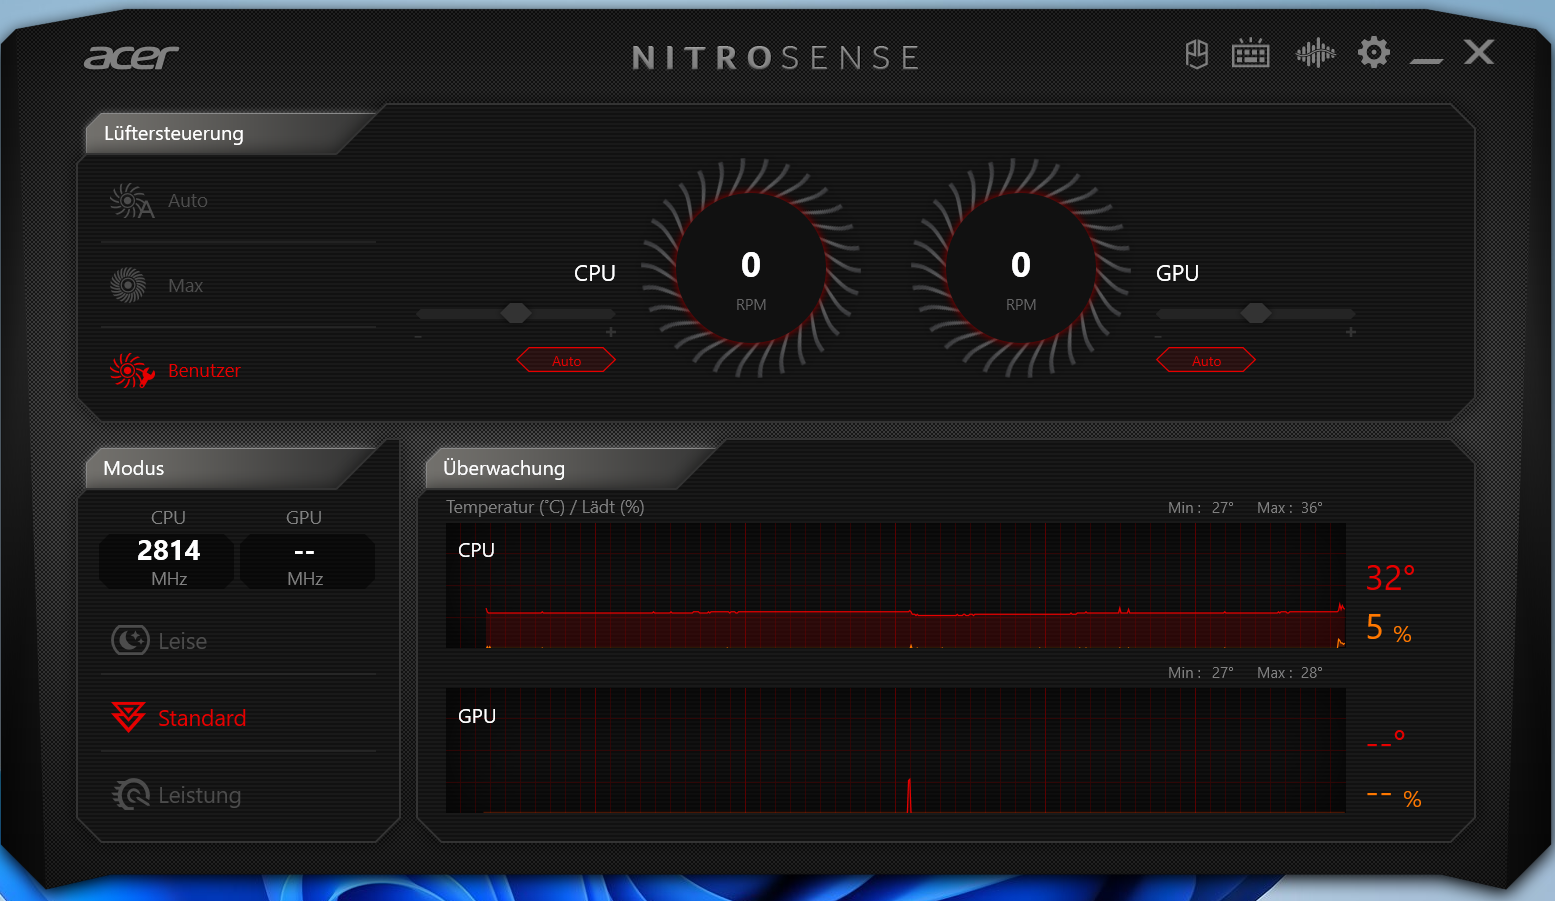
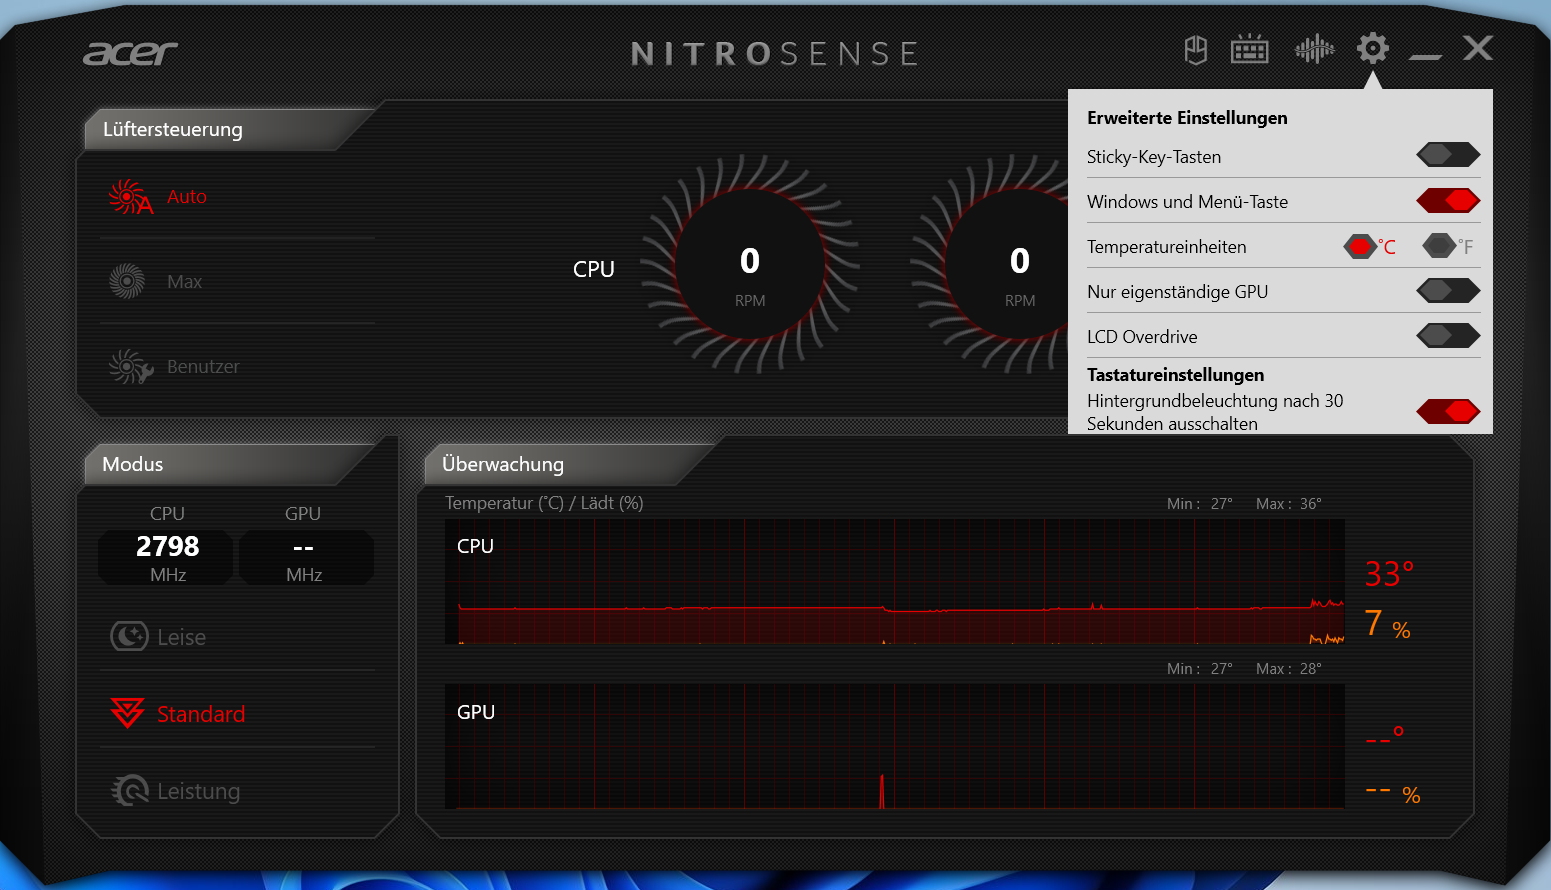
Za pomocą preinstalowanego oprogramowania NitroSense (centrum sterowania laptopa, patrz zdjęcia) można przełączać się między profilami wydajnościowymi ustalonymi przez producenta ("performance", "standard" i "quiet"). Wszystkie nasze testy przeprowadziliśmy z profilem "standardowym" i z kontrolą wentylatorów ustawioną na automatyczną. Wydajność CPU jest taka sama we wszystkich profilach wydajnościowych; wydajność GPU różni się nieznacznie.
Procesor
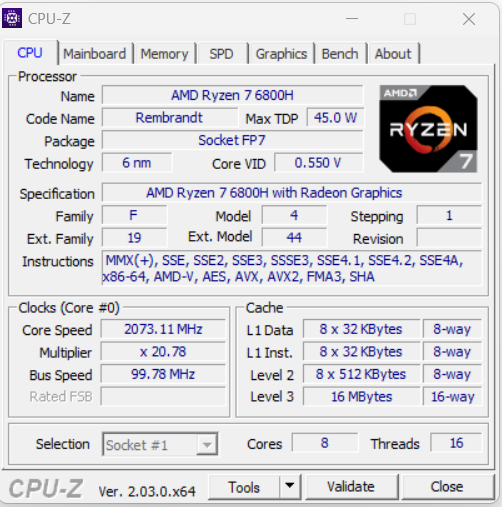
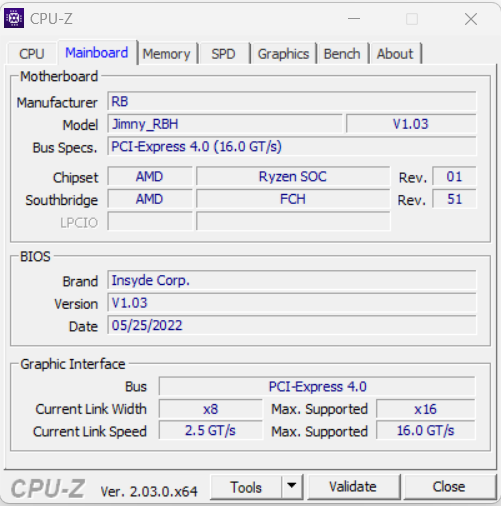
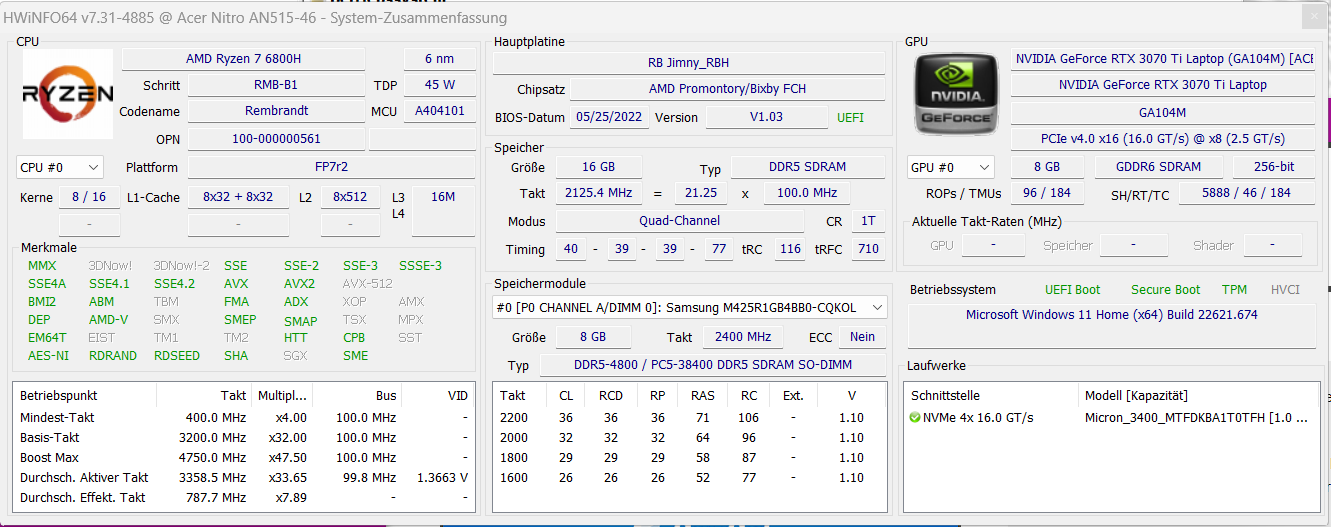
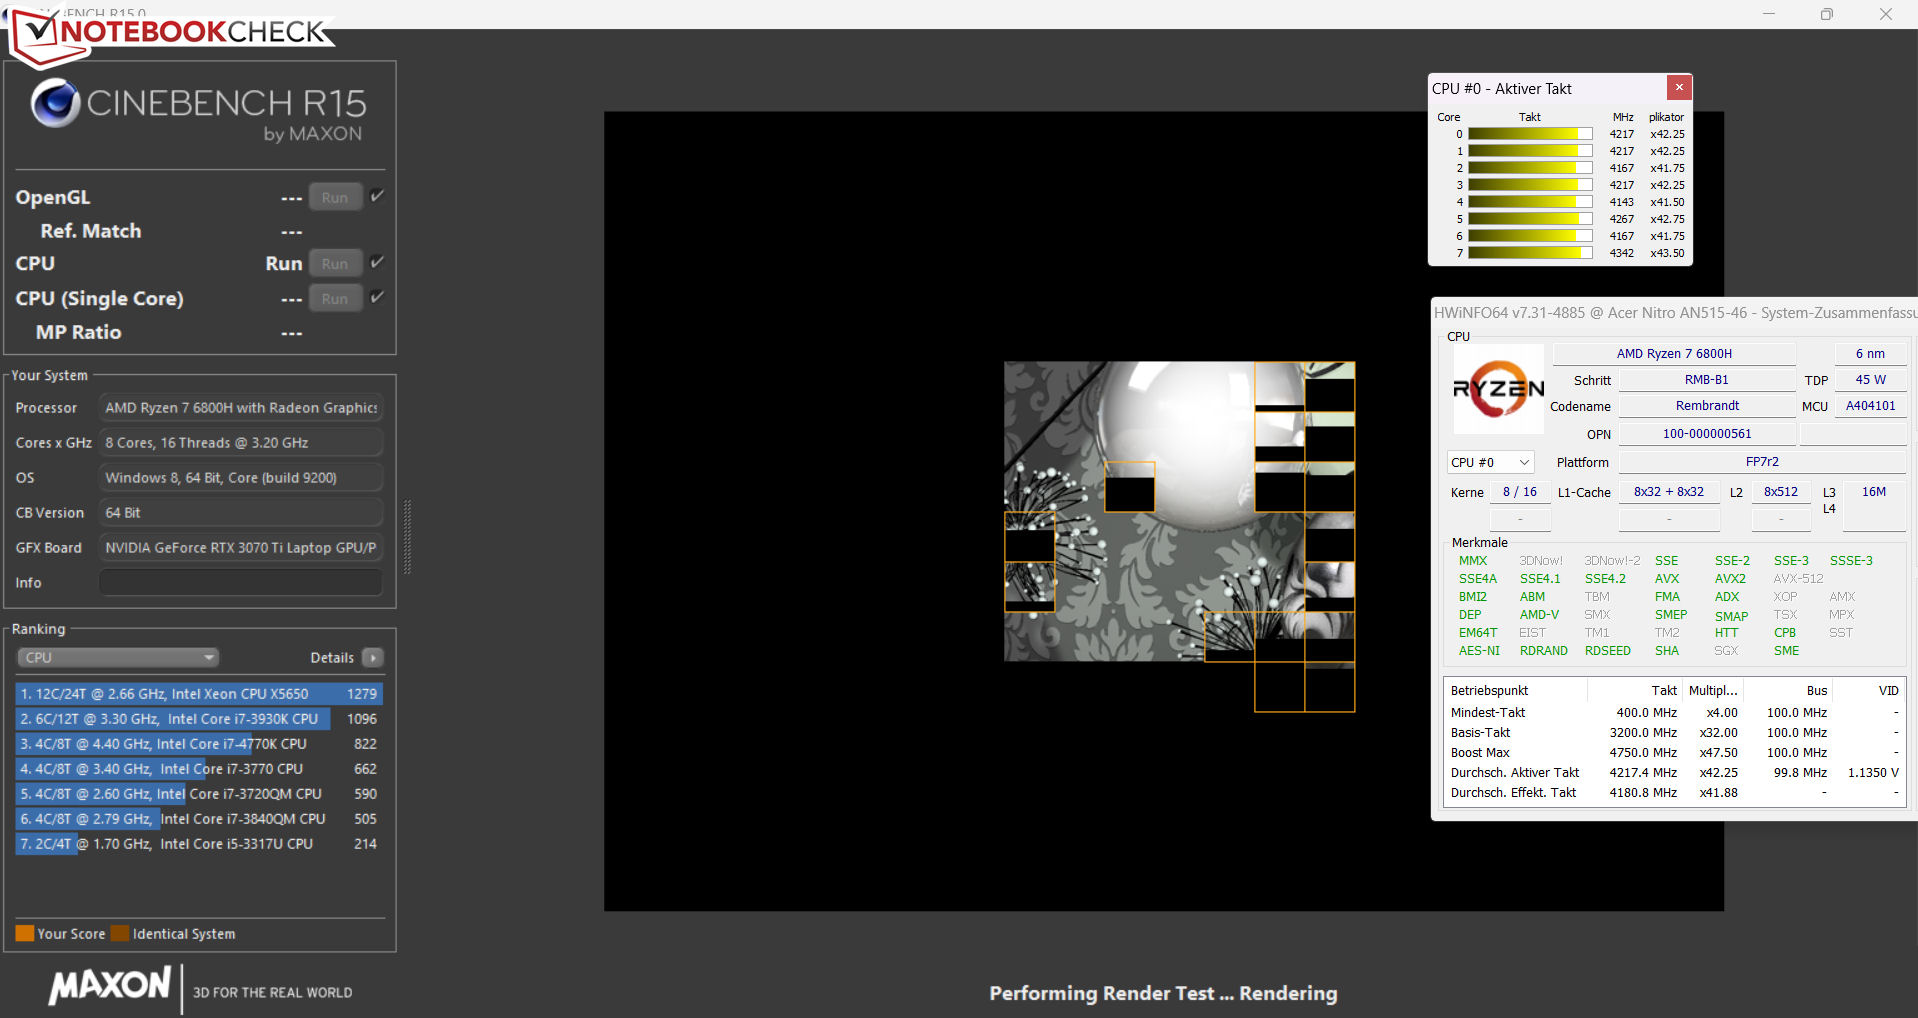
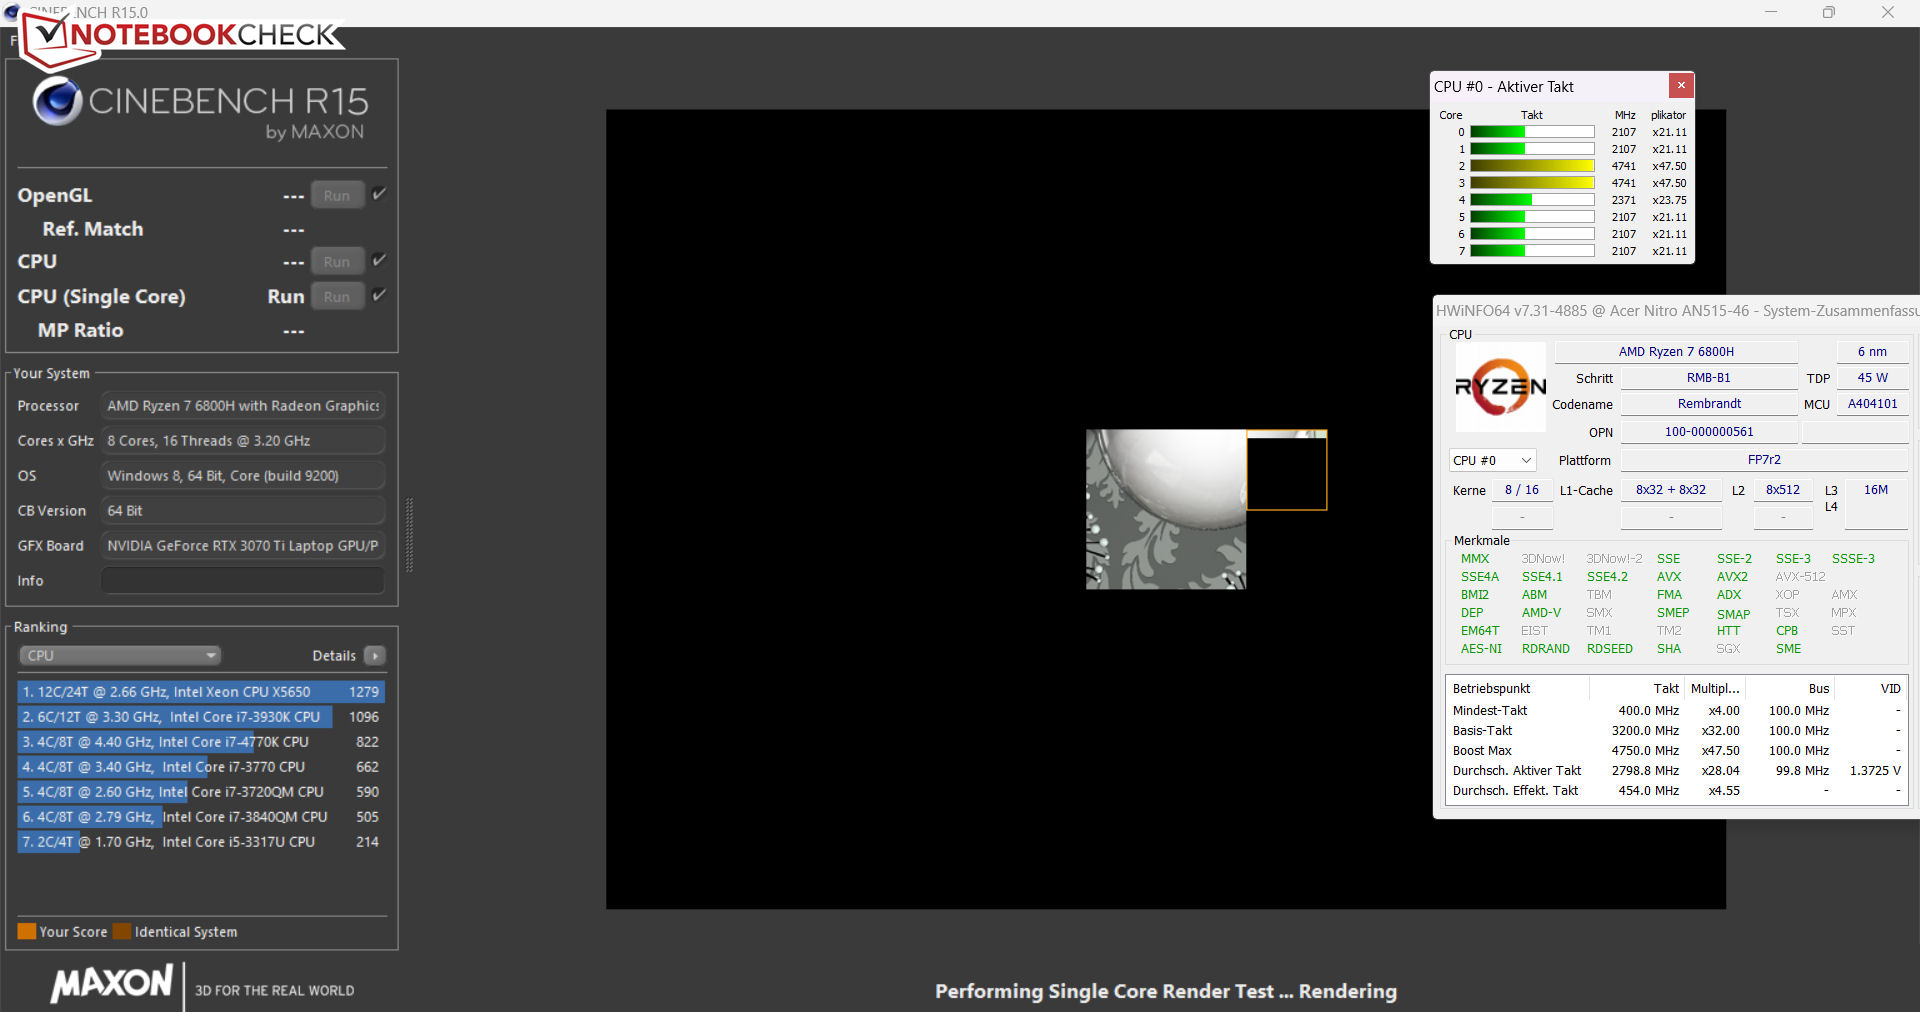
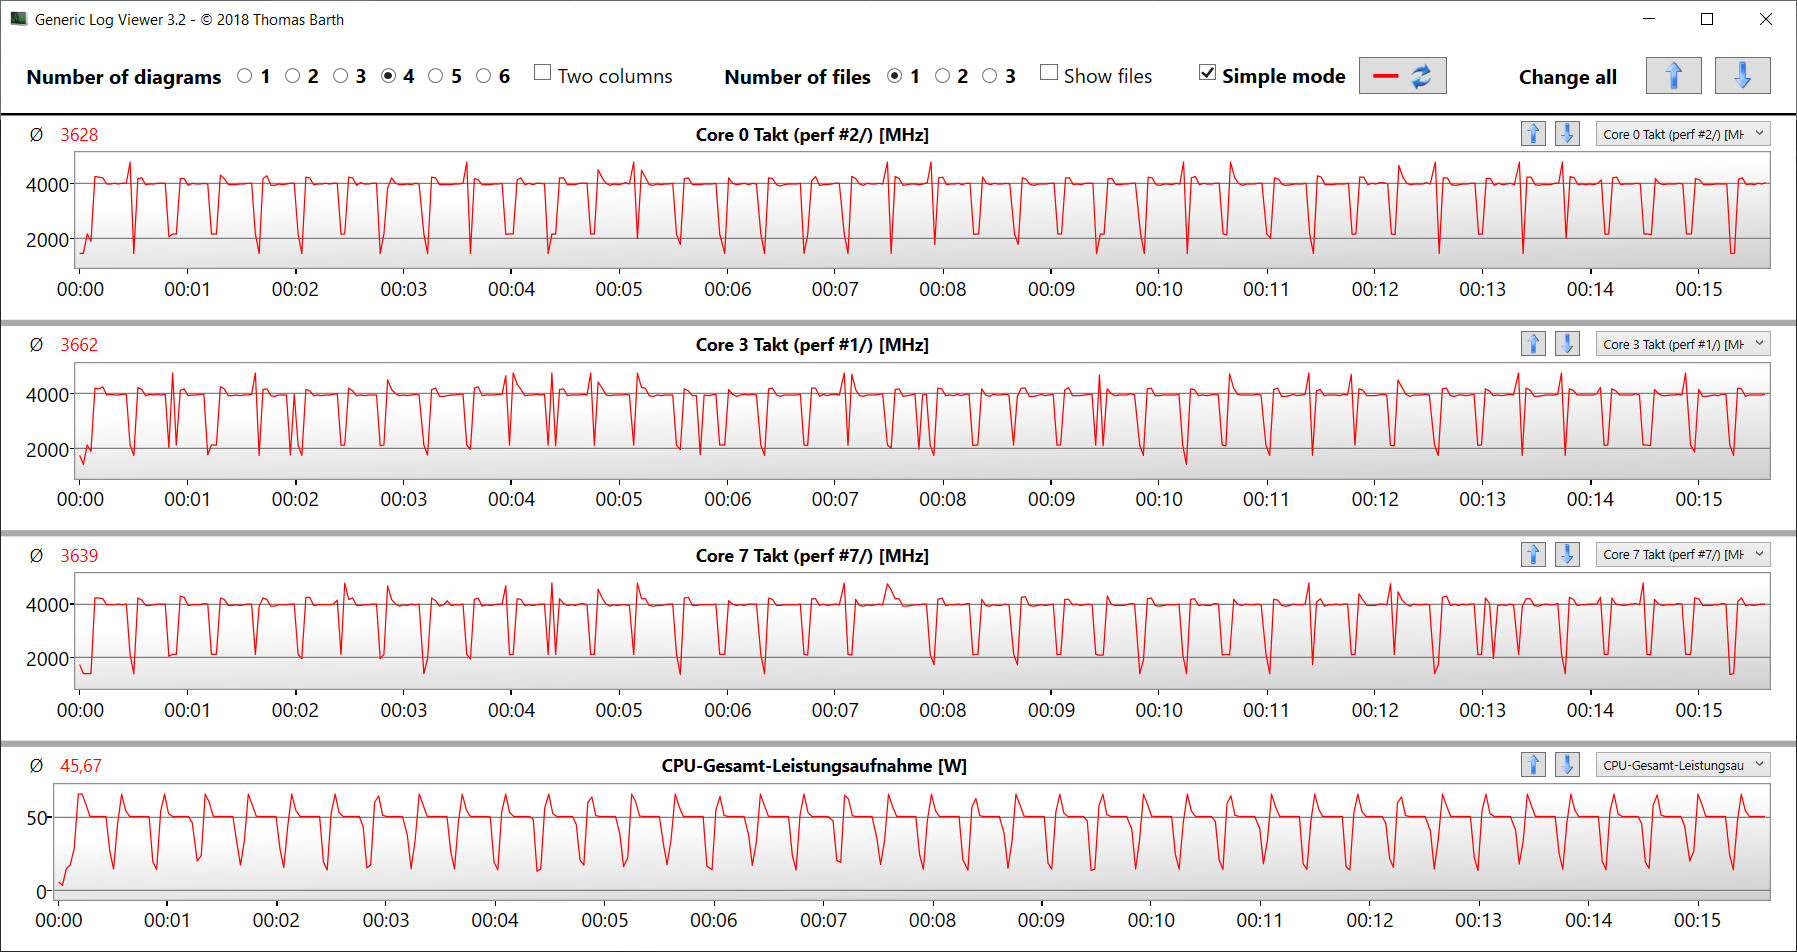
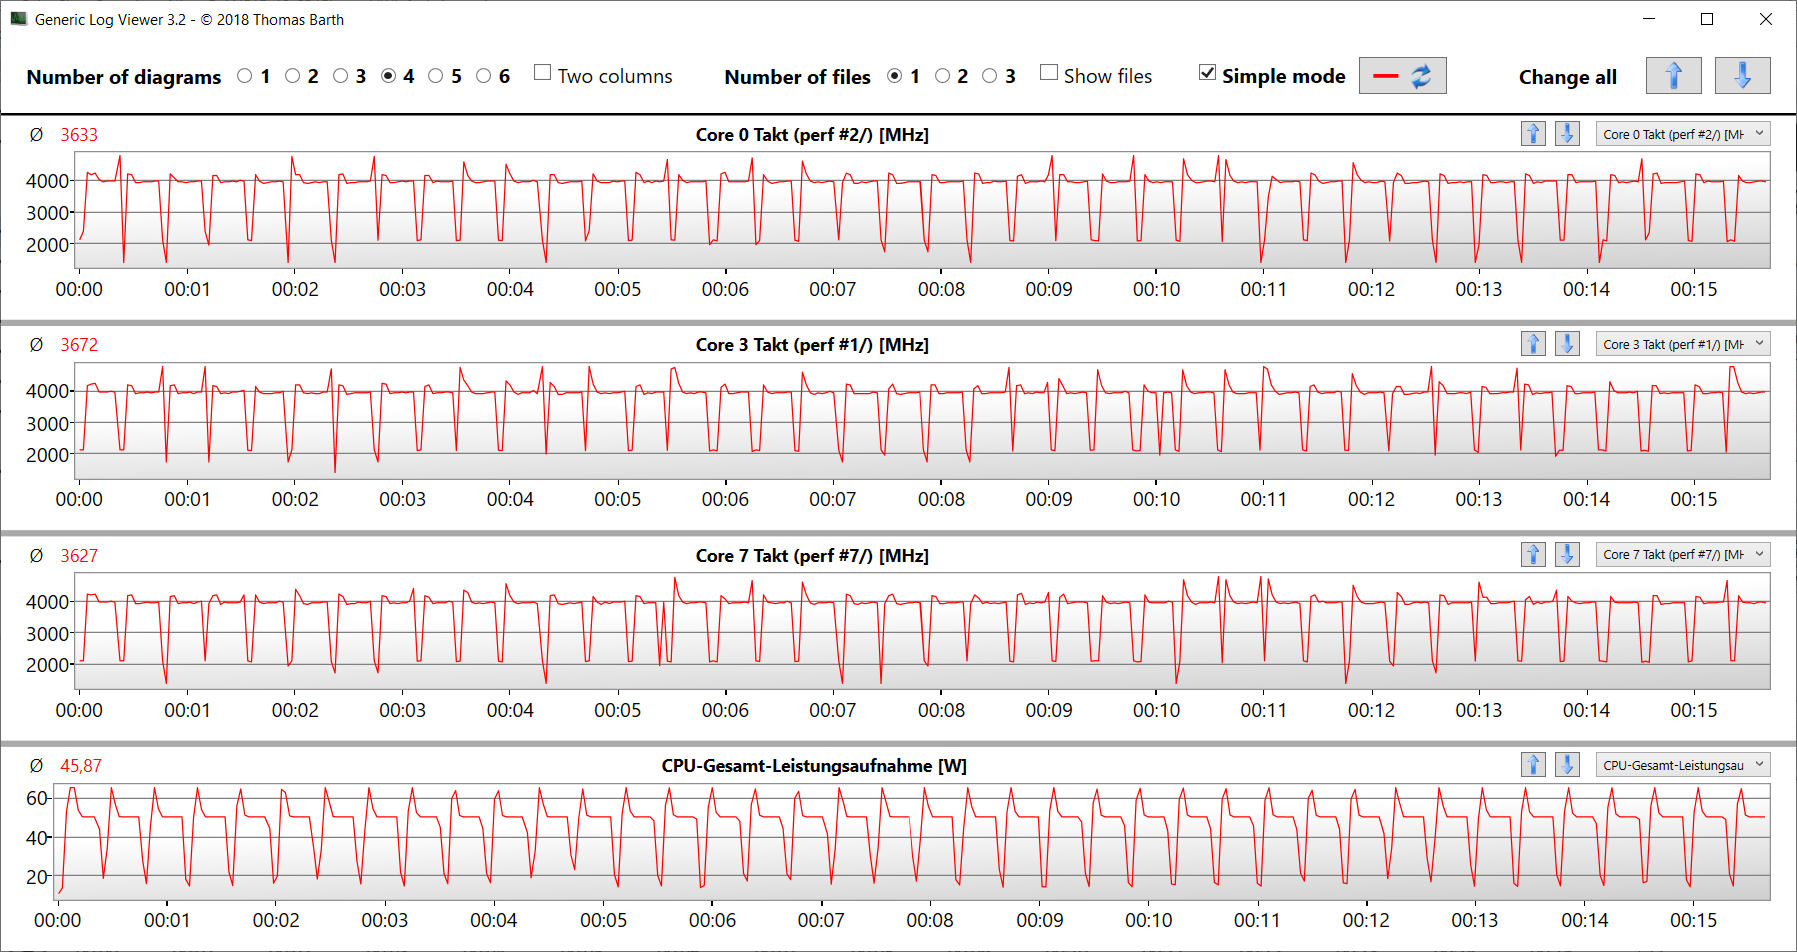
Część CPU w Ryzen 7 6800H APU (Rembrandt) składa się z ośmiordzeniowego procesora o podstawowej częstotliwości taktowania 3,2 GHz. Dzięki turbo częstotliwość taktowania może wzrosnąć do 4,75 GHz. Układ obsługuje jednoczesną wielowątkowość (praca dwóch wątków na rdzeń). Wyniki benchmarków procesora są takie same we wszystkich trzech profilach wydajności.
W teście wielowątkowym Cinebench R15 uzyskano taktowanie między 4 a 4,2 GHz. W teście jednowątkowym udało się uzyskać od 2 do 4,75 GHz. Na akumulatorze taktowanie procesora wynosiło 2,5 GHz (wielowątkowo) i od 1,2 do 2,5 GHz (jednowątkowo). Benchmark pętli CB15 potwierdził, że turbo procesora może być wykorzystywane bez przerwy.
Procesor oferuje ogólnie dobrą wydajność. Od czasu do czasu wypada jednak gorzej od procesorów Intel Alder Lake, zwłaszcza gdy mogą one wykorzystać swoje dodatkowe rdzenie CPU.
Cinebench R15 Multi Loop
| CPU Performance rating - Percent | |
| Średnia w klasie Gaming | |
| Acer Nitro 5 AN515-58-72QR | |
| MSI Katana GF66 12UGS | |
| Asus TUF Dash F15 FX517ZR | |
| Acer Nitro 5 AN515-46-R1A1 | |
| Przeciętny AMD Ryzen 7 6800H | |
| Schenker XMG Fusion 15 (Mid 22) | |
| Cinebench R23 | |
| Multi Core | |
| Średnia w klasie Gaming (10488 - 40970, n=110, ostatnie 2 lata) | |
| MSI Katana GF66 12UGS | |
| Acer Nitro 5 AN515-58-72QR | |
| Acer Nitro 5 AN515-46-R1A1 | |
| Asus TUF Dash F15 FX517ZR | |
| Przeciętny AMD Ryzen 7 6800H (11481 - 14660, n=11) | |
| Schenker XMG Fusion 15 (Mid 22) | |
| Single Core | |
| Średnia w klasie Gaming (1166 - 2356, n=110, ostatnie 2 lata) | |
| MSI Katana GF66 12UGS | |
| Acer Nitro 5 AN515-58-72QR | |
| Asus TUF Dash F15 FX517ZR | |
| Acer Nitro 5 AN515-46-R1A1 | |
| Przeciętny AMD Ryzen 7 6800H (1500 - 1552, n=9) | |
| Schenker XMG Fusion 15 (Mid 22) | |
| Cinebench R20 | |
| CPU (Multi Core) | |
| Średnia w klasie Gaming (4029 - 16108, n=109, ostatnie 2 lata) | |
| Acer Nitro 5 AN515-58-72QR | |
| MSI Katana GF66 12UGS | |
| Asus TUF Dash F15 FX517ZR | |
| Acer Nitro 5 AN515-46-R1A1 | |
| Przeciętny AMD Ryzen 7 6800H (4460 - 5661, n=9) | |
| Schenker XMG Fusion 15 (Mid 22) | |
| CPU (Single Core) | |
| Średnia w klasie Gaming (442 - 895, n=109, ostatnie 2 lata) | |
| MSI Katana GF66 12UGS | |
| Asus TUF Dash F15 FX517ZR | |
| Acer Nitro 5 AN515-58-72QR | |
| Acer Nitro 5 AN515-46-R1A1 | |
| Przeciętny AMD Ryzen 7 6800H (580 - 605, n=9) | |
| Schenker XMG Fusion 15 (Mid 22) | |
| Cinebench R15 | |
| CPU Multi 64Bit | |
| Średnia w klasie Gaming (1578 - 6271, n=109, ostatnie 2 lata) | |
| Acer Nitro 5 AN515-58-72QR | |
| MSI Katana GF66 12UGS | |
| MSI Katana GF66 12UGS | |
| Acer Nitro 5 AN515-46-R1A1 | |
| Asus TUF Dash F15 FX517ZR | |
| Przeciętny AMD Ryzen 7 6800H (1585 - 2366, n=10) | |
| Schenker XMG Fusion 15 (Mid 22) | |
| CPU Single 64Bit | |
| Średnia w klasie Gaming (188.8 - 343, n=109, ostatnie 2 lata) | |
| MSI Katana GF66 12UGS | |
| MSI Katana GF66 12UGS | |
| Acer Nitro 5 AN515-58-72QR | |
| Asus TUF Dash F15 FX517ZR | |
| Acer Nitro 5 AN515-46-R1A1 | |
| Przeciętny AMD Ryzen 7 6800H (182.7 - 250, n=10) | |
| Schenker XMG Fusion 15 (Mid 22) | |
| Blender - v2.79 BMW27 CPU | |
| Schenker XMG Fusion 15 (Mid 22) | |
| MSI Katana GF66 12UGS | |
| Przeciętny AMD Ryzen 7 6800H (213 - 268, n=8) | |
| Acer Nitro 5 AN515-46-R1A1 | |
| Asus TUF Dash F15 FX517ZR | |
| Acer Nitro 5 AN515-58-72QR | |
| Średnia w klasie Gaming (80 - 330, n=107, ostatnie 2 lata) | |
| 7-Zip 18.03 | |
| 7z b 4 | |
| Średnia w klasie Gaming (33491 - 148086, n=108, ostatnie 2 lata) | |
| Acer Nitro 5 AN515-46-R1A1 | |
| Przeciętny AMD Ryzen 7 6800H (55067 - 64817, n=8) | |
| Asus TUF Dash F15 FX517ZR | |
| Acer Nitro 5 AN515-58-72QR | |
| MSI Katana GF66 12UGS | |
| Schenker XMG Fusion 15 (Mid 22) | |
| 7z b 4 -mmt1 | |
| Średnia w klasie Gaming (4199 - 7436, n=108, ostatnie 2 lata) | |
| MSI Katana GF66 12UGS | |
| Acer Nitro 5 AN515-58-72QR | |
| Asus TUF Dash F15 FX517ZR | |
| Przeciętny AMD Ryzen 7 6800H (5521 - 5803, n=8) | |
| Acer Nitro 5 AN515-46-R1A1 | |
| Schenker XMG Fusion 15 (Mid 22) | |
| Geekbench 5.5 | |
| Multi-Core | |
| Średnia w klasie Gaming (6460 - 27010, n=108, ostatnie 2 lata) | |
| MSI Katana GF66 12UGS | |
| Asus TUF Dash F15 FX517ZR | |
| Acer Nitro 5 AN515-58-72QR | |
| Przeciętny AMD Ryzen 7 6800H (8898 - 10355, n=10) | |
| Acer Nitro 5 AN515-46-R1A1 | |
| Schenker XMG Fusion 15 (Mid 22) | |
| Single-Core | |
| Średnia w klasie Gaming (986 - 2474, n=108, ostatnie 2 lata) | |
| Asus TUF Dash F15 FX517ZR | |
| Acer Nitro 5 AN515-58-72QR | |
| MSI Katana GF66 12UGS | |
| Schenker XMG Fusion 15 (Mid 22) | |
| Przeciętny AMD Ryzen 7 6800H (1518 - 1568, n=10) | |
| Acer Nitro 5 AN515-46-R1A1 | |
| HWBOT x265 Benchmark v2.2 - 4k Preset | |
| Średnia w klasie Gaming (11.5 - 44.3, n=108, ostatnie 2 lata) | |
| Acer Nitro 5 AN515-58-72QR | |
| Acer Nitro 5 AN515-46-R1A1 | |
| Asus TUF Dash F15 FX517ZR | |
| Przeciętny AMD Ryzen 7 6800H (14.9 - 18.5, n=9) | |
| MSI Katana GF66 12UGS | |
| Schenker XMG Fusion 15 (Mid 22) | |
| LibreOffice - 20 Documents To PDF | |
| Przeciętny AMD Ryzen 7 6800H (48.7 - 79.5, n=8) | |
| Acer Nitro 5 AN515-46-R1A1 | |
| Średnia w klasie Gaming (19 - 88.8, n=108, ostatnie 2 lata) | |
| Schenker XMG Fusion 15 (Mid 22) | |
| Acer Nitro 5 AN515-58-72QR | |
| Asus TUF Dash F15 FX517ZR | |
| MSI Katana GF66 12UGS | |
| R Benchmark 2.5 - Overall mean | |
| Schenker XMG Fusion 15 (Mid 22) | |
| Przeciętny AMD Ryzen 7 6800H (0.4783 - 0.515, n=8) | |
| Acer Nitro 5 AN515-46-R1A1 | |
| Asus TUF Dash F15 FX517ZR | |
| Acer Nitro 5 AN515-58-72QR | |
| MSI Katana GF66 12UGS | |
| Średnia w klasie Gaming (0.3439 - 0.759, n=109, ostatnie 2 lata) | |
* ... im mniej tym lepiej
AIDA64: FP32 Ray-Trace | FPU Julia | CPU SHA3 | CPU Queen | FPU SinJulia | FPU Mandel | CPU AES | CPU ZLib | FP64 Ray-Trace | CPU PhotoWorxx
| Performance rating | |
| Średnia w klasie Gaming | |
| Acer Nitro 5 AN515-46-R1A1 | |
| Przeciętny AMD Ryzen 7 6800H | |
| Schenker XMG Fusion 15 (Mid 22) | |
| Asus TUF Dash F15 FX517ZR | |
| MSI Katana GF66 12UGS | |
| Acer Nitro 5 AN515-58-72QR | |
| AIDA64 / FP32 Ray-Trace | |
| Średnia w klasie Gaming (10227 - 85542, n=107, ostatnie 2 lata) | |
| Acer Nitro 5 AN515-46-R1A1 | |
| Przeciętny AMD Ryzen 7 6800H (12876 - 17031, n=8) | |
| Asus TUF Dash F15 FX517ZR | |
| Schenker XMG Fusion 15 (Mid 22) | |
| MSI Katana GF66 12UGS | |
| Acer Nitro 5 AN515-58-72QR | |
| AIDA64 / FPU Julia | |
| Średnia w klasie Gaming (51376 - 238426, n=107, ostatnie 2 lata) | |
| Acer Nitro 5 AN515-46-R1A1 | |
| Przeciętny AMD Ryzen 7 6800H (82673 - 105987, n=8) | |
| Asus TUF Dash F15 FX517ZR | |
| Schenker XMG Fusion 15 (Mid 22) | |
| Acer Nitro 5 AN515-58-72QR | |
| MSI Katana GF66 12UGS | |
| AIDA64 / CPU SHA3 | |
| Średnia w klasie Gaming (2180 - 9817, n=107, ostatnie 2 lata) | |
| Schenker XMG Fusion 15 (Mid 22) | |
| Acer Nitro 5 AN515-46-R1A1 | |
| Przeciętny AMD Ryzen 7 6800H (2886 - 3634, n=8) | |
| MSI Katana GF66 12UGS | |
| Acer Nitro 5 AN515-58-72QR | |
| Asus TUF Dash F15 FX517ZR | |
| AIDA64 / CPU Queen | |
| Średnia w klasie Gaming (49785 - 173351, n=98, ostatnie 2 lata) | |
| Acer Nitro 5 AN515-46-R1A1 | |
| MSI Katana GF66 12UGS | |
| Acer Nitro 5 AN515-58-72QR | |
| Przeciętny AMD Ryzen 7 6800H (75117 - 106322, n=8) | |
| Asus TUF Dash F15 FX517ZR | |
| Schenker XMG Fusion 15 (Mid 22) | |
| AIDA64 / FPU SinJulia | |
| Średnia w klasie Gaming (4424 - 33636, n=107, ostatnie 2 lata) | |
| Acer Nitro 5 AN515-46-R1A1 | |
| Przeciętny AMD Ryzen 7 6800H (11771 - 13120, n=8) | |
| Acer Nitro 5 AN515-58-72QR | |
| MSI Katana GF66 12UGS | |
| Schenker XMG Fusion 15 (Mid 22) | |
| Asus TUF Dash F15 FX517ZR | |
| AIDA64 / FPU Mandel | |
| Średnia w klasie Gaming (25115 - 128721, n=107, ostatnie 2 lata) | |
| Acer Nitro 5 AN515-46-R1A1 | |
| Przeciętny AMD Ryzen 7 6800H (45287 - 58327, n=8) | |
| Schenker XMG Fusion 15 (Mid 22) | |
| Asus TUF Dash F15 FX517ZR | |
| Acer Nitro 5 AN515-58-72QR | |
| MSI Katana GF66 12UGS | |
| AIDA64 / CPU AES | |
| Schenker XMG Fusion 15 (Mid 22) | |
| Acer Nitro 5 AN515-46-R1A1 | |
| Przeciętny AMD Ryzen 7 6800H (67816 - 137383, n=8) | |
| Średnia w klasie Gaming (39258 - 247074, n=107, ostatnie 2 lata) | |
| MSI Katana GF66 12UGS | |
| Asus TUF Dash F15 FX517ZR | |
| Acer Nitro 5 AN515-58-72QR | |
| AIDA64 / CPU ZLib | |
| Średnia w klasie Gaming (574 - 2531, n=107, ostatnie 2 lata) | |
| Acer Nitro 5 AN515-58-72QR | |
| MSI Katana GF66 12UGS | |
| Asus TUF Dash F15 FX517ZR | |
| Acer Nitro 5 AN515-46-R1A1 | |
| Przeciętny AMD Ryzen 7 6800H (732 - 901, n=8) | |
| Schenker XMG Fusion 15 (Mid 22) | |
| AIDA64 / FP64 Ray-Trace | |
| Średnia w klasie Gaming (5509 - 45446, n=107, ostatnie 2 lata) | |
| Acer Nitro 5 AN515-46-R1A1 | |
| Przeciętny AMD Ryzen 7 6800H (6917 - 8980, n=8) | |
| Asus TUF Dash F15 FX517ZR | |
| Schenker XMG Fusion 15 (Mid 22) | |
| Acer Nitro 5 AN515-58-72QR | |
| MSI Katana GF66 12UGS | |
| AIDA64 / CPU PhotoWorxx | |
| Średnia w klasie Gaming (12271 - 89891, n=107, ostatnie 2 lata) | |
| Asus TUF Dash F15 FX517ZR | |
| Przeciętny AMD Ryzen 7 6800H (26496 - 30360, n=8) | |
| Acer Nitro 5 AN515-46-R1A1 | |
| MSI Katana GF66 12UGS | |
| Schenker XMG Fusion 15 (Mid 22) | |
| Acer Nitro 5 AN515-58-72QR | |
Wydajność systemu
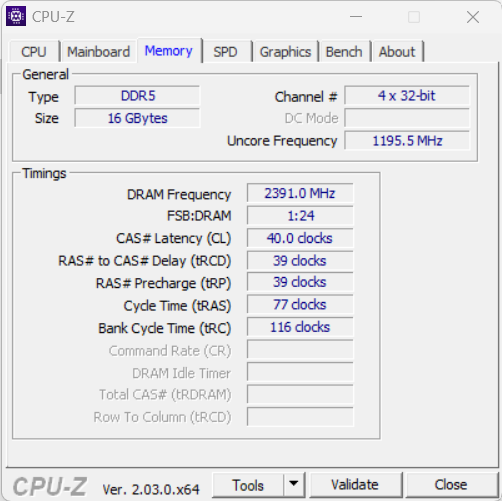
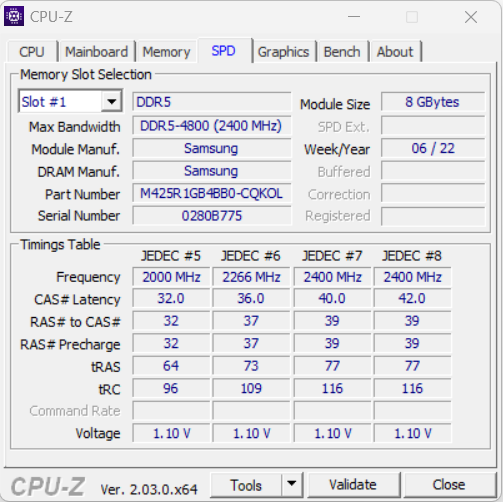
Dobrze dopracowany i płynnie działający system oferuje wystarczającą moc obliczeniową do wymagających zastosowań, takich jak renderowanie, obróbka wideo i gry. Wyniki w programie PCMark są dobre. Transfery pamięci RAM (DDR5-4800) są nieco niższe niż w porównywalnych notebookach, takich jak Asus TUF Dash F15.
CrossMark: Overall | Productivity | Creativity | Responsiveness
| PCMark 10 / Score | |
| Średnia w klasie Gaming (5828 - 11574, n=94, ostatnie 2 lata) | |
| MSI Katana GF66 12UGS | |
| Przeciętny AMD Ryzen 7 6800H, NVIDIA GeForce RTX 3070 Ti Laptop GPU (6783 - 7549, n=2) | |
| Acer Nitro 5 AN515-58-72QR | |
| Asus TUF Dash F15 FX517ZR | |
| Acer Nitro 5 AN515-46-R1A1 | |
| Schenker XMG Fusion 15 (Mid 22) | |
| PCMark 10 / Essentials | |
| Średnia w klasie Gaming (8810 - 12600, n=98, ostatnie 2 lata) | |
| Przeciętny AMD Ryzen 7 6800H, NVIDIA GeForce RTX 3070 Ti Laptop GPU (10343 - 10472, n=2) | |
| MSI Katana GF66 12UGS | |
| Acer Nitro 5 AN515-46-R1A1 | |
| Asus TUF Dash F15 FX517ZR | |
| Acer Nitro 5 AN515-58-72QR | |
| Schenker XMG Fusion 15 (Mid 22) | |
| PCMark 10 / Productivity | |
| Średnia w klasie Gaming (6845 - 18766, n=96, ostatnie 2 lata) | |
| MSI Katana GF66 12UGS | |
| Asus TUF Dash F15 FX517ZR | |
| Przeciętny AMD Ryzen 7 6800H, NVIDIA GeForce RTX 3070 Ti Laptop GPU (8991 - 9479, n=2) | |
| Acer Nitro 5 AN515-58-72QR | |
| Acer Nitro 5 AN515-46-R1A1 | |
| Schenker XMG Fusion 15 (Mid 22) | |
| PCMark 10 / Digital Content Creation | |
| Średnia w klasie Gaming (7602 - 19657, n=96, ostatnie 2 lata) | |
| MSI Katana GF66 12UGS | |
| Przeciętny AMD Ryzen 7 6800H, NVIDIA GeForce RTX 3070 Ti Laptop GPU (9108 - 11759, n=2) | |
| Acer Nitro 5 AN515-58-72QR | |
| Asus TUF Dash F15 FX517ZR | |
| Acer Nitro 5 AN515-46-R1A1 | |
| Schenker XMG Fusion 15 (Mid 22) | |
| CrossMark / Overall | |
| Średnia w klasie Gaming (1366 - 2409, n=96, ostatnie 2 lata) | |
| MSI Katana GF66 12UGS | |
| Asus TUF Dash F15 FX517ZR | |
| Acer Nitro 5 AN515-58-72QR | |
| Schenker XMG Fusion 15 (Mid 22) | |
| Przeciętny AMD Ryzen 7 6800H, NVIDIA GeForce RTX 3070 Ti Laptop GPU (1522 - 1643, n=2) | |
| Acer Nitro 5 AN515-46-R1A1 | |
| CrossMark / Productivity | |
| MSI Katana GF66 12UGS | |
| Średnia w klasie Gaming (1386 - 2254, n=96, ostatnie 2 lata) | |
| Acer Nitro 5 AN515-58-72QR | |
| Asus TUF Dash F15 FX517ZR | |
| Schenker XMG Fusion 15 (Mid 22) | |
| Przeciętny AMD Ryzen 7 6800H, NVIDIA GeForce RTX 3070 Ti Laptop GPU (1530 - 1600, n=2) | |
| Acer Nitro 5 AN515-46-R1A1 | |
| CrossMark / Creativity | |
| Średnia w klasie Gaming (1343 - 2729, n=96, ostatnie 2 lata) | |
| Asus TUF Dash F15 FX517ZR | |
| MSI Katana GF66 12UGS | |
| Acer Nitro 5 AN515-58-72QR | |
| Schenker XMG Fusion 15 (Mid 22) | |
| Przeciętny AMD Ryzen 7 6800H, NVIDIA GeForce RTX 3070 Ti Laptop GPU (1589 - 1746, n=2) | |
| Acer Nitro 5 AN515-46-R1A1 | |
| CrossMark / Responsiveness | |
| MSI Katana GF66 12UGS | |
| Średnia w klasie Gaming (1226 - 2334, n=96, ostatnie 2 lata) | |
| Acer Nitro 5 AN515-58-72QR | |
| Schenker XMG Fusion 15 (Mid 22) | |
| Asus TUF Dash F15 FX517ZR | |
| Przeciętny AMD Ryzen 7 6800H, NVIDIA GeForce RTX 3070 Ti Laptop GPU (1316 - 1481, n=2) | |
| Acer Nitro 5 AN515-46-R1A1 | |
| PCMark 8 Home Score Accelerated v2 | 5074 pkt. | |
| PCMark 8 Work Score Accelerated v2 | 5934 pkt. | |
| PCMark 10 Score | 6783 pkt. | |
Pomoc | ||
| AIDA64 / Memory Copy | |
| Średnia w klasie Gaming (21750 - 129946, n=107, ostatnie 2 lata) | |
| Asus TUF Dash F15 FX517ZR | |
| Przeciętny AMD Ryzen 7 6800H (48209 - 51186, n=8) | |
| Acer Nitro 5 AN515-46-R1A1 | |
| Schenker XMG Fusion 15 (Mid 22) | |
| MSI Katana GF66 12UGS | |
| Acer Nitro 5 AN515-58-72QR | |
| AIDA64 / Memory Read | |
| Średnia w klasie Gaming (22956 - 118858, n=107, ostatnie 2 lata) | |
| Asus TUF Dash F15 FX517ZR | |
| Acer Nitro 5 AN515-46-R1A1 | |
| Przeciętny AMD Ryzen 7 6800H (43828 - 51778, n=8) | |
| Schenker XMG Fusion 15 (Mid 22) | |
| MSI Katana GF66 12UGS | |
| Acer Nitro 5 AN515-58-72QR | |
| AIDA64 / Memory Write | |
| Średnia w klasie Gaming (22297 - 135096, n=107, ostatnie 2 lata) | |
| Asus TUF Dash F15 FX517ZR | |
| Acer Nitro 5 AN515-46-R1A1 | |
| Przeciętny AMD Ryzen 7 6800H (51116 - 55307, n=8) | |
| MSI Katana GF66 12UGS | |
| Schenker XMG Fusion 15 (Mid 22) | |
| Acer Nitro 5 AN515-58-72QR | |
| AIDA64 / Memory Latency | |
| Średnia w klasie Gaming (75.3 - 259, n=107, ostatnie 2 lata) | |
| MSI Katana GF66 12UGS | |
| Asus TUF Dash F15 FX517ZR | |
| Schenker XMG Fusion 15 (Mid 22) | |
| Acer Nitro 5 AN515-46-R1A1 | |
| Przeciętny AMD Ryzen 7 6800H (83.1 - 104.1, n=8) | |
| Acer Nitro 5 AN515-58-72QR | |
| Acer Nitro 5 AN515-58-72QR | |
* ... im mniej tym lepiej
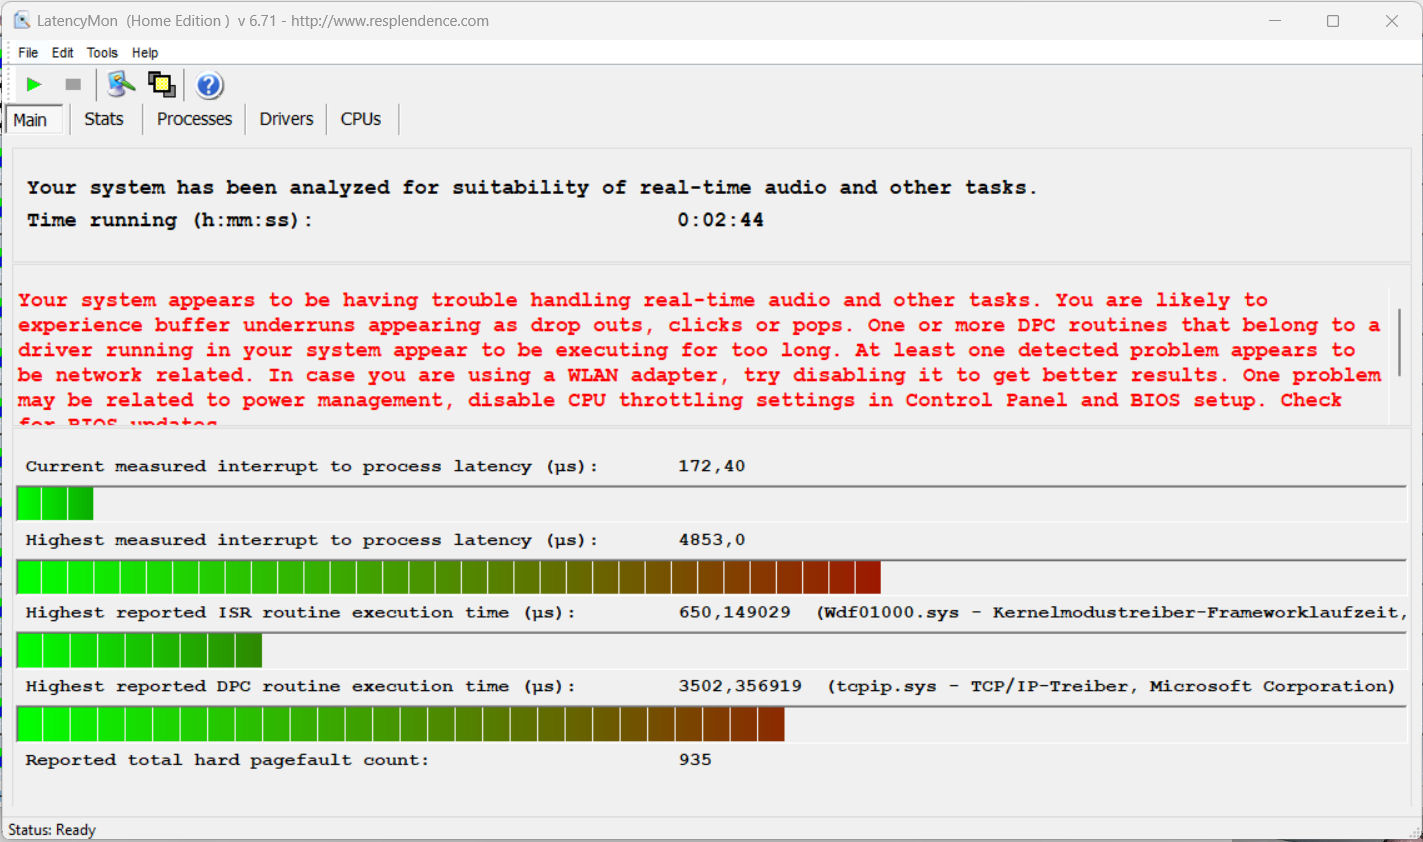
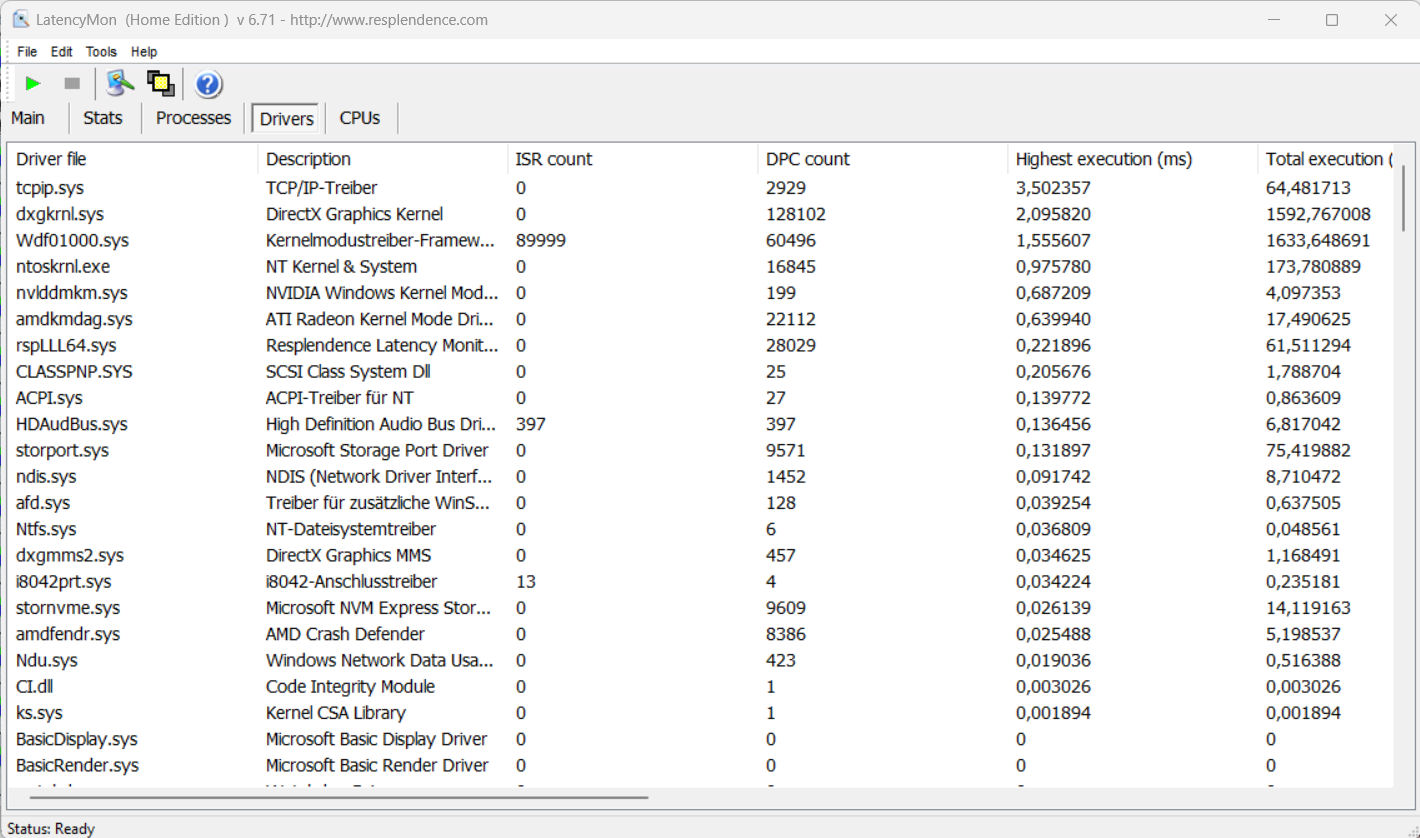
Opóźnienia DPC
Standardowy test Latency Monitor (przeglądanie stron internetowych, odtwarzanie filmów 4K, uruchomienie Prime95 High Load) wykazał pewne słabości w zakresie latencji DPC. Wydaje się, że system nie nadaje się do przetwarzania wideo i audio w czasie rzeczywistym. Przyszłe aktualizacje oprogramowania mogą poprawić lub nawet pogorszyć tę sytuację.
| DPC Latencies / LatencyMon - interrupt to process latency (max), Web, Youtube, Prime95 | |
| Acer Nitro 5 AN515-46-R1A1 | |
| Schenker XMG Fusion 15 (Mid 22) | |
| Acer Nitro 5 AN515-58-72QR | |
| MSI Katana GF66 12UGS | |
| Asus TUF Dash F15 FX517ZR | |
* ... im mniej tym lepiej
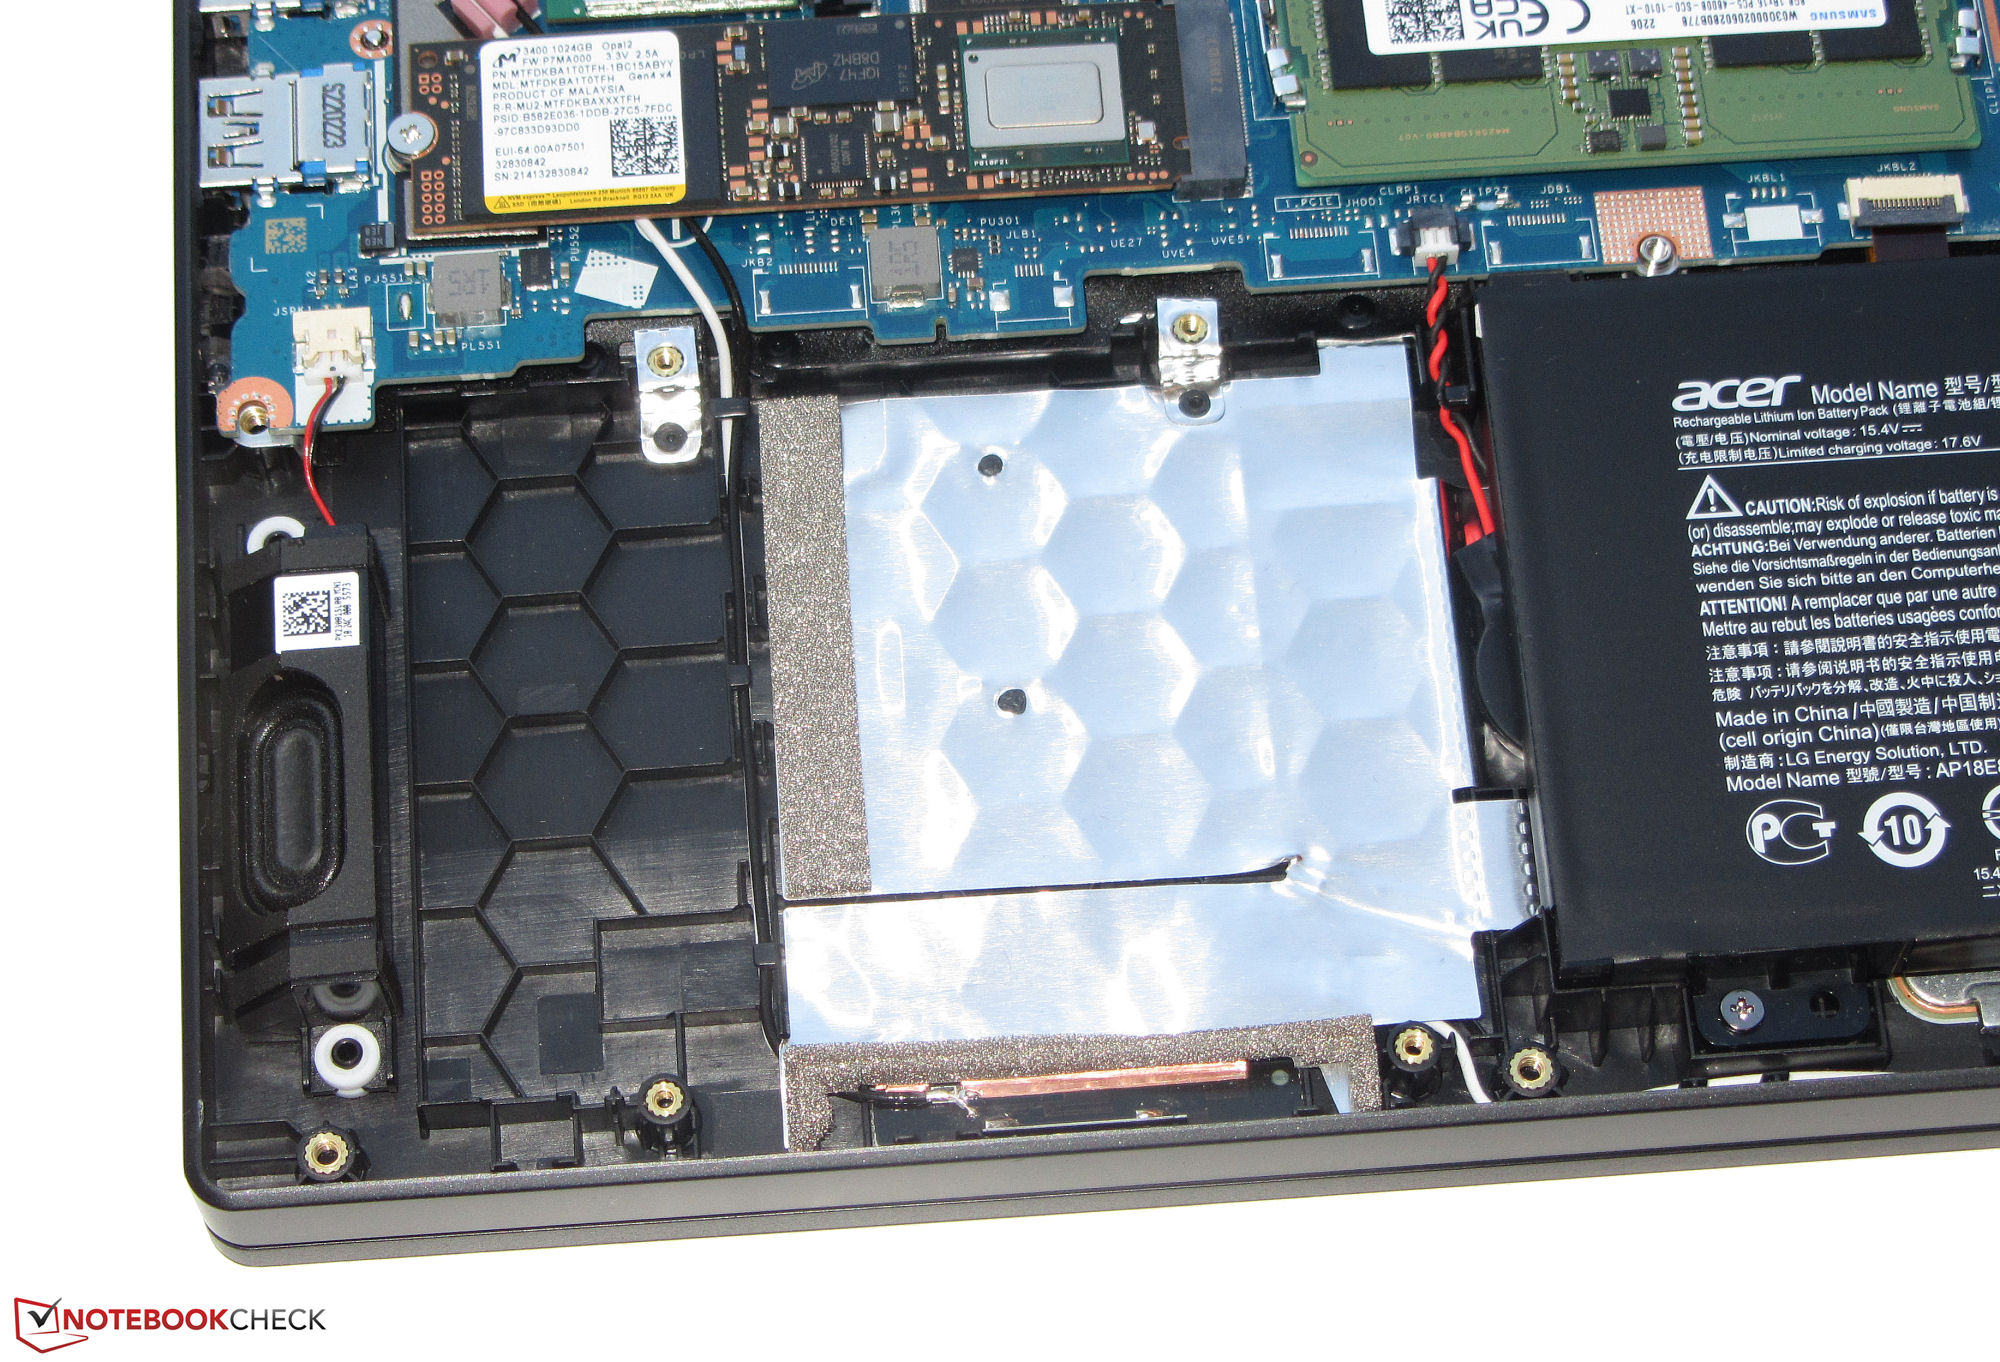
Urządzenie do przechowywania danych
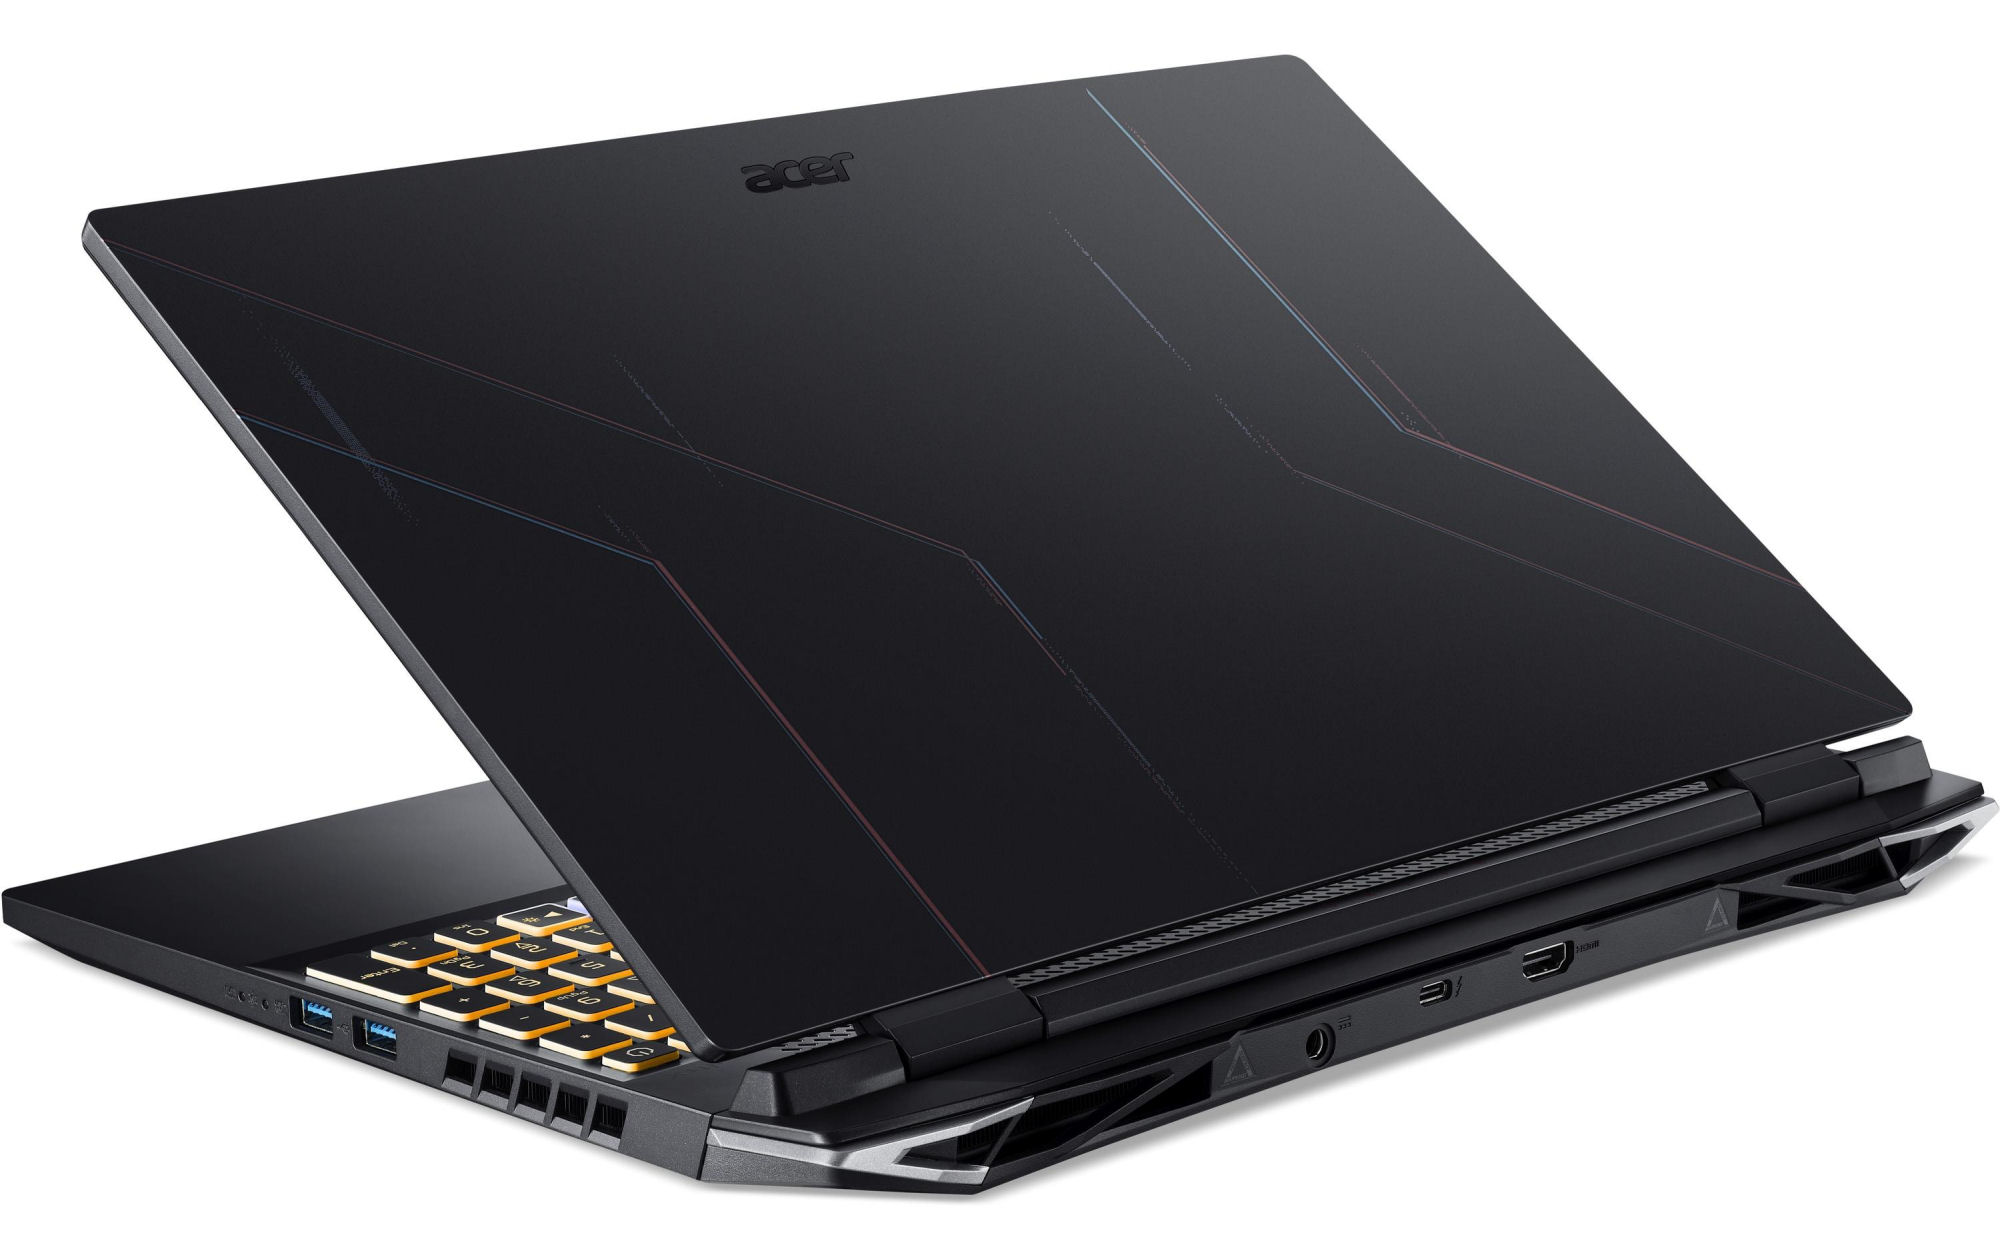
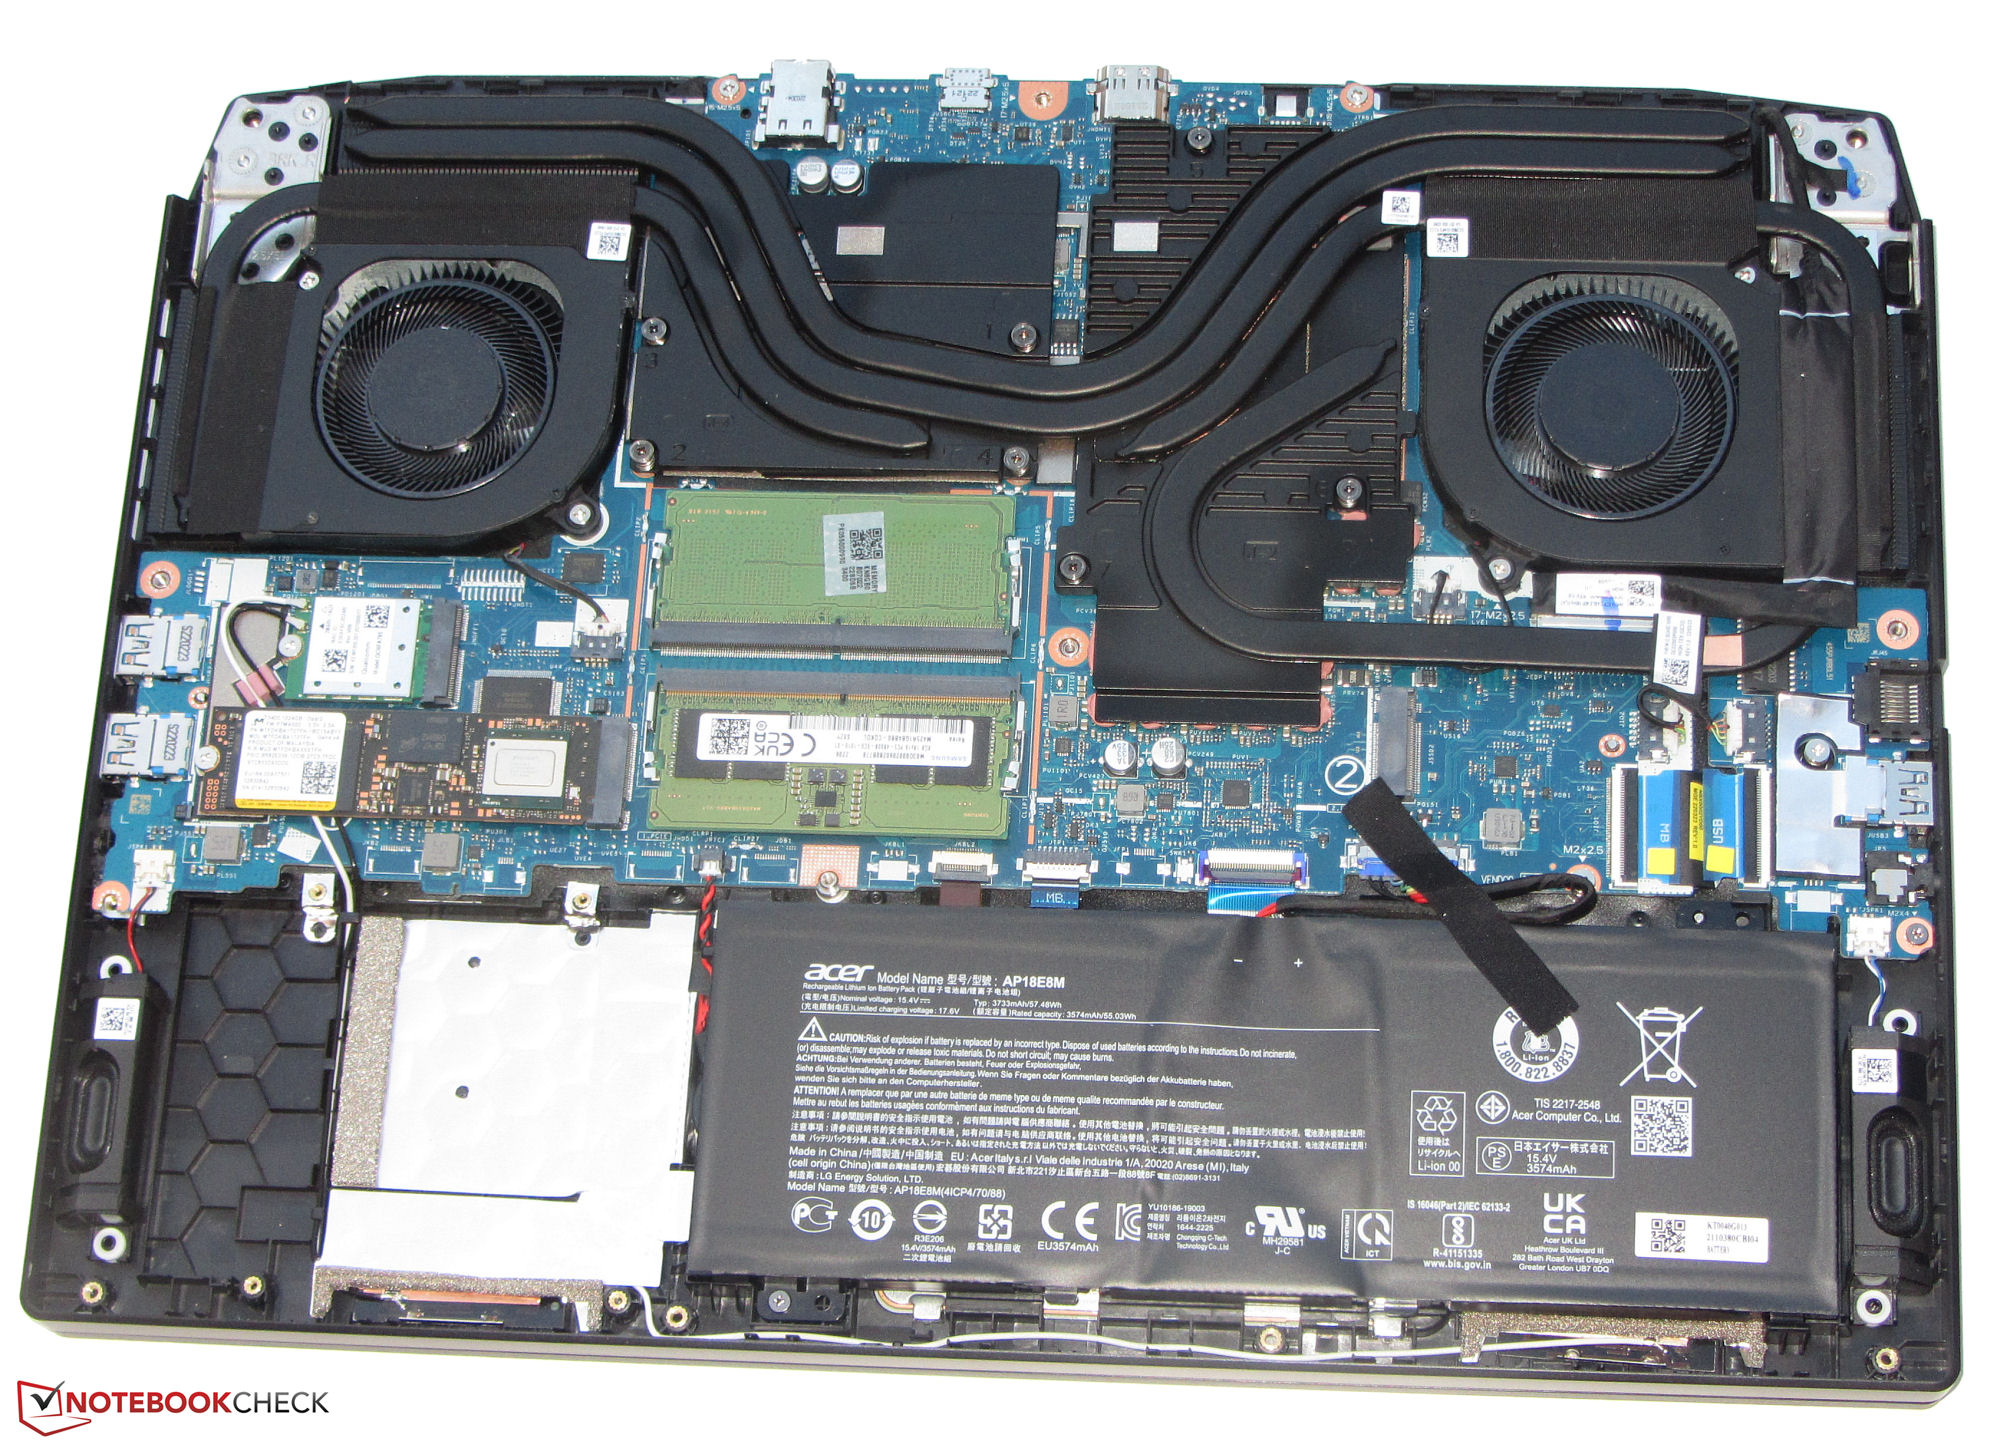
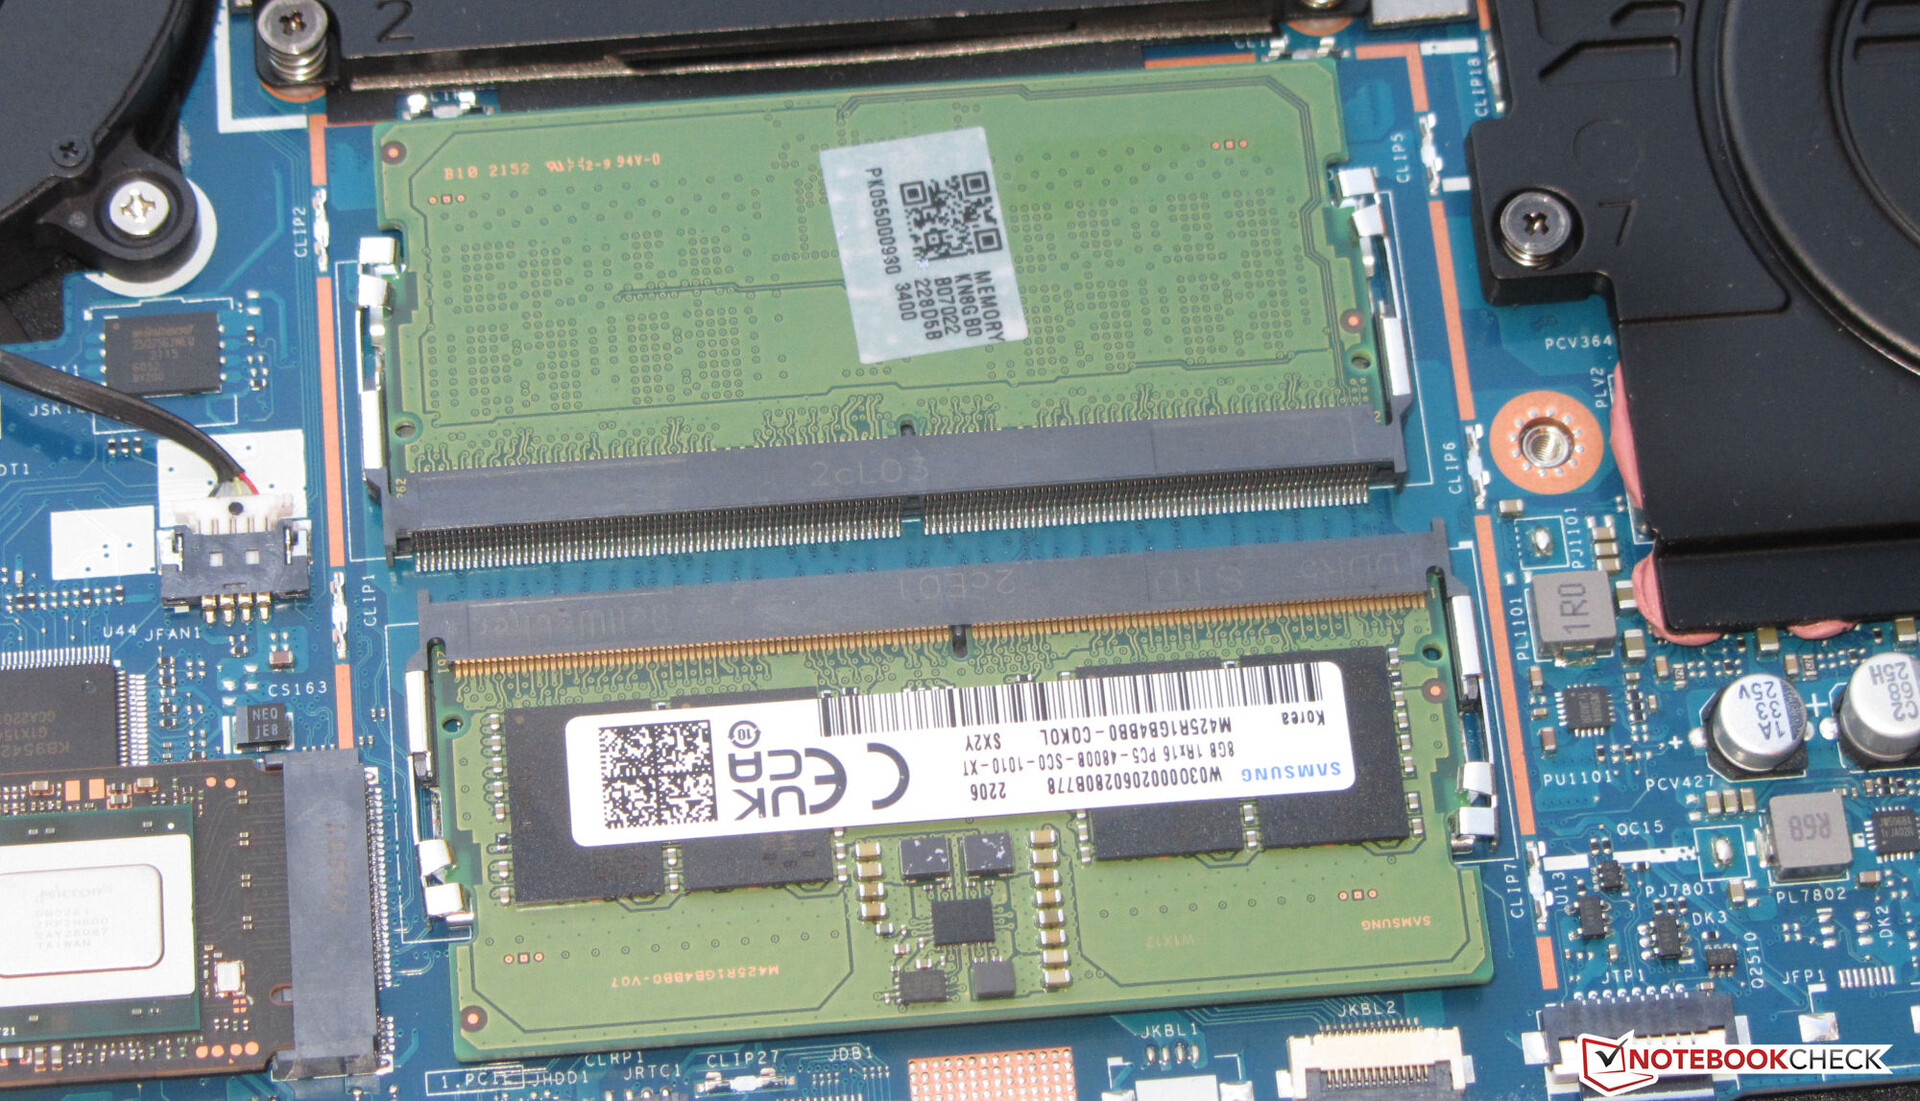
Dysk SSD o pojemności 1 TB (PCIe 4, M.2-2280) od Microna ma bardzo dobre transfery, ale cierpi na spadki wydajności spowodowane throttlingiem termicznym. AN515 posiada jeszcze jedno gniazdo na drugi dysk SSD PCIe 4. Teoretycznie notebook mógłby być wyposażony także w 2,5-calową pamięć masową, ale urządzenie nie posiada niezbędnego gniazda SATA ani odpowiedniego caddy na dysk.

| Drive Performance rating - Percent | |
| Schenker XMG Fusion 15 (Mid 22) | |
| Acer Nitro 5 AN515-58-72QR | |
| Średnia w klasie Gaming | |
| Acer Nitro 5 AN515-46-R1A1 | |
| MSI Katana GF66 12UGS | |
| Przeciętny Micron 3400 1TB MTFDKBA1T0TFH | |
| Asus TUF Dash F15 FX517ZR | |
* ... im mniej tym lepiej
Disk Throttling: DiskSpd Read Loop, Queue Depth 8
Grafika
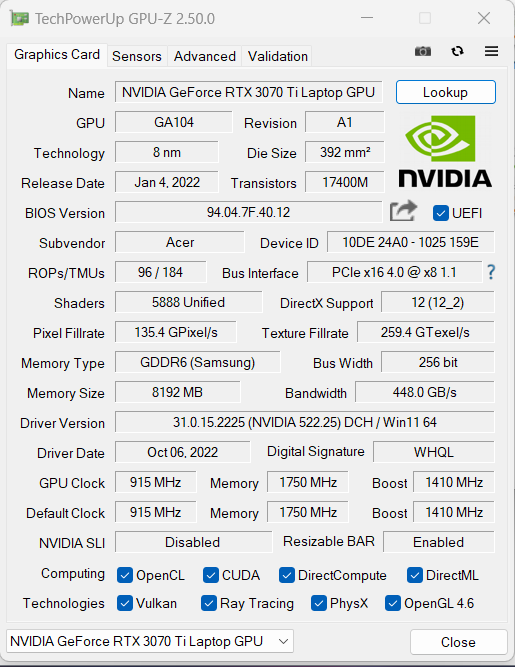
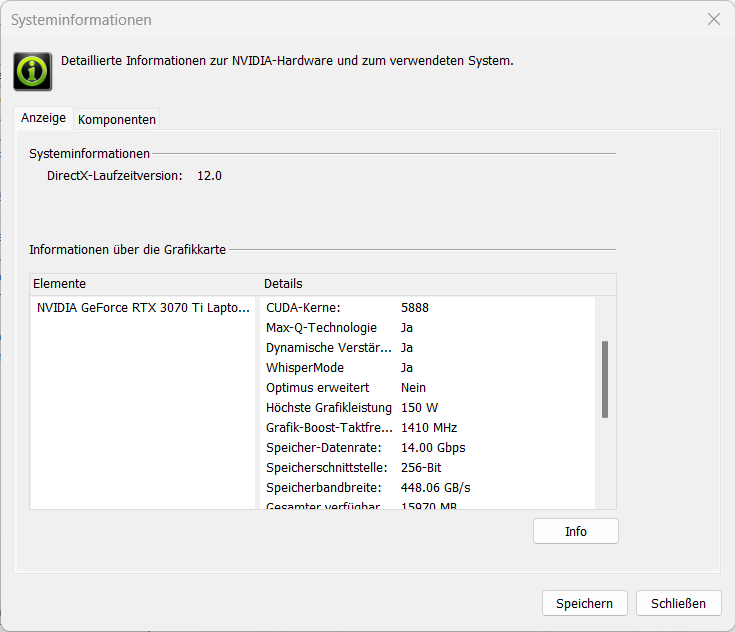
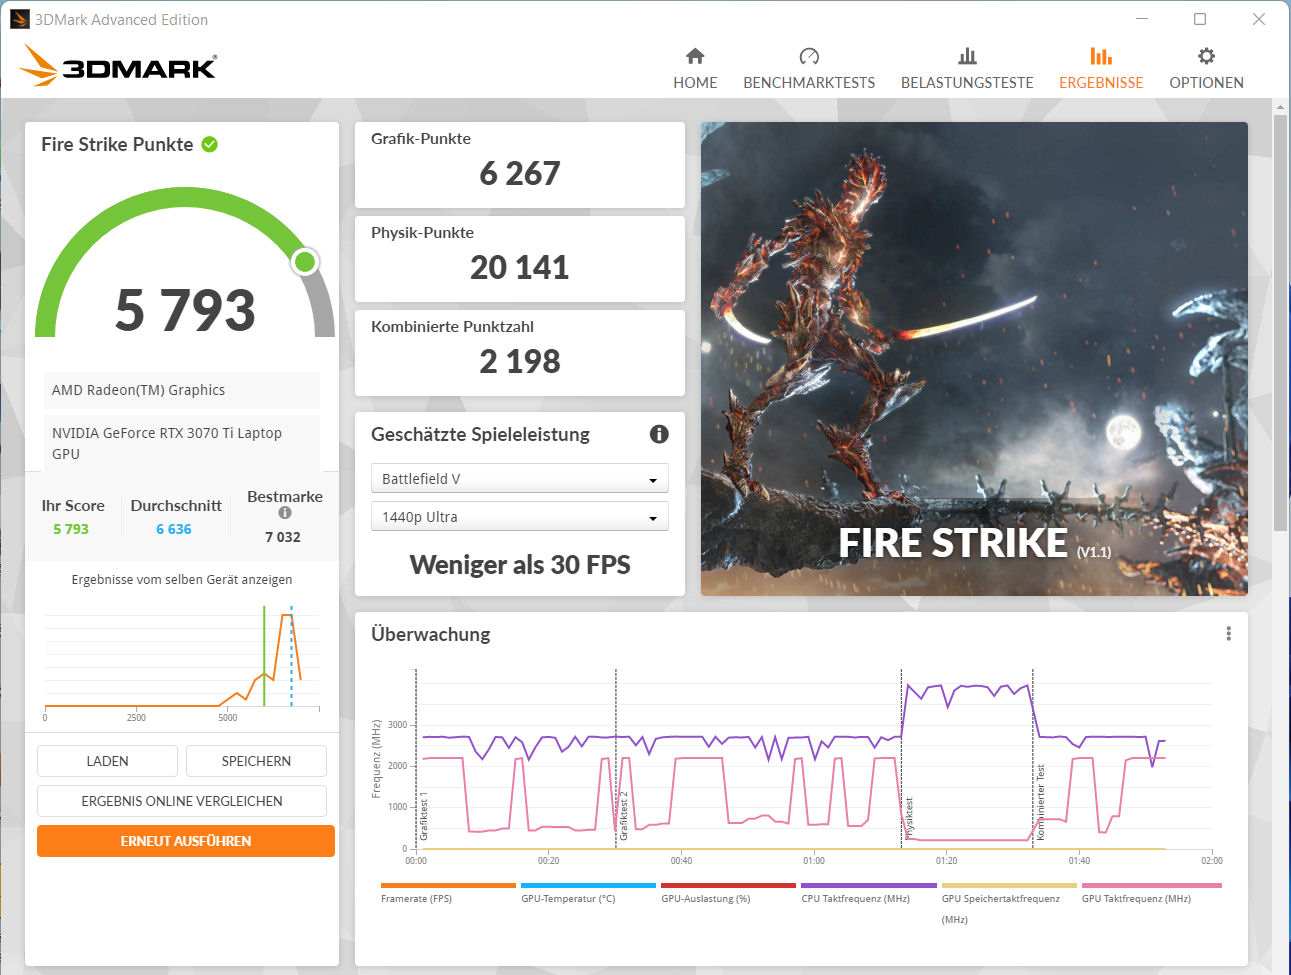
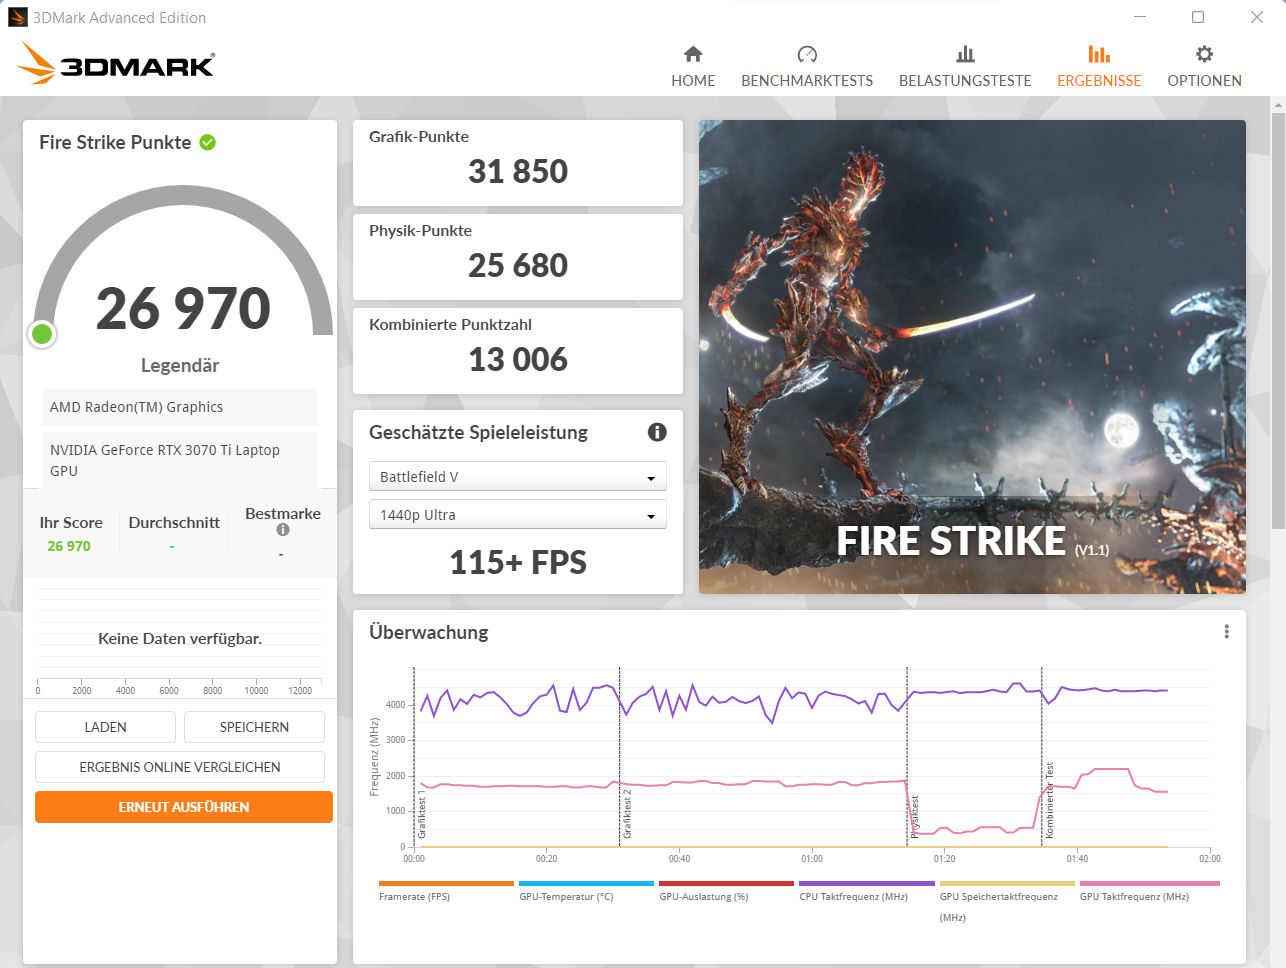
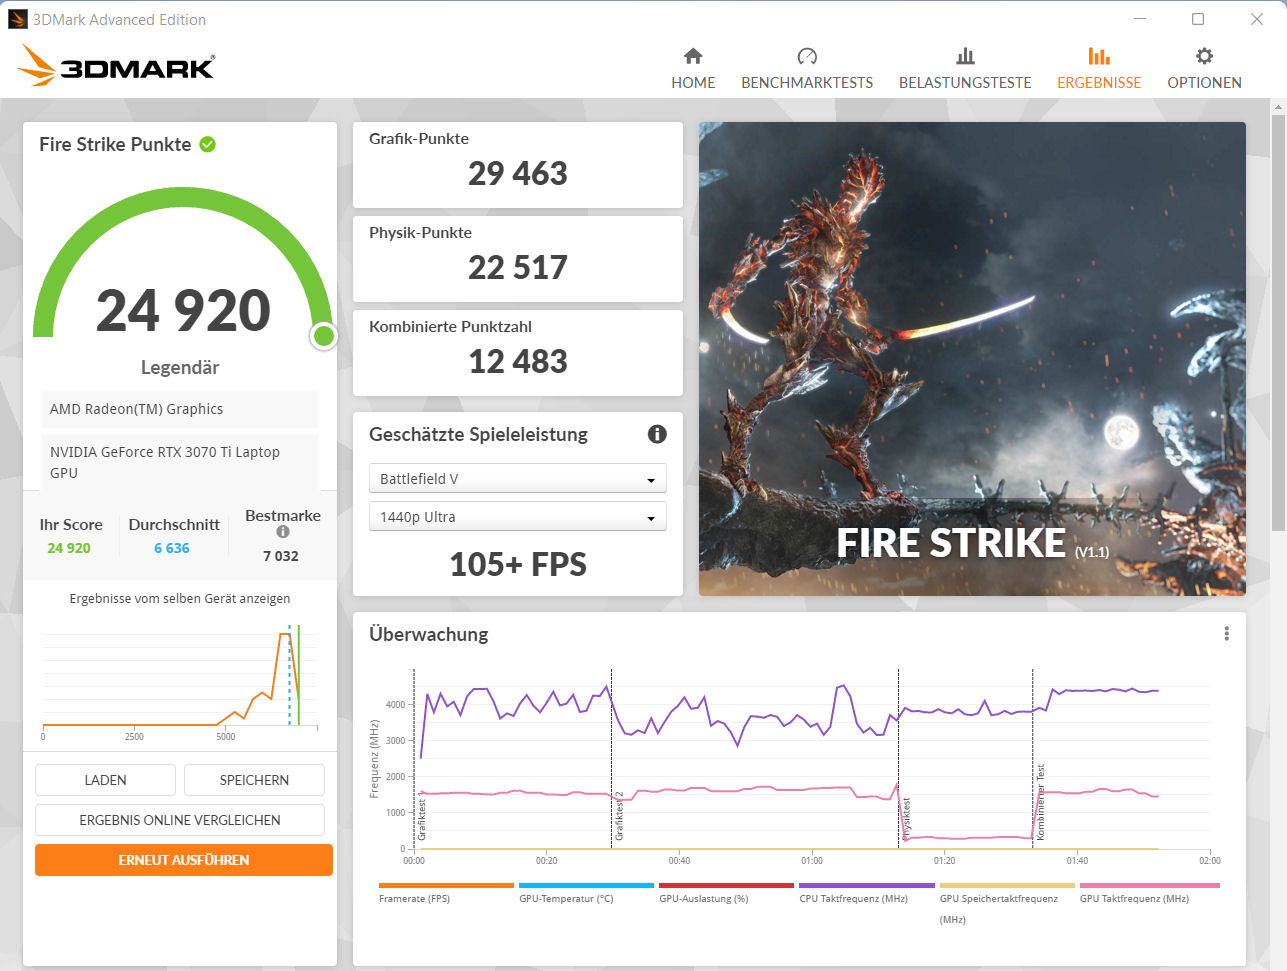
Acer przyznał modelowi GeForce RTX 3070 Ti (VRAM:8 192 MB GDDR6) maksymalne TGP w wysokości 150 W (125 W + 25 W Dynamic Boost). Wyniki 3DMark są powyżej średniej zmierzonej do tej pory dla kart graficznych RTX 3070 Ti. Różnice między profilami wydajności są minimalne (Zobacz zrzuty ekranu Fire Strike ). Urządzenie robi użytek z Dynamic Boost, co widać w naszym teście Witcher 3.
Wydajność graficzną można nieco poprawić, ustawiając bezpośrednie wyjście obrazu z GPU GeForce. Przełącznika tego można dokonać w BIOS-ie lub poprzez oprogramowanie NitroSense (należy kliknąć symbol ustawień). Acer stosuje MUX Switch, a urządzenie nie obsługuje Advanced Optimus.

| 3DMark Performance rating - Percent | |
| Średnia w klasie Gaming | |
| Acer Nitro 5 AN515-46-R1A1 | |
| Acer Nitro 5 AN515-46-R1A1 | |
| Przeciętny NVIDIA GeForce RTX 3070 Ti Laptop GPU | |
| Acer Nitro 5 AN515-58-72QR | |
| MSI Katana GF66 12UGS | |
| Schenker XMG Fusion 15 (Mid 22) | |
| Asus TUF Dash F15 FX517ZR | |
| 3DMark 11 - 1280x720 Performance GPU | |
| Średnia w klasie Gaming (21841 - 80022, n=106, ostatnie 2 lata) | |
| Acer Nitro 5 AN515-46-R1A1 (dGPU) | |
| Acer Nitro 5 AN515-46-R1A1 | |
| Acer Nitro 5 AN515-58-72QR | |
| Przeciętny NVIDIA GeForce RTX 3070 Ti Laptop GPU (13799 - 42569, n=36) | |
| MSI Katana GF66 12UGS | |
| Schenker XMG Fusion 15 (Mid 22) | |
| Asus TUF Dash F15 FX517ZR | |
| 3DMark | |
| 1920x1080 Fire Strike Graphics | |
| Średnia w klasie Gaming (12242 - 62849, n=118, ostatnie 2 lata) | |
| Acer Nitro 5 AN515-46-R1A1 (dGPU) | |
| Acer Nitro 5 AN515-46-R1A1 | |
| Przeciętny NVIDIA GeForce RTX 3070 Ti Laptop GPU (22612 - 32550, n=37) | |
| Acer Nitro 5 AN515-58-72QR | |
| MSI Katana GF66 12UGS | |
| Schenker XMG Fusion 15 (Mid 22) | |
| Asus TUF Dash F15 FX517ZR | |
| 2560x1440 Time Spy Graphics | |
| Średnia w klasie Gaming (5012 - 26212, n=117, ostatnie 2 lata) | |
| Acer Nitro 5 AN515-46-R1A1 (dGPU) | |
| Acer Nitro 5 AN515-46-R1A1 | |
| Przeciętny NVIDIA GeForce RTX 3070 Ti Laptop GPU (8142 - 12324, n=37) | |
| Acer Nitro 5 AN515-58-72QR | |
| MSI Katana GF66 12UGS | |
| Schenker XMG Fusion 15 (Mid 22) | |
| Asus TUF Dash F15 FX517ZR | |
| 2560x1440 Port Royal Graphics | |
| Średnia w klasie Gaming (4395 - 17286, n=70, ostatnie 2 lata) | |
| Acer Nitro 5 AN515-46-R1A1 (dGPU) | |
| Acer Nitro 5 AN515-46-R1A1 | |
| Przeciętny NVIDIA GeForce RTX 3070 Ti Laptop GPU (5091 - 7510, n=23) | |
| Acer Nitro 5 AN515-58-72QR | |
| MSI Katana GF66 12UGS | |
| Schenker XMG Fusion 15 (Mid 22) | |
| Asus TUF Dash F15 FX517ZR | |
| 3DMark 06 Standard Score | 43453 pkt. | |
| 3DMark 11 Performance | 28137 pkt. | |
| 3DMark Cloud Gate Standard Score | 56030 pkt. | |
| 3DMark Fire Strike Score | 25960 pkt. | |
| 3DMark Time Spy Score | 11042 pkt. | |
Pomoc | ||
| Blender | |
| v3.3 Classroom OPTIX/RTX | |
| Asus TUF Dash F15 FX517ZR | |
| Acer Nitro 5 AN515-46-R1A1 (3.3.0) | |
| Acer Nitro 5 AN515-46-R1A1 (3.3.0, dGPU) | |
| Średnia w klasie Gaming (9 - 32, n=109, ostatnie 2 lata) | |
| v3.3 Classroom CUDA | |
| Asus TUF Dash F15 FX517ZR | |
| Acer Nitro 5 AN515-46-R1A1 (3.3.0) | |
| Acer Nitro 5 AN515-46-R1A1 (3.3.0, dGPU) | |
| Średnia w klasie Gaming (15 - 228, n=109, ostatnie 2 lata) | |
| v3.3 Classroom CPU | |
| Schenker XMG Fusion 15 (Mid 22) | |
| Asus TUF Dash F15 FX517ZR | |
| Acer Nitro 5 AN515-46-R1A1 (3.3.0) | |
| Acer Nitro 5 AN515-46-R1A1 (3.3.0, dGPU) | |
| Średnia w klasie Gaming (122 - 565, n=105, ostatnie 2 lata) | |
* ... im mniej tym lepiej
Wydajność w grach
Sprzęt wspiera rozgrywkę w rozdzielczości FHD na maksymalnych ustawieniach. Częstotliwość odświeżania w testowanych tytułach jest często powyżej średniej dla RTX 3070 Ti. Wyprowadzenie obrazu przez GPU GeForce zwiększa liczbę klatek na sekundę. Test Witcher 3 potwierdza, że częstotliwości odświeżania pozostają stabilne przez długi czas.
| The Witcher 3 - 1920x1080 Ultra Graphics & Postprocessing (HBAO+) | |
| Średnia w klasie Gaming (95 - 240, n=8, ostatnie 2 lata) | |
| Acer Nitro 5 AN515-46-R1A1 (dGPU) | |
| Acer Nitro 5 AN515-46-R1A1 | |
| Przeciętny NVIDIA GeForce RTX 3070 Ti Laptop GPU (76.8 - 124.1, n=39) | |
| Acer Nitro 5 AN515-58-72QR | |
| MSI Katana GF66 12UGS | |
| Schenker XMG Fusion 15 (Mid 22) | |
| Asus TUF Dash F15 FX517ZR | |
| Dota 2 Reborn - 1920x1080 ultra (3/3) best looking | |
| Średnia w klasie Gaming (84.8 - 248, n=110, ostatnie 2 lata) | |
| MSI Katana GF66 12UGS | |
| Przeciętny NVIDIA GeForce RTX 3070 Ti Laptop GPU (68.7 - 160.5, n=38) | |
| Acer Nitro 5 AN515-58-72QR | |
| Schenker XMG Fusion 15 (Mid 22) | |
| Acer Nitro 5 AN515-46-R1A1 (dGPU) | |
| Asus TUF Dash F15 FX517ZR | |
| Acer Nitro 5 AN515-46-R1A1 | |
| X-Plane 11.11 - 1920x1080 high (fps_test=3) | |
| MSI Katana GF66 12UGS | |
| Asus TUF Dash F15 FX517ZR | |
| Średnia w klasie Gaming (52.1 - 143.5, n=113, ostatnie 2 lata) | |
| Przeciętny NVIDIA GeForce RTX 3070 Ti Laptop GPU (51.6 - 116.9, n=37) | |
| Acer Nitro 5 AN515-58-72QR | |
| Schenker XMG Fusion 15 (Mid 22) | |
| Acer Nitro 5 AN515-46-R1A1 (dGPU) | |
| Acer Nitro 5 AN515-46-R1A1 | |
| Final Fantasy XV Benchmark - 1920x1080 High Quality | |
| Średnia w klasie Gaming (41 - 215, n=101, ostatnie 2 lata) | |
| Acer Nitro 5 AN515-46-R1A1 (1.3, dGPU) | |
| Acer Nitro 5 AN515-46-R1A1 (1.3) | |
| Przeciętny NVIDIA GeForce RTX 3070 Ti Laptop GPU (49.5 - 122.4, n=35) | |
| Schenker XMG Fusion 15 (Mid 22) (1.3) | |
| MSI Katana GF66 12UGS (1.3) | |
| Acer Nitro 5 AN515-58-72QR (1.3) | |
| Asus TUF Dash F15 FX517ZR (1.3) | |
| GTA V - 1920x1080 Highest AA:4xMSAA + FX AF:16x | |
| Średnia w klasie Gaming (48.3 - 186.9, n=100, ostatnie 2 lata) | |
| Przeciętny NVIDIA GeForce RTX 3070 Ti Laptop GPU (44 - 123.9, n=36) | |
| Asus TUF Dash F15 FX517ZR | |
| MSI Katana GF66 12UGS | |
| Schenker XMG Fusion 15 (Mid 22) | |
| Acer Nitro 5 AN515-58-72QR | |
| Acer Nitro 5 AN515-46-R1A1 | |
| Acer Nitro 5 AN515-46-R1A1 (dGPU) | |
| Strange Brigade - 1920x1080 ultra AA:ultra AF:16 | |
| Średnia w klasie Gaming (76.3 - 456, n=91, ostatnie 2 lata) | |
| Acer Nitro 5 AN515-46-R1A1 (1.47.22.14 D3D12, dGPU) | |
| Przeciętny NVIDIA GeForce RTX 3070 Ti Laptop GPU (109 - 221, n=37) | |
| Acer Nitro 5 AN515-58-72QR (1.47.22.14 D3D12) | |
| Acer Nitro 5 AN515-46-R1A1 (1.47.22.14 D3D12) | |
| MSI Katana GF66 12UGS (1.47.22.14 D3D12) | |
| Schenker XMG Fusion 15 (Mid 22) (1.47.22.14 D3D12) | |
| Asus TUF Dash F15 FX517ZR (1.47.22.14 D3D12) | |
| F1 22 - 1920x1080 Ultra High Preset AA:T AF:16x | |
| Acer Nitro 5 AN515-46-R1A1 (923650, dGPU) | |
| Średnia w klasie Gaming (40.1 - 121.2, n=5, ostatnie 2 lata) | |
| Acer Nitro 5 AN515-46-R1A1 (923662) | |
| Przeciętny NVIDIA GeForce RTX 3070 Ti Laptop GPU (58.1 - 80, n=8) | |
| Far Cry 5 - 1920x1080 Ultra Preset AA:T | |
| Przeciętny NVIDIA GeForce RTX 3070 Ti Laptop GPU (91 - 138, n=25) | |
| Średnia w klasie Gaming (70 - 151, n=10, ostatnie 2 lata) | |
| MSI Katana GF66 12UGS | |
| Acer Nitro 5 AN515-46-R1A1 (dGPU) | |
| Schenker XMG Fusion 15 (Mid 22) | |
| Acer Nitro 5 AN515-46-R1A1 | |
| Asus TUF Dash F15 FX517ZR | |
| Acer Nitro 5 AN515-58-72QR | |
| Hitman 3 - 1920x1080 Maximum Settings AF:16x | |
| Acer Nitro 5 AN515-46-R1A1 | |
| Przeciętny NVIDIA GeForce RTX 3070 Ti Laptop GPU (138 - 157.7, n=3) | |
| God of War - 1920x1080 Ultra Preset | |
| Średnia w klasie Gaming (n=1ostatnie 2 lata) | |
| Acer Nitro 5 AN515-46-R1A1 | |
| Przeciętny NVIDIA GeForce RTX 3070 Ti Laptop GPU (55.1 - 64.3, n=5) | |
| Tiny Tina's Wonderlands - 1920x1080 Badass Preset (DX12) | |
| Średnia w klasie Gaming (55 - 159.4, n=5, ostatnie 2 lata) | |
| Acer Nitro 5 AN515-46-R1A1 | |
| Przeciętny NVIDIA GeForce RTX 3070 Ti Laptop GPU (89.8 - 93.7, n=4) | |
| Asus TUF Dash F15 FX517ZR | |
| Vampire Bloodhunt - 1920x1080 Ultra Preset | |
| Przeciętny NVIDIA GeForce RTX 3070 Ti Laptop GPU (168.6 - 189.9, n=2) | |
| Acer Nitro 5 AN515-46-R1A1 | |
| The Quarry - 1920x1080 Ultra Preset | |
| Acer Nitro 5 AN515-46-R1A1 | |
| Przeciętny NVIDIA GeForce RTX 3070 Ti Laptop GPU (80 - 81.5, n=2) | |
Witcher 3 FPS diagram
| low | med. | high | ultra | |
|---|---|---|---|---|
| GTA V (2015) | 174.2 | 167.3 | 149.5 | 92.5 |
| The Witcher 3 (2015) | 284 | 237 | 179.4 | 108.5 |
| Dota 2 Reborn (2015) | 130.9 | 120 | 112.1 | 108.5 |
| Final Fantasy XV Benchmark (2018) | 171.8 | 139.9 | 108.6 | |
| X-Plane 11.11 (2018) | 100.3 | 89.3 | 72.3 | |
| Far Cry 5 (2018) | 134 | 116 | 112 | 106 |
| Strange Brigade (2018) | 289 | 212 | 190.3 | 177 |
| Hitman 3 (2021) | 207.9 | 169.1 | 162.1 | 157.7 |
| God of War (2022) | 117.3 | 104.8 | 88.7 | 64.3 |
| Tiny Tina's Wonderlands (2022) | 183.3 | 159.8 | 118.3 | 93.7 |
| Vampire Bloodhunt (2022) | 197.6 | 185.1 | 172.7 | 168.6 |
| F1 22 (2022) | 207 | 205 | 192.3 | 73.2 |
| The Quarry (2022) | 149.6 | 120.7 | 101.5 | 81.5 |
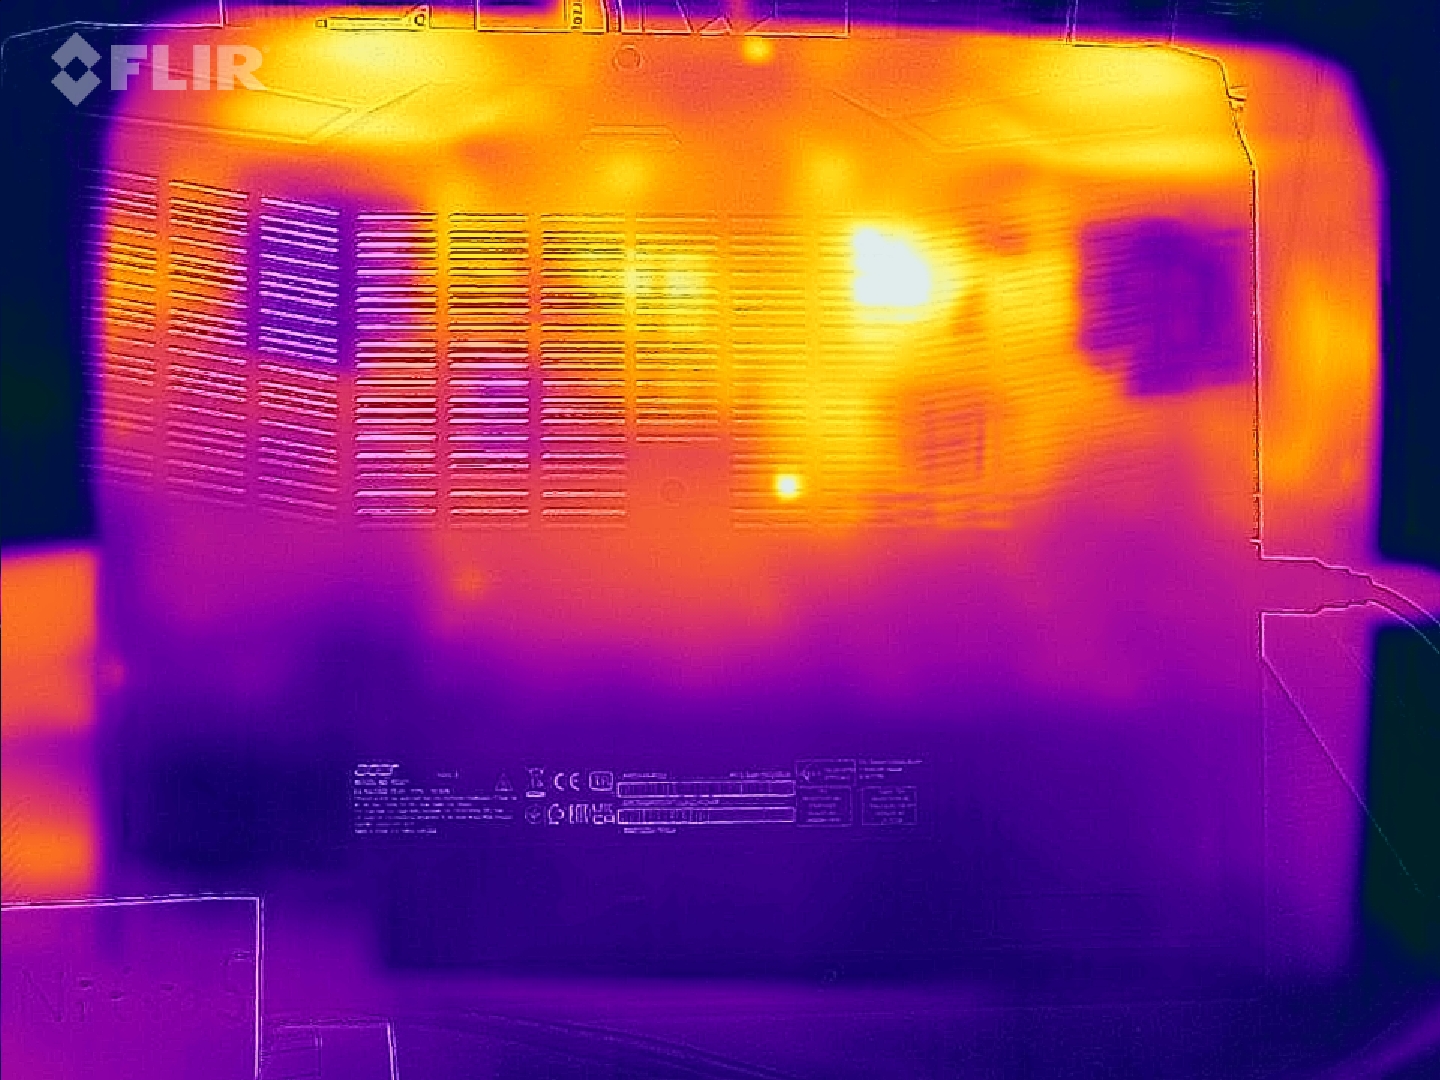
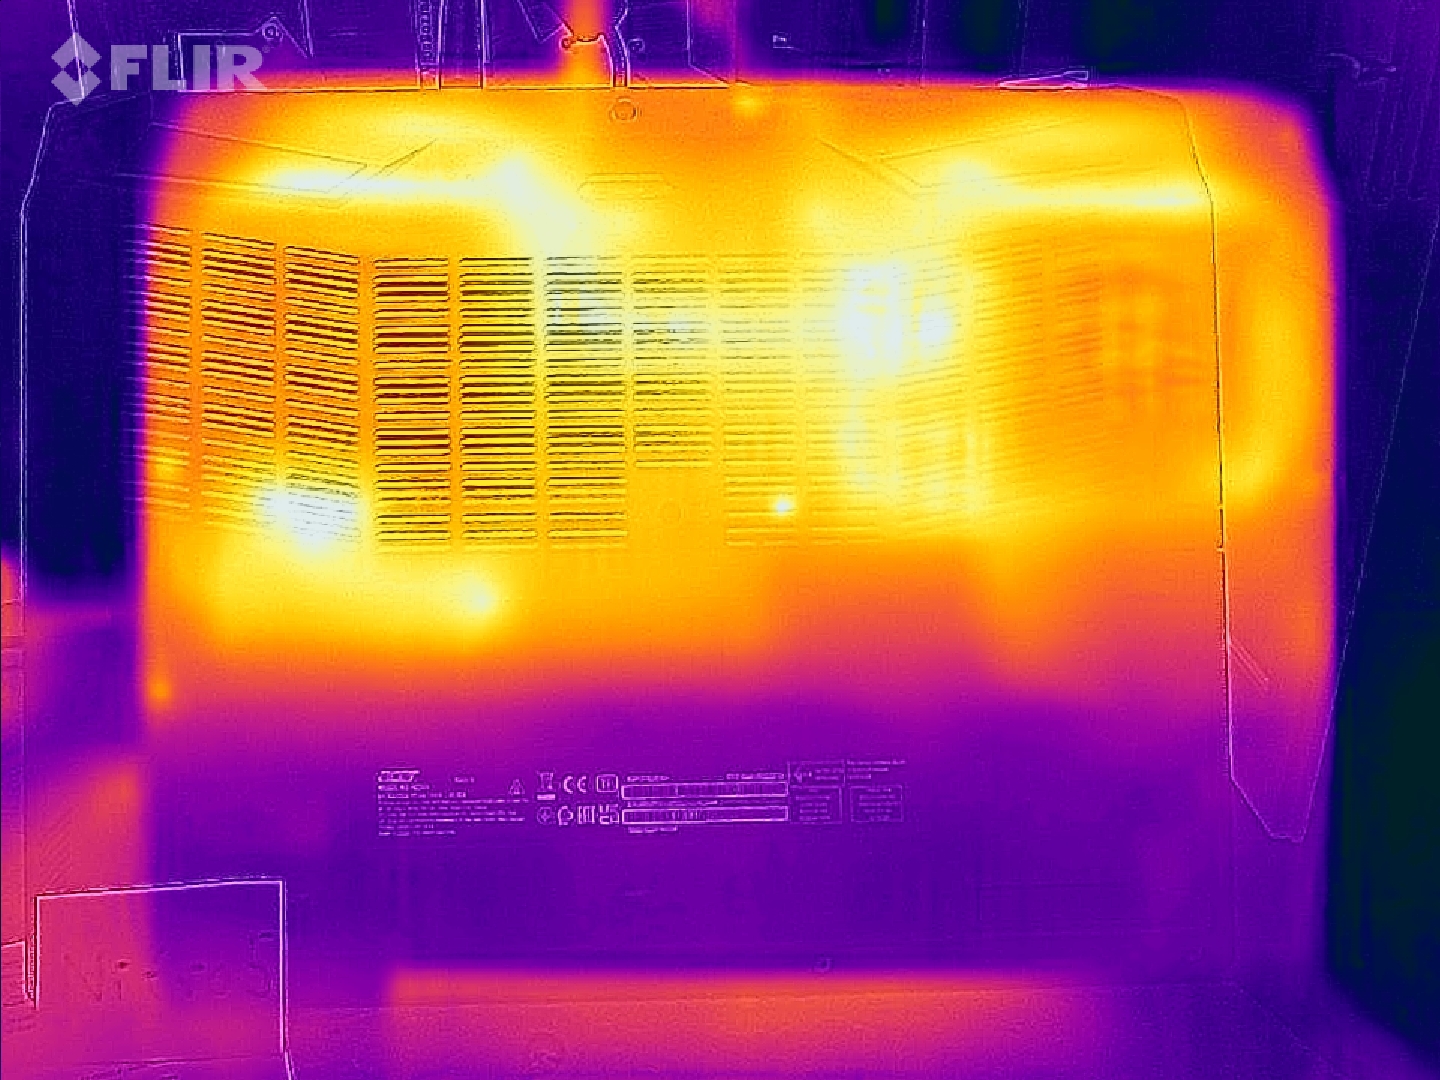
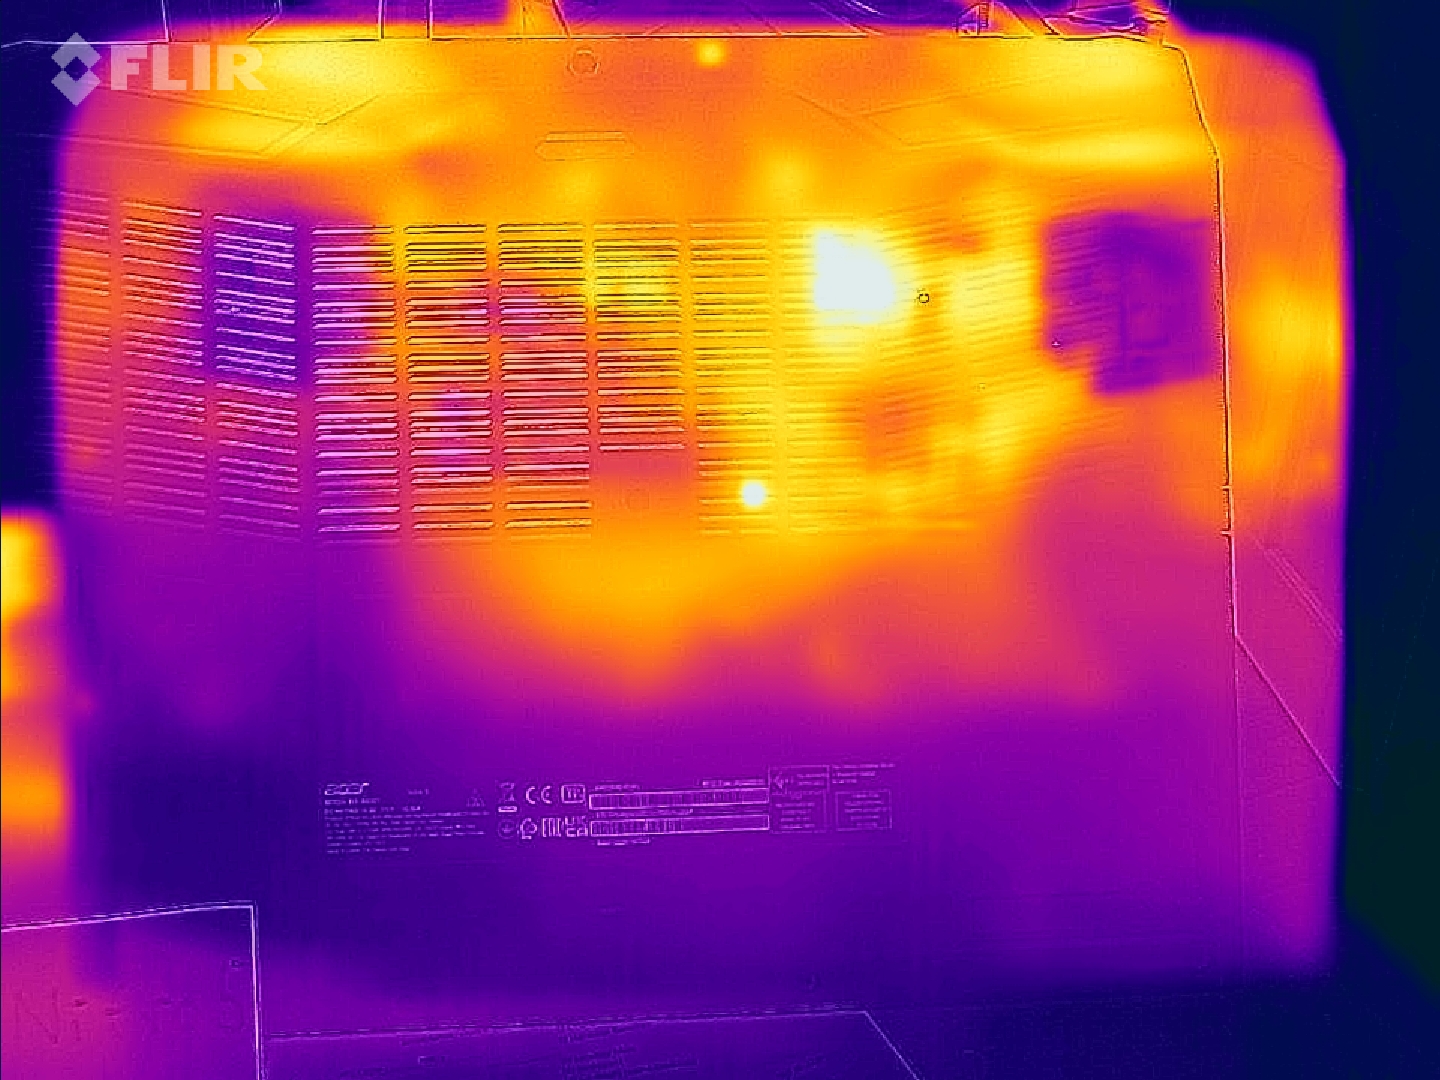
Emisja - AN515 nagrzewa się tylko umiarkowanie
Emisja hałasu
Podczas codziennego użytkowania (biuro, internet) i na biegu jałowym oba wentylatory pozostają wystarczająco ciche i potrafią nawet sporadycznie przestać pracować. Mimo to są one nieco nieprzewidywalne i poziom hałasu może wzrosnąć do 44,3 dB(A). Pod obciążeniem zmierzyliśmy maksymalnie 53,6 dB(A), co jest dość głośnym wynikiem.
Prędkość obrotową wentylatora można zwolnić za pomocą oprogramowania NitroSense urządzenia, ale nie można regulować krzywej wentylatora. Rozwój hałasu jest bardzo podobny w profilach "cichym" i "standardowym".
Hałas
| luz |
| 25 / 28.6 / 44.3 dB |
| obciążenie |
| 47.6 / 53.6 dB |
 | ||
30 dB cichy 40 dB(A) słyszalny 50 dB(A) irytujący |
||
min: | ||
| Acer Nitro 5 AN515-46-R1A1 GeForce RTX 3070 Ti Laptop GPU, R7 6800H, Micron 3400 1TB MTFDKBA1T0TFH | MSI Katana GF66 12UGS GeForce RTX 3070 Ti Laptop GPU, i7-12700H, Micron 2450 1TB MTFDKBA1T0TFK | Schenker XMG Fusion 15 (Mid 22) GeForce RTX 3070 Laptop GPU, i7-11800H, Samsung SSD 980 Pro 1TB MZ-V8P1T0BW | Asus TUF Dash F15 FX517ZR GeForce RTX 3070 Laptop GPU, i7-12650H, Samsung PM991a MZVLQ1T0HBLB | Acer Nitro 5 AN515-58-72QR GeForce RTX 3070 Ti Laptop GPU, i7-12700H, Samsung PM9A1 MZVL21T0HCLR | |
|---|---|---|---|---|---|
| Noise | 7% | 7% | 2% | 3% | |
| wyłączone / środowisko * (dB) | 25 | 26 -4% | 26 -4% | 26 -4% | 26 -4% |
| Idle Minimum * (dB) | 25 | 27 -8% | 26 -4% | 26 -4% | 26 -4% |
| Idle Average * (dB) | 28.6 | 28 2% | 28 2% | 32 -12% | 29 -1% |
| Idle Maximum * (dB) | 44.3 | 31 30% | 31 30% | 33 26% | 33 26% |
| Load Average * (dB) | 47.6 | 44 8% | 45 5% | 48 -1% | 47 1% |
| Load Maximum * (dB) | 53.6 | 45 16% | 48 10% | 49 9% | 53 1% |
| Witcher 3 ultra * (dB) | 44 | 46 | 47 | 53 |
* ... im mniej tym lepiej
Temperatura
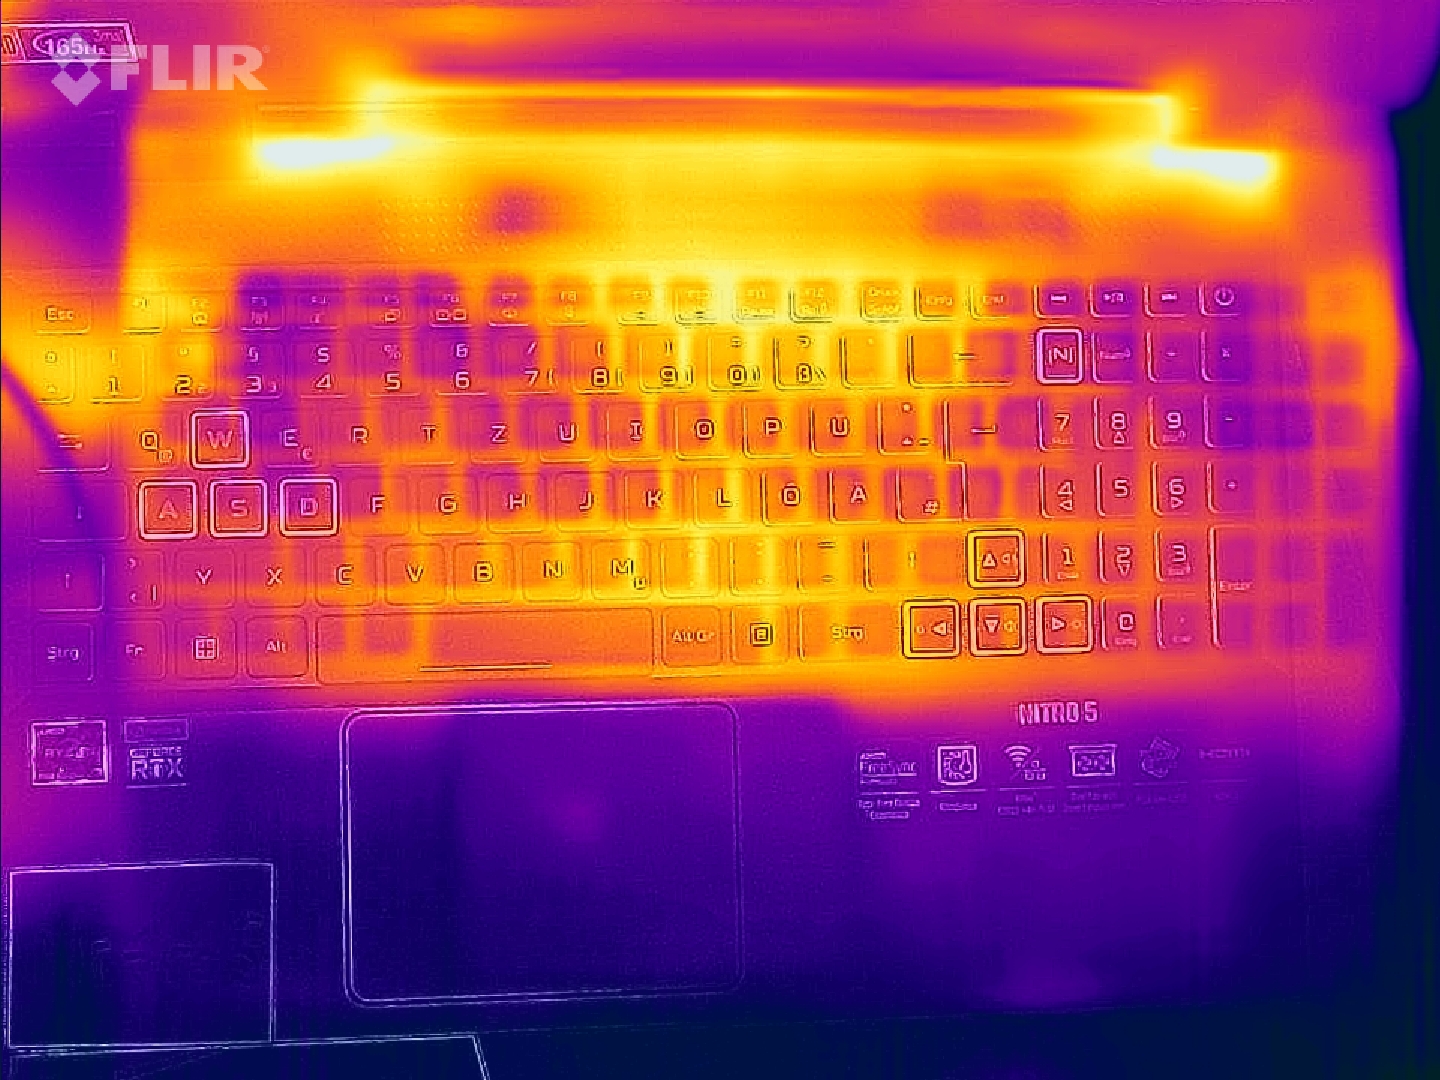
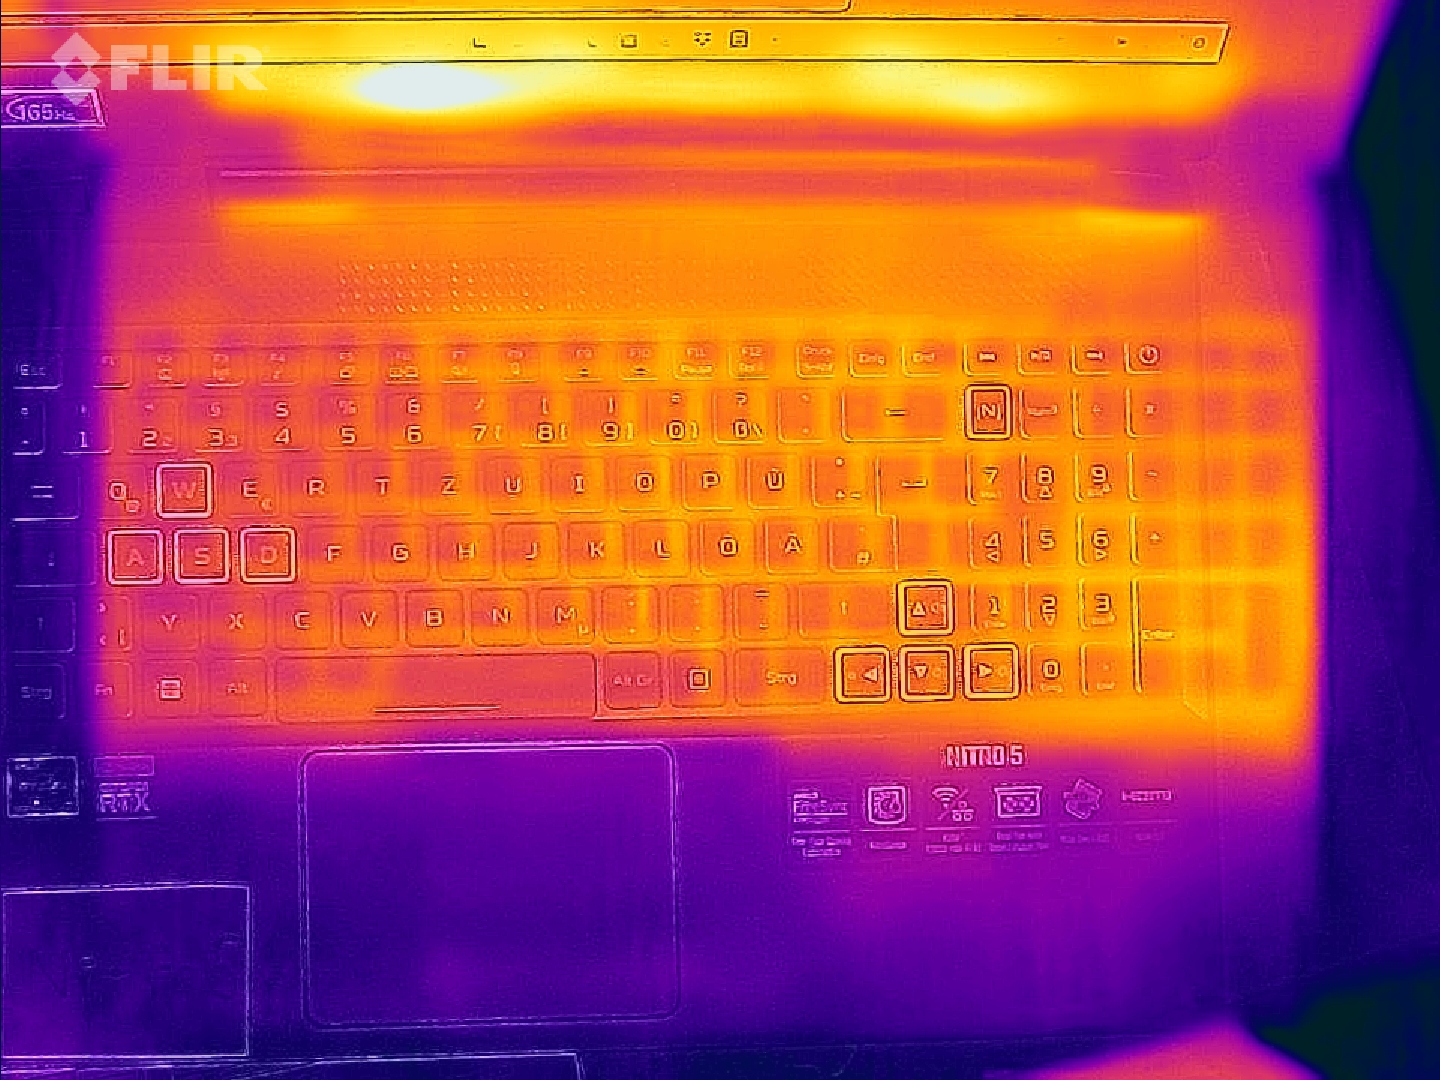
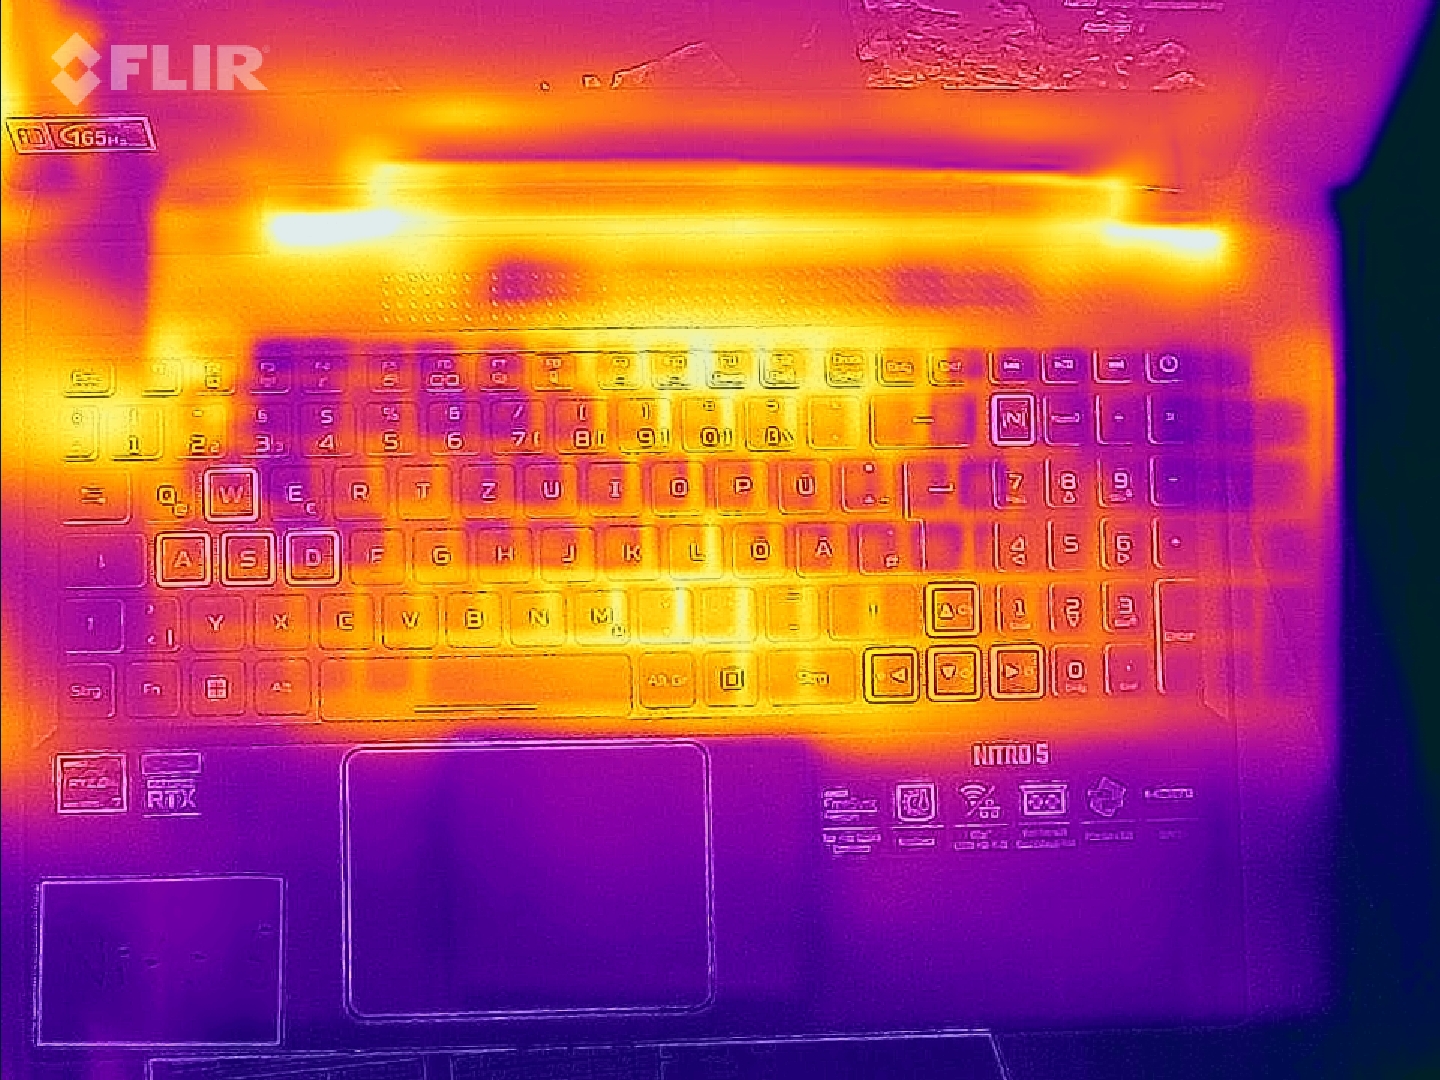
Temperatury powierzchni pozostają akceptowalne podczas codziennego użytkowania (biuro, internet) i tylko umiarkowanie rosną pod obciążeniem (stress test, Witcher 3). Jest to bardzo odmienne od siostrzanego modelu.
(-) Maksymalna temperatura w górnej części wynosi 48.1 °C / 119 F, w porównaniu do średniej 40.4 °C / 105 F , począwszy od 21.2 do 68.8 °C dla klasy Gaming.
(-) Dno nagrzewa się maksymalnie do 49.7 °C / 121 F, w porównaniu do średniej 43.2 °C / 110 F
(+) W stanie bezczynności średnia temperatura górnej części wynosi 26.4 °C / 80 F, w porównaniu ze średnią temperaturą urządzenia wynoszącą 33.9 °C / ### class_avg_f### F.
(+) Podczas gry w Wiedźmina 3 średnia temperatura górnej części wynosi 31.8 °C / 89 F, w porównaniu do średniej temperatury urządzenia wynoszącej 33.9 °C / ## #class_avg_f### F.
(+) Podpórki pod nadgarstki i touchpad są chłodniejsze niż temperatura skóry i maksymalnie 25.2 °C / 77.4 F i dlatego są chłodne w dotyku.
(+) Średnia temperatura obszaru podparcia dłoni w podobnych urządzeniach wynosiła 28.8 °C / 83.8 F (+3.6 °C / 6.4 F).
| Acer Nitro 5 AN515-46-R1A1 AMD Ryzen 7 6800H, NVIDIA GeForce RTX 3070 Ti Laptop GPU | MSI Katana GF66 12UGS Intel Core i7-12700H, NVIDIA GeForce RTX 3070 Ti Laptop GPU | Schenker XMG Fusion 15 (Mid 22) Intel Core i7-11800H, NVIDIA GeForce RTX 3070 Laptop GPU | Asus TUF Dash F15 FX517ZR Intel Core i7-12650H, NVIDIA GeForce RTX 3070 Laptop GPU | Acer Nitro 5 AN515-58-72QR Intel Core i7-12700H, NVIDIA GeForce RTX 3070 Ti Laptop GPU | |
|---|---|---|---|---|---|
| Heat | -25% | -20% | -9% | -5% | |
| Maximum Upper Side * (°C) | 48.1 | 61 -27% | 52 -8% | 52 -8% | 48 -0% |
| Maximum Bottom * (°C) | 49.7 | 55 -11% | 63 -27% | 52 -5% | 51 -3% |
| Idle Upper Side * (°C) | 30 | 43 -43% | 37 -23% | 33 -10% | 34 -13% |
| Idle Bottom * (°C) | 31.7 | 38 -20% | 38 -20% | 36 -14% | 33 -4% |
* ... im mniej tym lepiej
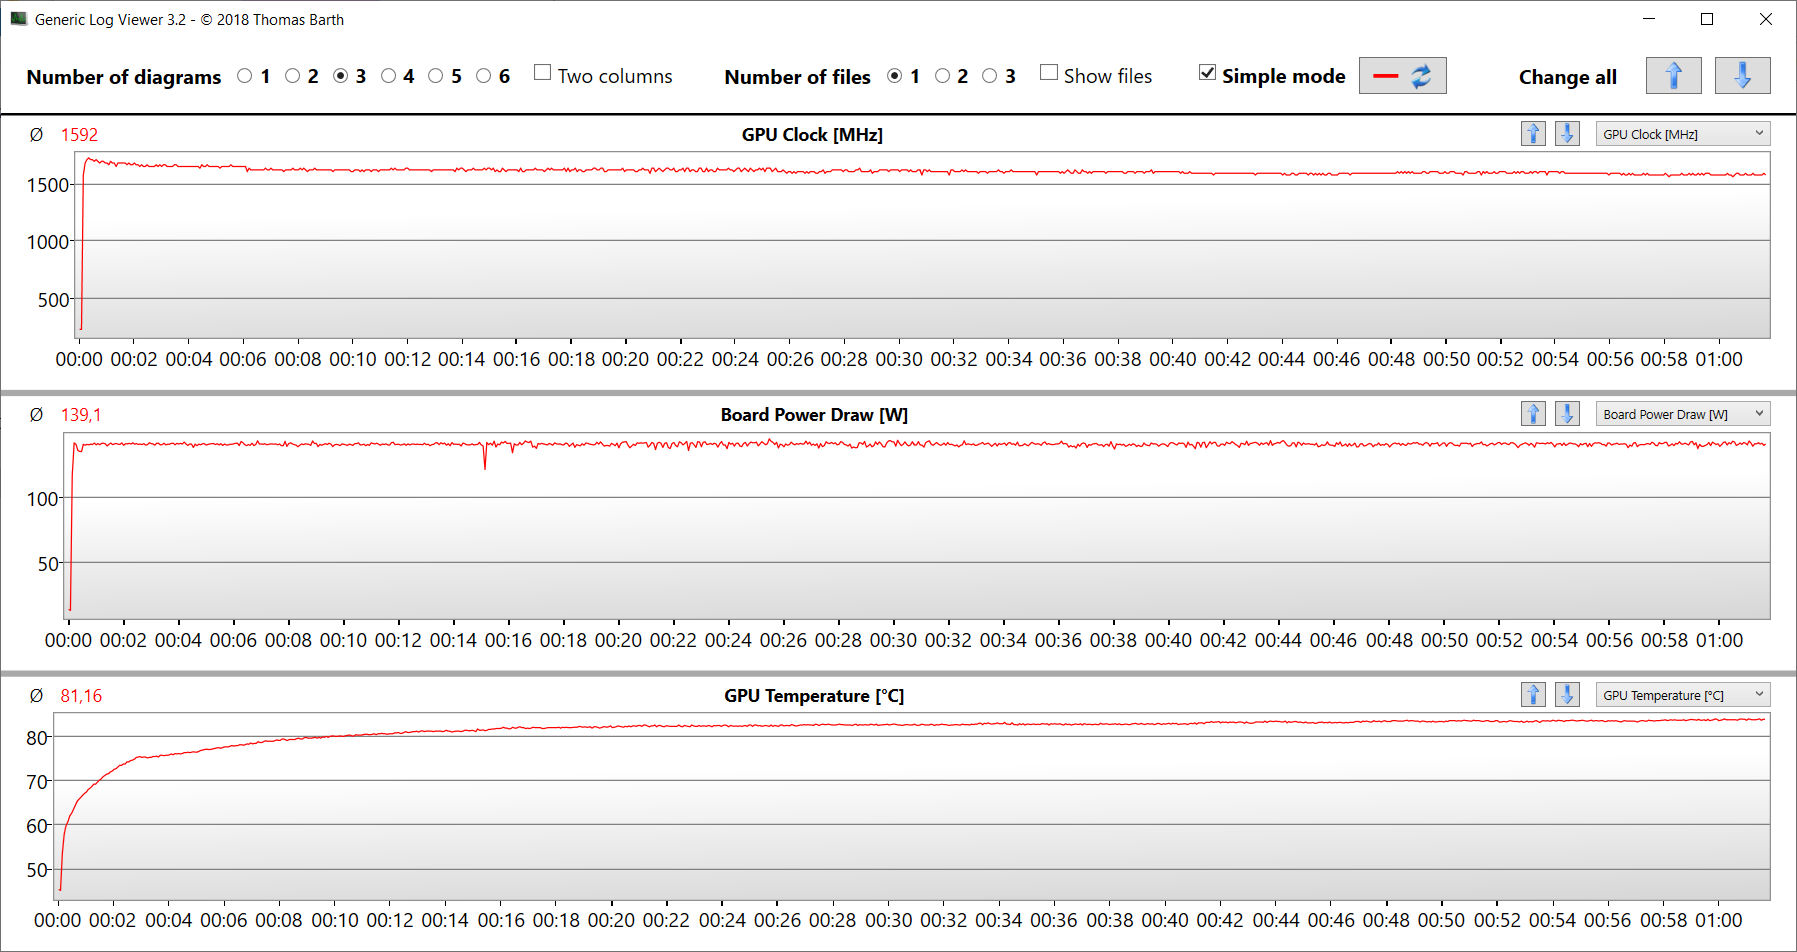
Test na stres
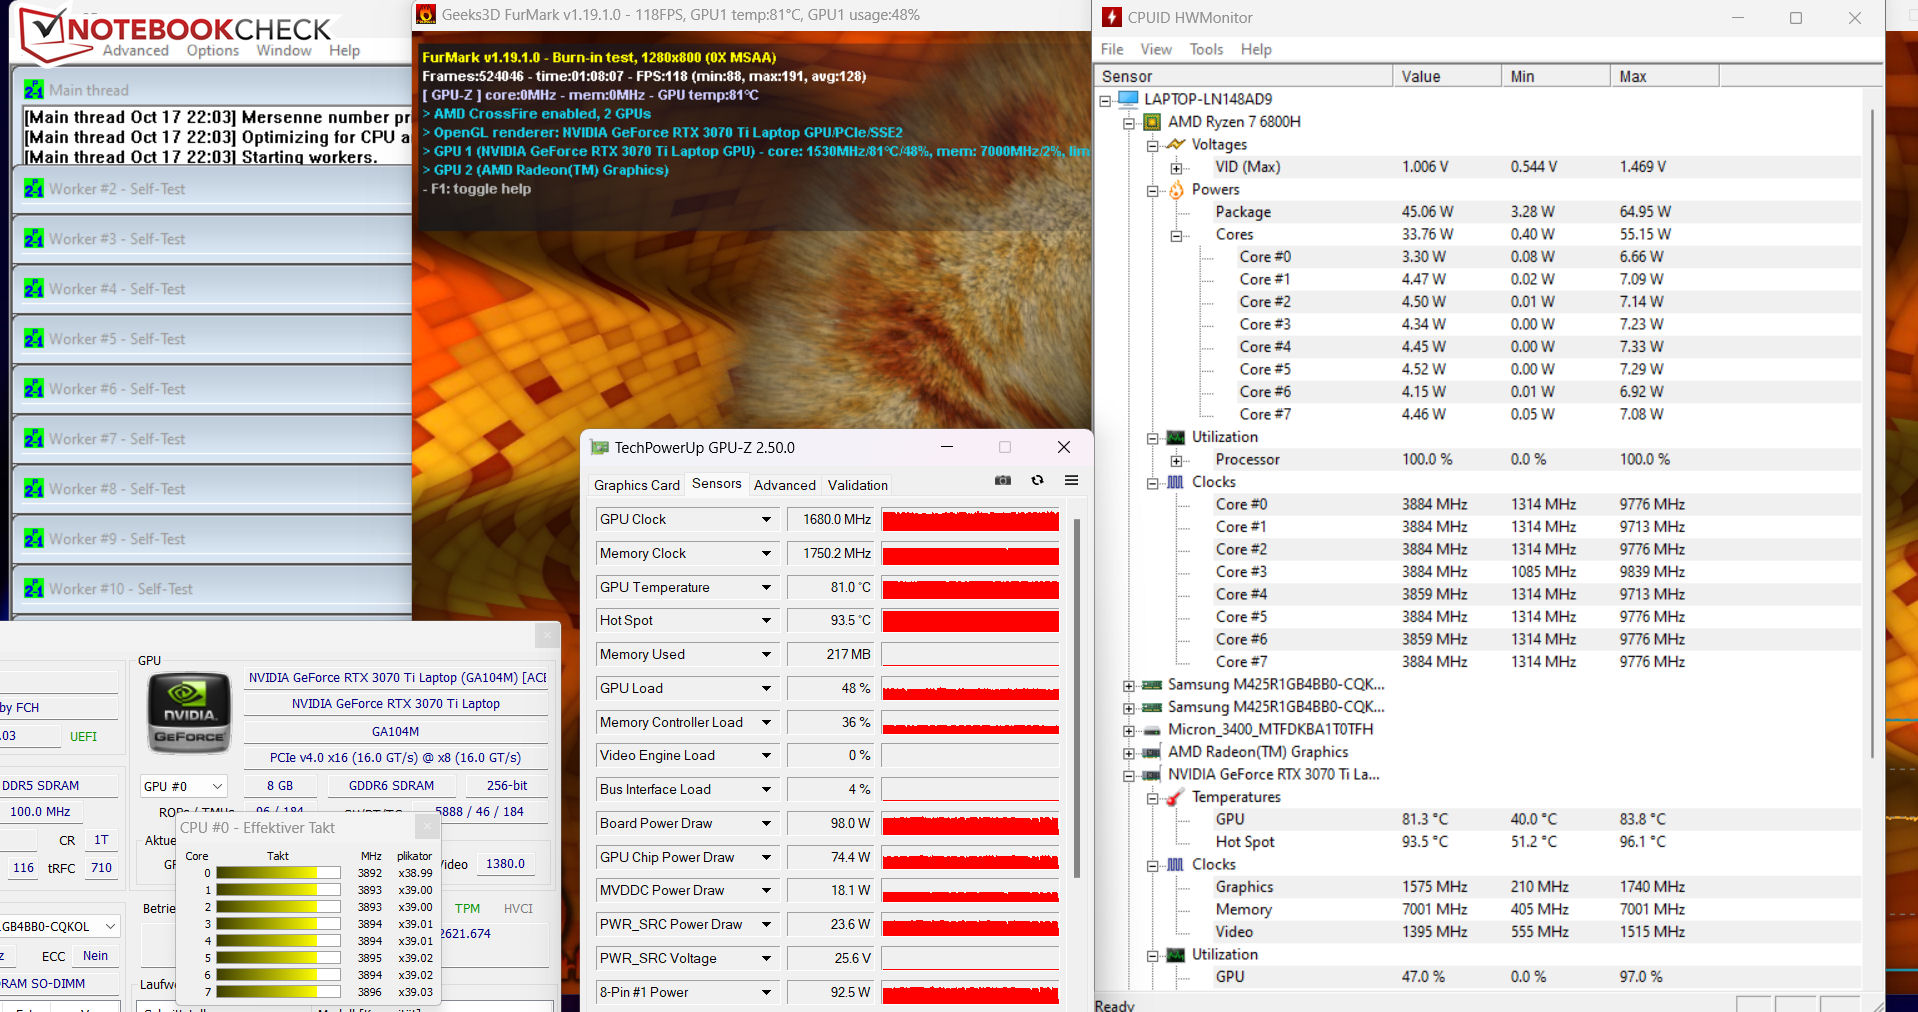
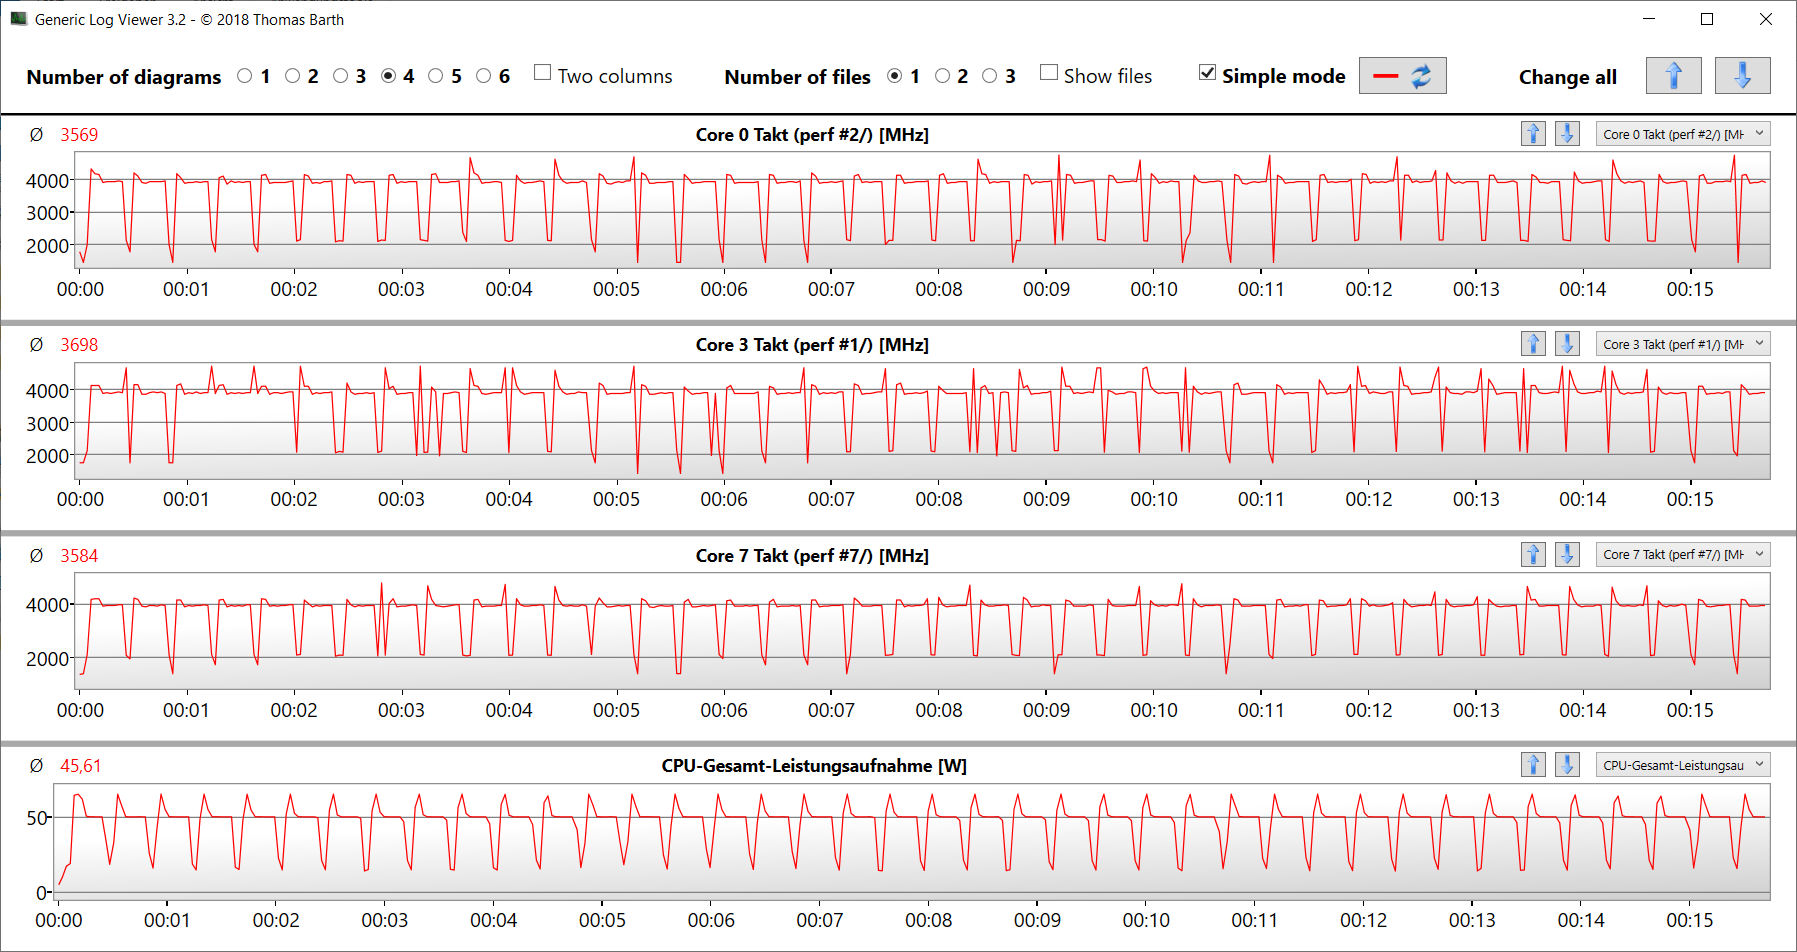
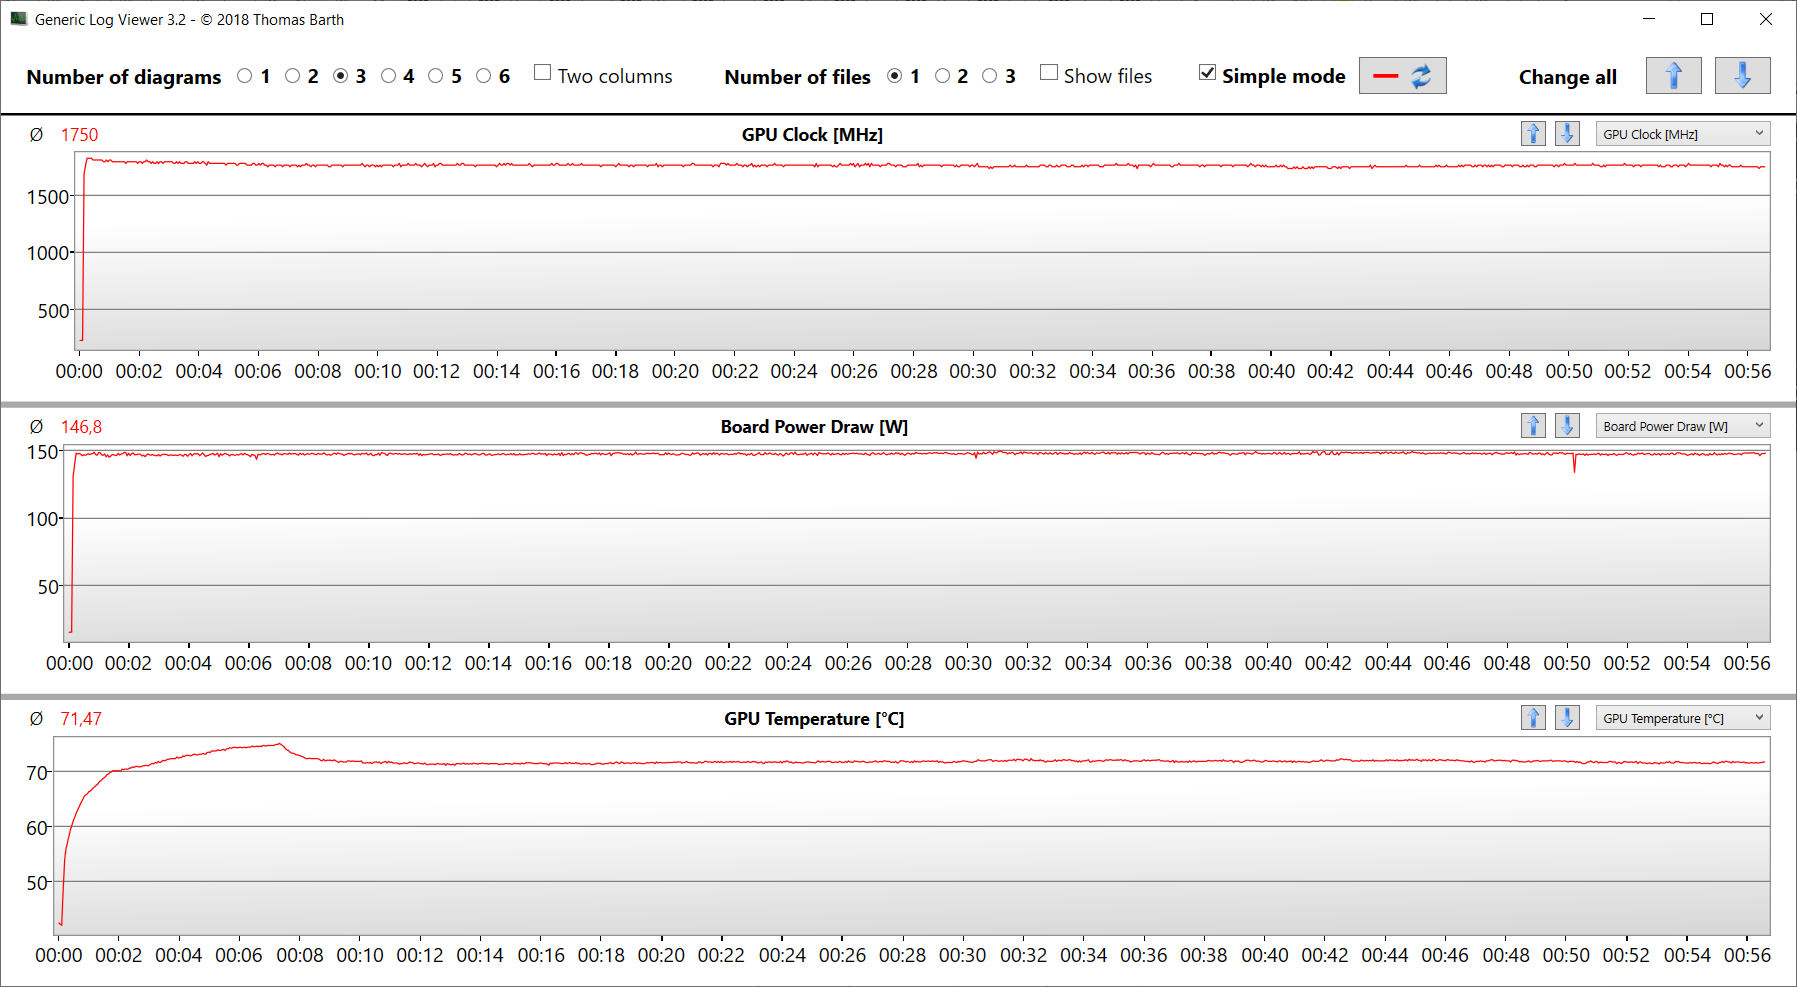
Test w stresie (Prime95 i FurMark są aktywowane w sposób ciągły) to ekstremalny scenariusz, który pozwala nam zbadać stabilność systemu pod maksymalnym obciążeniem. CPU (4,2 do 4,3 GHz) i GPU (1 000 do 1 600 MHz) rozpoczynają test z wysokim taktowaniem. W trakcie testu częstotliwość taktowania CPU nieco spada, natomiast częstotliwość taktowania GPU stabilizuje się na wysokim poziomie.
Mówcy
Dźwięk wytwarzany przez głośniki stereo jest odpowiedni, ale mógłby skorzystać z większej ilości basów.
Acer Nitro 5 AN515-46-R1A1 analiza dźwięku
(±) | głośność głośnika jest średnia, ale dobra (76.3 dB)
Bas 100 - 315 Hz
(-) | prawie brak basu - średnio 23% niższa od mediany
(±) | liniowość basu jest średnia (14.2% delta do poprzedniej częstotliwości)
Średnie 400 - 2000 Hz
(+) | zbalansowane środki średnie - tylko 3.1% od mediany
(+) | średnie są liniowe (6.9% delta do poprzedniej częstotliwości)
Wysokie 2–16 kHz
(+) | zrównoważone maksima - tylko 3.4% od mediany
(+) | wzloty są liniowe (6.3% delta do poprzedniej częstotliwości)
Ogólnie 100 - 16.000 Hz
(±) | liniowość ogólnego dźwięku jest średnia (19.7% różnicy w stosunku do mediany)
W porównaniu do tej samej klasy
» 69% wszystkich testowanych urządzeń w tej klasie było lepszych, 6% podobnych, 25% gorszych
» Najlepszy miał deltę 6%, średnia wynosiła ###średnia###%, najgorsza wynosiła 132%
W porównaniu do wszystkich testowanych urządzeń
» 50% wszystkich testowanych urządzeń było lepszych, 7% podobnych, 43% gorszych
» Najlepszy miał deltę 4%, średnia wynosiła ###średnia###%, najgorsza wynosiła 134%
Schenker XMG Fusion 15 (Mid 22) analiza dźwięku
(+) | głośniki mogą odtwarzać stosunkowo głośno (82 dB)
Bas 100 - 315 Hz
(-) | prawie brak basu - średnio 17.6% niższa od mediany
(±) | liniowość basu jest średnia (12.1% delta do poprzedniej częstotliwości)
Średnie 400 - 2000 Hz
(+) | zbalansowane środki średnie - tylko 3% od mediany
(+) | średnie są liniowe (3.9% delta do poprzedniej częstotliwości)
Wysokie 2–16 kHz
(+) | zrównoważone maksima - tylko 2.8% od mediany
(+) | wzloty są liniowe (5.5% delta do poprzedniej częstotliwości)
Ogólnie 100 - 16.000 Hz
(+) | ogólny dźwięk jest liniowy (13.3% różnicy w stosunku do mediany)
W porównaniu do tej samej klasy
» 19% wszystkich testowanych urządzeń w tej klasie było lepszych, 5% podobnych, 76% gorszych
» Najlepszy miał deltę 6%, średnia wynosiła ###średnia###%, najgorsza wynosiła 132%
W porównaniu do wszystkich testowanych urządzeń
» 14% wszystkich testowanych urządzeń było lepszych, 3% podobnych, 83% gorszych
» Najlepszy miał deltę 4%, średnia wynosiła ###średnia###%, najgorsza wynosiła 134%
Zarządzanie energią - komputer Acer z przyzwoitym czasem pracy na baterii
Zużycie energii
Nie zauważyliśmy żadnych niekonsekwencji, jeśli chodzi o zużycie energii przez AN515. Zużycie wzrosło do 230 watów i średnio 203 watów podczas stress testu/Witcher 3 testu, ale przez cały czas trwania obu testów utrzymywało się na stałym poziomie. Zasilacz AC (moc znamionowa: 280 W) jest wystarczająco duży, by pokryć zapotrzebowanie tego urządzenia.
| wyłączony / stan wstrzymania | |
| luz | |
| obciążenie |
|
Legenda:
min: | |
| Acer Nitro 5 AN515-46-R1A1 R7 6800H, GeForce RTX 3070 Ti Laptop GPU, Micron 3400 1TB MTFDKBA1T0TFH, IPS, 1920x1080, 15.6" | MSI Katana GF66 12UGS i7-12700H, GeForce RTX 3070 Ti Laptop GPU, Micron 2450 1TB MTFDKBA1T0TFK, IPS, 1920x1080, 15.6" | Schenker XMG Fusion 15 (Mid 22) i7-11800H, GeForce RTX 3070 Laptop GPU, Samsung SSD 980 Pro 1TB MZ-V8P1T0BW, IPS, 2560x1440, 15.6" | Asus TUF Dash F15 FX517ZR i7-12650H, GeForce RTX 3070 Laptop GPU, Samsung PM991a MZVLQ1T0HBLB, IPS, 2560x1440, 15.6" | Acer Nitro 5 AN515-58-72QR i7-12700H, GeForce RTX 3070 Ti Laptop GPU, Samsung PM9A1 MZVL21T0HCLR, IPS, 2560x1440, 15.6" | Przeciętny NVIDIA GeForce RTX 3070 Ti Laptop GPU | Średnia w klasie Gaming | |
|---|---|---|---|---|---|---|---|
| Power Consumption | -5% | -25% | -8% | -15% | -56% | -47% | |
| Idle Minimum * (Watt) | 7 | 9 -29% | 12 -71% | 10 -43% | 7 -0% | 14.2 ? -103% | 13.2 ? -89% |
| Idle Average * (Watt) | 8.9 | 13 -46% | 17 -91% | 14 -57% | 15 -69% | 19.9 ? -124% | 18.9 ? -112% |
| Idle Maximum * (Watt) | 14.4 | 20 -39% | 24 -67% | 20 -39% | 24 -67% | 26.2 ? -82% | 24.3 ? -69% |
| Load Average * (Watt) | 202 | 100 50% | 106 48% | 122 40% | 124 39% | 125.8 ? 38% | 108.3 ? 46% |
| Witcher 3 ultra * (Watt) | 203 | 149 27% | 159.9 21% | 138.6 32% | 195.1 4% | ||
| Load Maximum * (Watt) | 230 | 212 8% | 208 10% | 189 18% | 220 4% | 248 ? -8% | 254 ? -10% |
* ... im mniej tym lepiej
Power consumption Witcher 3 / stress test
Power consumption with an external screen
Czas pracy na baterii
Po MSI Katana (52 Wh), Nitro ma najniższą pojemność akumulatora w naszym zestawieniu (57,5 Wh). Mimo to osiąga on przyzwoite czasy pracy na akumulatorze i może nawet dotrzymać kroku niektórym z bardziej obficie wyposażonych konkurentów. Dzięki oszczędniejszemu procesorowi AMD i niższej rozdzielczości ekranu wyraźnie przewyższa swój siostrzany model oparty na procesorze Intela.
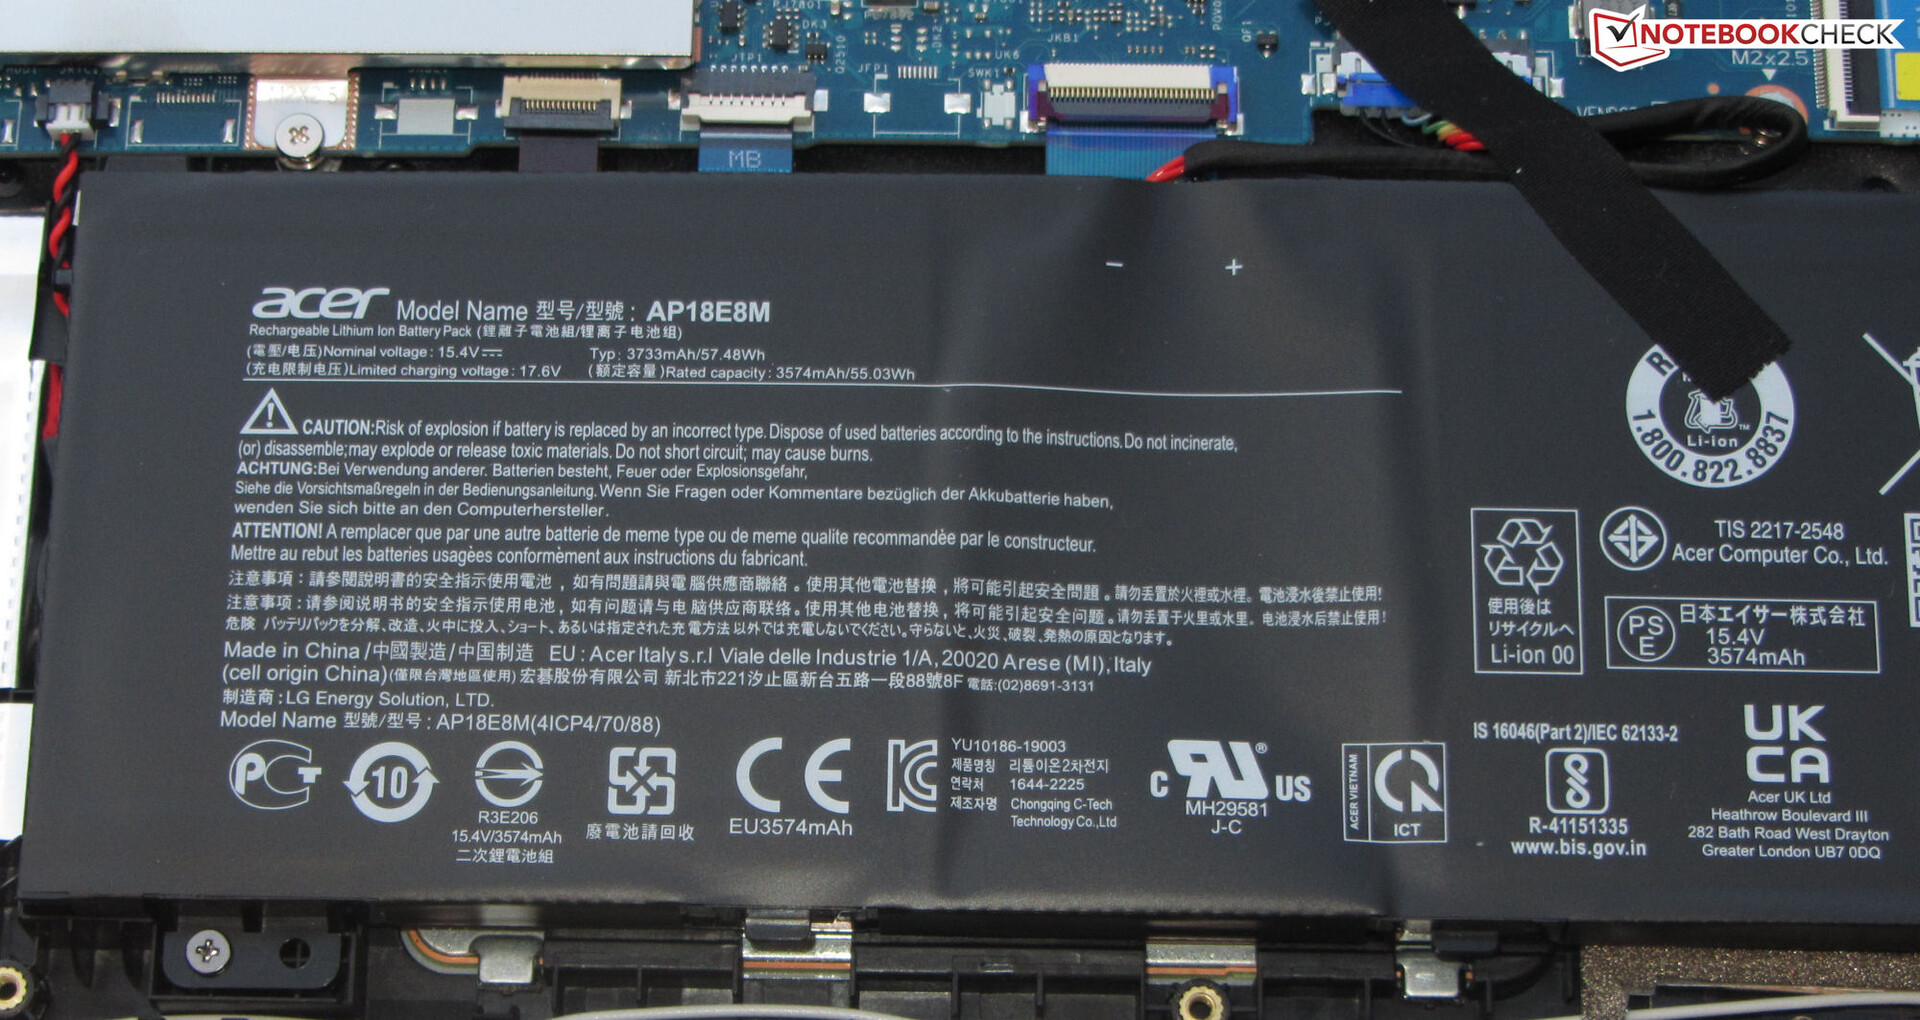
| Acer Nitro 5 AN515-46-R1A1 R7 6800H, GeForce RTX 3070 Ti Laptop GPU, 57.5 Wh | MSI Katana GF66 12UGS i7-12700H, GeForce RTX 3070 Ti Laptop GPU, 52 Wh | Schenker XMG Fusion 15 (Mid 22) i7-11800H, GeForce RTX 3070 Laptop GPU, 93.48 Wh | Asus TUF Dash F15 FX517ZR i7-12650H, GeForce RTX 3070 Laptop GPU, 76 Wh | Acer Nitro 5 AN515-58-72QR i7-12700H, GeForce RTX 3070 Ti Laptop GPU, 57.5 Wh | Średnia w klasie Gaming | |
|---|---|---|---|---|---|---|
| Czasy pracy | -26% | 37% | 26% | -26% | 16% | |
| Reader / Idle (h) | 10.5 | 15.5 48% | 10.8 3% | 5.7 -46% | 8.71 ? -17% | |
| H.264 (h) | 5.7 | 7.5 32% | 5.8 2% | 4.7 -18% | 8.26 ? 45% | |
| WiFi v1.3 (h) | 5.8 | 2.4 -59% | 7.4 28% | 7 21% | 3.9 -33% | 7.04 ? 21% |
| Load (h) | 1.3 | 1.4 8% | 1.8 38% | 2.3 77% | 1.2 -8% | 1.47 ? 13% |
Za
Przeciw
Werdykt - dobrze wyposażony notebook do gier
Nitro 5 jest stworzony do gier w FHD przy maksymalnych ustawieniach - dzięki m.in.Ryzen 7-6800HaPU iGeForce RTX 3070-Ti LaptopgPU (TGP: 150 W). Szybki dysk SSD PCIe-4 (1 TB) zapewnia niezbędną przestrzeń dyskową i gwarantuje krótkie czasy ładowania.
Acer Nitro 5 AN515-46 to szybki notebook do gier FHD, który nie wykazuje poważnych słabości.
CPU i GPU mogą zapewnić stale wysokie taktowanie. Urządzenie nagrzewa się umiarkowanie tylko pod obciążeniem. Niestety jego emisja hałasu nie jest lepsza niż zwykle: Nitro 5 potrafi być dość głośny. Matowy panel 15,6 cala (FHD, IPS, 165 Hz) dostarczył nam dobrych wrażeń.
Czas pracy notebooka na akumulatorze jest przyzwoity, ale nic nadzwyczajnego. Akumulator można ładować za pomocą uniwersalnego zasilacza USB-C (min. 65 W, 20 V), gdyż port USB 4 obsługuje Power Delivery (i DisplayPort). Oznacza to, że użytkownicy nie będą musieli koniecznie nosić ze sobą ważącego 280 W zasilacza.
Który model Nitro 5 jest lepszym wyborem? To zależy od Twoich potrzeb. Wersja AMD ma pamięć DDR5, niskie wartości zużycia energii i lepszy czas pracy na baterii. Mniej się też nagrzewa. Na stronieModel Intelaoferuje wyższą wydajność jednowątkową procesora, Thunderbolt 4 i lepszy wyświetlacz. Ale pamiętajmy: obie wersje Nitro są dostępne z panelem FHD lub QHD
Niektóre alternatywy dla Nitro to m.in.Schenker XMG Fusion 15 (Mid 22)orazAsus TUF Dash F15. Oba urządzenia oferują niższą wydajność GPU i zauważalnie nagrzewają się pod obciążeniem. Z drugiej strony są bardziej kompaktowe, ważą mniej i mają dłuższy czas pracy na baterii. Fusion oferuje zdecydowanie najdłuższe czasy pracy.
Cena i dostępność
Acer Nitro 5 AN515-46 jest dostępny na stronie producenta w cenie 2200 dolarów.
Acer Nitro 5 AN515-46-R1A1
- 28/10/2022 v7 (old)
Sascha Mölck
Price comparison

