Recenzja Gigabyte G5 KE: Średniej klasy laptop do gier, który sprawdza większość pól
Gigabyte oferuje kilka klas laptopów opartych na wydajności i budżecie. Podczas gdy serie Aorus i Aero są skierowane do segmentu premium w grach i tworzeniu treści, tradycyjne warianty Gigabyte, takie jak G5 i G7, są skierowane do bardziej mainstreamowych odbiorców gier.
Wcześniej recenzowaliśmy 17,3-calowy Gigabyte G7 KE a teraz mamy okazję przetestować 15,6-calowy Gigabyte G5 KE o w dużej mierze podobnej specyfikacji.
Nasz egzemplarz Gigabyte G5 KE wyposażony jest w Intel 12th gen Core i5-12500H procesor, GPU Nvidia GeForce RTX 3060 "Laptop, 16 GB RAM, dysk SSD o pojemności 512 GB oraz 15,6-calowy panel IPS o rozdzielczości 144 Hz.
Ta konfiguracja ustawi cię z powrotem przez ₹94,990 (1,155 USD) na rynku indyjskim. W tej recenzji, bierzemy Gigabyte G5 KE na przejażdżkę i sprawdzamy, czy dorównuje swoim rówieśnikom z segmentu gier średniej klasy.
Potencjalni konkurenci w porównaniu
Ocena | Data | Model | Waga | Wysokość | Rozmiar | Rezolucja | Cena |
|---|---|---|---|---|---|---|---|
| 81.8 % v7 (old) | 04/2023 | Gigabyte G5 KE i5-12500H, GeForce RTX 3060 Laptop GPU | 2 kg | 23.9 mm | 15.60" | 1920x1080 | |
| 82.8 % v7 (old) | 10/2022 | Lenovo IdeaPad Gaming 3 15IAH7 i5-12500H, GeForce RTX 3050 Ti Laptop GPU | 2.4 kg | 26 mm | 15.60" | 1920x1080 | |
| 83.3 % v7 (old) | 01/2023 | Gigabyte G7 KE i5-12500H, GeForce RTX 3060 Laptop GPU | 2.6 kg | 25 mm | 17.30" | 1920x1080 | |
| 87.4 % v7 (old) | 09/2022 | Honor MagicBook 14 2022 i5-12500H, GeForce RTX 2050 Mobile | 1.6 kg | 16.9 mm | 14.00" | 2160x1440 | |
| 87.9 % v7 (old) | 01/2023 | Schenker XMG Core 15 (M22) R7 6800H, GeForce RTX 3060 Laptop GPU | 2.1 kg | 23 mm | 15.60" | 2560x1440 | |
| 86.1 % v7 (old) | 10/2022 | Dell G16 7620 i7-12700H, GeForce RTX 3060 Laptop GPU | 2.6 kg | 26.9 mm | 16.00" | 2560x1600 | |
| 82.3 % v7 (old) | 09/2022 | Gigabyte A5 K1 R5 5600H, GeForce RTX 3060 Laptop GPU | 2.2 kg | 34 mm | 15.60" | 1920x1080 | |
| 87.2 % v7 (old) | Asus TUF Gaming F15 FX507ZM i7-12700H, GeForce RTX 3060 Laptop GPU | 2.1 kg | 24.95 mm | 15.60" | 1920x1080 | ||
| 84.3 % v7 (old) | HP Victus 16-e0179ng R7 5800H, GeForce RTX 3060 Laptop GPU | 2.5 kg | 23.5 mm | 16.10" | 1920x1080 |
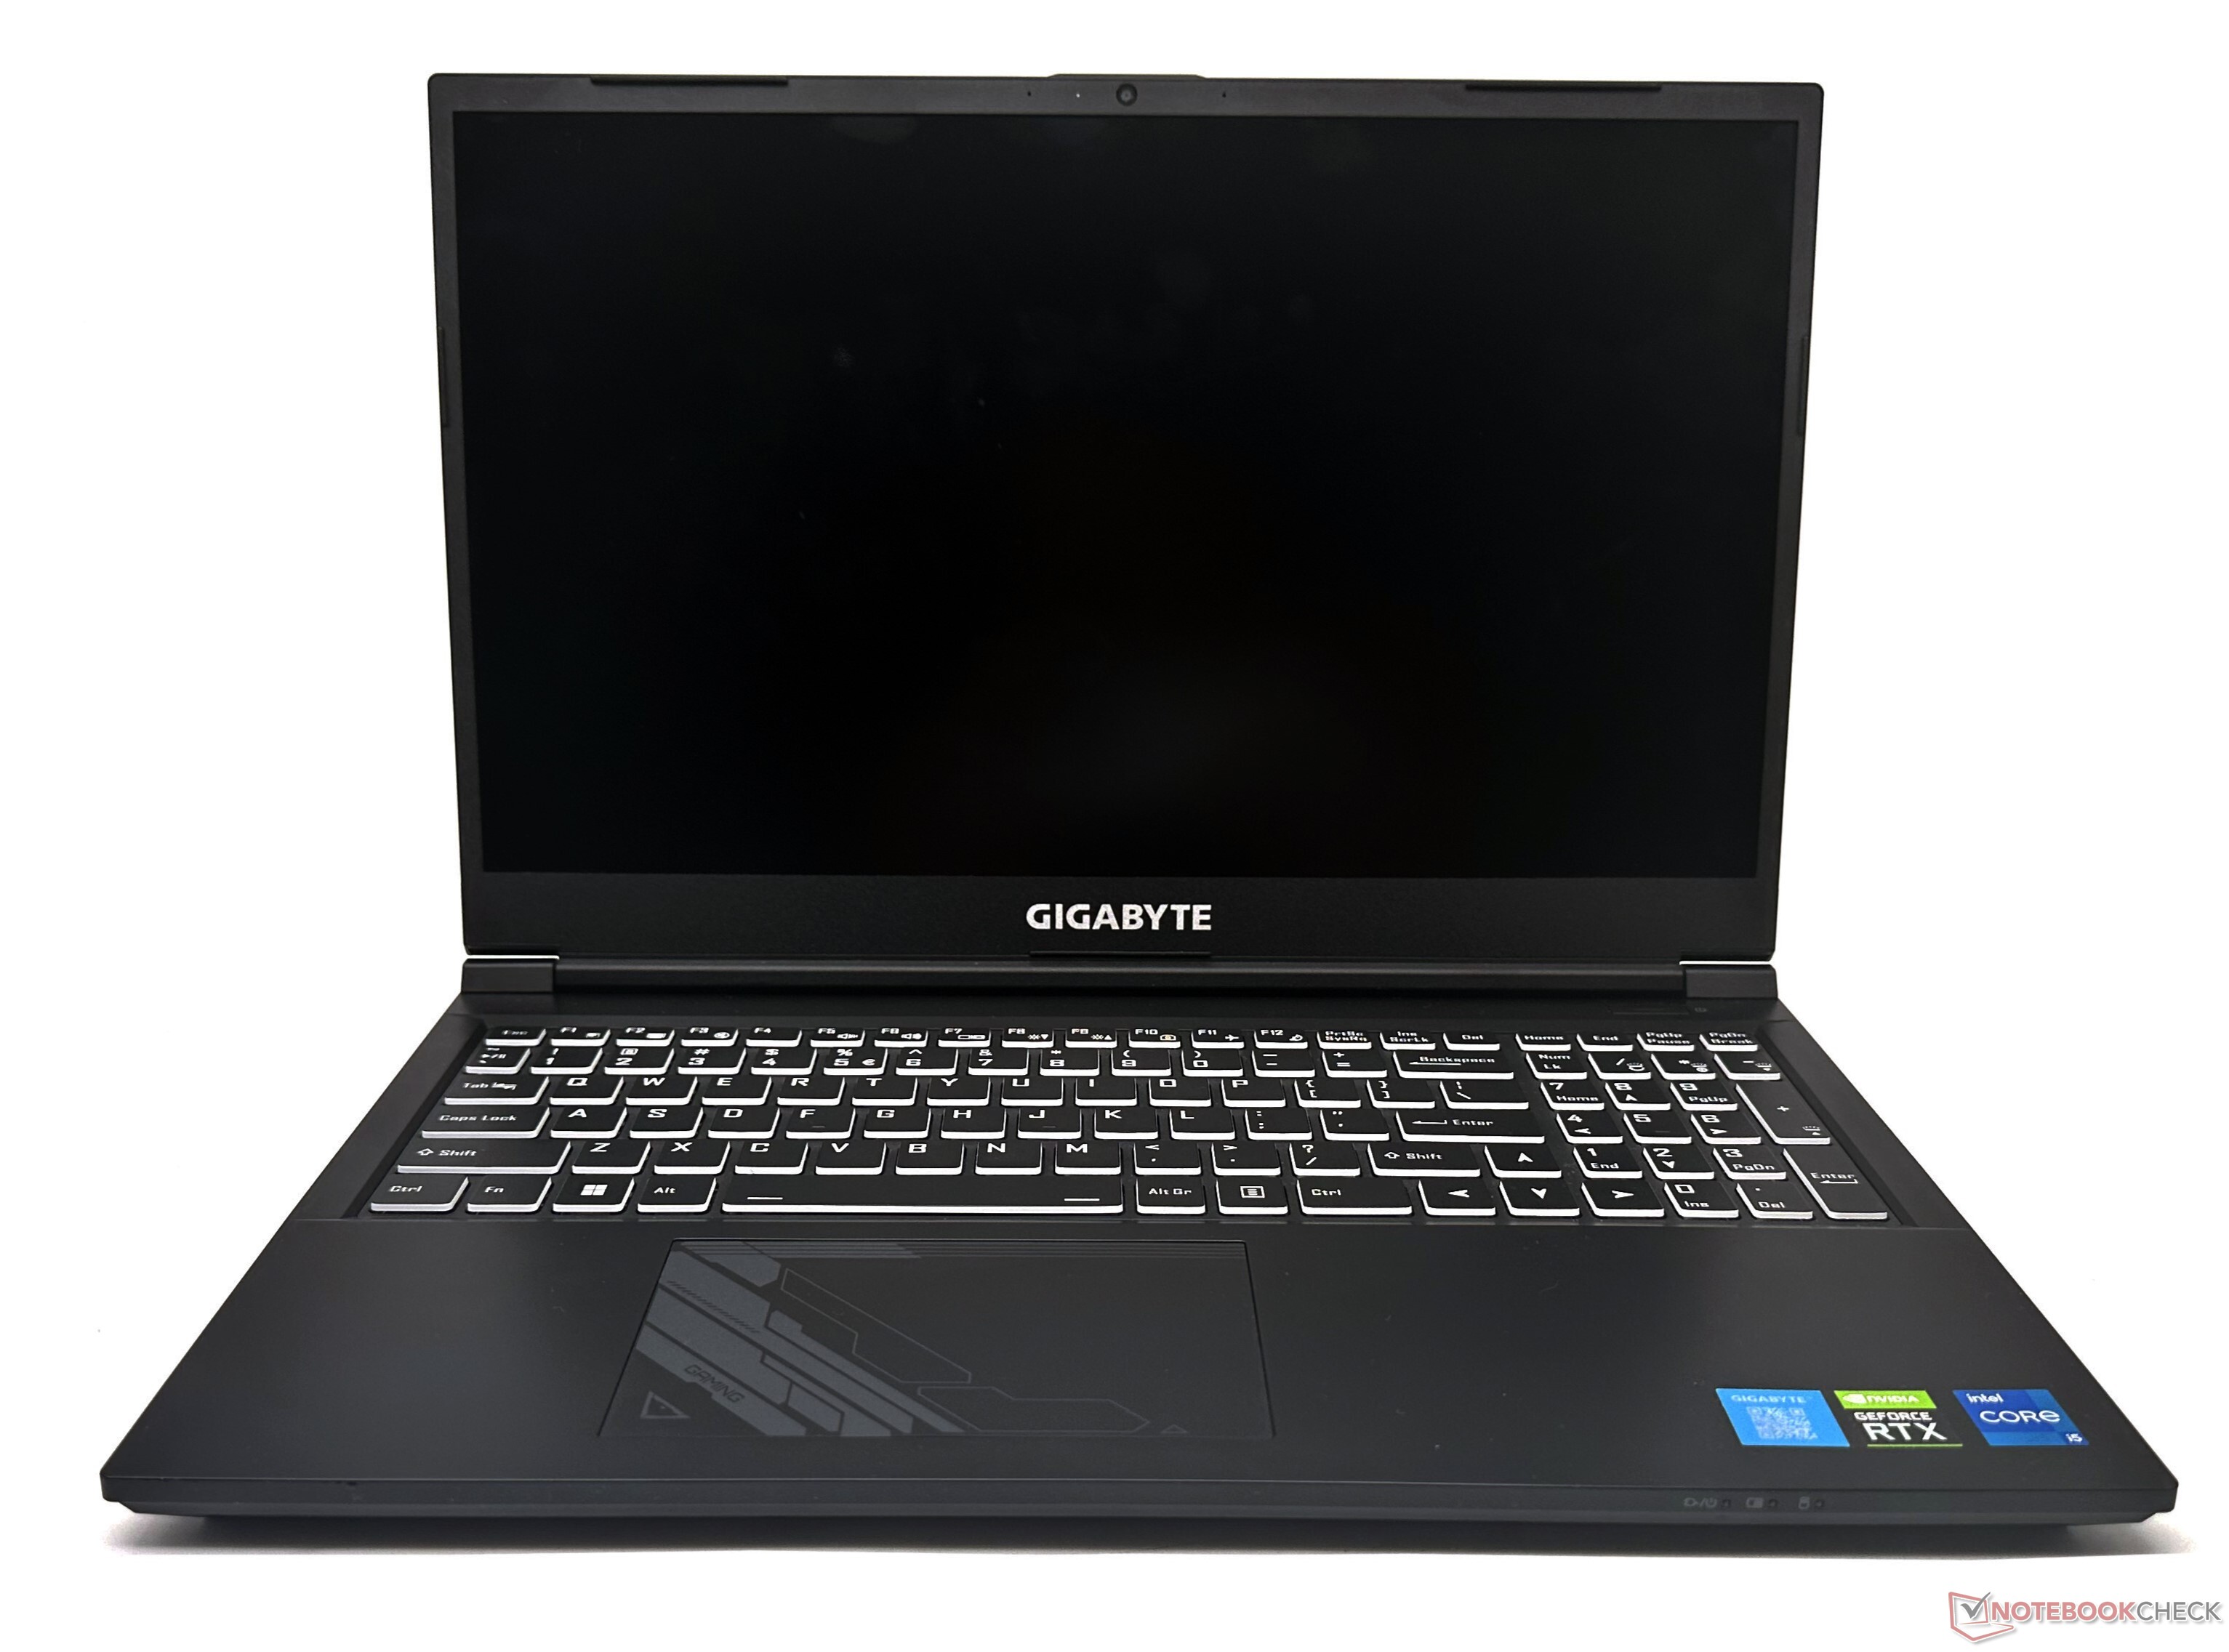
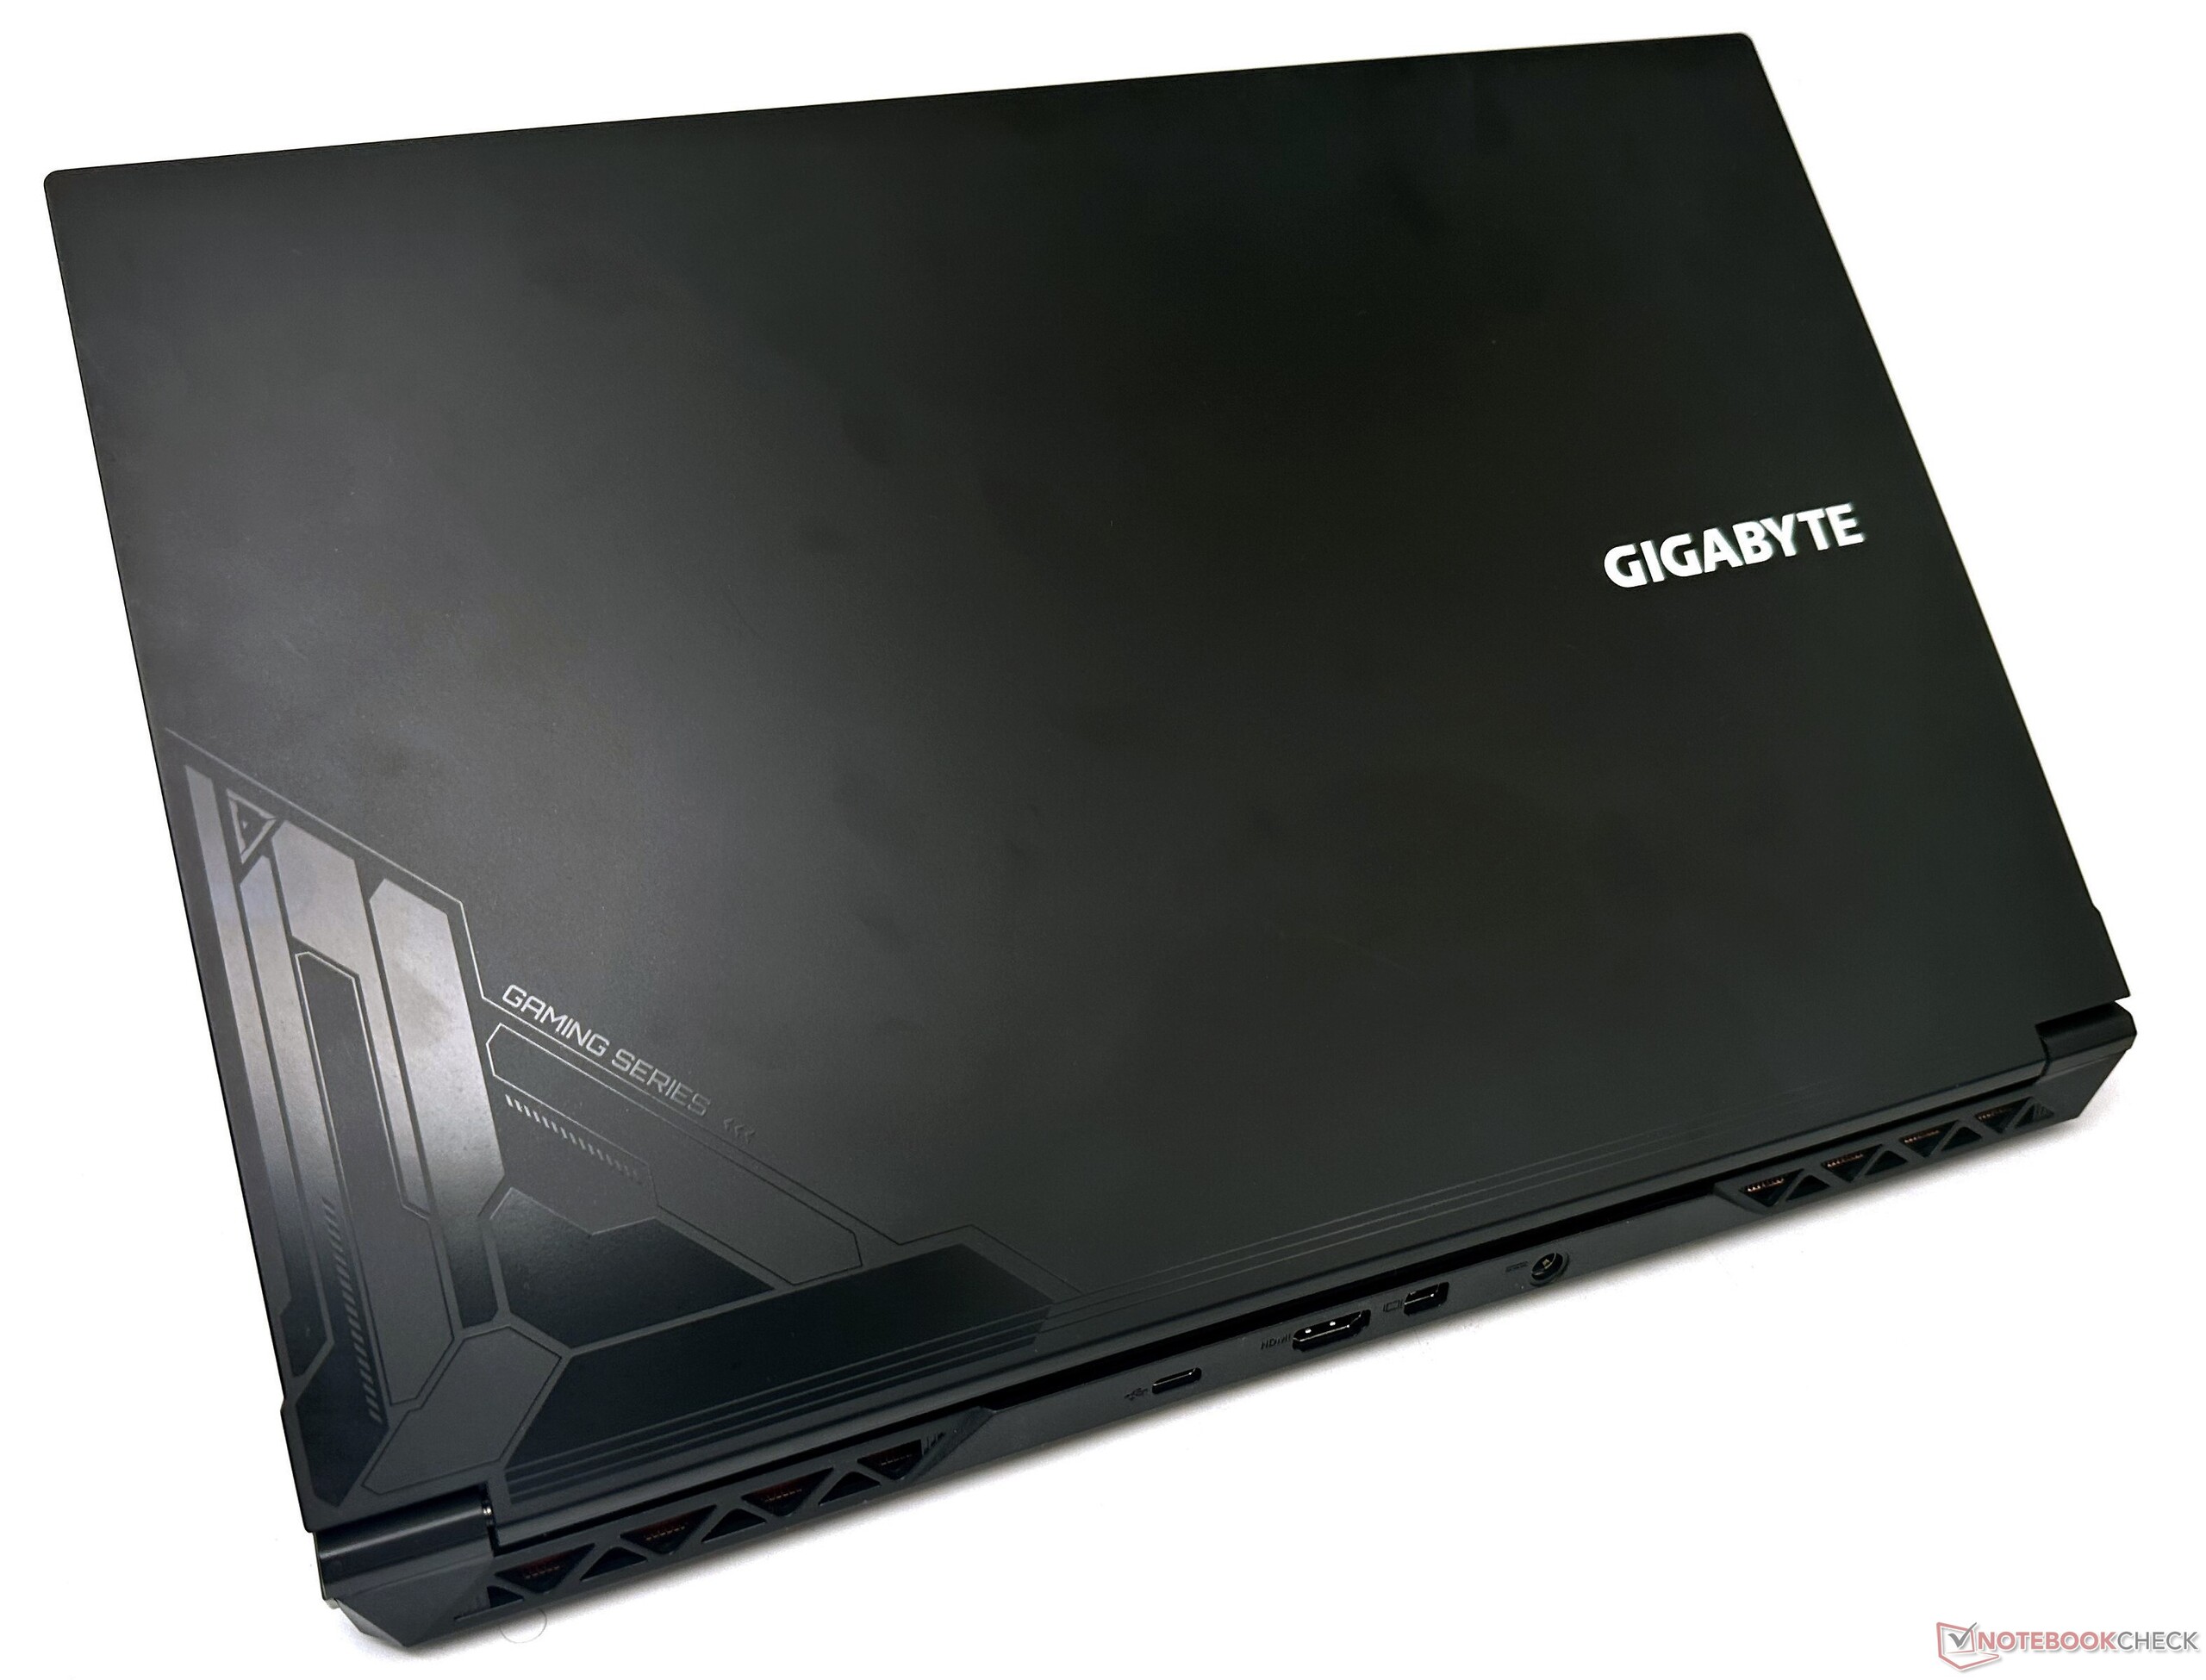
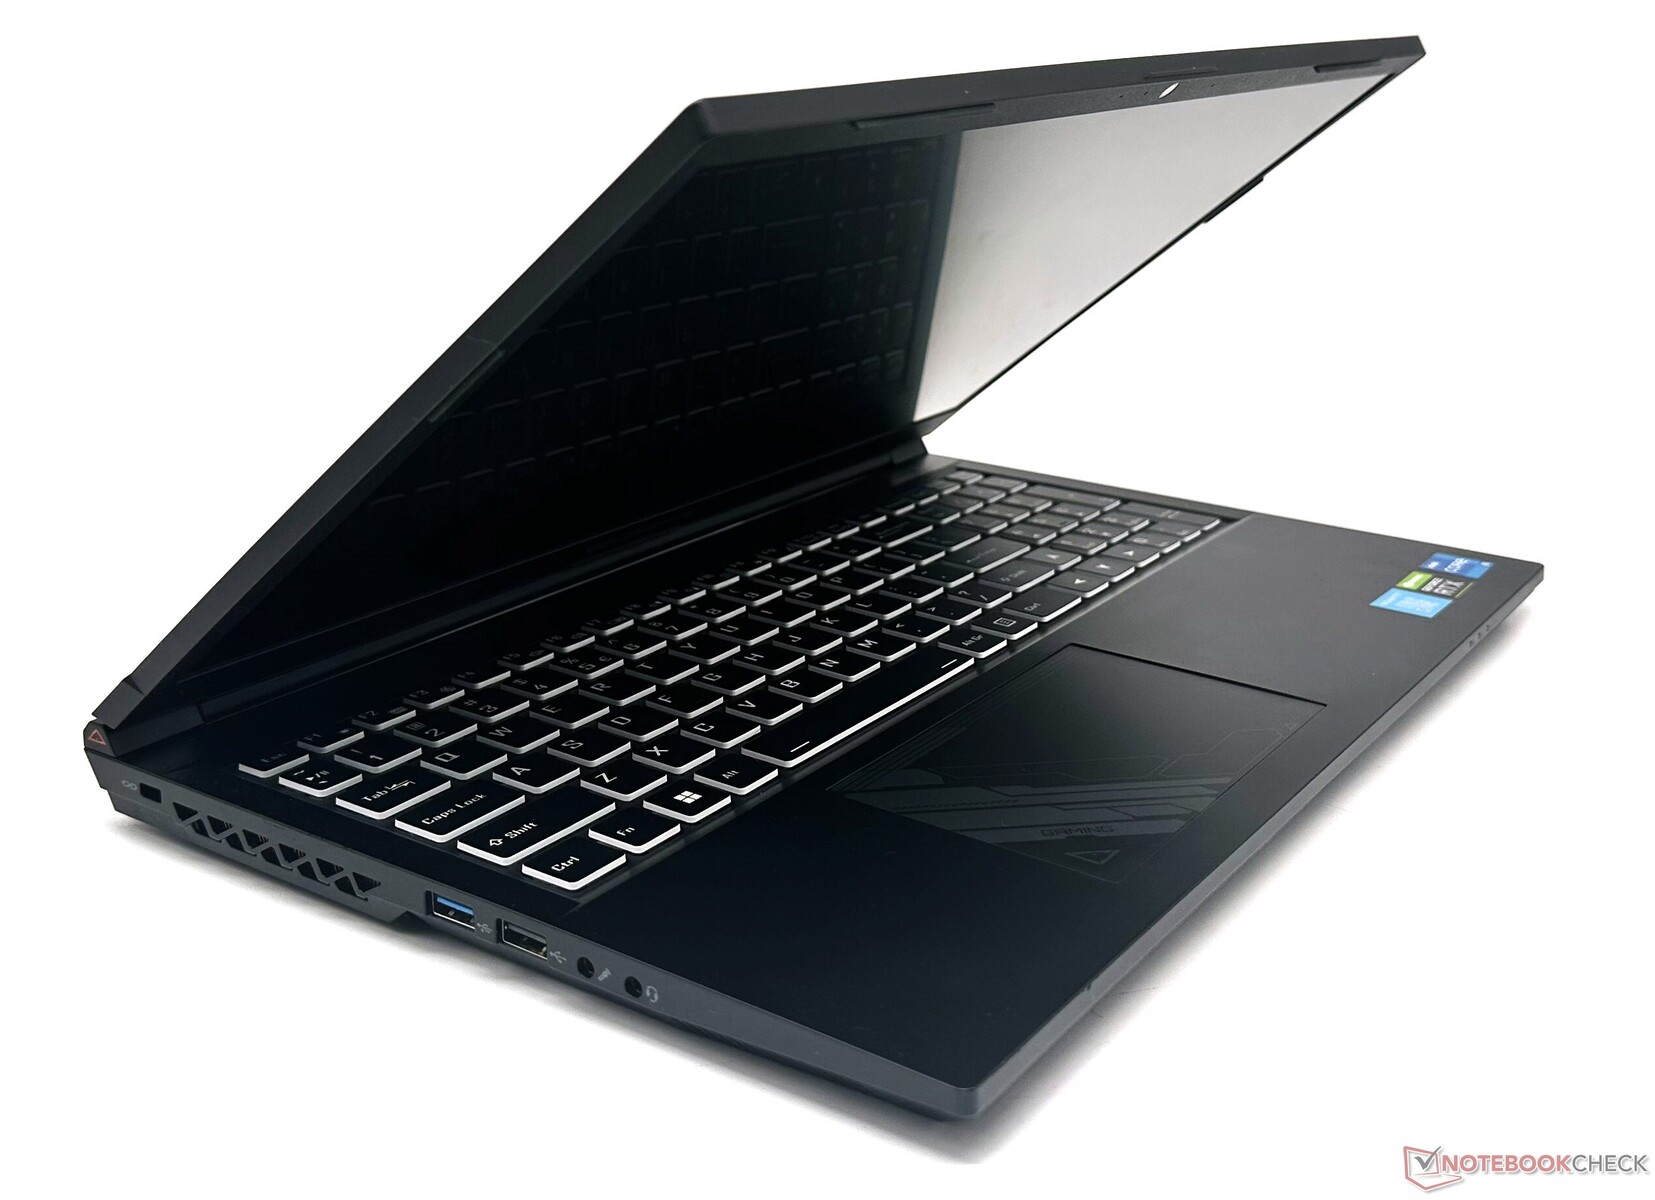
Podwozie: Głównie plastik z pewną dozą elastyczności
Konstrukcja Gigabyte G5 KE jest zgodna z oczekiwaniami w tym przedziale cenowym. Jest to w zasadzie konstrukcja Clevo, w pełni plastikowa, o gładkiej, matowej powierzchni, z kilkoma subtelnymi akcentami na tylnej części pokrywy i touchpadzie.
Przy 23,9 mm grubości, G5 KE jest podobny do konkurencji w tym segmencie, a jednocześnie jest znacznie cieńszy od Gigabyte A5 K1.
Obudowa G5 KE nie jest najsztywniejsza z tych, które widzieliśmy - pod naciskiem klawiatura znacznie się ugina, a wieko może się wykręcać. Jednak użytkownicy raczej nie doświadczą tego w codziennym użytkowaniu.
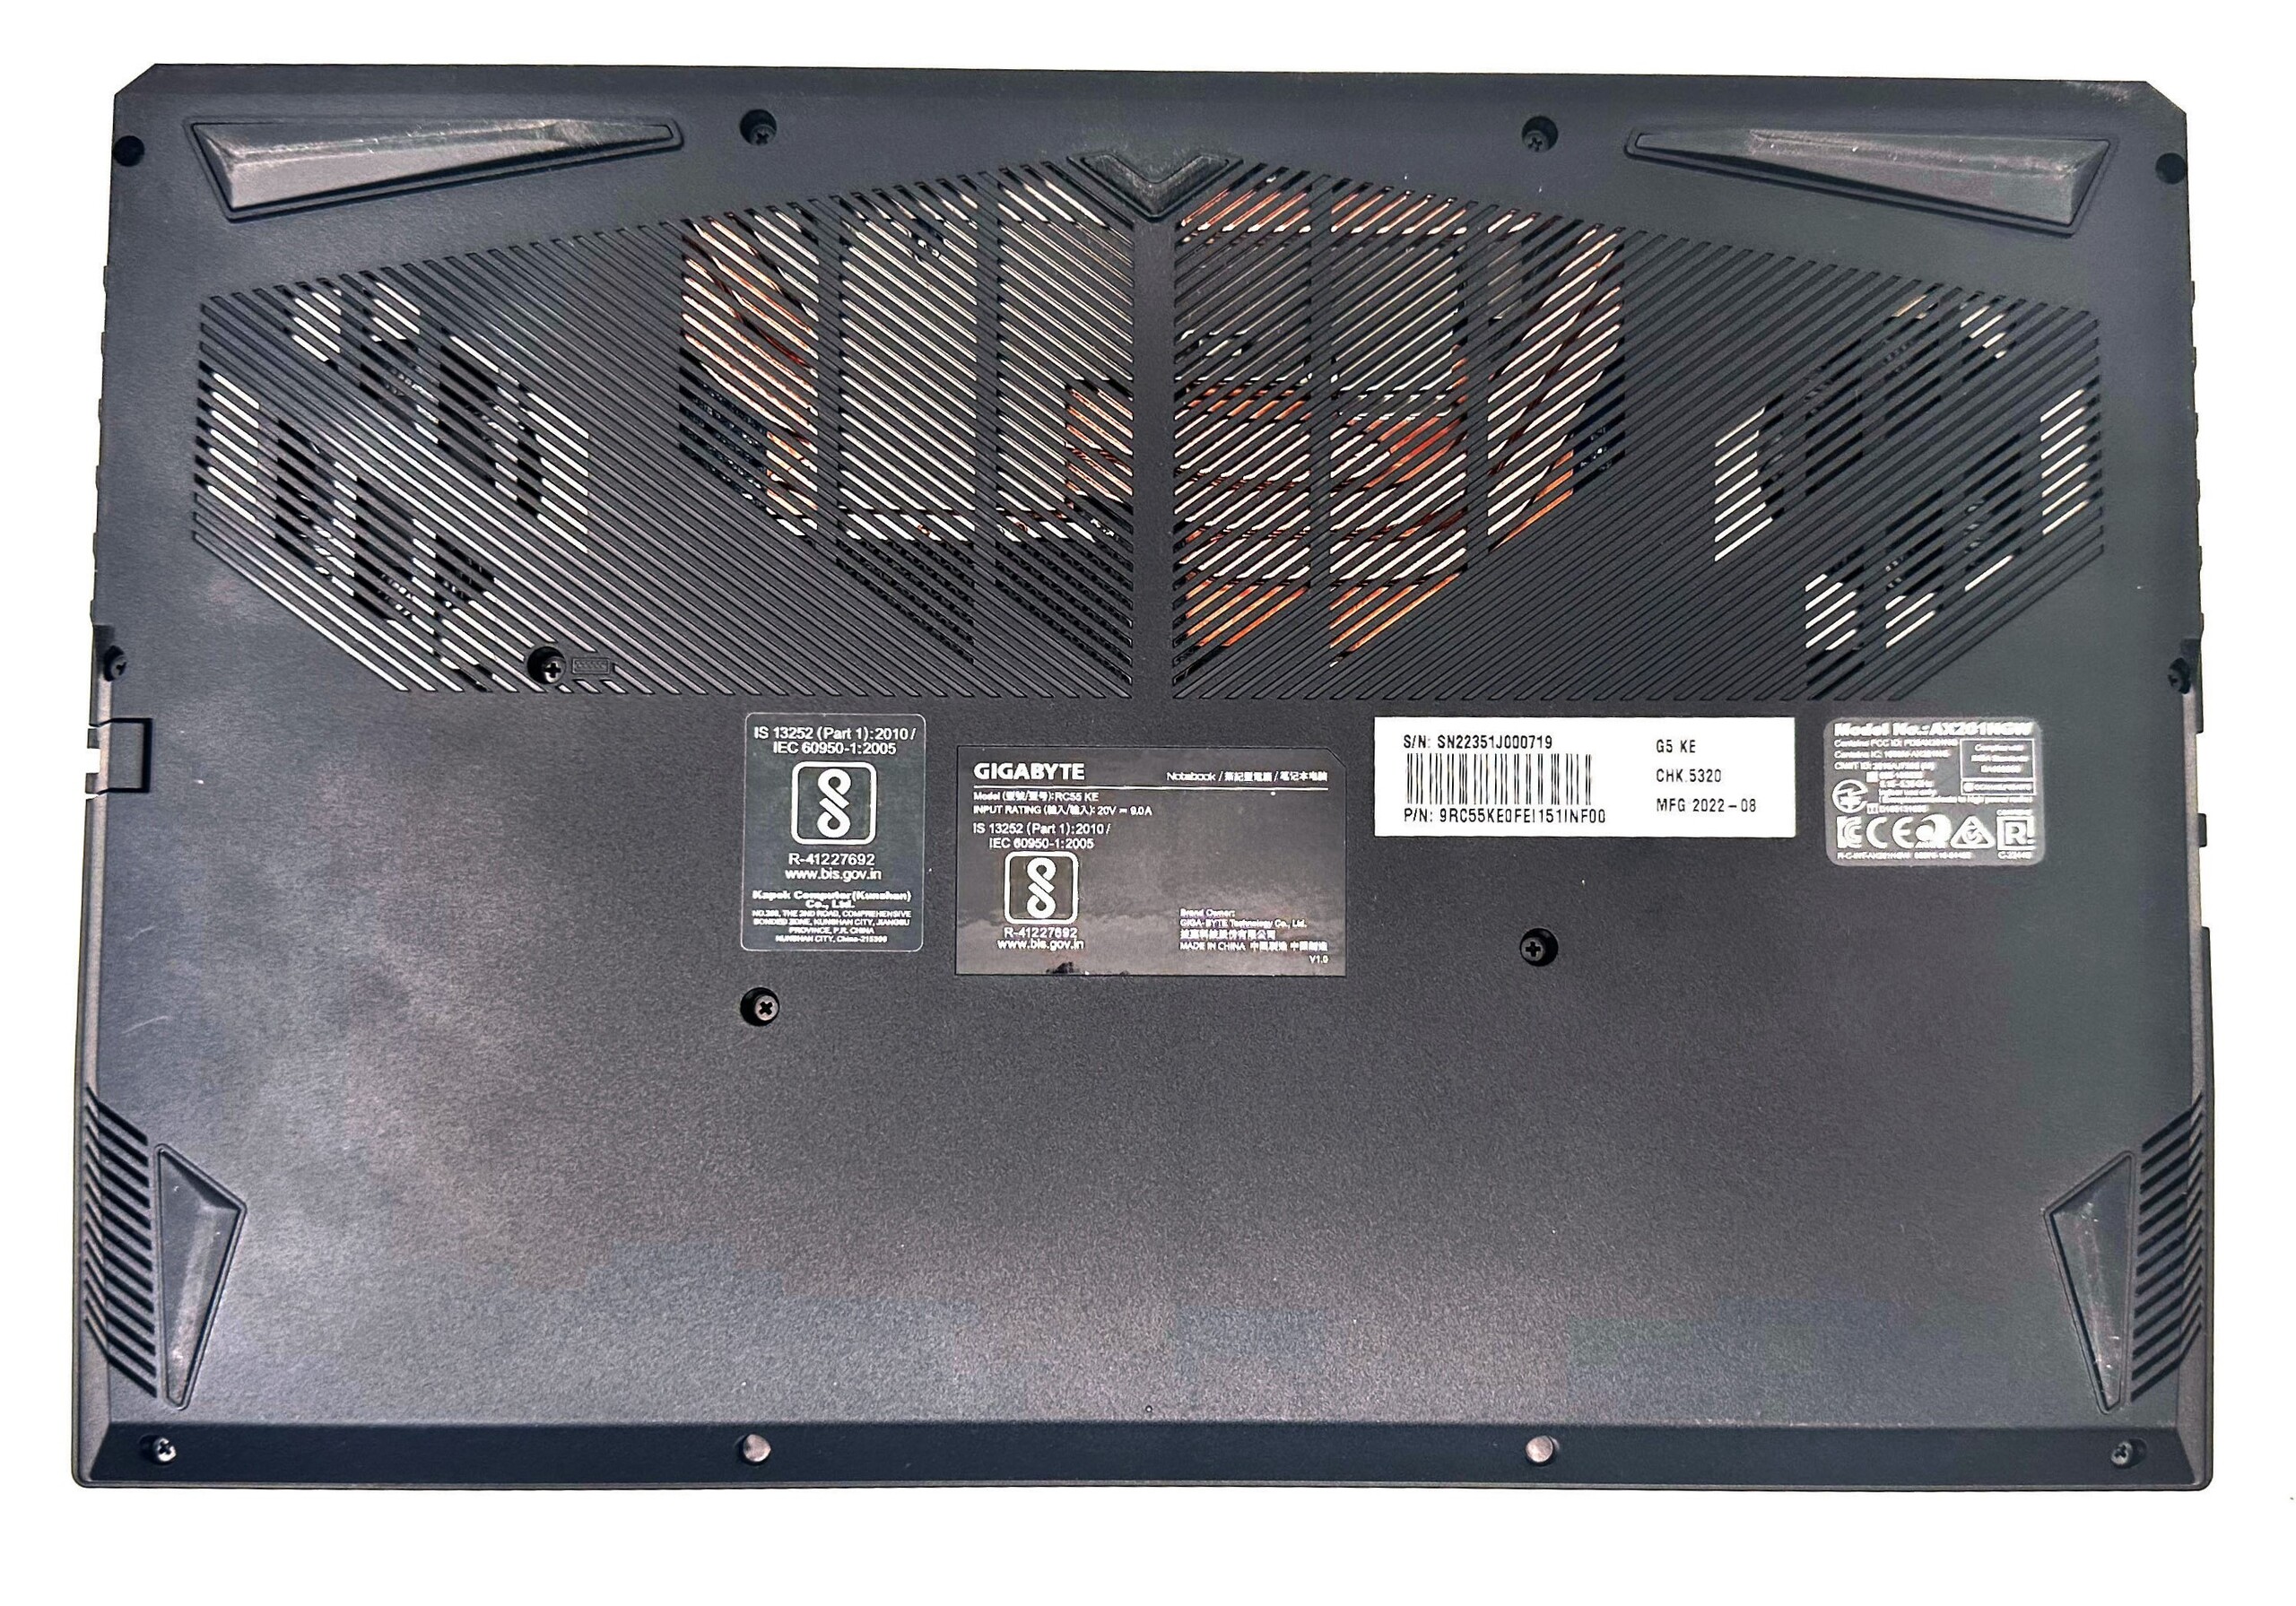
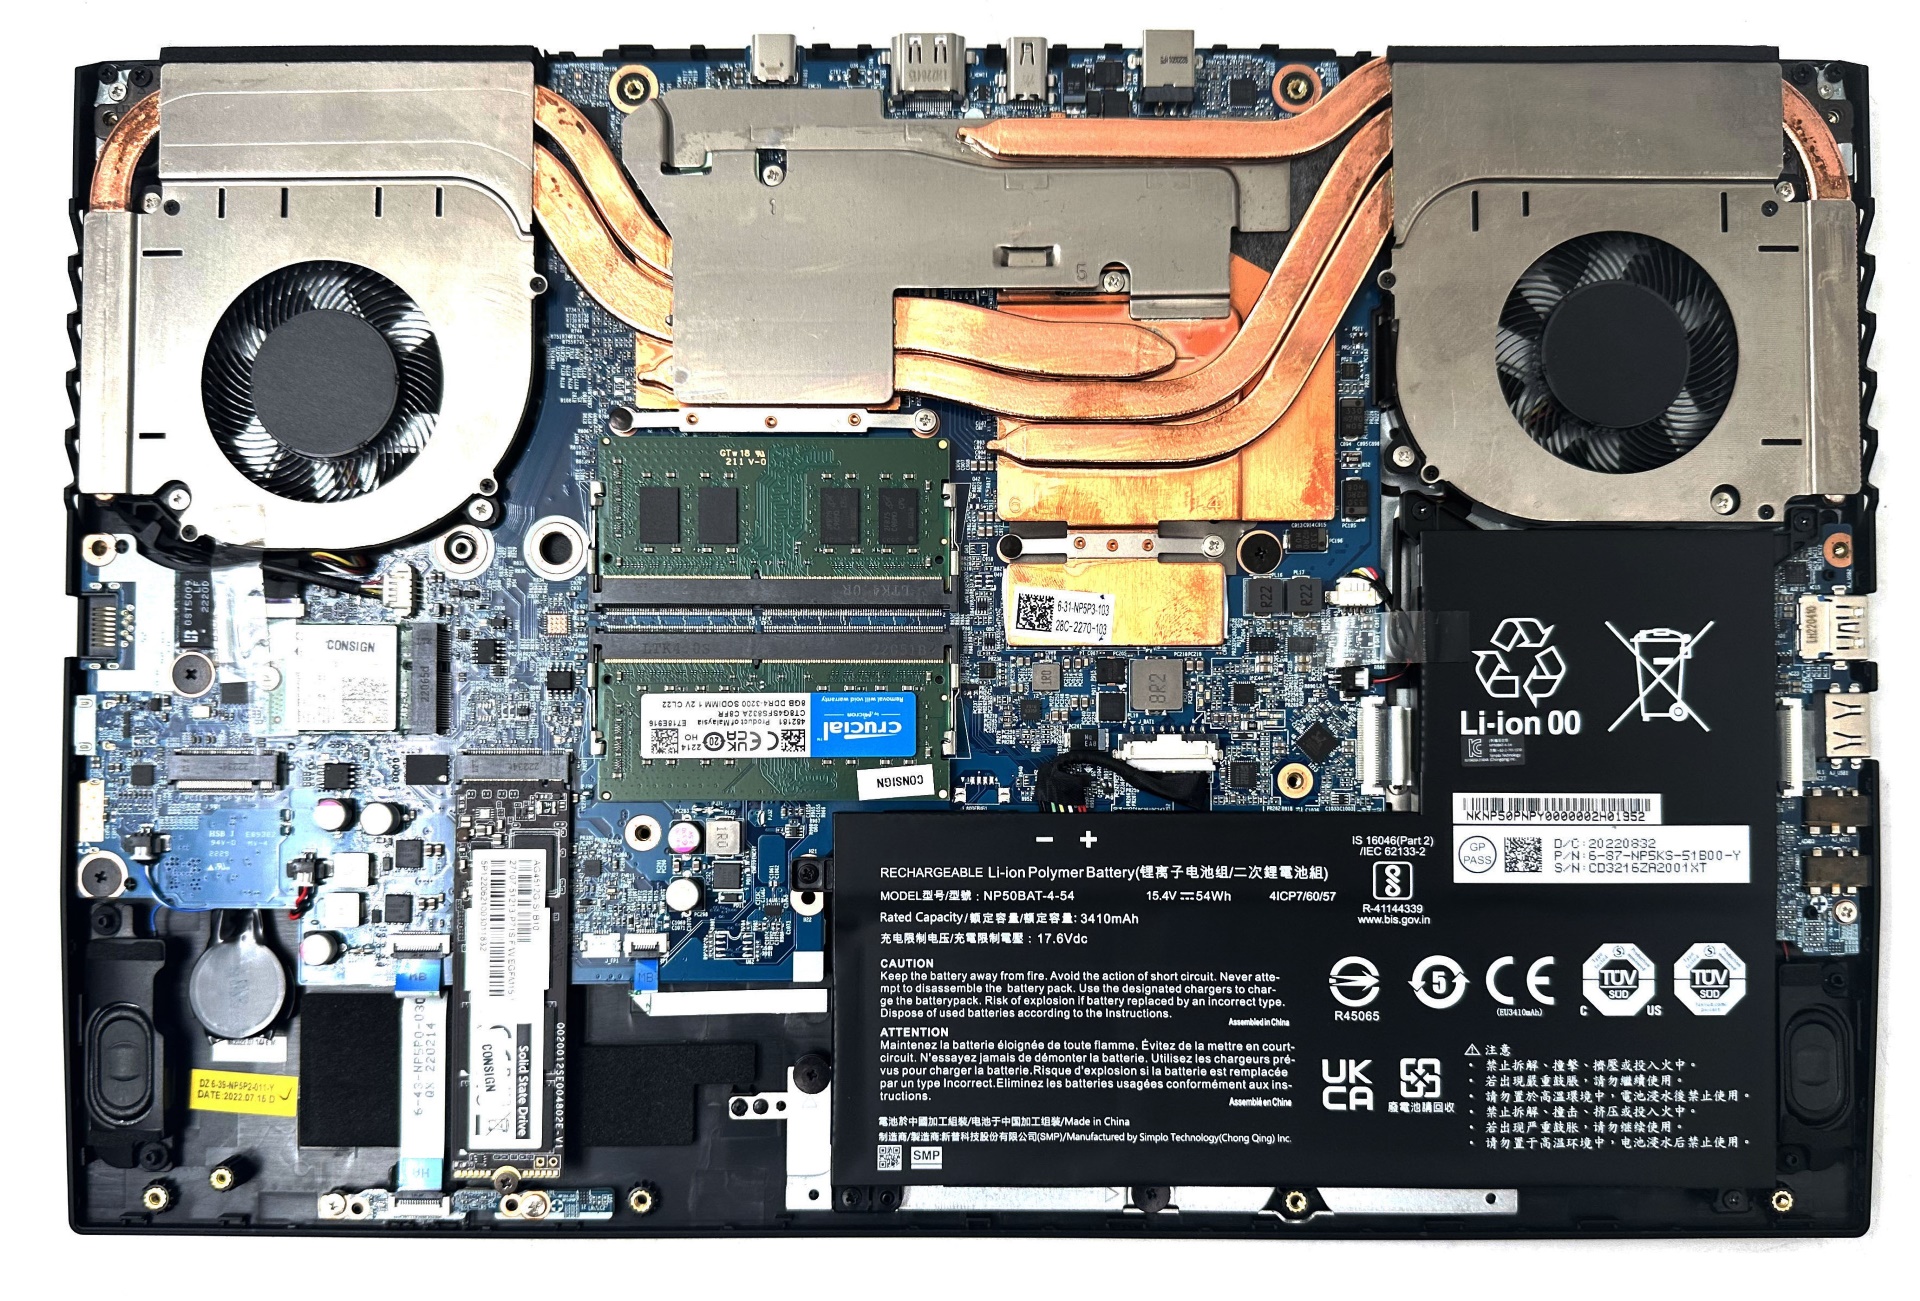
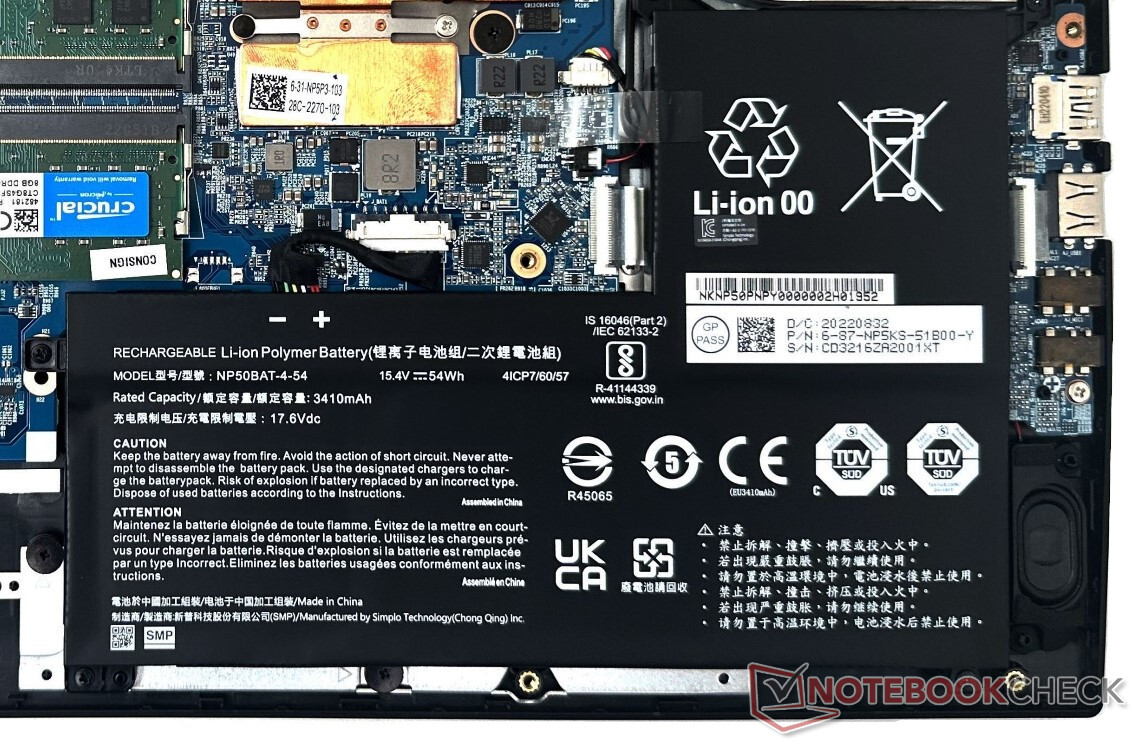
Odkręcenie 13 śrubek Philipsa odsłania wnętrze obudowy. Pamięć RAM DDR4, karta WLAN i dyski SSD mogą być wymieniane i ulepszane w razie potrzeby.

Łączność: Odpowiedni wybór portów i stabilne Wi-Fi
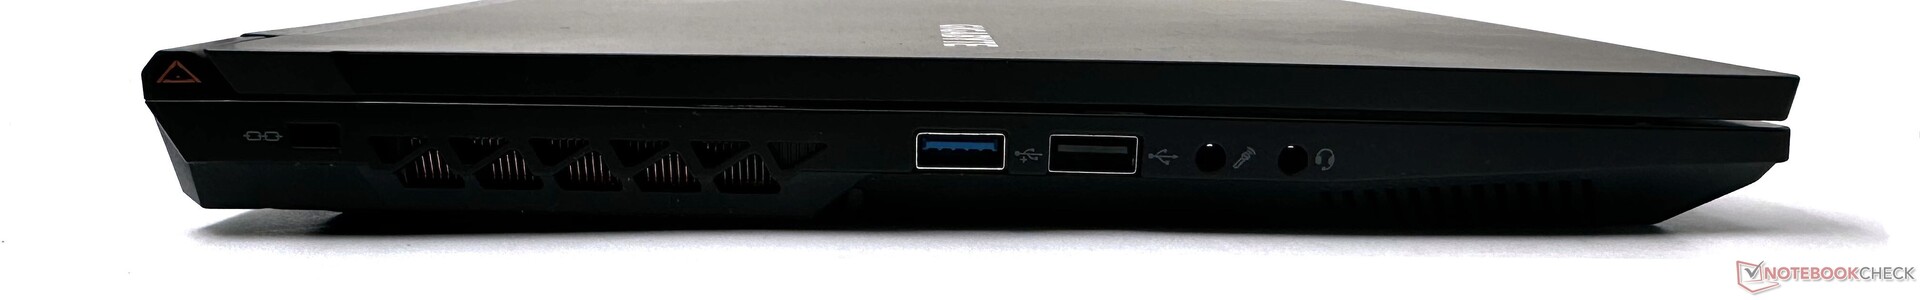
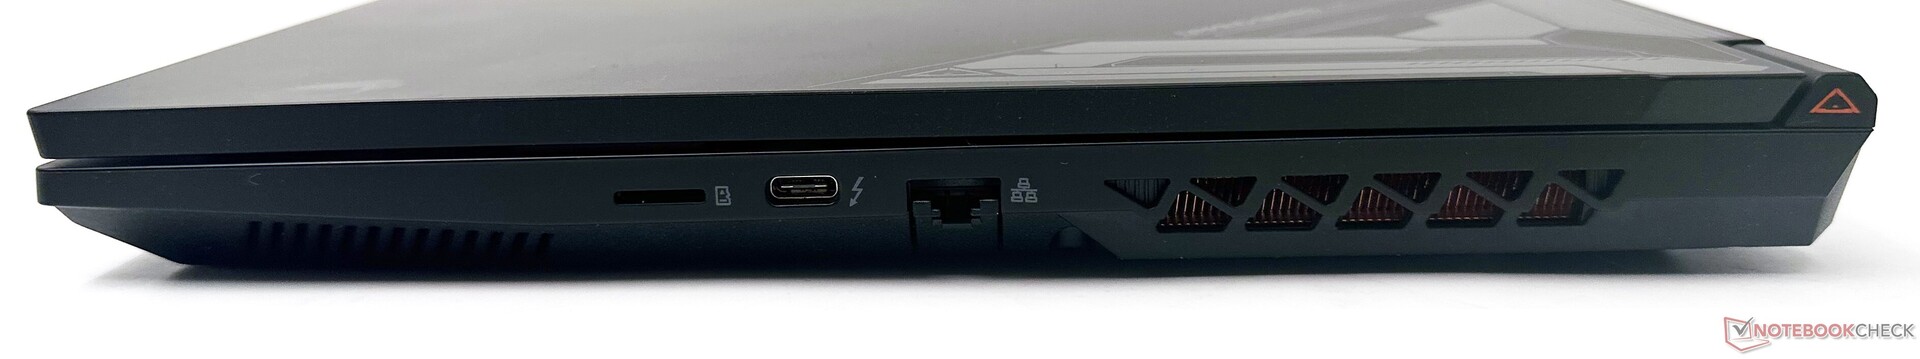
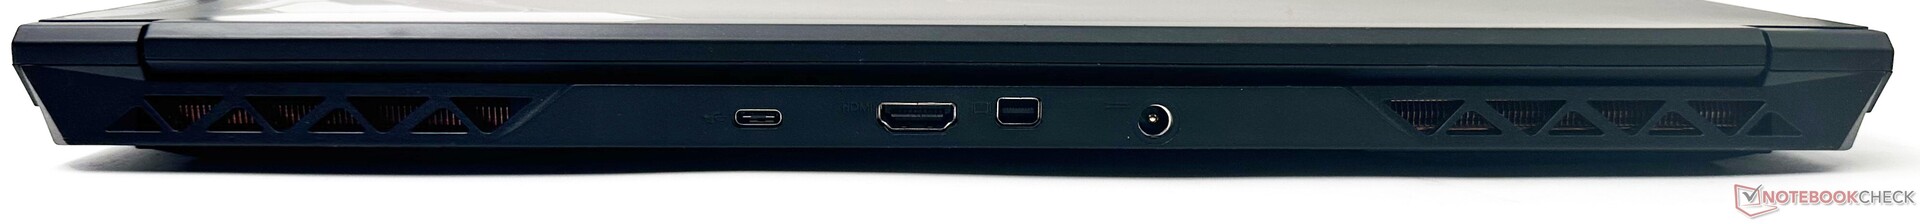
G5 KE oferuje bogaty wybór portów dzięki kombinacji portów USB typu A i typu C, w tym Thunderbolt 4. Obecność mini-DisplayPort 1.4 oraz wyjścia HDMI 2.1 pomaga w łatwym podłączeniu monitorów 4K o wysokiej częstotliwości odświeżania.
Porty nie stanowią żadnej przeszkody podczas podłączania wielu urządzeń. Dedykowany port mic-in - rzadkość w dzisiejszych czasach - przydaje się do podłączania wysokiej jakości mikrofonów lub może być przekonfigurowany do obsługi wielokanałowego dźwięku.
Szybkość odczytu kart microSD mogłaby być lepsza, ale G5 KE nie ma w tym aspekcie zbyt dużej konkurencji.
| SD Card Reader | |
| average JPG Copy Test (av. of 3 runs) | |
| Średnia w klasie Gaming (20.9 - 210, n=55, ostatnie 2 lata) | |
| Gigabyte G5 KE (AV PRO microSD 128 GB V60) | |
| Schenker XMG Core 15 (M22) (AV PRO microSD 128 GB V60) | |
| HP Victus 16-e0179ng (AV PRO microSD 128 GB V60) | |
| maximum AS SSD Seq Read Test (1GB) | |
| Średnia w klasie Gaming (25.5 - 261, n=52, ostatnie 2 lata) | |
| Gigabyte G5 KE (AV PRO microSD 128 GB V60) | |
| Gigabyte G7 KE (AV PRO microSD 128 GB V60) | |
| Schenker XMG Core 15 (M22) (AV PRO microSD 128 GB V60) | |
| HP Victus 16-e0179ng (AV PRO microSD 128 GB V60) | |
G5 KE nie oferuje Wi-Fi 6E. Mimo to zaobserwowaliśmy bardzo dobrą i dość spójną przepustowość w paśmie 5 GHz podczas testów z naszym referencyjnym routerem Asus ROG Rapture GT-AXE11000.
Kamera internetowa 720p wykazuje duże odchylenia w kolorach, a obrazom brakuje ogólnej ostrości. Powinna ona jednak nadawać się do przeprowadzania pojedynczych rozmów wideo.


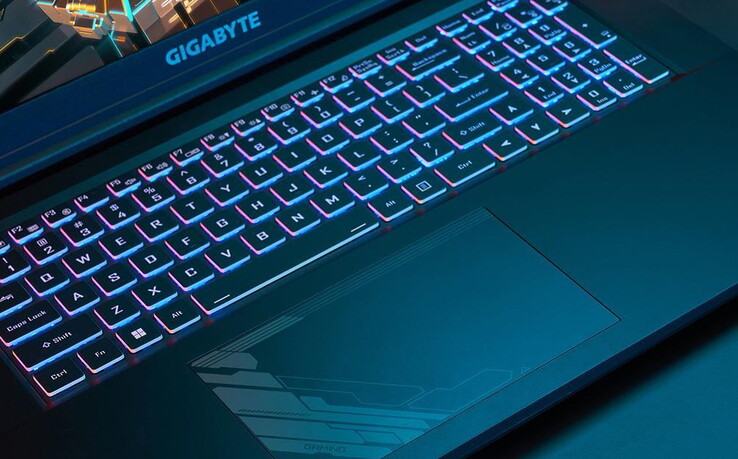
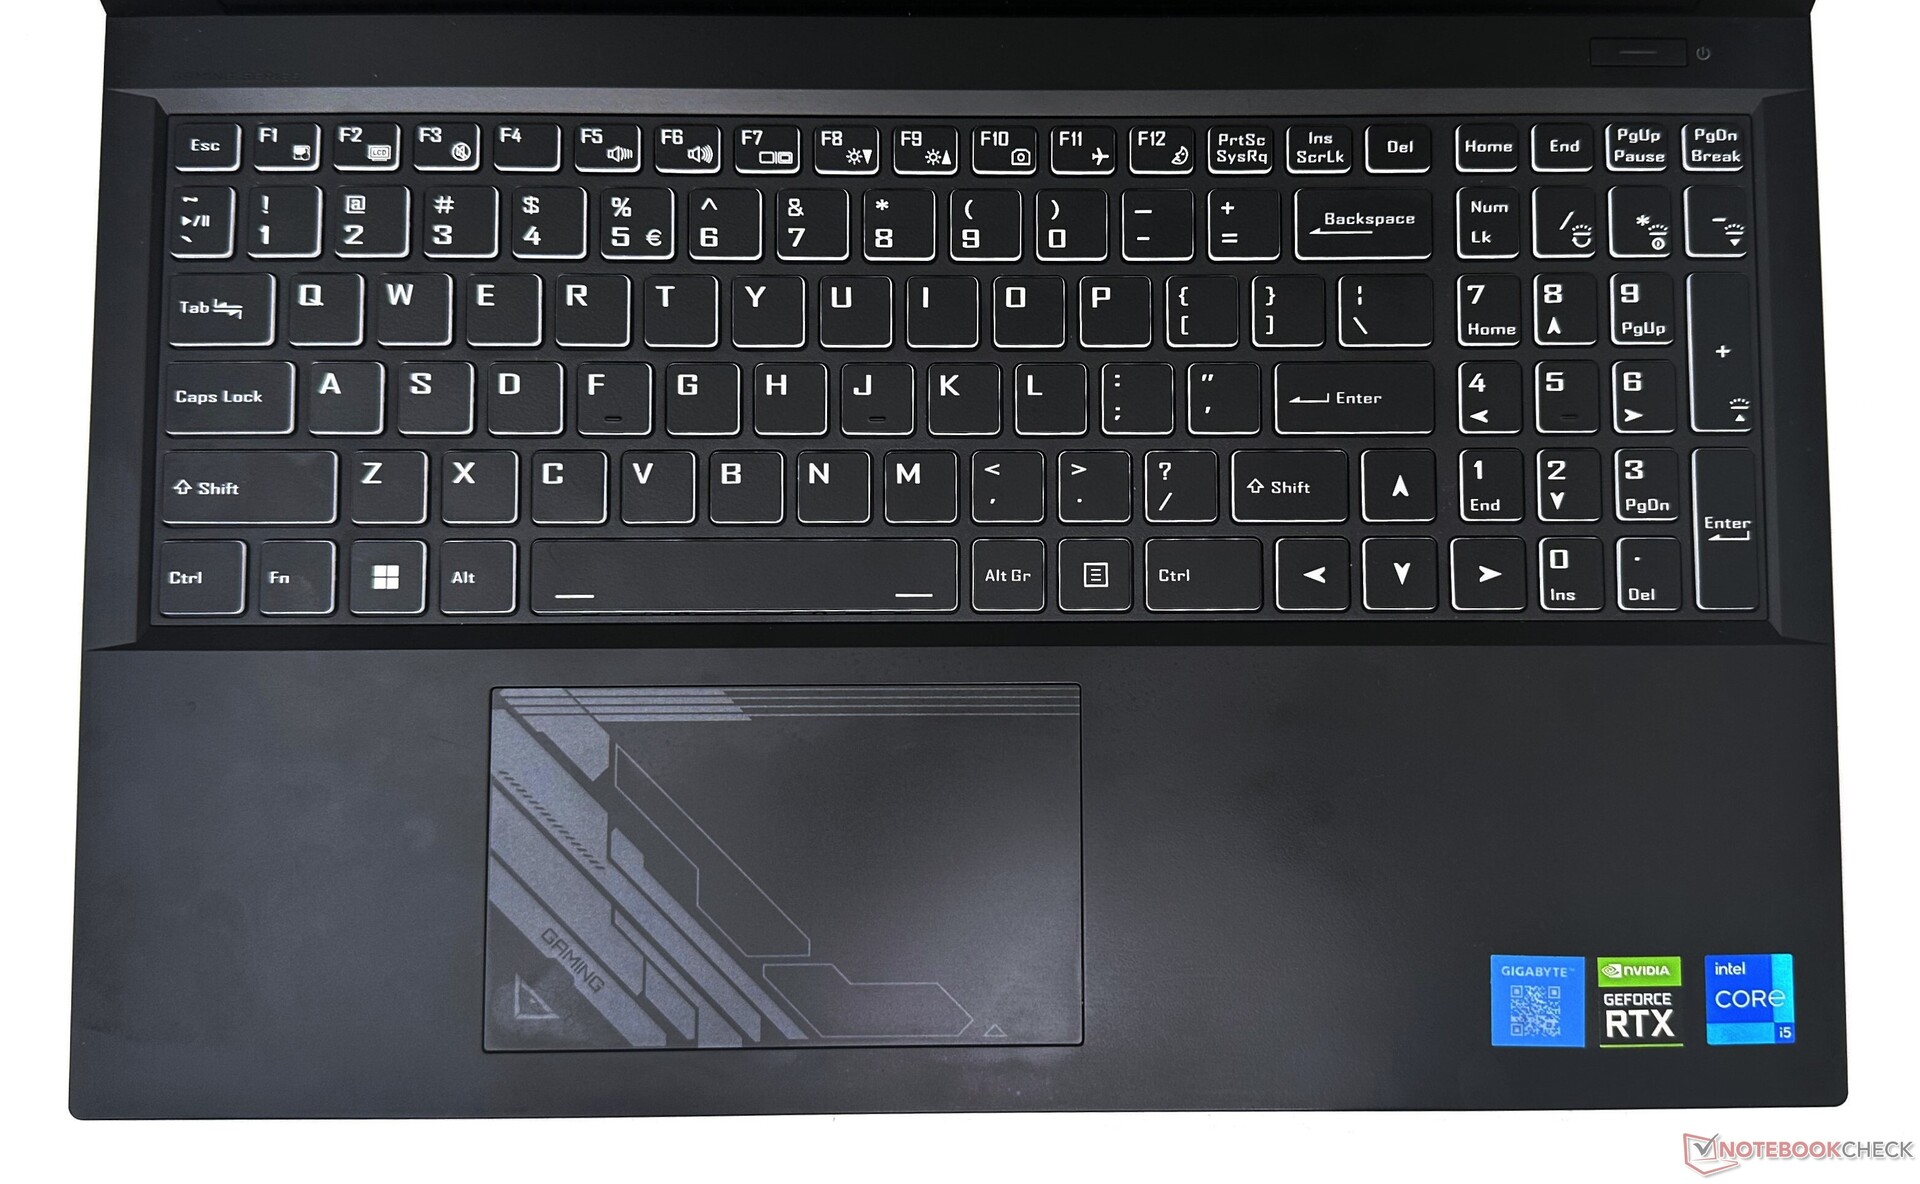
Urządzenia wejściowe: Pełnowymiarowe klawisze strzałek
Klawiatura typu chiclet oferuje przyzwoity skok i aktywację. Jednak pisanie jest nieco miękkie, a wrażenia dotykowe są nieco niewystarczające. Pełnowymiarowe klawisze strzałek umożliwiają wygodną nawigację w dokumentach i arkuszach kalkulacyjnych.
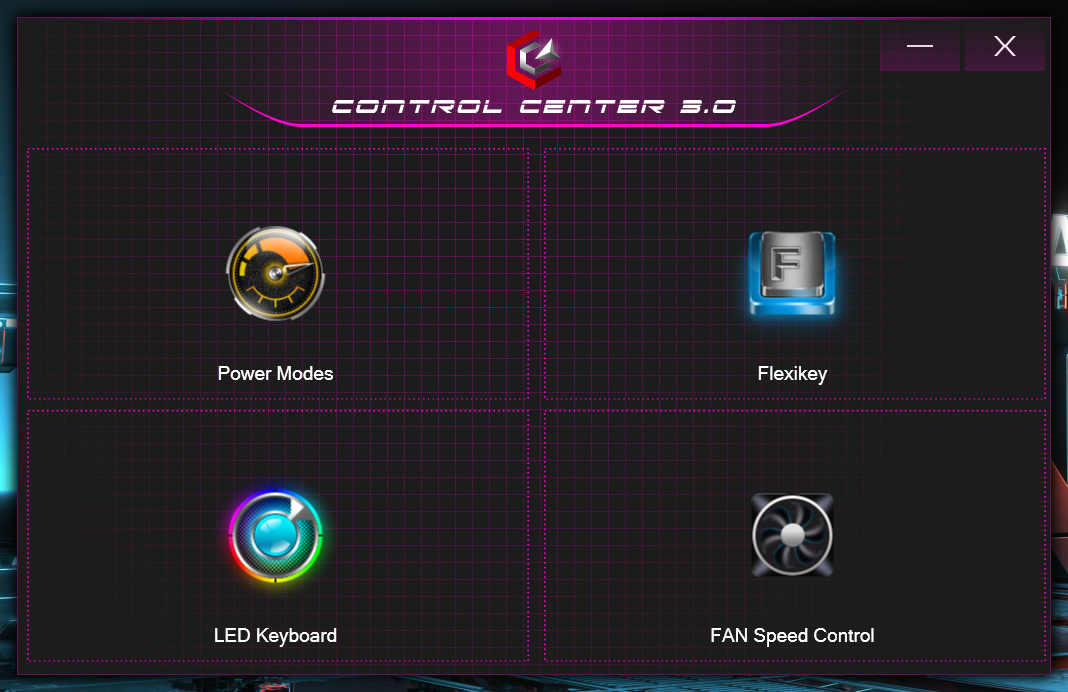
Podświetlenie RGB można regulować w czterech krokach. Nie jest to klawiatura z wielostrefowym podświetleniem RGB, ale niektóre ustawienia można dostosować za pomocą oprogramowania Control Center 3.0.
Touchpad o wymiarach 12 cm x 7,5 cm jest wystarczająco pojemny, obsługuje gesty Windows Precision i oferuje dobry ślizg z minimalnym oporem. Cała powierzchnia działa jak lewy przycisk myszy. Kliknięcia mają krótki skok i dobrą wyczuwalność.
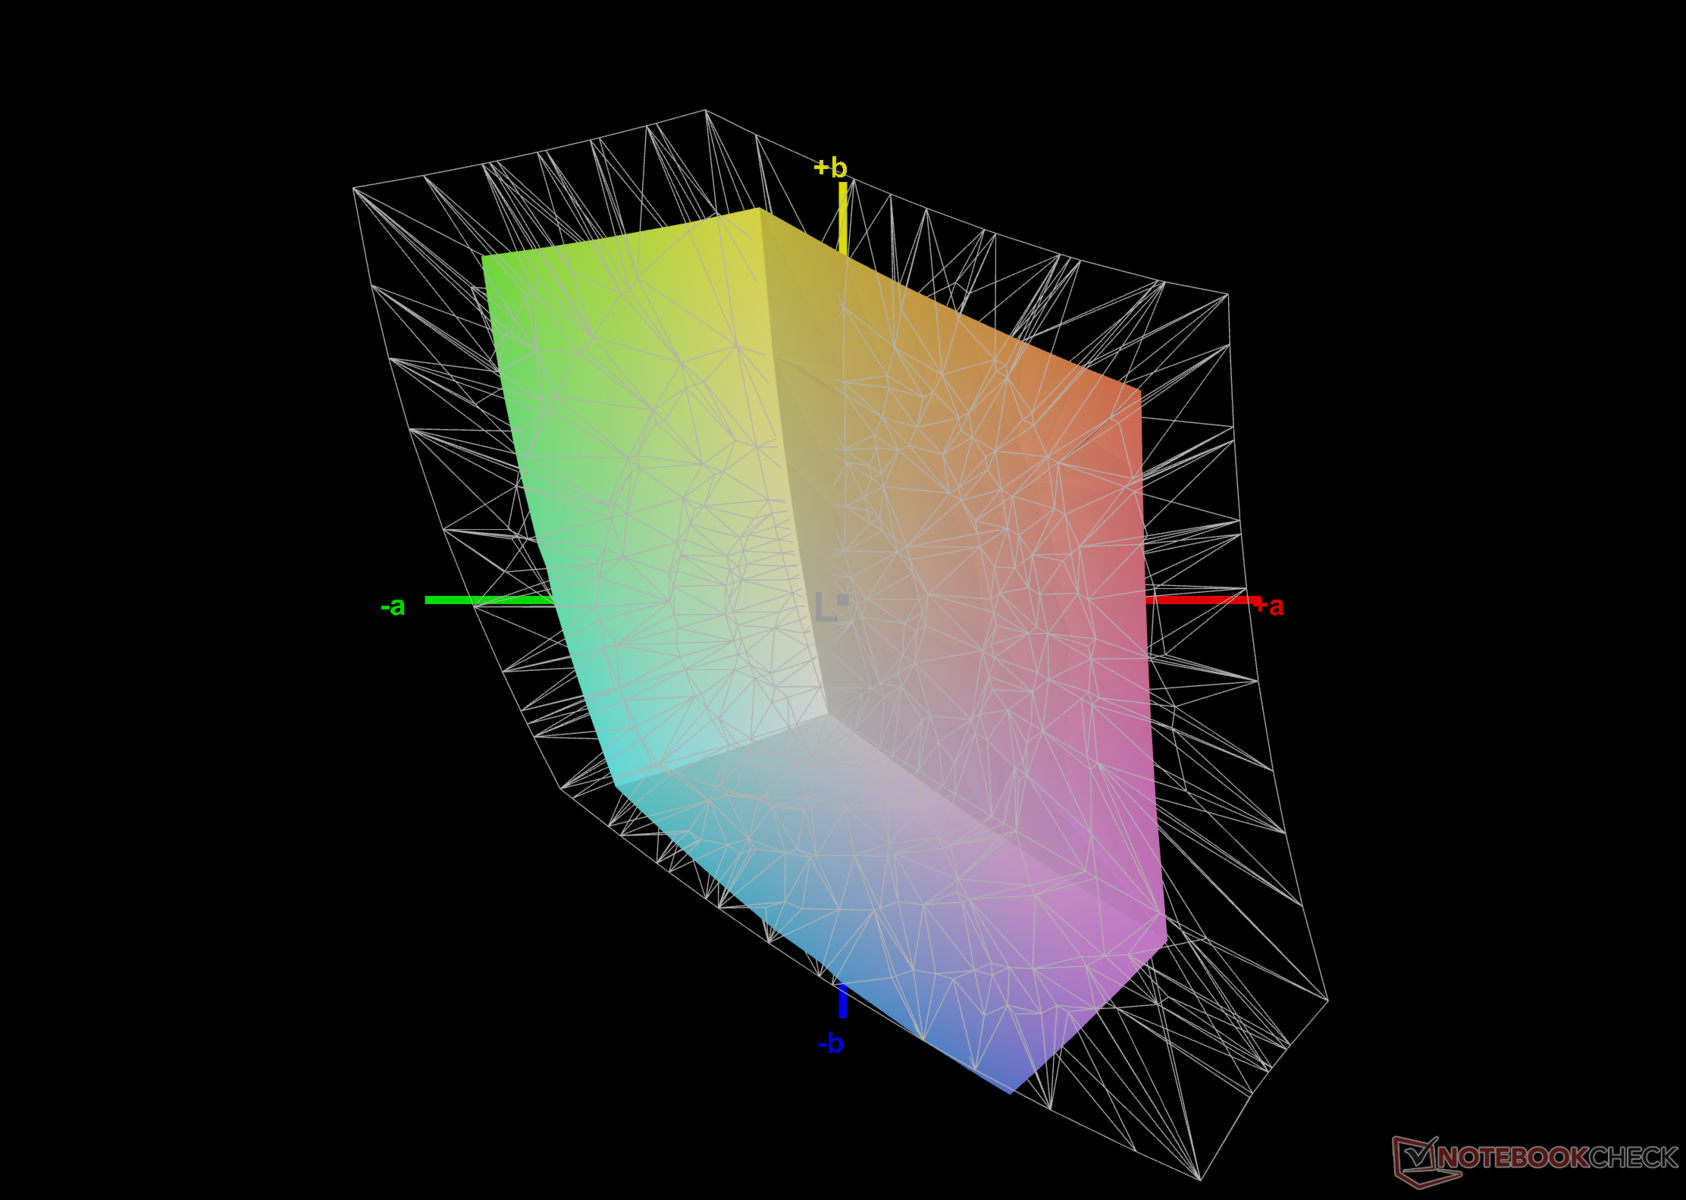
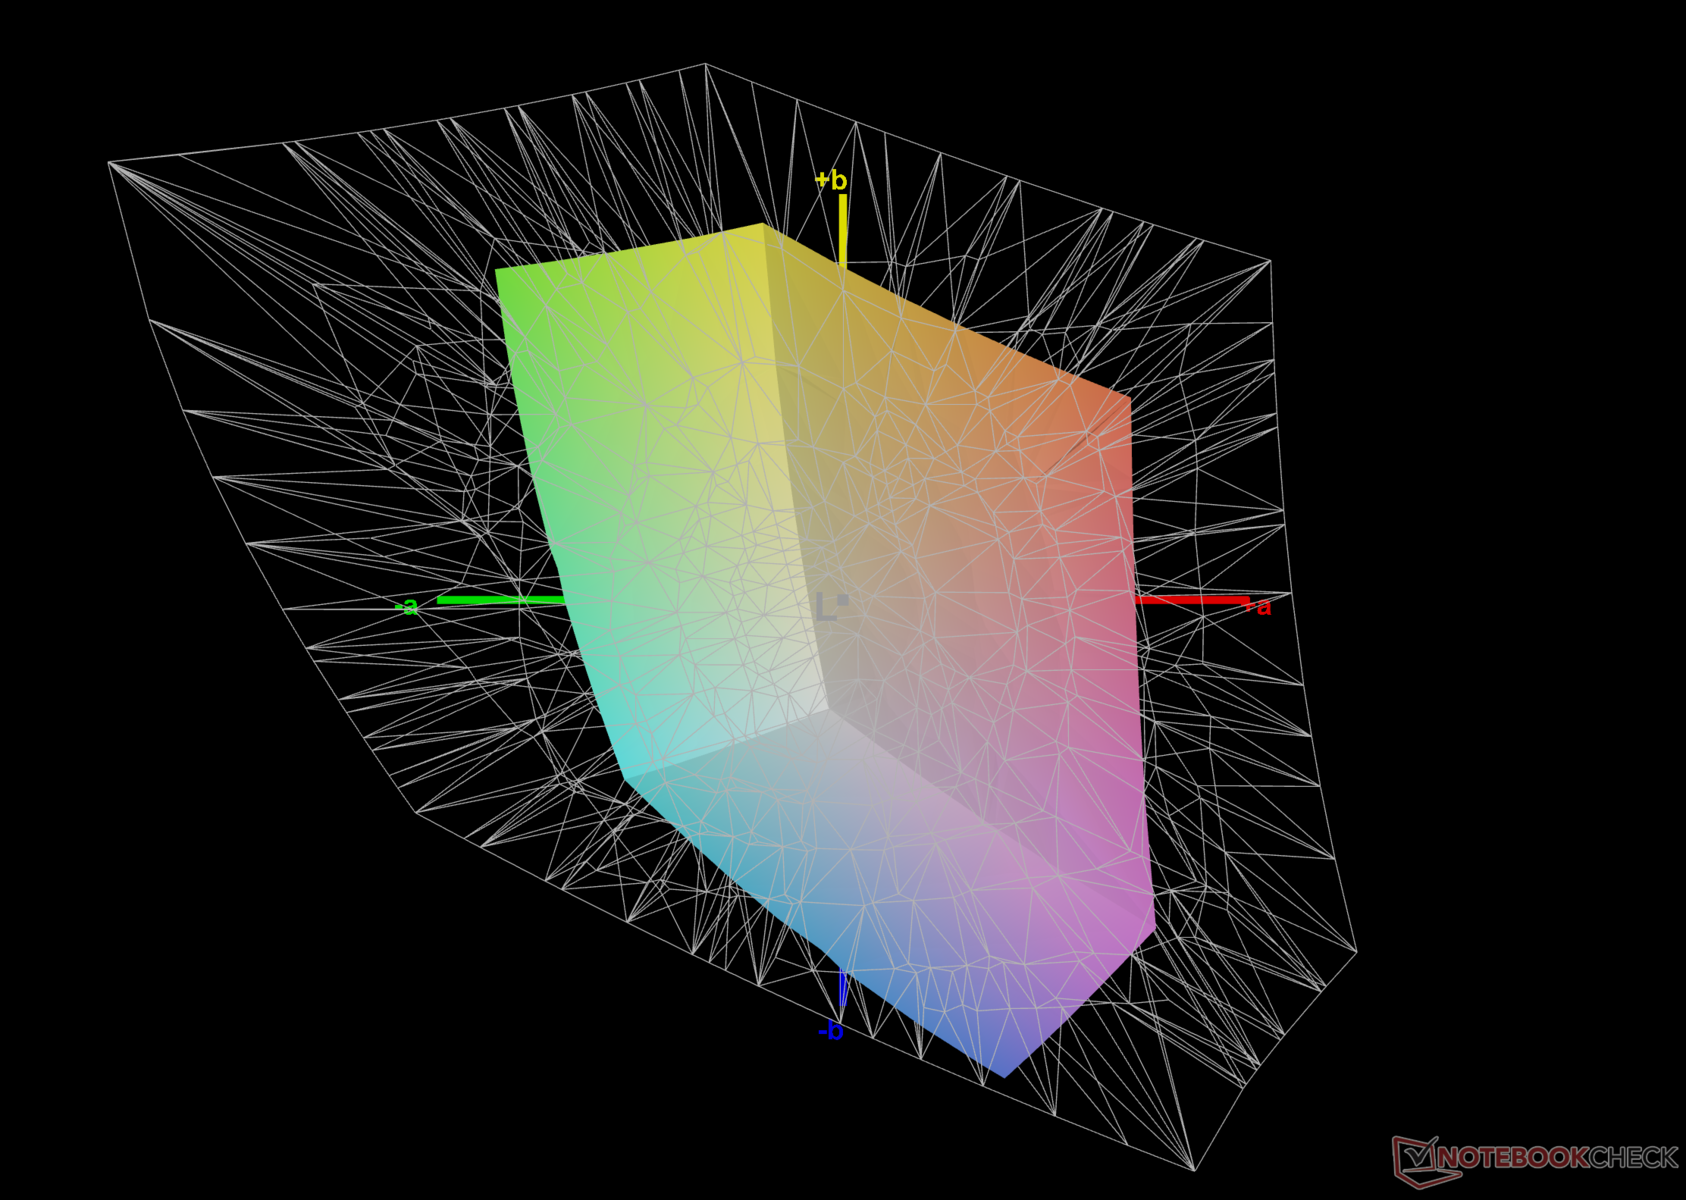
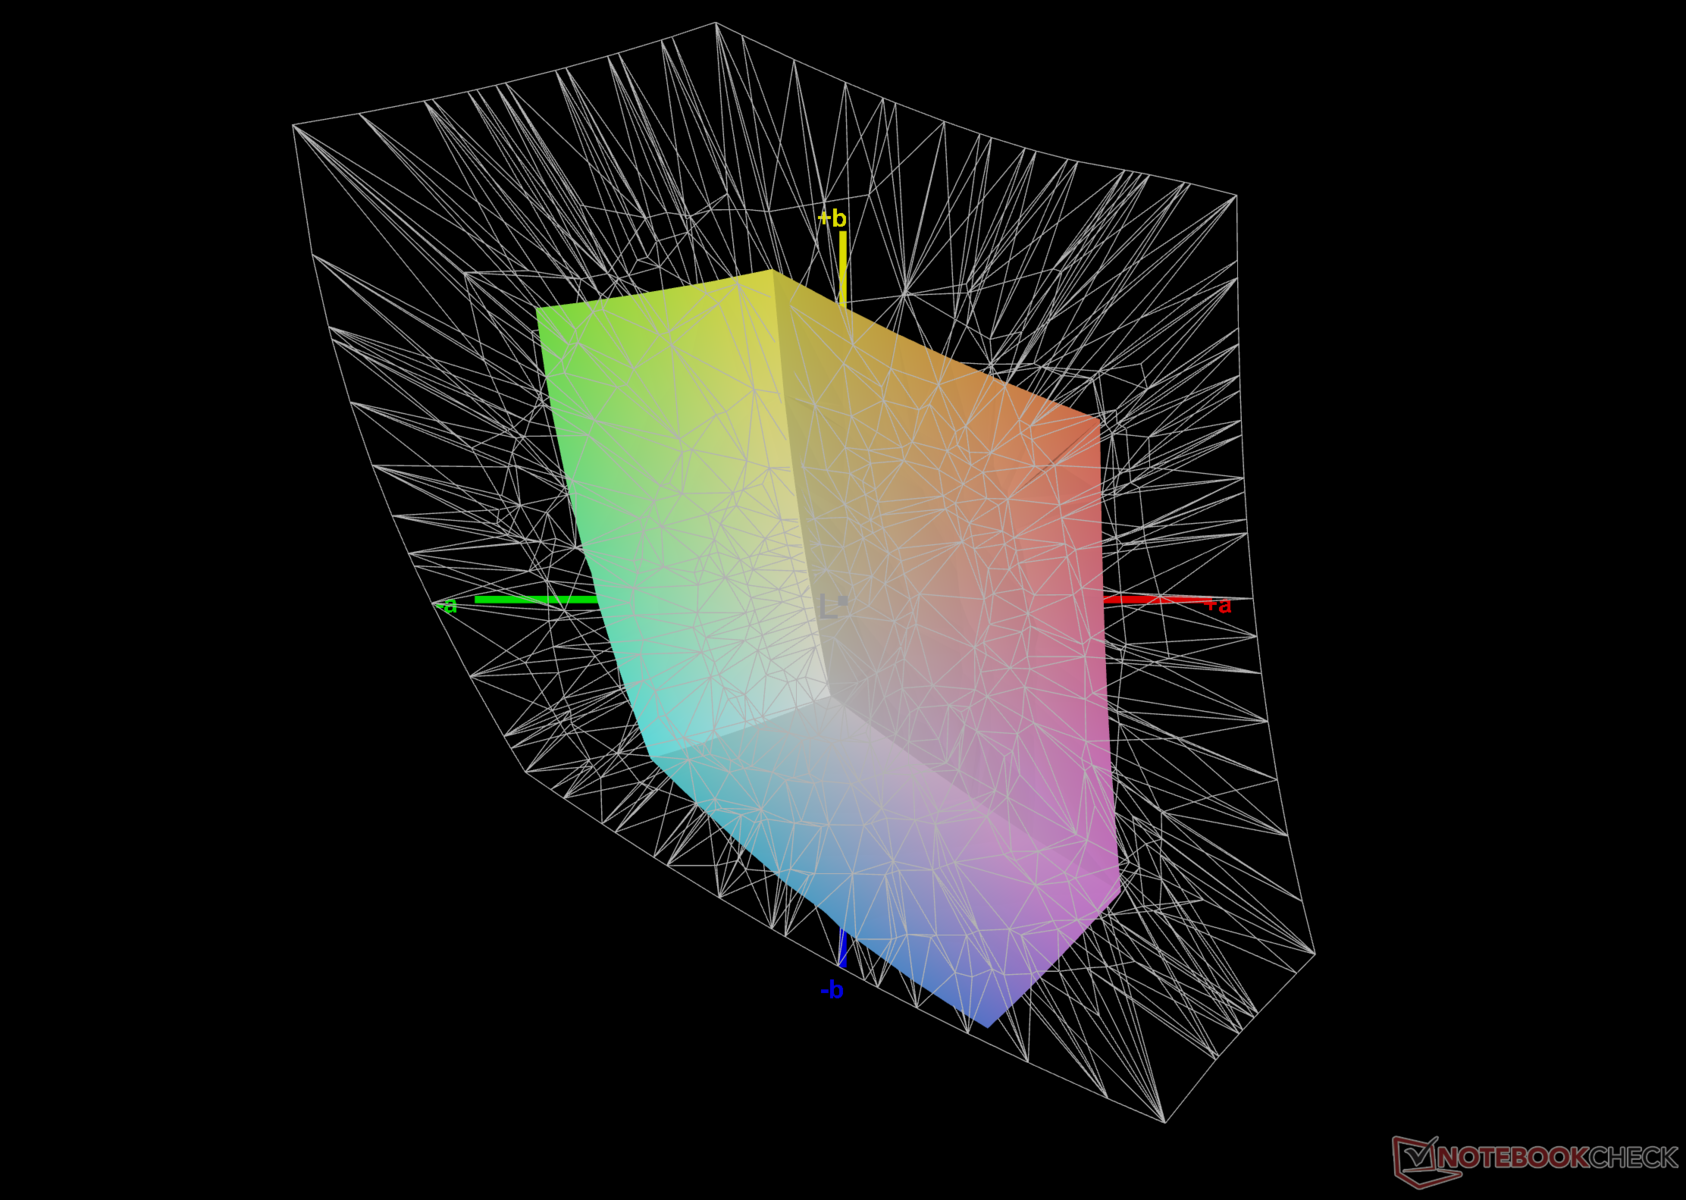
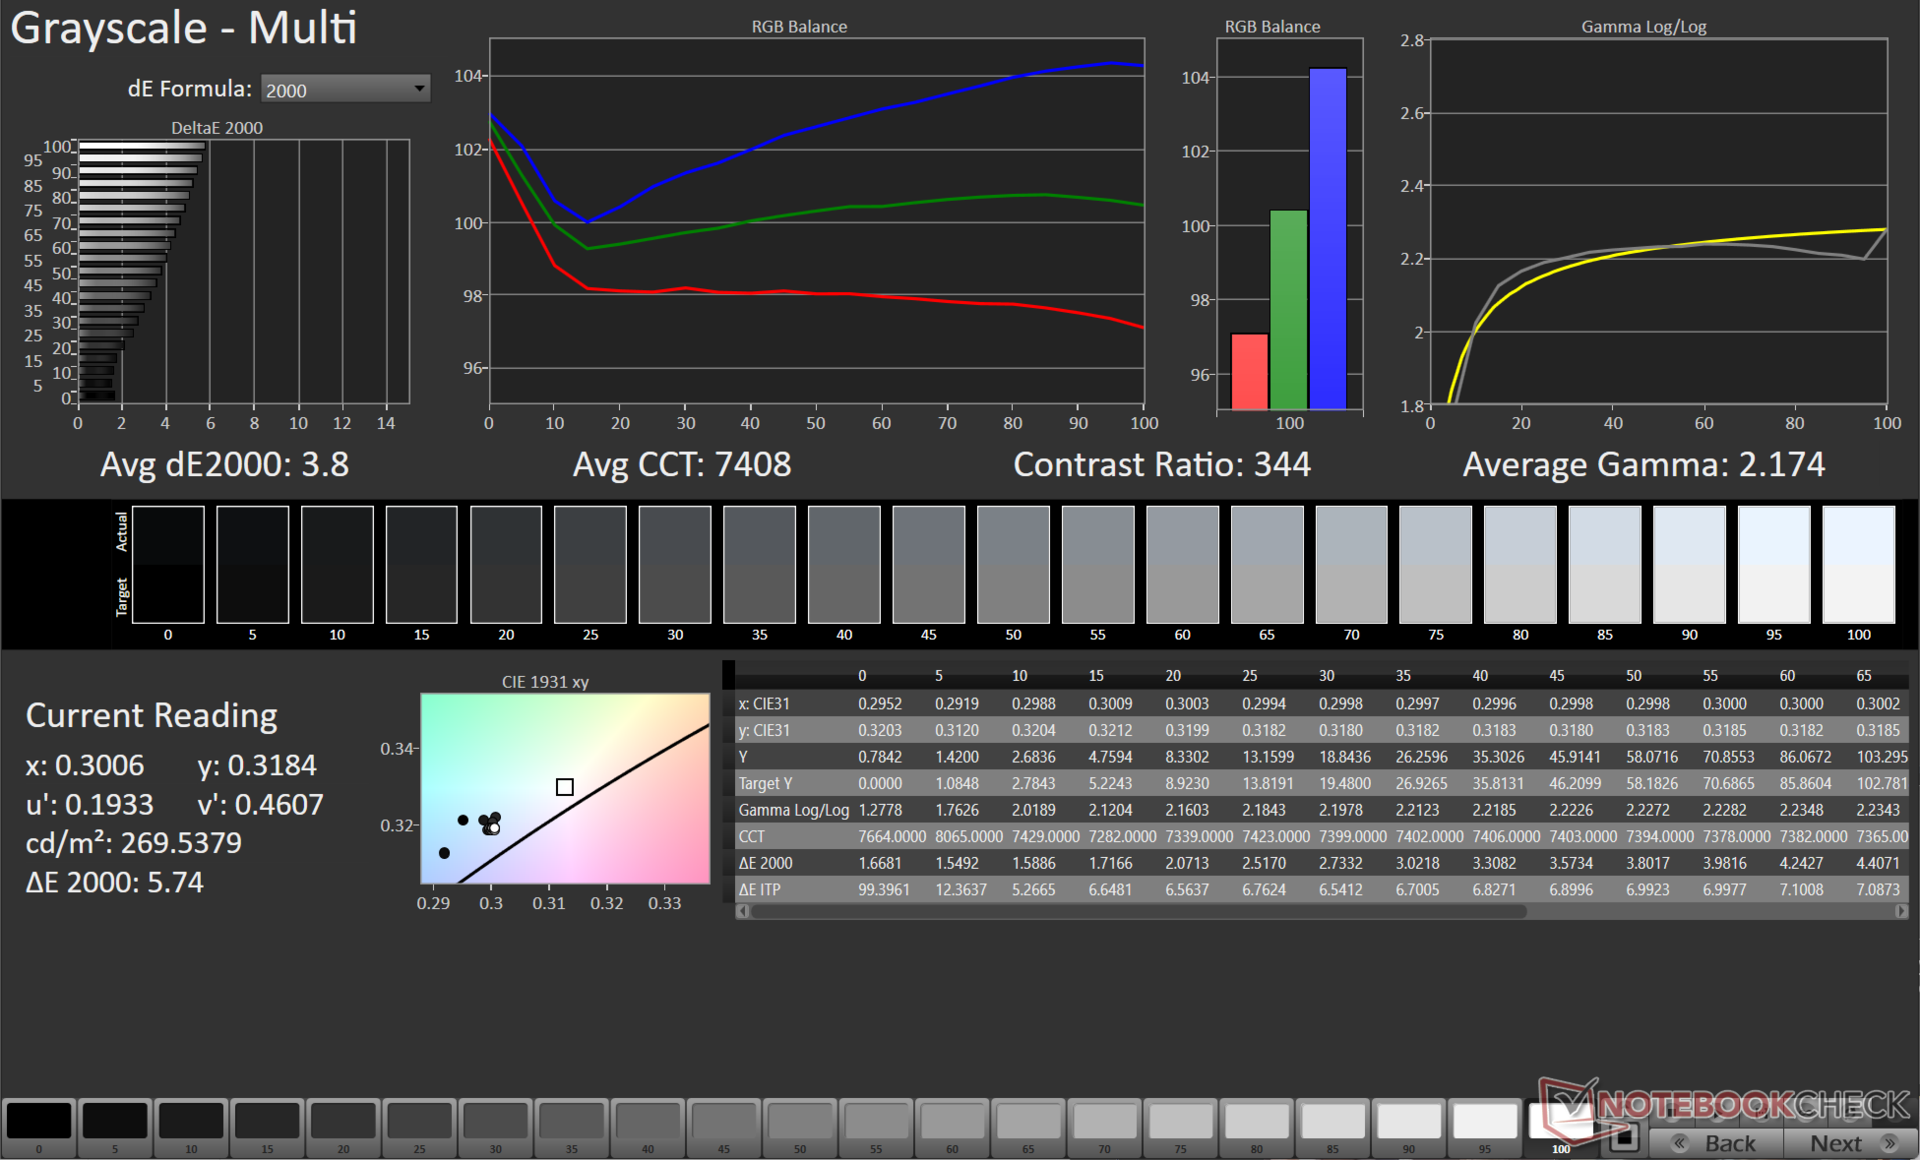
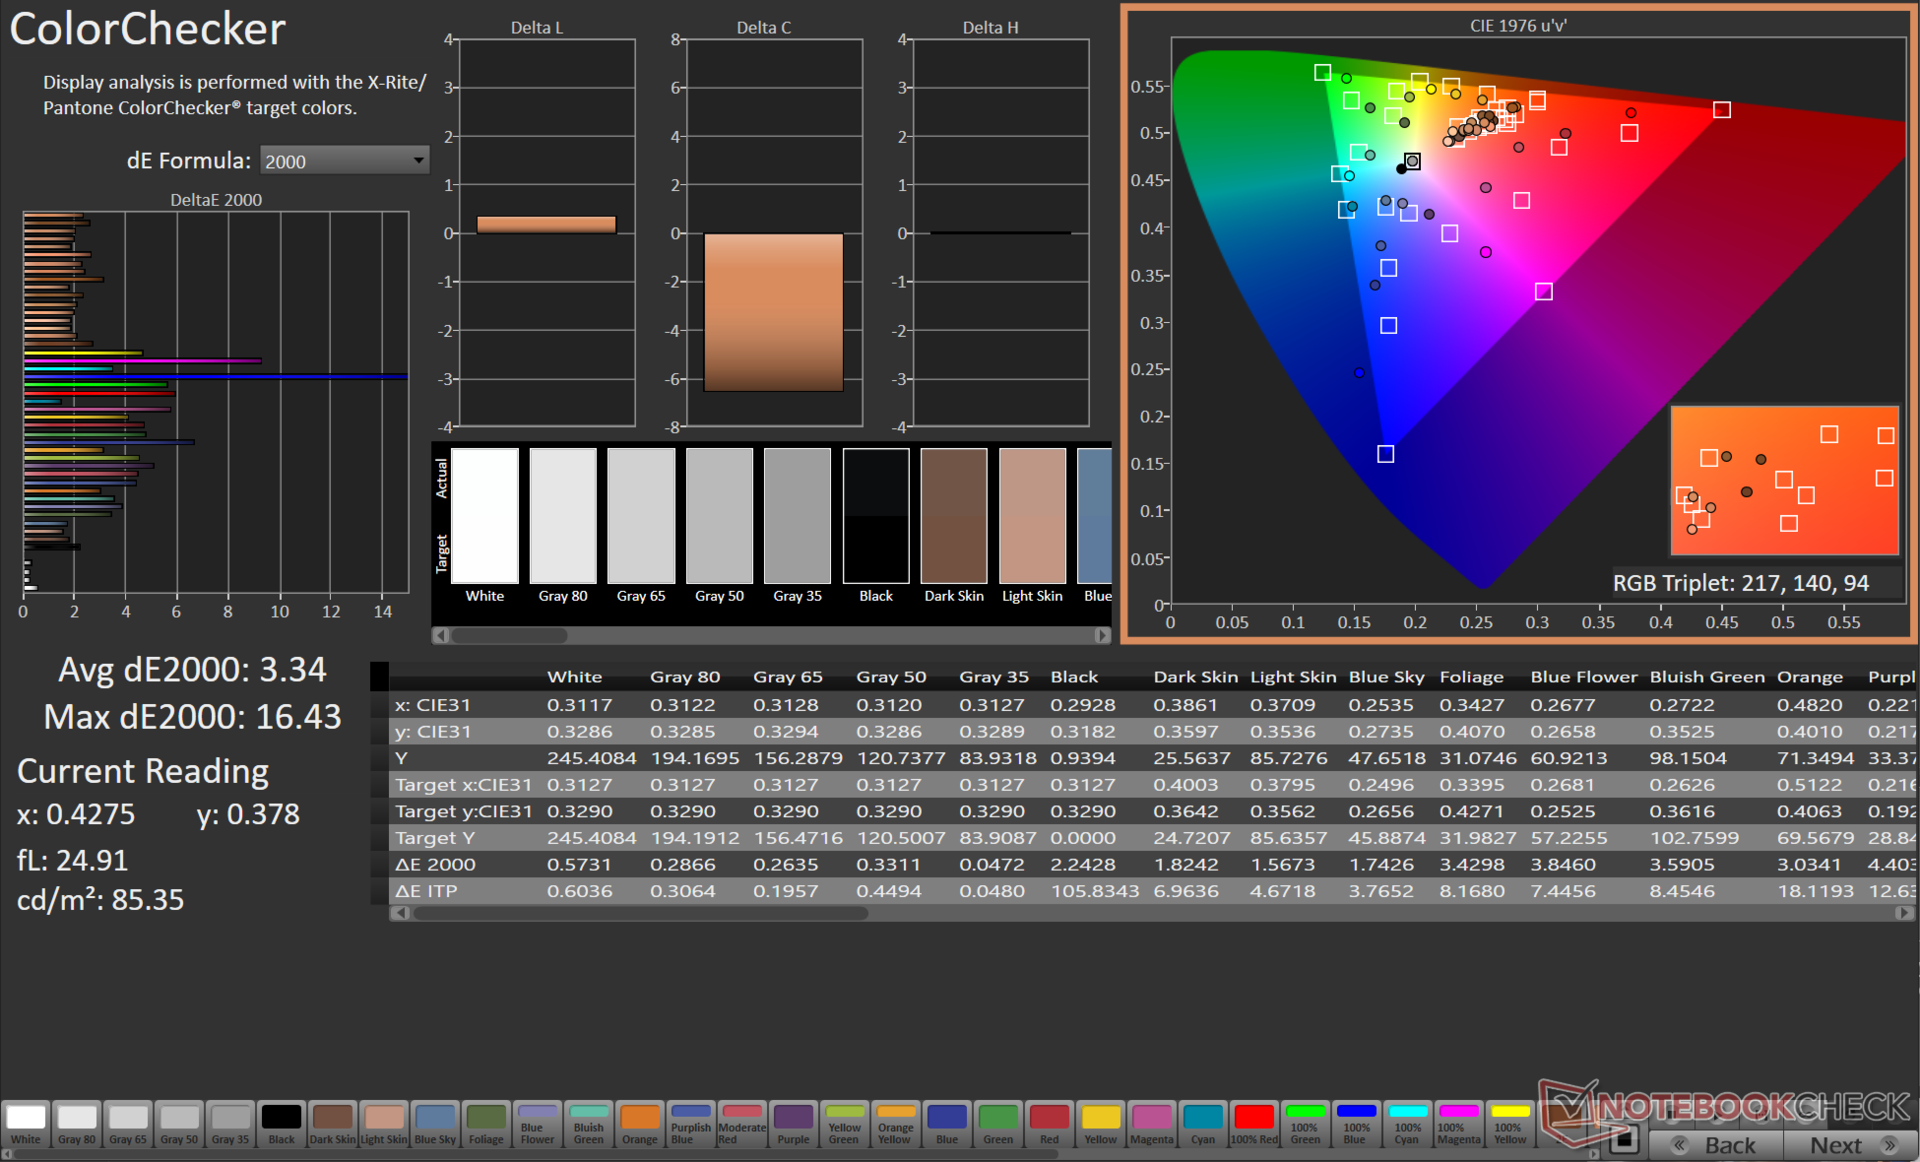
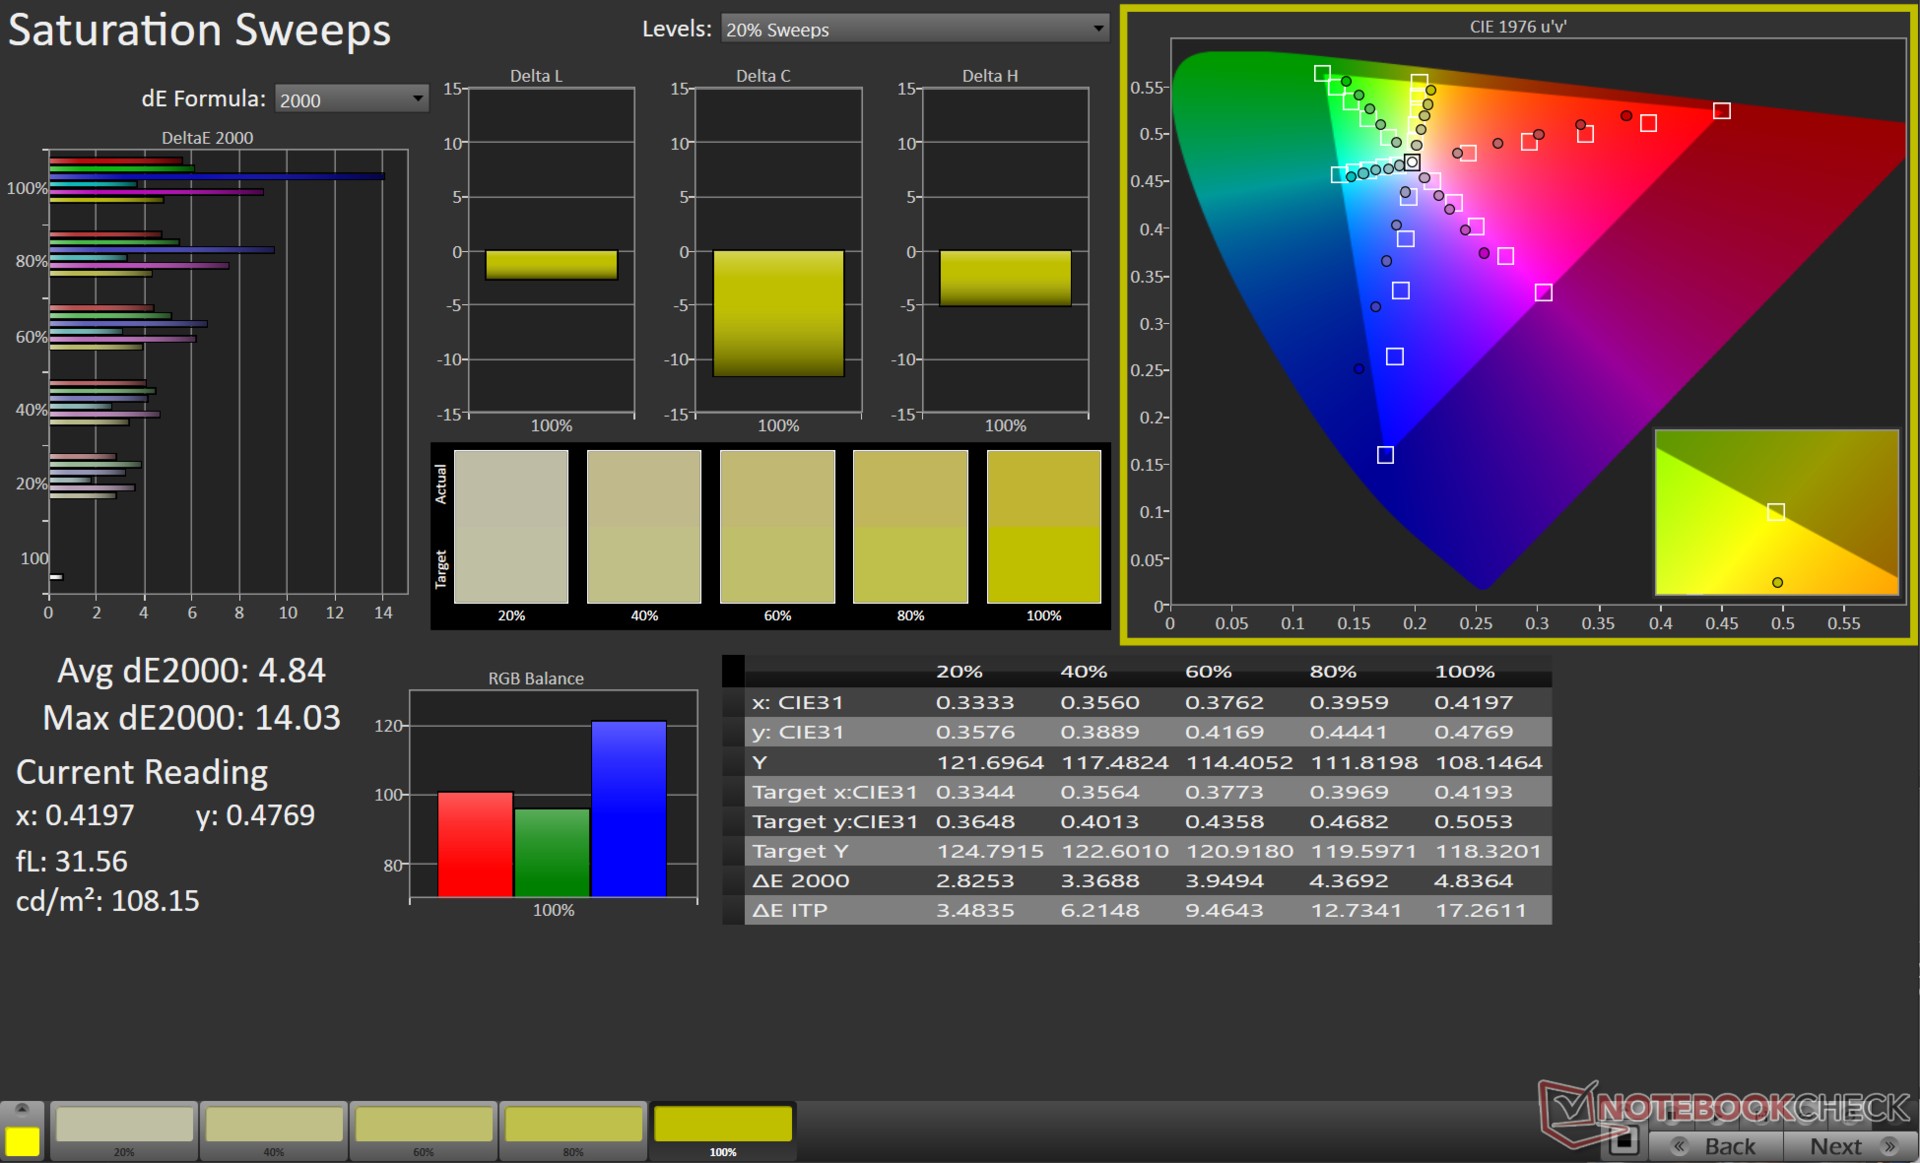
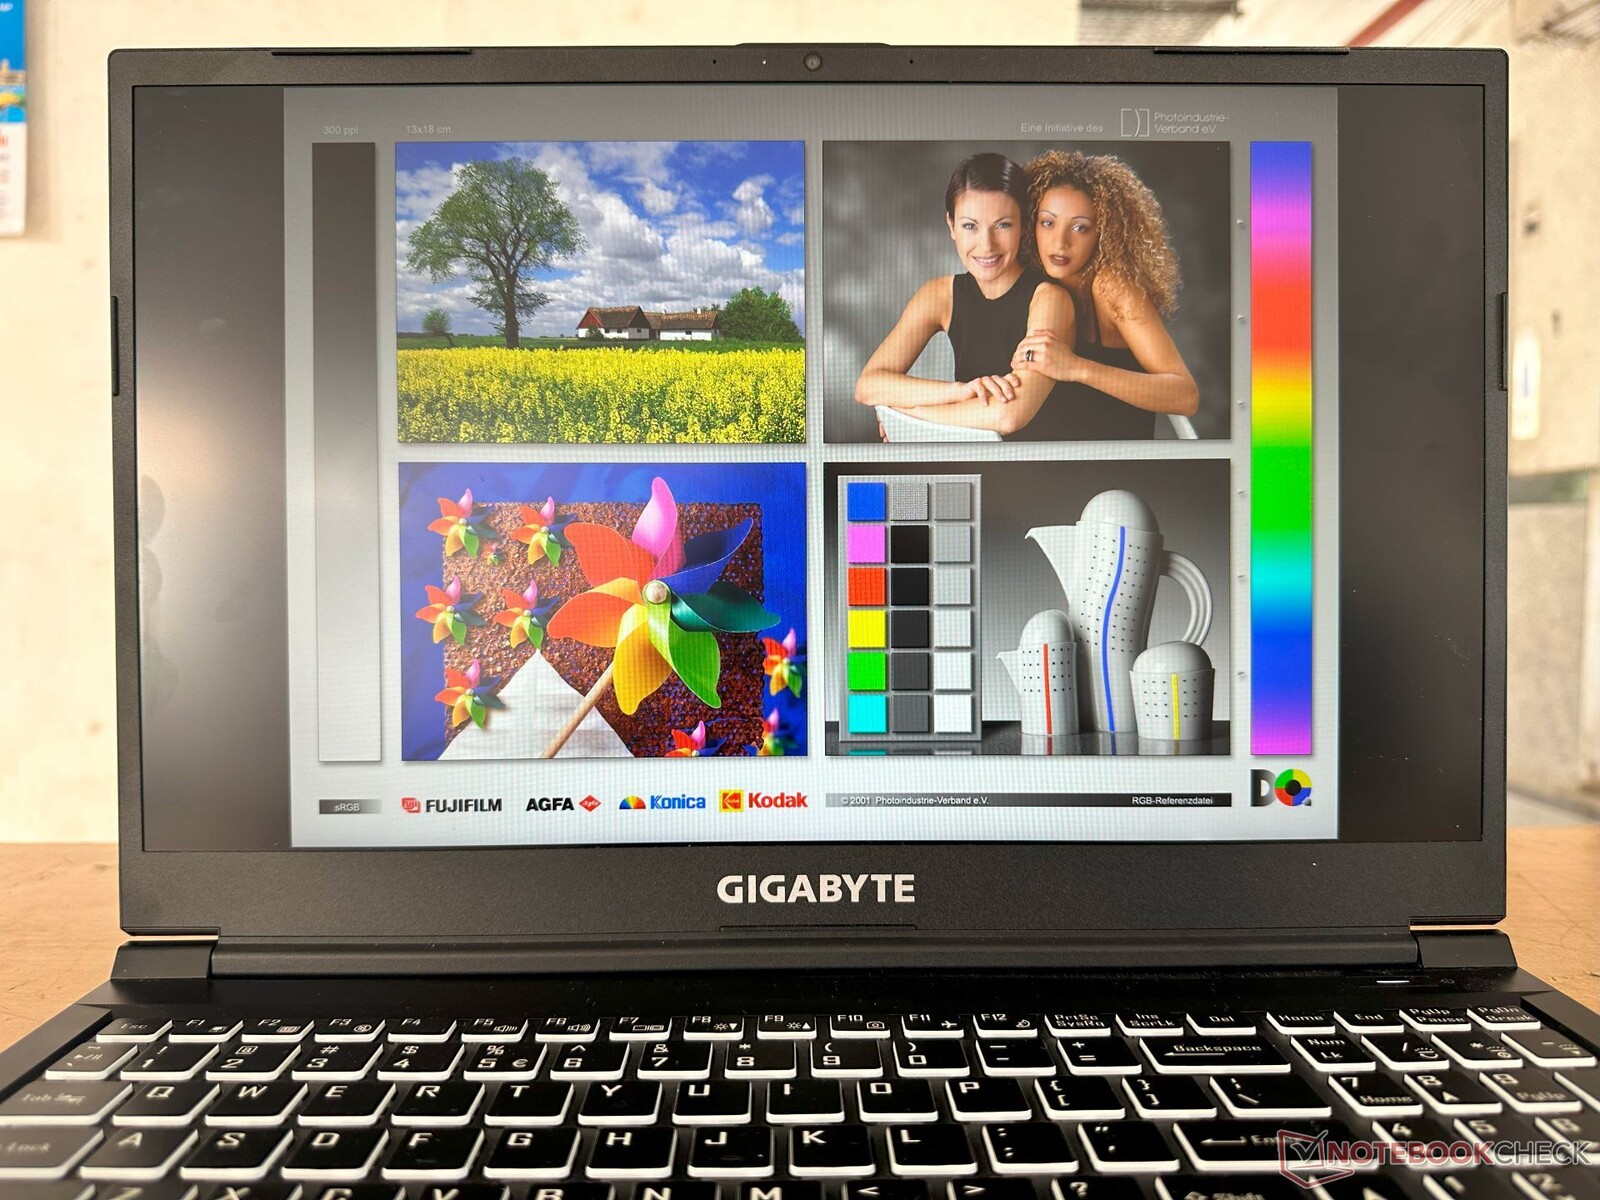
Wyświetlacz: Słabe pokrycie gamy kolorów z wysokim czasem reakcji i brakiem PWM
Panel Chi Mei w Gigabyte G5 KE o rozdzielczości 1080p 144 Hz zaczyna w tym momencie pokazywać swoje lata. Widzieliśmy ten panel już wcześniej w modelu 2021 Gigabyte G5 GD oraz Asus TUF Gaming F15 FX506HM. Konkurencja przeszła na lepsze panele o znacznie szerszym pokryciu palety barw.
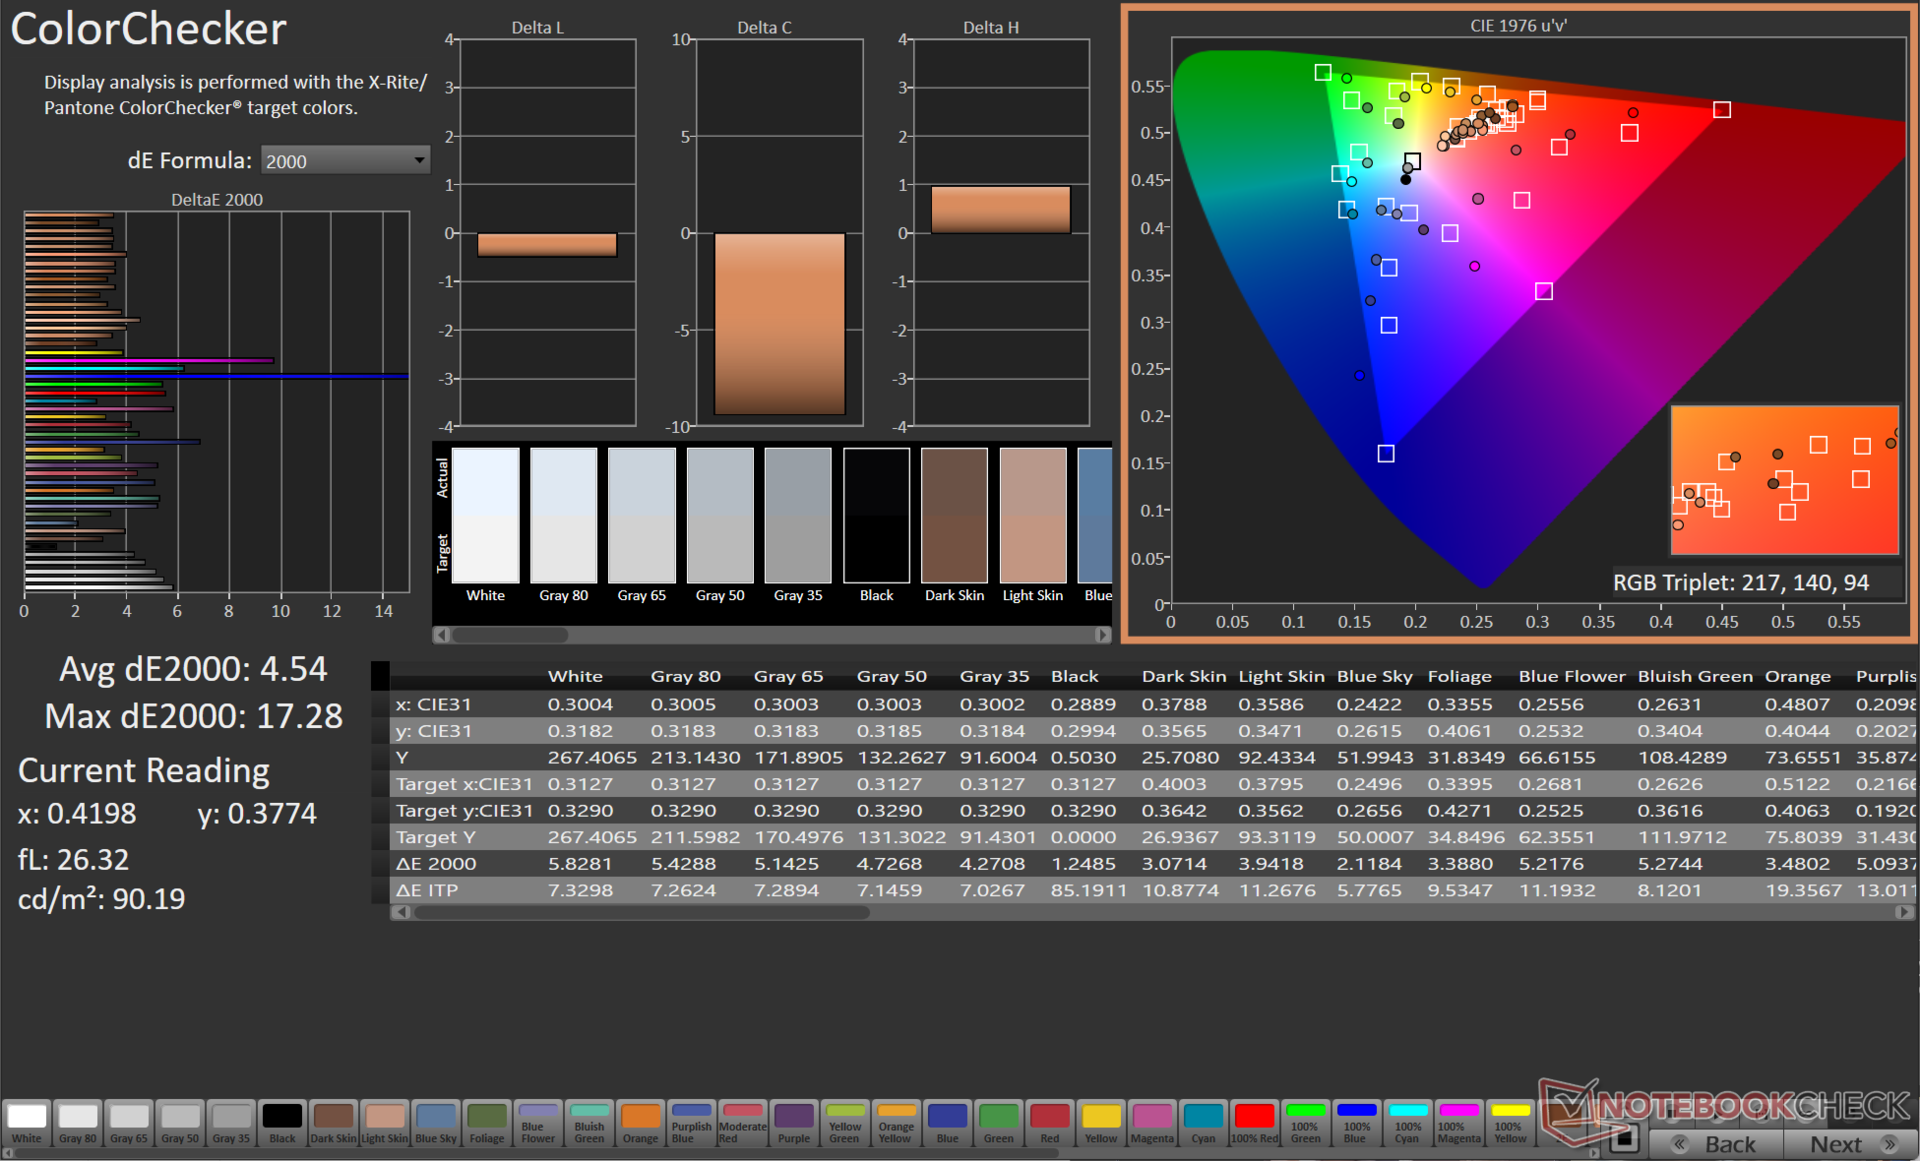
Rozkład jasności jest przyzwoity i wynosi 85%, ale zakres gamutu kolorów jest słaby jak na laptop z 2023 roku, a pokrycie sRGB wynosi zaledwie około 61%.


| |||||||||||||||||||||||||
rozświetlenie: 85 %
na akumulatorze: 266 cd/m²
kontrast: 538:1 (czerń: 0.5 cd/m²)
ΔE ColorChecker Calman: 4.54 | ∀{0.5-29.43 Ø4.71}
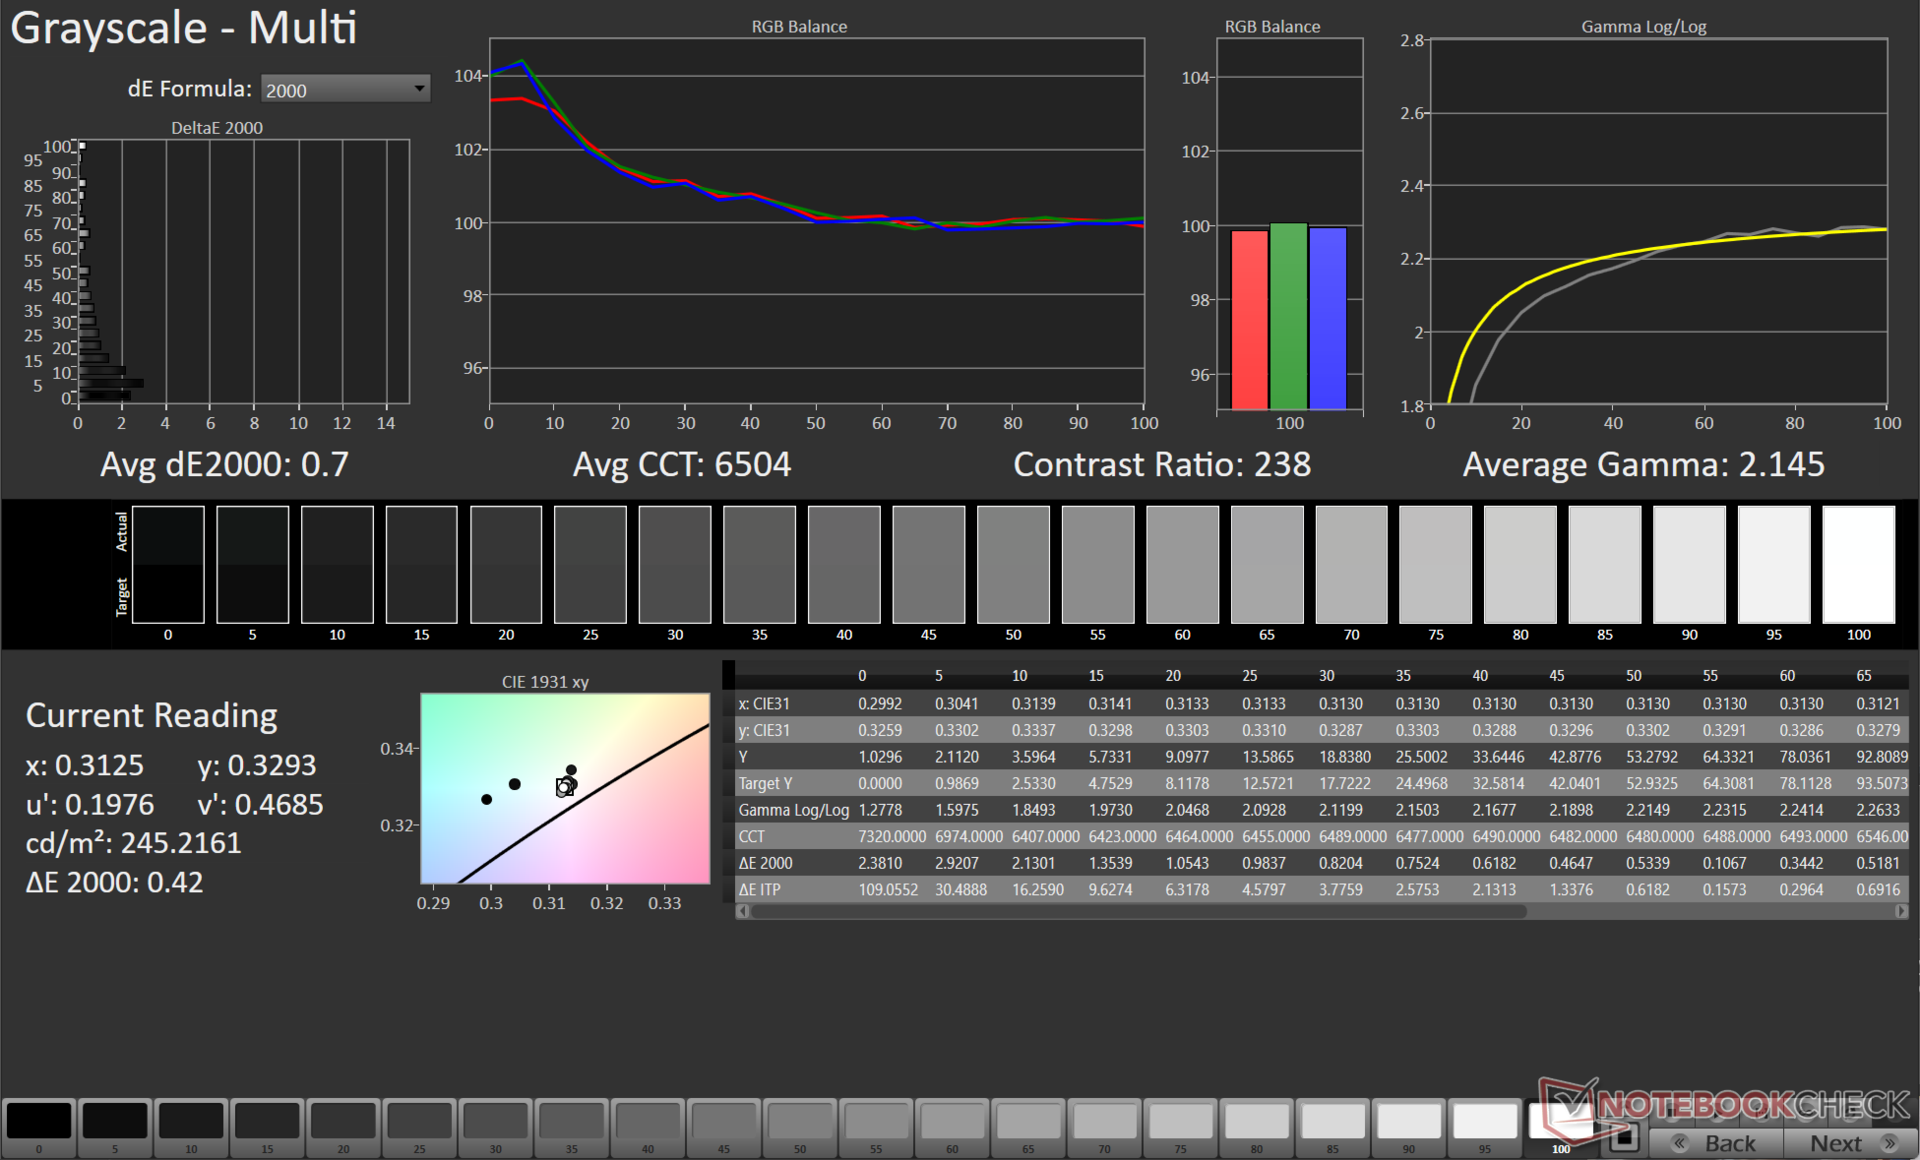
calibrated: 3.34
ΔE Greyscale Calman: 3.8 | ∀{0.09-98 Ø4.96}
42.1% AdobeRGB 1998 (Argyll 3D)
61% sRGB (Argyll 3D)
40.7% Display P3 (Argyll 3D)
Gamma: 2.17
CCT: 7408 K
| Gigabyte G5 KE Chi Mei N156HRA-EA1, , 1920x1080, 15.6" | Lenovo IdeaPad Gaming 3 15IAH7 Lenovo LEN156FHD, , 1920x1080, 15.6" | Gigabyte G7 KE AU Optronics B173HAN05.1, , 1920x1080, 17.3" | Honor MagicBook 14 2022 HD140ZB-01A, , 2160x1440, 14" | Schenker XMG Core 15 (M22) CSOT MNF601CA1-1, , 2560x1440, 15.6" | Dell G16 7620 BOE NE16QDM, , 2560x1600, 16" | Gigabyte A5 K1 BOEhydis NV156FHM-N4K (BOE08B3), , 1920x1080, 15.6" | Asus TUF Gaming F15 FX507ZM TL156VDXP0101, , 1920x1080, 15.6" | HP Victus 16-e0179ng BOE09BE, , 1920x1080, 16.1" | |
|---|---|---|---|---|---|---|---|---|---|
| Display | 66% | 69% | 64% | 66% | 65% | 56% | 62% | 72% | |
| Display P3 Coverage (%) | 40.7 | 69.1 70% | 70.4 73% | 67.9 67% | 68.8 69% | 68.3 68% | 64.4 58% | 66.4 63% | 72.6 78% |
| sRGB Coverage (%) | 61 | 99.2 63% | 99.8 64% | 98.5 61% | 99.3 63% | 98 61% | 92.5 52% | 97 59% | 100 64% |
| AdobeRGB 1998 Coverage (%) | 42.1 | 69.9 66% | 71.7 70% | 68.7 63% | 69.9 66% | 70.5 67% | 66.1 57% | 68.5 63% | 73.5 75% |
| Response Times | 53% | 68% | -41% | 50% | 56% | 48% | 55% | 44% | |
| Response Time Grey 50% / Grey 80% * (ms) | 26.64 ? | 13 ? 51% | 5 ? 81% | 37.2 ? -40% | 16 ? 40% | 8.6 ? 68% | 14.5 ? 46% | 5.6 ? 79% | 9.6 ? 64% |
| Response Time Black / White * (ms) | 18.65 ? | 8.4 ? 55% | 8.3 ? 55% | 26.3 ? -41% | 7.6 ? 59% | 10.4 ? 44% | 9.5 ? 49% | 12.8 ? 31% | 14.4 ? 23% |
| PWM Frequency (Hz) | 28400 ? | ||||||||
| Screen | 40% | 61% | 57% | 40% | 49% | 31% | 52% | 43% | |
| Brightness middle (cd/m²) | 269 | 338 26% | 307 14% | 330 23% | 378 41% | 369.4 37% | 295 10% | 353.7 31% | 361 34% |
| Brightness (cd/m²) | 248 | 329 33% | 301 21% | 320 29% | 371 50% | 348 40% | 281 13% | 340 37% | 341 38% |
| Brightness Distribution (%) | 85 | 92 8% | 93 9% | 90 6% | 93 9% | 83 -2% | 83 -2% | 89 5% | 88 4% |
| Black Level * (cd/m²) | 0.5 | 0.27 46% | 0.2 60% | 0.21 58% | 0.33 34% | 0.32 36% | 0.29 42% | 0.34 32% | 0.3 40% |
| Contrast (:1) | 538 | 1252 133% | 1535 185% | 1571 192% | 1145 113% | 1154 114% | 1017 89% | 1040 93% | 1203 124% |
| Colorchecker dE 2000 * | 4.54 | 2.88 37% | 1.32 71% | 1.8 60% | 2.84 37% | 1.78 61% | 4.36 4% | 1.74 62% | 2.44 46% |
| Colorchecker dE 2000 max. * | 17.28 | 9.35 46% | 4.6 73% | 4.7 73% | 5.51 68% | 4.41 74% | 6.92 60% | 3.63 79% | 6.37 63% |
| Colorchecker dE 2000 calibrated * | 3.34 | 1.22 63% | 1.03 69% | 1.6 52% | 2.75 18% | 1.22 63% | 1.2 64% | 0.5 85% | 1.26 62% |
| Greyscale dE 2000 * | 3.8 | 5 -32% | 2.1 45% | 3 21% | 4.08 -7% | 3.2 16% | 3.9 -3% | 2.1 45% | 4.6 -21% |
| Gamma | 2.17 101% | 2.162 102% | 2.247 98% | 2.18 101% | 2.4 92% | 2.2 100% | 2.106 104% | 2.3 96% | 2.268 97% |
| CCT | 7408 88% | 7497 87% | 6815 95% | 6697 97% | 5841 111% | 6750 96% | 7300 89% | 6257 104% | 6609 98% |
| Całkowita średnia (program / ustawienia) | 53% /
48% | 66% /
64% | 27% /
45% | 52% /
47% | 57% /
53% | 45% /
39% | 56% /
55% | 53% /
50% |
* ... im mniej tym lepiej
Nasza procedura kalibracyjna z wykorzystaniem spektrofotometru X-Rite i1Basic Pro 3 i oprogramowania do kalibracji kolorów Calman Ultimate firmy Portrait Displays daje w efekcie znacznie lepszą wartość Delta E 2000 w skali szarości.
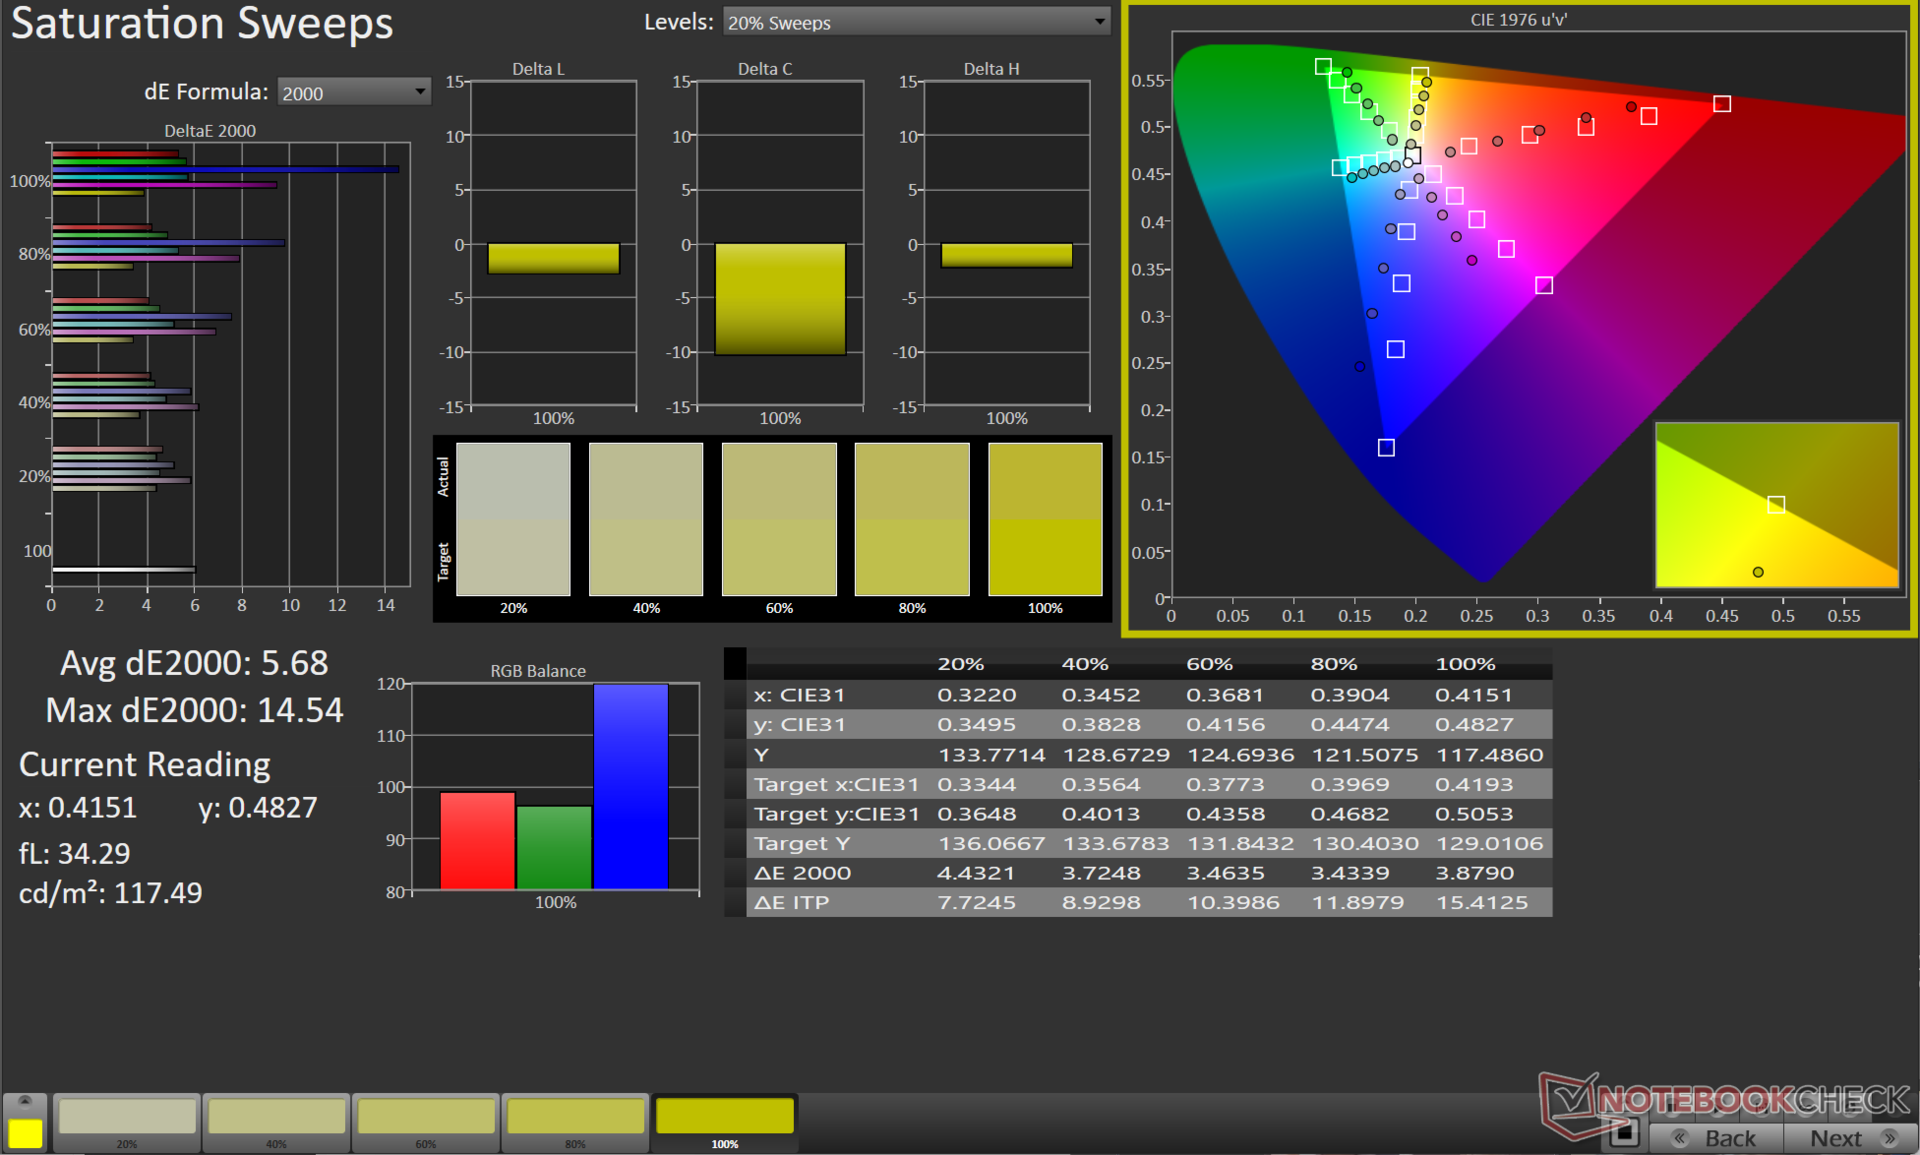
Niewiele można natomiast poprawić wartości ColorChecker. Kolory 100% Blue i 100% Magenta przyczyniają się do dużych odchyleń w dokładności kolorów.
Skalibrowany profil ICC można pobrać z powyższego linku.
Wyświetl czasy reakcji
| ↔ Czas reakcji od czerni do bieli | ||
|---|---|---|
| 18.65 ms ... wzrost ↗ i spadek ↘ łącznie | ↗ 10.83 ms wzrost | 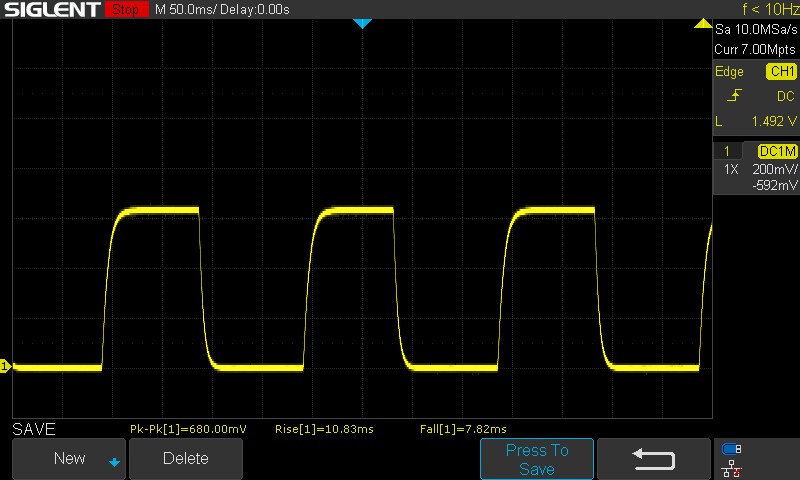 |
| ↘ 7.82 ms upadek | ||
| W naszych testach ekran wykazuje dobry współczynnik reakcji, ale może być zbyt wolny dla graczy rywalizujących ze sobą. Dla porównania, wszystkie testowane urządzenia wahają się od 0.1 (minimum) do 240 (maksimum) ms. » 42 % wszystkich urządzeń jest lepszych. Oznacza to, że zmierzony czas reakcji jest zbliżony do średniej wszystkich testowanych urządzeń (19.8 ms). | ||
| ↔ Czas reakcji 50% szarości do 80% szarości | ||
| 26.64 ms ... wzrost ↗ i spadek ↘ łącznie | ↗ 12.52 ms wzrost | 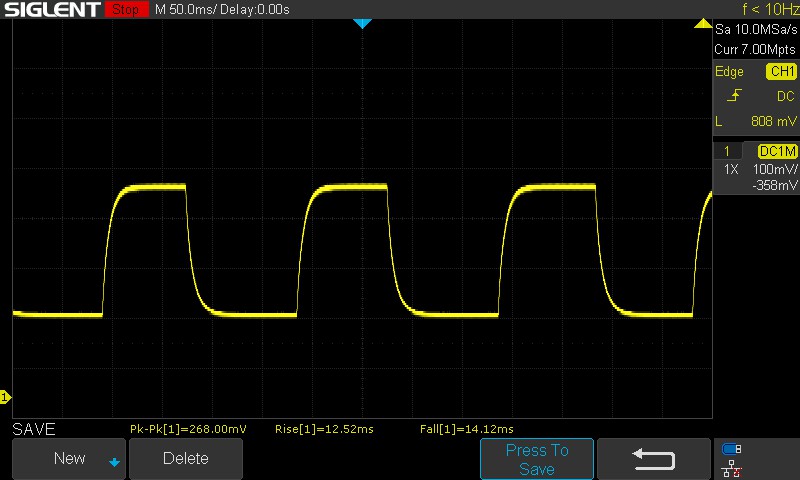 |
| ↘ 14.12 ms upadek | ||
| W naszych testach ekran wykazuje stosunkowo powolne tempo reakcji i może być zbyt wolny dla graczy. Dla porównania, wszystkie testowane urządzenia wahają się od 0.165 (minimum) do 636 (maksimum) ms. » 37 % wszystkich urządzeń jest lepszych. Oznacza to, że zmierzony czas reakcji jest lepszy od średniej wszystkich testowanych urządzeń (30.9 ms). | ||
Migotanie ekranu / PWM (modulacja szerokości impulsu)
| Migotanie ekranu/nie wykryto PWM | 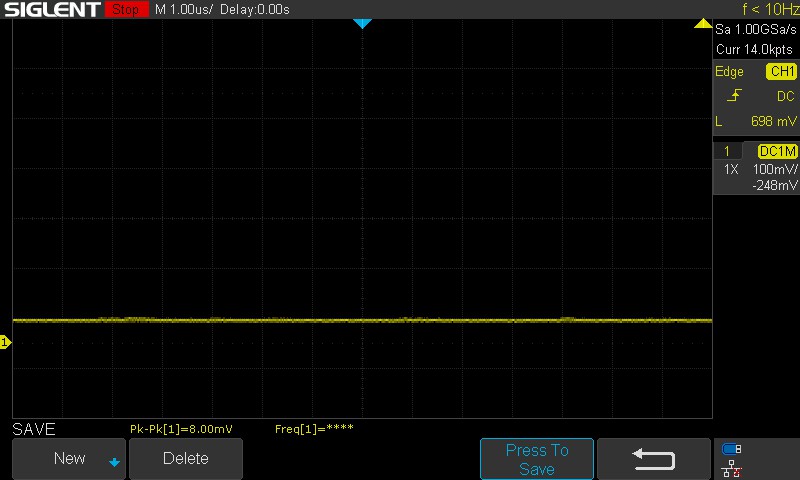 | ||
| ≤ 100 jasność cd/m² | |||
Dla porównania: 52 % wszystkich testowanych urządzeń nie używa PWM do przyciemniania wyświetlacza. Jeśli wykryto PWM, zmierzono średnio 7748 (minimum: 5 - maksimum: 343500) Hz. | |||
Czasy reakcji wyświetlacza, zwłaszcza przejścia od 50% szarości do 80% szarości, są trochę na wyższym poziomie jak na laptop do gier. Na wszystkich testowanych poziomach jasności nie zaobserwowaliśmy PWM.
Odsyłam do naszego artykuł o PWM a także nasza tabela rankingowa aby uzyskać więcej informacji i porównać testowane urządzenia.
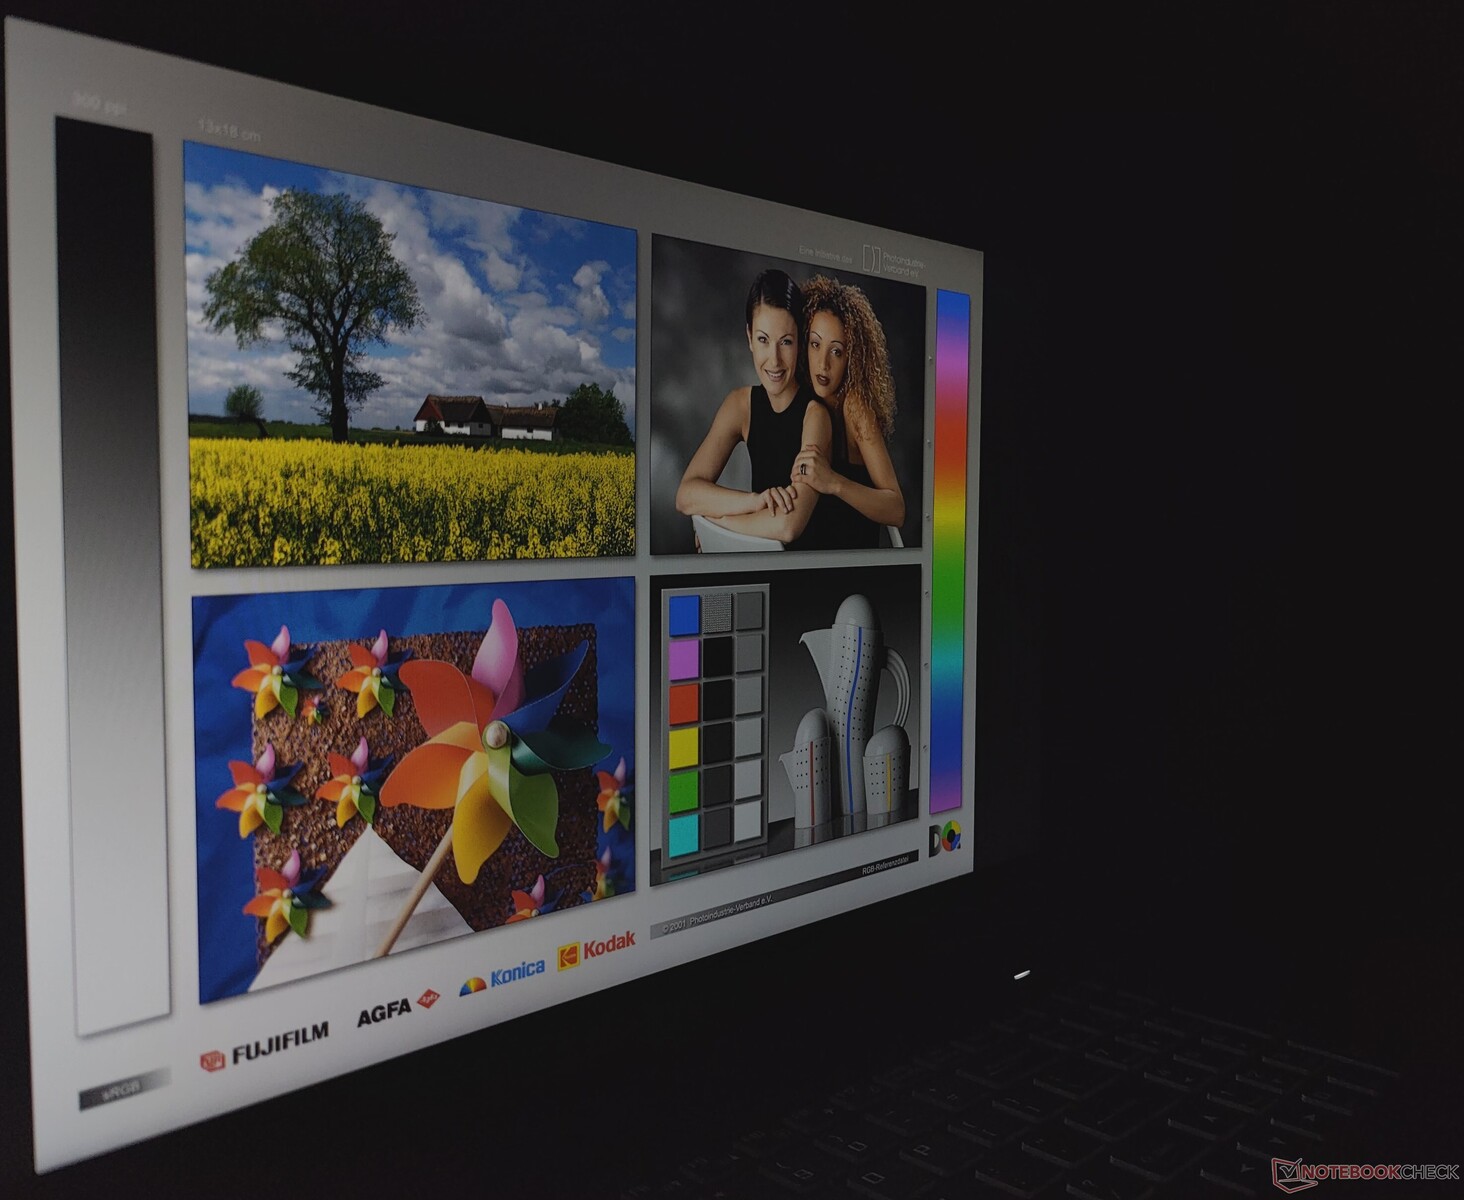
Oglądanie na zewnątrz jest czytelne, o ile na ekran nie pada bezpośrednie światło słoneczne. Występuje utrata jasności i informacji o kolorze przy ekstremalnych kątach widzenia.


Wydajność: Kombo Core i5-12500H i RTX 3060 nie sprawia większych niespodzianek
Gigabyte oferuje G5 w dwóch wariantach: G5 KE i G5 ME wyposażonych w 12C/16TIntel Core i5-12500H CPU. Podczas gdy G5 KE oferuje m.in Nvidia GeForce RTX 3060 Laptop GPUto G5 ME ma do dyspozycji RTX 3050 Ti - procesor graficzny dla laptopów i nie ma portu Thunderbolt 4.
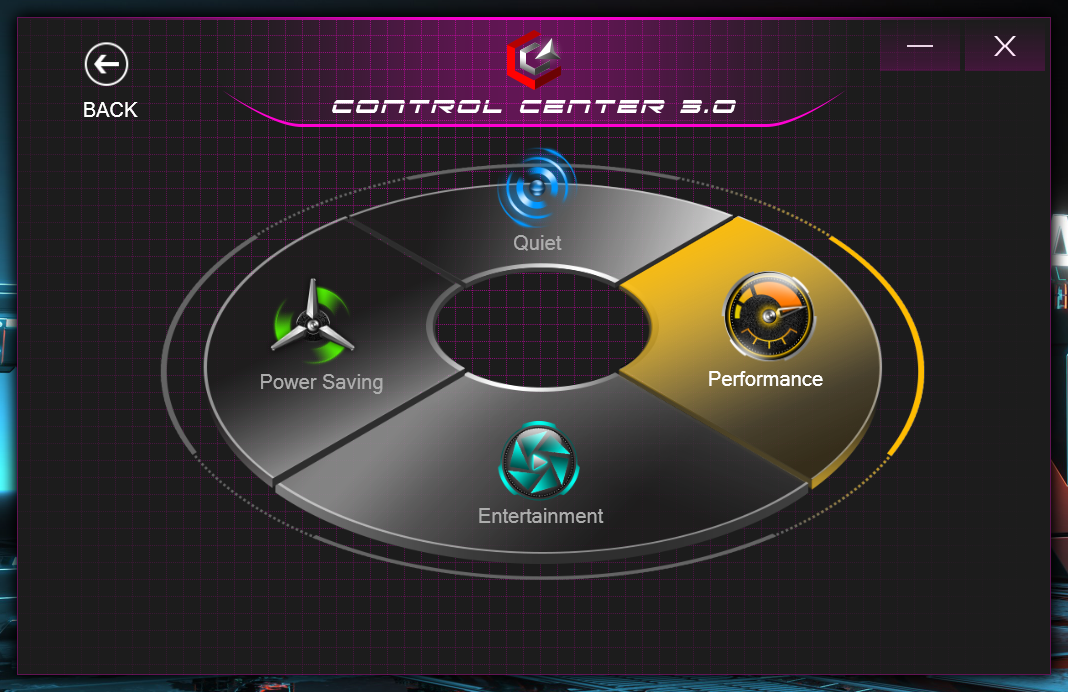
G5 KE oferuje cztery tryby wydajności, które wyszczególniono w poniższej tabeli:
| Tryb Performance | PL1 (PBP) / Tau | PL2 (MTP) / Tau |
|---|---|---|
| Quiet | 15 W / 8 s | 30 W / 2,44 ms |
| Power Saver | 30 W / 8 s | 30 W / 2,44 ms |
| Entertainment | 50 W / 28 s | 115 W / 2,44 ms |
| Wydajność | 115 W / 80 s | 135 W / 2,44 ms |
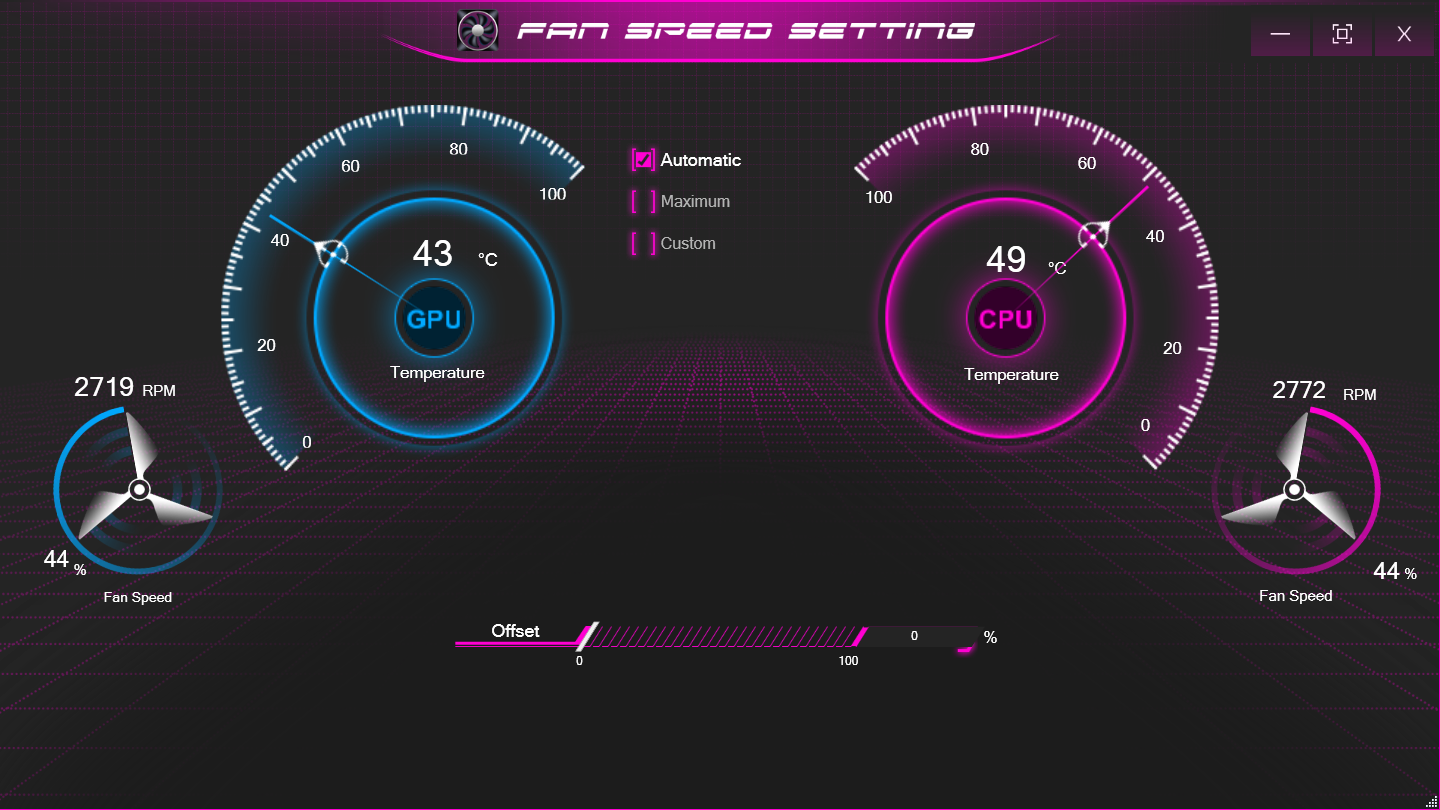
Do wszystkich benchmarków użyliśmy profilu Performance, natomiast testy baterii przeprowadziliśmy w trybie Power Saver. Centrum sterowania Clevo 3.0 pozwala na wybór różnych profili wydajności i ustawień prędkości wentylatora.
Procesor
Core i5-12500H w G5 KE jest w bliskim sąsiedztwie tego z G7 KE, a także m.in AMD Ryzen 7 6800H w XMG Core 15 (M22) w łącznych wynikach CPU. Pozostaje on jednak w tyle o 15% w porównaniu z m.in Core i7-12700H w Asus TUF Gaming F15.
Wydajność w teście wielordzeniowym Cinebench R15 jest w większości przypadków dobra, z wyjątkiem chwilowego spadku wyników w środku testu.
Cinebench R15 Multi Loop
Cinebench R20: CPU (Single Core) | CPU (Multi Core)
Cinebench R15: CPU Single 64Bit | CPU Multi 64Bit
Blender: v2.79 BMW27 CPU
7-Zip 18.03: 7z b 4 -mmt1 | 7z b 4
Geekbench 5.5: Single-Core | Multi-Core
HWBOT x265 Benchmark v2.2: 4k Preset
LibreOffice : 20 Documents To PDF
R Benchmark 2.5: Overall mean
| CPU Performance rating | |
| Średnia w klasie Gaming | |
| Asus TUF Gaming F15 FX507ZM | |
| Dell G16 7620 | |
| Gigabyte G7 KE | |
| Schenker XMG Core 15 (M22) | |
| Gigabyte G5 KE | |
| Honor MagicBook 14 2022 | |
| Lenovo IdeaPad Gaming 3 15IAH7 | |
| Przeciętny Intel Core i5-12500H | |
| HP Victus 16-e0179ng | |
| Gigabyte A5 K1 | |
| Cinebench R20 / CPU (Single Core) | |
| Średnia w klasie Gaming (442 - 913, n=107, ostatnie 2 lata) | |
| Asus TUF Gaming F15 FX507ZM | |
| Dell G16 7620 | |
| Gigabyte G7 KE | |
| Lenovo IdeaPad Gaming 3 15IAH7 | |
| Honor MagicBook 14 2022 | |
| Przeciętny Intel Core i5-12500H (602 - 656, n=9) | |
| Gigabyte G5 KE | |
| Schenker XMG Core 15 (M22) | |
| HP Victus 16-e0179ng | |
| Gigabyte A5 K1 | |
| Cinebench R20 / CPU (Multi Core) | |
| Średnia w klasie Gaming (4029 - 16433, n=107, ostatnie 2 lata) | |
| Asus TUF Gaming F15 FX507ZM | |
| Dell G16 7620 | |
| Lenovo IdeaPad Gaming 3 15IAH7 | |
| Schenker XMG Core 15 (M22) | |
| Gigabyte G7 KE | |
| Przeciętny Intel Core i5-12500H (4687 - 5640, n=9) | |
| Gigabyte G5 KE | |
| Honor MagicBook 14 2022 | |
| HP Victus 16-e0179ng | |
| Gigabyte A5 K1 | |
| Cinebench R15 / CPU Single 64Bit | |
| Średnia w klasie Gaming (188.8 - 350, n=107, ostatnie 2 lata) | |
| Asus TUF Gaming F15 FX507ZM | |
| Schenker XMG Core 15 (M22) | |
| Gigabyte G7 KE | |
| Lenovo IdeaPad Gaming 3 15IAH7 | |
| Dell G16 7620 | |
| Gigabyte G5 KE | |
| Honor MagicBook 14 2022 | |
| Przeciętny Intel Core i5-12500H (220 - 250, n=9) | |
| HP Victus 16-e0179ng | |
| Gigabyte A5 K1 | |
| Cinebench R15 / CPU Multi 64Bit | |
| Średnia w klasie Gaming (1578 - 6330, n=106, ostatnie 2 lata) | |
| Asus TUF Gaming F15 FX507ZM | |
| Dell G16 7620 | |
| Schenker XMG Core 15 (M22) | |
| Lenovo IdeaPad Gaming 3 15IAH7 | |
| Gigabyte G7 KE | |
| Przeciętny Intel Core i5-12500H (1970 - 2283, n=10) | |
| Gigabyte G5 KE | |
| Honor MagicBook 14 2022 | |
| Honor MagicBook 14 2022 | |
| HP Victus 16-e0179ng | |
| Gigabyte A5 K1 | |
| Blender / v2.79 BMW27 CPU | |
| Gigabyte A5 K1 | |
| Honor MagicBook 14 2022 | |
| HP Victus 16-e0179ng | |
| Przeciętny Intel Core i5-12500H (223 - 288, n=9) | |
| Gigabyte G5 KE | |
| Gigabyte G7 KE | |
| Lenovo IdeaPad Gaming 3 15IAH7 | |
| Schenker XMG Core 15 (M22) | |
| Dell G16 7620 | |
| Asus TUF Gaming F15 FX507ZM | |
| Średnia w klasie Gaming (79 - 330, n=105, ostatnie 2 lata) | |
| 7-Zip 18.03 / 7z b 4 -mmt1 | |
| Średnia w klasie Gaming (4199 - 7436, n=106, ostatnie 2 lata) | |
| Schenker XMG Core 15 (M22) | |
| HP Victus 16-e0179ng | |
| Gigabyte G7 KE | |
| Lenovo IdeaPad Gaming 3 15IAH7 | |
| Gigabyte A5 K1 | |
| Gigabyte G5 KE | |
| Asus TUF Gaming F15 FX507ZM | |
| Dell G16 7620 | |
| Przeciętny Intel Core i5-12500H (5151 - 5563, n=9) | |
| Honor MagicBook 14 2022 | |
| 7-Zip 18.03 / 7z b 4 | |
| Średnia w klasie Gaming (33491 - 148086, n=106, ostatnie 2 lata) | |
| Asus TUF Gaming F15 FX507ZM | |
| Dell G16 7620 | |
| Schenker XMG Core 15 (M22) | |
| HP Victus 16-e0179ng | |
| Gigabyte G5 KE | |
| Gigabyte G7 KE | |
| Honor MagicBook 14 2022 | |
| Przeciętny Intel Core i5-12500H (44105 - 54380, n=9) | |
| Gigabyte A5 K1 | |
| Lenovo IdeaPad Gaming 3 15IAH7 | |
| Geekbench 5.5 / Single-Core | |
| Średnia w klasie Gaming (986 - 2474, n=106, ostatnie 2 lata) | |
| Asus TUF Gaming F15 FX507ZM | |
| Honor MagicBook 14 2022 | |
| Gigabyte G7 KE | |
| Dell G16 7620 | |
| Gigabyte G5 KE | |
| Lenovo IdeaPad Gaming 3 15IAH7 | |
| Przeciętny Intel Core i5-12500H (1471 - 1693, n=9) | |
| Schenker XMG Core 15 (M22) | |
| HP Victus 16-e0179ng | |
| Gigabyte A5 K1 | |
| Geekbench 5.5 / Multi-Core | |
| Średnia w klasie Gaming (6460 - 28263, n=106, ostatnie 2 lata) | |
| Asus TUF Gaming F15 FX507ZM | |
| Dell G16 7620 | |
| Honor MagicBook 14 2022 | |
| Gigabyte G7 KE | |
| Gigabyte G5 KE | |
| Schenker XMG Core 15 (M22) | |
| Przeciętny Intel Core i5-12500H (7962 - 10828, n=9) | |
| Lenovo IdeaPad Gaming 3 15IAH7 | |
| HP Victus 16-e0179ng | |
| Gigabyte A5 K1 | |
| HWBOT x265 Benchmark v2.2 / 4k Preset | |
| Średnia w klasie Gaming (11.5 - 44.4, n=106, ostatnie 2 lata) | |
| Asus TUF Gaming F15 FX507ZM | |
| Dell G16 7620 | |
| Schenker XMG Core 15 (M22) | |
| Gigabyte G7 KE | |
| Gigabyte G5 KE | |
| Lenovo IdeaPad Gaming 3 15IAH7 | |
| HP Victus 16-e0179ng | |
| Przeciętny Intel Core i5-12500H (12 - 16.6, n=9) | |
| Honor MagicBook 14 2022 | |
| Gigabyte A5 K1 | |
| LibreOffice / 20 Documents To PDF | |
| Gigabyte A5 K1 | |
| Schenker XMG Core 15 (M22) | |
| Gigabyte G5 KE | |
| HP Victus 16-e0179ng | |
| Dell G16 7620 | |
| Asus TUF Gaming F15 FX507ZM | |
| Średnia w klasie Gaming (33.2 - 88.8, n=106, ostatnie 2 lata) | |
| Lenovo IdeaPad Gaming 3 15IAH7 | |
| Przeciętny Intel Core i5-12500H (40.1 - 58.5, n=9) | |
| Gigabyte G7 KE | |
| Honor MagicBook 14 2022 | |
| R Benchmark 2.5 / Overall mean | |
| Gigabyte A5 K1 | |
| HP Victus 16-e0179ng | |
| Lenovo IdeaPad Gaming 3 15IAH7 | |
| Przeciętny Intel Core i5-12500H (0.4748 - 0.535, n=9) | |
| Dell G16 7620 | |
| Honor MagicBook 14 2022 | |
| Gigabyte G5 KE | |
| Schenker XMG Core 15 (M22) | |
| Gigabyte G7 KE | |
| Asus TUF Gaming F15 FX507ZM | |
| Średnia w klasie Gaming (0.3439 - 0.759, n=107, ostatnie 2 lata) | |
* ... im mniej tym lepiej
Nasz dedykowany Intel Core i5-12500Hstrona zawiera więcej informacji i porównania w benchmarkach.
Wydajność systemu
Ogólna wydajność G5 KE w PCMark 10 jest taka sama jak laptopów opartych na procesorze Core i7-12700H, a w CrossMarku można dostrzec przewagę nad Schenkerem XMG Core 15 (M22) napędzanym procesorem Ryzen 7 6800H.
CrossMark: Overall | Productivity | Creativity | Responsiveness
| PCMark 10 / Score | |
| Średnia w klasie Gaming (5828 - 12414, n=94, ostatnie 2 lata) | |
| Asus TUF Gaming F15 FX507ZM | |
| Schenker XMG Core 15 (M22) | |
| Dell G16 7620 | |
| Gigabyte G5 KE | |
| Lenovo IdeaPad Gaming 3 15IAH7 | |
| Przeciętny Intel Core i5-12500H, NVIDIA GeForce RTX 3060 Laptop GPU (6126 - 7201, n=2) | |
| HP Victus 16-e0179ng | |
| Honor MagicBook 14 2022 | |
| Gigabyte A5 K1 | |
| Gigabyte G7 KE | |
| PCMark 10 / Essentials | |
| Gigabyte G5 KE | |
| Schenker XMG Core 15 (M22) | |
| Przeciętny Intel Core i5-12500H, NVIDIA GeForce RTX 3060 Laptop GPU (10301 - 11150, n=2) | |
| Średnia w klasie Gaming (8810 - 11935, n=98, ostatnie 2 lata) | |
| Honor MagicBook 14 2022 | |
| Asus TUF Gaming F15 FX507ZM | |
| Gigabyte G7 KE | |
| Dell G16 7620 | |
| Gigabyte A5 K1 | |
| Lenovo IdeaPad Gaming 3 15IAH7 | |
| HP Victus 16-e0179ng | |
| PCMark 10 / Productivity | |
| Średnia w klasie Gaming (6845 - 25323, n=96, ostatnie 2 lata) | |
| Schenker XMG Core 15 (M22) | |
| Lenovo IdeaPad Gaming 3 15IAH7 | |
| Gigabyte G5 KE | |
| Przeciętny Intel Core i5-12500H, NVIDIA GeForce RTX 3060 Laptop GPU (9038 - 9475, n=2) | |
| Asus TUF Gaming F15 FX507ZM | |
| Gigabyte G7 KE | |
| HP Victus 16-e0179ng | |
| Dell G16 7620 | |
| Honor MagicBook 14 2022 | |
| Gigabyte A5 K1 | |
| PCMark 10 / Digital Content Creation | |
| Średnia w klasie Gaming (7602 - 19954, n=96, ostatnie 2 lata) | |
| Asus TUF Gaming F15 FX507ZM | |
| Dell G16 7620 | |
| Schenker XMG Core 15 (M22) | |
| Gigabyte G5 KE | |
| Lenovo IdeaPad Gaming 3 15IAH7 | |
| HP Victus 16-e0179ng | |
| Przeciętny Intel Core i5-12500H, NVIDIA GeForce RTX 3060 Laptop GPU (6703 - 9593, n=2) | |
| Honor MagicBook 14 2022 | |
| Gigabyte A5 K1 | |
| Gigabyte G7 KE | |
| CrossMark / Overall | |
| Średnia w klasie Gaming (1366 - 2409, n=95, ostatnie 2 lata) | |
| Gigabyte G7 KE | |
| Honor MagicBook 14 2022 | |
| Przeciętny Intel Core i5-12500H, NVIDIA GeForce RTX 3060 Laptop GPU (1752 - 1824, n=2) | |
| Dell G16 7620 | |
| Gigabyte G5 KE | |
| Schenker XMG Core 15 (M22) | |
| CrossMark / Productivity | |
| Średnia w klasie Gaming (1386 - 2254, n=95, ostatnie 2 lata) | |
| Gigabyte G7 KE | |
| Przeciętny Intel Core i5-12500H, NVIDIA GeForce RTX 3060 Laptop GPU (1720 - 1804, n=2) | |
| Honor MagicBook 14 2022 | |
| Gigabyte G5 KE | |
| Dell G16 7620 | |
| Schenker XMG Core 15 (M22) | |
| CrossMark / Creativity | |
| Honor MagicBook 14 2022 | |
| Średnia w klasie Gaming (1343 - 2786, n=95, ostatnie 2 lata) | |
| Dell G16 7620 | |
| Gigabyte G7 KE | |
| Przeciętny Intel Core i5-12500H, NVIDIA GeForce RTX 3060 Laptop GPU (1778 - 1800, n=2) | |
| Gigabyte G5 KE | |
| Schenker XMG Core 15 (M22) | |
| CrossMark / Responsiveness | |
| Gigabyte G7 KE | |
| Przeciętny Intel Core i5-12500H, NVIDIA GeForce RTX 3060 Laptop GPU (1771 - 1966, n=2) | |
| Gigabyte G5 KE | |
| Honor MagicBook 14 2022 | |
| Średnia w klasie Gaming (1226 - 2334, n=95, ostatnie 2 lata) | |
| Dell G16 7620 | |
| Schenker XMG Core 15 (M22) | |
| PCMark 8 Home Score Accelerated v2 | 5554 pkt. | |
| PCMark 8 Work Score Accelerated v2 | 5937 pkt. | |
| PCMark 10 Score | 7201 pkt. | |
Pomoc | ||
Opóźnienie DPC
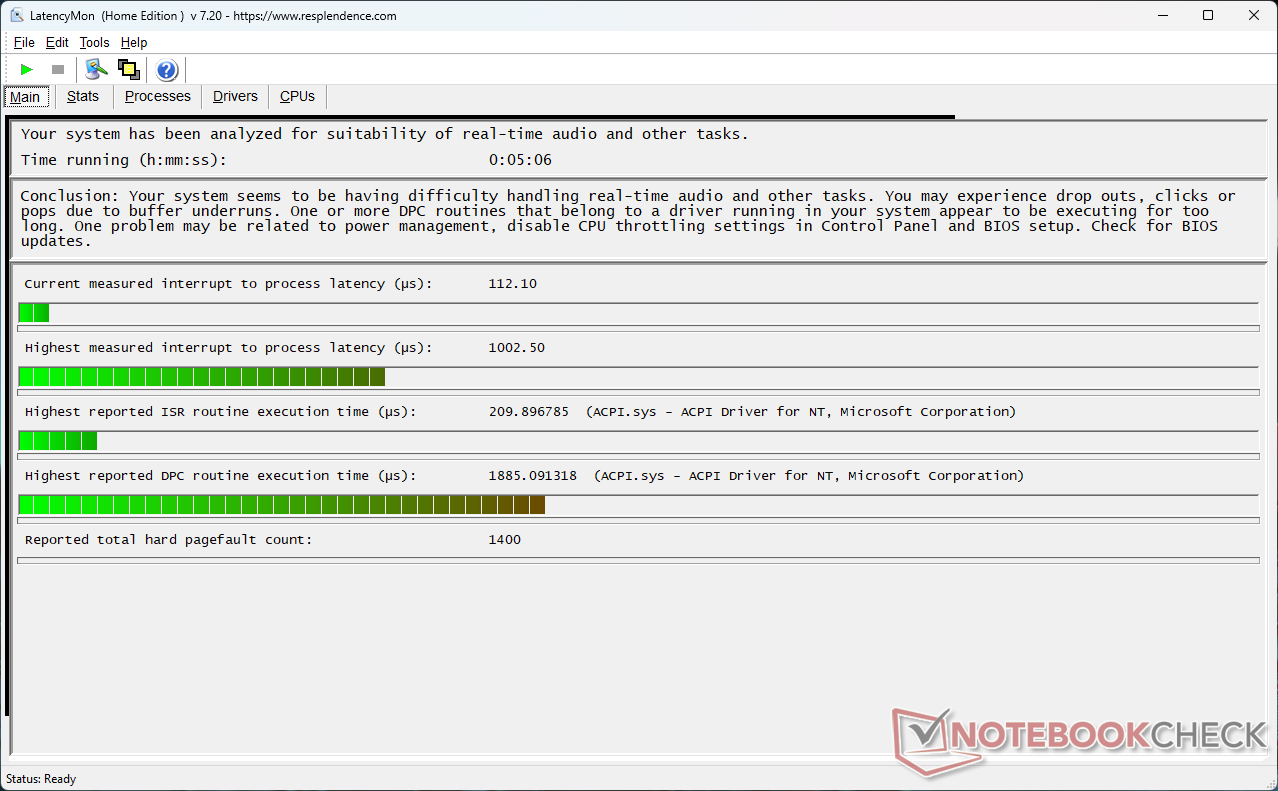
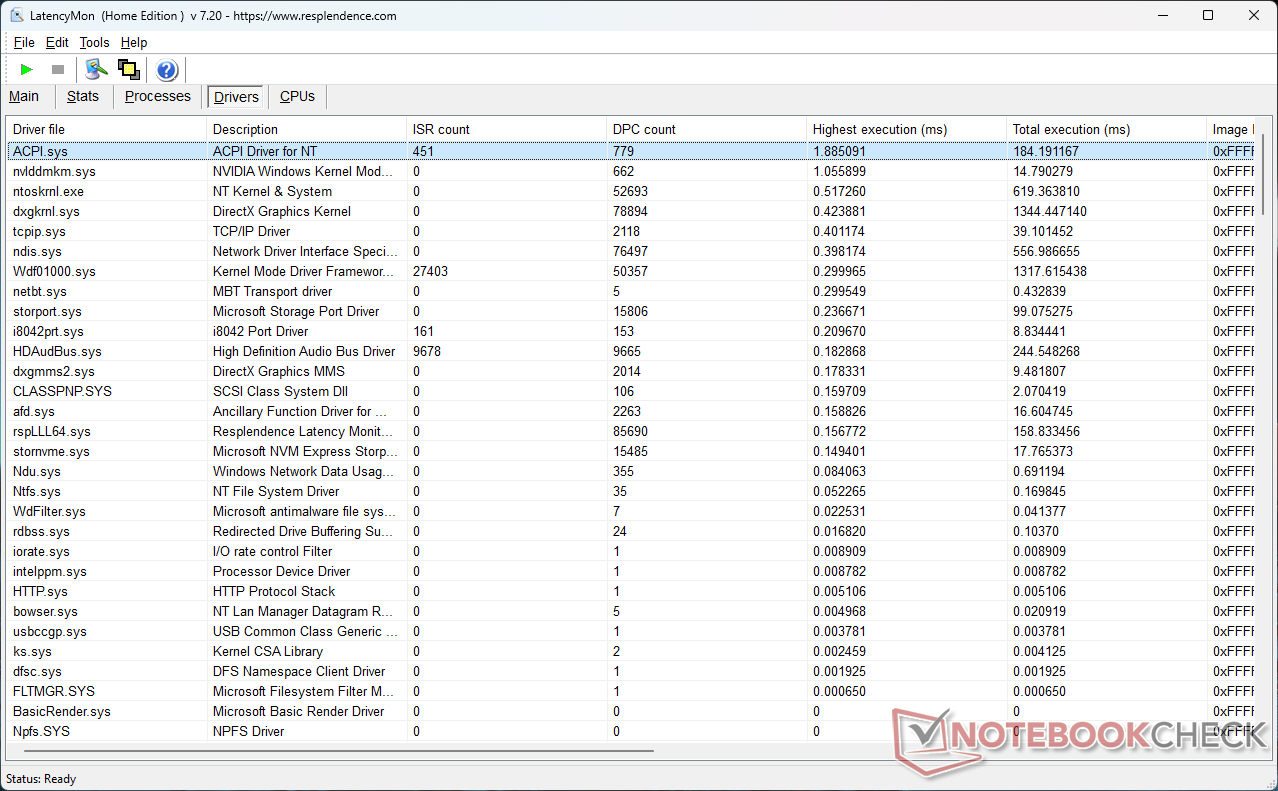
Opóźnienie DPC w G5 KE jest zapewne lepsze niż u większości konkurencji, ale wartości te wciąż znajdują się po wyższej stronie.
| DPC Latencies / LatencyMon - interrupt to process latency (max), Web, Youtube, Prime95 | |
| Schenker XMG Core 15 (M22) | |
| Gigabyte G7 KE | |
| Lenovo IdeaPad Gaming 3 15IAH7 | |
| HP Victus 16-e0179ng | |
| Gigabyte A5 K1 | |
| Gigabyte G5 KE | |
| Dell G16 7620 | |
| Asus TUF Gaming F15 FX507ZM | |
| Honor MagicBook 14 2022 | |
* ... im mniej tym lepiej
Odnieś się do naszegoDPC Latency Rakingwięcej porównań opóźnień w recenzowanych urządzeniach można znaleźć na stronie.
Urządzenia do przechowywania danych
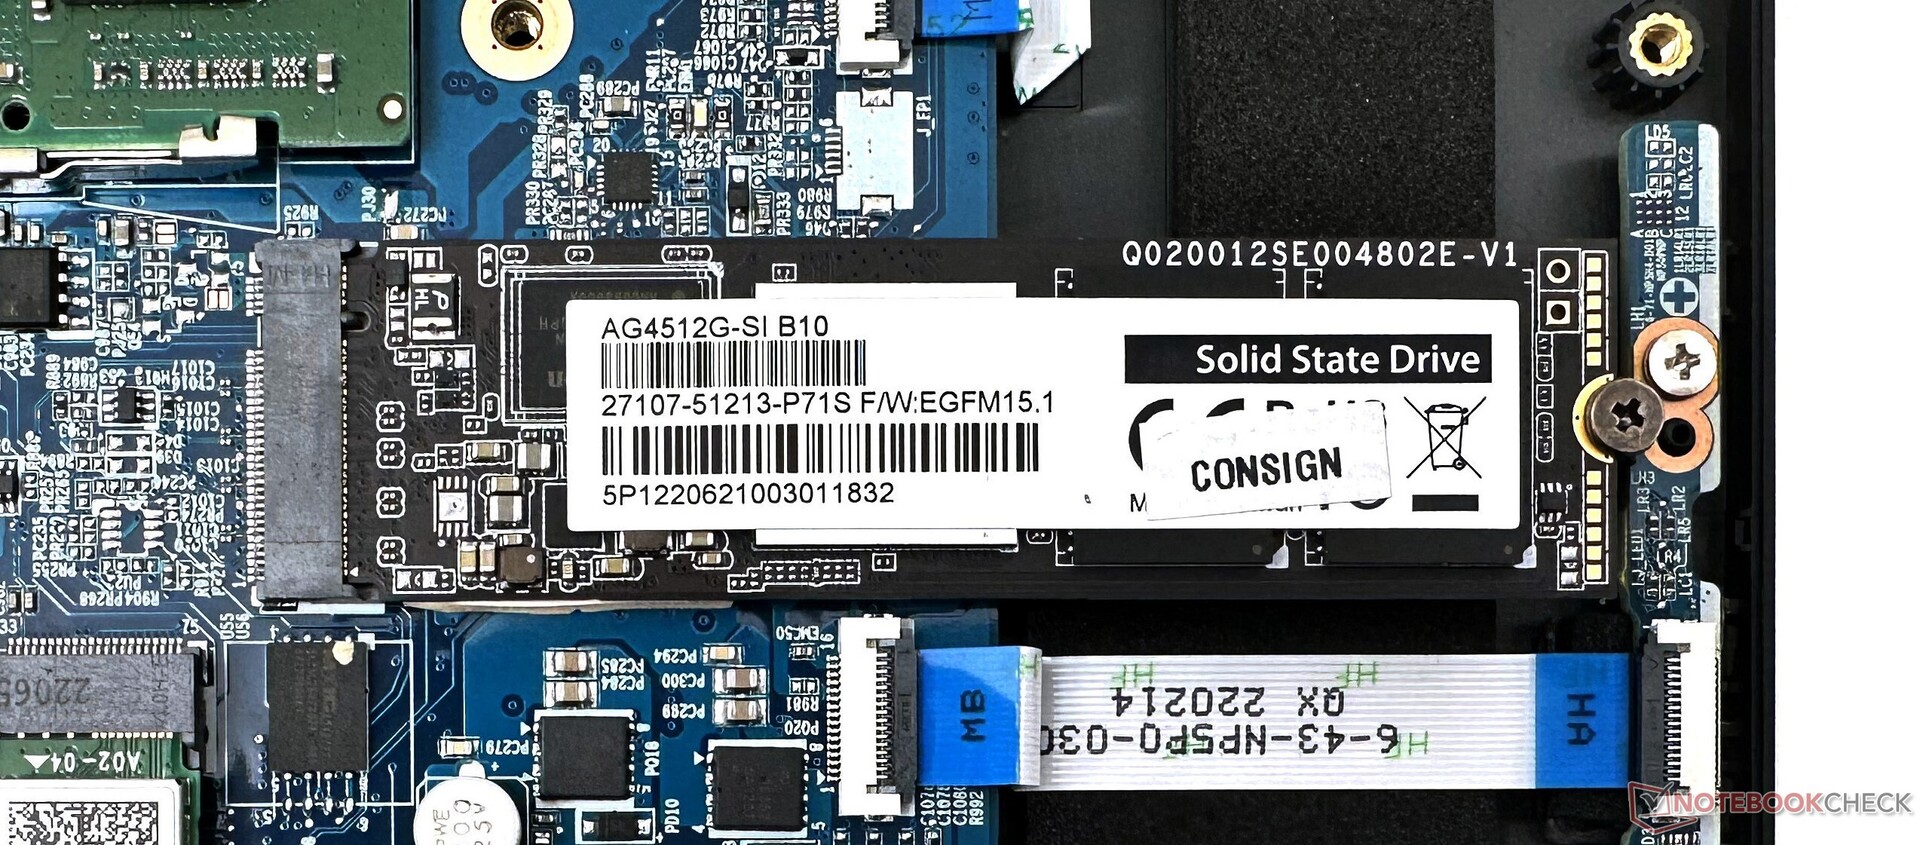
Nasz egzemplarz G5 KE był wyposażony w dysk SSD Gigabyte NVMe o pojemności 512 GB. Uważamy jednak, że wariant 1 TB tego dysku w G7 KE wypada lepiej pod niemal każdym względem. Dysk SSD cierpi na drastyczny throttling w naszym teście pętli odczytu DiskSpd.
Można zainstalować drugi dysk SSD NVMe, ale nie ma możliwości dodania 2,5-calowego dysku SATA.
| Gigabyte G5 KE Gigabyte AG4512G-SI B10 | Lenovo IdeaPad Gaming 3 15IAH7 Intel SSD 660p SSDPEKNW512G8 | Gigabyte G7 KE Gigabyte AG470S1TB-SI B10 | Honor MagicBook 14 2022 Samsung PM9A1 MZVL2512HCJQ | Asus TUF Gaming F15 FX507ZM SK Hynix HFM001TD3JX013N | HP Victus 16-e0179ng WDC PC SN730 SDBPNTY-1T00 | Przeciętny Gigabyte AG4512G-SI B10 | Średnia w klasie Gaming | |
|---|---|---|---|---|---|---|---|---|
| CrystalDiskMark 5.2 / 6 | -42% | 22% | 43% | -8% | -16% | 0% | 26% | |
| Write 4K (MB/s) | 303.3 | 64 -79% | 363.1 20% | 229.88 -24% | 217.7 -28% | 157.3 -48% | 303 ? 0% | 199.6 ? -34% |
| Read 4K (MB/s) | 64.25 | 77.05 20% | 59.23 -8% | 91.45 42% | 70.1 9% | 49 -24% | 64.3 ? 0% | 78.6 ? 22% |
| Write Seq (MB/s) | 2258 | 93.07 -96% | 2605 15% | 2844 26% | 2983 32% | 2258 ? 0% | 3758 ? 66% | |
| Read Seq (MB/s) | 2561 | 2570 0% | 2337 -9% | 2492 -3% | 2247 -12% | 2561 ? 0% | 3633 ? 42% | |
| Write 4K Q32T1 (MB/s) | 620.6 | 184.6 -70% | 806.9 30% | 627.94 1% | 408.3 -34% | 395 -36% | 621 ? 0% | 614 ? -1% |
| Read 4K Q32T1 (MB/s) | 866.2 | 461.5 -47% | 1019 18% | 868.92 0% | 524 -40% | 557 -36% | 866 ? 0% | 710 ? -18% |
| Write Seq Q32T1 (MB/s) | 2264.3 | 1659 -27% | 3612 60% | 5118.5 126% | 3011 33% | 3094 37% | 2264 ? 0% | 5333 ? 136% |
| Read Seq Q32T1 (MB/s) | 4717.3 | 2936 -38% | 7067 50% | 6866.5 46% | 3553 -25% | 2871 -39% | 4717 ? 0% | 7102 ? 51% |
| Write 4K Q8T8 (MB/s) | 2239.2 | 2910.25 30% | 2239 ? 0% | 1308 ? -42% | ||||
| Read 4K Q8T8 (MB/s) | 1188.1 | 2687.03 126% | 1188 ? 0% | 1647 ? 39% | ||||
| AS SSD | -48% | 39% | 28% | -23% | -21% | 0% | 21% | |
| Seq Read (MB/s) | 3697.92 | 2432.02 -34% | 4540.75 23% | 5233 42% | 3013 -19% | 2383 -36% | 3698 ? 0% | 5593 ? 51% |
| Seq Write (MB/s) | 2106.21 | 1229.14 -42% | 3805.55 81% | 3857 83% | 2768 31% | 2466 17% | 2106 ? 0% | 3974 ? 89% |
| 4K Read (MB/s) | 82.5 | 75.66 -8% | 99.79 21% | 85.14 3% | 66.9 -19% | 44.14 -46% | 82.5 ? 0% | 71.1 ? -14% |
| 4K Write (MB/s) | 312.09 | 242.19 -22% | 325.41 4% | 216.33 -31% | 184.8 -41% | 117.5 -62% | 312 ? 0% | 215 ? -31% |
| 4K-64 Read (MB/s) | 1675.54 | 441.63 -74% | 2914.54 74% | 2468.58 47% | 1923 15% | 1734 3% | 1676 ? 0% | 1629 ? -3% |
| 4K-64 Write (MB/s) | 1865.08 | 1218.61 -35% | 2915.33 56% | 3003.26 61% | 2198 18% | 2088 12% | 1865 ? 0% | 2942 ? 58% |
| Access Time Read * (ms) | 0.066 | 0.073 -11% | 0.094 -42% | 0.023 65% | 0.03 55% | 0.049 26% | 0.066 ? -0% | 0.06368 ? 4% |
| Access Time Write * (ms) | 0.013 | 0.033 -154% | 0.012 8% | 0.02 -54% | 0.081 -523% | 0.032 -146% | 0.013 ? -0% | 0.03777 ? -191% |
| Score Read (Points) | 2128 | 760 -64% | 3468 63% | 3077 45% | 2291 8% | 2017 -5% | 2128 ? 0% | 2260 ? 6% |
| Score Write (Points) | 2388 | 1584 -34% | 3621 52% | 3605 51% | 2660 11% | 2452 3% | 2388 ? 0% | 3554 ? 49% |
| Score Total (Points) | 5541 | 2702 -51% | 8837 59% | 8195 48% | 6117 10% | 5503 -1% | 5541 ? 0% | 6897 ? 24% |
| Copy ISO MB/s (MB/s) | 1077.37 | 1949.01 81% | 2093.45 94% | 2143 99% | 1077 ? 0% | 3168 ? 194% | ||
| Copy Program MB/s (MB/s) | 827.5 | 1079.42 30% | 447.36 -46% | 871 5% | 828 ? 0% | 981 ? 19% | ||
| Copy Game MB/s (MB/s) | 1460.58 | 2042.84 40% | 1195.09 -18% | 1840 26% | 1461 ? 0% | 2112 ? 45% | ||
| Całkowita średnia (program / ustawienia) | -45% /
-46% | 31% /
33% | 36% /
34% | -16% /
-18% | -19% /
-19% | 0% /
0% | 24% /
23% |
* ... im mniej tym lepiej

Disk Throttling: DiskSpd Read Loop, Queue Depth 8
Sprawdź nasze dedykowane Benchmarki SSD i HDD aby uzyskać więcej porównań urządzeń pamięci masowej.
Wydajność GPU
W 115 W GPU Nvidia GeForce RTX 3060 Laptop osiąga w testach 3DMark równe wyniki. KE G5 wykazuje dobrą przewagę nad HP Victus w testach syntetycznych dzięki konfiguracji 95 W TGP w tym ostatnim.
| 3DMark 11 - 1280x720 Performance GPU | |
| Średnia w klasie Gaming (21841 - 80022, n=105, ostatnie 2 lata) | |
| Asus TUF Gaming F15 FX507ZM | |
| Gigabyte G5 KE | |
| Schenker XMG Core 15 (M22) | |
| Dell G16 7620 | |
| Gigabyte G7 KE | |
| Gigabyte A5 K1 | |
| Przeciętny NVIDIA GeForce RTX 3060 Laptop GPU (13799 - 30772, n=43) | |
| HP Victus 16-e0179ng | |
| Lenovo IdeaPad Gaming 3 15IAH7 | |
| Honor MagicBook 14 2022 | |
| 3DMark 11 Performance | 26505 pkt. | |
| 3DMark Ice Storm Standard Score | 188480 pkt. | |
| 3DMark Cloud Gate Standard Score | 53162 pkt. | |
| 3DMark Fire Strike Score | 19966 pkt. | |
| 3DMark Fire Strike Extreme Score | 10252 pkt. | |
| 3DMark Time Spy Score | 8922 pkt. | |
Pomoc | ||
Wydajność w grach
Wydajność Gigabyte G5 KE w grach jest podobna do innych testowanych przez nas laptopów z RTX 3060, a w kilku grach udaje mu się nawet wyprzedzić G7 KE z tą samą konfiguracją.
Nie zauważyliśmy żadnych odczuwalnych spadków klatek podczas obciążania laptopa grą The Witcher 3 w rozdzielczości 1080p Ultra.
The Witcher 3 FPS Chart
| Cyberpunk 2077 1.6 | |
| 1920x1080 High Preset | |
| Dell G16 7620 | |
| Gigabyte G5 KE | |
| Przeciętny NVIDIA GeForce RTX 3060 Laptop GPU (42.2 - 87.7, n=14) | |
| Gigabyte G7 KE | |
| Honor MagicBook 14 2022 | |
| 1920x1080 Ultra Preset | |
| Gigabyte G5 KE | |
| Dell G16 7620 | |
| Przeciętny NVIDIA GeForce RTX 3060 Laptop GPU (40 - 78.8, n=16) | |
| Gigabyte G7 KE | |
| Honor MagicBook 14 2022 | |
| F1 2021 | |
| 1920x1080 High Preset AA:T AF:16x | |
| Gigabyte G5 KE | |
| Przeciętny NVIDIA GeForce RTX 3060 Laptop GPU (119 - 227, n=9) | |
| Honor MagicBook 14 2022 | |
| 1920x1080 Ultra High Preset + Raytracing AA:T AF:16x | |
| Gigabyte G5 KE | |
| Przeciętny NVIDIA GeForce RTX 3060 Laptop GPU (67 - 112.8, n=9) | |
| Honor MagicBook 14 2022 | |
| Far Cry 5 | |
| 1920x1080 High Preset AA:T | |
| Gigabyte G5 KE | |
| Średnia w klasie Gaming (82 - 163, n=6, ostatnie 2 lata) | |
| Gigabyte G7 KE | |
| Schenker XMG Core 15 (M22) | |
| Asus TUF Gaming F15 FX507ZM | |
| HP Victus 16-e0179ng | |
| Przeciętny NVIDIA GeForce RTX 3060 Laptop GPU (85 - 129, n=29) | |
| Honor MagicBook 14 2022 | |
| 1920x1080 Ultra Preset AA:T | |
| Gigabyte G5 KE | |
| Średnia w klasie Gaming (70 - 151, n=6, ostatnie 2 lata) | |
| Gigabyte G7 KE | |
| Asus TUF Gaming F15 FX507ZM | |
| Schenker XMG Core 15 (M22) | |
| HP Victus 16-e0179ng | |
| Przeciętny NVIDIA GeForce RTX 3060 Laptop GPU (80 - 120, n=31) | |
| Honor MagicBook 14 2022 | |
| Final Fantasy XV Benchmark - 1920x1080 High Quality | |
| Średnia w klasie Gaming (41 - 215, n=95, ostatnie 2 lata) | |
| Asus TUF Gaming F15 FX507ZM | |
| Schenker XMG Core 15 (M22) | |
| Gigabyte G5 KE | |
| Dell G16 7620 | |
| Gigabyte A5 K1 | |
| Gigabyte G7 KE | |
| Przeciętny NVIDIA GeForce RTX 3060 Laptop GPU (55 - 100.9, n=42) | |
| HP Victus 16-e0179ng | |
| Lenovo IdeaPad Gaming 3 15IAH7 | |
| Honor MagicBook 14 2022 | |
| Strange Brigade | |
| 1920x1080 high AA:high AF:8 | |
| Średnia w klasie Gaming (129.5 - 494, n=75, ostatnie 2 lata) | |
| Asus TUF Gaming F15 FX507ZM | |
| Dell G16 7620 | |
| Gigabyte G5 KE | |
| Gigabyte A5 K1 | |
| Schenker XMG Core 15 (M22) | |
| Gigabyte G7 KE | |
| Przeciętny NVIDIA GeForce RTX 3060 Laptop GPU (115.6 - 192.1, n=41) | |
| HP Victus 16-e0179ng | |
| Lenovo IdeaPad Gaming 3 15IAH7 | |
| Honor MagicBook 14 2022 | |
| 1920x1080 ultra AA:ultra AF:16 | |
| Średnia w klasie Gaming (76.3 - 458, n=87, ostatnie 2 lata) | |
| Asus TUF Gaming F15 FX507ZM | |
| Dell G16 7620 | |
| Gigabyte G5 KE | |
| Schenker XMG Core 15 (M22) | |
| Gigabyte A5 K1 | |
| Gigabyte G7 KE | |
| Przeciętny NVIDIA GeForce RTX 3060 Laptop GPU (102.2 - 166.3, n=43) | |
| HP Victus 16-e0179ng | |
| Lenovo IdeaPad Gaming 3 15IAH7 | |
| Honor MagicBook 14 2022 | |
| X-Plane 11.11 - 1920x1080 high (fps_test=3) | |
| Asus TUF Gaming F15 FX507ZM | |
| Dell G16 7620 | |
| Średnia w klasie Gaming (55.5 - 148.5, n=110, ostatnie 2 lata) | |
| Gigabyte G7 KE | |
| Gigabyte G5 KE | |
| Honor MagicBook 14 2022 | |
| Przeciętny NVIDIA GeForce RTX 3060 Laptop GPU (61.9 - 109.3, n=48) | |
| Lenovo IdeaPad Gaming 3 15IAH7 | |
| Schenker XMG Core 15 (M22) | |
| HP Victus 16-e0179ng | |
| Gigabyte A5 K1 | |
| The Witcher 3 | |
| 1920x1080 High Graphics & Postprocessing (Nvidia HairWorks Off) | |
| Średnia w klasie Gaming (341 - 404, n=2, ostatnie 2 lata) | |
| Asus TUF Gaming F15 FX507ZM | |
| Gigabyte G5 KE | |
| Dell G16 7620 | |
| Schenker XMG Core 15 (M22) | |
| Gigabyte A5 K1 | |
| Przeciętny NVIDIA GeForce RTX 3060 Laptop GPU (81 - 186.8, n=41) | |
| Gigabyte G7 KE | |
| HP Victus 16-e0179ng | |
| Lenovo IdeaPad Gaming 3 15IAH7 | |
| Honor MagicBook 14 2022 | |
| 1920x1080 Ultra Graphics & Postprocessing (HBAO+) | |
| Średnia w klasie Gaming (104.7 - 240, n=7, ostatnie 2 lata) | |
| Asus TUF Gaming F15 FX507ZM | |
| Gigabyte G5 KE | |
| Dell G16 7620 | |
| Gigabyte G7 KE | |
| Schenker XMG Core 15 (M22) | |
| Gigabyte A5 K1 | |
| Przeciętny NVIDIA GeForce RTX 3060 Laptop GPU (58.2 - 91.5, n=48) | |
| HP Victus 16-e0179ng | |
| Lenovo IdeaPad Gaming 3 15IAH7 | |
| Honor MagicBook 14 2022 | |
| GTA V | |
| 1920x1080 High/On (Advanced Graphics Off) AA:2xMSAA + FX AF:8x | |
| Dell G16 7620 | |
| Gigabyte G5 KE | |
| Gigabyte G7 KE | |
| Średnia w klasie Gaming (110.7 - 189, n=64, ostatnie 2 lata) | |
| Asus TUF Gaming F15 FX507ZM | |
| Schenker XMG Core 15 (M22) | |
| Gigabyte A5 K1 | |
| Przeciętny NVIDIA GeForce RTX 3060 Laptop GPU (120 - 179.4, n=42) | |
| HP Victus 16-e0179ng | |
| Lenovo IdeaPad Gaming 3 15IAH7 | |
| Honor MagicBook 14 2022 | |
| 1920x1080 Highest AA:4xMSAA + FX AF:16x | |
| Średnia w klasie Gaming (48.3 - 186.9, n=94, ostatnie 2 lata) | |
| Dell G16 7620 | |
| Gigabyte G7 KE | |
| Gigabyte G5 KE | |
| Asus TUF Gaming F15 FX507ZM | |
| Schenker XMG Core 15 (M22) | |
| Gigabyte A5 K1 | |
| Przeciętny NVIDIA GeForce RTX 3060 Laptop GPU (69.2 - 109.8, n=46) | |
| HP Victus 16-e0179ng | |
| Lenovo IdeaPad Gaming 3 15IAH7 | |
| Honor MagicBook 14 2022 | |
| Dota 2 Reborn | |
| 1920x1080 high (2/3) | |
| Średnia w klasie Gaming (82.8 - 280, n=107, ostatnie 2 lata) | |
| Dell G16 7620 | |
| Asus TUF Gaming F15 FX507ZM | |
| Gigabyte G7 KE | |
| Gigabyte G5 KE | |
| Honor MagicBook 14 2022 | |
| Przeciętny NVIDIA GeForce RTX 3060 Laptop GPU (98.9 - 169.2, n=49) | |
| HP Victus 16-e0179ng | |
| Gigabyte A5 K1 | |
| Schenker XMG Core 15 (M22) | |
| Lenovo IdeaPad Gaming 3 15IAH7 | |
| 1920x1080 ultra (3/3) best looking | |
| Średnia w klasie Gaming (84.8 - 252, n=108, ostatnie 2 lata) | |
| Asus TUF Gaming F15 FX507ZM | |
| Dell G16 7620 | |
| Gigabyte G5 KE | |
| Gigabyte G7 KE | |
| Honor MagicBook 14 2022 | |
| Przeciętny NVIDIA GeForce RTX 3060 Laptop GPU (90.7 - 154.8, n=49) | |
| HP Victus 16-e0179ng | |
| Gigabyte A5 K1 | |
| Schenker XMG Core 15 (M22) | |
| Lenovo IdeaPad Gaming 3 15IAH7 | |
| low | med. | high | ultra | |
|---|---|---|---|---|
| GTA V (2015) | 183.4 | 179.9 | 172.8 | 103 |
| The Witcher 3 (2015) | 333 | 255 | 168.7 | 87.6 |
| Dota 2 Reborn (2015) | 168.5 | 153.1 | 144.8 | 137.5 |
| Final Fantasy XV Benchmark (2018) | 179.3 | 118.9 | 90.3 | |
| X-Plane 11.11 (2018) | 118.4 | 105.6 | 86.7 | |
| Far Cry 5 (2018) | 159 | 134 | 129 | 118 |
| Strange Brigade (2018) | 385 | 216 | 175.3 | 153.3 |
| F1 2021 (2021) | 303 | 200 | 177.9 | 105.1 |
| Cyberpunk 2077 1.6 (2022) | 105.4 | 85.3 | 72.5 | 68 |
| F1 22 (2022) | 197 | 189.4 | 153.3 | 55.9 |
Sprawdź nasz dedykowany Nvidia GeForce RTX 3060 Laptop GPU strona, a także naszą wyczerpującą listę porównawczą dla graczy aby uzyskać więcej informacji i porównać wydajność.
Emissions: High surface temperatures and fan noise under load
Szum systemu
W testowanym trybie Performance szum systemu w spoczynku jest nieco wyższy i wynosi około 31 dB(A). Szum wentylatora osiąga granicę 55 dB(A) niezależnie od obciążenia.
Wydaje się, że Gigabyte ograniczył hałas wentylatorów poniżej 30 dB(A) w profilu Quiet. Jedynie w teście
Witcher 3 szum wentylatora w profilu Power Saving jest wysoki, co ilustruje poniższa tabela.
| Tryb pracy | Idle dB(A) | Load average dB(A) | Load maximum dB(A) | The Witcher 3 dB(A) |
|---|---|---|---|---|
| Quiet | 22,21 | 25,73 | 24,64 | 27,62 |
| Oszczędność energii | 22,65 | 24,75 | 24,62 | 49,05 |
| Rozrywka | 22,63 | 54,67 | 55,52 | 53,11 |
| Wydajność | 31,05 | 55,66 | 55,51 | 55,65 |
Hałas
| luz |
| 31.05 / 31.05 / 31.05 dB |
| obciążenie |
| 55.66 / 55.51 dB |
 | ||
30 dB cichy 40 dB(A) słyszalny 50 dB(A) irytujący |
||
min: | ||
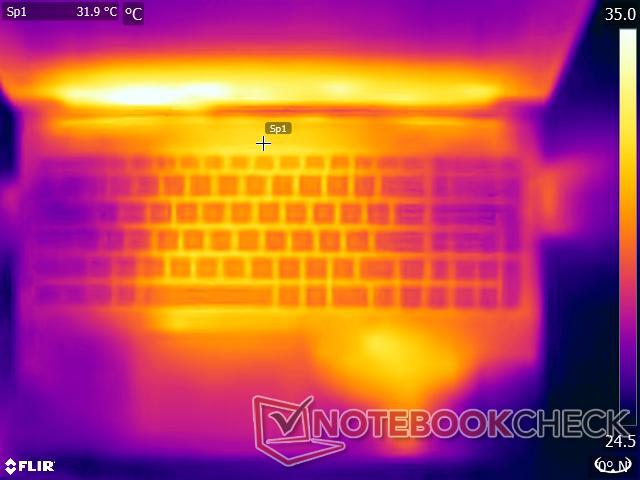
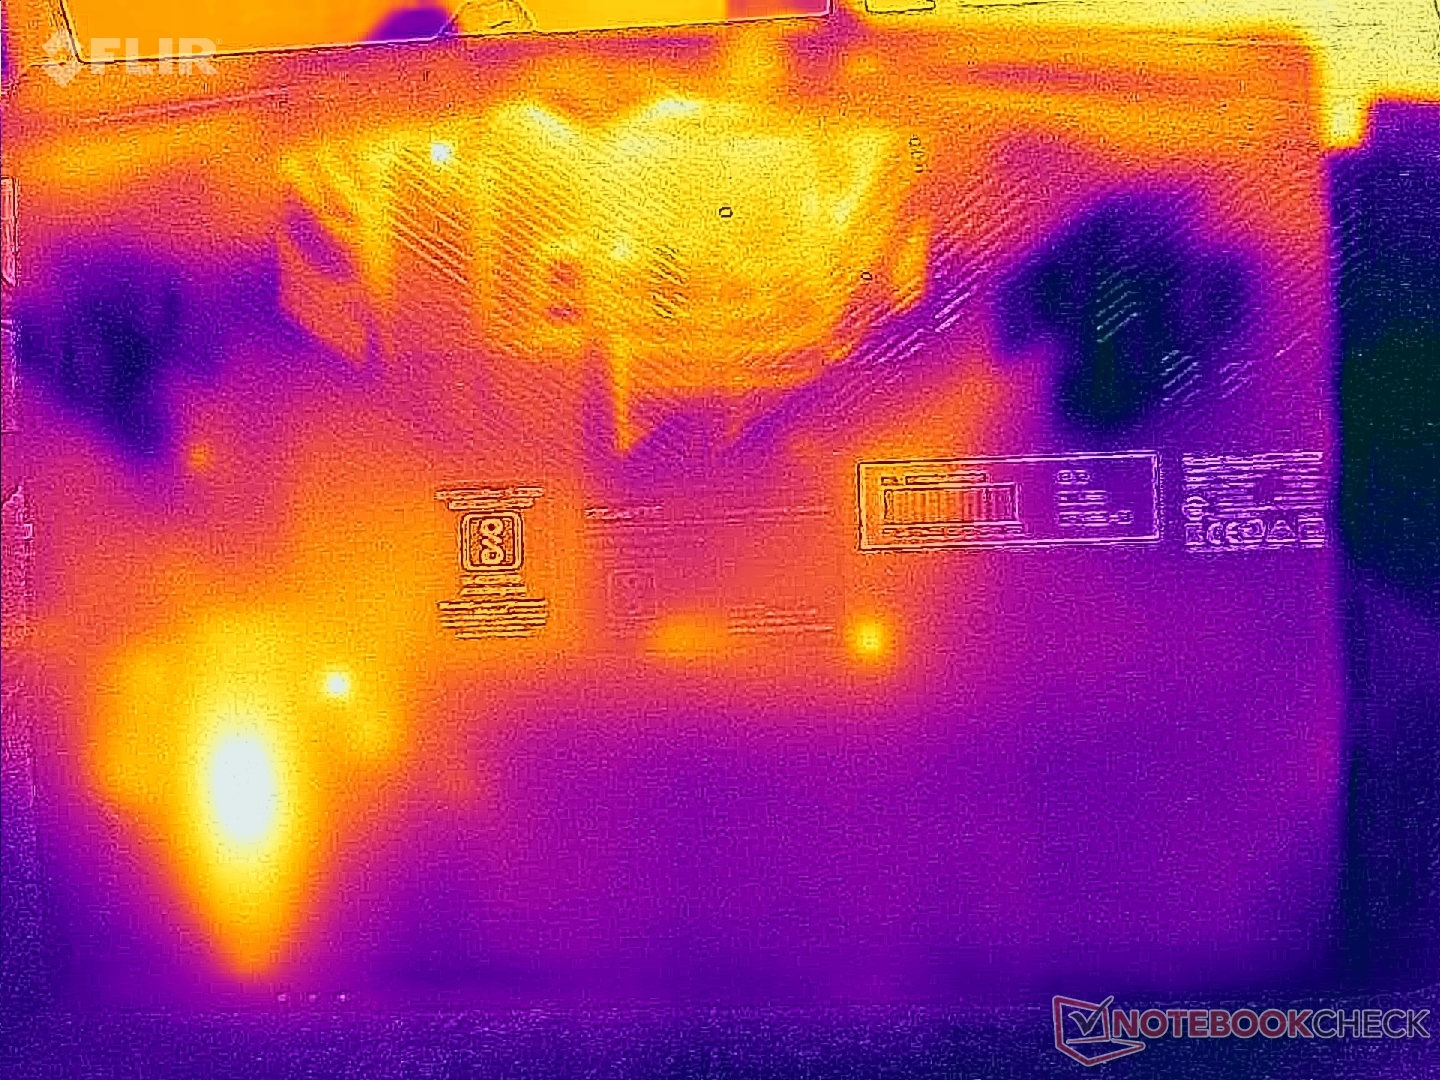
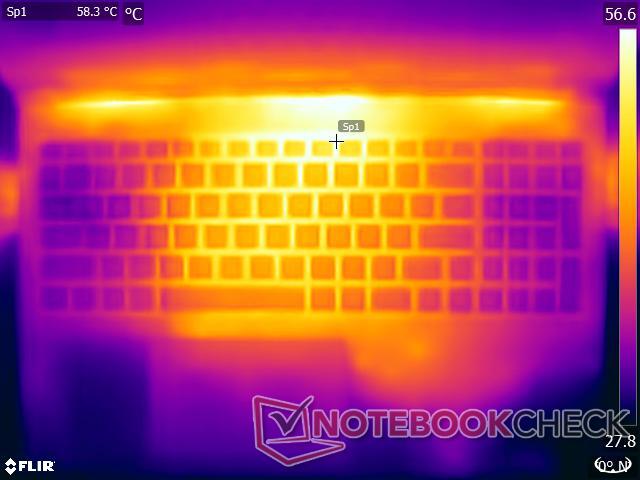
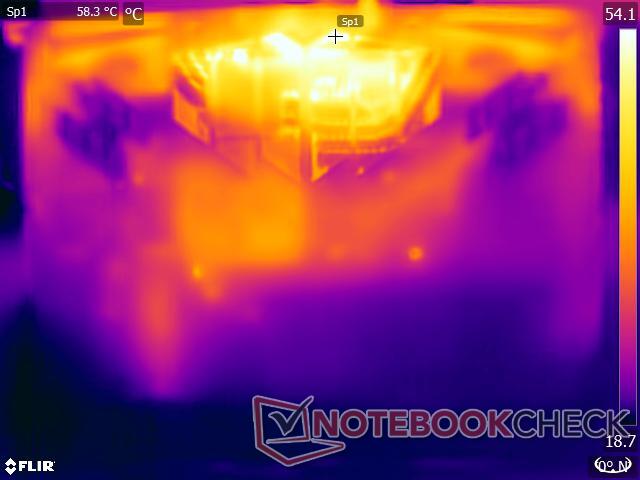
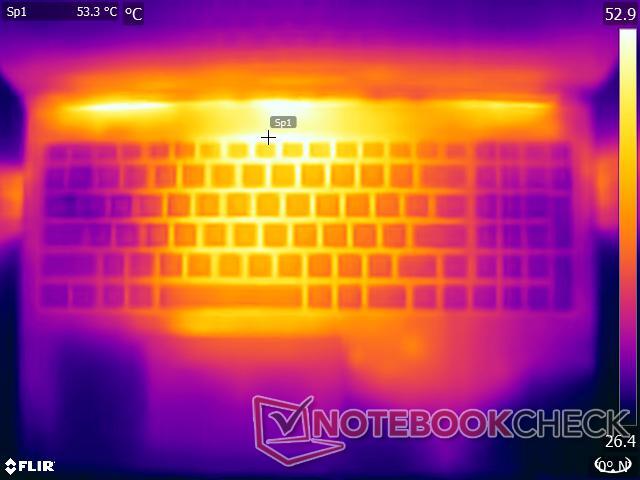
Temperatura
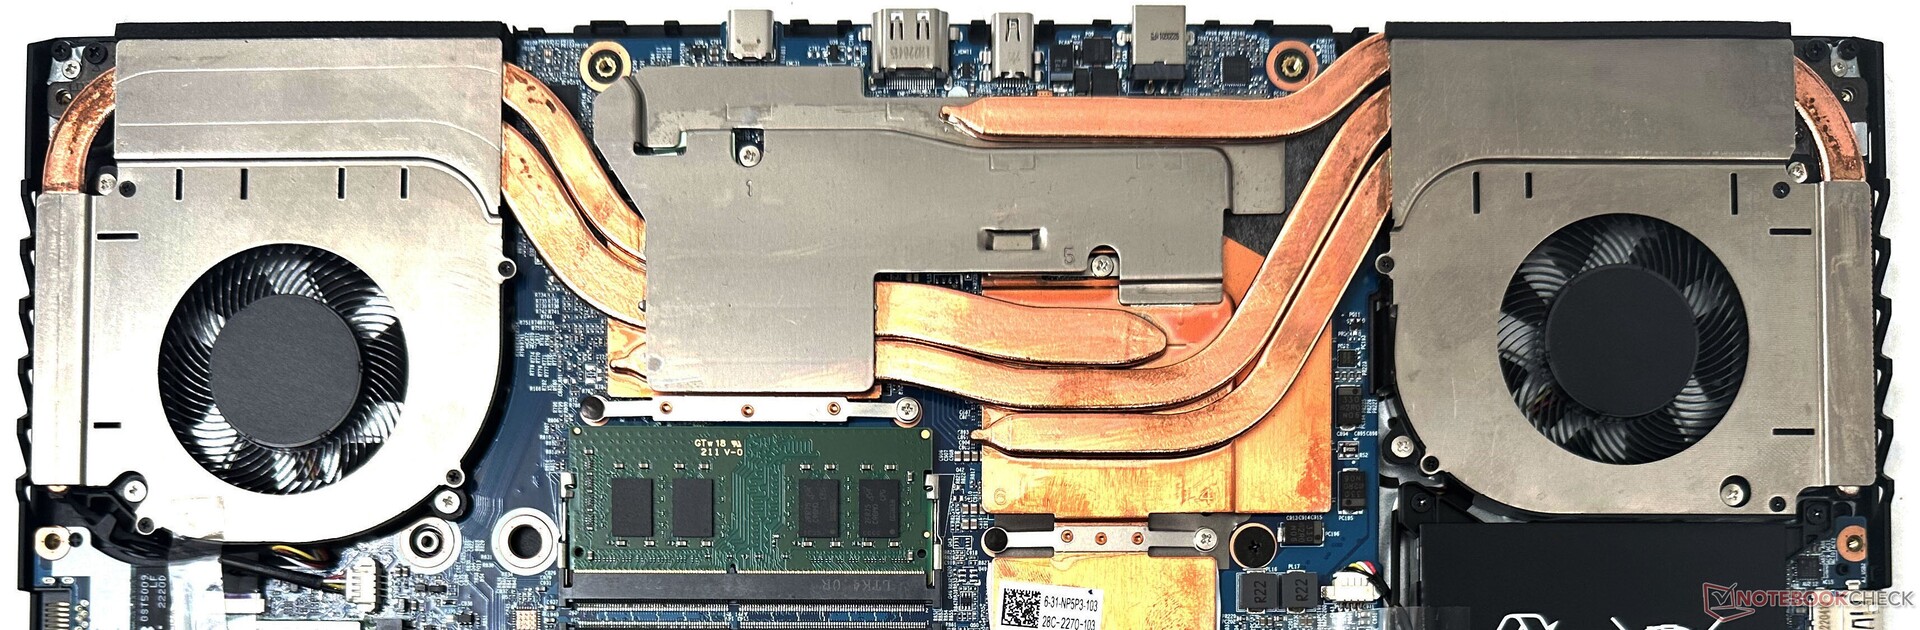
Podwójny system Gigabyte G5 KE z czterema wentylatorami dobrze radzi sobie z utrzymaniem temperatury rdzenia pod kontrolą, ale temperatury na powierzchni mogą wzrosnąć do 52,6°C na górze i do 62,4°C na dole przy dużym obciążeniu.
Również obszar touchpada może się dość mocno nagrzewać.
(-) Maksymalna temperatura w górnej części wynosi 52.6 °C / 127 F, w porównaniu do średniej 40.4 °C / 105 F , począwszy od 21.2 do 68.8 °C dla klasy Gaming.
(-) Dno nagrzewa się maksymalnie do 62.4 °C / 144 F, w porównaniu do średniej 43.2 °C / 110 F
(±) W stanie bezczynności średnia temperatura górnej części wynosi 32 °C / 90 F, w porównaniu ze średnią temperaturą urządzenia wynoszącą 33.9 °C / ### class_avg_f### F.
(-) Podczas gry w Wiedźmina 3 średnia temperatura górnej części wynosi 42.9 °C / 109 F, w porównaniu do średniej temperatury urządzenia wynoszącej 33.9 °C / ## #class_avg_f### F.
(-) Podpórki pod nadgarstki i touchpad mogą się bardzo nagrzać w dotyku, maksymalnie do 41.2 °C / 106.2 F.
(-) Średnia temperatura obszaru podparcia dłoni w podobnych urządzeniach wynosiła 28.8 °C / 83.8 F (-12.4 °C / -22.4 F).
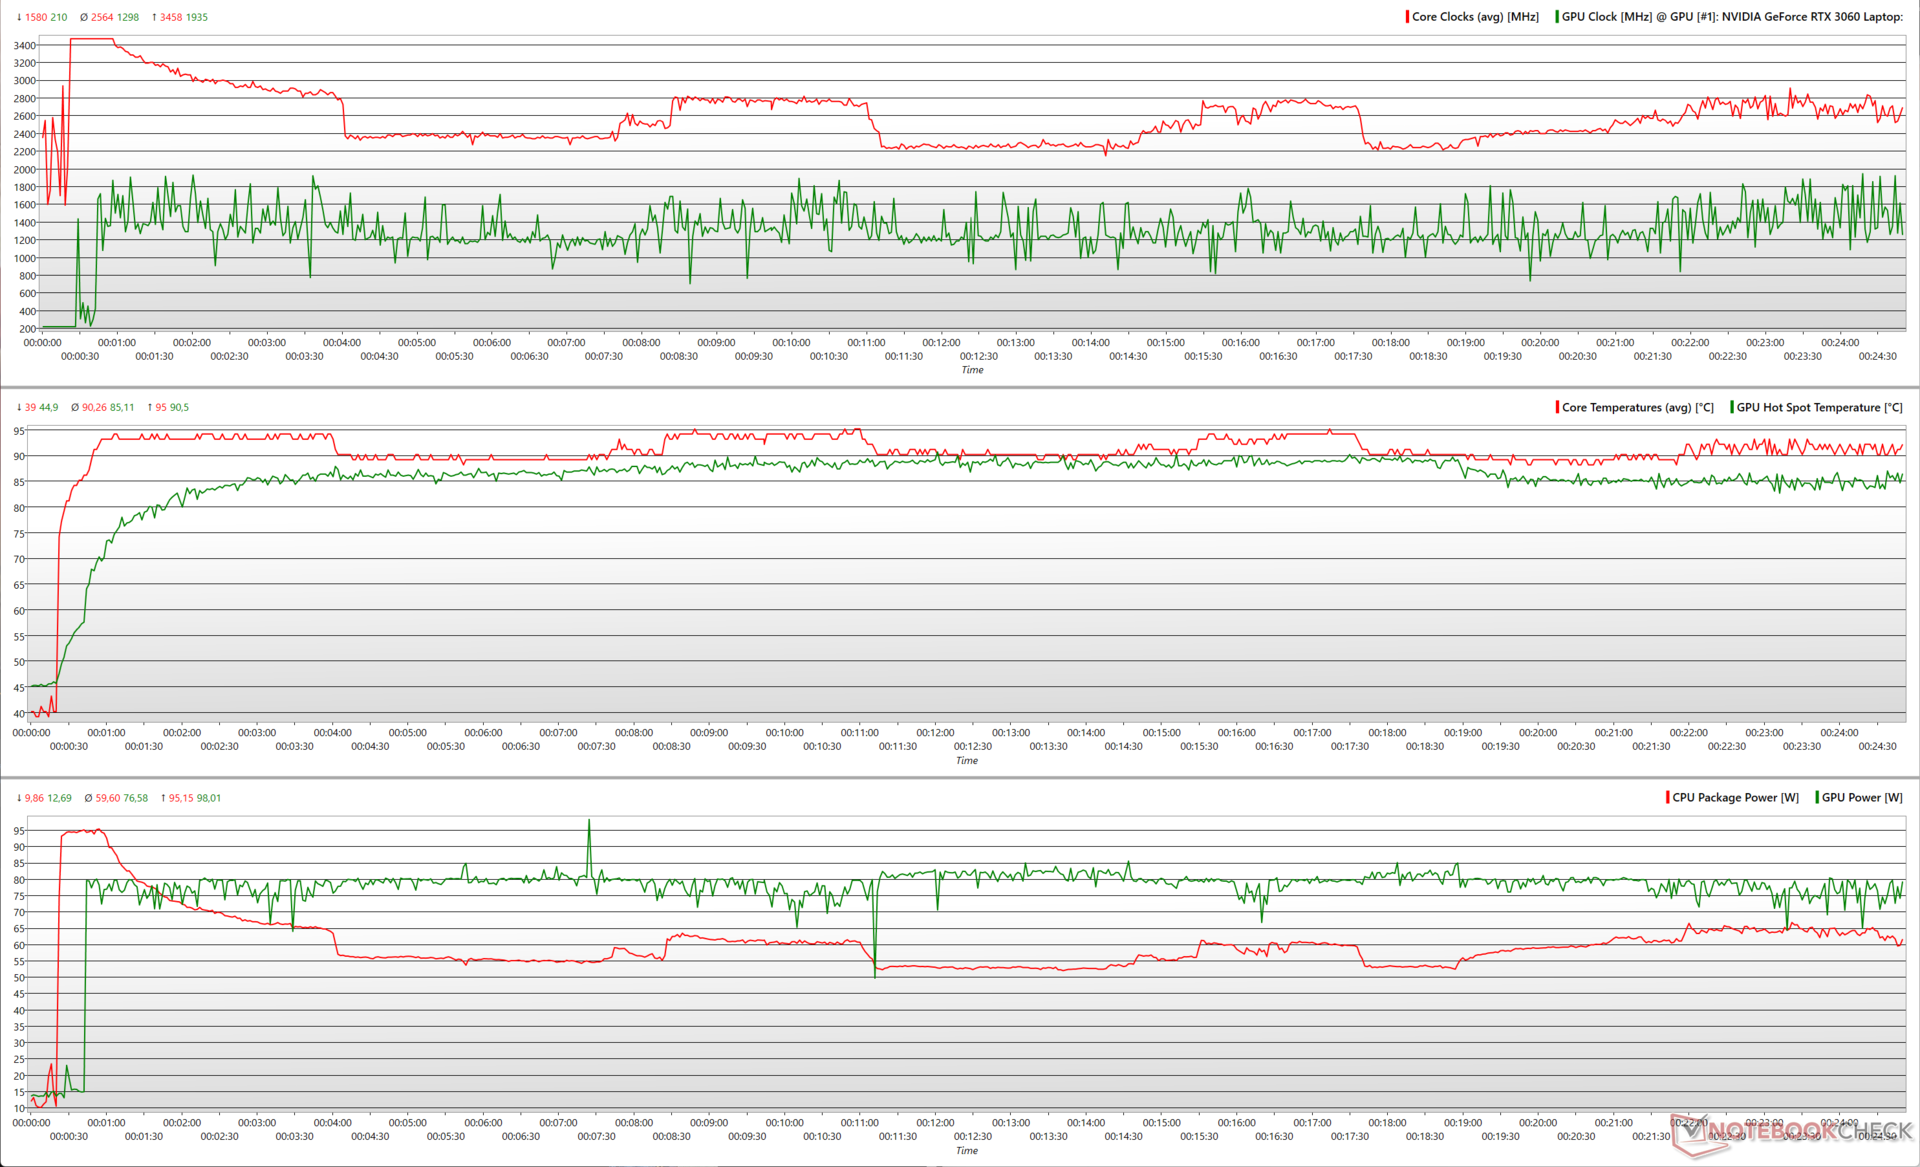
W połączonych testach Prime95 i FurMark procesor Core i5-12500H osiągnął na krótko szczytowe wartości około 3,5 GHz przy 95 W, po czym ustabilizował się na poziomie 2,5 GHz, osiągając średnio 60 W. Procesor graficzny RTX 3060 Laptop pobiera średnio około 75,6 W, ale osiąga 98 W mocy szczytowej, co daje maksymalne taktowanie rdzenia na poziomie 1,9 GHz.
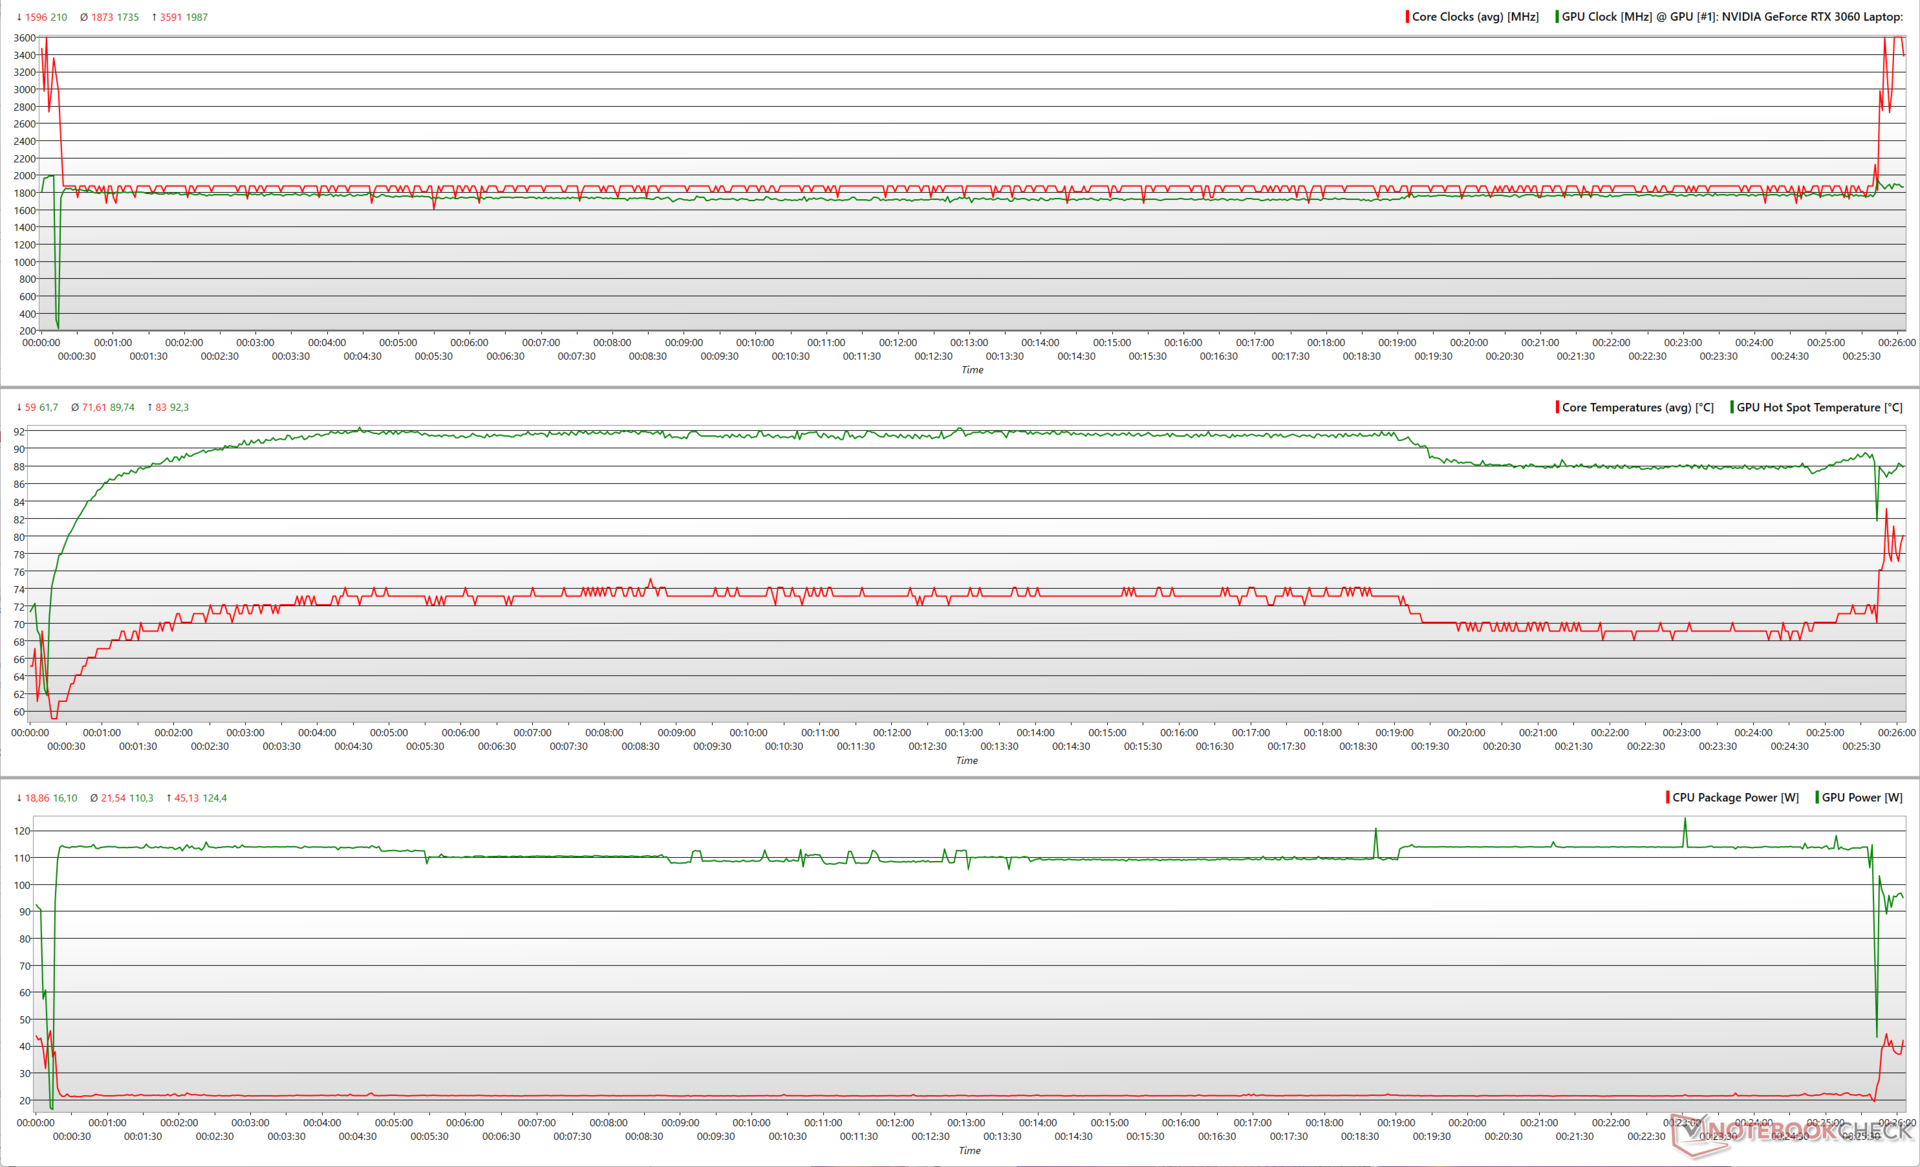
Podobne szczytowe taktowanie widzimy podczas stresu The Witcher 3, ale średnia moc pakietu CPU spada dalej do około 21,5 W, co pozwala RTX 3060 zużywać średnio do 110 W.

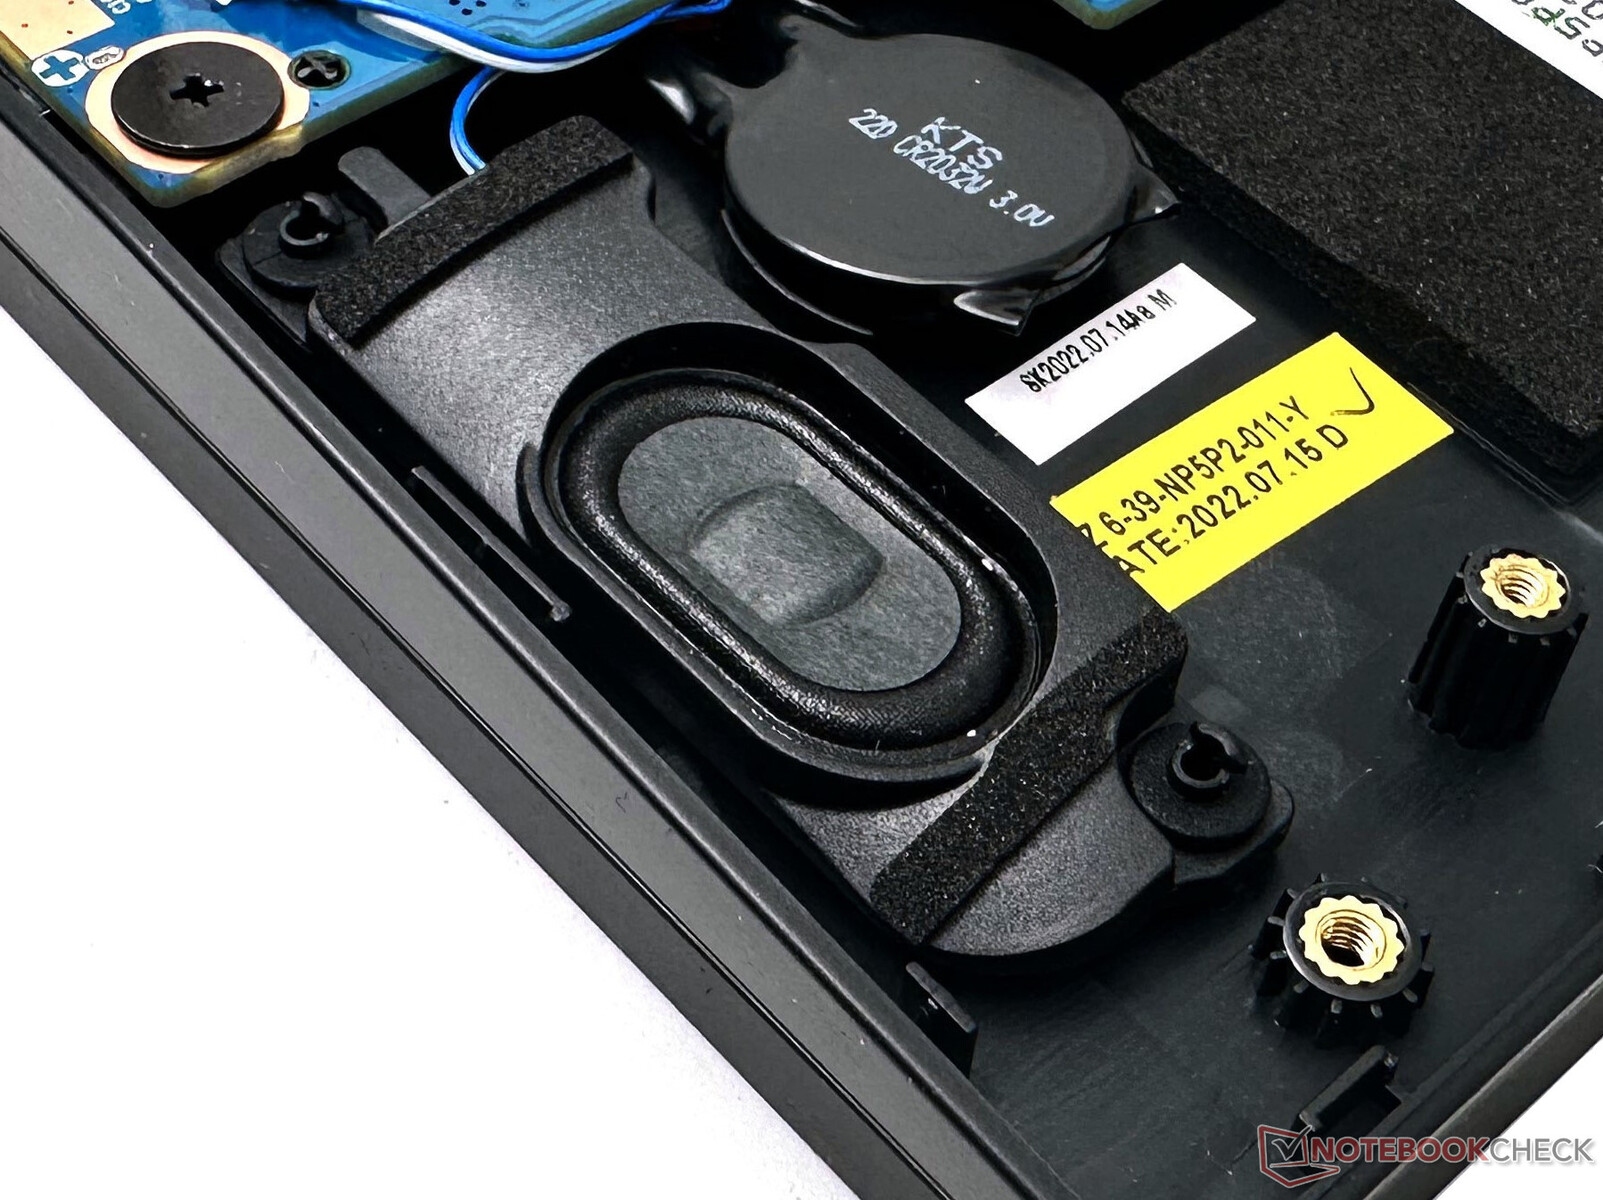
Mówcy
Głośniki G5 KE są w większości przypadków dość sprawne, a ich głośność jest bliska 75 dB(A). Bas jest prawie nieobecny, ale tony średnie i wysokie są przyzwoicie odwzorowane.
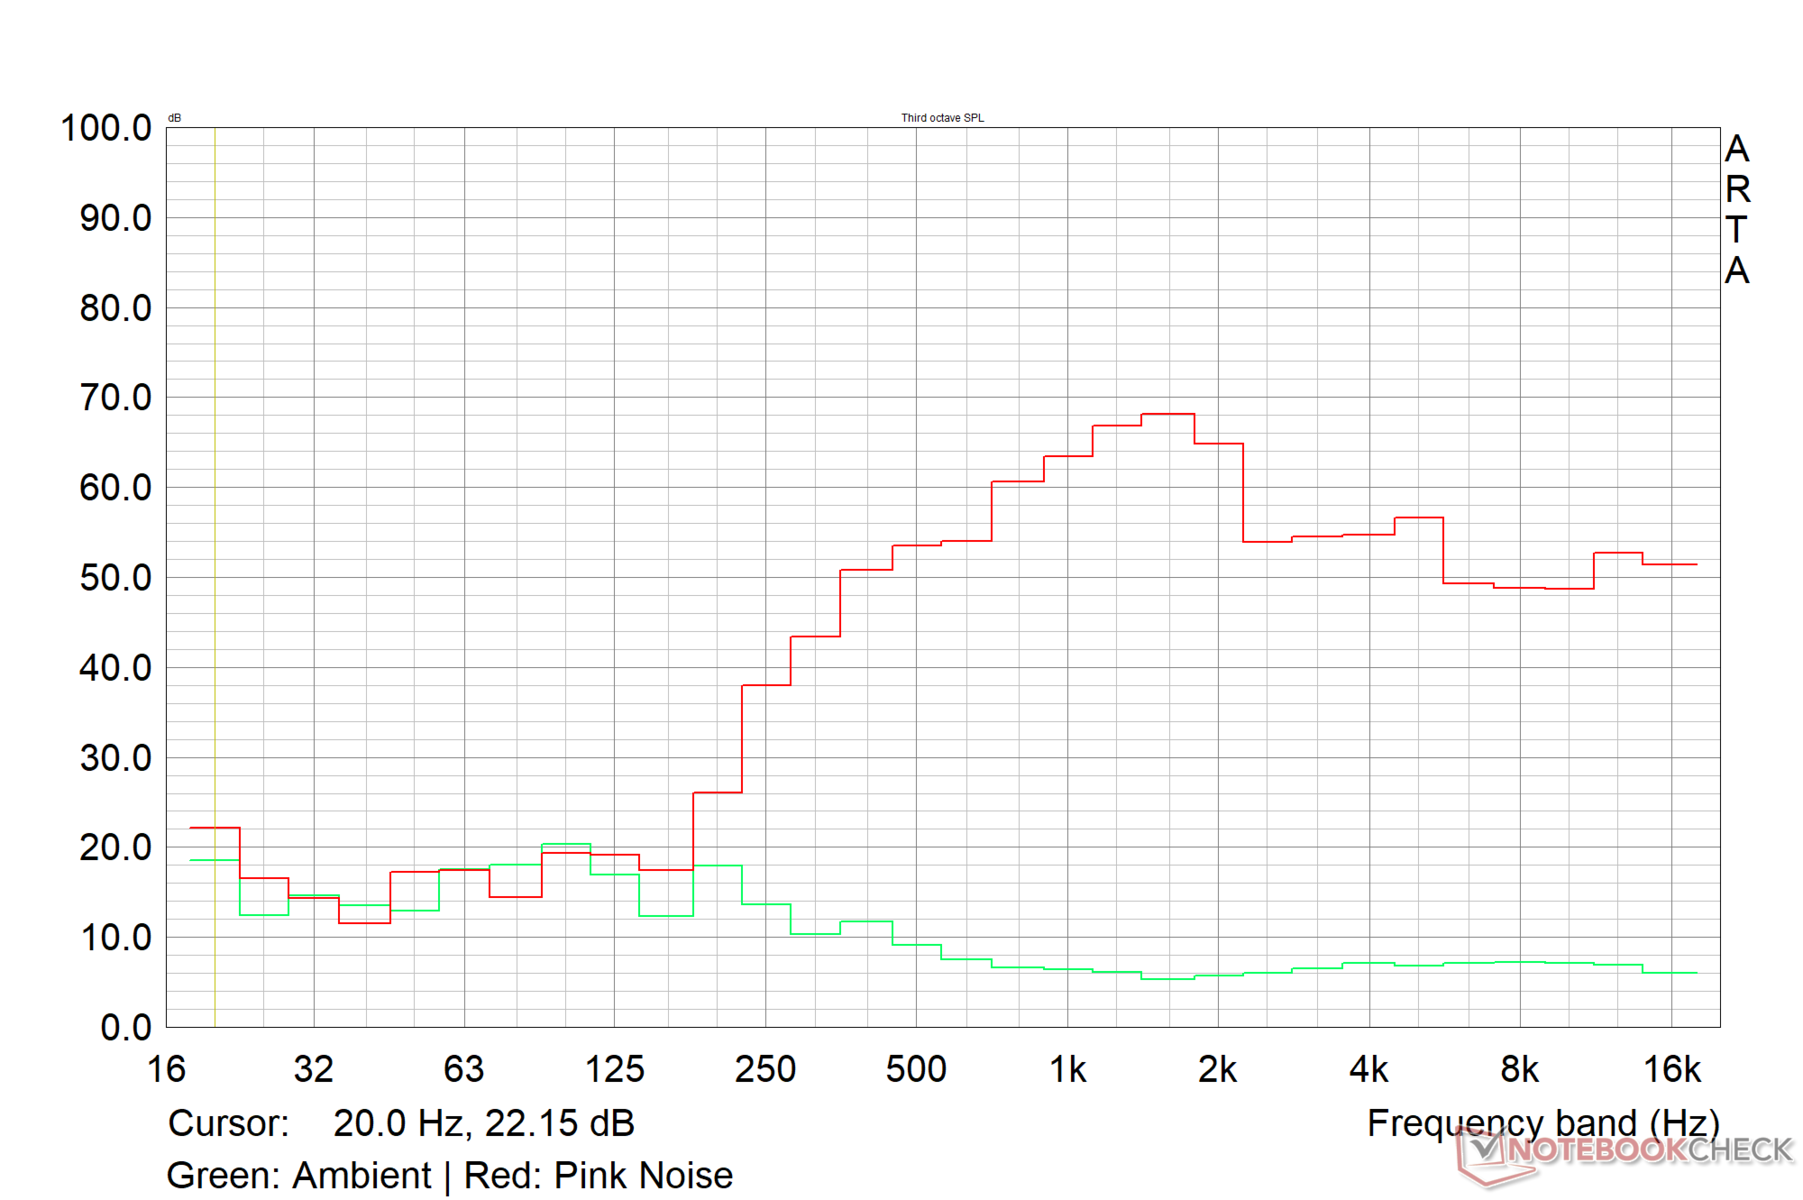
Gigabyte G5 KE analiza dźwięku
(±) | głośność głośnika jest średnia, ale dobra (73.6 dB)
Bas 100 - 315 Hz
(-) | prawie brak basu - średnio 25.5% niższa od mediany
(±) | liniowość basu jest średnia (12% delta do poprzedniej częstotliwości)
Średnie 400 - 2000 Hz
(±) | wyższe średnie - średnio 8.1% wyższe niż mediana
(±) | liniowość środka jest średnia (7.7% delta do poprzedniej częstotliwości)
Wysokie 2–16 kHz
(+) | zrównoważone maksima - tylko 2.9% od mediany
(+) | wzloty są liniowe (6.7% delta do poprzedniej częstotliwości)
Ogólnie 100 - 16.000 Hz
(±) | liniowość ogólnego dźwięku jest średnia (25.1% różnicy w stosunku do mediany)
W porównaniu do tej samej klasy
» 90% wszystkich testowanych urządzeń w tej klasie było lepszych, 3% podobnych, 7% gorszych
» Najlepszy miał deltę 6%, średnia wynosiła ###średnia###%, najgorsza wynosiła 132%
W porównaniu do wszystkich testowanych urządzeń
» 77% wszystkich testowanych urządzeń było lepszych, 5% podobnych, 18% gorszych
» Najlepszy miał deltę 4%, średnia wynosiła ###średnia###%, najgorsza wynosiła 134%
Apple MacBook Pro 16 2021 M1 Pro analiza dźwięku
(+) | głośniki mogą odtwarzać stosunkowo głośno (84.7 dB)
Bas 100 - 315 Hz
(+) | dobry bas - tylko 3.8% od mediany
(+) | bas jest liniowy (5.2% delta do poprzedniej częstotliwości)
Średnie 400 - 2000 Hz
(+) | zbalansowane środki średnie - tylko 1.3% od mediany
(+) | średnie są liniowe (2.1% delta do poprzedniej częstotliwości)
Wysokie 2–16 kHz
(+) | zrównoważone maksima - tylko 1.9% od mediany
(+) | wzloty są liniowe (2.7% delta do poprzedniej częstotliwości)
Ogólnie 100 - 16.000 Hz
(+) | ogólny dźwięk jest liniowy (4.6% różnicy w stosunku do mediany)
W porównaniu do tej samej klasy
» 0% wszystkich testowanych urządzeń w tej klasie było lepszych, 0% podobnych, 100% gorszych
» Najlepszy miał deltę 5%, średnia wynosiła ###średnia###%, najgorsza wynosiła 45%
W porównaniu do wszystkich testowanych urządzeń
» 0% wszystkich testowanych urządzeń było lepszych, 0% podobnych, 100% gorszych
» Najlepszy miał deltę 4%, średnia wynosiła ###średnia###%, najgorsza wynosiła 134%
Zarządzanie energią: Oszczędne pobieranie energii w stanie spoczynku przy przeciętnej żywotności baterii
Pobór mocy
Gigabyte G5 KE jest dość oszczędny pod względem poboru mocy od G7 KE, szczególnie w idle.
Na stronie Lenovo IdeaPad Gaming 3's RTX 3050 Ti Laptop GPU oraz połączenie 95 W RTX 3060 z HP Victus Ryzen 7 5800H pomagają tym urządzeniom zużywać stosunkowo mniej energii.
| wyłączony / stan wstrzymania | |
| luz | |
| obciążenie |
|
Legenda:
min: | |
| Gigabyte G5 KE i5-12500H, GeForce RTX 3060 Laptop GPU, IPS, 1920x1080, 15.6" | Lenovo IdeaPad Gaming 3 15IAH7 i5-12500H, GeForce RTX 3050 Ti Laptop GPU, IPS, 1920x1080, 15.6" | Gigabyte G7 KE i5-12500H, GeForce RTX 3060 Laptop GPU, IPS, 1920x1080, 17.3" | Schenker XMG Core 15 (M22) R7 6800H, GeForce RTX 3060 Laptop GPU, IPS, 2560x1440, 15.6" | Dell G16 7620 i7-12700H, GeForce RTX 3060 Laptop GPU, IPS, 2560x1600, 16" | Asus TUF Gaming F15 FX507ZM i7-12700H, GeForce RTX 3060 Laptop GPU, IPS, 1920x1080, 15.6" | HP Victus 16-e0179ng R7 5800H, GeForce RTX 3060 Laptop GPU, IPS, 1920x1080, 16.1" | Przeciętny NVIDIA GeForce RTX 3060 Laptop GPU | Średnia w klasie Gaming | |
|---|---|---|---|---|---|---|---|---|---|
| Power Consumption | 9% | -33% | -14% | -42% | -8% | 9% | -18% | -43% | |
| Idle Minimum * (Watt) | 7.66 | 8 -4% | 15 -96% | 11.8 -54% | 14.4 -88% | 6.3 18% | 5 35% | 10.4 ? -36% | 13 ? -70% |
| Idle Average * (Watt) | 10.3 | 10 3% | 17 -65% | 14.7 -43% | 17.8 -73% | 9.8 5% | 10 3% | 14.5 ? -41% | 19 ? -84% |
| Idle Maximum * (Watt) | 16.05 | 16 -0% | 24 -50% | 15 7% | 31.5 -96% | 26.5 -65% | 20 -25% | 21.4 ? -33% | 24.5 ? -53% |
| Load Average * (Watt) | 115.8 | 99 15% | 111 4% | 100 14% | 101.2 13% | 103.8 10% | 108 7% | 109.3 ? 6% | 111.1 ? 4% |
| Witcher 3 ultra * (Watt) | 168.7 | 144.6 14% | 174.1 -3% | 184 -9% | 176.9 -5% | 189 -12% | 145 14% | ||
| Load Maximum * (Watt) | 234.6 | 168 28% | 208 11% | 237 -1% | 242.9 -4% | 241.9 -3% | 189 19% | 206 ? 12% | 260 ? -11% |
* ... im mniej tym lepiej
Power Consumption: The Witcher 3 / Stress test
Power Consumption: External monitor
Czas pracy na baterii
Czasy pracy Gigabyte G5 KE na akumulatorze są po niższej stronie nawet przy obniżonej jasności 150 nitów. Nie jest to jednak rzadkość w przypadku laptopów do gier.
Podobnie jak w przypadku modelu G7 KE, w teście odtwarzania filmów H.264 1080p przy jasności 150 nitów odnotowaliśmy drastycznie niski czas pracy, wynoszący nieco ponad dwie godziny, nawet przy użyciu wszystkich napędów i aktualnych poprawek systemu operacyjnego.
| Battery Runtime - WiFi Websurfing | |
| Honor MagicBook 14 2022 | |
| Schenker XMG Core 15 (M22) | |
| Średnia w klasie Gaming (1.967 - 14.6, n=100, ostatnie 2 lata) | |
| Gigabyte A5 K1 | |
| HP Victus 16-e0179ng | |
| Lenovo IdeaPad Gaming 3 15IAH7 | |
| Gigabyte G5 KE | |
| Gigabyte G7 KE | |
| Dell G16 7620 | |
| Asus TUF Gaming F15 FX507ZM | |
Za
Przeciw
Werdykt: Mainstreamowy gracz z nieuniknionymi kompromisami
Podczas gdy Gigabyte w najbliższych tygodniach udostępni mnóstwo odświeżonych laptopów z serii Aorus, Aero i RTX 40 z procesorem Intel 13. gen. i RTX 40, G5 KE z Intel Core i5-12500H I Nvidia RTX 3060 Laptop GPU nadal stanowi dobrą opcję dla mainstreamowych graczy.
Gigabyte dobrze wykorzystuje połączenie procesora Core i5-12500H i karty graficznej RTX 3060 Laptop, dzięki czemu nie stwierdziliśmy żadnych problemów z ogólną wydajnością. Układ chłodzenia z dwoma wentylatorami i czterema ciepłowodami dobrze radzi sobie z zapewnieniem, że sprzęt nie dławi się pod obciążeniem.
Gigabyte G5 KE to zdolny laptop klasy średniej do gier w rozdzielczości 1080p Ultra z bardzo dobrą wydajnością procesora i układu graficznego. Nie spełnia on jednak oczekiwań w innych obszarach, które mogą być lub nie być krytyczne w zależności od priorytetów użytkownika.
W porównaniu do standardów z 2023 roku, wyświetlacz jest poniżej oczekiwań, zwłaszcza gdy konkurencyjne urządzenia, takie jak np Lenovo IdeaPad Gaming 3, Schenker XMG Core 15 (M22),, Asus TUF Gaming F15, a także autorska płyta Gigabyte'a G7 KE oferują znacznie lepsze panele z szerokim pokryciem palety kolorów i szybkim czasem reakcji.
Inne widoczne braki to dysk SSD, który drastycznie dławi się pod obciążeniem, wysokie temperatury powierzchni, głośne wentylatory i słaba żywotność baterii podczas odtwarzania wideo.
Jeśli te kompromisy nie mają dla Ciebie większego znaczenia, Gigabyte G5 KE to przyzwoity laptop klasy średniej do gier FHD z czysto użytkowego punktu widzenia, który powinien Ci służyć do 2023 roku.
Cena i dostępność
W Indiach, Gigabyte G5 KE jest obecnie sprzedawany na Flipkart w obniżonej cenie ₹94 990, podczas gdy Amazon India oferuje G5 ME z RTX 3050 Ti za ₹95 901.
G5 KE z RTX 3060 jest nieco trudny do znalezienia na rynkach międzynarodowych, ponieważ laptop jest wypierany przez konfigurację opartą na RTX 4050 lub RTX 4060.
Gigabyte G5 KE
- 24/04/2023 v7 (old)
Vaidyanathan Subramaniam
Przezroczystość
Wyboru urządzeń do recenzji dokonuje nasza redakcja. Próbka testowa została udostępniona autorowi jako pożyczka od producenta lub sprzedawcy detalicznego na potrzeby tej recenzji. Pożyczkodawca nie miał wpływu na tę recenzję, producent nie otrzymał też kopii tej recenzji przed publikacją. Nie było obowiązku publikowania tej recenzji. Jako niezależna firma medialna, Notebookcheck nie podlega władzy producentów, sprzedawców detalicznych ani wydawców.
Tak testuje Notebookcheck
Każdego roku Notebookcheck niezależnie sprawdza setki laptopów i smartfonów, stosując standardowe procedury, aby zapewnić porównywalność wszystkich wyników. Od około 20 lat stale rozwijamy nasze metody badawcze, ustanawiając przy tym standardy branżowe. W naszych laboratoriach testowych doświadczeni technicy i redaktorzy korzystają z wysokiej jakości sprzętu pomiarowego. Testy te obejmują wieloetapowy proces walidacji. Nasz kompleksowy system ocen opiera się na setkach uzasadnionych pomiarów i benchmarków, co pozwala zachować obiektywizm.Price comparison

