Recenzja Lenovo ThinkPad X1 Nano Gen 2: Najmniejszy laptop X1 w historii
")
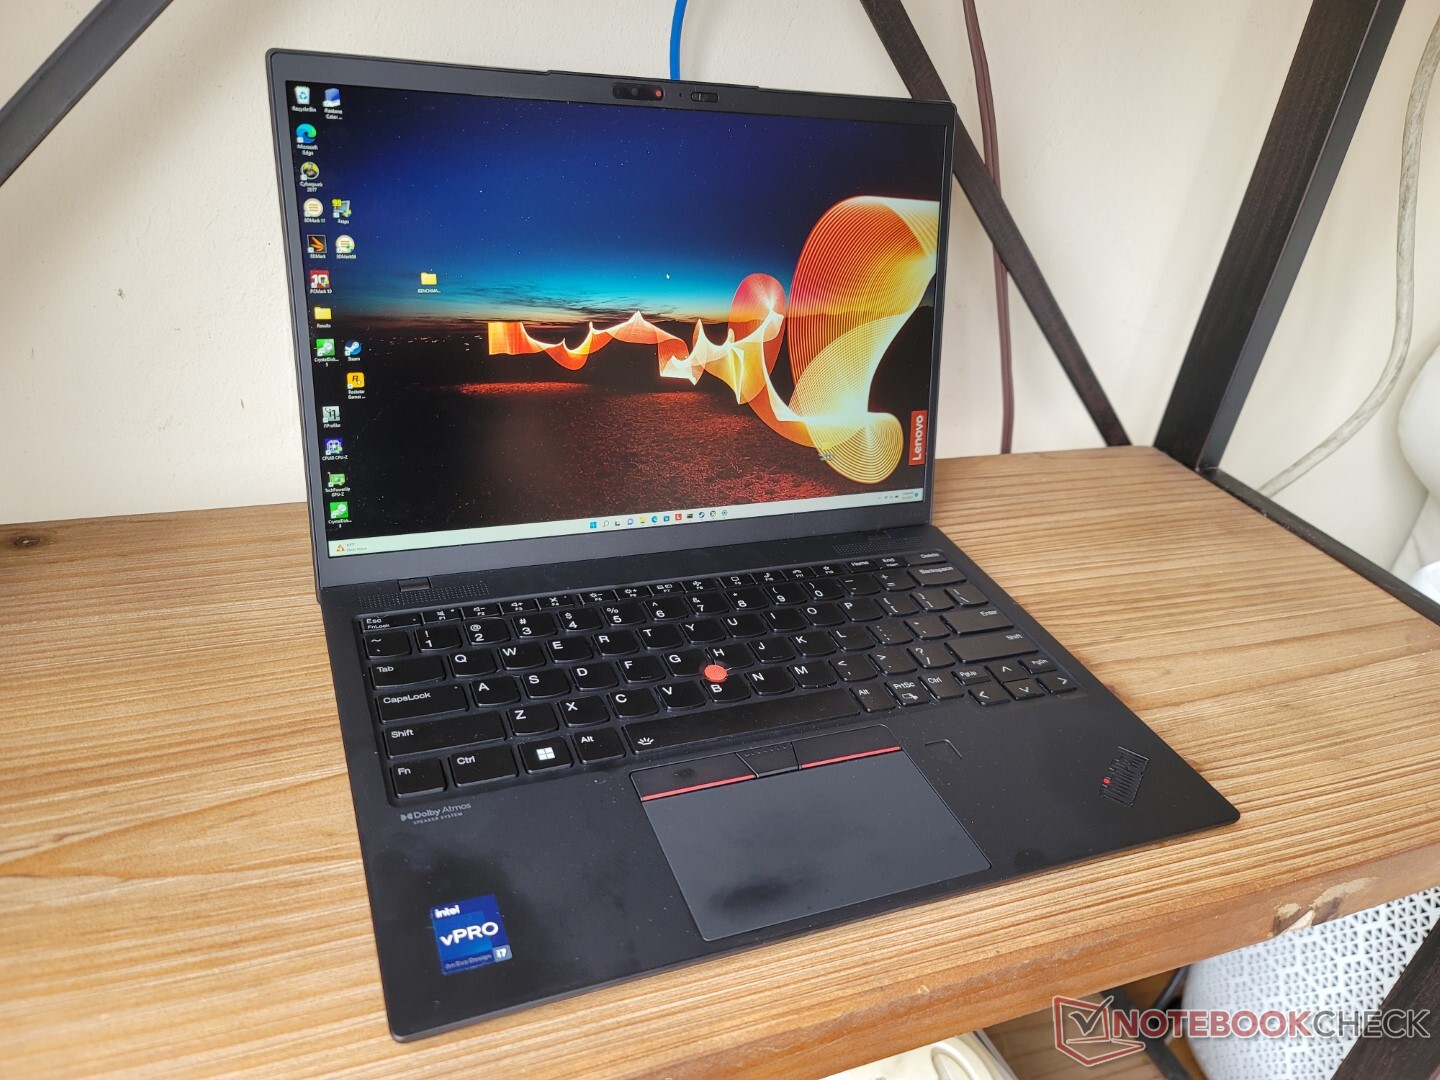
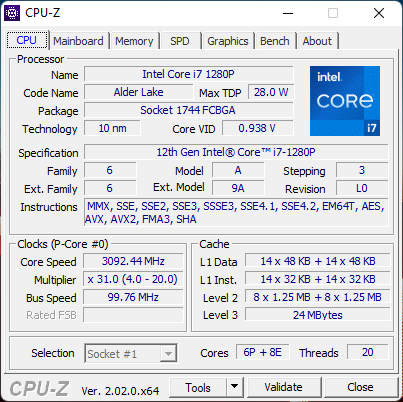
Jednym z największych zarzutów wobec ThinkPada X1 Nano Gen 1 był jego powolny procesor. Podczas gdy większość innych subnotebooków działała na pełnoprawnych 28 W procesorach Core i5-1135G7 lub i7-1165G7 11. generacji, Nano Gen 1 utknął z 15 W i7-1160G7. Model ten może i był superlekki, ale dawał poczucie, że niska waga ma bezpośredni wpływ na poziom wydajności. Nowy ThinkPad X1 Nano Gen 2 rozwiązuje ten problem, wymieniając procesor i7-1160G7 na właściwą opcję 12 gen 28 W i7-1280P vPro, co powinno uczynić X1 Nano Gen 2 jednym z najszybszych 13,0-calowych laptopów biznesowych, przynajmniej na papierze.
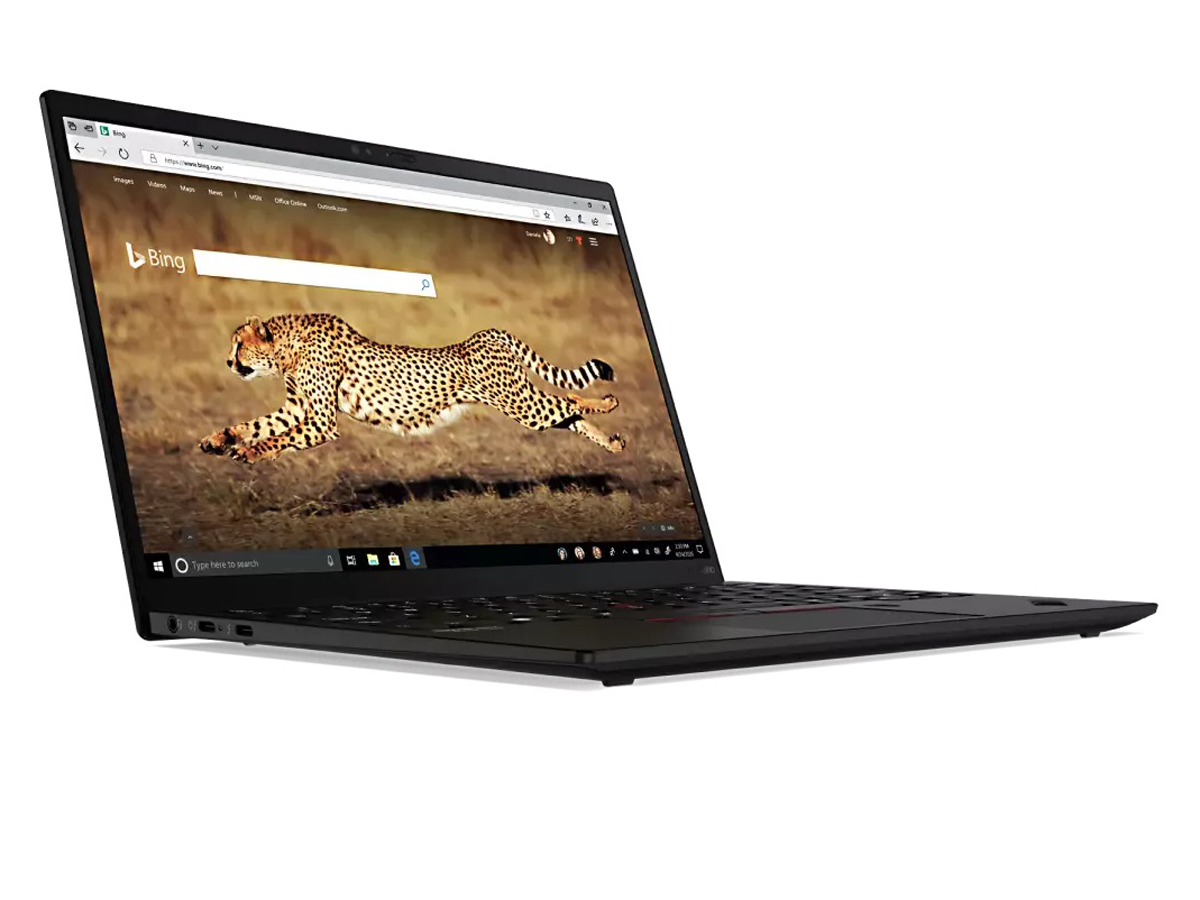
Poza modernizacją procesora model Gen 2 przynosi kilka innych zmian, w tym kamerę internetową o wyższej rozdzielczości, szybsze Wi-Fi i obsługę sieci WAN 5G. Zewnętrzna konstrukcja jest poza tym identyczna jak w modelu 2021 Gen 1, dlatego polecamy sprawdzenie naszej istniejącej recenzji Lenovo ThinkPad X1 Nano Laptop Review - Less than 1 kg for the Business Subnotebook with LTE , aby dowiedzieć się więcej o fizycznych cechach laptopa.
Do konkurentów w tej przestrzeni należą inne superlekkie 13-calowe laptopy biznesowe, takie jak HP Elite Dragonfly G3, Dell Latitude 13 7330, LG Gram series lub Dynabook Portege X30L.
Więcej recenzji Lenovo
Potencjalni konkurenci w porównaniu
Ocena | Data | Model | Waga | Wysokość | Rozmiar | Rezolucja | Cena |
|---|---|---|---|---|---|---|---|
| 88.9 % v7 (old) | 09/2022 | Lenovo ThinkPad X1 Nano Gen 2 Core i7-1280P i7-1280P, Iris Xe G7 96EUs | 958 g | 14.4 mm | 13.00" | 2160x1350 | |
| 89.8 % v7 (old) | Lenovo ThinkPad X1 Nano-20UN002UGE i7-1160G7, Iris Xe G7 96EUs | 946 g | 16 mm | 13.00" | 2160x1350 | ||
| 91 % v7 (old) | HP Elite Dragonfly G3 i7-1265U, Iris Xe G7 96EUs | 1.2 kg | 16.3 mm | 13.50" | 1920x1280 | ||
| 89 % v7 (old) | Dell Latitude 13 7330 i7-1265U, Iris Xe G7 96EUs | 1 kg | 16.96 mm | 13.30" | 1920x1080 | ||
| 85.1 % v7 (old) | Framework Laptop 13.5 12th Gen Intel i7-1260P, Iris Xe G7 96EUs | 1.3 kg | 15.85 mm | 13.50" | 2256x1504 | ||
| 87.8 % v7 (old) | Huawei MateBook X Pro 2021 i7-1165G7, Iris Xe G7 96EUs | 1.3 kg | 14.6 mm | 13.90" | 3000x2000 |
Sprawa
Komunikacja
Moduł WLAN został uaktualniony z Intel AX201 do AX211 dla obsługi Wi-Fi 6E. Nie doświadczyliśmy żadnych problemów z łącznością po sparowaniu z naszą siecią 6 GHz
LTE 5G Cat 20 lub 4G CAT 9 to opcjonalne ulepszenia WWAN. W urządzeniu znajdzie się slot Nano-SIM, jeśli zostanie skonfigurowany z tą funkcją.
| Networking | |
| iperf3 transmit AX12 | |
| Lenovo ThinkPad X1 Nano-20UN002UGE | |
| Huawei MateBook X Pro 2021 | |
| iperf3 receive AX12 | |
| Huawei MateBook X Pro 2021 | |
| Lenovo ThinkPad X1 Nano-20UN002UGE | |
| iperf3 receive AXE11000 6GHz | |
| Framework Laptop 13.5 12th Gen Intel | |
| Lenovo ThinkPad X1 Nano Gen 2 Core i7-1280P | |
| HP Elite Dragonfly G3 | |
| Dell Latitude 13 7330 | |
| iperf3 transmit AXE11000 6GHz | |
| Dell Latitude 13 7330 | |
| Framework Laptop 13.5 12th Gen Intel | |
| HP Elite Dragonfly G3 | |
| Lenovo ThinkPad X1 Nano Gen 2 Core i7-1280P | |
Kamera internetowa
Dell zaktualizował kamerę internetową z 720p w modelu Gen 1 do 1080p w tegorocznej wersji Gen 2. W rezultacie obraz nie jest już tak mętny, ale kolory są nadal słabe
W standardzie jest zarówno podczerwień, jak i fizyczna migawka kamery internetowej, która zapewnia prywatność.


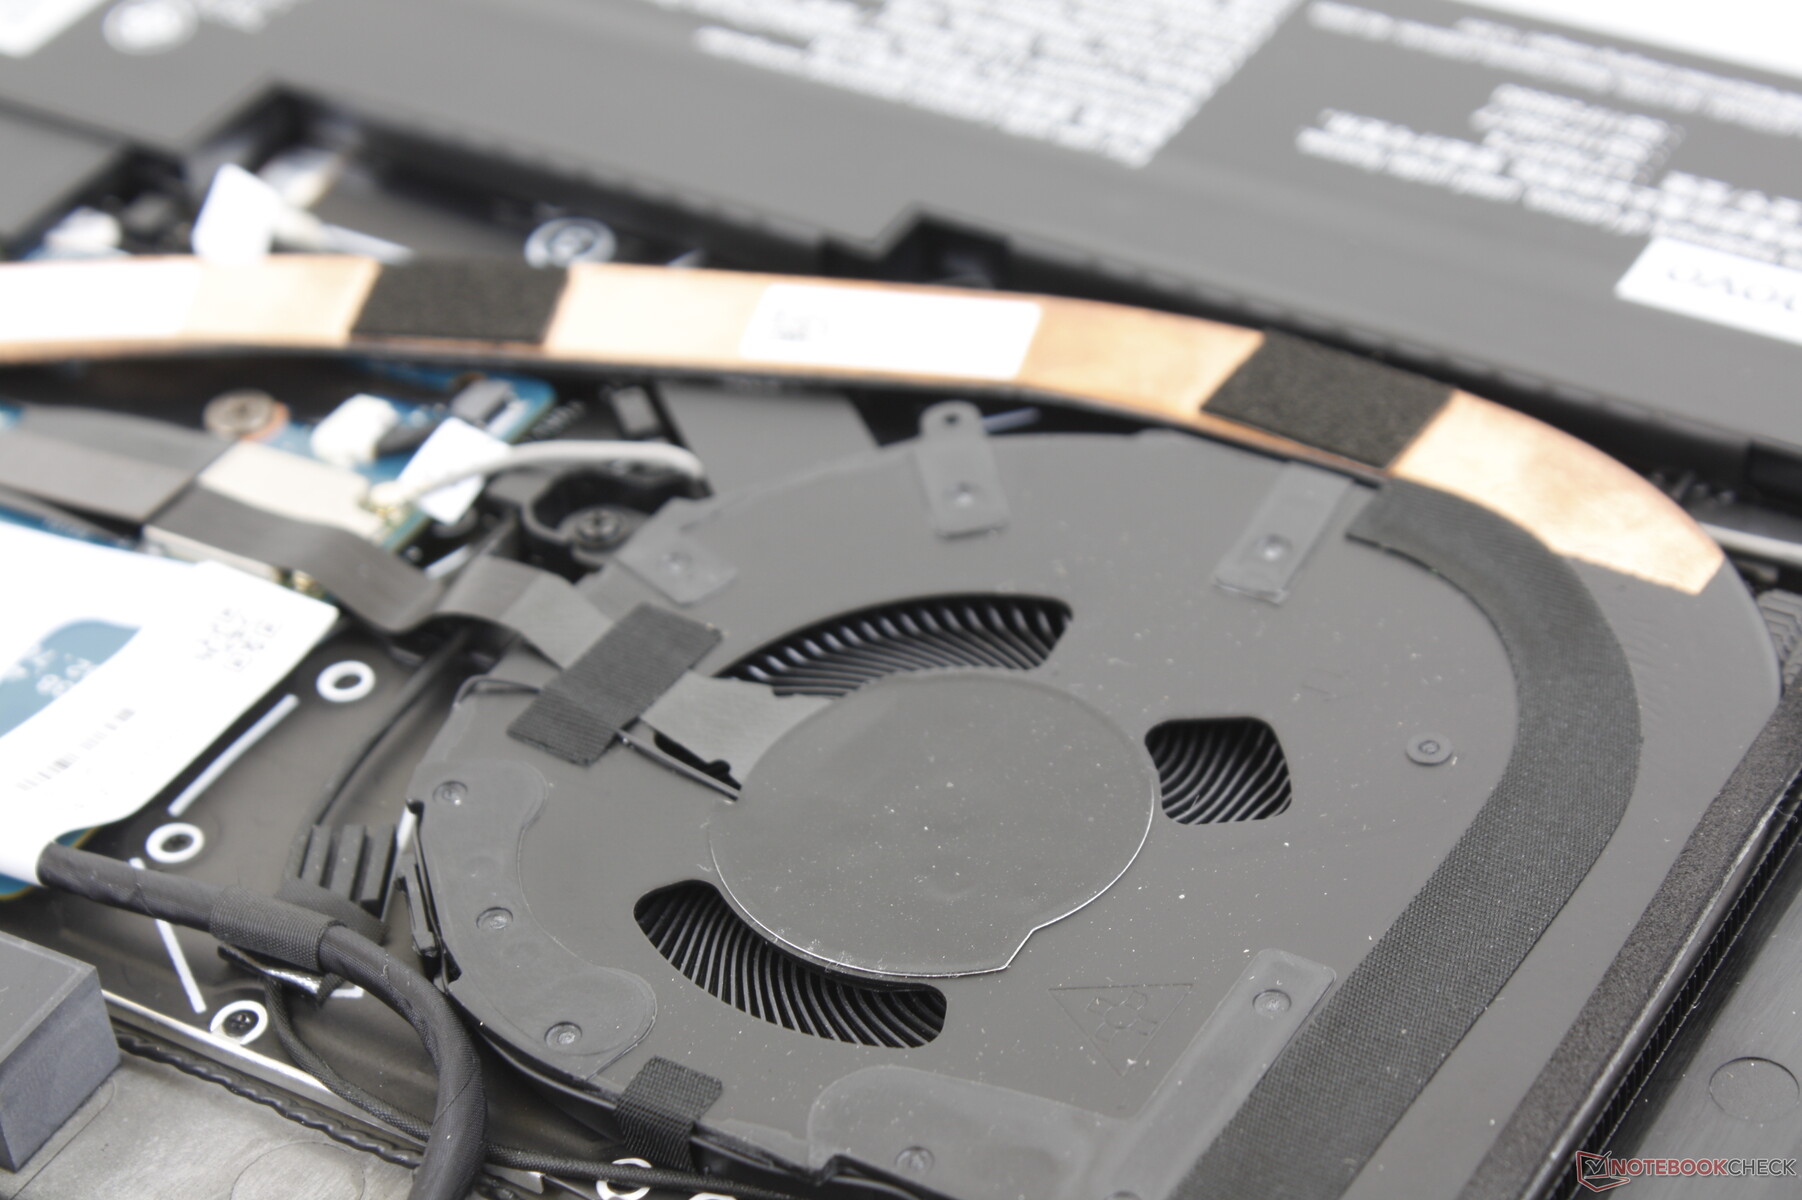
Konserwacja
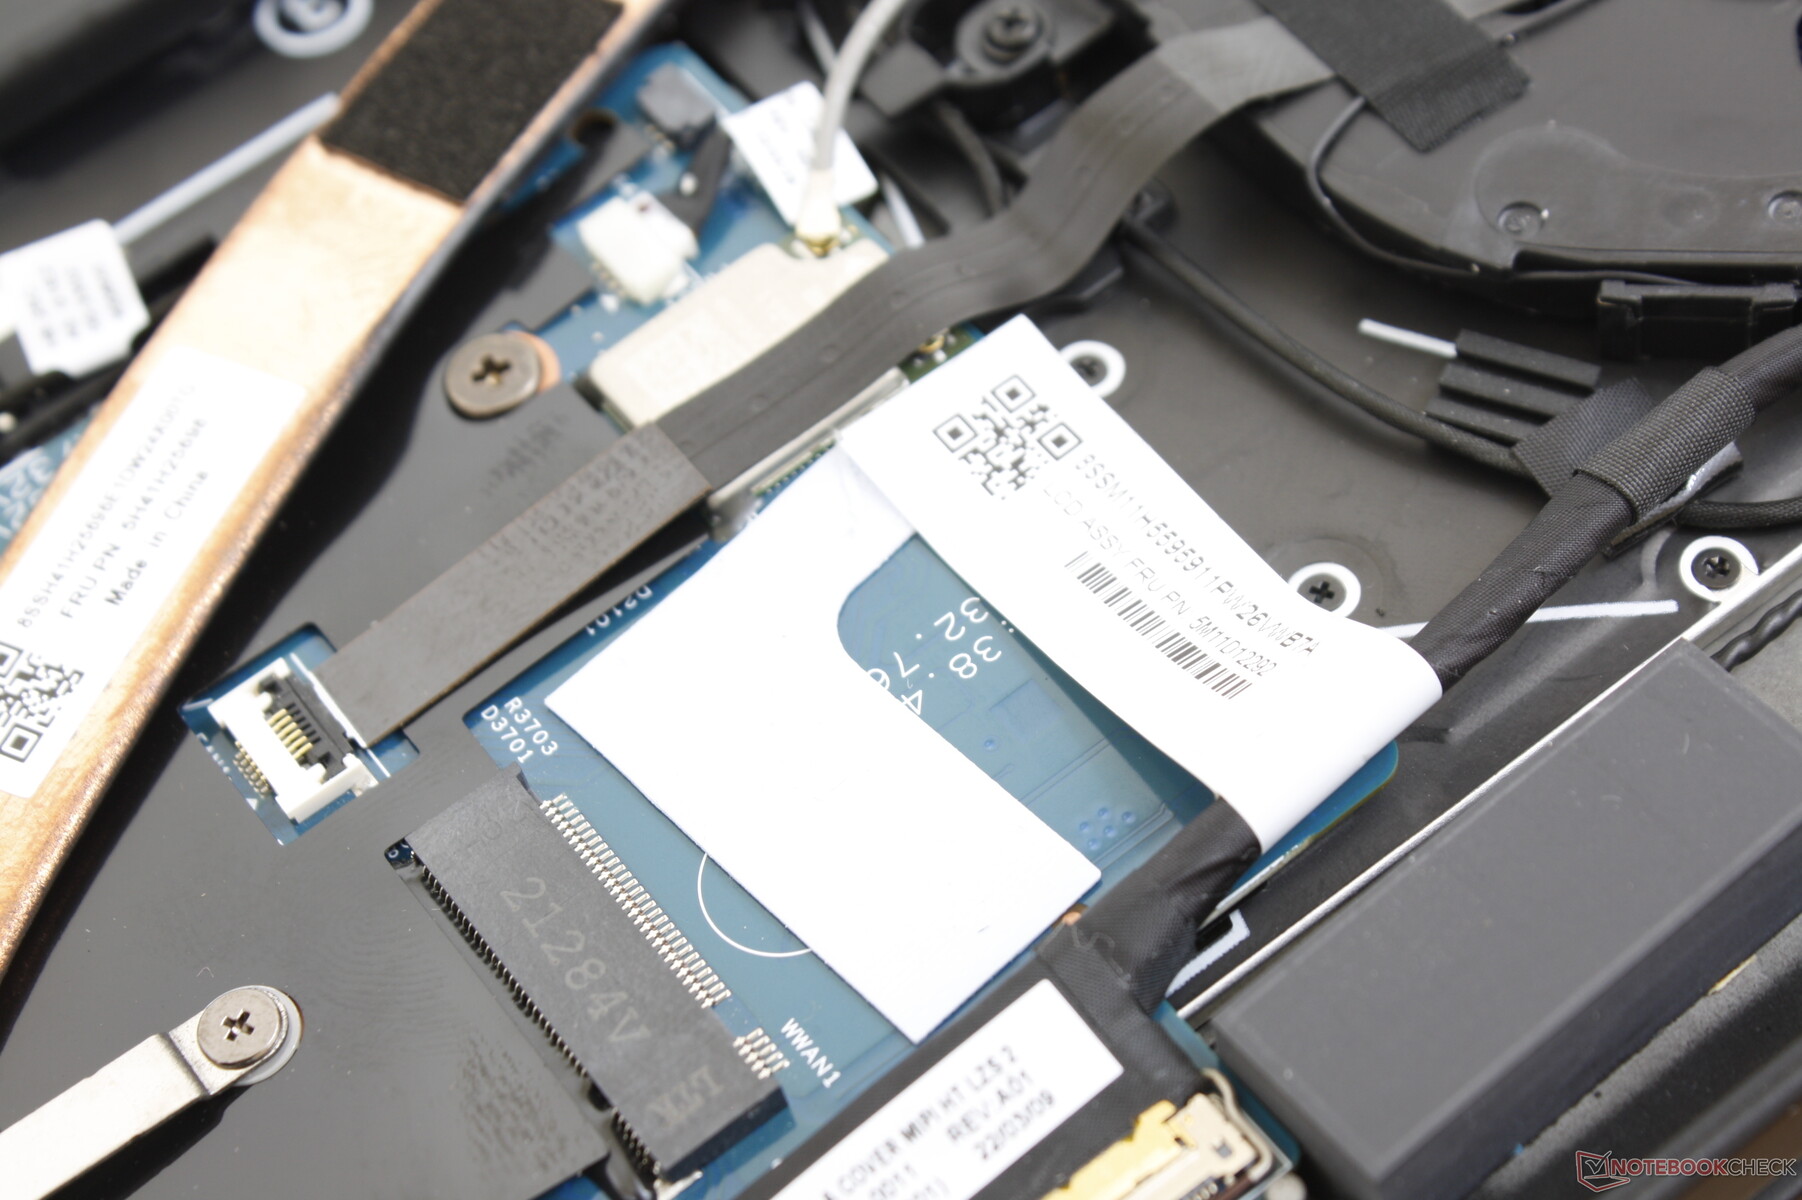
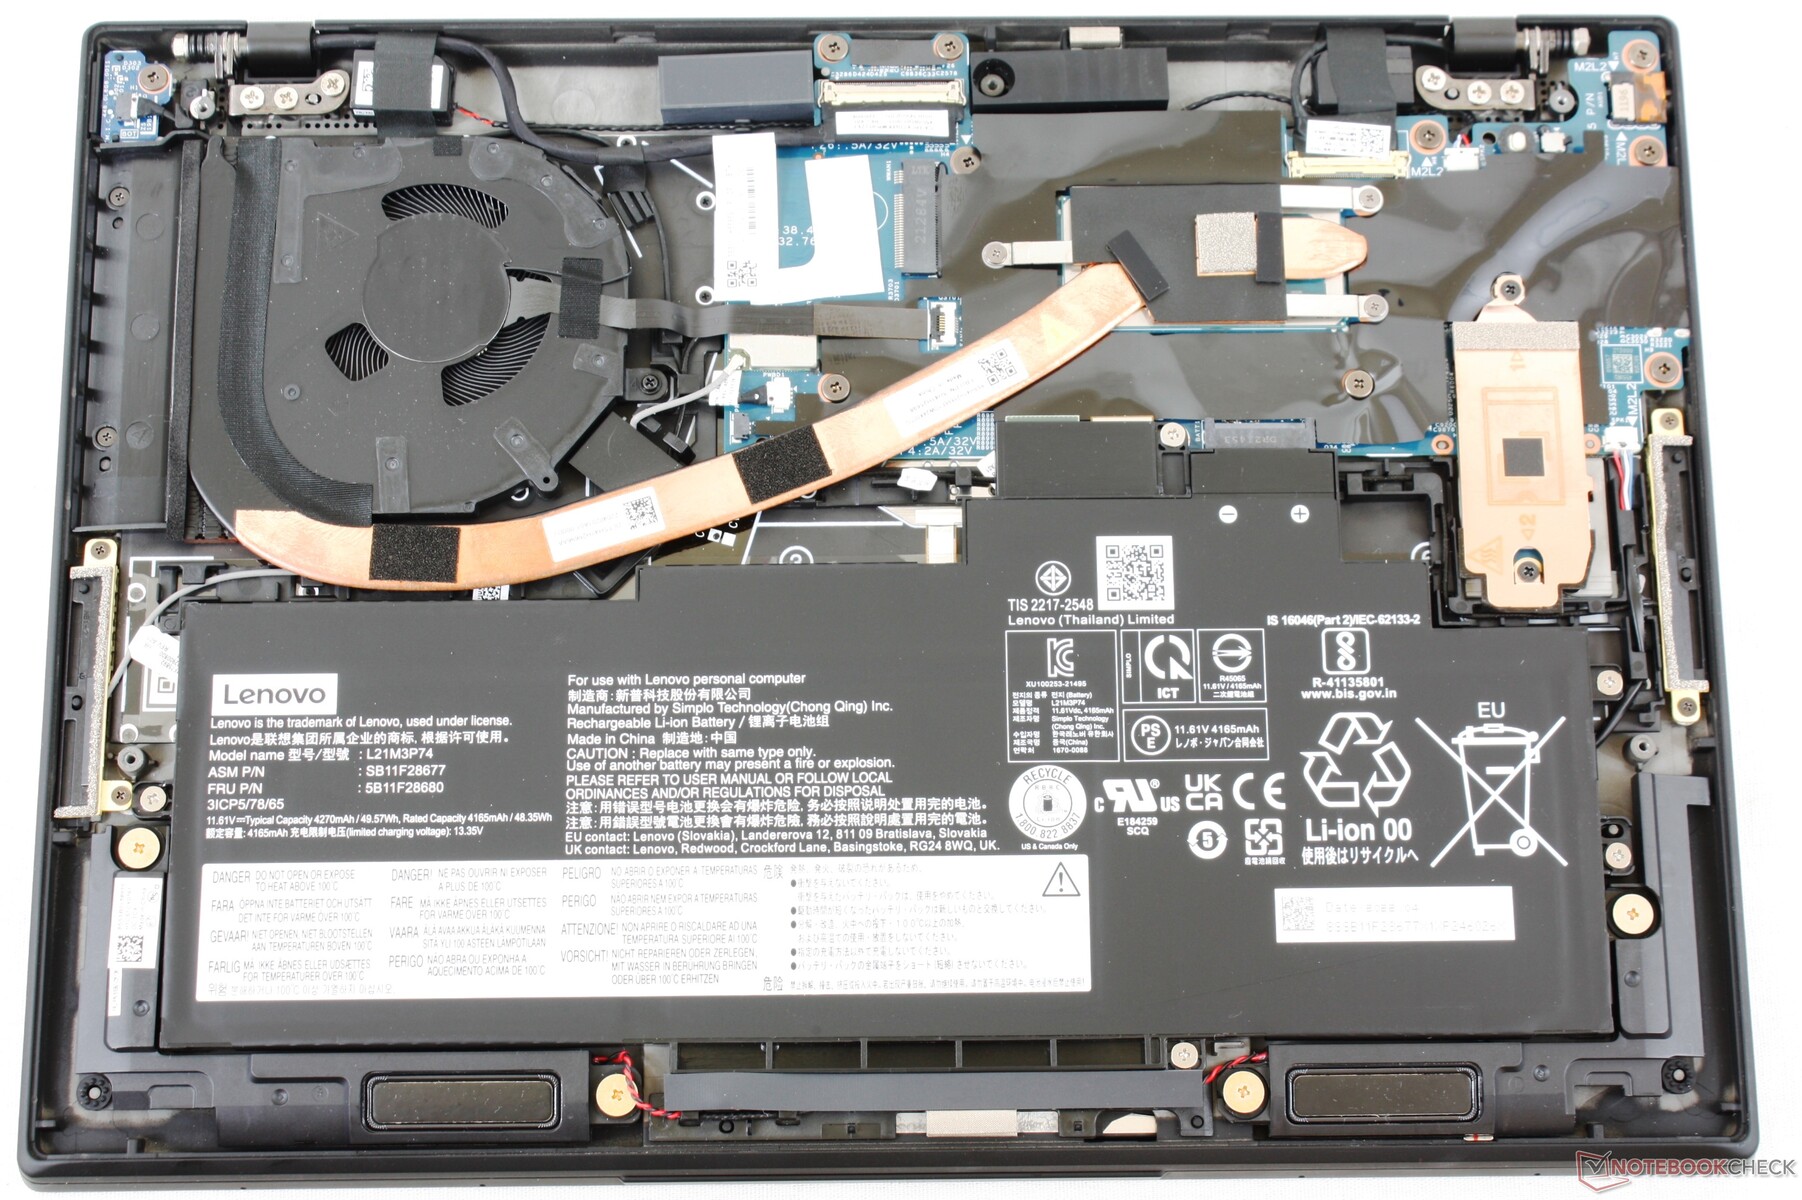
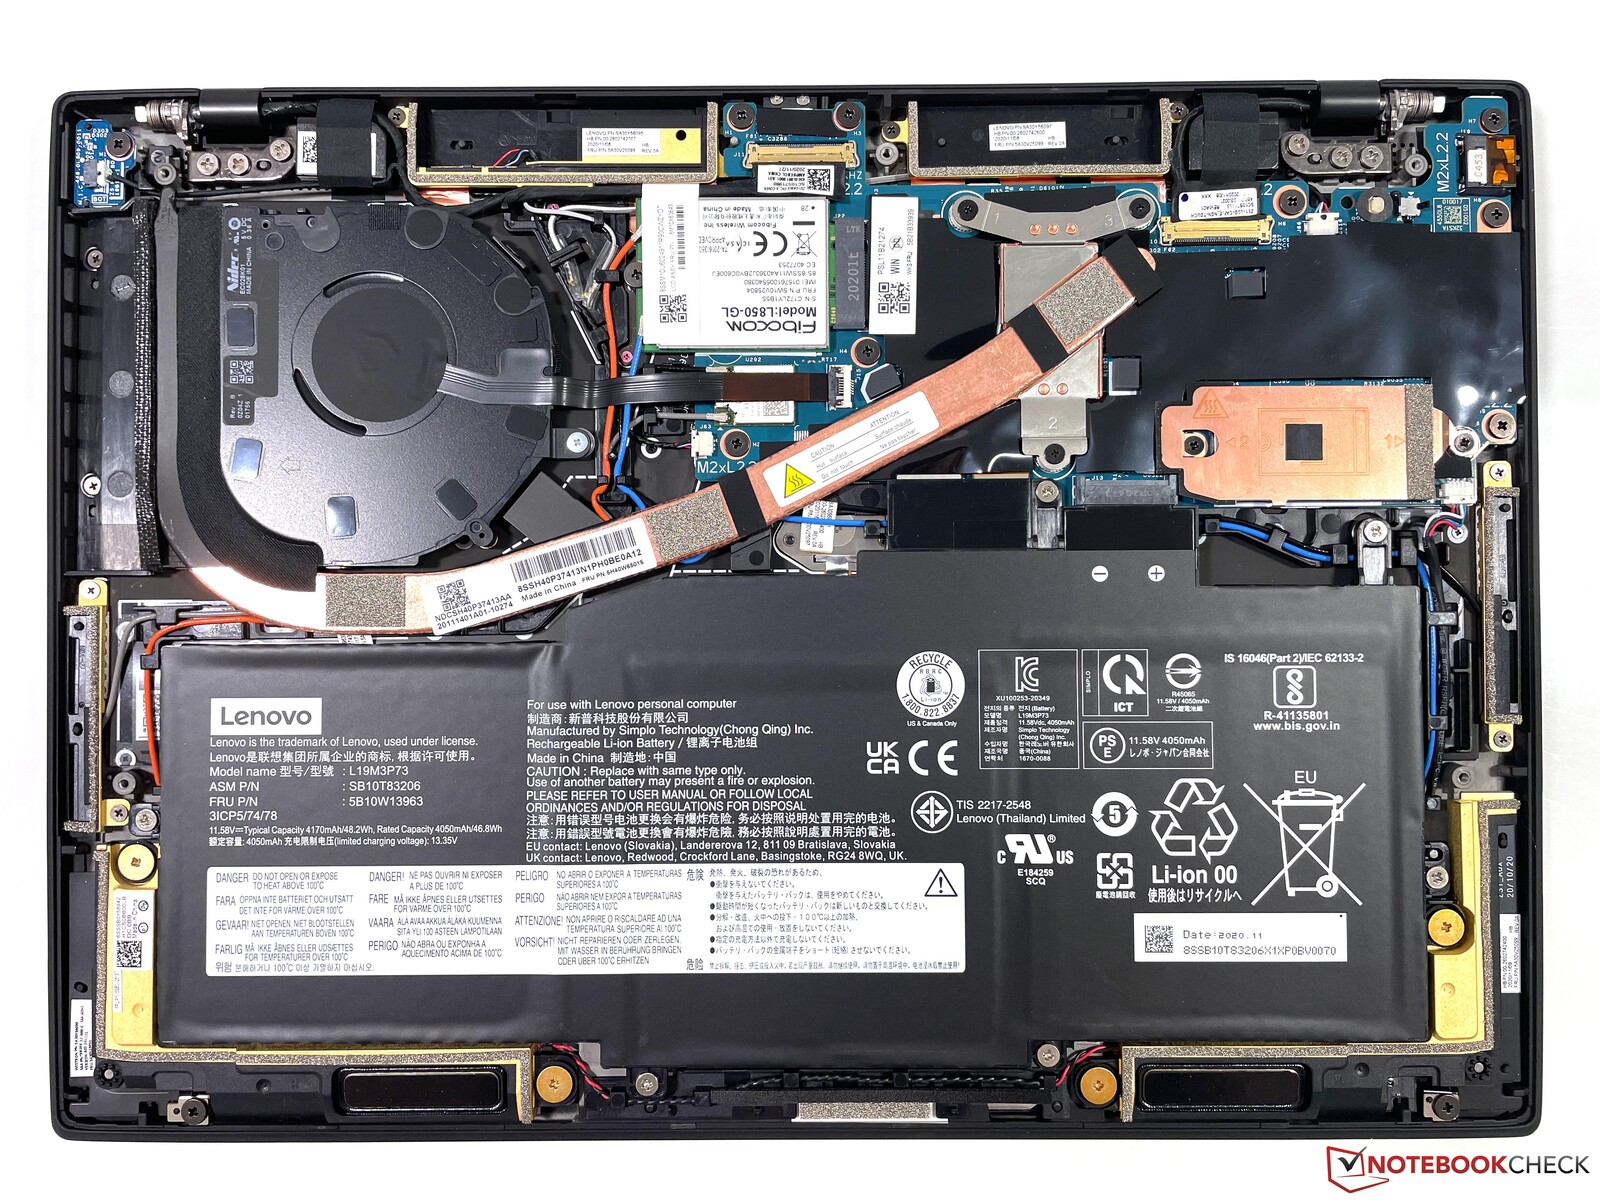
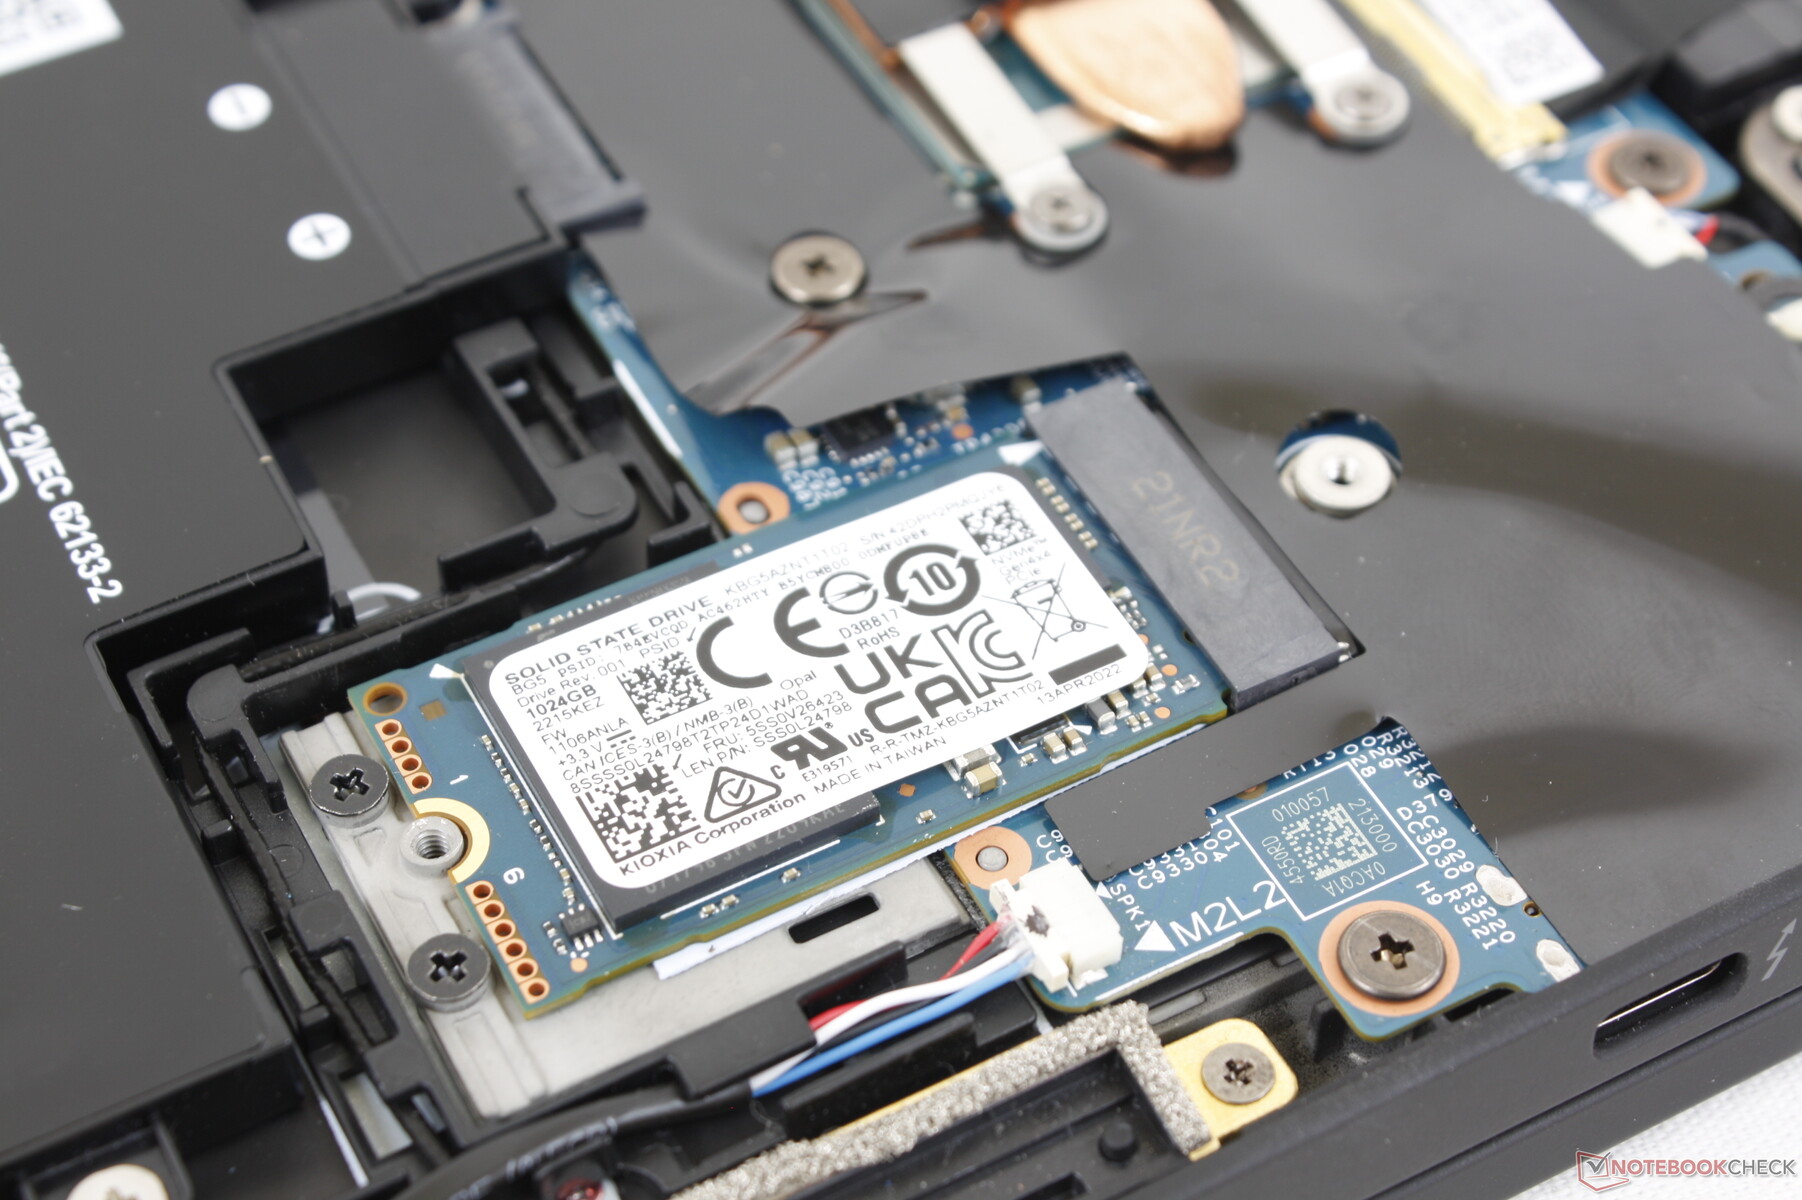
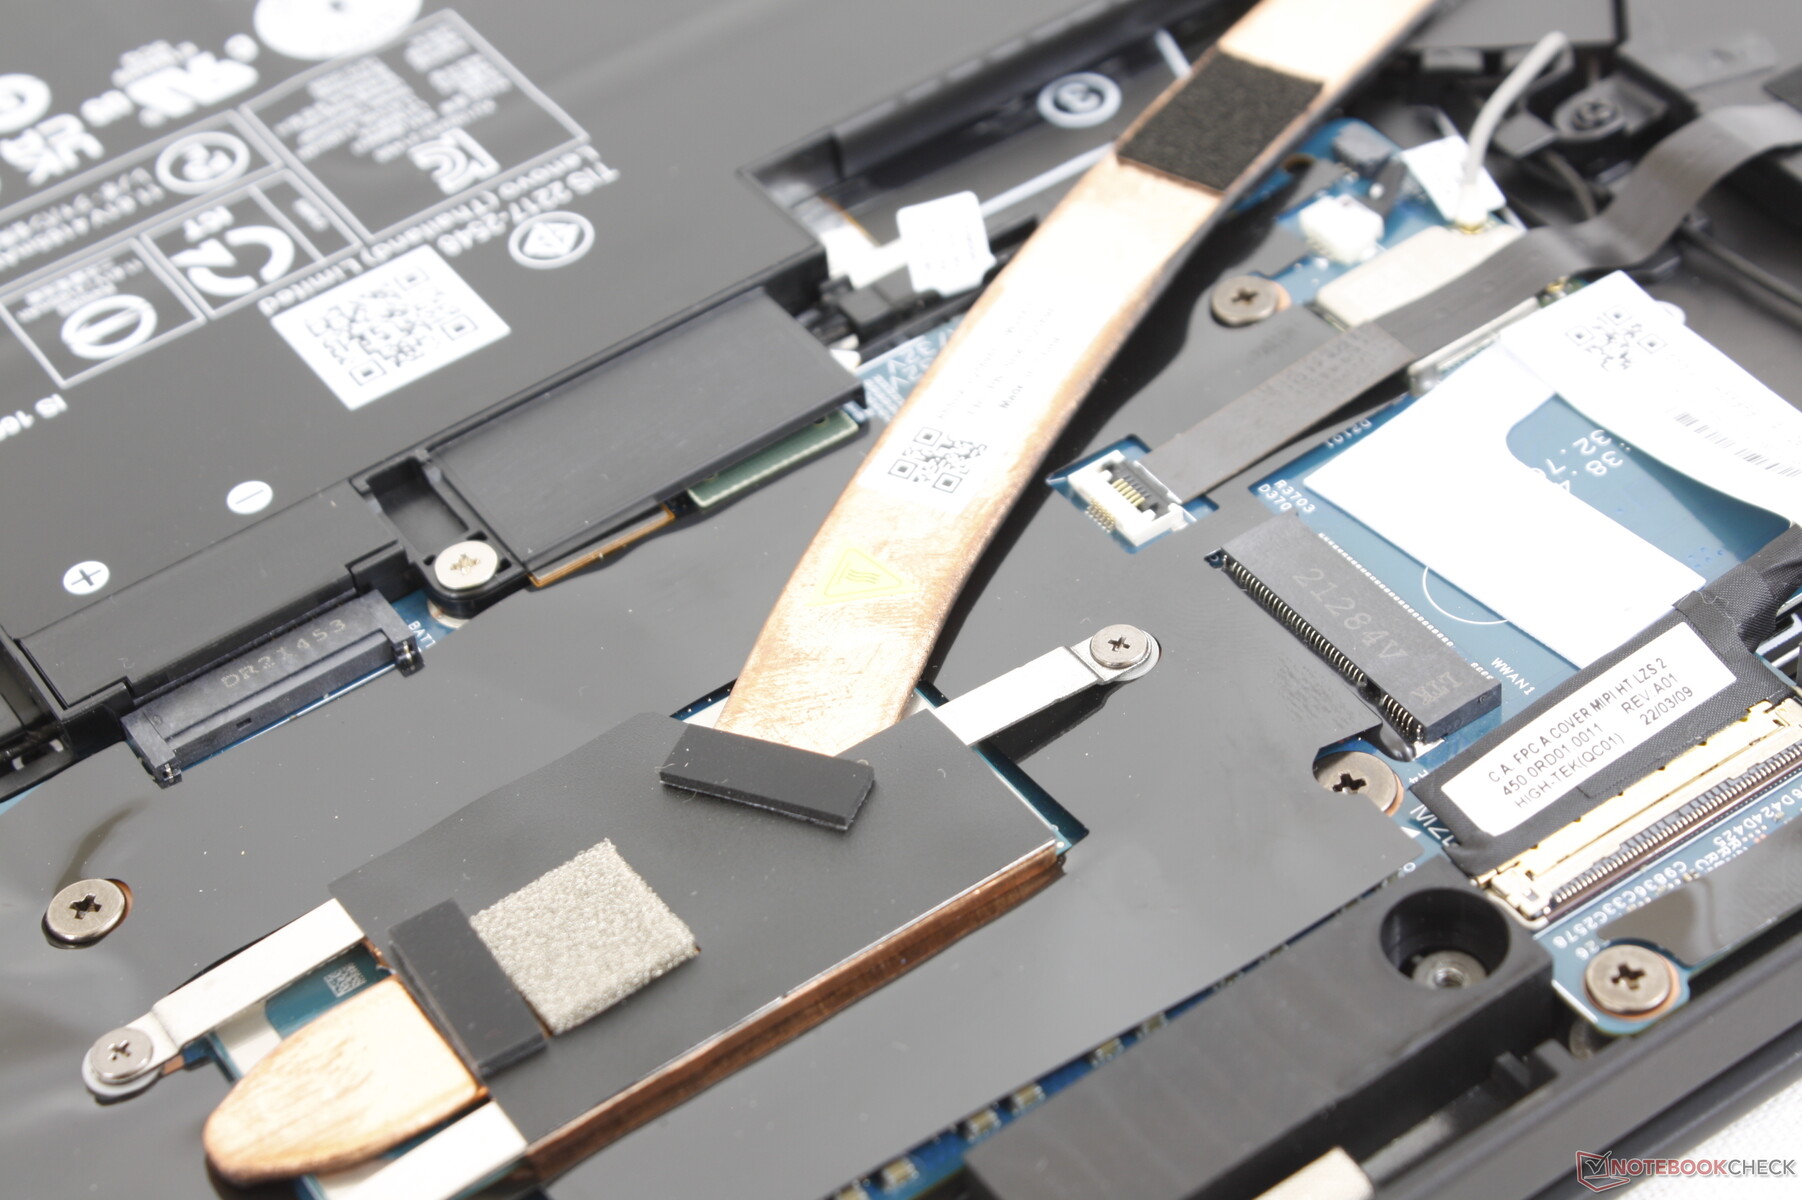
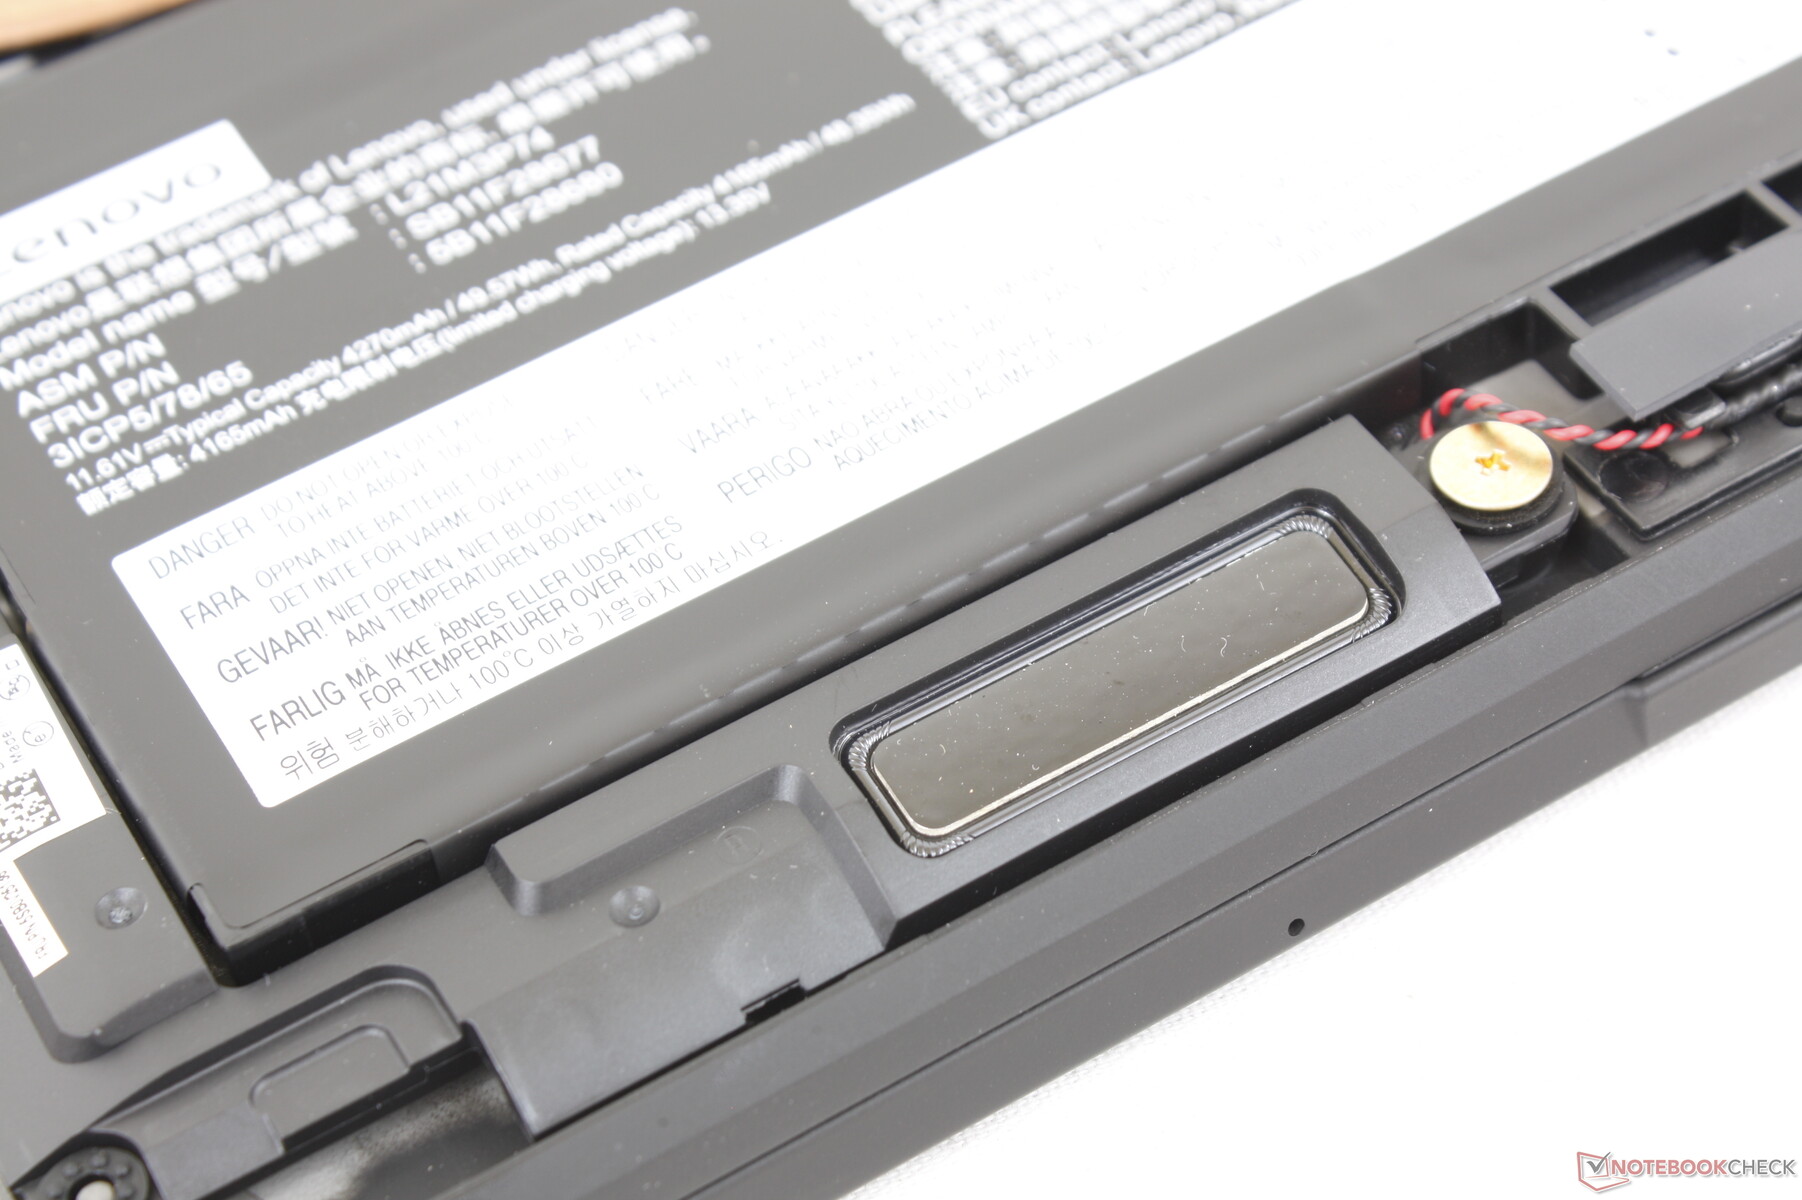
Dolny panel można łatwo zdjąć za pomocą śrubokręta Philips. Wyposażenie wewnętrzne jest w większości takie samo jak w modelu Gen 1, z wyjątkiem przesuniętego dysku SSD M.2 2242 i innych drobnych zmian, co widać na poniższych zdjęciach.
Akcesoria i gwarancja
W pudełku nie ma żadnych dodatków poza zasilaczem sieciowym i papierami. Obowiązuje roczna ograniczona gwarancja producenta, co jest rozczarowujące, biorąc pod uwagę wysoką cenę wyjściową tego modelu. 3-letnia gwarancja powinna być standardem.
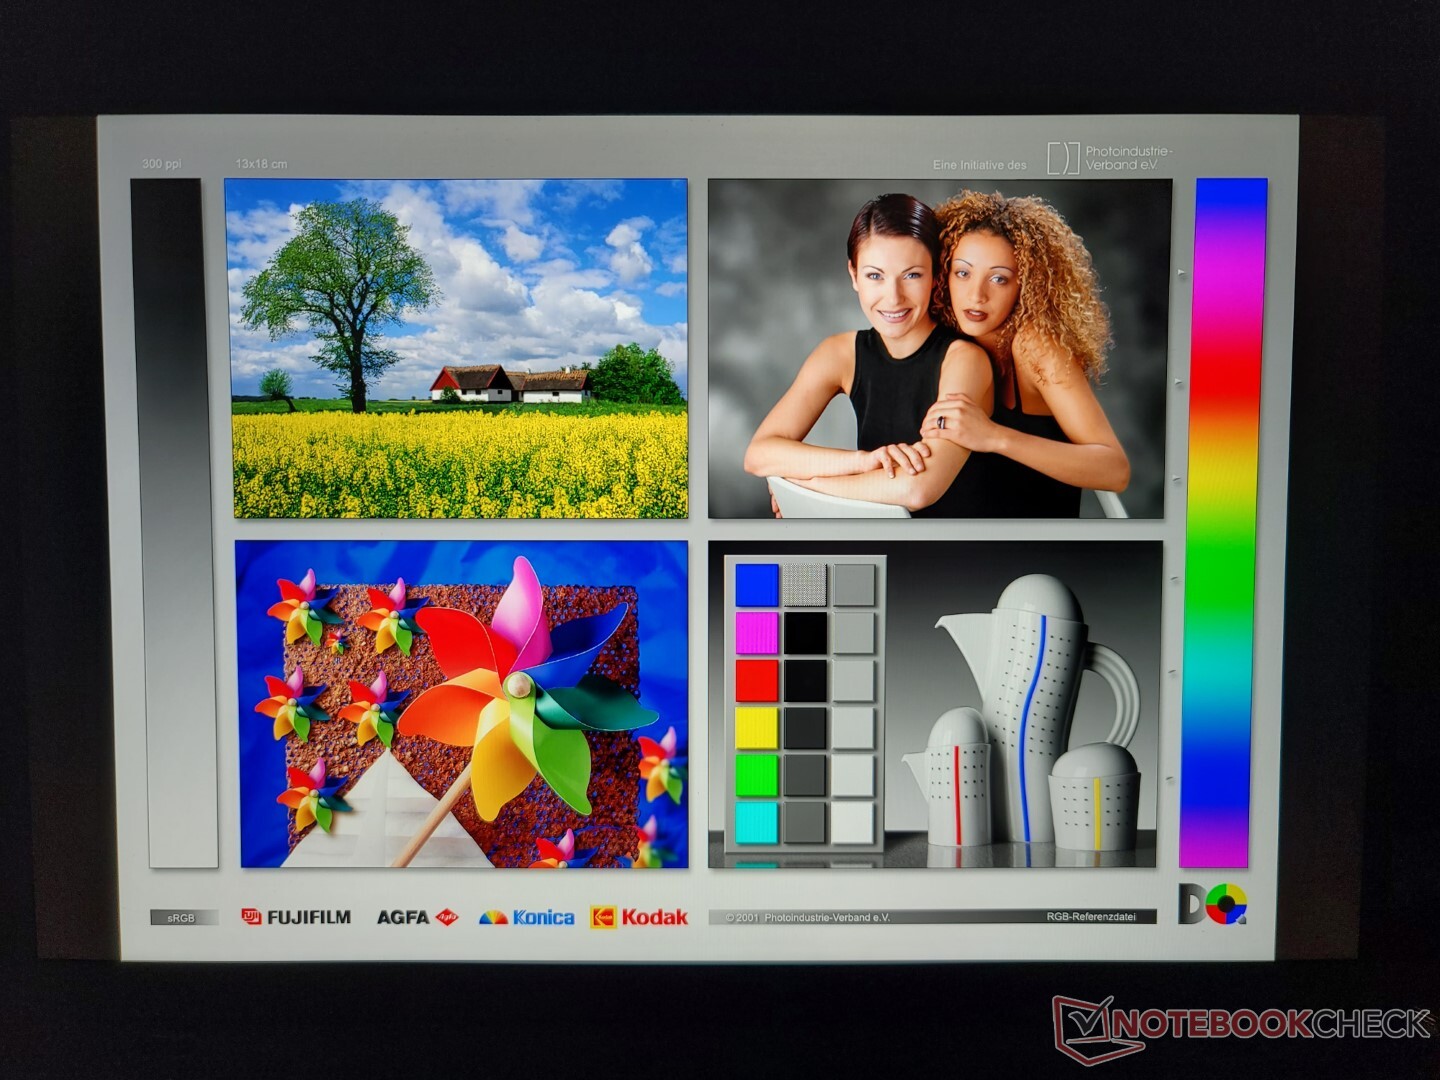
Wyświetl
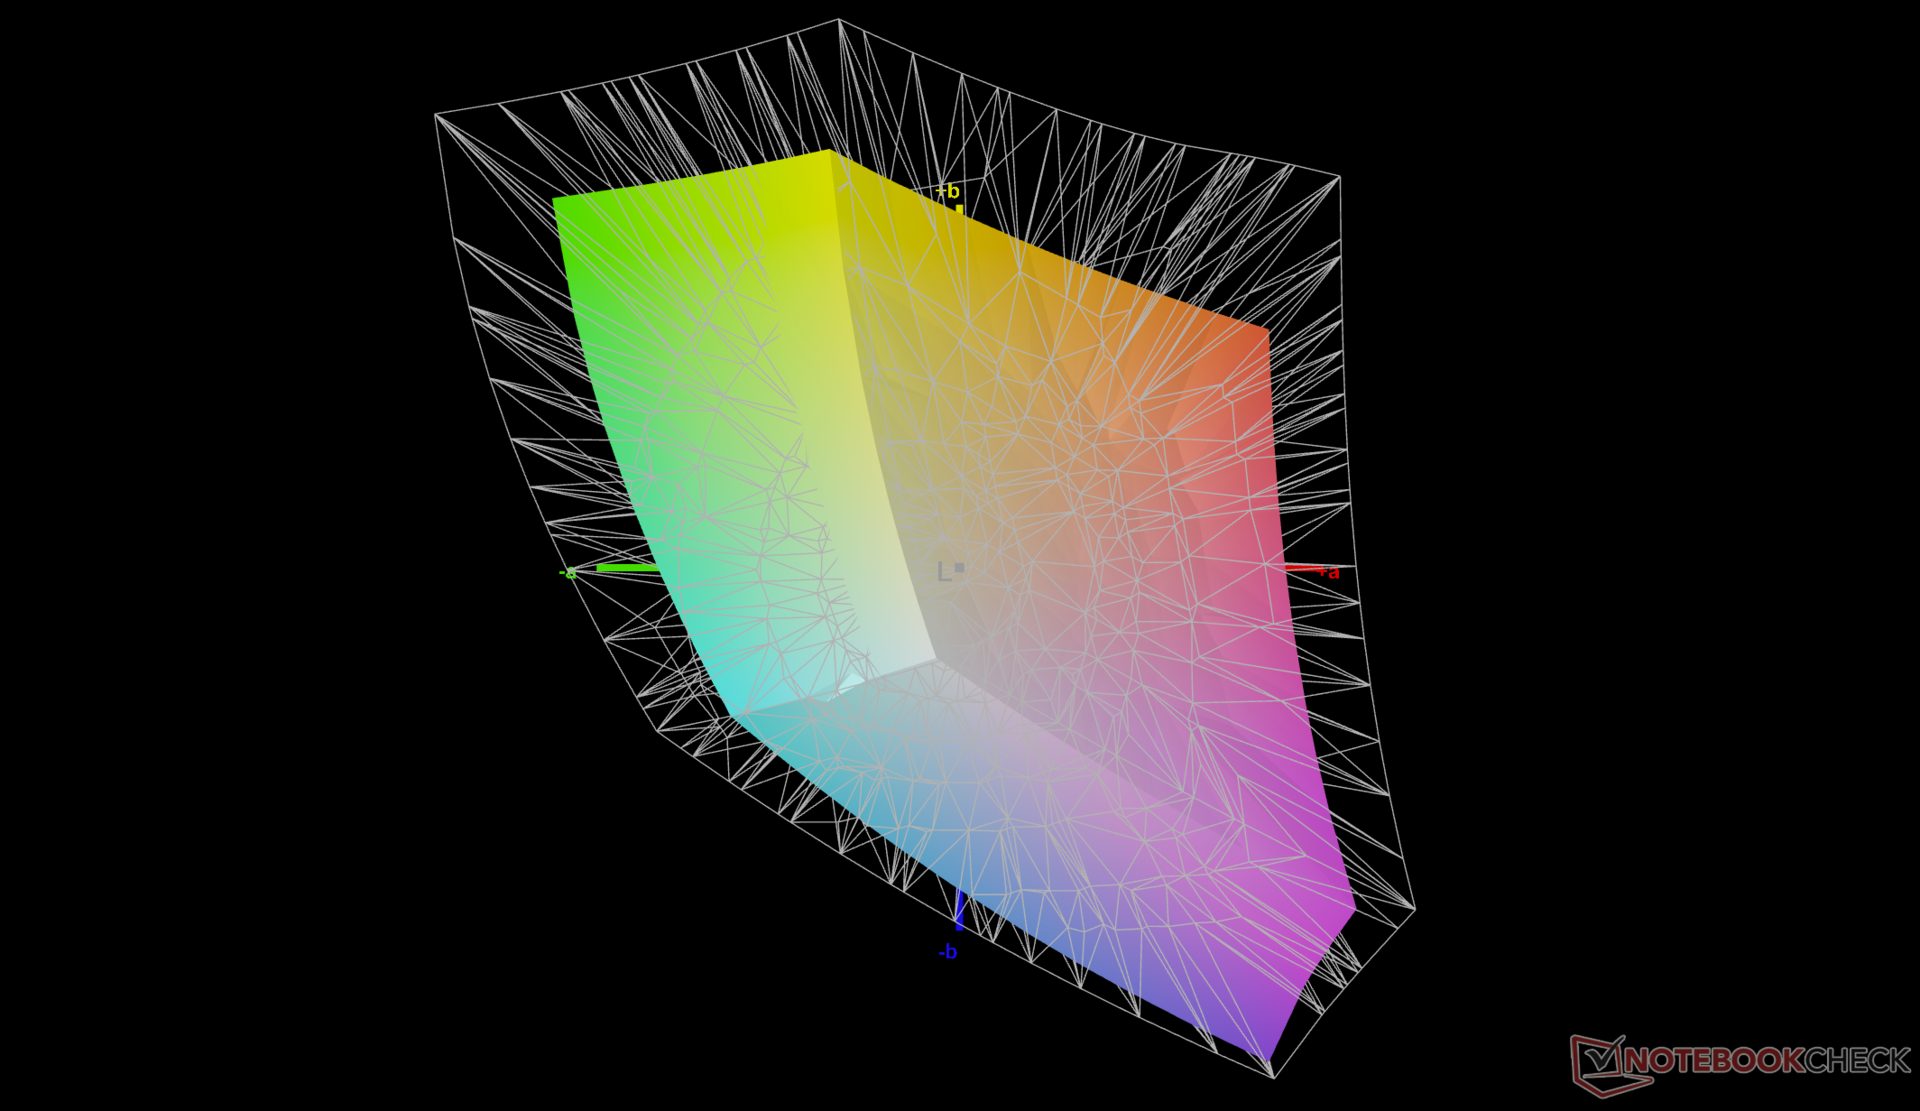
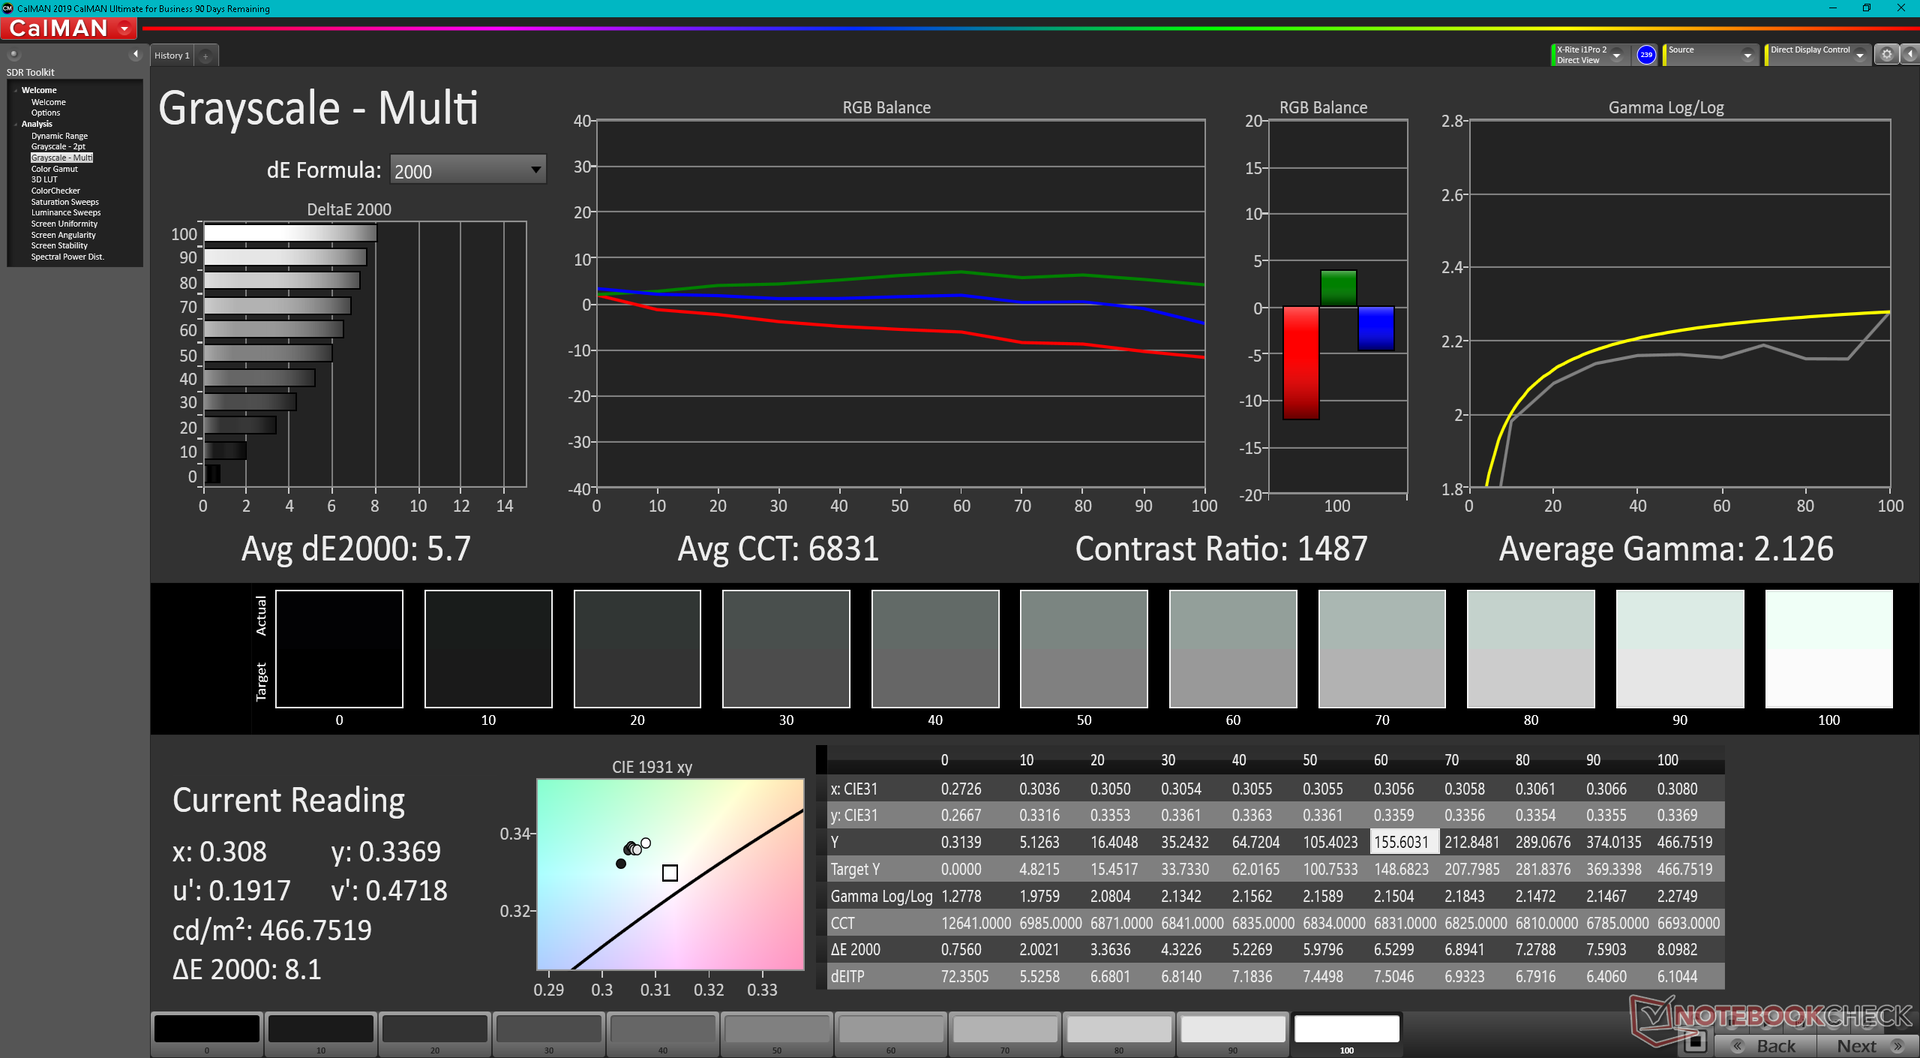
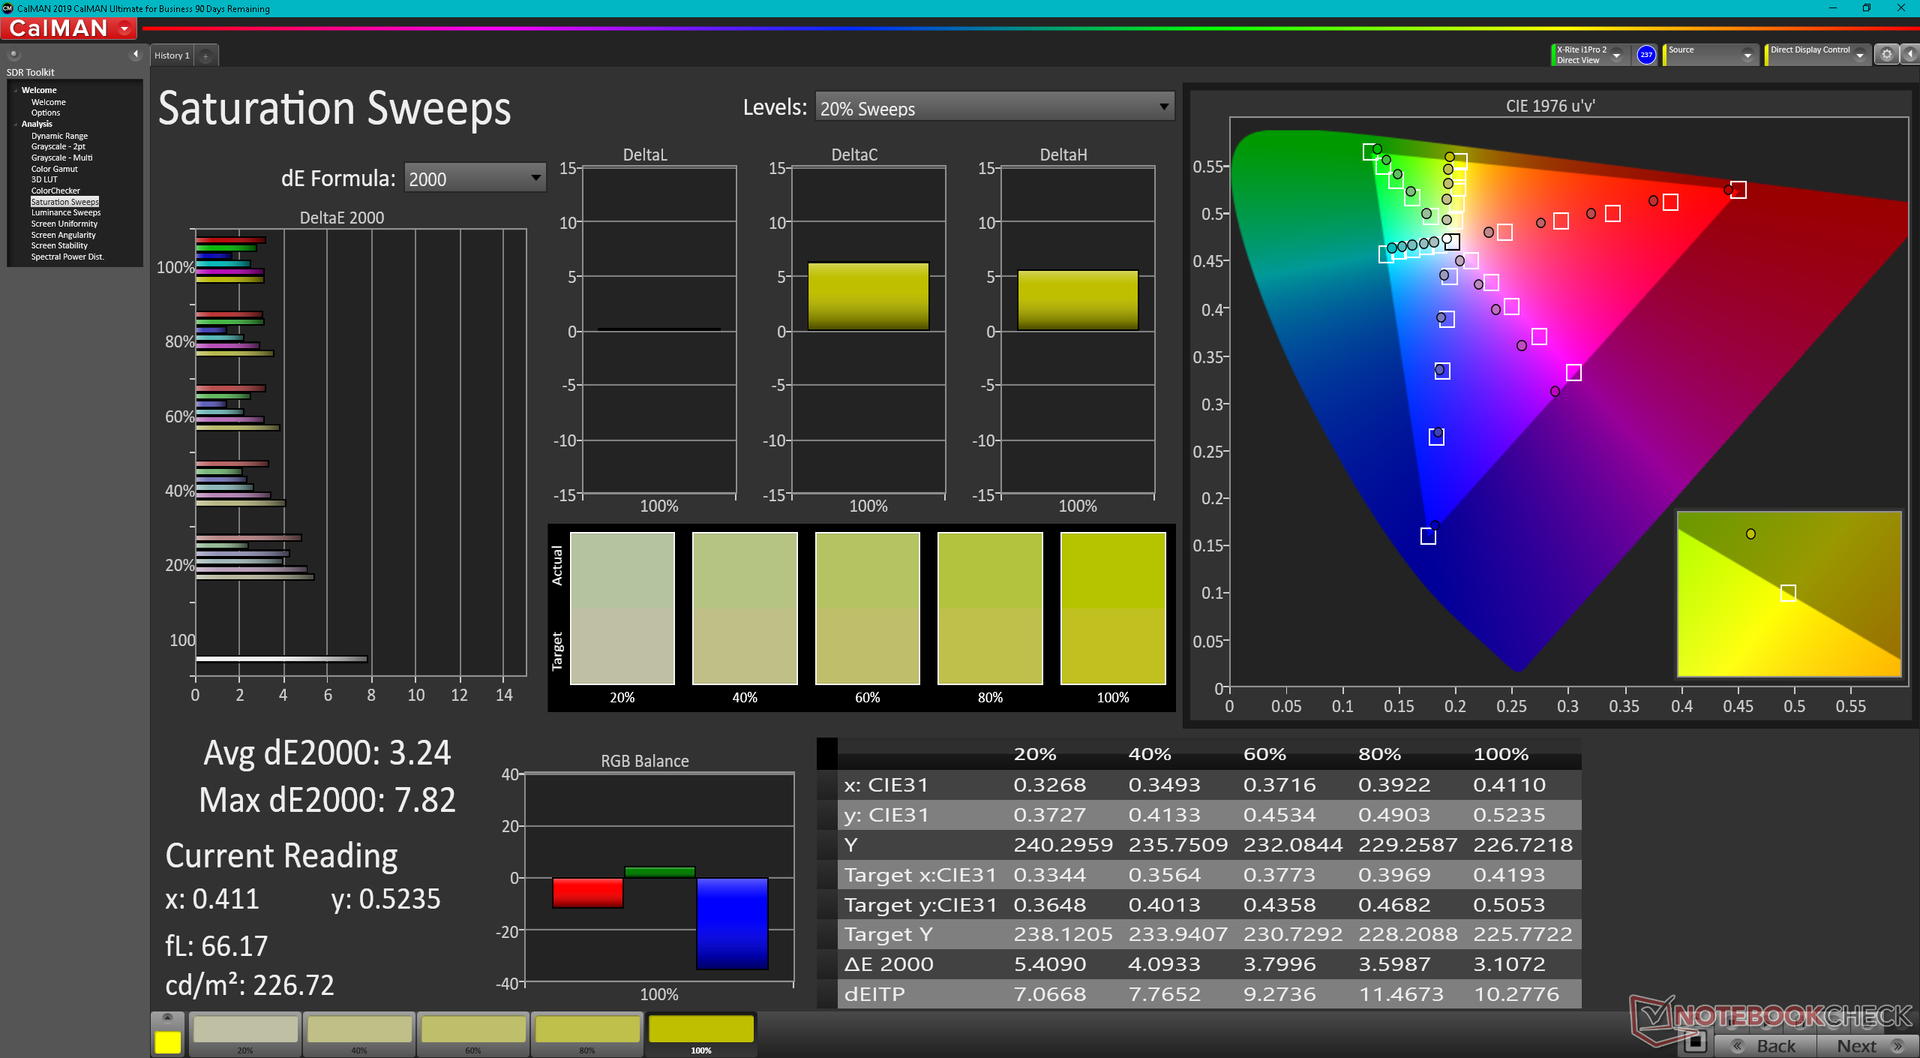
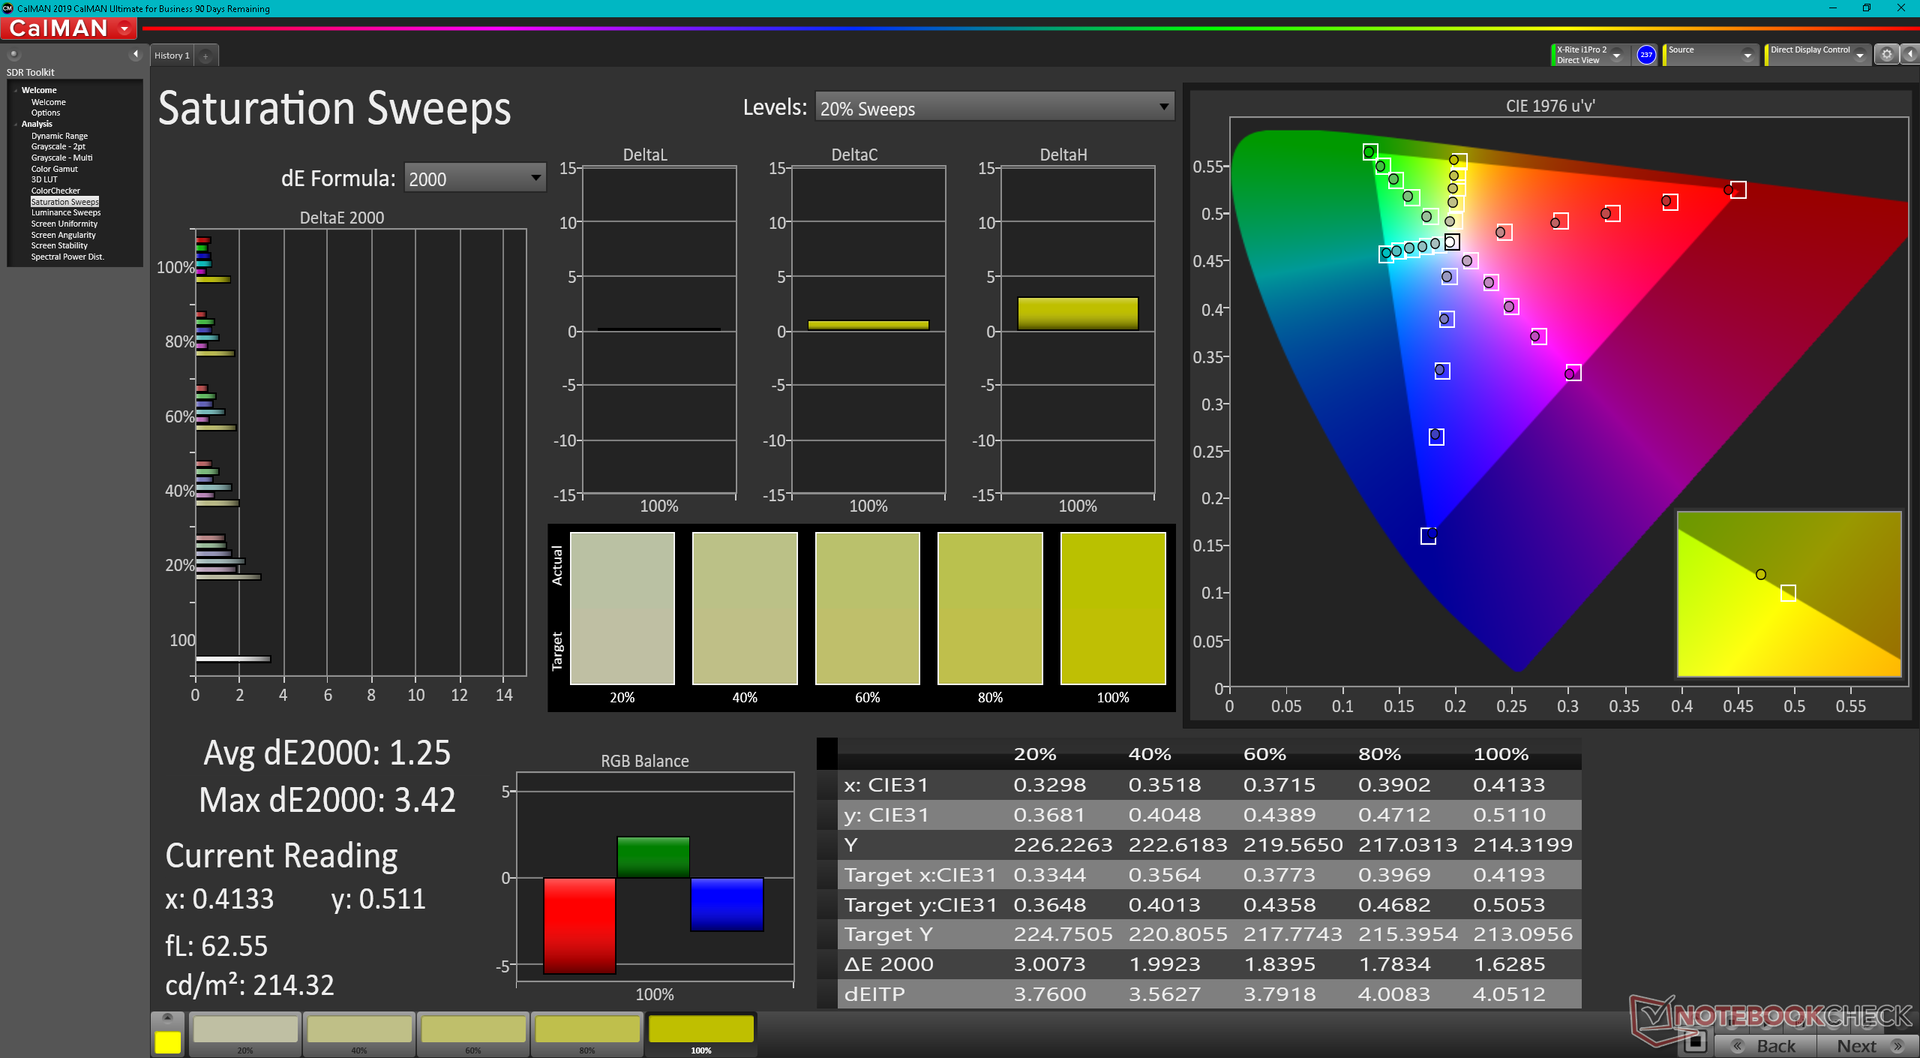
Nasz egzemplarz testowy Gen 2 wykorzystuje inny panel IPS niż ten, który znalazł się w oryginalnej wersji Gen 1 (P101ZFZ-BH2 vs. MND007ZA1-2). Niemniej jednak, ich podstawowe atrybuty pozostają niemal identyczne, zapewniając zasadniczo takie same wrażenia z oglądania. Użytkownicy nadal otrzymują 450-nitowy panel z pełnym pokryciem sRGB i kontrastem >1000:1. Czasy reakcji w czerni i bieli oraz szarości mogłyby być lepsze, ale nie stanowi to problemu w przypadku przeglądania stron internetowych czy pracy biurowej.


| |||||||||||||||||||||||||
rozświetlenie: 94 %
na akumulatorze: 469.6 cd/m²
kontrast: 1269:1 (czerń: 0.37 cd/m²)
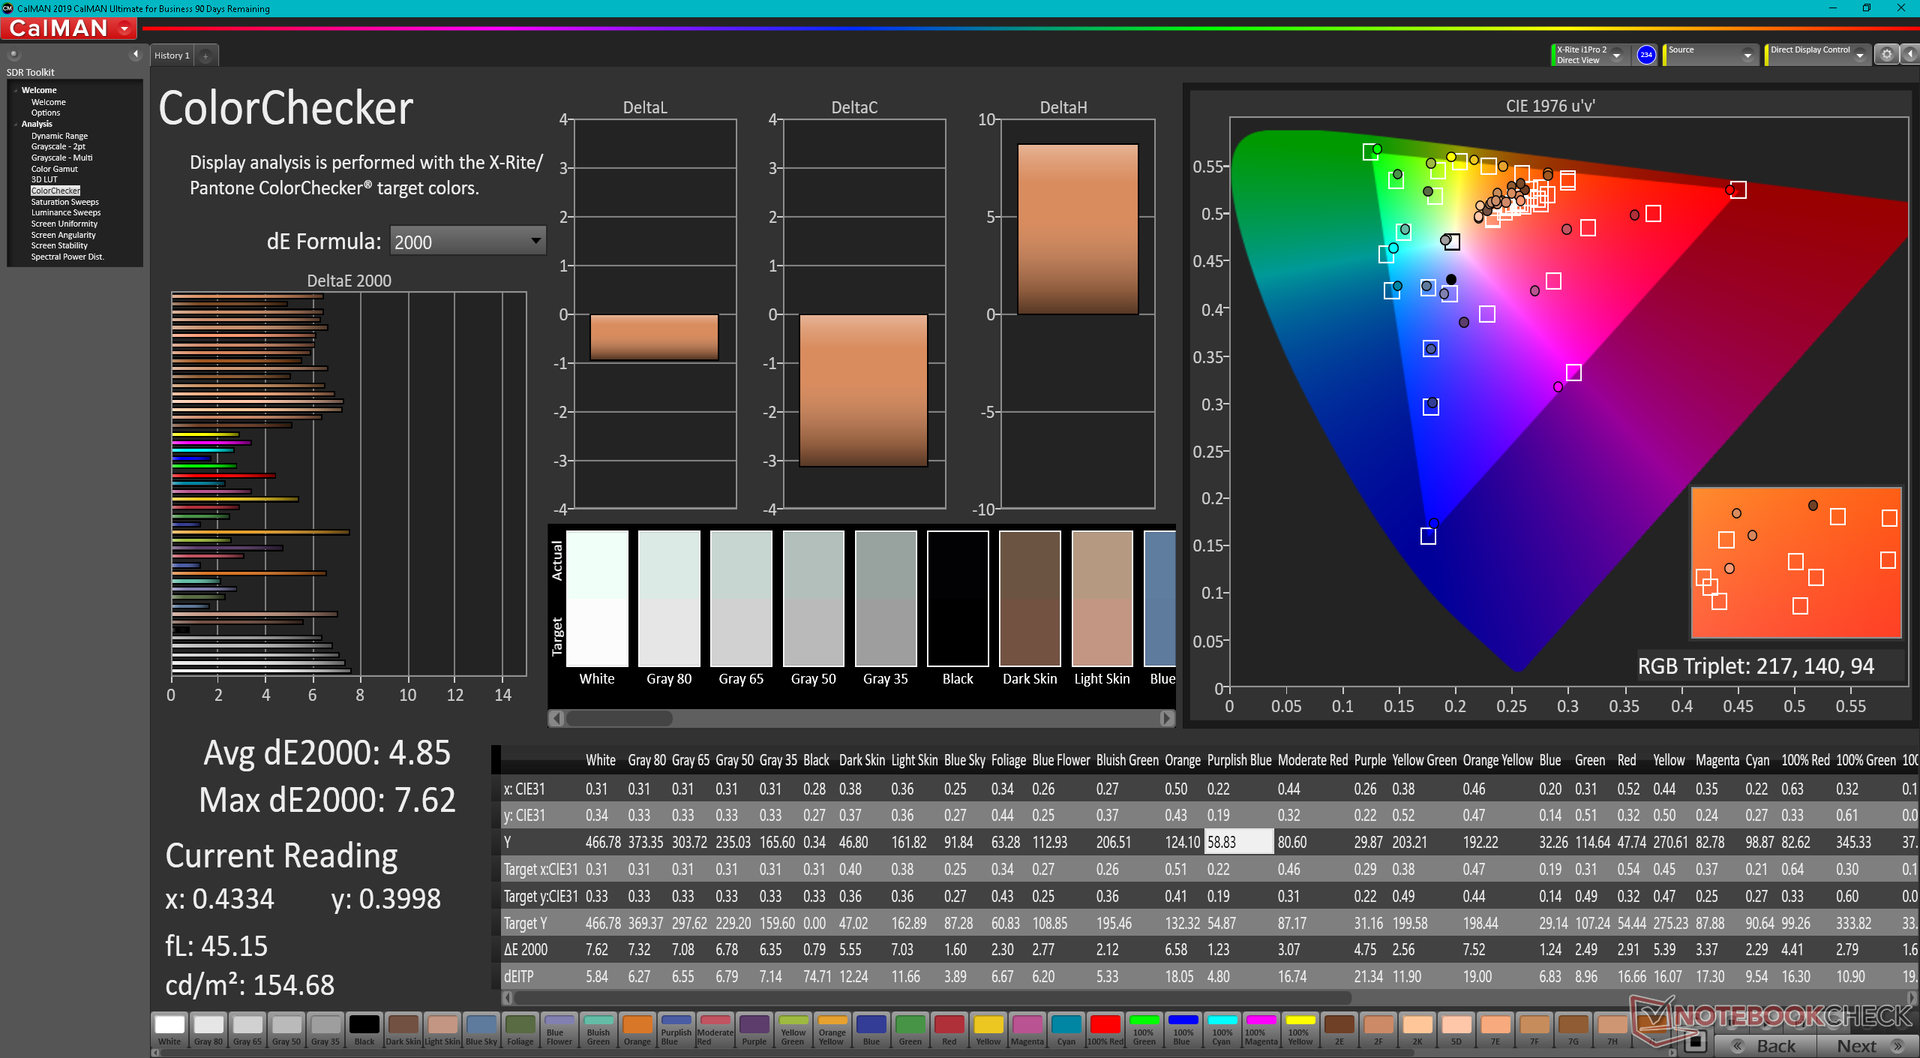
ΔE ColorChecker Calman: 4.85 | ∀{0.5-29.43 Ø4.72}
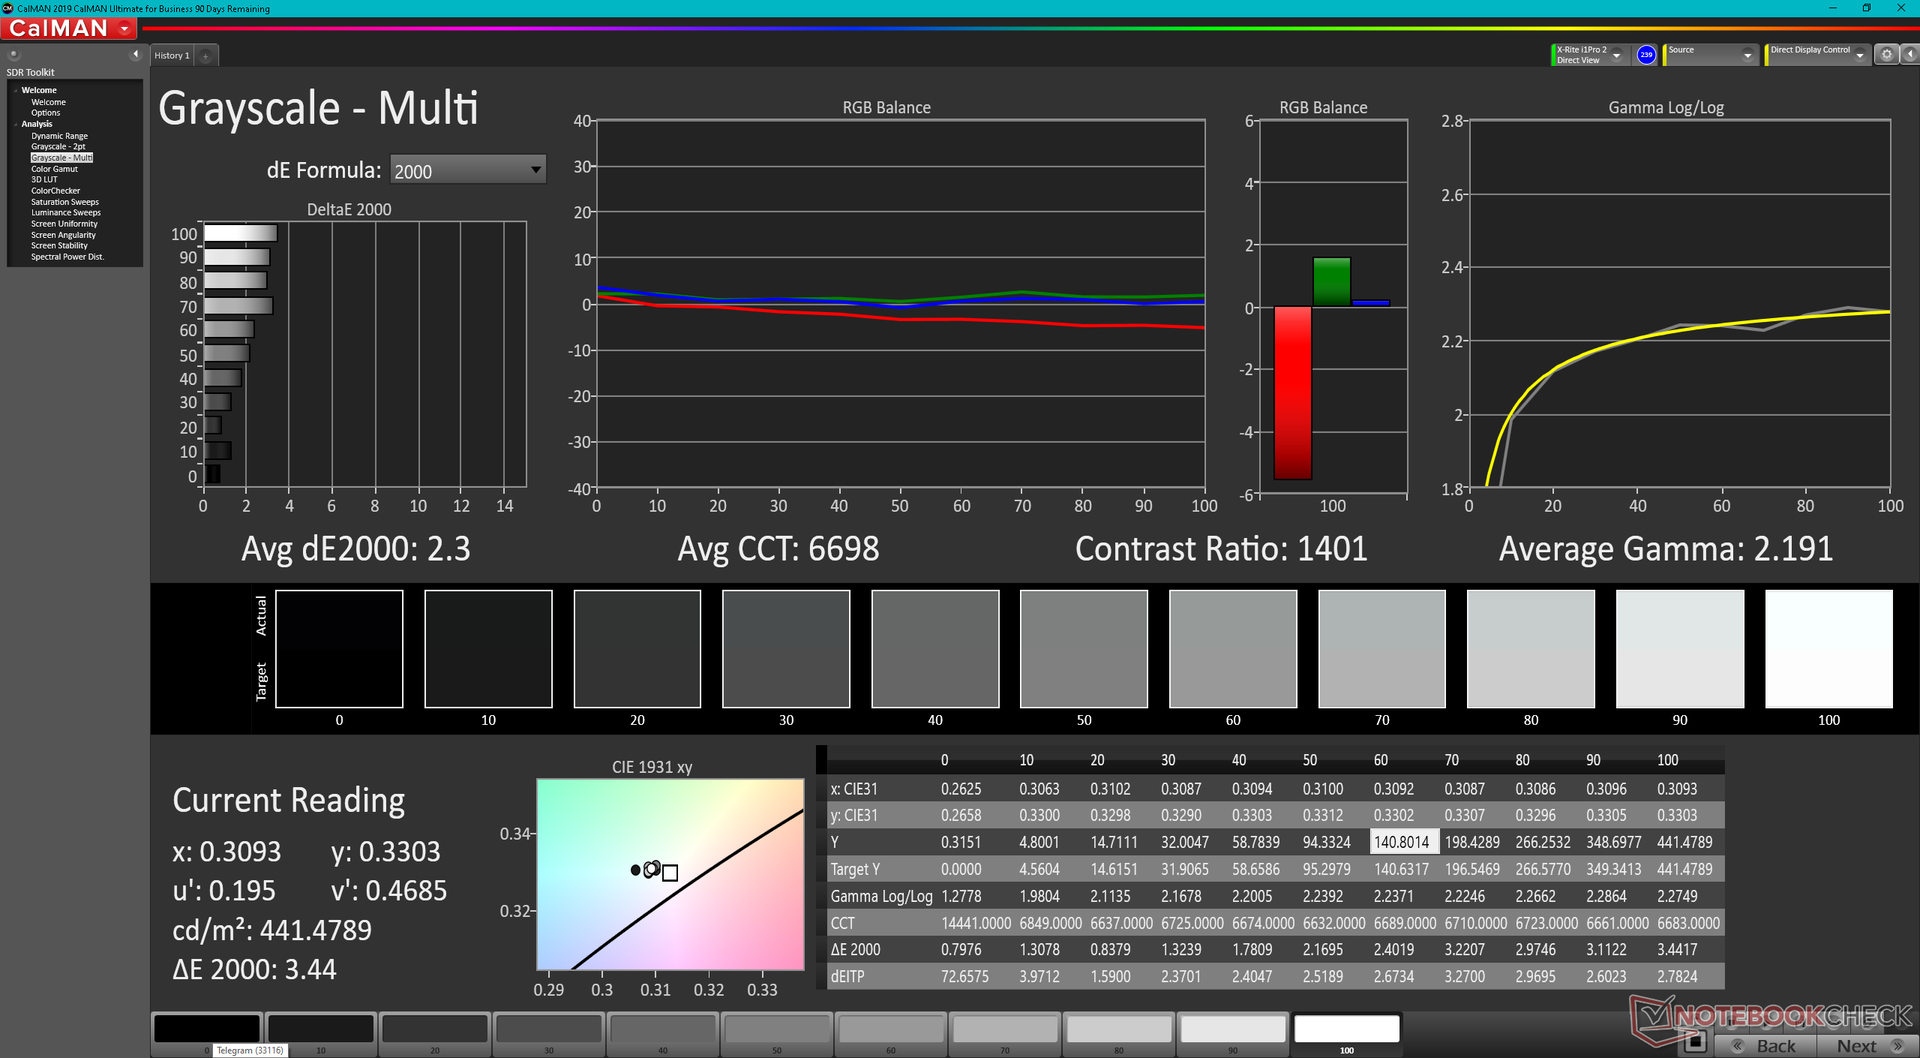
calibrated: 1.22
ΔE Greyscale Calman: 5.7 | ∀{0.09-98 Ø4.97}
68.3% AdobeRGB 1998 (Argyll 3D)
96.1% sRGB (Argyll 3D)
66.2% Display P3 (Argyll 3D)
Gamma: 2.13
CCT: 6931 K
| Lenovo ThinkPad X1 Nano Gen 2 Core i7-1280P P101ZFZ-BH2, IPS, 2160x1350, 13" | Lenovo ThinkPad X1 Nano-20UN002UGE MND007ZA1-2, IPS, 2160x1350, 13" | HP Elite Dragonfly G3 Chi Mei CMN13C0, IPS, 1920x1280, 13.5" | Dell Latitude 13 7330 LG Philips 133WF9, IPS, 1920x1080, 13.3" | Framework Laptop 13.5 12th Gen Intel BOE CQ NE135FBM-N41, IPS, 2256x1504, 13.5" | Huawei MateBook X Pro 2021 TIANMA XM, IPS, 3000x2000, 13.9" | |
|---|---|---|---|---|---|---|
| Display | 5% | 2% | -1% | 4% | -2% | |
| Display P3 Coverage (%) | 66.2 | 70.4 6% | 68 3% | 66.1 0% | 69.9 6% | 64.9 -2% |
| sRGB Coverage (%) | 96.1 | 99.9 4% | 98.3 2% | 93.5 -3% | 99.4 3% | 94.4 -2% |
| AdobeRGB 1998 Coverage (%) | 68.3 | 72 5% | 69.9 2% | 68.2 0% | 71.1 4% | 66.3 -3% |
| Response Times | -8% | -28% | -14% | 7% | 6% | |
| Response Time Grey 50% / Grey 80% * (ms) | 43.6 ? | 46.8 ? -7% | 50.8 ? -17% | 48.4 ? -11% | 34.7 ? 20% | 37.6 ? 14% |
| Response Time Black / White * (ms) | 25.6 ? | 28 ? -9% | 35.2 ? -38% | 29.6 ? -16% | 27.5 ? -7% | 26.4 ? -3% |
| PWM Frequency (Hz) | ||||||
| Screen | 29% | 19% | 24% | 13% | 26% | |
| Brightness middle (cd/m²) | 469.6 | 460 -2% | 387.2 -18% | 460.1 -2% | 449.6 -4% | 502 7% |
| Brightness (cd/m²) | 460 | 434 -6% | 360 -22% | 445 -3% | 431 -6% | 474 3% |
| Brightness Distribution (%) | 94 | 92 -2% | 80 -15% | 89 -5% | 90 -4% | 89 -5% |
| Black Level * (cd/m²) | 0.37 | 0.27 27% | 0.26 30% | 0.31 16% | 0.31 16% | 0.33 11% |
| Contrast (:1) | 1269 | 1704 34% | 1489 17% | 1484 17% | 1450 14% | 1521 20% |
| Colorchecker dE 2000 * | 4.85 | 1.1 77% | 2.36 51% | 2.42 50% | 2.76 43% | 1.35 72% |
| Colorchecker dE 2000 max. * | 7.62 | 4.5 41% | 4.79 37% | 3.97 48% | 7.96 -4% | 3.67 52% |
| Colorchecker dE 2000 calibrated * | 1.22 | 1 18% | 0.63 48% | 0.77 37% | 0.58 52% | 1.2 2% |
| Greyscale dE 2000 * | 5.7 | 1.6 72% | 3 47% | 2.3 60% | 5.2 9% | 1.7 70% |
| Gamma | 2.13 103% | 2.2 100% | 2.17 101% | 2.23 99% | 2.23 99% | 2.24 98% |
| CCT | 6931 94% | 6475 100% | 6137 106% | 6262 104% | 6475 100% | 6440 101% |
| Color Space (Percent of AdobeRGB 1998) (%) | 65.7 | 61.1 | ||||
| Color Space (Percent of sRGB) (%) | 99.9 | 94.3 | ||||
| Całkowita średnia (program / ustawienia) | 9% /
18% | -2% /
9% | 3% /
13% | 8% /
10% | 10% /
17% |
* ... im mniej tym lepiej
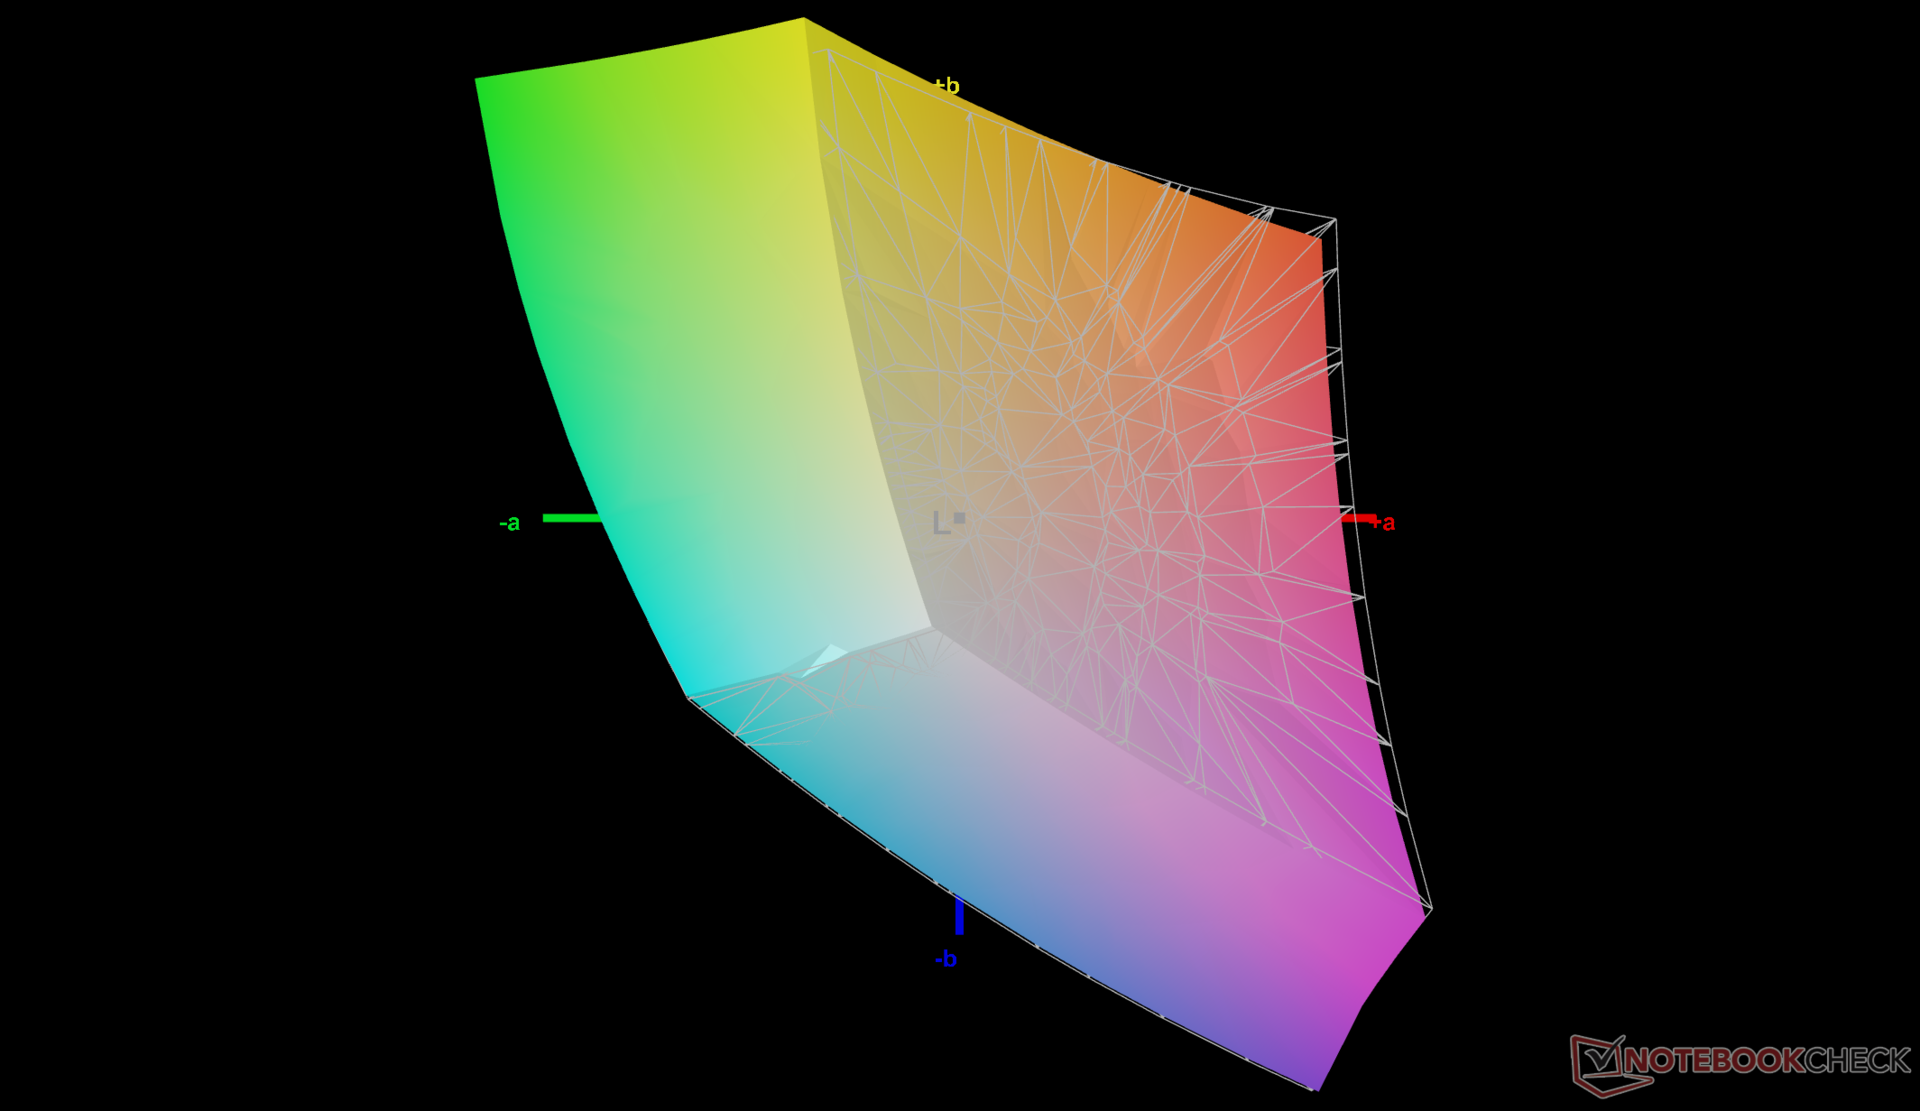
Panel nie jest dobrze skalibrowany po wyjęciu z pudełka. Samodzielna kalibracja znacznie poprawiłaby średnie wartości deltaE w skali szarości i kolorze z 5,7 i 4,85 do odpowiednio 2,3 i 1,22. Zalecamy kalibrację przez użytkownika końcowego, aby lepiej wykorzystać pełne pokrycie sRGB panelu.

Wyświetl czasy reakcji
| ↔ Czas reakcji od czerni do bieli | ||
|---|---|---|
| 25.6 ms ... wzrost ↗ i spadek ↘ łącznie | ↗ 13.2 ms wzrost | 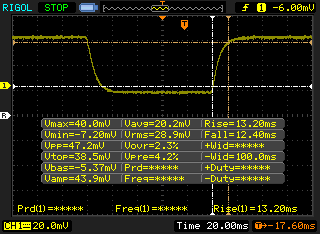 |
| ↘ 12.4 ms upadek | ||
| W naszych testach ekran wykazuje stosunkowo powolne tempo reakcji i może być zbyt wolny dla graczy. Dla porównania, wszystkie testowane urządzenia wahają się od 0.1 (minimum) do 240 (maksimum) ms. » 61 % wszystkich urządzeń jest lepszych. Oznacza to, że zmierzony czas reakcji jest gorszy od średniej wszystkich testowanych urządzeń (19.8 ms). | ||
| ↔ Czas reakcji 50% szarości do 80% szarości | ||
| 43.6 ms ... wzrost ↗ i spadek ↘ łącznie | ↗ 22 ms wzrost | 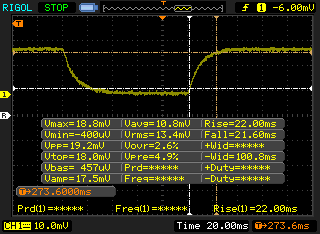 |
| ↘ 21.6 ms upadek | ||
| W naszych testach ekran wykazuje powolne tempo reakcji, co będzie niezadowalające dla graczy. Dla porównania, wszystkie testowane urządzenia wahają się od 0.165 (minimum) do 636 (maksimum) ms. » 73 % wszystkich urządzeń jest lepszych. Oznacza to, że zmierzony czas reakcji jest gorszy od średniej wszystkich testowanych urządzeń (31 ms). | ||
Migotanie ekranu / PWM (modulacja szerokości impulsu)
| Migotanie ekranu/nie wykryto PWM | 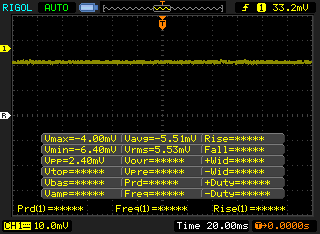 | ||
Dla porównania: 52 % wszystkich testowanych urządzeń nie używa PWM do przyciemniania wyświetlacza. Jeśli wykryto PWM, zmierzono średnio 7772 (minimum: 5 - maksimum: 343500) Hz. | |||
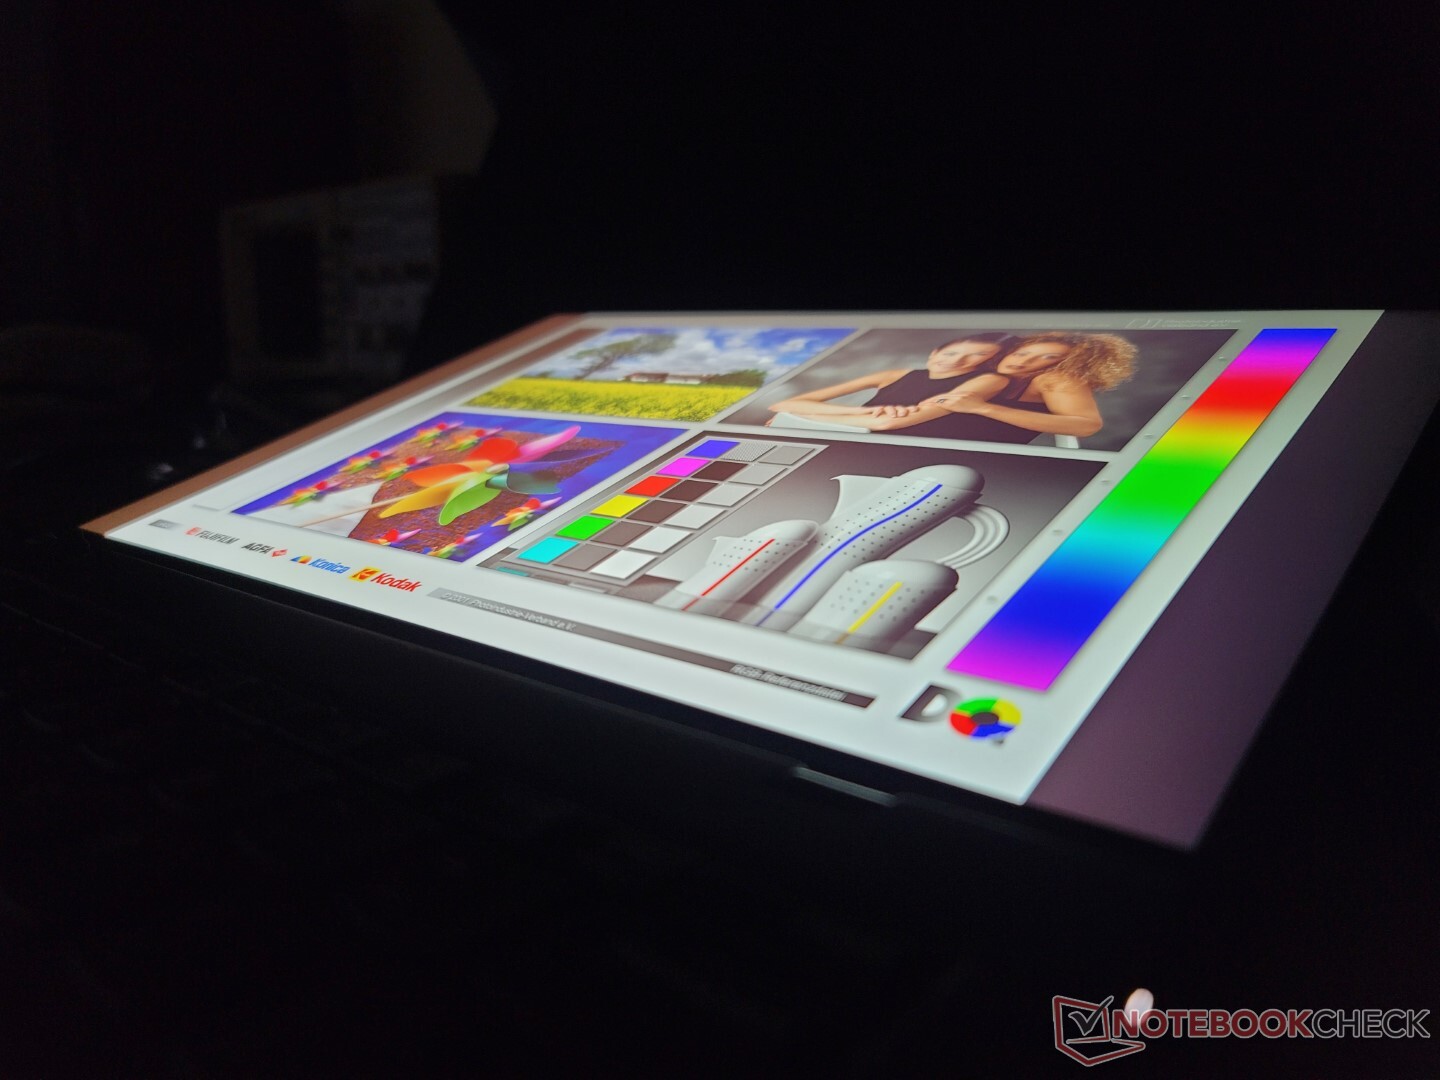
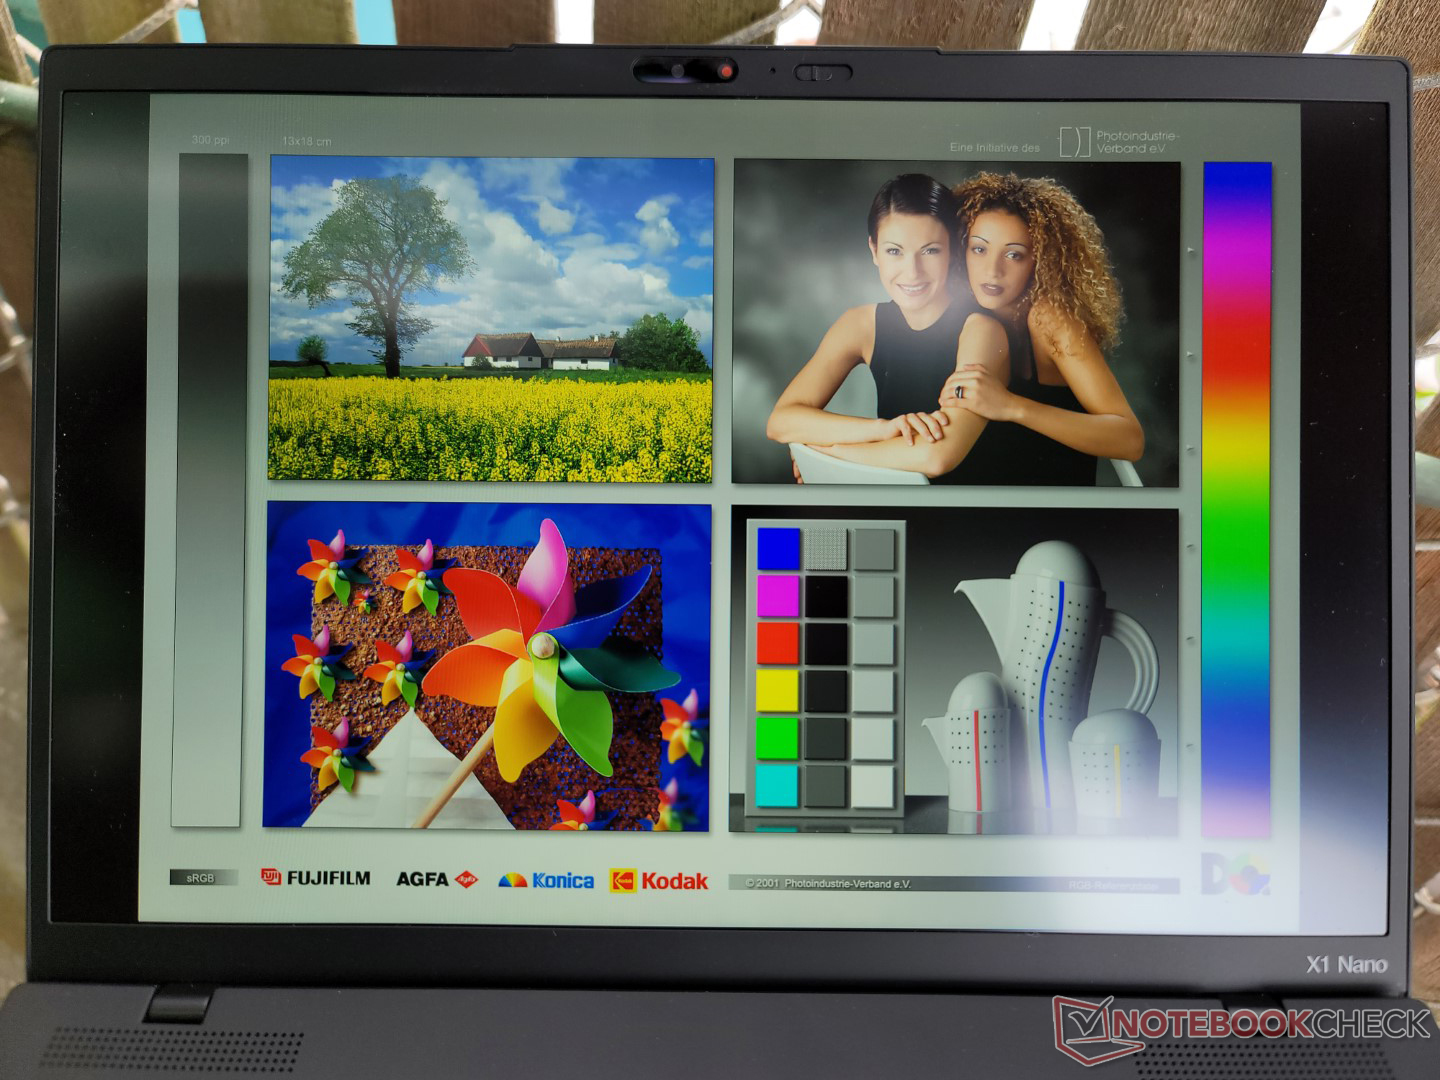
Widoczność na zewnątrz i kąty widzenia pozostają w większości takie same jak w modelu Gen 1, ponieważ Lenovo nie zwiększyło jasności ani kontrastu wyświetlacza w tegorocznym modelu.


Wydajność
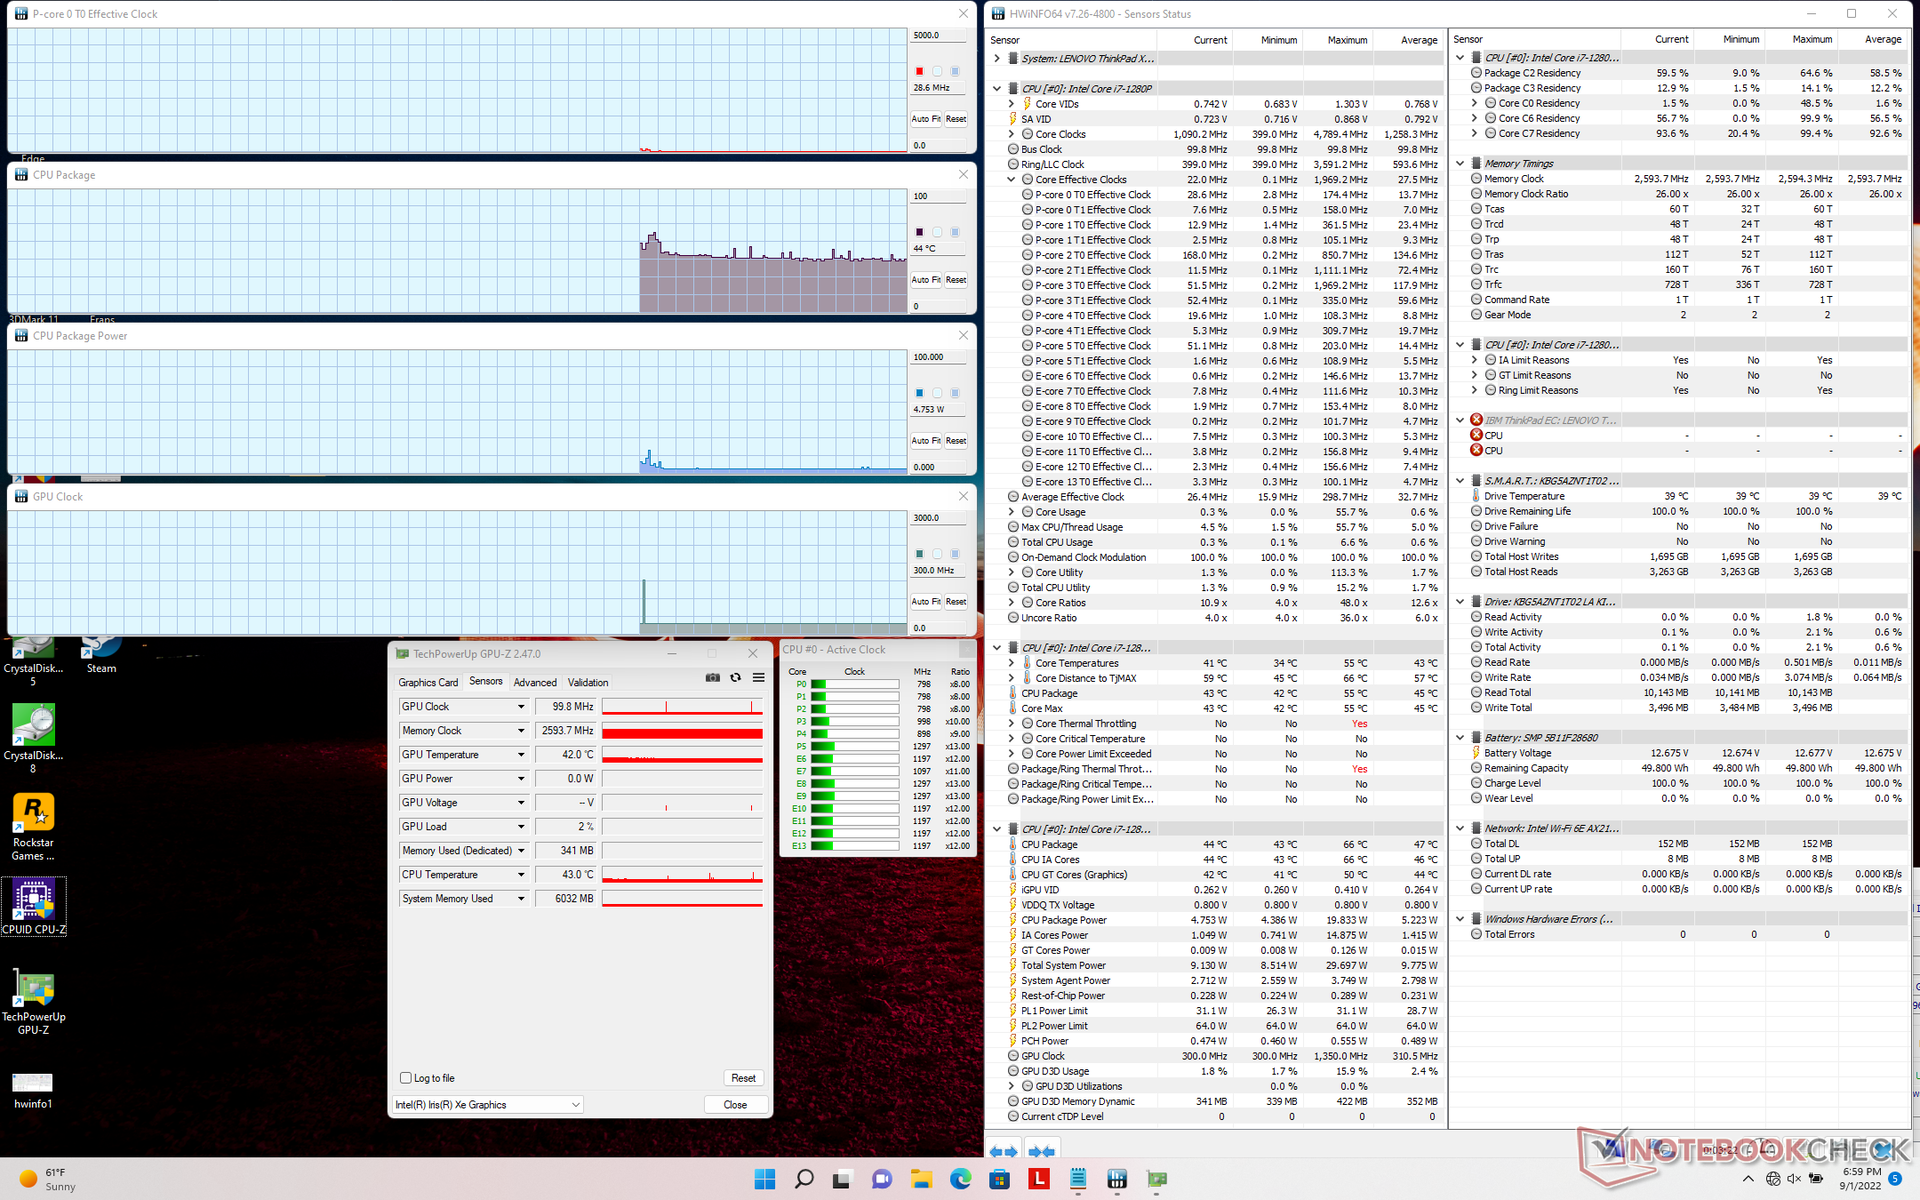
Warunki badania
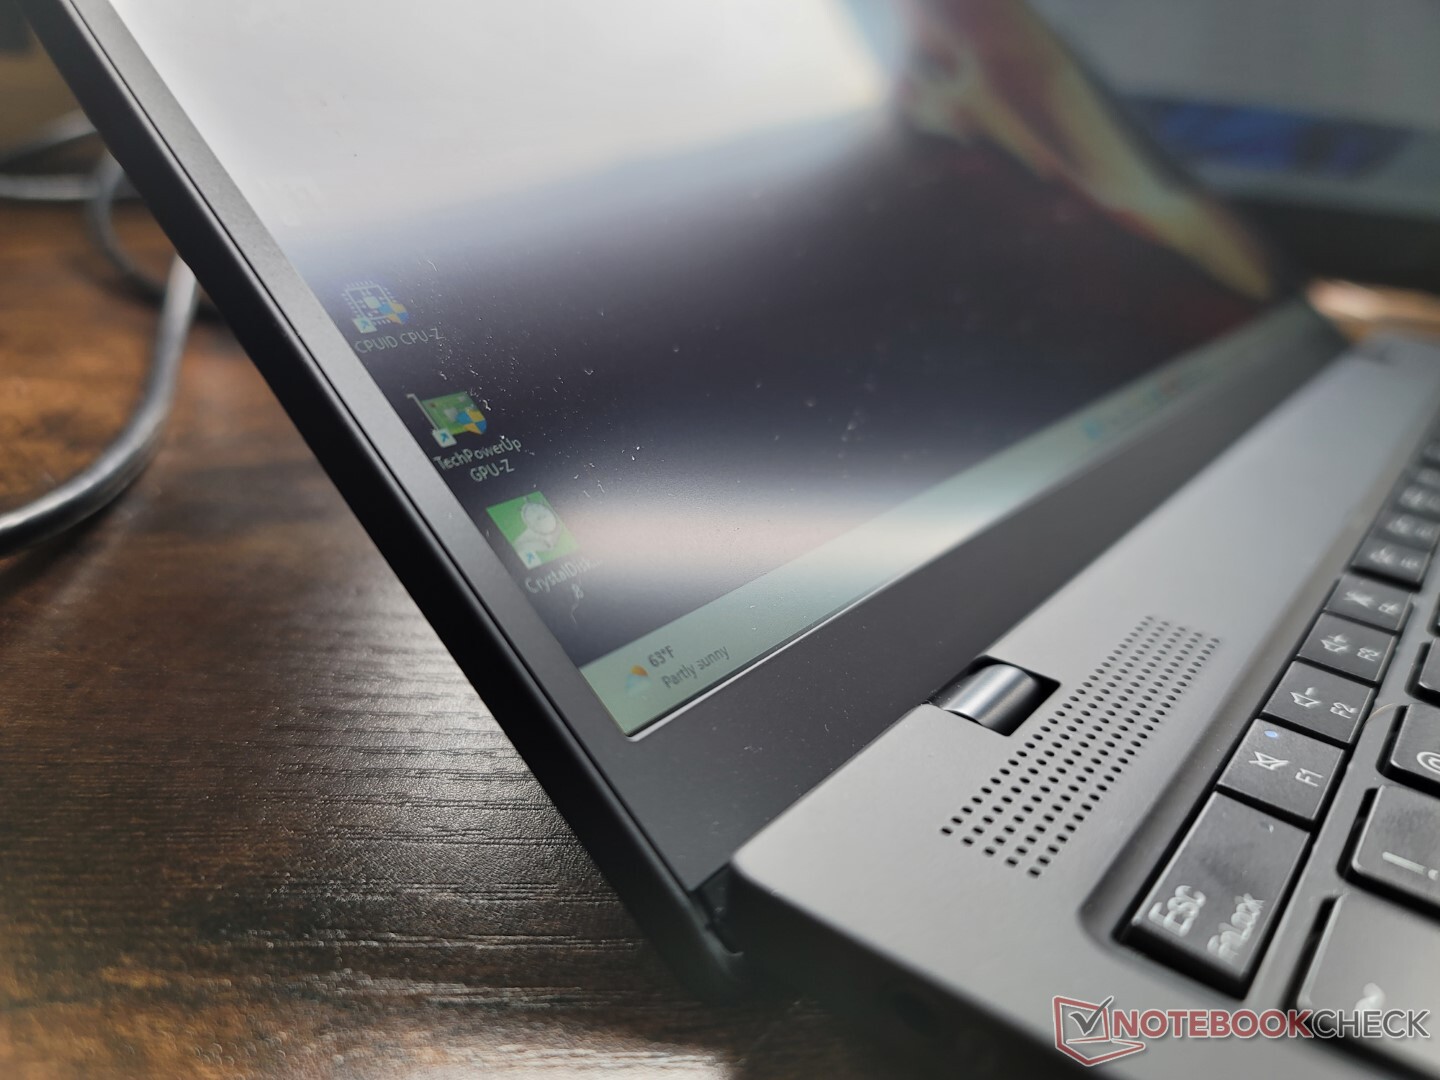
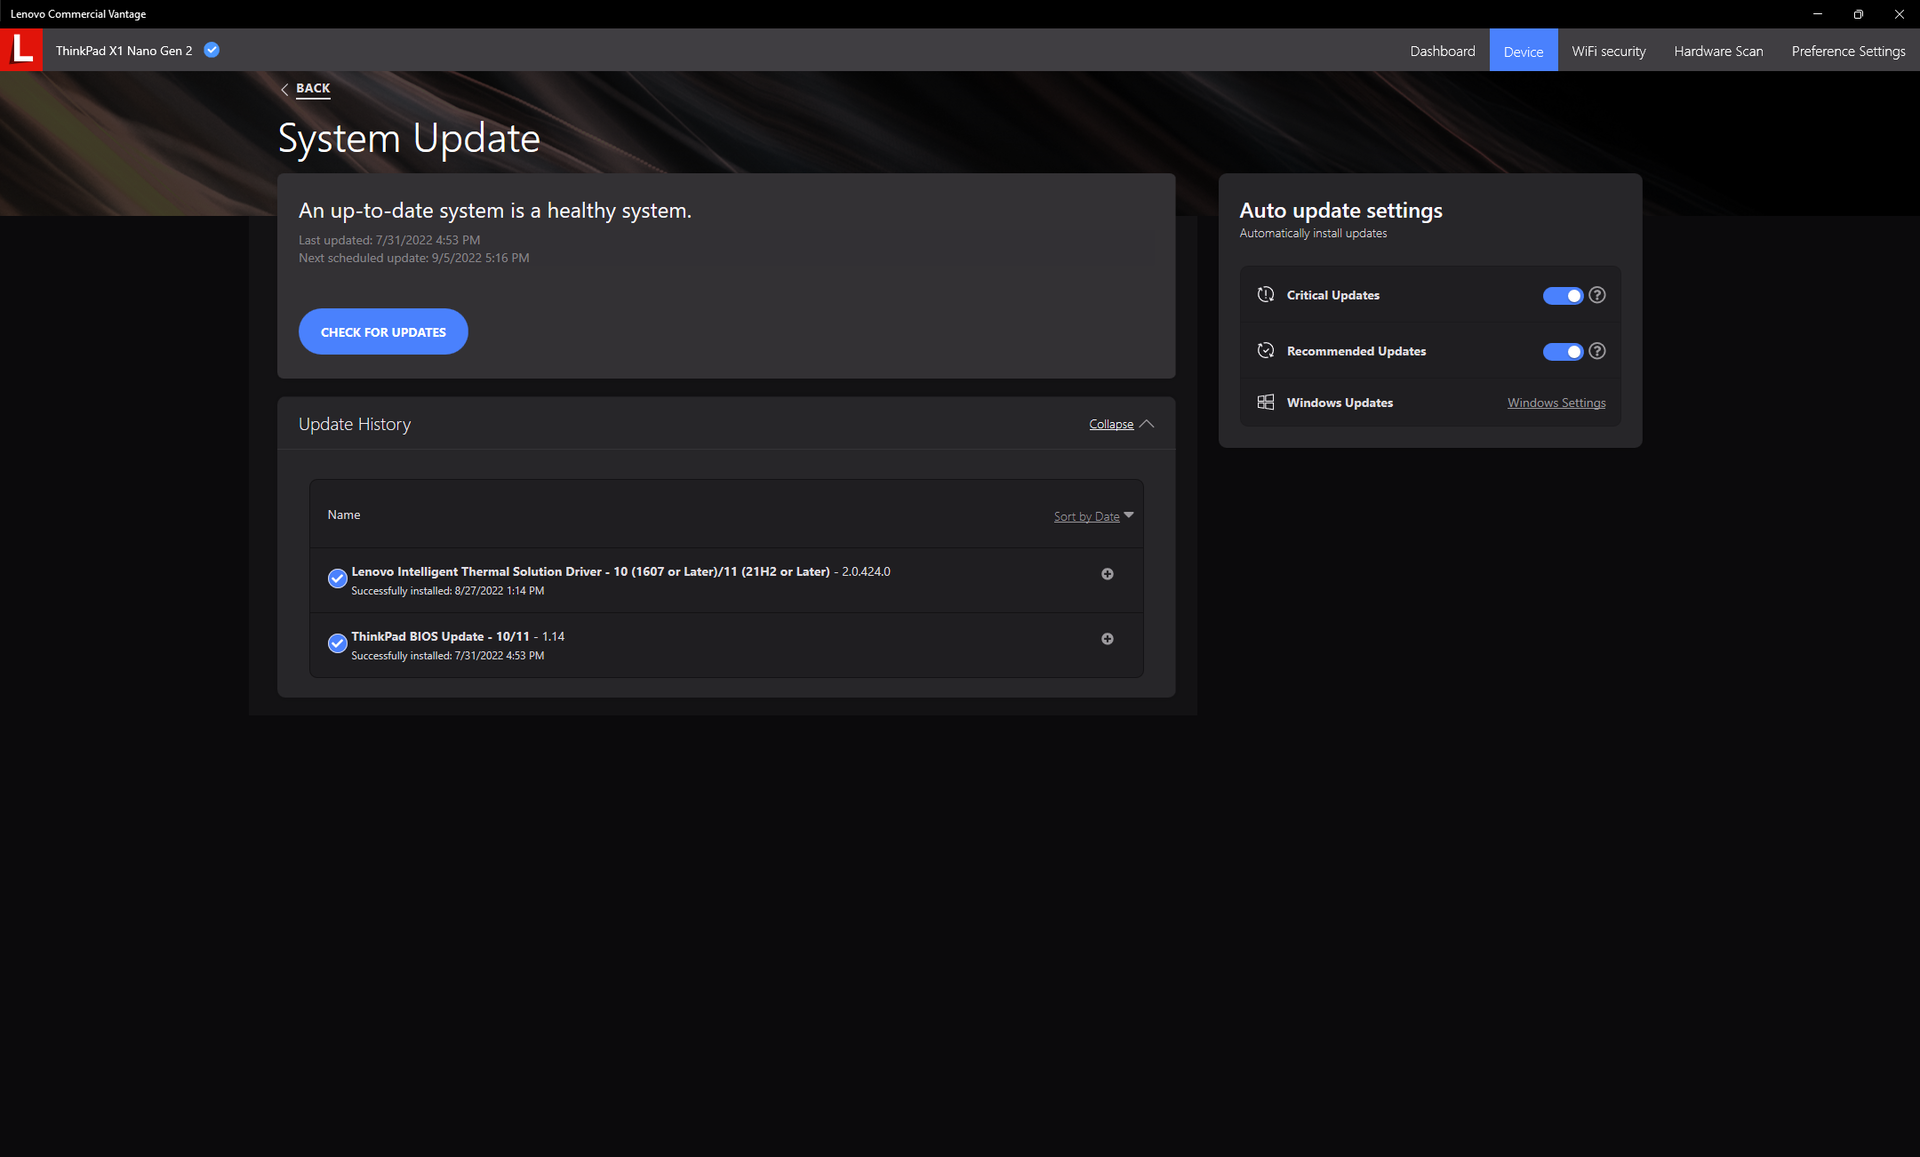
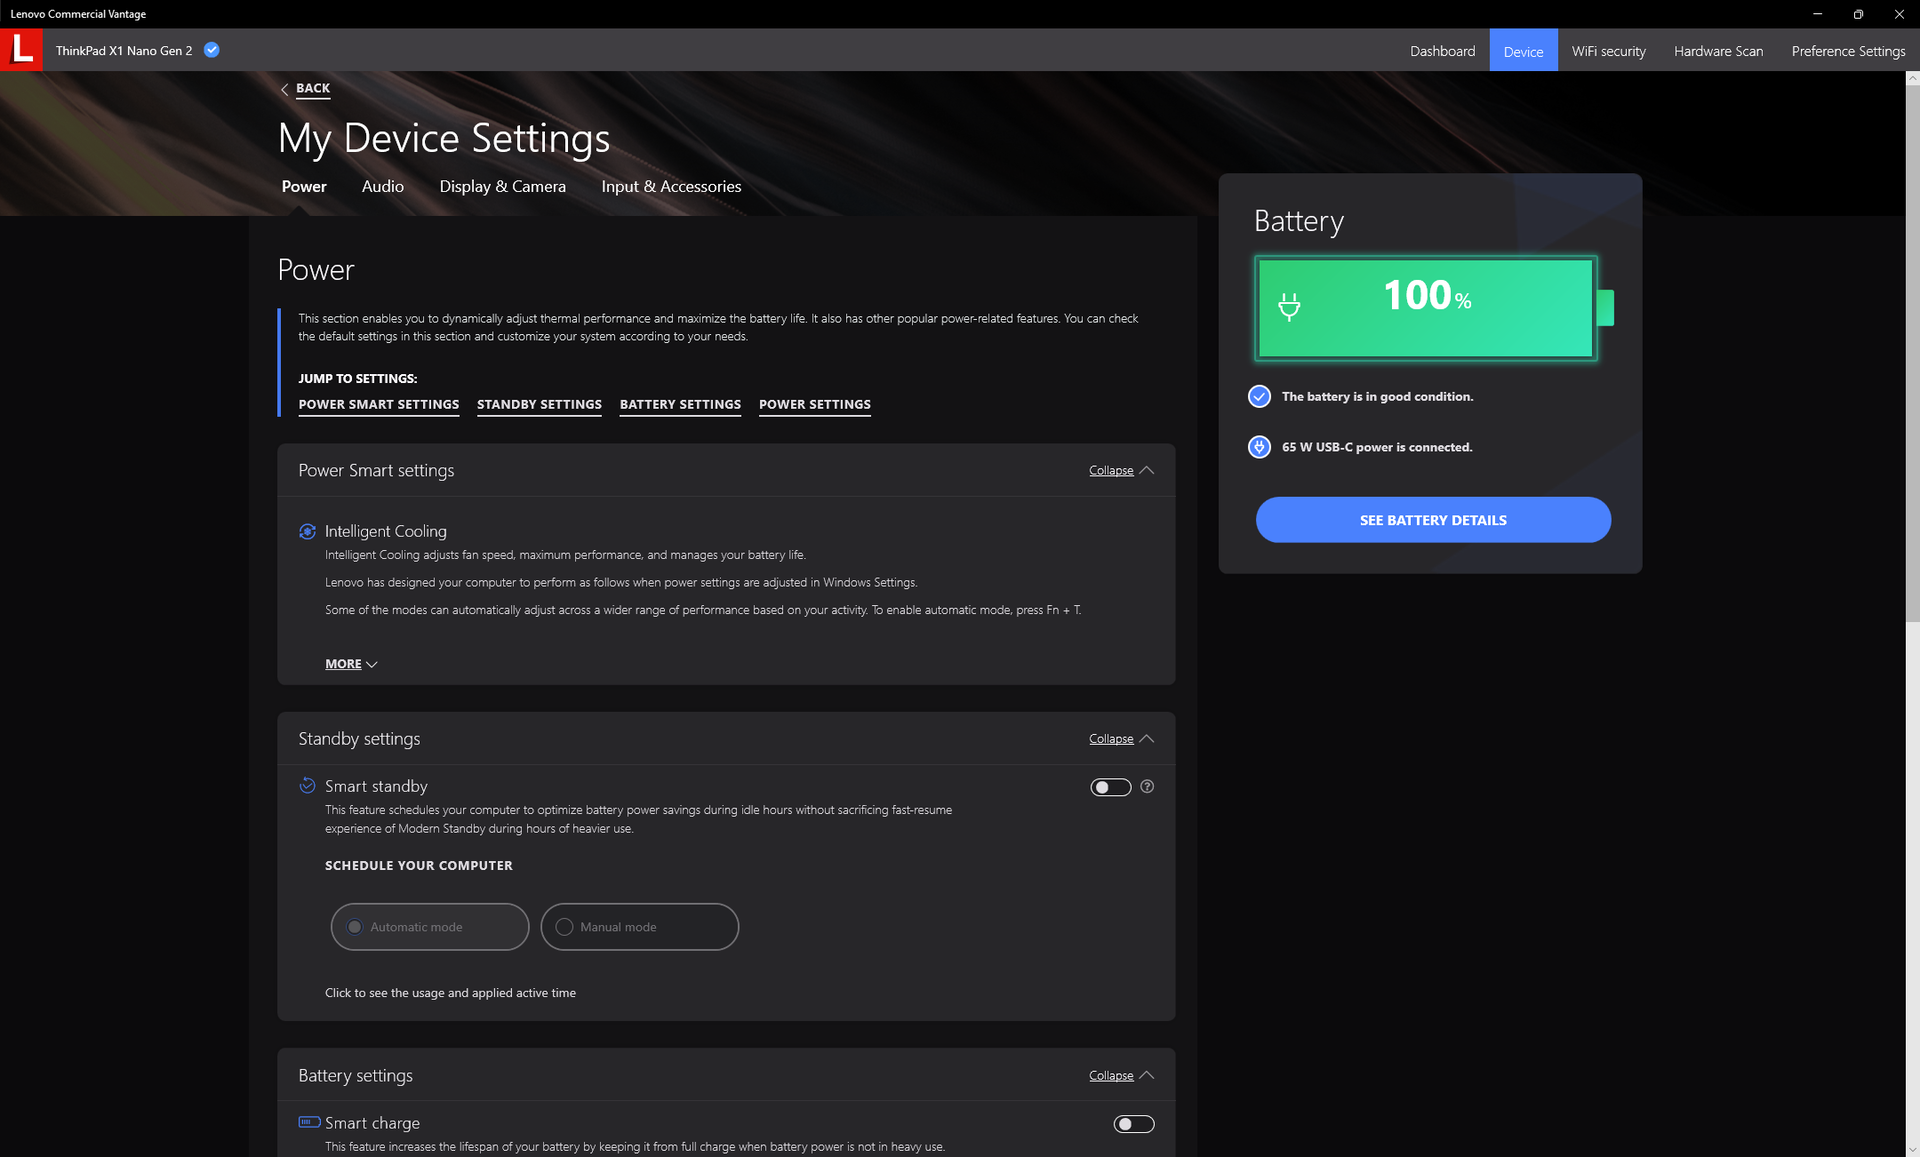
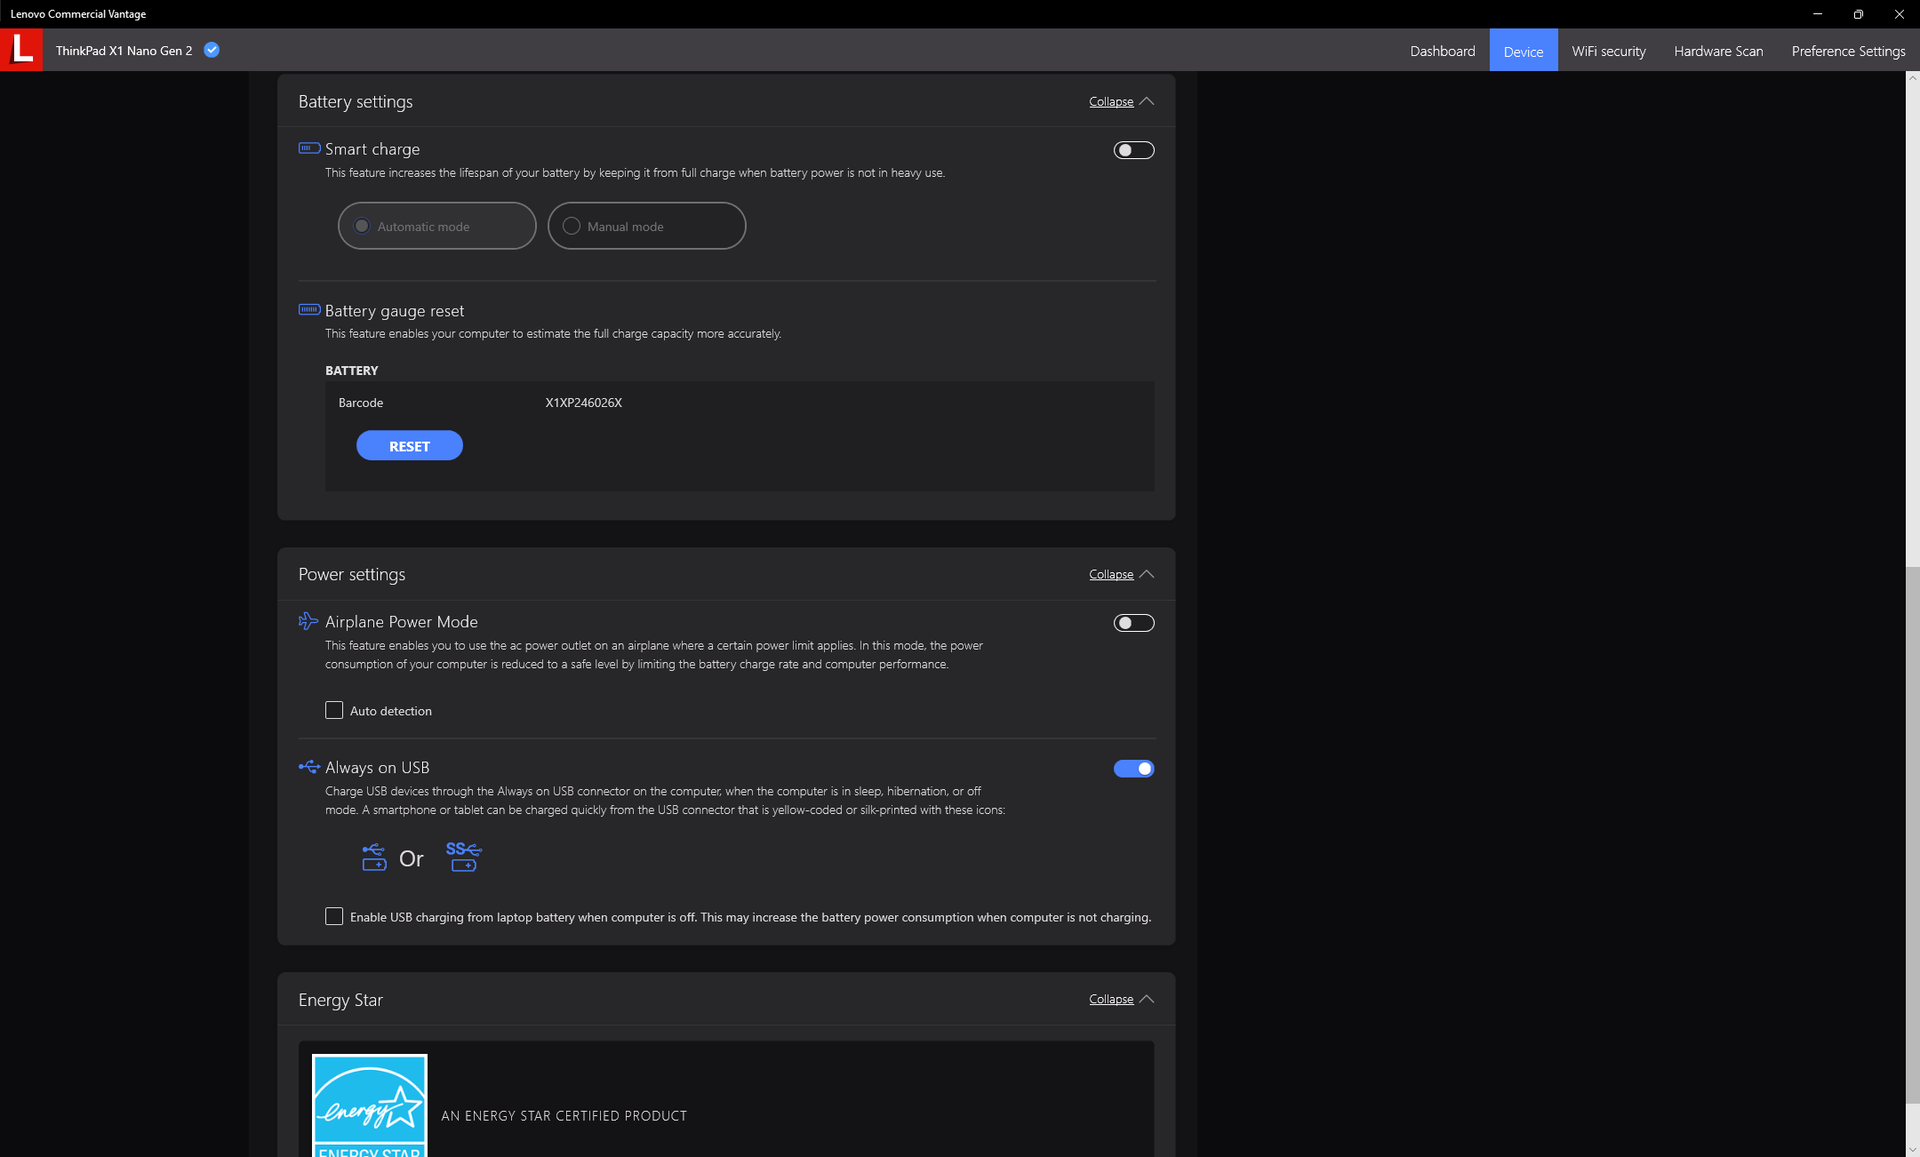
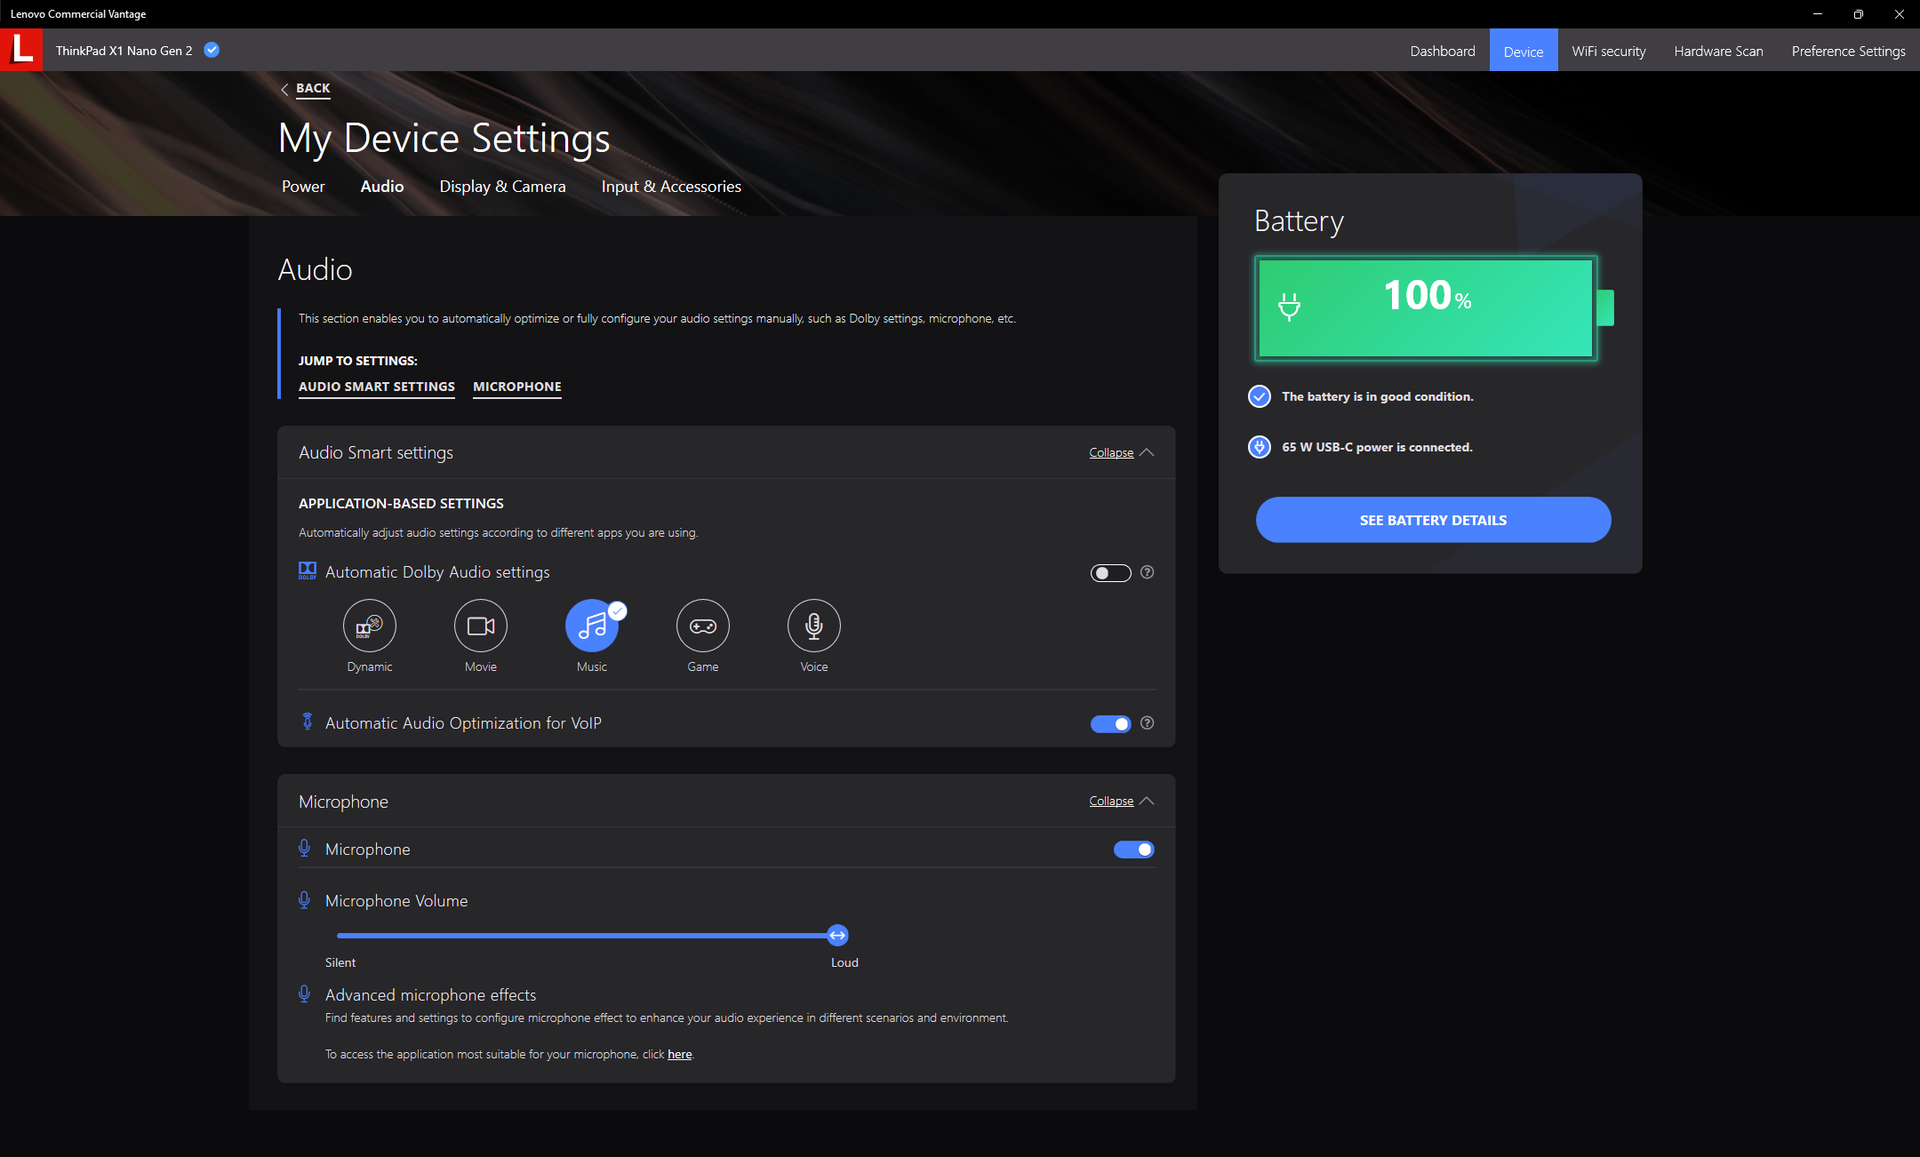
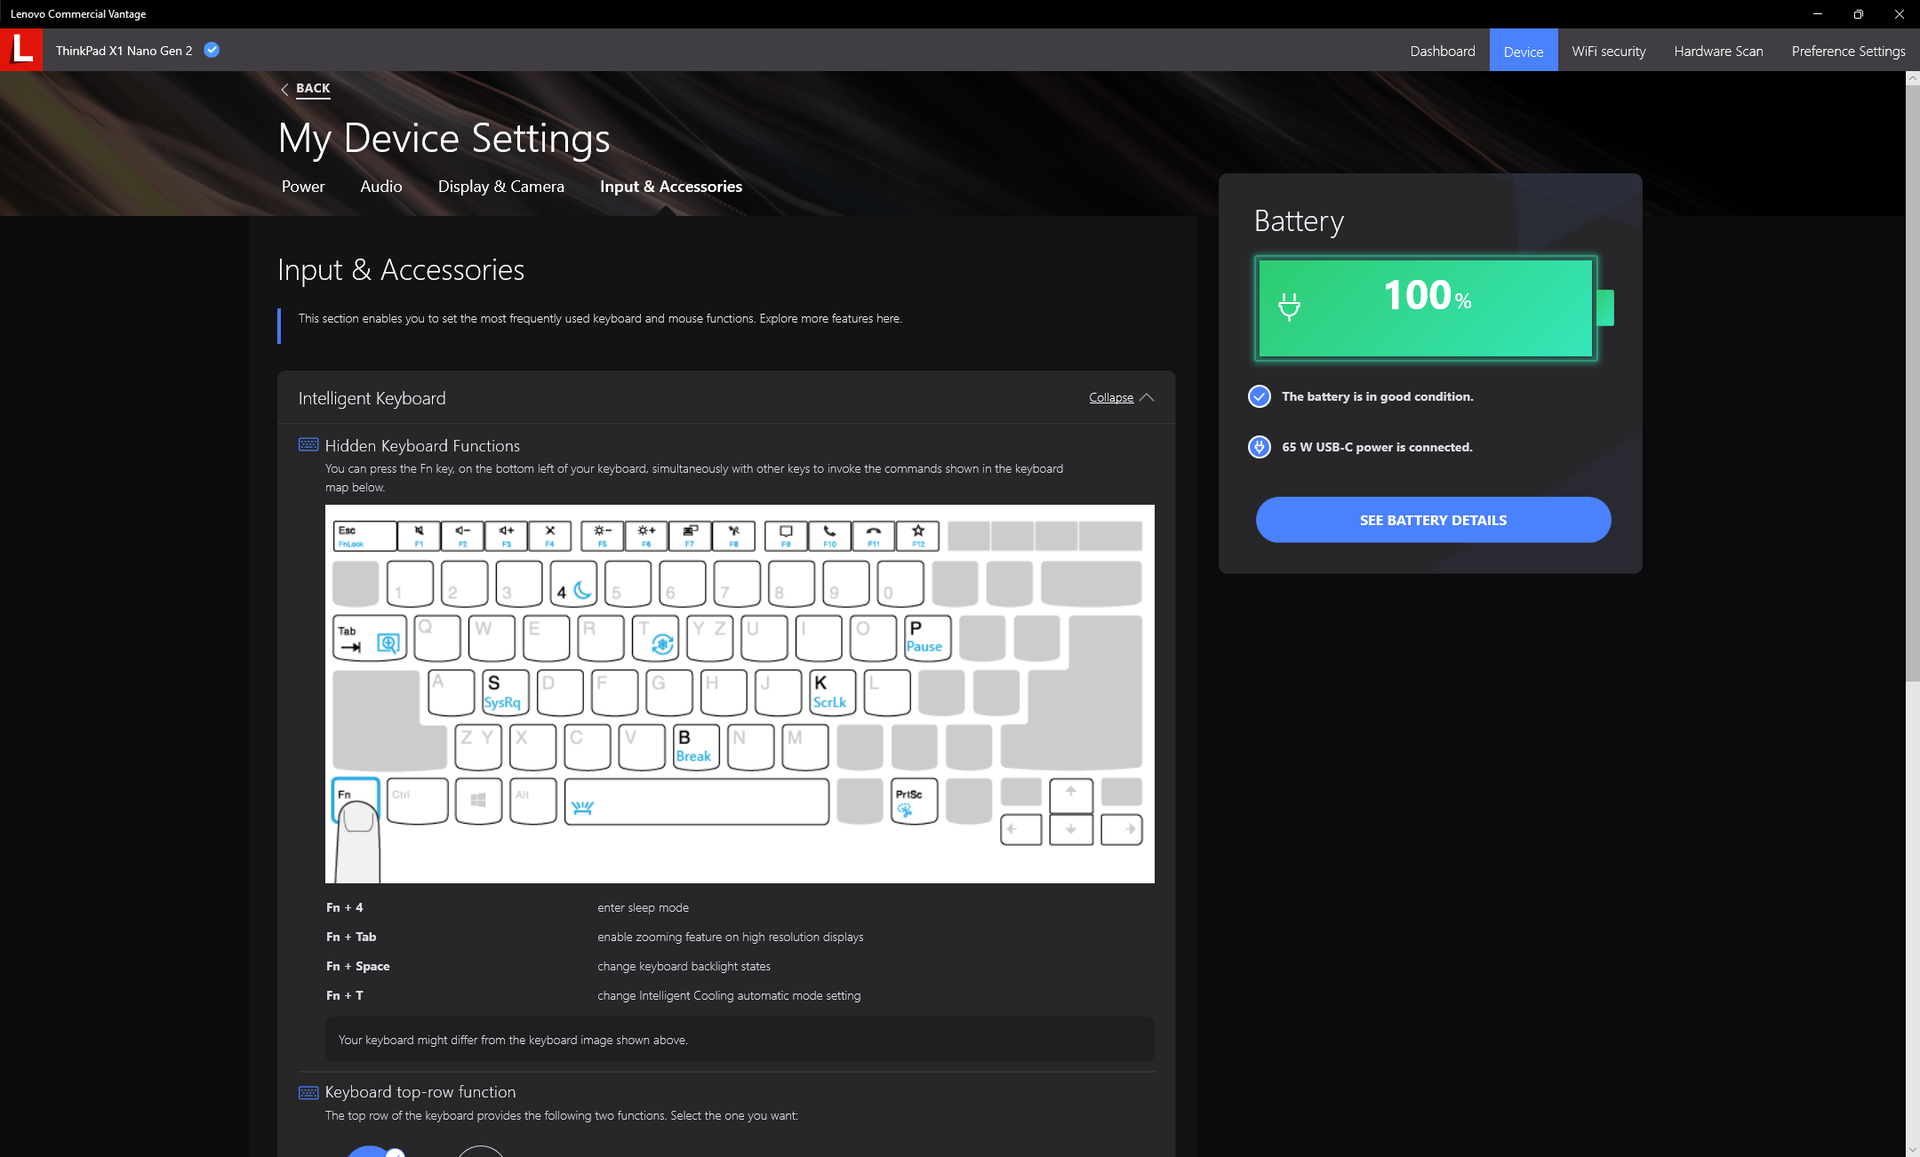
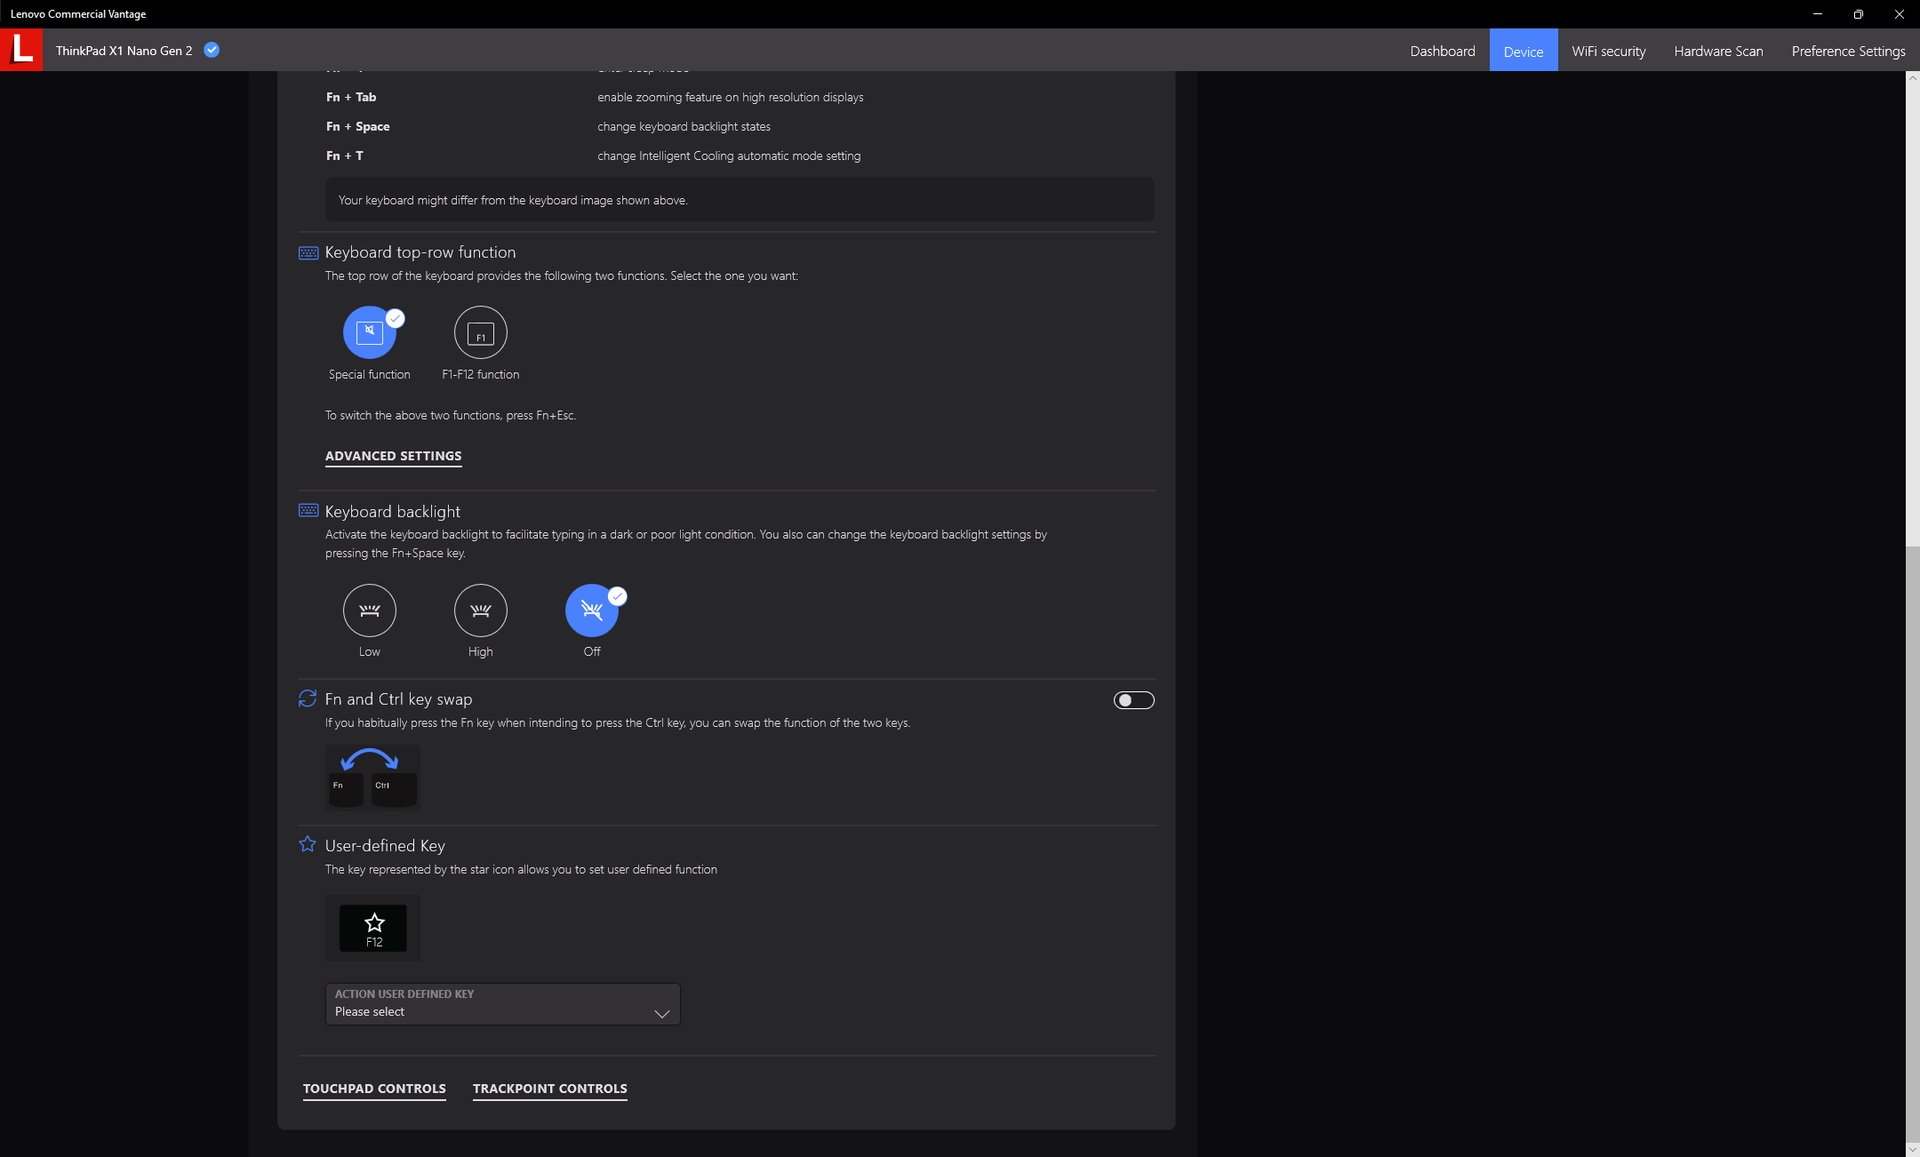
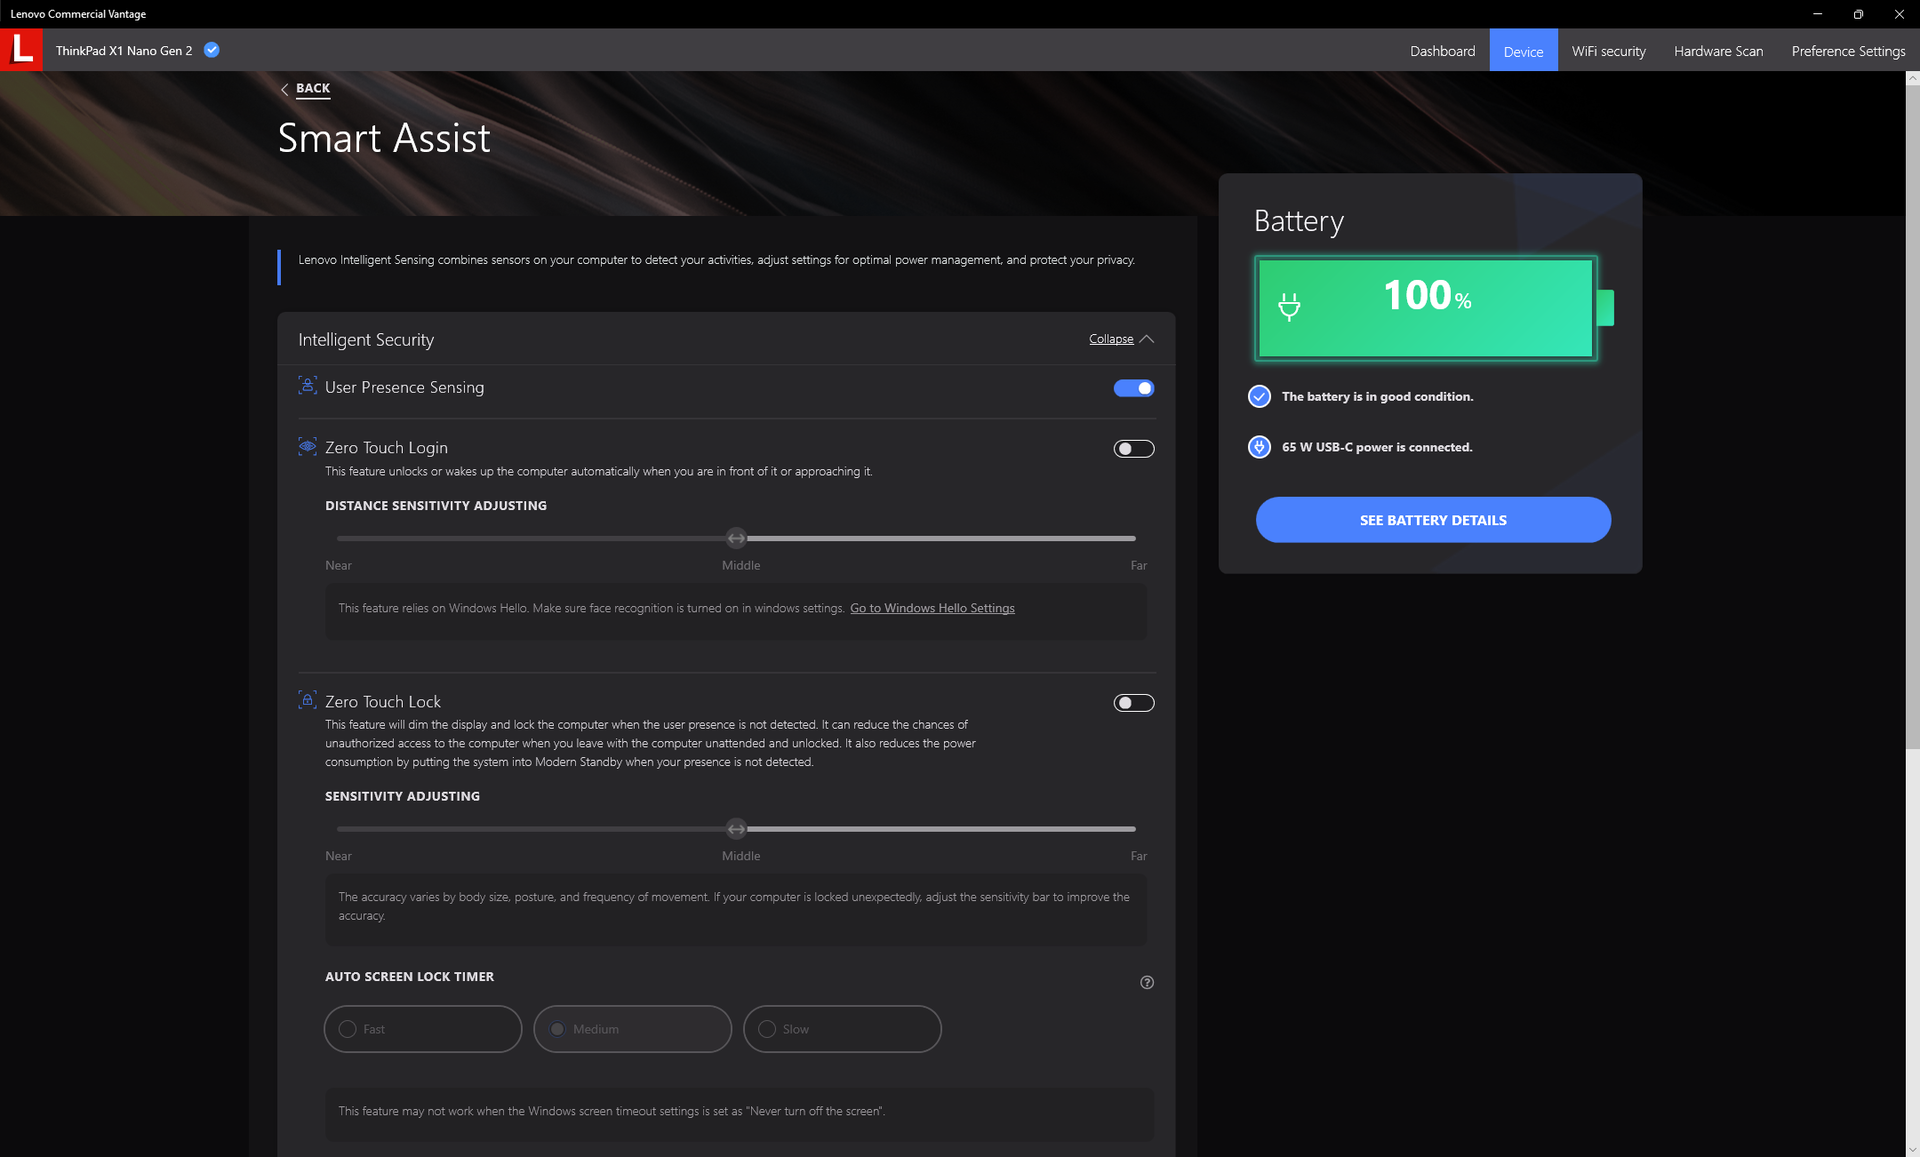
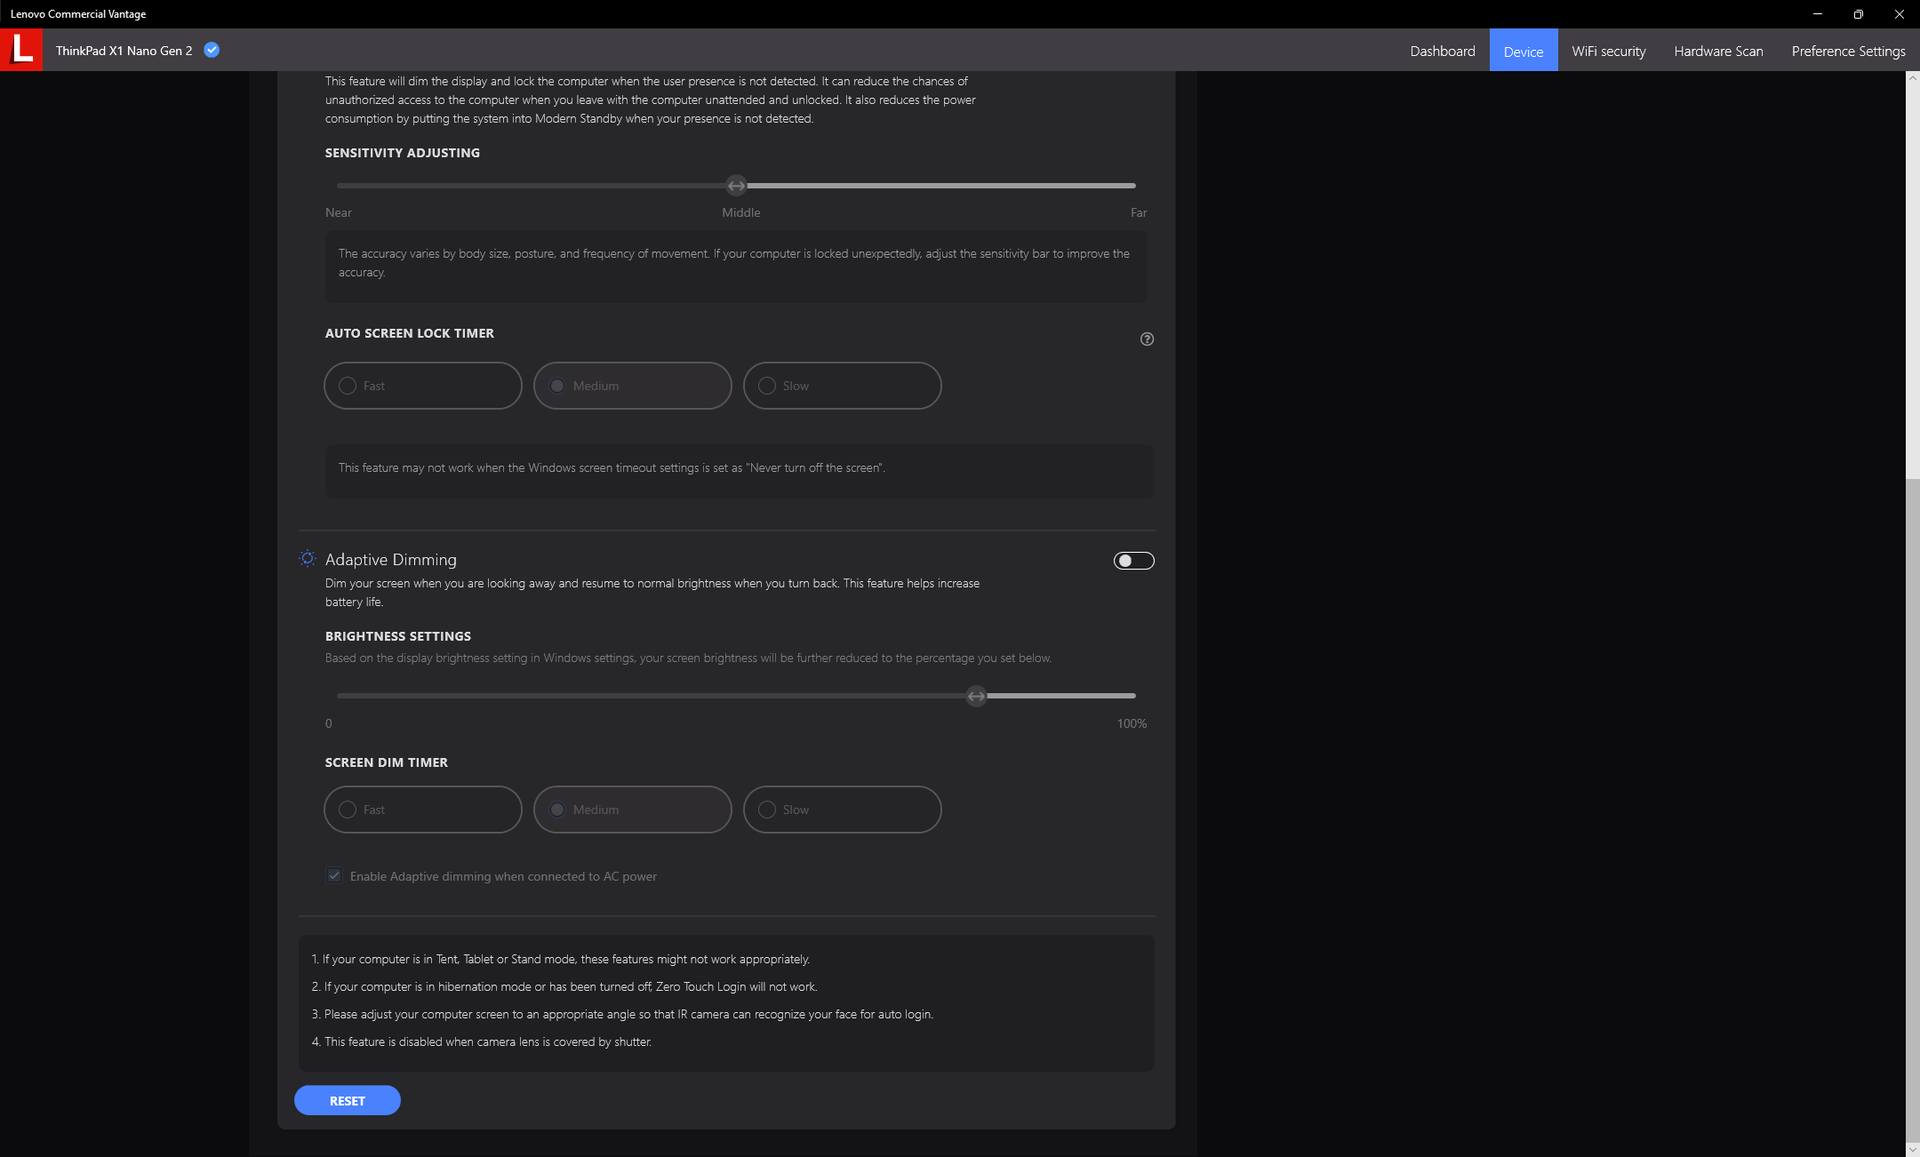
Ustawiliśmy nasze urządzenie w trybie "Best performance" poprzez system Windows przed przeprowadzeniem poniższych benchmarków wydajności. Zaleca się, aby użytkownicy zapoznali się z preinstalowanym oprogramowaniem Vantage, ponieważ wiele aktualizacji oprogramowania Lenovo i funkcji takich jak User Presence Sensing jest przełączanych tutaj, jak pokazano na poniższych zrzutach ekranu.
Procesor
Wydajność procesora to worek mieszany. Wysoki początkowy wynik wielowątkowy CineBench R15 (2118 pkt.) jest znakomity, ale po kolejnym uruchomieniu spada on drastycznie do 1485 pkt., co świadczy o słabej stabilności Turbo Boost i ostrzejszym throttlingu, niż w przypadku większości innych laptopów. W rzeczywistości wydajność wielowątkowa może spaść nawet o 48% pod obciążeniem, co pokazuje nasz test pętli CineBench R15 xT poniżej. Strona Laptop Framework z rzekomo wolniejszym Core i7-1260P jest w stanie przewyższyć nasz i7-1280P przez dłuższy czas. Innymi słowy, użytkownicy mogą cieszyć się początkowym, krótkim zrywem prędkości i7-1280P w Lenovo, zanim spadnie on z klifu.
Pomimo nieco rozczarowującej wydajności, nasz procesor i7-1280P w X1 Nano Gen 2 jest wciąż szybszy od Core i7-1160G7 w X1 Nano Gen 1 o około 80 procent, nawet po uwzględnieniu wszelkich problemów z dławieniem.
Cinebench R15 Multi Loop
Cinebench R23: Multi Core | Single Core
Cinebench R15: CPU Multi 64Bit | CPU Single 64Bit
Blender: v2.79 BMW27 CPU
7-Zip 18.03: 7z b 4 | 7z b 4 -mmt1
Geekbench 5.5: Multi-Core | Single-Core
HWBOT x265 Benchmark v2.2: 4k Preset
LibreOffice : 20 Documents To PDF
R Benchmark 2.5: Overall mean
| Cinebench R20 / CPU (Multi Core) | |
| Przeciętny Intel Core i7-1280P (3283 - 5415, n=8) | |
| Asus Zenbook S 13 OLED | |
| Framework Laptop 13.5 12th Gen Intel | |
| Lenovo ThinkPad Z13 21D2CTO1WW | |
| Lenovo ThinkPad X1 Nano Gen 2 Core i7-1280P | |
| HP Spectre x360 13.5 14t-ef000 | |
| Lenovo Yoga 6 13ALC6 | |
| HP Elite Dragonfly G3 | |
| Dynabook Portégé X30L-K-139 | |
| Lenovo ThinkPad X1 Nano-20UN002UGE | |
| Lenovo Yoga Slim 7-14IIL05 | |
| Dell Inspiron 13 7306-6TYH5 | |
| Lenovo ThinkPad X1 Titanium Yoga G1 20QB0016GE | |
| Cinebench R20 / CPU (Single Core) | |
| Framework Laptop 13.5 12th Gen Intel | |
| HP Spectre x360 13.5 14t-ef000 | |
| Przeciętny Intel Core i7-1280P (615 - 701, n=8) | |
| Lenovo ThinkPad X1 Nano Gen 2 Core i7-1280P | |
| HP Elite Dragonfly G3 | |
| Dynabook Portégé X30L-K-139 | |
| Dell Inspiron 13 7306-6TYH5 | |
| Lenovo ThinkPad Z13 21D2CTO1WW | |
| Asus Zenbook S 13 OLED | |
| Lenovo ThinkPad X1 Nano-20UN002UGE | |
| Lenovo Yoga 6 13ALC6 | |
| Lenovo Yoga Slim 7-14IIL05 | |
| Lenovo ThinkPad X1 Titanium Yoga G1 20QB0016GE | |
| Cinebench R23 / Multi Core | |
| Przeciętny Intel Core i7-1280P (8632 - 14803, n=8) | |
| Asus Zenbook S 13 OLED | |
| Framework Laptop 13.5 12th Gen Intel | |
| Lenovo ThinkPad Z13 21D2CTO1WW | |
| Lenovo ThinkPad X1 Nano Gen 2 Core i7-1280P | |
| HP Spectre x360 13.5 14t-ef000 | |
| Lenovo Yoga 6 13ALC6 | |
| HP Elite Dragonfly G3 | |
| Dynabook Portégé X30L-K-139 | |
| Lenovo ThinkPad X1 Nano-20UN002UGE | |
| Dell Inspiron 13 7306-6TYH5 | |
| Lenovo ThinkPad X1 Titanium Yoga G1 20QB0016GE | |
| Cinebench R23 / Single Core | |
| HP Spectre x360 13.5 14t-ef000 | |
| Lenovo ThinkPad X1 Nano Gen 2 Core i7-1280P | |
| Przeciętny Intel Core i7-1280P (1609 - 1787, n=7) | |
| Framework Laptop 13.5 12th Gen Intel | |
| HP Elite Dragonfly G3 | |
| Asus Zenbook S 13 OLED | |
| Dell Inspiron 13 7306-6TYH5 | |
| Lenovo ThinkPad Z13 21D2CTO1WW | |
| Dynabook Portégé X30L-K-139 | |
| Lenovo Yoga 6 13ALC6 | |
| Lenovo ThinkPad X1 Titanium Yoga G1 20QB0016GE | |
| Cinebench R15 / CPU Multi 64Bit | |
| Przeciętny Intel Core i7-1280P (1905 - 2332, n=7) | |
| Lenovo ThinkPad X1 Nano Gen 2 Core i7-1280P | |
| Asus Zenbook S 13 OLED | |
| Framework Laptop 13.5 12th Gen Intel | |
| Lenovo ThinkPad Z13 21D2CTO1WW | |
| HP Spectre x360 13.5 14t-ef000 | |
| HP Elite Dragonfly G3 | |
| Lenovo Yoga 6 13ALC6 | |
| Dynabook Portégé X30L-K-139 | |
| Lenovo ThinkPad X1 Nano-20UN002UGE | |
| Dell Inspiron 13 7306-6TYH5 | |
| Dell Inspiron 13 7306-6TYH5 | |
| Lenovo Yoga Slim 7-14IIL05 | |
| Lenovo ThinkPad X1 Titanium Yoga G1 20QB0016GE | |
| Cinebench R15 / CPU Single 64Bit | |
| Framework Laptop 13.5 12th Gen Intel | |
| HP Spectre x360 13.5 14t-ef000 | |
| Lenovo ThinkPad X1 Nano Gen 2 Core i7-1280P | |
| Asus Zenbook S 13 OLED | |
| Przeciętny Intel Core i7-1280P (203 - 258, n=7) | |
| Lenovo ThinkPad Z13 21D2CTO1WW | |
| Dell Inspiron 13 7306-6TYH5 | |
| Dell Inspiron 13 7306-6TYH5 | |
| HP Elite Dragonfly G3 | |
| Lenovo ThinkPad X1 Nano-20UN002UGE | |
| Lenovo Yoga 6 13ALC6 | |
| Lenovo Yoga Slim 7-14IIL05 | |
| Lenovo ThinkPad X1 Titanium Yoga G1 20QB0016GE | |
| Dynabook Portégé X30L-K-139 | |
| Blender / v2.79 BMW27 CPU | |
| Lenovo ThinkPad X1 Titanium Yoga G1 20QB0016GE | |
| Lenovo Yoga Slim 7-14IIL05 | |
| Dell Inspiron 13 7306-6TYH5 | |
| Lenovo ThinkPad X1 Nano-20UN002UGE | |
| Dynabook Portégé X30L-K-139 | |
| HP Elite Dragonfly G3 | |
| Lenovo ThinkPad Z13 21D2CTO1WW | |
| HP Spectre x360 13.5 14t-ef000 | |
| Lenovo Yoga 6 13ALC6 | |
| Asus Zenbook S 13 OLED | |
| Framework Laptop 13.5 12th Gen Intel | |
| Lenovo ThinkPad X1 Nano Gen 2 Core i7-1280P | |
| Przeciętny Intel Core i7-1280P (259 - 309, n=7) | |
| 7-Zip 18.03 / 7z b 4 | |
| Przeciętny Intel Core i7-1280P (45292 - 53710, n=7) | |
| Asus Zenbook S 13 OLED | |
| Lenovo ThinkPad X1 Nano Gen 2 Core i7-1280P | |
| Framework Laptop 13.5 12th Gen Intel | |
| Lenovo Yoga 6 13ALC6 | |
| HP Spectre x360 13.5 14t-ef000 | |
| Lenovo ThinkPad Z13 21D2CTO1WW | |
| HP Elite Dragonfly G3 | |
| Dynabook Portégé X30L-K-139 | |
| Lenovo ThinkPad X1 Nano-20UN002UGE | |
| Dell Inspiron 13 7306-6TYH5 | |
| Lenovo Yoga Slim 7-14IIL05 | |
| Lenovo ThinkPad X1 Titanium Yoga G1 20QB0016GE | |
| 7-Zip 18.03 / 7z b 4 -mmt1 | |
| Framework Laptop 13.5 12th Gen Intel | |
| Lenovo ThinkPad X1 Nano Gen 2 Core i7-1280P | |
| Przeciętny Intel Core i7-1280P (4995 - 5874, n=7) | |
| HP Spectre x360 13.5 14t-ef000 | |
| Asus Zenbook S 13 OLED | |
| Lenovo ThinkPad Z13 21D2CTO1WW | |
| Dell Inspiron 13 7306-6TYH5 | |
| HP Elite Dragonfly G3 | |
| Lenovo ThinkPad X1 Nano-20UN002UGE | |
| Lenovo Yoga 6 13ALC6 | |
| Dynabook Portégé X30L-K-139 | |
| Lenovo Yoga Slim 7-14IIL05 | |
| Lenovo ThinkPad X1 Titanium Yoga G1 20QB0016GE | |
| Geekbench 5.5 / Multi-Core | |
| Przeciętny Intel Core i7-1280P (9623 - 11811, n=7) | |
| Lenovo ThinkPad X1 Nano Gen 2 Core i7-1280P | |
| Framework Laptop 13.5 12th Gen Intel | |
| HP Spectre x360 13.5 14t-ef000 | |
| HP Elite Dragonfly G3 | |
| Asus Zenbook S 13 OLED | |
| Dynabook Portégé X30L-K-139 | |
| Lenovo ThinkPad Z13 21D2CTO1WW | |
| Dell Inspiron 13 7306-6TYH5 | |
| Lenovo ThinkPad X1 Nano-20UN002UGE | |
| Lenovo Yoga Slim 7-14IIL05 | |
| Lenovo ThinkPad X1 Titanium Yoga G1 20QB0016GE | |
| Geekbench 5.5 / Single-Core | |
| Lenovo ThinkPad X1 Nano Gen 2 Core i7-1280P | |
| Framework Laptop 13.5 12th Gen Intel | |
| HP Spectre x360 13.5 14t-ef000 | |
| Przeciętny Intel Core i7-1280P (1571 - 1802, n=7) | |
| Dynabook Portégé X30L-K-139 | |
| Dell Inspiron 13 7306-6TYH5 | |
| HP Elite Dragonfly G3 | |
| Asus Zenbook S 13 OLED | |
| Lenovo ThinkPad Z13 21D2CTO1WW | |
| Lenovo ThinkPad X1 Nano-20UN002UGE | |
| Lenovo ThinkPad X1 Titanium Yoga G1 20QB0016GE | |
| Lenovo Yoga Slim 7-14IIL05 | |
| HWBOT x265 Benchmark v2.2 / 4k Preset | |
| Asus Zenbook S 13 OLED | |
| Przeciętny Intel Core i7-1280P (9.62 - 14.5, n=5) | |
| Framework Laptop 13.5 12th Gen Intel | |
| HP Spectre x360 13.5 14t-ef000 | |
| Lenovo ThinkPad X1 Nano Gen 2 Core i7-1280P | |
| Lenovo Yoga 6 13ALC6 | |
| Lenovo ThinkPad Z13 21D2CTO1WW | |
| HP Elite Dragonfly G3 | |
| Dynabook Portégé X30L-K-139 | |
| Lenovo ThinkPad X1 Nano-20UN002UGE | |
| Dell Inspiron 13 7306-6TYH5 | |
| Lenovo Yoga Slim 7-14IIL05 | |
| Lenovo ThinkPad X1 Titanium Yoga G1 20QB0016GE | |
| LibreOffice / 20 Documents To PDF | |
| Lenovo Yoga 6 13ALC6 | |
| HP Elite Dragonfly G3 | |
| Lenovo ThinkPad Z13 21D2CTO1WW | |
| Lenovo Yoga Slim 7-14IIL05 | |
| Asus Zenbook S 13 OLED | |
| Lenovo ThinkPad X1 Nano-20UN002UGE | |
| Lenovo ThinkPad X1 Titanium Yoga G1 20QB0016GE | |
| Przeciętny Intel Core i7-1280P (41 - 61.6, n=8) | |
| Dynabook Portégé X30L-K-139 | |
| Dell Inspiron 13 7306-6TYH5 | |
| Lenovo ThinkPad X1 Nano Gen 2 Core i7-1280P | |
| HP Spectre x360 13.5 14t-ef000 | |
| Framework Laptop 13.5 12th Gen Intel | |
| R Benchmark 2.5 / Overall mean | |
| Lenovo ThinkPad X1 Titanium Yoga G1 20QB0016GE | |
| Lenovo Yoga Slim 7-14IIL05 | |
| Lenovo ThinkPad X1 Nano-20UN002UGE | |
| Lenovo Yoga 6 13ALC6 | |
| Dell Inspiron 13 7306-6TYH5 | |
| Lenovo ThinkPad Z13 21D2CTO1WW | |
| Dynabook Portégé X30L-K-139 | |
| HP Elite Dragonfly G3 | |
| Asus Zenbook S 13 OLED | |
| HP Spectre x360 13.5 14t-ef000 | |
| Przeciętny Intel Core i7-1280P (0.4505 - 0.512, n=7) | |
| Lenovo ThinkPad X1 Nano Gen 2 Core i7-1280P | |
| Framework Laptop 13.5 12th Gen Intel | |
Cinebench R23: Multi Core | Single Core
Cinebench R15: CPU Multi 64Bit | CPU Single 64Bit
Blender: v2.79 BMW27 CPU
7-Zip 18.03: 7z b 4 | 7z b 4 -mmt1
Geekbench 5.5: Multi-Core | Single-Core
HWBOT x265 Benchmark v2.2: 4k Preset
LibreOffice : 20 Documents To PDF
R Benchmark 2.5: Overall mean
* ... im mniej tym lepiej
AIDA64: FP32 Ray-Trace | FPU Julia | CPU SHA3 | CPU Queen | FPU SinJulia | FPU Mandel | CPU AES | CPU ZLib | FP64 Ray-Trace | CPU PhotoWorxx
| Performance rating | |
| Przeciętny Intel Core i7-1280P | |
| Lenovo ThinkPad X1 Nano Gen 2 Core i7-1280P | |
| Framework Laptop 13.5 12th Gen Intel | |
| Lenovo ThinkPad X1 Nano-20UN002UGE | |
| Dell Latitude 13 7330 | |
| HP Elite Dragonfly G3 | |
| Huawei MateBook X Pro 2021 | |
| AIDA64 / FP32 Ray-Trace | |
| Przeciętny Intel Core i7-1280P (7466 - 13068, n=6) | |
| Lenovo ThinkPad X1 Nano Gen 2 Core i7-1280P | |
| Lenovo ThinkPad X1 Nano-20UN002UGE | |
| Dell Latitude 13 7330 | |
| HP Elite Dragonfly G3 | |
| Framework Laptop 13.5 12th Gen Intel | |
| Huawei MateBook X Pro 2021 | |
| AIDA64 / FPU Julia | |
| Przeciętny Intel Core i7-1280P (38904 - 66081, n=6) | |
| Lenovo ThinkPad X1 Nano Gen 2 Core i7-1280P | |
| Dell Latitude 13 7330 | |
| HP Elite Dragonfly G3 | |
| Lenovo ThinkPad X1 Nano-20UN002UGE | |
| Framework Laptop 13.5 12th Gen Intel | |
| Huawei MateBook X Pro 2021 | |
| AIDA64 / CPU SHA3 | |
| Przeciętny Intel Core i7-1280P (1826 - 2992, n=6) | |
| Dell Latitude 13 7330 | |
| Lenovo ThinkPad X1 Nano-20UN002UGE | |
| Framework Laptop 13.5 12th Gen Intel | |
| Lenovo ThinkPad X1 Nano Gen 2 Core i7-1280P | |
| HP Elite Dragonfly G3 | |
| Huawei MateBook X Pro 2021 | |
| AIDA64 / CPU Queen | |
| Lenovo ThinkPad X1 Nano Gen 2 Core i7-1280P | |
| Przeciętny Intel Core i7-1280P (80180 - 100358, n=6) | |
| Framework Laptop 13.5 12th Gen Intel | |
| Dell Latitude 13 7330 | |
| HP Elite Dragonfly G3 | |
| Huawei MateBook X Pro 2021 | |
| Lenovo ThinkPad X1 Nano-20UN002UGE | |
| AIDA64 / FPU SinJulia | |
| Przeciętny Intel Core i7-1280P (5880 - 8571, n=6) | |
| Framework Laptop 13.5 12th Gen Intel | |
| Lenovo ThinkPad X1 Nano Gen 2 Core i7-1280P | |
| Dell Latitude 13 7330 | |
| HP Elite Dragonfly G3 | |
| Lenovo ThinkPad X1 Nano-20UN002UGE | |
| Huawei MateBook X Pro 2021 | |
| AIDA64 / FPU Mandel | |
| Przeciętny Intel Core i7-1280P (18907 - 32766, n=6) | |
| Lenovo ThinkPad X1 Nano Gen 2 Core i7-1280P | |
| Lenovo ThinkPad X1 Nano-20UN002UGE | |
| Dell Latitude 13 7330 | |
| HP Elite Dragonfly G3 | |
| Framework Laptop 13.5 12th Gen Intel | |
| Huawei MateBook X Pro 2021 | |
| AIDA64 / CPU AES | |
| Lenovo ThinkPad X1 Nano-20UN002UGE | |
| Framework Laptop 13.5 12th Gen Intel | |
| Przeciętny Intel Core i7-1280P (40691 - 99367, n=6) | |
| Huawei MateBook X Pro 2021 | |
| Lenovo ThinkPad X1 Nano Gen 2 Core i7-1280P | |
| Dell Latitude 13 7330 | |
| HP Elite Dragonfly G3 | |
| AIDA64 / CPU ZLib | |
| Przeciętny Intel Core i7-1280P (540 - 880, n=6) | |
| Framework Laptop 13.5 12th Gen Intel | |
| Dell Latitude 13 7330 | |
| Lenovo ThinkPad X1 Nano Gen 2 Core i7-1280P | |
| HP Elite Dragonfly G3 | |
| Lenovo ThinkPad X1 Nano-20UN002UGE | |
| Huawei MateBook X Pro 2021 | |
| AIDA64 / FP64 Ray-Trace | |
| Przeciętny Intel Core i7-1280P (4006 - 7184, n=6) | |
| Lenovo ThinkPad X1 Nano Gen 2 Core i7-1280P | |
| Lenovo ThinkPad X1 Nano-20UN002UGE | |
| Dell Latitude 13 7330 | |
| HP Elite Dragonfly G3 | |
| Framework Laptop 13.5 12th Gen Intel | |
| Huawei MateBook X Pro 2021 | |
| AIDA64 / CPU PhotoWorxx | |
| Przeciętny Intel Core i7-1280P (36663 - 48416, n=6) | |
| Huawei MateBook X Pro 2021 | |
| Lenovo ThinkPad X1 Nano Gen 2 Core i7-1280P | |
| HP Elite Dragonfly G3 | |
| Lenovo ThinkPad X1 Nano-20UN002UGE | |
| Framework Laptop 13.5 12th Gen Intel | |
| Dell Latitude 13 7330 | |
Wydajność systemu
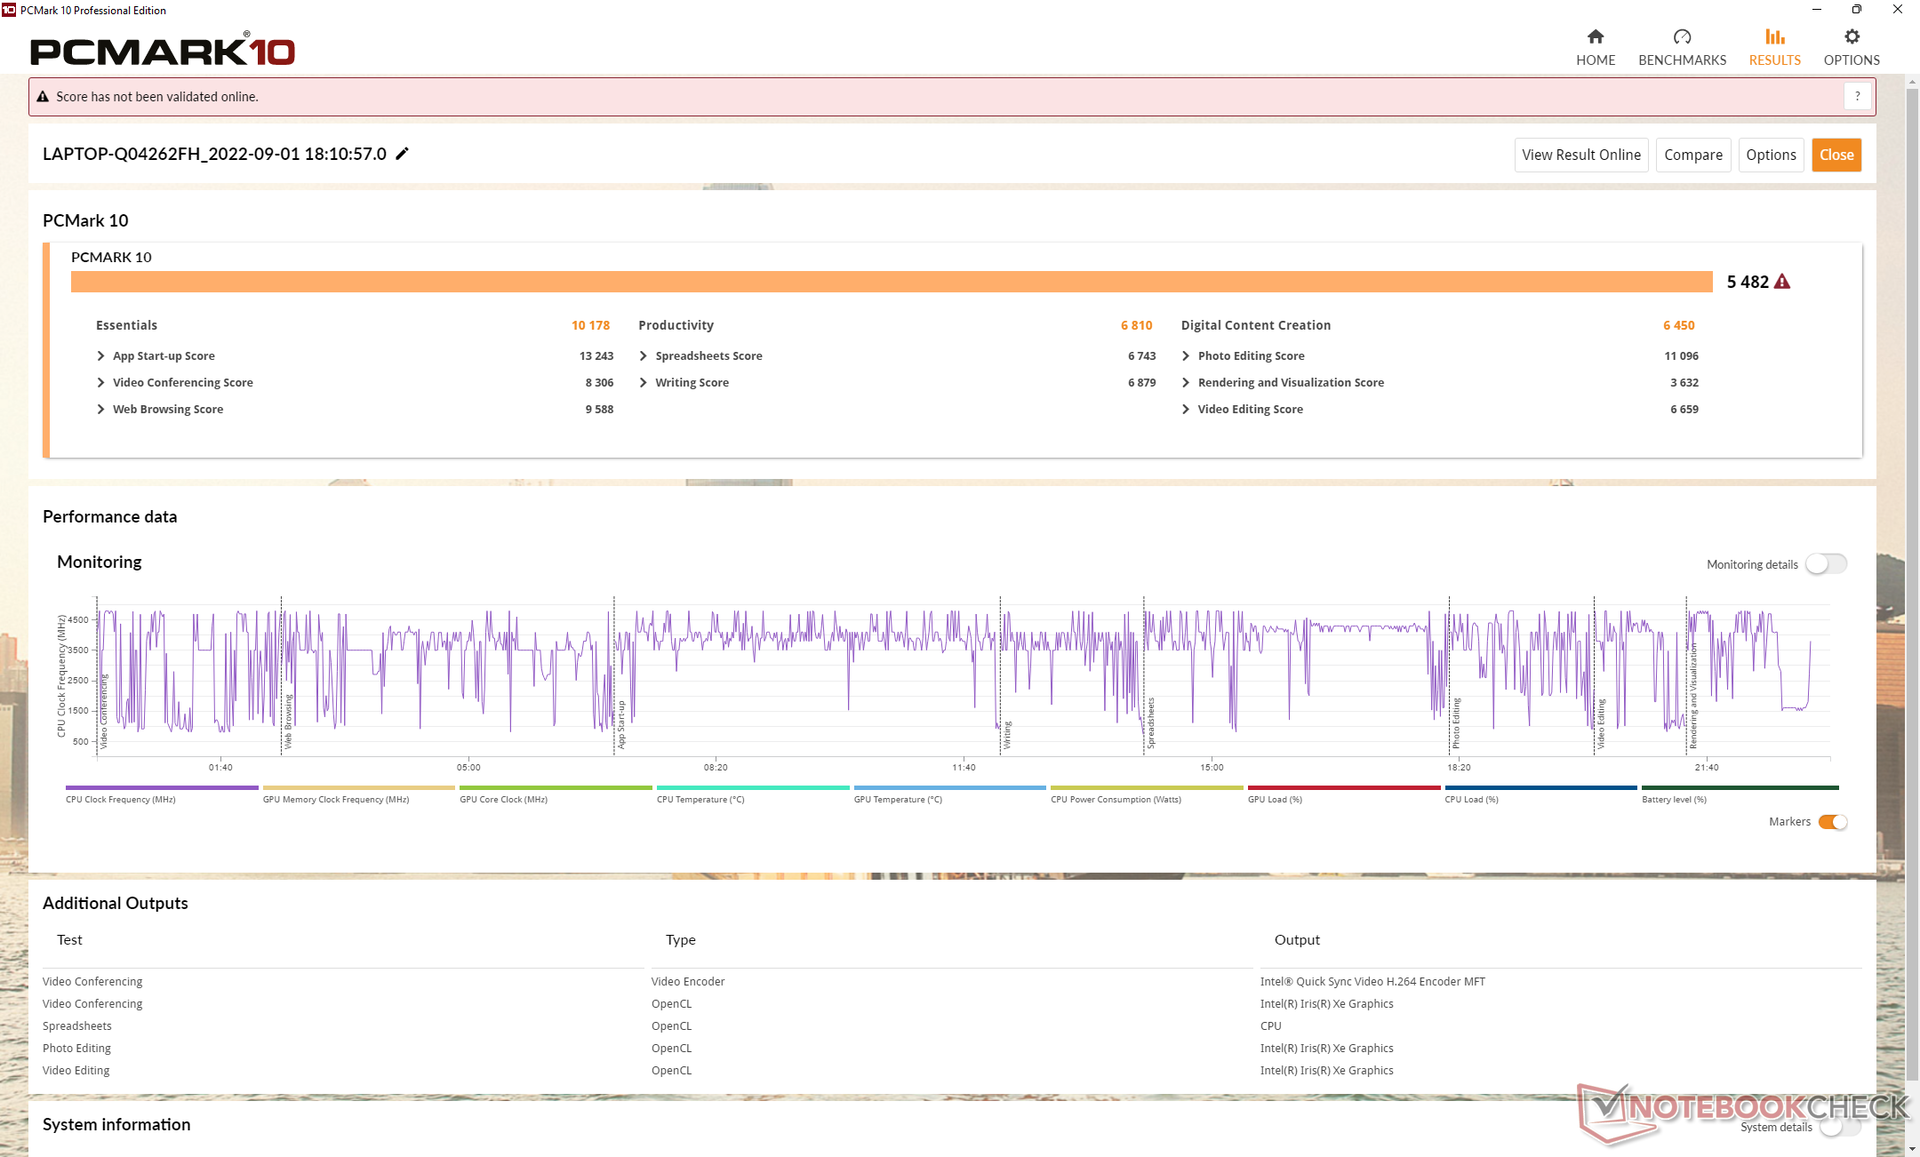
Wyniki PCMark 10 są konsekwentnie wyższe od modelu Gen 1 i większości innych laptopów 13-calowych ze względu na procesor z serii Core P. Różnica jest największa w podteście Digital Content Creation.
CrossMark: Overall | Productivity | Creativity | Responsiveness
| PCMark 10 / Score | |
| Framework Laptop 13.5 12th Gen Intel | |
| Przeciętny Intel Core i7-1280P, Intel Iris Xe Graphics G7 96EUs (5410 - 5994, n=4) | |
| Lenovo ThinkPad X1 Nano Gen 2 Core i7-1280P | |
| Dell Latitude 13 7330 | |
| Huawei MateBook X Pro 2021 | |
| HP Elite Dragonfly G3 | |
| Lenovo ThinkPad X1 Nano-20UN002UGE | |
| PCMark 10 / Essentials | |
| Framework Laptop 13.5 12th Gen Intel | |
| Dell Latitude 13 7330 | |
| Przeciętny Intel Core i7-1280P, Intel Iris Xe Graphics G7 96EUs (9719 - 10920, n=4) | |
| Huawei MateBook X Pro 2021 | |
| Lenovo ThinkPad X1 Nano Gen 2 Core i7-1280P | |
| Lenovo ThinkPad X1 Nano-20UN002UGE | |
| HP Elite Dragonfly G3 | |
| PCMark 10 / Productivity | |
| Framework Laptop 13.5 12th Gen Intel | |
| Dell Latitude 13 7330 | |
| Przeciętny Intel Core i7-1280P, Intel Iris Xe Graphics G7 96EUs (6301 - 7453, n=4) | |
| Lenovo ThinkPad X1 Nano Gen 2 Core i7-1280P | |
| Huawei MateBook X Pro 2021 | |
| Lenovo ThinkPad X1 Nano-20UN002UGE | |
| HP Elite Dragonfly G3 | |
| PCMark 10 / Digital Content Creation | |
| Przeciętny Intel Core i7-1280P, Intel Iris Xe Graphics G7 96EUs (6450 - 7180, n=4) | |
| Framework Laptop 13.5 12th Gen Intel | |
| Lenovo ThinkPad X1 Nano Gen 2 Core i7-1280P | |
| HP Elite Dragonfly G3 | |
| Dell Latitude 13 7330 | |
| Huawei MateBook X Pro 2021 | |
| Lenovo ThinkPad X1 Nano-20UN002UGE | |
| CrossMark / Overall | |
| Przeciętny Intel Core i7-1280P, Intel Iris Xe Graphics G7 96EUs (1677 - 1773, n=4) | |
| Lenovo ThinkPad X1 Nano Gen 2 Core i7-1280P | |
| Framework Laptop 13.5 12th Gen Intel | |
| Dell Latitude 13 7330 | |
| HP Elite Dragonfly G3 | |
| CrossMark / Productivity | |
| Przeciętny Intel Core i7-1280P, Intel Iris Xe Graphics G7 96EUs (1585 - 1709, n=4) | |
| Framework Laptop 13.5 12th Gen Intel | |
| Lenovo ThinkPad X1 Nano Gen 2 Core i7-1280P | |
| Dell Latitude 13 7330 | |
| HP Elite Dragonfly G3 | |
| CrossMark / Creativity | |
| Lenovo ThinkPad X1 Nano Gen 2 Core i7-1280P | |
| Przeciętny Intel Core i7-1280P, Intel Iris Xe Graphics G7 96EUs (1849 - 1928, n=4) | |
| Framework Laptop 13.5 12th Gen Intel | |
| HP Elite Dragonfly G3 | |
| Dell Latitude 13 7330 | |
| CrossMark / Responsiveness | |
| Przeciętny Intel Core i7-1280P, Intel Iris Xe Graphics G7 96EUs (1394 - 1746, n=4) | |
| Framework Laptop 13.5 12th Gen Intel | |
| Lenovo ThinkPad X1 Nano Gen 2 Core i7-1280P | |
| Dell Latitude 13 7330 | |
| HP Elite Dragonfly G3 | |
| PCMark 10 Score | 5482 pkt. | |
Pomoc | ||
| AIDA64 / Memory Copy | |
| Lenovo ThinkPad X1 Nano Gen 2 Core i7-1280P | |
| Przeciętny Intel Core i7-1280P (56337 - 73486, n=6) | |
| HP Elite Dragonfly G3 | |
| Huawei MateBook X Pro 2021 | |
| Lenovo ThinkPad X1 Nano-20UN002UGE | |
| Framework Laptop 13.5 12th Gen Intel | |
| Dell Latitude 13 7330 | |
| AIDA64 / Memory Read | |
| Lenovo ThinkPad X1 Nano Gen 2 Core i7-1280P | |
| Przeciętny Intel Core i7-1280P (63221 - 73719, n=6) | |
| Huawei MateBook X Pro 2021 | |
| HP Elite Dragonfly G3 | |
| Lenovo ThinkPad X1 Nano-20UN002UGE | |
| Framework Laptop 13.5 12th Gen Intel | |
| Dell Latitude 13 7330 | |
| AIDA64 / Memory Write | |
| Huawei MateBook X Pro 2021 | |
| Lenovo ThinkPad X1 Nano Gen 2 Core i7-1280P | |
| Przeciętny Intel Core i7-1280P (58729 - 68247, n=6) | |
| HP Elite Dragonfly G3 | |
| Lenovo ThinkPad X1 Nano-20UN002UGE | |
| Framework Laptop 13.5 12th Gen Intel | |
| Dell Latitude 13 7330 | |
| AIDA64 / Memory Latency | |
| Przeciętny Intel Core i7-1280P (93.1 - 153.3, n=6) | |
| HP Elite Dragonfly G3 | |
| Lenovo ThinkPad X1 Nano-20UN002UGE | |
| Lenovo ThinkPad X1 Nano Gen 2 Core i7-1280P | |
| Huawei MateBook X Pro 2021 | |
| Framework Laptop 13.5 12th Gen Intel | |
| Dell Latitude 13 7330 | |
* ... im mniej tym lepiej
Opóźnienie DPC
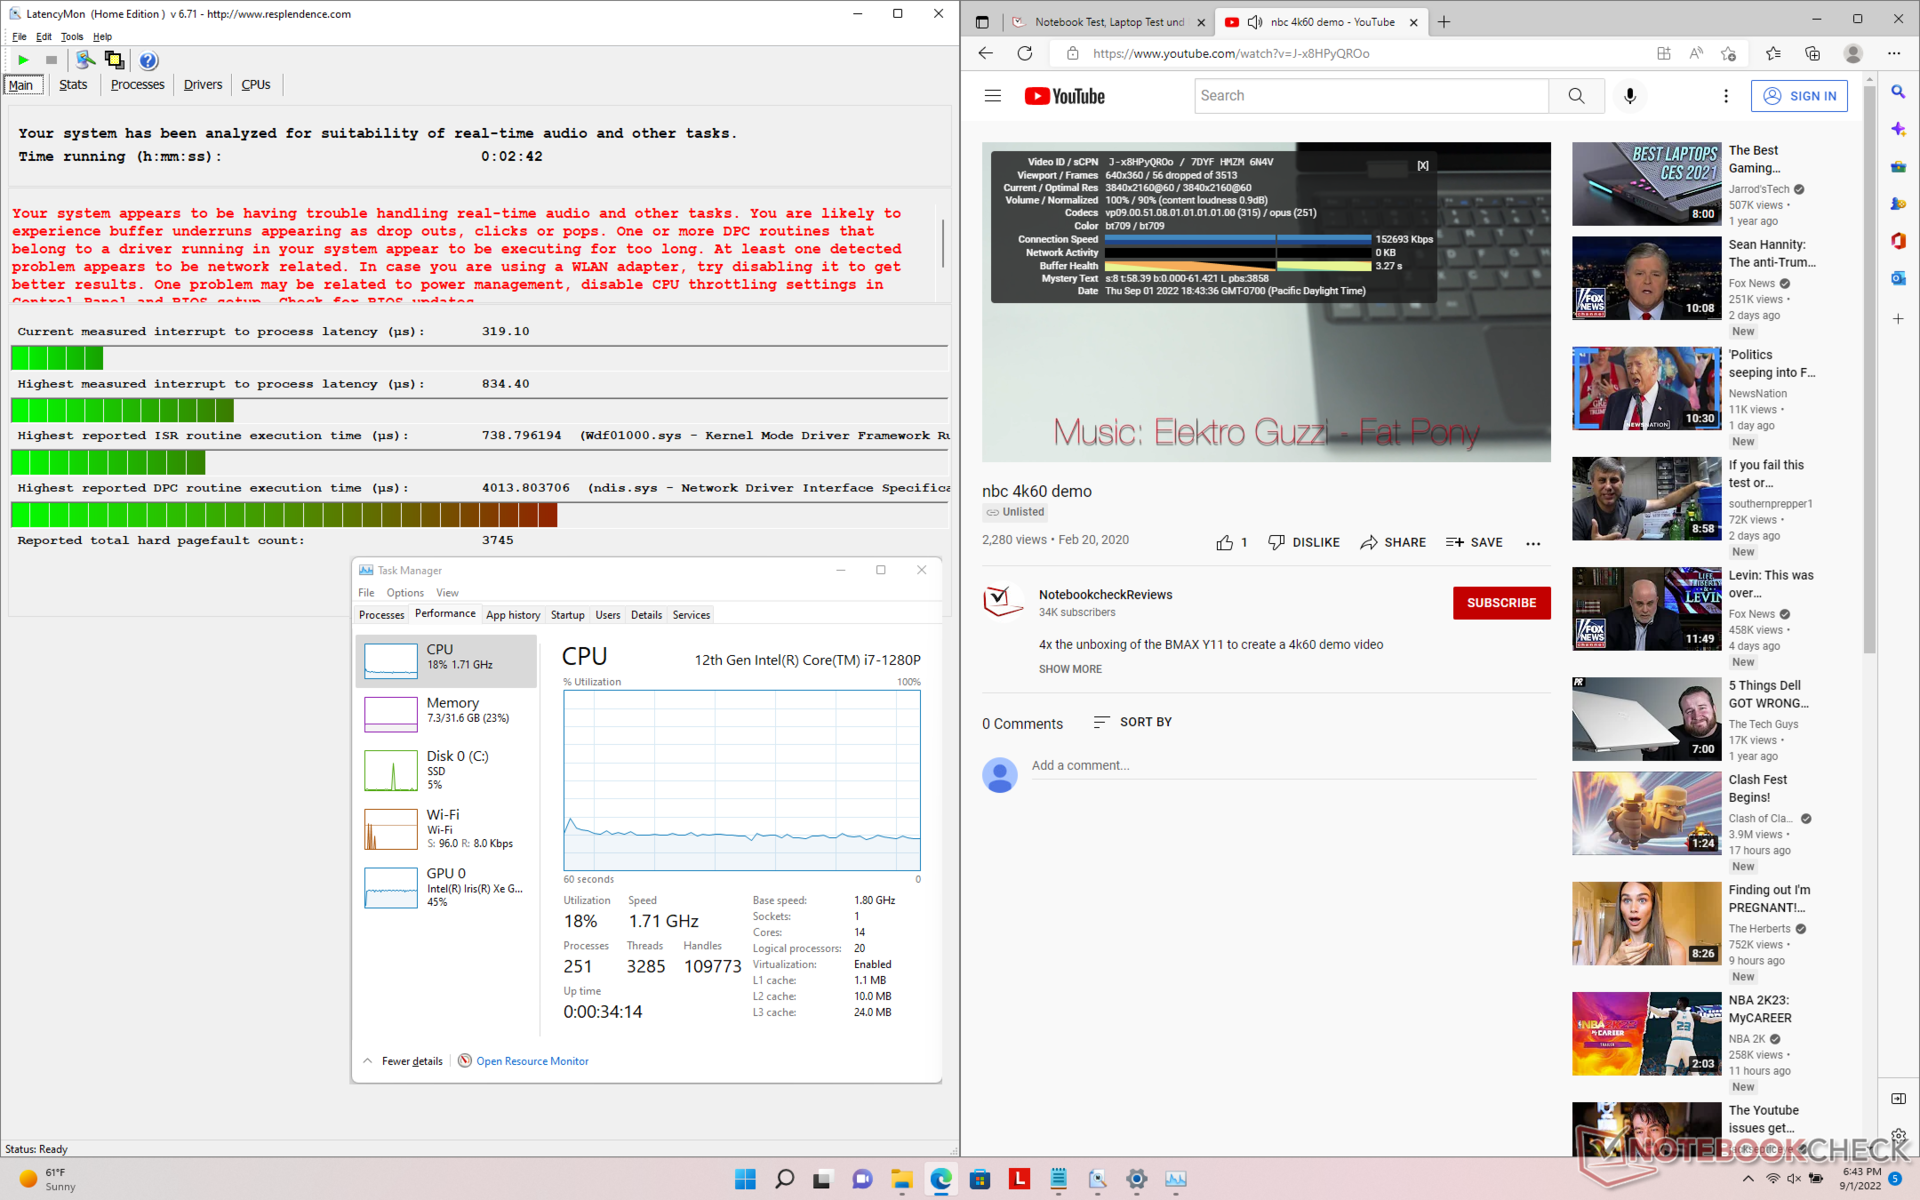
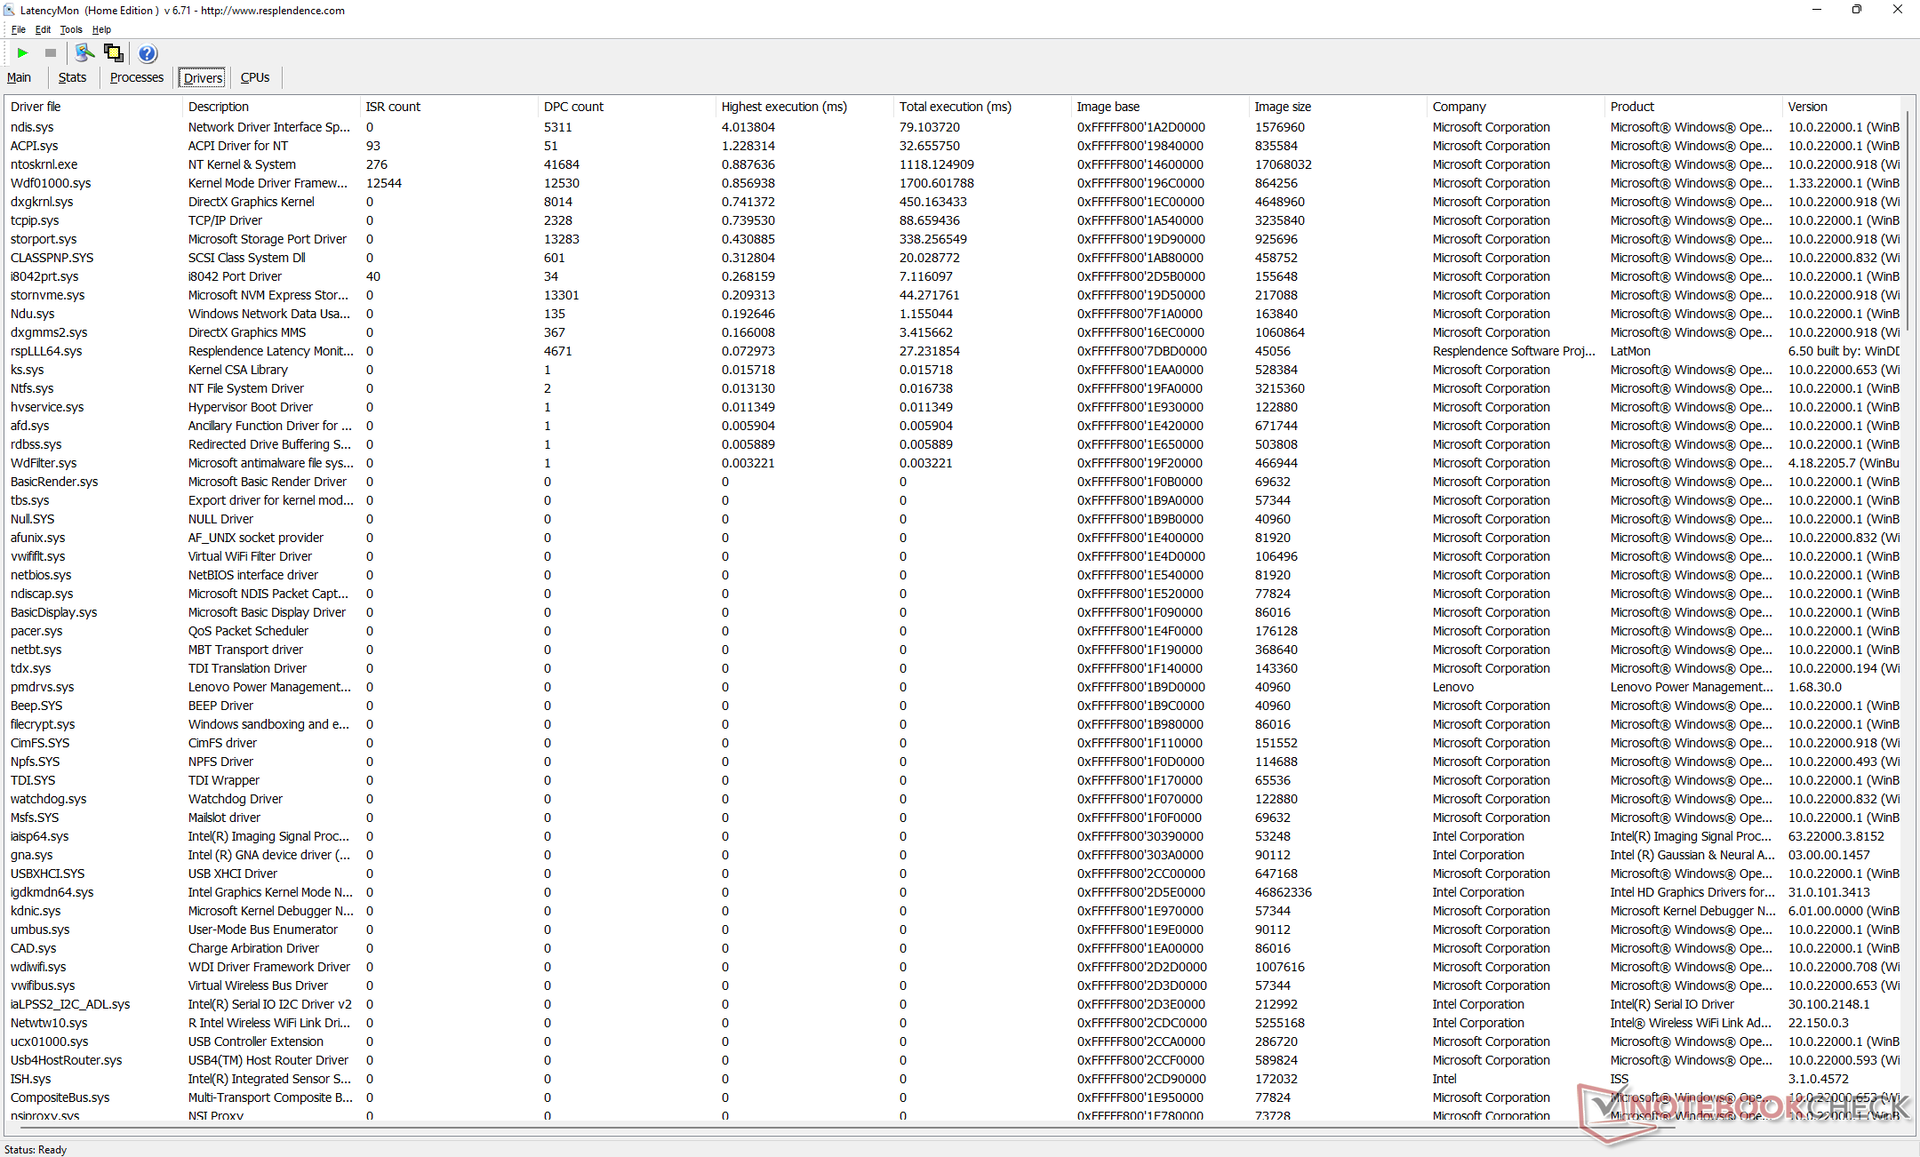
LatencyMon ujawnia problemy z DPC podczas otwierania wielu kart przeglądarki na naszej stronie głównej. odtwarzanie wideo w rozdzielczości 4K przy 60 FPS mogło być lepsze, ponieważ podczas naszego minutowego testu wideo odnotowaliśmy 56 opuszczonych klatek, nawet przy użyciu najnowszych sterowników graficznych w dniu publikacji.
| DPC Latencies / LatencyMon - interrupt to process latency (max), Web, Youtube, Prime95 | |
| Lenovo ThinkPad X1 Nano-20UN002UGE | |
| Huawei MateBook X Pro 2021 | |
| Framework Laptop 13.5 12th Gen Intel | |
| Lenovo ThinkPad X1 Nano Gen 2 Core i7-1280P | |
| Dell Latitude 13 7330 | |
| HP Elite Dragonfly G3 | |
* ... im mniej tym lepiej
Urządzenia do przechowywania danych
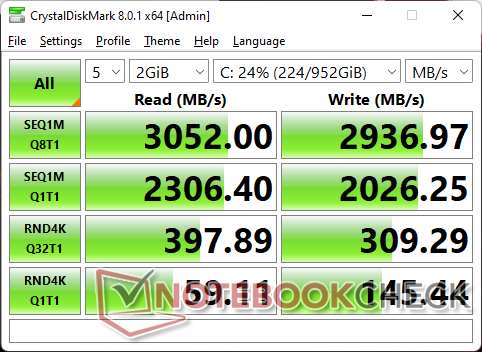
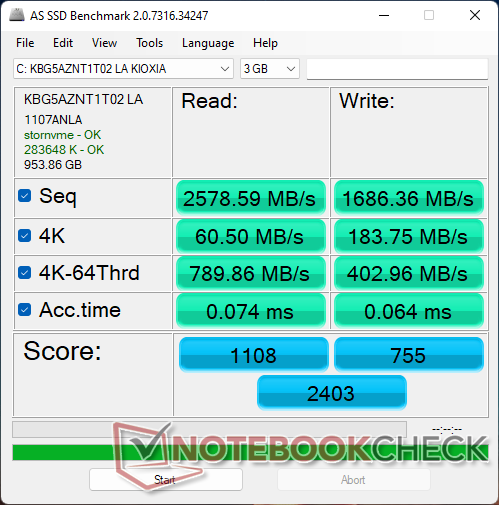
Nasz testowy egzemplarz wyposażony jest w Kioxia KBG5AZNT1T02 PCIe3 NVMe SSD zapewniający maksymalny trwały odczyt do 2700 MB/s. Rozczarowujący jest brak opcji PCIe4 w kasie, biorąc pod uwagę wysoką cenę ThinkPad X1 Nano, ale przynajmniej model ten jest wyposażony w miedzianą płytkę nad dyskiem SSD, aby pomóc w rozpraszaniu ciepła
Należy pamiętać, że dyski M.2 o pełnej długości 2280 nie są obsługiwane.

| Drive Performance rating - Percent | |
| Huawei MateBook X Pro 2021 | |
| HP Elite Dragonfly G3 | |
| Lenovo ThinkPad X1 Nano-20UN002UGE | |
| Framework Laptop 13.5 12th Gen Intel | |
| Lenovo ThinkPad X1 Nano Gen 2 Core i7-1280P | |
| Dell Latitude 13 7330 | |
| DiskSpd | |
| seq read | |
| Lenovo ThinkPad X1 Nano Gen 2 Core i7-1280P | |
| Huawei MateBook X Pro 2021 | |
| Lenovo ThinkPad X1 Nano-20UN002UGE | |
| HP Elite Dragonfly G3 | |
| Dell Latitude 13 7330 | |
| Framework Laptop 13.5 12th Gen Intel | |
| seq write | |
| HP Elite Dragonfly G3 | |
| Huawei MateBook X Pro 2021 | |
| Framework Laptop 13.5 12th Gen Intel | |
| Lenovo ThinkPad X1 Nano Gen 2 Core i7-1280P | |
| Lenovo ThinkPad X1 Nano-20UN002UGE | |
| Dell Latitude 13 7330 | |
| seq q8 t1 read | |
| HP Elite Dragonfly G3 | |
| Huawei MateBook X Pro 2021 | |
| Framework Laptop 13.5 12th Gen Intel | |
| Lenovo ThinkPad X1 Nano Gen 2 Core i7-1280P | |
| Lenovo ThinkPad X1 Nano-20UN002UGE | |
| Dell Latitude 13 7330 | |
| seq q8 t1 write | |
| HP Elite Dragonfly G3 | |
| Huawei MateBook X Pro 2021 | |
| Lenovo ThinkPad X1 Nano Gen 2 Core i7-1280P | |
| Framework Laptop 13.5 12th Gen Intel | |
| Lenovo ThinkPad X1 Nano-20UN002UGE | |
| Dell Latitude 13 7330 | |
| 4k q1 t1 read | |
| Lenovo ThinkPad X1 Nano Gen 2 Core i7-1280P | |
| HP Elite Dragonfly G3 | |
| Huawei MateBook X Pro 2021 | |
| Dell Latitude 13 7330 | |
| Framework Laptop 13.5 12th Gen Intel | |
| Lenovo ThinkPad X1 Nano-20UN002UGE | |
| 4k q1 t1 write | |
| Lenovo ThinkPad X1 Nano-20UN002UGE | |
| Huawei MateBook X Pro 2021 | |
| Framework Laptop 13.5 12th Gen Intel | |
| Lenovo ThinkPad X1 Nano Gen 2 Core i7-1280P | |
| Dell Latitude 13 7330 | |
| HP Elite Dragonfly G3 | |
| 4k q32 t16 read | |
| Huawei MateBook X Pro 2021 | |
| Lenovo ThinkPad X1 Nano-20UN002UGE | |
| Framework Laptop 13.5 12th Gen Intel | |
| Lenovo ThinkPad X1 Nano Gen 2 Core i7-1280P | |
| HP Elite Dragonfly G3 | |
| Dell Latitude 13 7330 | |
| 4k q32 t16 write | |
| Huawei MateBook X Pro 2021 | |
| Lenovo ThinkPad X1 Nano-20UN002UGE | |
| Framework Laptop 13.5 12th Gen Intel | |
| Dell Latitude 13 7330 | |
| Lenovo ThinkPad X1 Nano Gen 2 Core i7-1280P | |
| HP Elite Dragonfly G3 | |
| AS SSD | |
| Score Total | |
| Huawei MateBook X Pro 2021 | |
| HP Elite Dragonfly G3 | |
| Lenovo ThinkPad X1 Nano-20UN002UGE | |
| Framework Laptop 13.5 12th Gen Intel | |
| Lenovo ThinkPad X1 Nano Gen 2 Core i7-1280P | |
| Dell Latitude 13 7330 | |
| Score Read | |
| Huawei MateBook X Pro 2021 | |
| Framework Laptop 13.5 12th Gen Intel | |
| HP Elite Dragonfly G3 | |
| Lenovo ThinkPad X1 Nano-20UN002UGE | |
| Lenovo ThinkPad X1 Nano Gen 2 Core i7-1280P | |
| Dell Latitude 13 7330 | |
| Score Write | |
| Huawei MateBook X Pro 2021 | |
| HP Elite Dragonfly G3 | |
| Lenovo ThinkPad X1 Nano-20UN002UGE | |
| Framework Laptop 13.5 12th Gen Intel | |
| Lenovo ThinkPad X1 Nano Gen 2 Core i7-1280P | |
| Dell Latitude 13 7330 | |
| Seq Read | |
| HP Elite Dragonfly G3 | |
| Framework Laptop 13.5 12th Gen Intel | |
| Huawei MateBook X Pro 2021 | |
| Lenovo ThinkPad X1 Nano Gen 2 Core i7-1280P | |
| Lenovo ThinkPad X1 Nano-20UN002UGE | |
| Dell Latitude 13 7330 | |
| Seq Write | |
| Huawei MateBook X Pro 2021 | |
| HP Elite Dragonfly G3 | |
| Lenovo ThinkPad X1 Nano-20UN002UGE | |
| Lenovo ThinkPad X1 Nano Gen 2 Core i7-1280P | |
| Framework Laptop 13.5 12th Gen Intel | |
| Dell Latitude 13 7330 | |
| 4K Read | |
| Huawei MateBook X Pro 2021 | |
| Lenovo ThinkPad X1 Nano Gen 2 Core i7-1280P | |
| HP Elite Dragonfly G3 | |
| Framework Laptop 13.5 12th Gen Intel | |
| Lenovo ThinkPad X1 Nano-20UN002UGE | |
| Dell Latitude 13 7330 | |
| 4K Write | |
| Lenovo ThinkPad X1 Nano-20UN002UGE | |
| Framework Laptop 13.5 12th Gen Intel | |
| Lenovo ThinkPad X1 Nano Gen 2 Core i7-1280P | |
| Huawei MateBook X Pro 2021 | |
| HP Elite Dragonfly G3 | |
| Dell Latitude 13 7330 | |
| 4K-64 Read | |
| Huawei MateBook X Pro 2021 | |
| Framework Laptop 13.5 12th Gen Intel | |
| Lenovo ThinkPad X1 Nano-20UN002UGE | |
| Lenovo ThinkPad X1 Nano Gen 2 Core i7-1280P | |
| HP Elite Dragonfly G3 | |
| Dell Latitude 13 7330 | |
| 4K-64 Write | |
| Huawei MateBook X Pro 2021 | |
| HP Elite Dragonfly G3 | |
| Lenovo ThinkPad X1 Nano-20UN002UGE | |
| Framework Laptop 13.5 12th Gen Intel | |
| Lenovo ThinkPad X1 Nano Gen 2 Core i7-1280P | |
| Dell Latitude 13 7330 | |
| Access Time Read | |
| Framework Laptop 13.5 12th Gen Intel | |
| Dell Latitude 13 7330 | |
| Lenovo ThinkPad X1 Nano Gen 2 Core i7-1280P | |
| Lenovo ThinkPad X1 Nano-20UN002UGE | |
| HP Elite Dragonfly G3 | |
| Huawei MateBook X Pro 2021 | |
| Access Time Write | |
| Dell Latitude 13 7330 | |
| HP Elite Dragonfly G3 | |
| Huawei MateBook X Pro 2021 | |
| Lenovo ThinkPad X1 Nano-20UN002UGE | |
| Lenovo ThinkPad X1 Nano Gen 2 Core i7-1280P | |
| Framework Laptop 13.5 12th Gen Intel | |
* ... im mniej tym lepiej
Disk Throttling: DiskSpd Read Loop, Queue Depth 8
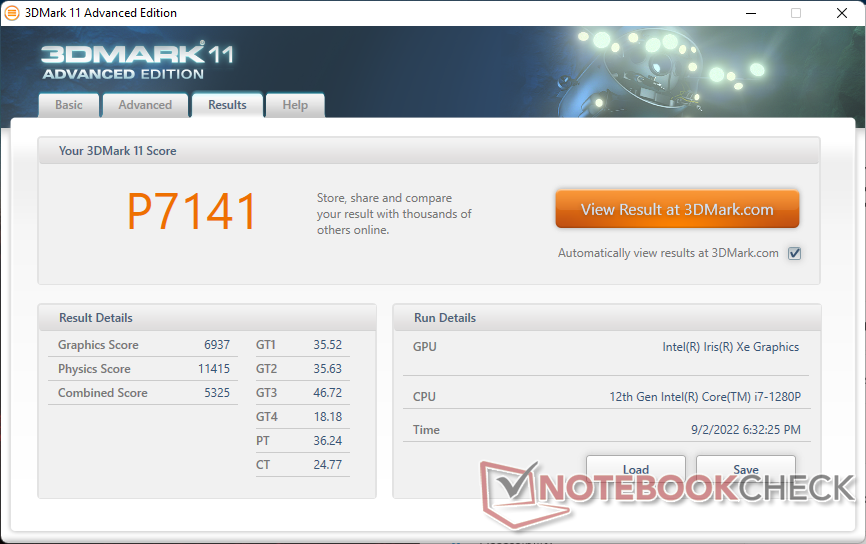
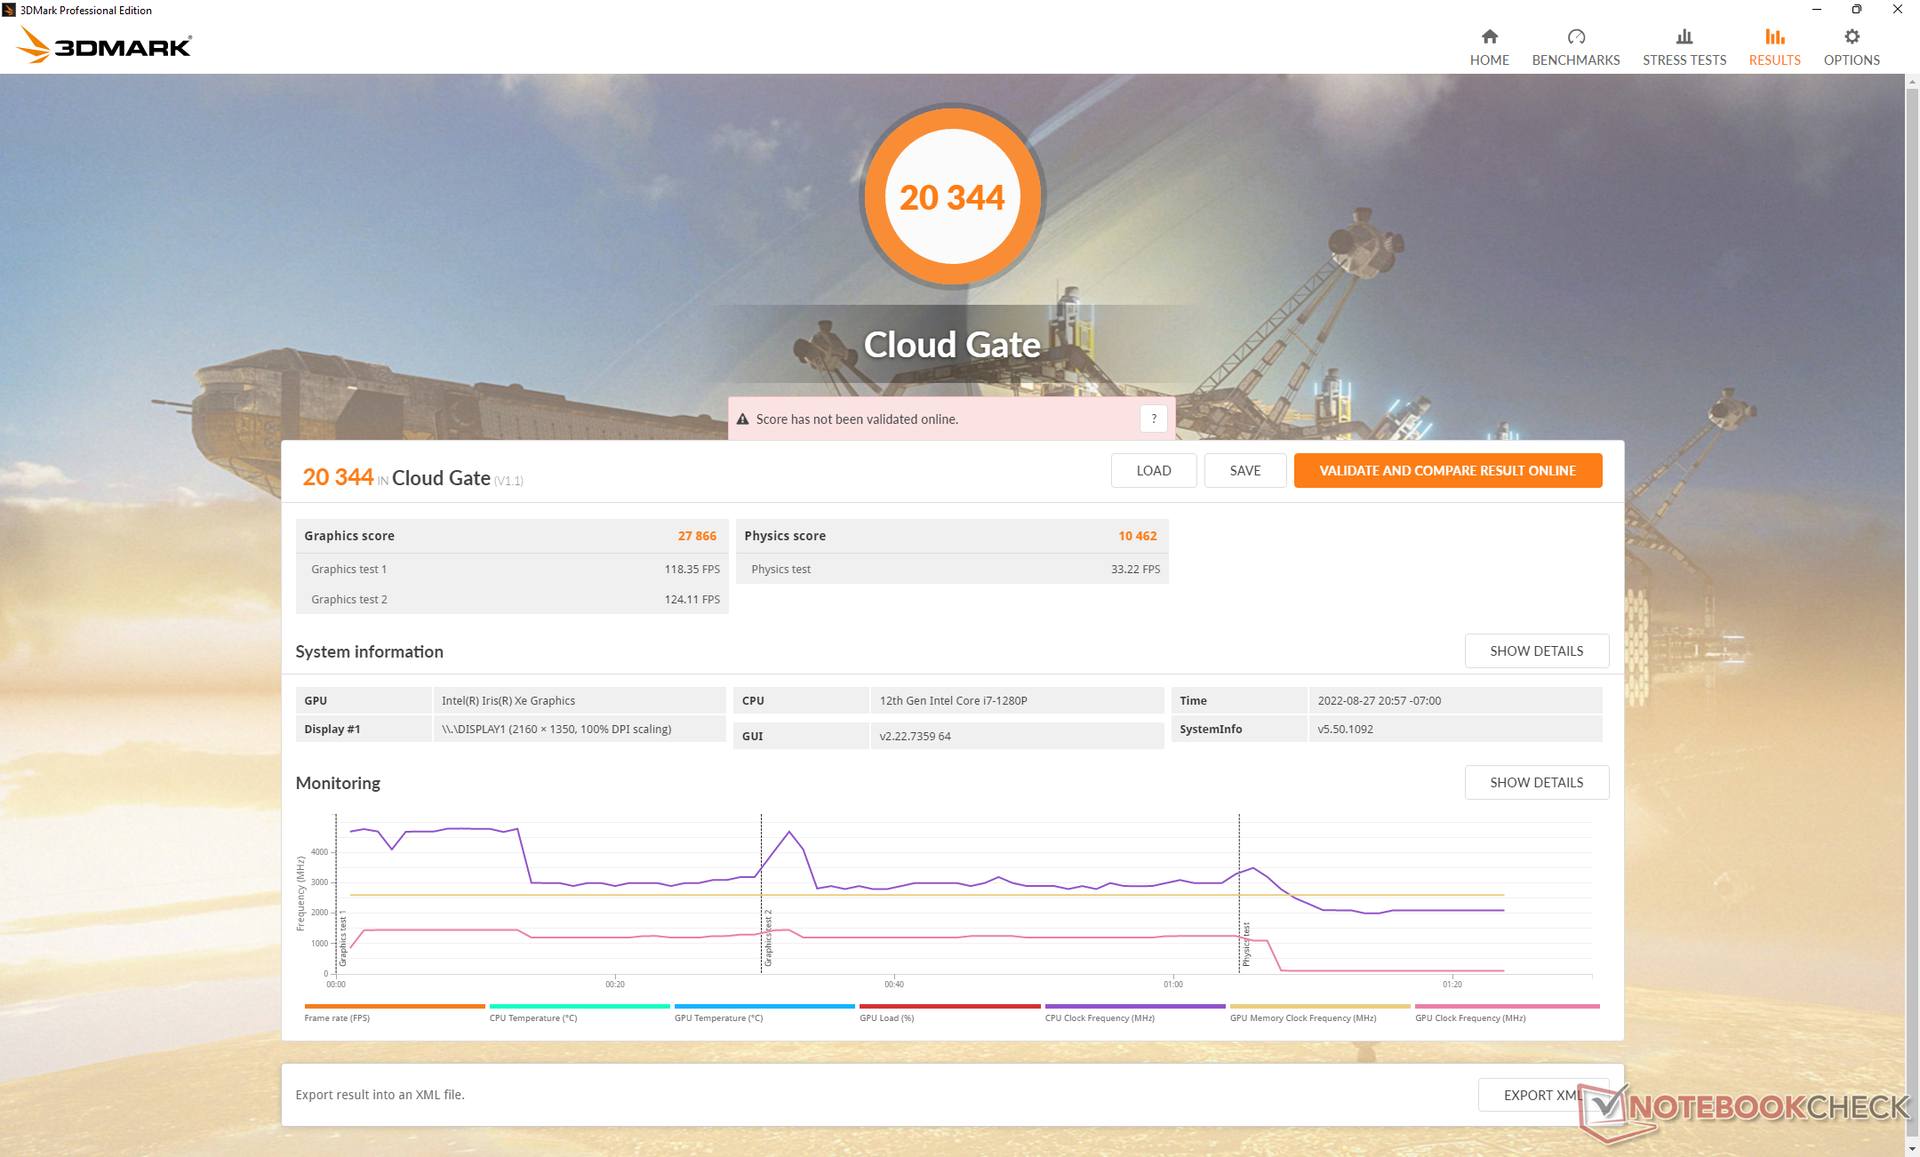
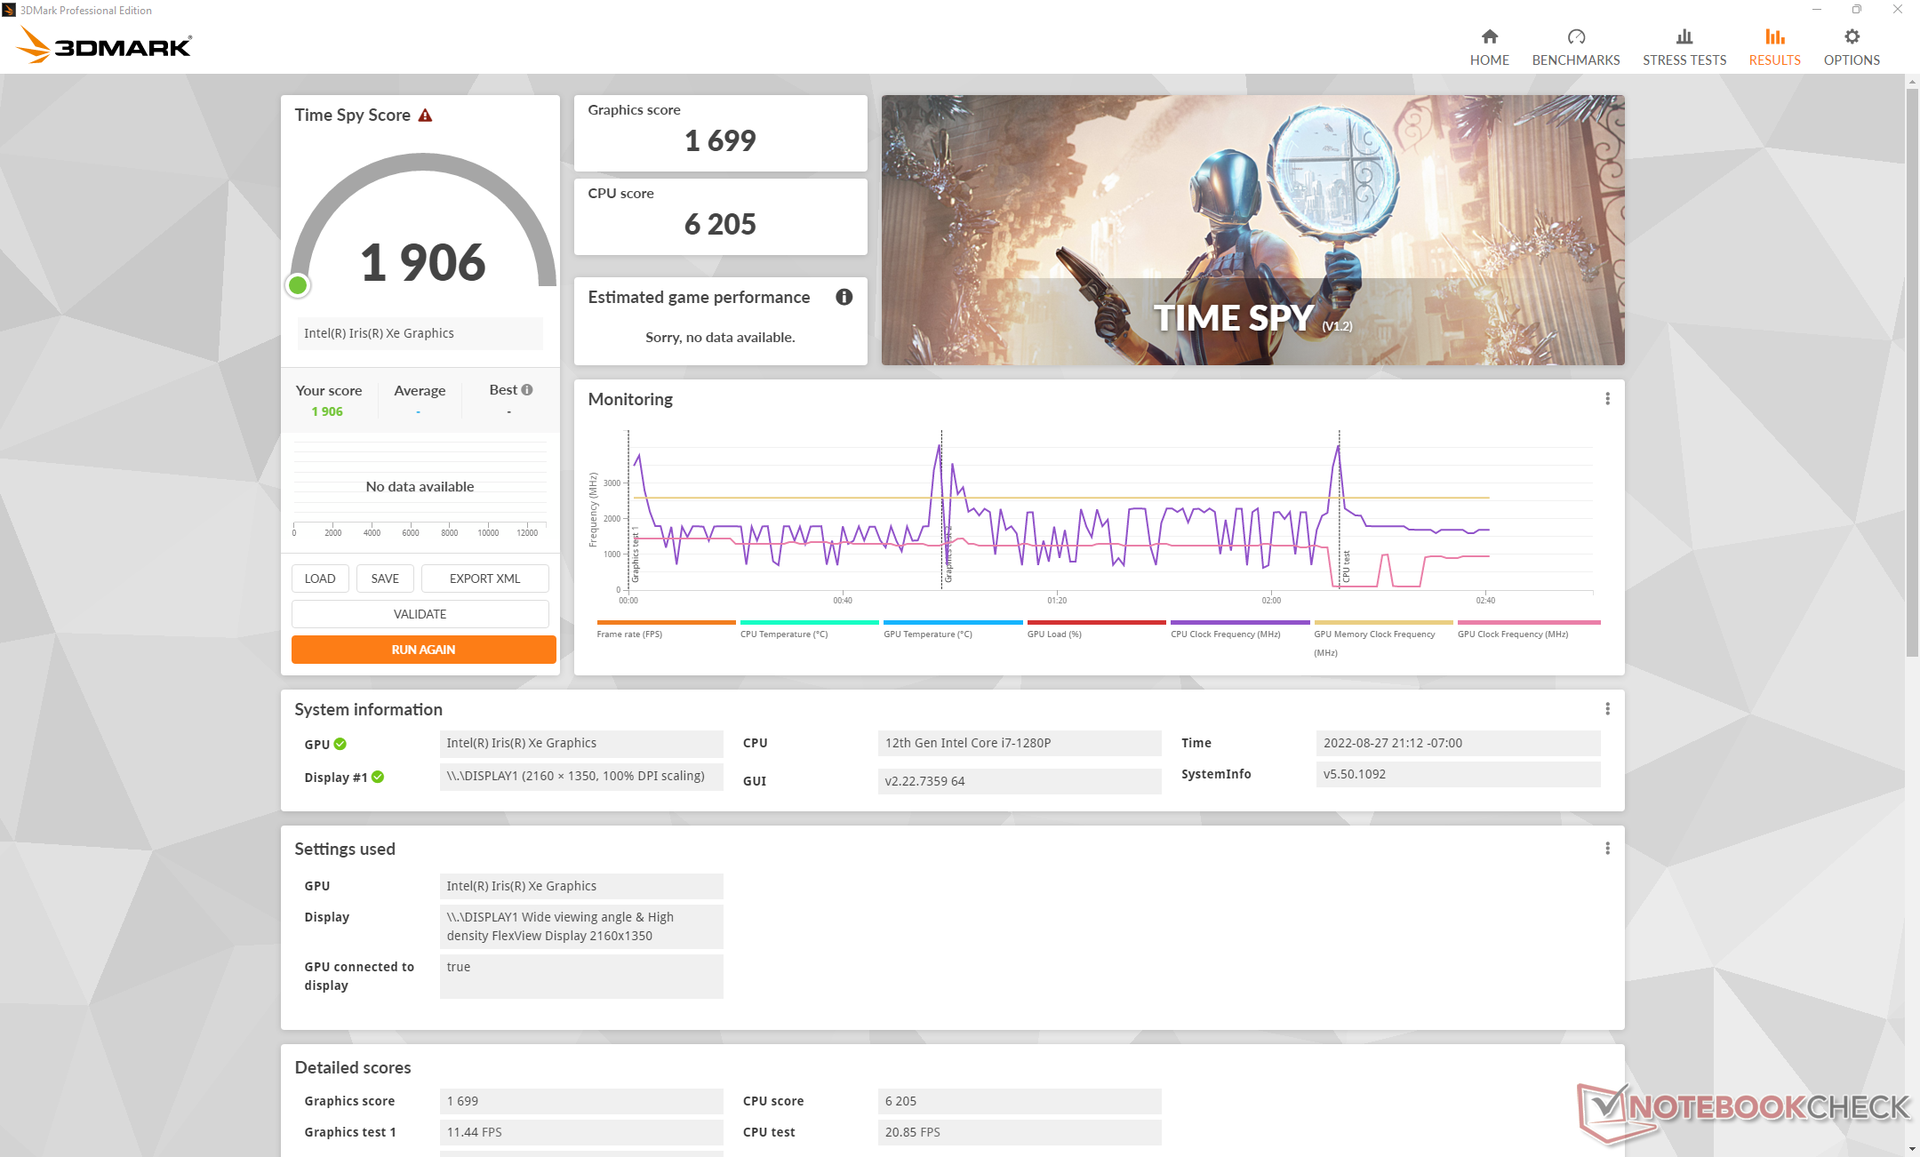
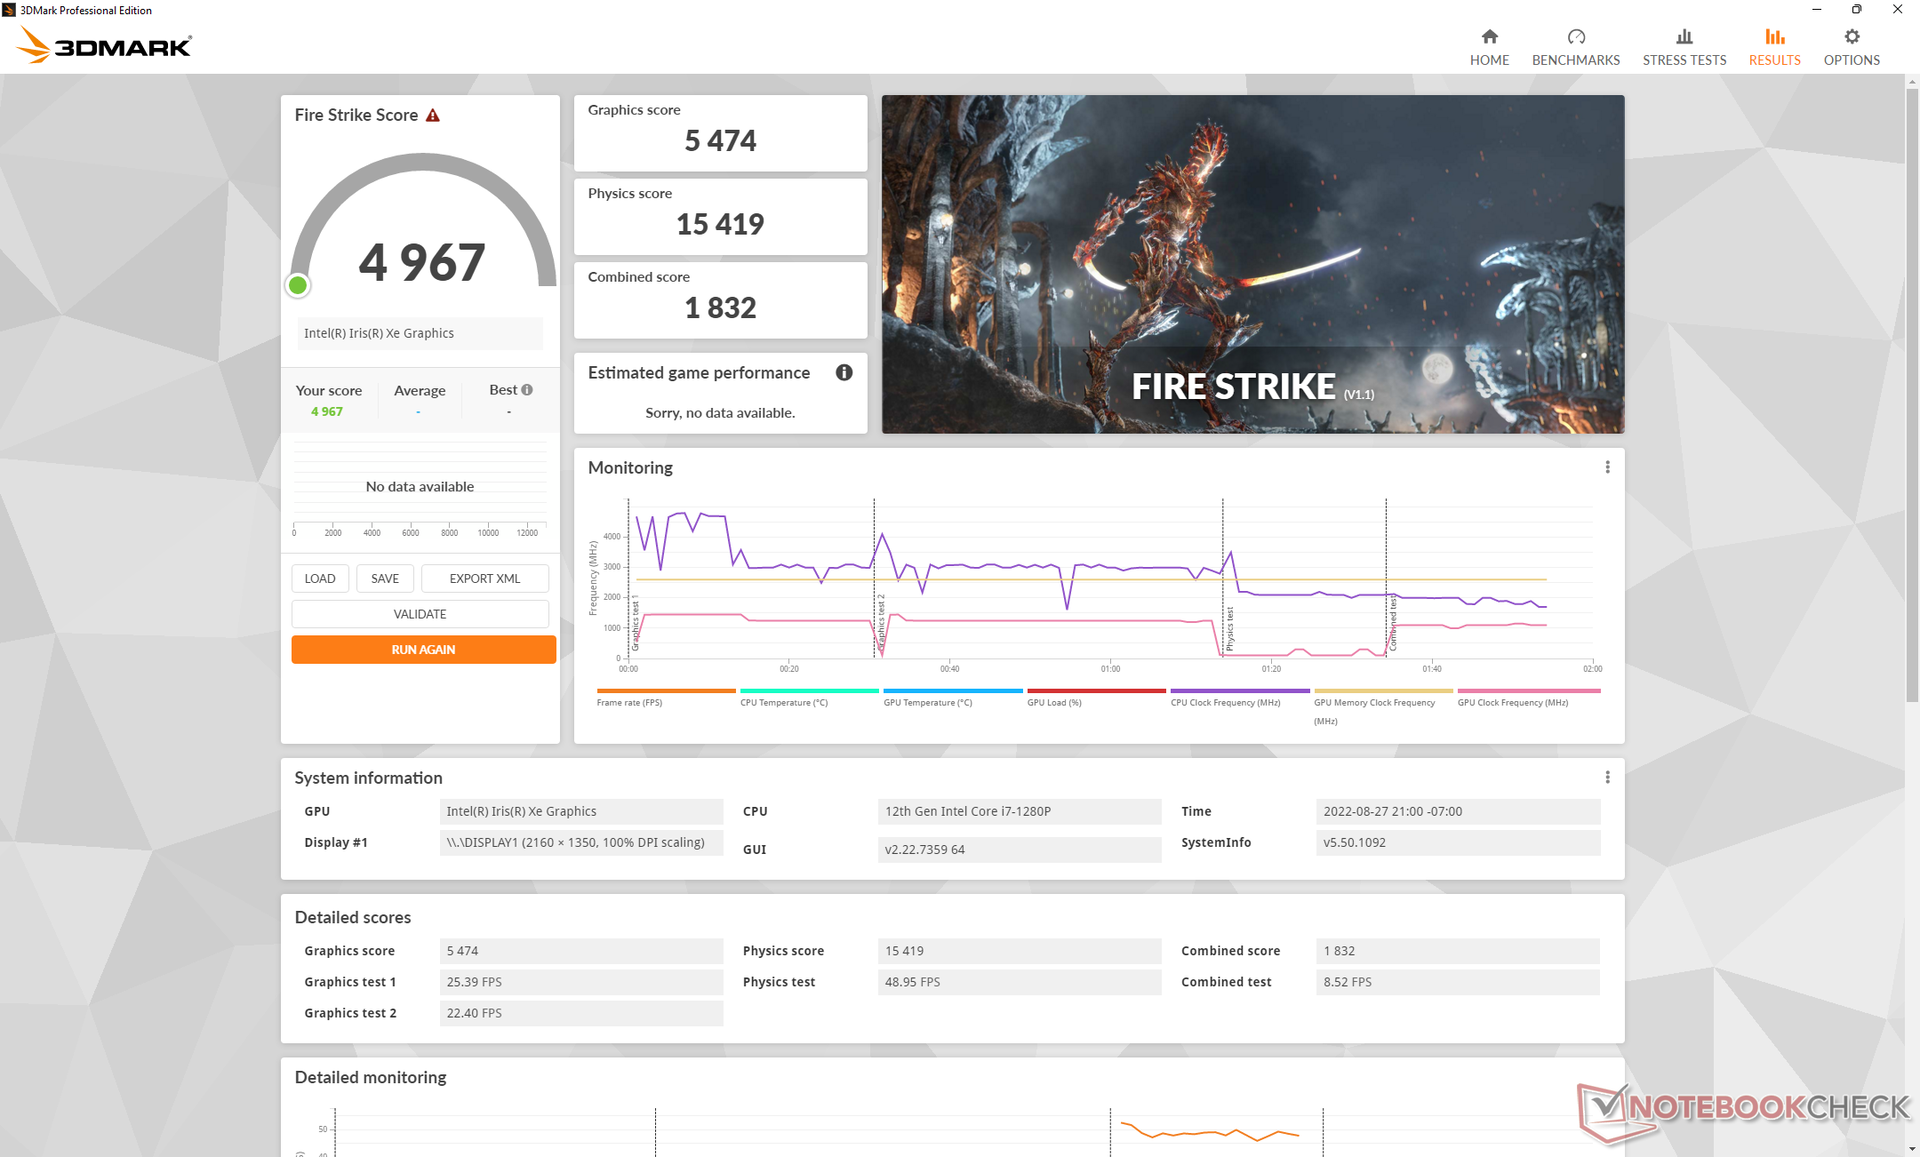
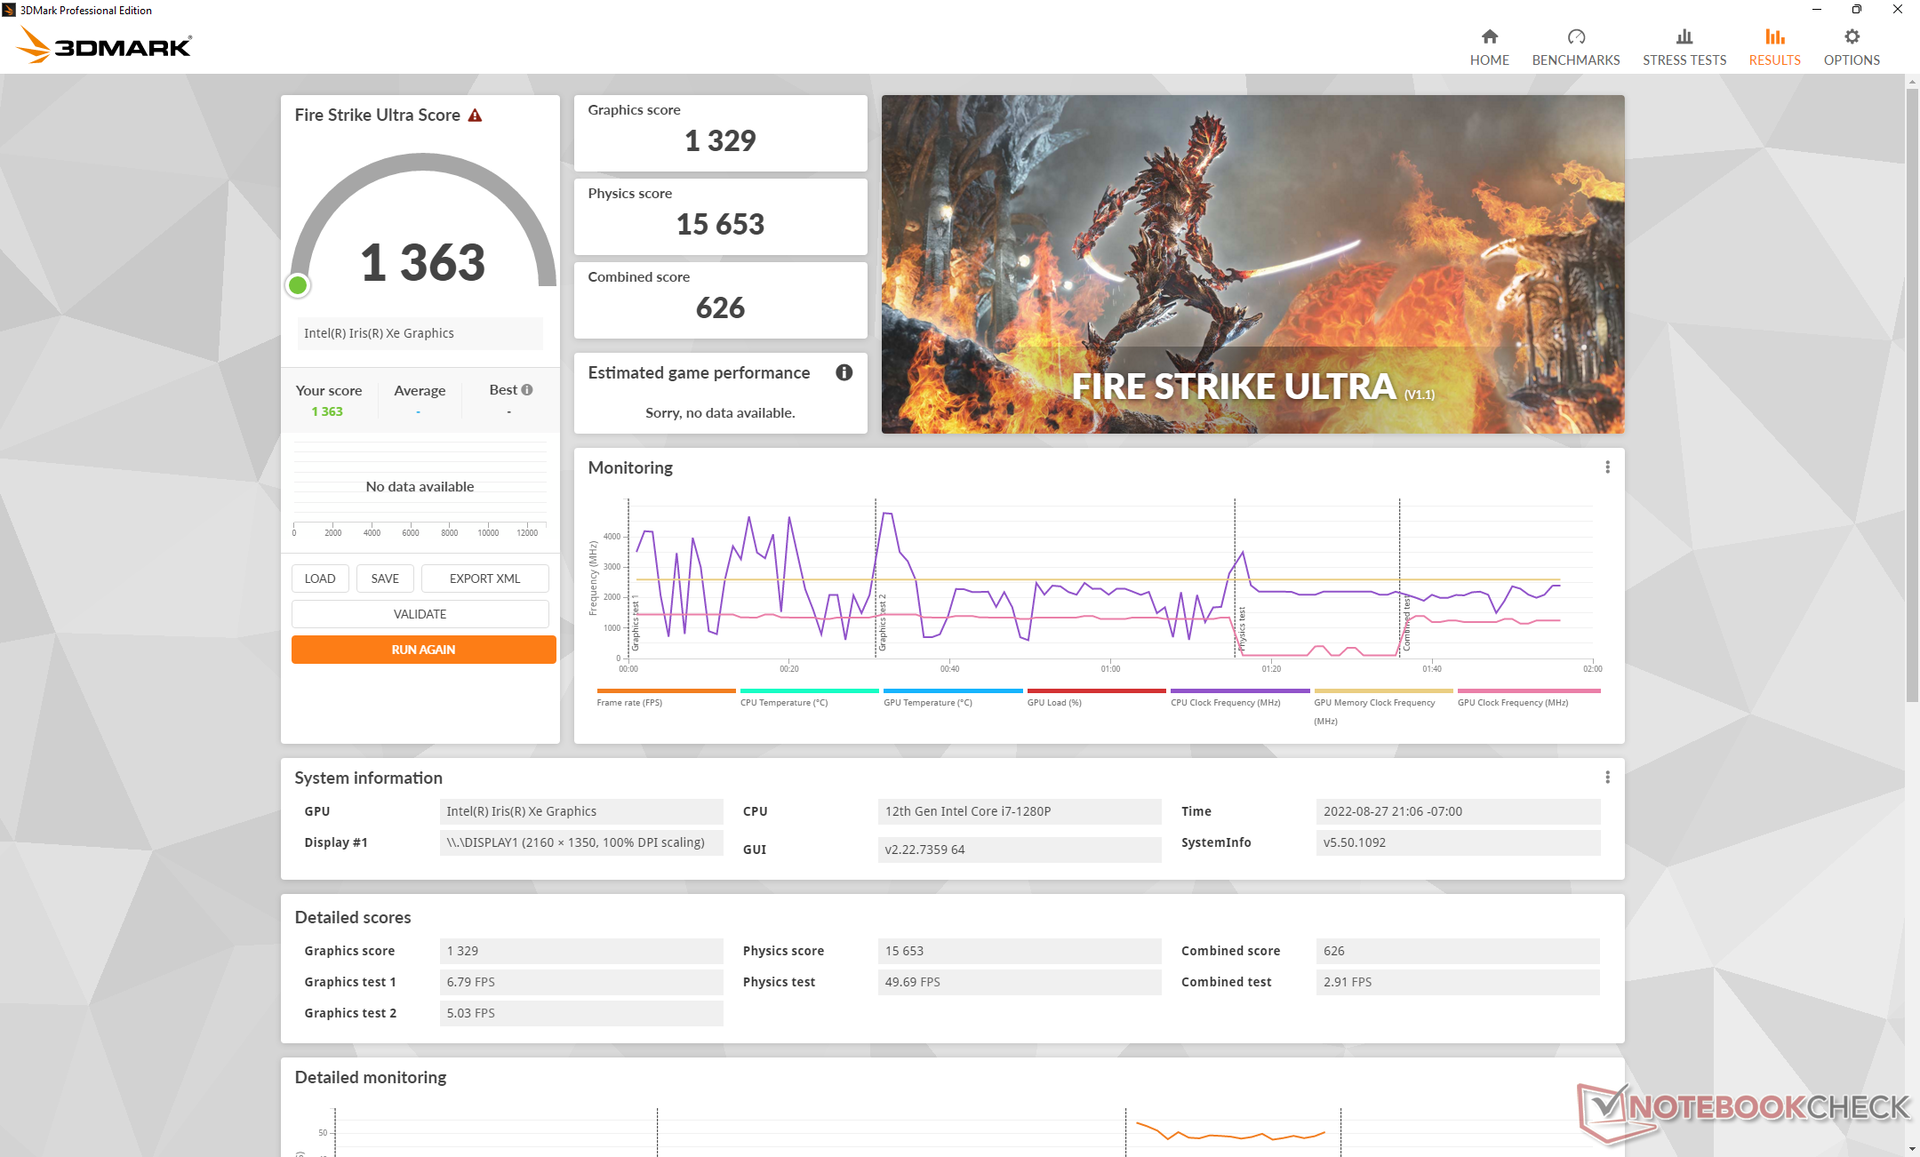
Wydajność GPU
Wydajność grafiki jest przyzwoita pomimo wspomnianego wyżej dławienia wydajności CPU. wyniki 3DMark są takie, jakie powinny być w stosunku do innych laptopów z tym samym Iris Xe 96 EUs GPU, ale dławienie zaczyna się pojawiać podczas uruchamiania prawdziwych gier. Dla przykładu, liczba klatek na sekundę przy Witcher 3 na najniższych ustawieniach 768p może wynosić nawet 106 FPS na początku testu, po czym szybko spada do 80 FPS kilka minut później, co pokazuje nasz poniższy wykres
Ogólna wydajność grafiki jest wciąż o około 30 procent wyższa niż w przypadku zeszłorocznego modelu Gen 1, zanim uwzględnimy jakiekolwiek dławienie wydajności.
| 3DMark | |
| 1920x1080 Fire Strike Graphics | |
| Asus Zenbook S 13 OLED | |
| Lenovo ThinkPad X1 Nano Gen 2 Core i7-1280P | |
| Dell Inspiron 13 7306-6TYH5 | |
| Framework Laptop 13.5 12th Gen Intel | |
| HP Spectre x360 13.5 14t-ef000 | |
| HP Elite Dragonfly G3 | |
| Przeciętny Intel Iris Xe Graphics G7 96EUs (2286 - 6624, n=222) | |
| Lenovo ThinkPad Z13 21D2CTO1WW | |
| Lenovo Yoga Slim 7-14IIL05 | |
| Lenovo ThinkPad X1 Nano-20UN002UGE | |
| Dynabook Portégé X30L-K-139 | |
| Lenovo Yoga 6 13ALC6 | |
| Lenovo ThinkPad X1 Titanium Yoga G1 20QB0016GE | |
| 2560x1440 Time Spy Graphics | |
| Asus Zenbook S 13 OLED | |
| Lenovo ThinkPad X1 Nano Gen 2 Core i7-1280P | |
| Framework Laptop 13.5 12th Gen Intel | |
| Dell Inspiron 13 7306-6TYH5 | |
| HP Spectre x360 13.5 14t-ef000 | |
| Lenovo ThinkPad Z13 21D2CTO1WW | |
| HP Elite Dragonfly G3 | |
| Przeciętny Intel Iris Xe Graphics G7 96EUs (707 - 1890, n=218) | |
| Lenovo Yoga Slim 7-14IIL05 | |
| Lenovo ThinkPad X1 Nano-20UN002UGE | |
| Dynabook Portégé X30L-K-139 | |
| Lenovo Yoga 6 13ALC6 | |
| Lenovo ThinkPad X1 Titanium Yoga G1 20QB0016GE | |
| 2560x1440 Time Spy Score | |
| Asus Zenbook S 13 OLED | |
| Lenovo ThinkPad X1 Nano Gen 2 Core i7-1280P | |
| Framework Laptop 13.5 12th Gen Intel | |
| HP Spectre x360 13.5 14t-ef000 | |
| Dell Inspiron 13 7306-6TYH5 | |
| Lenovo ThinkPad Z13 21D2CTO1WW | |
| HP Elite Dragonfly G3 | |
| Przeciętny Intel Iris Xe Graphics G7 96EUs (789 - 2159, n=215) | |
| Lenovo Yoga Slim 7-14IIL05 | |
| Lenovo ThinkPad X1 Nano-20UN002UGE | |
| Dynabook Portégé X30L-K-139 | |
| Lenovo Yoga 6 13ALC6 | |
| Lenovo ThinkPad X1 Titanium Yoga G1 20QB0016GE | |
| 3DMark 11 - 1280x720 Performance GPU | |
| Asus Zenbook S 13 OLED | |
| Lenovo ThinkPad X1 Nano Gen 2 Core i7-1280P | |
| Framework Laptop 13.5 12th Gen Intel | |
| Lenovo ThinkPad Z13 21D2CTO1WW | |
| Przeciętny Intel Iris Xe Graphics G7 96EUs (2867 - 7676, n=209) | |
| HP Spectre x360 13.5 14t-ef000 | |
| Lenovo Yoga Slim 7-14IIL05 | |
| HP Elite Dragonfly G3 | |
| Dell Inspiron 13 7306-6TYH5 | |
| Lenovo Yoga 6 13ALC6 | |
| Lenovo ThinkPad X1 Nano-20UN002UGE | |
| Dynabook Portégé X30L-K-139 | |
| Lenovo ThinkPad X1 Titanium Yoga G1 20QB0016GE | |
| 3DMark 11 Performance | 7141 pkt. | |
| 3DMark Cloud Gate Standard Score | 20344 pkt. | |
| 3DMark Fire Strike Score | 4967 pkt. | |
| 3DMark Time Spy Score | 1906 pkt. | |
Pomoc | ||
| Final Fantasy XV Benchmark | |
| 1280x720 Lite Quality | |
| Asus Zenbook S 13 OLED | |
| Lenovo ThinkPad Z13 21D2CTO1WW | |
| Dell Inspiron 13 7306-6TYH5 | |
| HP Spectre x360 13.5 14t-ef000 | |
| Framework Laptop 13.5 12th Gen Intel | |
| HP Elite Dragonfly G3 | |
| Przeciętny Intel Iris Xe Graphics G7 96EUs (14.9 - 56.5, n=189) | |
| Lenovo ThinkPad X1 Nano Gen 2 Core i7-1280P | |
| Lenovo Yoga 6 13ALC6 | |
| Dynabook Portégé X30L-K-139 | |
| 1920x1080 Standard Quality | |
| Asus Zenbook S 13 OLED | |
| Dell Inspiron 13 7306-6TYH5 | |
| HP Spectre x360 13.5 14t-ef000 | |
| Framework Laptop 13.5 12th Gen Intel | |
| HP Elite Dragonfly G3 | |
| Przeciętny Intel Iris Xe Graphics G7 96EUs (10.5 - 31.2, n=185) | |
| Lenovo ThinkPad Z13 21D2CTO1WW | |
| Lenovo ThinkPad X1 Nano Gen 2 Core i7-1280P | |
| Dynabook Portégé X30L-K-139 | |
| Lenovo Yoga 6 13ALC6 | |
| 1920x1080 High Quality | |
| Framework Laptop 13.5 12th Gen Intel | |
| Asus Zenbook S 13 OLED | |
| Lenovo ThinkPad X1 Nano Gen 2 Core i7-1280P | |
| Przeciętny Intel Iris Xe Graphics G7 96EUs (8.15 - 27.8, n=178) | |
| Dell Inspiron 13 7306-6TYH5 | |
| HP Spectre x360 13.5 14t-ef000 | |
| HP Elite Dragonfly G3 | |
| Lenovo ThinkPad Z13 21D2CTO1WW | |
| Dynabook Portégé X30L-K-139 | |
| Lenovo Yoga 6 13ALC6 | |
| The Witcher 3 | |
| 1024x768 Low Graphics & Postprocessing | |
| Asus Zenbook S 13 OLED | |
| Lenovo ThinkPad X1 Nano Gen 2 Core i7-1280P | |
| Framework Laptop 13.5 12th Gen Intel | |
| HP Spectre x360 13.5 14t-ef000 | |
| Przeciętny Intel Iris Xe Graphics G7 96EUs (28.9 - 117.2, n=188) | |
| Lenovo ThinkPad Z13 21D2CTO1WW | |
| Lenovo Yoga Slim 7-14IIL05 | |
| Lenovo ThinkPad X1 Nano-20UN002UGE | |
| HP Elite Dragonfly G3 | |
| Lenovo Yoga 6 13ALC6 | |
| Dynabook Portégé X30L-K-139 | |
| Lenovo ThinkPad X1 Titanium Yoga G1 20QB0016GE | |
| 1366x768 Medium Graphics & Postprocessing | |
| Lenovo ThinkPad X1 Nano Gen 2 Core i7-1280P | |
| Framework Laptop 13.5 12th Gen Intel | |
| Przeciętny Intel Iris Xe Graphics G7 96EUs (21.4 - 77.8, n=185) | |
| HP Elite Dragonfly G3 | |
| HP Spectre x360 13.5 14t-ef000 | |
| Dell Inspiron 13 7306-6TYH5 | |
| Dynabook Portégé X30L-K-139 | |
| Lenovo Yoga Slim 7-14IIL05 | |
| Lenovo ThinkPad X1 Nano-20UN002UGE | |
| Lenovo ThinkPad Z13 21D2CTO1WW | |
| Lenovo ThinkPad X1 Titanium Yoga G1 20QB0016GE | |
| Lenovo Yoga 6 13ALC6 | |
| 1920x1080 High Graphics & Postprocessing (Nvidia HairWorks Off) | |
| Asus Zenbook S 13 OLED | |
| Lenovo ThinkPad X1 Nano Gen 2 Core i7-1280P | |
| HP Spectre x360 13.5 14t-ef000 | |
| Framework Laptop 13.5 12th Gen Intel | |
| Przeciętny Intel Iris Xe Graphics G7 96EUs (10.6 - 45.9, n=191) | |
| HP Elite Dragonfly G3 | |
| Lenovo Yoga Slim 7-14IIL05 | |
| Lenovo ThinkPad X1 Nano-20UN002UGE | |
| Dynabook Portégé X30L-K-139 | |
| Lenovo ThinkPad Z13 21D2CTO1WW | |
| Dell Inspiron 13 7306-6TYH5 | |
| Lenovo ThinkPad X1 Titanium Yoga G1 20QB0016GE | |
| 1920x1080 Ultra Graphics & Postprocessing (HBAO+) | |
| Asus Zenbook S 13 OLED | |
| Lenovo Yoga Slim 7-14IIL05 | |
| Lenovo Yoga 6 13ALC6 | |
| Framework Laptop 13.5 12th Gen Intel | |
| Lenovo ThinkPad X1 Nano Gen 2 Core i7-1280P | |
| HP Spectre x360 13.5 14t-ef000 | |
| Przeciętny Intel Iris Xe Graphics G7 96EUs (8.79 - 20.1, n=181) | |
| HP Elite Dragonfly G3 | |
| Dell Inspiron 13 7306-6TYH5 | |
| Lenovo ThinkPad Z13 21D2CTO1WW | |
| Lenovo ThinkPad X1 Nano-20UN002UGE | |
| Dynabook Portégé X30L-K-139 | |
| Lenovo ThinkPad X1 Titanium Yoga G1 20QB0016GE | |
| Dota 2 Reborn | |
| 1280x720 min (0/3) fastest | |
| Dell Inspiron 13 7306-6TYH5 | |
| Framework Laptop 13.5 12th Gen Intel | |
| HP Spectre x360 13.5 14t-ef000 | |
| Lenovo Yoga Slim 7-14IIL05 | |
| Asus Zenbook S 13 OLED | |
| Lenovo ThinkPad X1 Nano Gen 2 Core i7-1280P | |
| Lenovo ThinkPad Z13 21D2CTO1WW | |
| Przeciętny Intel Iris Xe Graphics G7 96EUs (36 - 148, n=221) | |
| HP Elite Dragonfly G3 | |
| Dynabook Portégé X30L-K-139 | |
| Lenovo Yoga 6 13ALC6 | |
| Lenovo ThinkPad X1 Titanium Yoga G1 20QB0016GE | |
| Lenovo ThinkPad X1 Nano-20UN002UGE | |
| 1366x768 med (1/3) | |
| Lenovo Yoga Slim 7-14IIL05 | |
| Asus Zenbook S 13 OLED | |
| HP Spectre x360 13.5 14t-ef000 | |
| Framework Laptop 13.5 12th Gen Intel | |
| Dell Inspiron 13 7306-6TYH5 | |
| Lenovo ThinkPad X1 Nano Gen 2 Core i7-1280P | |
| Przeciętny Intel Iris Xe Graphics G7 96EUs (31.6 - 108.5, n=221) | |
| Lenovo ThinkPad Z13 21D2CTO1WW | |
| Lenovo Yoga 6 13ALC6 | |
| HP Elite Dragonfly G3 | |
| Lenovo ThinkPad X1 Nano-20UN002UGE | |
| Dynabook Portégé X30L-K-139 | |
| Lenovo ThinkPad X1 Titanium Yoga G1 20QB0016GE | |
| 1920x1080 high (2/3) | |
| Lenovo Yoga Slim 7-14IIL05 | |
| Asus Zenbook S 13 OLED | |
| HP Spectre x360 13.5 14t-ef000 | |
| Framework Laptop 13.5 12th Gen Intel | |
| HP Elite Dragonfly G3 | |
| Lenovo ThinkPad X1 Nano Gen 2 Core i7-1280P | |
| Przeciętny Intel Iris Xe Graphics G7 96EUs (23.2 - 88.1, n=221) | |
| Dell Inspiron 13 7306-6TYH5 | |
| Lenovo ThinkPad Z13 21D2CTO1WW | |
| Lenovo Yoga 6 13ALC6 | |
| Lenovo ThinkPad X1 Nano-20UN002UGE | |
| Lenovo ThinkPad X1 Titanium Yoga G1 20QB0016GE | |
| Dynabook Portégé X30L-K-139 | |
| 1920x1080 ultra (3/3) best looking | |
| Lenovo Yoga Slim 7-14IIL05 | |
| Asus Zenbook S 13 OLED | |
| HP Spectre x360 13.5 14t-ef000 | |
| Framework Laptop 13.5 12th Gen Intel | |
| HP Elite Dragonfly G3 | |
| Dell Inspiron 13 7306-6TYH5 | |
| Przeciętny Intel Iris Xe Graphics G7 96EUs (20.6 - 78.5, n=221) | |
| Lenovo ThinkPad X1 Nano Gen 2 Core i7-1280P | |
| Lenovo Yoga 6 13ALC6 | |
| Lenovo ThinkPad Z13 21D2CTO1WW | |
| Dynabook Portégé X30L-K-139 | |
| Lenovo ThinkPad X1 Titanium Yoga G1 20QB0016GE | |
| Lenovo ThinkPad X1 Nano-20UN002UGE | |
| X-Plane 11.11 | |
| 1280x720 low (fps_test=1) | |
| Lenovo Yoga Slim 7-14IIL05 | |
| Framework Laptop 13.5 12th Gen Intel | |
| Asus Zenbook S 13 OLED | |
| Dynabook Portégé X30L-K-139 | |
| Przeciętny Intel Iris Xe Graphics G7 96EUs (13.4 - 88.4, n=213) | |
| HP Spectre x360 13.5 14t-ef000 | |
| Lenovo ThinkPad X1 Nano Gen 2 Core i7-1280P | |
| Lenovo Yoga 6 13ALC6 | |
| HP Elite Dragonfly G3 | |
| Lenovo ThinkPad Z13 21D2CTO1WW | |
| Lenovo ThinkPad X1 Nano-20UN002UGE | |
| Dell Inspiron 13 7306-6TYH5 | |
| Lenovo ThinkPad X1 Titanium Yoga G1 20QB0016GE | |
| 1920x1080 med (fps_test=2) | |
| Lenovo Yoga Slim 7-14IIL05 | |
| Framework Laptop 13.5 12th Gen Intel | |
| HP Spectre x360 13.5 14t-ef000 | |
| Dell Inspiron 13 7306-6TYH5 | |
| Lenovo ThinkPad X1 Nano Gen 2 Core i7-1280P | |
| Asus Zenbook S 13 OLED | |
| Przeciętny Intel Iris Xe Graphics G7 96EUs (11.6 - 69.5, n=214) | |
| HP Elite Dragonfly G3 | |
| Lenovo Yoga 6 13ALC6 | |
| Dynabook Portégé X30L-K-139 | |
| Lenovo ThinkPad X1 Nano-20UN002UGE | |
| Lenovo ThinkPad Z13 21D2CTO1WW | |
| Lenovo ThinkPad X1 Titanium Yoga G1 20QB0016GE | |
| 1920x1080 high (fps_test=3) | |
| Lenovo Yoga Slim 7-14IIL05 | |
| Framework Laptop 13.5 12th Gen Intel | |
| HP Spectre x360 13.5 14t-ef000 | |
| Lenovo ThinkPad X1 Nano Gen 2 Core i7-1280P | |
| Asus Zenbook S 13 OLED | |
| Dell Inspiron 13 7306-6TYH5 | |
| Przeciętny Intel Iris Xe Graphics G7 96EUs (11.1 - 59.8, n=213) | |
| HP Elite Dragonfly G3 | |
| Lenovo Yoga 6 13ALC6 | |
| Lenovo ThinkPad X1 Nano-20UN002UGE | |
| Dynabook Portégé X30L-K-139 | |
| Lenovo ThinkPad Z13 21D2CTO1WW | |
| Lenovo ThinkPad X1 Titanium Yoga G1 20QB0016GE | |
| Strange Brigade | |
| 1280x720 lowest AF:1 | |
| Asus Zenbook S 13 OLED | |
| Lenovo ThinkPad Z13 21D2CTO1WW | |
| Framework Laptop 13.5 12th Gen Intel | |
| HP Spectre x360 13.5 14t-ef000 | |
| Lenovo ThinkPad X1 Nano Gen 2 Core i7-1280P | |
| Przeciętny Intel Iris Xe Graphics G7 96EUs (48.5 - 115.1, n=172) | |
| HP Elite Dragonfly G3 | |
| Dell Inspiron 13 7306-6TYH5 | |
| Lenovo Yoga 6 13ALC6 | |
| Dynabook Portégé X30L-K-139 | |
| 1920x1080 medium AA:medium AF:4 | |
| Asus Zenbook S 13 OLED | |
| Lenovo ThinkPad X1 Nano Gen 2 Core i7-1280P | |
| HP Spectre x360 13.5 14t-ef000 | |
| Framework Laptop 13.5 12th Gen Intel | |
| HP Elite Dragonfly G3 | |
| Lenovo ThinkPad Z13 21D2CTO1WW | |
| Dell Inspiron 13 7306-6TYH5 | |
| Przeciętny Intel Iris Xe Graphics G7 96EUs (18.2 - 51.4, n=170) | |
| Lenovo Yoga 6 13ALC6 | |
| Dynabook Portégé X30L-K-139 | |
| 1920x1080 high AA:high AF:8 | |
| Asus Zenbook S 13 OLED | |
| Lenovo ThinkPad Z13 21D2CTO1WW | |
| Framework Laptop 13.5 12th Gen Intel | |
| HP Spectre x360 13.5 14t-ef000 | |
| Lenovo ThinkPad X1 Nano Gen 2 Core i7-1280P | |
| HP Elite Dragonfly G3 | |
| Przeciętny Intel Iris Xe Graphics G7 96EUs (15.4 - 39.8, n=169) | |
| Dell Inspiron 13 7306-6TYH5 | |
| Lenovo Yoga 6 13ALC6 | |
| Dynabook Portégé X30L-K-139 | |
| 1920x1080 ultra AA:ultra AF:16 | |
| Asus Zenbook S 13 OLED | |
| Framework Laptop 13.5 12th Gen Intel | |
| HP Spectre x360 13.5 14t-ef000 | |
| Lenovo ThinkPad Z13 21D2CTO1WW | |
| HP Elite Dragonfly G3 | |
| Lenovo ThinkPad X1 Nano Gen 2 Core i7-1280P | |
| Przeciętny Intel Iris Xe Graphics G7 96EUs (13.2 - 31.7, n=167) | |
| Dell Inspiron 13 7306-6TYH5 | |
| Lenovo Yoga 6 13ALC6 | |
| Dynabook Portégé X30L-K-139 | |
| GTA V | |
| 1024x768 Lowest Settings possible | |
| Asus Zenbook S 13 OLED | |
| Lenovo ThinkPad Z13 21D2CTO1WW | |
| Framework Laptop 13.5 12th Gen Intel | |
| HP Spectre x360 13.5 14t-ef000 | |
| Przeciętny Intel Iris Xe Graphics G7 96EUs (52 - 166.4, n=168) | |
| Lenovo ThinkPad X1 Nano Gen 2 Core i7-1280P | |
| HP Elite Dragonfly G3 | |
| Lenovo Yoga 6 13ALC6 | |
| Dynabook Portégé X30L-K-139 | |
| Dell Inspiron 13 7306-6TYH5 | |
| 1920x1080 Lowest Settings possible | |
| HP Spectre x360 13.5 14t-ef000 | |
| Lenovo ThinkPad Z13 21D2CTO1WW | |
| Framework Laptop 13.5 12th Gen Intel | |
| HP Elite Dragonfly G3 | |
| Przeciętny Intel Iris Xe Graphics G7 96EUs (34.7 - 132.1, n=141) | |
| Lenovo ThinkPad X1 Nano Gen 2 Core i7-1280P | |
| Dell Inspiron 13 7306-6TYH5 | |
| Lenovo Yoga 6 13ALC6 | |
| 1366x768 Normal/Off AF:4x | |
| Asus Zenbook S 13 OLED | |
| HP Spectre x360 13.5 14t-ef000 | |
| Lenovo ThinkPad Z13 21D2CTO1WW | |
| Framework Laptop 13.5 12th Gen Intel | |
| Przeciętny Intel Iris Xe Graphics G7 96EUs (24.1 - 152.7, n=169) | |
| Lenovo ThinkPad X1 Nano Gen 2 Core i7-1280P | |
| HP Elite Dragonfly G3 | |
| Dell Inspiron 13 7306-6TYH5 | |
| Dynabook Portégé X30L-K-139 | |
| 1920x1080 Normal/Off AF:4x | |
| HP Spectre x360 13.5 14t-ef000 | |
| Lenovo ThinkPad Z13 21D2CTO1WW | |
| Framework Laptop 13.5 12th Gen Intel | |
| HP Elite Dragonfly G3 | |
| Przeciętny Intel Iris Xe Graphics G7 96EUs (20 - 119.3, n=142) | |
| Lenovo ThinkPad X1 Nano Gen 2 Core i7-1280P | |
| Dell Inspiron 13 7306-6TYH5 | |
| Lenovo Yoga 6 13ALC6 | |
| 1920x1080 High/On (Advanced Graphics Off) AA:2xMSAA + FX AF:8x | |
| Asus Zenbook S 13 OLED | |
| Lenovo ThinkPad Z13 21D2CTO1WW | |
| Dell Inspiron 13 7306-6TYH5 | |
| Lenovo Yoga 6 13ALC6 | |
| HP Spectre x360 13.5 14t-ef000 | |
| HP Elite Dragonfly G3 | |
| Przeciętny Intel Iris Xe Graphics G7 96EUs (9.39 - 51.6, n=162) | |
| Lenovo ThinkPad X1 Nano Gen 2 Core i7-1280P | |
| Framework Laptop 13.5 12th Gen Intel | |
| Dynabook Portégé X30L-K-139 | |
| 1920x1080 Highest AA:4xMSAA + FX AF:16x | |
| Asus Zenbook S 13 OLED | |
| Lenovo ThinkPad Z13 21D2CTO1WW | |
| HP Spectre x360 13.5 14t-ef000 | |
| HP Elite Dragonfly G3 | |
| Lenovo ThinkPad X1 Nano Gen 2 Core i7-1280P | |
| Lenovo Yoga 6 13ALC6 | |
| Przeciętny Intel Iris Xe Graphics G7 96EUs (4.13 - 22.9, n=156) | |
| Framework Laptop 13.5 12th Gen Intel | |
| Dynabook Portégé X30L-K-139 | |
| Cyberpunk 2077 1.6 | |
| 1920x1080 Low Preset | |
| Asus Zenbook S 13 OLED | |
| HP Spectre x360 13.5 14t-ef000 | |
| Framework Laptop 13.5 12th Gen Intel | |
| HP Elite Dragonfly G3 | |
| Przeciętny Intel Iris Xe Graphics G7 96EUs (13 - 25.9, n=42) | |
| Lenovo ThinkPad X1 Nano Gen 2 Core i7-1280P | |
| 1920x1080 Medium Preset | |
| Asus Zenbook S 13 OLED | |
| HP Spectre x360 13.5 14t-ef000 | |
| Framework Laptop 13.5 12th Gen Intel | |
| HP Elite Dragonfly G3 | |
| Lenovo ThinkPad X1 Nano Gen 2 Core i7-1280P | |
| Przeciętny Intel Iris Xe Graphics G7 96EUs (10.8 - 21.7, n=37) | |
| 1920x1080 High Preset | |
| Asus Zenbook S 13 OLED | |
| HP Spectre x360 13.5 14t-ef000 | |
| Framework Laptop 13.5 12th Gen Intel | |
| HP Elite Dragonfly G3 | |
| Przeciętny Intel Iris Xe Graphics G7 96EUs (9.8 - 16.9, n=34) | |
| Lenovo ThinkPad X1 Nano Gen 2 Core i7-1280P | |
| 1920x1080 Ultra Preset | |
| Asus Zenbook S 13 OLED | |
| Framework Laptop 13.5 12th Gen Intel | |
| HP Spectre x360 13.5 14t-ef000 | |
| Przeciętny Intel Iris Xe Graphics G7 96EUs (7.4 - 16.8, n=32) | |
| HP Elite Dragonfly G3 | |
| Lenovo ThinkPad X1 Nano Gen 2 Core i7-1280P | |
Witcher 3 FPS Chart
| low | med. | high | ultra | |
|---|---|---|---|---|
| GTA V (2015) | 97.2 | 82.3 | 21.9 | 9.84 |
| The Witcher 3 (2015) | 107.2 | 67.3 | 35 | 15.1 |
| Dota 2 Reborn (2015) | 106.1 | 76 | 55.6 | 49 |
| Final Fantasy XV Benchmark (2018) | 35.8 | 20.7 | 20.7 | |
| X-Plane 11.11 (2018) | 38.8 | 39.9 | 35.4 | |
| Strange Brigade (2018) | 88.1 | 41 | 32 | 25.1 |
| Cyberpunk 2077 1.6 (2022) | 18.3 | 16.1 | 12.3 | 9.5 |
Emisje
Szum systemu
Hałas wentylatora jest powiązany z trzema profilami zasilania Lenovo Vantage: Quiet, Balanced lub Intelligent Cooling oraz Best Performance. System jest cichszy niż oczekiwano nawet przy domyślnym profilu Intelligent Cooling. Podczas uruchamiania pierwszej sceny benchmarku 3DMark 06, na przykład, wewnętrzny wentylator pozostawał bardzo cichy przez całą scenę, podobnie jak to obserwowaliśmy w przypadku modelu Dragonfly G3 lubMateBook X Pro w podobnych warunkach. W przypadku ustawienia opcji Best Performance, należy jednak liczyć się z tym, że przy większych obciążeniach, takich jak gry, wentylator będzie pulsował częściej, osiągając nawet 40 dB(A). W przeciwnym razie zalecamy ustawienie Inteligentnego chłodzenia w większości scenariuszy.
Warto zauważyć, że nasz testowy egzemplarz wykazywał szumy elektroniczne lub wycie cewek podczas pracy na biegu jałowym. Szum ten ustępował chwilowo podczas uruchomienia programu 3DMark 06, co wyjaśnia dlaczego nasz pomiar hałasu podczas uruchomienia benchmarku jest niższy niż podczas pracy na biegu jałowym (23,9 vs. 23,3 dB(A)).
Hałas
| luz |
| 23.9 / 23.9 / 23.9 dB |
| obciążenie |
| 23.3 / 40.9 dB |
 | ||
30 dB cichy 40 dB(A) słyszalny 50 dB(A) irytujący |
||
min: | ||
| Lenovo ThinkPad X1 Nano Gen 2 Core i7-1280P Iris Xe G7 96EUs, i7-1280P, Kioxia BG5 KBG5AZNT1T02 | Lenovo ThinkPad X1 Nano-20UN002UGE Iris Xe G7 96EUs, i7-1160G7, WDC PC SN530 SDBPNPZ-512G | HP Elite Dragonfly G3 Iris Xe G7 96EUs, i7-1265U, Micron 3400 MTFDKBA512TFH 512GB | Dell Latitude 13 7330 Iris Xe G7 96EUs, i7-1265U, Toshiba KBG40ZNS512G NVMe | Framework Laptop 13.5 12th Gen Intel Iris Xe G7 96EUs, i7-1260P, WDC PC SN730 SDBPNTY-512G | Huawei MateBook X Pro 2021 Iris Xe G7 96EUs, i7-1165G7, Samsung PM981a MZVLB1T0HBLR | |
|---|---|---|---|---|---|---|
| Noise | -11% | 6% | -8% | -18% | -3% | |
| wyłączone / środowisko * (dB) | 23.3 | 24.9 -7% | 22.8 2% | 23.4 -0% | 22.8 2% | 25.4 -9% |
| Idle Minimum * (dB) | 23.9 | 24.9 -4% | 23.2 3% | 23.4 2% | 23 4% | 25.6 -7% |
| Idle Average * (dB) | 23.9 | 26.3 -10% | 23.2 3% | 23.4 2% | 23 4% | 25.6 -7% |
| Idle Maximum * (dB) | 23.9 | 31.8 -33% | 23.2 3% | 23.4 2% | 23 4% | 25.6 -7% |
| Load Average * (dB) | 23.3 | 34.3 -47% | 25.1 -8% | 37.8 -62% | 47.3 -103% | 28.7 -23% |
| Witcher 3 ultra * (dB) | 40.9 | 34.3 16% | 32 22% | 39.2 4% | 47.3 -16% | 32 22% |
| Load Maximum * (dB) | 40.9 | 37.5 8% | 35.2 14% | 43 -5% | 49.8 -22% | 38.2 7% |
* ... im mniej tym lepiej
Temperatura
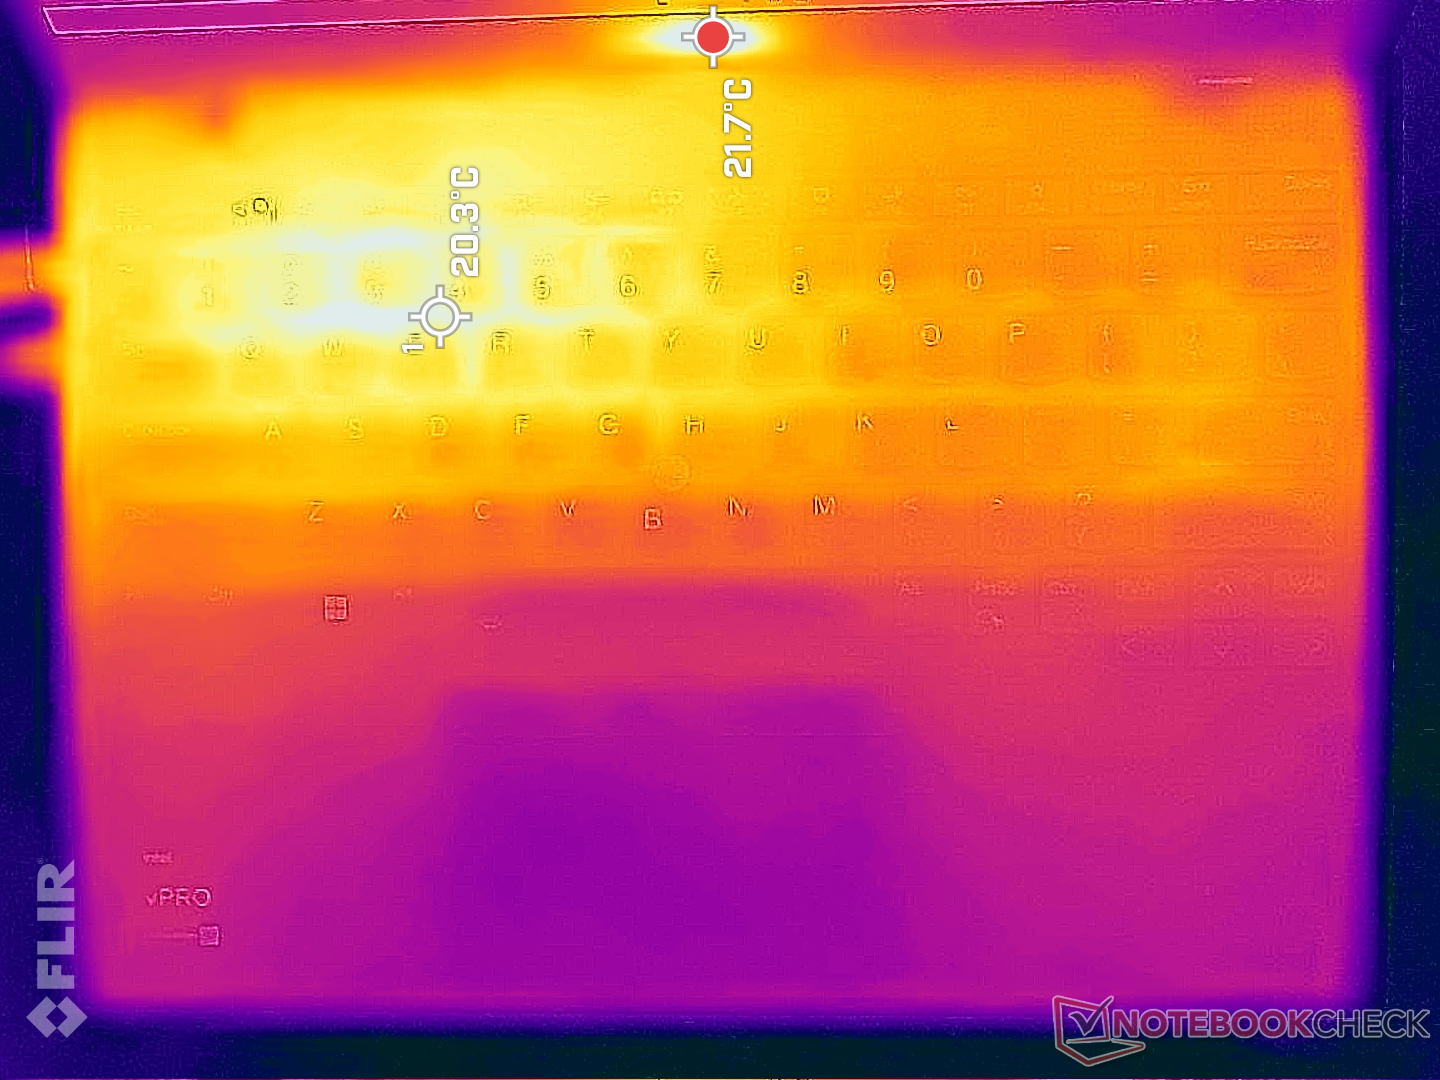
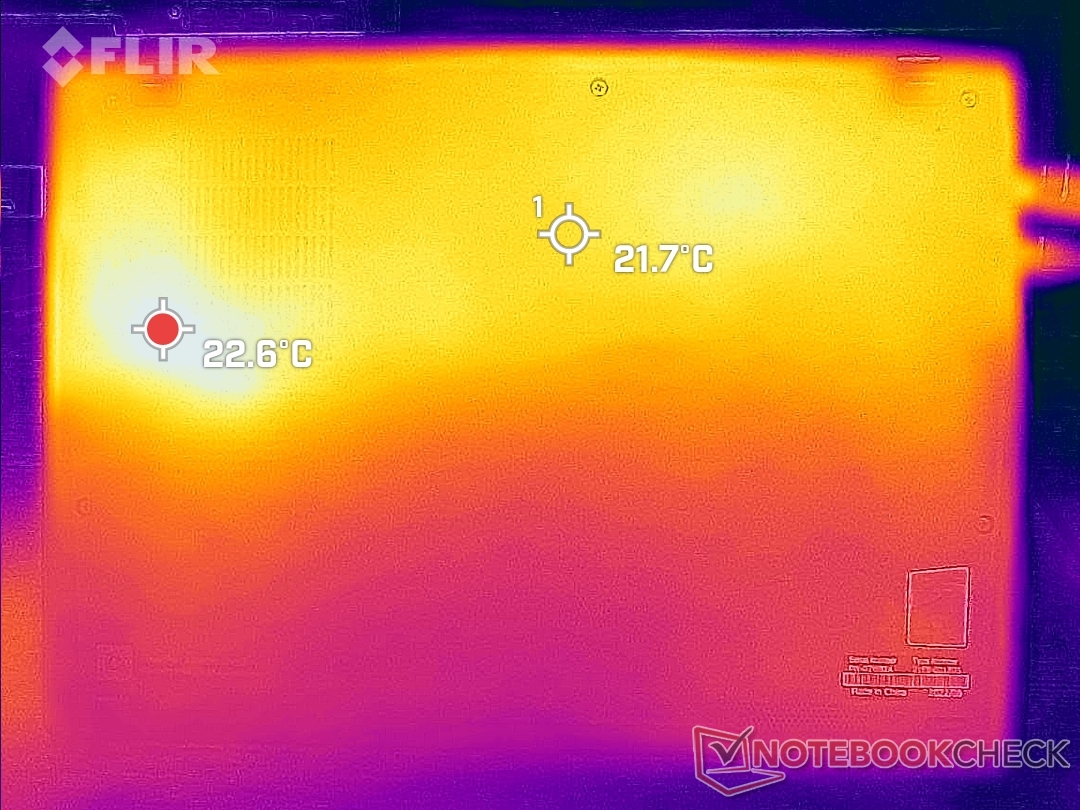
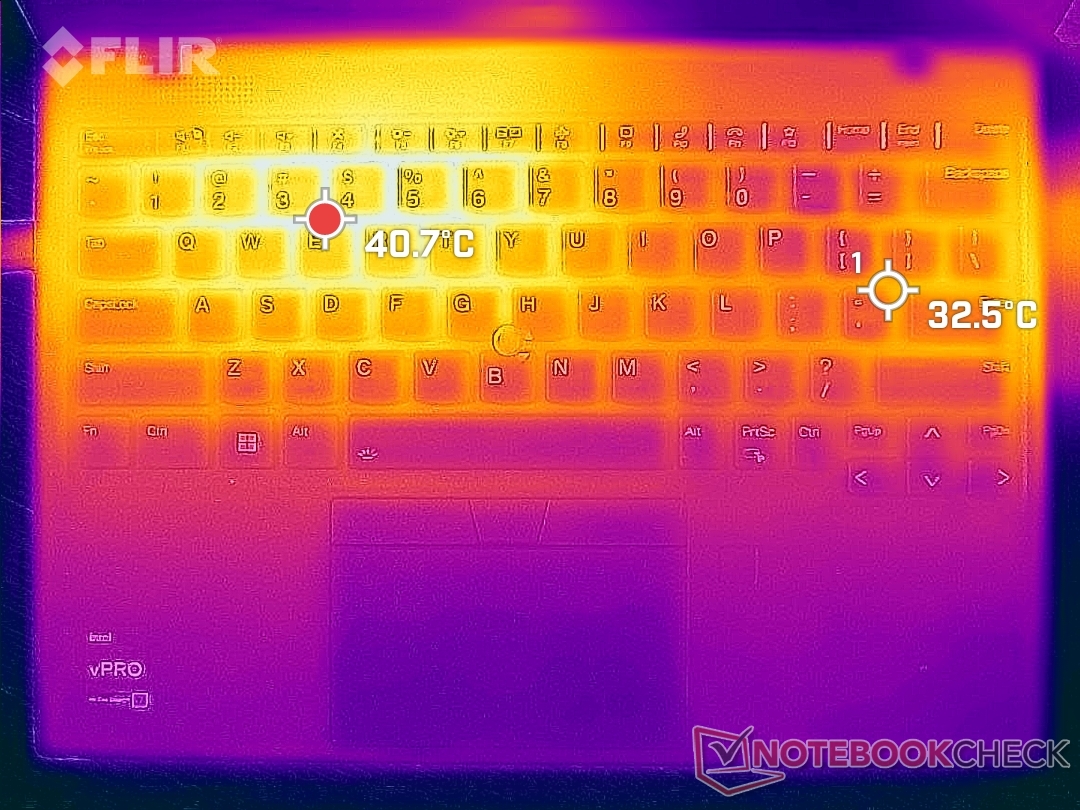
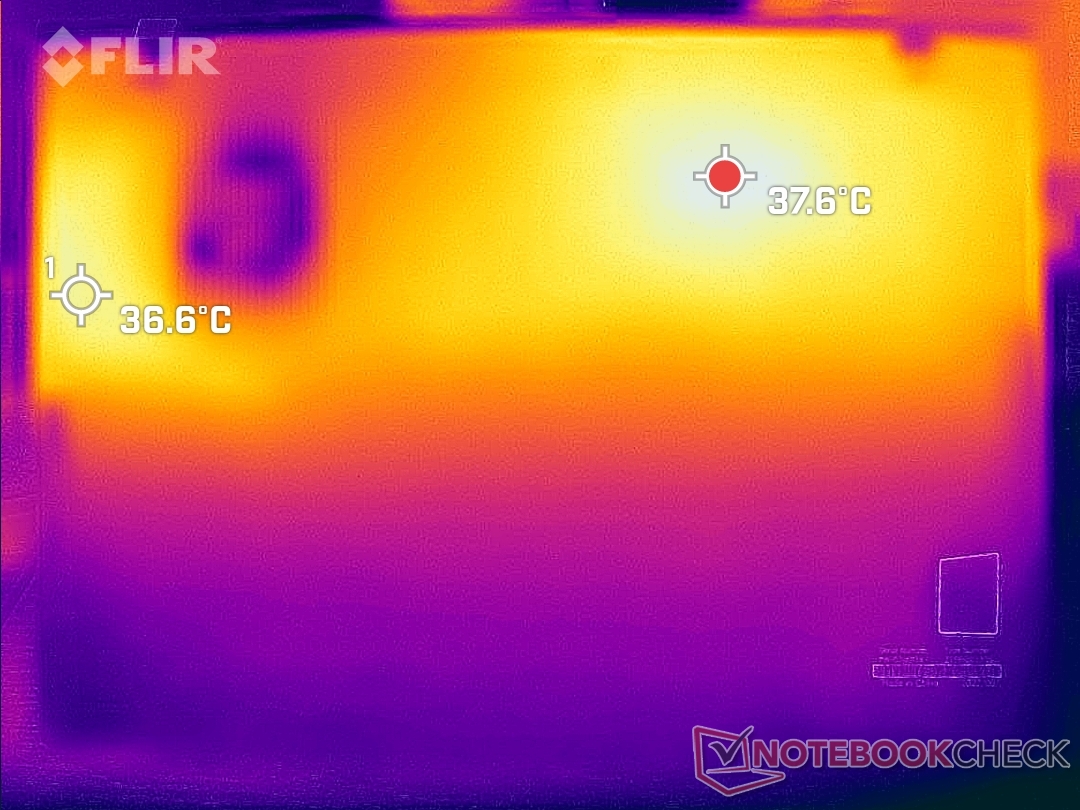
Temperatury powierzchni nie są wcale cieplejsze w naszym nowszym egzemplarzu Gen 2 w porównaniu do Gen 1. W rzeczywistości gorący punkt na spodzie jest chłodniejszy i wynosi zaledwie 40 stopni Celsjusza w porównaniu do 48 stopni Celsjusza w zeszłorocznym modelu, co może być spowodowane wspomnianym wyżej dławieniem wydajności. Spodziewajcie się, że lewa połowa klawiatury będzie zawsze cieplejsza niż prawa, jak pokazują poniższe mapy temperatur, ponieważ procesor jest umieszczony po lewej stronie obudowy.
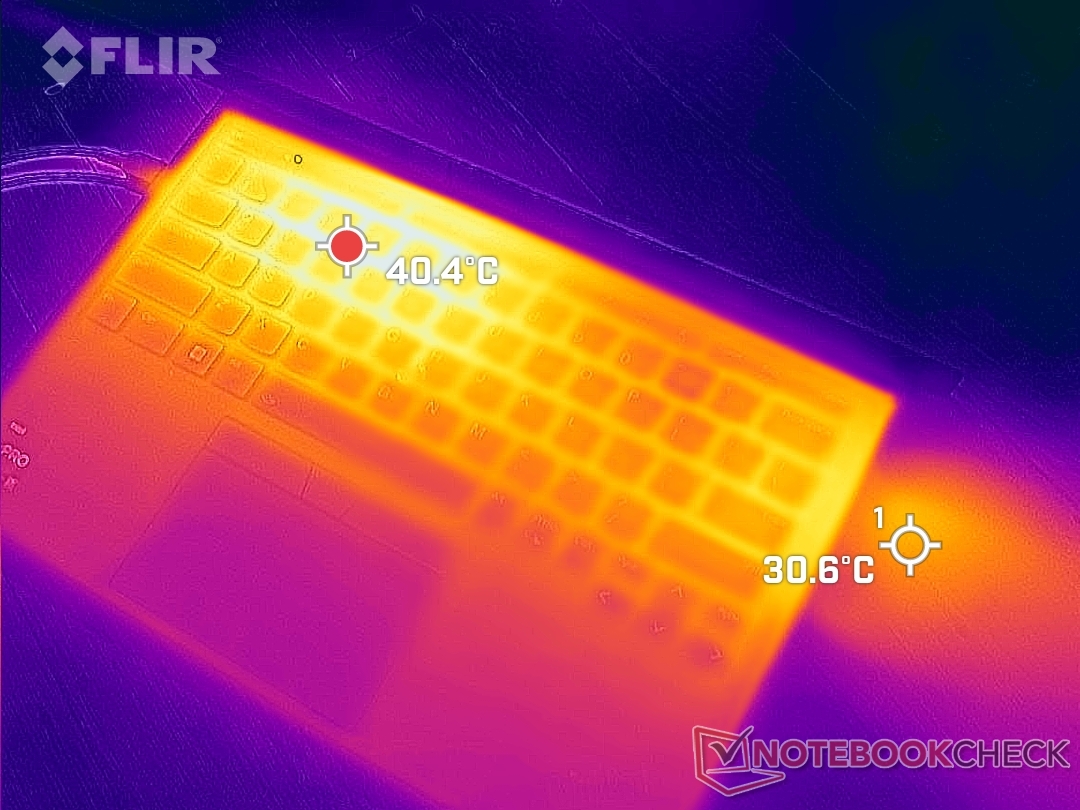
(±) Maksymalna temperatura w górnej części wynosi 42.4 °C / 108 F, w porównaniu do średniej 35.9 °C / 97 F , począwszy od 21.4 do 59 °C dla klasy Subnotebook.
(±) Dno nagrzewa się maksymalnie do 40.2 °C / 104 F, w porównaniu do średniej 39.2 °C / 103 F
(+) W stanie bezczynności średnia temperatura górnej części wynosi 25.3 °C / 78 F, w porównaniu ze średnią temperaturą urządzenia wynoszącą 30.8 °C / ### class_avg_f### F.
(+) Podpórki pod nadgarstki i touchpad są chłodniejsze niż temperatura skóry i maksymalnie 30.2 °C / 86.4 F i dlatego są chłodne w dotyku.
(±) Średnia temperatura obszaru podparcia dłoni w podobnych urządzeniach wynosiła 28.2 °C / 82.8 F (-2 °C / -3.6 F).
| Lenovo ThinkPad X1 Nano Gen 2 Core i7-1280P Intel Core i7-1280P, Intel Iris Xe Graphics G7 96EUs | Lenovo ThinkPad X1 Nano-20UN002UGE Intel Core i7-1160G7, Intel Iris Xe Graphics G7 96EUs | HP Elite Dragonfly G3 Intel Core i7-1265U, Intel Iris Xe Graphics G7 96EUs | Dell Latitude 13 7330 Intel Core i7-1265U, Intel Iris Xe Graphics G7 96EUs | Framework Laptop 13.5 12th Gen Intel Intel Core i7-1260P, Intel Iris Xe Graphics G7 96EUs | Huawei MateBook X Pro 2021 Intel Core i7-1165G7, Intel Iris Xe Graphics G7 96EUs | |
|---|---|---|---|---|---|---|
| Heat | 1% | 2% | 8% | 4% | -7% | |
| Maximum Upper Side * (°C) | 42.4 | 42.2 -0% | 39 8% | 38.6 9% | 36.8 13% | 42.2 -0% |
| Maximum Bottom * (°C) | 40.2 | 47.5 -18% | 42.2 -5% | 42 -4% | 42.4 -5% | 40.4 -0% |
| Idle Upper Side * (°C) | 27.8 | 24.3 13% | 26.8 4% | 23.8 14% | 24.2 13% | 31.2 -12% |
| Idle Bottom * (°C) | 27.8 | 25.3 9% | 28.2 -1% | 24.6 12% | 29 -4% | 32.2 -16% |
* ... im mniej tym lepiej
Stress Test
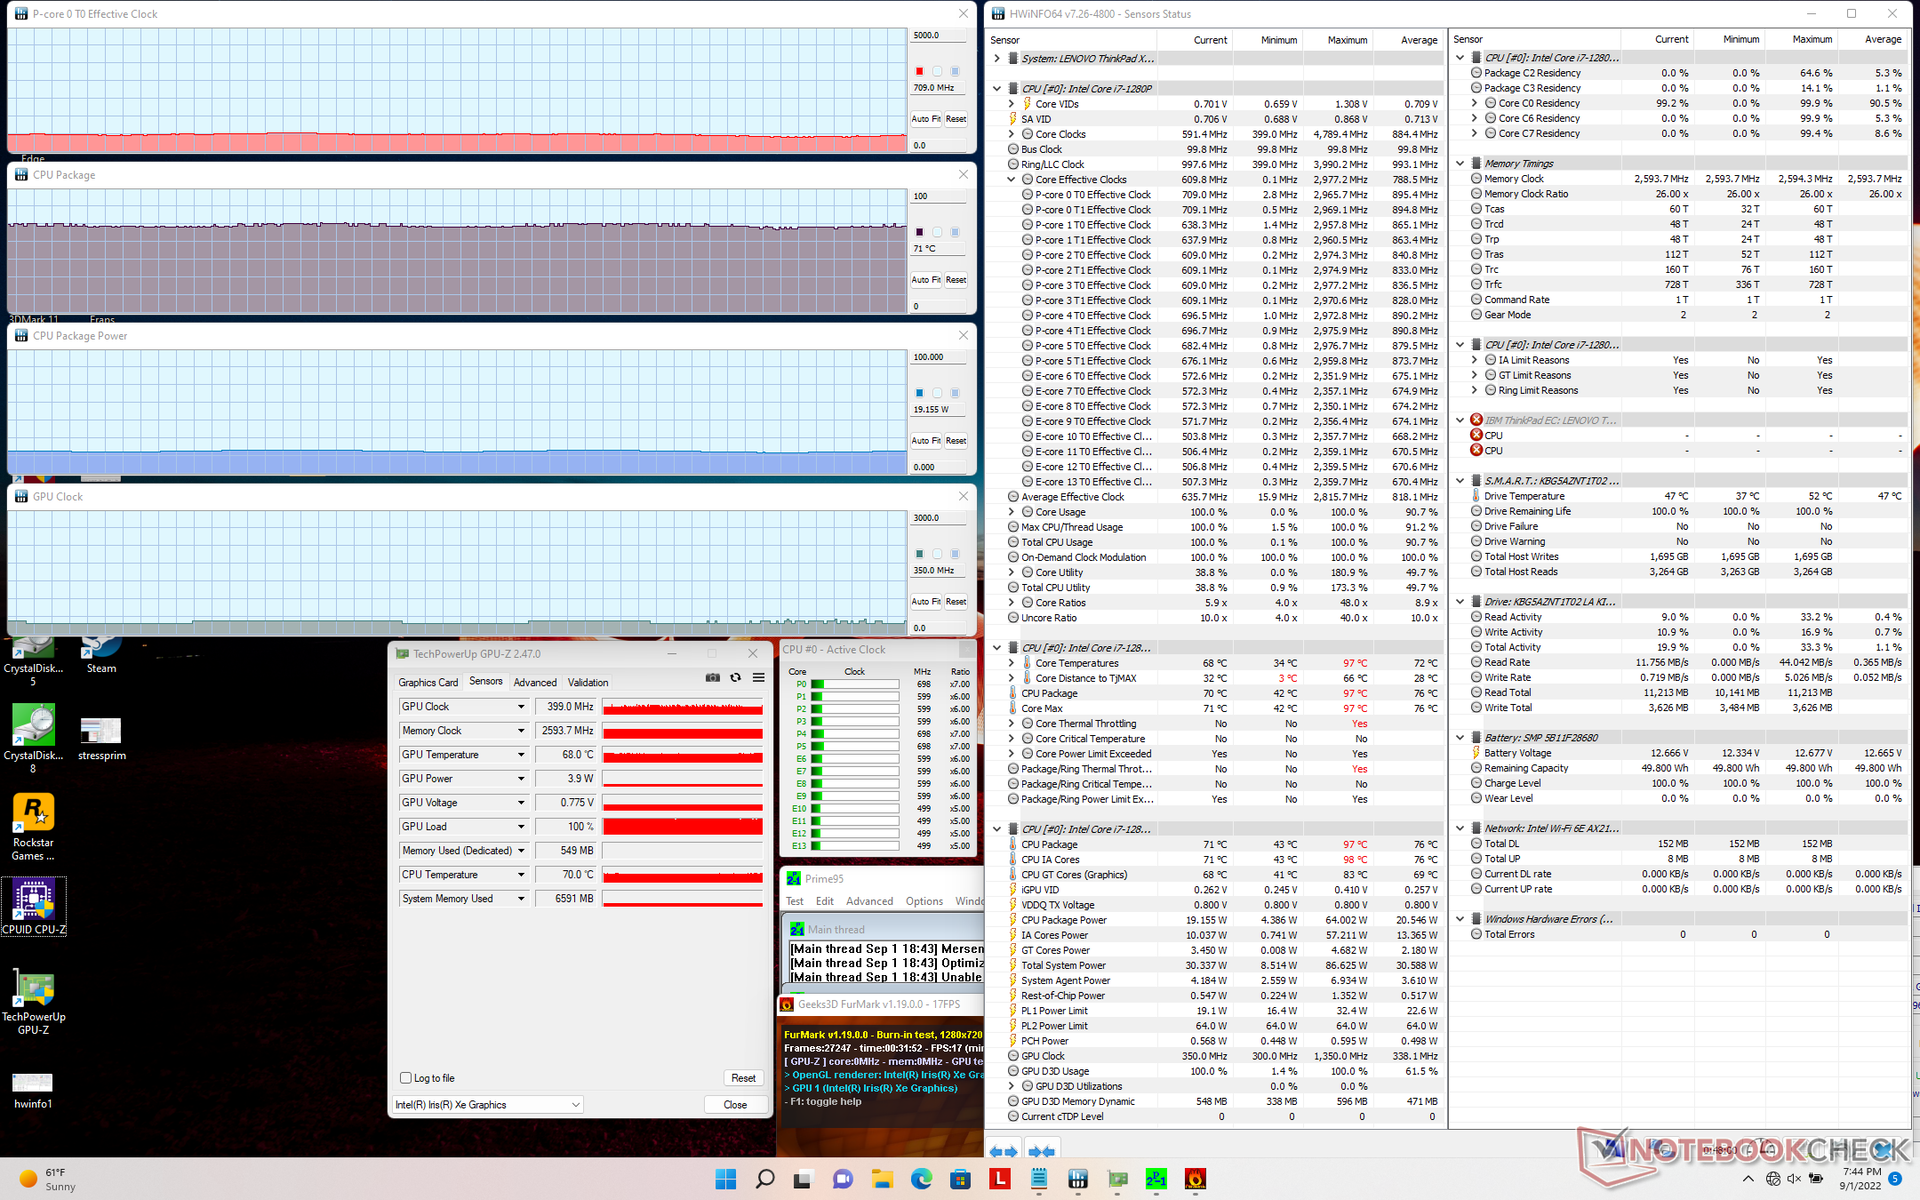
W teście Prime95 częstotliwość taktowania CPU i pobór mocy przez płytę główną wzrosły odpowiednio do 3 GHz i 64 W. Jednakże, temperatura wzrosłaby do alarmującego poziomu 97 C i tak maksymalne Turbo Boost trwałoby tylko przez kilka sekund, zanim częstotliwość taktowania i pobór mocy spadłyby do zaledwie 1,3 GHz i 23 W, odpowiednio, przy nieco niższej temperaturze rdzenia wynoszącej 85 C. Przeprowadzenie tego samego testu na większym i cięższym Laptop Framework wyposażonym w procesor i7-1260P uzyskałby wyższe stabilne częstotliwości taktowania, wynoszące dla porównania około 2,5 GHz.
Częstotliwości taktowania GPU i temperatura podczas pracy Witcher 3 ustabilizowałyby się na poziomie odpowiednio 948 MHz i 69 C, w porównaniu z 1396 MHz i 83 C we wspomnianym modelu Framework.
Wydajność nie spada w przypadku pracy na zasilaniu akumulatorowym. Test 3DMark 11 na akumulatorze przyniósł wyniki Fizyki i Grafiki na poziomie odpowiednio 13122 i 6668 punktów, w porównaniu do 11415 i 6937 punktów na zasilaniu sieciowym.
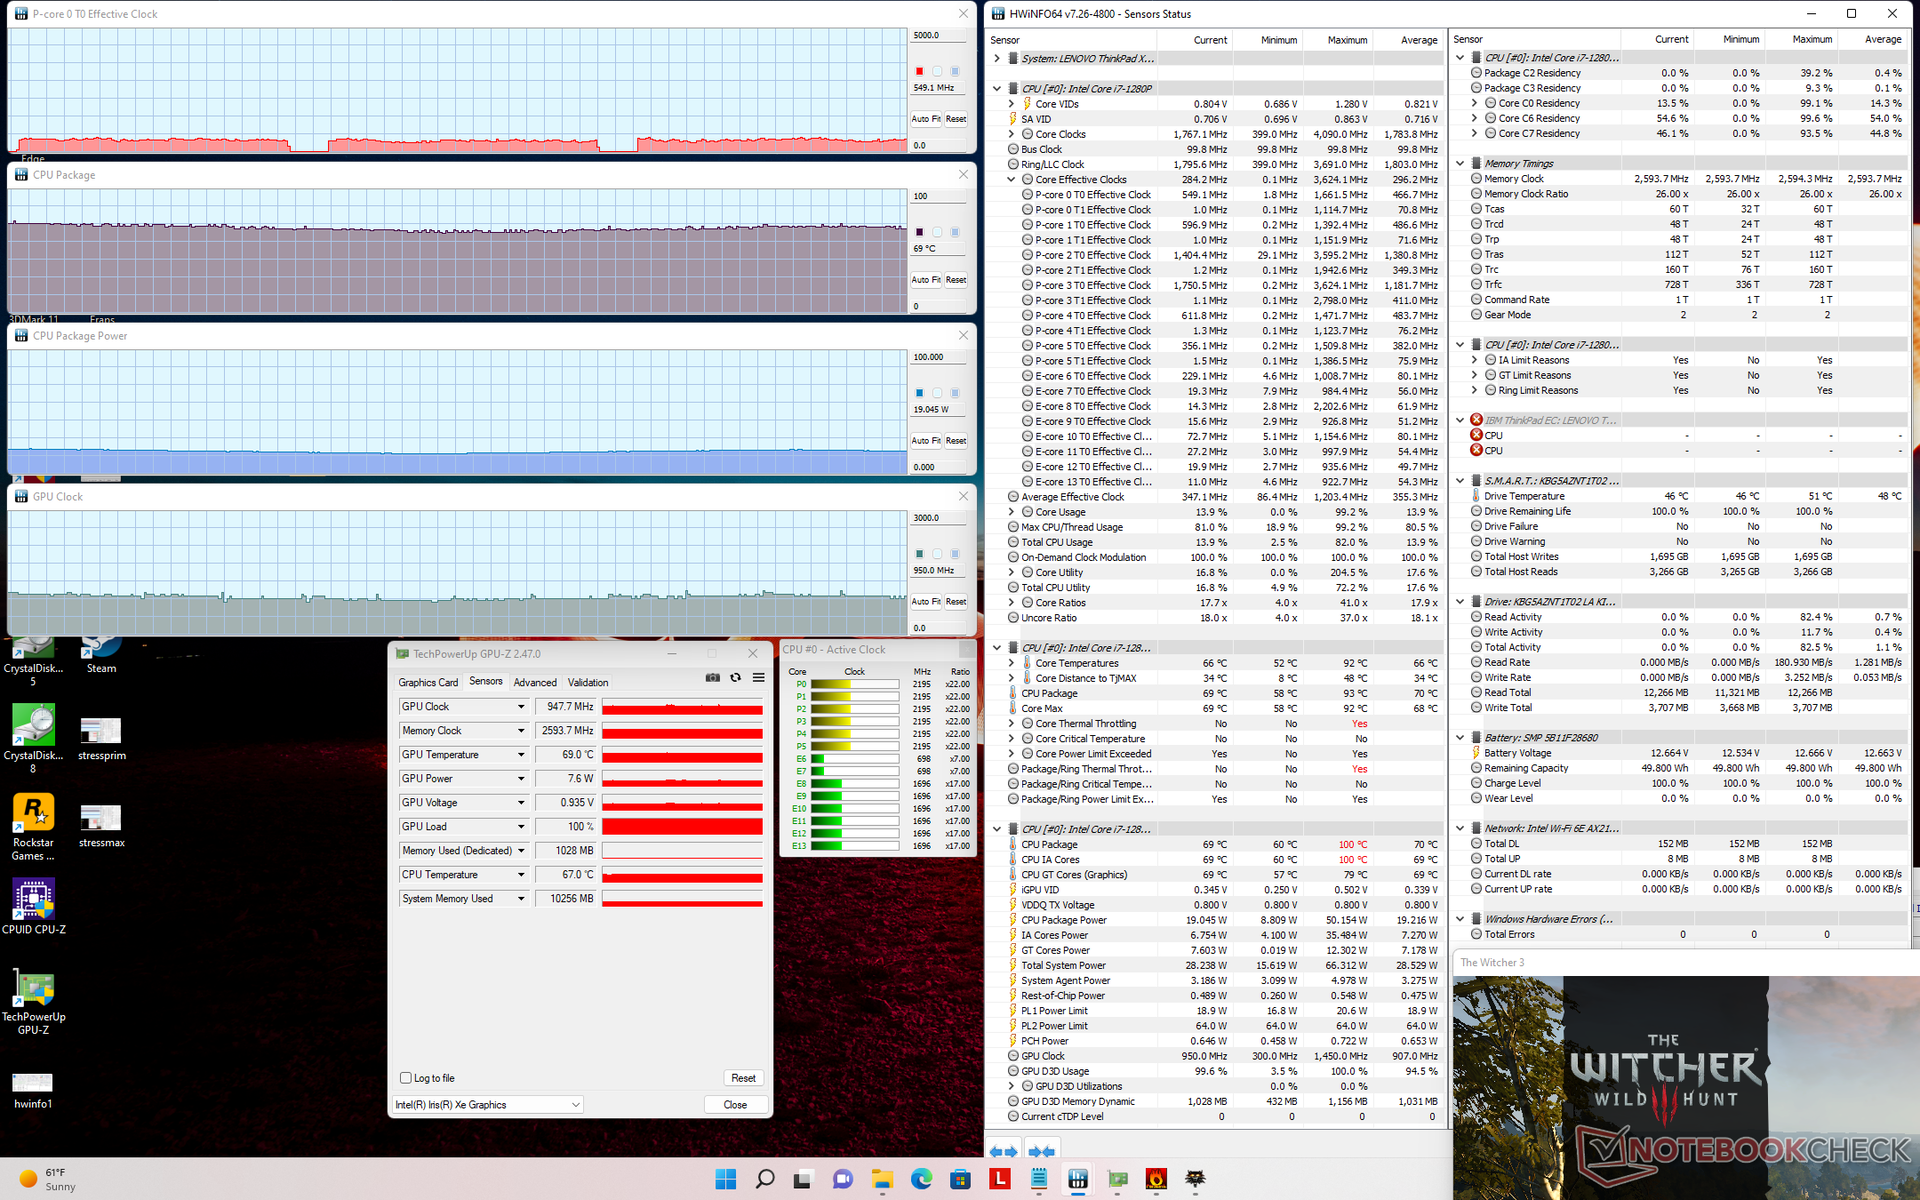
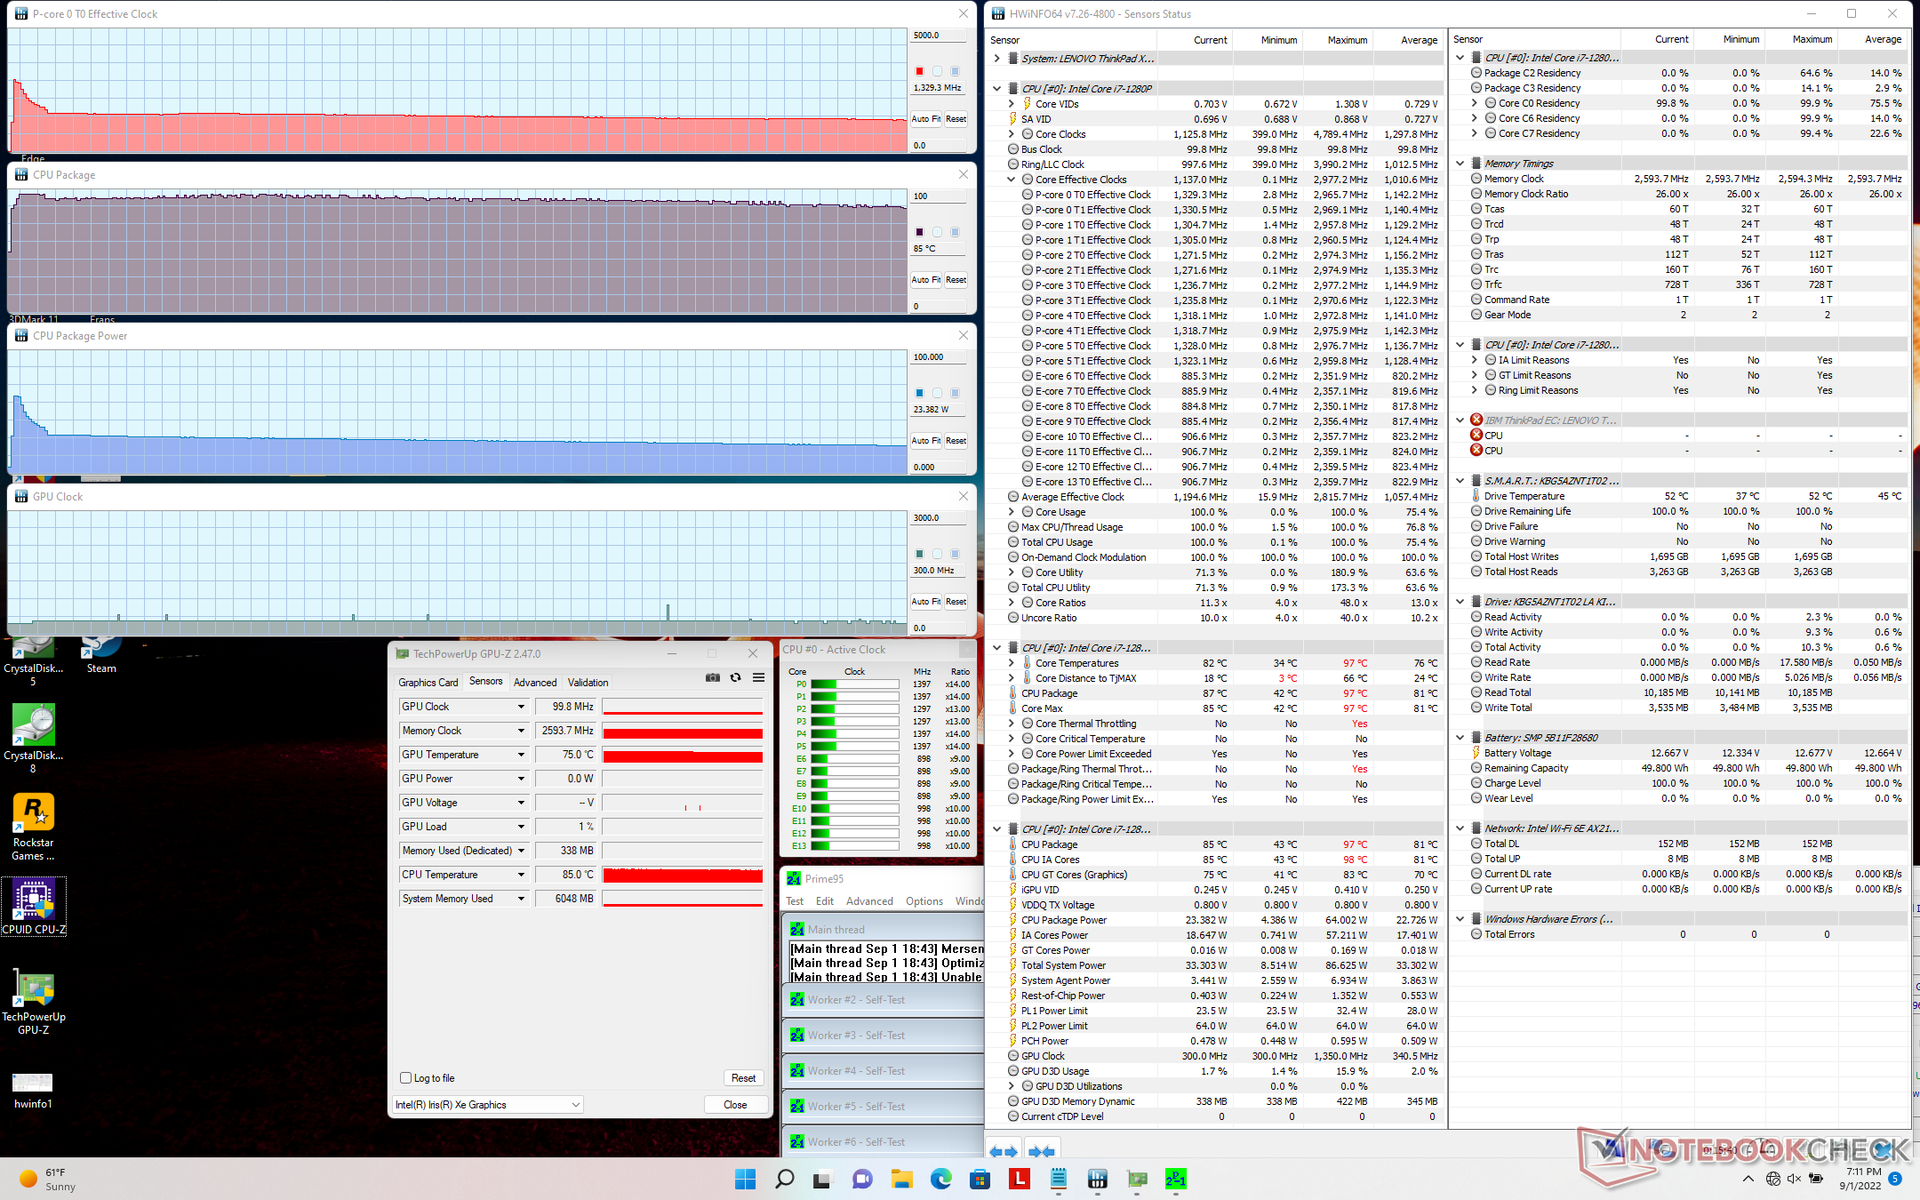
| ZegarCPU (GHz) | Zegar GPU (MHz) | Średnia temperatura CPU (°C) | |
| System w stanie bezczynności | -- | -- | 44 |
| Prime95 Stress | 1.3 | -- | 85 |
| Prime95+ FurMark Stress | 0.7 | 399 | 71 |
| Witcher 3 Stress | ~0,5 | 948 | 69 |
Mówcy
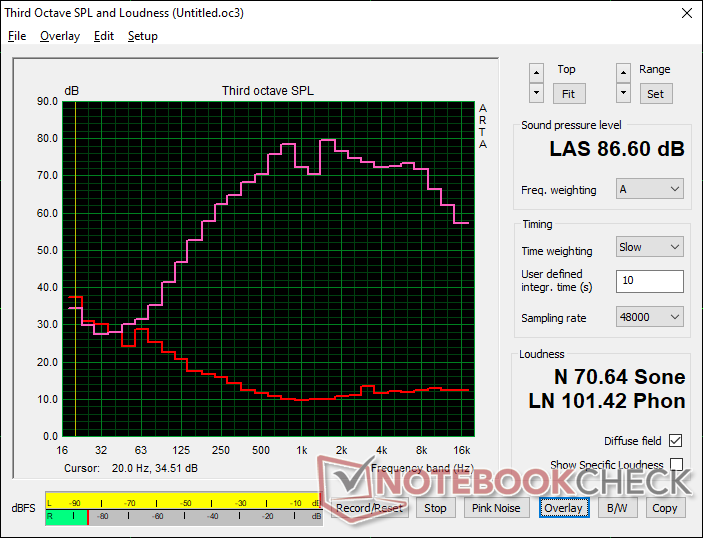
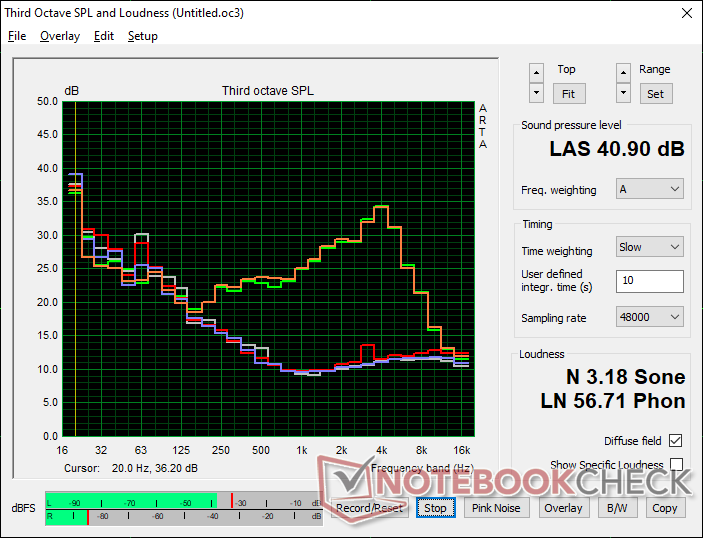
Lenovo ThinkPad X1 Nano Gen 2 Core i7-1280P analiza dźwięku
(+) | głośniki mogą odtwarzać stosunkowo głośno (86.6 dB)
Bas 100 - 315 Hz
(-) | prawie brak basu - średnio 16.3% niższa od mediany
(±) | liniowość basu jest średnia (8.4% delta do poprzedniej częstotliwości)
Średnie 400 - 2000 Hz
(+) | zbalansowane środki średnie - tylko 4% od mediany
(±) | liniowość środka jest średnia (7.3% delta do poprzedniej częstotliwości)
Wysokie 2–16 kHz
(+) | zrównoważone maksima - tylko 2.7% od mediany
(+) | wzloty są liniowe (3% delta do poprzedniej częstotliwości)
Ogólnie 100 - 16.000 Hz
(+) | ogólny dźwięk jest liniowy (12.8% różnicy w stosunku do mediany)
W porównaniu do tej samej klasy
» 19% wszystkich testowanych urządzeń w tej klasie było lepszych, 4% podobnych, 77% gorszych
» Najlepszy miał deltę 5%, średnia wynosiła ###średnia###%, najgorsza wynosiła 53%
W porównaniu do wszystkich testowanych urządzeń
» 12% wszystkich testowanych urządzeń było lepszych, 3% podobnych, 85% gorszych
» Najlepszy miał deltę 4%, średnia wynosiła ###średnia###%, najgorsza wynosiła 134%
Apple MacBook Pro 16 2021 M1 Pro analiza dźwięku
(+) | głośniki mogą odtwarzać stosunkowo głośno (84.7 dB)
Bas 100 - 315 Hz
(+) | dobry bas - tylko 3.8% od mediany
(+) | bas jest liniowy (5.2% delta do poprzedniej częstotliwości)
Średnie 400 - 2000 Hz
(+) | zbalansowane środki średnie - tylko 1.3% od mediany
(+) | średnie są liniowe (2.1% delta do poprzedniej częstotliwości)
Wysokie 2–16 kHz
(+) | zrównoważone maksima - tylko 1.9% od mediany
(+) | wzloty są liniowe (2.7% delta do poprzedniej częstotliwości)
Ogólnie 100 - 16.000 Hz
(+) | ogólny dźwięk jest liniowy (4.6% różnicy w stosunku do mediany)
W porównaniu do tej samej klasy
» 0% wszystkich testowanych urządzeń w tej klasie było lepszych, 0% podobnych, 100% gorszych
» Najlepszy miał deltę 5%, średnia wynosiła ###średnia###%, najgorsza wynosiła 45%
W porównaniu do wszystkich testowanych urządzeń
» 0% wszystkich testowanych urządzeń było lepszych, 0% podobnych, 100% gorszych
» Najlepszy miał deltę 4%, średnia wynosiła ###średnia###%, najgorsza wynosiła 134%
Zarządzanie energią
Pobór mocy
System jest generalnie bardziej wymagający od innych 13-calowych subnotebooków, gdyż jako jeden z niewielu posiada procesor z serii Core P. W stanie spoczynku na pulpicie pobiera od 3 do 15 W, podczas gdy HP Dragonfly G3, Latitude 7330lub oryginalny ThinkPad X1 Nano w podobnych warunkach pobierałyby 7 lub 9 W
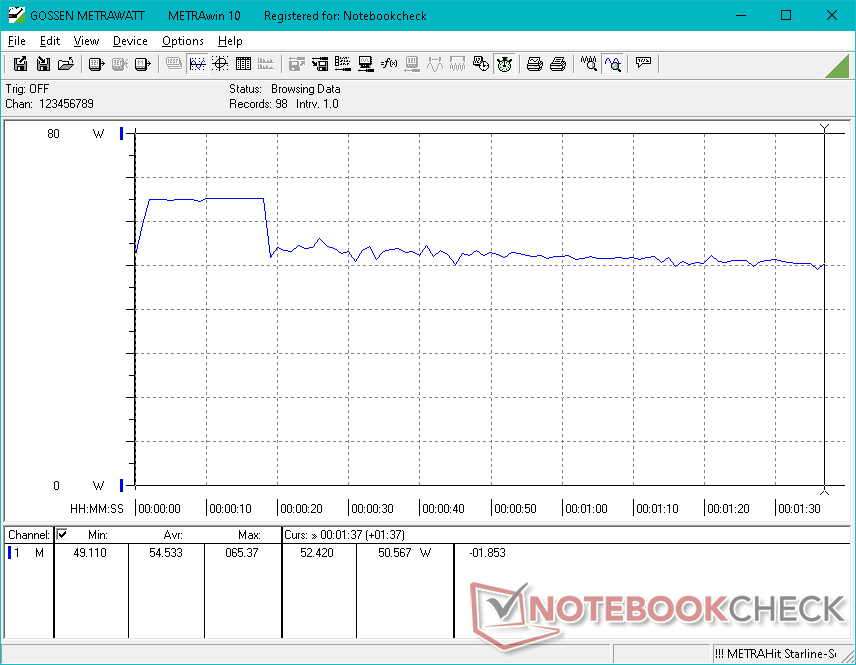
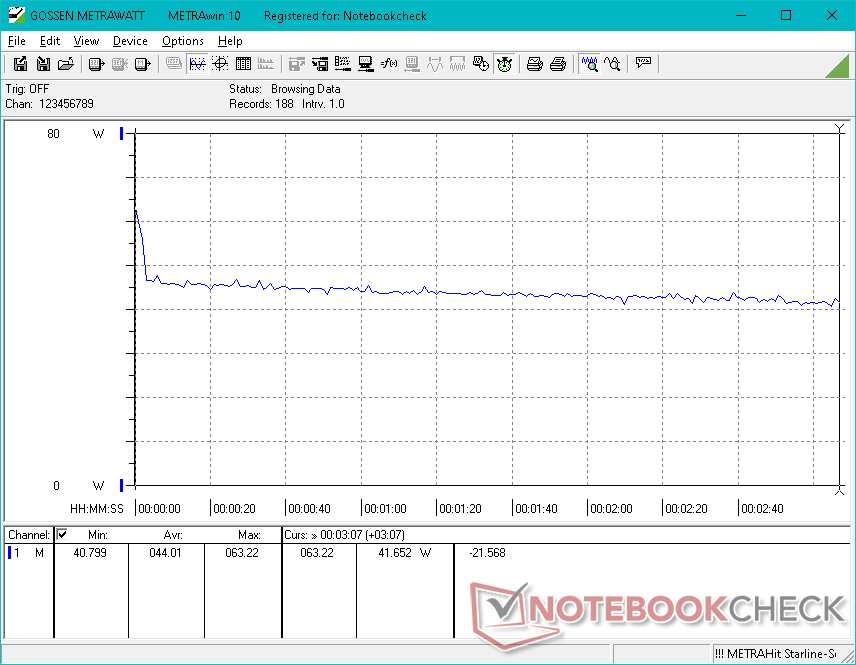
Różnice w poborze mocy rosną jeszcze bardziej przy bardziej wymagających obciążeniach. 3DMark 06 lub Witcher 3wymagałyby od 44 do 55 W, czyli znacznie więcej, niż wspomniane HP, Dell czy oryginalny X1 Nano. Procesor Core i7-1280P może i jest szybszy, ale z pewnością wiąże się to z kosztami
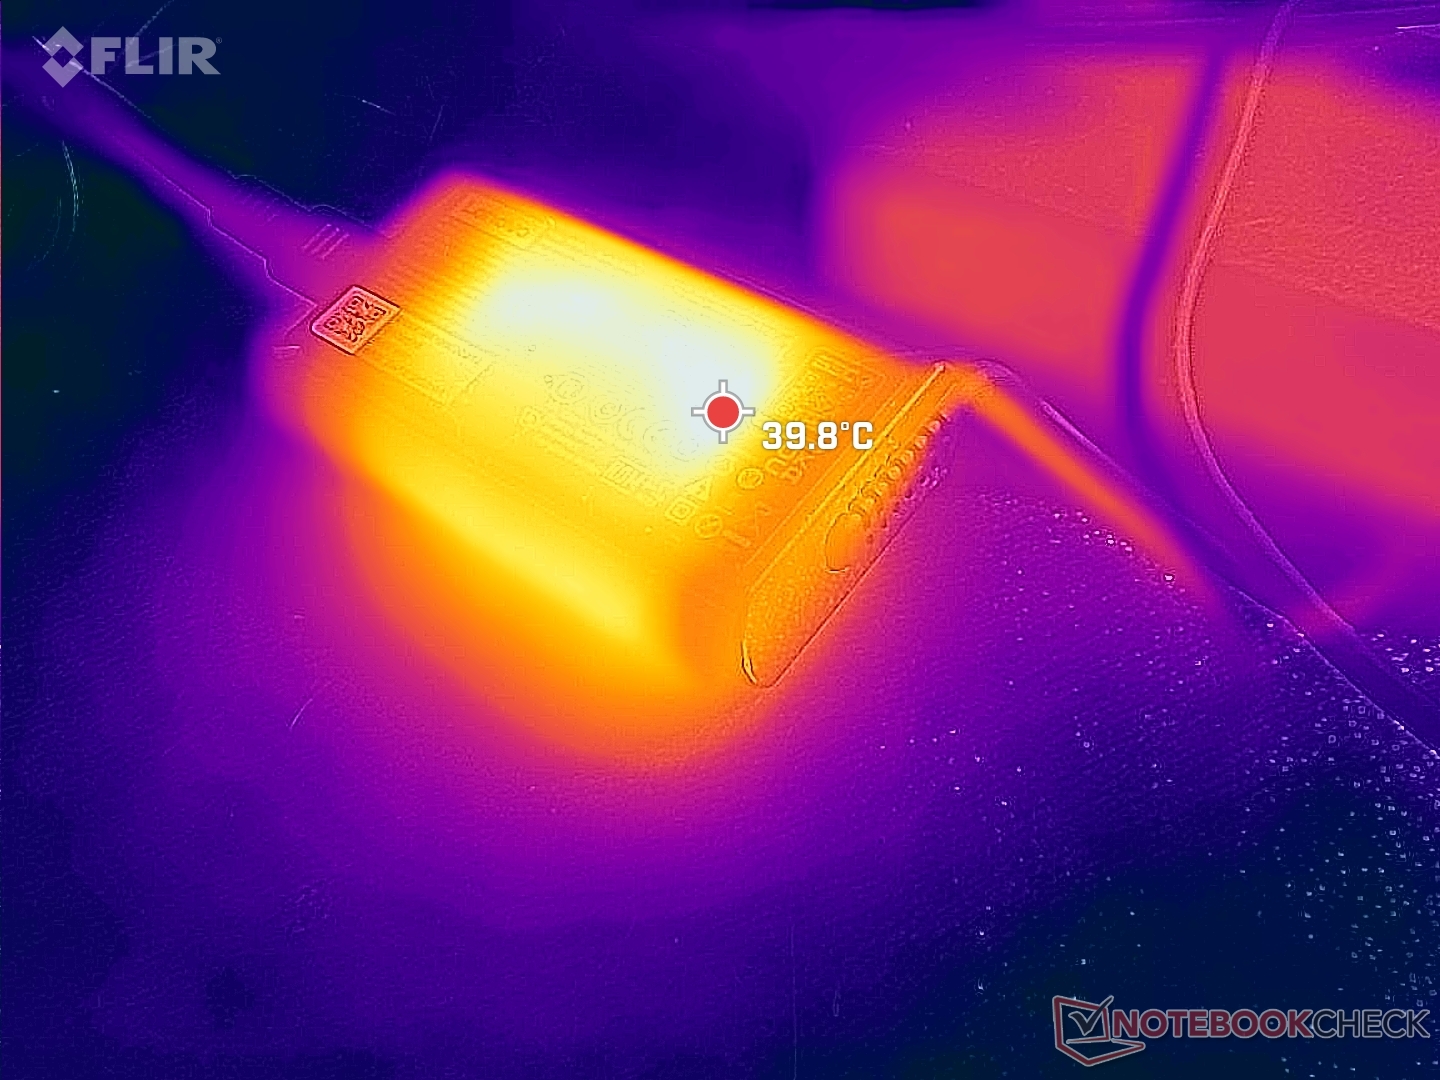
Z małego (~8,7 x 5,2 x 2,2 cm) zasilacza sieciowego o mocy 65,4 W jesteśmy w stanie zarejestrować chwilowy maksymalny pobór mocy, zanim włączy się throttling, co pokazują nasze zrzuty ekranu poniżej.
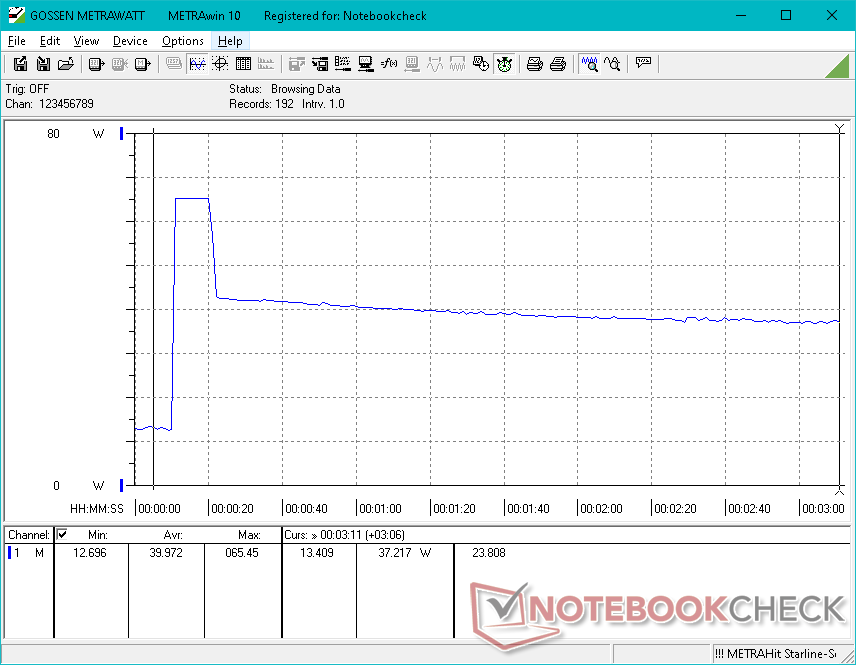
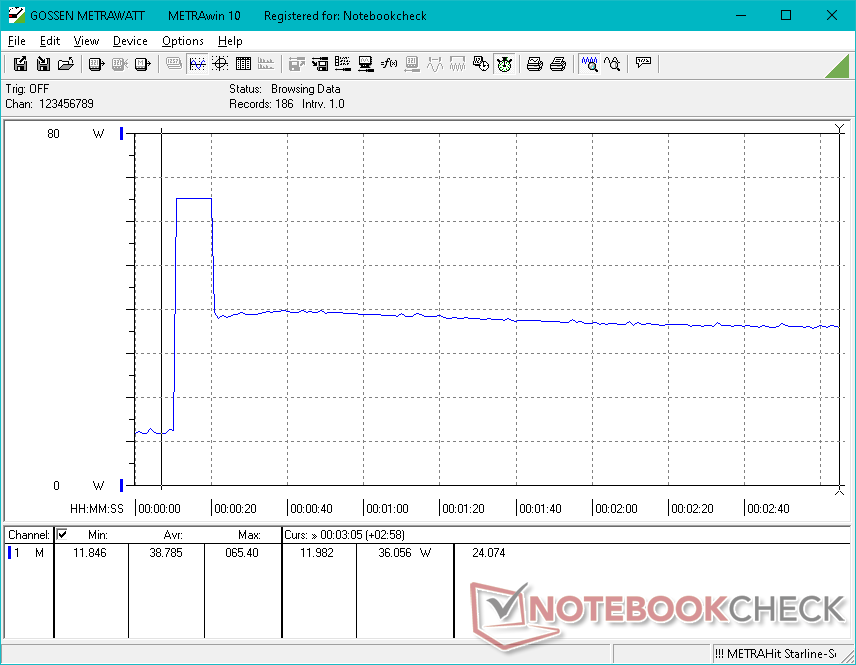
| wyłączony / stan wstrzymania | |
| luz | |
| obciążenie |
|
Legenda:
min: | |
| Lenovo ThinkPad X1 Nano Gen 2 Core i7-1280P i7-1280P, Iris Xe G7 96EUs, Kioxia BG5 KBG5AZNT1T02, IPS, 2160x1350, 13" | Lenovo ThinkPad X1 Nano-20UN002UGE i7-1160G7, Iris Xe G7 96EUs, WDC PC SN530 SDBPNPZ-512G, IPS, 2160x1350, 13" | HP Elite Dragonfly G3 i7-1265U, Iris Xe G7 96EUs, Micron 3400 MTFDKBA512TFH 512GB, IPS, 1920x1280, 13.5" | Dell Latitude 13 7330 i7-1265U, Iris Xe G7 96EUs, Toshiba KBG40ZNS512G NVMe, IPS, 1920x1080, 13.3" | Framework Laptop 13.5 12th Gen Intel i7-1260P, Iris Xe G7 96EUs, WDC PC SN730 SDBPNTY-512G, IPS, 2256x1504, 13.5" | Huawei MateBook X Pro 2021 i7-1165G7, Iris Xe G7 96EUs, Samsung PM981a MZVLB1T0HBLR, IPS, 3000x2000, 13.9" | |
|---|---|---|---|---|---|---|
| Power Consumption | 25% | 16% | 21% | -11% | -11% | |
| Idle Minimum * (Watt) | 3.4 | 3.3 3% | 3.4 -0% | 2.8 18% | 5.3 -56% | 6.7 -97% |
| Idle Average * (Watt) | 6.5 | 5.7 12% | 5.6 14% | 4.8 26% | 8.4 -29% | 10 -54% |
| Idle Maximum * (Watt) | 14.4 | 9.1 37% | 8.4 42% | 7.3 49% | 11.2 22% | 10.3 28% |
| Load Average * (Watt) | 54.5 | 29.6 46% | 40.8 25% | 48.1 12% | 57.4 -5% | 35.7 34% |
| Witcher 3 ultra * (Watt) | 44 | 27.7 37% | 35.5 19% | 35.4 20% | 46.7 -6% | 32.7 26% |
| Load Maximum * (Watt) | 65.4 | 55.1 16% | 68.4 -5% | 63.6 3% | 61.2 6% | 67.6 -3% |
* ... im mniej tym lepiej
Power Consumption Witcher 3 / Stresstest
Power Consumption external Monitor
Czas pracy na baterii
Czasy pracy są o wiele krótsze, niż w zeszłorocznym modelu, i to o prawie połowę (!) nawet przy zrównoważonym profilu zasilania, co jest prawdopodobnie spowodowane bardziej wymagającym procesorem z serii Core P. Przy zaledwie 5 godzinach pracy w sieci WLAN X1 Nano Gen 2 nie będzie działał tak długo jak większość innych subnotebooków.
| Lenovo ThinkPad X1 Nano Gen 2 Core i7-1280P i7-1280P, Iris Xe G7 96EUs, 49.5 Wh | Lenovo ThinkPad X1 Nano-20UN002UGE i7-1160G7, Iris Xe G7 96EUs, 48.2 Wh | HP Elite Dragonfly G3 i7-1265U, Iris Xe G7 96EUs, 68 Wh | Dell Latitude 13 7330 i7-1265U, Iris Xe G7 96EUs, 41 Wh | Framework Laptop 13.5 12th Gen Intel i7-1260P, Iris Xe G7 96EUs, 55 Wh | Huawei MateBook X Pro 2021 i7-1165G7, Iris Xe G7 96EUs, 56 Wh | |
|---|---|---|---|---|---|---|
| Czasy pracy | 94% | 131% | 63% | 47% | 106% | |
| WiFi v1.3 (h) | 5.1 | 9.9 94% | 11.8 131% | 8.3 63% | 7.5 47% | 10.5 106% |
| H.264 (h) | 15.4 | |||||
| Load (h) | 1.6 | 3.5 | 1.4 | 3 | ||
| Reader / Idle (h) | 37.8 | 21.9 | 19.5 |
Za
Przeciw
Werdykt - Lekki sprinter, ale nie maratończyk
ThinkPad X1 Nano Gen 2 jest doskonałym przykładem tego, co dzieje się, gdy wymieniasz procesor 15 W na procesor 28 W w laptopie zaprojektowanym pierwotnie do pracy z procesorem 15 W. Zobaczysz szybsze działanie, ale ten wzrost wydajności będzie tylko w krótkich seriach ze względu na ograniczenia rozwiązania chłodzącego. System jest więc najlepszy tam, gdzie krótkie wybuchy wysokiej wydajności mogą się przydać, np. przy uruchamianiu aplikacji, sporadycznej edycji zdjęć czy rozpakowywaniu małych plików. Jeśli jednak zamierzasz używać laptopa do intensywnych prac z procesorem trwających przez dłuższy czas, to tutejszy procesor może nie być tak szybki, jak byś tego oczekiwał. Należy pamiętać, że jest to wspólna wada większości, jeśli nie wszystkich superlekkich (<1 kg) laptopów, takich jak np Dragonfly G3, Latitude 7330lub LG Gram.
Innym ważnym aspektem do rozważenia jest to, że czas pracy na baterii został znacznie skrócony, ponieważ pojemność baterii pozostaje zasadniczo niezmieniona pomimo nowszego i bardziej wymagającego mocy procesora. W rezultacie możesz potrzebować bardziej uważać na ładowanie podczas podróży.
ThinkPad X1 Nano Gen 2 jest bezsprzecznie szybszy od oryginalnego modelu Gen 1, ale odbywa się to kosztem krótszych czasów pracy i potencjalnego dławienia wydajności.
Pomimo ograniczonej trwałości Turbo Boost procesora, X1 Nano Gen 2 jest nadal znacznie szybszym systemem niż starszy model Gen 1 bez konieczności zmiany czegokolwiek w obudowie, wyświetlaczu czy wadze. Użytkownicy szukający maksymalnej wydajności procesora mogą rozważyć cięższe laptopy z mocniejszymi rozwiązaniami chłodzącymi, jak np ThinkPad serii T zamiast.
Cena i dostępność
ThinkPad X1 Nano Gen 2 jest już szeroko dostępny za pośrednictwem resellerów, takich jak Amazon oraz Newegg w cenie od 1700 USD w przypadku konfiguracji z procesorem Core i5 i wyświetlaczem FHD do 2300 USD w przypadku konfiguracji z procesorem Core i7 i wyświetlaczem 2K. Alternatywnie, użytkownicy mogą zakupić bezpośrednio od Lenovo.
Lenovo ThinkPad X1 Nano Gen 2 Core i7-1280P
- 04/09/2022 v7 (old)
Allen Ngo
Price comparison

