Recenzja high-endowego komputera stacjonarnego XMG SECTOR z procesorem Intel Core i9-13900K i Nvidią GeForce RTX 4090

Wielu osobom Schenker kojarzy się z mocnymi laptopami. Dodany branding "XMG" wskazuje na high-endowe urządzenia gamingowe, do których tymczasem zaliczają się również komputery stacjonarne. W tej recenzji skupimy się na opartym na Intelu modelu XMG SECTOR. Podstawowa konfiguracja kosztuje 1 239 euro (1 306 dolarów) i jest wyposażona w procesor Intel Core i5-12400F, 16 GB pamięci RAM i kartę graficzną Nvidia GeForce RTX 3060. Nasz egzemplarz recenzencki to model high-end wyposażony w Core i9-13900K i GeForce RTX 4090ale ma też bardzo wysoką cenę, wynoszącą około 4 700 euro (4 956 dolarów). Jednak dzięki wielu opcjom oferowanym przez sklep XMGmożna wyposażyć komputer w różne komponenty sprzętowe i złożyć system dostosowany specjalnie do swoich potrzeb.
Szczegółowe spojrzenie na XMG SECTOR Intel
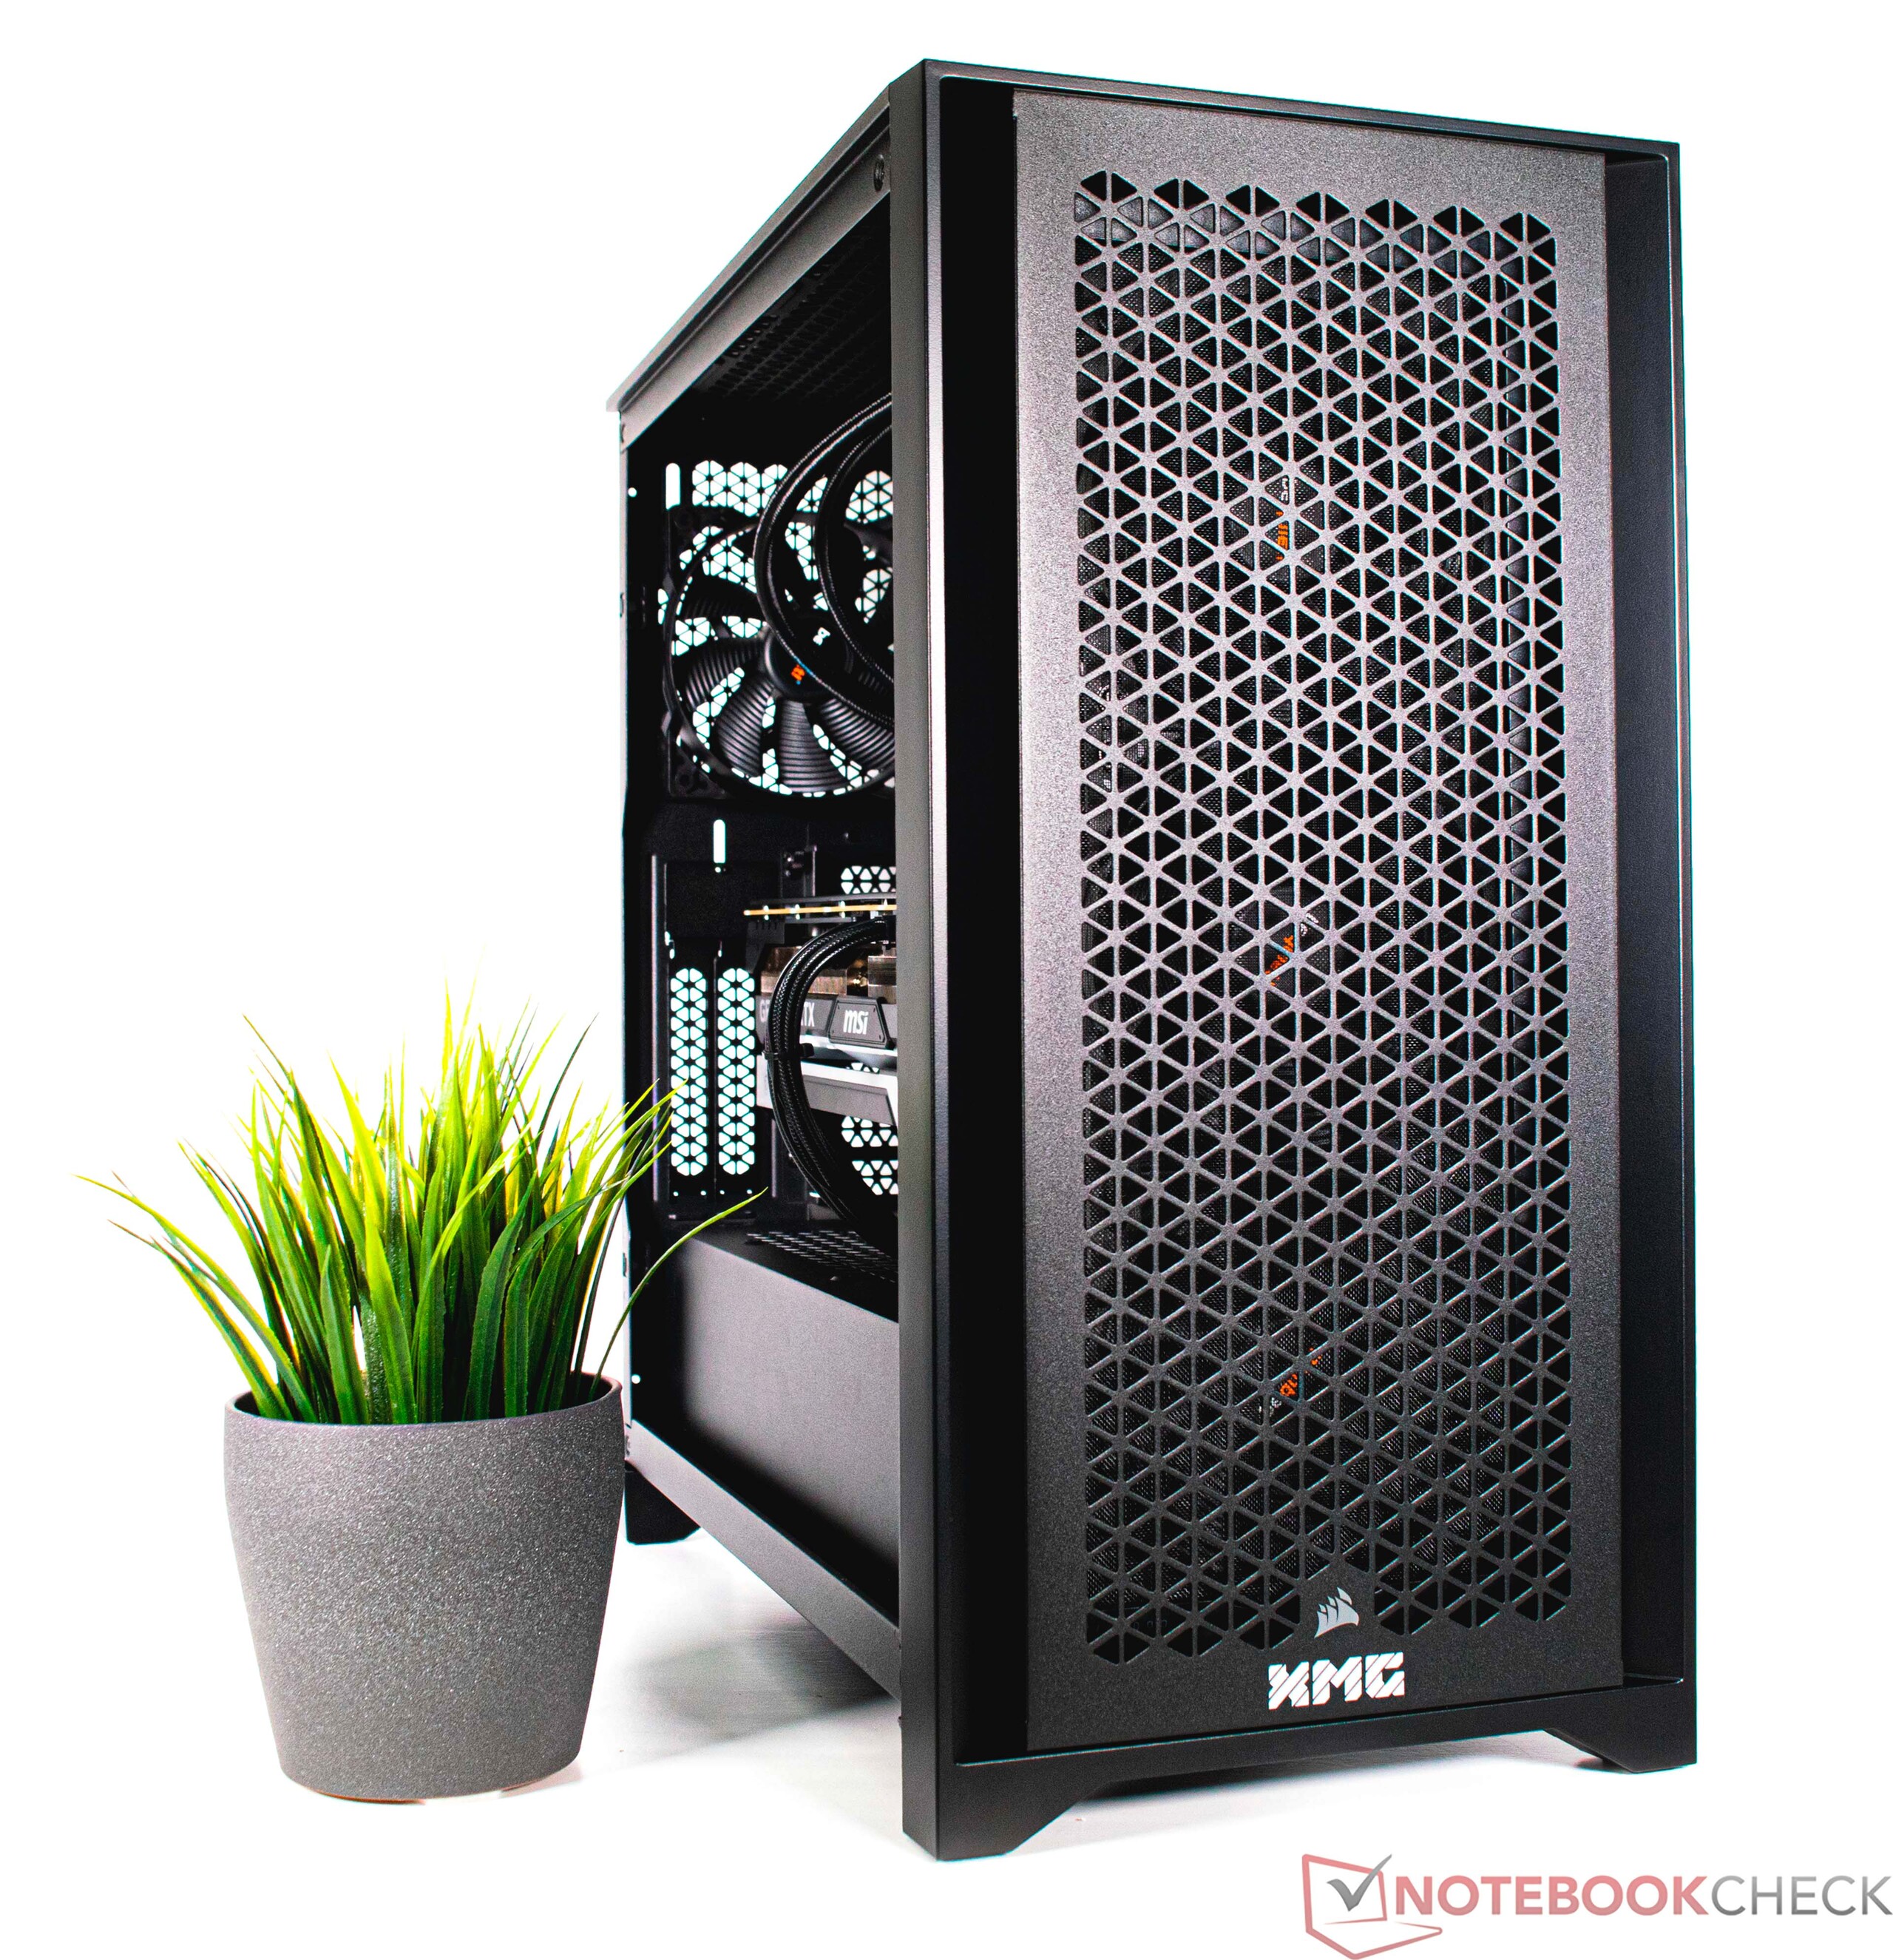
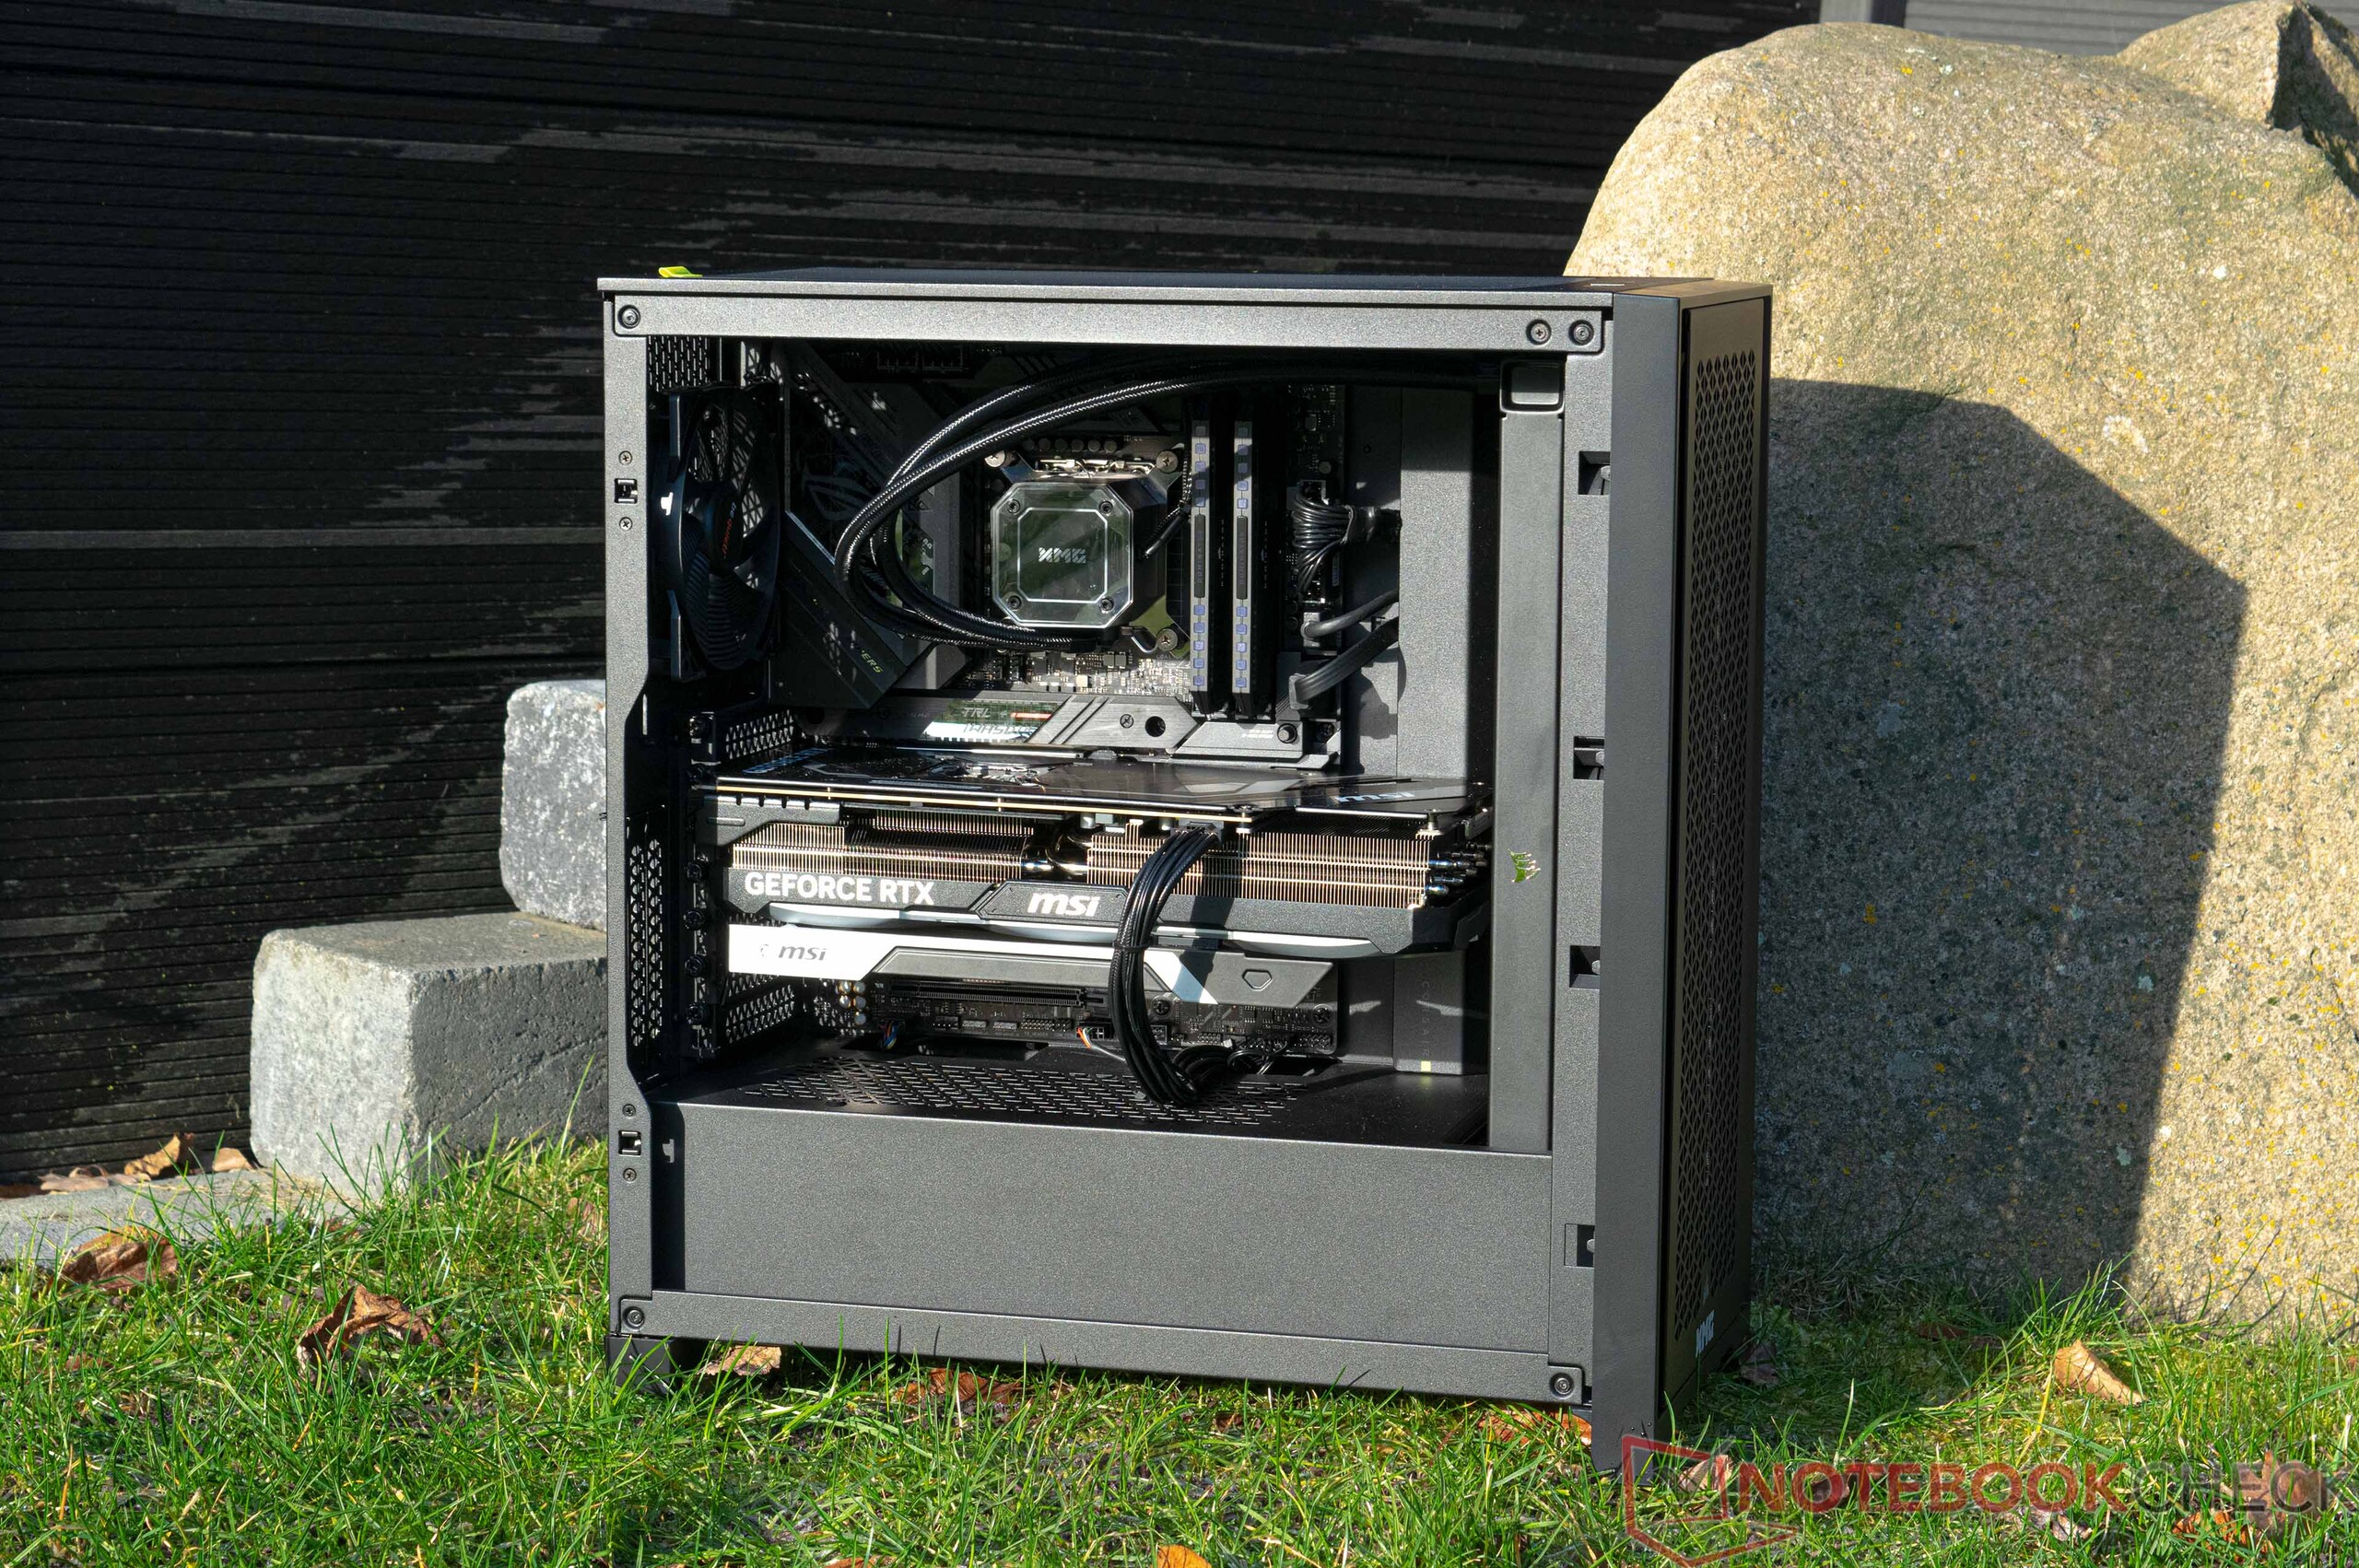
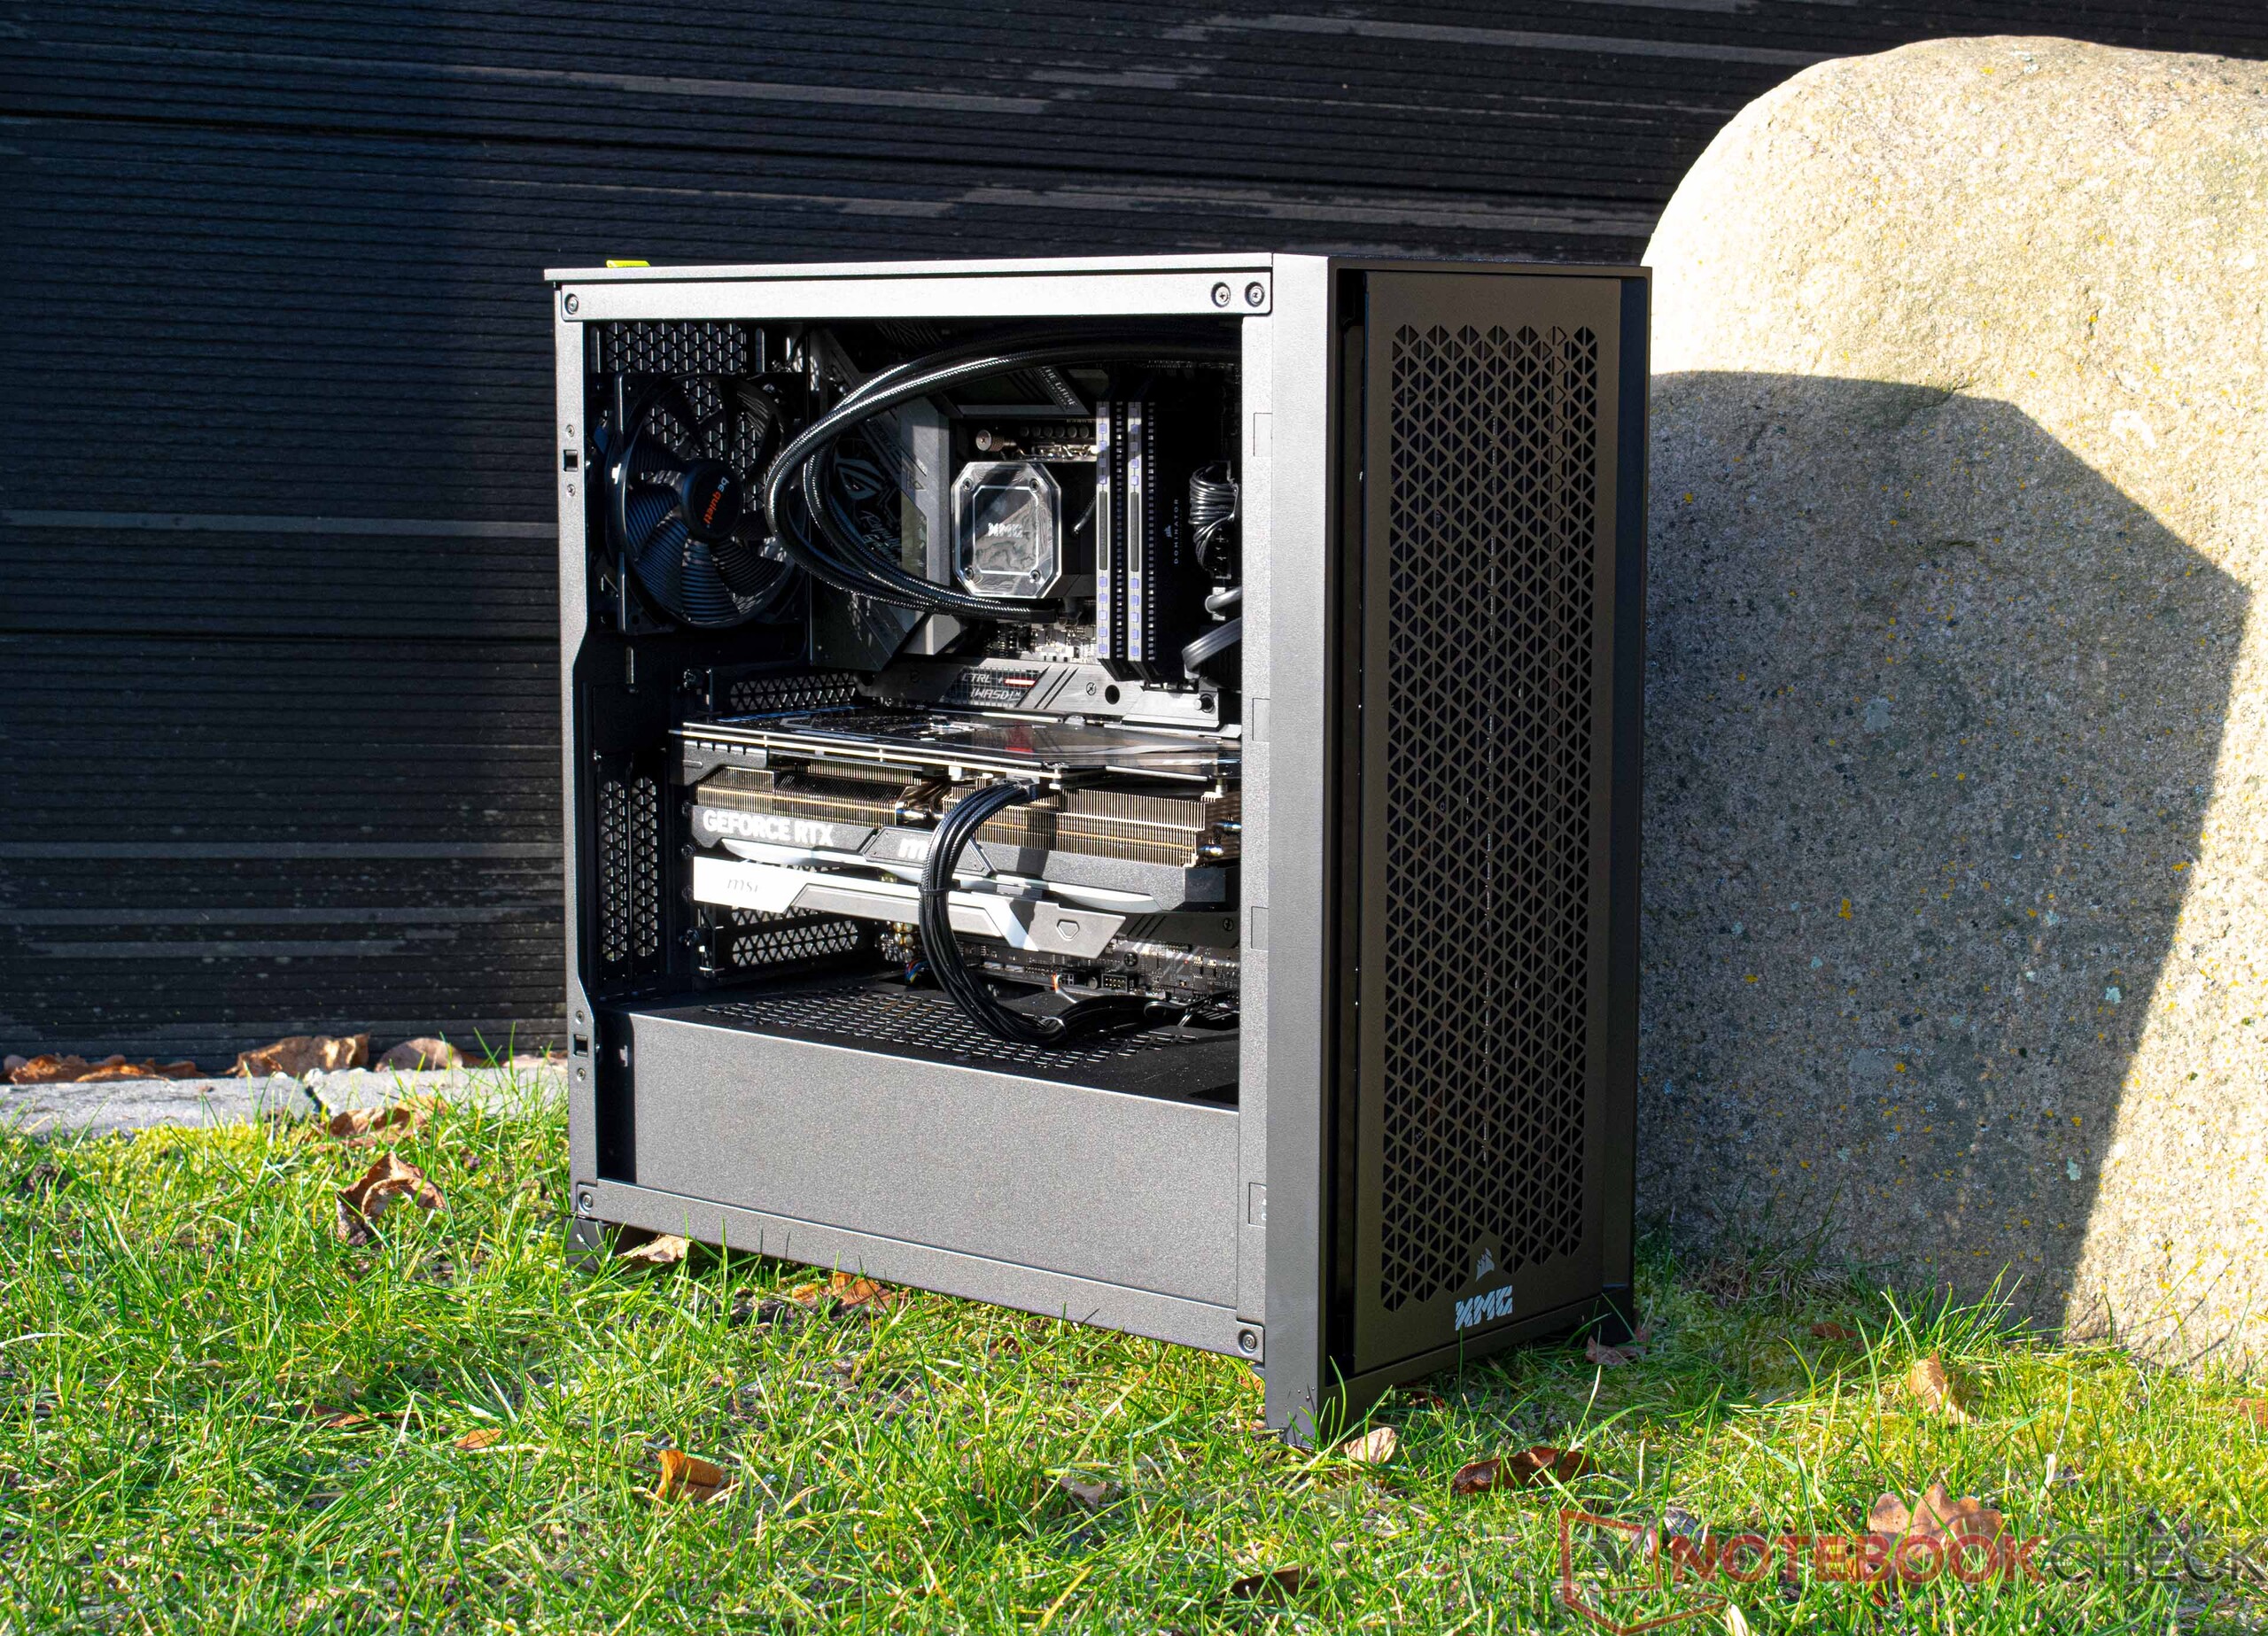
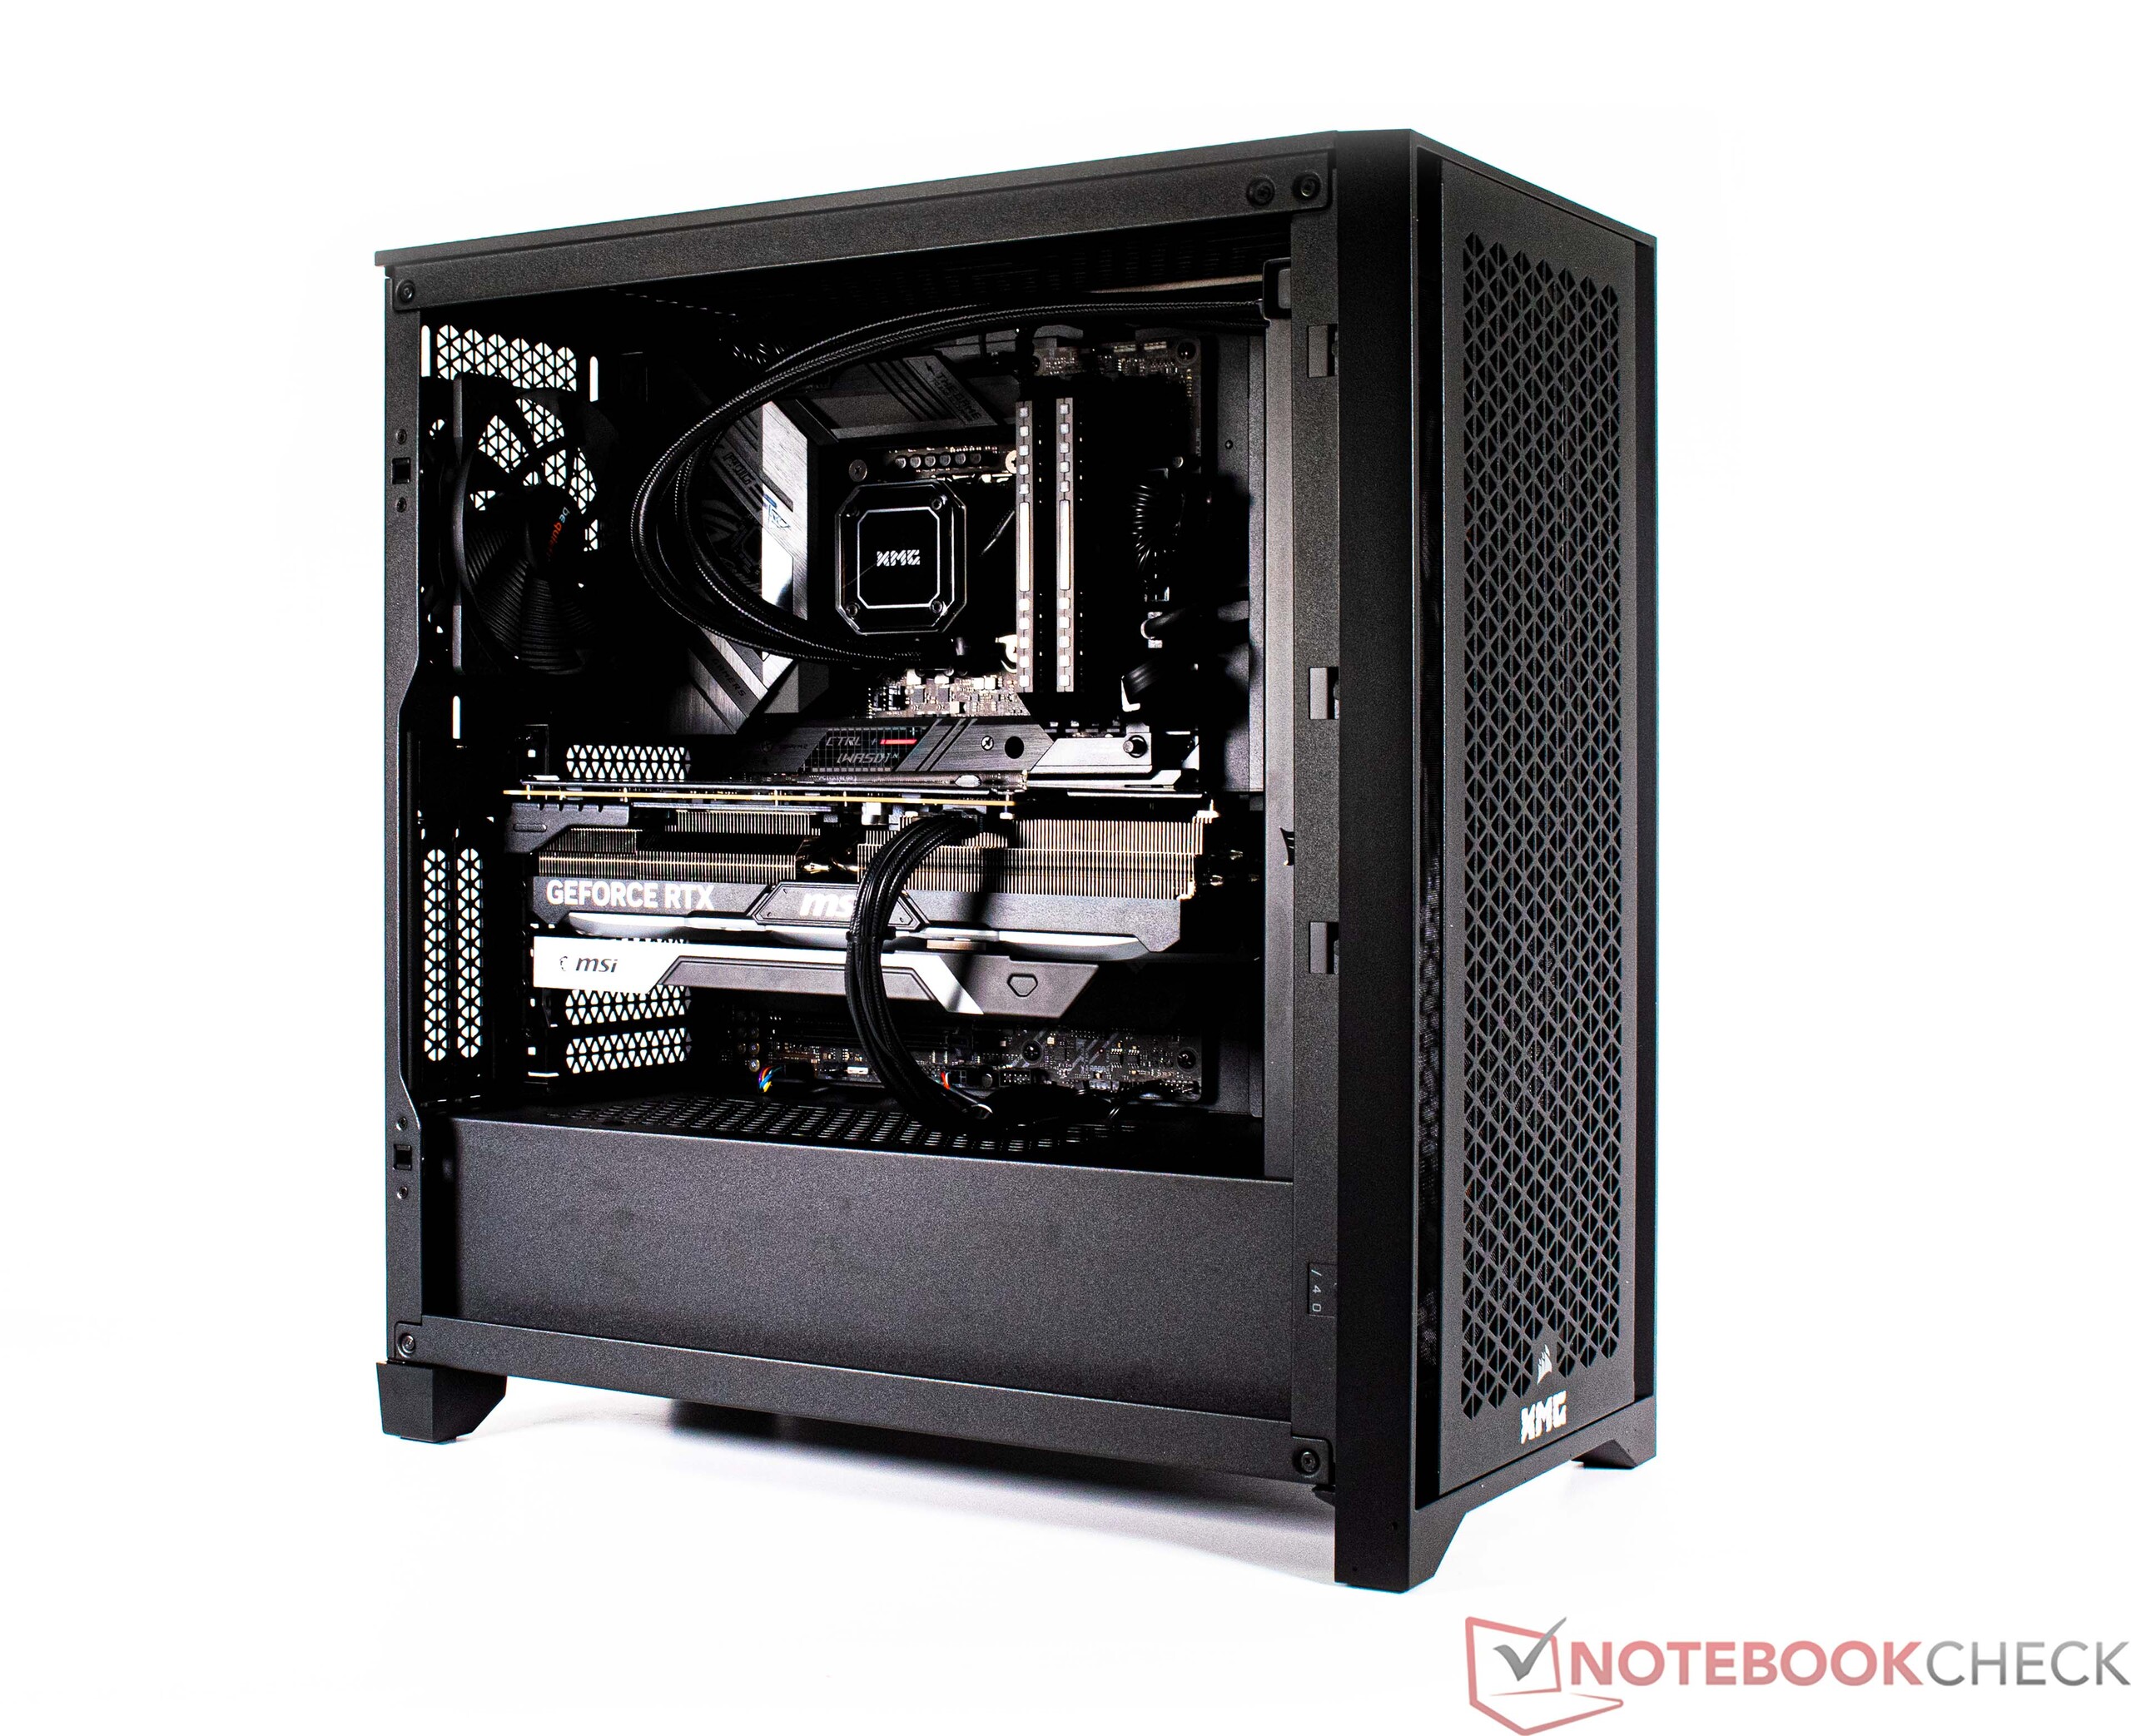
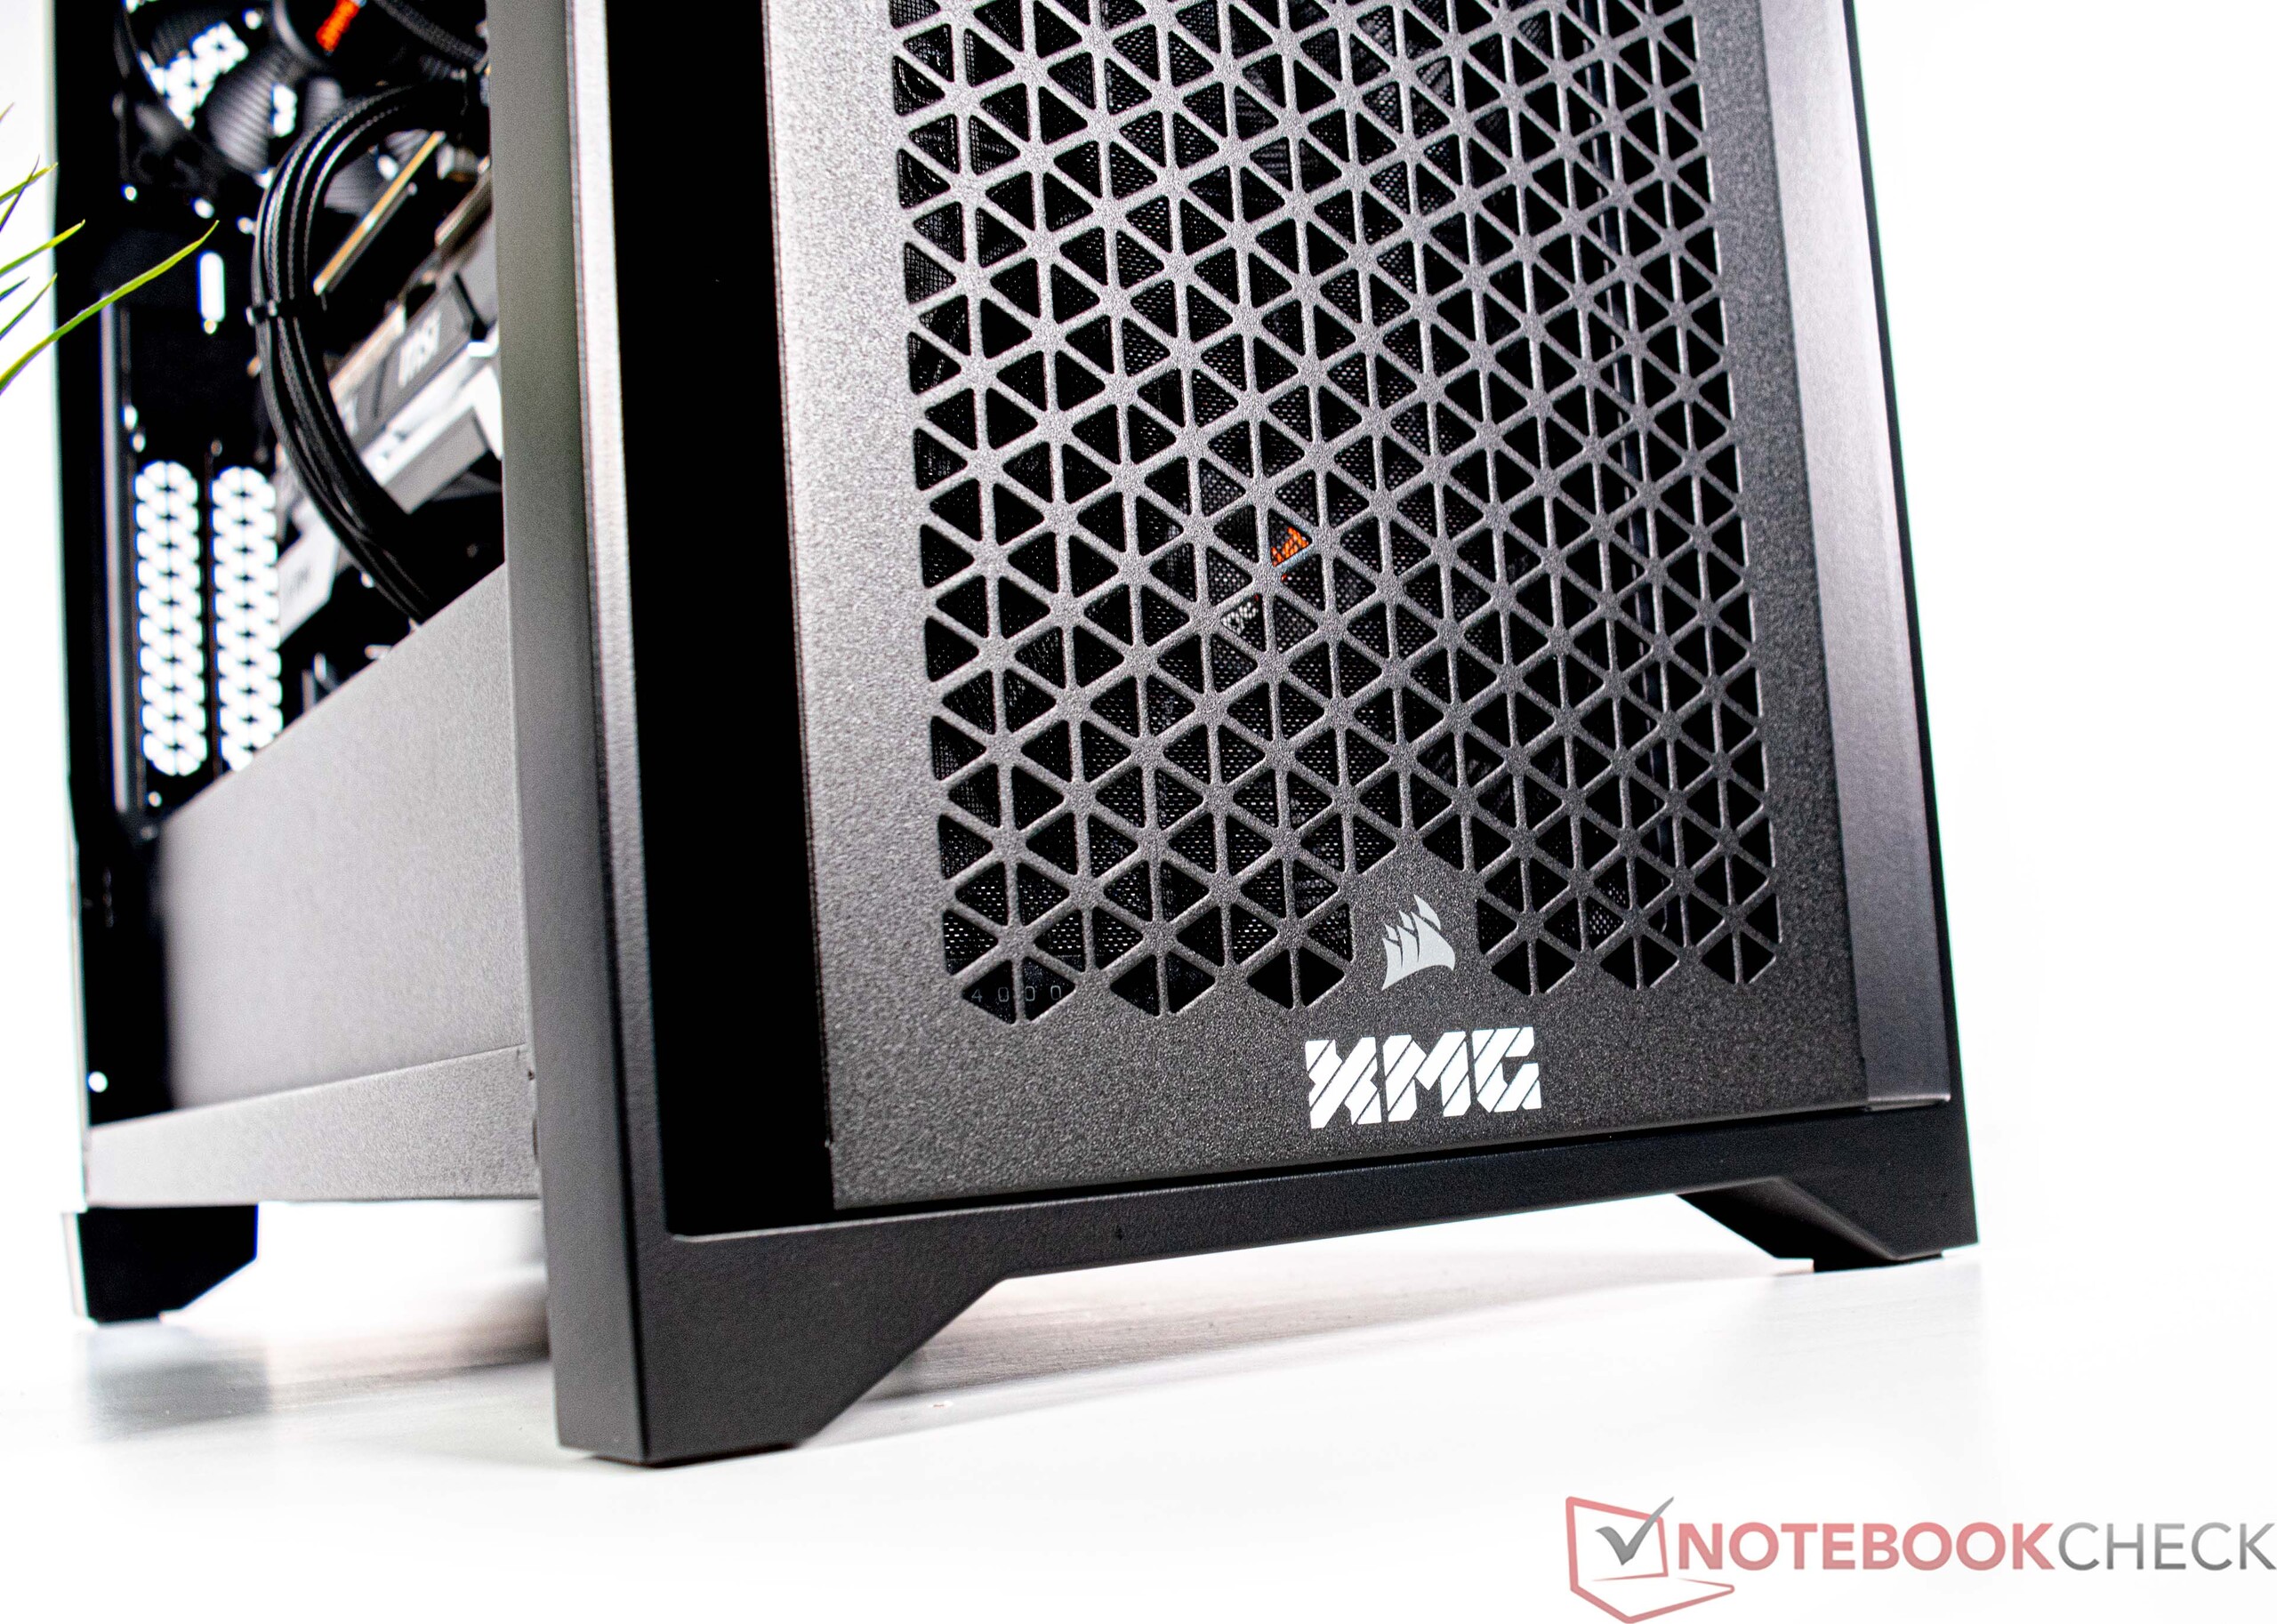
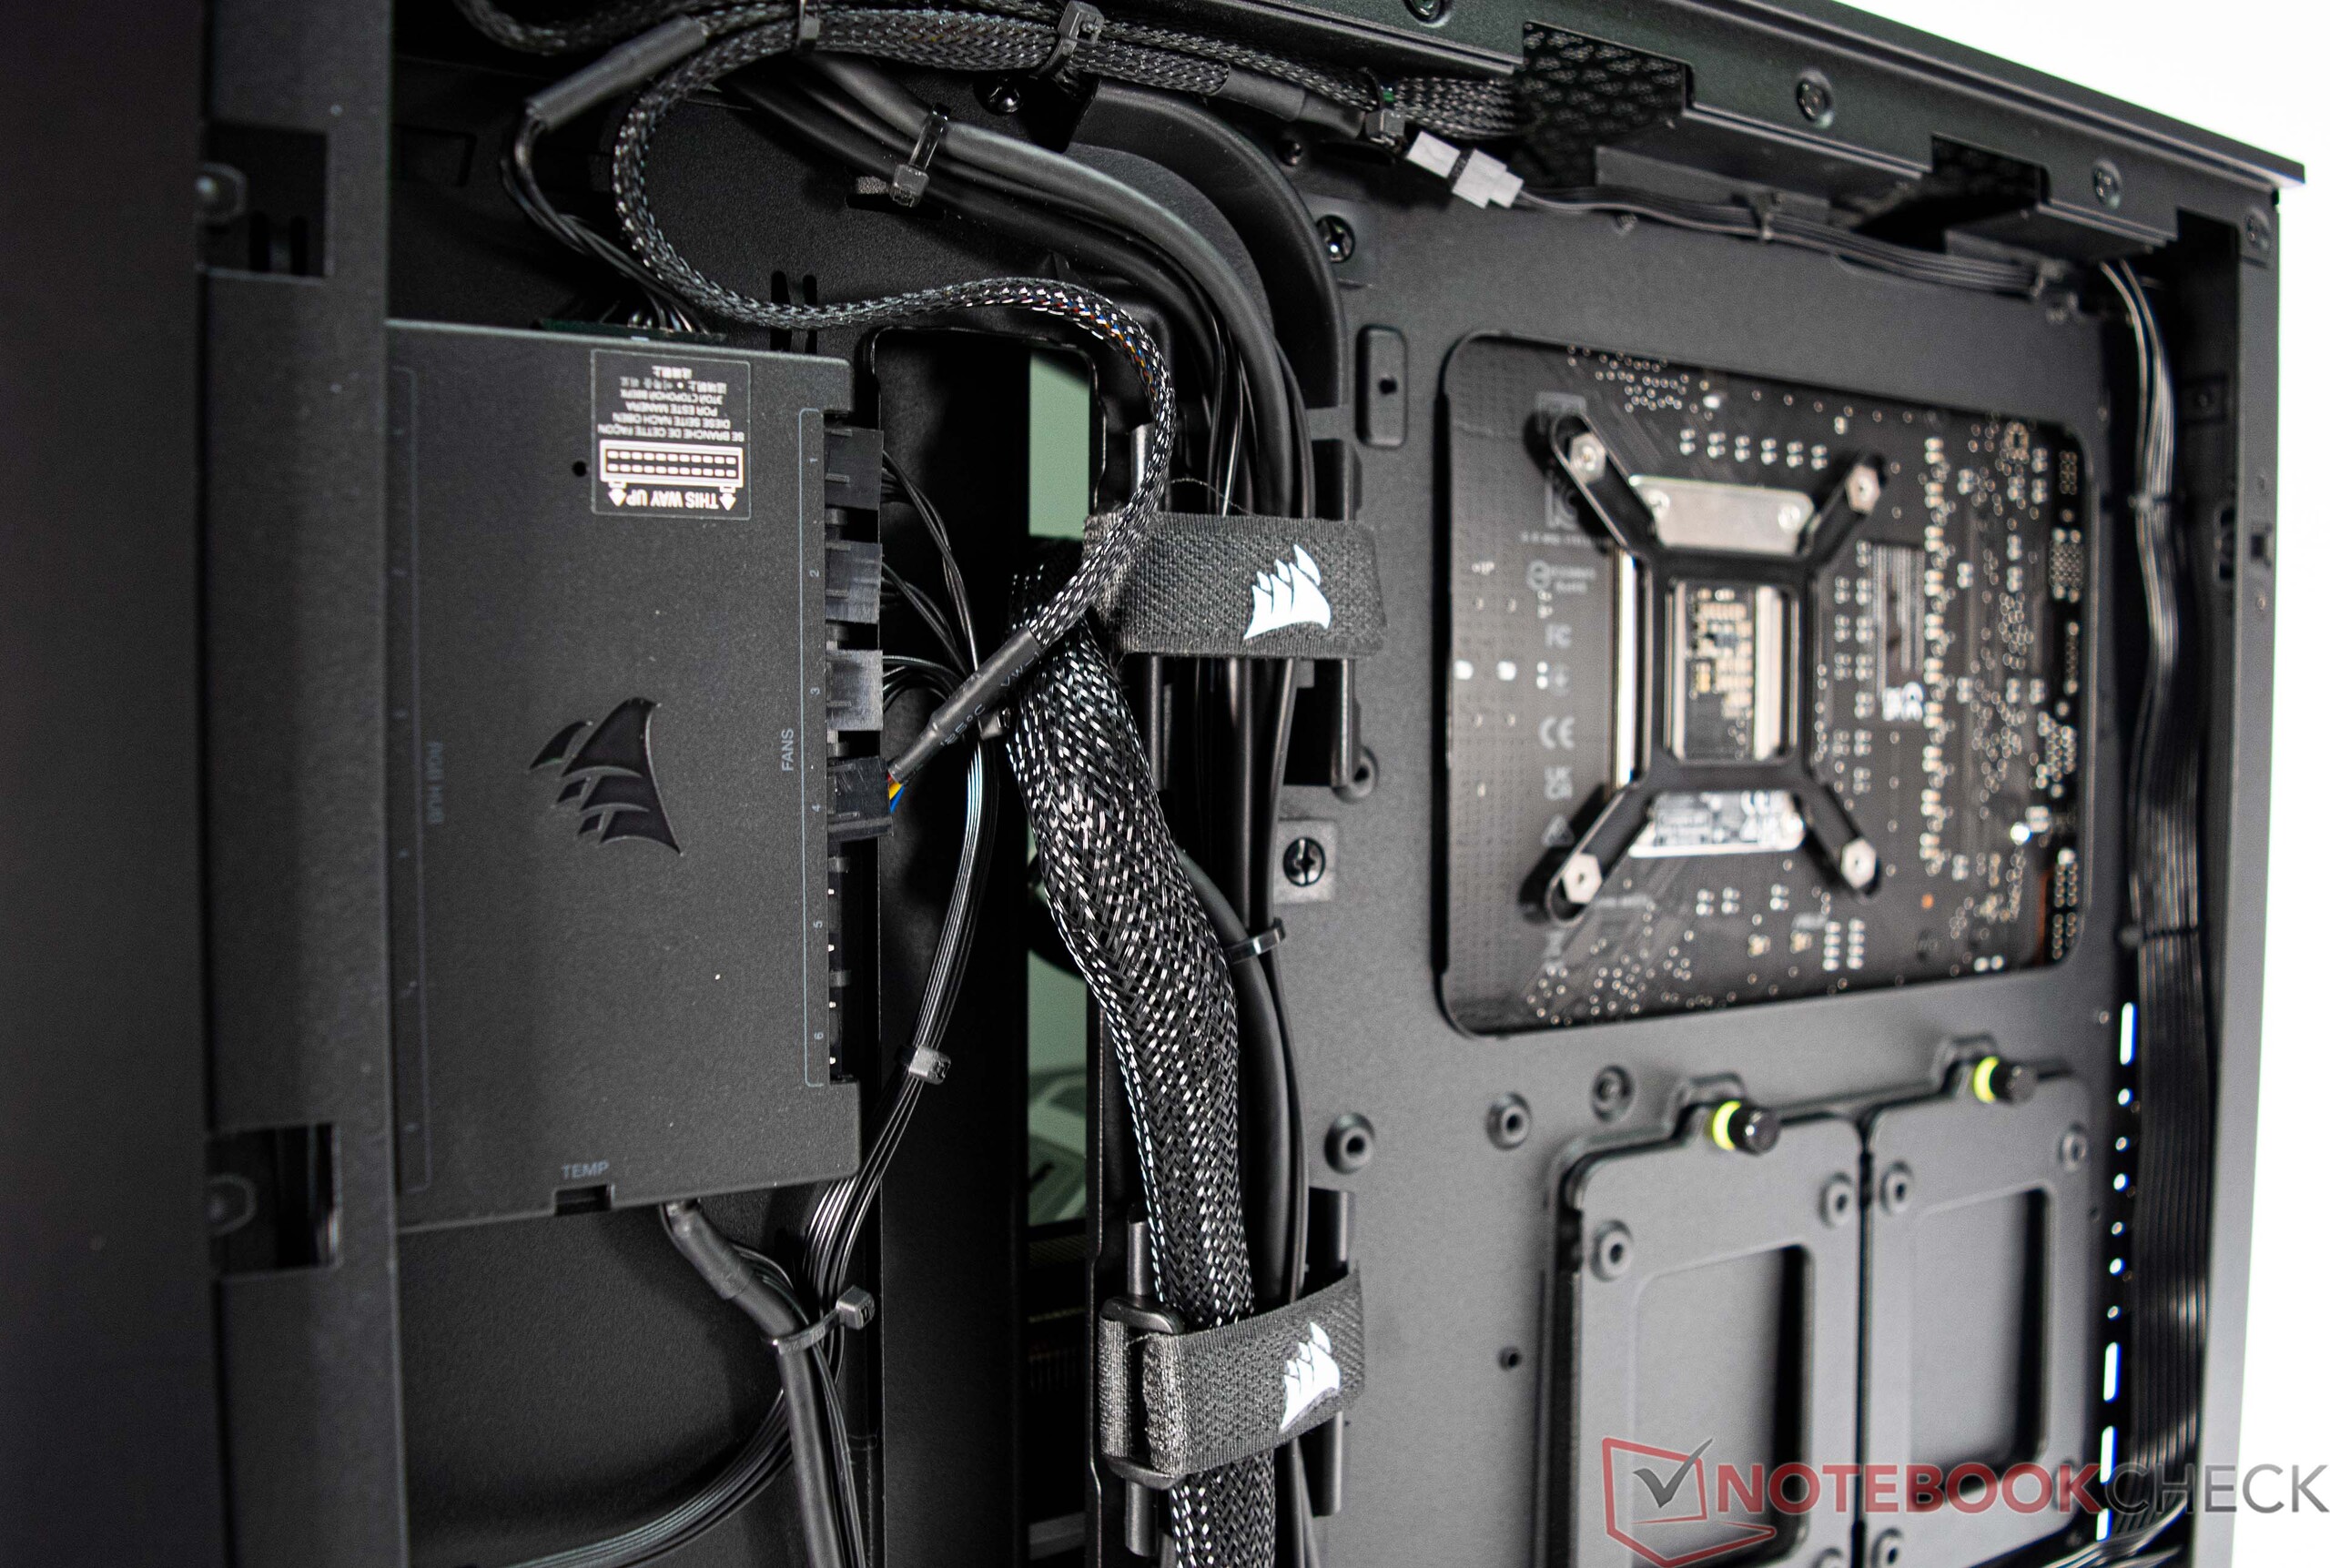
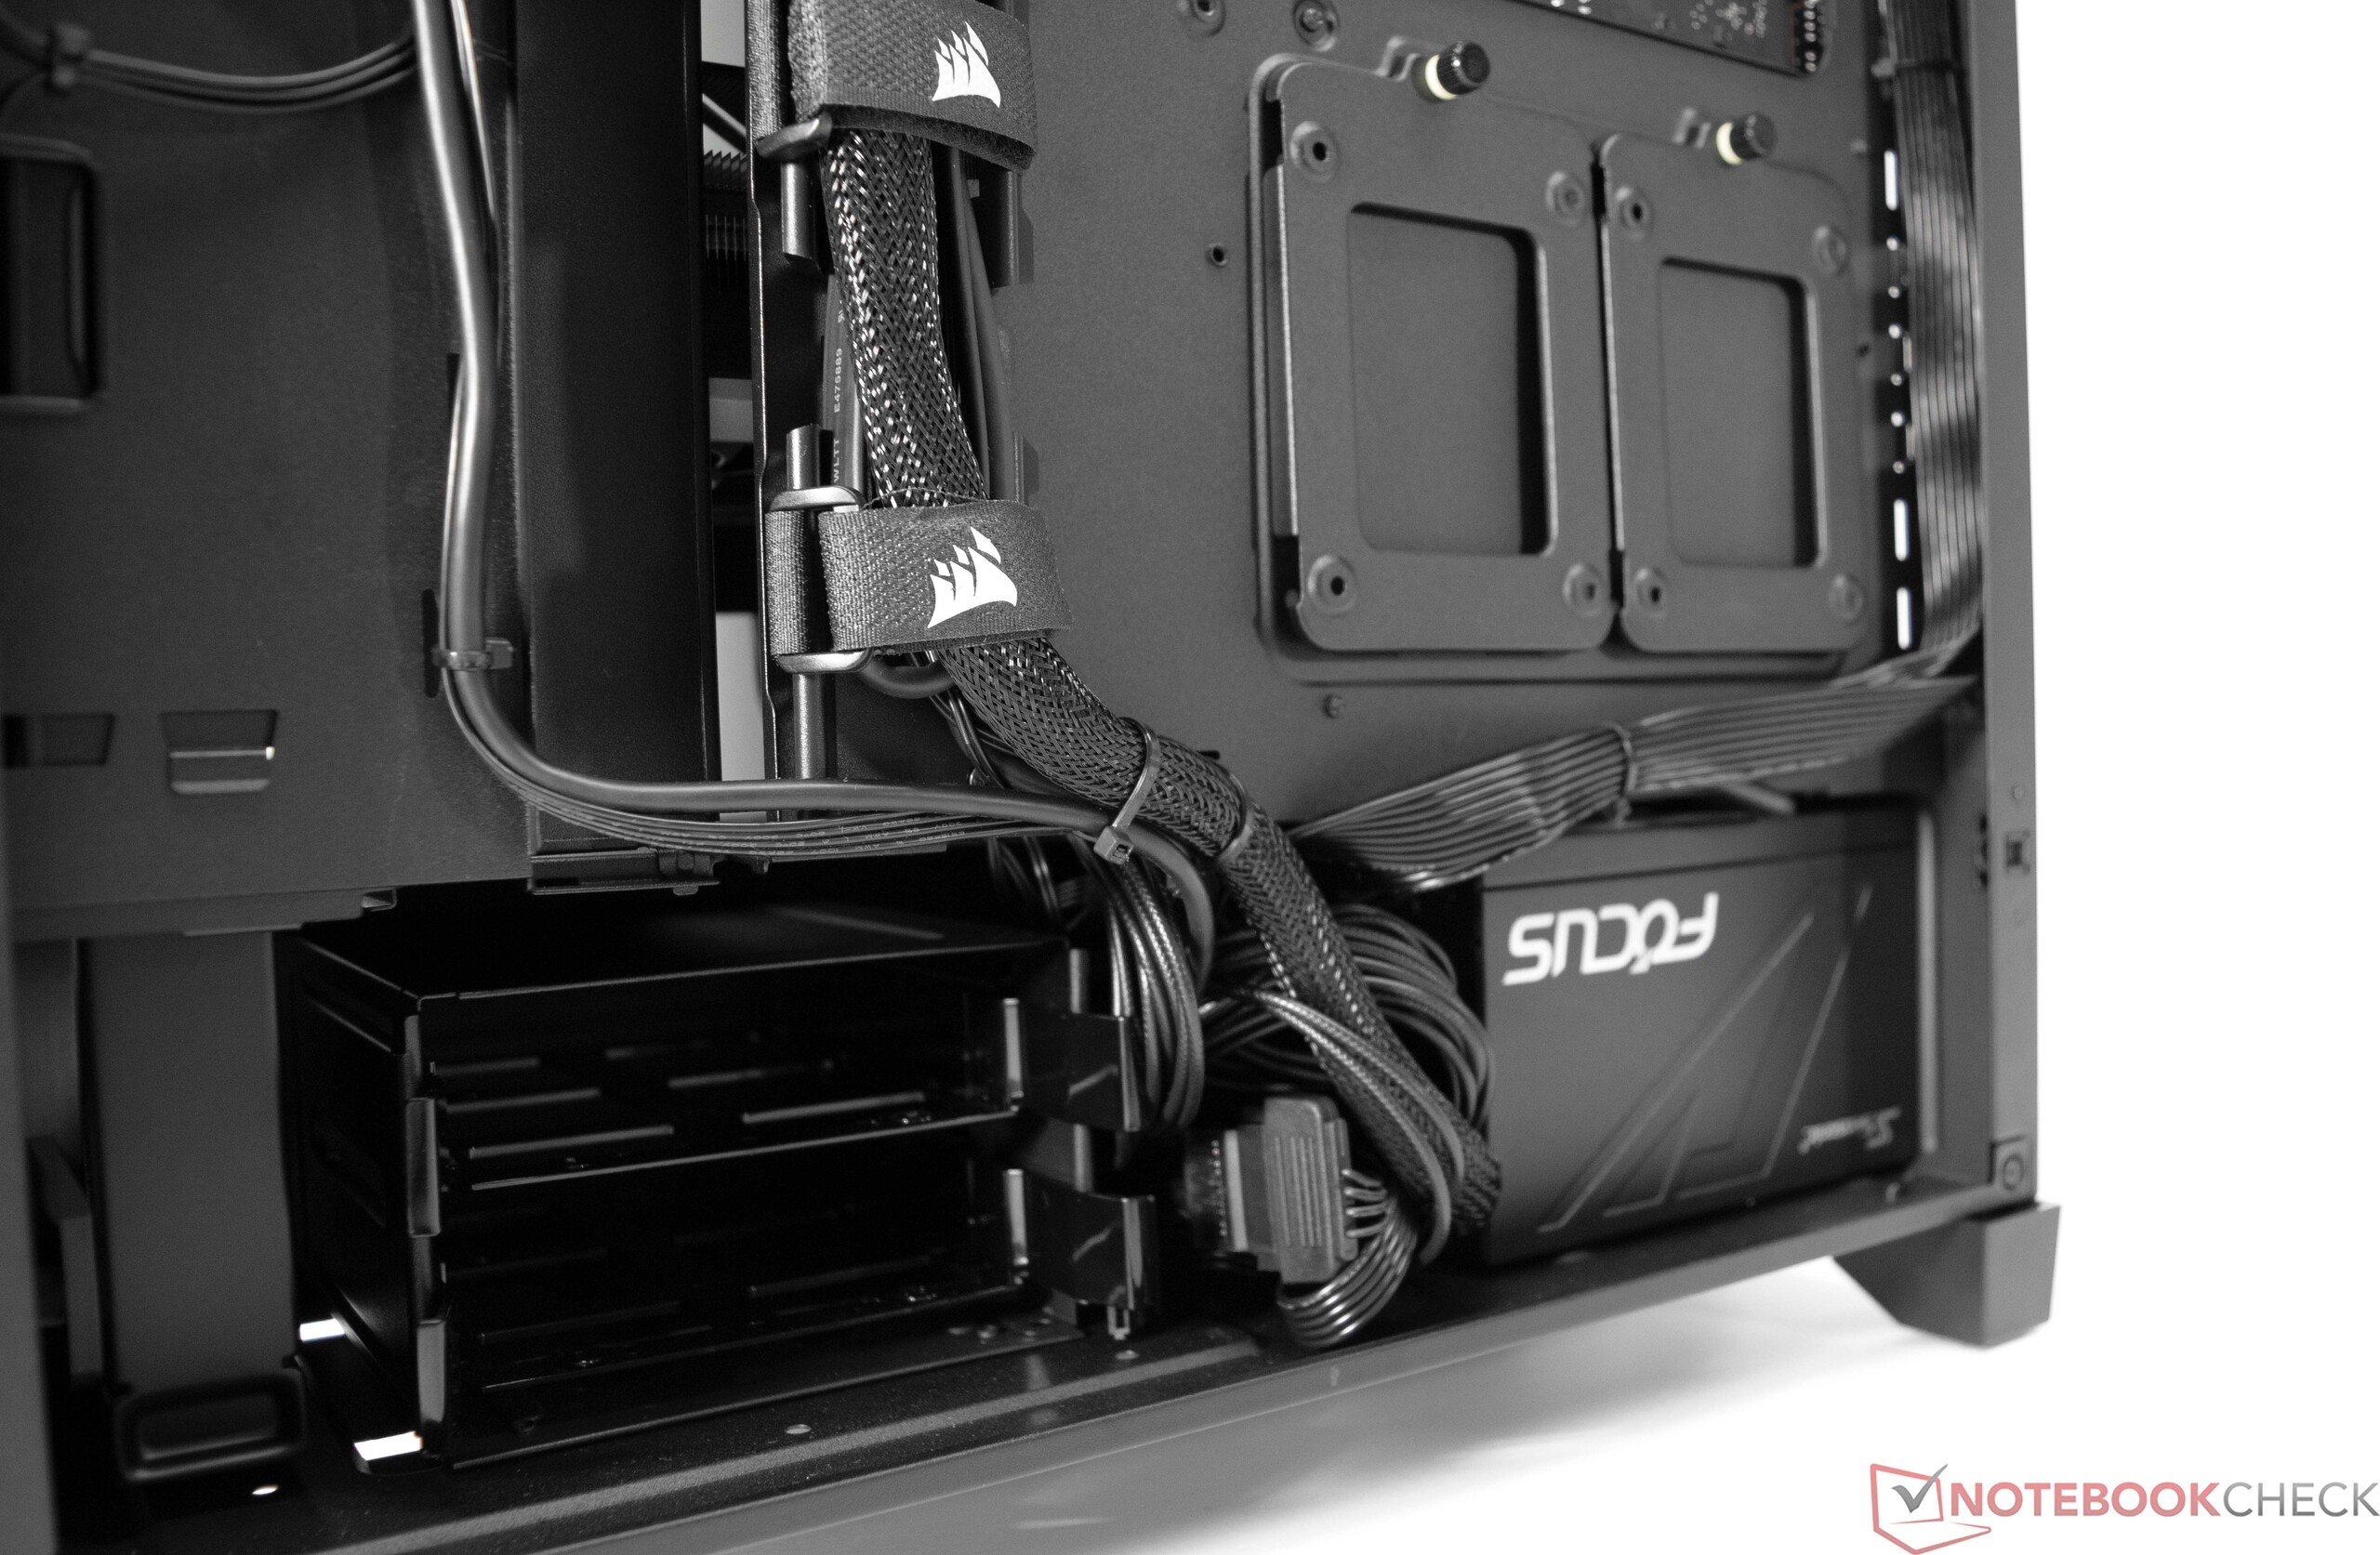
Obudowa - Corsair 4000D Airflow
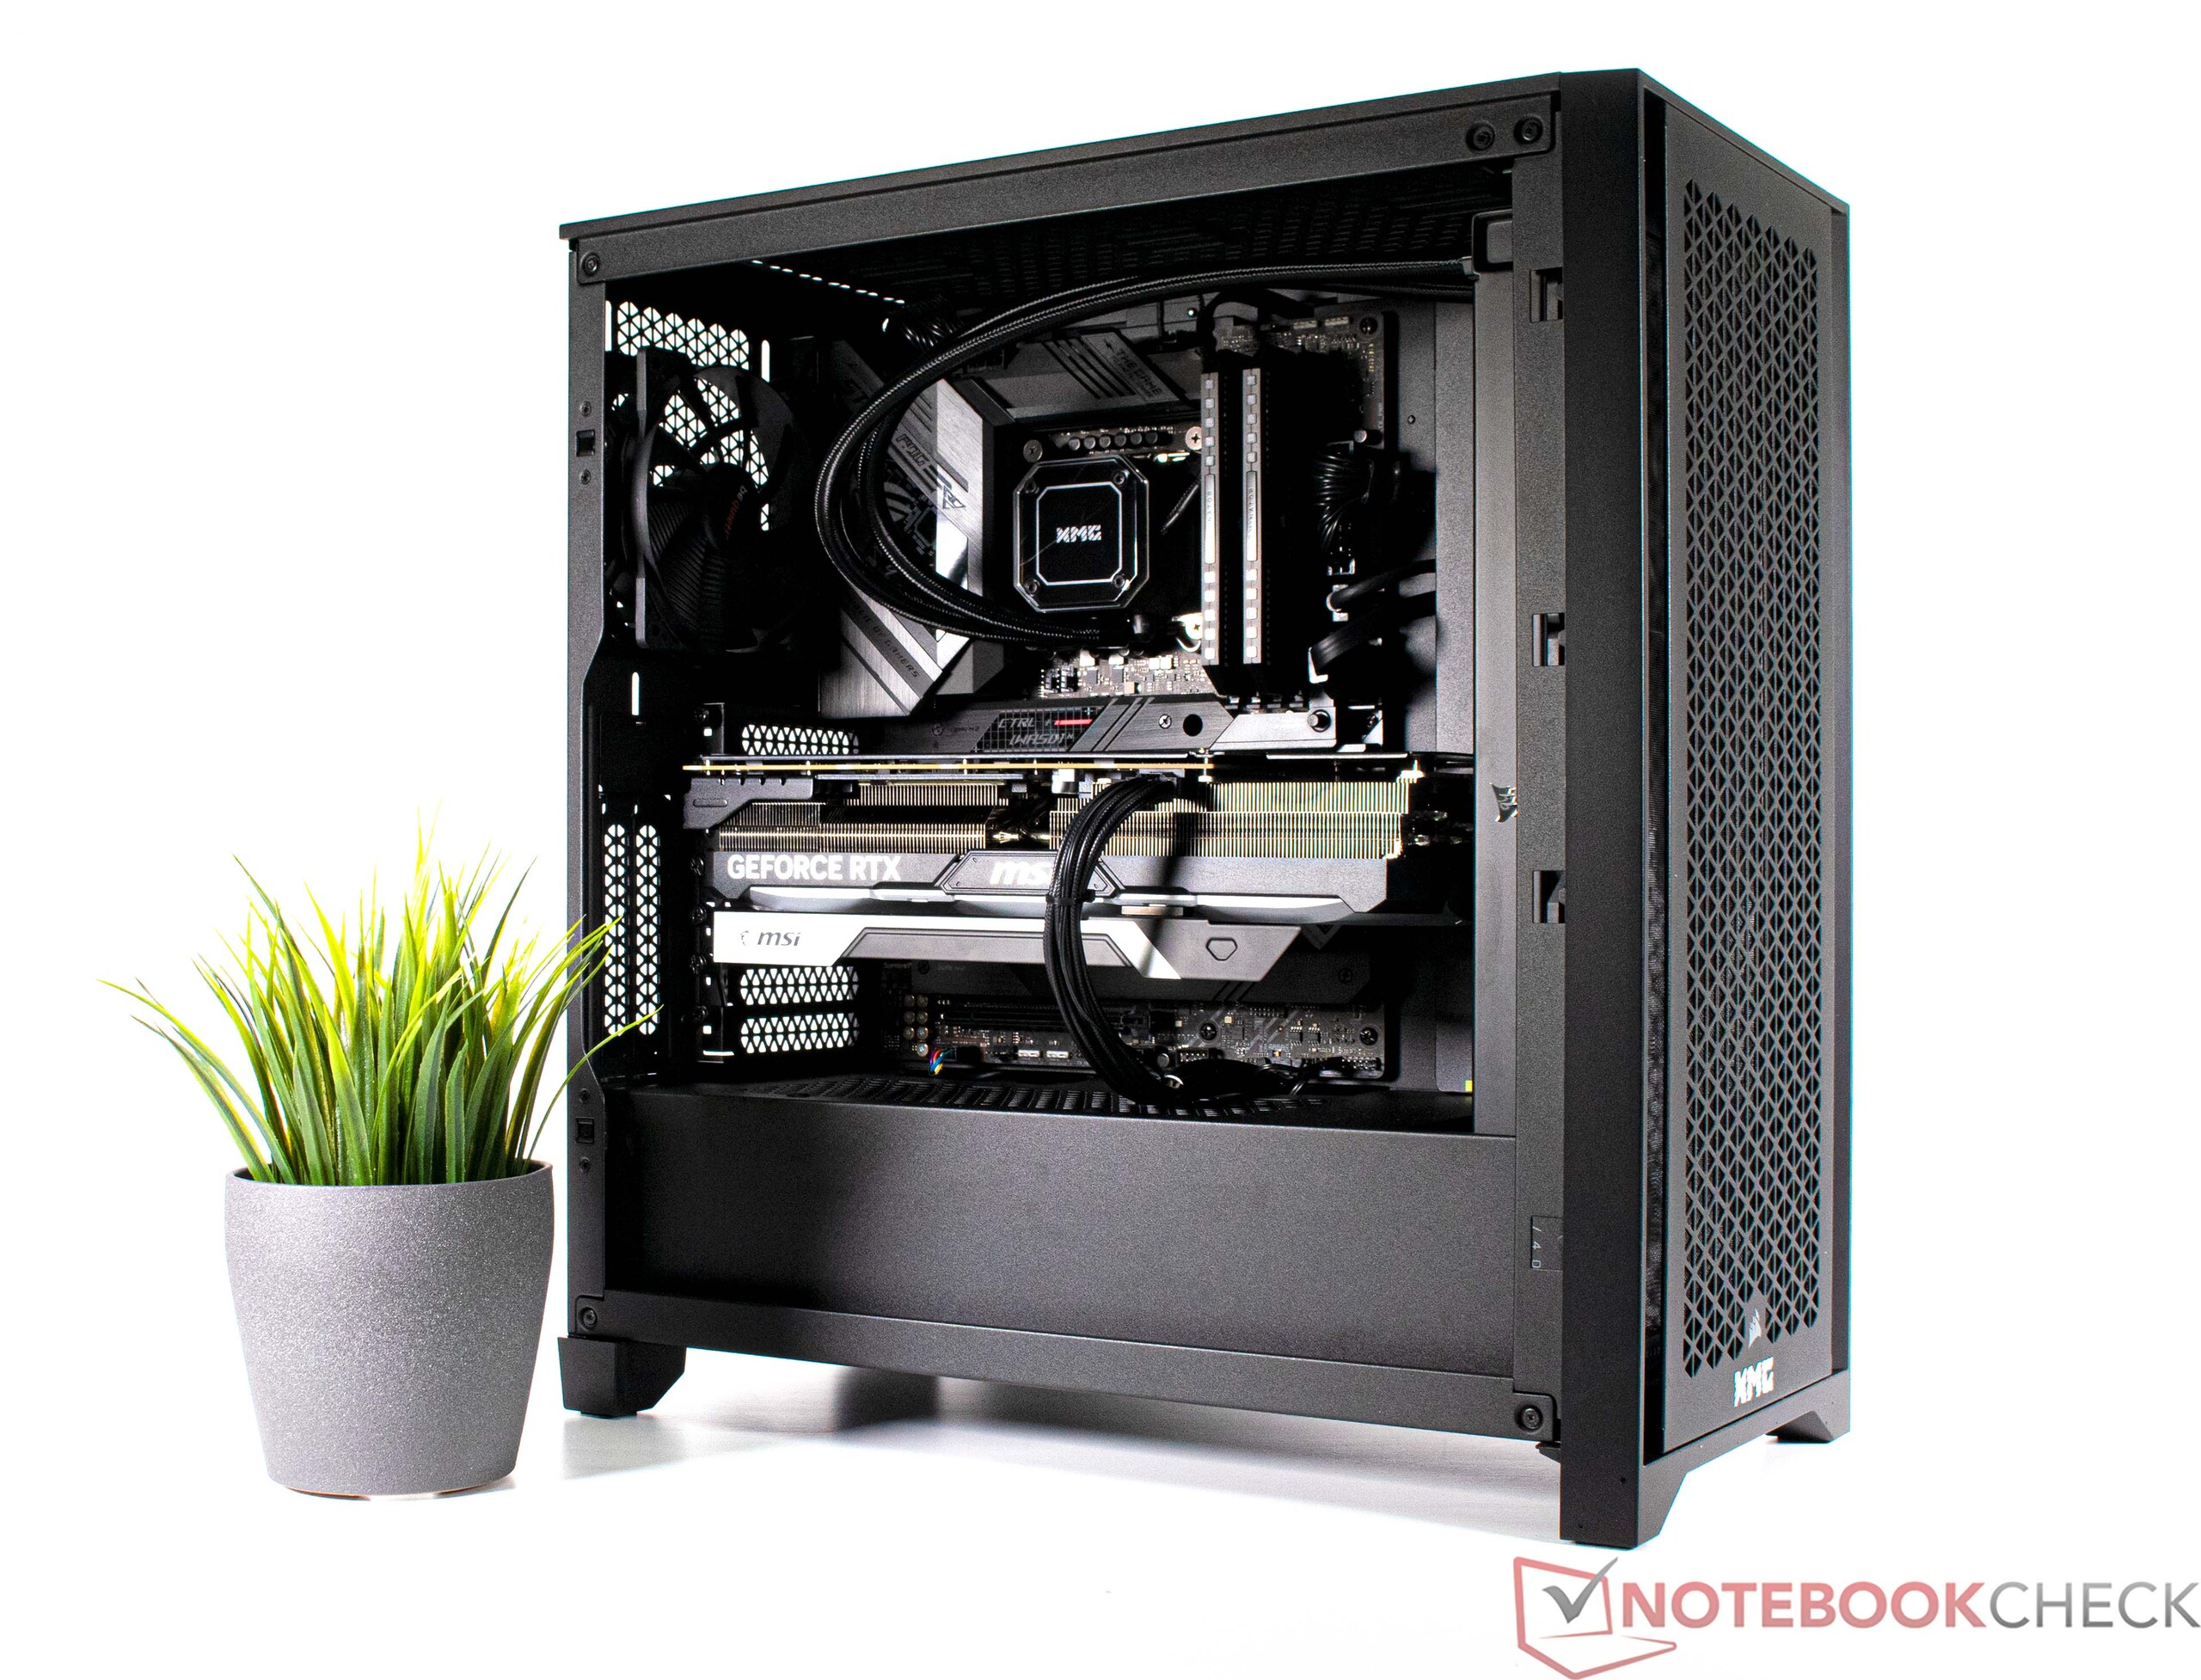
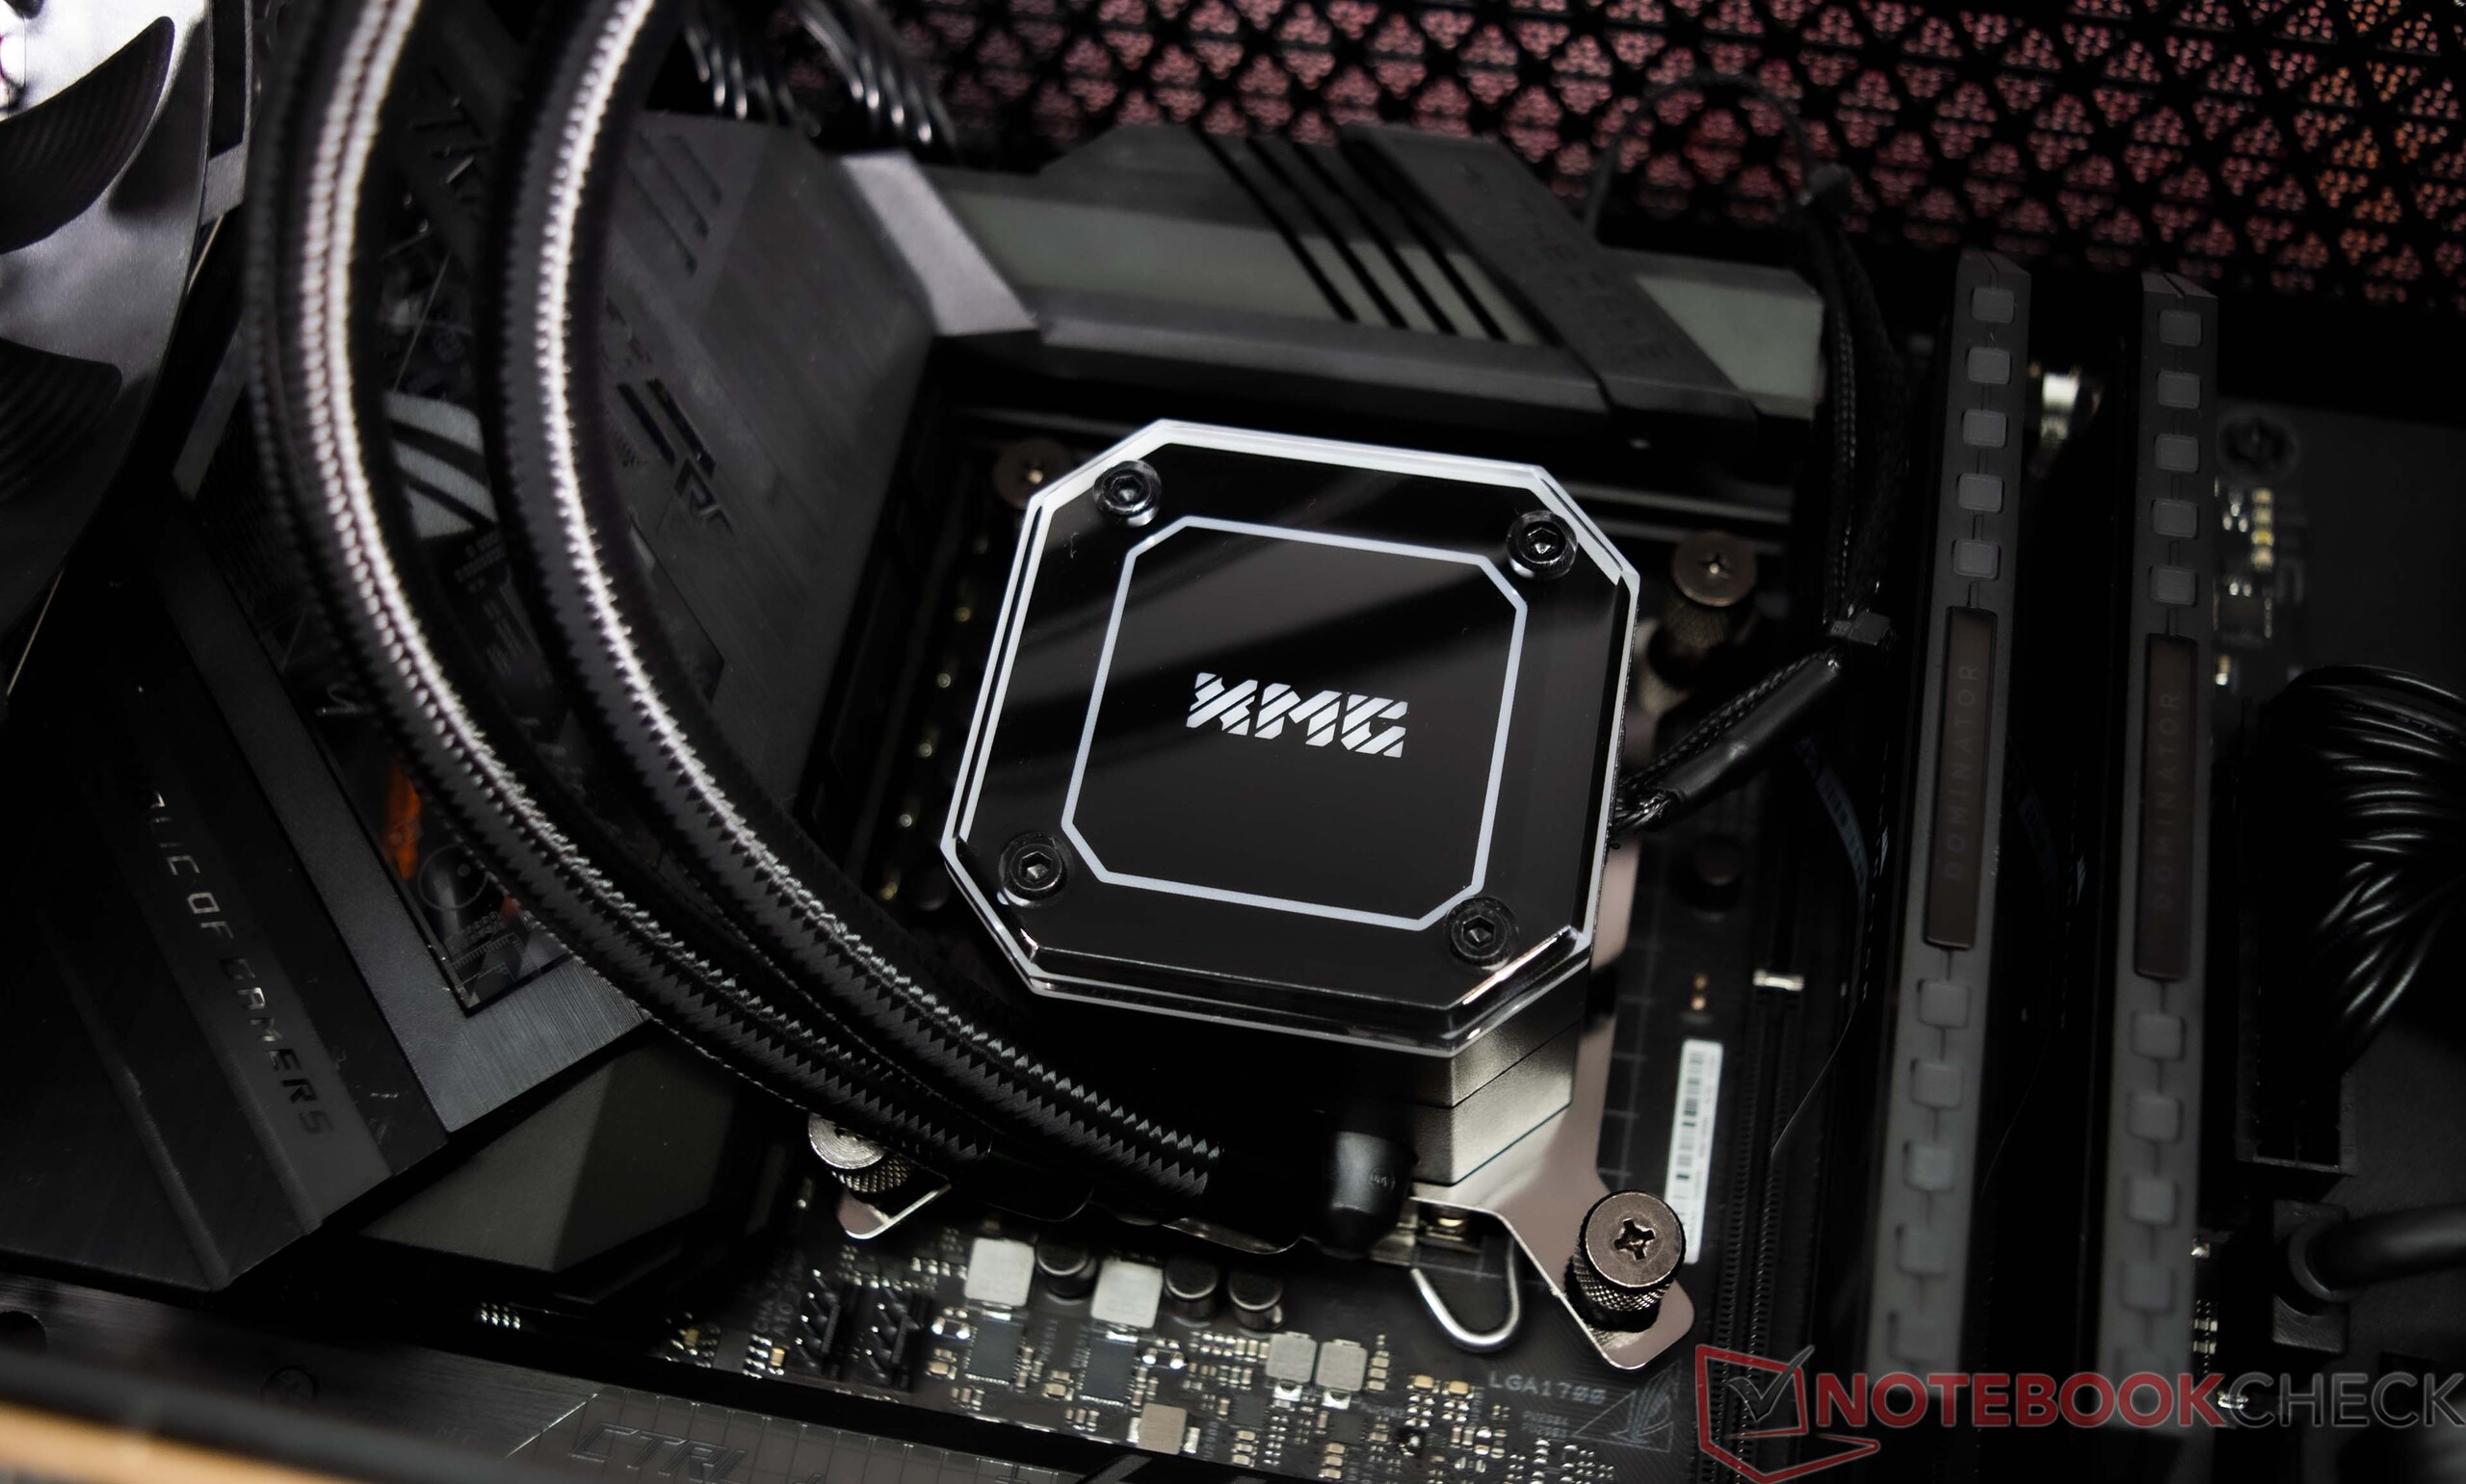
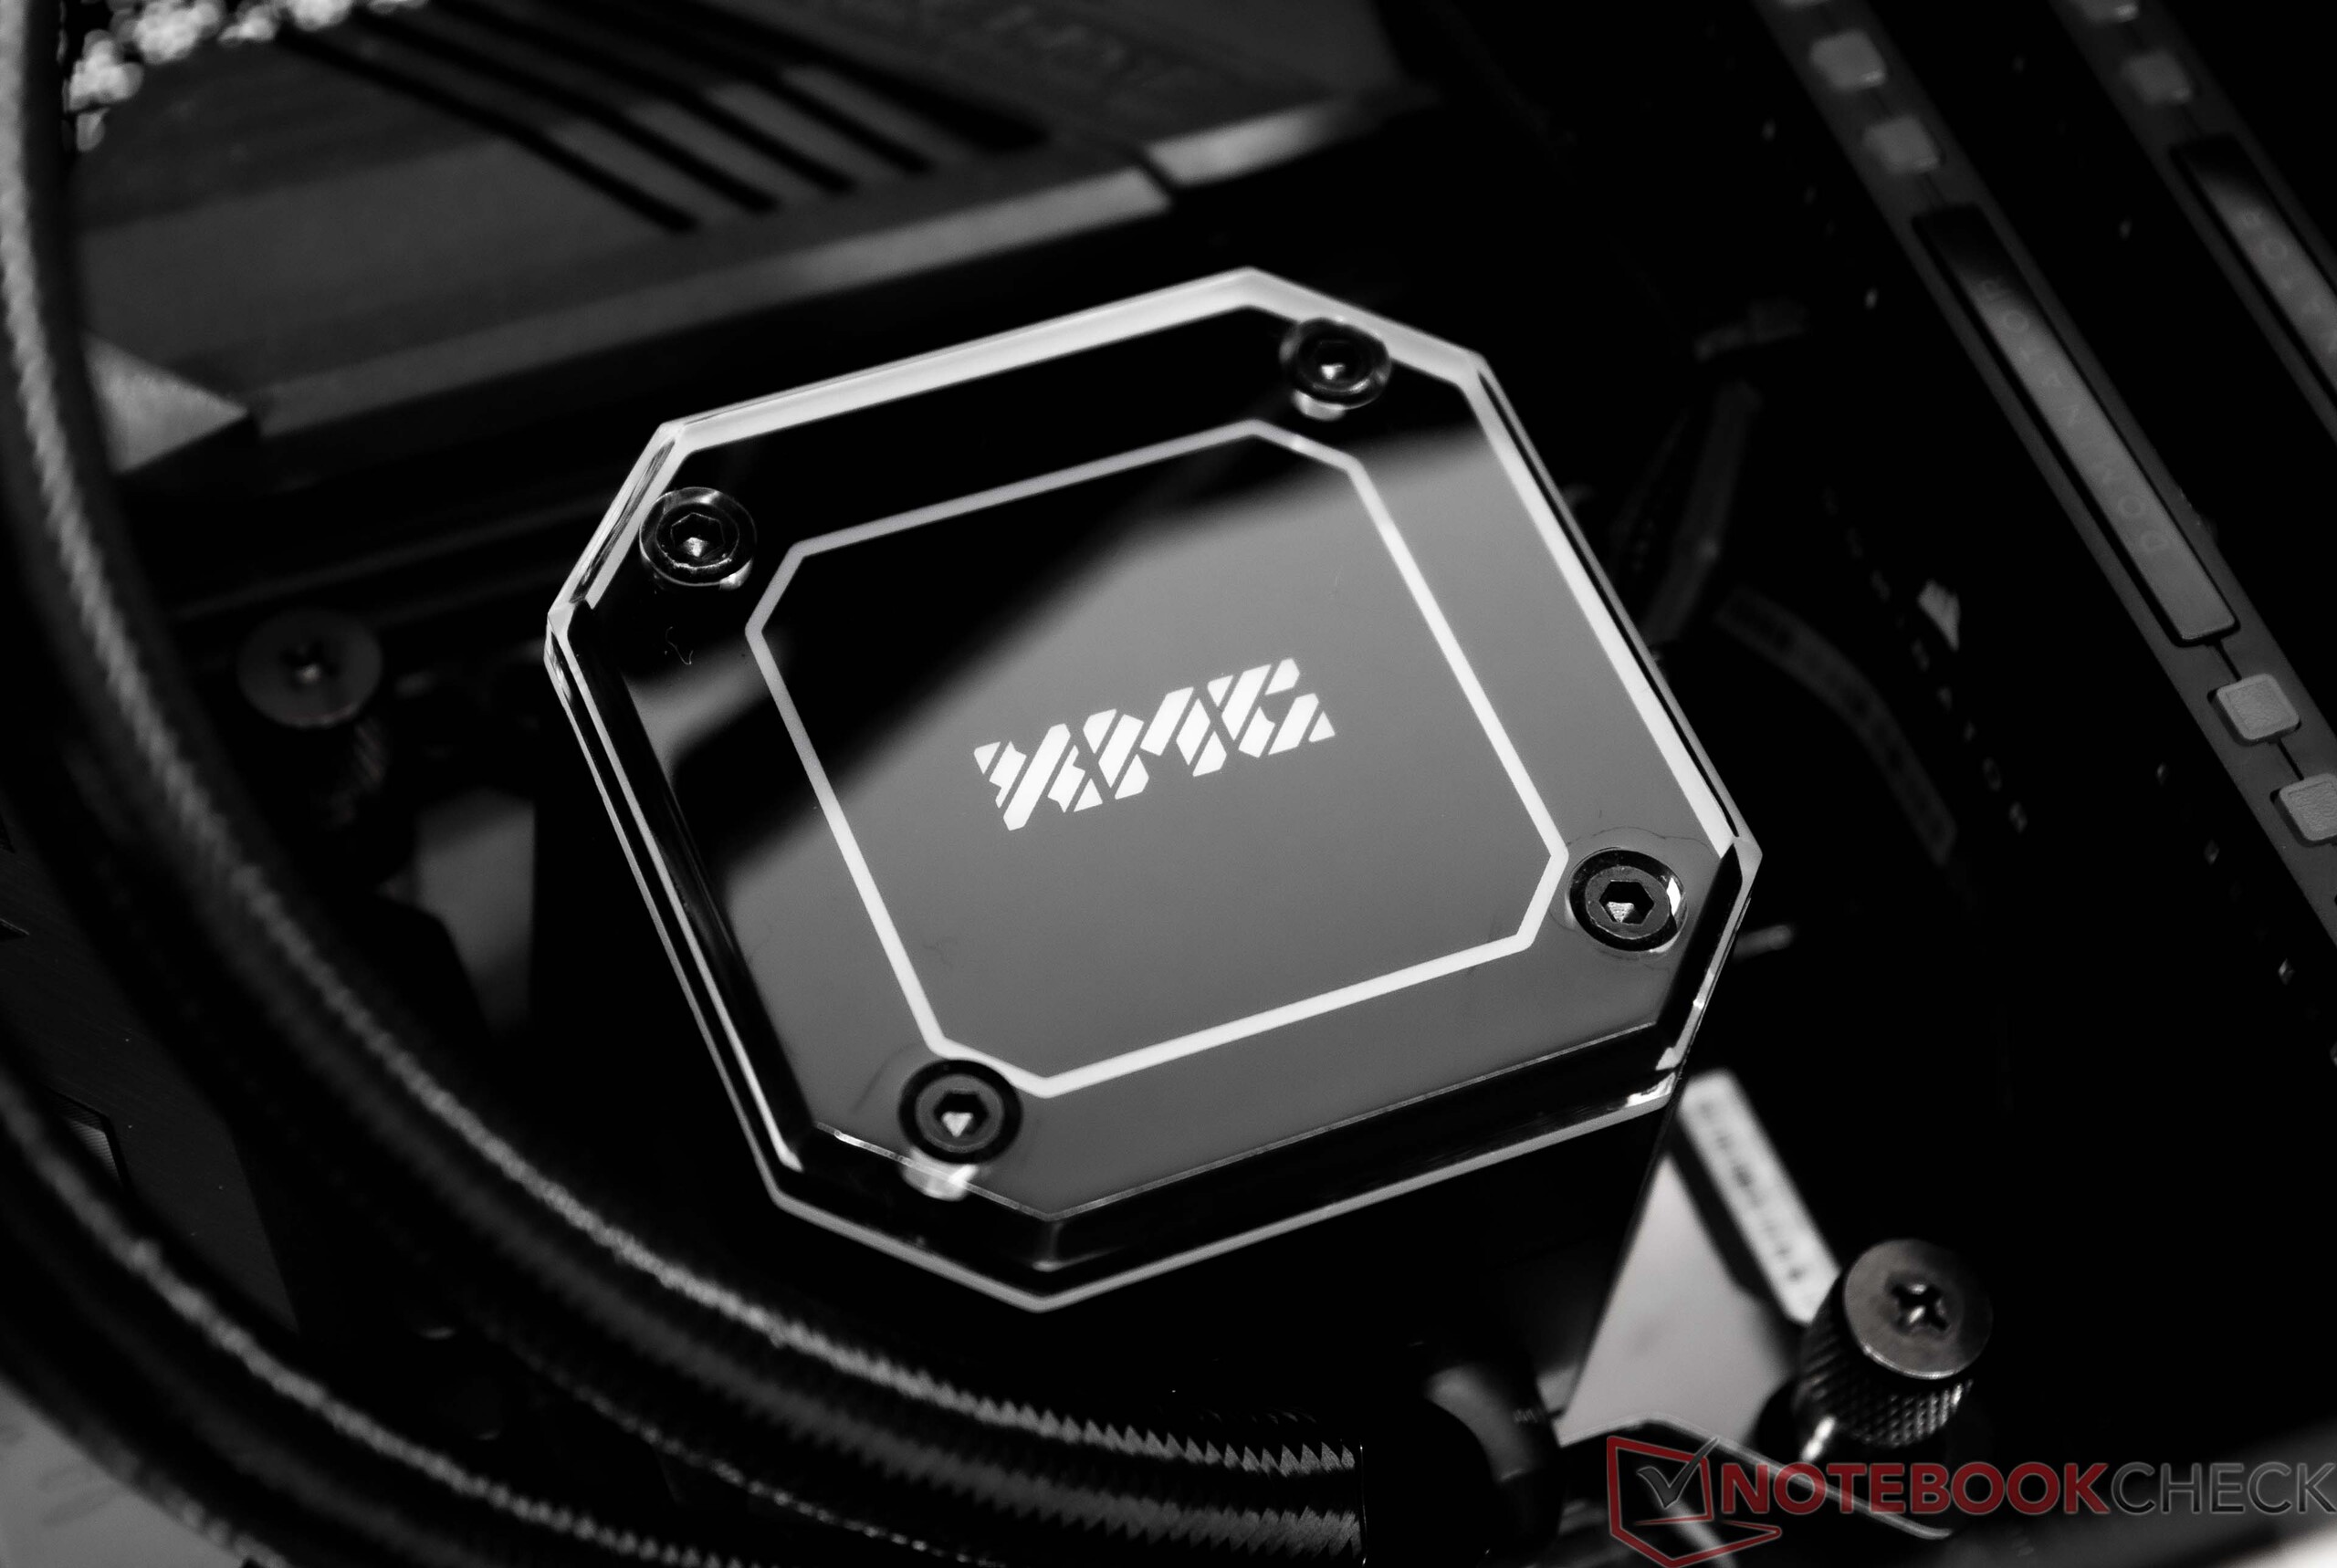
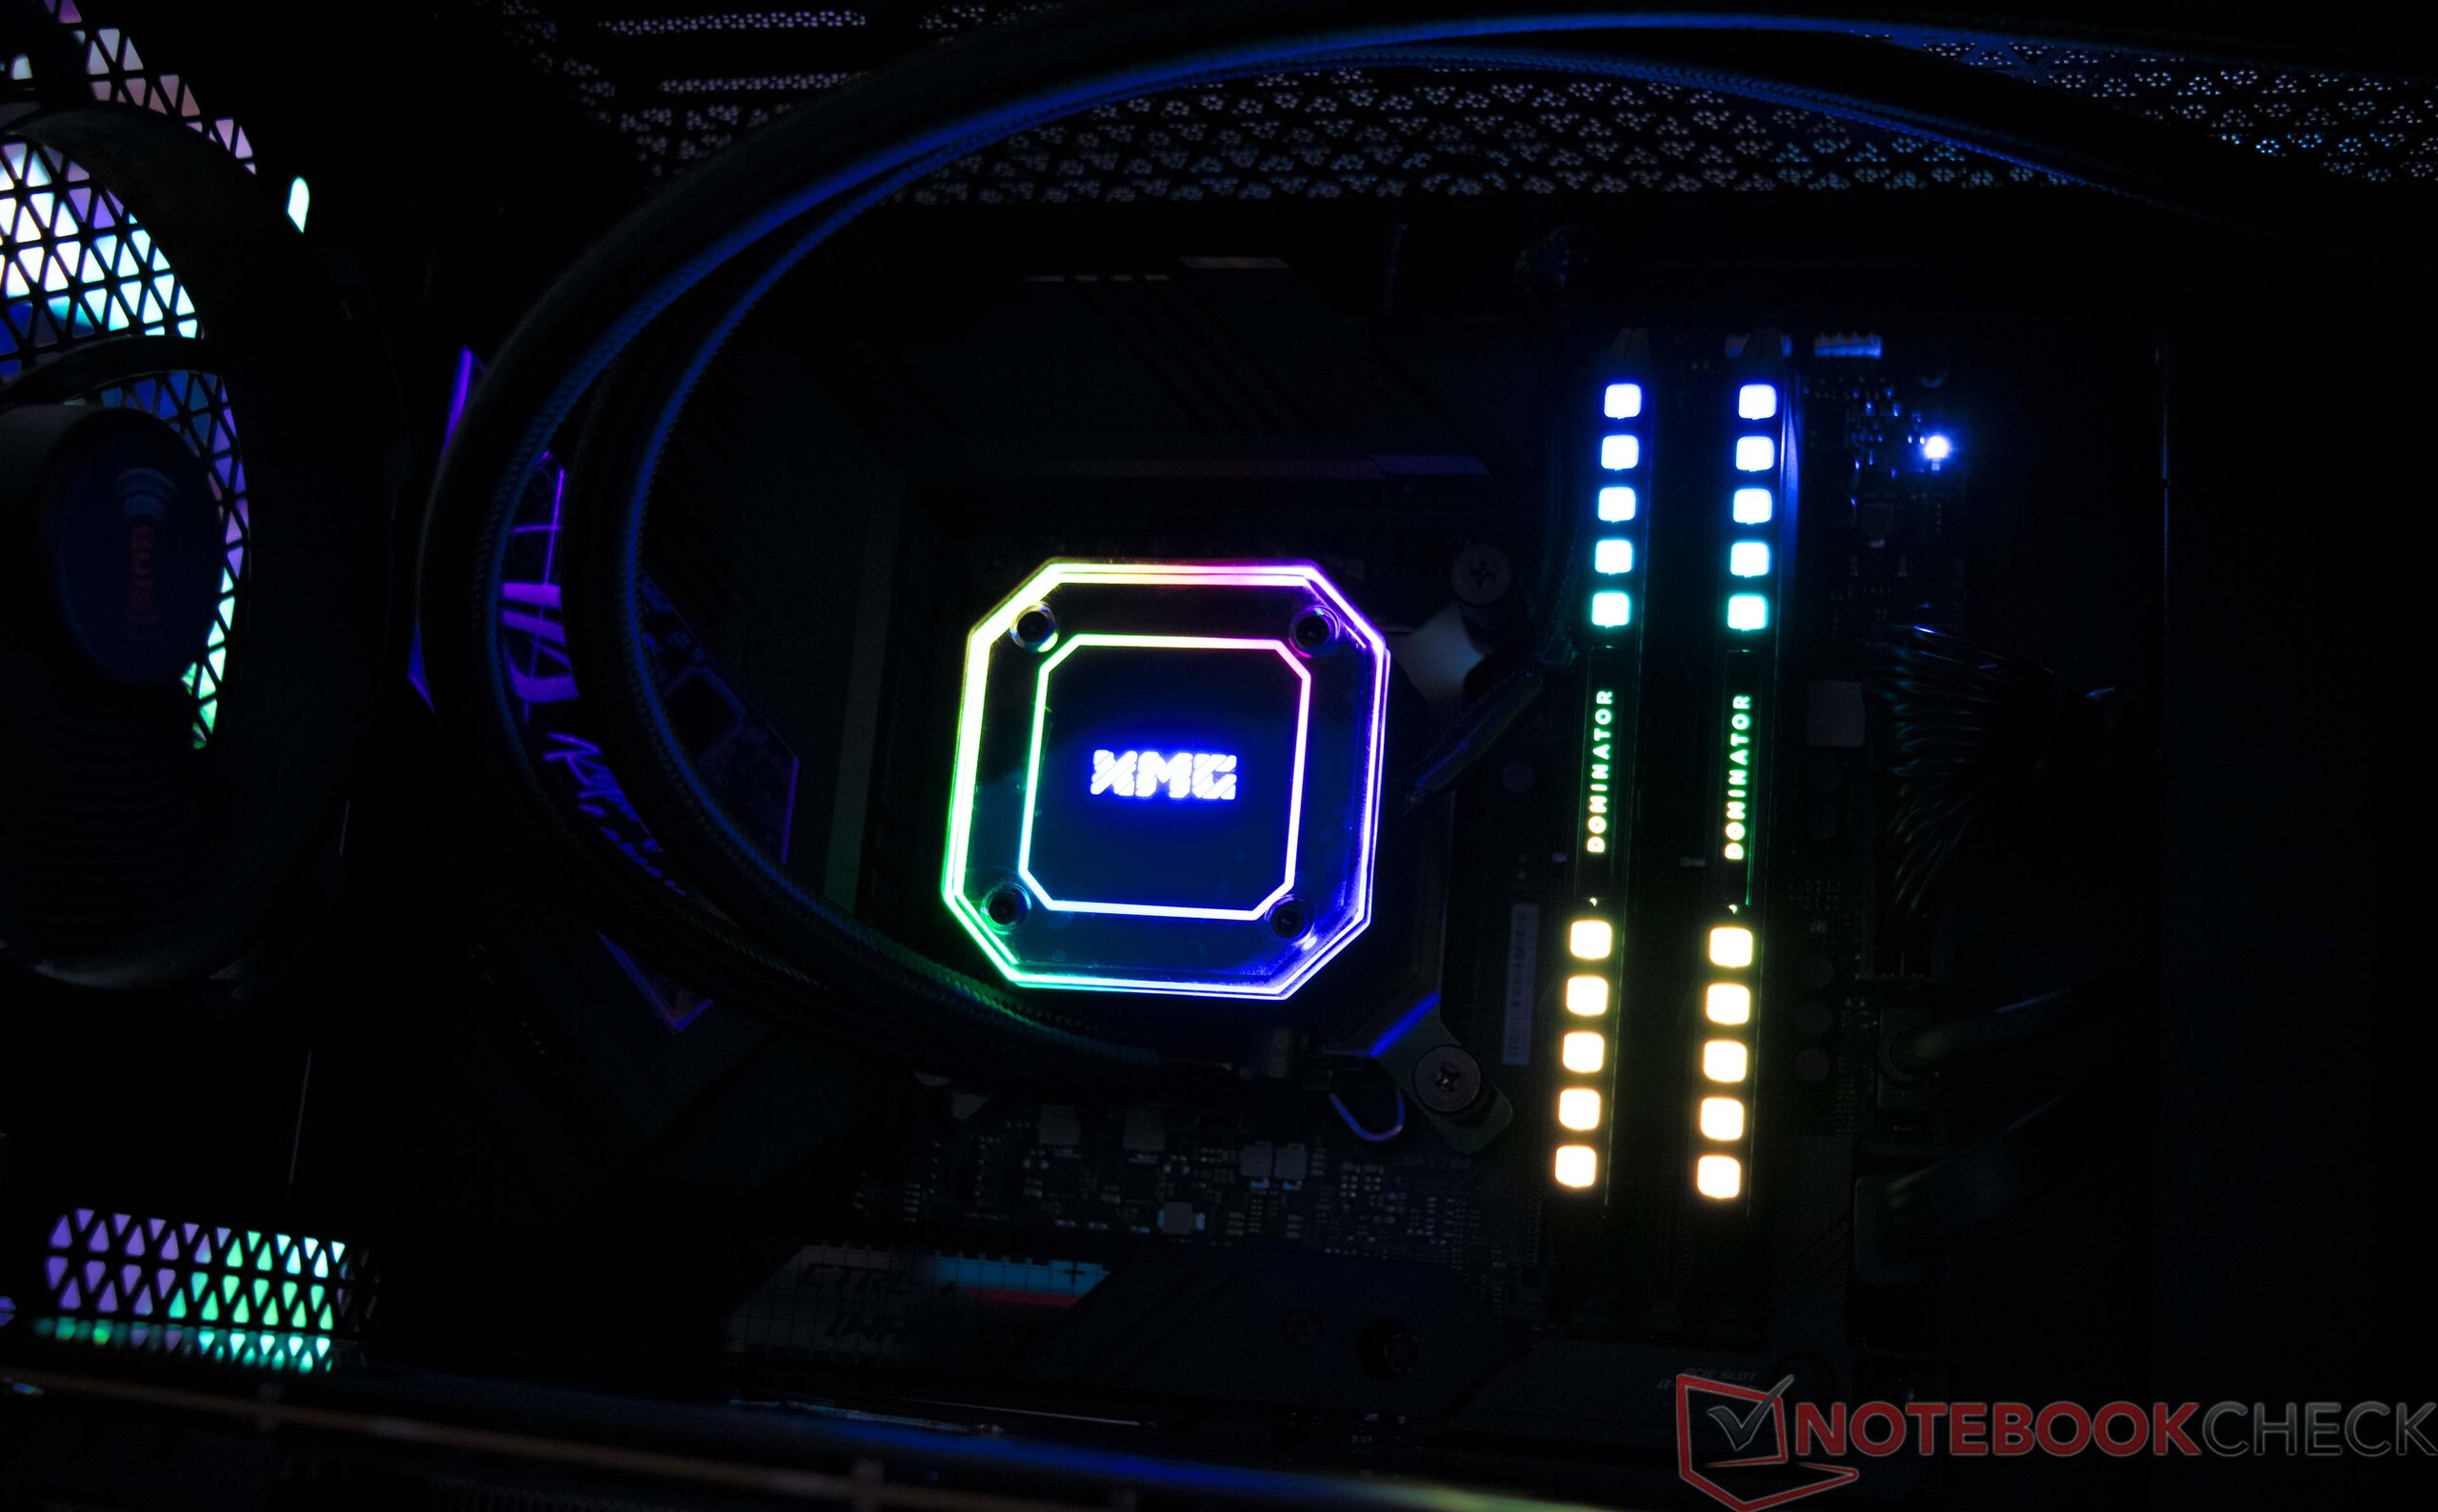
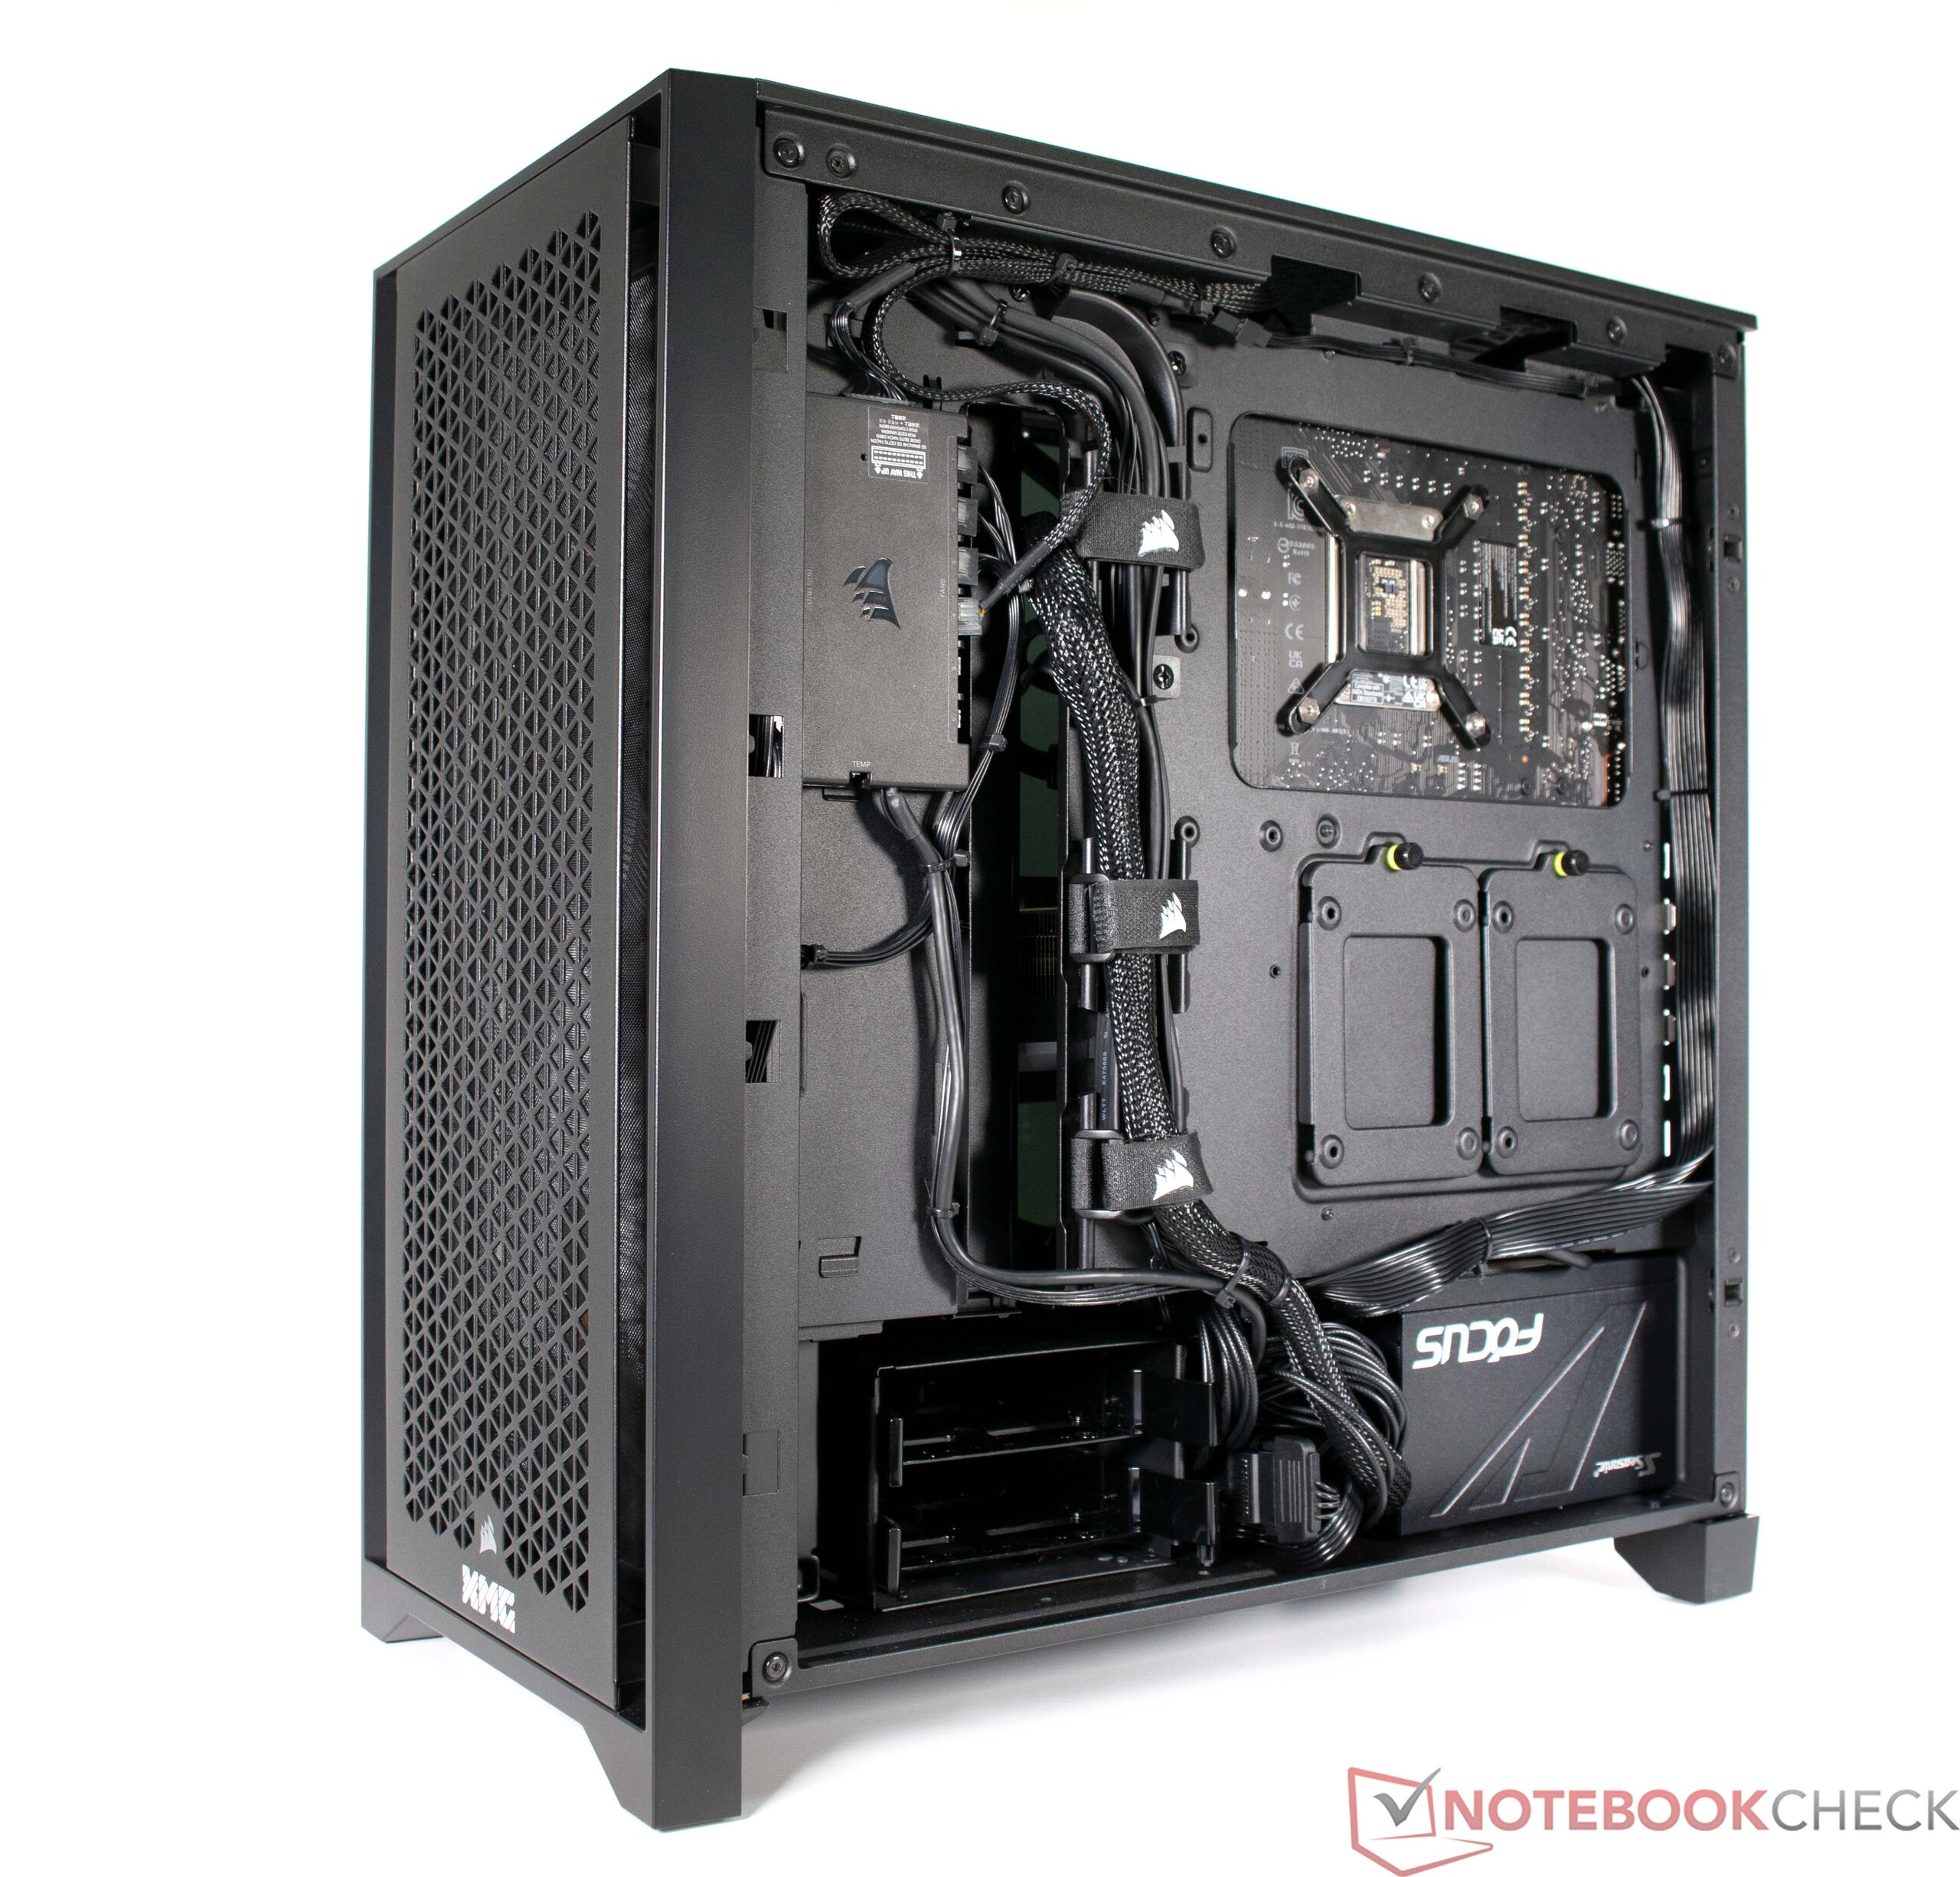
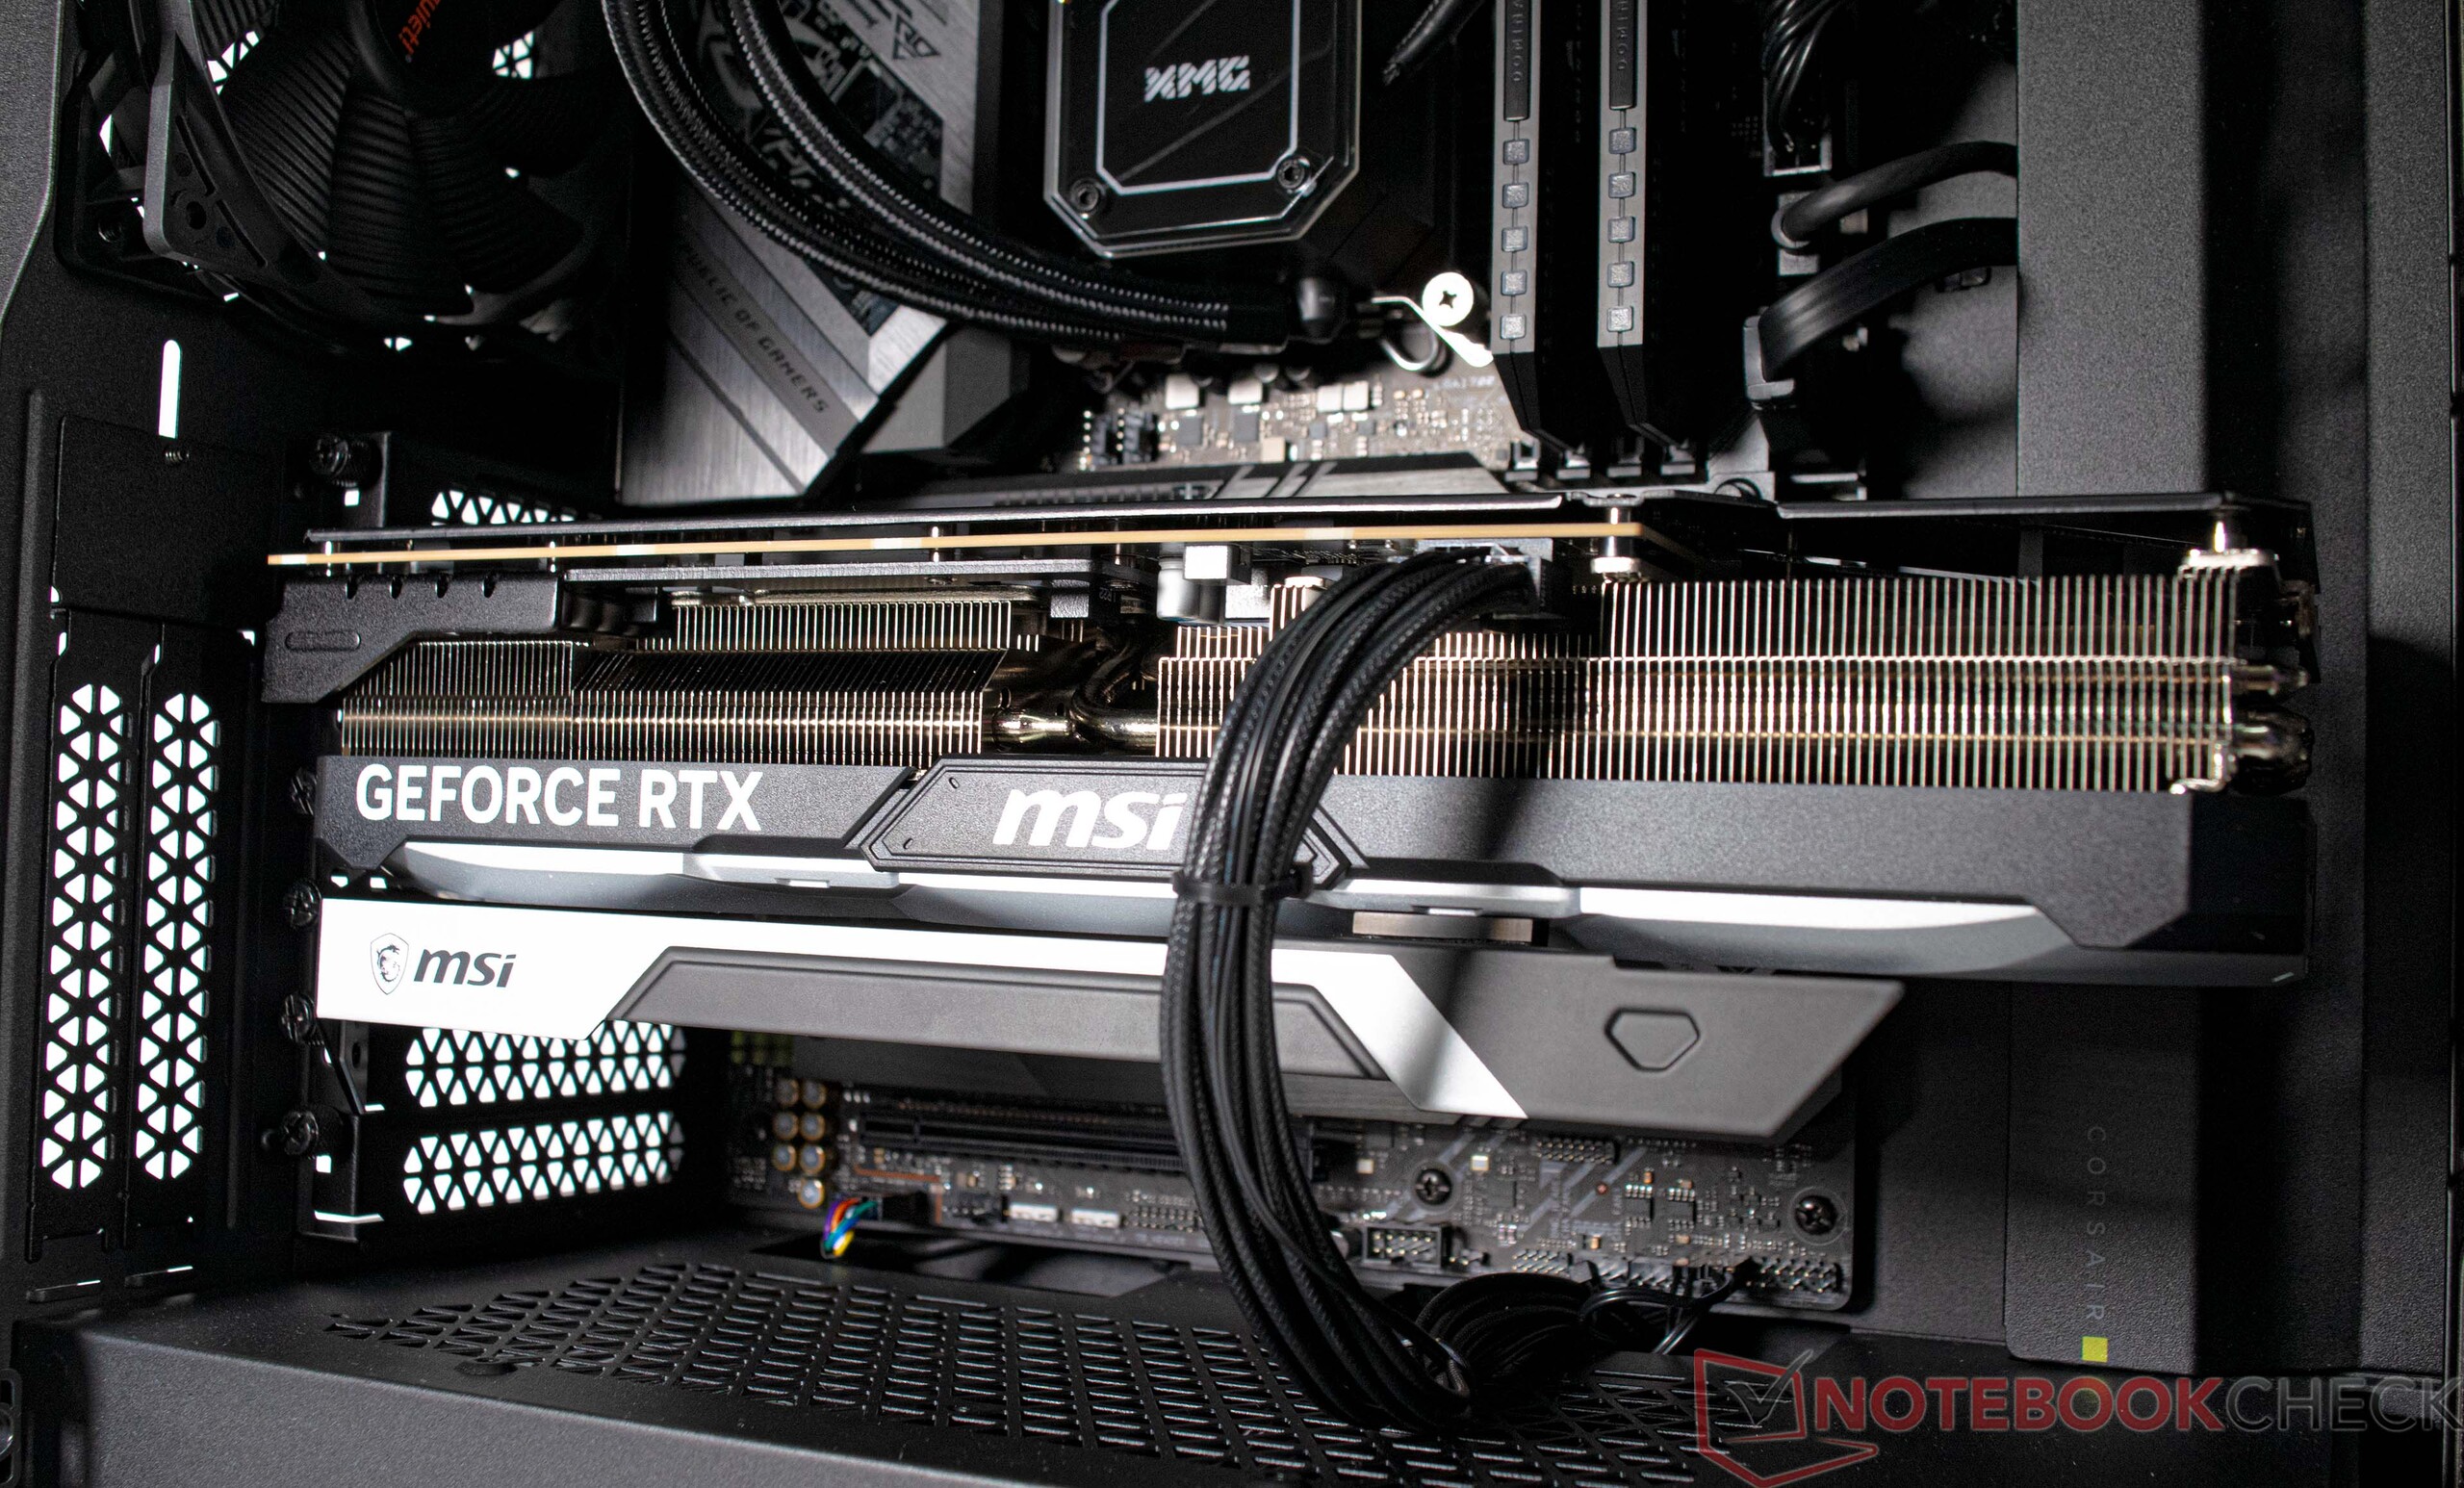
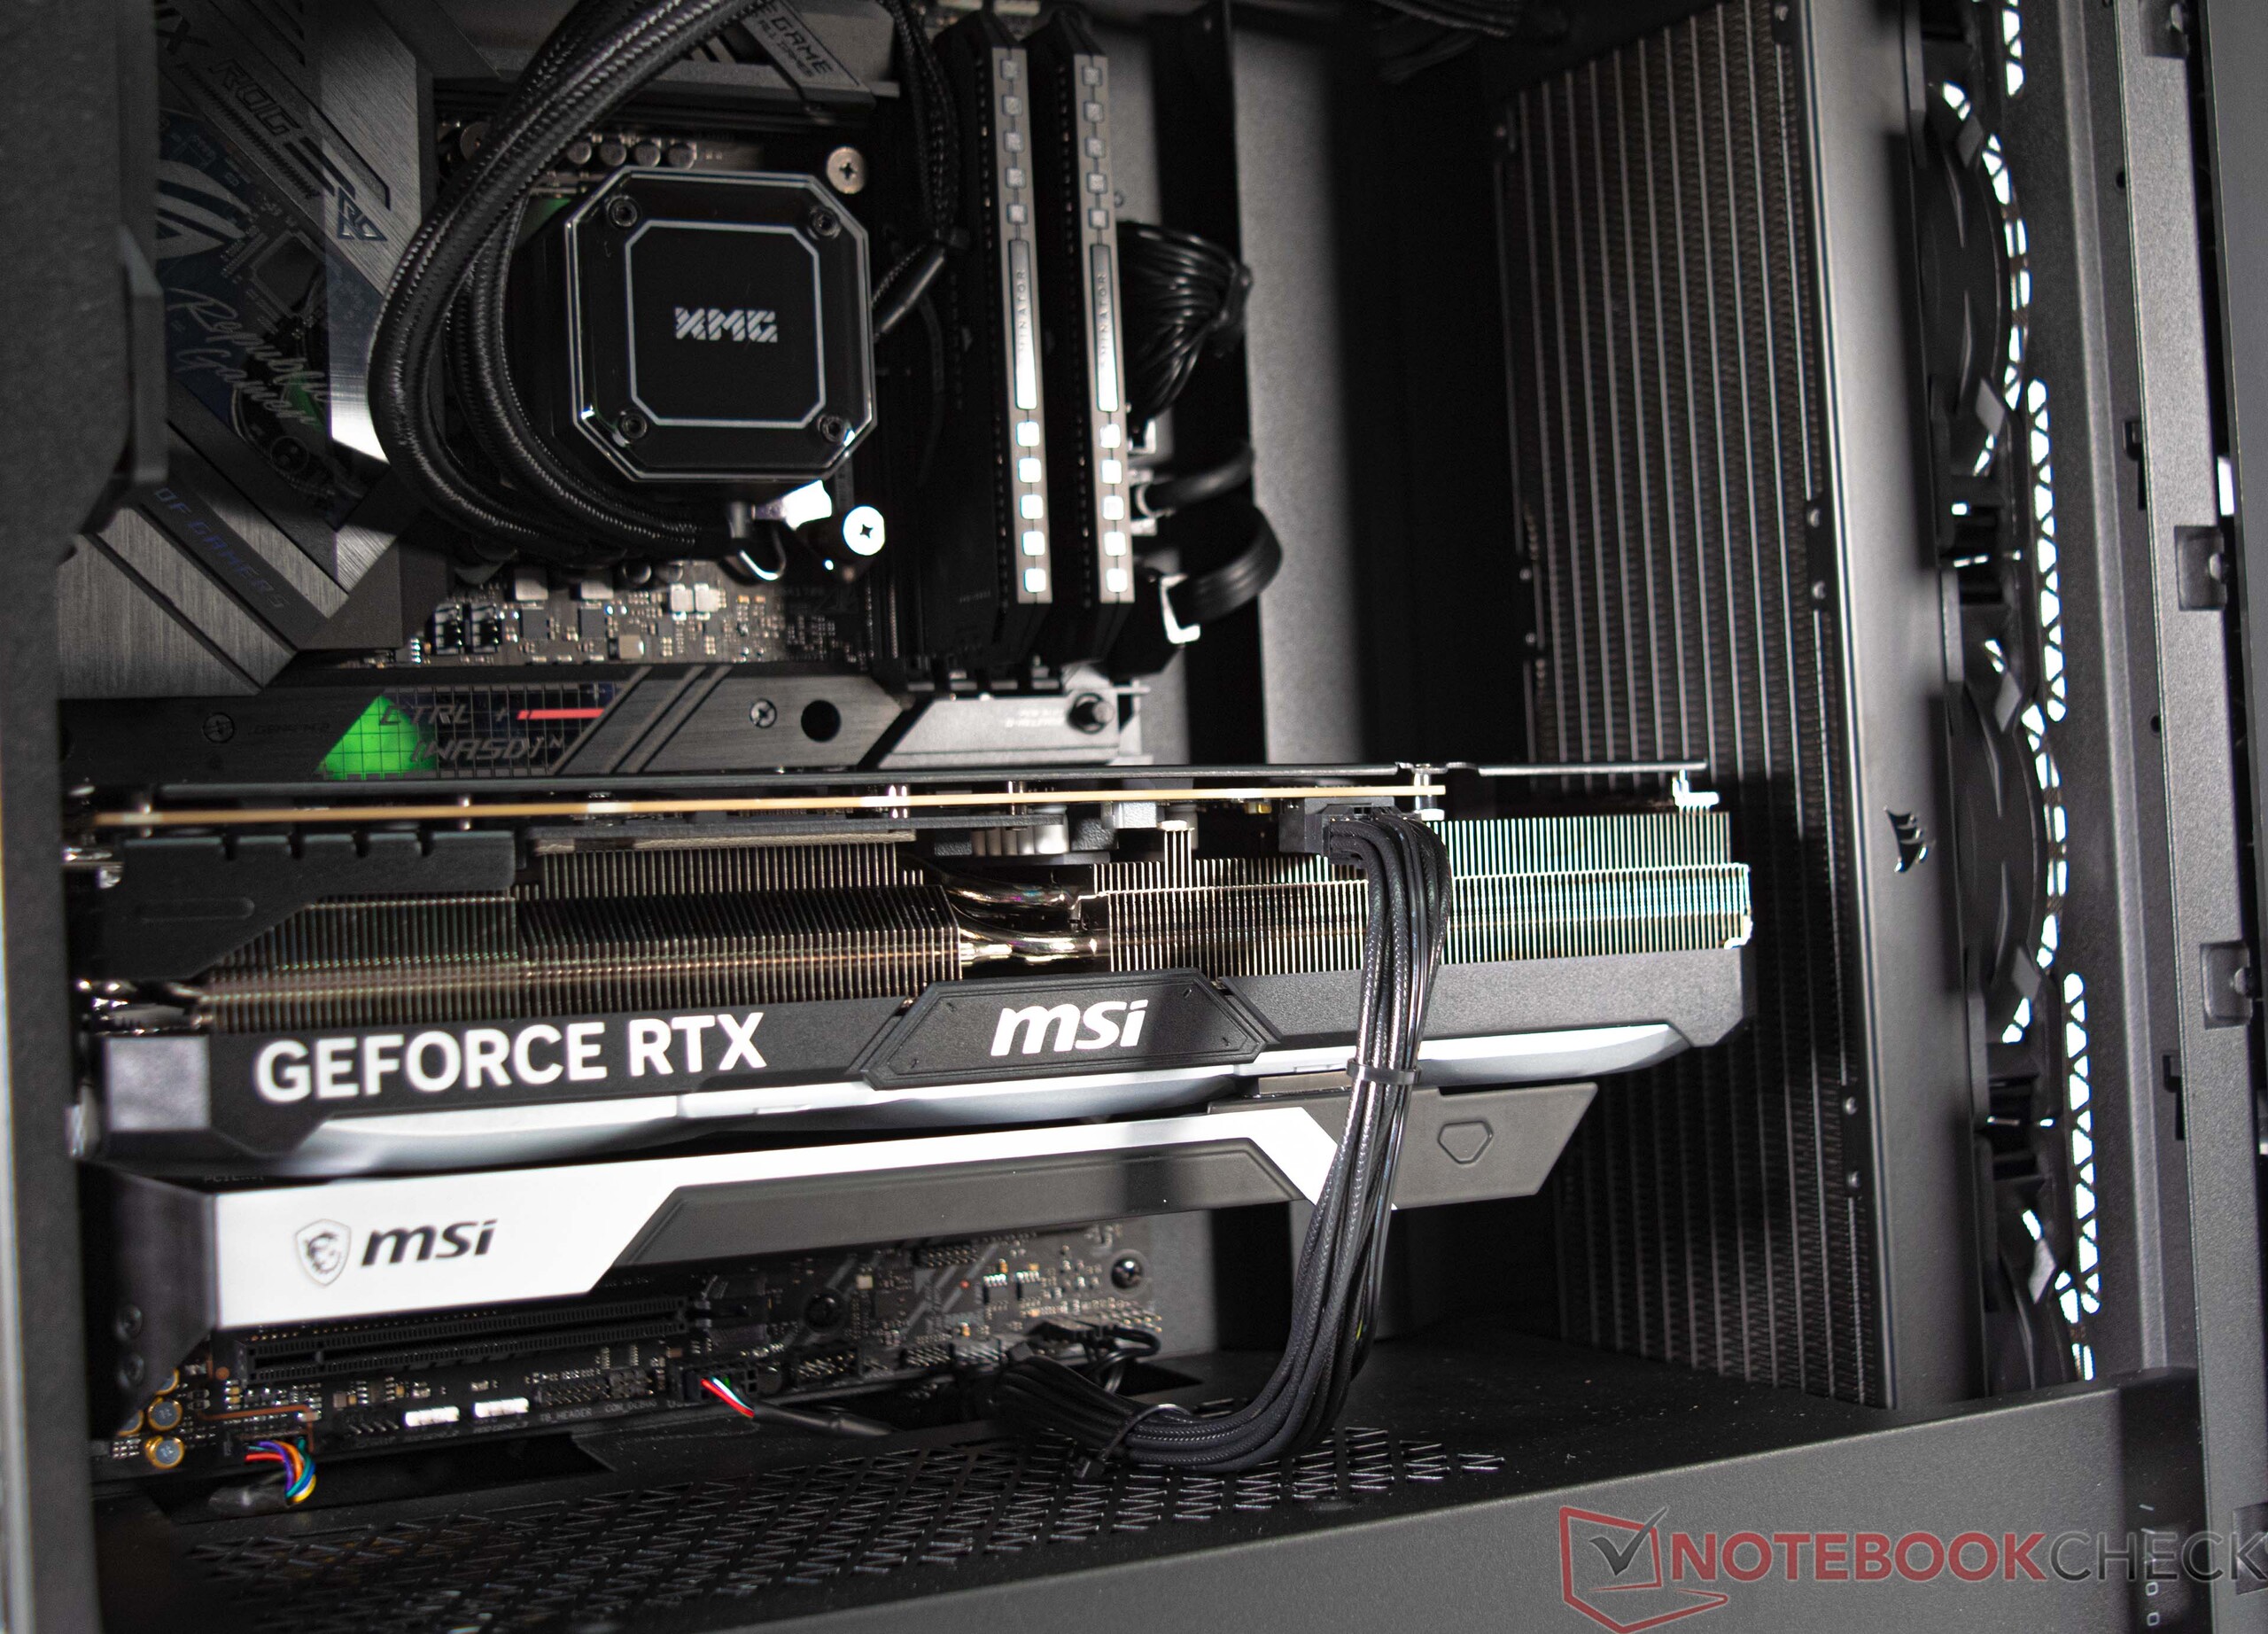
Schenker zamontował sprzęt XMG SECTOR Intel w czarnej obudowie Corsair 4000D Airflow. Obudowa posiada okno z ciemnego szkła, które ma za zadanie wyeksponować znajdujące się wewnątrz komponenty za pomocą efektów świetlnych. Jednak dołączony cooler AIO oraz moduły pamięci Corsair Dominator RGB to jedyne źródła oświetlenia w naszej konfiguracji recenzenckiej.
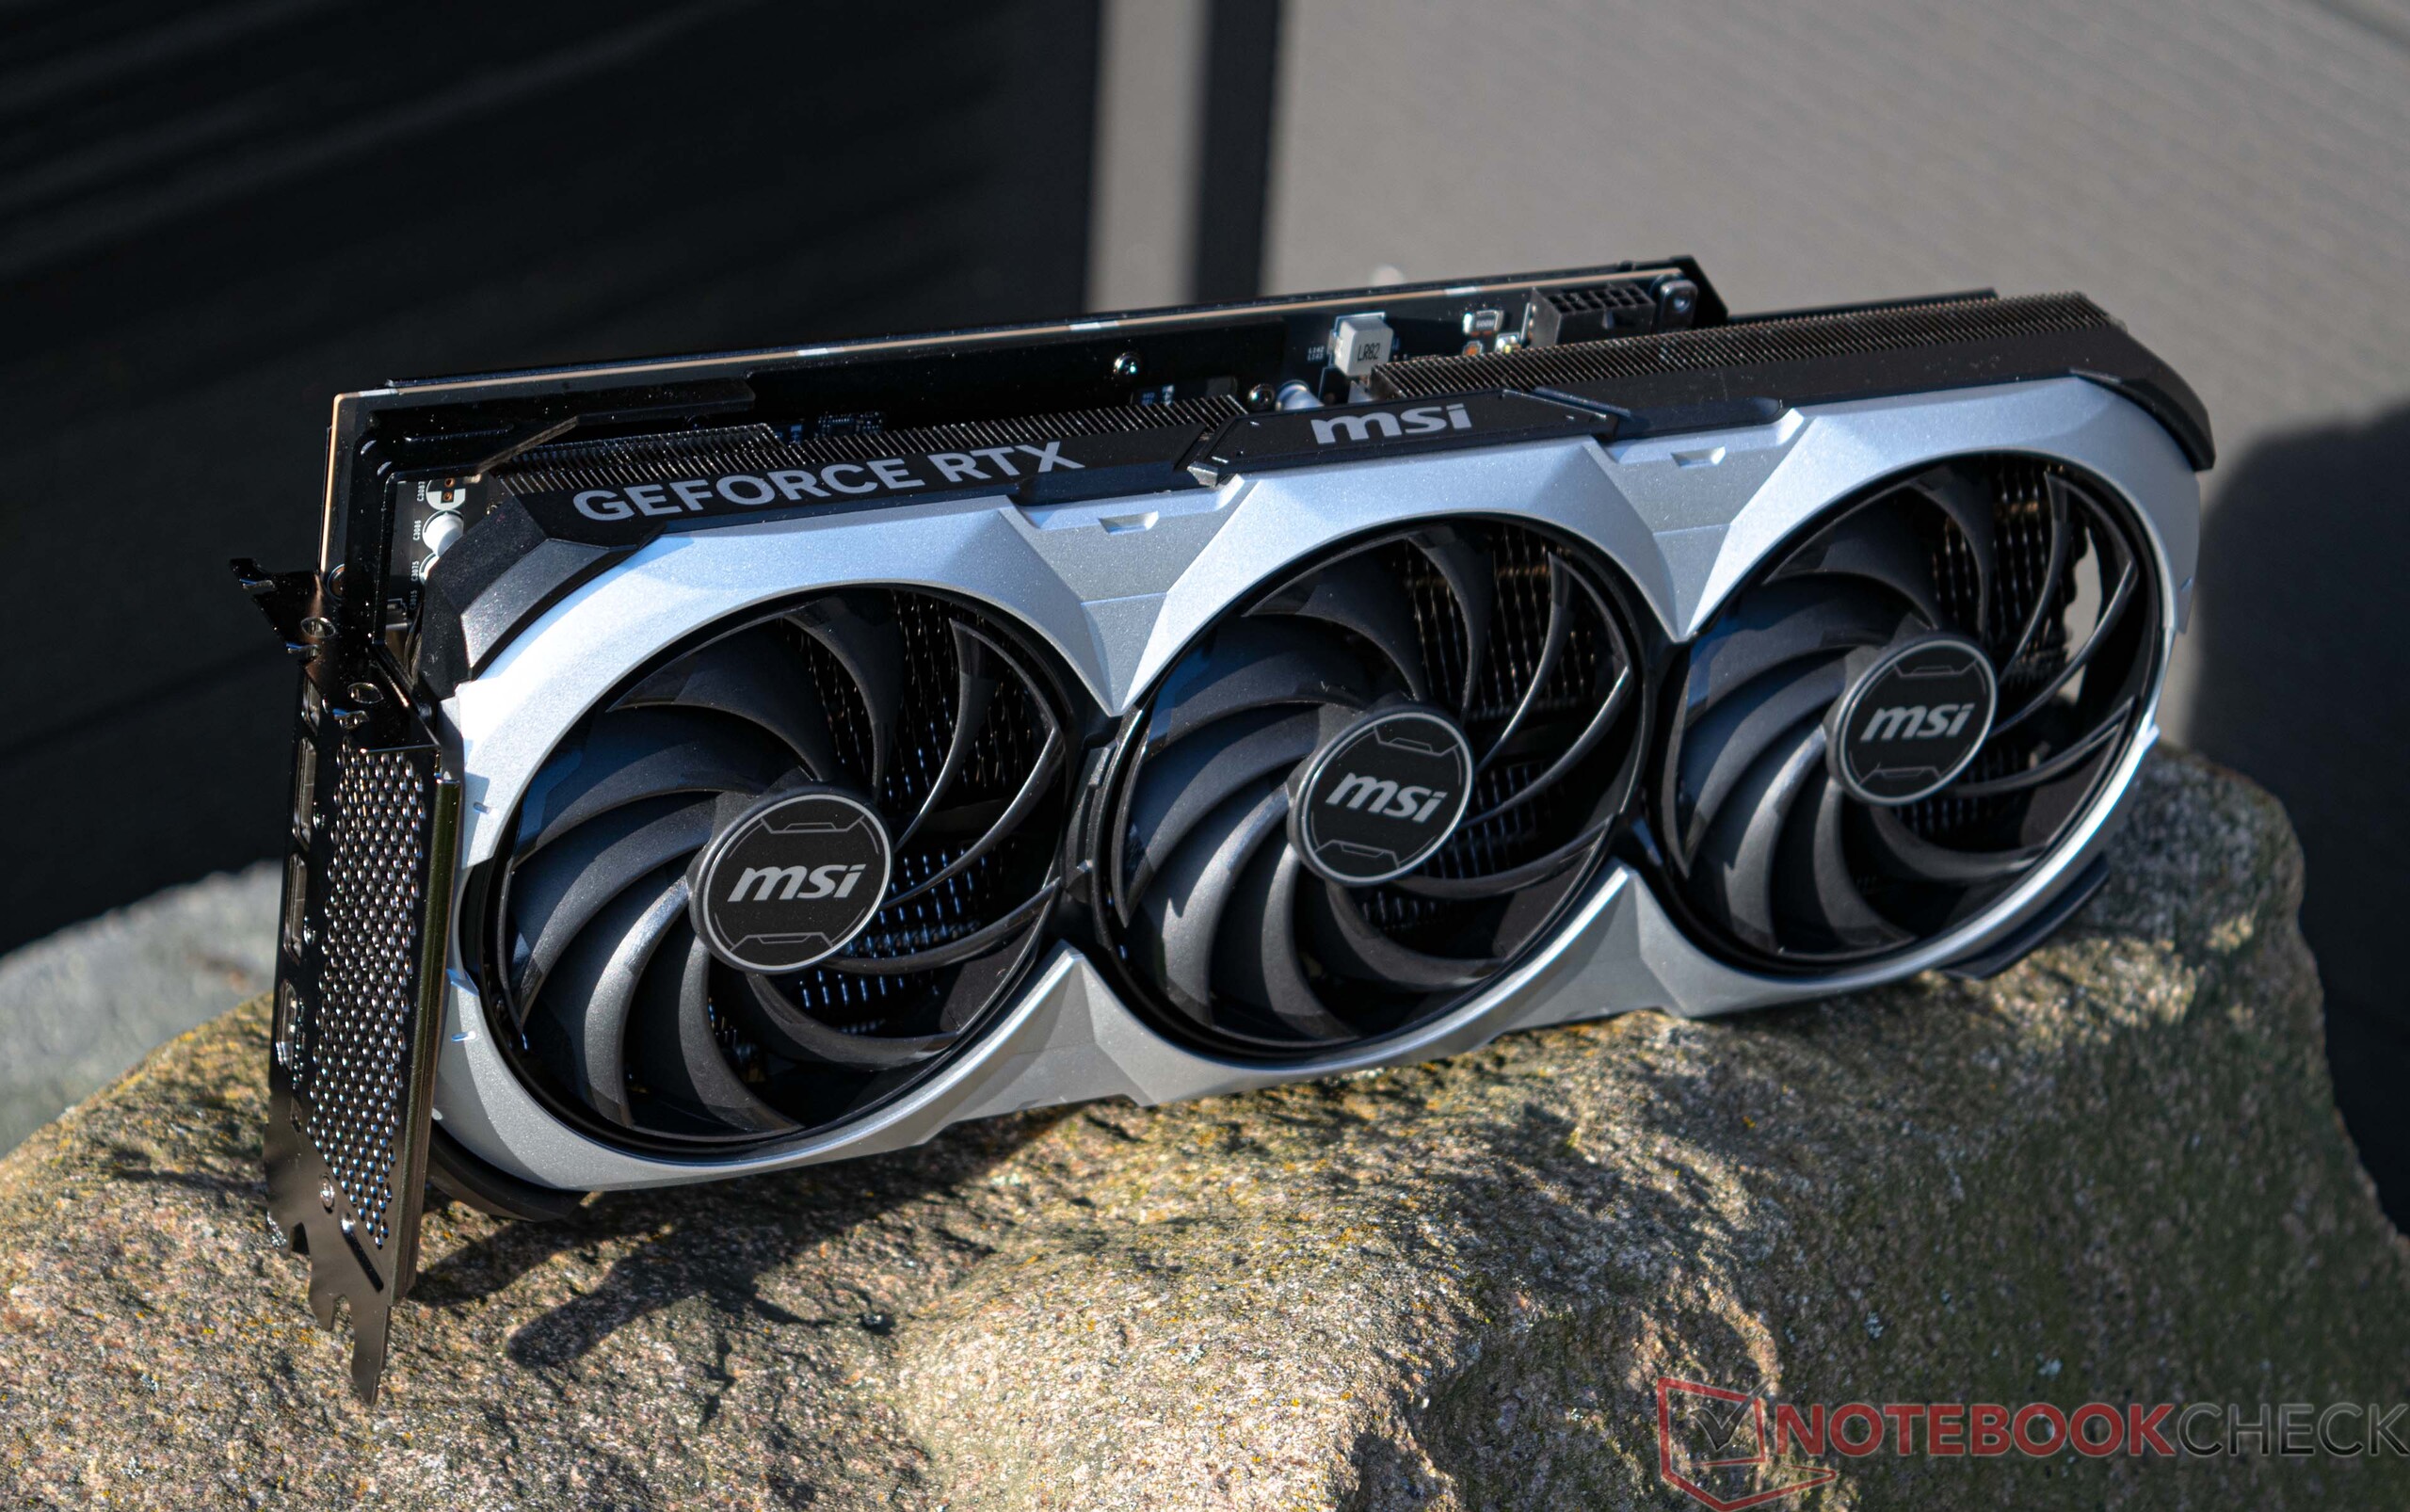
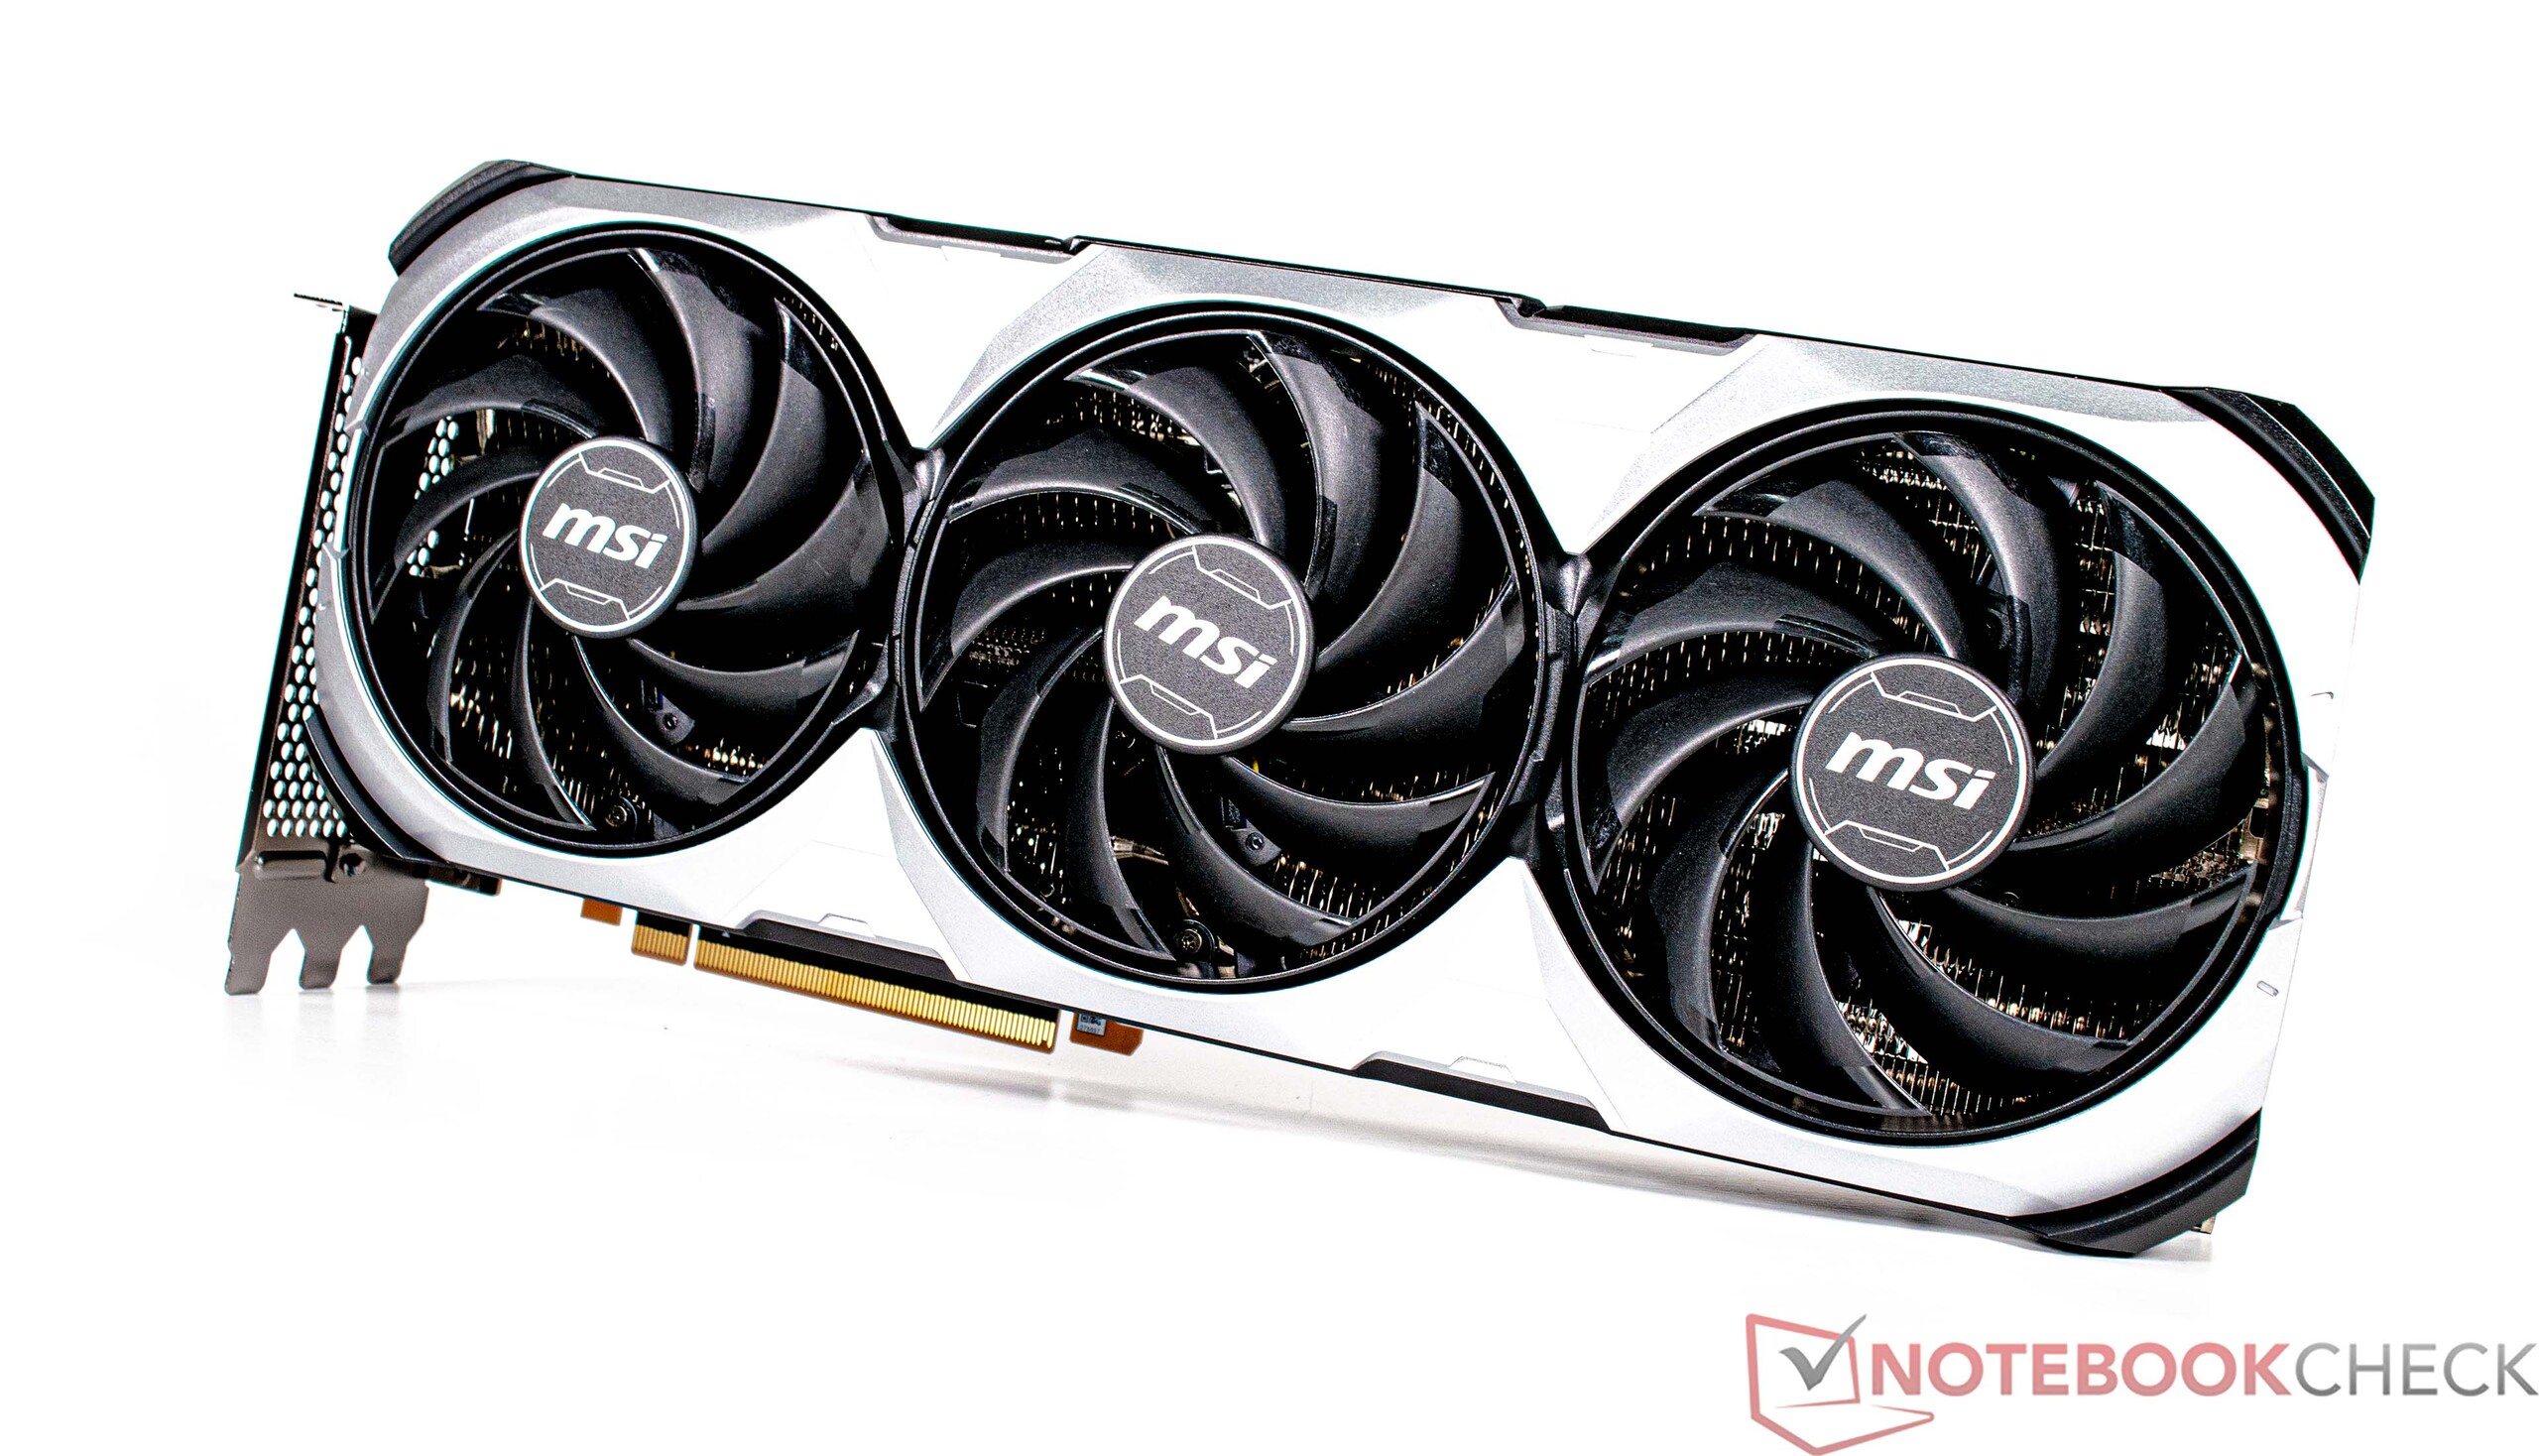
Corsair 4000D Airflow jest zasadniczo bardzo wysokiej klasy obudową z wystarczającą ilością miejsca na liczne komponenty. Nawet masywny MSI GeForce RTX 4090 VENTUS 3X bez problemu mieści się w obudowie.
Specyfikacje
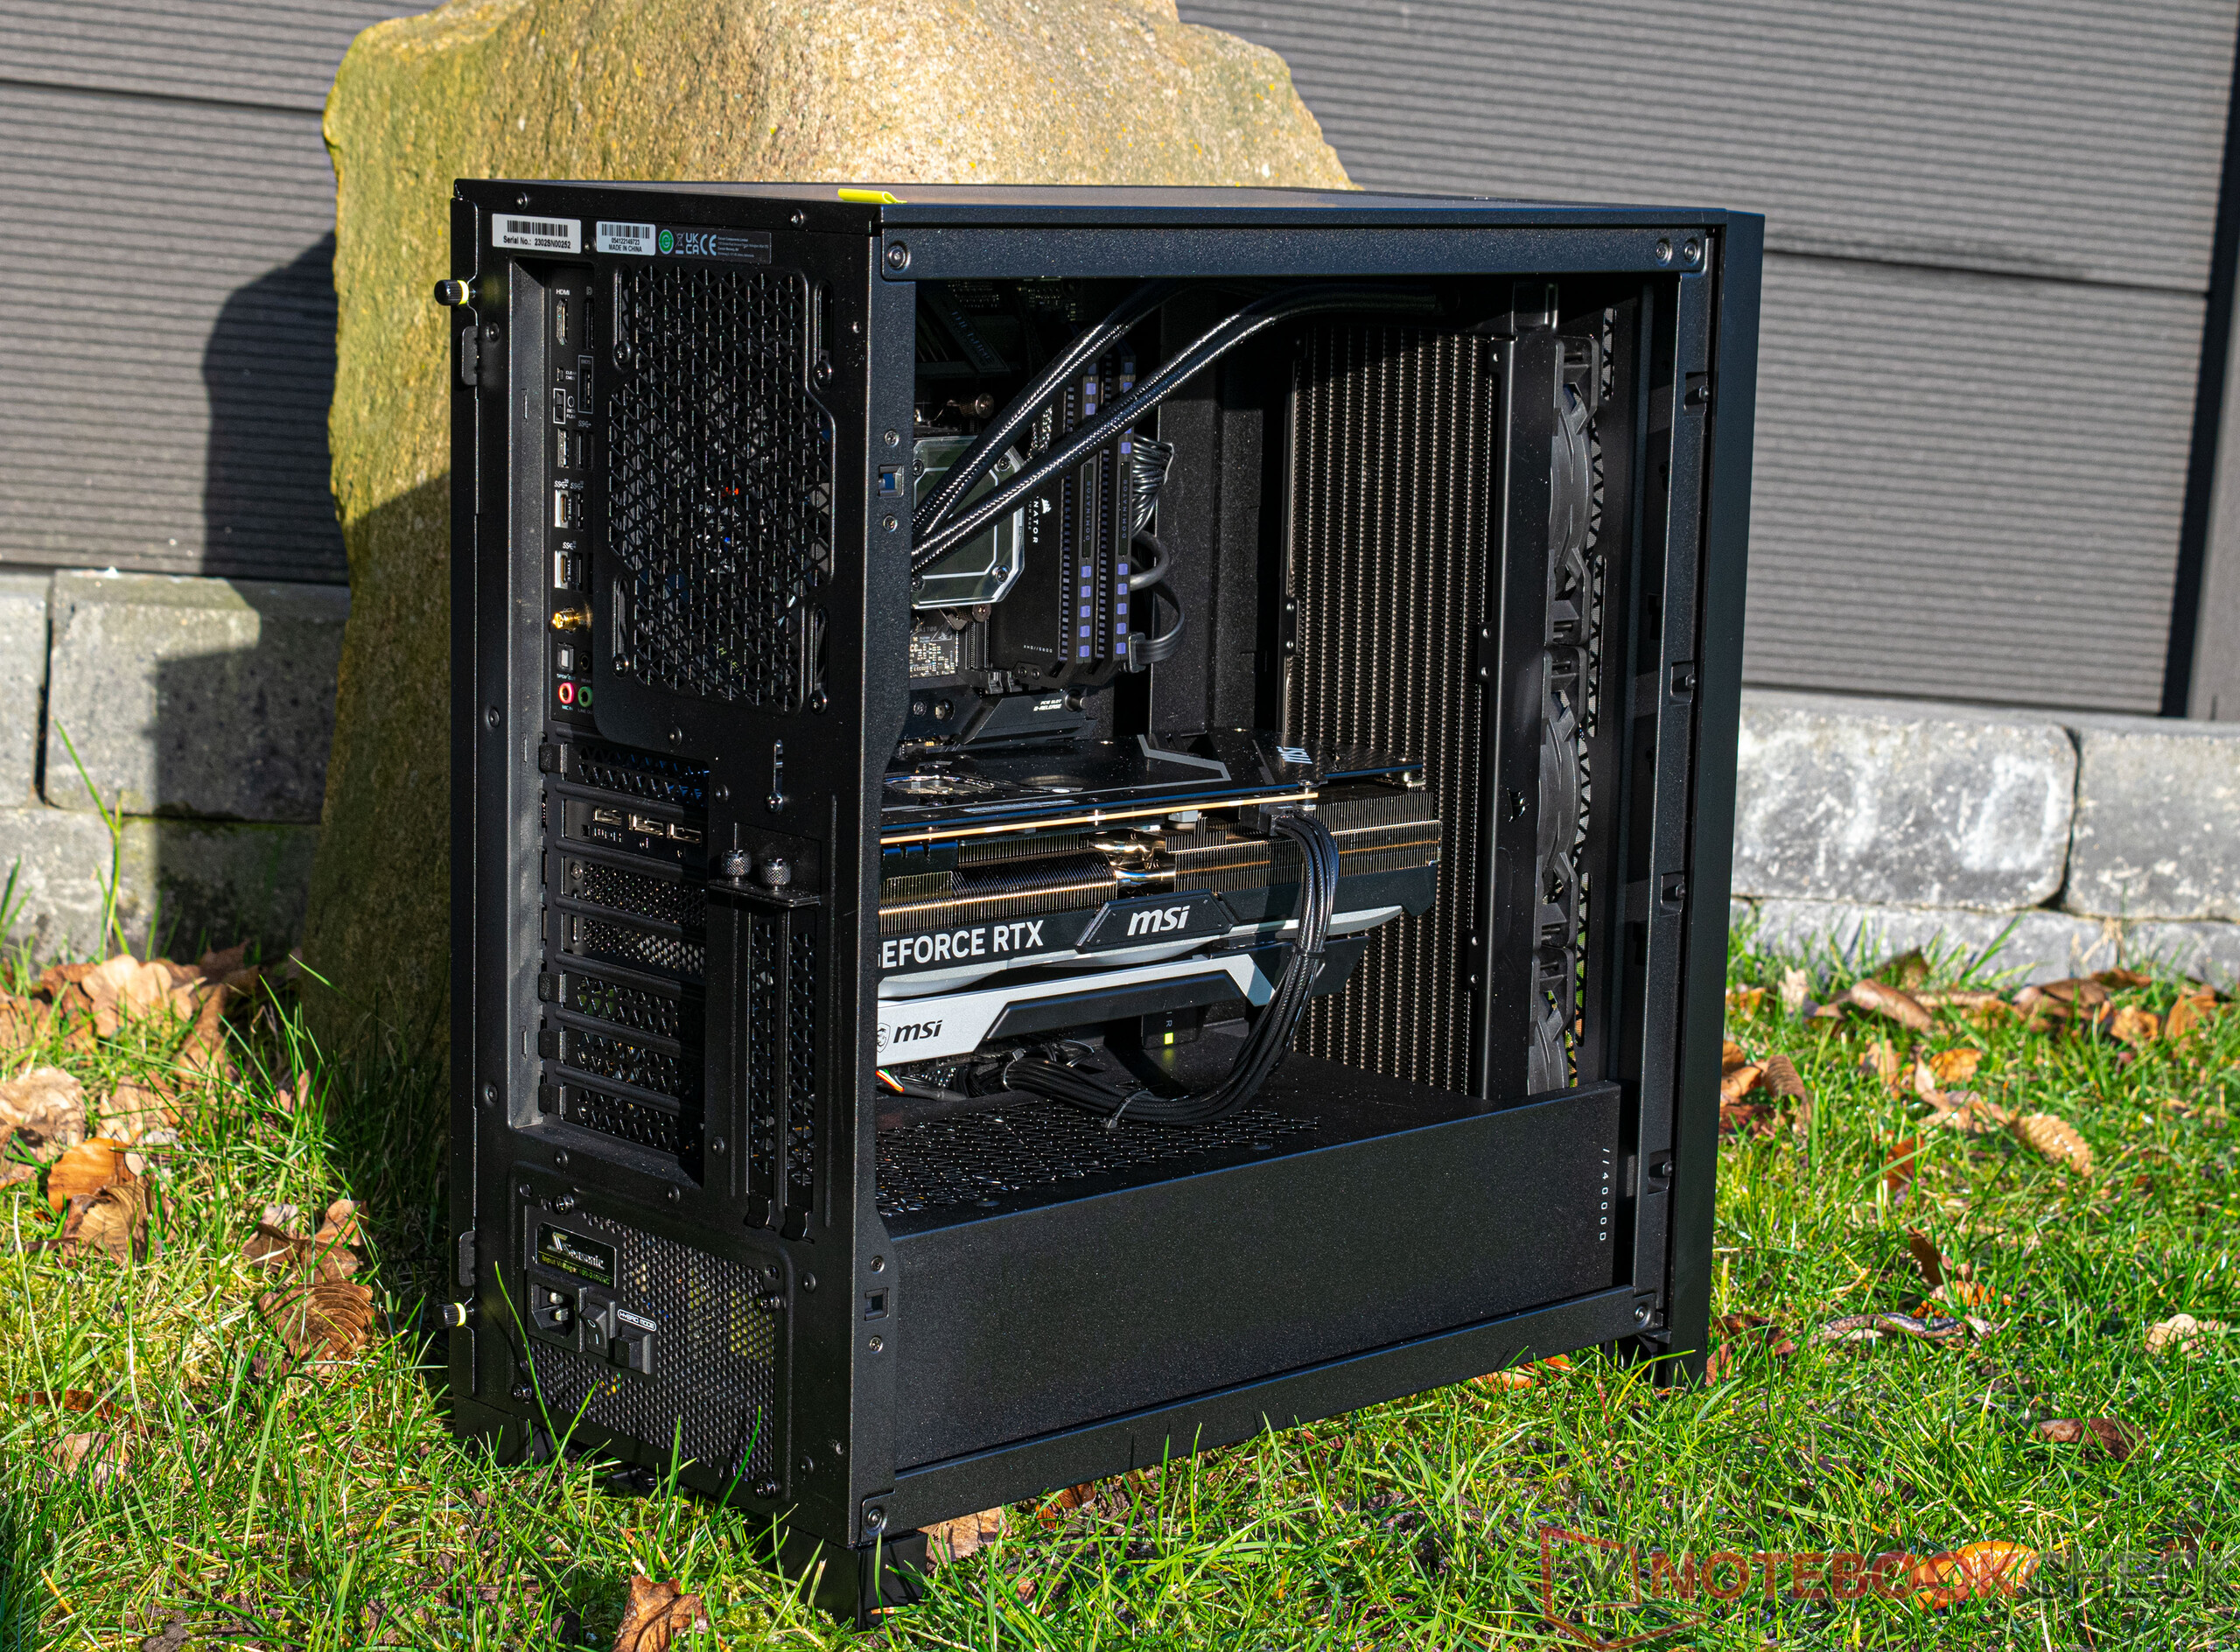
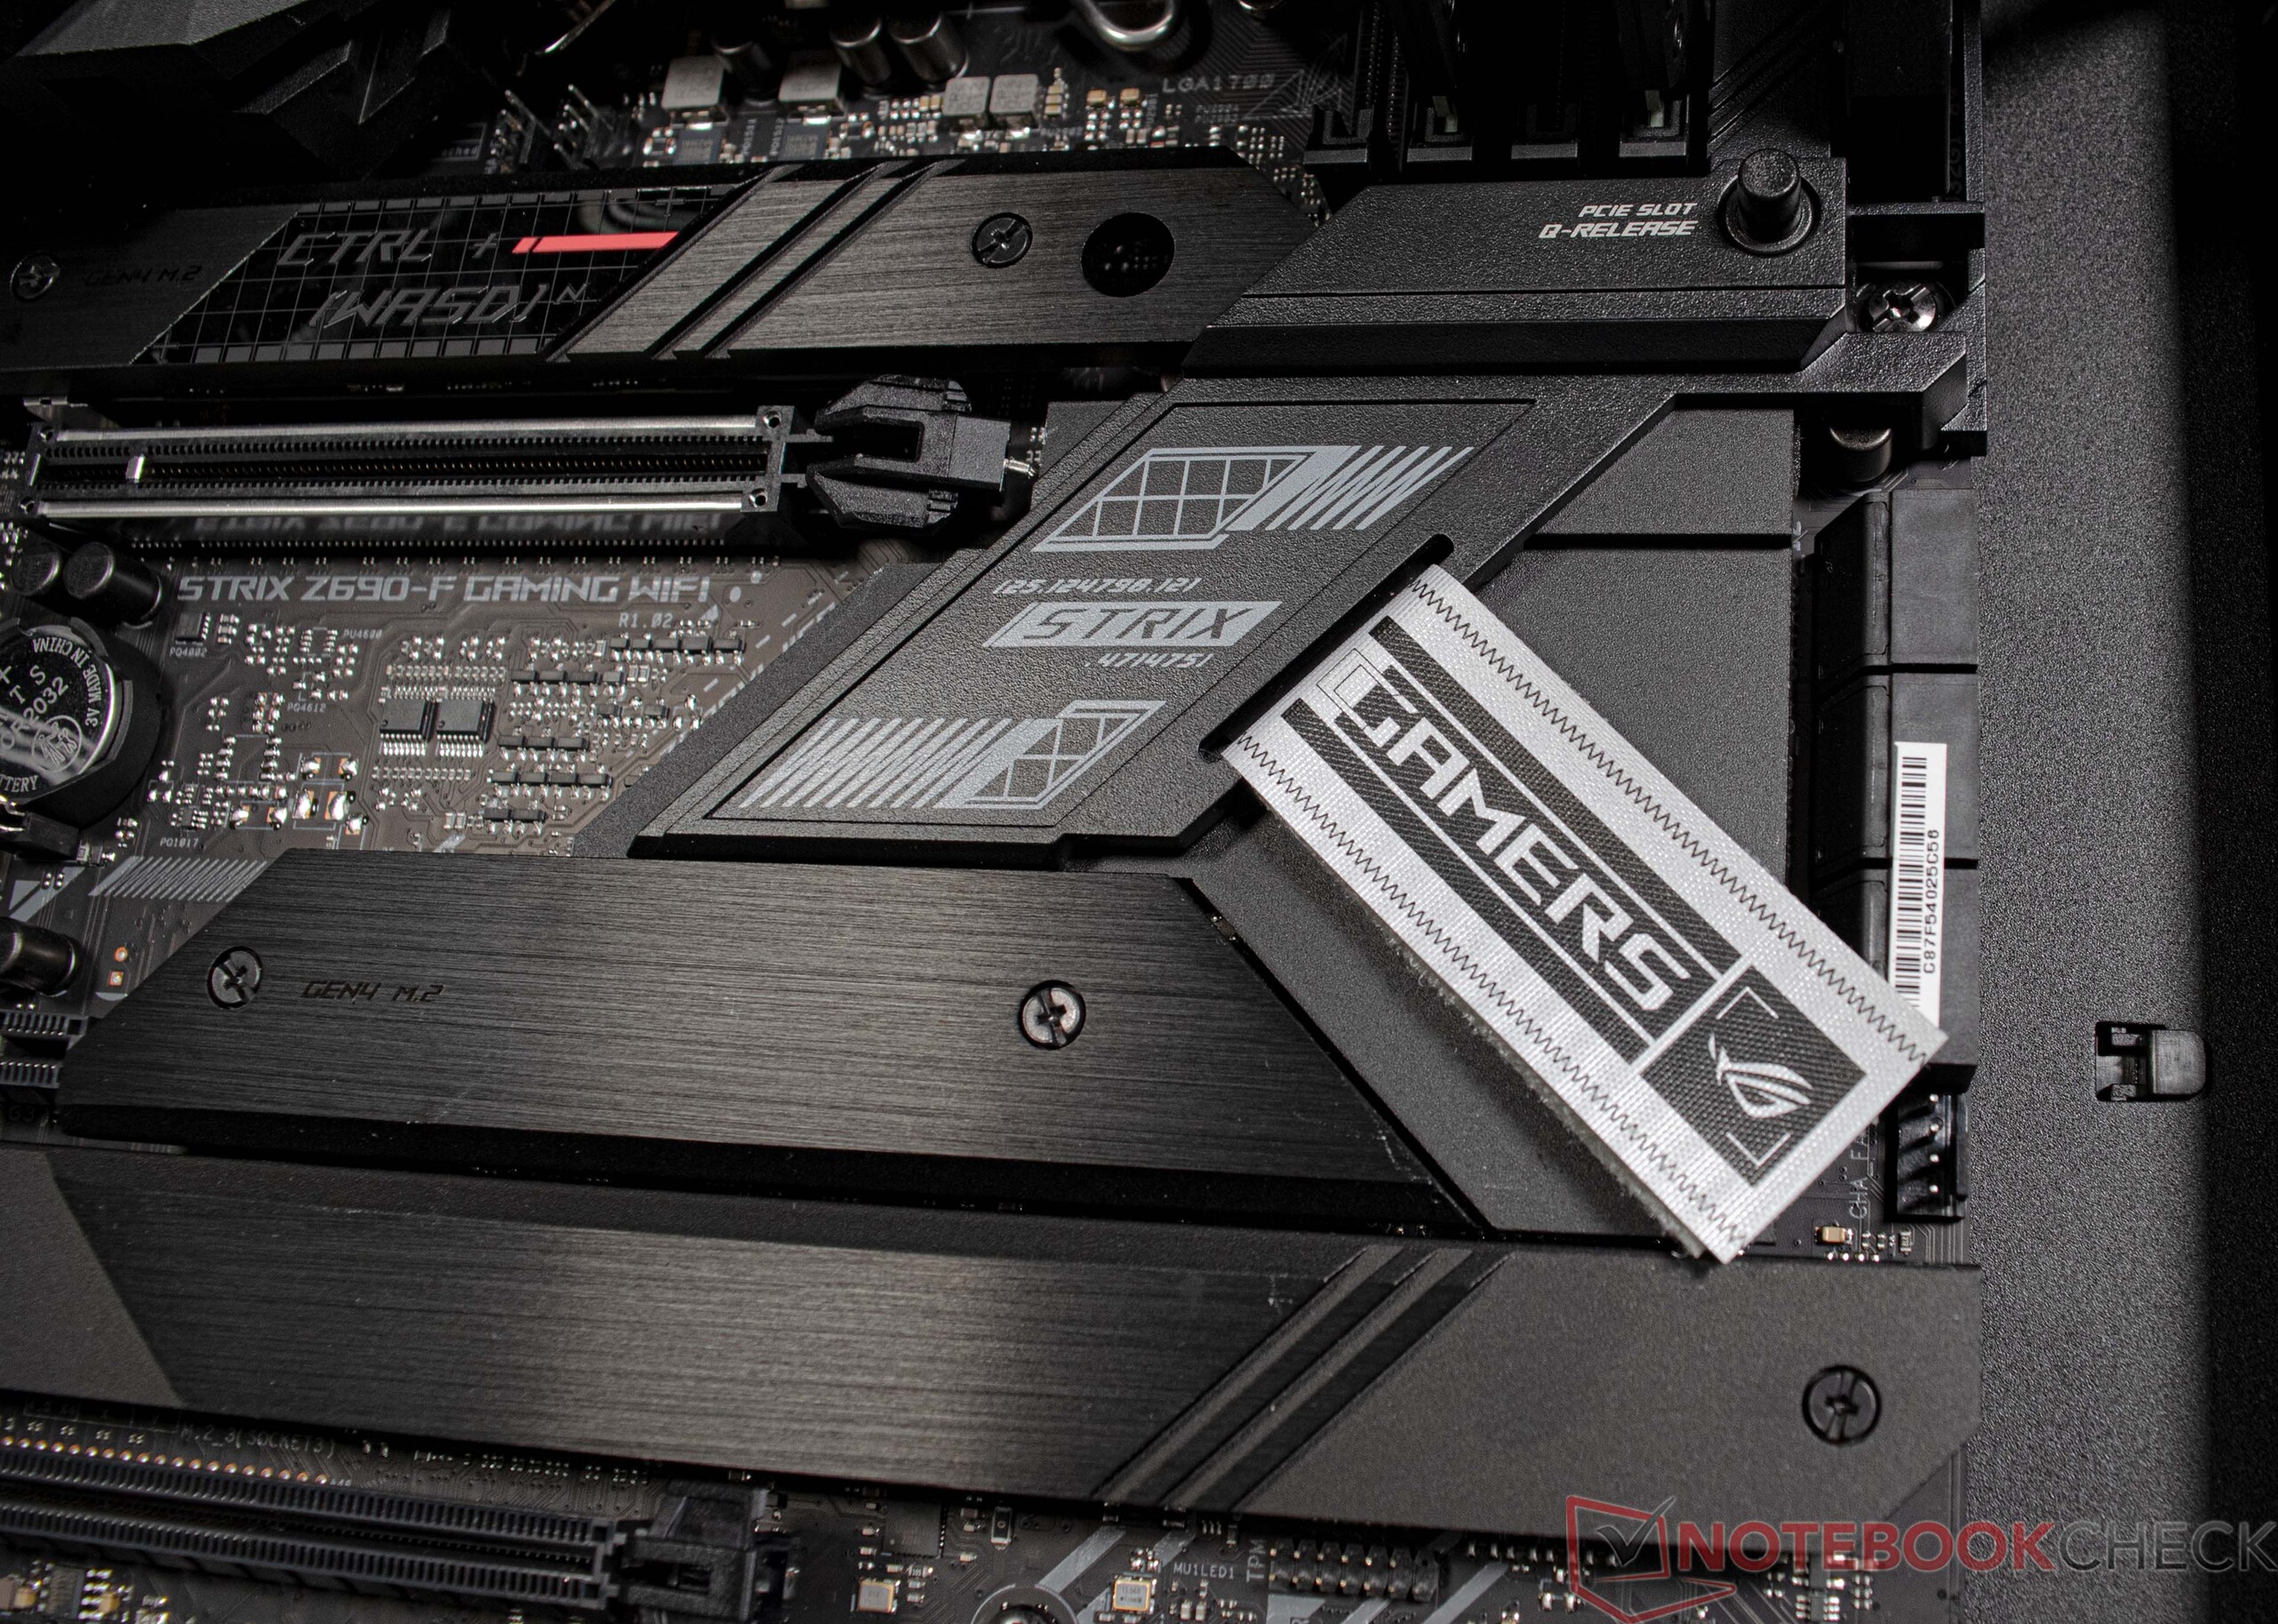
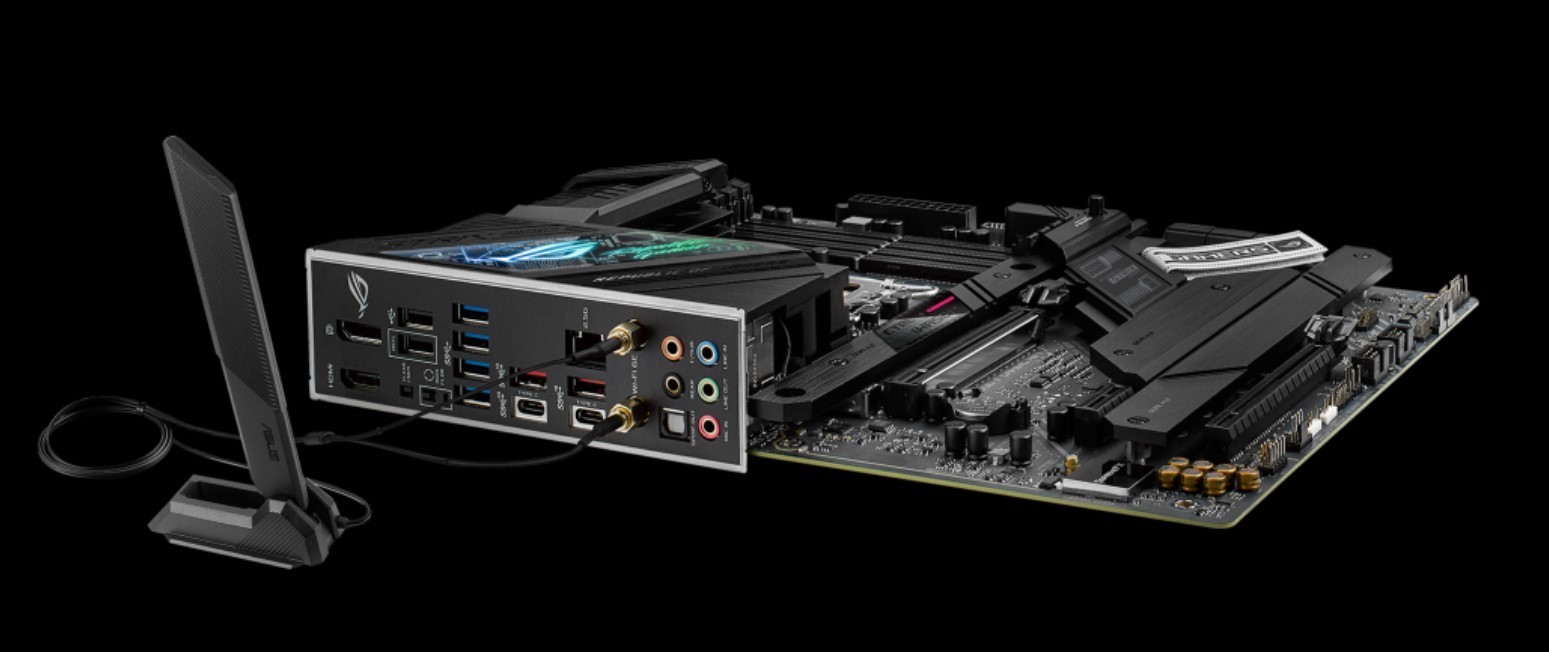
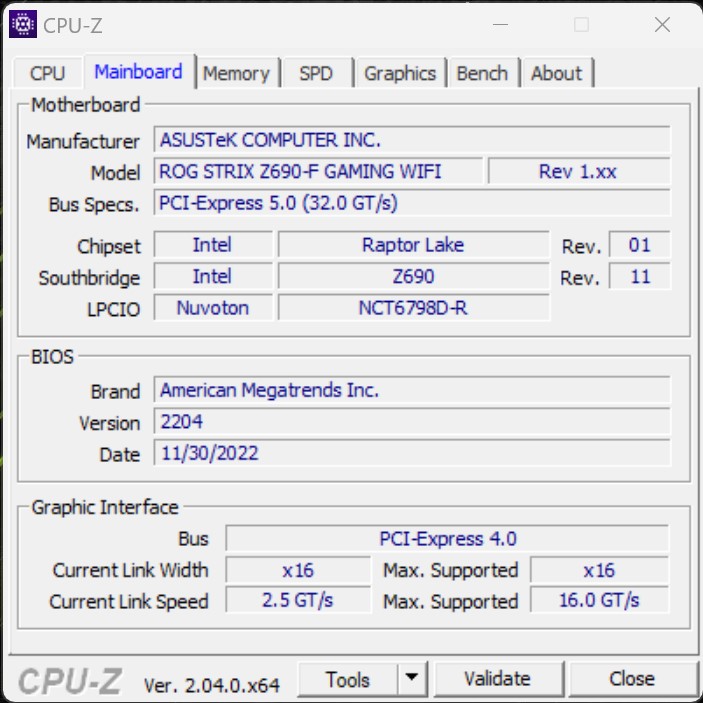
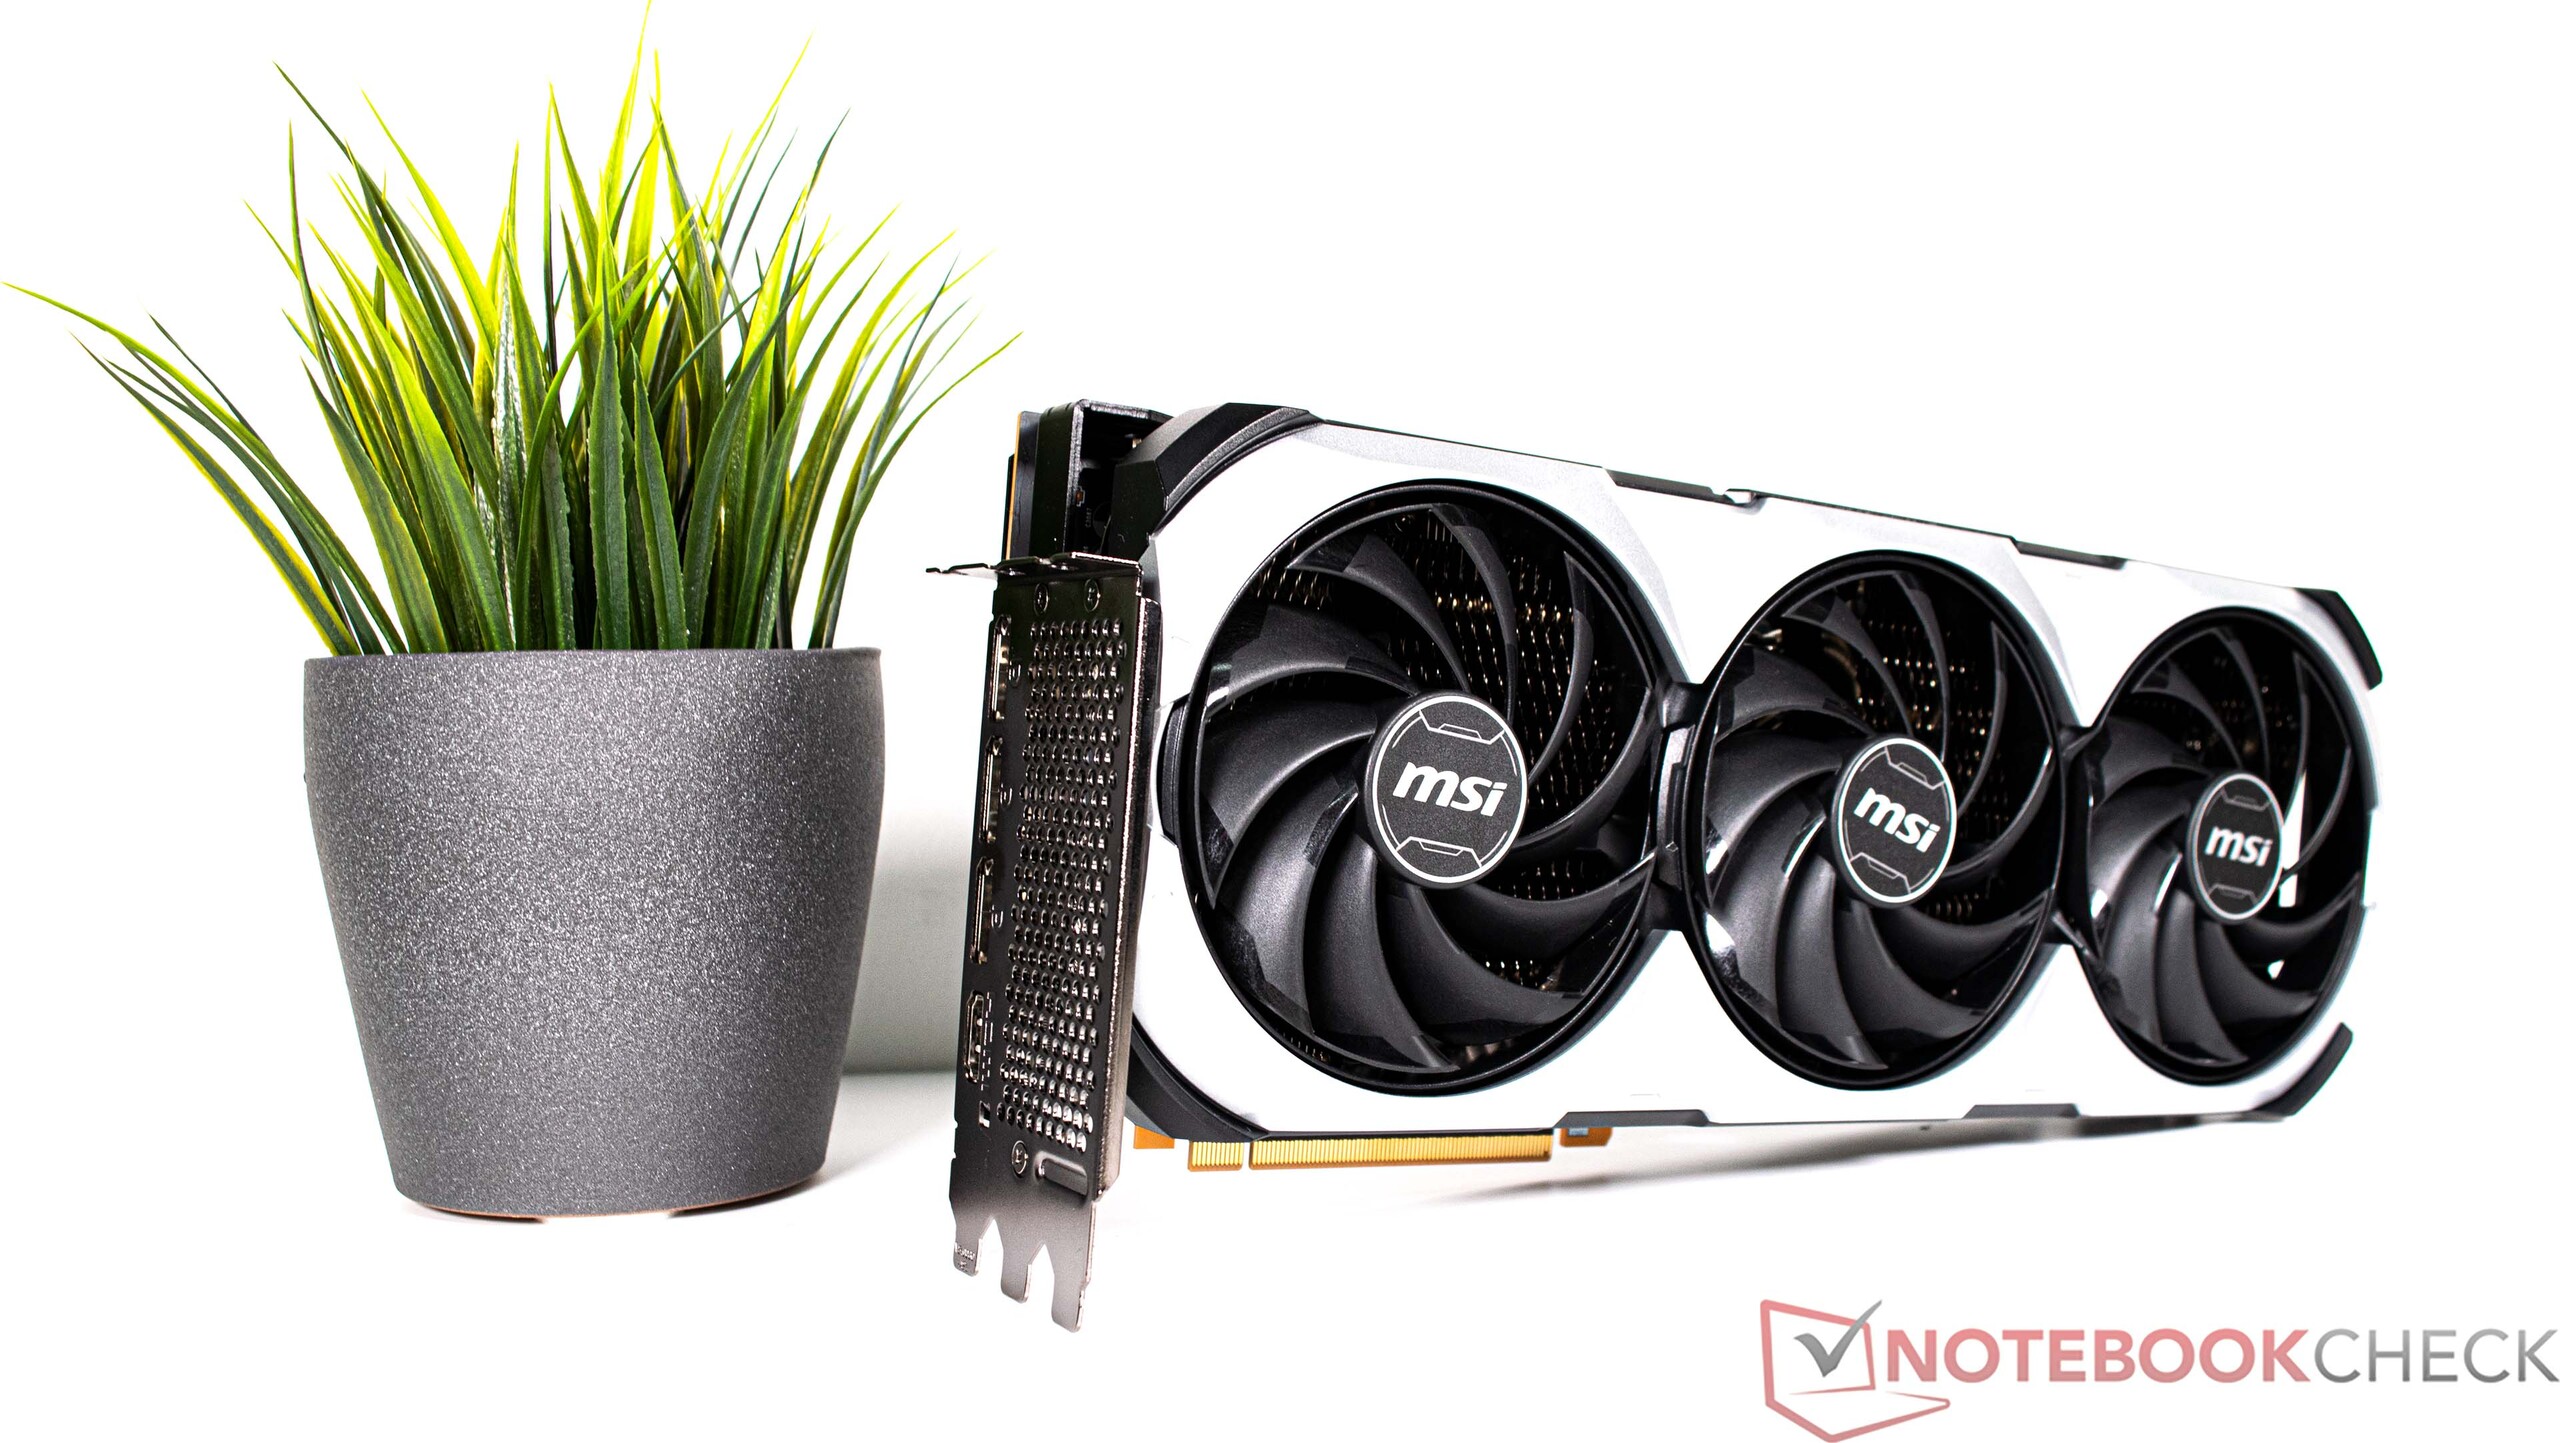
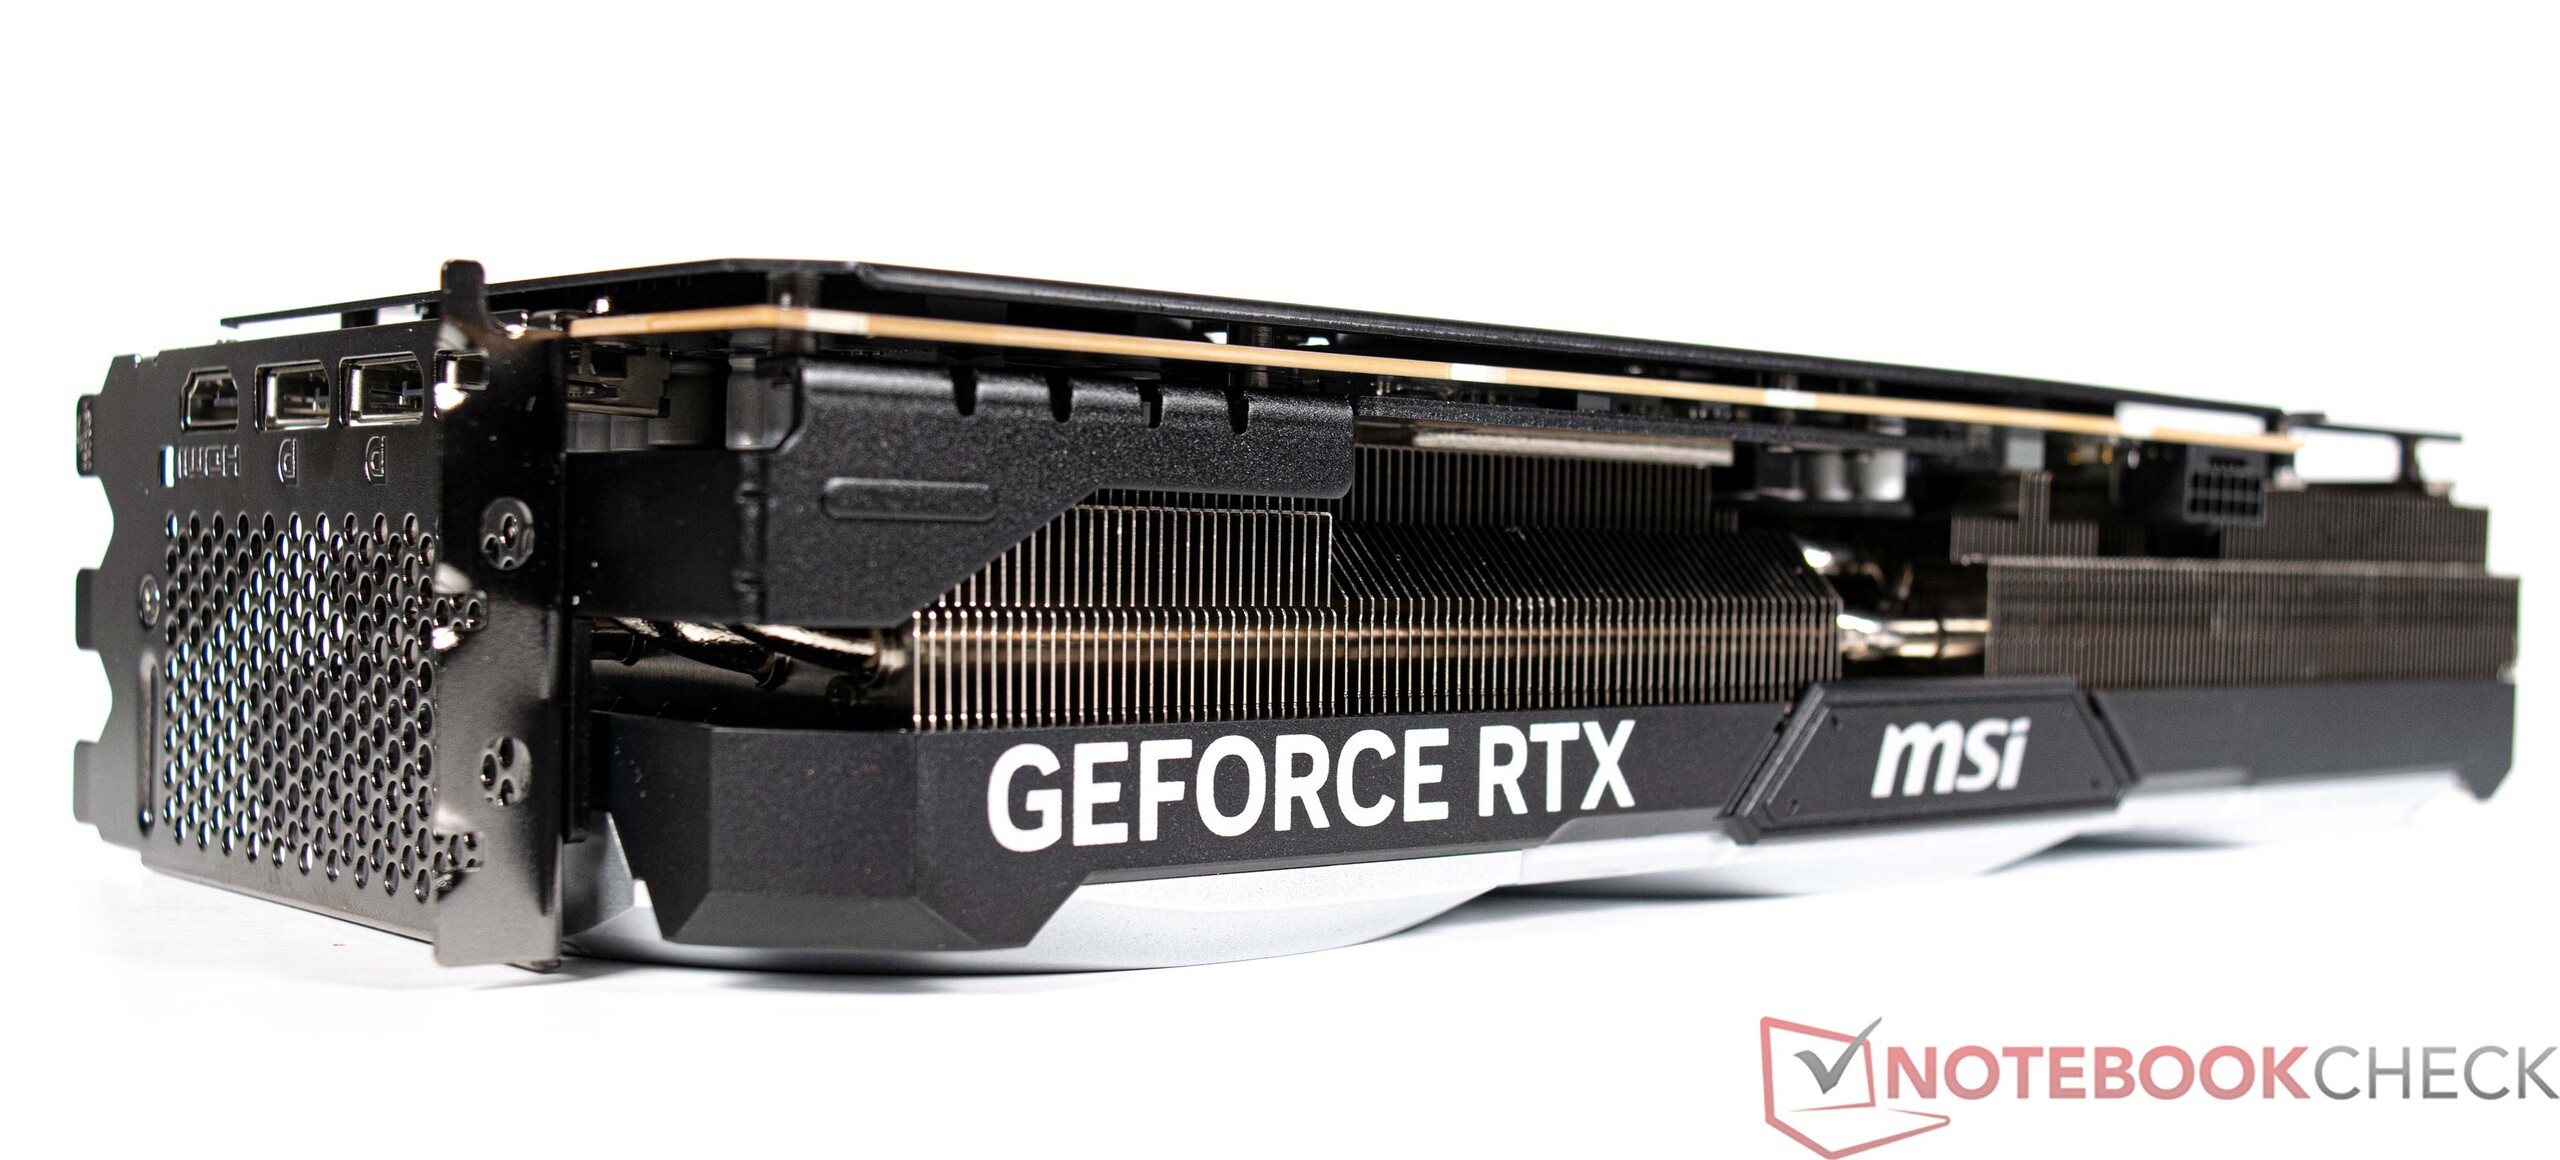
W kwestii portów I/O nie poczyniono praktycznie żadnych kompromisów. Na przykład dołączona płyta główna (Asus ROG Strix Z690-F Gaming) oferuje niezliczoną ilość interfejsów USB i nowoczesnych portów do obsługi sieci. Ponadto może pomieścić do czterech dysków SSD M.2 oraz 128 GB pamięci RAM DDR5 i jest wyposażona w złącza 6x SATA 6 Gb/s. Użytkownicy mają bezpośredni dostęp do jednego portu USB-A i jednego USB-C na przednim panelu Corsair 4000D Airflow. Dostępne wyjścia wyświetlania zależą od karty graficznej w systemie. Nasz egzemplarz recenzencki posiada trzy porty DisplayPort i jedno wyjście HDMI. Jeśli Twój system nie jest wyposażony w procesor non-F, możesz wykorzystać zintegrowane GPU procesora do wyjścia wideo jako alternatywę dla dedykowanej karty graficznej. Istnieją także różne sposoby na napędzanie wyświetlaczy z płyty głównej.
Łączność
W Asusie ROG Strix Z690-F Gaming zainstalowano moduł bezprzewodowy Intel Wi-Fi 6E AX211. Nie byliśmy w pełni zachwyceni wydajnością modułu podczas testów z naszym referencyjnym routerem, Asusem ROG Rapture GT-AXE11000. Zarejestrowane prędkości transferu były poniżej naszych oczekiwań, gdy system był podłączony do sieci 5G. Po przełączeniu na połączenie 6G szybkość transferu uległa znacznej poprawie. Jako alternatywę, płyta główna w naszym egzemplarzu recenzenckim posiada również interfejs RJ45, który obsługuje prędkości do 2,5 Gbit/s.
| Networking | |
| iperf3 receive AXE11000 | |
| Przeciętny Intel Wi-Fi 6E AX211 (582 - 1890, n=276) | |
| Minisforum Neptune Series NAD9 | |
| Intel NUC13 Raptor Canyon | |
| Średnia w klasie Desktop (n=1ostatnie 2 lata) | |
| Minipc Union Ace Magician AMR5 | |
| Schenker XMG SECTOR, i9 13900K, RTX 4090 | |
| Minisforum EliteMini B550 | |
| iperf3 transmit AXE11000 | |
| Intel NUC13 Raptor Canyon | |
| Minisforum Neptune Series NAD9 | |
| Przeciętny Intel Wi-Fi 6E AX211 (64 - 1921, n=276) | |
| Minipc Union Ace Magician AMR5 | |
| Średnia w klasie Desktop (n=1ostatnie 2 lata) | |
| Schenker XMG SECTOR, i9 13900K, RTX 4090 | |
| Minisforum EliteMini B550 | |
| iperf3 transmit AXE11000 6GHz | |
| Schenker XMG SECTOR, i9 13900K, RTX 4090 | |
| Przeciętny Intel Wi-Fi 6E AX211 (385 - 1851, n=226) | |
| Średnia w klasie Desktop (n=1ostatnie 2 lata) | |
| Minipc Union Ace Magician AMR5 | |
| Minisforum EliteMini B550 | |
| iperf3 receive AXE11000 6GHz | |
| Schenker XMG SECTOR, i9 13900K, RTX 4090 | |
| Przeciętny Intel Wi-Fi 6E AX211 (700 - 1857, n=226) | |
| Minipc Union Ace Magician AMR5 | |
| Średnia w klasie Desktop (n=1ostatnie 2 lata) | |
| Minisforum EliteMini B550 | |
Akcesoria
W pudełku, oprócz samego komputera, znajdziemy różne akcesoria do płyty głównej, takie jak kable i anteny Wi-Fi, a także nieużywane kable należące do zasilacza, który jest w pełni modularny.
Konserwacja
Konserwacja XMG SECTOR Intel jest bardzo prosta. Boczne panele Corsair 4000D Airflow można łatwo zdjąć, co pozwala szybko i wygodnie oczyścić wentylatory z kurzu. Dołączony do zestawu Corsair iCUE H150i Elite Capellix to wydajne rozwiązanie chłodzące AIO, które nie wymaga dużej konserwacji.
Gwarancja
Schenker zapewnia 36-miesięczną gwarancję podstawową z usługą pickup & return na każdy XMG SECTOR Intel. Nie ma jednak możliwości przedłużenia okresu gwarancyjnego podczas procesu zamawiania.
Wydajność - drugi najszybszy procesor Intel spotyka się z najszybszym układem GPU
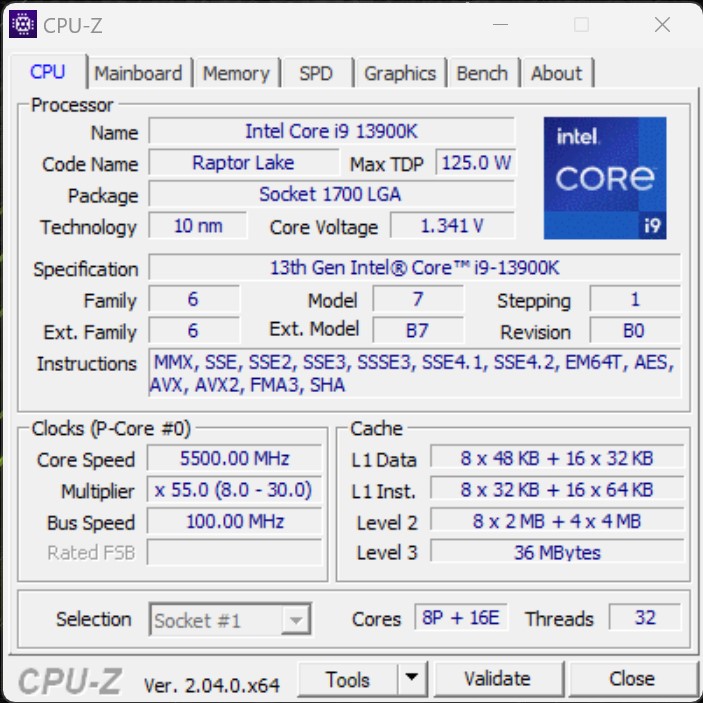
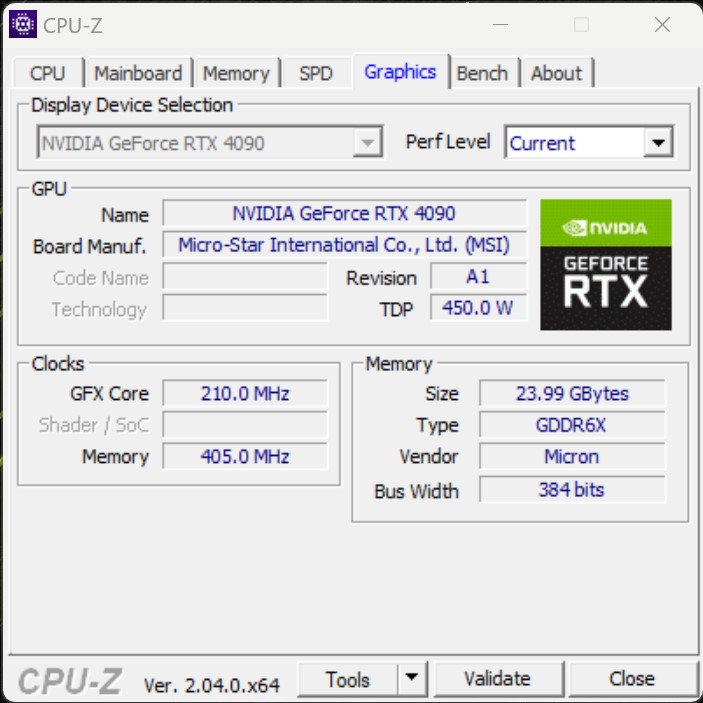
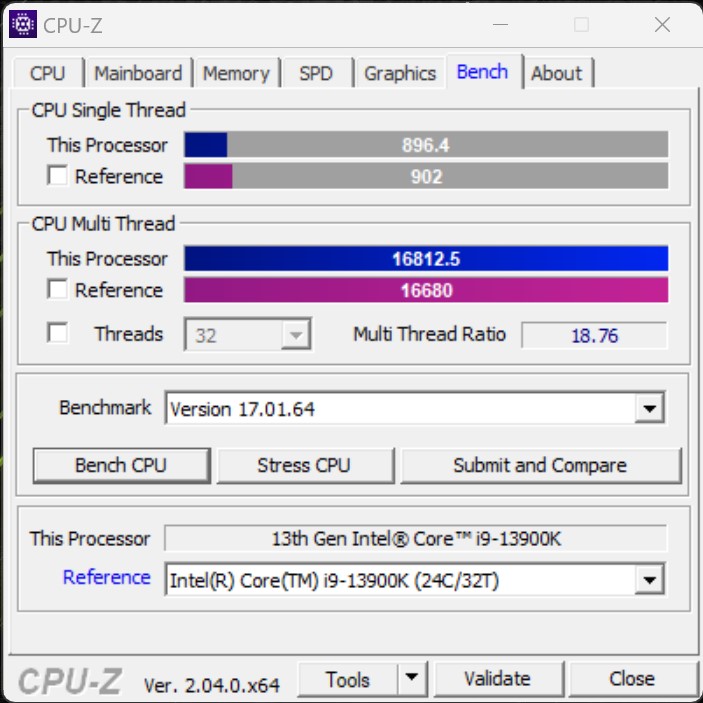
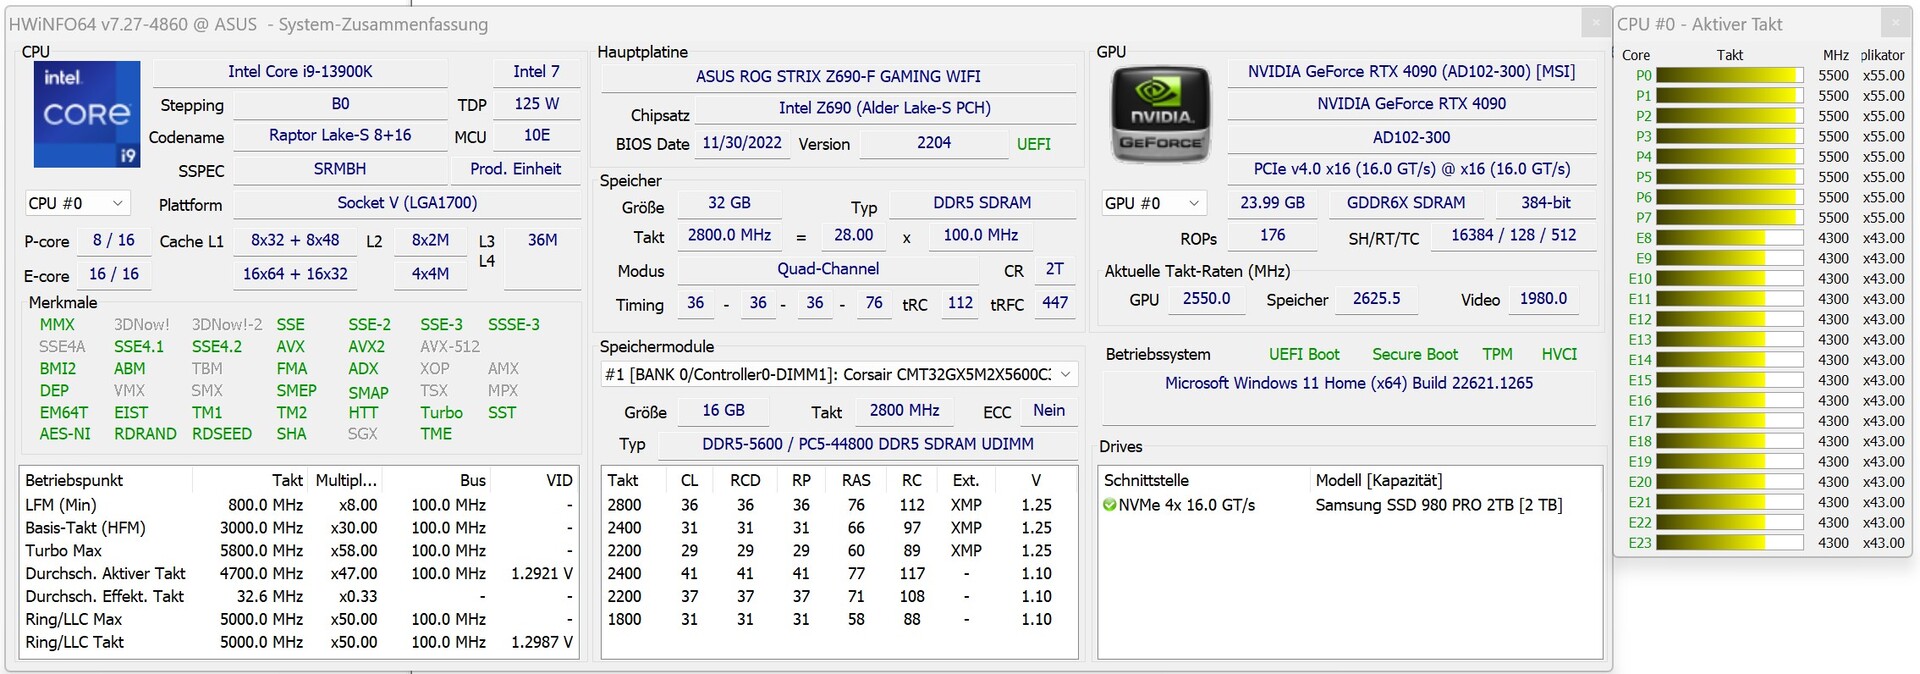
Intel XMG SECTOR w tej recenzji wyposażony jest w drugi najszybszy gamingowy procesor Intela - tj Core i9-13900K. Procesor jest flankowany przez 32 GB pamięci i dysk SSD o imponującej pojemności 2 TB, co oznacza, że system ma wystarczająco dużo pamięci masowej, aby pomieścić gry PC o dużym rozmiarze instalacji. Dołączona karta graficzna to MSI GeForce RTX 4090 VENTUS 3X, czyli najszybsze obecnie GPU na rynku konsumenckim.
Warunki badania
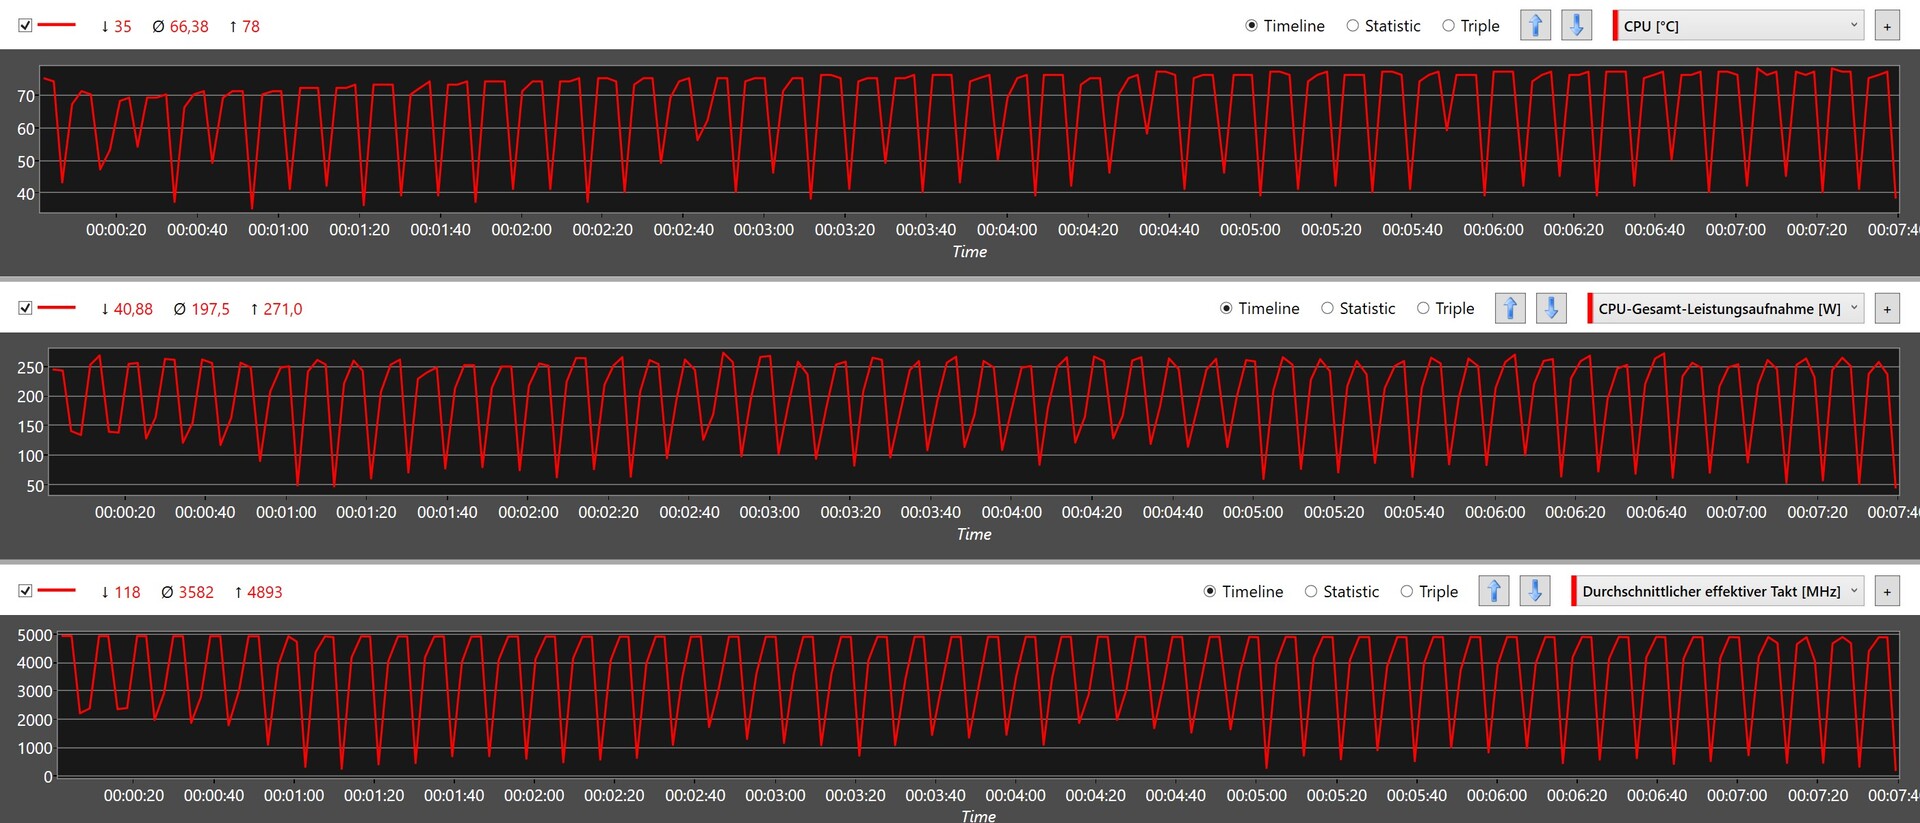
Wszystkie testy związane z wydajnością zostały przeprowadzone z profilem zasilania ustawionym na "High performance", tak abyśmy mogli uzyskać jak najlepsze wyniki. Co więcej, producent wyłączył już w BIOS-ie wszelkie ograniczenia dotyczące zużycia energii przez procesor. W efekcie Core i9-13900K nie był ograniczony do maksymalnego poboru mocy na poziomie 253 W (PL2 procesora). Na inny plan zasilania przełączyliśmy się dopiero podczas pomiaru poboru mocy i poziomu hałasu. Odwiedź tę stronę aby dowiedzieć się więcej o naszych kryteriach testowych.
Procesor
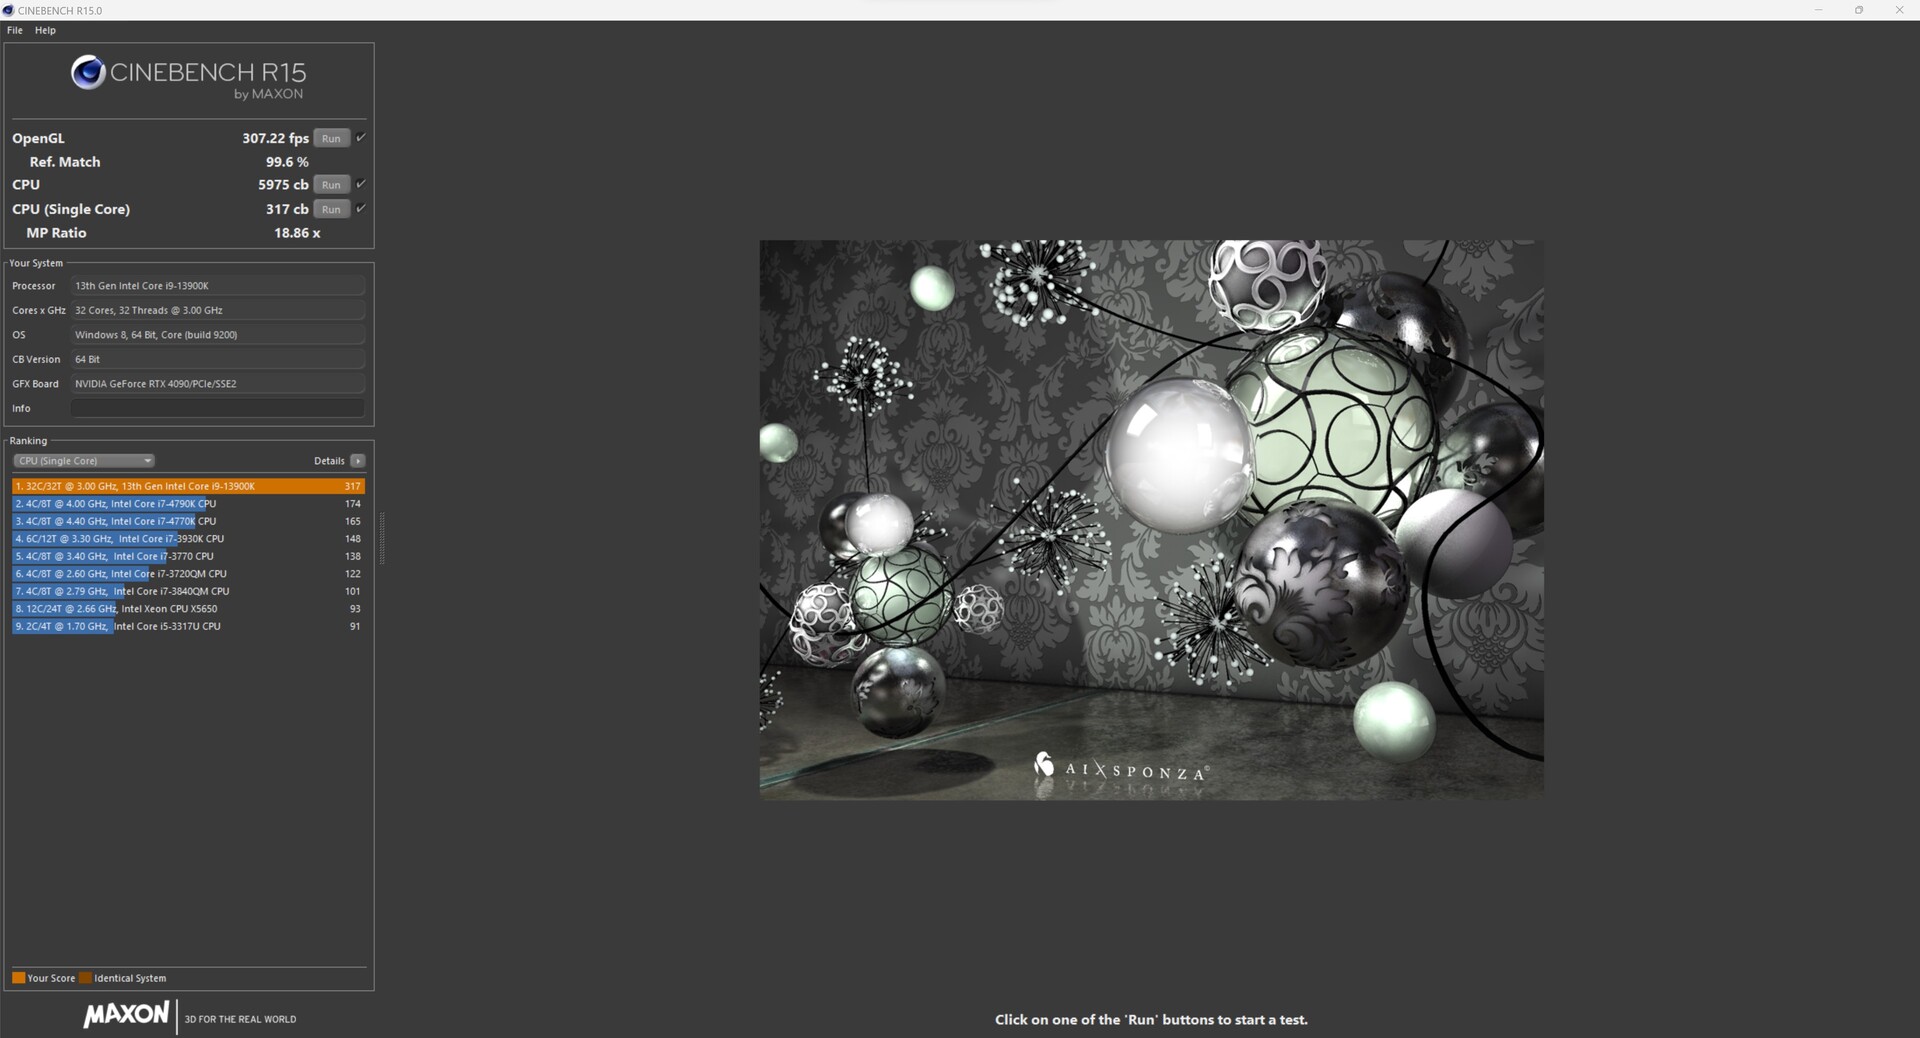
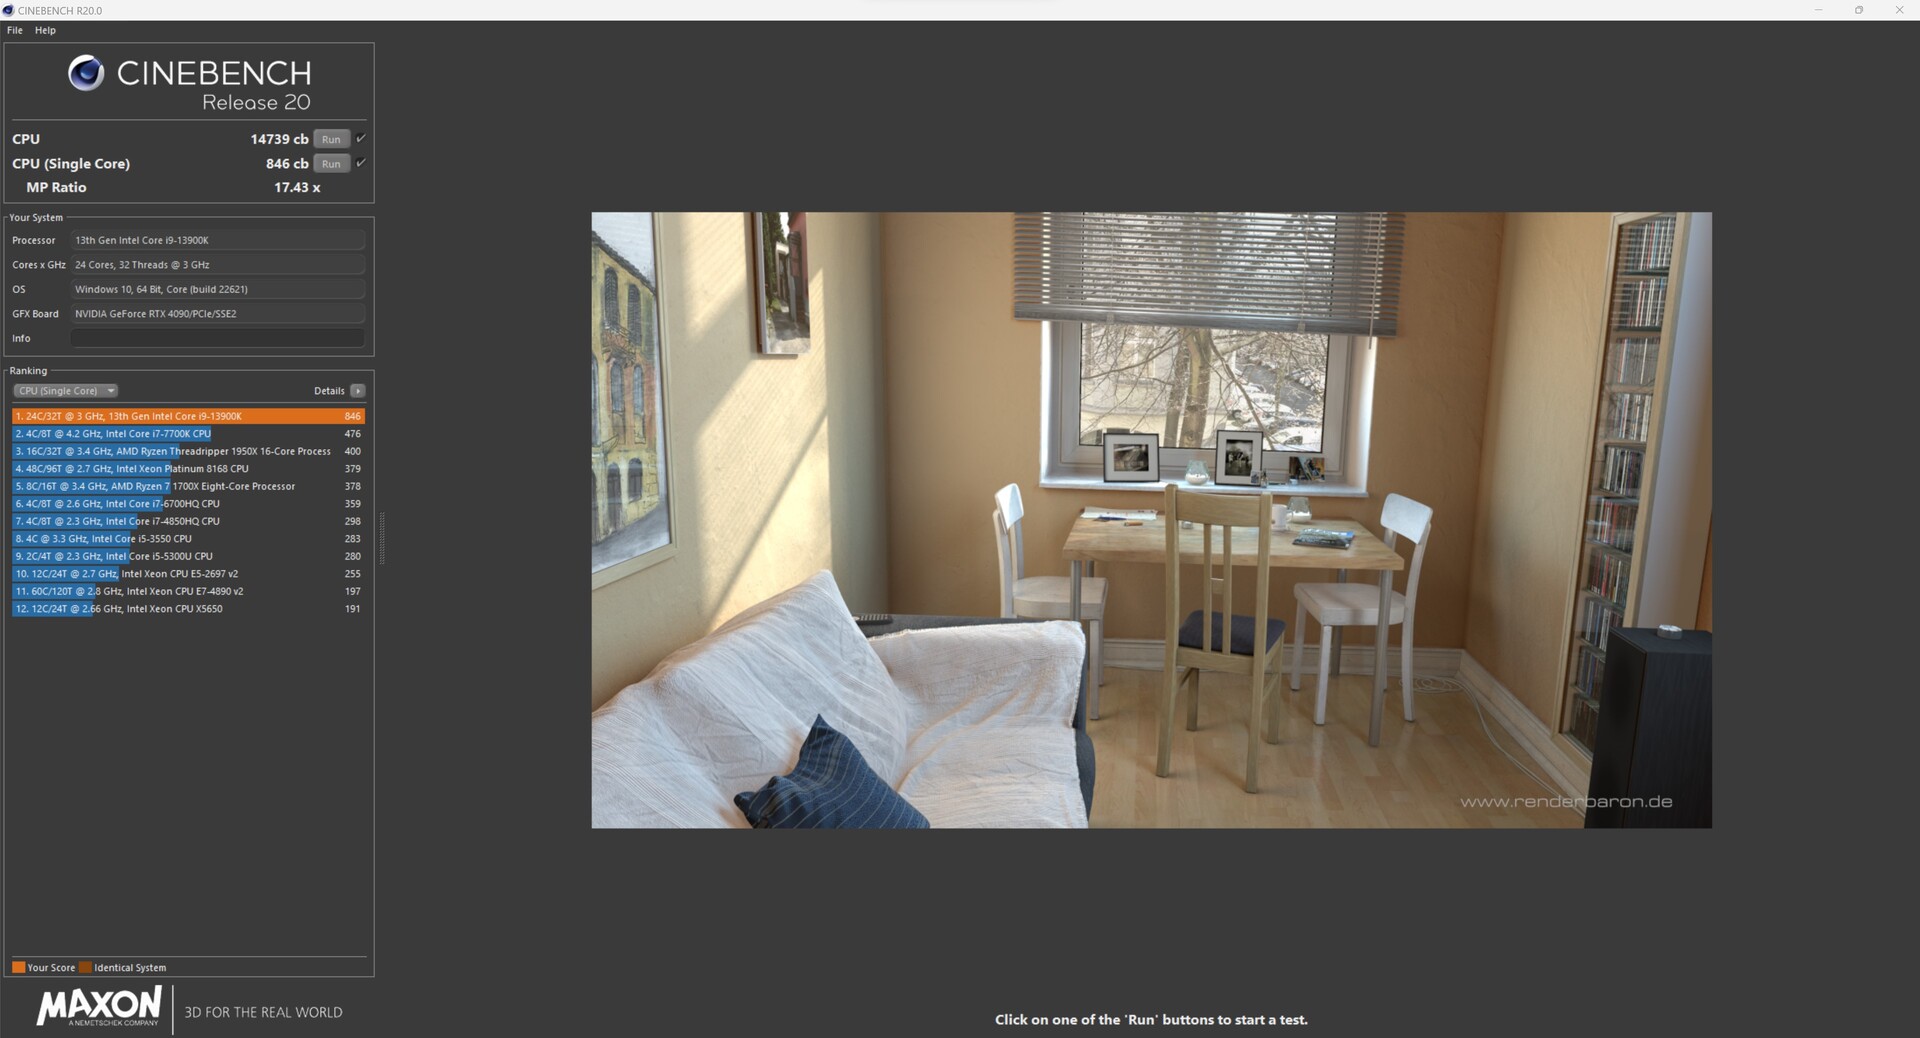
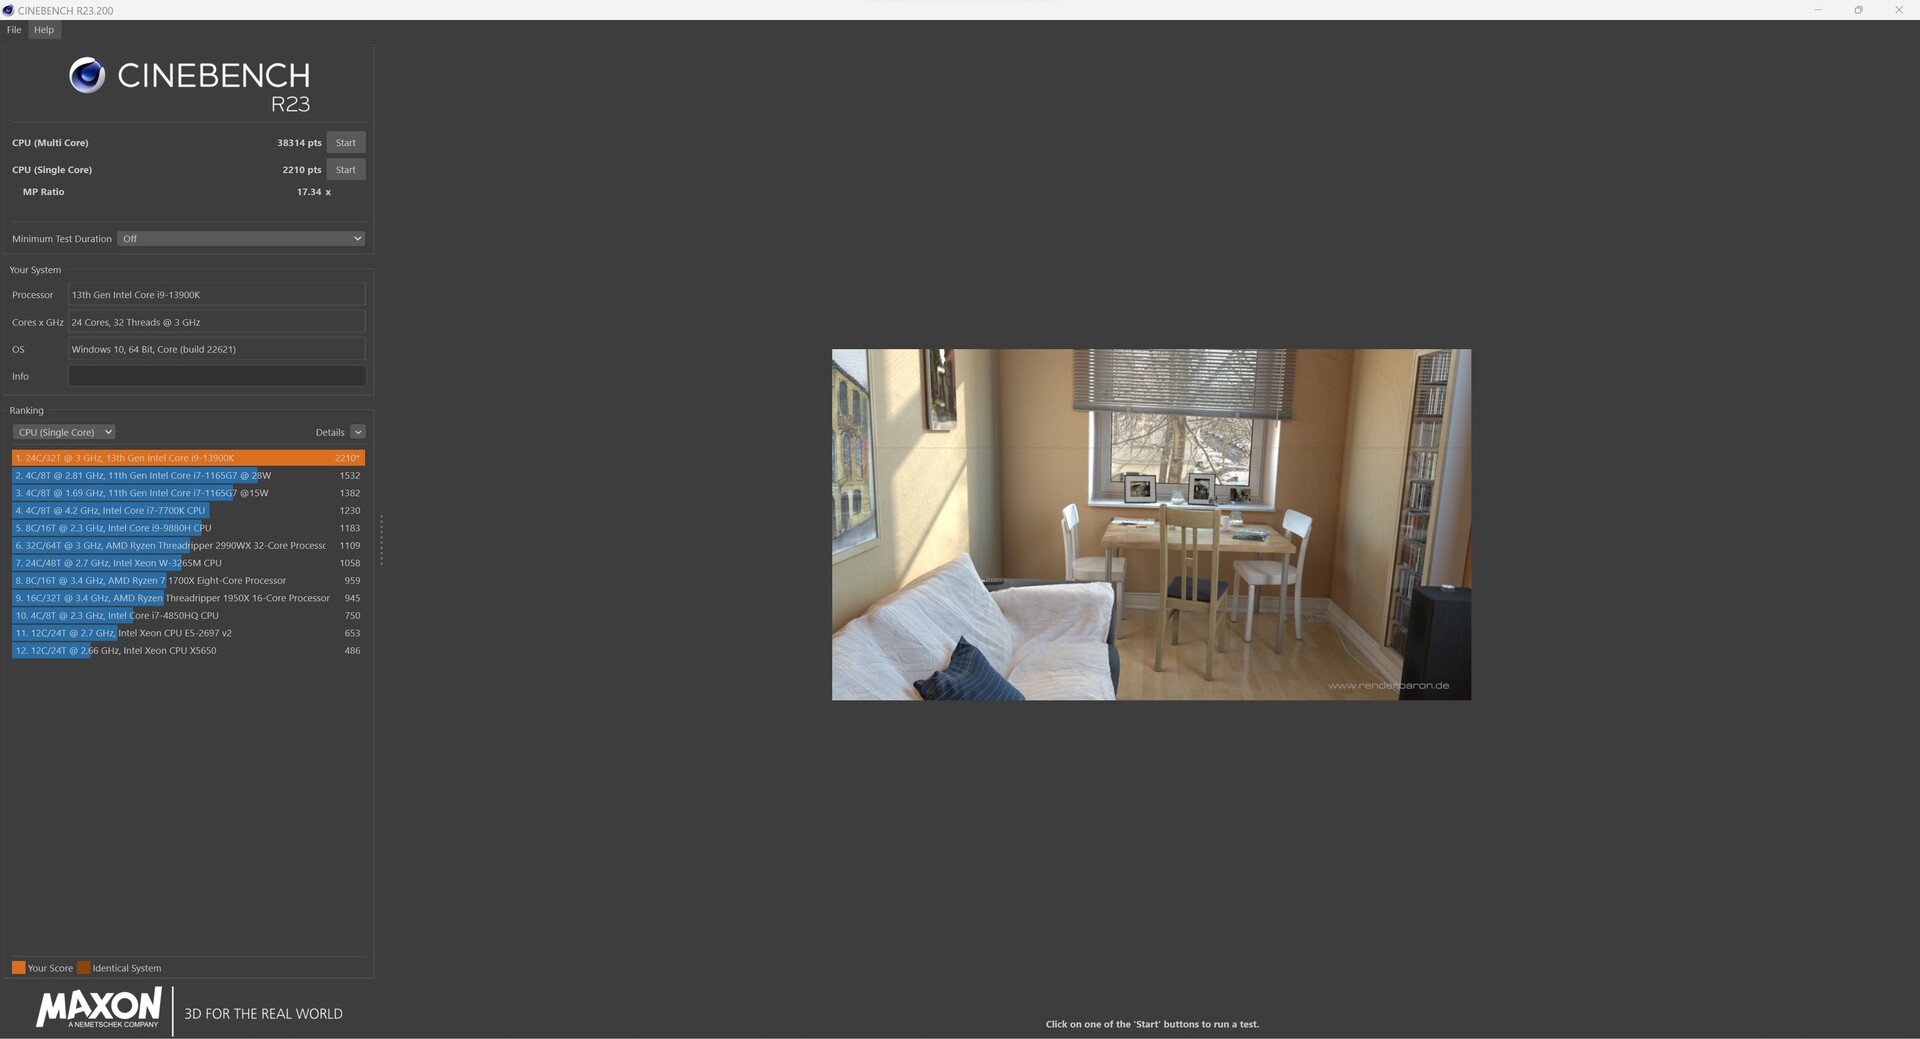
Nasz XMG SECTOR Intel jest napędzany przez Core i9-13900K, który jest obecnie drugim najszybszym procesorem Intela do gier. Wyniki uzyskane przez jednostkę recenzencką są tak dobre, jak można się było spodziewać. Mieści się on na szyi z innymi urządzeniami w naszym porównaniu. Jeśli chodzi o ocenę wydajności, różnica pomiędzy XMG SECTOR a podobnie wyposażonym systemem testowym jest niezwykle mała i wynosi zaledwie 2% i można ją przypisać niemalże tolerancji pomiarowej.
Procesor nie jest związany żadnymi limitami mocy, ponieważ wszystkie ograniczenia zostały zniesione. W związku z tym wydajność procesora jest ograniczona przez temperaturę, co idzie w parze z zainstalowanym coolerem AIO.
Więcej benchmarków procesora można znaleźć na tej stronie.
| Performance rating - Percent | |
| Intel Core i9-13900K, Intel Core i9-13900K | |
| Schenker XMG SECTOR, i9 13900K, RTX 4090, Intel Core i9-13900K | |
| NVIDIA GeForce RTX 3090 Founders Edition, AMD Ryzen 9 7950X | |
| Intel NUC13 Raptor Canyon, Intel Core i9-13900K | |
| AMD Ryzen 9 7900X, AMD Ryzen 9 7900X | |
| Corsair One i300, Intel Core i9-12900K | |
| Intel Core i9-12900K, Intel Core i9-12900K | |
| Intel Core i5-13600K, Intel Core i5-13600K | |
| Intel Dragon Canyon NUC - RTX 3060, Intel Core i9-12900 | |
| Minisforum Neptune Series NAD9, Intel Core i9-12900H | |
| Cinebench R15 | |
| CPU Single 64Bit | |
| NVIDIA GeForce RTX 3090 Founders Edition, AMD Ryzen 9 7950X | |
| Intel Core i9-13900K, Intel Core i9-13900K | |
| AMD Ryzen 9 7900X, AMD Ryzen 9 7900X | |
| Intel NUC13 Raptor Canyon, Intel Core i9-13900K | |
| Schenker XMG SECTOR, i9 13900K, RTX 4090, Intel Core i9-13900K | |
| Corsair One i300, Intel Core i9-12900K | |
| Intel Core i5-13600K, Intel Core i5-13600K | |
| Intel Core i9-12900K, Intel Core i9-12900K | |
| Intel Dragon Canyon NUC - RTX 3060, Intel Core i9-12900 | |
| Minisforum Neptune Series NAD9, Intel Core i9-12900H | |
| CPU Multi 64Bit | |
| NVIDIA GeForce RTX 3090 Founders Edition, AMD Ryzen 9 7950X | |
| Intel Core i9-13900K, Intel Core i9-13900K | |
| Schenker XMG SECTOR, i9 13900K, RTX 4090, Intel Core i9-13900K | |
| Intel NUC13 Raptor Canyon, Intel Core i9-13900K | |
| AMD Ryzen 9 7900X, AMD Ryzen 9 7900X | |
| Intel Core i9-12900K, Intel Core i9-12900K | |
| Intel Core i5-13600K, Intel Core i5-13600K | |
| Corsair One i300, Intel Core i9-12900K | |
| Intel Dragon Canyon NUC - RTX 3060, Intel Core i9-12900 | |
| Minisforum Neptune Series NAD9, Intel Core i9-12900H | |
| Cinebench R20 | |
| CPU (Single Core) | |
| Intel NUC13 Raptor Canyon, Intel Core i9-13900K | |
| Schenker XMG SECTOR, i9 13900K, RTX 4090, Intel Core i9-13900K | |
| Intel Core i9-13900K, Intel Core i9-13900K | |
| NVIDIA GeForce RTX 3090 Founders Edition, AMD Ryzen 9 7950X | |
| AMD Ryzen 9 7900X, AMD Ryzen 9 7900X | |
| Corsair One i300, Intel Core i9-12900K | |
| Intel Core i5-13600K, Intel Core i5-13600K | |
| Intel Core i9-12900K, Intel Core i9-12900K | |
| Intel Dragon Canyon NUC - RTX 3060, Intel Core i9-12900 | |
| Minisforum Neptune Series NAD9, Intel Core i9-12900H | |
| CPU (Multi Core) | |
| Intel Core i9-13900K, Intel Core i9-13900K | |
| NVIDIA GeForce RTX 3090 Founders Edition, AMD Ryzen 9 7950X | |
| Schenker XMG SECTOR, i9 13900K, RTX 4090, Intel Core i9-13900K | |
| Intel NUC13 Raptor Canyon, Intel Core i9-13900K | |
| AMD Ryzen 9 7900X, AMD Ryzen 9 7900X | |
| Intel Core i9-12900K, Intel Core i9-12900K | |
| Corsair One i300, Intel Core i9-12900K | |
| Intel Core i5-13600K, Intel Core i5-13600K | |
| Intel Dragon Canyon NUC - RTX 3060, Intel Core i9-12900 | |
| Minisforum Neptune Series NAD9, Intel Core i9-12900H | |
| Cinebench R23 | |
| Single Core | |
| Intel Core i9-13900K, Intel Core i9-13900K | |
| Schenker XMG SECTOR, i9 13900K, RTX 4090, Intel Core i9-13900K | |
| Intel NUC13 Raptor Canyon, Intel Core i9-13900K | |
| NVIDIA GeForce RTX 3090 Founders Edition, AMD Ryzen 9 7950X | |
| AMD Ryzen 9 7900X, AMD Ryzen 9 7900X | |
| Corsair One i300, Intel Core i9-12900K | |
| Intel Core i5-13600K, Intel Core i5-13600K | |
| Intel Core i9-12900K, Intel Core i9-12900K | |
| Intel Dragon Canyon NUC - RTX 3060, Intel Core i9-12900 | |
| Minisforum Neptune Series NAD9, Intel Core i9-12900H | |
| Multi Core | |
| Intel Core i9-13900K, Intel Core i9-13900K | |
| Schenker XMG SECTOR, i9 13900K, RTX 4090, Intel Core i9-13900K | |
| NVIDIA GeForce RTX 3090 Founders Edition, AMD Ryzen 9 7950X | |
| Intel NUC13 Raptor Canyon, Intel Core i9-13900K | |
| AMD Ryzen 9 7900X, AMD Ryzen 9 7900X | |
| Intel Core i9-12900K, Intel Core i9-12900K | |
| Corsair One i300, Intel Core i9-12900K | |
| Intel Core i5-13600K, Intel Core i5-13600K | |
| Intel Dragon Canyon NUC - RTX 3060, Intel Core i9-12900 | |
| Minisforum Neptune Series NAD9, Intel Core i9-12900H | |
| Cinebench R11.5 | |
| CPU Single 64Bit | |
| Intel Core i9-13900K, Intel Core i9-13900K | |
| NVIDIA GeForce RTX 3090 Founders Edition, AMD Ryzen 9 7950X | |
| AMD Ryzen 9 7900X, AMD Ryzen 9 7900X | |
| Schenker XMG SECTOR, i9 13900K, RTX 4090, Intel Core i9-13900K | |
| Intel NUC13 Raptor Canyon, Intel Core i9-13900K | |
| Corsair One i300, Intel Core i9-12900K | |
| Intel Core i9-12900K, Intel Core i9-12900K | |
| Intel Core i5-13600K, Intel Core i5-13600K | |
| Intel Dragon Canyon NUC - RTX 3060, Intel Core i9-12900 | |
| Minisforum Neptune Series NAD9, Intel Core i9-12900H | |
| CPU Multi 64Bit | |
| Intel Core i9-13900K, Intel Core i9-13900K | |
| NVIDIA GeForce RTX 3090 Founders Edition, AMD Ryzen 9 7950X | |
| Schenker XMG SECTOR, i9 13900K, RTX 4090, Intel Core i9-13900K | |
| Intel NUC13 Raptor Canyon, Intel Core i9-13900K | |
| AMD Ryzen 9 7900X, AMD Ryzen 9 7900X | |
| Intel Core i9-12900K, Intel Core i9-12900K | |
| Corsair One i300, Intel Core i9-12900K | |
| Intel Core i5-13600K, Intel Core i5-13600K | |
| Intel Dragon Canyon NUC - RTX 3060, Intel Core i9-12900 | |
| Minisforum Neptune Series NAD9, Intel Core i9-12900H | |
| Blender - v2.79 BMW27 CPU | |
| Minisforum Neptune Series NAD9, Intel Core i9-12900H | |
| Intel Dragon Canyon NUC - RTX 3060, Intel Core i9-12900 | |
| Intel Core i5-13600K, Intel Core i5-13600K | |
| Corsair One i300, Intel Core i9-12900K | |
| Intel Core i9-12900K, Intel Core i9-12900K | |
| AMD Ryzen 9 7900X, AMD Ryzen 9 7900X | |
| Intel NUC13 Raptor Canyon, Intel Core i9-13900K | |
| NVIDIA GeForce RTX 3090 Founders Edition, AMD Ryzen 9 7950X | |
| Schenker XMG SECTOR, i9 13900K, RTX 4090, Intel Core i9-13900K | |
| Intel Core i9-13900K, Intel Core i9-13900K | |
| wPrime 2.10 | |
| 32m | |
| Intel Core i9-12900K, Intel Core i9-12900K | |
| Minisforum Neptune Series NAD9, Intel Core i9-12900H | |
| Intel Dragon Canyon NUC - RTX 3060, Intel Core i9-12900 | |
| Intel Core i5-13600K, Intel Core i5-13600K | |
| Corsair One i300, Intel Core i9-12900K | |
| Schenker XMG SECTOR, i9 13900K, RTX 4090, Intel Core i9-13900K | |
| Intel NUC13 Raptor Canyon, Intel Core i9-13900K | |
| Intel Core i9-13900K, Intel Core i9-13900K | |
| AMD Ryzen 9 7900X, AMD Ryzen 9 7900X | |
| NVIDIA GeForce RTX 3090 Founders Edition, AMD Ryzen 9 7950X | |
| 1024m | |
| Intel Dragon Canyon NUC - RTX 3060, Intel Core i9-12900 | |
| Corsair One i300, Intel Core i9-12900K | |
| Intel Core i9-12900K, Intel Core i9-12900K | |
| Minisforum Neptune Series NAD9, Intel Core i9-12900H | |
| Intel Core i5-13600K, Intel Core i5-13600K | |
| Intel NUC13 Raptor Canyon, Intel Core i9-13900K | |
| Schenker XMG SECTOR, i9 13900K, RTX 4090, Intel Core i9-13900K | |
| Intel Core i9-13900K, Intel Core i9-13900K | |
| AMD Ryzen 9 7900X, AMD Ryzen 9 7900X | |
| NVIDIA GeForce RTX 3090 Founders Edition, AMD Ryzen 9 7950X | |
| X264 HD Benchmark 4.0 | |
| Pass 1 | |
| Schenker XMG SECTOR, i9 13900K, RTX 4090, Intel Core i9-13900K | |
| Intel NUC13 Raptor Canyon, Intel Core i9-13900K | |
| Intel Core i9-13900K, Intel Core i9-13900K | |
| Intel Core i5-13600K, Intel Core i5-13600K | |
| NVIDIA GeForce RTX 3090 Founders Edition, AMD Ryzen 9 7950X | |
| AMD Ryzen 9 7900X, AMD Ryzen 9 7900X | |
| Intel Core i9-12900K, Intel Core i9-12900K | |
| Corsair One i300, Intel Core i9-12900K | |
| Intel Dragon Canyon NUC - RTX 3060, Intel Core i9-12900 | |
| Minisforum Neptune Series NAD9, Intel Core i9-12900H | |
| Pass 2 | |
| Schenker XMG SECTOR, i9 13900K, RTX 4090, Intel Core i9-13900K | |
| Intel Core i9-13900K, Intel Core i9-13900K | |
| NVIDIA GeForce RTX 3090 Founders Edition, AMD Ryzen 9 7950X | |
| Intel NUC13 Raptor Canyon, Intel Core i9-13900K | |
| AMD Ryzen 9 7900X, AMD Ryzen 9 7900X | |
| Intel Core i9-12900K, Intel Core i9-12900K | |
| Intel Core i5-13600K, Intel Core i5-13600K | |
| Corsair One i300, Intel Core i9-12900K | |
| Intel Dragon Canyon NUC - RTX 3060, Intel Core i9-12900 | |
| Minisforum Neptune Series NAD9, Intel Core i9-12900H | |
| WinRAR - Result | |
| AMD Ryzen 9 7900X, AMD Ryzen 9 7900X | |
| NVIDIA GeForce RTX 3090 Founders Edition, AMD Ryzen 9 7950X | |
| Intel Core i9-13900K, Intel Core i9-13900K | |
| Schenker XMG SECTOR, i9 13900K, RTX 4090, Intel Core i9-13900K | |
| Intel NUC13 Raptor Canyon, Intel Core i9-13900K | |
| Corsair One i300, Intel Core i9-12900K | |
| Intel Core i5-13600K, Intel Core i5-13600K | |
| Intel Core i9-12900K, Intel Core i9-12900K | |
| Intel Dragon Canyon NUC - RTX 3060, Intel Core i9-12900 | |
| Minisforum Neptune Series NAD9, Intel Core i9-12900H | |
| Geekbench 5.5 | |
| Multi-Core | |
| NVIDIA GeForce RTX 3090 Founders Edition, AMD Ryzen 9 7950X | |
| Intel Core i9-13900K, Intel Core i9-13900K | |
| Schenker XMG SECTOR, i9 13900K, RTX 4090, Intel Core i9-13900K | |
| Intel NUC13 Raptor Canyon, Intel Core i9-13900K | |
| AMD Ryzen 9 7900X, AMD Ryzen 9 7900X | |
| Intel Core i9-12900K, Intel Core i9-12900K | |
| Corsair One i300, Intel Core i9-12900K | |
| Intel Core i5-13600K, Intel Core i5-13600K | |
| Minisforum Neptune Series NAD9, Intel Core i9-12900H | |
| Intel Dragon Canyon NUC - RTX 3060, Intel Core i9-12900 | |
| Single-Core | |
| NVIDIA GeForce RTX 3090 Founders Edition, AMD Ryzen 9 7950X | |
| Intel Core i9-13900K, Intel Core i9-13900K | |
| AMD Ryzen 9 7900X, AMD Ryzen 9 7900X | |
| Schenker XMG SECTOR, i9 13900K, RTX 4090, Intel Core i9-13900K | |
| Intel NUC13 Raptor Canyon, Intel Core i9-13900K | |
| Intel Core i9-12900K, Intel Core i9-12900K | |
| Corsair One i300, Intel Core i9-12900K | |
| Intel Core i5-13600K, Intel Core i5-13600K | |
| Minisforum Neptune Series NAD9, Intel Core i9-12900H | |
| Intel Dragon Canyon NUC - RTX 3060, Intel Core i9-12900 | |
| Geekbench 5.0 | |
| 5.0 Multi-Core | |
| NVIDIA GeForce RTX 3090 Founders Edition, AMD Ryzen 9 7950X | |
| Intel Core i9-13900K, Intel Core i9-13900K | |
| Schenker XMG SECTOR, i9 13900K, RTX 4090, Intel Core i9-13900K | |
| Intel NUC13 Raptor Canyon, Intel Core i9-13900K | |
| AMD Ryzen 9 7900X, AMD Ryzen 9 7900X | |
| Intel Core i9-12900K, Intel Core i9-12900K | |
| Corsair One i300, Intel Core i9-12900K | |
| Intel Core i5-13600K, Intel Core i5-13600K | |
| Minisforum Neptune Series NAD9, Intel Core i9-12900H | |
| Intel Dragon Canyon NUC - RTX 3060, Intel Core i9-12900 | |
| 5.0 Single-Core | |
| NVIDIA GeForce RTX 3090 Founders Edition, AMD Ryzen 9 7950X | |
| Intel Core i9-13900K, Intel Core i9-13900K | |
| AMD Ryzen 9 7900X, AMD Ryzen 9 7900X | |
| Schenker XMG SECTOR, i9 13900K, RTX 4090, Intel Core i9-13900K | |
| Intel NUC13 Raptor Canyon, Intel Core i9-13900K | |
| Intel Core i9-12900K, Intel Core i9-12900K | |
| Intel Core i5-13600K, Intel Core i5-13600K | |
| Corsair One i300, Intel Core i9-12900K | |
| Minisforum Neptune Series NAD9, Intel Core i9-12900H | |
| Intel Dragon Canyon NUC - RTX 3060, Intel Core i9-12900 | |
| 3DMark 11 - 1280x720 Performance Physics | |
| Intel Core i9-13900K, Intel Core i9-13900K | |
| Schenker XMG SECTOR, i9 13900K, RTX 4090, Intel Core i9-13900K | |
| Intel Core i5-13600K, Intel Core i5-13600K | |
| Intel NUC13 Raptor Canyon, Intel Core i9-13900K | |
| Corsair One i300, Intel Core i9-12900K | |
| AMD Ryzen 9 7900X, AMD Ryzen 9 7900X | |
| NVIDIA GeForce RTX 3090 Founders Edition, AMD Ryzen 9 7950X | |
| Intel Core i9-12900K, Intel Core i9-12900K | |
| Intel Dragon Canyon NUC - RTX 3060, Intel Core i9-12900 | |
| Minisforum Neptune Series NAD9, Intel Core i9-12900H | |
| 7-Zip 18.03 | |
| 7z b 4 | |
| NVIDIA GeForce RTX 3090 Founders Edition, AMD Ryzen 9 7950X | |
| Schenker XMG SECTOR, i9 13900K, RTX 4090, Intel Core i9-13900K | |
| Intel Core i9-13900K, Intel Core i9-13900K | |
| Intel NUC13 Raptor Canyon, Intel Core i9-13900K | |
| AMD Ryzen 9 7900X, AMD Ryzen 9 7900X | |
| Intel Core i9-12900K, Intel Core i9-12900K | |
| Corsair One i300, Intel Core i9-12900K | |
| Intel Core i5-13600K, Intel Core i5-13600K | |
| Minisforum Neptune Series NAD9, Intel Core i9-12900H | |
| Intel Dragon Canyon NUC - RTX 3060, Intel Core i9-12900 | |
| 7z b 4 -mmt1 | |
| NVIDIA GeForce RTX 3090 Founders Edition, AMD Ryzen 9 7950X | |
| AMD Ryzen 9 7900X, AMD Ryzen 9 7900X | |
| Intel Core i9-13900K, Intel Core i9-13900K | |
| Intel NUC13 Raptor Canyon, Intel Core i9-13900K | |
| Schenker XMG SECTOR, i9 13900K, RTX 4090, Intel Core i9-13900K | |
| Corsair One i300, Intel Core i9-12900K | |
| Intel Core i9-12900K, Intel Core i9-12900K | |
| Intel Core i5-13600K, Intel Core i5-13600K | |
| Minisforum Neptune Series NAD9, Intel Core i9-12900H | |
| Intel Dragon Canyon NUC - RTX 3060, Intel Core i9-12900 | |
| HWBOT x265 Benchmark v2.2 - 4k Preset | |
| NVIDIA GeForce RTX 3090 Founders Edition, AMD Ryzen 9 7950X | |
| Intel Core i9-13900K, Intel Core i9-13900K | |
| Schenker XMG SECTOR, i9 13900K, RTX 4090, Intel Core i9-13900K | |
| AMD Ryzen 9 7900X, AMD Ryzen 9 7900X | |
| Intel NUC13 Raptor Canyon, Intel Core i9-13900K | |
| Intel Core i9-12900K, Intel Core i9-12900K | |
| Corsair One i300, Intel Core i9-12900K | |
| Intel Core i5-13600K, Intel Core i5-13600K | |
| Intel Dragon Canyon NUC - RTX 3060, Intel Core i9-12900 | |
| Minisforum Neptune Series NAD9, Intel Core i9-12900H | |
| R Benchmark 2.5 - Overall mean | |
| Intel Dragon Canyon NUC - RTX 3060, Intel Core i9-12900 | |
| Minisforum Neptune Series NAD9, Intel Core i9-12900H | |
| Intel Core i9-12900K, Intel Core i9-12900K | |
| Intel Core i5-13600K, Intel Core i5-13600K | |
| Corsair One i300, Intel Core i9-12900K | |
| Intel NUC13 Raptor Canyon, Intel Core i9-13900K | |
| AMD Ryzen 9 7900X, AMD Ryzen 9 7900X | |
| NVIDIA GeForce RTX 3090 Founders Edition, AMD Ryzen 9 7950X | |
| Schenker XMG SECTOR, i9 13900K, RTX 4090, Intel Core i9-13900K | |
| Intel Core i9-13900K, Intel Core i9-13900K | |
| LibreOffice - 20 Documents To PDF | |
| Intel Dragon Canyon NUC - RTX 3060, Intel Core i9-12900 | |
| Intel NUC13 Raptor Canyon, Intel Core i9-13900K | |
| Intel Core i9-12900K, Intel Core i9-12900K | |
| Corsair One i300, Intel Core i9-12900K | |
| Minisforum Neptune Series NAD9, Intel Core i9-12900H | |
| Schenker XMG SECTOR, i9 13900K, RTX 4090, Intel Core i9-13900K | |
| Intel Core i9-13900K, Intel Core i9-13900K | |
| NVIDIA GeForce RTX 3090 Founders Edition, AMD Ryzen 9 7950X | |
| Intel Core i5-13600K, Intel Core i5-13600K | |
| AMD Ryzen 9 7900X, AMD Ryzen 9 7900X | |
| WebXPRT 3 - Overall | |
| Schenker XMG SECTOR, i9 13900K, RTX 4090, Intel Core i9-13900K | |
| AMD Ryzen 9 7900X, AMD Ryzen 9 7900X | |
| NVIDIA GeForce RTX 3090 Founders Edition, AMD Ryzen 9 7950X | |
| Intel Core i9-13900K, Intel Core i9-13900K | |
| Intel NUC13 Raptor Canyon, Intel Core i9-13900K | |
| Intel Core i5-13600K, Intel Core i5-13600K | |
| Corsair One i300, Intel Core i9-12900K | |
| Intel Core i9-12900K, Intel Core i9-12900K | |
| Minisforum Neptune Series NAD9, Intel Core i9-12900H | |
| Intel Dragon Canyon NUC - RTX 3060, Intel Core i9-12900 | |
| Mozilla Kraken 1.1 - Total | |
| Intel Dragon Canyon NUC - RTX 3060, Intel Core i9-12900 | |
| Minisforum Neptune Series NAD9, Intel Core i9-12900H | |
| Intel Core i9-12900K, Intel Core i9-12900K | |
| Corsair One i300, Intel Core i9-12900K | |
| Intel Core i5-13600K, Intel Core i5-13600K | |
| Intel NUC13 Raptor Canyon, Intel Core i9-13900K | |
| NVIDIA GeForce RTX 3090 Founders Edition, AMD Ryzen 9 7950X | |
| Intel Core i9-13900K, Intel Core i9-13900K | |
| AMD Ryzen 9 7900X, AMD Ryzen 9 7900X | |
| Schenker XMG SECTOR, i9 13900K, RTX 4090, Intel Core i9-13900K | |
* ... im mniej tym lepiej
XMG SECTOR Intel w pętli Cinebench R15 Multi
Uruchomienie Cinebench R15 w pętli dało nam pierwsze spojrzenie na to, jak wydajne jest rozwiązanie chłodzące w komputerze. Po kilku pierwszych uruchomieniach nie było zauważalnego spadku wydajności. Intel XMG SECTOR wypadł bardzo dobrze, otrzymując średni wynik 5,917.
Wydajność systemu
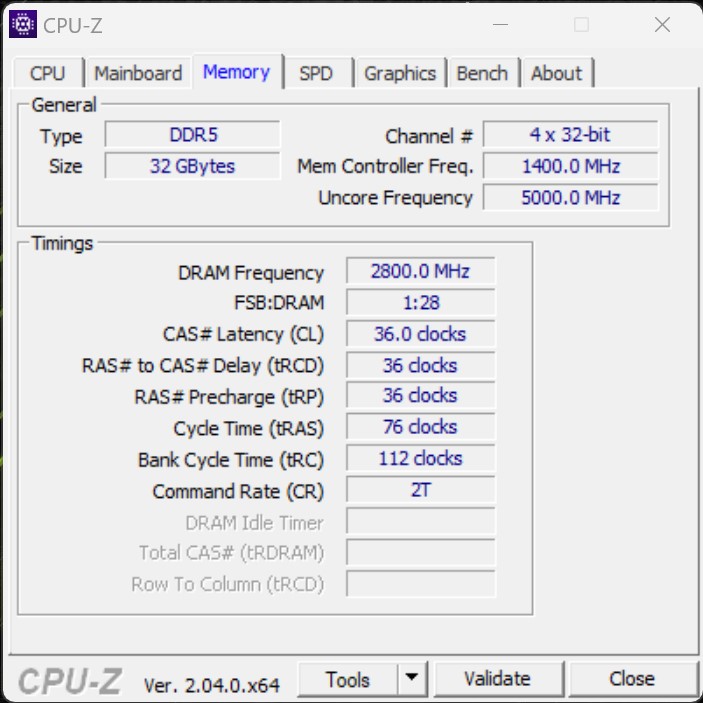
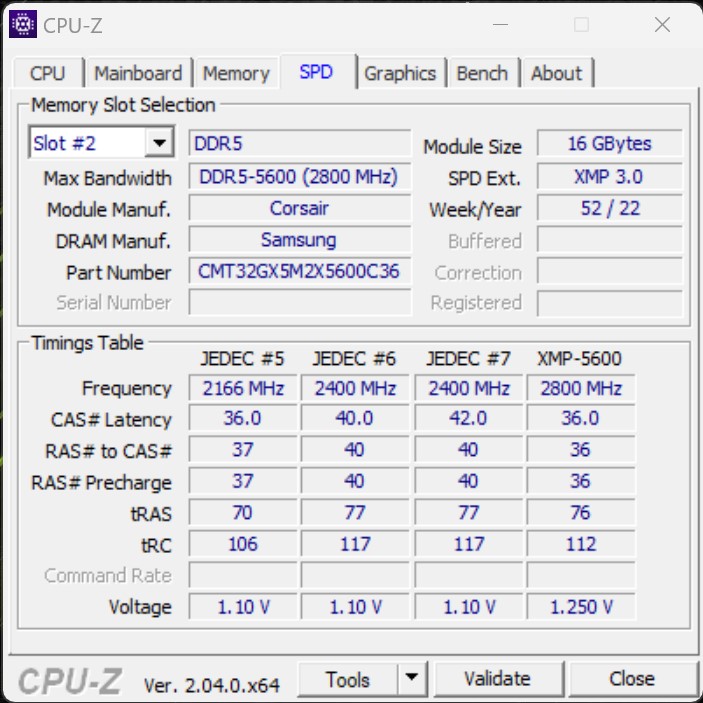
Intel XMG SECTOR był niezwykle szybki w syntetycznych benchmarkach, dzięki czemu dorównał konkurencji. Ponadto nasz egzemplarz recenzencki osiągnął znakomite wyniki w testach pamięci AIDA64 i zdołał zapewnić sobie pierwsze miejsce dzięki szybkim pamięciom (DDR5-5600) i niskim opóźnieniom. Podczas naszego pobytu z XMG SECTOR Intel działał bardzo szybko, bez żadnych znaczących opóźnień.
| Performance rating - Percent | |
| AMD Ryzen 9 7900X | |
| NVIDIA GeForce RTX 3090 Founders Edition | |
| Intel Core i9-13900K | |
| Schenker XMG SECTOR, i9 13900K, RTX 4090 | |
| Intel Core i5-13600K | |
| Intel NUC13 Raptor Canyon | |
| Corsair One i300 | |
| Intel Core i9-12900K | |
| Intel Dragon Canyon NUC - RTX 3060 | |
| Minisforum Neptune Series NAD9 | |
| PCMark 10 | |
| Score | |
| Schenker XMG SECTOR, i9 13900K, RTX 4090 | |
| AMD Ryzen 9 7900X | |
| NVIDIA GeForce RTX 3090 Founders Edition | |
| Intel Core i9-13900K | |
| Intel Core i5-13600K | |
| Intel NUC13 Raptor Canyon | |
| Corsair One i300 | |
| Intel Core i9-12900K | |
| Intel Dragon Canyon NUC - RTX 3060 | |
| Minisforum Neptune Series NAD9 | |
| Essentials | |
| Intel Core i9-13900K | |
| AMD Ryzen 9 7900X | |
| NVIDIA GeForce RTX 3090 Founders Edition | |
| Intel Core i5-13600K | |
| Schenker XMG SECTOR, i9 13900K, RTX 4090 | |
| Corsair One i300 | |
| Intel NUC13 Raptor Canyon | |
| Minisforum Neptune Series NAD9 | |
| Intel Dragon Canyon NUC - RTX 3060 | |
| Intel Core i9-12900K | |
| Productivity | |
| AMD Ryzen 9 7900X | |
| NVIDIA GeForce RTX 3090 Founders Edition | |
| Intel Core i5-13600K | |
| Intel Core i9-13900K | |
| Schenker XMG SECTOR, i9 13900K, RTX 4090 | |
| Intel NUC13 Raptor Canyon | |
| Intel Core i9-12900K | |
| Corsair One i300 | |
| Intel Dragon Canyon NUC - RTX 3060 | |
| Minisforum Neptune Series NAD9 | |
| CrossMark / Overall | |
| Intel Core i9-13900K, Intel Core i9-13900K | |
| NVIDIA GeForce RTX 3090 Founders Edition, AMD Ryzen 9 7950X | |
| Schenker XMG SECTOR, i9 13900K, RTX 4090, Intel Core i9-13900K | |
| AMD Ryzen 9 7900X, AMD Ryzen 9 7900X | |
| Corsair One i300, Intel Core i9-12900K | |
| Intel Core i5-13600K, Intel Core i5-13600K | |
| Intel NUC13 Raptor Canyon, Intel Core i9-13900K | |
| Minisforum Neptune Series NAD9, Intel Core i9-12900H | |
| Intel Dragon Canyon NUC - RTX 3060, Intel Core i9-12900 | |
| CrossMark / Productivity | |
| Intel Core i9-13900K, Intel Core i9-13900K | |
| NVIDIA GeForce RTX 3090 Founders Edition, AMD Ryzen 9 7950X | |
| Schenker XMG SECTOR, i9 13900K, RTX 4090, Intel Core i9-13900K | |
| AMD Ryzen 9 7900X, AMD Ryzen 9 7900X | |
| Corsair One i300, Intel Core i9-12900K | |
| Intel Core i5-13600K, Intel Core i5-13600K | |
| Intel NUC13 Raptor Canyon, Intel Core i9-13900K | |
| Minisforum Neptune Series NAD9, Intel Core i9-12900H | |
| Intel Dragon Canyon NUC - RTX 3060, Intel Core i9-12900 | |
| CrossMark / Creativity | |
| NVIDIA GeForce RTX 3090 Founders Edition, AMD Ryzen 9 7950X | |
| Intel Core i9-13900K, Intel Core i9-13900K | |
| Schenker XMG SECTOR, i9 13900K, RTX 4090, Intel Core i9-13900K | |
| AMD Ryzen 9 7900X, AMD Ryzen 9 7900X | |
| Intel NUC13 Raptor Canyon, Intel Core i9-13900K | |
| Corsair One i300, Intel Core i9-12900K | |
| Intel Core i5-13600K, Intel Core i5-13600K | |
| Minisforum Neptune Series NAD9, Intel Core i9-12900H | |
| Intel Dragon Canyon NUC - RTX 3060, Intel Core i9-12900 | |
| CrossMark / Responsiveness | |
| Intel Core i9-13900K, Intel Core i9-13900K | |
| Intel Core i5-13600K, Intel Core i5-13600K | |
| NVIDIA GeForce RTX 3090 Founders Edition, AMD Ryzen 9 7950X | |
| AMD Ryzen 9 7900X, AMD Ryzen 9 7900X | |
| Schenker XMG SECTOR, i9 13900K, RTX 4090, Intel Core i9-13900K | |
| Corsair One i300, Intel Core i9-12900K | |
| Minisforum Neptune Series NAD9, Intel Core i9-12900H | |
| Intel NUC13 Raptor Canyon, Intel Core i9-13900K | |
| Intel Dragon Canyon NUC - RTX 3060, Intel Core i9-12900 | |
| AIDA64 / Memory Copy | |
| Schenker XMG SECTOR, i9 13900K, RTX 4090 | |
| Intel Core i9-13900K | |
| Przeciętny Intel Core i9-13900K (68722 - 80203, n=4) | |
| Corsair One i300 | |
| Intel Core i9-12900K | |
| NVIDIA GeForce RTX 3090 Founders Edition | |
| Intel Core i5-13600K | |
| Średnia w klasie Desktop (54743 - 98416, n=21, ostatnie 2 lata) | |
| AMD Ryzen 9 7900X | |
| Intel NUC13 Raptor Canyon | |
| Minisforum Neptune Series NAD9 | |
| Intel Dragon Canyon NUC - RTX 3060 | |
| AIDA64 / Memory Read | |
| Schenker XMG SECTOR, i9 13900K, RTX 4090 | |
| Intel Core i9-13900K | |
| Przeciętny Intel Core i9-13900K (73392 - 88780, n=4) | |
| Intel Core i9-12900K | |
| NVIDIA GeForce RTX 3090 Founders Edition | |
| Intel Core i5-13600K | |
| Średnia w klasie Desktop (58375 - 110448, n=21, ostatnie 2 lata) | |
| AMD Ryzen 9 7900X | |
| Corsair One i300 | |
| Intel NUC13 Raptor Canyon | |
| Intel Dragon Canyon NUC - RTX 3060 | |
| Minisforum Neptune Series NAD9 | |
| AIDA64 / Memory Write | |
| NVIDIA GeForce RTX 3090 Founders Edition | |
| Średnia w klasie Desktop (60635 - 93889, n=21, ostatnie 2 lata) | |
| Schenker XMG SECTOR, i9 13900K, RTX 4090 | |
| AMD Ryzen 9 7900X | |
| Intel Core i9-13900K | |
| Przeciętny Intel Core i9-13900K (68948 - 78678, n=4) | |
| Intel Core i9-12900K | |
| Intel Core i5-13600K | |
| Corsair One i300 | |
| Intel NUC13 Raptor Canyon | |
| Minisforum Neptune Series NAD9 | |
| Intel Dragon Canyon NUC - RTX 3060 | |
| AIDA64 / Memory Latency | |
| Minisforum Neptune Series NAD9 | |
| Intel NUC13 Raptor Canyon | |
| Średnia w klasie Desktop (68.5 - 168, n=21, ostatnie 2 lata) | |
| Intel Dragon Canyon NUC - RTX 3060 | |
| Corsair One i300 | |
| Intel Core i5-13600K | |
| Przeciętny Intel Core i9-13900K (72.6 - 93.4, n=4) | |
| Intel Core i9-13900K | |
| Schenker XMG SECTOR, i9 13900K, RTX 4090 | |
| AMD Ryzen 9 7900X | |
| NVIDIA GeForce RTX 3090 Founders Edition | |
* ... im mniej tym lepiej
Pamięć masowa
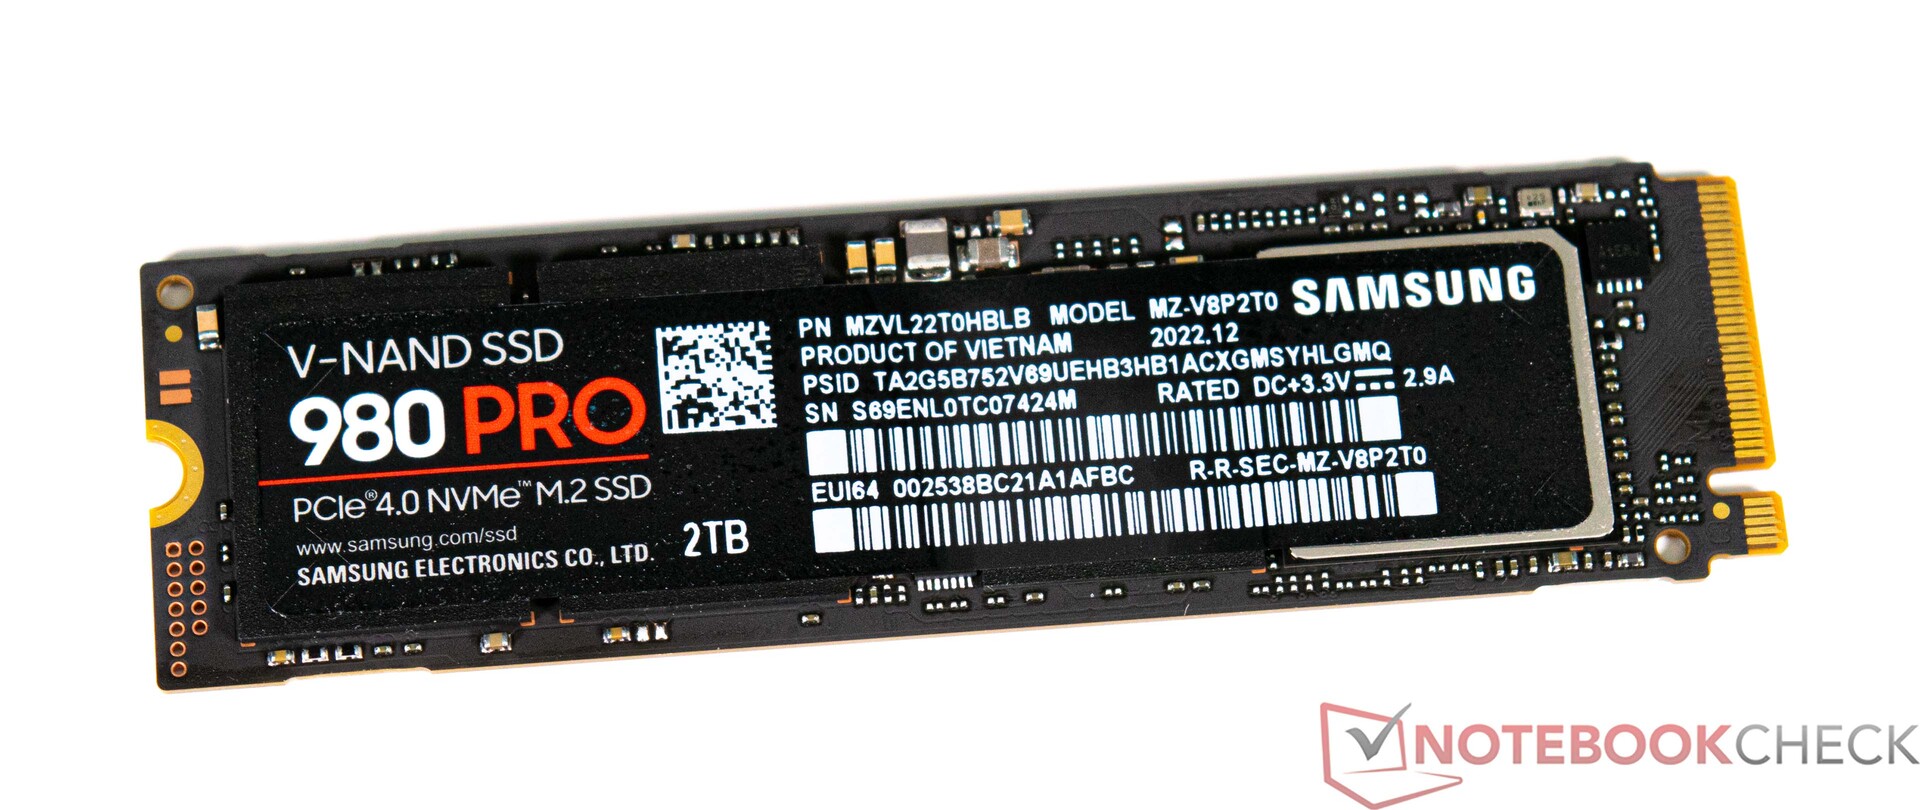
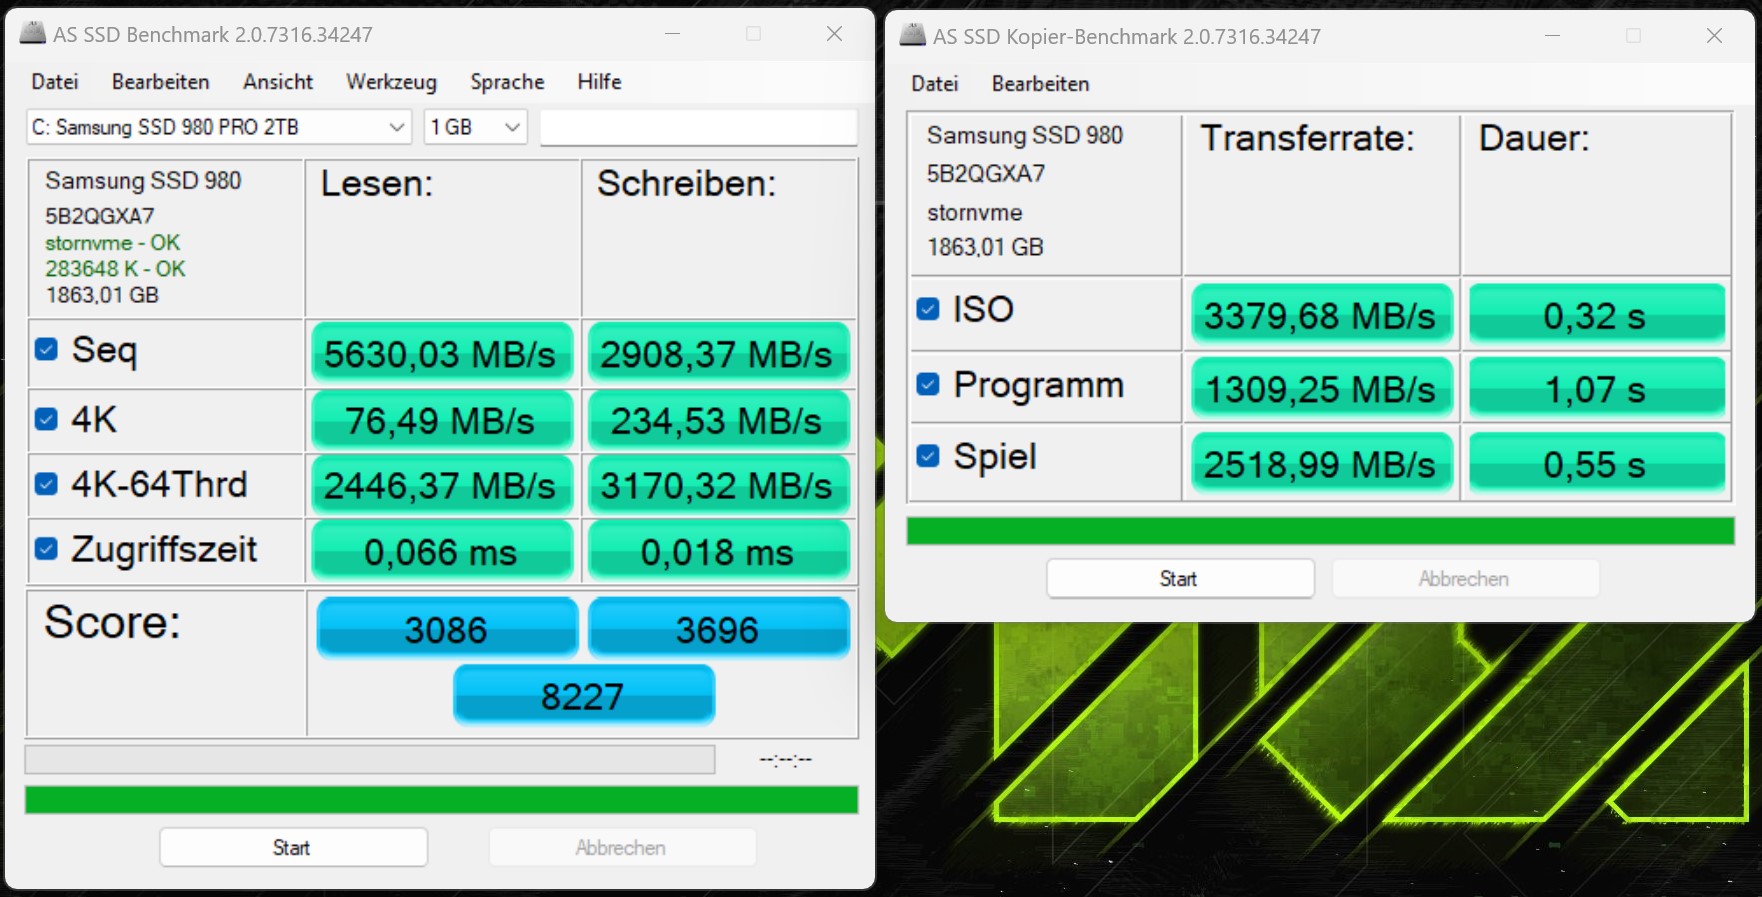
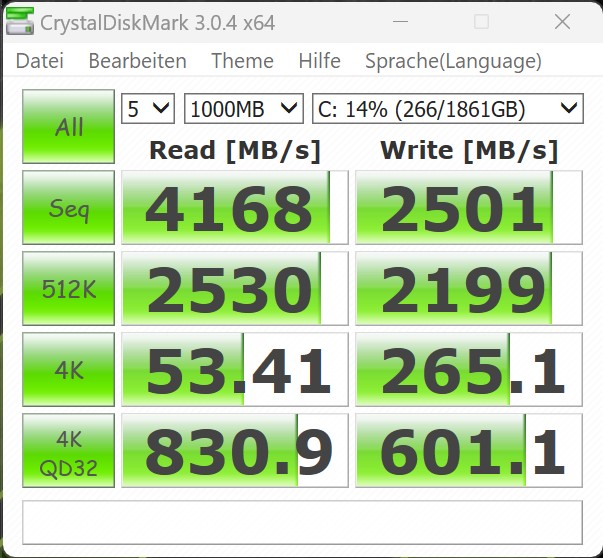
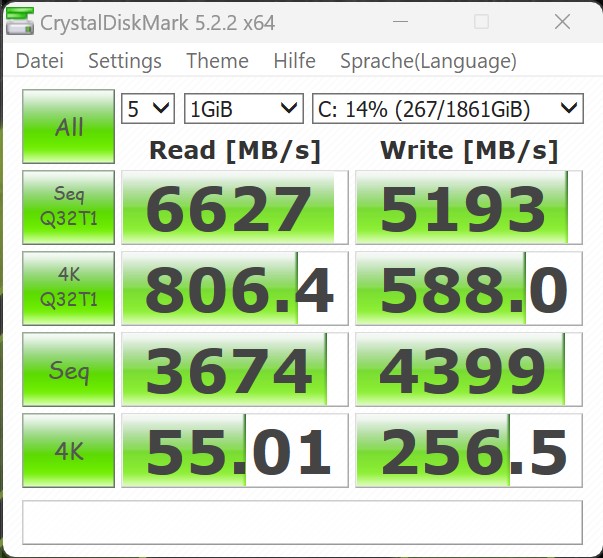
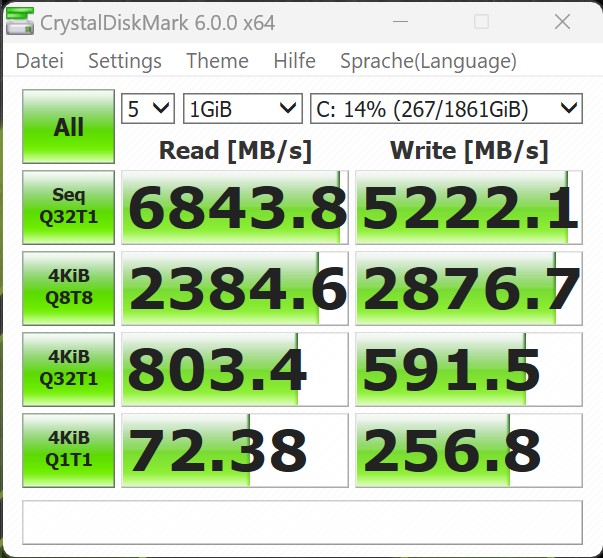
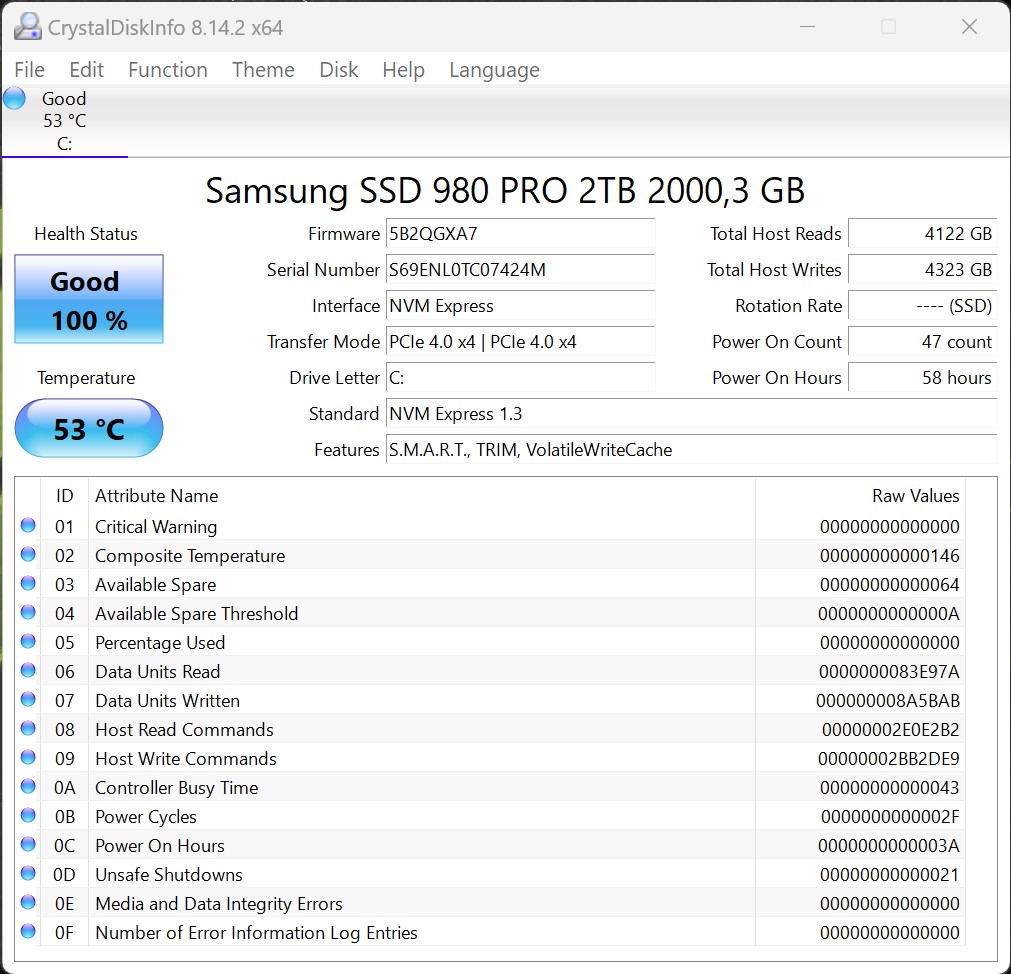
Nasz egzemplarz recenzencki został wyposażony w superszybki dysk SSD NVMe firmy Samsung. Samsung 980 Pro to jeden z najszybszych dysków SSD klasy konsumenckiej. Widać to również w benchmarkach: dysk niemal konsekwentnie przewyższał rozwiązania pamięci masowej w konkurencyjnych urządzeniach. Jedynie Kingston Fury Renegade w Intel NUC13 Raptor Canyon był w stanie przewyższyć wydajność Samsunga 980 Pro w AS-SSD Benchmark. To jednak wystarczy, by dysk SSD Samsunga zajął pierwsze miejsce w klasyfikacji ogólnej. Nawet podczas stress testu dysk zdołał utrzymać wysoką prędkość odczytu przez dłuższy czas, co wskazuje na wysoką skuteczność chłodzenia SSD.
Na płycie Asus ROG Strix Z690-F Gaming można zainstalować jeszcze do trzech dysków SSD M.2. Istnieje również możliwość podłączenia jeszcze większej ilości dysków pamięci masowej przez SATA.
Zapoznaj się z naszą tabelą porównawczą urządzeń pamięci masowej https://www.notebookcheck.net/Laptop-harddisks-HDD-SSD-benchmarks.22089.0.html aby uzyskać więcej informacji i poznać benchmarki.

| Drive Performance rating - Percent | |
| Średnia w klasie Desktop | |
| Schenker XMG SECTOR, i9 13900K, RTX 4090 | |
| Corsair One i300 | |
| NVIDIA GeForce RTX 3090 Founders Edition | |
| Intel NUC13 Raptor Canyon | |
| Intel Core i5-13600K | |
| Intel Core i9-13900K | |
| Minisforum Neptune Series NAD9 | |
| Intel Core i9-12900K -11! | |
| Intel Dragon Canyon NUC - RTX 3060 -11! | |
* ... im mniej tym lepiej
Sustained Read: DiskSpd Read Loop, Queue Depth 8
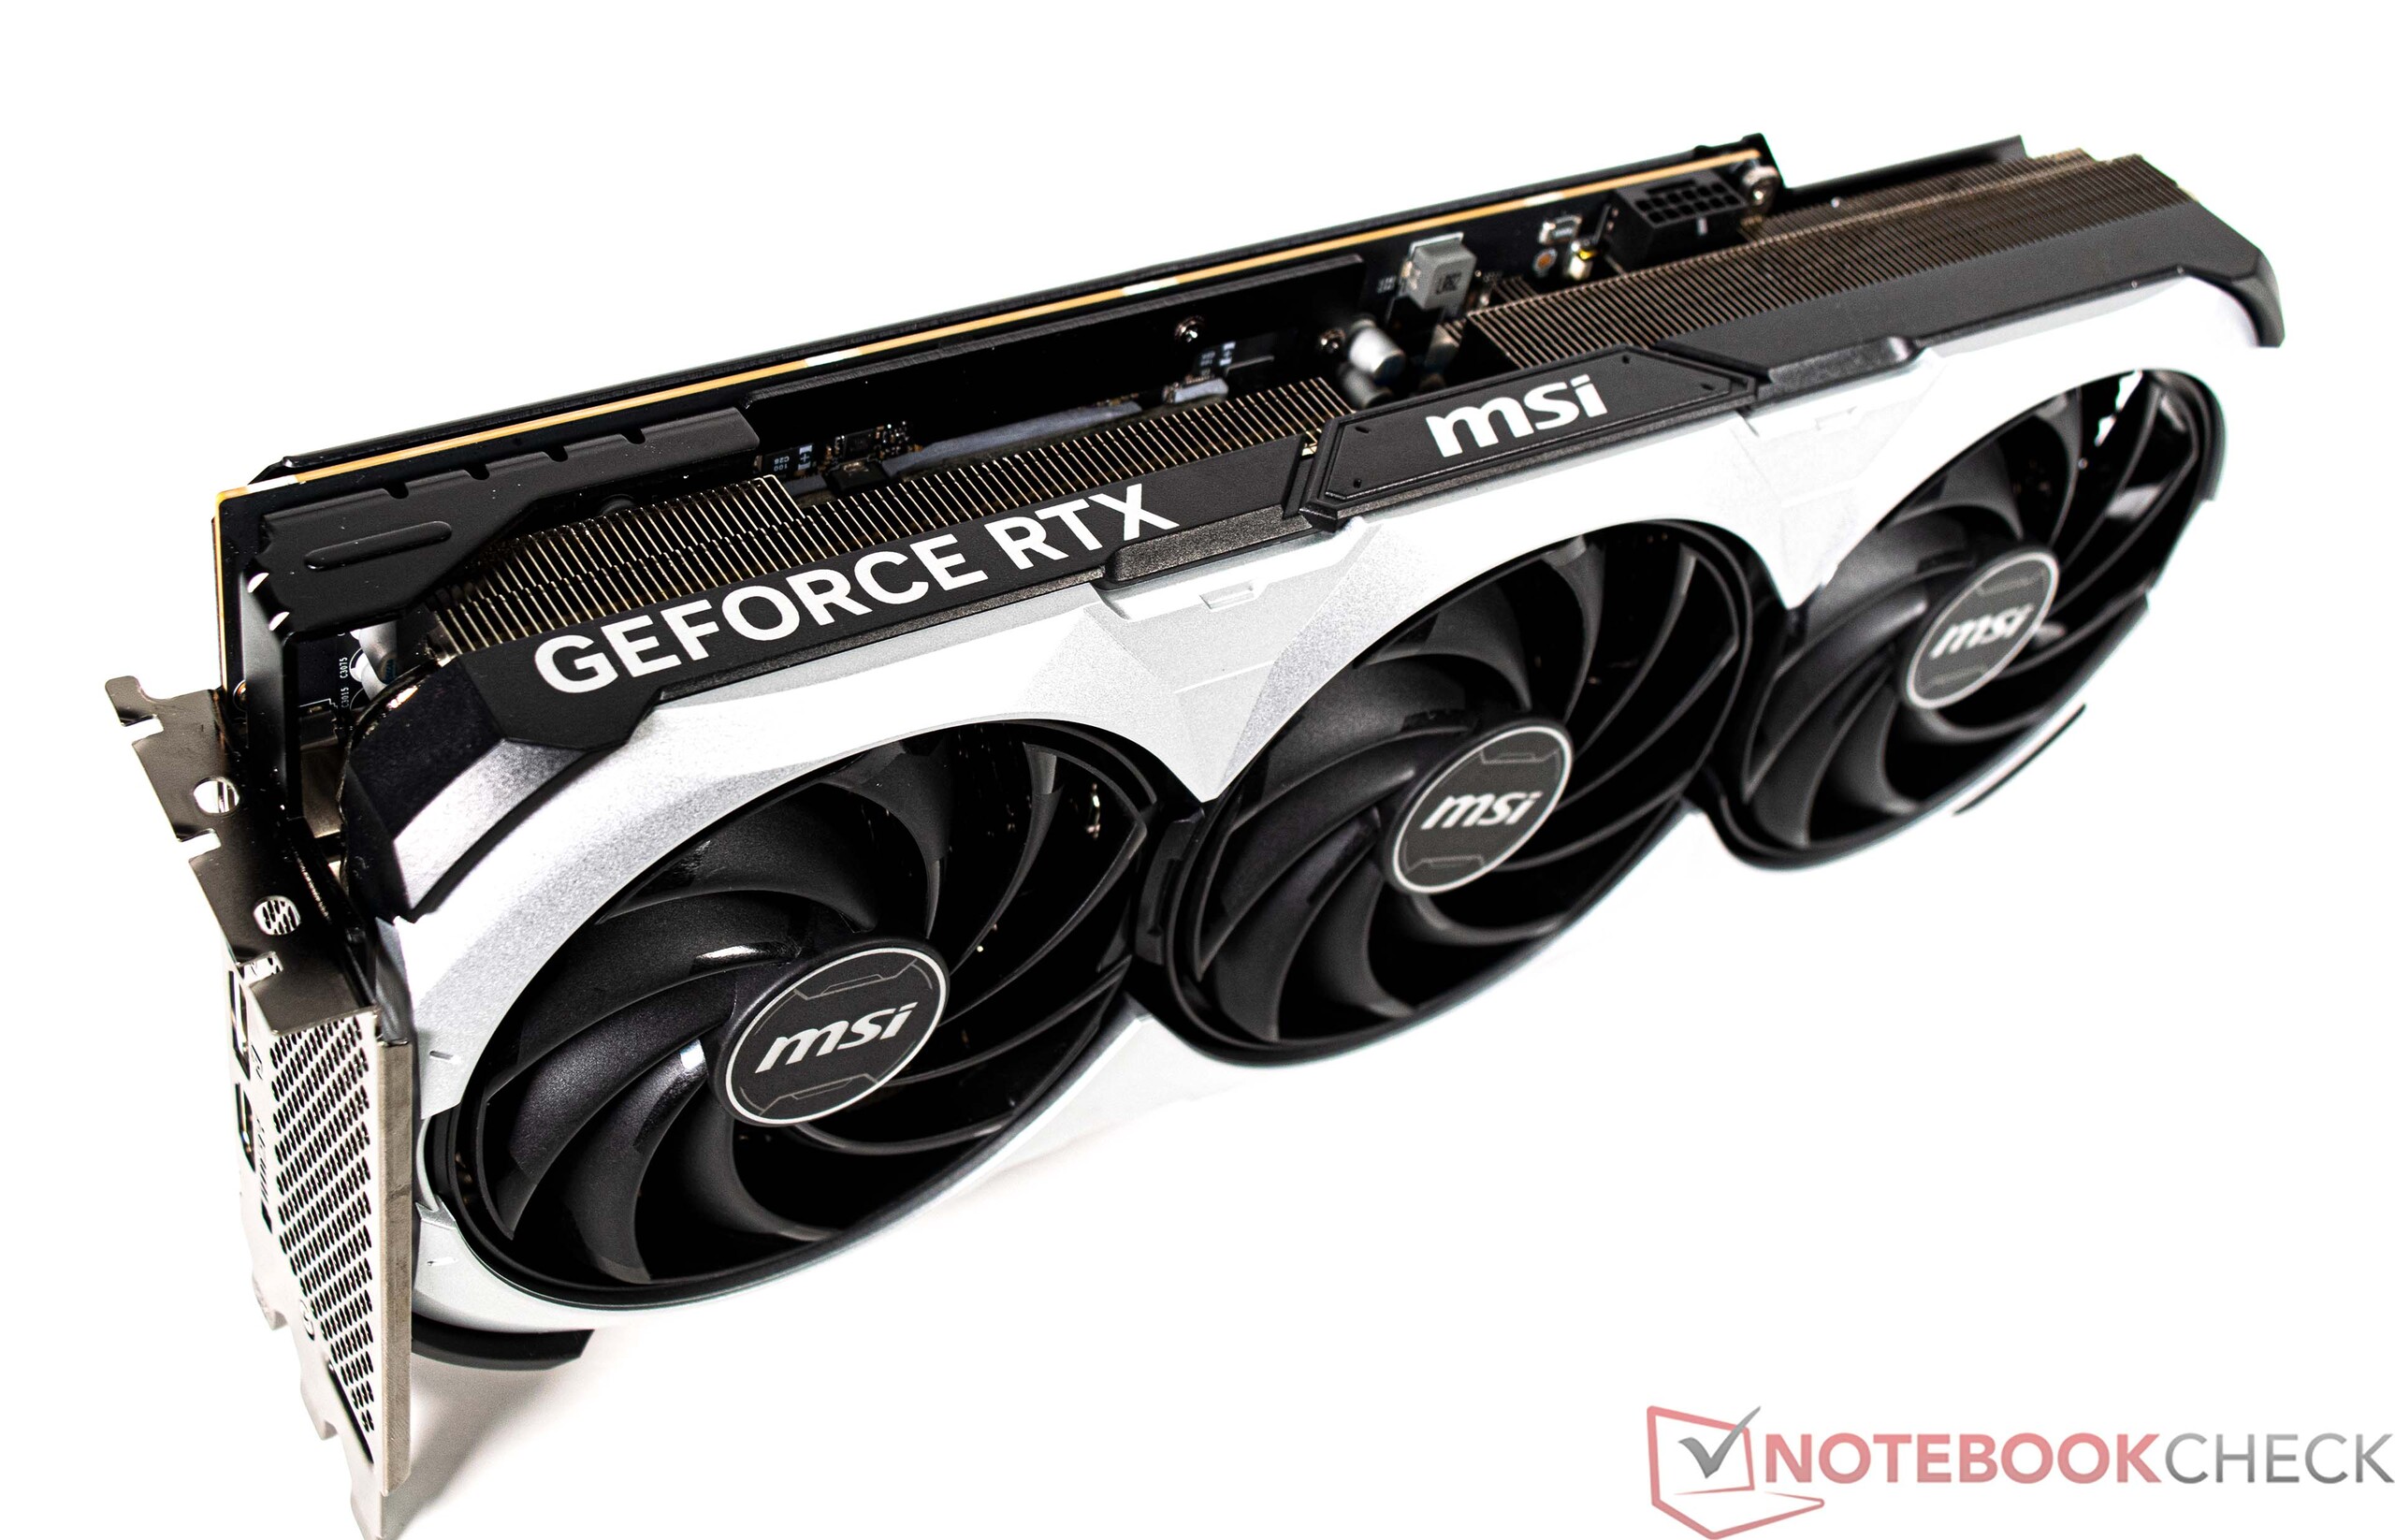
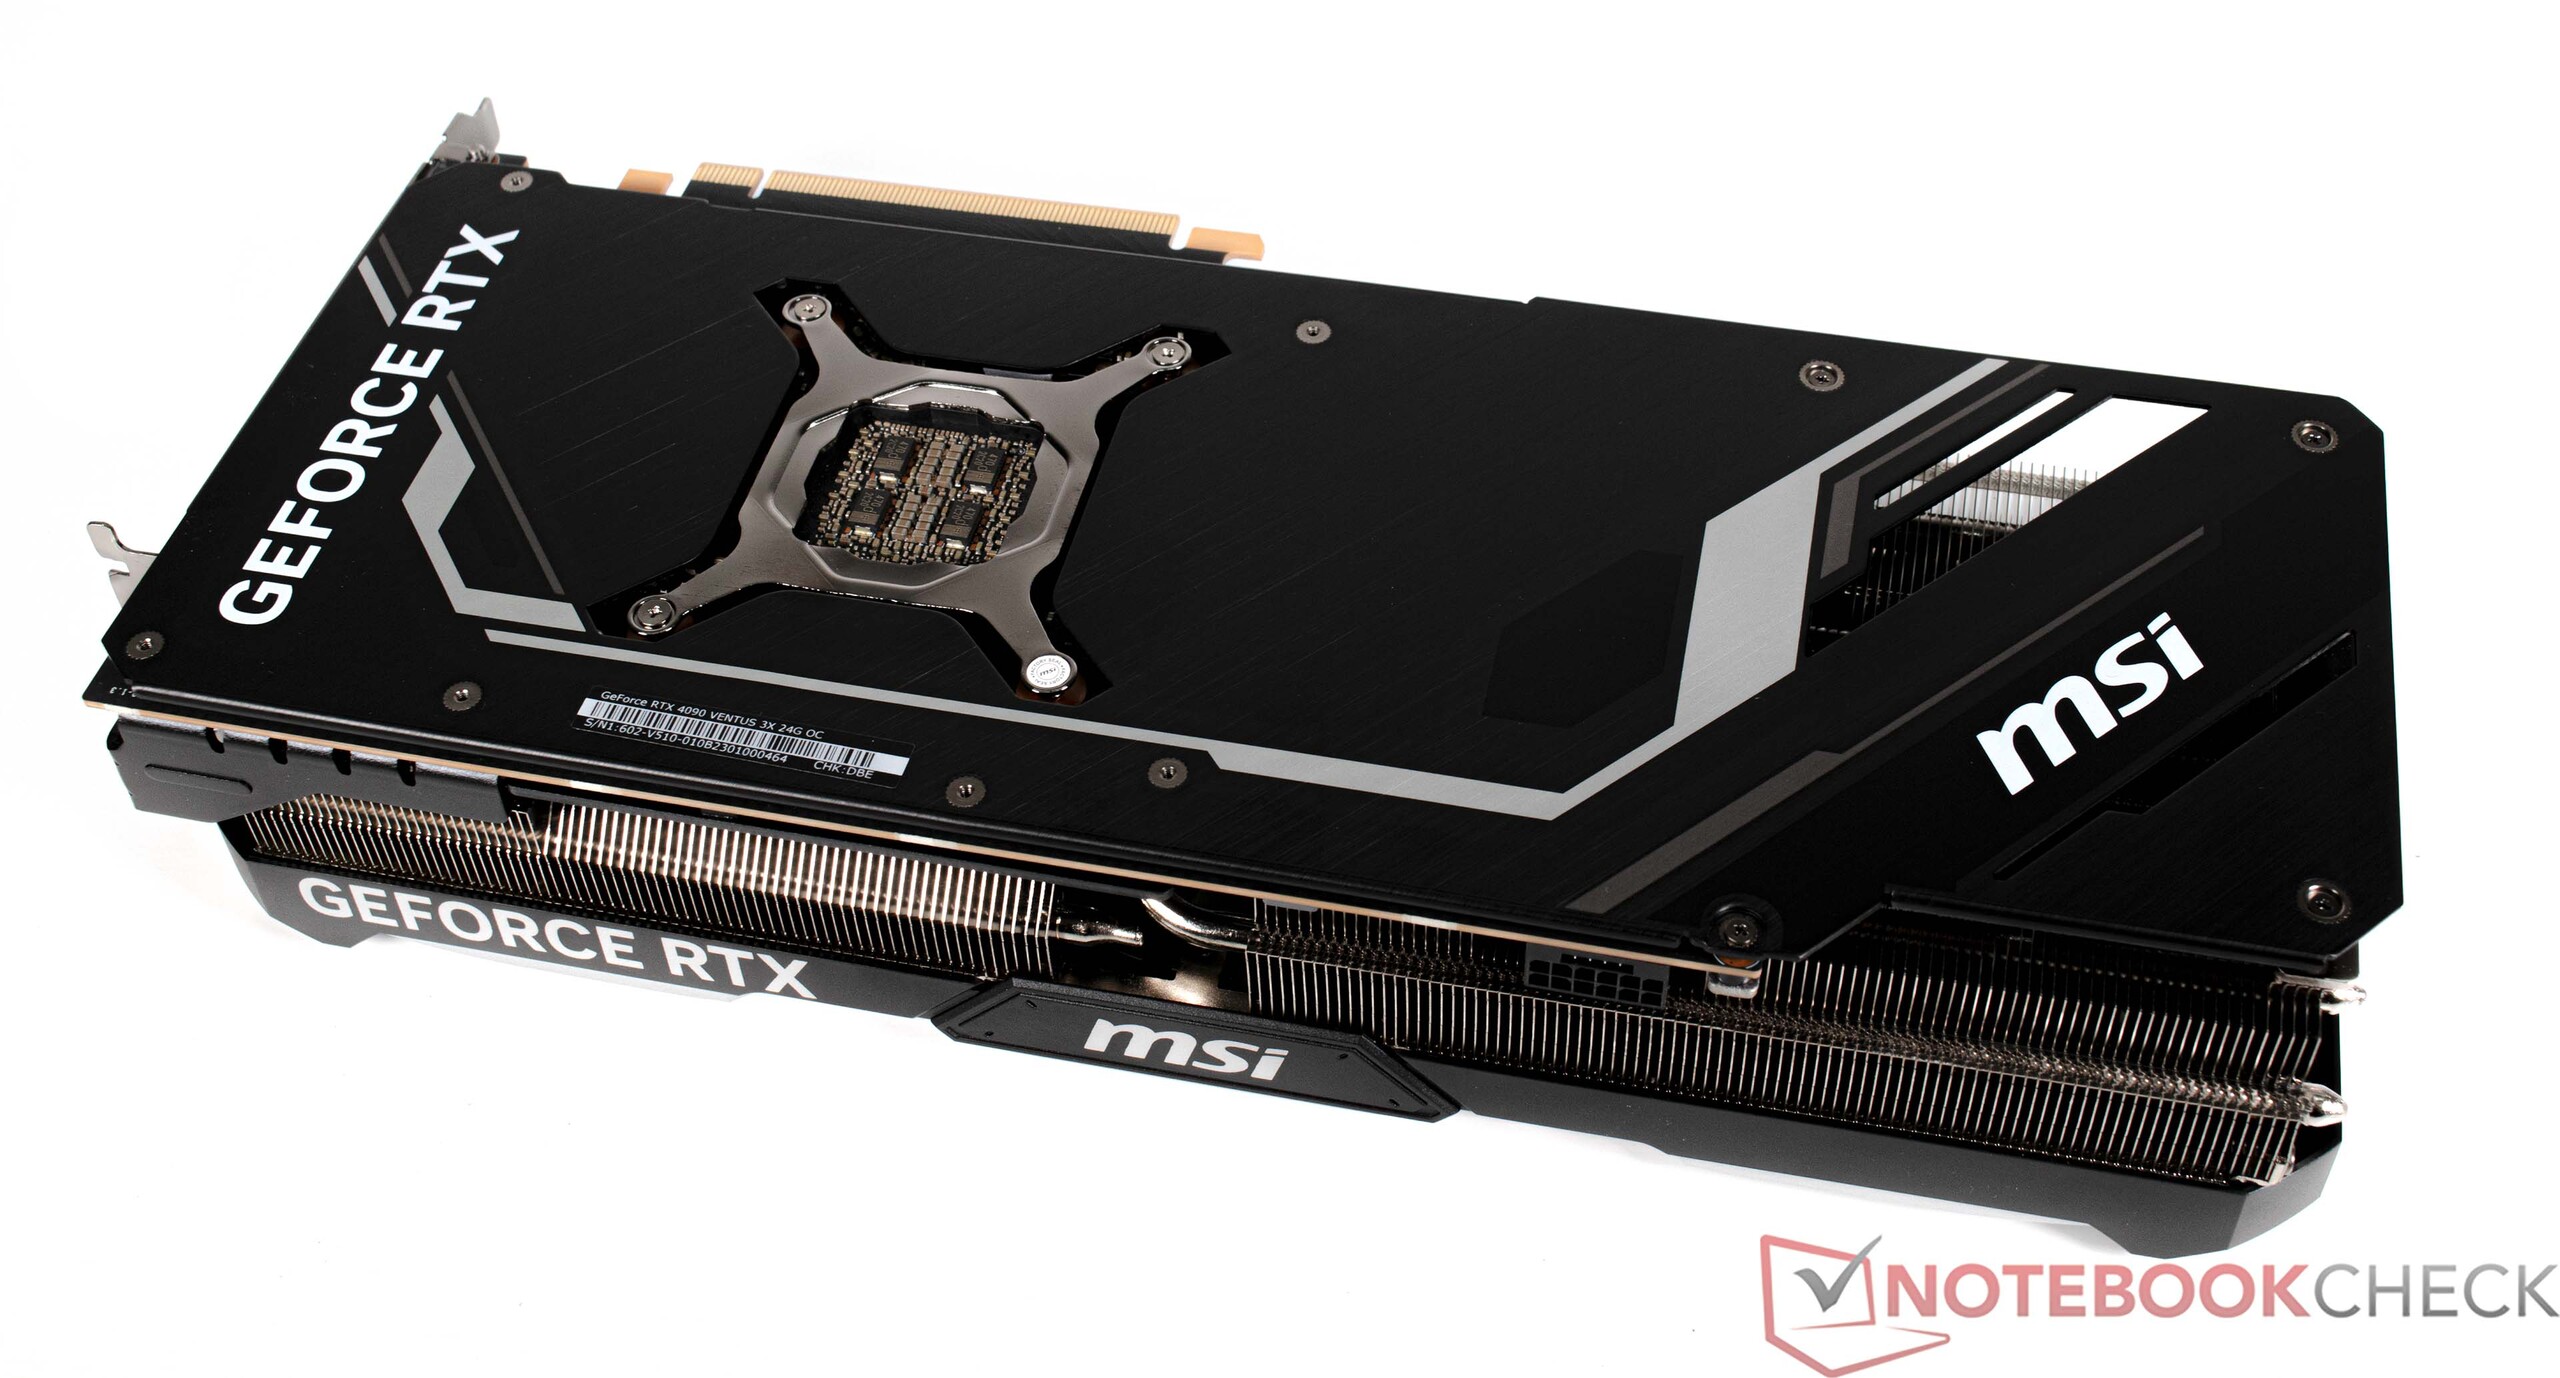
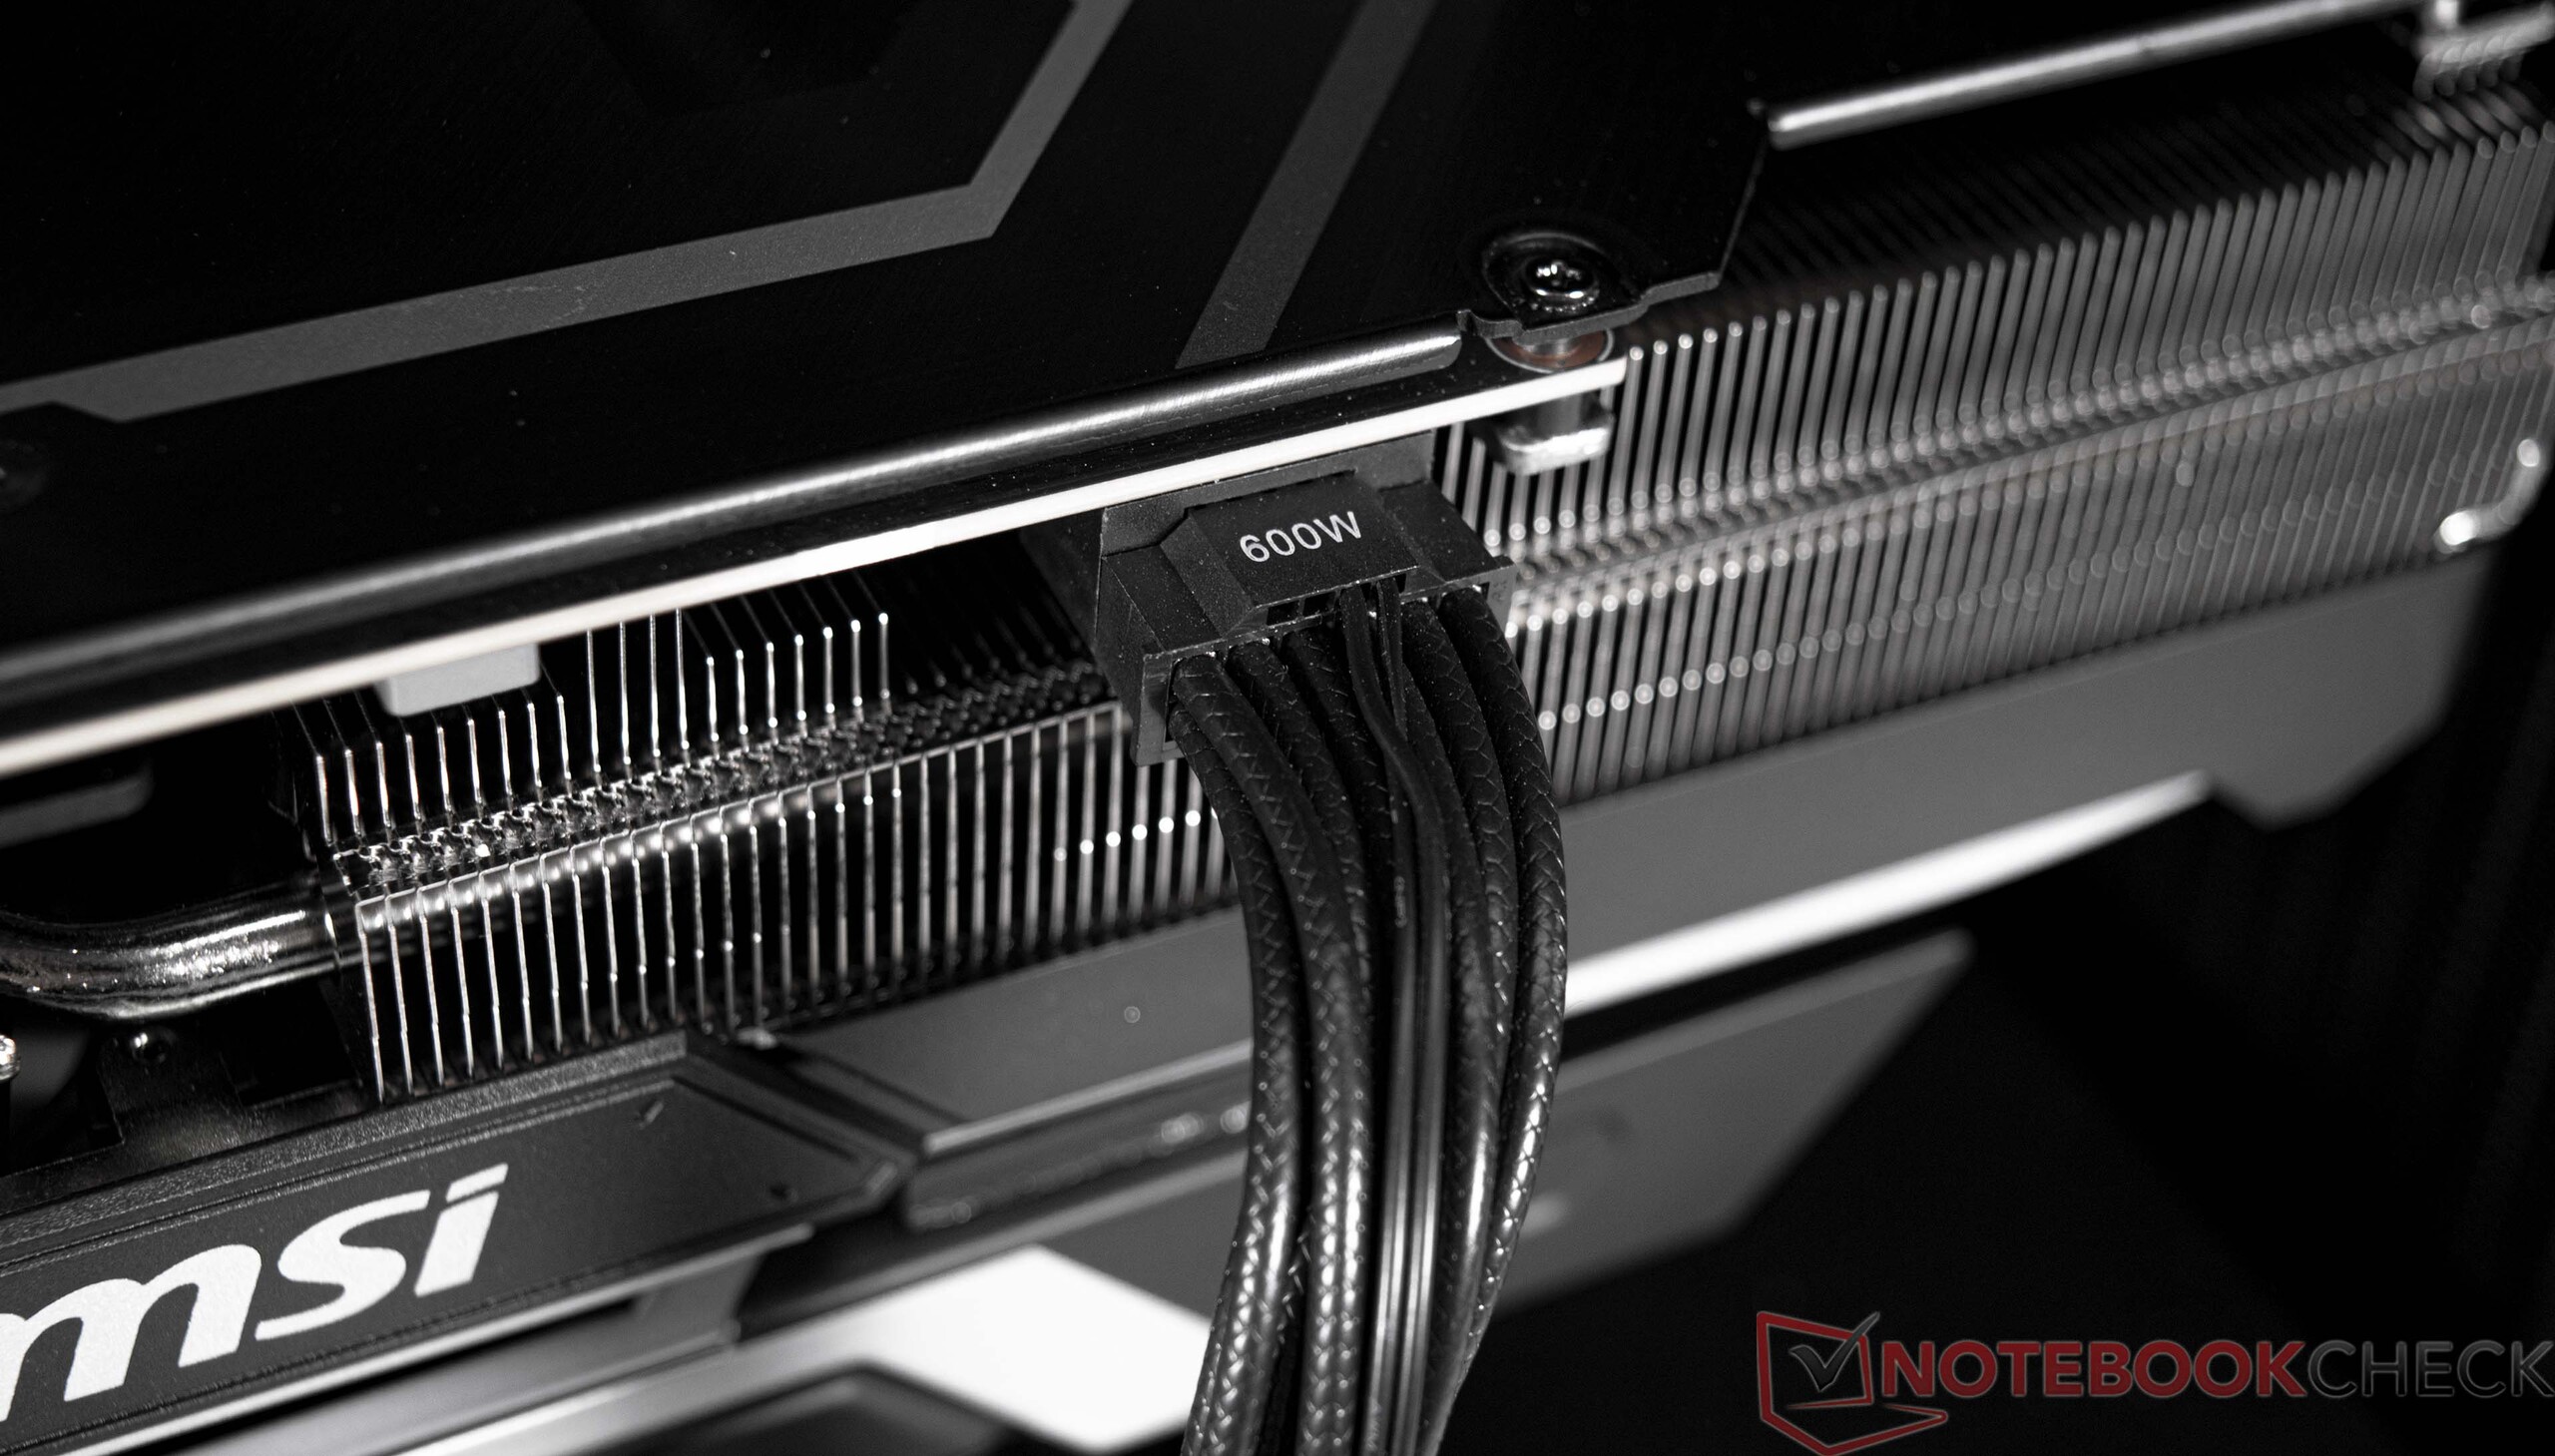
Karta graficzna - Bez kompromisów z GeForce RTX 4090
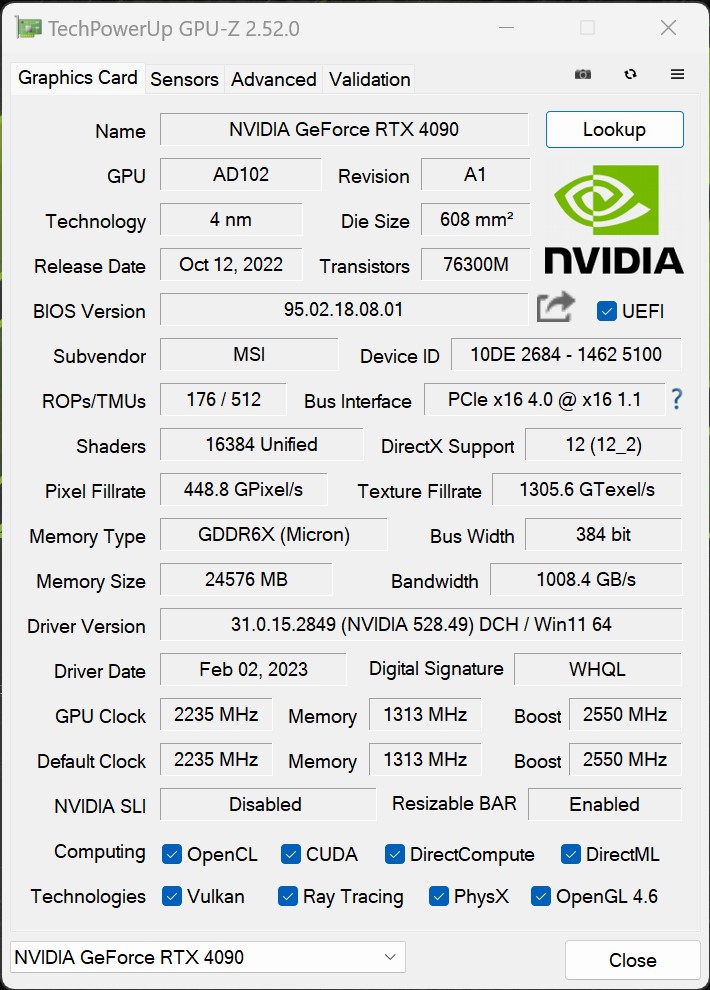
Syntetyczne wzorce
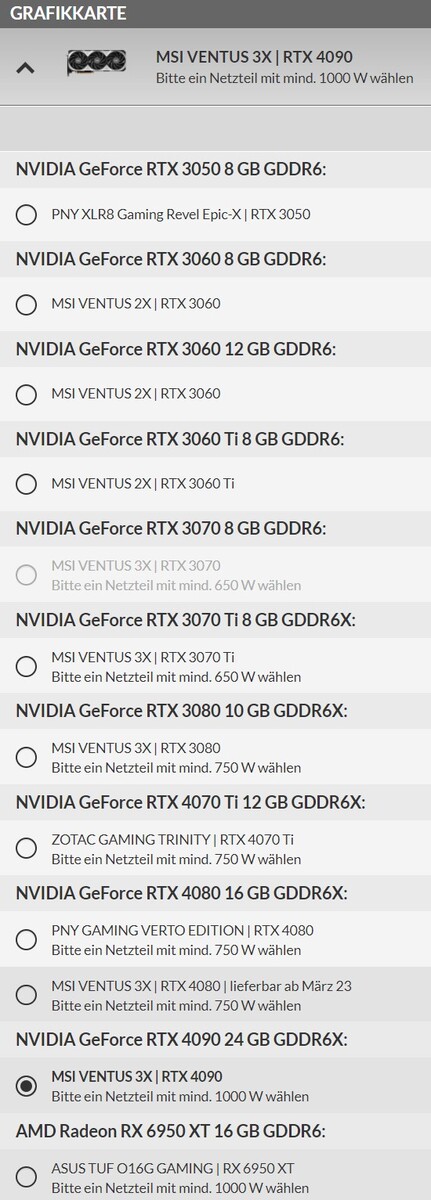
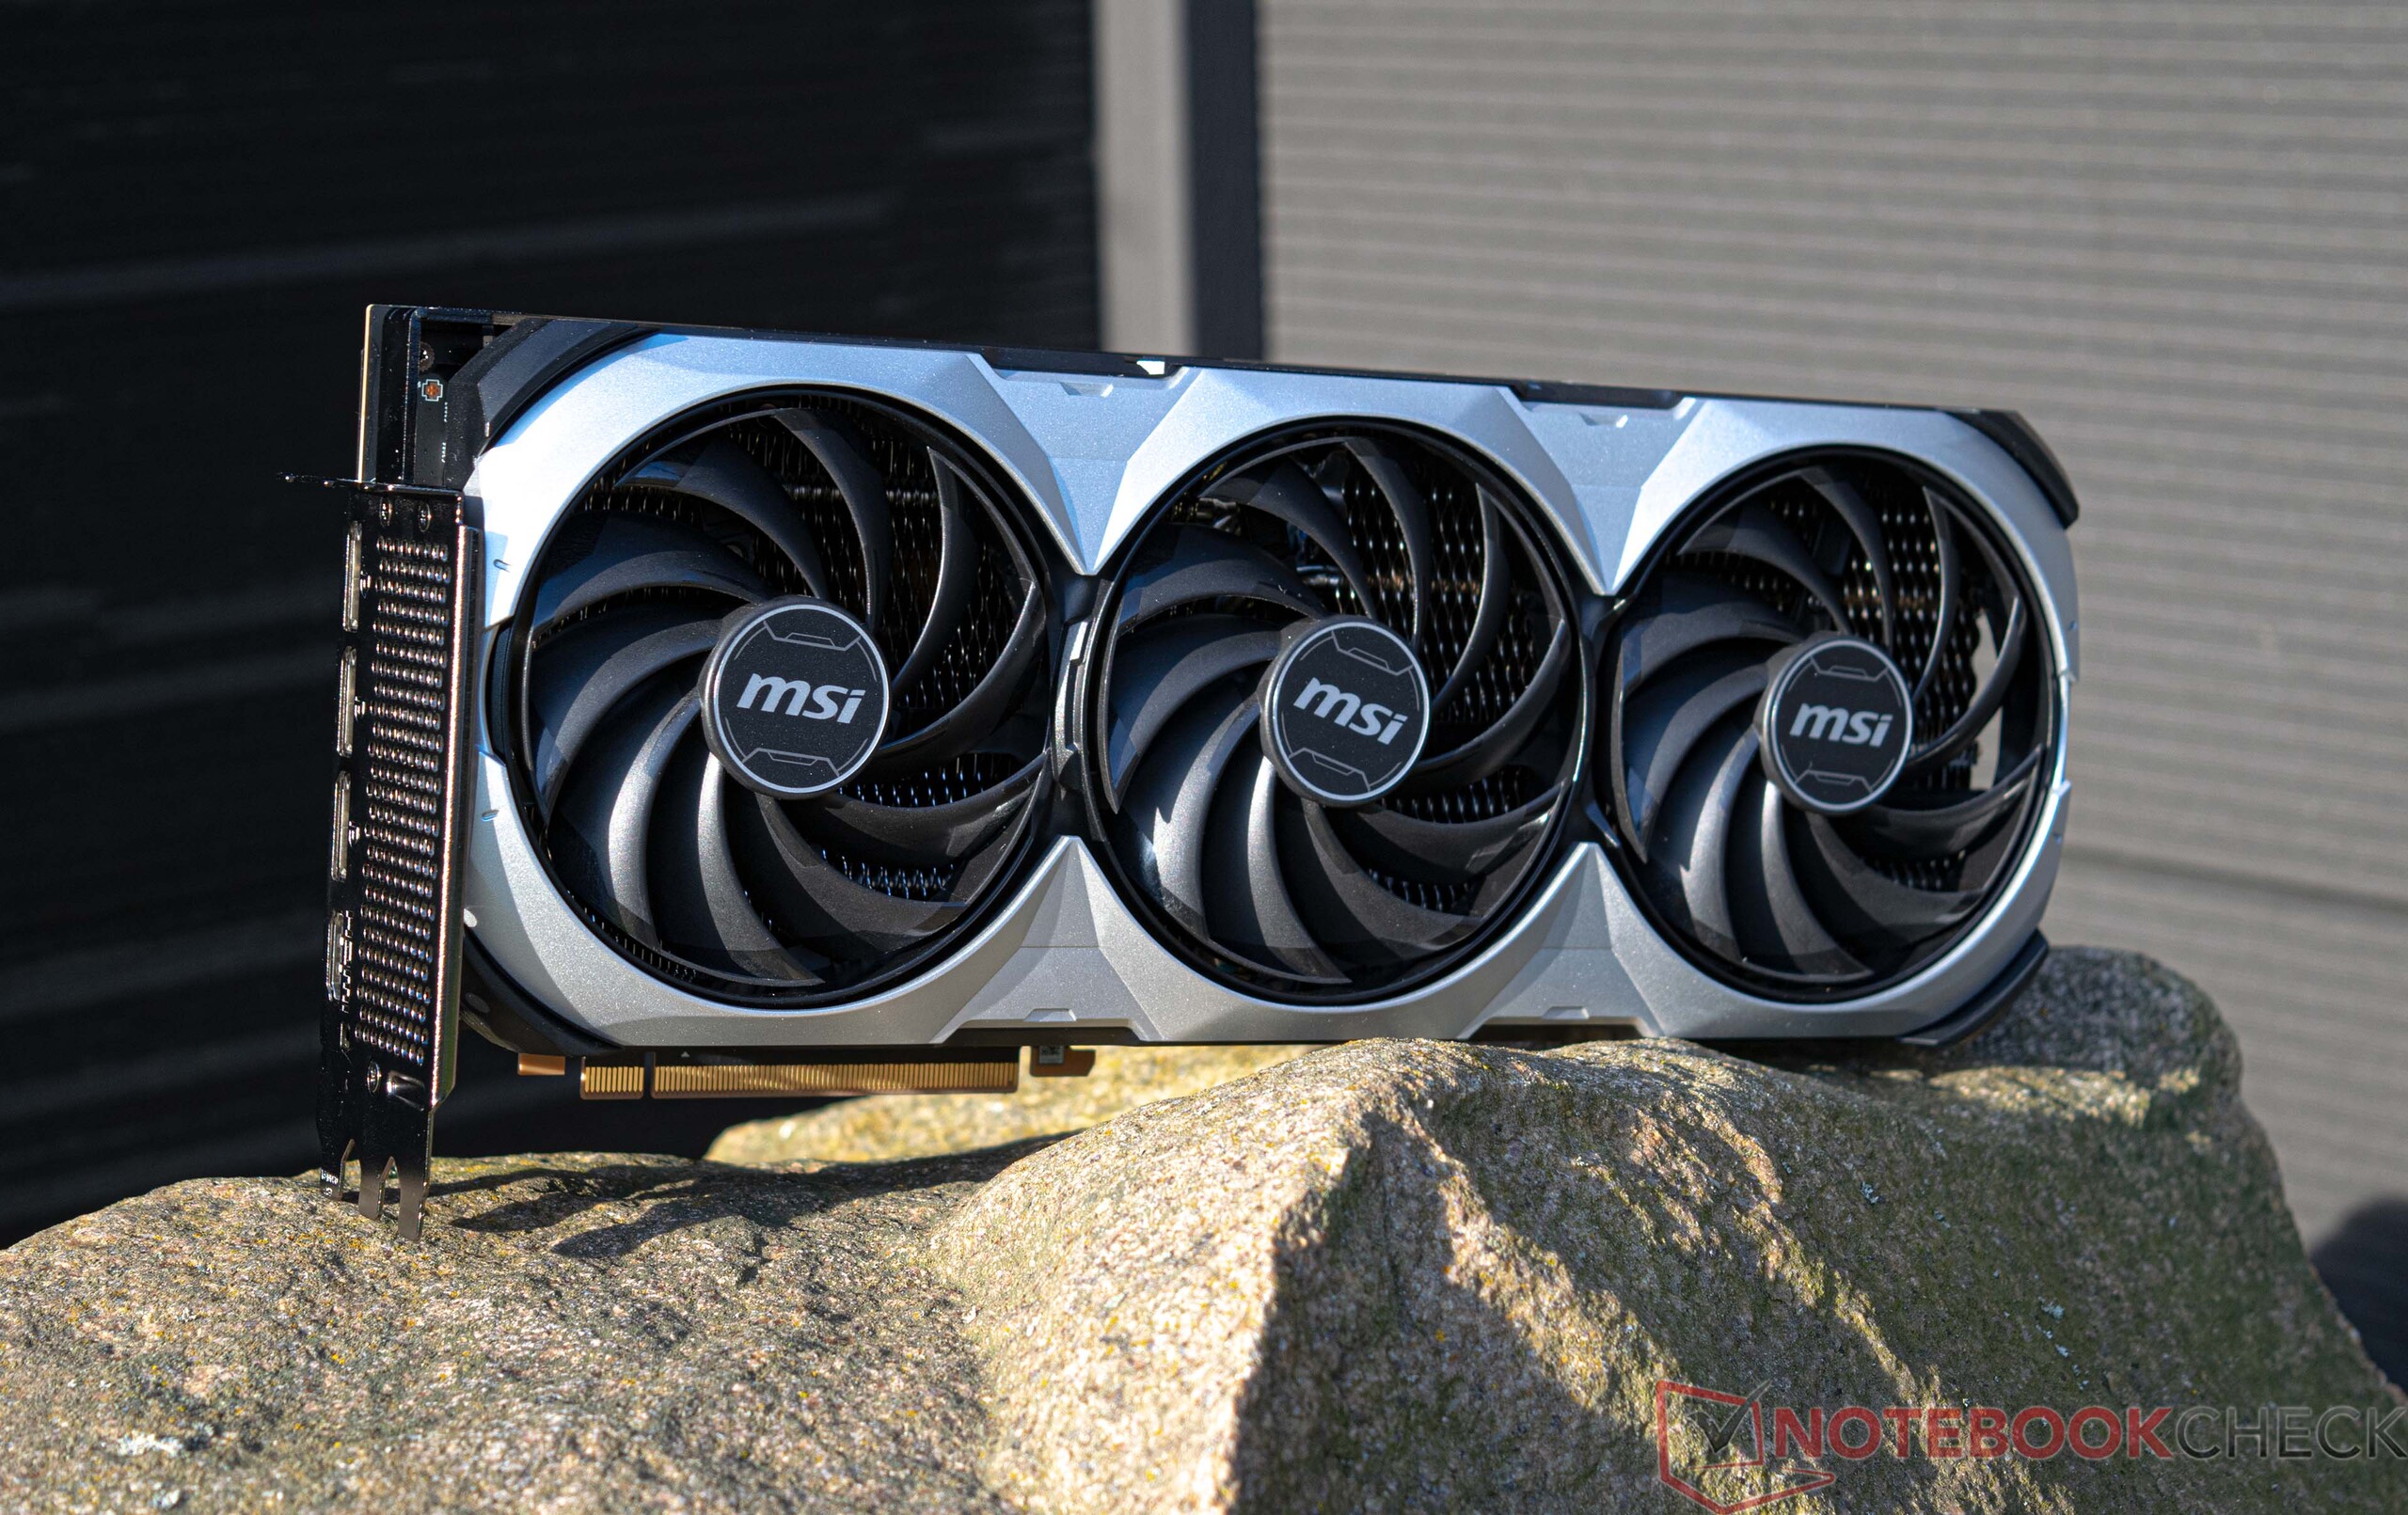
Nasz egzemplarz recenzencki jest wyposażony w najszybszą obecnie konsumencką kartę graficzną - Nvidia GeForce RTX 4090. Procesor graficzny zapewnił niezwykle wysoką wydajność we wszystkich naszych testach syntetycznych, co jest bardzo zgodne z naszymi oczekiwaniami. W połączeniu z Core i9-13900K, jednostka recenzencka wylądowała na drugim miejscu w rankingu 3DMark. Pierwsze miejsce przypadło kolejnemuGeForce RTX 4090, tym razem model od KFA2. Niemniej jednak MSI GeForce RTX 4090 VENTUS 3X potrafi bardzo dobrze trzymać się w starciu z kartą KFA2. Model MSI zajmuje sporo miejsca w XMG SECTOR Intela. MSI nie zdecydowało się jednak na wyposażenie karty w żadne wymyślne efekty świetlne. Flagowy układ graficzny Nvidii ma sporą przewagę nad high-endowymi kartami graficznymi AMD. Konfigurator pozwala wybrać z szerokiej gamy kart graficznych Nvidia z serii 30 i 40. Jeśli koniecznie chcesz mieć w swoim systemie kartę AMD, to jedyną opcją jest tutaj m.in Radeon RX 6950 XT. Karty AMD z serii 7000 nie są obecnie dostępne do wyboru.
Przejdź na ta strona aby uzyskać więcej informacji technicznych na temat karty Nvidia GeForce RTX 4090.
Odwiedź naszą tabelę porównawczą GPU https://www.notebookcheck.net/Mobile-Graphics-Cards-Benchmark-List.844.0.html aby uzyskać więcej informacji i wyniki benchmarków.
Compute benchmarks and professional applications
| 3DMark 05 Standard | 68661 pkt. | |
| 3DMark 06 Standard Score | 70557 pkt. | |
| 3DMark Vantage P Result | 133759 pkt. | |
| 3DMark 11 Performance | 62922 pkt. | |
| 3DMark Ice Storm Standard Score | 257615 pkt. | |
| 3DMark Cloud Gate Standard Score | 85474 pkt. | |
| 3DMark Fire Strike Score | 45450 pkt. | |
| 3DMark Fire Strike Extreme Score | 37831 pkt. | |
| 3DMark Time Spy Score | 32024 pkt. | |
Pomoc | ||
Wydajność w grach
Świetne wyniki widoczne w syntetycznych benchmarkach są wzmocnione przez doskonałą wydajność XMG SECTOR Intel w grach. Nie trzeba dodawać, że kluczową rolę odgrywa w tym GeForce RTX 4090. Jednak aby skutecznie wykorzystać moc najszybszego układu graficznego Nvidii, będziesz potrzebował również niezwykle szybkiego procesora. Podobnie, zalecamy granie w gry głównie w rozdzielczości 2160p i na maksymalnych ustawieniach, aby móc przede wszystkim wykorzystać wydajność karty graficznej. Osoby, które grają tylko w 1080p, mogą po prostu zdecydować się na kartę RTX 4070 Ti i zaoszczędzić sobie sporo pieniędzy.
Specjalne funkcje RTX, takie jak DLSS 3.0 i generowanie klatek (FG) są obecnie ekskluzywne dla kart z serii RTX 40. Oznacza to, że jeśli chcesz cieszyć się tymi nowymi funkcjami, nie masz innego wyboru niż nabycie GPU z serii RTX 40. Intel XMG SECTOR jest w stanie płynnie uruchomić wszystkie testowane gry w rozdzielczości 2160p i ustawieniach maksymalnych. Co więcej, ci, którzy chcą włączyć ray tracing, mogą w większości przypadków korzystać z tej funkcji bez żadnych ograniczeń. Jednak niektóre gry, takie jak Cyberpunk 2077, mogą rzucić na kolana nawet tak high-endową platformę jak XMG SECTOR. Włączenie DLSS pomoże komputerowi uruchomić te gry ponownie płynnie w rozdzielczości 2160p. Ze swojej strony, AMD oferuje podobną funkcję w postaci FSR. Ostatecznie to od twórców gier zależy, czy zaimplementują te funkcje. Możesz odwiedzić tę stronę aby znaleźć listę gier, które albo już wspierają DLSS 3.0, albo zrobią to w przyszłości.
| Metro Exodus - 1920x1080 Ultra Quality DXR AF:16x | |
| NVIDIA GeForce RTX 4090 | |
| AMD Radeon RX 7900 XTX | |
| NVIDIA GeForce RTX 4080 | |
| NVIDIA GeForce RTX 4090 | |
| AMD Radeon RX 7900 XT | |
| NVIDIA GeForce RTX 3080 Ti | |
| NVIDIA GeForce RTX 3090 | |
| Far Cry 6 - 1920x1080 Ultra Graphics Quality + HD Textures + DXR AA:T | |
| NVIDIA GeForce RTX 4080 | |
| AMD Radeon RX 7900 XTX | |
| AMD Radeon RX 7900 XT | |
| NVIDIA GeForce RTX 4090 | |
| NVIDIA GeForce RTX 4090 | |
| NVIDIA GeForce RTX 3080 Ti | |
| NVIDIA GeForce RTX 3090 | |
| AMD Radeon RX 6800 | |
| AMD Radeon RX 6950 XT | |
| Cyberpunk 2077 1.6 | |
| 3840x2160 Ray Tracing Ultra Preset (DLSS off) | |
| NVIDIA GeForce RTX 4090 | |
| NVIDIA GeForce RTX 4090 (1.6) | |
| NVIDIA GeForce RTX 4080 (1.6) | |
| NVIDIA GeForce RTX 3090 (1.6) | |
| AMD Radeon RX 7900 XTX (1.61) | |
| NVIDIA GeForce RTX 3080 Ti (1.61) | |
| AMD Radeon RX 7900 XT (1.61) | |
| AMD Radeon RX 6800 (1.61) | |
| 1920x1080 Ray Tracing Ultra Preset (DLSS off) | |
| NVIDIA GeForce RTX 4090 | |
| NVIDIA GeForce RTX 4090 (1.6) | |
| NVIDIA GeForce RTX 4080 (1.6) | |
| NVIDIA GeForce RTX 3080 Ti (1.61) | |
| NVIDIA GeForce RTX 3090 (1.6) | |
| AMD Radeon RX 7900 XTX (1.61) | |
| AMD Radeon RX 7900 XT (1.61) | |
| AMD Radeon RX 6800 (1.61) | |
| Control - 1920x1080 High Quality Preset & High Ray Tracing Preset (DX12) | |
| NVIDIA GeForce RTX 4090 | |
| NVIDIA GeForce RTX 4080 | |
| NVIDIA GeForce RTX 4090 | |
| AMD Radeon RX 7900 XTX | |
| NVIDIA GeForce RTX 3080 Ti | |
| AMD Radeon RX 7900 XT | |
| AMD Radeon RX 6950 XT | |
| Ghostwire Tokyo - 1920x1080 Highest Settings + Maximum Ray Tracing | |
| NVIDIA GeForce RTX 4090 | |
| NVIDIA GeForce RTX 4090 | |
| NVIDIA GeForce RTX 4080 | |
| AMD Radeon RX 7900 XTX | |
| NVIDIA GeForce RTX 3080 Ti | |
| AMD Radeon RX 7900 XT | |
| Guardians of the Galaxy - 1920x1080 Ultra Preset + Ultra Ray-Tracing | |
| NVIDIA GeForce RTX 4090 | |
| AMD Radeon RX 7900 XTX | |
| AMD Radeon RX 7900 XT | |
| The Callisto Protocol - 1920x1080 Ultra Preset (without FSR Upscaling) + Full Ray-Tracing | |
| AMD Radeon RX 7900 XTX | |
| NVIDIA GeForce RTX 4090 | |
| NVIDIA GeForce RTX 4090 | |
| AMD Radeon RX 7900 XT | |
| NVIDIA GeForce RTX 3080 Ti | |
| AMD Radeon RX 6800 | |
| low | med. | high | ultra | QHD | 4K DLSS | 4K | |
|---|---|---|---|---|---|---|---|
| GTA V (2015) | 187.6 | 187.6 | 187 | 165.9 | 166.3 | 187.5 | |
| The Witcher 3 (2015) | 731.4 | 664.6 | 613.4 | 314.1 | 282 | ||
| Dota 2 Reborn (2015) | 287.9 | 258.5 | 256.3 | 219.7 | 226.8 | ||
| Final Fantasy XV Benchmark (2018) | 234 | 232 | 227 | 224 | 155.7 | ||
| X-Plane 11.11 (2018) | 237 | 209 | 160.6 | 139.3 | |||
| Far Cry 5 (2018) | 240 | 208 | 201 | 187 | 187 | 173 | |
| Strange Brigade (2018) | 627 | 506 | 506 | 506 | 488 | 281 | |
| Shadow of the Tomb Raider (2018) | 300 | 288 | 285 | 282 | 269 | 186 | |
| Far Cry New Dawn (2019) | 206 | 188 | 180 | 161 | 164 | 152 | |
| Metro Exodus (2019) | 260 | 235 | 191.9 | 177.3 | 165 | 136.3 | |
| Control (2019) | 233 | 233 | 233 | 232 | 114.4 | ||
| Borderlands 3 (2019) | 243 | 213 | 197.3 | 182.9 | 182.5 | 132.9 | |
| F1 2020 (2020) | 521 | 445 | 431 | 395 | 386 | 282 | |
| F1 2021 (2021) | 632 | 585 | 501 | 277 | 267 | 196.6 | |
| Far Cry 6 (2021) | 213 | 187.4 | 168.7 | 166.8 | 163.8 | 133.4 | |
| Guardians of the Galaxy (2021) | 220 | 220 | 219 | 216 | 215 | 214 | |
| Forza Horizon 5 (2021) | 285 | 245 | 244 | 187 | 178 | 148 | |
| God of War (2022) | 263 | 263 | 255 | 203 | 173.4 | 125.1 | |
| GRID Legends (2022) | 311 | 286 | 258 | 248 | 242 | 191.4 | |
| Cyberpunk 2077 1.6 (2022) | 195 | 185 | 182 | 181 | 167 | 80 | |
| Ghostwire Tokyo (2022) | 278 | 275 | 273 | 272 | 266 | 174.7 | |
| Tiny Tina's Wonderlands (2022) | 413 | 355 | 309 | 280 | 224 | 128.4 | |
| F1 22 (2022) | 415 | 377 | 364 | 195.4 | 149.7 | 81.1 | |
| A Plague Tale Requiem (2022) | 188.6 | 175.4 | 158.5 | 147.8 | 104.6 | 193.6 | 74.7 |
| Uncharted Legacy of Thieves Collection (2022) | 139.5 | 138.1 | 137.1 | 136.6 | 134.9 | 99.1 | |
| Call of Duty Modern Warfare 2 2022 (2022) | 248 | 247 | 232 | 230 | 187 | 215 | 128 |
| Spider-Man Miles Morales (2022) | 169.9 | 163.3 | 150.9 | 149.3 | 127.4 | 126.8 | |
| The Callisto Protocol (2022) | 234.8 | 224 | 204.9 | 203.8 | 184.8 | 124.9 | |
| The Witcher 3 v4 (2023) | 304 | 271 | 218 | 198.8 | 154.1 | 199.7 |
Emisje
Emisja hałasu
Na podstawie naszych pomiarów system jest stosunkowo cichy w stanie spoczynku i wytwarza tylko 32 dB(A) hałasu. Pod średnim obciążeniem komputer jest słyszalny, ale nadal cichy, ponieważ karta graficzna może być nadal pasywnie chłodzona. Wentylatory obudowy i trzy wentylatory GPU włączają się tylko wtedy, gdy system jest mocno obciążony. Nasz miernik poziomu dźwięku zmierzył podczas testu obciążeniowego szczytowe natężenie hałasu na poziomie 40,6 dB(A).
Hałas
| luz |
| 32 / 32.1 / 32.3 dB |
| obciążenie |
| 32.4 / 40.6 dB |
 | ||
30 dB cichy 40 dB(A) słyszalny 50 dB(A) irytujący |
||
min: | ||
Temperatura
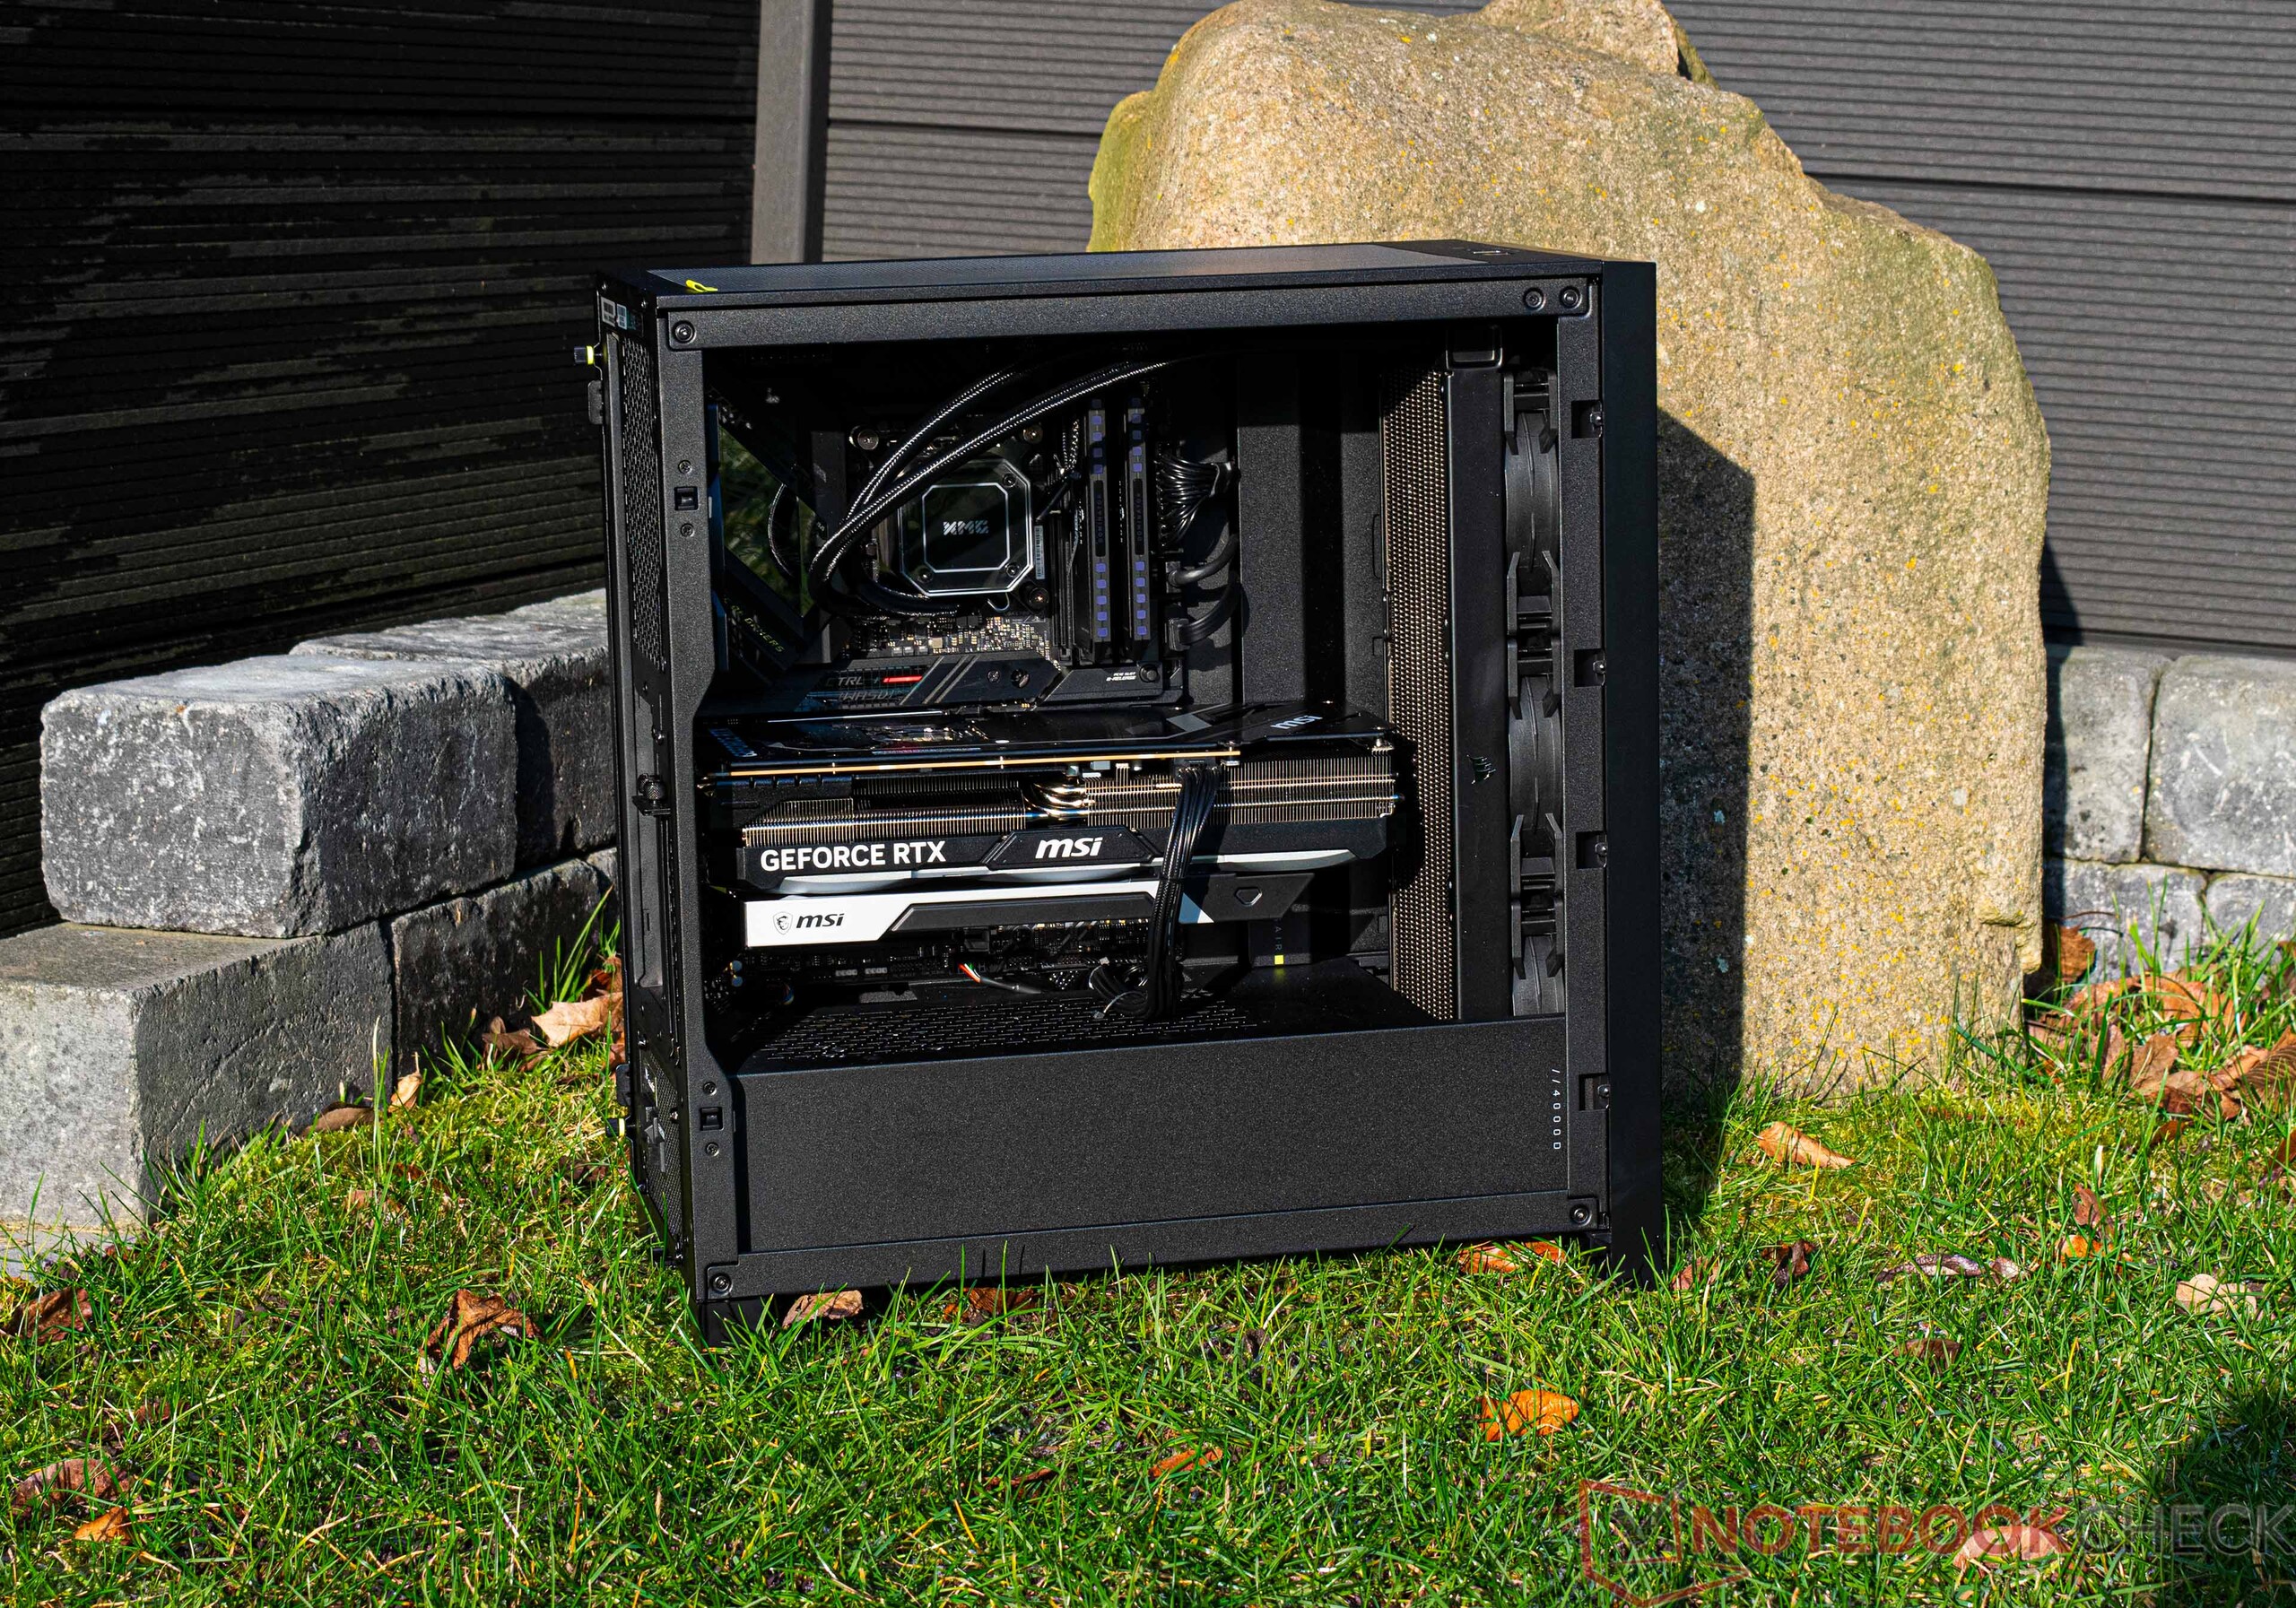
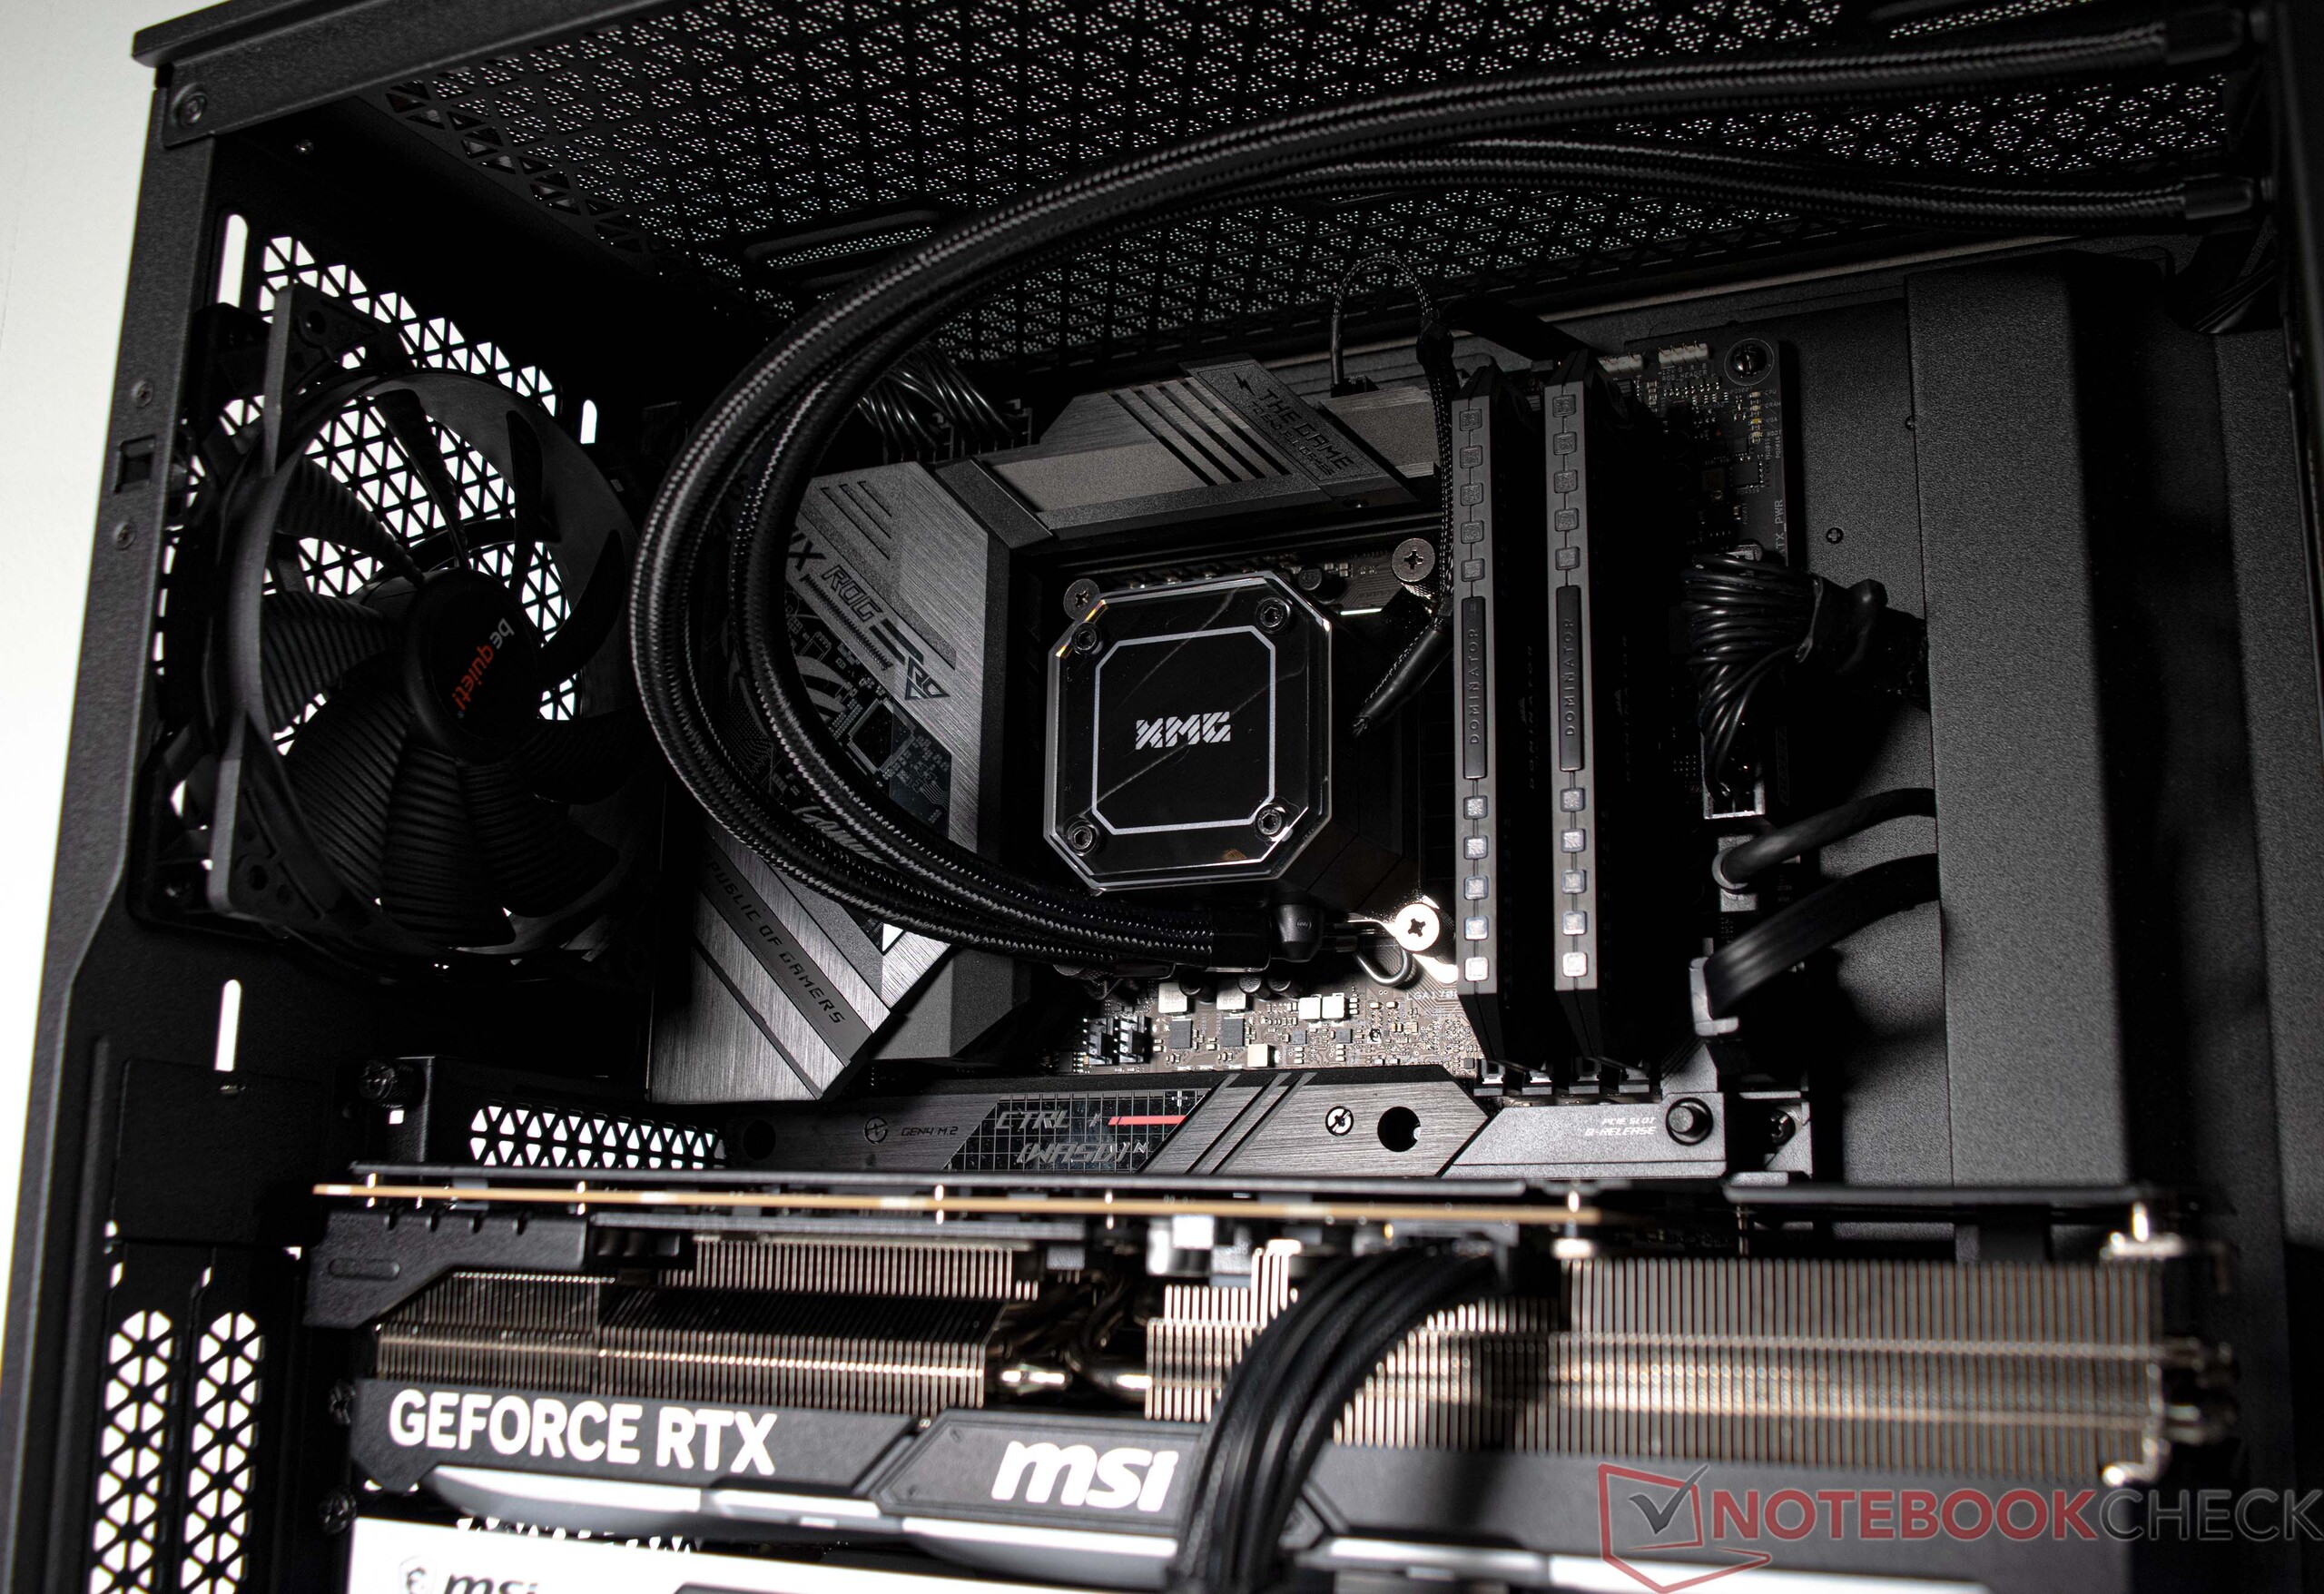
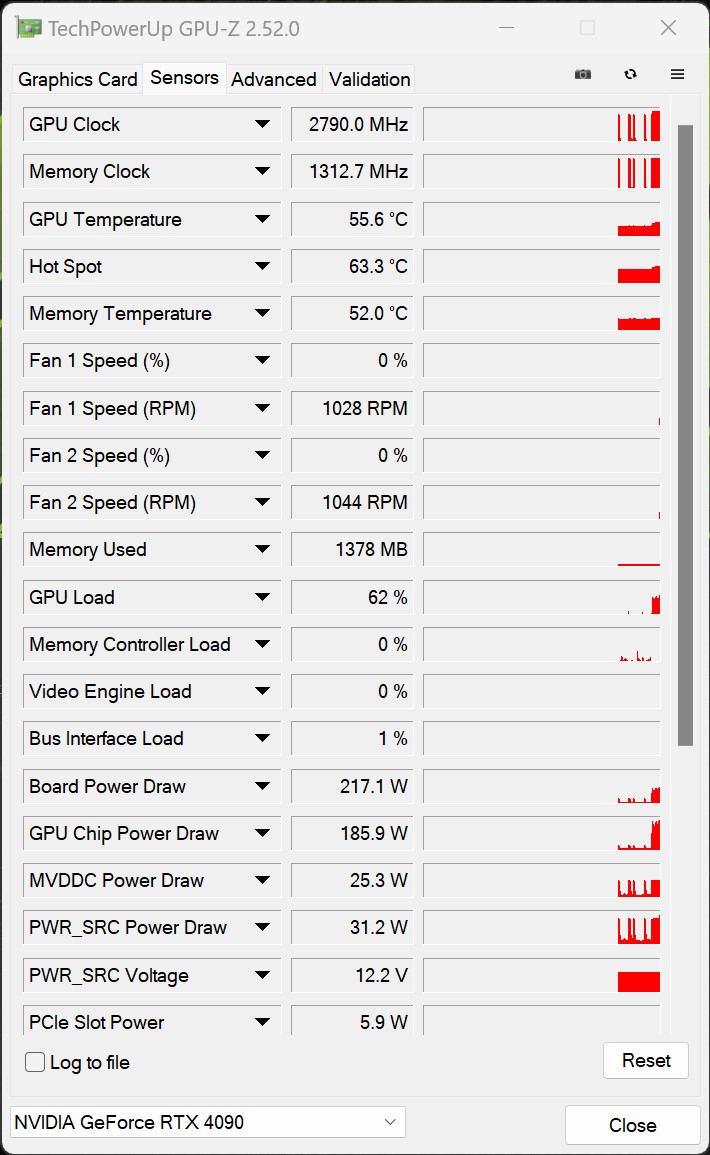
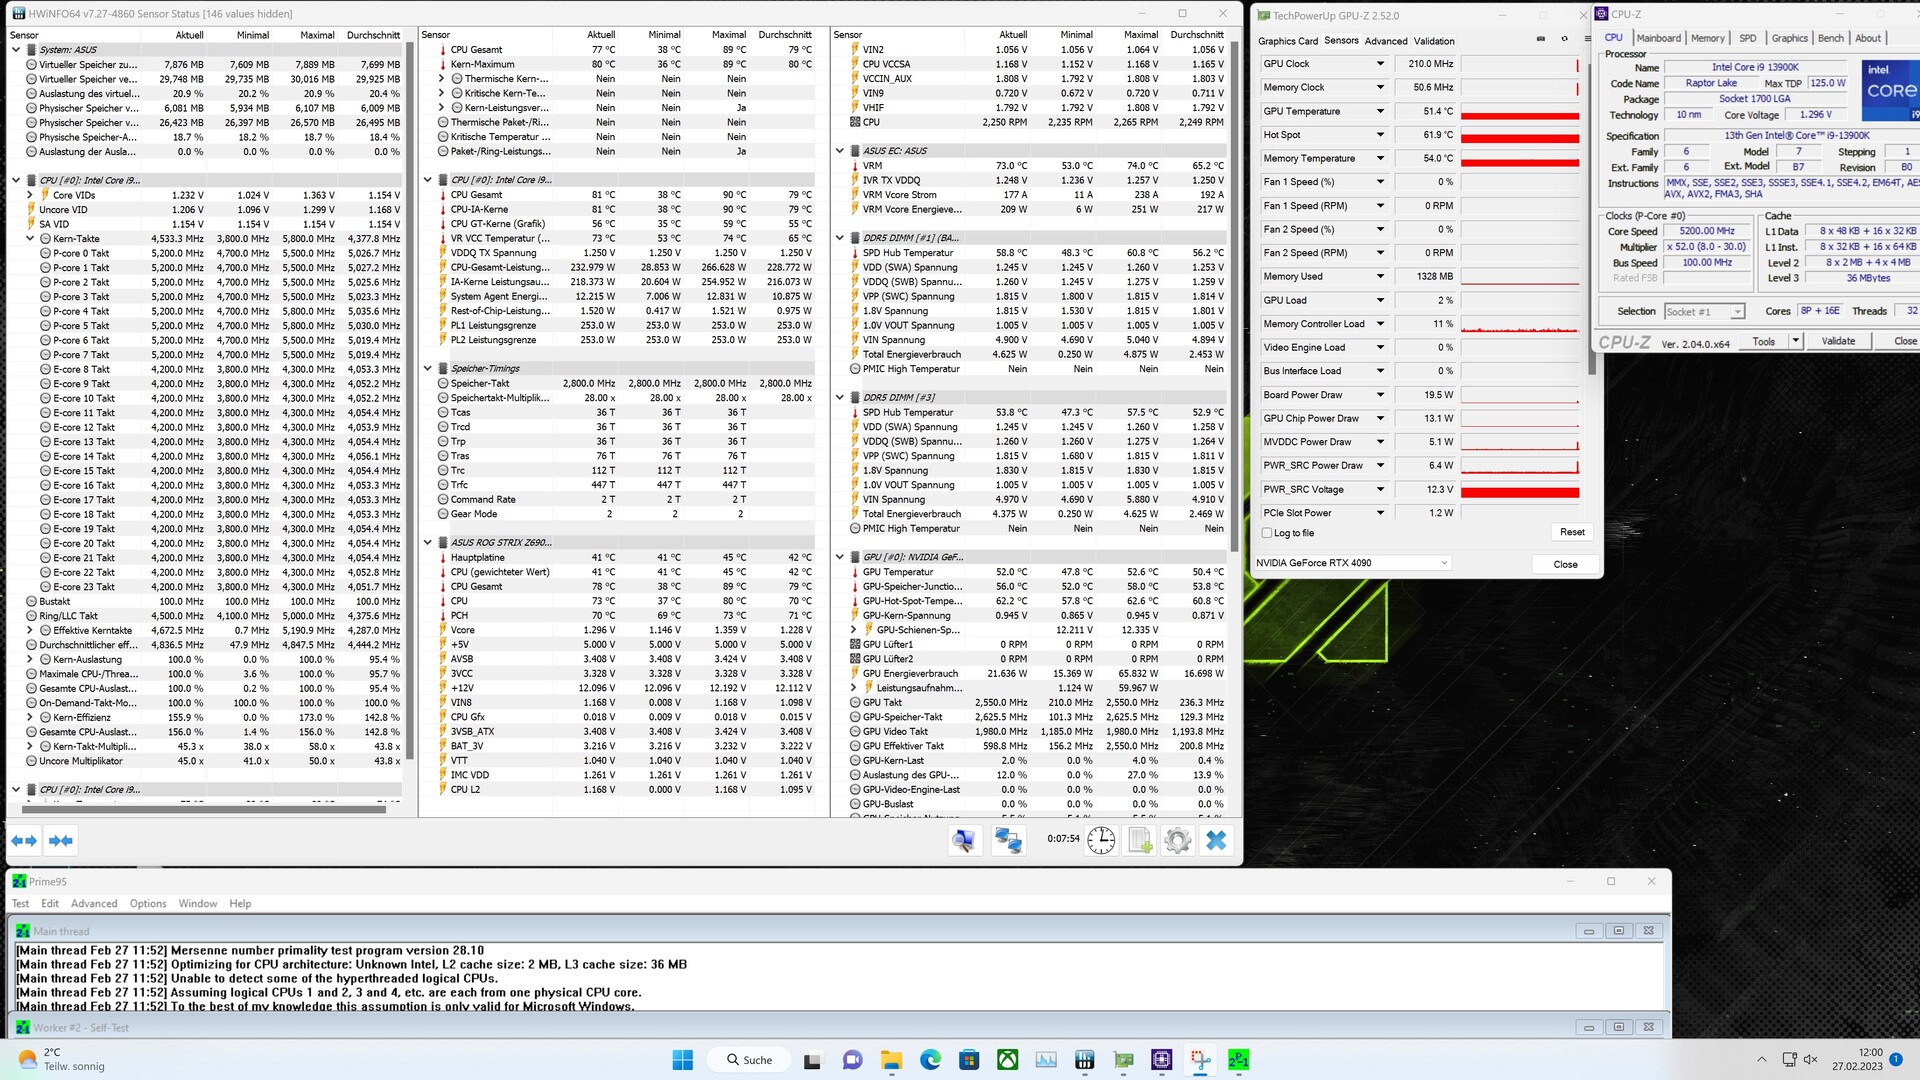
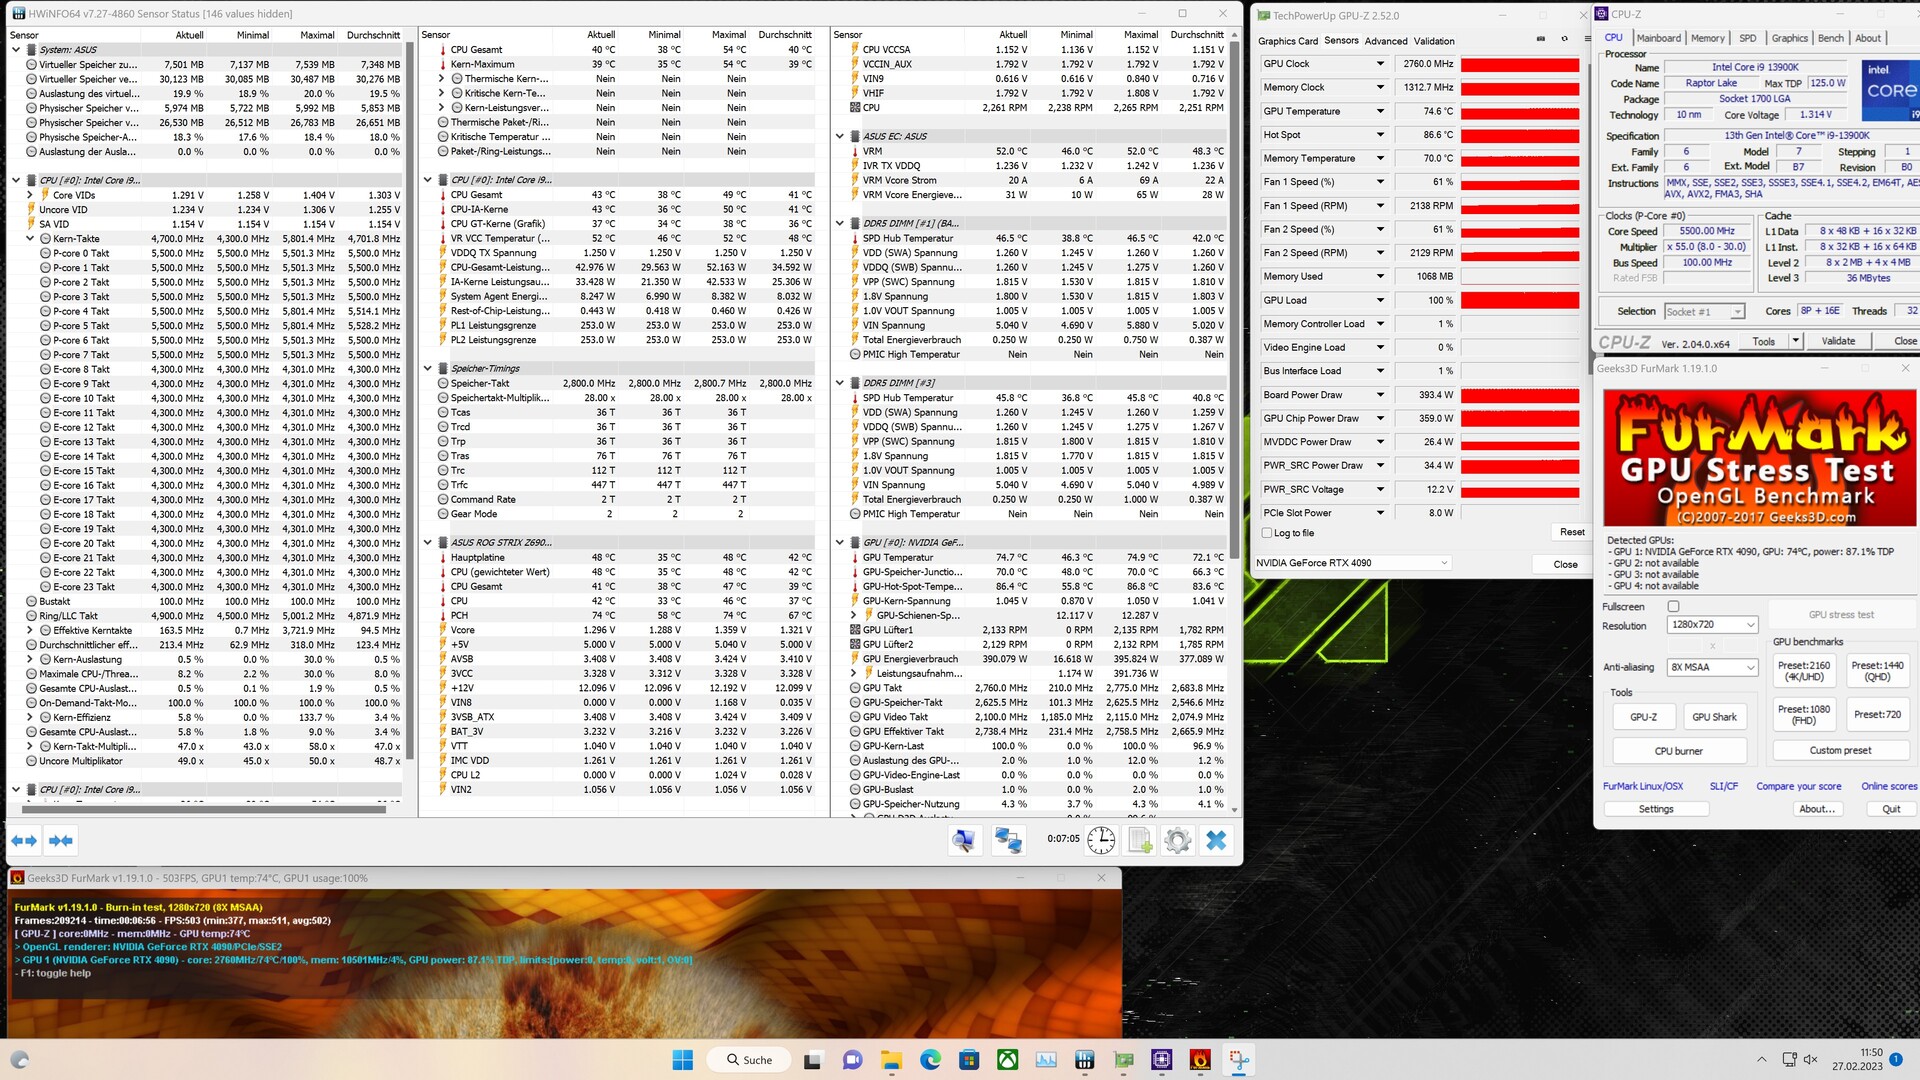
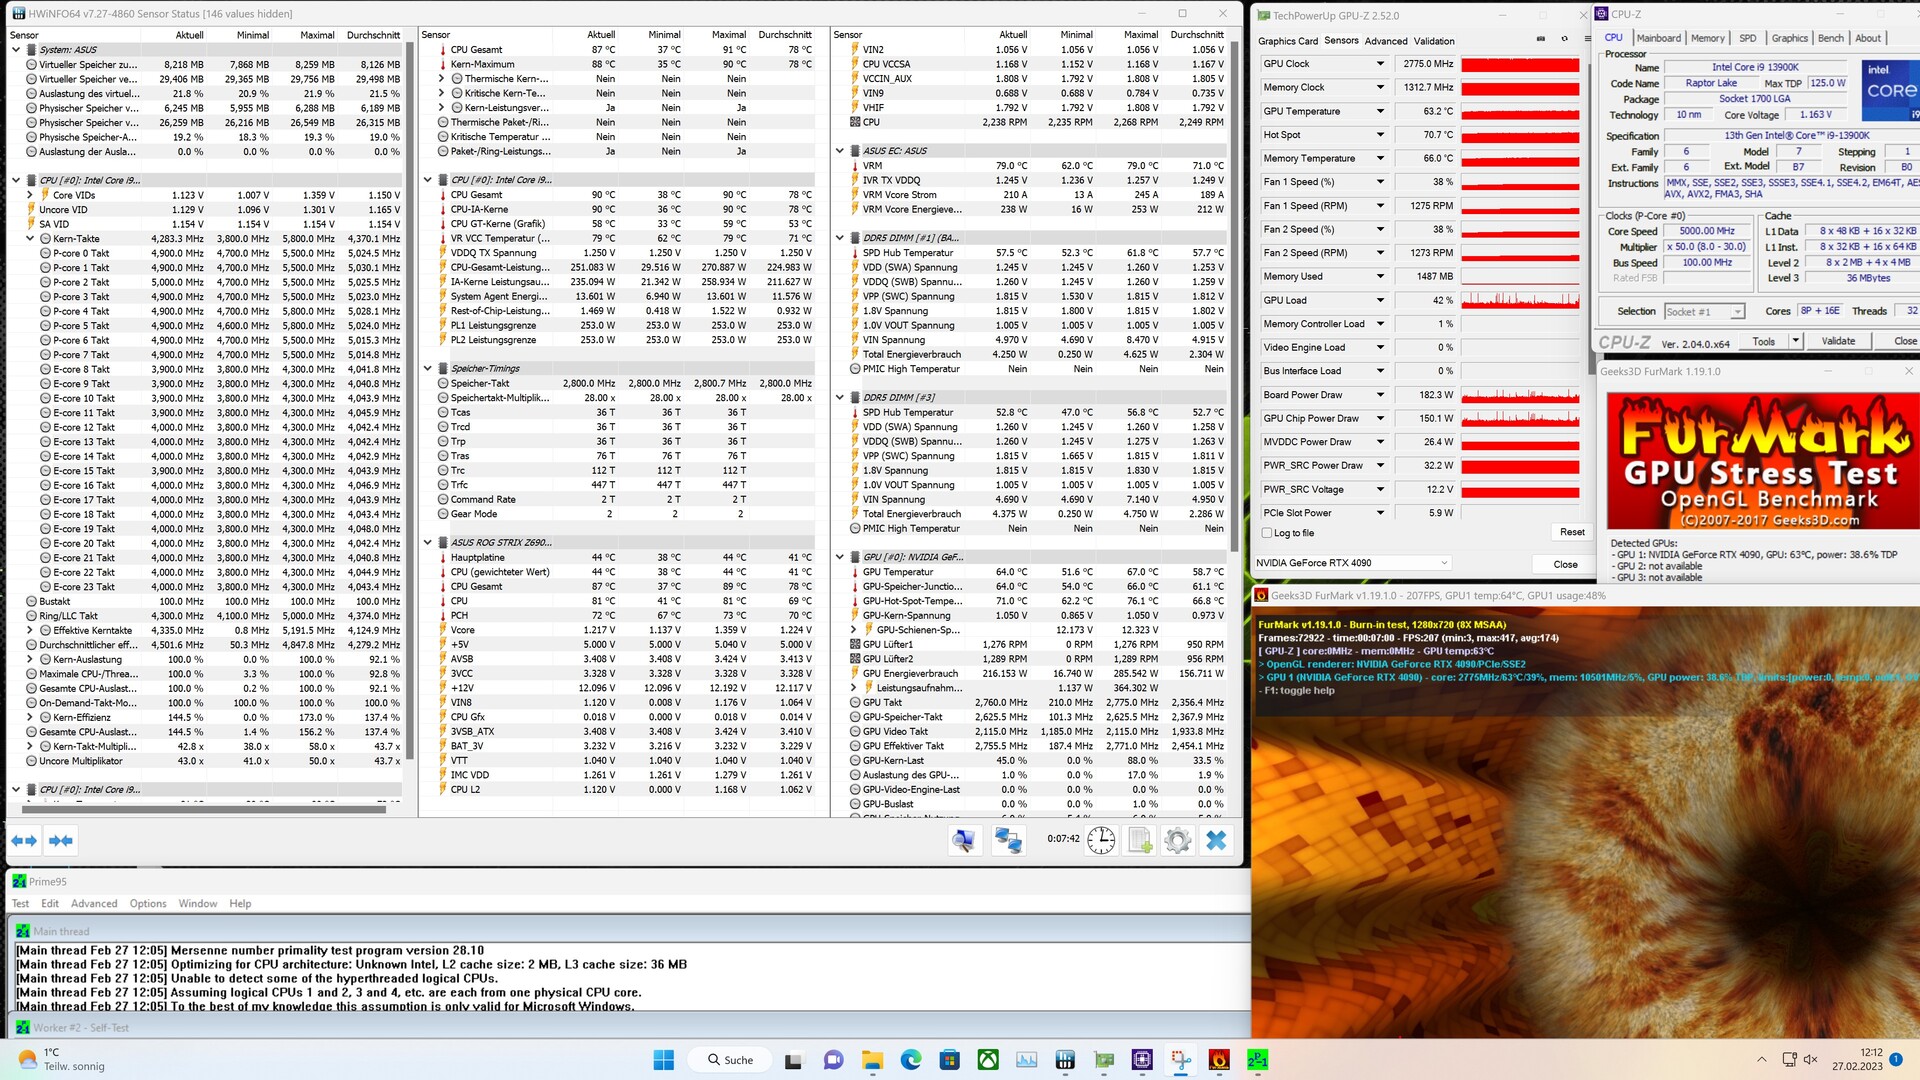
Intel XMG SECTOR został zaprojektowany tak, aby zasysać chłodne powietrze z przodu i kierować ciepłe powietrze na zewnątrz obudowy u góry i z tyłu. Jednak system wykorzystuje tylko jeden wentylator do usuwania ciepłego powietrza z obudowy. Na górze nie ma zainstalowanych żadnych wentylatorów. Mimo to Corsair 4000D Airflow wykorzystuje trzy wentylatory wlotowe do wytworzenia dodatniego ciśnienia, dzięki czemu ciepłe powietrze może zostać wypchnięte z obudowy. Radiator 360 mm coolera AIO został zamontowany tuż za przednim panelem, aby zapewnić optymalne chłodzenie procesora. W teście obciążeniowym CPU osiągnął nawet 90°C (195°F) przy średnim poborze mocy 228 W, podczas gdy temperatura GPU wyniosła prawie 75°C (167°F), co jest całkowicie bezpieczne.
Pobór mocy
Cały system zasilany jest przez zasilacz Seasonic o mocy znamionowej 1000 W. Podczas naszych testów, zasilacz nie miał problemów z dostarczeniem komponentom wystarczającej ilości energii nawet pod pełnym obciążeniem. Biorąc pod uwagę wszystkie high-endowe komponenty w środku, oczywiste jest, że system nie będzie lekki w zużyciu energii. Pobór mocy w stanie spoczynku wynosił od 78 do 96 watów, co jest wartością akceptowalną. Dla porównania, 1000-watowy zasilacz musiał dostarczyć średnio 511 watów podczas gry. Zauważyliśmy kilka sporadycznych, większych skoków poboru mocy, ale nawet szczytowe użycie do 778 watów nie doprowadziło zasilacza do granic możliwości. W porównaniu, recenzowana jednostka jest nieznacznie gorsza od naszego systemu testowego z podobną kartą graficzną.
| Power Consumption / The Witcher 3 ultra (external Monitor) | |
| AMD Radeon RX 6950 XT | |
| NVIDIA GeForce RTX 3090 Ti (Idle: 102 W) | |
| NVIDIA GeForce RTX 3090 | |
| NVIDIA GeForce RTX 4090 | |
| NVIDIA GeForce RTX 3080 12 GB | |
| NVIDIA GeForce RTX 4090 | |
| AMD Radeon RX 6900 XT (Idle: 99.15 W) | |
| Power Consumption / FurMark 1.19 GPU Stress Test (external Monitor) | |
| NVIDIA GeForce RTX 4090 | |
| AMD Radeon RX 6950 XT | |
| NVIDIA GeForce RTX 3090 | |
| NVIDIA GeForce RTX 3080 12 GB | |
| AMD Radeon RX 6900 XT (Idle: 99.15 W) | |
| NVIDIA GeForce RTX 4090 | |
* ... im mniej tym lepiej
| wyłączony / stan wstrzymania | |
| luz | |
| obciążenie |
|
Legenda:
min: | |
Power consumption with external monitor
Za
Przeciw
Werdykt - Błyskotliwie szybki komputer do gier

Wyposażony w Intel Core i9-13900K i Nvidia GeForce RTX 4090nasza recenzowana konfiguracja XMG SECTOR Intel jest jednym z najszybszych komputerów do gier, jakie można obecnie złożyć. System siedzi również na dość nowoczesnym fundamencie, mimo że jego płyta główna ma "tylko" chipset Z690. Mimo to system korzysta z pamięci DDR5. Co więcej, jego dysk twardy zapewnia solidną wydajność, a dzięki pojemności 2 TB oferuje nawet wystarczająco dużo miejsca, aby pomieścić wiele gier.
Oparty na procesorze Intel Core i9-13900K, Intel XMG SECTOR oferuje doskonałą wydajność dla całego szeregu przypadków użycia. W połączeniu z GeForce RTX 4090, system jest obecnie jednym z najszybszych komputerów do gier dostępnych na rynku.
Nasz egzemplarz recenzencki dysponuje tak ogromną wydajnością, że może płynnie uruchamiać wszystkie nowoczesne gry w rozdzielczości 2160p. System ten z pewnością nie jest tani, a jego cena wynosi około 4 600 euro (4 851 dolarów). Niemniej jednak, konfiguracja ta ma sens, jeśli chcesz grać w najnowsze gry bez żadnych kompromisów. Podobnie wyposażony system AMD z procesorem Ryzen 9 7950X (dostępny w sklepie również jako XMG SECTOR AMD) kosztuje mniej więcej 300 € (316 USD) więcej
.Cena i dostępność
XMG SECTOR Intel jest dostępny w sklepie internetowym Schenkera bestware.com i kosztuje około 4 600 euro (4 851 dolarów). Za pomocą kompleksowego konfiguratora można również wybrać komponenty w oparciu o konkretne potrzeby.
Schenker XMG SECTOR, i9 13900K, RTX 4090
- 04/03/2023 v7 (old)
Sebastian Bade
Przezroczystość
Wyboru urządzeń do recenzji dokonuje nasza redakcja. Próbka testowa została udostępniona autorowi jako pożyczka od producenta lub sprzedawcy detalicznego na potrzeby tej recenzji. Pożyczkodawca nie miał wpływu na tę recenzję, producent nie otrzymał też kopii tej recenzji przed publikacją. Nie było obowiązku publikowania tej recenzji. Jako niezależna firma medialna, Notebookcheck nie podlega władzy producentów, sprzedawców detalicznych ani wydawców.
Tak testuje Notebookcheck
Każdego roku Notebookcheck niezależnie sprawdza setki laptopów i smartfonów, stosując standardowe procedury, aby zapewnić porównywalność wszystkich wyników. Od około 20 lat stale rozwijamy nasze metody badawcze, ustanawiając przy tym standardy branżowe. W naszych laboratoriach testowych doświadczeni technicy i redaktorzy korzystają z wysokiej jakości sprzętu pomiarowego. Testy te obejmują wieloetapowy proces walidacji. Nasz kompleksowy system ocen opiera się na setkach uzasadnionych pomiarów i benchmarków, co pozwala zachować obiektywizm.
