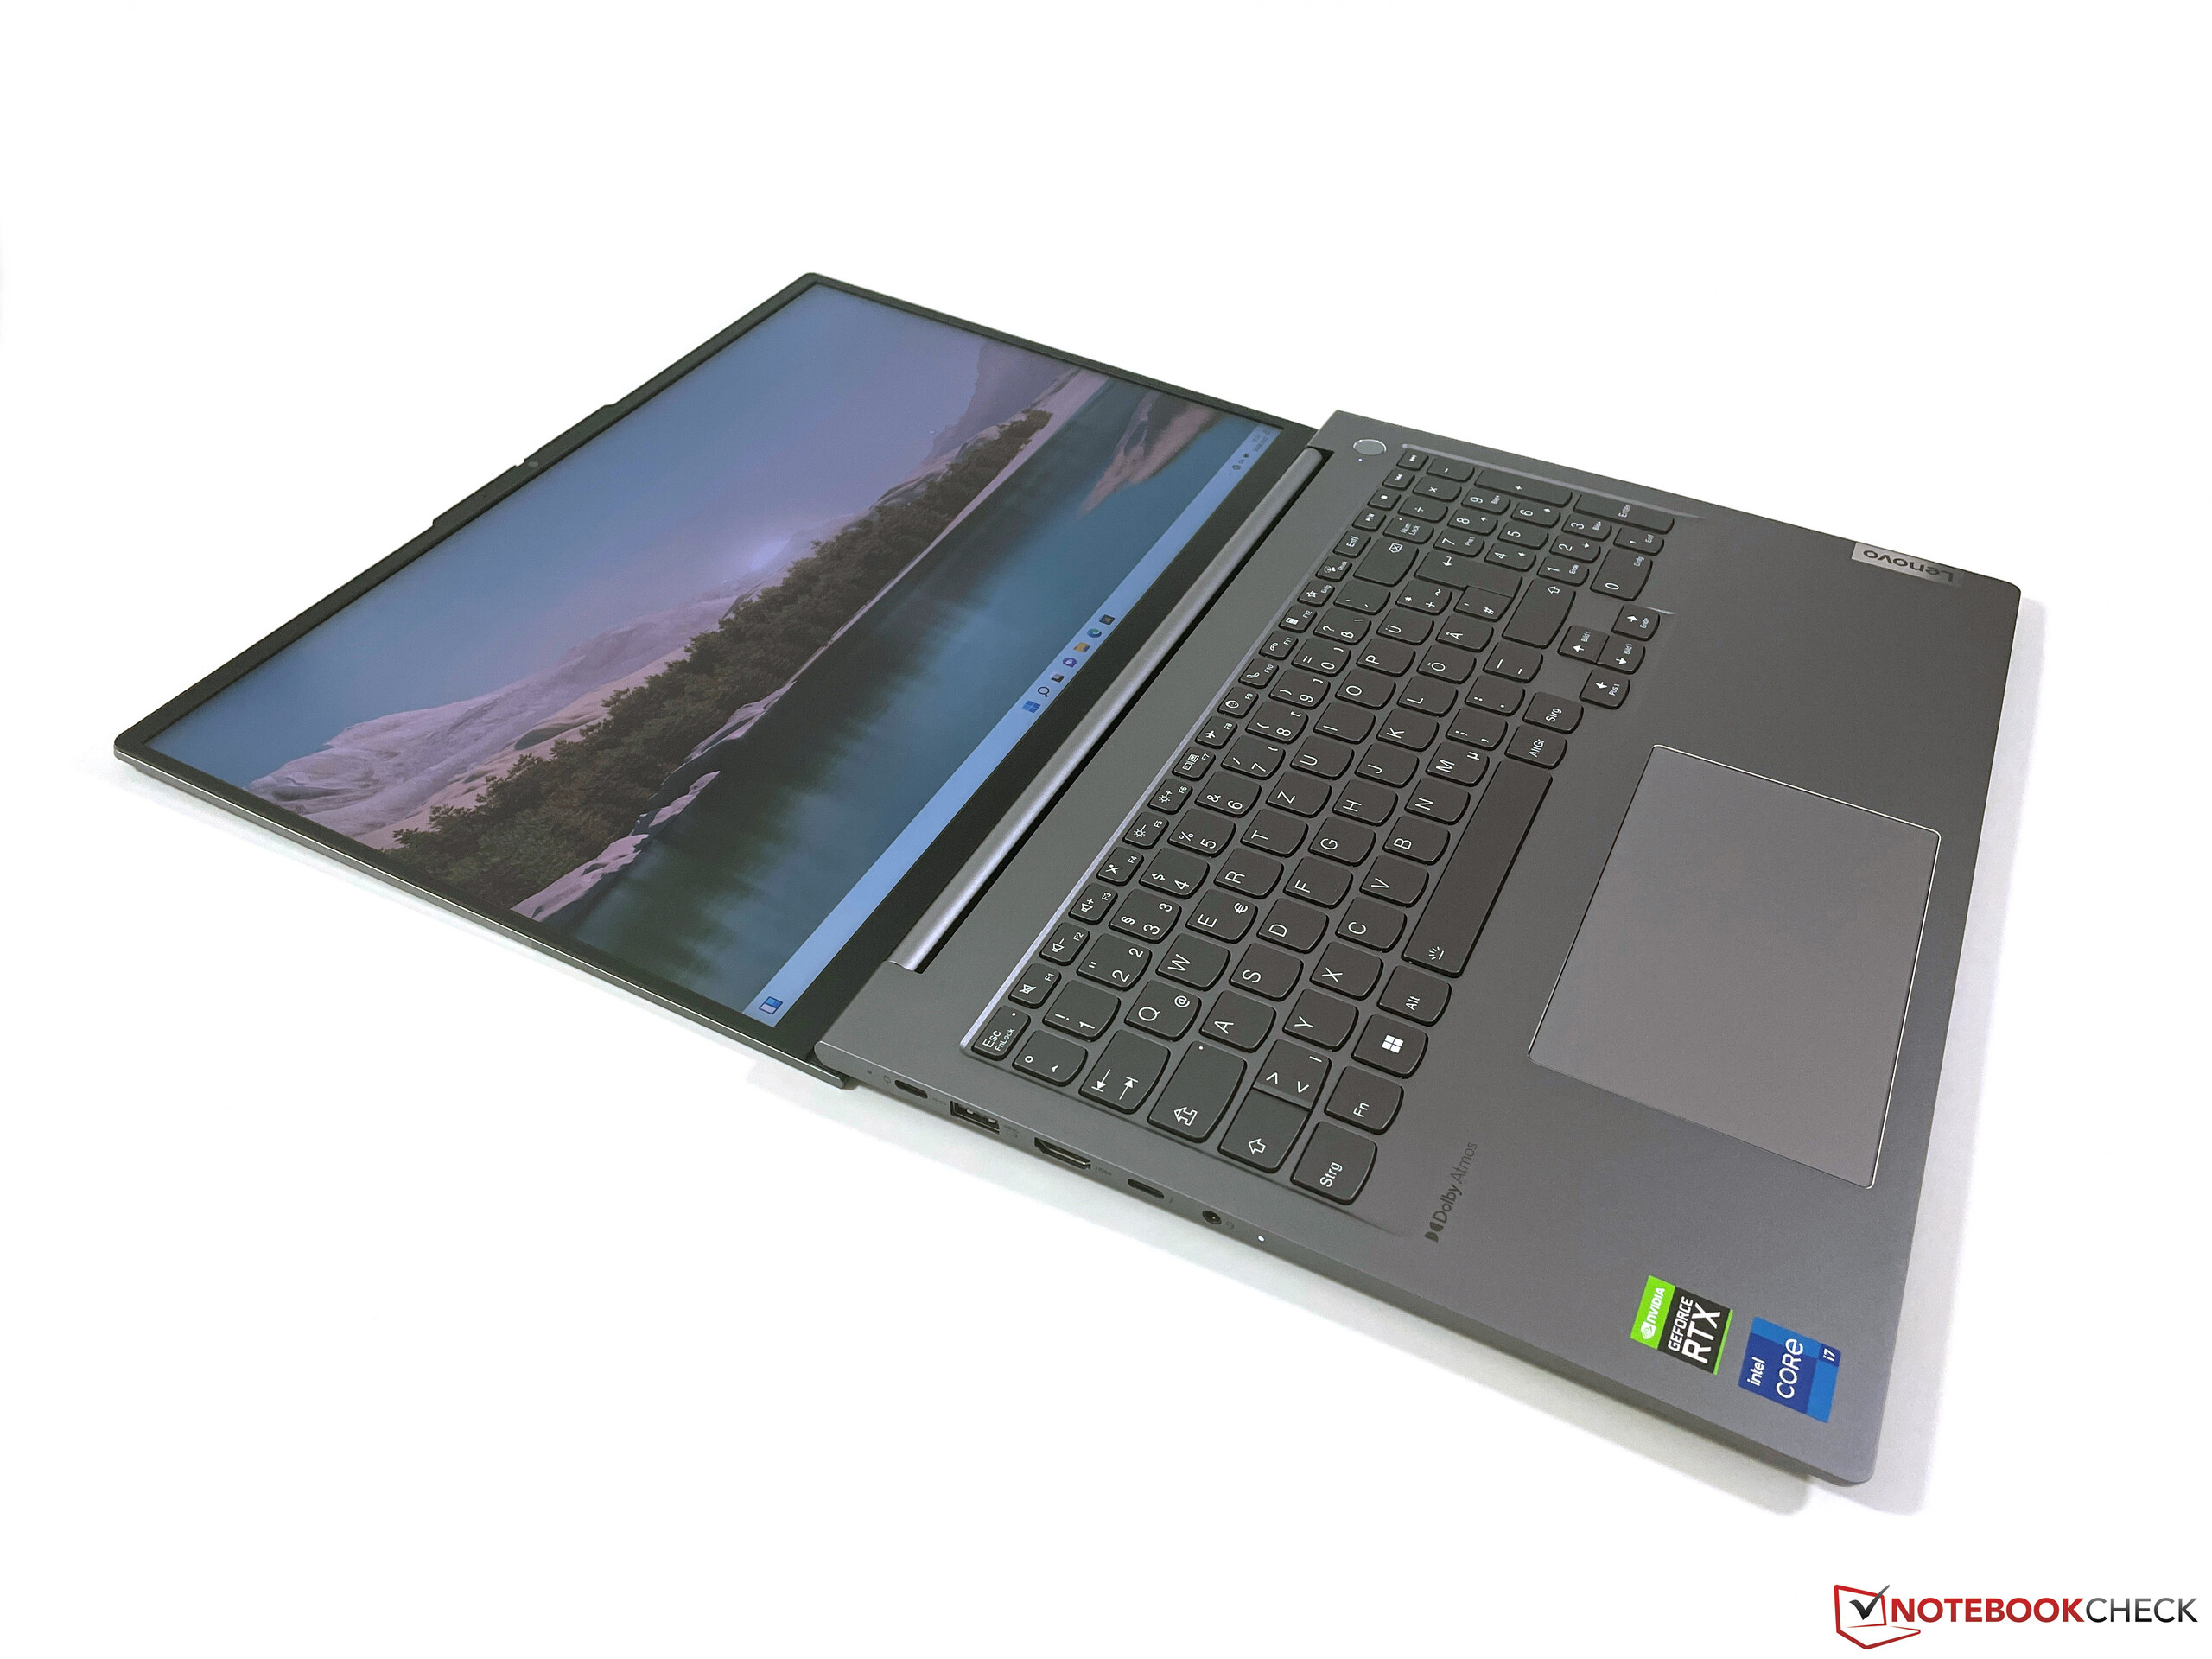
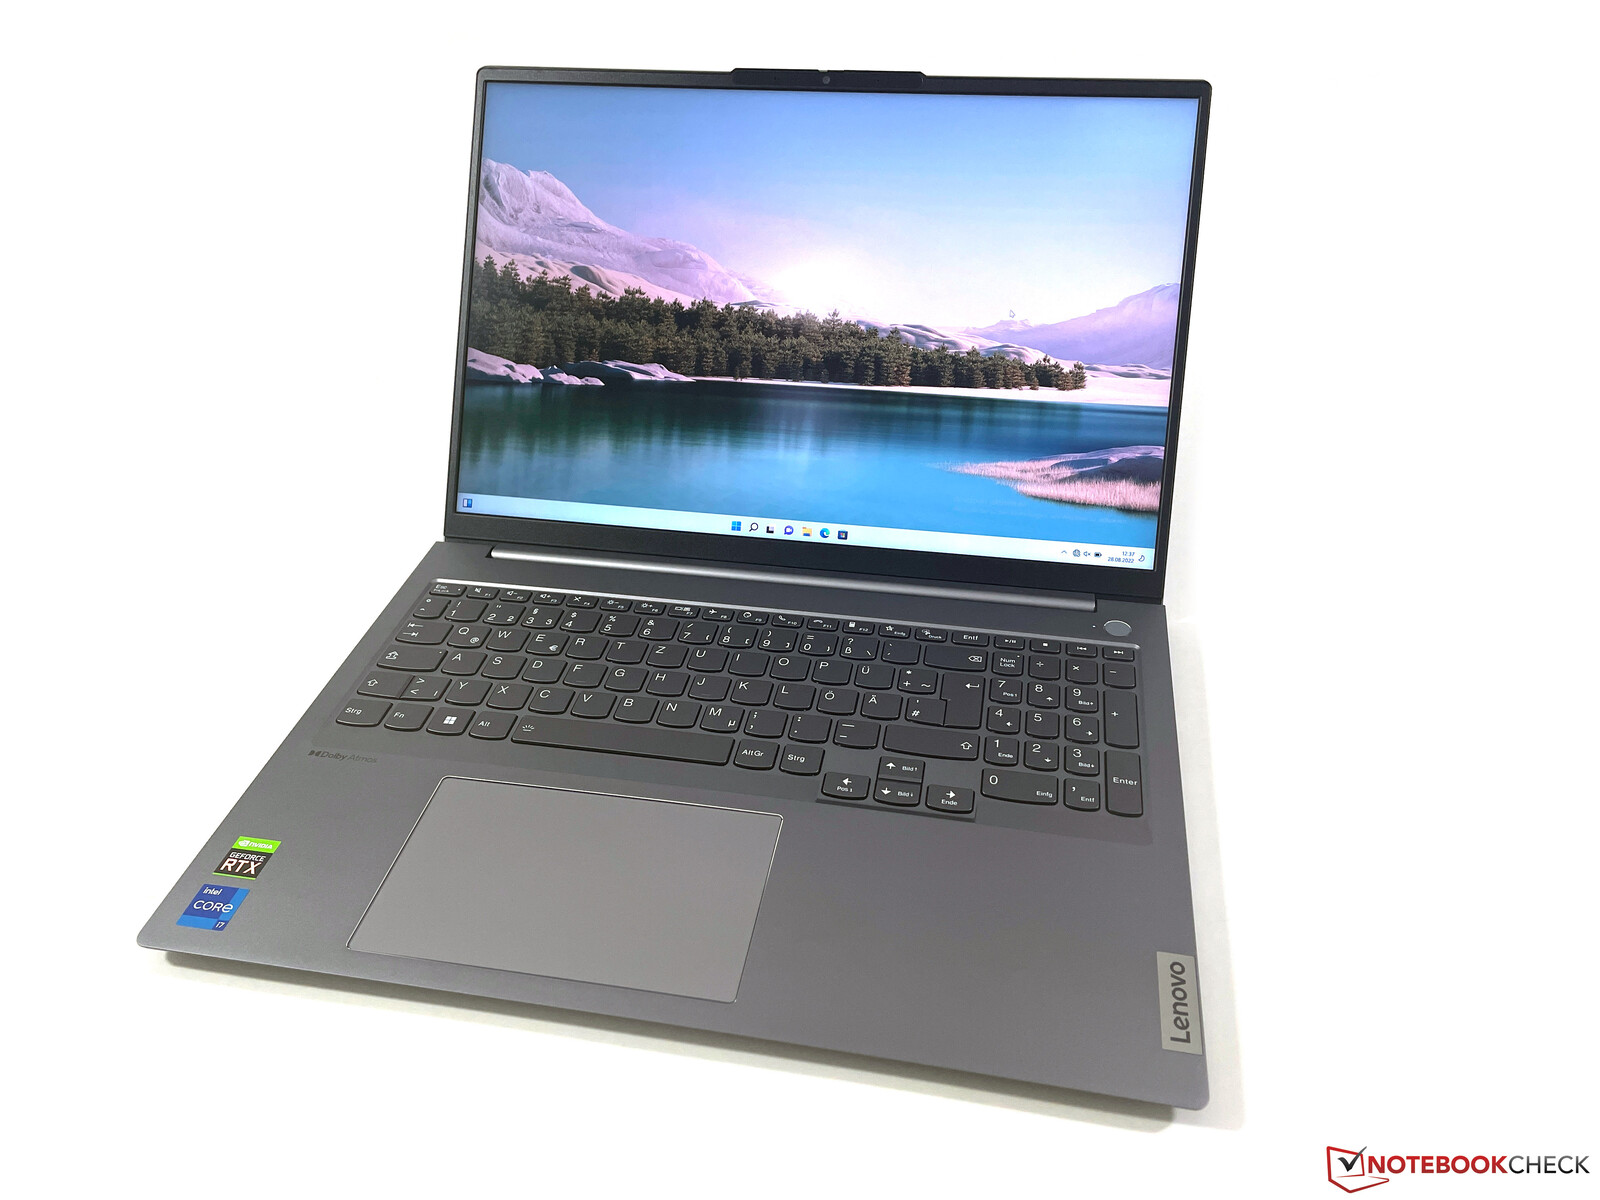
Recenzja Lenovo ThinkBook 16 G4+: Dobry laptop multimedialny o sporej mocy
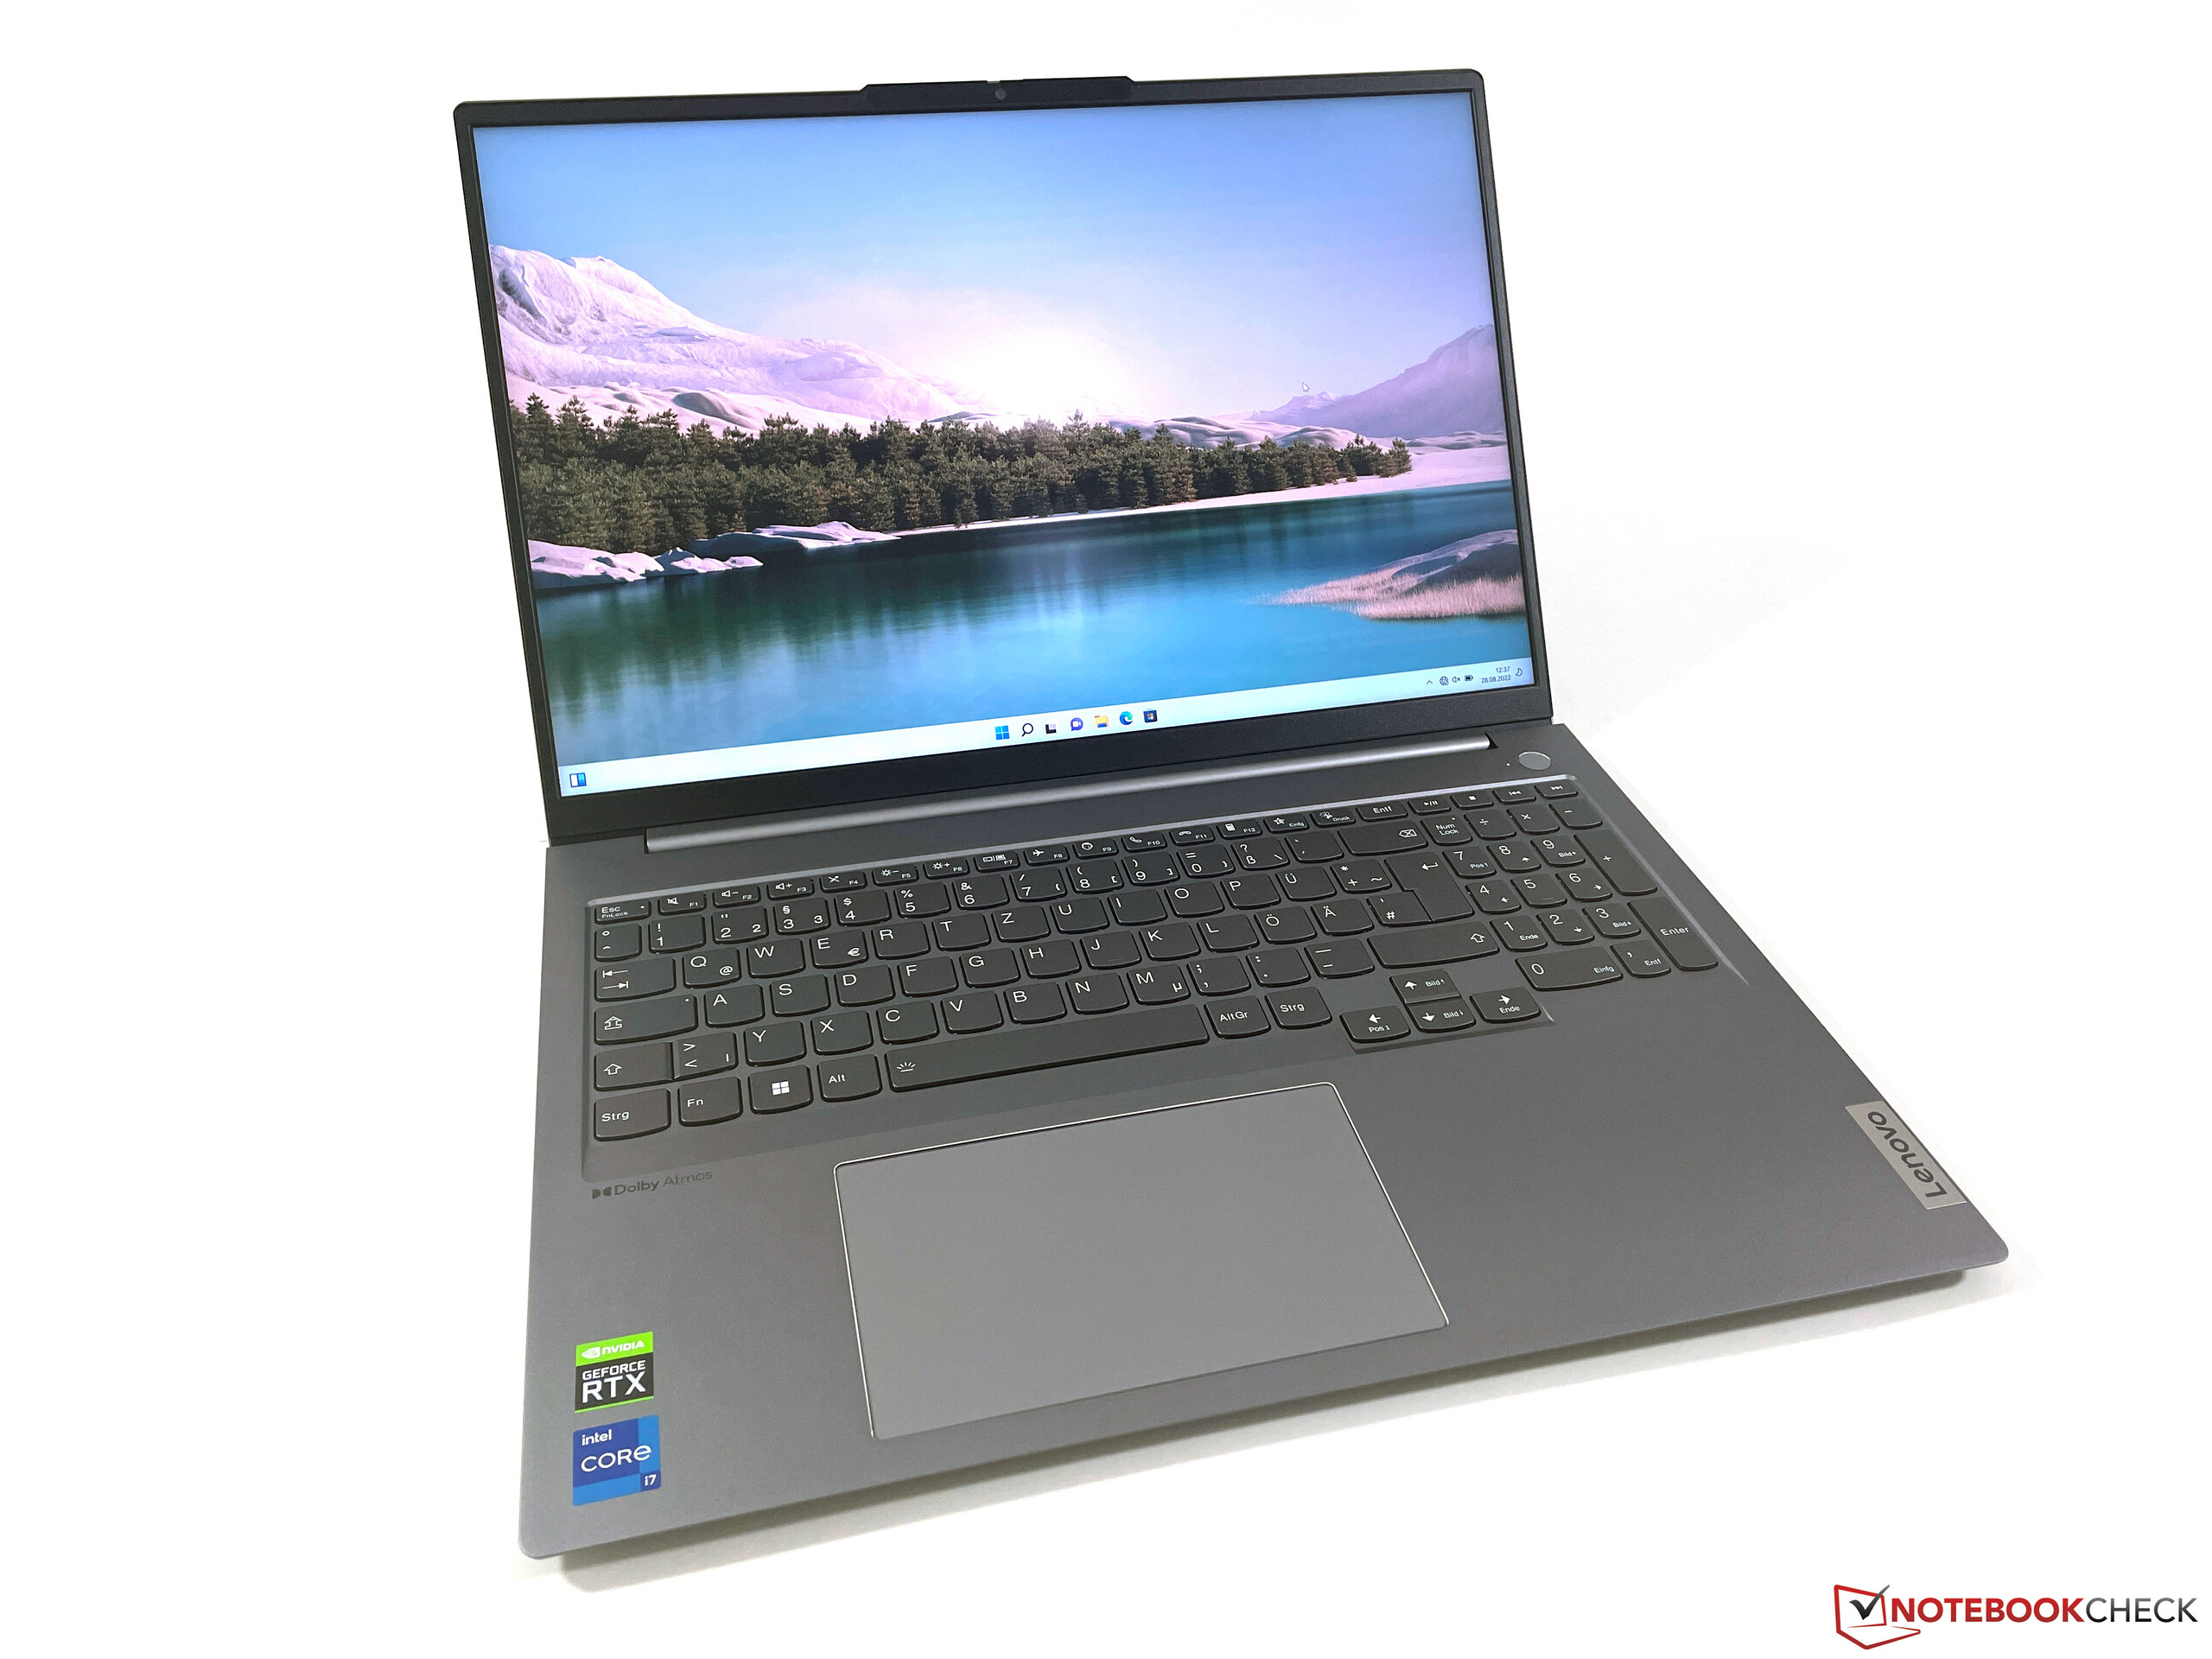
Wraz z modelem ThinkBook 16 G4+, Lenovo wprowadza na rynek 16-calowy multimedialny notebook z wydajnymi podzespołami i mnóstwem nowoczesnych funkcji w cenie RRP wynoszącej 1200 euro (~1200 USD). Oprócz najnowszego procesora Intel Core i7-12700H, znajdziemy tu dedykowany GeForce RTX 2050 od Nvidii, a także nowoczesne funkcje, takie jak Thunderbolt 4, Wi-Fi 6E czy PCIe 4.0. Wyświetlacz to matowy panel IPS o rozdzielczości WQHD, a obok 16 GB pamięci RAM znajduje się duży dysk SSD o pojemności 1 TB. Nasza próbka recenzencka to model kampusowy bez systemu operacyjnego.
Potencjalni konkurenci w porównaniu
Ocena | Data | Model | Waga | Wysokość | Rozmiar | Rezolucja | Cena |
|---|---|---|---|---|---|---|---|
| 88.4 % v7 (old) | 10/2022 | Lenovo ThinkBook 16 G4+ IAP i7-12700H, GeForce RTX 2050 Mobile | 1.8 kg | 16.5 mm | 16.00" | 2560x1600 | |
| 87.4 % v7 (old) | Dell Inspiron 16 Plus 7620 i7-12700H, GeForce RTX 3050 Ti Laptop GPU | 2.1 kg | 18.99 mm | 16.00" | 3072x1920 | ||
| 86.2 % v7 (old) | Acer Swift X SFX16-51G-5388 i5-11320H, GeForce RTX 3050 4GB Laptop GPU | 1.8 kg | 18.9 mm | 16.10" | 1920x1080 | ||
v (old) | Asus Vivobook Pro 16X-M7600QE R9 5900HX, GeForce RTX 3050 Ti Laptop GPU | 1.9 kg | 19 mm | 16.10" | 3840x2400 | ||
| 83.6 % v7 (old) | Huawei MateBook D 16 2022 i7-12700H, Iris Xe G7 96EUs | 1.7 kg | 18.4 mm | 16.00" | 1920x1200 | ||
| 79.8 % v7 (old) | Samsung Galaxy Book2 15 i7-1260P, A350M | 1.6 kg | 15 mm | 15.60" | 1920x1080 |
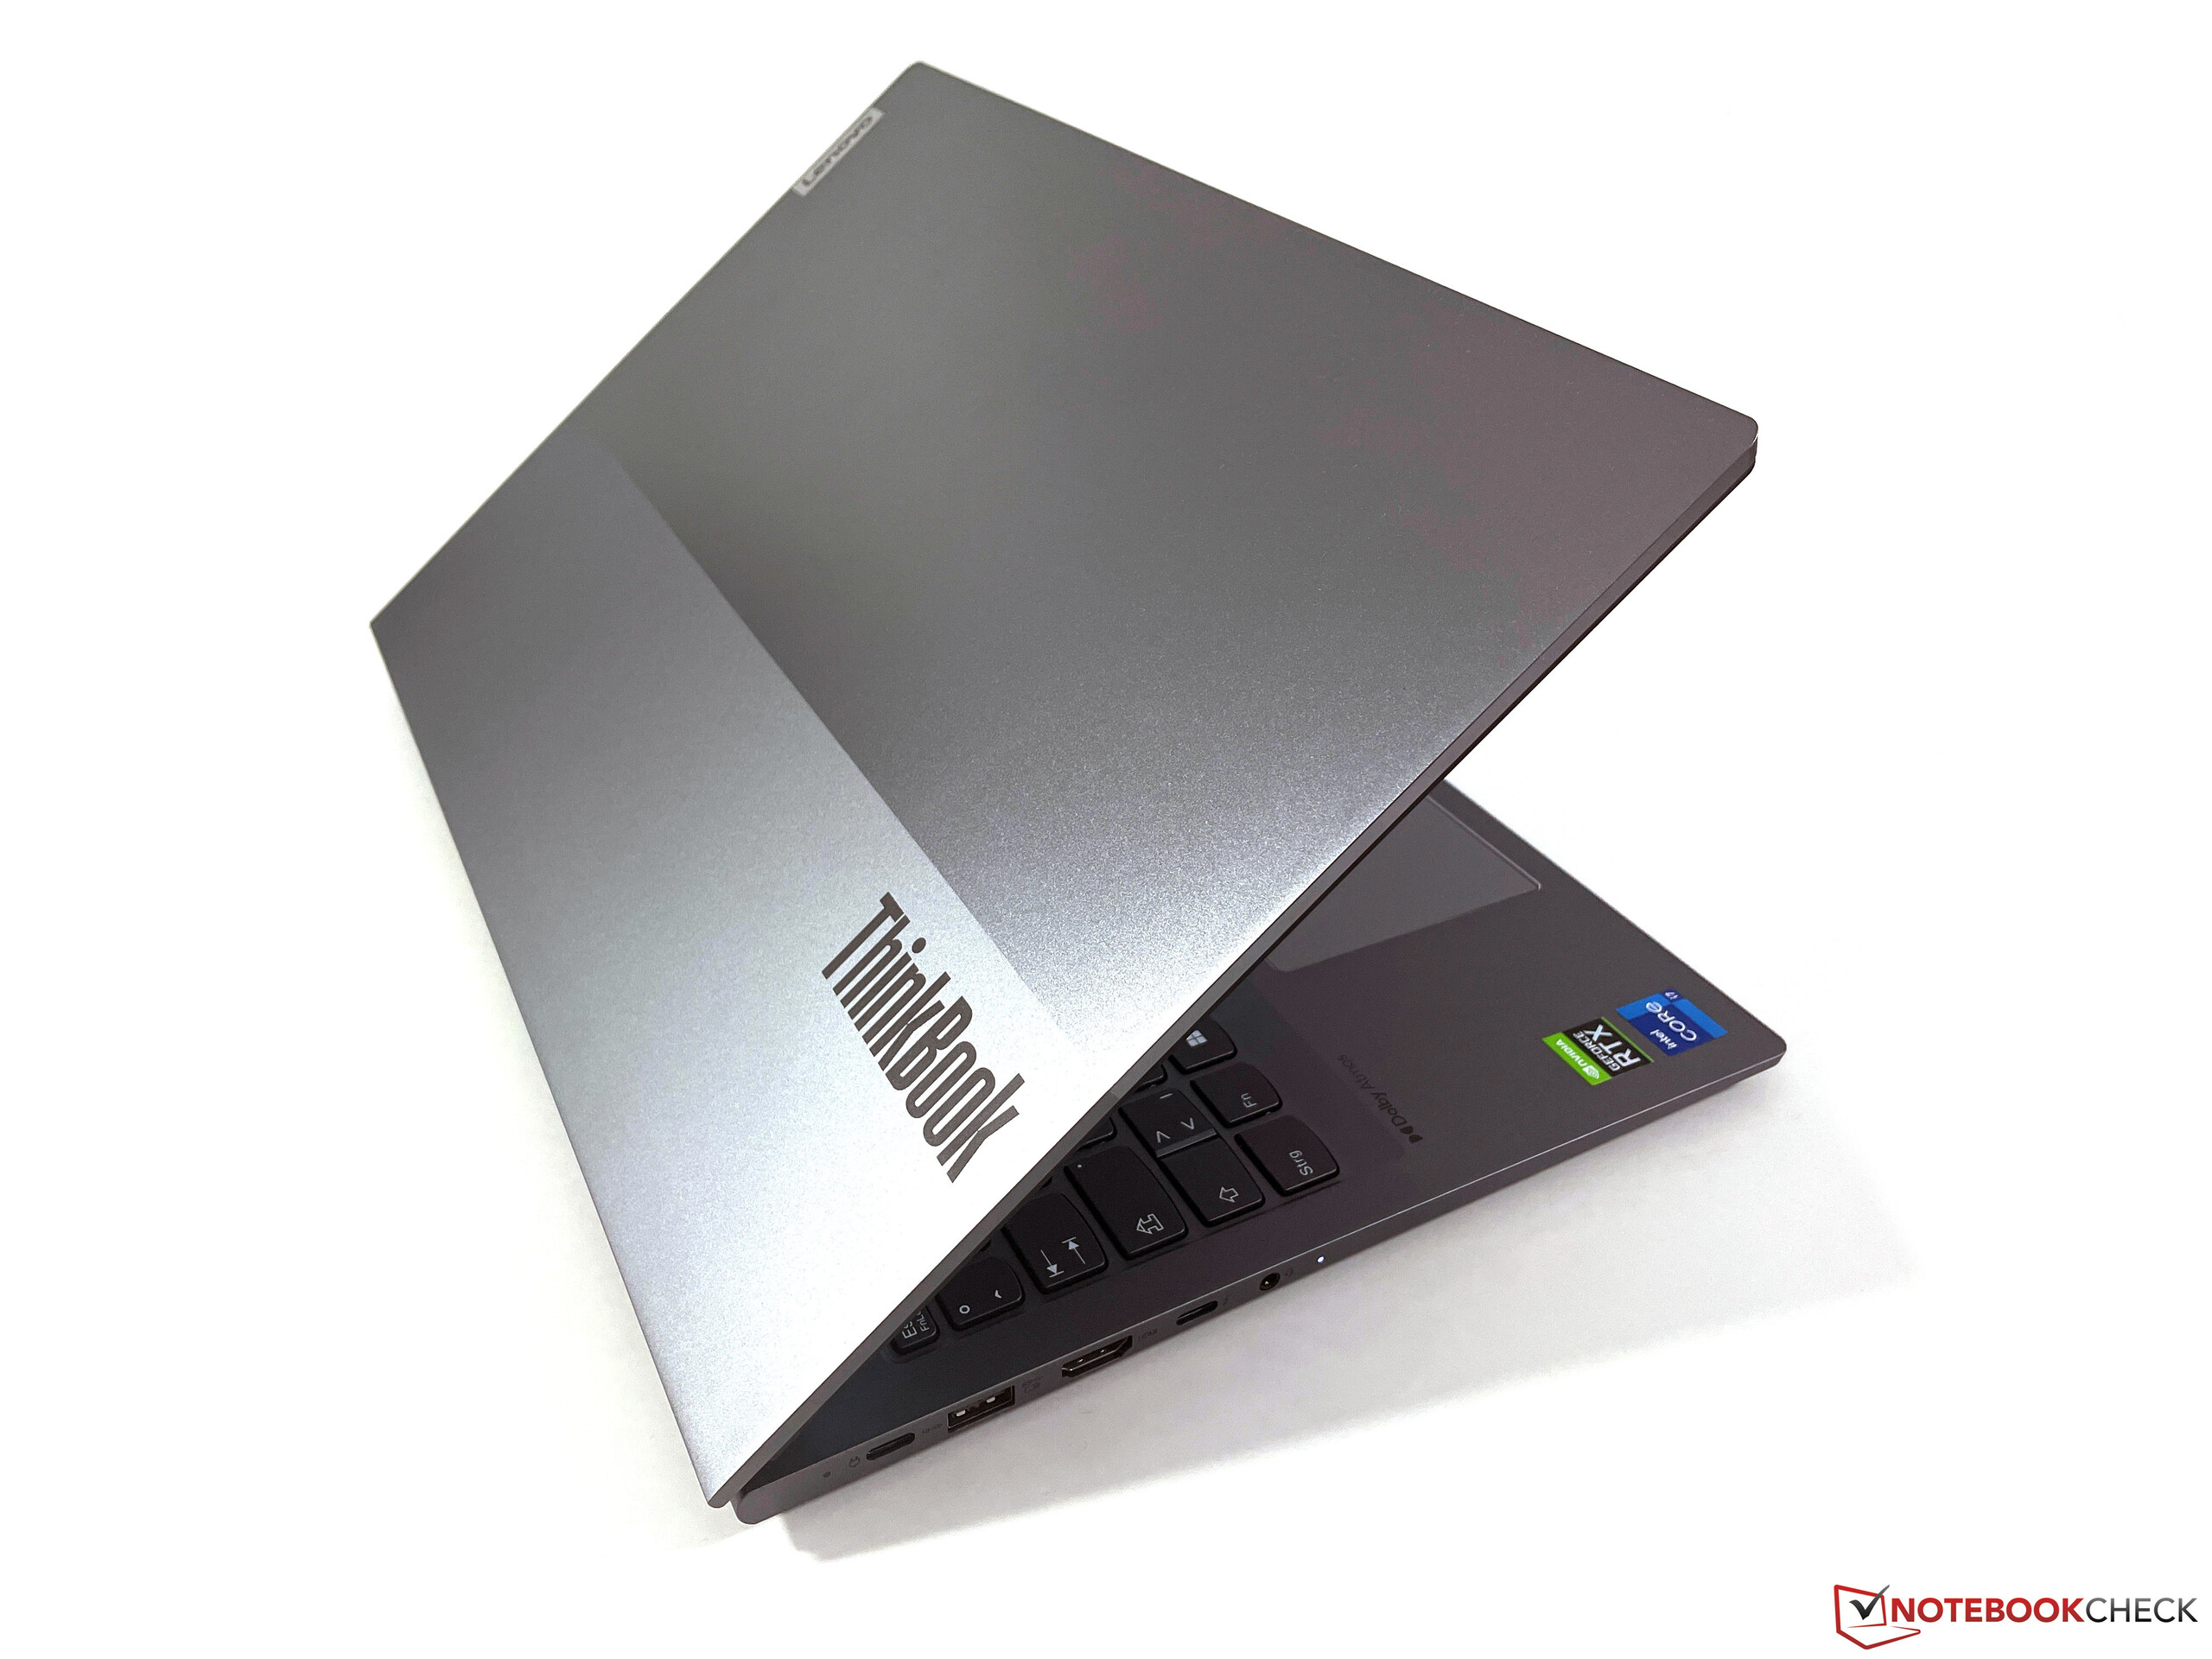
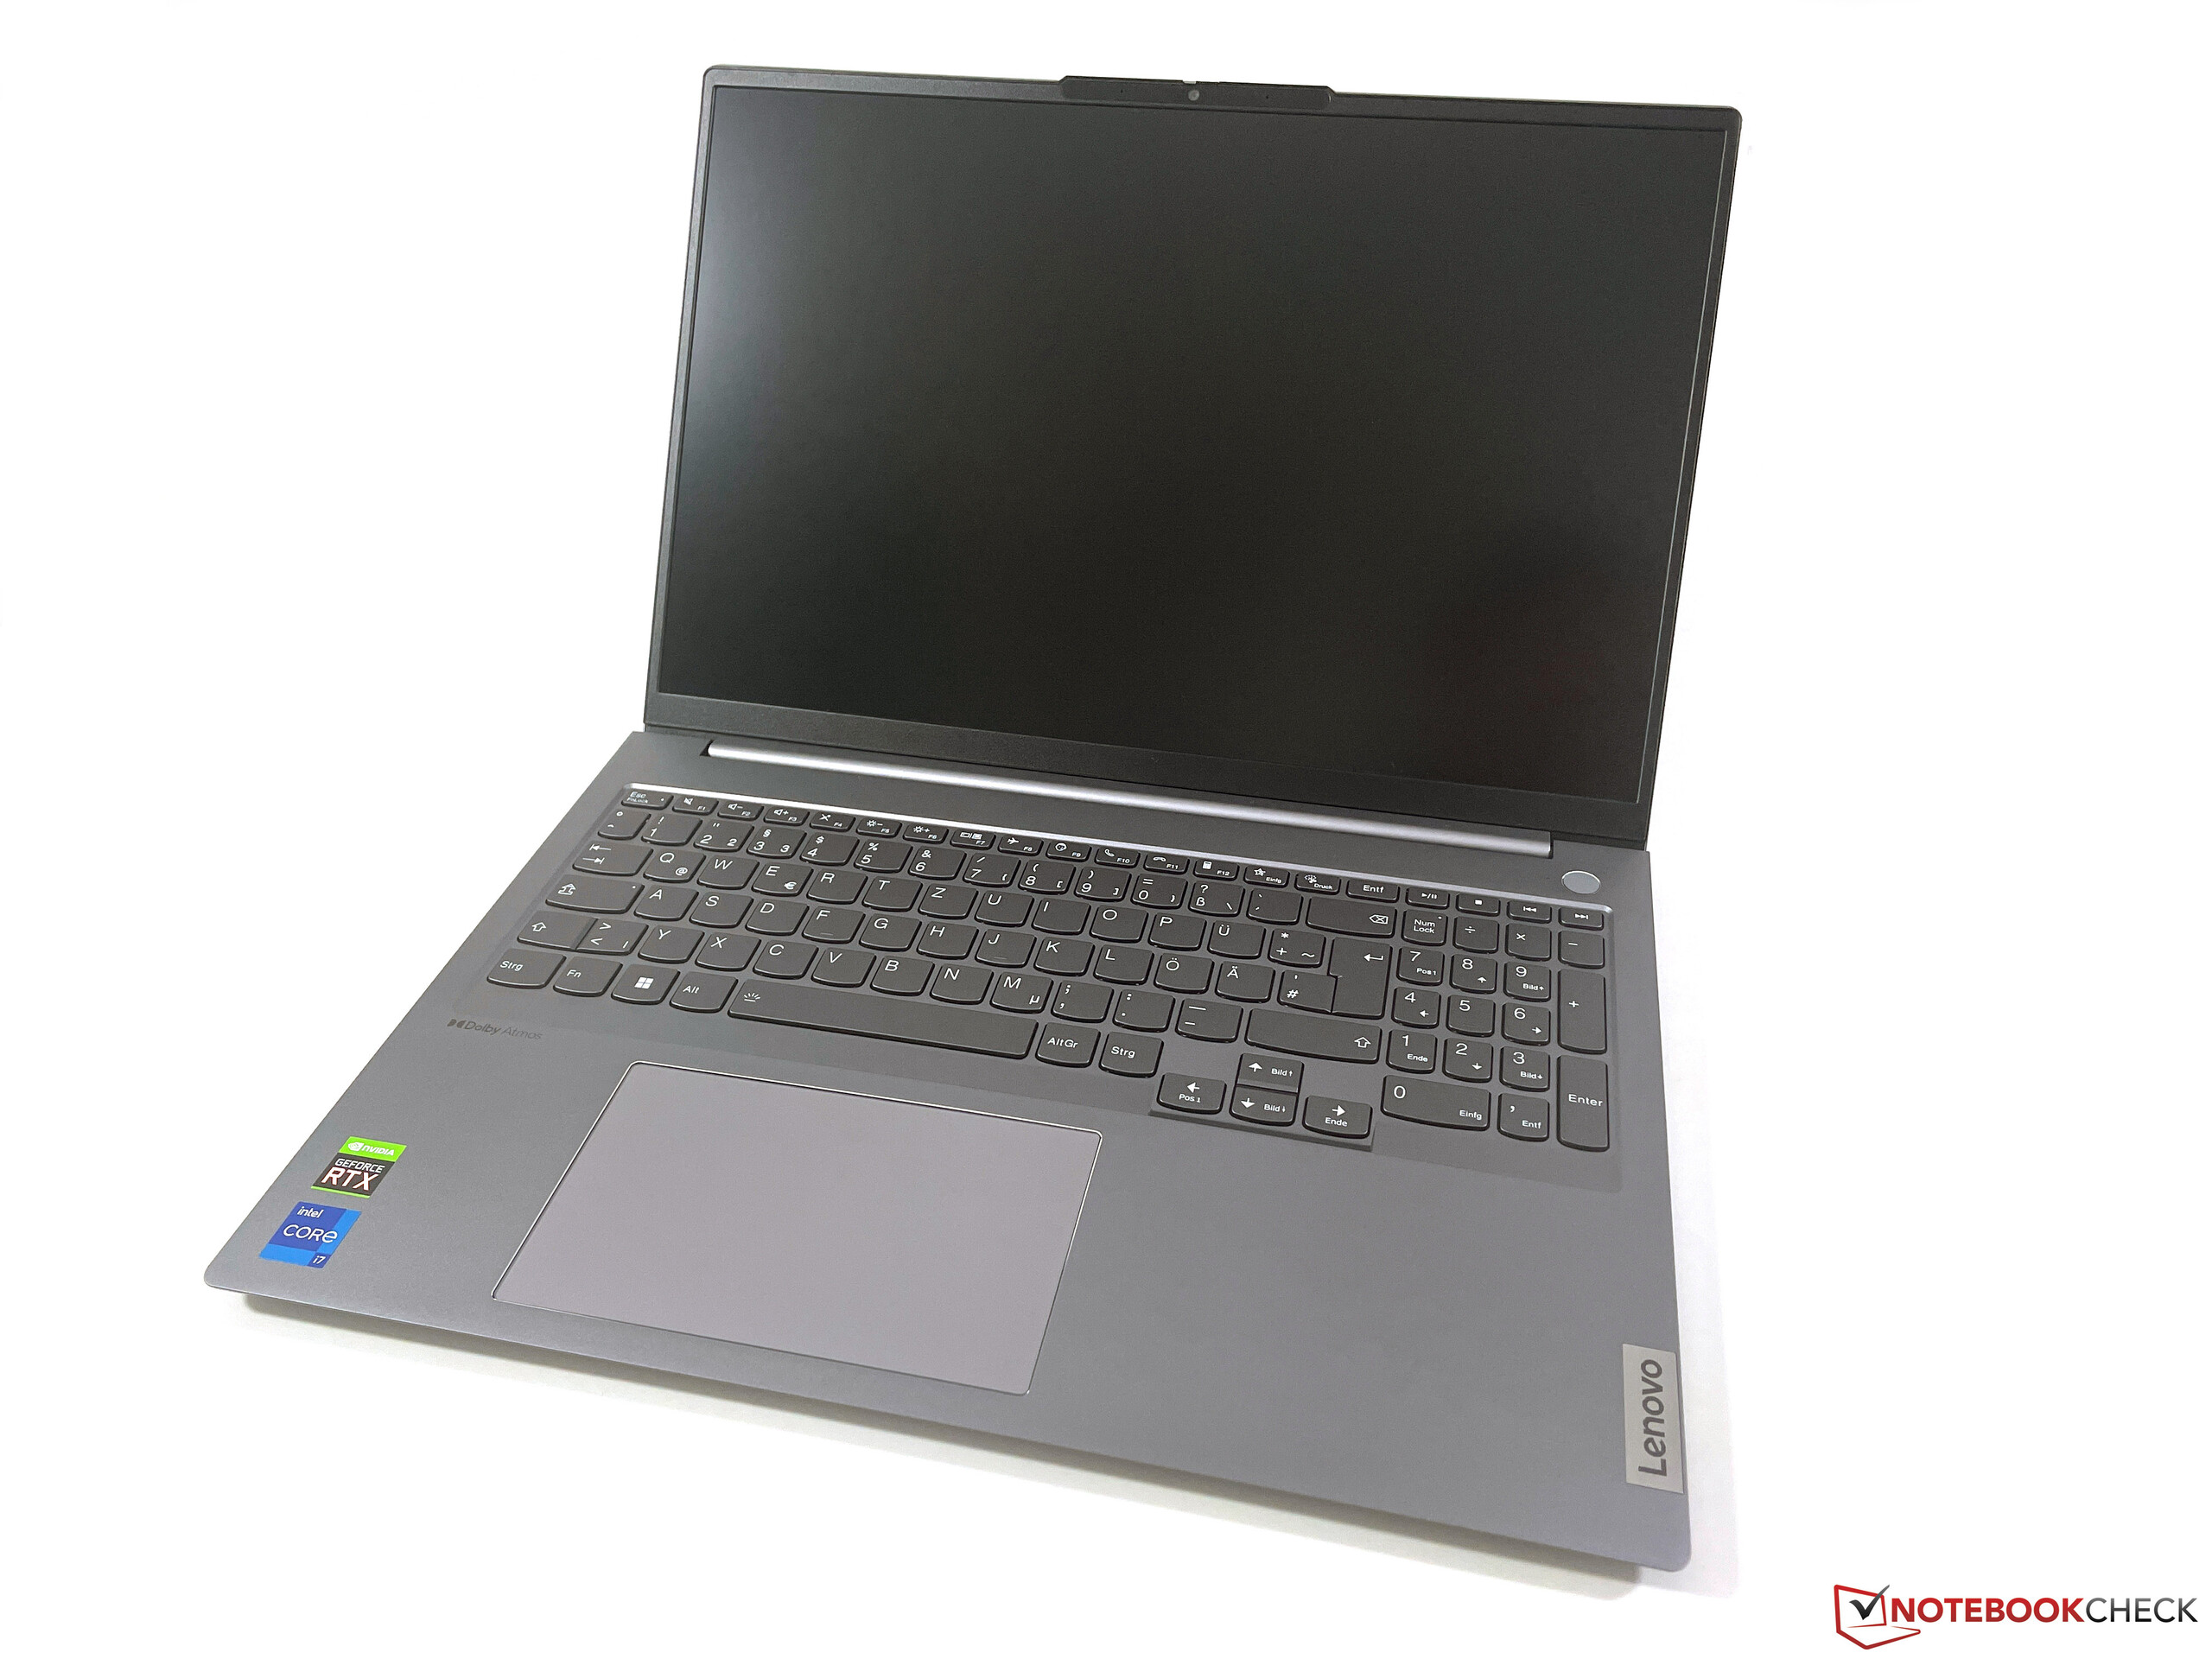
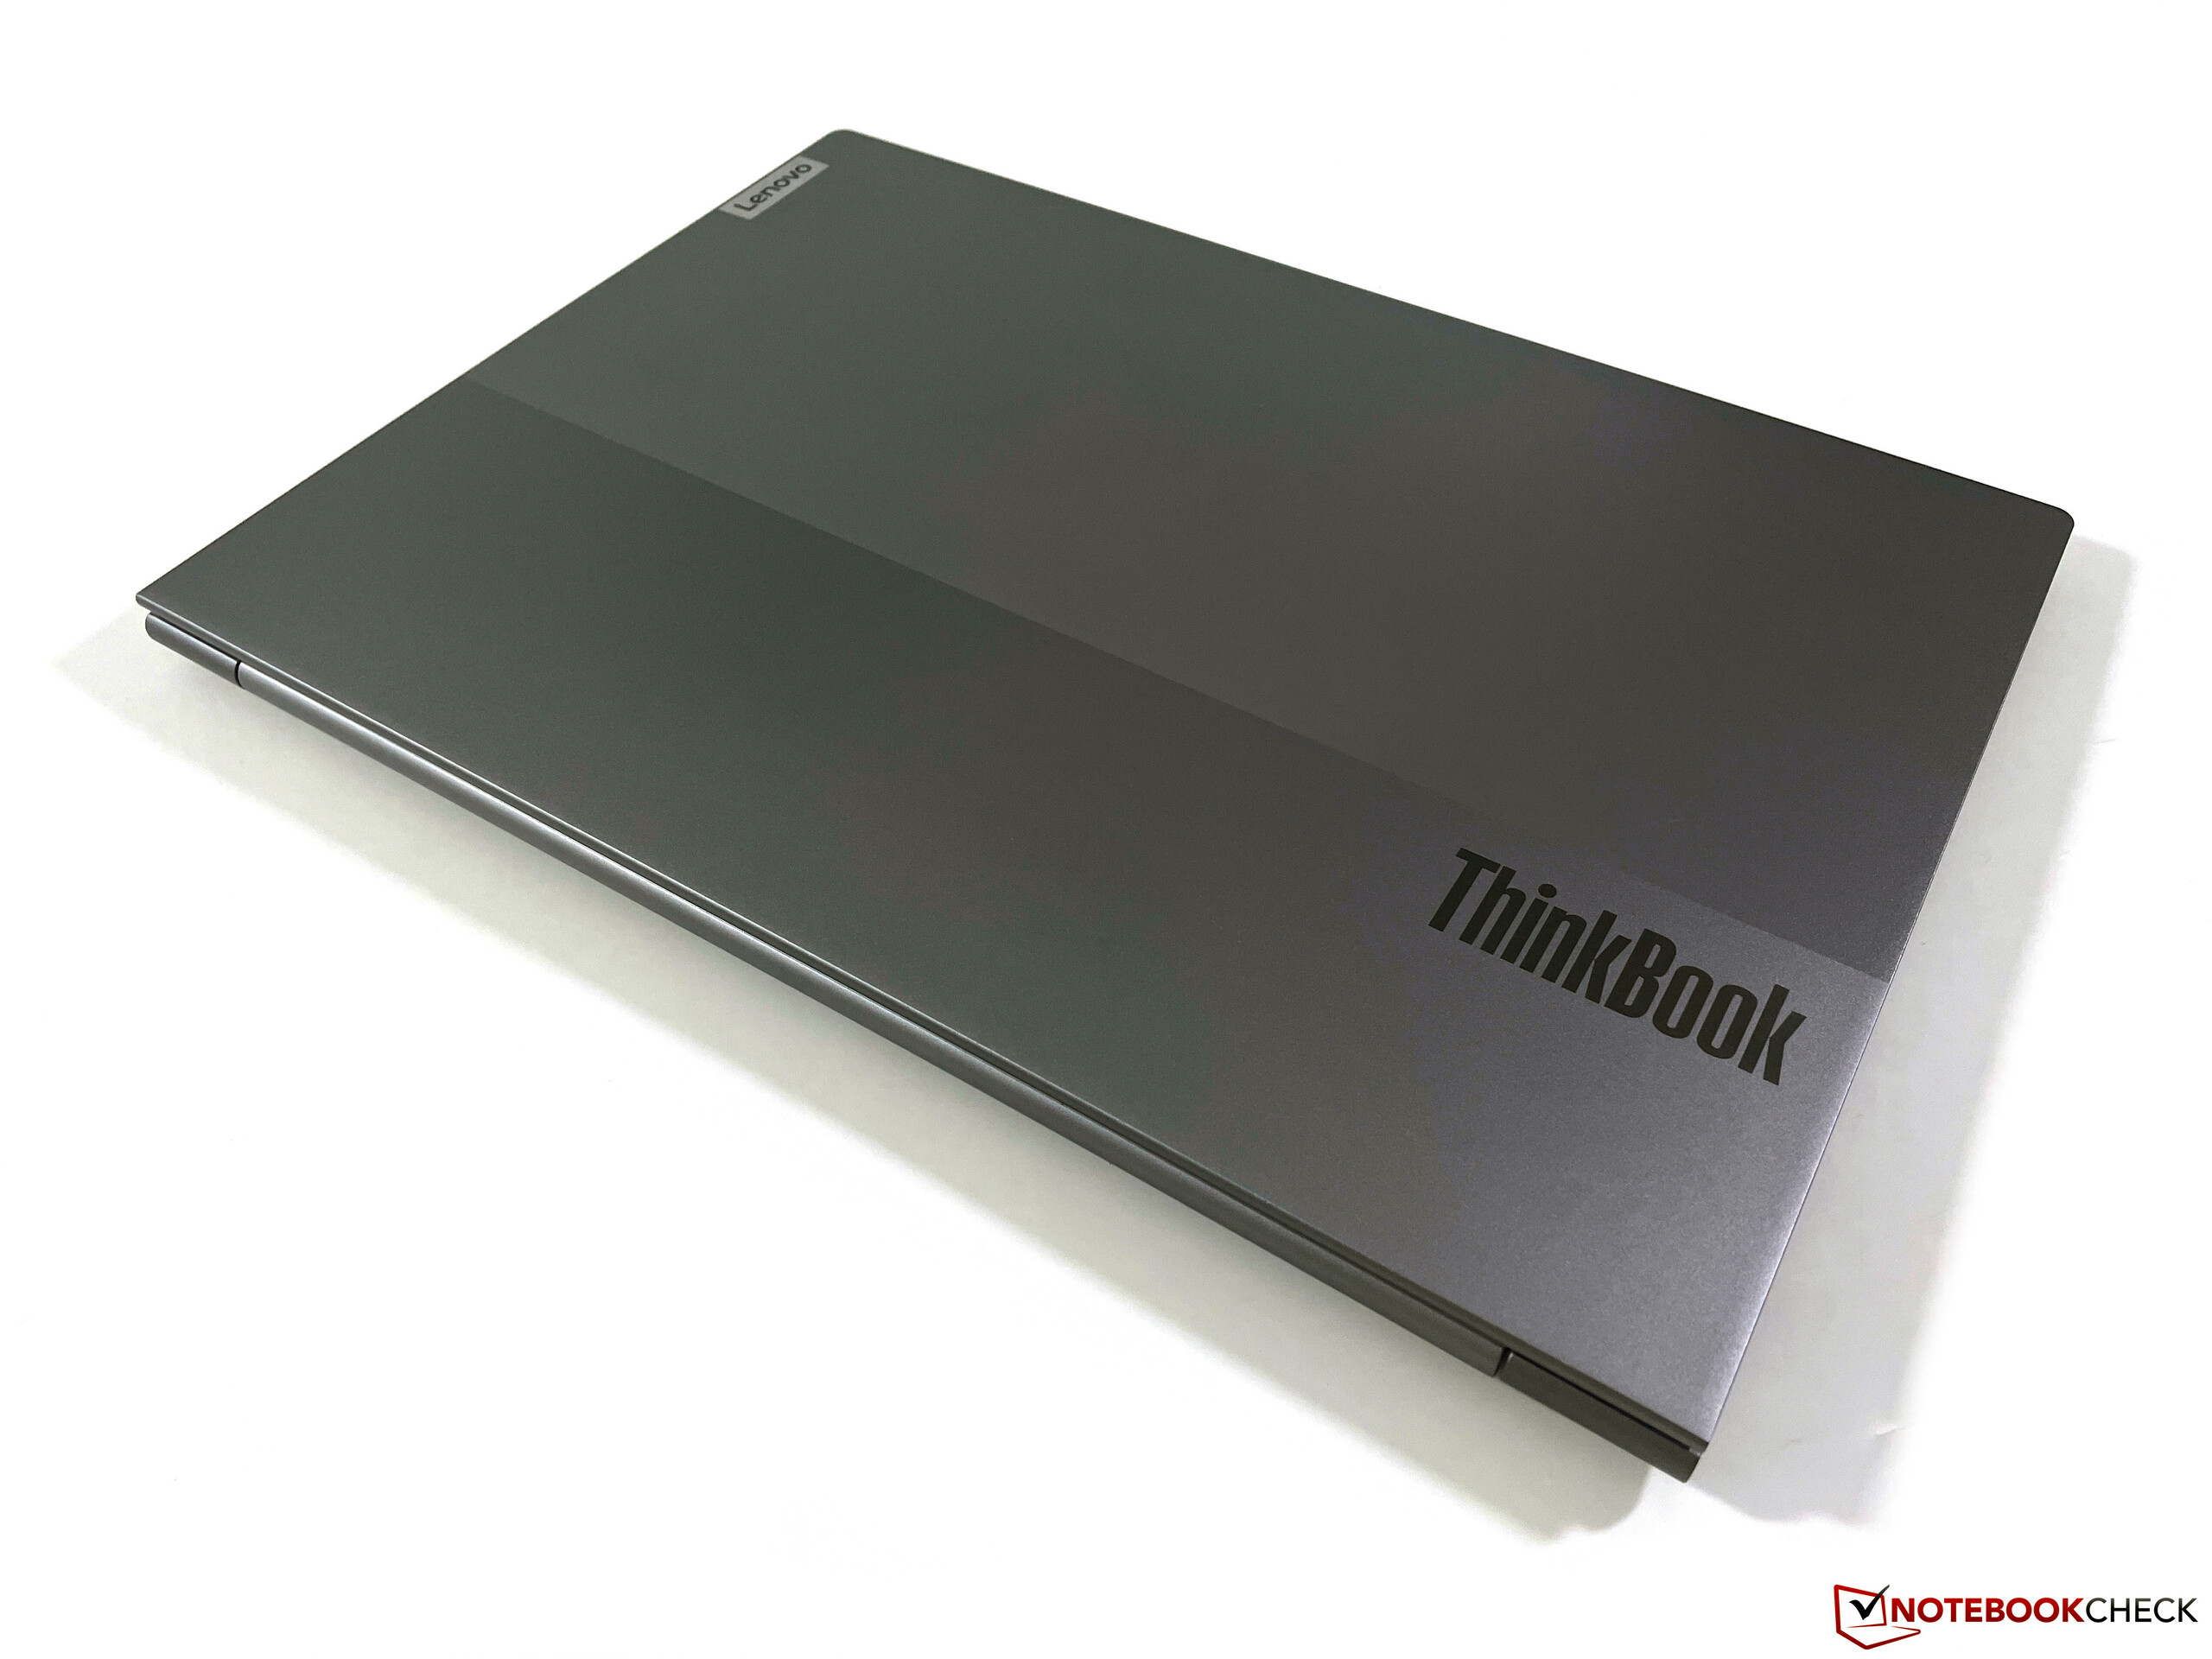
Obudowa - Lenovo korzysta z aluminium
Lenovo do wykonania obudowy (tzn. pokrywy i jednostki bazowej) użyło głównie aluminium, a powierzchnie są piaskowane, a także anodowane. Gładkie powierzchnie są przyjemne w dotyku i dają wrażenie wysokiej jakości. Odciski palców są widoczne stosunkowo szybko, ale można je również łatwo usunąć. Wizualnie obudowa w kolorze srebrnym wygląda elegancko i dobrze pasuje do środowisk profesjonalnych. Jedynym akcentem wizualnym jest dwukolorowa pokrywa wyświetlacza o dwóch różnych odcieniach szarości.
Pod względem wykonania ThinkBook sprawia zasadniczo dobre wrażenie, ale jest jeszcze miejsce na poprawę. Z jednostki zasadniczej udało nam się wydobyć ciche odgłosy skrzypienia, a obszar klawiatury również daje się wcisnąć. Pokrywa wyświetlacza okazuje się bardziej stabilna - nie udało nam się wywołać żadnych błędów w obrazie, ale przy zmianie kąta otwarcia wyświetlacz wyraźnie się chwieje. Możliwe jest otwarcie o maksymalnie 180 stopni, a zawiasy są dobrze wyregulowane, gdyż otwieranie jedną ręką nie stanowi problemu.
Z wyjątkiemAcer Swift X, 16-calowe urządzenia z pola porównania są bardzo podobne pod względem rozmiarów. ThinkBook jest jednak nieco cieńszy od większości rywali - ma tylko 1,65 cm. Waga wynosi 1,82 kg, nie licząc dodatkowych 400 gramów na zasilacz.
Sprzęt - ThinkBook z Thunderbolt 4
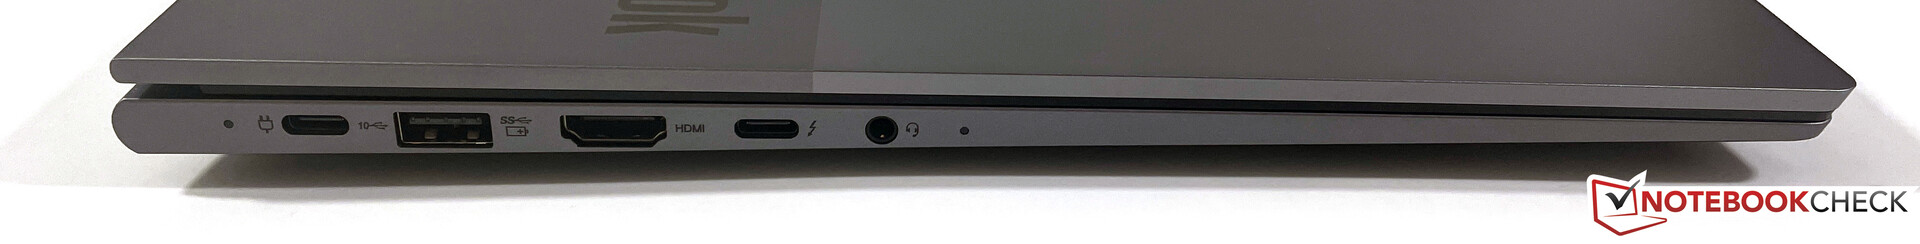
ThinkBook 16 G4+ oferuje praktycznie wszystkie porty, jakich można sobie życzyć. Oprócz nowoczesnego portu Thunderbolt 4 są tu także zwykłe porty USB-A, pełnoprawne wyjście HDMI oraz port Gigabit Ethernet. Pod klapką z prawej strony znajduje się nawet ukryty port USB, który jest zgodny tylko ze standardem 2.0, ale doskonale nadaje się do podłączonych na stałe dongli, takich jak zewnętrzne urządzenia wejściowe.
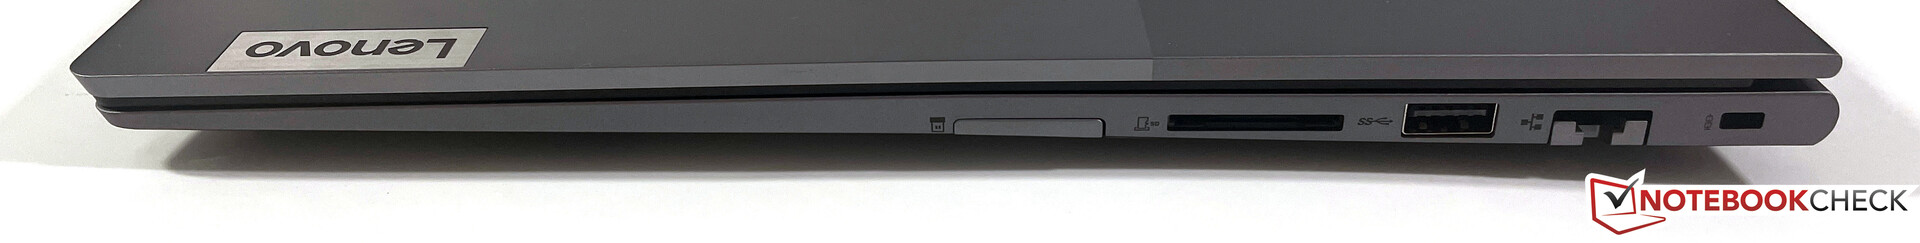
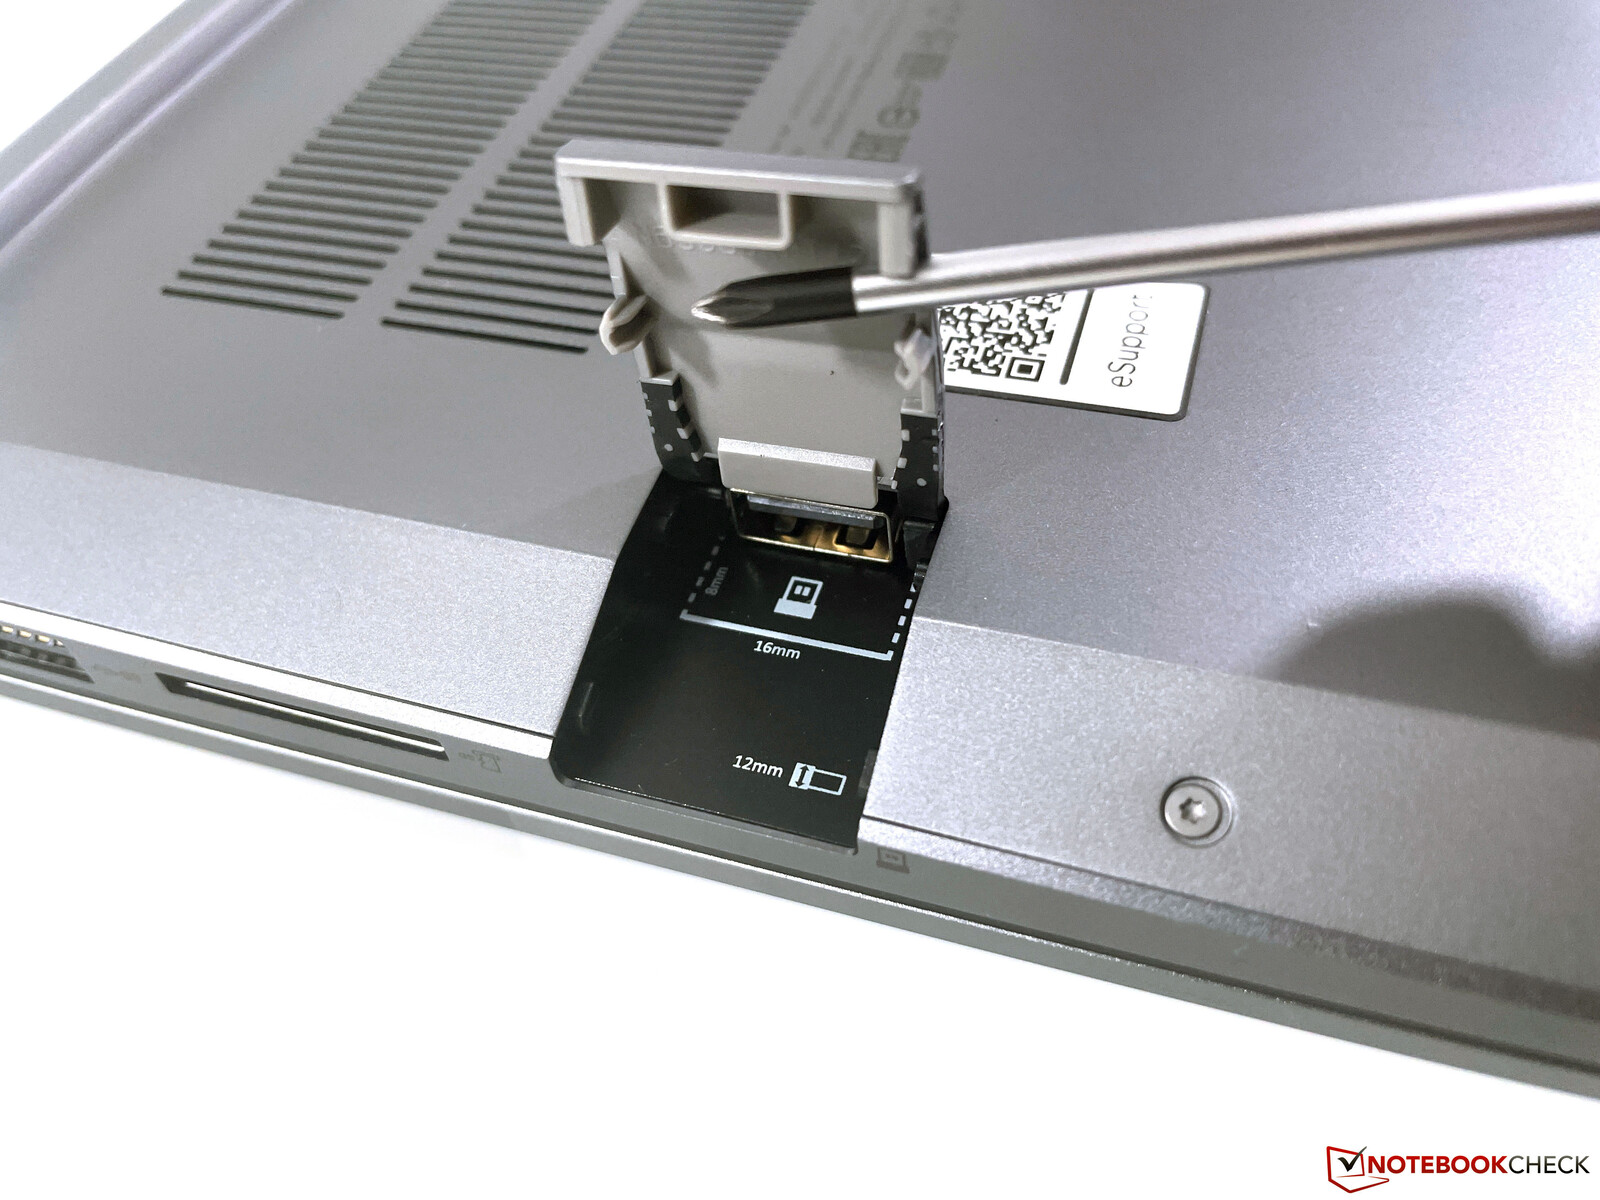
Czytnik kart SD
Po prawej stronie znajduje się czytnik kart SD, który nie mieści w pełni kart pamięci (wystają one o około 2 cm). Za pośrednictwem naszej karty referencyjnej (Angelbird AV Pro V60 UHS-II) zmierzyliśmy transfer na poziomie prawie 90 MB/s, co stawia ThinkBooka przed konkurentami, których czytniki kart działają tylko przez USB 2.0.
| SD Card Reader | |
| average JPG Copy Test (av. of 3 runs) | |
| Średnia w klasie Multimedia (23 - 531, n=43, ostatnie 2 lata) | |
| Lenovo ThinkBook 16 G4+ IAP (Angelbird AV Pro V60) | |
| Asus Vivobook Pro 16X-M7600QE (AV Pro SD microSD 128 GB V60) | |
| Dell Inspiron 16 Plus 7620 (Toshiba Exceria Pro SDXC 64 GB UHS-II) | |
| Samsung Galaxy Book2 15 (Angelbird AV Pro V60) | |
| maximum AS SSD Seq Read Test (1GB) | |
| Średnia w klasie Multimedia (27.9 - 1455, n=42, ostatnie 2 lata) | |
| Lenovo ThinkBook 16 G4+ IAP (Angelbird AV Pro V60) | |
| Asus Vivobook Pro 16X-M7600QE (AV Pro SD microSD 128 GB V60) | |
| Dell Inspiron 16 Plus 7620 (Toshiba Exceria Pro SDXC 64 GB UHS-II) | |
| Samsung Galaxy Book2 15 (Angelbird AV Pro V60) | |
Komunikacja
Oprócz modułu Gigabit Ethernet (Intel I219-V), Lenovo instaluje bardzo nowoczesny moduł Intel AX211E Wi-Fi 6E, który teoretycznie obsługuje najnowsze sieci 6 GHz. Nie udało nam się jednak połączyć z siecią 6 GHz naszego referencyjnego routera od Asusa. Mimo to transfery były bardzo wysokie i stabilne w sieci 5 GHz, co sprawia, że w praktyce nie ma realnych ograniczeń.
| Networking | |
| iperf3 transmit AX12 | |
| Przeciętny Intel Wi-Fi 6E AX211 (1003 - 1501, n=4) | |
| Acer Swift X SFX16-51G-5388 | |
| Asus Vivobook Pro 16X-M7600QE | |
| iperf3 receive AX12 | |
| Acer Swift X SFX16-51G-5388 | |
| Przeciętny Intel Wi-Fi 6E AX211 (1178 - 1623, n=4) | |
| Asus Vivobook Pro 16X-M7600QE | |
| iperf3 transmit AXE11000 | |
| Samsung Galaxy Book2 15 | |
| Lenovo ThinkBook 16 G4+ IAP | |
| Huawei MateBook D 16 2022 | |
| Średnia w klasie Multimedia (606 - 1978, n=61, ostatnie 2 lata) | |
| Przeciętny Intel Wi-Fi 6E AX211 (64 - 1921, n=276) | |
| iperf3 receive AXE11000 | |
| Lenovo ThinkBook 16 G4+ IAP | |
| Samsung Galaxy Book2 15 | |
| Huawei MateBook D 16 2022 | |
| Przeciętny Intel Wi-Fi 6E AX211 (582 - 1890, n=276) | |
| Średnia w klasie Multimedia (682 - 1818, n=61, ostatnie 2 lata) | |
Kamera internetowa
ThinkBook oferuje kamerę internetową 1080p z mechaniczną migawką, która zapewnia lepszy obraz niż poprzednie moduły 720p. Dodatkowo dostępna jest kamera IR do rozpoznawania twarzy poprzez Windows Hello.


Konserwacja
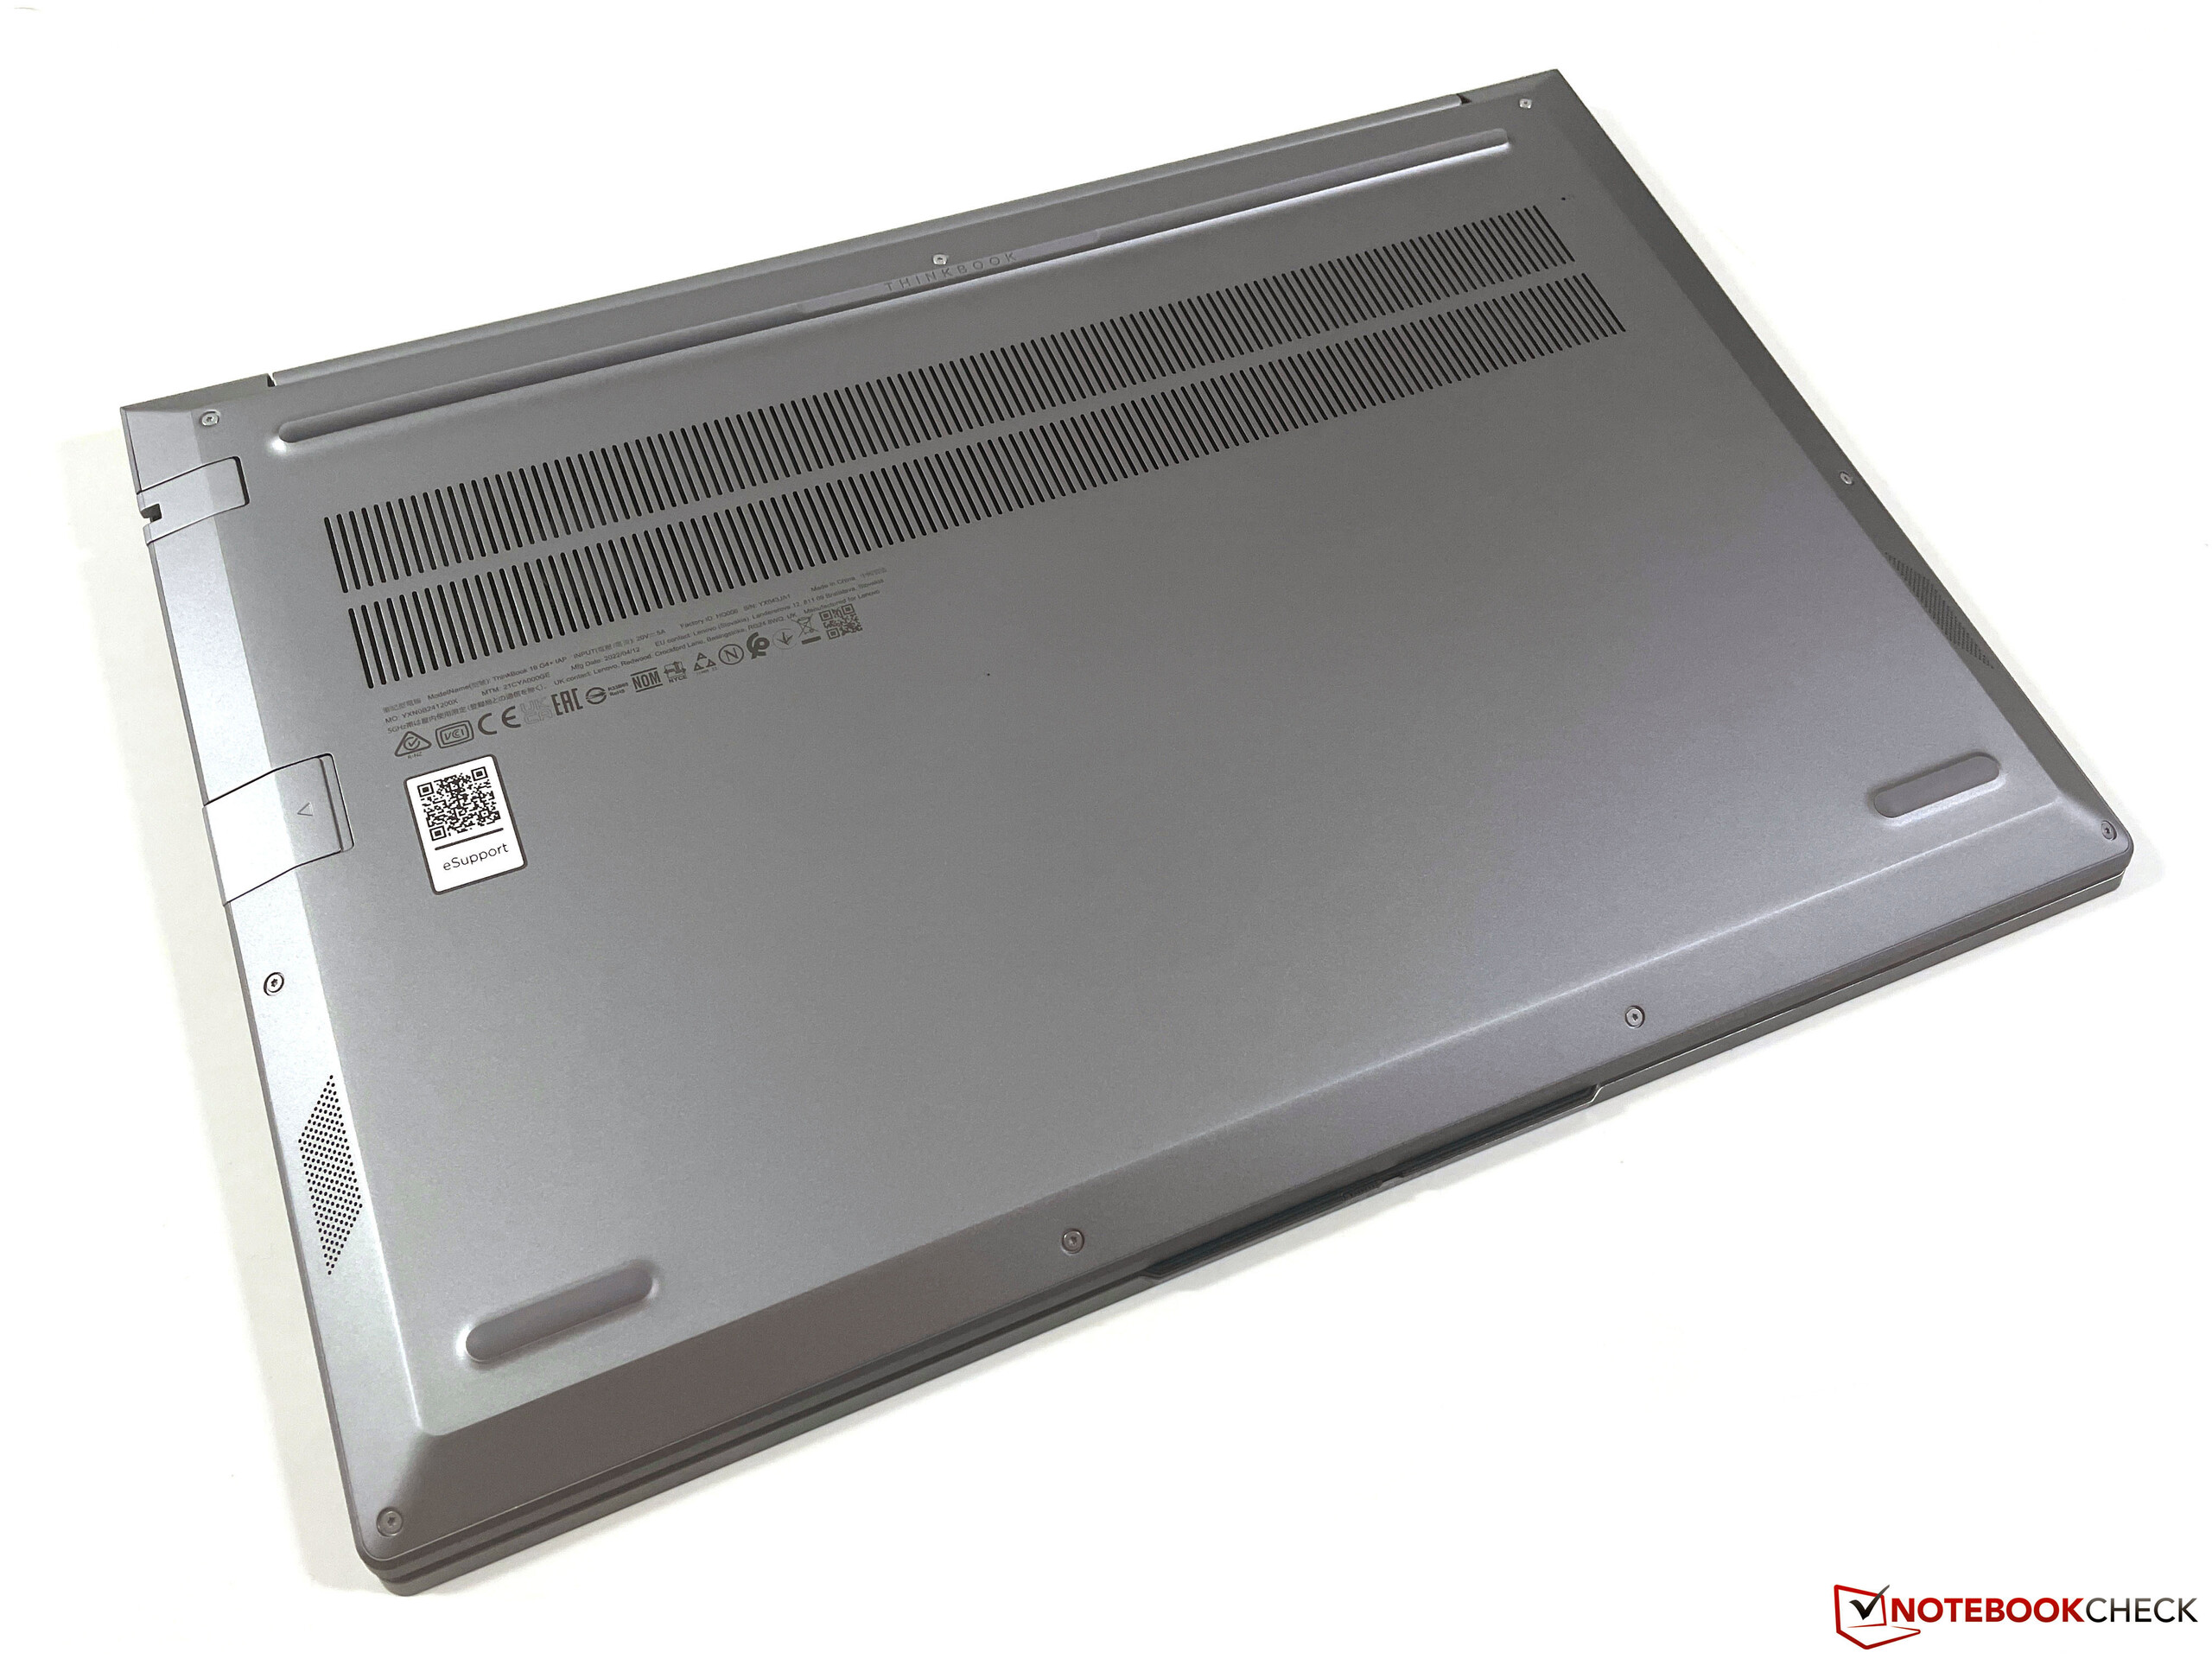
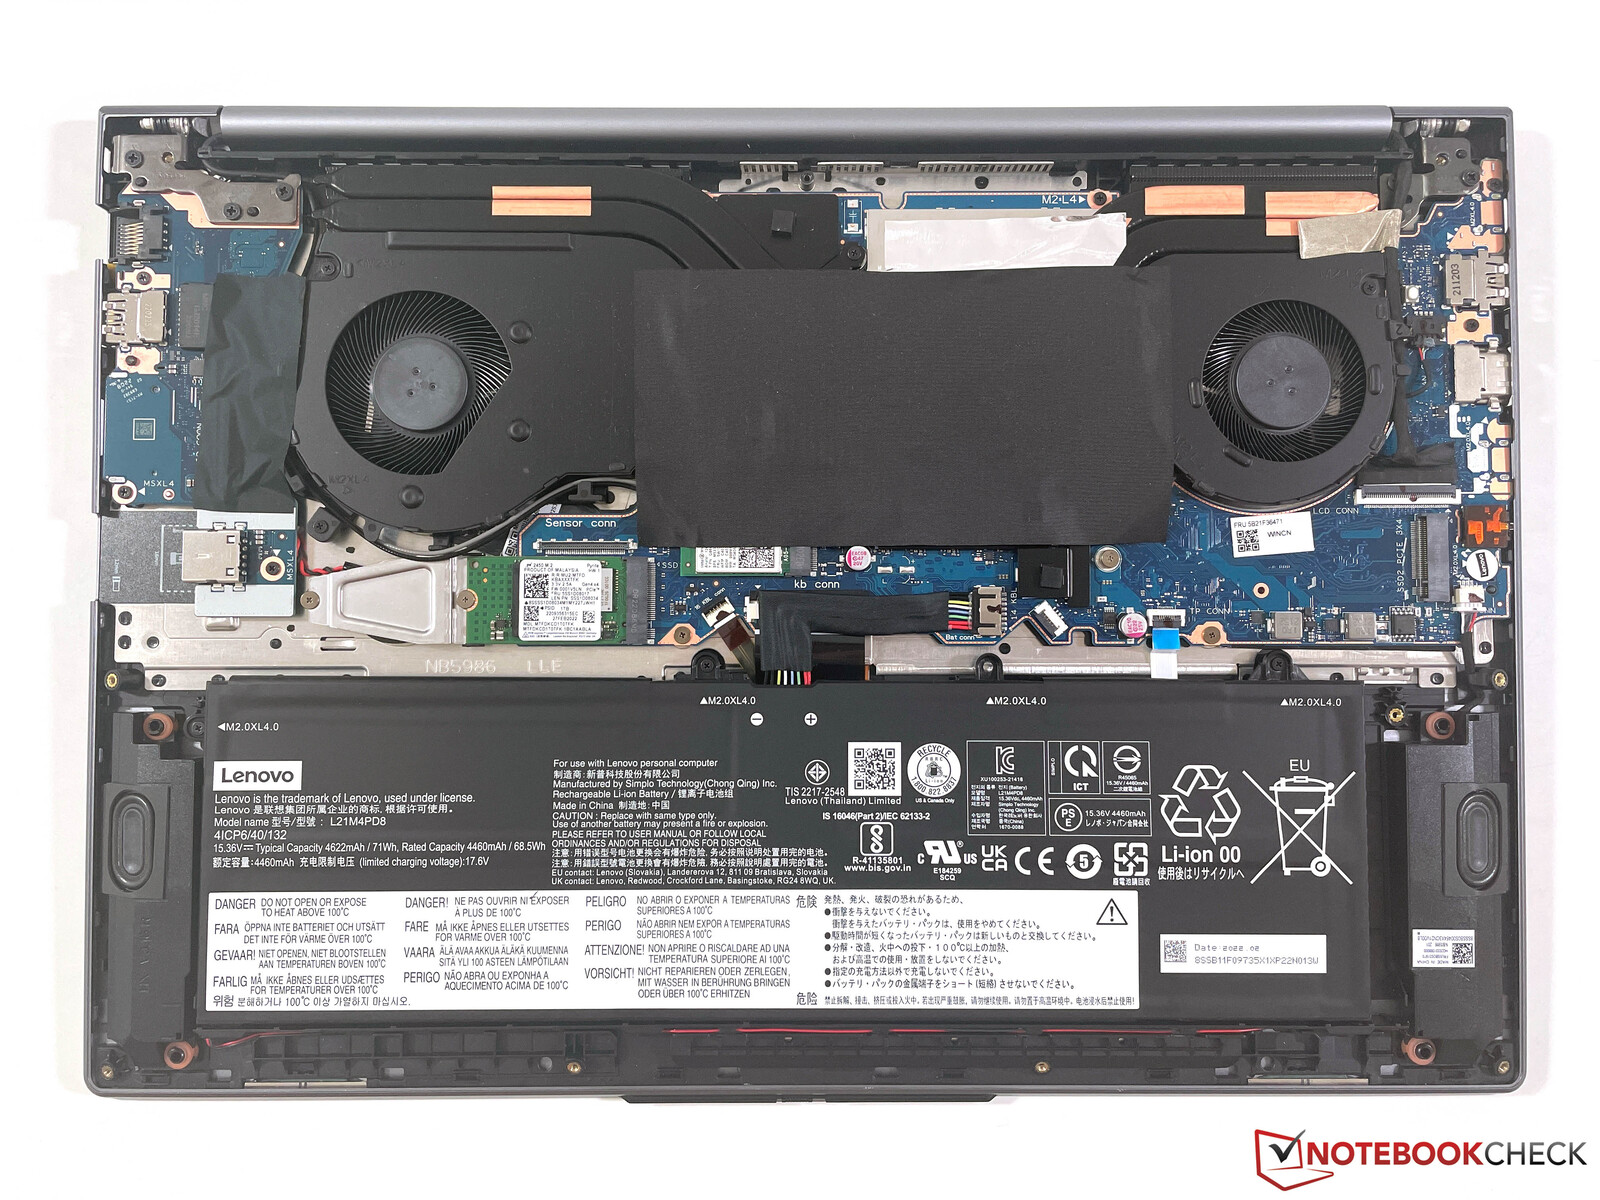
Płyta podstawowa jest przymocowana łącznie 10 śrubkami Torx (T5) i można ją łatwo zdjąć. Po tym można wyczyścić dwa wentylatory i uzyskać dostęp do dwóch gniazd M.2-2280 dla dysków SSD. Moduł WLAN jest częściowo przyklejony, ale można go w zasadzie wymienić. Tylko pamięć RAM jest przylutowana i nie można jej uaktualnić.
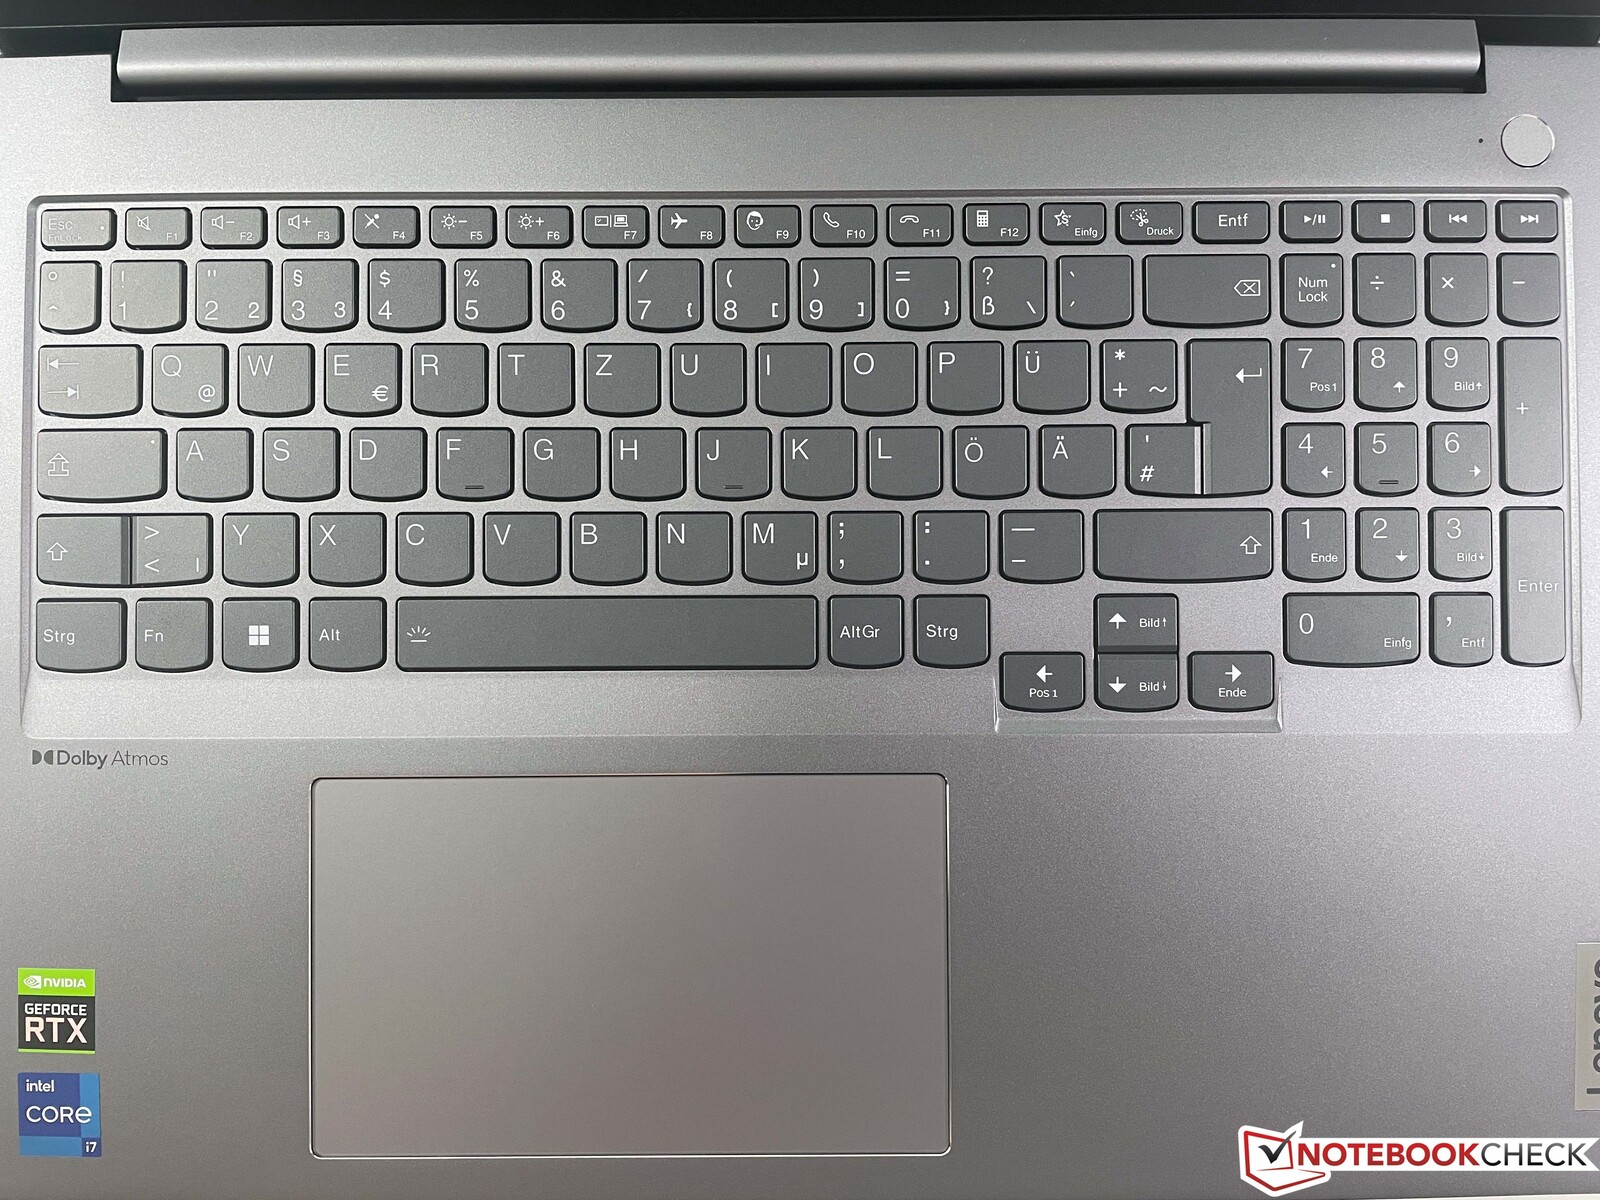
Urządzenia wejściowe - laptop multimedialny z przeciętną klawiaturą
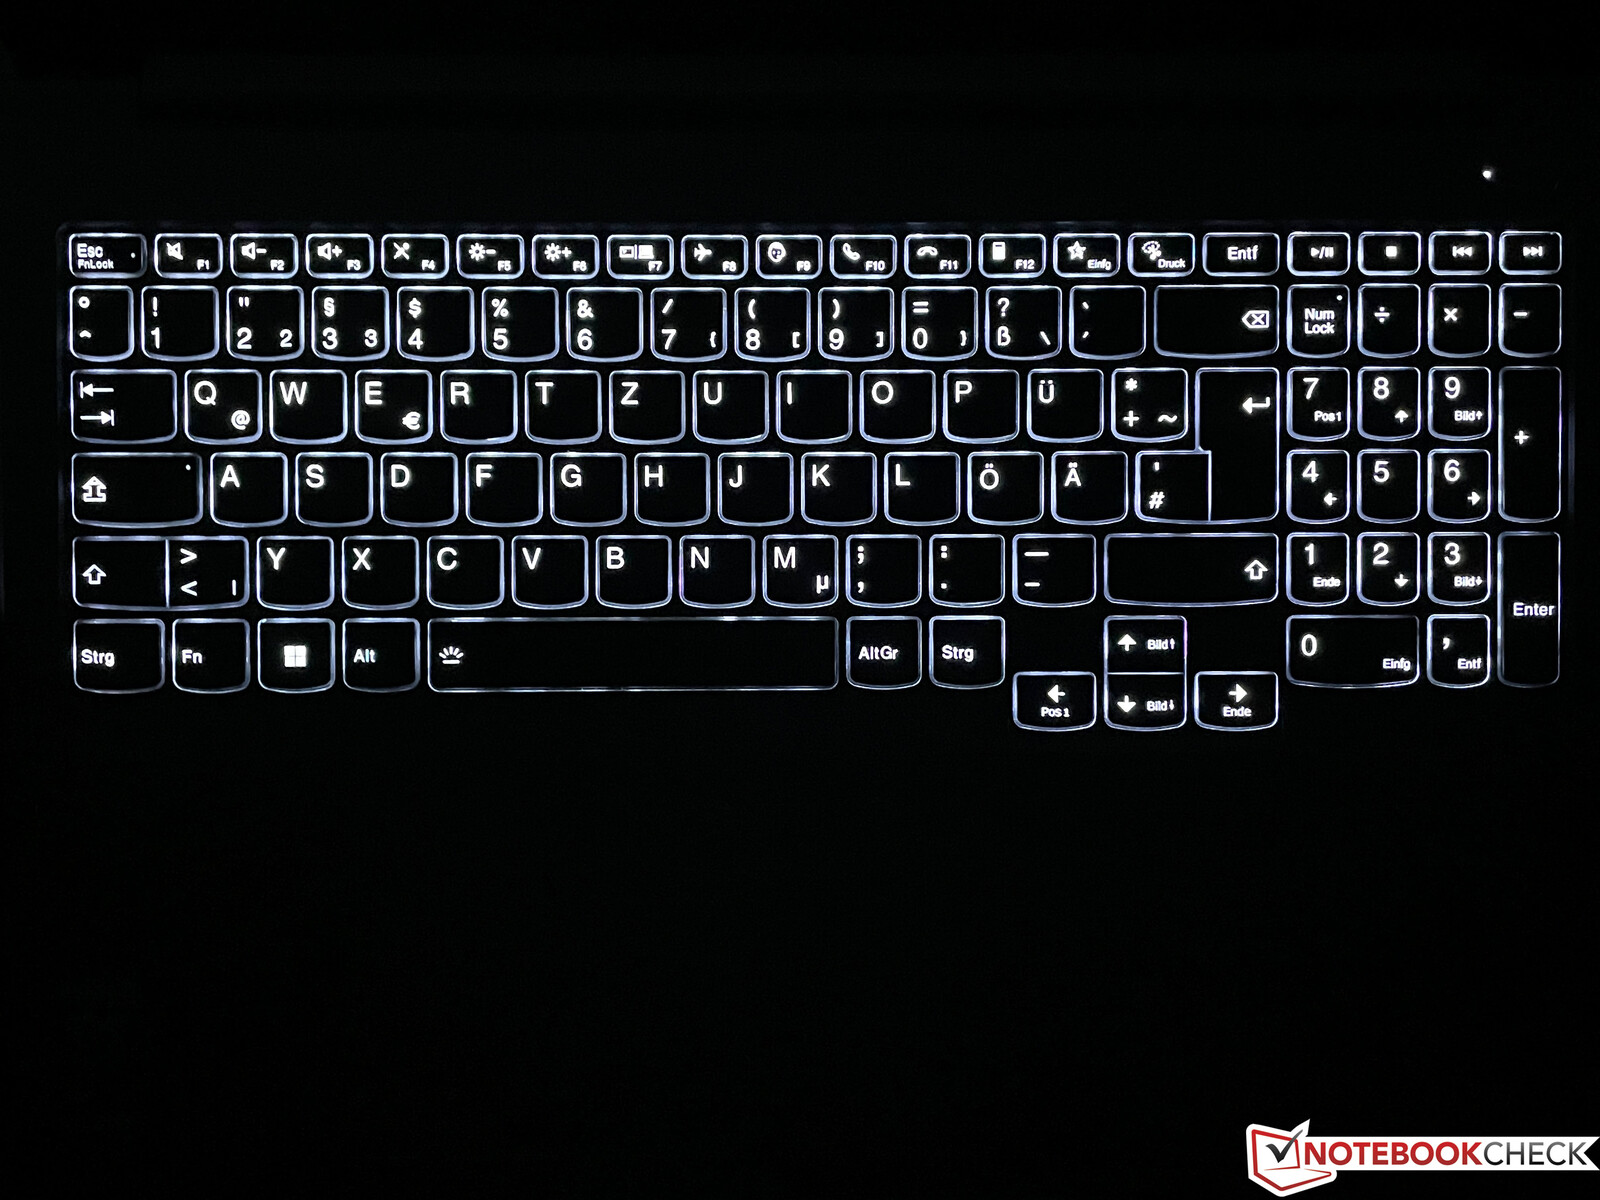
Ciemnoszara klawiatura oferuje dwustopniowe białe podświetlenie, a także dedykowany blok numeryczny po prawej stronie, choć klawisze są tu nieco węższe. Pod względem odczuć podczas pisania ThinkBook przypomina raczej IdeaPady producenta niż ThinkPady. Skok klawiszy jest dość krótki, ale przynajmniej sprzężenie zwrotne jest bardzo precyzyjne, a klawisze również nie grzechoczą. Naszym zdaniem Lenovo marnuje tu pewien potencjał; istnieją wygodniejsze wejścia, jeśli często wpisujemy bardzo długie teksty. Przycisk zasilania znajduje się po prawej stronie nad klawiaturą i zawiera skaner linii papilarnych.
Duży ClickPad został przesunięty nieco w lewo i przy wymiarach 12 x 7,5 cm oferuje wystarczająco dużo miejsca na nawigację wskaźnikiem, jak również na gesty z użyciem maksymalnie czterech palców. Działa to bardzo dobrze dzięki standardowi Microsoft Precision, a pad również nie grzechocze. Dolną połowę można fizycznie nacisnąć, ale charakteryzuje się to głośnymi i tanio brzmiącymi odgłosami klikania, więc należy tylko stukać w podkładkę (tap to click).
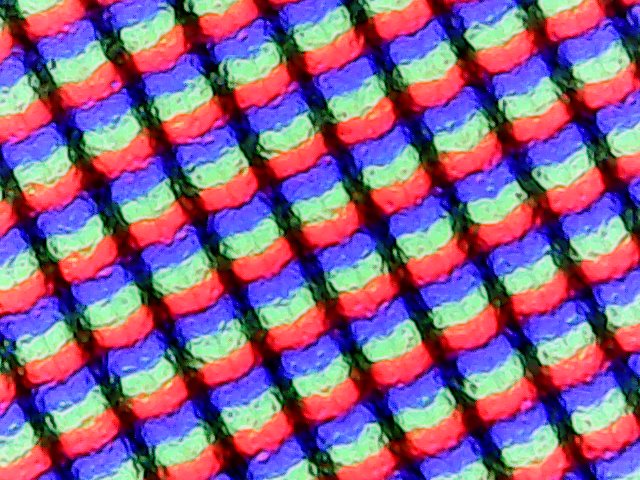
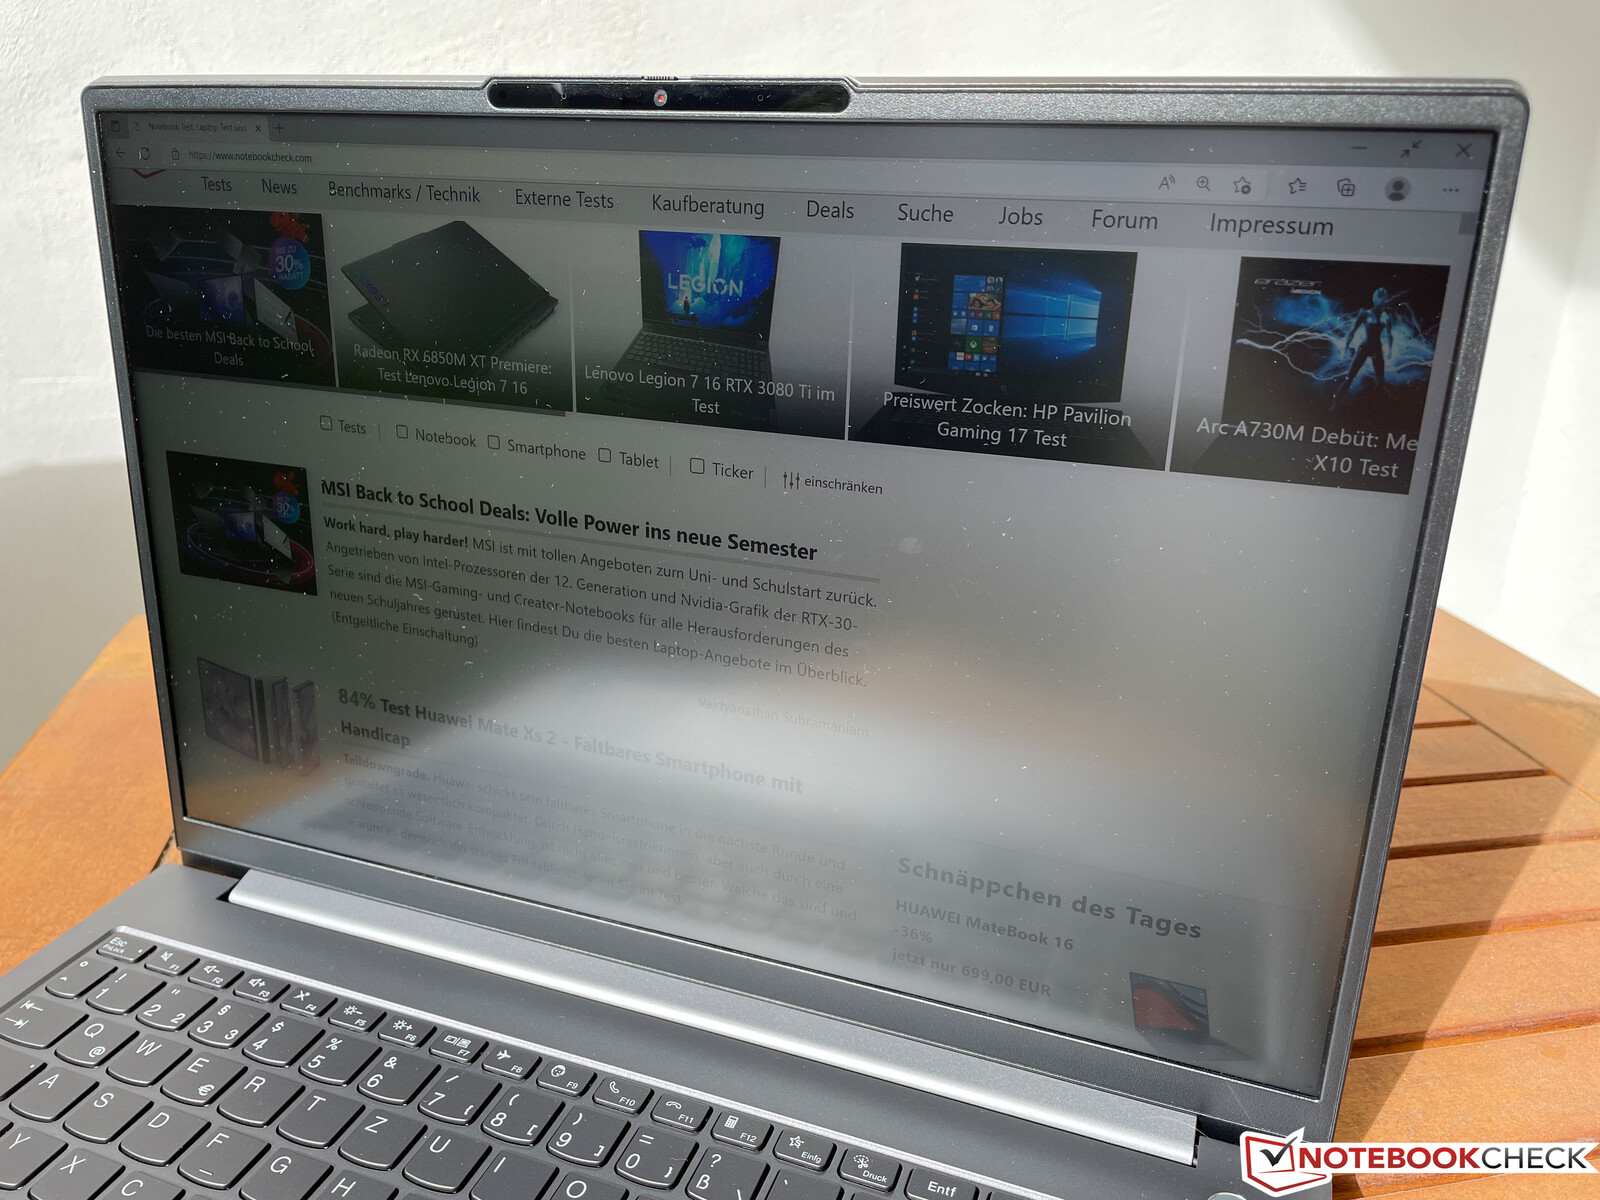
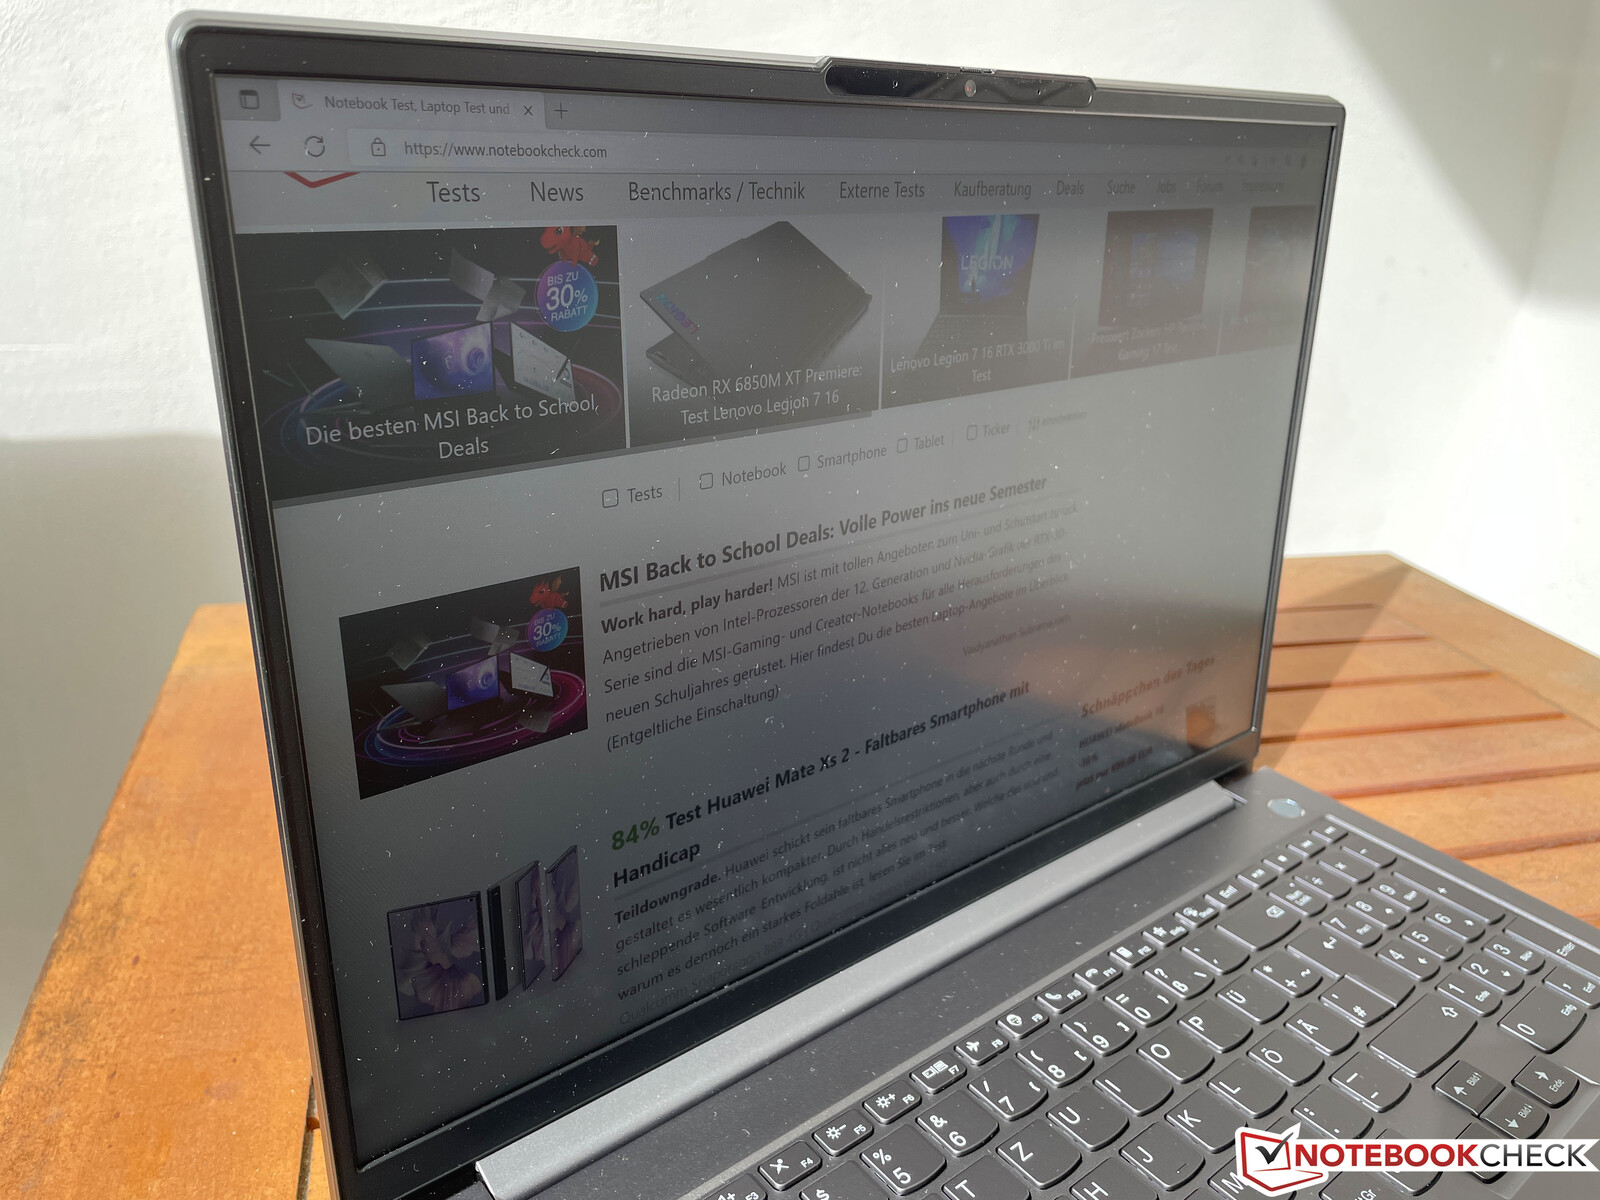
Wyświetlacz - Matowy panel IPS o rozdzielczości WQHD
Lenovo wyposaża ThinkBooka 16 G4+ w matowy panel WQHD w formacie 16:10, ale istnieją dwie różne wersje ekranu IPS. W naszym samplu recenzenckim zastosowano panel 60 Hz, ale według arkusza specyfikacji opcjonalnie dostępny jest także model 120 Hz z fabryczną kalibracją kolorów.
Nasze subiektywne wrażenia z obrazu na matowym panelu są bardzo dobre. Treść jest wyświetlana wyraźnie, kolory są żywe, a jasne obszary nie są ziarniste. Określiliśmy bardzo dobry współczynnik kontrastu na poziomie prawie 1700:1 (wartość czerni 0,23), co z pewnością również przyczynia się do wrażenia żywego obrazu. Lenovo określa jasność na poziomie 350 cd/m², którą nasz panel po prostu przewyższa. Nie występuje migotanie PWM, a czasy reakcji są niepozorne, ale na ciemnych tłach przy wysokich poziomach jasności występują wyraźnie widoczne aureole. Stabilność kątów widzenia wyświetlacza IPS jest bardzo dobra, ale treści HDR nie są obsługiwane.

| |||||||||||||||||||||||||
rozświetlenie: 91 %
na akumulatorze: 372 cd/m²
kontrast: 1613:1 (czerń: 0.23 cd/m²)
ΔE ColorChecker Calman: 2.6 | ∀{0.5-29.43 Ø4.73}
calibrated: 1.3
ΔE Greyscale Calman: 3.7 | ∀{0.09-98 Ø4.97}
71.7% AdobeRGB 1998 (Argyll 3D)
97.5% sRGB (Argyll 3D)
69.6% Display P3 (Argyll 3D)
Gamma: 2.32
CCT: 7271 K
| Lenovo ThinkBook 16 G4+ IAP LEN160WQXGA, IPS, 2560x1600, 16" | Dell Inspiron 16 Plus 7620 BOE NE16N41, IPS, 3072x1920, 16" | Acer Swift X SFX16-51G-5388 Chi Mei N161HCA-EA3, , 1920x1080, 16.1" | Asus Vivobook Pro 16X-M7600QE Samsung ATNA60YV02-0, OLED, 3840x2400, 16.1" | Huawei MateBook D 16 2022 BOE NV160WUM-NH0, IPS, 1920x1200, 16" | Samsung Galaxy Book2 15 NE156FHM-NS0, IPS, 1920x1080, 15.6" | |
|---|---|---|---|---|---|---|
| Display | 2% | -5% | 27% | -4% | -27% | |
| Display P3 Coverage (%) | 69.6 | 70.8 2% | 65.1 -6% | 99.8 43% | 66.2 -5% | 49.6 -29% |
| sRGB Coverage (%) | 97.5 | 99.5 2% | 95.65 -2% | 100 3% | 96.4 -1% | 74.8 -23% |
| AdobeRGB 1998 Coverage (%) | 71.7 | 73.2 2% | 66.75 -7% | 96.9 35% | 68.3 -5% | 51.3 -28% |
| Response Times | -42% | -6% | 91% | -2% | -24% | |
| Response Time Grey 50% / Grey 80% * (ms) | 32.7 ? | 38 ? -16% | 30 ? 8% | 2 ? 94% | 30.5 ? 7% | 32.3 ? 1% |
| Response Time Black / White * (ms) | 16.8 ? | 28 ? -67% | 20 ? -19% | 2 ? 88% | 18.7 ? -11% | 25 ? -49% |
| PWM Frequency (Hz) | 60 ? | |||||
| Screen | 8% | 11% | 14% | -19% | -71% | |
| Brightness middle (cd/m²) | 371 | 288.9 -22% | 276 -26% | 392 6% | 319 -14% | 337 -9% |
| Brightness (cd/m²) | 357 | 276 -23% | 264 -26% | 396 11% | 317 -11% | 325 -9% |
| Brightness Distribution (%) | 91 | 92 1% | 85 -7% | 98 8% | 90 -1% | 89 -2% |
| Black Level * (cd/m²) | 0.23 | 0.26 -13% | 0.16 30% | 0.23 -0% | 0.4 -74% | |
| Contrast (:1) | 1613 | 1111 -31% | 1725 7% | 1387 -14% | 843 -48% | |
| Colorchecker dE 2000 * | 2.6 | 1.88 28% | 1.8 31% | 1.74 33% | 3.4 -31% | 4.7 -81% |
| Colorchecker dE 2000 max. * | 4.4 | 4.37 1% | 3.77 14% | 3.18 28% | 8.1 -84% | 15.7 -257% |
| Colorchecker dE 2000 calibrated * | 1.3 | 0.42 68% | 0.63 52% | 1.85 -42% | 0.8 38% | 2.8 -115% |
| Greyscale dE 2000 * | 3.7 | 1.4 62% | 2.76 25% | 1.77 52% | 5.7 -54% | 5.4 -46% |
| Gamma | 2.32 95% | 2.3 96% | 2.37 93% | 2.22 99% | 2.1 105% | 2.07 106% |
| CCT | 7271 89% | 6634 98% | 6564 99% | 6483 100% | 7433 87% | 7727 84% |
| Całkowita średnia (program / ustawienia) | -11% /
-0% | 0% /
5% | 44% /
30% | -8% /
-13% | -41% /
-55% |
* ... im mniej tym lepiej
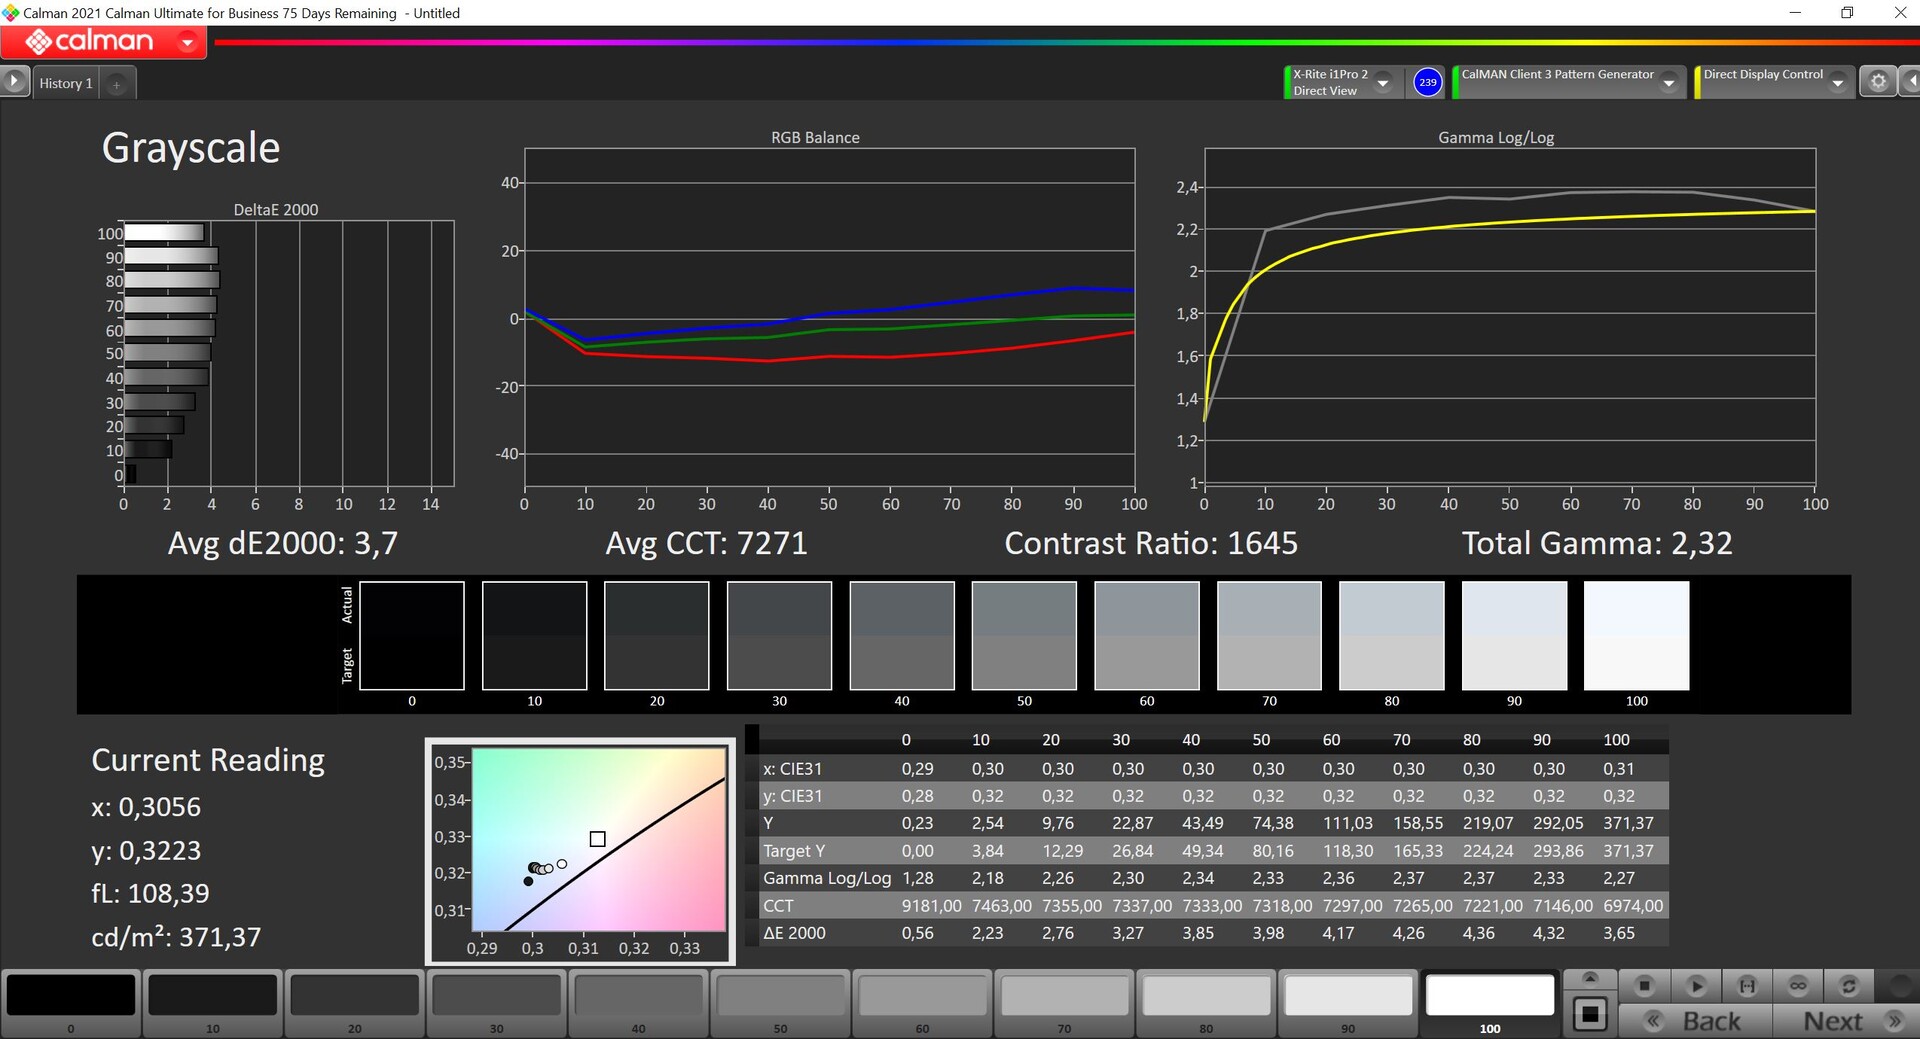
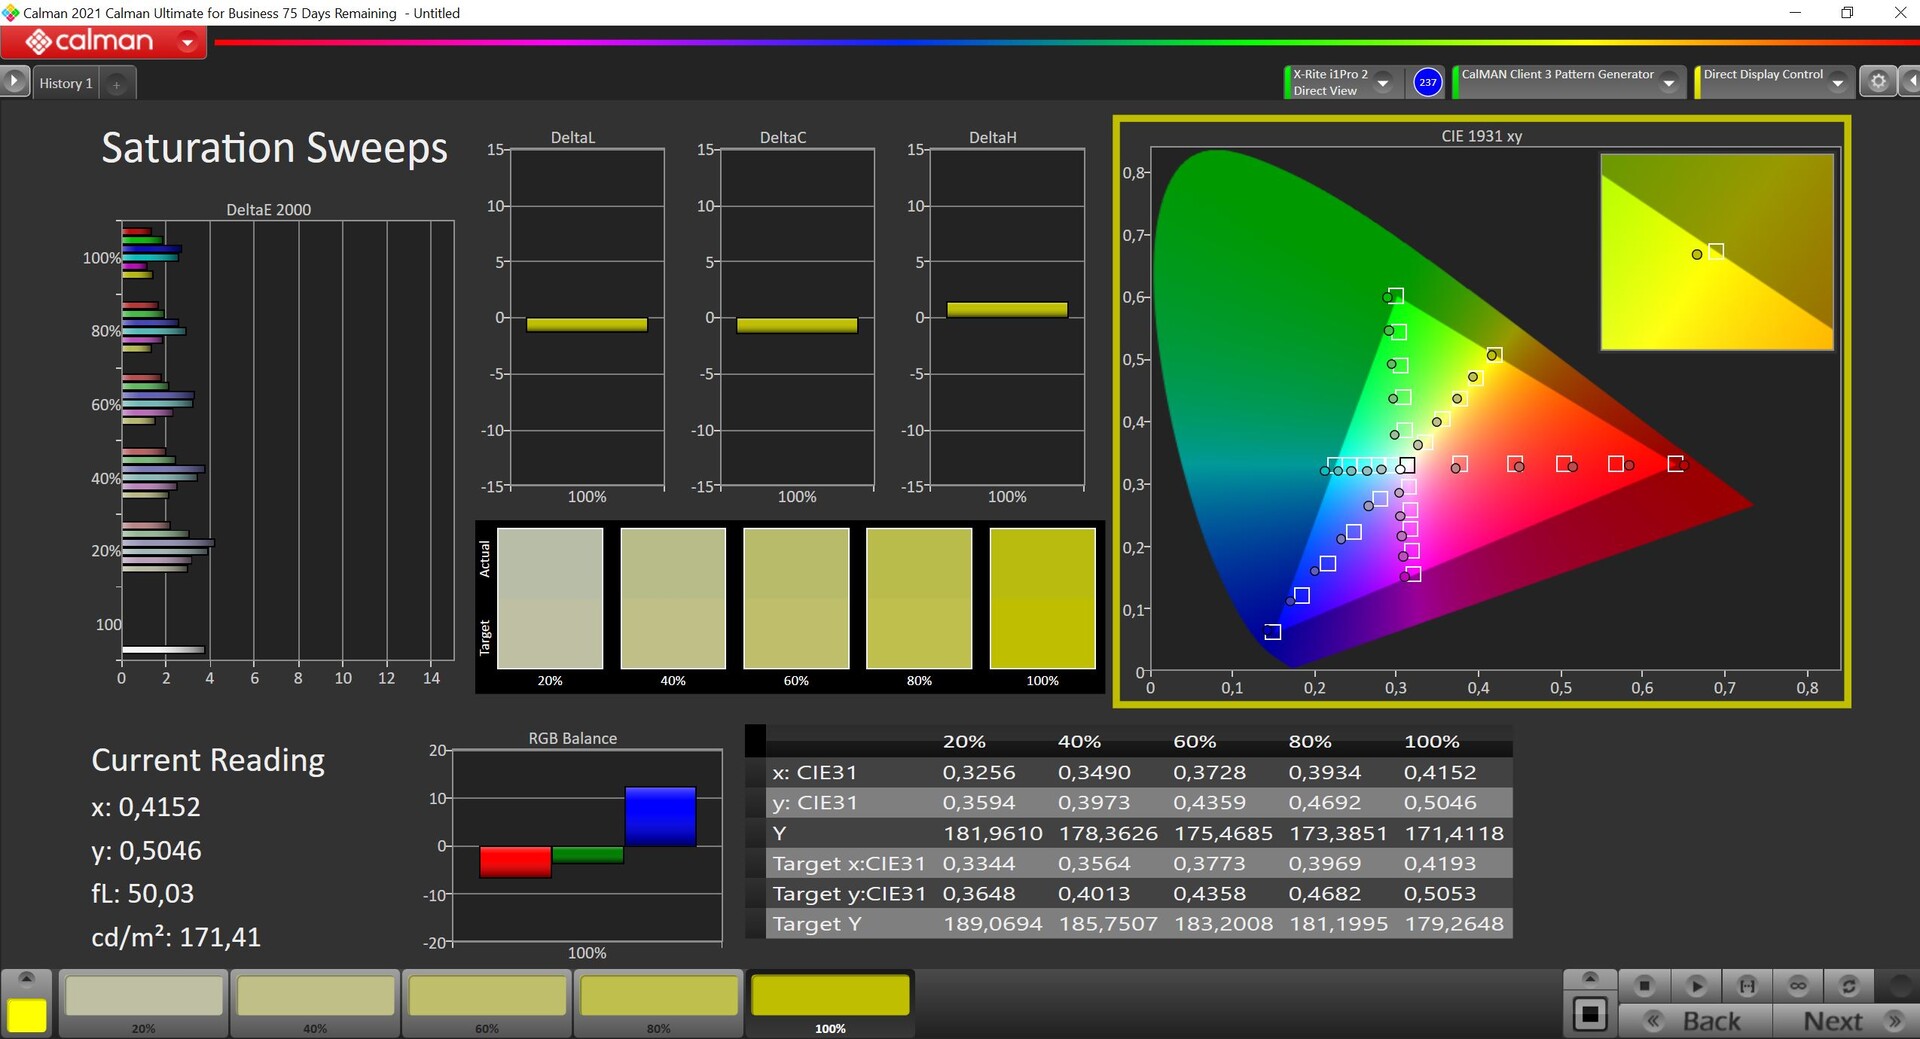
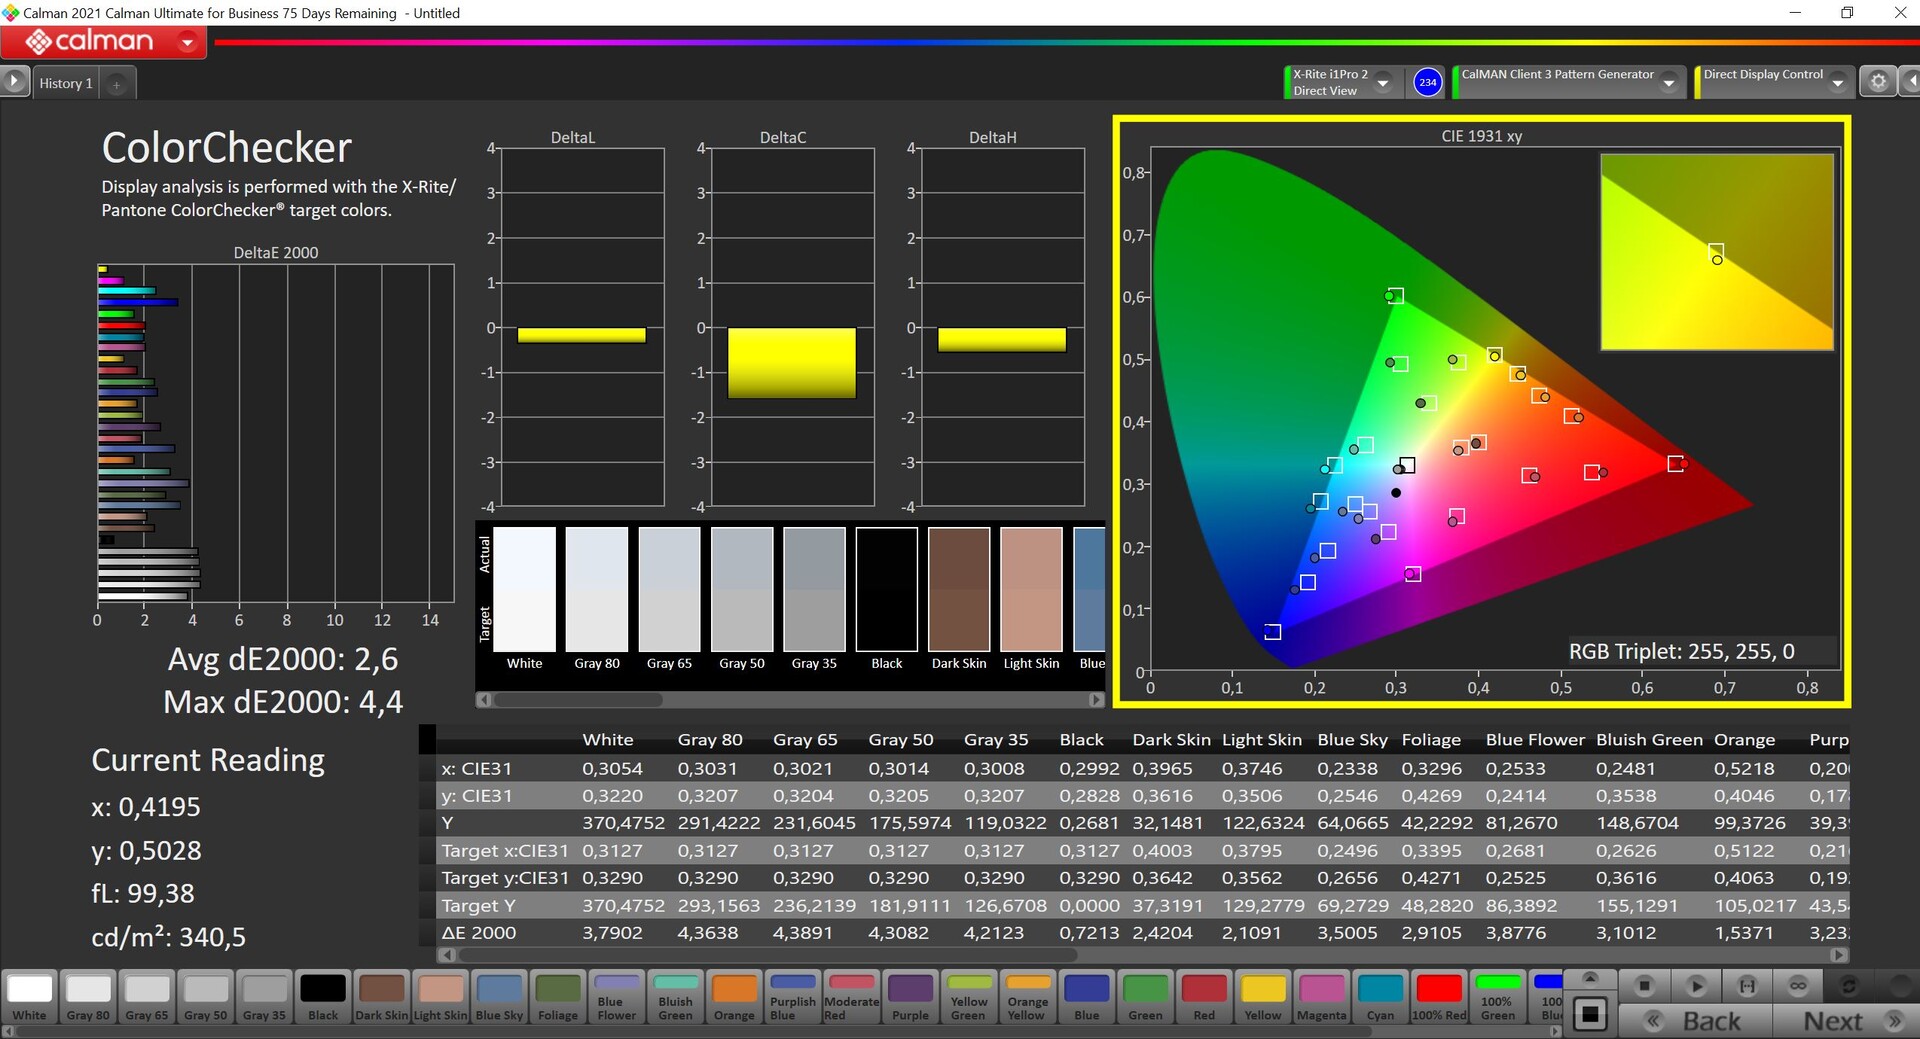
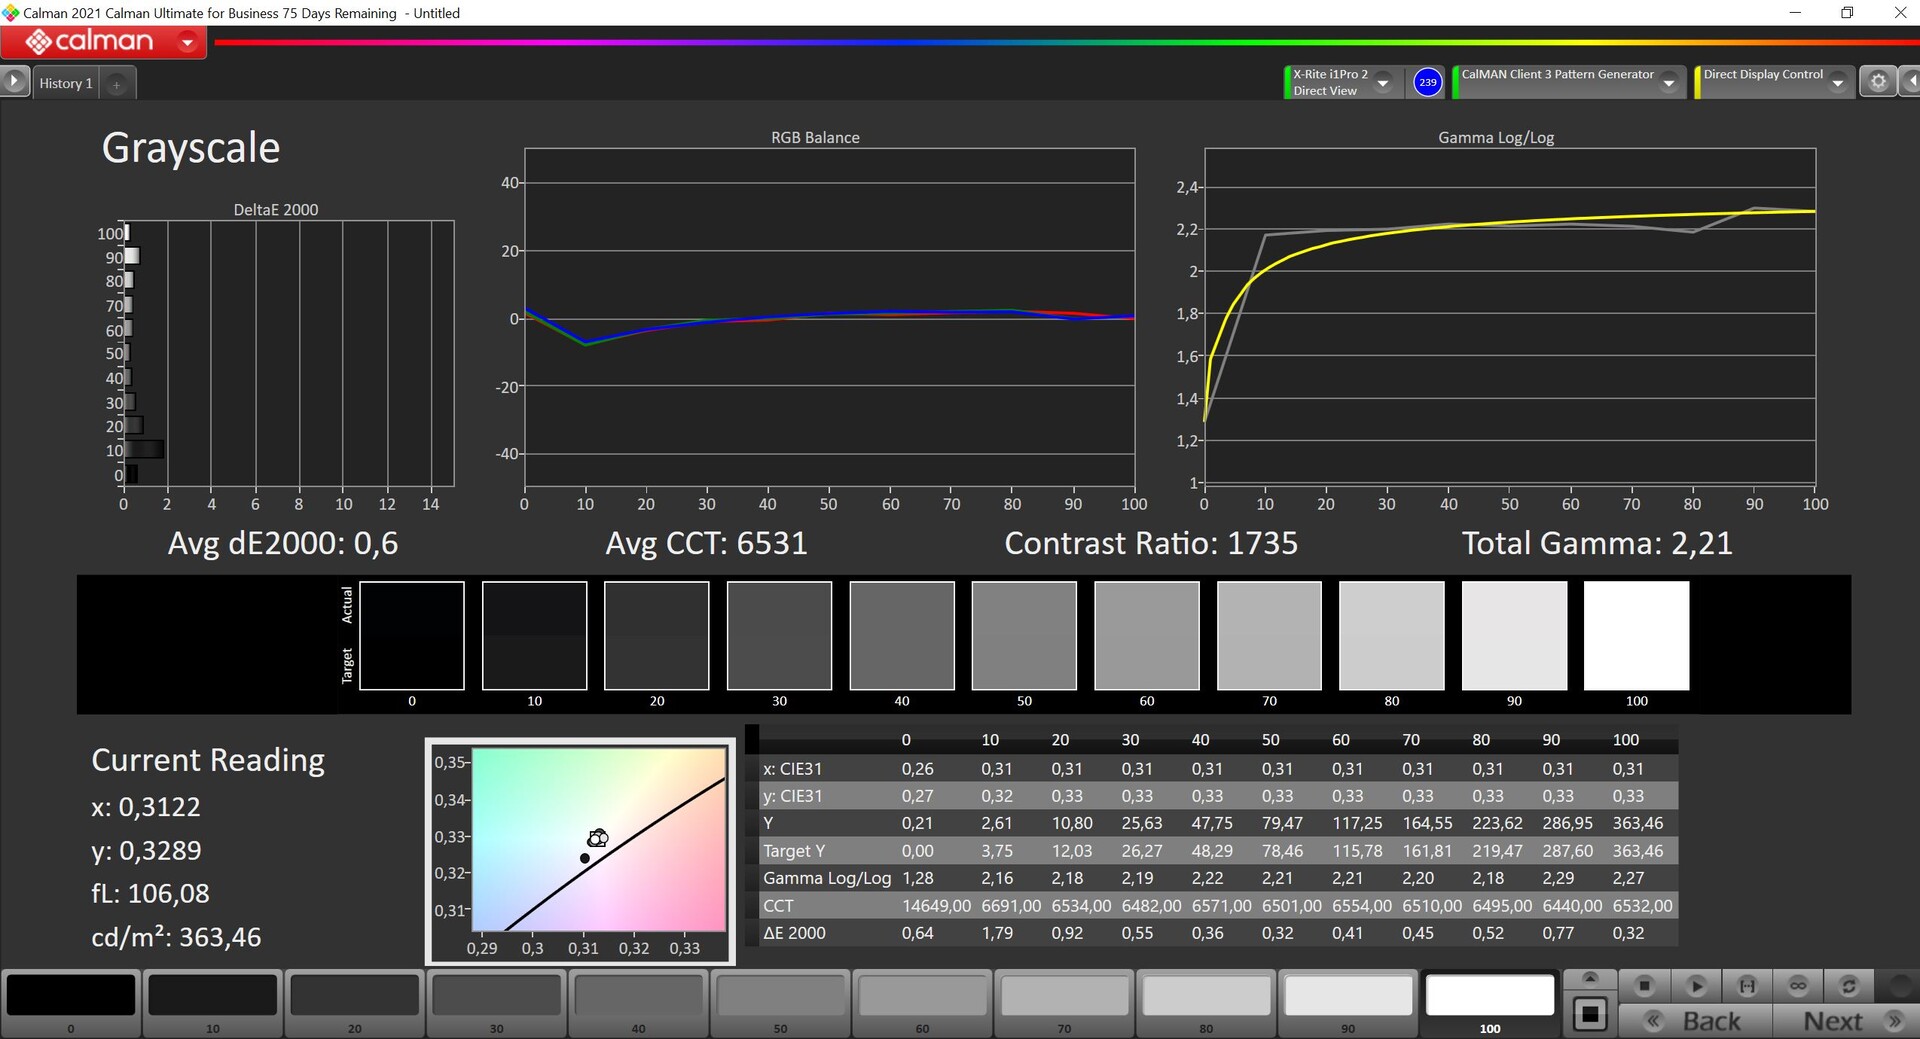
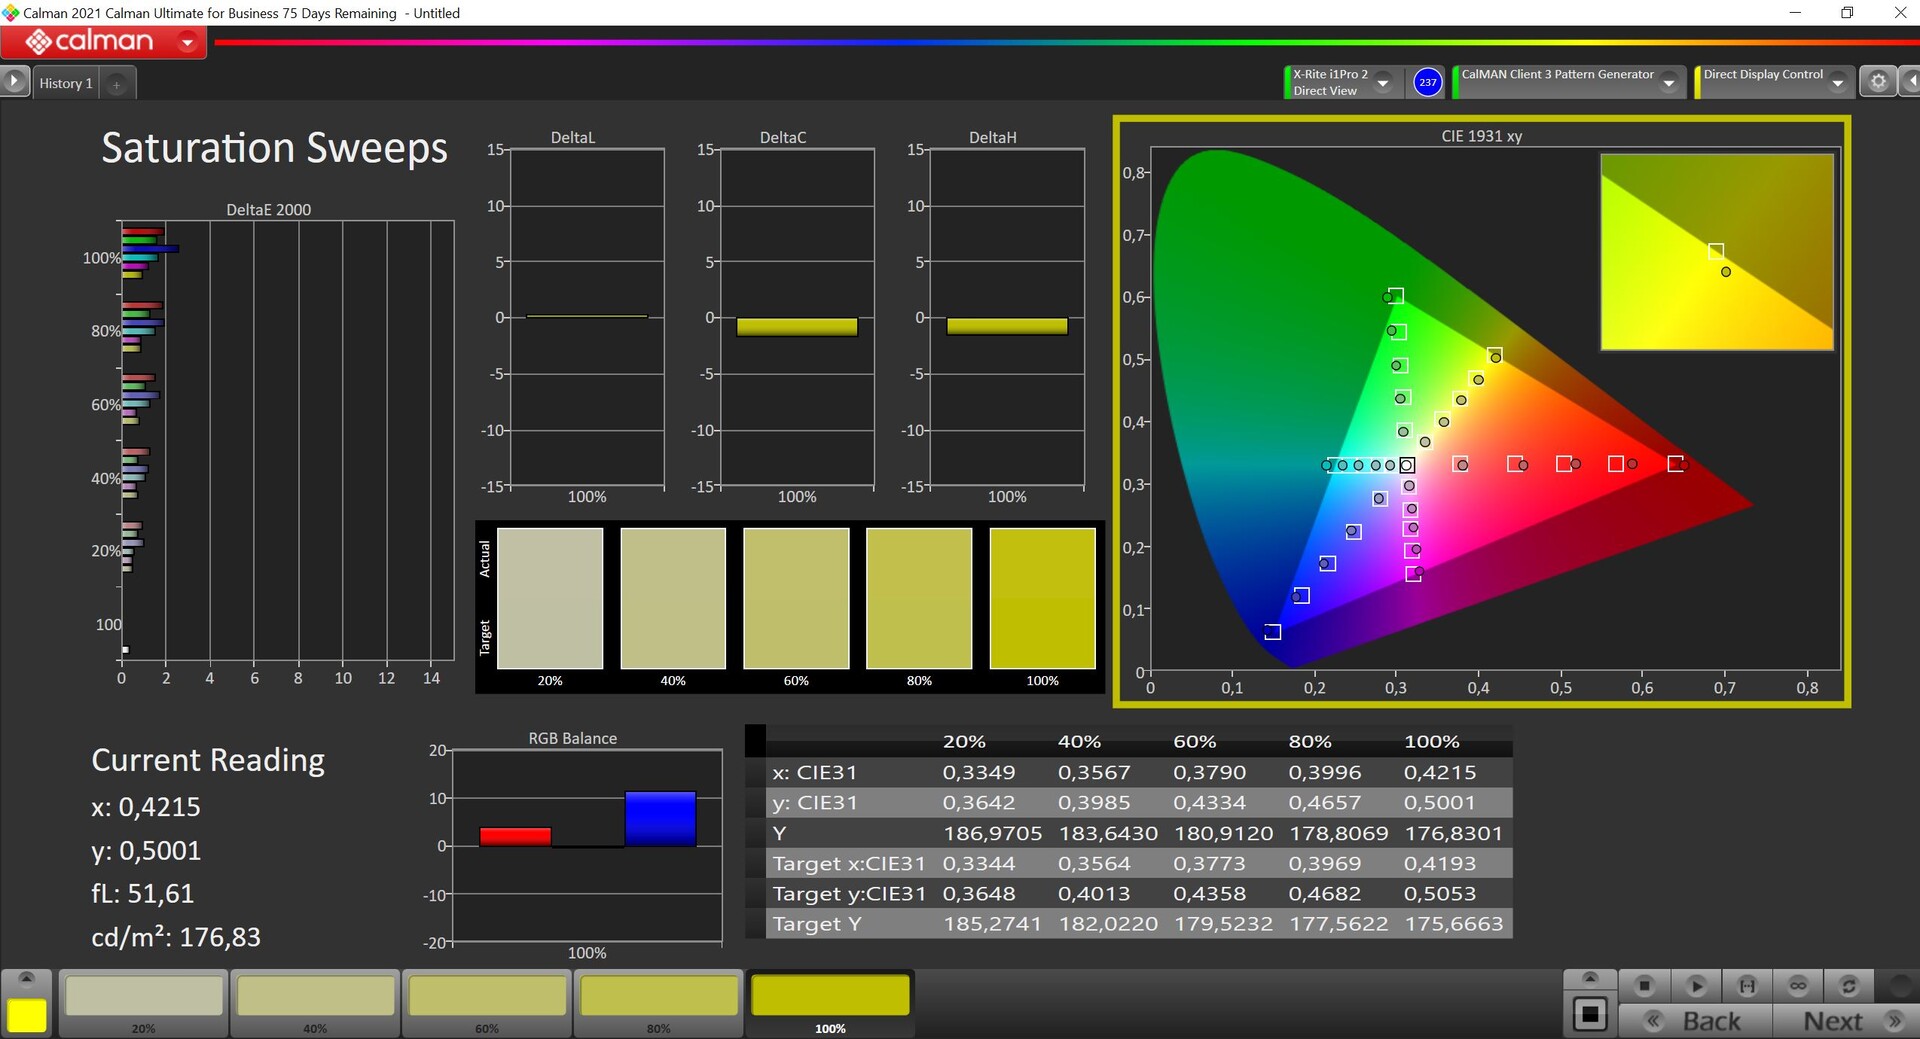

Nasza analiza za pomocą profesjonalnego oprogramowania CalMAN (X-Rite i1 Pro 2) ujawniła lekko niebieskawy odcień w połączeniu z nieco zbyt chłodną temperaturą barwową. Z drugiej strony, odchylenia skali szarości, a także kolorów w stosunku do referencyjnej przestrzeni barw sRGB są już dość niskie. Jeśli nie chcemy edytować zdjęć, to niekoniecznie musimy kalibrować panel, ale wciąż jest tu spory potencjał i po naszej kalibracji wyniki są znacznie lepsze, a wszystkie kolory są poniżej ważnego odchylenia DeltaE-2000 wynoszącego 3. Wraz z niemal pełnym pokryciem sRGB możliwa jest także edycja obrazów/wideo
Wyświetl czasy reakcji
| ↔ Czas reakcji od czerni do bieli | ||
|---|---|---|
| 16.8 ms ... wzrost ↗ i spadek ↘ łącznie | ↗ 6.4 ms wzrost | 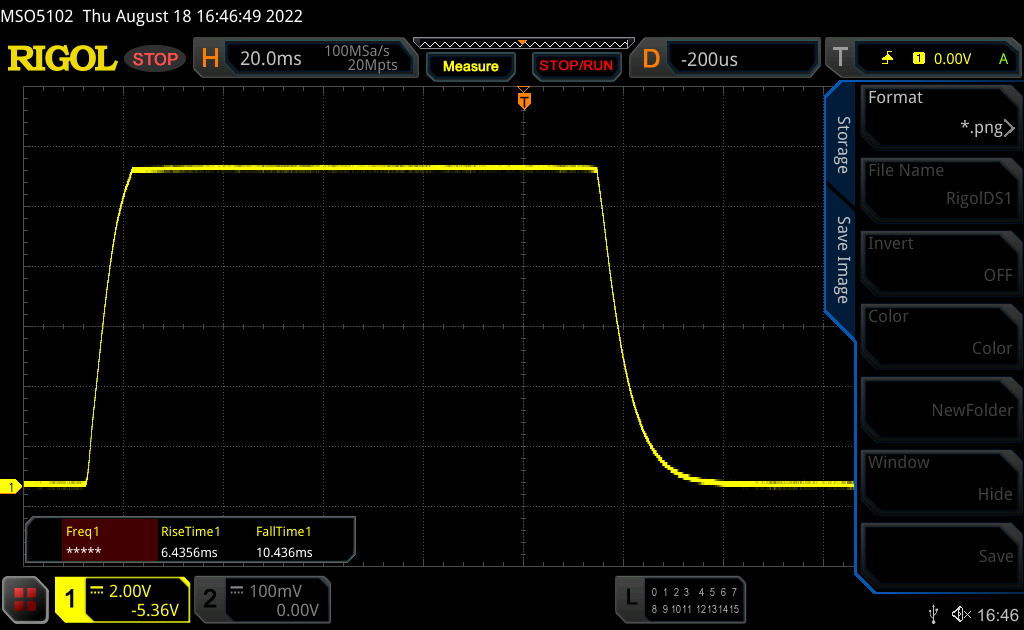 |
| ↘ 10.4 ms upadek | ||
| W naszych testach ekran wykazuje dobry współczynnik reakcji, ale może być zbyt wolny dla graczy rywalizujących ze sobą. Dla porównania, wszystkie testowane urządzenia wahają się od 0.1 (minimum) do 240 (maksimum) ms. » 38 % wszystkich urządzeń jest lepszych. Oznacza to, że zmierzony czas reakcji jest lepszy od średniej wszystkich testowanych urządzeń (19.9 ms). | ||
| ↔ Czas reakcji 50% szarości do 80% szarości | ||
| 32.7 ms ... wzrost ↗ i spadek ↘ łącznie | ↗ 15.7 ms wzrost | 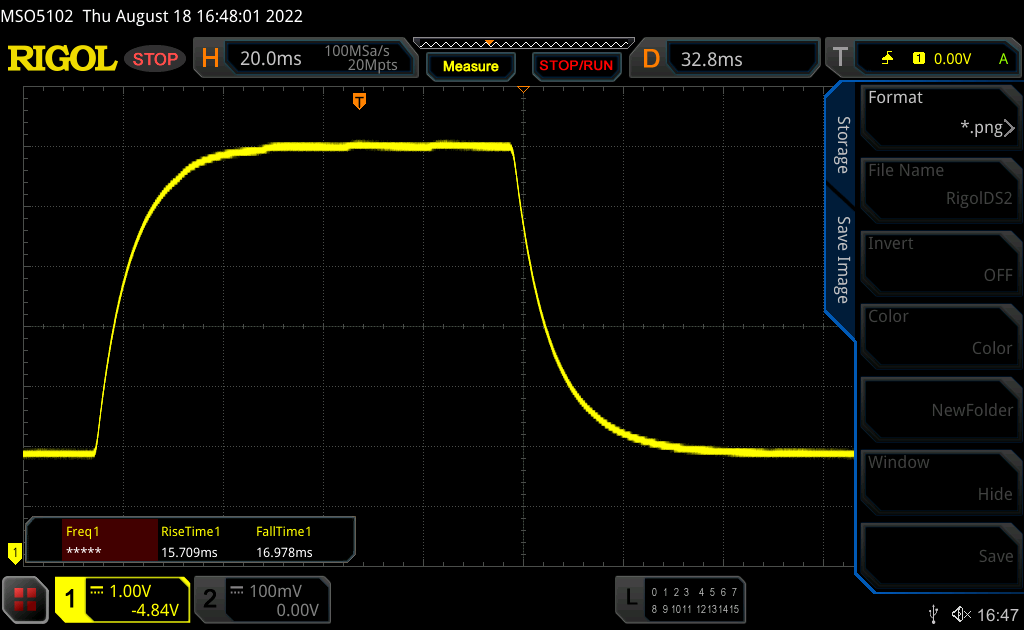 |
| ↘ 17 ms upadek | ||
| W naszych testach ekran wykazuje powolne tempo reakcji, co będzie niezadowalające dla graczy. Dla porównania, wszystkie testowane urządzenia wahają się od 0.165 (minimum) do 636 (maksimum) ms. » 44 % wszystkich urządzeń jest lepszych. Oznacza to, że zmierzony czas reakcji jest zbliżony do średniej wszystkich testowanych urządzeń (31.1 ms). | ||
Migotanie ekranu / PWM (modulacja szerokości impulsu)
| Migotanie ekranu/nie wykryto PWM |  | ||
Dla porównania: 52 % wszystkich testowanych urządzeń nie używa PWM do przyciemniania wyświetlacza. Jeśli wykryto PWM, zmierzono średnio 7794 (minimum: 5 - maksimum: 343500) Hz. | |||
Matowa powierzchnia ekranu pomaga oczywiście na zewnątrz i można komfortowo pracować w pochmurne dni, ale w bardzo jasne dni wyświetlacz musi być nieco jaśniejszy.
Wydajność - Alder Lake i GeForce RTX
Warunki badania
Jak zwykle Lenovo oferuje własne ustawienia zasilania, które można ustawić za pomocą preinstalowanego oprogramowania Vantage lub kombinacji klawiszy Fn+P. W poniższej tabeli wymieniliśmy odpowiednie wartości TDP/TGP dla CPU i GPU. Do testów wykorzystaliśmy ustawienie Wysoka wydajność .
| Tryb wydajności | Obciążenie CPU | Obciążenie GPU | Test obciążeniowy | Maks. głośność wentylatora |
|---|---|---|---|---|
| Oszczędzanie baterii | 64 -> 20 watów | 20 watów | CPU: 20 watówGPU: 20 watów |
30,5 dB(A) |
| Intelligent Cooling | 72 -> 35 watów | 36 watów | CPU: 24 watyGPU : 36 watów |
43,7 dB(A) |
| High Performance | 80 -> 55 watów | 60 watów | CPU: 20 watówGPU : 50 watów |
47 dB(A) |
Procesor
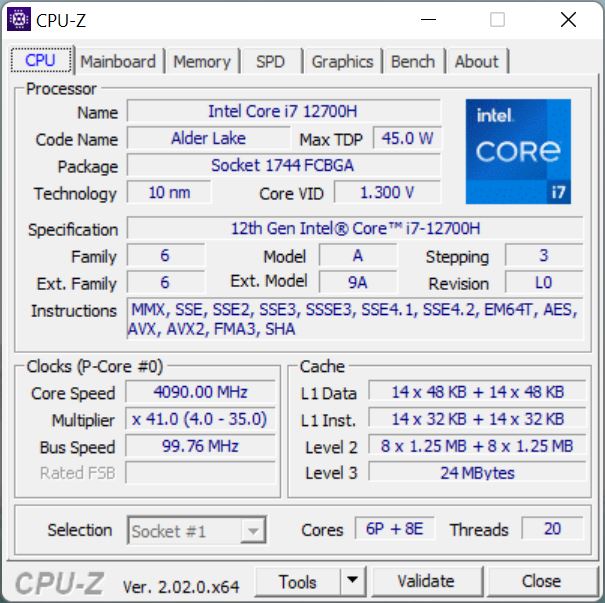
Na stronie Core i7-12700Hto szybki procesor Intela z obecnej generacji Alder Lake, który opiera się na hybrydowej architekturze z 6 rdzeniami o szybkiej wydajności i 8 wydajnymi. Dzięki wysokim limitom mocy wydajność ThinkBooka 16 G4+ jest bardzo dobra, a osiągi procesora są lepsze od rywali. Nawet pod trwałym obciążeniem procesor utrzymuje się na poziomie 55 W i zapewnia dobre wyniki. Maksymalne zużycie jest jednak ograniczone do 70 W w trybie akumulatorowym, a potem szybko osiąga 64 W, dlatego wydajność wielordzeniowa jest o ~12% niższa, kiedy nie jest podłączona do prądu. Więcej benchmarków CPU jest dostępnych tutaj.
Cinebench R15 Multi Sustained Load
Cinebench R23: Multi Core | Single Core
Cinebench R20: CPU (Multi Core) | CPU (Single Core)
Cinebench R15: CPU Multi 64Bit | CPU Single 64Bit
Blender: v2.79 BMW27 CPU
7-Zip 18.03: 7z b 4 | 7z b 4 -mmt1
Geekbench 5.5: Multi-Core | Single-Core
HWBOT x265 Benchmark v2.2: 4k Preset
LibreOffice : 20 Documents To PDF
R Benchmark 2.5: Overall mean
| CPU Performance rating | |
| Średnia w klasie Multimedia | |
| Lenovo ThinkBook 16 G4+ IAP | |
| Przeciętny Intel Core i7-12700H | |
| Dell Inspiron 16 Plus 7620 | |
| Huawei MateBook D 16 2022 | |
| Asus Vivobook Pro 16X-M7600QE | |
| Samsung Galaxy Book2 15 | |
| Acer Swift X SFX16-51G-5388 | |
| Cinebench R23 / Multi Core | |
| Średnia w klasie Multimedia (4861 - 33362, n=81, ostatnie 2 lata) | |
| Lenovo ThinkBook 16 G4+ IAP | |
| Przeciętny Intel Core i7-12700H (4032 - 19330, n=64) | |
| Dell Inspiron 16 Plus 7620 | |
| Asus Vivobook Pro 16X-M7600QE | |
| Asus Vivobook Pro 16X-M7600QE | |
| Huawei MateBook D 16 2022 | |
| Samsung Galaxy Book2 15 | |
| Acer Swift X SFX16-51G-5388 | |
| Cinebench R23 / Single Core | |
| Średnia w klasie Multimedia (1128 - 2459, n=73, ostatnie 2 lata) | |
| Lenovo ThinkBook 16 G4+ IAP | |
| Huawei MateBook D 16 2022 | |
| Samsung Galaxy Book2 15 | |
| Dell Inspiron 16 Plus 7620 | |
| Przeciętny Intel Core i7-12700H (778 - 1826, n=63) | |
| Asus Vivobook Pro 16X-M7600QE | |
| Asus Vivobook Pro 16X-M7600QE | |
| Acer Swift X SFX16-51G-5388 | |
| Cinebench R20 / CPU (Multi Core) | |
| Średnia w klasie Multimedia (1887 - 12912, n=64, ostatnie 2 lata) | |
| Lenovo ThinkBook 16 G4+ IAP | |
| Przeciętny Intel Core i7-12700H (1576 - 7407, n=64) | |
| Dell Inspiron 16 Plus 7620 | |
| Asus Vivobook Pro 16X-M7600QE | |
| Asus Vivobook Pro 16X-M7600QE | |
| Huawei MateBook D 16 2022 | |
| Samsung Galaxy Book2 15 | |
| Acer Swift X SFX16-51G-5388 | |
| Cinebench R20 / CPU (Single Core) | |
| Średnia w klasie Multimedia (425 - 853, n=64, ostatnie 2 lata) | |
| Lenovo ThinkBook 16 G4+ IAP | |
| Samsung Galaxy Book2 15 | |
| Dell Inspiron 16 Plus 7620 | |
| Przeciętny Intel Core i7-12700H (300 - 704, n=64) | |
| Huawei MateBook D 16 2022 | |
| Asus Vivobook Pro 16X-M7600QE | |
| Asus Vivobook Pro 16X-M7600QE | |
| Acer Swift X SFX16-51G-5388 | |
| Cinebench R15 / CPU Multi 64Bit | |
| Średnia w klasie Multimedia (856 - 5224, n=68, ostatnie 2 lata) | |
| Przeciętny Intel Core i7-12700H (1379 - 2916, n=70) | |
| Lenovo ThinkBook 16 G4+ IAP | |
| Dell Inspiron 16 Plus 7620 | |
| Huawei MateBook D 16 2022 | |
| Huawei MateBook D 16 2022 | |
| Asus Vivobook Pro 16X-M7600QE | |
| Asus Vivobook Pro 16X-M7600QE | |
| Samsung Galaxy Book2 15 | |
| Acer Swift X SFX16-51G-5388 | |
| Cinebench R15 / CPU Single 64Bit | |
| Średnia w klasie Multimedia (184.8 - 326, n=66, ostatnie 2 lata) | |
| Lenovo ThinkBook 16 G4+ IAP | |
| Huawei MateBook D 16 2022 | |
| Dell Inspiron 16 Plus 7620 | |
| Przeciętny Intel Core i7-12700H (113 - 263, n=65) | |
| Samsung Galaxy Book2 15 | |
| Asus Vivobook Pro 16X-M7600QE | |
| Asus Vivobook Pro 16X-M7600QE | |
| Acer Swift X SFX16-51G-5388 | |
| Blender / v2.79 BMW27 CPU | |
| Acer Swift X SFX16-51G-5388 | |
| Samsung Galaxy Book2 15 | |
| Huawei MateBook D 16 2022 | |
| Asus Vivobook Pro 16X-M7600QE | |
| Asus Vivobook Pro 16X-M7600QE | |
| Średnia w klasie Multimedia (100 - 557, n=65, ostatnie 2 lata) | |
| Dell Inspiron 16 Plus 7620 | |
| Przeciętny Intel Core i7-12700H (168 - 732, n=63) | |
| Lenovo ThinkBook 16 G4+ IAP | |
| 7-Zip 18.03 / 7z b 4 | |
| Lenovo ThinkBook 16 G4+ IAP | |
| Przeciętny Intel Core i7-12700H (22844 - 73067, n=63) | |
| Dell Inspiron 16 Plus 7620 | |
| Średnia w klasie Multimedia (29095 - 130368, n=62, ostatnie 2 lata) | |
| Asus Vivobook Pro 16X-M7600QE | |
| Asus Vivobook Pro 16X-M7600QE | |
| Huawei MateBook D 16 2022 | |
| Samsung Galaxy Book2 15 | |
| Acer Swift X SFX16-51G-5388 | |
| 7-Zip 18.03 / 7z b 4 -mmt1 | |
| Średnia w klasie Multimedia (3666 - 7545, n=63, ostatnie 2 lata) | |
| Asus Vivobook Pro 16X-M7600QE | |
| Asus Vivobook Pro 16X-M7600QE | |
| Huawei MateBook D 16 2022 | |
| Lenovo ThinkBook 16 G4+ IAP | |
| Przeciętny Intel Core i7-12700H (2743 - 5972, n=63) | |
| Dell Inspiron 16 Plus 7620 | |
| Samsung Galaxy Book2 15 | |
| Acer Swift X SFX16-51G-5388 | |
| Geekbench 5.5 / Multi-Core | |
| Średnia w klasie Multimedia (4652 - 20422, n=62, ostatnie 2 lata) | |
| Lenovo ThinkBook 16 G4+ IAP | |
| Dell Inspiron 16 Plus 7620 | |
| Przeciętny Intel Core i7-12700H (5144 - 13745, n=64) | |
| Huawei MateBook D 16 2022 | |
| Asus Vivobook Pro 16X-M7600QE | |
| Asus Vivobook Pro 16X-M7600QE | |
| Samsung Galaxy Book2 15 | |
| Acer Swift X SFX16-51G-5388 | |
| Geekbench 5.5 / Single-Core | |
| Średnia w klasie Multimedia (805 - 2974, n=62, ostatnie 2 lata) | |
| Huawei MateBook D 16 2022 | |
| Lenovo ThinkBook 16 G4+ IAP | |
| Samsung Galaxy Book2 15 | |
| Dell Inspiron 16 Plus 7620 | |
| Przeciętny Intel Core i7-12700H (803 - 1851, n=64) | |
| Asus Vivobook Pro 16X-M7600QE | |
| Asus Vivobook Pro 16X-M7600QE | |
| Acer Swift X SFX16-51G-5388 | |
| HWBOT x265 Benchmark v2.2 / 4k Preset | |
| Średnia w klasie Multimedia (5.26 - 36.1, n=63, ostatnie 2 lata) | |
| Lenovo ThinkBook 16 G4+ IAP | |
| Przeciętny Intel Core i7-12700H (4.67 - 21.8, n=64) | |
| Dell Inspiron 16 Plus 7620 | |
| Asus Vivobook Pro 16X-M7600QE | |
| Asus Vivobook Pro 16X-M7600QE | |
| Huawei MateBook D 16 2022 | |
| Samsung Galaxy Book2 15 | |
| Acer Swift X SFX16-51G-5388 | |
| LibreOffice / 20 Documents To PDF | |
| Asus Vivobook Pro 16X-M7600QE | |
| Asus Vivobook Pro 16X-M7600QE | |
| Acer Swift X SFX16-51G-5388 | |
| Średnia w klasie Multimedia (23.9 - 146.7, n=64, ostatnie 2 lata) | |
| Lenovo ThinkBook 16 G4+ IAP | |
| Dell Inspiron 16 Plus 7620 | |
| Przeciętny Intel Core i7-12700H (34.2 - 95.3, n=63) | |
| Samsung Galaxy Book2 15 | |
| Huawei MateBook D 16 2022 | |
| R Benchmark 2.5 / Overall mean | |
| Acer Swift X SFX16-51G-5388 | |
| Asus Vivobook Pro 16X-M7600QE | |
| Asus Vivobook Pro 16X-M7600QE | |
| Dell Inspiron 16 Plus 7620 | |
| Przeciętny Intel Core i7-12700H (0.4441 - 1.052, n=63) | |
| Samsung Galaxy Book2 15 | |
| Średnia w klasie Multimedia (0.3604 - 0.947, n=63, ostatnie 2 lata) | |
| Lenovo ThinkBook 16 G4+ IAP | |
| Huawei MateBook D 16 2022 | |
* ... im mniej tym lepiej
AIDA64: FP32 Ray-Trace | FPU Julia | CPU SHA3 | CPU Queen | FPU SinJulia | FPU Mandel | CPU AES | CPU ZLib | FP64 Ray-Trace | CPU PhotoWorxx
| Performance rating | |
| Średnia w klasie Multimedia | |
| Asus Vivobook Pro 16X-M7600QE | |
| Lenovo ThinkBook 16 G4+ IAP | |
| Dell Inspiron 16 Plus 7620 | |
| Przeciętny Intel Core i7-12700H | |
| Huawei MateBook D 16 2022 | |
| Samsung Galaxy Book2 15 | |
| Acer Swift X SFX16-51G-5388 | |
| AIDA64 / FP32 Ray-Trace | |
| Średnia w klasie Multimedia (2214 - 50388, n=60, ostatnie 2 lata) | |
| Lenovo ThinkBook 16 G4+ IAP | |
| Asus Vivobook Pro 16X-M7600QE | |
| Asus Vivobook Pro 16X-M7600QE | |
| Dell Inspiron 16 Plus 7620 | |
| Huawei MateBook D 16 2022 | |
| Przeciętny Intel Core i7-12700H (2585 - 17957, n=64) | |
| Acer Swift X SFX16-51G-5388 | |
| Samsung Galaxy Book2 15 | |
| AIDA64 / FPU Julia | |
| Asus Vivobook Pro 16X-M7600QE | |
| Asus Vivobook Pro 16X-M7600QE | |
| Średnia w klasie Multimedia (12867 - 201874, n=61, ostatnie 2 lata) | |
| Lenovo ThinkBook 16 G4+ IAP | |
| Dell Inspiron 16 Plus 7620 | |
| Huawei MateBook D 16 2022 | |
| Przeciętny Intel Core i7-12700H (12439 - 90760, n=64) | |
| Acer Swift X SFX16-51G-5388 | |
| Samsung Galaxy Book2 15 | |
| AIDA64 / CPU SHA3 | |
| Średnia w klasie Multimedia (653 - 8623, n=61, ostatnie 2 lata) | |
| Lenovo ThinkBook 16 G4+ IAP | |
| Asus Vivobook Pro 16X-M7600QE | |
| Asus Vivobook Pro 16X-M7600QE | |
| Przeciętny Intel Core i7-12700H (833 - 4242, n=64) | |
| Dell Inspiron 16 Plus 7620 | |
| Huawei MateBook D 16 2022 | |
| Acer Swift X SFX16-51G-5388 | |
| Samsung Galaxy Book2 15 | |
| AIDA64 / CPU Queen | |
| Lenovo ThinkBook 16 G4+ IAP | |
| Asus Vivobook Pro 16X-M7600QE | |
| Asus Vivobook Pro 16X-M7600QE | |
| Przeciętny Intel Core i7-12700H (57923 - 103202, n=63) | |
| Huawei MateBook D 16 2022 | |
| Dell Inspiron 16 Plus 7620 | |
| Średnia w klasie Multimedia (13483 - 181505, n=49, ostatnie 2 lata) | |
| Samsung Galaxy Book2 15 | |
| Acer Swift X SFX16-51G-5388 | |
| AIDA64 / FPU SinJulia | |
| Asus Vivobook Pro 16X-M7600QE | |
| Asus Vivobook Pro 16X-M7600QE | |
| Lenovo ThinkBook 16 G4+ IAP | |
| Średnia w klasie Multimedia (1240 - 28794, n=61, ostatnie 2 lata) | |
| Przeciętny Intel Core i7-12700H (3249 - 9939, n=64) | |
| Dell Inspiron 16 Plus 7620 | |
| Huawei MateBook D 16 2022 | |
| Samsung Galaxy Book2 15 | |
| Acer Swift X SFX16-51G-5388 | |
| AIDA64 / FPU Mandel | |
| Asus Vivobook Pro 16X-M7600QE | |
| Asus Vivobook Pro 16X-M7600QE | |
| Średnia w klasie Multimedia (6395 - 105740, n=60, ostatnie 2 lata) | |
| Lenovo ThinkBook 16 G4+ IAP | |
| Dell Inspiron 16 Plus 7620 | |
| Przeciętny Intel Core i7-12700H (7135 - 44760, n=64) | |
| Huawei MateBook D 16 2022 | |
| Acer Swift X SFX16-51G-5388 | |
| Samsung Galaxy Book2 15 | |
| AIDA64 / CPU AES | |
| Asus Vivobook Pro 16X-M7600QE | |
| Asus Vivobook Pro 16X-M7600QE | |
| Huawei MateBook D 16 2022 | |
| Przeciętny Intel Core i7-12700H (31839 - 144360, n=64) | |
| Lenovo ThinkBook 16 G4+ IAP | |
| Średnia w klasie Multimedia (13243 - 126790, n=61, ostatnie 2 lata) | |
| Dell Inspiron 16 Plus 7620 | |
| Acer Swift X SFX16-51G-5388 | |
| Samsung Galaxy Book2 15 | |
| AIDA64 / CPU ZLib | |
| Lenovo ThinkBook 16 G4+ IAP | |
| Średnia w klasie Multimedia (167.2 - 2022, n=61, ostatnie 2 lata) | |
| Dell Inspiron 16 Plus 7620 | |
| Przeciętny Intel Core i7-12700H (305 - 1171, n=64) | |
| Asus Vivobook Pro 16X-M7600QE | |
| Asus Vivobook Pro 16X-M7600QE | |
| Huawei MateBook D 16 2022 | |
| Samsung Galaxy Book2 15 | |
| Acer Swift X SFX16-51G-5388 | |
| AIDA64 / FP64 Ray-Trace | |
| Średnia w klasie Multimedia (1014 - 26875, n=61, ostatnie 2 lata) | |
| Asus Vivobook Pro 16X-M7600QE | |
| Asus Vivobook Pro 16X-M7600QE | |
| Lenovo ThinkBook 16 G4+ IAP | |
| Dell Inspiron 16 Plus 7620 | |
| Przeciętny Intel Core i7-12700H (1437 - 9692, n=64) | |
| Huawei MateBook D 16 2022 | |
| Acer Swift X SFX16-51G-5388 | |
| Samsung Galaxy Book2 15 | |
| AIDA64 / CPU PhotoWorxx | |
| Średnia w klasie Multimedia (12860 - 88154, n=61, ostatnie 2 lata) | |
| Samsung Galaxy Book2 15 | |
| Lenovo ThinkBook 16 G4+ IAP | |
| Huawei MateBook D 16 2022 | |
| Acer Swift X SFX16-51G-5388 | |
| Dell Inspiron 16 Plus 7620 | |
| Przeciętny Intel Core i7-12700H (12863 - 52207, n=64) | |
| Asus Vivobook Pro 16X-M7600QE | |
| Asus Vivobook Pro 16X-M7600QE | |
Wydajność systemu
W codziennym użytkowaniu ThinkBook 16 G4+ jest laptopem niezwykle responsywnym i biorąc pod uwagę wydajne podzespoły, nie należy się martwić o wąskie gardła wydajności w najbliższych latach. W naszej próbce testowej nie mogliśmy uruchomić syntetycznego PCMarka 10, gdyż zawsze się zawieszał mimo kilku reinstalacji programu a także sterowników. Był to jedyny problem, jaki napotkaliśmy podczas testów, a wyniki w pozostałych benchmarkach są bardzo dobre, zgodnie z oczekiwaniami.
WebXPRT 3: Overall
WebXPRT 4: Overall
Jetstream 2: 2.0 Total
Mozilla Kraken 1.1: Total
Octane V2: Total Score
LibreOffice : 20 Documents To PDF
| CrossMark / Overall | |
| Huawei MateBook D 16 2022 | |
| Średnia w klasie Multimedia (866 - 2728, n=67, ostatnie 2 lata) | |
| Lenovo ThinkBook 16 G4+ IAP | |
| Przeciętny Intel Core i7-12700H, NVIDIA GeForce RTX 2050 Mobile (n=1) | |
| Dell Inspiron 16 Plus 7620 | |
| Acer Swift X SFX16-51G-5388 | |
| CrossMark / Productivity | |
| Huawei MateBook D 16 2022 | |
| Średnia w klasie Multimedia (931 - 2489, n=67, ostatnie 2 lata) | |
| Lenovo ThinkBook 16 G4+ IAP | |
| Przeciętny Intel Core i7-12700H, NVIDIA GeForce RTX 2050 Mobile (n=1) | |
| Dell Inspiron 16 Plus 7620 | |
| Acer Swift X SFX16-51G-5388 | |
| CrossMark / Creativity | |
| Średnia w klasie Multimedia (907 - 3465, n=67, ostatnie 2 lata) | |
| Huawei MateBook D 16 2022 | |
| Lenovo ThinkBook 16 G4+ IAP | |
| Przeciętny Intel Core i7-12700H, NVIDIA GeForce RTX 2050 Mobile (n=1) | |
| Dell Inspiron 16 Plus 7620 | |
| Acer Swift X SFX16-51G-5388 | |
| CrossMark / Responsiveness | |
| Huawei MateBook D 16 2022 | |
| Lenovo ThinkBook 16 G4+ IAP | |
| Przeciętny Intel Core i7-12700H, NVIDIA GeForce RTX 2050 Mobile (n=1) | |
| Dell Inspiron 16 Plus 7620 | |
| Średnia w klasie Multimedia (605 - 2024, n=67, ostatnie 2 lata) | |
| Acer Swift X SFX16-51G-5388 | |
| WebXPRT 3 / Overall | |
| Średnia w klasie Multimedia (136.4 - 596, n=70, ostatnie 2 lata) | |
| Huawei MateBook D 16 2022 | |
| Dell Inspiron 16 Plus 7620 | |
| Lenovo ThinkBook 16 G4+ IAP | |
| Przeciętny Intel Core i7-12700H, NVIDIA GeForce RTX 2050 Mobile (n=1) | |
| Asus Vivobook Pro 16X-M7600QE | |
| Samsung Galaxy Book2 15 | |
| Acer Swift X SFX16-51G-5388 | |
| WebXPRT 4 / Overall | |
| Średnia w klasie Multimedia (167.3 - 402, n=71, ostatnie 2 lata) | |
| Huawei MateBook D 16 2022 | |
| Lenovo ThinkBook 16 G4+ IAP | |
| Przeciętny Intel Core i7-12700H, NVIDIA GeForce RTX 2050 Mobile (n=1) | |
| Dell Inspiron 16 Plus 7620 | |
| Samsung Galaxy Book2 15 | |
| Acer Swift X SFX16-51G-5388 | |
| Jetstream 2 / 2.0 Total | |
| Średnia w klasie Multimedia (261 - 481, n=36, ostatnie 2 lata) | |
| Dell Inspiron 16 Plus 7620 | |
| Lenovo ThinkBook 16 G4+ IAP | |
| Przeciętny Intel Core i7-12700H, NVIDIA GeForce RTX 2050 Mobile (n=1) | |
| Huawei MateBook D 16 2022 | |
| Samsung Galaxy Book2 15 | |
| Acer Swift X SFX16-51G-5388 | |
| Mozilla Kraken 1.1 / Total | |
| Acer Swift X SFX16-51G-5388 | |
| Asus Vivobook Pro 16X-M7600QE | |
| Asus Vivobook Pro 16X-M7600QE | |
| Samsung Galaxy Book2 15 | |
| Dell Inspiron 16 Plus 7620 | |
| Huawei MateBook D 16 2022 | |
| Lenovo ThinkBook 16 G4+ IAP | |
| Przeciętny Intel Core i7-12700H, NVIDIA GeForce RTX 2050 Mobile (n=1) | |
| Średnia w klasie Multimedia (228 - 835, n=74, ostatnie 2 lata) | |
| Octane V2 / Total Score | |
| Średnia w klasie Multimedia (64079 - 153175, n=35, ostatnie 2 lata) | |
| Huawei MateBook D 16 2022 | |
| Lenovo ThinkBook 16 G4+ IAP | |
| Przeciętny Intel Core i7-12700H, NVIDIA GeForce RTX 2050 Mobile (n=1) | |
| Samsung Galaxy Book2 15 | |
| Acer Swift X SFX16-51G-5388 | |
| LibreOffice / 20 Documents To PDF | |
| Asus Vivobook Pro 16X-M7600QE | |
| Asus Vivobook Pro 16X-M7600QE | |
| Acer Swift X SFX16-51G-5388 | |
| Średnia w klasie Multimedia (23.9 - 146.7, n=64, ostatnie 2 lata) | |
| Lenovo ThinkBook 16 G4+ IAP | |
| Przeciętny Intel Core i7-12700H, NVIDIA GeForce RTX 2050 Mobile (n=1) | |
| Dell Inspiron 16 Plus 7620 | |
| Samsung Galaxy Book2 15 | |
| Huawei MateBook D 16 2022 | |
* ... im mniej tym lepiej
» No benchmarks for this notebook found!
| AIDA64 / Memory Copy | |
| Średnia w klasie Multimedia (21158 - 132135, n=61, ostatnie 2 lata) | |
| Lenovo ThinkBook 16 G4+ IAP | |
| Samsung Galaxy Book2 15 | |
| Huawei MateBook D 16 2022 | |
| Acer Swift X SFX16-51G-5388 | |
| Dell Inspiron 16 Plus 7620 | |
| Przeciętny Intel Core i7-12700H (25615 - 80511, n=64) | |
| Asus Vivobook Pro 16X-M7600QE | |
| Asus Vivobook Pro 16X-M7600QE | |
| AIDA64 / Memory Read | |
| Średnia w klasie Multimedia (19699 - 174586, n=61, ostatnie 2 lata) | |
| Lenovo ThinkBook 16 G4+ IAP | |
| Dell Inspiron 16 Plus 7620 | |
| Samsung Galaxy Book2 15 | |
| Przeciętny Intel Core i7-12700H (25586 - 79442, n=64) | |
| Huawei MateBook D 16 2022 | |
| Acer Swift X SFX16-51G-5388 | |
| Asus Vivobook Pro 16X-M7600QE | |
| Asus Vivobook Pro 16X-M7600QE | |
| AIDA64 / Memory Write | |
| Średnia w klasie Multimedia (17733 - 134998, n=61, ostatnie 2 lata) | |
| Samsung Galaxy Book2 15 | |
| Acer Swift X SFX16-51G-5388 | |
| Huawei MateBook D 16 2022 | |
| Lenovo ThinkBook 16 G4+ IAP | |
| Dell Inspiron 16 Plus 7620 | |
| Przeciętny Intel Core i7-12700H (23679 - 88660, n=64) | |
| Asus Vivobook Pro 16X-M7600QE | |
| Asus Vivobook Pro 16X-M7600QE | |
| AIDA64 / Memory Latency | |
| Średnia w klasie Multimedia (7 - 535, n=60, ostatnie 2 lata) | |
| Acer Swift X SFX16-51G-5388 | |
| Lenovo ThinkBook 16 G4+ IAP | |
| Huawei MateBook D 16 2022 | |
| Dell Inspiron 16 Plus 7620 | |
| Przeciętny Intel Core i7-12700H (76.2 - 133.9, n=62) | |
| Asus Vivobook Pro 16X-M7600QE | |
| Asus Vivobook Pro 16X-M7600QE | |
| Samsung Galaxy Book2 15 | |
* ... im mniej tym lepiej
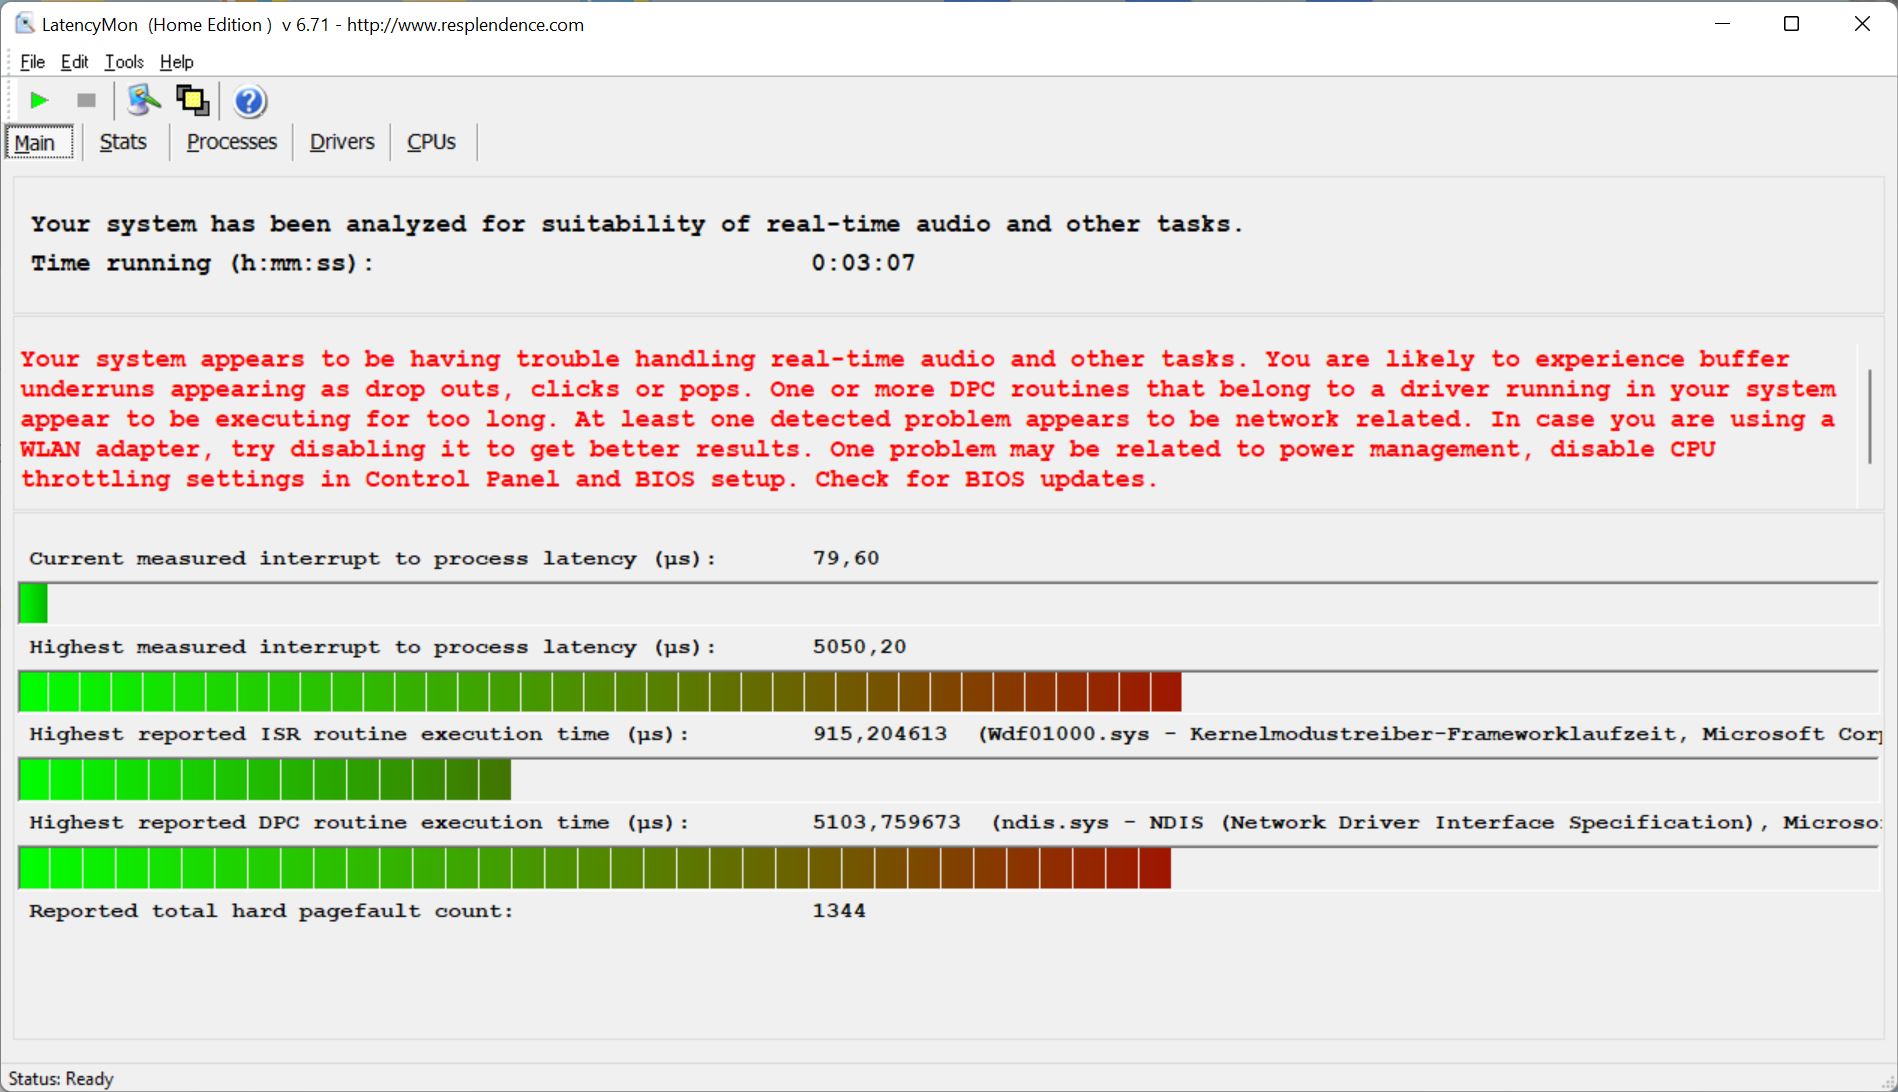
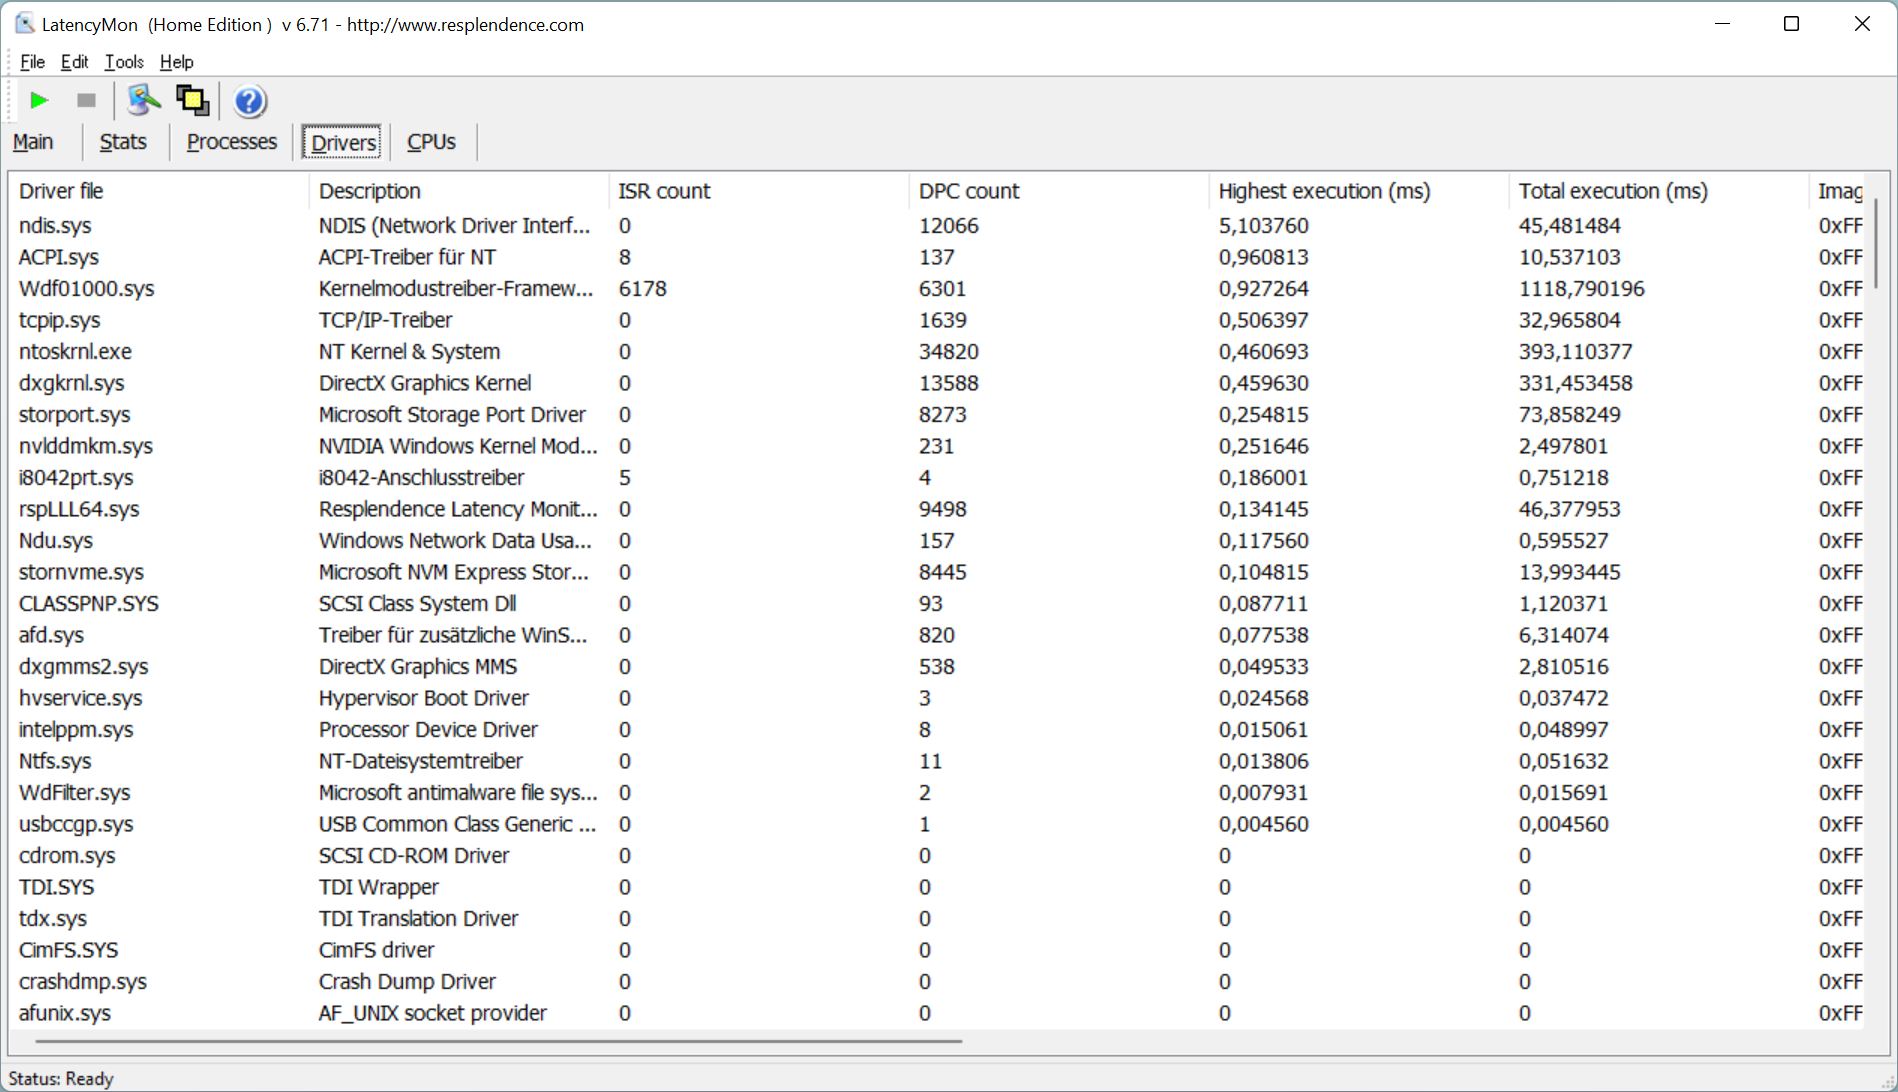
Opóźnienie DPC
W naszym standaryzowanym teście opóźnień (przeglądanie stron internetowych, odtwarzanie YouTube 4K, obciążenie procesora) ThinkBook 16 G4+ wykazuje poważne ograniczenia w stosunku do obecnej wersji i dlatego nie nadaje się do korzystania z aplikacji audio w czasie rzeczywistym.
| DPC Latencies / LatencyMon - interrupt to process latency (max), Web, Youtube, Prime95 | |
| Acer Swift X SFX16-51G-5388 | |
| Lenovo ThinkBook 16 G4+ IAP | |
| Asus Vivobook Pro 16X-M7600QE | |
| Dell Inspiron 16 Plus 7620 | |
| Samsung Galaxy Book2 15 | |
| Huawei MateBook D 16 2022 | |
* ... im mniej tym lepiej
Massenspeicher
ThinkBook 16 G4+ oferuje dwa gniazda M.2-2280 dla dysków SSD, z których jedno wykorzystuje szybkie połączenie PCIe 4.0, a drugie PCIe 3.0. W naszym egzemplarzu recenzenckim zainstalowano kompaktowy Micron 2450 (M.2-2242), który jest już dyskiem SSD PCIe 4.0, ale ten dysk nie jest najszybszy, gdyż producent określa maksymalny transfer na 3,6 GB/s. W efekcie końcowym mamy do czynienia z dyskiem SSD PCIe 4.0 o prędkości PCIe 3.0. Niemniej jednak w praktyce nie przedstawia to żadnych realnych ograniczeń i wydajność pozostaje stabilna nawet przy dłuższym obciążeniu. Dysk SSD oferuje pojemność 1 TB, przy czym po pierwszym uruchomieniu pozostaje do dyspozycji 916 GB. Więcej benchmarków dysków SSD jest dostępnych m.in.tutaj.

| Drive Performance rating - Percent | |
| Średnia w klasie Multimedia | |
| Huawei MateBook D 16 2022 | |
| Lenovo ThinkBook 16 G4+ IAP | |
| Asus Vivobook Pro 16X-M7600QE | |
| Przeciętny Micron 2450 1TB MTFDKCD1T0TFK | |
| Dell Inspiron 16 Plus 7620 | |
| Samsung Galaxy Book2 15 | |
| Acer Swift X SFX16-51G-5388 | |
| DiskSpd | |
| seq read | |
| Średnia w klasie Multimedia (453 - 5278, n=64, ostatnie 2 lata) | |
| Dell Inspiron 16 Plus 7620 | |
| Asus Vivobook Pro 16X-M7600QE | |
| Asus Vivobook Pro 16X-M7600QE | |
| Lenovo ThinkBook 16 G4+ IAP | |
| Przeciętny Micron 2450 1TB MTFDKCD1T0TFK (1926 - 2124, n=3) | |
| Huawei MateBook D 16 2022 | |
| Acer Swift X SFX16-51G-5388 | |
| Samsung Galaxy Book2 15 | |
| seq write | |
| Średnia w klasie Multimedia (384 - 5711, n=64, ostatnie 2 lata) | |
| Lenovo ThinkBook 16 G4+ IAP | |
| Przeciętny Micron 2450 1TB MTFDKCD1T0TFK (2459 - 2750, n=3) | |
| Asus Vivobook Pro 16X-M7600QE | |
| Asus Vivobook Pro 16X-M7600QE | |
| Dell Inspiron 16 Plus 7620 | |
| Samsung Galaxy Book2 15 | |
| Huawei MateBook D 16 2022 | |
| Acer Swift X SFX16-51G-5388 | |
| seq q8 t1 read | |
| Średnia w klasie Multimedia (467 - 7137, n=64, ostatnie 2 lata) | |
| Asus Vivobook Pro 16X-M7600QE | |
| Asus Vivobook Pro 16X-M7600QE | |
| Lenovo ThinkBook 16 G4+ IAP | |
| Przeciętny Micron 2450 1TB MTFDKCD1T0TFK (3314 - 3377, n=3) | |
| Huawei MateBook D 16 2022 | |
| Dell Inspiron 16 Plus 7620 | |
| Samsung Galaxy Book2 15 | |
| Acer Swift X SFX16-51G-5388 | |
| seq q8 t1 write | |
| Średnia w klasie Multimedia (247 - 6954, n=64, ostatnie 2 lata) | |
| Lenovo ThinkBook 16 G4+ IAP | |
| Przeciętny Micron 2450 1TB MTFDKCD1T0TFK (3174 - 3241, n=3) | |
| Asus Vivobook Pro 16X-M7600QE | |
| Asus Vivobook Pro 16X-M7600QE | |
| Dell Inspiron 16 Plus 7620 | |
| Huawei MateBook D 16 2022 | |
| Samsung Galaxy Book2 15 | |
| Acer Swift X SFX16-51G-5388 | |
| 4k q1 t1 read | |
| Dell Inspiron 16 Plus 7620 | |
| Średnia w klasie Multimedia (18.8 - 97.7, n=64, ostatnie 2 lata) | |
| Lenovo ThinkBook 16 G4+ IAP | |
| Asus Vivobook Pro 16X-M7600QE | |
| Asus Vivobook Pro 16X-M7600QE | |
| Przeciętny Micron 2450 1TB MTFDKCD1T0TFK (46 - 61.2, n=3) | |
| Samsung Galaxy Book2 15 | |
| Acer Swift X SFX16-51G-5388 | |
| Huawei MateBook D 16 2022 | |
| 4k q1 t1 write | |
| Huawei MateBook D 16 2022 | |
| Samsung Galaxy Book2 15 | |
| Lenovo ThinkBook 16 G4+ IAP | |
| Dell Inspiron 16 Plus 7620 | |
| Średnia w klasie Multimedia (40.3 - 311, n=64, ostatnie 2 lata) | |
| Przeciętny Micron 2450 1TB MTFDKCD1T0TFK (130 - 187.8, n=3) | |
| Acer Swift X SFX16-51G-5388 | |
| Asus Vivobook Pro 16X-M7600QE | |
| Asus Vivobook Pro 16X-M7600QE | |
| 4k q32 t16 read | |
| Średnia w klasie Multimedia (190.3 - 6121, n=64, ostatnie 2 lata) | |
| Huawei MateBook D 16 2022 | |
| Asus Vivobook Pro 16X-M7600QE | |
| Asus Vivobook Pro 16X-M7600QE | |
| Lenovo ThinkBook 16 G4+ IAP | |
| Samsung Galaxy Book2 15 | |
| Przeciętny Micron 2450 1TB MTFDKCD1T0TFK (666 - 923, n=3) | |
| Acer Swift X SFX16-51G-5388 | |
| Dell Inspiron 16 Plus 7620 | |
| 4k q32 t16 write | |
| Huawei MateBook D 16 2022 | |
| Średnia w klasie Multimedia (154.9 - 4447, n=64, ostatnie 2 lata) | |
| Samsung Galaxy Book2 15 | |
| Acer Swift X SFX16-51G-5388 | |
| Asus Vivobook Pro 16X-M7600QE | |
| Asus Vivobook Pro 16X-M7600QE | |
| Lenovo ThinkBook 16 G4+ IAP | |
| Dell Inspiron 16 Plus 7620 | |
| Przeciętny Micron 2450 1TB MTFDKCD1T0TFK (294 - 501, n=3) | |
| AS SSD | |
| Score Total | |
| Średnia w klasie Multimedia (482 - 10877, n=61, ostatnie 2 lata) | |
| Asus Vivobook Pro 16X-M7600QE | |
| Lenovo ThinkBook 16 G4+ IAP | |
| Przeciętny Micron 2450 1TB MTFDKCD1T0TFK (3758 - 4750, n=3) | |
| Huawei MateBook D 16 2022 | |
| Acer Swift X SFX16-51G-5388 | |
| Samsung Galaxy Book2 15 | |
| Dell Inspiron 16 Plus 7620 | |
| Score Read | |
| Asus Vivobook Pro 16X-M7600QE | |
| Średnia w klasie Multimedia (192 - 4062, n=61, ostatnie 2 lata) | |
| Huawei MateBook D 16 2022 | |
| Acer Swift X SFX16-51G-5388 | |
| Lenovo ThinkBook 16 G4+ IAP | |
| Dell Inspiron 16 Plus 7620 | |
| Przeciętny Micron 2450 1TB MTFDKCD1T0TFK (986 - 1296, n=3) | |
| Samsung Galaxy Book2 15 | |
| Score Write | |
| Lenovo ThinkBook 16 G4+ IAP | |
| Średnia w klasie Multimedia (191 - 4781, n=61, ostatnie 2 lata) | |
| Przeciętny Micron 2450 1TB MTFDKCD1T0TFK (2297 - 2826, n=3) | |
| Asus Vivobook Pro 16X-M7600QE | |
| Huawei MateBook D 16 2022 | |
| Acer Swift X SFX16-51G-5388 | |
| Samsung Galaxy Book2 15 | |
| Dell Inspiron 16 Plus 7620 | |
| Seq Read | |
| Średnia w klasie Multimedia (484 - 5834, n=61, ostatnie 2 lata) | |
| Asus Vivobook Pro 16X-M7600QE | |
| Lenovo ThinkBook 16 G4+ IAP | |
| Huawei MateBook D 16 2022 | |
| Przeciętny Micron 2450 1TB MTFDKCD1T0TFK (2717 - 2825, n=3) | |
| Acer Swift X SFX16-51G-5388 | |
| Dell Inspiron 16 Plus 7620 | |
| Samsung Galaxy Book2 15 | |
| Seq Write | |
| Średnia w klasie Multimedia (344 - 5698, n=61, ostatnie 2 lata) | |
| Przeciętny Micron 2450 1TB MTFDKCD1T0TFK (1852 - 2154, n=3) | |
| Huawei MateBook D 16 2022 | |
| Lenovo ThinkBook 16 G4+ IAP | |
| Asus Vivobook Pro 16X-M7600QE | |
| Samsung Galaxy Book2 15 | |
| Dell Inspiron 16 Plus 7620 | |
| Acer Swift X SFX16-51G-5388 | |
| 4K Read | |
| Dell Inspiron 16 Plus 7620 | |
| Średnia w klasie Multimedia (17.5 - 89.9, n=61, ostatnie 2 lata) | |
| Huawei MateBook D 16 2022 | |
| Lenovo ThinkBook 16 G4+ IAP | |
| Acer Swift X SFX16-51G-5388 | |
| Przeciętny Micron 2450 1TB MTFDKCD1T0TFK (45.1 - 58.4, n=3) | |
| Asus Vivobook Pro 16X-M7600QE | |
| Samsung Galaxy Book2 15 | |
| 4K Write | |
| Huawei MateBook D 16 2022 | |
| Lenovo ThinkBook 16 G4+ IAP | |
| Dell Inspiron 16 Plus 7620 | |
| Średnia w klasie Multimedia (43.1 - 268, n=61, ostatnie 2 lata) | |
| Przeciętny Micron 2450 1TB MTFDKCD1T0TFK (131 - 227, n=3) | |
| Samsung Galaxy Book2 15 | |
| Acer Swift X SFX16-51G-5388 | |
| Asus Vivobook Pro 16X-M7600QE | |
| 4K-64 Read | |
| Asus Vivobook Pro 16X-M7600QE | |
| Huawei MateBook D 16 2022 | |
| Średnia w klasie Multimedia (125.7 - 3394, n=61, ostatnie 2 lata) | |
| Acer Swift X SFX16-51G-5388 | |
| Lenovo ThinkBook 16 G4+ IAP | |
| Dell Inspiron 16 Plus 7620 | |
| Przeciętny Micron 2450 1TB MTFDKCD1T0TFK (665 - 955, n=3) | |
| Samsung Galaxy Book2 15 | |
| 4K-64 Write | |
| Lenovo ThinkBook 16 G4+ IAP | |
| Przeciętny Micron 2450 1TB MTFDKCD1T0TFK (1970 - 2413, n=3) | |
| Średnia w klasie Multimedia (75.2 - 4042, n=61, ostatnie 2 lata) | |
| Asus Vivobook Pro 16X-M7600QE | |
| Huawei MateBook D 16 2022 | |
| Acer Swift X SFX16-51G-5388 | |
| Samsung Galaxy Book2 15 | |
| Dell Inspiron 16 Plus 7620 | |
| Access Time Read | |
| Dell Inspiron 16 Plus 7620 | |
| Acer Swift X SFX16-51G-5388 | |
| Samsung Galaxy Book2 15 | |
| Średnia w klasie Multimedia (0.018 - 0.168, n=61, ostatnie 2 lata) | |
| Przeciętny Micron 2450 1TB MTFDKCD1T0TFK (0.025 - 0.09, n=3) | |
| Asus Vivobook Pro 16X-M7600QE | |
| Lenovo ThinkBook 16 G4+ IAP | |
| Huawei MateBook D 16 2022 | |
| Access Time Write | |
| Przeciętny Micron 2450 1TB MTFDKCD1T0TFK (0.131 - 0.132, n=3) | |
| Lenovo ThinkBook 16 G4+ IAP | |
| Asus Vivobook Pro 16X-M7600QE | |
| Średnia w klasie Multimedia (0.014 - 0.754, n=61, ostatnie 2 lata) | |
| Dell Inspiron 16 Plus 7620 | |
| Acer Swift X SFX16-51G-5388 | |
| Samsung Galaxy Book2 15 | |
| Huawei MateBook D 16 2022 | |
* ... im mniej tym lepiej
Sustained Read Performance: DiskSpd Read Loop, Queue Depth 8
Karta graficzna
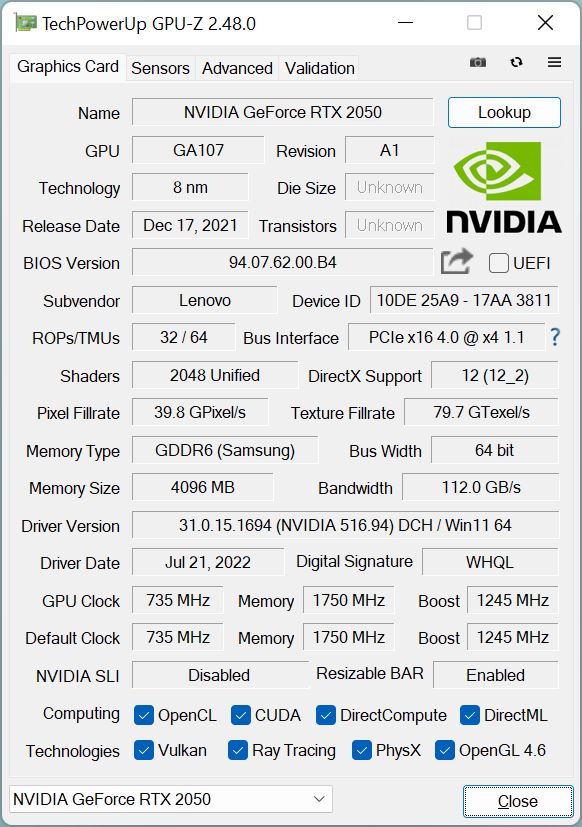
W codziennym użytkowaniu obliczeniami graficznymi często zajmuje się zintegrowany z procesoremIris Xe Graphics G7. Dedykowany Nvidia GeForce RTX 2050włącza się automatycznie tylko przy większym obciążeniu. W zasadzie ten GPU to GeForce MX570, ale obsługuje również RayTracing i DLSS. TGP jest ustawiony na maksymalnie 50 watów, przy czym kolejne 10 watów może być wykorzystane przez procesor. Zaobserwowaliśmy maksymalne taktowanie rdzenia na poziomie 1 762 MHz.
W benchmarkach syntetycznych RTX 2050 plasuje się zazwyczaj tuż za m.in RTX 3050, który działa nieco wydajniej. Ponadto w wymagających testach GPU jest ponad dwukrotnie szybszy od Iris Xe Graphics G7. Nie ma spadku wydajności pod długotrwałym obciążeniem, gdyż wymagający test stresu Time Spy został bez problemu zaliczony z wynikiem 99,7%.
Pobór energii przez GPU jest jednak ograniczony do 30 W w trybie bateryjnym, co prowadzi do spadku wydajności o 15%. Więcej benchmarków GPU dostępnych jest w naszymsekcja technologiczna.
| 3DMark 11 - 1280x720 Performance GPU | |
| Średnia w klasie Multimedia (3765 - 60002, n=62, ostatnie 2 lata) | |
| Dell Inspiron 16 Plus 7620 | |
| Asus Vivobook Pro 16X-M7600QE | |
| Lenovo ThinkBook 16 G4+ IAP | |
| Przeciętny NVIDIA GeForce RTX 2050 Mobile (10598 - 15411, n=10) | |
| Acer Swift X SFX16-51G-5388 | |
| Samsung Galaxy Book2 15 | |
| Huawei MateBook D 16 2022 | |
| 3DMark | |
| 1280x720 Cloud Gate Standard Graphics | |
| Dell Inspiron 16 Plus 7620 | |
| Acer Swift X SFX16-51G-5388 | |
| Lenovo ThinkBook 16 G4+ IAP | |
| Przeciętny NVIDIA GeForce RTX 2050 Mobile (47225 - 66365, n=9) | |
| Średnia w klasie Multimedia (16765 - 143501, n=34, ostatnie 2 lata) | |
| Samsung Galaxy Book2 15 | |
| Asus Vivobook Pro 16X-M7600QE | |
| Huawei MateBook D 16 2022 | |
| 1920x1080 Fire Strike Graphics | |
| Średnia w klasie Multimedia (2328 - 48907, n=66, ostatnie 2 lata) | |
| Dell Inspiron 16 Plus 7620 | |
| Lenovo ThinkBook 16 G4+ IAP | |
| Asus Vivobook Pro 16X-M7600QE | |
| Przeciętny NVIDIA GeForce RTX 2050 Mobile (8249 - 10621, n=10) | |
| Acer Swift X SFX16-51G-5388 | |
| Samsung Galaxy Book2 15 | |
| Huawei MateBook D 16 2022 | |
| 2560x1440 Time Spy Graphics | |
| Średnia w klasie Multimedia (696 - 19403, n=67, ostatnie 2 lata) | |
| Dell Inspiron 16 Plus 7620 | |
| Asus Vivobook Pro 16X-M7600QE | |
| Lenovo ThinkBook 16 G4+ IAP | |
| Acer Swift X SFX16-51G-5388 | |
| Przeciętny NVIDIA GeForce RTX 2050 Mobile (1072 - 3938, n=10) | |
| Samsung Galaxy Book2 15 | |
| Huawei MateBook D 16 2022 | |
| Geekbench 5.5 | |
| OpenCL Score | |
| Dell Inspiron 16 Plus 7620 | |
| Średnia w klasie Multimedia (11562 - 217159, n=62, ostatnie 2 lata) | |
| Asus Vivobook Pro 16X-M7600QE | |
| Asus Vivobook Pro 16X-M7600QE | |
| Acer Swift X SFX16-51G-5388 | |
| Lenovo ThinkBook 16 G4+ IAP | |
| Przeciętny NVIDIA GeForce RTX 2050 Mobile (42403 - 52623, n=10) | |
| Samsung Galaxy Book2 15 | |
| Huawei MateBook D 16 2022 | |
| Vulkan Score 5.5 | |
| Dell Inspiron 16 Plus 7620 | |
| Średnia w klasie Multimedia (2104 - 161655, n=56, ostatnie 2 lata) | |
| Samsung Galaxy Book2 15 | |
| Przeciętny NVIDIA GeForce RTX 2050 Mobile (14448 - 35429, n=9) | |
| Huawei MateBook D 16 2022 | |
| Lenovo ThinkBook 16 G4+ IAP | |
| V-Ray 5 Benchmark - GPU CUDA | |
| Średnia w klasie Multimedia (277 - 1482, n=7, ostatnie 2 lata) | |
| Acer Swift X SFX16-51G-5388 | |
| Przeciętny NVIDIA GeForce RTX 2050 Mobile (169 - 214, n=3) | |
| V-Ray Benchmark Next 4.10 - GPU | |
| Średnia w klasie Multimedia (32 - 1191, n=60, ostatnie 2 lata) | |
| Asus Vivobook Pro 16X-M7600QE | |
| Asus Vivobook Pro 16X-M7600QE | |
| Acer Swift X SFX16-51G-5388 | |
| Lenovo ThinkBook 16 G4+ IAP | |
| Przeciętny NVIDIA GeForce RTX 2050 Mobile (66 - 109, n=10) | |
| Huawei MateBook D 16 2022 | |
| Samsung Galaxy Book2 15 | |
| Blender - v3.3 Classroom CUDA | |
| Przeciętny NVIDIA GeForce RTX 2050 Mobile (126 - 175, n=9) | |
| Lenovo ThinkBook 16 G4+ IAP | |
| Acer Swift X SFX16-51G-5388 | |
| Dell Inspiron 16 Plus 7620 | |
| Średnia w klasie Multimedia (20 - 186, n=24, ostatnie 2 lata) | |
* ... im mniej tym lepiej
| 3DMark Vantage P Result | 52669 pkt. | |
| 3DMark 11 Performance | 15277 pkt. | |
| 3DMark Cloud Gate Standard Score | 40781 pkt. | |
| 3DMark Fire Strike Score | 9274 pkt. | |
| 3DMark Time Spy Score | 4300 pkt. | |
Pomoc | ||
Wydajność w grach
Wydajność w grach w przypadkuRTX 2050jest dobra, a ThinkBook 16 G4+ ponownie plasuje się za RTX 3050 Ti a w wielu przypadkach także RTX 3050. W wiele tytułów można więc grać płynnie w Full HD i na wysokich detalach, a natywna rozdzielczość WQHD jest też w niektórych przypadkach możliwa. Obniżenie detali w FHD jest wymagane tylko w przypadku wymagających tytułów, takich jak Cyberpoint 2077. Nasza pętla Witcher 3 pokazuje, że wydajność nie spada podczas dłuższych sesji gier. Więcej benchmarków gamingowych dostępnych jest tutaj.
| The Witcher 3 | |
| 1920x1080 High Graphics & Postprocessing (Nvidia HairWorks Off) | |
| Dell Inspiron 16 Plus 7620 | |
| Średnia w klasie Multimedia (22 - 224, n=13, ostatnie 2 lata) | |
| Lenovo ThinkBook 16 G4+ IAP | |
| Asus Vivobook Pro 16X-M7600QE | |
| Przeciętny NVIDIA GeForce RTX 2050 Mobile (46.7 - 78, n=8) | |
| Acer Swift X SFX16-51G-5388 | |
| Samsung Galaxy Book2 15 | |
| Huawei MateBook D 16 2022 | |
| 1920x1080 Ultra Graphics & Postprocessing (HBAO+) | |
| Dell Inspiron 16 Plus 7620 | |
| Średnia w klasie Multimedia (11 - 121, n=13, ostatnie 2 lata) | |
| Asus Vivobook Pro 16X-M7600QE | |
| Lenovo ThinkBook 16 G4+ IAP | |
| Przeciętny NVIDIA GeForce RTX 2050 Mobile (24.3 - 39.6, n=9) | |
| Acer Swift X SFX16-51G-5388 | |
| Samsung Galaxy Book2 15 | |
| Huawei MateBook D 16 2022 | |
| GTA V | |
| 1920x1080 Highest AA:4xMSAA + FX AF:16x | |
| Dell Inspiron 16 Plus 7620 | |
| Asus Vivobook Pro 16X-M7600QE | |
| Średnia w klasie Multimedia (7.92 - 141.6, n=63, ostatnie 2 lata) | |
| Lenovo ThinkBook 16 G4+ IAP | |
| Acer Swift X SFX16-51G-5388 | |
| Przeciętny NVIDIA GeForce RTX 2050 Mobile (35.6 - 55.8, n=10) | |
| Samsung Galaxy Book2 15 | |
| Huawei MateBook D 16 2022 | |
| 1920x1080 High/On (Advanced Graphics Off) AA:2xMSAA + FX AF:8x | |
| Dell Inspiron 16 Plus 7620 | |
| Lenovo ThinkBook 16 G4+ IAP | |
| Acer Swift X SFX16-51G-5388 | |
| Przeciętny NVIDIA GeForce RTX 2050 Mobile (74 - 111.5, n=10) | |
| Średnia w klasie Multimedia (19.5 - 186.1, n=56, ostatnie 2 lata) | |
| Samsung Galaxy Book2 15 | |
| Huawei MateBook D 16 2022 | |
| 2560x1440 Highest AA:4xMSAA + FX AF:16x | |
| Średnia w klasie Multimedia (9.23 - 119.8, n=22, ostatnie 2 lata) | |
| Dell Inspiron 16 Plus 7620 | |
| Lenovo ThinkBook 16 G4+ IAP | |
| Przeciętny NVIDIA GeForce RTX 2050 Mobile (n=1) | |
| Cyberpunk 2077 1.6 | |
| 1920x1080 High Preset | |
| Dell Inspiron 16 Plus 7620 | |
| Lenovo ThinkBook 16 G4+ IAP | |
| Przeciętny NVIDIA GeForce RTX 2050 Mobile (19.1 - 31, n=4) | |
| Samsung Galaxy Book2 15 | |
| 1920x1080 Ultra Preset | |
| Dell Inspiron 16 Plus 7620 | |
| Lenovo ThinkBook 16 G4+ IAP | |
| Przeciętny NVIDIA GeForce RTX 2050 Mobile (16.8 - 27.4, n=4) | |
| Samsung Galaxy Book2 15 | |
| Dota 2 Reborn | |
| 1920x1080 high (2/3) | |
| Dell Inspiron 16 Plus 7620 | |
| Lenovo ThinkBook 16 G4+ IAP | |
| Asus Vivobook Pro 16X-M7600QE | |
| Asus Vivobook Pro 16X-M7600QE | |
| Acer Swift X SFX16-51G-5388 | |
| Przeciętny NVIDIA GeForce RTX 2050 Mobile (70.9 - 140, n=10) | |
| Średnia w klasie Multimedia (31.1 - 196.9, n=68, ostatnie 2 lata) | |
| Huawei MateBook D 16 2022 | |
| Samsung Galaxy Book2 15 | |
| 1920x1080 ultra (3/3) best looking | |
| Dell Inspiron 16 Plus 7620 | |
| Lenovo ThinkBook 16 G4+ IAP | |
| Asus Vivobook Pro 16X-M7600QE | |
| Asus Vivobook Pro 16X-M7600QE | |
| Acer Swift X SFX16-51G-5388 | |
| Przeciętny NVIDIA GeForce RTX 2050 Mobile (66.1 - 130.1, n=10) | |
| Średnia w klasie Multimedia (29 - 179.9, n=68, ostatnie 2 lata) | |
| Huawei MateBook D 16 2022 | |
| Samsung Galaxy Book2 15 | |
| Final Fantasy XV Benchmark | |
| 1920x1080 High Quality | |
| Dell Inspiron 16 Plus 7620 | |
| Średnia w klasie Multimedia (7.61 - 144.4, n=66, ostatnie 2 lata) | |
| Asus Vivobook Pro 16X-M7600QE | |
| Lenovo ThinkBook 16 G4+ IAP | |
| Acer Swift X SFX16-51G-5388 | |
| Przeciętny NVIDIA GeForce RTX 2050 Mobile (24.8 - 42.9, n=10) | |
| Huawei MateBook D 16 2022 | |
| Samsung Galaxy Book2 15 | |
| 2560x1440 High Quality | |
| Średnia w klasie Multimedia (15.9 - 129.9, n=26, ostatnie 2 lata) | |
| Dell Inspiron 16 Plus 7620 | |
| Asus Vivobook Pro 16X-M7600QE | |
| Lenovo ThinkBook 16 G4+ IAP | |
| Przeciętny NVIDIA GeForce RTX 2050 Mobile (20.5 - 29, n=3) | |
| Far Cry 5 | |
| 1920x1080 High Preset AA:T | |
| Asus Vivobook Pro 16X-M7600QE | |
| Średnia w klasie Multimedia (19 - 150, n=23, ostatnie 2 lata) | |
| Lenovo ThinkBook 16 G4+ IAP | |
| Acer Swift X SFX16-51G-5388 | |
| Przeciętny NVIDIA GeForce RTX 2050 Mobile (35 - 71, n=5) | |
| Samsung Galaxy Book2 15 | |
| 1920x1080 Ultra Preset AA:T | |
| Asus Vivobook Pro 16X-M7600QE | |
| Lenovo ThinkBook 16 G4+ IAP | |
| Acer Swift X SFX16-51G-5388 | |
| Średnia w klasie Multimedia (17 - 145, n=23, ostatnie 2 lata) | |
| Przeciętny NVIDIA GeForce RTX 2050 Mobile (34 - 66, n=5) | |
| Samsung Galaxy Book2 15 | |
| 2560x1440 Ultra Preset AA:T | |
| Średnia w klasie Multimedia (45 - 106, n=4, ostatnie 2 lata) | |
| Asus Vivobook Pro 16X-M7600QE | |
| Lenovo ThinkBook 16 G4+ IAP | |
| Przeciętny NVIDIA GeForce RTX 2050 Mobile (35 - 39, n=2) | |
| F1 2021 | |
| 1920x1080 High Preset AA:T AF:16x | |
| Asus Vivobook Pro 16X-M7600QE | |
| Lenovo ThinkBook 16 G4+ IAP | |
| Przeciętny NVIDIA GeForce RTX 2050 Mobile (66.2 - 107.6, n=3) | |
| Samsung Galaxy Book2 15 | |
| Huawei MateBook D 16 2022 | |
| 1920x1080 Ultra High Preset + Raytracing AA:T AF:16x | |
| Asus Vivobook Pro 16X-M7600QE | |
| Przeciętny NVIDIA GeForce RTX 2050 Mobile (36.1 - 52.3, n=3) | |
| Lenovo ThinkBook 16 G4+ IAP | |
| Huawei MateBook D 16 2022 | |
| Samsung Galaxy Book2 15 | |
Witcher 3 FPS Chart
| low | med. | high | ultra | QHD | |
|---|---|---|---|---|---|
| GTA V (2015) | 179.1 | 175.3 | 108.1 | 52.9 | 37.3 |
| The Witcher 3 (2015) | 216 | 139 | 77 | 38.3 | |
| Dota 2 Reborn (2015) | 167.4 | 153.9 | 140 | 129.6 | |
| Final Fantasy XV Benchmark (2018) | 109.1 | 61 | 41.8 | 29 | |
| X-Plane 11.11 (2018) | 139.6 | 106.4 | 90.1 | ||
| Far Cry 5 (2018) | 118 | 68 | 62 | 60 | 39 |
| Strange Brigade (2018) | 196.9 | 86.8 | 71.5 | 63.1 | 46.5 |
| F1 2021 (2021) | 229 | 130.6 | 99.5 | 44.1 | 28.2 |
| Cyberpunk 2077 1.6 (2022) | 49 | 41 | 31 | 25 |
Emisje - Gaming wymaga słuchawek
Hałas
Na biegu jałowym lub pod niewielkim obciążeniem oba wentylatory prawie zawsze pozostają wyłączone, nawet w trybie High Performance . Pod większym obciążeniem w tym trybie szybko osiągają jednak maksymalną prędkość obrotową, co odpowiada poziomowi hałasu 47 dB(A). Jest to już wyraźnie słyszalne i dlatego zalecamy słuchawki podczas grania. W trybie Intelligent Cooling laptop jest podczas grania tylko minimalnie cichszy, na poziomie nieco poniżej 44 dB(A). Jeżeli nie wymaga się dużej wydajności, można bez problemu przełączyć się na tryb oszczędzania akumulatora, gdyż wentylatory rzadko się dobijają i są prawie niesłyszalne, ale tryb ten raczej nie nadaje się do gier ze względu na redukcję mocy. Nie wykryto żadnych elektronicznych odgłosów.
Hałas
| luz |
| 24.2 / 24.2 / 24.2 dB |
| obciążenie |
| 47 / 47 dB |
 | ||
30 dB cichy 40 dB(A) słyszalny 50 dB(A) irytujący |
||
min: | ||
| Lenovo ThinkBook 16 G4+ IAP GeForce RTX 2050 Mobile, i7-12700H, Micron 2450 1TB MTFDKCD1T0TFK | Dell Inspiron 16 Plus 7620 GeForce RTX 3050 Ti Laptop GPU, i7-12700H, Kioxia BG5 KBG50ZNS512G | Acer Swift X SFX16-51G-5388 GeForce RTX 3050 4GB Laptop GPU, i5-11320H, Samsung PM991 MZVLQ512HBLU | Asus Vivobook Pro 16X-M7600QE GeForce RTX 3050 Ti Laptop GPU, R9 5900HX, SK Hynix HFM001TD3JX013N | Huawei MateBook D 16 2022 Iris Xe G7 96EUs, i7-12700H, Silicon Motion PCIe-8 SSD | Samsung Galaxy Book2 15 A350M, i7-1260P, Samsung PM991 MZVLQ512HBLU | |
|---|---|---|---|---|---|---|
| Noise | -6% | -3% | -5% | 2% | -4% | |
| wyłączone / środowisko * (dB) | 24.2 | 23.3 4% | 25.4 -5% | 26 -7% | 24.2 -0% | 24.3 -0% |
| Idle Minimum * (dB) | 24.2 | 25.7 -6% | 25.4 -5% | 27 -12% | 24.2 -0% | 24.3 -0% |
| Idle Average * (dB) | 24.2 | 26.1 -8% | 25.4 -5% | 27 -12% | 25.8 -7% | 24.3 -0% |
| Idle Maximum * (dB) | 24.2 | 30.6 -26% | 27.8 -15% | 27.5 -14% | 30.5 -26% | 29.8 -23% |
| Load Average * (dB) | 47 | 46.2 2% | 41 13% | 41.7 11% | 39.8 15% | 47.5 -1% |
| Witcher 3 ultra * (dB) | 47 | 49.2 -5% | 39.8 15% | 47.5 -1% | ||
| Load Maximum * (dB) | 47 | 49.4 -5% | 47 -0% | 45.3 4% | 39.8 15% | 47.5 -1% |
* ... im mniej tym lepiej
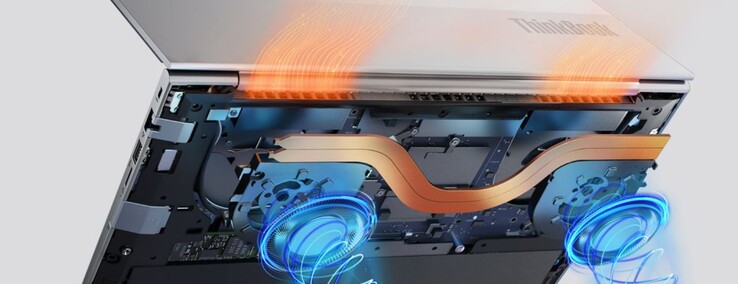
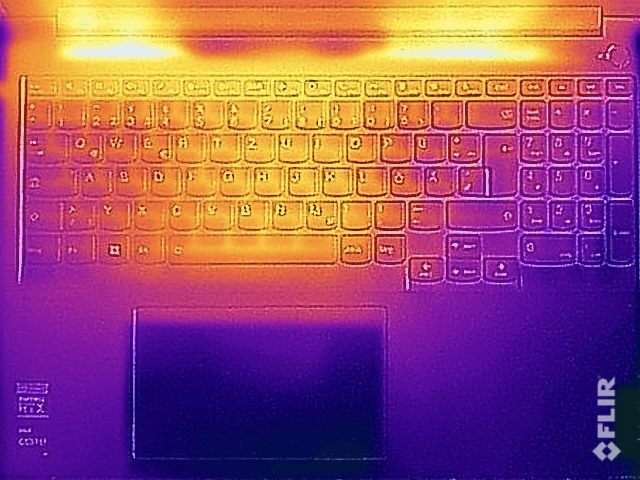
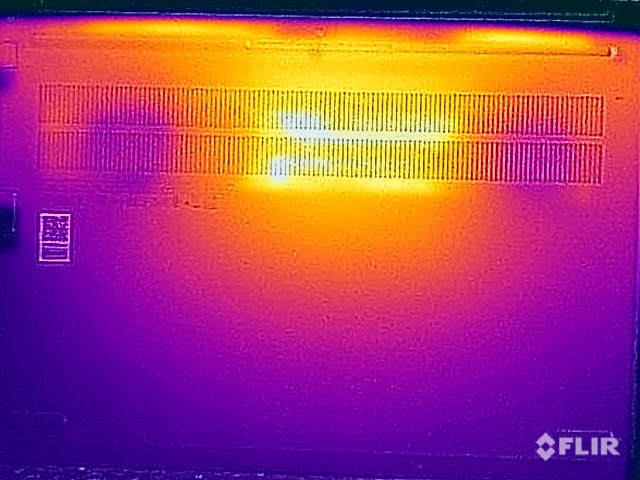
Temperatura
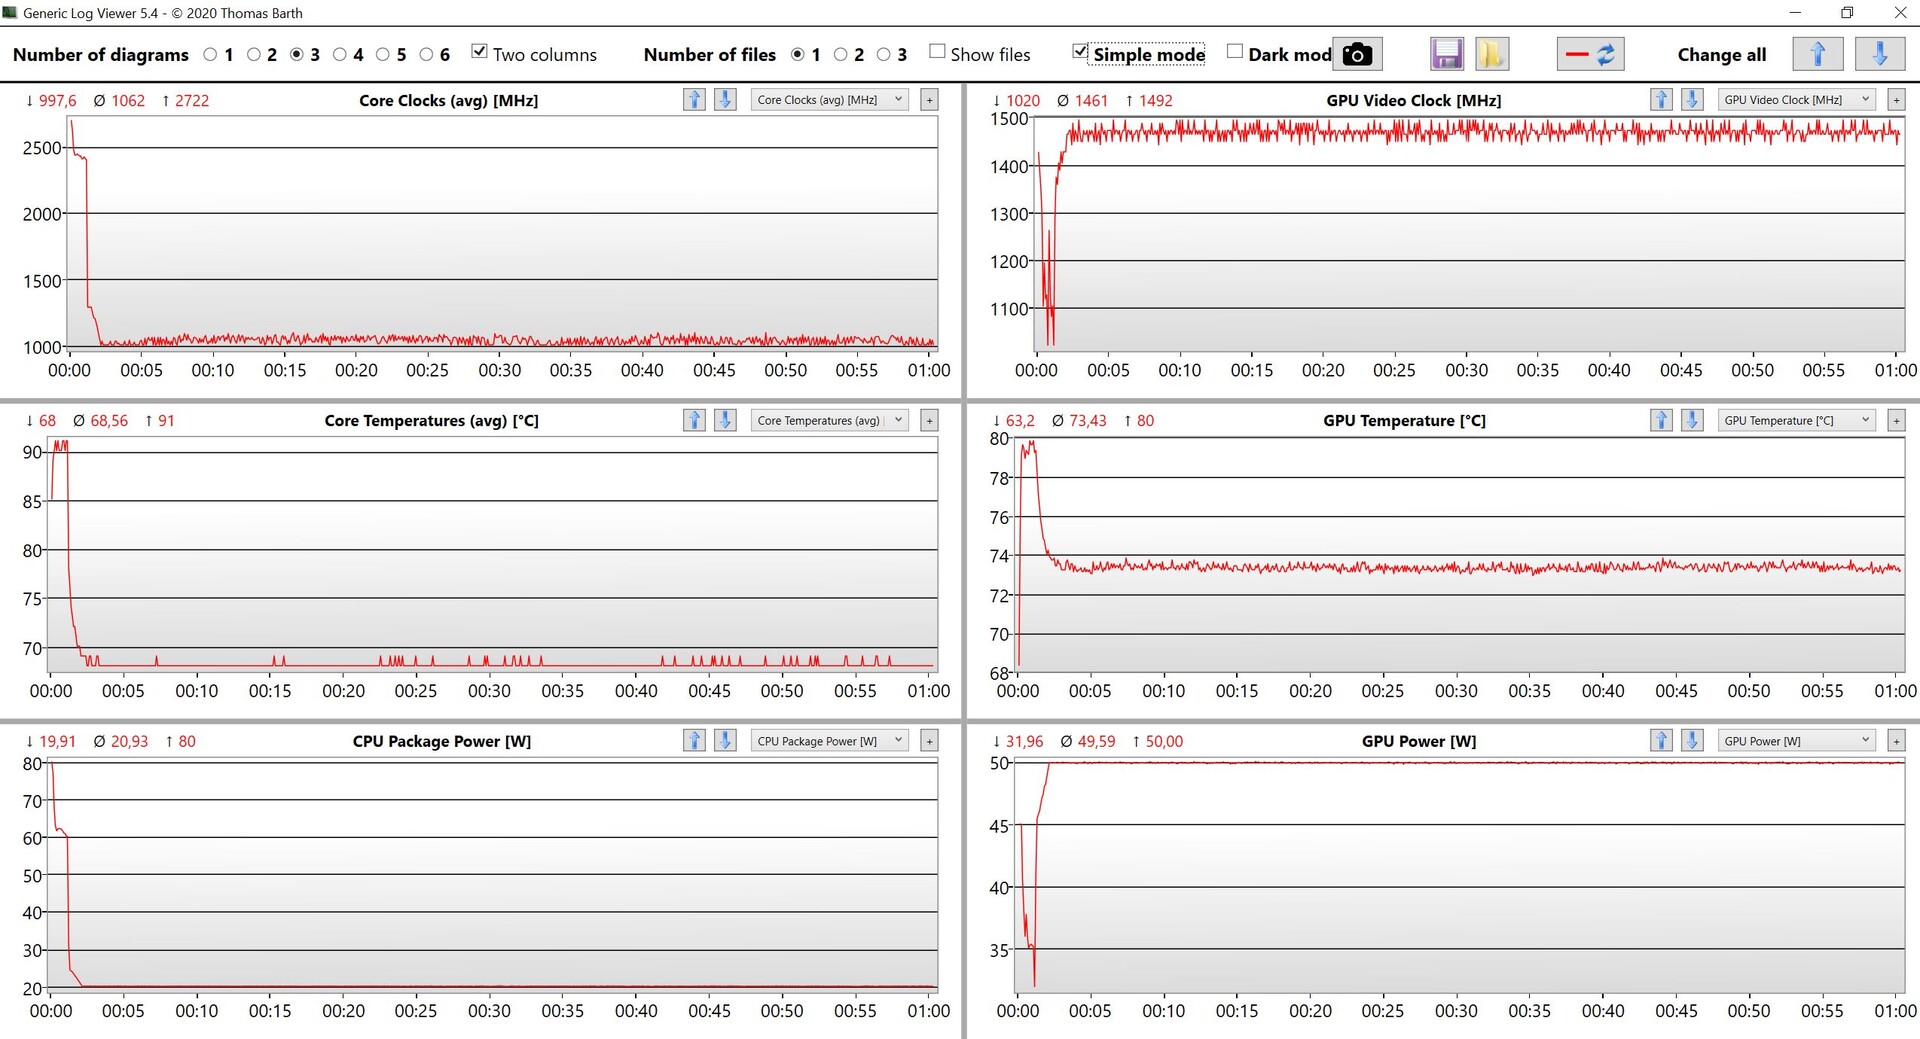
Aluminiowa obudowa w ogóle nie nagrzewa się pod małym obciążeniem. Znacznie gorętsza staje się dopiero podczas gier lub testów obciążeniowych. Na górnej stronie jednostki zasadniczej zarejestrowaliśmy około 42 °C w środkowym/górnym obszarze klawiatury, co jest odczuwalne także podczas pisania, ale nie jest nieprzyjemne. Na spodzie, w centralnym obszarze tylnej części obudowy znajduje się hotspot, gdzie zmierzyliśmy około 50 °C. Należy tu unikać bezpośredniego kontaktu skóry z metalowymi powierzchniami.
W testach obciążeniowych procesor startuje z pełną mocą, by po kilku minutach zrównać się z 20 W, podczas gdy karta graficzna stabilizuje się przy 50 W i pozostaje na tym poziomie. GPU jest więc traktowane priorytetowo w trybie High Performance, podczas gdy procesor może zużywać nieco więcej energii w trybie Intelligent Cooling (24/36 W).
(±) Maksymalna temperatura w górnej części wynosi 42.9 °C / 109 F, w porównaniu do średniej 36.8 °C / 98 F , począwszy od 21 do 71 °C dla klasy Multimedia.
(-) Dno nagrzewa się maksymalnie do 50.6 °C / 123 F, w porównaniu do średniej 39.1 °C / 102 F
(+) W stanie bezczynności średnia temperatura górnej części wynosi 25.3 °C / 78 F, w porównaniu ze średnią temperaturą urządzenia wynoszącą 31.3 °C / ### class_avg_f### F.
(±) Podczas gry w Wiedźmina 3 średnia temperatura górnej części wynosi 36.1 °C / 97 F, w porównaniu do średniej temperatury urządzenia wynoszącej 31.3 °C / ## #class_avg_f### F.
(+) Podpórki pod nadgarstki i touchpad są chłodniejsze niż temperatura skóry i maksymalnie 28.3 °C / 82.9 F i dlatego są chłodne w dotyku.
(±) Średnia temperatura obszaru podparcia dłoni w podobnych urządzeniach wynosiła 28.7 °C / 83.7 F (+0.4 °C / 0.8 F).
| Lenovo ThinkBook 16 G4+ IAP Intel Core i7-12700H, NVIDIA GeForce RTX 2050 Mobile | Dell Inspiron 16 Plus 7620 Intel Core i7-12700H, NVIDIA GeForce RTX 3050 Ti Laptop GPU | Acer Swift X SFX16-51G-5388 Intel Core i5-11320H, NVIDIA GeForce RTX 3050 4GB Laptop GPU | Asus Vivobook Pro 16X-M7600QE AMD Ryzen 9 5900HX, NVIDIA GeForce RTX 3050 Ti Laptop GPU | Huawei MateBook D 16 2022 Intel Core i7-12700H, Intel Iris Xe Graphics G7 96EUs | Samsung Galaxy Book2 15 Intel Core i7-1260P, Intel Arc A350M | |
|---|---|---|---|---|---|---|
| Heat | -7% | -13% | 3% | -3% | 1% | |
| Maximum Upper Side * (°C) | 42.9 | 46 -7% | 52.4 -22% | 39.4 8% | 41.8 3% | 44.6 -4% |
| Maximum Bottom * (°C) | 50.6 | 45.8 9% | 50 1% | 43.6 14% | 47.3 7% | 47.5 6% |
| Idle Upper Side * (°C) | 26 | 29.2 -12% | 30.3 -17% | 27.6 -6% | 28.3 -9% | 25.8 1% |
| Idle Bottom * (°C) | 26.5 | 31 -17% | 30.4 -15% | 27.5 -4% | 30.2 -14% | 26.1 2% |
* ... im mniej tym lepiej
Mówcy
Lenovo wyposaża ThinkBooka 16 G4+ w dwa głośniki stereo (2x 2 W), które znajdują się w przedniej części jednostki zasadniczej i kierują dźwięk w dół. Pod względem brzmienia moduły są przeciętne i porównywalne z bezpośrednim konkurentem, tj Dell Inspiron 16 Plus, gdyż obu modelom brakuje mocy i basów. Do odtwarzania muzyki w tle lub okazjonalnych filmów jakość dźwięku jest wystarczająca, a w przypadku odtwarzania mowy (np. konferencji) jest nawet bardzo dobra dzięki liniowej reprodukcji tonów wysokich/wysokich. Do gier czy wieczorów filmowych należy jednak używać zewnętrznych głośników lub słuchawek.
Lenovo ThinkBook 16 G4+ IAP analiza dźwięku
(±) | głośność głośnika jest średnia, ale dobra (77.6 dB)
Bas 100 - 315 Hz
(-) | prawie brak basu - średnio 17.3% niższa od mediany
(±) | liniowość basu jest średnia (10.3% delta do poprzedniej częstotliwości)
Średnie 400 - 2000 Hz
(+) | zbalansowane środki średnie - tylko 4.6% od mediany
(+) | średnie są liniowe (4.6% delta do poprzedniej częstotliwości)
Wysokie 2–16 kHz
(+) | zrównoważone maksima - tylko 1.6% od mediany
(+) | wzloty są liniowe (6.2% delta do poprzedniej częstotliwości)
Ogólnie 100 - 16.000 Hz
(±) | liniowość ogólnego dźwięku jest średnia (15.7% różnicy w stosunku do mediany)
W porównaniu do tej samej klasy
» 39% wszystkich testowanych urządzeń w tej klasie było lepszych, 5% podobnych, 56% gorszych
» Najlepszy miał deltę 5%, średnia wynosiła ###średnia###%, najgorsza wynosiła 45%
W porównaniu do wszystkich testowanych urządzeń
» 24% wszystkich testowanych urządzeń było lepszych, 5% podobnych, 71% gorszych
» Najlepszy miał deltę 4%, średnia wynosiła ###średnia###%, najgorsza wynosiła 134%
Dell Inspiron 16 Plus 7620 analiza dźwięku
(+) | głośniki mogą odtwarzać stosunkowo głośno (87.8 dB)
Bas 100 - 315 Hz
(-) | prawie brak basu - średnio 22.2% niższa od mediany
(±) | liniowość basu jest średnia (9.7% delta do poprzedniej częstotliwości)
Średnie 400 - 2000 Hz
(+) | zbalansowane środki średnie - tylko 3.3% od mediany
(+) | średnie są liniowe (5.3% delta do poprzedniej częstotliwości)
Wysokie 2–16 kHz
(+) | zrównoważone maksima - tylko 2.5% od mediany
(+) | wzloty są liniowe (4.7% delta do poprzedniej częstotliwości)
Ogólnie 100 - 16.000 Hz
(+) | ogólny dźwięk jest liniowy (13.4% różnicy w stosunku do mediany)
W porównaniu do tej samej klasy
» 28% wszystkich testowanych urządzeń w tej klasie było lepszych, 5% podobnych, 68% gorszych
» Najlepszy miał deltę 5%, średnia wynosiła ###średnia###%, najgorsza wynosiła 45%
W porównaniu do wszystkich testowanych urządzeń
» 14% wszystkich testowanych urządzeń było lepszych, 4% podobnych, 83% gorszych
» Najlepszy miał deltę 4%, średnia wynosiła ###średnia###%, najgorsza wynosiła 134%
Zarządzanie energią - ThinkBook z przyzwoitą wytrzymałością
Pobór mocy
Wartości poboru mocy w spoczynku ThinkBooka są całkowicie akceptowalne w świetle dużego panelu WQHD i wynoszą maksymalnie ~12 W. Dołączony 100-watowy zasilacz szybko staje się jednak czynnikiem ograniczającym pod obciążeniem. W skrajnym przypadku narzędzie HWiNFO wyprowadza na początku stress testu maksymalny łączny pobór 162 watów, a po ocenie danych widzimy, że przez krótki czas z akumulatora trzeba wydobyć także do 70 watów. Sytuacja stabilizuje się po kilku minutach, ale z pewnością nie sprzyja to żywotności akumulatora, jeśli pod obciążeniem trzeba go ciągle stukać.
| wyłączony / stan wstrzymania | |
| luz | |
| obciążenie |
|
Legenda:
min: | |
| Lenovo ThinkBook 16 G4+ IAP i7-12700H, GeForce RTX 2050 Mobile, Micron 2450 1TB MTFDKCD1T0TFK, IPS, 2560x1600, 16" | Dell Inspiron 16 Plus 7620 i7-12700H, GeForce RTX 3050 Ti Laptop GPU, Kioxia BG5 KBG50ZNS512G, IPS, 3072x1920, 16" | Acer Swift X SFX16-51G-5388 i5-11320H, GeForce RTX 3050 4GB Laptop GPU, Samsung PM991 MZVLQ512HBLU, , 1920x1080, 16.1" | Asus Vivobook Pro 16X-M7600QE R9 5900HX, GeForce RTX 3050 Ti Laptop GPU, SK Hynix HFM001TD3JX013N, OLED, 3840x2400, 16.1" | Huawei MateBook D 16 2022 i7-12700H, Iris Xe G7 96EUs, Silicon Motion PCIe-8 SSD, IPS, 1920x1200, 16" | Samsung Galaxy Book2 15 i7-1260P, A350M, Samsung PM991 MZVLQ512HBLU, IPS, 1920x1080, 15.6" | Przeciętny NVIDIA GeForce RTX 2050 Mobile | Średnia w klasie Multimedia | |
|---|---|---|---|---|---|---|---|---|
| Power Consumption | -29% | 0% | -22% | 12% | 30% | 11% | 1% | |
| Idle Minimum * (Watt) | 5 | 6.8 -36% | 7 -40% | 8.2 -64% | 6.1 -22% | 4 20% | 5.11 ? -2% | 5.71 ? -14% |
| Idle Average * (Watt) | 11.2 | 9.6 14% | 10.1 10% | 16.2 -45% | 10.6 5% | 7.8 30% | 9.15 ? 18% | 10.1 ? 10% |
| Idle Maximum * (Watt) | 11.6 | 17 -47% | 15 -29% | 19.7 -70% | 11.5 1% | 8.5 27% | 11.2 ? 3% | 12.4 ? -7% |
| Load Average * (Watt) | 89.3 | 117.5 -32% | 63.3 29% | 65.8 26% | 65.5 27% | 59.1 34% | 70.6 ? 21% | 65 ? 27% |
| Witcher 3 ultra * (Watt) | 83 | 113.1 -36% | 63.3 24% | 65.6 21% | 61.2 26% | 56.7 32% | ||
| Load Maximum * (Watt) | 102 | 137.4 -35% | 94 8% | 104 -2% | 68.4 33% | 62.4 39% | 87.4 ? 14% | 112.2 ? -10% |
* ... im mniej tym lepiej
Power consumption Witcher 3 / Stress test
Power cosumption with an external monitor
Czas pracy na baterii
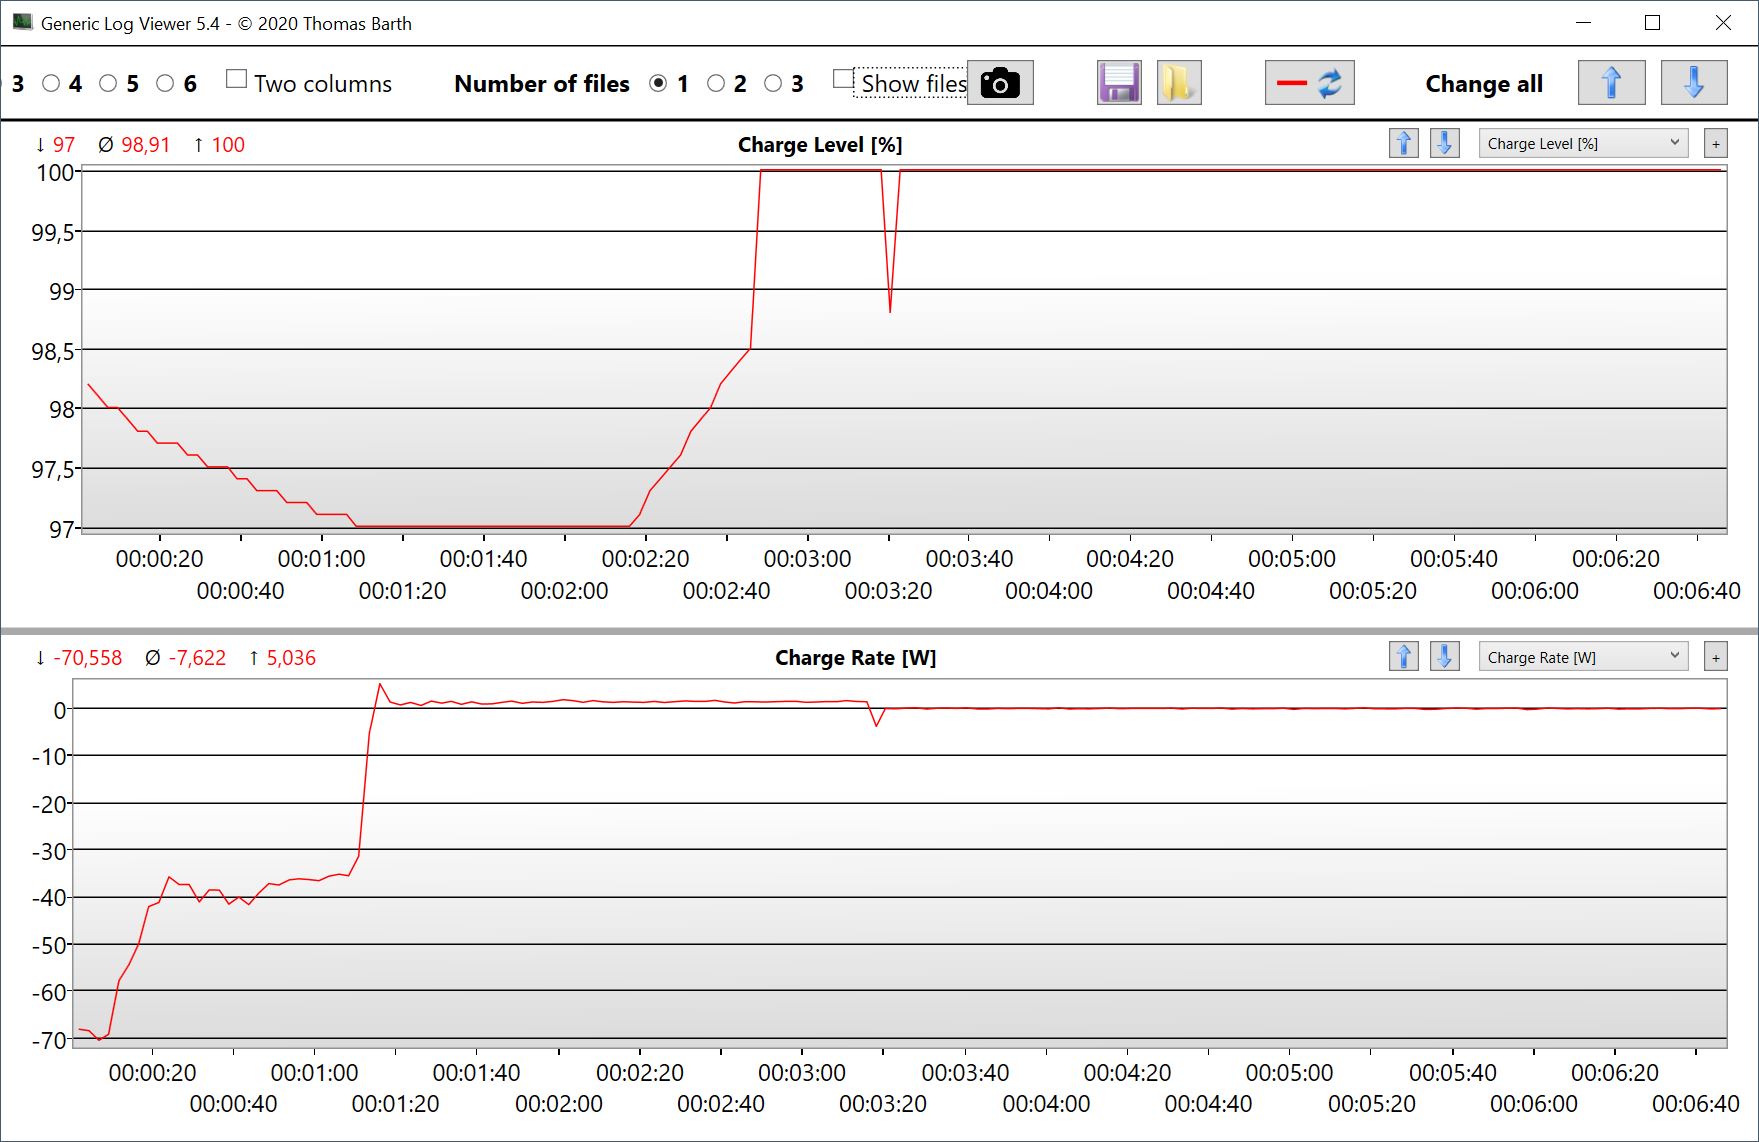
Akumulator o pojemności 71 Wh pozwala na przyzwoite czasy pracy - nasz egzemplarz testowy wytrzymał w testach WLAN od 6:43 h do 8:09 h, zależnie od jasności ekranu. Nieco ponad 12 godzin jest nawet możliwe przy odtwarzaniu wideo przy 150 cd/m² (co odpowiada 71% maksymalnej jasności). Ta duża różnica w stosunku do testu WLAN pokazuje po raz kolejny, że obecne procesory Alder Lake nie pracują szczególnie wydajnie, nawet pod obciążeniem jednordzeniowym (czyli podczas surfowania po internecie).
Pełny proces ładowania przy włączonym urządzeniu trwa około 100 minut przy liniowej krzywej ładowania, ale jest też opcja ładowania ekspresowego, które trwa zaledwie 73 minuty (60% jest dostępne już po 28 minutach).
| Lenovo ThinkBook 16 G4+ IAP i7-12700H, GeForce RTX 2050 Mobile, 71 Wh | Dell Inspiron 16 Plus 7620 i7-12700H, GeForce RTX 3050 Ti Laptop GPU, 86 Wh | Acer Swift X SFX16-51G-5388 i5-11320H, GeForce RTX 3050 4GB Laptop GPU, 58.7 Wh | Asus Vivobook Pro 16X-M7600QE R9 5900HX, GeForce RTX 3050 Ti Laptop GPU, 96 Wh | Huawei MateBook D 16 2022 i7-12700H, Iris Xe G7 96EUs, 60 Wh | Samsung Galaxy Book2 15 i7-1260P, A350M, 54 Wh | Średnia w klasie Multimedia | |
|---|---|---|---|---|---|---|---|
| Czasy pracy | -2% | -11% | 6% | -13% | -5% | 29% | |
| H.264 (h) | 12.6 | 8.4 -33% | 10.6 -16% | 16.4 ? 30% | |||
| WiFi v1.3 (h) | 8.2 | 9.6 17% | 8.1 -1% | 11.3 38% | 7.1 -13% | 8.2 0% | 12 ? 46% |
| Load (h) | 1.5 | 1.2 -20% | 1.5 0% | 1.1 -27% | 1.5 0% | 1.675 ? 12% |
Za
Przeciw
Werdykt - ThinkBook 16 G4+ to bardzo dobry laptop multimedialny

Lenovo ThinkBook 16 G4+ to bardzo solidny multimedialny notebook, który ma niewiele punktów krytycznych, poza słabym zasilaniem podczas szczytowego obciążenia. Jednostka zasadnicza mogłaby być nieco stabilniejsza, a Lenovo ma też pole do popisu w kwestii klawiatury, ale te punkty nie zniechęciłyby nas do jego zakupu.
Duży 16-calowy wyświetlacz IPS oferuje bardzo dobrą jakość obrazu wolną od PWM, a jasne powierzchnie nie wydają się ziarniste mimo matowej powierzchni. Choć brakuje tutaj dodatkowych funkcji, takich jak HDR, wyższa częstotliwość odświeżania czy rozszerzona przestrzeń barw, panel jest jednak w zupełności wystarczający do swoich celów. Wartości wydajnościowe, dzięki połączeniu procesora Intel Core i7-12700H i Nvidia GeForce RTX 2050, są bardzo dobre. Nawet granie w gry nie stanowi dla ThinkBooka problemu.
W ThinkBook 16 G4+ Lenovo oferuje bardzo dobry multimedialny notebook, który nie ma większych słabych punktów, a w codziennym użytkowaniu zachwyca rozbudowaną łącznością, wysoką wydajnością i dobrym wyświetlaczem IPS.
Konkurencyjne urządzenia, takie jak np Dell Inspiron 16 Plus czy też Acer Swift X, oferują nieco szybsze i wydajniejsze układy graficzne w postaci m.in RTX 3050 oraz RTX 3050 Ti, ale zmagają się z ciemniejszymi wyświetlaczami. Ogólnie rzecz biorąc, ThinkBook 16 G4+ to bardzo solidny laptop, który, biorąc wszystko pod uwagę, plasuje się przed rywalami.
Cena i dostępność
Dostępność Lenovo ThinkBook 16 G4+ wydaje się być nieliczna na całym świecie. Na przykład oficjalna strona Lenovo wymienia laptopa w France (1 079,00 EUR), Włochy (1 659,00 EUR), Singapur (SG$1 504,07) oraz Zjednoczonych Emiratów Arabskich.
Powyższa lista nie jest wyczerpująca. Ceny są aktualne na dzień 20.09.2022 i mogą ulec zmianie
Lenovo ThinkBook 16 G4+ IAP
- 20/09/2022 v7 (old)
Andreas Osthoff
Price comparison

