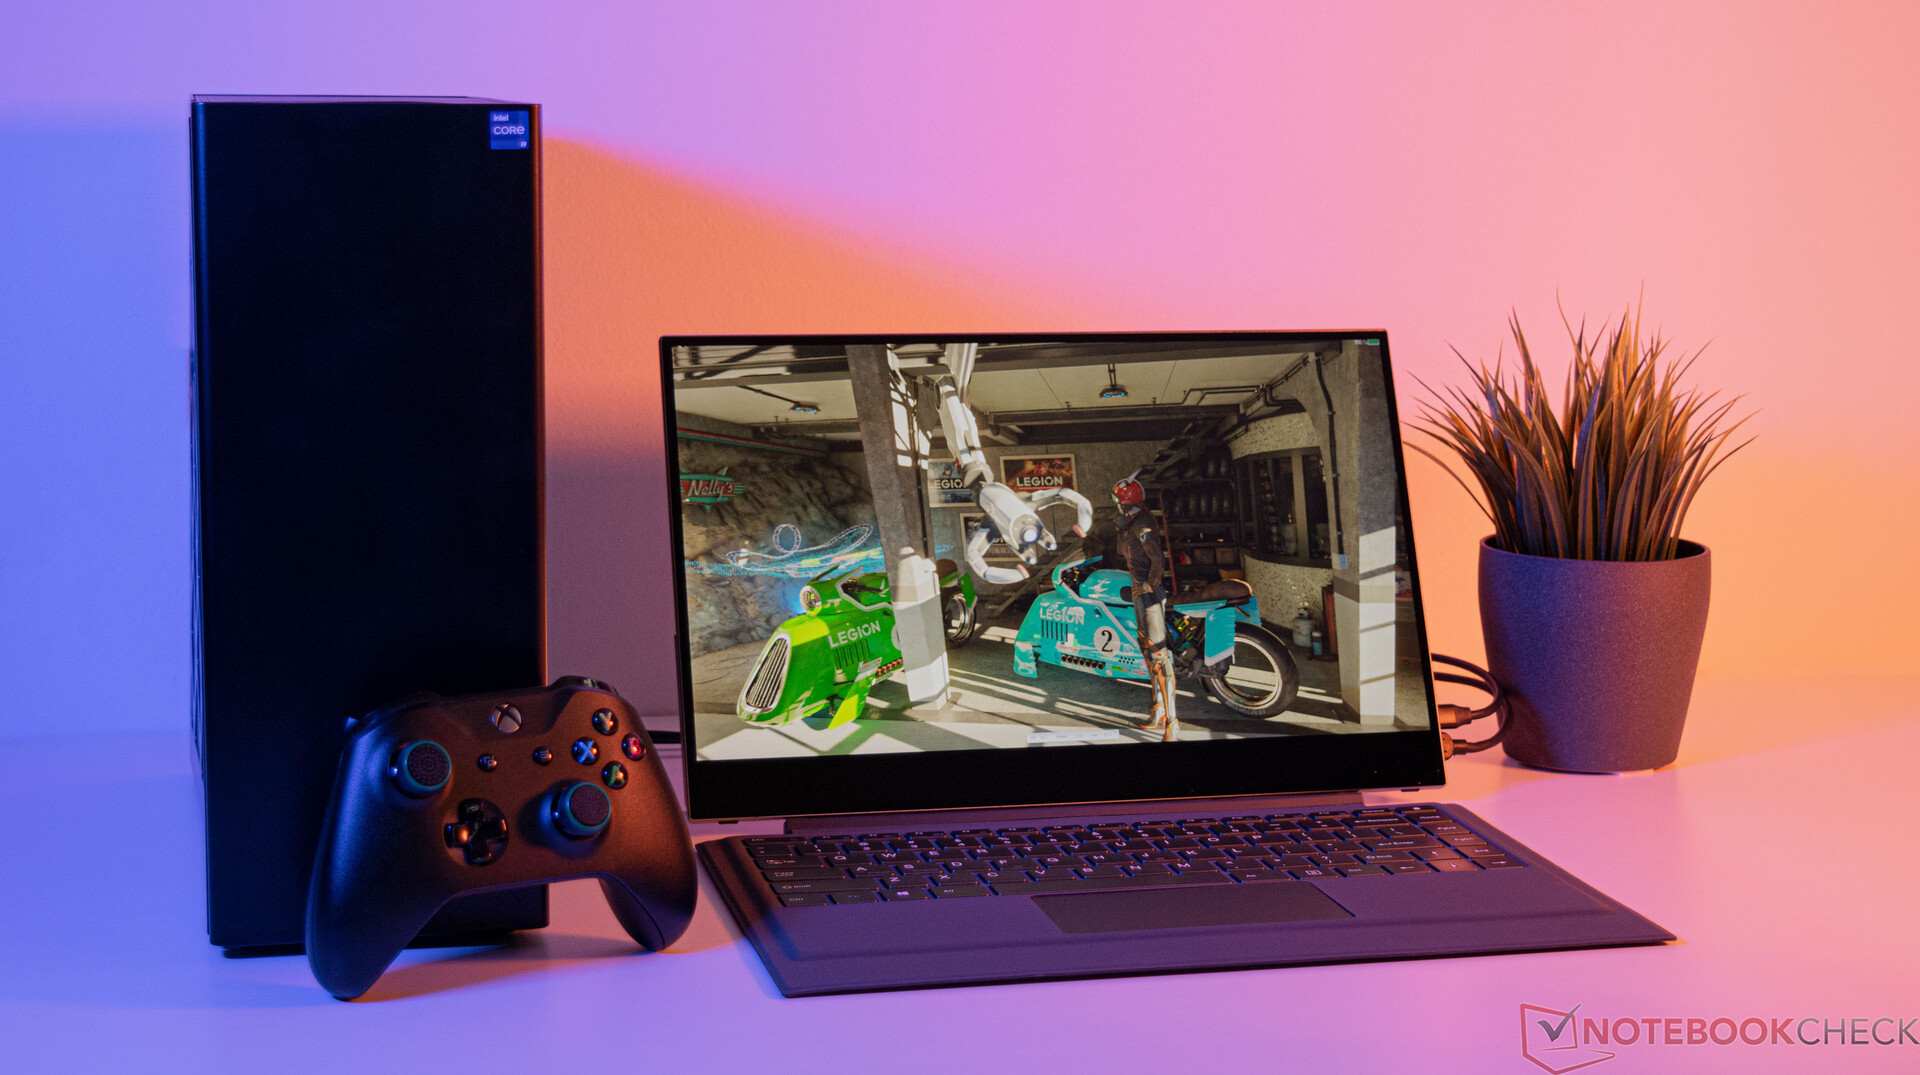
Intel NUC 13 Extreme Raptor Canyon mini PC z Core i9-13900K i GeForce RTX 3080 Ti w recenzji
")
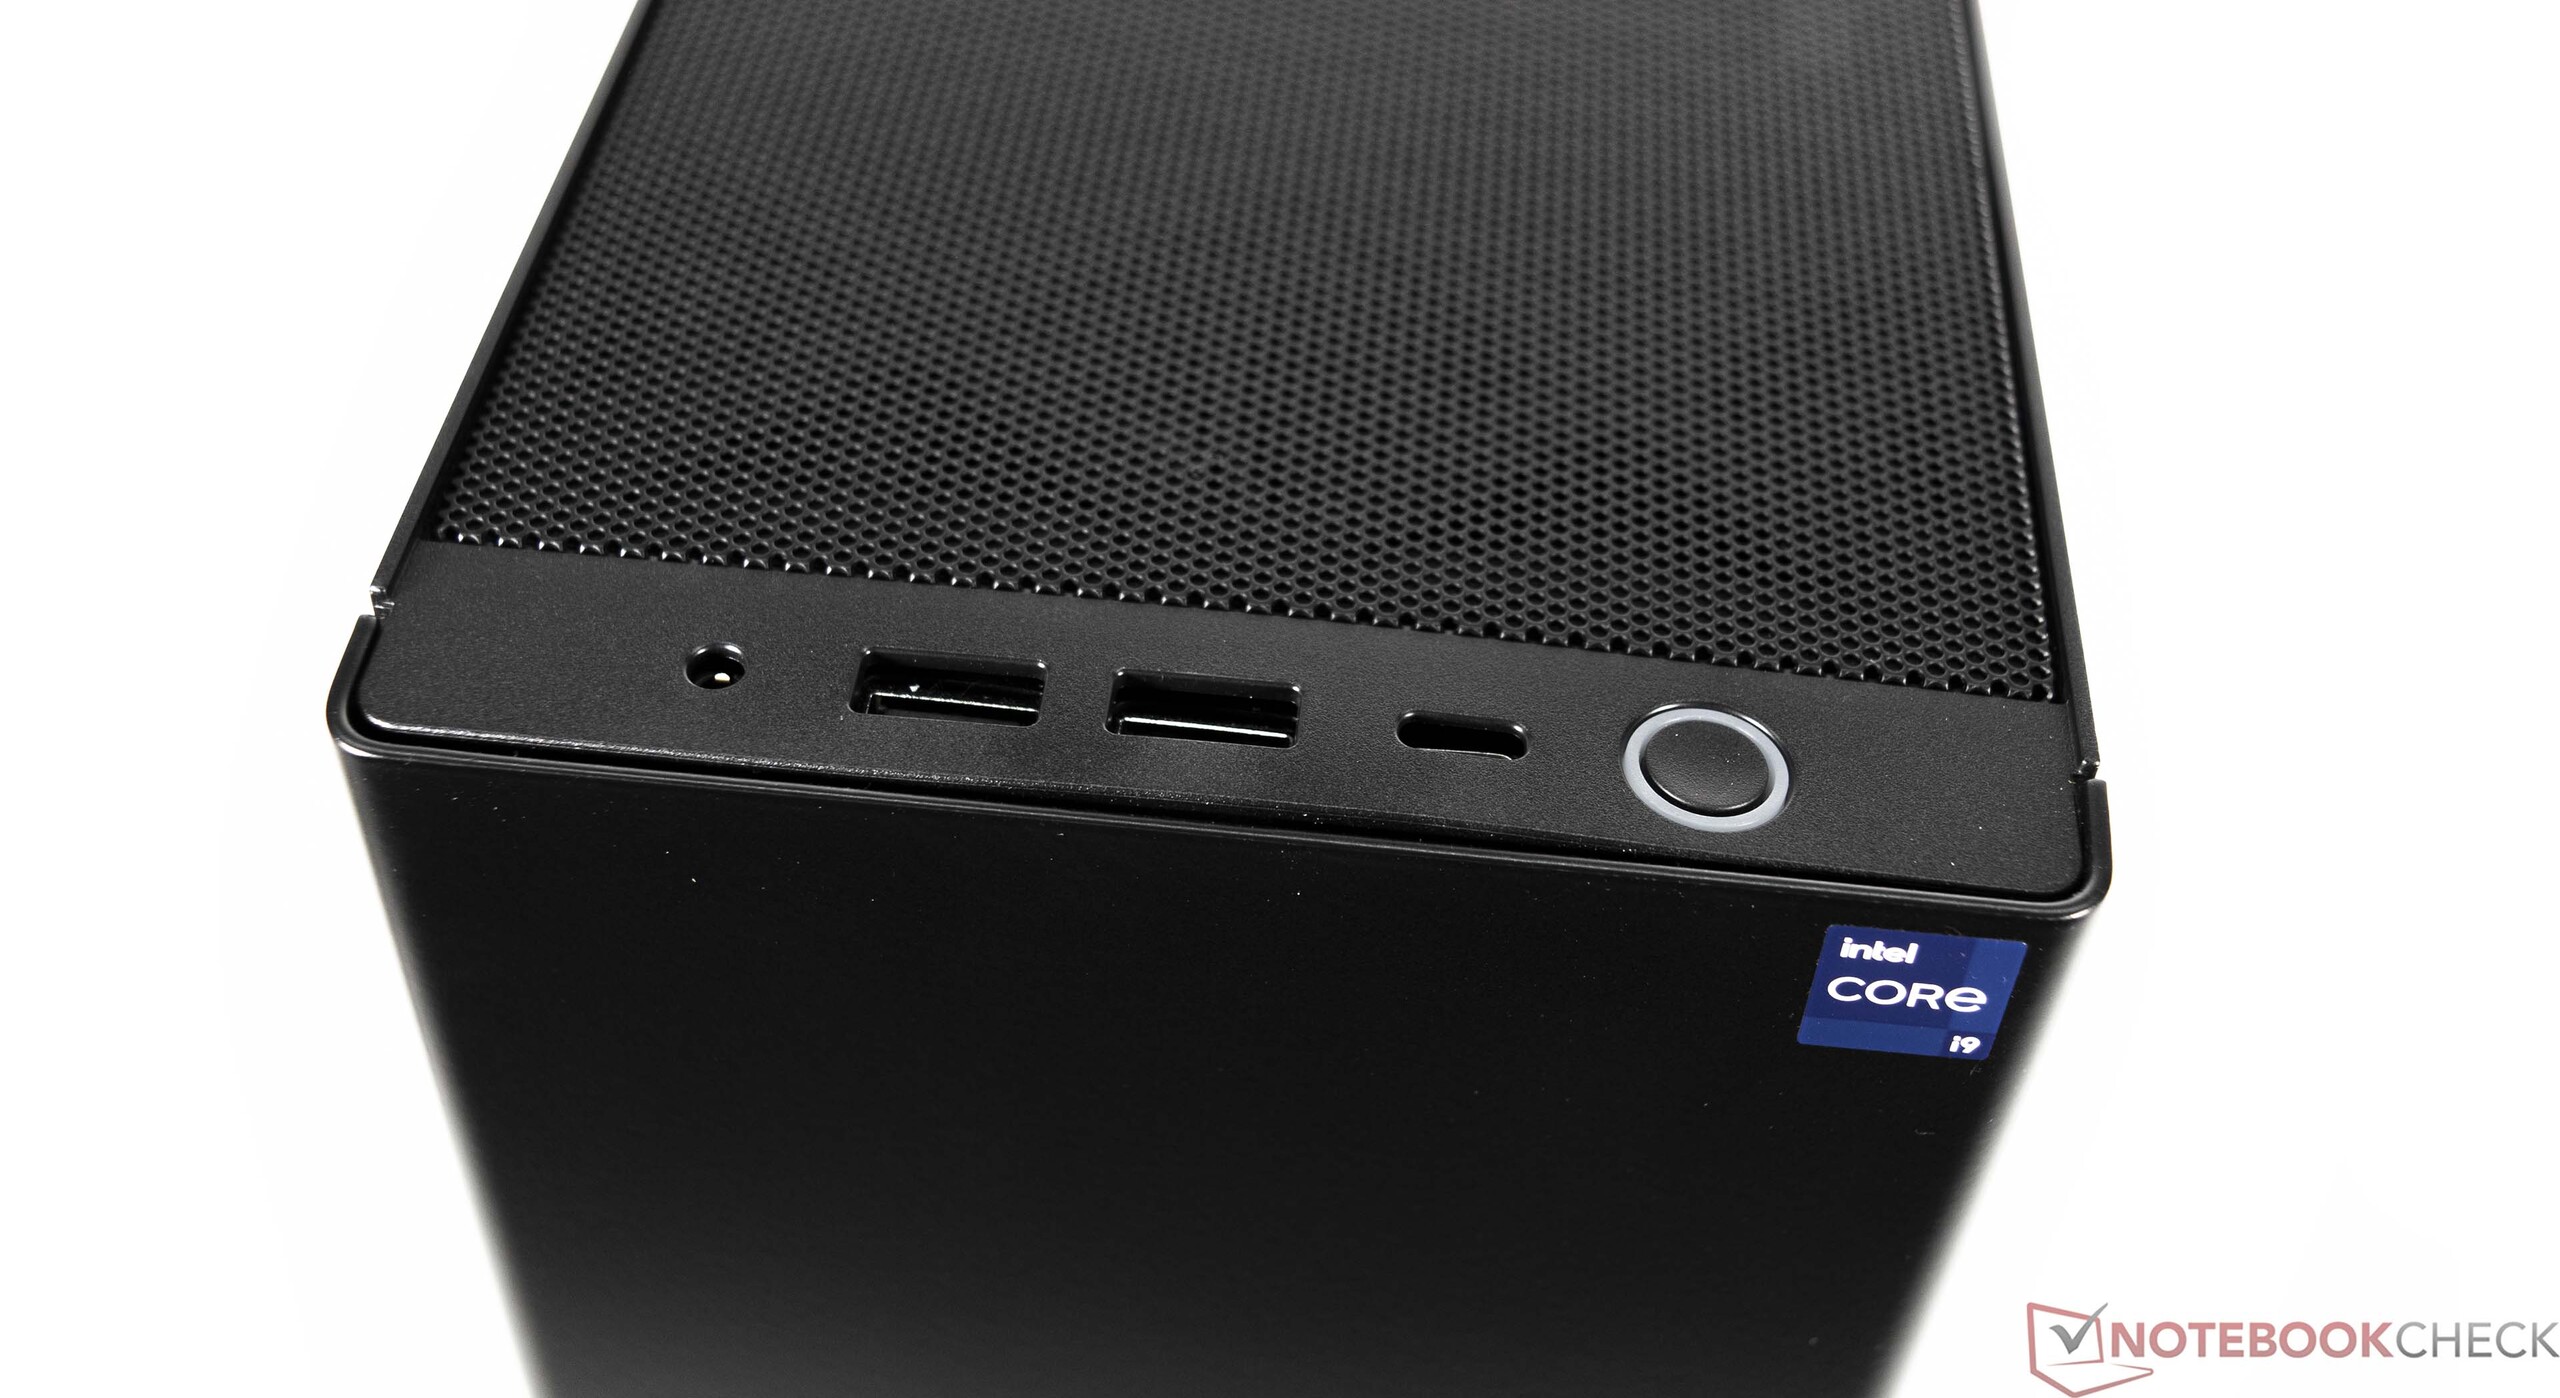
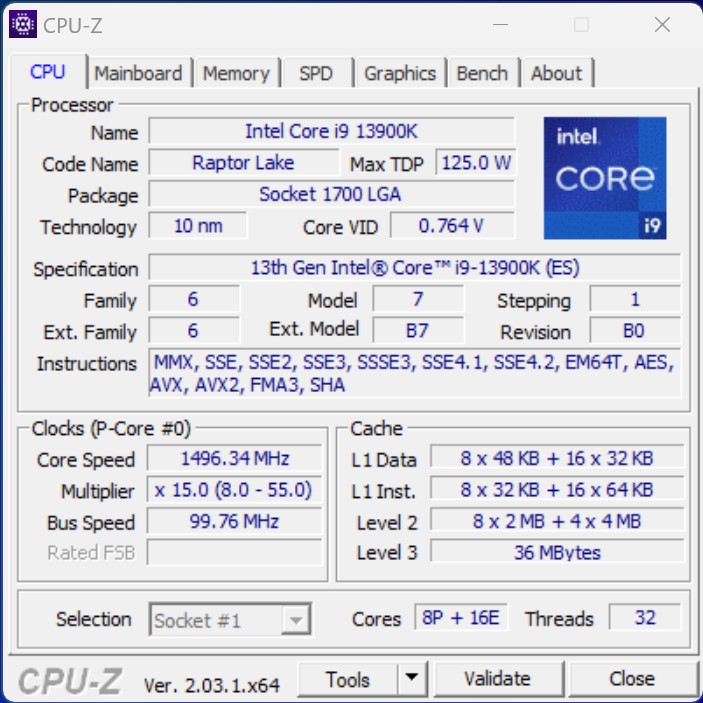
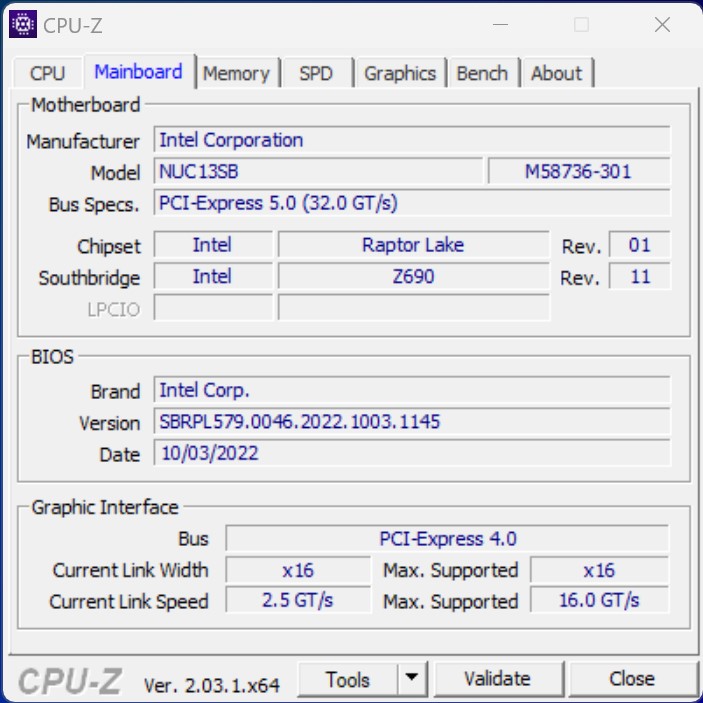
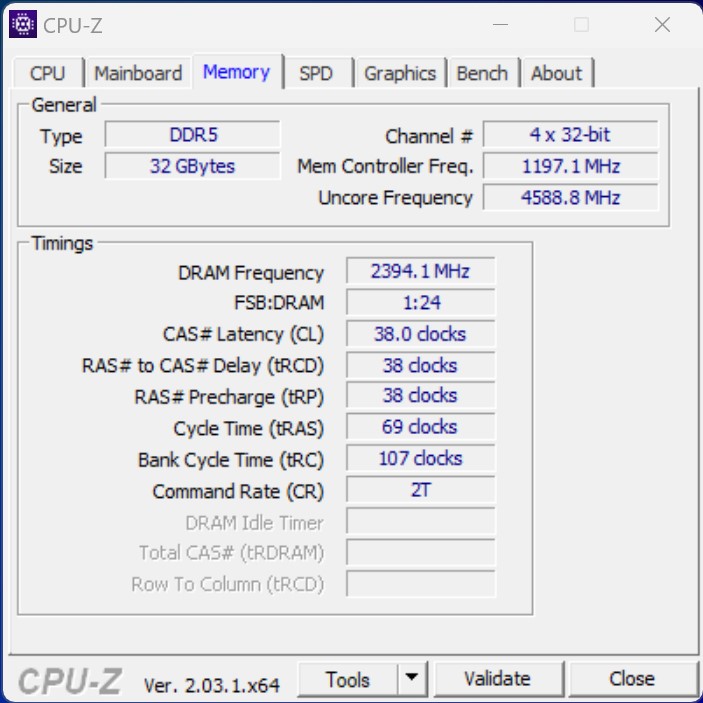
Po Beast Canyon i Dragon Canyon, najnowszy zestaw Intel Raptor Canyon NUC Extreme Kit znacząco odbiega od designu poprzedników. Jednak Intel nadal celuje w bardzo kompaktowy komputer, który nie pozostawia prawie nic do życzenia. Co więcej, istnieje możliwość zainstalowania pełnowymiarowej karty graficznej. W przypadku procesora dostępne są modele z aktualnej linii Intel Raptor Lake. Użytkownicy mogą oczywiście wybrać także własny procesor, ponieważ nie jest on lutowany. W tej recenzji nasz NUC 13 Extreme Raptor Canyon wykorzystuje m.in Intel Core i9-13900K. Dodatkowo Nvidia GeForce RTX 3080 Ti zapewnia wystarczającą wydajność 3D nawet dla wymagających graczy.
Należy zauważyć, że Intel NUC 13 Extreme Kit to system barebone, który jest dostarczany bez dysku SSD, pamięci RAM i karty graficznej. Cena zależy od dołączonego procesora. Model podstawowy z.Intel Core i5-13600K kosztuje 1179 USD, natomiast najwyższa konfiguracja jest dostępna za 1549 USD.
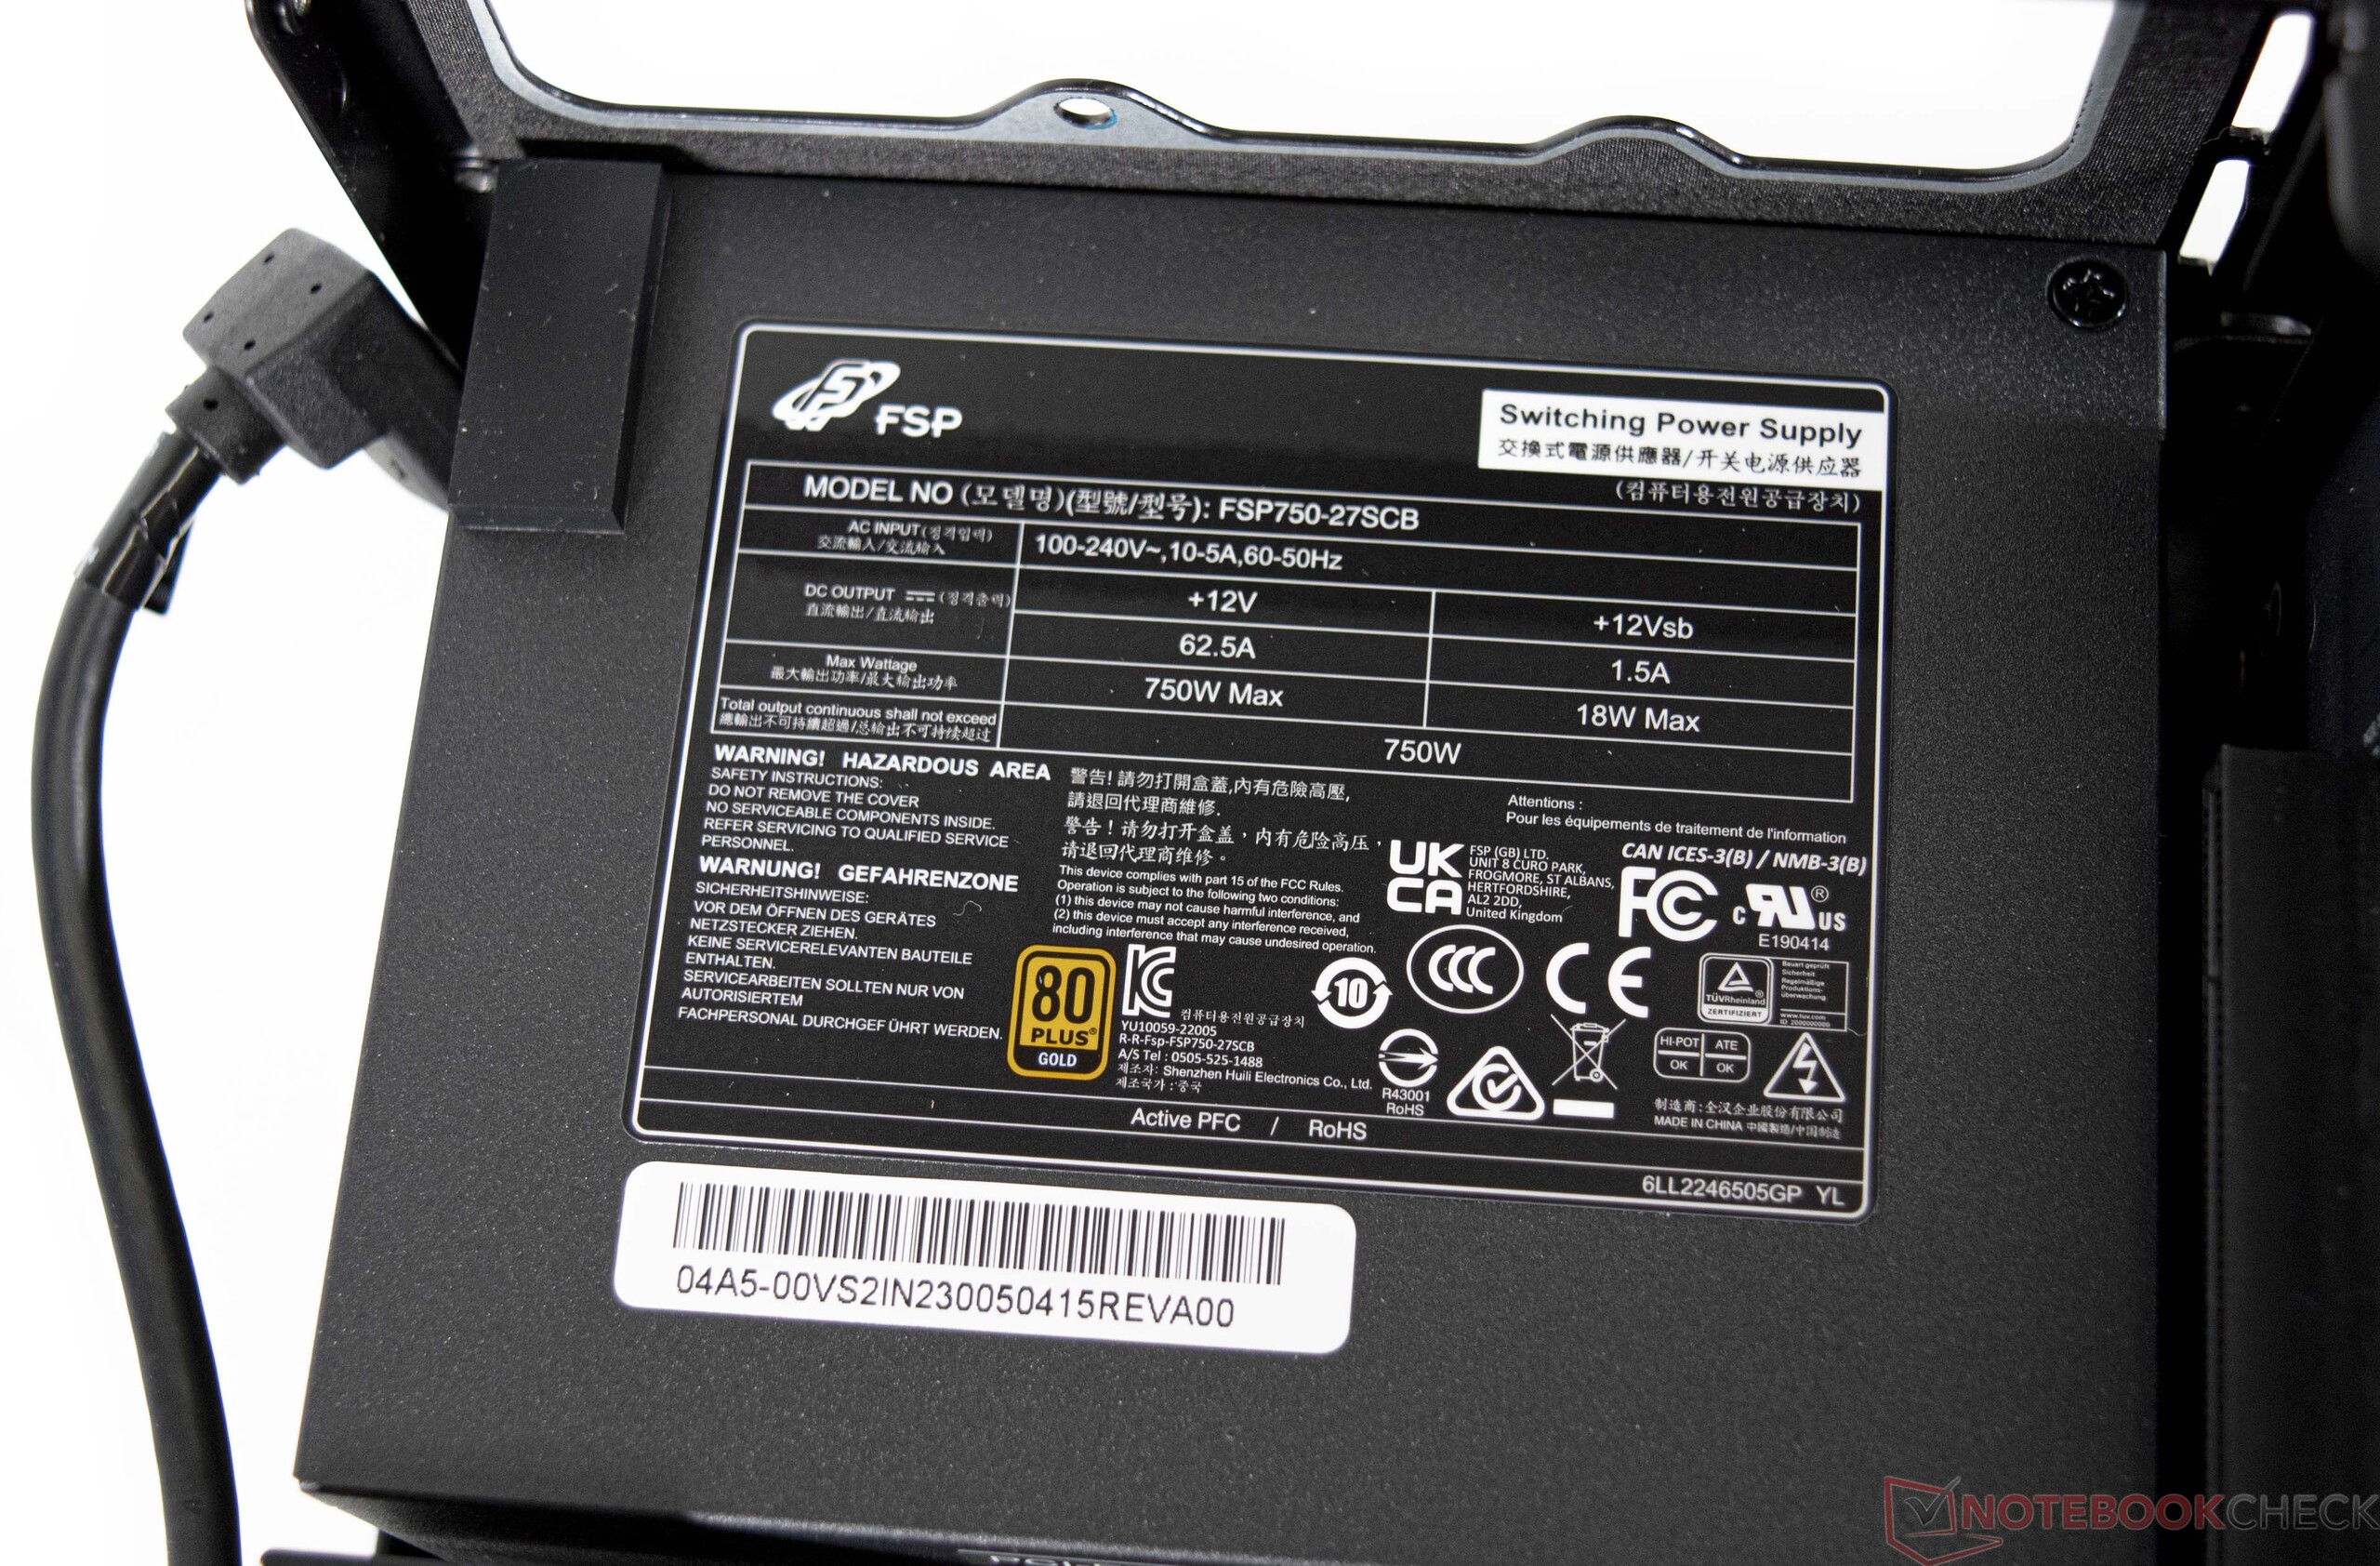
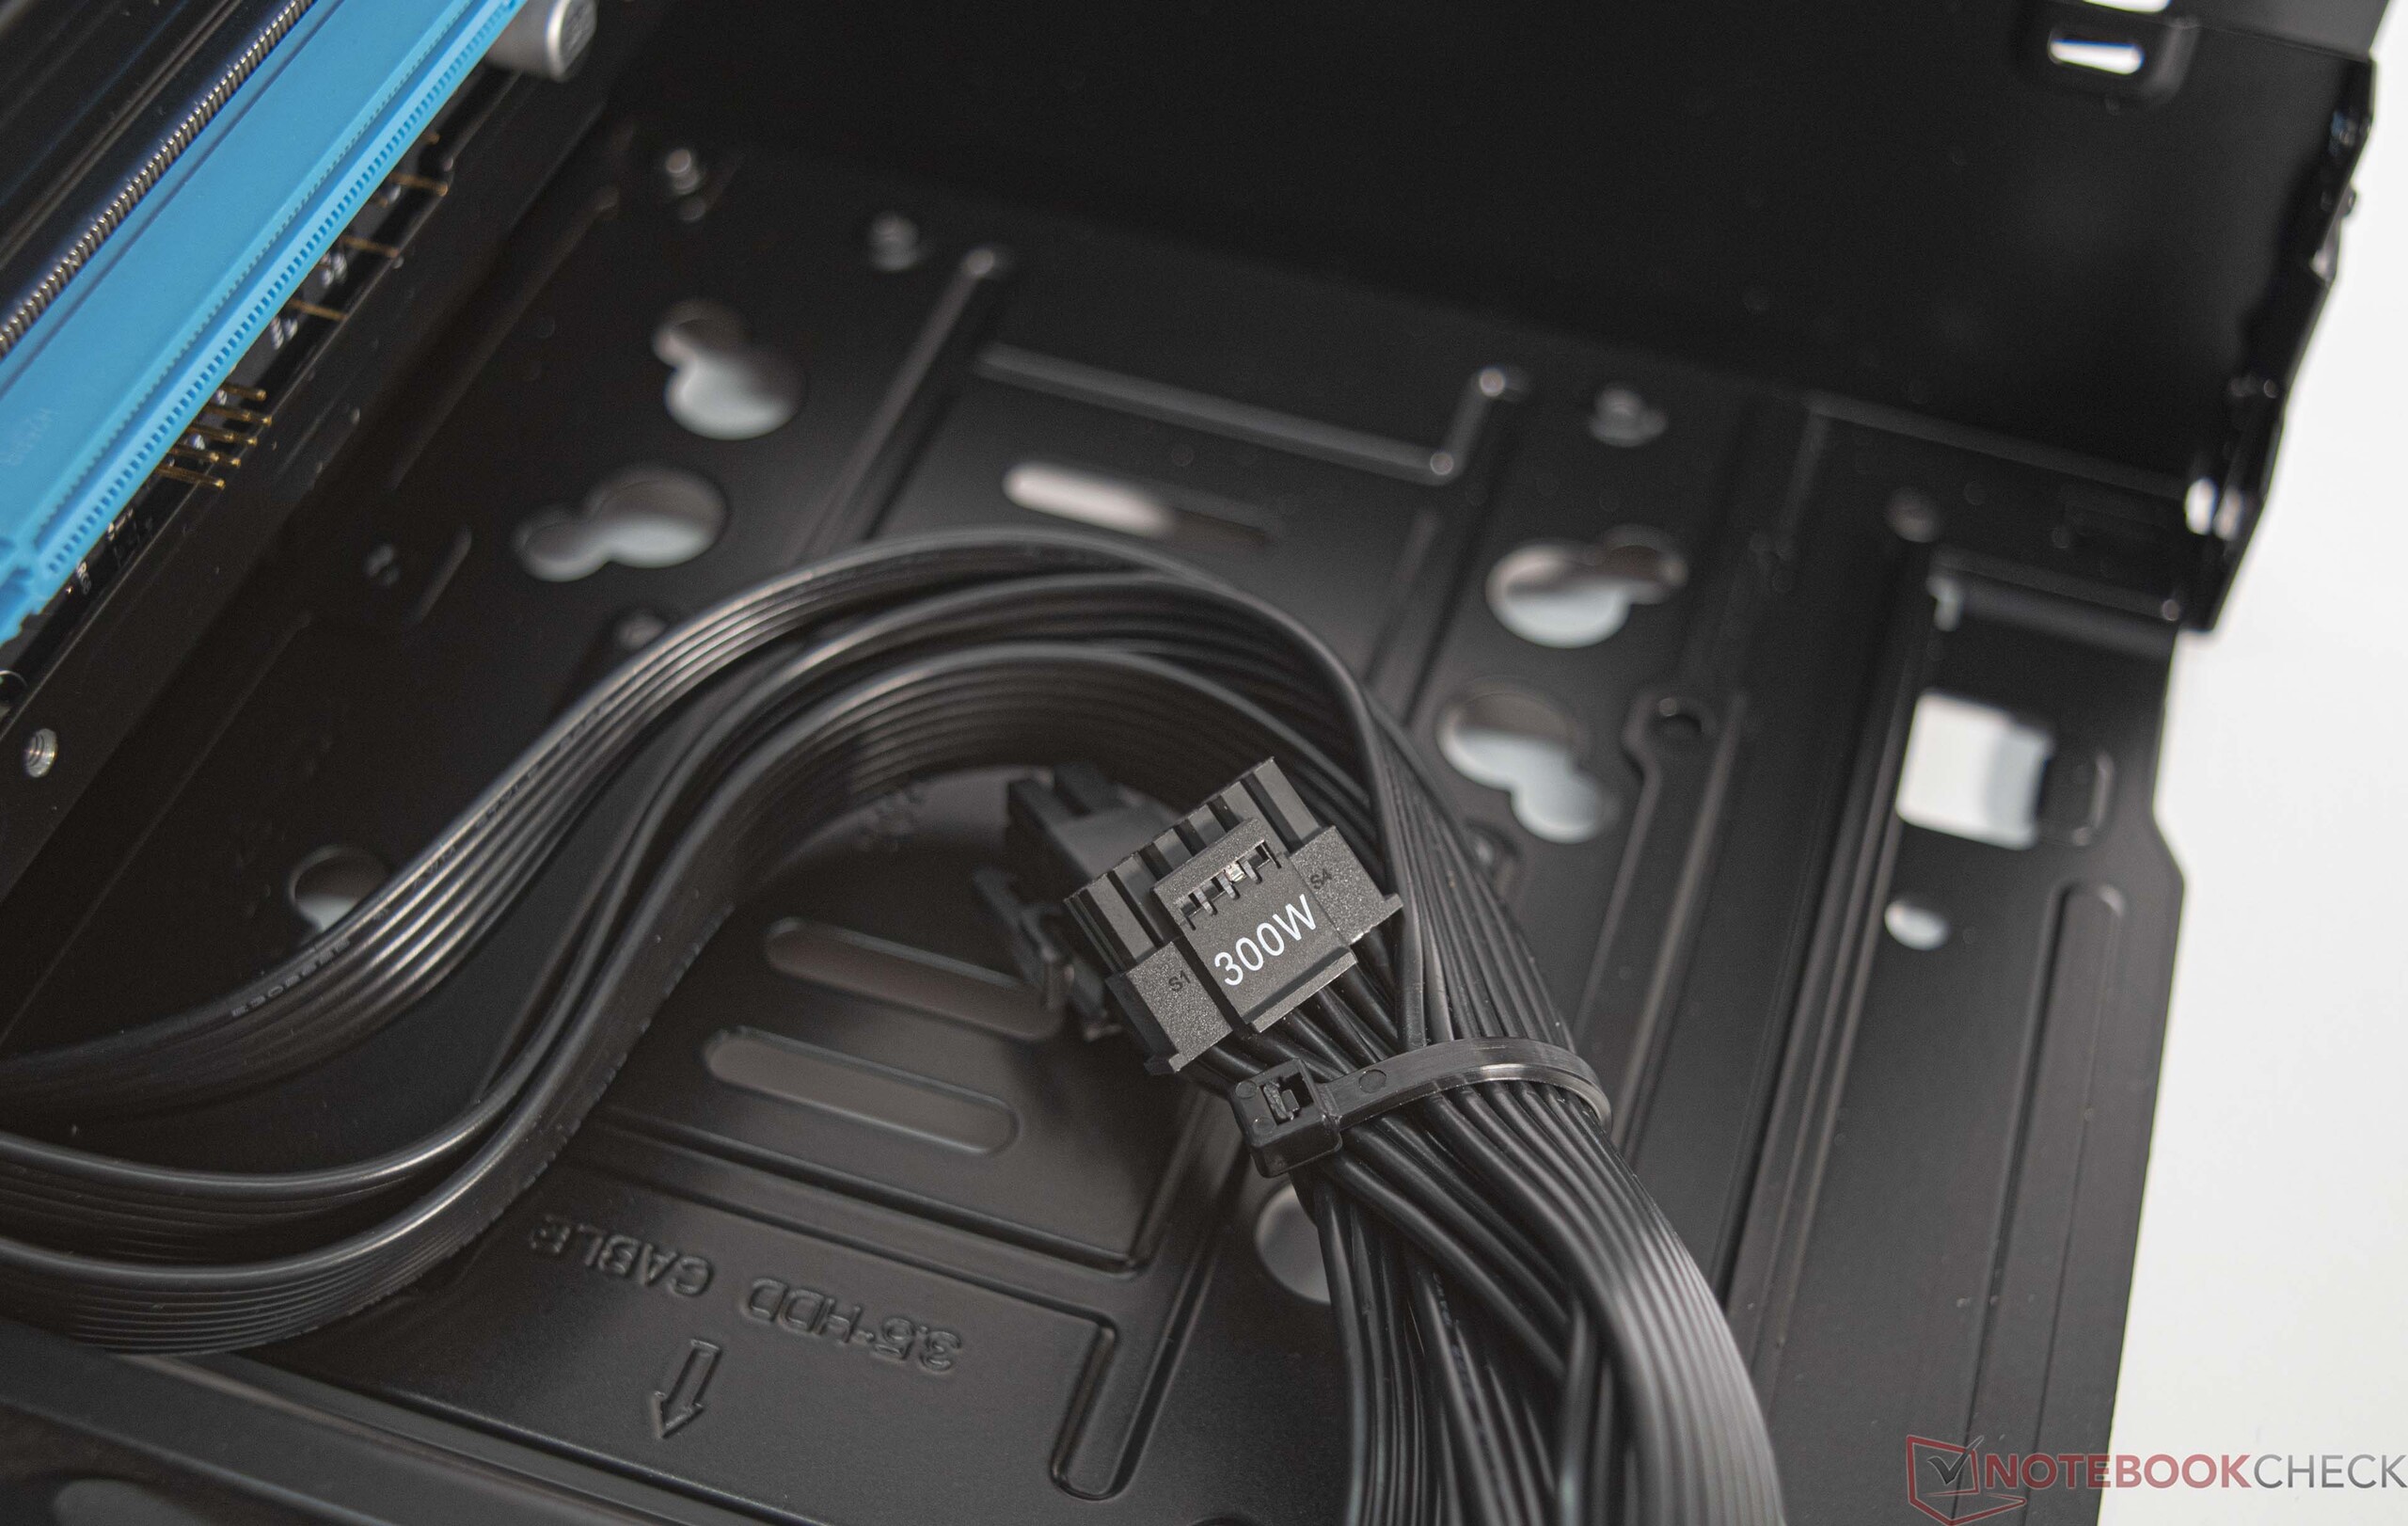
Obsługiwane są dedykowane rozwiązania graficzne o maksymalnej długości 31 cm (~12 in). Dzięki dołączonemu 750-watowemu zasilaczowi SFX można wykorzystać nawet obecne modele GPU z wyższej półki. Teoretycznie możliwe jest zmieszczenie nawet np Nvidia GeForce RTX 4090 FE. Problemem jest kabel 12VHPWR, który może dostarczyć tylko do 300 watów. Ponieważ w zestawie z zasilaczem znajdują się tylko trzy kable 6+2 dla GPU, to i tak budżet mocy jest ograniczony do 450 W.
Intel NUC 13 Extreme Raptor Canyon

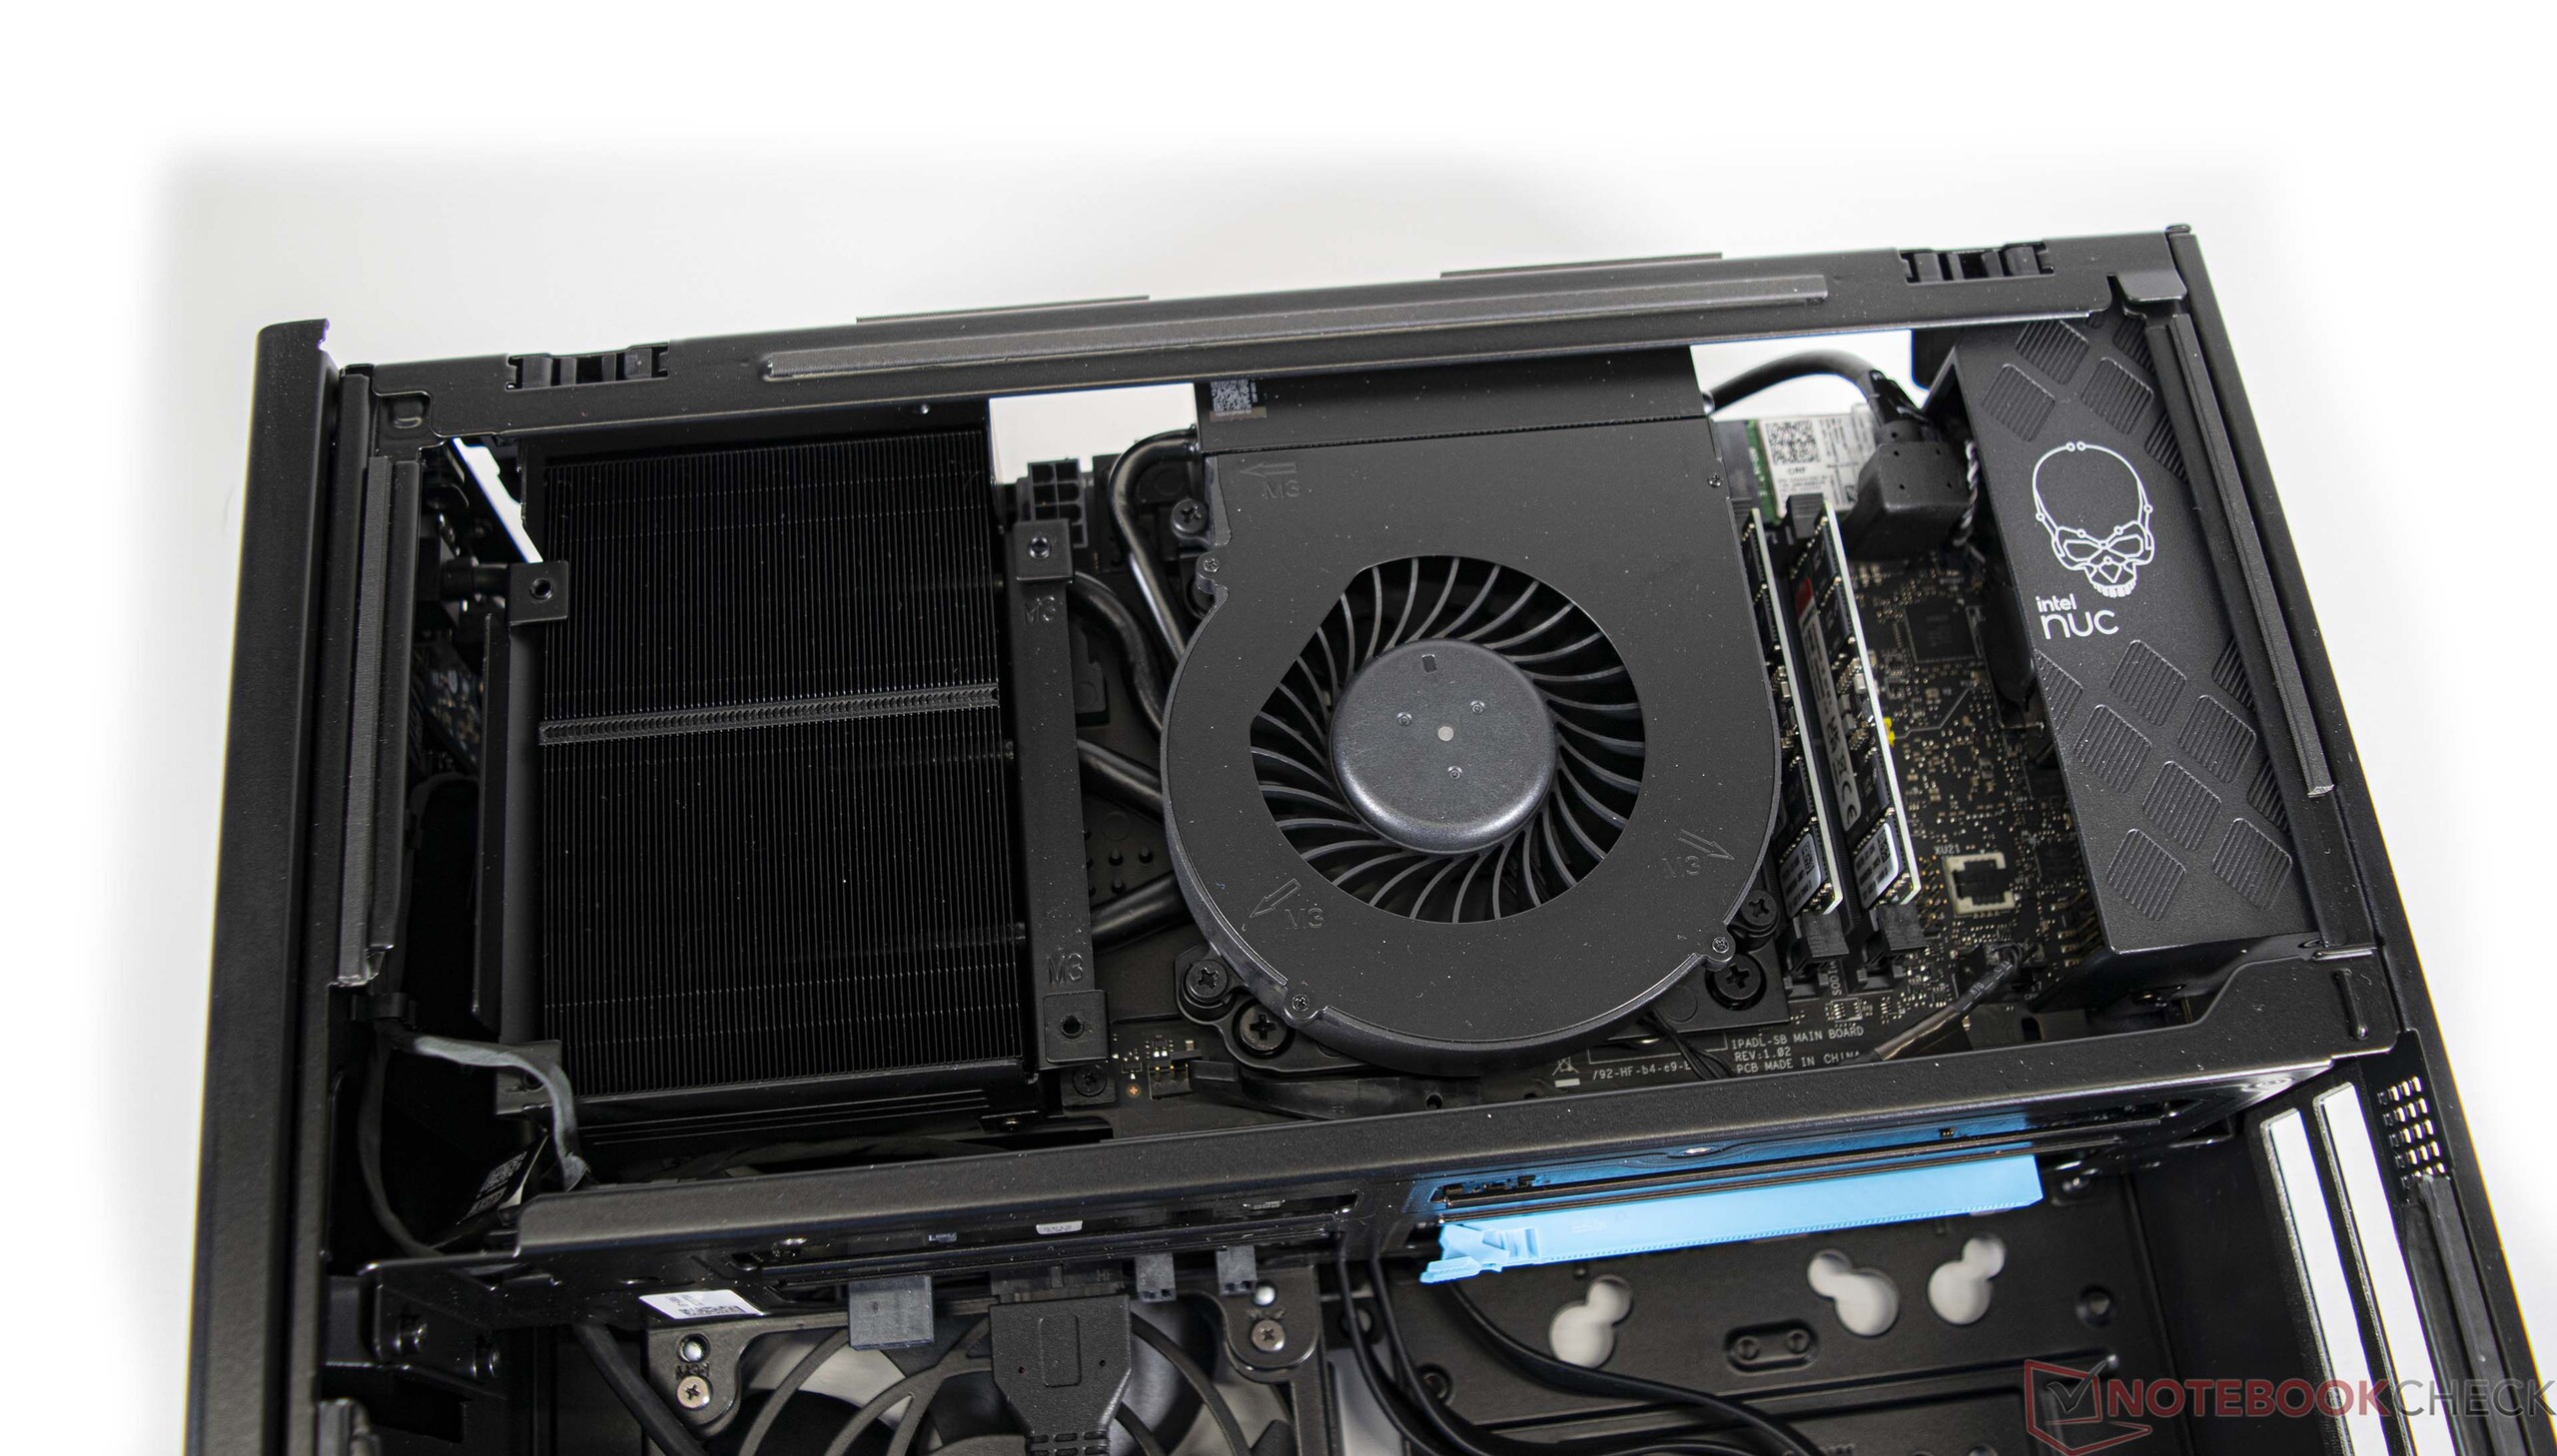
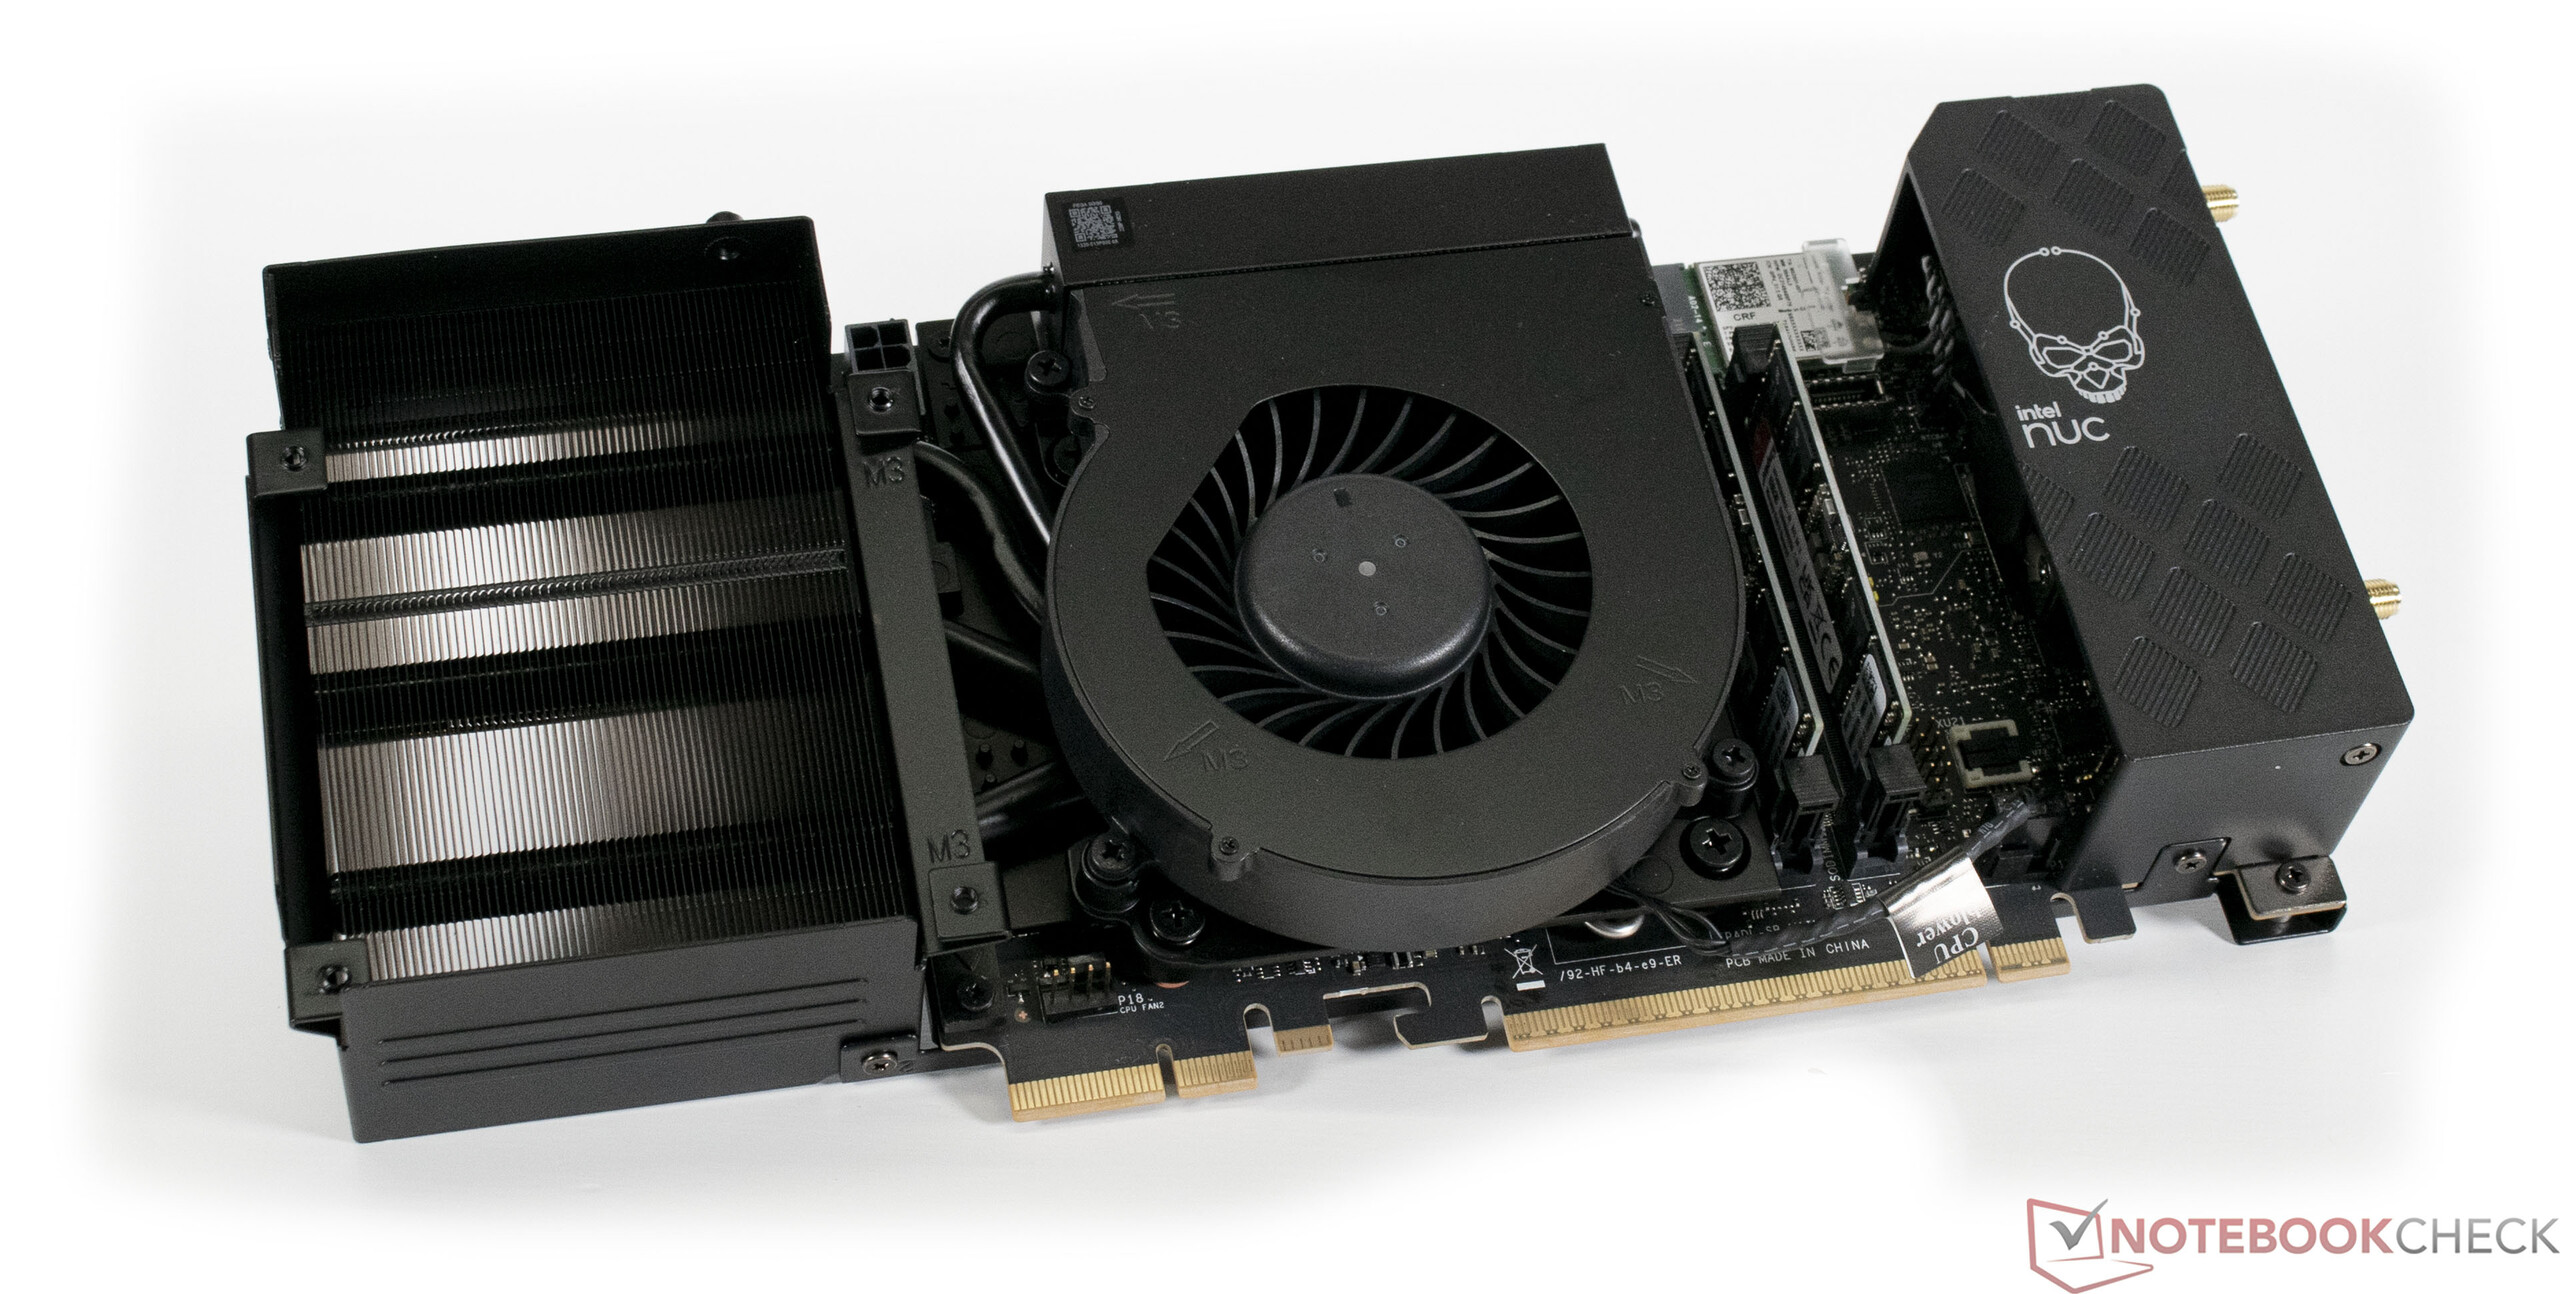
Intel NUC 13 Extreme Compute Element w szczegółach
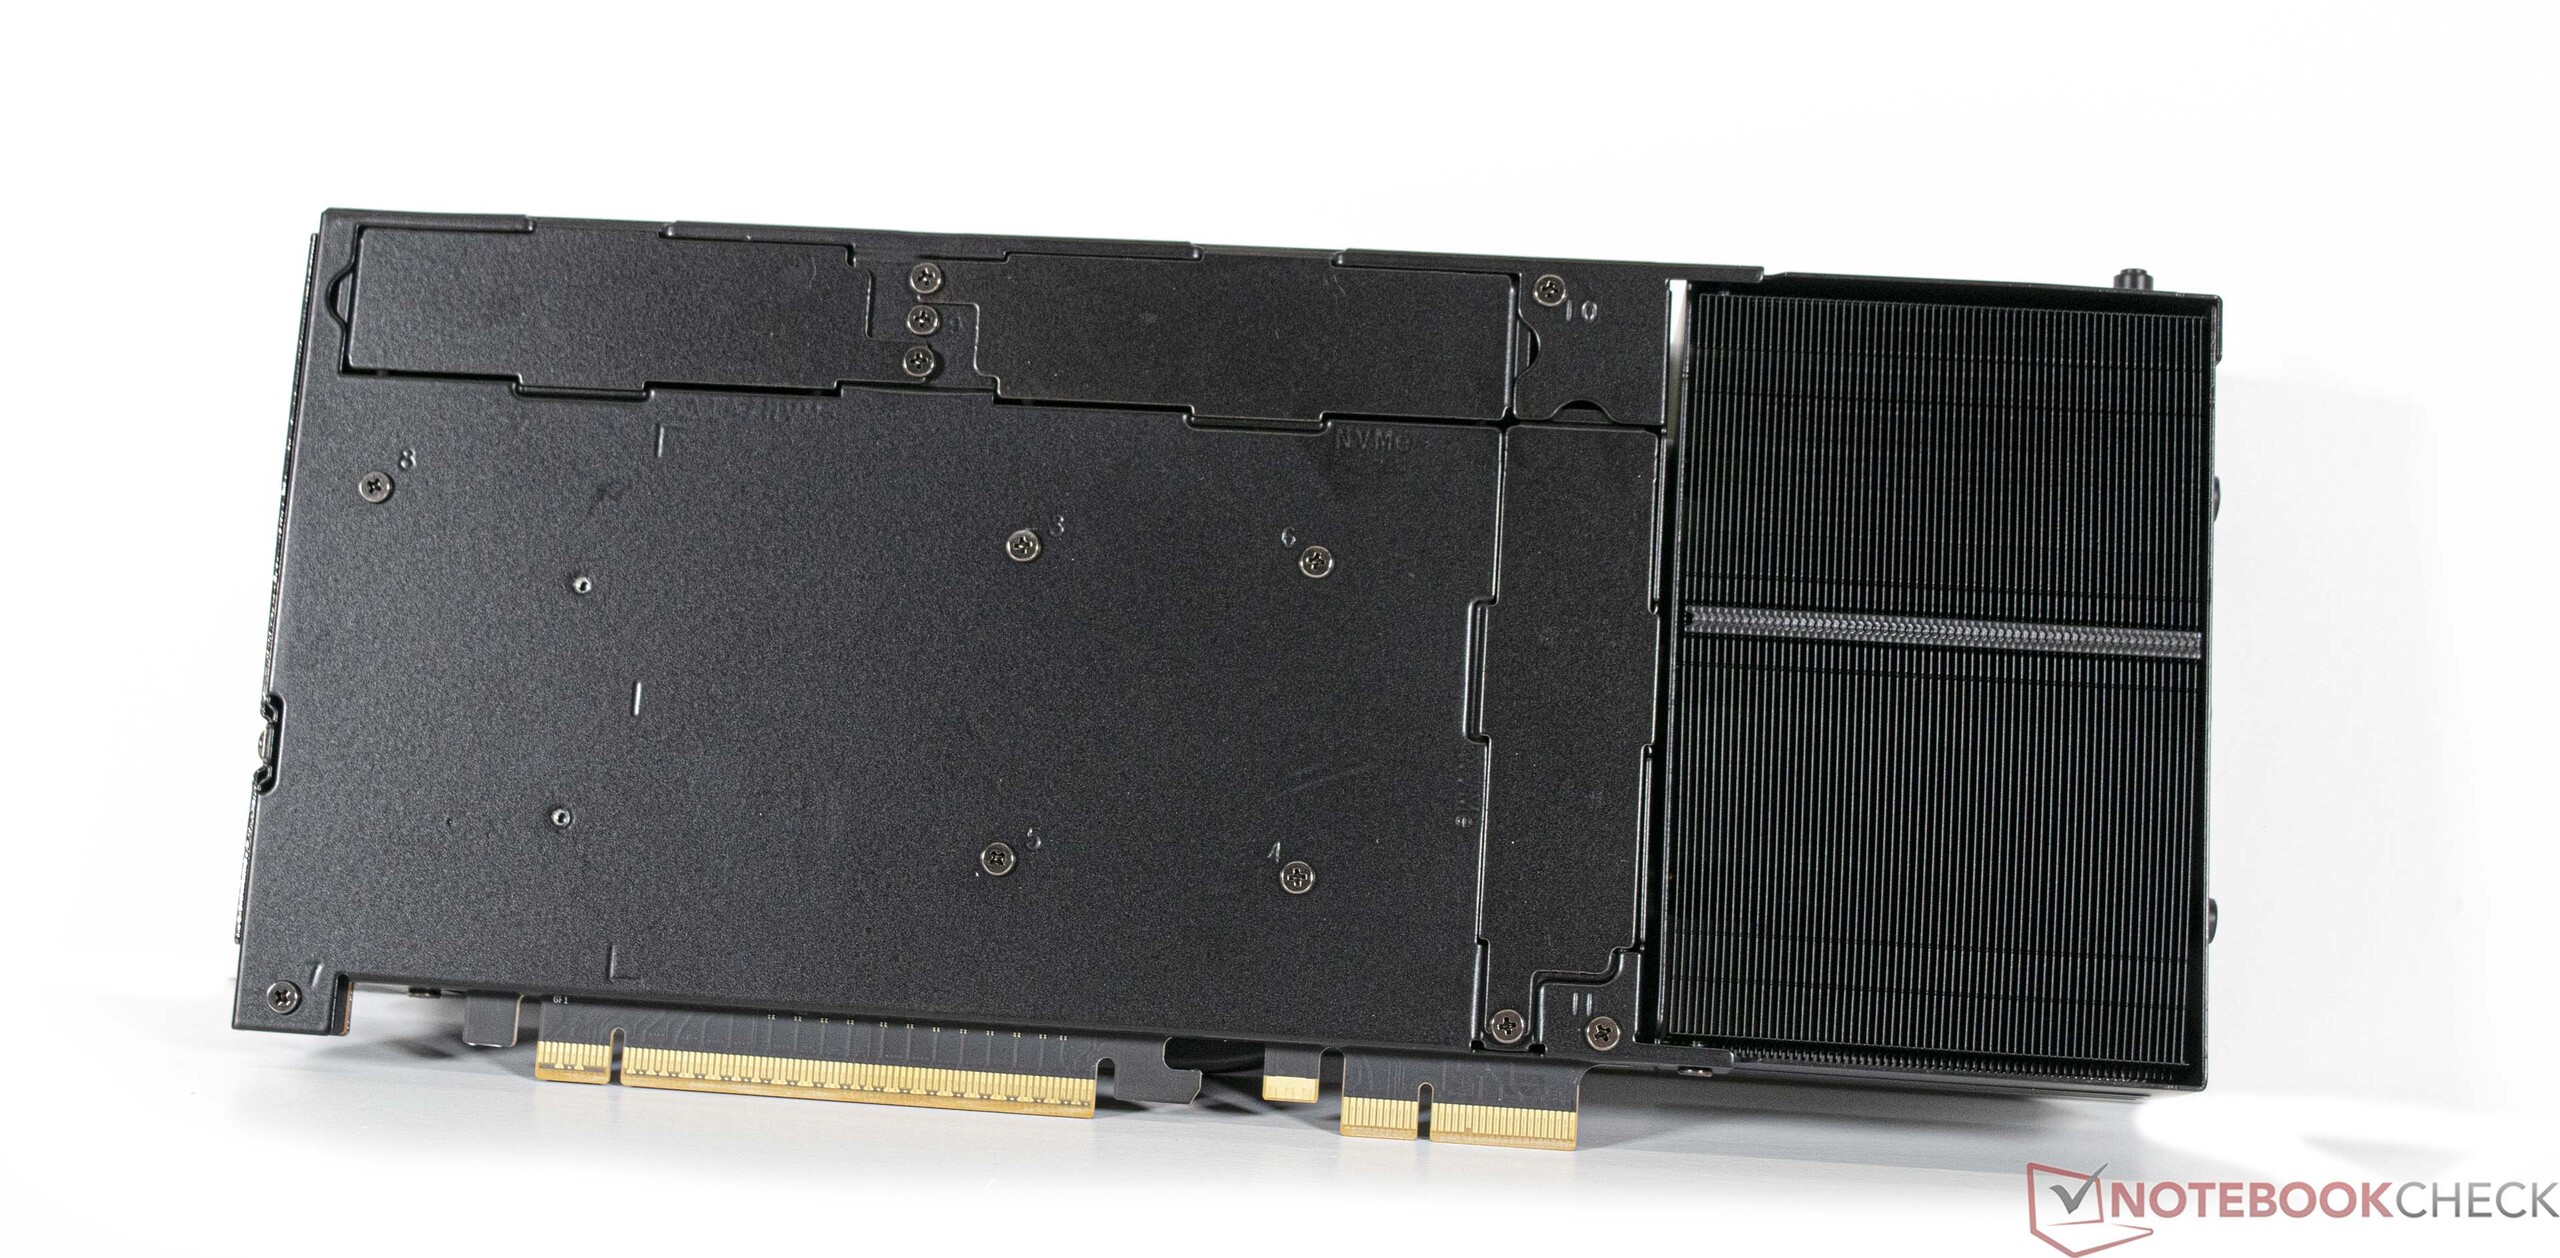
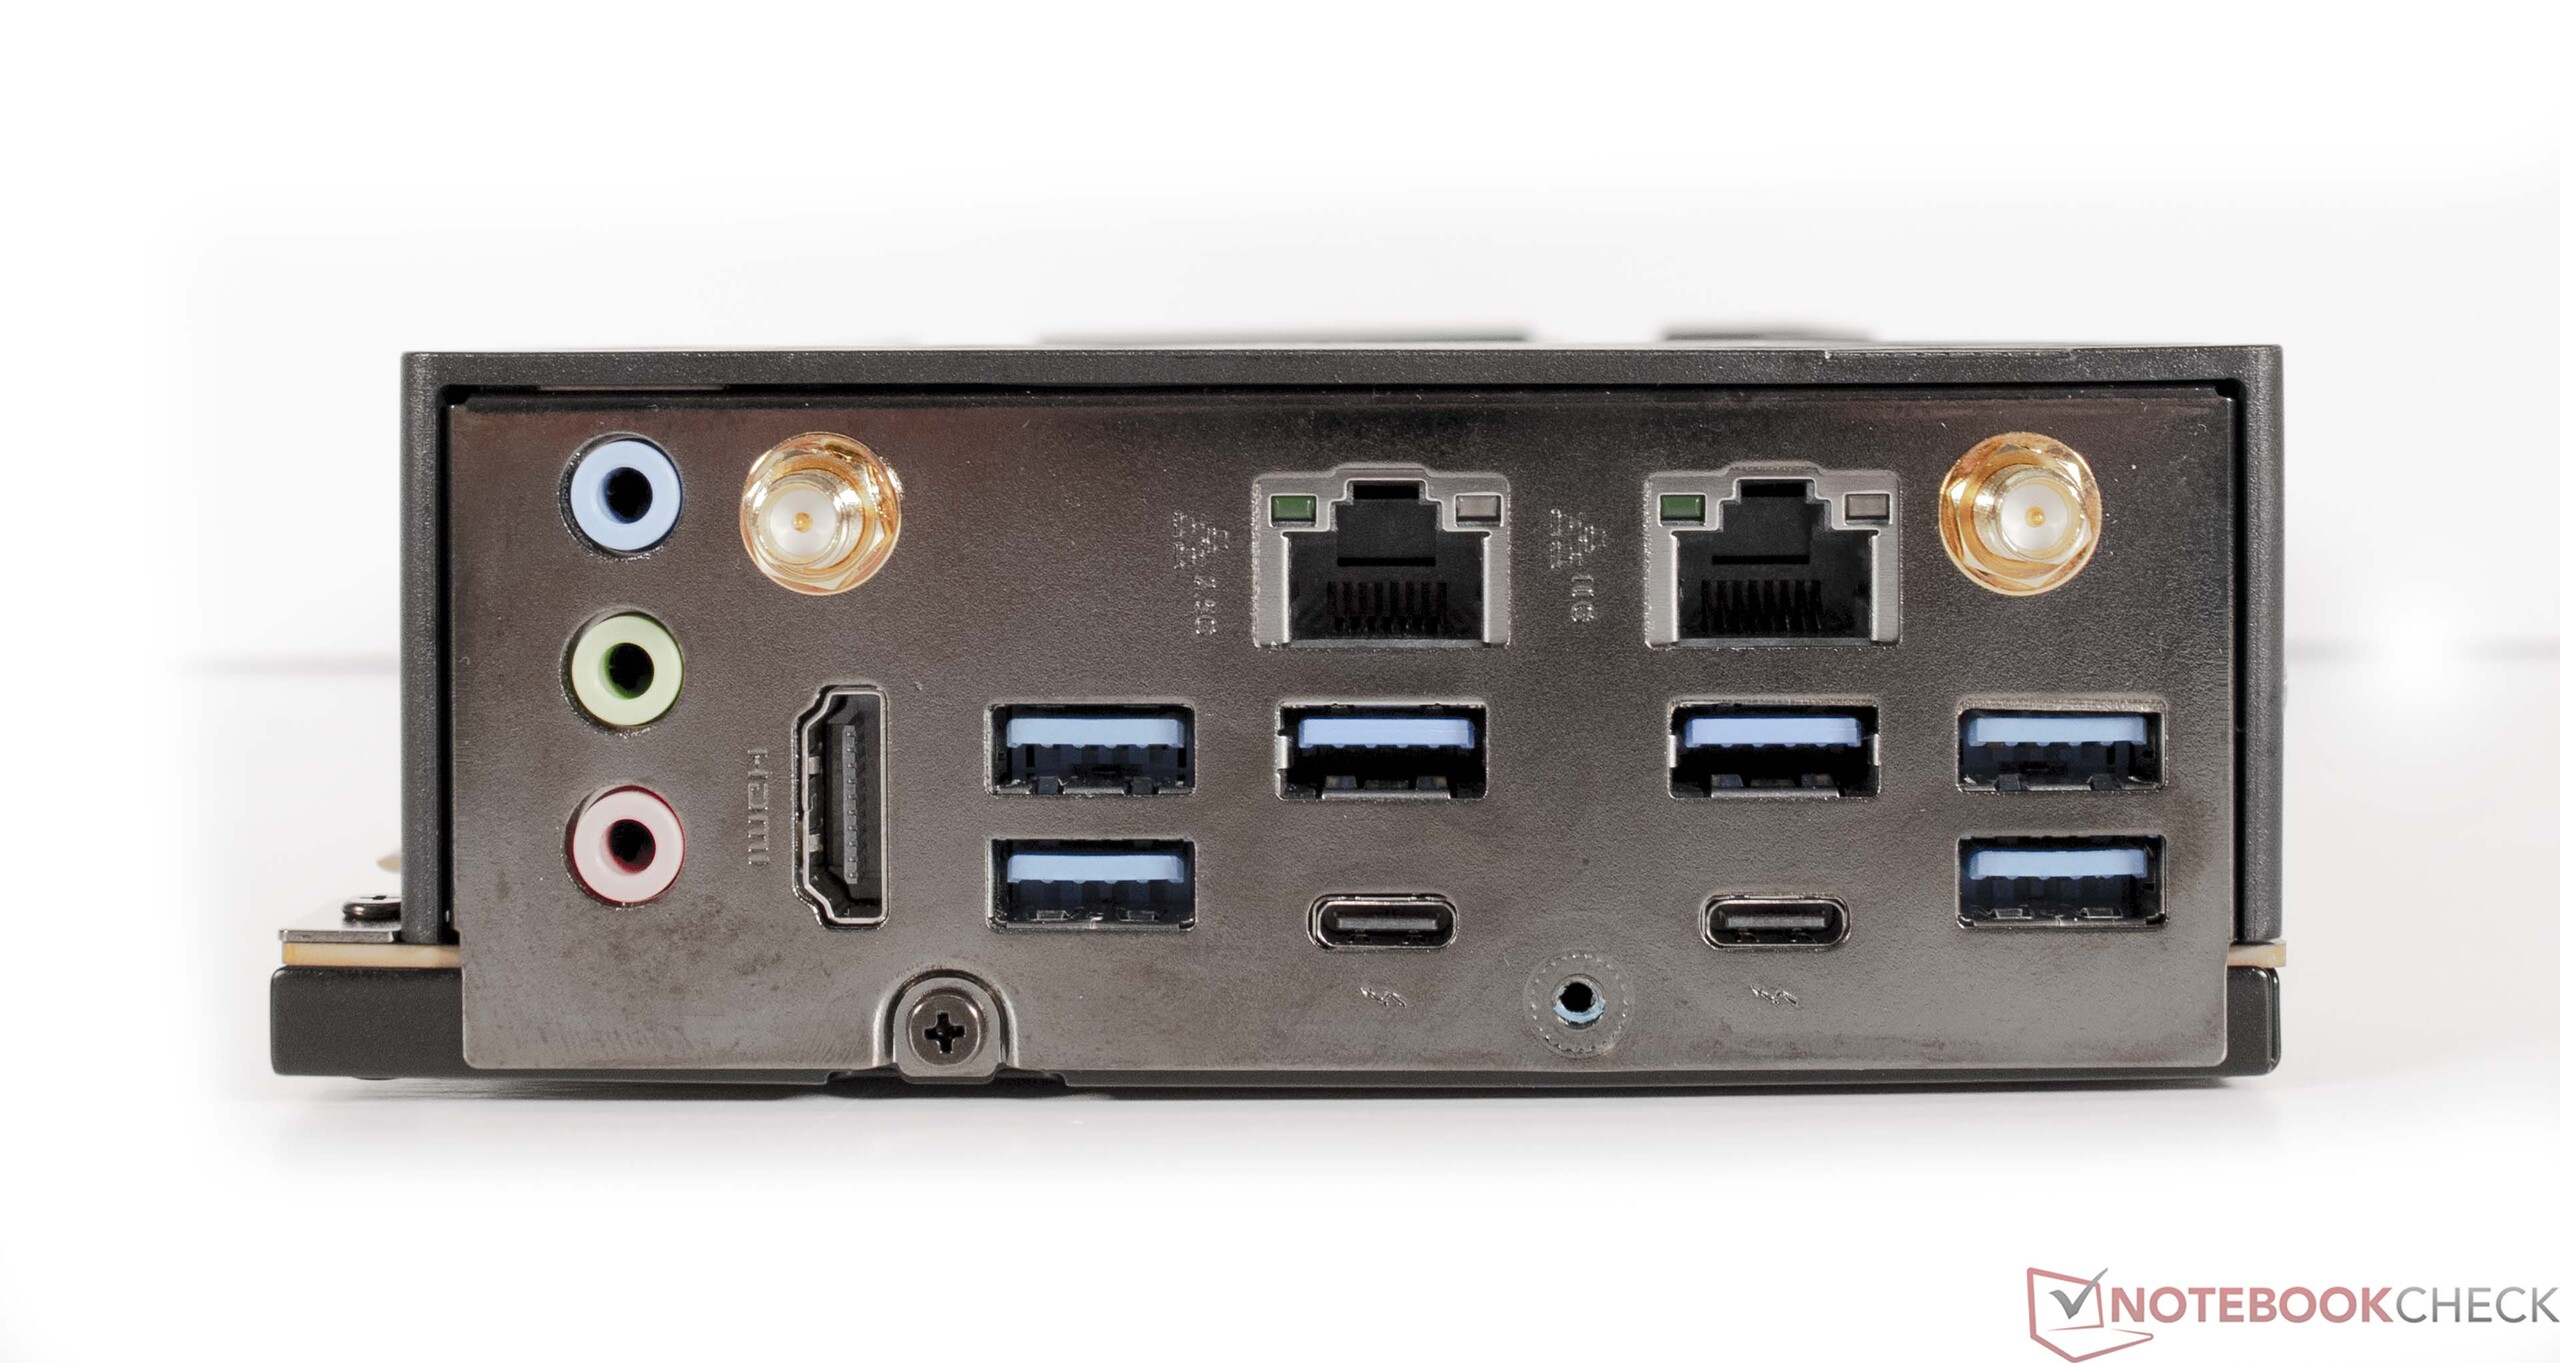
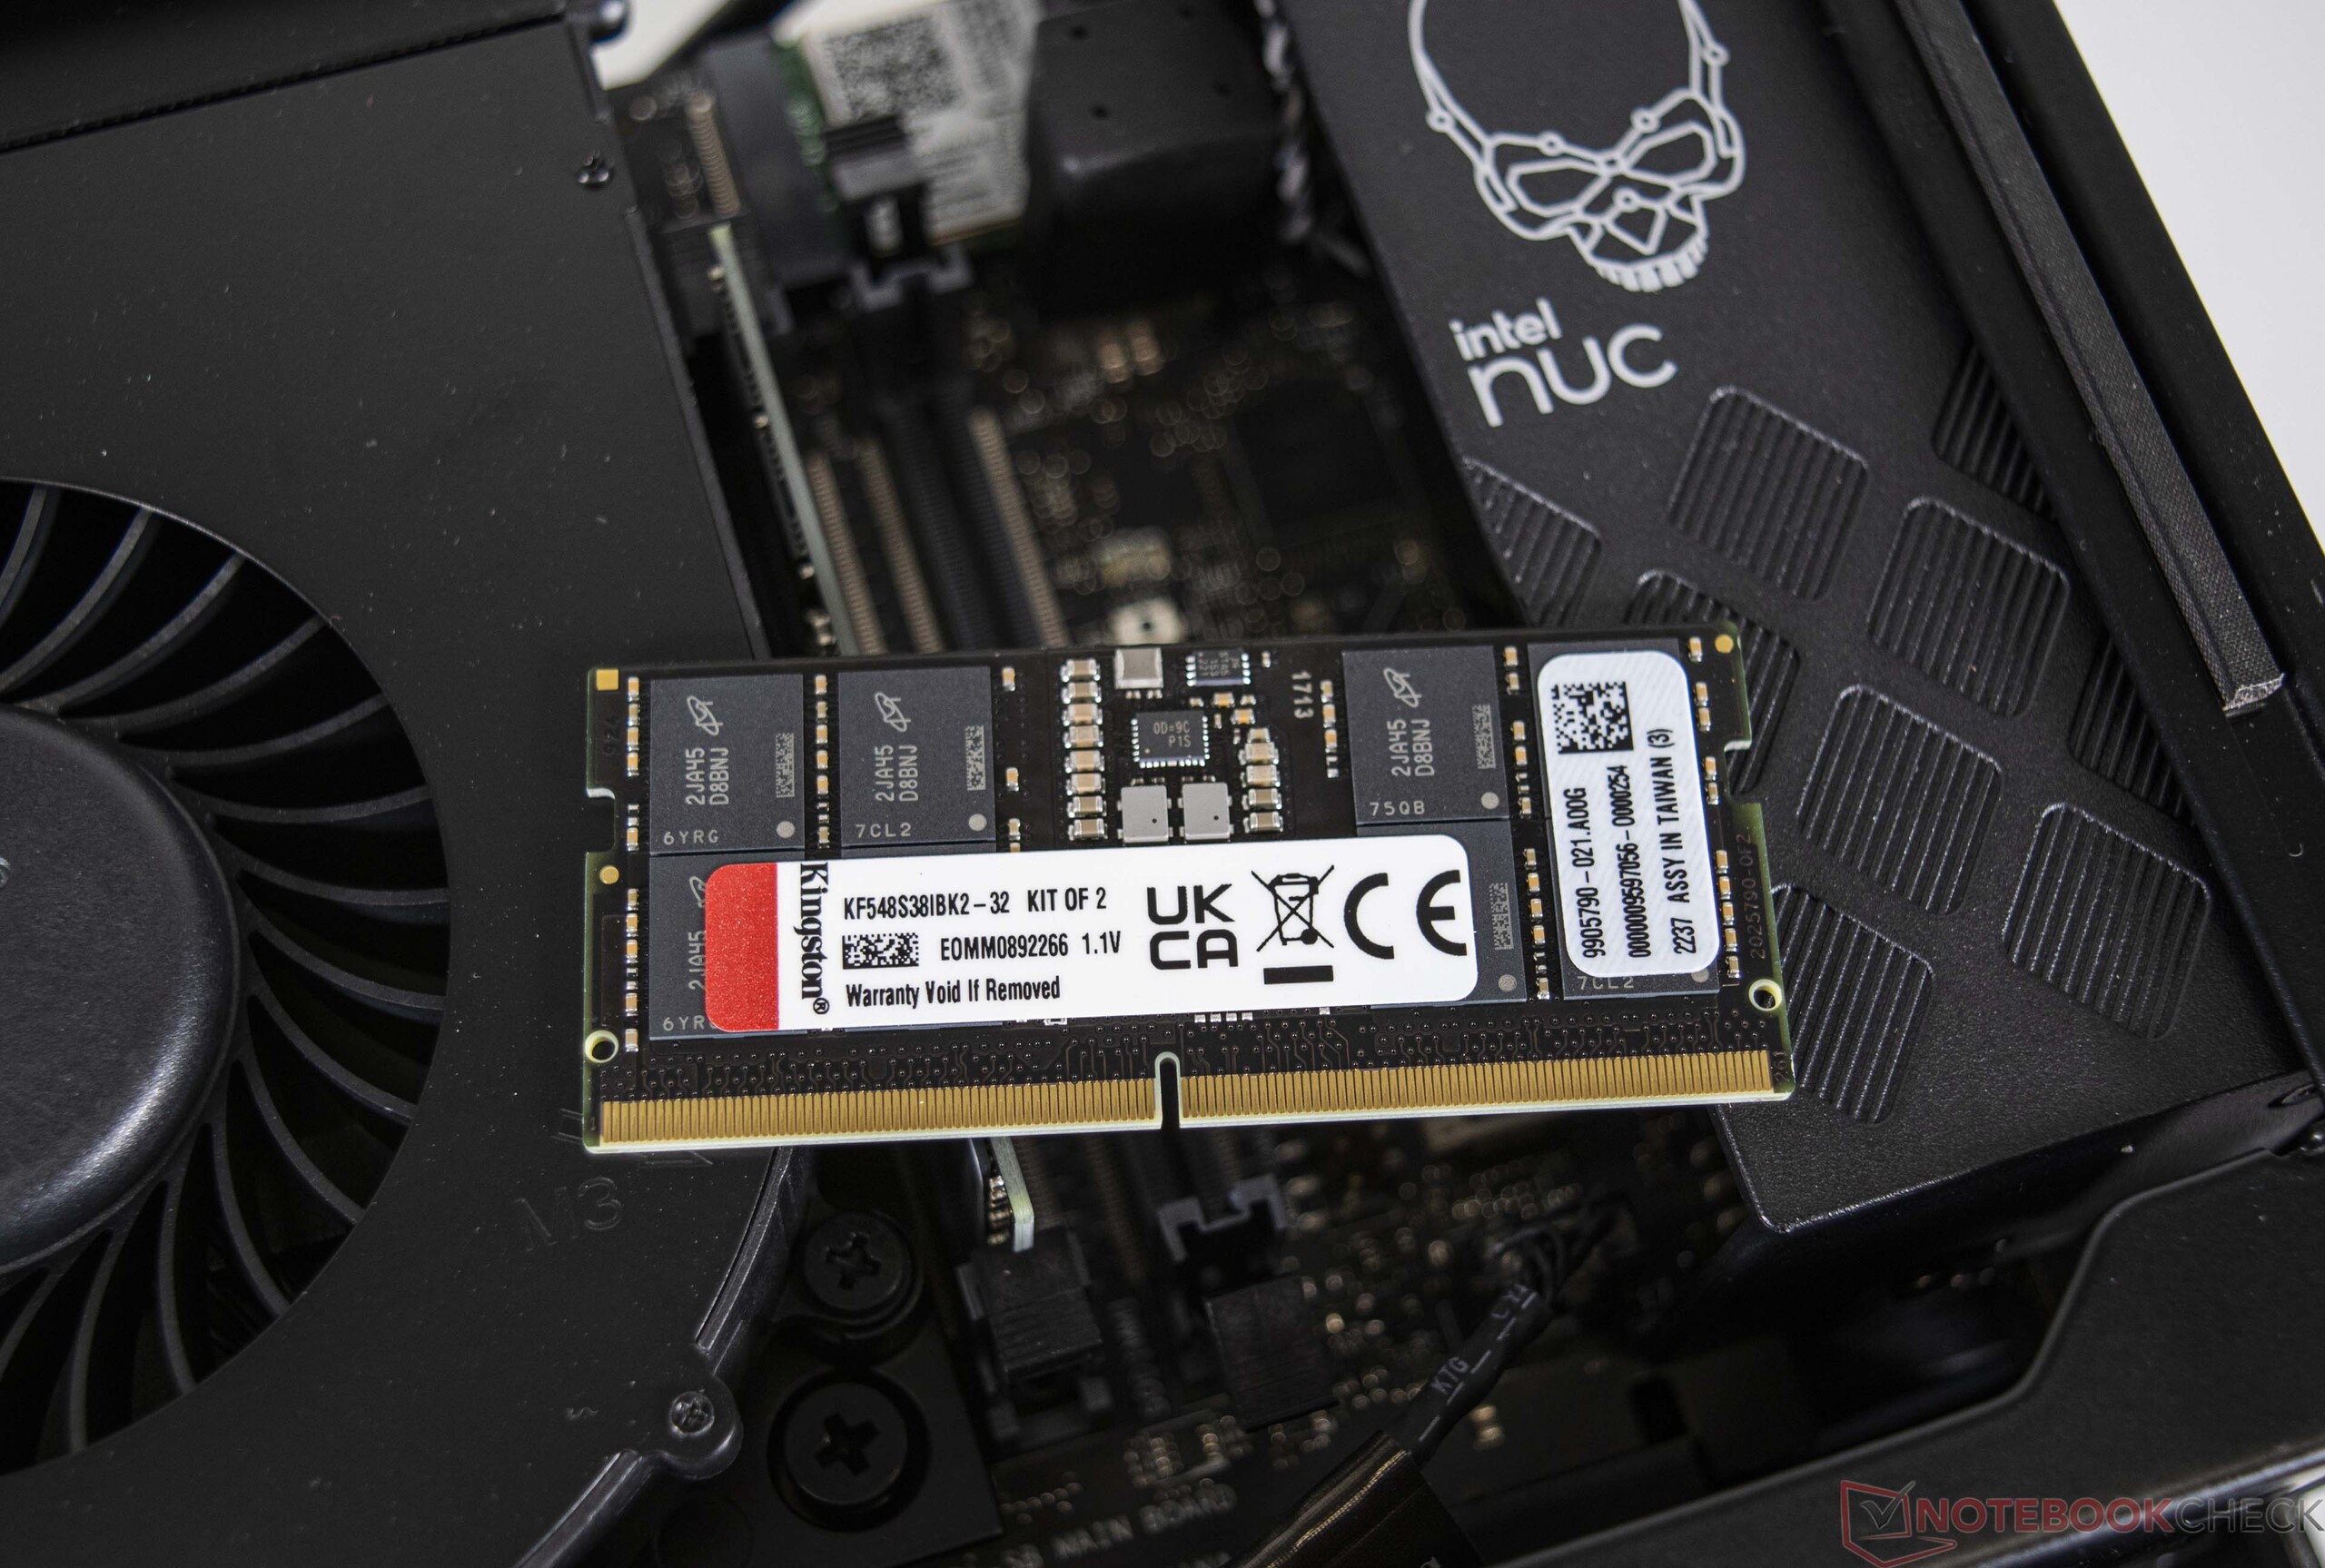
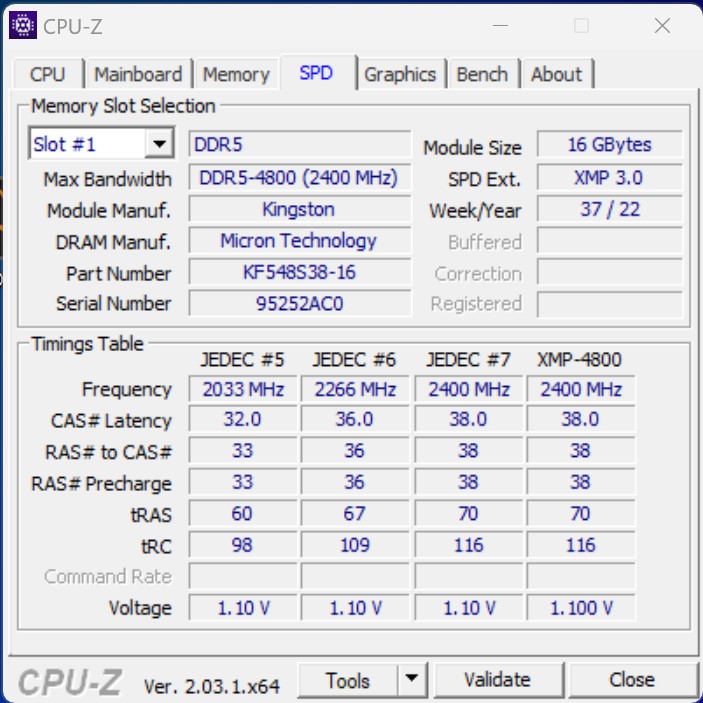
Z Intel Core i9-13900K, nasza konfiguracja Intel NUC 13 Extreme jest wyposażona w najszybszy dostępny obecnie procesor do gier. Ma on łącznie 24 rdzenie i 32 wątki. Stało się powszechnie wiadomo, że procesory generacji Raptor Lake wykorzystują hybrydową konstrukcję zawierającą rdzenie E i P. Podobnie jak w modelu Intel NUC 12 Extreme, jego poprzednik zawiera również standardowy procesor do komputerów stacjonarnych. Dodatkowo Compute Element jest wyposażony we wszystkie niezbędne porty. Na spodzie PCB znajdują się trzy gniazda NVMe SSD, a z boku wszystkie interfejsy zewnętrzne.
Wydajność Wi-Fi
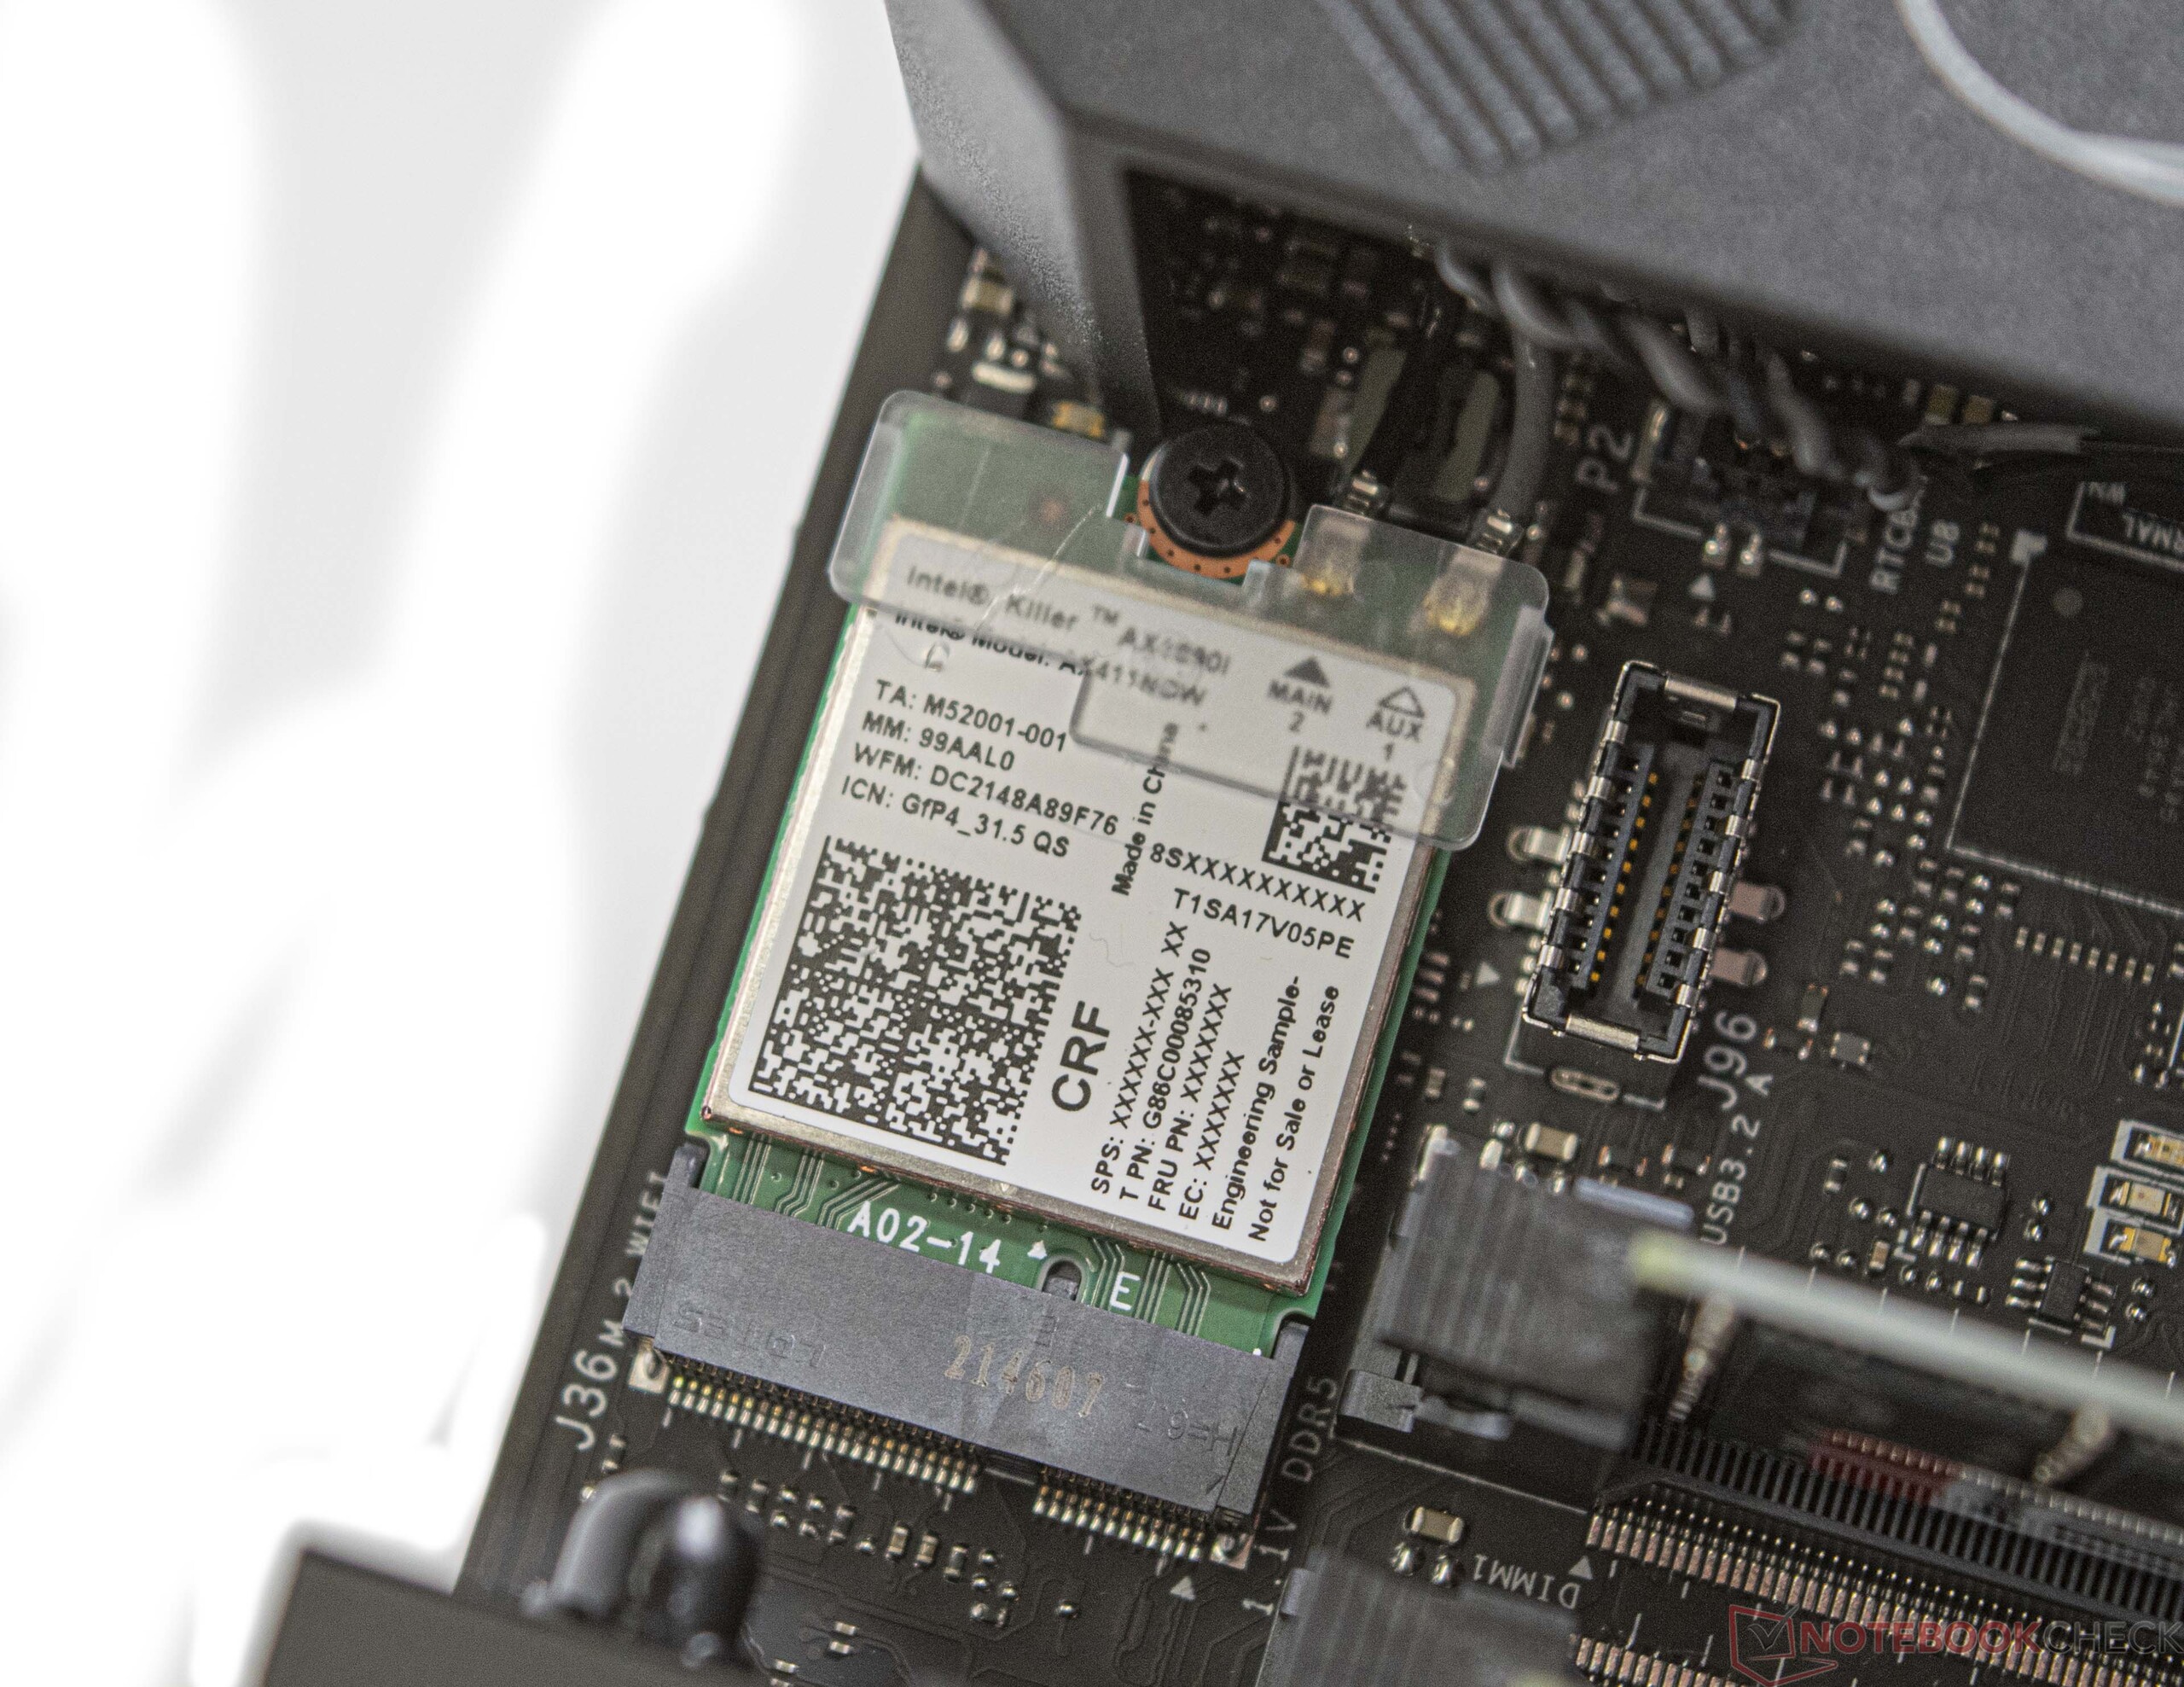
Intel NUC 13 Extreme Raptor Canyon integruje moduł Wi-Fi Killer Wi-Fi 6E AX1690i. W połączeniu z naszym referencyjnym routerem Asus ROG Rapture GT-AXE11000 mierzymy dobre prędkości wysyłania i pobierania danych. Jednostka Wi-Fi jest modułem na Compute Element, a więc może być wymieniana przez użytkownika. Do komunikacji przewodowej dostępny jest zarówno interfejs 10 Gb/s, jak i 2,5 Gb/s.
Uwagi
Nie udało nam się uzyskać stabilnego połączenia Wi-Fi 6G z naszym urządzeniem testowym. Aktualizacja podzespołów o najnowsze sterowniki i aktualizacje firmware dla Intel NUC 13 Extreme Raptor Canyon, a także naszego testowego routera nie poprawiła sytuacji. Zrewidujemy tę część recenzji, jeśli sytuacja zmieni się w ciągu najbliższych kilku dni, zanim będziemy musieli zwrócić urządzenie.
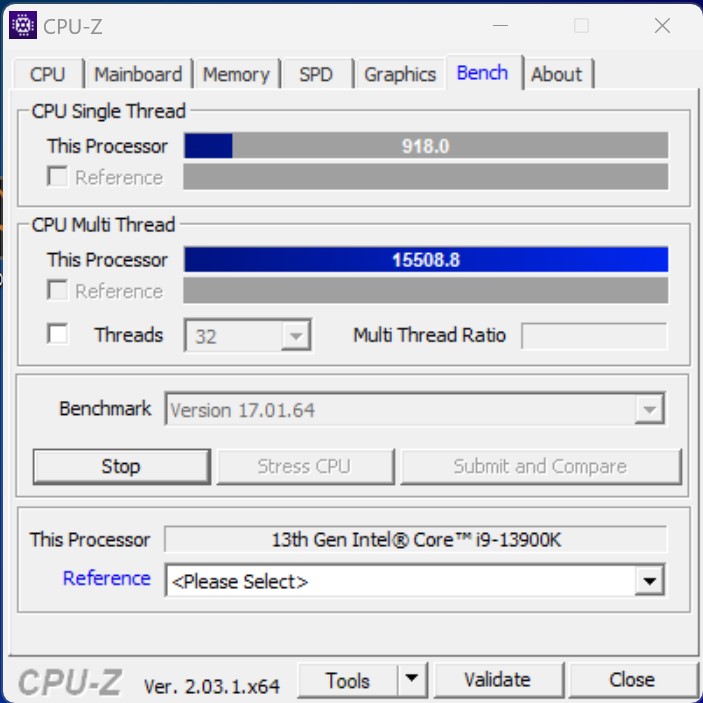
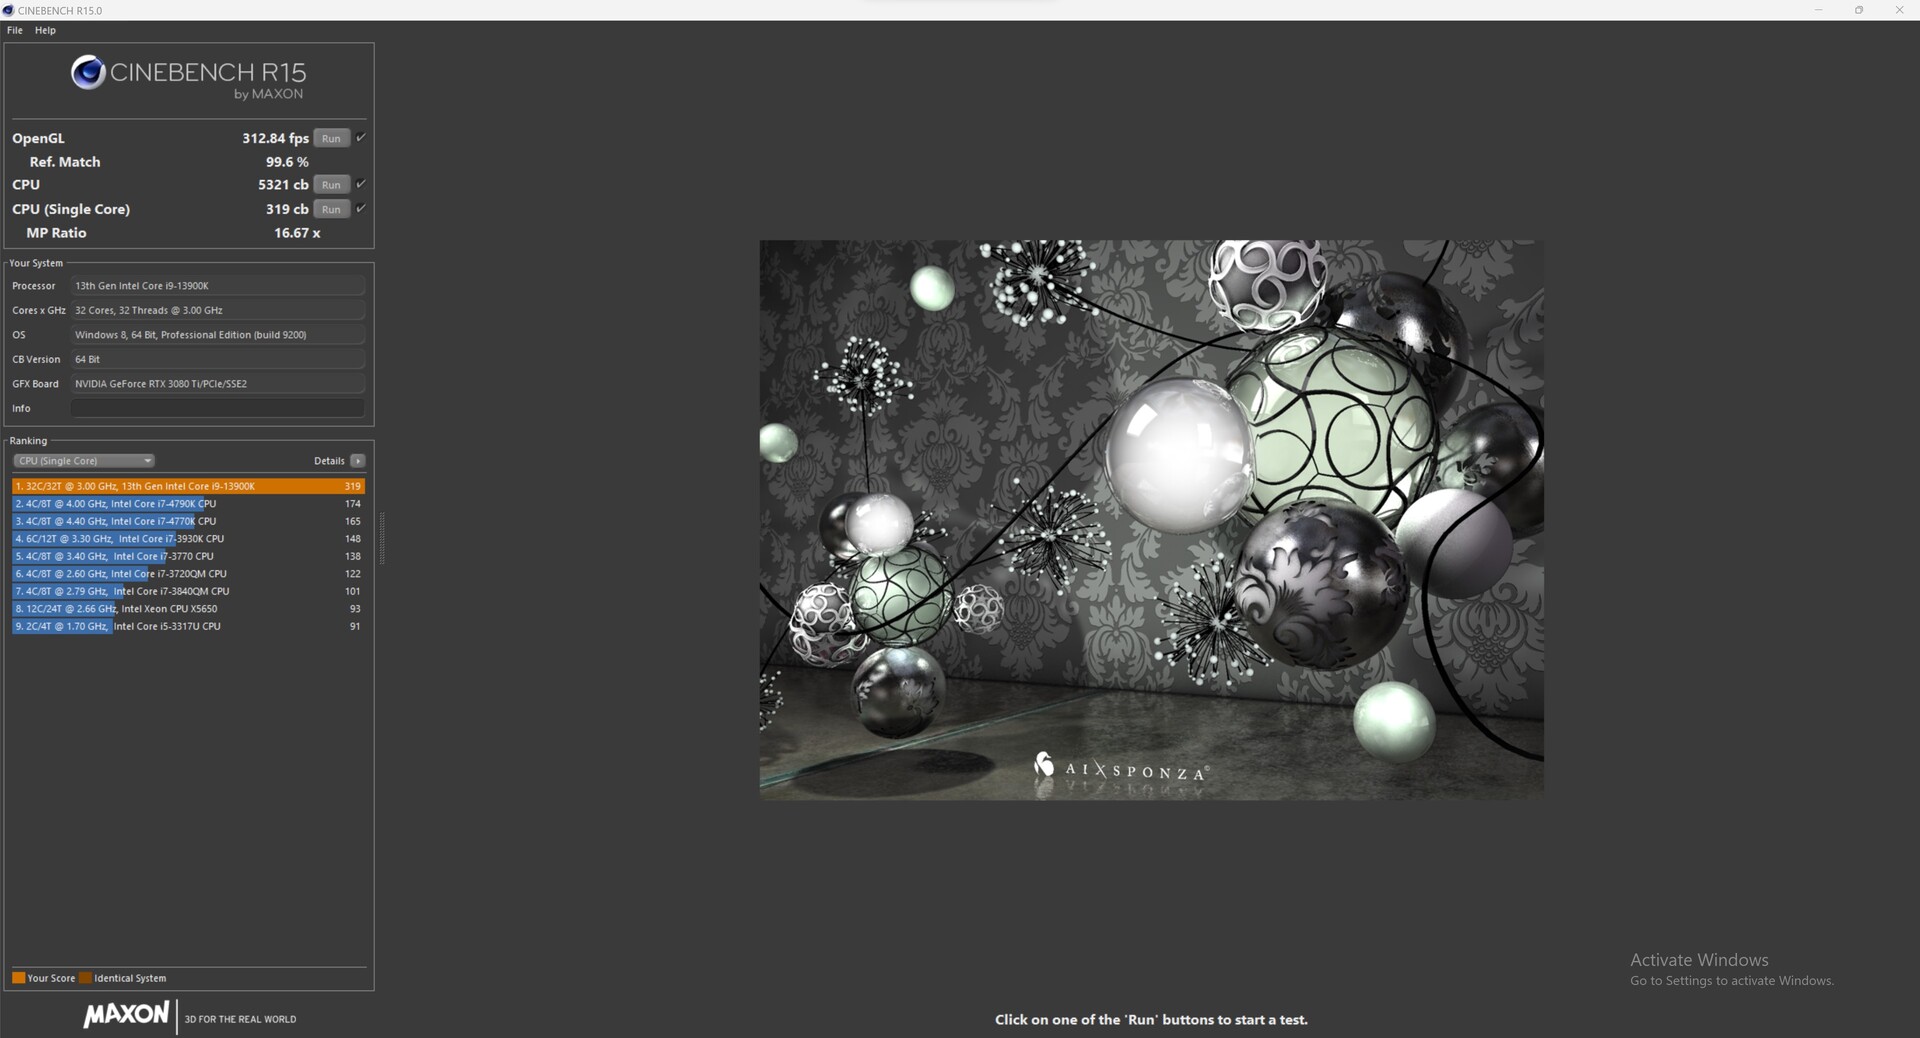
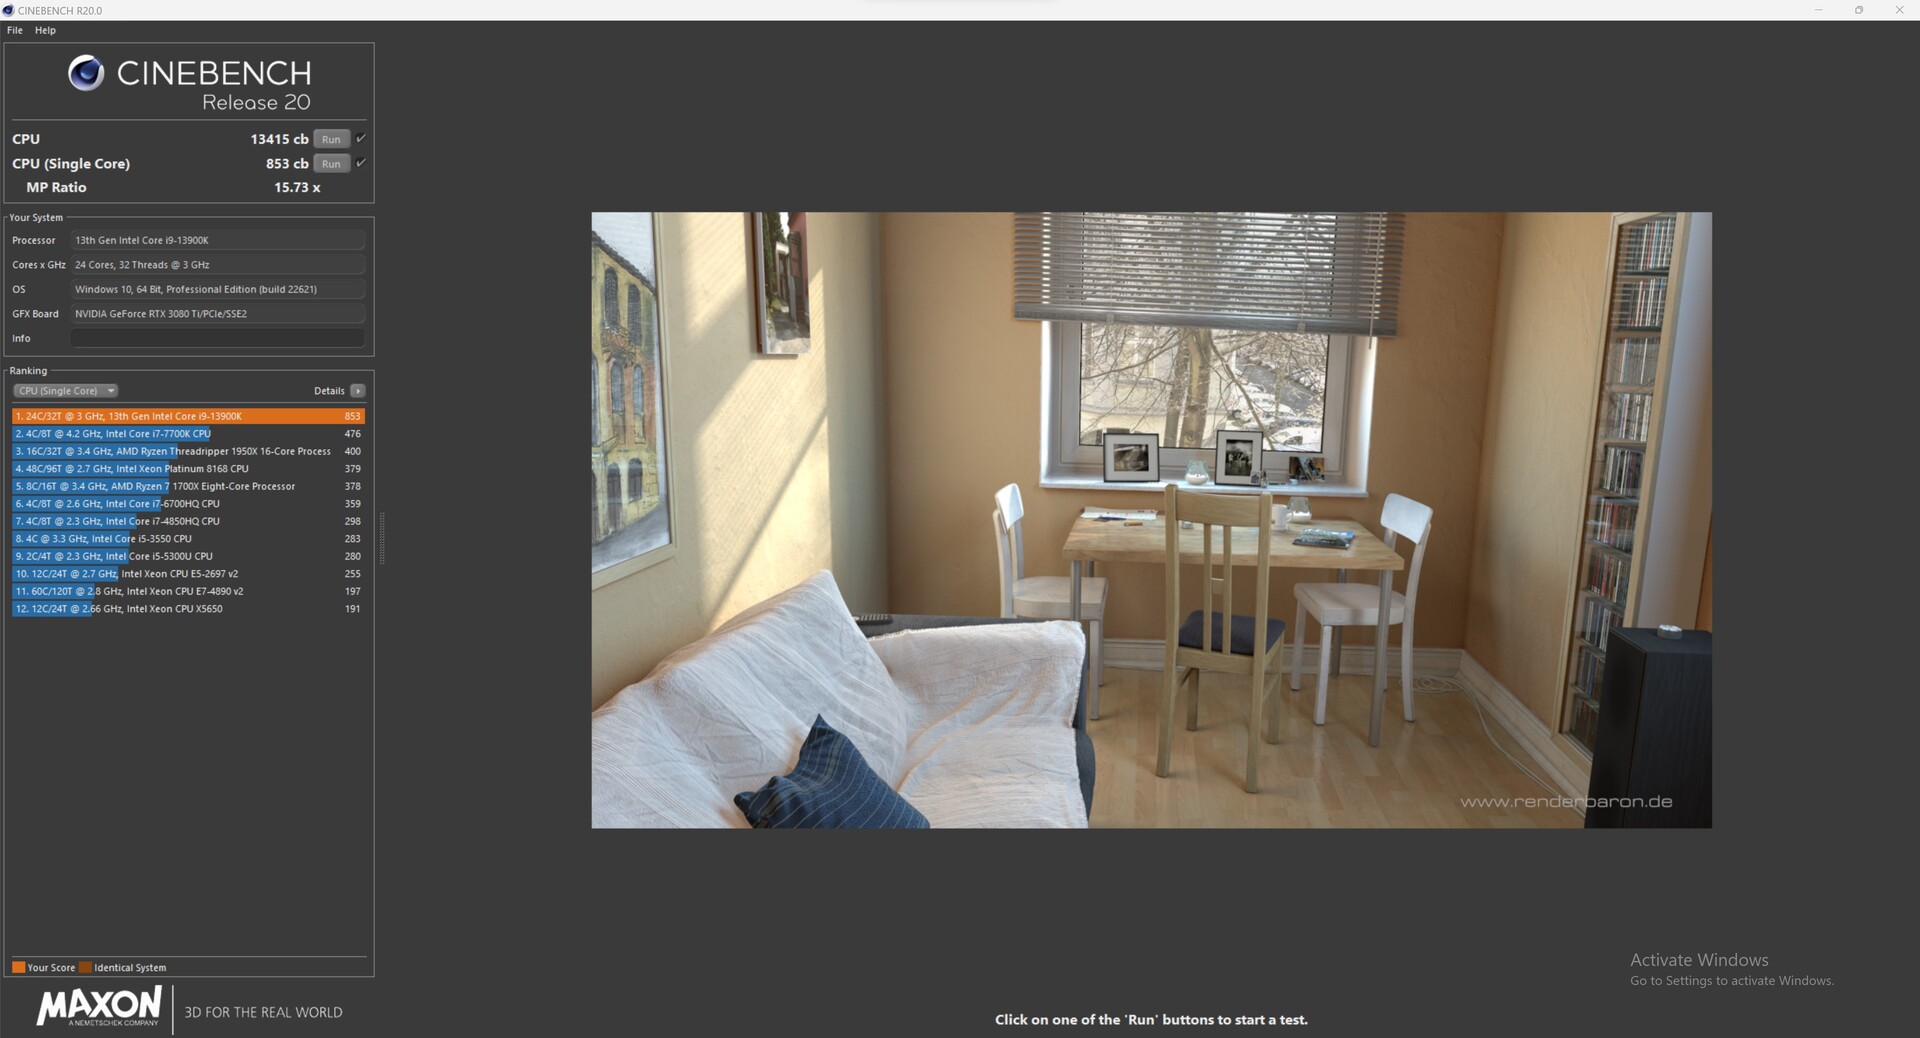
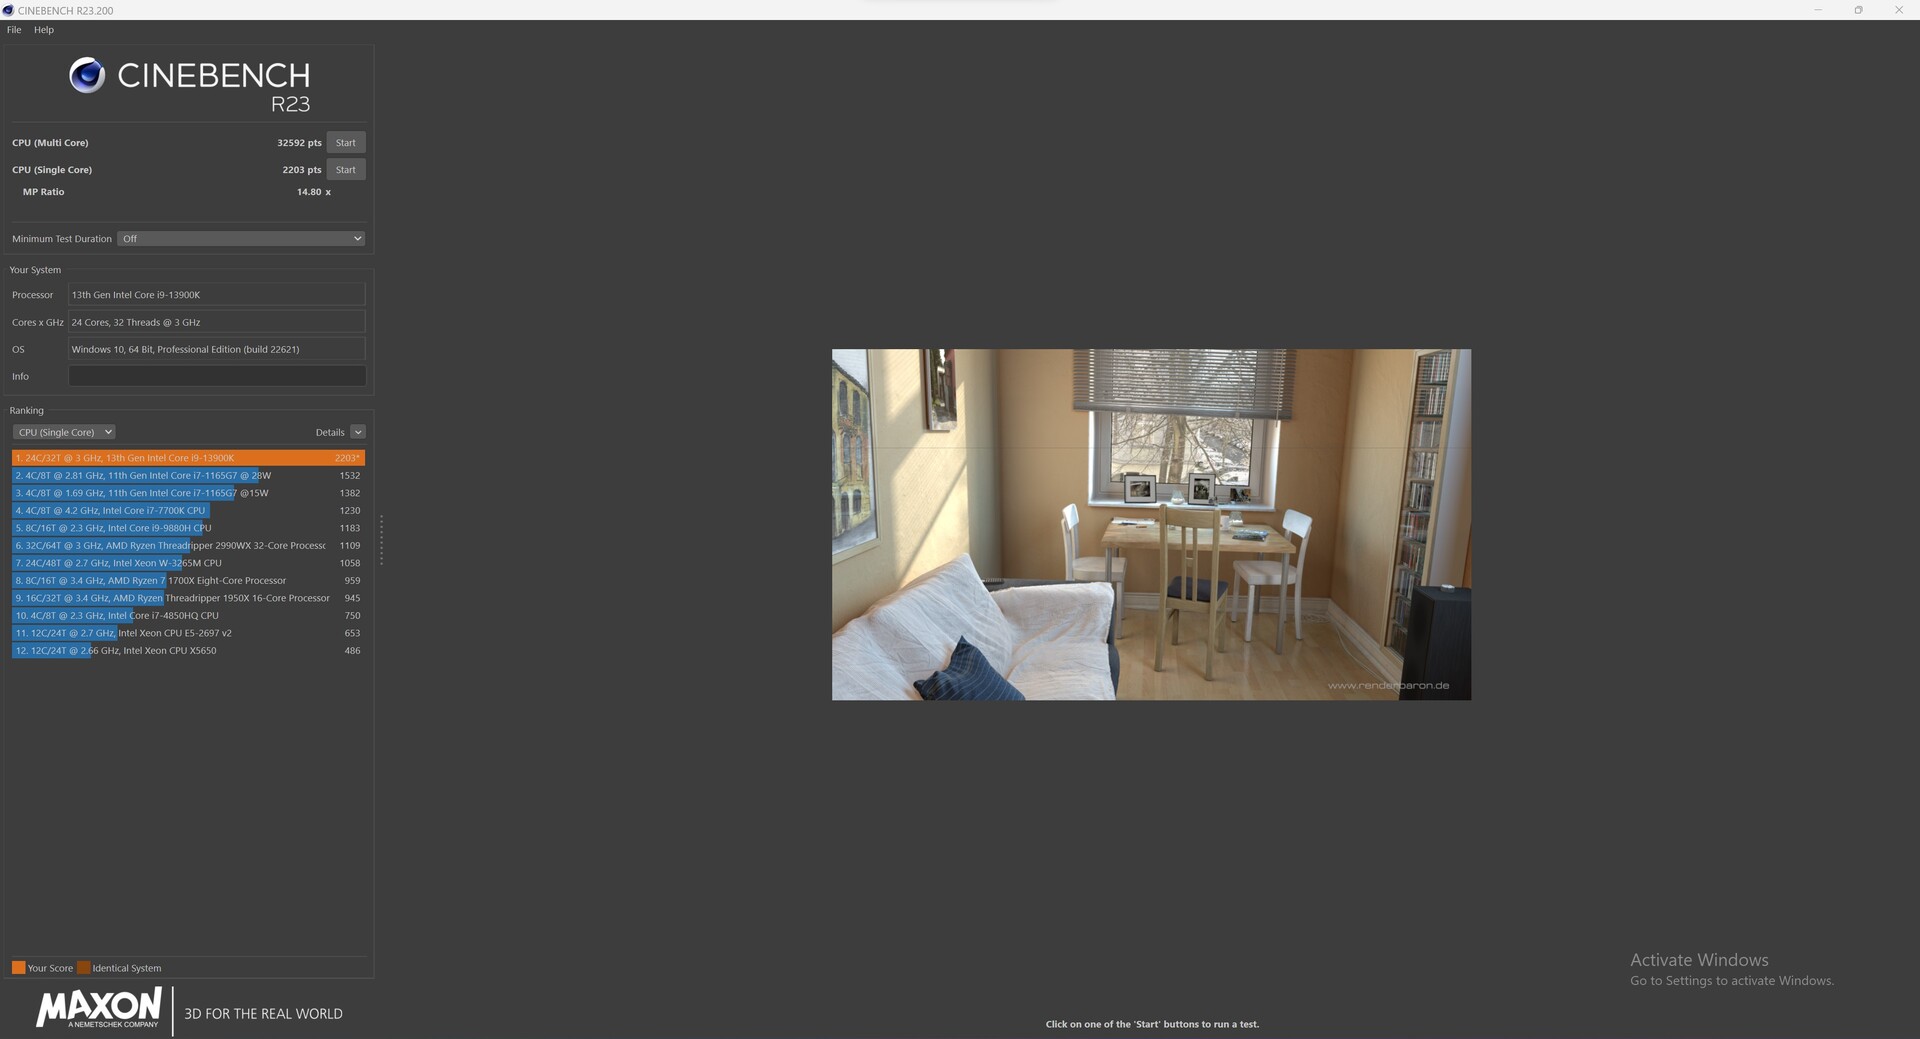
Benchmarki procesora
Z Intel Core i9-13900K, Intel NUC 13 Extreme Raptor Canyon wykorzystuje najszybszy procesor Intela do gier. W związku z tym dobre wyniki w benchmarkach odpowiadają naszym oczekiwaniom. Pomimo stosunkowo małego rozwiązania chłodzącego mierzymy deficyt wydajności wynoszący tylko 7% w porównaniu z innym systemem stacjonarnym z potężnym chłodzeniem cieczą.
Jeśli chodzi o limity mocy, istnieją pewne niewielkie ograniczenia, a limit 150 watów wyjaśnia niewielką różnicę. Większość aplikacji nie wykorzysta pełnych 250 watów. Łącząc Intel NUC 13 Extreme Raptor Canyon z mniej wydajnym Intel Core i5-13600K, poziom wydajności powinien odpowiadać wynikom w naszej tabeli porównawczej. Niższy PL2 (181 W) prawdopodobnie zrekompensuje część deficytu pod pełnym obciążeniem.
Więcej benchmarków procesora można znaleźć tutaj.
| Performance rating - Percent | |
| Intel Core i9-13900K | |
| AMD Ryzen 9 7950X | |
| Intel Core i9-13900K | |
| AMD Ryzen 9 7900X | |
| Intel Core i9-12900K | |
| Intel Core i5-13600K | |
| AMD Ryzen 5 7600X | |
| Intel Core i5-12600K | |
| Cinebench R15 | |
| CPU Single 64Bit | |
| AMD Ryzen 9 7950X | |
| Intel Core i9-13900K | |
| AMD Ryzen 9 7900X | |
| Intel Core i9-13900K | |
| AMD Ryzen 5 7600X | |
| Intel Core i5-13600K | |
| Intel Core i9-12900K | |
| Intel Core i5-12600K | |
| CPU Multi 64Bit | |
| AMD Ryzen 9 7950X | |
| Intel Core i9-13900K | |
| Intel Core i9-13900K | |
| AMD Ryzen 9 7900X | |
| Intel Core i9-12900K | |
| Intel Core i5-13600K | |
| Intel Core i5-12600K | |
| AMD Ryzen 5 7600X | |
| Cinebench R20 | |
| CPU (Single Core) | |
| Intel Core i9-13900K | |
| Intel Core i9-13900K | |
| AMD Ryzen 9 7950X | |
| AMD Ryzen 9 7900X | |
| Intel Core i5-13600K | |
| Intel Core i9-12900K | |
| AMD Ryzen 5 7600X | |
| Intel Core i5-12600K | |
| CPU (Multi Core) | |
| Intel Core i9-13900K | |
| AMD Ryzen 9 7950X | |
| Intel Core i9-13900K | |
| AMD Ryzen 9 7900X | |
| Intel Core i9-12900K | |
| Intel Core i5-13600K | |
| Intel Core i5-12600K | |
| AMD Ryzen 5 7600X | |
| Cinebench R23 | |
| Single Core | |
| Intel Core i9-13900K | |
| Intel Core i9-13900K | |
| AMD Ryzen 9 7950X | |
| AMD Ryzen 9 7900X | |
| Intel Core i5-13600K | |
| Intel Core i9-12900K | |
| AMD Ryzen 5 7600X | |
| Intel Core i5-12600K | |
| Multi Core | |
| Intel Core i9-13900K | |
| AMD Ryzen 9 7950X | |
| Intel Core i9-13900K | |
| AMD Ryzen 9 7900X | |
| Intel Core i9-12900K | |
| Intel Core i5-13600K | |
| Intel Core i5-12600K | |
| AMD Ryzen 5 7600X | |
| Cinebench R11.5 | |
| CPU Single 64Bit | |
| Intel Core i9-13900K | |
| AMD Ryzen 9 7950X | |
| AMD Ryzen 9 7900X | |
| Intel Core i9-13900K | |
| AMD Ryzen 5 7600X | |
| Intel Core i9-12900K | |
| Intel Core i5-13600K | |
| Intel Core i5-12600K | |
| CPU Multi 64Bit | |
| Intel Core i9-13900K | |
| AMD Ryzen 9 7950X | |
| Intel Core i9-13900K | |
| AMD Ryzen 9 7900X | |
| Intel Core i9-12900K | |
| Intel Core i5-13600K | |
| Intel Core i5-12600K | |
| AMD Ryzen 5 7600X | |
| Cinebench R10 | |
| Rendering Single CPUs 64Bit | |
| Intel Core i9-13900K | |
| Intel Core i9-13900K | |
| AMD Ryzen 9 7900X | |
| AMD Ryzen 9 7950X | |
| Intel Core i5-13600K | |
| Intel Core i9-12900K | |
| AMD Ryzen 5 7600X | |
| Intel Core i5-12600K | |
| Rendering Multiple CPUs 64Bit | |
| Intel Core i9-13900K | |
| Intel Core i9-13900K | |
| AMD Ryzen 9 7950X | |
| AMD Ryzen 9 7900X | |
| Intel Core i9-12900K | |
| Intel Core i5-13600K | |
| AMD Ryzen 5 7600X | |
| Intel Core i5-12600K | |
| Blender - v2.79 BMW27 CPU | |
| AMD Ryzen 5 7600X | |
| Intel Core i5-12600K | |
| Intel Core i5-13600K | |
| Intel Core i9-12900K | |
| AMD Ryzen 9 7900X | |
| Intel Core i9-13900K | |
| AMD Ryzen 9 7950X | |
| Intel Core i9-13900K | |
| wPrime 2.10 | |
| 32m | |
| Intel Core i9-12900K | |
| Intel Core i5-12600K | |
| AMD Ryzen 5 7600X | |
| Intel Core i5-13600K | |
| Intel Core i9-13900K | |
| Intel Core i9-13900K | |
| AMD Ryzen 9 7900X | |
| AMD Ryzen 9 7950X | |
| 1024m | |
| Intel Core i5-12600K | |
| Intel Core i9-12900K | |
| Intel Core i5-13600K | |
| Intel Core i9-13900K | |
| Intel Core i9-13900K | |
| AMD Ryzen 5 7600X | |
| AMD Ryzen 9 7900X | |
| AMD Ryzen 9 7950X | |
| X264 HD Benchmark 4.0 | |
| Pass 1 | |
| Intel Core i9-13900K | |
| Intel Core i9-13900K | |
| Intel Core i5-13600K | |
| AMD Ryzen 9 7950X | |
| AMD Ryzen 9 7900X | |
| Intel Core i9-12900K | |
| AMD Ryzen 5 7600X | |
| Intel Core i5-12600K | |
| Pass 2 | |
| Intel Core i9-13900K | |
| AMD Ryzen 9 7950X | |
| Intel Core i9-13900K | |
| AMD Ryzen 9 7900X | |
| Intel Core i9-12900K | |
| Intel Core i5-13600K | |
| Intel Core i5-12600K | |
| AMD Ryzen 5 7600X | |
| WinRAR - Result | |
| AMD Ryzen 9 7900X | |
| AMD Ryzen 9 7950X | |
| AMD Ryzen 5 7600X | |
| Intel Core i9-13900K | |
| Intel Core i9-13900K | |
| Intel Core i5-13600K | |
| Intel Core i9-12900K | |
| Intel Core i5-12600K | |
| TrueCrypt | |
| AES Mean 100MB | |
| AMD Ryzen 9 7950X | |
| Intel Core i9-13900K | |
| Intel Core i9-13900K | |
| Intel Core i5-13600K | |
| Intel Core i9-12900K | |
| AMD Ryzen 9 7900X | |
| AMD Ryzen 5 7600X | |
| Intel Core i5-12600K | |
| Twofish Mean 100MB | |
| Intel Core i9-13900K | |
| Intel Core i9-13900K | |
| AMD Ryzen 9 7950X | |
| Intel Core i9-12900K | |
| Intel Core i5-13600K | |
| AMD Ryzen 9 7900X | |
| Intel Core i5-12600K | |
| AMD Ryzen 5 7600X | |
| Serpent Mean 100MB | |
| Intel Core i9-13900K | |
| AMD Ryzen 9 7950X | |
| Intel Core i9-13900K | |
| Intel Core i9-12900K | |
| Intel Core i5-13600K | |
| AMD Ryzen 9 7900X | |
| Intel Core i5-12600K | |
| AMD Ryzen 5 7600X | |
| Geekbench 5.5 | |
| Multi-Core | |
| AMD Ryzen 9 7950X | |
| Intel Core i9-13900K | |
| Intel Core i9-13900K | |
| AMD Ryzen 9 7900X | |
| Intel Core i9-12900K | |
| Intel Core i5-13600K | |
| Intel Core i5-12600K | |
| AMD Ryzen 5 7600X | |
| Single-Core | |
| AMD Ryzen 9 7950X | |
| Intel Core i9-13900K | |
| AMD Ryzen 9 7900X | |
| AMD Ryzen 5 7600X | |
| Intel Core i9-13900K | |
| Intel Core i9-12900K | |
| Intel Core i5-13600K | |
| Intel Core i5-12600K | |
| Geekbench 5.0 | |
| 5.0 Multi-Core | |
| AMD Ryzen 9 7950X | |
| Intel Core i9-13900K | |
| Intel Core i9-13900K | |
| AMD Ryzen 9 7900X | |
| Intel Core i9-12900K | |
| Intel Core i5-13600K | |
| Intel Core i5-12600K | |
| AMD Ryzen 5 7600X | |
| 5.0 Single-Core | |
| AMD Ryzen 9 7950X | |
| Intel Core i9-13900K | |
| AMD Ryzen 9 7900X | |
| Intel Core i9-13900K | |
| AMD Ryzen 5 7600X | |
| Intel Core i9-12900K | |
| Intel Core i5-13600K | |
| Intel Core i5-12600K | |
| Geekbench 4.4 | |
| 64 Bit Single-Core Score | |
| Intel Core i9-13900K | |
| AMD Ryzen 9 7950X | |
| Intel Core i9-13900K | |
| AMD Ryzen 9 7900X | |
| AMD Ryzen 5 7600X | |
| Intel Core i9-12900K | |
| Intel Core i5-13600K | |
| Intel Core i5-12600K | |
| 64 Bit Multi-Core Score | |
| AMD Ryzen 9 7950X | |
| Intel Core i9-13900K | |
| Intel Core i9-13900K | |
| AMD Ryzen 9 7900X | |
| Intel Core i9-12900K | |
| Intel Core i5-13600K | |
| AMD Ryzen 5 7600X | |
| Intel Core i5-12600K | |
| 3DMark 11 - 1280x720 Performance Physics | |
| Intel Core i9-13900K | |
| Intel Core i5-13600K | |
| Intel Core i9-13900K | |
| AMD Ryzen 9 7900X | |
| AMD Ryzen 9 7950X | |
| Intel Core i9-12900K | |
| AMD Ryzen 5 7600X | |
| Intel Core i5-12600K | |
| 7-Zip 18.03 | |
| 7z b 4 | |
| AMD Ryzen 9 7950X | |
| Intel Core i9-13900K | |
| Intel Core i9-13900K | |
| AMD Ryzen 9 7900X | |
| Intel Core i9-12900K | |
| Intel Core i5-13600K | |
| AMD Ryzen 5 7600X | |
| Intel Core i5-12600K | |
| 7z b 4 -mmt1 | |
| AMD Ryzen 9 7950X | |
| AMD Ryzen 9 7900X | |
| AMD Ryzen 5 7600X | |
| Intel Core i9-13900K | |
| Intel Core i9-13900K | |
| Intel Core i9-12900K | |
| Intel Core i5-13600K | |
| Intel Core i5-12600K | |
| HWBOT x265 Benchmark v2.2 - 4k Preset | |
| AMD Ryzen 9 7950X | |
| Intel Core i9-13900K | |
| AMD Ryzen 9 7900X | |
| Intel Core i9-13900K | |
| Intel Core i5-12600K | |
| Intel Core i9-12900K | |
| Intel Core i5-13600K | |
| AMD Ryzen 5 7600X | |
| R Benchmark 2.5 - Overall mean | |
| Intel Core i5-12600K | |
| Intel Core i9-12900K | |
| Intel Core i5-13600K | |
| Intel Core i9-13900K | |
| AMD Ryzen 5 7600X | |
| AMD Ryzen 9 7900X | |
| AMD Ryzen 9 7950X | |
| Intel Core i9-13900K | |
| LibreOffice - 20 Documents To PDF | |
| Intel Core i5-12600K | |
| Intel Core i9-13900K | |
| Intel Core i9-12900K | |
| AMD Ryzen 5 7600X | |
| Intel Core i9-13900K | |
| AMD Ryzen 9 7950X | |
| Intel Core i5-13600K | |
| AMD Ryzen 9 7900X | |
| WebXPRT 3 - Overall | |
| AMD Ryzen 9 7900X | |
| AMD Ryzen 9 7950X | |
| AMD Ryzen 5 7600X | |
| Intel Core i9-13900K | |
| Intel Core i9-13900K | |
| Intel Core i5-13600K | |
| Intel Core i9-12900K | |
| Intel Core i5-12600K | |
| Mozilla Kraken 1.1 - Total | |
| Intel Core i5-12600K | |
| Intel Core i9-12900K | |
| Intel Core i5-13600K | |
| AMD Ryzen 5 7600X | |
| Intel Core i9-13900K | |
| AMD Ryzen 9 7950X | |
| Intel Core i9-13900K | |
| AMD Ryzen 9 7900X | |
| 3DMark | |
| 3840x2160 Fire Strike Ultra Physics | |
| Intel Core i9-13900K | |
| Intel Core i9-13900K | |
| AMD Ryzen 9 7900X | |
| AMD Ryzen 9 7950X | |
| Intel Core i9-12900K | |
| Intel Core i5-13600K | |
| AMD Ryzen 5 7600X | |
| Intel Core i5-12600K | |
| 1920x1080 Fire Strike Physics | |
| Intel Core i9-13900K | |
| Intel Core i9-13900K | |
| AMD Ryzen 9 7900X | |
| AMD Ryzen 9 7950X | |
| Intel Core i9-12900K | |
| Intel Core i5-13600K | |
| AMD Ryzen 5 7600X | |
| Intel Core i5-12600K | |
| 2560x1440 Time Spy CPU | |
| Intel Core i9-13900K | |
| Intel Core i9-12900K | |
| Intel Core i5-13600K | |
| AMD Ryzen 9 7900X | |
| AMD Ryzen 9 7950X | |
| Intel Core i9-13900K | |
| Intel Core i5-12600K | |
| AMD Ryzen 5 7600X | |
* ... im mniej tym lepiej
AIDA64: FP32 Ray-Trace | FPU Julia | CPU SHA3 | CPU Queen | FPU SinJulia | FPU Mandel | CPU AES | CPU ZLib | FP64 Ray-Trace | CPU PhotoWorxx
| Performance rating | |
| AMD Ryzen 9 7950X | |
| Intel Core i9-13900K | |
| AMD Ryzen 9 7900X | |
| Średnia w klasie Desktop | |
| Intel Core i9-13900K | |
| Intel Core i5-13600K | |
| Intel Core i9-12900K | |
| AMD Ryzen 5 7600X | |
| AMD Ryzen 9 5900HX | |
| Intel Core i5-12600K | |
| Intel Core i7-11800H | |
| AIDA64 / FP32 Ray-Trace | |
| AMD Ryzen 9 7950X | |
| Średnia w klasie Desktop (12248 - 84577, n=21, ostatnie 2 lata) | |
| Intel Core i9-13900K | |
| AMD Ryzen 9 7900X | |
| Intel Core i9-13900K | |
| Intel Core i5-13600K | |
| AMD Ryzen 5 7600X | |
| AMD Ryzen 9 5900HX | |
| Intel Core i9-12900K | |
| Intel Core i7-11800H | |
| Intel Core i5-12600K | |
| AIDA64 / FPU Julia | |
| AMD Ryzen 9 7950X | |
| AMD Ryzen 9 7900X | |
| Intel Core i9-13900K | |
| Średnia w klasie Desktop (65152 - 246125, n=21, ostatnie 2 lata) | |
| Intel Core i9-13900K | |
| Intel Core i5-13600K | |
| AMD Ryzen 5 7600X | |
| AMD Ryzen 9 5900HX | |
| Intel Core i9-12900K | |
| Intel Core i7-11800H | |
| Intel Core i5-12600K | |
| AIDA64 / CPU SHA3 | |
| AMD Ryzen 9 7950X | |
| Intel Core i9-13900K | |
| AMD Ryzen 9 7900X | |
| Średnia w klasie Desktop (2982 - 10804, n=21, ostatnie 2 lata) | |
| Intel Core i9-13900K | |
| Intel Core i5-13600K | |
| Intel Core i9-12900K | |
| Intel Core i7-11800H | |
| AMD Ryzen 5 7600X | |
| AMD Ryzen 9 5900HX | |
| Intel Core i5-12600K | |
| AIDA64 / CPU Queen | |
| AMD Ryzen 9 7950X | |
| AMD Ryzen 9 7900X | |
| Intel Core i9-13900K | |
| Intel Core i9-13900K | |
| Średnia w klasie Desktop (76512 - 187912, n=18, ostatnie 2 lata) | |
| Intel Core i5-13600K | |
| Intel Core i9-12900K | |
| AMD Ryzen 5 7600X | |
| AMD Ryzen 9 5900HX | |
| Intel Core i7-11800H | |
| Intel Core i5-12600K | |
| AIDA64 / FPU SinJulia | |
| AMD Ryzen 9 7950X | |
| AMD Ryzen 9 7900X | |
| Intel Core i9-13900K | |
| Średnia w klasie Desktop (6443 - 35251, n=21, ostatnie 2 lata) | |
| Intel Core i9-13900K | |
| Intel Core i9-12900K | |
| AMD Ryzen 5 7600X | |
| AMD Ryzen 9 5900HX | |
| Intel Core i5-13600K | |
| Intel Core i7-11800H | |
| Intel Core i5-12600K | |
| AIDA64 / FPU Mandel | |
| AMD Ryzen 9 7950X | |
| AMD Ryzen 9 7900X | |
| Intel Core i9-13900K | |
| Średnia w klasie Desktop (31697 - 129745, n=21, ostatnie 2 lata) | |
| Intel Core i9-13900K | |
| Intel Core i5-13600K | |
| AMD Ryzen 9 5900HX | |
| AMD Ryzen 5 7600X | |
| Intel Core i9-12900K | |
| Intel Core i7-11800H | |
| Intel Core i5-12600K | |
| AIDA64 / CPU AES | |
| AMD Ryzen 9 7950X | |
| Intel Core i9-13900K | |
| AMD Ryzen 9 7900X | |
| Intel Core i5-13600K | |
| Średnia w klasie Desktop (57777 - 513073, n=21, ostatnie 2 lata) | |
| AMD Ryzen 5 7600X | |
| AMD Ryzen 9 5900HX | |
| Intel Core i9-13900K | |
| Intel Core i7-11800H | |
| Intel Core i9-12900K | |
| Intel Core i5-12600K | |
| AIDA64 / CPU ZLib | |
| Intel Core i9-13900K | |
| AMD Ryzen 9 7950X | |
| Intel Core i9-13900K | |
| AMD Ryzen 9 7900X | |
| Średnia w klasie Desktop (887 - 2674, n=21, ostatnie 2 lata) | |
| Intel Core i9-12900K | |
| Intel Core i5-13600K | |
| Intel Core i5-12600K | |
| AMD Ryzen 5 7600X | |
| AMD Ryzen 9 5900HX | |
| Intel Core i7-11800H | |
| AIDA64 / FP64 Ray-Trace | |
| AMD Ryzen 9 7950X | |
| Średnia w klasie Desktop (6471 - 44013, n=21, ostatnie 2 lata) | |
| Intel Core i9-13900K | |
| AMD Ryzen 9 7900X | |
| Intel Core i9-13900K | |
| Intel Core i5-13600K | |
| AMD Ryzen 5 7600X | |
| Intel Core i9-12900K | |
| AMD Ryzen 9 5900HX | |
| Intel Core i7-11800H | |
| Intel Core i5-12600K | |
| AIDA64 / CPU PhotoWorxx | |
| Intel Core i9-13900K | |
| Intel Core i5-12600K | |
| Intel Core i5-13600K | |
| Intel Core i9-12900K | |
| Średnia w klasie Desktop (38071 - 63949, n=21, ostatnie 2 lata) | |
| Intel Core i9-13900K | |
| AMD Ryzen 9 7950X | |
| AMD Ryzen 9 7900X | |
| AMD Ryzen 5 7600X | |
| Intel Core i7-11800H | |
| AMD Ryzen 9 5900HX | |
Intel NUC 13 Extreme Kit: Cinebench R15 Multi Loop
Nasza pętla Cinebench R15 Multi pokazuje znaczny spadek wydajności po pierwszej pętli. Ze względu na kompaktowe rozwiązanie chłodzenia i limity mocy, obserwujemy niższy poziom wydajności w porównaniu do Intel Core i9-13900K w alternatywnym systemie z Intel Core i9-13900K pod ciągłym obciążeniem procesora. To powiedziawszy, wynik 4779 punktów jest nadal znacząco wyższy niż w przypadku Intel Dragon Canyon NUC.
Wydajność systemu
Jeśli chodzi o syntetyczne benchmarki, Intel NUC 13 Extreme Raptor Canyon błyszczy bardzo szybką wydajnością systemu. Tutaj.Intel Core i9-13900K z lepszym chłodzeniem wciąż ma niewielką przewagę. Konkurenci z Minisforum i bezpośredni poprzednicy z serii NUC nie mają jednak szans. Subiektywnie nasz system testowy jest bardzo szybki i responsywny, nie ma zauważalnych opóźnień.
| Performance rating - Percent | |
| AMD Ryzen 9 7900X, AMD Ryzen 9 7900X | |
| NVIDIA GeForce RTX 3090 Founders Edition, AMD Ryzen 9 7950X | |
| AMD Ryzen 5 7600X, AMD Ryzen 5 7600X | |
| Intel Core i9-13900K, Intel Core i9-13900K | |
| Intel Core i5-13600K, Intel Core i5-13600K | |
| Intel NUC13 Raptor Canyon, Intel Core i9-13900K | |
| Intel Core i9-12900K, Intel Core i9-12900K | |
| Intel Core i5-12600K, Intel Core i5-12600K | |
| Intel Dragon Canyon NUC - RTX 3060, Intel Core i9-12900 | |
| Intel Beast Canyon NUC, Intel Core i9-11900KB | |
| Minisforum Neptune Series HX90G, AMD Ryzen 9 5900HX | |
| Minisforum NUCX i7, Intel Core i7-11800H | |
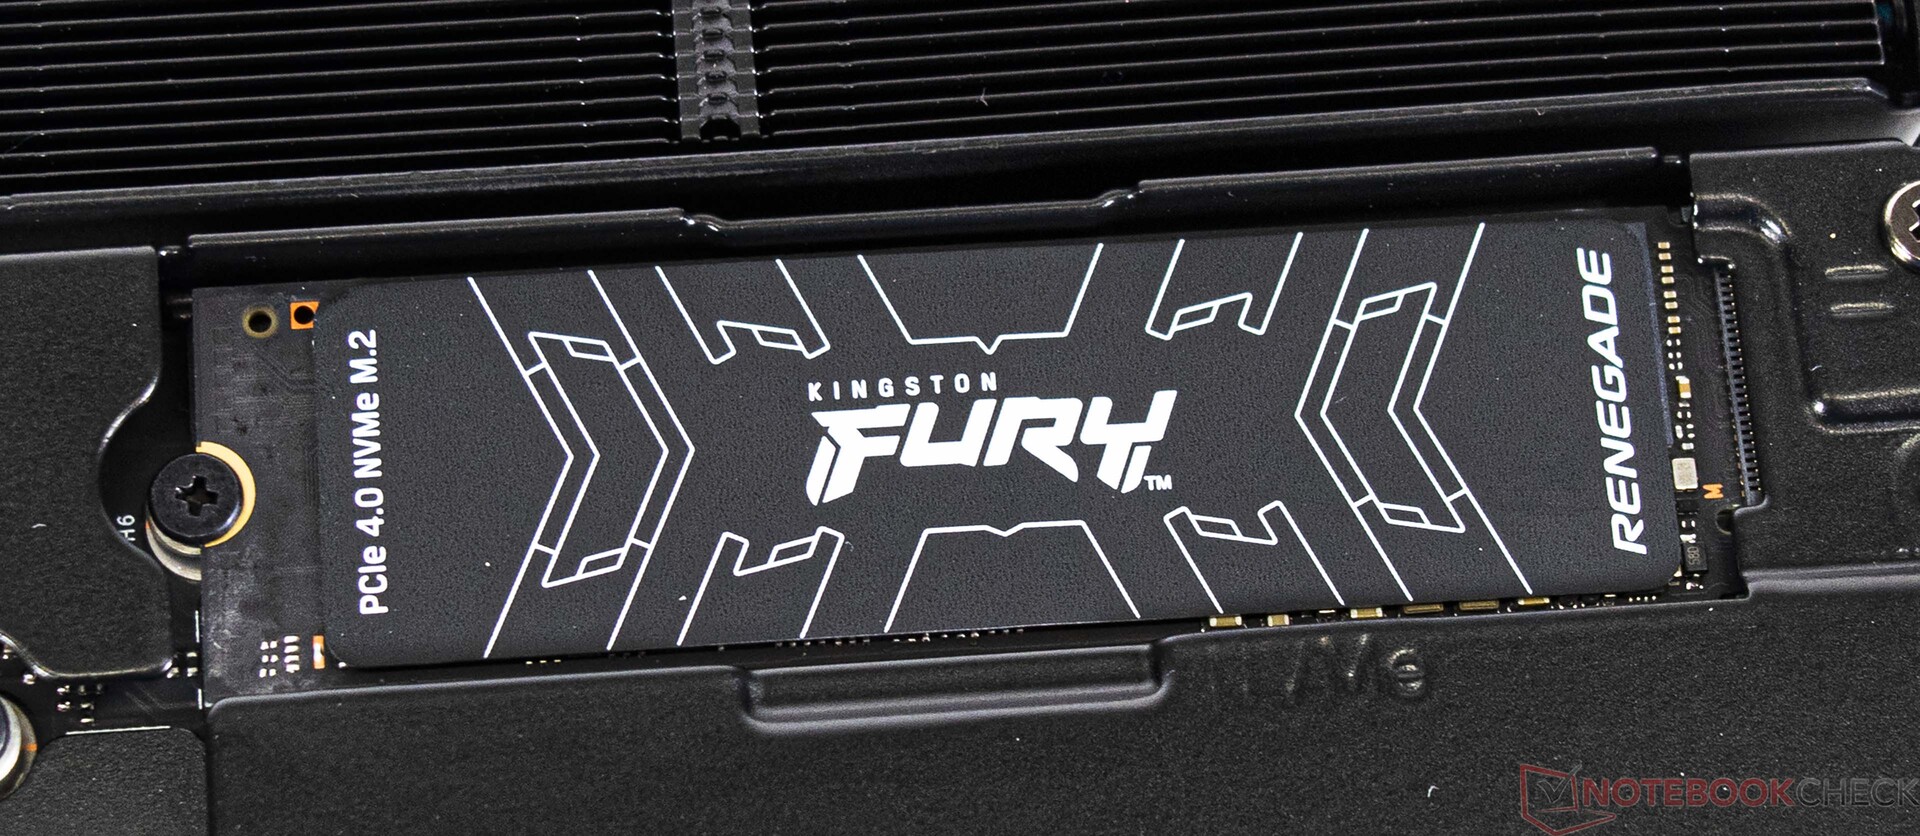
Rozwiązanie w zakresie przechowywania
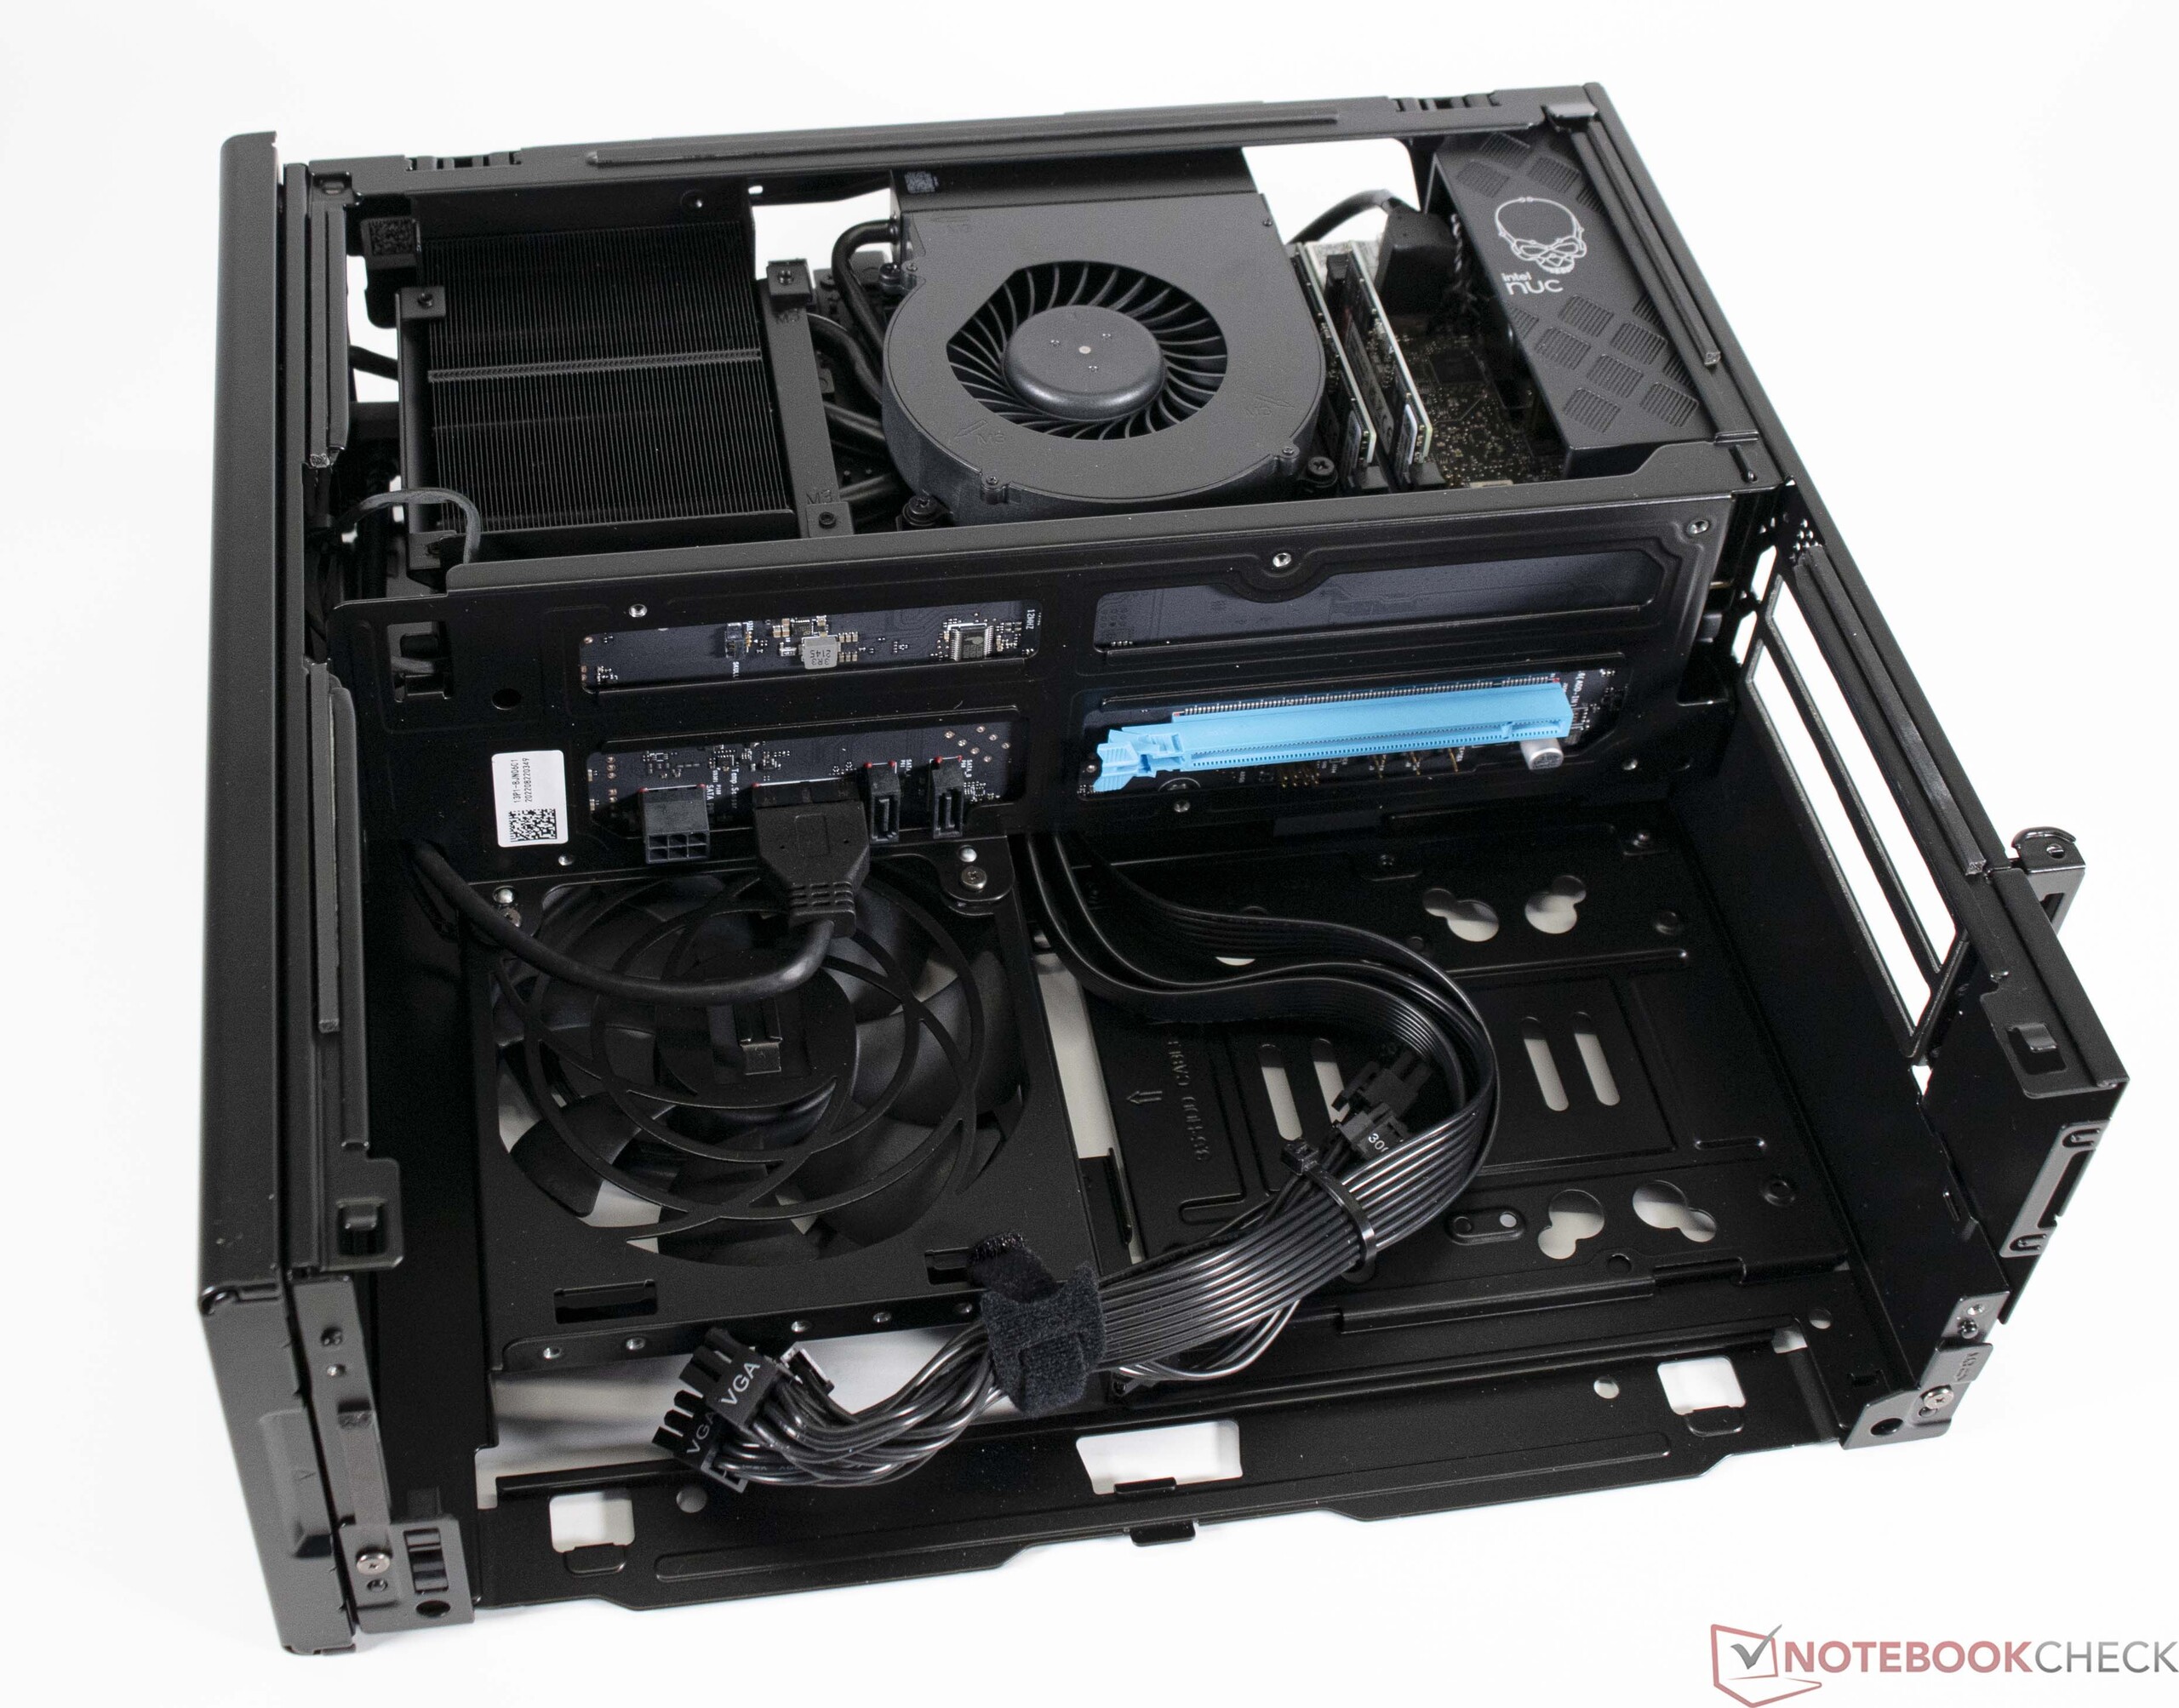
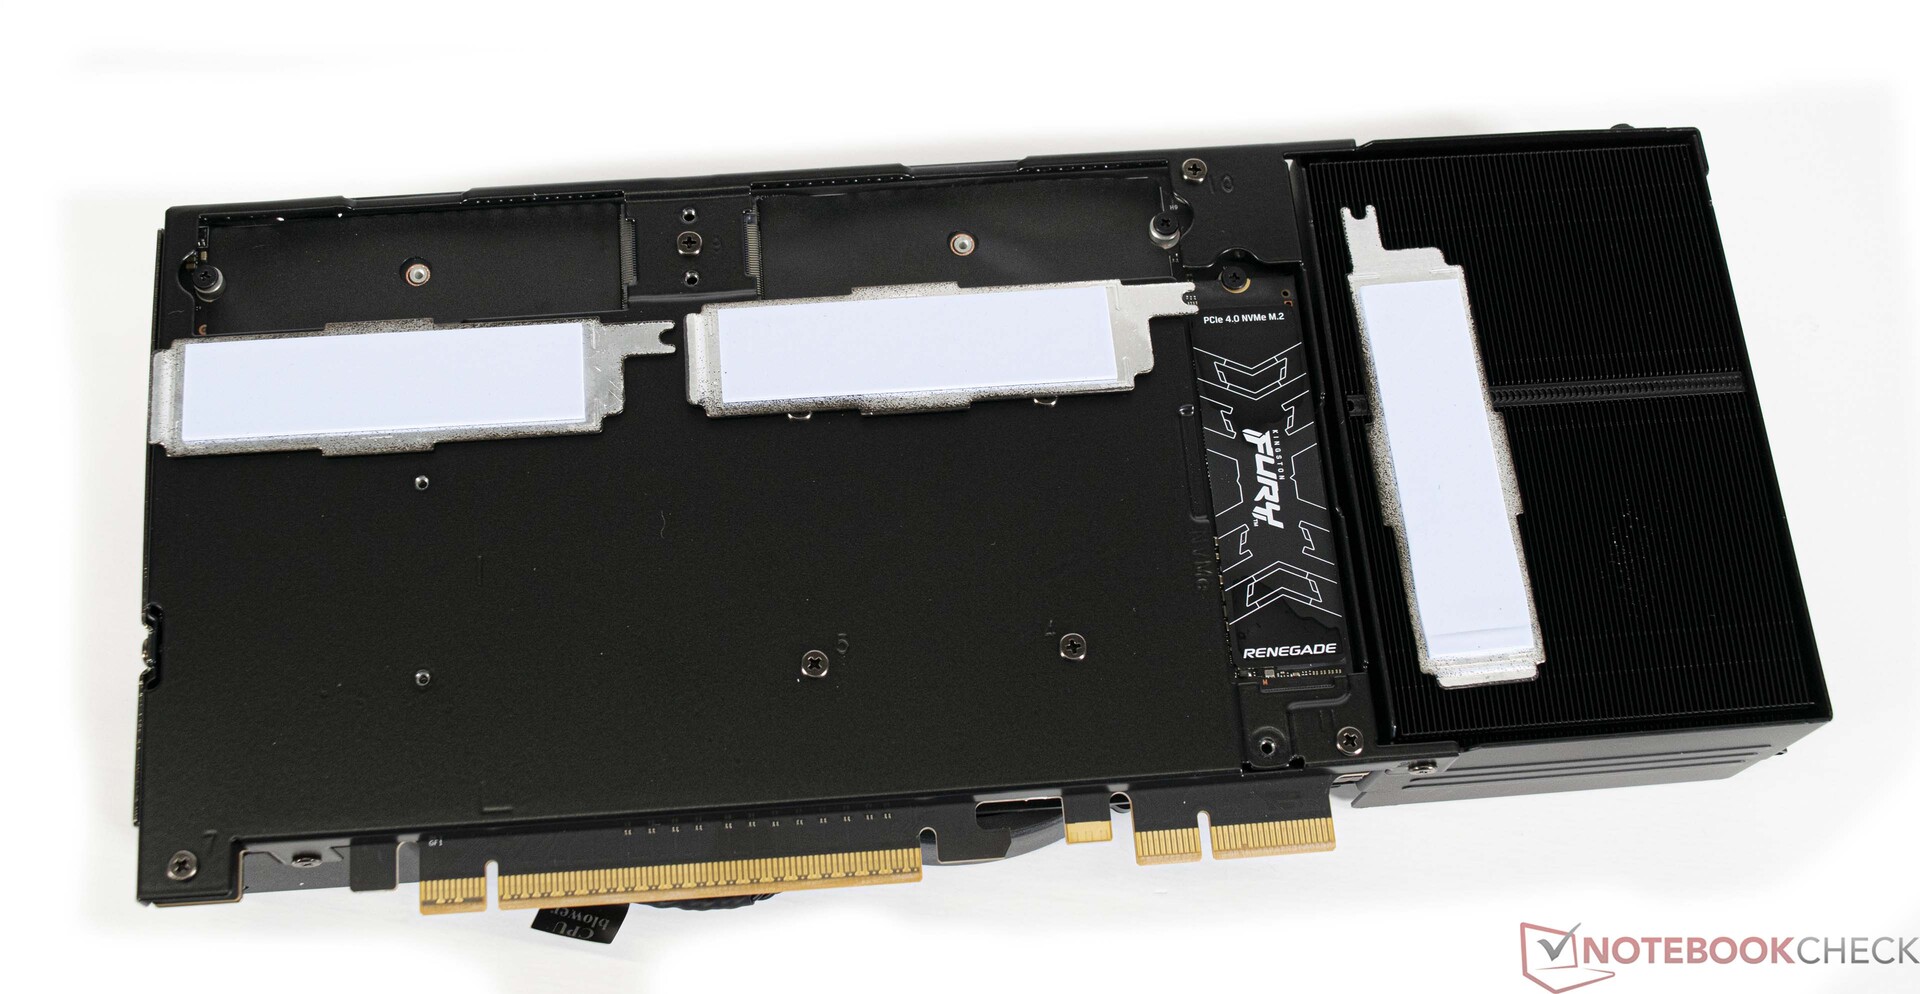
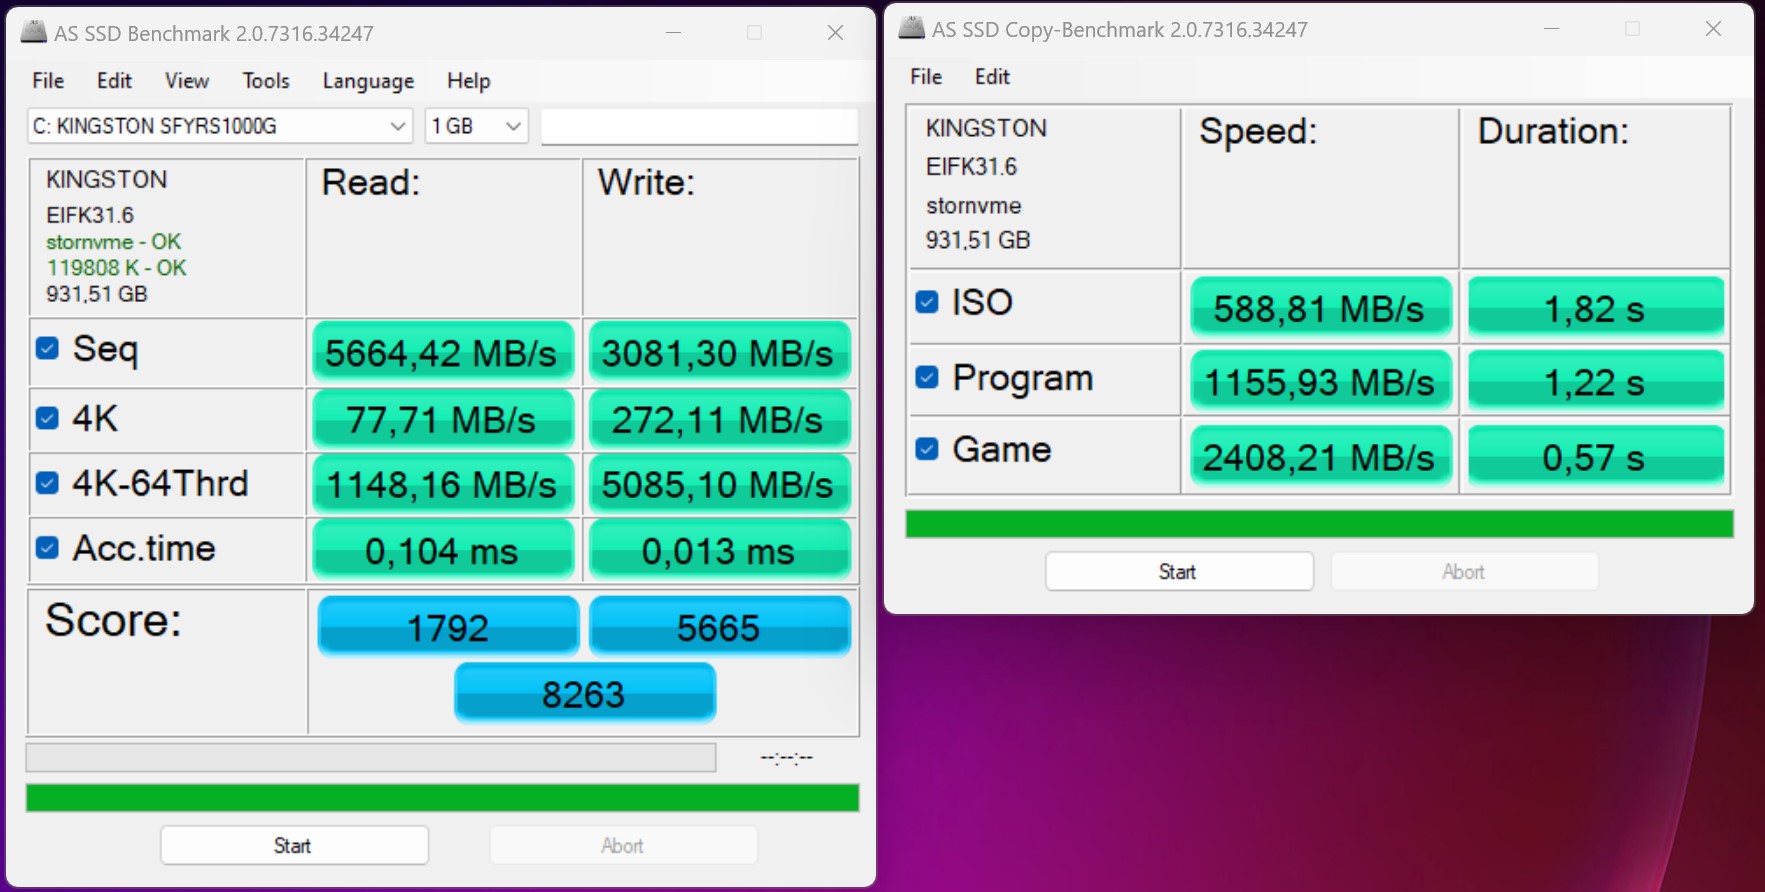
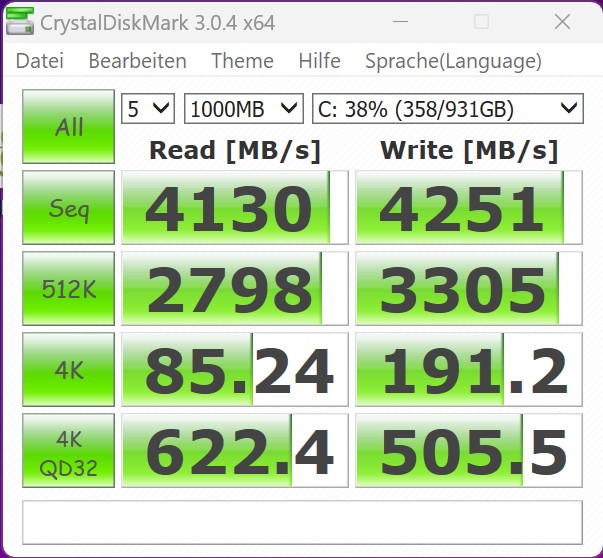
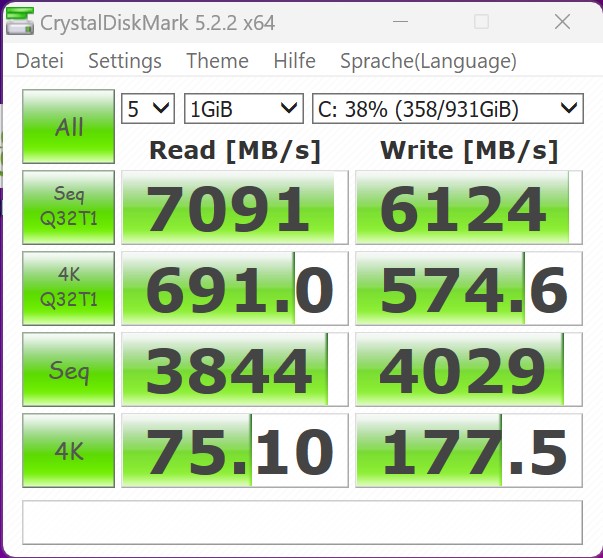
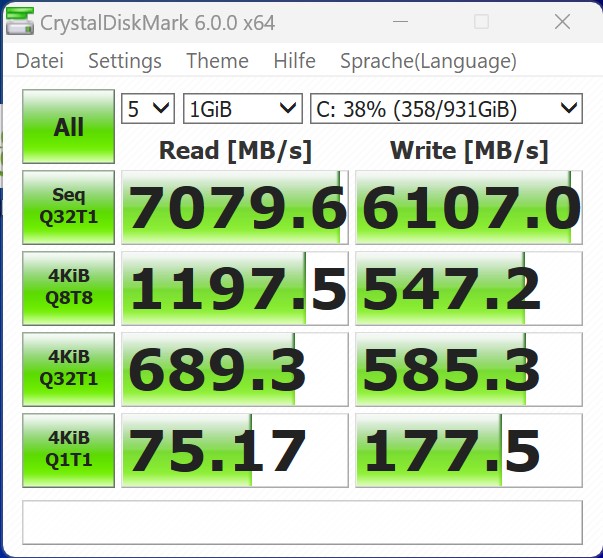
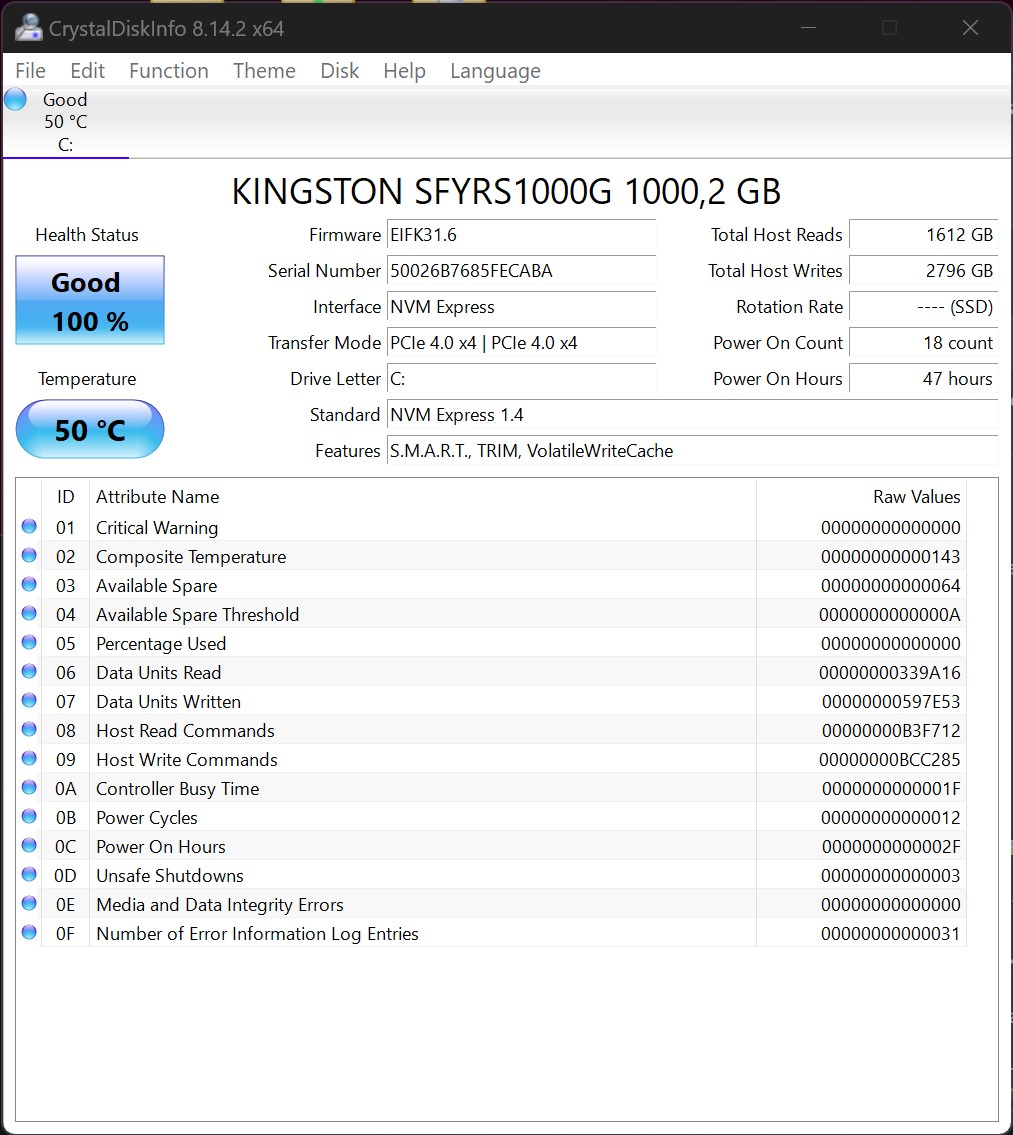
W naszej próbce testowej jako dysk systemowy zastosowano bardzo szybki dysk SSD Kingston NVMe. Model ten radzi sobie bardzo dobrze, osiągając piekielnie szybkie prędkości transferu zarówno w AS SSD, jak i DiskSpd. Ponieważ Intel NUC 13 Extreme Raptor Canyon jest systemem barebone, użytkownicy mogą wybrać dysk SSD, który chcą zainstalować. Compute Element obsługuje w sumie do trzech dysków SSD M.2. Instalacja dysków SSD jest nieco kłopotliwa, ponieważ Compute Element najpierw musi być całkowicie usunięty z NUC 13.
Więcej porównań i benchmarków można znaleźć w naszej tabela porównawcza.

| Drive Performance rating - Percent | |
| Średnia w klasie Desktop | |
| Przeciętny Kingston Fury Renegade SFYRS1000G | |
| Intel NUC13 Raptor Canyon | |
| Intel Beast Canyon NUC | |
| Intel Dragon Canyon NUC - RTX 3060 -11! | |
| Minisforum Neptune Series HX90G | |
| Minisforum NUCX i7 | |
* ... im mniej tym lepiej
Disk Throttling: DiskSpd Read Loop, Queue Depth 8
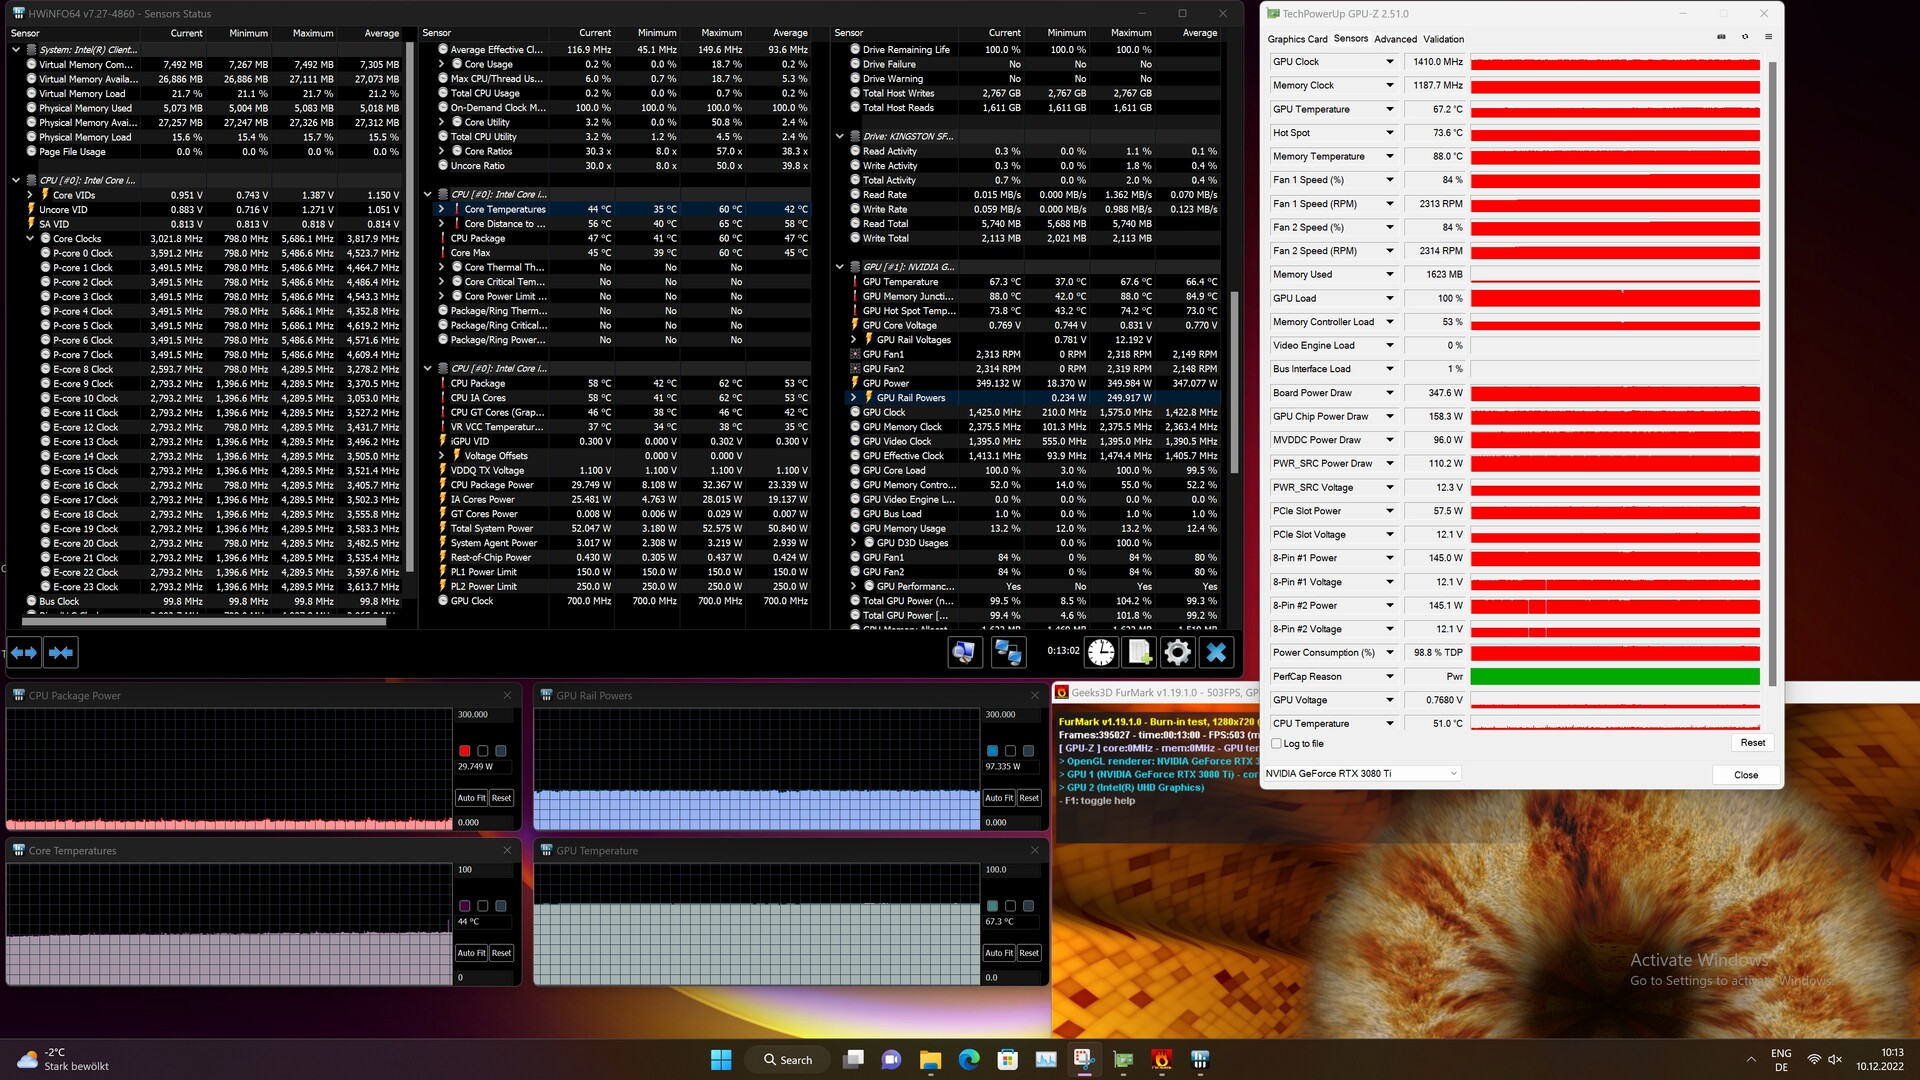
Wydajność GPU
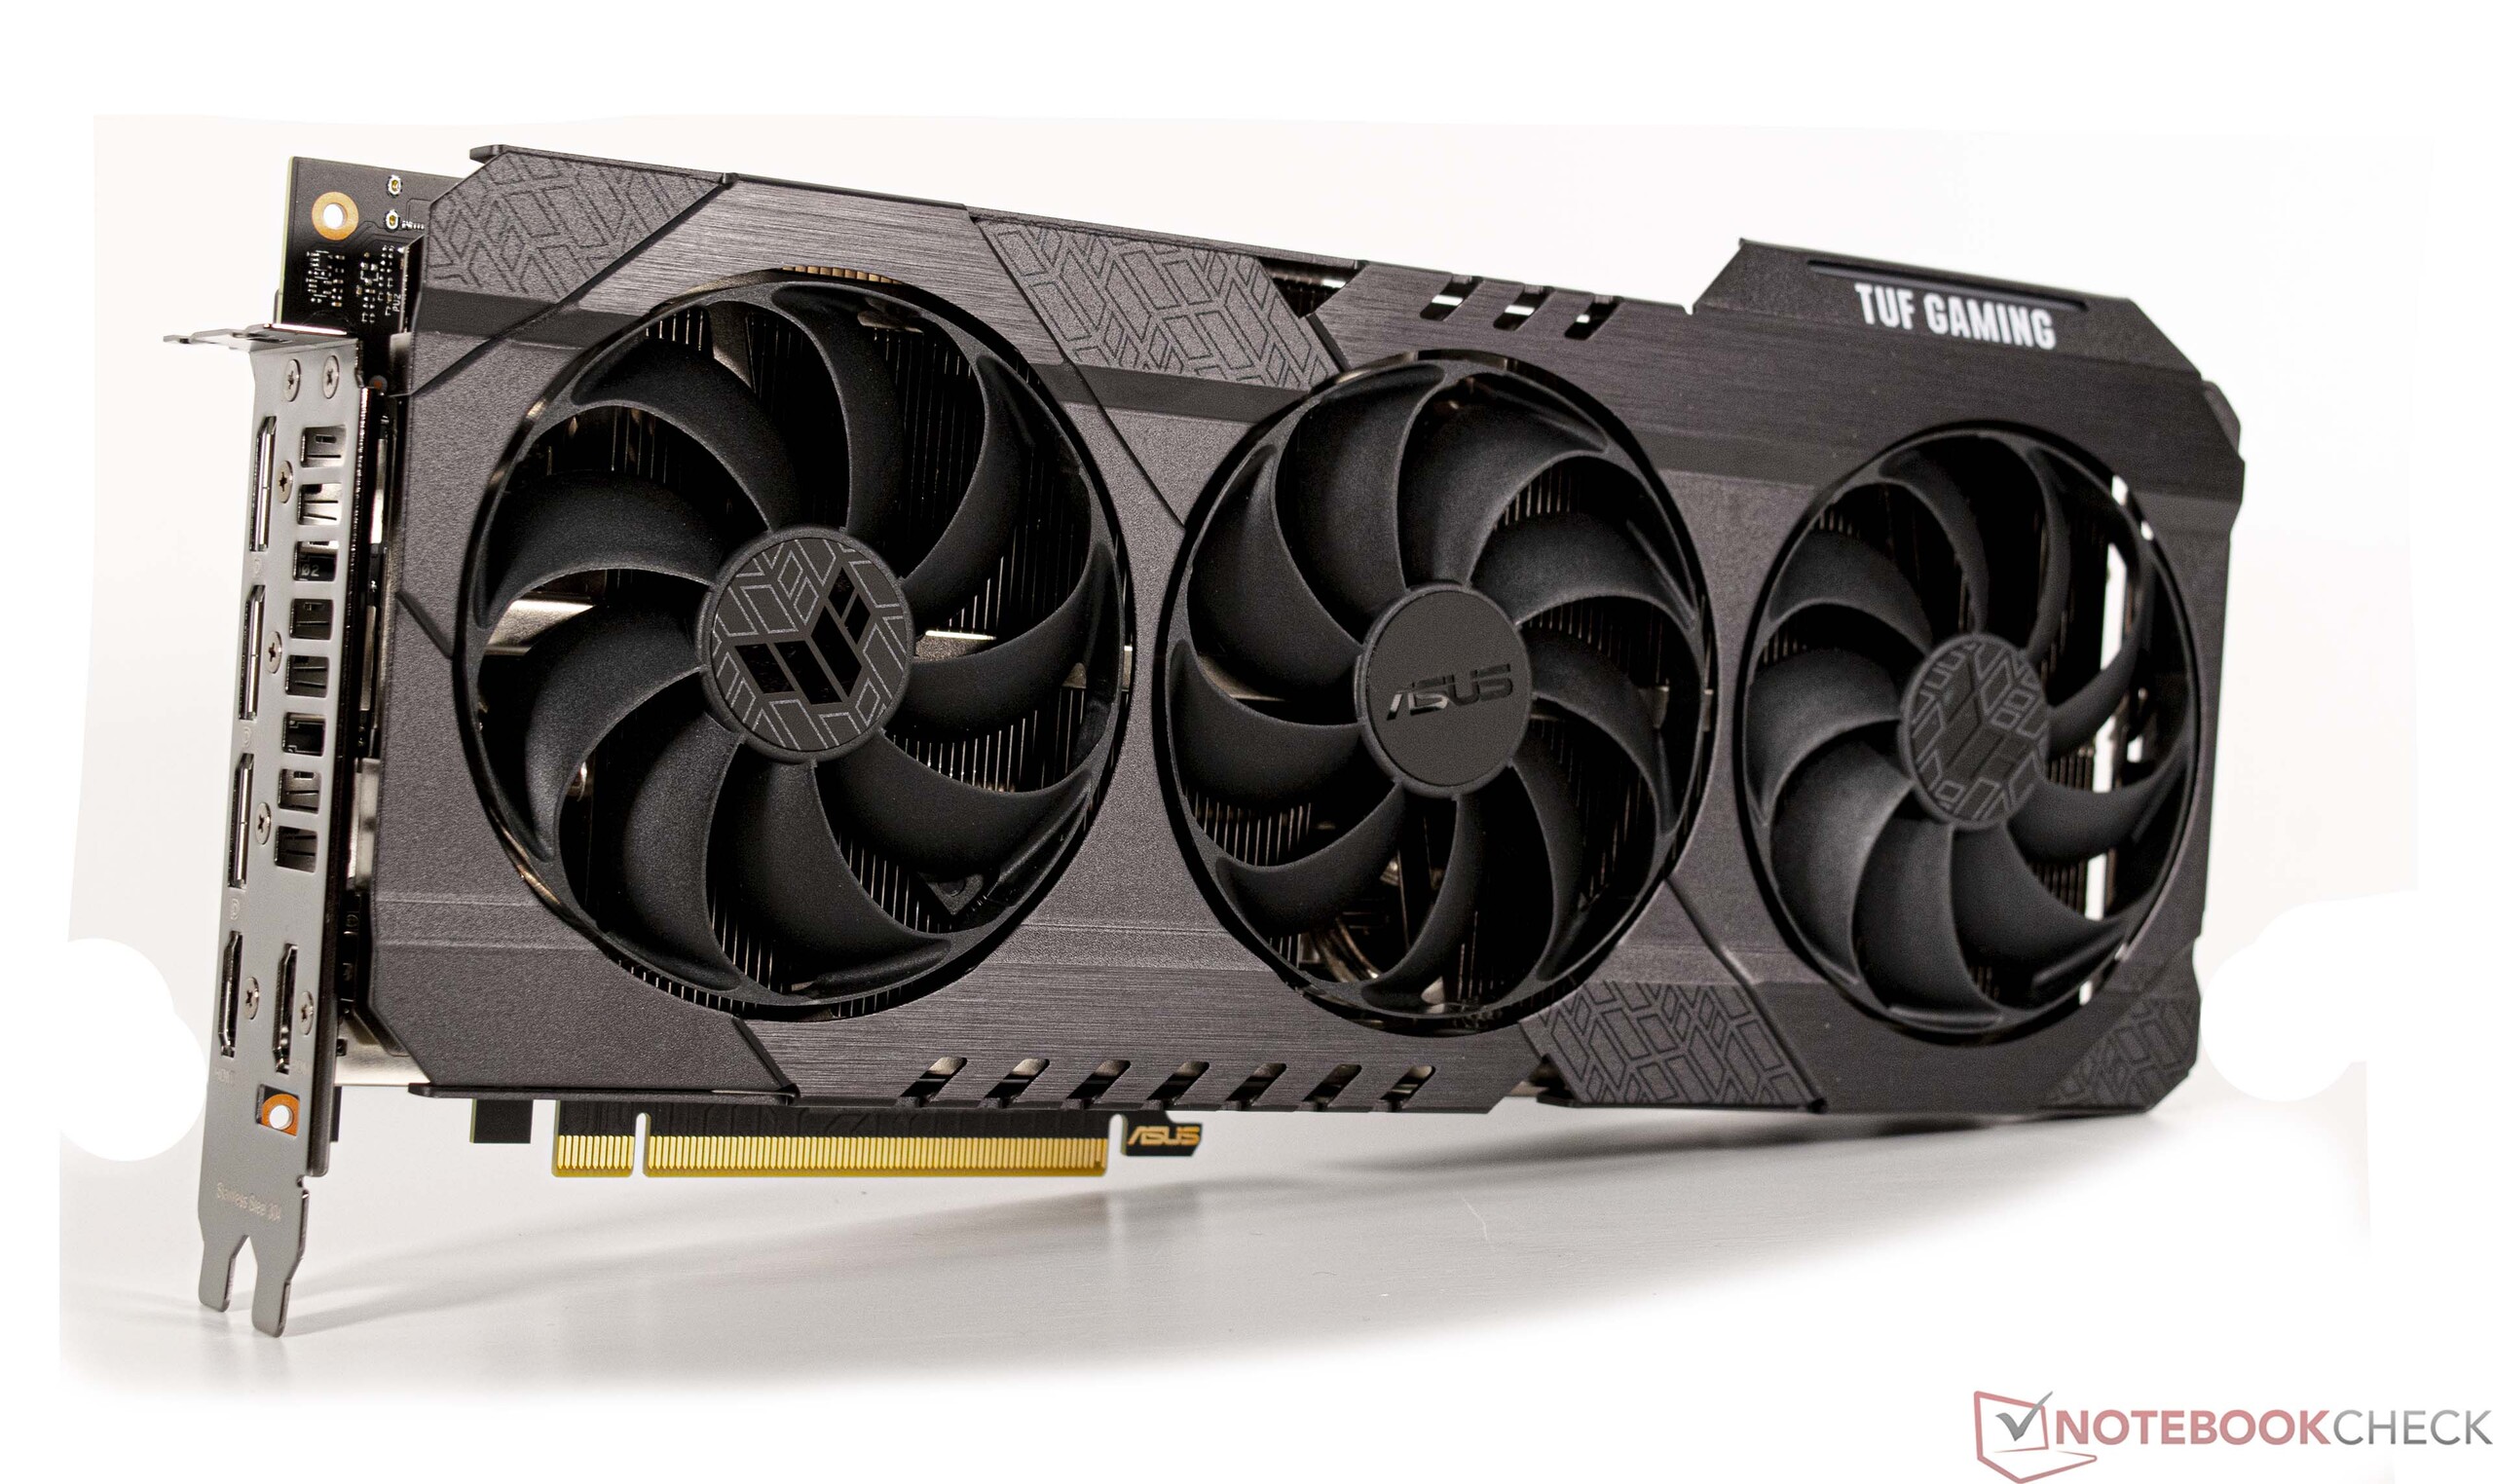
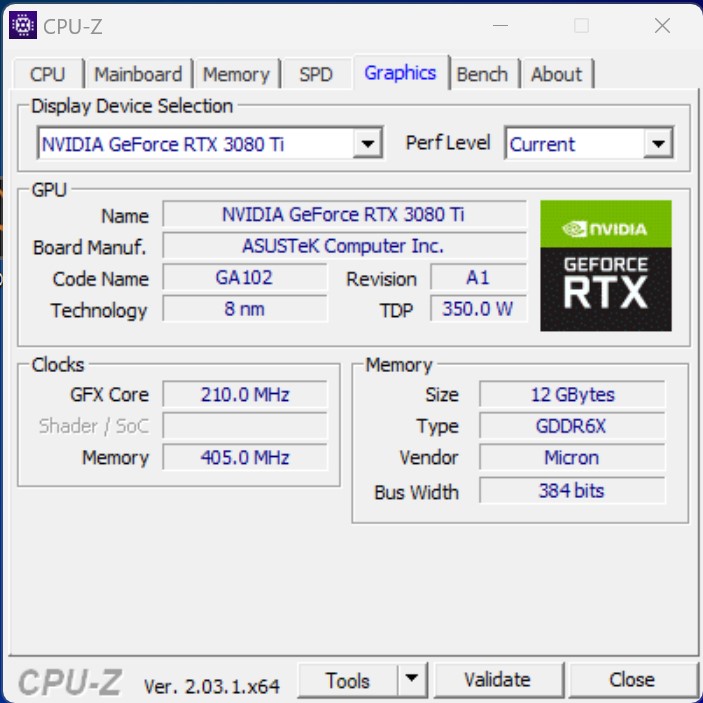
Intel wyposażył nasz testowy egzemplarz w Nvidia GeForce RTX 3080 Ti. GPU oferuje świetną wydajność i niemal dorównuje Nvidia GeForce RTX 3090. Chociaż przy 12 GB pamięci VRAM jest o połowę mniejszy niż RTX 3090, to i tak jest to wystarczające w większości przypadków. Z 350 watami zainstalowany model działa na granicy tego, co uznalibyśmy za rozsądne i nie zalecamy stosowania jeszcze większych GPU w kompaktowym systemie. Dotyczy to tylko poboru mocy, ponieważ system fizycznie obsługuje nawet m.in Nvidia GeForce RTX 4090. Użytkownicy, którzy upierają się przy karcie z serii GeForce-RTX-4000, mogą być lepsi od Nvidia GeForce RTX 4080. Z TGP do 320 watów, jest bardziej ekonomiczny i znacznie szybszy niż nasz GeForce RTX 3080 Ti od Asusa.
Więcej porównań i benchmarków można znaleźć na naszej Strona GPU.
| 3DMark Performance rating - Percent | |
| ASUS TUF Gaming GeForce RTX 3080 Ti OC | |
| Corsair One i300 | |
| Intel Core i9-13900K | |
| Intel NUC13 Raptor Canyon | |
| Minisforum NUCX i7 | |
| Minisforum Neptune Series HX90G | |
| Intel Dragon Canyon NUC - RTX 3060 | |
| Intel Beast Canyon NUC | |
| 3DMark 11 - 1280x720 Performance GPU | |
| ASUS TUF Gaming GeForce RTX 3080 Ti OC | |
| Corsair One i300 | |
| Intel Core i9-13900K | |
| Intel NUC13 Raptor Canyon | |
| Minisforum NUCX i7 | |
| Minisforum Neptune Series HX90G | |
| Intel Dragon Canyon NUC - RTX 3060 | |
| Intel Beast Canyon NUC | |
| 3DMark | |
| 1920x1080 Fire Strike Graphics | |
| ASUS TUF Gaming GeForce RTX 3080 Ti OC | |
| Corsair One i300 | |
| Intel Core i9-13900K | |
| Intel NUC13 Raptor Canyon | |
| Minisforum NUCX i7 | |
| Minisforum Neptune Series HX90G | |
| Intel Dragon Canyon NUC - RTX 3060 | |
| Intel Beast Canyon NUC | |
| 2560x1440 Time Spy Graphics | |
| ASUS TUF Gaming GeForce RTX 3080 Ti OC | |
| Intel NUC13 Raptor Canyon | |
| Intel Core i9-13900K | |
| Corsair One i300 | |
| Minisforum NUCX i7 | |
| Intel Dragon Canyon NUC - RTX 3060 | |
| Intel Beast Canyon NUC | |
| Minisforum Neptune Series HX90G | |
| Fire Strike Extreme Graphics | |
| ASUS TUF Gaming GeForce RTX 3080 Ti OC | |
| Intel Core i9-13900K | |
| Corsair One i300 | |
| Intel NUC13 Raptor Canyon | |
| Minisforum NUCX i7 | |
| Minisforum Neptune Series HX90G | |
| Intel Dragon Canyon NUC - RTX 3060 | |
| Intel Beast Canyon NUC | |
| Performance rating - Percent | |
| ASUS TUF Gaming GeForce RTX 3080 Ti OC | |
| Intel Core i9-13900K | |
| Intel NUC13 Raptor Canyon | |
| Corsair One i300 | |
| Minisforum NUCX i7 | |
| Intel Dragon Canyon NUC - RTX 3060 | |
| Intel Beast Canyon NUC | |
| Minisforum Neptune Series HX90G | |
| Unigine Heaven 4.0 | |
| Extreme Preset OpenGL | |
| ASUS TUF Gaming GeForce RTX 3080 Ti OC | |
| Intel NUC13 Raptor Canyon | |
| Intel Core i9-13900K | |
| Corsair One i300 | |
| Minisforum NUCX i7 | |
| Minisforum Neptune Series HX90G | |
| Intel Dragon Canyon NUC - RTX 3060 | |
| Intel Beast Canyon NUC | |
| Extreme Preset DX11 | |
| ASUS TUF Gaming GeForce RTX 3080 Ti OC | |
| Intel Core i9-13900K | |
| Intel NUC13 Raptor Canyon | |
| Corsair One i300 | |
| Minisforum NUCX i7 | |
| Intel Dragon Canyon NUC - RTX 3060 | |
| Intel Beast Canyon NUC | |
| Minisforum Neptune Series HX90G | |
| Unigine Valley 1.0 | |
| 1920x1080 Extreme HD DirectX AA:x8 | |
| Intel Core i9-13900K | |
| Intel NUC13 Raptor Canyon | |
| ASUS TUF Gaming GeForce RTX 3080 Ti OC | |
| Corsair One i300 | |
| Minisforum NUCX i7 | |
| Intel Dragon Canyon NUC - RTX 3060 | |
| Intel Beast Canyon NUC | |
| Minisforum Neptune Series HX90G | |
| 1920x1080 Extreme HD Preset OpenGL AA:x8 | |
| Intel Core i9-13900K | |
| Intel NUC13 Raptor Canyon | |
| ASUS TUF Gaming GeForce RTX 3080 Ti OC | |
| Corsair One i300 | |
| Minisforum NUCX i7 | |
| Intel Dragon Canyon NUC - RTX 3060 | |
| Intel Beast Canyon NUC | |
| Minisforum Neptune Series HX90G | |
| Unigine Superposition | |
| 1920x1080 1080p High | |
| ASUS TUF Gaming GeForce RTX 3080 Ti OC | |
| Intel Core i9-13900K | |
| Corsair One i300 | |
| Intel NUC13 Raptor Canyon | |
| Minisforum NUCX i7 | |
| Intel Beast Canyon NUC | |
| Intel Dragon Canyon NUC - RTX 3060 | |
| Minisforum Neptune Series HX90G | |
| 1920x1080 1080p Extreme | |
| ASUS TUF Gaming GeForce RTX 3080 Ti OC | |
| Corsair One i300 | |
| Intel NUC13 Raptor Canyon | |
| Intel Core i9-13900K | |
| Minisforum NUCX i7 | |
| Intel Dragon Canyon NUC - RTX 3060 | |
| Intel Beast Canyon NUC | |
| Minisforum Neptune Series HX90G | |
| 3840x2160 4k Optimized | |
| ASUS TUF Gaming GeForce RTX 3080 Ti OC | |
| Intel Core i9-13900K | |
| Corsair One i300 | |
| Intel NUC13 Raptor Canyon | |
| Minisforum NUCX i7 | |
| Intel Beast Canyon NUC | |
| Intel Dragon Canyon NUC - RTX 3060 | |
| Minisforum Neptune Series HX90G | |
| ComputeMark v2.1 - 1024x600 Normal, Score | |
| Intel Core i9-13900K | |
| ASUS TUF Gaming GeForce RTX 3080 Ti OC | |
| Intel NUC13 Raptor Canyon | |
| Corsair One i300 | |
| Minisforum NUCX i7 | |
| Intel Dragon Canyon NUC - RTX 3060 | |
| Intel Beast Canyon NUC | |
| Minisforum Neptune Series HX90G | |
| 3DMark 05 Standard | 82816 pkt. | |
| 3DMark 06 Standard Score | 71555 pkt. | |
| 3DMark Vantage P Result | 118753 pkt. | |
| 3DMark 11 Performance | 46806 pkt. | |
| 3DMark Ice Storm Standard Score | 288716 pkt. | |
| 3DMark Cloud Gate Standard Score | 76027 pkt. | |
| 3DMark Fire Strike Score | 37178 pkt. | |
| 3DMark Fire Strike Extreme Score | 23232 pkt. | |
| 3DMark Time Spy Score | 18822 pkt. | |
Pomoc | ||
Wydajność w grach
Chociaż Nvidia GeForce RTX 3080 Ti nie należy już do najnowszych kart graficznych, to model ten z pewnością nie jest złym wyborem. Połączenie z Intel Core i9-13900K i GeForce RTX 3080 Ti wciąż ma sporo sensu, gdyż jest w stanie płynnie wyświetlać nawet najnowsze gry na maksymalnych ustawieniach. Deficyt wydajności w porównaniu do szybszej Nvidia GeForce RTX 3090 jest marginalny. W systemie opartym na.AMD Ryzen 9 7950Xktóry zbudowaliśmy dla celów porównawczych, ta sama Nvidia GeForce RTX 3080 Ti nie osiąga dużego skoku wydajności, ponieważ wydajność procesora staje się mniej ważna, gdy GPU jest bliskie pełnego obciążenia.
Jeśli chodzi o wybór karty graficznej, zalecamy użytkownikom sprawdzenie kompatybilności ich ulubionego modelu, ponieważ obsługiwana maksymalna długość jest ograniczona. Rozwiązania graficzne nie mogą przekroczyć maksymalnej długości 31,3 cm (~12,32 in). Jeśli chodzi o grubość, obudowa pozwala na umieszczenie do trzech slotów.
| GTA V | |
| 1920x1080 Highest AA:4xMSAA + FX AF:16x | |
| Intel Core i9-13900K | |
| ASUS TUF Gaming GeForce RTX 3080 Ti OC | |
| Intel NUC13 Raptor Canyon | |
| Corsair One i300 | |
| Minisforum NUCX i7 | |
| Intel Beast Canyon NUC | |
| Intel Dragon Canyon NUC - RTX 3060 | |
| Minisforum Neptune Series HX90G | |
| 3840x2160 High/On (Advanced Graphics Off) AA:FX AF:8x | |
| ASUS TUF Gaming GeForce RTX 3080 Ti OC | |
| Intel Core i9-13900K | |
| Intel NUC13 Raptor Canyon | |
| Corsair One i300 | |
| Minisforum NUCX i7 | |
| Intel Beast Canyon NUC | |
| Intel Dragon Canyon NUC - RTX 3060 | |
| Minisforum Neptune Series HX90G | |
| The Witcher 3 | |
| 1920x1080 Ultra Graphics & Postprocessing (HBAO+) | |
| ASUS TUF Gaming GeForce RTX 3080 Ti OC | |
| Corsair One i300 | |
| Intel Core i9-13900K | |
| Intel NUC13 Raptor Canyon | |
| Minisforum NUCX i7 | |
| Intel Dragon Canyon NUC - RTX 3060 | |
| Minisforum Neptune Series HX90G | |
| 3840x2160 High Graphics & Postprocessing (Nvidia HairWorks Off) | |
| Intel NUC13 Raptor Canyon | |
| ASUS TUF Gaming GeForce RTX 3080 Ti OC | |
| Intel Core i9-13900K | |
| Corsair One i300 | |
| Minisforum NUCX i7 | |
| Intel Dragon Canyon NUC - RTX 3060 | |
| Minisforum Neptune Series HX90G | |
| Final Fantasy XV Benchmark | |
| 3840x2160 High Quality | |
| Intel Core i9-13900K | |
| ASUS TUF Gaming GeForce RTX 3080 Ti OC | |
| Intel NUC13 Raptor Canyon | |
| Corsair One i300 | |
| Minisforum NUCX i7 | |
| Intel Beast Canyon NUC | |
| Intel Dragon Canyon NUC - RTX 3060 | |
| Minisforum Neptune Series HX90G | |
| 1920x1080 High Quality | |
| Intel Core i9-13900K | |
| ASUS TUF Gaming GeForce RTX 3080 Ti OC | |
| Intel NUC13 Raptor Canyon | |
| Corsair One i300 | |
| Minisforum NUCX i7 | |
| Intel Beast Canyon NUC | |
| Intel Dragon Canyon NUC - RTX 3060 | |
| Minisforum Neptune Series HX90G | |
| X-Plane 11.11 | |
| 3840x2160 high (fps_test=3) | |
| Intel Core i9-13900K | |
| Intel NUC13 Raptor Canyon | |
| Corsair One i300 | |
| ASUS TUF Gaming GeForce RTX 3080 Ti OC | |
| Intel Beast Canyon NUC | |
| Intel Dragon Canyon NUC - RTX 3060 | |
| Minisforum NUCX i7 | |
| Minisforum Neptune Series HX90G | |
| 1920x1080 high (fps_test=3) | |
| Intel NUC13 Raptor Canyon | |
| Intel Core i9-13900K | |
| ASUS TUF Gaming GeForce RTX 3080 Ti OC | |
| Corsair One i300 | |
| Intel Beast Canyon NUC | |
| Intel Dragon Canyon NUC - RTX 3060 | |
| Minisforum NUCX i7 | |
| Minisforum Neptune Series HX90G | |
| Far Cry 5 | |
| 1920x1080 Ultra Preset AA:T | |
| Intel Core i9-13900K | |
| ASUS TUF Gaming GeForce RTX 3080 Ti OC | |
| Intel NUC13 Raptor Canyon | |
| Corsair One i300 | |
| Intel Dragon Canyon NUC - RTX 3060 | |
| Intel Beast Canyon NUC | |
| Minisforum NUCX i7 | |
| Minisforum Neptune Series HX90G | |
| 3840x2160 Ultra Preset AA:T | |
| Intel Core i9-13900K | |
| ASUS TUF Gaming GeForce RTX 3080 Ti OC | |
| Intel NUC13 Raptor Canyon | |
| Corsair One i300 | |
| Minisforum NUCX i7 | |
| Intel Beast Canyon NUC | |
| Intel Dragon Canyon NUC - RTX 3060 | |
| Minisforum Neptune Series HX90G | |
| Far Cry New Dawn | |
| 1920x1080 Ultra Preset | |
| Intel Core i9-13900K | |
| ASUS TUF Gaming GeForce RTX 3080 Ti OC | |
| Intel NUC13 Raptor Canyon | |
| Corsair One i300 | |
| Intel Dragon Canyon NUC - RTX 3060 | |
| Intel Beast Canyon NUC | |
| Minisforum NUCX i7 | |
| Minisforum Neptune Series HX90G | |
| 3840x2160 Ultra Preset | |
| Intel Core i9-13900K | |
| ASUS TUF Gaming GeForce RTX 3080 Ti OC | |
| Intel NUC13 Raptor Canyon | |
| Corsair One i300 | |
| Minisforum NUCX i7 | |
| Intel Dragon Canyon NUC - RTX 3060 | |
| Intel Beast Canyon NUC | |
| Minisforum Neptune Series HX90G | |
| Far Cry 6 | |
| 1920x1080 Ultra Graphics Quality + HD Textures AA:T | |
| ASUS TUF Gaming GeForce RTX 3080 Ti OC | |
| Intel Core i9-13900K | |
| Corsair One i300 | |
| Intel NUC13 Raptor Canyon | |
| Minisforum NUCX i7 | |
| Intel Dragon Canyon NUC - RTX 3060 | |
| Intel Beast Canyon NUC | |
| Minisforum Neptune Series HX90G | |
| 3840x2160 Ultra Graphics Quality + HD Textures AA:T | |
| ASUS TUF Gaming GeForce RTX 3080 Ti OC | |
| Intel NUC13 Raptor Canyon | |
| Intel Core i9-13900K | |
| Corsair One i300 | |
| Intel Dragon Canyon NUC - RTX 3060 | |
| Intel Beast Canyon NUC | |
| Minisforum Neptune Series HX90G | |
| Metro Exodus | |
| 1920x1080 Ultra Quality AF:16x | |
| ASUS TUF Gaming GeForce RTX 3080 Ti OC | |
| Intel Core i9-13900K | |
| Corsair One i300 | |
| Intel NUC13 Raptor Canyon | |
| Minisforum NUCX i7 | |
| Intel Dragon Canyon NUC - RTX 3060 | |
| Intel Beast Canyon NUC | |
| Minisforum Neptune Series HX90G | |
| 3840x2160 Ultra Quality AF:16x | |
| ASUS TUF Gaming GeForce RTX 3080 Ti OC | |
| Intel NUC13 Raptor Canyon | |
| Intel Core i9-13900K | |
| Corsair One i300 | |
| Minisforum NUCX i7 | |
| Intel Dragon Canyon NUC - RTX 3060 | |
| Intel Beast Canyon NUC | |
| Minisforum Neptune Series HX90G | |
| Borderlands 3 | |
| 3840x2160 Badass Overall Quality (DX11) | |
| Intel NUC13 Raptor Canyon | |
| ASUS TUF Gaming GeForce RTX 3080 Ti OC | |
| Intel Core i9-13900K | |
| Corsair One i300 | |
| Intel Beast Canyon NUC | |
| Minisforum NUCX i7 | |
| Intel Dragon Canyon NUC - RTX 3060 | |
| Minisforum Neptune Series HX90G | |
| 1920x1080 Badass Overall Quality (DX11) | |
| ASUS TUF Gaming GeForce RTX 3080 Ti OC | |
| Intel Core i9-13900K | |
| Intel NUC13 Raptor Canyon | |
| Corsair One i300 | |
| Intel Beast Canyon NUC | |
| Intel Dragon Canyon NUC - RTX 3060 | |
| Minisforum NUCX i7 | |
| Minisforum Neptune Series HX90G | |
| F1 2020 | |
| 1920x1080 Ultra High Preset AA:T AF:16x | |
| ASUS TUF Gaming GeForce RTX 3080 Ti OC | |
| Intel NUC13 Raptor Canyon | |
| Corsair One i300 | |
| Intel Core i9-13900K | |
| Minisforum NUCX i7 | |
| Intel Beast Canyon NUC | |
| Intel Dragon Canyon NUC - RTX 3060 | |
| Minisforum Neptune Series HX90G | |
| 3840x2160 Ultra High Preset AA:T AF:16x | |
| ASUS TUF Gaming GeForce RTX 3080 Ti OC | |
| Intel NUC13 Raptor Canyon | |
| Corsair One i300 | |
| Intel Core i9-13900K | |
| Minisforum NUCX i7 | |
| Intel Beast Canyon NUC | |
| Intel Dragon Canyon NUC - RTX 3060 | |
| Minisforum Neptune Series HX90G | |
| F1 2021 | |
| 1920x1080 Ultra High Preset + Raytracing AA:T AF:16x | |
| ASUS TUF Gaming GeForce RTX 3080 Ti OC | |
| Intel NUC13 Raptor Canyon | |
| Intel Core i9-13900K | |
| Corsair One i300 | |
| Minisforum NUCX i7 | |
| Intel Beast Canyon NUC | |
| Intel Dragon Canyon NUC - RTX 3060 | |
| Minisforum Neptune Series HX90G | |
| 3840x2160 Ultra High Preset + Raytracing AA:T AF:16x | |
| ASUS TUF Gaming GeForce RTX 3080 Ti OC | |
| Intel Core i9-13900K | |
| Intel NUC13 Raptor Canyon | |
| Corsair One i300 | |
| Minisforum NUCX i7 | |
| Intel Beast Canyon NUC | |
| Intel Dragon Canyon NUC - RTX 3060 | |
| Minisforum Neptune Series HX90G | |
| Forza Horizon 5 | |
| 1920x1080 Extreme Preset | |
| ASUS TUF Gaming GeForce RTX 3080 Ti OC | |
| Intel NUC13 Raptor Canyon | |
| Intel Core i9-13900K | |
| Corsair One i300 | |
| Minisforum NUCX i7 | |
| Minisforum Neptune Series HX90G | |
| 3840x2160 Extreme Preset | |
| ASUS TUF Gaming GeForce RTX 3080 Ti OC | |
| Intel NUC13 Raptor Canyon | |
| Intel Core i9-13900K | |
| Corsair One i300 | |
| Minisforum NUCX i7 | |
| Minisforum Neptune Series HX90G | |
| low | med. | high | ultra | QHD | 4K | |
|---|---|---|---|---|---|---|
| GTA V (2015) | 187.6 | 187.4 | 187 | 161.5 | 152.8 | 182 |
| The Witcher 3 (2015) | 702 | 564 | 374 | 179.1 | 156.8 | |
| Dota 2 Reborn (2015) | 278.9 | 242.4 | 234.1 | 216.6 | 211.1 | |
| Final Fantasy XV Benchmark (2018) | 234 | 229 | 180.6 | 141 | 84.2 | |
| X-Plane 11.11 (2018) | 232 | 202 | 148.8 | 127.3 | ||
| Far Cry 5 (2018) | 239 | 208 | 198 | 186 | 176 | 109 |
| Strange Brigade (2018) | 613 | 489 | 407 | 359 | 269 | 161 |
| Far Cry New Dawn (2019) | 200 | 174 | 167 | 150 | 144 | 109 |
| Metro Exodus (2019) | 241 | 200 | 165.8 | 134 | 115 | 76.5 |
| Borderlands 3 (2019) | 229 | 195.3 | 179.7 | 160 | 128.7 | 74 |
| F1 2020 (2020) | 520 | 448 | 419 | 310 | 240 | 145.2 |
| F1 2021 (2021) | 615 | 525 | 428 | 225 | 174.3 | 103.2 |
| Far Cry 6 (2021) | 211 | 180.4 | 160.6 | 120.7 | 136 | 86 |
| Forza Horizon 5 (2021) | 256 | 191 | 182 | 129 | 117 | 87 |
| God of War (2022) | 229 | 200 | 166.6 | 119.6 | 105.8 | 77.5 |
| Tiny Tina's Wonderlands (2022) | 355 | 291 | 211 | 168.5 | 123.1 | 70 |
| F1 22 (2022) | 367 | 342 | 321 | 128.8 | 85.6 | 43 |
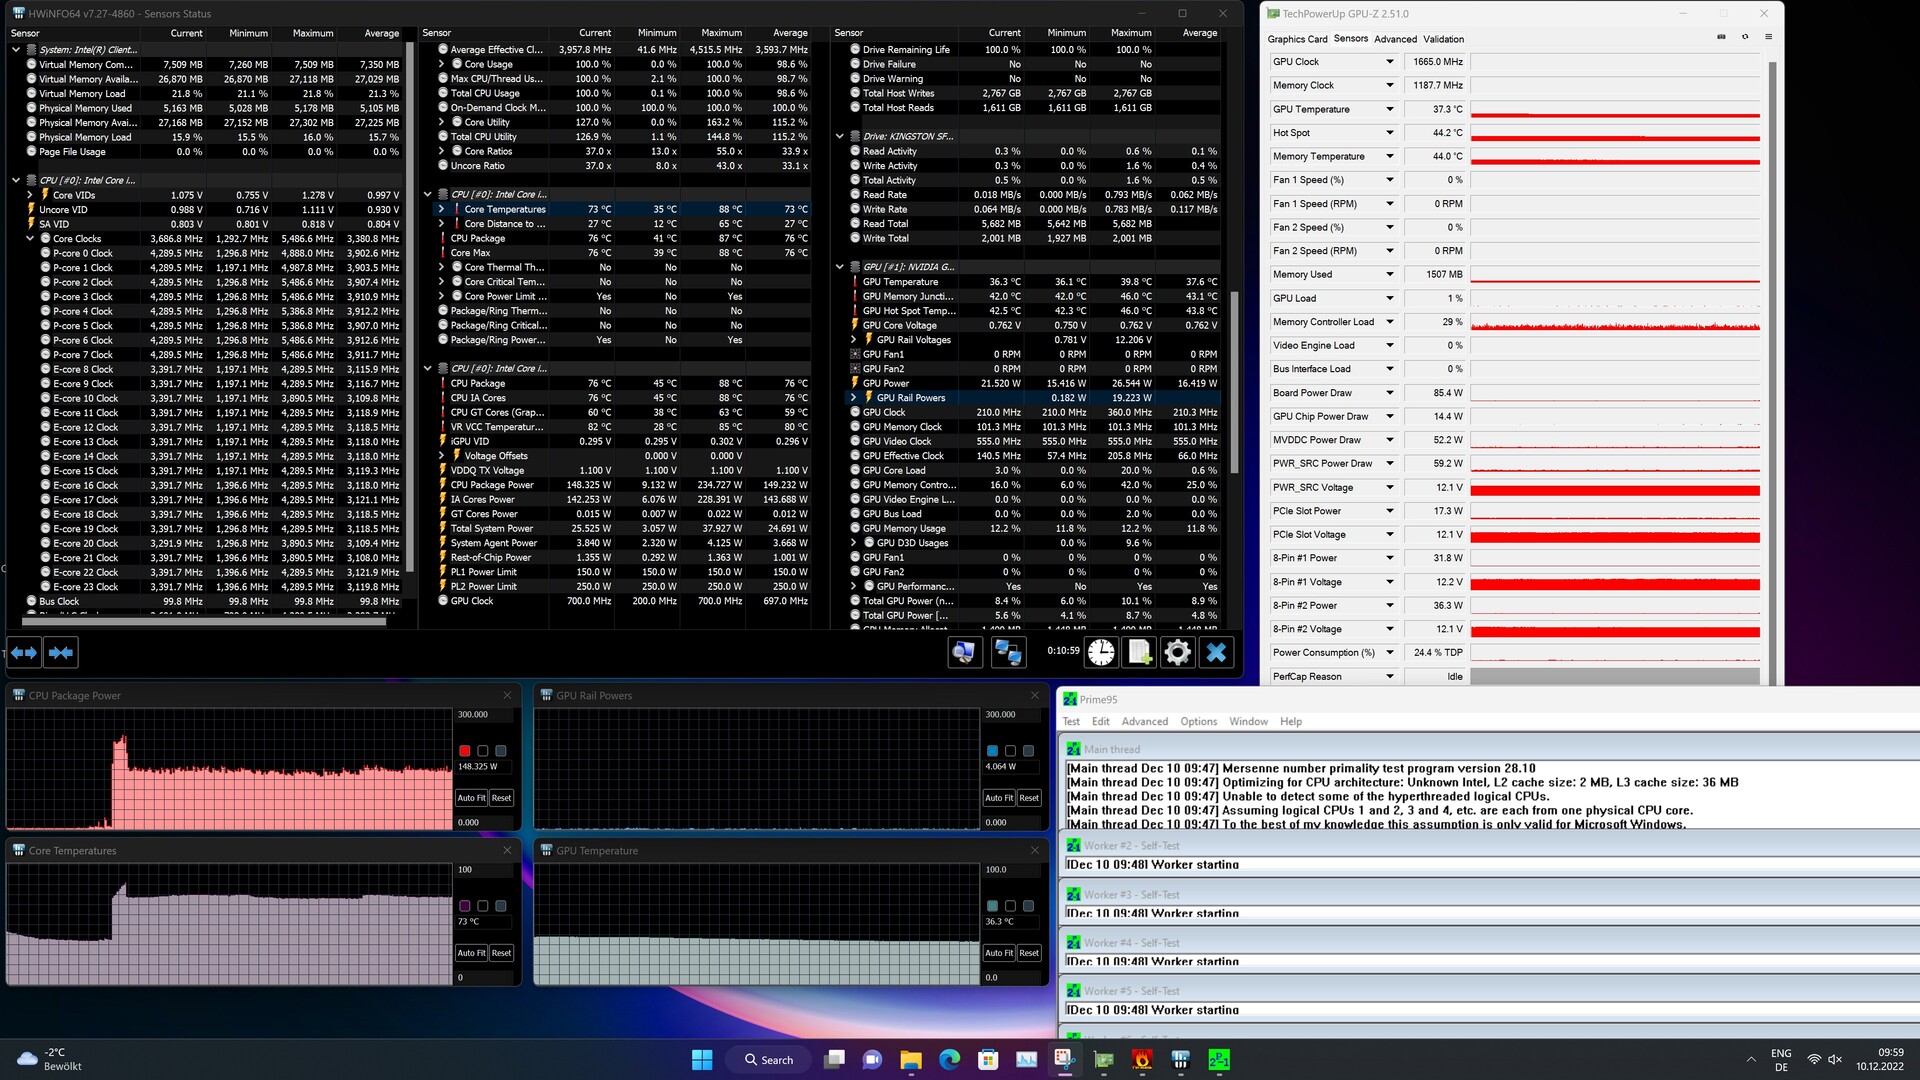
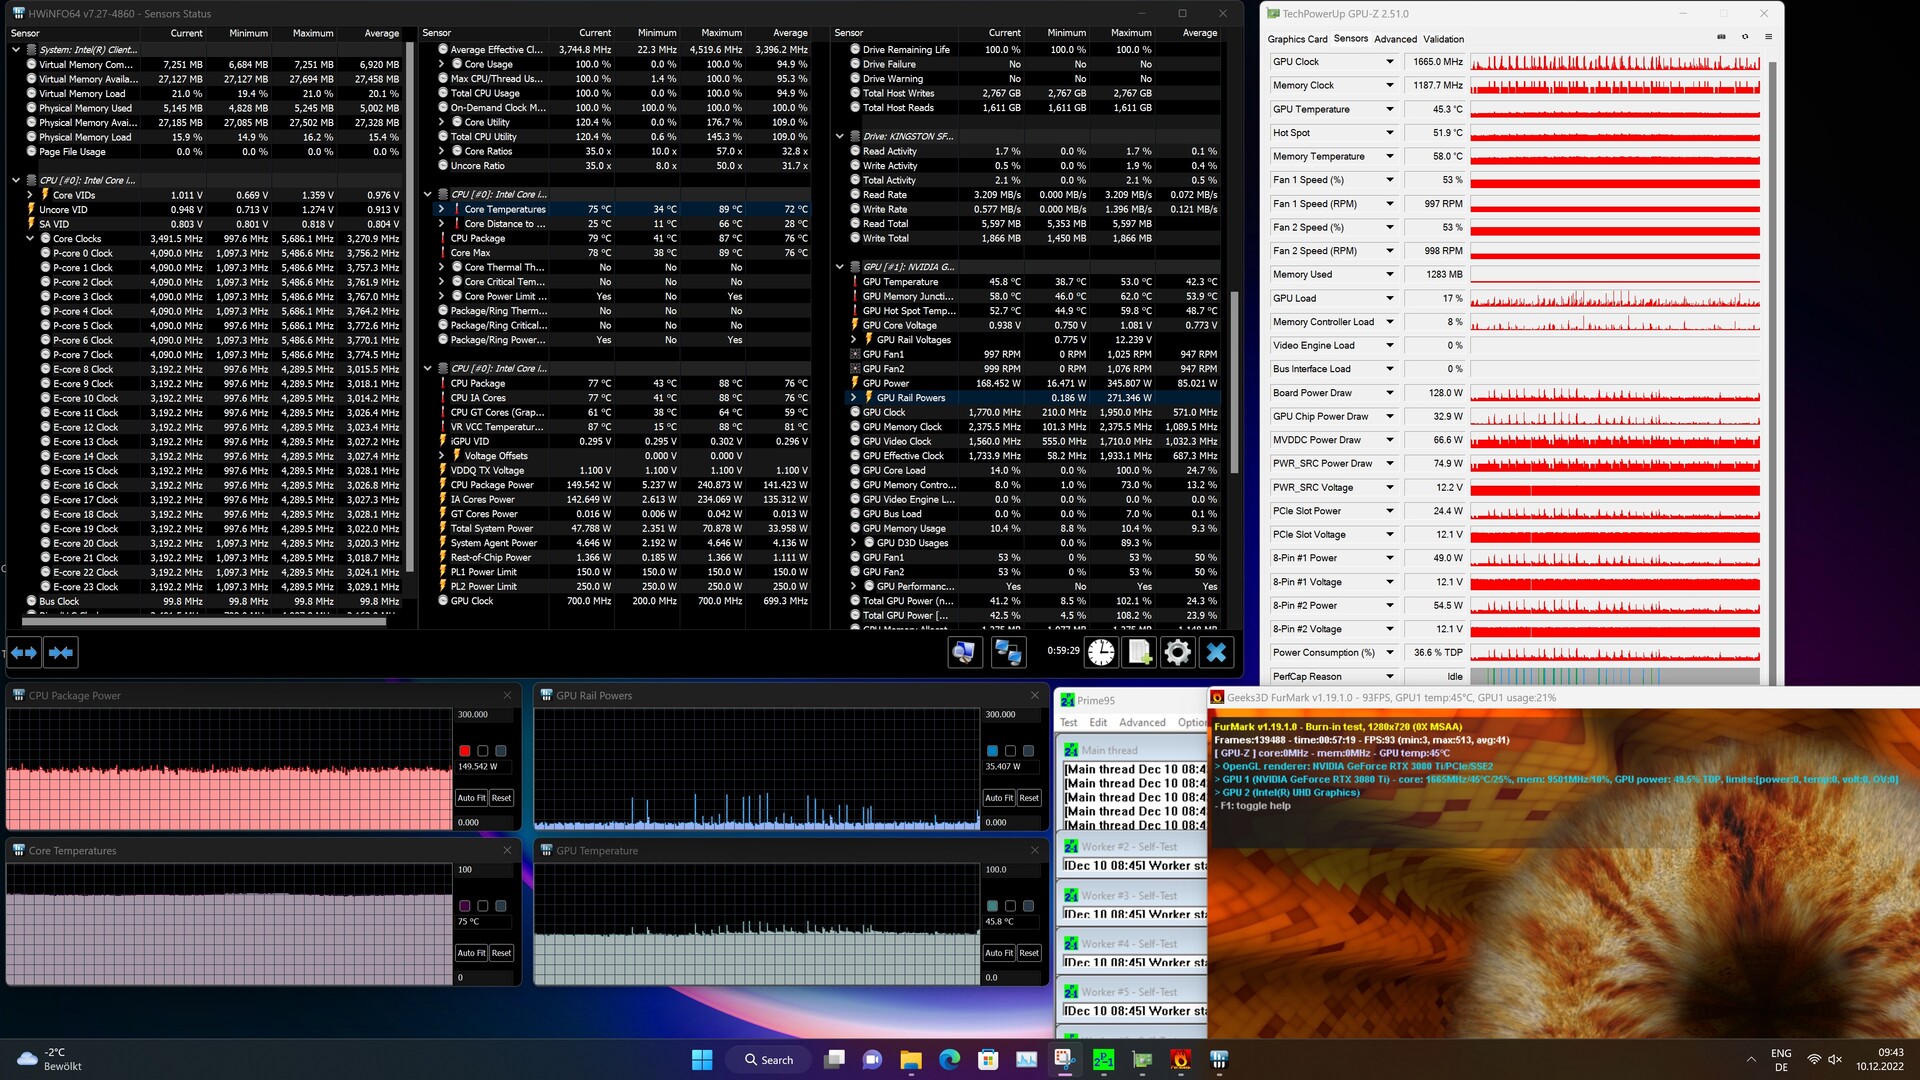
Emisje
Temperatury i hałas systemowy
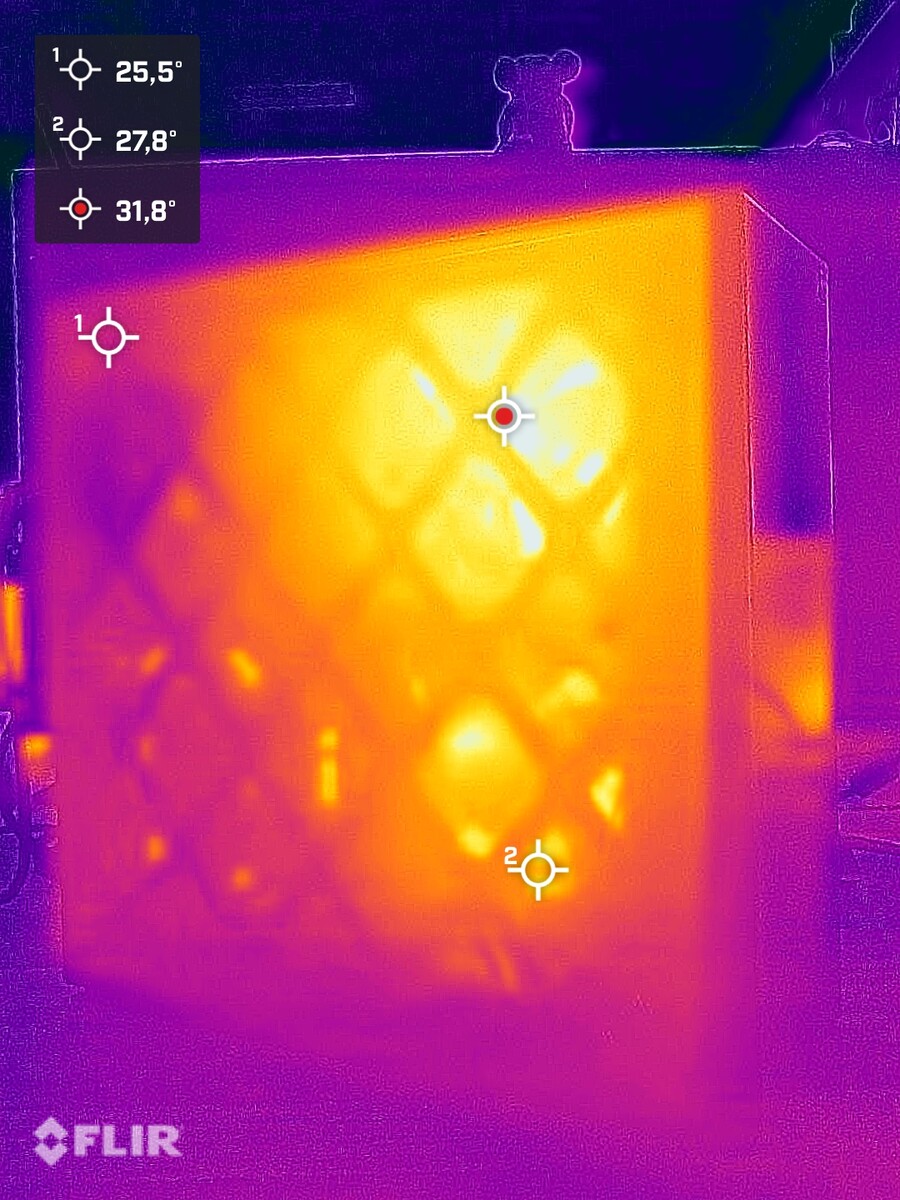
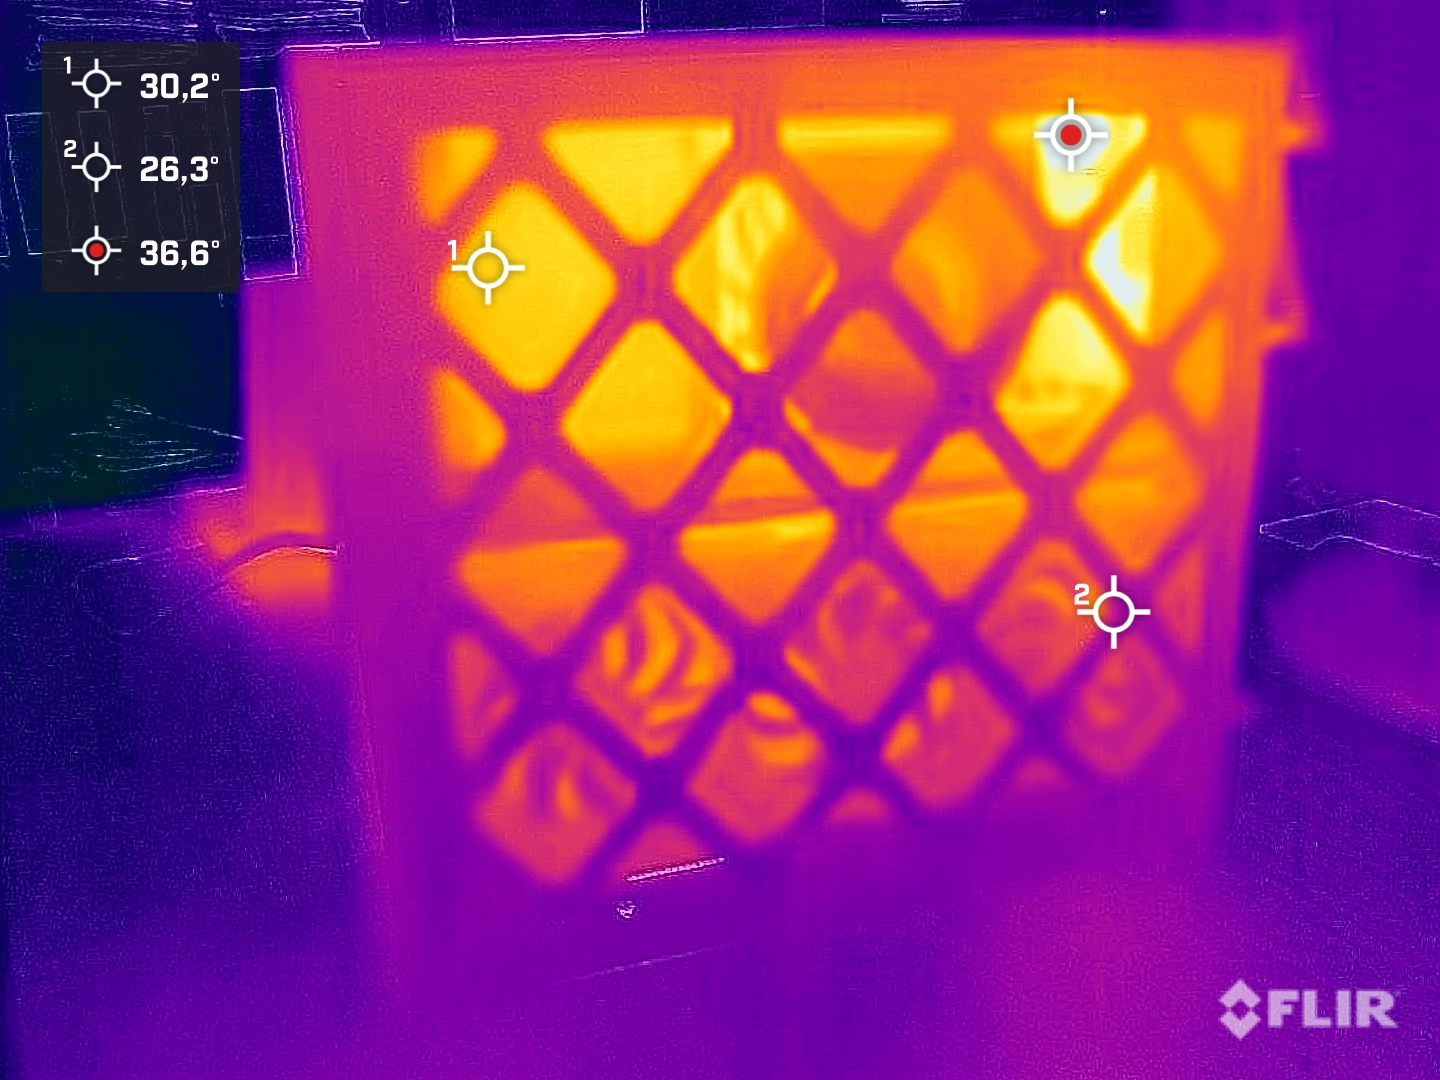
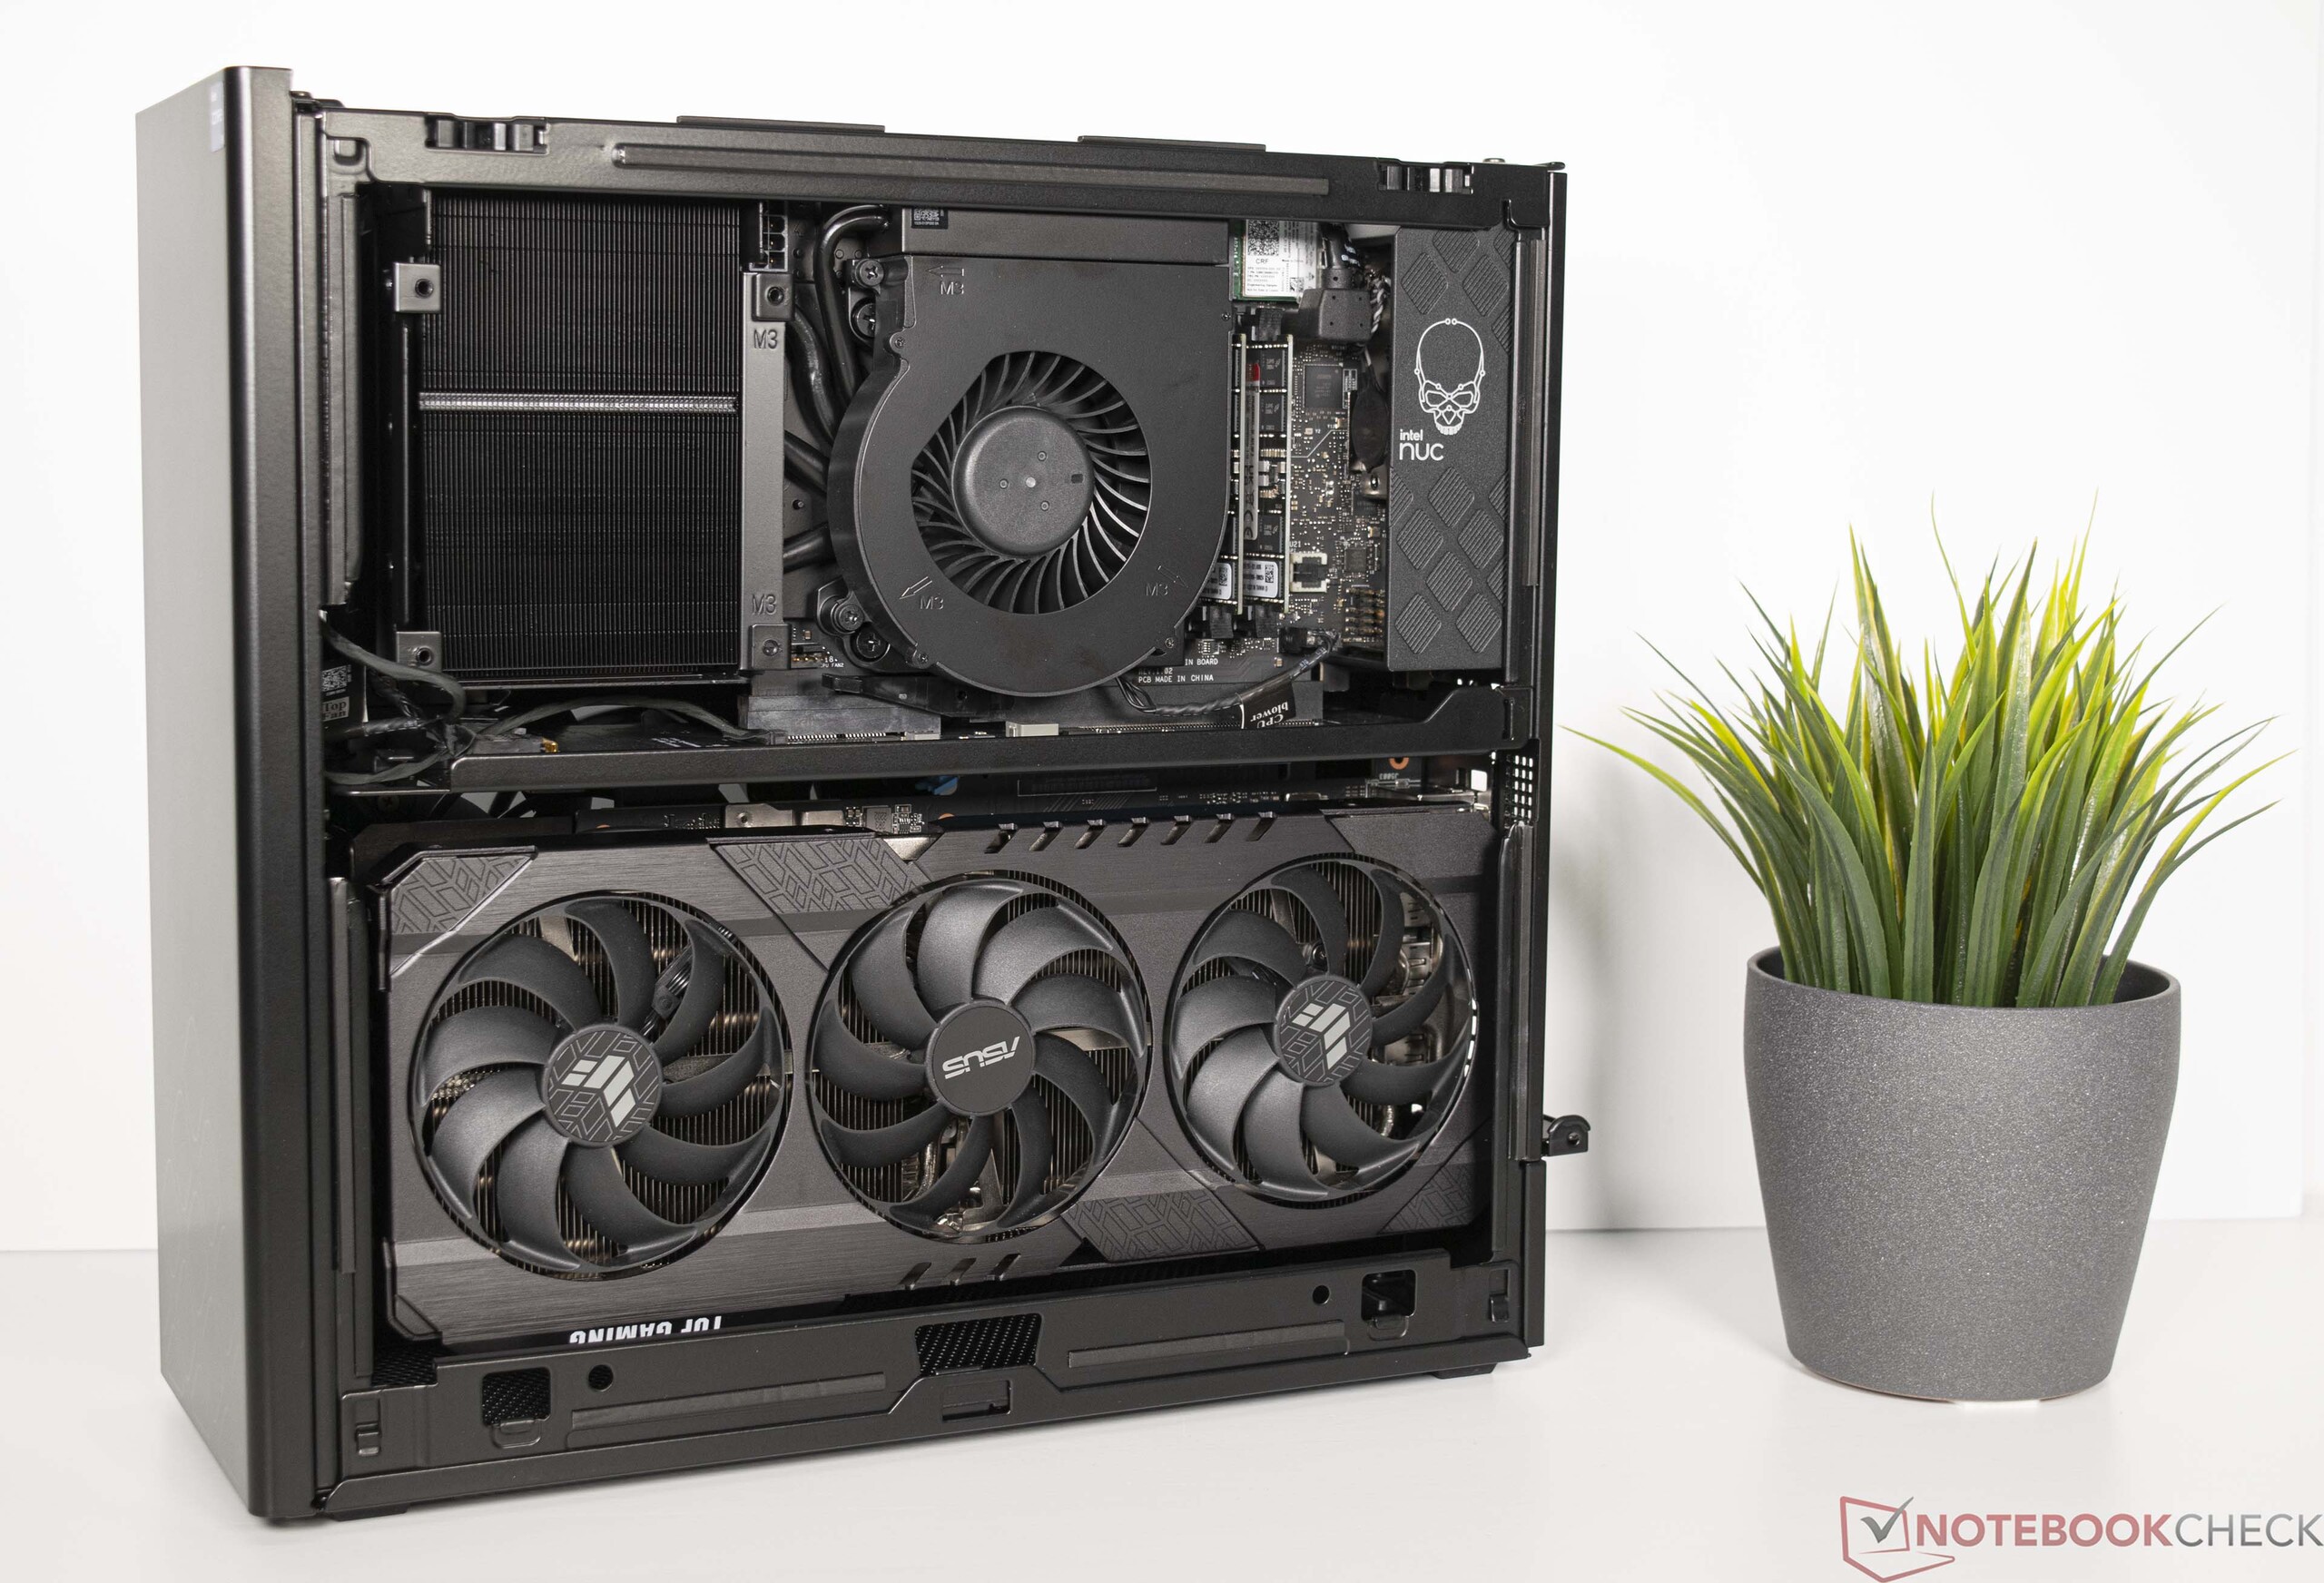
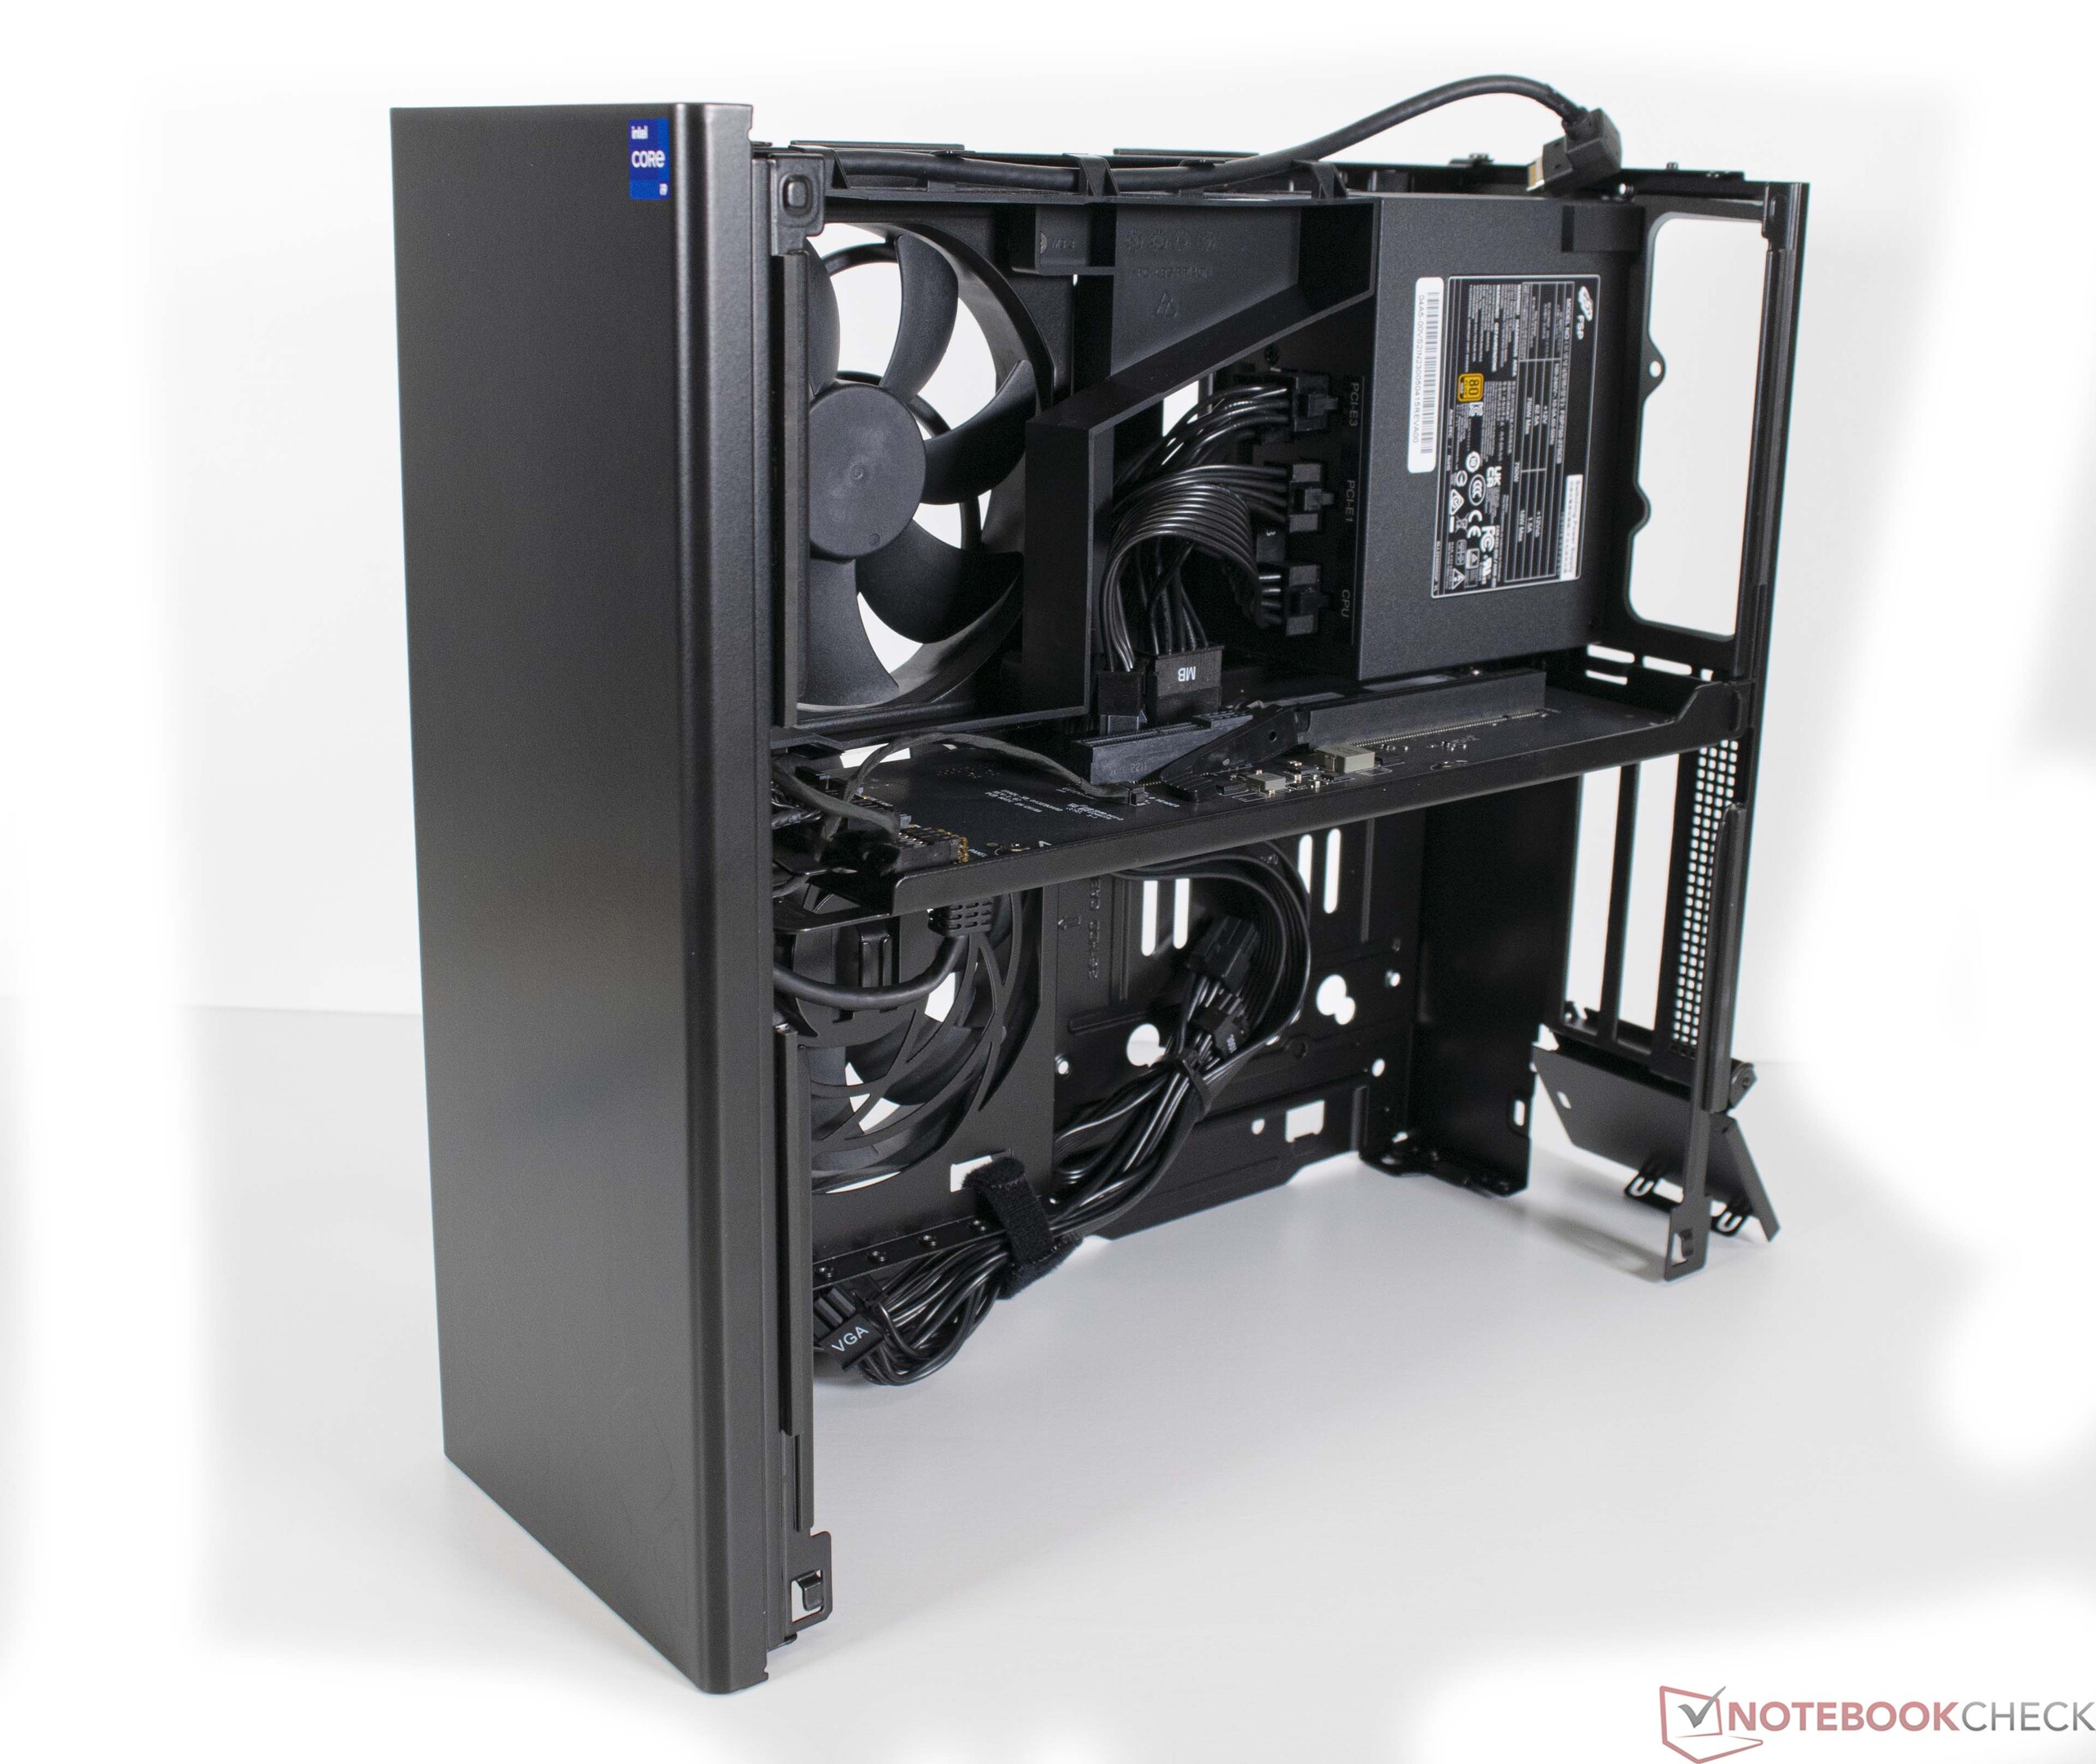
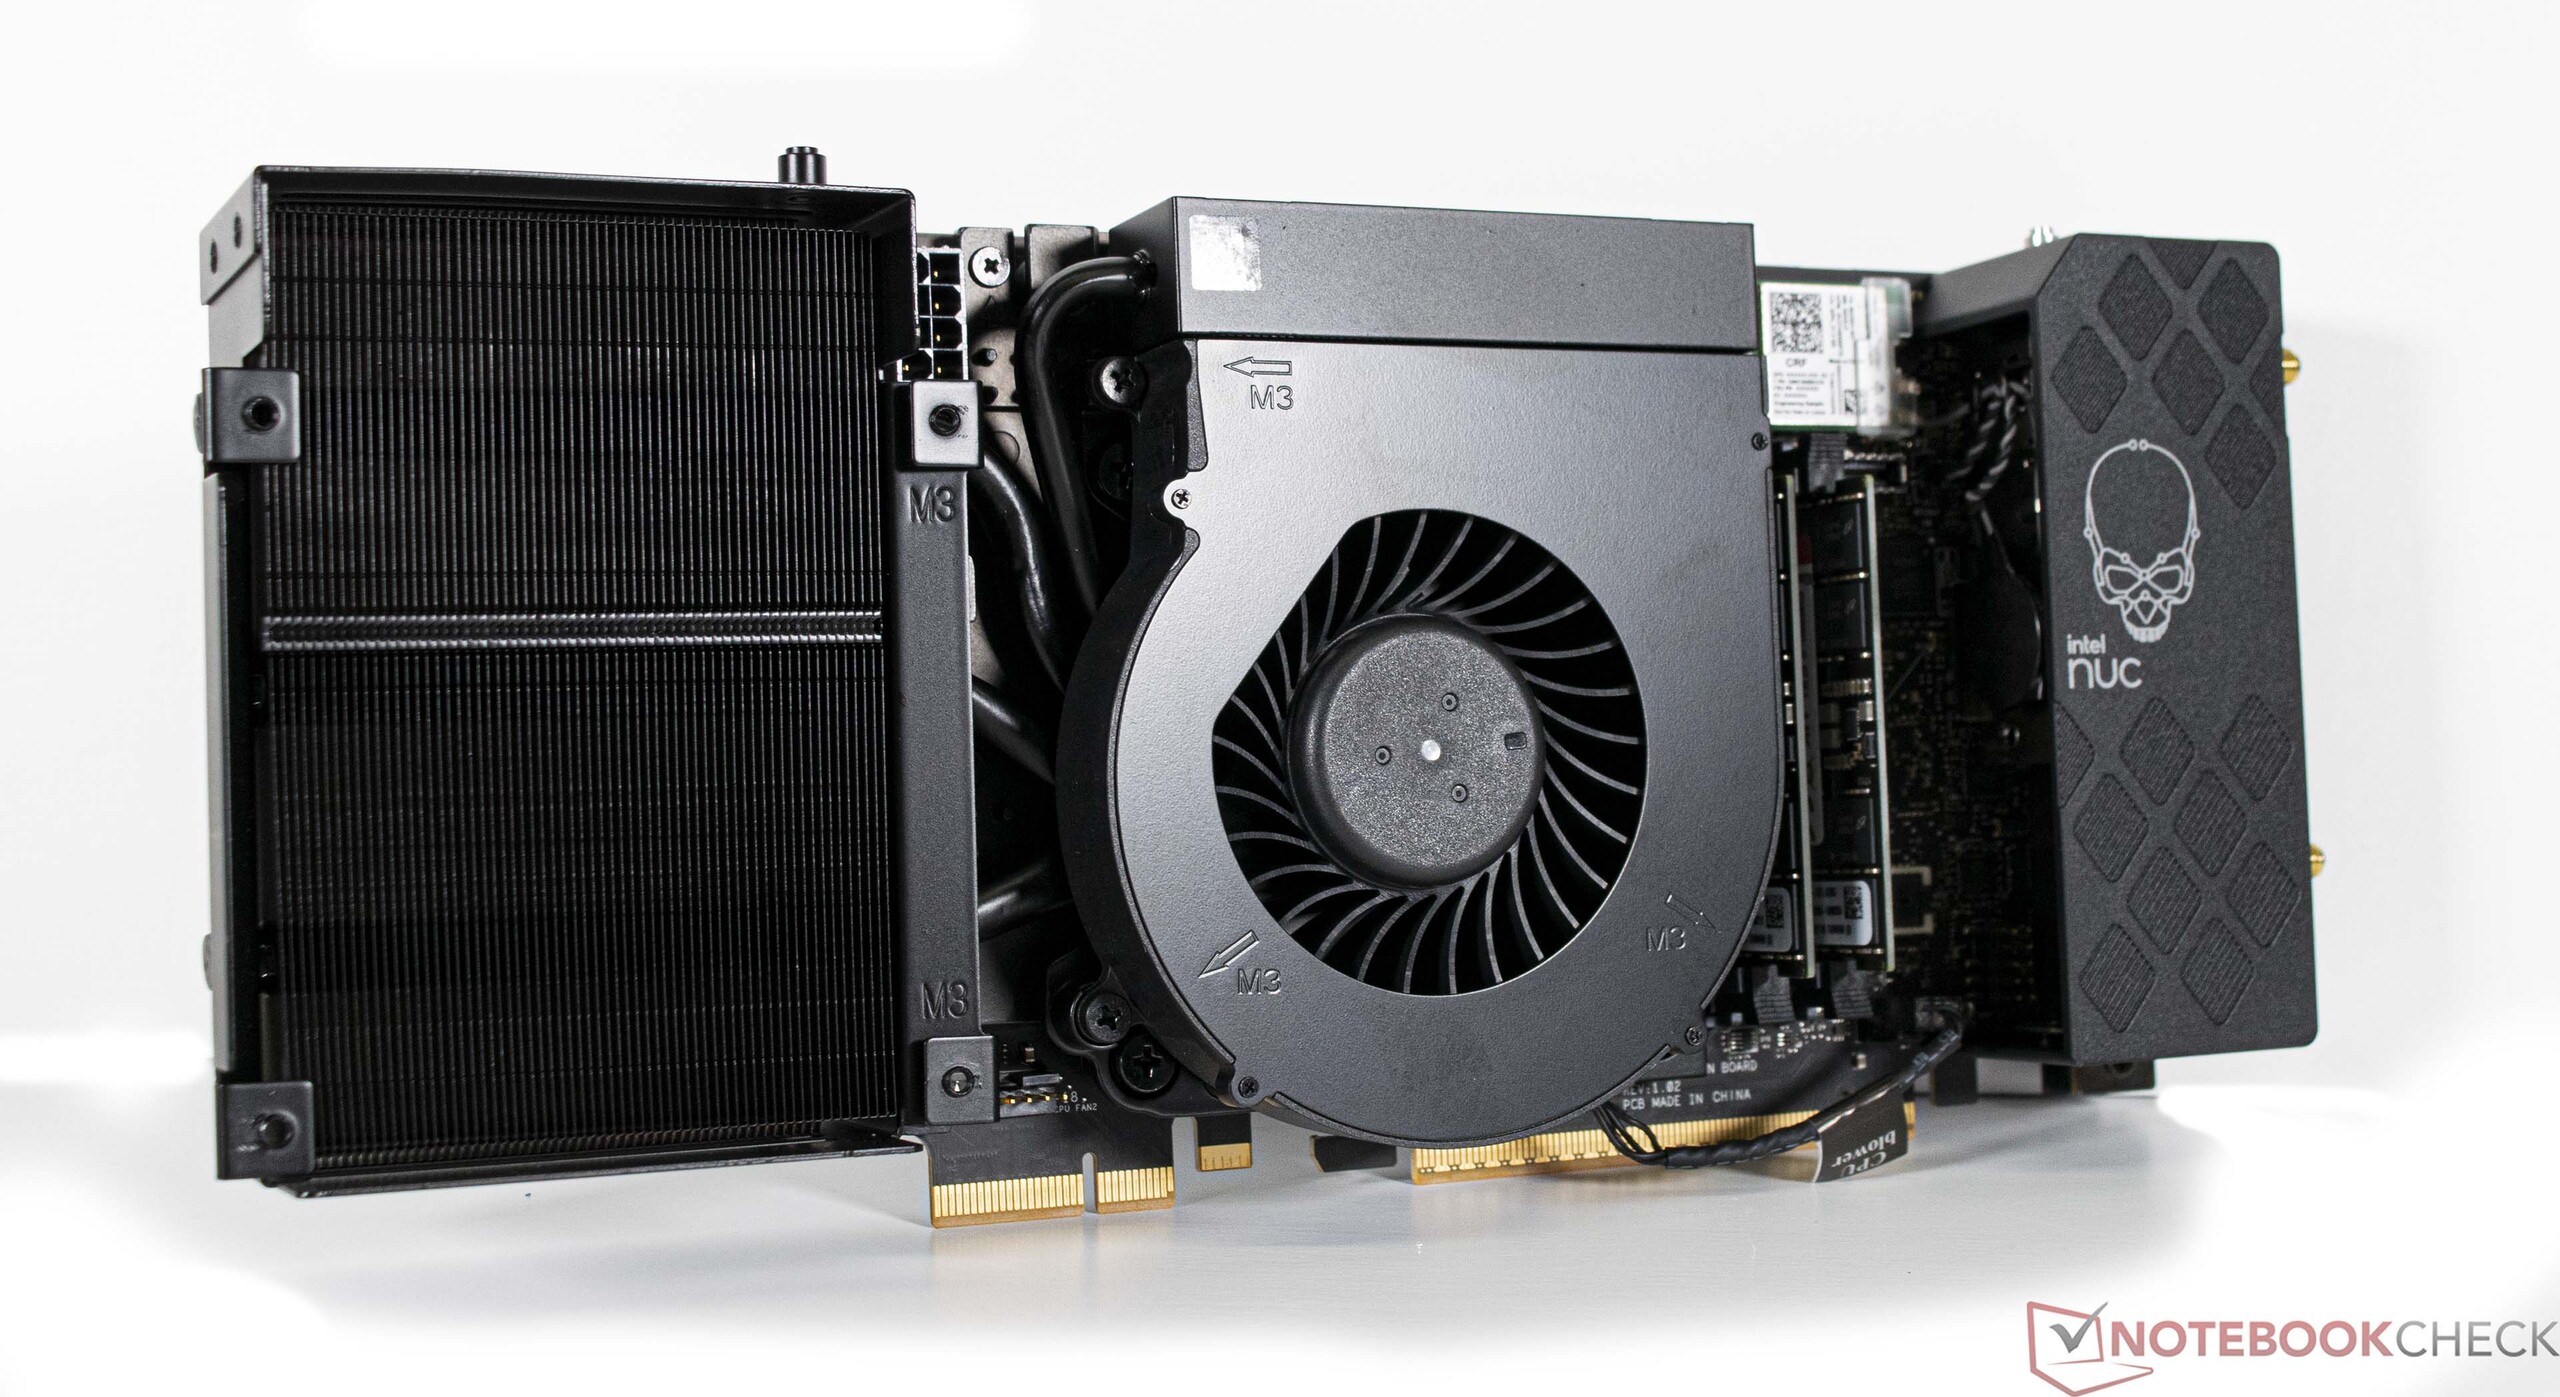
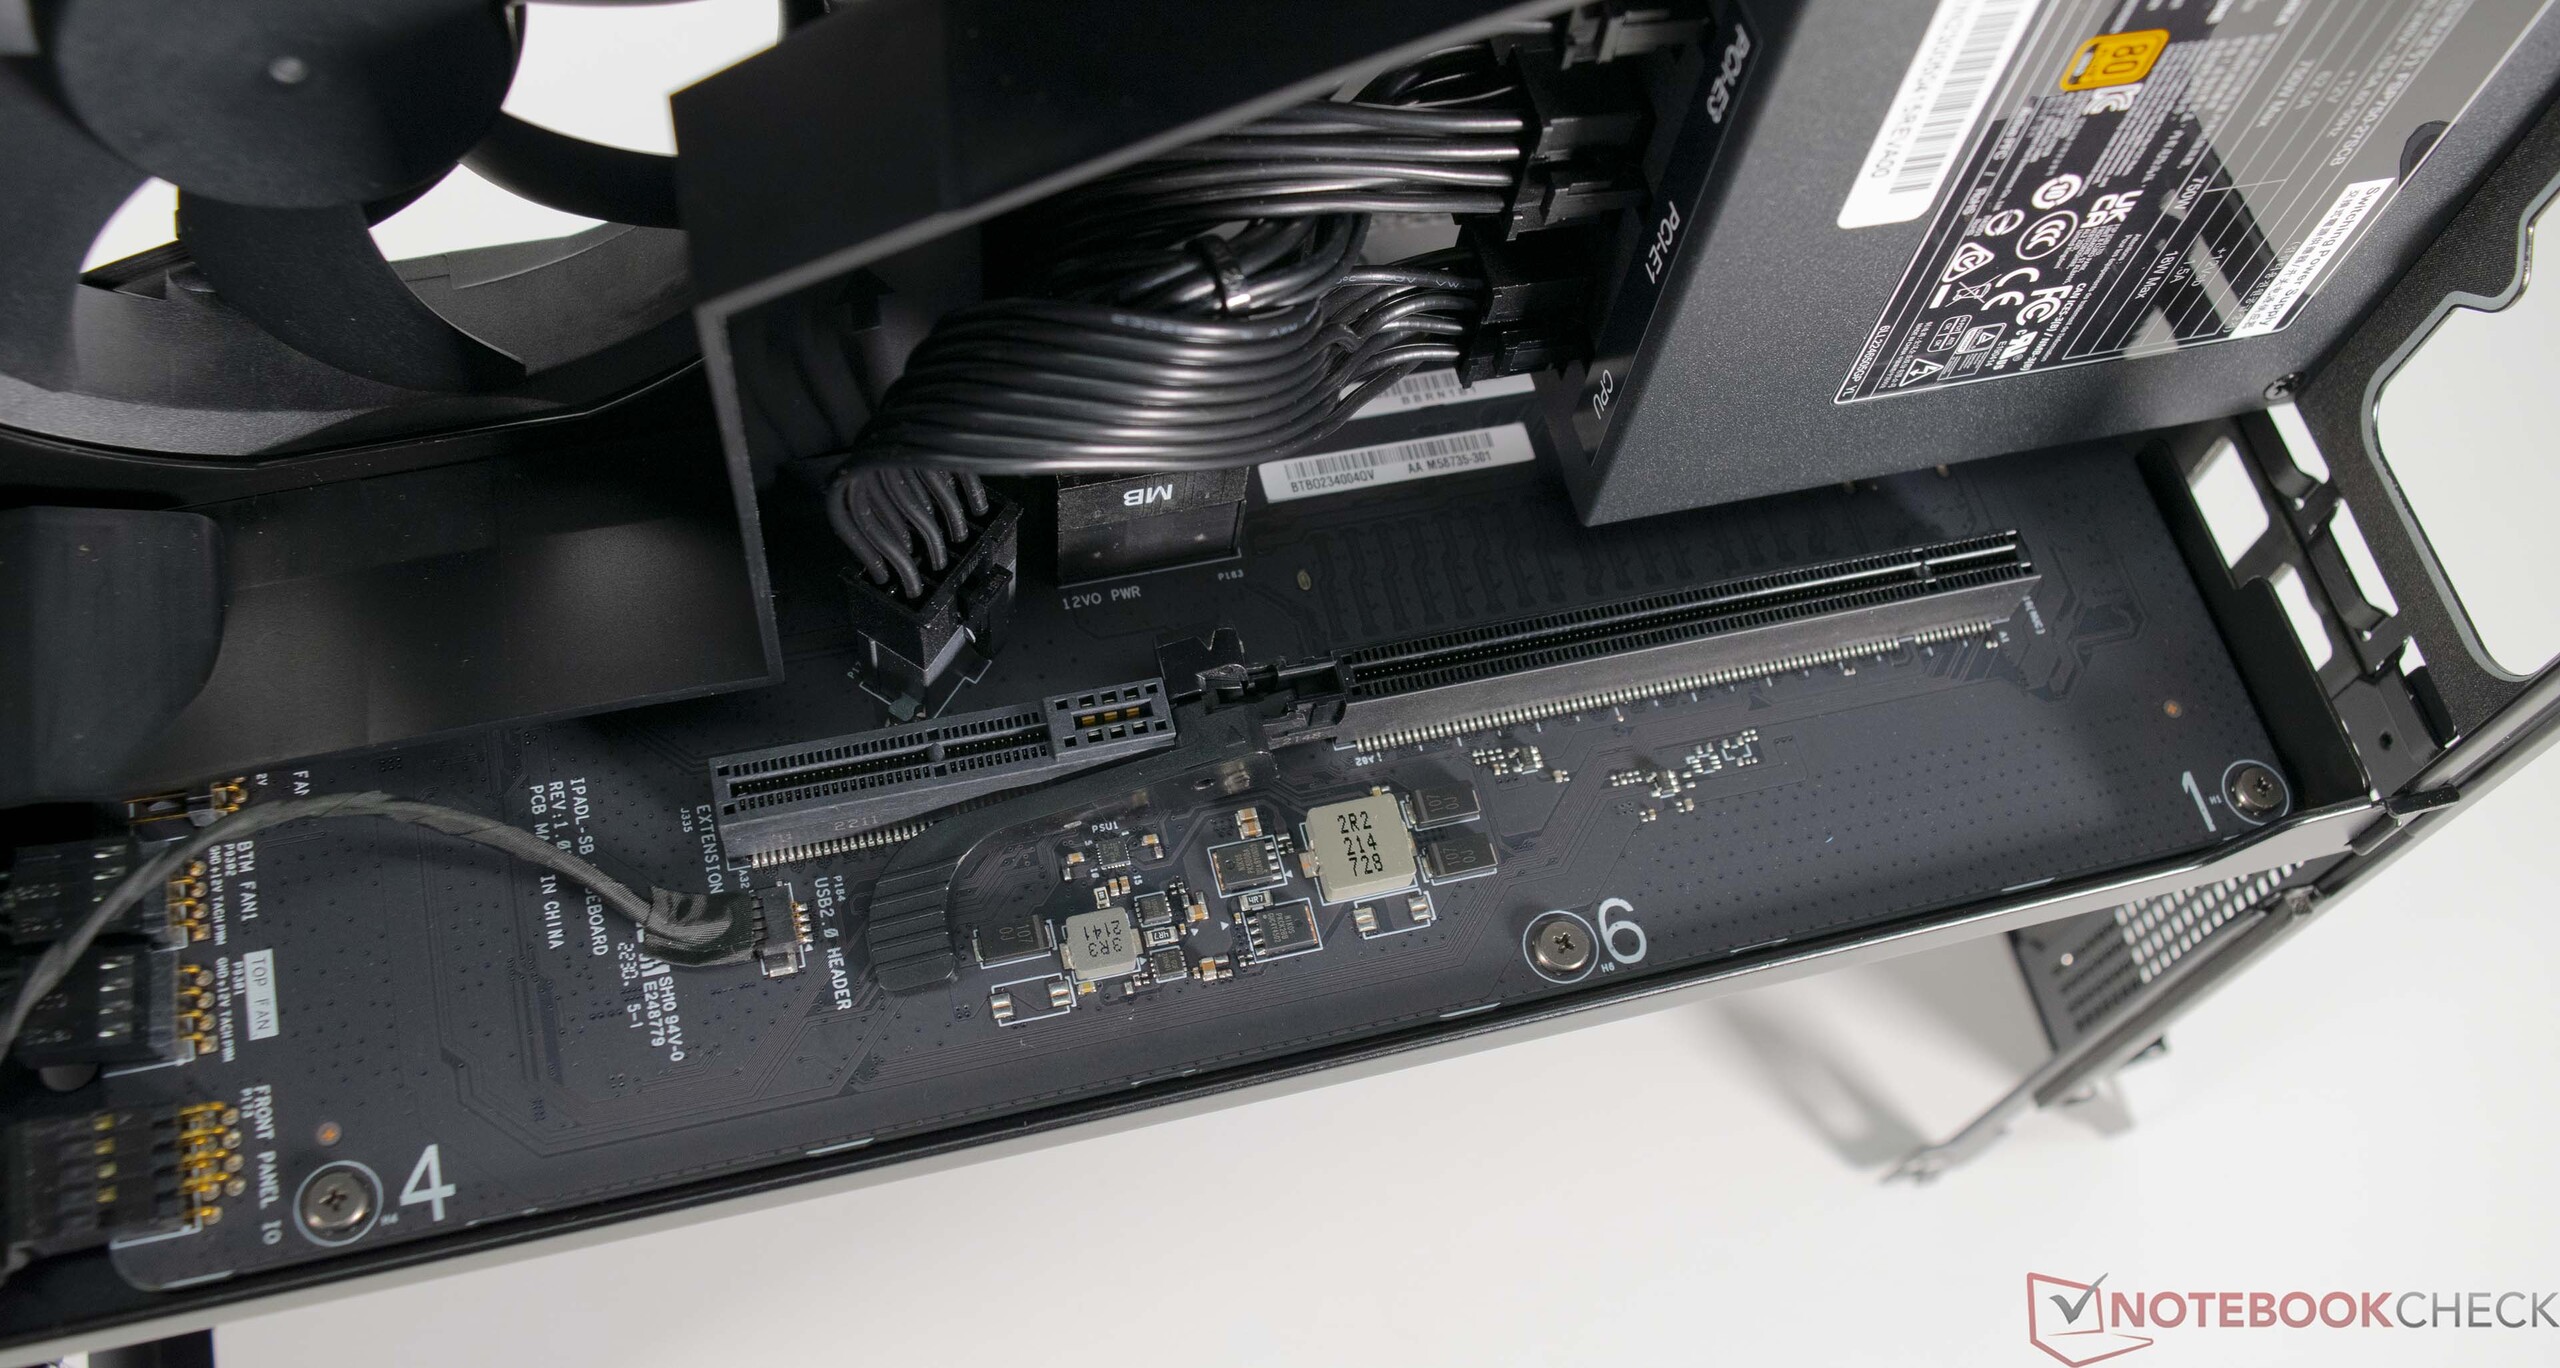
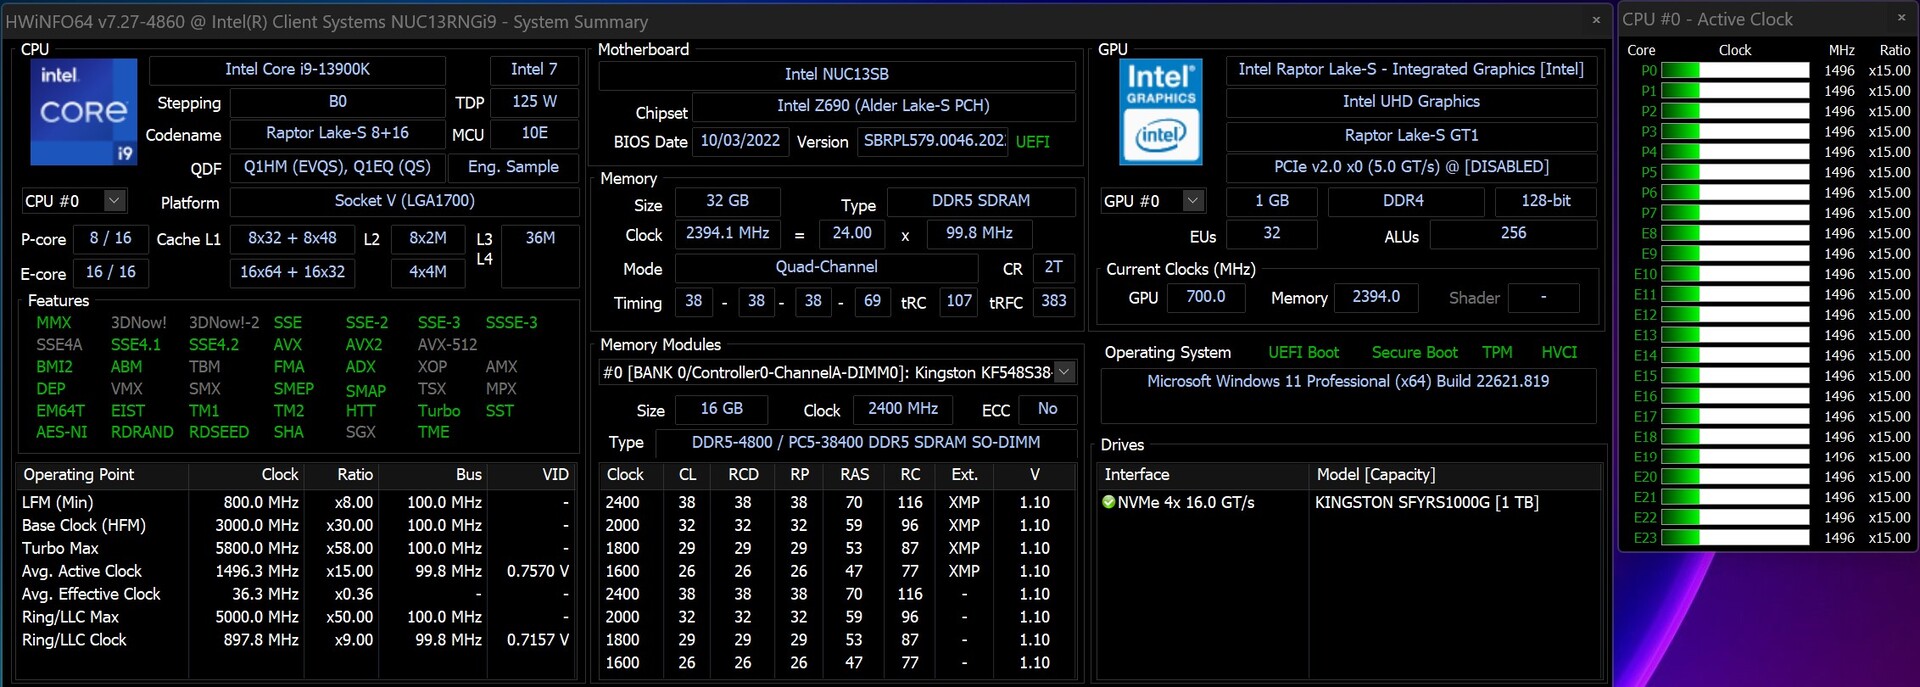
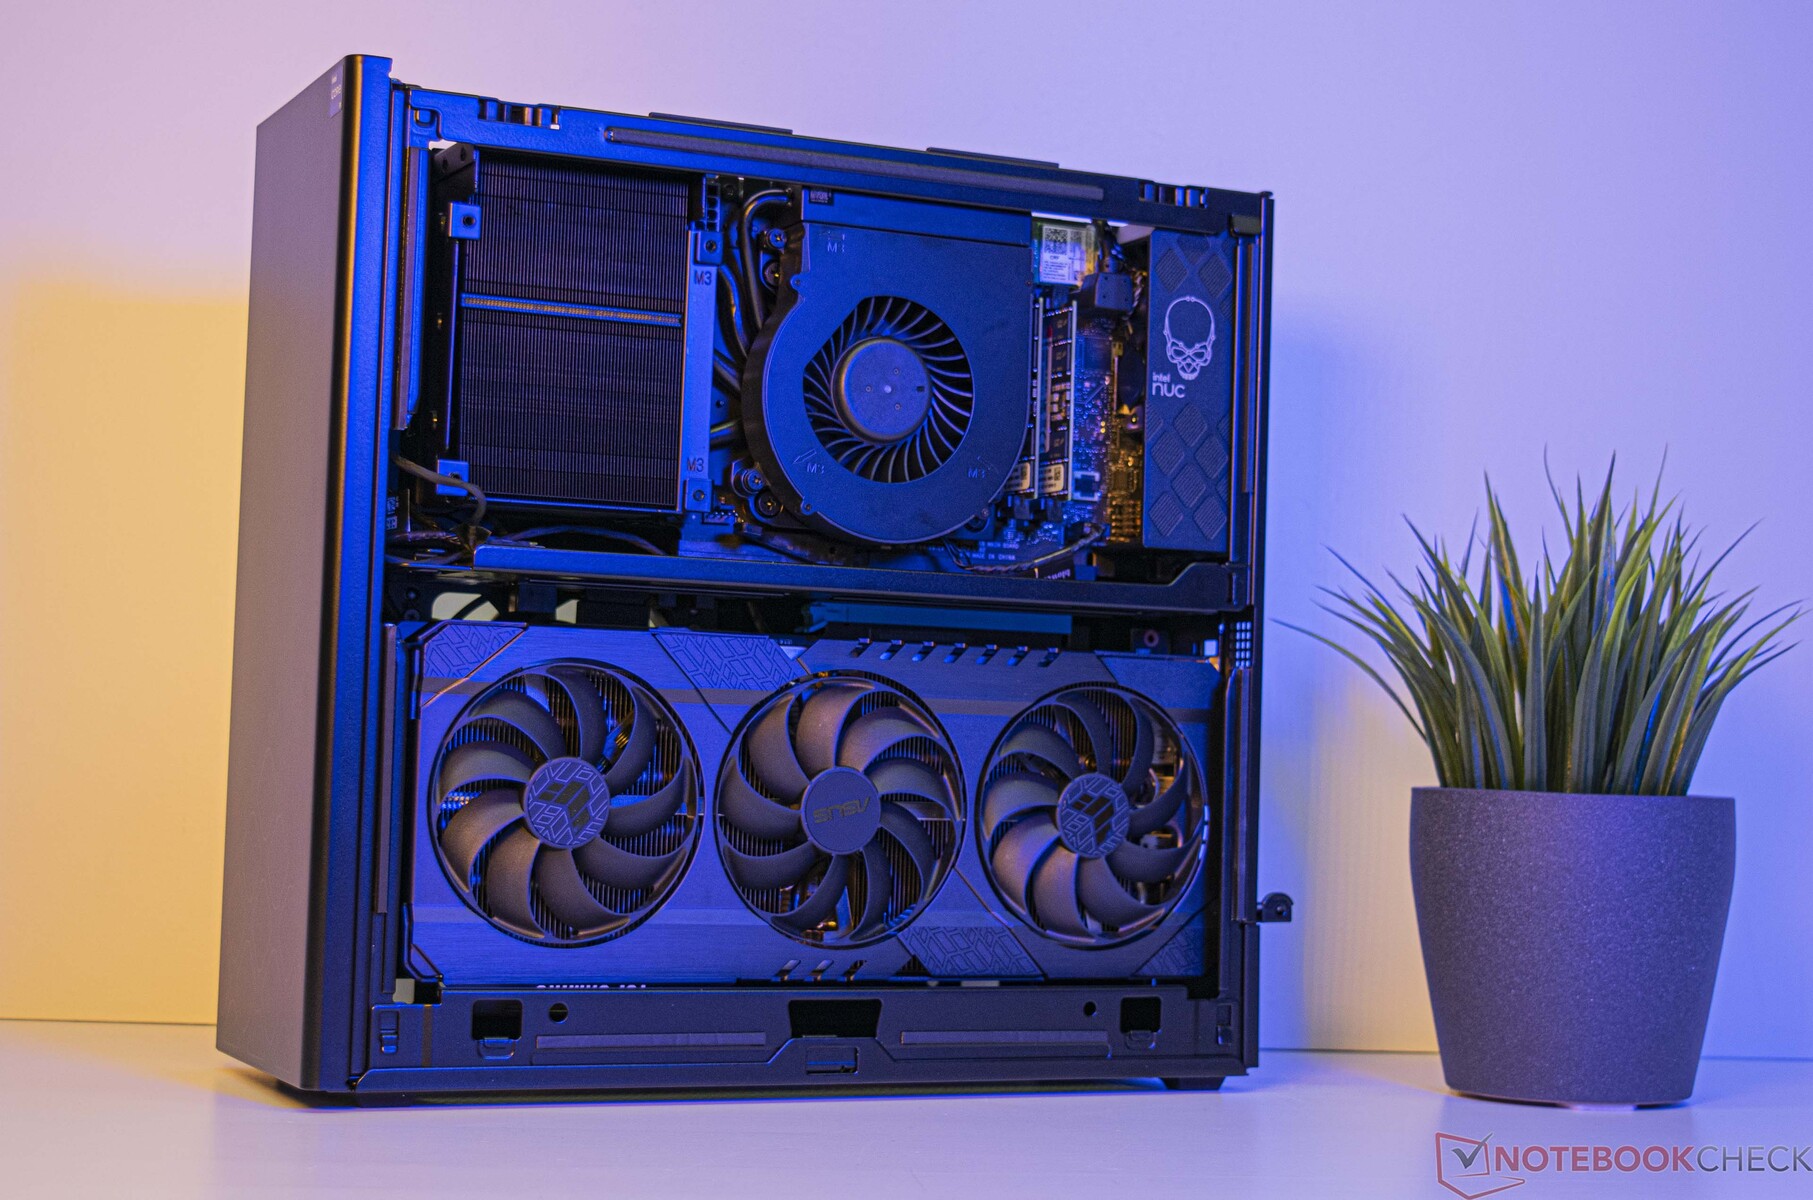
Obudowa Intel NUC 13 Extreme Raptor Canyon jest podzielona na dwie komory. W górnej części mieści się Compute Element, w skład którego wchodzi procesor, pamięć RAM i dysk SSD oraz zasilacz, natomiast dół zarezerwowany jest w całości dla dedykowanej karty graficznej. Choć koncepcja ta sprawdza się w praktyce, to PL2 z np Intel Core i9-13900K można utrzymać tylko przez krótki czas. Pod obciążeniem procesor nieuchronnie osiąga 100 °C. To jednak oznacza, że procesor rzadko osiąga tę temperaturę tylko przez bardzo krótki czas. Przeciętnie temperatura CPU stabilizuje się między 60 a 90 °C, w zależności od scenariusza.
Jeśli chodzi o emisję hałasu, to w naszej konfiguracji system pozostaje stosunkowo cichy. Wprawdzie przy 39 dB(A) szum systemu jest zauważalny pod pełnym obciążeniem, ale wciąż daleko mu do uciążliwości. Podczas grania mierzymy podobną wartość nieco powyżej 38 dB(A). Zainstalowana karta graficzna jest więc głównym źródłem hałasu pod obciążeniem. Możliwe jest stworzenie bardzo cichego systemu za pomocą cichszego modelu.
Hałas
| luz |
| 32.1 / 32.1 / 32.1 dB |
| obciążenie |
| 33.4 / 39 dB |
 | ||
30 dB cichy 40 dB(A) słyszalny 50 dB(A) irytujący |
||
min: | ||
Zużycie energii

Konwersją prądu zmiennego zajmuje się 750-watowy zasilacz SFX. Ponieważ podczas gry zmierzyliśmy maksymalny pobór mocy na poziomie 499 W, użytkownicy nie będą musieli się martwić nawet wtedy, gdy system będzie pod pełnym obciążeniem. Podczas naszych testów zaobserwowaliśmy również 544-watowe szczyty, które nie doprowadziły do żadnych problemów. Karta graficzna pobierająca 350 W zużywa lwią część energii podczas gry. Odradzamy stosowanie GPU z jeszcze wyższym TGP. Nowy kabel 21VHPWR i tak może dostarczyć tylko do 300 watów - przynajmniej według legendy na wtyczce. W sumie mamy do dyspozycji trzy kable 6+2-PCIe.
| Intel NUC13 Raptor Canyon i9-13900K, GeForce RTX 3080 Ti | Minisforum Neptune Series HX90G R9 5900HX, Radeon RX 6600M | Minisforum NUCX i7 i7-11800H, GeForce RTX 3070 Laptop GPU | Przeciętny NVIDIA GeForce RTX 3080 Ti | Średnia w klasie Desktop | |
|---|---|---|---|---|---|
| Power Consumption | 51% | 36% | 0% | 40% | |
| Idle Minimum * (Watt) | 39 | 17.8 54% | 28.2 28% | 39 ? -0% | 17.9 ? 54% |
| Idle Average * (Watt) | 42 | 17.9 57% | 29.9 29% | 42 ? -0% | 37.2 ? 11% |
| Idle Maximum * (Watt) | 52 | 18.1 65% | 36.2 30% | 52 ? -0% | 41.3 ? 21% |
| Load Average * (Watt) | 228 | 82.1 64% | 83.2 64% | 228 ? -0% | 96.7 ? 58% |
| Load Maximum * (Watt) | 308 | 262 15% | 215.7 30% | 308 ? -0% | 141.6 ? 54% |
| Witcher 3 ultra * (Watt) | 167 | ||||
| Cyberpunk 2077 ultra external monitor * (Watt) | 177 |
* ... im mniej tym lepiej
| wyłączony / stan wstrzymania | |
| luz | |
| obciążenie |
|
Legenda:
min: | |
Consumption External Monitor
Za
Przeciw
Werdykt - wiele ulepszeń i znacznie większa wydajność
Intel NUC 13 Extreme Raptor Canyon pod wieloma względami spisuje się dobrze. Wraz z obecnymi modelami Raptor Lake producent nie tylko aktualizuje sprzęt, ale także remontuje obudowę. Jest ona teraz znacznie większa niż wcześniej. W efekcie nie uznajemy już tego systemu za mini PC, choć Intel może się z tym nie zgodzić. Przy objętości 14 litrów, Intel NUC 13 Extreme Raptor Canyon konkuruje z m.in Corsair-One-i300, która przy 12 litrach jest nieco bardziej kompaktowa.
Nasza konfiguracja systemu przychodzi z wystarczającą wydajnością dla wszystkich najnowszych tytułów w 2160p. Ze względu na barebone'owy charakter NUC 13 Raptor Canyon, urządzenie można dostosować do wymagań i preferencji użytkownika. Strona Intel Core i9-13900K sprawuje się wyjątkowo dobrze, czego się nie spodziewaliśmy. Co więcej, urządzenie pozostaje stosunkowo ciche nawet pod obciążeniem.
Intel NUC 13 Extreme Kit oparty jest na procesorze Intel Core i9-13900K i oferuje bardzo szybką wydajność. Sparowany z odpowiednim GPU może być świetnym systemem do gier lub wysokiej klasy stacją roboczą.
System, w skład którego wchodzi procesor, kosztuje obecnie 1550 USD. Dodanie pamięci RAM, dysku SSD i GPU może szybko wywindować cenę na oszałamiające wyżyny. Konkurenci, tacy jak wspomniany wcześniej Corsair One i300, kosztują nawet około 5000 USD.
Nowa obudowa wygląda elegancko i sprawia wrażenie solidnej dzięki zastosowaniu materiałów najwyższej jakości. Dodatkowo posiada funkcjonalny design, który korzystnie wpływa na możliwości chłodzenia. Niezależnie od tego, istnieją wady, takie jak trudno dostępne dyski SSD i brak czytnika kart. Zeszłoroczny model nadal zawierał ten ostatni, oferując szybkie prędkości UHS-II.
Cena i dostępność
W Chinach Intel NUC 13 Extreme Raptor Canyon pojawi się w 4 kwartale 2022 roku. Globalna premiera nastąpi w pierwszym kwartale 2023 roku. W zależności od konfiguracji, NUC 13 Extreme kosztuje od 1179 USD do 1549 USD bez GPU, pamięci RAM i dysku SSD - to normalne dla NUC-ów. Compute Element jest też dostępny osobno bez obudowy PC w cenie od 760 do 1100 USD.
Firma Intel udostępniła nam na czas tej recenzji model Intel NUC 13 Extreme Raptor Canyon.

