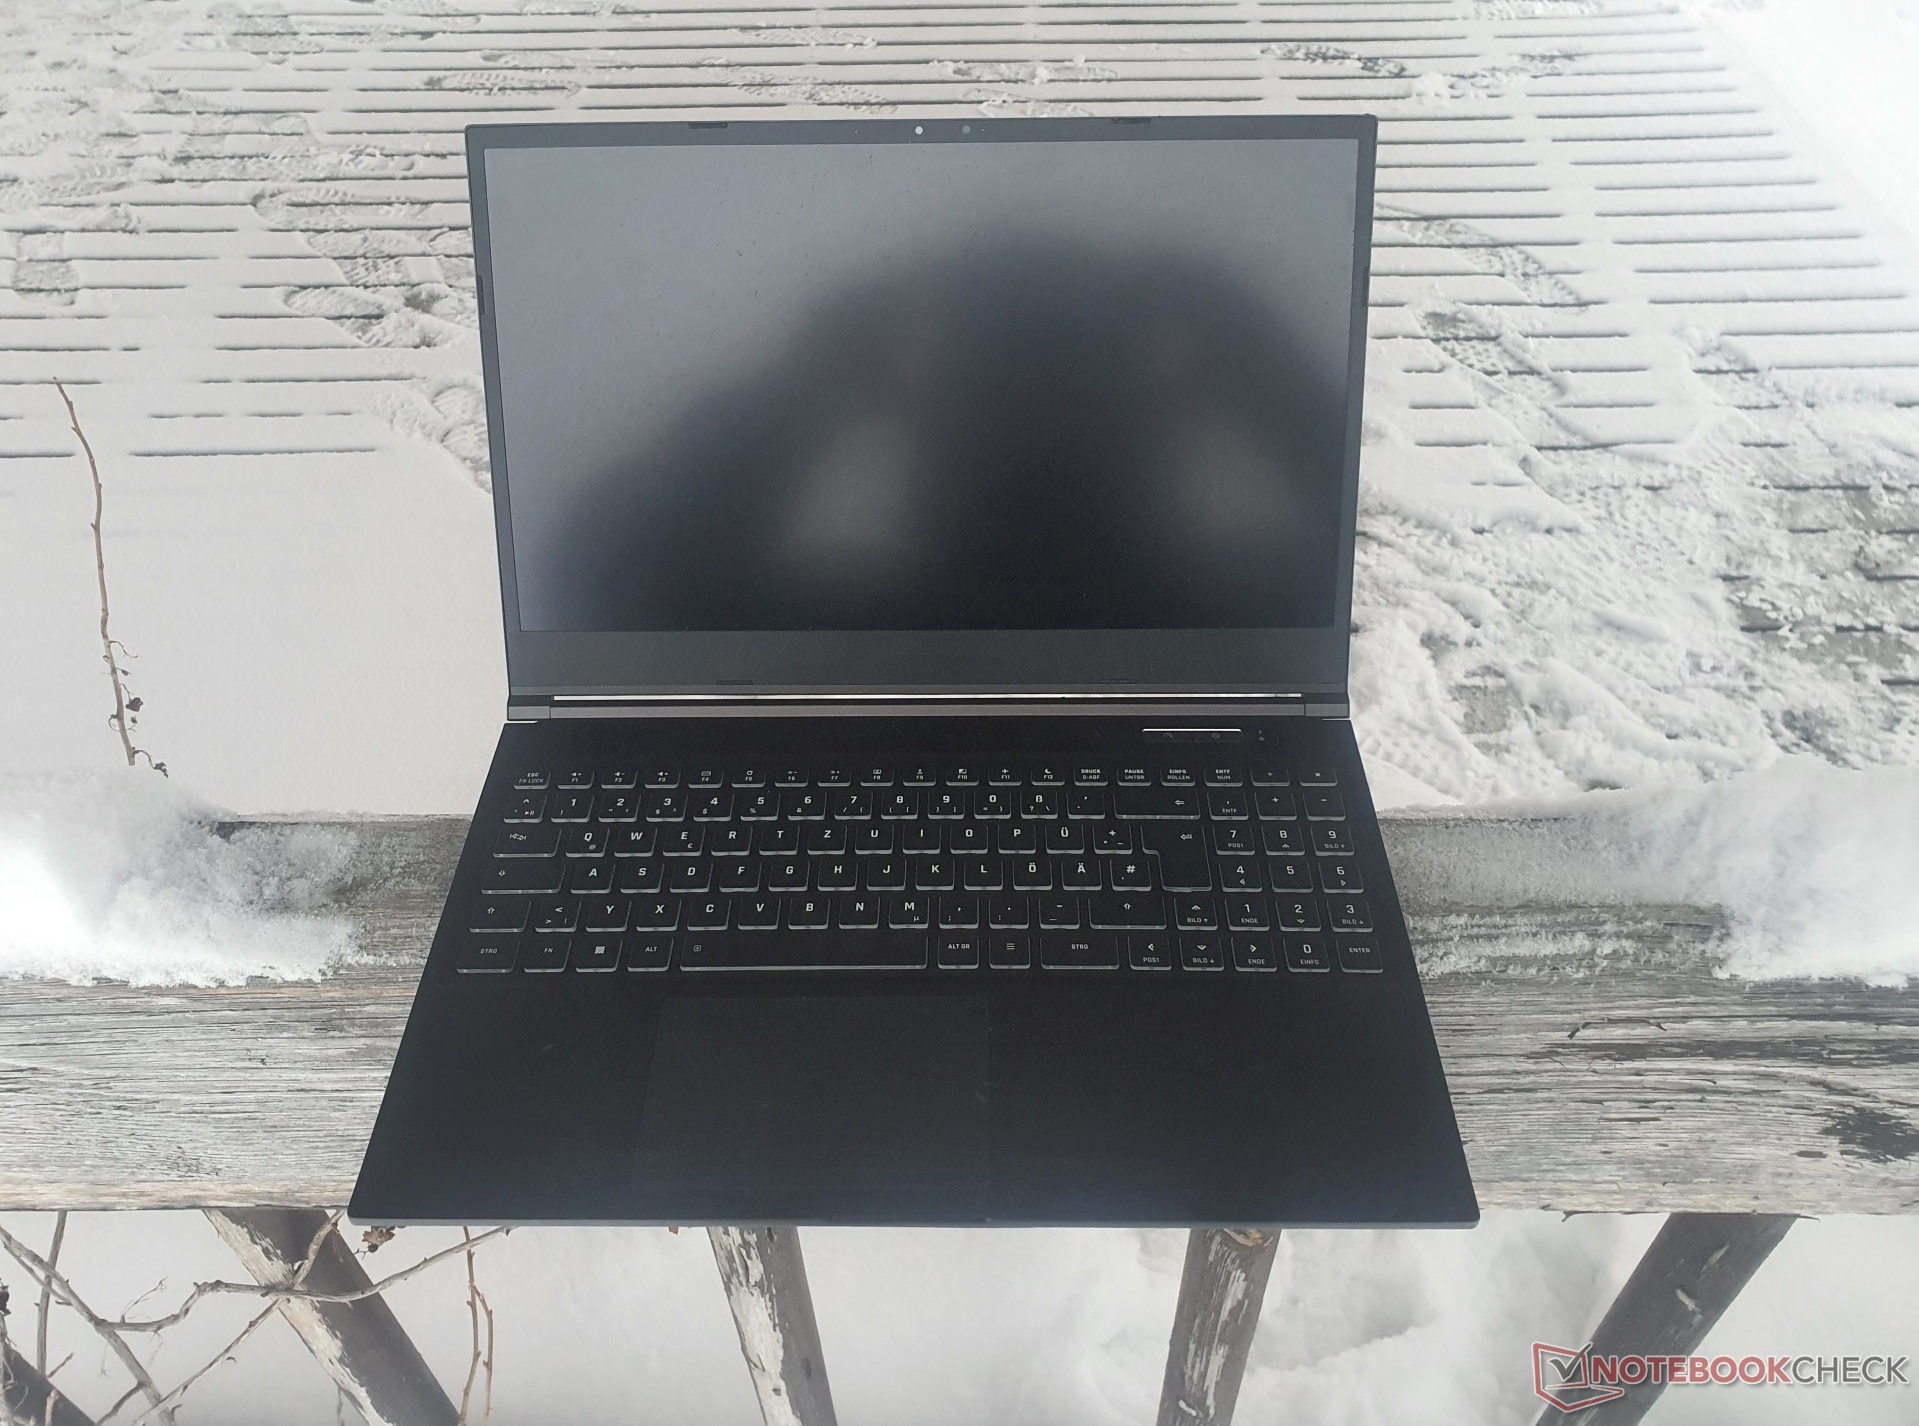
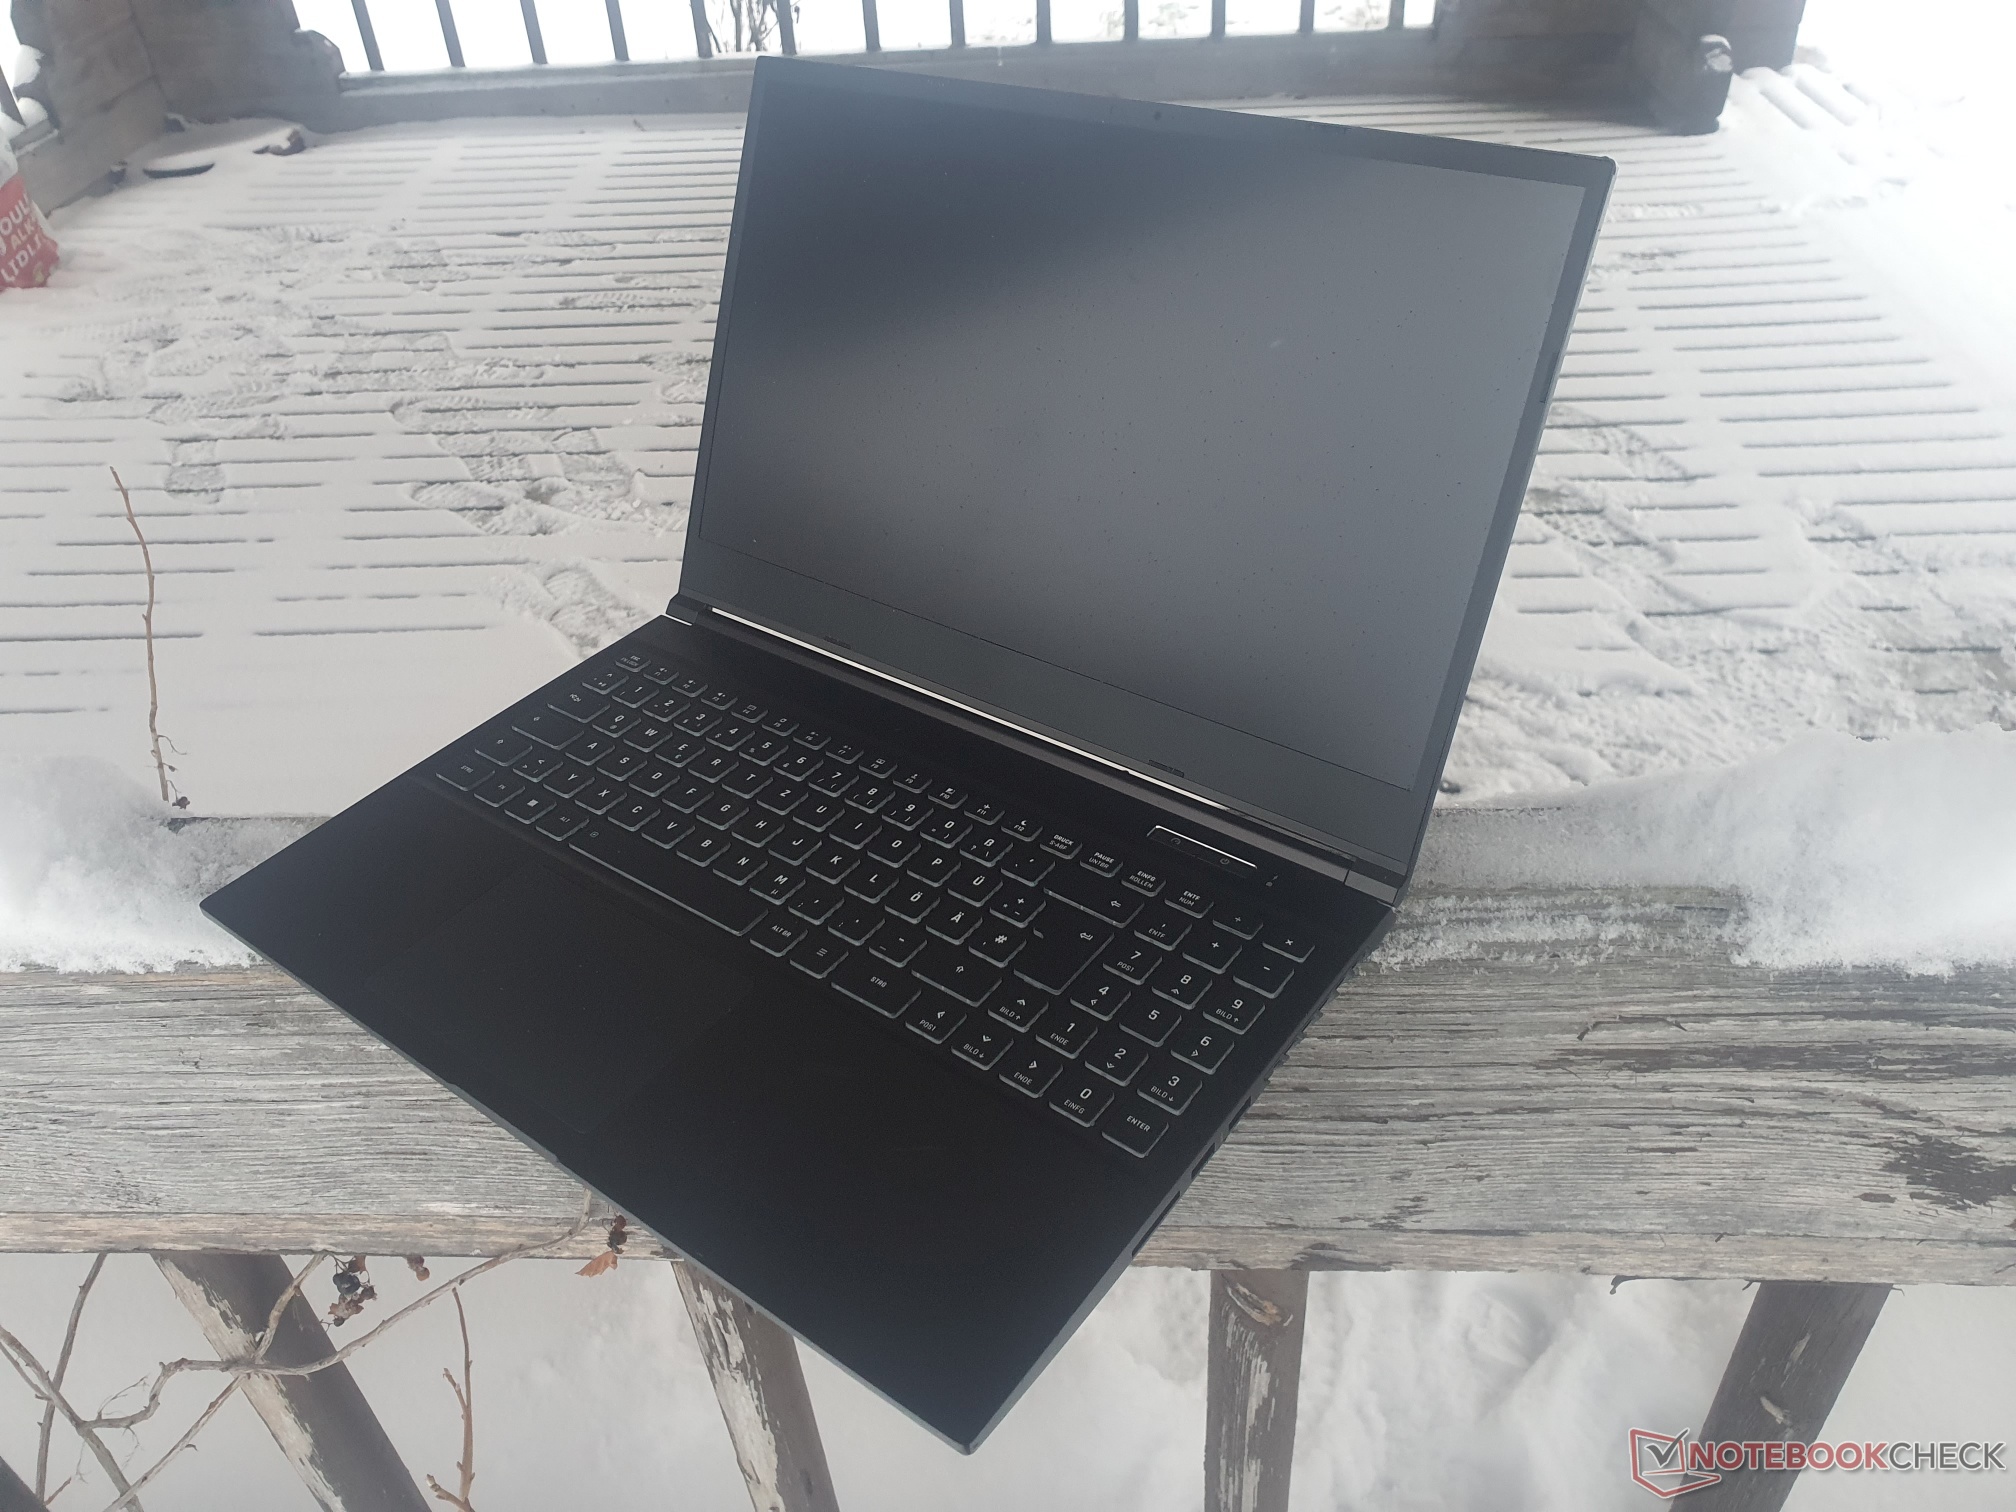
Schenker XMG Core 15 M22 w recenzji: Gamingowy średniak z przyłączem wodnym
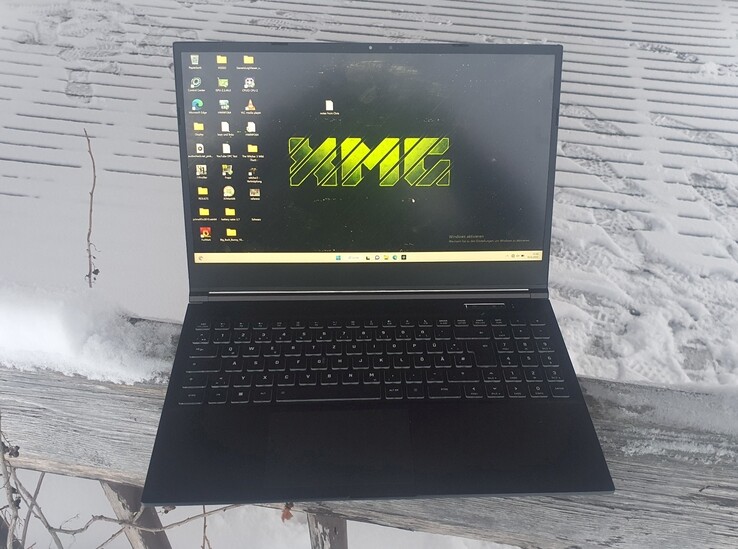
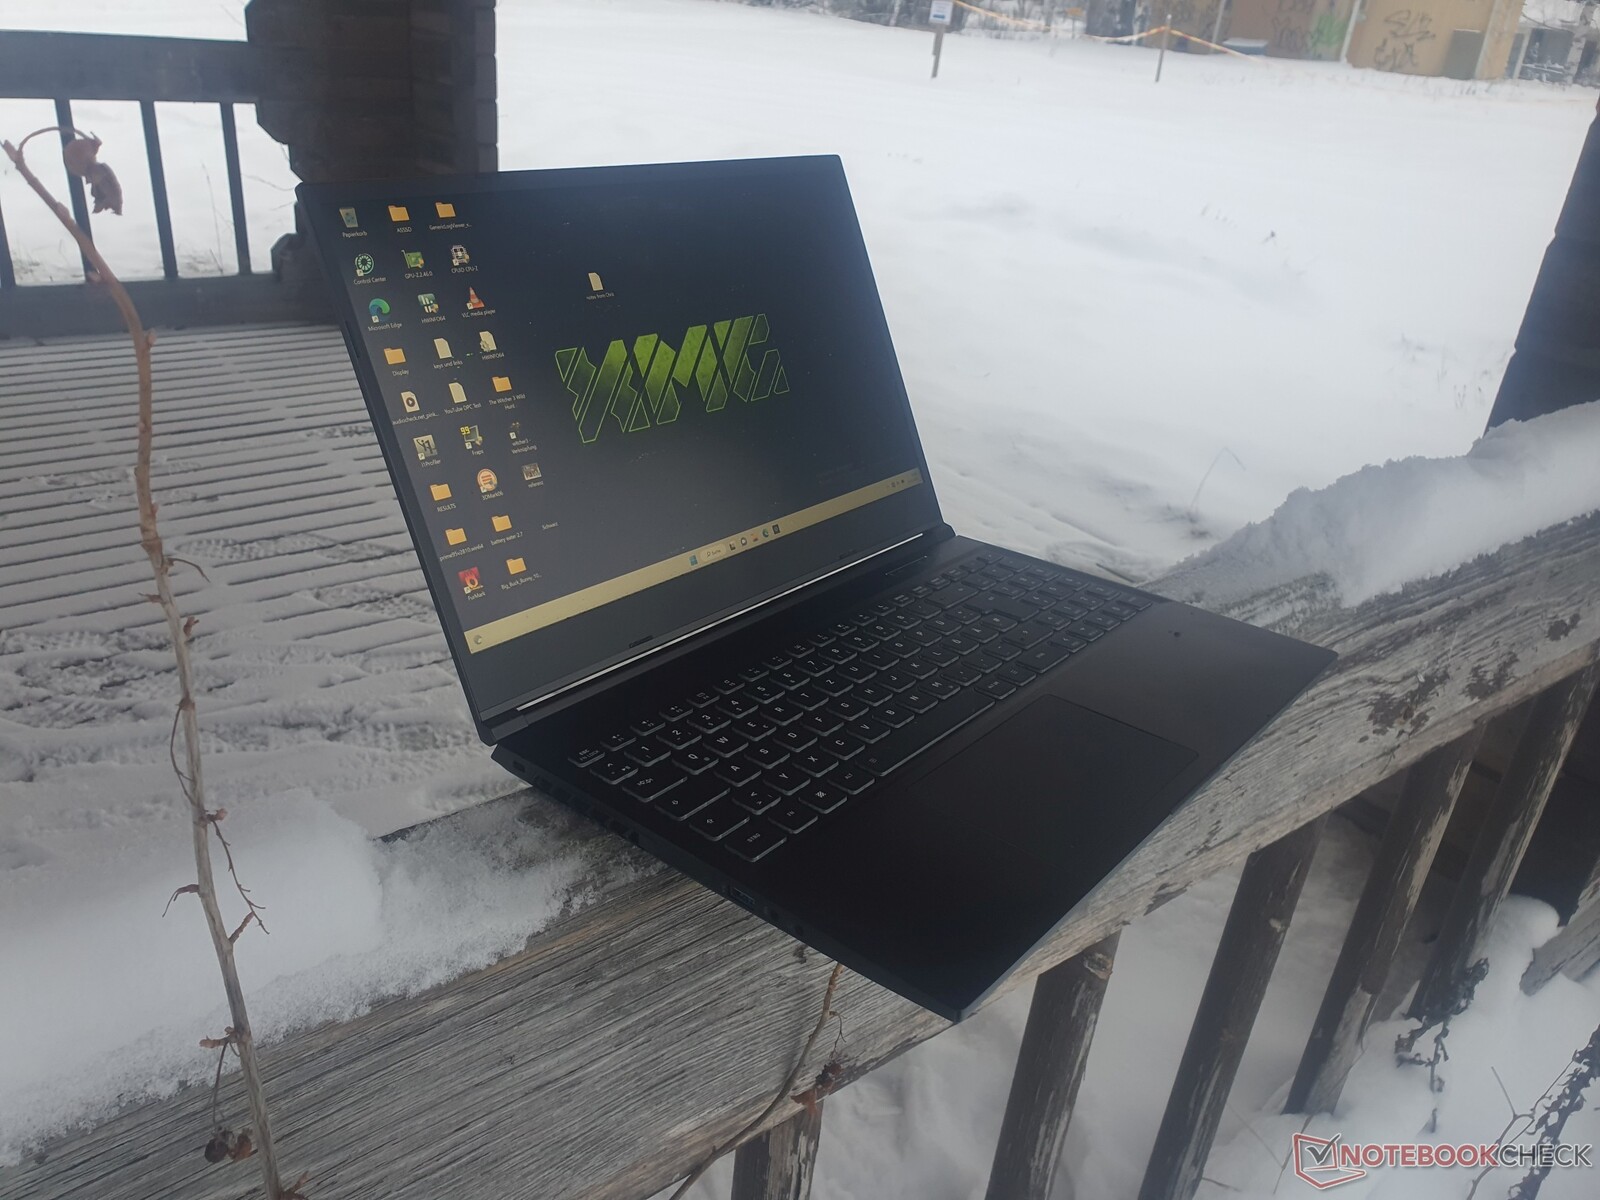
Schenker postawił sobie za cel dostarczenie mocnego laptopa gamingowego z wyższej średniej półki z modelem XMG Core 15 (M22). Tym samym oferuje on nie tylko maksymalne 140 W TGP z Nvidia GeForce RTX 3060 wraz z przełącznikiem MUX, ale także szybki procesor AMD Ryzen 7 6800H.
Otrzymujemy szybki panel WQHD o częstotliwości 165 Hz, a także wsparcie zewnętrznego chłodzenia wodnego, które skądinąd stosowane jest tylko w absolutnej klasie wyższej Schenkera, co widzieliśmy np. w XMG Neo 15, którego już szczegółowo testowaliśmy. Wszystko to dostępne jest za 1817 euro (~1935 dolarów). Core 15 plasuje się pomiędzy m.in Apex 15 i Neo 15.
W segmencie średnim jest sporo konkurencji, np. Asus'aTUF Gaming F15, Lenovo's Legion 5oraz Alienware m15. Interesujący dla naszego porównania jest również autorski Fusion 15 firmy XMG.
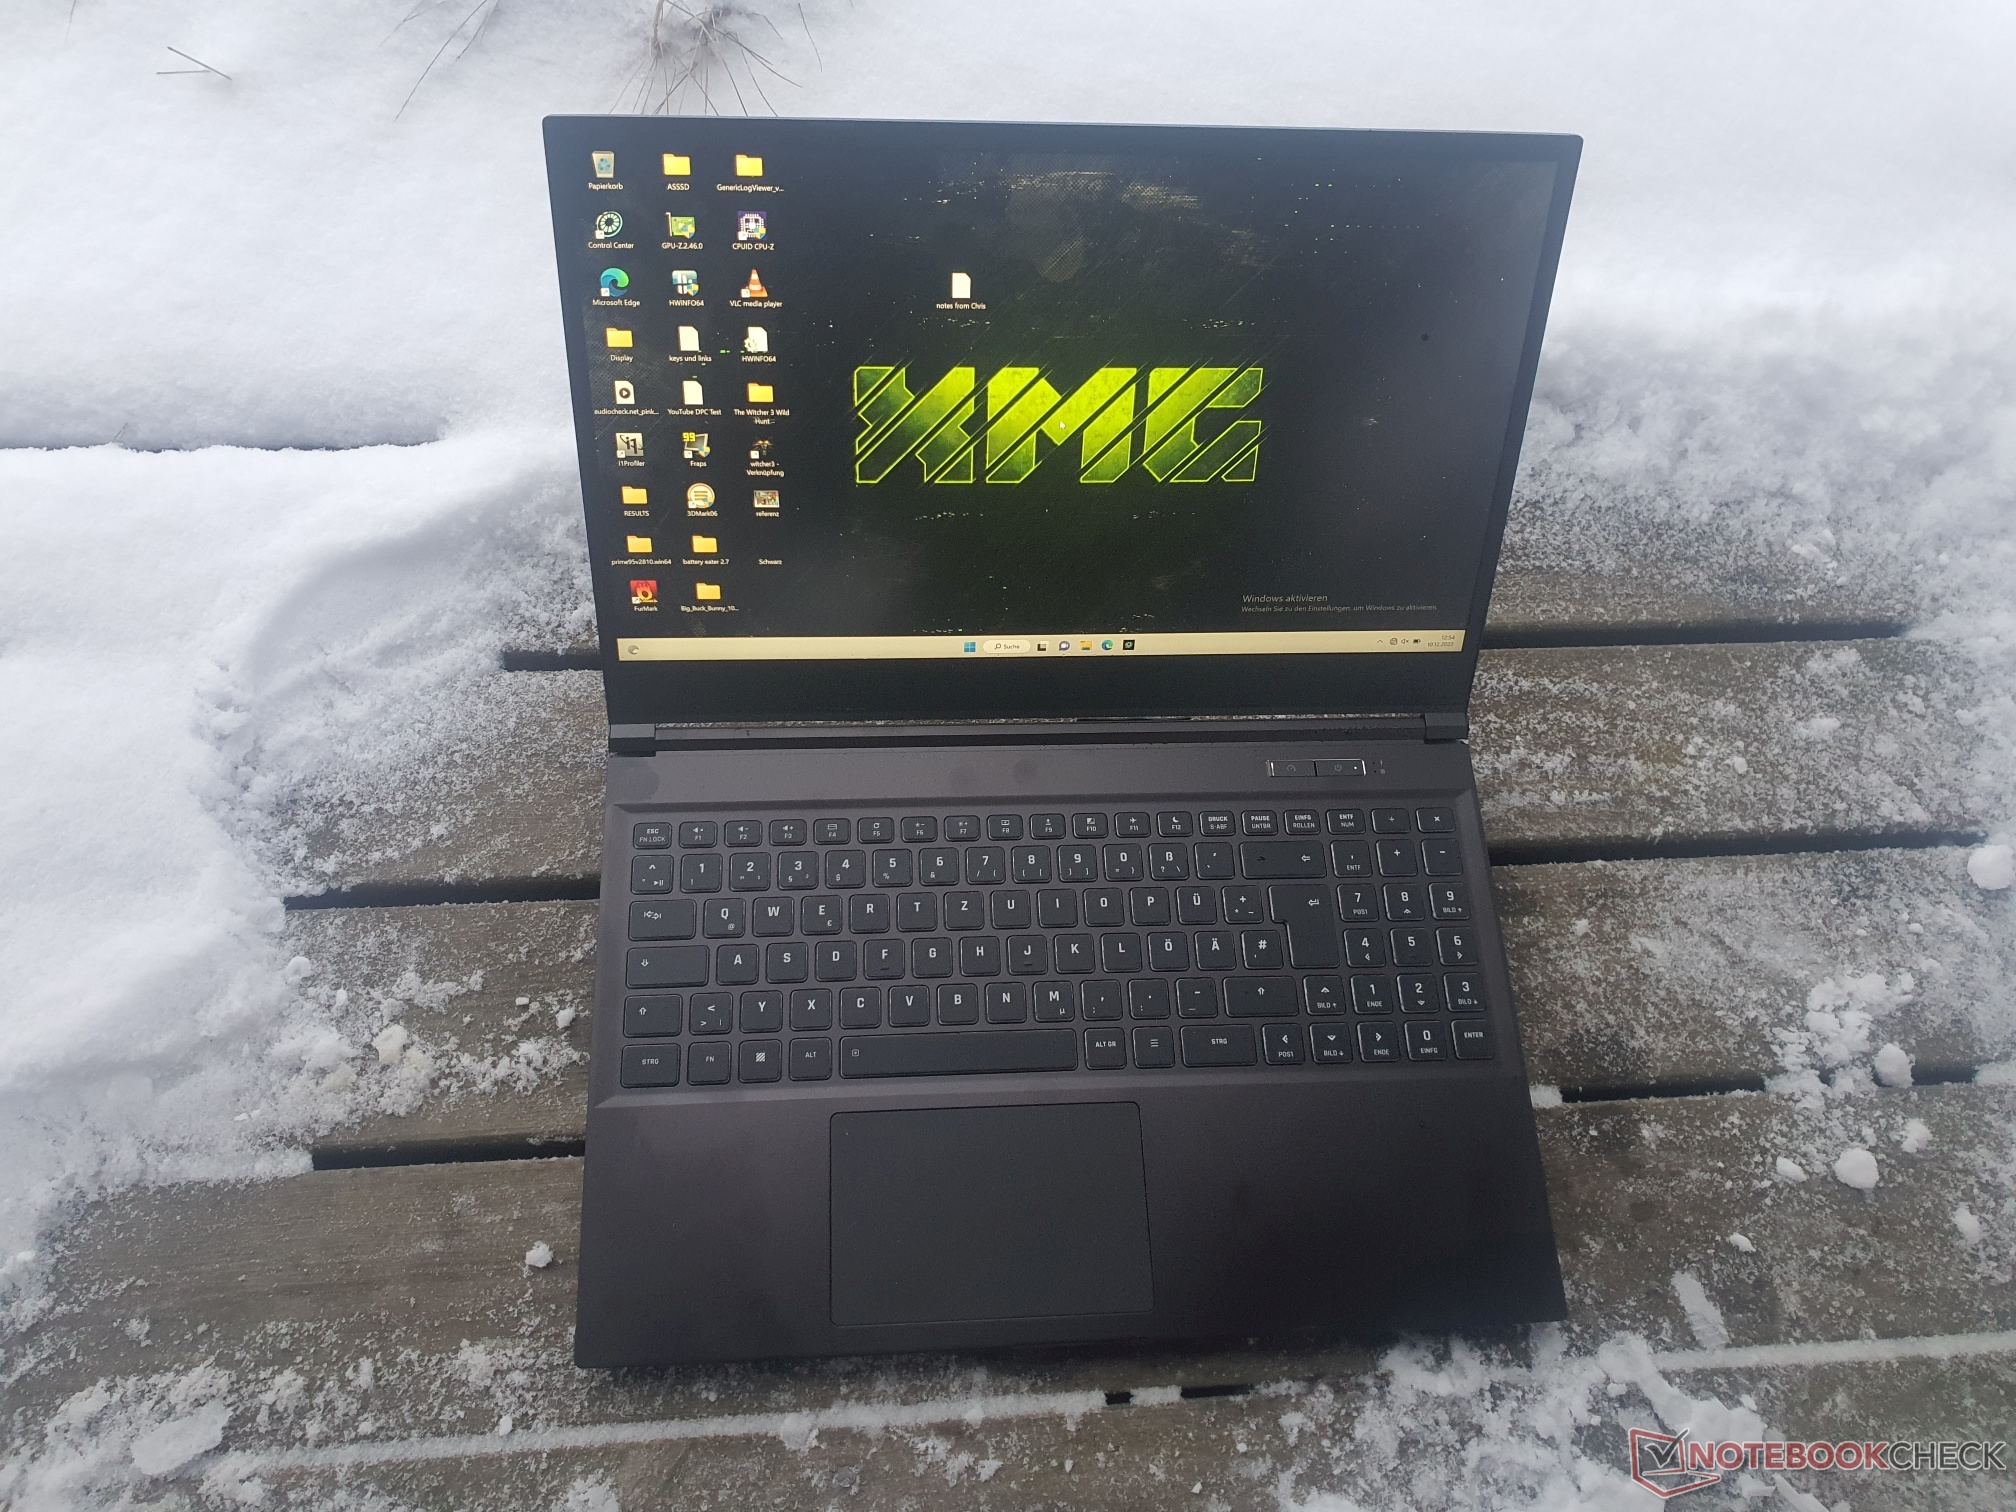
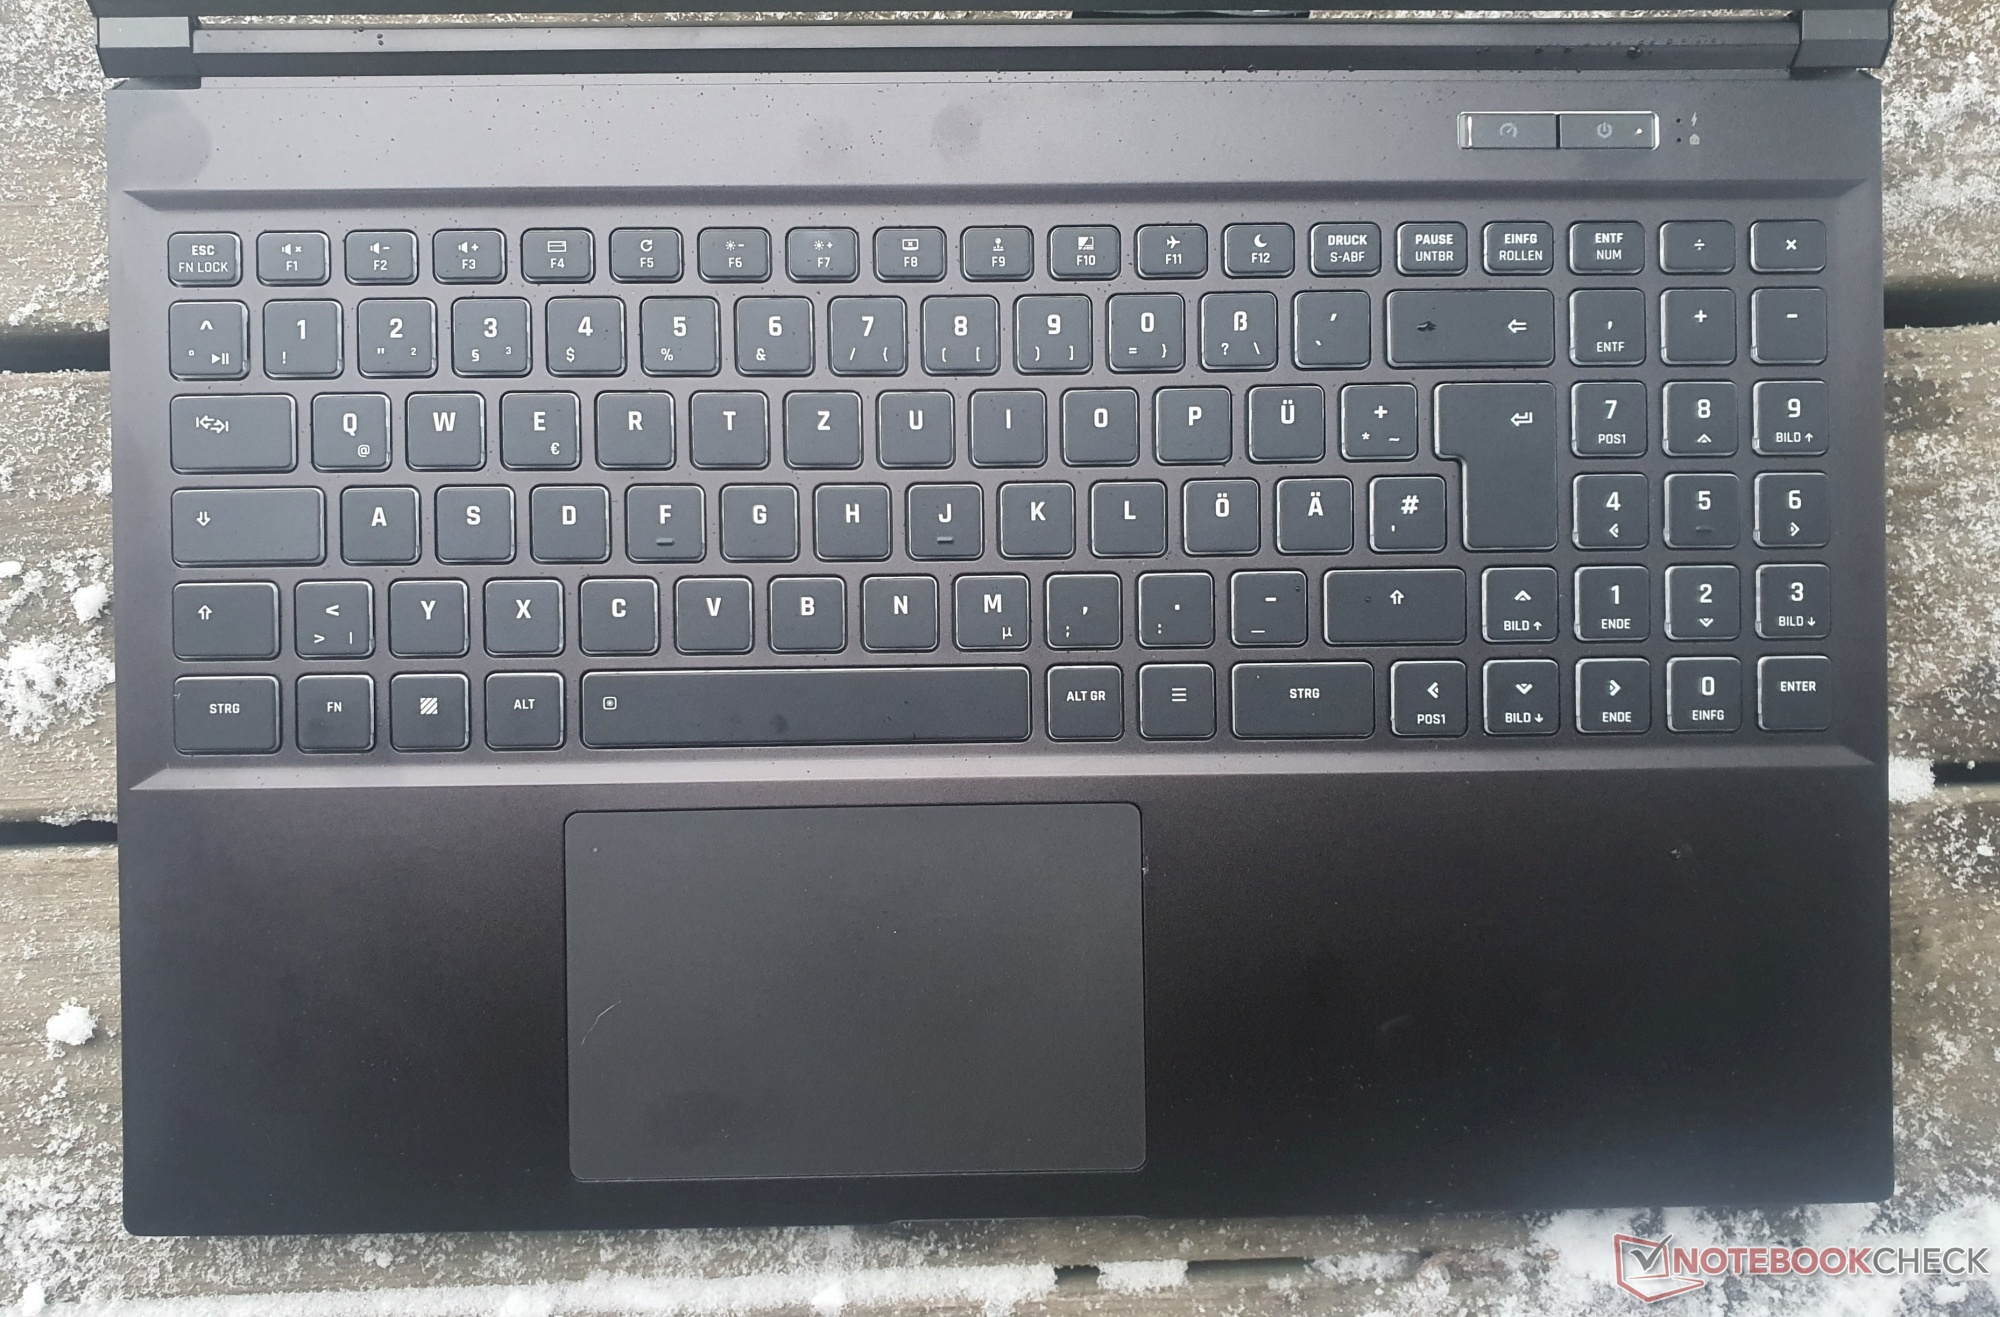
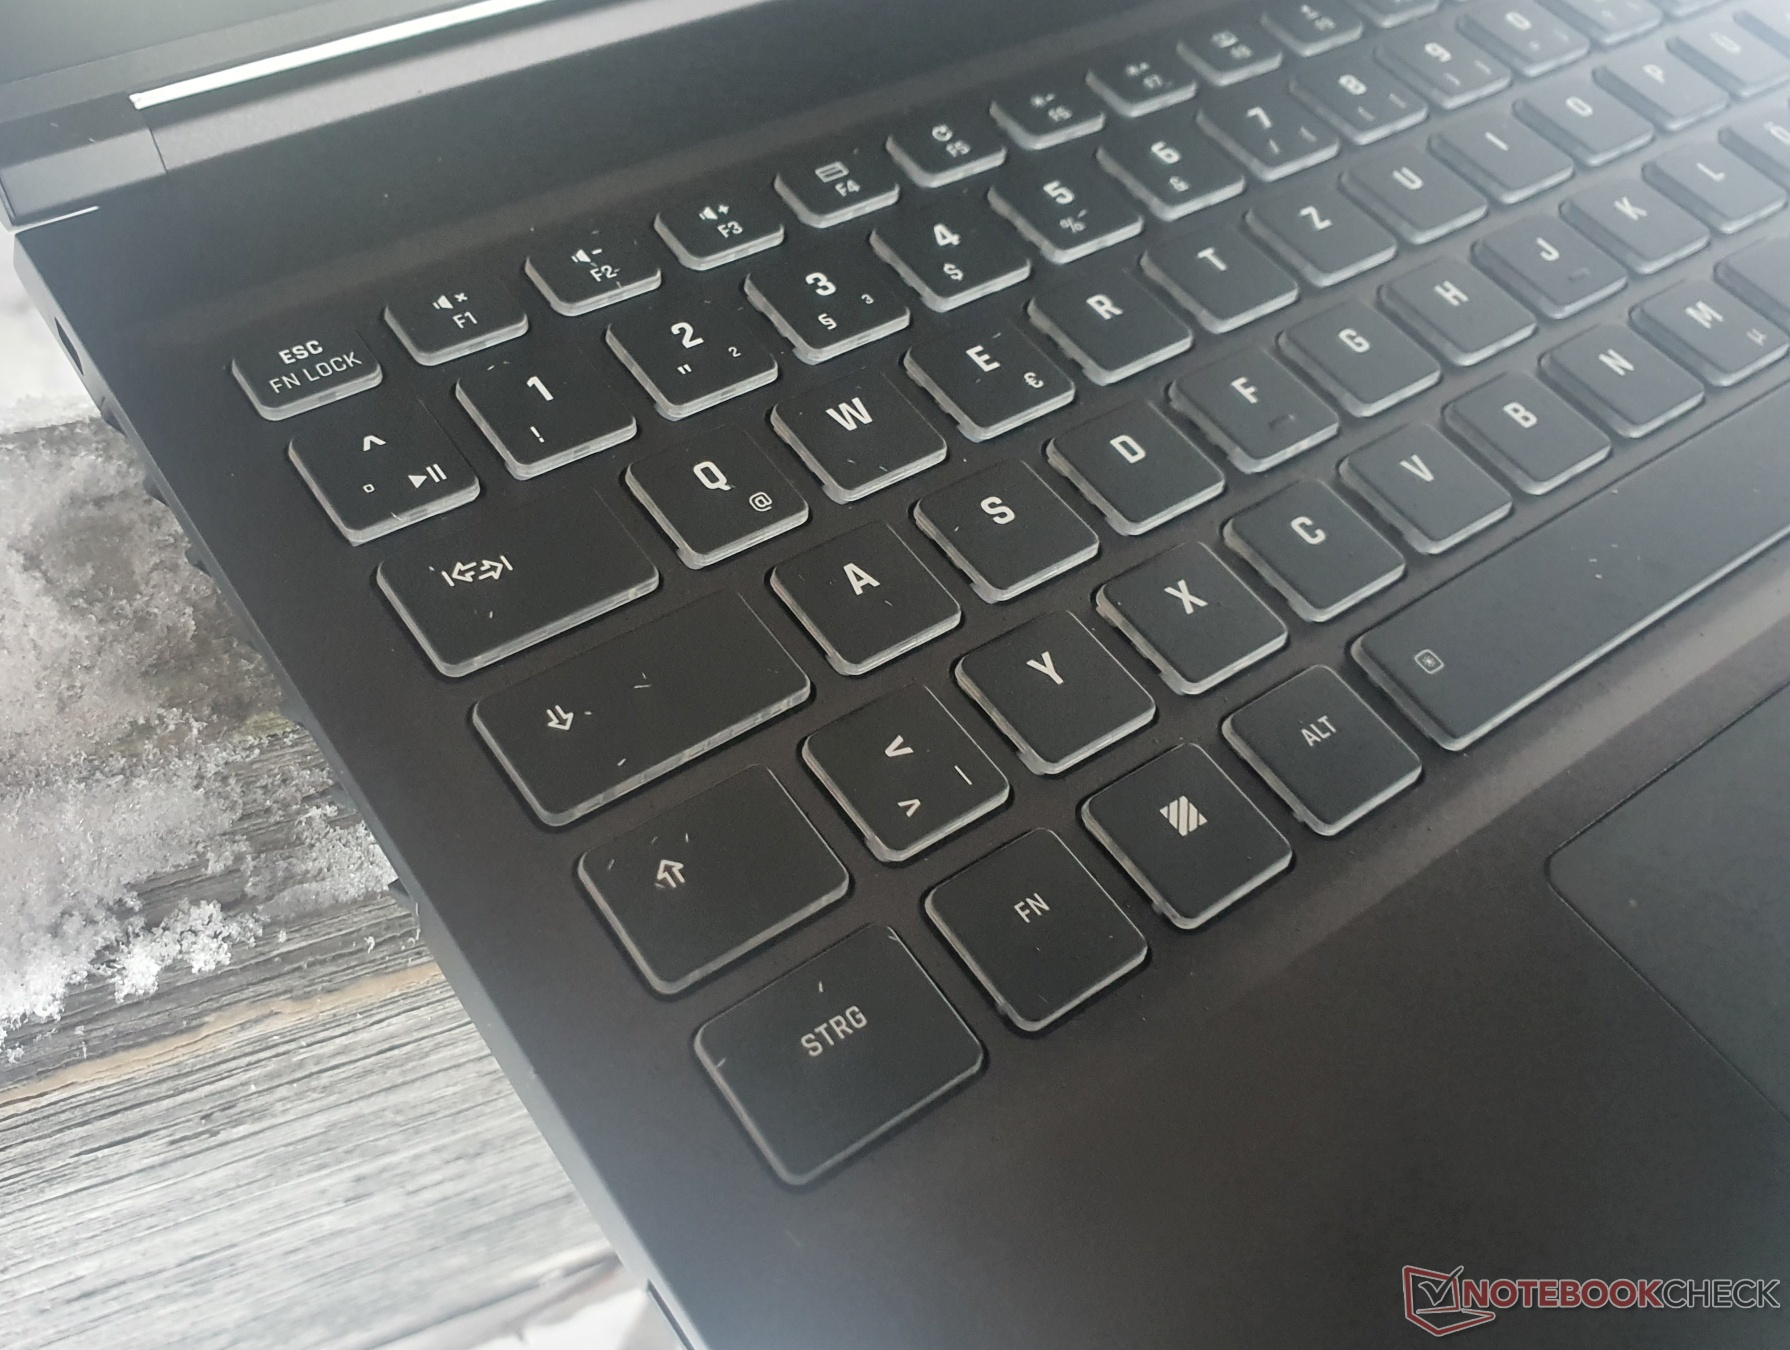
Obudowa Core 15 w zasadzie pozostała bez zmian, więc o szczegółach i urządzeniach wejścia możecie przeczytać w naszej Recenzja poprzedniego modelu.
Więcej recenzji Schenkera:
XMG Neo 15(Ryzen 9 6900HX, RTX 3070 Ti, klawiatura mech., XMG Oasis)
XMG Neo 17 (Ryzen 9 6900HX, RTX 3080 Ti, klawiatura mech., XMG Oasis)
XMG Fusion 15(Core i7-11800H, RTX 3070, klawiatura mech.)
XMG Pro 15(Core i7-12700H, RTX 3080 Ti)
XMG Pro 17(Core i9-12900H, RTX 3080 Ti)
XMG Apex 15 Max(Ryzen 9 5900Xprocesor do komputerów stacjonarnych, RTX 3070)
Potencjalni konkurenci w porównaniu
Ocena | Data | Model | Waga | Wysokość | Rozmiar | Rezolucja | Cena |
|---|---|---|---|---|---|---|---|
| 87.9 % v7 (old) | 01/2023 | Schenker XMG Core 15 (M22) R7 6800H, GeForce RTX 3060 Laptop GPU | 2.1 kg | 23 mm | 15.60" | 2560x1440 | |
| 87.5 % v7 (old) | 11/2022 | Lenovo Legion 5 15IAH7H 82RB i7-12700H, GeForce RTX 3060 Laptop GPU | 2.4 kg | 19.99 mm | 15.60" | 1920x1080 | |
| 87.4 % v7 (old) | Schenker XMG Fusion 15 (Mid 22) i7-11800H, GeForce RTX 3070 Laptop GPU | 1.9 kg | 21.65 mm | 15.60" | 2560x1440 | ||
| 87.2 % v7 (old) | Asus TUF Gaming F15 FX507ZM i7-12700H, GeForce RTX 3060 Laptop GPU | 2.1 kg | 24.95 mm | 15.60" | 1920x1080 | ||
| 84.7 % v7 (old) | 08/2025 | Alienware m15 R5 Ryzen Edition R7 5800H, GeForce RTX 3060 Laptop GPU | 2.5 kg | 22.85 mm | 15.60" | 1920x1080 | |
| 84.9 % v7 (old) | Schenker XMG Core 15 Ampere R7 4800H, GeForce RTX 3060 Laptop GPU | 2 kg | 22.9 mm | 15.60" | 2560x1440 |

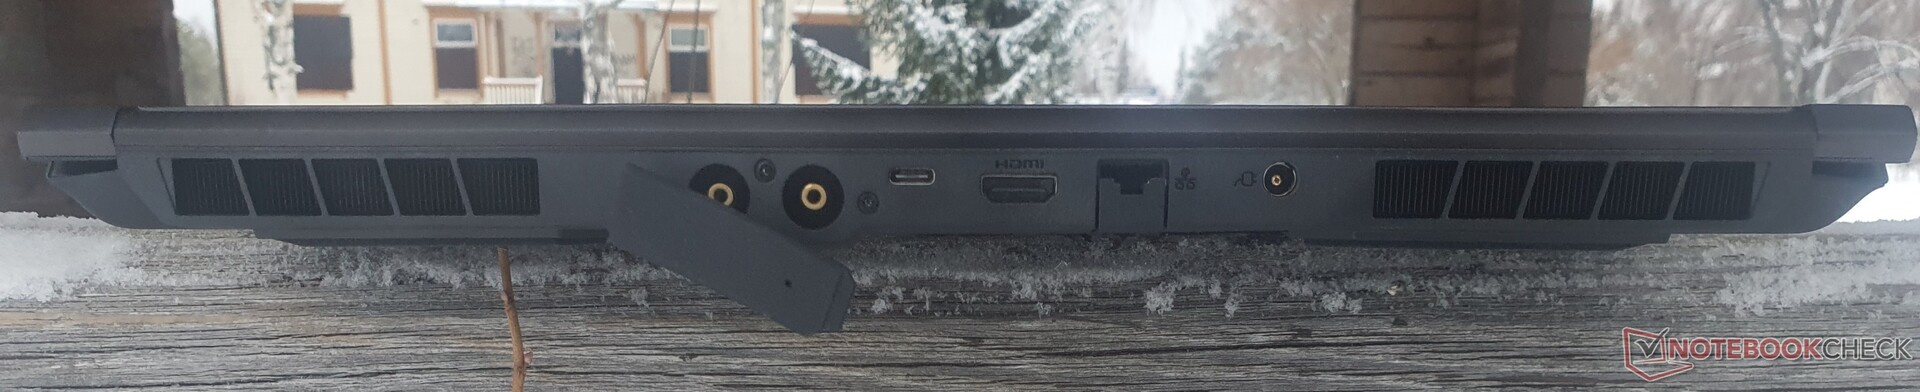
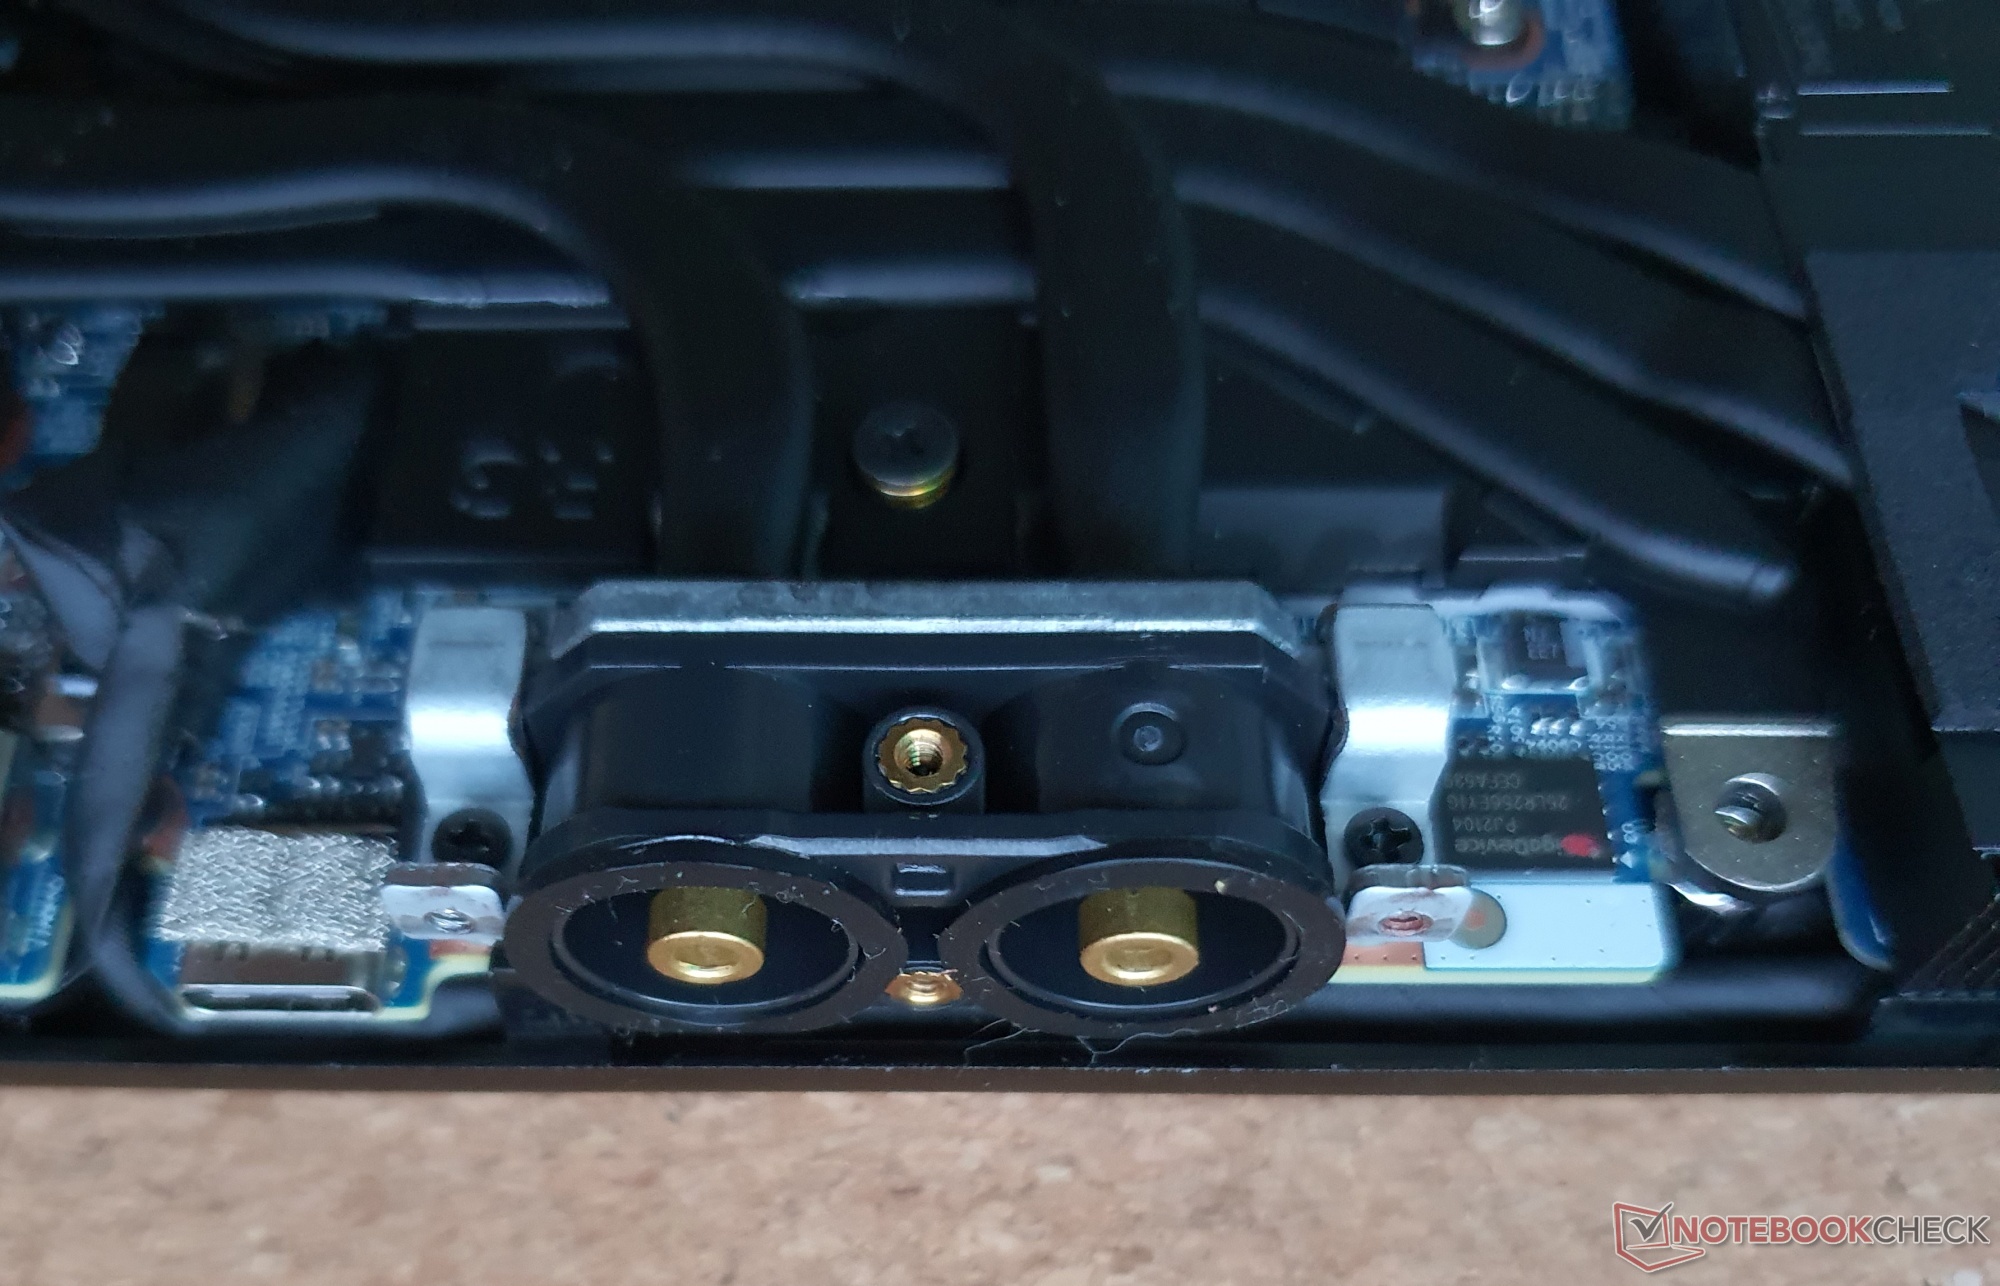
Cechy: port wodny, ale brak USB4 i USB-C-PD
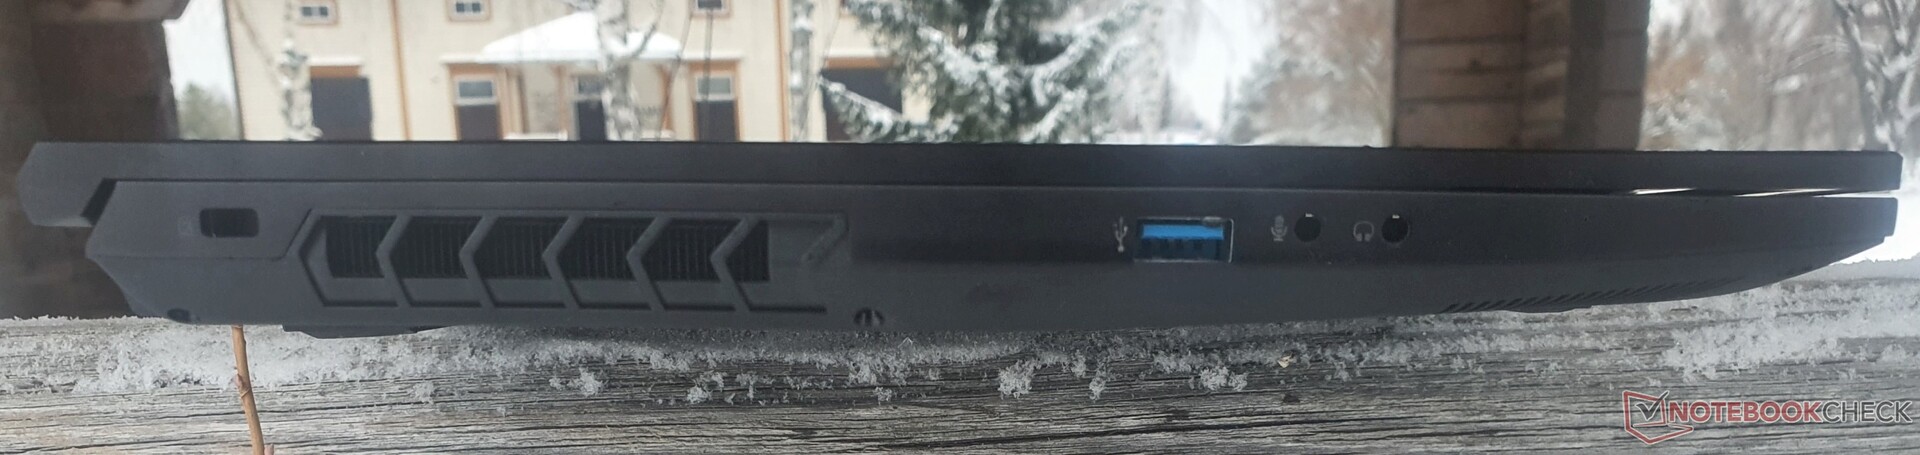
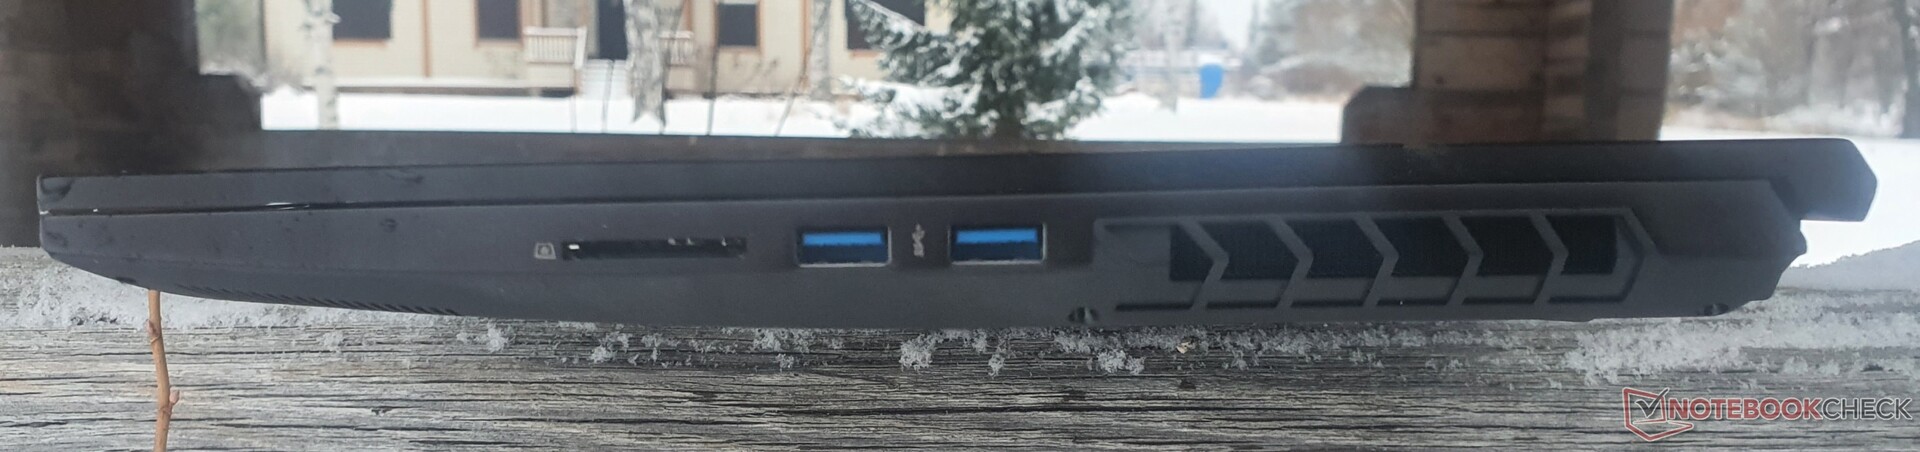
W porównaniu z poprzednikiem, port dla zewnętrznego chłodzenia wodnego XMG Oasis jest ciekawą i przydatną innowacją. Port USB 2.0 na lewym boku ustępuje miejsca szybszemu USB-A 3.2 Gen2, natomiast nadal brakuje nam USB4 i ładowania przez USB-C.
Czytnik kart SD
| SD Card Reader | |
| average JPG Copy Test (av. of 3 runs) | |
| Średnia w klasie Gaming (20.9 - 210, n=54, ostatnie 2 lata) | |
| Schenker XMG Core 15 Ampere (Toshiba Exceria Pro SDXC 64 GB UHS-II) | |
| Schenker XMG Apex 15 Max (AV PRO microSD 128 GB V60) | |
| Schenker XMG Fusion 15 (Mid 22) (AV PRO microSD 128 GB V60) | |
| Schenker XMG Core 15 (M22) (AV PRO microSD 128 GB V60) | |
| maximum AS SSD Seq Read Test (1GB) | |
| Średnia w klasie Gaming (25.5 - 261, n=51, ostatnie 2 lata) | |
| Schenker XMG Apex 15 Max (AV PRO microSD 128 GB V60) | |
| Schenker XMG Core 15 Ampere (Toshiba Exceria Pro SDXC 64 GB UHS-II) | |
| Schenker XMG Core 15 (M22) (AV PRO microSD 128 GB V60) | |
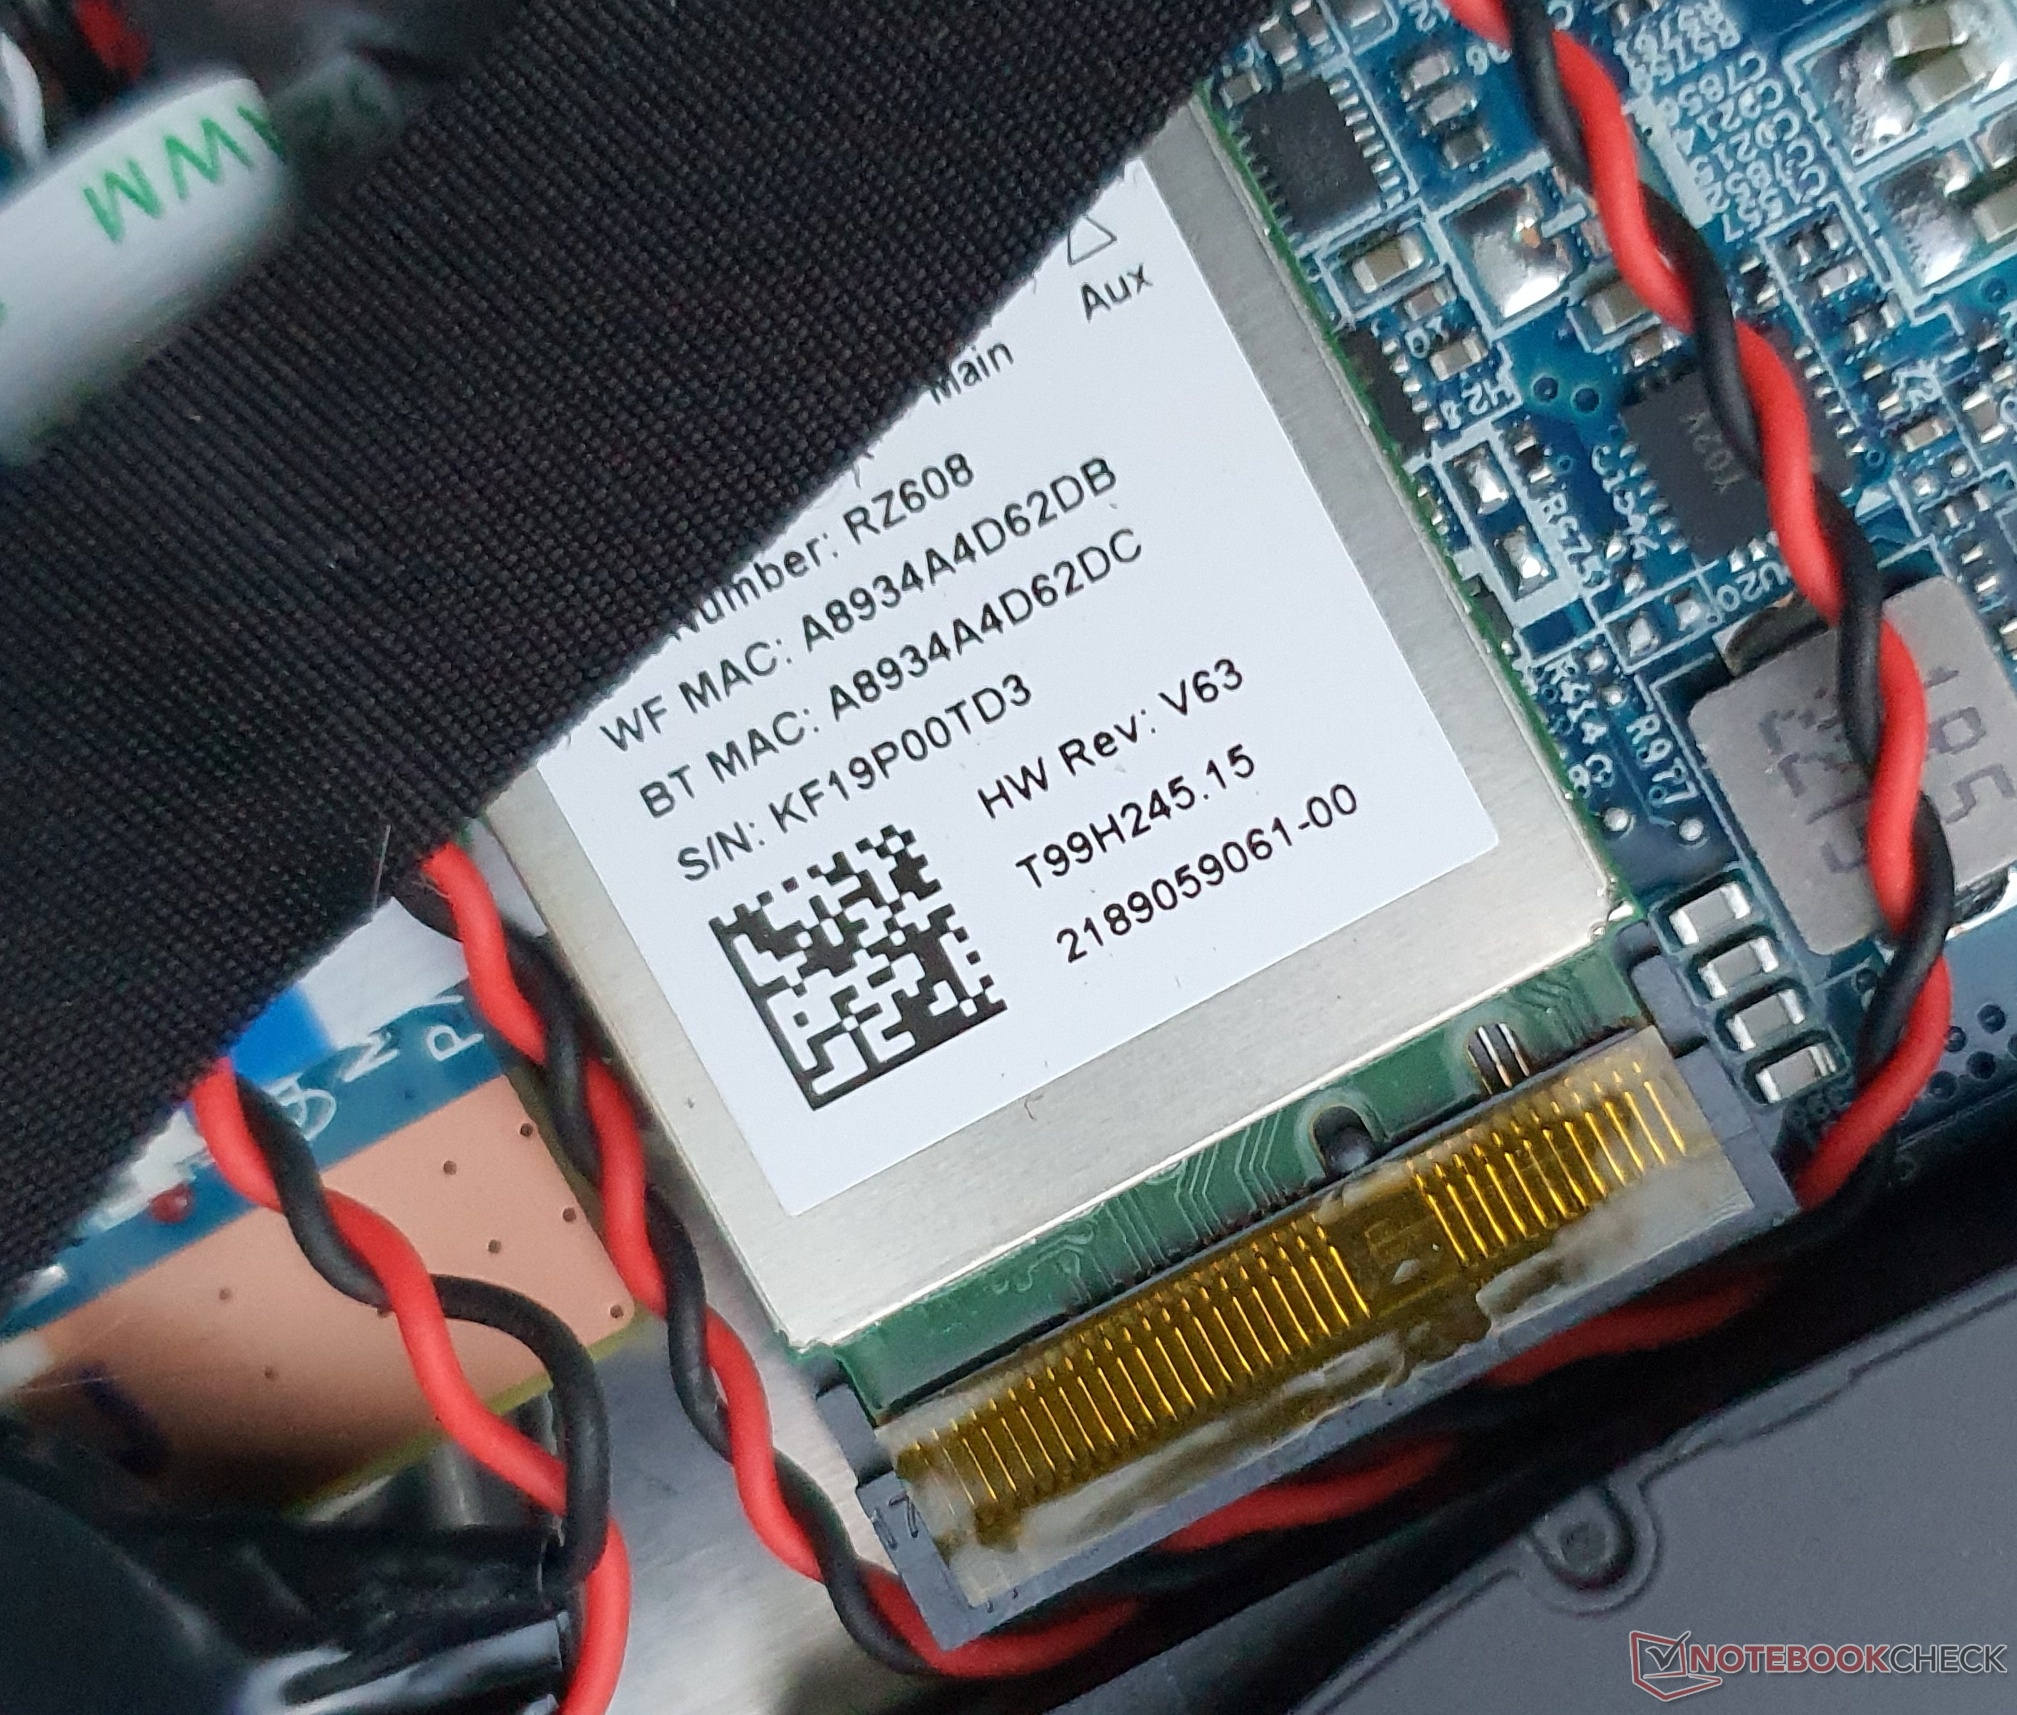
Komunikacja

| Networking | |
| iperf3 receive AXE11000 6GHz | |
| Lenovo Legion 5 15IAH7H 82RB | |
| Schenker XMG Core 15 (M22) | |
| Przeciętny MediaTek RZ608 (430 - 961, n=16) | |
| iperf3 receive AXE11000 | |
| Schenker XMG Fusion 15 (Mid 22) | |
| Lenovo Legion 5 15IAH7H 82RB | |
| Schenker XMG Core 15 (M22) | |
| Przeciętny MediaTek RZ608 (430 - 975, n=20) | |
| iperf3 transmit AXE11000 6GHz | |
| Lenovo Legion 5 15IAH7H 82RB | |
| Schenker XMG Core 15 (M22) | |
| Przeciętny MediaTek RZ608 (572 - 980, n=16) | |
| iperf3 transmit AXE11000 | |
| Lenovo Legion 5 15IAH7H 82RB | |
| Schenker XMG Fusion 15 (Mid 22) | |
| Schenker XMG Core 15 (M22) | |
| Przeciętny MediaTek RZ608 (572 - 979, n=20) | |
| iperf3 receive AX12 | |
| Asus TUF Gaming F15 FX507ZM | |
| Schenker XMG Core 15 Ampere | |
| Alienware m15 R5 Ryzen Edition | |
| Przeciętny MediaTek RZ608 (837 - 880, n=2) | |
| iperf3 transmit AX12 | |
| Schenker XMG Core 15 Ampere | |
| Alienware m15 R5 Ryzen Edition | |
| Asus TUF Gaming F15 FX507ZM | |
| Przeciętny MediaTek RZ608 (657 - 821, n=2) | |

 GeForce RTX 3060 Laptop GPU, R7 6800H, Samsung SSD 980 Pro 1TB MZ-V8P1T0BW")
 GeForce RTX 3060 Laptop GPU, R7 6800H, Samsung SSD 980 Pro 1TB MZ-V8P1T0BW")
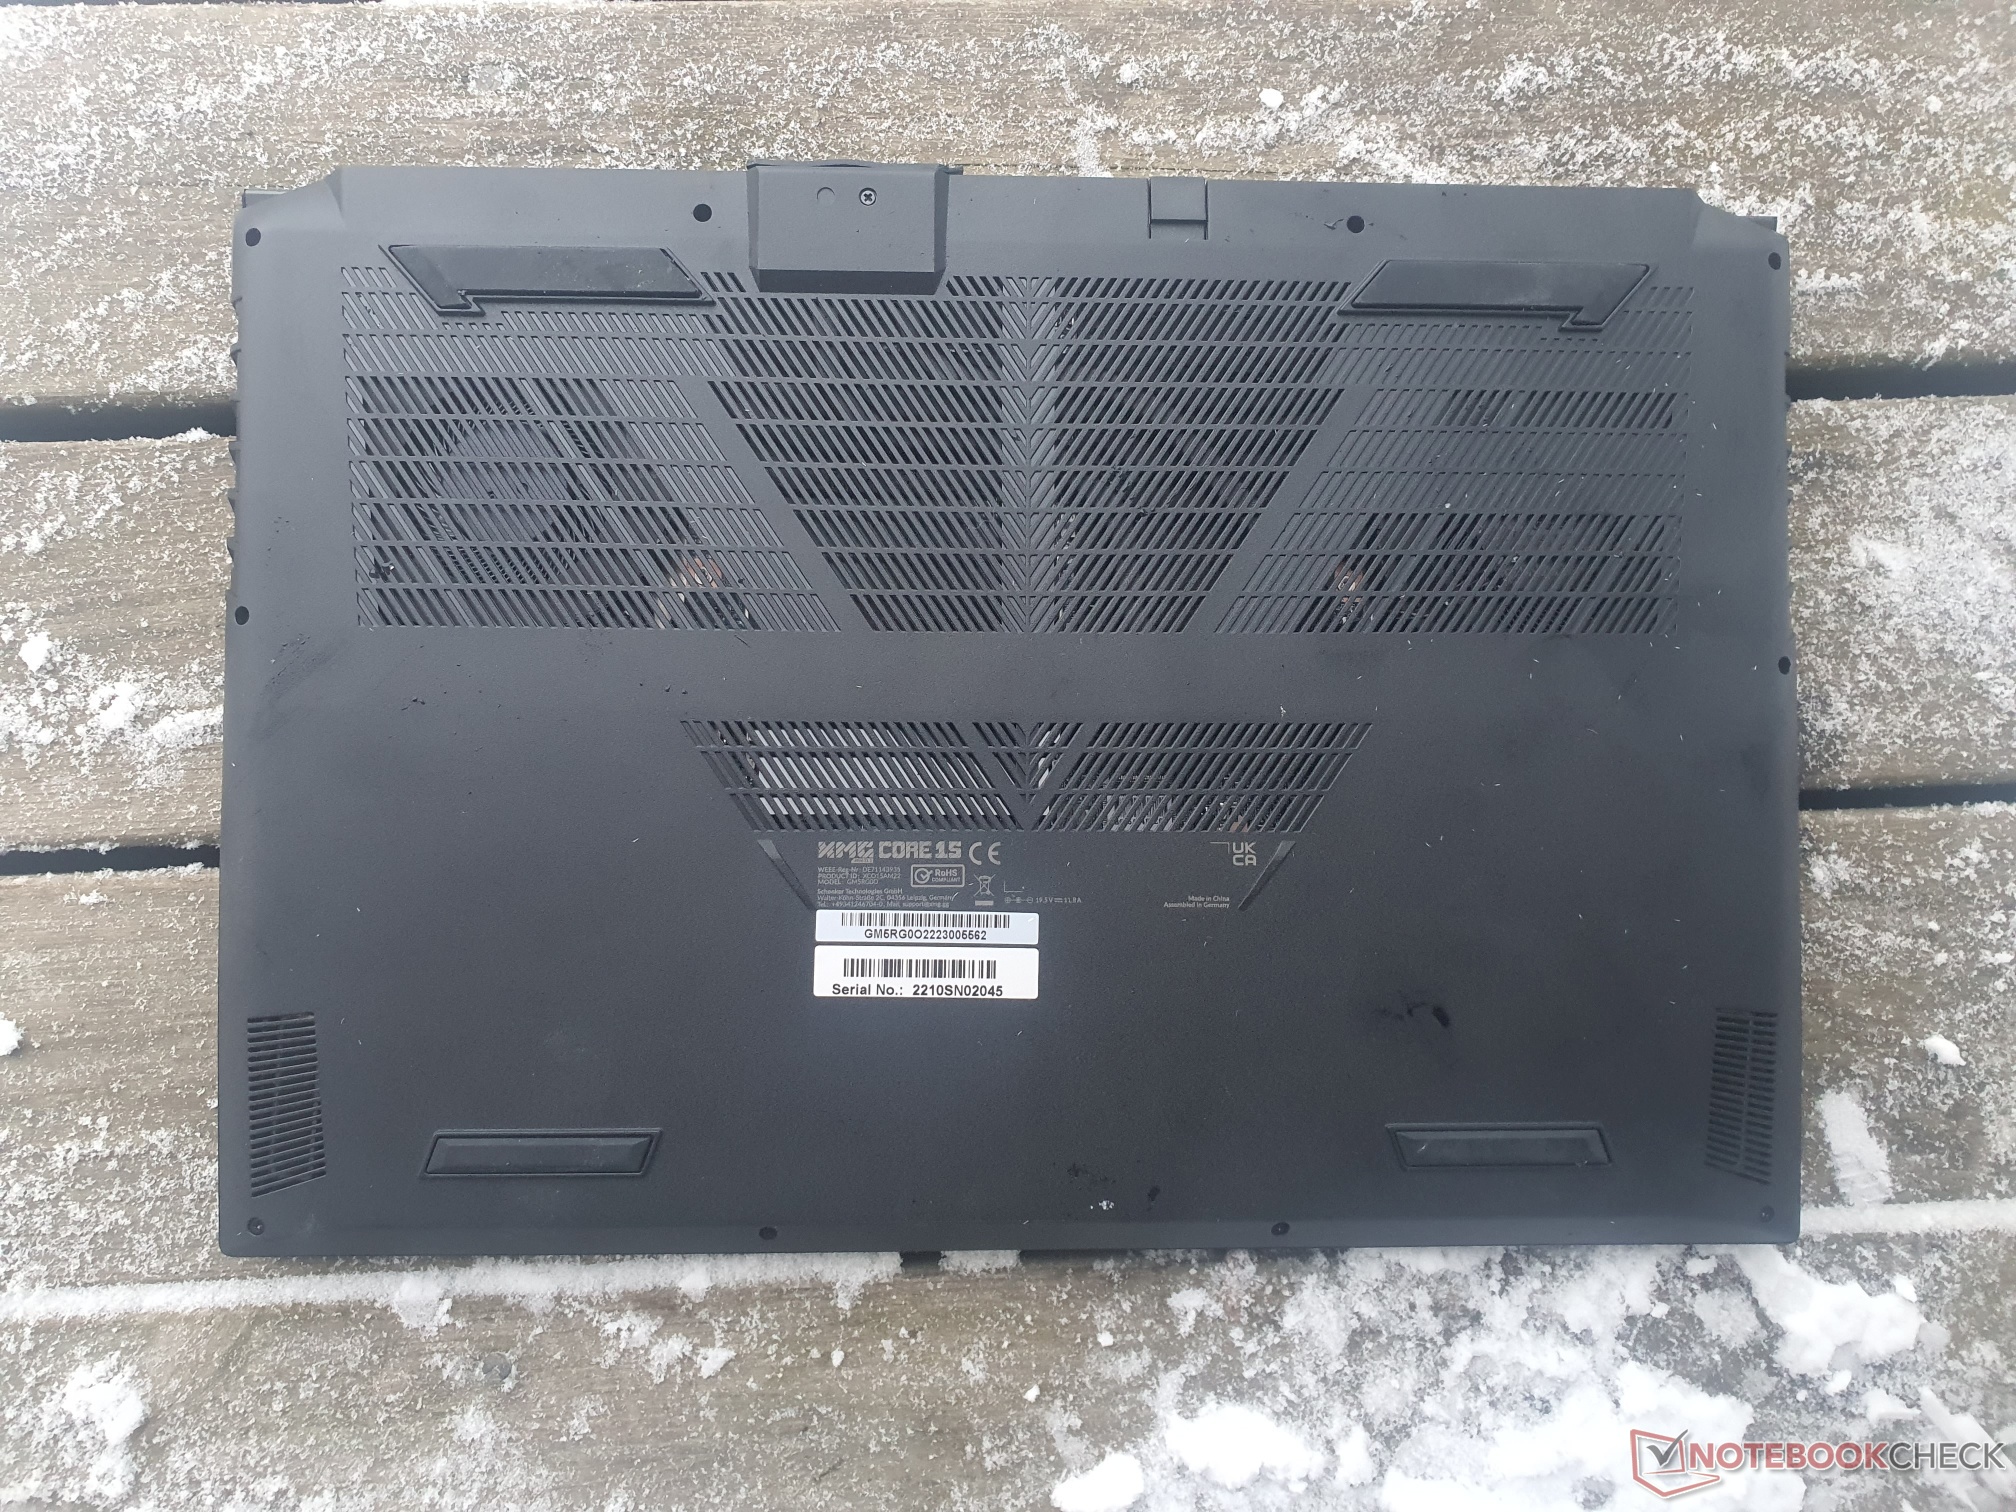
Konserwacja
Wyświetlacz: WQHD 165 Hz z szybkim czasem reakcji

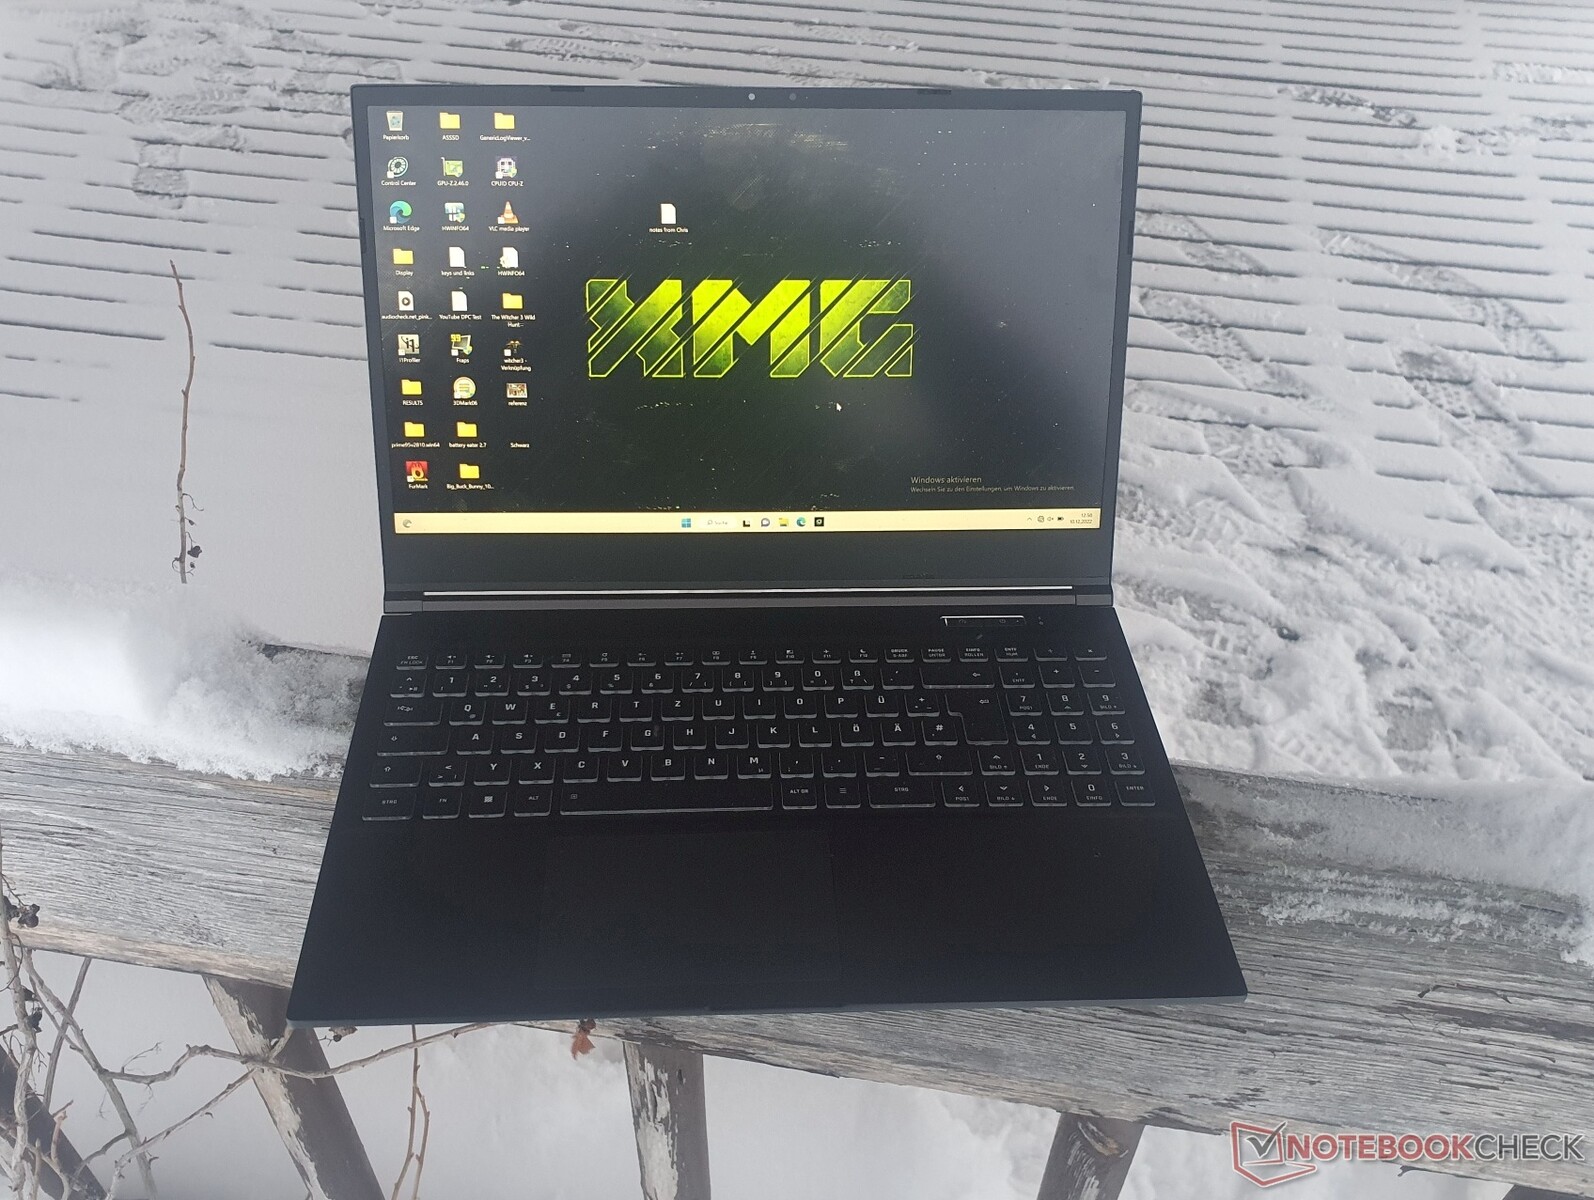
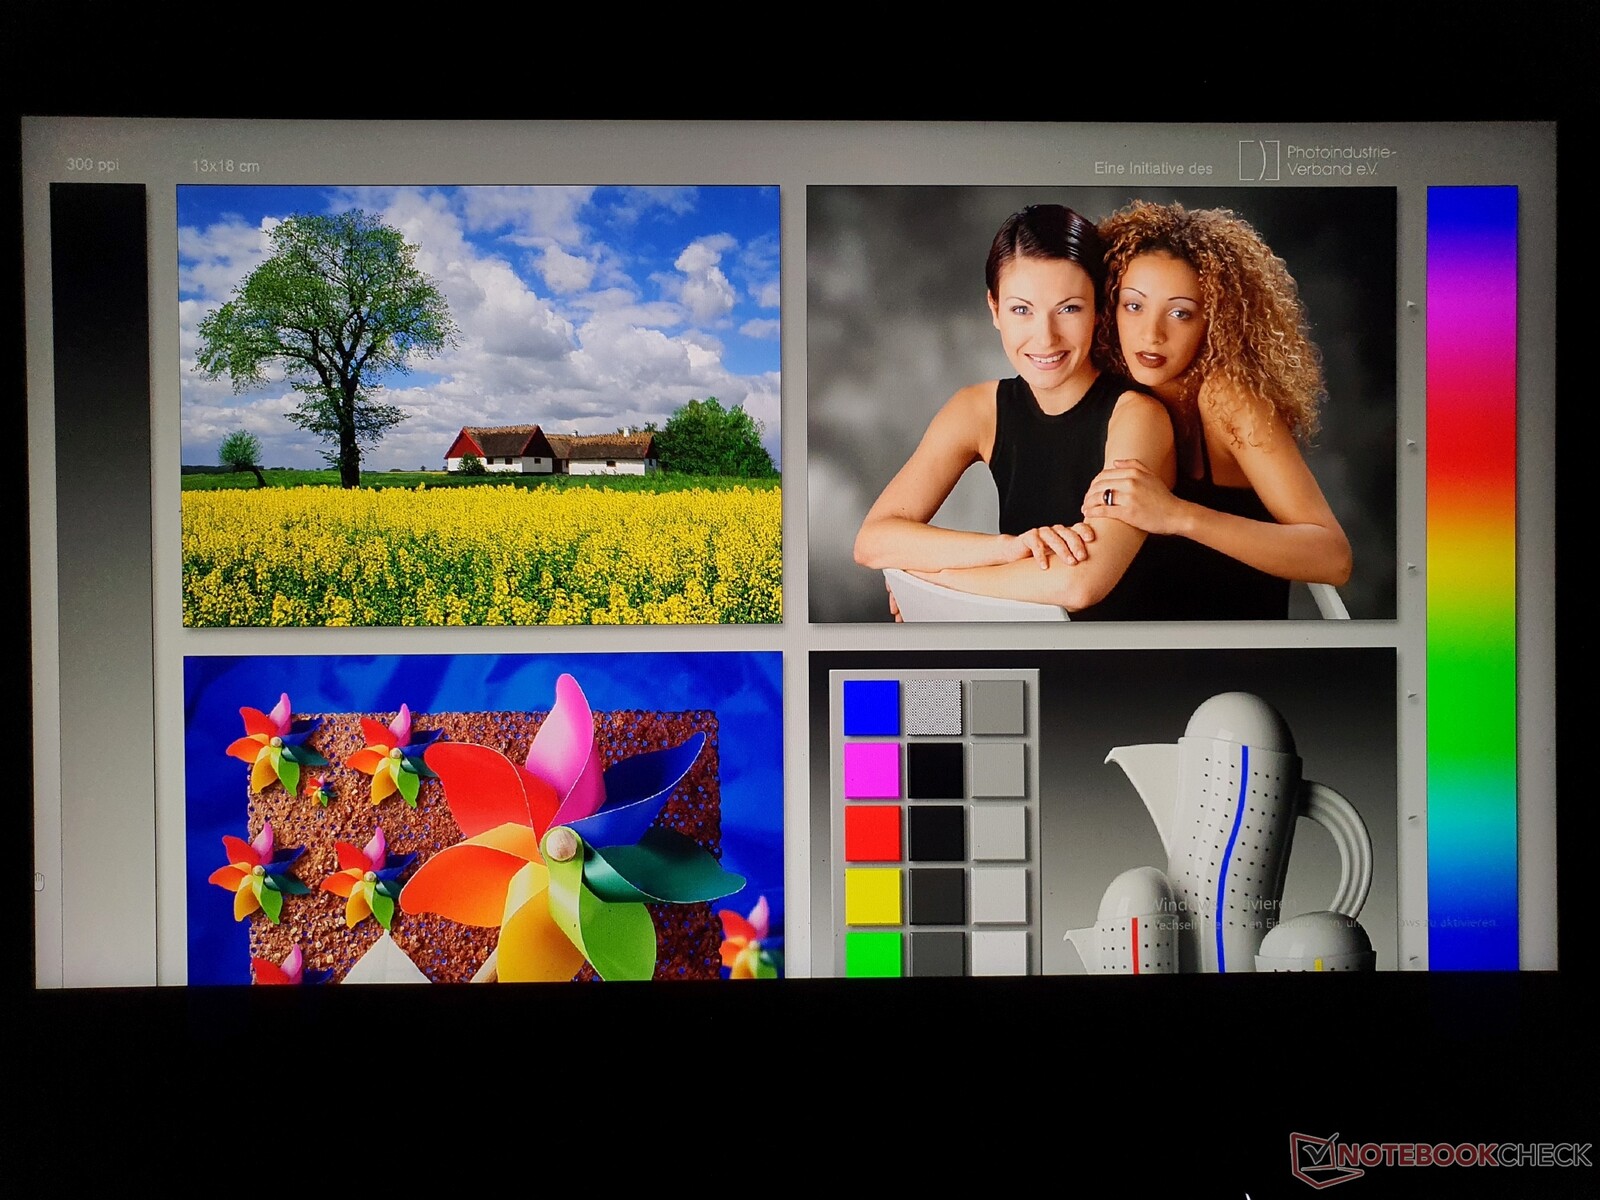
Schenker oferuje dwie opcje wyświetlacza dla XMG Core 15: FHD 144 Hz z 300 cd/m² i 90% sRGB, a także zainstalowany w testowanym urządzeniu panel WQHD (2 560 x 1 440) o częstotliwości odświeżania 165 Hz (83-165 Hz dynamicznie), określonej 350 cd/m² i 95% sRGB. Specyfikacja jasności matowego wyświetlacza 16:9 została przekroczona ze średnią wartością 371 cd/m². Na stronie Legion 5 Projest jaśniejszy o 500 cd/m², co przydaje się w zastosowaniach zewnętrznych.
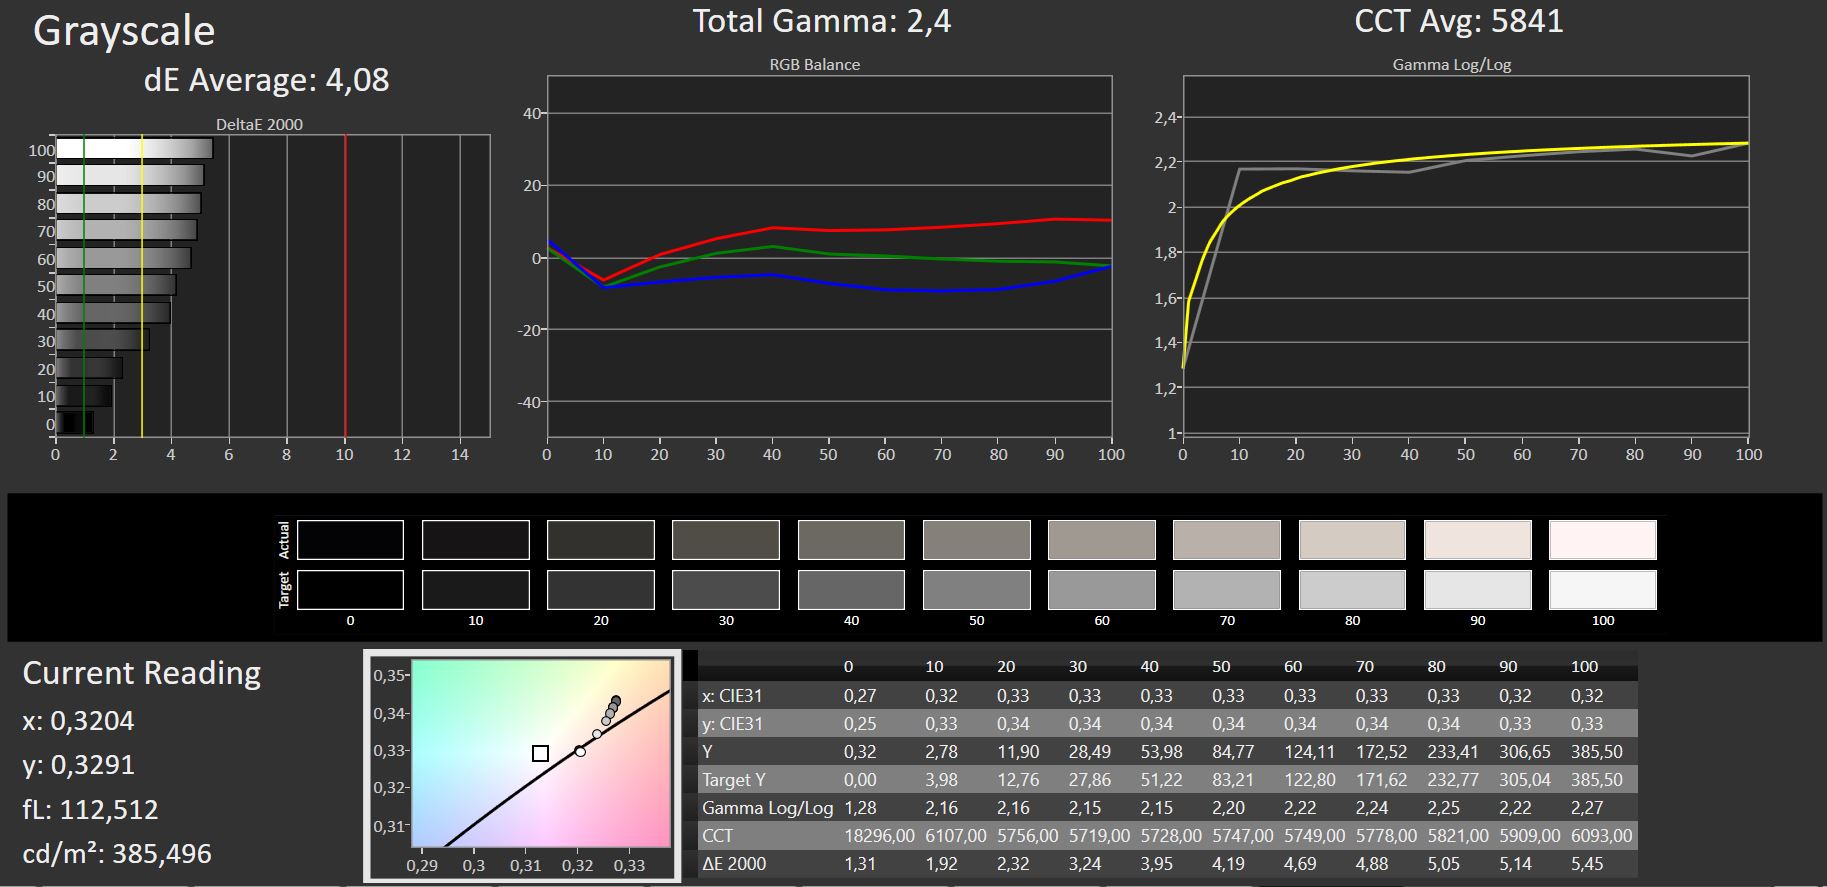
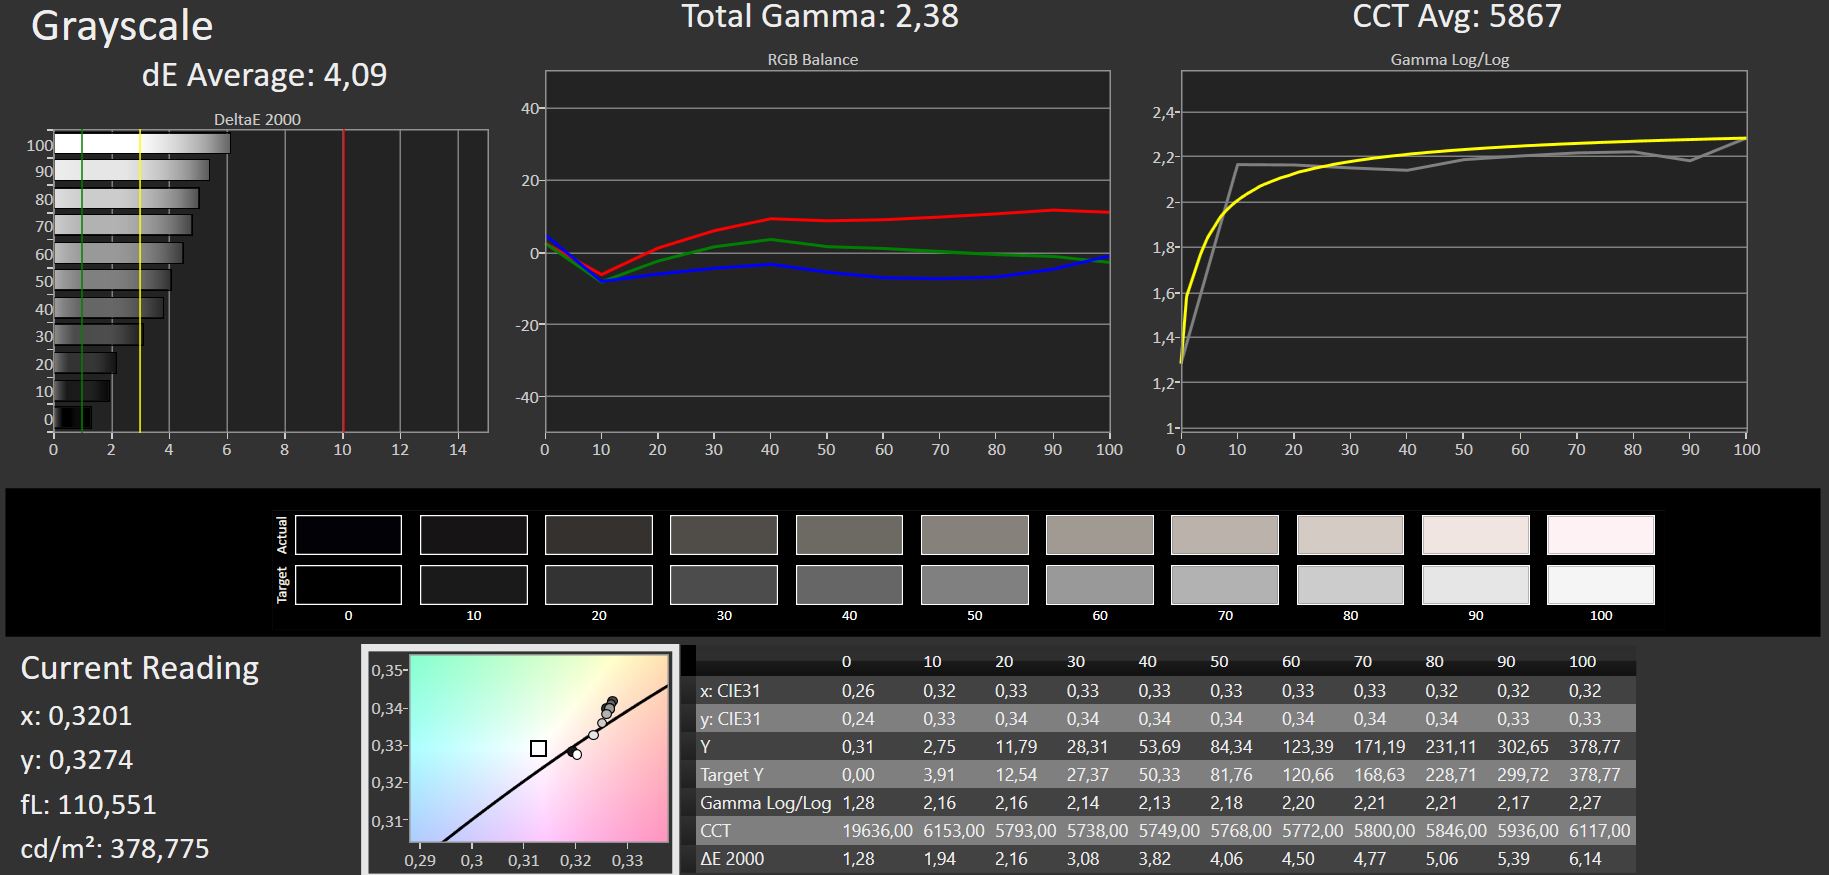
Kontrast i poziom czerni są na dobrym poziomie i wynoszą odpowiednio 1 145:1 i 0,32 cd/m², a podświetlenie jest dość równomierne. Wartość bieli wynosząca 5.841K jest nieco oddalona od optimum (6.500K).
Czasy reakcji są krótkie do bardzo krótkich i wynoszą 16 ms (GtG), a także 7,6 ms (BtW), przy czym tylko Alienware m15 osiąga w tym zakresie znaczącą przewagę. Nie udało nam się stwierdzić żadnego migotania PWM.
| |||||||||||||||||||||||||
rozświetlenie: 93 %
na akumulatorze: 384 cd/m²
kontrast: 1145:1 (czerń: 0.33 cd/m²)
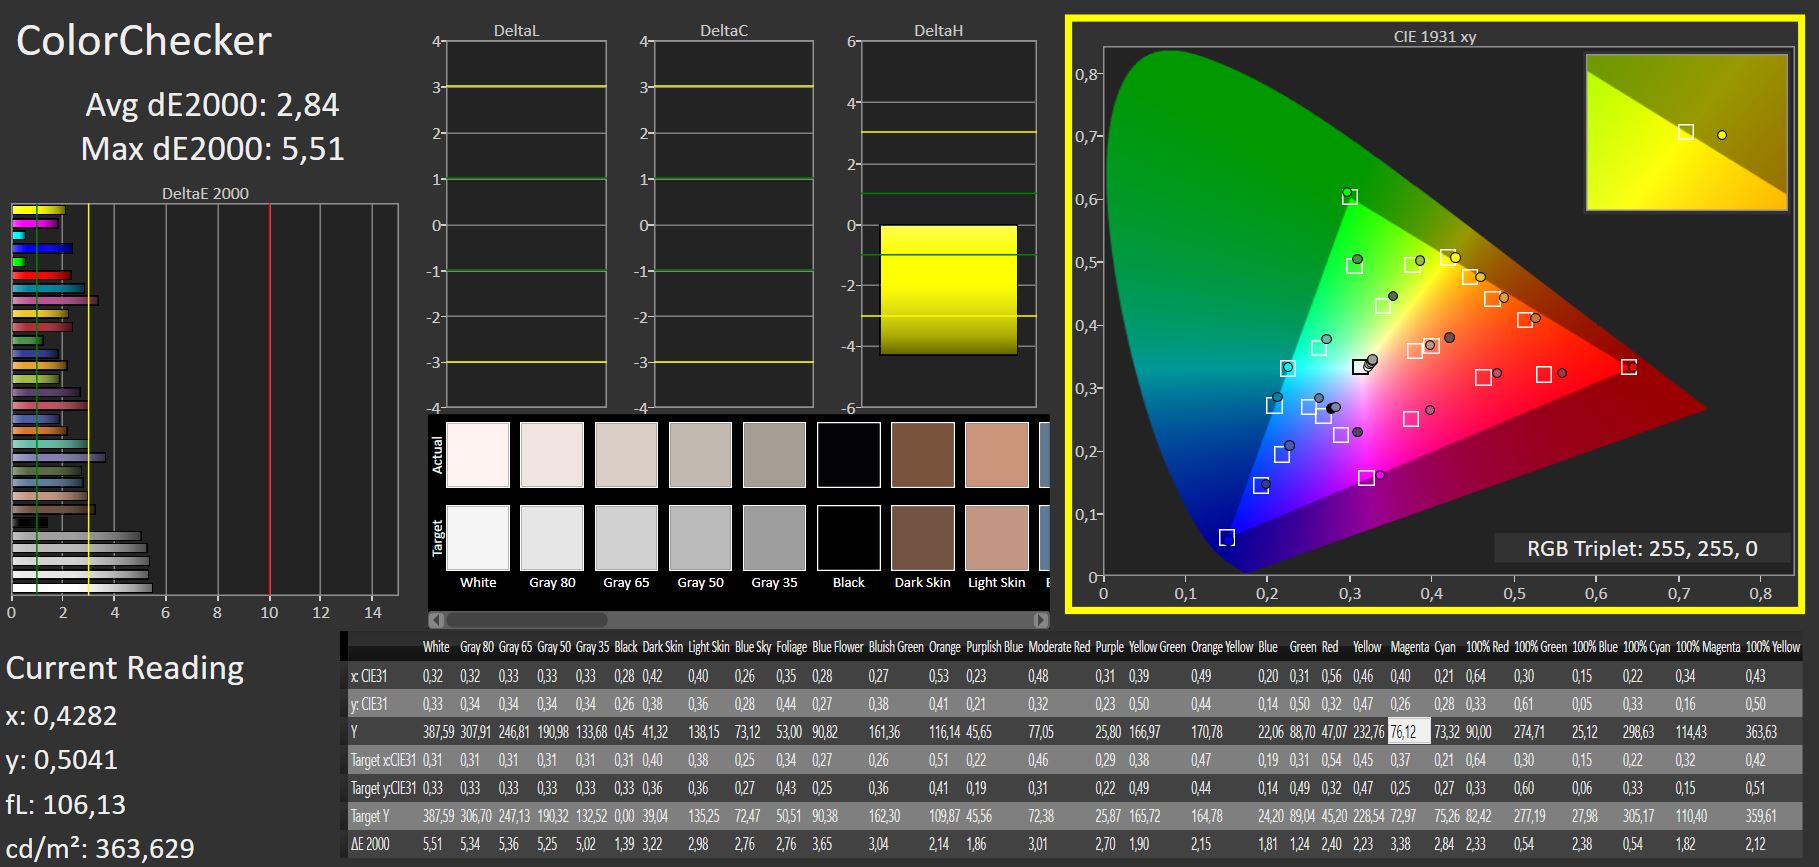
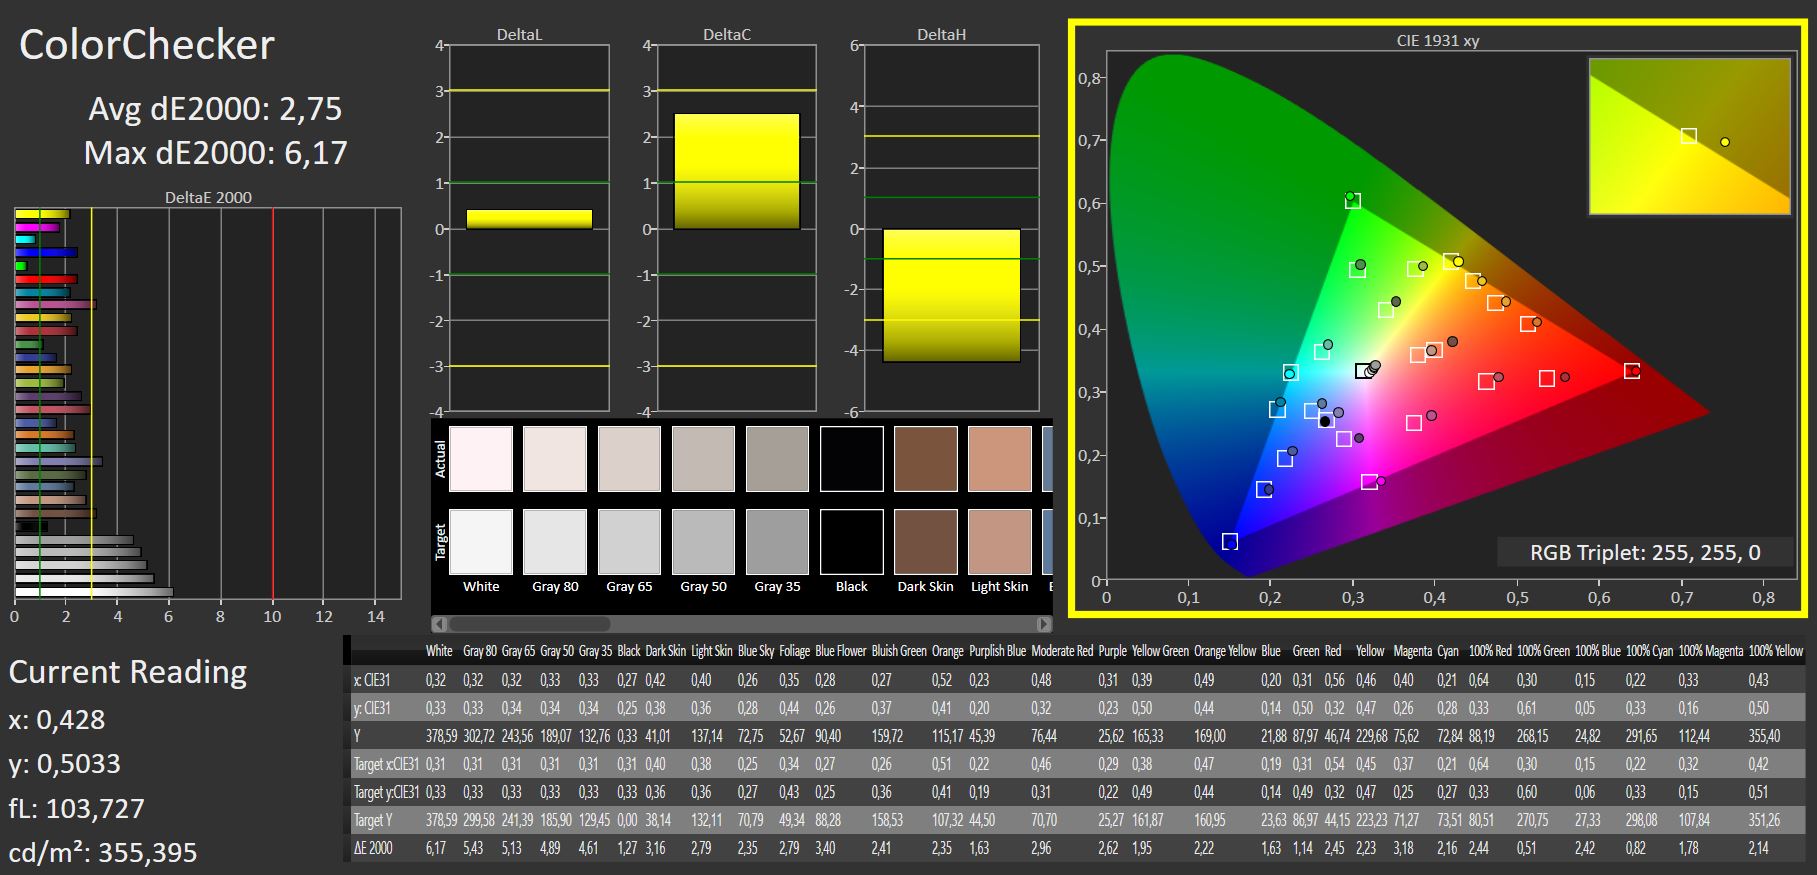
ΔE ColorChecker Calman: 2.84 | ∀{0.5-29.43 Ø4.72}
calibrated: 2.75
ΔE Greyscale Calman: 4.08 | ∀{0.09-98 Ø4.97}
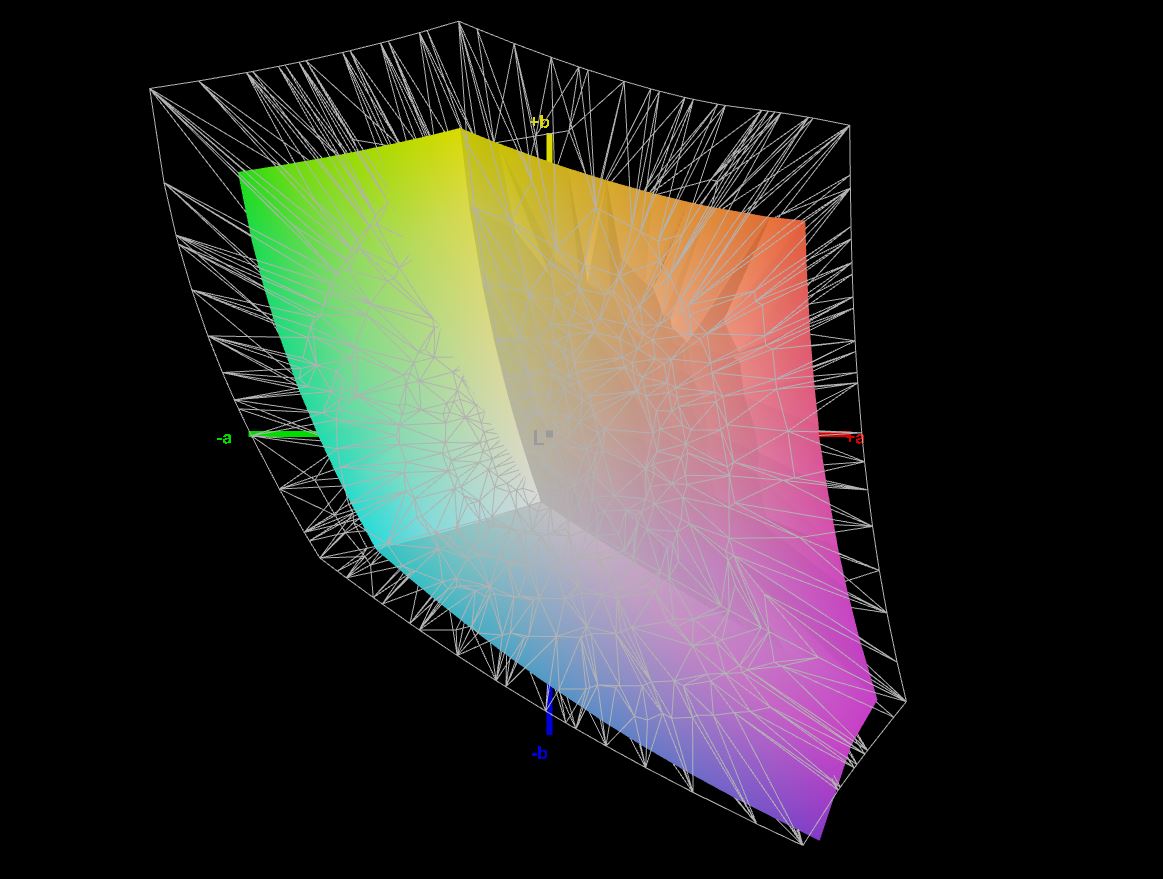
69.9% AdobeRGB 1998 (Argyll 3D)
99.3% sRGB (Argyll 3D)
68.8% Display P3 (Argyll 3D)
Gamma: 2.4
CCT: 5841 K
| Schenker XMG Core 15 (M22) CSOT MNF601CA1-1, IPS, 2560x1440, 15.6" | Schenker XMG Fusion 15 (Mid 22) BOE CQ NE156QHM-NY2, IPS, 2560x1440, 15.6" | Lenovo Legion 5 15IAH7H 82RB CSOT MNF601CA1-3, IPS, 1920x1080, 15.6" | Asus TUF Gaming F15 FX507ZM TL156VDXP0101, IPS, 1920x1080, 15.6" | Alienware m15 R5 Ryzen Edition B156HAN, IPS, 1920x1080, 15.6" | Schenker XMG Core 15 Ampere BOE CQ NE156QHM-NY2, IPS, 2560x1440, 15.6" | |
|---|---|---|---|---|---|---|
| Display | -2% | 0% | -2% | 0% | ||
| Display P3 Coverage (%) | 68.8 | 67.3 -2% | 69.1 0% | 66.4 -3% | 69.8 1% | |
| sRGB Coverage (%) | 99.3 | 96.7 -3% | 99.5 0% | 97 -2% | 98.8 -1% | |
| AdobeRGB 1998 Coverage (%) | 69.9 | 68.2 -2% | 70 0% | 68.5 -2% | 70.7 1% | |
| Response Times | 18% | -26% | -2% | 32% | -15% | |
| Response Time Grey 50% / Grey 80% * (ms) | 16 ? | 11.6 ? 27% | 14.8 ? 7% | 5.6 ? 65% | 4 ? 75% | 14.8 ? 7% |
| Response Time Black / White * (ms) | 7.6 ? | 7 ? 8% | 12 ? -58% | 12.8 ? -68% | 8.4 ? -11% | 10.4 ? -37% |
| PWM Frequency (Hz) | ||||||
| Screen | -11% | -13% | 19% | 10% | 23% | |
| Brightness middle (cd/m²) | 378 | 326 -14% | 363.5 -4% | 353.7 -6% | 329 -13% | 347 -8% |
| Brightness (cd/m²) | 371 | 303 -18% | 350 -6% | 340 -8% | 321 -13% | 328 -12% |
| Brightness Distribution (%) | 93 | 89 -4% | 89 -4% | 89 -4% | 92 -1% | 89 -4% |
| Black Level * (cd/m²) | 0.33 | 0.33 -0% | 0.39 -18% | 0.34 -3% | 0.27 18% | 0.27 18% |
| Contrast (:1) | 1145 | 988 -14% | 932 -19% | 1040 -9% | 1219 6% | 1285 12% |
| Colorchecker dE 2000 * | 2.84 | 2.73 4% | 3.68 -30% | 1.74 39% | 2.78 2% | 1.66 42% |
| Colorchecker dE 2000 max. * | 5.51 | 9.54 -73% | 8.92 -62% | 3.63 34% | 4.88 11% | 3.03 45% |
| Colorchecker dE 2000 calibrated * | 2.75 | 1.36 51% | 0.53 81% | 0.5 82% | 1.63 41% | 1.23 55% |
| Greyscale dE 2000 * | 4.08 | 5.2 -27% | 6.5 -59% | 2.1 49% | 2.5 39% | 1.6 61% |
| Gamma | 2.4 92% | 2.074 106% | 2.2 100% | 2.3 96% | 2.106 104% | 2.278 97% |
| CCT | 5841 111% | 6911 94% | 5995 108% | 6257 104% | 6201 105% | 6430 101% |
| Color Space (Percent of AdobeRGB 1998) (%) | 76 | 71 | ||||
| Color Space (Percent of sRGB) (%) | 99 | 94 | ||||
| Całkowita średnia (program / ustawienia) | 2% /
-5% | -13% /
-12% | 5% /
12% | 21% /
14% | 3% /
13% |
* ... im mniej tym lepiej
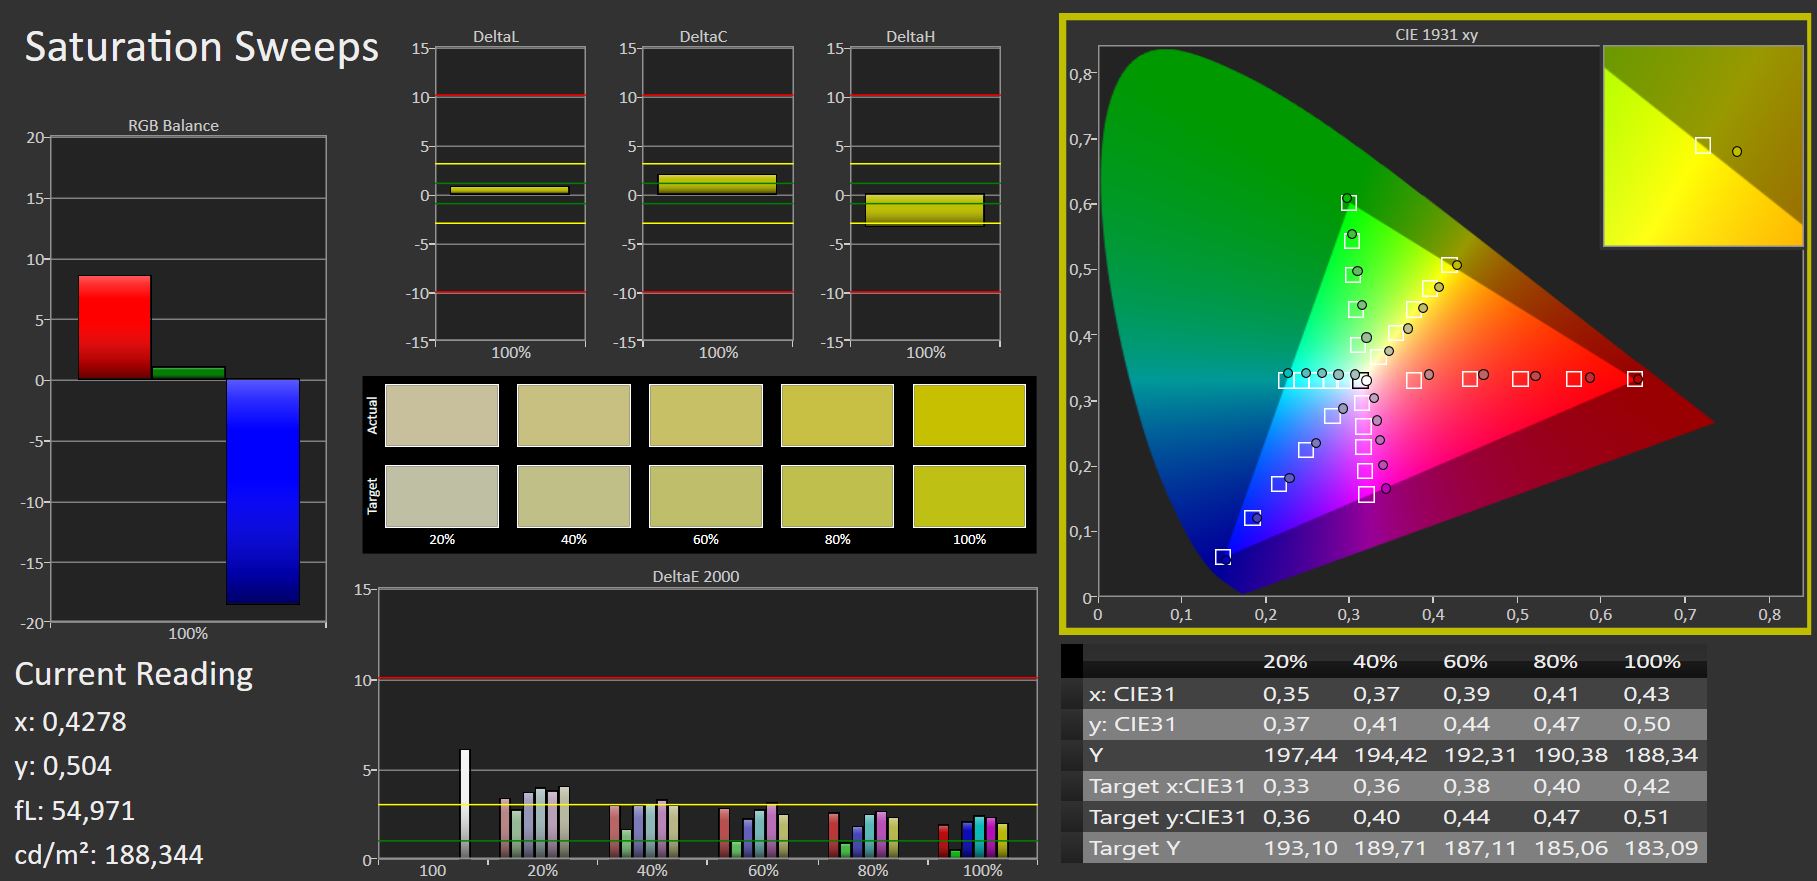
Przestrzeń kolorów sRGB jest pokryta w 99,3%, co umożliwia profesjonalną edycję obrazów w dziedzinie cyfrowej. Jednak większe przestrzenie kolorów, takie jak DCI-P3 do edycji wideo i AdobeRGB, których celem jest profesjonalny druk edytowanych obrazów, są pokryte tylko przez Alienware m15 oraz HP Envy 16 pokrywa je niemal w całości.
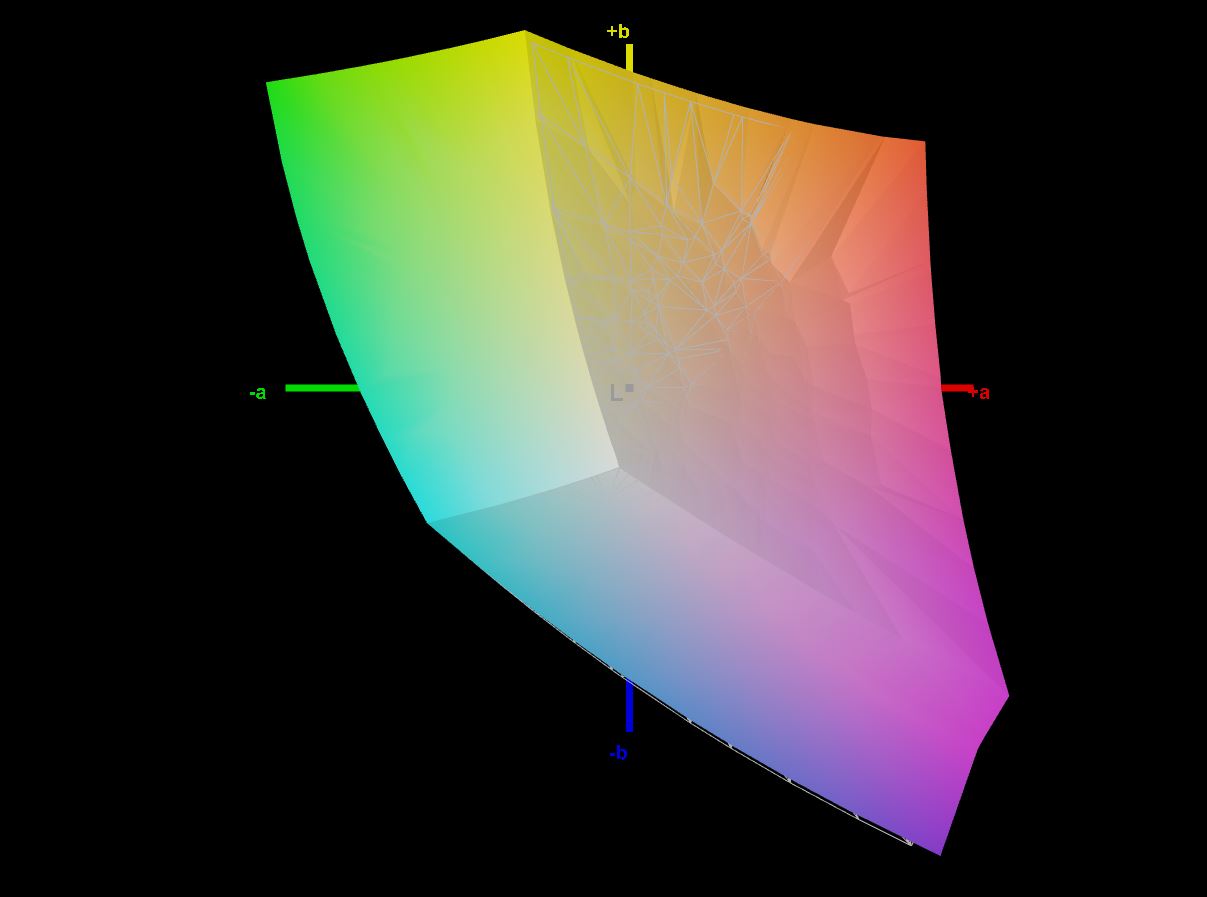
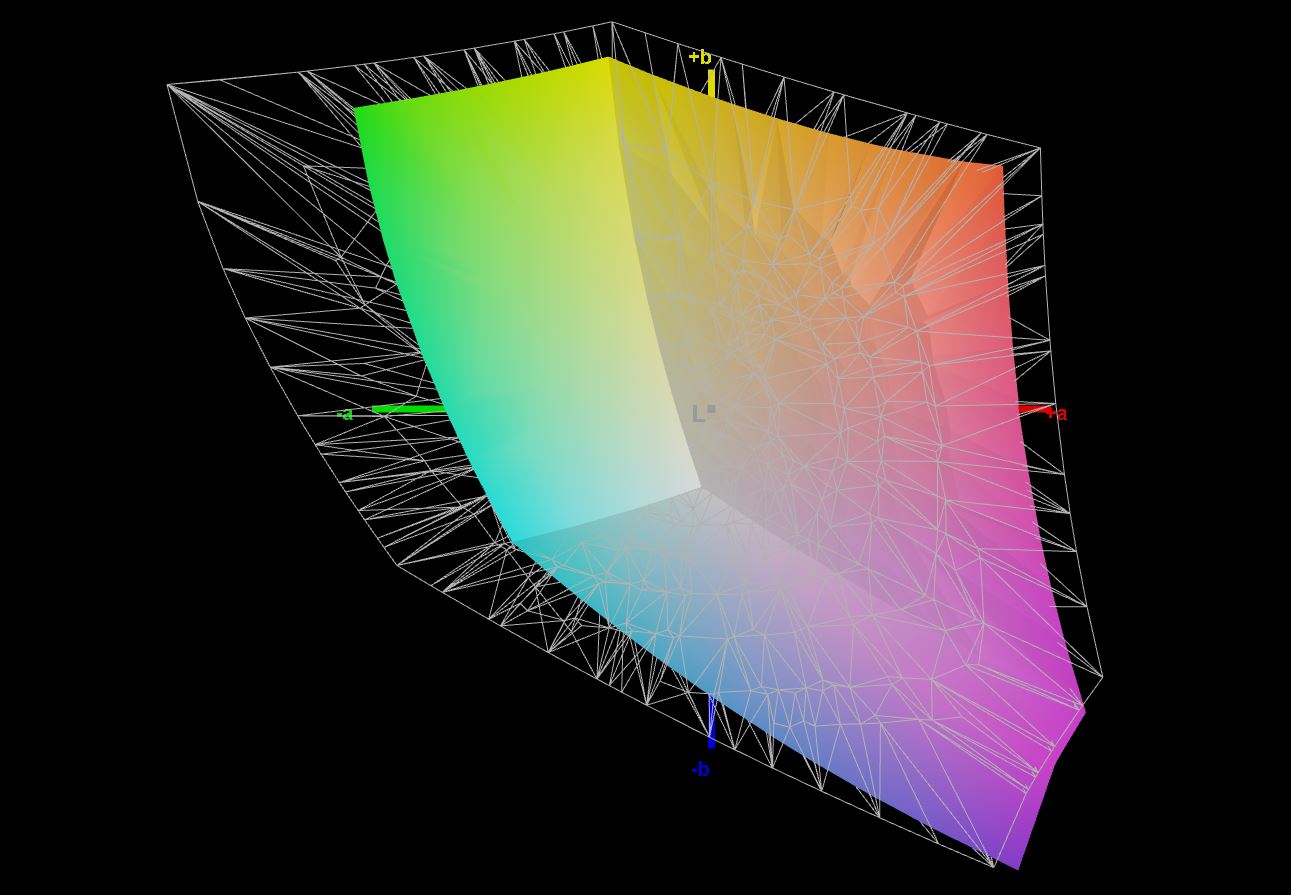
Prawie wszystkie kolory utrzymują się poniżej progu DeltaE 3. Jednak w fabryce widoczne jest lekkie czerwone odbicie, które nie znika nawet po naszej kalibracji. Nasz skalibrowany profil kolorów można pobraćtutaj.

Wyświetl czasy reakcji
| ↔ Czas reakcji od czerni do bieli | ||
|---|---|---|
| 7.6 ms ... wzrost ↗ i spadek ↘ łącznie | ↗ 3 ms wzrost | 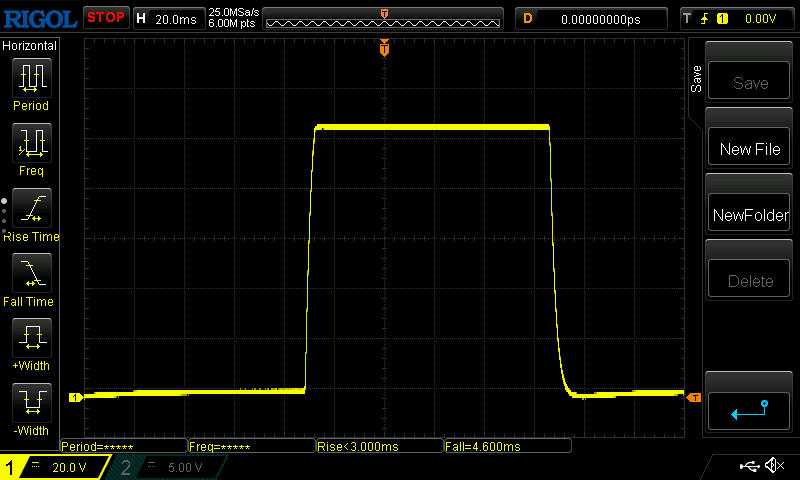 |
| ↘ 4.6 ms upadek | ||
| W naszych testach ekran wykazuje bardzo szybką reakcję i powinien bardzo dobrze nadawać się do szybkich gier. Dla porównania, wszystkie testowane urządzenia wahają się od 0.1 (minimum) do 240 (maksimum) ms. » 22 % wszystkich urządzeń jest lepszych. Oznacza to, że zmierzony czas reakcji jest lepszy od średniej wszystkich testowanych urządzeń (19.9 ms). | ||
| ↔ Czas reakcji 50% szarości do 80% szarości | ||
| 16 ms ... wzrost ↗ i spadek ↘ łącznie | ↗ 7 ms wzrost | 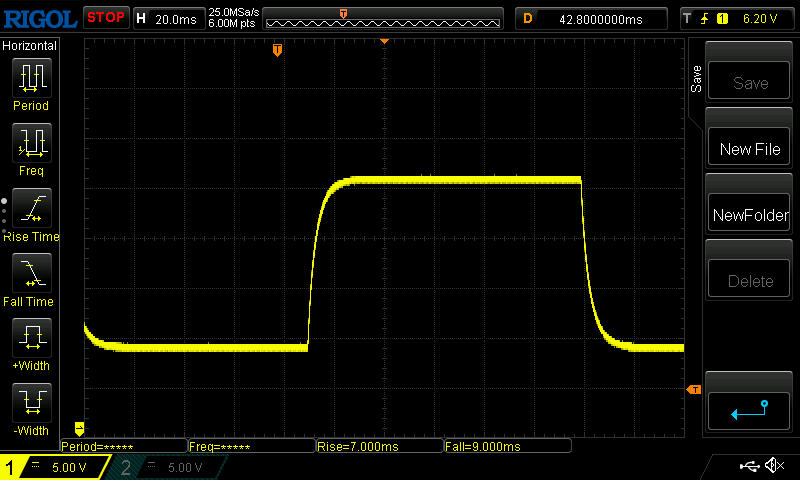 |
| ↘ 9 ms upadek | ||
| W naszych testach ekran wykazuje dobry współczynnik reakcji, ale może być zbyt wolny dla graczy rywalizujących ze sobą. Dla porównania, wszystkie testowane urządzenia wahają się od 0.165 (minimum) do 636 (maksimum) ms. » 30 % wszystkich urządzeń jest lepszych. Oznacza to, że zmierzony czas reakcji jest lepszy od średniej wszystkich testowanych urządzeń (31.1 ms). | ||
Migotanie ekranu / PWM (modulacja szerokości impulsu)
| Migotanie ekranu/nie wykryto PWM | 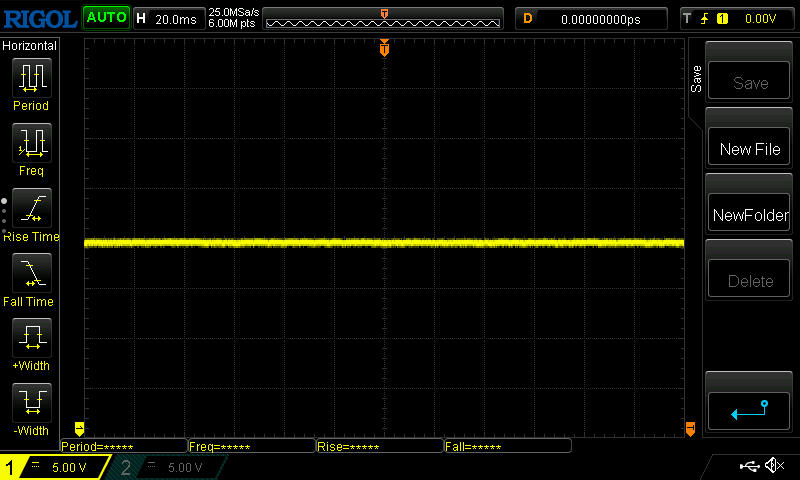 | ||
Dla porównania: 52 % wszystkich testowanych urządzeń nie używa PWM do przyciemniania wyświetlacza. Jeśli wykryto PWM, zmierzono średnio 7784 (minimum: 5 - maksimum: 343500) Hz. | |||
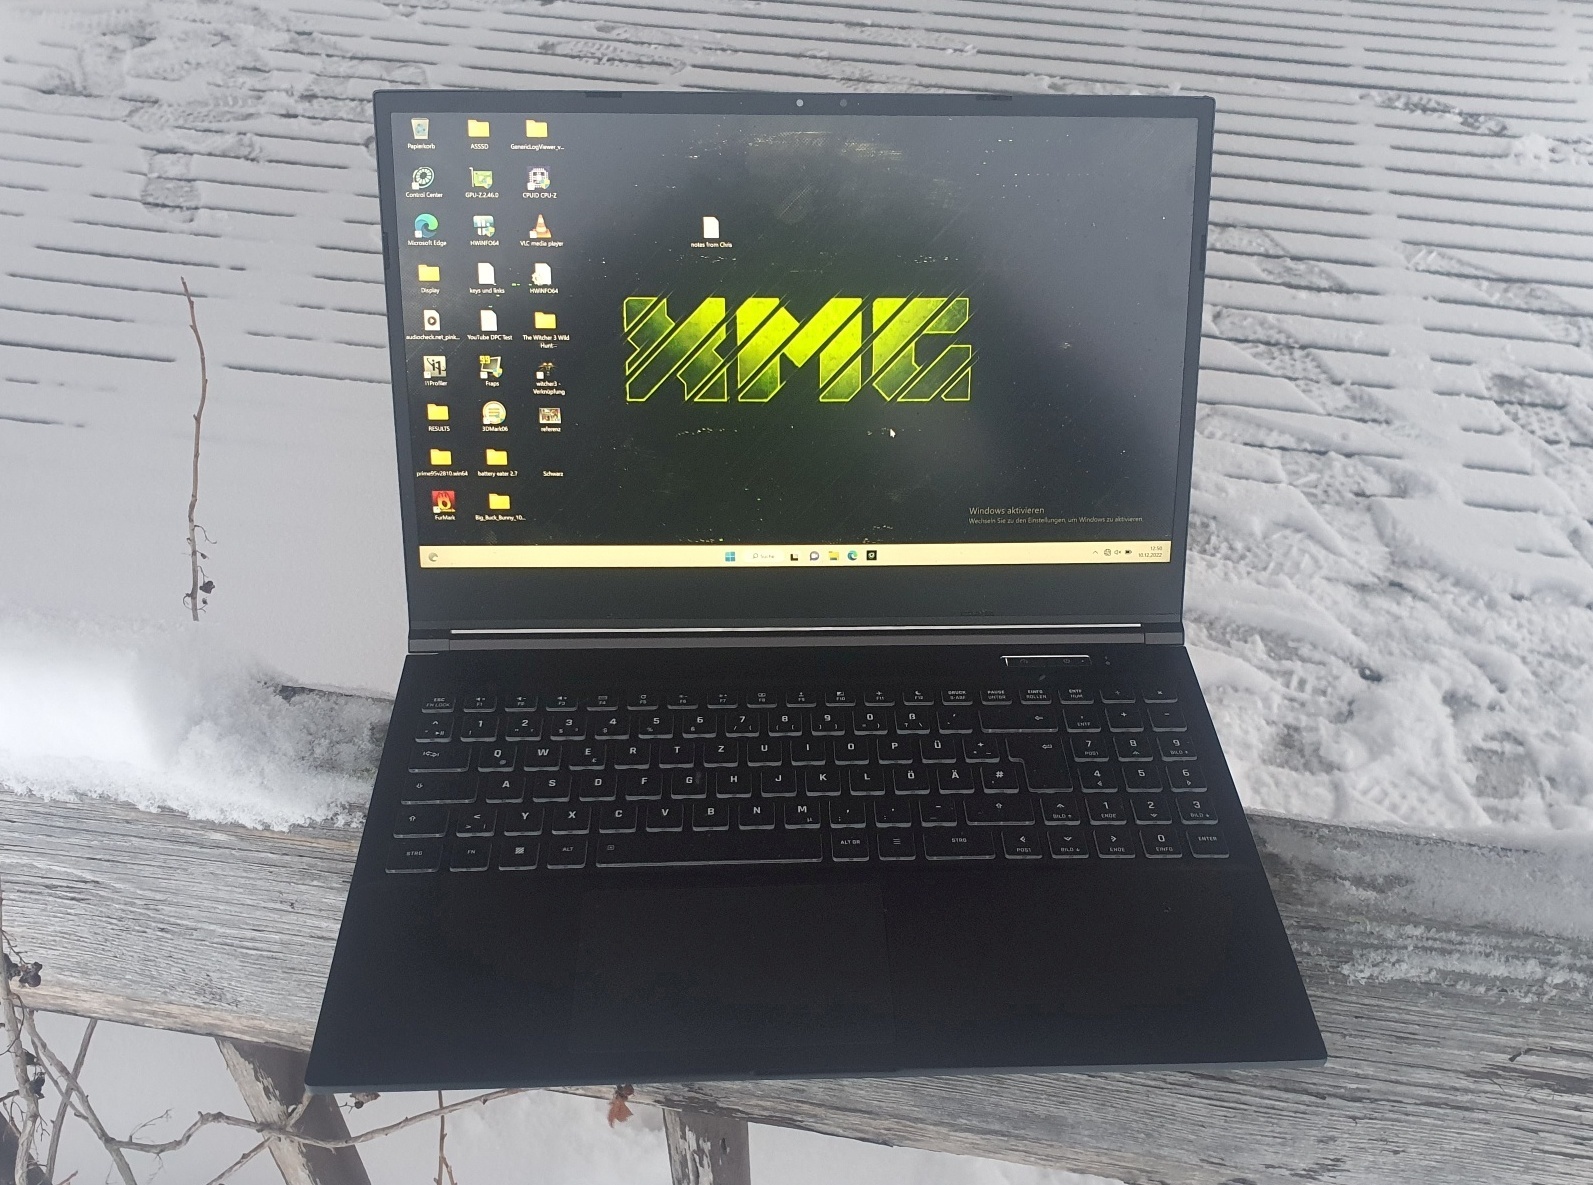
Wyświetlacz o jasności 371 cd/m² mimo matowego wykończenia można dobrze odczytać tylko bez bezpośredniego światła słonecznego z tyłu.

Wydajność: RTX 3060 z maksymalnym TGP, ale są szybsze
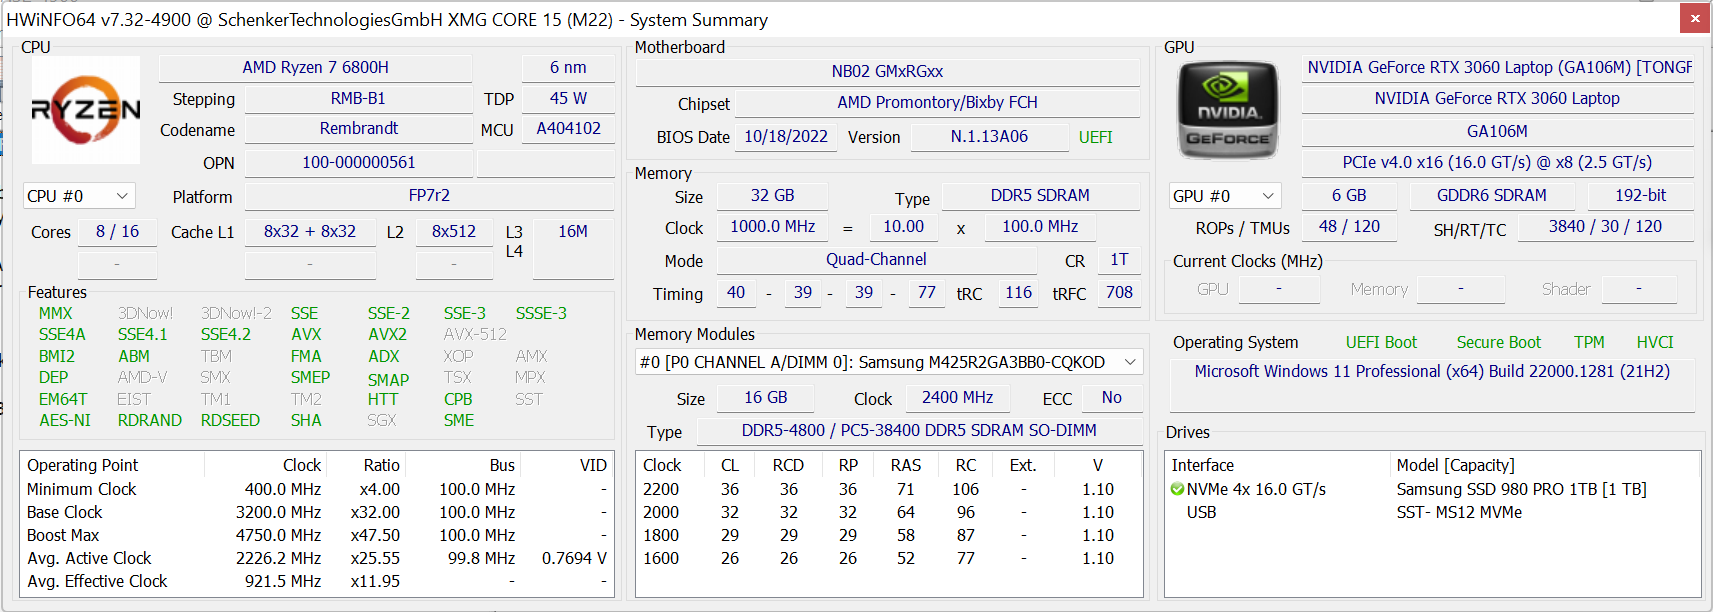
15,6-calowy laptop do gier jest bardzo wydajny dzięki m.in Nvidia RTX 3060 o mocy 140 W TGP przeznaczonej do obecnych gier, nie ma innej opcji GPU. Procesor Ryzen 7 6800H jest również mocny i jest jedynym wyborem. Pamięć RAM i pamięć masowa są hojne, odpowiednio z 32 GB DDR5-4800 (maksymalnie 64 GB) i 1 TB PCIe 4.0 SSD. Zadania stacji roboczej i praca z wideo są również wykonywane szybko i produkują bardzo niskie emisje, gdy korzystają z zewnętrznego chłodzenia wodnego.

Warunki badania
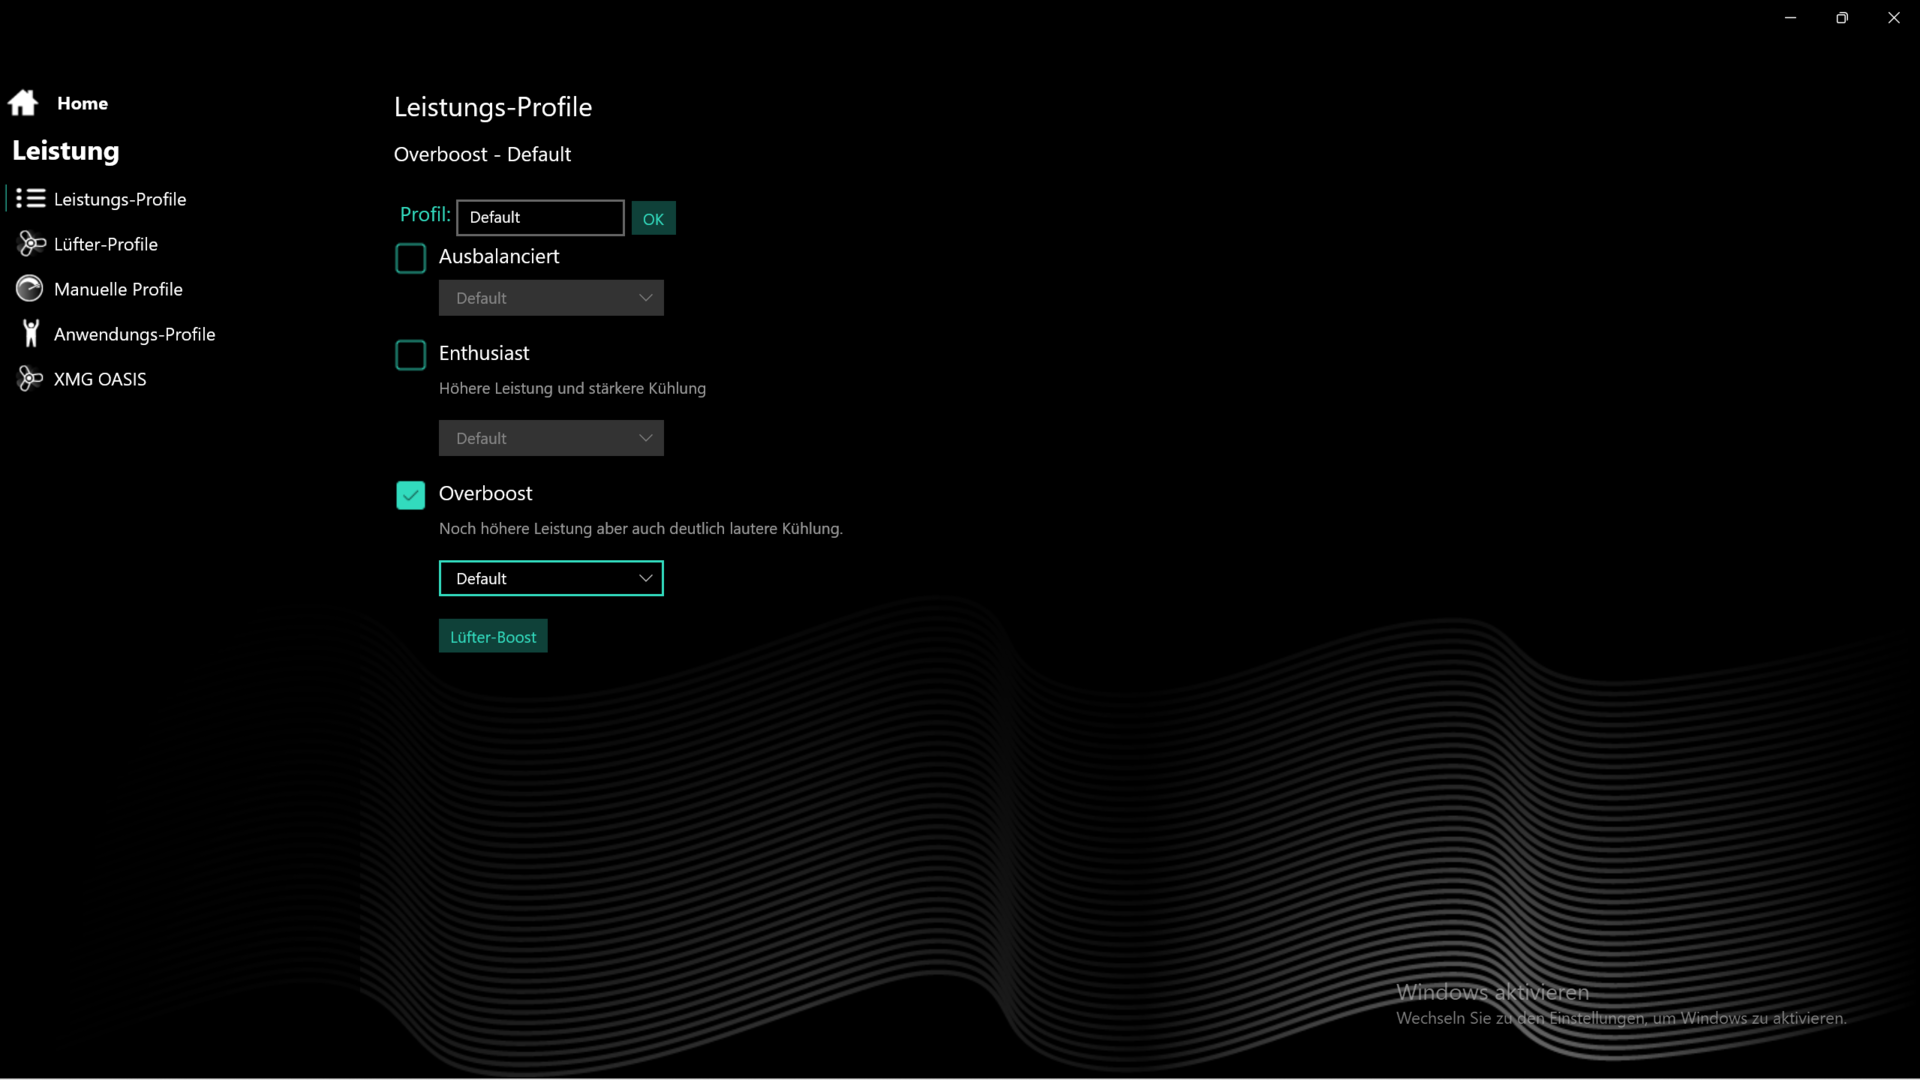
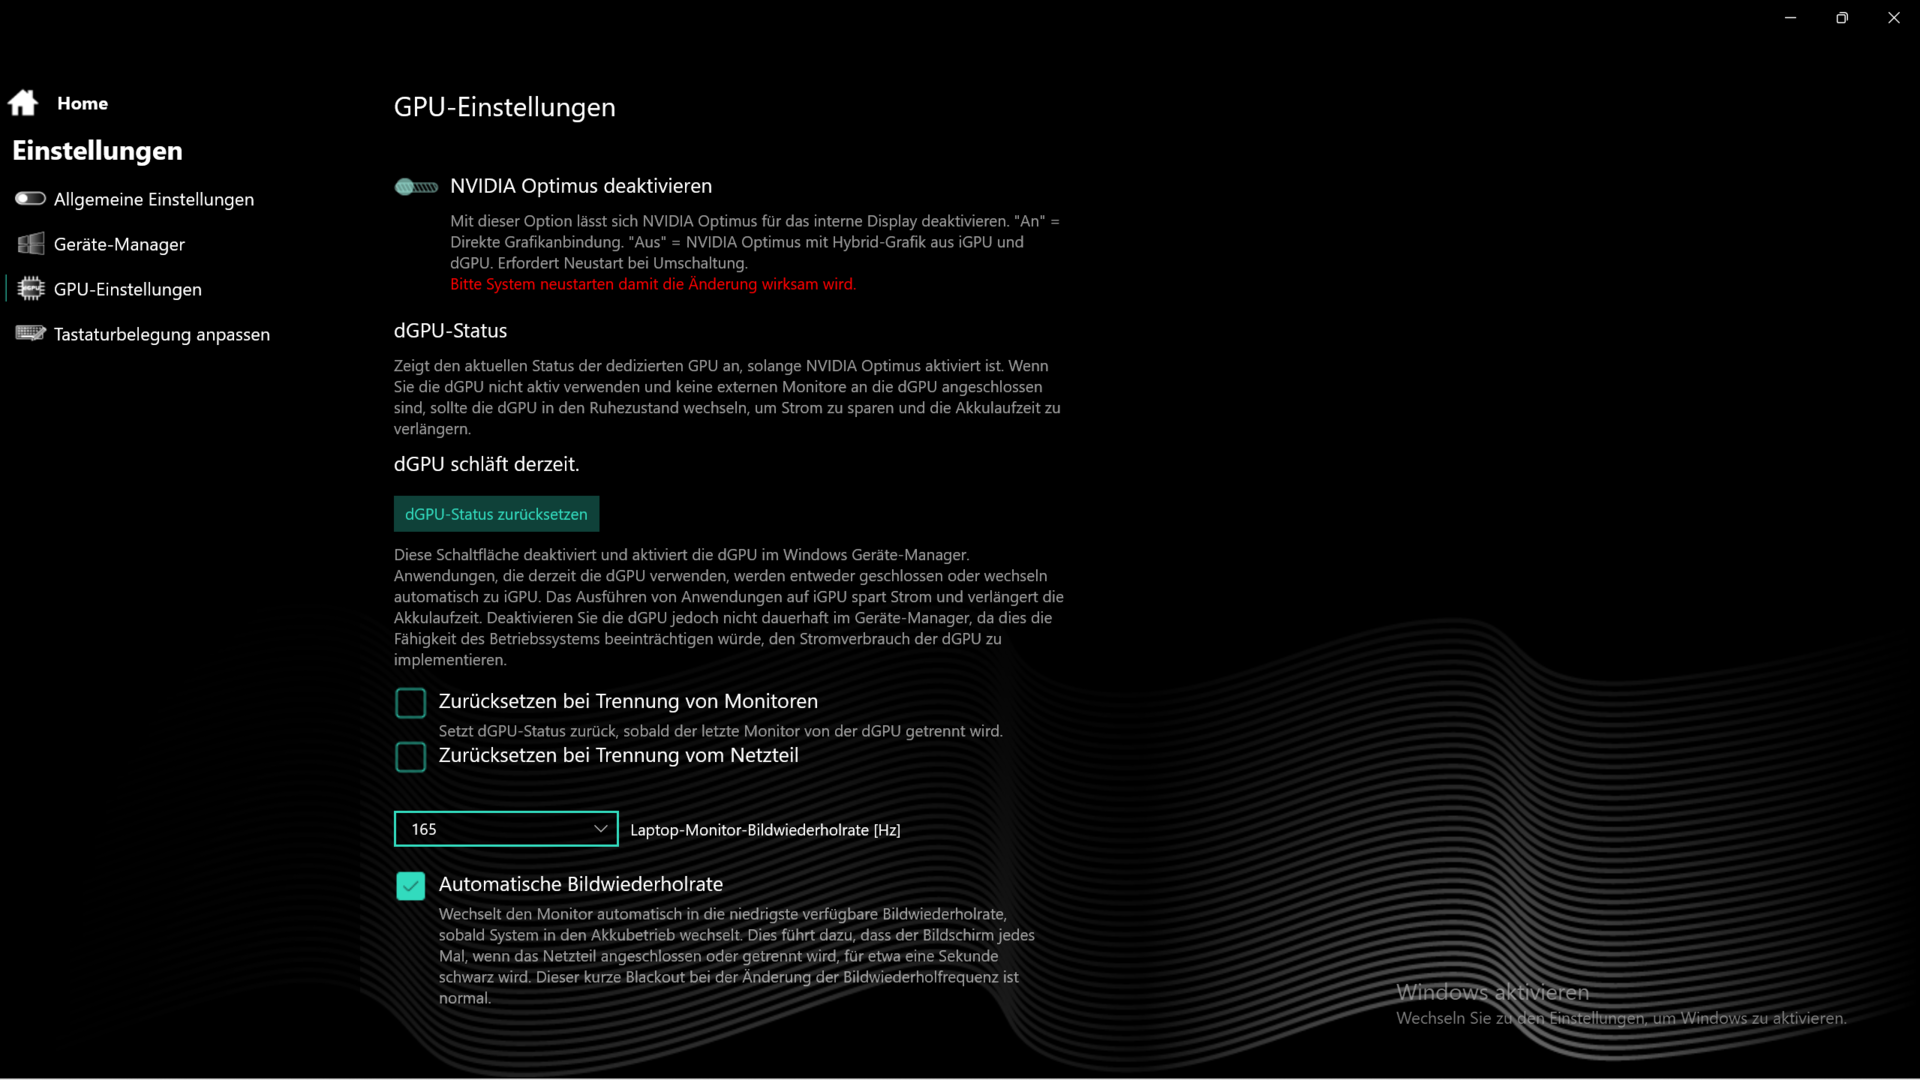
Schenker oferuje w Core 15 trzy tryby zasilania, ale także indywidualne profile. Za pomocą przycisku na lewo od przycisku zasilania można (de)aktywować dany profil, co może być przydatne w wielu scenariuszach. Overboost pozwala na stałe ograniczenie mocy do 75 W dla procesora, 60 W w trybie Enthusiast i 35 W w trybie Balanced. Jest też funkcja Fan Boost, która utrzymuje procesor w chłodzie o około 5 °C przy znacznie wyższym poziomie hałasu.
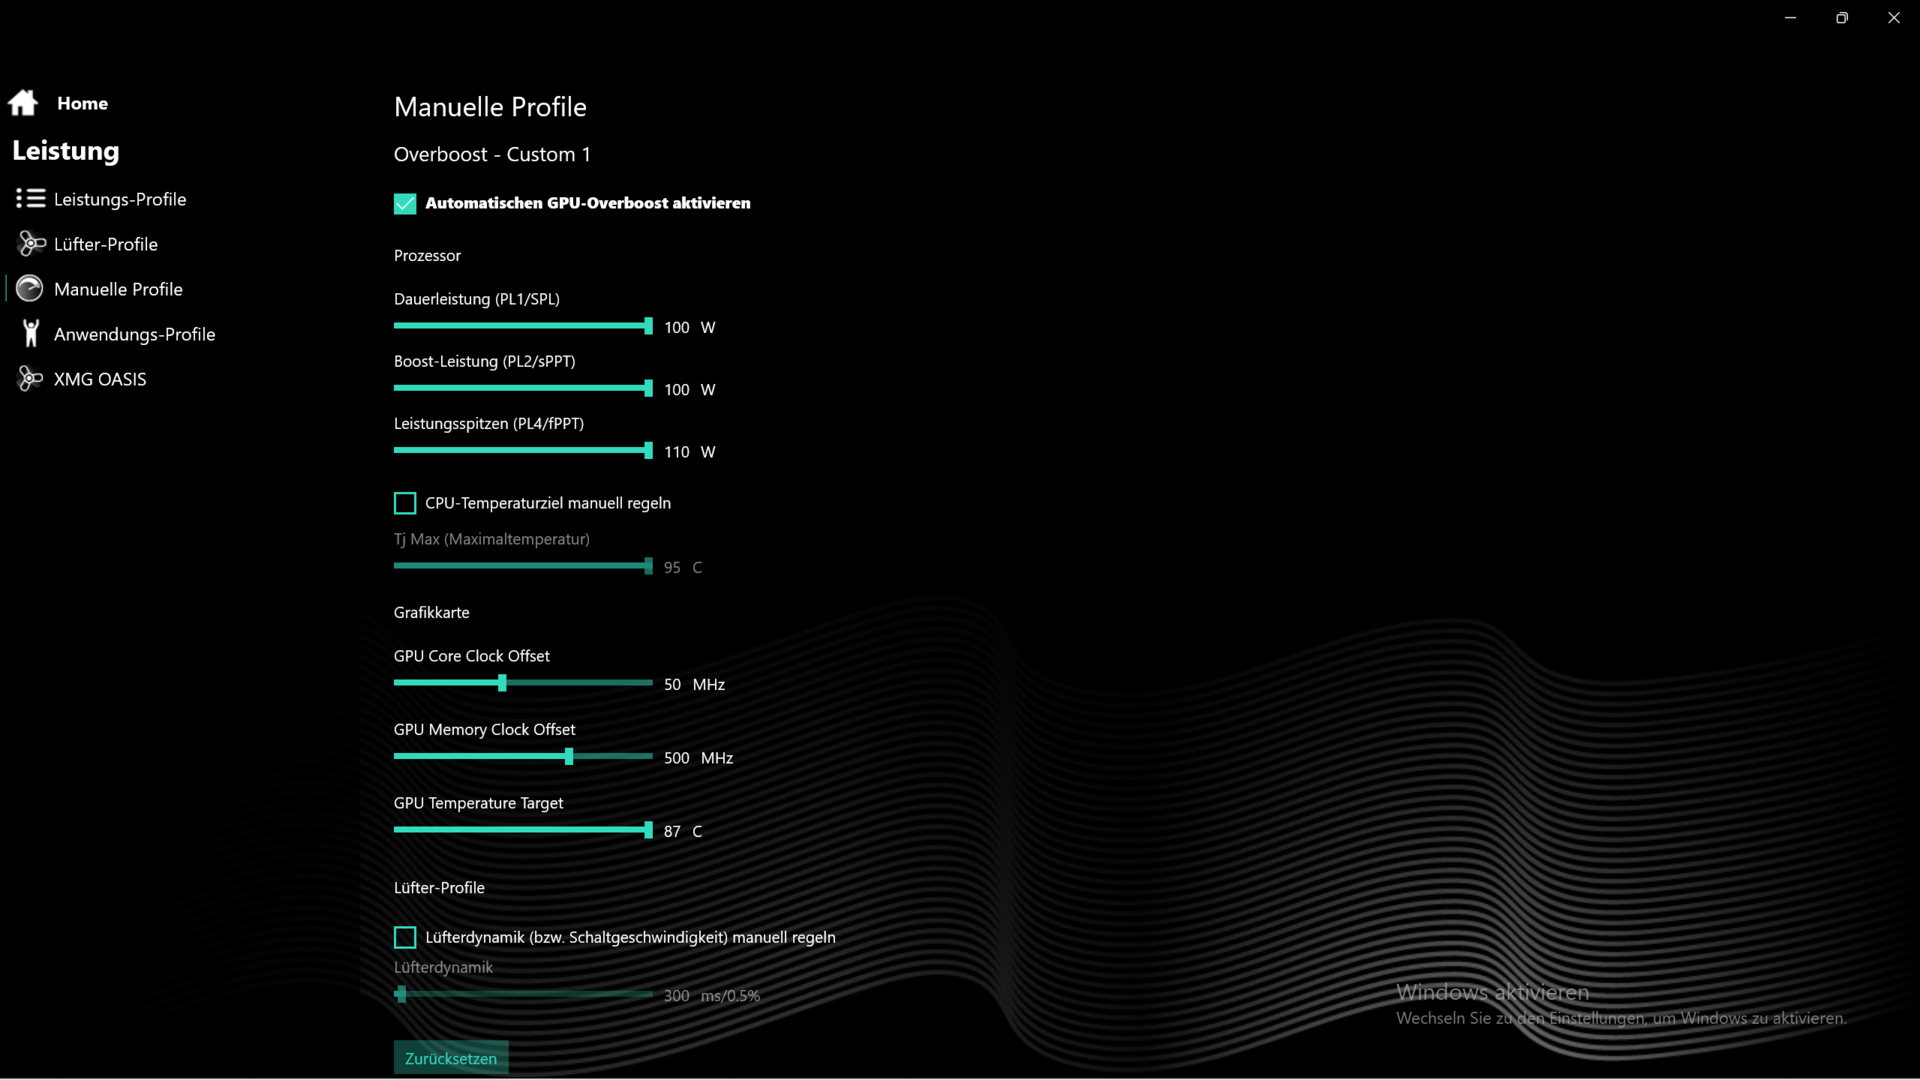
Benchmarki wydajnościowe zostały przeprowadzone w ustawieniu Overboost, ale i tak polecamy Enthusiast, który zapewnia w zasadzie taką samą wydajność przy cichszym hałasie. Przesunięcie suwaków TDP na 100 W dodało tylko 5 W do limitu mocy, a podkręcenie GPU do zalecanych wartości (patrz zrzut ekranu "Ustawienia GPU") dodało kilka dodatkowych procent.
Procesor
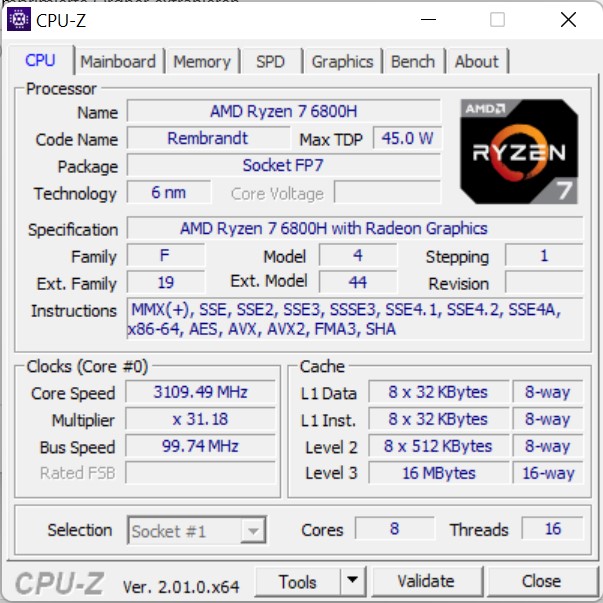
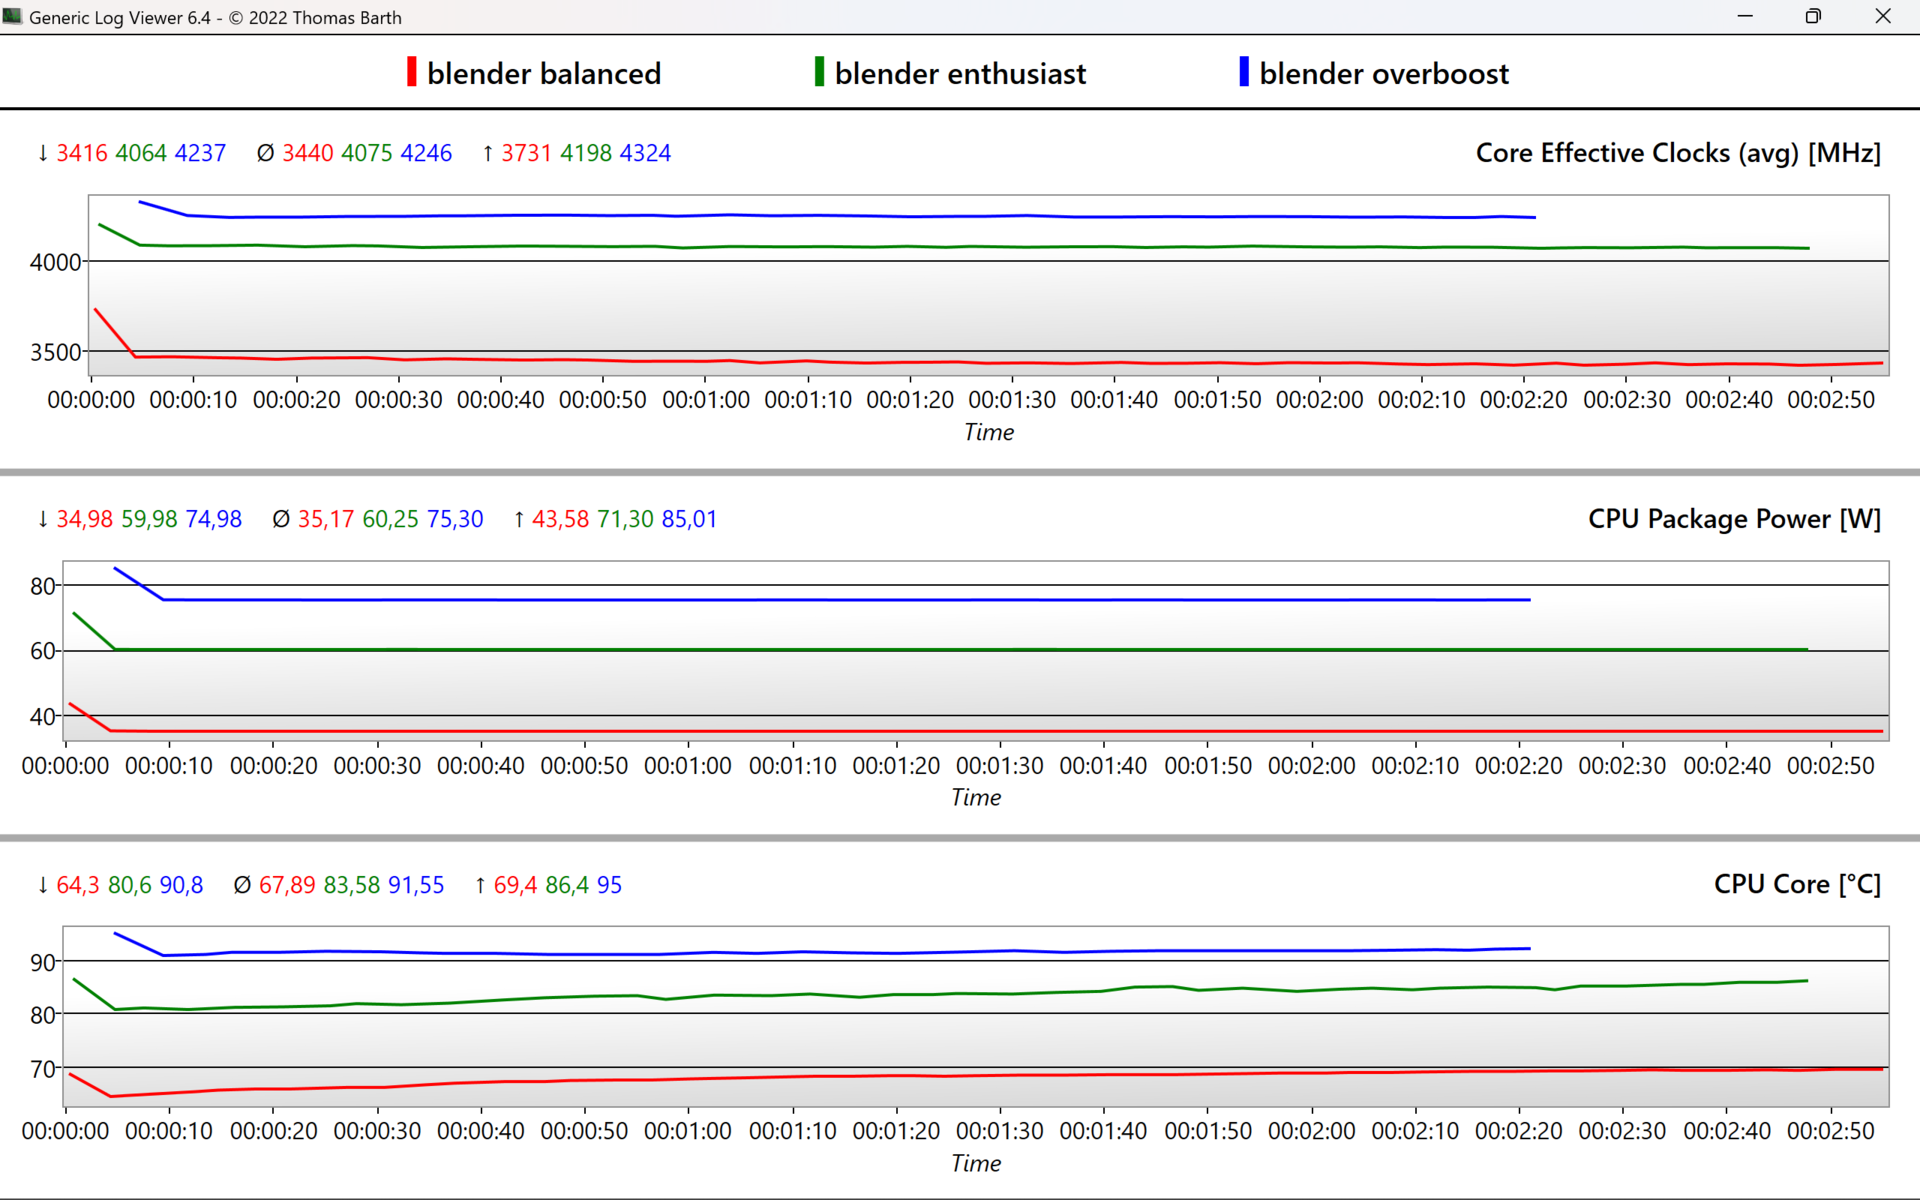
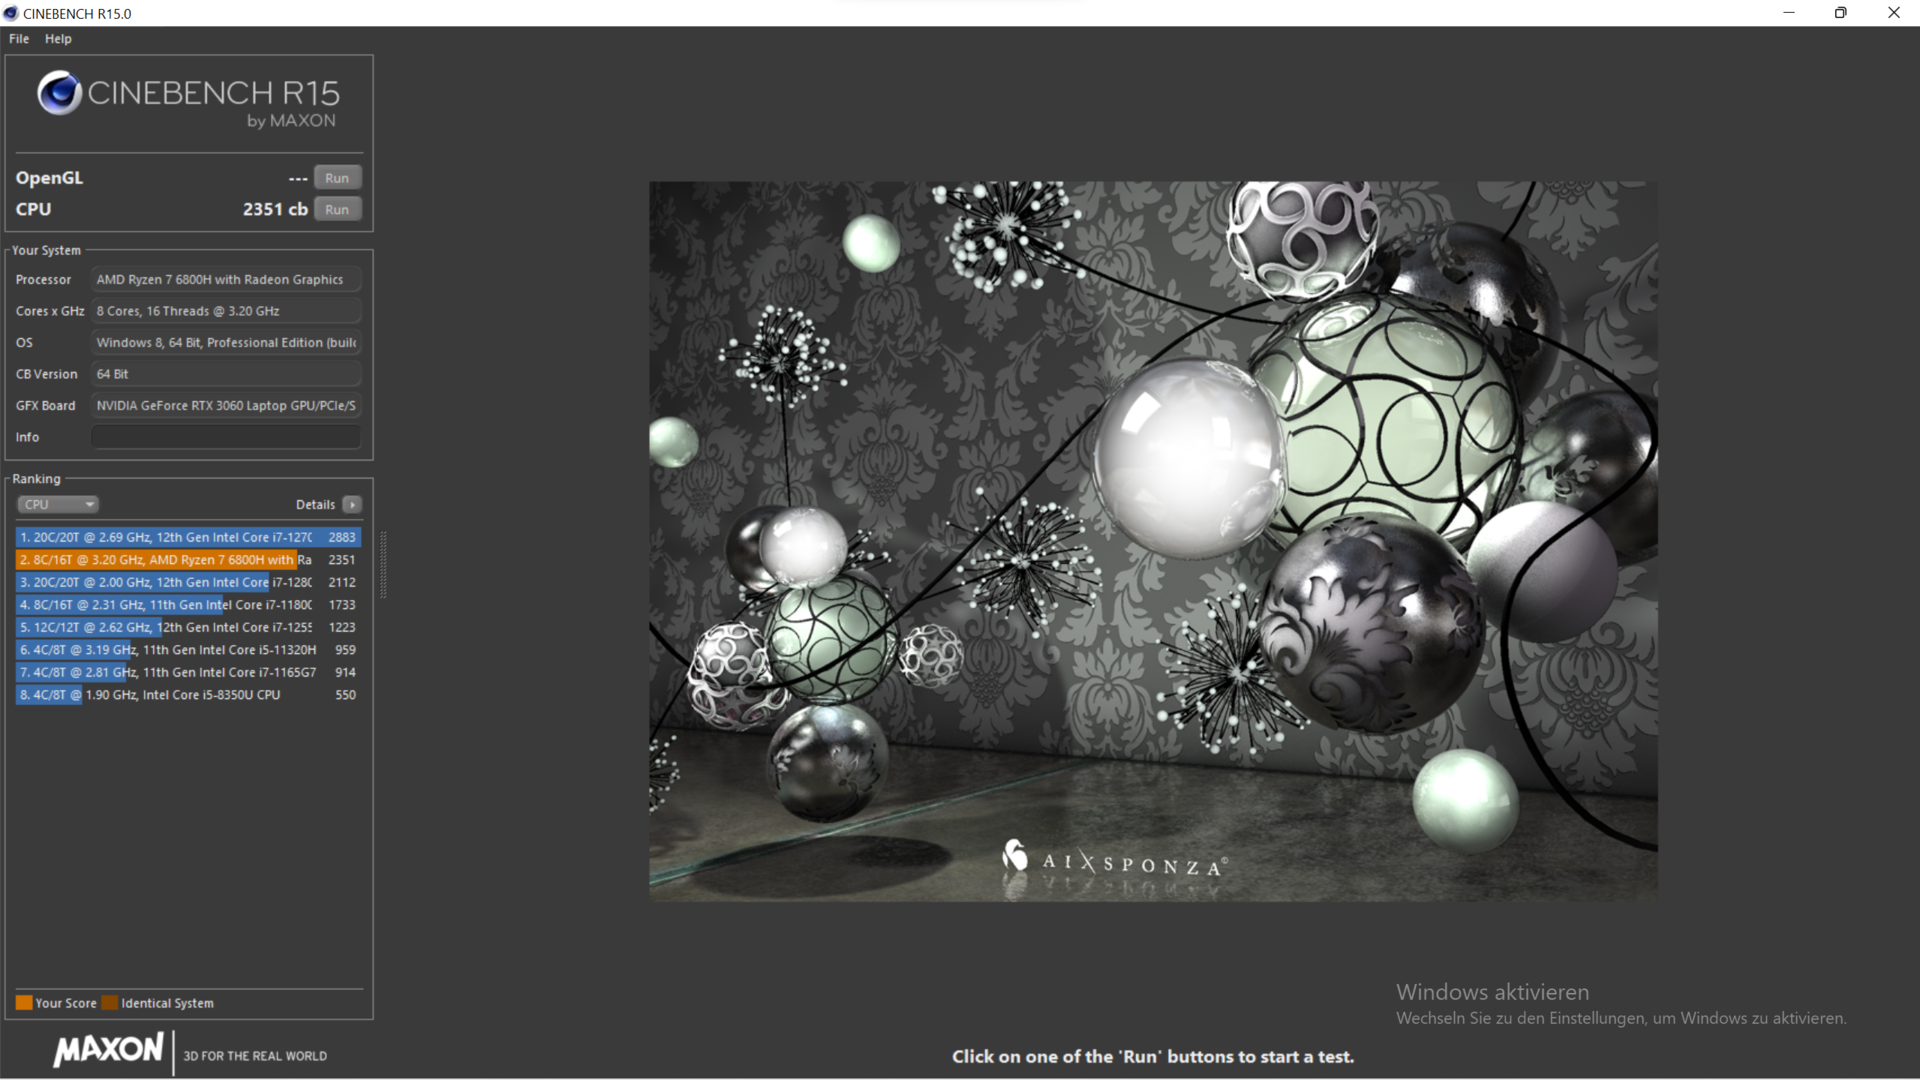
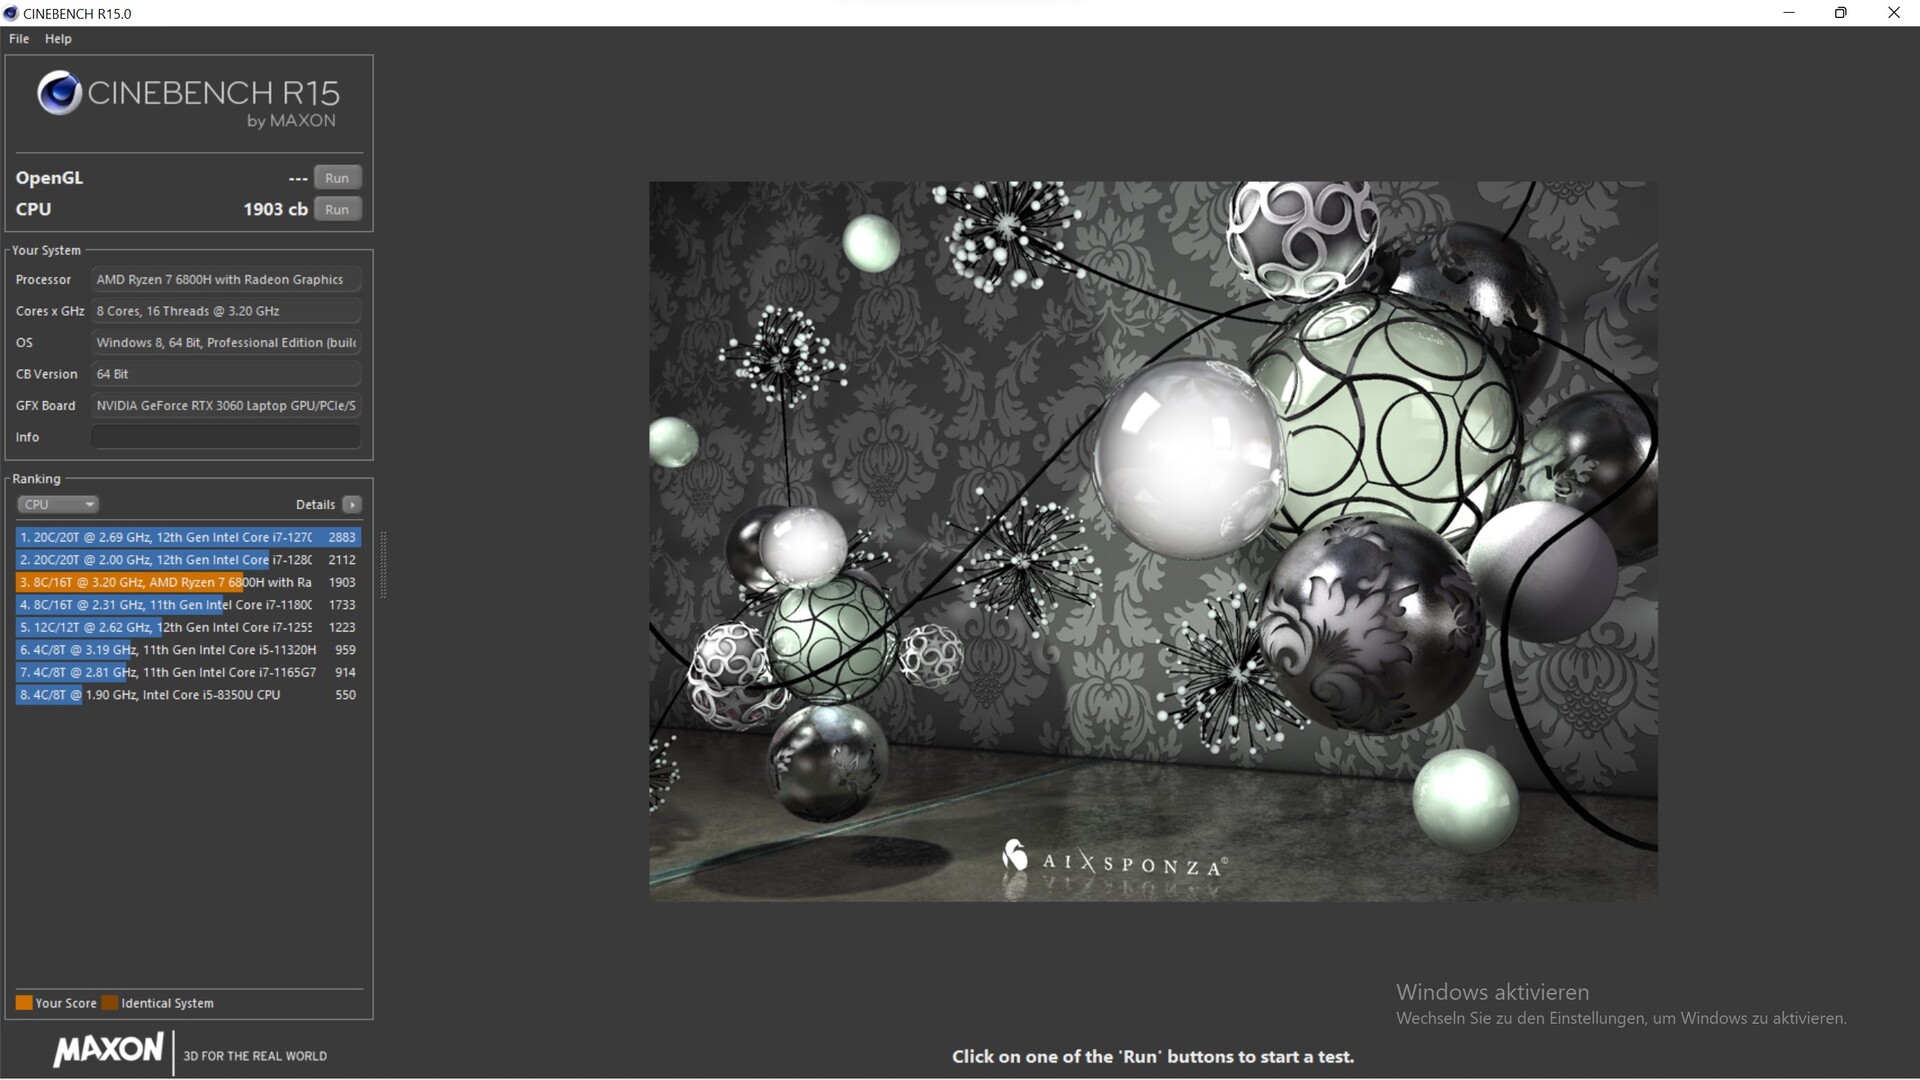
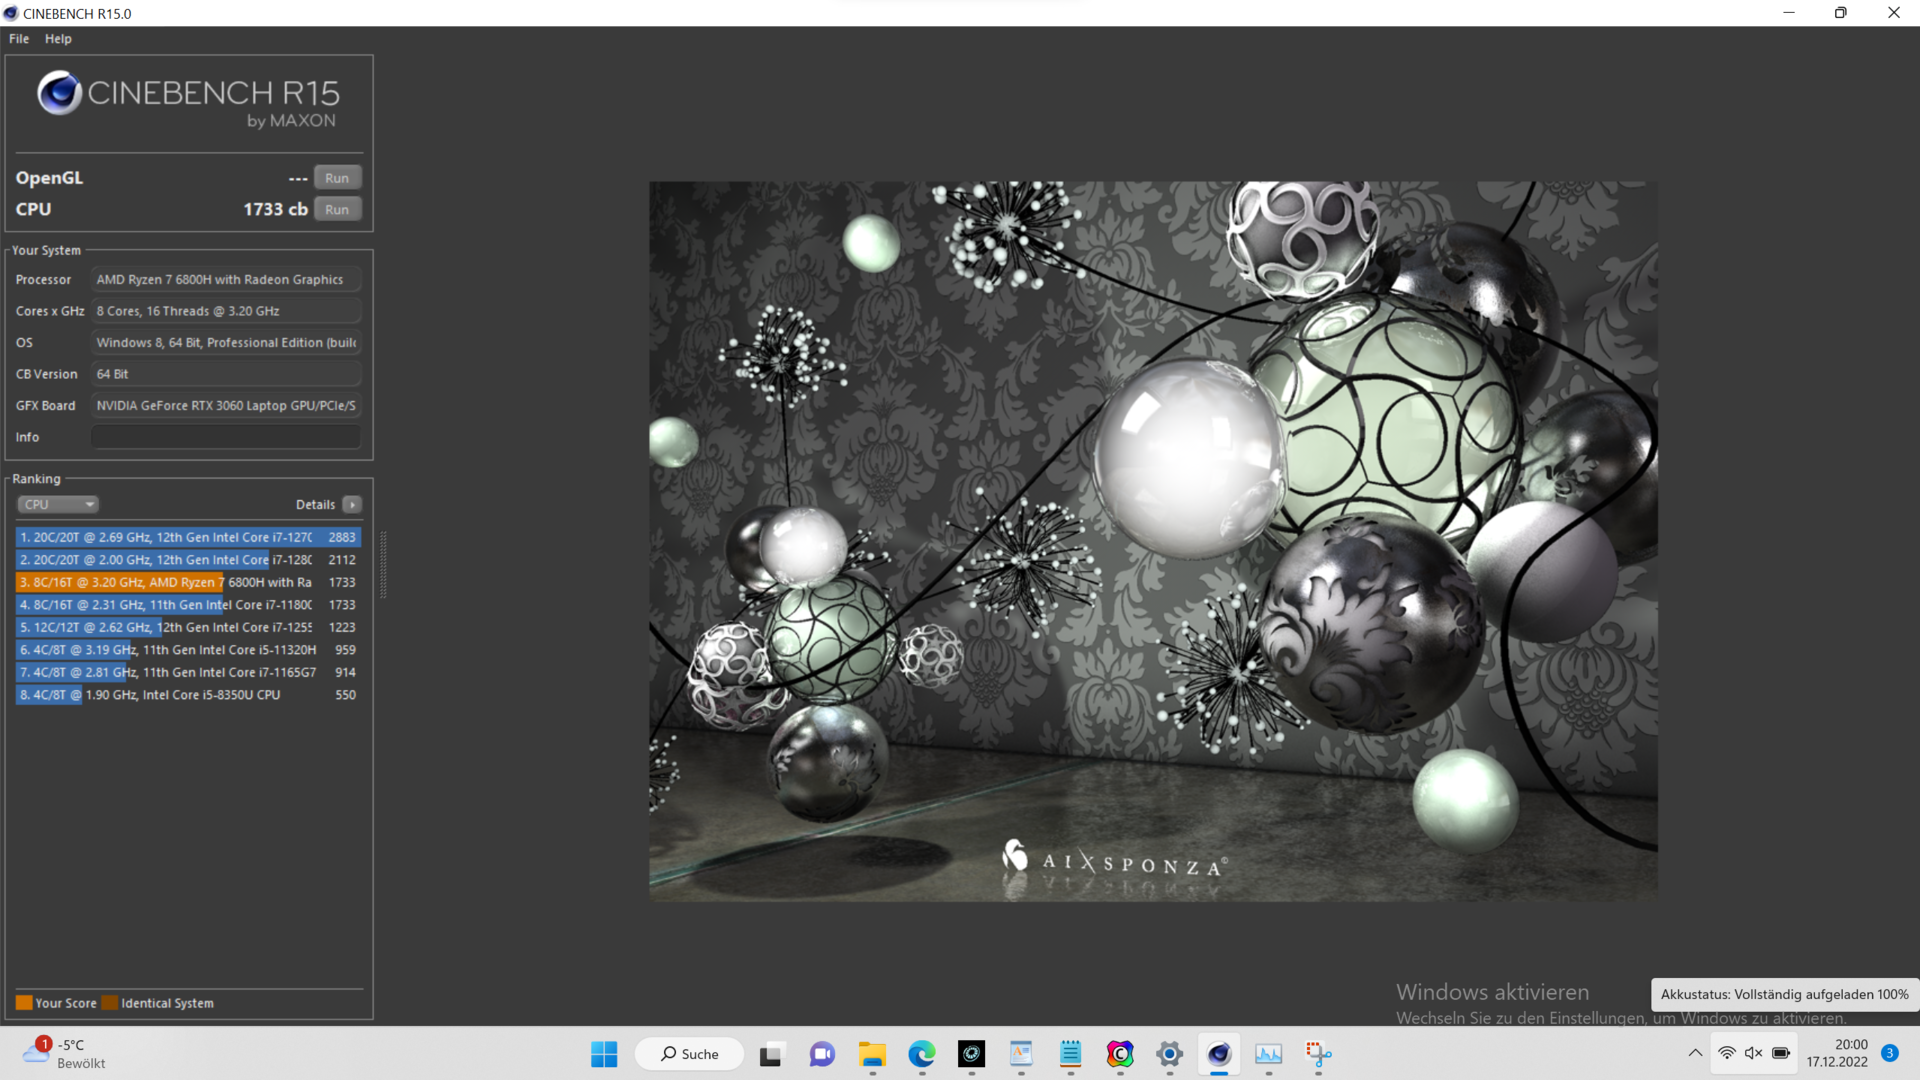
AMD Ryzen 7 6800H to procesor o mocy 45 W, który w XMG Core 15 pracuje na stałe z mocą 75 W, dzięki czemu w temperaturze około 92 °C (~198 °F) można utrzymać taktowanie 4,3 GHz dla wszystkich ośmiu rdzeni. Przez kilka sekund do procesora dostarczane jest 85 W.
Nasza pętla Cinebench R15 pokazuje, że Core i7-12700H działa znacznie szybciej w Legion 5 i TUF Gaming F15 , chociaż XMG wykorzystuje potencjał Ryzen 7 6800H. Przy ograniczeniu mocy do 35 W (tryb zrównoważony) wydajność wydajnego procesora Ryzen spada tylko o 20%
W trybie bateryjnym wydajność spada o około 25% pomimoOverboost.

Cinebench R15 Multi endurance test
Cinebench R23: Multi Core | Single Core
Cinebench R20: CPU (Multi Core) | CPU (Single Core)
Cinebench R15: CPU Multi 64Bit | CPU Single 64Bit
Blender: v2.79 BMW27 CPU
7-Zip 18.03: 7z b 4 | 7z b 4 -mmt1
Geekbench 5.5: Multi-Core | Single-Core
HWBOT x265 Benchmark v2.2: 4k Preset
LibreOffice : 20 Documents To PDF
R Benchmark 2.5: Overall mean
| CPU Performance rating | |
| Średnia w klasie Gaming | |
| Lenovo Legion 5 15IAH7H 82RB | |
| Asus TUF Gaming F15 FX507ZM | |
| Schenker XMG Core 15 (M22) | |
| Przeciętny AMD Ryzen 7 6800H | |
| Alienware m15 R5 Ryzen Edition | |
| Schenker XMG Fusion 15 (Mid 22) | |
| Schenker XMG Core 15 Ampere | |
| Cinebench R23 / Multi Core | |
| Średnia w klasie Gaming (10488 - 40970, n=110, ostatnie 2 lata) | |
| Lenovo Legion 5 15IAH7H 82RB | |
| Asus TUF Gaming F15 FX507ZM | |
| Schenker XMG Core 15 (M22) | |
| Przeciętny AMD Ryzen 7 6800H (11481 - 14660, n=11) | |
| Alienware m15 R5 Ryzen Edition | |
| Schenker XMG Core 15 Ampere | |
| Schenker XMG Fusion 15 (Mid 22) | |
| Cinebench R23 / Single Core | |
| Średnia w klasie Gaming (1166 - 2356, n=110, ostatnie 2 lata) | |
| Lenovo Legion 5 15IAH7H 82RB | |
| Asus TUF Gaming F15 FX507ZM | |
| Schenker XMG Core 15 (M22) | |
| Przeciętny AMD Ryzen 7 6800H (1500 - 1552, n=9) | |
| Schenker XMG Fusion 15 (Mid 22) | |
| Alienware m15 R5 Ryzen Edition | |
| Schenker XMG Core 15 Ampere | |
| Cinebench R20 / CPU (Multi Core) | |
| Średnia w klasie Gaming (4029 - 16108, n=109, ostatnie 2 lata) | |
| Lenovo Legion 5 15IAH7H 82RB | |
| Asus TUF Gaming F15 FX507ZM | |
| Schenker XMG Core 15 (M22) | |
| Przeciętny AMD Ryzen 7 6800H (4460 - 5661, n=9) | |
| Alienware m15 R5 Ryzen Edition | |
| Schenker XMG Core 15 Ampere | |
| Schenker XMG Fusion 15 (Mid 22) | |
| Cinebench R20 / CPU (Single Core) | |
| Średnia w klasie Gaming (442 - 895, n=109, ostatnie 2 lata) | |
| Lenovo Legion 5 15IAH7H 82RB | |
| Asus TUF Gaming F15 FX507ZM | |
| Schenker XMG Core 15 (M22) | |
| Przeciętny AMD Ryzen 7 6800H (580 - 605, n=9) | |
| Schenker XMG Fusion 15 (Mid 22) | |
| Alienware m15 R5 Ryzen Edition | |
| Schenker XMG Core 15 Ampere | |
| Cinebench R15 / CPU Multi 64Bit | |
| Średnia w klasie Gaming (1578 - 6271, n=109, ostatnie 2 lata) | |
| Lenovo Legion 5 15IAH7H 82RB | |
| Asus TUF Gaming F15 FX507ZM | |
| Schenker XMG Core 15 (M22) | |
| Przeciętny AMD Ryzen 7 6800H (1585 - 2366, n=10) | |
| Alienware m15 R5 Ryzen Edition | |
| Schenker XMG Core 15 Ampere | |
| Schenker XMG Fusion 15 (Mid 22) | |
| Cinebench R15 / CPU Single 64Bit | |
| Średnia w klasie Gaming (188.8 - 343, n=109, ostatnie 2 lata) | |
| Lenovo Legion 5 15IAH7H 82RB | |
| Asus TUF Gaming F15 FX507ZM | |
| Schenker XMG Core 15 (M22) | |
| Przeciętny AMD Ryzen 7 6800H (182.7 - 250, n=10) | |
| Alienware m15 R5 Ryzen Edition | |
| Schenker XMG Fusion 15 (Mid 22) | |
| Schenker XMG Core 15 Ampere | |
| Blender / v2.79 BMW27 CPU | |
| Schenker XMG Fusion 15 (Mid 22) | |
| Alienware m15 R5 Ryzen Edition | |
| Schenker XMG Core 15 Ampere | |
| Przeciętny AMD Ryzen 7 6800H (213 - 268, n=8) | |
| Schenker XMG Core 15 (M22) | |
| Asus TUF Gaming F15 FX507ZM | |
| Lenovo Legion 5 15IAH7H 82RB | |
| Średnia w klasie Gaming (80 - 330, n=107, ostatnie 2 lata) | |
| 7-Zip 18.03 / 7z b 4 | |
| Średnia w klasie Gaming (33491 - 148086, n=108, ostatnie 2 lata) | |
| Lenovo Legion 5 15IAH7H 82RB | |
| Asus TUF Gaming F15 FX507ZM | |
| Schenker XMG Core 15 (M22) | |
| Przeciętny AMD Ryzen 7 6800H (55067 - 64817, n=8) | |
| Alienware m15 R5 Ryzen Edition | |
| Schenker XMG Core 15 Ampere | |
| Schenker XMG Fusion 15 (Mid 22) | |
| 7-Zip 18.03 / 7z b 4 -mmt1 | |
| Średnia w klasie Gaming (4199 - 7436, n=108, ostatnie 2 lata) | |
| Lenovo Legion 5 15IAH7H 82RB | |
| Schenker XMG Core 15 (M22) | |
| Przeciętny AMD Ryzen 7 6800H (5521 - 5803, n=8) | |
| Alienware m15 R5 Ryzen Edition | |
| Schenker XMG Fusion 15 (Mid 22) | |
| Asus TUF Gaming F15 FX507ZM | |
| Schenker XMG Core 15 Ampere | |
| Geekbench 5.5 / Multi-Core | |
| Średnia w klasie Gaming (6460 - 27010, n=108, ostatnie 2 lata) | |
| Lenovo Legion 5 15IAH7H 82RB | |
| Asus TUF Gaming F15 FX507ZM | |
| Schenker XMG Core 15 (M22) | |
| Przeciętny AMD Ryzen 7 6800H (8898 - 10355, n=10) | |
| Schenker XMG Fusion 15 (Mid 22) | |
| Schenker XMG Core 15 Ampere | |
| Alienware m15 R5 Ryzen Edition | |
| Geekbench 5.5 / Single-Core | |
| Średnia w klasie Gaming (986 - 2474, n=108, ostatnie 2 lata) | |
| Lenovo Legion 5 15IAH7H 82RB | |
| Asus TUF Gaming F15 FX507ZM | |
| Schenker XMG Fusion 15 (Mid 22) | |
| Schenker XMG Core 15 (M22) | |
| Przeciętny AMD Ryzen 7 6800H (1518 - 1568, n=10) | |
| Alienware m15 R5 Ryzen Edition | |
| Schenker XMG Core 15 Ampere | |
| HWBOT x265 Benchmark v2.2 / 4k Preset | |
| Średnia w klasie Gaming (11.5 - 44.3, n=108, ostatnie 2 lata) | |
| Lenovo Legion 5 15IAH7H 82RB | |
| Asus TUF Gaming F15 FX507ZM | |
| Schenker XMG Core 15 (M22) | |
| Przeciętny AMD Ryzen 7 6800H (14.9 - 18.5, n=9) | |
| Alienware m15 R5 Ryzen Edition | |
| Schenker XMG Core 15 Ampere | |
| Schenker XMG Fusion 15 (Mid 22) | |
| LibreOffice / 20 Documents To PDF | |
| Schenker XMG Core 15 (M22) | |
| Schenker XMG Core 15 Ampere | |
| Alienware m15 R5 Ryzen Edition | |
| Przeciętny AMD Ryzen 7 6800H (48.7 - 79.5, n=8) | |
| Asus TUF Gaming F15 FX507ZM | |
| Średnia w klasie Gaming (19 - 88.8, n=108, ostatnie 2 lata) | |
| Schenker XMG Fusion 15 (Mid 22) | |
| Lenovo Legion 5 15IAH7H 82RB | |
| R Benchmark 2.5 / Overall mean | |
| Schenker XMG Core 15 Ampere | |
| Schenker XMG Fusion 15 (Mid 22) | |
| Alienware m15 R5 Ryzen Edition | |
| Przeciętny AMD Ryzen 7 6800H (0.4783 - 0.515, n=8) | |
| Schenker XMG Core 15 (M22) | |
| Asus TUF Gaming F15 FX507ZM | |
| Lenovo Legion 5 15IAH7H 82RB | |
| Średnia w klasie Gaming (0.3439 - 0.759, n=109, ostatnie 2 lata) | |
* ... im mniej tym lepiej
AIDA64: FP32 Ray-Trace | FPU Julia | CPU SHA3 | CPU Queen | FPU SinJulia | FPU Mandel | CPU AES | CPU ZLib | FP64 Ray-Trace | CPU PhotoWorxx
| Performance rating | |
| Średnia w klasie Gaming | |
| Lenovo Legion 5 15IAH7H 82RB | |
| Schenker XMG Core 15 (M22) | |
| Przeciętny AMD Ryzen 7 6800H | |
| Alienware m15 R5 Ryzen Edition | |
| Schenker XMG Core 15 Ampere | |
| Schenker XMG Fusion 15 (Mid 22) | |
| Asus TUF Gaming F15 FX507ZM | |
| AIDA64 / FP32 Ray-Trace | |
| Średnia w klasie Gaming (10227 - 85542, n=107, ostatnie 2 lata) | |
| Lenovo Legion 5 15IAH7H 82RB | |
| Schenker XMG Core 15 (M22) | |
| Przeciętny AMD Ryzen 7 6800H (12876 - 17031, n=8) | |
| Schenker XMG Core 15 Ampere | |
| Alienware m15 R5 Ryzen Edition | |
| Schenker XMG Fusion 15 (Mid 22) | |
| Asus TUF Gaming F15 FX507ZM | |
| AIDA64 / FPU Julia | |
| Średnia w klasie Gaming (51376 - 238426, n=107, ostatnie 2 lata) | |
| Schenker XMG Core 15 (M22) | |
| Przeciętny AMD Ryzen 7 6800H (82673 - 105987, n=8) | |
| Alienware m15 R5 Ryzen Edition | |
| Lenovo Legion 5 15IAH7H 82RB | |
| Schenker XMG Core 15 Ampere | |
| Schenker XMG Fusion 15 (Mid 22) | |
| Asus TUF Gaming F15 FX507ZM | |
| AIDA64 / CPU SHA3 | |
| Średnia w klasie Gaming (2180 - 9817, n=107, ostatnie 2 lata) | |
| Lenovo Legion 5 15IAH7H 82RB | |
| Schenker XMG Fusion 15 (Mid 22) | |
| Schenker XMG Core 15 (M22) | |
| Asus TUF Gaming F15 FX507ZM | |
| Przeciętny AMD Ryzen 7 6800H (2886 - 3634, n=8) | |
| Alienware m15 R5 Ryzen Edition | |
| Schenker XMG Core 15 Ampere | |
| AIDA64 / CPU Queen | |
| Średnia w klasie Gaming (49785 - 173351, n=98, ostatnie 2 lata) | |
| Lenovo Legion 5 15IAH7H 82RB | |
| Asus TUF Gaming F15 FX507ZM | |
| Schenker XMG Core 15 Ampere | |
| Przeciętny AMD Ryzen 7 6800H (75117 - 106322, n=8) | |
| Alienware m15 R5 Ryzen Edition | |
| Schenker XMG Core 15 (M22) | |
| Schenker XMG Fusion 15 (Mid 22) | |
| AIDA64 / FPU SinJulia | |
| Średnia w klasie Gaming (4424 - 33636, n=107, ostatnie 2 lata) | |
| Schenker XMG Core 15 Ampere | |
| Schenker XMG Core 15 (M22) | |
| Przeciętny AMD Ryzen 7 6800H (11771 - 13120, n=8) | |
| Alienware m15 R5 Ryzen Edition | |
| Lenovo Legion 5 15IAH7H 82RB | |
| Asus TUF Gaming F15 FX507ZM | |
| Schenker XMG Fusion 15 (Mid 22) | |
| AIDA64 / FPU Mandel | |
| Średnia w klasie Gaming (25115 - 128721, n=107, ostatnie 2 lata) | |
| Schenker XMG Core 15 (M22) | |
| Przeciętny AMD Ryzen 7 6800H (45287 - 58327, n=8) | |
| Alienware m15 R5 Ryzen Edition | |
| Lenovo Legion 5 15IAH7H 82RB | |
| Schenker XMG Core 15 Ampere | |
| Schenker XMG Fusion 15 (Mid 22) | |
| Asus TUF Gaming F15 FX507ZM | |
| AIDA64 / CPU AES | |
| Lenovo Legion 5 15IAH7H 82RB | |
| Schenker XMG Fusion 15 (Mid 22) | |
| Alienware m15 R5 Ryzen Edition | |
| Przeciętny AMD Ryzen 7 6800H (67816 - 137383, n=8) | |
| Średnia w klasie Gaming (39258 - 247074, n=107, ostatnie 2 lata) | |
| Schenker XMG Core 15 Ampere | |
| Schenker XMG Core 15 (M22) | |
| Asus TUF Gaming F15 FX507ZM | |
| AIDA64 / CPU ZLib | |
| Średnia w klasie Gaming (574 - 2531, n=107, ostatnie 2 lata) | |
| Asus TUF Gaming F15 FX507ZM | |
| Lenovo Legion 5 15IAH7H 82RB | |
| Schenker XMG Core 15 (M22) | |
| Schenker XMG Core 15 Ampere | |
| Przeciętny AMD Ryzen 7 6800H (732 - 901, n=8) | |
| Alienware m15 R5 Ryzen Edition | |
| Schenker XMG Fusion 15 (Mid 22) | |
| AIDA64 / FP64 Ray-Trace | |
| Średnia w klasie Gaming (5509 - 45446, n=107, ostatnie 2 lata) | |
| Lenovo Legion 5 15IAH7H 82RB | |
| Schenker XMG Core 15 (M22) | |
| Przeciętny AMD Ryzen 7 6800H (6917 - 8980, n=8) | |
| Schenker XMG Core 15 Ampere | |
| Alienware m15 R5 Ryzen Edition | |
| Schenker XMG Fusion 15 (Mid 22) | |
| Asus TUF Gaming F15 FX507ZM | |
| AIDA64 / CPU PhotoWorxx | |
| Średnia w klasie Gaming (12271 - 89891, n=107, ostatnie 2 lata) | |
| Lenovo Legion 5 15IAH7H 82RB | |
| Asus TUF Gaming F15 FX507ZM | |
| Schenker XMG Core 15 (M22) | |
| Przeciętny AMD Ryzen 7 6800H (26496 - 30360, n=8) | |
| Schenker XMG Core 15 Ampere | |
| Schenker XMG Fusion 15 (Mid 22) | |
| Alienware m15 R5 Ryzen Edition | |
Wydajność systemu
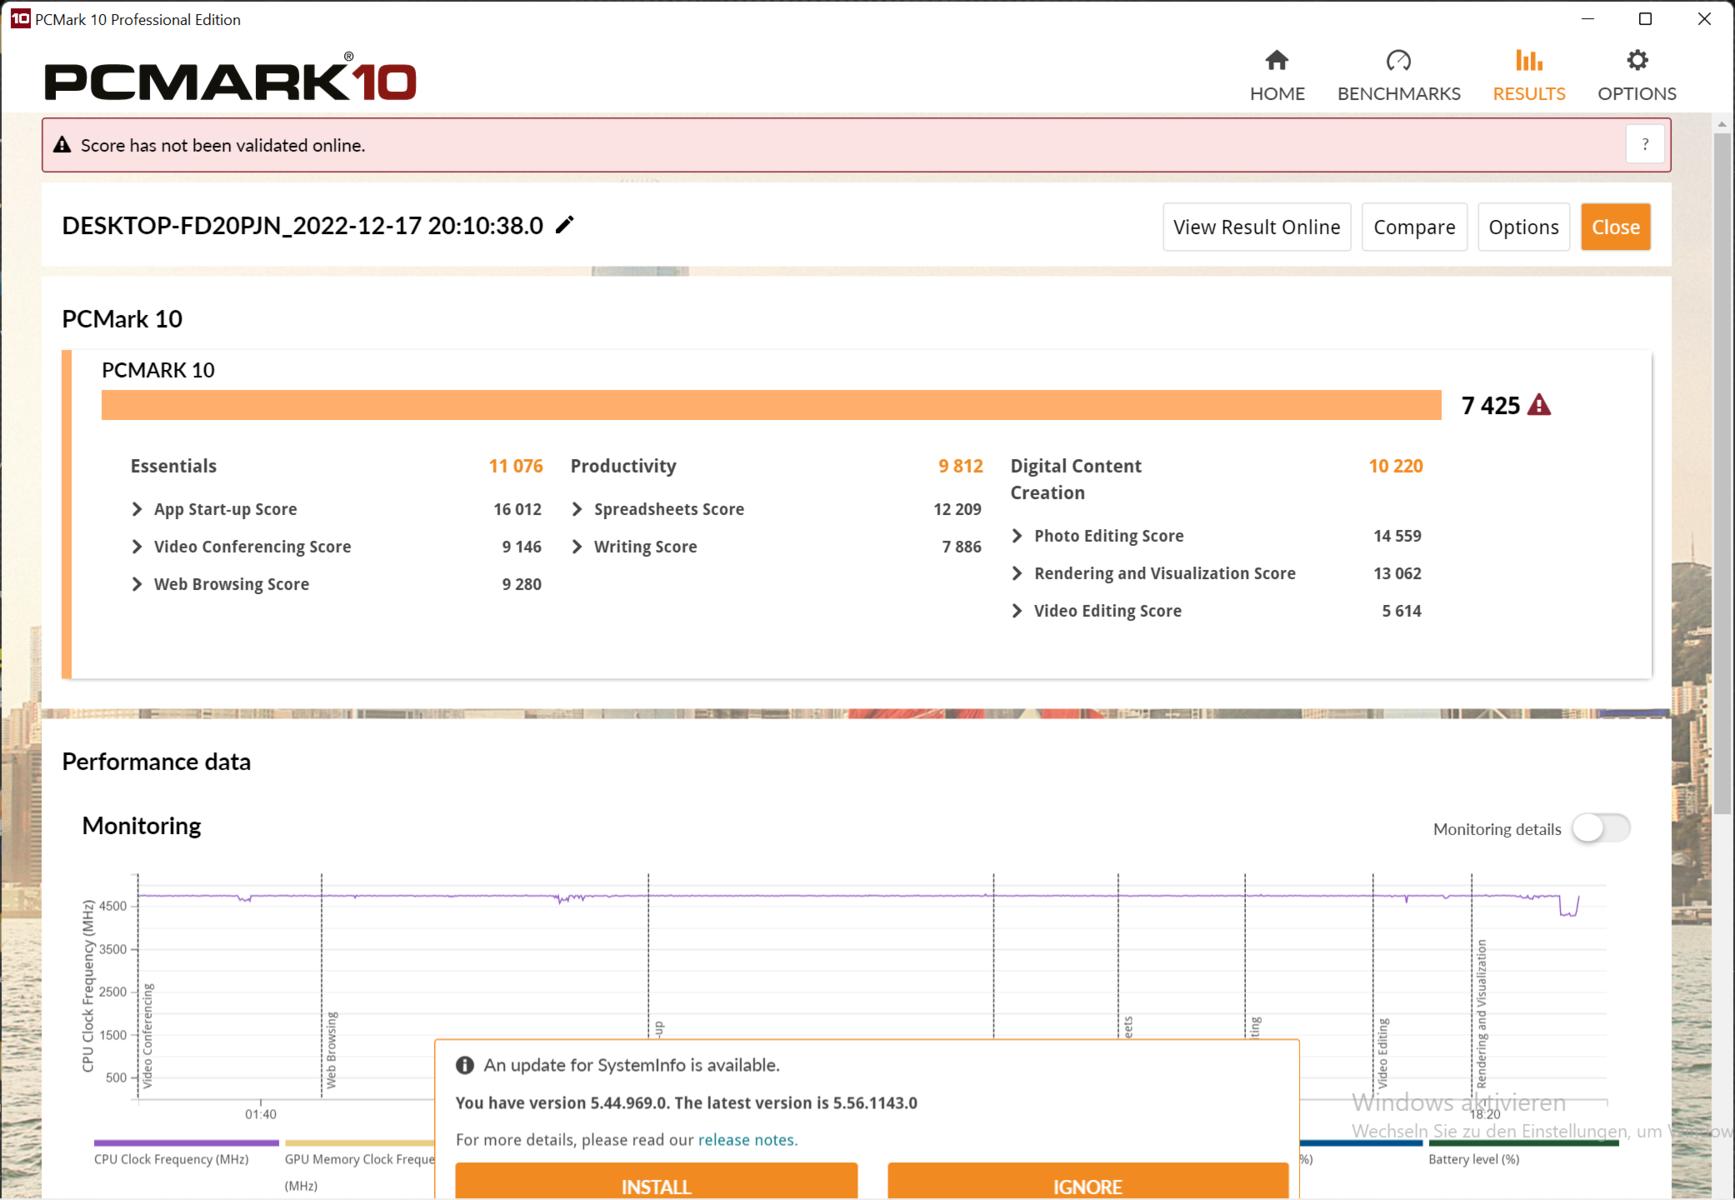
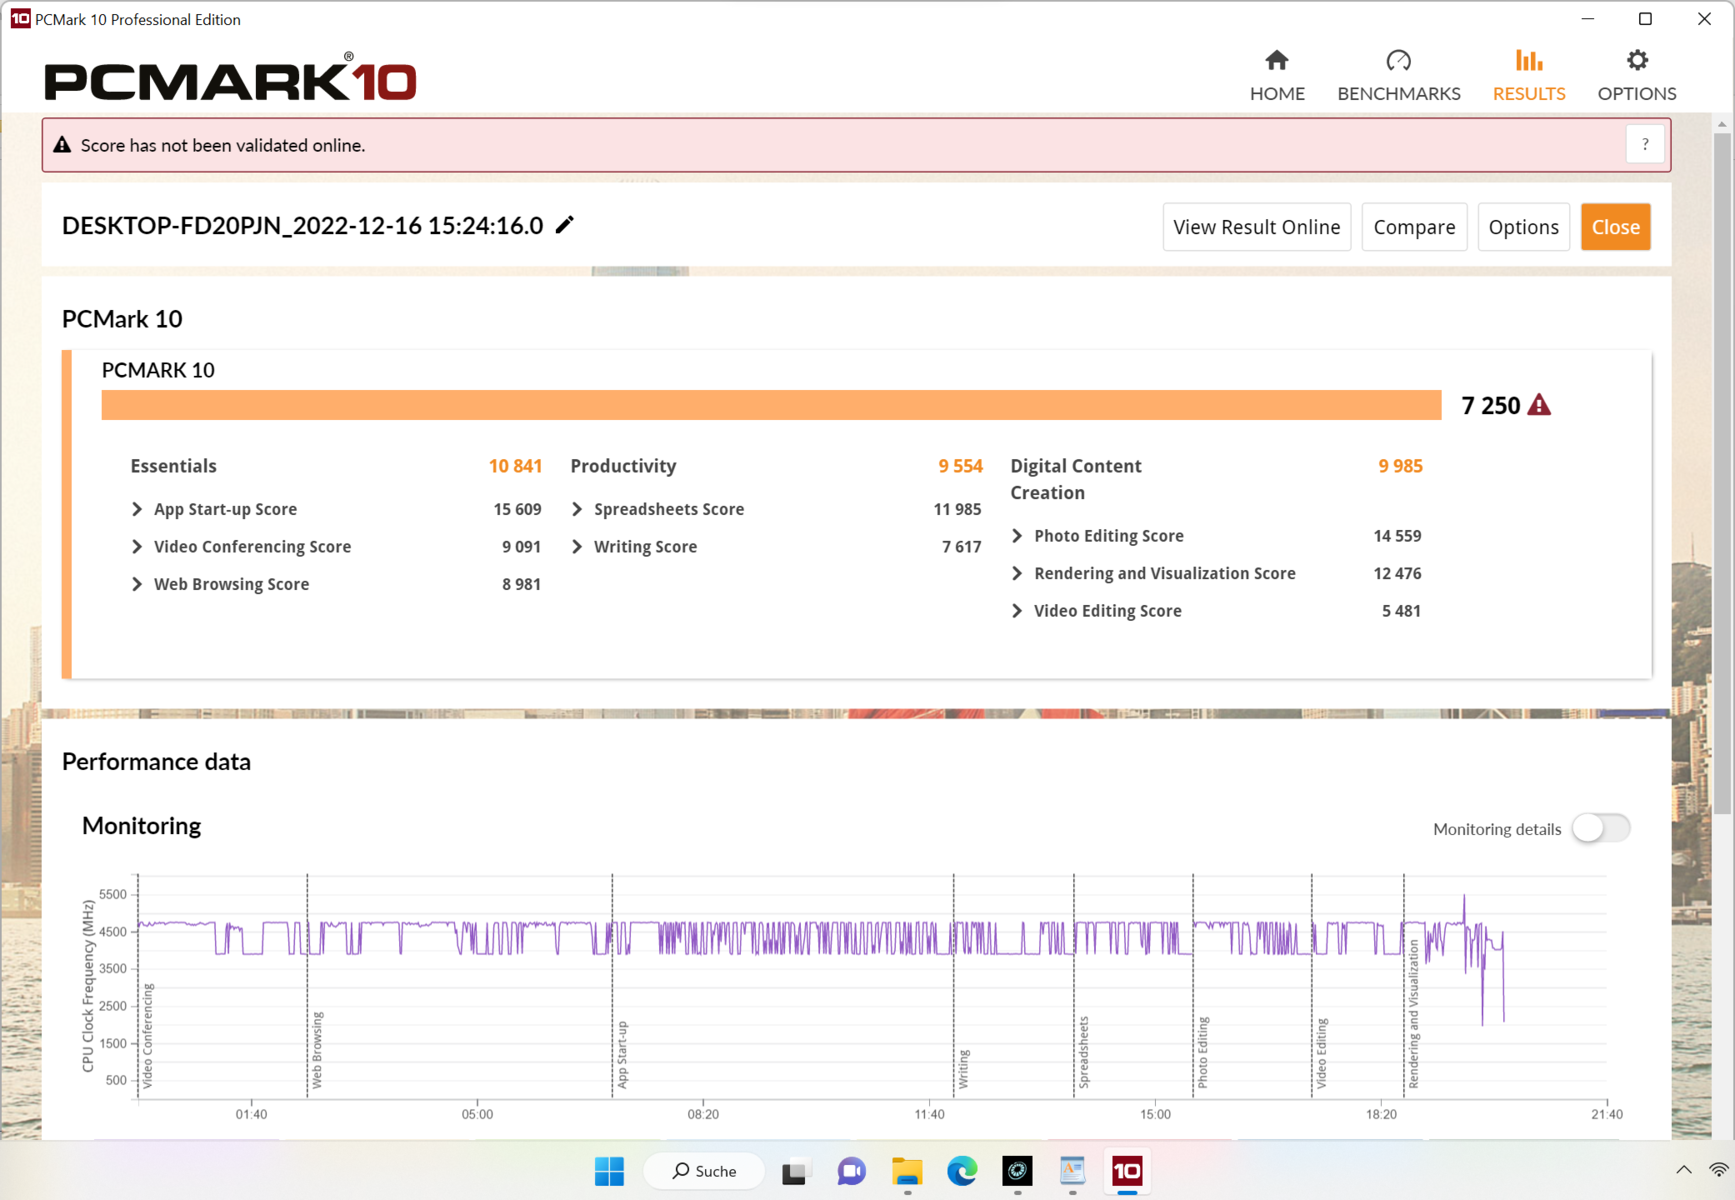
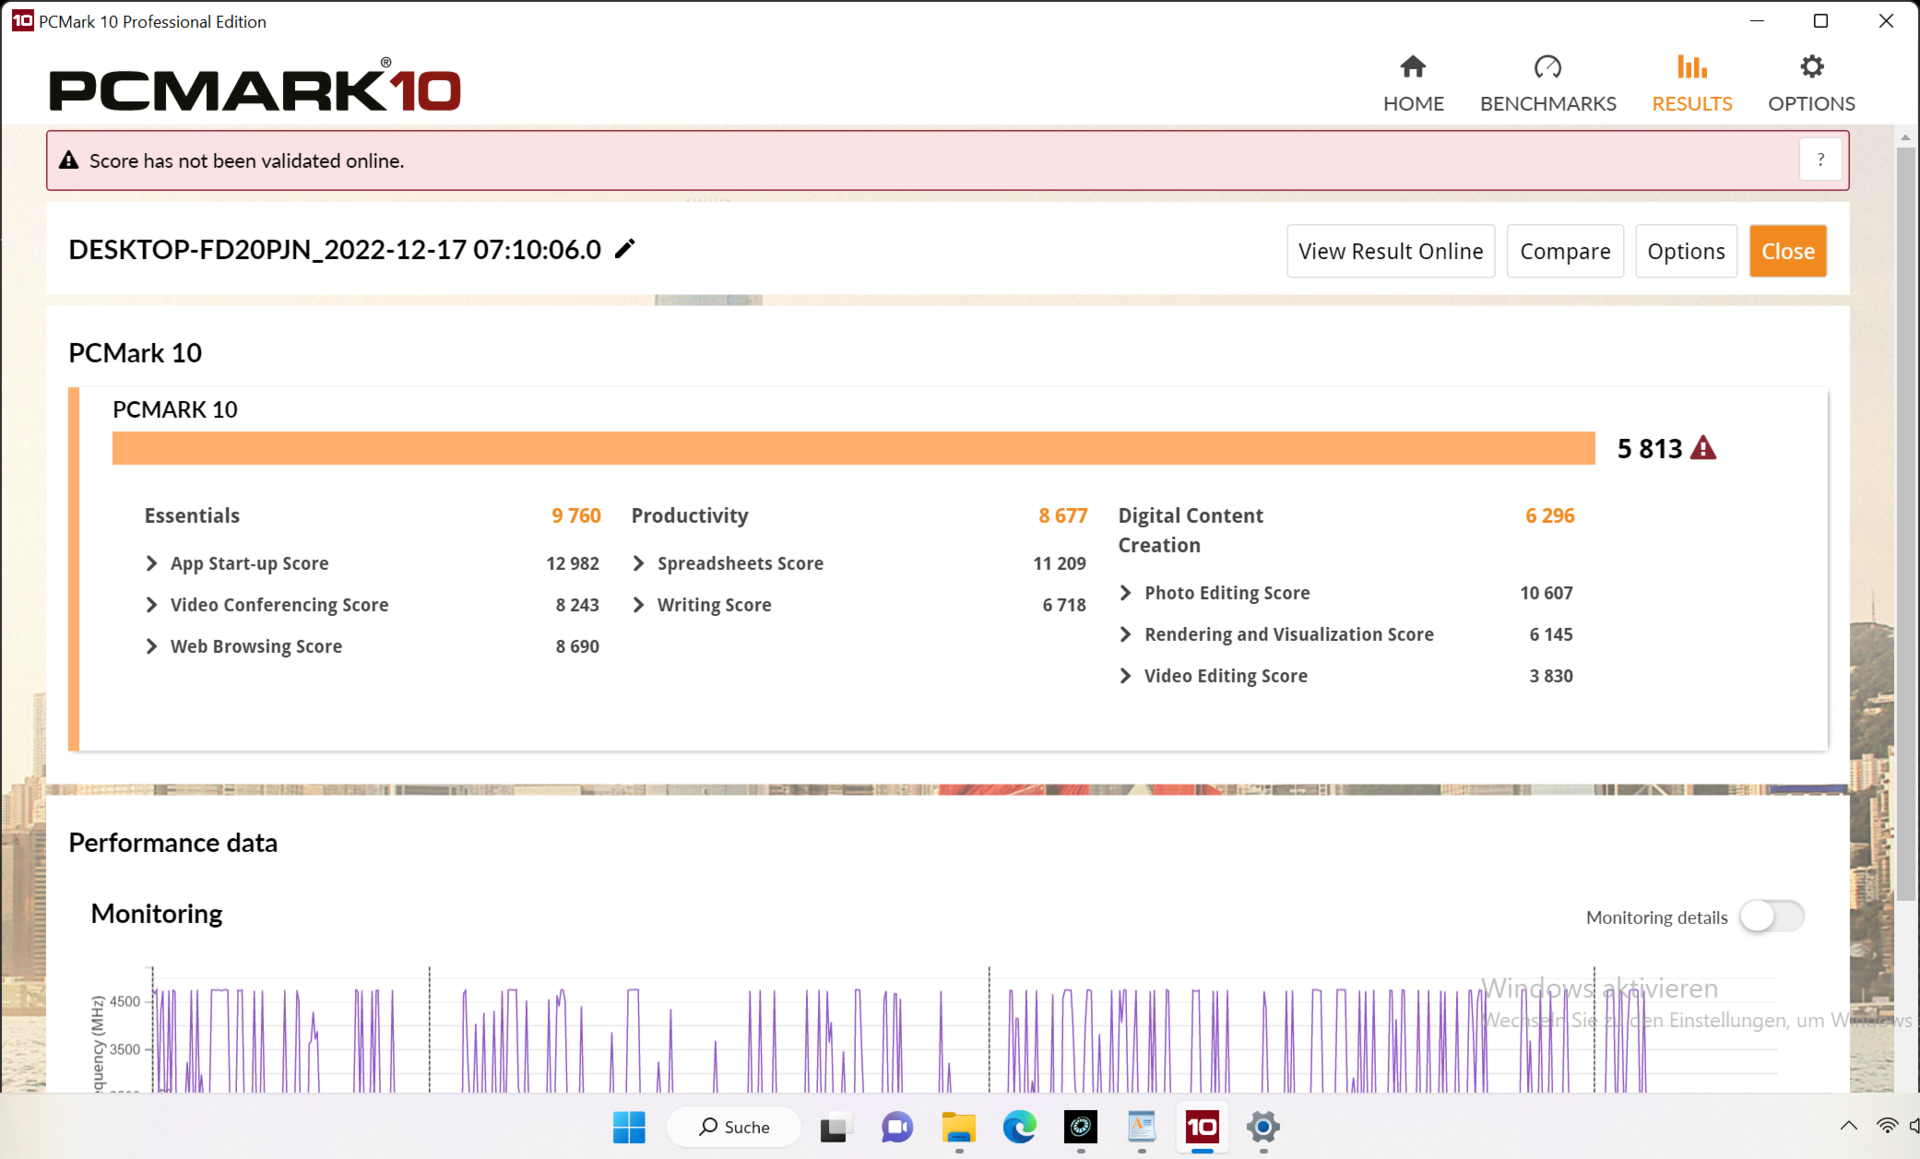
Benchmark PCMark 10 wykazał wynik na oczekiwanym poziomie dla tej konfiguracji systemu. Codzienne zadania są przetwarzane szybko i bez opóźnień.
Przeglądanie stron internetowych jest nieco szybsze w systemach Intela ze względu na silniejsze Turbo i wydajność pojedynczego rdzenia - ale w praktyce różnica jest mało zauważalna.
CrossMark: Overall | Productivity | Creativity | Responsiveness
Mozilla Kraken 1.1: Total
Speedometer 2.0: Result 2.0
Octane V2: Total Score
Jetstream 2: 2.0 Total
WebXPRT 3: Overall
WebXPRT 4: Overall
| PCMark 10 / Score | |
| Średnia w klasie Gaming (5828 - 11574, n=94, ostatnie 2 lata) | |
| Lenovo Legion 5 15IAH7H 82RB | |
| Asus TUF Gaming F15 FX507ZM | |
| Schenker XMG Core 15 (M22) | |
| Przeciętny AMD Ryzen 7 6800H, NVIDIA GeForce RTX 3060 Laptop GPU (n=1) | |
| Alienware m15 R5 Ryzen Edition | |
| Schenker XMG Fusion 15 (Mid 22) | |
| Schenker XMG Core 15 Ampere | |
| PCMark 10 / Essentials | |
| Lenovo Legion 5 15IAH7H 82RB | |
| Schenker XMG Core 15 (M22) | |
| Przeciętny AMD Ryzen 7 6800H, NVIDIA GeForce RTX 3060 Laptop GPU (n=1) | |
| Średnia w klasie Gaming (8810 - 12600, n=98, ostatnie 2 lata) | |
| Asus TUF Gaming F15 FX507ZM | |
| Alienware m15 R5 Ryzen Edition | |
| Schenker XMG Fusion 15 (Mid 22) | |
| Schenker XMG Core 15 Ampere | |
| PCMark 10 / Productivity | |
| Średnia w klasie Gaming (6845 - 18766, n=96, ostatnie 2 lata) | |
| Lenovo Legion 5 15IAH7H 82RB | |
| Schenker XMG Core 15 (M22) | |
| Przeciętny AMD Ryzen 7 6800H, NVIDIA GeForce RTX 3060 Laptop GPU (n=1) | |
| Asus TUF Gaming F15 FX507ZM | |
| Alienware m15 R5 Ryzen Edition | |
| Schenker XMG Fusion 15 (Mid 22) | |
| Schenker XMG Core 15 Ampere | |
| PCMark 10 / Digital Content Creation | |
| Średnia w klasie Gaming (7602 - 19657, n=96, ostatnie 2 lata) | |
| Lenovo Legion 5 15IAH7H 82RB | |
| Asus TUF Gaming F15 FX507ZM | |
| Schenker XMG Core 15 (M22) | |
| Przeciętny AMD Ryzen 7 6800H, NVIDIA GeForce RTX 3060 Laptop GPU (n=1) | |
| Alienware m15 R5 Ryzen Edition | |
| Schenker XMG Core 15 Ampere | |
| Schenker XMG Fusion 15 (Mid 22) | |
| CrossMark / Overall | |
| Lenovo Legion 5 15IAH7H 82RB | |
| Średnia w klasie Gaming (1366 - 2409, n=96, ostatnie 2 lata) | |
| Schenker XMG Fusion 15 (Mid 22) | |
| Schenker XMG Core 15 (M22) | |
| Przeciętny AMD Ryzen 7 6800H, NVIDIA GeForce RTX 3060 Laptop GPU (n=1) | |
| CrossMark / Productivity | |
| Lenovo Legion 5 15IAH7H 82RB | |
| Średnia w klasie Gaming (1386 - 2254, n=96, ostatnie 2 lata) | |
| Schenker XMG Fusion 15 (Mid 22) | |
| Schenker XMG Core 15 (M22) | |
| Przeciętny AMD Ryzen 7 6800H, NVIDIA GeForce RTX 3060 Laptop GPU (n=1) | |
| CrossMark / Creativity | |
| Średnia w klasie Gaming (1343 - 2729, n=96, ostatnie 2 lata) | |
| Lenovo Legion 5 15IAH7H 82RB | |
| Schenker XMG Core 15 (M22) | |
| Przeciętny AMD Ryzen 7 6800H, NVIDIA GeForce RTX 3060 Laptop GPU (n=1) | |
| Schenker XMG Fusion 15 (Mid 22) | |
| CrossMark / Responsiveness | |
| Lenovo Legion 5 15IAH7H 82RB | |
| Średnia w klasie Gaming (1226 - 2334, n=96, ostatnie 2 lata) | |
| Schenker XMG Fusion 15 (Mid 22) | |
| Schenker XMG Core 15 (M22) | |
| Przeciętny AMD Ryzen 7 6800H, NVIDIA GeForce RTX 3060 Laptop GPU (n=1) | |
| Mozilla Kraken 1.1 / Total | |
| Schenker XMG Core 15 Ampere | |
| Schenker XMG Fusion 15 (Mid 22) | |
| Alienware m15 R5 Ryzen Edition | |
| Schenker XMG Core 15 (M22) | |
| Przeciętny AMD Ryzen 7 6800H, NVIDIA GeForce RTX 3060 Laptop GPU (n=1) | |
| Asus TUF Gaming F15 FX507ZM | |
| Lenovo Legion 5 15IAH7H 82RB | |
| Średnia w klasie Gaming (391 - 590, n=104, ostatnie 2 lata) | |
| Speedometer 2.0 / Result 2.0 | |
| Średnia w klasie Gaming (29 - 686, n=28, ostatnie 2 lata) | |
| Schenker XMG Core 15 (M22) | |
| Przeciętny AMD Ryzen 7 6800H, NVIDIA GeForce RTX 3060 Laptop GPU (n=1) | |
| Alienware m15 R5 Ryzen Edition | |
| Octane V2 / Total Score | |
| Średnia w klasie Gaming (89353 - 139447, n=29, ostatnie 2 lata) | |
| Schenker XMG Core 15 (M22) | |
| Przeciętny AMD Ryzen 7 6800H, NVIDIA GeForce RTX 3060 Laptop GPU (n=1) | |
| Alienware m15 R5 Ryzen Edition | |
| Jetstream 2 / 2.0 Total | |
| Średnia w klasie Gaming (291 - 516, n=30, ostatnie 2 lata) | |
| Lenovo Legion 5 15IAH7H 82RB | |
| Asus TUF Gaming F15 FX507ZM | |
| Schenker XMG Core 15 (M22) | |
| Przeciętny AMD Ryzen 7 6800H, NVIDIA GeForce RTX 3060 Laptop GPU (n=1) | |
| Alienware m15 R5 Ryzen Edition | |
| WebXPRT 3 / Overall | |
| Lenovo Legion 5 15IAH7H 82RB | |
| Średnia w klasie Gaming (242 - 532, n=99, ostatnie 2 lata) | |
| Asus TUF Gaming F15 FX507ZM | |
| Schenker XMG Core 15 (M22) | |
| Przeciętny AMD Ryzen 7 6800H, NVIDIA GeForce RTX 3060 Laptop GPU (n=1) | |
| Alienware m15 R5 Ryzen Edition | |
| Schenker XMG Fusion 15 (Mid 22) | |
| Schenker XMG Core 15 Ampere | |
| WebXPRT 4 / Overall | |
| Średnia w klasie Gaming (176.4 - 354, n=99, ostatnie 2 lata) | |
| Lenovo Legion 5 15IAH7H 82RB | |
| Schenker XMG Core 15 (M22) | |
| Przeciętny AMD Ryzen 7 6800H, NVIDIA GeForce RTX 3060 Laptop GPU (n=1) | |
| Schenker XMG Fusion 15 (Mid 22) | |
* ... im mniej tym lepiej
| PCMark 10 Score | 7250 pkt. | |
Pomoc | ||
| AIDA64 / Memory Copy | |
| Średnia w klasie Gaming (21750 - 129946, n=107, ostatnie 2 lata) | |
| Asus TUF Gaming F15 FX507ZM | |
| Lenovo Legion 5 15IAH7H 82RB | |
| Schenker XMG Core 15 (M22) | |
| Przeciętny AMD Ryzen 7 6800H (48209 - 51186, n=8) | |
| Schenker XMG Fusion 15 (Mid 22) | |
| Schenker XMG Core 15 Ampere | |
| Alienware m15 R5 Ryzen Edition | |
| AIDA64 / Memory Read | |
| Średnia w klasie Gaming (22956 - 118858, n=107, ostatnie 2 lata) | |
| Lenovo Legion 5 15IAH7H 82RB | |
| Asus TUF Gaming F15 FX507ZM | |
| Schenker XMG Core 15 (M22) | |
| Przeciętny AMD Ryzen 7 6800H (43828 - 51778, n=8) | |
| Schenker XMG Fusion 15 (Mid 22) | |
| Schenker XMG Core 15 Ampere | |
| Alienware m15 R5 Ryzen Edition | |
| AIDA64 / Memory Write | |
| Średnia w klasie Gaming (22297 - 135096, n=107, ostatnie 2 lata) | |
| Lenovo Legion 5 15IAH7H 82RB | |
| Asus TUF Gaming F15 FX507ZM | |
| Schenker XMG Core 15 (M22) | |
| Przeciętny AMD Ryzen 7 6800H (51116 - 55307, n=8) | |
| Schenker XMG Fusion 15 (Mid 22) | |
| Schenker XMG Core 15 Ampere | |
| Alienware m15 R5 Ryzen Edition | |
| AIDA64 / Memory Latency | |
| Średnia w klasie Gaming (75.3 - 259, n=107, ostatnie 2 lata) | |
| Lenovo Legion 5 15IAH7H 82RB | |
| Schenker XMG Fusion 15 (Mid 22) | |
| Przeciętny AMD Ryzen 7 6800H (83.1 - 104.1, n=8) | |
| Schenker XMG Core 15 (M22) | |
| Schenker XMG Core 15 Ampere | |
| Alienware m15 R5 Ryzen Edition | |
| Asus TUF Gaming F15 FX507ZM | |
* ... im mniej tym lepiej
Opóźnienia DPC
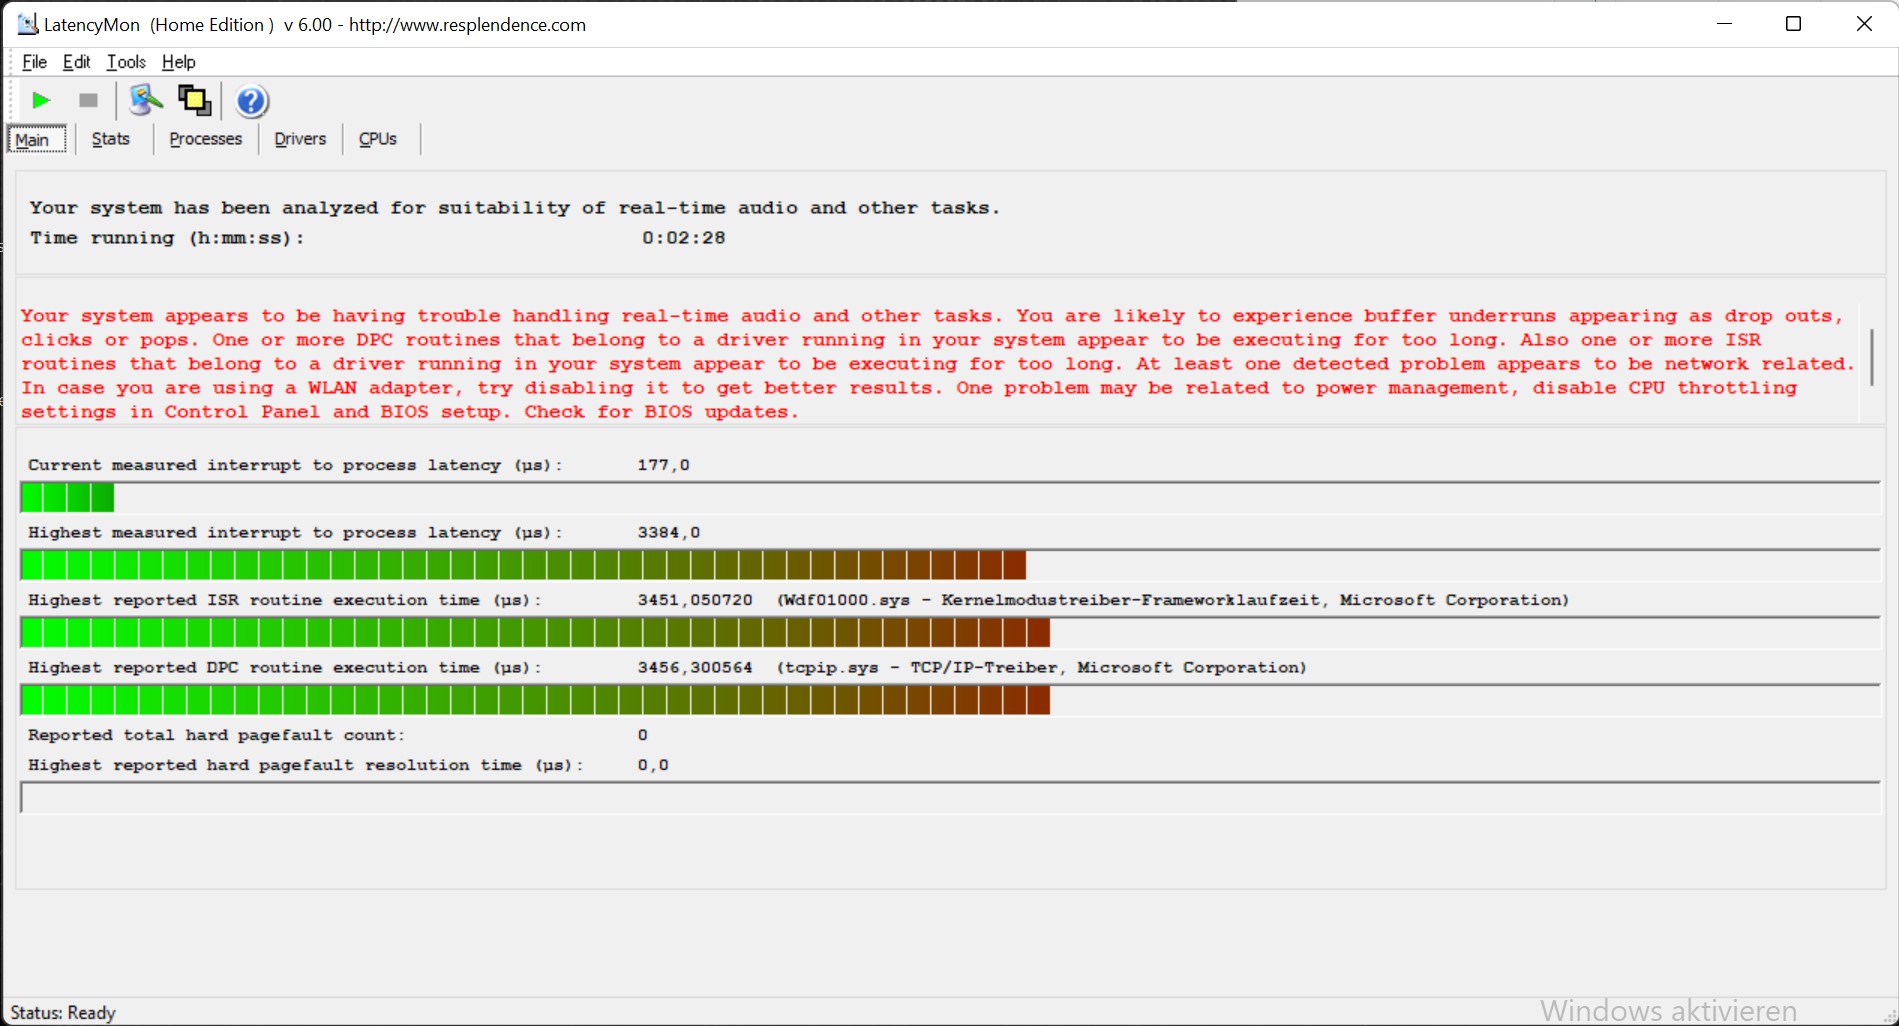
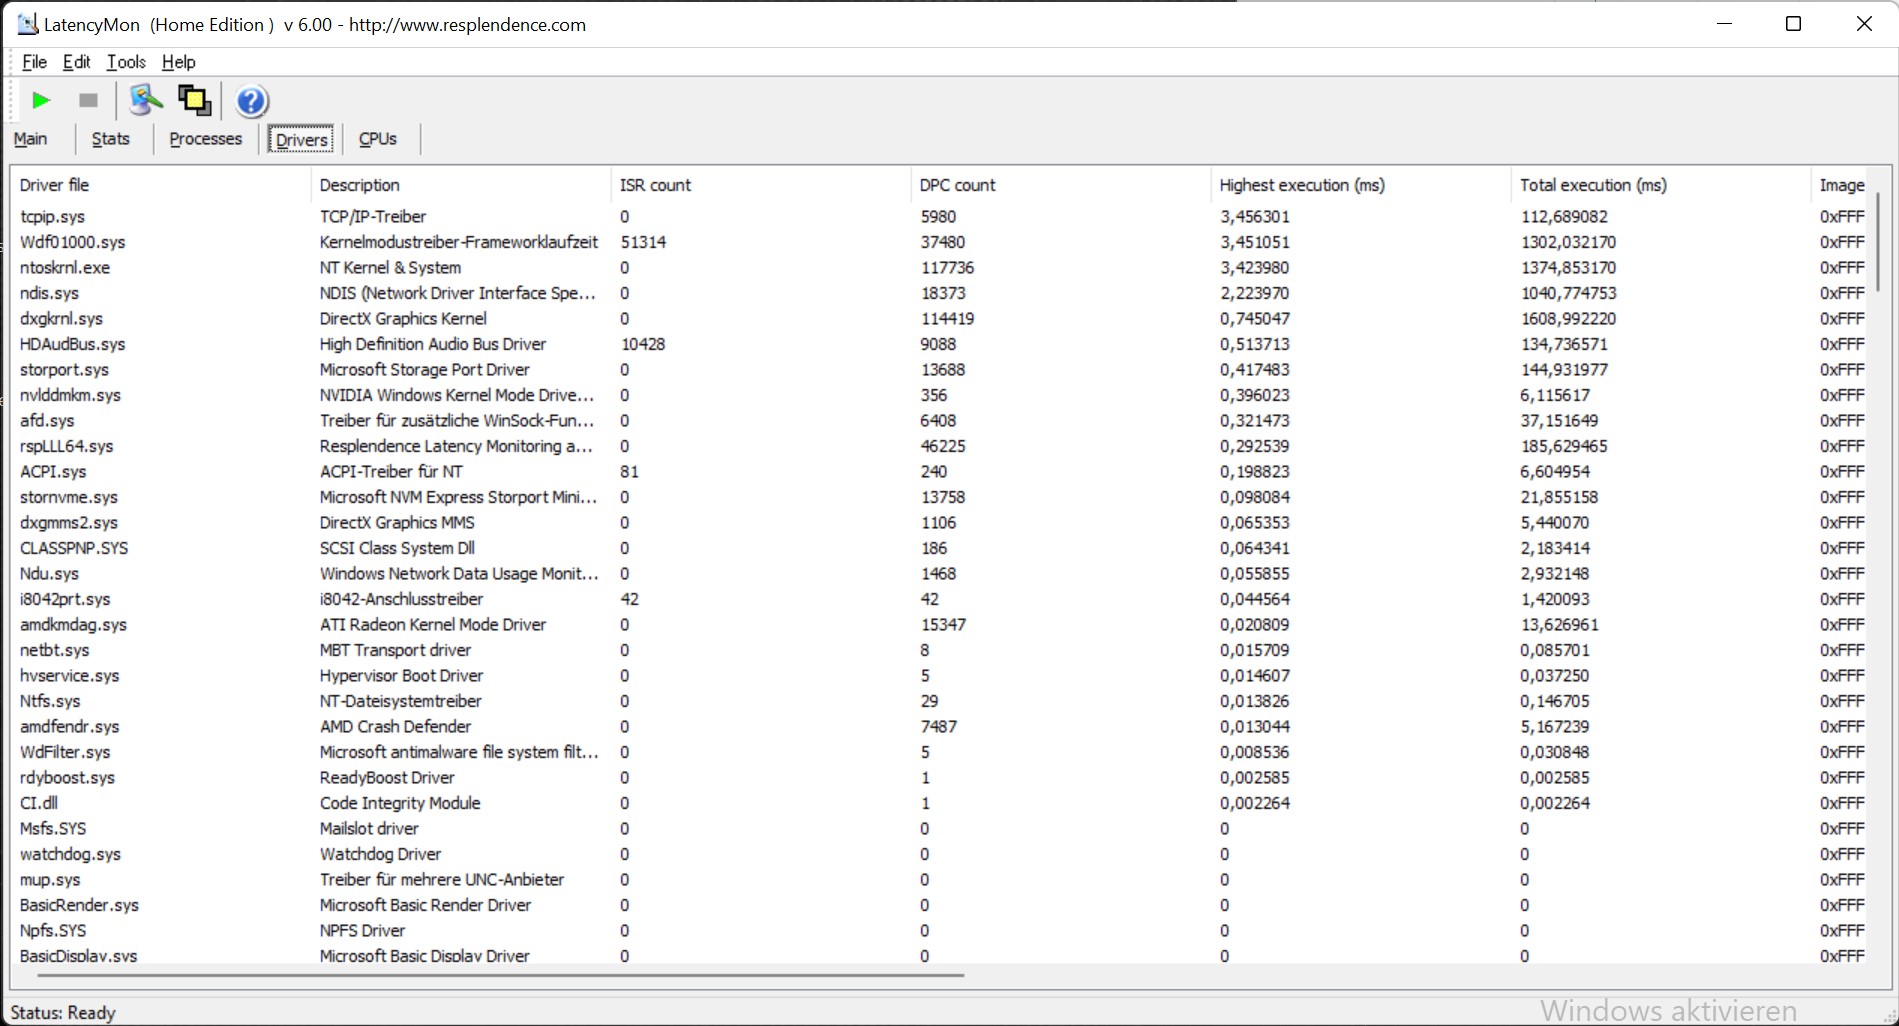
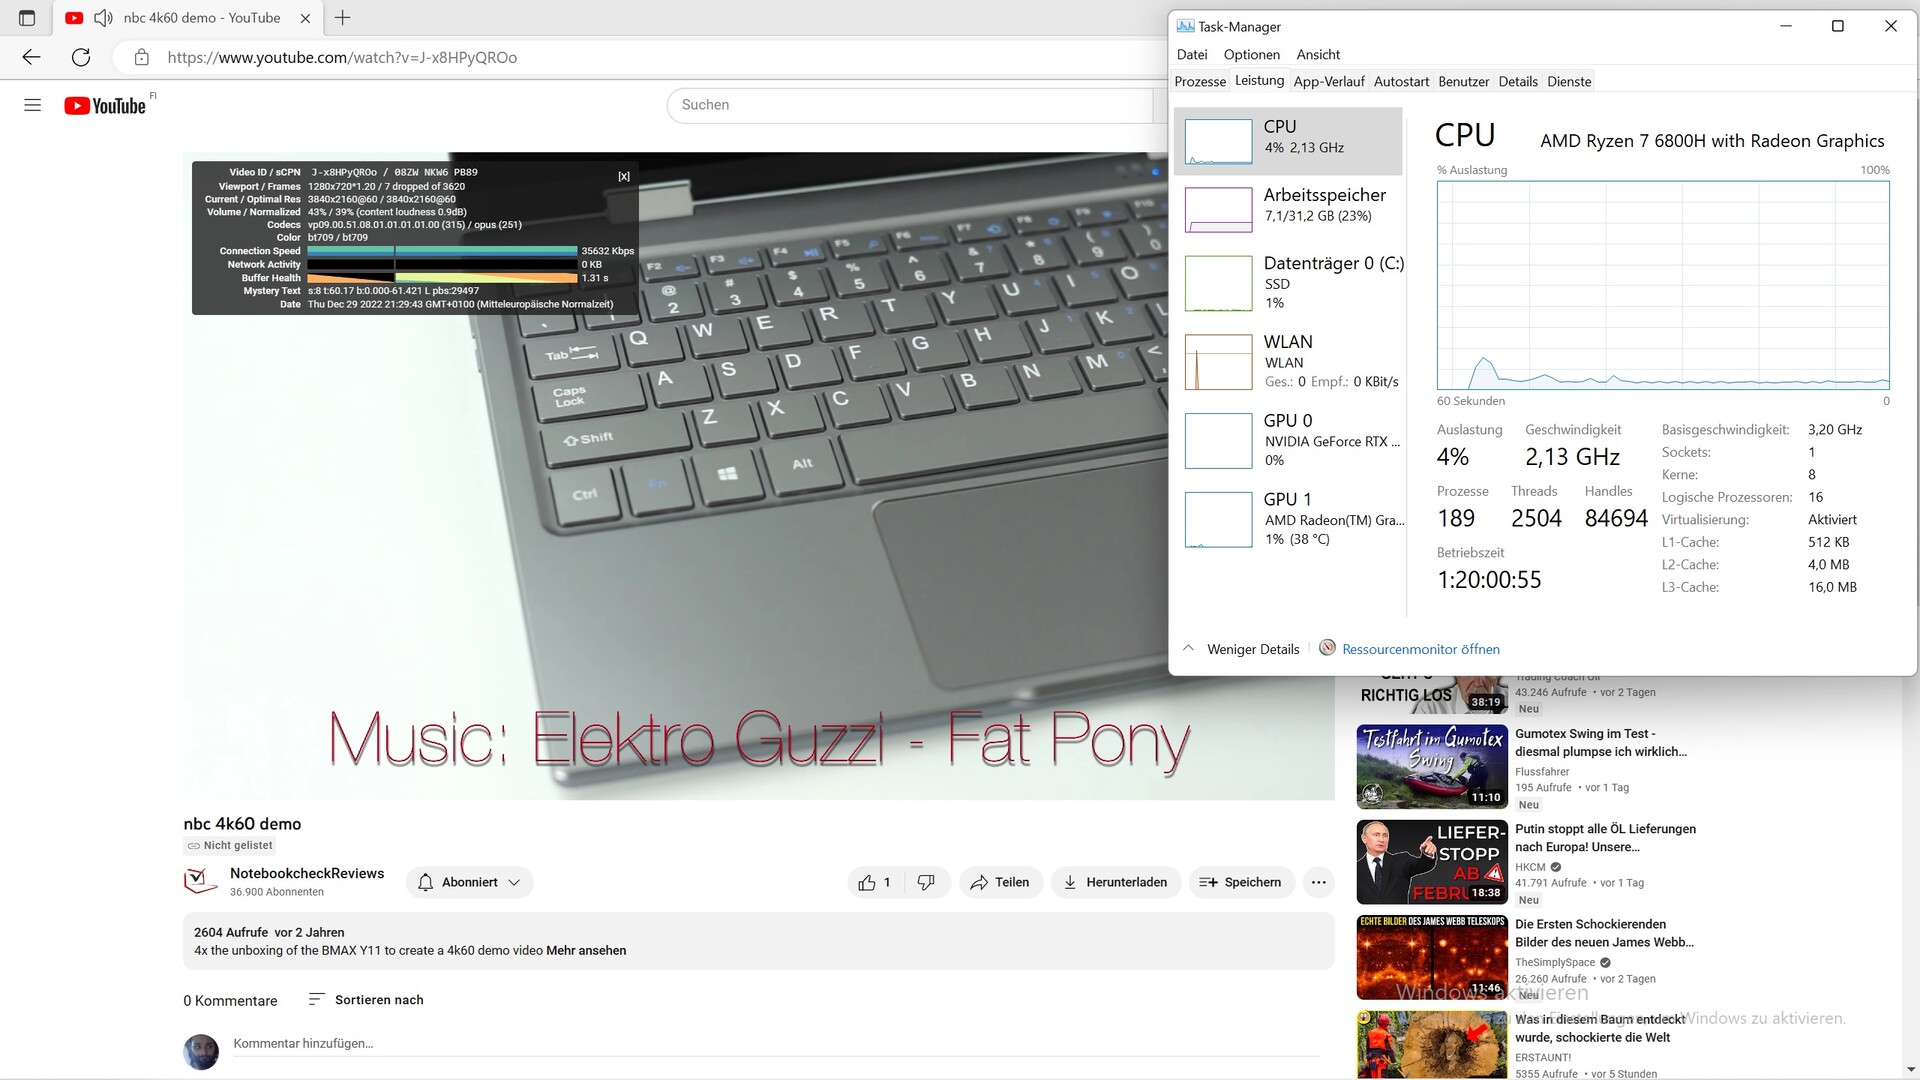
| DPC Latencies / LatencyMon - interrupt to process latency (max), Web, Youtube, Prime95 | |
| Schenker XMG Core 15 (M22) | |
| Schenker XMG Fusion 15 (Mid 22) | |
| Lenovo Legion 5 15IAH7H 82RB | |
| Asus TUF Gaming F15 FX507ZM | |
| Schenker XMG Core 15 Ampere | |
| Alienware m15 R5 Ryzen Edition | |
* ... im mniej tym lepiej
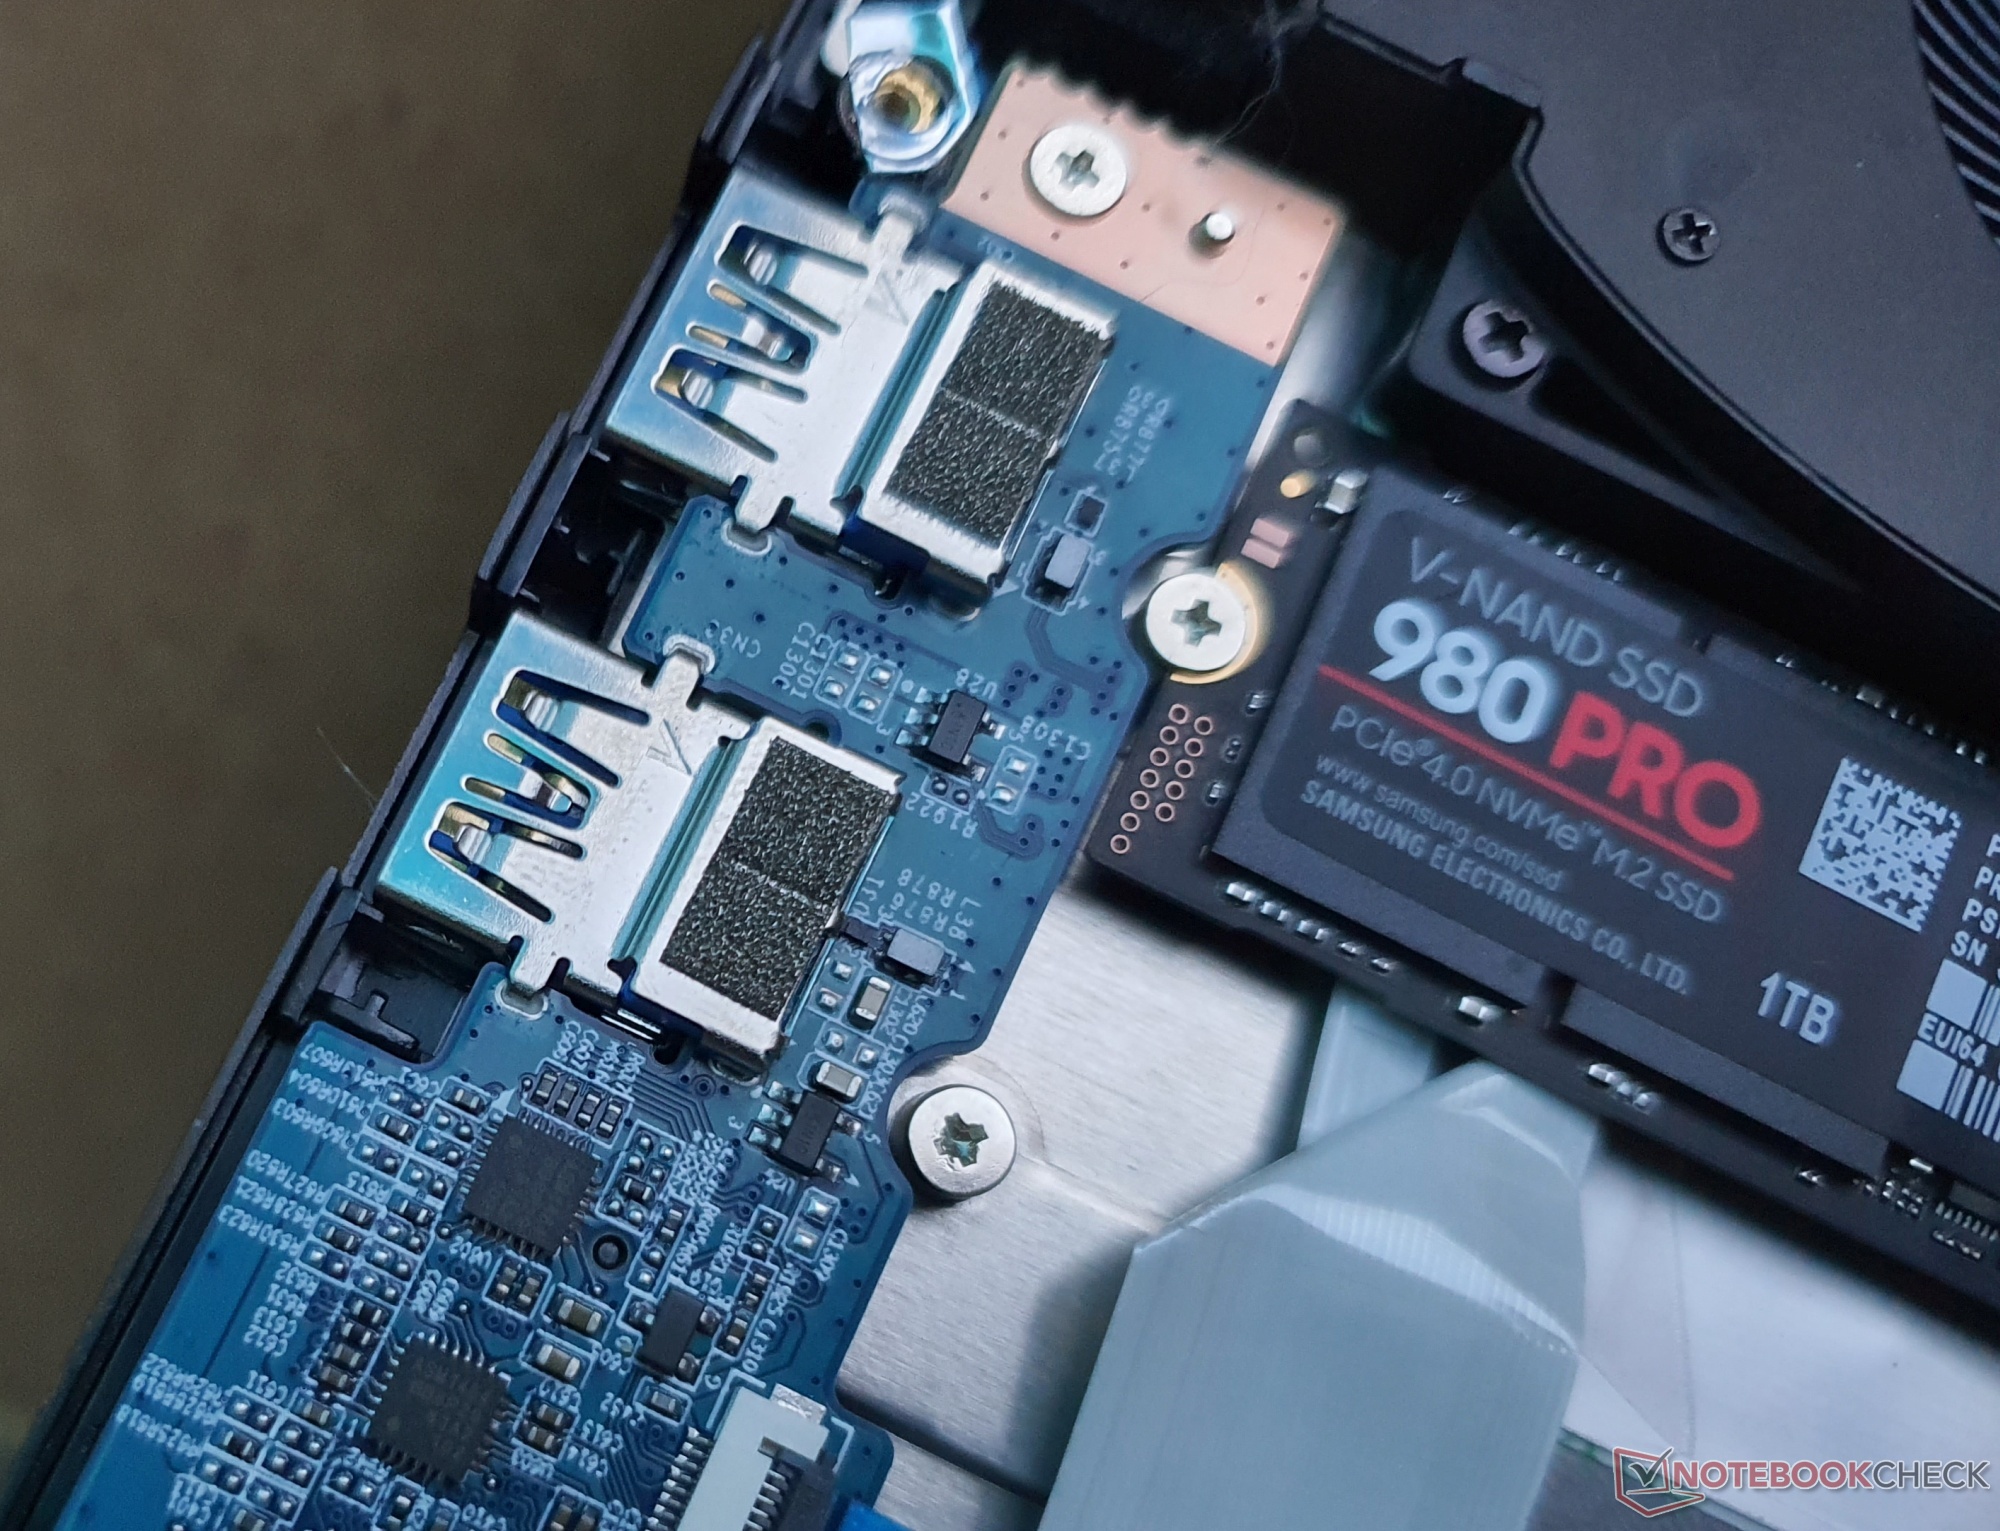
Pamięć masowa

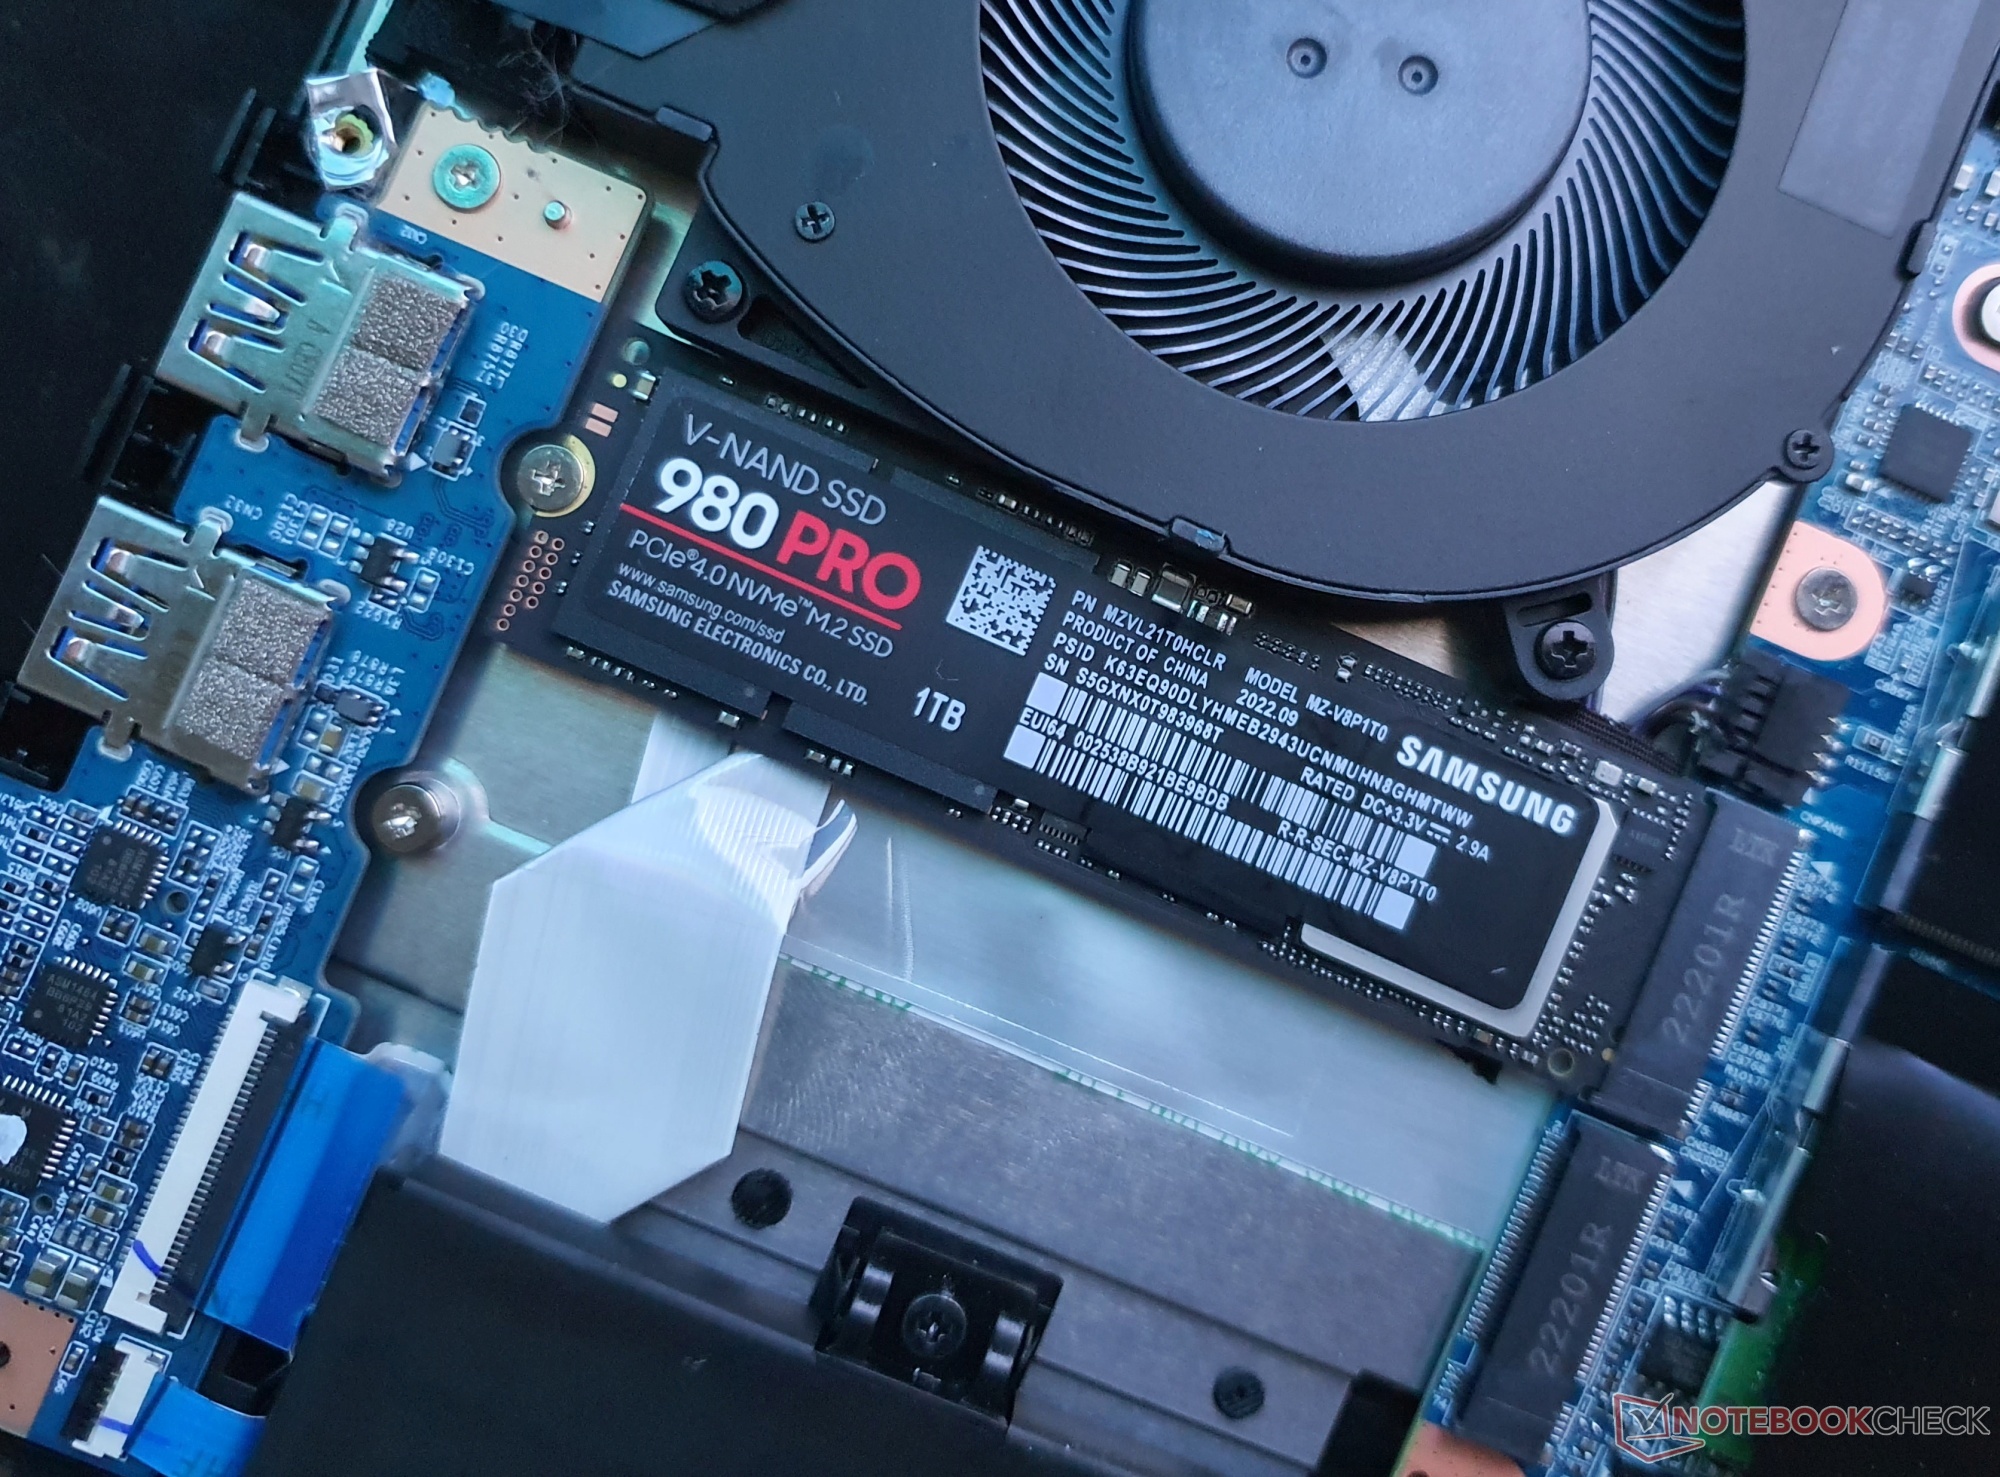
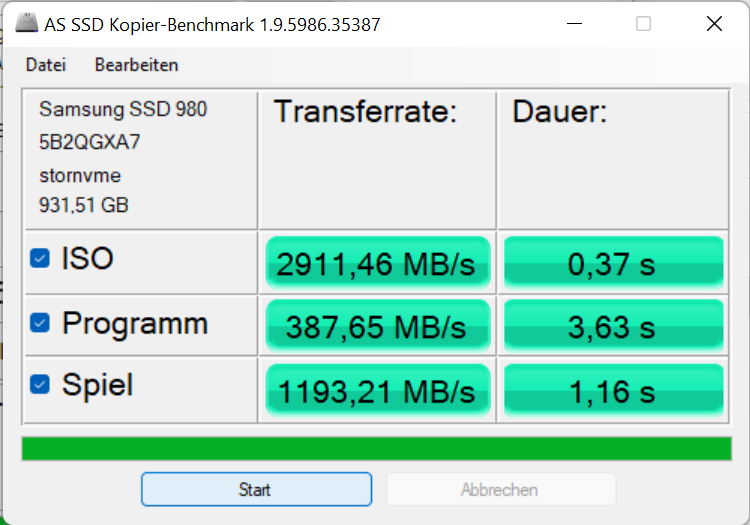
Zainstalowany Samsung 980 Pro 1 TB osiąga prędkości PCIe 4.0 nawet pod stałym obciążeniem, ale zmaga się z 32-64 jednoczesnymi procesami odczytu/zapisu 4K w laptopie XMG, co ma znaczenie głównie dla serwerów. Ten sam dysk SSD jest szybszy w XMG Fusion 15, więc jego potencjał nie jest w pełni wykorzystywany przez Core 15.
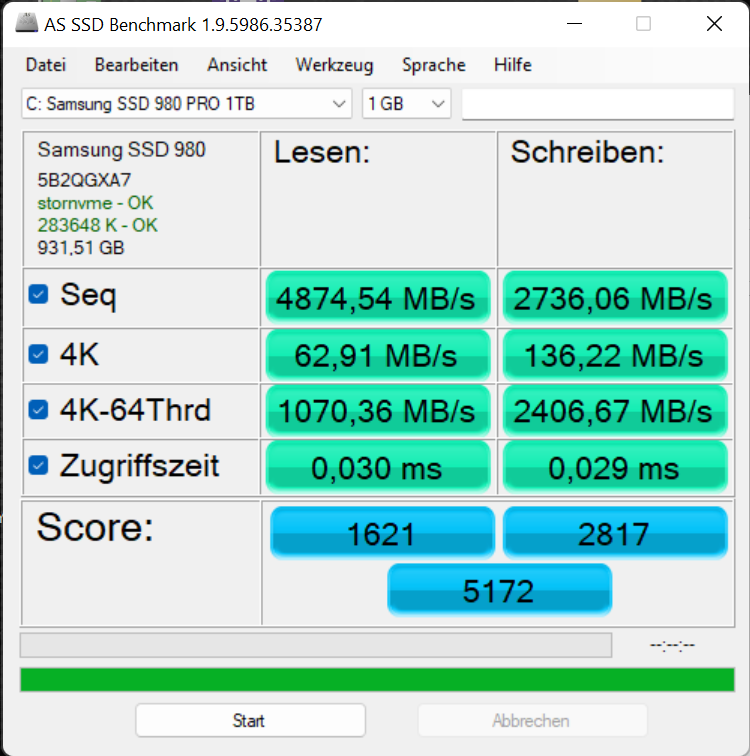
| Schenker XMG Core 15 (M22) Samsung SSD 980 Pro 1TB MZ-V8P1T0BW | Lenovo Legion 5 15IAH7H 82RB | Schenker XMG Fusion 15 (Mid 22) Samsung SSD 980 Pro 1TB MZ-V8P1T0BW | Asus TUF Gaming F15 FX507ZM SK Hynix HFM001TD3JX013N | Alienware m15 R5 Ryzen Edition Toshiba KBG40ZNS512G NVMe | Schenker XMG Core 15 Ampere Samsung SSD 970 EVO Plus 1TB | |
|---|---|---|---|---|---|---|
| AS SSD | 37% | 21% | 7% | -78% | 5% | |
| Seq Read (MB/s) | 4874 | 5844.9 20% | 5171.96 6% | 3013 -38% | 2082 -57% | 2829 -42% |
| Seq Write (MB/s) | 2711 | 2038.42 -25% | 3881.37 43% | 2768 2% | 825 -70% | 2646 -2% |
| 4K Read (MB/s) | 63 | 71.99 14% | 66.29 5% | 66.9 6% | 42.41 -33% | 54.8 -13% |
| 4K Write (MB/s) | 136 | 310.54 128% | 189.98 40% | 184.8 36% | 98.3 -28% | 179.1 32% |
| 4K-64 Read (MB/s) | 1070 | 2771.98 159% | 2539.3 137% | 1923 80% | 1255 17% | 1734 62% |
| 4K-64 Write (MB/s) | 2407 | 4007.67 67% | 3144.88 31% | 2198 -9% | 738 -69% | 2396 0% |
| Access Time Read * (ms) | 0.03 | 0.037 -23% | 0.07 -133% | 0.03 -0% | 0.109 -263% | 0.033 -10% |
| Access Time Write * (ms) | 0.029 | 0.053 -83% | 0.022 24% | 0.081 -179% | 0.17 -486% | 0.021 28% |
| Score Read (Points) | 1621 | 3428 111% | 3123 93% | 2291 41% | 1506 -7% | 2072 28% |
| Score Write (Points) | 2814 | 4522 61% | 3723 32% | 2660 -5% | 918 -67% | 2839 1% |
| Score Total (Points) | 5168 | 9510 84% | 8376 62% | 6117 18% | 3136 -39% | 5965 15% |
| Copy ISO MB/s (MB/s) | 2911 | 2320.82 -20% | 2364.44 -19% | 2143 -26% | 1391 -52% | 2119 -27% |
| Copy Program MB/s (MB/s) | 388 | 429.5 11% | 329.45 -15% | 871 124% | 645 66% | 406.1 5% |
| Copy Game MB/s (MB/s) | 1193 | 1290.19 8% | 1079.59 -10% | 1840 54% | 1101 -8% | 1086 -9% |
| DiskSpd | 135% | 174% | 80% | -24% | 84% | |
| seq read (MB/s) | 3429 | 5217 52% | 4199 22% | 2383 -31% | 1726 -50% | 2367 -31% |
| seq write (MB/s) | 3148 | 4897 56% | 4299 37% | 2894 -8% | 1520 -52% | 2601 -17% |
| seq q8 t1 read (MB/s) | 6850 | 7087 3% | 6847 0% | 3554 -48% | 2314 -66% | 3347 -51% |
| seq q8 t1 write (MB/s) | 4927 | 1498 -70% | 4999 1% | 2869 -42% | 1449 -71% | 3263 -34% |
| 4k q1 t1 read (MB/s) | 61.1 | 74.8 22% | 77.9 27% | 69.4 14% | 48.3 -21% | 52.3 -14% |
| 4k q1 t1 write (MB/s) | 132.2 | 369 179% | 239 81% | 211 60% | 121 -8% | 204 54% |
| 4k q32 t16 read (MB/s) | 1010 | 4443 340% | 4309 327% | 2217 120% | 1301 29% | 1853 83% |
| 4k q32 t16 write (MB/s) | 345 | 2050 494% | 3435 896% | 2314 571% | 497 44% | 2683 678% |
| Całkowita średnia (program / ustawienia) | 86% /
72% | 98% /
77% | 44% /
34% | -51% /
-59% | 45% /
33% |
* ... im mniej tym lepiej
| Drive Performance rating - Percent | |
| Lenovo Legion 5 15IAH7H 82RB | |
| Schenker XMG Fusion 15 (Mid 22) | |
| Przeciętny Samsung SSD 980 Pro 1TB MZ-V8P1T0BW | |
| Średnia w klasie Gaming | |
| Asus TUF Gaming F15 FX507ZM | |
| Schenker XMG Core 15 Ampere | |
| Schenker XMG Core 15 (M22) | |
| Alienware m15 R5 Ryzen Edition | |
* ... im mniej tym lepiej
Continuous: DiskSpd Read Loop, Queue Depth 8
Karta graficzna
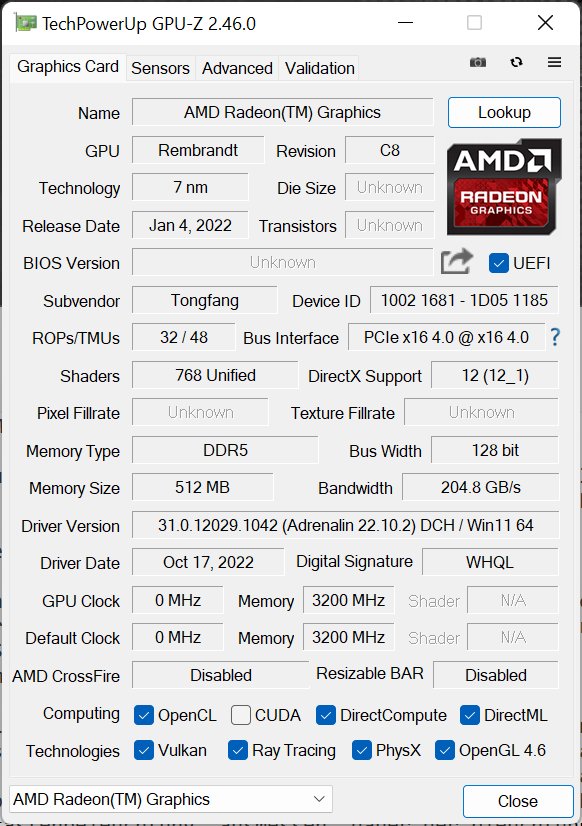
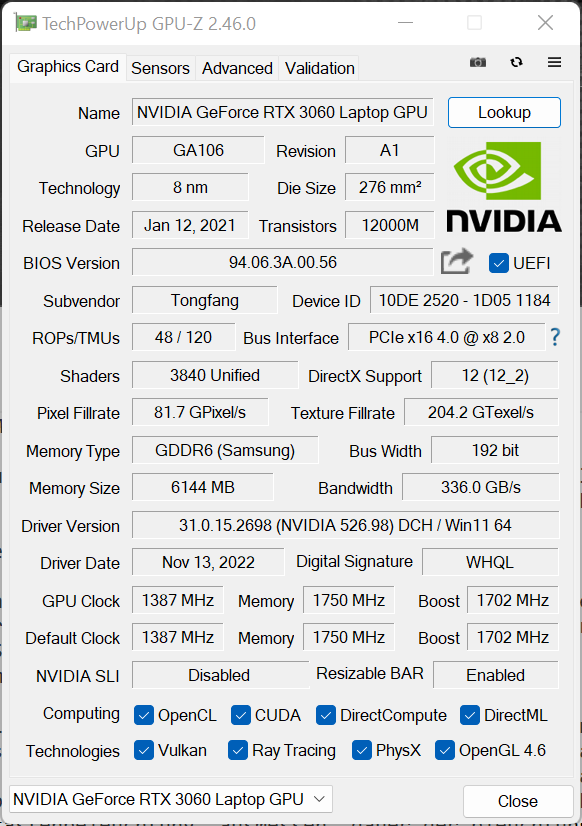
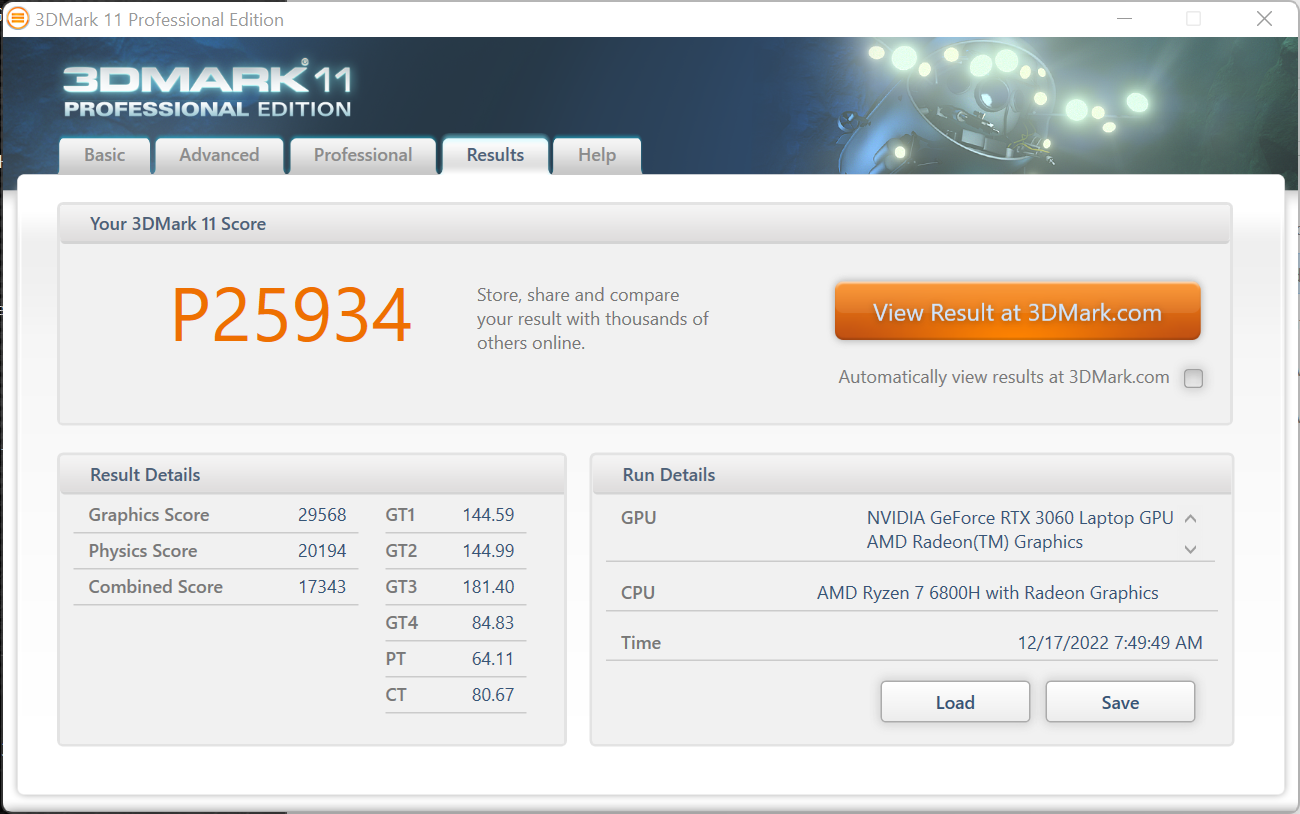
Oprócz zintegrowanego Radeona 680M, laptop gamingowy posiada oczywiście dedykowaną jednostkę graficzną - w przypadku XMG Core 15 jest to GeForce RTX 3060 z 140-W TGP
.Wiele nowszych gier może być płynnie renderowanych w natywnej rozdzielczości WQHD, ale bardzo wymagające wydajności gry będą prawdopodobnie musiały cieszyć się w FullHD lub na niższych poziomach detali.
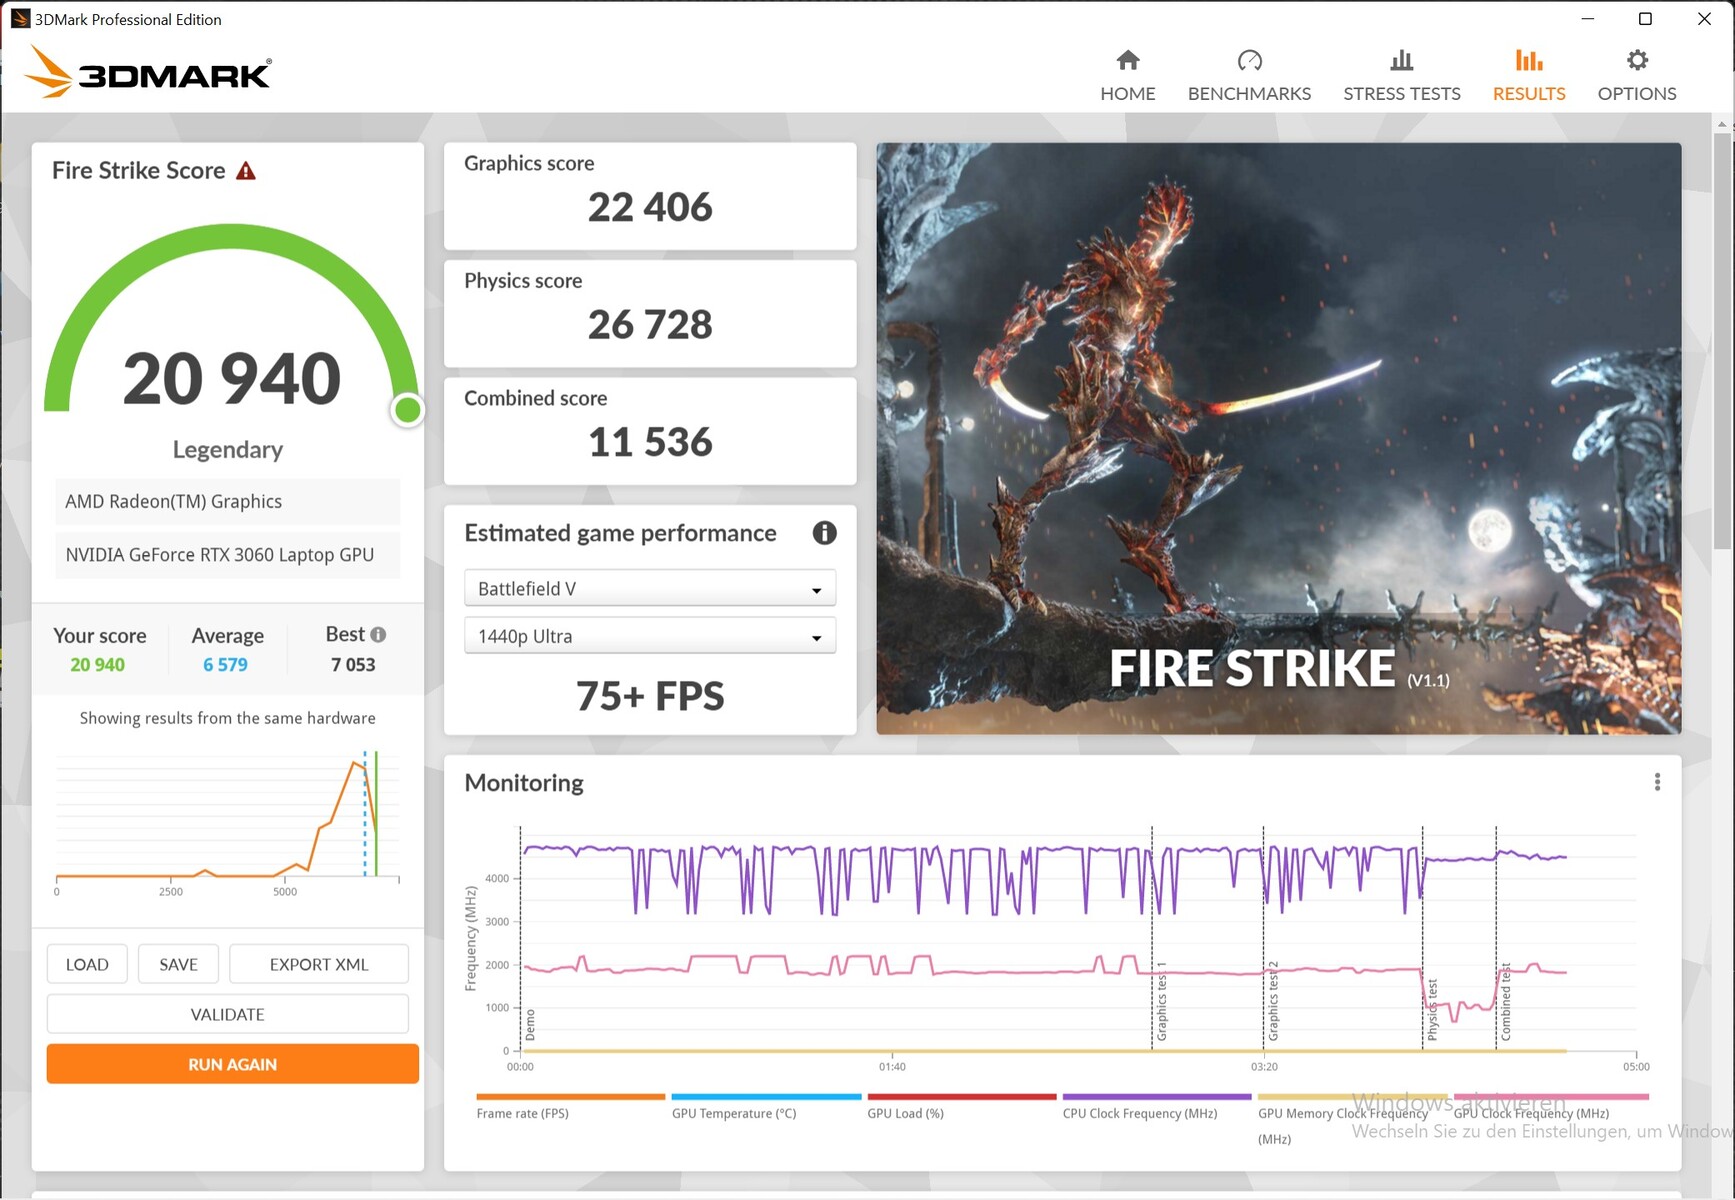
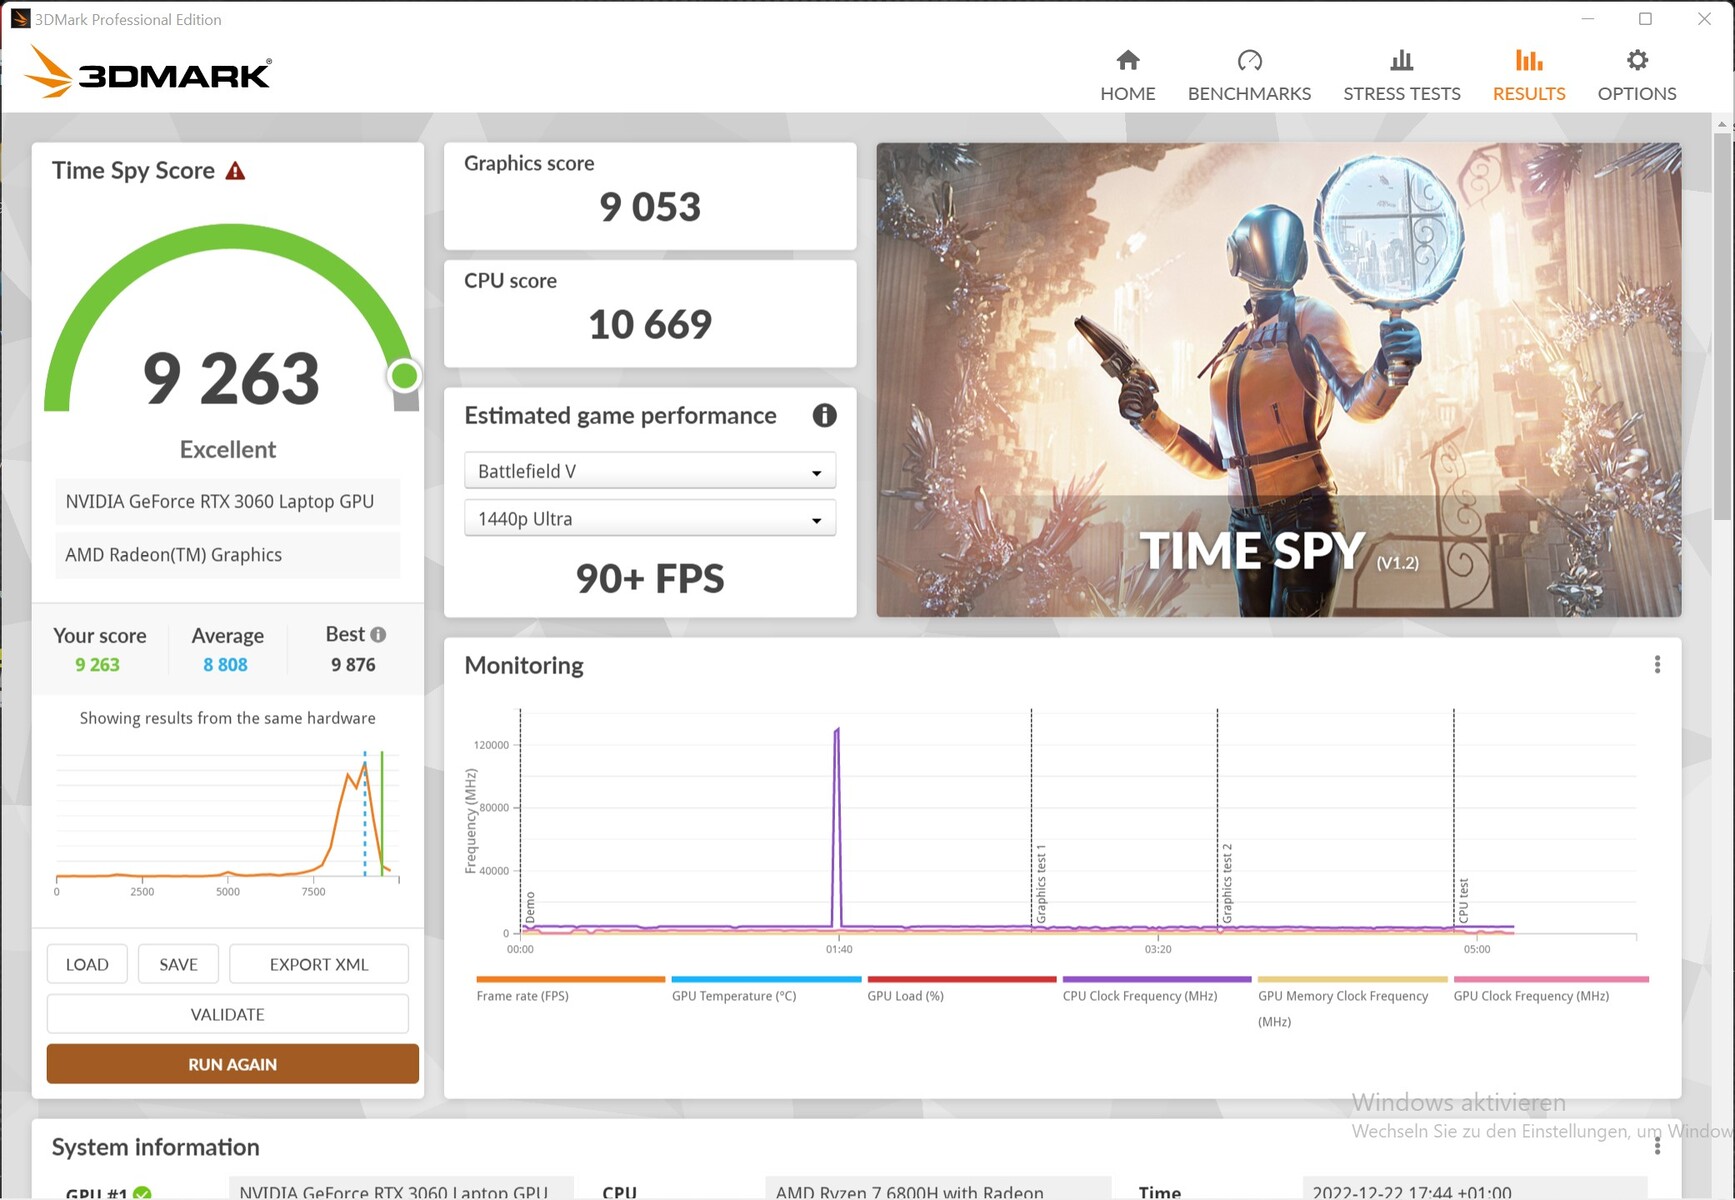
Funkcja podkręcania w XMG Control Center może zwiększyć wydajność o 3-4% w zależności od aplikacji 3D, a przełącznik MUX (wymagany restart) dodaje ~5%. Mimo to Core 15 musi przyznać się do porażki w starciu z innymi graczami z RTX 3060, choć różnica nie jest zbyt duża.
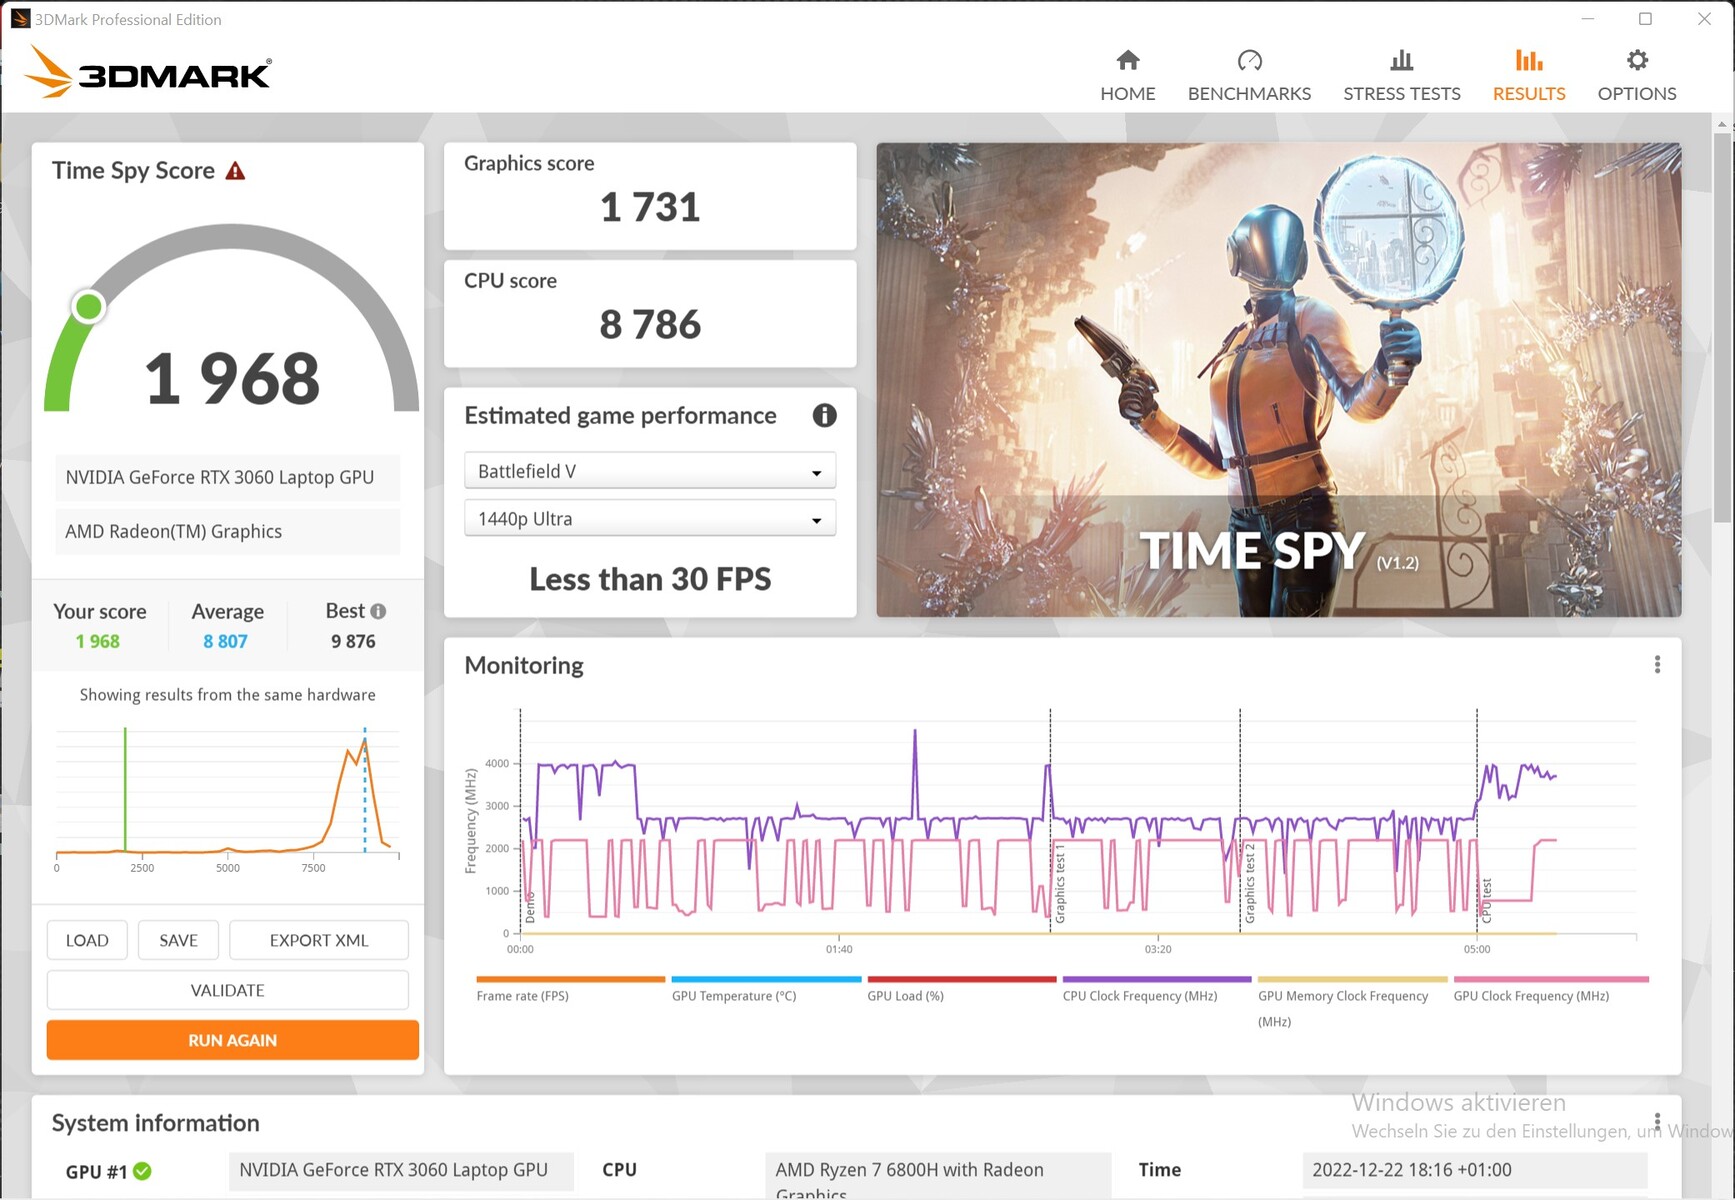
Wydajność grafiki spada znacząco na zasilaniu bateryjnym, więc pozostaje tylko 25% pierwotnej wydajności. Jest to częściowo spowodowane małą baterią 62 Wh, która w przeciwnym razie rozładowałaby się zbyt szybko.
| 3DMark Performance rating - Percent | |
| Średnia w klasie Gaming | |
| Schenker XMG Fusion 15 (Mid 22) | |
| Asus TUF Gaming F15 FX507ZM | |
| Lenovo Legion 5 15ACH-82JU00C6GE-FL | |
| Schenker XMG Core 15 Ampere | |
| Schenker XMG Core 15 (M22) | |
| Schenker XMG Apex 15 NH57E PS | |
| Przeciętny NVIDIA GeForce RTX 3060 Laptop GPU | |
| Alienware m15 R5 Ryzen Edition | |
| 3DMark 11 - 1280x720 Performance GPU | |
| Średnia w klasie Gaming (21841 - 80022, n=106, ostatnie 2 lata) | |
| Schenker XMG Fusion 15 (Mid 22) | |
| Asus TUF Gaming F15 FX507ZM | |
| Schenker XMG Apex 15 NH57E PS | |
| Schenker XMG Core 15 (M22) | |
| Lenovo Legion 5 15ACH-82JU00C6GE-FL | |
| Schenker XMG Core 15 Ampere | |
| Alienware m15 R5 Ryzen Edition | |
| Przeciętny NVIDIA GeForce RTX 3060 Laptop GPU (13799 - 30772, n=43) | |
| 3DMark | |
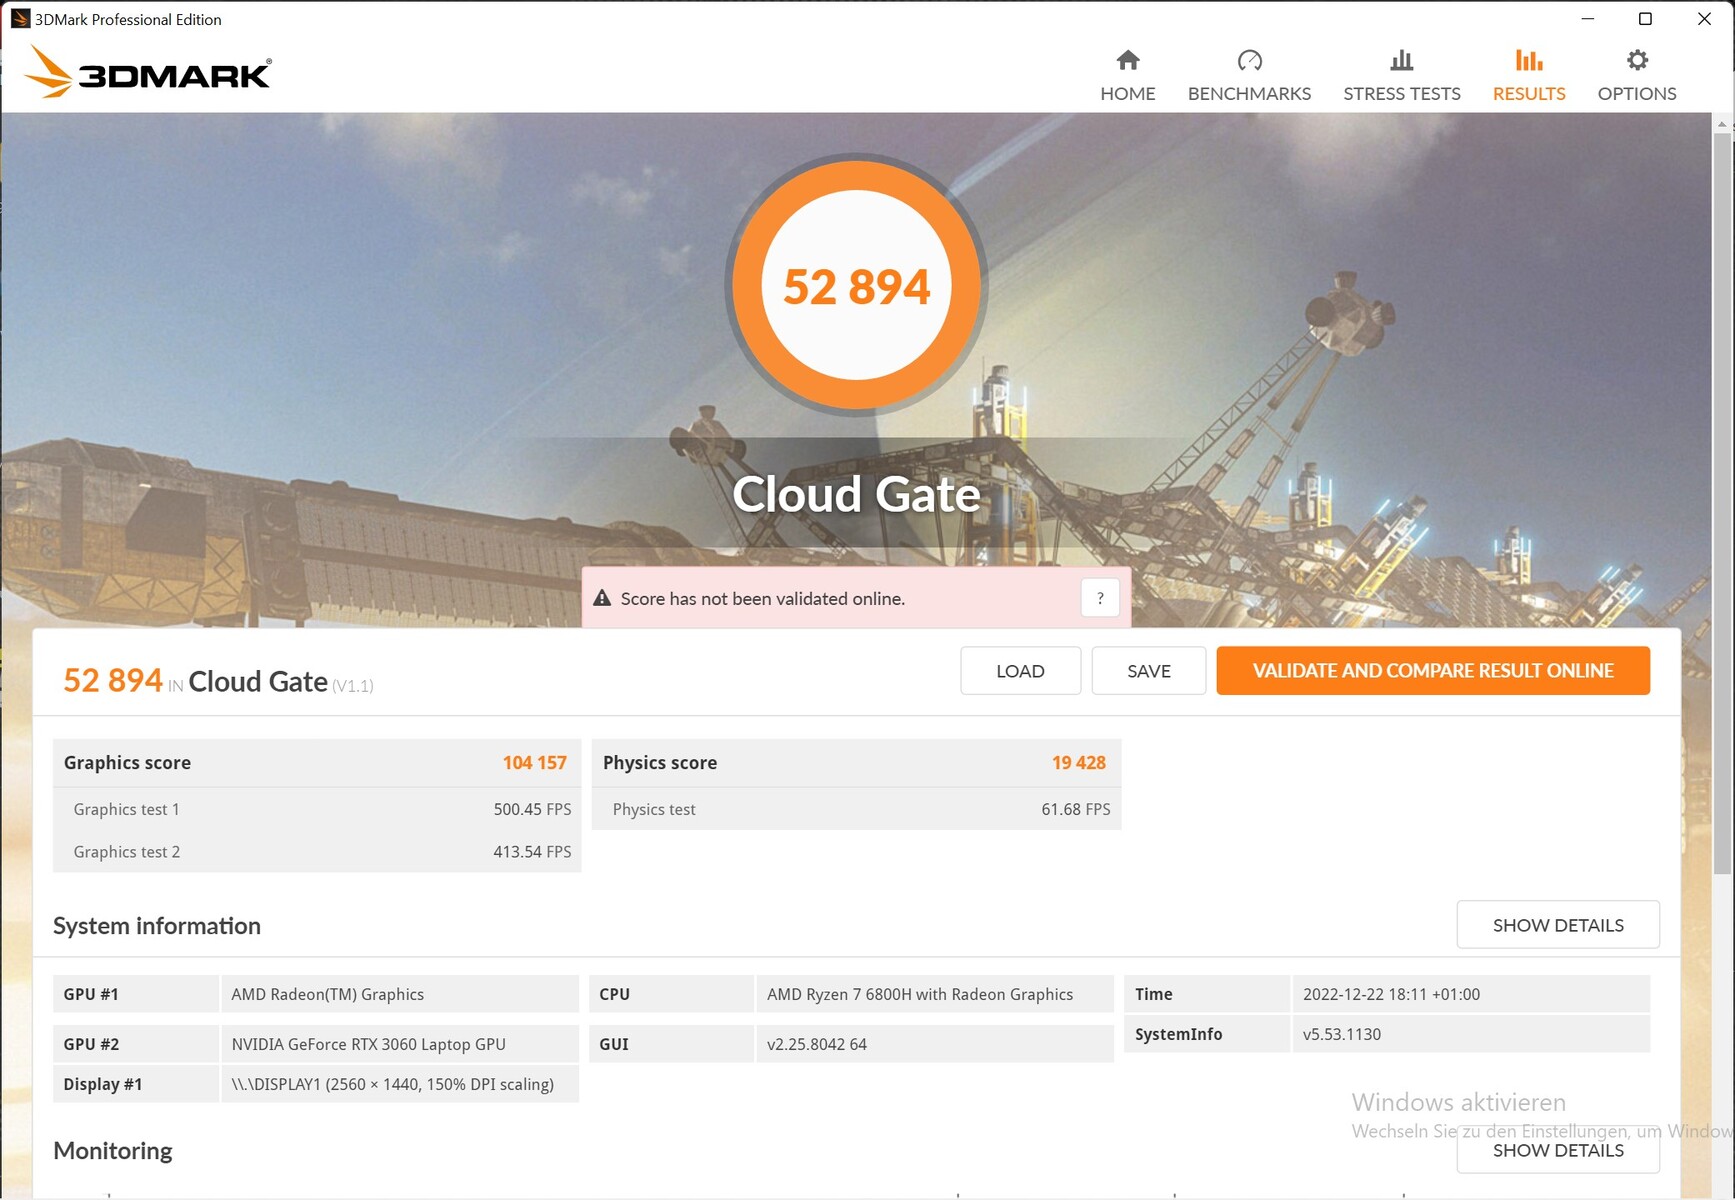
| 1280x720 Cloud Gate Standard Graphics | |
| Średnia w klasie Gaming (86886 - 223650, n=61, ostatnie 2 lata) | |
| Schenker XMG Fusion 15 (Mid 22) | |
| Schenker XMG Core 15 Ampere | |
| Lenovo Legion 5 15ACH-82JU00C6GE-FL | |
| Asus TUF Gaming F15 FX507ZM | |
| Schenker XMG Core 15 (M22) | |
| Przeciętny NVIDIA GeForce RTX 3060 Laptop GPU (33126 - 136826, n=38) | |
| Schenker XMG Apex 15 NH57E PS | |
| Alienware m15 R5 Ryzen Edition | |
| 1920x1080 Fire Strike Graphics | |
| Średnia w klasie Gaming (12242 - 62849, n=118, ostatnie 2 lata) | |
| Schenker XMG Fusion 15 (Mid 22) | |
| Asus TUF Gaming F15 FX507ZM | |
| Schenker XMG Core 15 (M22) | |
| Schenker XMG Apex 15 NH57E PS | |
| Lenovo Legion 5 15ACH-82JU00C6GE-FL | |
| Przeciętny NVIDIA GeForce RTX 3060 Laptop GPU (16354 - 23109, n=49) | |
| Alienware m15 R5 Ryzen Edition | |
| Schenker XMG Core 15 Ampere | |
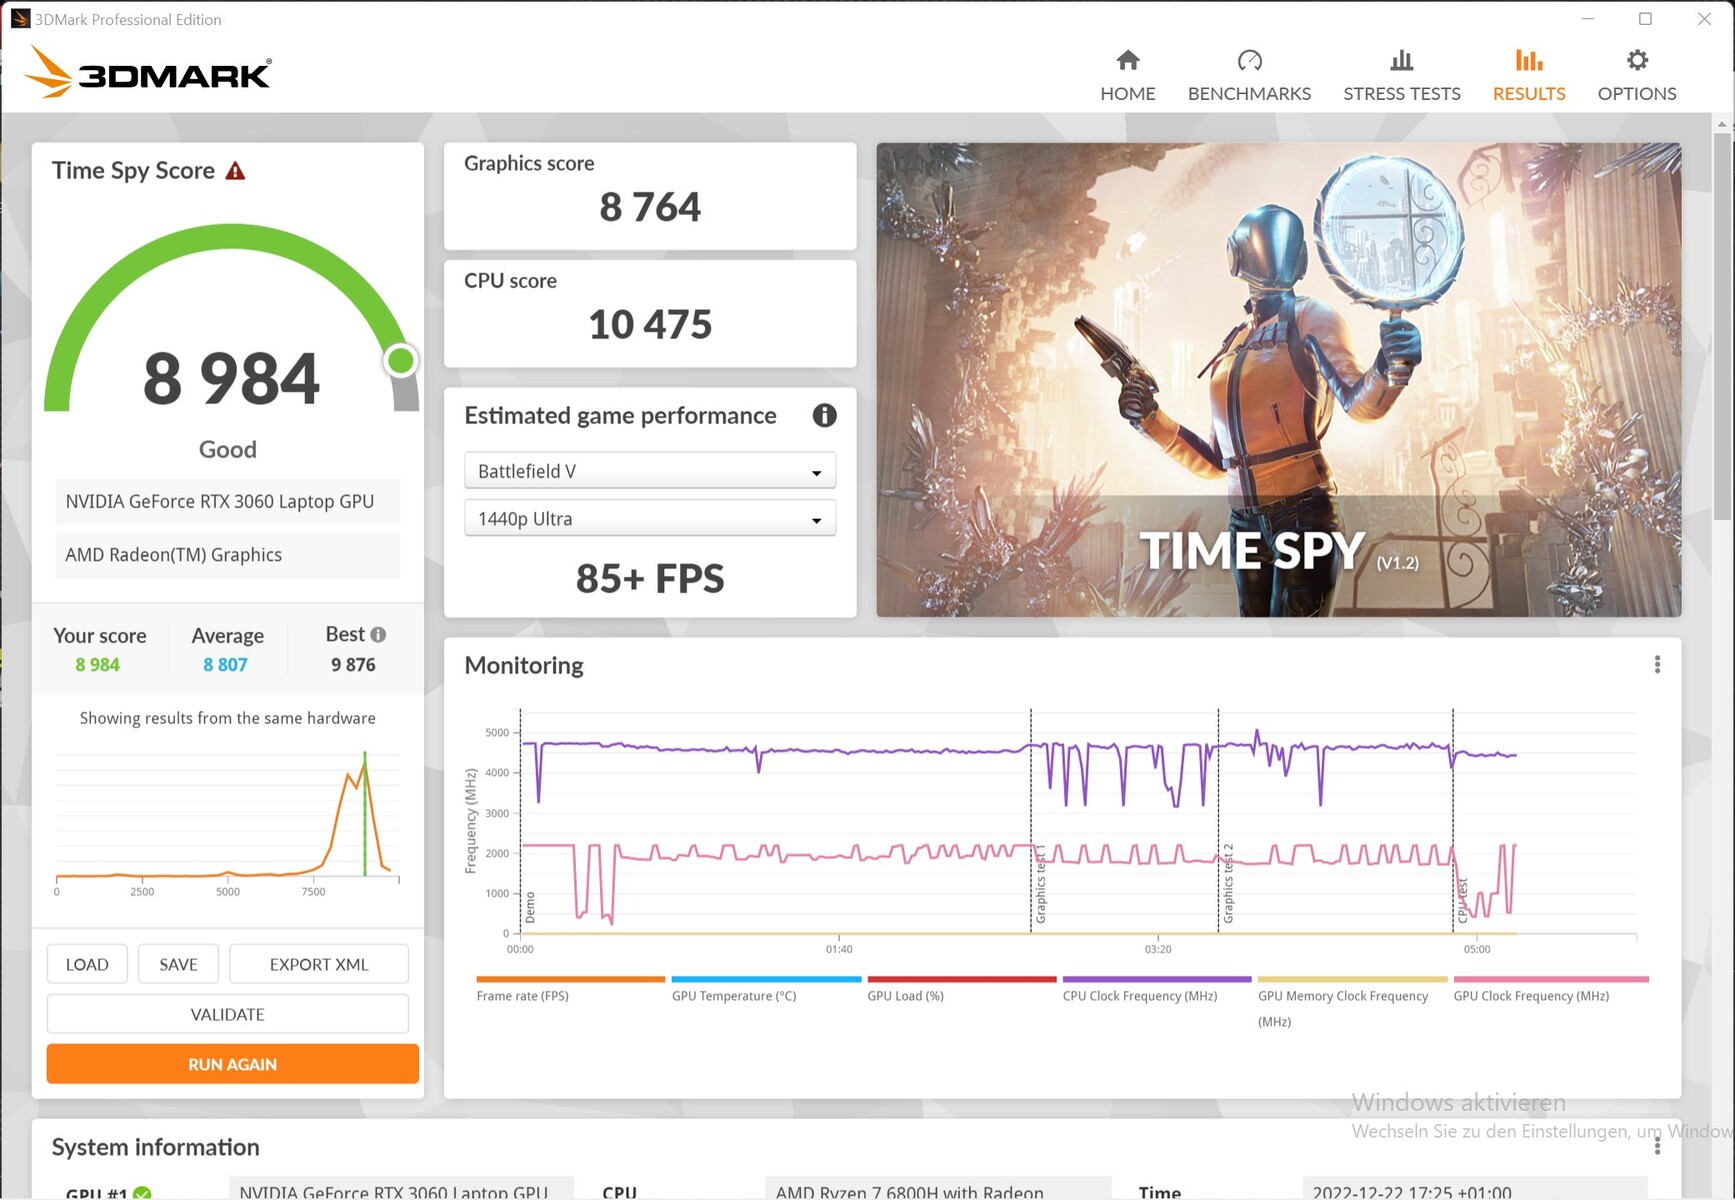
| 2560x1440 Time Spy Graphics | |
| Średnia w klasie Gaming (5012 - 26212, n=117, ostatnie 2 lata) | |
| Asus TUF Gaming F15 FX507ZM | |
| Schenker XMG Fusion 15 (Mid 22) | |
| Schenker XMG Apex 15 NH57E PS | |
| Lenovo Legion 5 15ACH-82JU00C6GE-FL | |
| Schenker XMG Core 15 (M22) | |
| Schenker XMG Core 15 Ampere | |
| Alienware m15 R5 Ryzen Edition | |
| Przeciętny NVIDIA GeForce RTX 3060 Laptop GPU (6285 - 9235, n=49) | |
| 3DMark 11 Performance | 25934 pkt. | |
| 3DMark Cloud Gate Standard Score | 52894 pkt. | |
| 3DMark Fire Strike Score | 20940 pkt. | |
| 3DMark Time Spy Score | 8984 pkt. | |
Pomoc | ||
| Blender | |
| v3.3 Classroom OPTIX/RTX | |
| HP Envy 16 h0112nr | |
| HP ZBook Studio 16 G9 62U04EA | |
| MSI CreatorPro Z16P B12UKST | |
| Schenker XMG Core 15 (M22) | |
| Lenovo Legion 5 15IAH7H 82RB | |
| v3.3 Classroom CUDA | |
| HP ZBook Studio 16 G9 62U04EA | |
| HP Envy 16 h0112nr | |
| MSI CreatorPro Z16P B12UKST | |
| Schenker XMG Core 15 (M22) | |
| Lenovo Legion 5 15IAH7H 82RB | |
| v3.3 Classroom CPU | |
| Schenker XMG Fusion 15 (Mid 22) | |
| HP Envy 16 h0112nr | |
| Schenker XMG Core 15 (M22) | |
| MSI CreatorPro Z16P B12UKST | |
| HP ZBook Studio 16 G9 62U04EA | |
| Lenovo Legion 5 15IAH7H 82RB | |
| 3DMark - 2560x1440 Time Spy Graphics | |
| Asus TUF Gaming F15 FX507ZM | |
| Lenovo Legion 5 15IAH7H 82RB | |
| Schenker XMG Fusion 15 (Mid 22) | |
| Schenker XMG Core 15 (M22) | |
| Schenker XMG Core 15 Ampere | |
| Alienware m15 R5 Ryzen Edition | |
| HP Envy 16 h0112nr | |
| MSI CreatorPro Z16P B12UKST | |
| HP ZBook Studio 16 G9 62U04EA | |
| V-Ray Benchmark Next 4.10 - GPU | |
| Schenker XMG Fusion 15 (Mid 22) | |
| Schenker XMG Core 15 (M22) | |
| Schenker XMG Core 15 Ampere | |
| Alienware m15 R5 Ryzen Edition | |
| MSI CreatorPro Z16P B12UKST | |
| HP ZBook Studio 16 G9 62U04EA | |
| V-Ray 5 Benchmark | |
| GPU CUDA | |
| Schenker XMG Fusion 15 (Mid 22) | |
| Schenker XMG Core 15 (M22) | |
| MSI CreatorPro Z16P B12UKST | |
| GPU RTX | |
| Schenker XMG Fusion 15 (Mid 22) | |
| Schenker XMG Core 15 (M22) | |
| MSI CreatorPro Z16P B12UKST | |
| Geekbench 5.5 - OpenCL Score | |
| Schenker XMG Fusion 15 (Mid 22) | |
| Asus TUF Gaming F15 FX507ZM | |
| Lenovo Legion 5 15IAH7H 82RB | |
| Schenker XMG Core 15 (M22) | |
| Alienware m15 R5 Ryzen Edition | |
| MSI CreatorPro Z16P B12UKST | |
| Schenker XMG Core 15 Ampere | |
| HP Envy 16 h0112nr | |
| HP ZBook Studio 16 G9 62U04EA | |
* ... im mniej tym lepiej
Wydajność w grach
Konkurencja z tą samą jednostką graficzną przewyższa XMG Core 15 nawet o 13% w grach pomimo wysokiego TGP, które mierzymy na poziomie 134 W, podczas gdy on przynajmniej nie nagrzewa się zbytnio przy 84 °C (~183 °F). Taktowanie rdzenia na poziomie ~1.800 MHz jest już powyżej specyfikacji 1.702 MHz. Wydajność odpowiada wyższej klasie średniej.
| Performance rating - Percent | |
| Średnia w klasie Gaming | |
| Asus TUF Gaming F15 FX507ZM | |
| Asus ROG Strix Scar 15 G533zm | |
| Schenker XMG Fusion 15 (Mid 22) | |
| Schenker XMG Core 15 (M22) | |
| Przeciętny NVIDIA GeForce RTX 3060 Laptop GPU | |
| Lenovo Legion S7 15ACH6 82K80030GE | |
| Alienware m15 R5 Ryzen Edition | |
| Medion Erazer Deputy P25 | |
| MSI GF65 Thin 10UE | |
| The Witcher 3 - 1920x1080 Ultra Graphics & Postprocessing (HBAO+) | |
| Średnia w klasie Gaming (95 - 240, n=8, ostatnie 2 lata) | |
| Schenker XMG Fusion 15 (Mid 22) | |
| Asus TUF Gaming F15 FX507ZM | |
| Asus ROG Strix Scar 15 G533zm | |
| Schenker XMG Core 15 (M22) | |
| Lenovo Legion S7 15ACH6 82K80030GE | |
| Medion Erazer Deputy P25 | |
| Przeciętny NVIDIA GeForce RTX 3060 Laptop GPU (58.2 - 91.5, n=48) | |
| Alienware m15 R5 Ryzen Edition | |
| MSI GF65 Thin 10UE | |
| GTA V - 1920x1080 Highest AA:4xMSAA + FX AF:16x | |
| Średnia w klasie Gaming (48.3 - 186.9, n=100, ostatnie 2 lata) | |
| Asus ROG Strix Scar 15 G533zm | |
| Schenker XMG Fusion 15 (Mid 22) | |
| Asus TUF Gaming F15 FX507ZM | |
| Schenker XMG Core 15 (M22) | |
| Lenovo Legion S7 15ACH6 82K80030GE | |
| Przeciętny NVIDIA GeForce RTX 3060 Laptop GPU (69.2 - 109.8, n=46) | |
| Alienware m15 R5 Ryzen Edition | |
| Medion Erazer Deputy P25 | |
| MSI GF65 Thin 10UE | |
| Far Cry 5 - 1920x1080 Ultra Preset AA:T | |
| Średnia w klasie Gaming (70 - 151, n=10, ostatnie 2 lata) | |
| Asus ROG Strix Scar 15 G533zm | |
| Asus TUF Gaming F15 FX507ZM | |
| Schenker XMG Fusion 15 (Mid 22) | |
| Schenker XMG Core 15 (M22) | |
| Lenovo Legion S7 15ACH6 82K80030GE | |
| Przeciętny NVIDIA GeForce RTX 3060 Laptop GPU (80 - 120, n=31) | |
| MSI GF65 Thin 10UE | |
| Alienware m15 R5 Ryzen Edition | |
| Medion Erazer Deputy P25 | |
| Final Fantasy XV Benchmark - 1920x1080 High Quality | |
| Średnia w klasie Gaming (41 - 215, n=101, ostatnie 2 lata) | |
| Schenker XMG Fusion 15 (Mid 22) | |
| Asus TUF Gaming F15 FX507ZM | |
| Schenker XMG Core 15 (M22) | |
| Asus ROG Strix Scar 15 G533zm | |
| Przeciętny NVIDIA GeForce RTX 3060 Laptop GPU (55 - 100.9, n=42) | |
| Medion Erazer Deputy P25 | |
| Alienware m15 R5 Ryzen Edition | |
| Lenovo Legion S7 15ACH6 82K80030GE | |
| MSI GF65 Thin 10UE | |
| Strange Brigade - 1920x1080 ultra AA:ultra AF:16 | |
| Średnia w klasie Gaming (76.3 - 456, n=91, ostatnie 2 lata) | |
| Schenker XMG Fusion 15 (Mid 22) | |
| Asus TUF Gaming F15 FX507ZM | |
| Asus ROG Strix Scar 15 G533zm | |
| Schenker XMG Core 15 (M22) | |
| Medion Erazer Deputy P25 | |
| Przeciętny NVIDIA GeForce RTX 3060 Laptop GPU (102.2 - 166.3, n=43) | |
| Lenovo Legion S7 15ACH6 82K80030GE | |
| Alienware m15 R5 Ryzen Edition | |
| MSI GF65 Thin 10UE | |
| Dota 2 Reborn - 1920x1080 ultra (3/3) best looking | |
| Średnia w klasie Gaming (84.8 - 248, n=110, ostatnie 2 lata) | |
| Asus ROG Strix Scar 15 G533zm | |
| Asus TUF Gaming F15 FX507ZM | |
| Przeciętny NVIDIA GeForce RTX 3060 Laptop GPU (90.7 - 154.8, n=49) | |
| Schenker XMG Fusion 15 (Mid 22) | |
| Lenovo Legion S7 15ACH6 82K80030GE | |
| Schenker XMG Core 15 (M22) | |
| Alienware m15 R5 Ryzen Edition | |
| Medion Erazer Deputy P25 | |
| MSI GF65 Thin 10UE | |
| X-Plane 11.11 - 1920x1080 high (fps_test=3) | |
| Asus TUF Gaming F15 FX507ZM | |
| Asus ROG Strix Scar 15 G533zm | |
| Średnia w klasie Gaming (52.1 - 143.5, n=113, ostatnie 2 lata) | |
| Schenker XMG Fusion 15 (Mid 22) | |
| Przeciętny NVIDIA GeForce RTX 3060 Laptop GPU (61.9 - 109.3, n=48) | |
| Schenker XMG Core 15 (M22) | |
| Lenovo Legion S7 15ACH6 82K80030GE | |
| Alienware m15 R5 Ryzen Edition | |
| Medion Erazer Deputy P25 | |
| MSI GF65 Thin 10UE | |
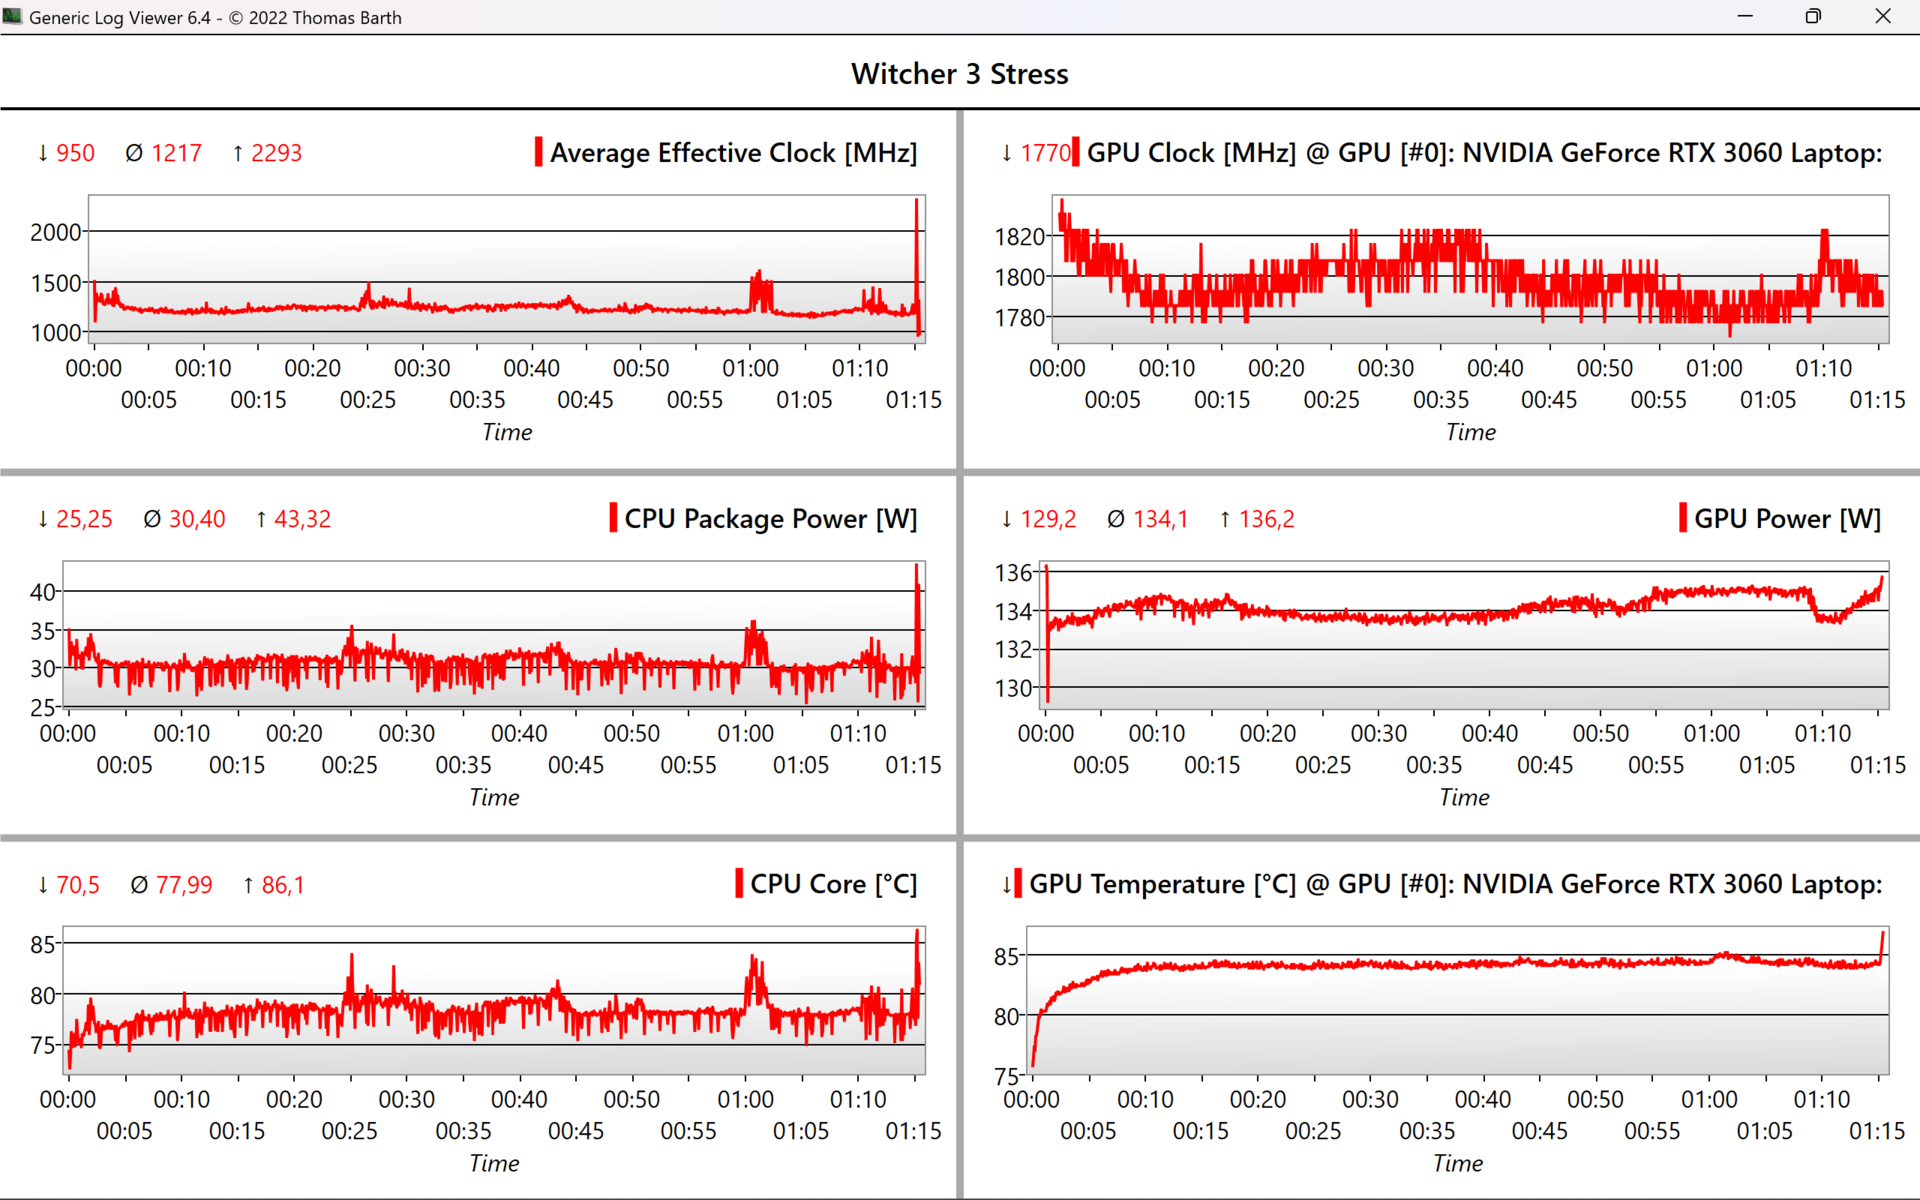
Częstotliwość taktowania pozostaje stabilna nawet po godzinie w The Witcher 3, a co za tym idzie, również FPS, co pokazują dwa poniższe wykresy.
Witcher 3 FPS-Diagram
| low | med. | high | ultra | QHD | |
|---|---|---|---|---|---|
| GTA V (2015) | 178.7 | 172.1 | 158.4 | 97.3 | 86.5 |
| The Witcher 3 (2015) | 303 | 253 | 159.7 | 81.5 | |
| Dota 2 Reborn (2015) | 136.8 | 126.5 | 117.6 | 112.3 | |
| Final Fantasy XV Benchmark (2018) | 178.4 | 119.5 | 91.9 | 67.5 | |
| X-Plane 11.11 (2018) | 104.8 | 93.3 | 74.2 | ||
| Far Cry 5 (2018) | 118 | 107 | 90 | ||
| Strange Brigade (2018) | 273 | 200 | 171.7 | 152.7 | |
| God of War (2022) | 92.6 | 73.1 | 51.5 | 44 |
Emisja: Cicha gra z wysokim FPS możliwa dzięki XMG Core 15
Emisja hałasu
Wentylatory pozostają wyłączone głównie na biegu jałowym, a także podczas przeglądania stron internetowych. Podczas pełnego obciążenia procesora występuje dość głośny hałas 42 dB(A), ale można go opanować zwłaszcza dzięki trybowi zrównoważonemu, który wciąż ma w zanadrzu sporo mocy.
Podczas grania robi się bardzo głośno, bo aż 55 dB(A), ale szum o niskiej częstotliwości pozostaje stosunkowo przyjemny. Tutaj również tryb zrównoważony stanowi wyraźne remedium, a FPS spadł tylko o 5% na przykład w GTA V, co jest bardzo dobrym wynikiem. Ex-factory, XMG Fusion 15 i Alienware m15 pozostają znacznie cichsze podczas gry, osiągając odpowiednio 46 i 48 dB(A).
.
Hałas
| luz |
| 23 / 23 / 23 dB |
| obciążenie |
| 42.41 / 55.05 dB |
 | ||
30 dB cichy 40 dB(A) słyszalny 50 dB(A) irytujący |
||
min: | ||
| Schenker XMG Core 15 (M22) R7 6800H, GeForce RTX 3060 Laptop GPU | Lenovo Legion 5 15IAH7H 82RB i7-12700H, GeForce RTX 3060 Laptop GPU | Schenker XMG Fusion 15 (Mid 22) i7-11800H, GeForce RTX 3070 Laptop GPU | Asus TUF Gaming F15 FX507ZM i7-12700H, GeForce RTX 3060 Laptop GPU | Alienware m15 R5 Ryzen Edition R7 5800H, GeForce RTX 3060 Laptop GPU | Schenker XMG Core 15 Ampere R7 4800H, GeForce RTX 3060 Laptop GPU | |
|---|---|---|---|---|---|---|
| Noise | 3% | -9% | -1% | -7% | -8% | |
| wyłączone / środowisko * (dB) | 23 | 23.3 -1% | 26 -13% | 23.2 -1% | 24 -4% | 24 -4% |
| Idle Minimum * (dB) | 23 | 23.5 -2% | 26 -13% | 23.6 -3% | 24 -4% | 26 -13% |
| Idle Average * (dB) | 23 | 23.5 -2% | 28 -22% | 23.6 -3% | 25 -9% | 28 -22% |
| Idle Maximum * (dB) | 23 | 26.8 -17% | 31 -35% | 25.4 -10% | 35 -52% | 30 -30% |
| Load Average * (dB) | 42.41 | 29.3 31% | 45 -6% | 38 10% | 44 -4% | 42 1% |
| Witcher 3 ultra * (dB) | 54.71 | 51.4 6% | 46 16% | 54.1 1% | 48 12% | 50 9% |
| Load Maximum * (dB) | 55.05 | 53 4% | 48 13% | 57.2 -4% | 50 9% | 52 6% |
* ... im mniej tym lepiej
Temperatura
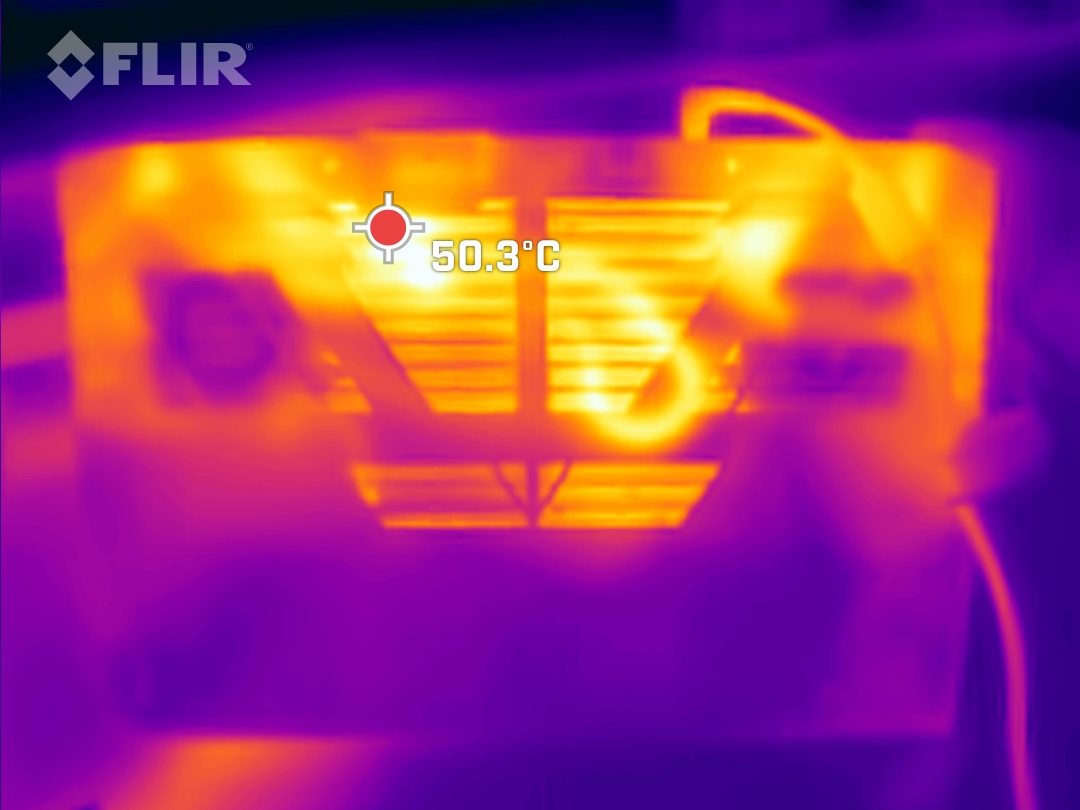
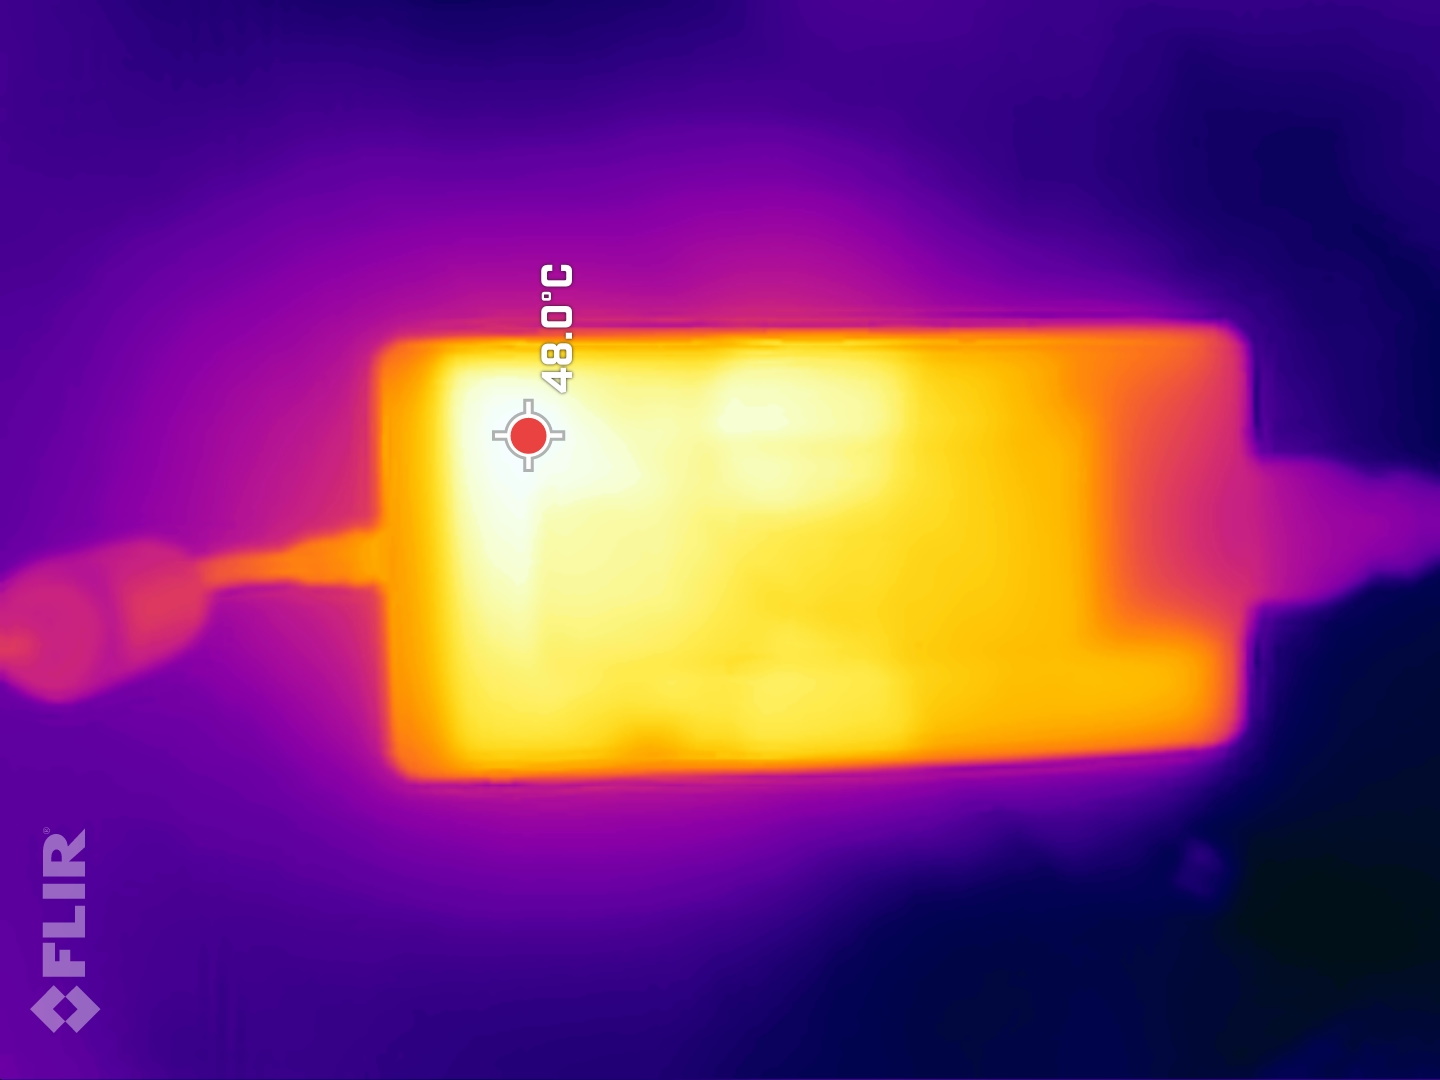
Temperatury nigdy nie są w gorącym terytorium, nawet podczas gry. Pod maksymalnym obciążeniem na spodzie urządzenia występuje hotspot o temperaturze 51°C (~124°F), podczas gdy Alienware m15 i Schenker XMG Fusion 15 działają znacznie goręcej, odpowiednio 61°C i 63°C (~142 i ~145°F).
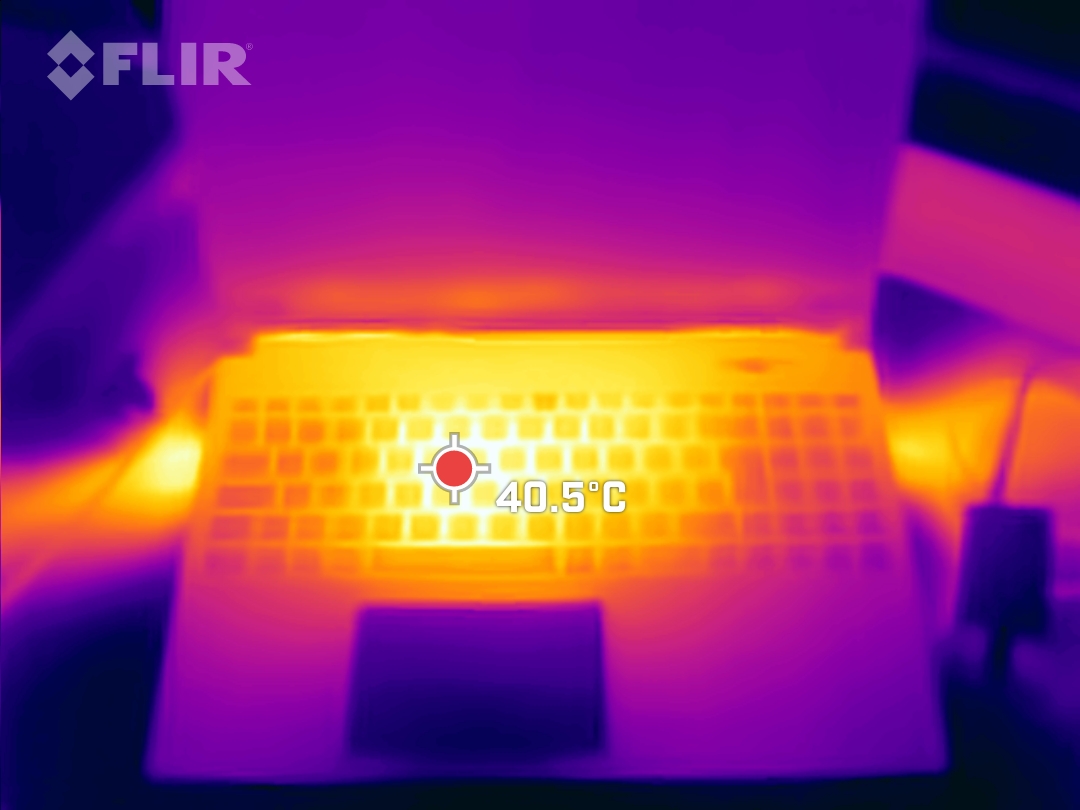
(-) Maksymalna temperatura w górnej części wynosi 48 °C / 118 F, w porównaniu do średniej 40.4 °C / 105 F , począwszy od 21.2 do 68.8 °C dla klasy Gaming.
(-) Dno nagrzewa się maksymalnie do 51 °C / 124 F, w porównaniu do średniej 43.2 °C / 110 F
(+) W stanie bezczynności średnia temperatura górnej części wynosi 25.6 °C / 78 F, w porównaniu ze średnią temperaturą urządzenia wynoszącą 33.9 °C / ### class_avg_f### F.
(±) Podczas gry w Wiedźmina 3 średnia temperatura górnej części wynosi 34.9 °C / 95 F, w porównaniu do średniej temperatury urządzenia wynoszącej 33.9 °C / ## #class_avg_f### F.
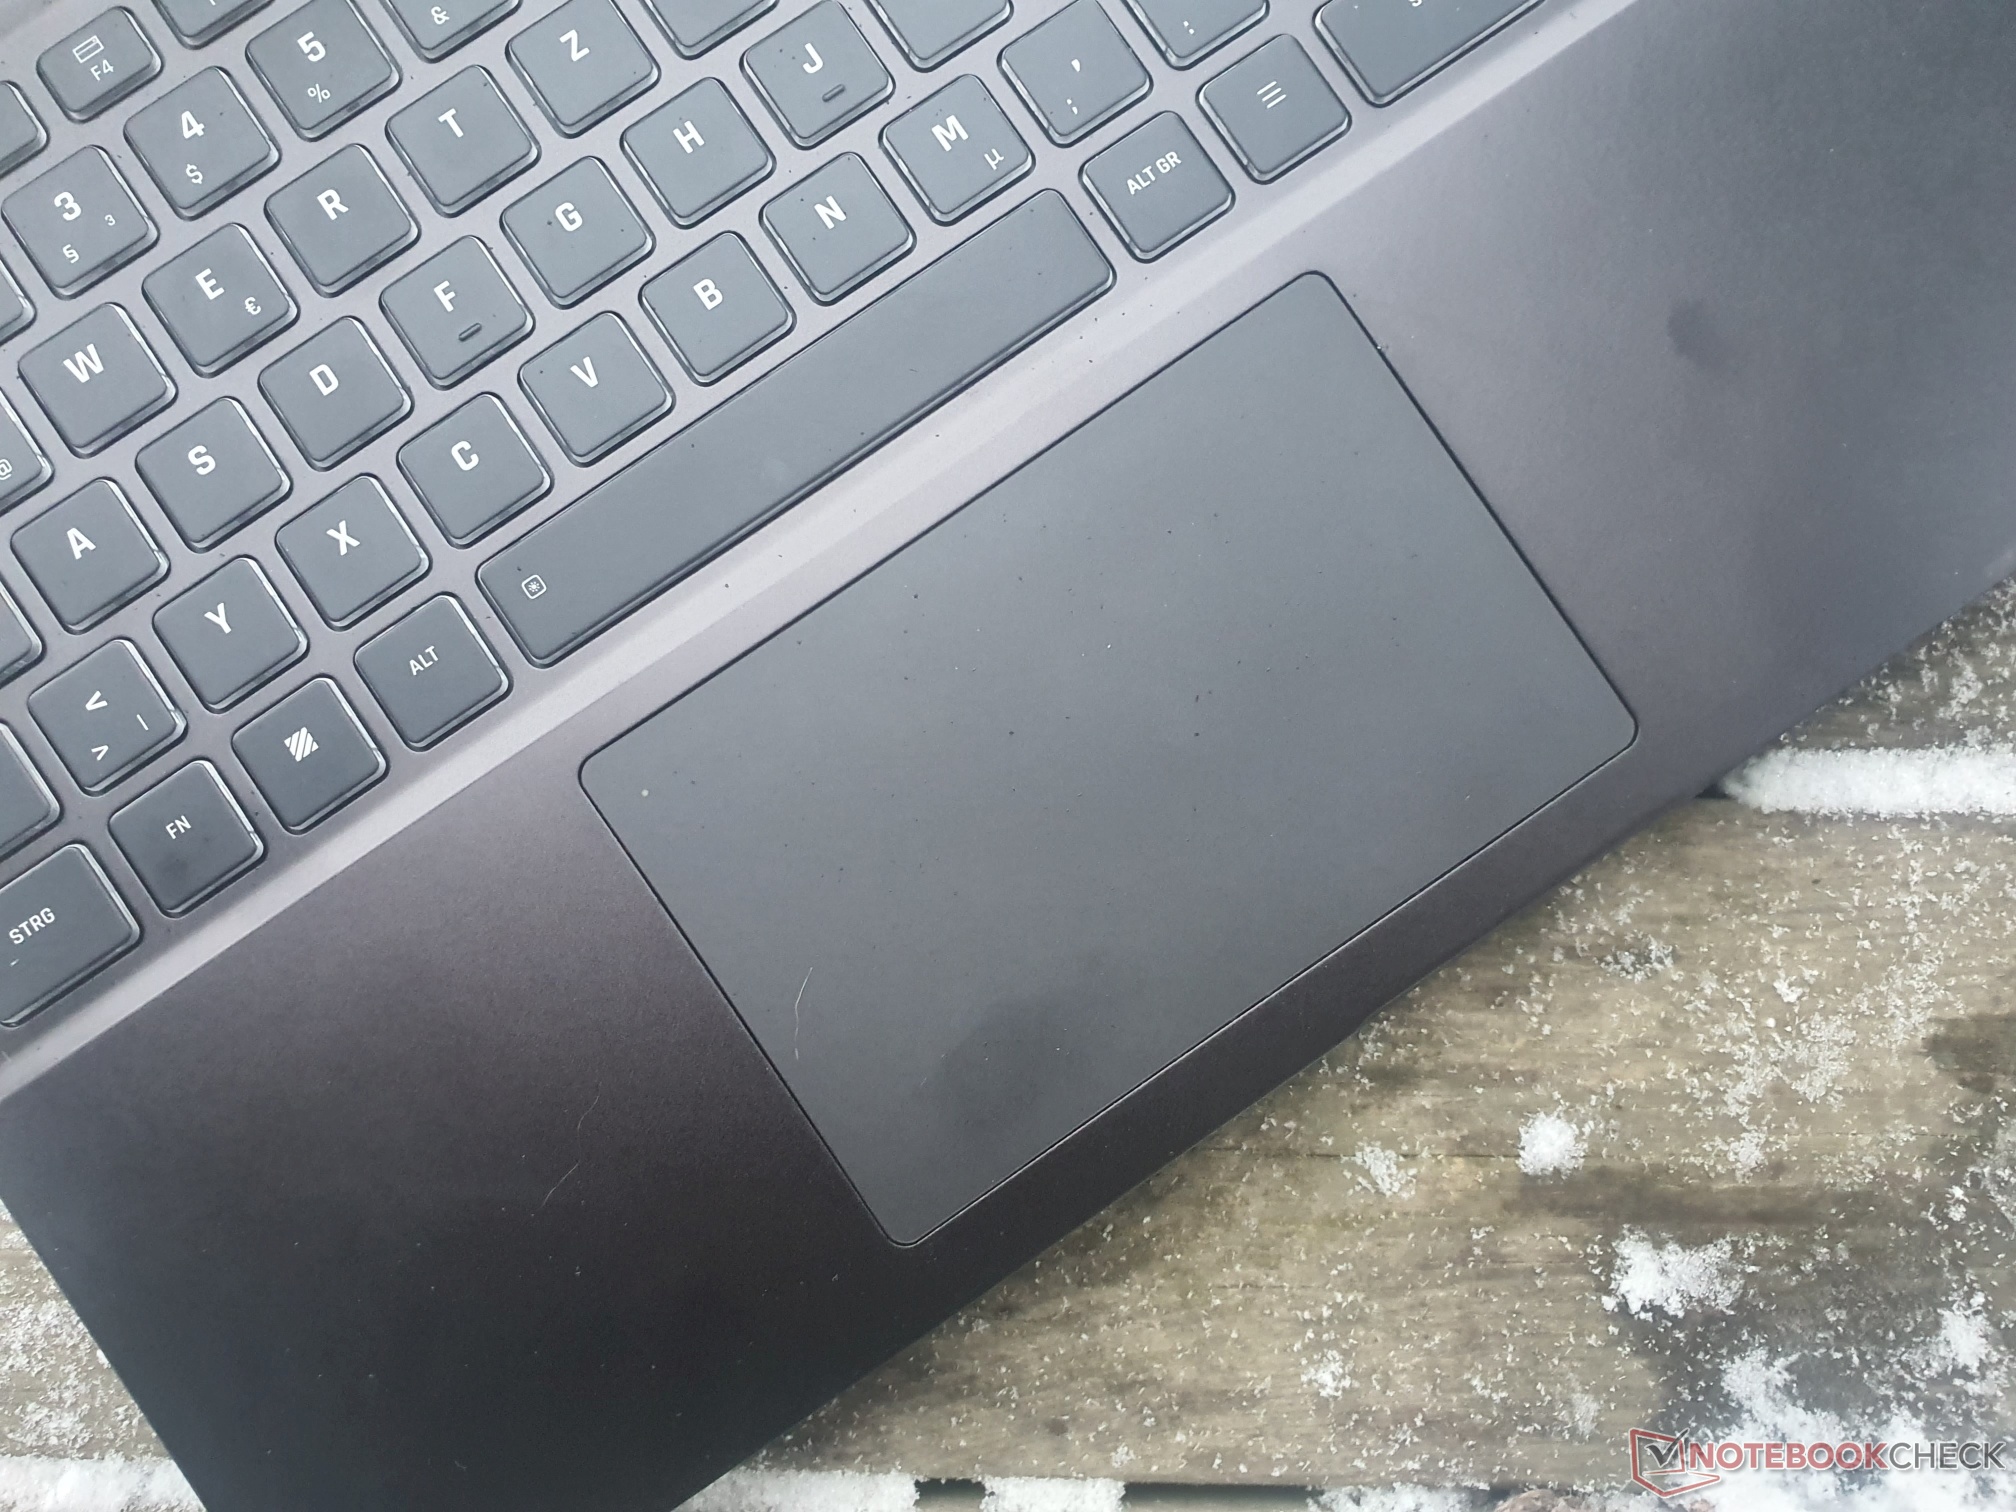
(+) Podpórki pod nadgarstki i touchpad są chłodniejsze niż temperatura skóry i maksymalnie 28 °C / 82.4 F i dlatego są chłodne w dotyku.
(±) Średnia temperatura obszaru podparcia dłoni w podobnych urządzeniach wynosiła 28.8 °C / 83.8 F (+0.8 °C / 1.4 F).
| Schenker XMG Core 15 (M22) AMD Ryzen 7 6800H, NVIDIA GeForce RTX 3060 Laptop GPU | Lenovo Legion 5 15IAH7H 82RB Intel Core i7-12700H, NVIDIA GeForce RTX 3060 Laptop GPU | Schenker XMG Fusion 15 (Mid 22) Intel Core i7-11800H, NVIDIA GeForce RTX 3070 Laptop GPU | Asus TUF Gaming F15 FX507ZM Intel Core i7-12700H, NVIDIA GeForce RTX 3060 Laptop GPU | Alienware m15 R5 Ryzen Edition AMD Ryzen 7 5800H, NVIDIA GeForce RTX 3060 Laptop GPU | Schenker XMG Core 15 Ampere AMD Ryzen 7 4800H, NVIDIA GeForce RTX 3060 Laptop GPU | |
|---|---|---|---|---|---|---|
| Heat | 11% | -20% | -11% | -20% | 2% | |
| Maximum Upper Side * (°C) | 48 | 37.8 21% | 52 -8% | 44.4 7% | 62 -29% | 48 -0% |
| Maximum Bottom * (°C) | 51 | 51 -0% | 63 -24% | 48.8 4% | 61 -20% | 50 2% |
| Idle Upper Side * (°C) | 28 | 25.8 8% | 37 -32% | 37.8 -35% | 36 -29% | 28 -0% |
| Idle Bottom * (°C) | 33 | 28.8 13% | 38 -15% | 39.6 -20% | 33 -0% | 31 6% |
* ... im mniej tym lepiej
Test na stres
Nawet w połączonym teście obciążeniowym CPU nadal oblicza nieco powyżej bazowego taktowania 3,2 GHz, podczas gdy rozgrzewa się do 86 °C (~187 °F) w pierwszych 40 minutach i 93 °C (~199 °F) później, gdy łączne TDP przesuwa się na korzyść CPU, a więc odzyskuje on 4 GHz. Temperatura GPU wynosi tutaj 86 °C, podczas gdy taktowanie zegara wynosiło ~1,400 MHz.
Wykonany bezpośrednio po tym benchmark GPU wypadł bez spadku wydajności.
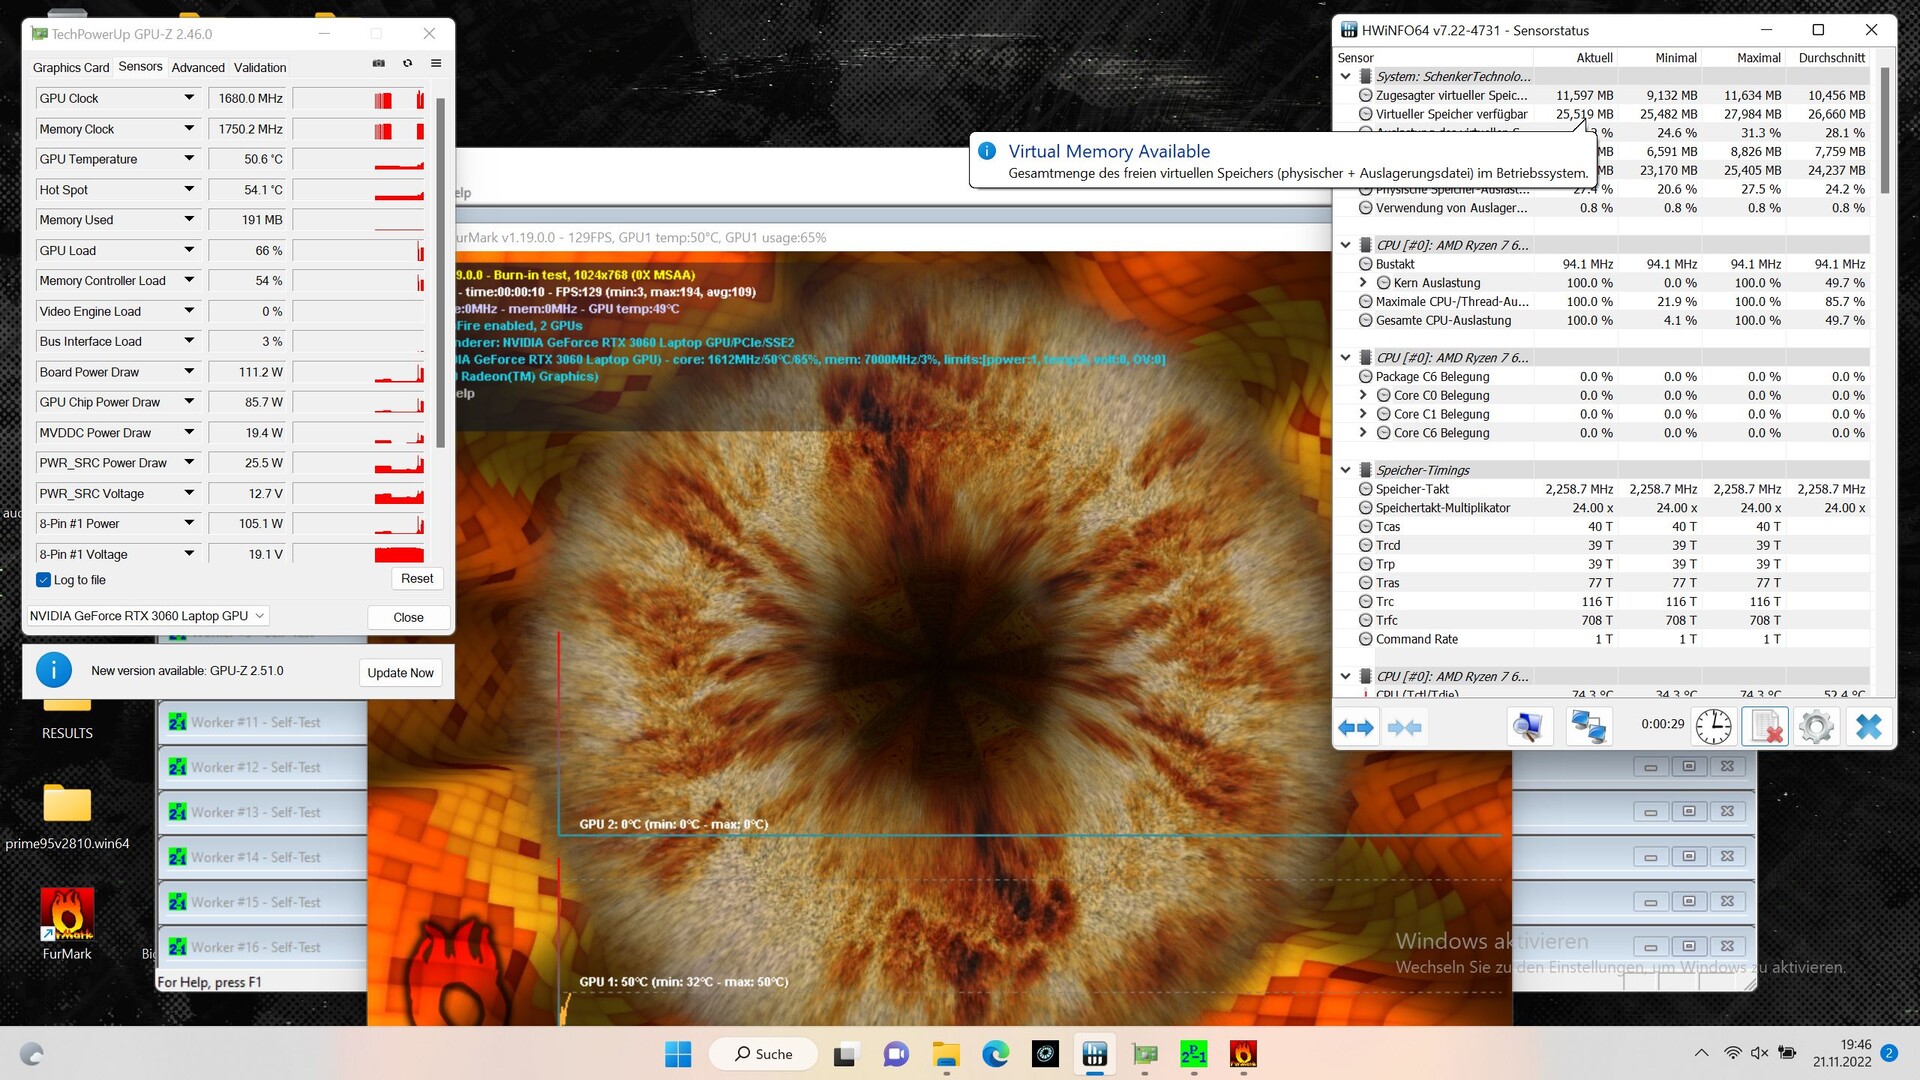
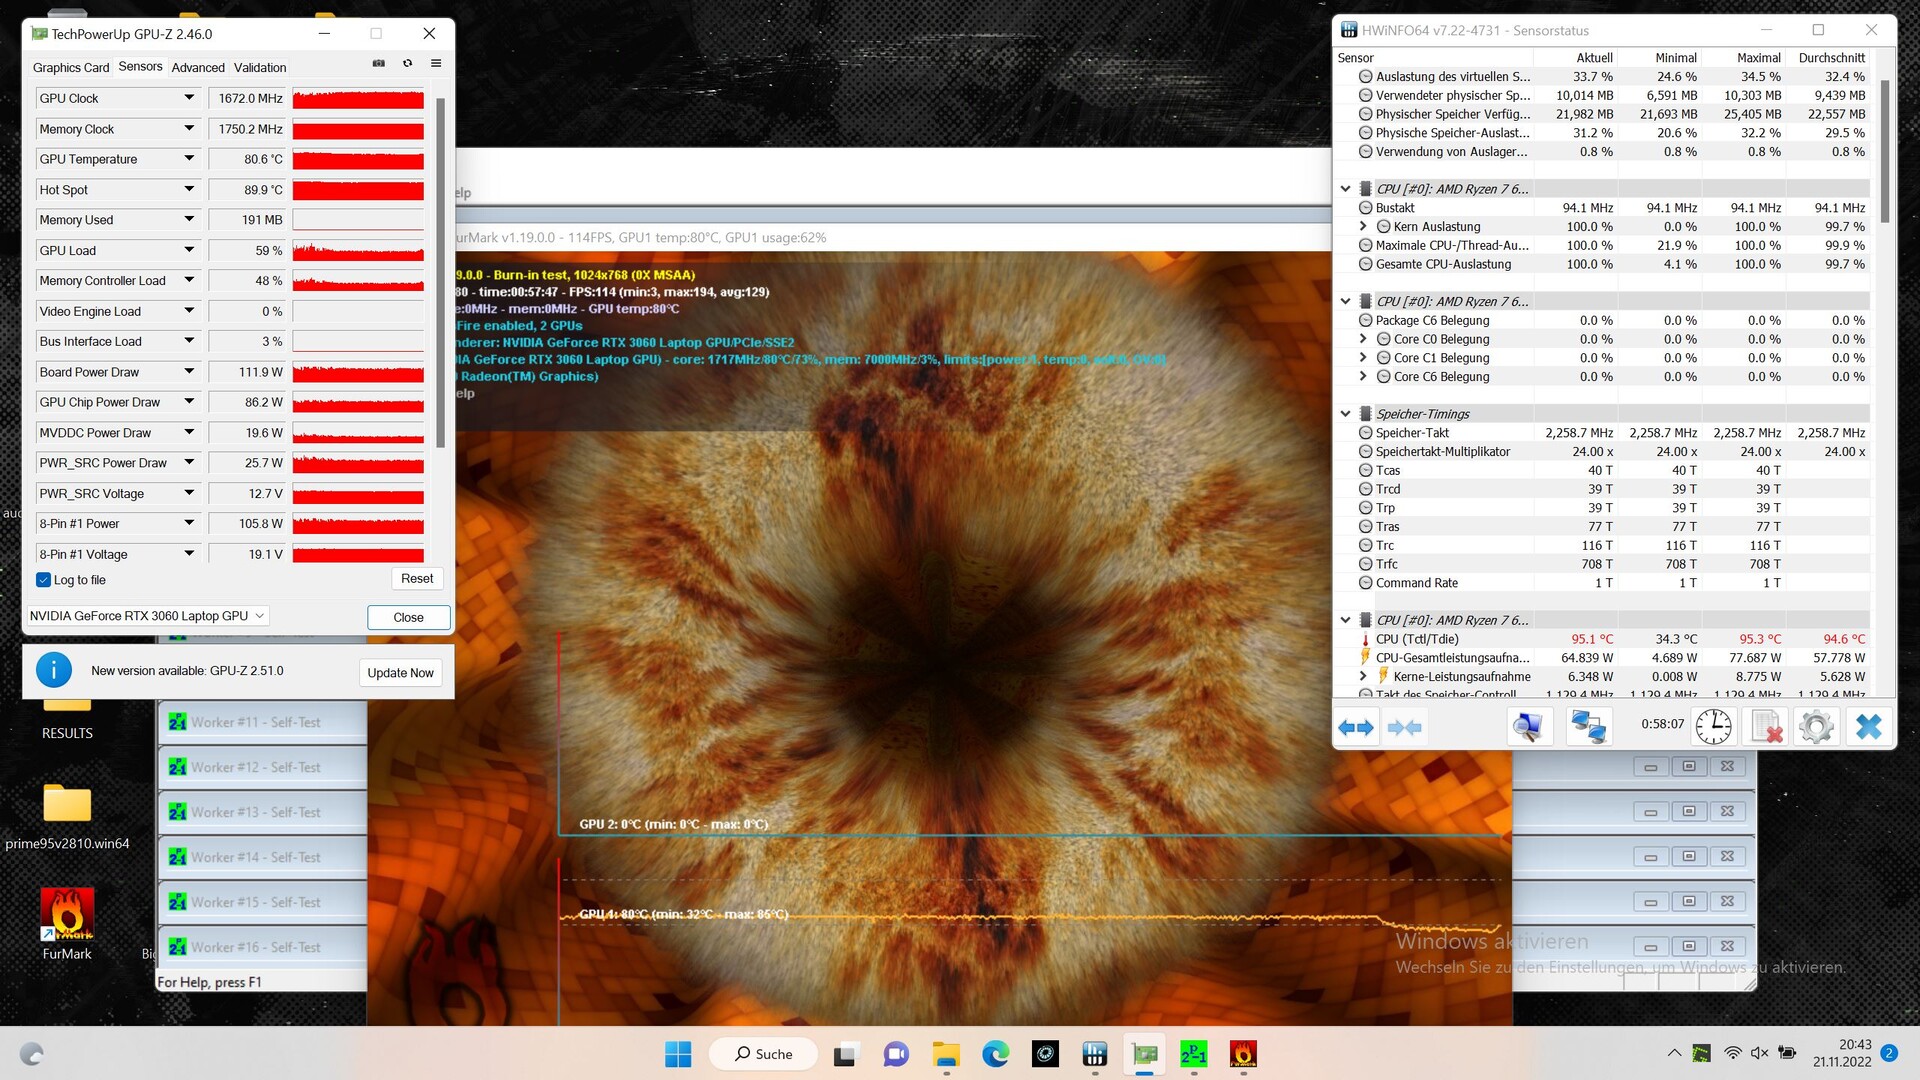
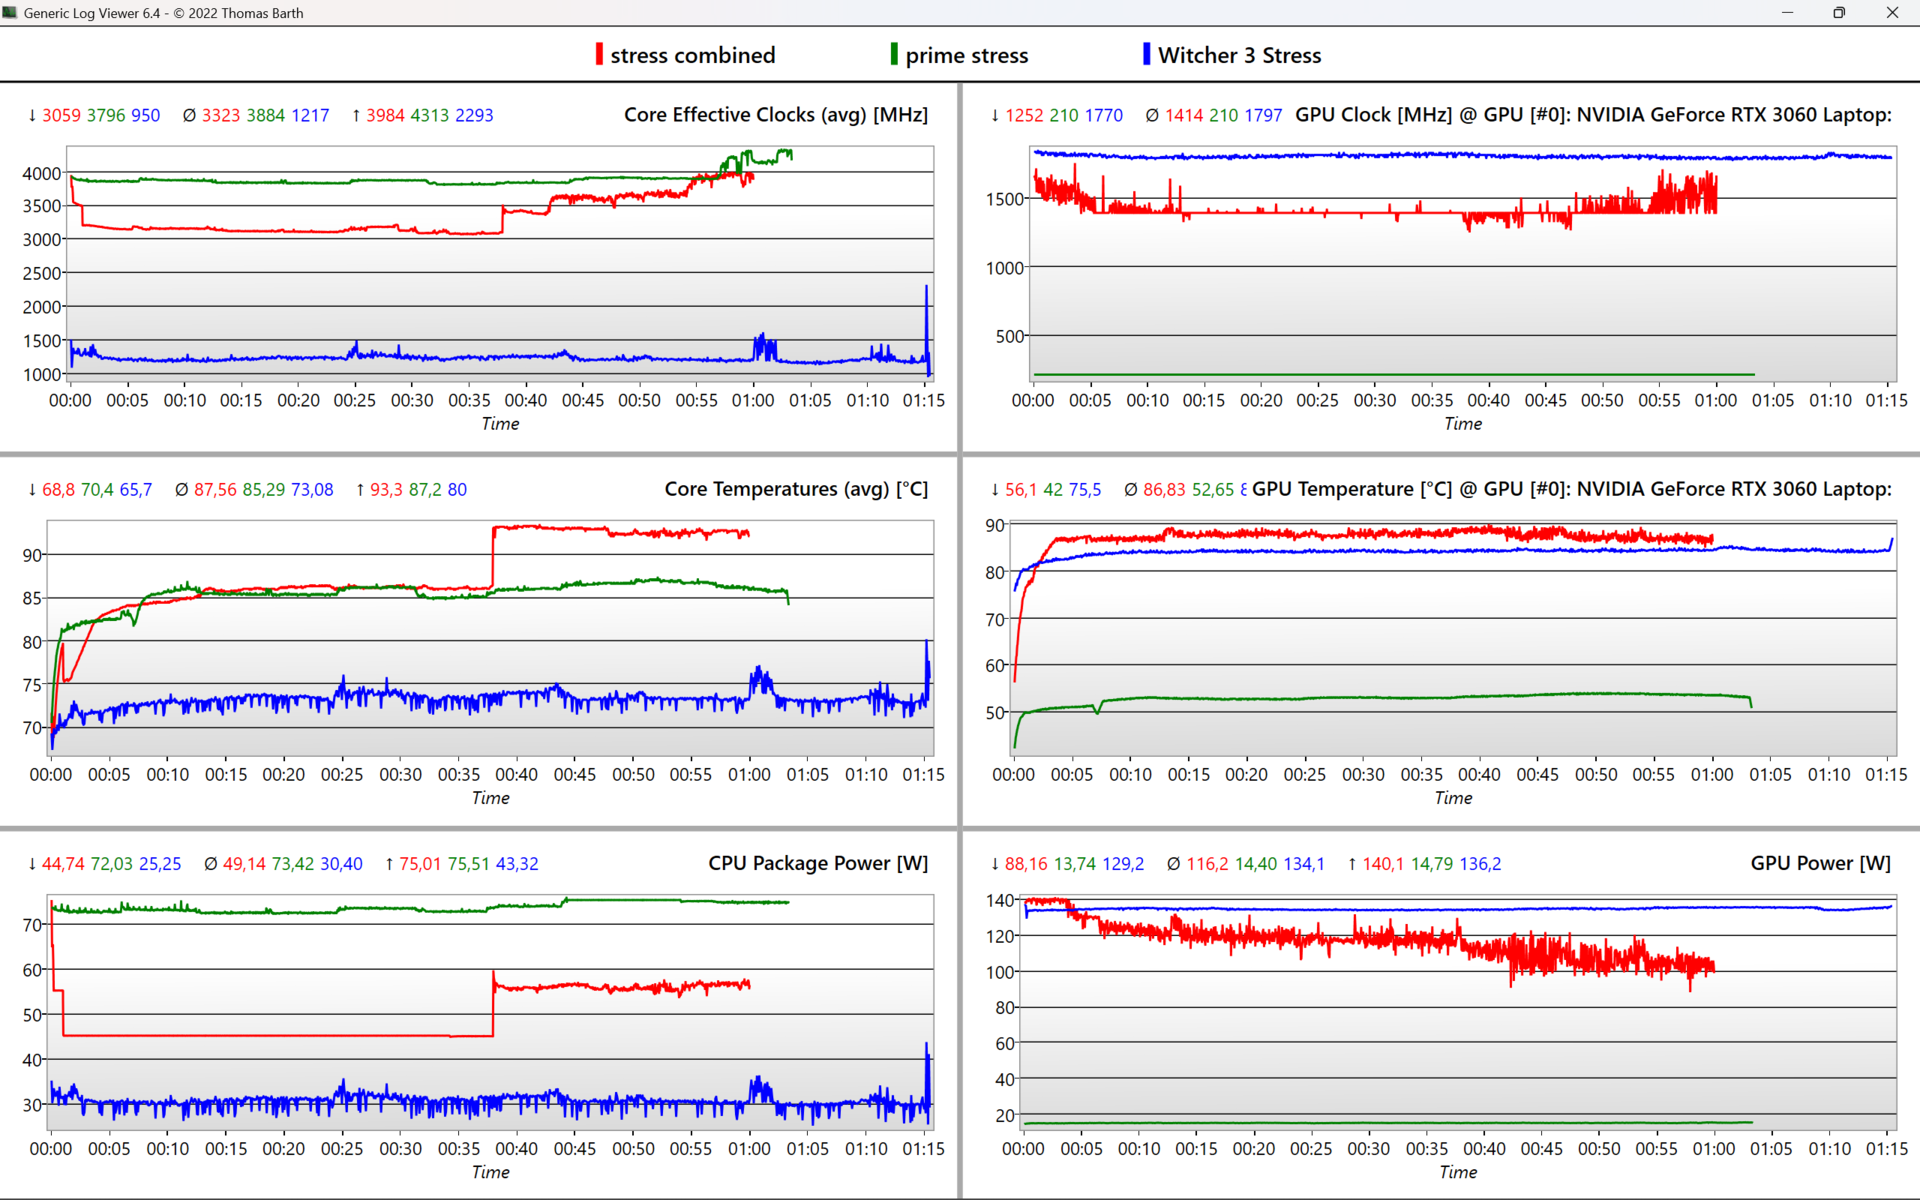
| ZegarCPU (GHz) | Zegar GPU (MHz) | Średnia temperatura CPU (°C) | Średnia temperatura GPU (°C) | |
| System Idle | 0.15 | 200 | 34 | 42 |
| Prime95, stres | 3,9 | 200 | 85 | 53 |
| Prime95 + FurMark, Stress | 3.3 | 1,400 | 93 | 87 |
| Witcher 3, Stress | 1,2 | 1,800 | 73 | 84 |
Mówca
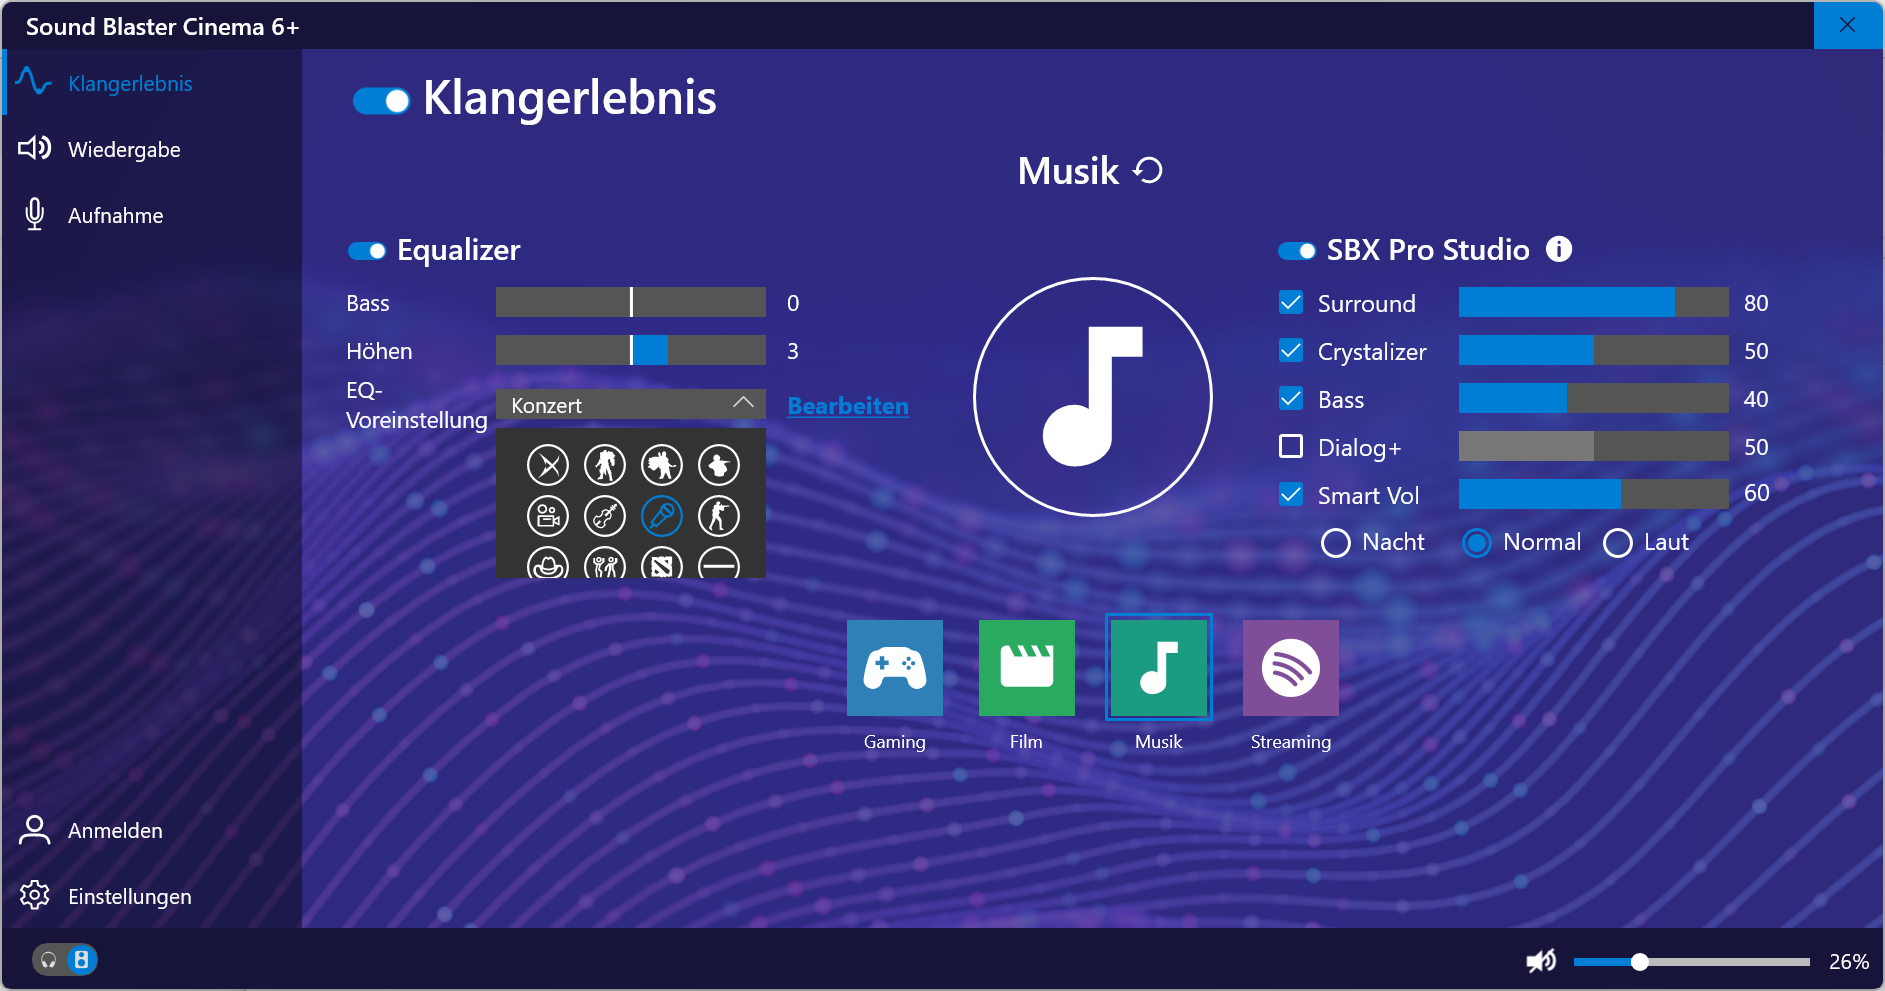
System dźwięku stereo oferuje liniowe i zrównoważone wysokie tony, a nawet posiada implikowane basy. Oprogramowanie Sound Blaster Cinema 6+ poprawia dźwięk poprzez wybór różnych trybów. Aby uzyskać lepsze wrażenia dźwiękowe, należy jeszcze podłączyć słuchawki lub zewnętrzny system dźwiękowy przez złącze jack lub Bluetooth.
Schenker XMG Core 15 (M22) analiza dźwięku
(±) | głośność głośnika jest średnia, ale dobra (81.28 dB)
Bas 100 - 315 Hz
(-) | prawie brak basu - średnio 19.8% niższa od mediany
(+) | bas jest liniowy (6.4% delta do poprzedniej częstotliwości)
Średnie 400 - 2000 Hz
(±) | wyższe średnie - średnio 6.2% wyższe niż mediana
(±) | liniowość środka jest średnia (7.9% delta do poprzedniej częstotliwości)
Wysokie 2–16 kHz
(+) | zrównoważone maksima - tylko 1.8% od mediany
(+) | wzloty są liniowe (4.8% delta do poprzedniej częstotliwości)
Ogólnie 100 - 16.000 Hz
(±) | liniowość ogólnego dźwięku jest średnia (17.1% różnicy w stosunku do mediany)
W porównaniu do tej samej klasy
» 46% wszystkich testowanych urządzeń w tej klasie było lepszych, 12% podobnych, 43% gorszych
» Najlepszy miał deltę 6%, średnia wynosiła ###średnia###%, najgorsza wynosiła 132%
W porównaniu do wszystkich testowanych urządzeń
» 31% wszystkich testowanych urządzeń było lepszych, 8% podobnych, 61% gorszych
» Najlepszy miał deltę 4%, średnia wynosiła ###średnia###%, najgorsza wynosiła 134%
Lenovo Legion Slim 7-16IAH 82TF004YGE analiza dźwięku
(±) | głośność głośnika jest średnia, ale dobra (73.4 dB)
Bas 100 - 315 Hz
(±) | zredukowany bas - średnio 10% niższy od mediany
(±) | liniowość basu jest średnia (13.4% delta do poprzedniej częstotliwości)
Średnie 400 - 2000 Hz
(+) | zbalansowane środki średnie - tylko 1.2% od mediany
(+) | średnie są liniowe (3.3% delta do poprzedniej częstotliwości)
Wysokie 2–16 kHz
(±) | wyższe maksima - średnio 5.5% wyższe od mediany
(±) | liniowość wysokich wartości jest średnia (10.6% delta do poprzedniej częstotliwości)
Ogólnie 100 - 16.000 Hz
(+) | ogólny dźwięk jest liniowy (13% różnicy w stosunku do mediany)
W porównaniu do tej samej klasy
» 18% wszystkich testowanych urządzeń w tej klasie było lepszych, 3% podobnych, 79% gorszych
» Najlepszy miał deltę 6%, średnia wynosiła ###średnia###%, najgorsza wynosiła 132%
W porównaniu do wszystkich testowanych urządzeń
» 13% wszystkich testowanych urządzeń było lepszych, 2% podobnych, 85% gorszych
» Najlepszy miał deltę 4%, średnia wynosiła ###średnia###%, najgorsza wynosiła 134%
Zarządzanie energią: Gamingowy laptop AMD z użytecznym czasem pracy na baterii
Zużycie energii
Zużycie energii jest w zasadzie na oczekiwanym poziomie i mniej więcej dorównuje konkurencji na naszym polu porównawczym. Tylko Legion 5 pobiera z gniazdka znacznie więcej soku w stanie spoczynku, podczas gdy TUF Gaming F15 jest najbardziej oszczędny w idle w naszym zestawieniu. Zasilacz o mocy 230 W staje na wysokości zadania, gdyż w szczycie rzadko osiąga 236 W.
| luz | |
| obciążenie |
|
Legenda:
min: | |
| Schenker XMG Core 15 (M22) R7 6800H, GeForce RTX 3060 Laptop GPU, Samsung SSD 980 Pro 1TB MZ-V8P1T0BW, IPS, 2560x1440, 15.6" | Lenovo Legion 5 15IAH7H 82RB i7-12700H, GeForce RTX 3060 Laptop GPU, , IPS, 1920x1080, 15.6" | Schenker XMG Fusion 15 (Mid 22) i7-11800H, GeForce RTX 3070 Laptop GPU, Samsung SSD 980 Pro 1TB MZ-V8P1T0BW, IPS, 2560x1440, 15.6" | Asus TUF Gaming F15 FX507ZM i7-12700H, GeForce RTX 3060 Laptop GPU, SK Hynix HFM001TD3JX013N, IPS, 1920x1080, 15.6" | Alienware m15 R5 Ryzen Edition R7 5800H, GeForce RTX 3060 Laptop GPU, Toshiba KBG40ZNS512G NVMe, IPS, 1920x1080, 15.6" | Schenker XMG Core 15 Ampere R7 4800H, GeForce RTX 3060 Laptop GPU, Samsung SSD 970 EVO Plus 1TB, IPS, 2560x1440, 15.6" | Przeciętny NVIDIA GeForce RTX 3060 Laptop GPU | Średnia w klasie Gaming | |
|---|---|---|---|---|---|---|---|---|
| Power Consumption | -64% | -10% | -1% | -12% | -2% | -5% | -24% | |
| Idle Minimum * (Watt) | 11.8 | 19.8 -68% | 12 -2% | 6.3 47% | 11 7% | 11 7% | 10.4 ? 12% | 13.2 ? -12% |
| Idle Average * (Watt) | 14.7 | 26.2 -78% | 17 -16% | 9.8 33% | 14 5% | 14 5% | 14.5 ? 1% | 18.9 ? -29% |
| Idle Maximum * (Watt) | 15 | 48.2 -221% | 24 -60% | 26.5 -77% | 25 -67% | 20 -33% | 21.4 ? -43% | 24.3 ? -62% |
| Load Average * (Watt) | 100 | 102.9 -3% | 106 -6% | 103.8 -4% | 123 -23% | 94 6% | 109.3 ? -9% | 108.3 ? -8% |
| Witcher 3 ultra * (Watt) | 184 | 186.7 -1% | 159.9 13% | 189 -3% | 176 4% | 167 9% | ||
| Load Maximum * (Watt) | 237 | 268 -13% | 208 12% | 241.9 -2% | 226 5% | 251 -6% | 206 ? 13% | 254 ? -7% |
* ... im mniej tym lepiej
Energy consumption Witcher 3 / Stress test
Energy consumption with external monitor
Żywotność baterii
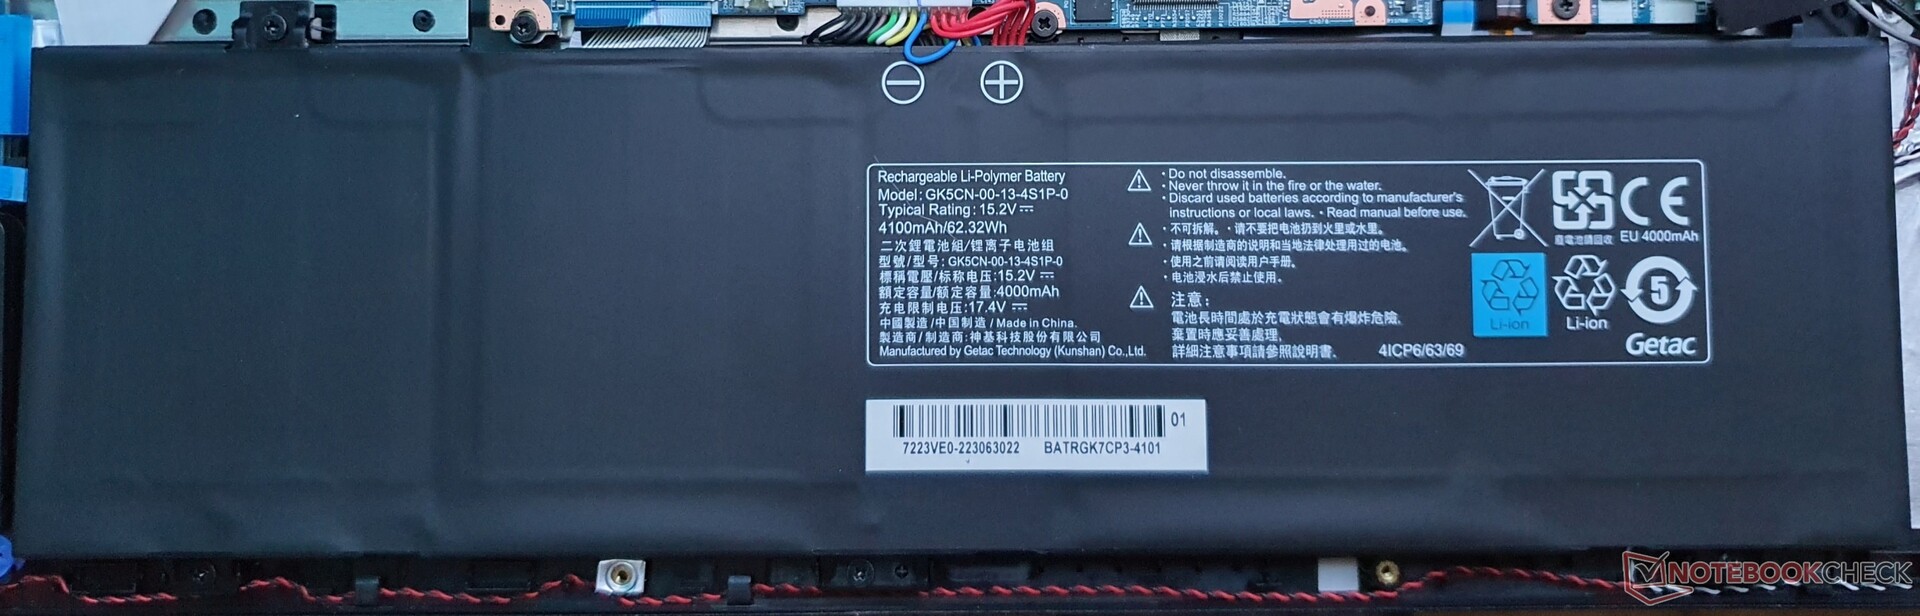
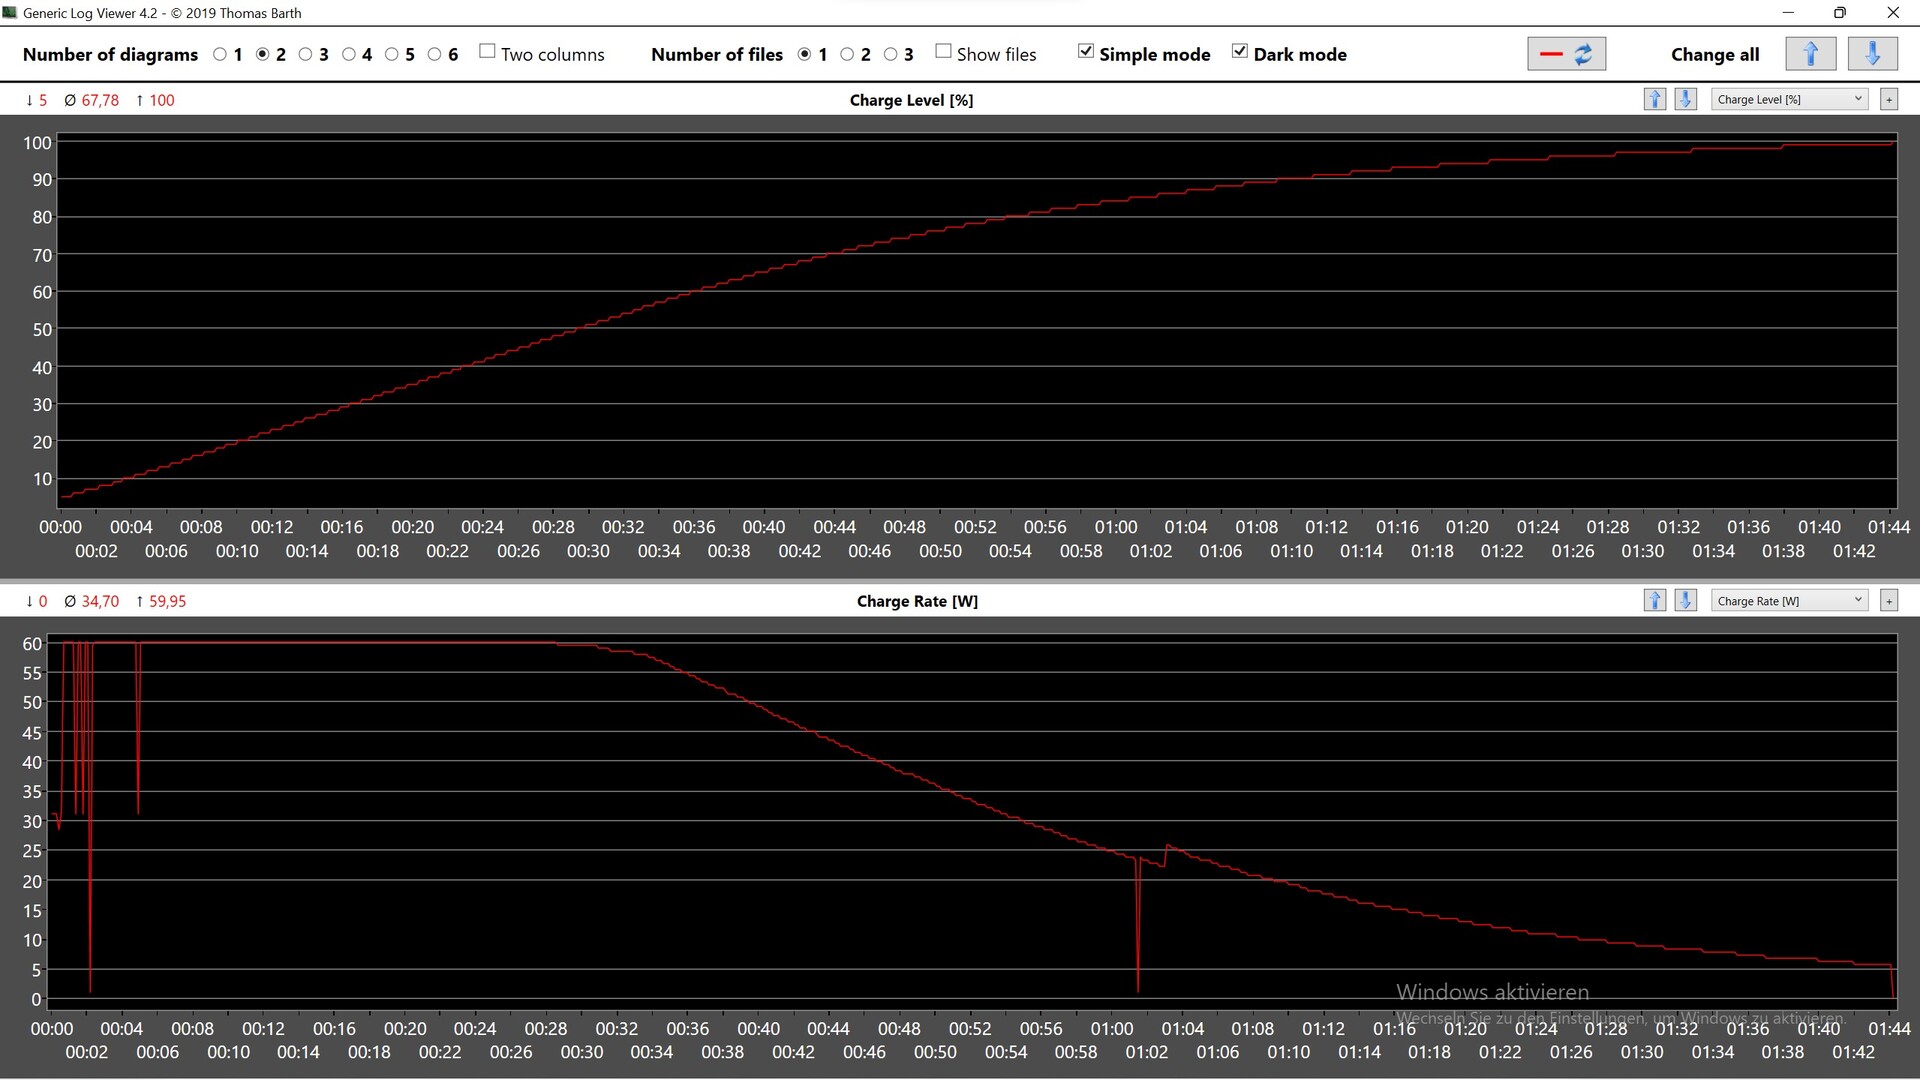
Mimo niewielkiego akumulatora o pojemności 62 Wh czasy pracy wynoszące 7:45 h, na przykład podczas przeglądania stron internetowych w temperaturze 150 cd/m², są całkiem przyzwoite. Testowaliśmy w trybie Enthusiast , podczas gdy częstotliwość odświeżania jest automatycznie redukowana do 60 Hz na zasilaniu akumulatorowym.
XMG Core 15 wytrzymuje więc najdłużej na naszym polu porównawczym i jest wydajnym graczem, gdyż cała konkurencja stawia na jeszcze większe akumulatory, o pojemności od 80 do 93 Wh. Akumulator jest w połowie ładowany w 30 minut.
| Schenker XMG Core 15 (M22) R7 6800H, GeForce RTX 3060 Laptop GPU, 62 Wh | Lenovo Legion 5 15IAH7H 82RB i7-12700H, GeForce RTX 3060 Laptop GPU, 80 Wh | Schenker XMG Fusion 15 (Mid 22) i7-11800H, GeForce RTX 3070 Laptop GPU, 93.48 Wh | Asus TUF Gaming F15 FX507ZM i7-12700H, GeForce RTX 3060 Laptop GPU, 90 Wh | Alienware m15 R5 Ryzen Edition R7 5800H, GeForce RTX 3060 Laptop GPU, 86 Wh | Schenker XMG Core 15 Ampere R7 4800H, GeForce RTX 3060 Laptop GPU, 62 Wh | Średnia w klasie Gaming | |
|---|---|---|---|---|---|---|---|
| Czasy pracy | -18% | 30% | -19% | -27% | -9% | 12% | |
| WiFi v1.3 (h) | 7.8 | 5 -36% | 7.4 -5% | 4.8 -38% | 5.1 -35% | 5.8 -26% | 7.04 ? -10% |
| Load (h) | 1.1 | 1.1 0% | 1.8 64% | 1.1 0% | 0.9 -18% | 1.2 9% | 1.47 ? 34% |
| H.264 (h) | 7.5 | 8.8 | 6 | 8.26 ? | |||
| Witcher 3 ultra (h) | 1.6 |
Za
Przeciw
Werdykt: Szybki laptop do gier Schenker z RTX 3060
Ogólnie rzecz biorąc, XMG Core 15 Schenkera okazuje się być solidnym graczem z wyższej półki średniej. Wydajność 3D jest na ponadprzeciętnym poziomie, ale niektóre modele z tym samym TGP, jak Asus TUF Gaming czy Asus ROG Strix Scar, są jeszcze szybsze. AMD Ryzen 7 6800H przynajmniej przyczynia się do oszczędnej pracy, choć pozostaje (minimalnie) w tyle za rywalami z i7-12700H Intela.
Mimo niewielkiego akumulatora o pojemności 62 Wh ten kompaktowy laptop do gier osiąga najdłuższe czasy pracy na baterii - 7:45 h w naszym polu porównawczym, a matowy wyświetlacz WQHD o częstotliwości odświeżania 165 Hz i szybkich czasach reakcji jest również więcej niż godny szacunku. Cicha gra jest możliwa bez większych spadków wydajności dzięki trybowi Balanced , ale przyjemność z gry jest bardzo ograniczona z dala od gniazdka elektrycznego.
Ci, którzy mogą obejść się bez USB4, Power Delivery i grania na baterii, otrzymają solidnego i potencjalnie cichego gracza klasy średniej z opcjonalnym chłodzeniem wodnym za 1817 euro (~$1935).
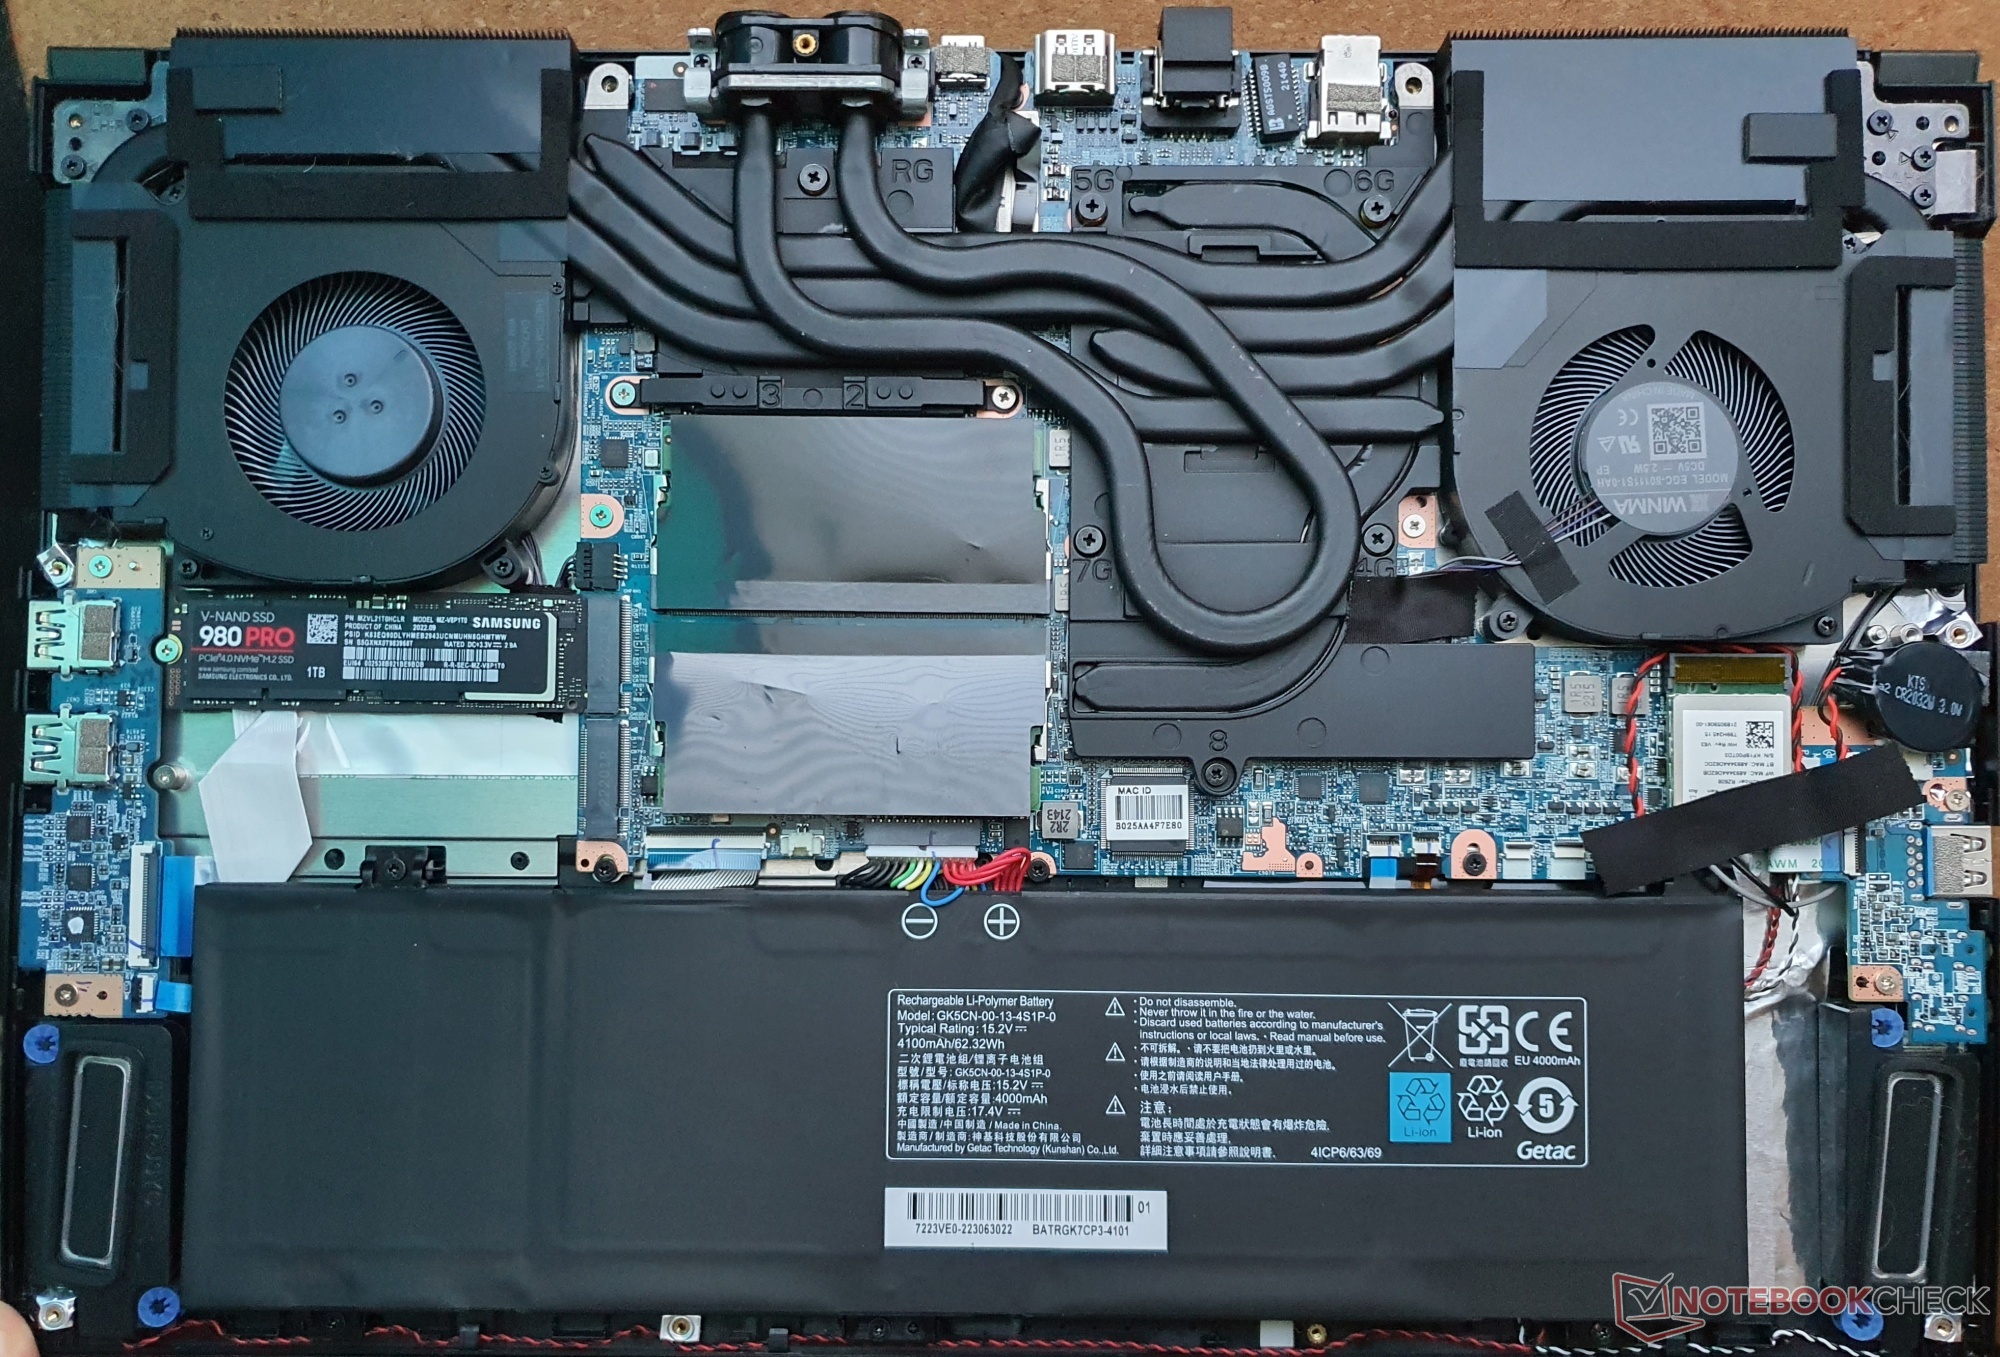
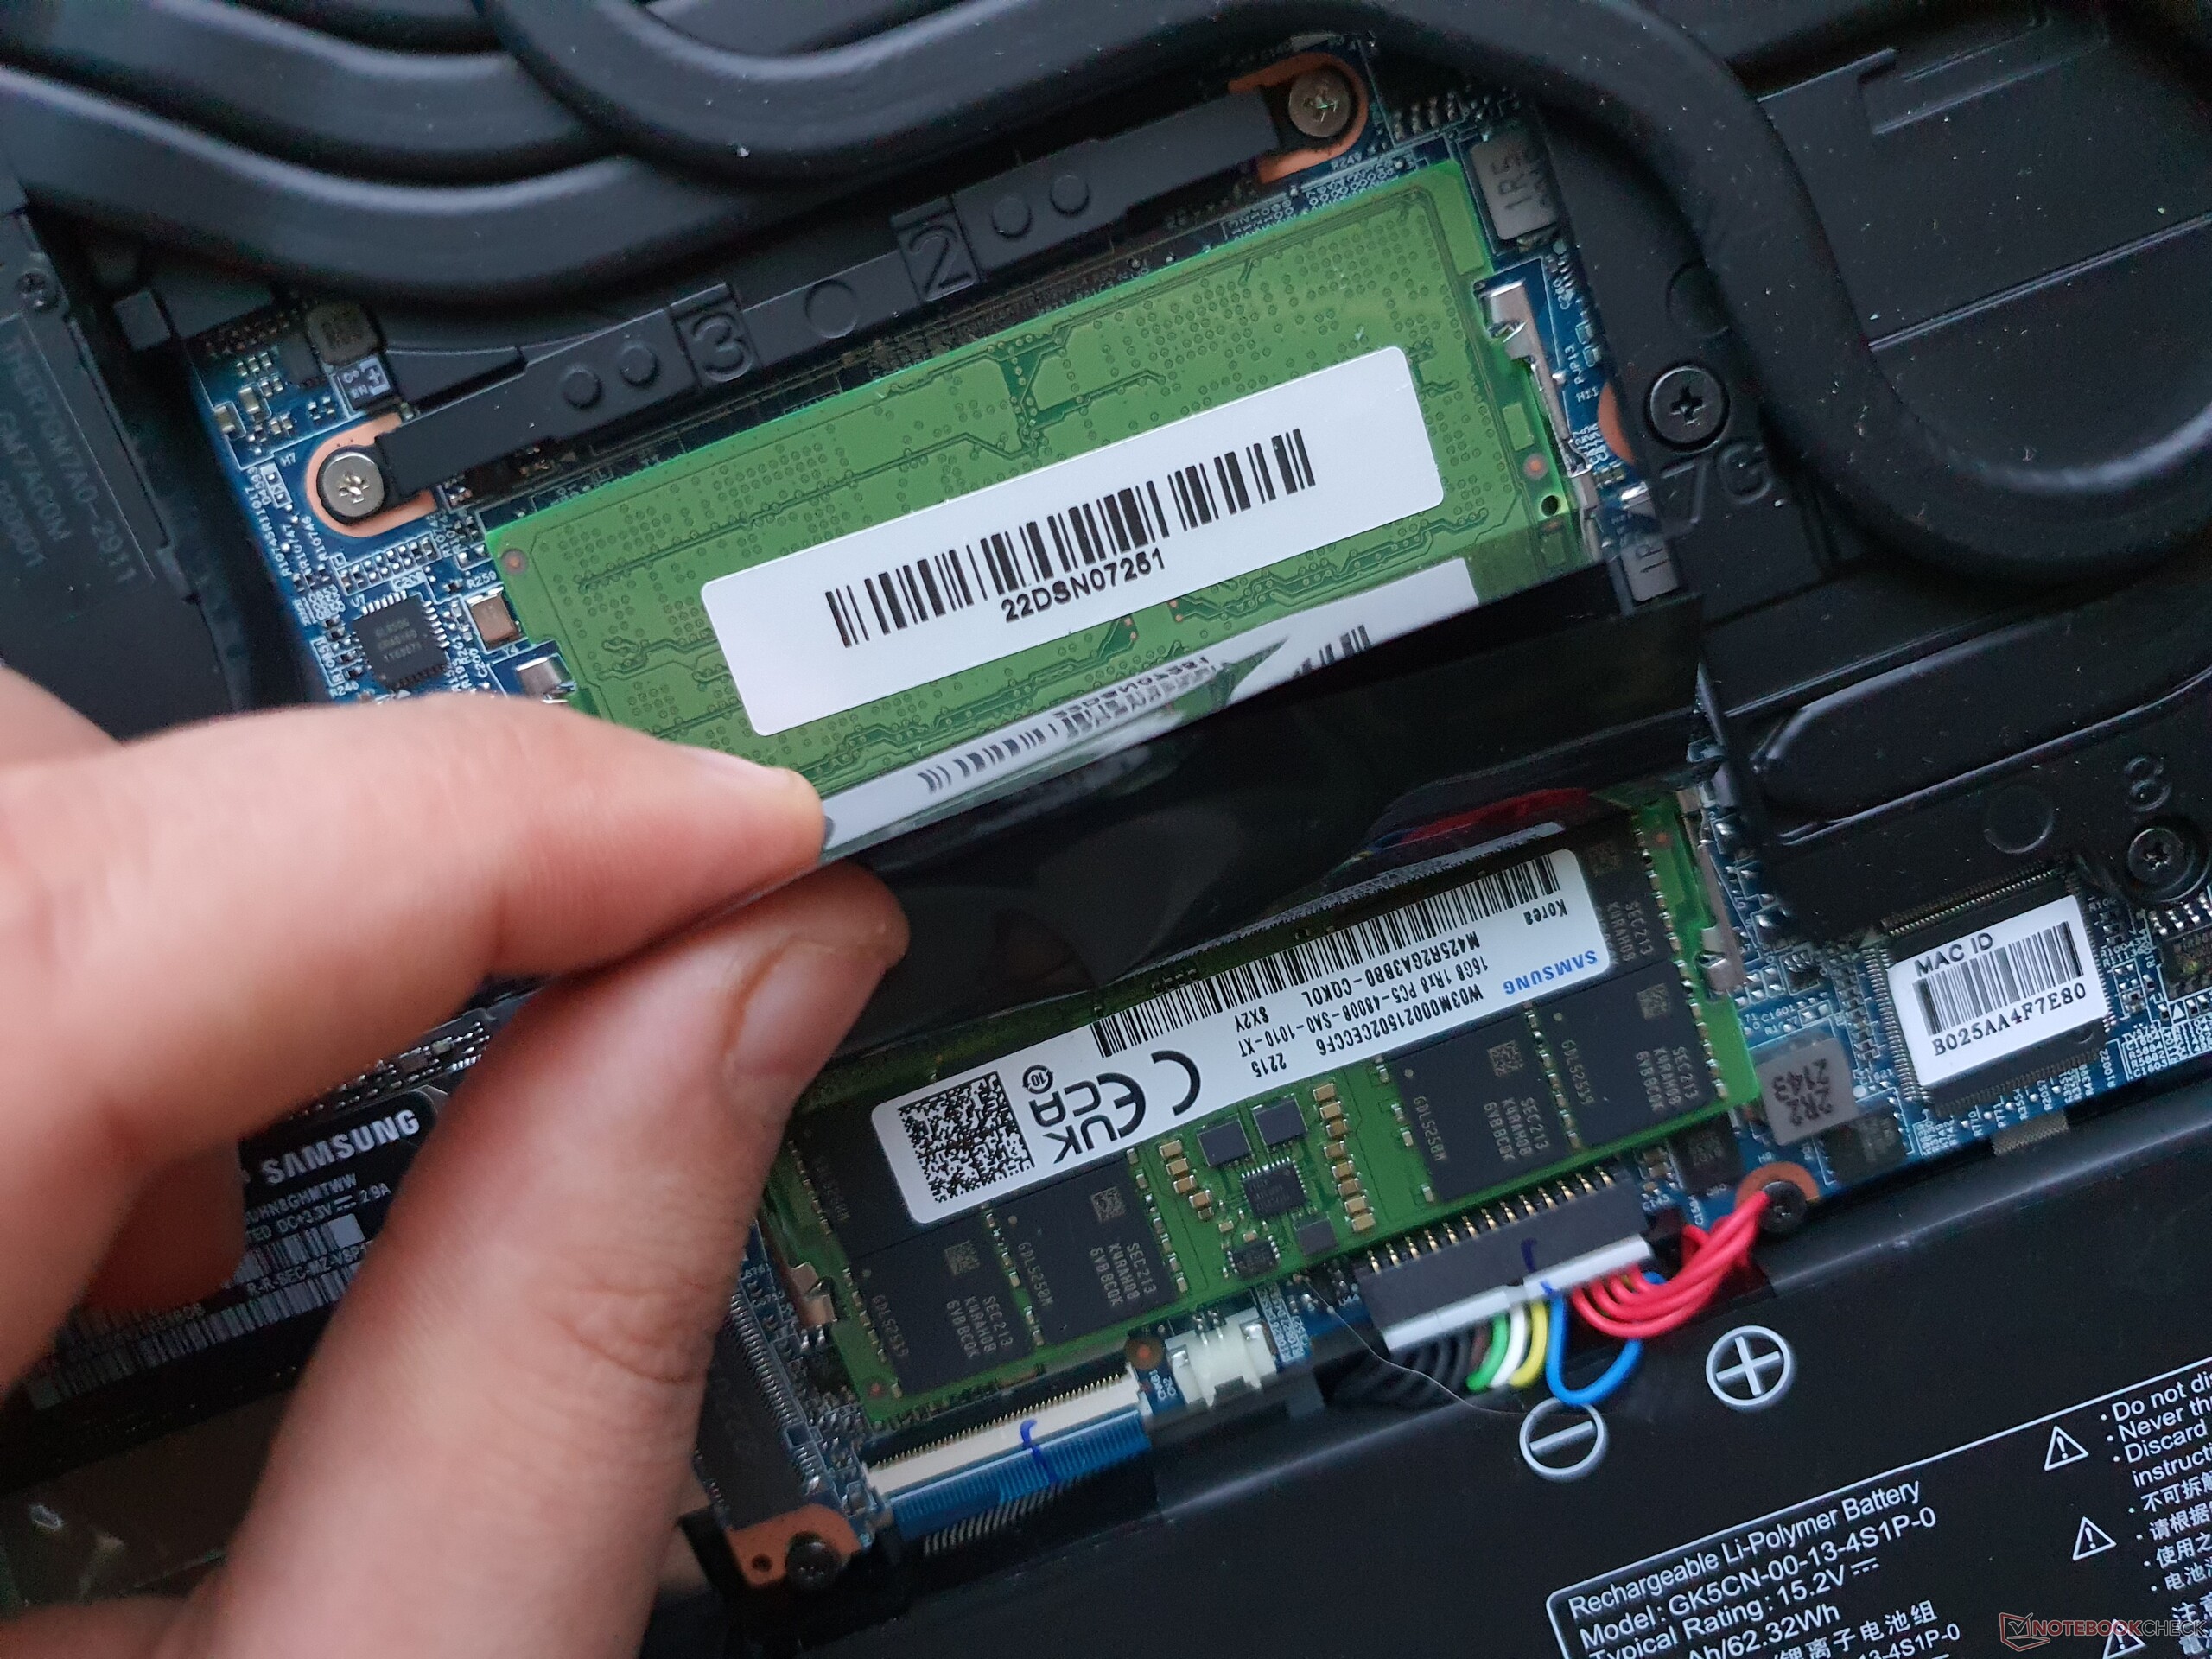
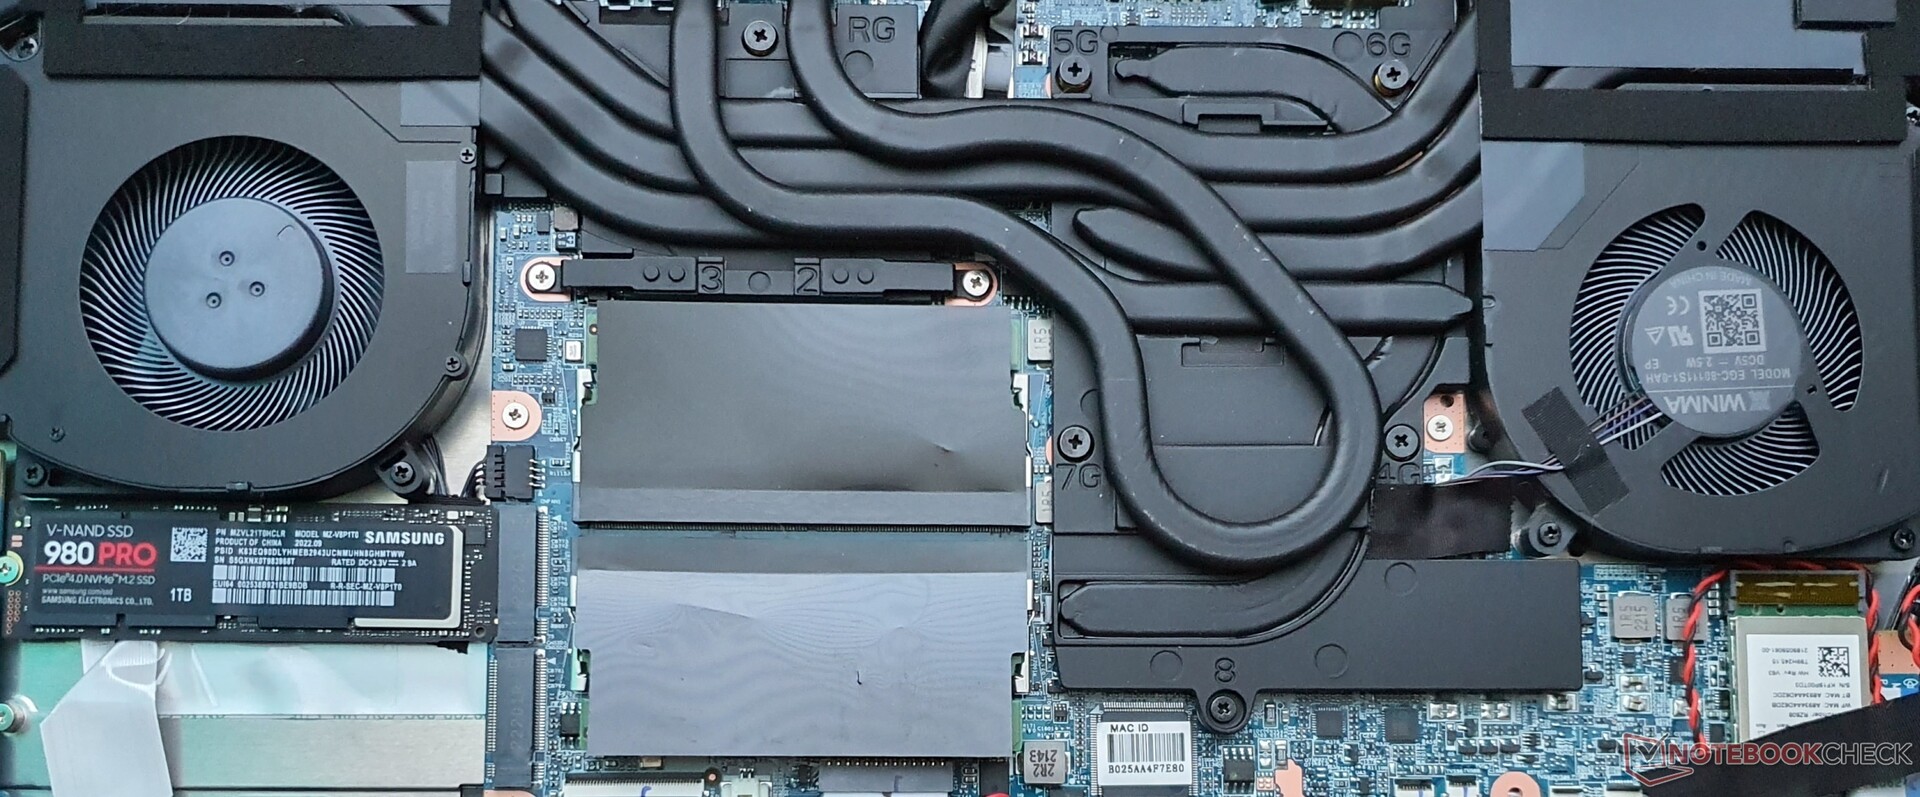
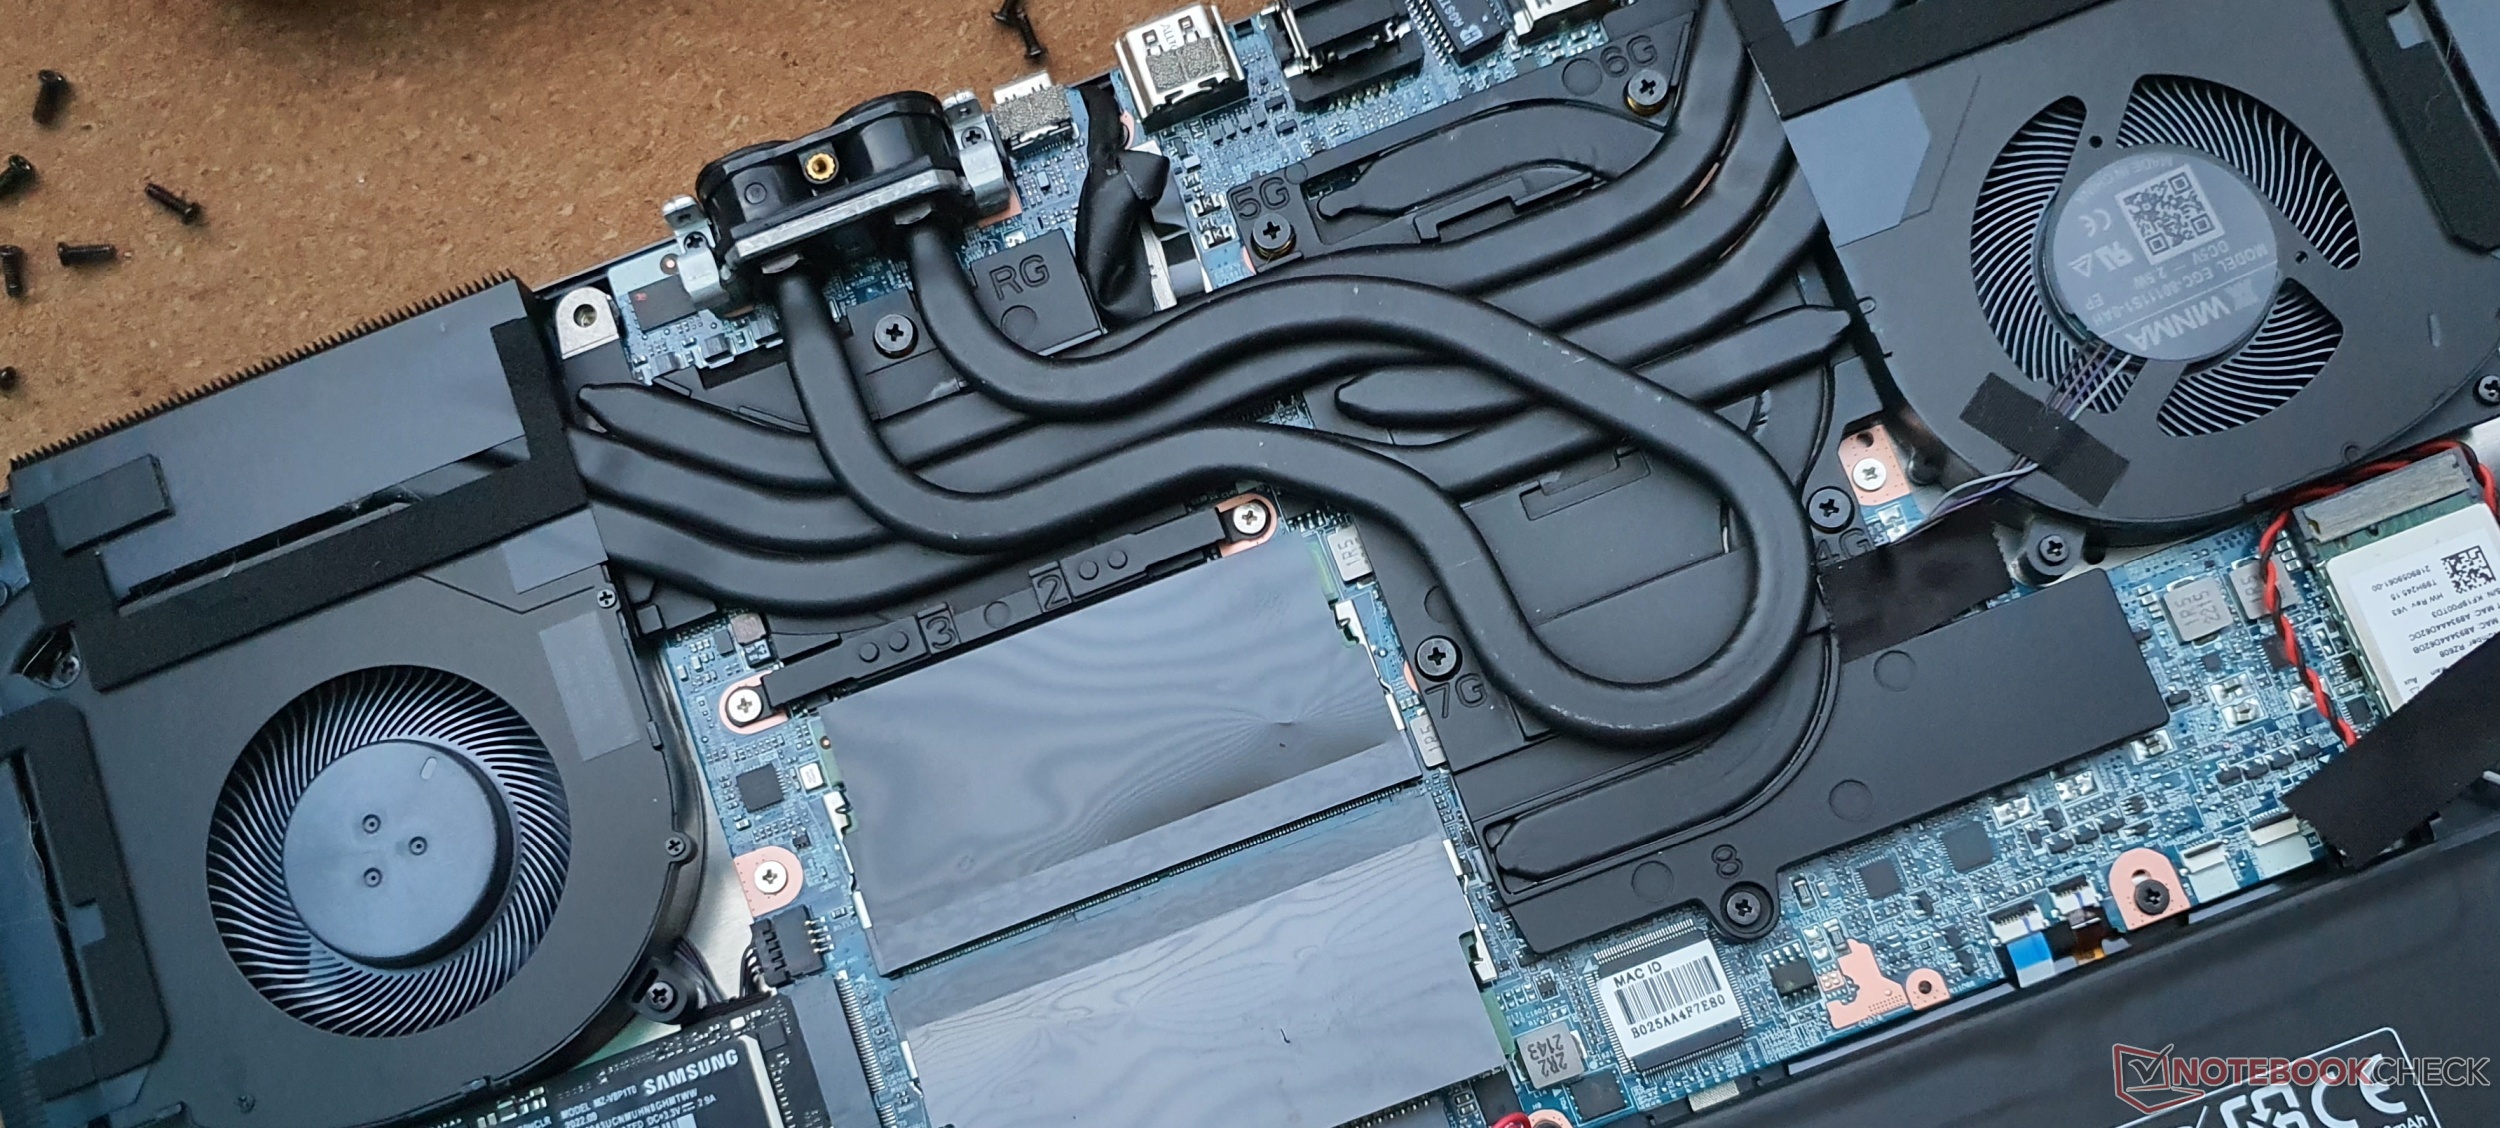
Konserwację ułatwiają dwa gniazda M.2-2280 na dyski SSD PCIe 4.0, a także dwa gniazda na pamięci RAM, można też zmienić nieco powolny moduł WiFi. Z Per-Key RGB i Advanced Optimus trzeba zrezygnować, ale dostępny jest przełącznik MUX, a także możliwość podkręcania GPU.
Lenovo Legion 5 Pro oferuje potencjalnie szybszy RTX 3070, jaśniejszy i większy wyświetlacz 16:10 oraz lepszą klawiaturę w podobnej cenie. XMG Fusion 15 od Lenovo oferuje jeszcze lepszą, ponieważ jest mechaniczna. Rekomendacją jest również Legion Slim 7i, ponieważ w momencie pisania tej recenzji jest już dostępny za 1529 euro (~$1629) w podobnej konfiguracji.
.
Cena i dostępność
Schenker's XMG Core 15 (M22) jest obecnie oferowany w testowanej konfiguracji za 1,817 Euro (~$1935) w Bestware. Najtańszy obecnie model z tym samym CPU+GPU, ale mniejszą ilością pamięci i panelem FHD 144 Hz można kupić już za 1492 euro (~$1589).
Schenker XMG Core 15 (M22)
- 02/01/2023 v7 (old)
Marvin Gollor
Price comparison
