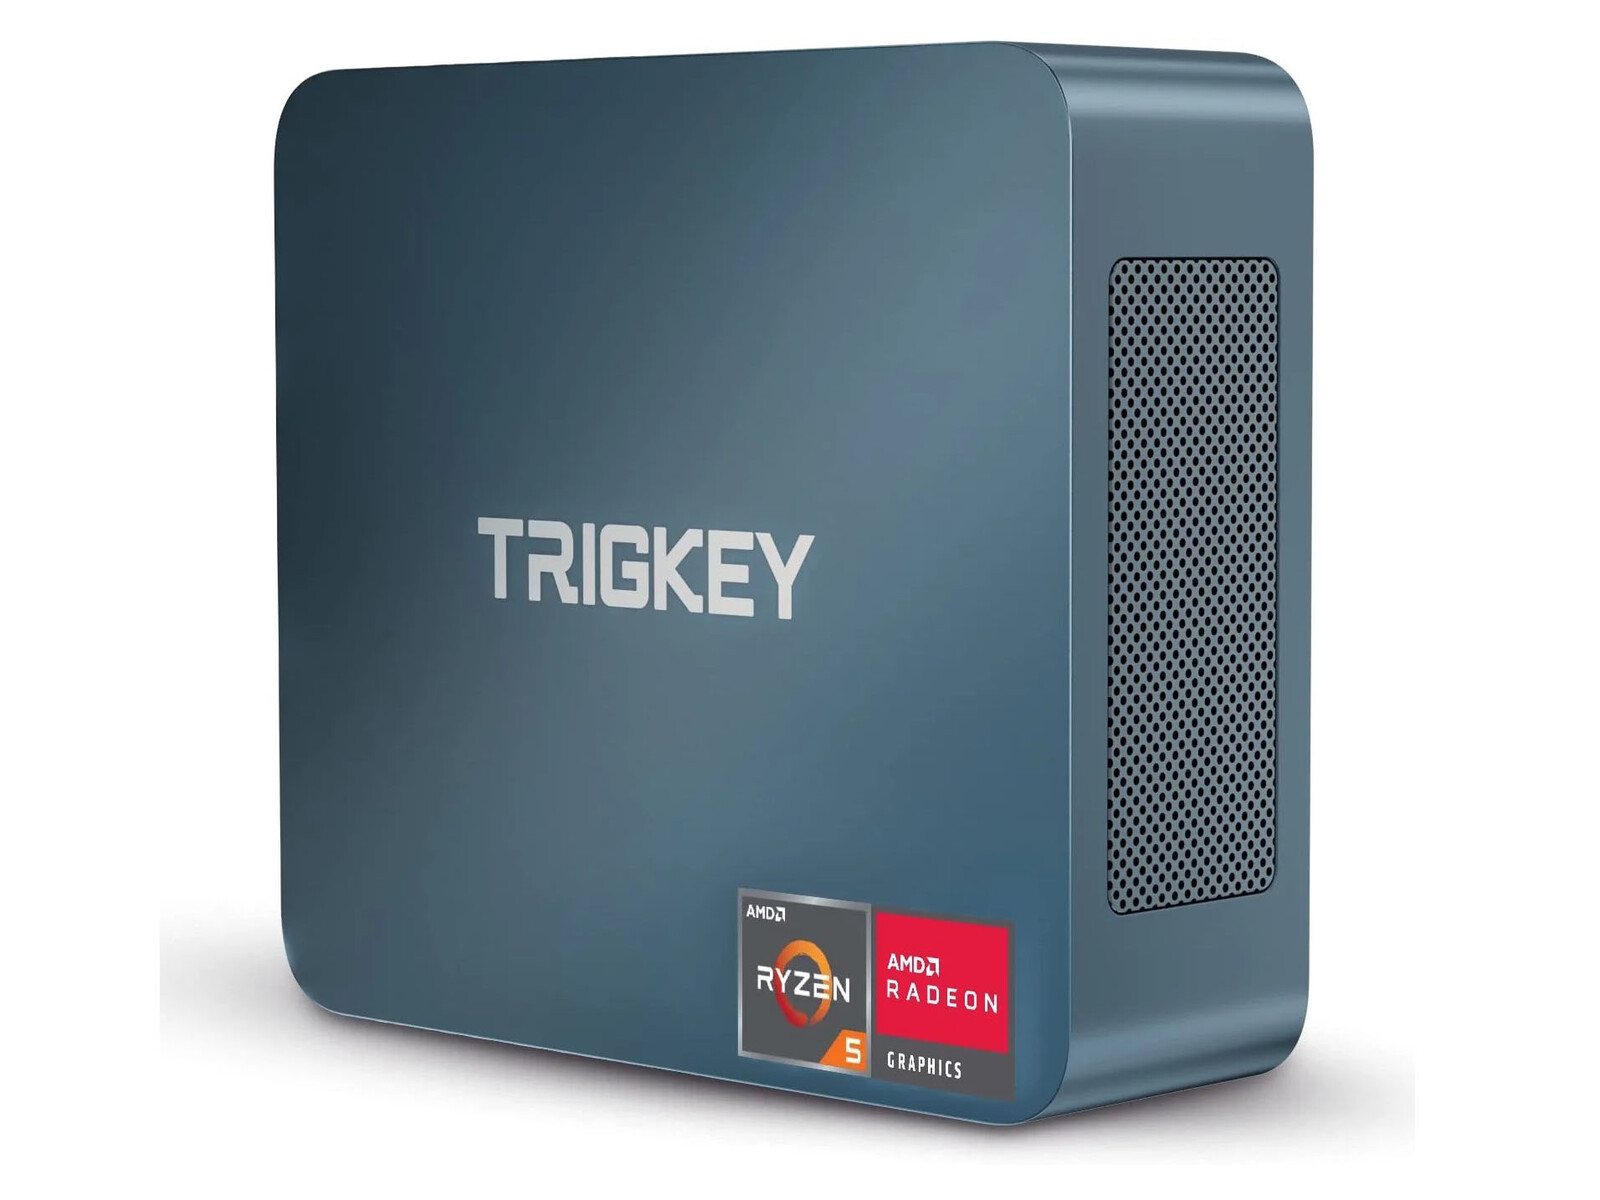
Recenzja mini PC Trigkey S3: Wydajność zbliżona do Core i3 za cenę Celerona lub Atoma
Trigkey specjalizuje się w niedrogich mini komputerach działających na starszych procesorach, aby utrzymać niskie ceny. S3 jest jednym z takich modeli działających na trzyletnim Ryzen 5 3550H w cenie około 280 USD
Do konkurentów w tej przestrzeni należą inne tanie mini PC, jak np BMax B5 Pro, Beelink U59, lub Chuwi LarkBox.
Potencjalni konkurenci w porównaniu
Ocena | Data | Model | Waga | Wysokość | Rozmiar | Rezolucja | Cena |
|---|---|---|---|---|---|---|---|
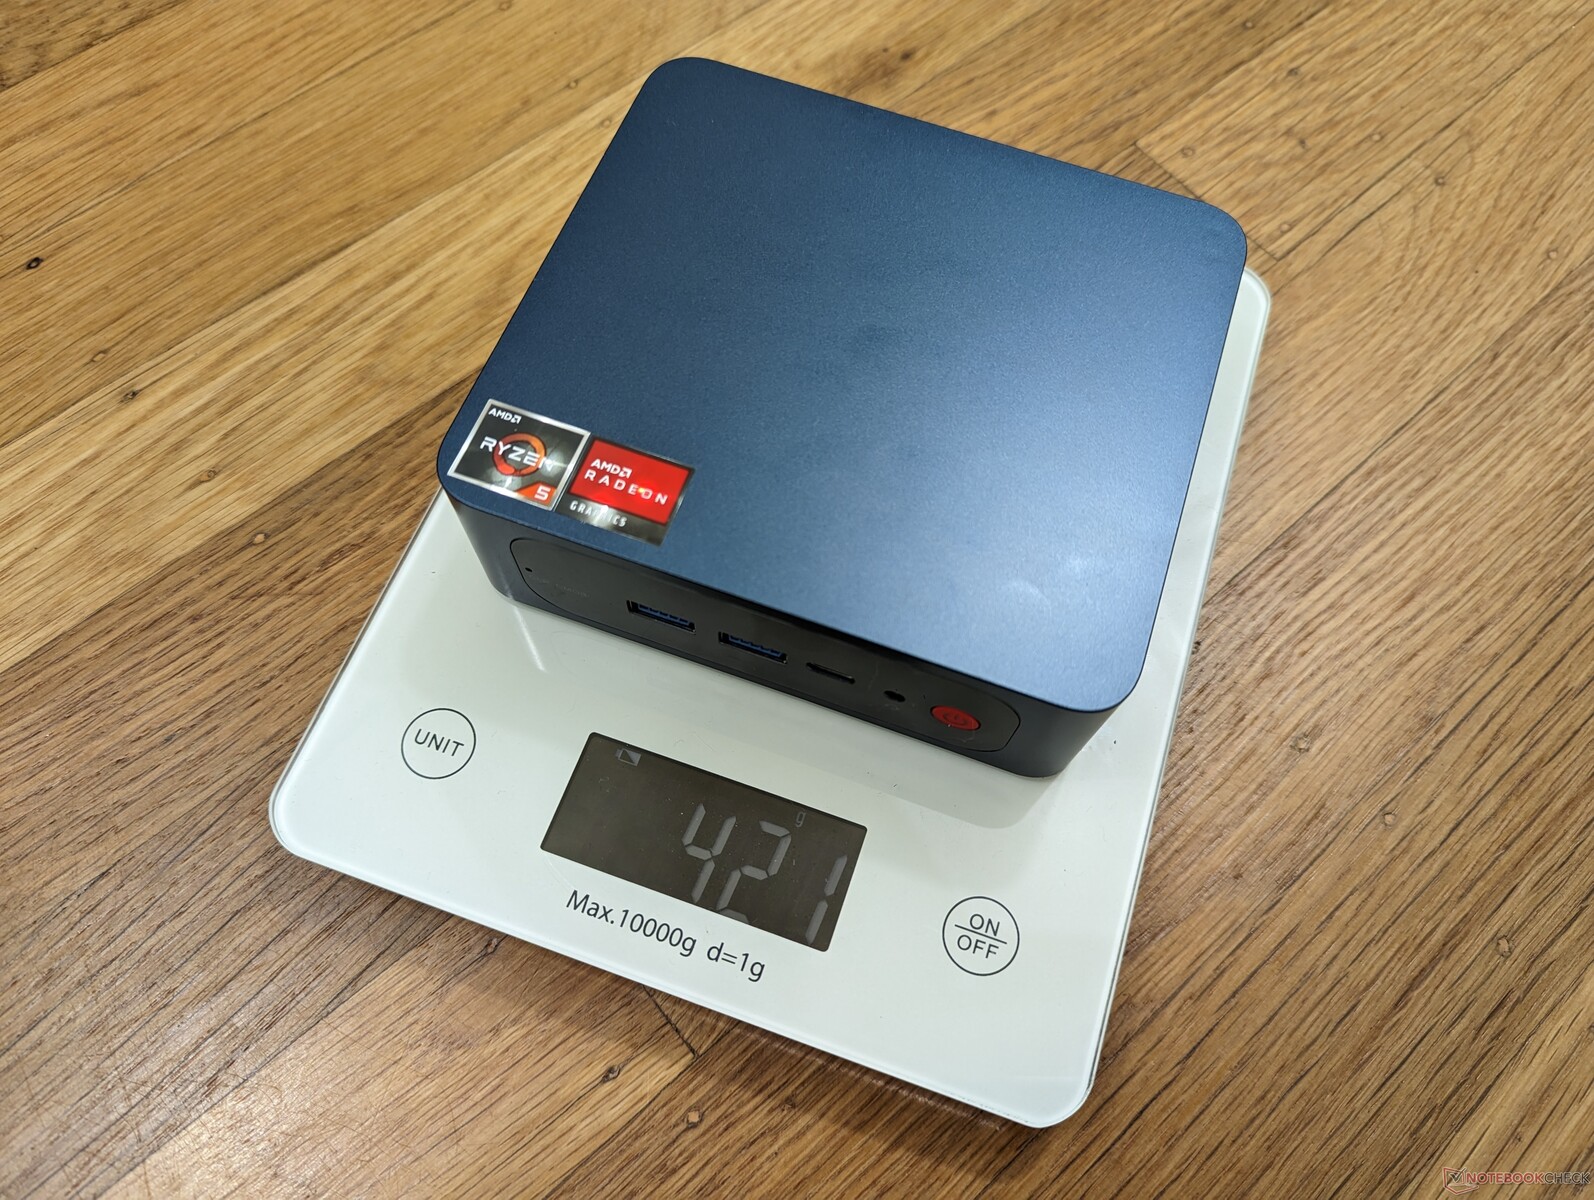
v (old) | 01/2023 | Trigkey S3 R5 3550H, Vega 8 | 419 g | 40.7 mm | x | ||
v (old) | 11/2022 | Intel NUC Pro Chassis_i7_1265U i7-1265U, Iris Xe G7 96EUs | 35 mm | x | |||
v (old) | Intel NUC11TNKi5 i5-1135G7, Iris Xe G7 80EUs | 504 g | 37 mm | x | |||
v (old) | 12/2022 | Beelink SEi12 Core i5-1235U i5-1235U, Iris Xe G7 80EUs | 465 g | 42 mm | x | ||
v (old) | 10/2022 | Beelink SEi11 Pro i5-11320H, Iris Xe G7 96EUs | 440 g | 40 mm | x | ||
v (old) | 10/2022 | Beelink SER Pro Ryzen 5 5600H R5 5600H, Vega 7 | 498 g | 42 mm | x |
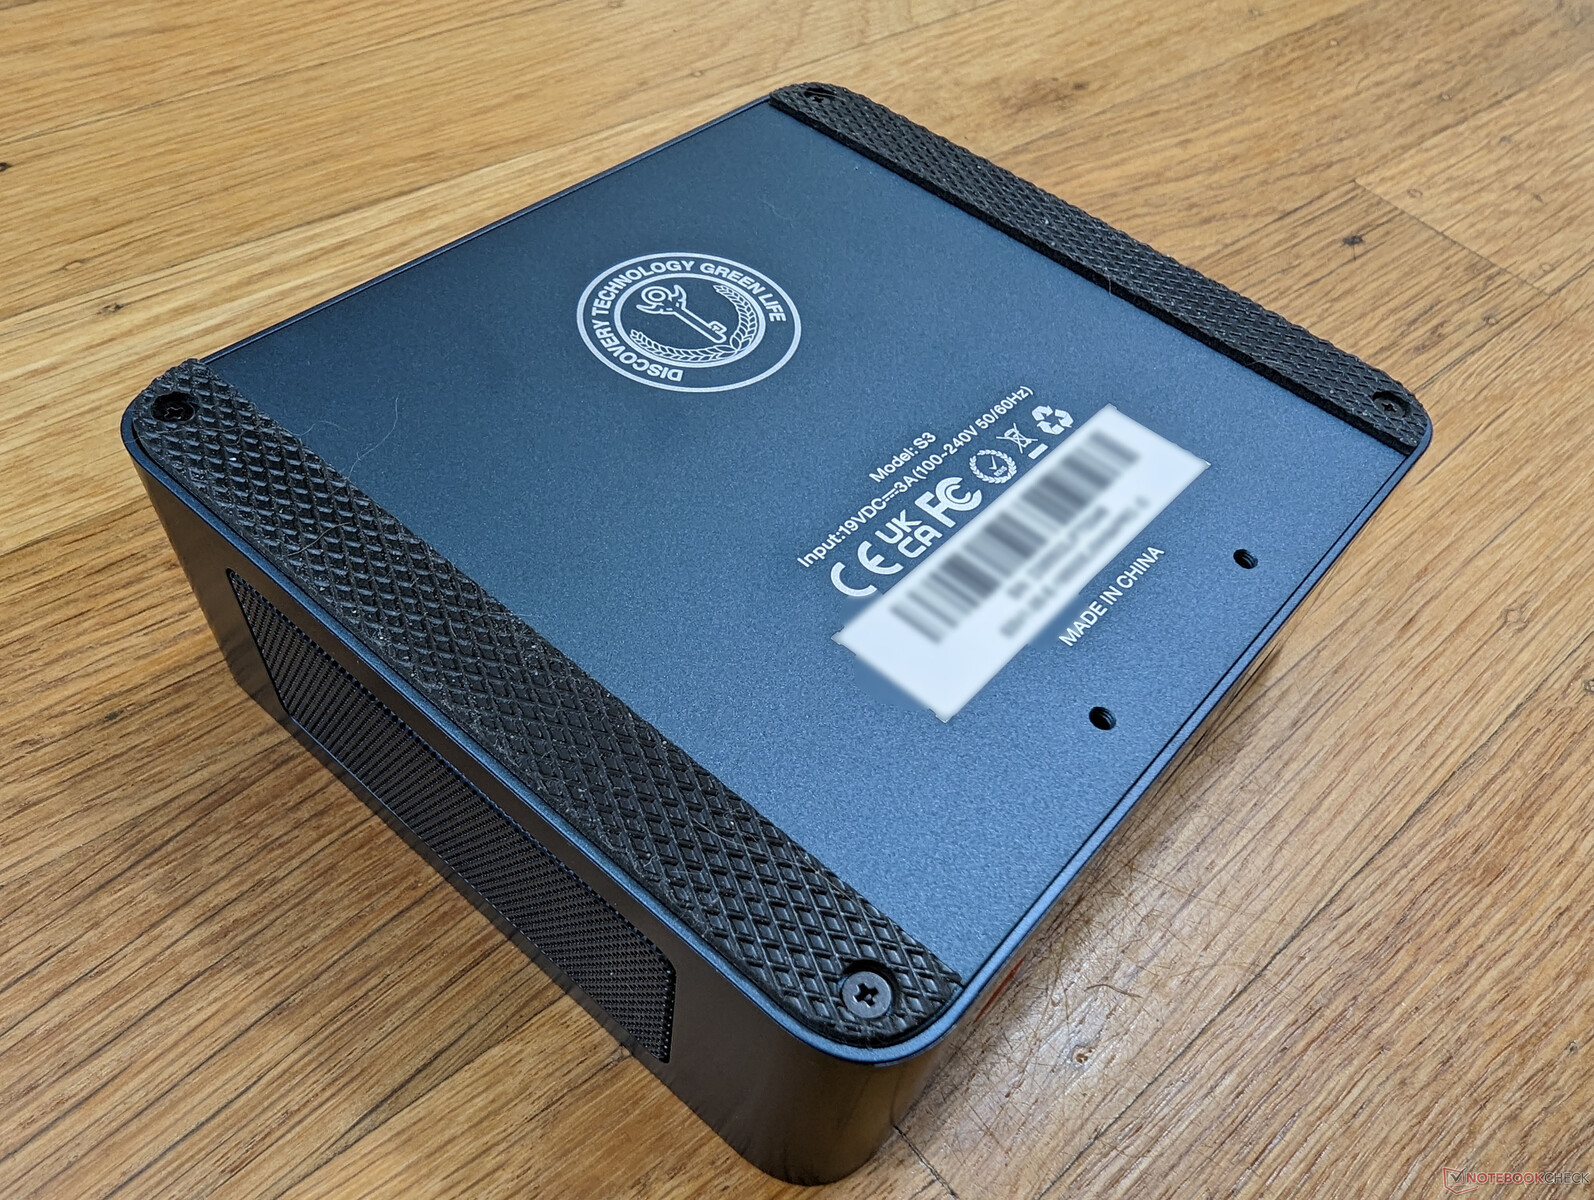
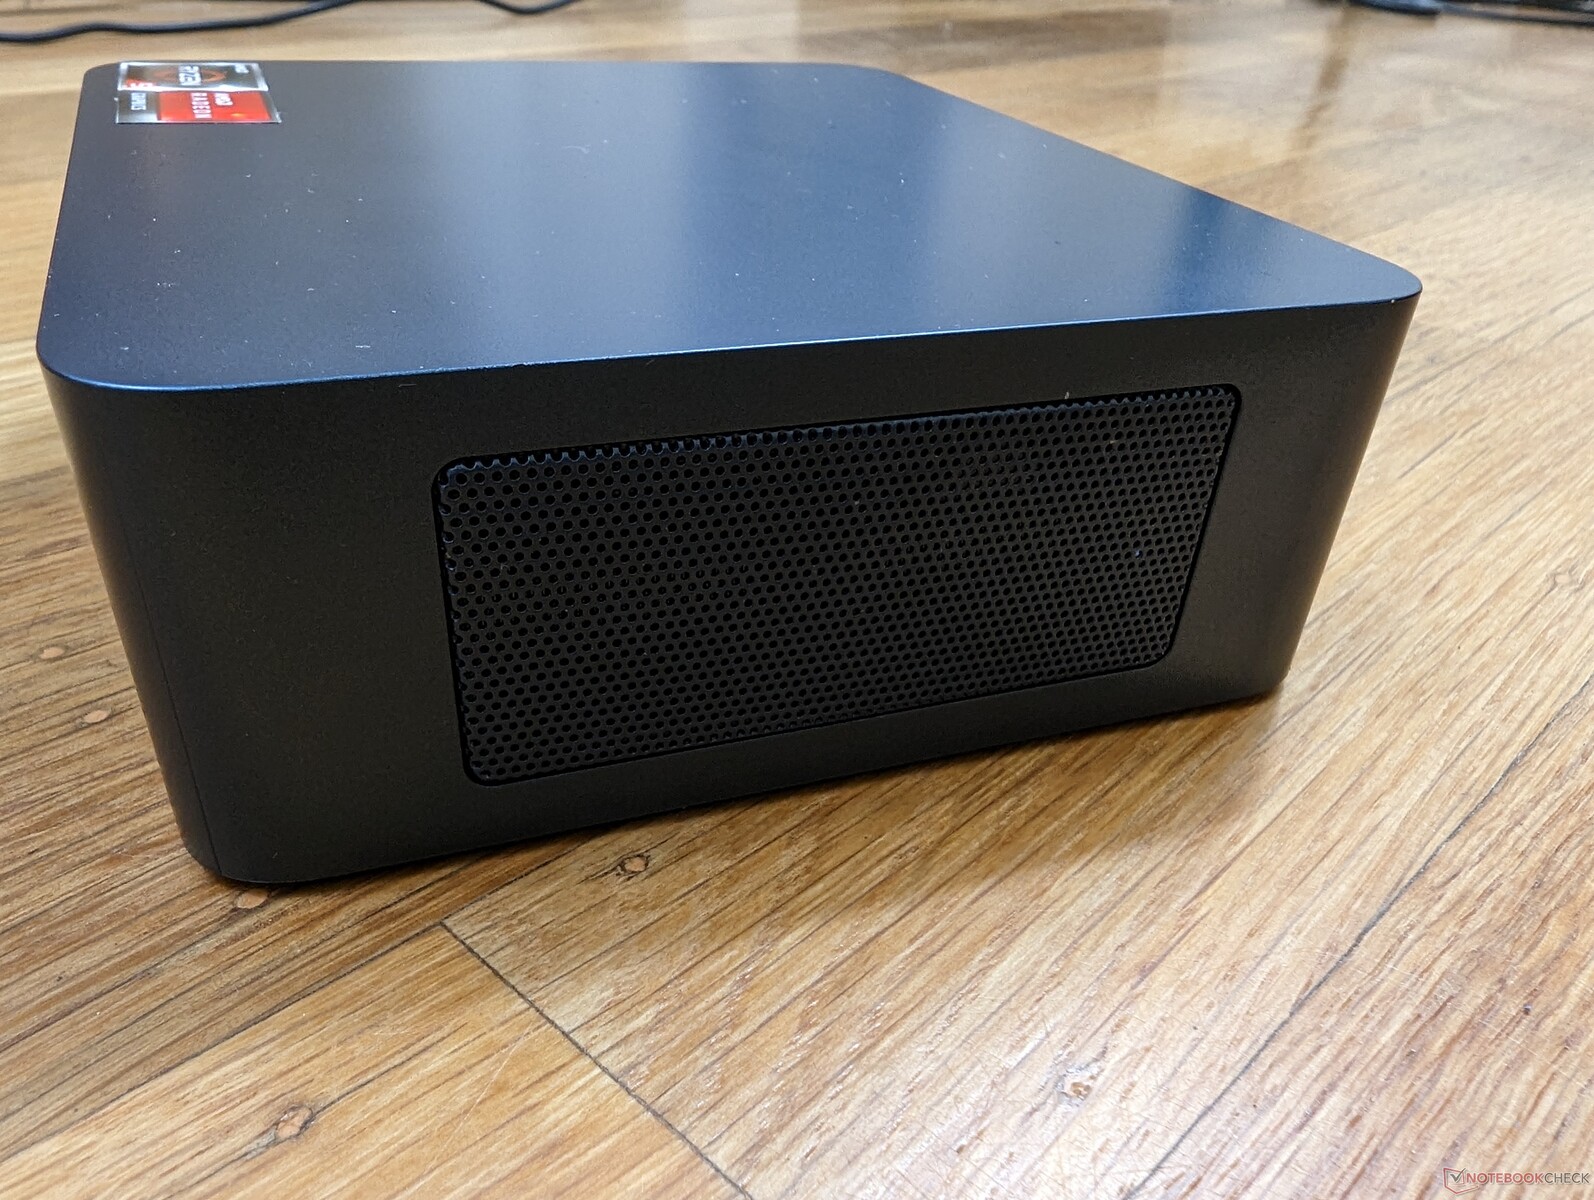
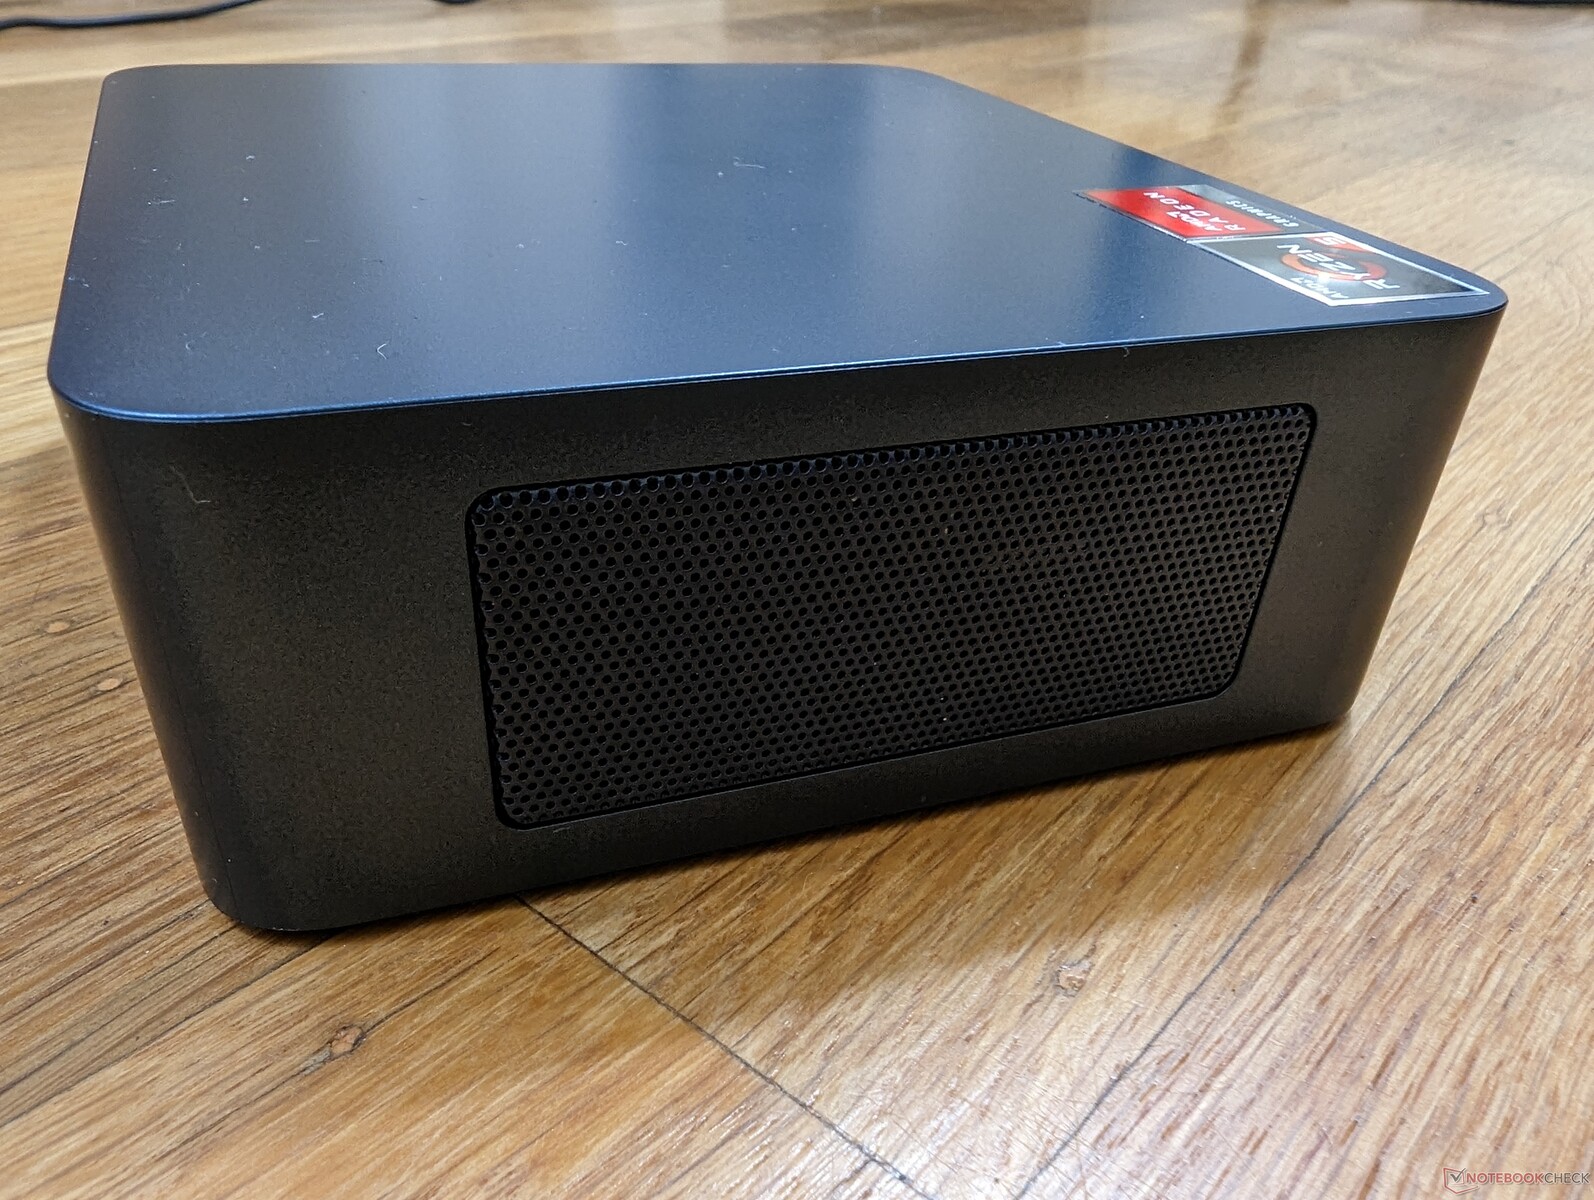
Sprawa
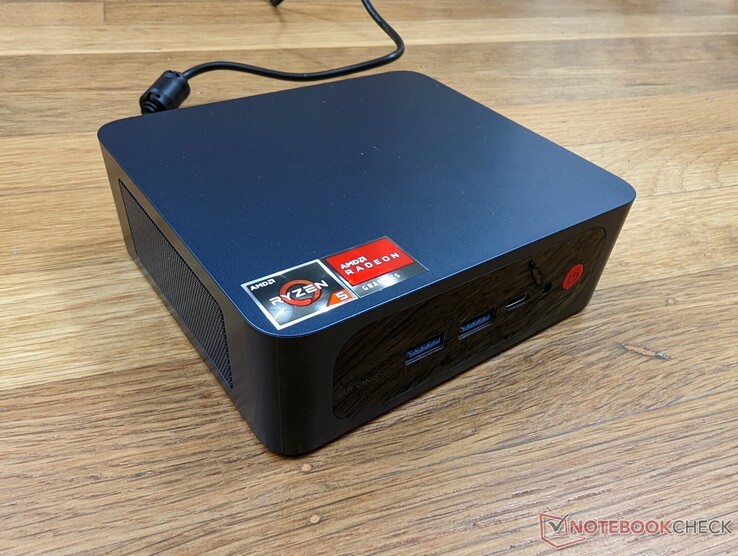
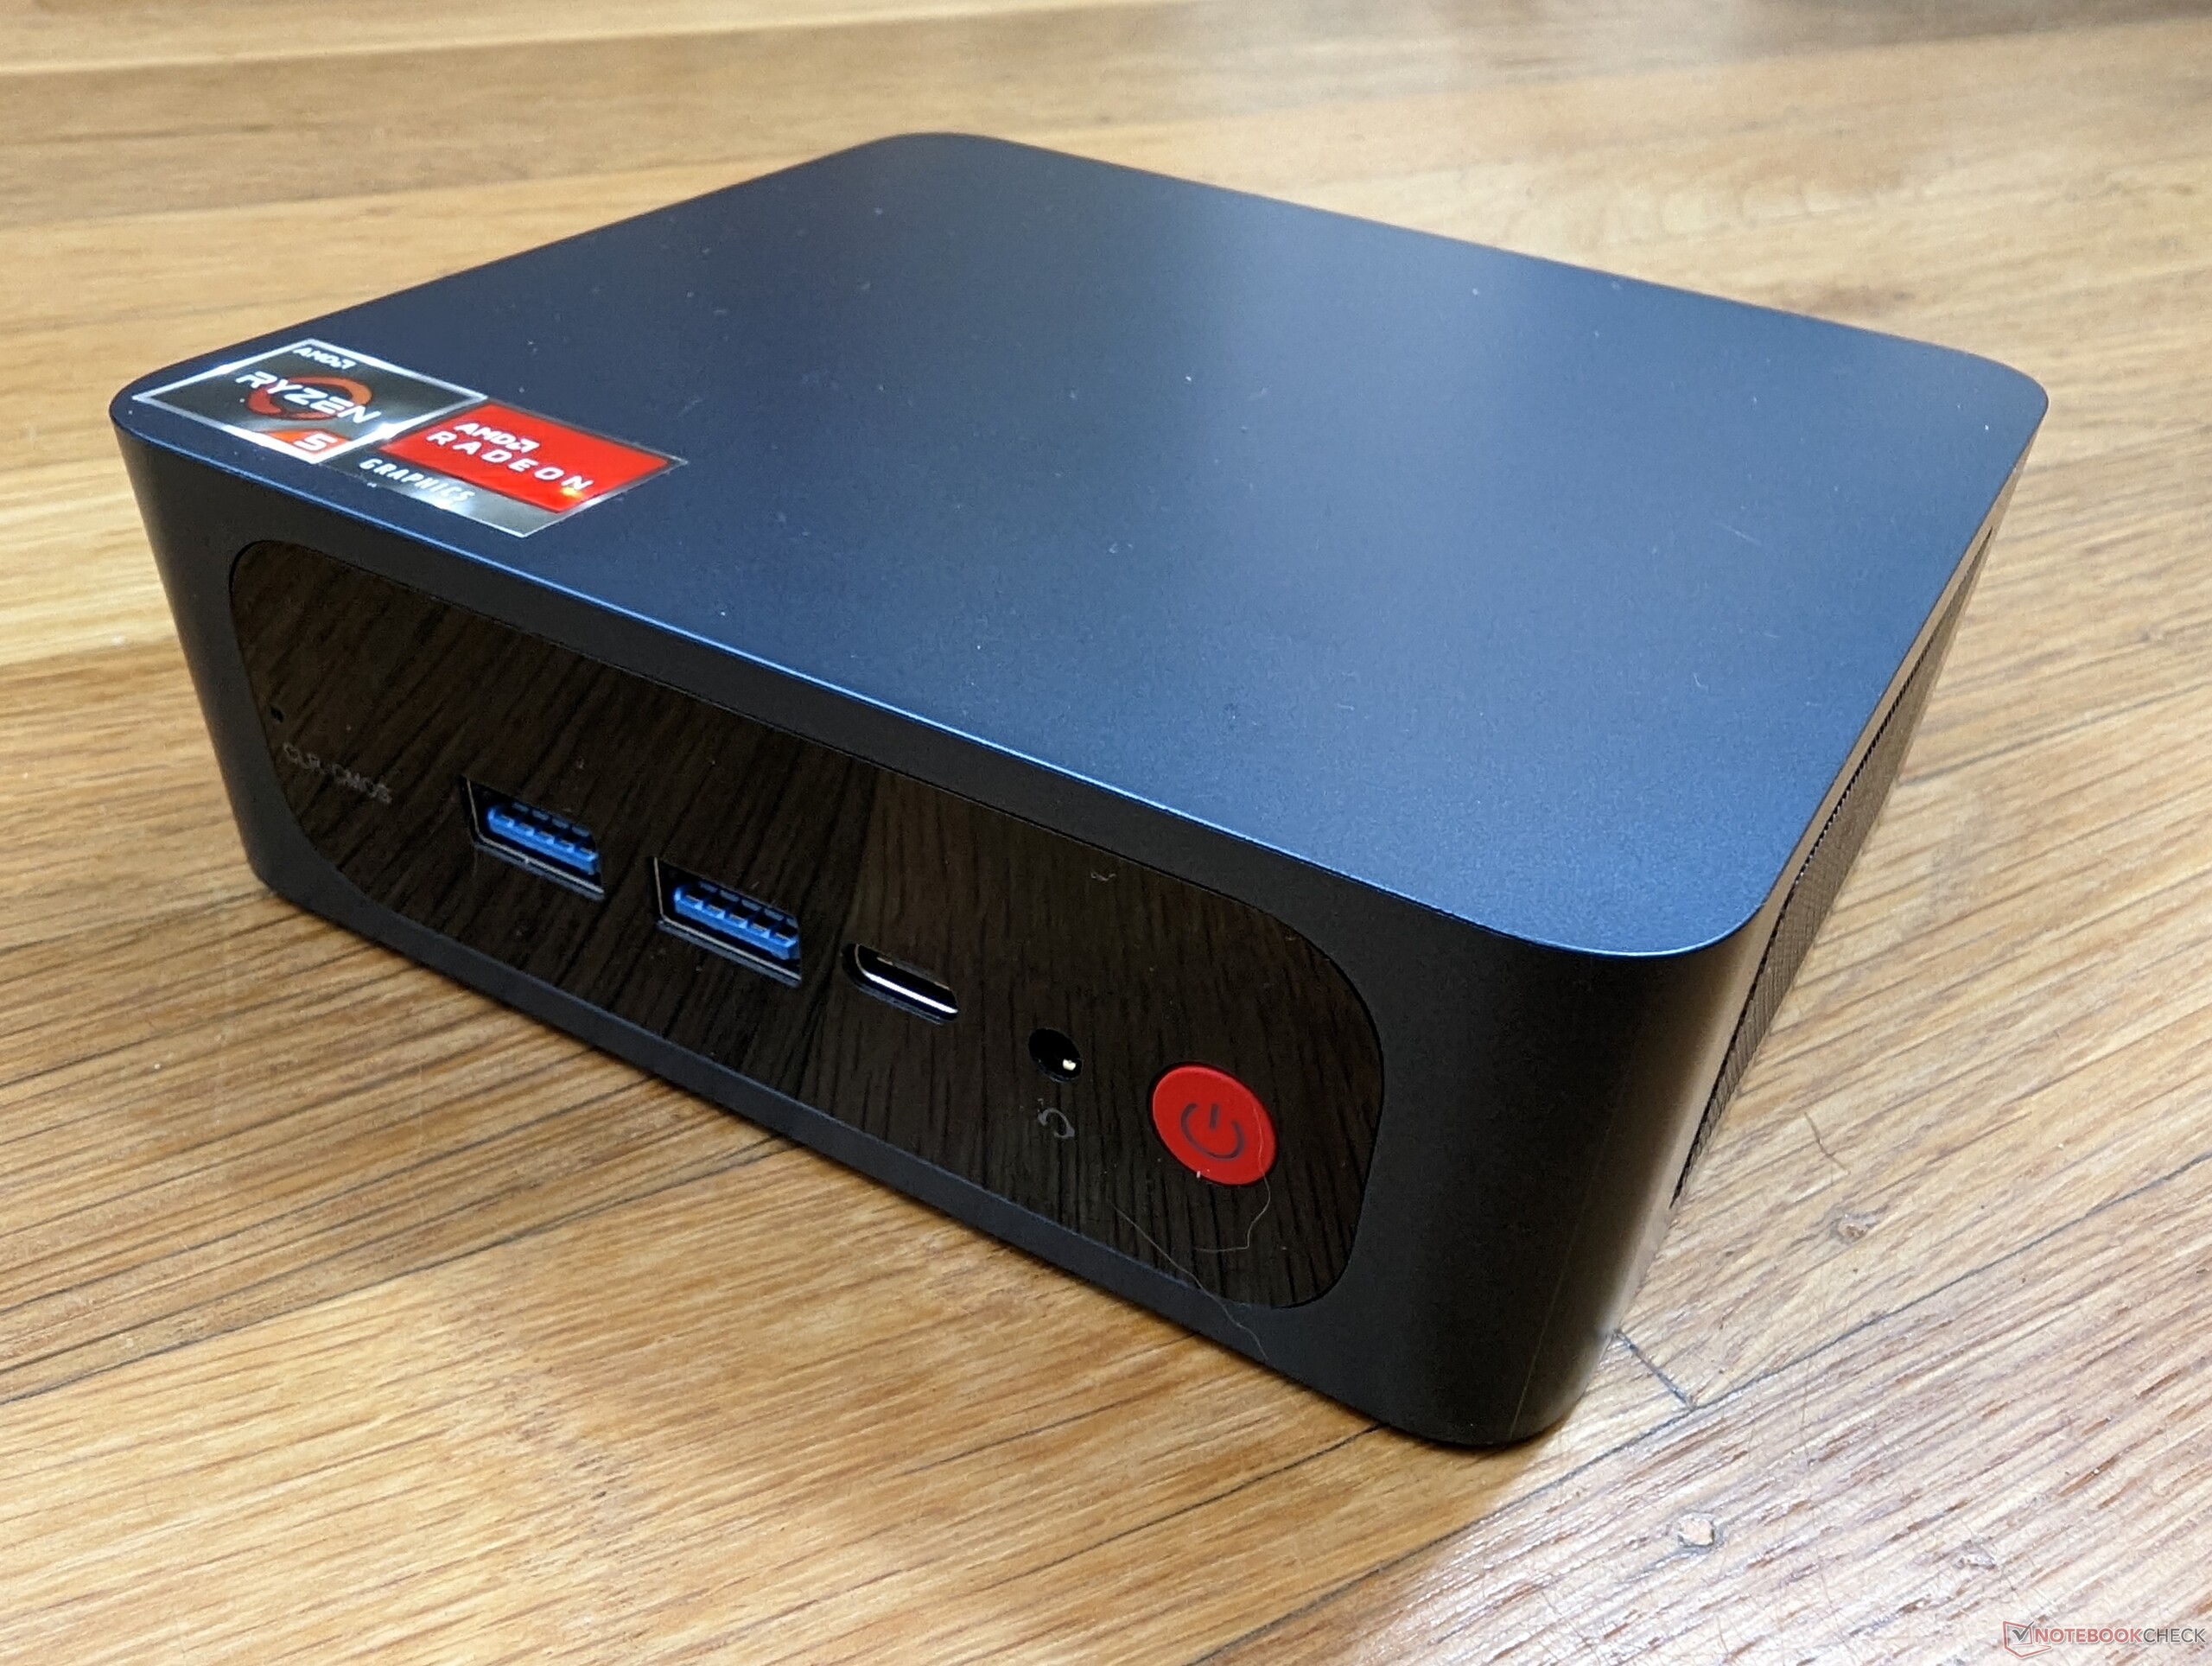
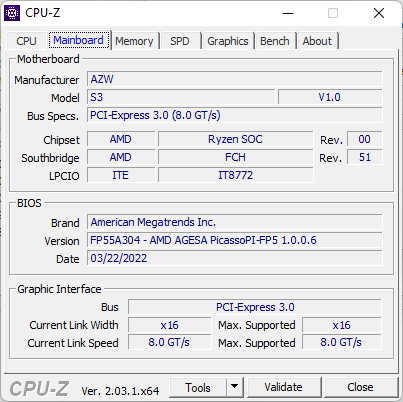
Plastikowa obudowa ma kształt podobny do Beelink SEi8 ale z kilkoma powierzchownymi różnicami. Na przykład górna część obudowy jest teraz matowa i zrównana z krawędziami boków, co daje czystszy wygląd. Opcje portów i obsługa są poza tym niemal identyczne.
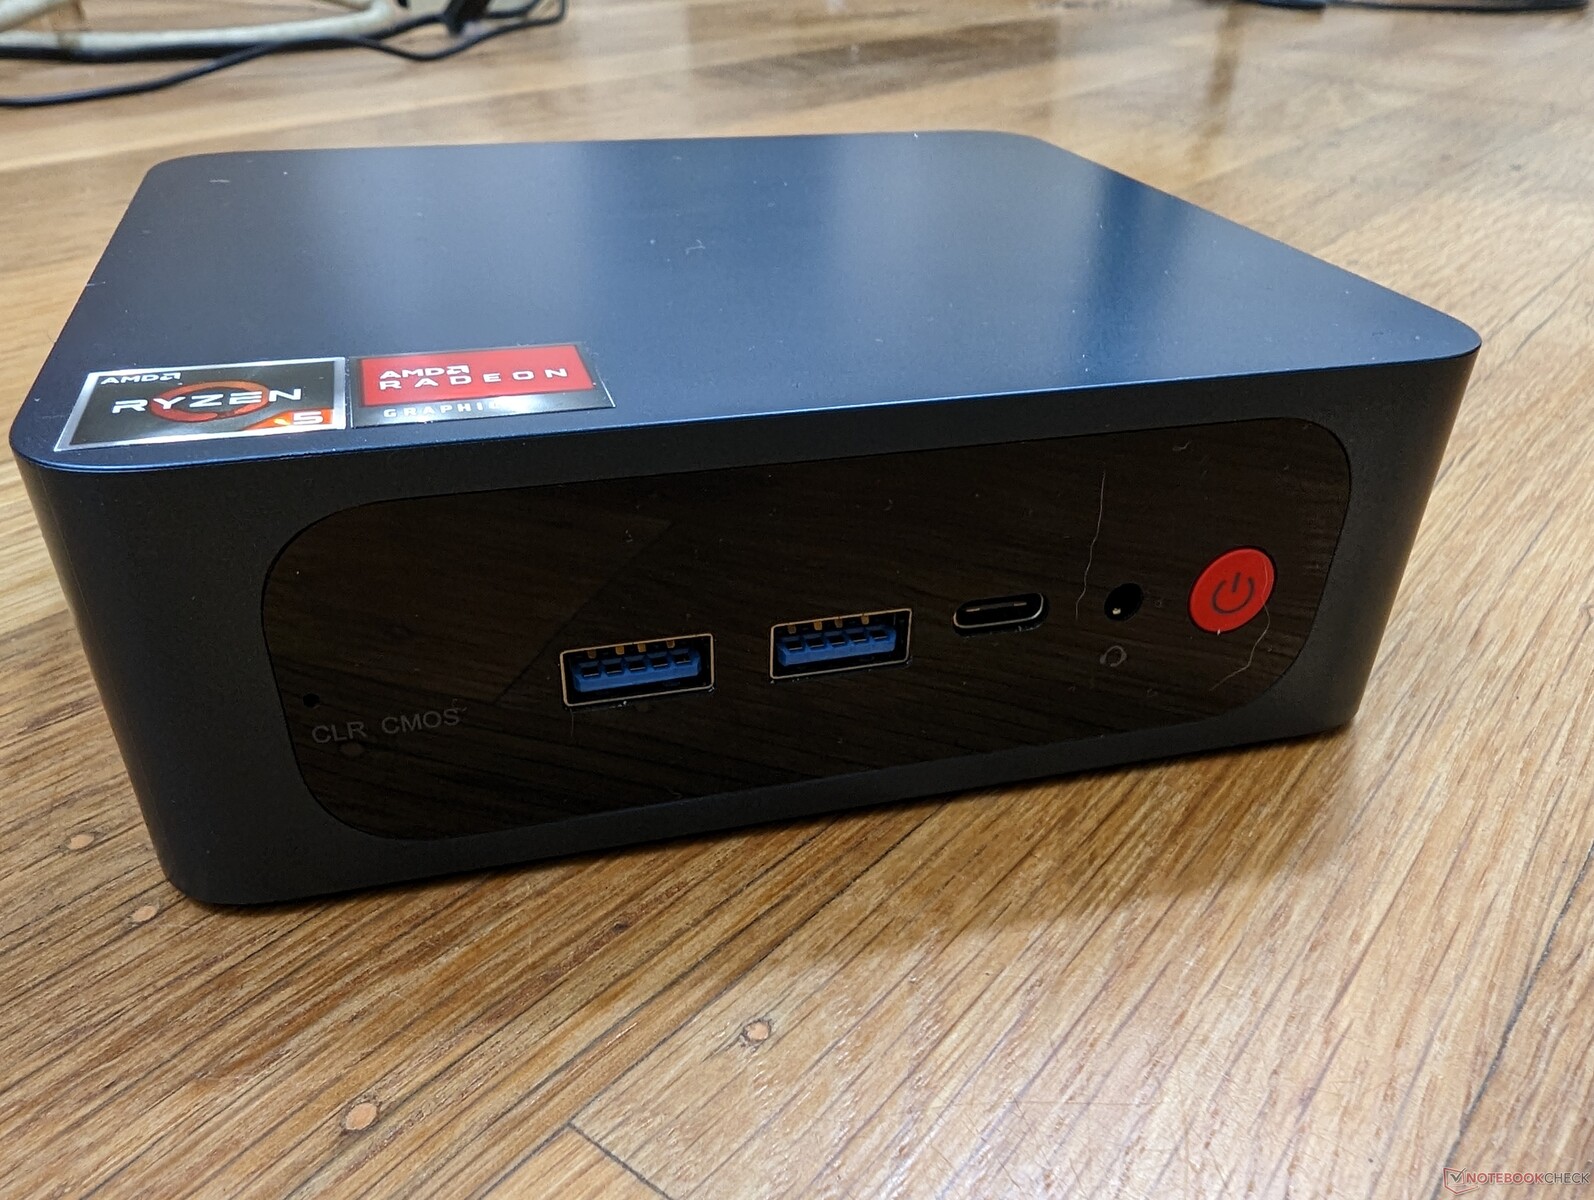
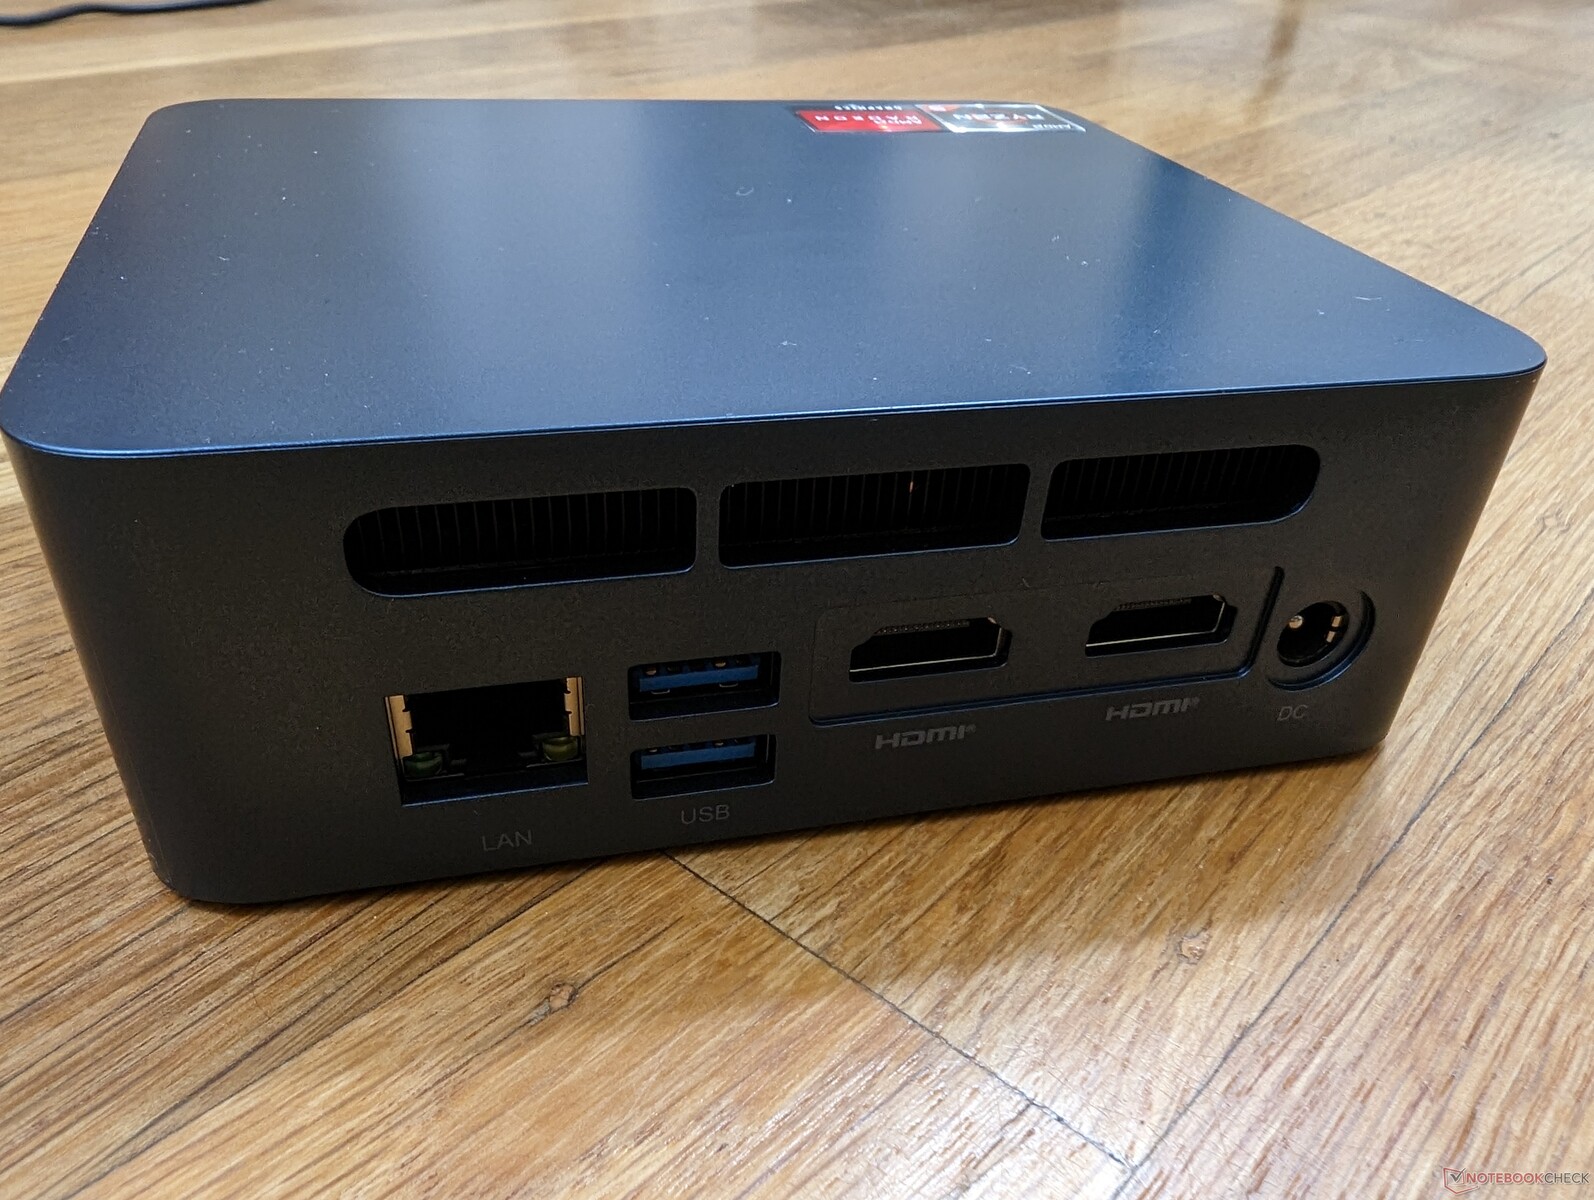
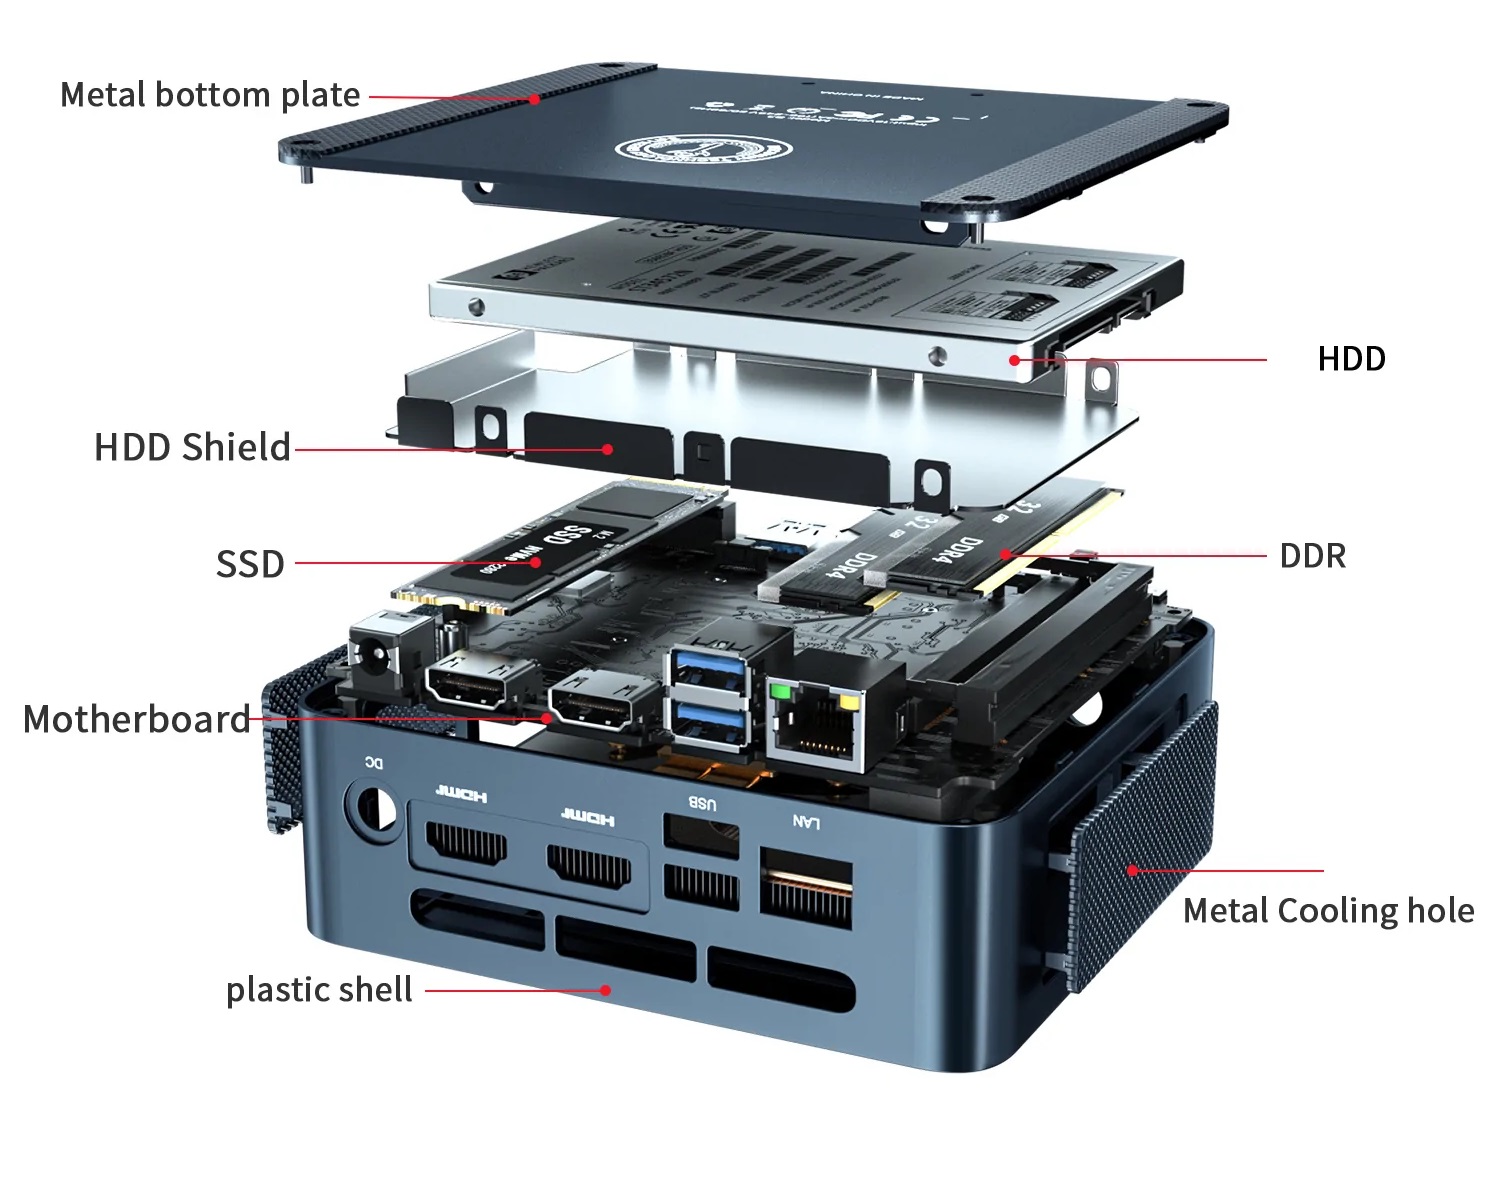
Łączność
Opcje portów są obfite, ale pojedynczy port USB-C wydaje się być tylko dla danych lub do ładowania urządzeń zewnętrznych. Nasz zewnętrzny monitor USB-C nie działałby z Trigkey.
Komunikacja
System jest dostarczany ze starszym 1x1 Intel Dual Band Wireless-AC 3165 dla szybkości transferu, która jest tylko ułamkiem tego, co potrafią nowoczesne moduły Wi-Fi 6 i 6E. Mimo to wydajność jest stabilna i wystarczająca do strumieniowania 1080p i przeglądania stron internetowych.
| Networking | |
| iperf3 transmit AX12 | |
| Intel NUC11TNKi5 | |
| iperf3 receive AX12 | |
| Intel NUC11TNKi5 | |
| iperf3 receive AXE11000 6GHz | |
| Intel NUC Pro Chassis_i7_1265U | |
| Beelink SER Pro Ryzen 5 5600H | |
| Beelink SEi11 Pro | |
| iperf3 receive AXE11000 | |
| Beelink SEi12 Core i5-1235U | |
| Trigkey S3 | |
| iperf3 transmit AXE11000 | |
| Beelink SEi12 Core i5-1235U | |
| Trigkey S3 | |
| iperf3 transmit AXE11000 6GHz | |
| Intel NUC Pro Chassis_i7_1265U | |
| Beelink SER Pro Ryzen 5 5600H | |
| Beelink SEi11 Pro | |
Konserwacja
Dolny panel powinien dać się łatwo zdjąć, ale śruby są miękkie i mogą się wykrzywić łatwiej niż w większości innych mini PC. Tak niestety stało się w naszym egzemplarzu, dlatego zalecamy właścicielom dużą ostrożność podczas serwisowania urządzenia. Dla porównania, Intel NUC posiada śruby kciukowe, które umożliwiają szybsze serwisowanie bez użycia narzędzi.
Akcesoria i gwarancja
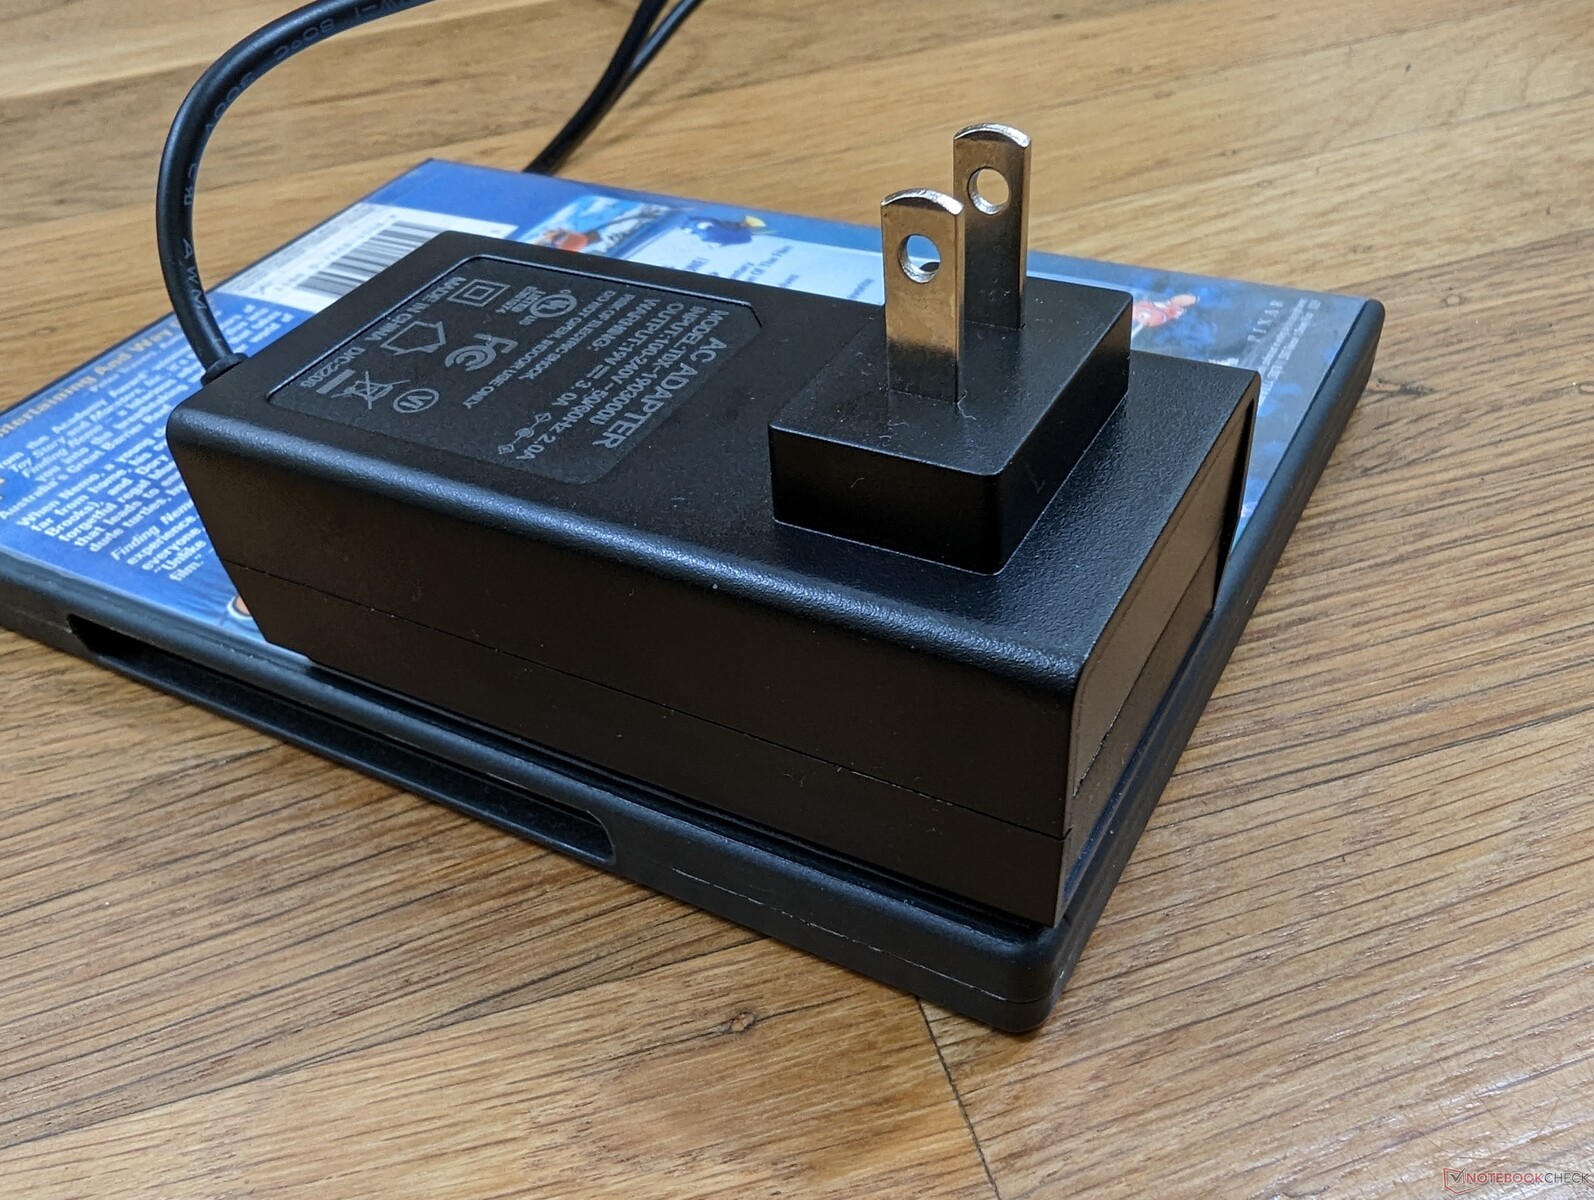
W opakowaniu detalicznym znajduje się uchwyt do montażu na ścianie, zasilacz sieciowy, instrukcja obsługi oraz dwa kable HDMI. Obowiązuje zwyczajowa roczna ograniczona gwarancja producenta.
Wydajność
Warunki badania
Przed przeprowadzeniem poniższych benchmarków ustawiliśmy system Windows w trybie Performance. System nie jest dostarczany z żadnymi preinstalowanymi aplikacjami typu "centrum kontroli", służącymi do dostosowywania profili zasilania.
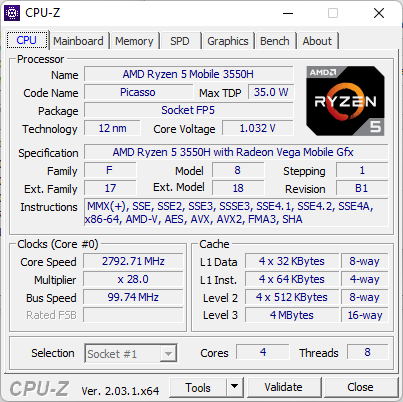
Procesor
Ogólna wydajność procesora jest znacznie wolniejsza niż jakiegokolwiek procesora 11 lub 12 generacji Intel Core i5 lub i7 z serii U, ale wciąż zauważalnie szybsza niż jakiekolwiek rozwiązanie Celeron lub Atom dostępne obecnie na rynku. Tym samym Ryzen 5 3550H w naszym Trigkeyu jest bardziej porównywalny z komputerem opartym na Intel Core i3 lub dużo starszym Core i5-8260U. Szkoda, że producent nie zdecydował się na m.in Ryzen 7 4800U ponieważ procesor Zen 2 to ogromny upgrade w stosunku do serii Zen+ H.
Cinebench R15 Multi Loop
Cinebench R20: CPU (Multi Core) | CPU (Single Core)
Cinebench R23: Multi Core | Single Core
Cinebench R15: CPU Multi 64Bit | CPU Single 64Bit
Blender: v2.79 BMW27 CPU
7-Zip 18.03: 7z b 4 | 7z b 4 -mmt1
Geekbench 5.5: Multi-Core | Single-Core
HWBOT x265 Benchmark v2.2: 4k Preset
LibreOffice : 20 Documents To PDF
R Benchmark 2.5: Overall mean
| CPU Performance rating | |
| Beelink GTR6 | |
| Intel NUC 12 Pro Kit NUC12WSKi7 | |
| Intel NUC Pro Chassis_i7_1265U | |
| Beelink SEi12 Core i5-1235U | |
| Beelink SER Pro Ryzen 5 5600H | |
| Beelink SEi11 Pro | |
| Intel NUC Pro Chassis_i7_1185G7 | |
| Prime Computer PrimeBook Circular-i7-1165G7 | |
| Minipc Union NiPoGi CK10 - 10810U | |
| Beelink SER3 -2! | |
| Przeciętny AMD Ryzen 5 3550H | |
| Trigkey S3 | |
| MSI Cubi 5 10M -8! | |
| Beelink SEi8 | |
| BMAX B5 Pro G7H8 | |
| Beelink U59 N5105 | |
| Geekom MiniAir 11 Special Edition | |
| Chuwi LapBook Plus -6! | |
| Chuwi Hi10 Air -12! | |
| Cinebench R20 / CPU (Multi Core) | |
| Beelink GTR6 | |
| Intel NUC 12 Pro Kit NUC12WSKi7 | |
| Intel NUC Pro Chassis_i7_1265U | |
| Beelink SEi12 Core i5-1235U | |
| Beelink SER Pro Ryzen 5 5600H | |
| Beelink SEi11 Pro | |
| Prime Computer PrimeBook Circular-i7-1165G7 | |
| Intel NUC Pro Chassis_i7_1185G7 | |
| Przeciętny AMD Ryzen 5 3550H (1421 - 1728, n=8) | |
| Beelink SER3 | |
| Minipc Union NiPoGi CK10 - 10810U | |
| BMAX B5 Pro G7H8 | |
| Trigkey S3 | |
| Geekom MiniAir 11 Special Edition | |
| Beelink U59 N5105 | |
| Beelink SEi8 | |
| MSI Cubi 5 10M | |
| Chuwi LapBook Plus | |
| Cinebench R20 / CPU (Single Core) | |
| Intel NUC 12 Pro Kit NUC12WSKi7 | |
| Intel NUC Pro Chassis_i7_1265U | |
| Beelink GTR6 | |
| Beelink SEi12 Core i5-1235U | |
| Prime Computer PrimeBook Circular-i7-1165G7 | |
| Beelink SEi11 Pro | |
| Intel NUC Pro Chassis_i7_1185G7 | |
| Beelink SER Pro Ryzen 5 5600H | |
| Minipc Union NiPoGi CK10 - 10810U | |
| MSI Cubi 5 10M | |
| BMAX B5 Pro G7H8 | |
| Beelink SER3 | |
| Trigkey S3 | |
| Przeciętny AMD Ryzen 5 3550H (331 - 370, n=8) | |
| Beelink SEi8 | |
| Beelink U59 N5105 | |
| Geekom MiniAir 11 Special Edition | |
| Chuwi LapBook Plus | |
| Cinebench R23 / Multi Core | |
| Beelink GTR6 | |
| Intel NUC 12 Pro Kit NUC12WSKi7 | |
| Intel NUC Pro Chassis_i7_1265U | |
| Beelink SEi12 Core i5-1235U | |
| Beelink SER Pro Ryzen 5 5600H | |
| Beelink SEi11 Pro | |
| Prime Computer PrimeBook Circular-i7-1165G7 | |
| Intel NUC Pro Chassis_i7_1185G7 | |
| Przeciętny AMD Ryzen 5 3550H (3646 - 4213, n=2) | |
| Beelink SER3 | |
| Minipc Union NiPoGi CK10 - 10810U | |
| Trigkey S3 | |
| BMAX B5 Pro G7H8 | |
| Beelink U59 N5105 | |
| Geekom MiniAir 11 Special Edition | |
| Beelink SEi8 | |
| MSI Cubi 5 10M | |
| Cinebench R23 / Single Core | |
| Intel NUC 12 Pro Kit NUC12WSKi7 | |
| Intel NUC Pro Chassis_i7_1265U | |
| Beelink SEi12 Core i5-1235U | |
| Beelink GTR6 | |
| Prime Computer PrimeBook Circular-i7-1165G7 | |
| Beelink SEi11 Pro | |
| Intel NUC Pro Chassis_i7_1185G7 | |
| Beelink SER Pro Ryzen 5 5600H | |
| Minipc Union NiPoGi CK10 - 10810U | |
| MSI Cubi 5 10M | |
| Beelink SER3 | |
| Trigkey S3 | |
| Beelink SEi8 | |
| Przeciętny AMD Ryzen 5 3550H (850 - 922, n=2) | |
| BMAX B5 Pro G7H8 | |
| Beelink U59 N5105 | |
| Geekom MiniAir 11 Special Edition | |
| Cinebench R15 / CPU Multi 64Bit | |
| Beelink GTR6 | |
| Intel NUC 12 Pro Kit NUC12WSKi7 | |
| Beelink SEi12 Core i5-1235U | |
| Intel NUC Pro Chassis_i7_1265U | |
| Beelink SER Pro Ryzen 5 5600H | |
| Beelink SEi11 Pro | |
| Prime Computer PrimeBook Circular-i7-1165G7 | |
| Intel NUC Pro Chassis_i7_1185G7 | |
| Przeciętny AMD Ryzen 5 3550H (635 - 769, n=11) | |
| Beelink SER3 | |
| Trigkey S3 | |
| BMAX B5 Pro G7H8 | |
| Minipc Union NiPoGi CK10 - 10810U | |
| Geekom MiniAir 11 Special Edition | |
| Beelink U59 N5105 | |
| Beelink SEi8 | |
| MSI Cubi 5 10M | |
| Chuwi LapBook Plus | |
| Chuwi Hi10 Air | |
| Cinebench R15 / CPU Single 64Bit | |
| Intel NUC 12 Pro Kit NUC12WSKi7 | |
| Beelink GTR6 | |
| Intel NUC Pro Chassis_i7_1265U | |
| Beelink SEi12 Core i5-1235U | |
| Prime Computer PrimeBook Circular-i7-1165G7 | |
| Beelink SER Pro Ryzen 5 5600H | |
| Intel NUC Pro Chassis_i7_1185G7 | |
| Beelink SEi11 Pro | |
| Minipc Union NiPoGi CK10 - 10810U | |
| MSI Cubi 5 10M | |
| BMAX B5 Pro G7H8 | |
| Beelink SER3 | |
| Trigkey S3 | |
| Przeciętny AMD Ryzen 5 3550H (77 - 146, n=11) | |
| Beelink SEi8 | |
| Beelink U59 N5105 | |
| Geekom MiniAir 11 Special Edition | |
| Chuwi LapBook Plus | |
| Chuwi Hi10 Air | |
| Blender / v2.79 BMW27 CPU | |
| Chuwi LapBook Plus | |
| Beelink U59 N5105 | |
| Geekom MiniAir 11 Special Edition | |
| Beelink SEi8 | |
| Prime Computer PrimeBook Circular-i7-1165G7 | |
| BMAX B5 Pro G7H8 | |
| Trigkey S3 | |
| Minipc Union NiPoGi CK10 - 10810U | |
| Przeciętny AMD Ryzen 5 3550H (612 - 759, n=6) | |
| Beelink SER3 | |
| Intel NUC Pro Chassis_i7_1185G7 | |
| Beelink SEi11 Pro | |
| Beelink SEi12 Core i5-1235U | |
| Beelink SER Pro Ryzen 5 5600H | |
| Intel NUC Pro Chassis_i7_1265U | |
| Intel NUC 12 Pro Kit NUC12WSKi7 | |
| Beelink GTR6 | |
| 7-Zip 18.03 / 7z b 4 | |
| Beelink GTR6 | |
| Intel NUC 12 Pro Kit NUC12WSKi7 | |
| Beelink SER Pro Ryzen 5 5600H | |
| Intel NUC Pro Chassis_i7_1265U | |
| Beelink SEi12 Core i5-1235U | |
| Beelink SEi11 Pro | |
| Prime Computer PrimeBook Circular-i7-1165G7 | |
| Intel NUC Pro Chassis_i7_1185G7 | |
| Minipc Union NiPoGi CK10 - 10810U | |
| BMAX B5 Pro G7H8 | |
| Przeciętny AMD Ryzen 5 3550H (16683 - 19409, n=6) | |
| Trigkey S3 | |
| Beelink SER3 | |
| Beelink U59 N5105 | |
| Geekom MiniAir 11 Special Edition | |
| Beelink SEi8 | |
| Chuwi LapBook Plus | |
| 7-Zip 18.03 / 7z b 4 -mmt1 | |
| Beelink GTR6 | |
| Intel NUC 12 Pro Kit NUC12WSKi7 | |
| Beelink SER Pro Ryzen 5 5600H | |
| Intel NUC Pro Chassis_i7_1265U | |
| Prime Computer PrimeBook Circular-i7-1165G7 | |
| Intel NUC Pro Chassis_i7_1185G7 | |
| Beelink SEi12 Core i5-1235U | |
| Beelink SEi11 Pro | |
| Minipc Union NiPoGi CK10 - 10810U | |
| BMAX B5 Pro G7H8 | |
| Beelink SER3 | |
| Beelink SEi8 | |
| Trigkey S3 | |
| Przeciętny AMD Ryzen 5 3550H (3472 - 3652, n=6) | |
| Beelink U59 N5105 | |
| Geekom MiniAir 11 Special Edition | |
| Chuwi LapBook Plus | |
| Geekbench 5.5 / Multi-Core | |
| Intel NUC 12 Pro Kit NUC12WSKi7 | |
| Beelink GTR6 | |
| Intel NUC Pro Chassis_i7_1265U | |
| Beelink SEi12 Core i5-1235U | |
| Beelink SER Pro Ryzen 5 5600H | |
| Intel NUC Pro Chassis_i7_1185G7 | |
| Beelink SEi11 Pro | |
| Prime Computer PrimeBook Circular-i7-1165G7 | |
| Minipc Union NiPoGi CK10 - 10810U | |
| Przeciętny AMD Ryzen 5 3550H (3162 - 3486, n=5) | |
| Trigkey S3 | |
| Beelink U59 N5105 | |
| Geekom MiniAir 11 Special Edition | |
| Beelink SEi8 | |
| BMAX B5 Pro G7H8 | |
| Geekbench 5.5 / Single-Core | |
| Intel NUC 12 Pro Kit NUC12WSKi7 | |
| Intel NUC Pro Chassis_i7_1265U | |
| Beelink GTR6 | |
| Beelink SEi12 Core i5-1235U | |
| Prime Computer PrimeBook Circular-i7-1165G7 | |
| Beelink SEi11 Pro | |
| Intel NUC Pro Chassis_i7_1185G7 | |
| Beelink SER Pro Ryzen 5 5600H | |
| Minipc Union NiPoGi CK10 - 10810U | |
| Trigkey S3 | |
| Przeciętny AMD Ryzen 5 3550H (880 - 907, n=5) | |
| Beelink SEi8 | |
| Geekom MiniAir 11 Special Edition | |
| Beelink U59 N5105 | |
| BMAX B5 Pro G7H8 | |
| HWBOT x265 Benchmark v2.2 / 4k Preset | |
| Beelink GTR6 | |
| Intel NUC 12 Pro Kit NUC12WSKi7 | |
| Beelink SER Pro Ryzen 5 5600H | |
| Intel NUC Pro Chassis_i7_1265U | |
| Beelink SEi12 Core i5-1235U | |
| Beelink SEi11 Pro | |
| Intel NUC Pro Chassis_i7_1185G7 | |
| Minipc Union NiPoGi CK10 - 10810U | |
| Prime Computer PrimeBook Circular-i7-1165G7 | |
| Beelink SER3 | |
| Przeciętny AMD Ryzen 5 3550H (3.7 - 4.43, n=5) | |
| Trigkey S3 | |
| Beelink SEi8 | |
| Geekom MiniAir 11 Special Edition | |
| Beelink U59 N5105 | |
| BMAX B5 Pro G7H8 | |
| Chuwi LapBook Plus | |
| LibreOffice / 20 Documents To PDF | |
| BMAX B5 Pro G7H8 | |
| Geekom MiniAir 11 Special Edition | |
| Beelink U59 N5105 | |
| Trigkey S3 | |
| Beelink SER3 | |
| Przeciętny AMD Ryzen 5 3550H (73.3 - 92.7, n=4) | |
| Beelink SEi8 | |
| Minipc Union NiPoGi CK10 - 10810U | |
| Beelink SER Pro Ryzen 5 5600H | |
| Prime Computer PrimeBook Circular-i7-1165G7 | |
| Beelink SEi11 Pro | |
| Intel NUC Pro Chassis_i7_1265U | |
| Beelink SEi12 Core i5-1235U | |
| Intel NUC Pro Chassis_i7_1185G7 | |
| Beelink GTR6 | |
| Intel NUC 12 Pro Kit NUC12WSKi7 | |
| R Benchmark 2.5 / Overall mean | |
| BMAX B5 Pro G7H8 | |
| Geekom MiniAir 11 Special Edition | |
| Beelink U59 N5105 | |
| Beelink SEi8 | |
| Przeciętny AMD Ryzen 5 3550H (0.732 - 0.752, n=4) | |
| Trigkey S3 | |
| Beelink SER3 | |
| Minipc Union NiPoGi CK10 - 10810U | |
| Prime Computer PrimeBook Circular-i7-1165G7 | |
| Intel NUC Pro Chassis_i7_1185G7 | |
| Beelink SEi11 Pro | |
| Beelink SER Pro Ryzen 5 5600H | |
| Beelink SEi12 Core i5-1235U | |
| Intel NUC Pro Chassis_i7_1265U | |
| Intel NUC 12 Pro Kit NUC12WSKi7 | |
| Beelink GTR6 | |
Cinebench R20: CPU (Multi Core) | CPU (Single Core)
Cinebench R23: Multi Core | Single Core
Cinebench R15: CPU Multi 64Bit | CPU Single 64Bit
Blender: v2.79 BMW27 CPU
7-Zip 18.03: 7z b 4 | 7z b 4 -mmt1
Geekbench 5.5: Multi-Core | Single-Core
HWBOT x265 Benchmark v2.2: 4k Preset
LibreOffice : 20 Documents To PDF
R Benchmark 2.5: Overall mean
* ... im mniej tym lepiej
* ... im mniej tym lepiej
AIDA64: FP32 Ray-Trace | FPU Julia | CPU SHA3 | CPU Queen | FPU SinJulia | FPU Mandel | CPU AES | CPU ZLib | FP64 Ray-Trace | CPU PhotoWorxx
| Performance rating | |
| Beelink SER Pro Ryzen 5 5600H | |
| Intel NUC Pro Chassis_i7_1265U | |
| Beelink SEi12 Core i5-1235U | |
| Beelink SEi11 Pro | |
| Intel NUC11TNKi5 | |
| Przeciętny AMD Ryzen 5 3550H | |
| Trigkey S3 | |
| AIDA64 / FP32 Ray-Trace | |
| Beelink SER Pro Ryzen 5 5600H | |
| Beelink SEi11 Pro | |
| Intel NUC Pro Chassis_i7_1265U | |
| Beelink SEi12 Core i5-1235U | |
| Intel NUC11TNKi5 | |
| Przeciętny AMD Ryzen 5 3550H (2996 - 3607, n=5) | |
| Trigkey S3 | |
| AIDA64 / FPU Julia | |
| Beelink SER Pro Ryzen 5 5600H | |
| Intel NUC Pro Chassis_i7_1265U | |
| Beelink SEi12 Core i5-1235U | |
| Beelink SEi11 Pro | |
| Intel NUC11TNKi5 | |
| Przeciętny AMD Ryzen 5 3550H (16278 - 18781, n=5) | |
| Trigkey S3 | |
| AIDA64 / CPU SHA3 | |
| Beelink SER Pro Ryzen 5 5600H | |
| Beelink SEi11 Pro | |
| Intel NUC Pro Chassis_i7_1265U | |
| Beelink SEi12 Core i5-1235U | |
| Intel NUC11TNKi5 | |
| Przeciętny AMD Ryzen 5 3550H (847 - 983, n=4) | |
| Trigkey S3 | |
| AIDA64 / CPU Queen | |
| Beelink SER Pro Ryzen 5 5600H | |
| Intel NUC Pro Chassis_i7_1265U | |
| Beelink SEi12 Core i5-1235U | |
| Beelink SEi11 Pro | |
| Intel NUC11TNKi5 | |
| Przeciętny AMD Ryzen 5 3550H (42017 - 48622, n=5) | |
| Trigkey S3 | |
| AIDA64 / FPU SinJulia | |
| Beelink SER Pro Ryzen 5 5600H | |
| Przeciętny AMD Ryzen 5 3550H (5386 - 6316, n=5) | |
| Trigkey S3 | |
| Intel NUC Pro Chassis_i7_1265U | |
| Beelink SEi11 Pro | |
| Beelink SEi12 Core i5-1235U | |
| Intel NUC11TNKi5 | |
| AIDA64 / FPU Mandel | |
| Beelink SER Pro Ryzen 5 5600H | |
| Intel NUC Pro Chassis_i7_1265U | |
| Beelink SEi11 Pro | |
| Intel NUC11TNKi5 | |
| Beelink SEi12 Core i5-1235U | |
| Przeciętny AMD Ryzen 5 3550H (8460 - 9767, n=5) | |
| Trigkey S3 | |
| AIDA64 / CPU AES | |
| Beelink SER Pro Ryzen 5 5600H | |
| Beelink SEi11 Pro | |
| Beelink SEi12 Core i5-1235U | |
| Intel NUC11TNKi5 | |
| Intel NUC Pro Chassis_i7_1265U | |
| Przeciętny AMD Ryzen 5 3550H (27486 - 32316, n=5) | |
| Trigkey S3 | |
| AIDA64 / CPU ZLib | |
| Beelink SEi12 Core i5-1235U | |
| Intel NUC Pro Chassis_i7_1265U | |
| Beelink SER Pro Ryzen 5 5600H | |
| Intel NUC11TNKi5 | |
| Beelink SEi11 Pro | |
| Przeciętny AMD Ryzen 5 3550H (299 - 352, n=5) | |
| Trigkey S3 | |
| AIDA64 / FP64 Ray-Trace | |
| Beelink SER Pro Ryzen 5 5600H | |
| Intel NUC Pro Chassis_i7_1265U | |
| Beelink SEi11 Pro | |
| Intel NUC11TNKi5 | |
| Beelink SEi12 Core i5-1235U | |
| Przeciętny AMD Ryzen 5 3550H (1584 - 1914, n=5) | |
| Trigkey S3 | |
| AIDA64 / CPU PhotoWorxx | |
| Intel NUC Pro Chassis_i7_1265U | |
| Beelink SEi12 Core i5-1235U | |
| Beelink SEi11 Pro | |
| Beelink SER Pro Ryzen 5 5600H | |
| Intel NUC11TNKi5 | |
| Trigkey S3 | |
| Przeciętny AMD Ryzen 5 3550H (14325 - 17838, n=5) | |
Wydajność systemu
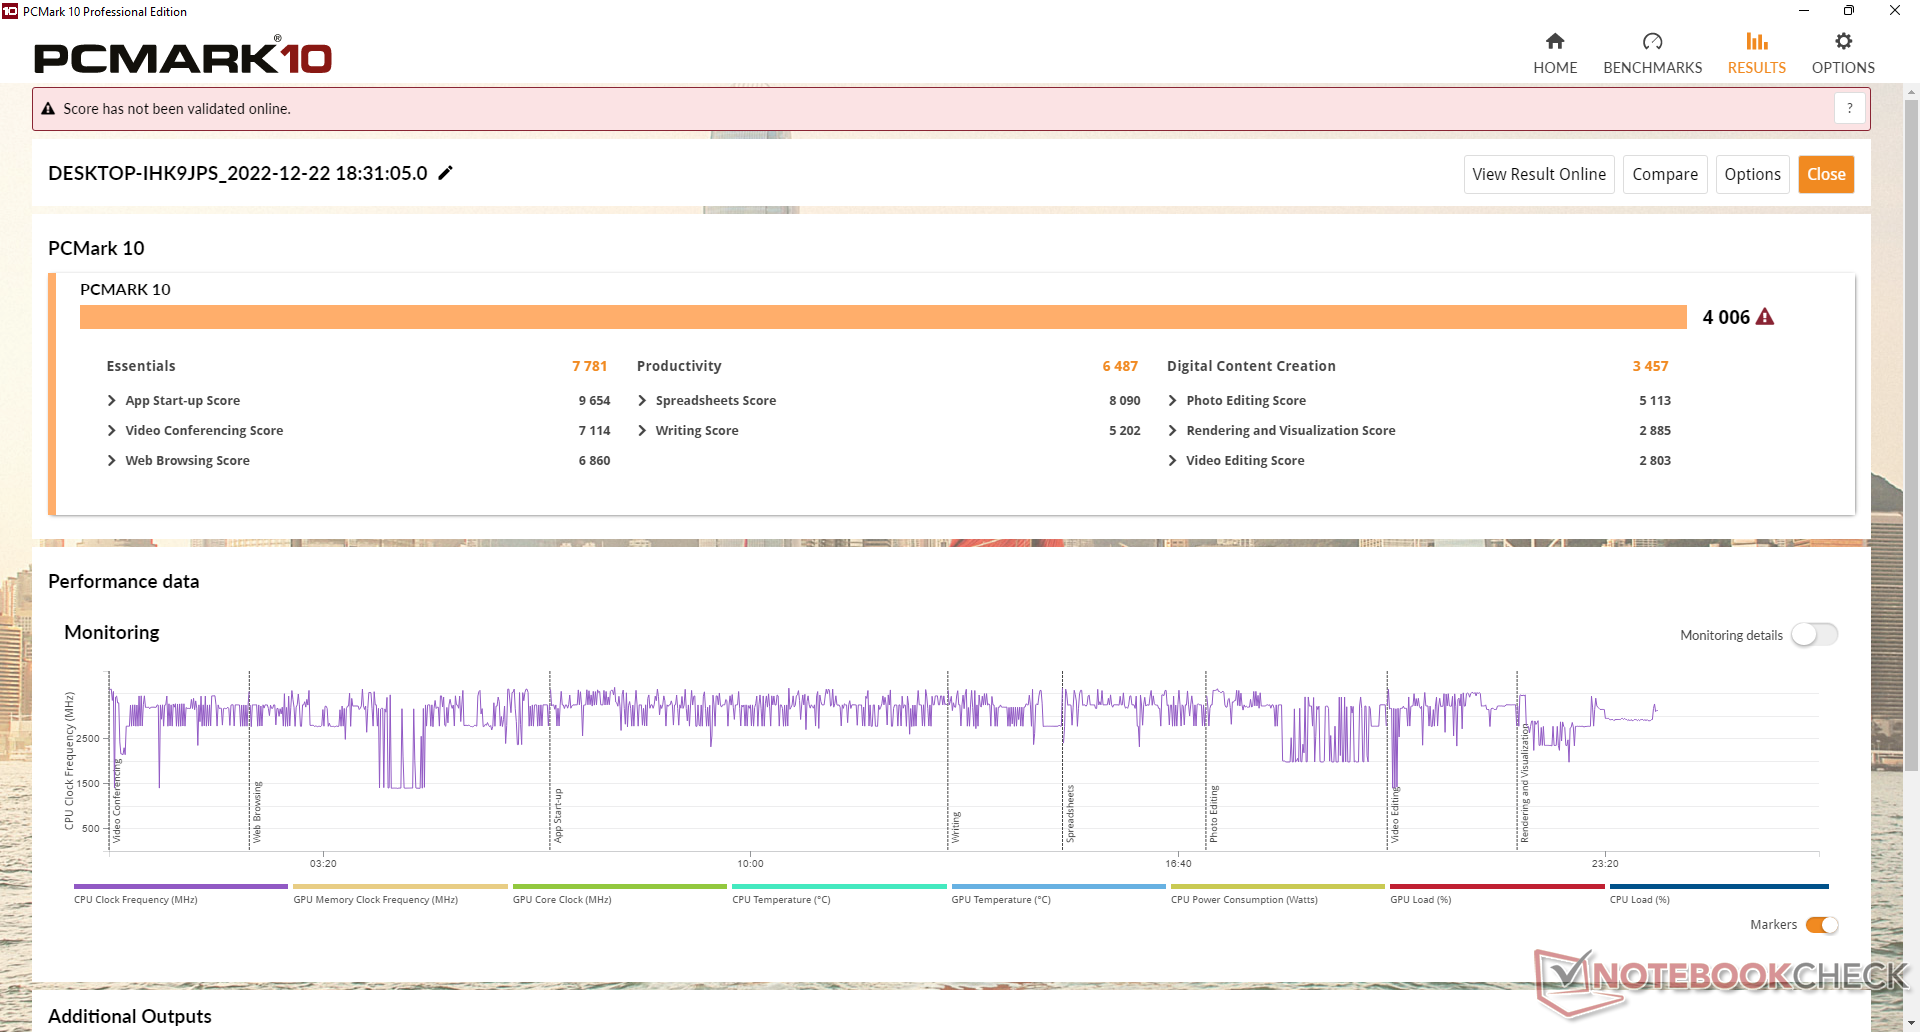
Zgodnie z oczekiwaniami, wyniki PCMark mieszczą się pomiędzy wolniejszymi mini PC napędzanymi procesorami Celeron lub Atom, a szybszymi mini PC napędzanymi nowocześniejszymi procesorami Intela 11 lub 12 generacji.
CrossMark: Overall | Productivity | Creativity | Responsiveness
| PCMark 10 / Score | |
| Beelink SER Pro Ryzen 5 5600H | |
| Beelink SEi12 Core i5-1235U | |
| Intel NUC Pro Chassis_i7_1265U | |
| Beelink SEi11 Pro | |
| Intel NUC11TNKi5 | |
| Przeciętny AMD Ryzen 5 3550H, AMD Radeon RX Vega 8 (Ryzen 2000/3000) (4006 - 4307, n=4) | |
| Trigkey S3 | |
| Beelink U59 N5105 | |
| Chuwi LapBook Plus | |
| PCMark 10 / Essentials | |
| Beelink SEi12 Core i5-1235U | |
| Beelink SER Pro Ryzen 5 5600H | |
| Beelink SEi11 Pro | |
| Intel NUC Pro Chassis_i7_1265U | |
| Intel NUC11TNKi5 | |
| Przeciętny AMD Ryzen 5 3550H, AMD Radeon RX Vega 8 (Ryzen 2000/3000) (7781 - 8579, n=4) | |
| Trigkey S3 | |
| Beelink U59 N5105 | |
| Chuwi LapBook Plus | |
| PCMark 10 / Productivity | |
| Beelink SER Pro Ryzen 5 5600H | |
| Beelink SEi12 Core i5-1235U | |
| Intel NUC Pro Chassis_i7_1265U | |
| Beelink SEi11 Pro | |
| Trigkey S3 | |
| Przeciętny AMD Ryzen 5 3550H, AMD Radeon RX Vega 8 (Ryzen 2000/3000) (5995 - 6487, n=4) | |
| Intel NUC11TNKi5 | |
| Beelink U59 N5105 | |
| Chuwi LapBook Plus | |
| PCMark 10 / Digital Content Creation | |
| Intel NUC Pro Chassis_i7_1265U | |
| Beelink SER Pro Ryzen 5 5600H | |
| Beelink SEi12 Core i5-1235U | |
| Beelink SEi11 Pro | |
| Intel NUC11TNKi5 | |
| Przeciętny AMD Ryzen 5 3550H, AMD Radeon RX Vega 8 (Ryzen 2000/3000) (3457 - 3947, n=4) | |
| Trigkey S3 | |
| Beelink U59 N5105 | |
| Chuwi LapBook Plus | |
| CrossMark / Overall | |
| Beelink SEi12 Core i5-1235U | |
| Intel NUC Pro Chassis_i7_1265U | |
| Beelink SEi11 Pro | |
| Beelink SER Pro Ryzen 5 5600H | |
| Trigkey S3 | |
| Przeciętny AMD Ryzen 5 3550H, AMD Radeon RX Vega 8 (Ryzen 2000/3000) (n=1) | |
| Beelink U59 N5105 | |
| CrossMark / Productivity | |
| Beelink SEi12 Core i5-1235U | |
| Intel NUC Pro Chassis_i7_1265U | |
| Beelink SEi11 Pro | |
| Beelink SER Pro Ryzen 5 5600H | |
| Trigkey S3 | |
| Przeciętny AMD Ryzen 5 3550H, AMD Radeon RX Vega 8 (Ryzen 2000/3000) (n=1) | |
| Beelink U59 N5105 | |
| CrossMark / Creativity | |
| Intel NUC Pro Chassis_i7_1265U | |
| Beelink SEi12 Core i5-1235U | |
| Beelink SER Pro Ryzen 5 5600H | |
| Beelink SEi11 Pro | |
| Trigkey S3 | |
| Przeciętny AMD Ryzen 5 3550H, AMD Radeon RX Vega 8 (Ryzen 2000/3000) (n=1) | |
| Beelink U59 N5105 | |
| CrossMark / Responsiveness | |
| Beelink SEi12 Core i5-1235U | |
| Beelink SEi11 Pro | |
| Intel NUC Pro Chassis_i7_1265U | |
| Beelink SER Pro Ryzen 5 5600H | |
| Trigkey S3 | |
| Przeciętny AMD Ryzen 5 3550H, AMD Radeon RX Vega 8 (Ryzen 2000/3000) (n=1) | |
| Beelink U59 N5105 | |
| PCMark 10 Score | 4006 pkt. | |
Pomoc | ||
| AIDA64 / Memory Copy | |
| Intel NUC Pro Chassis_i7_1265U | |
| Beelink SEi12 Core i5-1235U | |
| Beelink SER Pro Ryzen 5 5600H | |
| Beelink SEi11 Pro | |
| Trigkey S3 | |
| Przeciętny AMD Ryzen 5 3550H (28887 - 32188, n=5) | |
| Intel NUC11TNKi5 | |
| AIDA64 / Memory Read | |
| Intel NUC Pro Chassis_i7_1265U | |
| Beelink SER Pro Ryzen 5 5600H | |
| Beelink SEi12 Core i5-1235U | |
| Beelink SEi11 Pro | |
| Trigkey S3 | |
| Przeciętny AMD Ryzen 5 3550H (31862 - 35172, n=5) | |
| Intel NUC11TNKi5 | |
| AIDA64 / Memory Write | |
| Intel NUC Pro Chassis_i7_1265U | |
| Beelink SEi11 Pro | |
| Beelink SEi12 Core i5-1235U | |
| Beelink SER Pro Ryzen 5 5600H | |
| Trigkey S3 | |
| Przeciętny AMD Ryzen 5 3550H (32493 - 35847, n=5) | |
| Intel NUC11TNKi5 | |
| AIDA64 / Memory Latency | |
| Przeciętny AMD Ryzen 5 3550H (95 - 120, n=5) | |
| Intel NUC Pro Chassis_i7_1265U | |
| Trigkey S3 | |
| Beelink SEi12 Core i5-1235U | |
| Intel NUC11TNKi5 | |
| Beelink SEi11 Pro | |
| Beelink SER Pro Ryzen 5 5600H | |
* ... im mniej tym lepiej
Opóźnienie DPC
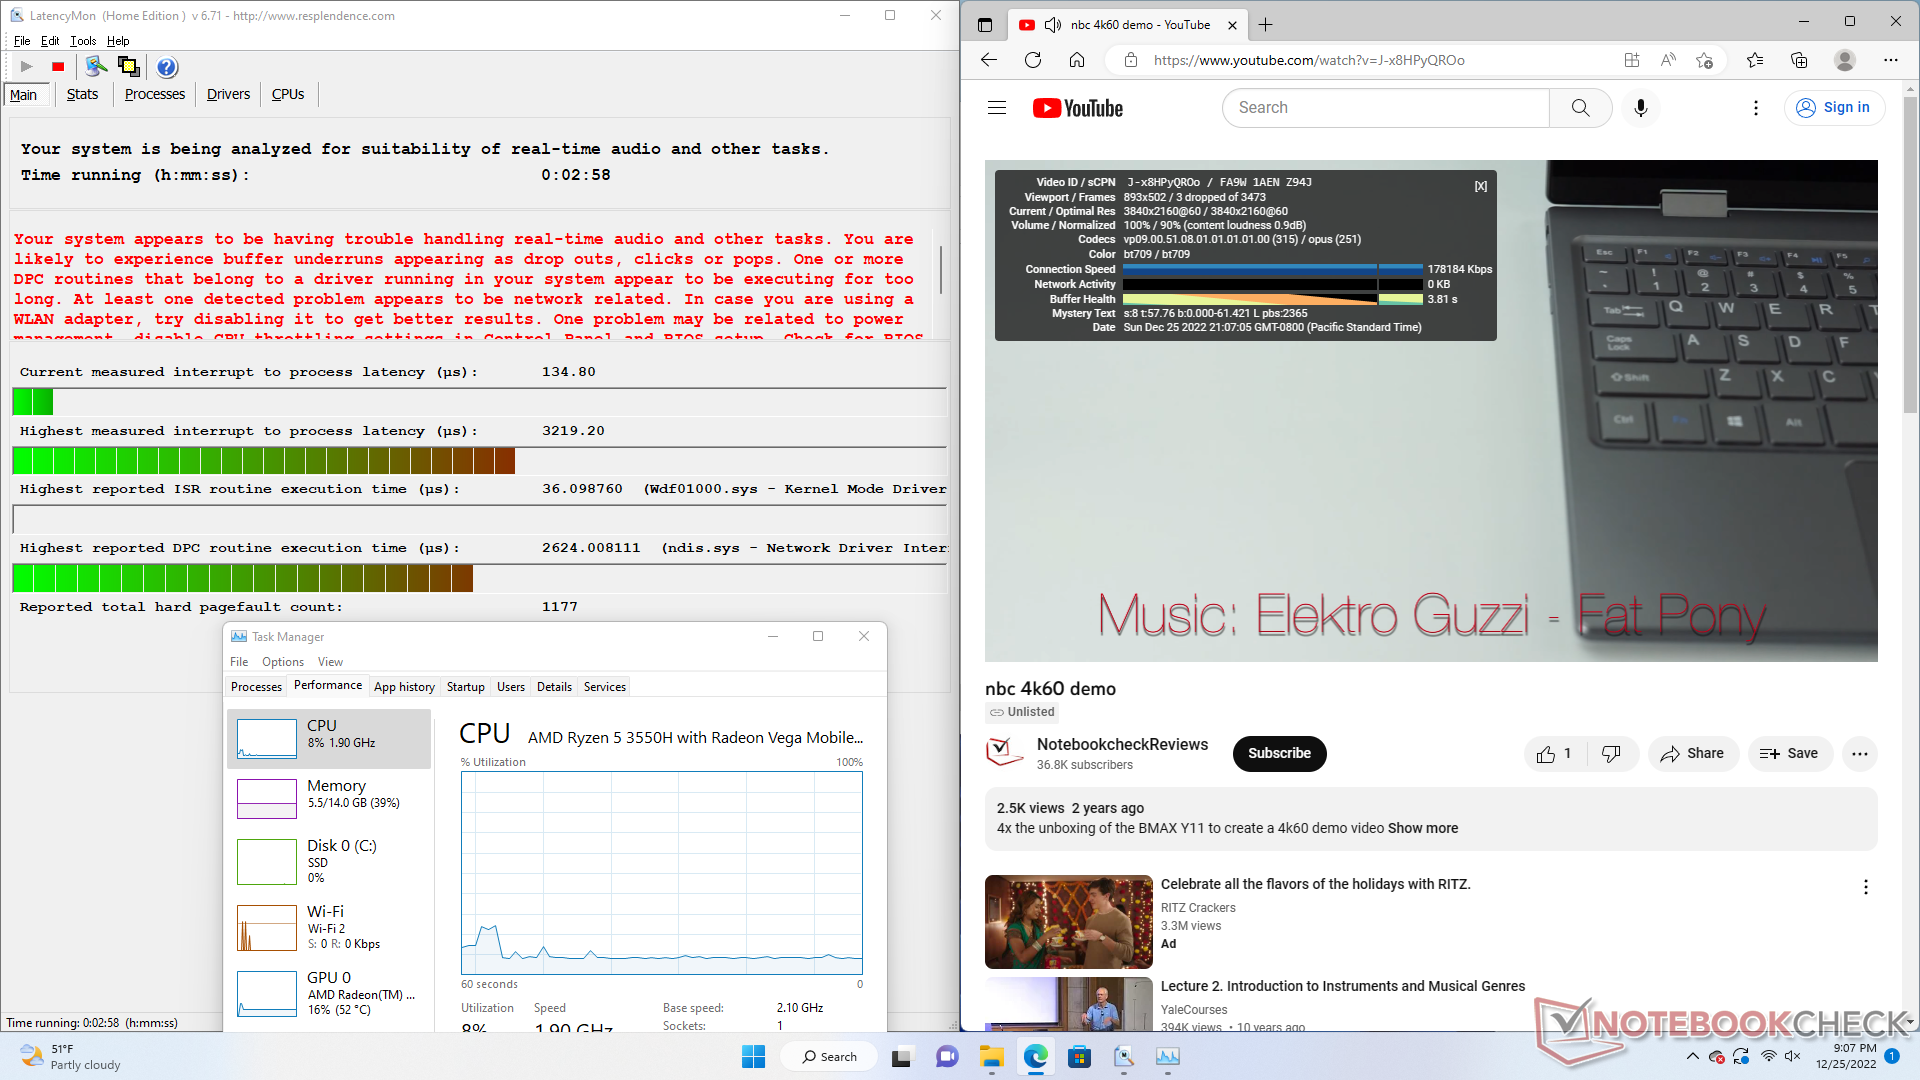
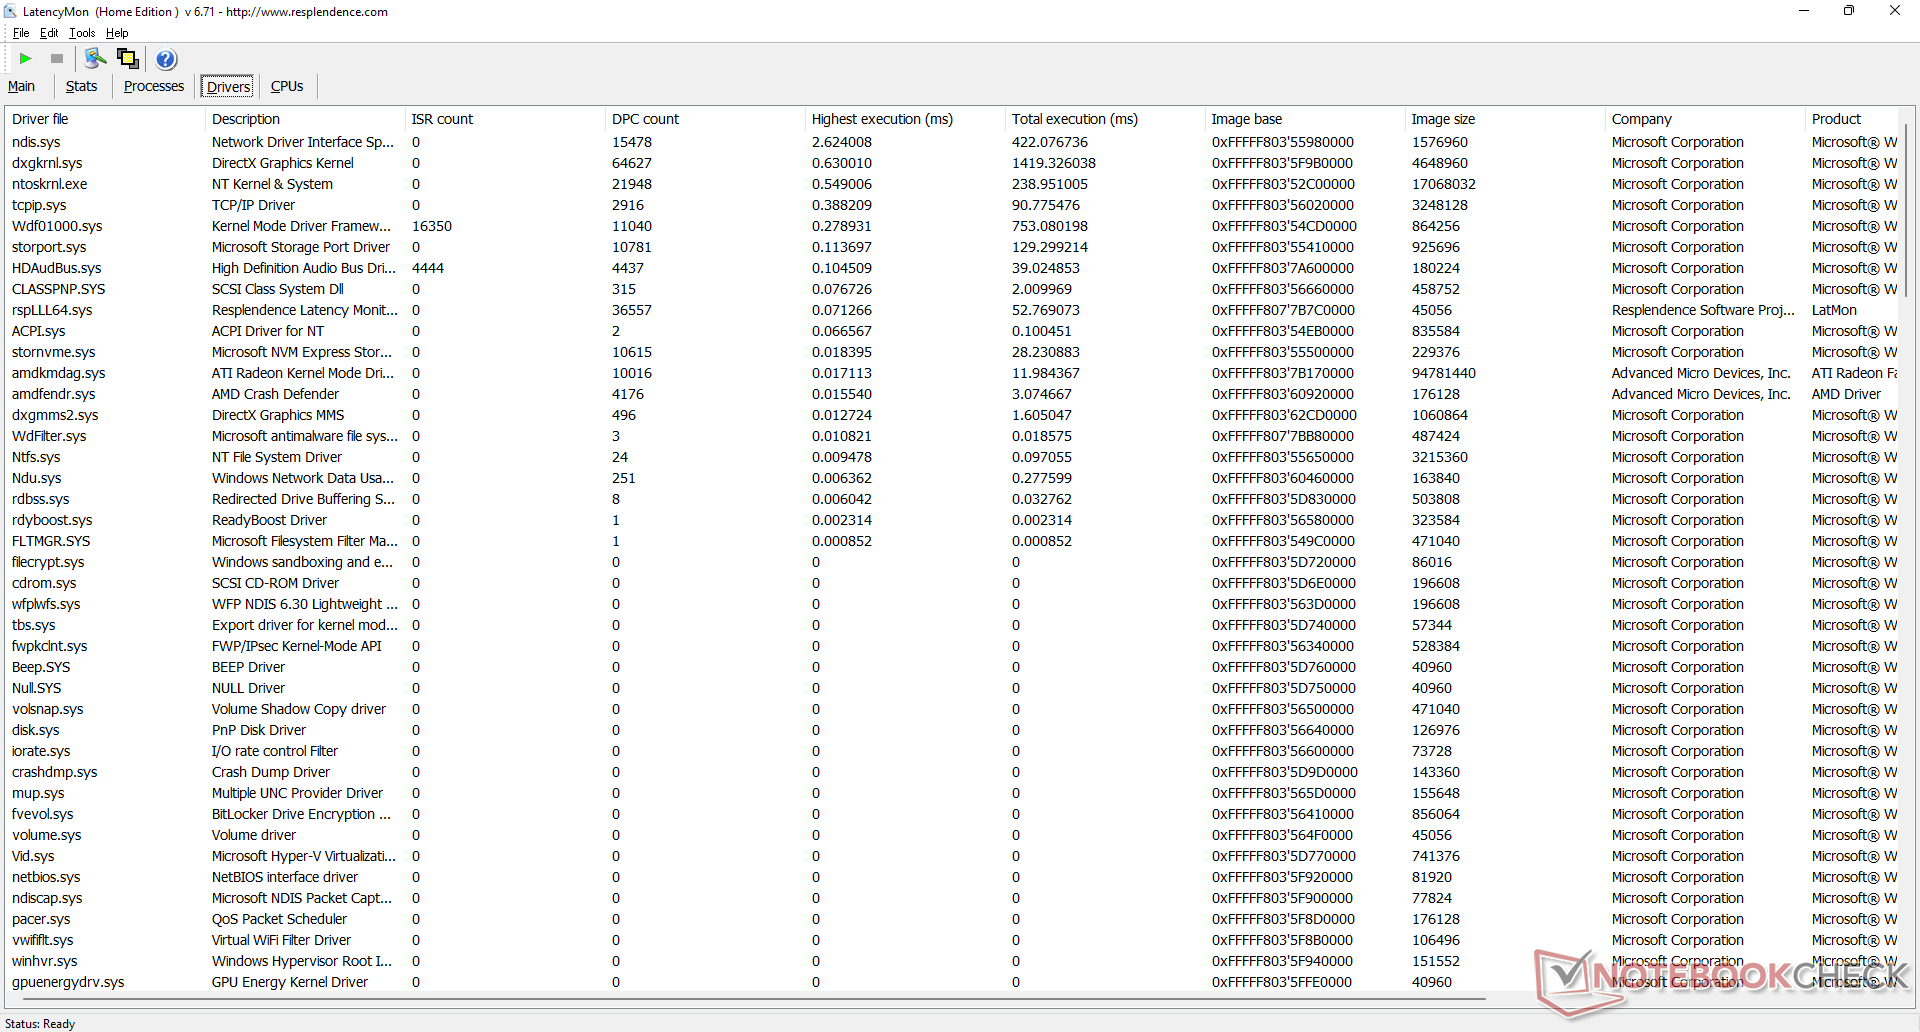
LatencyMon ujawnia problemy z DPC podczas otwierania wielu kart przeglądarki na naszej stronie głównej. odtwarzanie wideo w rozdzielczości 4K przy 60 FPS jest w większości przypadków płynne, z zaledwie 3 opuszczonymi klatkami podczas naszego minutowego filmu testowego.
| DPC Latencies / LatencyMon - interrupt to process latency (max), Web, Youtube, Prime95 | |
| Trigkey S3 | |
| Intel NUC Pro Chassis_i7_1265U | |
| Beelink SEi12 Core i5-1235U | |
| Beelink SER Pro Ryzen 5 5600H | |
| Intel NUC11TNKi5 | |
| Beelink SEi11 Pro | |
* ... im mniej tym lepiej
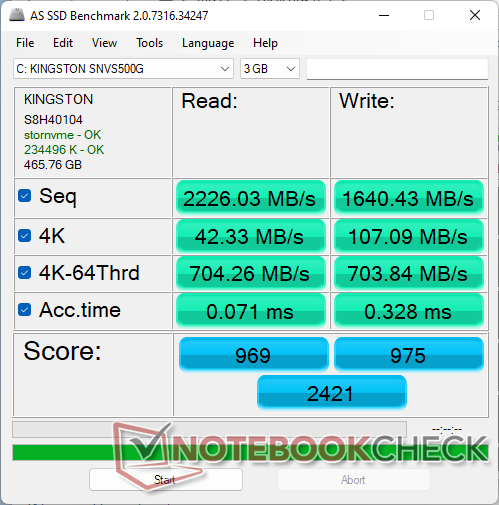
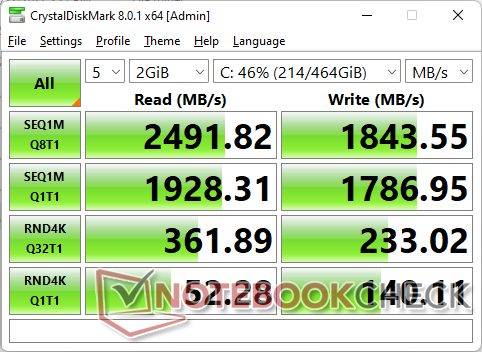
Urządzenia do przechowywania danych
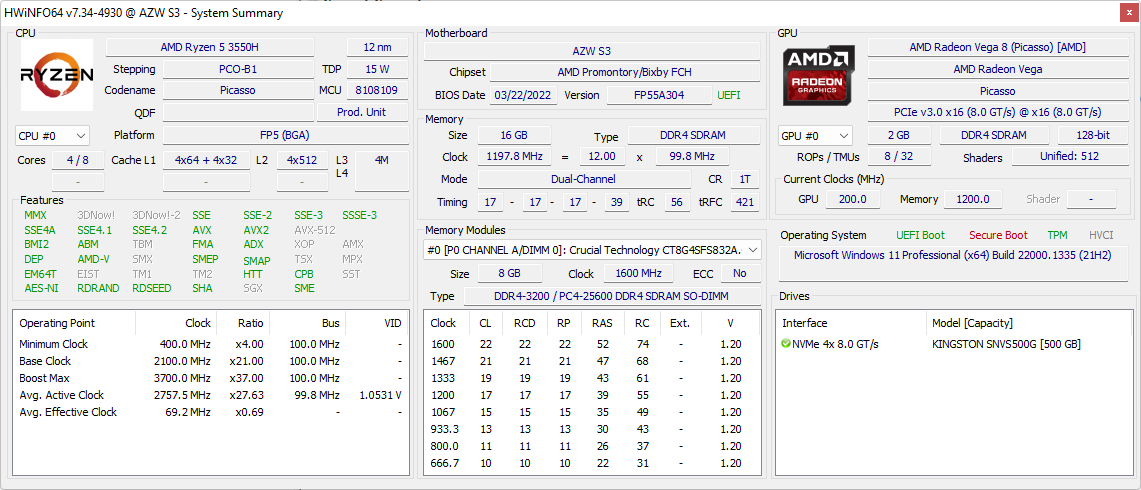
Trigkey używa tego samegoKingston NV1 SNVS/500GCN M.2 2280 NVMe SSD, który można znaleźć w wielu mini komputerach Beelink, np SEi11 Pro lub SER Pro. Jest to budżetowy dysk PCIe3 x4 o maksymalnym trwałym transferze około 2500 MB/s. Użytkownicy mogą zainstalować jeden dysk SSD M.2 i jeden 2,5-calowy dysk SATA III, jeśli mogą otworzyć dolny panel.

| Drive Performance rating - Percent | |
| Beelink SEi12 Core i5-1235U | |
| Intel NUC Pro Chassis_i7_1265U | |
| Beelink SEi11 Pro | |
| Beelink SER Pro Ryzen 5 5600H -11! | |
| Trigkey S3 | |
| Intel NUC11TNKi5 | |
* ... im mniej tym lepiej
Disk Throttling: DiskSpd Read Loop, Queue Depth 8
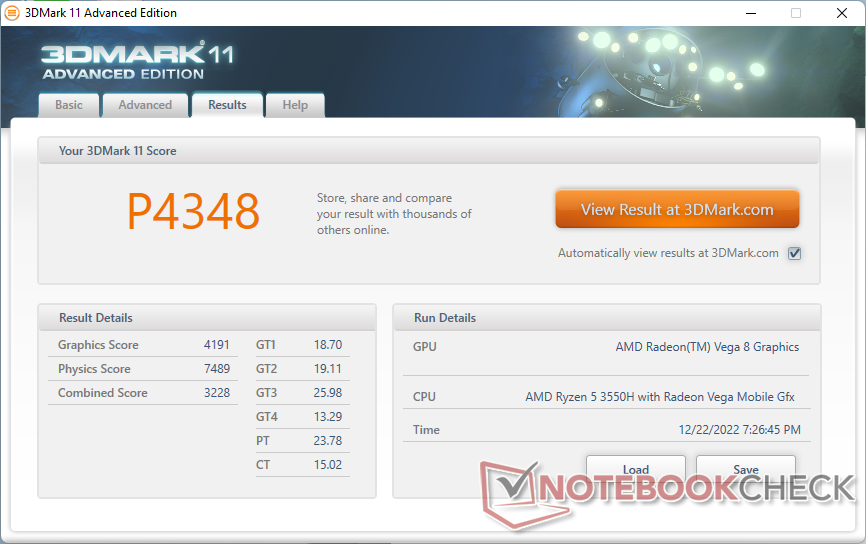
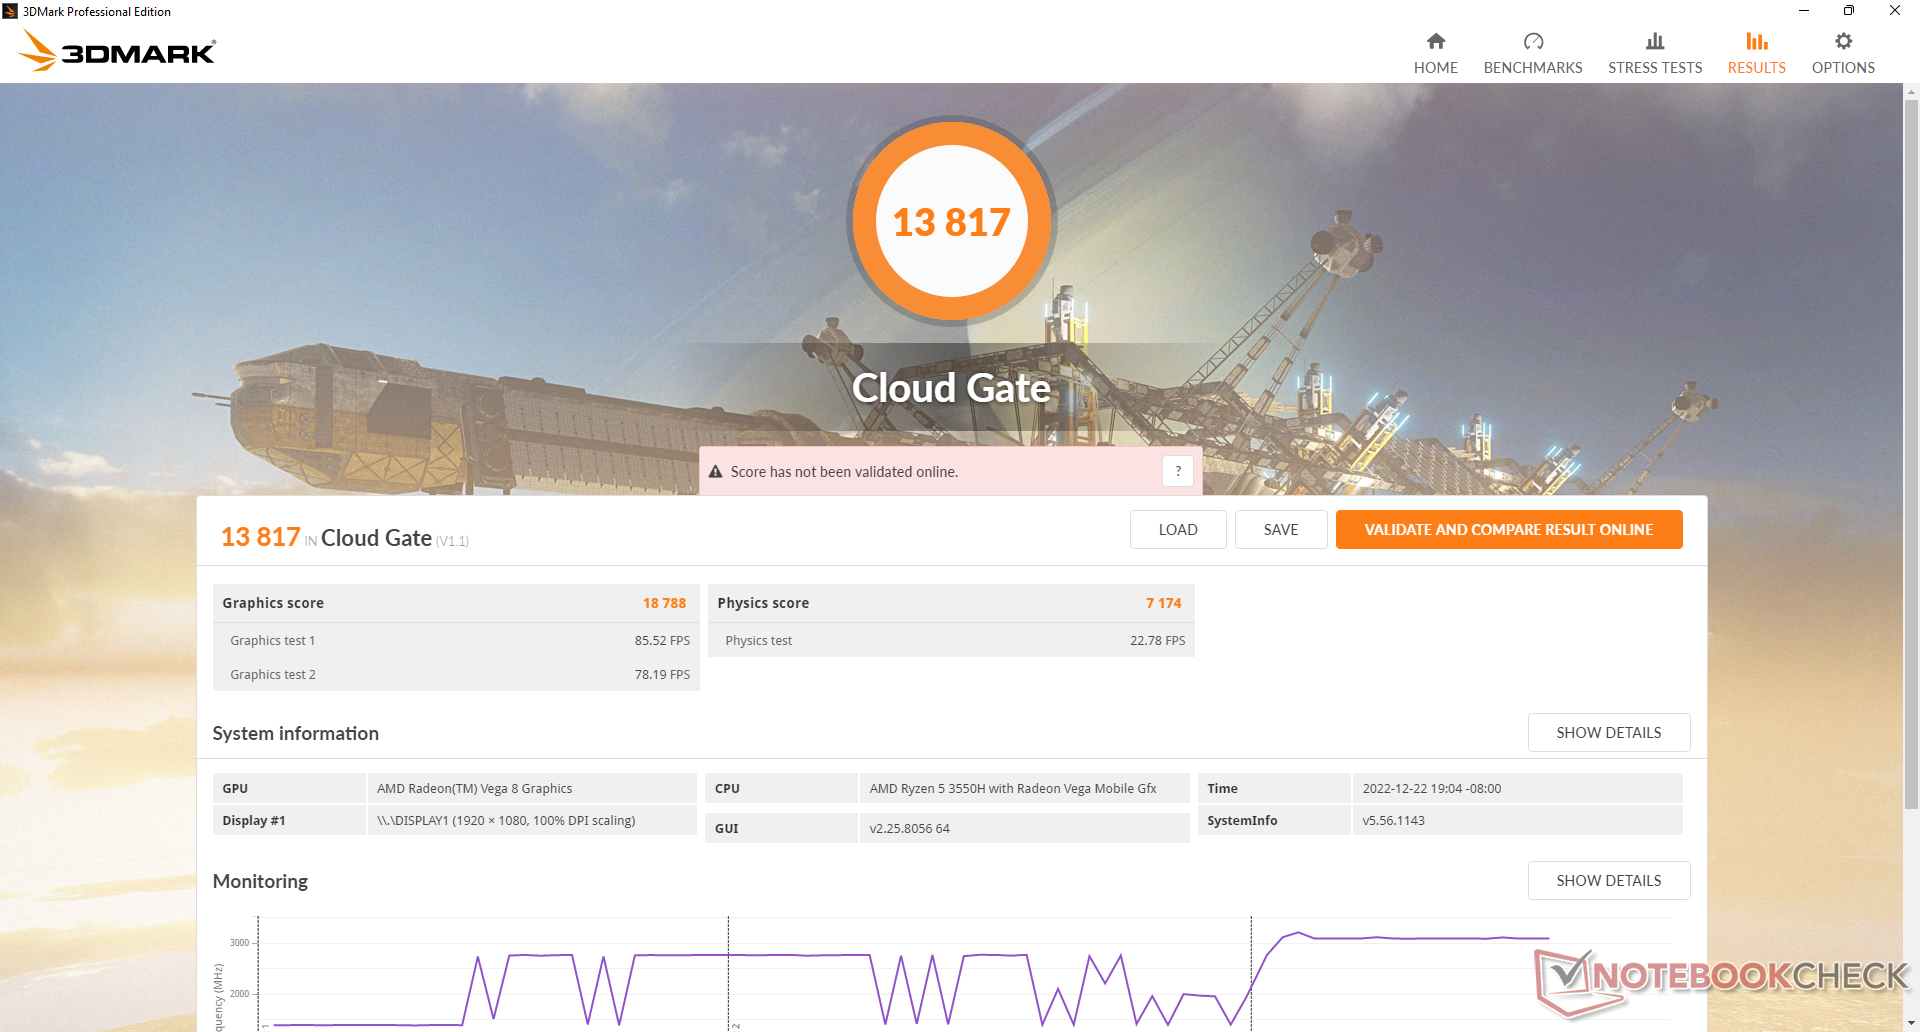
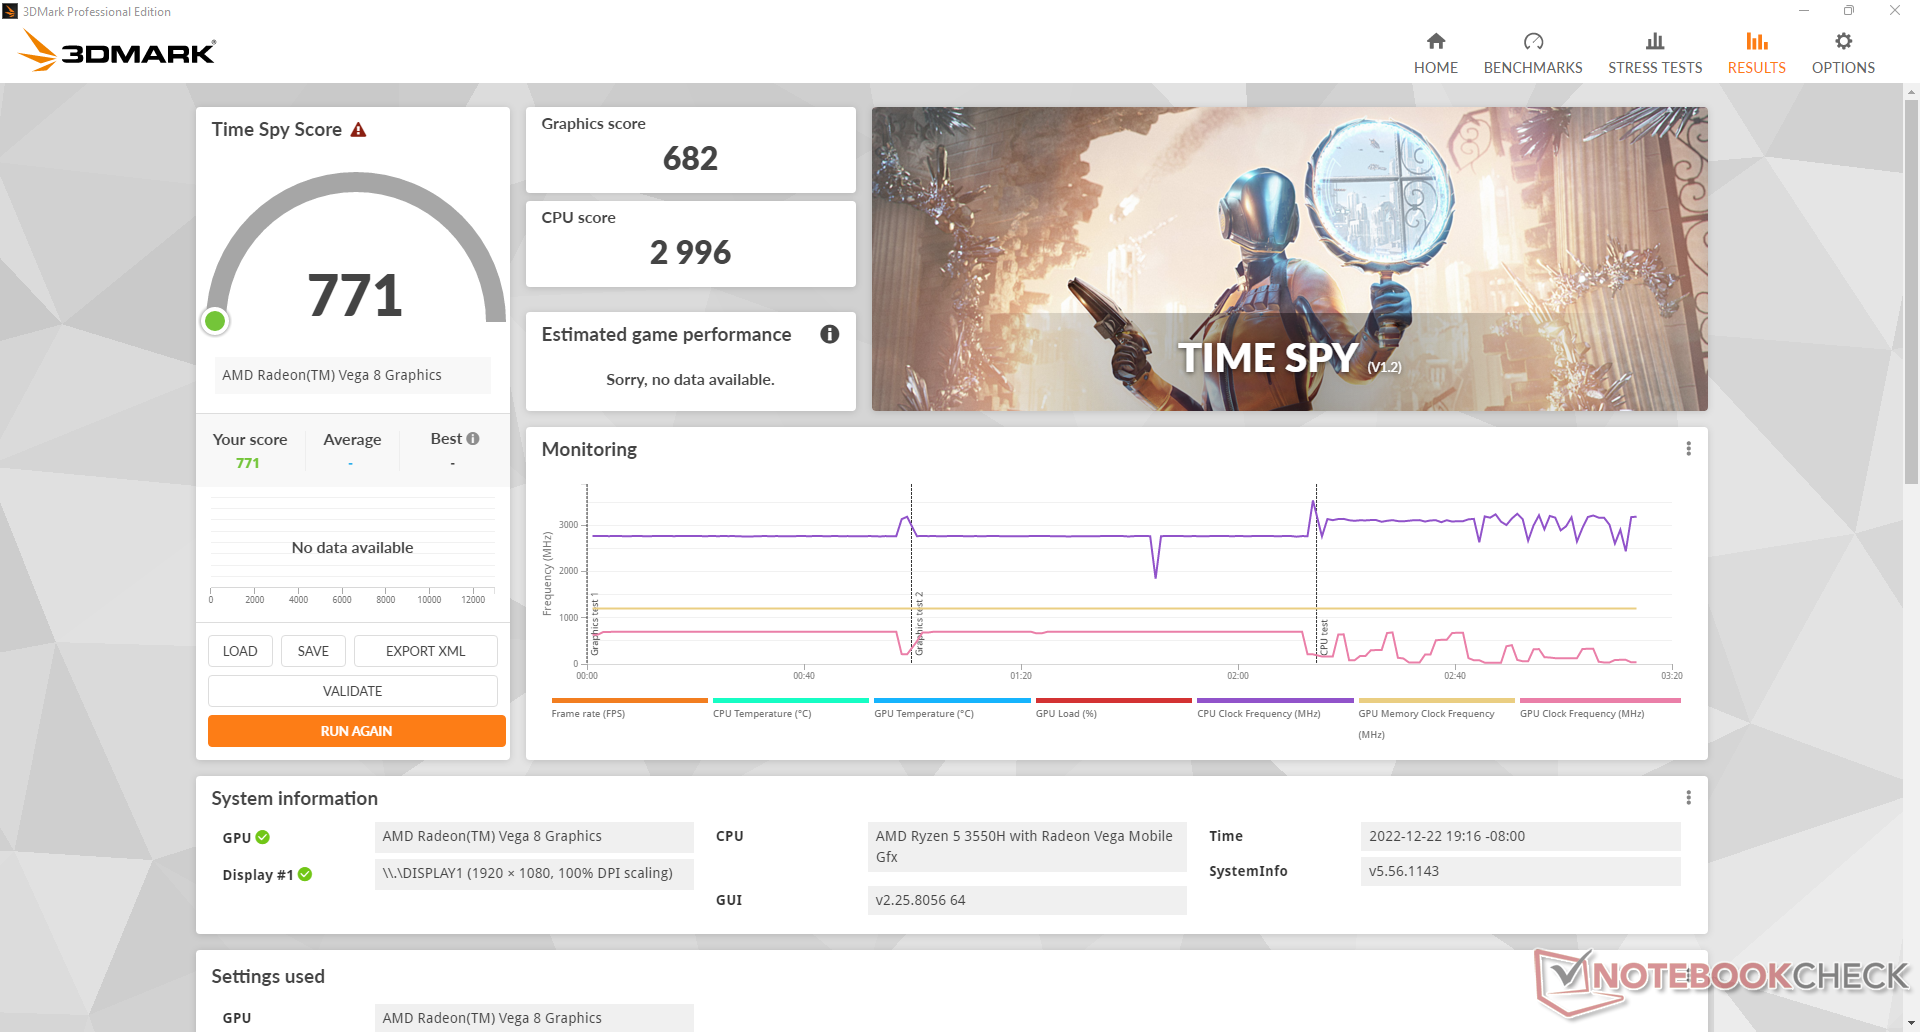
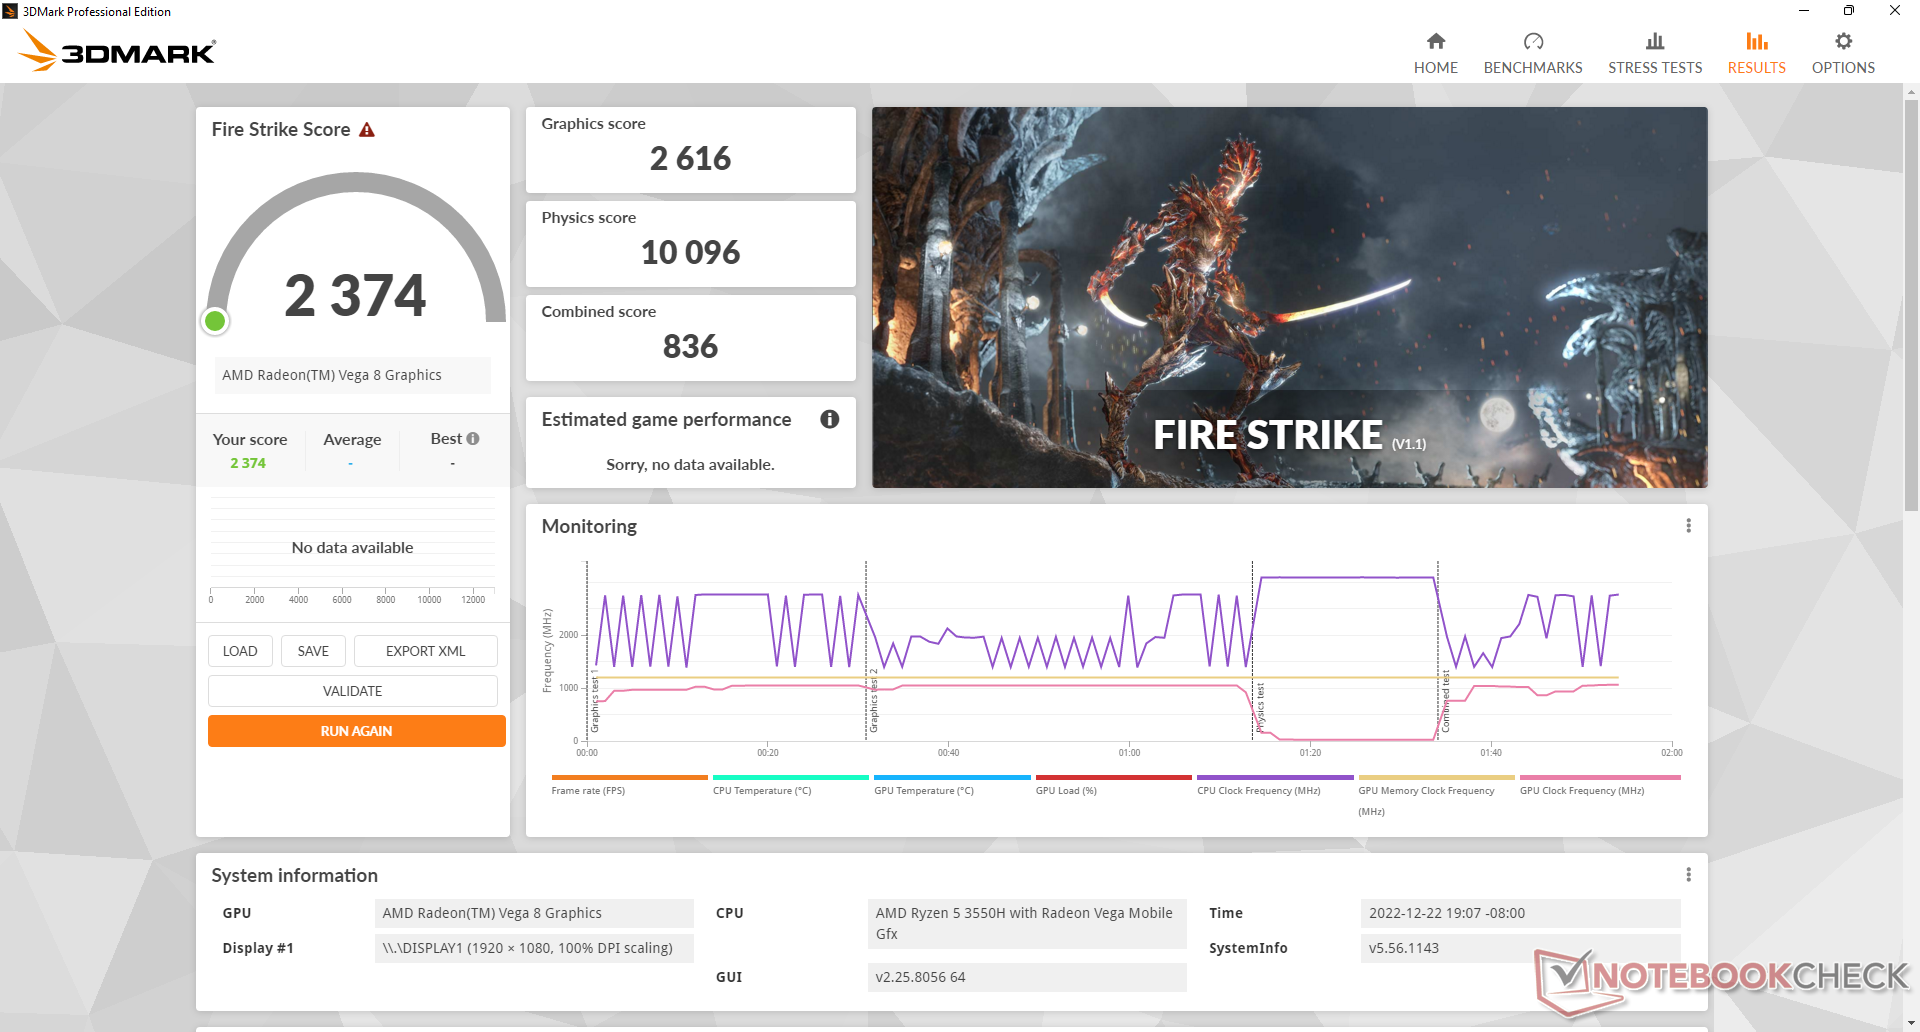
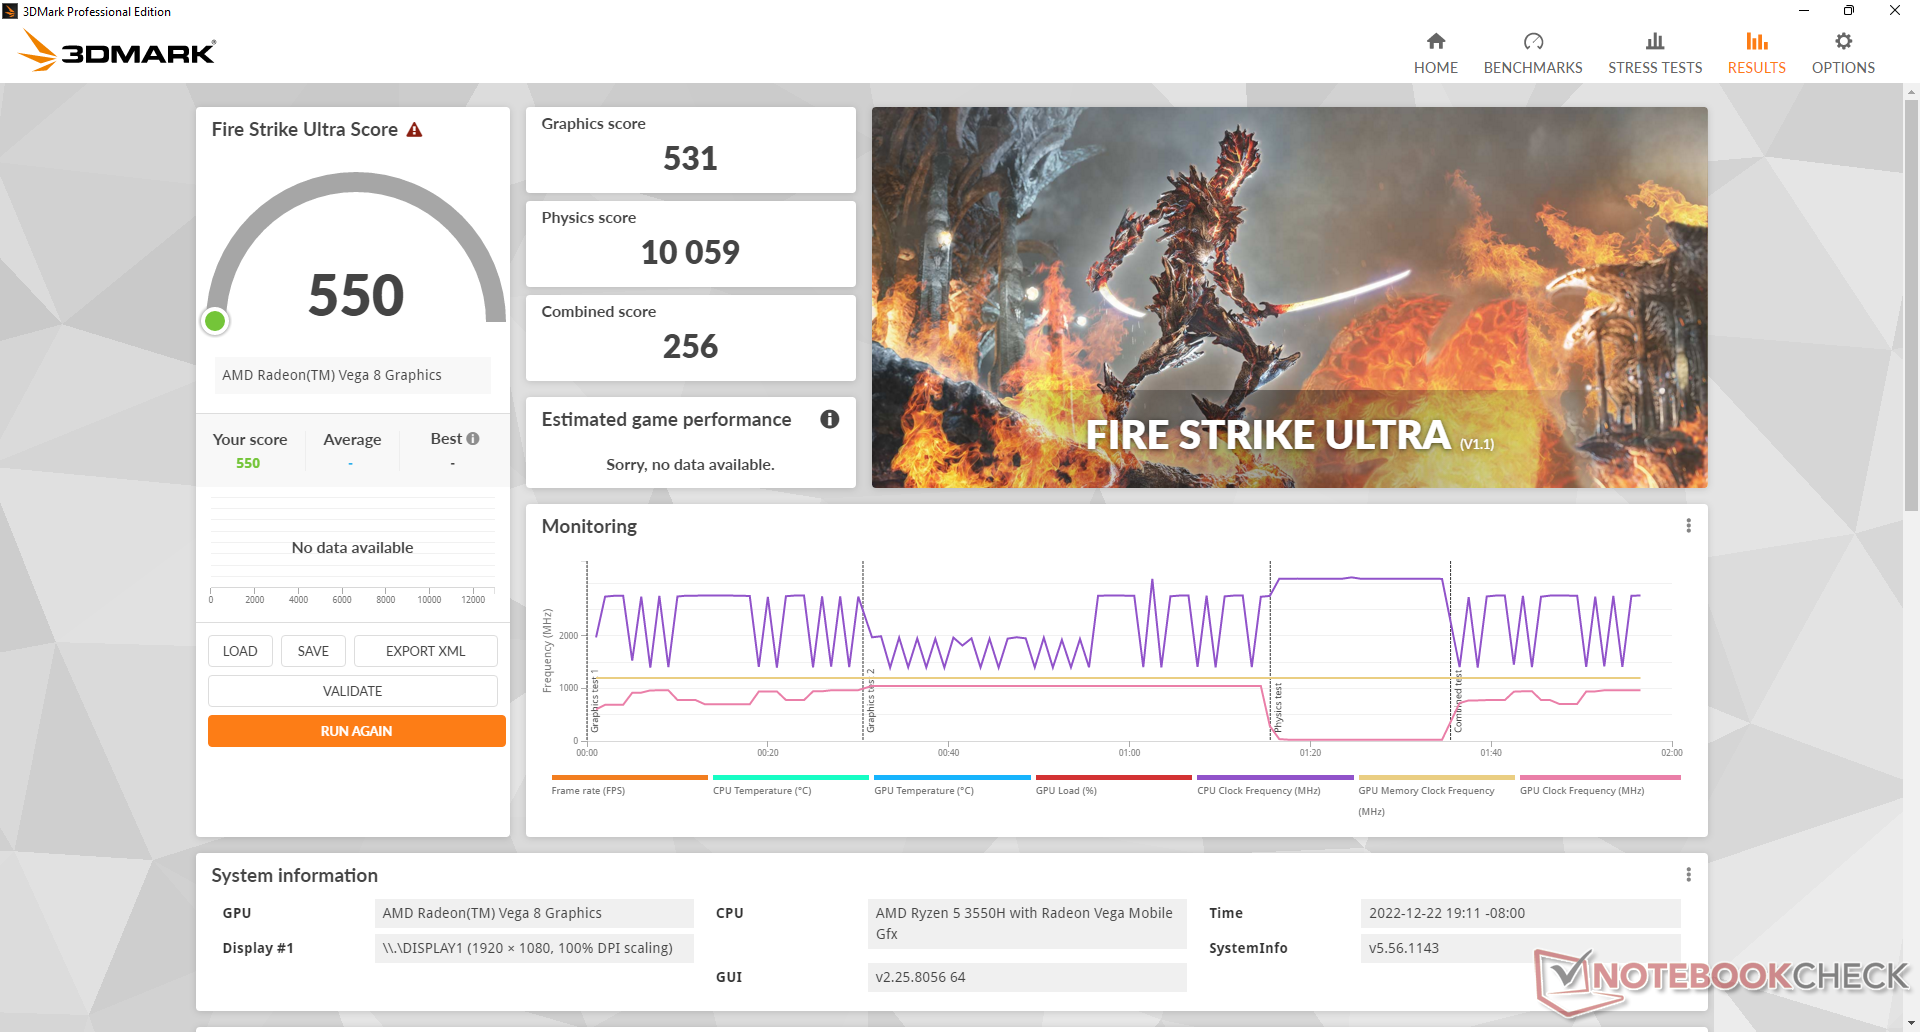
Wydajność GPU
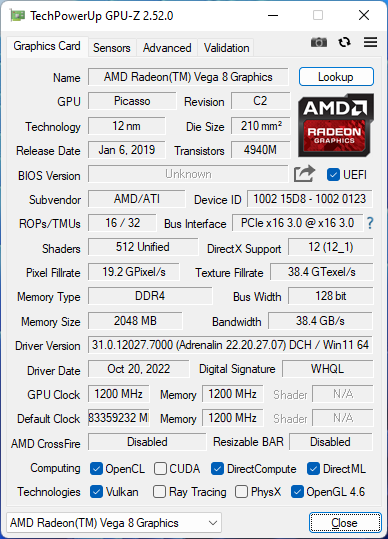
Wydajność surowej grafiki jest mniej więcej dwukrotnie wyższa niż w przypadku UHD Graphics 620 powszechnie spotykanej w procesorach Intel 10. generacji lub starszych. Nie jest to wystarczające do zasilania większości gier, ale każda odrobina pomaga podczas strumieniowania lub pracy na ekranach o wyższej rozdzielczości.
| 3DMark Performance rating - Percent | |
| Beelink GTR6 | |
| Intel NUC Pro Chassis_i7_1185G7 | |
| Intel NUC 12 Pro Kit NUC12WSKi7 | |
| Beelink SEi11 Pro | |
| Intel NUC Pro Chassis_i7_1265U | |
| Beelink SER Pro Ryzen 5 5600H | |
| Prime Computer PrimeBook Circular-i7-1165G7 | |
| Intel NUC Pro Chassis_i5_1245U | |
| Beelink SEi12 Core i5-1235U | |
| Trigkey S3 | |
| Przeciętny AMD Radeon RX Vega 8 (Ryzen 2000/3000) | |
| Beelink SER3 | |
| BMAX B5 Pro G7H8 | |
| Minipc Union NiPoGi CK10 - 10810U | |
| Beelink U59 N5105 | |
| Geekom MiniAir 11 Special Edition -1! | |
| Chuwi LapBook Plus -1! | |
| Chuwi Hi10 Air -3! | |
| 3DMark 11 - 1280x720 Performance GPU | |
| Beelink GTR6 | |
| Intel NUC 12 Pro Kit NUC12WSKi7 | |
| Intel NUC Pro Chassis_i7_1185G7 | |
| Beelink SEi11 Pro | |
| Intel NUC Pro Chassis_i7_1265U | |
| Prime Computer PrimeBook Circular-i7-1165G7 | |
| Beelink SER Pro Ryzen 5 5600H | |
| Intel NUC Pro Chassis_i5_1245U | |
| Beelink SEi12 Core i5-1235U | |
| Trigkey S3 | |
| Przeciętny AMD Radeon RX Vega 8 (Ryzen 2000/3000) (1668 - 4317, n=44) | |
| Beelink SER3 | |
| BMAX B5 Pro G7H8 | |
| Minipc Union NiPoGi CK10 - 10810U | |
| Beelink U59 N5105 | |
| Geekom MiniAir 11 Special Edition | |
| Chuwi LapBook Plus | |
| Chuwi Hi10 Air | |
| 3DMark 11 Performance | 4348 pkt. | |
| 3DMark Cloud Gate Standard Score | 13817 pkt. | |
| 3DMark Fire Strike Score | 2374 pkt. | |
| 3DMark Time Spy Score | 771 pkt. | |
Pomoc | ||
Włączony tryb jałowy Witcher 3 pokazuje, że częstotliwość odświeżania obrazu okresowo spada do poziomu 30 FPS na krótki czas, a następnie powraca do normy. Takie zachowanie sugeruje słabą optymalizację lub przerwanie działania w tle, co może potencjalnie prowadzić do zrzucania klatek podczas przesyłania strumieniowego innych treści.
Witcher 3 FPS Chart
| low | med. | high | ultra | |
|---|---|---|---|---|
| GTA V (2015) | 81.2 | 72.3 | 21.8 | 10.3 |
| The Witcher 3 (2015) | 50.7 | 33.8 | 18.3 | 10.1 |
| Dota 2 Reborn (2015) | 73 | 64.4 | 40.7 | 37.8 |
| Final Fantasy XV Benchmark (2018) | 27.2 | 13.8 | 9.68 | |
| X-Plane 11.11 (2018) | 11.5 | 10.5 | 9.58 | |
| Strange Brigade (2018) | 65.5 | 21.8 | 17.5 | 14.6 |
| Cyberpunk 2077 1.6 (2022) | 10.8 | 8.6 | 6.3 | 5 |
Emisje
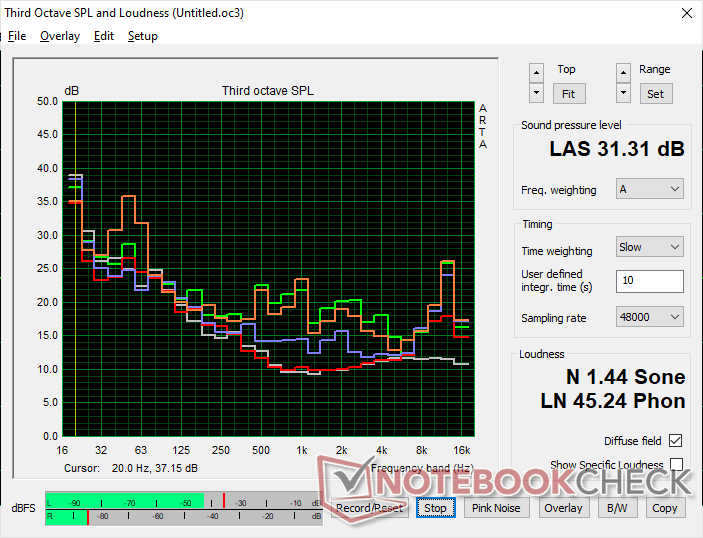
Szum systemu
Szum wentylatora jest zaskakująco cichy, aby być mocną stroną S3. Podczas pracy pod dużym obciążeniem udało nam się osiągnąć maksymalnie tylko nieco ponad 31 dB(A), w porównaniu do 40 dB(A) lub więcej w szybszych mini PC, takich jak Beelink SEi12 czy Beelink SER Pro.
Hałas
| luz |
| 24.5 / 24.5 / 24.5 dB |
| obciążenie |
| 27.1 / 31.3 dB |
 | ||
30 dB cichy 40 dB(A) słyszalny 50 dB(A) irytujący |
||
min: | ||
| Trigkey S3 Vega 8, R5 3550H, Kingston NV1 SNVS/500GCN | Intel NUC Pro Chassis_i7_1265U Iris Xe G7 96EUs, i7-1265U, WDC PC SN720 SDAQNTW-512G | Intel NUC11TNKi5 Iris Xe G7 80EUs, i5-1135G7, Transcend M.2 SSD 430S TS512GMTS430S | Beelink SEi12 Core i5-1235U Iris Xe G7 80EUs, i5-1235U, Kingston NV1 SNVS/500GCN | Beelink SEi11 Pro Iris Xe G7 96EUs, i5-11320H, Kingston NV1 SNVS/500GCN | Beelink SER Pro Ryzen 5 5600H Vega 7, R5 5600H, Kingston NV1 SNVS/500GCN | |
|---|---|---|---|---|---|---|
| Noise | -36% | -36% | -13% | -9% | -10% | |
| wyłączone / środowisko * (dB) | 23.2 | 30.5 -31% | 24.8 -7% | 23.3 -0% | 22.8 2% | 22.8 2% |
| Idle Minimum * (dB) | 24.5 | 31.4 -28% | 35.6 -45% | 27.8 -13% | 24.7 -1% | 26.1 -7% |
| Idle Average * (dB) | 24.5 | 31.4 -28% | 35.6 -45% | 27.8 -13% | 24.7 -1% | 26.1 -7% |
| Idle Maximum * (dB) | 24.5 | 31.4 -28% | 35.6 -45% | 27.8 -13% | 25.3 -3% | 28.7 -17% |
| Load Average * (dB) | 27.1 | 43.8 -62% | 36.2 -34% | 32 -18% | 33.2 -23% | 32.3 -19% |
| Witcher 3 ultra * (dB) | 30.6 | 38 -24% | 34.1 -11% | 34.5 -13% | 32.8 -7% | |
| Load Maximum * (dB) | 31.3 | 44 -41% | 47.6 -52% | 39.2 -25% | 37.8 -21% | 36.4 -16% |
* ... im mniej tym lepiej
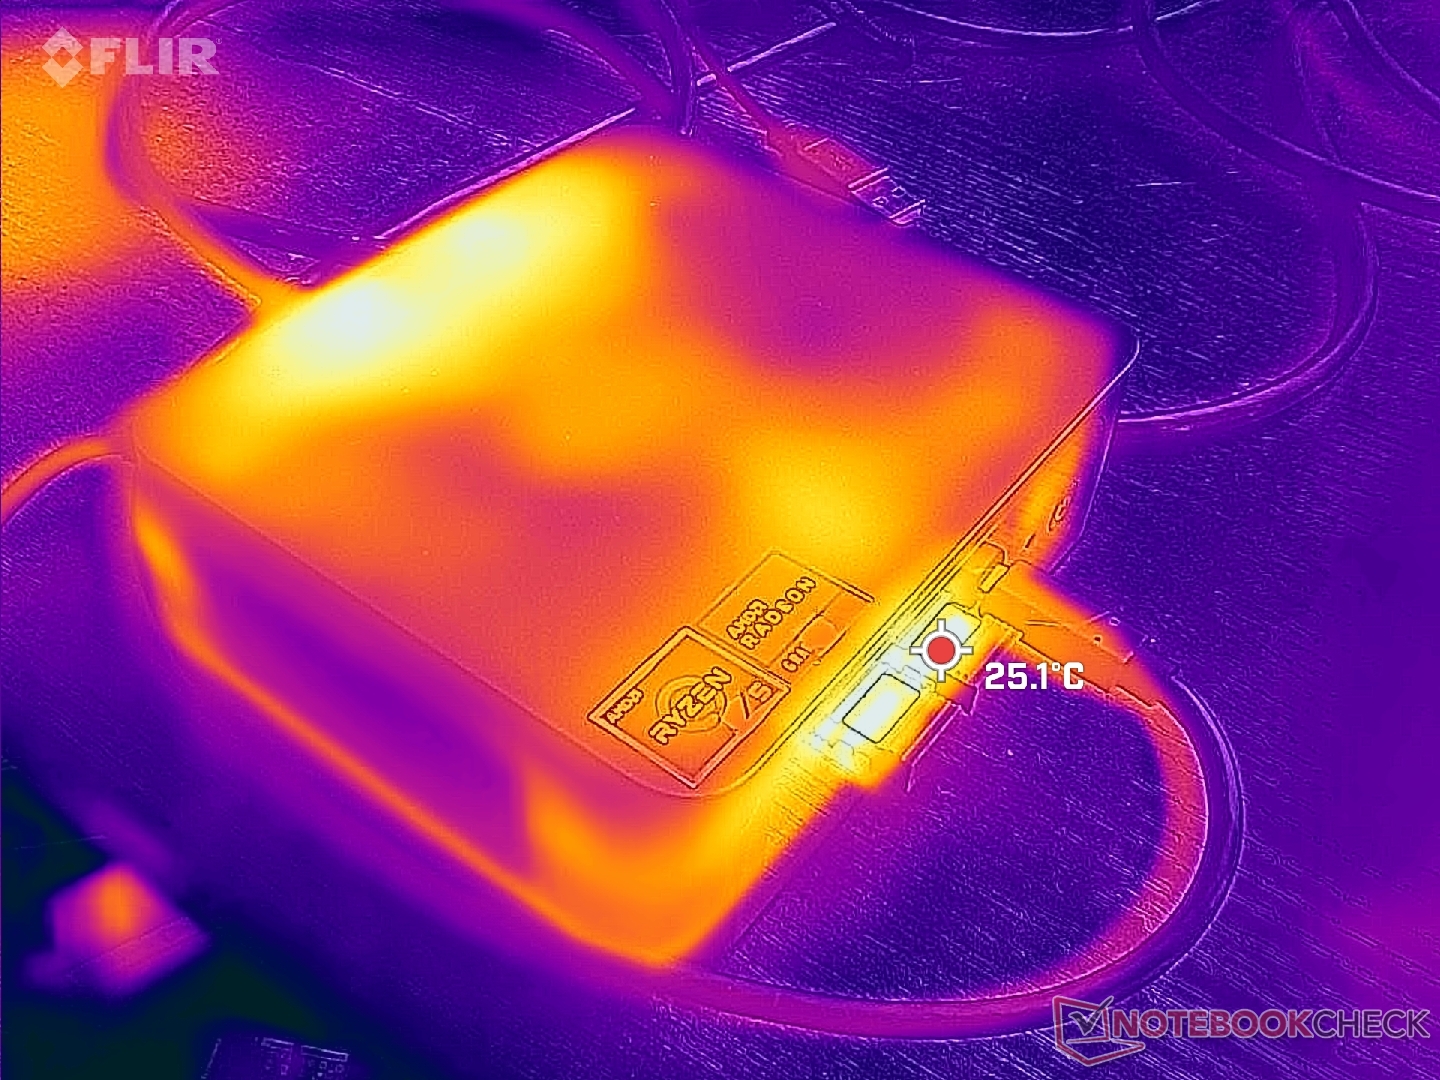
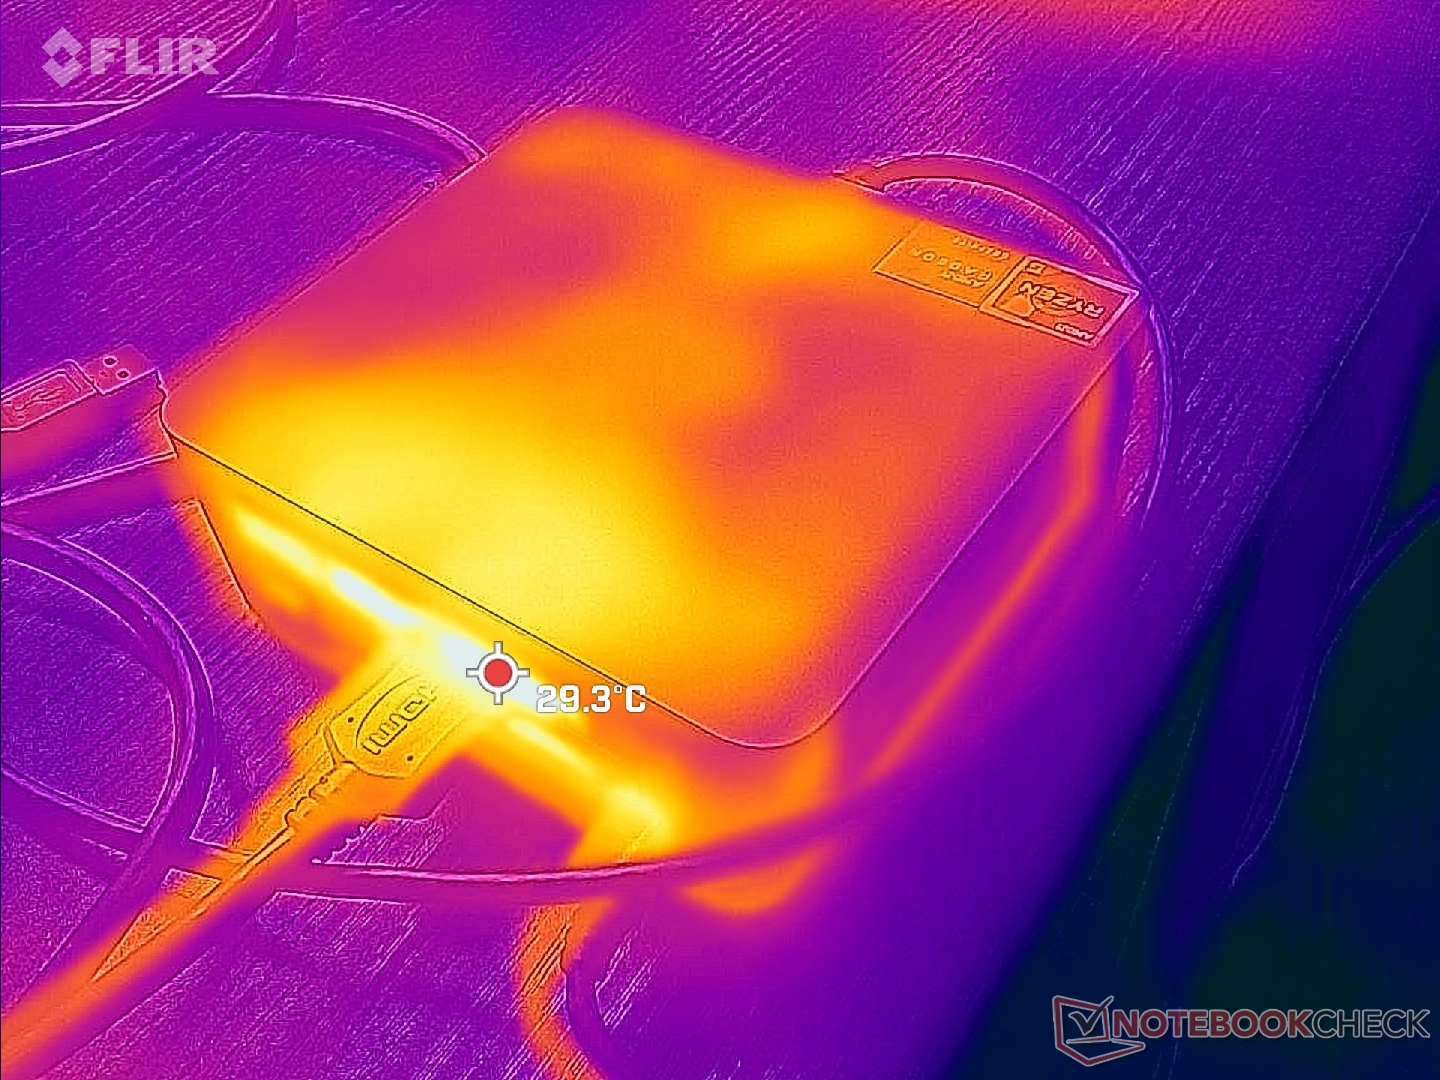
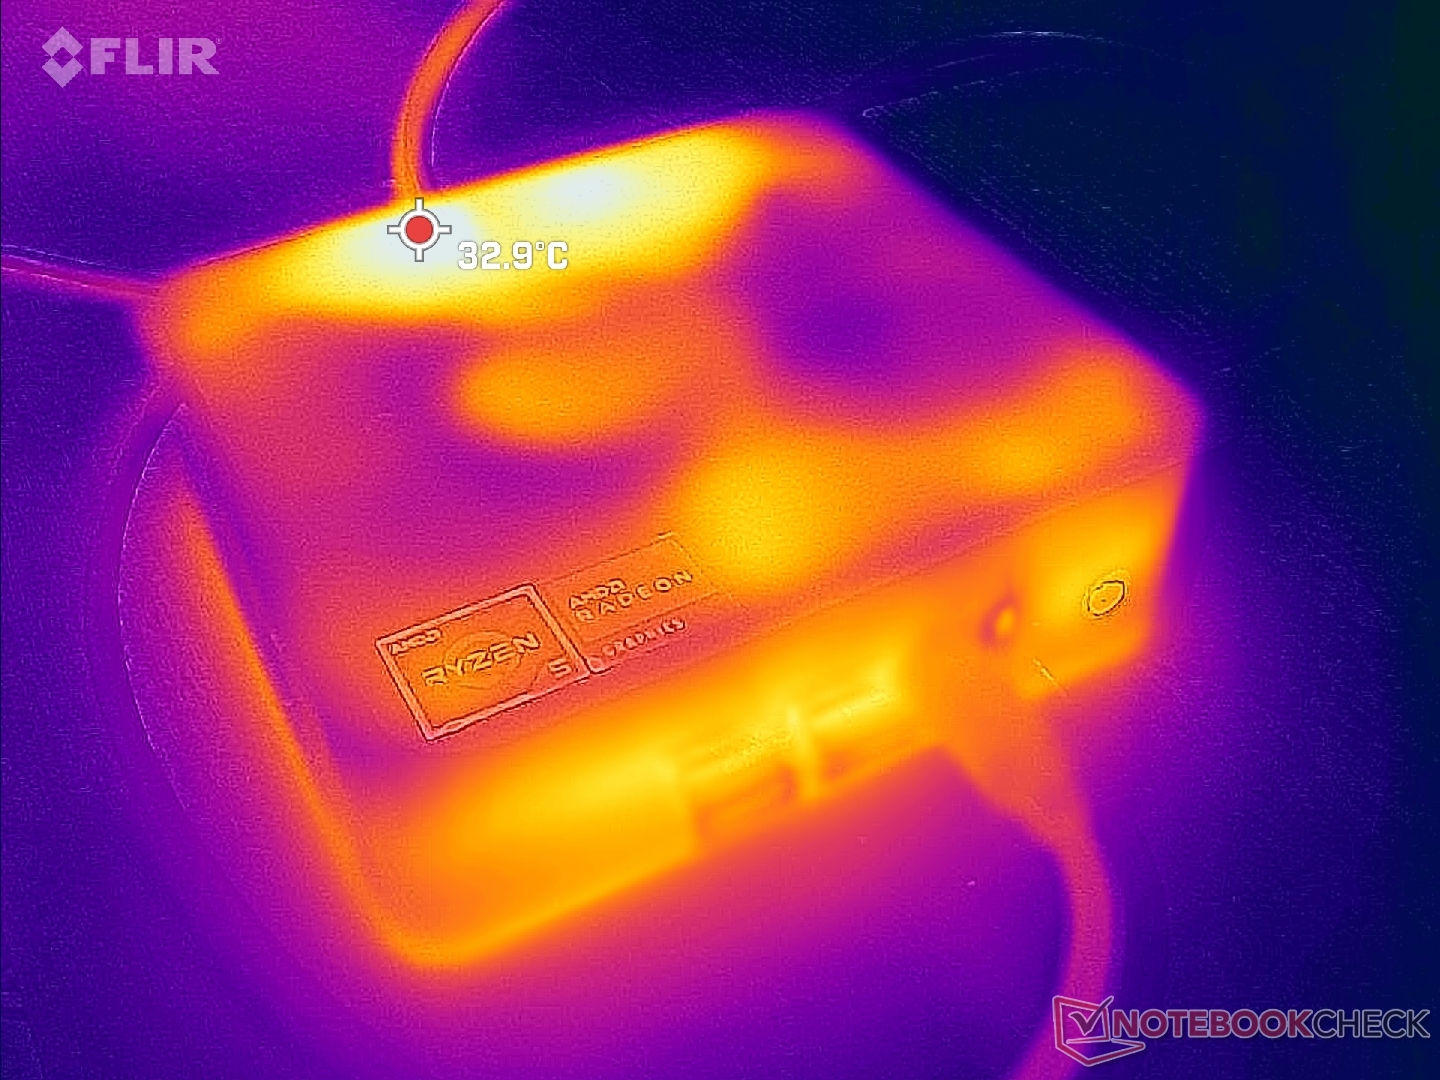
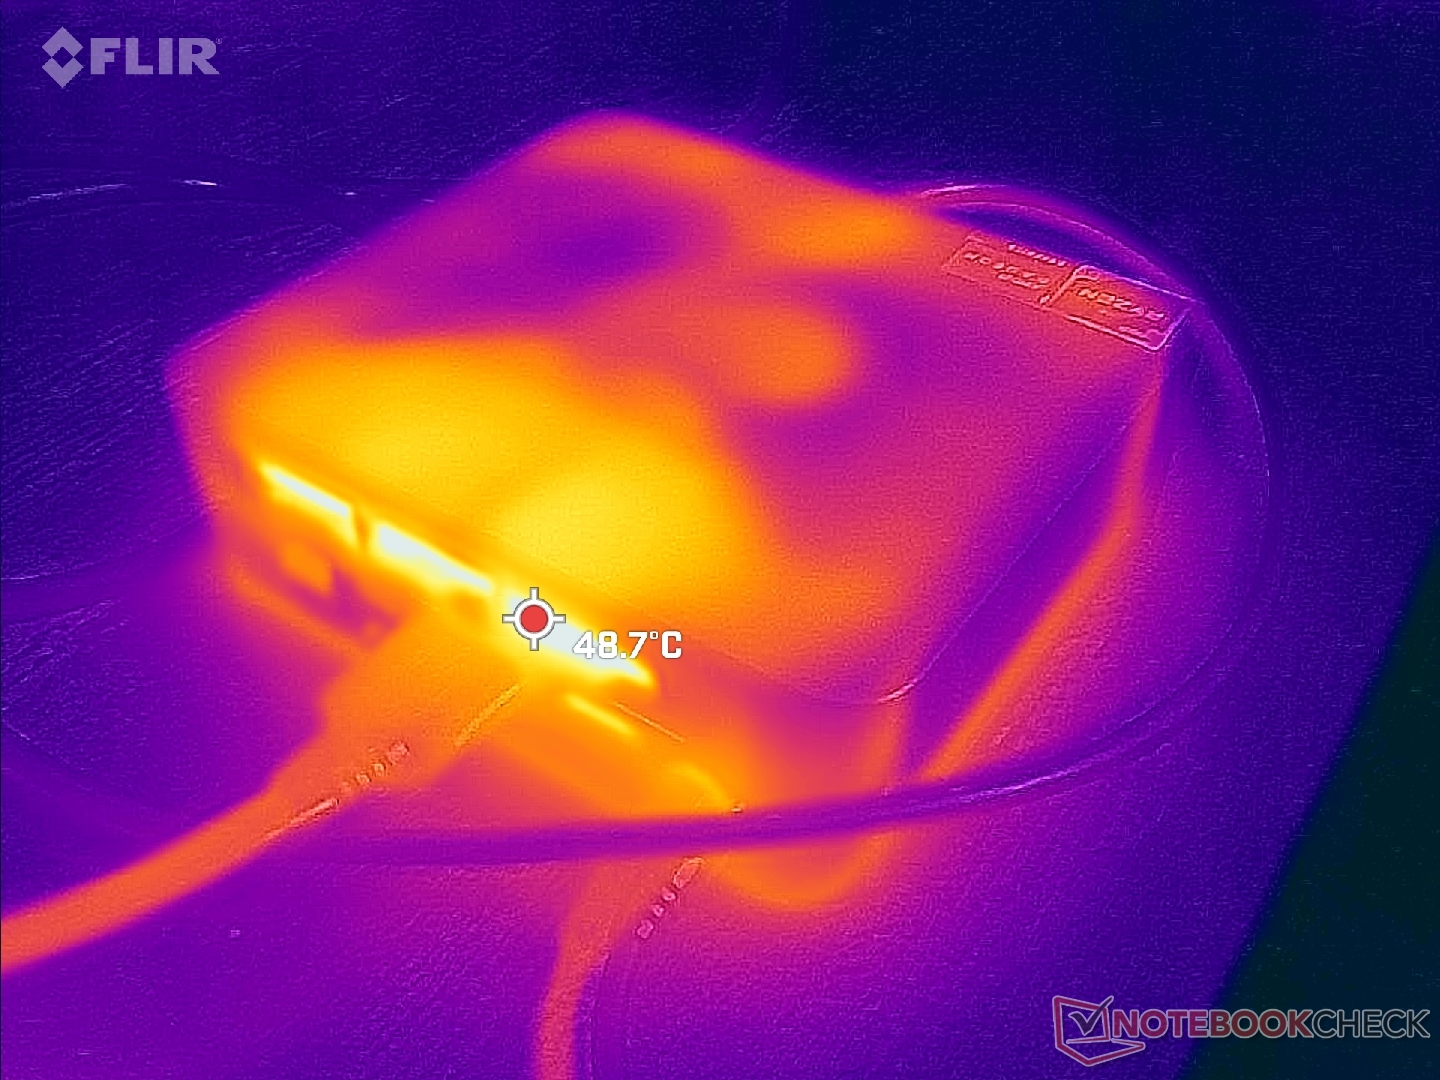
Temperatura
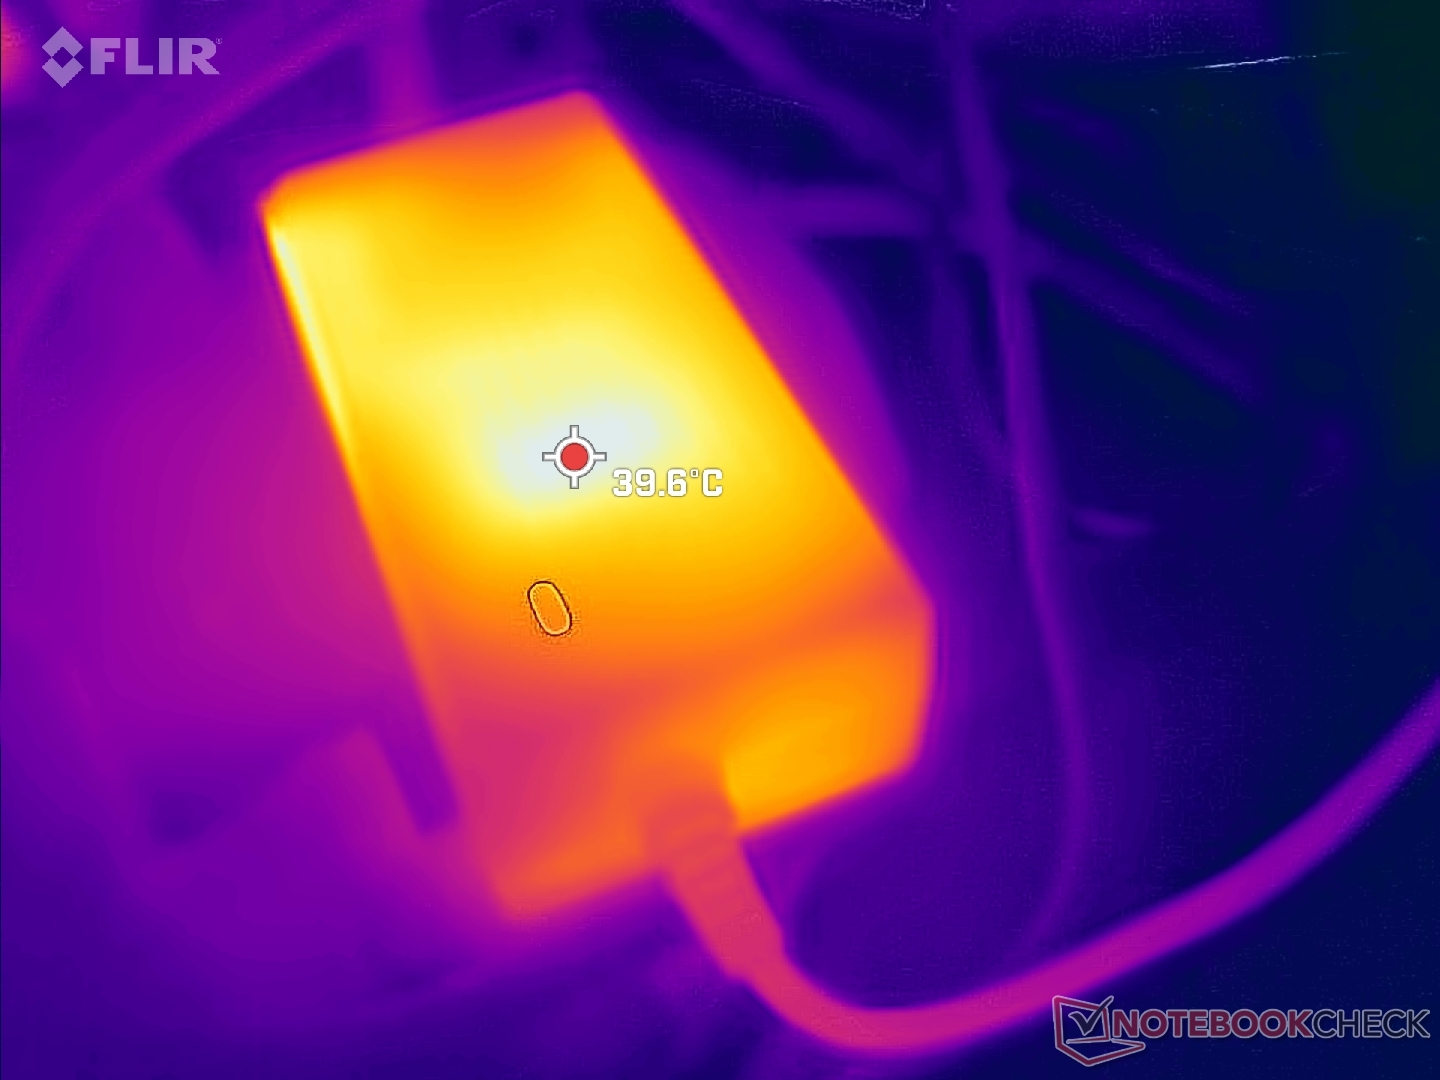
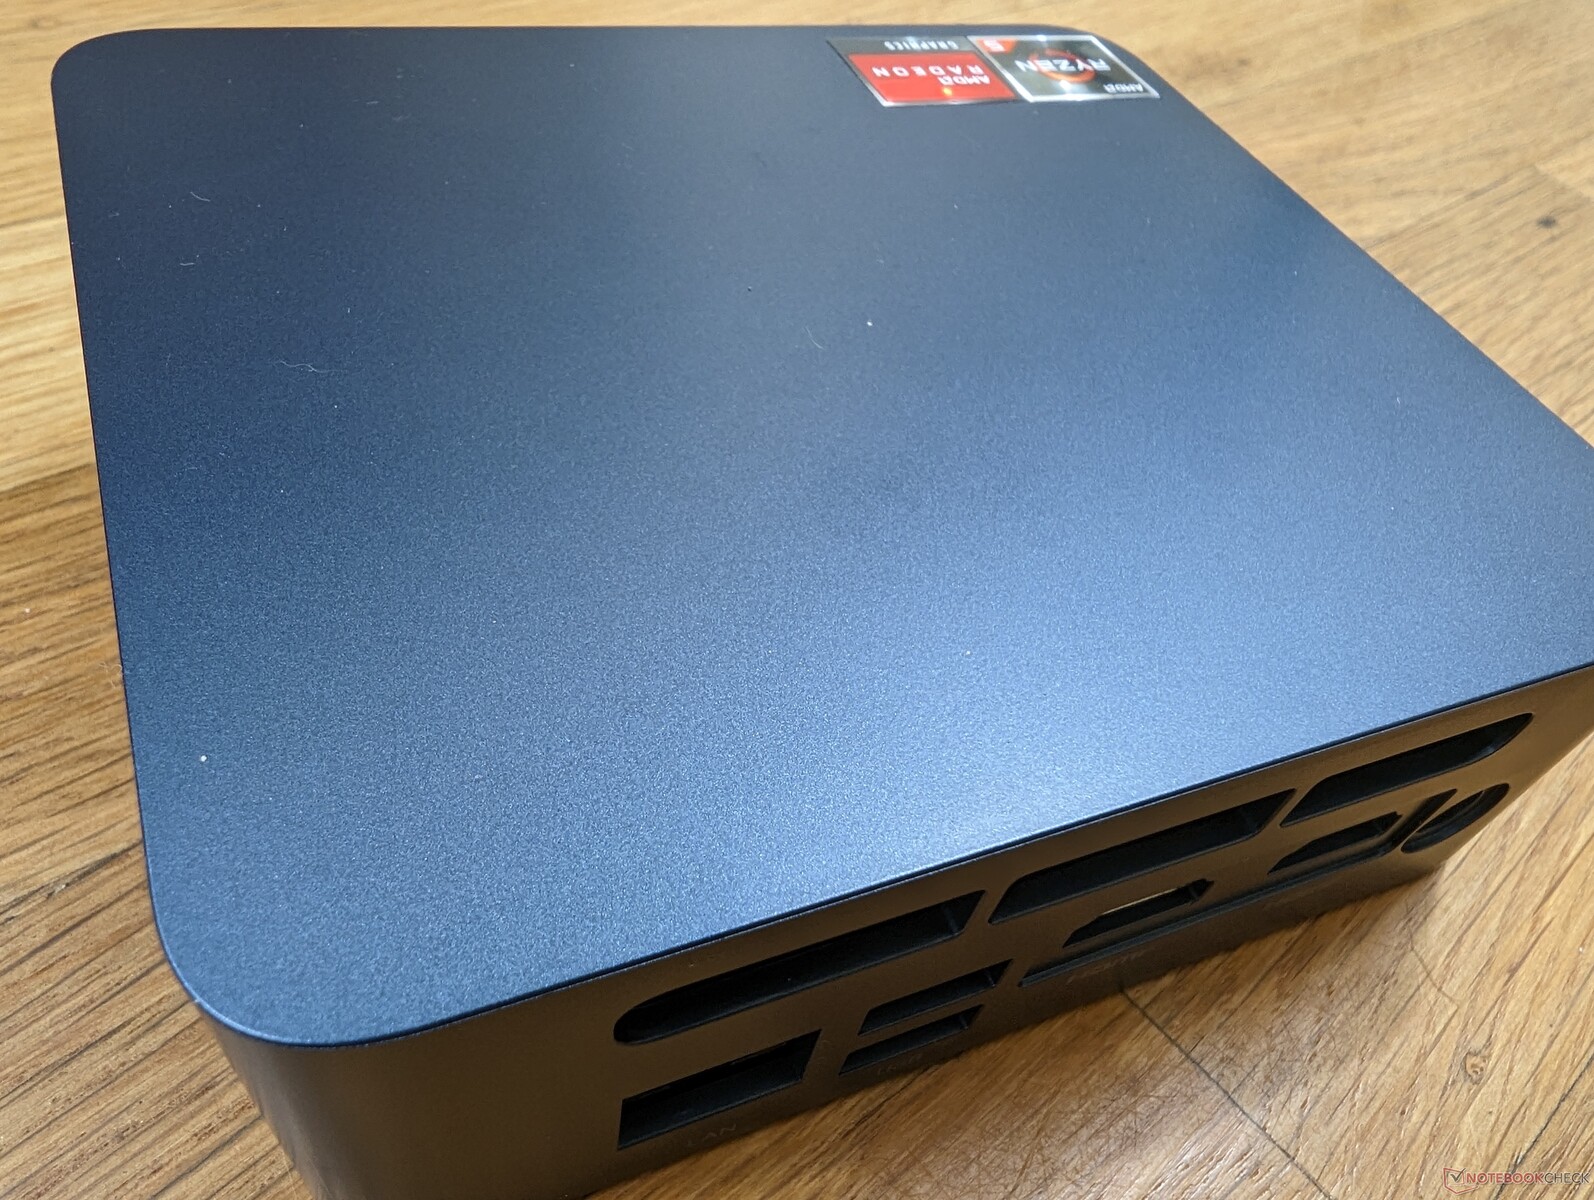
Temperatury powierzchni są najcieplejsze w kierunku tyłu, gdzie ucieka gorące powietrze. Chłodne powietrze napływa z boków, a nie z góry, jak w przypadku Beelink SEi12, co oznacza, że można bezpiecznie umieścić na wierzchu mini PC przedmioty takie jak papier, nie utrudniając przepływu powietrza.
Stress Test
Podczas uruchomienia Prime95 w celu obciążenia procesora, częstotliwość taktowania CPU i pobór mocy na płycie wzrosły odpowiednio do 3 GHz i 13 W, po czym spadły kilka sekund później i ustabilizowały się na poziomie 2,7 GHz, 11 W i 74 C. Temperatura rdzenia ustabilizowała się na poziomie 70 C podczas pracy Witcher 3 co jest porównywalne z Beelink SEi12 w podobnych warunkach testowych, ale wciąż cieplejsza niż naIntel NUC11TNKi5 Pro.
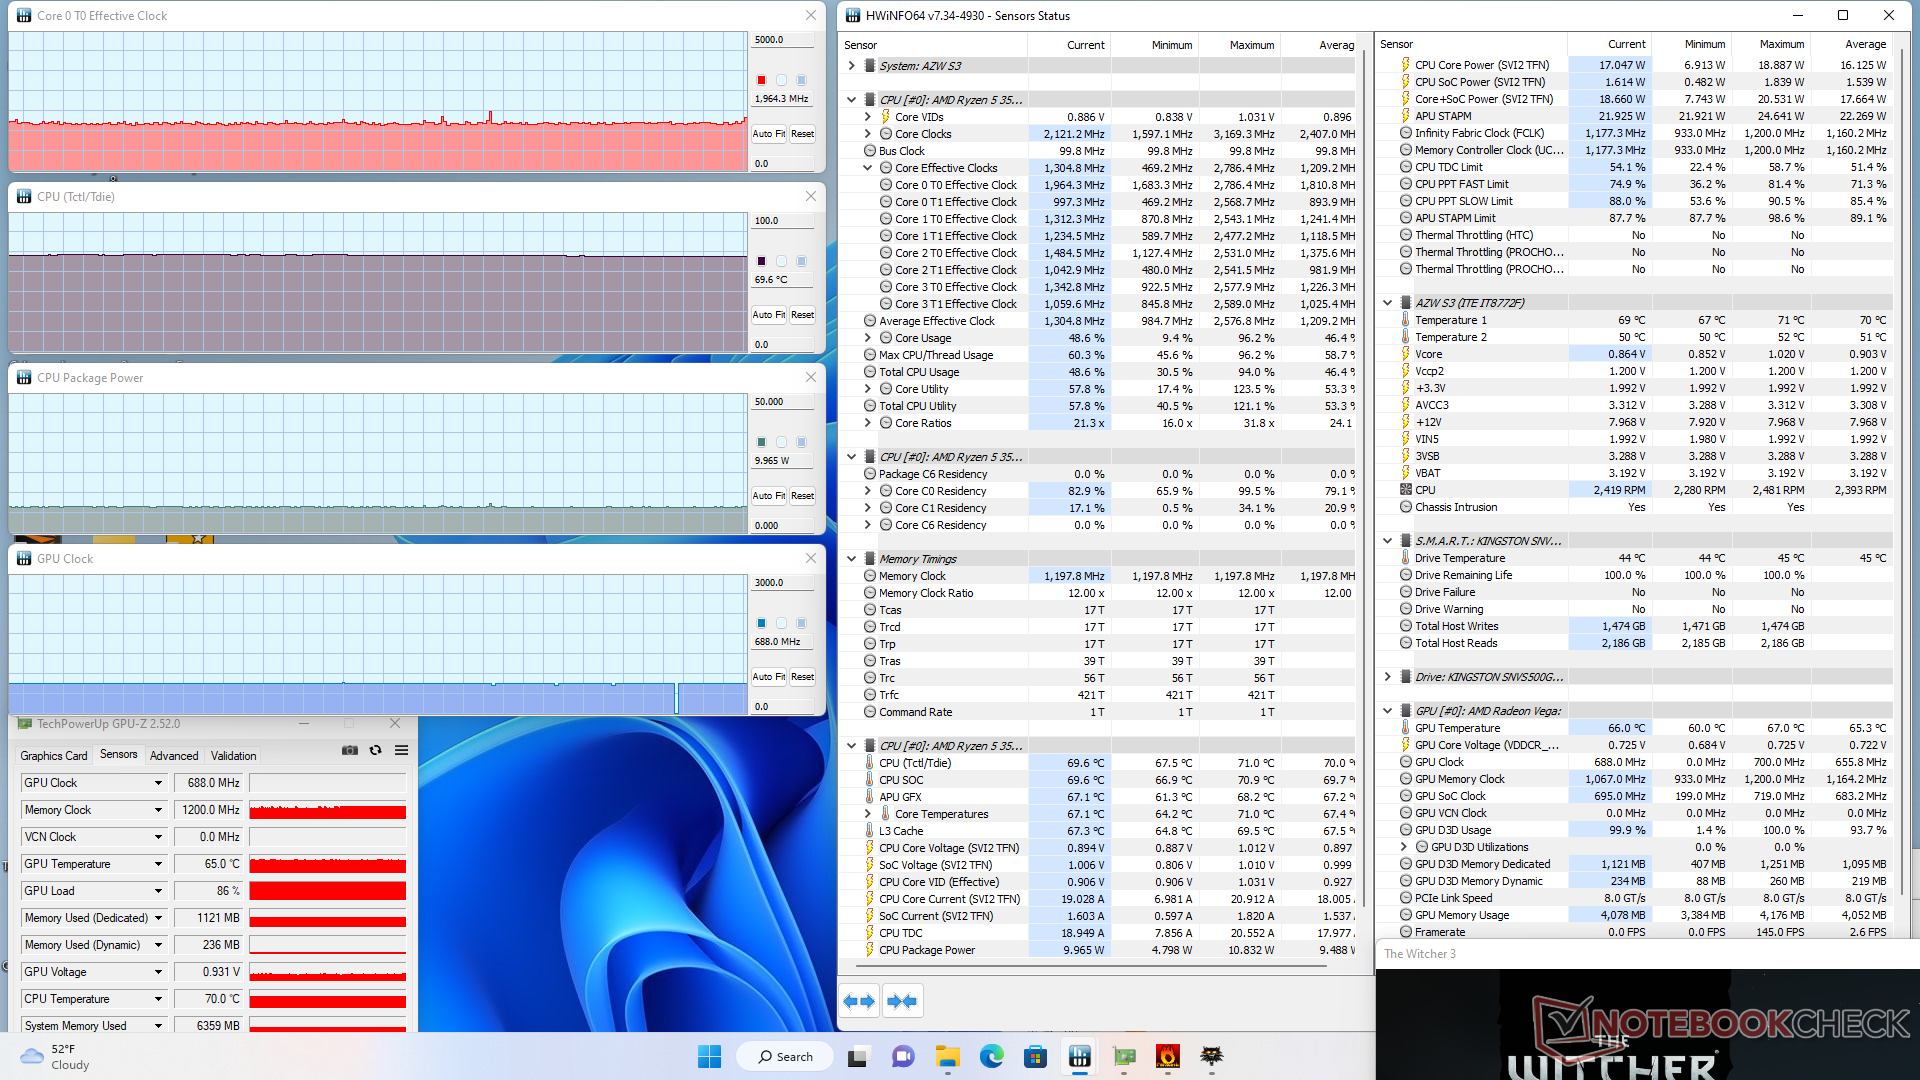
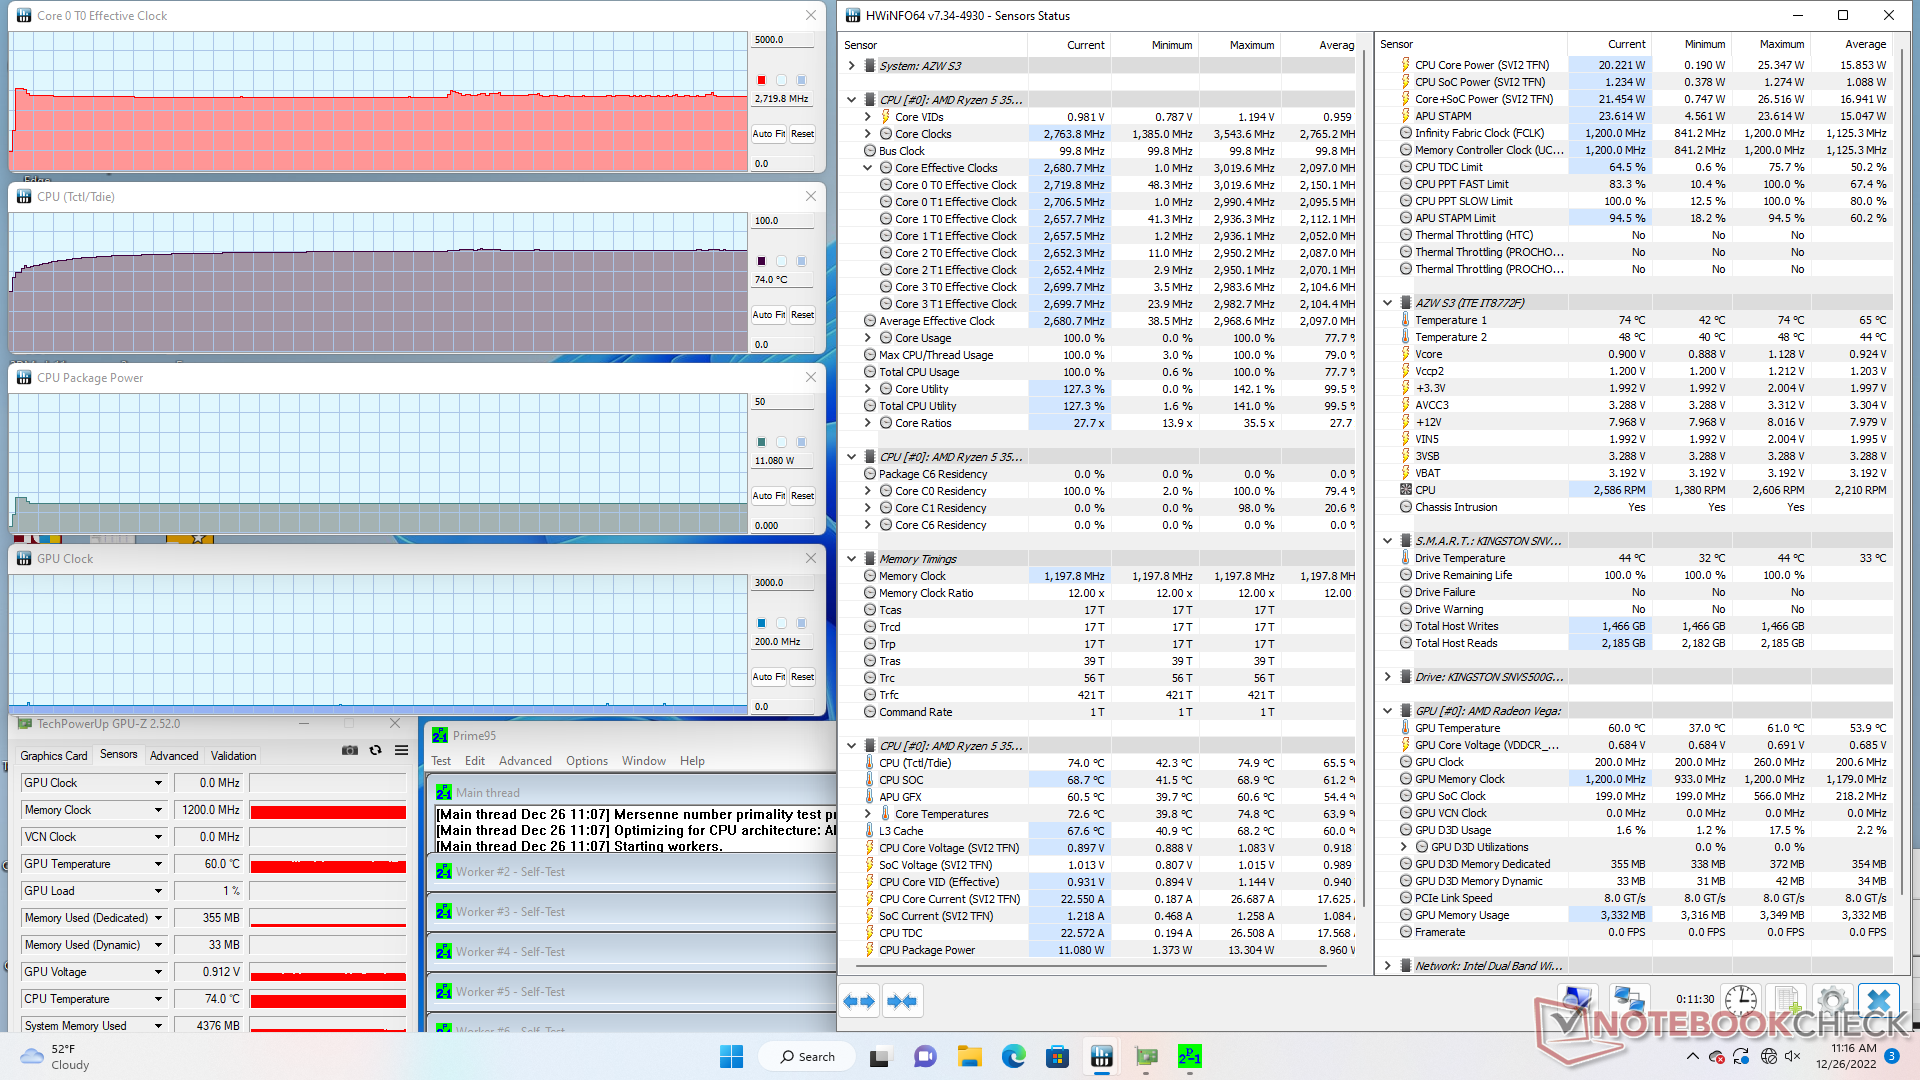
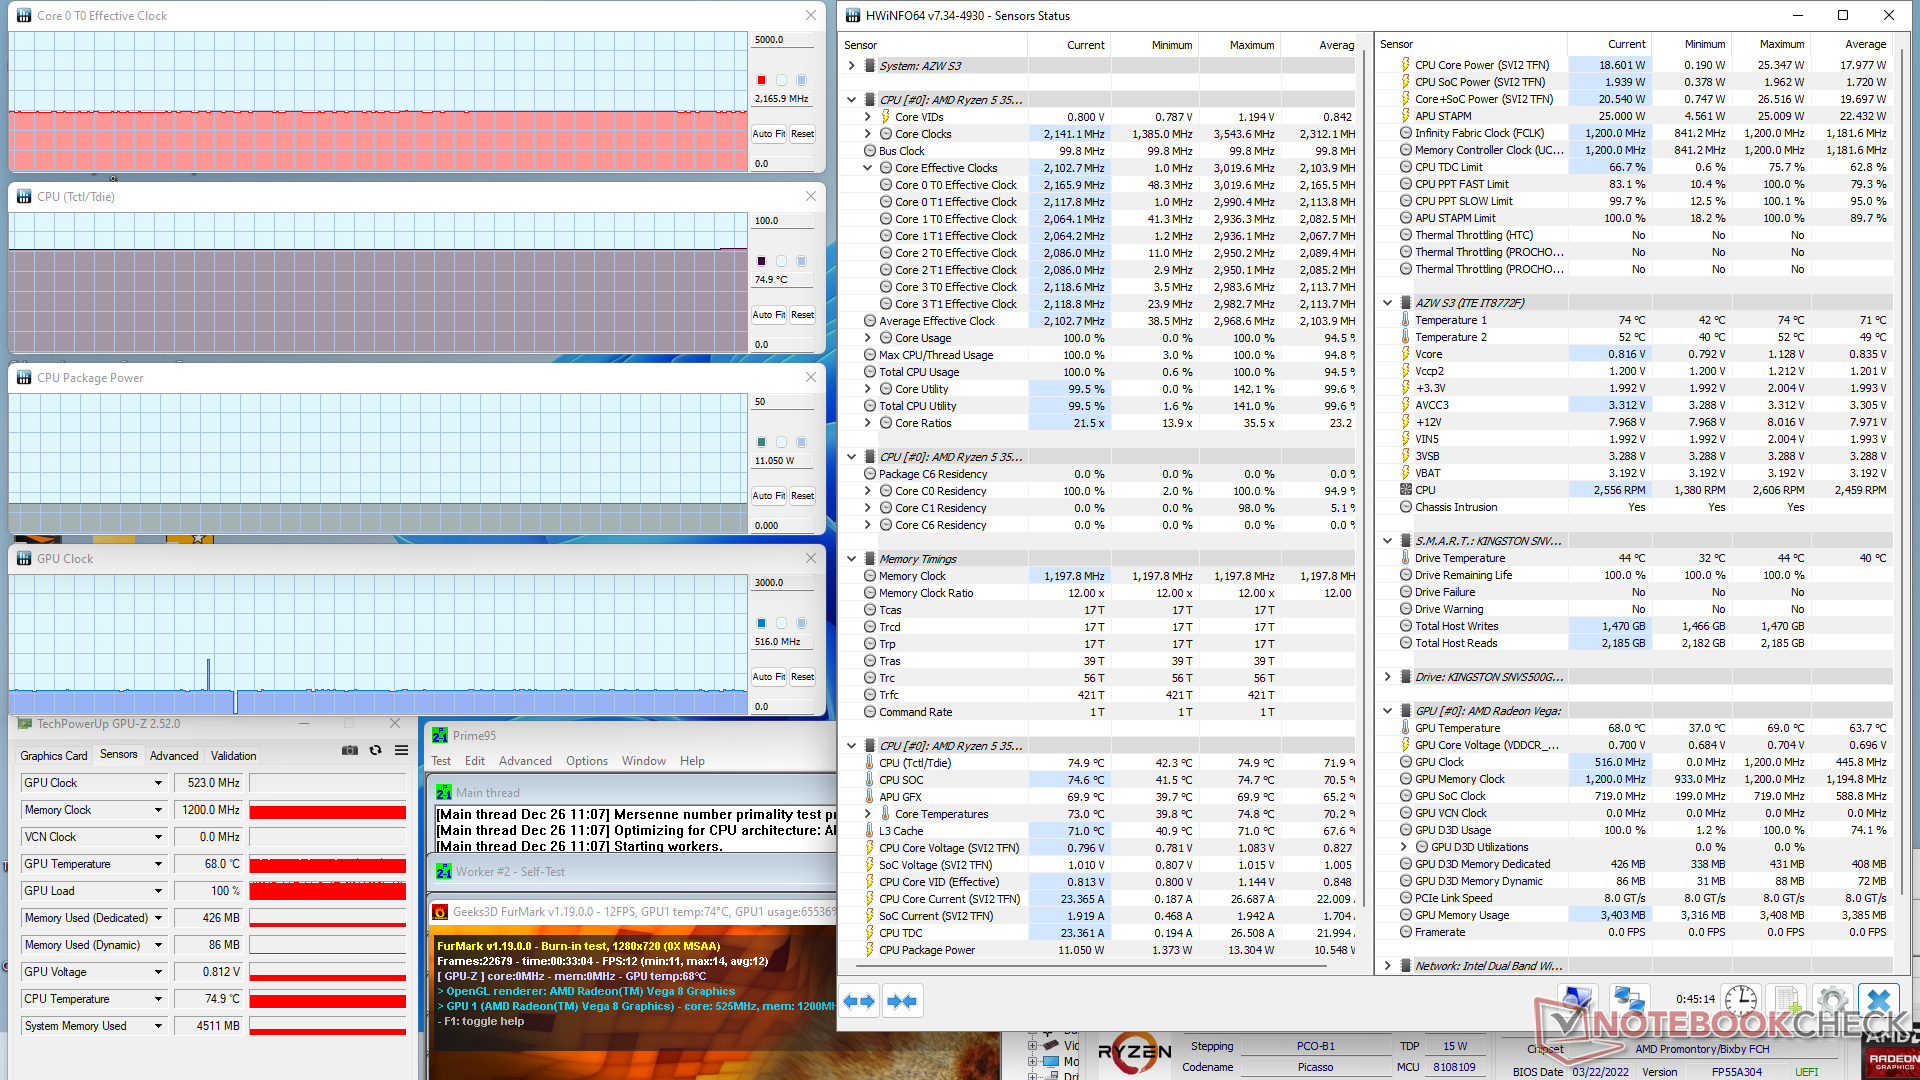
| ZegarCPU (GHz) | Zegar GPU (MHz) | Średnia temperatura CPU (°C) | |
| System w stanie bezczynności | -- | -- | 42 |
| Prime95 Stress | 2.7 | -- | 74 |
| Prime95 + FurMark Stress | 2.2 | 523 | 75 |
| Witcher 3 Stress | 2.0 | 688 | 70 |
Zarządzanie energią
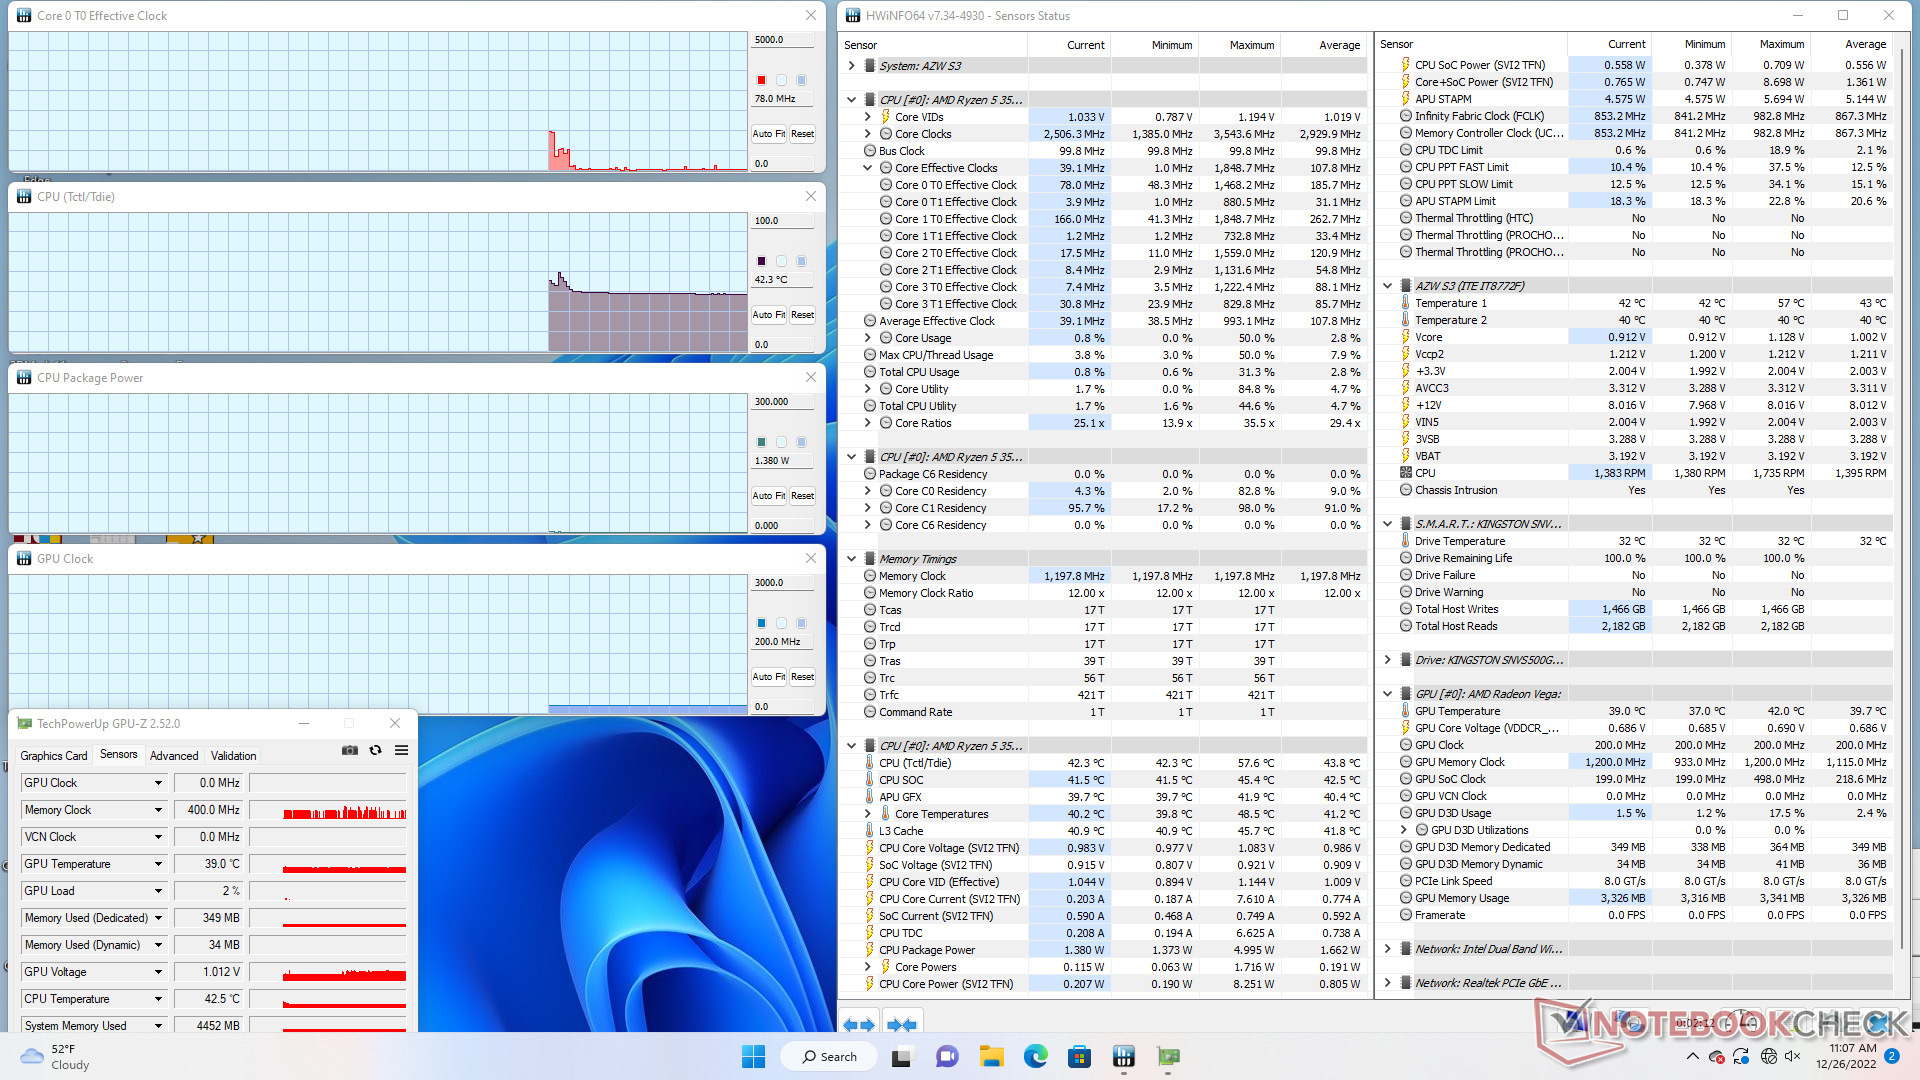
Pobór mocy
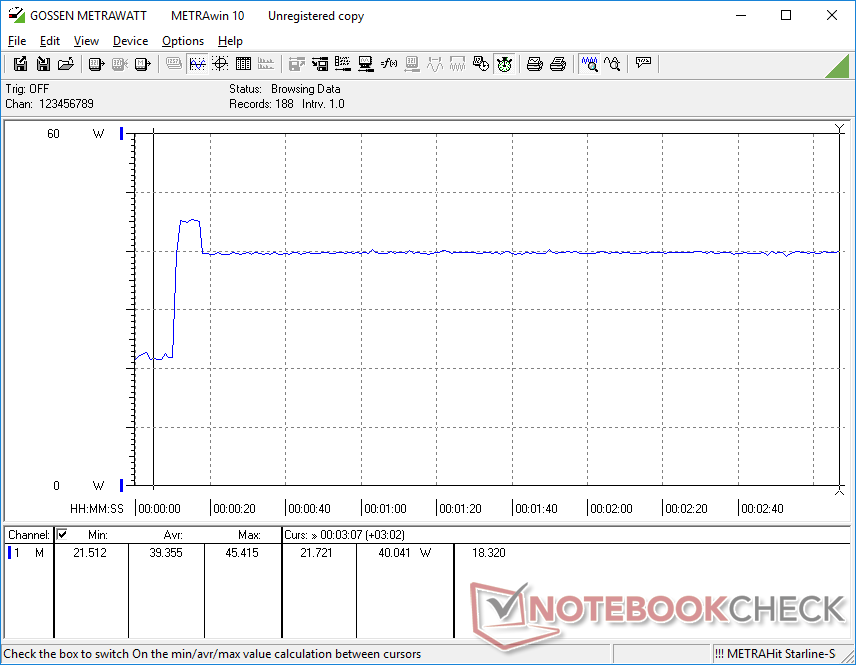
Pobór mocy na biegu jałowym jest stosunkowo wysoki i wynosi do 22 W, w porównaniu z połową tego, co można znaleźć w mini komputerach PC z serii U, takich jak Intel NUC11 czy Beelink SEi12, co nie jest niespodziewane, biorąc pod uwagę, że S3 jest napędzany przez starszy procesor z serii H. Sytuacja ulega odwróceniu przy większych obciążeniach, takich jak gry, pomimo wolniejszej wydajności graficznej zintegrowanego układu Radeon Vega 8. Ogólna słaba wydajność na wat nie jest zaskakująca, biorąc pod uwagę, że seria Zen+ ma już kilka lat.
| wyłączony / stan wstrzymania | |
| luz | |
| obciążenie |
|
Legenda:
min: | |
| Trigkey S3 R5 3550H, Vega 8, Kingston NV1 SNVS/500GCN, , x, | GMK NucBox 2 i5-8259U, Iris Plus Graphics 655, Netac S930E8/256GPN, , x, | Intel NUC11TNKi5 i5-1135G7, Iris Xe G7 80EUs, Transcend M.2 SSD 430S TS512GMTS430S, , x, | Beelink SEi12 Core i5-1235U i5-1235U, Iris Xe G7 80EUs, Kingston NV1 SNVS/500GCN, , x, | Beelink SEi11 Pro i5-11320H, Iris Xe G7 96EUs, Kingston NV1 SNVS/500GCN, , x, | Beelink SER Pro Ryzen 5 5600H R5 5600H, Vega 7, Kingston NV1 SNVS/500GCN, , x, | |
|---|---|---|---|---|---|---|
| Power Consumption | 32% | 2% | -35% | 3% | 21% | |
| Idle Minimum * (Watt) | 11.3 | 6.1 46% | 11.5 -2% | 15.8 -40% | 9.8 13% | 5.4 52% |
| Idle Average * (Watt) | 21.8 | 6.8 69% | 12.4 43% | 16.8 23% | 10.3 53% | 8.2 62% |
| Idle Maximum * (Watt) | 22.2 | 7.3 67% | 12.9 42% | 17 23% | 10.5 53% | 8.3 63% |
| Load Average * (Watt) | 39.7 | 46.3 -17% | 40.7 -3% | 54.4 -37% | 54.2 -37% | 49.3 -24% |
| Witcher 3 ultra * (Watt) | 37.5 | 43.9 -17% | 50.7 -35% | 53.1 -42% | 46.1 -23% | |
| Load Maximum * (Watt) | 48.9 | 50.7 -4% | 73.5 -50% | 119.1 -144% | 59 -21% | 50.2 -3% |
* ... im mniej tym lepiej
Power Consumption Witcher 3 / Stresstest
Power Consumption external Monitor
Za
Przeciw
Werdykt - Szybszy niż Celeron czy Atom Alternatywy
W przypadku mini PC w przedziale poniżej 300 USD, najczęściej wybieramy Intel Celeron lub Atom-powered ponieważ takie procesory są wolniejsze i tańsze niż zwykłe opcje Core. Szybkie procesory nie są naprawdę konieczne dla większości podstawowych celów HTPC, ale Celeron i Atom procesory są notorycznie zbyt wolne dla nawet minimalnych wysiłków wielozadaniowych. To jest, gdzie Trigkey S3 kroki w jak jego Ryzen 5 3550H CPU może zapewnić, że dodatkowe wydajności oomph bez konieczności podnoszenia cen.
Trigkey S3 oferuje wydajność zbliżoną do Core i3 w cenie mini PC z Atomem lub Celeronem.
Główną wadą jest to, że Ryzen 5 3550H jest starszym procesorem, a więc wymaga nieco więcej mocy do działania w wielu sytuacjach niż najnowsze opcje z serii U. Mimo to hałas wentylatora nie jest na szczęście głośniejszy, mimo wyższego poboru mocy.
Cena i dostępność
Trigkey S3 jest już wysyłany na Amazon w cenie 280 USD.
Price comparison

