Recenzja mini PC Beelink SEi12: Przewyższa pod tym względem Intel NUC 11

Beelink dostarcza szeroką gamę mini PC zaprojektowanych dla rynku budżetowego i średniego. Choć nie ma jeszcze modeli z dedykowanymi procesorami graficznymi, wiele z nich ma już preinstalowany system Windows 11, pamięć RAM i magazyny danych, które są wystarczające dla centrów medialnych, skrzynek do streamingu lub typowych codziennych zadań biurowych
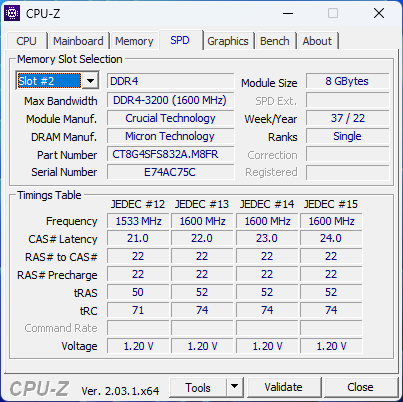
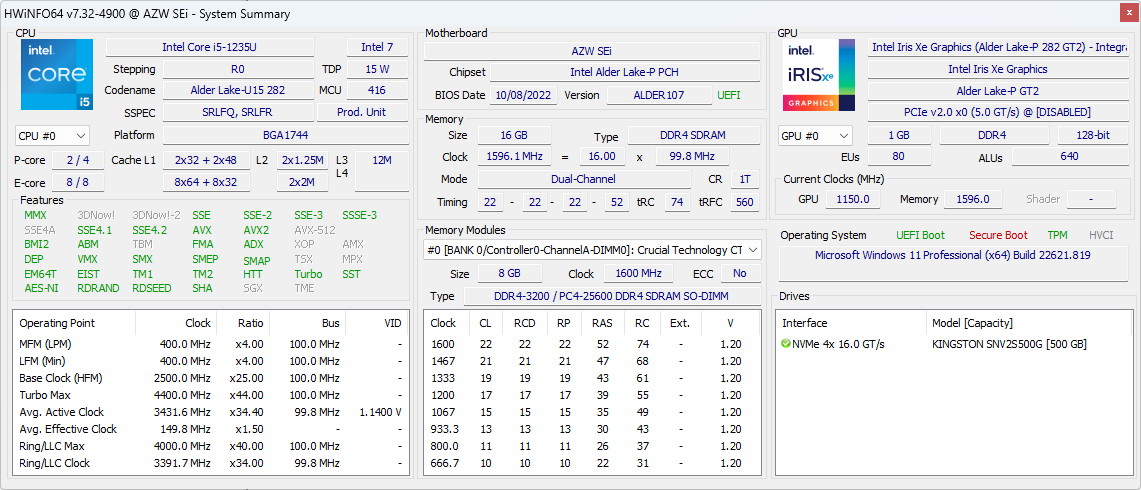
Najnowszy mini PC od Beelink to SEi12, który jest wyposażony w 12-generacyjny procesor Core i5-1235U, podczas gdy większość innych niedrogich alternatyw jest zazwyczaj wyposażona w starsze lub wolniejsze procesory, aby utrzymać niskie koszty. Nasz egzemplarz recenzencki można znaleźć w sieci za jedyne 460 USD
Konkurenci SEi12 to większość innych mini PC napędzanych przez procesory z serii U, takich jak wiele Modele Intel NUC, BMAX B5 Pro, lub Ace Magician AMR5
Więcej recenzji Beelink:
Potencjalni konkurenci w porównaniu
Ocena | Data | Model | Waga | Wysokość | Rozmiar | Rezolucja | Cena |
|---|---|---|---|---|---|---|---|
v (old) | 12/2022 | Beelink SEi12 Core i5-1235U i5-1235U, Iris Xe G7 80EUs | 465 g | 42 mm | x | ||
v (old) | Beelink SEi8 i3-8109U, Iris Plus Graphics 655 | 346 g | 41 mm | x | |||
v (old) | Beelink SER4 R7 4800U, Vega 8 | 494 g | 40 mm | x | |||
v (old) | Intel NUC11PAQi7 i7-1165G7, Iris Xe G7 96EUs | 647 g | 56 mm | x | |||
v (old) | 11/2022 | BMAX B5 Pro G7H8 i5-8260U, UHD Graphics 620 | 369 g | 43.2 mm | x | ||
v (old) | Intel Hades Canyon NUC8i7HVK i7-8809G, Vega M GH | 1.3 kg | 39 mm | x |
Sprawa
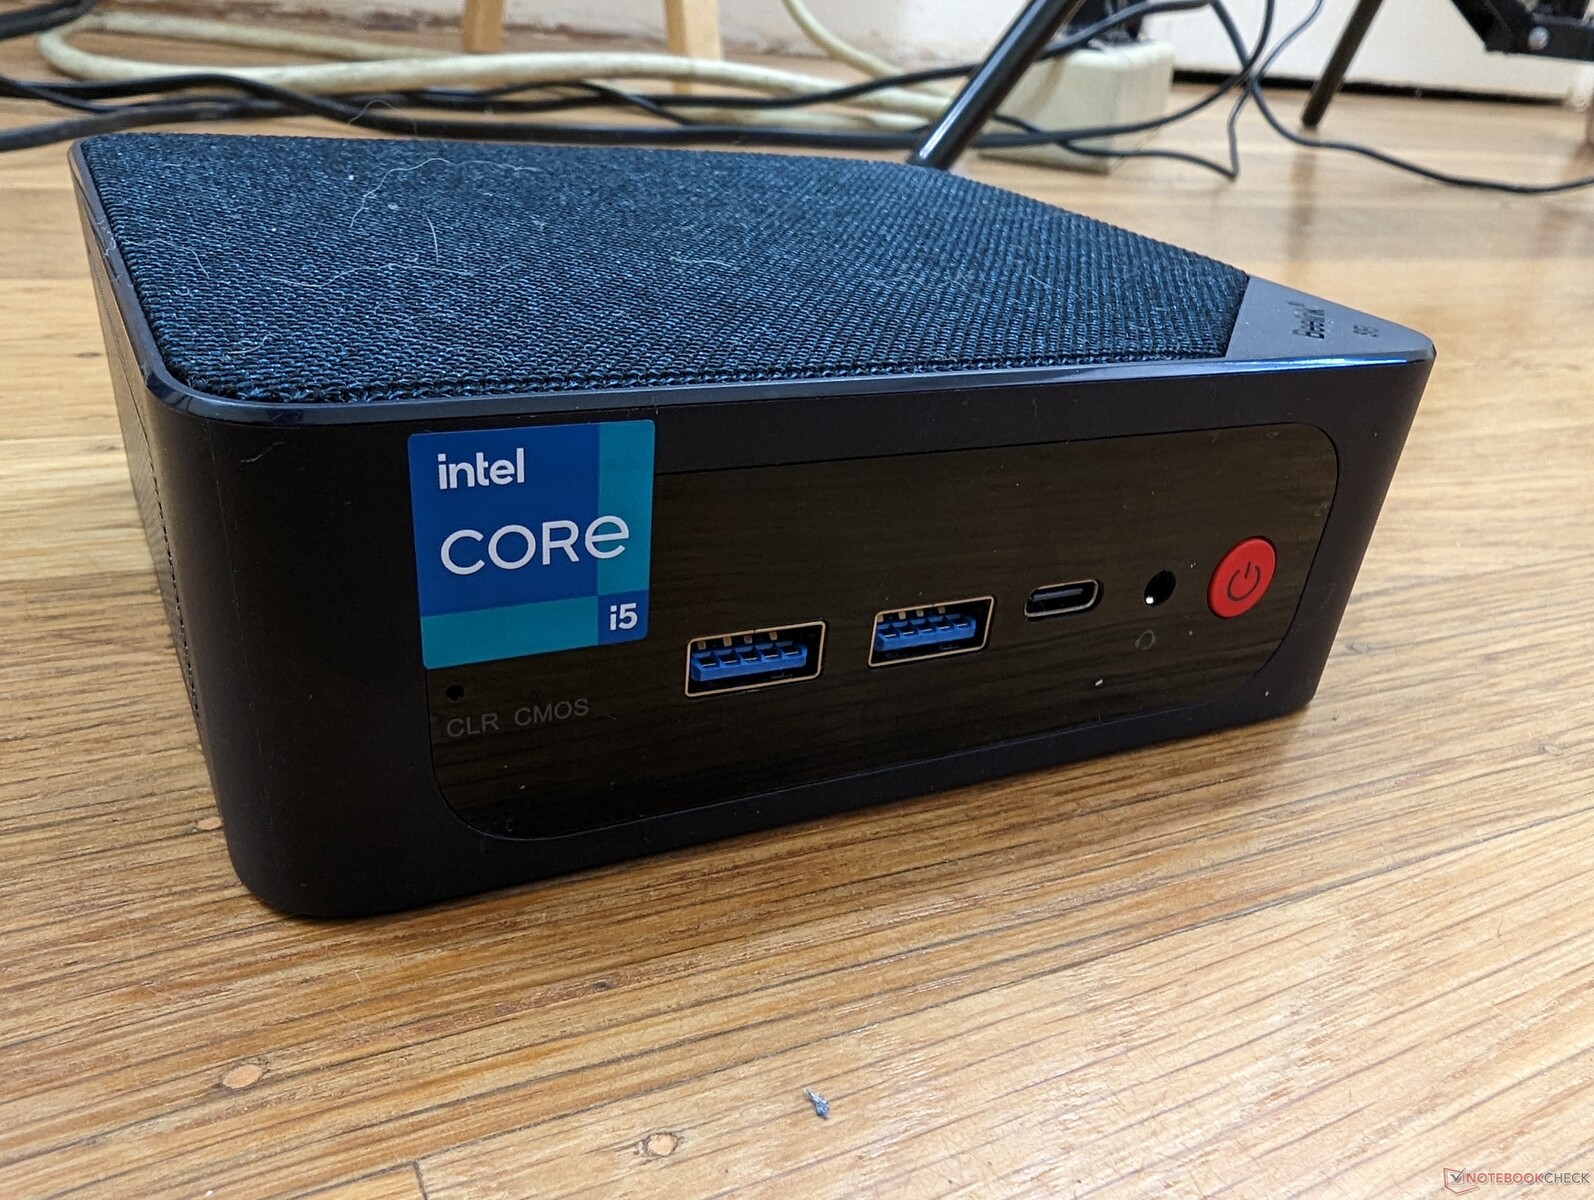
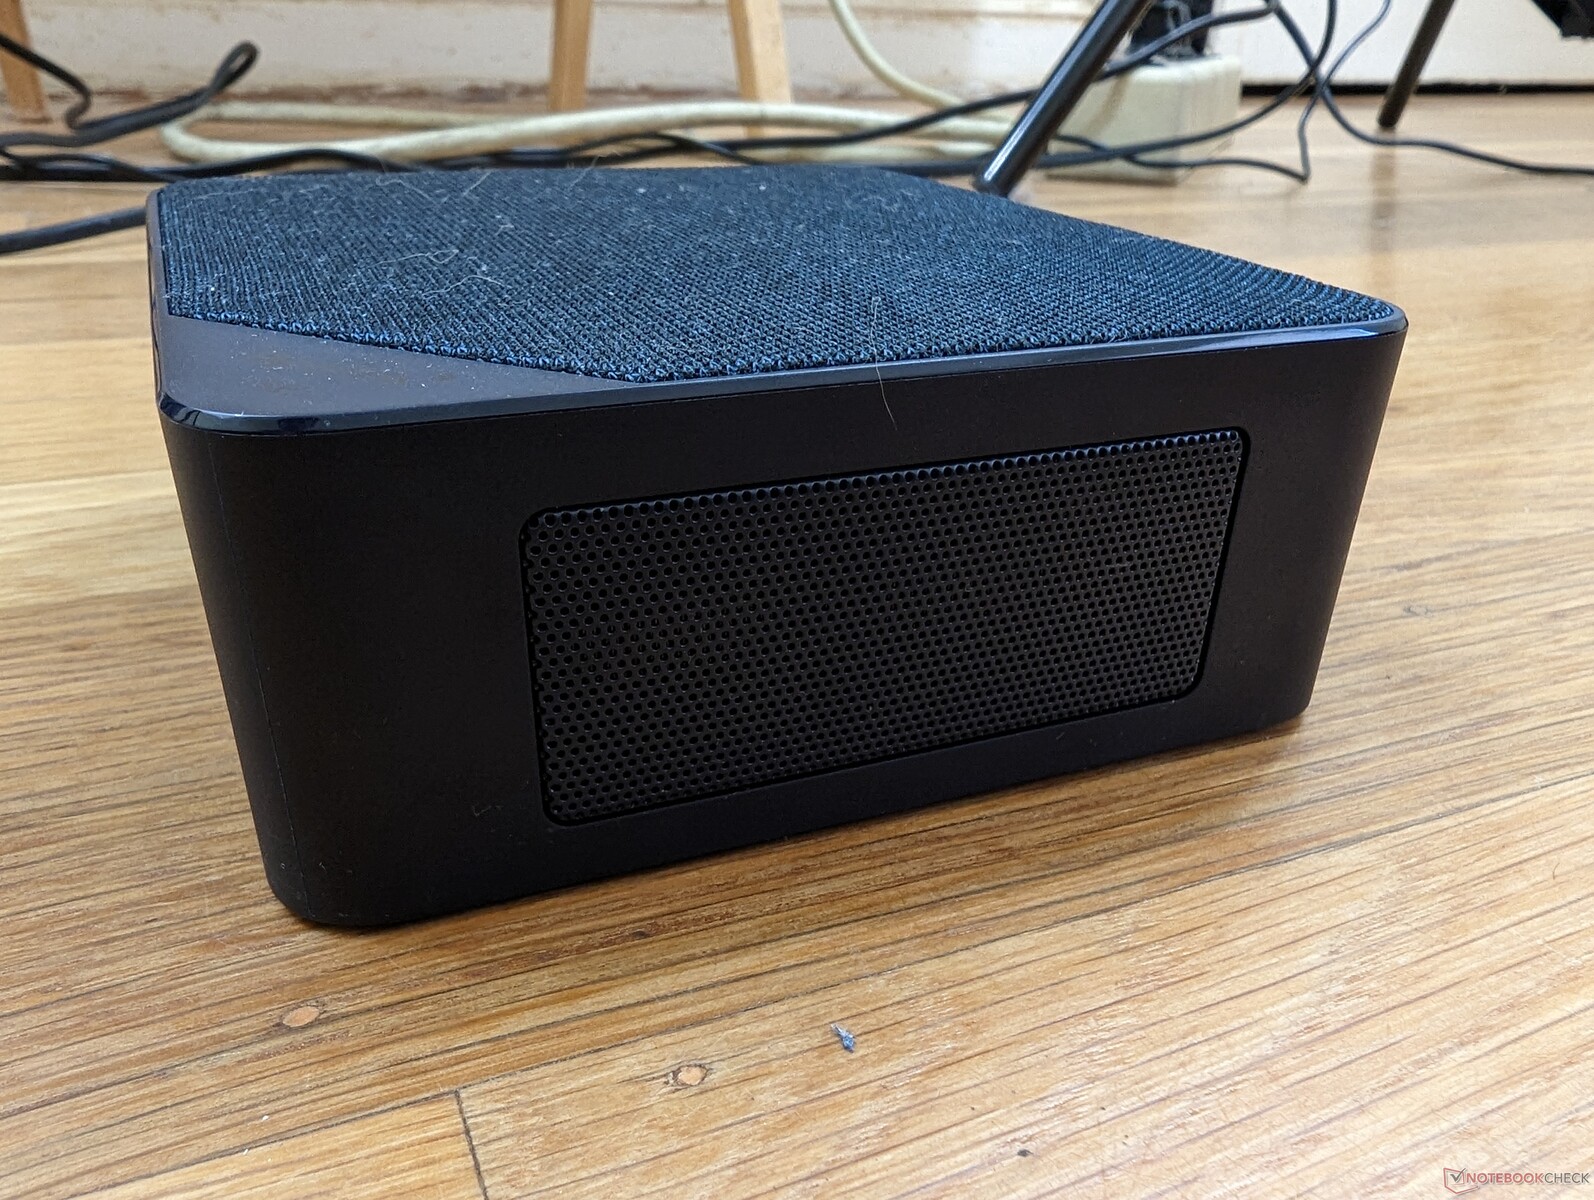
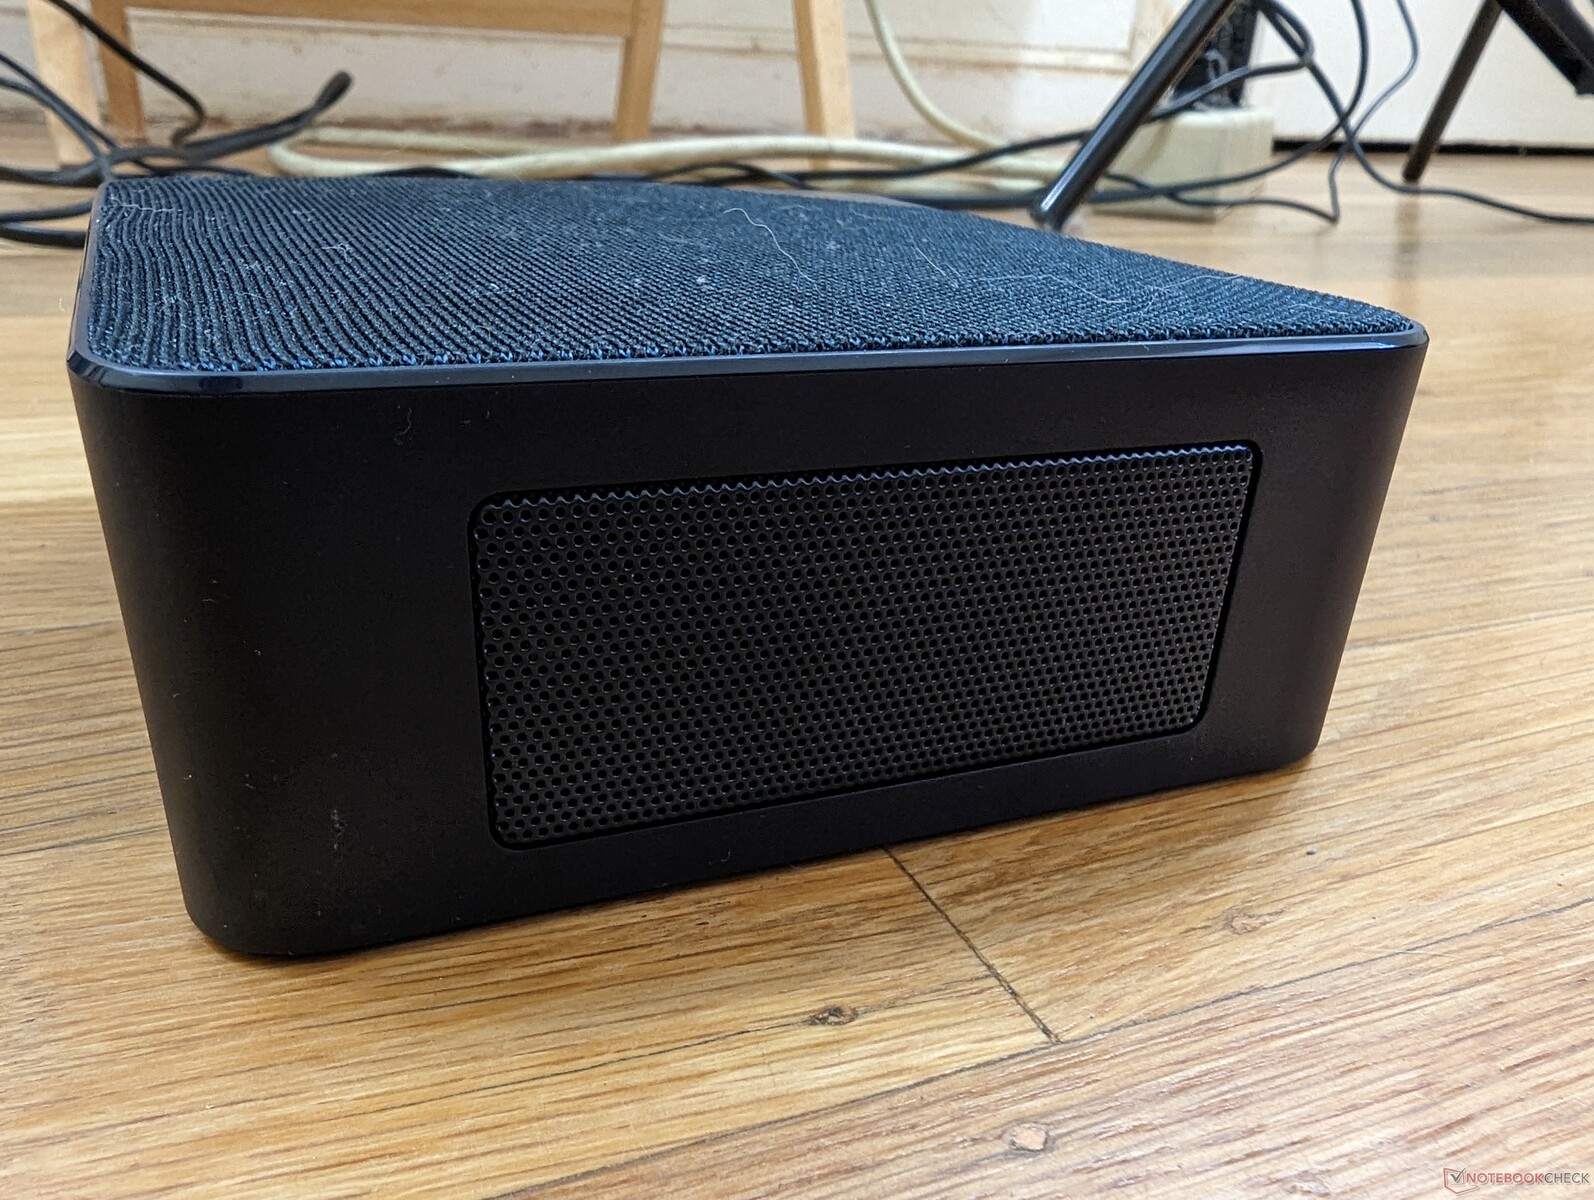
Obudowa jest tylko nieznacznie grubsza i cięższa od starszego SEi 11ale poza tym ma podobne materiały metalowe i cechy fizyczne. Najbardziej zauważalnym aspektem wizualnym SEi12 jest nowy polar lub tkanina na górnej powierzchni, podczas gdy starsze konstrukcje Beelink były po prostu gładkim plastikiem lub perforowaną plastikową siatką. Tkanina jest gładka w dotyku i sprawia wrażenie luksusowej, ale jej czyszczenie może być trudne, ponieważ włosy i kurz łatwiej się do niej przyczepiają.

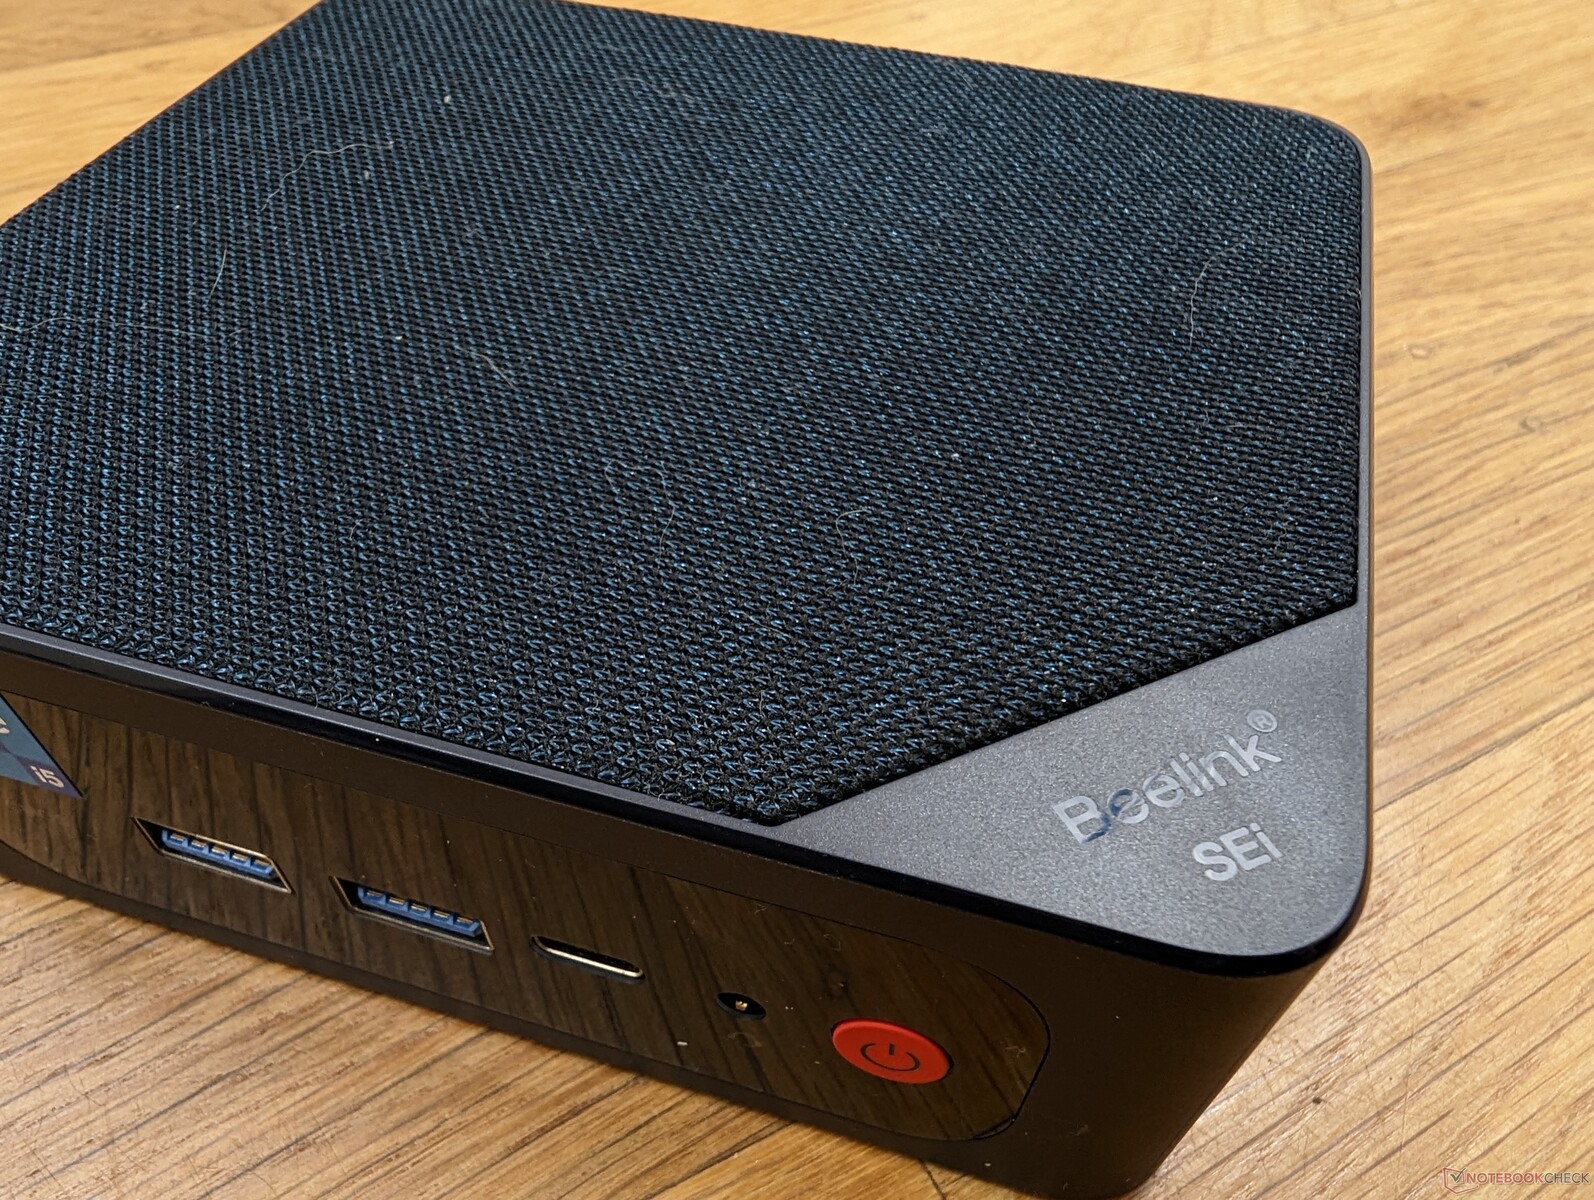
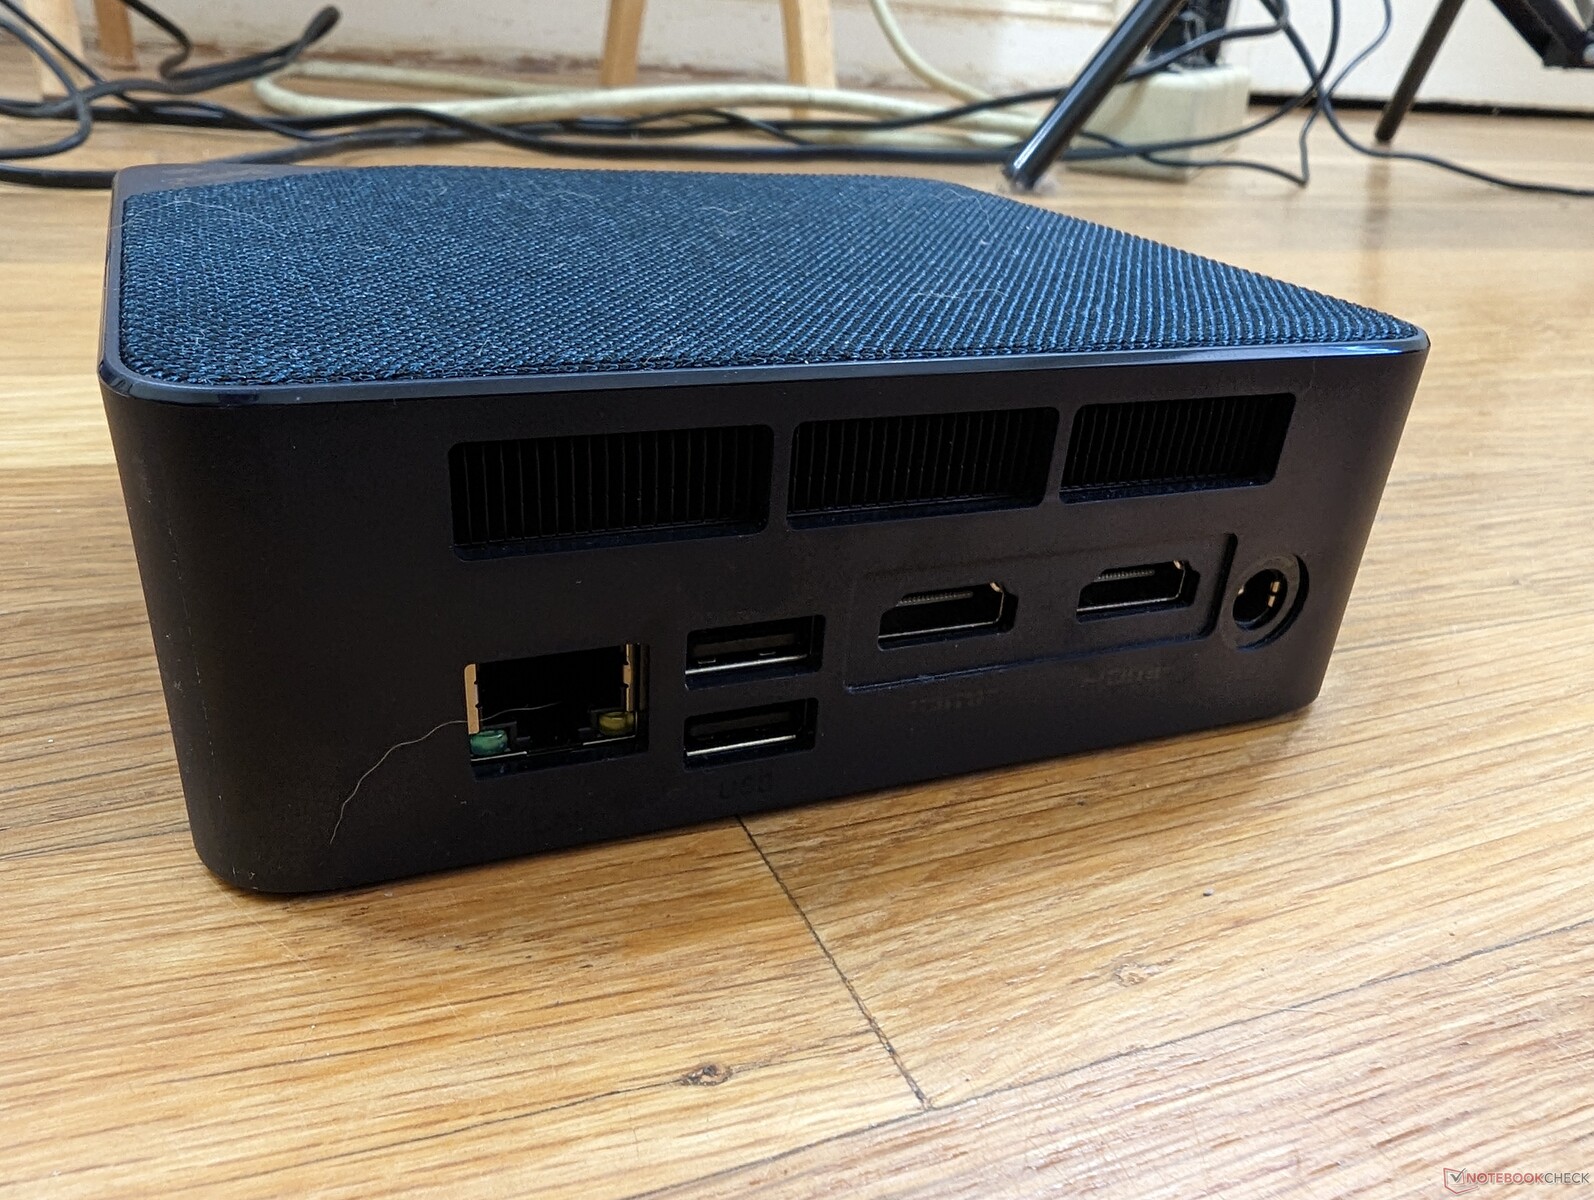
Łączność - brak Thunderbolt
Opcje portów są doskonałe - do wyboru jest pięć portów USB i dwa HDMI. Nie udało nam się jednak wyprowadzić żadnego sygnału wideo z portu USB-C, co oznacza, że DisplayPort-over-USB może nie być obsługiwany. System nie może być również zasilany przez USB-C.
Komunikacja
Intel AX201 standardowo zapewnia łączność Wi-Fi 6 i Bluetooth 5.2. Nie ma opcji Wi-Fi 6E, które mogłyby obniżyć koszty, ale użytkownicy mogą zainstalować własny moduł Wi-Fi 6E, jeśli chcą. Szybkość transferu danych jest mimo wszystko szybka i stabilna.
| Networking | |
| iperf3 transmit AX12 | |
| Beelink SER4 | |
| Intel NUC11PAQi7 | |
| Intel Hades Canyon NUC8i7HVK | |
| Beelink SEi8 | |
| iperf3 receive AX12 | |
| Beelink SER4 | |
| Intel NUC11PAQi7 | |
| Intel Hades Canyon NUC8i7HVK | |
| Beelink SEi8 | |
| iperf3 receive AXE11000 | |
| Beelink SEi12 Core i5-1235U | |
| BMAX B5 Pro G7H8 | |
| iperf3 transmit AXE11000 | |
| Beelink SEi12 Core i5-1235U | |
| BMAX B5 Pro G7H8 | |
Konserwacja
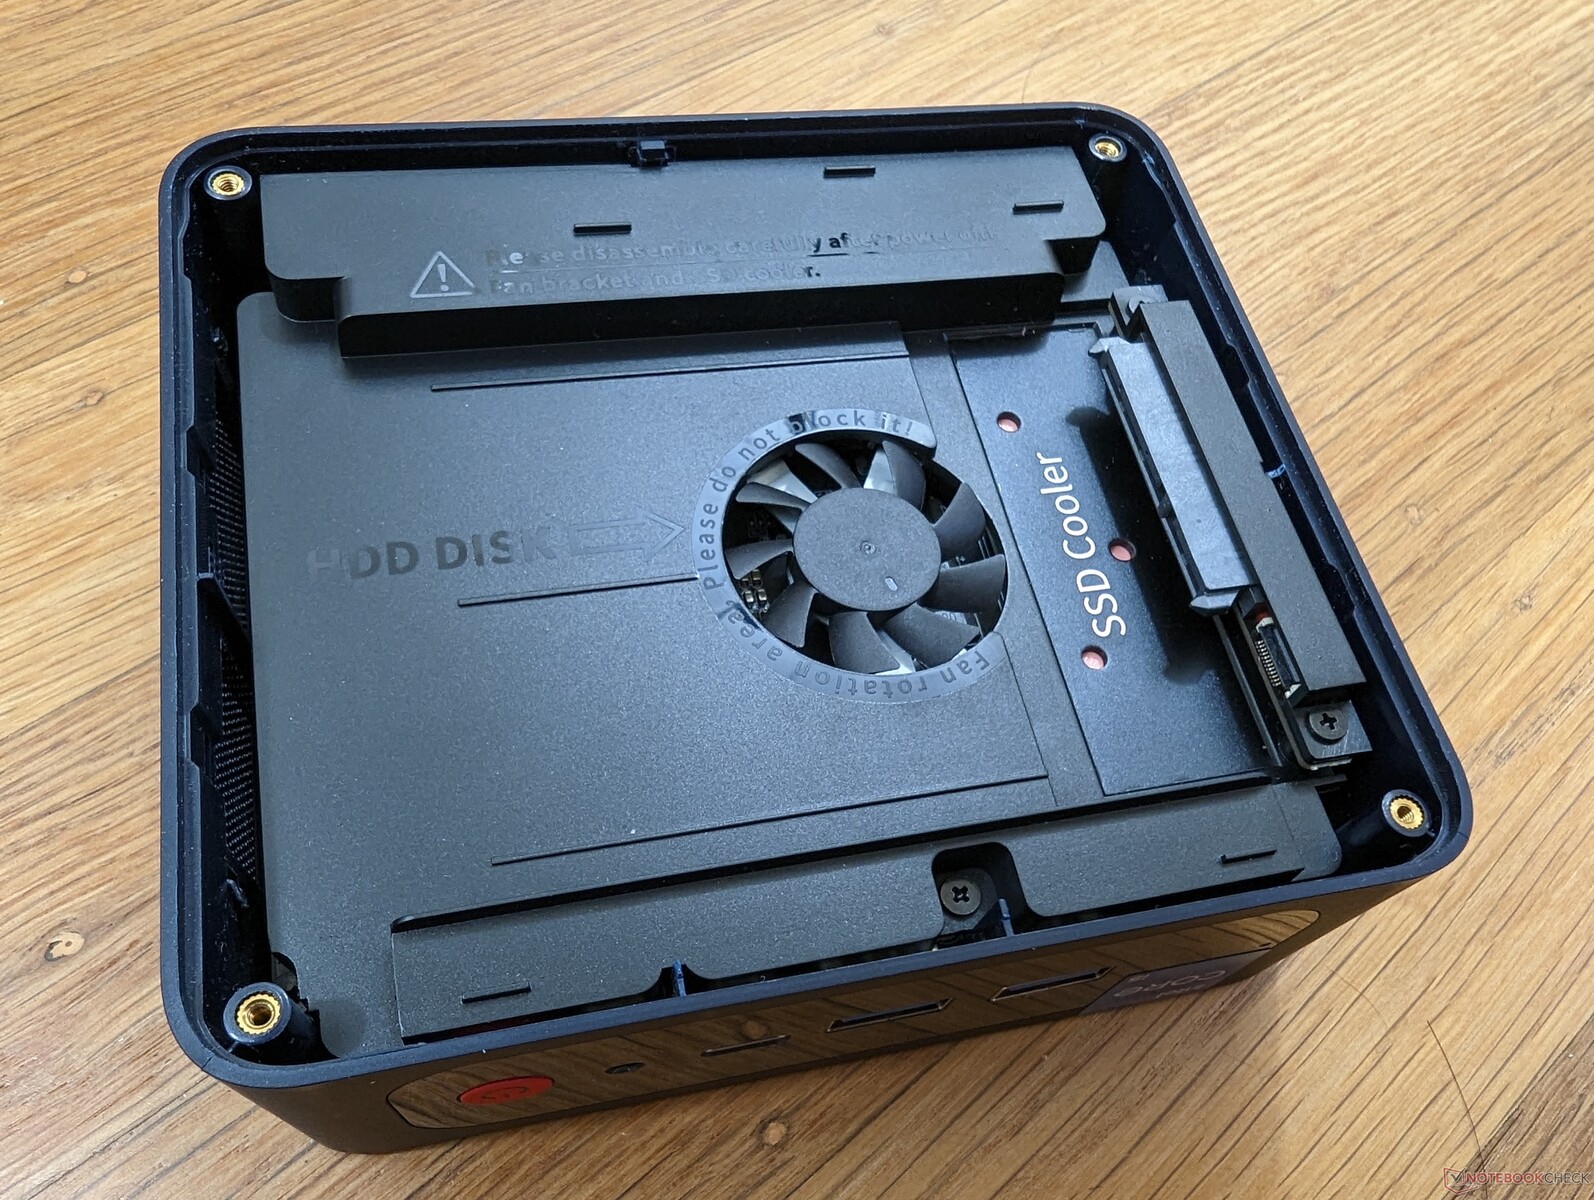
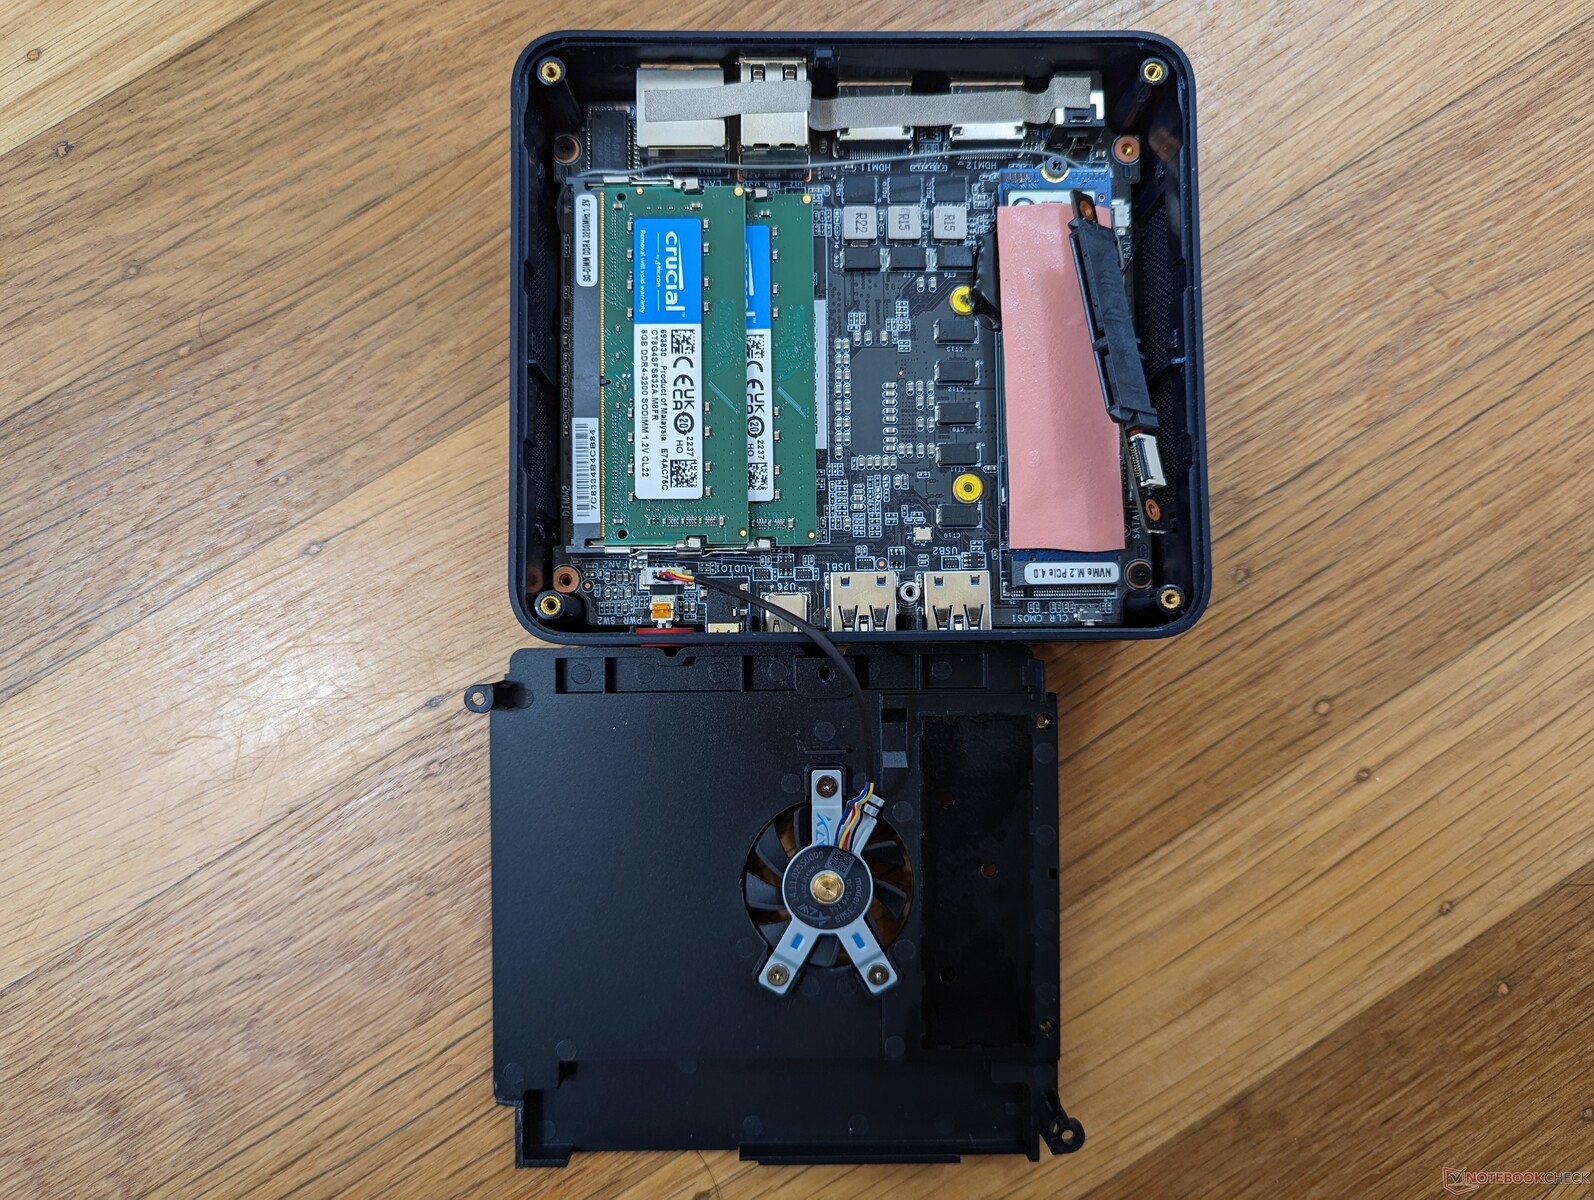
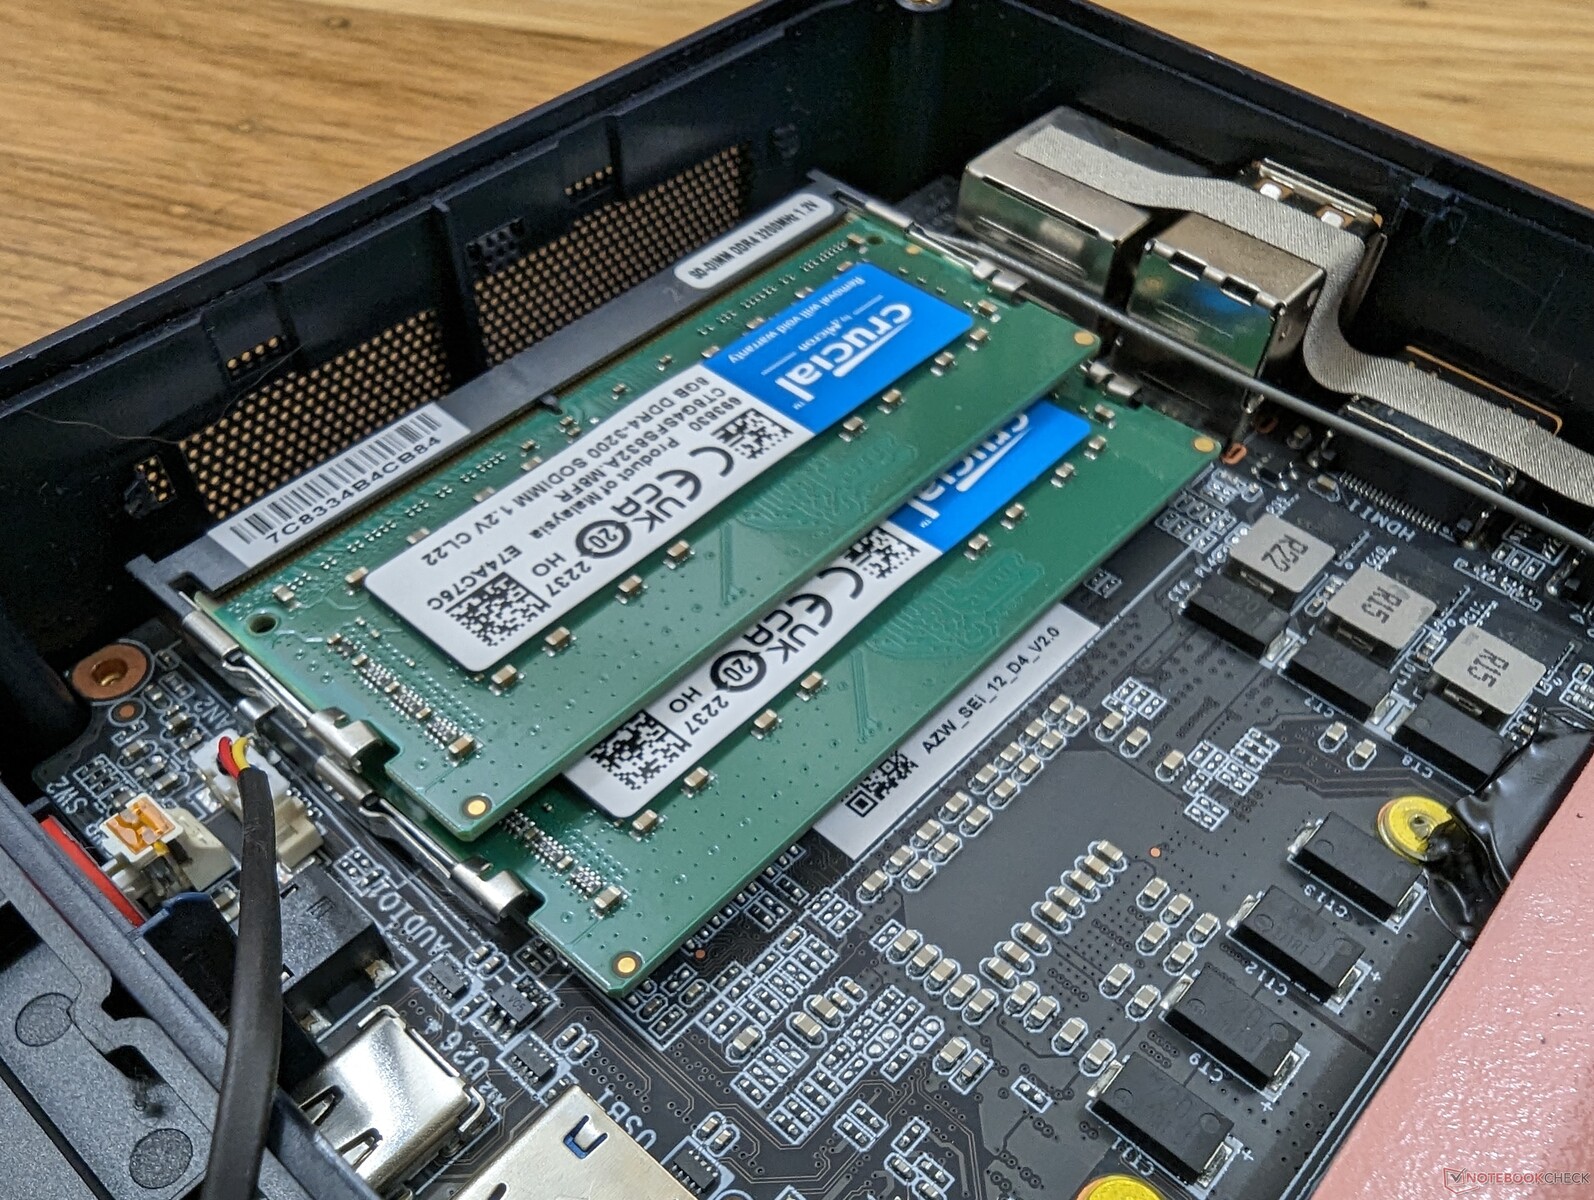
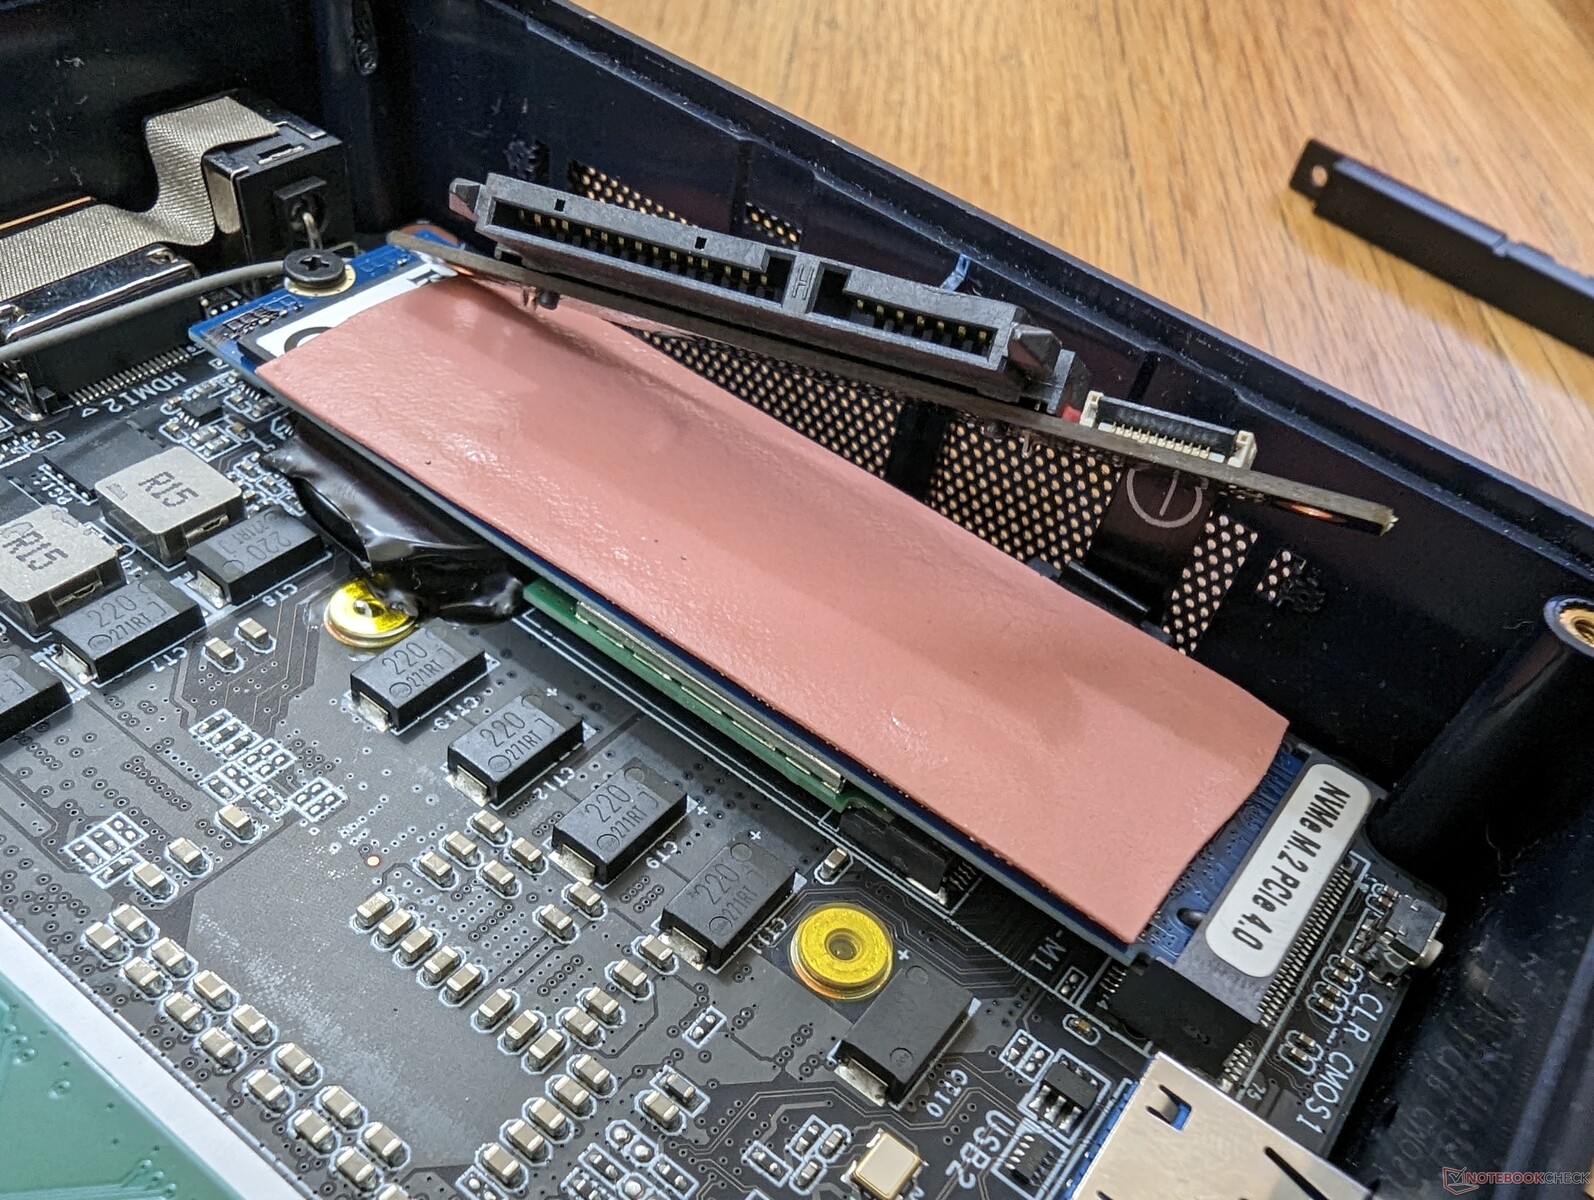
Serwisowanie wymaga nieco więcej pracy niż w przypadku większości innych mini PC. Zdejmując dolną płytę odsłaniamy jeden z wentylatorów, który musi być następnie usunięty, aby odsłonić pamięć RAM, dysk SSD M.2 i moduły WLAN M.2, jak widać na poniższych zdjęciach. Na szczęście wystarczy zwykły śrubokręt Philipsa do wszelkich modernizacji.
Akcesoria i gwarancja
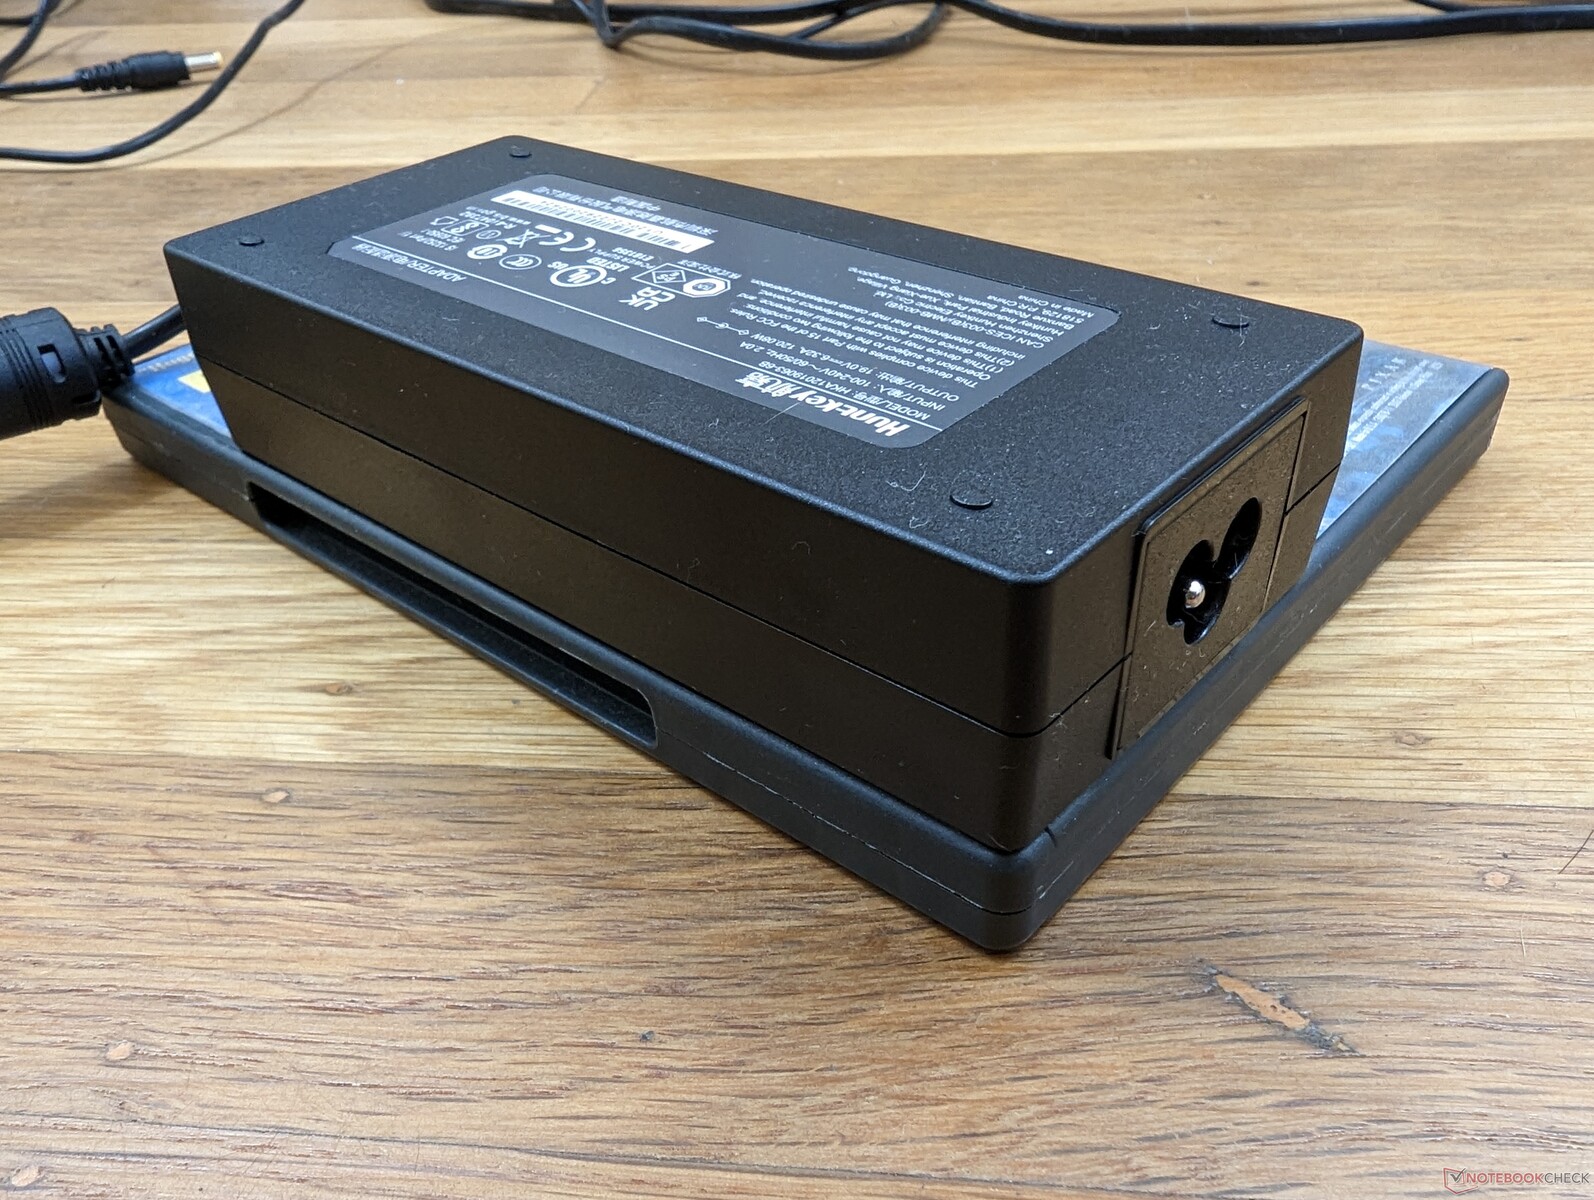
W pudełku detalicznym znajdują się dwa kable HDMI, uchwyt VESA ze śrubami, instrukcja obsługi oraz zasilacz sieciowy. Obowiązuje roczna ograniczona gwarancja producenta w porównaniu do trzech lat w przypadku zakupu Intel NUC.
Wydajność

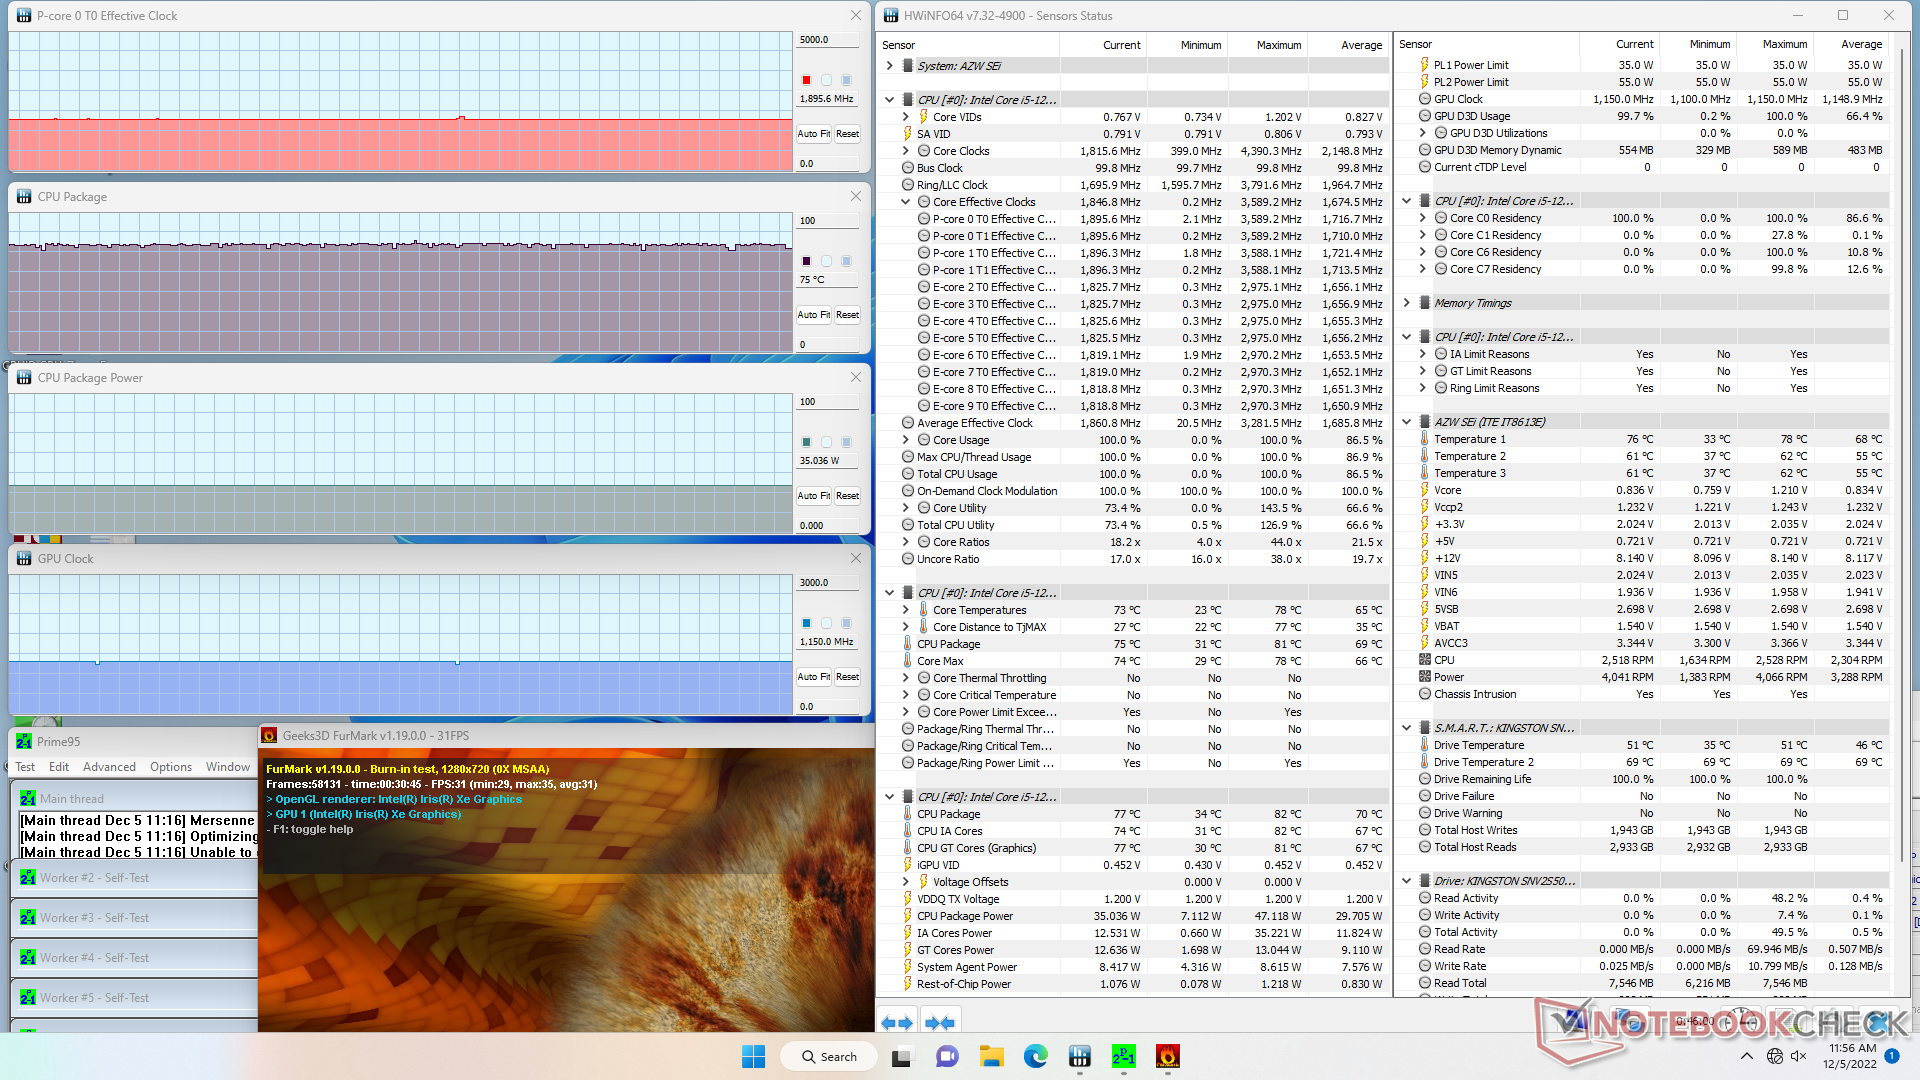
Warunki badania
Przed przeprowadzeniem poniższych testów wydajnościowych ustawiliśmy nasze urządzenie w trybie Performance. Producent nie dołącza żadnych preinstalowanych aplikacji ani oprogramowania typu "centrum sterowania" do żadnego ze swoich mini PC.
Procesor
Wydajność procesora jest doskonała, a wyniki są znacznie szybsze niż w przypadkuGateway Ultra Slim 14.1 lub VAIO FE 14.1 z tymi samymi procesorami 12. generacji Core i5-1235U CPU. Trwałość Turbo Boost mogłaby być jednak z pewnością lepsza, gdyż wyniki CineBench R15 xT spadają z czasem o około 14%, co pokazuje poniższy wykres. Wysokiego potencjału Turbo Boost i tak nie należy się spodziewać, biorąc pod uwagę, że jest to procesor z serii Core U
Ogólna wydajność wielowątkowa jest o około 15 procent szybsza od 11. generacji Core i7-1165G7 w droższym NUC11.
Cinebench R15 Multi Loop
Cinebench R23: Multi Core | Single Core
Cinebench R15: CPU Multi 64Bit | CPU Single 64Bit
Blender: v2.79 BMW27 CPU
7-Zip 18.03: 7z b 4 | 7z b 4 -mmt1
Geekbench 5.5: Multi-Core | Single-Core
HWBOT x265 Benchmark v2.2: 4k Preset
LibreOffice : 20 Documents To PDF
R Benchmark 2.5: Overall mean
| Cinebench R20 / CPU (Multi Core) | |
| Beelink SER4 | |
| Intel NUC Pro Chassis_i7_1265U | |
| HP Spectre x360 13.5 14t-ef000 | |
| Beelink SEi12 Core i5-1235U | |
| Przeciętny Intel Core i5-1235U (1783 - 3537, n=8) | |
| Intel NUC11PAQi7 | |
| Intel NUC Pro Chassis_i7_1185G7 | |
| Intel Hades Canyon NUC8i7HVK | |
| BMAX B5 Pro G7H8 | |
| Beelink SEi8 | |
| Cinebench R20 / CPU (Single Core) | |
| HP Spectre x360 13.5 14t-ef000 | |
| Intel NUC Pro Chassis_i7_1265U | |
| Beelink SEi12 Core i5-1235U | |
| Przeciętny Intel Core i5-1235U (566 - 651, n=8) | |
| Intel NUC11PAQi7 | |
| Intel NUC Pro Chassis_i7_1185G7 | |
| Beelink SER4 | |
| Intel Hades Canyon NUC8i7HVK | |
| BMAX B5 Pro G7H8 | |
| Beelink SEi8 | |
| Cinebench R23 / Multi Core | |
| Beelink SER4 | |
| Intel NUC Pro Chassis_i7_1265U | |
| HP Spectre x360 13.5 14t-ef000 | |
| Beelink SEi12 Core i5-1235U | |
| Intel NUC11PAQi7 | |
| Przeciętny Intel Core i5-1235U (2485 - 9208, n=8) | |
| Intel NUC Pro Chassis_i7_1185G7 | |
| BMAX B5 Pro G7H8 | |
| Beelink SEi8 | |
| Cinebench R23 / Single Core | |
| HP Spectre x360 13.5 14t-ef000 | |
| Intel NUC Pro Chassis_i7_1265U | |
| Beelink SEi12 Core i5-1235U | |
| Przeciętny Intel Core i5-1235U (1444 - 1698, n=8) | |
| Intel NUC Pro Chassis_i7_1185G7 | |
| Beelink SER4 | |
| Beelink SEi8 | |
| BMAX B5 Pro G7H8 | |
| Cinebench R15 / CPU Multi 64Bit | |
| Beelink SER4 | |
| Beelink SEi12 Core i5-1235U | |
| HP Spectre x360 13.5 14t-ef000 | |
| Intel NUC Pro Chassis_i7_1265U | |
| Przeciętny Intel Core i5-1235U (785 - 1587, n=8) | |
| Intel NUC11PAQi7 | |
| Intel Hades Canyon NUC8i7HVK | |
| Intel NUC Pro Chassis_i7_1185G7 | |
| BMAX B5 Pro G7H8 | |
| Beelink SEi8 | |
| Cinebench R15 / CPU Single 64Bit | |
| HP Spectre x360 13.5 14t-ef000 | |
| Intel NUC Pro Chassis_i7_1265U | |
| Beelink SEi12 Core i5-1235U | |
| Intel NUC11PAQi7 | |
| Intel NUC Pro Chassis_i7_1185G7 | |
| Przeciętny Intel Core i5-1235U (151.5 - 242, n=8) | |
| Beelink SER4 | |
| Intel Hades Canyon NUC8i7HVK | |
| BMAX B5 Pro G7H8 | |
| Beelink SEi8 | |
| Blender / v2.79 BMW27 CPU | |
| Beelink SEi8 | |
| BMAX B5 Pro G7H8 | |
| Intel NUC Pro Chassis_i7_1185G7 | |
| Intel Hades Canyon NUC8i7HVK | |
| Przeciętny Intel Core i5-1235U (366 - 662, n=8) | |
| Intel NUC11PAQi7 | |
| Beelink SEi12 Core i5-1235U | |
| HP Spectre x360 13.5 14t-ef000 | |
| Intel NUC Pro Chassis_i7_1265U | |
| Beelink SER4 | |
| 7-Zip 18.03 / 7z b 4 | |
| Beelink SER4 | |
| HP Spectre x360 13.5 14t-ef000 | |
| Intel NUC Pro Chassis_i7_1265U | |
| Beelink SEi12 Core i5-1235U | |
| Przeciętny Intel Core i5-1235U (20166 - 38643, n=8) | |
| Intel NUC11PAQi7 | |
| Intel NUC Pro Chassis_i7_1185G7 | |
| Intel Hades Canyon NUC8i7HVK | |
| BMAX B5 Pro G7H8 | |
| Beelink SEi8 | |
| 7-Zip 18.03 / 7z b 4 -mmt1 | |
| HP Spectre x360 13.5 14t-ef000 | |
| Intel NUC11PAQi7 | |
| Intel NUC Pro Chassis_i7_1265U | |
| Intel NUC Pro Chassis_i7_1185G7 | |
| Beelink SEi12 Core i5-1235U | |
| Przeciętny Intel Core i5-1235U (4371 - 5233, n=8) | |
| Beelink SER4 | |
| Intel Hades Canyon NUC8i7HVK | |
| BMAX B5 Pro G7H8 | |
| Beelink SEi8 | |
| Geekbench 5.5 / Multi-Core | |
| Intel NUC Pro Chassis_i7_1265U | |
| HP Spectre x360 13.5 14t-ef000 | |
| Beelink SEi12 Core i5-1235U | |
| Przeciętny Intel Core i5-1235U (5528 - 8571, n=10) | |
| Beelink SER4 | |
| Intel NUC Pro Chassis_i7_1185G7 | |
| Intel NUC11PAQi7 | |
| Beelink SEi8 | |
| BMAX B5 Pro G7H8 | |
| Geekbench 5.5 / Single-Core | |
| Intel NUC Pro Chassis_i7_1265U | |
| HP Spectre x360 13.5 14t-ef000 | |
| Beelink SEi12 Core i5-1235U | |
| Intel NUC11PAQi7 | |
| Przeciętny Intel Core i5-1235U (1426 - 1643, n=10) | |
| Intel NUC Pro Chassis_i7_1185G7 | |
| Beelink SER4 | |
| Beelink SEi8 | |
| BMAX B5 Pro G7H8 | |
| HWBOT x265 Benchmark v2.2 / 4k Preset | |
| Beelink SER4 | |
| HP Spectre x360 13.5 14t-ef000 | |
| Intel NUC Pro Chassis_i7_1265U | |
| Beelink SEi12 Core i5-1235U | |
| Intel NUC11PAQi7 | |
| Przeciętny Intel Core i5-1235U (4.99 - 9.43, n=8) | |
| Intel Hades Canyon NUC8i7HVK | |
| Intel NUC Pro Chassis_i7_1185G7 | |
| Beelink SEi8 | |
| BMAX B5 Pro G7H8 | |
| LibreOffice / 20 Documents To PDF | |
| BMAX B5 Pro G7H8 | |
| Beelink SEi8 | |
| Beelink SER4 | |
| Przeciętny Intel Core i5-1235U (42.4 - 65.5, n=8) | |
| Intel NUC Pro Chassis_i7_1265U | |
| Beelink SEi12 Core i5-1235U | |
| Intel NUC Pro Chassis_i7_1185G7 | |
| HP Spectre x360 13.5 14t-ef000 | |
| Intel NUC11PAQi7 | |
| R Benchmark 2.5 / Overall mean | |
| BMAX B5 Pro G7H8 | |
| Beelink SEi8 | |
| Intel NUC Pro Chassis_i7_1185G7 | |
| Beelink SER4 | |
| Intel NUC11PAQi7 | |
| Przeciętny Intel Core i5-1235U (0.4986 - 0.603, n=8) | |
| Beelink SEi12 Core i5-1235U | |
| Intel NUC Pro Chassis_i7_1265U | |
| HP Spectre x360 13.5 14t-ef000 | |
* ... im mniej tym lepiej
AIDA64: FP32 Ray-Trace | FPU Julia | CPU SHA3 | CPU Queen | FPU SinJulia | FPU Mandel | CPU AES | CPU ZLib | FP64 Ray-Trace | CPU PhotoWorxx
| Performance rating | |
| Beelink SER4 | |
| HP Spectre x360 13.5 14t-ef000 | |
| Intel NUC Pro Chassis_i7_1265U | |
| Beelink SEi12 Core i5-1235U | |
| Intel NUC Pro Chassis_i7_1185G7 | |
| Przeciętny Intel Core i5-1235U | |
| BMAX B5 Pro G7H8 | |
| Beelink SEi8 | |
| AIDA64 / FP32 Ray-Trace | |
| Beelink SER4 | |
| HP Spectre x360 13.5 14t-ef000 | |
| Intel NUC Pro Chassis_i7_1185G7 | |
| Intel NUC Pro Chassis_i7_1265U | |
| Beelink SEi12 Core i5-1235U | |
| Przeciętny Intel Core i5-1235U (3078 - 7457, n=8) | |
| BMAX B5 Pro G7H8 | |
| Beelink SEi8 | |
| AIDA64 / FPU Julia | |
| Beelink SER4 | |
| HP Spectre x360 13.5 14t-ef000 | |
| Intel NUC Pro Chassis_i7_1265U | |
| Beelink SEi12 Core i5-1235U | |
| Intel NUC Pro Chassis_i7_1185G7 | |
| Przeciętny Intel Core i5-1235U (15838 - 37760, n=8) | |
| BMAX B5 Pro G7H8 | |
| Beelink SEi8 | |
| AIDA64 / CPU SHA3 | |
| HP Spectre x360 13.5 14t-ef000 | |
| Intel NUC Pro Chassis_i7_1185G7 | |
| Intel NUC Pro Chassis_i7_1265U | |
| Beelink SEi12 Core i5-1235U | |
| Beelink SER4 | |
| Przeciętny Intel Core i5-1235U (978 - 2072, n=8) | |
| BMAX B5 Pro G7H8 | |
| Beelink SEi8 | |
| AIDA64 / CPU Queen | |
| Beelink SER4 | |
| Intel NUC Pro Chassis_i7_1265U | |
| HP Spectre x360 13.5 14t-ef000 | |
| Beelink SEi12 Core i5-1235U | |
| Przeciętny Intel Core i5-1235U (45680 - 62404, n=8) | |
| Intel NUC Pro Chassis_i7_1185G7 | |
| BMAX B5 Pro G7H8 | |
| Beelink SEi8 | |
| AIDA64 / FPU SinJulia | |
| Beelink SER4 | |
| Intel NUC Pro Chassis_i7_1265U | |
| Beelink SEi12 Core i5-1235U | |
| Intel NUC Pro Chassis_i7_1185G7 | |
| HP Spectre x360 13.5 14t-ef000 | |
| BMAX B5 Pro G7H8 | |
| Przeciętny Intel Core i5-1235U (3099 - 4644, n=8) | |
| Beelink SEi8 | |
| AIDA64 / FPU Mandel | |
| Beelink SER4 | |
| HP Spectre x360 13.5 14t-ef000 | |
| Intel NUC Pro Chassis_i7_1265U | |
| Intel NUC Pro Chassis_i7_1185G7 | |
| Beelink SEi12 Core i5-1235U | |
| Przeciętny Intel Core i5-1235U (8046 - 18819, n=8) | |
| BMAX B5 Pro G7H8 | |
| Beelink SEi8 | |
| AIDA64 / CPU AES | |
| Intel NUC Pro Chassis_i7_1185G7 | |
| HP Spectre x360 13.5 14t-ef000 | |
| Beelink SEi12 Core i5-1235U | |
| Beelink SER4 | |
| Intel NUC Pro Chassis_i7_1265U | |
| Przeciętny Intel Core i5-1235U (23386 - 67140, n=8) | |
| BMAX B5 Pro G7H8 | |
| Beelink SEi8 | |
| AIDA64 / CPU ZLib | |
| Beelink SEi12 Core i5-1235U | |
| Beelink SER4 | |
| Intel NUC Pro Chassis_i7_1265U | |
| HP Spectre x360 13.5 14t-ef000 | |
| Przeciętny Intel Core i5-1235U (329 - 633, n=8) | |
| Intel NUC Pro Chassis_i7_1185G7 | |
| BMAX B5 Pro G7H8 | |
| Beelink SEi8 | |
| AIDA64 / FP64 Ray-Trace | |
| Beelink SER4 | |
| HP Spectre x360 13.5 14t-ef000 | |
| Intel NUC Pro Chassis_i7_1265U | |
| Intel NUC Pro Chassis_i7_1185G7 | |
| Beelink SEi12 Core i5-1235U | |
| Przeciętny Intel Core i5-1235U (1670 - 3928, n=8) | |
| BMAX B5 Pro G7H8 | |
| Beelink SEi8 | |
| AIDA64 / CPU PhotoWorxx | |
| Intel NUC Pro Chassis_i7_1265U | |
| HP Spectre x360 13.5 14t-ef000 | |
| Intel NUC Pro Chassis_i7_1185G7 | |
| Przeciętny Intel Core i5-1235U (15933 - 41909, n=8) | |
| Beelink SEi12 Core i5-1235U | |
| Beelink SER4 | |
| BMAX B5 Pro G7H8 | |
| Beelink SEi8 | |
Wydajność systemu
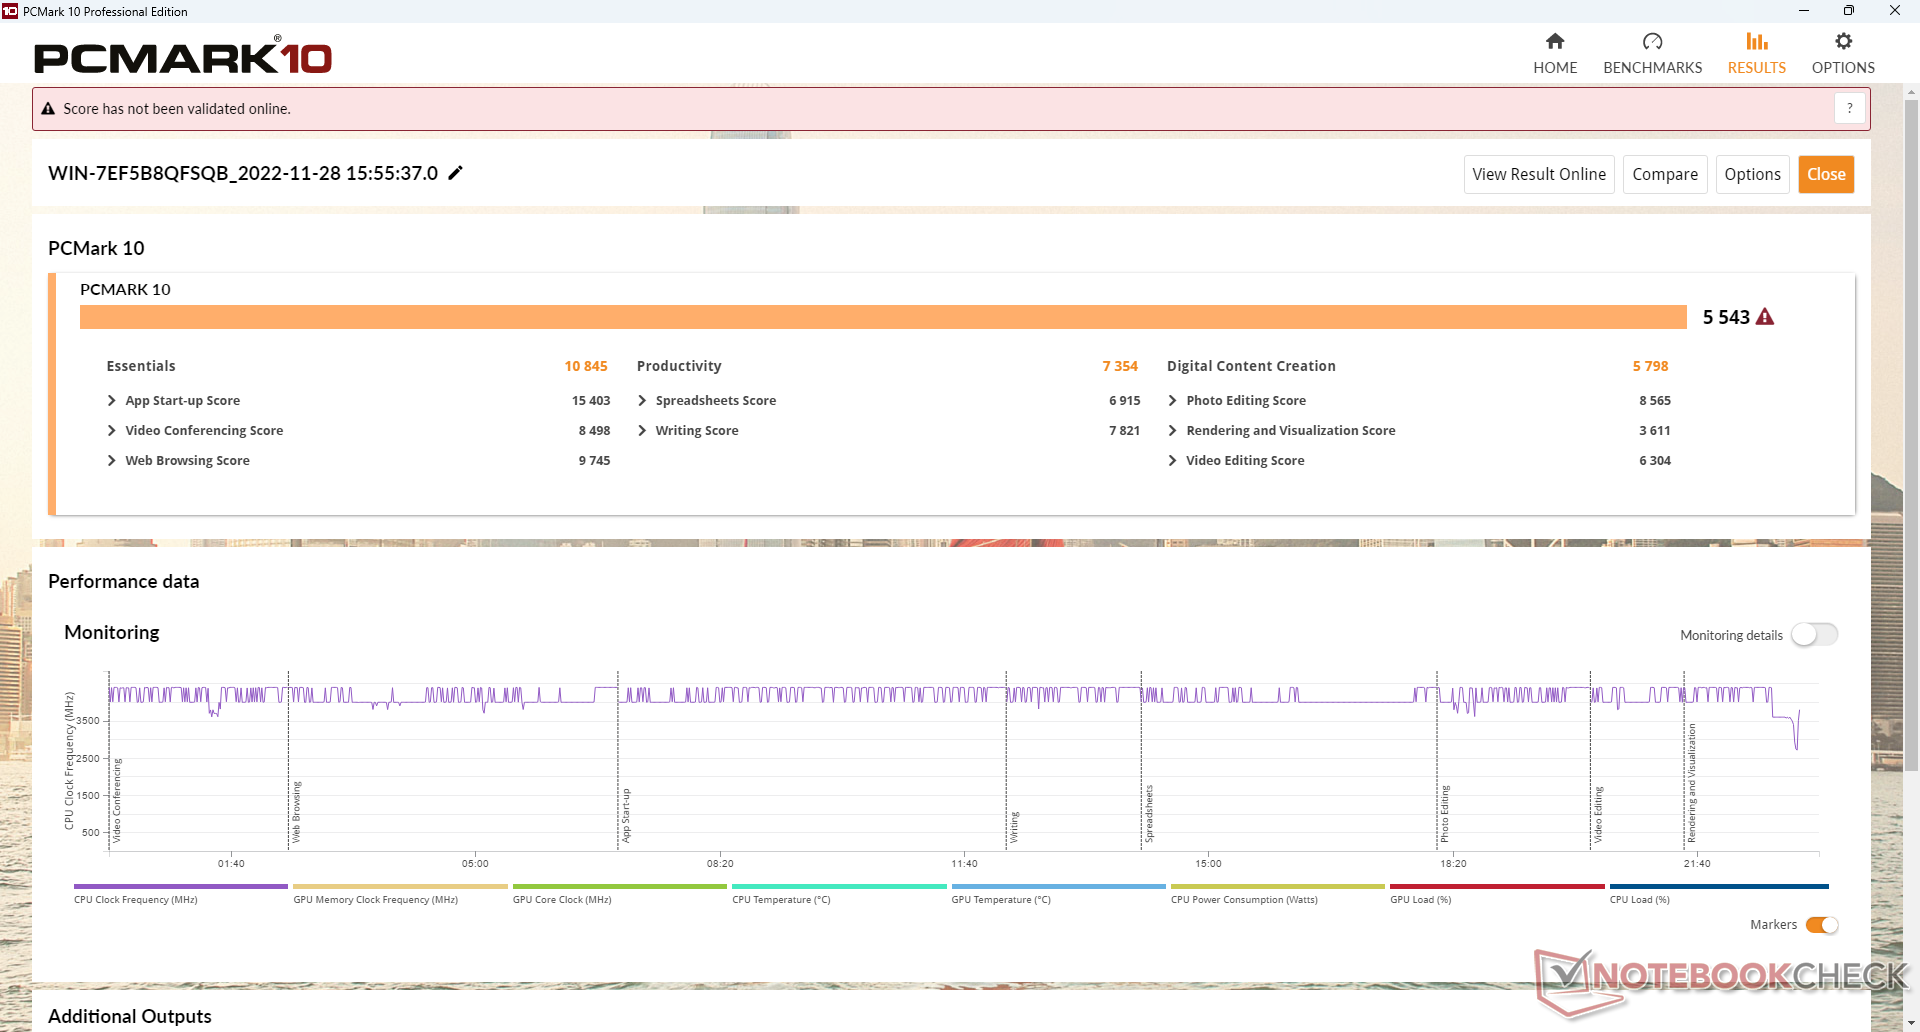
Wyniki PCMark są znacznie wyższe niż w przypadku starszego modeluBeelink SEi8 który wykorzystuje 8. gen. i3-8109U i wolniejszy dysk SSD Intel 660p.
CrossMark: Overall | Productivity | Creativity | Responsiveness
| PCMark 10 / Score | |
| Beelink SEi12 Core i5-1235U | |
| Intel Hades Canyon NUC8i7HVK | |
| Beelink SER4 | |
| Intel NUC11PAQi7 | |
| Przeciętny Intel Core i5-1235U, Intel Iris Xe Graphics G7 80EUs (4528 - 5543, n=8) | |
| BMAX B5 Pro G7H8 | |
| Beelink SEi8 | |
| PCMark 10 / Essentials | |
| Beelink SEi12 Core i5-1235U | |
| Intel NUC11PAQi7 | |
| Przeciętny Intel Core i5-1235U, Intel Iris Xe Graphics G7 80EUs (9143 - 11273, n=8) | |
| Beelink SER4 | |
| Intel Hades Canyon NUC8i7HVK | |
| BMAX B5 Pro G7H8 | |
| Beelink SEi8 | |
| PCMark 10 / Productivity | |
| Beelink SER4 | |
| Intel Hades Canyon NUC8i7HVK | |
| Beelink SEi12 Core i5-1235U | |
| Intel NUC11PAQi7 | |
| Przeciętny Intel Core i5-1235U, Intel Iris Xe Graphics G7 80EUs (6440 - 7354, n=8) | |
| BMAX B5 Pro G7H8 | |
| Beelink SEi8 | |
| PCMark 10 / Digital Content Creation | |
| Beelink SEi12 Core i5-1235U | |
| Intel Hades Canyon NUC8i7HVK | |
| Beelink SER4 | |
| Przeciętny Intel Core i5-1235U, Intel Iris Xe Graphics G7 80EUs (4220 - 5839, n=8) | |
| Intel NUC11PAQi7 | |
| BMAX B5 Pro G7H8 | |
| Beelink SEi8 | |
| CrossMark / Overall | |
| Beelink SEi12 Core i5-1235U | |
| Przeciętny Intel Core i5-1235U, Intel Iris Xe Graphics G7 80EUs (983 - 1644, n=8) | |
| BMAX B5 Pro G7H8 | |
| CrossMark / Productivity | |
| Beelink SEi12 Core i5-1235U | |
| Przeciętny Intel Core i5-1235U, Intel Iris Xe Graphics G7 80EUs (1026 - 1676, n=8) | |
| BMAX B5 Pro G7H8 | |
| CrossMark / Creativity | |
| Beelink SEi12 Core i5-1235U | |
| Przeciętny Intel Core i5-1235U, Intel Iris Xe Graphics G7 80EUs (1032 - 1618, n=8) | |
| BMAX B5 Pro G7H8 | |
| CrossMark / Responsiveness | |
| Beelink SEi12 Core i5-1235U | |
| Przeciętny Intel Core i5-1235U, Intel Iris Xe Graphics G7 80EUs (746 - 1867, n=8) | |
| BMAX B5 Pro G7H8 | |
| PCMark 10 Score | 5543 pkt. | |
Pomoc | ||
| AIDA64 / Memory Copy | |
| Przeciętny Intel Core i5-1235U (24653 - 61921, n=8) | |
| Beelink SEi12 Core i5-1235U | |
| Beelink SER4 | |
| Beelink SEi8 | |
| BMAX B5 Pro G7H8 | |
| AIDA64 / Memory Read | |
| Przeciętny Intel Core i5-1235U (24441 - 66108, n=8) | |
| Beelink SEi12 Core i5-1235U | |
| Beelink SER4 | |
| BMAX B5 Pro G7H8 | |
| Beelink SEi8 | |
| AIDA64 / Memory Write | |
| Przeciętny Intel Core i5-1235U (25156 - 75808, n=8) | |
| Beelink SEi12 Core i5-1235U | |
| Beelink SER4 | |
| BMAX B5 Pro G7H8 | |
| Beelink SEi8 | |
| AIDA64 / Memory Latency | |
| Beelink SER4 | |
| BMAX B5 Pro G7H8 | |
| Beelink SEi12 Core i5-1235U | |
| Przeciętny Intel Core i5-1235U (76.3 - 119, n=8) | |
| Beelink SEi8 | |
* ... im mniej tym lepiej
Opóźnienie DPC
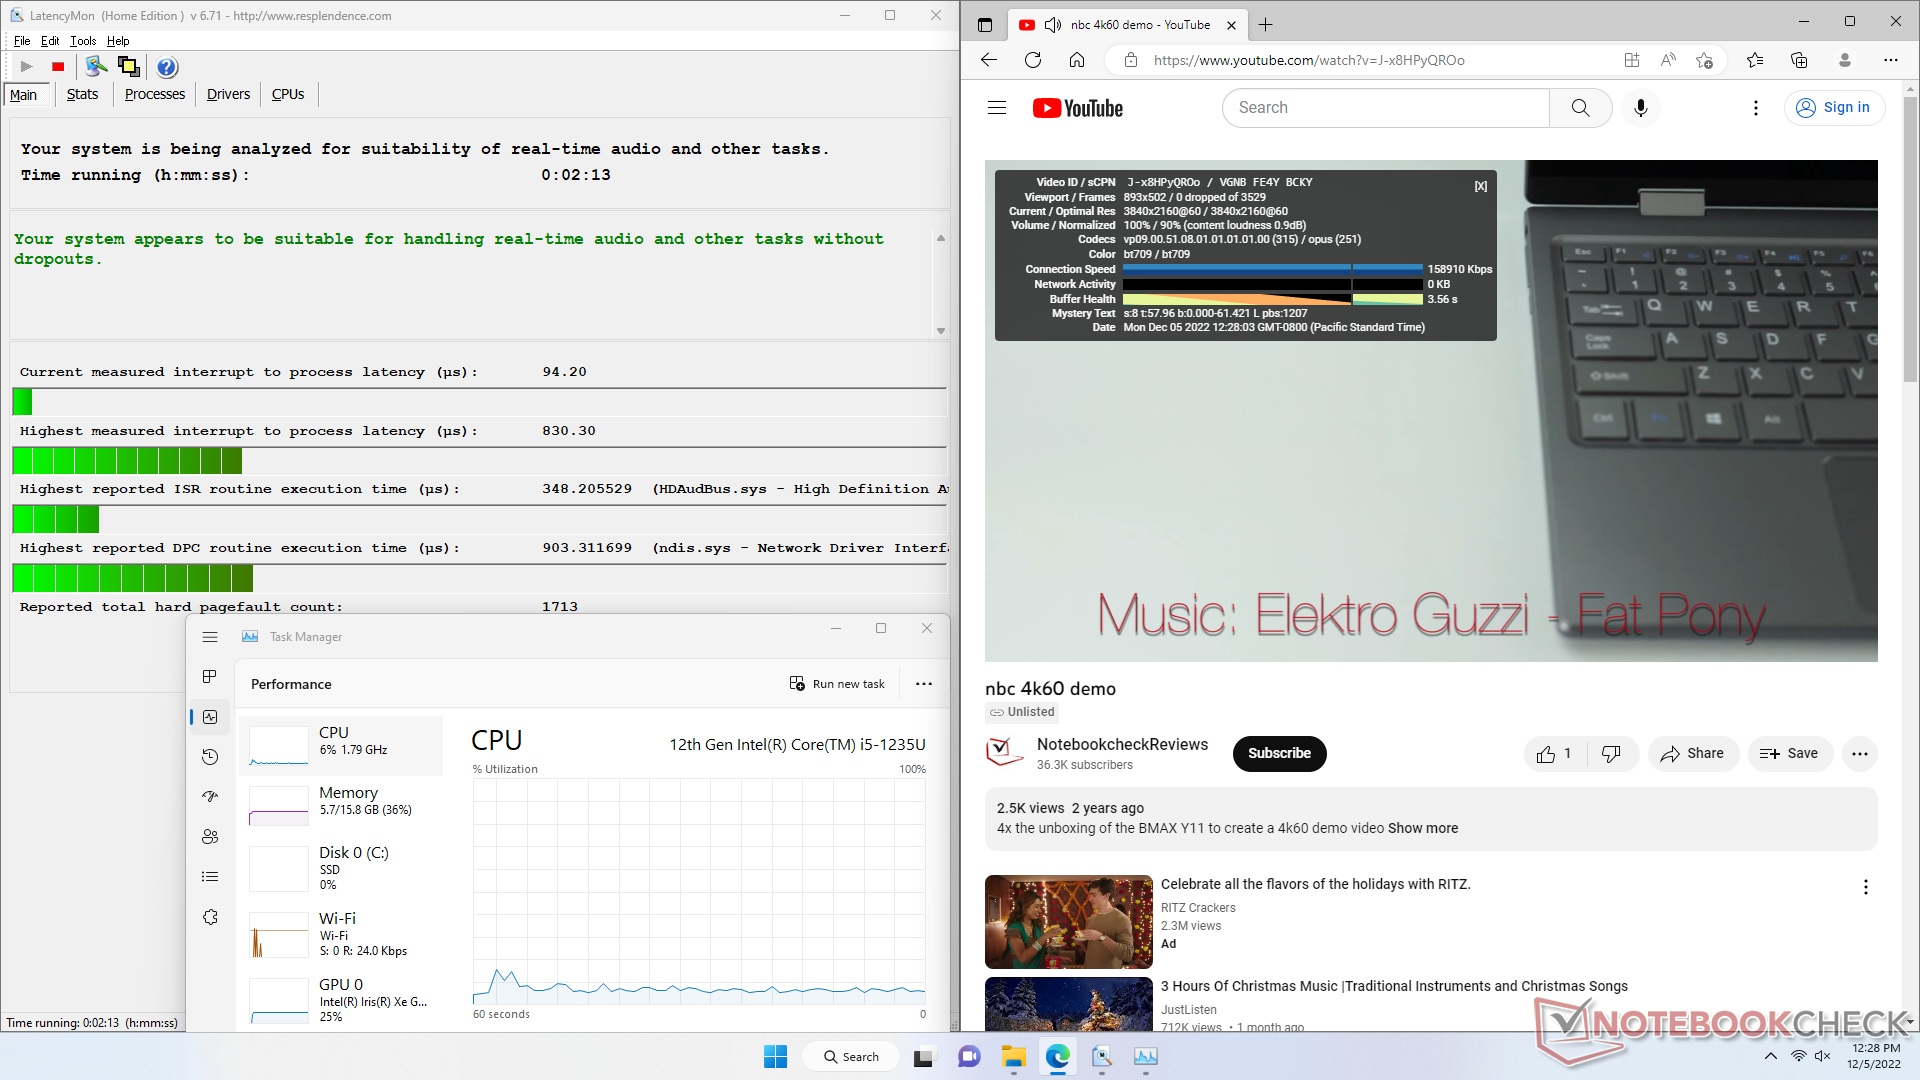
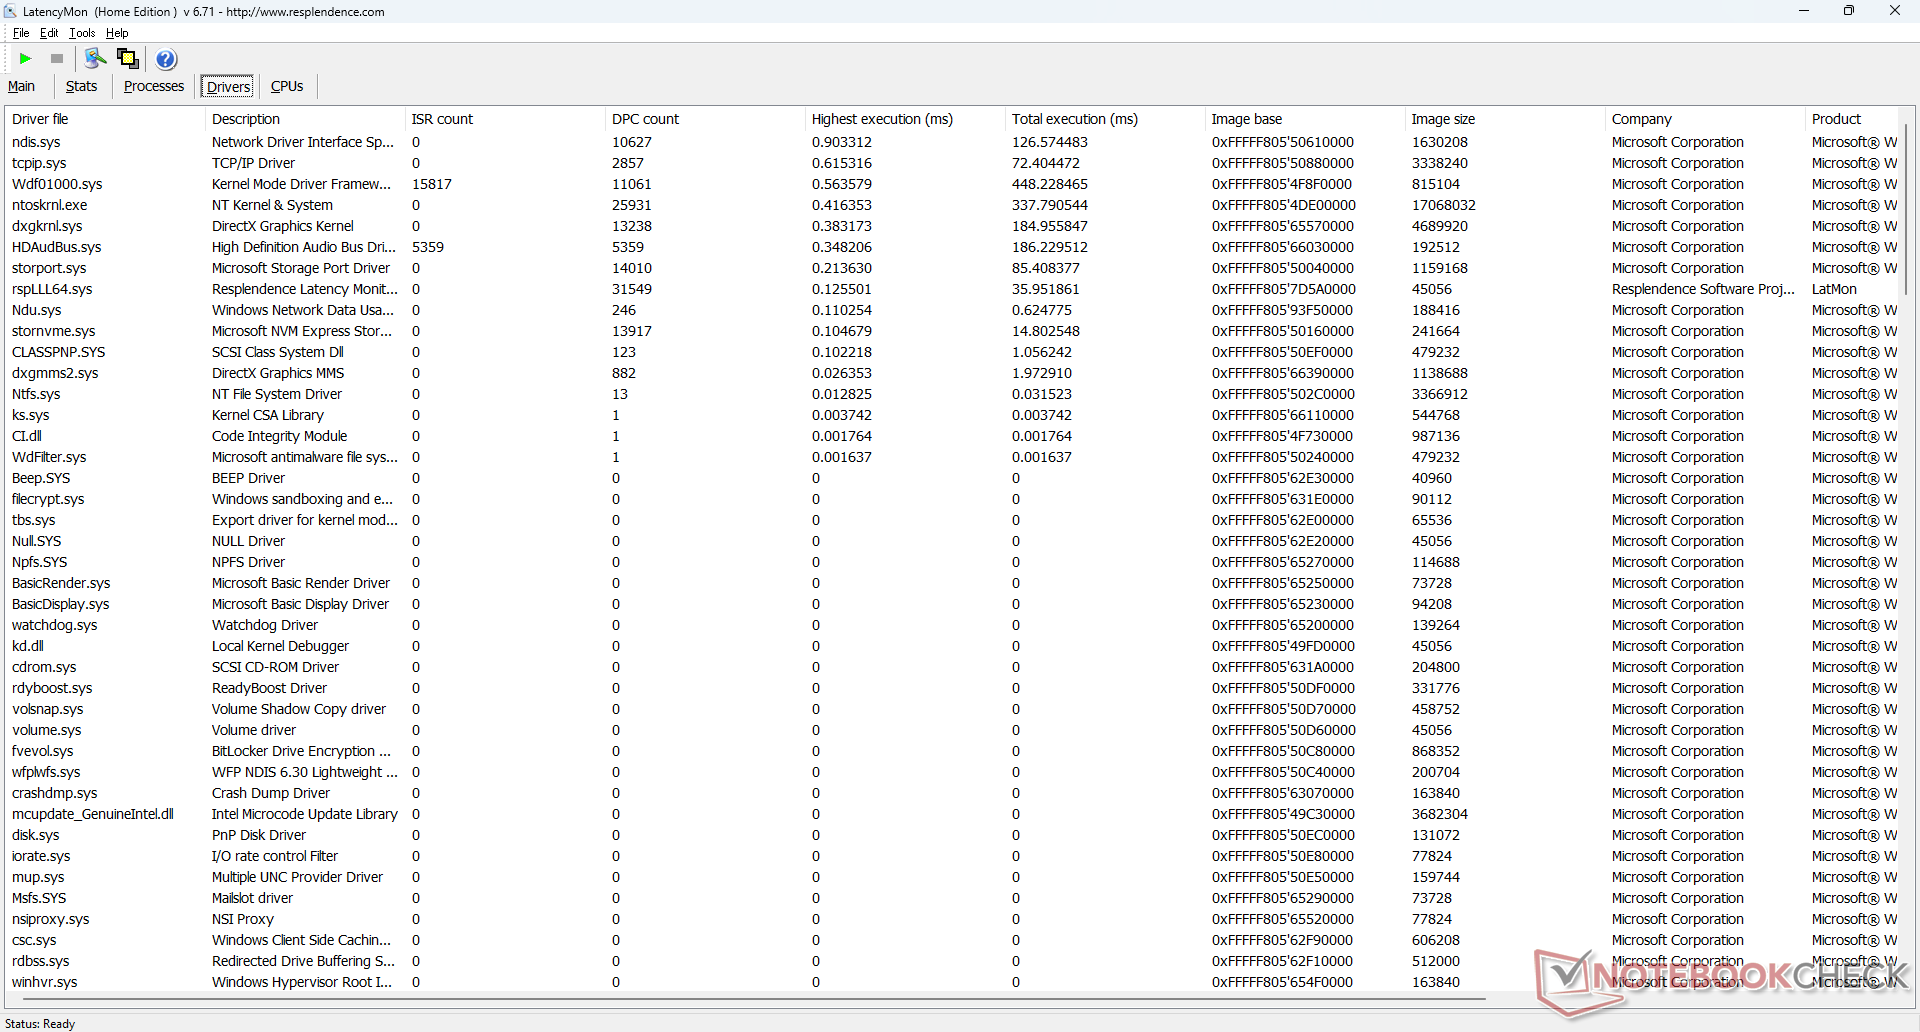
LatencyMon nie ujawnia żadnych problemów z DPC podczas otwierania wielu kart przeglądarki na naszej stronie głównej. odtwarzanie wideo w rozdzielczości 4K przy 60 FPS jest płynne i nie ma problemów z klatkami.
| DPC Latencies / LatencyMon - interrupt to process latency (max), Web, Youtube, Prime95 | |
| Beelink SEi12 Core i5-1235U | |
| Intel NUC11PAQi7 | |
| BMAX B5 Pro G7H8 | |
| Beelink SER4 | |
| Beelink SEi11 Pro | |
* ... im mniej tym lepiej
Urządzenia do przechowywania danych
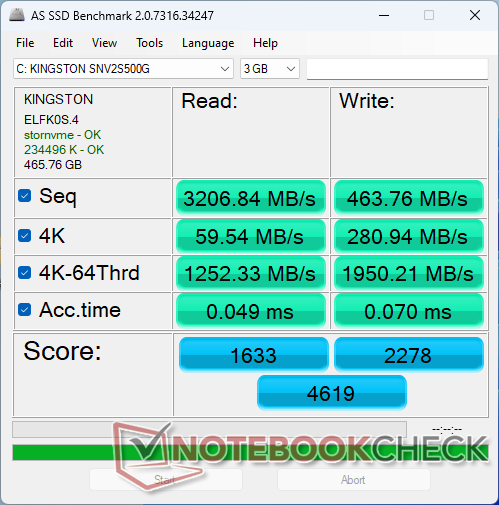
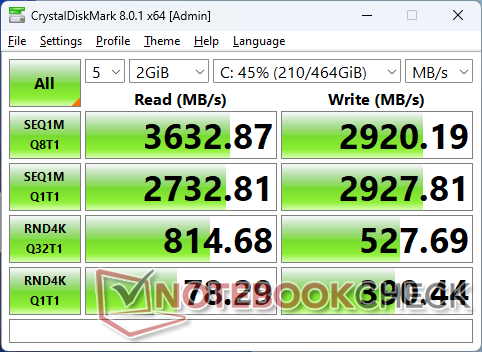
System obsługuje dyski SSD PCIe4 x4 NVMe i zawiera nawet radiator, aby utrzymać temperatury w ryzach. Niemniej jednak, urządzenie jest dostarczane z wolniejszym dyskiem Kingston NV1 PCIe3 x4 NVMe SSD jako środek oszczędnościowy. Podczas uruchamiania programu DiskSpd w pętli, możemy zaobserwować spadek prędkości transferu z 3600 MB/s do 1700 MB/s, co może sugerować niedostateczną wydajność radiatora.

| Drive Performance rating - Percent | |
| Intel NUC11PAQi7 | |
| Beelink SEi12 Core i5-1235U | |
| Intel Hades Canyon NUC8i7HVK -8! | |
| BMAX B5 Pro G7H8 | |
| Beelink SEi11 Pro | |
| Beelink SER4 | |
| DiskSpd | |
| seq read | |
| Intel NUC11PAQi7 | |
| Beelink SEi12 Core i5-1235U | |
| BMAX B5 Pro G7H8 | |
| Beelink SEi11 Pro | |
| Beelink SER4 | |
| seq write | |
| Intel NUC11PAQi7 | |
| Beelink SEi12 Core i5-1235U | |
| Beelink SEi11 Pro | |
| BMAX B5 Pro G7H8 | |
| Beelink SER4 | |
| seq q8 t1 read | |
| Intel NUC11PAQi7 | |
| Beelink SEi12 Core i5-1235U | |
| BMAX B5 Pro G7H8 | |
| Beelink SEi11 Pro | |
| Beelink SER4 | |
| seq q8 t1 write | |
| Intel NUC11PAQi7 | |
| Beelink SEi12 Core i5-1235U | |
| BMAX B5 Pro G7H8 | |
| Beelink SEi11 Pro | |
| Beelink SER4 | |
| 4k q1 t1 read | |
| Beelink SEi12 Core i5-1235U | |
| Beelink SER4 | |
| Intel NUC11PAQi7 | |
| Beelink SEi11 Pro | |
| BMAX B5 Pro G7H8 | |
| 4k q1 t1 write | |
| Beelink SEi12 Core i5-1235U | |
| Beelink SER4 | |
| Beelink SEi11 Pro | |
| BMAX B5 Pro G7H8 | |
| Intel NUC11PAQi7 | |
| 4k q32 t16 read | |
| Intel NUC11PAQi7 | |
| Beelink SEi12 Core i5-1235U | |
| BMAX B5 Pro G7H8 | |
| Beelink SEi11 Pro | |
| Beelink SER4 | |
| 4k q32 t16 write | |
| Intel NUC11PAQi7 | |
| Beelink SEi12 Core i5-1235U | |
| BMAX B5 Pro G7H8 | |
| Beelink SER4 | |
| Beelink SEi11 Pro | |
| AS SSD | |
| Score Total | |
| Intel NUC11PAQi7 | |
| Beelink SEi12 Core i5-1235U | |
| Intel Hades Canyon NUC8i7HVK | |
| Beelink SEi11 Pro | |
| BMAX B5 Pro G7H8 | |
| Beelink SER4 | |
| Score Read | |
| Intel NUC11PAQi7 | |
| Beelink SEi12 Core i5-1235U | |
| Intel Hades Canyon NUC8i7HVK | |
| Beelink SEi11 Pro | |
| BMAX B5 Pro G7H8 | |
| Beelink SER4 | |
| Score Write | |
| Intel NUC11PAQi7 | |
| Beelink SEi12 Core i5-1235U | |
| Beelink SEi11 Pro | |
| BMAX B5 Pro G7H8 | |
| Beelink SER4 | |
| Intel Hades Canyon NUC8i7HVK | |
| Seq Read | |
| Intel NUC11PAQi7 | |
| Beelink SEi12 Core i5-1235U | |
| BMAX B5 Pro G7H8 | |
| Beelink SEi11 Pro | |
| Beelink SER4 | |
| Intel Hades Canyon NUC8i7HVK | |
| Seq Write | |
| Intel NUC11PAQi7 | |
| BMAX B5 Pro G7H8 | |
| Beelink SEi11 Pro | |
| Beelink SER4 | |
| Intel Hades Canyon NUC8i7HVK | |
| Beelink SEi12 Core i5-1235U | |
| 4K Read | |
| Intel Hades Canyon NUC8i7HVK | |
| Beelink SEi12 Core i5-1235U | |
| Beelink SER4 | |
| Intel NUC11PAQi7 | |
| BMAX B5 Pro G7H8 | |
| Beelink SEi11 Pro | |
| 4K Write | |
| Beelink SEi12 Core i5-1235U | |
| Beelink SEi11 Pro | |
| Beelink SER4 | |
| BMAX B5 Pro G7H8 | |
| Intel Hades Canyon NUC8i7HVK | |
| Intel NUC11PAQi7 | |
| 4K-64 Read | |
| Intel NUC11PAQi7 | |
| Intel Hades Canyon NUC8i7HVK | |
| Beelink SEi12 Core i5-1235U | |
| Beelink SEi11 Pro | |
| BMAX B5 Pro G7H8 | |
| Beelink SER4 | |
| 4K-64 Write | |
| Intel NUC11PAQi7 | |
| Beelink SEi12 Core i5-1235U | |
| Beelink SEi11 Pro | |
| BMAX B5 Pro G7H8 | |
| Beelink SER4 | |
| Intel Hades Canyon NUC8i7HVK | |
| Access Time Read | |
| Beelink SER4 | |
| BMAX B5 Pro G7H8 | |
| Intel NUC11PAQi7 | |
| Beelink SEi11 Pro | |
| Beelink SEi12 Core i5-1235U | |
| Intel Hades Canyon NUC8i7HVK | |
| Access Time Write | |
| Beelink SEi11 Pro | |
| BMAX B5 Pro G7H8 | |
| Intel NUC11PAQi7 | |
| Beelink SER4 | |
| Beelink SEi12 Core i5-1235U | |
| Intel Hades Canyon NUC8i7HVK | |
* ... im mniej tym lepiej
Disk Throttling: DiskSpd Read Loop, Queue Depth 8
Wydajność GPU
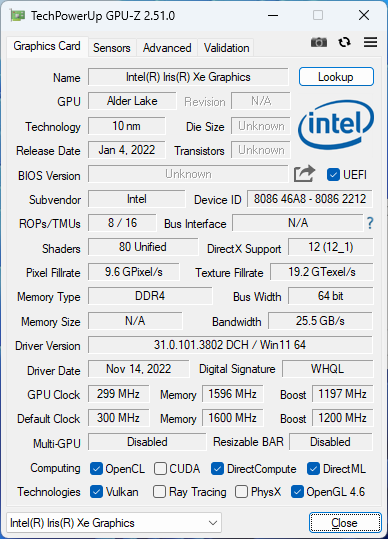
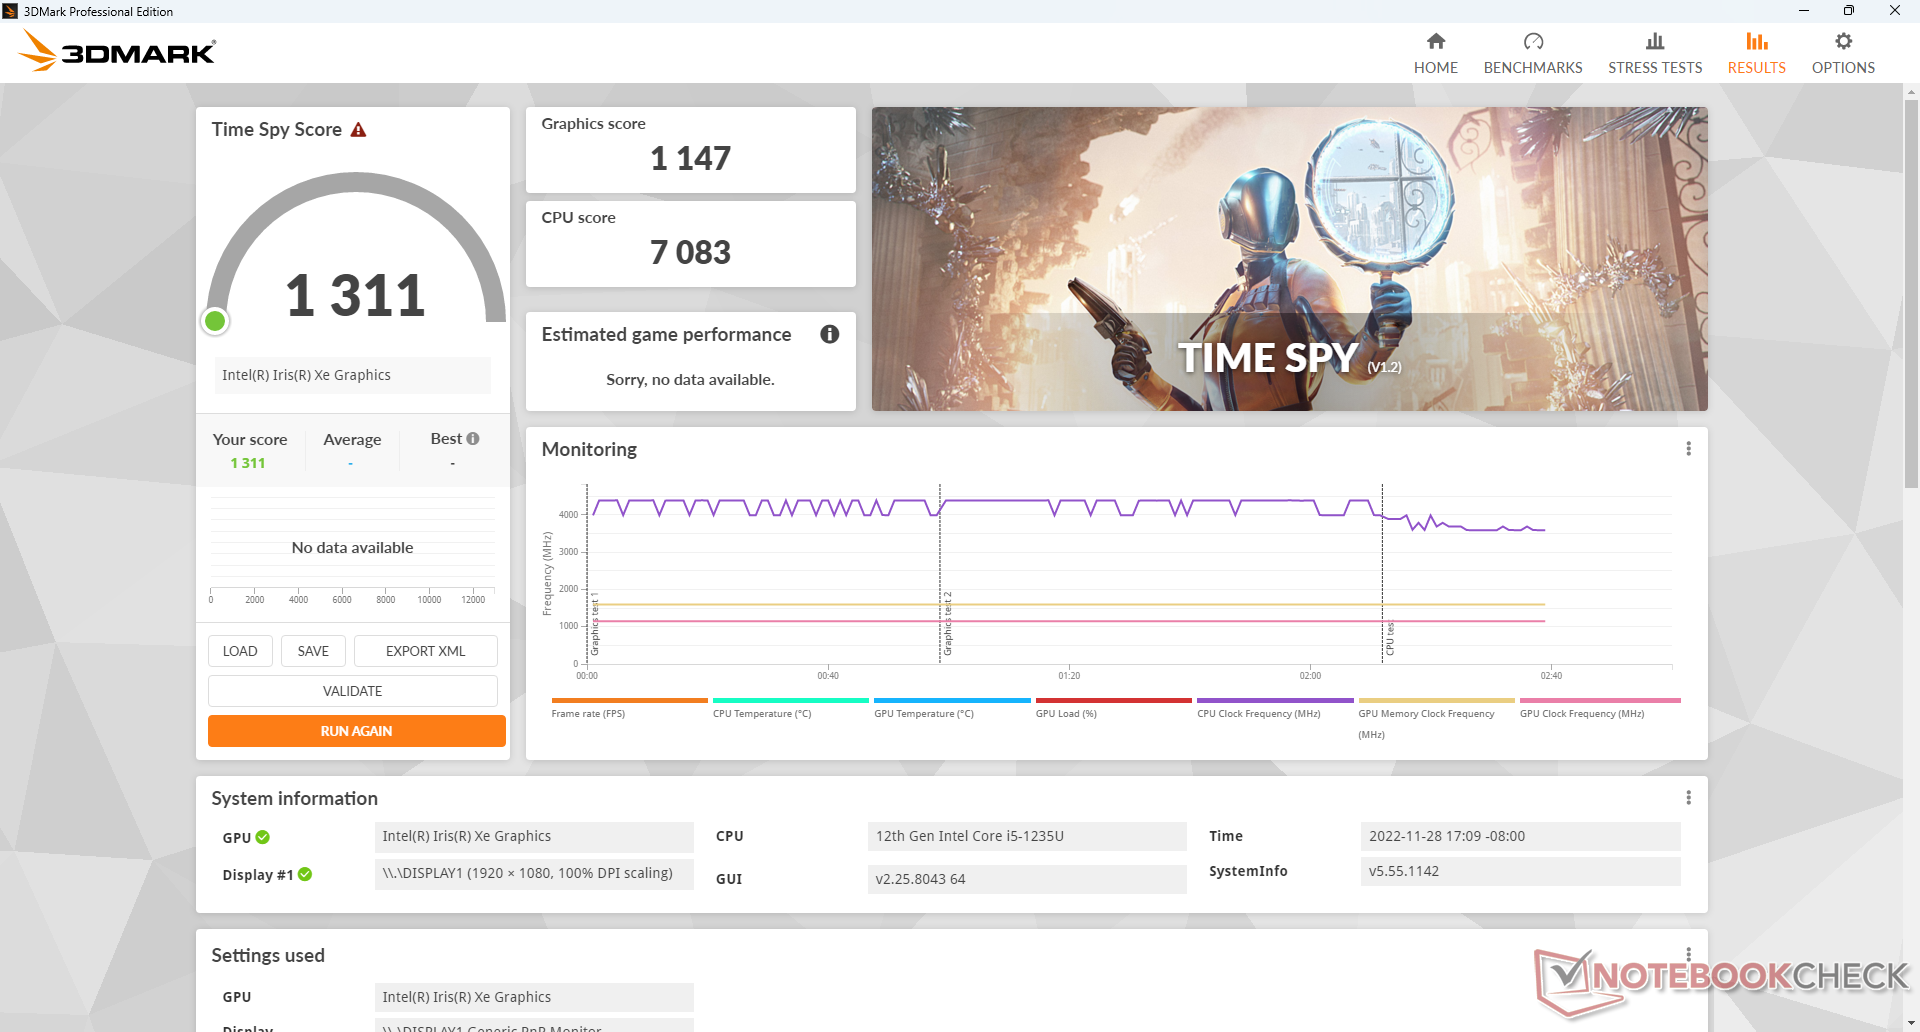
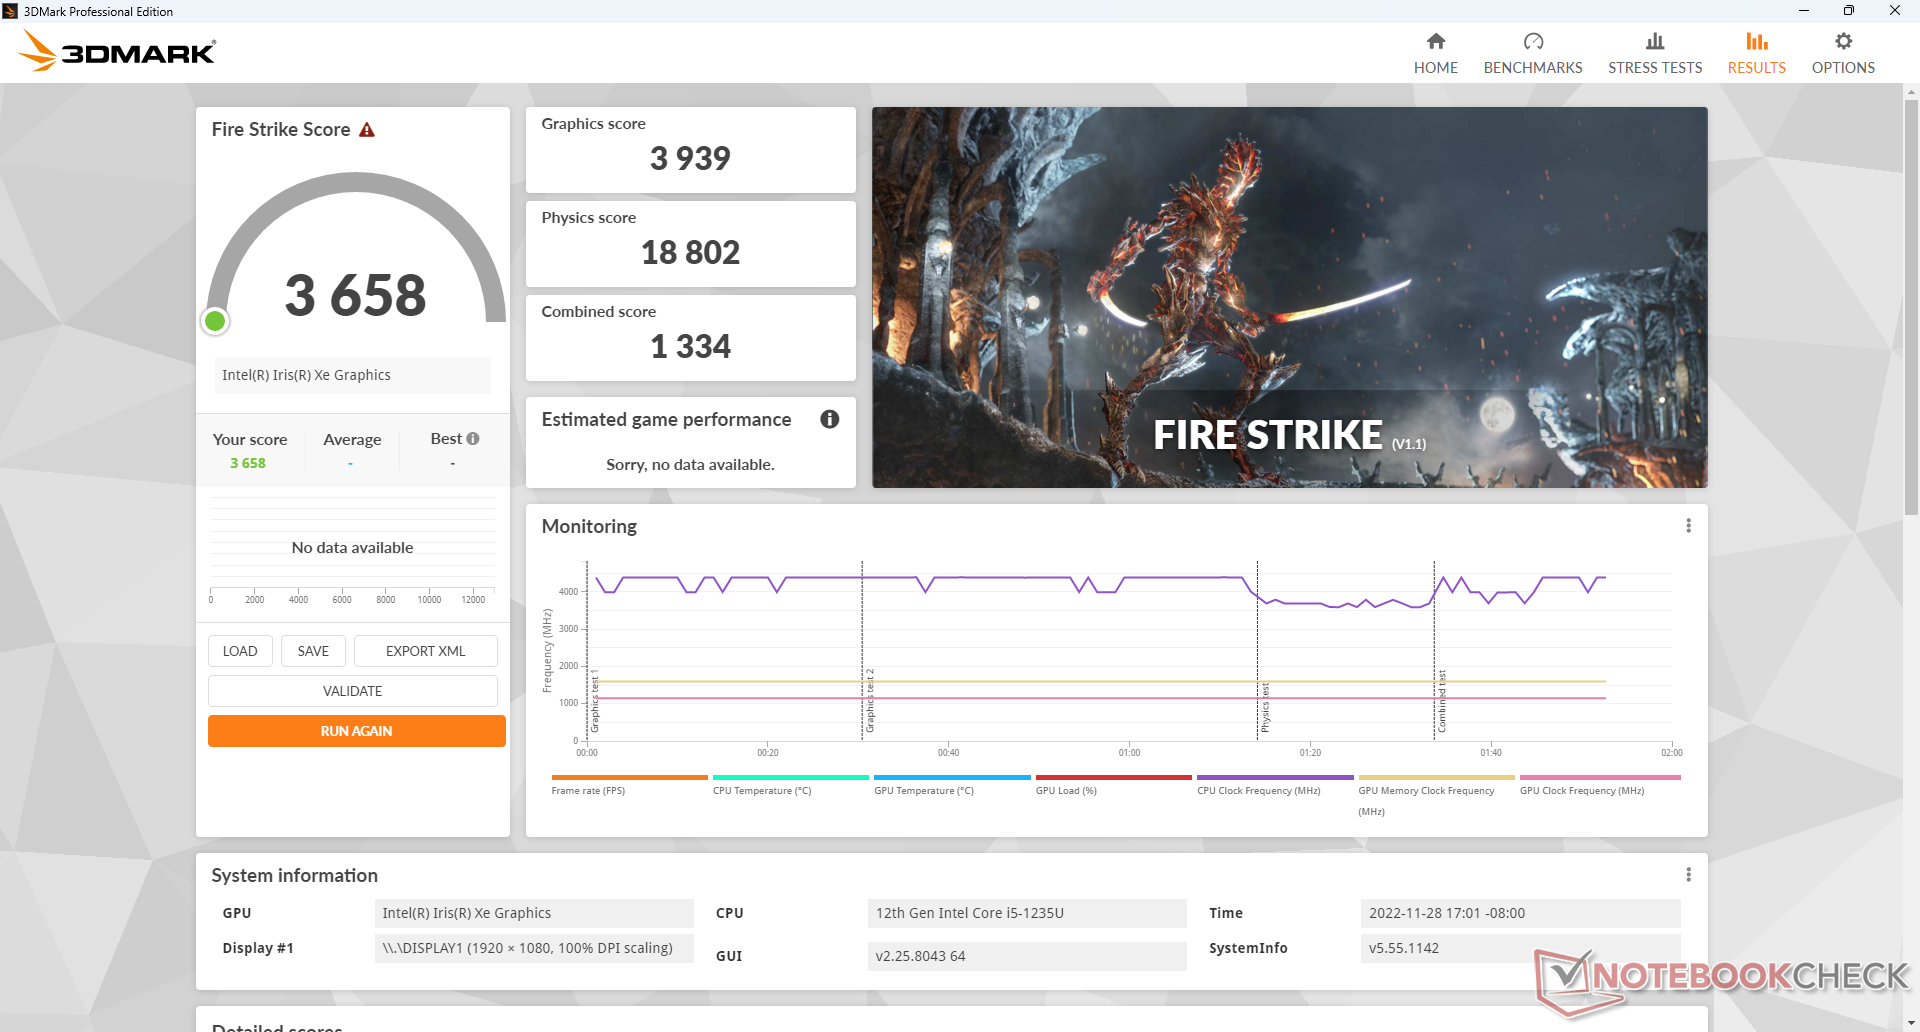
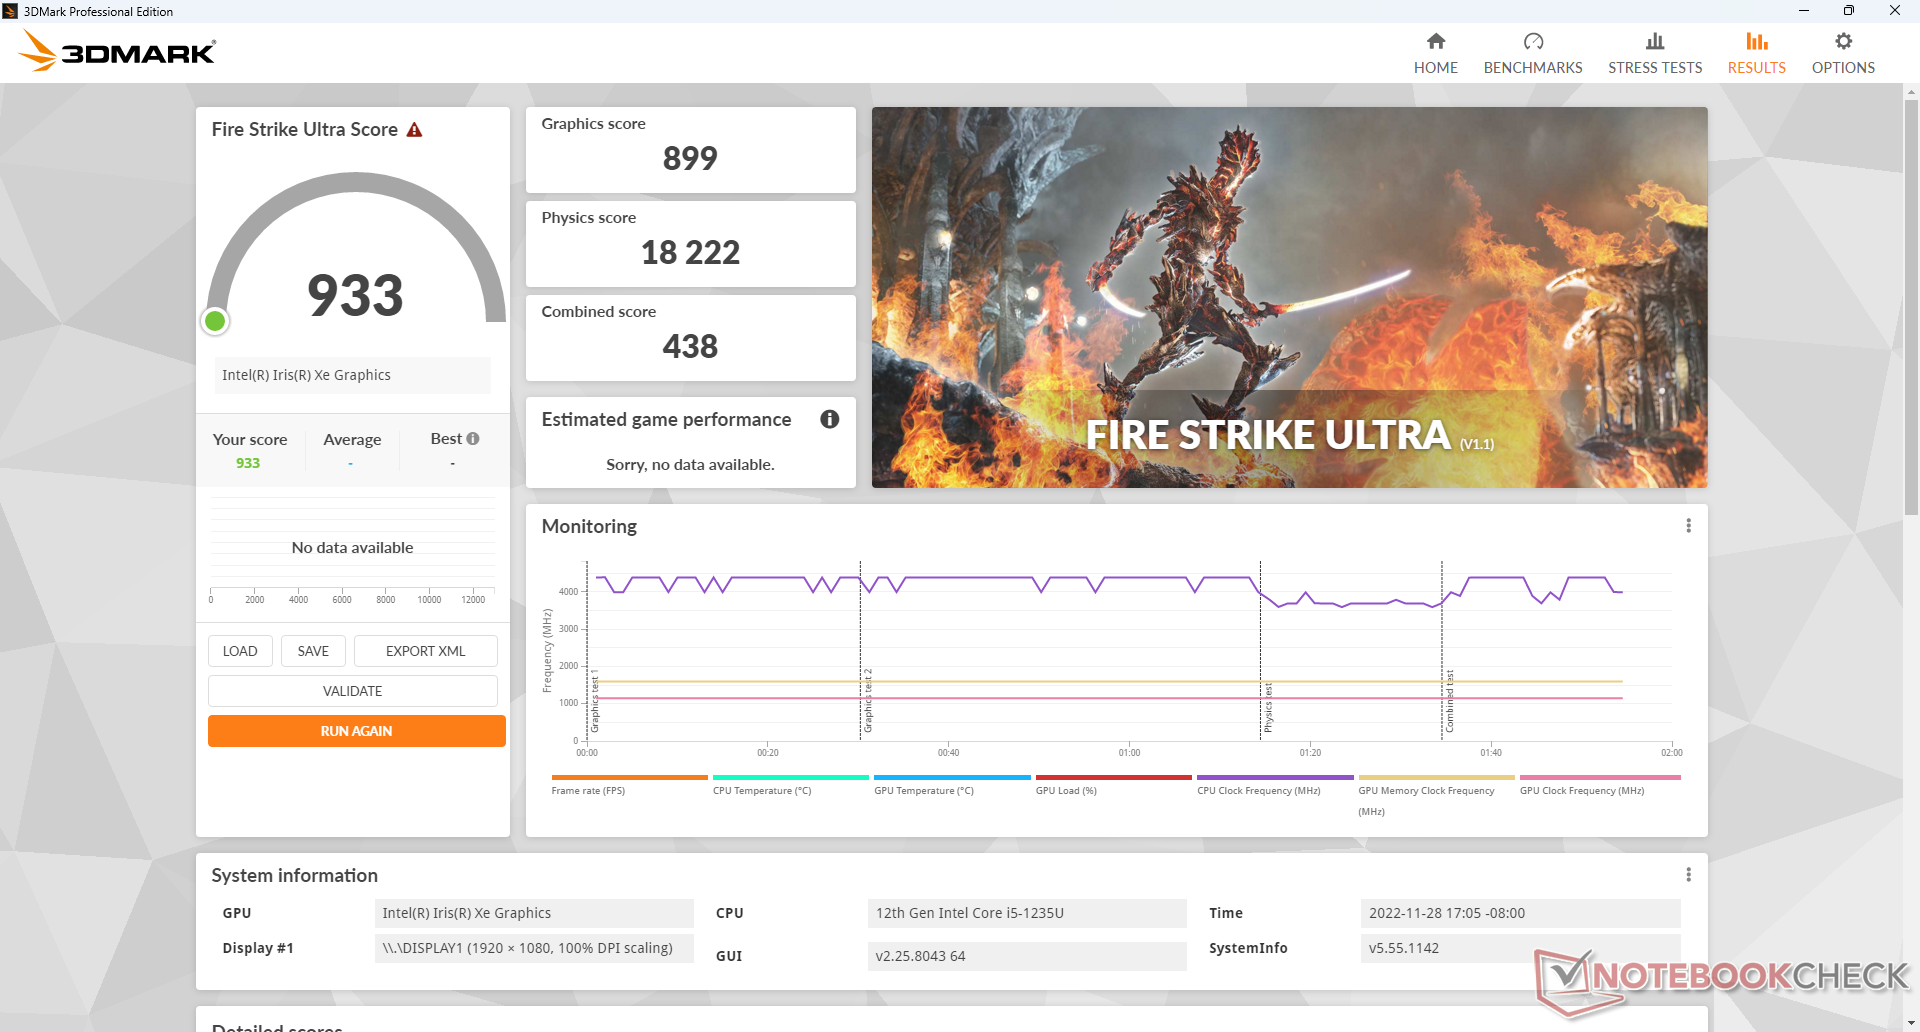
Wydajność graficzna jest na poziomie, którego oczekujemy od innych komputerów z tym samym zintegrowanym Iris Xe G7 80 EUs GPU. Należy pamiętać, że inne komputery z procesorem Iris Xe G7 96 EUs mogą być szybsze nawet o 25 do 40 procent, jeśli zostaną skonfigurowane z dwukanałową pamięcią RAM zamiast jednokanałowej.
| 3DMark | |
| 1920x1080 Fire Strike Graphics | |
| Intel Hades Canyon NUC8i7HVK | |
| Intel NUC 12 Pro Kit NUC12WSKi7 | |
| Beelink SEi12 Core i5-1235U | |
| Beelink SER4 | |
| Przeciętny Intel Iris Xe Graphics G7 80EUs (1560 - 5398, n=114) | |
| Intel NUC11PAQi7 | |
| Beelink SEi8 | |
| BMAX B5 Pro G7H8 | |
| 2560x1440 Time Spy Graphics | |
| Intel Hades Canyon NUC8i7HVK | |
| Intel NUC 12 Pro Kit NUC12WSKi7 | |
| Beelink SER4 | |
| Przeciętny Intel Iris Xe Graphics G7 80EUs (561 - 1576, n=111) | |
| Intel NUC11PAQi7 | |
| Beelink SEi12 Core i5-1235U | |
| Beelink SEi8 | |
| BMAX B5 Pro G7H8 | |
| 2560x1440 Time Spy Score | |
| Intel Hades Canyon NUC8i7HVK | |
| Intel NUC 12 Pro Kit NUC12WSKi7 | |
| Beelink SER4 | |
| Przeciętny Intel Iris Xe Graphics G7 80EUs (630 - 1791, n=111) | |
| Intel NUC11PAQi7 | |
| Beelink SEi12 Core i5-1235U | |
| Beelink SEi8 | |
| BMAX B5 Pro G7H8 | |
| 3DMark 11 - 1280x720 Performance GPU | |
| Intel Hades Canyon NUC8i7HVK | |
| Intel NUC 12 Pro Kit NUC12WSKi7 | |
| Beelink SER4 | |
| Intel NUC11PAQi7 | |
| Przeciętny Intel Iris Xe Graphics G7 80EUs (2246 - 6579, n=112) | |
| Beelink SEi12 Core i5-1235U | |
| Beelink SEi8 | |
| BMAX B5 Pro G7H8 | |
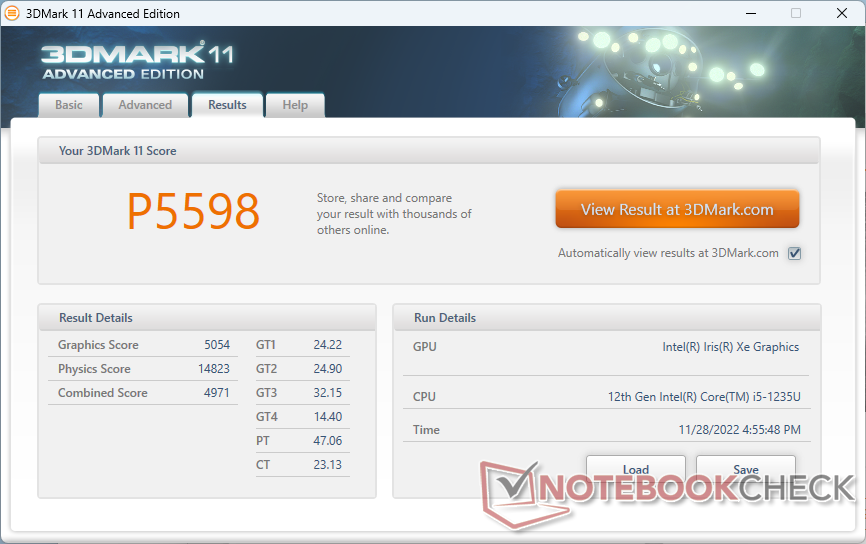
| 3DMark 11 Performance | 5598 pkt. | |
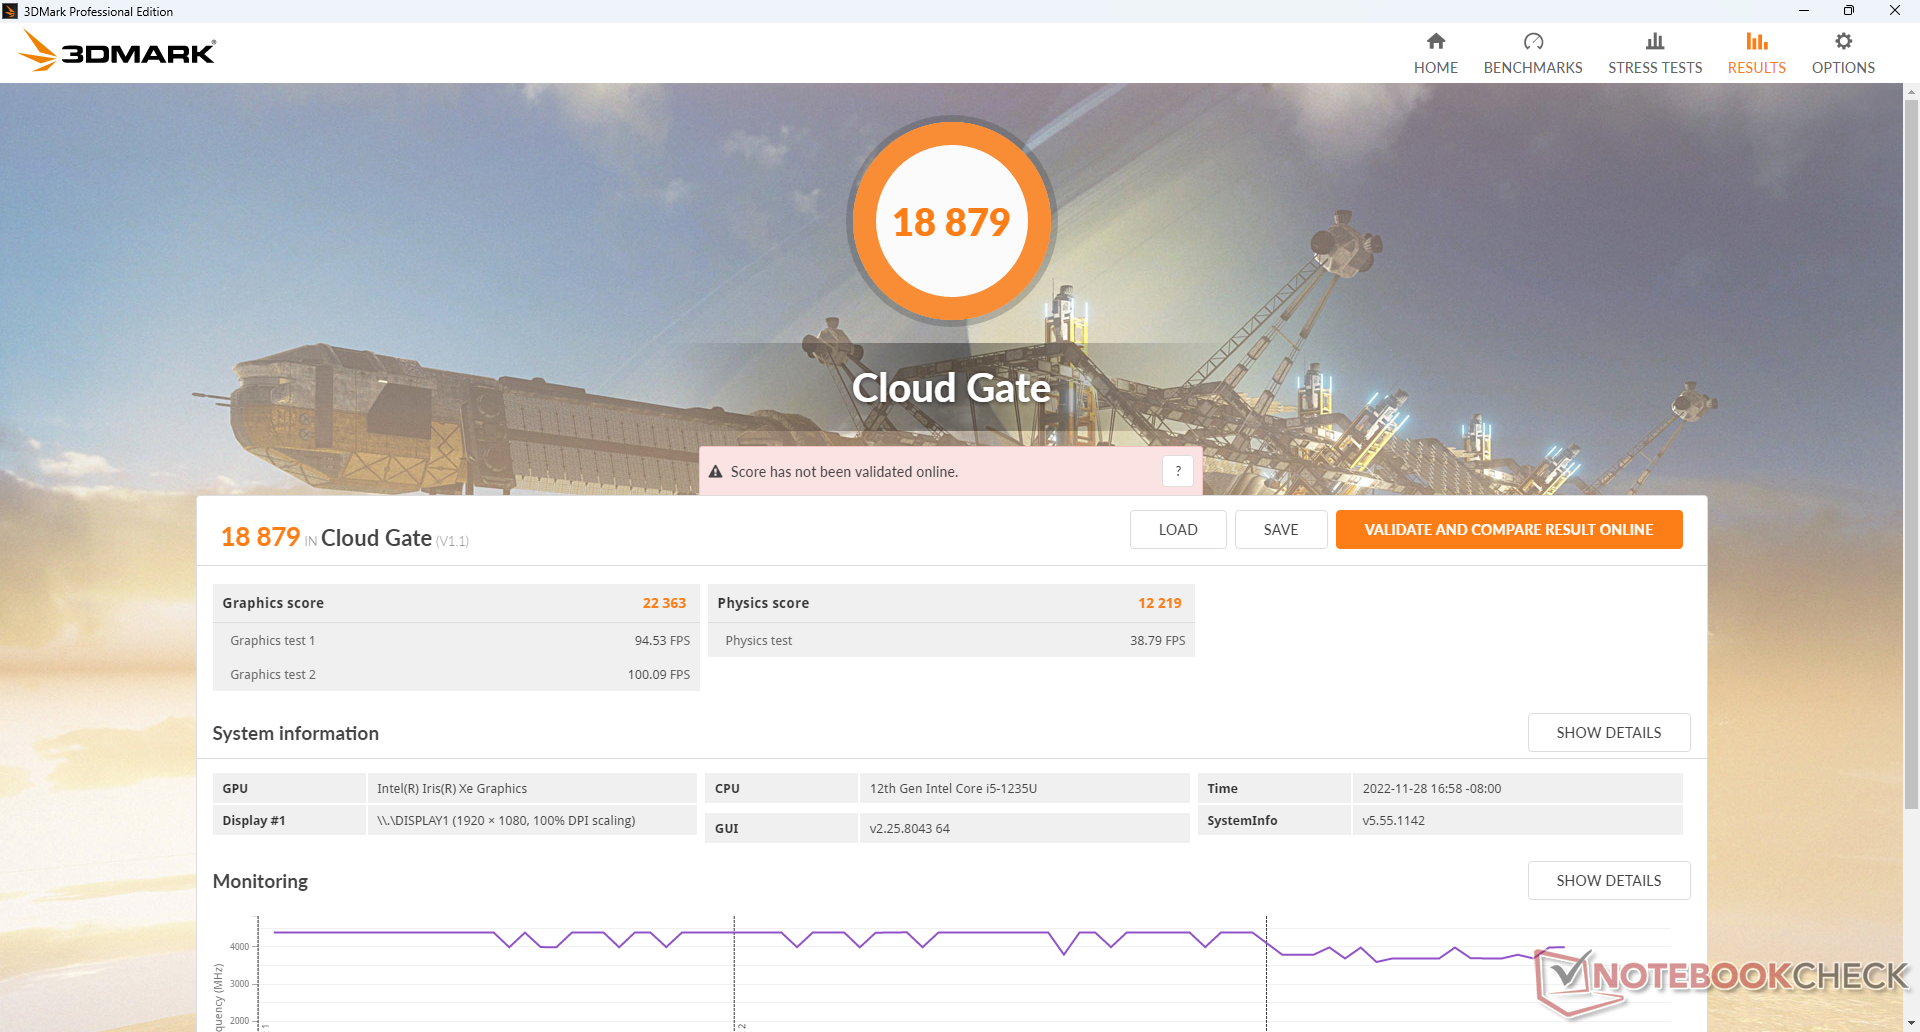
| 3DMark Cloud Gate Standard Score | 18879 pkt. | |
| 3DMark Fire Strike Score | 3658 pkt. | |
| 3DMark Time Spy Score | 1311 pkt. | |
Pomoc | ||
| Blender - v3.3 Classroom CPU | |
| BMAX B5 Pro G7H8 | |
| Intel NUC Pro Chassis_i7_1185G7 | |
| Przeciętny Intel Iris Xe Graphics G7 80EUs (463 - 3047, n=53) | |
| HP Spectre x360 13.5 14t-ef000 | |
| Beelink SEi12 Core i5-1235U | |
| Intel NUC Pro Chassis_i7_1265U | |
* ... im mniej tym lepiej
| Performance rating - Percent | |
| Intel Hades Canyon NUC8i7HVK | |
| Beelink SEi11 Pro -1! | |
| Beelink SER4 | |
| Beelink SEi12 Core i5-1235U | |
| Intel NUC11PAQi7 | |
| BMAX B5 Pro G7H8 -5! | |
| The Witcher 3 - 1920x1080 Ultra Graphics & Postprocessing (HBAO+) | |
| Intel Hades Canyon NUC8i7HVK | |
| Beelink SER4 | |
| Beelink SEi11 Pro | |
| Beelink SEi12 Core i5-1235U | |
| Intel NUC11PAQi7 | |
| GTA V - 1920x1080 Highest AA:4xMSAA + FX AF:16x | |
| Intel Hades Canyon NUC8i7HVK | |
| Beelink SER4 | |
| Beelink SEi12 Core i5-1235U | |
| Intel NUC11PAQi7 | |
| Final Fantasy XV Benchmark - 1920x1080 High Quality | |
| Intel Hades Canyon NUC8i7HVK | |
| Beelink SEi11 Pro | |
| Beelink SER4 | |
| Beelink SEi12 Core i5-1235U | |
| Intel NUC11PAQi7 | |
| Strange Brigade - 1920x1080 ultra AA:ultra AF:16 | |
| Intel Hades Canyon NUC8i7HVK | |
| Beelink SER4 | |
| Beelink SEi11 Pro | |
| Beelink SEi12 Core i5-1235U | |
| Intel NUC11PAQi7 | |
| Dota 2 Reborn - 1920x1080 ultra (3/3) best looking | |
| Intel Hades Canyon NUC8i7HVK | |
| Beelink SER4 | |
| Beelink SEi11 Pro | |
| Beelink SEi12 Core i5-1235U | |
| Intel NUC11PAQi7 | |
| BMAX B5 Pro G7H8 | |
| X-Plane 11.11 - 1920x1080 high (fps_test=3) | |
| Intel Hades Canyon NUC8i7HVK | |
| Beelink SEi11 Pro | |
| Beelink SER4 | |
| Beelink SEi12 Core i5-1235U | |
| Intel NUC11PAQi7 | |
| Final Fantasy XV Benchmark | |
| 1280x720 Lite Quality | |
| Intel Hades Canyon NUC8i7HVK | |
| Intel NUC Pro Chassis_i7_1185G7 | |
| Intel NUC Pro Chassis_i7_1265U | |
| HP Spectre x360 13.5 14t-ef000 | |
| Beelink SER4 | |
| Beelink SEi12 Core i5-1235U | |
| Przeciętny Intel Iris Xe Graphics G7 80EUs (8.32 - 45.6, n=107) | |
| Intel NUC11PAQi7 | |
| Beelink SEi8 | |
| BMAX B5 Pro G7H8 | |
| 1920x1080 Standard Quality | |
| Intel Hades Canyon NUC8i7HVK | |
| Intel NUC Pro Chassis_i7_1265U | |
| Intel NUC Pro Chassis_i7_1185G7 | |
| HP Spectre x360 13.5 14t-ef000 | |
| Beelink SEi12 Core i5-1235U | |
| Beelink SER4 | |
| Przeciętny Intel Iris Xe Graphics G7 80EUs (4.47 - 25.4, n=100) | |
| Intel NUC11PAQi7 | |
| Beelink SEi8 | |
| 1920x1080 High Quality | |
| Intel NUC Pro Chassis_i7_1265U | |
| Intel Hades Canyon NUC8i7HVK | |
| Intel NUC Pro Chassis_i7_1185G7 | |
| HP Spectre x360 13.5 14t-ef000 | |
| Beelink SER4 | |
| Beelink SEi12 Core i5-1235U | |
| Przeciętny Intel Iris Xe Graphics G7 80EUs (4.01 - 22, n=92) | |
| Intel NUC11PAQi7 | |
| Beelink SEi8 | |
| Cyberpunk 2077 1.6 | |
| 1920x1080 Low Preset | |
| Intel Hades Canyon NUC8i7HVK | |
| HP Spectre x360 13.5 14t-ef000 | |
| Przeciętny Intel Iris Xe Graphics G7 80EUs (9.1 - 17.8, n=7) | |
| Beelink SEi12 Core i5-1235U | |
| 1920x1080 Medium Preset | |
| Intel Hades Canyon NUC8i7HVK | |
| HP Spectre x360 13.5 14t-ef000 | |
| Przeciętny Intel Iris Xe Graphics G7 80EUs (11.4 - 14.7, n=5) | |
| Beelink SEi12 Core i5-1235U | |
| 1920x1080 High Preset | |
| Intel Hades Canyon NUC8i7HVK | |
| HP Spectre x360 13.5 14t-ef000 | |
| Przeciętny Intel Iris Xe Graphics G7 80EUs (9 - 11.3, n=4) | |
| Beelink SEi12 Core i5-1235U | |
| 1920x1080 Ultra Preset | |
| Intel Hades Canyon NUC8i7HVK | |
| HP Spectre x360 13.5 14t-ef000 | |
| Przeciętny Intel Iris Xe Graphics G7 80EUs (7.4 - 9.71, n=4) | |
| Beelink SEi12 Core i5-1235U | |
| X-Plane 11.11 | |
| 1280x720 low (fps_test=1) | |
| Intel Hades Canyon NUC8i7HVK | |
| Beelink SEi12 Core i5-1235U | |
| Intel NUC Pro Chassis_i7_1265U | |
| Intel NUC11PAQi7 | |
| Beelink SER4 | |
| HP Spectre x360 13.5 14t-ef000 | |
| Intel NUC Pro Chassis_i7_1185G7 | |
| Przeciętny Intel Iris Xe Graphics G7 80EUs (9.12 - 74.4, n=111) | |
| Beelink SEi8 | |
| 1920x1080 med (fps_test=2) | |
| Intel Hades Canyon NUC8i7HVK | |
| HP Spectre x360 13.5 14t-ef000 | |
| Intel NUC Pro Chassis_i7_1265U | |
| Intel NUC Pro Chassis_i7_1185G7 | |
| Beelink SER4 | |
| Beelink SEi12 Core i5-1235U | |
| Intel NUC11PAQi7 | |
| Przeciętny Intel Iris Xe Graphics G7 80EUs (6.45 - 40.5, n=112) | |
| Beelink SEi8 | |
| 1920x1080 high (fps_test=3) | |
| Intel Hades Canyon NUC8i7HVK | |
| HP Spectre x360 13.5 14t-ef000 | |
| Intel NUC Pro Chassis_i7_1185G7 | |
| Intel NUC Pro Chassis_i7_1265U | |
| Beelink SER4 | |
| Beelink SEi12 Core i5-1235U | |
| Intel NUC11PAQi7 | |
| Przeciętny Intel Iris Xe Graphics G7 80EUs (5.55 - 36.3, n=110) | |
| Beelink SEi8 | |
Witcher 3 FPS Chart
| low | med. | high | ultra | |
|---|---|---|---|---|
| GTA V (2015) | 117.5 | 98.7 | 17.2 | 7.41 |
| The Witcher 3 (2015) | 77.7 | 48.7 | 26 | 12.2 |
| Dota 2 Reborn (2015) | 93.8 | 88.7 | 45.5 | 42.2 |
| Final Fantasy XV Benchmark (2018) | 35.7 | 19.3 | 13.5 | |
| X-Plane 11.11 (2018) | 48.4 | 32.8 | 29.5 | |
| Strange Brigade (2018) | 65.9 | 26.5 | 21.4 | 17.5 |
| Cyberpunk 2077 1.6 (2022) | 13.4 | 11.4 | 9 | 7.4 |
Emisje
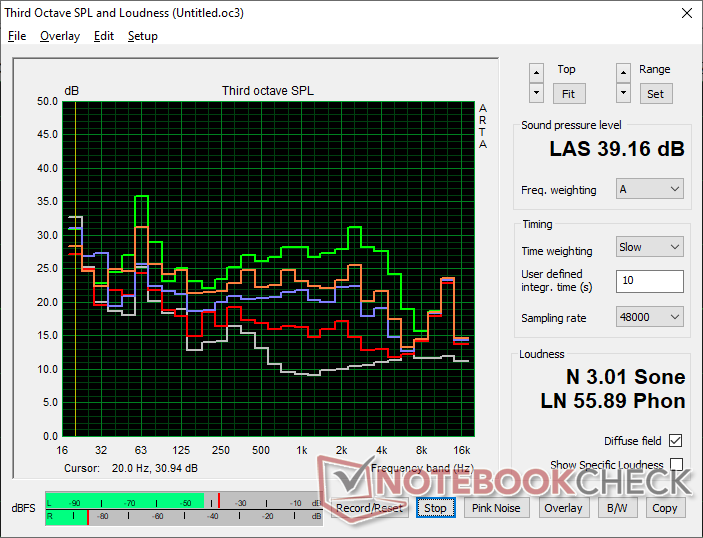
Szum systemu
Podobnie jak w przypadku innych mini PC od Beelinka, szum wentylatora jest zawsze obecny w SEi12 i wynosi prawie 28 dB(A) na tle cichego tła 23 dB(A). Na szczęście system nie staje się rozpraszająco głośny nawet przy większym obciążeniu. Uruchomienie Witcher 3 lub 3DMark 06 spowodowałoby porównywalny poziom hałasu wentylatorów do Intel NUC 11PAQ w podobnych warunkach. Szum wentylatora może czasami osiągnąć 39 dB(A), aczkolwiek tylko przez krótki czas, po czym spada z powrotem do niskiego zakresu 30 dB(A). Mocniejsze mini PC, takie jak seria Beelink SER, są jeszcze głośniejsze.
Hałas
| luz |
| 27.8 / 27.8 / 27.8 dB |
| obciążenie |
| 32 / 39.2 dB |
 | ||
30 dB cichy 40 dB(A) słyszalny 50 dB(A) irytujący |
||
min: | ||
| Beelink SEi12 Core i5-1235U Iris Xe G7 80EUs, i5-1235U, Kingston NV1 SNVS/500GCN | Beelink SEi8 Iris Plus Graphics 655, i3-8109U, Intel SSD 660p SSDPEKNW512G8 | Beelink SER4 Vega 8, R7 4800U, Intel SSD 660p SSDPEKNW512G8 | Intel NUC11PAQi7 Iris Xe G7 96EUs, i7-1165G7, Samsung SSD 980 Pro 500GB MZ-V8P500BW | BMAX B5 Pro G7H8 UHD Graphics 620, i5-8260U | Intel Hades Canyon NUC8i7HVK Vega M GH, i7-8809G, Intel Optane 120 GB SSDPEK1W120GA | |
|---|---|---|---|---|---|---|
| Noise | -4% | -14% | -4% | 10% | -14% | |
| wyłączone / środowisko * (dB) | 23.3 | 24.5 -5% | 23.4 -0% | 25.6 -10% | 23 1% | 28.7 -23% |
| Idle Minimum * (dB) | 27.8 | 26.5 5% | 33.2 -19% | 25.6 8% | 25.1 10% | 29 -4% |
| Idle Average * (dB) | 27.8 | 26.5 5% | 33.2 -19% | 25.6 8% | 25.1 10% | 29 -4% |
| Idle Maximum * (dB) | 27.8 | 31.1 -12% | 33.2 -19% | 25.6 8% | 25.1 10% | 29 -4% |
| Load Average * (dB) | 32 | 37.7 -18% | 38.6 -21% | 33.6 -5% | 28.6 11% | 36 -13% |
| Witcher 3 ultra * (dB) | 34.1 | 39.2 -15% | 33.6 1% | 30.1 12% | 42 -23% | |
| Load Maximum * (dB) | 39.2 | 37.5 4% | 40.8 -4% | 54.5 -39% | 34 13% | 49.4 -26% |
* ... im mniej tym lepiej
Temperatura
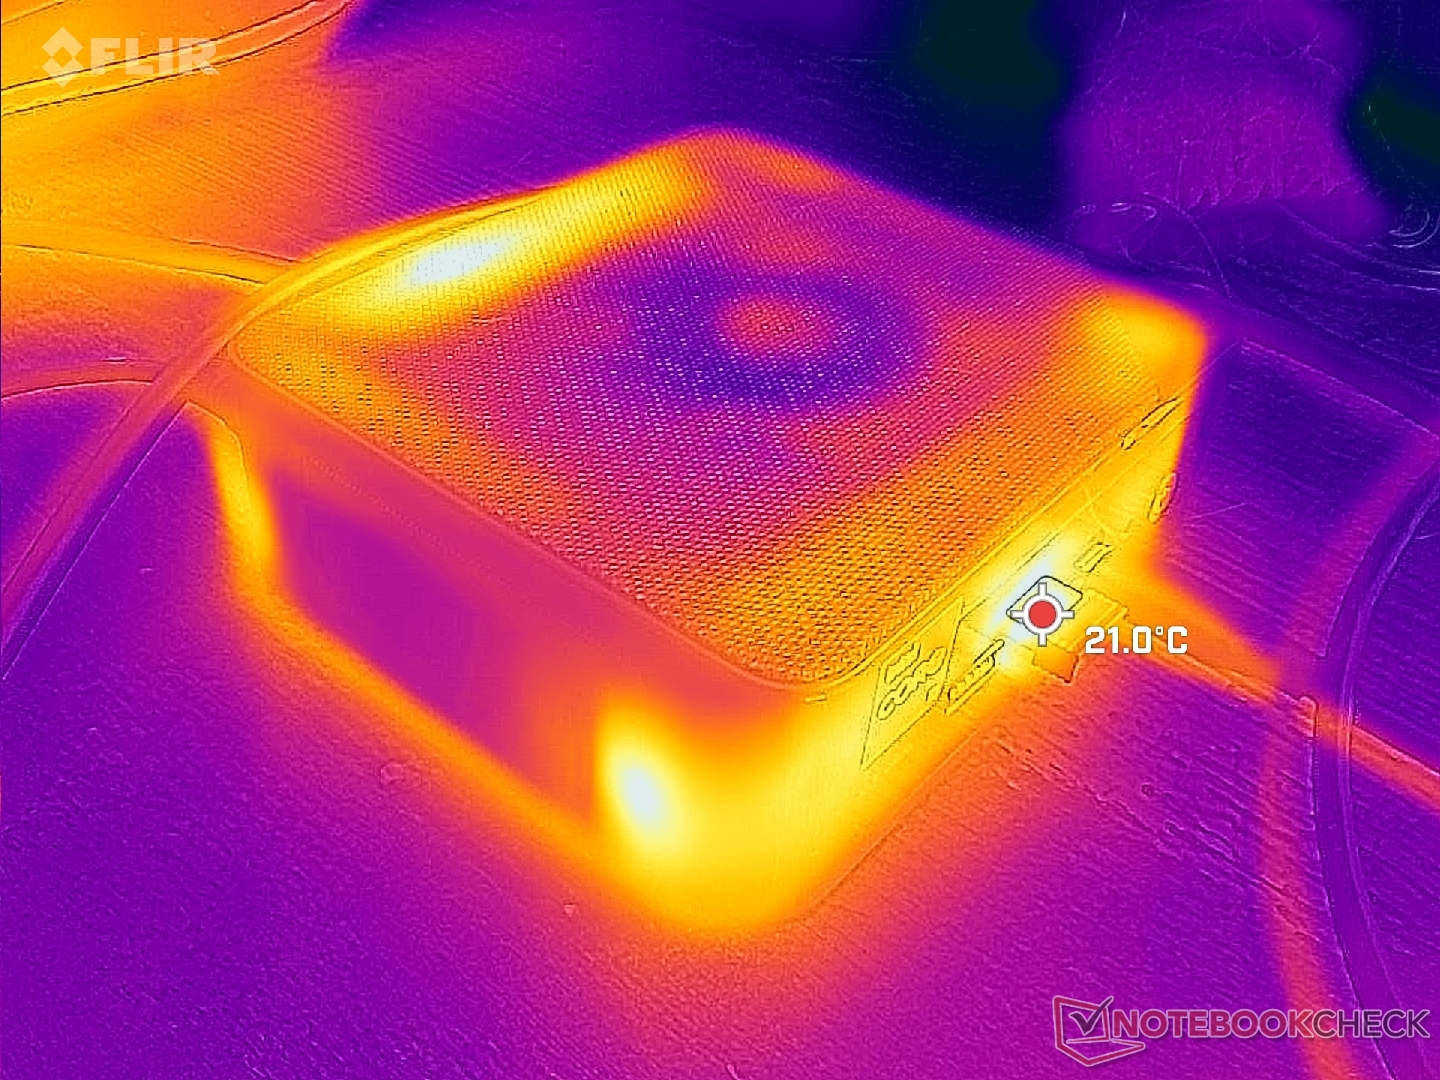
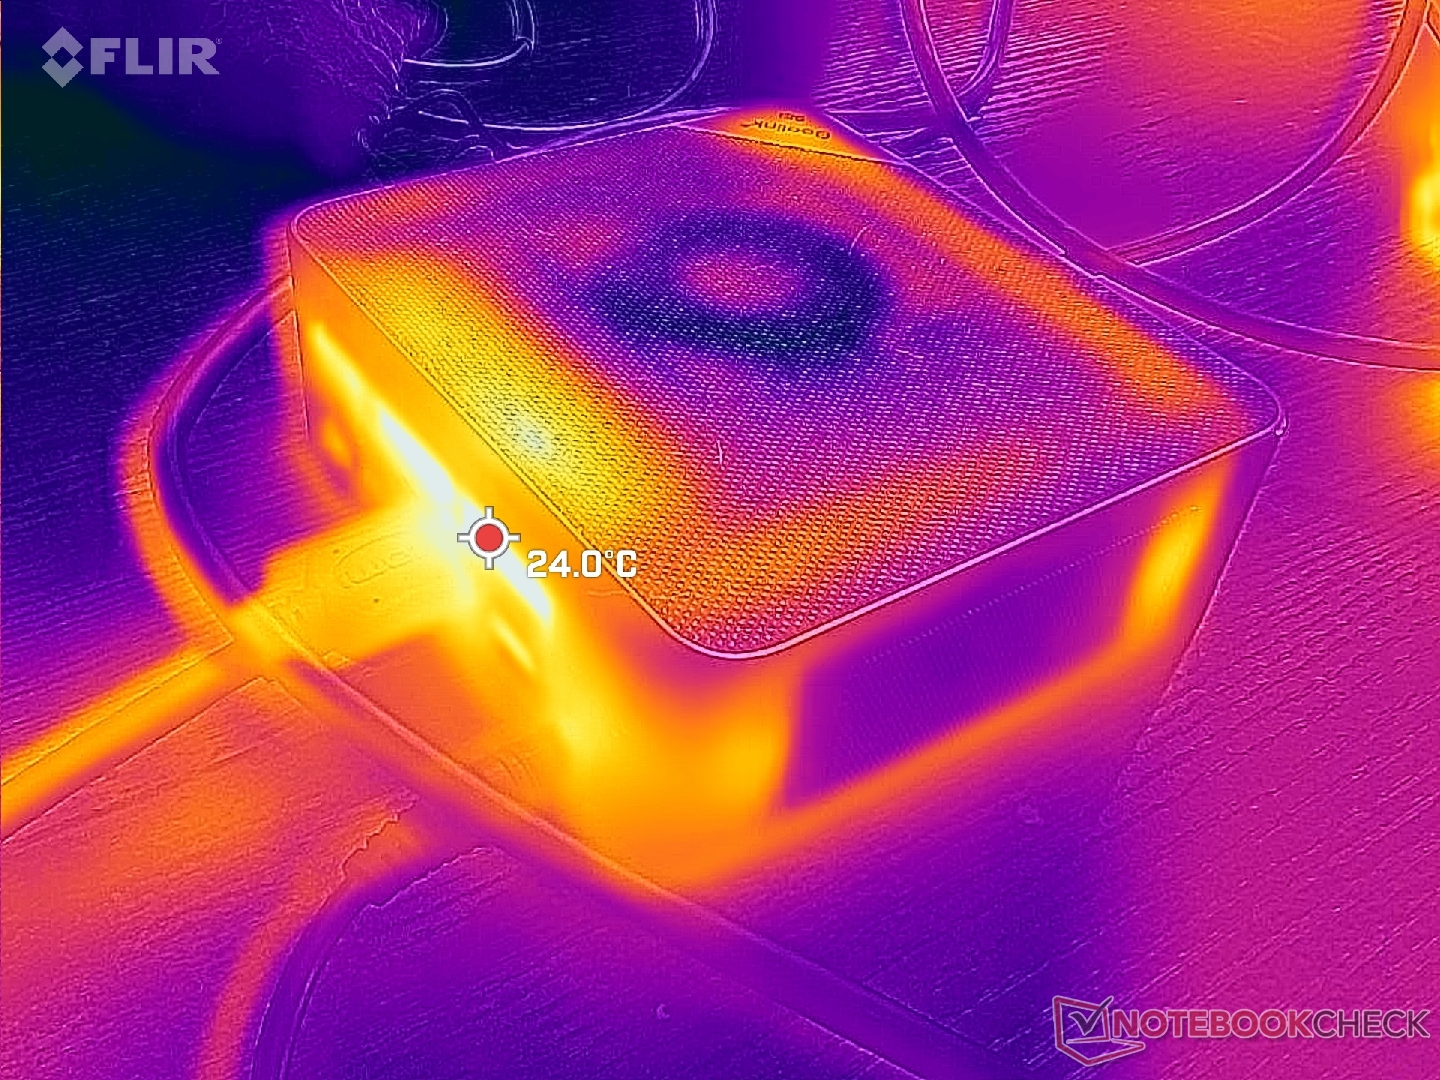
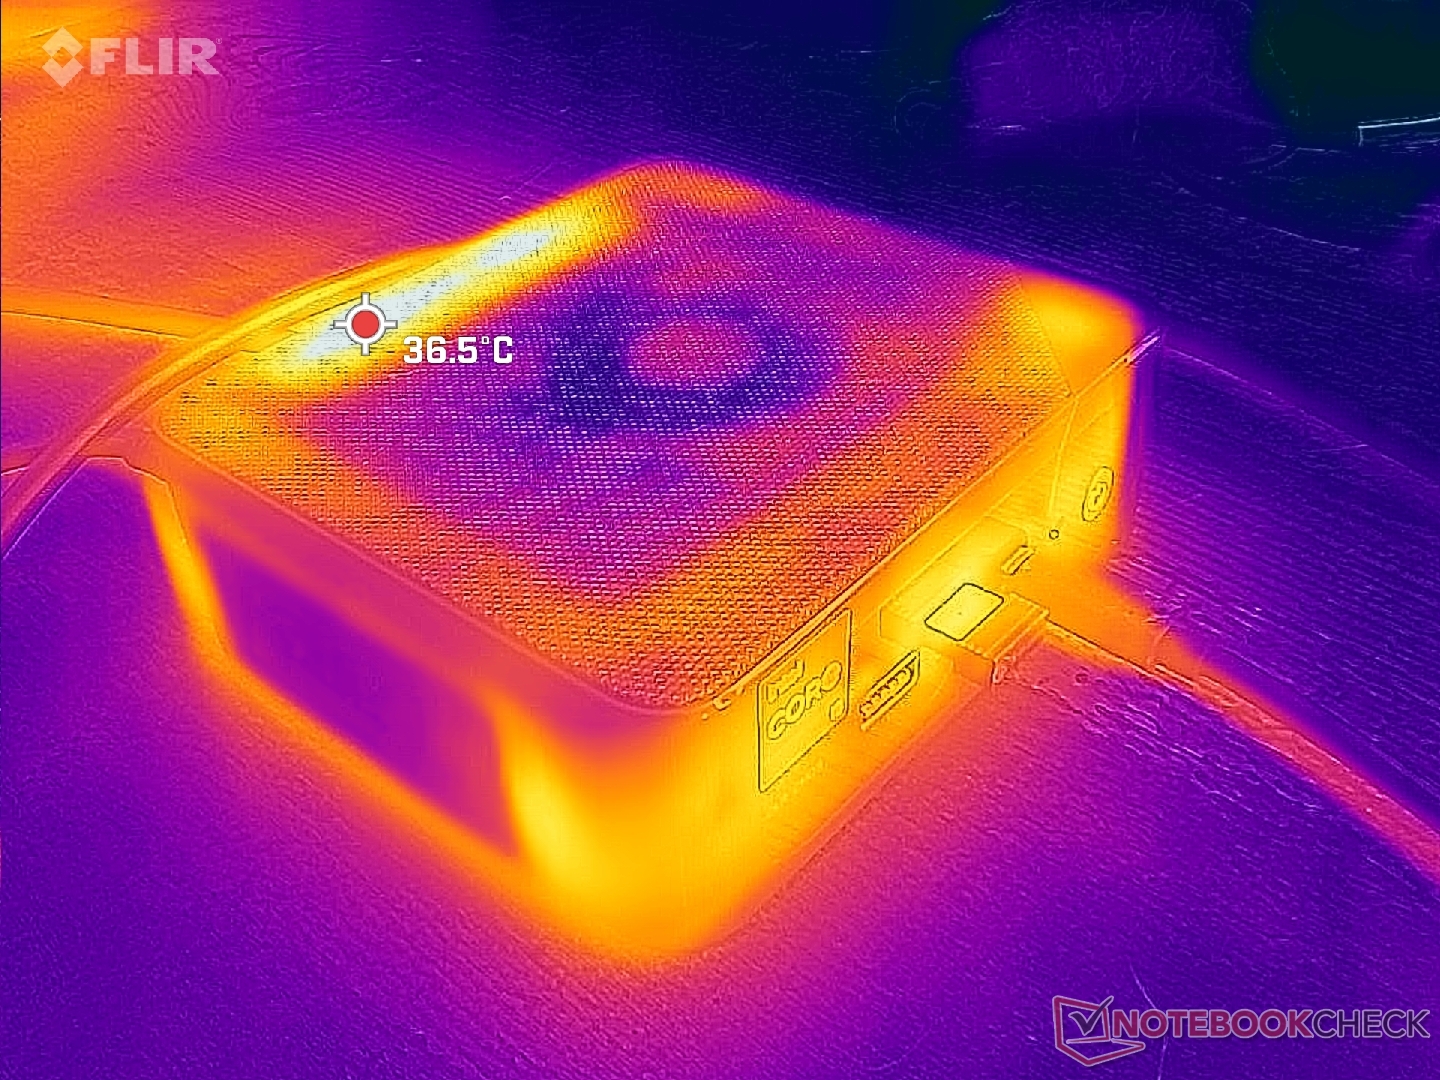
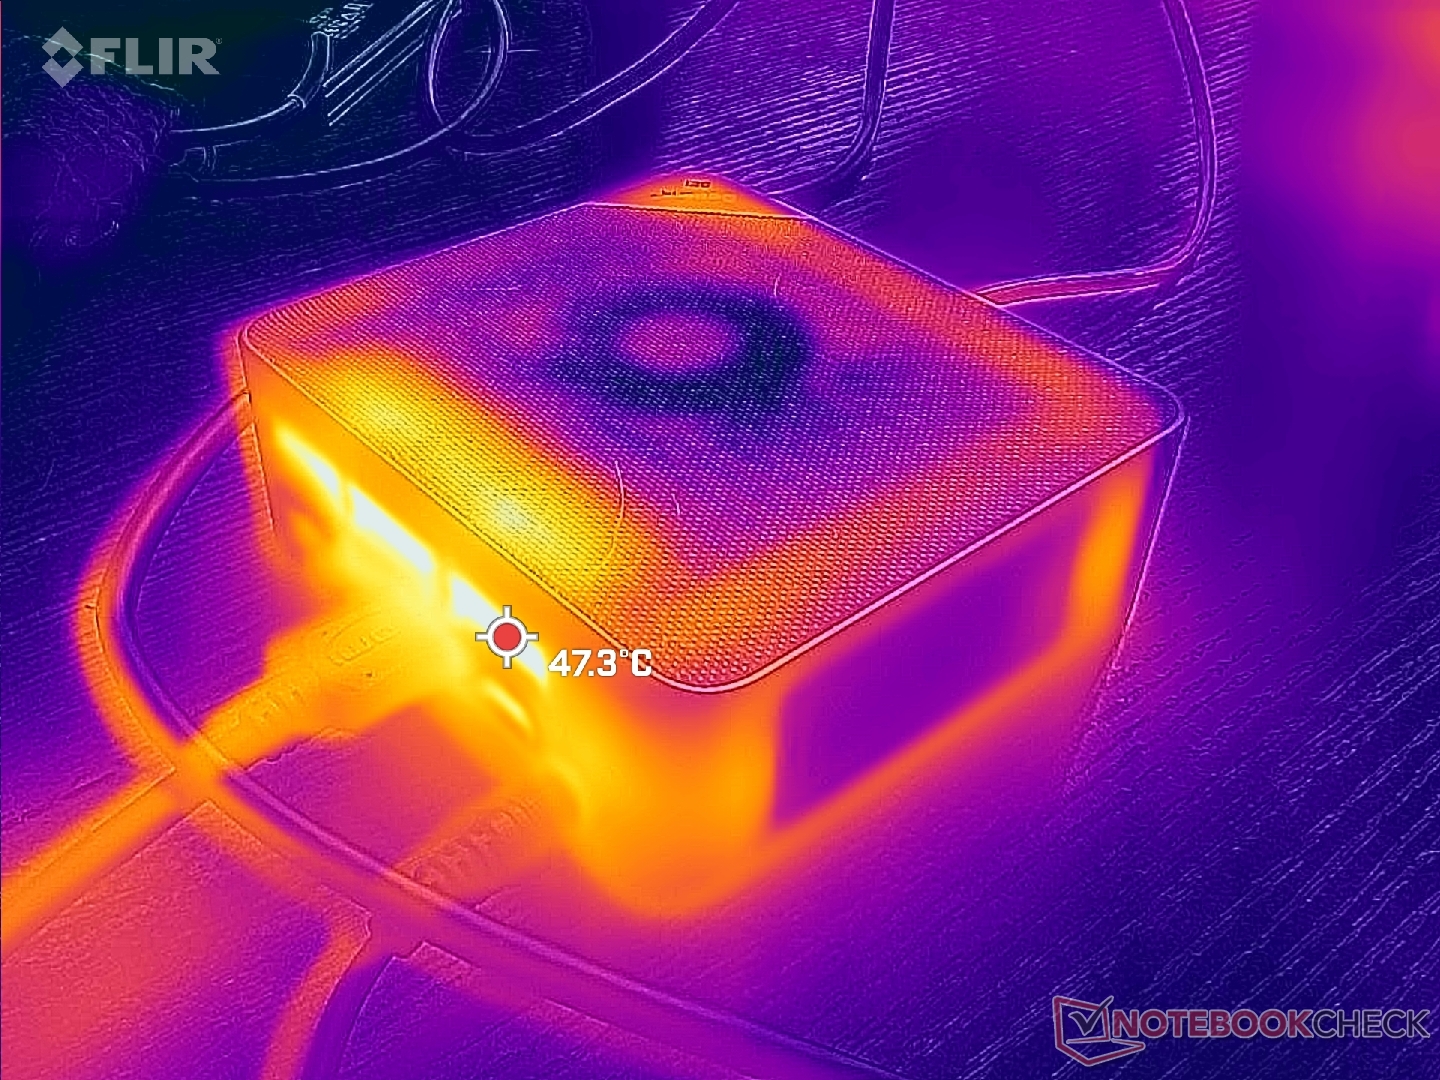
Chłodne powietrze dostaje się z boków i górnej siatki, podczas gdy ciepłe powietrze wychodzi przez tył, co pokazują poniższe mapy temperatur. Gorący punkt na tylnej ściance może osiągnąć temperaturę 47 C w przypadku wymagających zastosowań. Nie zaleca się umieszczania jakichkolwiek przedmiotów na górze urządzenia, w przeciwnym razie przepływ powietrza zostanie ograniczony.
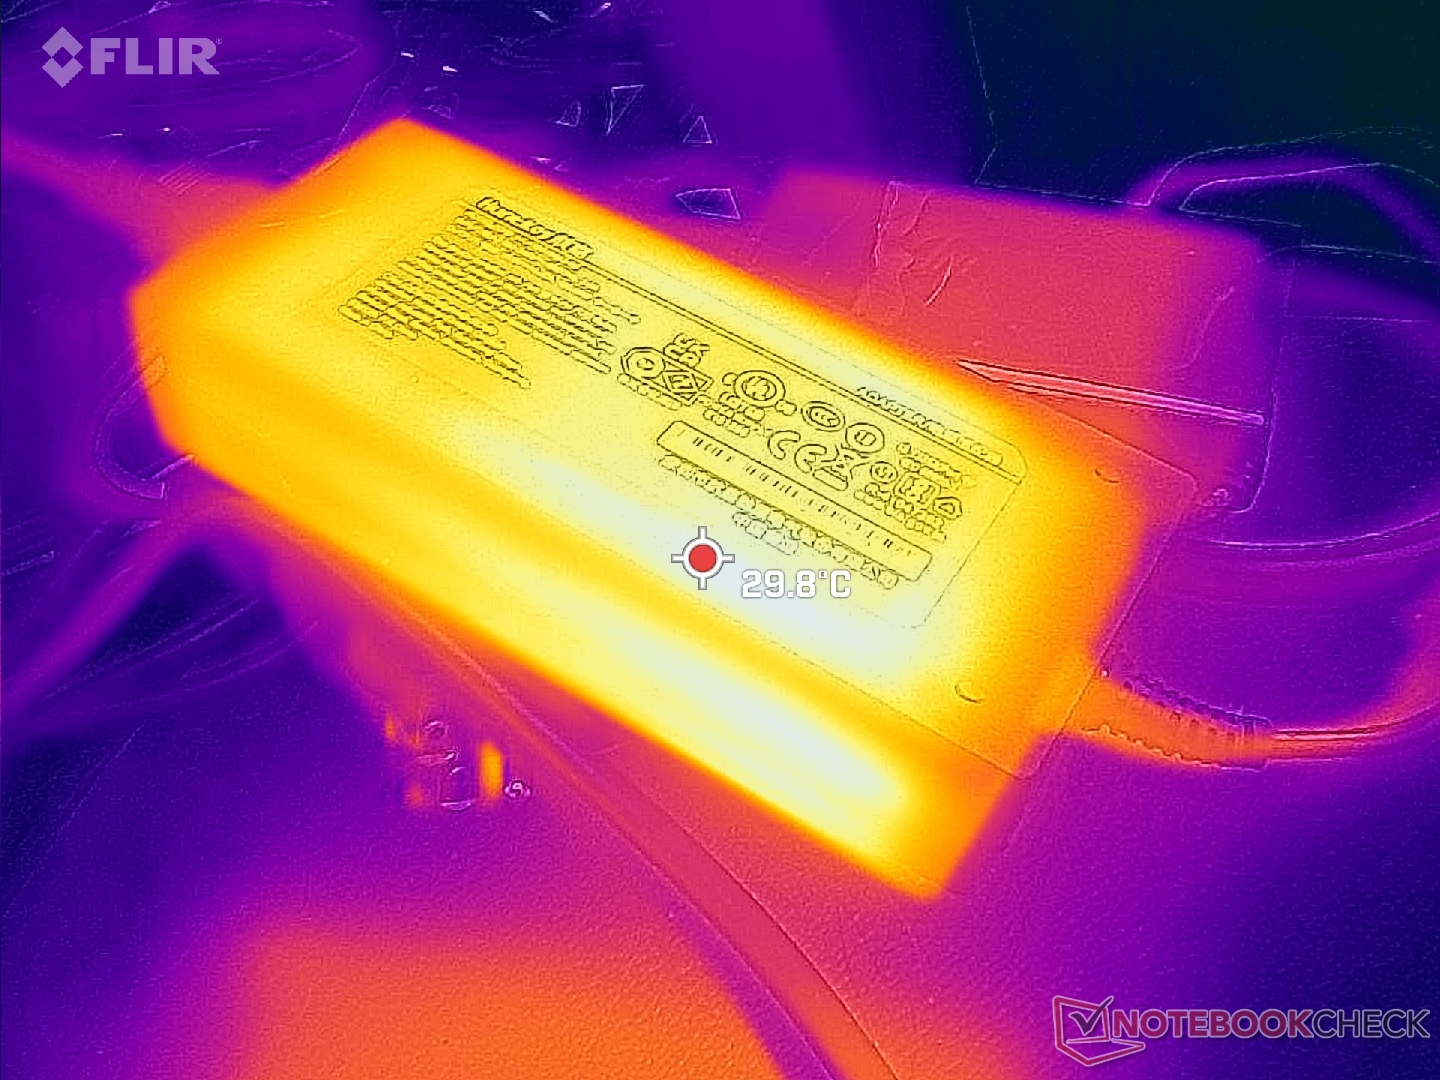
Zasilacz AC może osiągnąć temperaturę 30 C podczas długotrwałej pracy z wymagającym obciążeniem.
Stress Test
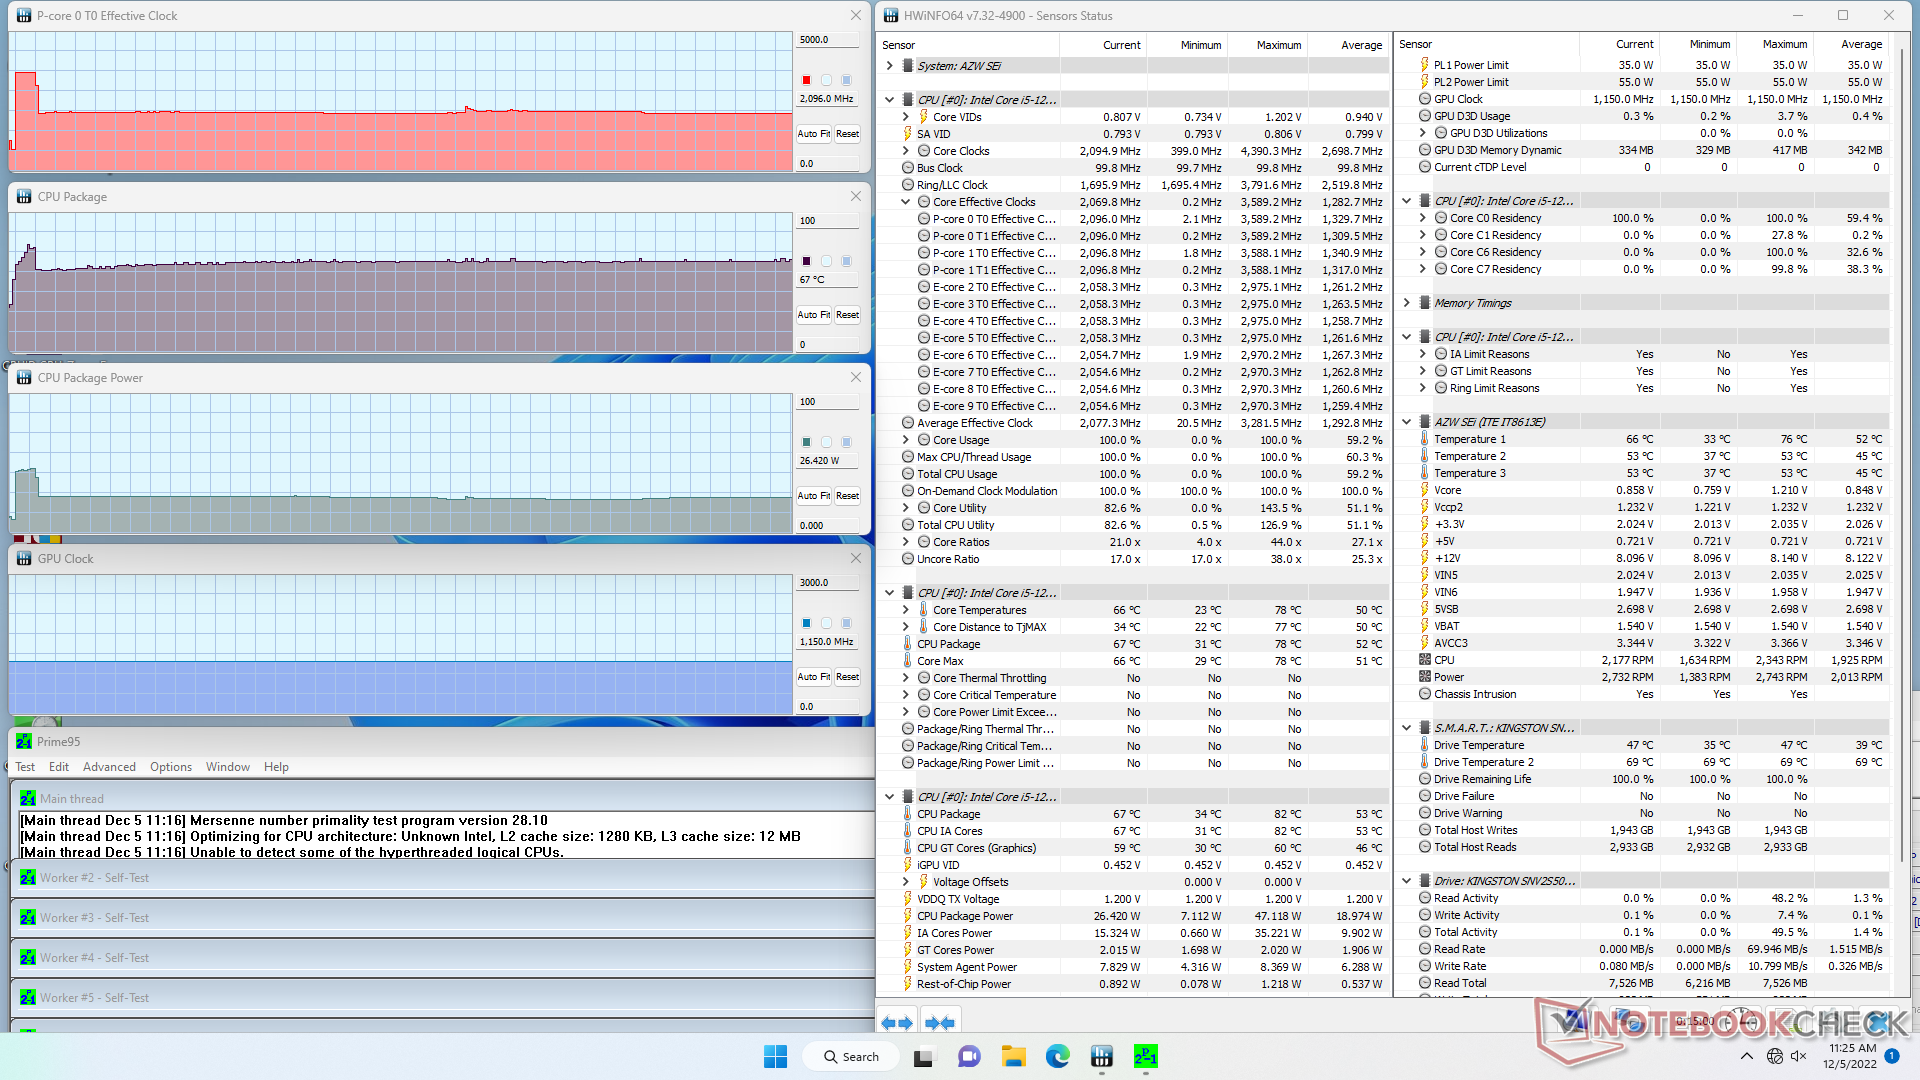
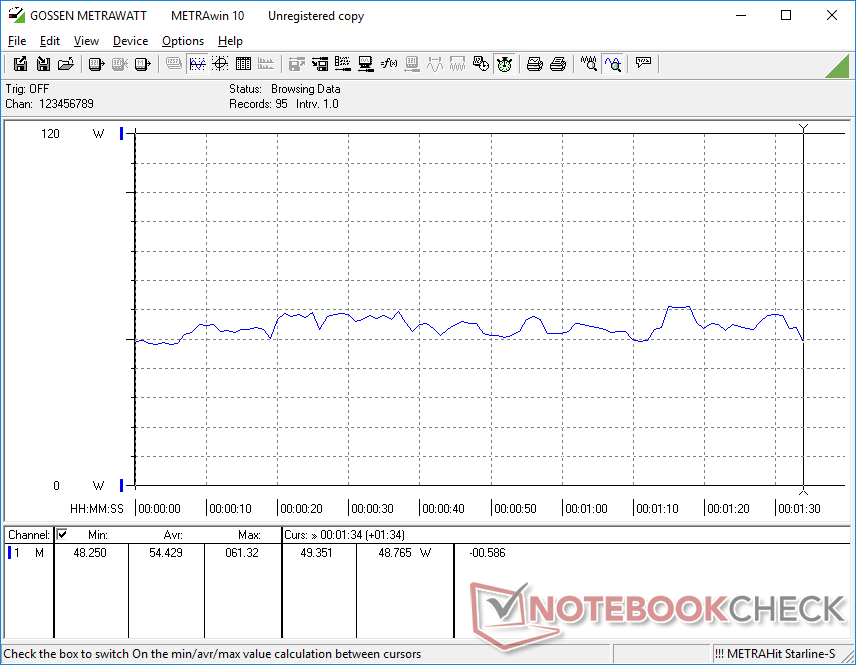
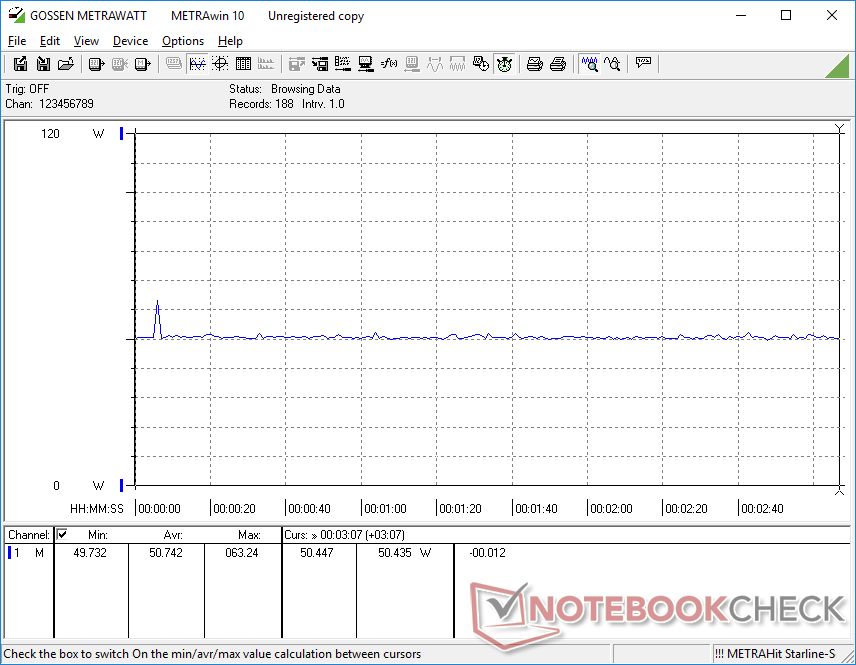
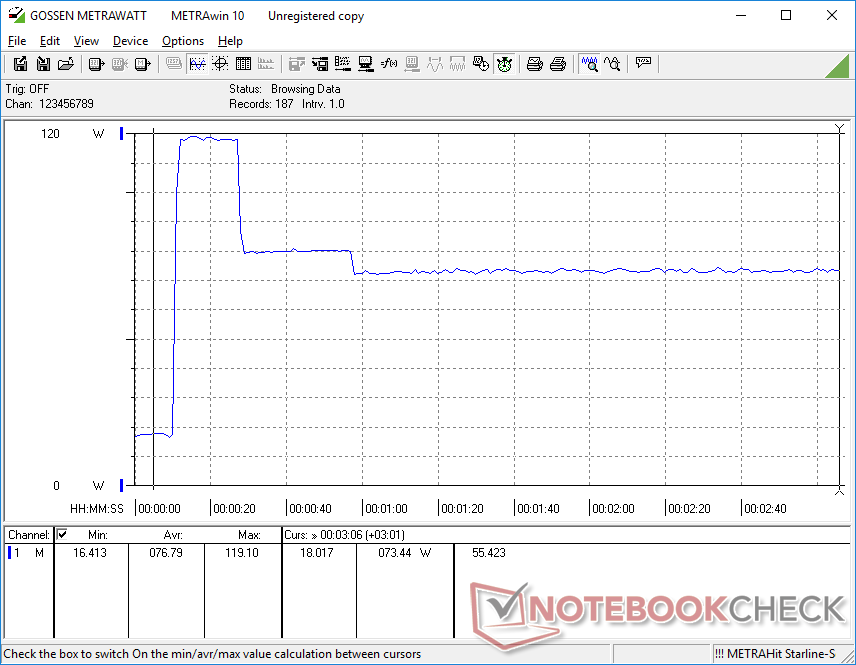
Podczas obciążenia programem Prime95 procesor zwiększa częstotliwość taktowania do 3,6 GHz przy poborze mocy 47 W. Kiedy jednak temperatura rdzenia osiągnie 76 C zaledwie kilka sekund później, częstotliwość taktowania i pobór mocy spadną odpowiednio do 2,1 GHz i 27 W, by utrzymać chłodniejszą temperaturę rdzenia na poziomie 67 C.
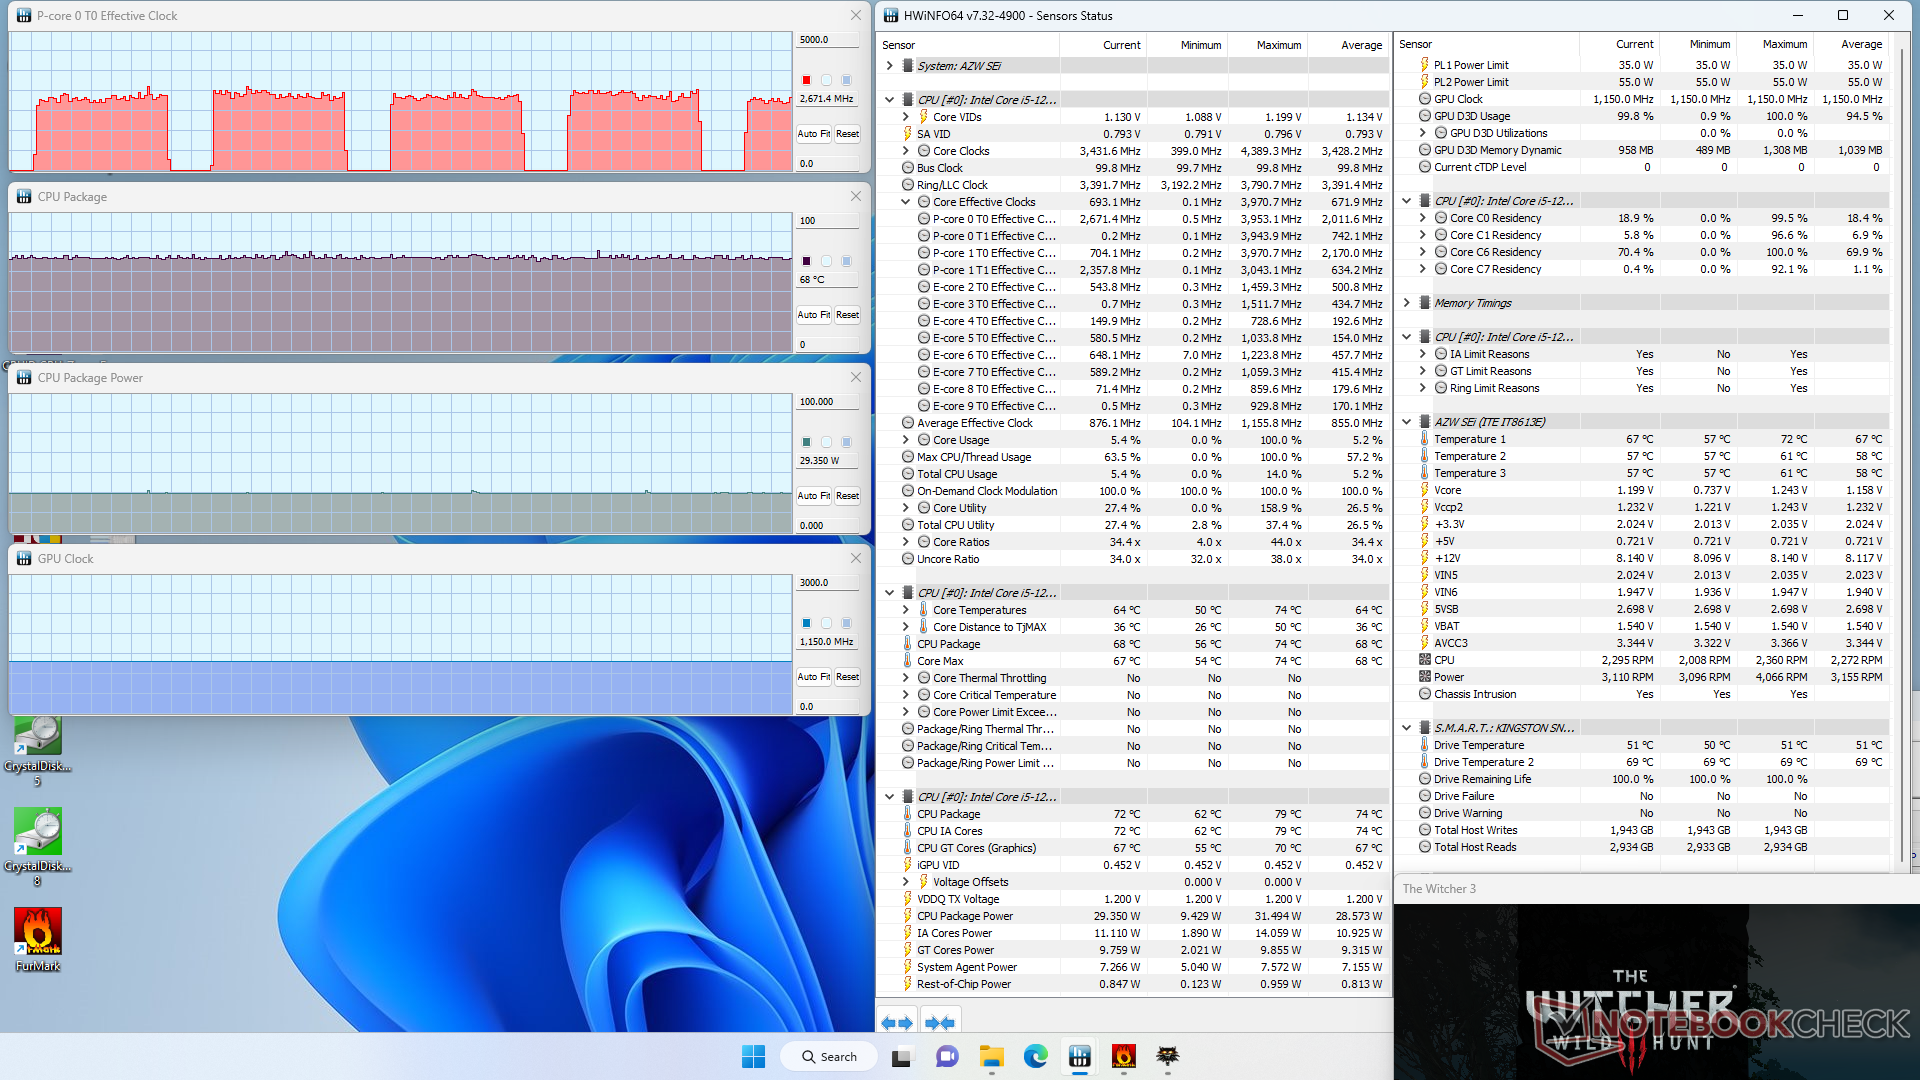
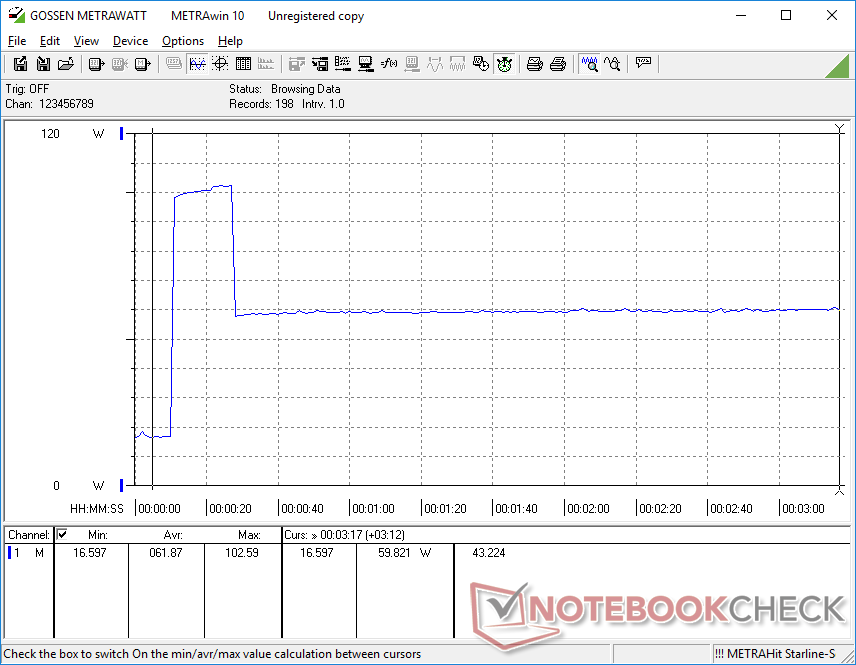
Częstotliwości taktowania GPU i temperatura podczas pracy Witcher 3 ustabilizowałyby się na poziomie odpowiednio 1150 MHz i 68 C, w porównaniu z 1300 MHz i 57 C w droższym modelu Intel NUC11PAQi7.
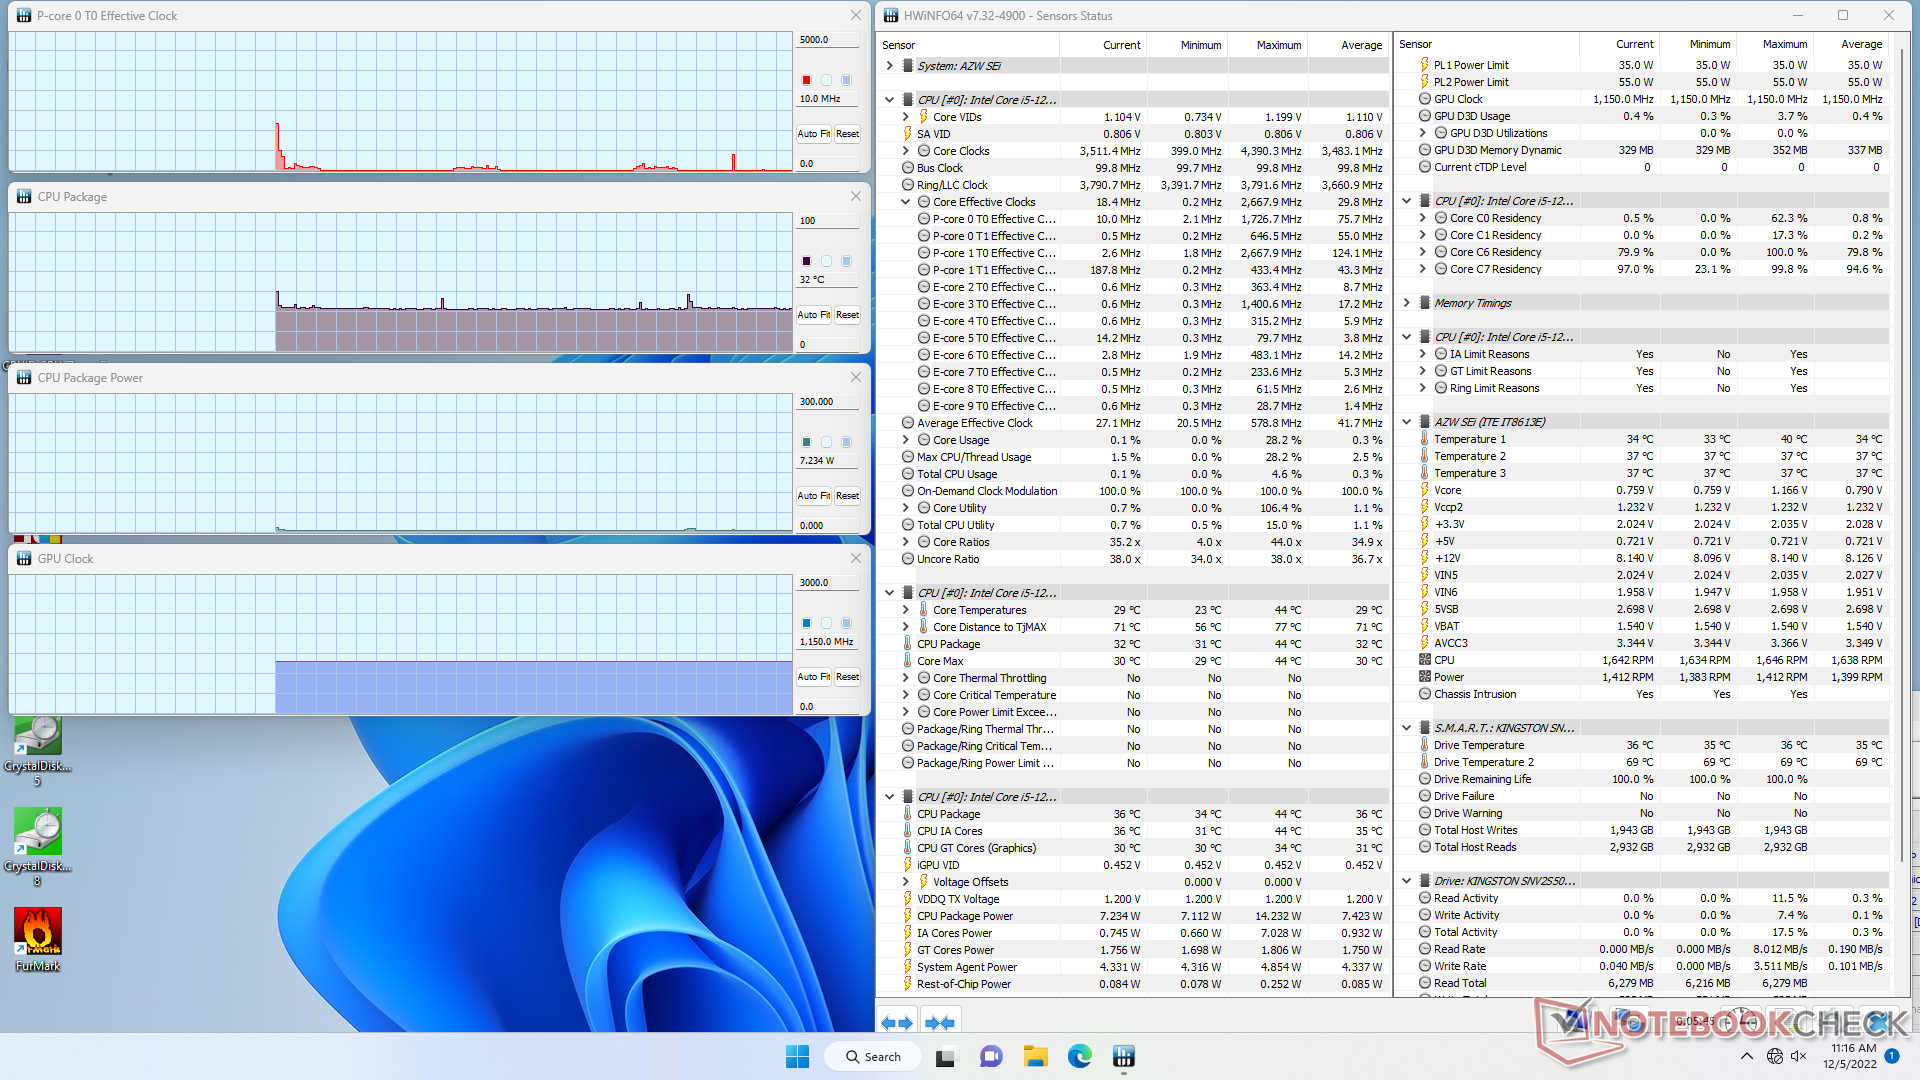
| ZegarCPU (GHz) | Zegar GPU (MHz) | Średnia temperatura CPU (°C) | |
| System Idle | -- | -- | 32 |
| Prime95 Stress | 2.1 | 1150 | 67 |
| Prime95 + FurMark Stress | 1.9 | 1150 | 75 |
| Witcher 3 Stress | ~2,6 | 1150 | 68 |
Zarządzanie energią
Pobór mocy
Pobór mocy jest stosunkowo wysoki, co może tłumaczyć większy niż oczekiwano zasilacz AC. Praca na biegu jałowym na pulpicie zużywa około 17 W, w porównaniu z mniej niż połową tej wartości w innych mini komputerach z serii U, takich jak np SER4 lub Intel NUC11. W przypadku wymagających obciążeń, takich jak gry, zużycie wynosi średnio około 50 W w porównaniu z nieco poniżej 40 W w NUC11.
| wyłączony / stan wstrzymania | |
| luz | |
| obciążenie |
|
Legenda:
min: | |
| Beelink SEi12 Core i5-1235U i5-1235U, Iris Xe G7 80EUs, Kingston NV1 SNVS/500GCN, , x, | Beelink SEi8 i3-8109U, Iris Plus Graphics 655, Intel SSD 660p SSDPEKNW512G8, , x, | Beelink SER4 R7 4800U, Vega 8, Intel SSD 660p SSDPEKNW512G8, , x, | Intel NUC11PAQi7 i7-1165G7, Iris Xe G7 96EUs, Samsung SSD 980 Pro 500GB MZ-V8P500BW, , x, | BMAX B5 Pro G7H8 i5-8260U, UHD Graphics 620, , , x, | Intel Hades Canyon NUC8i7HVK i7-8809G, Vega M GH, Intel Optane 120 GB SSDPEK1W120GA, , x, | |
|---|---|---|---|---|---|---|
| Power Consumption | 49% | 59% | 49% | 49% | -38% | |
| Idle Minimum * (Watt) | 15.8 | 7.5 53% | 4.1 74% | 5.6 65% | 6 62% | 15.5 2% |
| Idle Average * (Watt) | 16.8 | 7.6 55% | 4.1 76% | 5.6 67% | 6.2 63% | 16.2 4% |
| Idle Maximum * (Watt) | 17 | 9.2 46% | 4.6 73% | 6 65% | 6.3 63% | 16.5 3% |
| Load Average * (Watt) | 54.4 | 41.1 24% | 35.6 35% | 31.4 42% | 42.8 21% | 83.4 -53% |
| Witcher 3 ultra * (Watt) | 50.7 | 35.6 30% | 39 23% | 35 31% | 121.7 -140% | |
| Load Maximum * (Watt) | 119.1 | 41.4 65% | 39.9 66% | 80.5 32% | 55.8 53% | 173.5 -46% |
* ... im mniej tym lepiej
Power Consumption Witcher 3 / Stresstest
Power Consumption external Monitor
Warning: More than one pro / contra elements for this language found
Za
Przeciw
Werdykt - niska cena bez cięć w wydajności
SEi12 oferuje porównywalny, a często nawet lepszy poziom wydajności niż Intel NUC11 z procesorem Core U, a jednocześnie kosztuje znacznie mniej. Na przykład NUC11PAH z procesorem Core i5-1135G7, 16 GB RAM i 256 GB SSD kosztuje obecnie 550 dolarów, podczas gdy nasz SEi12 z podwójną ilością pamięci masowej kosztuje zaledwie 400 dolarów. Model ten nie opiera się na przerażająco powolnych Celeronach czy Atomach, aby osiągnąć atrakcyjną cenę i to pozostaje kluczowym punktem sprzedaży dla wielu mini PC od Beelink.
Brak wsparcia dla Thunderbolt jest rozczarowujący, ale prawdopodobnie wpłynie to tylko na entuzjastów, którzy chcą połączyć łańcuchy monitorów o wysokiej rozdzielczości lub podłączyć eGPU. Co warte, Intel zaczyna walczyć z tym problemem, oferując w najnowszej serii NUC12 jeszcze szybsze procesory Core P. Jeśli jesteś zadowolony z wydajności nowoczesnego Ultrabooka, to Core i5-1235U w SEi12 będzie nadal więcej niż wystarczający i na pewno znacznie szybszy niż większość mini PC w tym samym przedziale cenowym.
Cena i dostępność
Beelink SEi12 jest obecnie w sprzedaży za 400 USD na Amazon w dół od jego początkowej ceny 480 USD. Alternatywnie, użytkownicy mogą kupić bezpośrednio od producenta za 460 USD.
Price comparison

