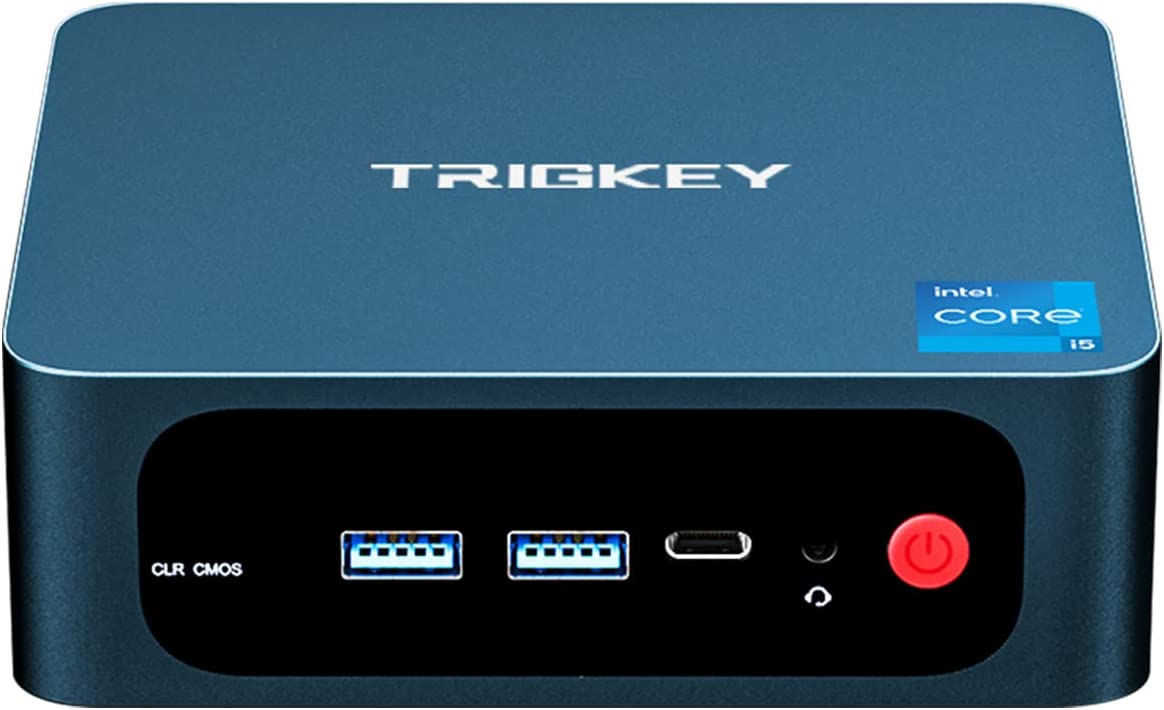
Recenzja Trigkey Speed S: Gotowy do pracy mini PC z Core i5-11320H za niską cenę
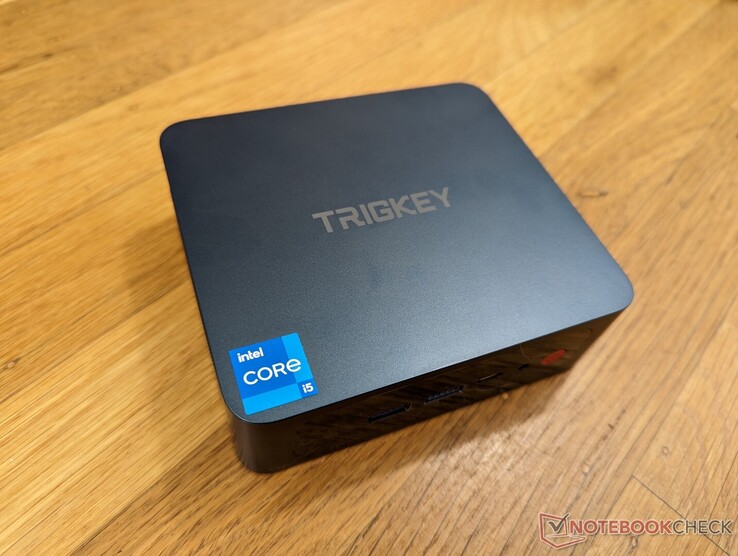
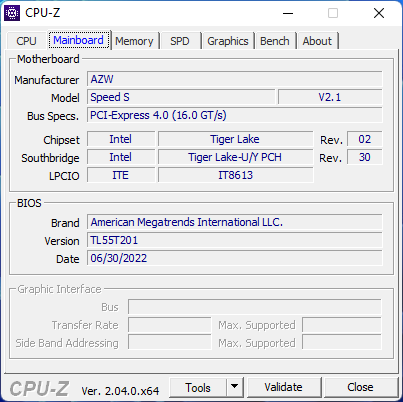
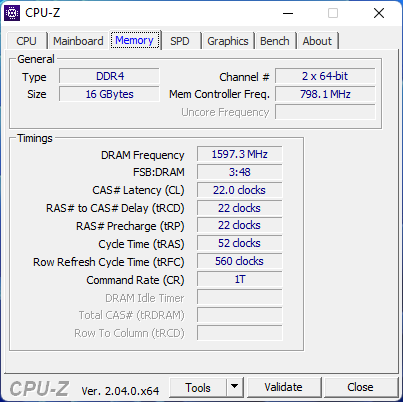
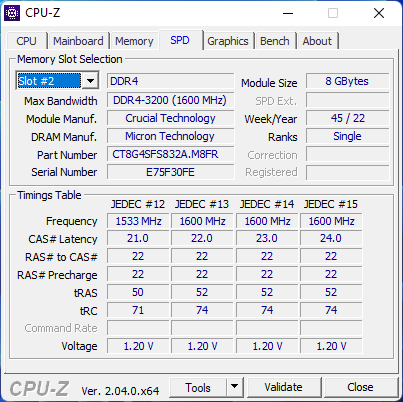
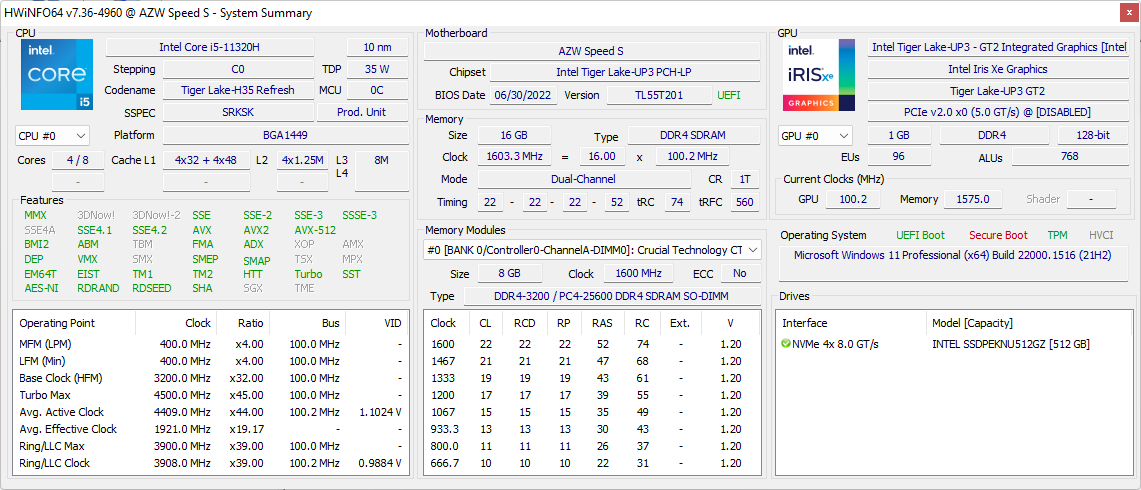
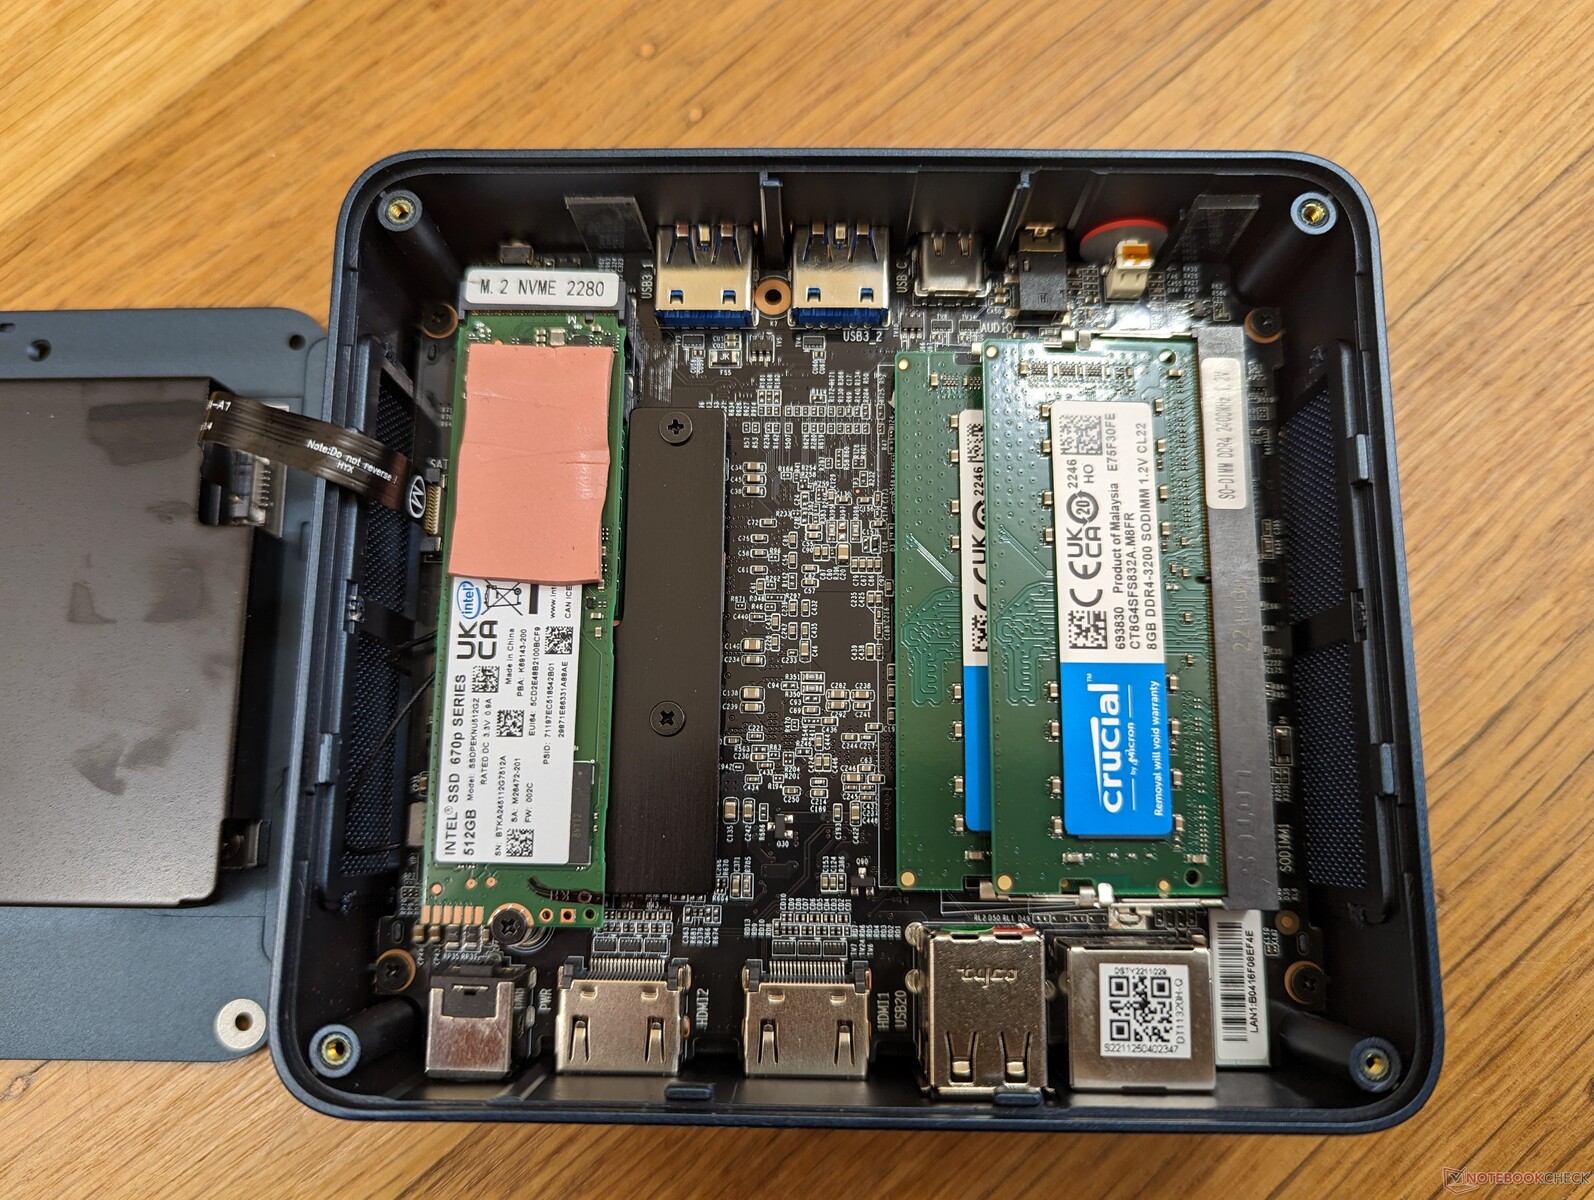
Trigkey Speed S to szybsza wersja Trigkey S3. Zamiast starzejącego się Ryzen 5 3550Hspeed S wykorzystuje 11 gen Core i5-11320H utrzymując cenę w bardzo przystępnym przedziale poniżej 400 dolarów. Nasza konkretna konfiguracja recenzencka jest wyposażona w 16 GB pamięci RAM DDR4-3200 i dysk SSD M.2 PCIe3 x4 o pojemności 512 GB.
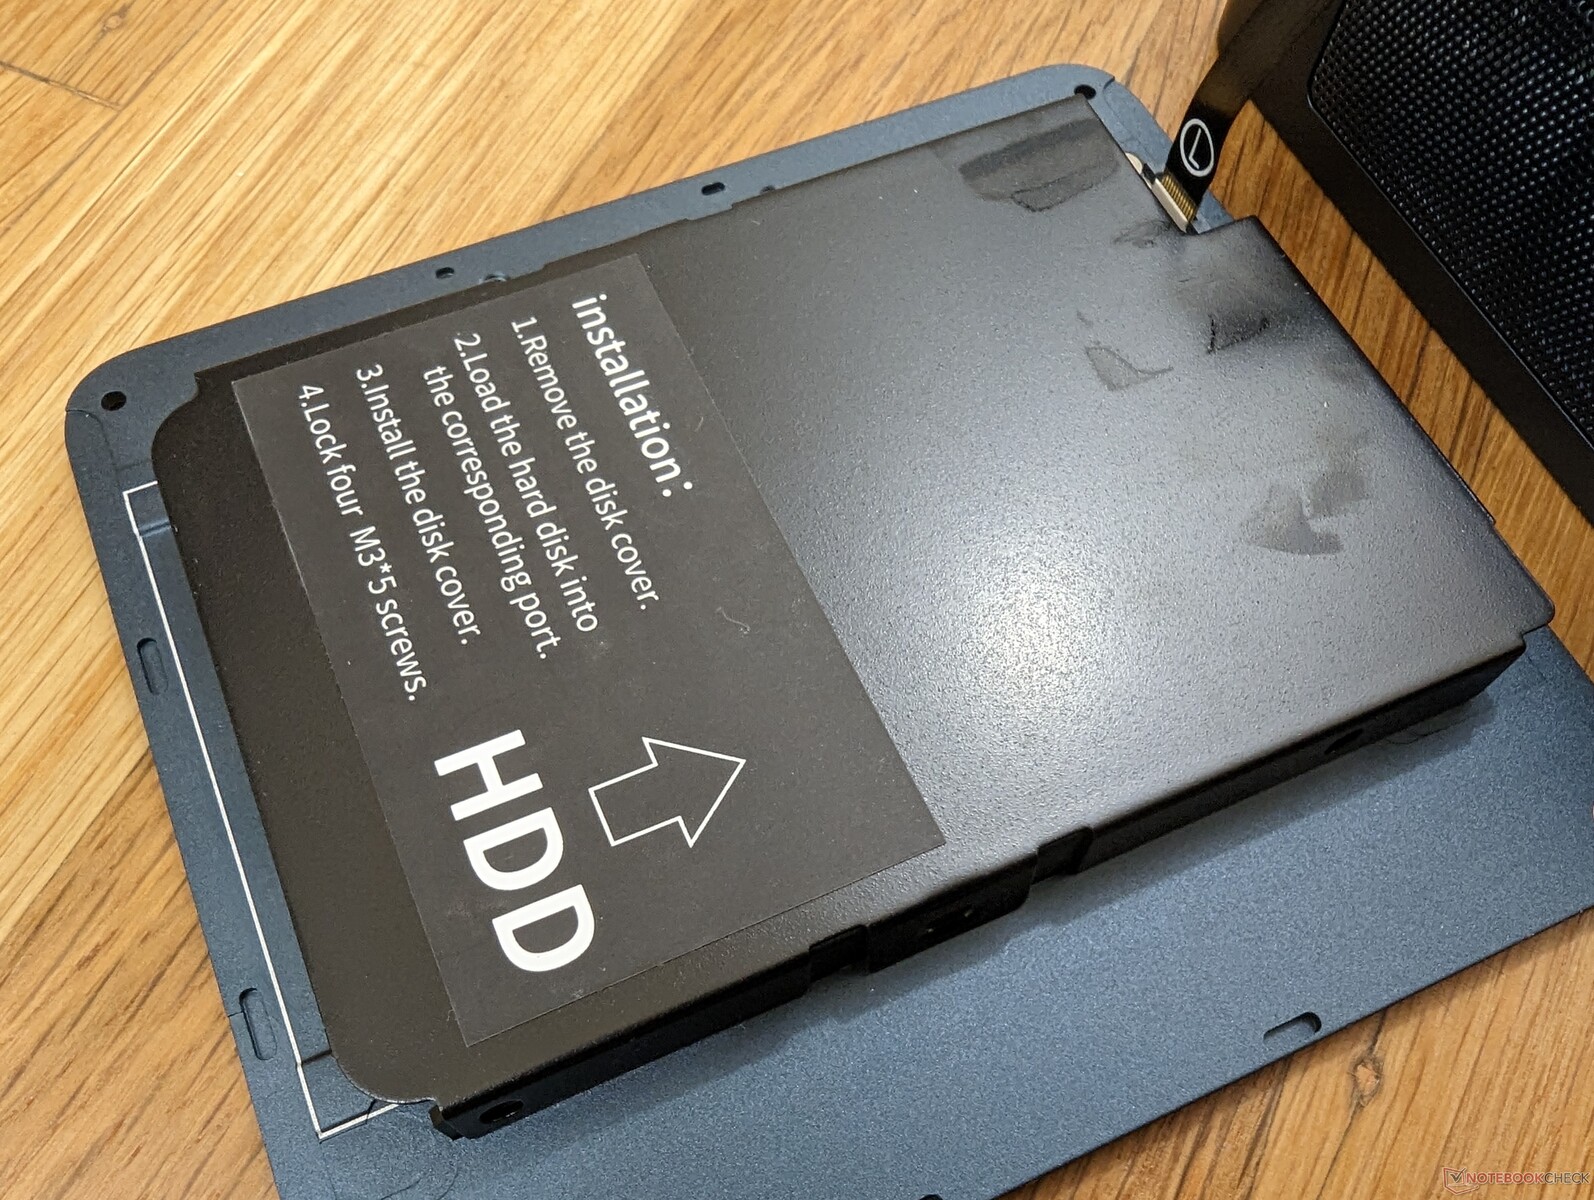
Poza powyższymi różnicami, Speed S ma taką samą konstrukcję obudowy i funkcje jak S3, dlatego zalecamy sprawdzenie naszej recenzji modelu S3 istniejącą recenzję S3 aby dowiedzieć się więcej o cechach fizycznych tej serii. Ta recenzja pokaże, jakich korzyści w zakresie wydajności mogą oczekiwać użytkownicy obu modeli.
Alternatywą dla Speed S są inne budżetowe mini PC, takie jak BMax B5 Pro i Beelink SEi lub Seria SER.
Więcej recenzji Trigkey:
Potencjalni konkurenci w porównaniu
Ocena | Data | Model | Waga | Wysokość | Rozmiar | Rezolucja | Cena |
|---|---|---|---|---|---|---|---|
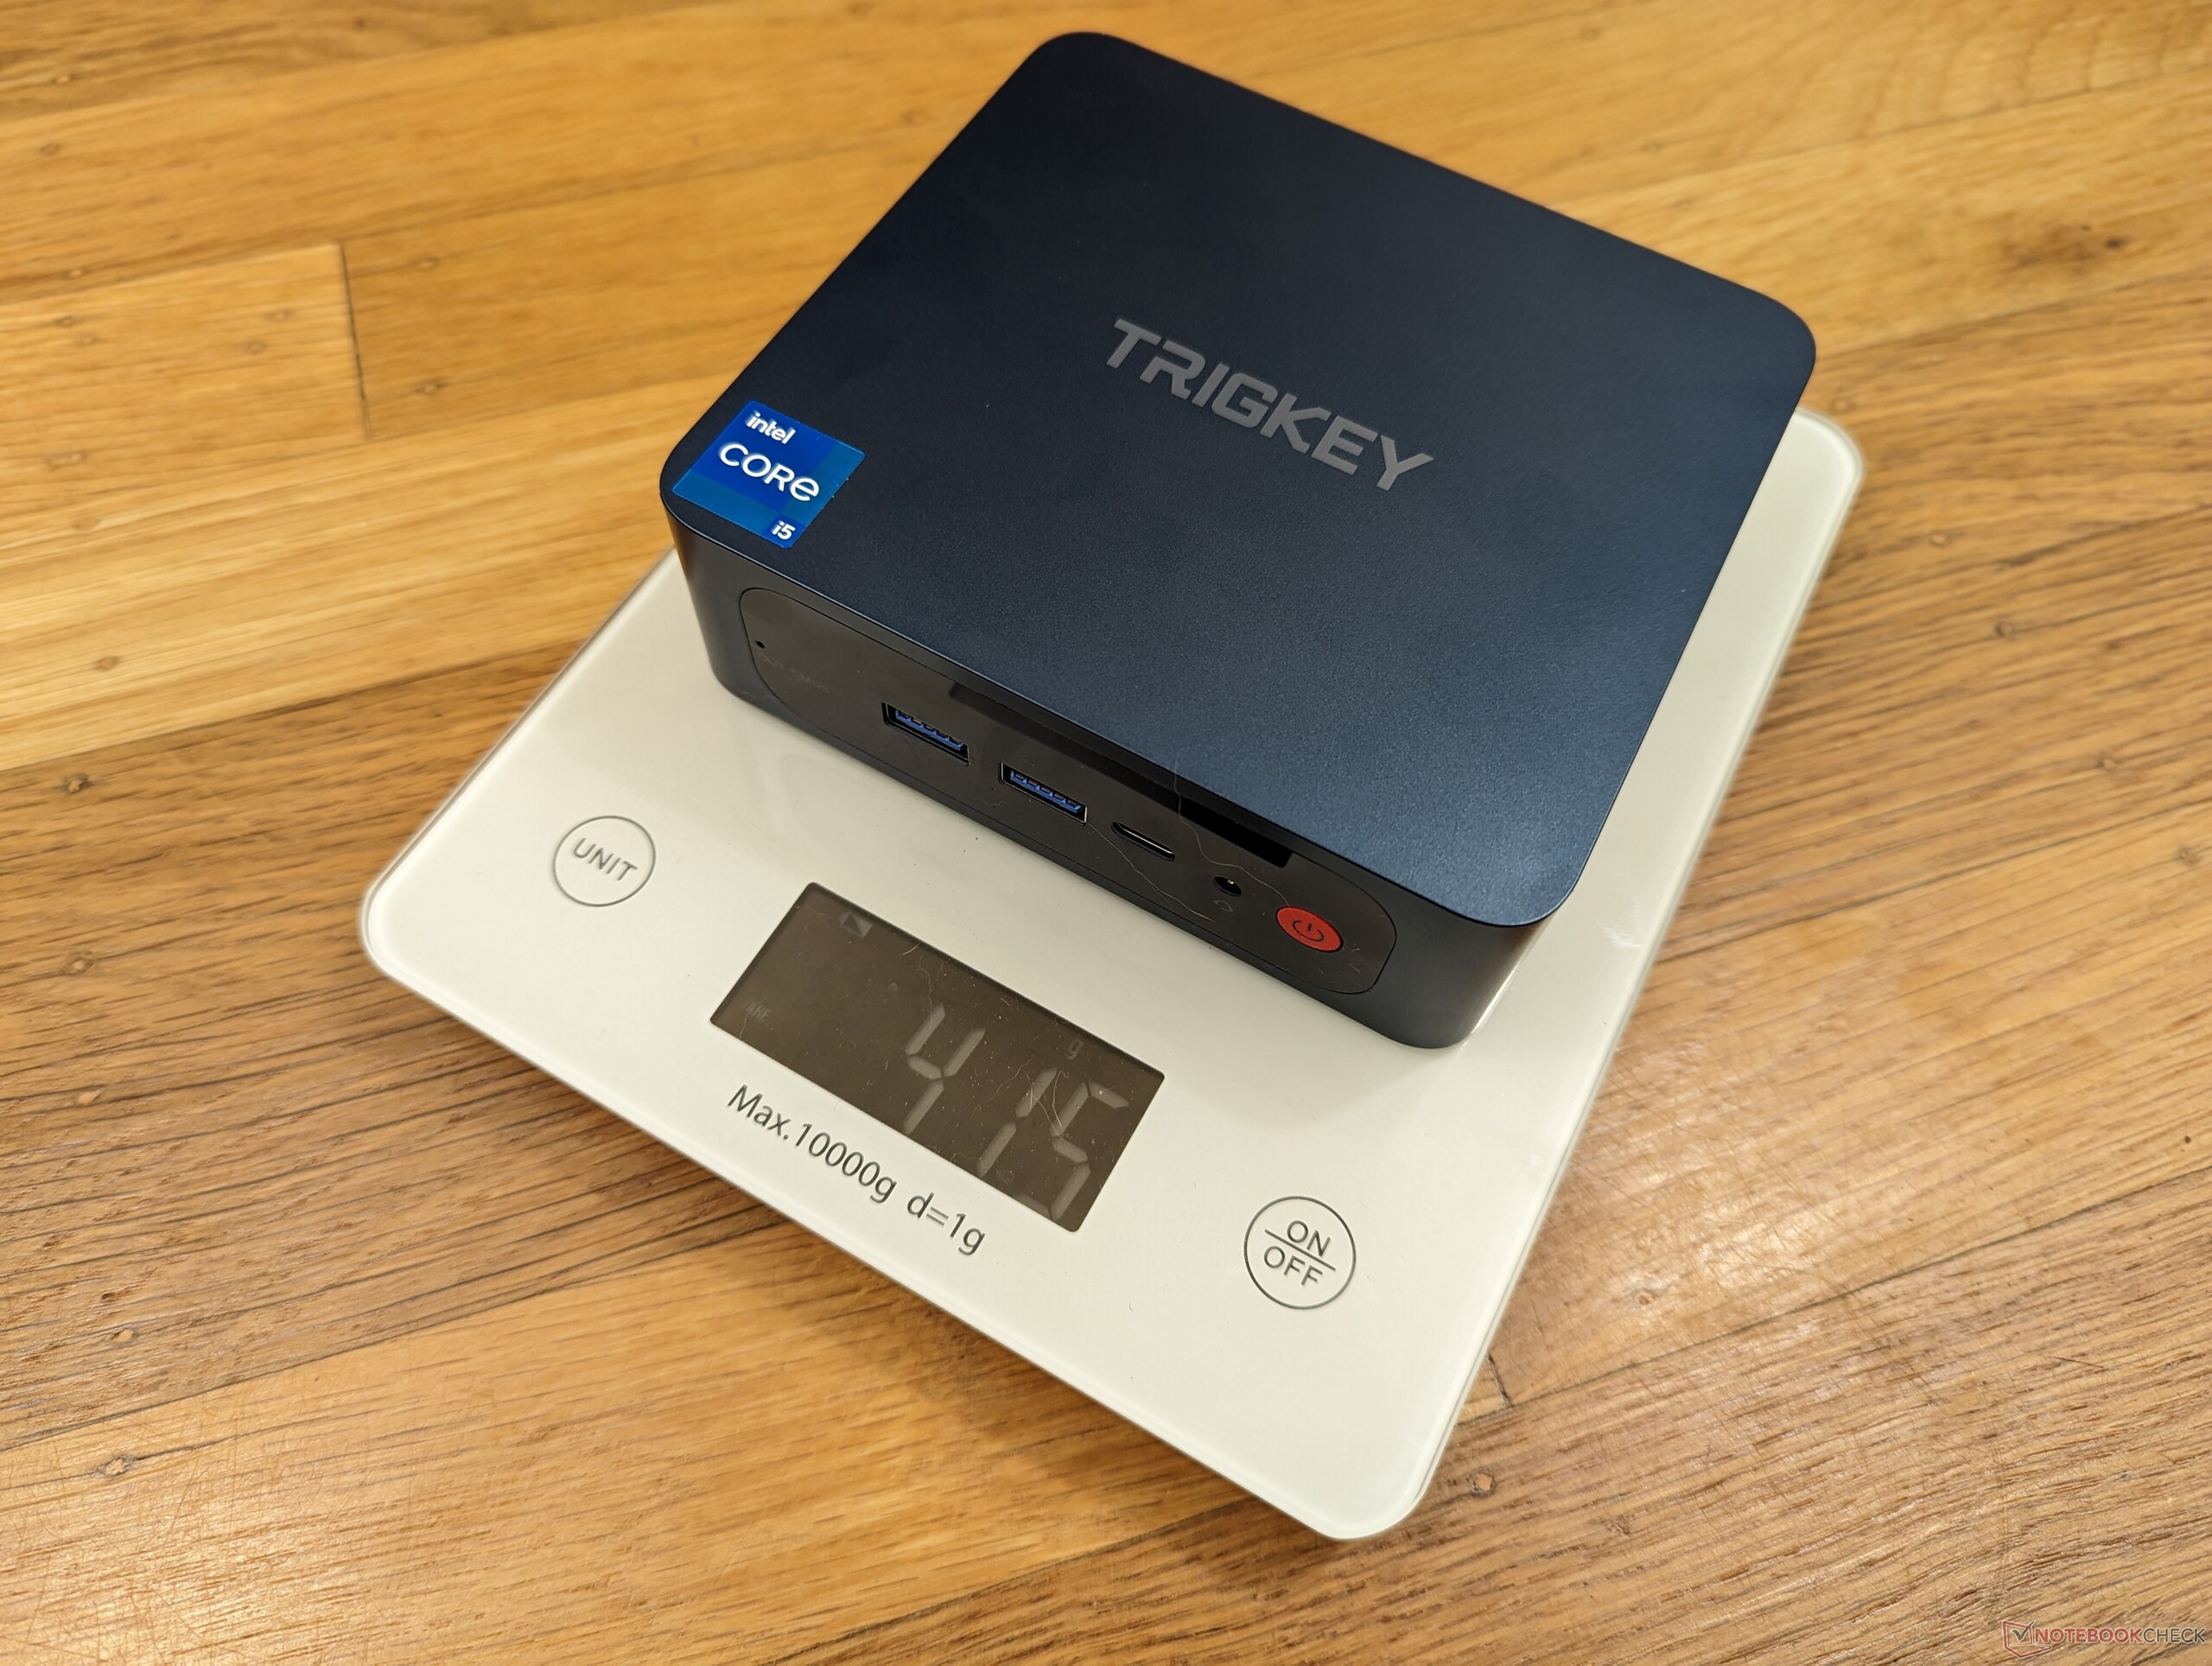
v (old) | 03/2023 | Trigkey Speed S i5-11320H, Iris Xe G7 96EUs | 415 g | 40.7 mm | x | ||
v (old) | 01/2023 | Trigkey S3 R5 3550H, Vega 8 | 419 g | 40.7 mm | x | ||
v (old) | 12/2022 | Beelink SEi12 Core i5-1235U i5-1235U, Iris Xe G7 80EUs | 465 g | 42 mm | x | ||
v (old) | 10/2022 | Beelink SER Pro Ryzen 5 5600H R5 5600H, Vega 7 | 498 g | 42 mm | x | ||
| 78.9 % v7 (old) | 11/2022 | Intel NUC 12 Pro Kit NUC12WSKi7 i7-1260P, Iris Xe G7 96EUs | 511 g | 37 mm | x | ||
v (old) | 11/2022 | BMAX B5 Pro G7H8 i5-8260U, UHD Graphics 620 | 369 g | 43.2 mm | x |
Sprawa
Komunikacja
Wydajność sieci bezprzewodowej waha się bardziej niż oczekiwano, co pokazuje poniższy wykres, nawet po wielokrotnym ponawianiu prób. Mimo to jest wystarczająco szybka do strumieniowania wideo 4K.
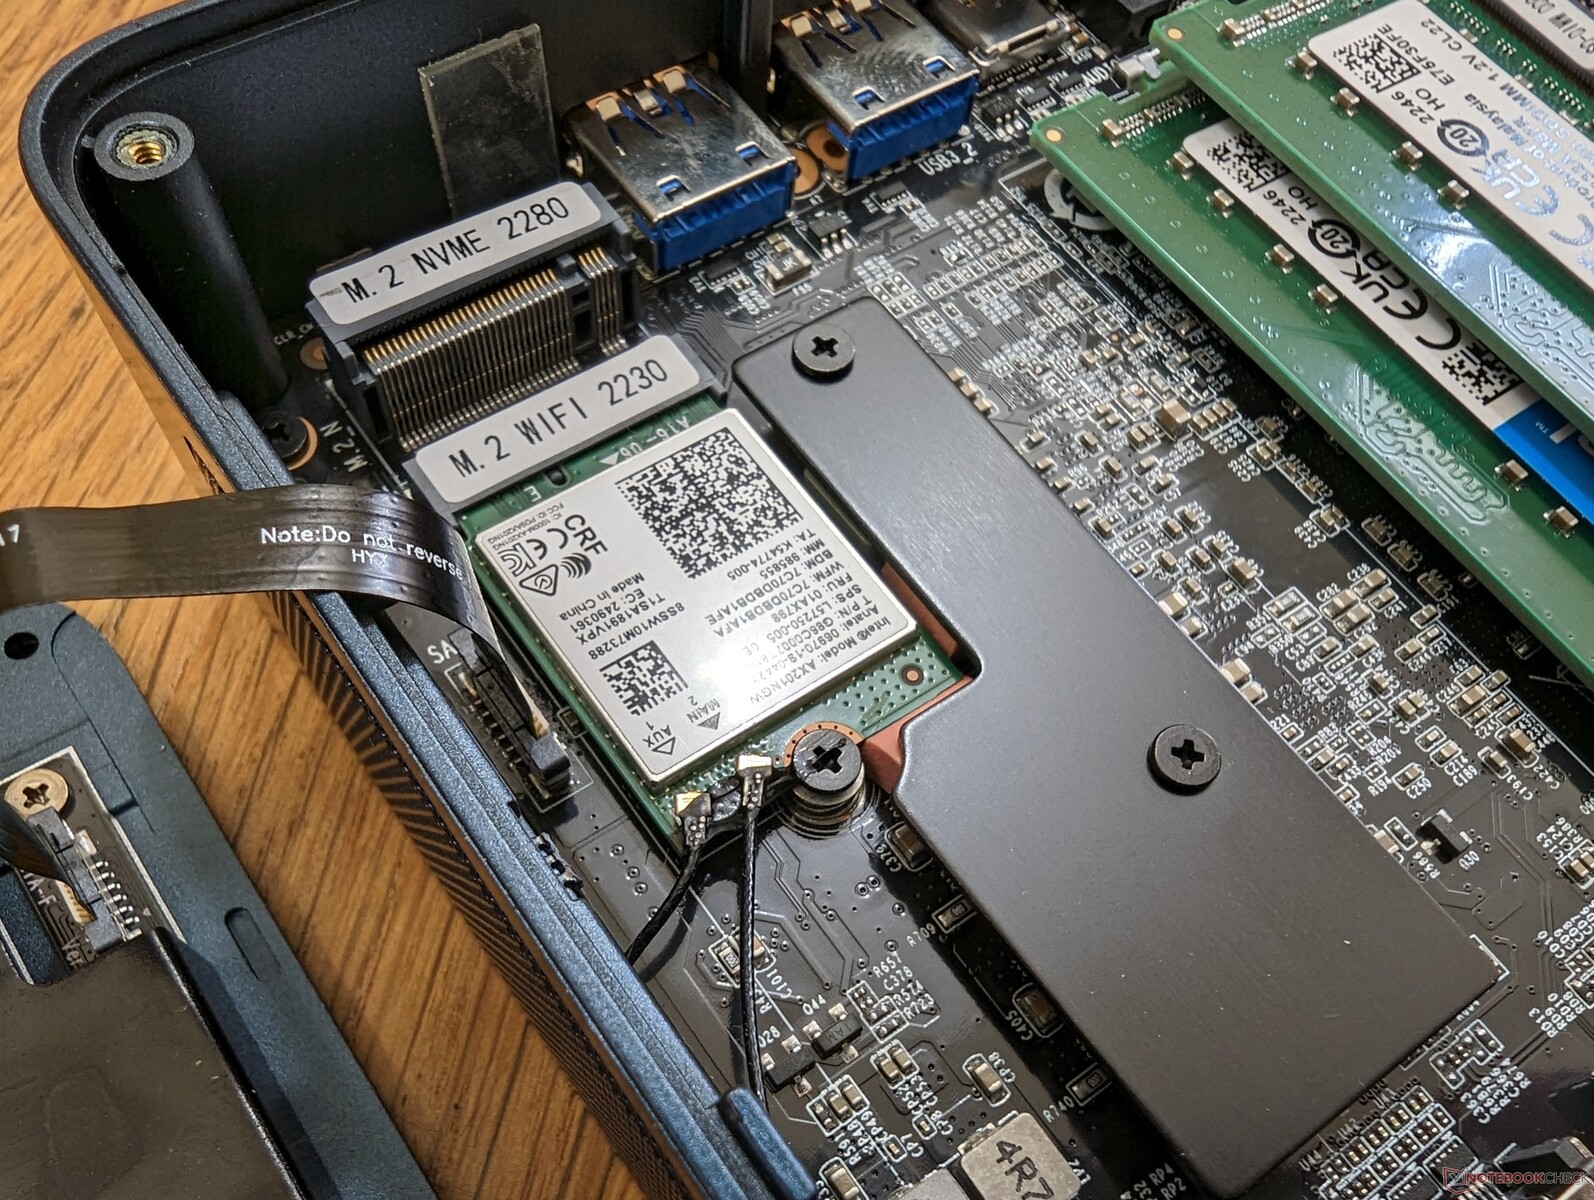
Intel AX201 nie obsługuje Wi-Fi 6E.
| Networking | |
| iperf3 transmit AXE11000 | |
| Beelink SEi12 Core i5-1235U | |
| Trigkey Speed S | |
| BMAX B5 Pro G7H8 | |
| Trigkey S3 | |
| iperf3 receive AXE11000 | |
| Beelink SEi12 Core i5-1235U | |
| Trigkey Speed S | |
| BMAX B5 Pro G7H8 | |
| Trigkey S3 | |
| iperf3 transmit AXE11000 6GHz | |
| Intel NUC 12 Pro Kit NUC12WSKi7 | |
| Beelink SER Pro Ryzen 5 5600H | |
| iperf3 receive AXE11000 6GHz | |
| Intel NUC 12 Pro Kit NUC12WSKi7 | |
| Beelink SER Pro Ryzen 5 5600H | |
Wydajność
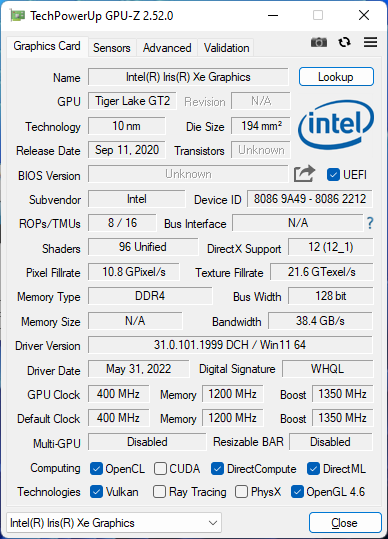
Procesor - Core i5-11320H
Cinebench R15 Multi Loop
Cinebench R23: Multi Core | Single Core
Cinebench R20: CPU (Multi Core) | CPU (Single Core)
Cinebench R15: CPU Multi 64Bit | CPU Single 64Bit
Blender: v2.79 BMW27 CPU
7-Zip 18.03: 7z b 4 | 7z b 4 -mmt1
Geekbench 5.5: Multi-Core | Single-Core
HWBOT x265 Benchmark v2.2: 4k Preset
LibreOffice : 20 Documents To PDF
R Benchmark 2.5: Overall mean
| CPU Performance rating | |
| Intel NUC 12 Pro Kit NUC12WSKi7 | |
| Beelink SEi12 Core i5-1235U | |
| Beelink SER Pro Ryzen 5 5600H | |
| Przeciętny Intel Core i5-11320H | |
| Trigkey Speed S | |
| Trigkey S3 | |
| BMAX B5 Pro G7H8 | |
| Cinebench R23 / Multi Core | |
| Intel NUC 12 Pro Kit NUC12WSKi7 | |
| Beelink SEi12 Core i5-1235U | |
| Beelink SER Pro Ryzen 5 5600H | |
| Przeciętny Intel Core i5-11320H (5720 - 6051, n=4) | |
| Trigkey Speed S | |
| Trigkey S3 | |
| BMAX B5 Pro G7H8 | |
| Cinebench R23 / Single Core | |
| Intel NUC 12 Pro Kit NUC12WSKi7 | |
| Beelink SEi12 Core i5-1235U | |
| Trigkey Speed S | |
| Przeciętny Intel Core i5-11320H (1341 - 1467, n=4) | |
| Beelink SER Pro Ryzen 5 5600H | |
| Trigkey S3 | |
| BMAX B5 Pro G7H8 | |
| Cinebench R20 / CPU (Multi Core) | |
| Intel NUC 12 Pro Kit NUC12WSKi7 | |
| Beelink SEi12 Core i5-1235U | |
| Beelink SER Pro Ryzen 5 5600H | |
| Przeciętny Intel Core i5-11320H (2208 - 2349, n=4) | |
| Trigkey Speed S | |
| BMAX B5 Pro G7H8 | |
| Trigkey S3 | |
| Cinebench R20 / CPU (Single Core) | |
| Intel NUC 12 Pro Kit NUC12WSKi7 | |
| Beelink SEi12 Core i5-1235U | |
| Trigkey Speed S | |
| Przeciętny Intel Core i5-11320H (557 - 567, n=4) | |
| Beelink SER Pro Ryzen 5 5600H | |
| BMAX B5 Pro G7H8 | |
| Trigkey S3 | |
| Cinebench R15 / CPU Multi 64Bit | |
| Intel NUC 12 Pro Kit NUC12WSKi7 | |
| Beelink SEi12 Core i5-1235U | |
| Beelink SER Pro Ryzen 5 5600H | |
| Przeciętny Intel Core i5-11320H (857 - 1019, n=4) | |
| Trigkey Speed S | |
| Trigkey S3 | |
| BMAX B5 Pro G7H8 | |
| Cinebench R15 / CPU Single 64Bit | |
| Intel NUC 12 Pro Kit NUC12WSKi7 | |
| Beelink SEi12 Core i5-1235U | |
| Beelink SER Pro Ryzen 5 5600H | |
| Trigkey Speed S | |
| Przeciętny Intel Core i5-11320H (212 - 215, n=4) | |
| BMAX B5 Pro G7H8 | |
| Trigkey S3 | |
| Blender / v2.79 BMW27 CPU | |
| BMAX B5 Pro G7H8 | |
| Trigkey S3 | |
| Trigkey Speed S | |
| Przeciętny Intel Core i5-11320H (507 - 543, n=4) | |
| Beelink SEi12 Core i5-1235U | |
| Beelink SER Pro Ryzen 5 5600H | |
| Intel NUC 12 Pro Kit NUC12WSKi7 | |
| 7-Zip 18.03 / 7z b 4 | |
| Intel NUC 12 Pro Kit NUC12WSKi7 | |
| Beelink SER Pro Ryzen 5 5600H | |
| Beelink SEi12 Core i5-1235U | |
| Przeciętny Intel Core i5-11320H (24718 - 26858, n=4) | |
| Trigkey Speed S | |
| BMAX B5 Pro G7H8 | |
| Trigkey S3 | |
| 7-Zip 18.03 / 7z b 4 -mmt1 | |
| Intel NUC 12 Pro Kit NUC12WSKi7 | |
| Beelink SER Pro Ryzen 5 5600H | |
| Beelink SEi12 Core i5-1235U | |
| Trigkey Speed S | |
| Przeciętny Intel Core i5-11320H (4813 - 5119, n=4) | |
| BMAX B5 Pro G7H8 | |
| Trigkey S3 | |
| Geekbench 5.5 / Multi-Core | |
| Intel NUC 12 Pro Kit NUC12WSKi7 | |
| Beelink SEi12 Core i5-1235U | |
| Beelink SER Pro Ryzen 5 5600H | |
| Przeciętny Intel Core i5-11320H (4927 - 5955, n=4) | |
| Trigkey Speed S | |
| Trigkey S3 | |
| BMAX B5 Pro G7H8 | |
| Geekbench 5.5 / Single-Core | |
| Intel NUC 12 Pro Kit NUC12WSKi7 | |
| Beelink SEi12 Core i5-1235U | |
| Trigkey Speed S | |
| Przeciętny Intel Core i5-11320H (1453 - 1523, n=4) | |
| Beelink SER Pro Ryzen 5 5600H | |
| Trigkey S3 | |
| BMAX B5 Pro G7H8 | |
| HWBOT x265 Benchmark v2.2 / 4k Preset | |
| Intel NUC 12 Pro Kit NUC12WSKi7 | |
| Beelink SER Pro Ryzen 5 5600H | |
| Beelink SEi12 Core i5-1235U | |
| Przeciętny Intel Core i5-11320H (7.25 - 7.91, n=4) | |
| Trigkey Speed S | |
| Trigkey S3 | |
| BMAX B5 Pro G7H8 | |
| LibreOffice / 20 Documents To PDF | |
| BMAX B5 Pro G7H8 | |
| Trigkey S3 | |
| Beelink SER Pro Ryzen 5 5600H | |
| Beelink SEi12 Core i5-1235U | |
| Przeciętny Intel Core i5-11320H (44 - 50, n=4) | |
| Intel NUC 12 Pro Kit NUC12WSKi7 | |
| Trigkey Speed S | |
| R Benchmark 2.5 / Overall mean | |
| BMAX B5 Pro G7H8 | |
| Trigkey S3 | |
| Przeciętny Intel Core i5-11320H (0.581 - 0.622, n=4) | |
| Trigkey Speed S | |
| Beelink SER Pro Ryzen 5 5600H | |
| Beelink SEi12 Core i5-1235U | |
| Intel NUC 12 Pro Kit NUC12WSKi7 | |
* ... im mniej tym lepiej
| Blender | |
| v3.3 Classroom HIP/AMD | |
| Trigkey S3 | |
| v3.3 Classroom CPU | |
| BMAX B5 Pro G7H8 | |
| Trigkey S3 | |
| Trigkey Speed S | |
| Beelink SEi12 Core i5-1235U | |
| Przeciętny Intel Iris Xe Graphics G7 96EUs (336 - 1259, n=109) | |
| Beelink SER Pro Ryzen 5 5600H | |
| Intel NUC 12 Pro Kit NUC12WSKi7 | |
* ... im mniej tym lepiej
AIDA64: FP32 Ray-Trace | FPU Julia | CPU SHA3 | CPU Queen | FPU SinJulia | FPU Mandel | CPU AES | CPU ZLib | FP64 Ray-Trace | CPU PhotoWorxx
| Performance rating | |
| Intel NUC 12 Pro Kit NUC12WSKi7 | |
| Beelink SER Pro Ryzen 5 5600H | |
| Beelink SEi12 Core i5-1235U | |
| Przeciętny Intel Core i5-11320H | |
| Trigkey Speed S | |
| BMAX B5 Pro G7H8 | |
| Trigkey S3 | |
| AIDA64 / FP32 Ray-Trace | |
| Intel NUC 12 Pro Kit NUC12WSKi7 | |
| Beelink SER Pro Ryzen 5 5600H | |
| Trigkey Speed S | |
| Przeciętny Intel Core i5-11320H (6369 - 7489, n=4) | |
| Beelink SEi12 Core i5-1235U | |
| BMAX B5 Pro G7H8 | |
| Trigkey S3 | |
| AIDA64 / FPU Julia | |
| Beelink SER Pro Ryzen 5 5600H | |
| Intel NUC 12 Pro Kit NUC12WSKi7 | |
| Beelink SEi12 Core i5-1235U | |
| Trigkey Speed S | |
| Przeciętny Intel Core i5-11320H (27391 - 31637, n=4) | |
| BMAX B5 Pro G7H8 | |
| Trigkey S3 | |
| AIDA64 / CPU SHA3 | |
| Intel NUC 12 Pro Kit NUC12WSKi7 | |
| Beelink SER Pro Ryzen 5 5600H | |
| Trigkey Speed S | |
| Przeciętny Intel Core i5-11320H (1847 - 2099, n=4) | |
| Beelink SEi12 Core i5-1235U | |
| BMAX B5 Pro G7H8 | |
| Trigkey S3 | |
| AIDA64 / CPU Queen | |
| Intel NUC 12 Pro Kit NUC12WSKi7 | |
| Beelink SER Pro Ryzen 5 5600H | |
| Beelink SEi12 Core i5-1235U | |
| Trigkey Speed S | |
| Przeciętny Intel Core i5-11320H (43565 - 52477, n=4) | |
| BMAX B5 Pro G7H8 | |
| Trigkey S3 | |
| AIDA64 / FPU SinJulia | |
| Beelink SER Pro Ryzen 5 5600H | |
| Intel NUC 12 Pro Kit NUC12WSKi7 | |
| Trigkey S3 | |
| Trigkey Speed S | |
| Przeciętny Intel Core i5-11320H (4381 - 5011, n=4) | |
| Beelink SEi12 Core i5-1235U | |
| BMAX B5 Pro G7H8 | |
| AIDA64 / FPU Mandel | |
| Beelink SER Pro Ryzen 5 5600H | |
| Intel NUC 12 Pro Kit NUC12WSKi7 | |
| Trigkey Speed S | |
| Przeciętny Intel Core i5-11320H (16659 - 18770, n=4) | |
| Beelink SEi12 Core i5-1235U | |
| BMAX B5 Pro G7H8 | |
| Trigkey S3 | |
| AIDA64 / CPU AES | |
| Intel NUC 12 Pro Kit NUC12WSKi7 | |
| Beelink SER Pro Ryzen 5 5600H | |
| Trigkey Speed S | |
| Przeciętny Intel Core i5-11320H (59851 - 76500, n=4) | |
| Beelink SEi12 Core i5-1235U | |
| Trigkey S3 | |
| BMAX B5 Pro G7H8 | |
| AIDA64 / CPU ZLib | |
| Intel NUC 12 Pro Kit NUC12WSKi7 | |
| Beelink SEi12 Core i5-1235U | |
| Beelink SER Pro Ryzen 5 5600H | |
| Przeciętny Intel Core i5-11320H (330 - 410, n=4) | |
| Trigkey Speed S | |
| Trigkey S3 | |
| BMAX B5 Pro G7H8 | |
| AIDA64 / FP64 Ray-Trace | |
| Intel NUC 12 Pro Kit NUC12WSKi7 | |
| Beelink SER Pro Ryzen 5 5600H | |
| Przeciętny Intel Core i5-11320H (3536 - 4021, n=4) | |
| Trigkey Speed S | |
| Beelink SEi12 Core i5-1235U | |
| BMAX B5 Pro G7H8 | |
| Trigkey S3 | |
| AIDA64 / CPU PhotoWorxx | |
| Przeciętny Intel Core i5-11320H (25964 - 36644, n=4) | |
| Beelink SEi12 Core i5-1235U | |
| Intel NUC 12 Pro Kit NUC12WSKi7 | |
| Trigkey Speed S | |
| Beelink SER Pro Ryzen 5 5600H | |
| BMAX B5 Pro G7H8 | |
| Trigkey S3 | |
Wydajność systemu
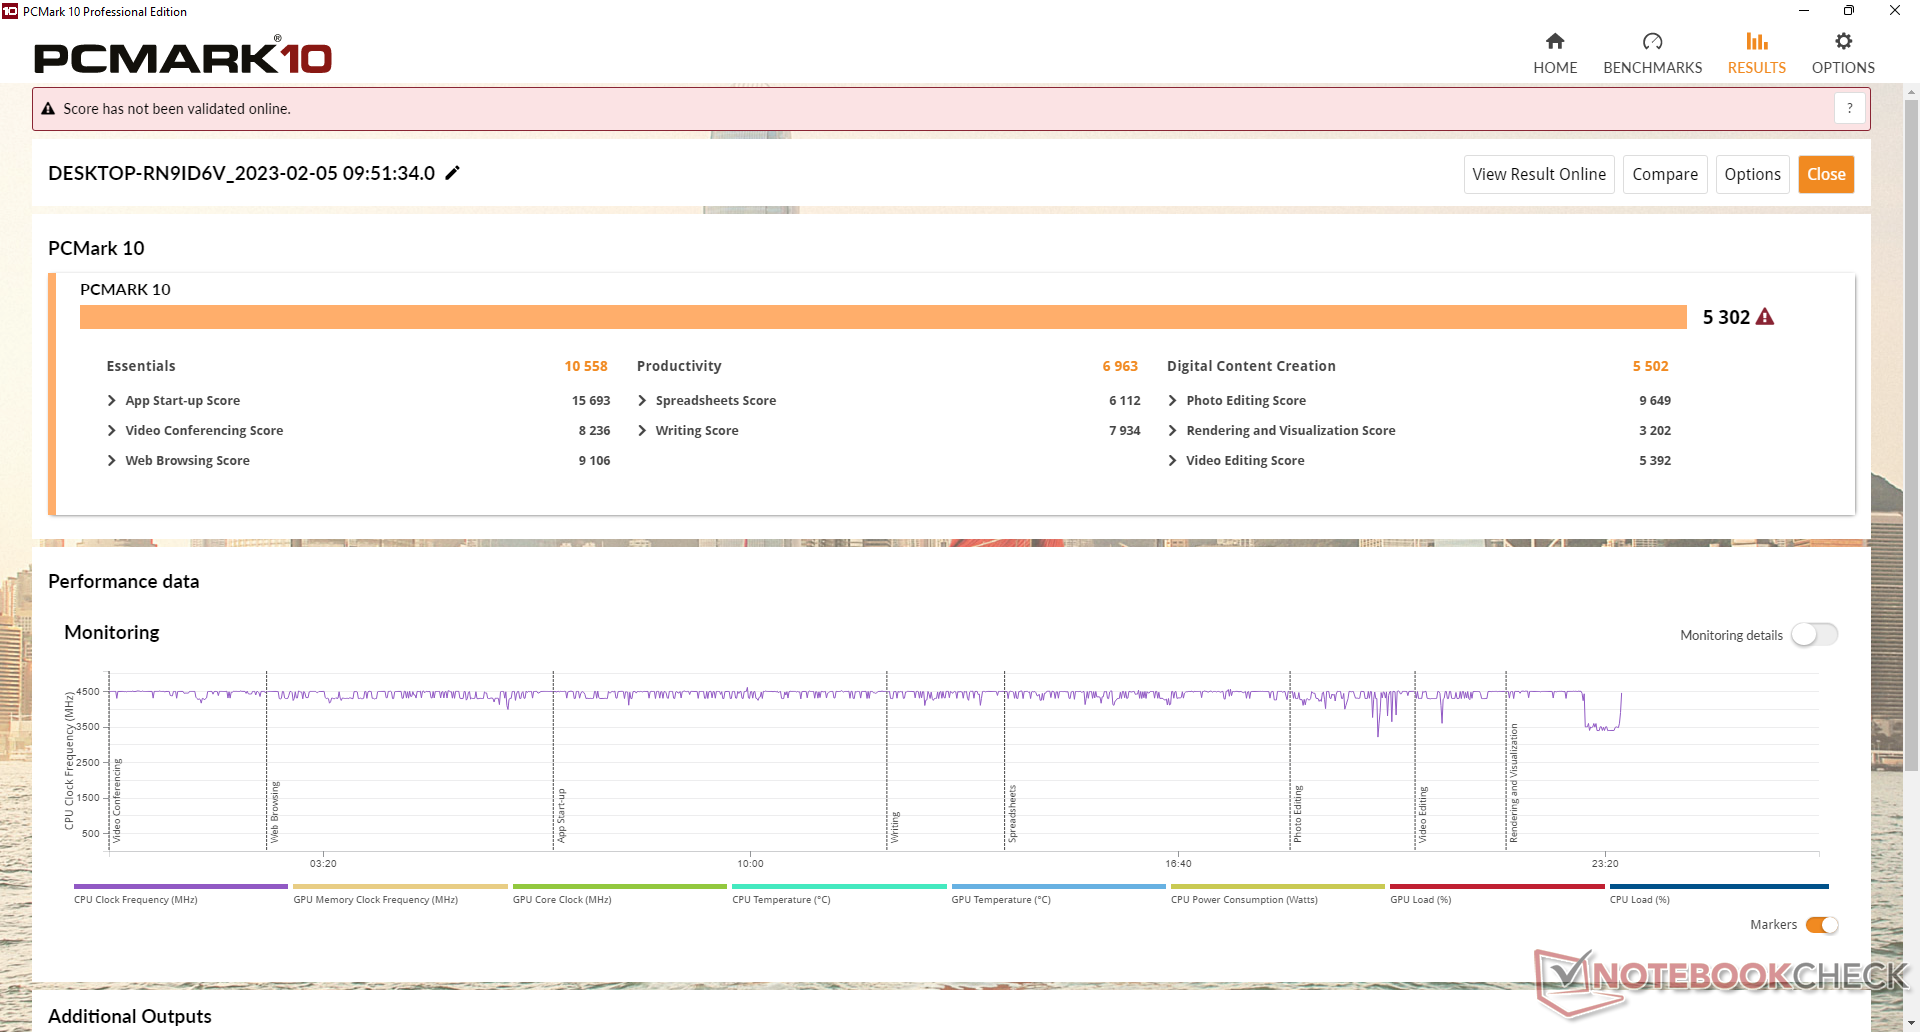
CrossMark: Overall | Productivity | Creativity | Responsiveness
| PCMark 10 / Score | |
| Intel NUC 12 Pro Kit NUC12WSKi7 | |
| Beelink SER Pro Ryzen 5 5600H | |
| Beelink SEi12 Core i5-1235U | |
| Trigkey Speed S | |
| Przeciętny Intel Core i5-11320H, Intel Iris Xe Graphics G7 96EUs (5095 - 5302, n=3) | |
| Trigkey S3 | |
| BMAX B5 Pro G7H8 | |
| PCMark 10 / Essentials | |
| Beelink SEi12 Core i5-1235U | |
| Intel NUC 12 Pro Kit NUC12WSKi7 | |
| Trigkey Speed S | |
| Beelink SER Pro Ryzen 5 5600H | |
| Przeciętny Intel Core i5-11320H, Intel Iris Xe Graphics G7 96EUs (9556 - 10558, n=3) | |
| BMAX B5 Pro G7H8 | |
| Trigkey S3 | |
| PCMark 10 / Productivity | |
| Beelink SER Pro Ryzen 5 5600H | |
| Intel NUC 12 Pro Kit NUC12WSKi7 | |
| Beelink SEi12 Core i5-1235U | |
| Trigkey Speed S | |
| Przeciętny Intel Core i5-11320H, Intel Iris Xe Graphics G7 96EUs (6832 - 6963, n=3) | |
| Trigkey S3 | |
| BMAX B5 Pro G7H8 | |
| PCMark 10 / Digital Content Creation | |
| Intel NUC 12 Pro Kit NUC12WSKi7 | |
| Beelink SER Pro Ryzen 5 5600H | |
| Beelink SEi12 Core i5-1235U | |
| Trigkey Speed S | |
| Przeciętny Intel Core i5-11320H, Intel Iris Xe Graphics G7 96EUs (5048 - 5615, n=3) | |
| Trigkey S3 | |
| BMAX B5 Pro G7H8 | |
| CrossMark / Overall | |
| Intel NUC 12 Pro Kit NUC12WSKi7 | |
| Beelink SEi12 Core i5-1235U | |
| Trigkey Speed S | |
| Przeciętny Intel Core i5-11320H, Intel Iris Xe Graphics G7 96EUs (1300 - 1371, n=3) | |
| Beelink SER Pro Ryzen 5 5600H | |
| Trigkey S3 | |
| BMAX B5 Pro G7H8 | |
| CrossMark / Productivity | |
| Beelink SEi12 Core i5-1235U | |
| Intel NUC 12 Pro Kit NUC12WSKi7 | |
| Trigkey Speed S | |
| Przeciętny Intel Core i5-11320H, Intel Iris Xe Graphics G7 96EUs (1376 - 1456, n=3) | |
| Beelink SER Pro Ryzen 5 5600H | |
| Trigkey S3 | |
| BMAX B5 Pro G7H8 | |
| CrossMark / Creativity | |
| Intel NUC 12 Pro Kit NUC12WSKi7 | |
| Beelink SEi12 Core i5-1235U | |
| Beelink SER Pro Ryzen 5 5600H | |
| Trigkey Speed S | |
| Przeciętny Intel Core i5-11320H, Intel Iris Xe Graphics G7 96EUs (1241 - 1256, n=3) | |
| Trigkey S3 | |
| BMAX B5 Pro G7H8 | |
| CrossMark / Responsiveness | |
| Beelink SEi12 Core i5-1235U | |
| Trigkey Speed S | |
| Intel NUC 12 Pro Kit NUC12WSKi7 | |
| Przeciętny Intel Core i5-11320H, Intel Iris Xe Graphics G7 96EUs (1260 - 1494, n=3) | |
| Beelink SER Pro Ryzen 5 5600H | |
| BMAX B5 Pro G7H8 | |
| Trigkey S3 | |
| PCMark 10 Score | 5302 pkt. | |
Pomoc | ||
| AIDA64 / Memory Copy | |
| Przeciętny Intel Core i5-11320H (41106 - 55961, n=4) | |
| Intel NUC 12 Pro Kit NUC12WSKi7 | |
| Beelink SEi12 Core i5-1235U | |
| Beelink SER Pro Ryzen 5 5600H | |
| Trigkey Speed S | |
| Trigkey S3 | |
| BMAX B5 Pro G7H8 | |
| AIDA64 / Memory Read | |
| Przeciętny Intel Core i5-11320H (46516 - 52799, n=4) | |
| Beelink SER Pro Ryzen 5 5600H | |
| Trigkey Speed S | |
| Intel NUC 12 Pro Kit NUC12WSKi7 | |
| Beelink SEi12 Core i5-1235U | |
| Trigkey S3 | |
| BMAX B5 Pro G7H8 | |
| AIDA64 / Memory Write | |
| Przeciętny Intel Core i5-11320H (46760 - 63323, n=4) | |
| Trigkey Speed S | |
| Beelink SEi12 Core i5-1235U | |
| Intel NUC 12 Pro Kit NUC12WSKi7 | |
| Beelink SER Pro Ryzen 5 5600H | |
| Trigkey S3 | |
| BMAX B5 Pro G7H8 | |
| AIDA64 / Memory Latency | |
| Trigkey S3 | |
| BMAX B5 Pro G7H8 | |
| Intel NUC 12 Pro Kit NUC12WSKi7 | |
| Przeciętny Intel Core i5-11320H (77.6 - 114.1, n=4) | |
| Beelink SEi12 Core i5-1235U | |
| Beelink SER Pro Ryzen 5 5600H | |
| Trigkey Speed S | |
* ... im mniej tym lepiej
Opóźnienie DPC
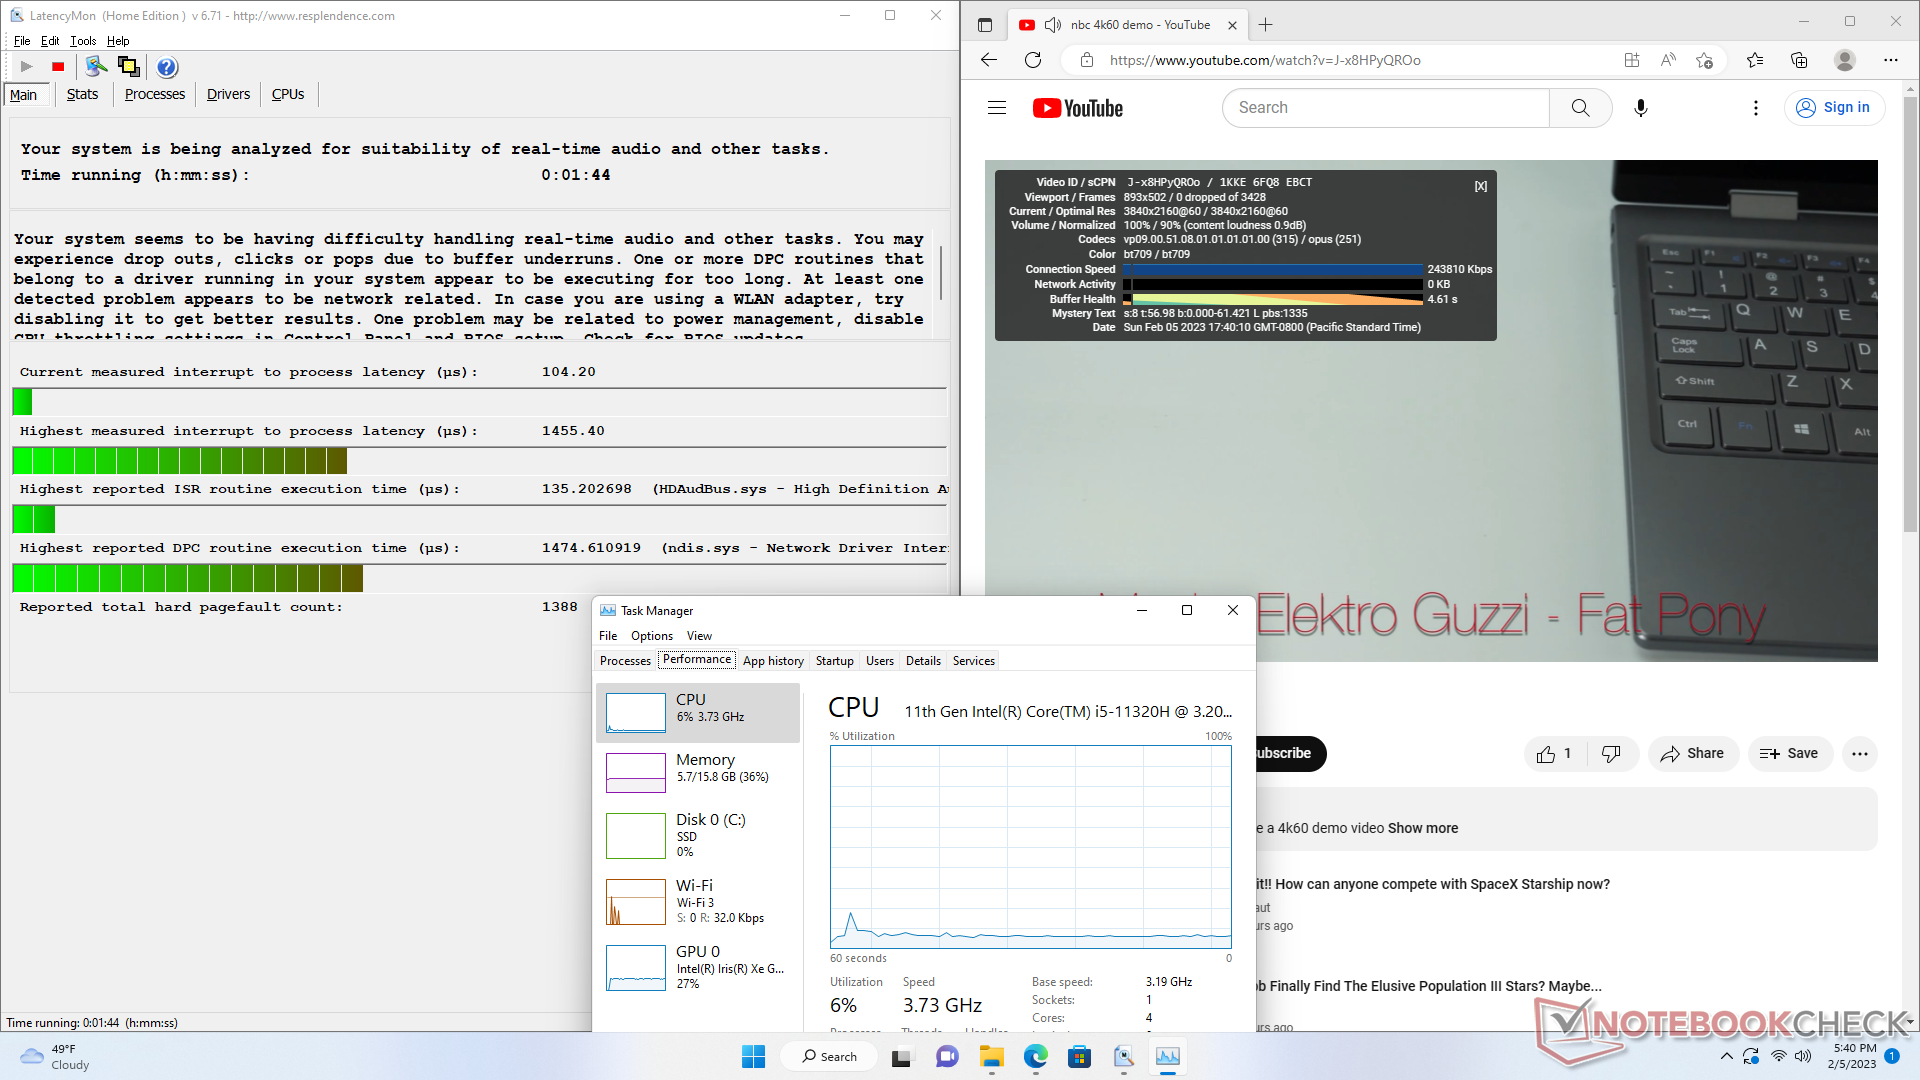
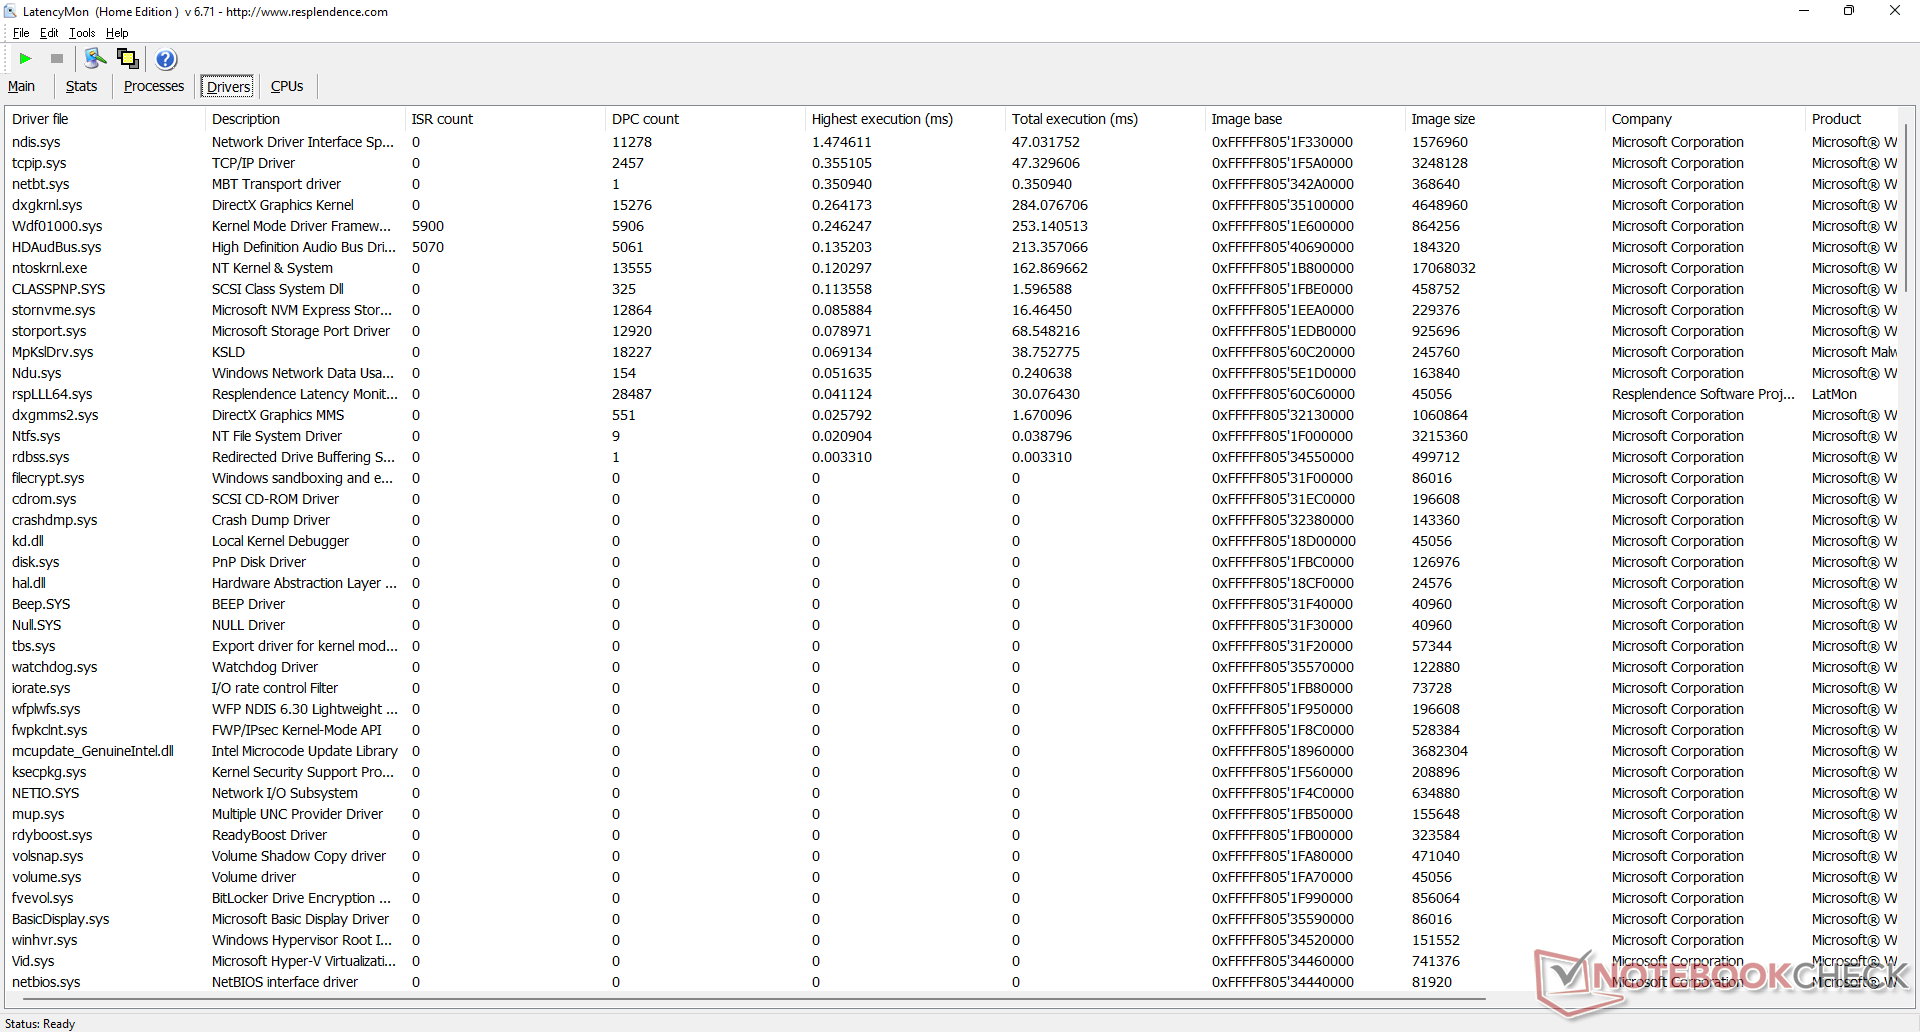
| DPC Latencies / LatencyMon - interrupt to process latency (max), Web, Youtube, Prime95 | |
| Trigkey S3 | |
| Trigkey Speed S | |
| Beelink SEi12 Core i5-1235U | |
| Intel NUC 12 Pro Kit NUC12WSKi7 | |
| Beelink SER Pro Ryzen 5 5600H | |
| BMAX B5 Pro G7H8 | |
* ... im mniej tym lepiej
Urządzenia do przechowywania danych
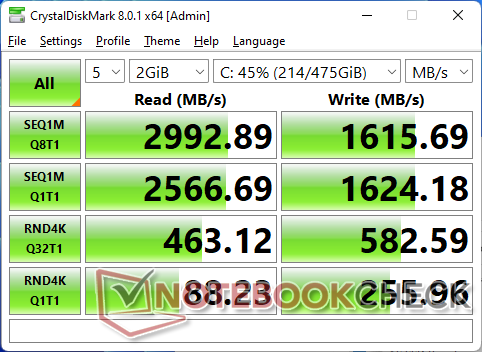
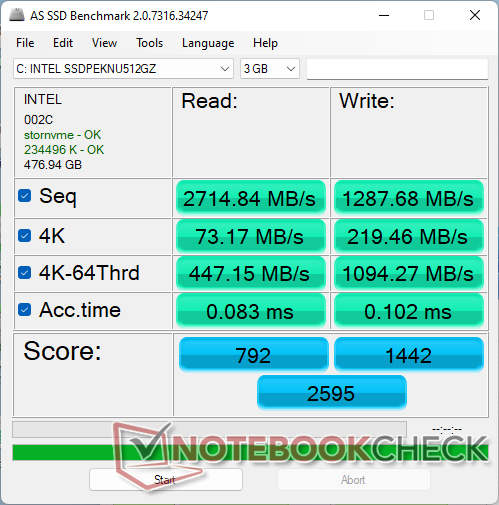

* ... im mniej tym lepiej
Disk Throttling: DiskSpd Read Loop, Queue Depth 8
Wydajność GPU
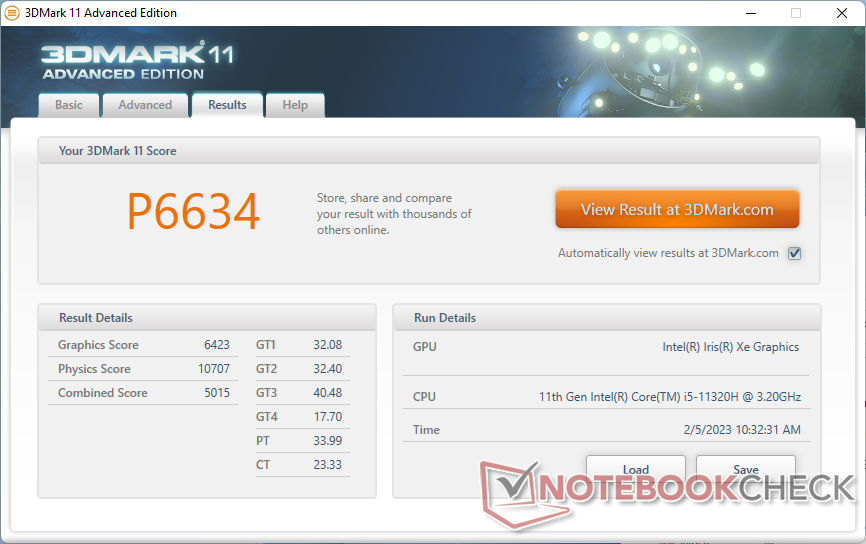
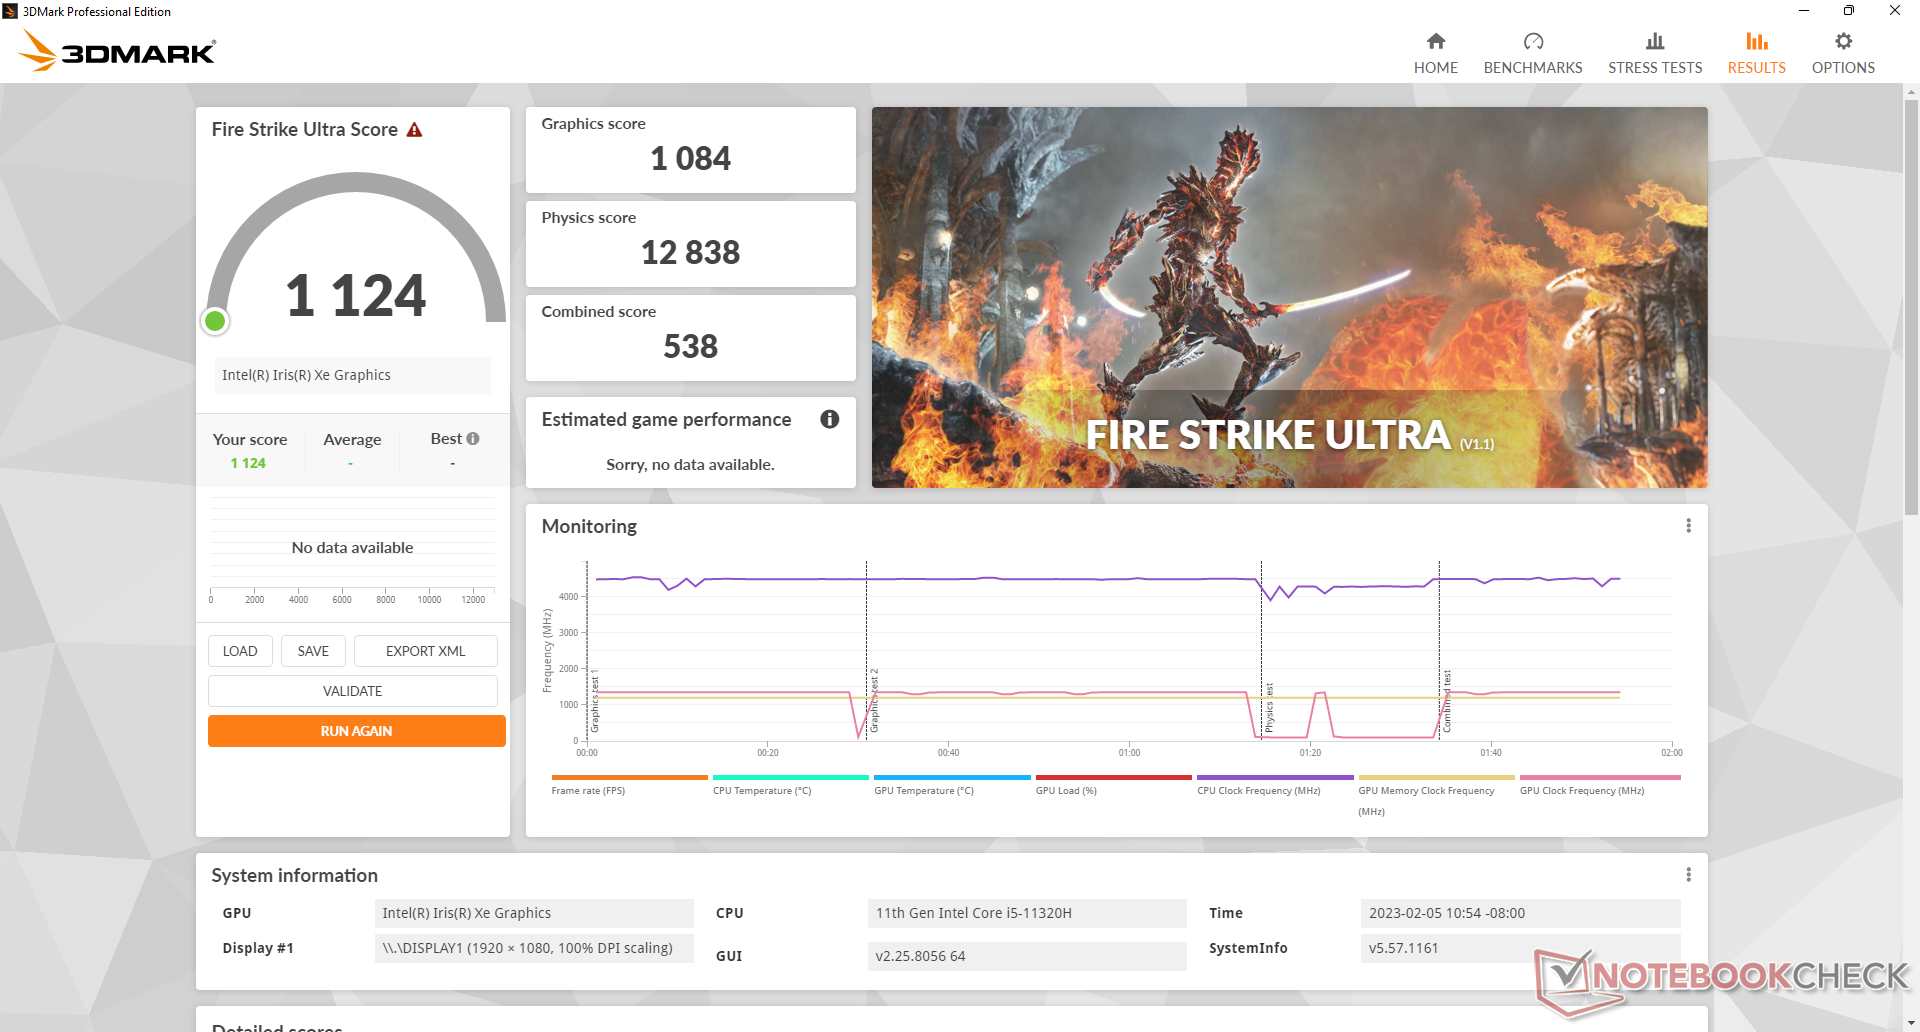
| 3DMark 11 Performance | 6634 pkt. | |
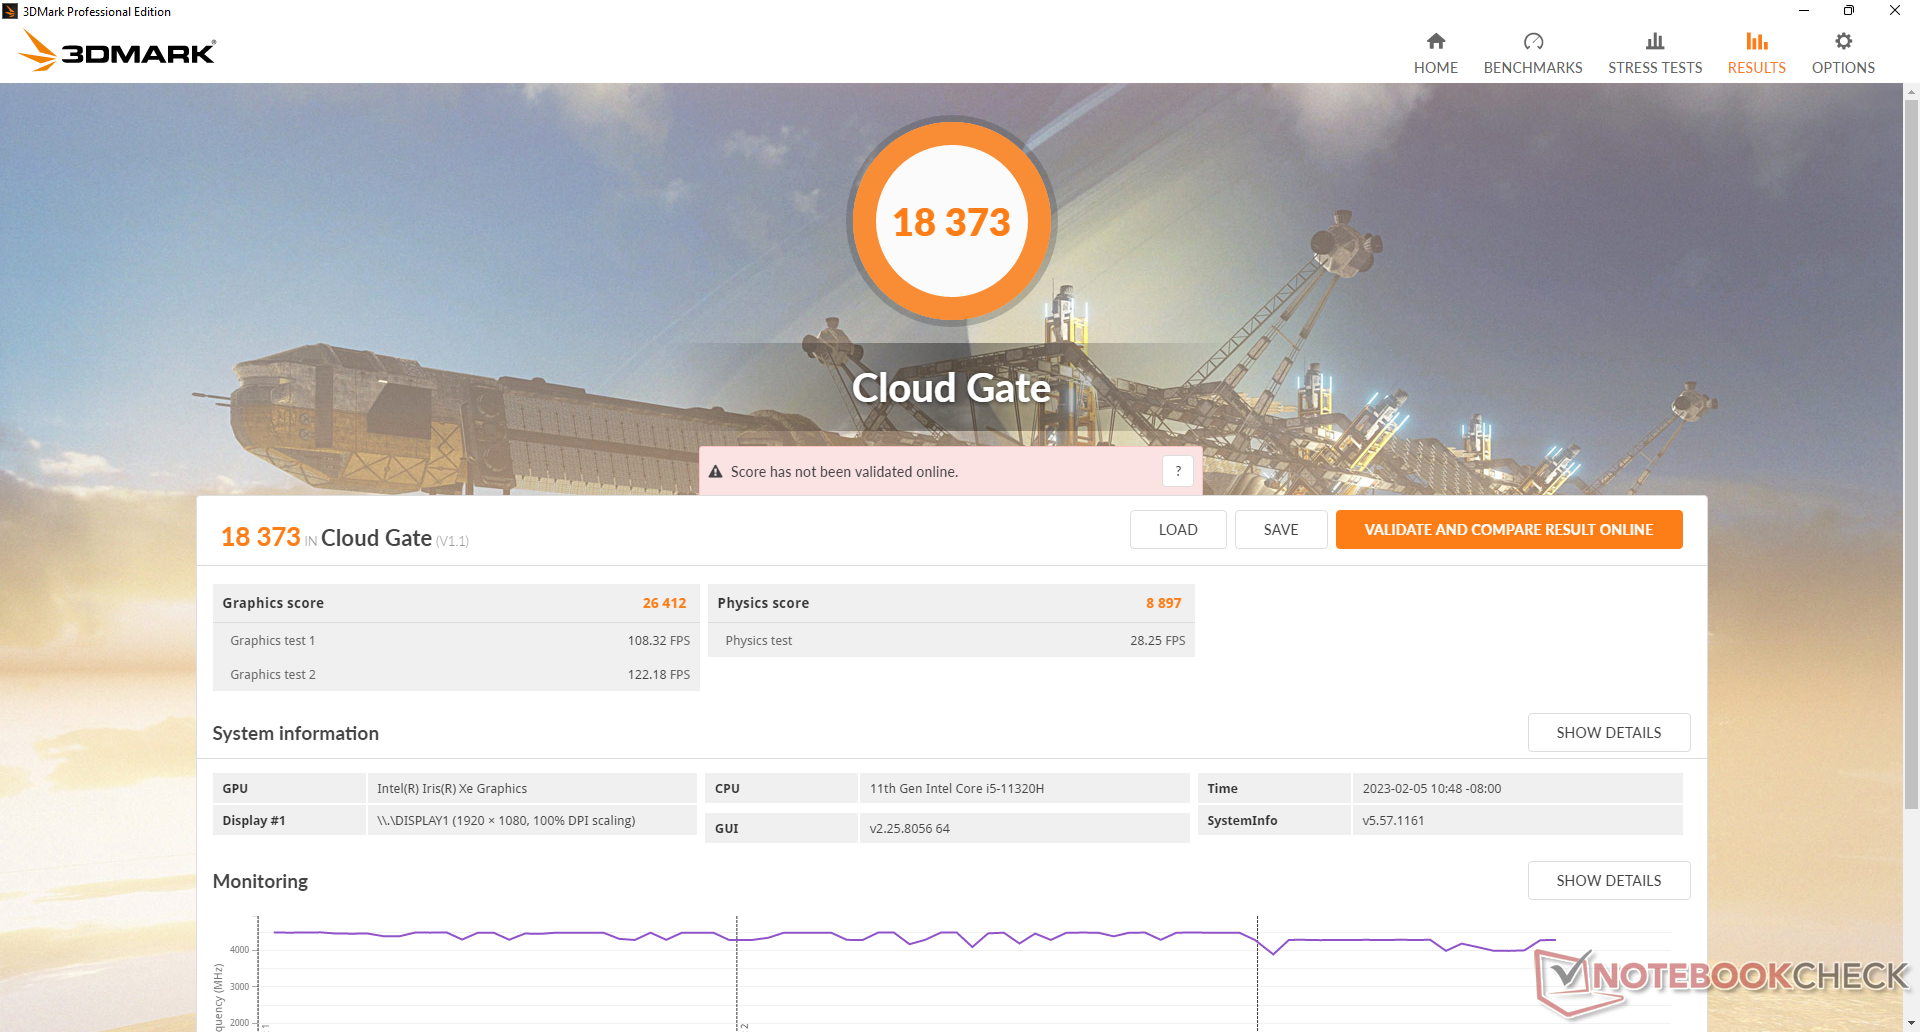
| 3DMark Cloud Gate Standard Score | 18373 pkt. | |
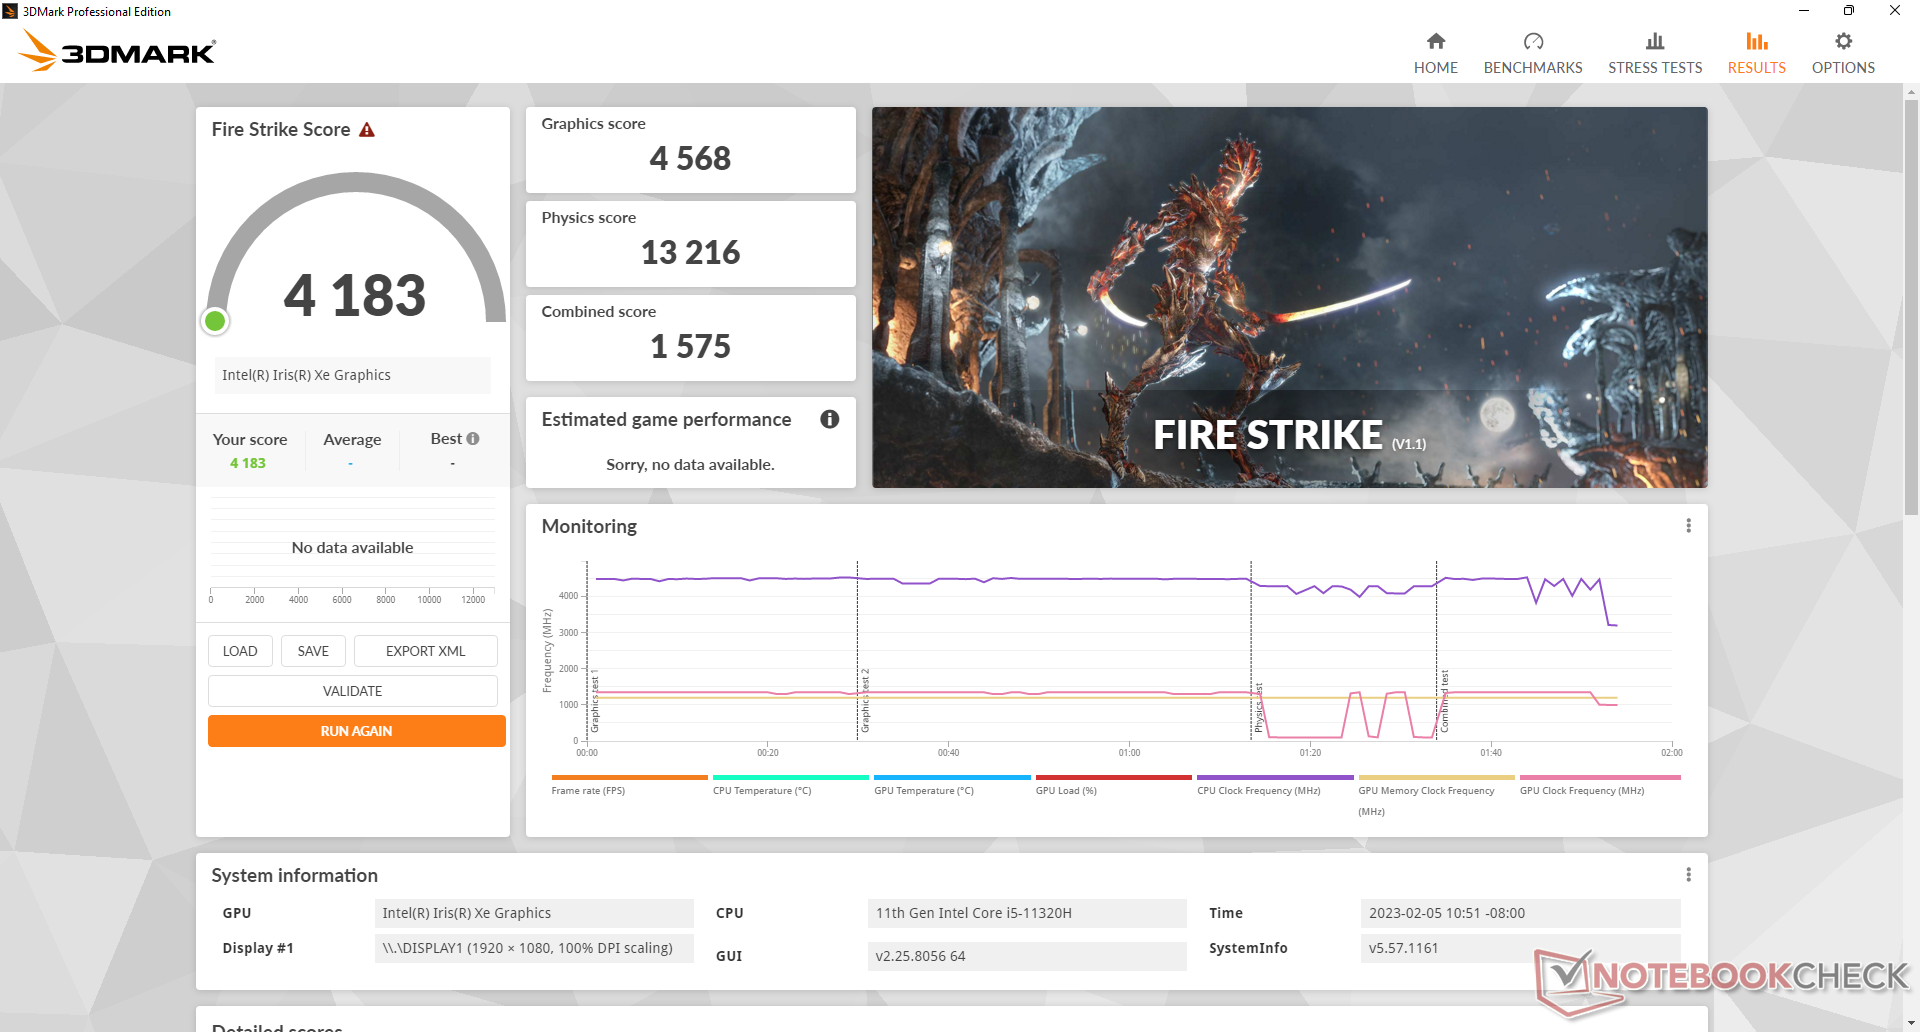
| 3DMark Fire Strike Score | 4183 pkt. | |
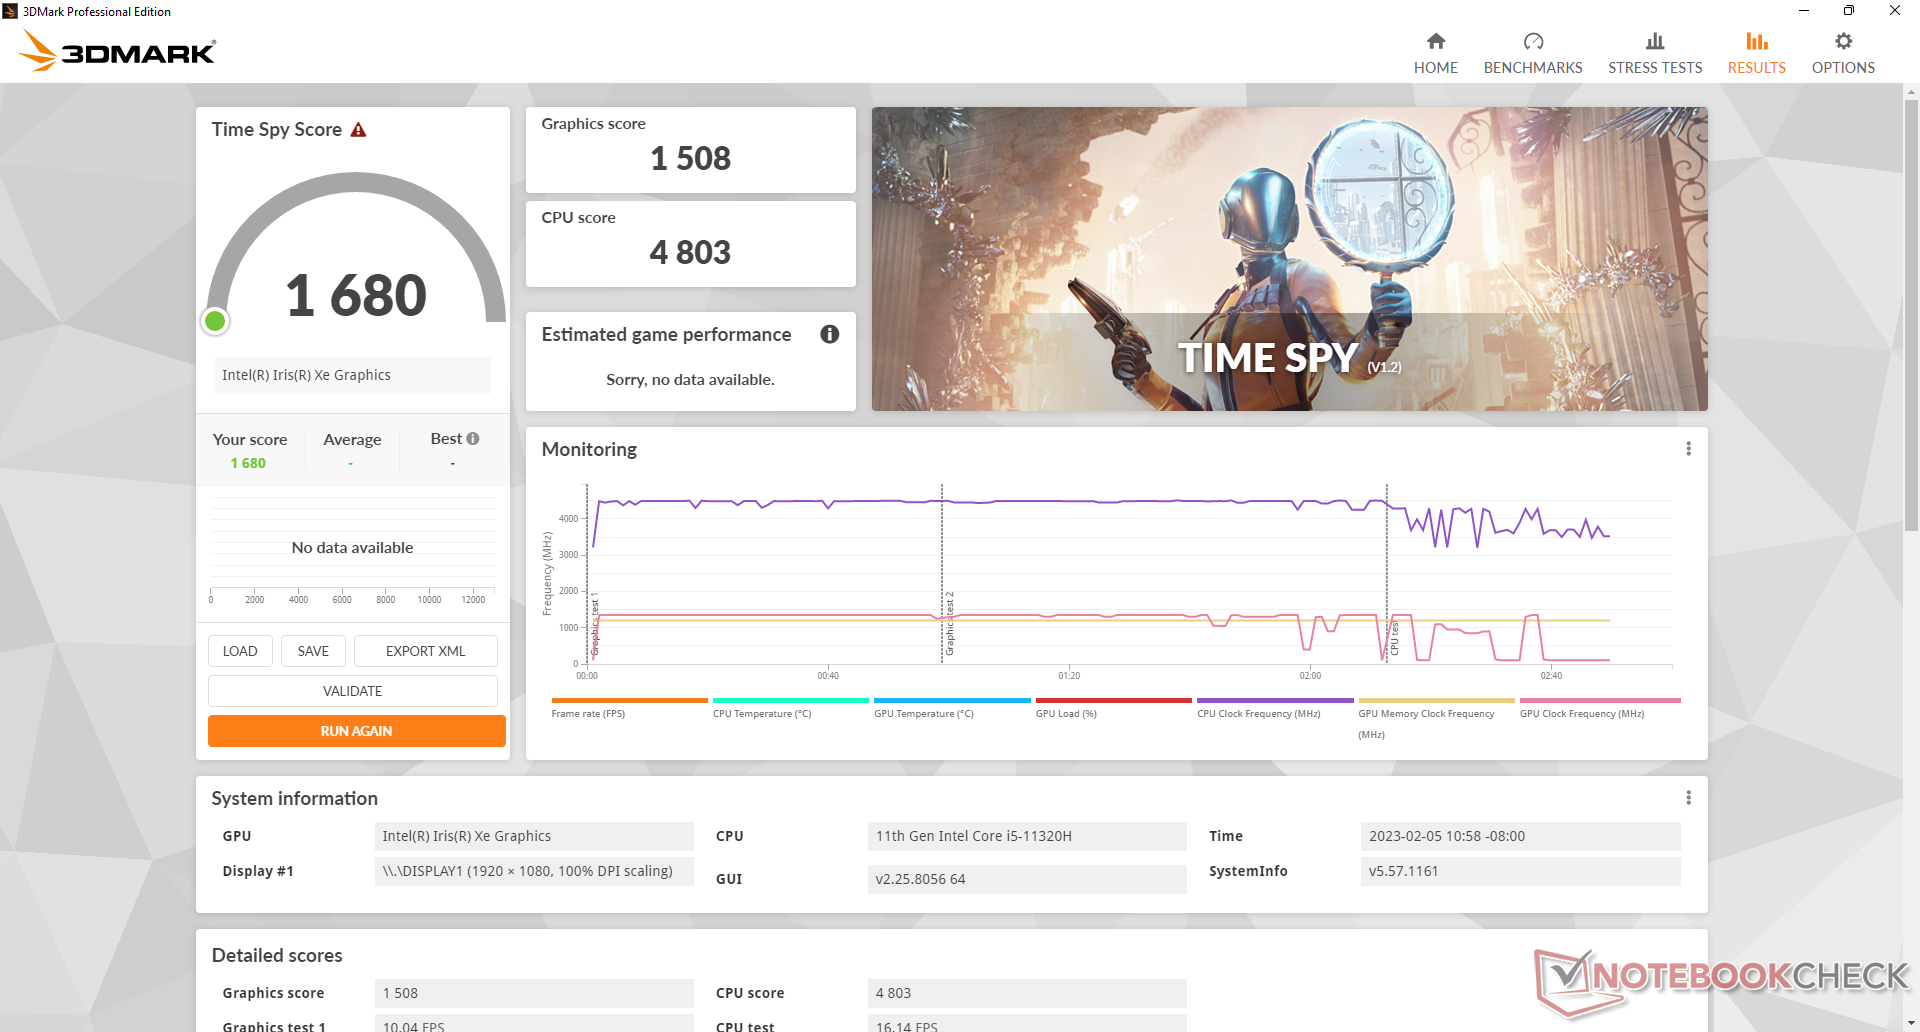
| 3DMark Time Spy Score | 1680 pkt. | |
Pomoc | ||
| The Witcher 3 | |
| 1024x768 Low Graphics & Postprocessing | |
| Intel NUC 12 Pro Kit NUC12WSKi7 | |
| Trigkey Speed S | |
| Przeciętny Intel Iris Xe Graphics G7 96EUs (28.9 - 117.2, n=188) | |
| Beelink SER Pro Ryzen 5 5600H | |
| Beelink SEi12 Core i5-1235U | |
| Trigkey S3 | |
| BMAX B5 Pro G7H8 | |
| 1366x768 Medium Graphics & Postprocessing | |
| Przeciętny Intel Iris Xe Graphics G7 96EUs (21.4 - 77.8, n=185) | |
| Trigkey Speed S | |
| Beelink SER Pro Ryzen 5 5600H | |
| Beelink SEi12 Core i5-1235U | |
| Trigkey S3 | |
| BMAX B5 Pro G7H8 | |
| 1920x1080 High Graphics & Postprocessing (Nvidia HairWorks Off) | |
| Przeciętny Intel Iris Xe Graphics G7 96EUs (10.6 - 45.9, n=191) | |
| Beelink SEi12 Core i5-1235U | |
| Beelink SER Pro Ryzen 5 5600H | |
| Trigkey Speed S | |
| Trigkey S3 | |
| Intel NUC 12 Pro Kit NUC12WSKi7 | |
| BMAX B5 Pro G7H8 | |
| 1920x1080 Ultra Graphics & Postprocessing (HBAO+) | |
| Beelink SER Pro Ryzen 5 5600H | |
| Przeciętny Intel Iris Xe Graphics G7 96EUs (8.79 - 20.1, n=181) | |
| Trigkey Speed S | |
| Beelink SEi12 Core i5-1235U | |
| Trigkey S3 | |
| Cyberpunk 2077 1.6 - 1920x1080 Low Preset | |
| Beelink SER Pro Ryzen 5 5600H | |
| Przeciętny Intel Iris Xe Graphics G7 96EUs (13 - 25.9, n=42) | |
| Beelink SEi12 Core i5-1235U | |
| Trigkey S3 | |
Witcher 3 FPS Chart
| low | med. | high | ultra | |
|---|---|---|---|---|
| GTA V (2015) | 92.2 | 80.3 | 23.4 | 9.04 |
| The Witcher 3 (2015) | 87.8 | 53.5 | 23.5 | 13.1 |
| Dota 2 Reborn (2015) | 121 | 79.4 | 50.6 | 52.3 |
| Final Fantasy XV Benchmark (2018) | 39.8 | 21.3 | 15.4 | |
| X-Plane 11.11 (2018) | 51.1 | 43.7 | 38.7 | |
| Strange Brigade (2018) | 80.1 | 34.5 | 28.5 | 22.9 |
Emisje
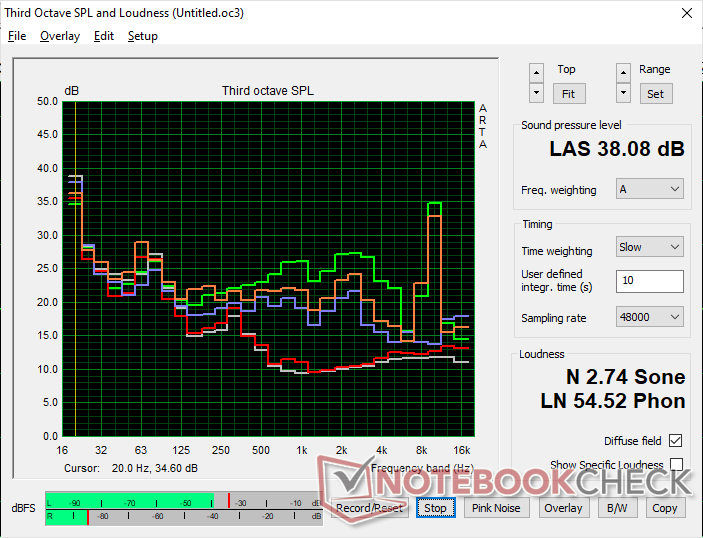
Szum systemu
Choć sam wewnętrzny wentylator jest w większości niesłyszalny podczas strumieniowania treści, nasz egzemplarz czasami wykazywał zauważalny elektroniczny szum lub wycie cewki o częstotliwości ~10 kHz, jak pokazuje poniższy wykres. Zjawisko to występowało najczęściej, gdy procesor był mocno obciążony, np. podczas gry. Niestety, wycie nie ustępowało nawet po wielu godzinach gry. Takie zachowanie sugeruje, że do złożenia tego modelu użyto tanich części.
Miejmy nadzieję, że problem dotyczy tylko naszego egzemplarza recenzenckiego i nie jest charakterystyczny dla urządzeń dostępnych w sprzedaży detalicznej.
Hałas
| luz |
| 24.1 / 24.1 / 26.6 dB |
| obciążenie |
| 30.4 / 38.1 dB |
 | ||
30 dB cichy 40 dB(A) słyszalny 50 dB(A) irytujący |
||
min: | ||
| Trigkey Speed S Iris Xe G7 96EUs, i5-11320H, Intel SSD 670p SSDPEKNU512GZ | Trigkey S3 Vega 8, R5 3550H, Kingston NV1 SNVS/500GCN | Beelink SEi12 Core i5-1235U Iris Xe G7 80EUs, i5-1235U, Kingston NV1 SNVS/500GCN | Beelink SER Pro Ryzen 5 5600H Vega 7, R5 5600H, Kingston NV1 SNVS/500GCN | Intel NUC 12 Pro Kit NUC12WSKi7 Iris Xe G7 96EUs, i7-1260P, Transcend M.2 SSD 2200S TS512GMTE220S | BMAX B5 Pro G7H8 UHD Graphics 620, i5-8260U | |
|---|---|---|---|---|---|---|
| Noise | 5% | -8% | -4% | -28% | 3% | |
| wyłączone / środowisko * (dB) | 23.5 | 23.2 1% | 23.3 1% | 22.8 3% | 30.4 -29% | 23 2% |
| Idle Minimum * (dB) | 24.1 | 24.5 -2% | 27.8 -15% | 26.1 -8% | 33.1 -37% | 25.1 -4% |
| Idle Average * (dB) | 24.1 | 24.5 -2% | 27.8 -15% | 26.1 -8% | 33.1 -37% | 25.1 -4% |
| Idle Maximum * (dB) | 26.6 | 24.5 8% | 27.8 -5% | 28.7 -8% | 33.1 -24% | 25.1 6% |
| Load Average * (dB) | 30.4 | 27.1 11% | 32 -5% | 32.3 -6% | 38.1 -25% | 28.6 6% |
| Witcher 3 ultra * (dB) | 30.4 | 30.6 -1% | 34.1 -12% | 32.8 -8% | 30.1 1% | |
| Load Maximum * (dB) | 38.1 | 31.3 18% | 39.2 -3% | 36.4 4% | 43.6 -14% | 34 11% |
* ... im mniej tym lepiej
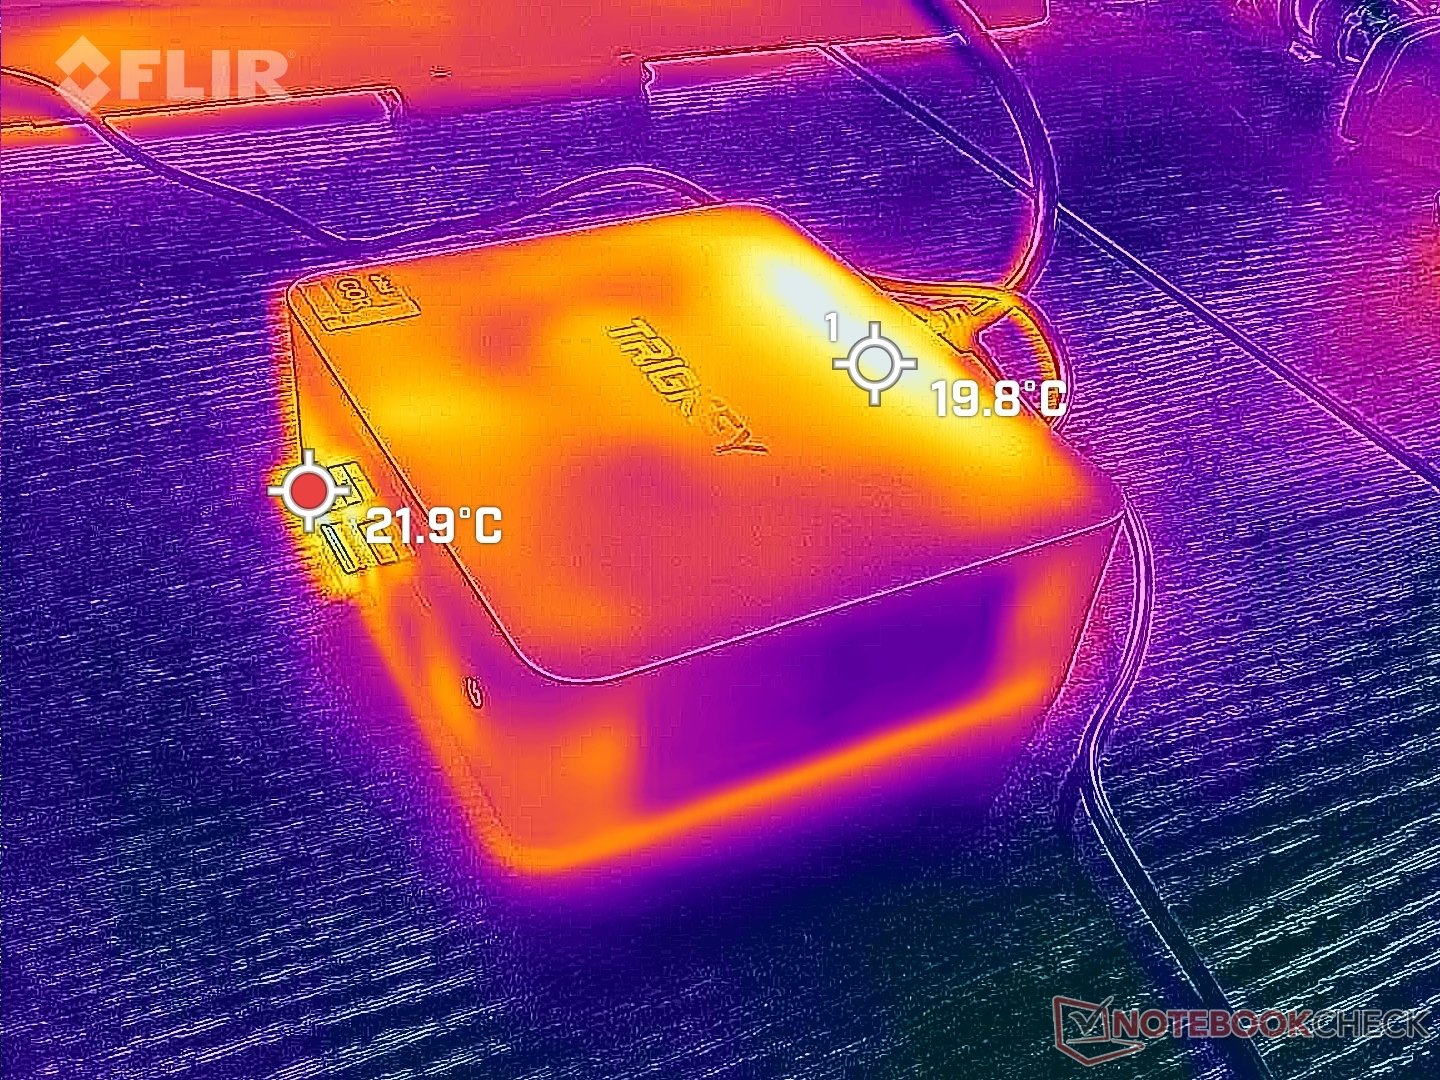
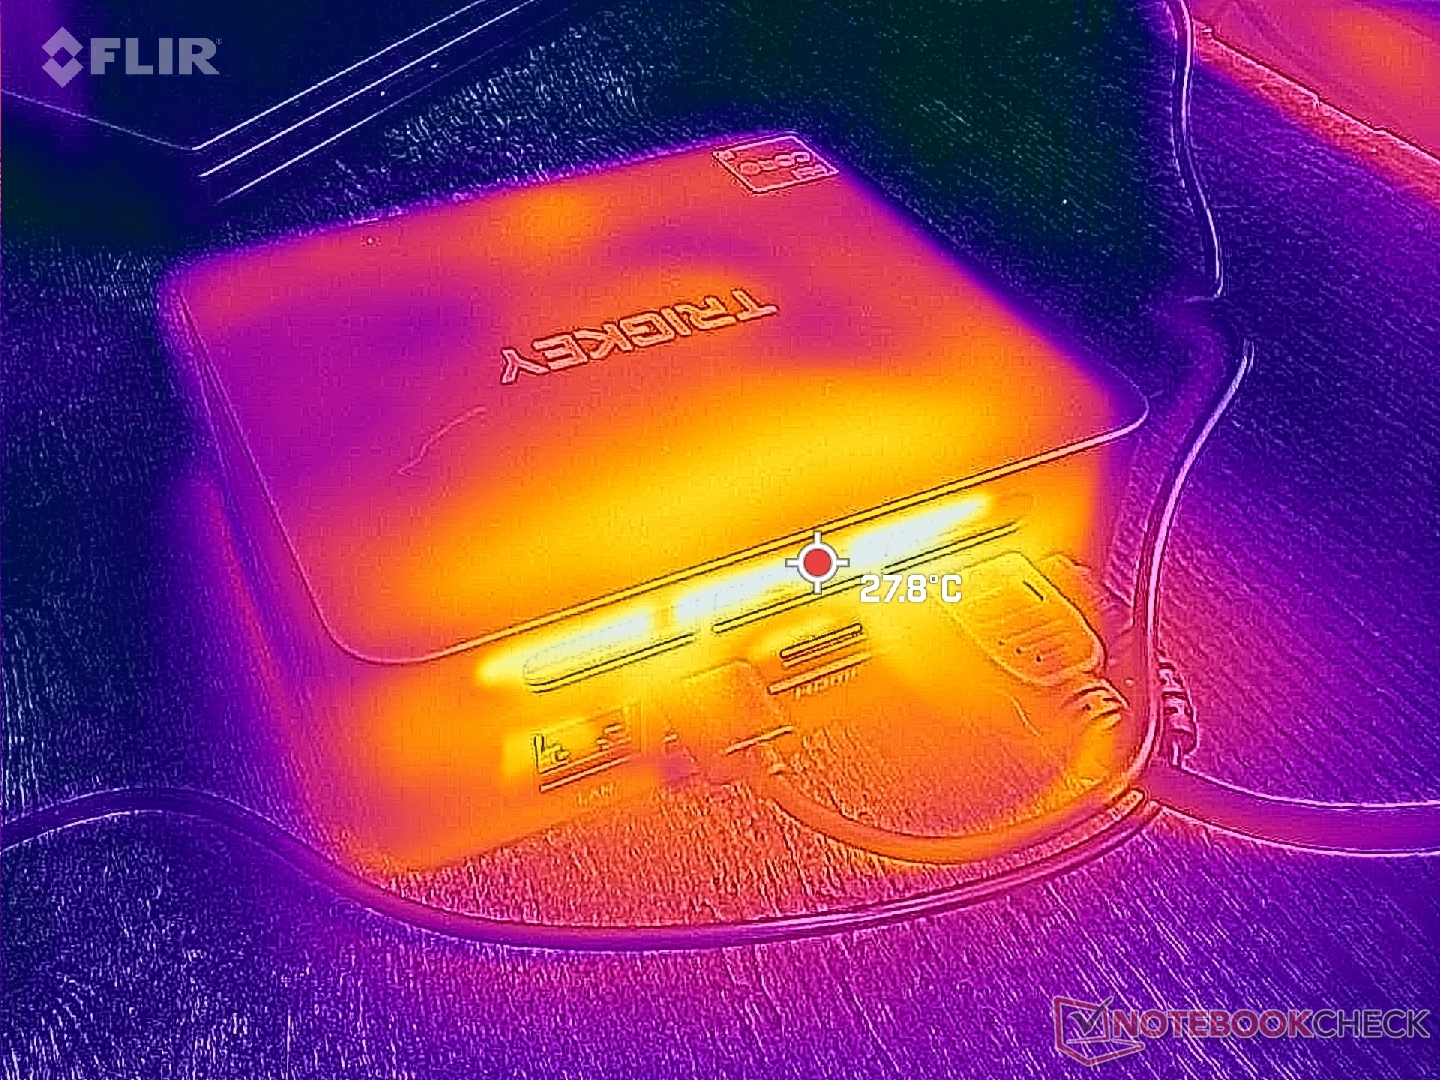
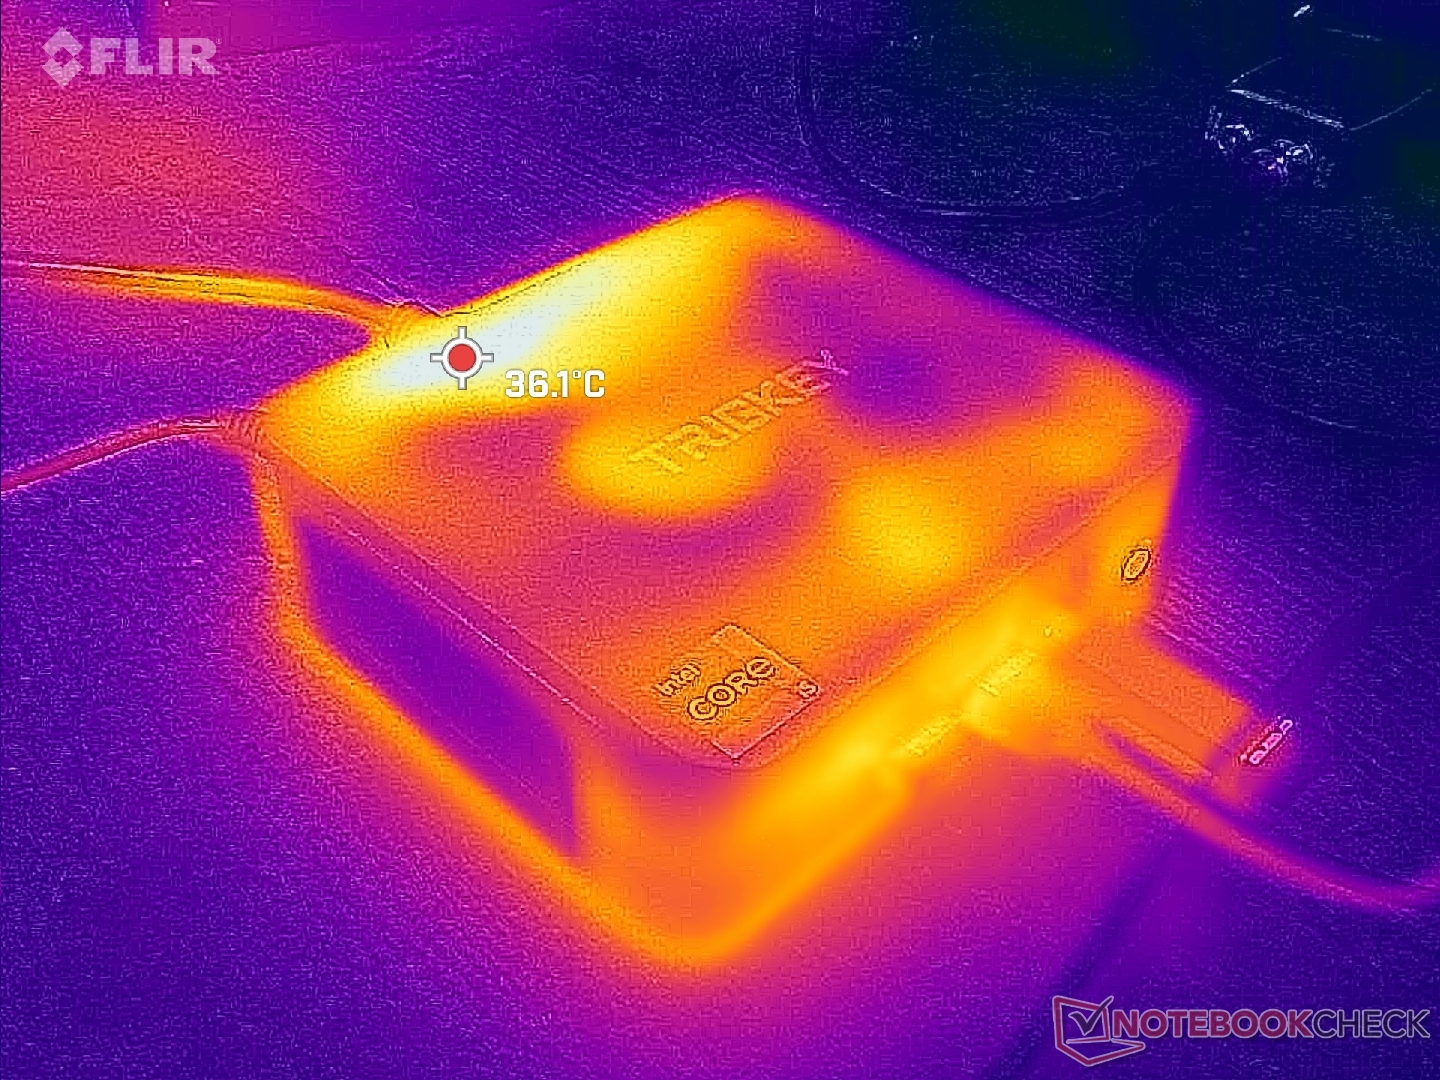
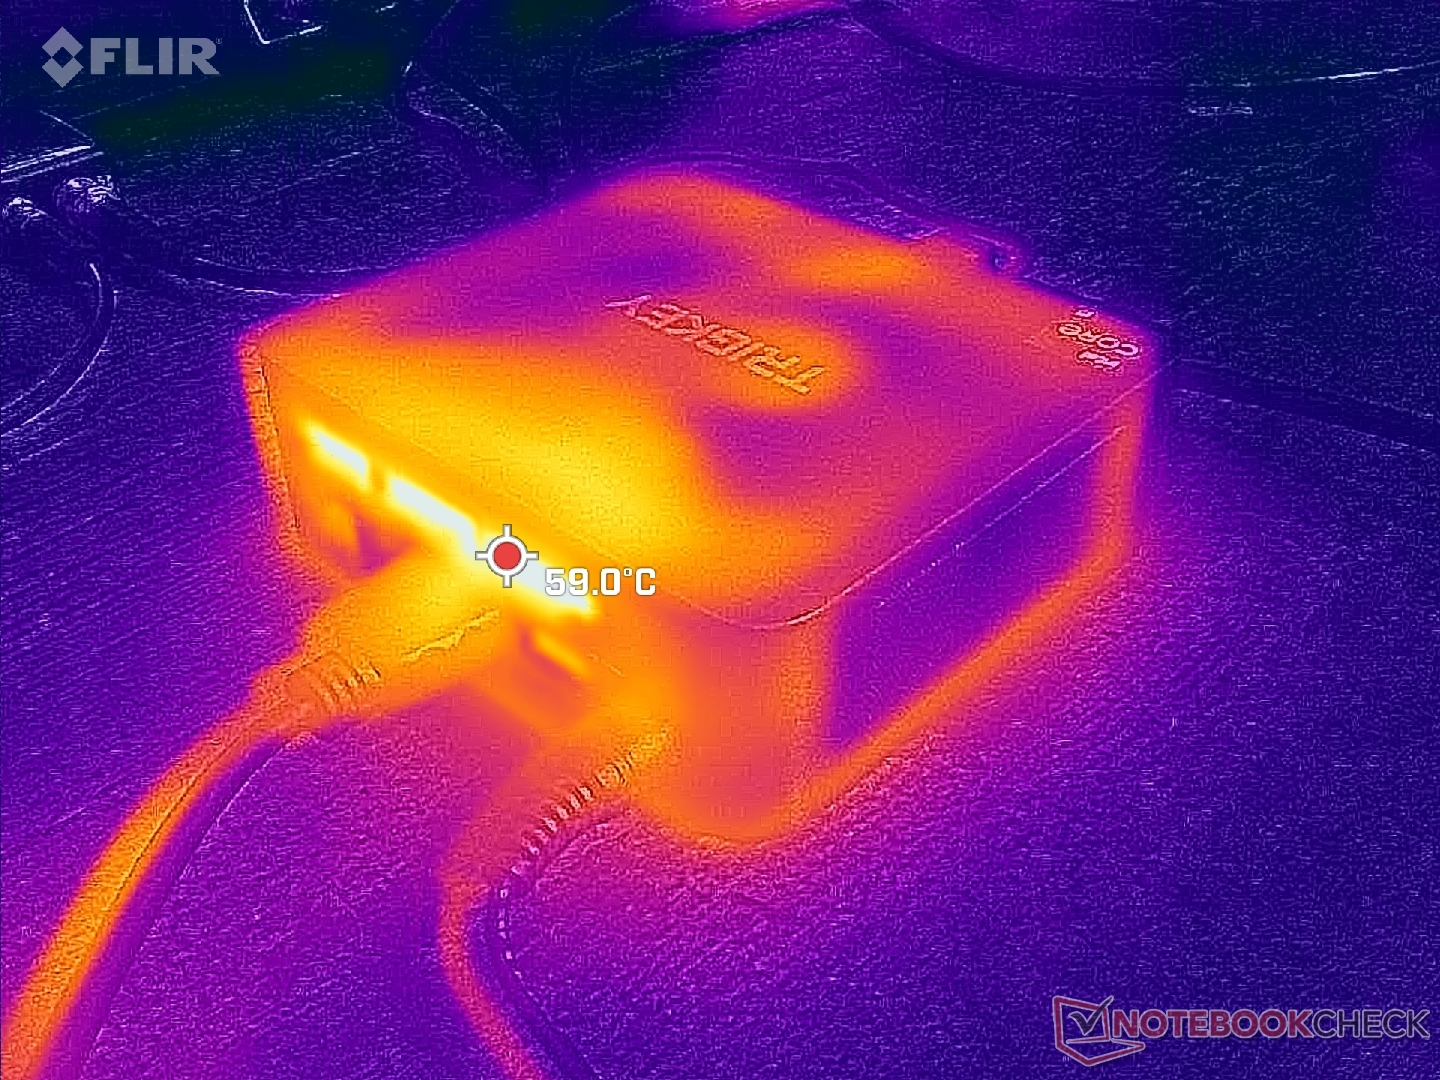
Temperatura
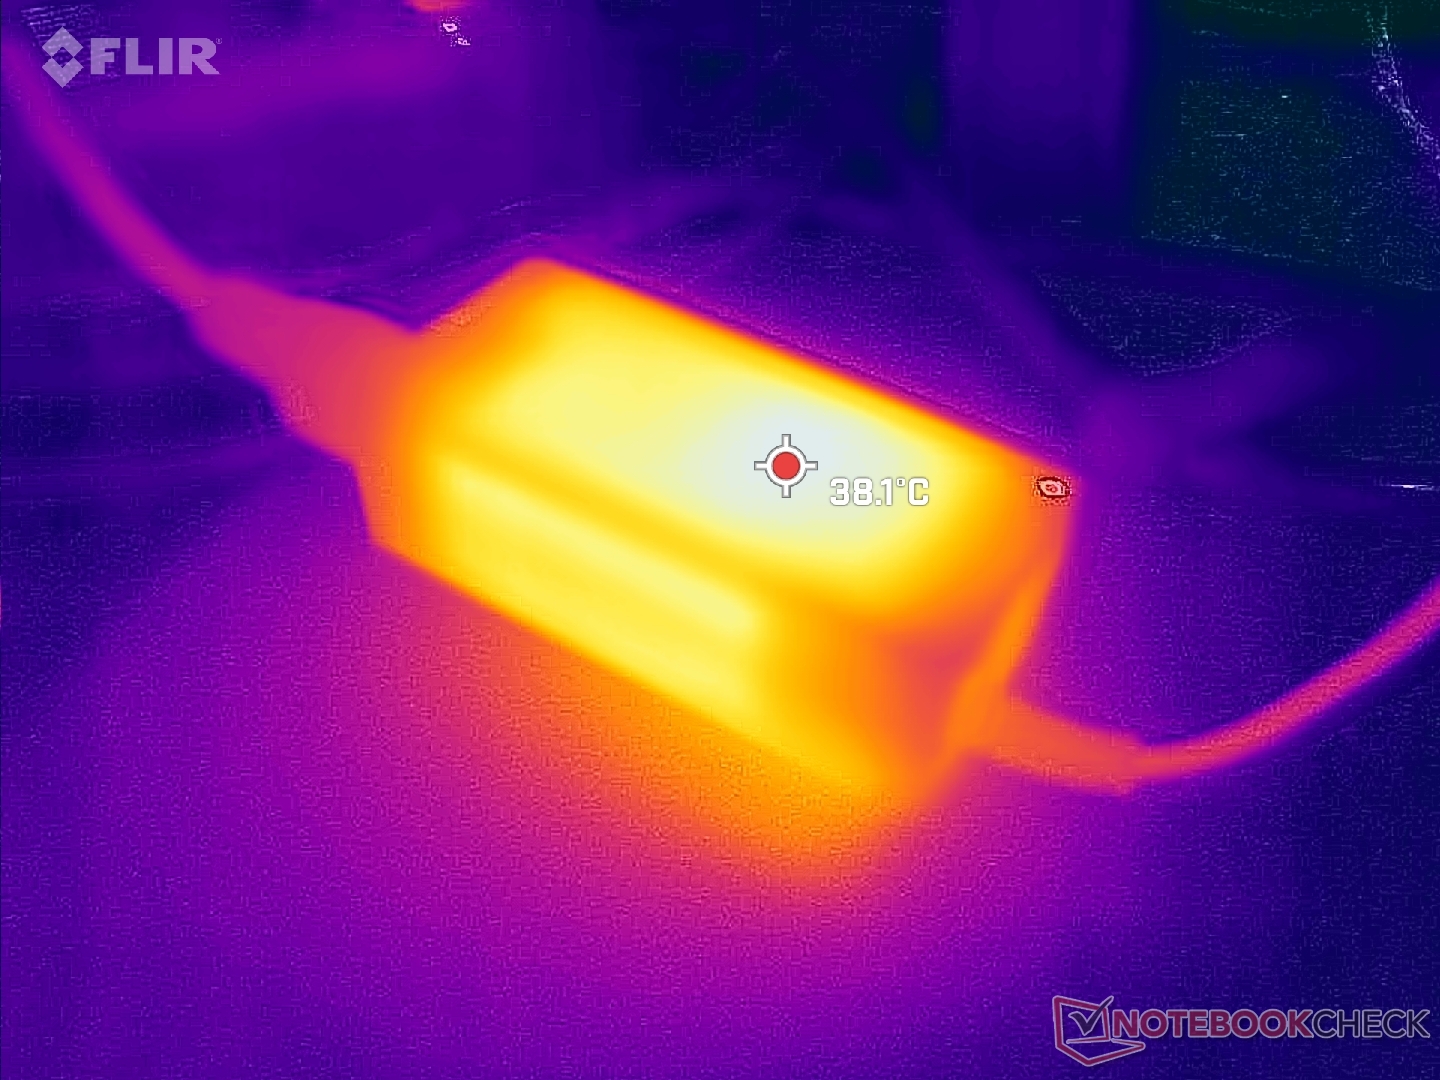
Temperatury powierzchni są najcieplejsze wzdłuż tyłu, gdzie wychodzi gorące powietrze. Chłodne powietrze napływa z boków obudowy.
Stress Test
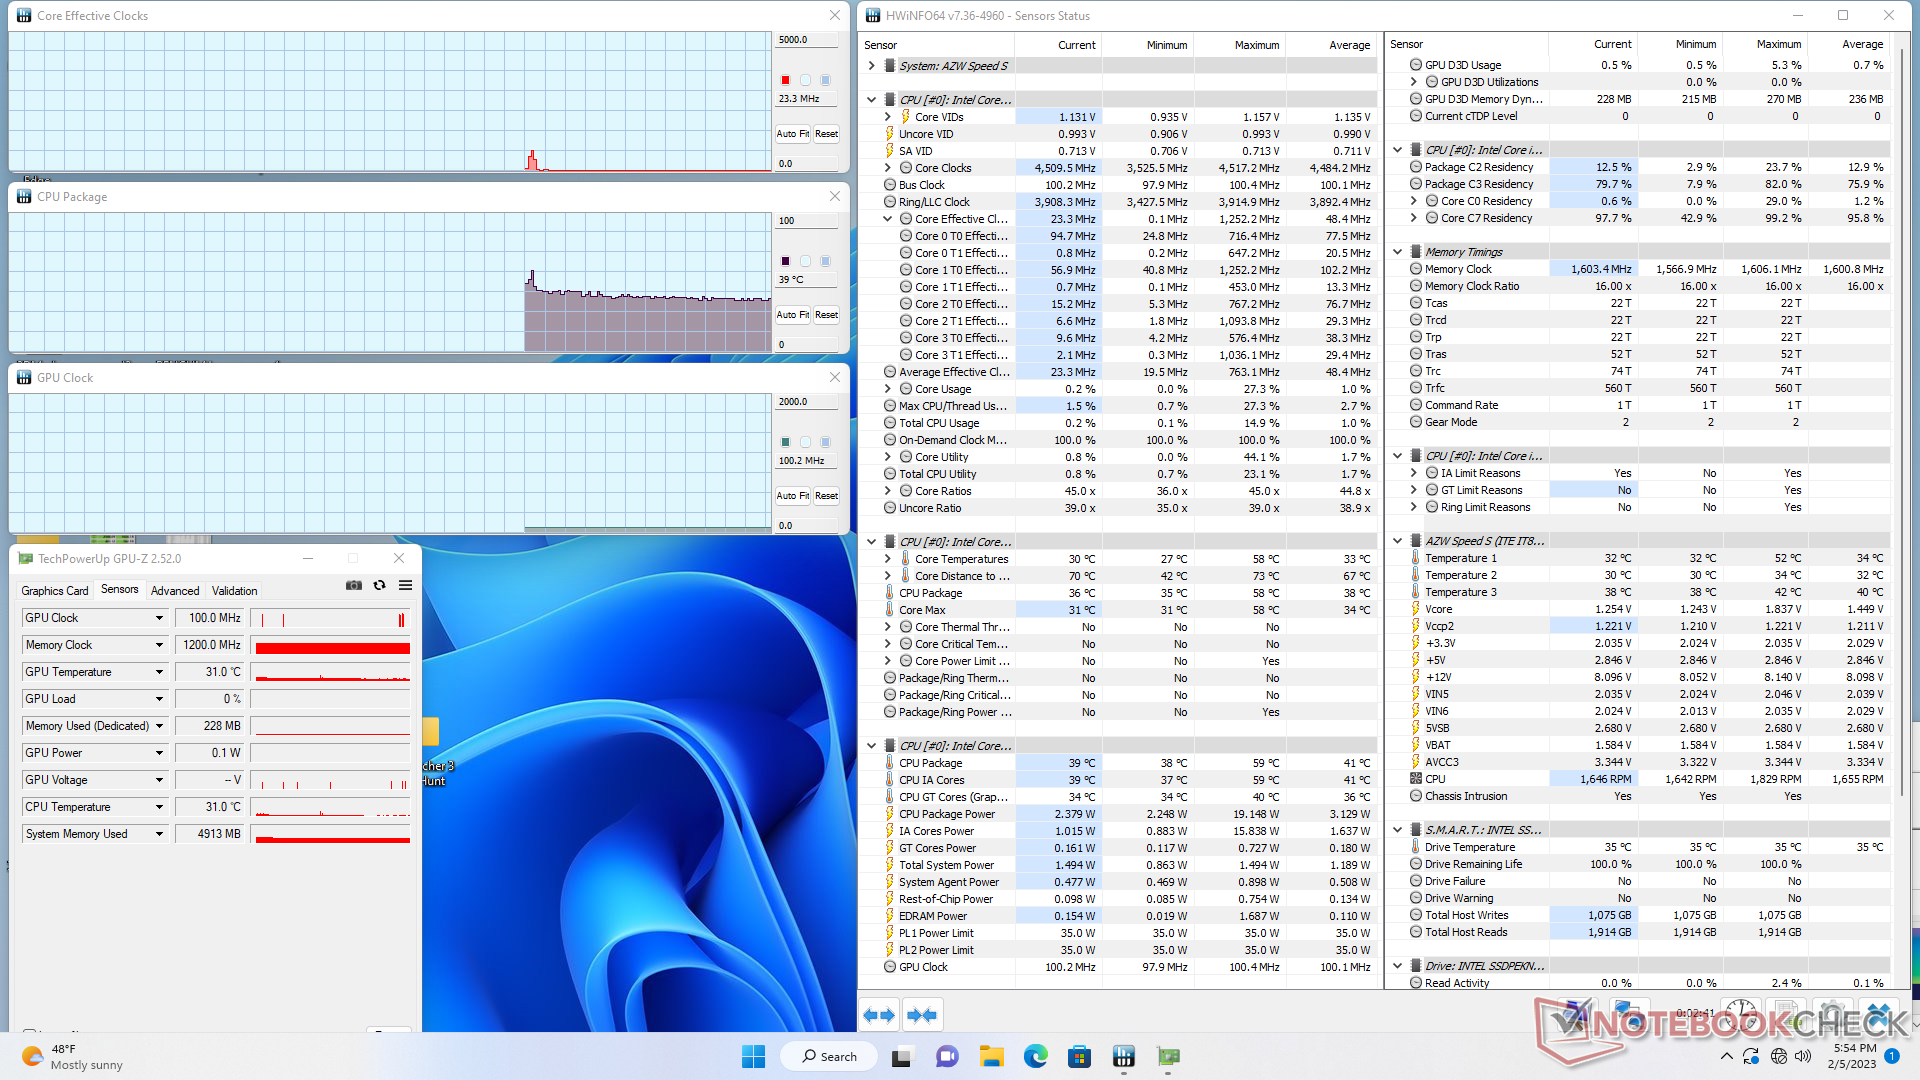
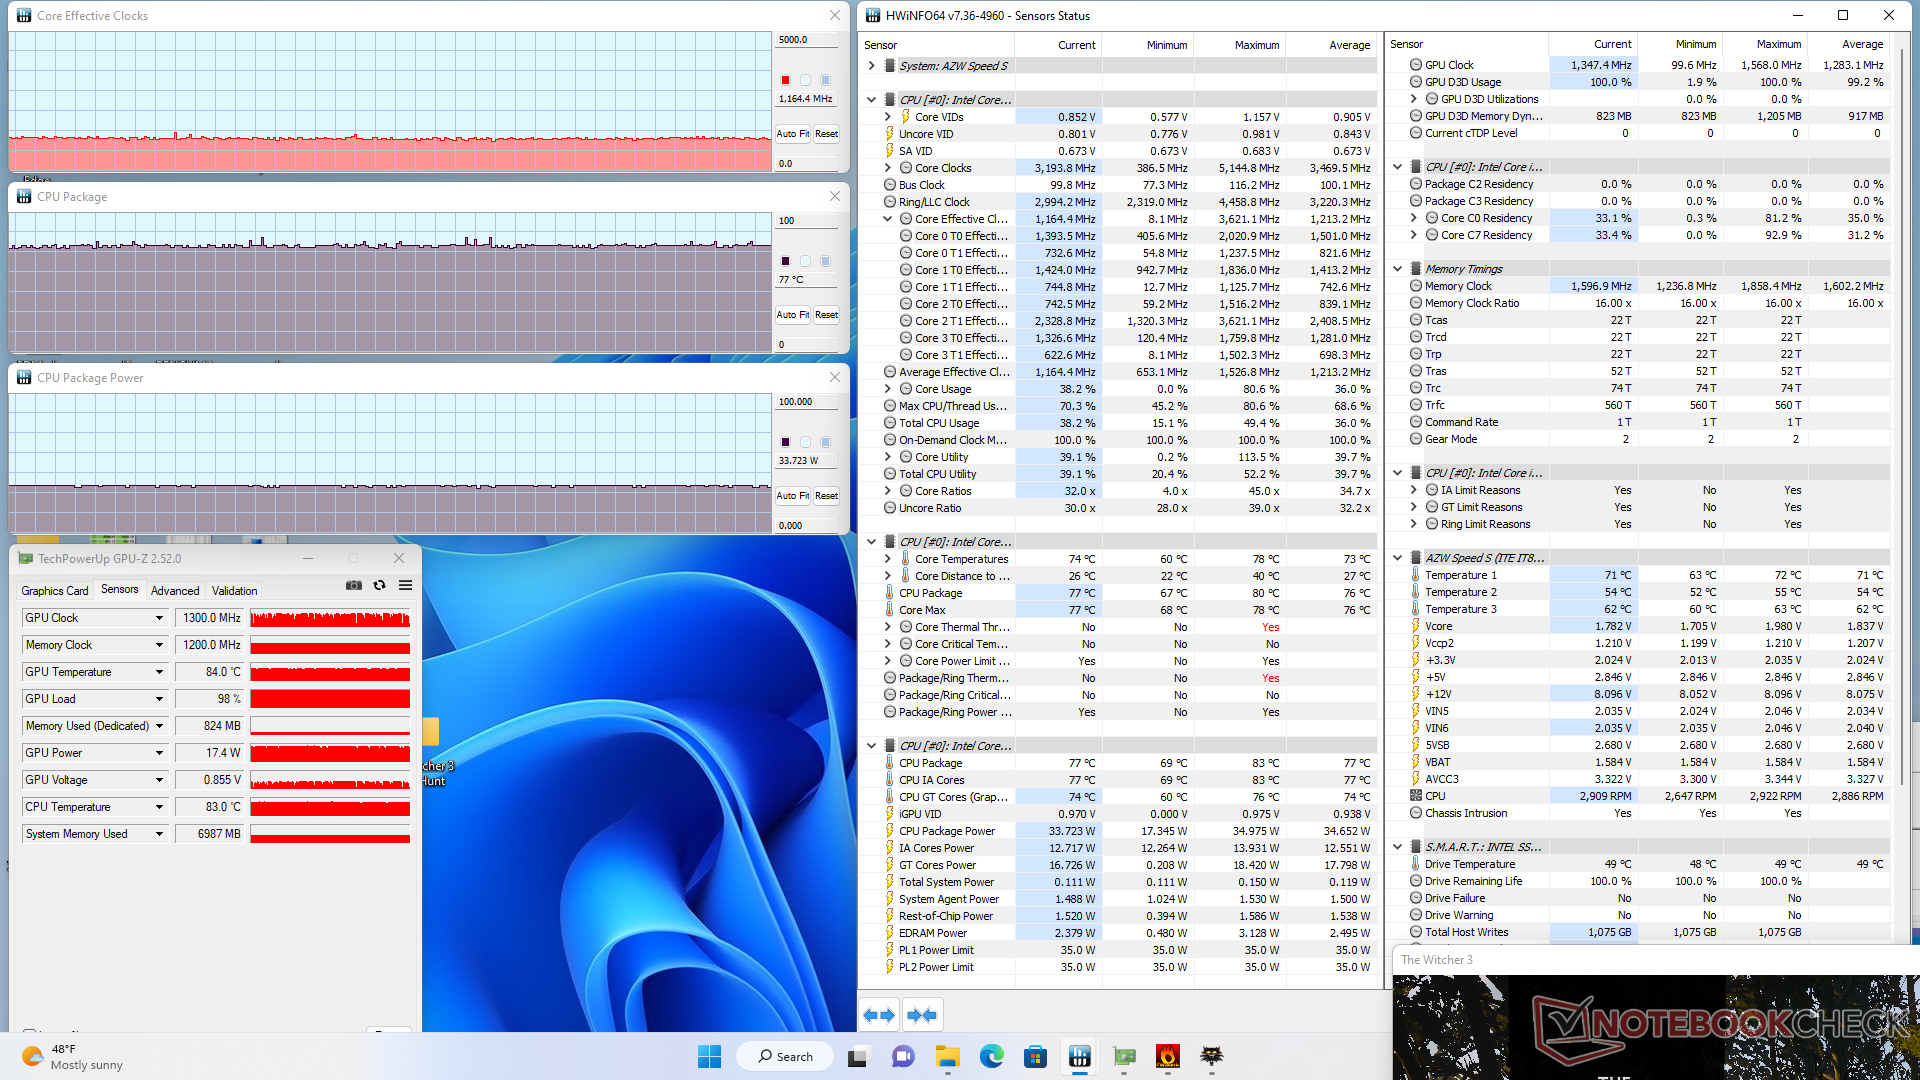
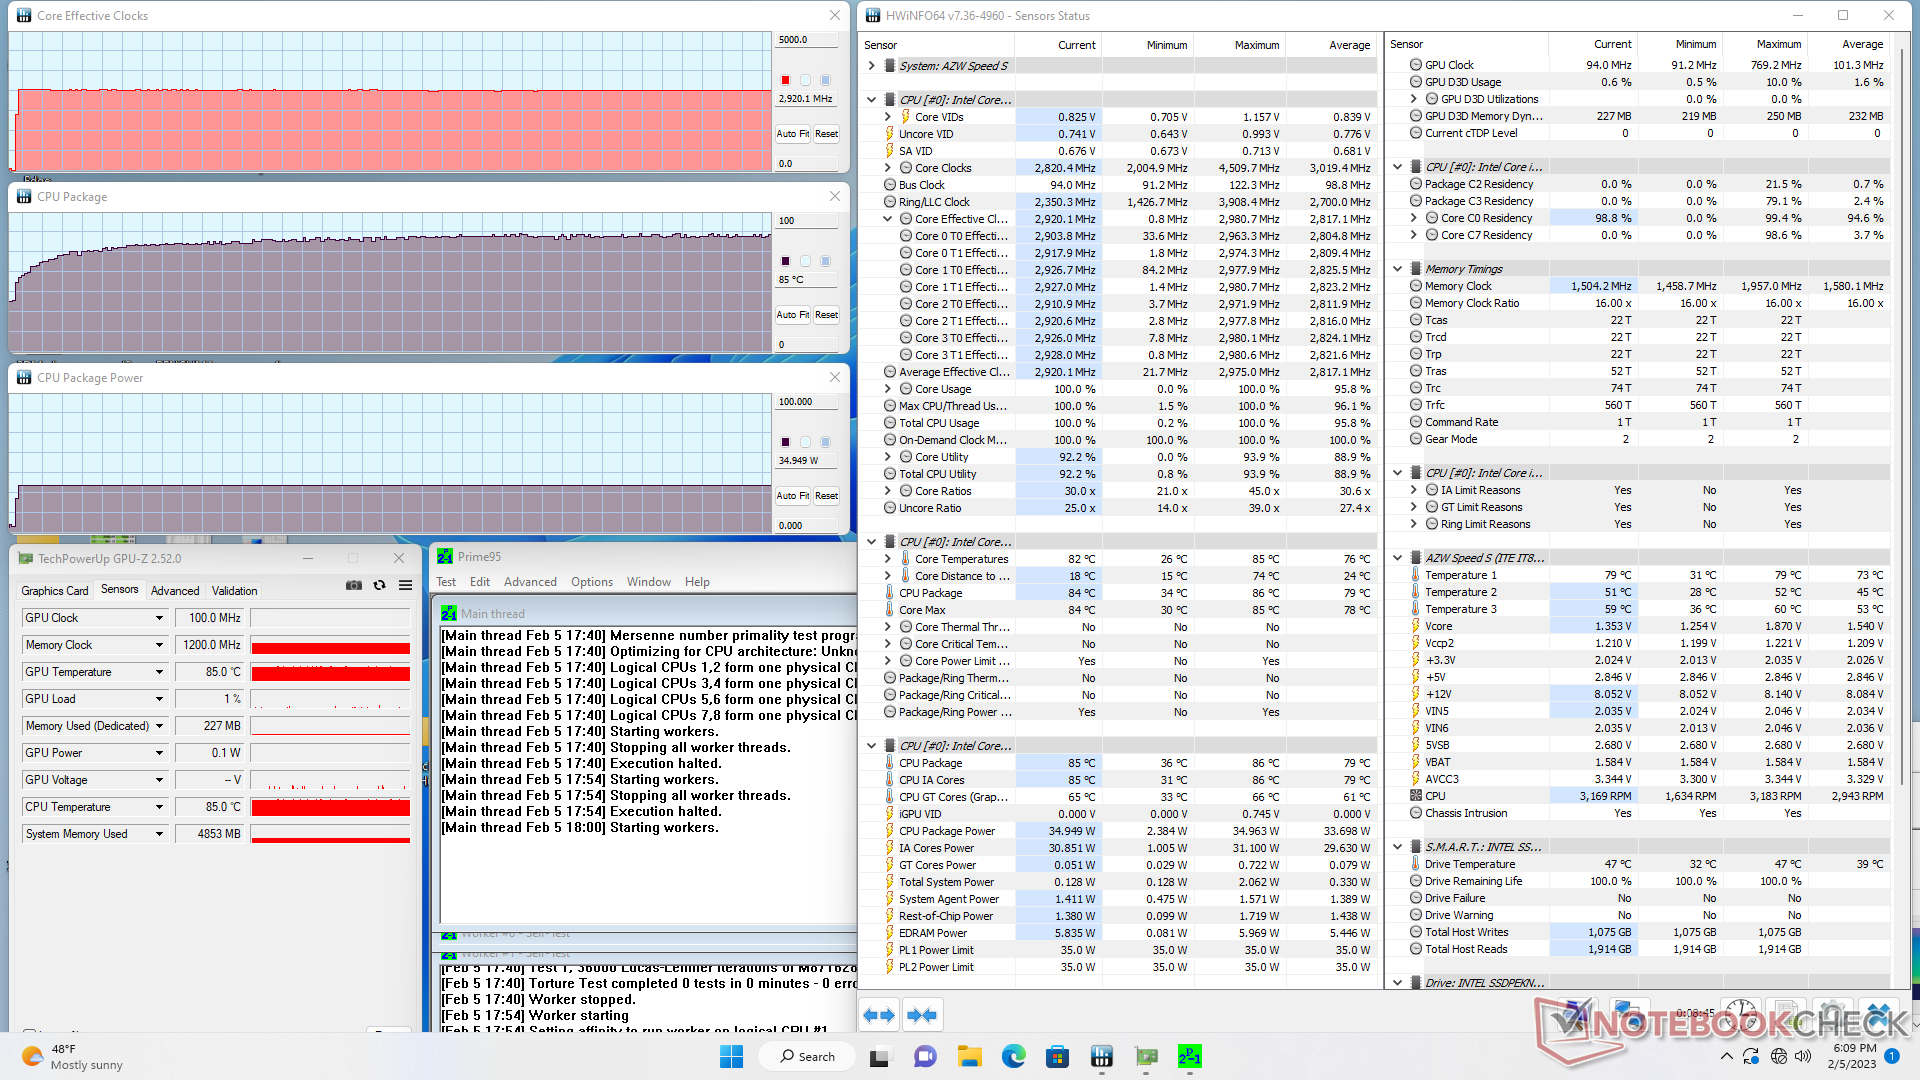
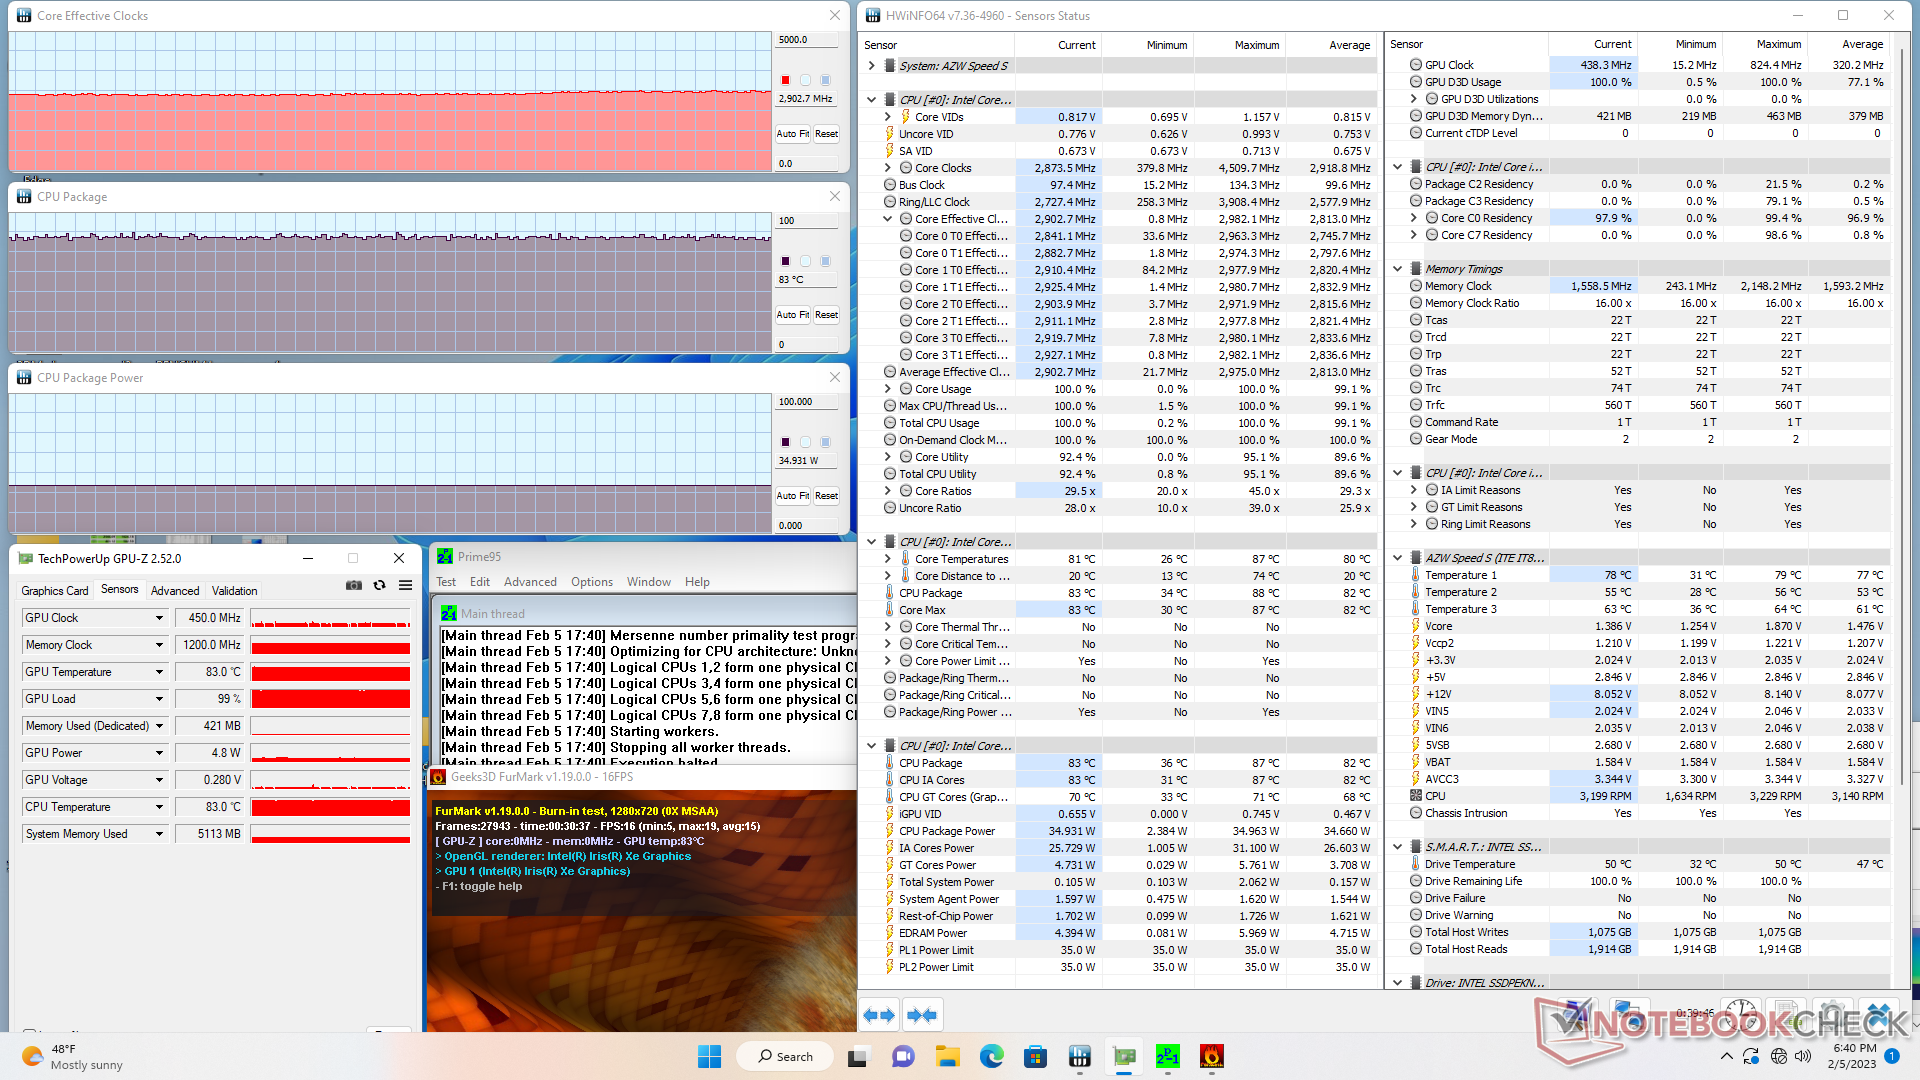
| Taktowanie CPU (GHz) | Taktowanie GPU (MHz) | Średnia temperatura CPU (°C) | |
| System Idle | -- | -- | 39 |
| Prime95 Stress | 2.9 | -- | 86 |
| Prime95+FurMark Stress | 2.9 | 438 | 83 |
| Witcher 3 Stress | 1.2 | 1347 | 77 |
Zarządzanie energią
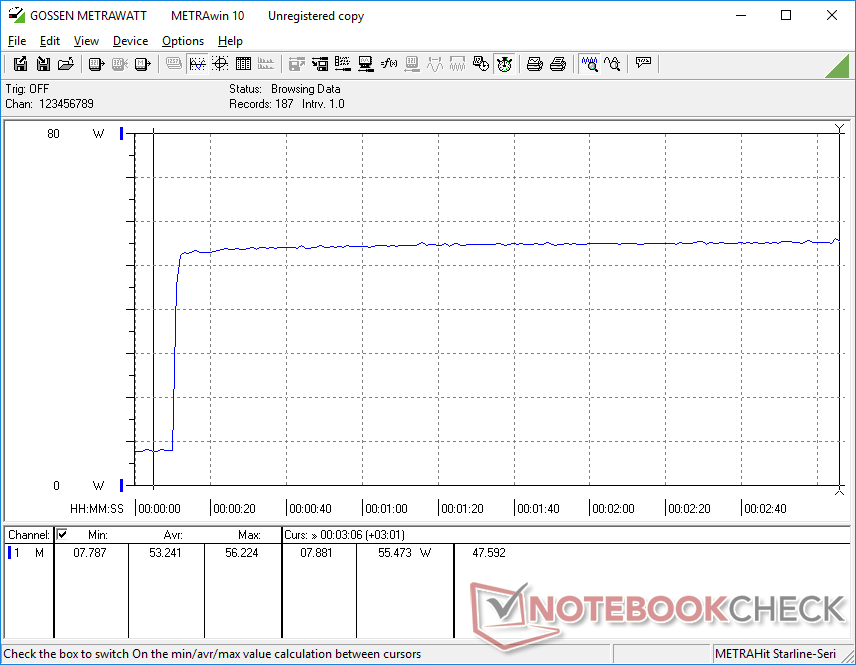
Pobór mocy
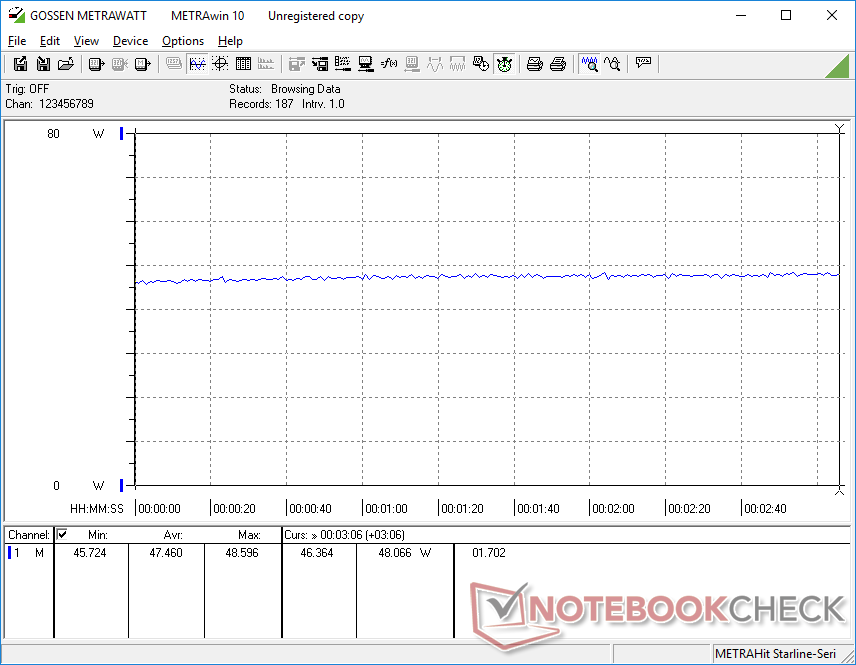

| wyłączony / stan wstrzymania | |
| luz | |
| obciążenie |
|
Legenda:
min: | |
| Trigkey Speed S i5-11320H, Iris Xe G7 96EUs, Intel SSD 670p SSDPEKNU512GZ, , x, | Trigkey S3 R5 3550H, Vega 8, Kingston NV1 SNVS/500GCN, , x, | Beelink SEi12 Core i5-1235U i5-1235U, Iris Xe G7 80EUs, Kingston NV1 SNVS/500GCN, , x, | Beelink SER Pro Ryzen 5 5600H R5 5600H, Vega 7, Kingston NV1 SNVS/500GCN, , x, | Intel NUC 12 Pro Kit NUC12WSKi7 i7-1260P, Iris Xe G7 96EUs, Transcend M.2 SSD 2200S TS512GMTE220S, , x, | BMAX B5 Pro G7H8 i5-8260U, UHD Graphics 620, , , x, | |
|---|---|---|---|---|---|---|
| Power Consumption | -61% | -82% | 4% | -59% | 15% | |
| Idle Minimum * (Watt) | 6.7 | 11.3 -69% | 15.8 -136% | 5.4 19% | 12.1 -81% | 6 10% |
| Idle Average * (Watt) | 8 | 21.8 -173% | 16.8 -110% | 8.2 -2% | 12.2 -53% | 6.2 22% |
| Idle Maximum * (Watt) | 8.1 | 22.2 -174% | 17 -110% | 8.3 -2% | 12.3 -52% | 6.3 22% |
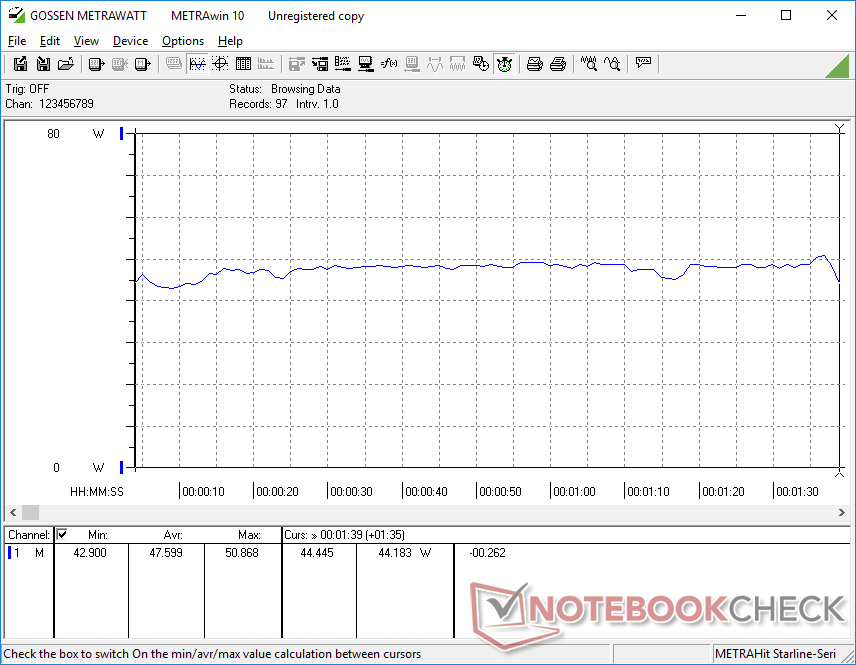
| Load Average * (Watt) | 47.6 | 39.7 17% | 54.4 -14% | 49.3 -4% | 64 -34% | 42.8 10% |
| Witcher 3 ultra * (Watt) | 47.5 | 37.5 21% | 50.7 -7% | 46.1 3% | 35 26% | |
| Load Maximum * (Watt) | 56.3 | 48.9 13% | 119.1 -112% | 50.2 11% | 98.8 -75% | 55.8 1% |
* ... im mniej tym lepiej
Power Consumption Witcher 3 / Stresstest
Power Consumption external Monitor
Za
Przeciw
Werdykt
Alternatywy NUC systematycznie spadają w cenie, nie tracąc przy tym na wydajności dzięki dostarczaniu ich z procesorami serii H. Ceny są teraz tak niskie, że zaczynają wypierać wolniejsze mini PC z Atomem lub Celeronem. Za 400 USD, Trigkey Speed S jest gotowy do pracy i o połowę tańszy od wielu komputerów Intel NUC wyposażonych w podobną konfigurację pamięci RAM i pamięci masowej. Nie oferuje on niektórych zaawansowanych funkcji, takich jak Thunderbolt, Wi-Fi 6E czy 2,5 Gbit Ethernet, ale wielu użytkownikom HTPC raczej nie będzie to przeszkadzać, jeśli chodzi o strumieniowanie wideo 1080p lub 4K.
Trigkey Speed S jest przekonujący na każdym froncie w porównaniu do innych mini PC w tym samym przedziale cenowym.
W porównaniu z Trigkey S3, Speed S oferuje od 70 do 120 procent szybszą wydajność grafiki i od 50 do 60 procent szybszą wydajność wielowątkowego procesora. Pod obciążeniem zużywa nieco więcej energii, ale zarówno wydajność na wat, jak i wydajność na dolara pozostają na wysokim poziomie. Na wszelki wypadek zalecamy sprawdzenie, czy po otrzymaniu produktu nie występują szumy elektroniczne lub wycie cewek.
Cena i dostępność
Recenzowany Trigkey Speed S jest już dostępny na Am azonie w cenie 399 USD.
Przezroczystość
Wyboru urządzeń do recenzji dokonuje nasza redakcja. Próbka testowa została udostępniona autorowi jako pożyczka od producenta lub sprzedawcy detalicznego na potrzeby tej recenzji. Pożyczkodawca nie miał wpływu na tę recenzję, producent nie otrzymał też kopii tej recenzji przed publikacją. Nie było obowiązku publikowania tej recenzji. Jako niezależna firma medialna, Notebookcheck nie podlega władzy producentów, sprzedawców detalicznych ani wydawców.
Tak testuje Notebookcheck
Każdego roku Notebookcheck niezależnie sprawdza setki laptopów i smartfonów, stosując standardowe procedury, aby zapewnić porównywalność wszystkich wyników. Od około 20 lat stale rozwijamy nasze metody badawcze, ustanawiając przy tym standardy branżowe. W naszych laboratoriach testowych doświadczeni technicy i redaktorzy korzystają z wysokiej jakości sprzętu pomiarowego. Testy te obejmują wieloetapowy proces walidacji. Nasz kompleksowy system ocen opiera się na setkach uzasadnionych pomiarów i benchmarków, co pozwala zachować obiektywizm.Price comparison

