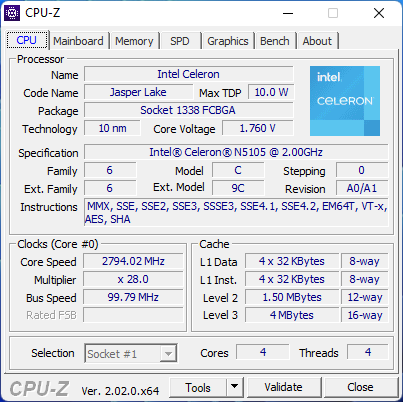
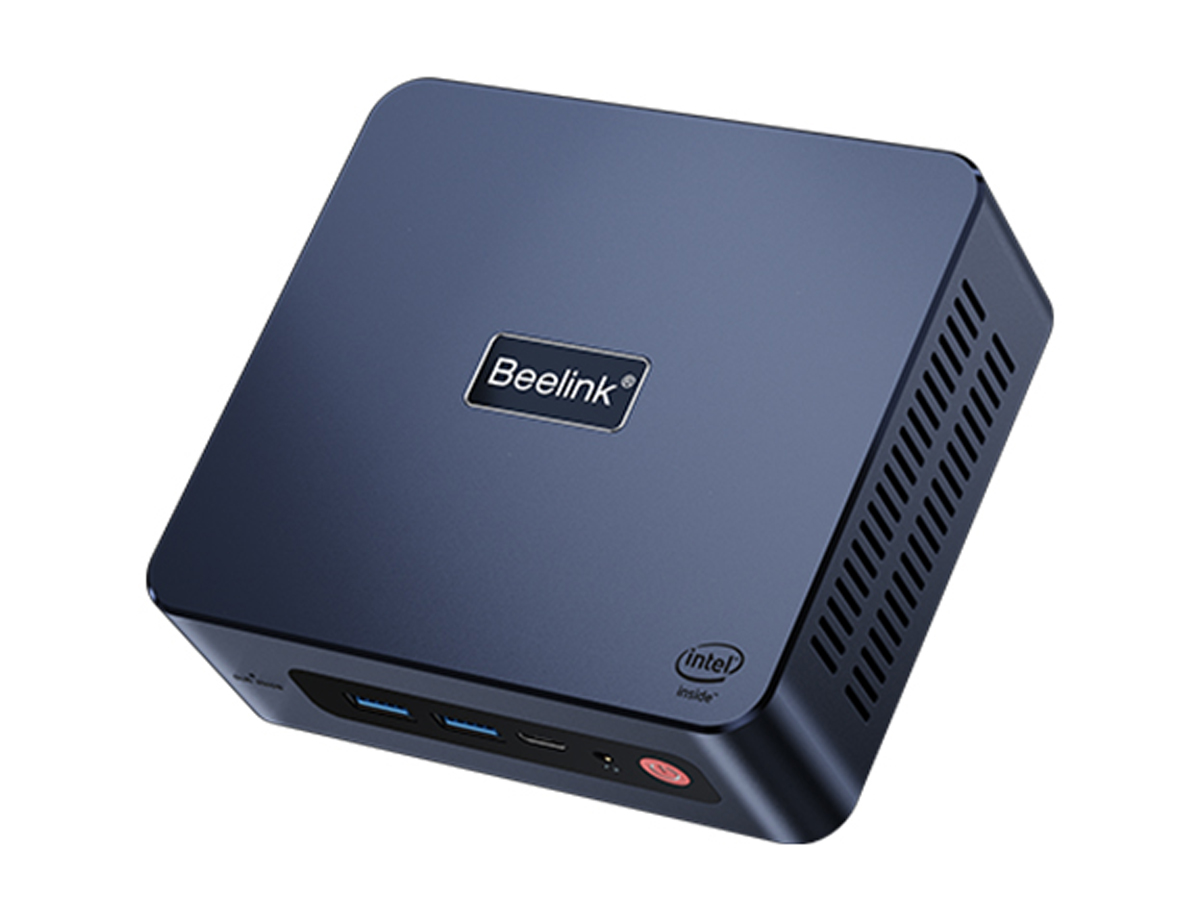
Celeron N5105 debiutujący w Jasper Lake: Recenzja mini PC Beelink U59
Beelink zaktualizował jeden ze swoich najtańszych mini PC o szybszy procesor Jasper Lake Intel Celeron N5105, który zastąpił Celeron N5095 w poprzednim Modelu U59. Chociaż obudowa pozostaje prawie taka sama jak wcześniej, istnieje kilka istotnych różnic, które odnotujemy w poniższej recenzji
Beelink U59 konkuruje z innymi niedrogimi mini PC jak np Zotac Nano series, GMK NucBox series, czy też Chuwi GBox
Więcej recenzji Beelink:
Potencjalni konkurenci w porównaniu
Ocena | Data | Model | Waga | Wysokość | Rozmiar | Rezolucja | Cena |
|---|---|---|---|---|---|---|---|
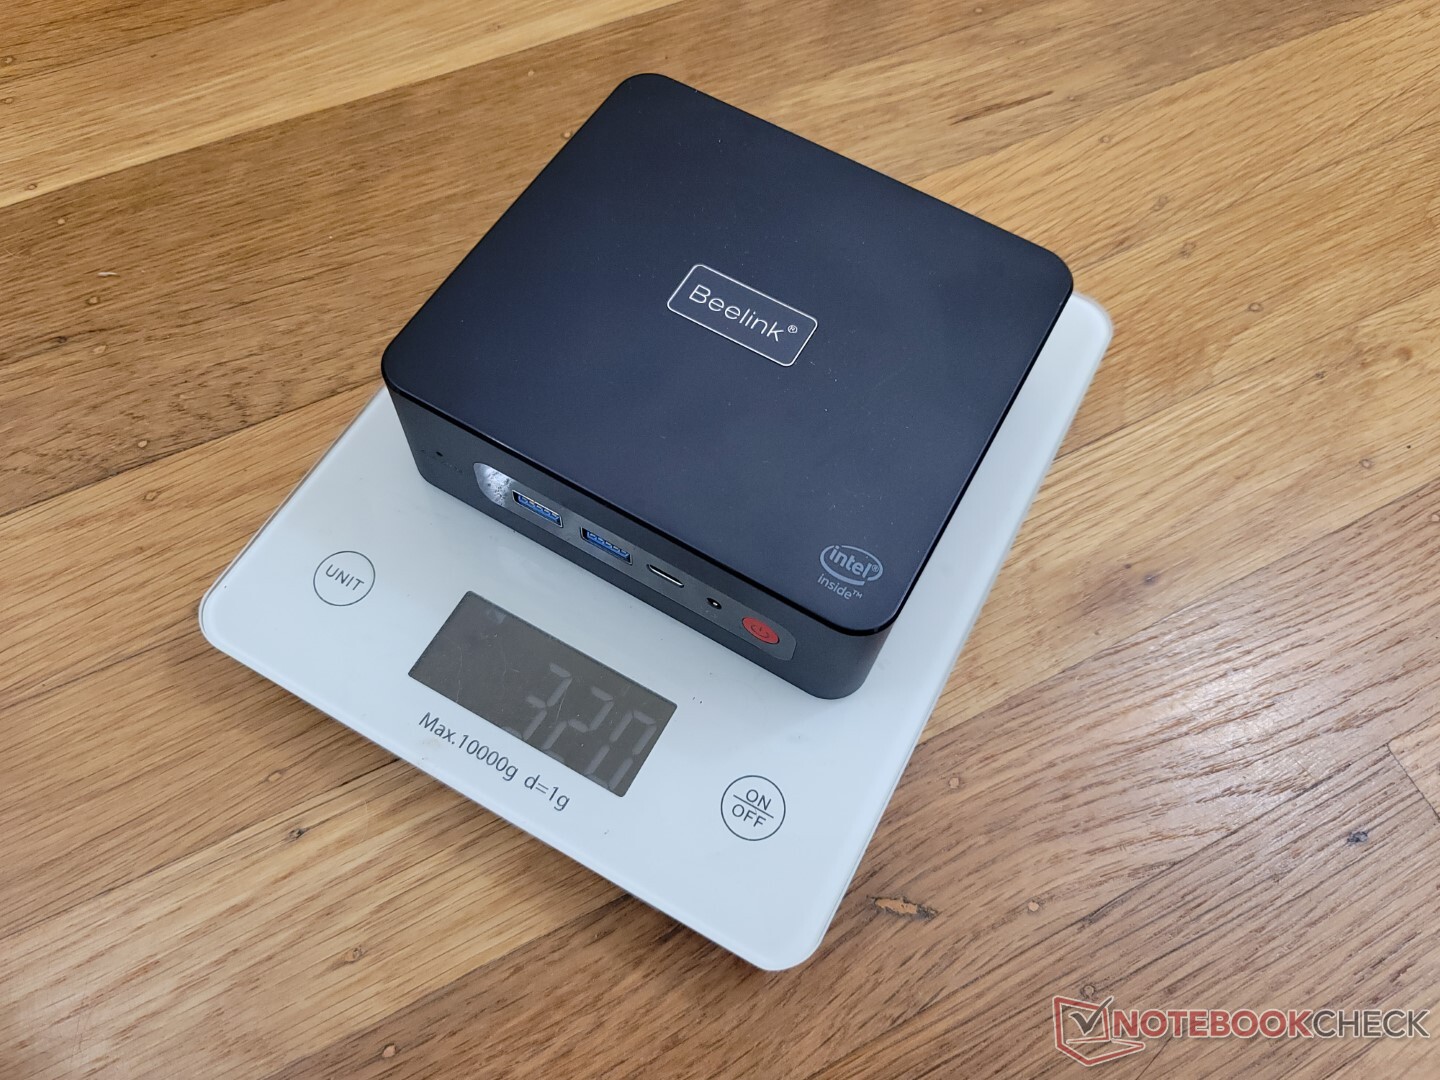
v (old) | 09/2022 | Beelink U59 N5105 Celeron N5105, UHD Graphics (Jasper Lake 24 EU) | 320 g | 42 mm | x | ||
v (old) | Beelink U59 Mini-S Celeron N5095, UHD Graphics (Jasper Lake 16 EU) | 279 g | 41 mm | x | |||
v (old) | Beelink SER4 R7 4800U, Vega 8 | 494 g | 40 mm | x | |||
v (old) | Beelink SER3 R7 3750H, Vega 10 | 492 g | 40 mm | x | |||
v (old) | Intel NUC11TNKi5 i5-1135G7, Iris Xe G7 80EUs | 504 g | 37 mm | x | |||
v (old) | Zotac ZBOX PI336 pico Celeron N6211, UHD Graphics (Elkhart Lake 16 EU) | 293 g | 20.7 mm | x |
Sprawa
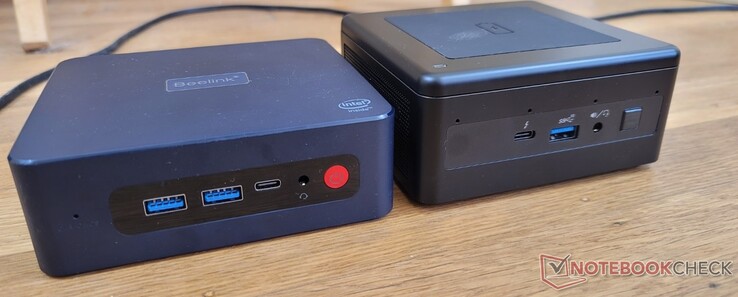
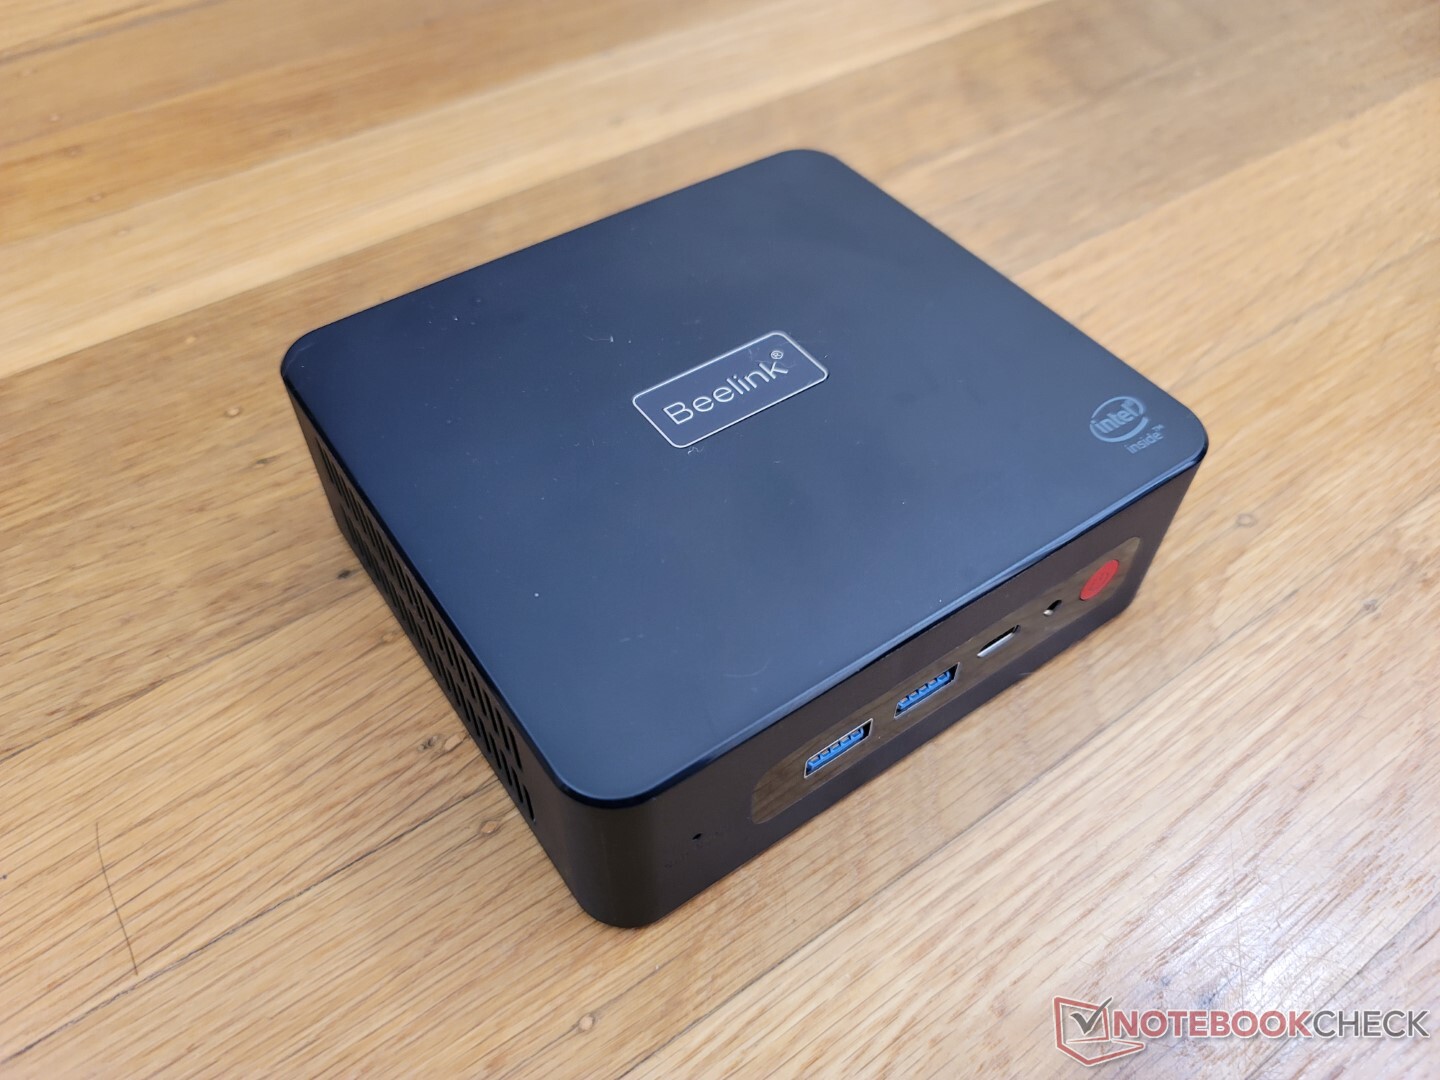
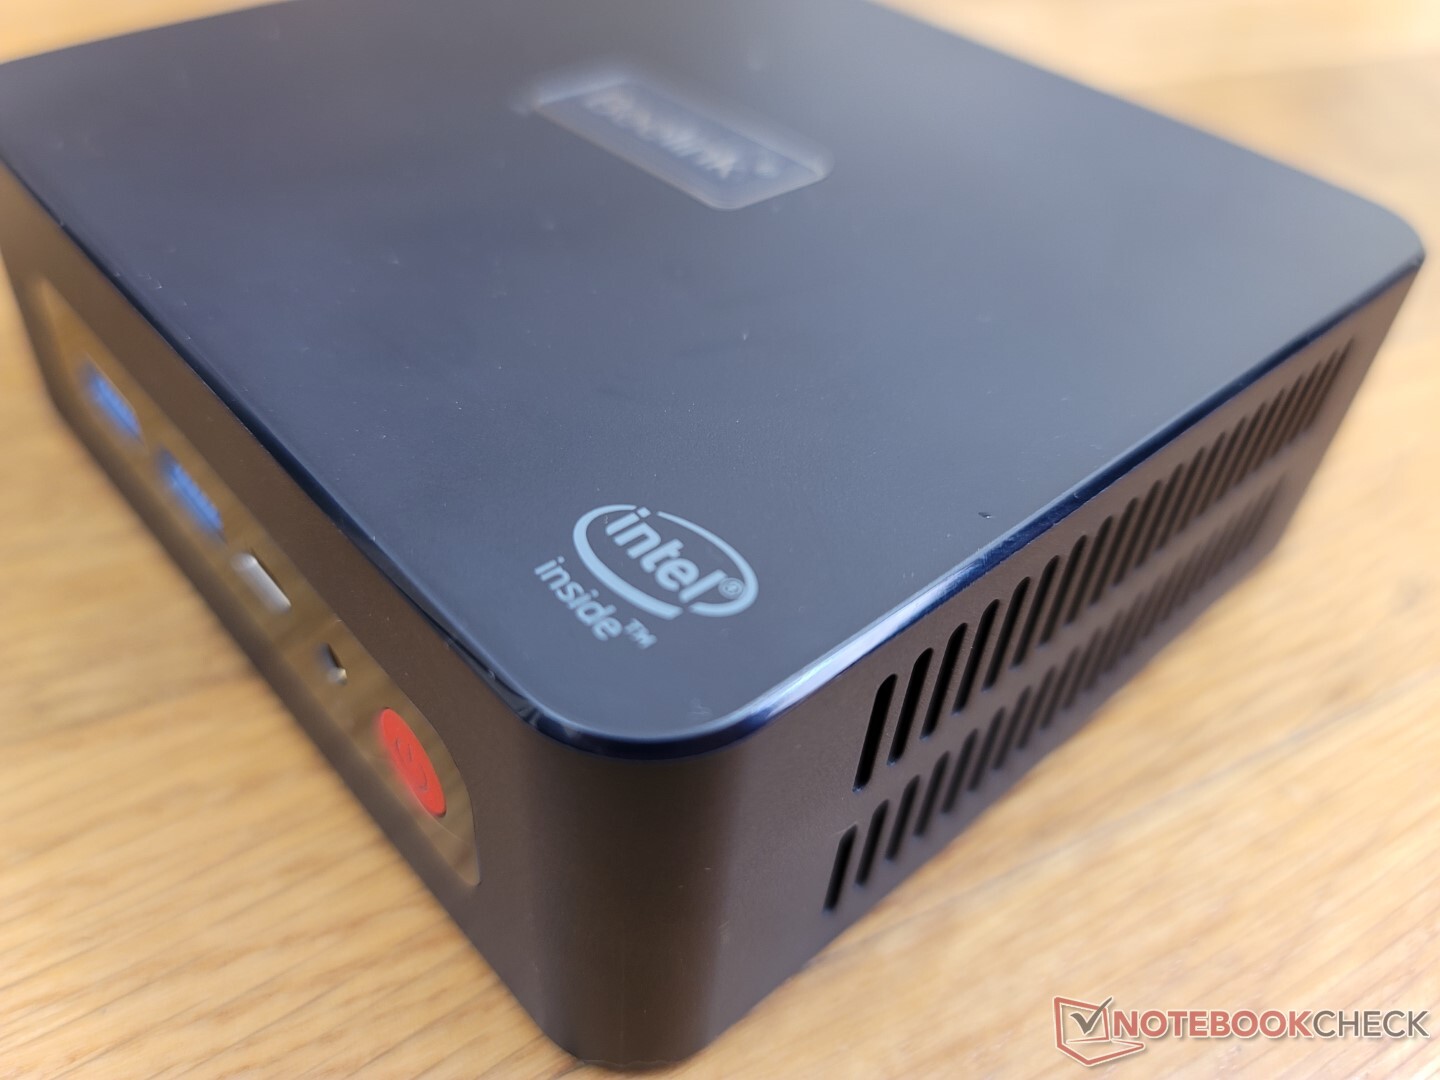
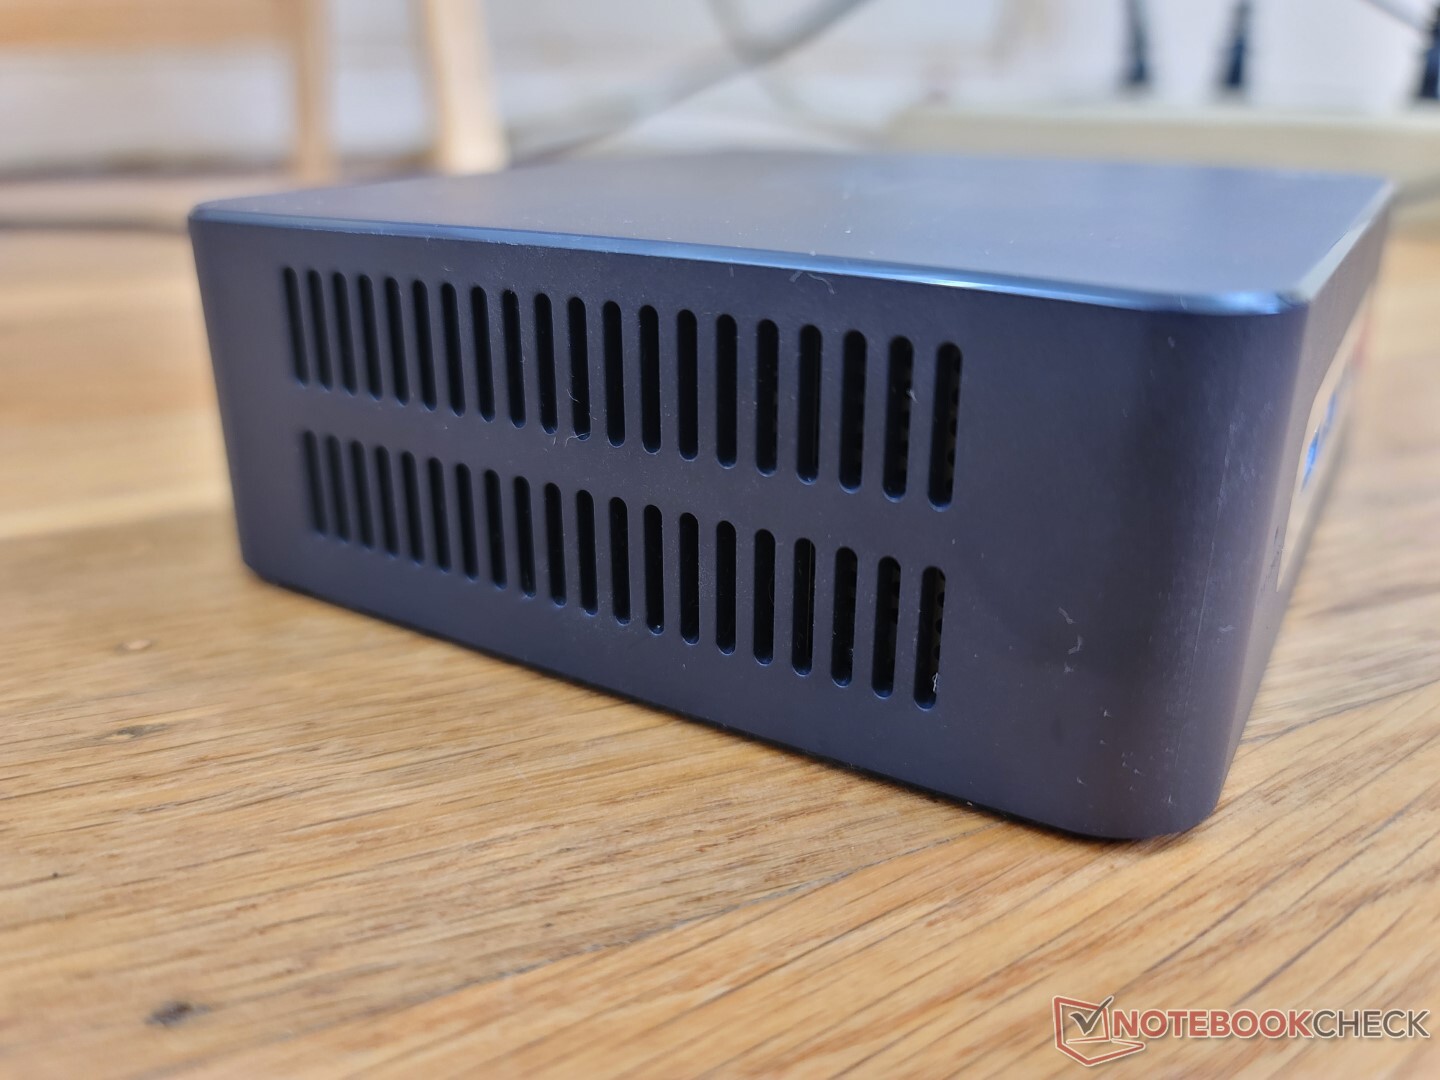
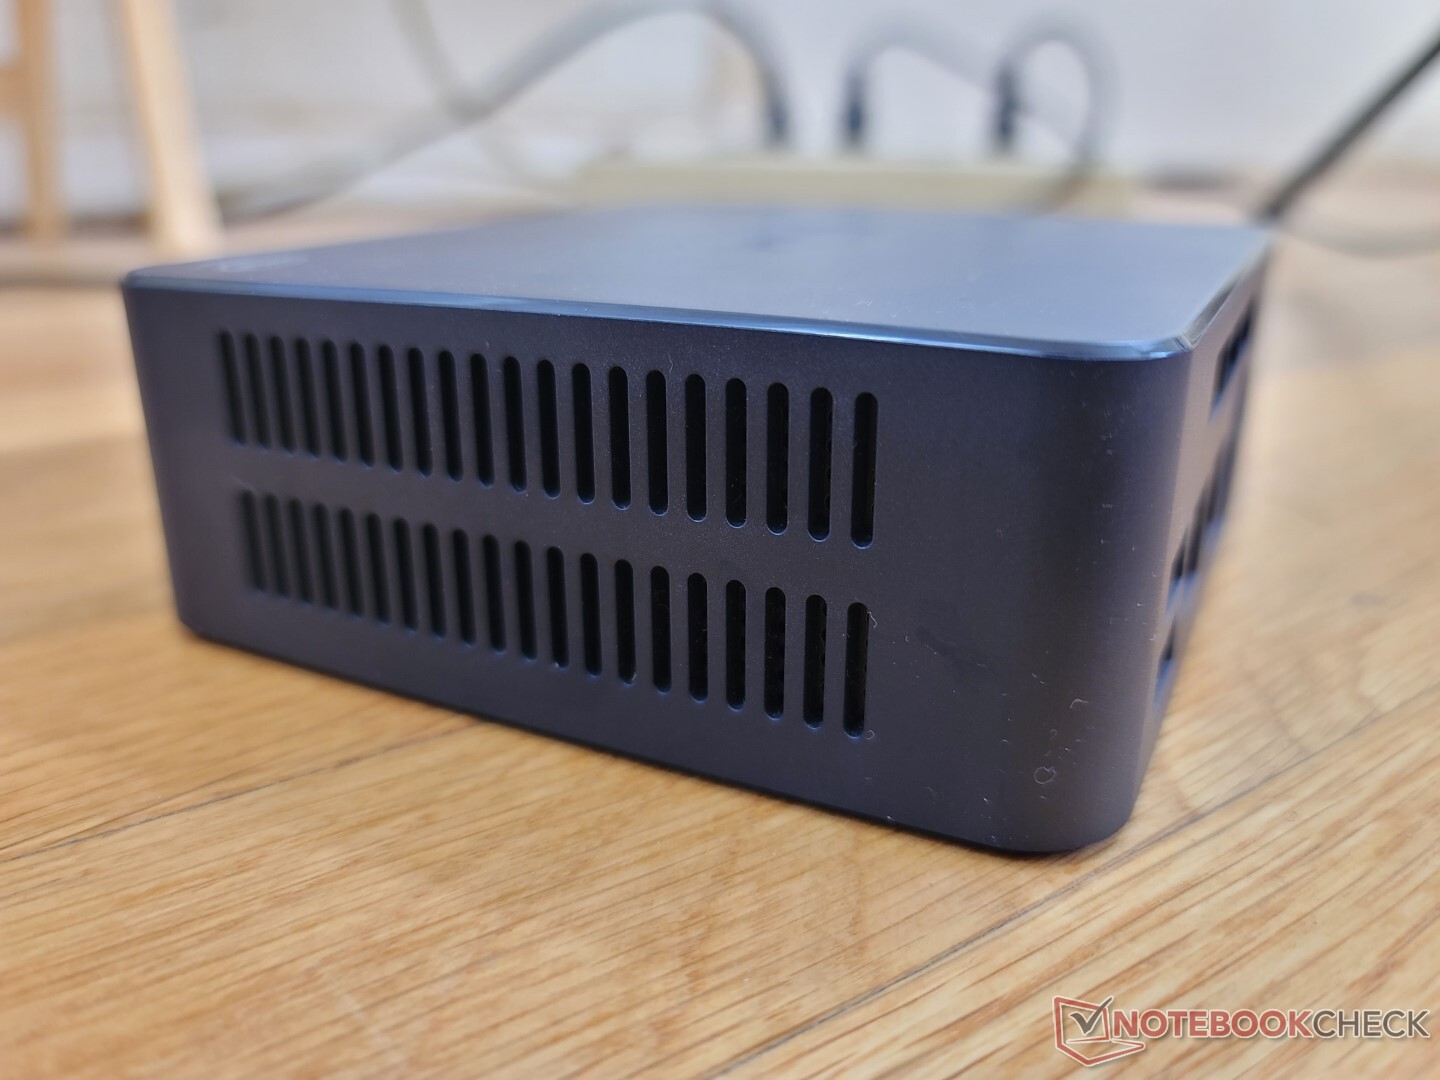
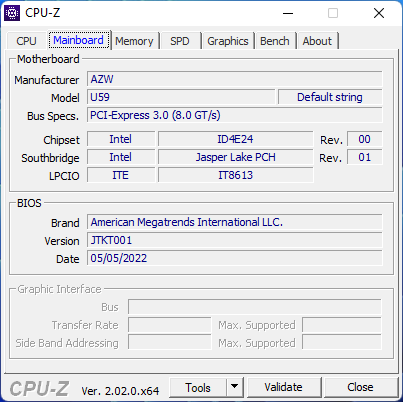
Co ciekawe, Beelink oferuje trzy strony różnych U59 każdy z nich ma nieco inne opcje portów, wygląd i cechy wewnętrzne. Ich wymiary i waga są jednak niemal identyczne. W przypadku naszego recenzowanego modelu obudowa ma większe kratki wentylacyjne oraz całkowicie matową górę i logo w porównaniu z mniejszymi kratkami i błyszczącą górą w poprzednich modelach.
Łączność
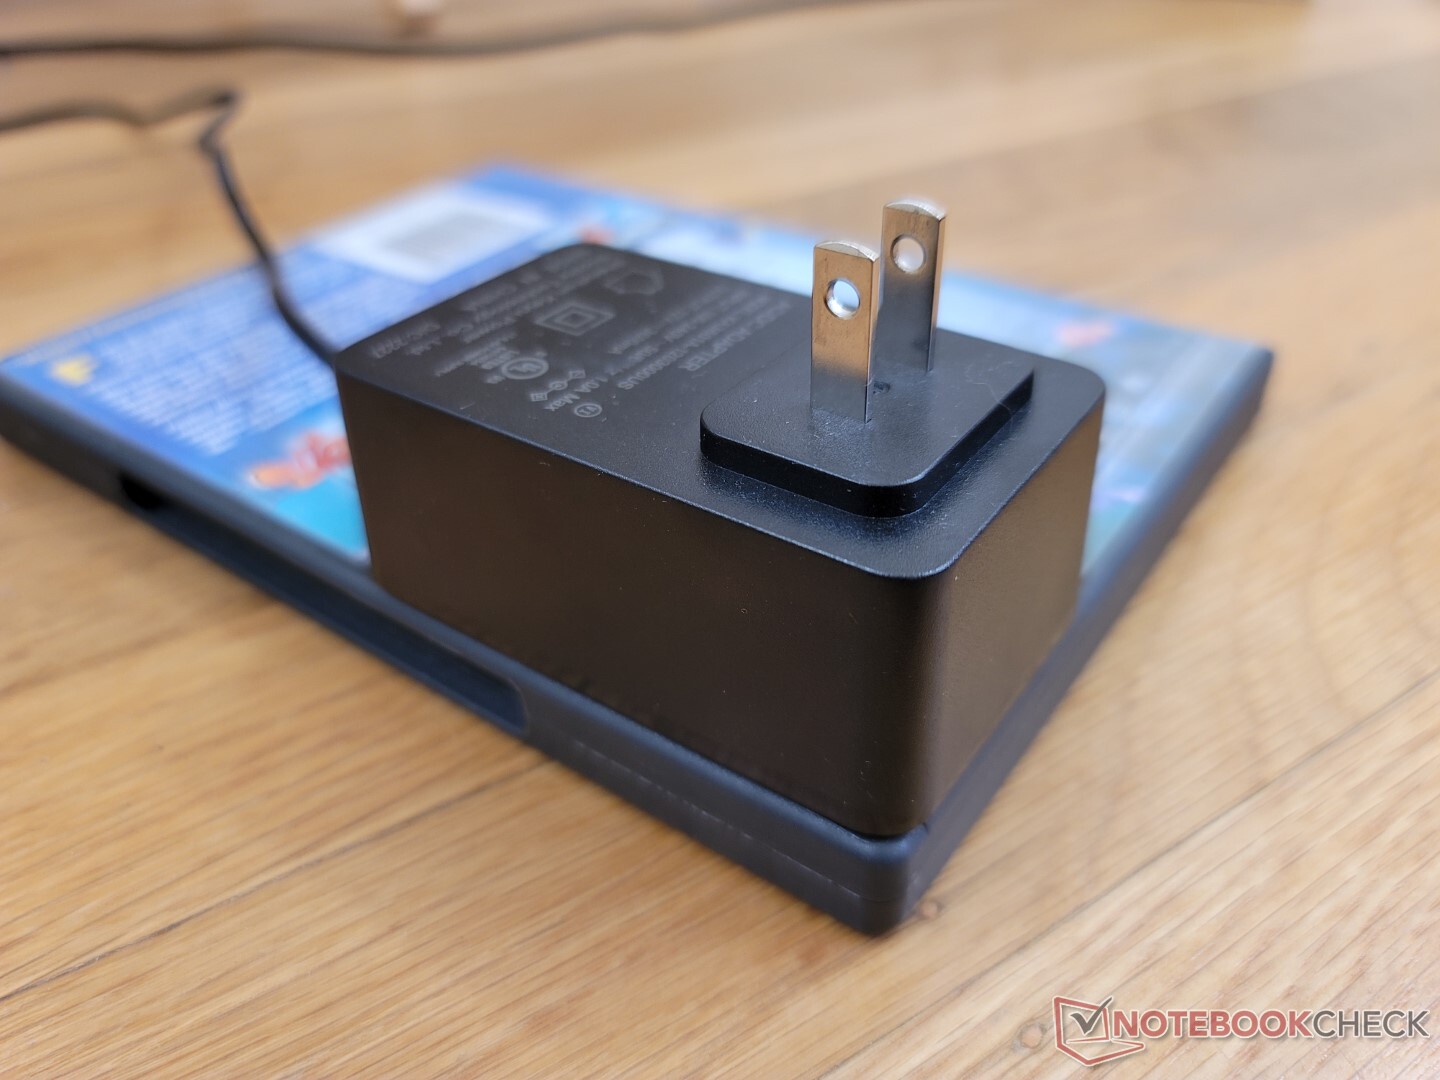
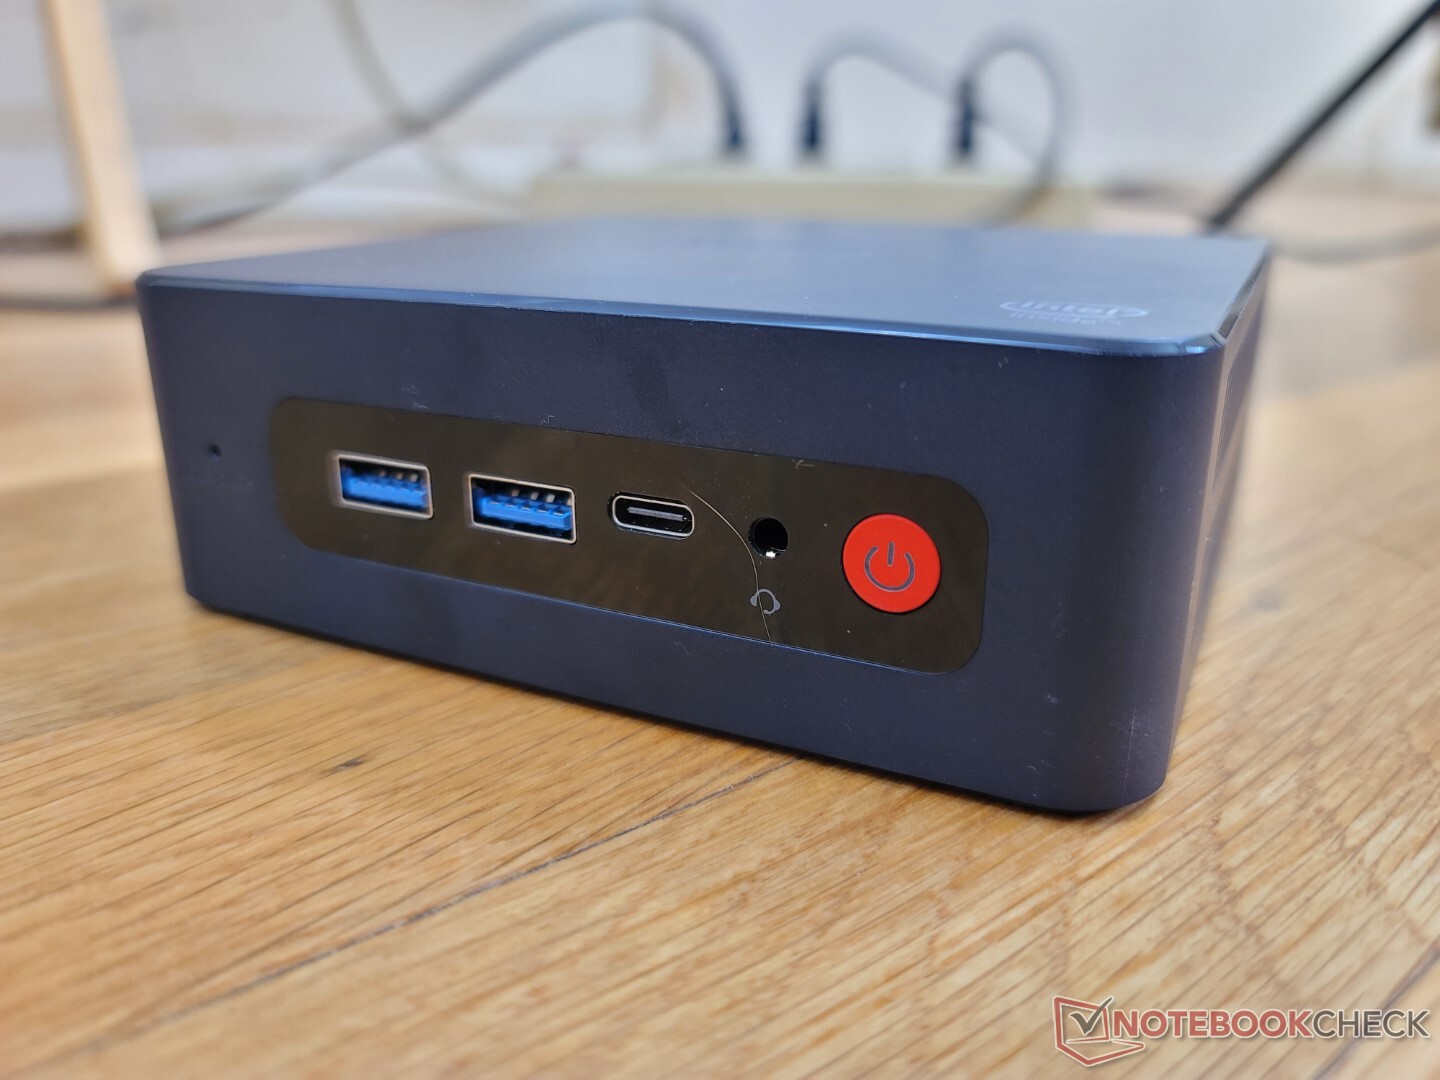
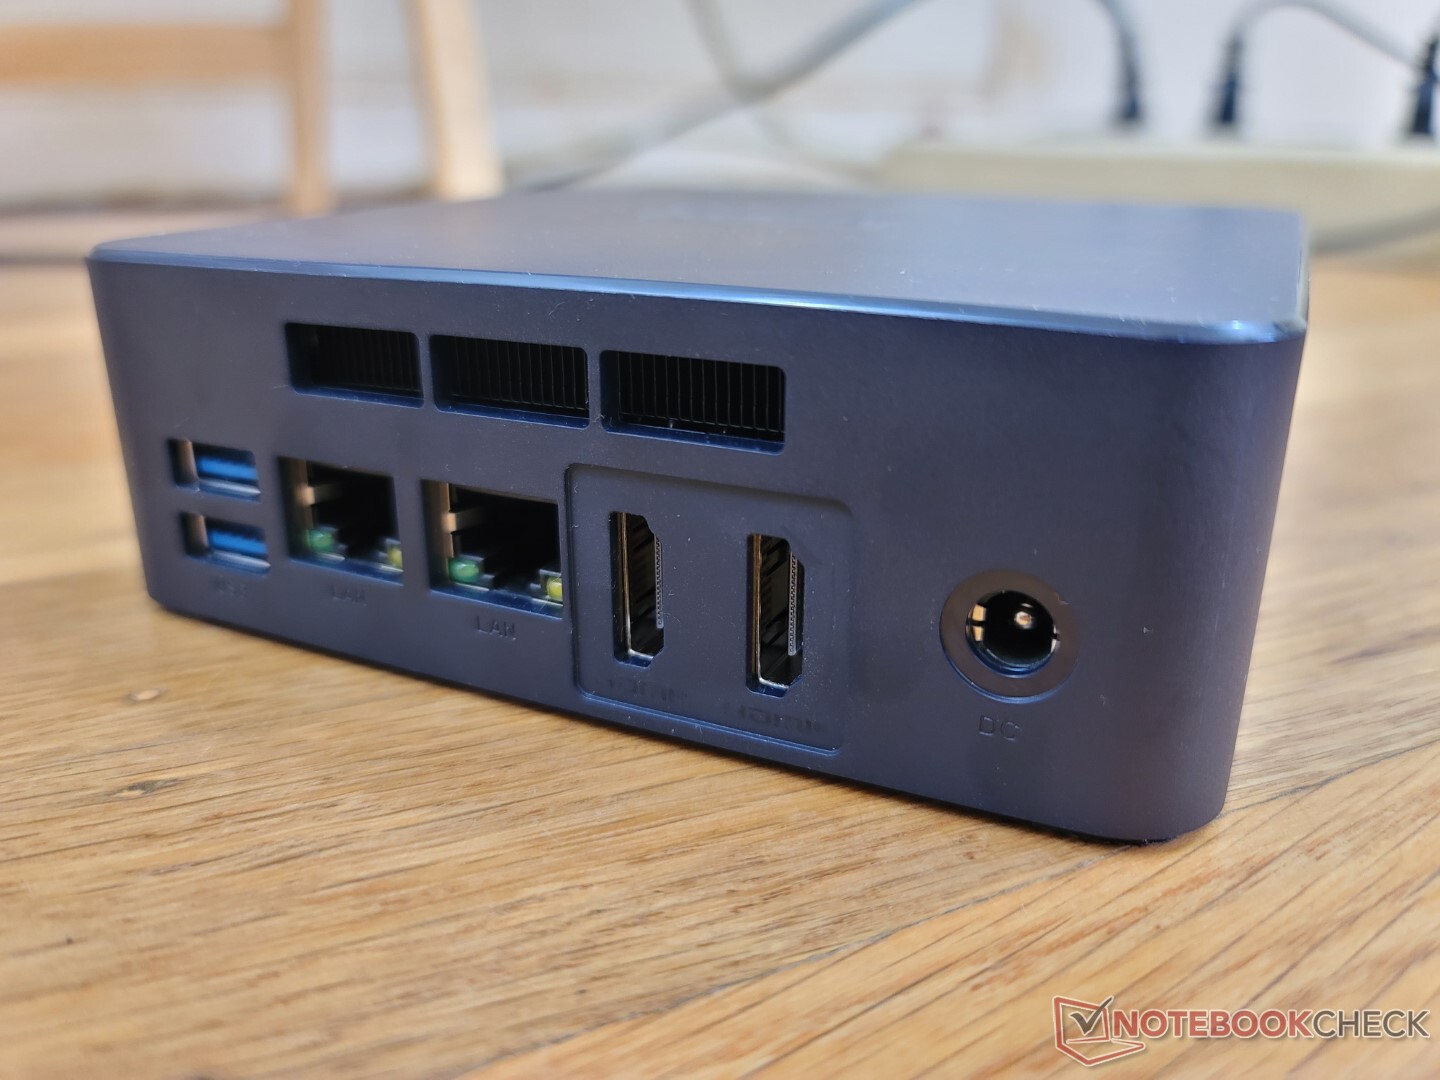
Opcje portów są w większości identyczne jak w oryginalnym U59, w tym port USB-C i brak blokady Kensington Lock. W przypadku nowszego modelu producent zintegrował jednak drugi port RJ-45, co daje łącznie dwa. Warto zauważyć, że port USB-C obsługuje tutaj DisplayPort, ale nie Power Delivery, a więc system jest zdany na autorski zasilacz AC w kwestii zasilania.
Komunikacja
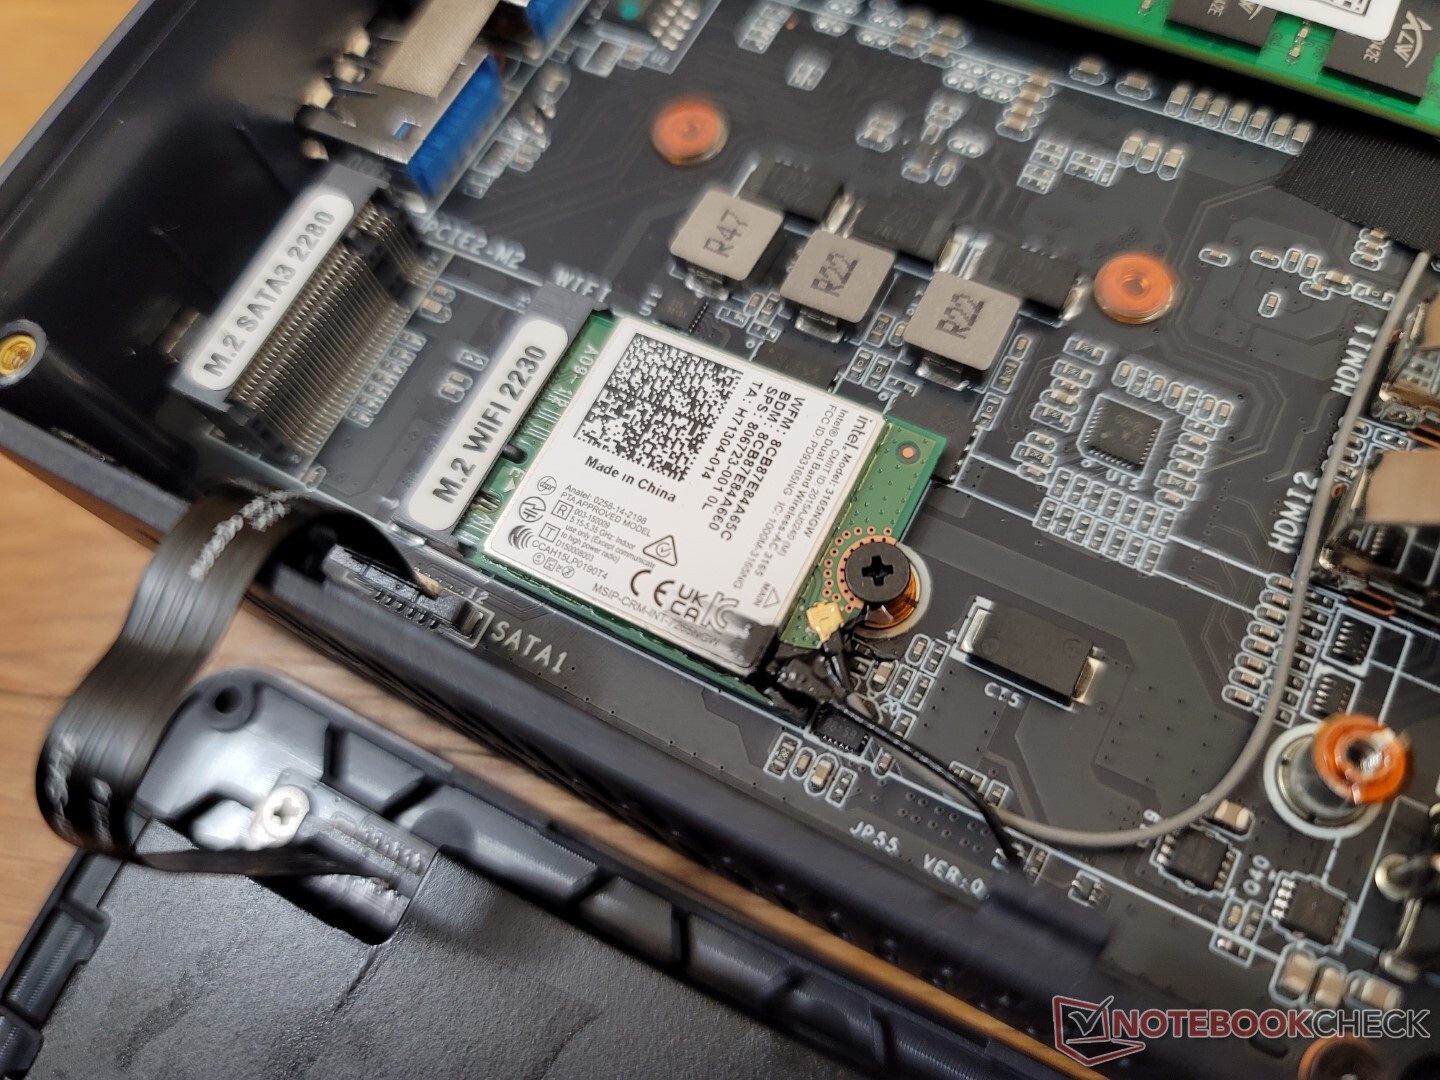
Moduł Intel 3165 WLAN jest wymienny, inaczej niż w wersji U59 Mini-S. Choć powolny, nie doświadczyliśmy problemów z łącznością podczas strumieniowania treści 4K.
| Networking | |
| iperf3 transmit AX12 | |
| Intel NUC11TNKi5 | |
| Beelink SER4 | |
| Beelink SER3 | |
| iperf3 receive AX12 | |
| Intel NUC11TNKi5 | |
| Beelink SER4 | |
| Beelink SER3 | |
| iperf3 receive AXE11000 | |
| Beelink U59 N5105 | |
| Beelink U59 Mini-S | |
| iperf3 transmit AXE11000 | |
| Beelink U59 N5105 | |
| Beelink U59 Mini-S | |
Konserwacja
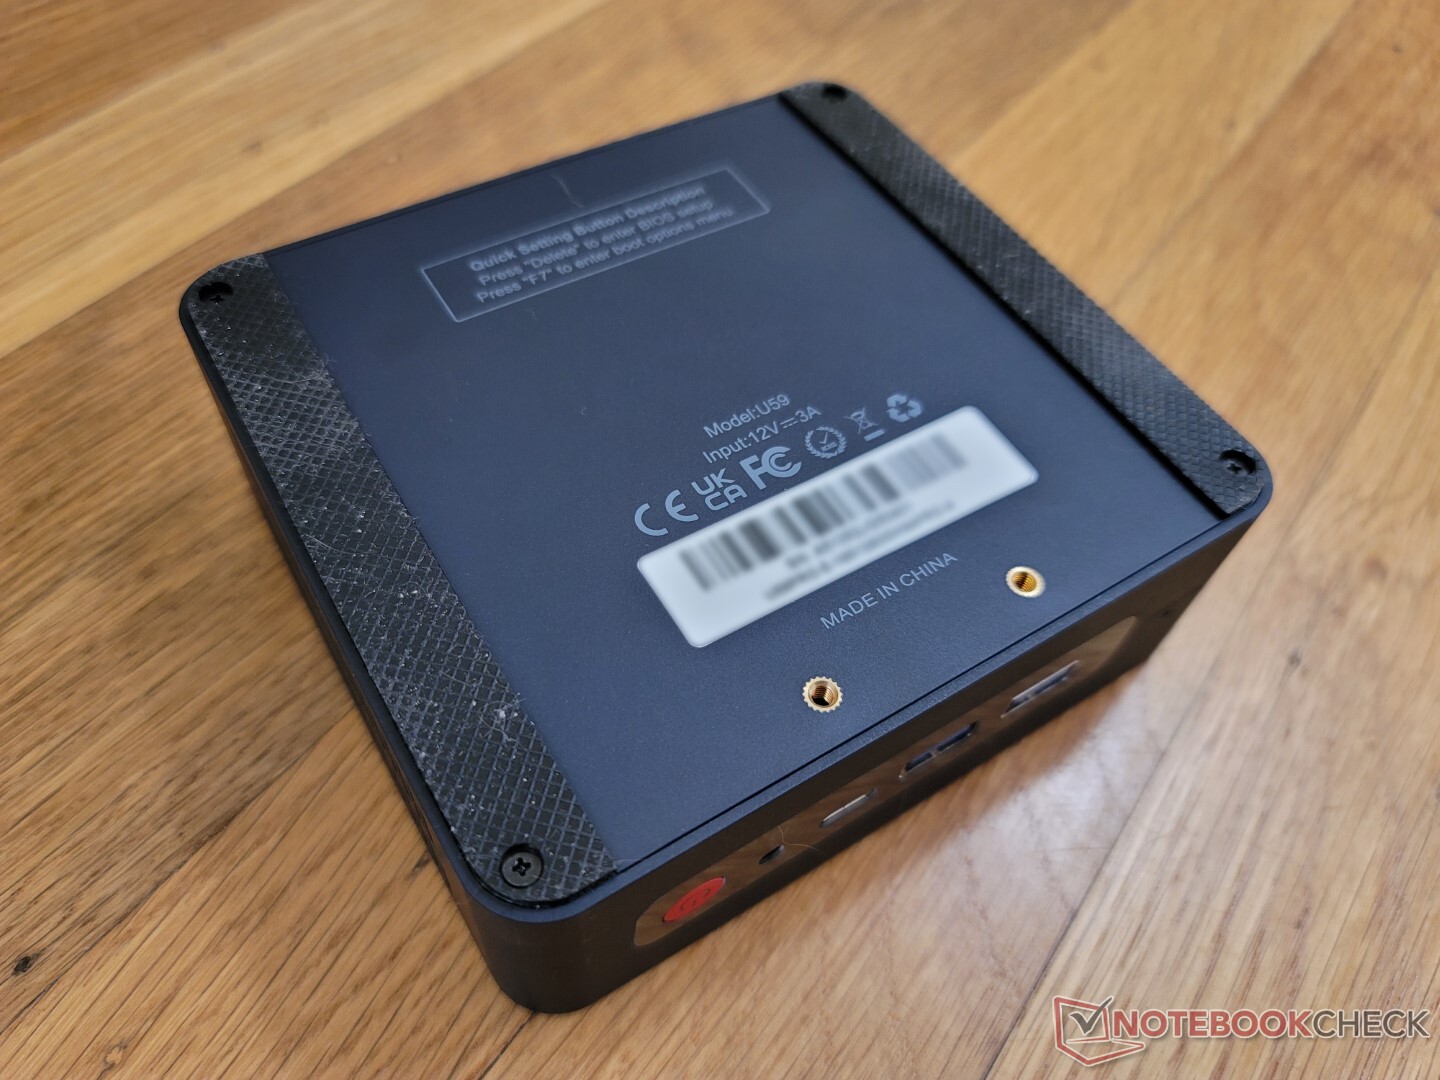
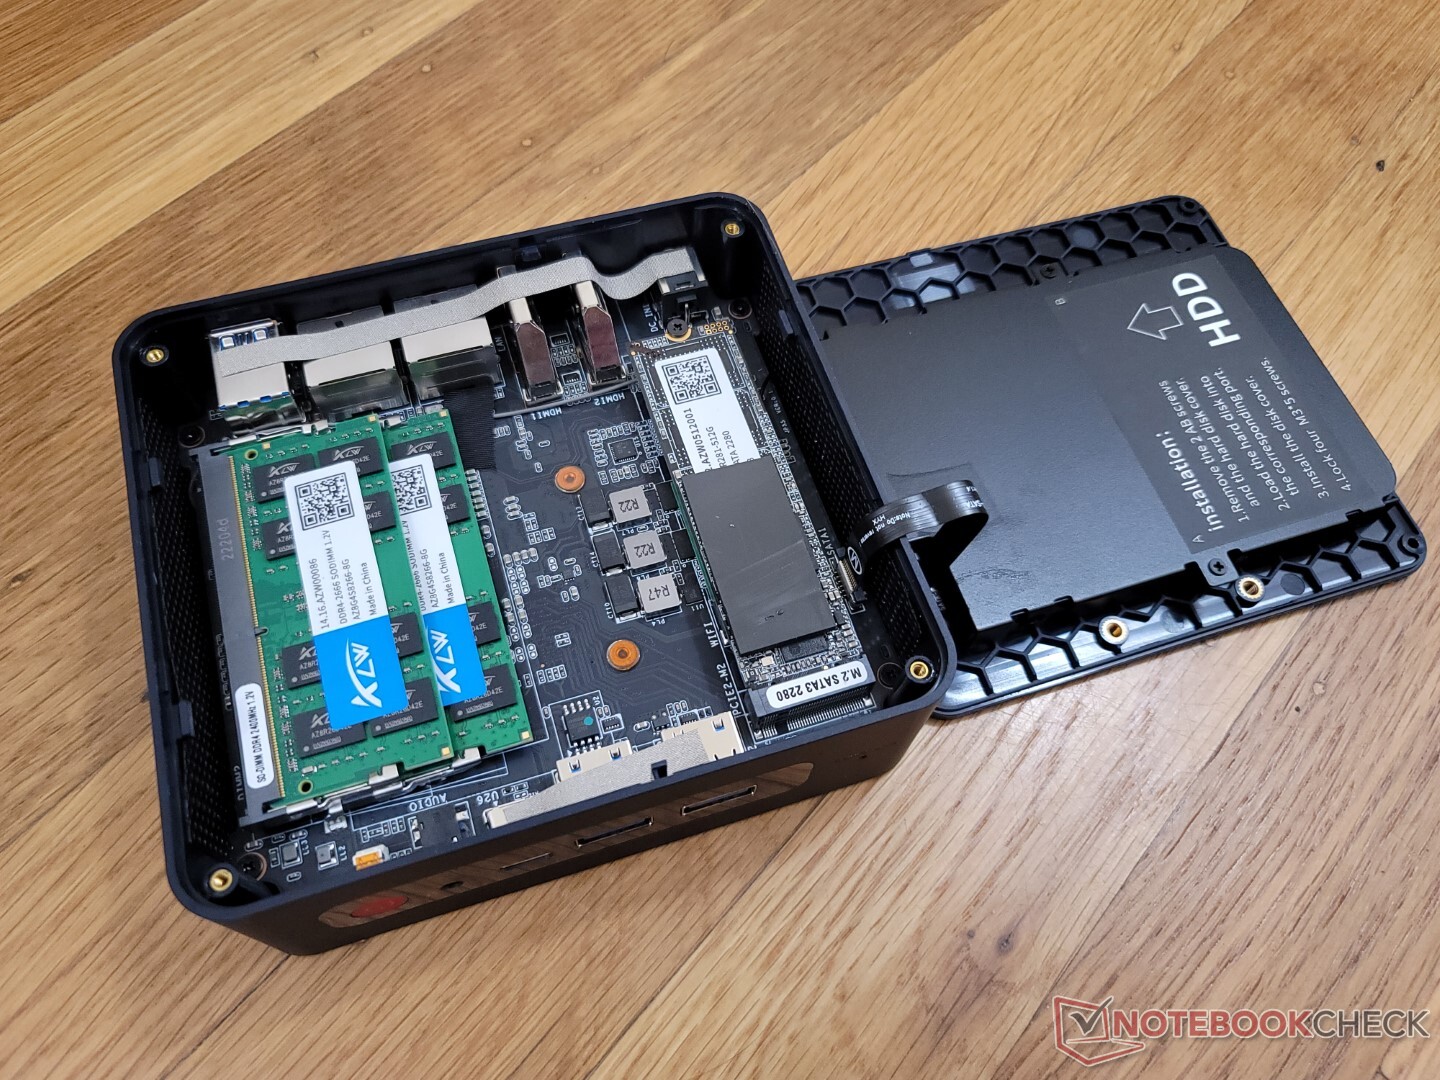
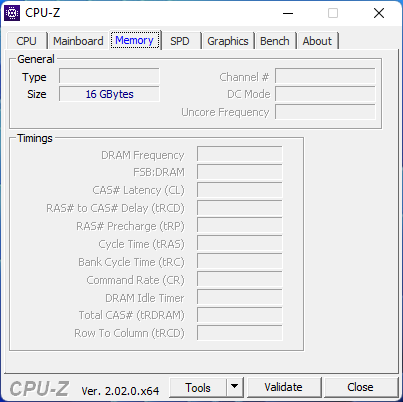
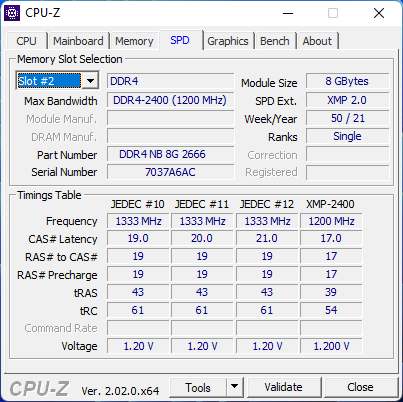
Dolny panel można zdjąć za pomocą śrubokręta Philipsa, aby odsłonić 2x gniazda pamięci masowej (M.2 SATA 2280 + 2,5-calowy SATA III), 2x gniazda SODIMM oraz wymienny moduł M.2 WLAN. Dla porównania, U59 Mini-S jest ograniczony do pamięci jednokanałowej z pojedynczym gniazdem SODIMM.
Akcesoria i gwarancja
W pudełku znajdują się dwa kable HDMI, zasilacz AC, papiery oraz uchwyt do montażu VESA.
W przypadku zakupu w USA obowiązuje standardowa roczna ograniczona gwarancja.
Wydajność
Warunki badania
Przed przeprowadzeniem poniższych testów ustawiliśmy nasz testowy egzemplarz w trybie Performance za pośrednictwem systemu Windows. Nie ma żadnych specyficznych dla producenta programów ani funkcji BIOS-u związanych z wydajnością mini PC.
Procesor
Wydajność procesora jest tylko o włos szybsza od N5095 zarówno w operacjach jedno- jak i wielowątkowych. Różnica w wydajności jest tak mała, że równie dobrze mogą to być te same procesory.
Cinebench R15 Multi Loop
Cinebench R23: Multi Core | Single Core
Cinebench R15: CPU Multi 64Bit | CPU Single 64Bit
Blender: v2.79 BMW27 CPU
7-Zip 18.03: 7z b 4 | 7z b 4 -mmt1
Geekbench 5.5: Multi-Core | Single-Core
HWBOT x265 Benchmark v2.2: 4k Preset
LibreOffice : 20 Documents To PDF
R Benchmark 2.5: Overall mean
| Cinebench R20 / CPU (Multi Core) | |
| Beelink SER4 | |
| Intel NUC11TNKi5 | |
| Beelink SER3 | |
| Lenovo IdeaPad 3 15ITL05 81X80074GE | |
| Beelink U59 N5105 | |
| Przeciętny Intel Celeron N5105 (n=1) | |
| Teclast TBOLT F15 Pro | |
| Beelink U59 Mini-S | |
| Beelink SEi8 | |
| HP 17-by2437ng | |
| Zotac ZBOX PI336 pico | |
| Cinebench R20 / CPU (Single Core) | |
| Lenovo IdeaPad 3 15ITL05 81X80074GE | |
| Intel NUC11TNKi5 | |
| Beelink SER4 | |
| Teclast TBOLT F15 Pro | |
| HP 17-by2437ng | |
| Beelink SER3 | |
| Beelink SEi8 | |
| Beelink U59 N5105 | |
| Przeciętny Intel Celeron N5105 (n=1) | |
| Beelink U59 Mini-S | |
| Zotac ZBOX PI336 pico | |
| Cinebench R23 / Multi Core | |
| Beelink SER4 | |
| Intel NUC11TNKi5 | |
| Beelink SER3 | |
| Lenovo IdeaPad 3 15ITL05 81X80074GE | |
| Beelink U59 N5105 | |
| Przeciętny Intel Celeron N5105 (n=1) | |
| Beelink U59 Mini-S | |
| Teclast TBOLT F15 Pro | |
| Beelink SEi8 | |
| Zotac ZBOX PI336 pico | |
| Cinebench R23 / Single Core | |
| Intel NUC11TNKi5 | |
| Lenovo IdeaPad 3 15ITL05 81X80074GE | |
| Beelink SER4 | |
| Teclast TBOLT F15 Pro | |
| Beelink SER3 | |
| Beelink SEi8 | |
| Beelink U59 N5105 | |
| Przeciętny Intel Celeron N5105 (n=1) | |
| Beelink U59 Mini-S | |
| Zotac ZBOX PI336 pico | |
| Cinebench R15 / CPU Multi 64Bit | |
| Beelink SER4 | |
| Intel NUC11TNKi5 | |
| Beelink SER3 | |
| Lenovo IdeaPad 3 15ITL05 81X80074GE | |
| Beelink U59 N5105 | |
| Przeciętny Intel Celeron N5105 (n=1) | |
| Beelink U59 Mini-S | |
| Teclast TBOLT F15 Pro | |
| Beelink SEi8 | |
| HP 17-by2437ng | |
| Zotac ZBOX PI336 pico | |
| Cinebench R15 / CPU Single 64Bit | |
| Intel NUC11TNKi5 | |
| Beelink SER4 | |
| HP 17-by2437ng | |
| Teclast TBOLT F15 Pro | |
| Beelink SER3 | |
| Lenovo IdeaPad 3 15ITL05 81X80074GE | |
| Beelink SEi8 | |
| Beelink U59 N5105 | |
| Przeciętny Intel Celeron N5105 (n=1) | |
| Beelink U59 Mini-S | |
| Zotac ZBOX PI336 pico | |
| Blender / v2.79 BMW27 CPU | |
| Zotac ZBOX PI336 pico | |
| Beelink U59 Mini-S | |
| Beelink U59 N5105 | |
| Przeciętny Intel Celeron N5105 (n=1) | |
| Teclast TBOLT F15 Pro | |
| HP 17-by2437ng | |
| Beelink SEi8 | |
| Lenovo IdeaPad 3 15ITL05 81X80074GE | |
| Beelink SER3 | |
| Intel NUC11TNKi5 | |
| Beelink SER4 | |
| 7-Zip 18.03 / 7z b 4 | |
| Beelink SER4 | |
| Intel NUC11TNKi5 | |
| Beelink SER3 | |
| Lenovo IdeaPad 3 15ITL05 81X80074GE | |
| Beelink U59 N5105 | |
| Przeciętny Intel Celeron N5105 (n=1) | |
| Beelink U59 Mini-S | |
| HP 17-by2437ng | |
| Teclast TBOLT F15 Pro | |
| Beelink SEi8 | |
| Zotac ZBOX PI336 pico | |
| 7-Zip 18.03 / 7z b 4 -mmt1 | |
| Intel NUC11TNKi5 | |
| Lenovo IdeaPad 3 15ITL05 81X80074GE | |
| Beelink SER4 | |
| HP 17-by2437ng | |
| Teclast TBOLT F15 Pro | |
| Beelink SER3 | |
| Beelink SEi8 | |
| Beelink U59 Mini-S | |
| Beelink U59 N5105 | |
| Przeciętny Intel Celeron N5105 (n=1) | |
| Zotac ZBOX PI336 pico | |
| Geekbench 5.5 / Multi-Core | |
| Beelink SER4 | |
| Intel NUC11TNKi5 | |
| Lenovo IdeaPad 3 15ITL05 81X80074GE | |
| Teclast TBOLT F15 Pro | |
| Beelink U59 N5105 | |
| Przeciętny Intel Celeron N5105 (n=1) | |
| HP 17-by2437ng | |
| Beelink U59 Mini-S | |
| Beelink SEi8 | |
| Zotac ZBOX PI336 pico | |
| Geekbench 5.5 / Single-Core | |
| Intel NUC11TNKi5 | |
| Lenovo IdeaPad 3 15ITL05 81X80074GE | |
| Beelink SER4 | |
| Teclast TBOLT F15 Pro | |
| HP 17-by2437ng | |
| Beelink SEi8 | |
| Beelink U59 N5105 | |
| Przeciętny Intel Celeron N5105 (n=1) | |
| Beelink U59 Mini-S | |
| Zotac ZBOX PI336 pico | |
| HWBOT x265 Benchmark v2.2 / 4k Preset | |
| Beelink SER4 | |
| Intel NUC11TNKi5 | |
| Beelink SER3 | |
| Lenovo IdeaPad 3 15ITL05 81X80074GE | |
| Beelink SEi8 | |
| HP 17-by2437ng | |
| Teclast TBOLT F15 Pro | |
| Beelink U59 N5105 | |
| Przeciętny Intel Celeron N5105 (n=1) | |
| Beelink U59 Mini-S | |
| Zotac ZBOX PI336 pico | |
| LibreOffice / 20 Documents To PDF | |
| Zotac ZBOX PI336 pico | |
| Beelink U59 Mini-S | |
| Beelink U59 N5105 | |
| Przeciętny Intel Celeron N5105 (n=1) | |
| Beelink SER3 | |
| Teclast TBOLT F15 Pro | |
| Beelink SEi8 | |
| HP 17-by2437ng | |
| Beelink SER4 | |
| Intel NUC11TNKi5 | |
| Lenovo IdeaPad 3 15ITL05 81X80074GE | |
| R Benchmark 2.5 / Overall mean | |
| Zotac ZBOX PI336 pico | |
| Beelink U59 Mini-S | |
| Beelink U59 N5105 | |
| Przeciętny Intel Celeron N5105 (n=1) | |
| Beelink SEi8 | |
| Teclast TBOLT F15 Pro | |
| HP 17-by2437ng | |
| Beelink SER3 | |
| Lenovo IdeaPad 3 15ITL05 81X80074GE | |
| Intel NUC11TNKi5 | |
| Beelink SER4 | |
* ... im mniej tym lepiej
AIDA64: FP32 Ray-Trace | FPU Julia | CPU SHA3 | CPU Queen | FPU SinJulia | FPU Mandel | CPU AES | CPU ZLib | FP64 Ray-Trace | CPU PhotoWorxx
| Performance rating | |
| Beelink SER4 | |
| Intel NUC11TNKi5 | |
| Beelink SER3 | |
| Beelink U59 N5105 | |
| Beelink U59 Mini-S | |
| Zotac ZBOX PI336 pico | |
| AIDA64 / FP32 Ray-Trace | |
| Beelink SER4 | |
| Intel NUC11TNKi5 | |
| Beelink SER3 | |
| Beelink U59 Mini-S | |
| Beelink U59 N5105 | |
| Zotac ZBOX PI336 pico | |
| AIDA64 / FPU Julia | |
| Beelink SER4 | |
| Intel NUC11TNKi5 | |
| Beelink SER3 | |
| Beelink U59 N5105 | |
| Beelink U59 Mini-S | |
| Zotac ZBOX PI336 pico | |
| AIDA64 / CPU SHA3 | |
| Intel NUC11TNKi5 | |
| Beelink SER4 | |
| Beelink SER3 | |
| Beelink U59 N5105 | |
| Beelink U59 Mini-S | |
| Zotac ZBOX PI336 pico | |
| AIDA64 / CPU Queen | |
| Beelink SER4 | |
| Intel NUC11TNKi5 | |
| Beelink SER3 | |
| Beelink U59 N5105 | |
| Beelink U59 Mini-S | |
| Zotac ZBOX PI336 pico | |
| AIDA64 / FPU SinJulia | |
| Beelink SER4 | |
| Beelink SER3 | |
| Intel NUC11TNKi5 | |
| Beelink U59 Mini-S | |
| Beelink U59 N5105 | |
| Zotac ZBOX PI336 pico | |
| AIDA64 / FPU Mandel | |
| Beelink SER4 | |
| Intel NUC11TNKi5 | |
| Beelink SER3 | |
| Beelink U59 N5105 | |
| Beelink U59 Mini-S | |
| Zotac ZBOX PI336 pico | |
| AIDA64 / CPU AES | |
| Intel NUC11TNKi5 | |
| Beelink SER4 | |
| Beelink SER3 | |
| Beelink U59 N5105 | |
| Beelink U59 Mini-S | |
| Zotac ZBOX PI336 pico | |
| AIDA64 / CPU ZLib | |
| Beelink SER4 | |
| Intel NUC11TNKi5 | |
| Beelink SER3 | |
| Beelink U59 N5105 | |
| Beelink U59 Mini-S | |
| Zotac ZBOX PI336 pico | |
| AIDA64 / FP64 Ray-Trace | |
| Beelink SER4 | |
| Intel NUC11TNKi5 | |
| Beelink SER3 | |
| Beelink U59 N5105 | |
| Beelink U59 Mini-S | |
| Zotac ZBOX PI336 pico | |
| AIDA64 / CPU PhotoWorxx | |
| Beelink SER4 | |
| Intel NUC11TNKi5 | |
| Beelink U59 N5105 | |
| Beelink SER3 | |
| Beelink U59 Mini-S | |
| Zotac ZBOX PI336 pico | |
Wydajność systemu
CrossMark: Overall | Productivity | Creativity | Responsiveness
| PCMark 10 / Score | |
| Beelink SER4 | |
| Intel NUC11TNKi5 | |
| Beelink SER3 | |
| Beelink U59 N5105 | |
| Przeciętny Intel Celeron N5105, Intel UHD Graphics (Jasper Lake 24 EU) (n=1) | |
| Beelink U59 Mini-S | |
| PCMark 10 / Essentials | |
| Beelink SER4 | |
| Intel NUC11TNKi5 | |
| Beelink SER3 | |
| Beelink U59 N5105 | |
| Przeciętny Intel Celeron N5105, Intel UHD Graphics (Jasper Lake 24 EU) (n=1) | |
| Beelink U59 Mini-S | |
| PCMark 10 / Productivity | |
| Beelink SER4 | |
| Intel NUC11TNKi5 | |
| Beelink SER3 | |
| Beelink U59 N5105 | |
| Przeciętny Intel Celeron N5105, Intel UHD Graphics (Jasper Lake 24 EU) (n=1) | |
| Beelink U59 Mini-S | |
| PCMark 10 / Digital Content Creation | |
| Beelink SER4 | |
| Intel NUC11TNKi5 | |
| Beelink SER3 | |
| Beelink U59 N5105 | |
| Przeciętny Intel Celeron N5105, Intel UHD Graphics (Jasper Lake 24 EU) (n=1) | |
| Beelink U59 Mini-S | |
| CrossMark / Overall | |
| Beelink U59 N5105 | |
| Przeciętny Intel Celeron N5105, Intel UHD Graphics (Jasper Lake 24 EU) (n=1) | |
| Beelink U59 Mini-S | |
| CrossMark / Productivity | |
| Beelink U59 N5105 | |
| Przeciętny Intel Celeron N5105, Intel UHD Graphics (Jasper Lake 24 EU) (n=1) | |
| Beelink U59 Mini-S | |
| CrossMark / Creativity | |
| Beelink U59 N5105 | |
| Przeciętny Intel Celeron N5105, Intel UHD Graphics (Jasper Lake 24 EU) (n=1) | |
| Beelink U59 Mini-S | |
| CrossMark / Responsiveness | |
| Beelink U59 N5105 | |
| Przeciętny Intel Celeron N5105, Intel UHD Graphics (Jasper Lake 24 EU) (n=1) | |
| Beelink U59 Mini-S | |
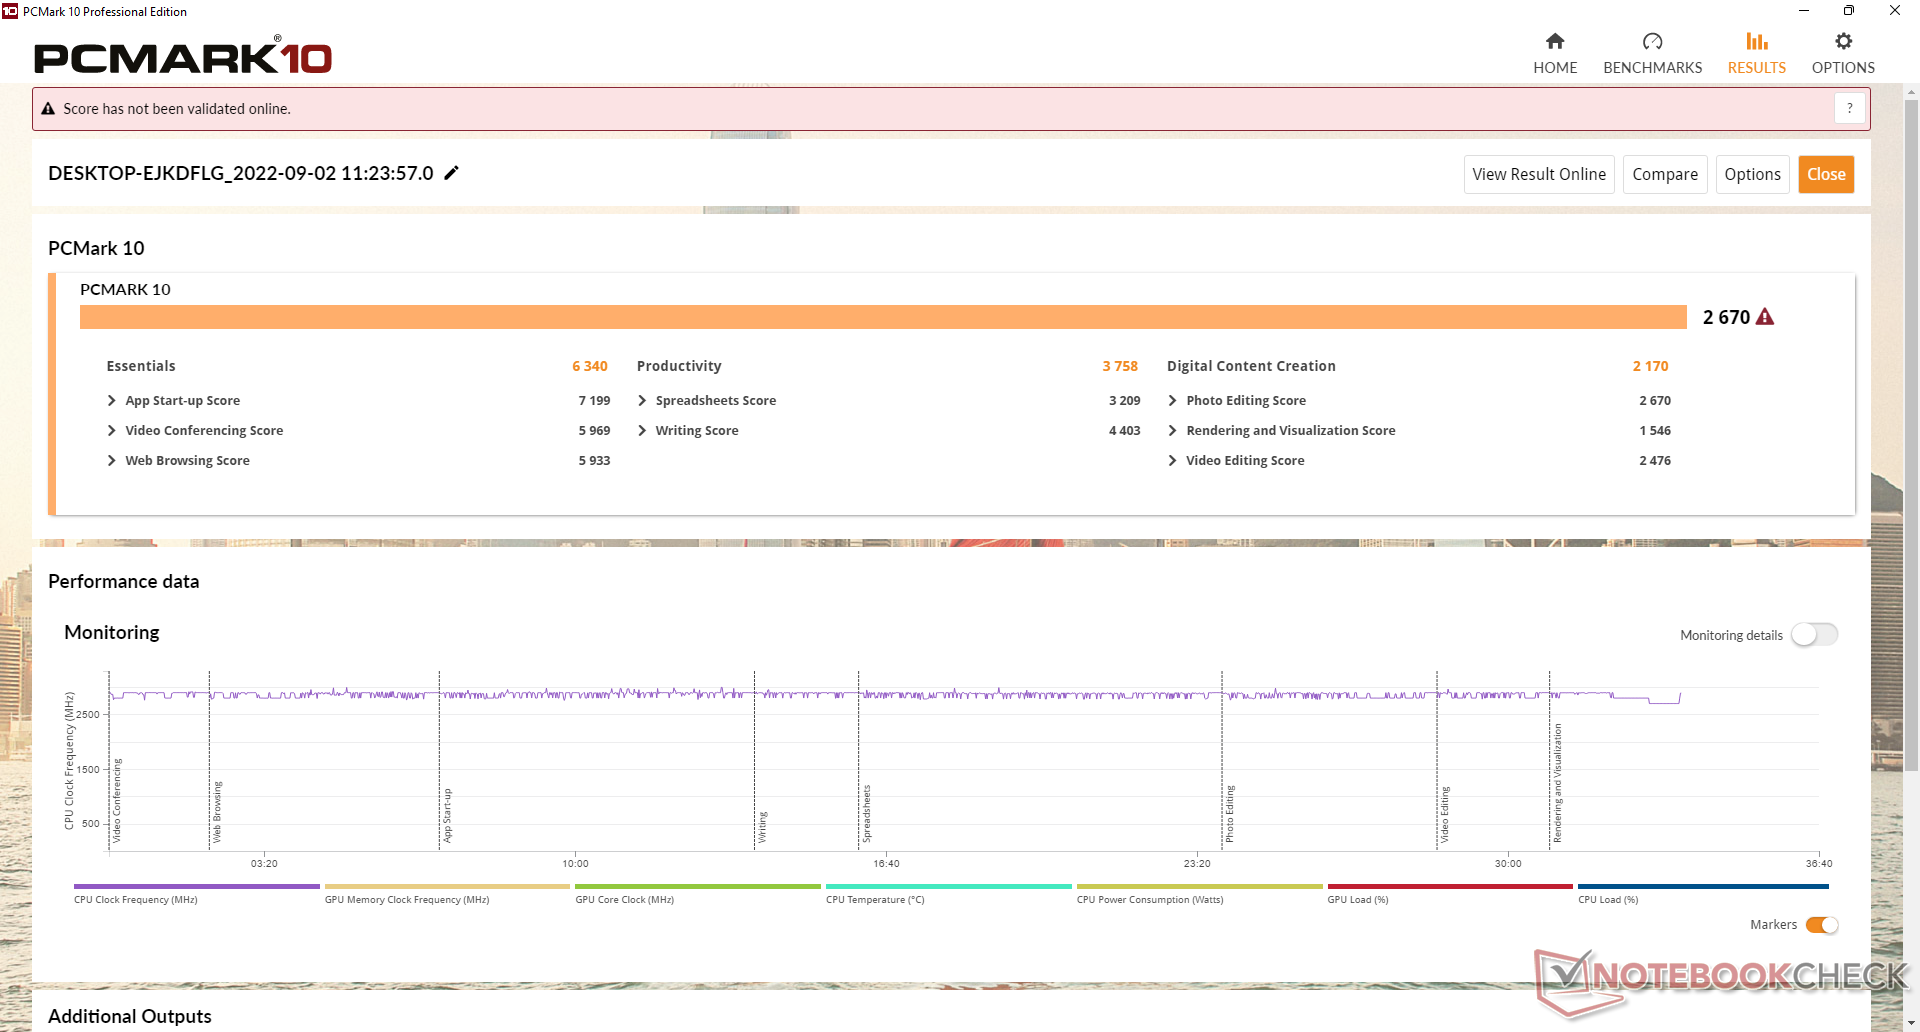
| PCMark 10 Score | 2670 pkt. | |
Pomoc | ||
| AIDA64 / Memory Copy | |
| Beelink SER4 | |
| Beelink U59 N5105 | |
| Intel NUC11TNKi5 | |
| Beelink U59 Mini-S | |
| Beelink SER3 | |
| Zotac ZBOX PI336 pico | |
| AIDA64 / Memory Read | |
| Beelink SER4 | |
| Intel NUC11TNKi5 | |
| Beelink SER3 | |
| Beelink U59 N5105 | |
| Beelink U59 Mini-S | |
| Zotac ZBOX PI336 pico | |
| AIDA64 / Memory Write | |
| Beelink SER4 | |
| Beelink U59 N5105 | |
| Intel NUC11TNKi5 | |
| Beelink U59 Mini-S | |
| Beelink SER3 | |
| Zotac ZBOX PI336 pico | |
| AIDA64 / Memory Latency | |
| Beelink SER3 | |
| Beelink SER4 | |
| Intel NUC11TNKi5 | |
| Zotac ZBOX PI336 pico | |
| Beelink U59 N5105 | |
| Beelink U59 Mini-S | |
* ... im mniej tym lepiej
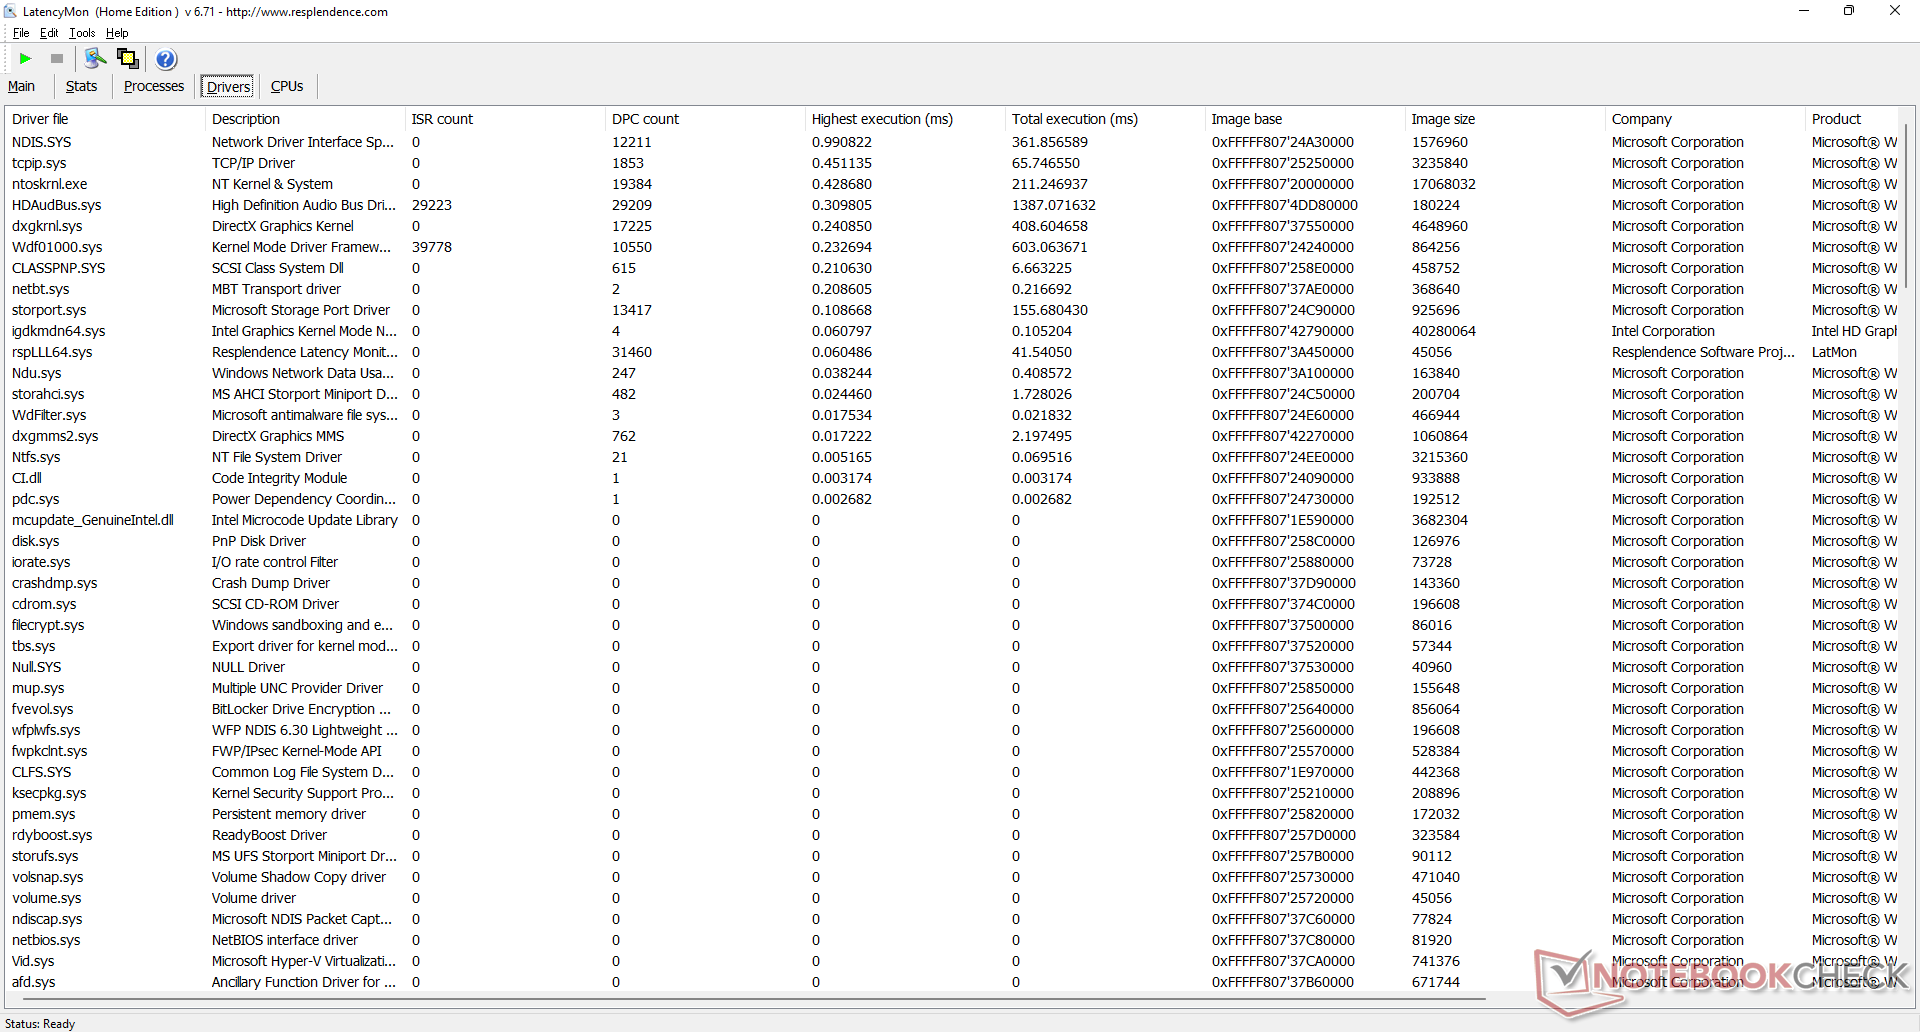
Opóźnienie DPC
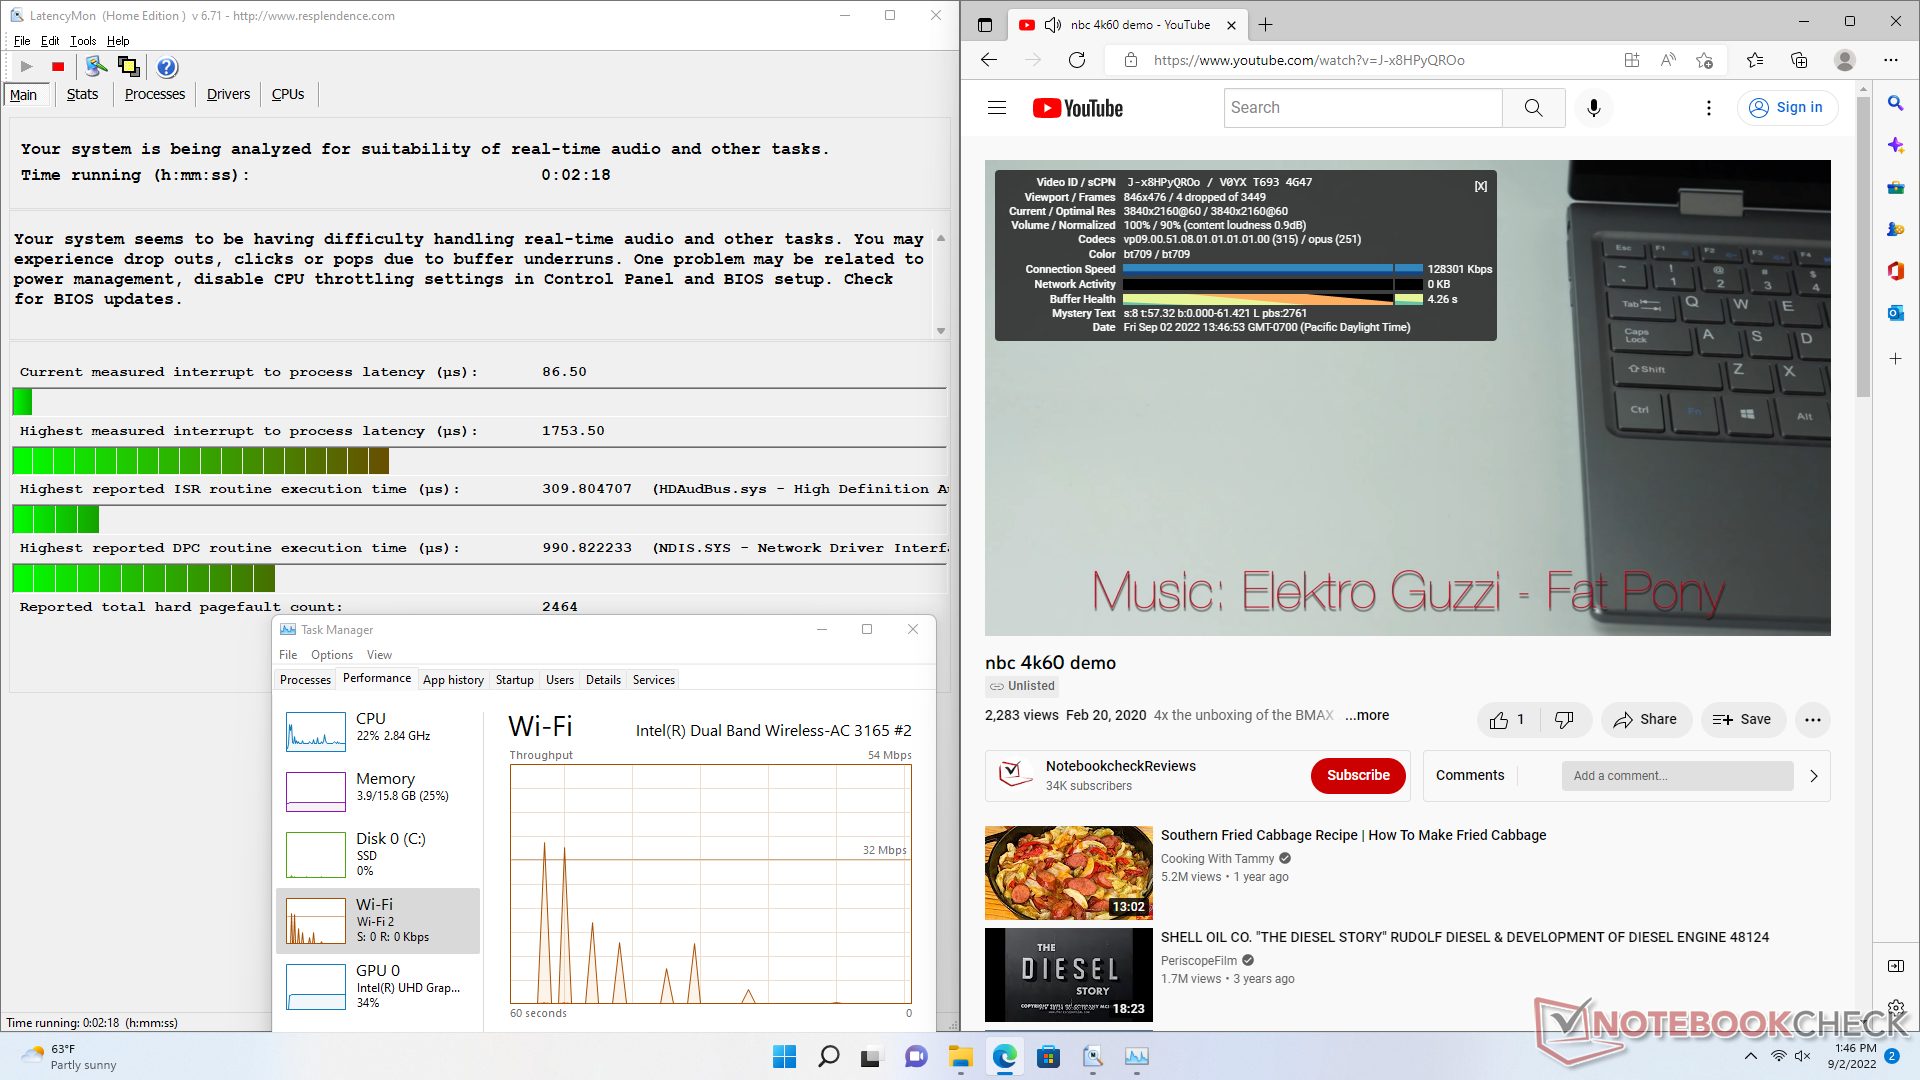
LatencyMon ujawnia problemy z DPC podczas otwierania wielu kart przeglądarki na naszej stronie głównej. odtwarzanie wideo 4K przy 60 FPS jest niemal perfekcyjne - podczas naszego minutowego filmu testowego spadły tylko 4 klatki.
| DPC Latencies / LatencyMon - interrupt to process latency (max), Web, Youtube, Prime95 | |
| Beelink U59 N5105 | |
| Beelink U59 Mini-S | |
| Zotac ZBOX PI336 pico | |
| Beelink SER3 | |
| Intel NUC11TNKi5 | |
| Beelink SER4 | |
* ... im mniej tym lepiej
Urządzenia do przechowywania danych
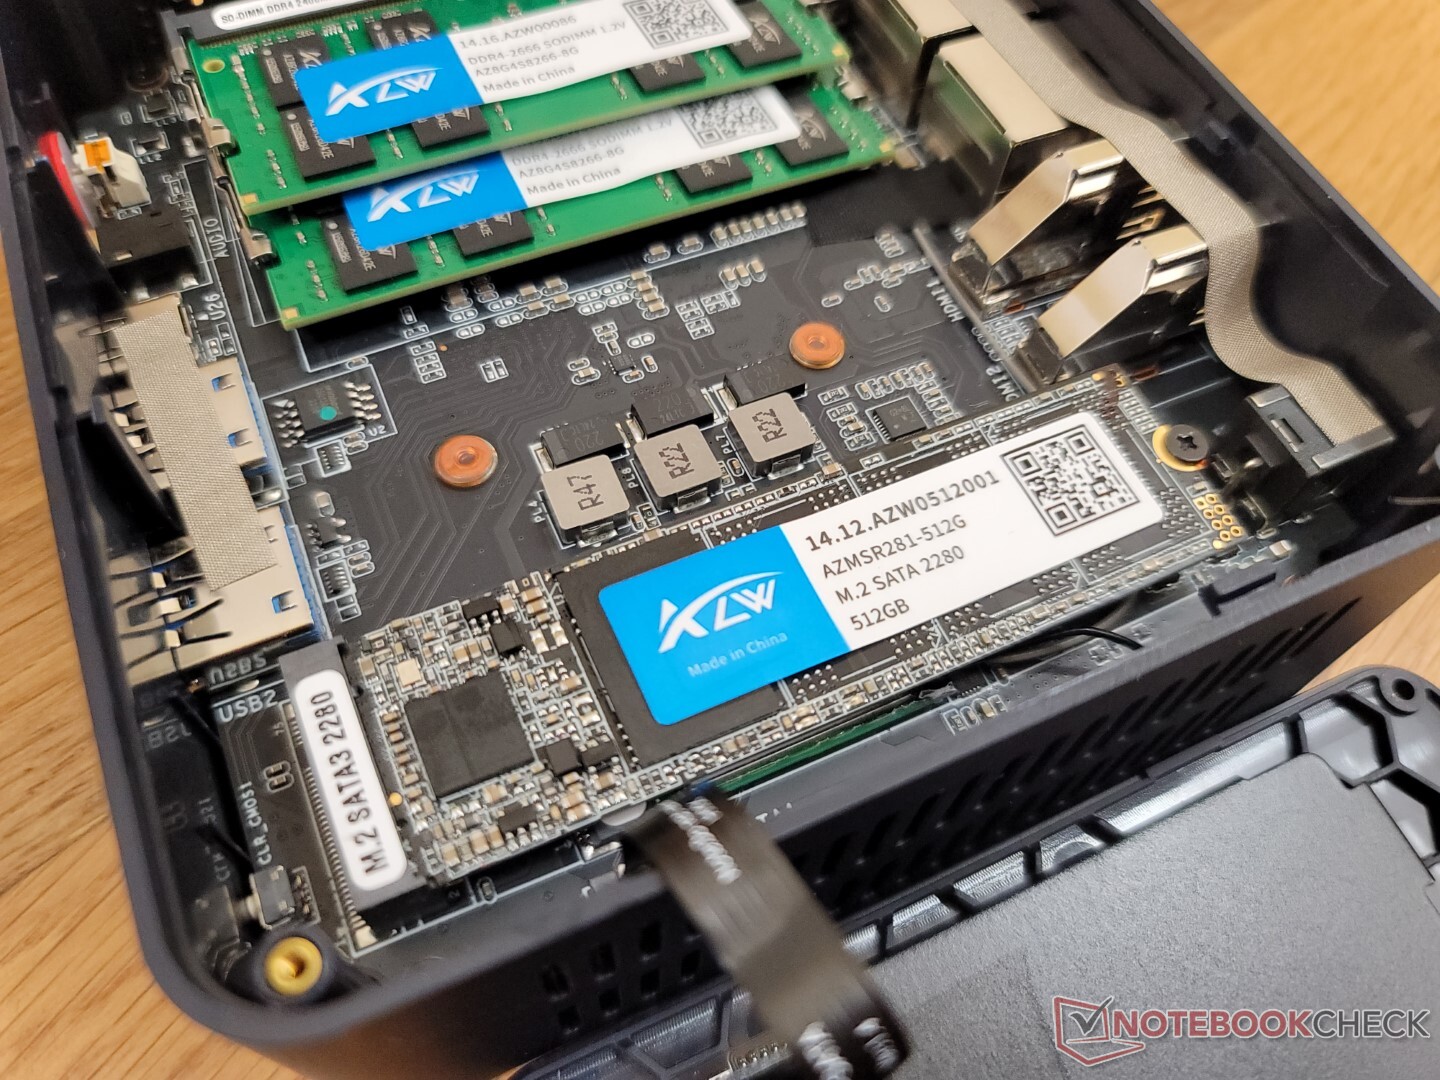
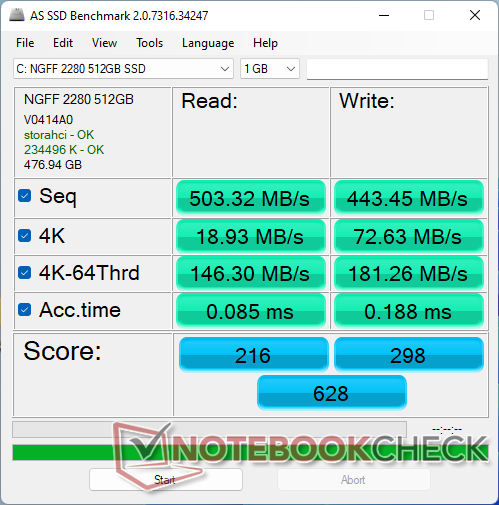
Model ten jest dostarczany z dyskiem M.2 SATA III zamiast NVMe prawdopodobnie w celu zaoszczędzenia kosztów. Biorąc pod uwagę procesor, dysk SATA III jest jednak akceptowalny. StronaSilicon Motion AZW w naszym egzemplarzu testowym osiągnąłby świetne wyniki sekwencyjnego odczytu i zapisu na poziomie 400 MB/s
W zestawie znajduje się mała podkładka termiczna dla dysku SSD, co jest zaskakujące w budżetowym mini PC, takim jak U59. Podkładka znajduje się pomiędzy dyskiem SSD a metalową 2,5-calową obudową SATA III, która jest przymocowana do górnej części dolnego panelu.

| Drive Performance rating - Percent | |
| Beelink SER3 | |
| Beelink SER4 | |
| Intel NUC11TNKi5 | |
| Beelink U59 N5105 | |
| Beelink U59 Mini-S | |
| Zotac ZBOX PI336 pico | |
| DiskSpd | |
| seq read | |
| Beelink SER4 | |
| Beelink SER3 | |
| Intel NUC11TNKi5 | |
| Beelink U59 N5105 | |
| Beelink U59 Mini-S | |
| Zotac ZBOX PI336 pico | |
| seq write | |
| Beelink SER3 | |
| Beelink SER4 | |
| Intel NUC11TNKi5 | |
| Beelink U59 N5105 | |
| Beelink U59 Mini-S | |
| Zotac ZBOX PI336 pico | |
| seq q8 t1 read | |
| Beelink SER3 | |
| Beelink SER4 | |
| Intel NUC11TNKi5 | |
| Beelink U59 N5105 | |
| Beelink U59 Mini-S | |
| Zotac ZBOX PI336 pico | |
| seq q8 t1 write | |
| Beelink SER3 | |
| Beelink SER4 | |
| Intel NUC11TNKi5 | |
| Beelink U59 Mini-S | |
| Beelink U59 N5105 | |
| Zotac ZBOX PI336 pico | |
| 4k q1 t1 read | |
| Beelink SER4 | |
| Beelink SER3 | |
| Beelink U59 N5105 | |
| Intel NUC11TNKi5 | |
| Beelink U59 Mini-S | |
| Zotac ZBOX PI336 pico | |
| 4k q1 t1 write | |
| Beelink SER4 | |
| Beelink SER3 | |
| Beelink U59 N5105 | |
| Beelink U59 Mini-S | |
| Intel NUC11TNKi5 | |
| Zotac ZBOX PI336 pico | |
| 4k q32 t16 read | |
| Beelink SER3 | |
| Beelink SER4 | |
| Intel NUC11TNKi5 | |
| Beelink U59 N5105 | |
| Beelink U59 Mini-S | |
| Zotac ZBOX PI336 pico | |
| 4k q32 t16 write | |
| Beelink SER4 | |
| Beelink SER3 | |
| Intel NUC11TNKi5 | |
| Beelink U59 N5105 | |
| Beelink U59 Mini-S | |
| Zotac ZBOX PI336 pico | |
| AS SSD | |
| Score Total | |
| Beelink SER3 | |
| Beelink SER4 | |
| Intel NUC11TNKi5 | |
| Beelink U59 N5105 | |
| Beelink U59 Mini-S | |
| Zotac ZBOX PI336 pico | |
| Score Read | |
| Beelink SER3 | |
| Beelink SER4 | |
| Intel NUC11TNKi5 | |
| Beelink U59 N5105 | |
| Beelink U59 Mini-S | |
| Zotac ZBOX PI336 pico | |
| Score Write | |
| Beelink SER4 | |
| Beelink SER3 | |
| Intel NUC11TNKi5 | |
| Beelink U59 Mini-S | |
| Beelink U59 N5105 | |
| Zotac ZBOX PI336 pico | |
| Seq Read | |
| Beelink SER4 | |
| Beelink SER3 | |
| Intel NUC11TNKi5 | |
| Beelink U59 N5105 | |
| Beelink U59 Mini-S | |
| Zotac ZBOX PI336 pico | |
| Seq Write | |
| Beelink SER3 | |
| Beelink SER4 | |
| Intel NUC11TNKi5 | |
| Beelink U59 N5105 | |
| Beelink U59 Mini-S | |
| Zotac ZBOX PI336 pico | |
| 4K Read | |
| Beelink SER4 | |
| Beelink SER3 | |
| Intel NUC11TNKi5 | |
| Beelink U59 N5105 | |
| Beelink U59 Mini-S | |
| Zotac ZBOX PI336 pico | |
| 4K Write | |
| Beelink SER4 | |
| Beelink SER3 | |
| Beelink U59 N5105 | |
| Beelink U59 Mini-S | |
| Intel NUC11TNKi5 | |
| Zotac ZBOX PI336 pico | |
| 4K-64 Read | |
| Beelink SER3 | |
| Beelink SER4 | |
| Intel NUC11TNKi5 | |
| Beelink U59 N5105 | |
| Beelink U59 Mini-S | |
| Zotac ZBOX PI336 pico | |
| 4K-64 Write | |
| Beelink SER4 | |
| Beelink SER3 | |
| Intel NUC11TNKi5 | |
| Beelink U59 Mini-S | |
| Beelink U59 N5105 | |
| Zotac ZBOX PI336 pico | |
| Access Time Read | |
| Zotac ZBOX PI336 pico | |
| Beelink U59 Mini-S | |
| Intel NUC11TNKi5 | |
| Beelink SER4 | |
| Beelink U59 N5105 | |
| Beelink SER3 | |
| Access Time Write | |
| Zotac ZBOX PI336 pico | |
| Beelink SER3 | |
| Intel NUC11TNKi5 | |
| Beelink U59 N5105 | |
| Beelink U59 Mini-S | |
| Beelink SER4 | |
* ... im mniej tym lepiej
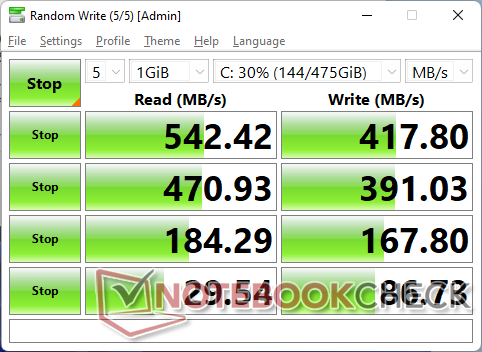
Disk Throttling: DiskSpd Read Loop, Queue Depth 8
Wydajność GPU
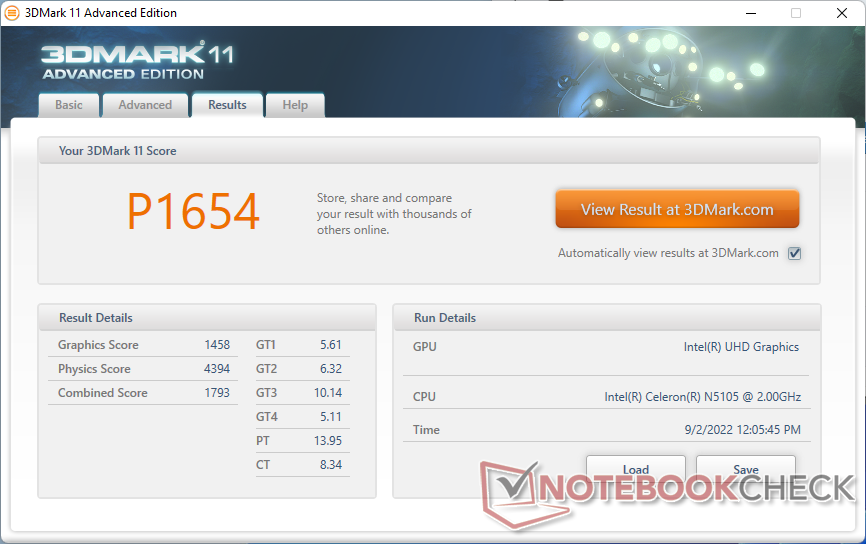
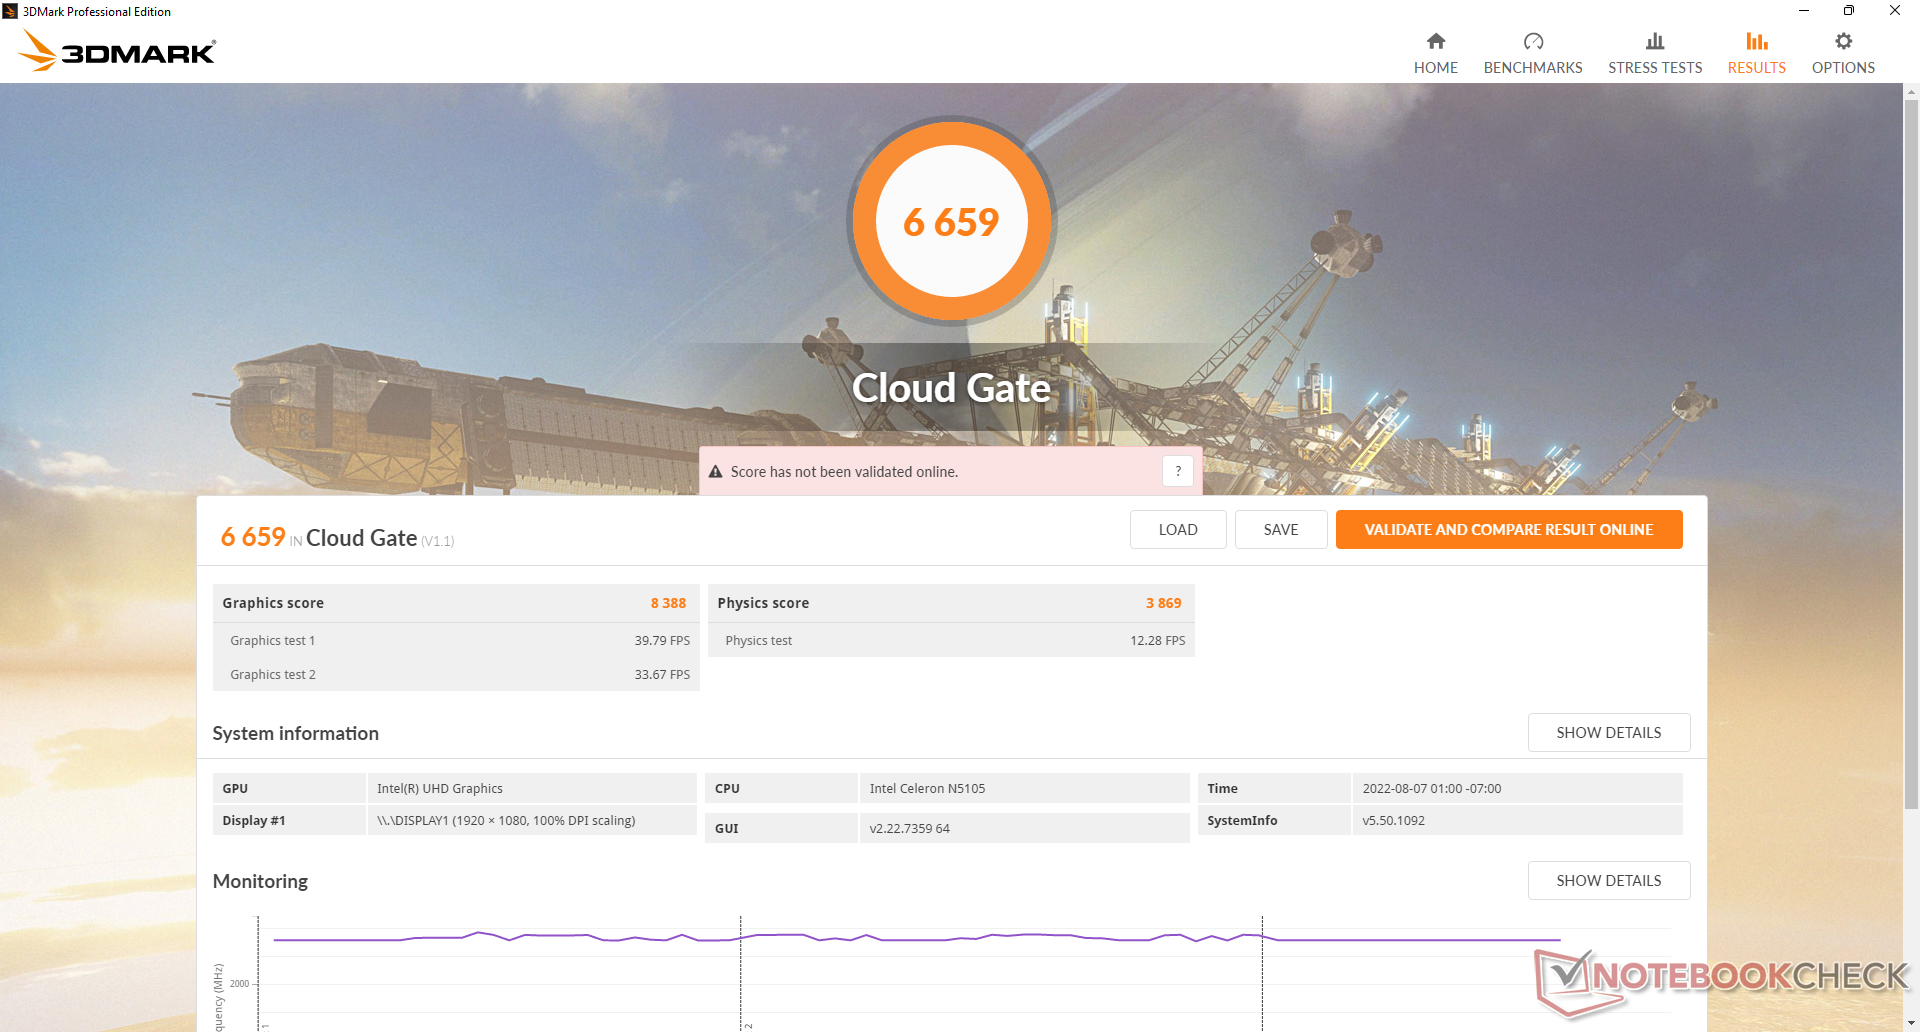
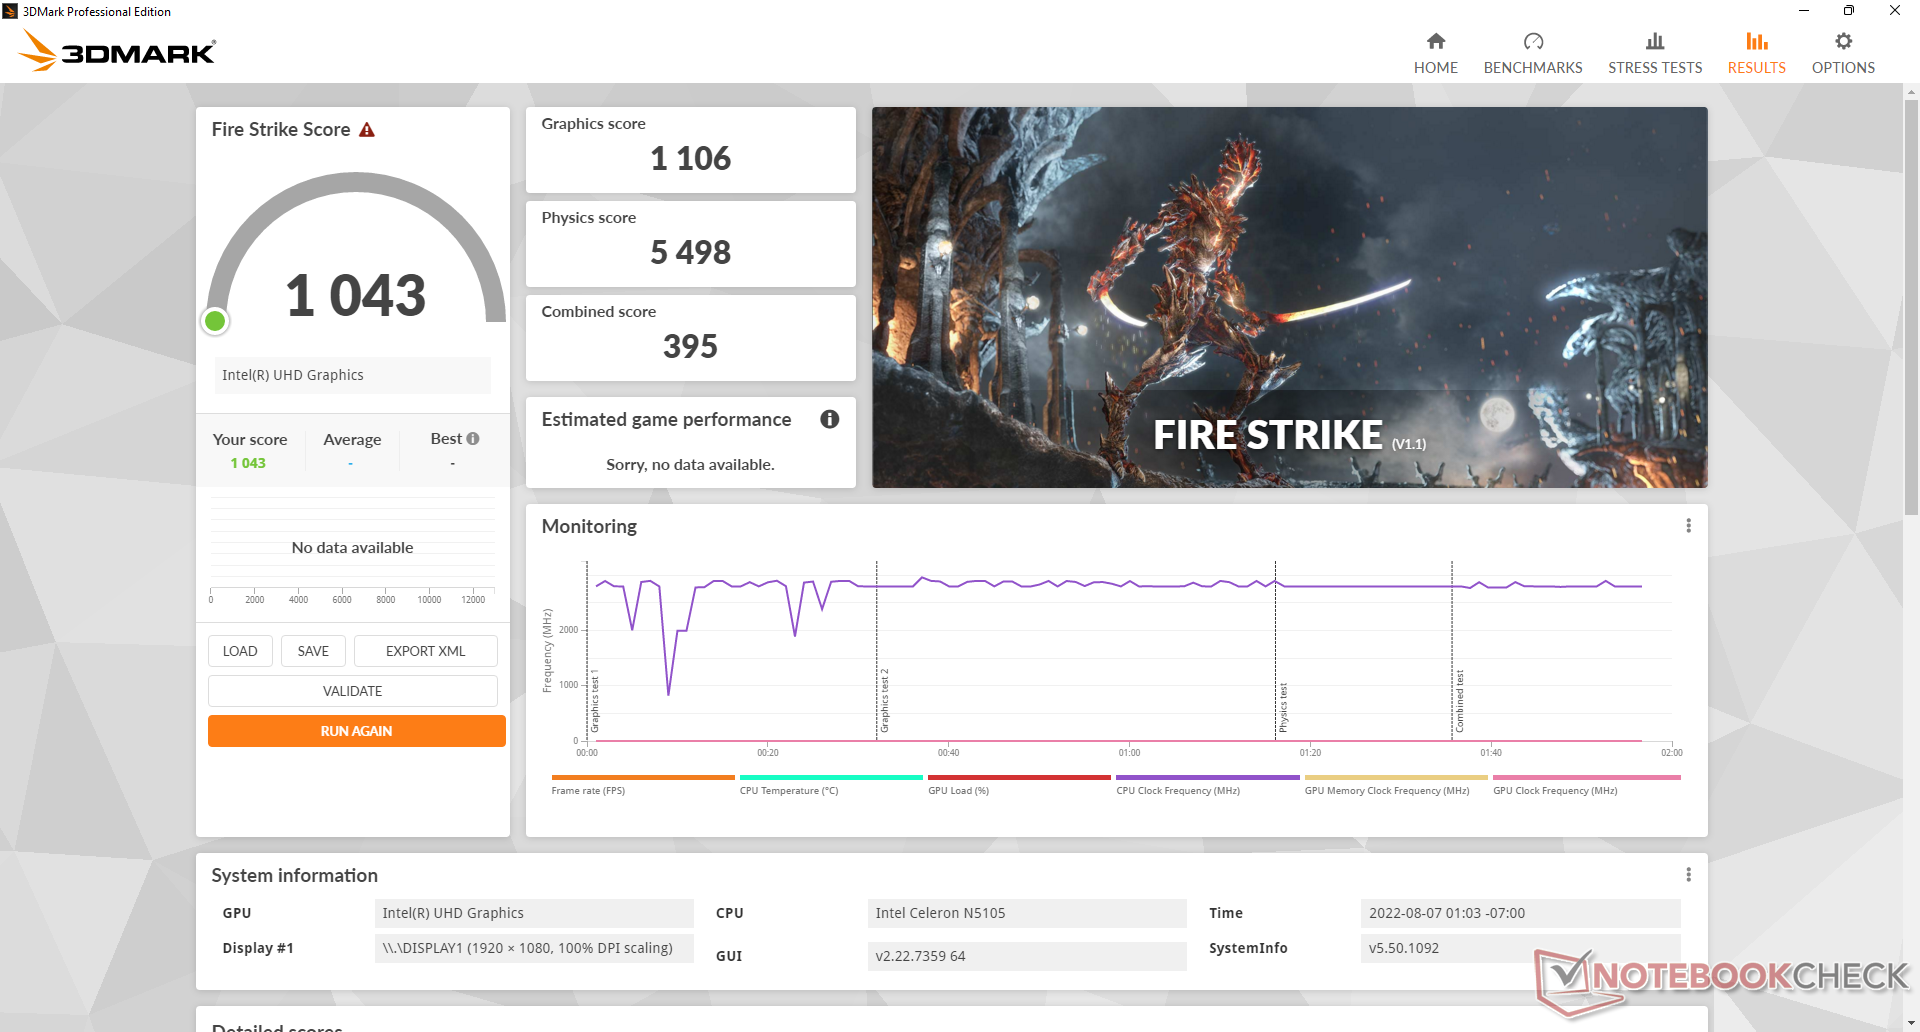
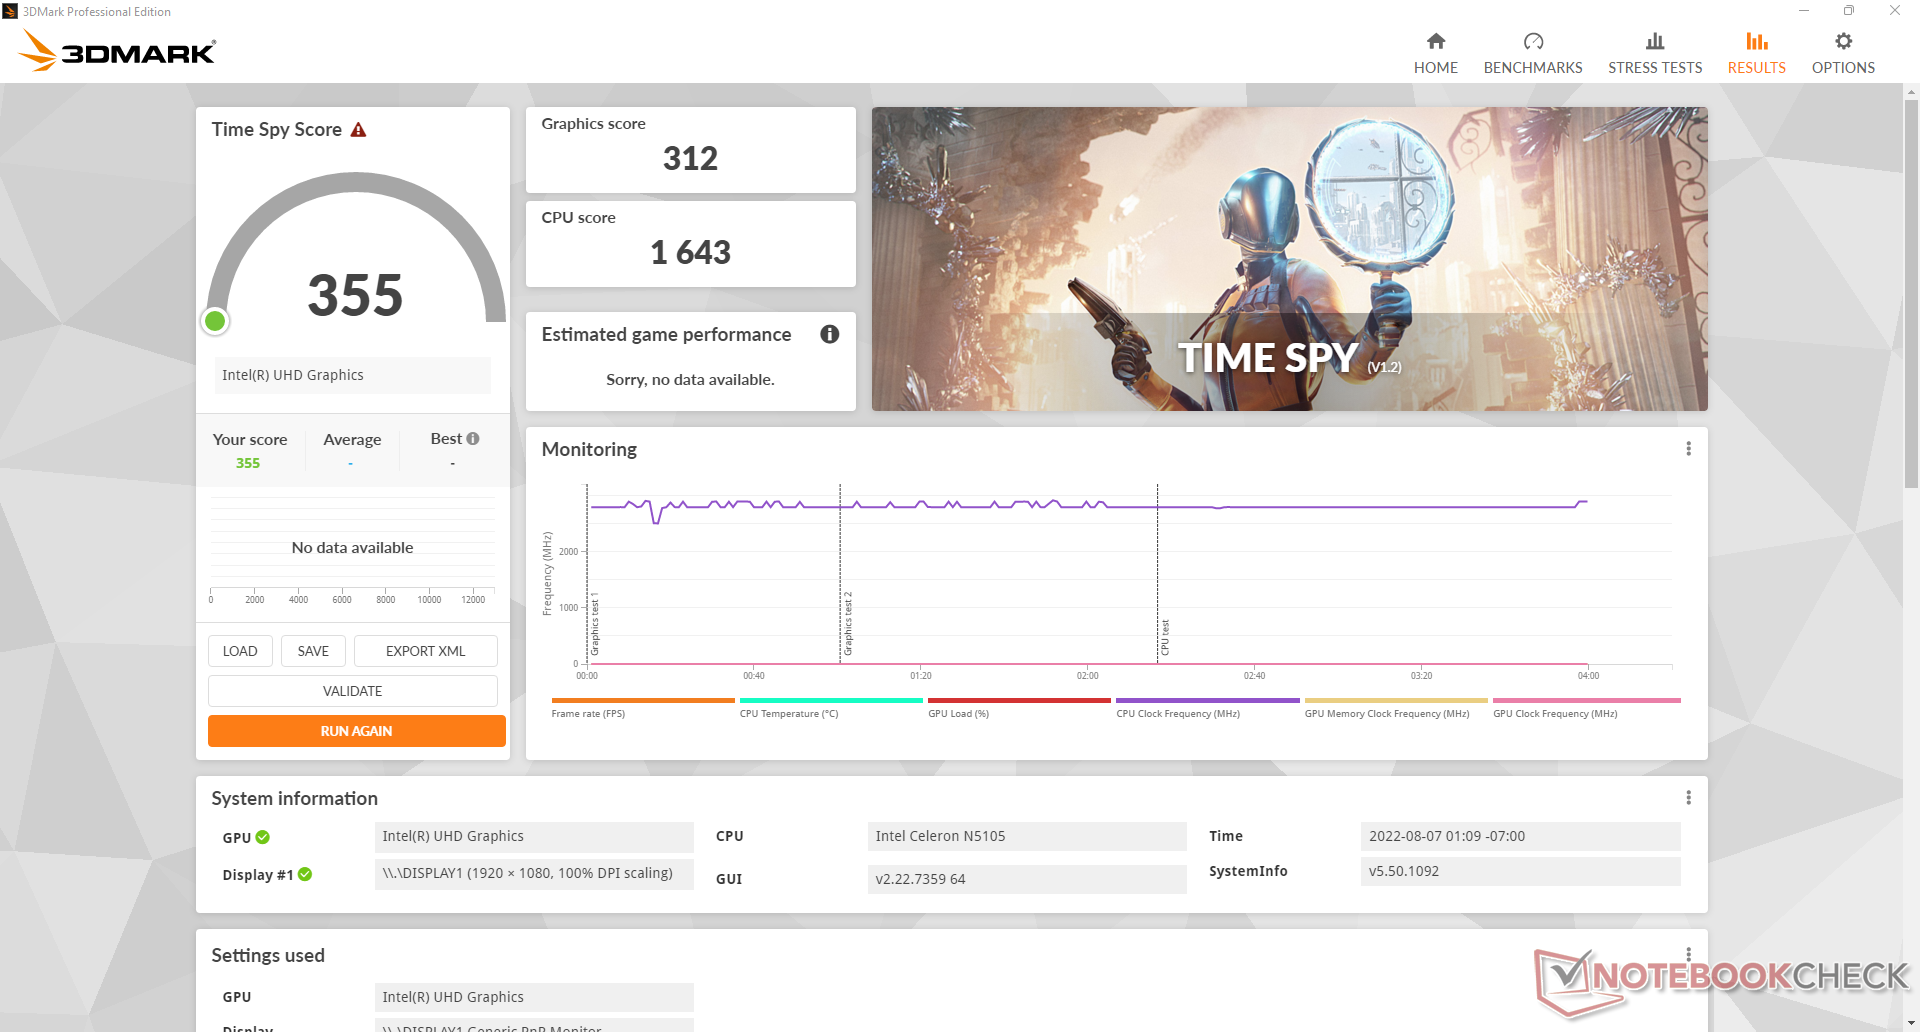
Zintegrowany procesor graficzny otrzymuje aktualizację z Jasper Lake 16 EUs w zeszłorocznym Celeronie N5095 do Jasper Lake 24 EUs w tegorocznym U59 N5105. wyniki 3DMark są o 80 procent szybsze na nowszym GPU w porównaniu do zeszłorocznego U59, co oznacza znaczny wzrost w stosunku do roku poprzedniego. Należy jednak pamiętać, że nasz U59 N5095 dostarczany był z 8 GB jednokanałowej pamięci RAM w porównaniu do 16 GB dwukanałowej pamięci RAM w naszym U59 N5105. Dwukanałowa pamięć RAM może stanowić od 30 do 50 procent tej różnicy w wydajności. Niemniej jednak, jest to nadal jedno z wolniejszych rozwiązań zintegrowanego GPU, a więc nie nadaje się do większości gier, zarówno nowych jak i starych.
| 3DMark | |
| 1920x1080 Fire Strike Graphics | |
| Beelink SER4 | |
| Intel NUC11TNKi5 | |
| Lenovo IdeaPad 3 15ITL05 81X80074GE | |
| Beelink SER3 | |
| Beelink SEi8 | |
| Teclast TBOLT F15 Pro | |
| Beelink U59 N5105 | |
| Przeciętny Intel UHD Graphics (Jasper Lake 24 EU) (n=1) | |
| HP 17-by2437ng | |
| Beelink U59 Mini-S | |
| Zotac ZBOX PI336 pico | |
| 2560x1440 Time Spy Graphics | |
| Beelink SER4 | |
| Intel NUC11TNKi5 | |
| Lenovo IdeaPad 3 15ITL05 81X80074GE | |
| Beelink SER3 | |
| Beelink SEi8 | |
| Teclast TBOLT F15 Pro | |
| HP 17-by2437ng | |
| Beelink U59 N5105 | |
| Przeciętny Intel UHD Graphics (Jasper Lake 24 EU) (n=1) | |
| Beelink U59 Mini-S | |
| 2560x1440 Time Spy Score | |
| Beelink SER4 | |
| Intel NUC11TNKi5 | |
| Lenovo IdeaPad 3 15ITL05 81X80074GE | |
| Beelink SER3 | |
| Beelink SEi8 | |
| Teclast TBOLT F15 Pro | |
| HP 17-by2437ng | |
| Beelink U59 N5105 | |
| Przeciętny Intel UHD Graphics (Jasper Lake 24 EU) (n=1) | |
| Beelink U59 Mini-S | |
| 3DMark 11 - 1280x720 Performance GPU | |
| Beelink SER4 | |
| Intel NUC11TNKi5 | |
| Lenovo IdeaPad 3 15ITL05 81X80074GE | |
| Beelink SER3 | |
| Beelink SEi8 | |
| Teclast TBOLT F15 Pro | |
| HP 17-by2437ng | |
| Beelink U59 N5105 | |
| Przeciętny Intel UHD Graphics (Jasper Lake 24 EU) (n=1) | |
| Beelink U59 Mini-S | |
| Zotac ZBOX PI336 pico | |
| 3DMark 11 Performance | 1654 pkt. | |
| 3DMark Cloud Gate Standard Score | 6659 pkt. | |
| 3DMark Fire Strike Score | 1043 pkt. | |
| 3DMark Time Spy Score | 355 pkt. | |
Pomoc | ||
| The Witcher 3 | |
| 1024x768 Low Graphics & Postprocessing | |
| Beelink SER4 | |
| Intel NUC11TNKi5 | |
| Lenovo IdeaPad 3 15ITL05 81X80074GE | |
| Beelink SER3 | |
| Teclast TBOLT F15 Pro | |
| Beelink U59 N5105 | |
| Przeciętny Intel UHD Graphics (Jasper Lake 24 EU) (n=1) | |
| 1366x768 Medium Graphics & Postprocessing | |
| Beelink SER4 | |
| Lenovo IdeaPad 3 15ITL05 81X80074GE | |
| Beelink SER3 | |
| Teclast TBOLT F15 Pro | |
| Beelink U59 N5105 | |
| Przeciętny Intel UHD Graphics (Jasper Lake 24 EU) (n=1) | |
| 1920x1080 High Graphics & Postprocessing (Nvidia HairWorks Off) | |
| Beelink SER4 | |
| Lenovo IdeaPad 3 15ITL05 81X80074GE | |
| Beelink SER3 | |
| Teclast TBOLT F15 Pro | |
| Beelink U59 N5105 | |
| Przeciętny Intel UHD Graphics (Jasper Lake 24 EU) (n=1) | |
| 1920x1080 Ultra Graphics & Postprocessing (HBAO+) | |
| Beelink SER4 | |
| Lenovo IdeaPad 3 15ITL05 81X80074GE | |
| Beelink SER3 | |
| Beelink U59 N5105 | |
| Przeciętny Intel UHD Graphics (Jasper Lake 24 EU) (n=1) | |
| X-Plane 11.11 | |
| 1280x720 low (fps_test=1) | |
| Beelink SER4 | |
| Lenovo IdeaPad 3 15ITL05 81X80074GE | |
| Intel NUC11TNKi5 | |
| Teclast TBOLT F15 Pro | |
| Beelink SER3 | |
| Beelink SEi8 | |
| Beelink U59 N5105 | |
| Przeciętny Intel UHD Graphics (Jasper Lake 24 EU) (n=1) | |
| Beelink U59 Mini-S | |
| Zotac ZBOX PI336 pico | |
| 1920x1080 med (fps_test=2) | |
| Beelink SER4 | |
| Intel NUC11TNKi5 | |
| Lenovo IdeaPad 3 15ITL05 81X80074GE | |
| Beelink SER3 | |
| Beelink SEi8 | |
| Teclast TBOLT F15 Pro | |
| Beelink U59 N5105 | |
| Przeciętny Intel UHD Graphics (Jasper Lake 24 EU) (n=1) | |
| Beelink U59 Mini-S | |
| Zotac ZBOX PI336 pico | |
| 1920x1080 high (fps_test=3) | |
| Beelink SER4 | |
| Intel NUC11TNKi5 | |
| Lenovo IdeaPad 3 15ITL05 81X80074GE | |
| Beelink SER3 | |
| Teclast TBOLT F15 Pro | |
| Beelink SEi8 | |
| Beelink U59 N5105 | |
| Przeciętny Intel UHD Graphics (Jasper Lake 24 EU) (n=1) | |
| Beelink U59 Mini-S | |
| Zotac ZBOX PI336 pico | |
| Final Fantasy XV Benchmark - 1280x720 Lite Quality | |
| Beelink SER4 | |
| Intel NUC11TNKi5 | |
| Lenovo IdeaPad 3 15ITL05 81X80074GE | |
| Beelink SER3 | |
| Beelink SEi8 | |
| Teclast TBOLT F15 Pro | |
| Beelink U59 N5105 | |
| Przeciętny Intel UHD Graphics (Jasper Lake 24 EU) (n=1) | |
| Beelink U59 Mini-S | |
| Zotac ZBOX PI336 pico | |
| Dota 2 Reborn | |
| 1280x720 min (0/3) fastest | |
| Beelink SER4 | |
| Beelink SEi8 | |
| Lenovo IdeaPad 3 15ITL05 81X80074GE | |
| Teclast TBOLT F15 Pro | |
| Intel NUC11TNKi5 | |
| Beelink U59 N5105 | |
| Przeciętny Intel UHD Graphics (Jasper Lake 24 EU) (n=1) | |
| Beelink SER3 | |
| Beelink U59 Mini-S | |
| Zotac ZBOX PI336 pico | |
| 1366x768 med (1/3) | |
| Beelink SER4 | |
| Intel NUC11TNKi5 | |
| Beelink SER3 | |
| Lenovo IdeaPad 3 15ITL05 81X80074GE | |
| Beelink SEi8 | |
| Teclast TBOLT F15 Pro | |
| Beelink U59 N5105 | |
| Przeciętny Intel UHD Graphics (Jasper Lake 24 EU) (n=1) | |
| Beelink U59 Mini-S | |
| Zotac ZBOX PI336 pico | |
| 1920x1080 high (2/3) | |
| Beelink SER4 | |
| Intel NUC11TNKi5 | |
| Beelink SER3 | |
| Lenovo IdeaPad 3 15ITL05 81X80074GE | |
| Beelink SEi8 | |
| Teclast TBOLT F15 Pro | |
| Beelink U59 N5105 | |
| Przeciętny Intel UHD Graphics (Jasper Lake 24 EU) (n=1) | |
| Beelink U59 Mini-S | |
| Zotac ZBOX PI336 pico | |
| 1920x1080 ultra (3/3) best looking | |
| Beelink SER4 | |
| Intel NUC11TNKi5 | |
| Beelink SER3 | |
| Lenovo IdeaPad 3 15ITL05 81X80074GE | |
| Beelink SEi8 | |
| Teclast TBOLT F15 Pro | |
| Beelink U59 N5105 | |
| Przeciętny Intel UHD Graphics (Jasper Lake 24 EU) (n=1) | |
| Beelink U59 Mini-S | |
| Zotac ZBOX PI336 pico | |
| low | med. | high | ultra | |
|---|---|---|---|---|
| The Witcher 3 (2015) | 21.6 | 14.4 | 7.8 | 3.9 |
| Dota 2 Reborn (2015) | 73.8 | 24.1 | 16.8 | 15.5 |
| Final Fantasy XV Benchmark (2018) | 13.7 | |||
| X-Plane 11.11 (2018) | 20.8 | 13.3 | 12.3 |
Emisje
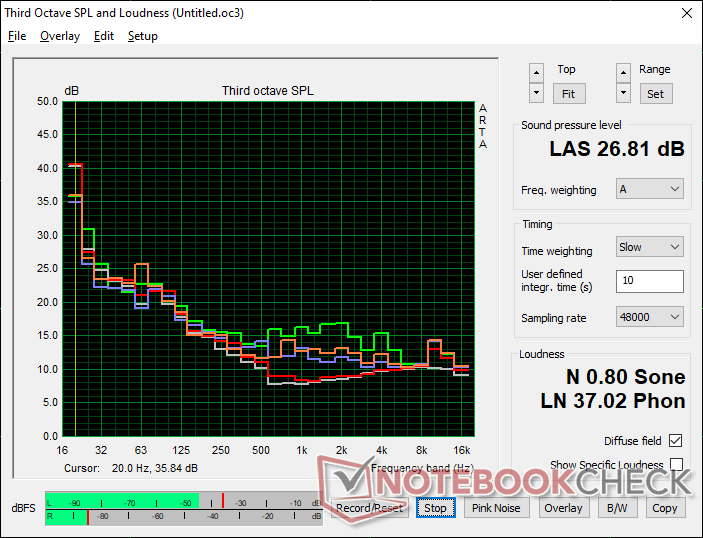
Szum systemu
Szum wentylatora jest cichy bez względu na obciążenie, nawet przy ustawieniu trybu Performance. Maksymalnie udało nam się zarejestrować tylko niecałe 27 dB(A) na tle 21,5 dB(A) w porównaniu do 34 dB(A) w zeszłorocznym U59. Jest to jeden z najcichszych mini PC, jeśli nie zdecydujemy się na modele bez wentylatora, jak Zotac ZBOX PI336.
Nasz testowany egzemplarz wykazywał niewielkie szumy elektroniczne lub wycie cewek, co pomaga wyjaśnić hałas na biegu jałowym na poziomie 22,1 dB(A).
Hałas
| luz |
| 22.1 / 22.1 / 22.1 dB |
| obciążenie |
| 23.9 / 26.8 dB |
 | ||
30 dB cichy 40 dB(A) słyszalny 50 dB(A) irytujący |
||
min: | ||
| Beelink U59 N5105 UHD Graphics (Jasper Lake 24 EU), Celeron N5105, Silicon Motion AZW 512G NV428 | Beelink U59 Mini-S UHD Graphics (Jasper Lake 16 EU), Celeron N5095, Silicon Motion AZW 256G M.228 220426 C SATA 3 | Beelink SER4 Vega 8, R7 4800U, Intel SSD 660p SSDPEKNW512G8 | Beelink SER3 Vega 10, R7 3750H, GSemi AZW GSDFN512TS3F1OGCX | Intel NUC11TNKi5 Iris Xe G7 80EUs, i5-1135G7, Transcend M.2 SSD 430S TS512GMTS430S | Zotac ZBOX PI336 pico UHD Graphics (Elkhart Lake 16 EU), Celeron N6211, SanDisk DF4128 | |
|---|---|---|---|---|---|---|
| Noise | -12% | -48% | -31% | -55% | ||
| wyłączone / środowisko * (dB) | 21.5 | 23.3 -8% | 23.4 -9% | 23.4 -9% | 24.8 -15% | |
| Idle Minimum * (dB) | 22.1 | 24.2 -10% | 33.2 -50% | 23.4 -6% | 35.6 -61% | |
| Idle Average * (dB) | 22.1 | 24.2 -10% | 33.2 -50% | 23.4 -6% | 35.6 -61% | |
| Idle Maximum * (dB) | 22.1 | 24.2 -10% | 33.2 -50% | 29.4 -33% | 35.6 -61% | |
| Load Average * (dB) | 23.9 | 25.1 -5% | 38.6 -62% | 35.2 -47% | 36.2 -51% | |
| Witcher 3 ultra * (dB) | 24.4 | 39.2 -61% | 37.2 -52% | 38 -56% | ||
| Load Maximum * (dB) | 26.8 | 33.9 -26% | 40.8 -52% | 43.3 -62% | 47.6 -78% |
* ... im mniej tym lepiej
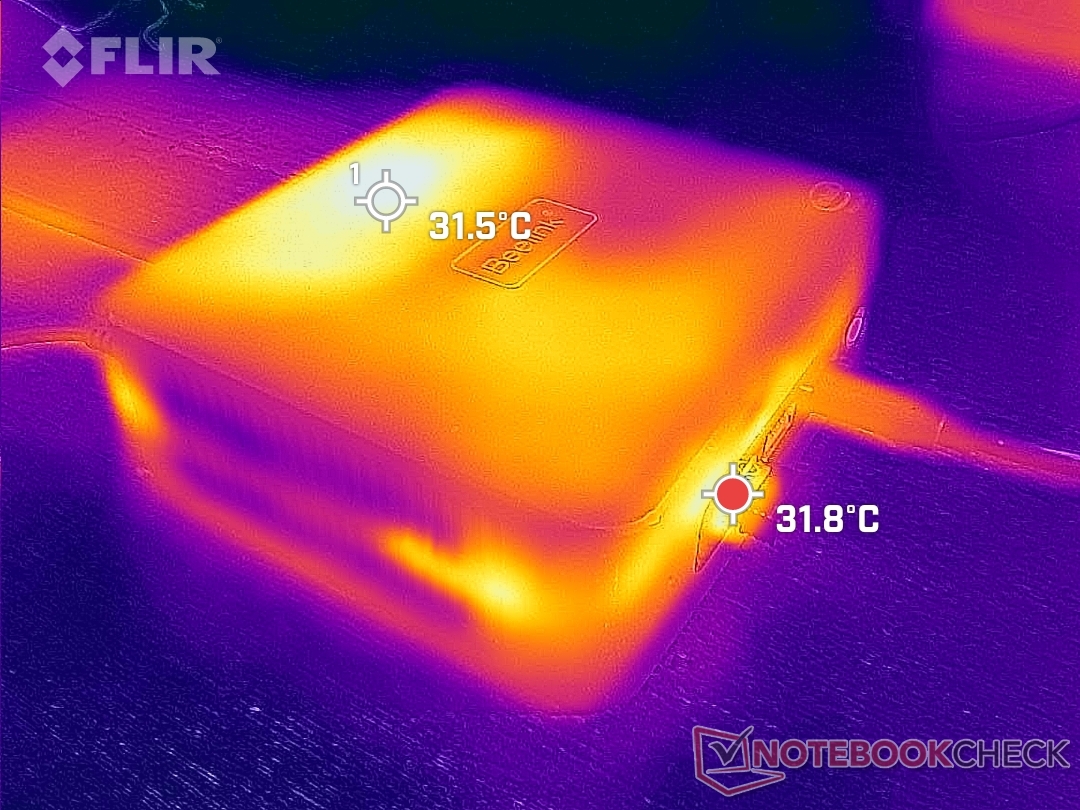
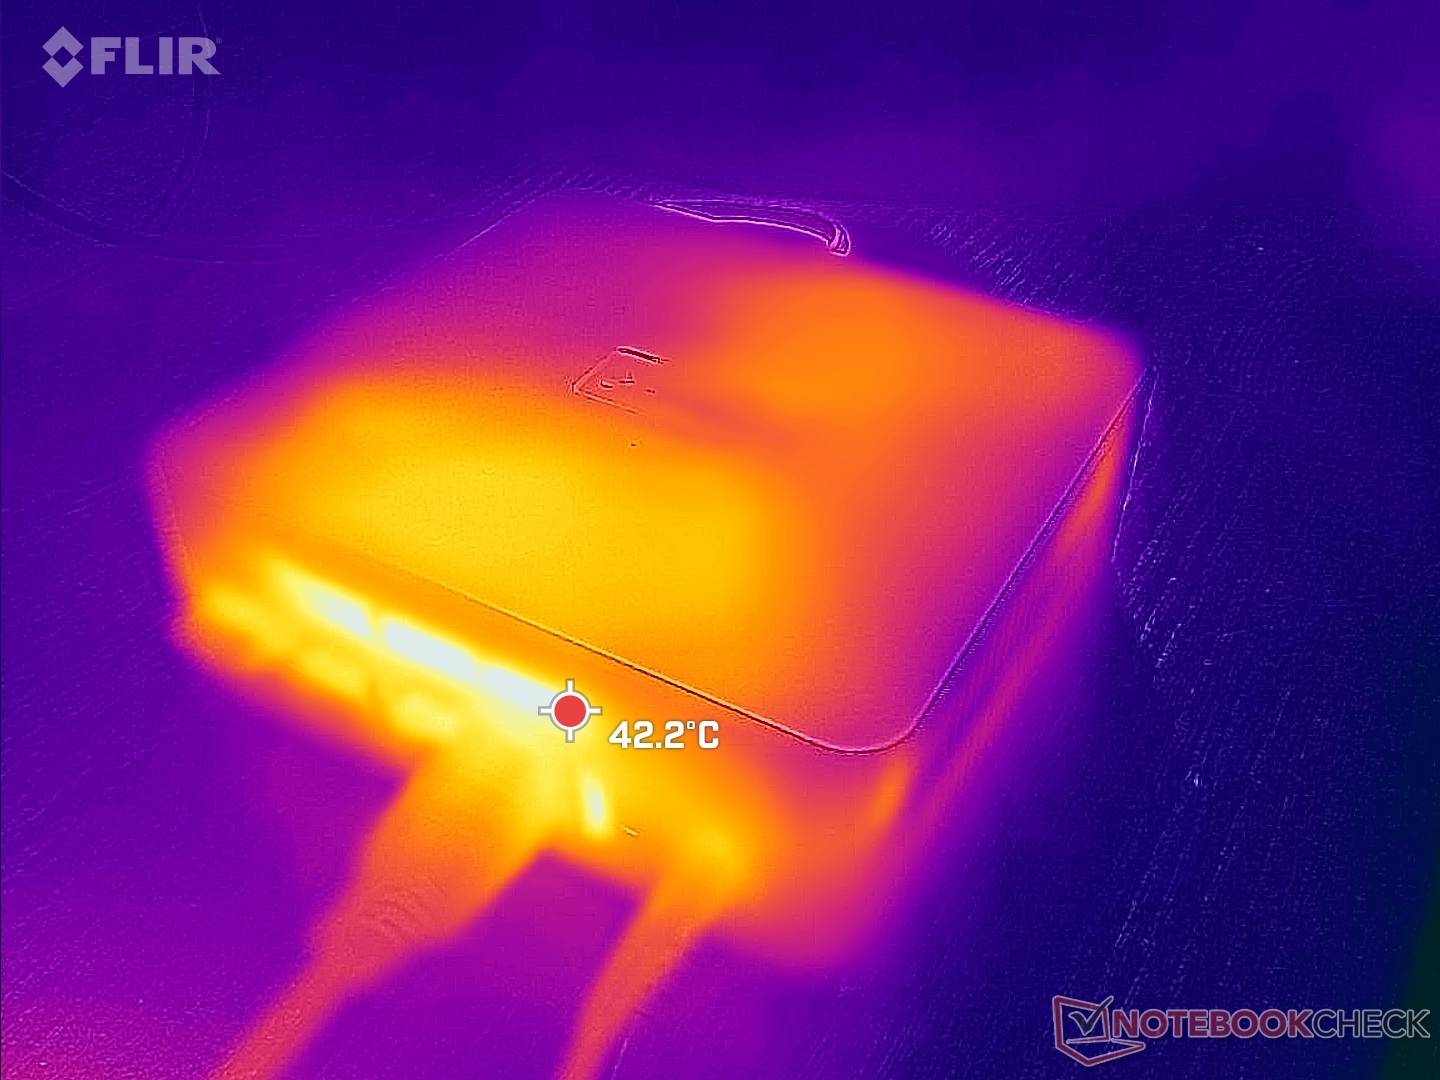
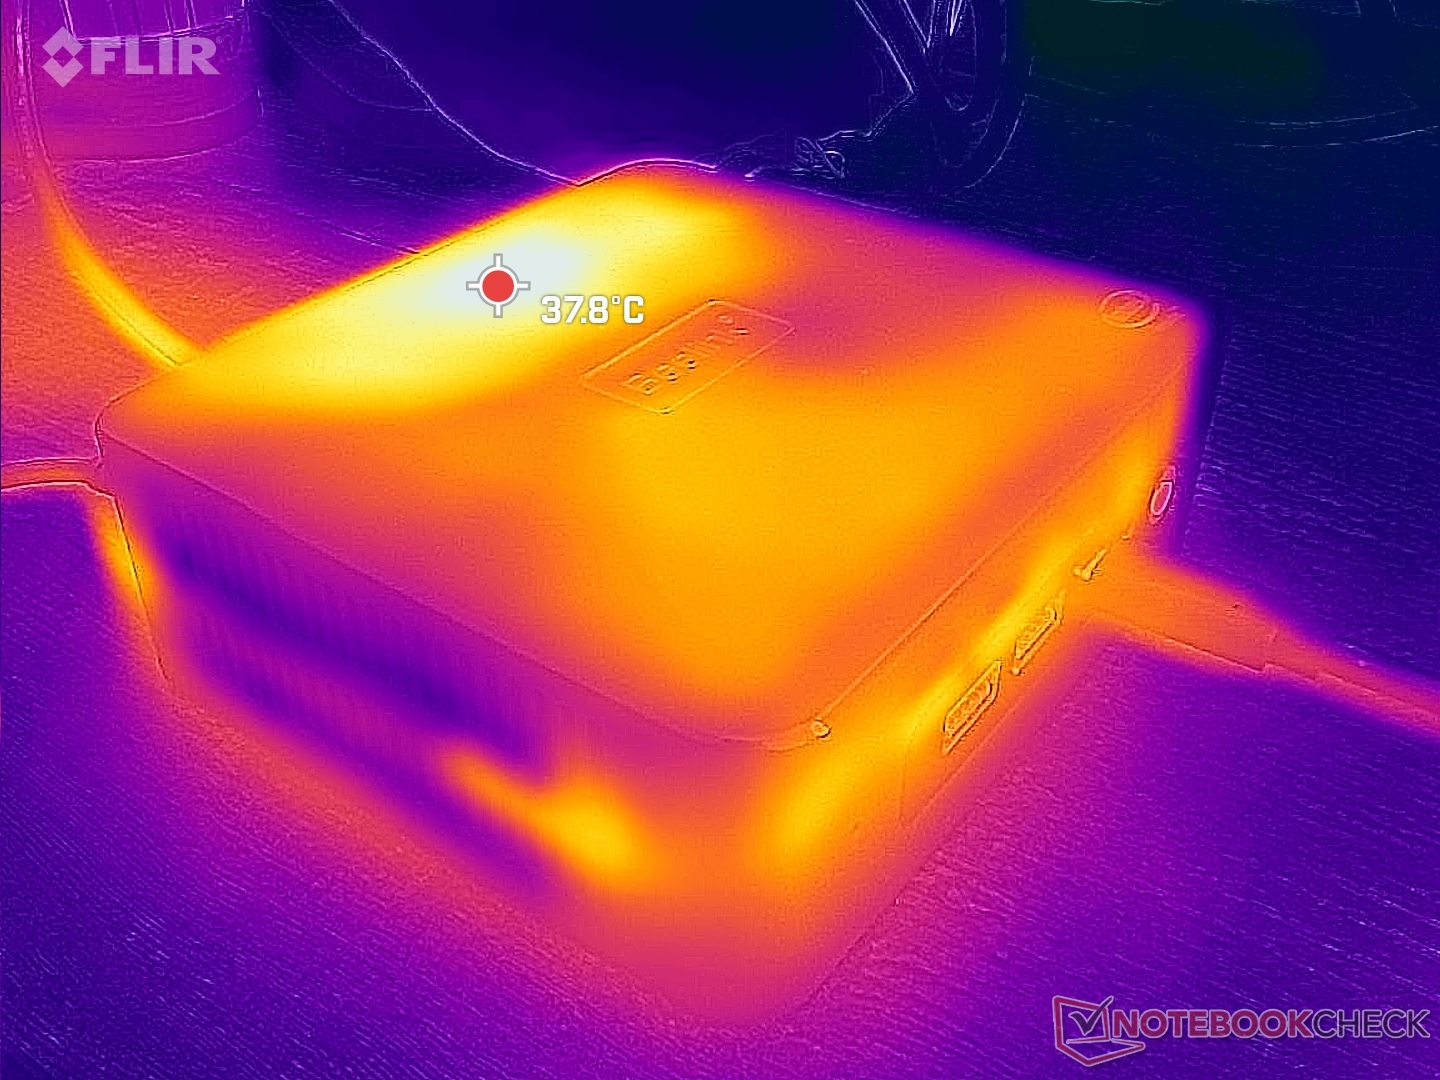
Temperatura
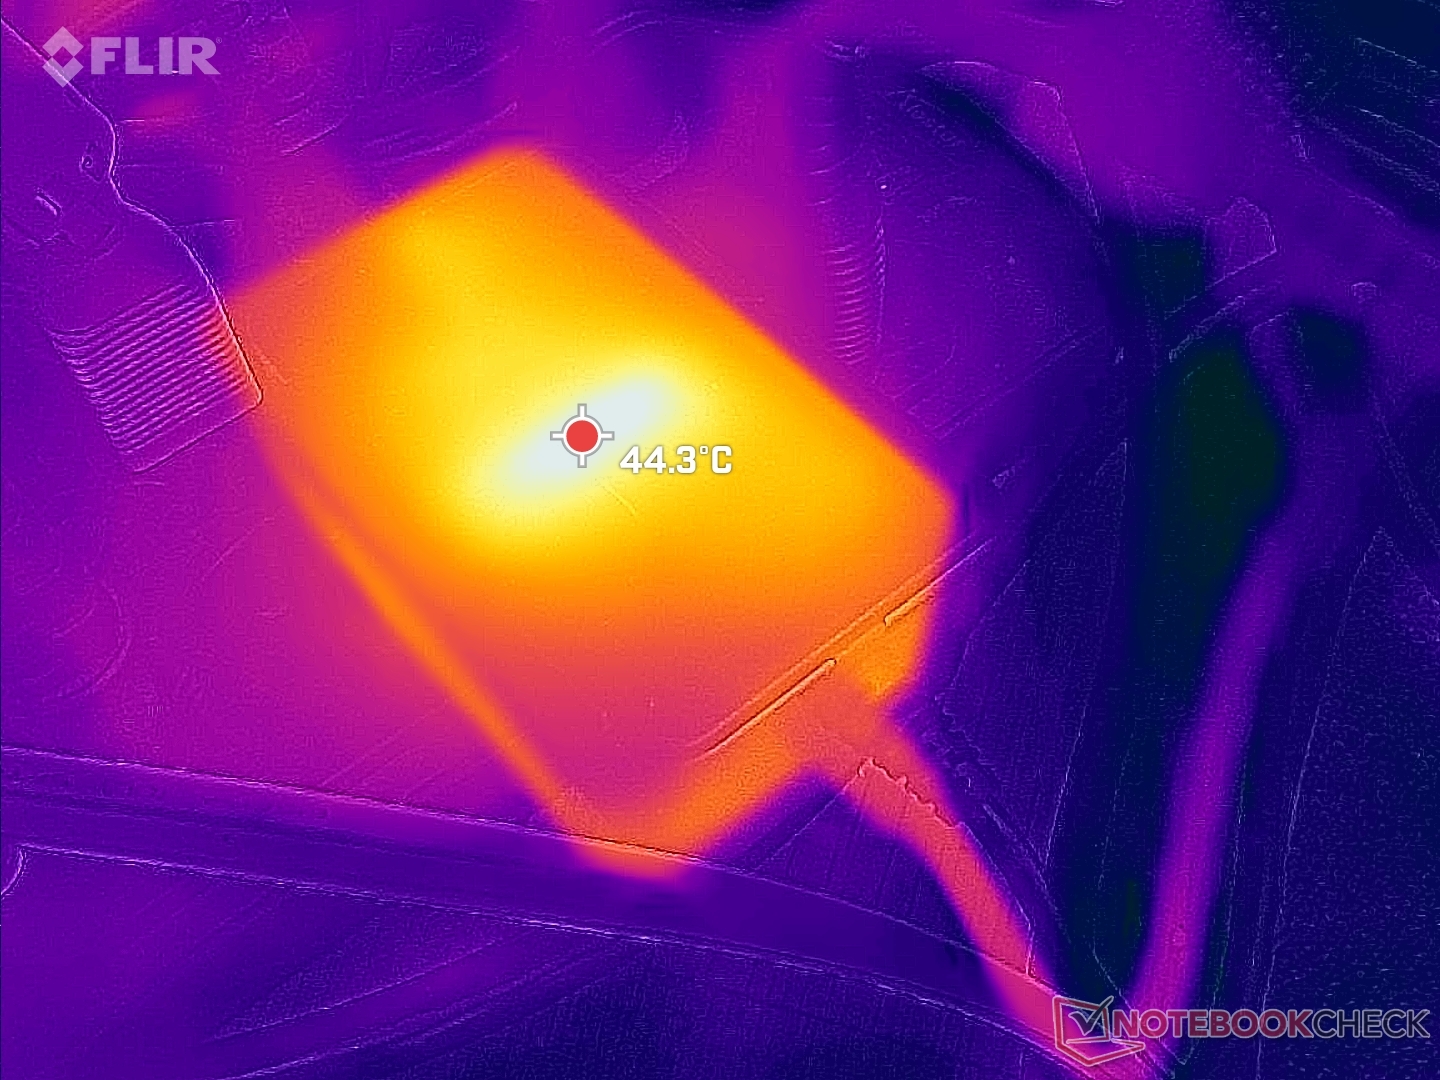
Temperatury powierzchni są ciepłe nawet podczas pracy na biegu jałowym na pulpicie, ponieważ wentylator jest tak małomówny. Wierzch jednostki może osiągnąć 32 C, kiedy nie są uruchomione żadne aplikacje, lub do 38 C, kiedy przez dłuższy czas działają obciążające aplikacje. Gorące punkty znajdują się w tylnej części obudowy, najbliżej tylnych kratek wentylacyjnych.
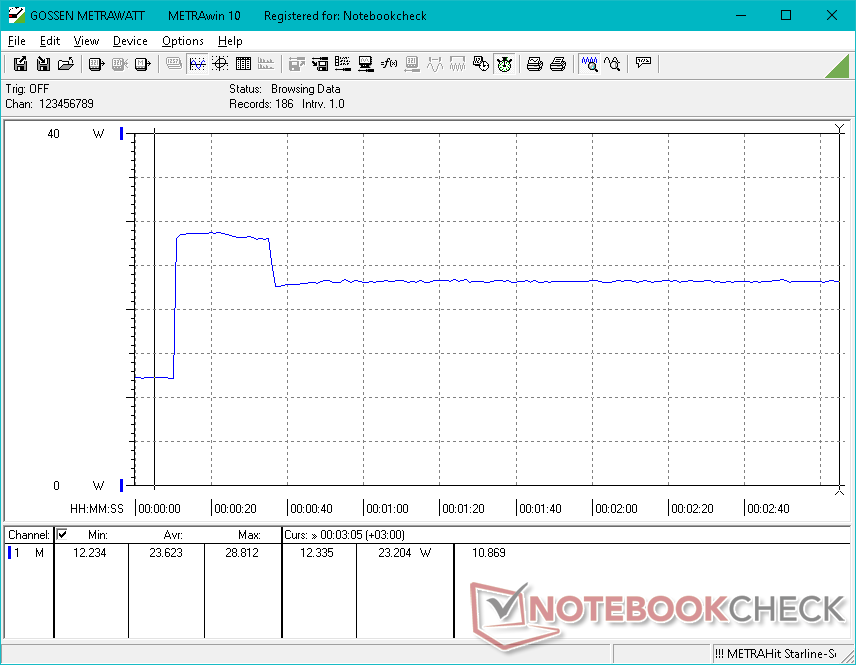
Stress Test
Częstotliwości taktowania procesora, temperatura i pobór mocy płyty głównej wzrosłyby do 2,8 GHz, 86 C i 20 W, odpowiednio, podczas inicjowania stresu Prime95. Jednak po około 20 sekundach częstotliwość taktowania i pobór mocy spadały odpowiednio do 2,4 GHz i 15 W, aby utrzymać temperaturę rdzenia na poziomie 76 C, jak pokazuje poniższy zrzut ekranu. Jest to faktycznie wolniejsze i chłodniejsze o 200 MHz i 9 C, odpowiednio, od tego, co odnotowaliśmy na zeszłorocznym U59 ze starszym N5095.
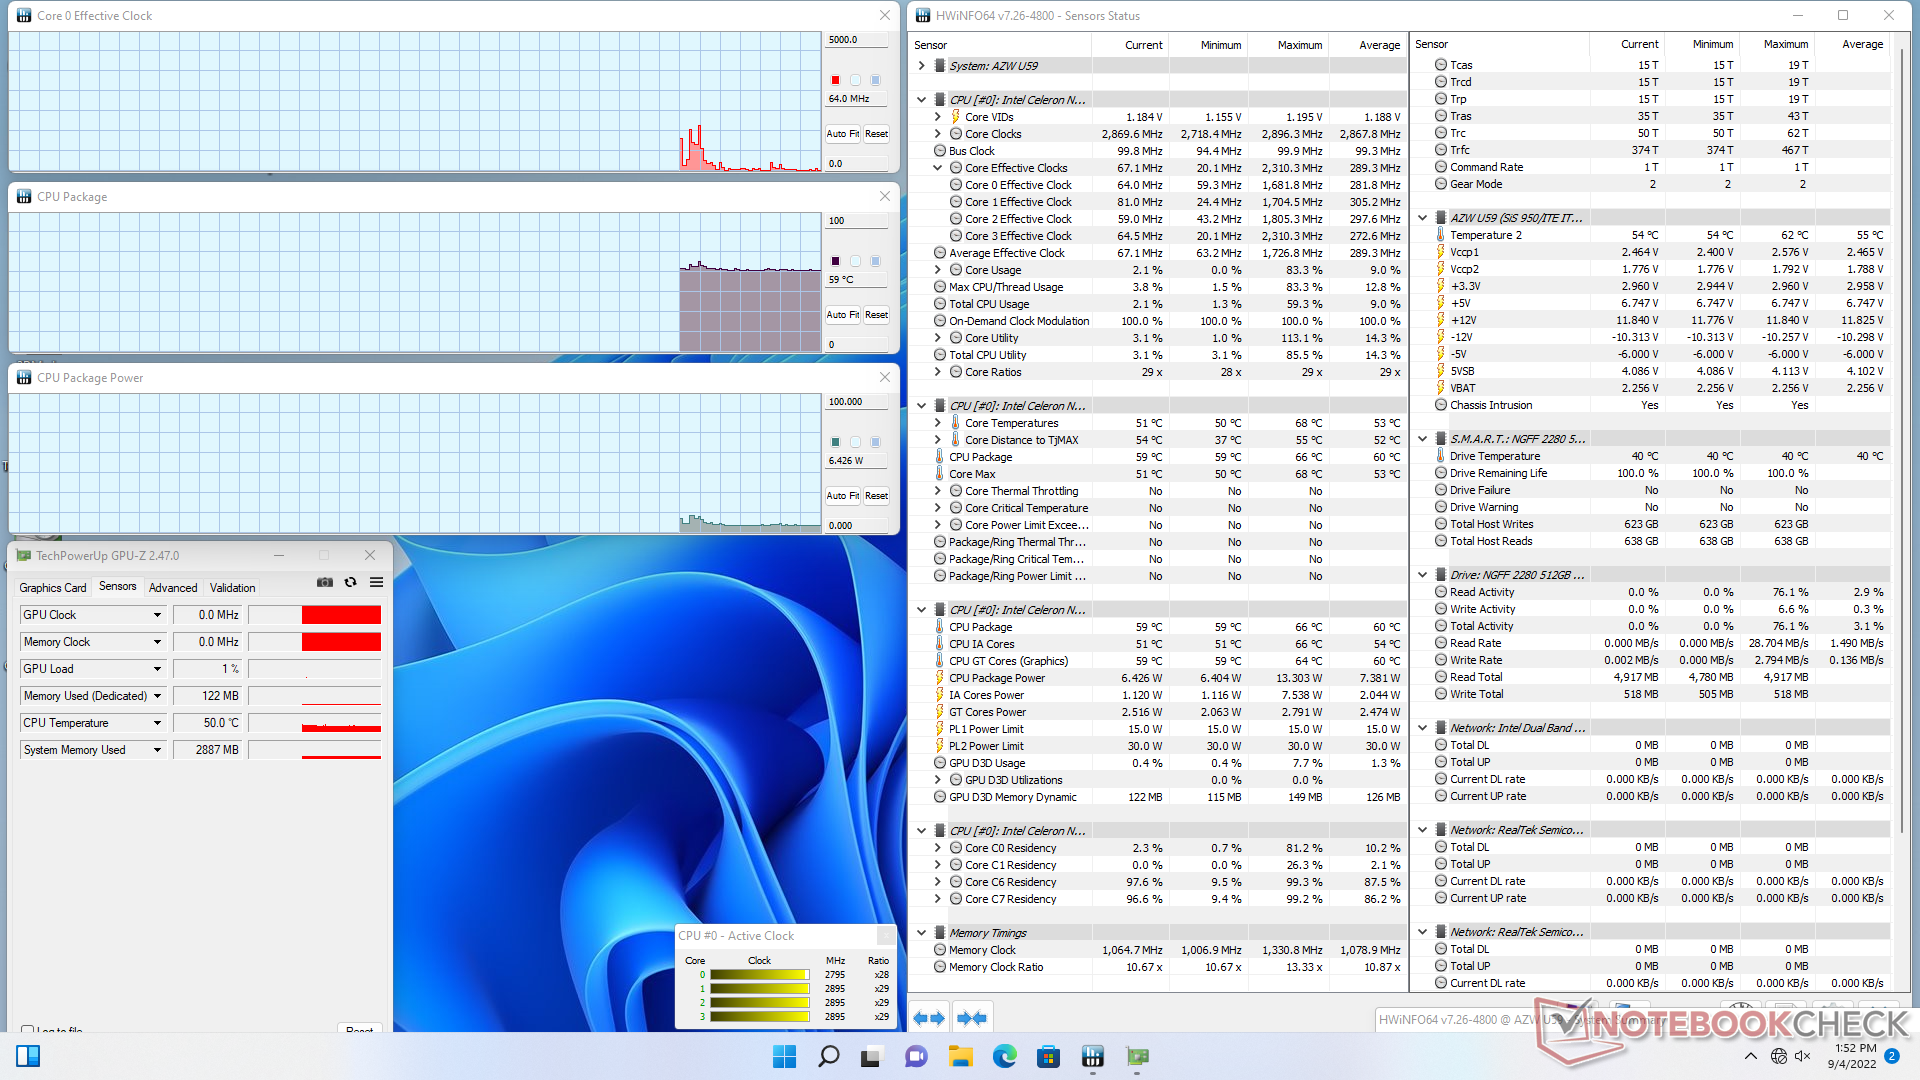
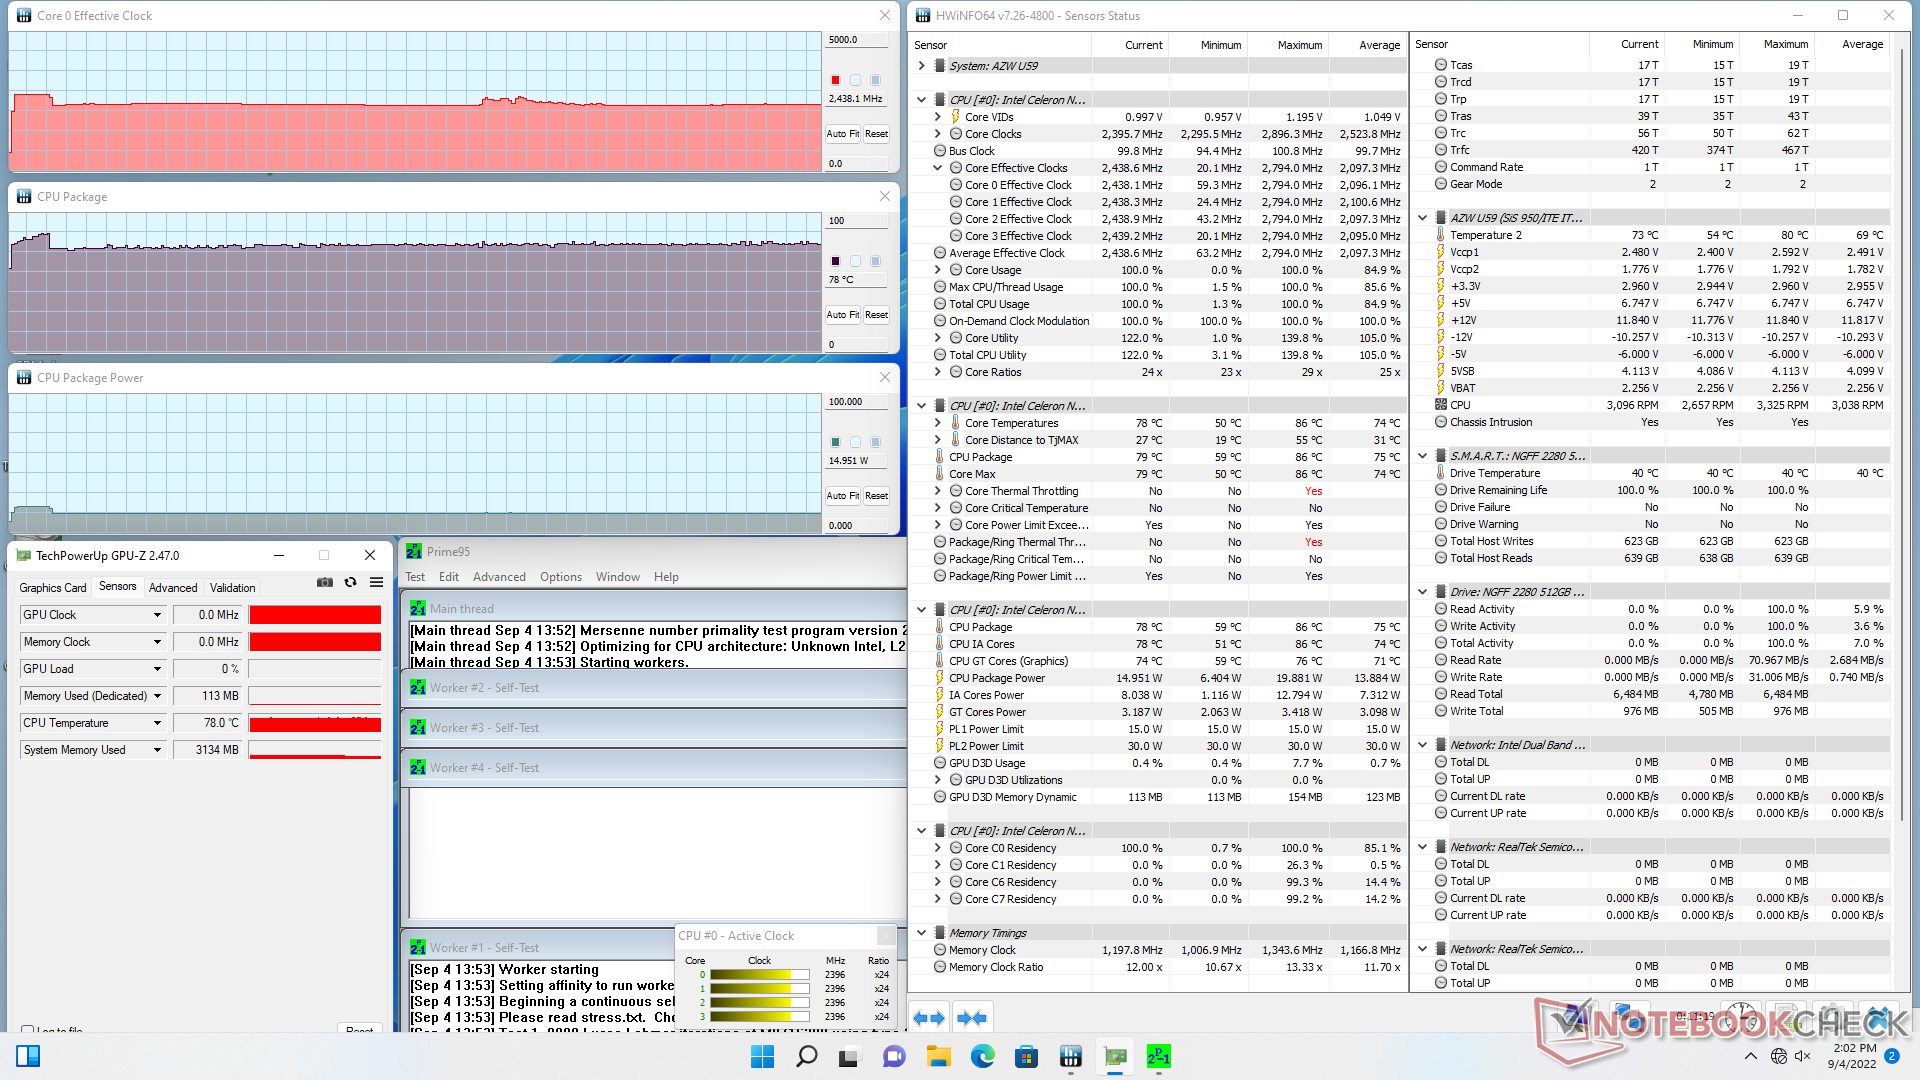
| ZegarCPU (GHz) | Zegar GPU (MHz) | Średnia temperatura CPU (°C) | |
| System w stanie bezczynności | -- | -- | 59 |
| Prime95 Stress | 2.4 | -- | 78 |
Zarządzanie energią
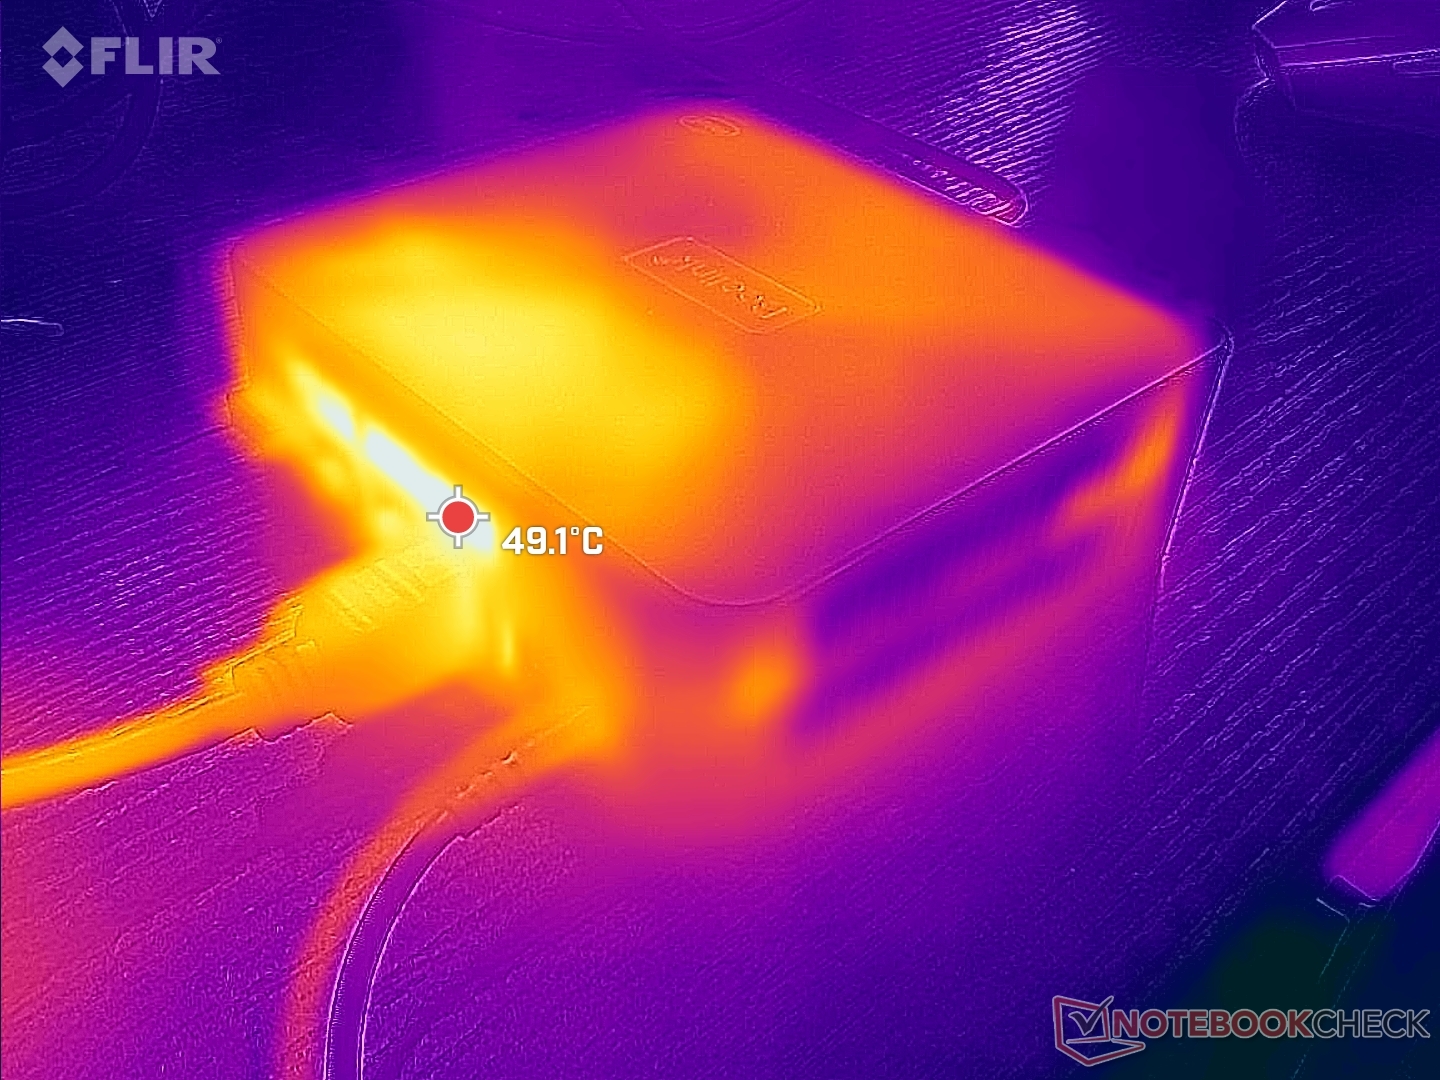
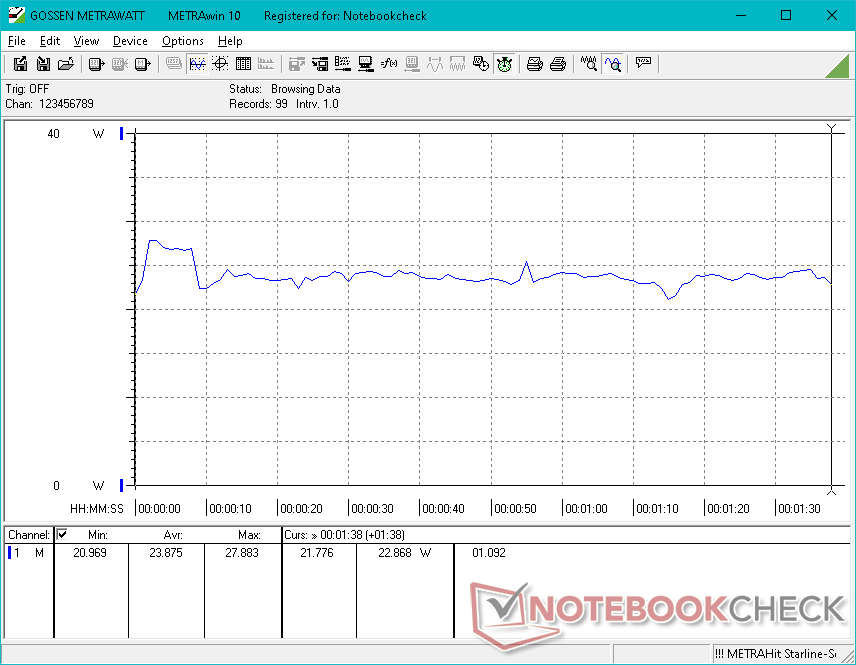
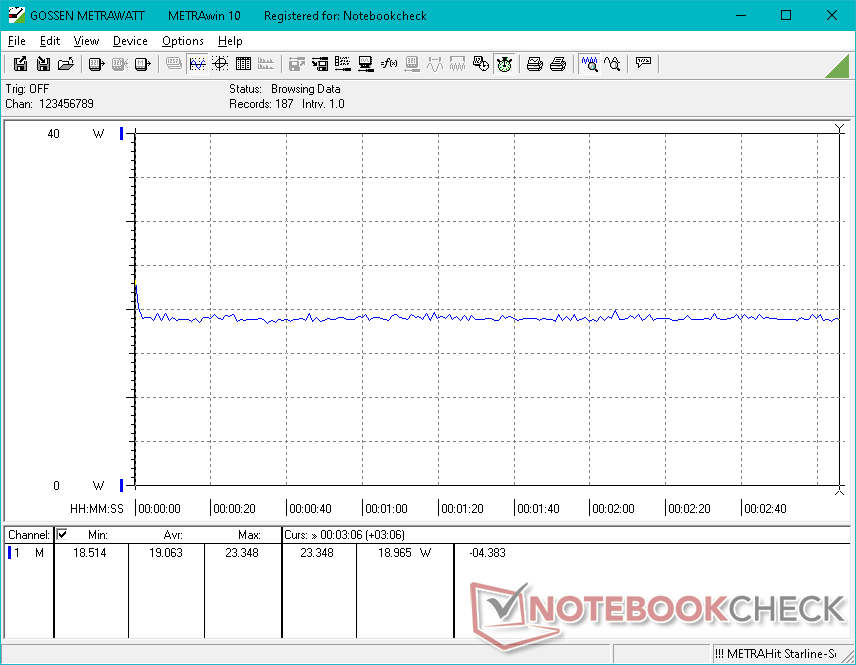
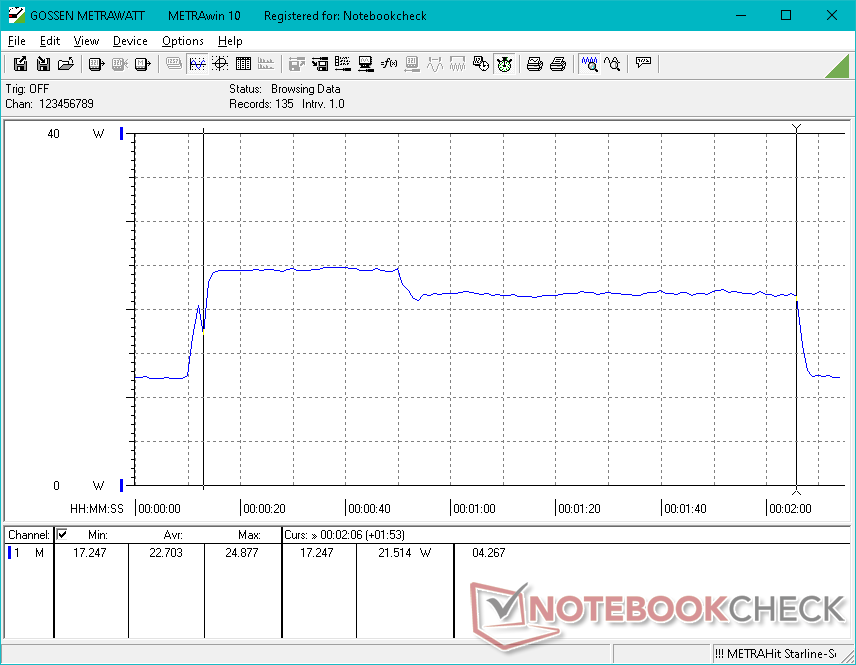
Pobór mocy
System jest tylko nieco bardziej wymagający niż na zeszłorocznym U59 ze starszym Celeronem N5095. Wspomniane wcześniej zyski z GPU są jednak warte dodatkowych kilku watów. Ogólny pobór jest wciąż znacznie niższy niż w przypadku mini PC napędzanych przez procesory Core U lub Ryzen U, jak np Intel NUC11 czy Beelink SER4
Udało nam się zarejestrować chwilowy maksymalny pobór 29 W z małego (~7,8 x 4,6 x 3,2 cm) zasilacza AC 36 W podczas pracy w stresie Prime95.
| wyłączony / stan wstrzymania | |
| luz | |
| obciążenie |
|
Legenda:
min: | |
| Beelink U59 N5105 Celeron N5105, UHD Graphics (Jasper Lake 24 EU), Silicon Motion AZW 512G NV428, , x, | Beelink U59 Mini-S Celeron N5095, UHD Graphics (Jasper Lake 16 EU), Silicon Motion AZW 256G M.228 220426 C SATA 3, , x, | Beelink SER4 R7 4800U, Vega 8, Intel SSD 660p SSDPEKNW512G8, , x, | Beelink SER3 R7 3750H, Vega 10, GSemi AZW GSDFN512TS3F1OGCX, , x, | Intel NUC11TNKi5 i5-1135G7, Iris Xe G7 80EUs, Transcend M.2 SSD 430S TS512GMTS430S, , x, | Zotac ZBOX PI336 pico Celeron N6211, UHD Graphics (Elkhart Lake 16 EU), SanDisk DF4128, , x, | |
|---|---|---|---|---|---|---|
| Power Consumption | 15% | -4% | -27% | -82% | 42% | |
| Idle Minimum * (Watt) | 6.7 | 7 -4% | 4.1 39% | 7 -4% | 11.5 -72% | 5.4 19% |
| Idle Average * (Watt) | 8.1 | 7 14% | 4.1 49% | 9.1 -12% | 12.4 -53% | 5.5 32% |
| Idle Maximum * (Watt) | 11.6 | 7.6 34% | 4.6 60% | 9.7 16% | 12.9 -11% | 6.2 47% |
| Load Average * (Watt) | 23.9 | 18.3 23% | 35.6 -49% | 29.5 -23% | 40.7 -70% | 11.3 53% |
| Witcher 3 ultra * (Watt) | 19.1 | 35.6 -86% | 32.5 -70% | 43.9 -130% | ||
| Load Maximum * (Watt) | 28.8 | 27.1 6% | 39.9 -39% | 48.7 -69% | 73.5 -155% | 11.8 59% |
* ... im mniej tym lepiej
Power Consumption Witcher 3 / Stresstest
Power Consumption external Monitor
Za
Przeciw
Werdykt - Ten sam procesor, szybszy układ graficzny
Jeśli chodzi o szybkość przetwarzania, to nie ma prawie żadnego powodu, aby wybrać Celeron N5105 nad N5095. N5105 może być nieco chłodniejszy, ale nie oferuje żadnego znaczącego wzrostu wydajności jednowątkowej lub wielowątkowej. Jego zalety leżą natomiast w zintegrowanym GPU, który jest szybszy od zintegrowanego GPU w N5095 z dużo większym marginesem.
Niestety, procesor graficzny w N5105 jest nadal powolny, przez co interfejs Windows jest nadal lagodny, gdy uruchamiamy więcej niż jedną lub dwie aplikacje jednocześnie. W tym przypadku możliwości strumieniowania w U59 N5105 są w zasadzie takie same jak w U59 N5095. Zaleca się, aby w miarę możliwości szukać jednostek z dwukanałową pamięcią RAM, aby zmaksymalizować wydajność zintegrowanego GPU.
Jeśli chodzi o sam mini PC, U59 posiada całkiem sporo funkcji, biorąc pod uwagę jego bardzo niską cenę. Konfiguracje są dostarczane z preinstalowanym systemem Windows 11 i bardzo pojemnym dyskiem SSD 512 GB z 16 GB pamięci RAM za jedyne około 200 USD, podczas gdy Intel NUC może łatwo kosztować ponad dwa razy tyle bez żadnej pamięci RAM lub pamięci masowej. Jeśli wszystko, czego szukasz, to podstawowe strumieniowanie 1080p lub przeglądanie stron internetowych, to ten U59 zrobi to wystarczająco. Dla cięższych wielozadaniowości i więcej nad głową, jednak będziesz chciał zainwestować w mini PC z szybszych procesorów Core lub Ryzen, takich jak Bellink SEI lub SER serii.
Cena i dostępność
Beelink U59 w konfiguracji z naszej recenzji jest obecnie dostępny w cenie 200 USD przy zakupie bezpośrednio od producenta. Alternatywnie, Amazon ma tę konfigurację w magazynie za 240 USD i 200 USD dla 16 GB i 8 GB SKU, odpowiednio.
Price comparison

