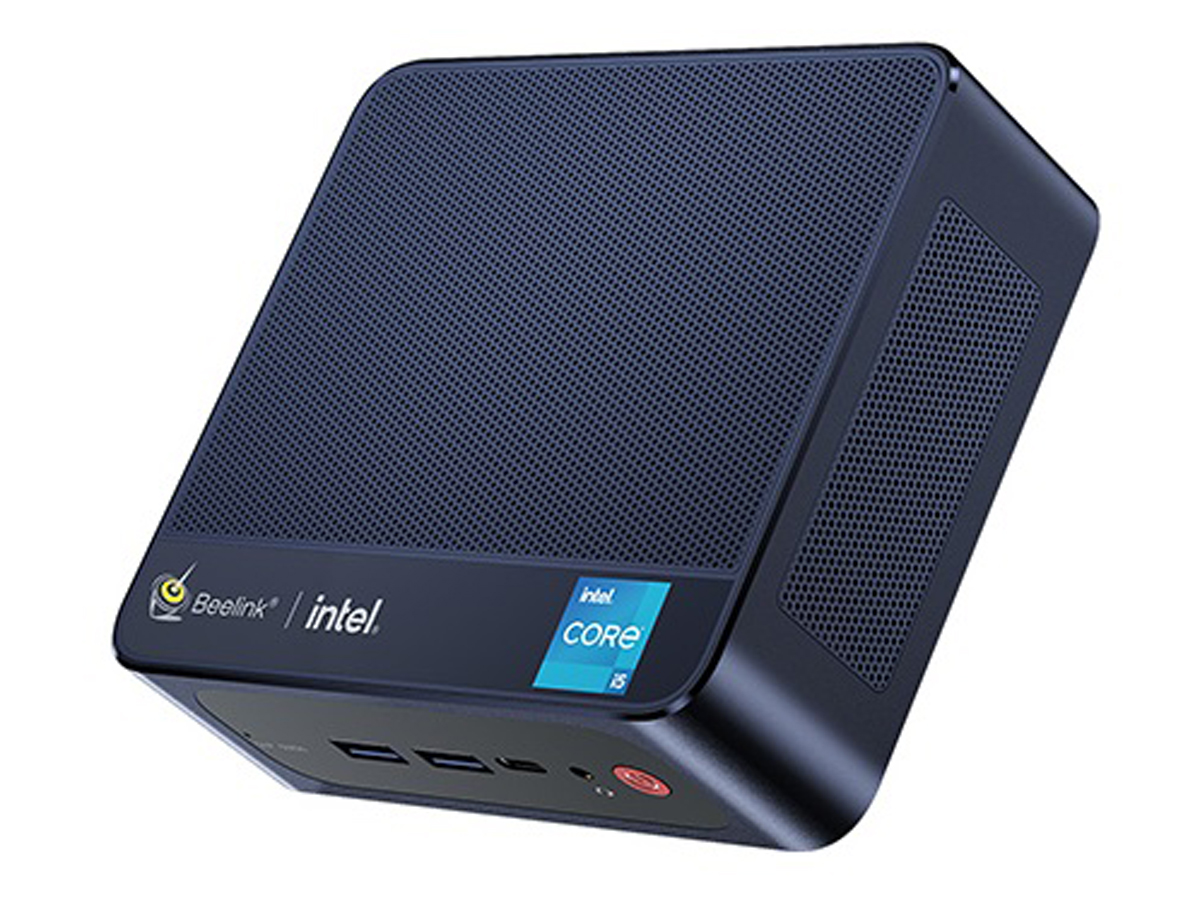
Recenzja mini PC Beelink SEi11: Tańszy niż Intel NUC 11, ale równie szybki

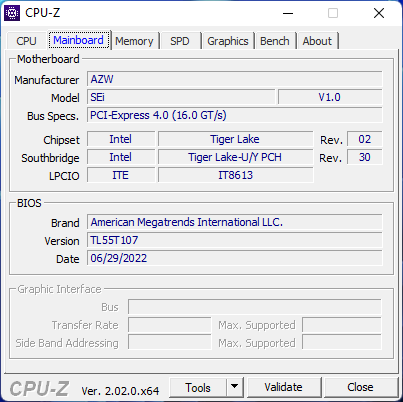
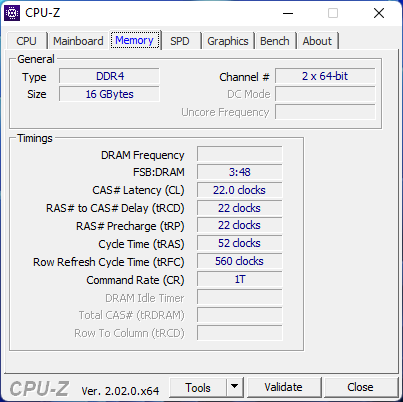
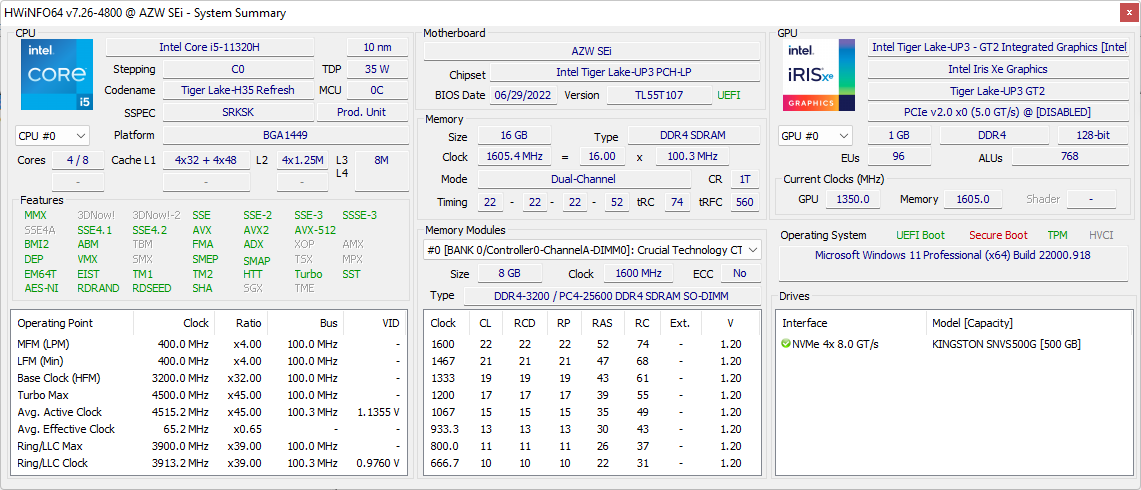
W przeciwieństwie do Beelink GTI 11, SEi11 jest napędzany przez procesor Intel Core serii H zamiast serii Core U. W tej chwili dostępna jest tylko jedna konfiguracja z 11 genem Tiger Lake-H Core i5-11320H, 16 GB pamięci RAM i 500 GB NVMe SSD w cenie około 450 USD
SEi11 konkuruje bezpośrednio z serią Intel NUC, jak np NUC11PAQ lub NUC11TNK
Więcej recenzji Beelink:
Potencjalni konkurenci w porównaniu
Ocena | Data | Model | Waga | Wysokość | Rozmiar | Rezolucja | Cena |
|---|---|---|---|---|---|---|---|
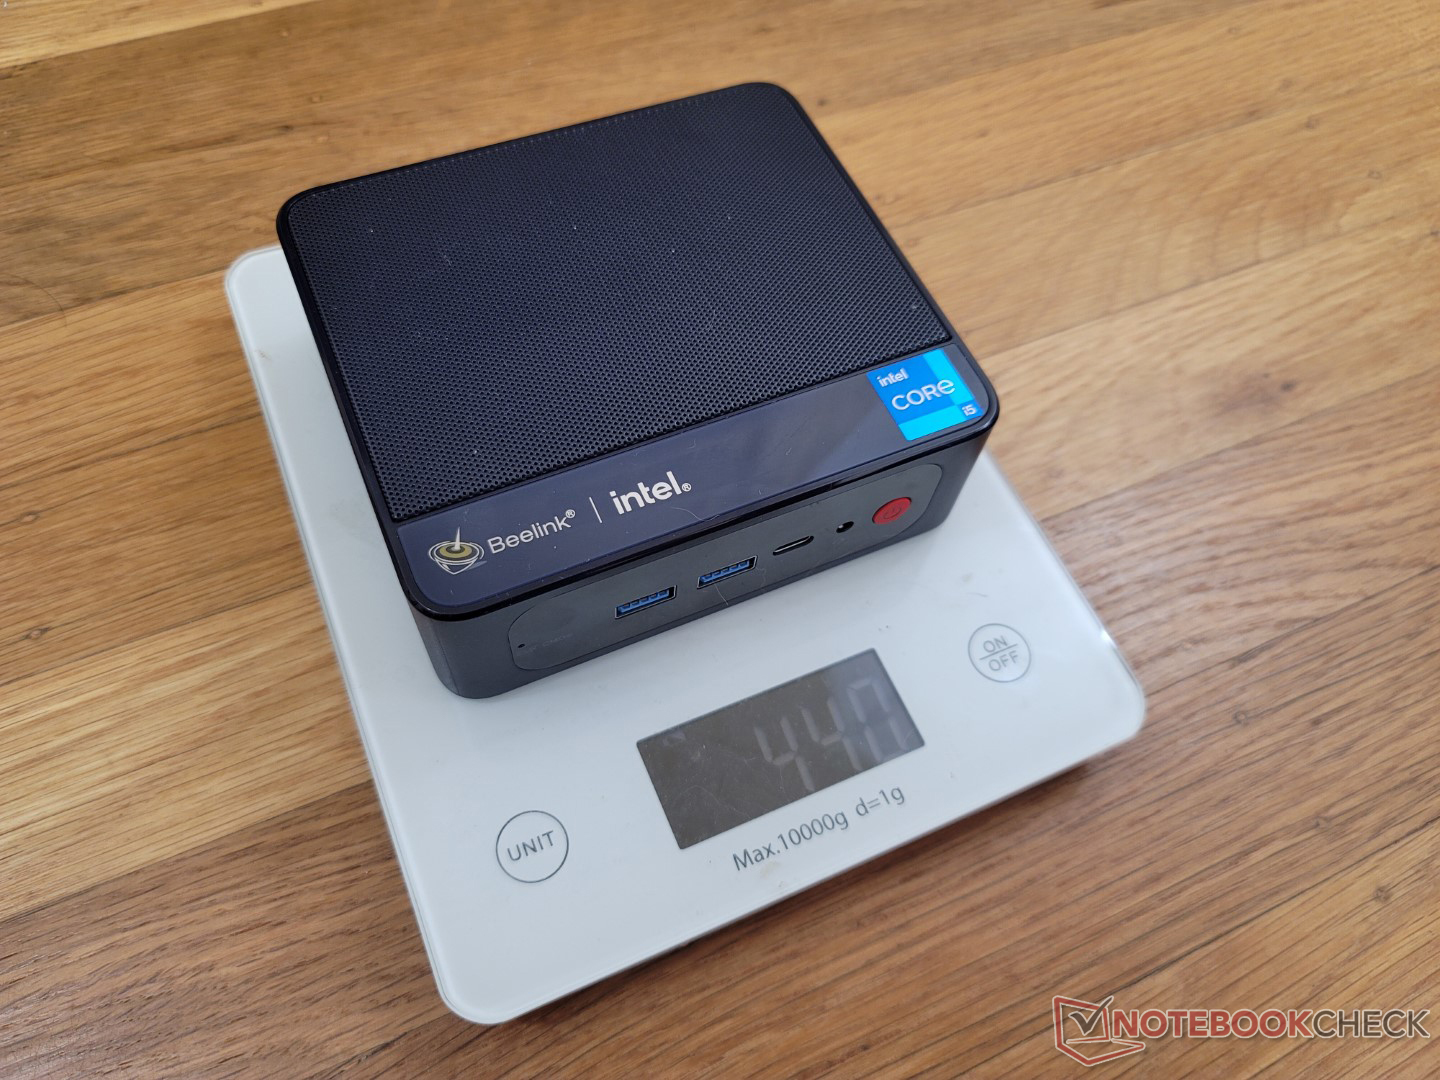
v (old) | 10/2022 | Beelink SEi11 Pro i5-11320H, Iris Xe G7 96EUs | 440 g | 40 mm | x | ||
v (old) | Beelink GTR5 R9 5900HX, Vega 8 | 686 g | 39 mm | x | |||
v (old) | Beelink GTI 11 i5-1135G7, Iris Xe G7 80EUs | 638 g | 39 mm | x | |||
v (old) | Beelink SER4 R7 4800U, Vega 8 | 494 g | 40 mm | x | |||
v (old) | Intel NUC11TNKi5 i5-1135G7, Iris Xe G7 80EUs | 504 g | 37 mm | x |
Sprawa
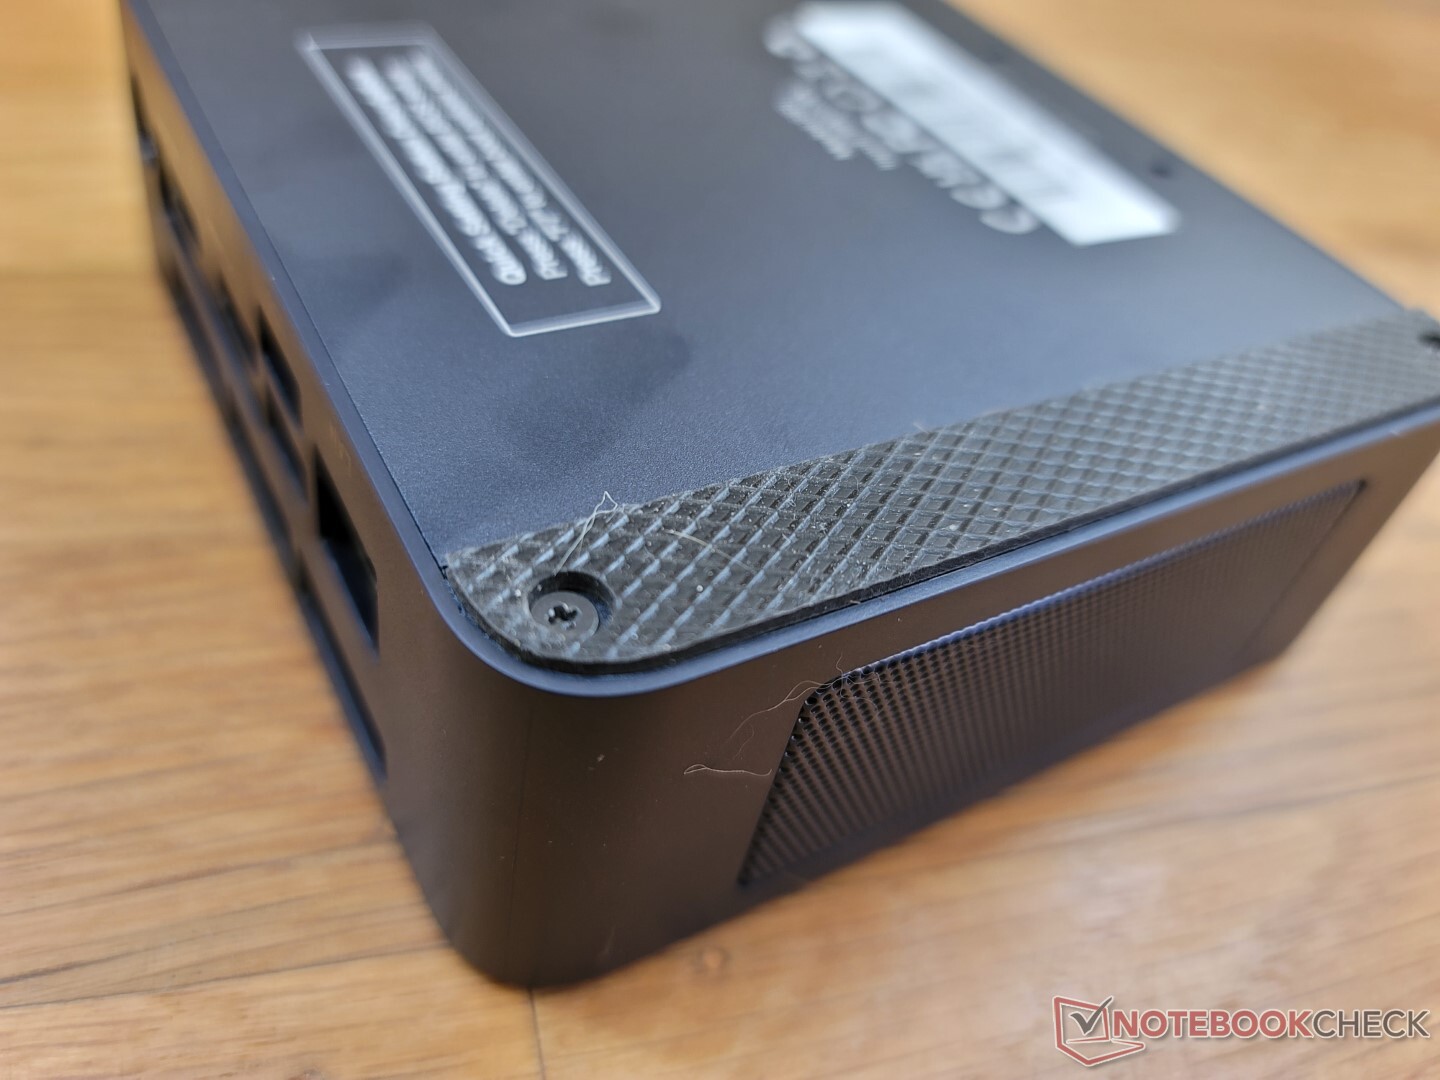
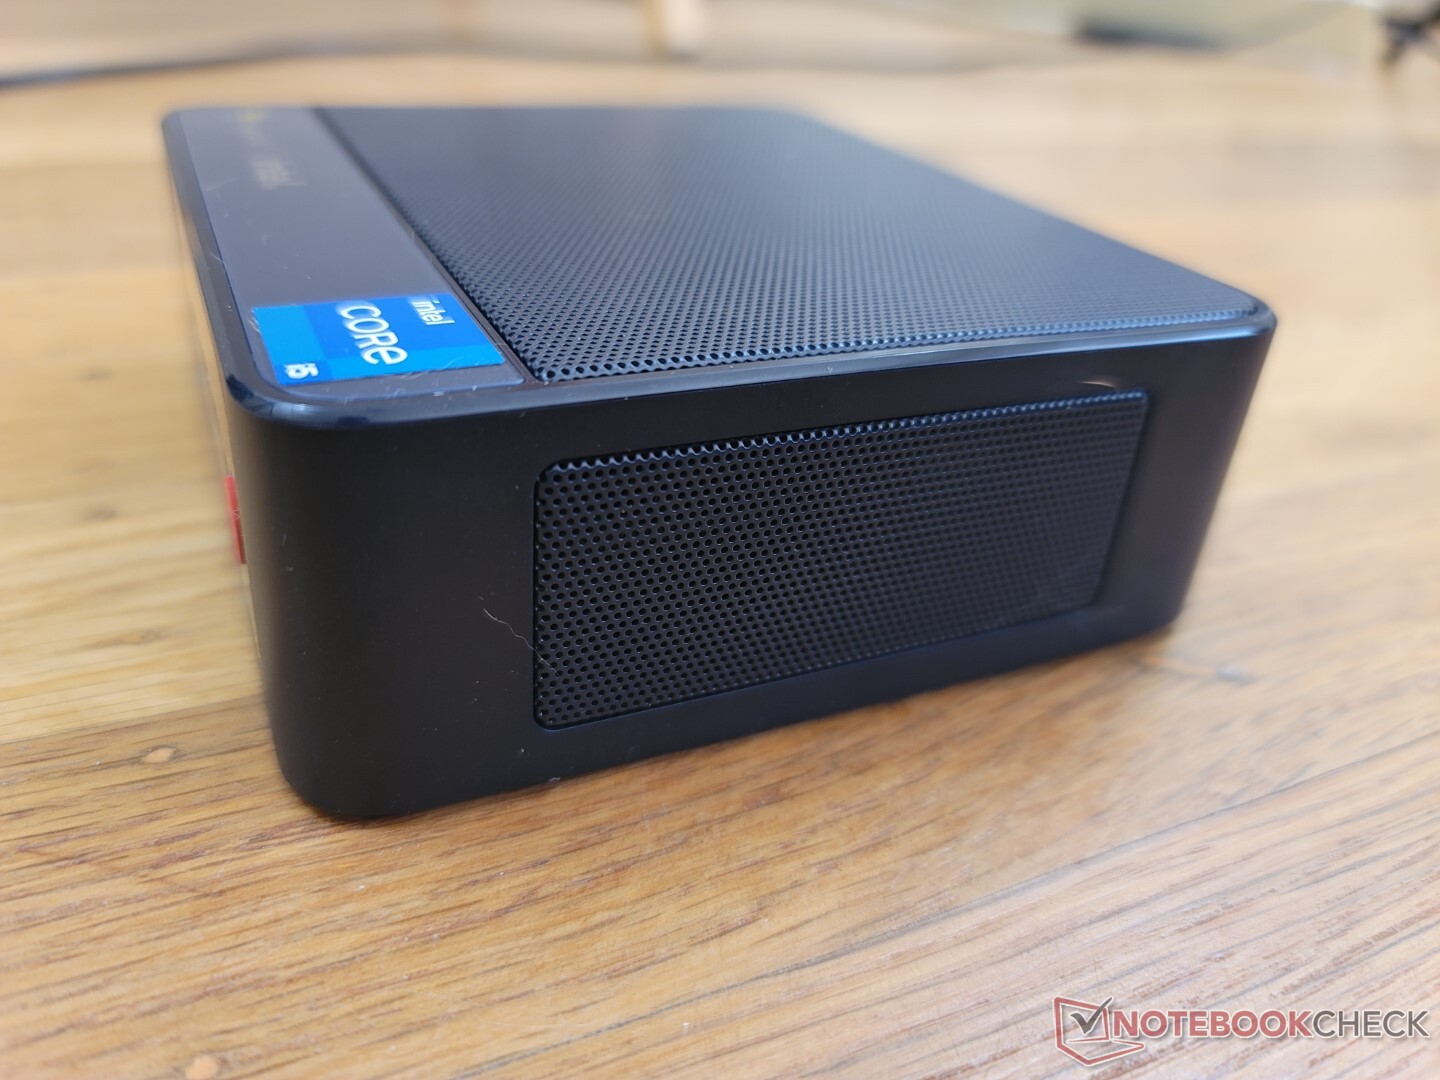
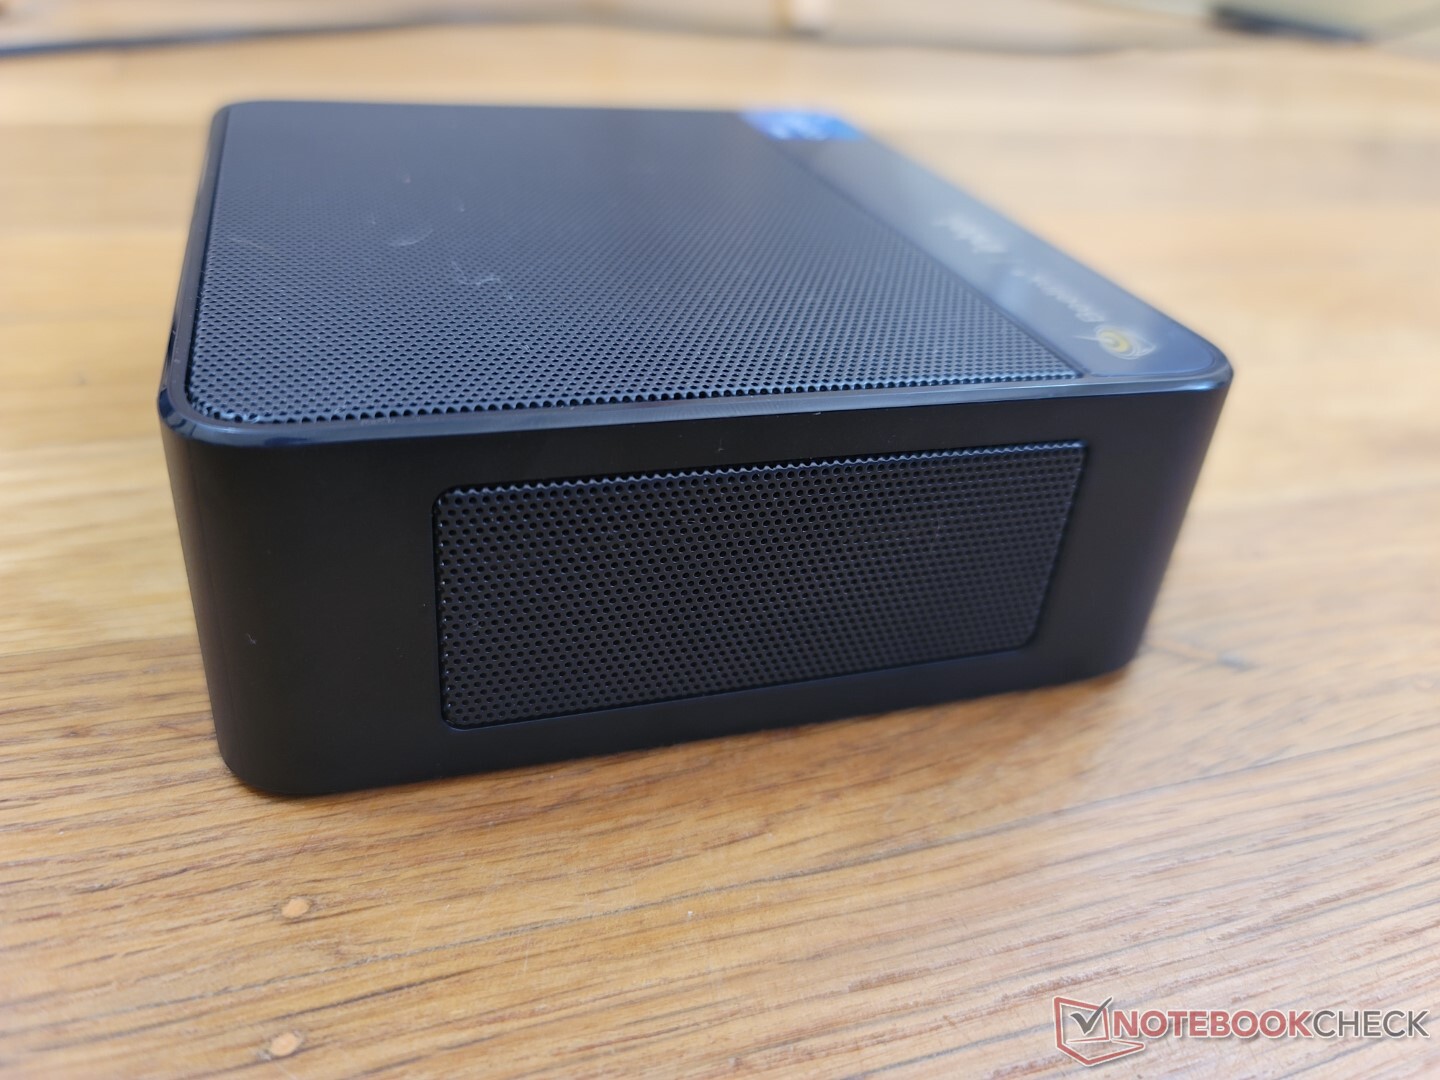
Obudowa jest w zasadzie intelowską wersją zasilanego przez AMD modelu Beelink SER4. Wymiary i budowa są niemal identyczne, ale SEi11 jest o około 50 gramów lżejszy, prawdopodobnie z powodu kilku drobnych zmian wewnętrznych. Wizualnie, urządzenie nie posiada czerwonej siatki na bokach oraz chromowanych krawędzi i rogów obecnych w SER4.
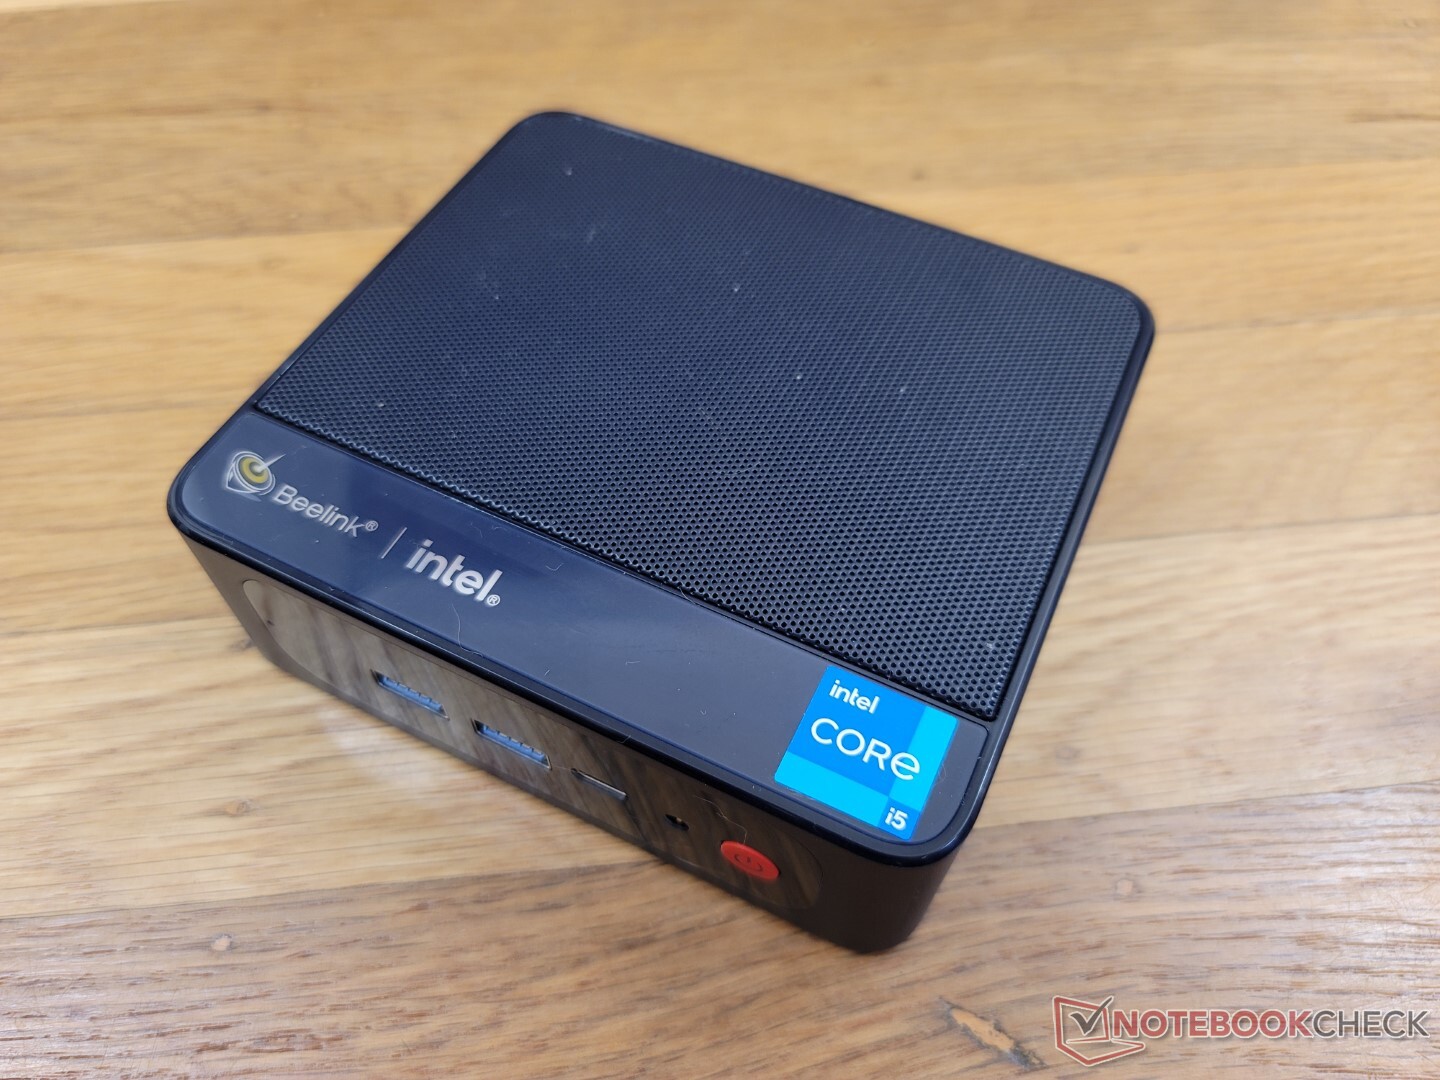
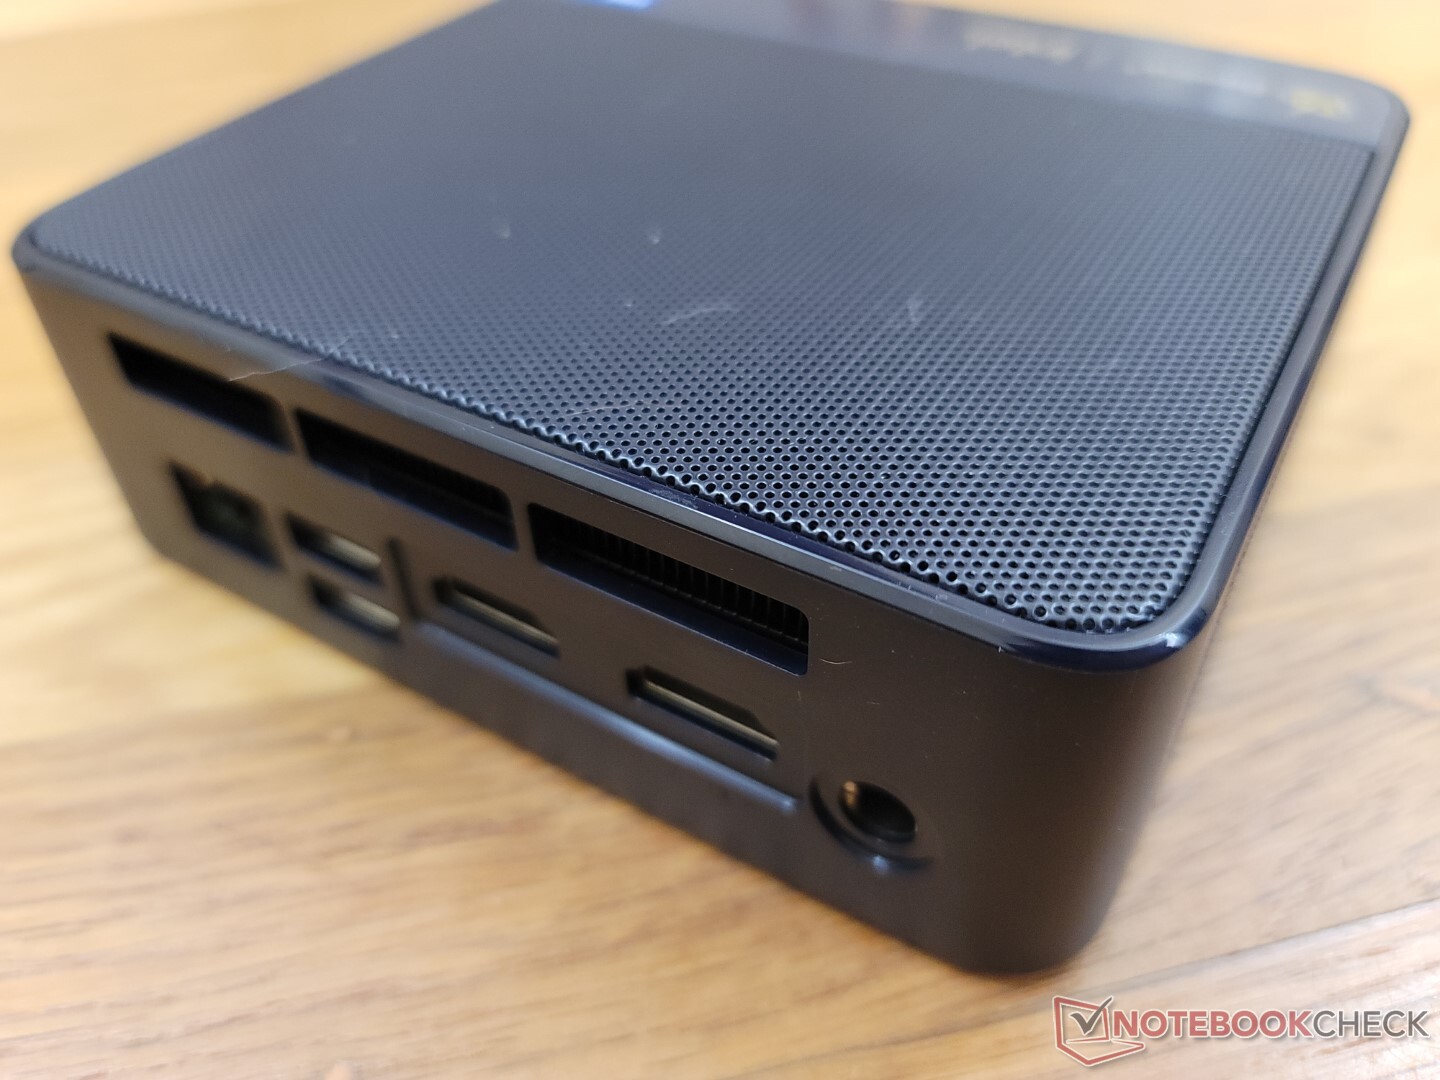
Łączność
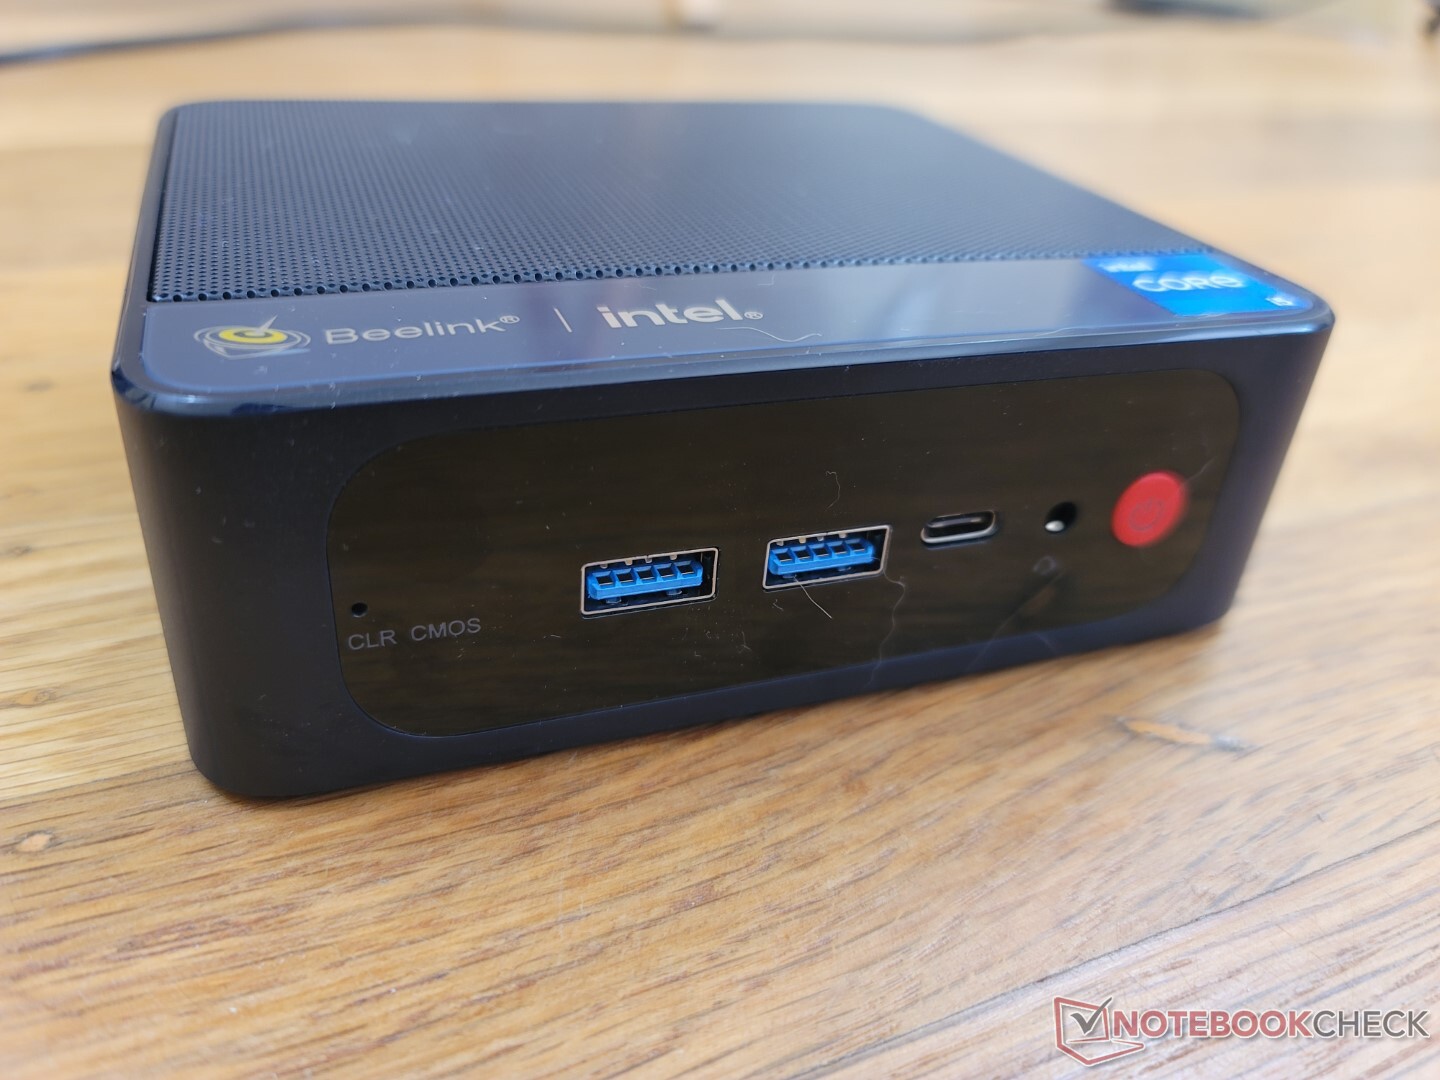
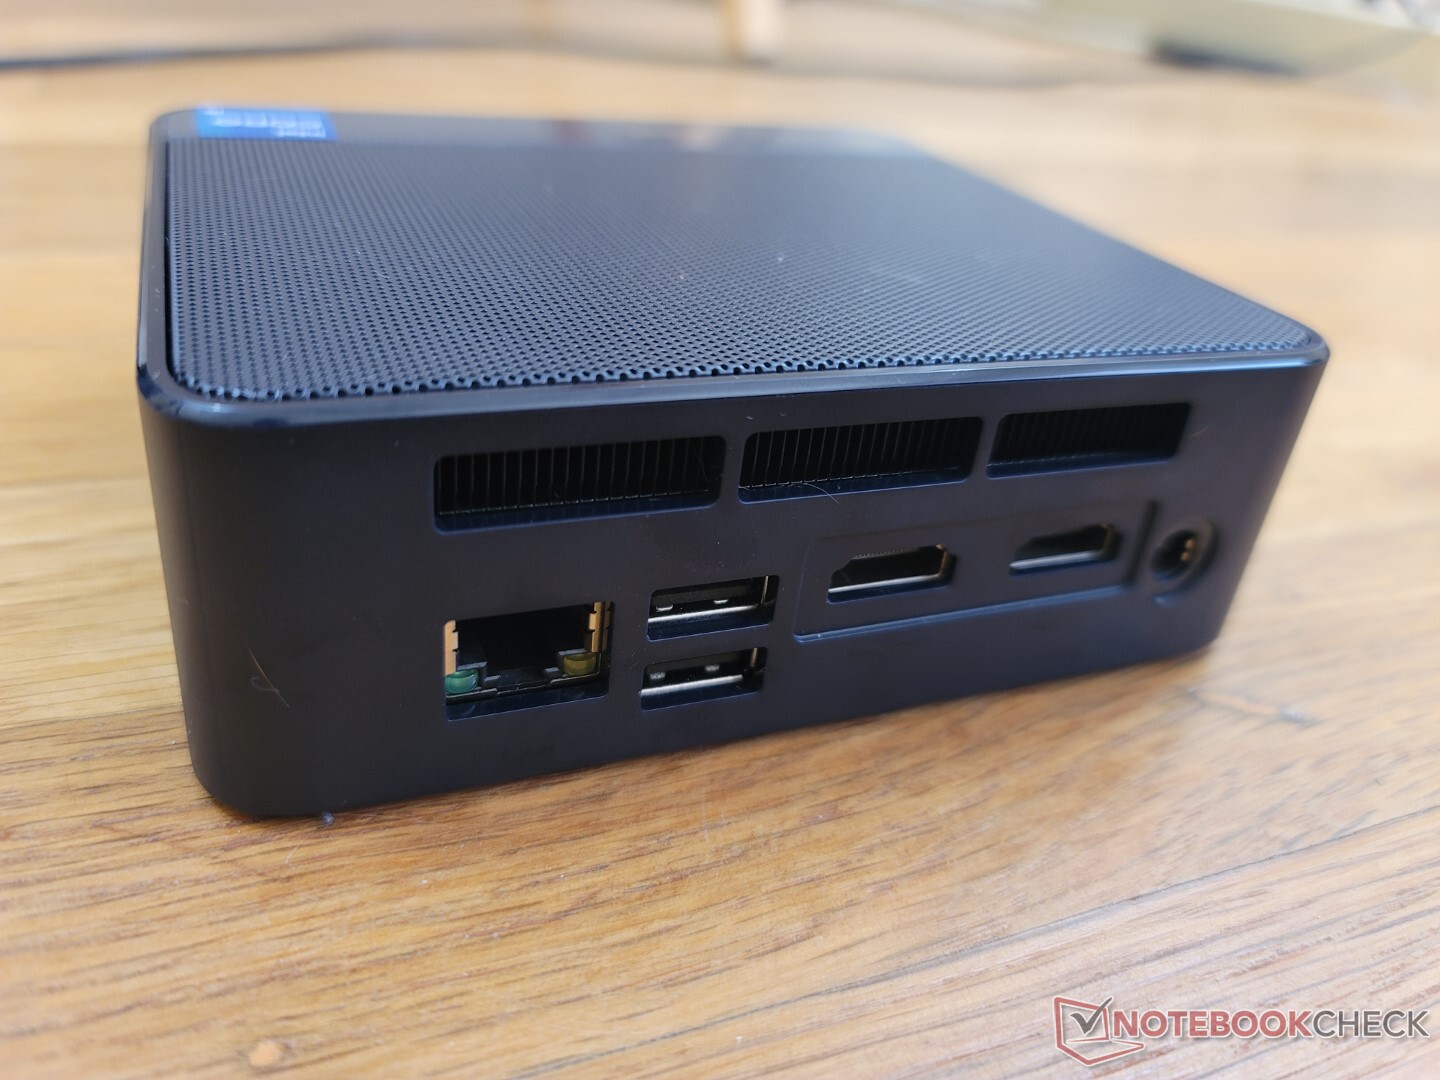
Opcje portów i ich rozmieszczenie są identyczne jak w SER4. Należy pamiętać, że port USB-C nie obsługuje DisplayPort ani Power Delivery, a więc jest przydatny tylko do transmisji danych lub ładowania urządzeń zewnętrznych. Próbowaliśmy podłączyć zewnętrzne monitory USB-C i zasilacze USB-C, ale żaden nie działałby z SEi11.
Komunikacja
Urządzenie dostarcza stosunkowo nowy układ MediaTek RZ608 dla łączności Wi-Fi 6E i Bluetooth 5.2. Niestety, moduł ten nie jest tak niezawodny ani tak szybki jak typowe rozwiązania Intel AX. Po sparowaniu z naszą siecią 6 GHz, prędkość transferu wynosi zaledwie ~750 Mbps w porównaniu z prawie dwukrotnie wyższym wynikiem w przypadku Intel AX201 lub AX210. Ponadto, system miałby problemy z wykryciem naszej sieci 6 GHz w pierwszej kolejności.
| Networking | |
| iperf3 transmit AX12 | |
| Intel NUC11TNKi5 | |
| Beelink GTI 11 | |
| Beelink SER4 | |
| Beelink GTR5 | |
| iperf3 receive AX12 | |
| Intel NUC11TNKi5 | |
| Beelink GTI 11 | |
| Beelink SER4 | |
| Beelink GTR5 | |
| iperf3 receive AXE11000 6GHz | |
| Beelink SEi11 Pro | |
| iperf3 transmit AXE11000 6GHz | |
| Beelink SEi11 Pro | |
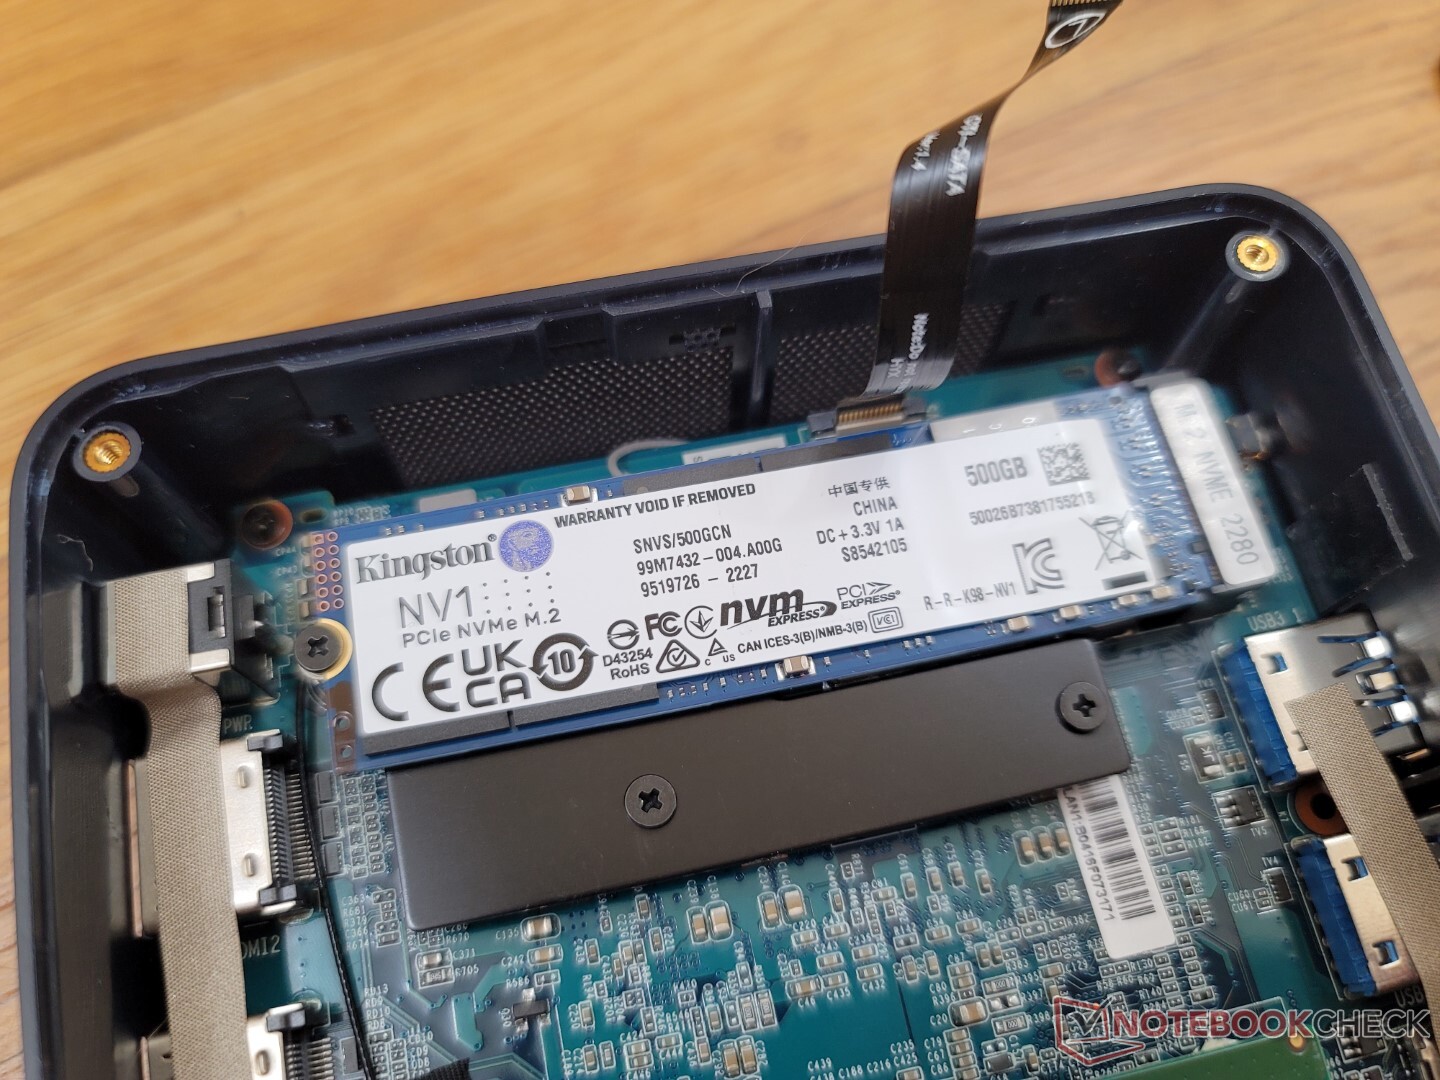
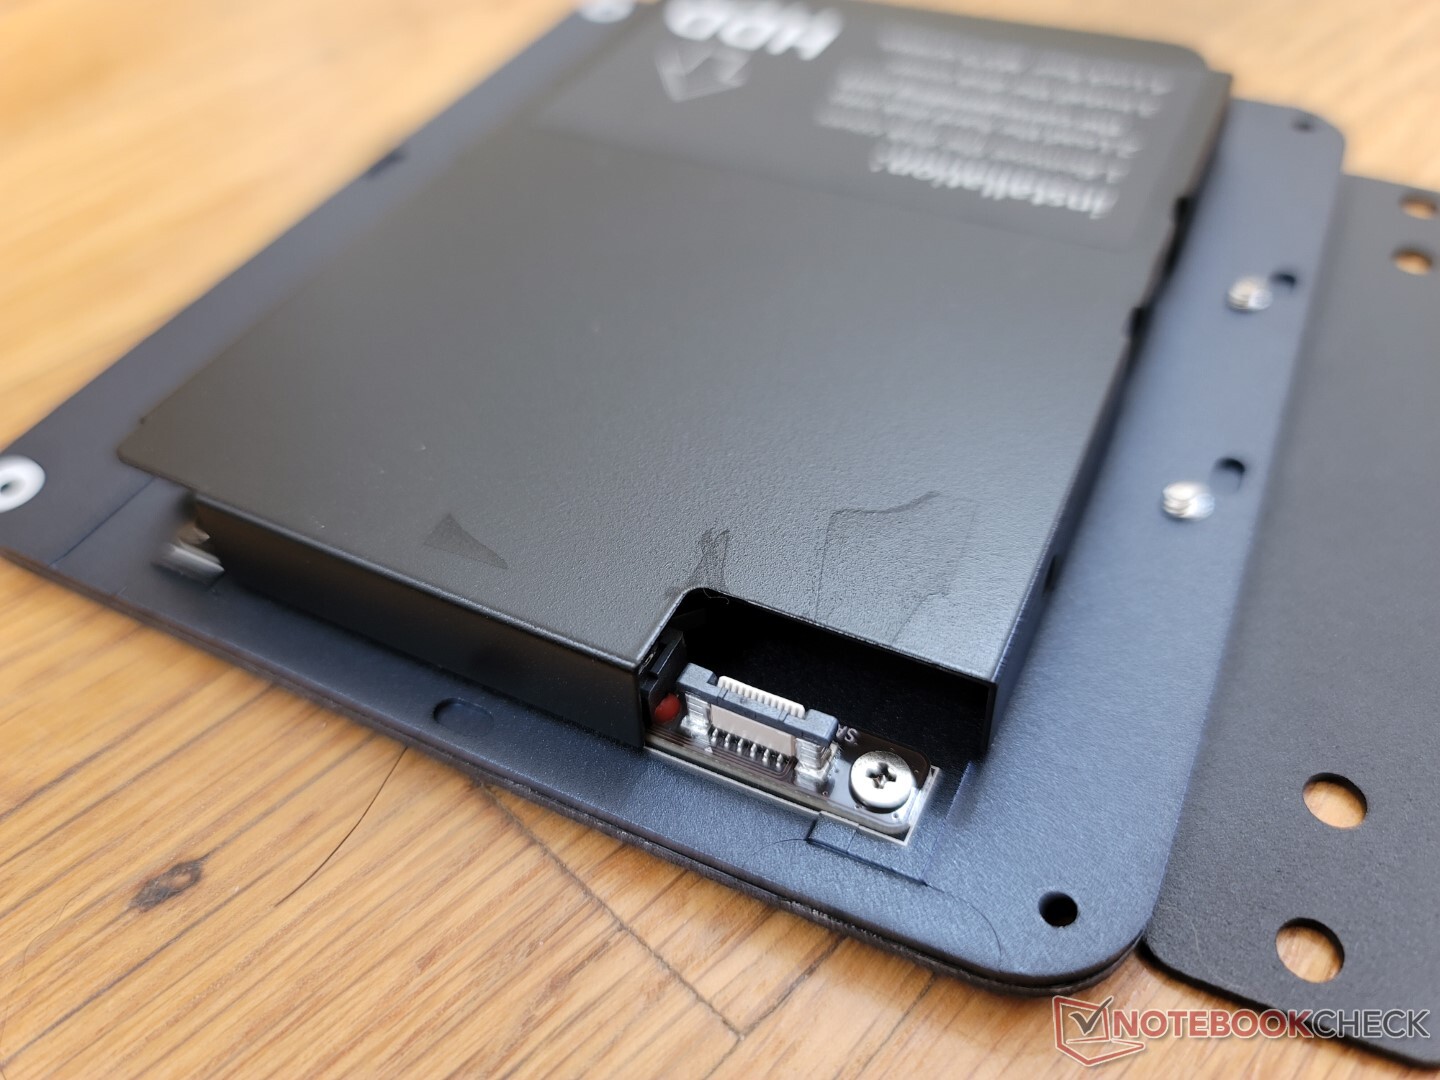
Konserwacja
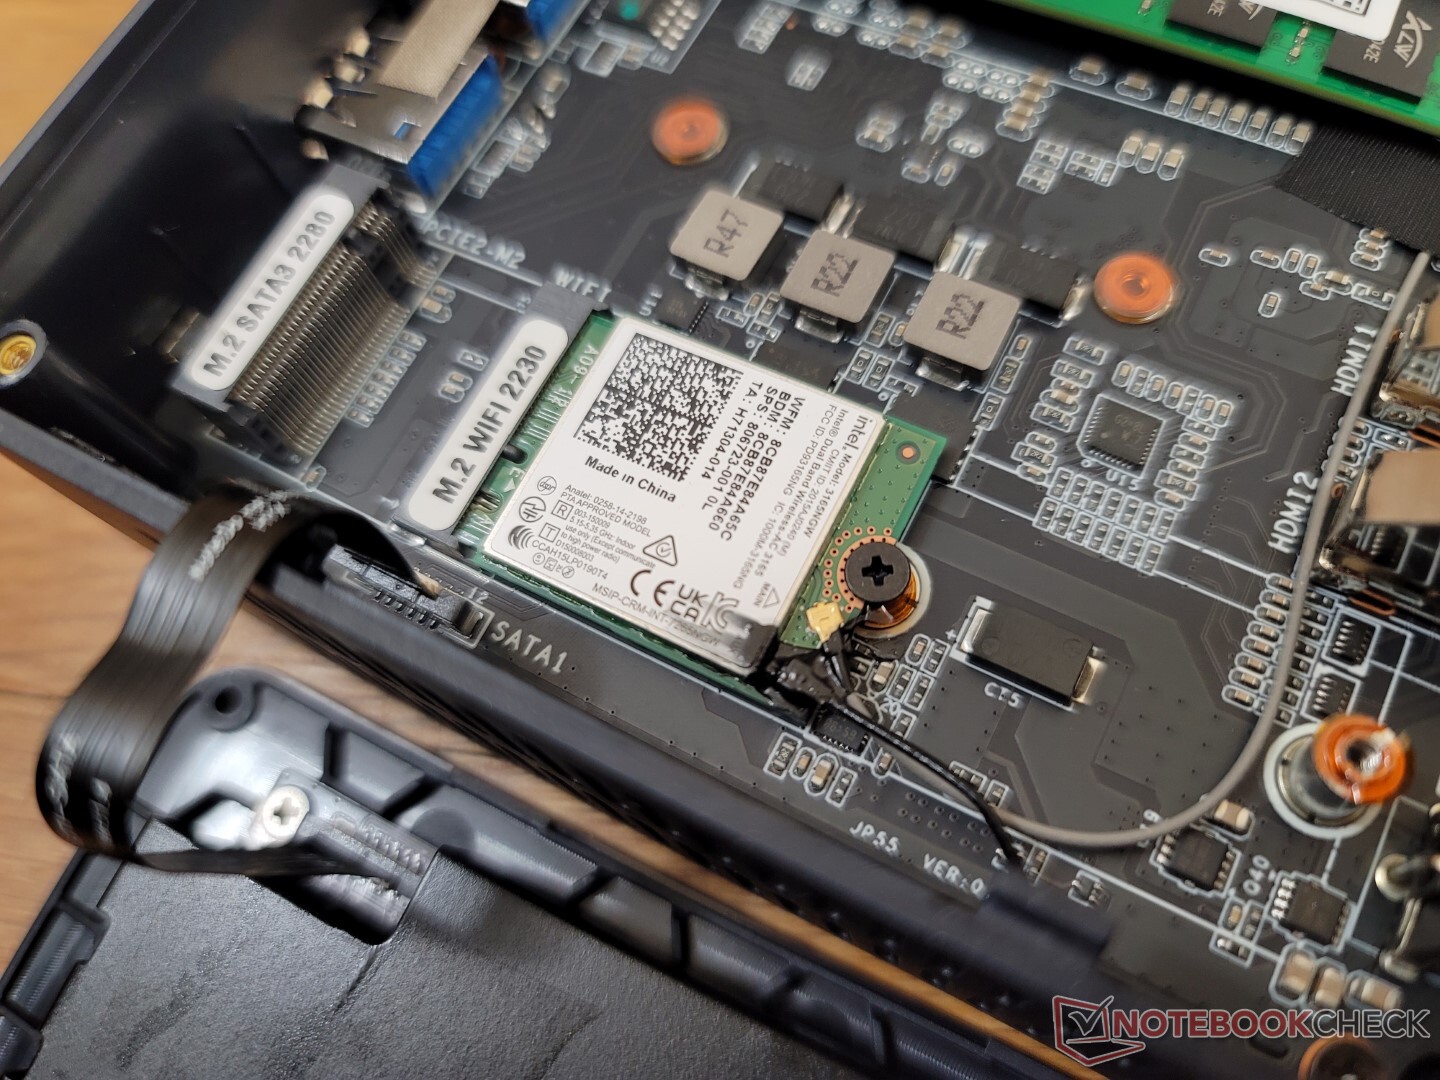
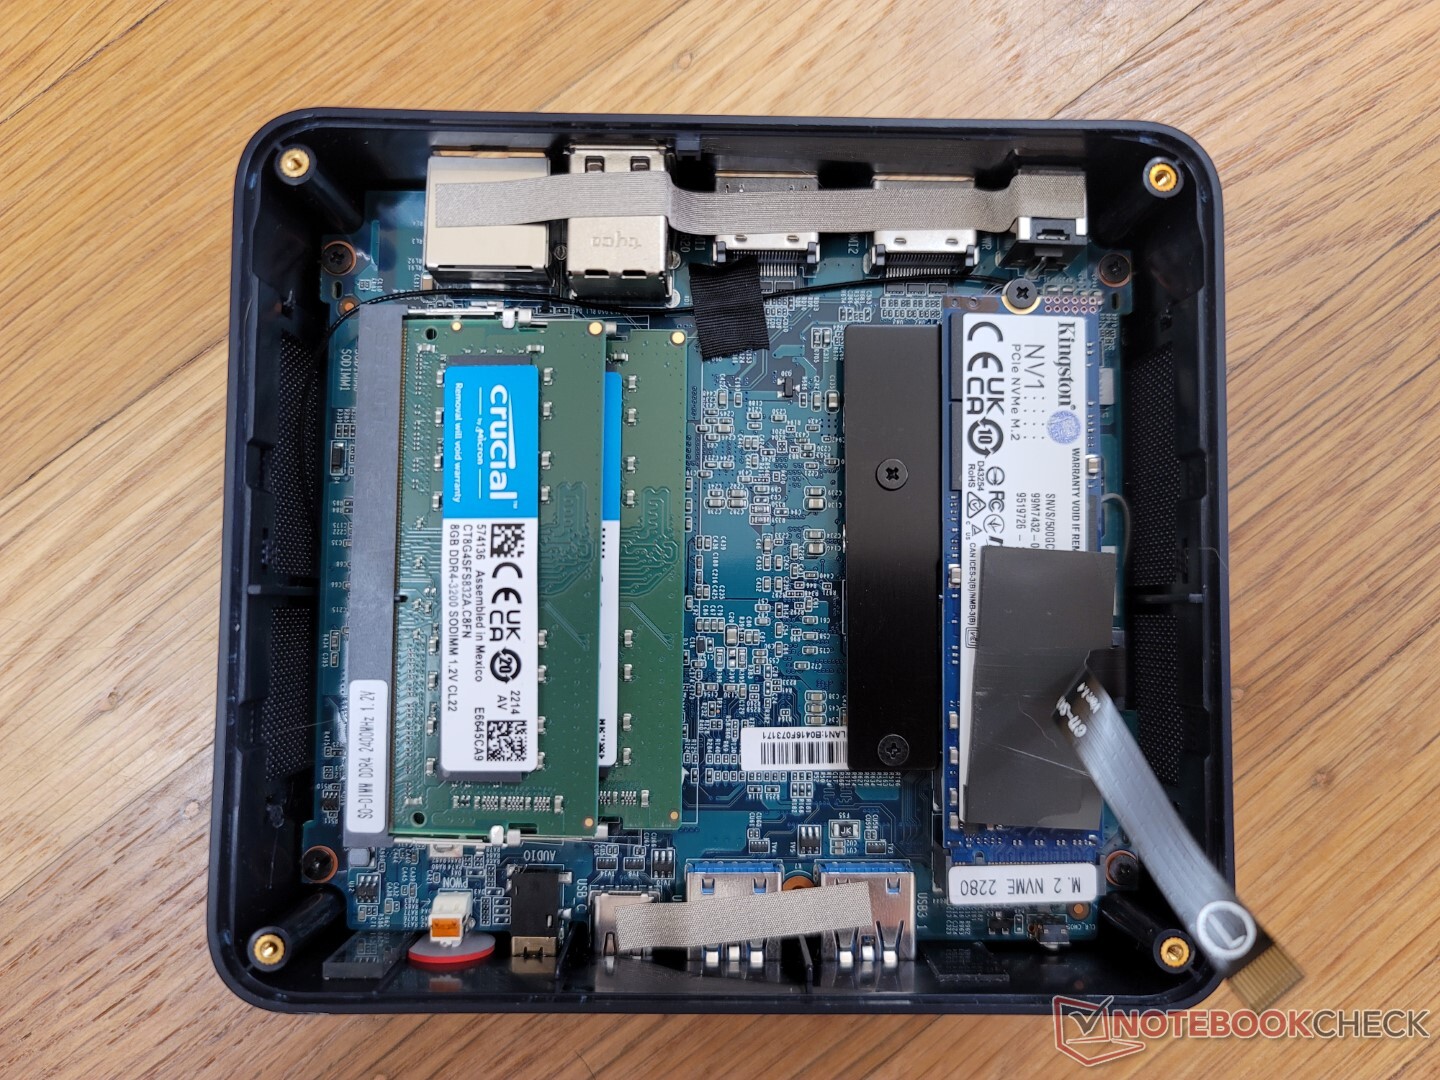
Dolny panel jest zabezpieczony 4 śrubami Philipsa. Aby jednak faktycznie go zdjąć, zalecamy przymocowanie uchwytu montażowego VESA, aby można go było użyć jako uchwytu do wyciągnięcia płaskiej płyty
Użytkownicy mają bezpośredni dostęp do gniazda M.2 2280 SSD, 2,5-calowej zatoki SATA III, modułu WLAN oraz gniazda 2x DDR4 SODIMM.
Akcesoria i gwarancja
W pudełku detalicznym znajdują się 2x kable HDMI, zasilacz AC, papiery, uchwyt montażowy VESA oraz dodatkowe śruby. W przypadku zakupu w USA obowiązuje roczna ograniczona gwarancja producenta. Dla porównania, modele Intel NUC standardowo objęte są trzyletnią gwarancją.
Wydajność
Warunki badania
Przed przeprowadzeniem poniższych benchmarków ustawiliśmy nasz egzemplarz w trybie Performance za pośrednictwem systemu Windows. Nie ma żadnej preinstalowanej aplikacji w stylu centrum sterowania, która umożliwiałaby regulację wydajności procesora.
Procesor
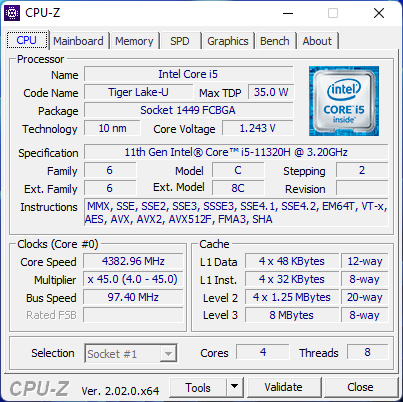
Na stronie Core i5-11320H jest rzadko spotykanym procesorem, ponieważ większość innych komputerów wyposażonych w procesory Tiger Lake-H zazwyczaj wykorzystuje Core i5-11300H zamiast niego. Procesor i5-11320H działa zasadniczo tak samo we wszystkich intencjach i celach. Na papierze widać niewielkie różnice w częstotliwości taktowania, które jednak nie mają wpływu na większość zastosowań, co wynika z naszych obserwacji w Beelink.
Cinebench R15 Multi Loop
Cinebench R23: Multi Core | Single Core
Cinebench R15: CPU Multi 64Bit | CPU Single 64Bit
Blender: v2.79 BMW27 CPU
7-Zip 18.03: 7z b 4 | 7z b 4 -mmt1
Geekbench 5.5: Multi-Core | Single-Core
HWBOT x265 Benchmark v2.2: 4k Preset
LibreOffice : 20 Documents To PDF
R Benchmark 2.5: Overall mean
| Cinebench R20 / CPU (Multi Core) | |
| Honor MagicBook 14 2022 | |
| Beelink GTR5 | |
| Lenovo IdeaPad Gaming 3 15ARH7 | |
| Beelink SER4 | |
| Minipc Union Ace Magician AMR5 | |
| Dell Inspiron 15 Plus | |
| Razer Blade 15 Advanced Model Early 2021 | |
| Przeciętny Intel Core i5-11320H (2208 - 2349, n=4) | |
| Lenovo Ideapad Gaming 3 15IHU-82K1002RGE | |
| Beelink SEi11 Pro | |
| Prime Computer PrimeBook Circular-i7-1165G7 | |
| Intel NUC11TNKi5 | |
| Cinebench R20 / CPU (Single Core) | |
| Honor MagicBook 14 2022 | |
| Beelink GTR5 | |
| Prime Computer PrimeBook Circular-i7-1165G7 | |
| Lenovo IdeaPad Gaming 3 15ARH7 | |
| Dell Inspiron 15 Plus | |
| Beelink SEi11 Pro | |
| Przeciętny Intel Core i5-11320H (557 - 567, n=4) | |
| Minipc Union Ace Magician AMR5 | |
| Intel NUC11TNKi5 | |
| Lenovo Ideapad Gaming 3 15IHU-82K1002RGE | |
| Beelink SER4 | |
| Razer Blade 15 Advanced Model Early 2021 | |
| Cinebench R23 / Multi Core | |
| Honor MagicBook 14 2022 | |
| Beelink GTR5 | |
| Lenovo IdeaPad Gaming 3 15ARH7 | |
| Beelink SER4 | |
| Dell Inspiron 15 Plus | |
| Minipc Union Ace Magician AMR5 | |
| Razer Blade 15 Advanced Model Early 2021 | |
| Przeciętny Intel Core i5-11320H (5720 - 6051, n=4) | |
| Beelink SEi11 Pro | |
| Lenovo Ideapad Gaming 3 15IHU-82K1002RGE | |
| Prime Computer PrimeBook Circular-i7-1165G7 | |
| Intel NUC11TNKi5 | |
| Cinebench R23 / Single Core | |
| Honor MagicBook 14 2022 | |
| Beelink GTR5 | |
| Prime Computer PrimeBook Circular-i7-1165G7 | |
| Beelink SEi11 Pro | |
| Dell Inspiron 15 Plus | |
| Lenovo IdeaPad Gaming 3 15ARH7 | |
| Przeciętny Intel Core i5-11320H (1341 - 1467, n=4) | |
| Minipc Union Ace Magician AMR5 | |
| Intel NUC11TNKi5 | |
| Lenovo Ideapad Gaming 3 15IHU-82K1002RGE | |
| Beelink SER4 | |
| Razer Blade 15 Advanced Model Early 2021 | |
| Cinebench R15 / CPU Multi 64Bit | |
| Honor MagicBook 14 2022 | |
| Honor MagicBook 14 2022 | |
| Beelink GTR5 | |
| Lenovo IdeaPad Gaming 3 15ARH7 | |
| Beelink SER4 | |
| Minipc Union Ace Magician AMR5 | |
| Dell Inspiron 15 Plus | |
| Razer Blade 15 Advanced Model Early 2021 | |
| Lenovo Ideapad Gaming 3 15IHU-82K1002RGE | |
| Przeciętny Intel Core i5-11320H (857 - 1019, n=4) | |
| Beelink SEi11 Pro | |
| Prime Computer PrimeBook Circular-i7-1165G7 | |
| Intel NUC11TNKi5 | |
| Cinebench R15 / CPU Single 64Bit | |
| Beelink GTR5 | |
| Honor MagicBook 14 2022 | |
| Lenovo IdeaPad Gaming 3 15ARH7 | |
| Minipc Union Ace Magician AMR5 | |
| Prime Computer PrimeBook Circular-i7-1165G7 | |
| Dell Inspiron 15 Plus | |
| Beelink SEi11 Pro | |
| Przeciętny Intel Core i5-11320H (212 - 215, n=4) | |
| Lenovo Ideapad Gaming 3 15IHU-82K1002RGE | |
| Intel NUC11TNKi5 | |
| Razer Blade 15 Advanced Model Early 2021 | |
| Beelink SER4 | |
| Blender / v2.79 BMW27 CPU | |
| Prime Computer PrimeBook Circular-i7-1165G7 | |
| Intel NUC11TNKi5 | |
| Beelink SEi11 Pro | |
| Przeciętny Intel Core i5-11320H (507 - 543, n=4) | |
| Lenovo Ideapad Gaming 3 15IHU-82K1002RGE | |
| Dell Inspiron 15 Plus | |
| Razer Blade 15 Advanced Model Early 2021 | |
| Minipc Union Ace Magician AMR5 | |
| Beelink SER4 | |
| Lenovo IdeaPad Gaming 3 15ARH7 | |
| Honor MagicBook 14 2022 | |
| Beelink GTR5 | |
| 7-Zip 18.03 / 7z b 4 | |
| Beelink GTR5 | |
| Honor MagicBook 14 2022 | |
| Beelink SER4 | |
| Lenovo IdeaPad Gaming 3 15ARH7 | |
| Minipc Union Ace Magician AMR5 | |
| Razer Blade 15 Advanced Model Early 2021 | |
| Dell Inspiron 15 Plus | |
| Przeciętny Intel Core i5-11320H (24718 - 26858, n=4) | |
| Beelink SEi11 Pro | |
| Lenovo Ideapad Gaming 3 15IHU-82K1002RGE | |
| Prime Computer PrimeBook Circular-i7-1165G7 | |
| Intel NUC11TNKi5 | |
| 7-Zip 18.03 / 7z b 4 -mmt1 | |
| Beelink GTR5 | |
| Lenovo IdeaPad Gaming 3 15ARH7 | |
| Razer Blade 15 Advanced Model Early 2021 | |
| Honor MagicBook 14 2022 | |
| Prime Computer PrimeBook Circular-i7-1165G7 | |
| Minipc Union Ace Magician AMR5 | |
| Beelink SEi11 Pro | |
| Dell Inspiron 15 Plus | |
| Przeciętny Intel Core i5-11320H (4813 - 5119, n=4) | |
| Lenovo Ideapad Gaming 3 15IHU-82K1002RGE | |
| Intel NUC11TNKi5 | |
| Beelink SER4 | |
| Geekbench 5.5 / Multi-Core | |
| Honor MagicBook 14 2022 | |
| Beelink GTR5 | |
| Razer Blade 15 Advanced Model Early 2021 | |
| Lenovo IdeaPad Gaming 3 15ARH7 | |
| Beelink SER4 | |
| Minipc Union Ace Magician AMR5 | |
| Przeciętny Intel Core i5-11320H (4927 - 5955, n=4) | |
| Beelink SEi11 Pro | |
| Prime Computer PrimeBook Circular-i7-1165G7 | |
| Dell Inspiron 15 Plus | |
| Intel NUC11TNKi5 | |
| Lenovo Ideapad Gaming 3 15IHU-82K1002RGE | |
| Geekbench 5.5 / Single-Core | |
| Honor MagicBook 14 2022 | |
| Beelink GTR5 | |
| Prime Computer PrimeBook Circular-i7-1165G7 | |
| Beelink SEi11 Pro | |
| Przeciętny Intel Core i5-11320H (1453 - 1523, n=4) | |
| Lenovo IdeaPad Gaming 3 15ARH7 | |
| Minipc Union Ace Magician AMR5 | |
| Intel NUC11TNKi5 | |
| Dell Inspiron 15 Plus | |
| Lenovo Ideapad Gaming 3 15IHU-82K1002RGE | |
| Razer Blade 15 Advanced Model Early 2021 | |
| Beelink SER4 | |
| HWBOT x265 Benchmark v2.2 / 4k Preset | |
| Beelink GTR5 | |
| Honor MagicBook 14 2022 | |
| Lenovo IdeaPad Gaming 3 15ARH7 | |
| Beelink SER4 | |
| Minipc Union Ace Magician AMR5 | |
| Razer Blade 15 Advanced Model Early 2021 | |
| Dell Inspiron 15 Plus | |
| Lenovo Ideapad Gaming 3 15IHU-82K1002RGE | |
| Przeciętny Intel Core i5-11320H (7.25 - 7.91, n=4) | |
| Beelink SEi11 Pro | |
| Intel NUC11TNKi5 | |
| Prime Computer PrimeBook Circular-i7-1165G7 | |
| LibreOffice / 20 Documents To PDF | |
| Beelink SER4 | |
| Lenovo IdeaPad Gaming 3 15ARH7 | |
| Razer Blade 15 Advanced Model Early 2021 | |
| Lenovo Ideapad Gaming 3 15IHU-82K1002RGE | |
| Dell Inspiron 15 Plus | |
| Prime Computer PrimeBook Circular-i7-1165G7 | |
| Intel NUC11TNKi5 | |
| Minipc Union Ace Magician AMR5 | |
| Beelink GTR5 | |
| Beelink SEi11 Pro | |
| Przeciętny Intel Core i5-11320H (44 - 50, n=4) | |
| Honor MagicBook 14 2022 | |
| R Benchmark 2.5 / Overall mean | |
| Intel NUC11TNKi5 | |
| Lenovo Ideapad Gaming 3 15IHU-82K1002RGE | |
| Prime Computer PrimeBook Circular-i7-1165G7 | |
| Dell Inspiron 15 Plus | |
| Przeciętny Intel Core i5-11320H (0.581 - 0.622, n=4) | |
| Beelink SEi11 Pro | |
| Razer Blade 15 Advanced Model Early 2021 | |
| Beelink SER4 | |
| Minipc Union Ace Magician AMR5 | |
| Lenovo IdeaPad Gaming 3 15ARH7 | |
| Honor MagicBook 14 2022 | |
| Beelink GTR5 | |
* ... im mniej tym lepiej
AIDA64: FP32 Ray-Trace | FPU Julia | CPU SHA3 | CPU Queen | FPU SinJulia | FPU Mandel | CPU AES | CPU ZLib | FP64 Ray-Trace | CPU PhotoWorxx
| Performance rating | |
| Beelink GTR5 | |
| Beelink SER4 | |
| Beelink GTI 11 | |
| Przeciętny Intel Core i5-11320H | |
| Beelink SEi11 Pro | |
| Intel NUC11TNKi5 | |
| AIDA64 / FP32 Ray-Trace | |
| Beelink GTR5 | |
| Beelink SER4 | |
| Beelink GTI 11 | |
| Beelink SEi11 Pro | |
| Przeciętny Intel Core i5-11320H (6369 - 7489, n=4) | |
| Intel NUC11TNKi5 | |
| AIDA64 / FPU Julia | |
| Beelink GTR5 | |
| Beelink SER4 | |
| Beelink GTI 11 | |
| Beelink SEi11 Pro | |
| Przeciętny Intel Core i5-11320H (27391 - 31637, n=4) | |
| Intel NUC11TNKi5 | |
| AIDA64 / CPU SHA3 | |
| Beelink GTR5 | |
| Beelink GTI 11 | |
| Beelink SEi11 Pro | |
| Przeciętny Intel Core i5-11320H (1847 - 2099, n=4) | |
| Intel NUC11TNKi5 | |
| Beelink SER4 | |
| AIDA64 / CPU Queen | |
| Beelink GTR5 | |
| Beelink SER4 | |
| Przeciętny Intel Core i5-11320H (43565 - 52477, n=4) | |
| Beelink SEi11 Pro | |
| Beelink GTI 11 | |
| Intel NUC11TNKi5 | |
| AIDA64 / FPU SinJulia | |
| Beelink GTR5 | |
| Beelink SER4 | |
| Beelink SEi11 Pro | |
| Przeciętny Intel Core i5-11320H (4381 - 5011, n=4) | |
| Intel NUC11TNKi5 | |
| Beelink GTI 11 | |
| AIDA64 / FPU Mandel | |
| Beelink GTR5 | |
| Beelink SER4 | |
| Beelink GTI 11 | |
| Beelink SEi11 Pro | |
| Przeciętny Intel Core i5-11320H (16659 - 18770, n=4) | |
| Intel NUC11TNKi5 | |
| AIDA64 / CPU AES | |
| Beelink GTR5 | |
| Beelink SEi11 Pro | |
| Przeciętny Intel Core i5-11320H (59851 - 76500, n=4) | |
| Beelink GTI 11 | |
| Intel NUC11TNKi5 | |
| Beelink SER4 | |
| AIDA64 / CPU ZLib | |
| Beelink GTR5 | |
| Beelink SER4 | |
| Intel NUC11TNKi5 | |
| Beelink GTI 11 | |
| Beelink SEi11 Pro | |
| Przeciętny Intel Core i5-11320H (330 - 410, n=4) | |
| AIDA64 / FP64 Ray-Trace | |
| Beelink GTR5 | |
| Beelink SER4 | |
| Beelink GTI 11 | |
| Beelink SEi11 Pro | |
| Przeciętny Intel Core i5-11320H (3536 - 4021, n=4) | |
| Intel NUC11TNKi5 | |
| AIDA64 / CPU PhotoWorxx | |
| Beelink GTI 11 | |
| Przeciętny Intel Core i5-11320H (25964 - 36644, n=4) | |
| Beelink SEi11 Pro | |
| Beelink SER4 | |
| Beelink GTR5 | |
| Intel NUC11TNKi5 | |
Wydajność systemu
CrossMark: Overall | Productivity | Creativity | Responsiveness
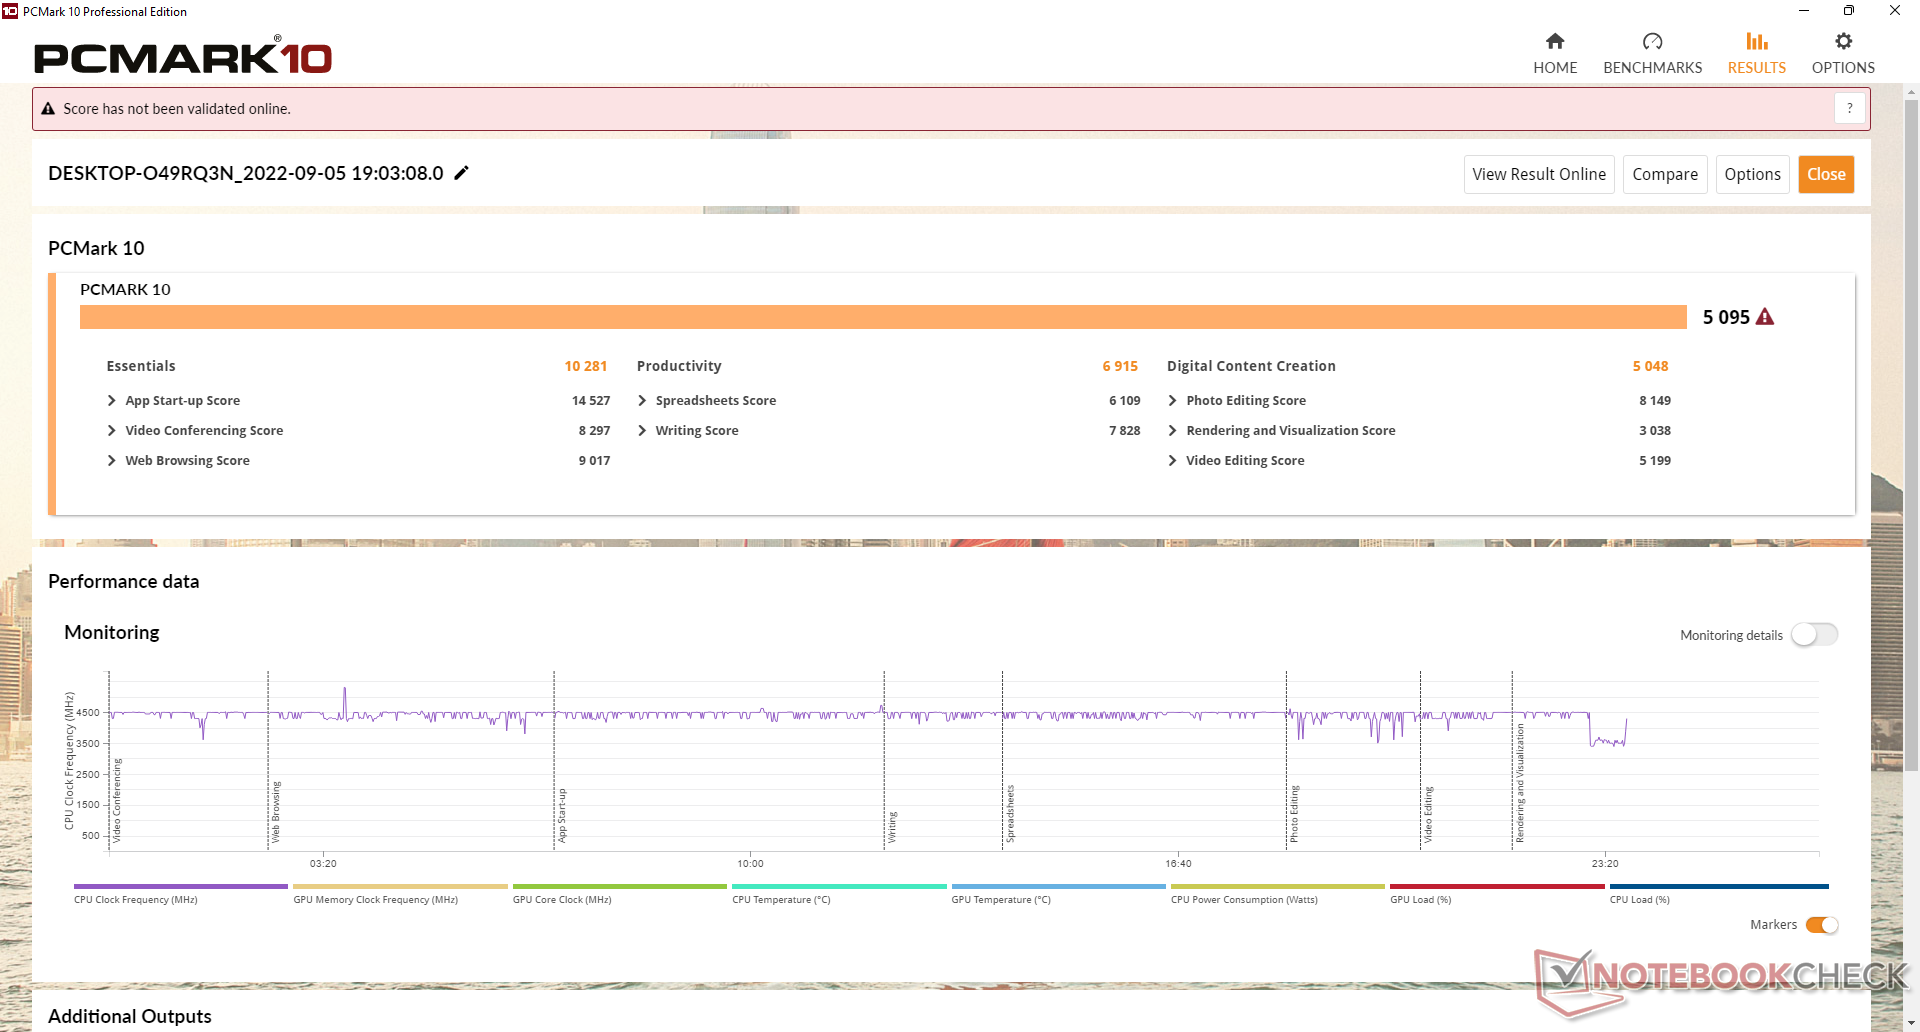
| PCMark 10 / Score | |
| Beelink GTR5 | |
| Beelink SER4 | |
| Przeciętny Intel Core i5-11320H, Intel Iris Xe Graphics G7 96EUs (5095 - 5302, n=3) | |
| Beelink SEi11 Pro | |
| Beelink GTI 11 | |
| Intel NUC11TNKi5 | |
| PCMark 10 / Essentials | |
| Beelink GTR5 | |
| Beelink SEi11 Pro | |
| Przeciętny Intel Core i5-11320H, Intel Iris Xe Graphics G7 96EUs (9556 - 10558, n=3) | |
| Beelink GTI 11 | |
| Beelink SER4 | |
| Intel NUC11TNKi5 | |
| PCMark 10 / Productivity | |
| Beelink GTR5 | |
| Beelink SER4 | |
| Beelink SEi11 Pro | |
| Przeciętny Intel Core i5-11320H, Intel Iris Xe Graphics G7 96EUs (6832 - 6963, n=3) | |
| Beelink GTI 11 | |
| Intel NUC11TNKi5 | |
| PCMark 10 / Digital Content Creation | |
| Beelink GTR5 | |
| Beelink SER4 | |
| Przeciętny Intel Core i5-11320H, Intel Iris Xe Graphics G7 96EUs (5048 - 5615, n=3) | |
| Beelink GTI 11 | |
| Beelink SEi11 Pro | |
| Intel NUC11TNKi5 | |
| CrossMark / Overall | |
| Beelink GTR5 | |
| Beelink SEi11 Pro | |
| Przeciętny Intel Core i5-11320H, Intel Iris Xe Graphics G7 96EUs (1300 - 1371, n=3) | |
| CrossMark / Productivity | |
| Beelink GTR5 | |
| Beelink SEi11 Pro | |
| Przeciętny Intel Core i5-11320H, Intel Iris Xe Graphics G7 96EUs (1376 - 1456, n=3) | |
| CrossMark / Creativity | |
| Beelink GTR5 | |
| Beelink SEi11 Pro | |
| Przeciętny Intel Core i5-11320H, Intel Iris Xe Graphics G7 96EUs (1241 - 1256, n=3) | |
| CrossMark / Responsiveness | |
| Przeciętny Intel Core i5-11320H, Intel Iris Xe Graphics G7 96EUs (1260 - 1494, n=3) | |
| Beelink SEi11 Pro | |
| Beelink GTR5 | |
| PCMark 10 Score | 5095 pkt. | |
Pomoc | ||
| AIDA64 / Memory Copy | |
| Przeciętny Intel Core i5-11320H (41106 - 55961, n=4) | |
| Beelink GTR5 | |
| Beelink SEi11 Pro | |
| Beelink GTI 11 | |
| Beelink SER4 | |
| Intel NUC11TNKi5 | |
| AIDA64 / Memory Read | |
| Przeciętny Intel Core i5-11320H (46516 - 52799, n=4) | |
| Beelink GTR5 | |
| Beelink GTI 11 | |
| Beelink SEi11 Pro | |
| Beelink SER4 | |
| Intel NUC11TNKi5 | |
| AIDA64 / Memory Write | |
| Przeciętny Intel Core i5-11320H (46760 - 63323, n=4) | |
| Beelink SEi11 Pro | |
| Beelink GTI 11 | |
| Beelink SER4 | |
| Beelink GTR5 | |
| Intel NUC11TNKi5 | |
| AIDA64 / Memory Latency | |
| Beelink SER4 | |
| Przeciętny Intel Core i5-11320H (77.6 - 114.1, n=4) | |
| Intel NUC11TNKi5 | |
| Beelink SEi11 Pro | |
| Beelink GTR5 | |
| Beelink GTI 11 | |
* ... im mniej tym lepiej
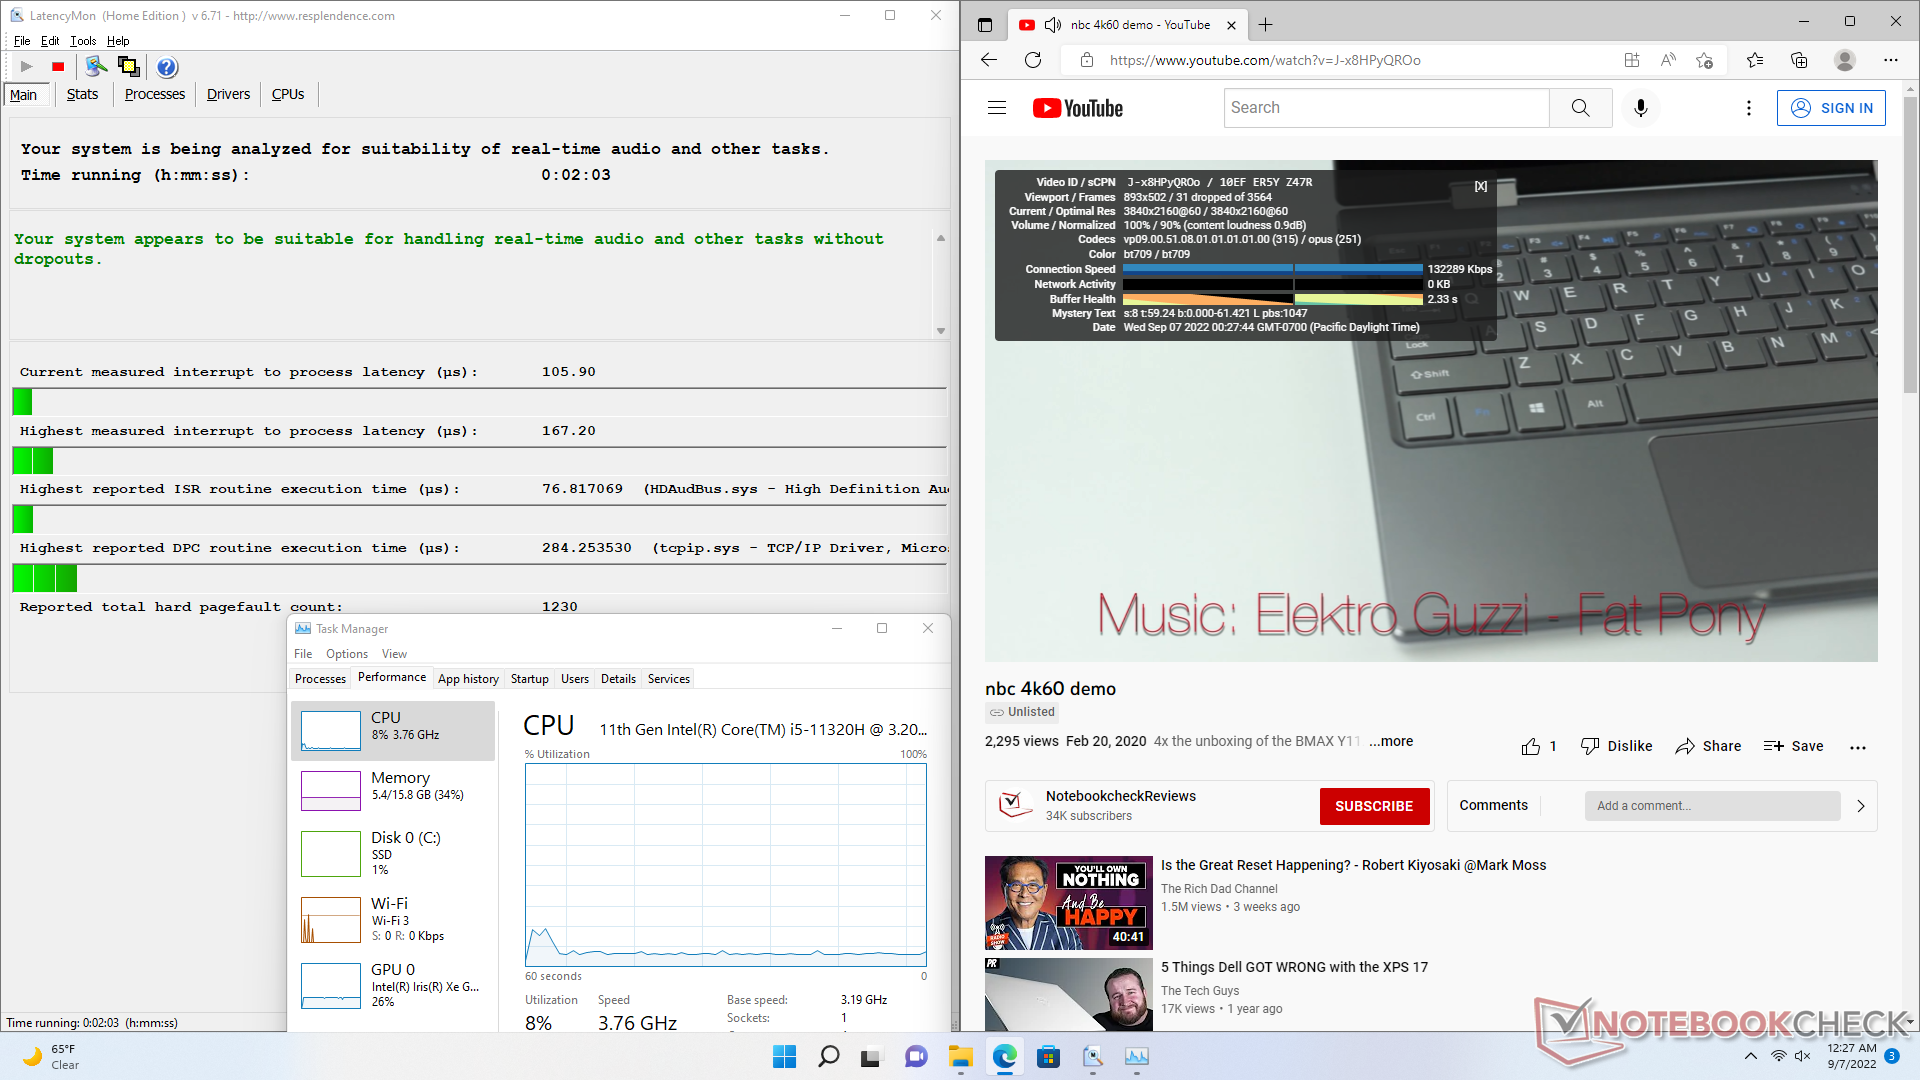
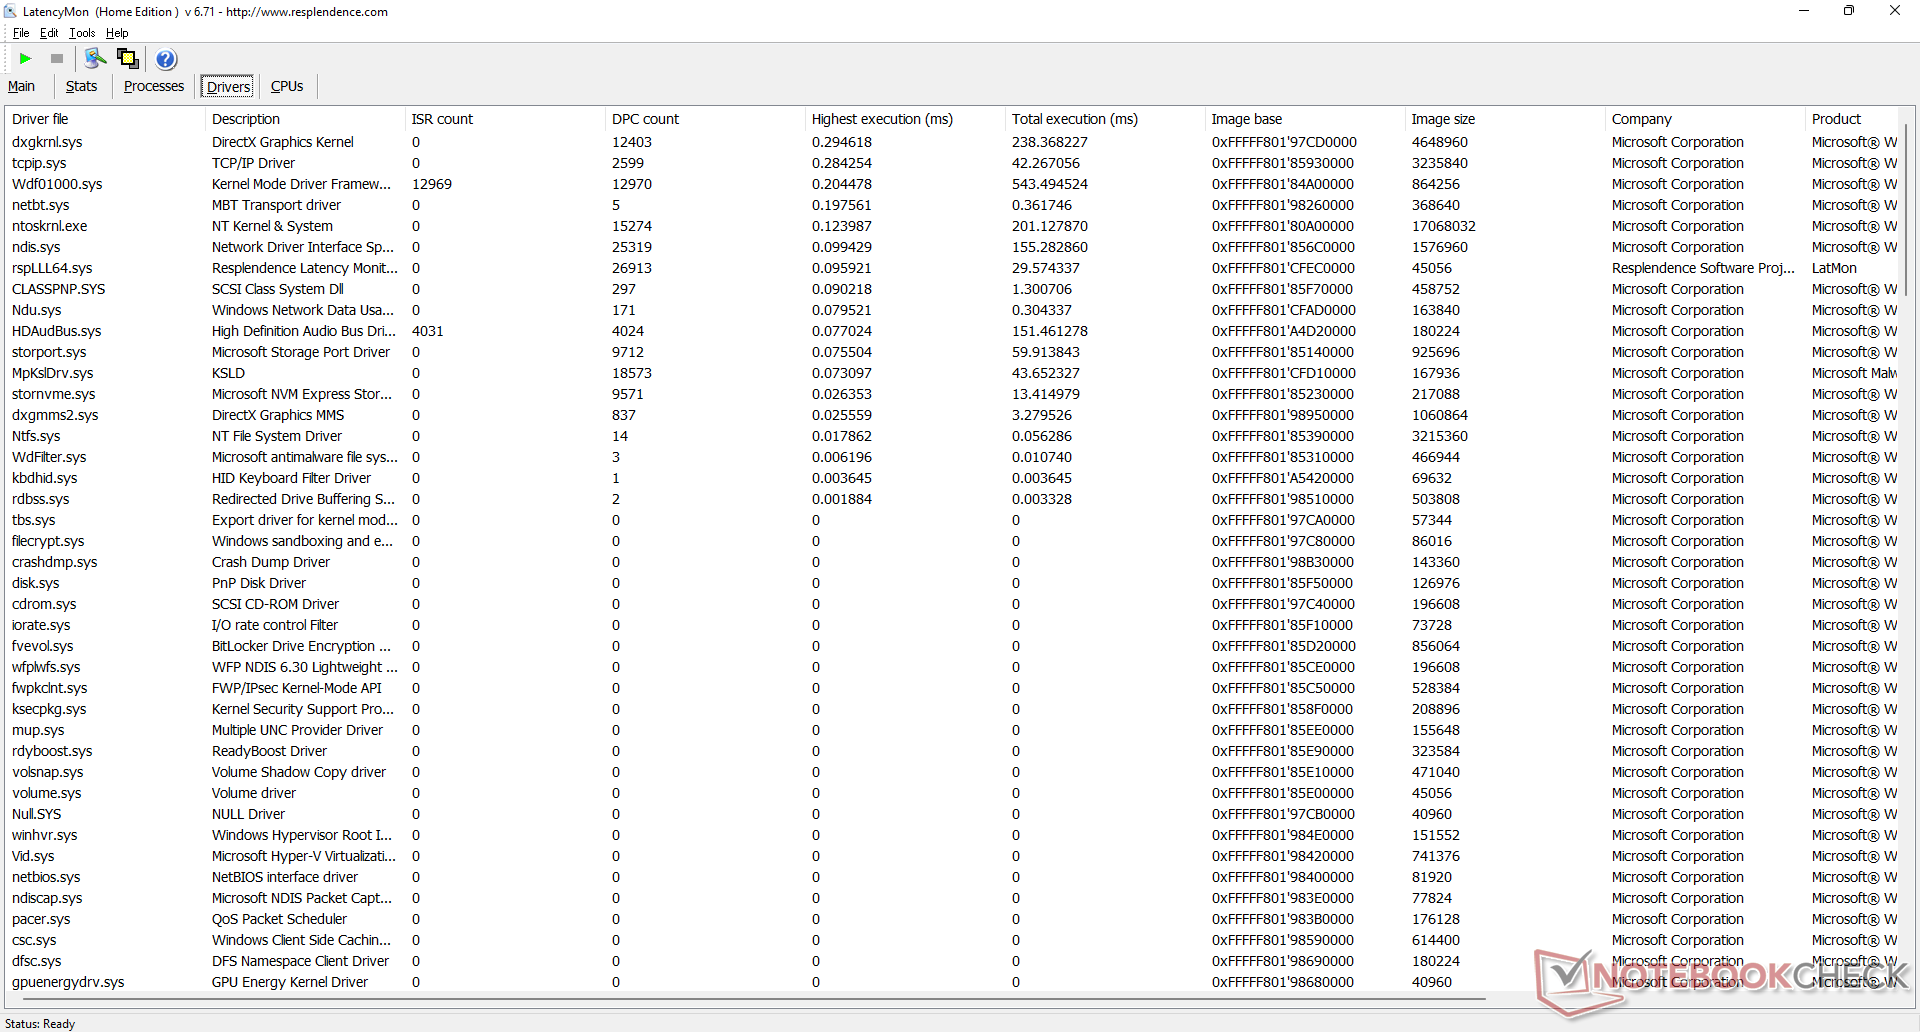
Opóźnienie DPC
LatencyMon nie wykazał żadnych problemów z DPC podczas otwierania wielu kart przeglądarki na naszej stronie głównej lub w stresie Prime95. Niestety, odtwarzanie w rozdzielczości 4K przy 60 FPS jest niedoskonałe - podczas naszego minutowego testu wideo spadło 31 klatek.
| DPC Latencies / LatencyMon - interrupt to process latency (max), Web, Youtube, Prime95 | |
| Intel NUC11TNKi5 | |
| Beelink SER4 | |
| Beelink GTI 11 | |
| Beelink SEi11 Pro | |
| Beelink GTR5 | |
* ... im mniej tym lepiej
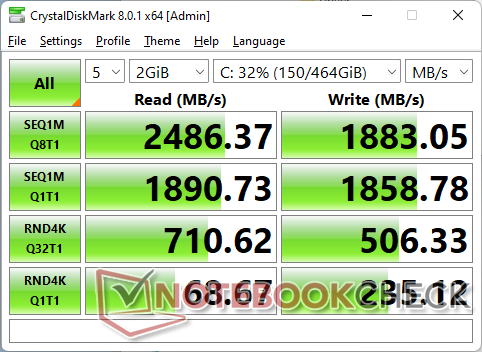
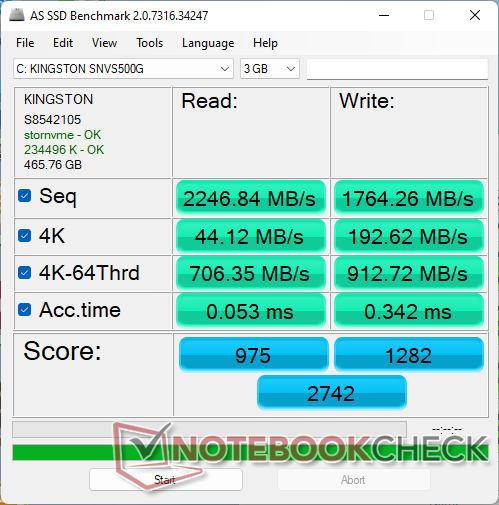
Urządzenia do przechowywania danych
SEi11 Pro jest wyposażony wKingston NV1 SBVS500GCN M.2 SSD, który znajduje się w GTR5. Jest to średniej klasy dysk PCIe3 x4 o sekwencyjnej prędkości odczytu około 2300 MB/s w porównaniu z >3000 MB/s w Samsungu PM981a.

| Drive Performance rating - Percent | |
| Beelink GTI 11 | |
| Beelink GTR5 | |
| Beelink SEi11 Pro | |
| Beelink SER4 | |
| Intel NUC11TNKi5 | |
| DiskSpd | |
| seq read | |
| Beelink GTR5 | |
| Beelink SEi11 Pro | |
| Beelink GTI 11 | |
| Beelink SER4 | |
| Intel NUC11TNKi5 | |
| seq write | |
| Beelink GTI 11 | |
| Beelink GTR5 | |
| Beelink SEi11 Pro | |
| Beelink SER4 | |
| Intel NUC11TNKi5 | |
| seq q8 t1 read | |
| Beelink GTR5 | |
| Beelink SEi11 Pro | |
| Beelink GTI 11 | |
| Beelink SER4 | |
| Intel NUC11TNKi5 | |
| seq q8 t1 write | |
| Beelink GTI 11 | |
| Beelink GTR5 | |
| Beelink SEi11 Pro | |
| Beelink SER4 | |
| Intel NUC11TNKi5 | |
| 4k q1 t1 read | |
| Beelink GTI 11 | |
| Beelink SER4 | |
| Beelink GTR5 | |
| Beelink SEi11 Pro | |
| Intel NUC11TNKi5 | |
| 4k q1 t1 write | |
| Beelink GTI 11 | |
| Beelink GTR5 | |
| Beelink SER4 | |
| Beelink SEi11 Pro | |
| Intel NUC11TNKi5 | |
| 4k q32 t16 read | |
| Beelink GTI 11 | |
| Beelink GTR5 | |
| Beelink SEi11 Pro | |
| Beelink SER4 | |
| Intel NUC11TNKi5 | |
| 4k q32 t16 write | |
| Beelink GTI 11 | |
| Beelink SER4 | |
| Beelink GTR5 | |
| Beelink SEi11 Pro | |
| Intel NUC11TNKi5 | |
| AS SSD | |
| Score Total | |
| Beelink GTI 11 | |
| Beelink SEi11 Pro | |
| Beelink GTR5 | |
| Beelink SER4 | |
| Intel NUC11TNKi5 | |
| Score Read | |
| Beelink GTI 11 | |
| Beelink SEi11 Pro | |
| Beelink GTR5 | |
| Beelink SER4 | |
| Intel NUC11TNKi5 | |
| Score Write | |
| Beelink GTI 11 | |
| Beelink SEi11 Pro | |
| Beelink GTR5 | |
| Beelink SER4 | |
| Intel NUC11TNKi5 | |
| Seq Read | |
| Beelink GTR5 | |
| Beelink SEi11 Pro | |
| Beelink GTI 11 | |
| Beelink SER4 | |
| Intel NUC11TNKi5 | |
| Seq Write | |
| Beelink GTI 11 | |
| Beelink SEi11 Pro | |
| Beelink GTR5 | |
| Beelink SER4 | |
| Intel NUC11TNKi5 | |
| 4K Read | |
| Beelink GTI 11 | |
| Beelink SER4 | |
| Beelink SEi11 Pro | |
| Beelink GTR5 | |
| Intel NUC11TNKi5 | |
| 4K Write | |
| Beelink GTI 11 | |
| Beelink SEi11 Pro | |
| Beelink SER4 | |
| Beelink GTR5 | |
| Intel NUC11TNKi5 | |
| 4K-64 Read | |
| Beelink GTI 11 | |
| Beelink SEi11 Pro | |
| Beelink GTR5 | |
| Beelink SER4 | |
| Intel NUC11TNKi5 | |
| 4K-64 Write | |
| Beelink GTI 11 | |
| Beelink SEi11 Pro | |
| Beelink GTR5 | |
| Beelink SER4 | |
| Intel NUC11TNKi5 | |
| Access Time Read | |
| Intel NUC11TNKi5 | |
| Beelink SER4 | |
| Beelink GTR5 | |
| Beelink SEi11 Pro | |
| Beelink GTI 11 | |
| Access Time Write | |
| Beelink SEi11 Pro | |
| Beelink GTR5 | |
| Intel NUC11TNKi5 | |
| Beelink SER4 | |
| Beelink GTI 11 | |
* ... im mniej tym lepiej
Disk Throttling: DiskSpd Read Loop, Queue Depth 8
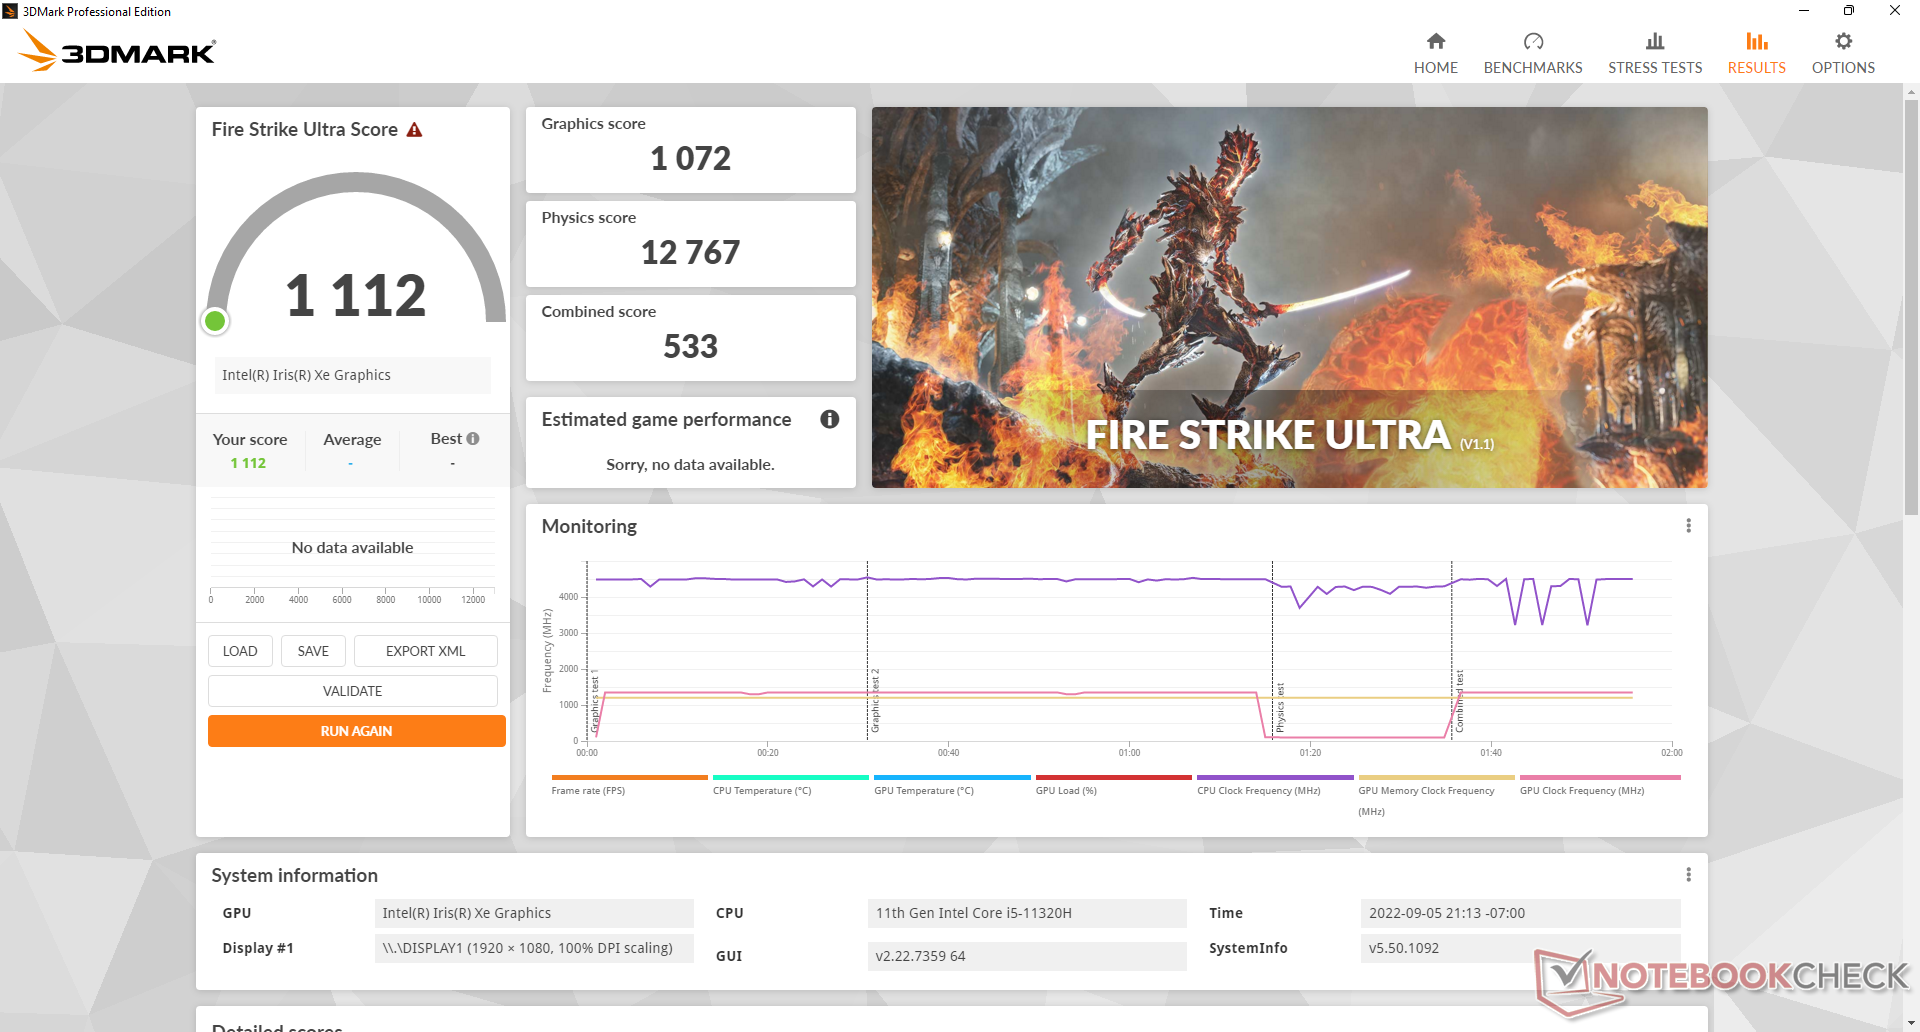
Wydajność GPU
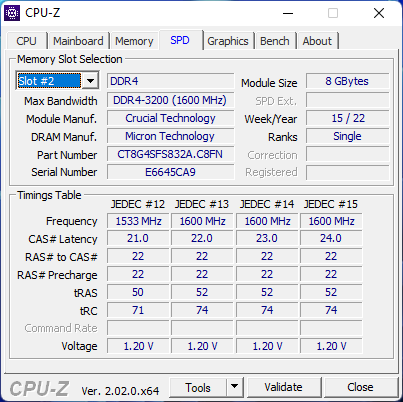
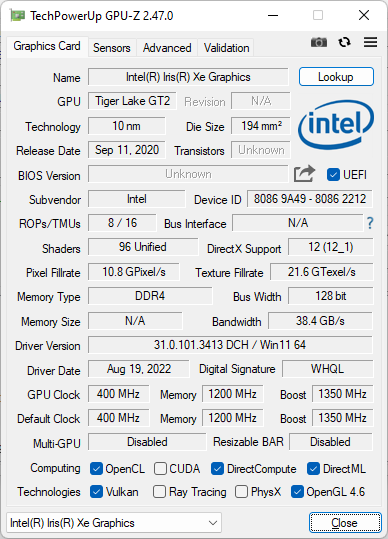
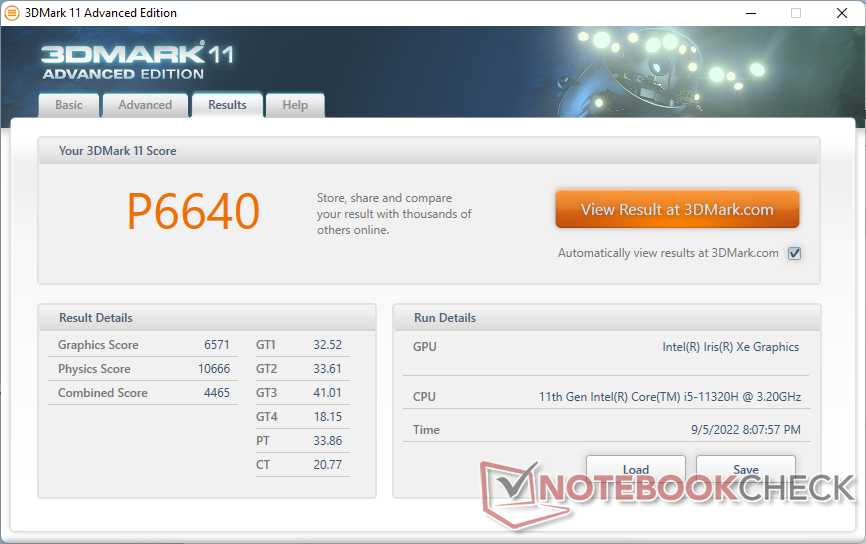
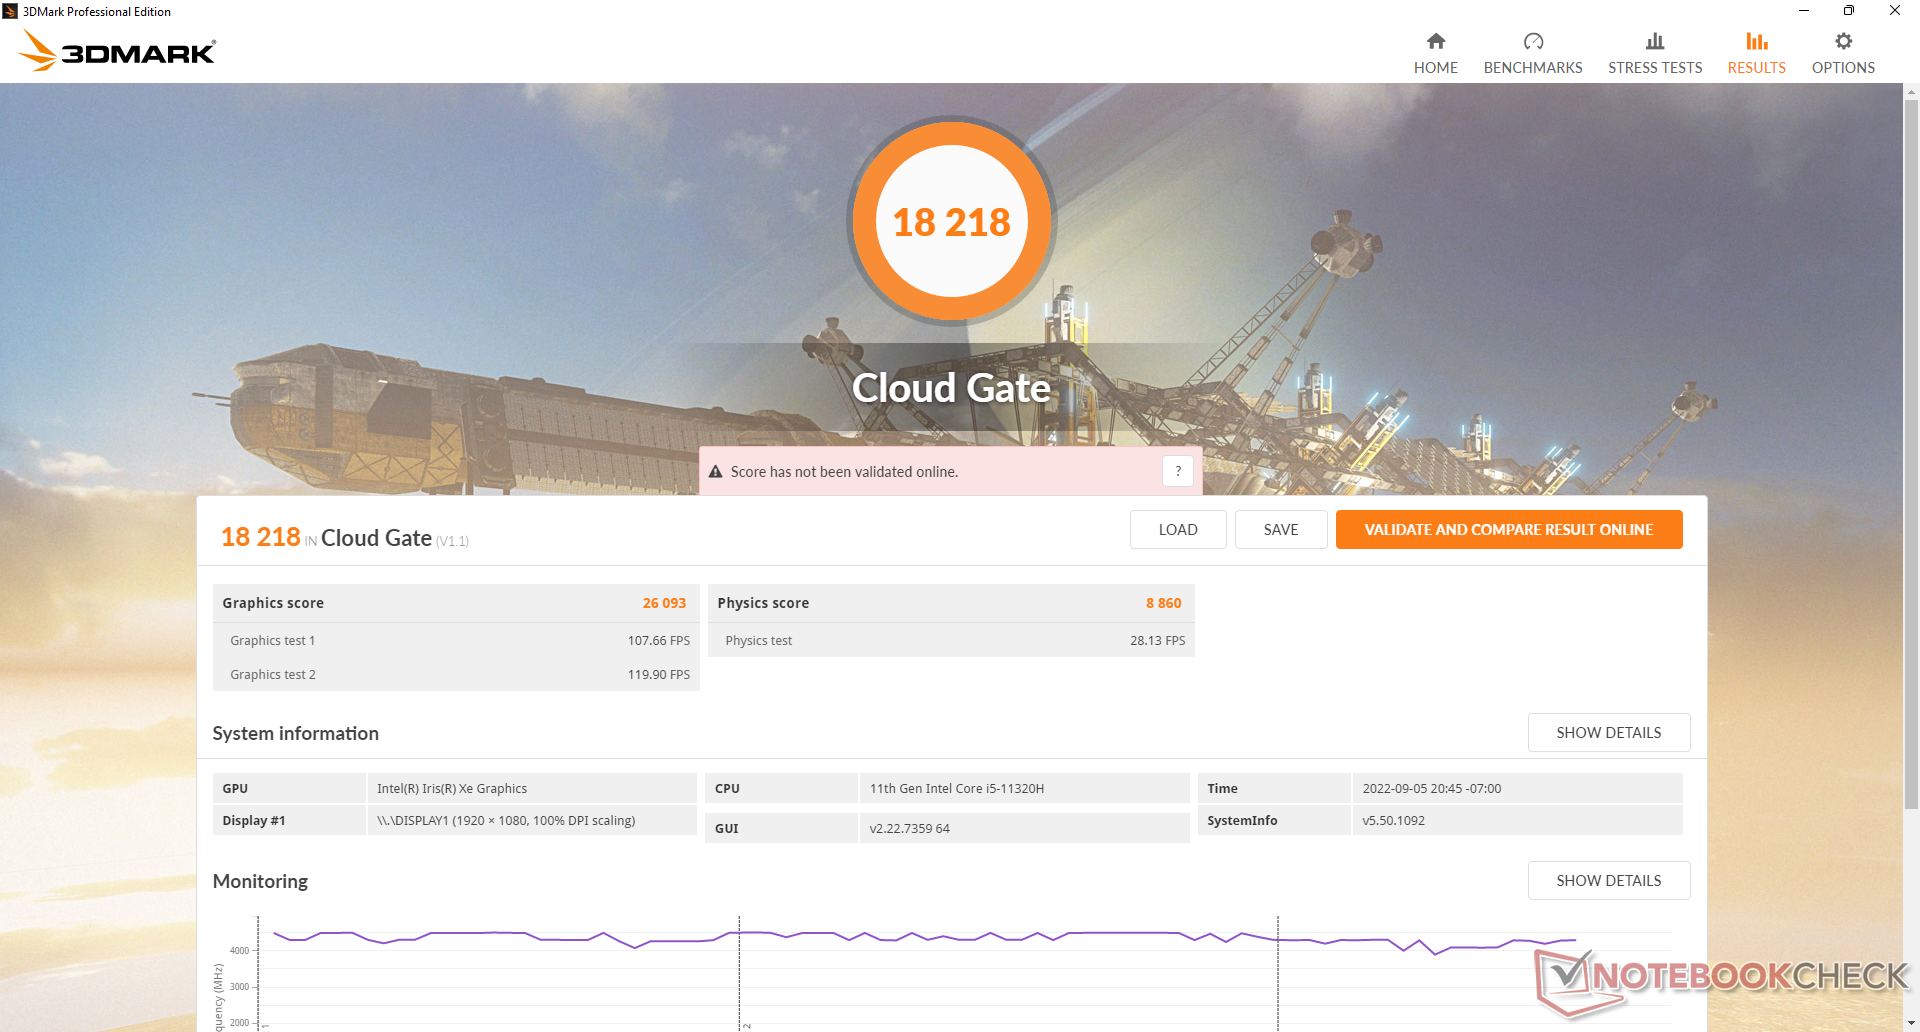
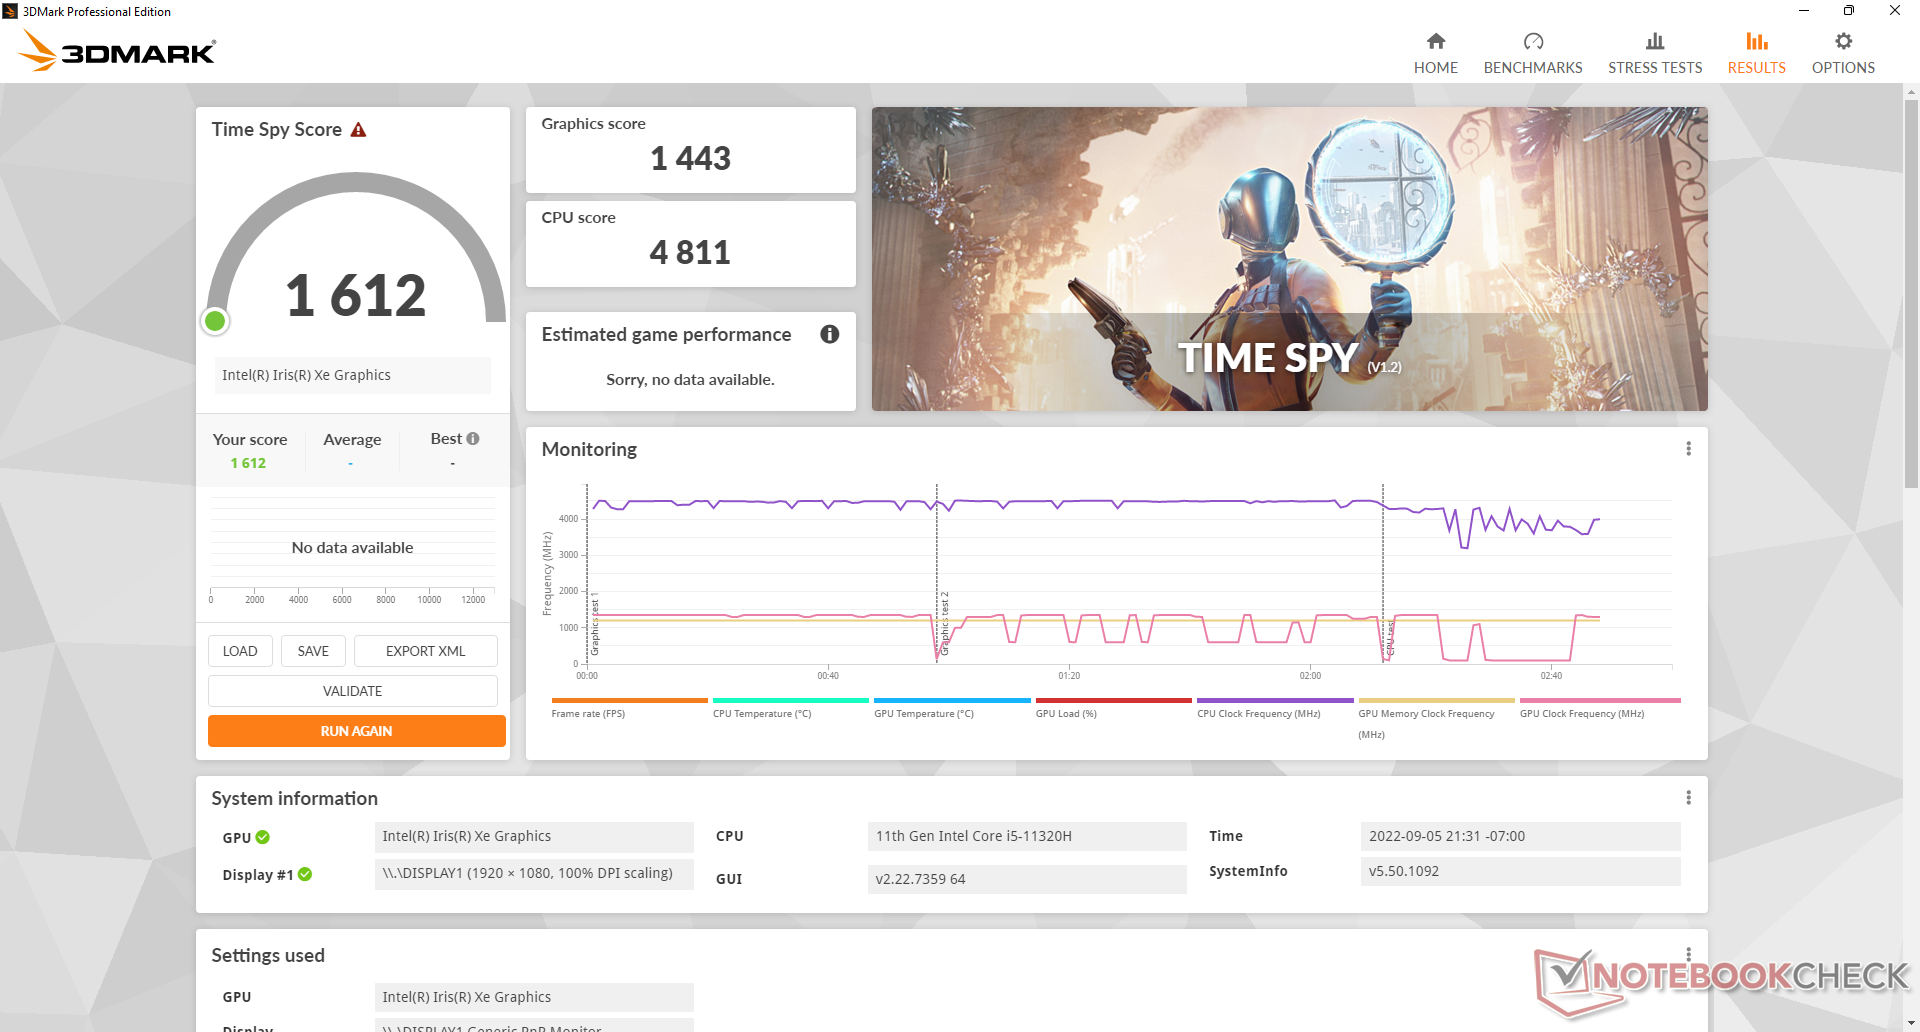
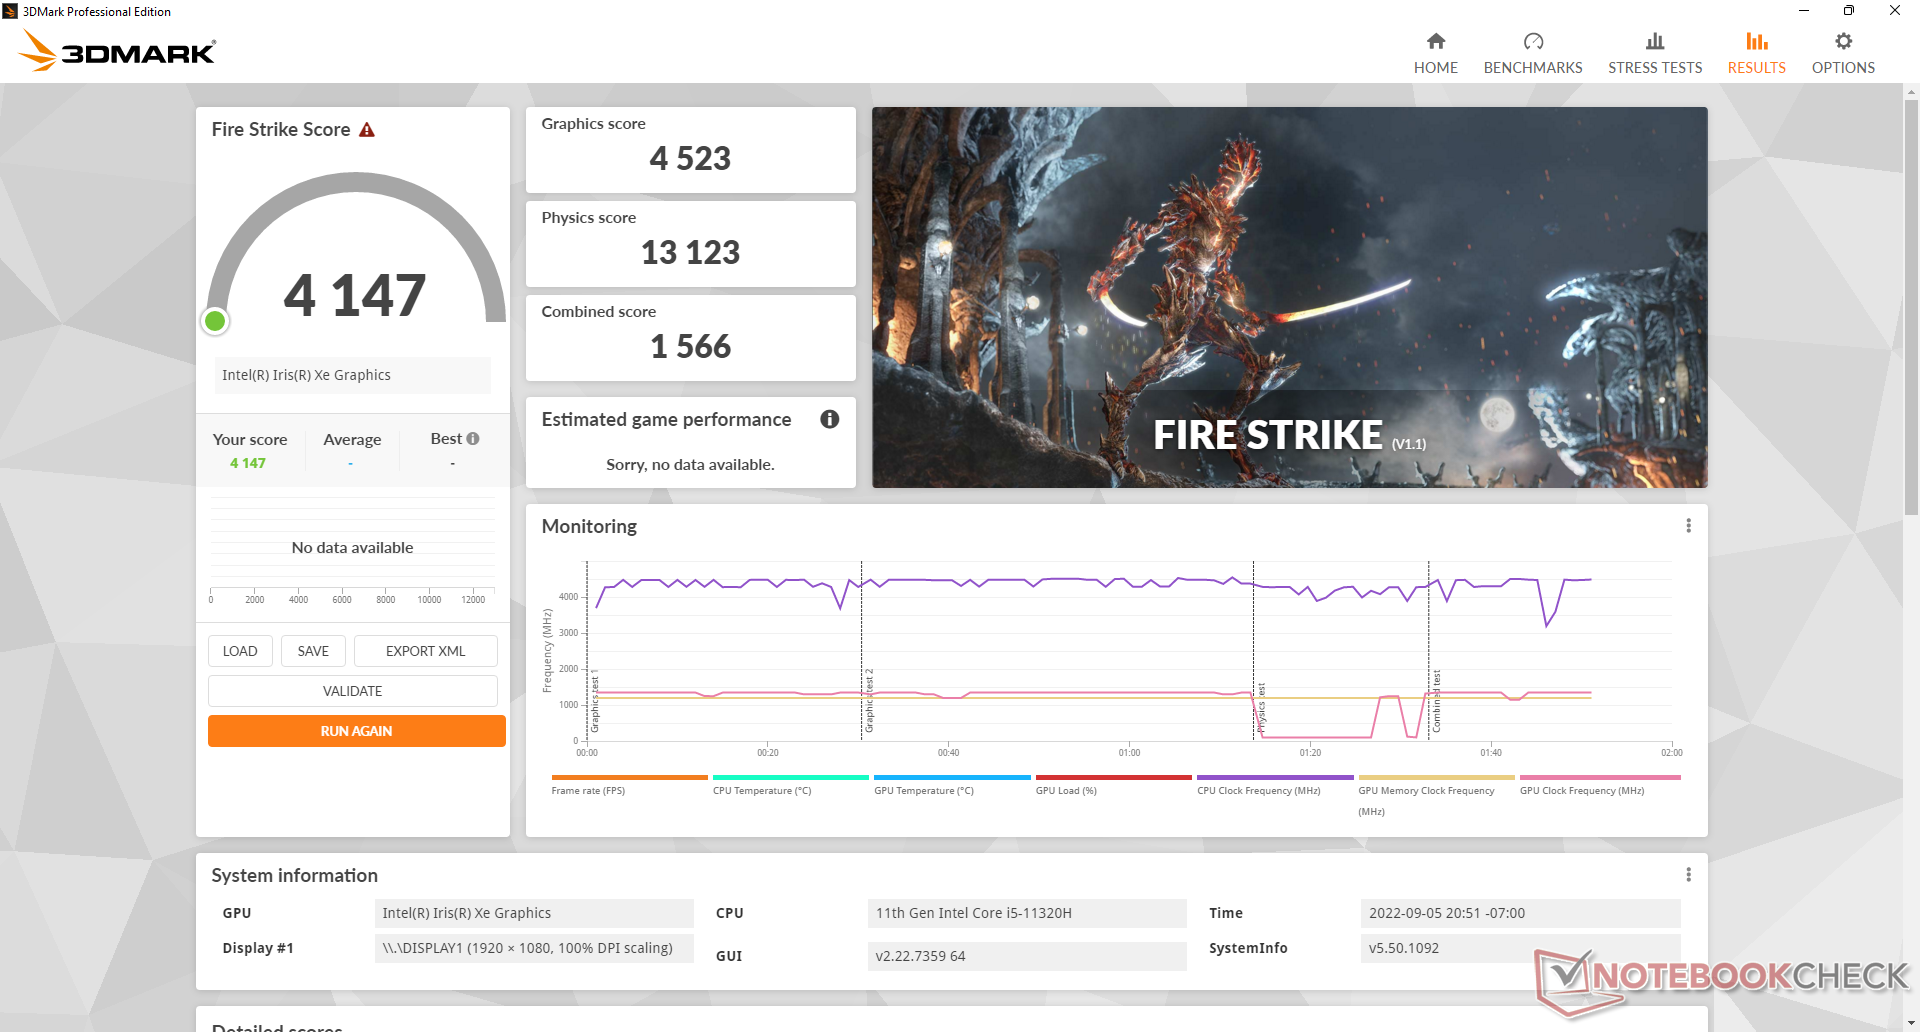
Wydajność zintegrowanej grafiki jest na poziomie, którego oczekujemy w stosunku do innych komputerów z tym samym Iris Xe 96 EUs GPU. Pamiętaj, aby skonfigurować SEi11 z dwukanałową pamięcią RAM, w przeciwnym razie wydajność grafiki może spaść nawet o 30-40%.
| 3DMark | |
| 1920x1080 Fire Strike Graphics | |
| Honor MagicBook 14 2022 | |
| Przeciętny Intel Iris Xe Graphics G7 96EUs (2286 - 6624, n=222) | |
| Beelink SEi11 Pro | |
| Beelink GTR5 | |
| Prime Computer PrimeBook Circular-i7-1165G7 | |
| Beelink SER4 | |
| Minipc Union Ace Magician AMR5 | |
| Intel NUC11TNKi5 | |
| 2560x1440 Time Spy Graphics | |
| Honor MagicBook 14 2022 | |
| Przeciętny Intel Iris Xe Graphics G7 96EUs (707 - 1890, n=218) | |
| Beelink SEi11 Pro | |
| Beelink GTR5 | |
| Prime Computer PrimeBook Circular-i7-1165G7 | |
| Beelink SER4 | |
| Minipc Union Ace Magician AMR5 | |
| Intel NUC11TNKi5 | |
| 2560x1440 Time Spy Score | |
| Honor MagicBook 14 2022 | |
| Przeciętny Intel Iris Xe Graphics G7 96EUs (789 - 2159, n=215) | |
| Beelink GTR5 | |
| Beelink SEi11 Pro | |
| Beelink SER4 | |
| Prime Computer PrimeBook Circular-i7-1165G7 | |
| Minipc Union Ace Magician AMR5 | |
| Intel NUC11TNKi5 | |
| 3DMark 11 - 1280x720 Performance GPU | |
| Honor MagicBook 14 2022 | |
| Beelink GTR5 | |
| Beelink SEi11 Pro | |
| Przeciętny Intel Iris Xe Graphics G7 96EUs (2867 - 7676, n=209) | |
| Prime Computer PrimeBook Circular-i7-1165G7 | |
| Beelink SER4 | |
| Minipc Union Ace Magician AMR5 | |
| Intel NUC11TNKi5 | |
| 3DMark 11 Performance | 6640 pkt. | |
| 3DMark Cloud Gate Standard Score | 18218 pkt. | |
| 3DMark Fire Strike Score | 4147 pkt. | |
| 3DMark Time Spy Score | 1612 pkt. | |
Pomoc | ||
| The Witcher 3 | |
| 1024x768 Low Graphics & Postprocessing | |
| Beelink SEi11 Pro | |
| Beelink GTR5 | |
| Przeciętny Intel Iris Xe Graphics G7 96EUs (28.9 - 117.2, n=188) | |
| Beelink GTI 11 | |
| Beelink SER4 | |
| Intel NUC11TNKi5 | |
| 1366x768 Medium Graphics & Postprocessing | |
| Beelink GTR5 | |
| Beelink SEi11 Pro | |
| Przeciętny Intel Iris Xe Graphics G7 96EUs (21.4 - 77.8, n=185) | |
| Beelink GTI 11 | |
| Beelink SER4 | |
| 1920x1080 High Graphics & Postprocessing (Nvidia HairWorks Off) | |
| Przeciętny Intel Iris Xe Graphics G7 96EUs (10.6 - 45.9, n=191) | |
| Beelink SEi11 Pro | |
| Beelink GTR5 | |
| Beelink GTI 11 | |
| Beelink SER4 | |
| 1920x1080 Ultra Graphics & Postprocessing (HBAO+) | |
| Beelink GTR5 | |
| Beelink SER4 | |
| Przeciętny Intel Iris Xe Graphics G7 96EUs (8.79 - 20.1, n=181) | |
| Beelink SEi11 Pro | |
| Beelink GTI 11 | |
| Cyberpunk 2077 1.6 | |
| 1920x1080 Low Preset | |
| Przeciętny Intel Iris Xe Graphics G7 96EUs (13 - 25.9, n=42) | |
| Beelink SEi11 Pro | |
| 1920x1080 Medium Preset | |
| Przeciętny Intel Iris Xe Graphics G7 96EUs (10.8 - 21.7, n=37) | |
| Beelink SEi11 Pro | |
| 1920x1080 High Preset | |
| Przeciętny Intel Iris Xe Graphics G7 96EUs (9.8 - 16.9, n=34) | |
| Beelink SEi11 Pro | |
| 1920x1080 Ultra Preset | |
| Przeciętny Intel Iris Xe Graphics G7 96EUs (7.4 - 16.8, n=32) | |
| Beelink SEi11 Pro | |
| GTA V | |
| 1024x768 Lowest Settings possible | |
| Beelink GTR5 | |
| Beelink SER4 | |
| Przeciętny Intel Iris Xe Graphics G7 96EUs (52 - 166.4, n=168) | |
| Beelink GTI 11 | |
| Beelink SEi11 Pro | |
| 1920x1080 Lowest Settings possible | |
| Beelink GTR5 | |
| Przeciętny Intel Iris Xe Graphics G7 96EUs (34.7 - 132.1, n=141) | |
| Beelink SER4 | |
| Beelink SEi11 Pro | |
| Beelink GTI 11 | |
| 1366x768 Normal/Off AF:4x | |
| Beelink GTR5 | |
| Beelink SER4 | |
| Przeciętny Intel Iris Xe Graphics G7 96EUs (24.1 - 152.7, n=169) | |
| Beelink GTI 11 | |
| Beelink SEi11 Pro | |
| 1920x1080 Normal/Off AF:4x | |
| Beelink GTR5 | |
| Beelink SER4 | |
| Przeciętny Intel Iris Xe Graphics G7 96EUs (20 - 119.3, n=142) | |
| Beelink SEi11 Pro | |
| Beelink GTI 11 | |
| 1920x1080 High/On (Advanced Graphics Off) AA:2xMSAA + FX AF:8x | |
| Beelink GTR5 | |
| Beelink SER4 | |
| Beelink SEi11 Pro | |
| Przeciętny Intel Iris Xe Graphics G7 96EUs (9.39 - 51.6, n=162) | |
| Beelink GTI 11 | |
| 1920x1080 Highest AA:4xMSAA + FX AF:16x | |
| Beelink GTR5 | |
| Beelink SER4 | |
| Przeciętny Intel Iris Xe Graphics G7 96EUs (4.13 - 22.9, n=156) | |
| Beelink GTI 11 | |
| Final Fantasy XV Benchmark | |
| 1280x720 Lite Quality | |
| Beelink GTR5 | |
| Przeciętny Intel Iris Xe Graphics G7 96EUs (14.9 - 56.5, n=189) | |
| Beelink SEi11 Pro | |
| Beelink SER4 | |
| Beelink GTI 11 | |
| Intel NUC11TNKi5 | |
| 1920x1080 Standard Quality | |
| Beelink GTR5 | |
| Przeciętny Intel Iris Xe Graphics G7 96EUs (10.5 - 31.2, n=185) | |
| Beelink SEi11 Pro | |
| Beelink SER4 | |
| Beelink GTI 11 | |
| Intel NUC11TNKi5 | |
| 1920x1080 High Quality | |
| Przeciętny Intel Iris Xe Graphics G7 96EUs (8.15 - 27.8, n=178) | |
| Beelink GTR5 | |
| Beelink SEi11 Pro | |
| Beelink SER4 | |
| Beelink GTI 11 | |
| Intel NUC11TNKi5 | |
| X-Plane 11.11 | |
| 1280x720 low (fps_test=1) | |
| Beelink GTR5 | |
| Beelink SEi11 Pro | |
| Przeciętny Intel Iris Xe Graphics G7 96EUs (13.4 - 88.4, n=213) | |
| Beelink SER4 | |
| Intel NUC11TNKi5 | |
| Beelink GTI 11 | |
| 1920x1080 med (fps_test=2) | |
| Beelink GTR5 | |
| Beelink SEi11 Pro | |
| Przeciętny Intel Iris Xe Graphics G7 96EUs (11.6 - 69.5, n=214) | |
| Beelink SER4 | |
| Intel NUC11TNKi5 | |
| Beelink GTI 11 | |
| 1920x1080 high (fps_test=3) | |
| Beelink GTR5 | |
| Beelink SEi11 Pro | |
| Przeciętny Intel Iris Xe Graphics G7 96EUs (11.1 - 59.8, n=213) | |
| Beelink SER4 | |
| Intel NUC11TNKi5 | |
| Beelink GTI 11 | |
| Dota 2 Reborn | |
| 1280x720 min (0/3) fastest | |
| Beelink GTR5 | |
| Beelink GTI 11 | |
| Beelink SEi11 Pro | |
| Beelink SER4 | |
| Przeciętny Intel Iris Xe Graphics G7 96EUs (36 - 148, n=221) | |
| Intel NUC11TNKi5 | |
| 1366x768 med (1/3) | |
| Beelink GTR5 | |
| Beelink SER4 | |
| Beelink GTI 11 | |
| Beelink SEi11 Pro | |
| Przeciętny Intel Iris Xe Graphics G7 96EUs (31.6 - 108.5, n=221) | |
| Intel NUC11TNKi5 | |
| 1920x1080 high (2/3) | |
| Beelink GTR5 | |
| Przeciętny Intel Iris Xe Graphics G7 96EUs (23.2 - 88.1, n=221) | |
| Beelink SER4 | |
| Beelink SEi11 Pro | |
| Beelink GTI 11 | |
| Intel NUC11TNKi5 | |
| 1920x1080 ultra (3/3) best looking | |
| Beelink GTR5 | |
| Beelink SER4 | |
| Przeciętny Intel Iris Xe Graphics G7 96EUs (20.6 - 78.5, n=221) | |
| Beelink SEi11 Pro | |
| Beelink GTI 11 | |
| Intel NUC11TNKi5 | |
| Strange Brigade | |
| 1280x720 lowest AF:1 | |
| Beelink GTR5 | |
| Przeciętny Intel Iris Xe Graphics G7 96EUs (48.5 - 115.1, n=172) | |
| Beelink SER4 | |
| Beelink SEi11 Pro | |
| Beelink GTI 11 | |
| 1920x1080 medium AA:medium AF:4 | |
| Beelink GTR5 | |
| Przeciętny Intel Iris Xe Graphics G7 96EUs (18.2 - 51.4, n=170) | |
| Beelink SEi11 Pro | |
| Beelink SER4 | |
| Beelink GTI 11 | |
| 1920x1080 high AA:high AF:8 | |
| Beelink GTR5 | |
| Przeciętny Intel Iris Xe Graphics G7 96EUs (15.4 - 39.8, n=169) | |
| Beelink SER4 | |
| Beelink SEi11 Pro | |
| Beelink GTI 11 | |
| 1920x1080 ultra AA:ultra AF:16 | |
| Beelink GTR5 | |
| Beelink SER4 | |
| Przeciętny Intel Iris Xe Graphics G7 96EUs (13.2 - 31.7, n=167) | |
| Beelink SEi11 Pro | |
| Beelink GTI 11 | |
Witcher 3 FPS Chart
| low | med. | high | ultra | |
|---|---|---|---|---|
| GTA V (2015) | 94.2 | 77.6 | 23.2 | |
| The Witcher 3 (2015) | 89.7 | 53.7 | 27.8 | 13.8 |
| Dota 2 Reborn (2015) | 119.6 | 78.6 | 50.4 | 47.4 |
| Final Fantasy XV Benchmark (2018) | 38.6 | 20.3 | 14.9 | |
| X-Plane 11.11 (2018) | 58.2 | 41.2 | 37.3 | |
| Strange Brigade (2018) | 79.3 | 33.9 | 27.7 | 22.2 |
| Cyberpunk 2077 1.6 (2022) | 18.6 | 15.6 | 11.7 | 9.8 |
Emisje
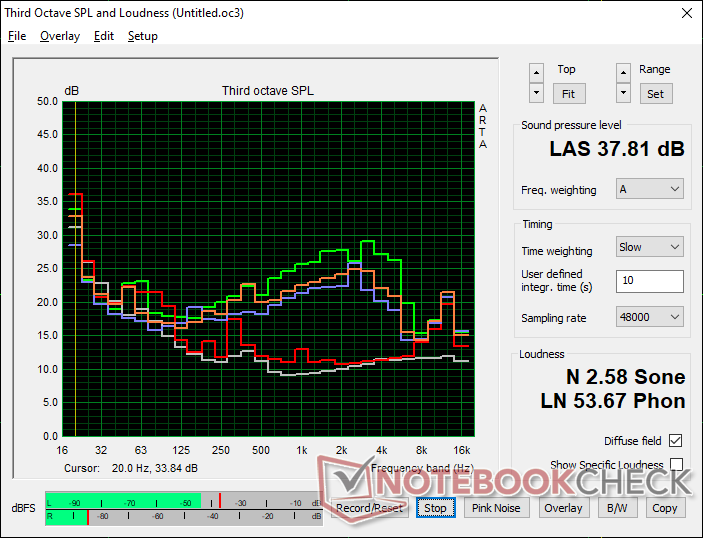
Szum systemu
Wentylator w urządzeniu jest zawsze aktywny, niezależnie od obciążenia ekranu czy aktywności. Na szczęście jest on stosunkowo cichy (24,7 dB(A) na tle 22,8 dB(A)), ale użytkownicy oczekujący całkowicie bezgłośnego mini PC nie znajdą go tutaj
Przy bardziej wymagających obciążeniach ogólny hałas wentylatora jest jednak cichszy niż w wielu innych mini PC. Na przykład podczas przeglądania stron internetowych lub strumieniowania wideo szum wentylatora oscyluje w granicach 25-28 dB(A) w porównaniu z ponad 30 dB(A) w modelu GTR5 lub Intel NUC11. Wentylator osiąga szczytowy poziom 38 dB(A), gdy procesor jest wykorzystywany w 100% przez dłuższy czas, co ponownie jest zauważalnie cichsze niż w przypadku wielu alternatywnych rozwiązań.
Hałas
| luz |
| 24.7 / 24.7 / 25.3 dB |
| obciążenie |
| 33.2 / 37.8 dB |
 | ||
30 dB cichy 40 dB(A) słyszalny 50 dB(A) irytujący |
||
min: | ||
| Beelink SEi11 Pro Iris Xe G7 96EUs, i5-11320H, Kingston NV1 SNVS/500GCN | Beelink GTR5 Vega 8, R9 5900HX, Kingston NV1 SNVS/500GCN | Beelink GTI 11 Iris Xe G7 80EUs, i5-1135G7, Kingston SA2000M8500G | Beelink SER4 Vega 8, R7 4800U, Intel SSD 660p SSDPEKNW512G8 | Intel NUC11TNKi5 Iris Xe G7 80EUs, i5-1135G7, Transcend M.2 SSD 430S TS512GMTS430S | |
|---|---|---|---|---|---|
| Noise | -26% | -31% | -20% | -26% | |
| wyłączone / środowisko * (dB) | 22.8 | 23.1 -1% | 25.7 -13% | 23.4 -3% | 24.8 -9% |
| Idle Minimum * (dB) | 24.7 | 34.2 -38% | 28.4 -15% | 33.2 -34% | 35.6 -44% |
| Idle Average * (dB) | 24.7 | 34.2 -38% | 32 -30% | 33.2 -34% | 35.6 -44% |
| Idle Maximum * (dB) | 25.3 | 34.2 -35% | 37.7 -49% | 33.2 -31% | 35.6 -41% |
| Load Average * (dB) | 33.2 | 44.6 -34% | 44.2 -33% | 38.6 -16% | 36.2 -9% |
| Witcher 3 ultra * (dB) | 34.5 | 41.4 -20% | 44.5 -29% | 39.2 -14% | 38 -10% |
| Load Maximum * (dB) | 37.8 | 45.1 -19% | 56 -48% | 40.8 -8% | 47.6 -26% |
* ... im mniej tym lepiej
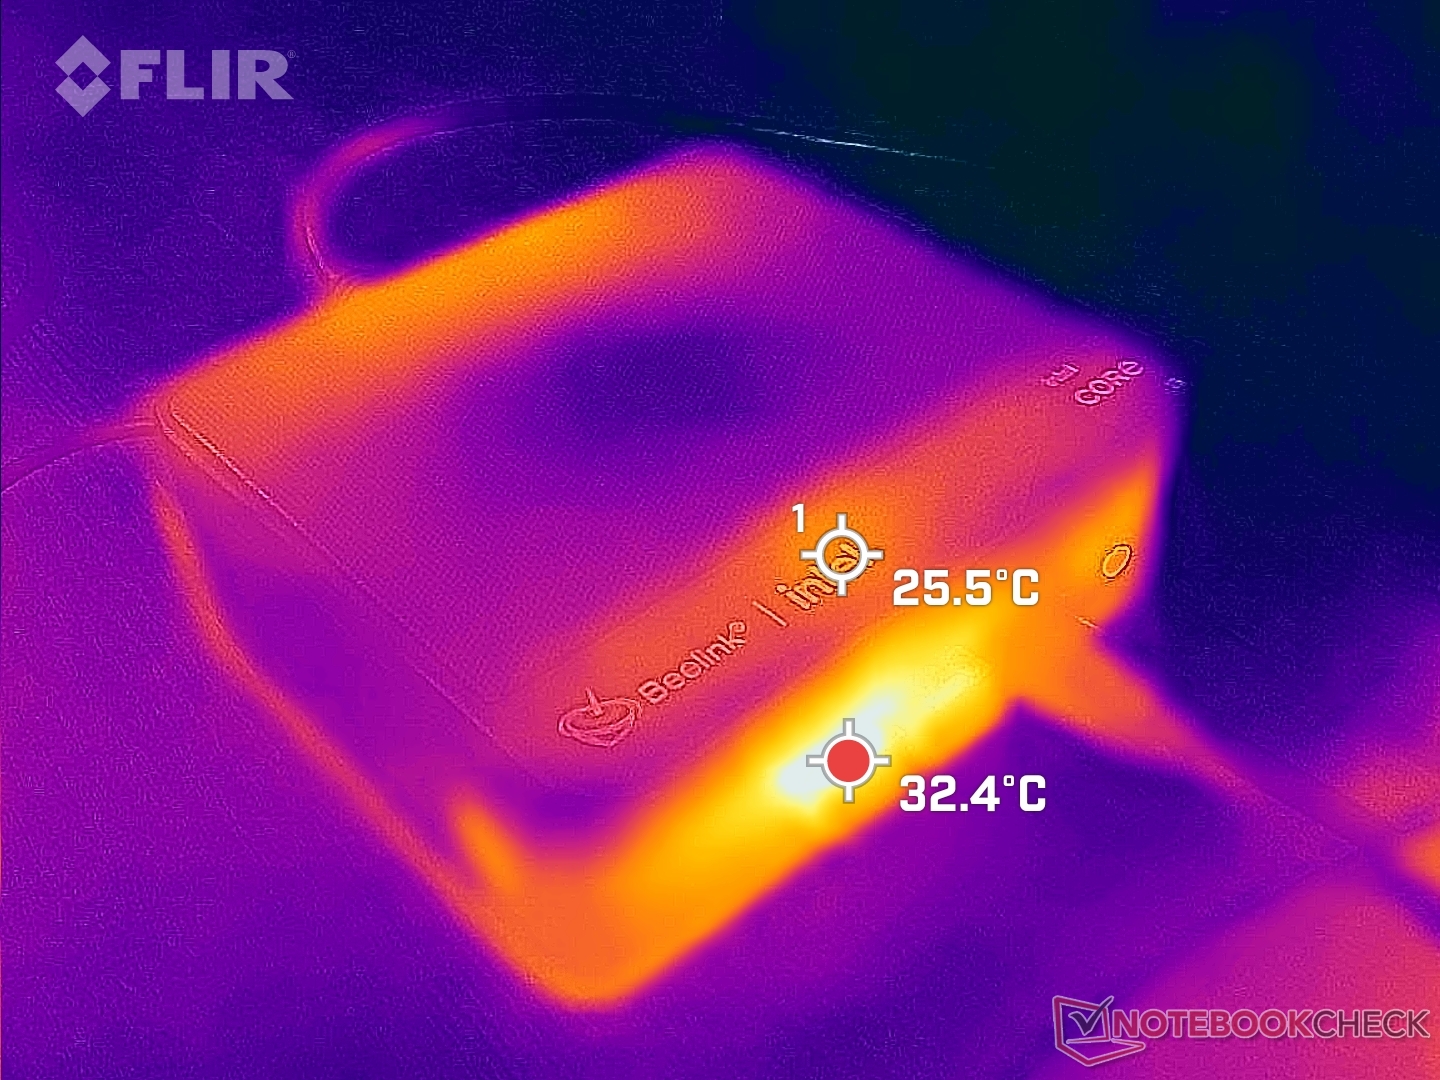
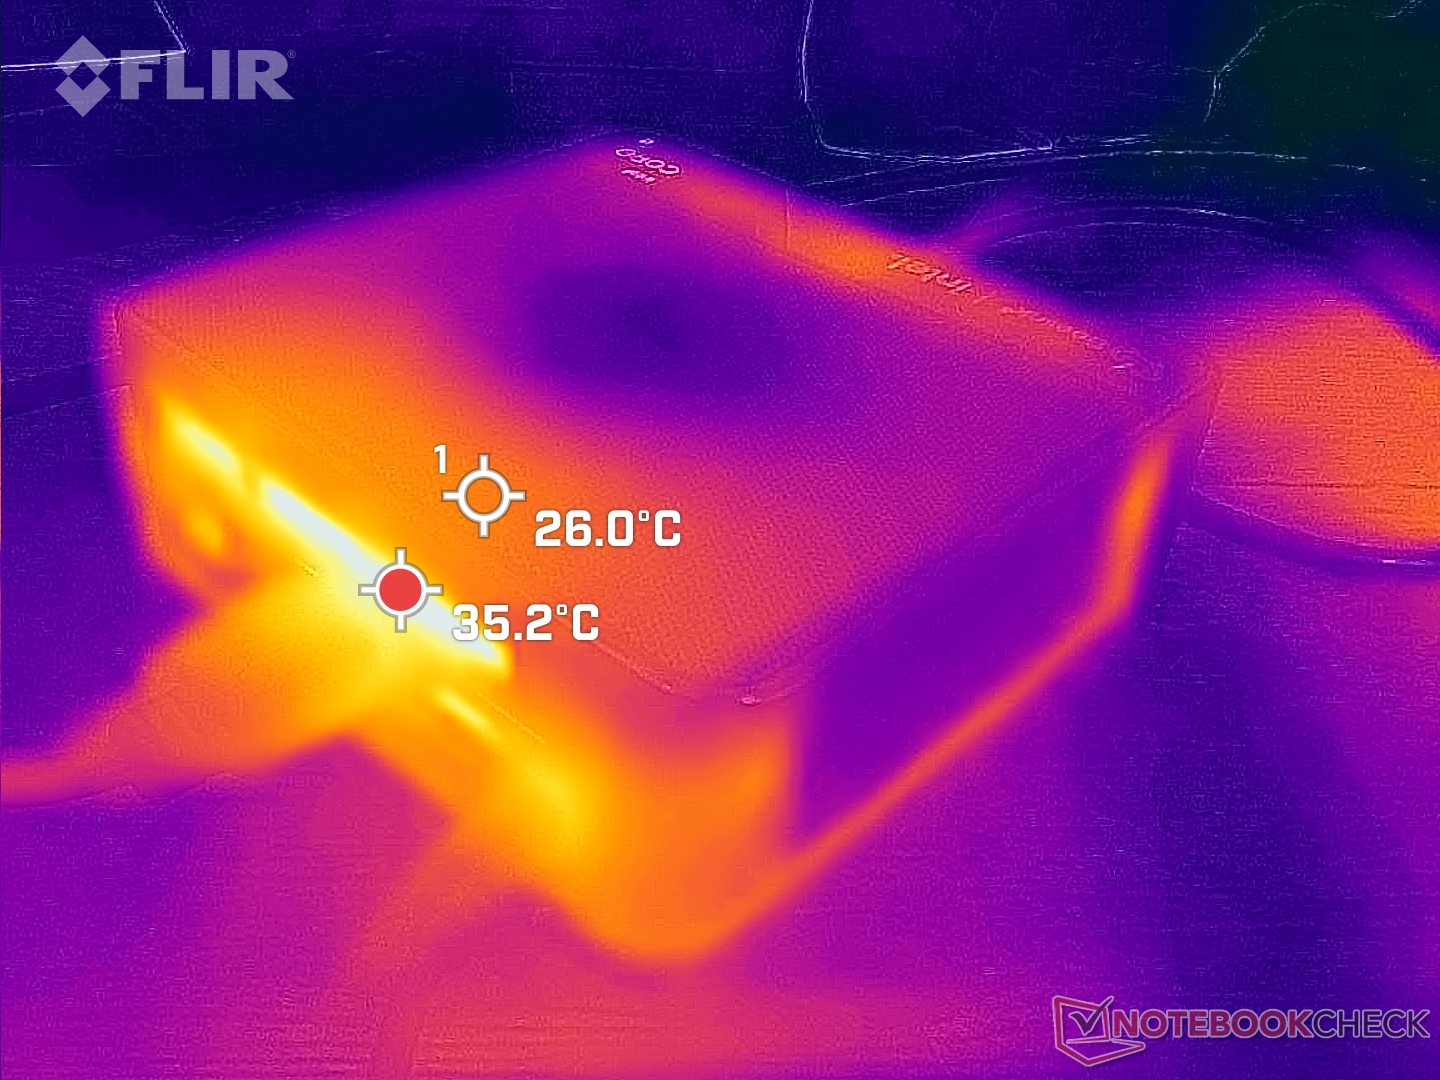
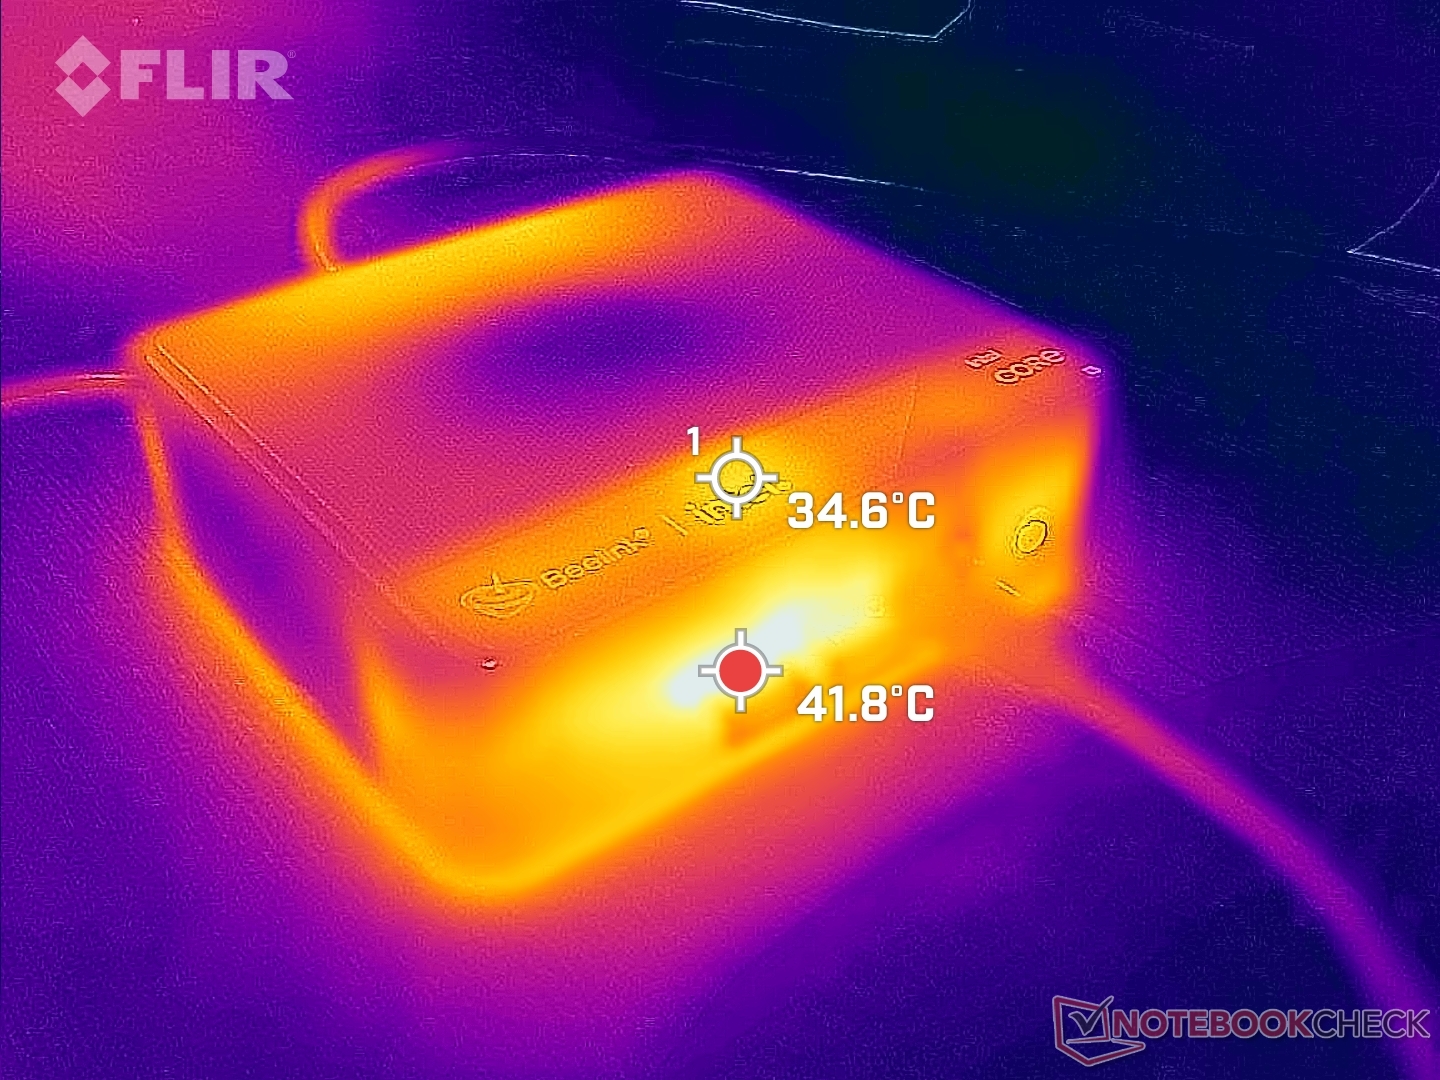
Temperatura
Chłodne powietrze jest wciągane przez górną powierzchnię urządzenia, podczas gdy spaliny wydostają się z tyłu, co pokazują nasze mapy temperatur poniżej. W związku z tym nie należy umieszczać na nim przedmiotów takich jak książki czy papiery.
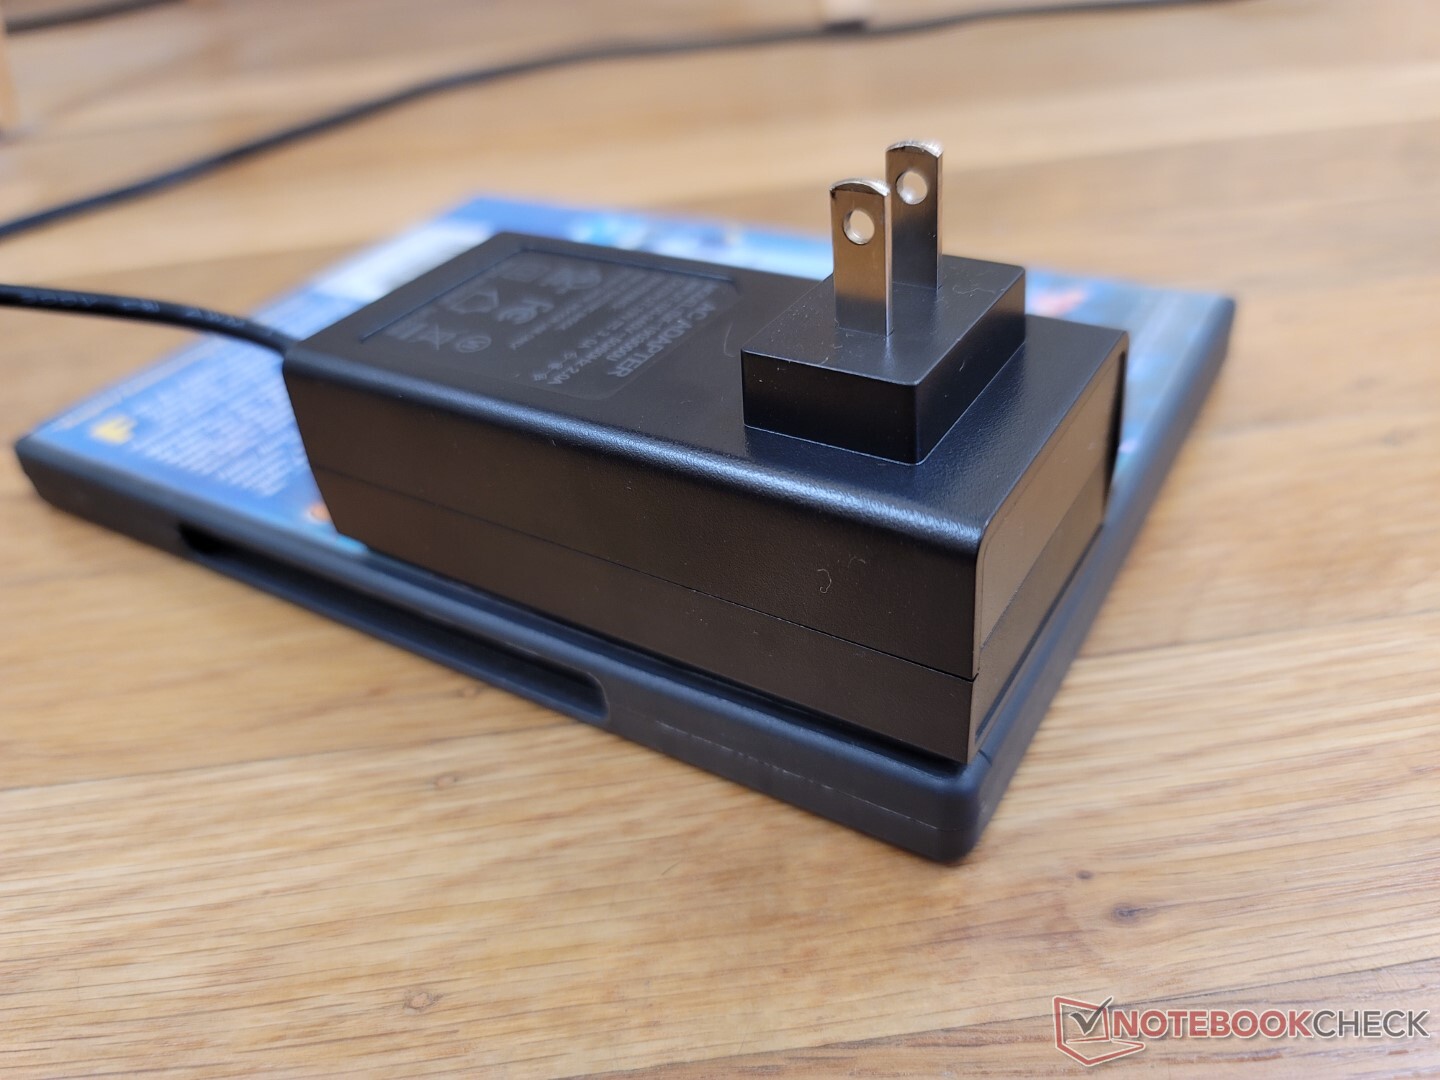
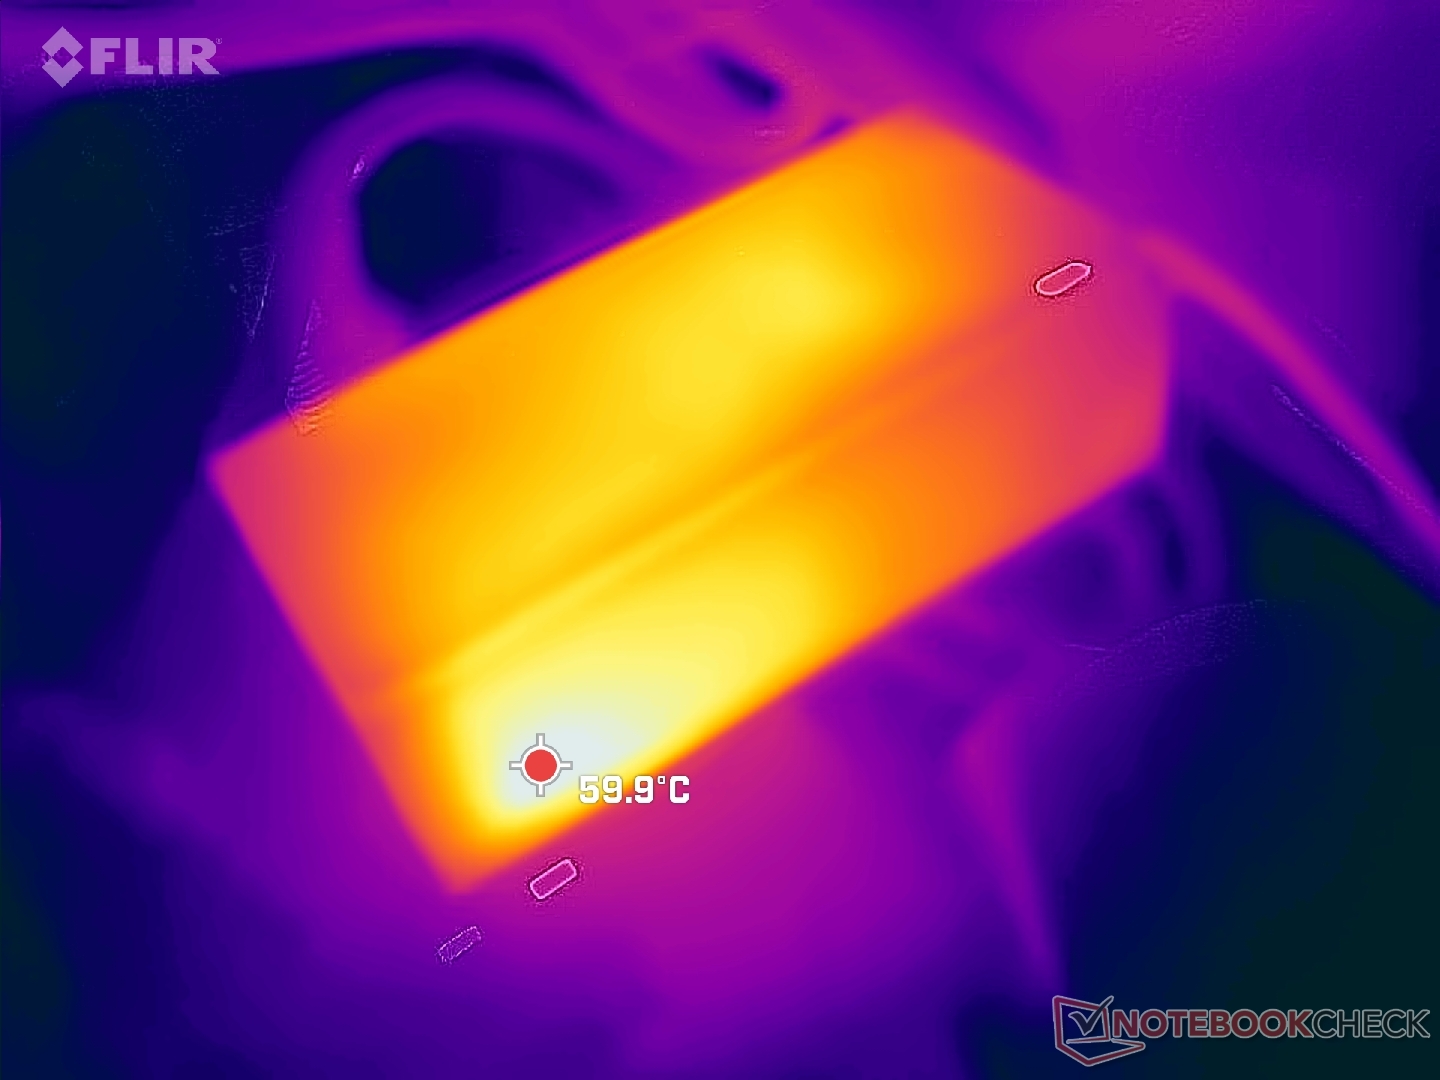
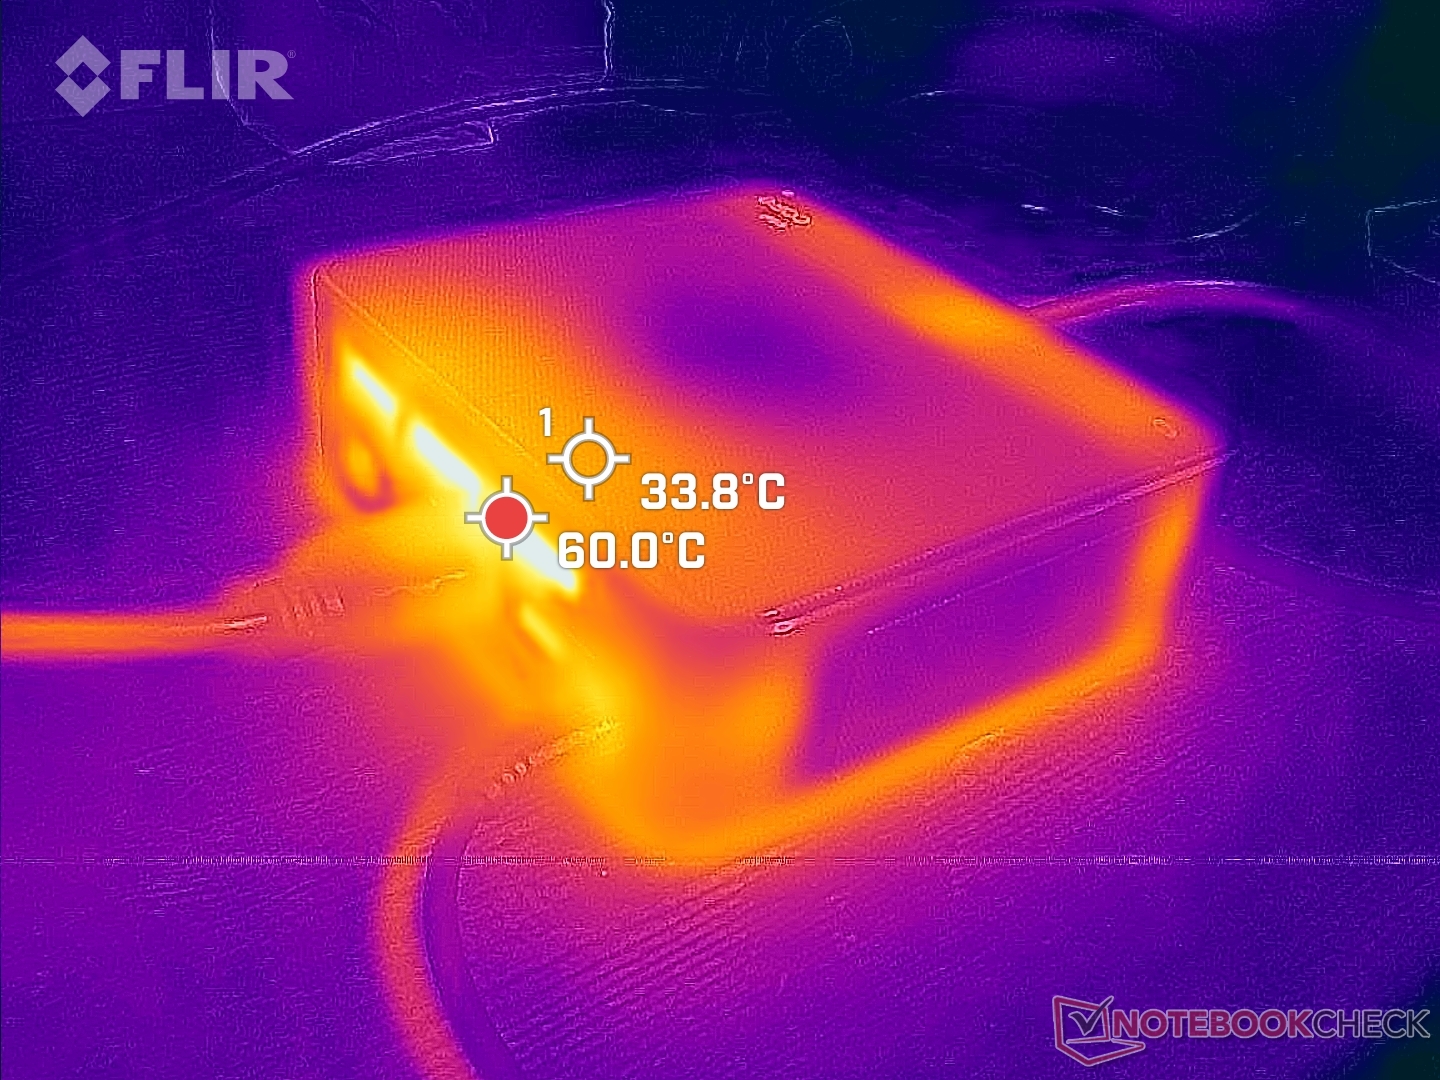
Należy pamiętać, że zasilacz AC może być wyraźnie cieplejszy niż większość innych zasilaczy dostarczanych z laptopami.
Stress Test
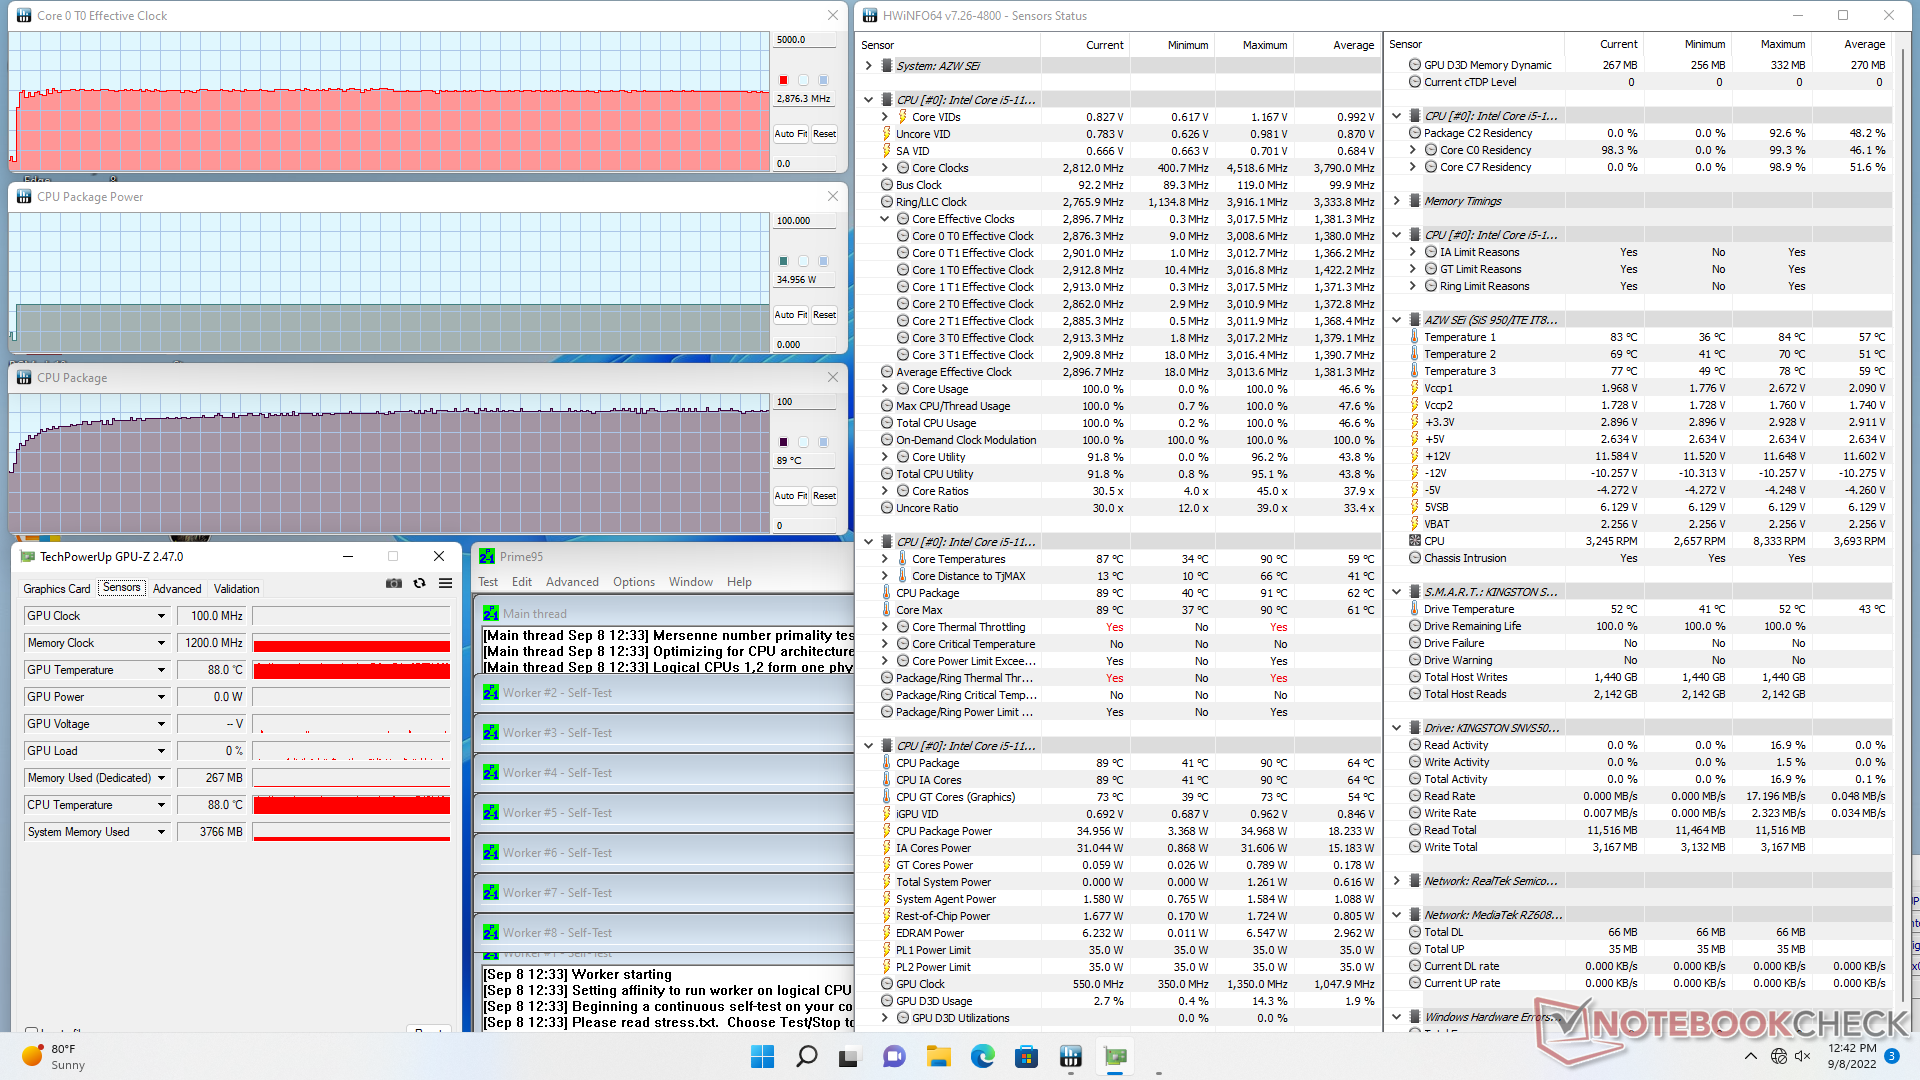
Częstotliwość taktowania i pobór mocy na płycie wzrosły do 2,9 GHz i 35 W, odpowiednio, po zainicjowaniu stresu Prime95. System jest w stanie utrzymać te wartości w nieskończoność, aczkolwiek przy stosunkowo wysokiej temperaturze rdzenia wynoszącej 90 C. 35 W to górny zakres TDP dla Core i5-11320H, a więc SEi11 wykorzystuje procesor w stopniu zbliżonym do jego maksymalnego potencjału.
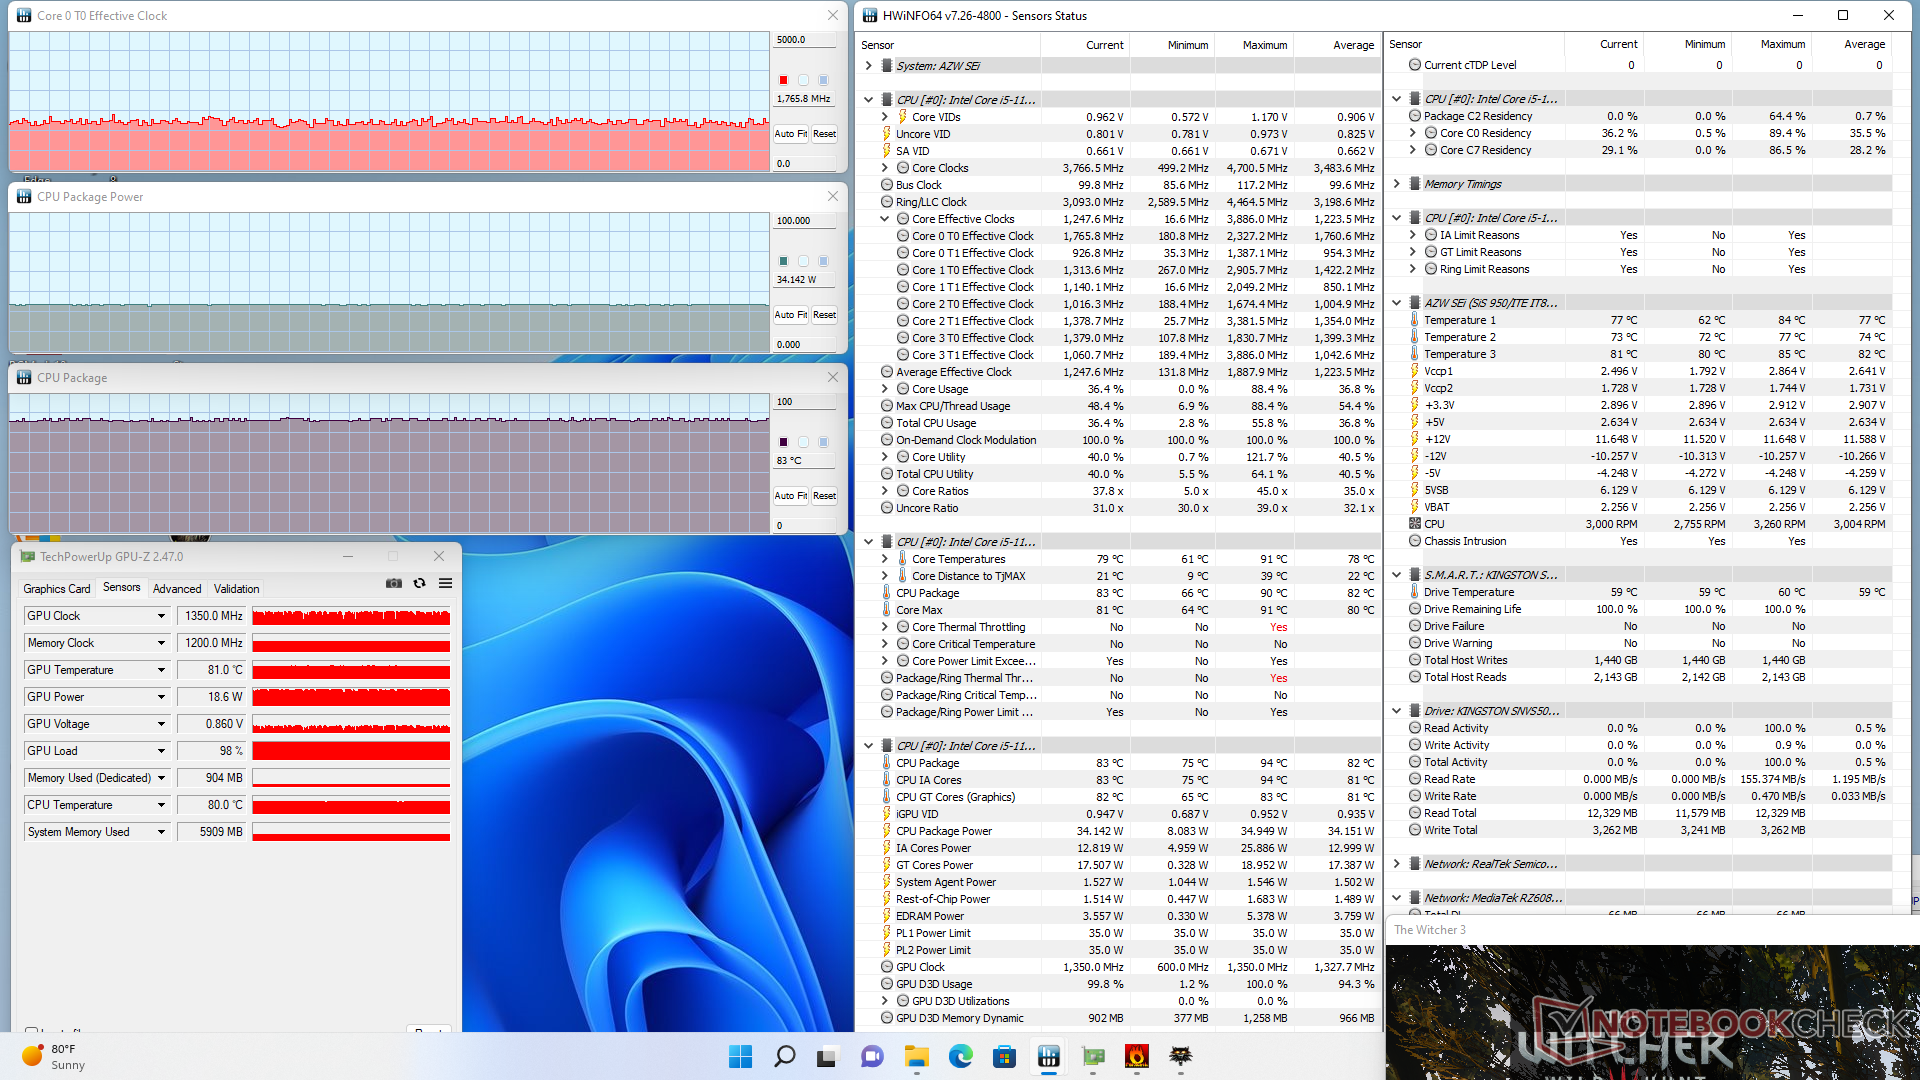
Częstotliwości taktowania GPU i temperatura podczas pracy Witcher 3 są względnie stabilne i wynoszą odpowiednio 1350 MHz i 83 C. Przeprowadzenie tego samego testu na Intel NUC11 z procesorem Core i5-1135G7 spowodowałoby znacznie niższą temperaturę rdzenia, wynoszącą dla porównania 58 C.
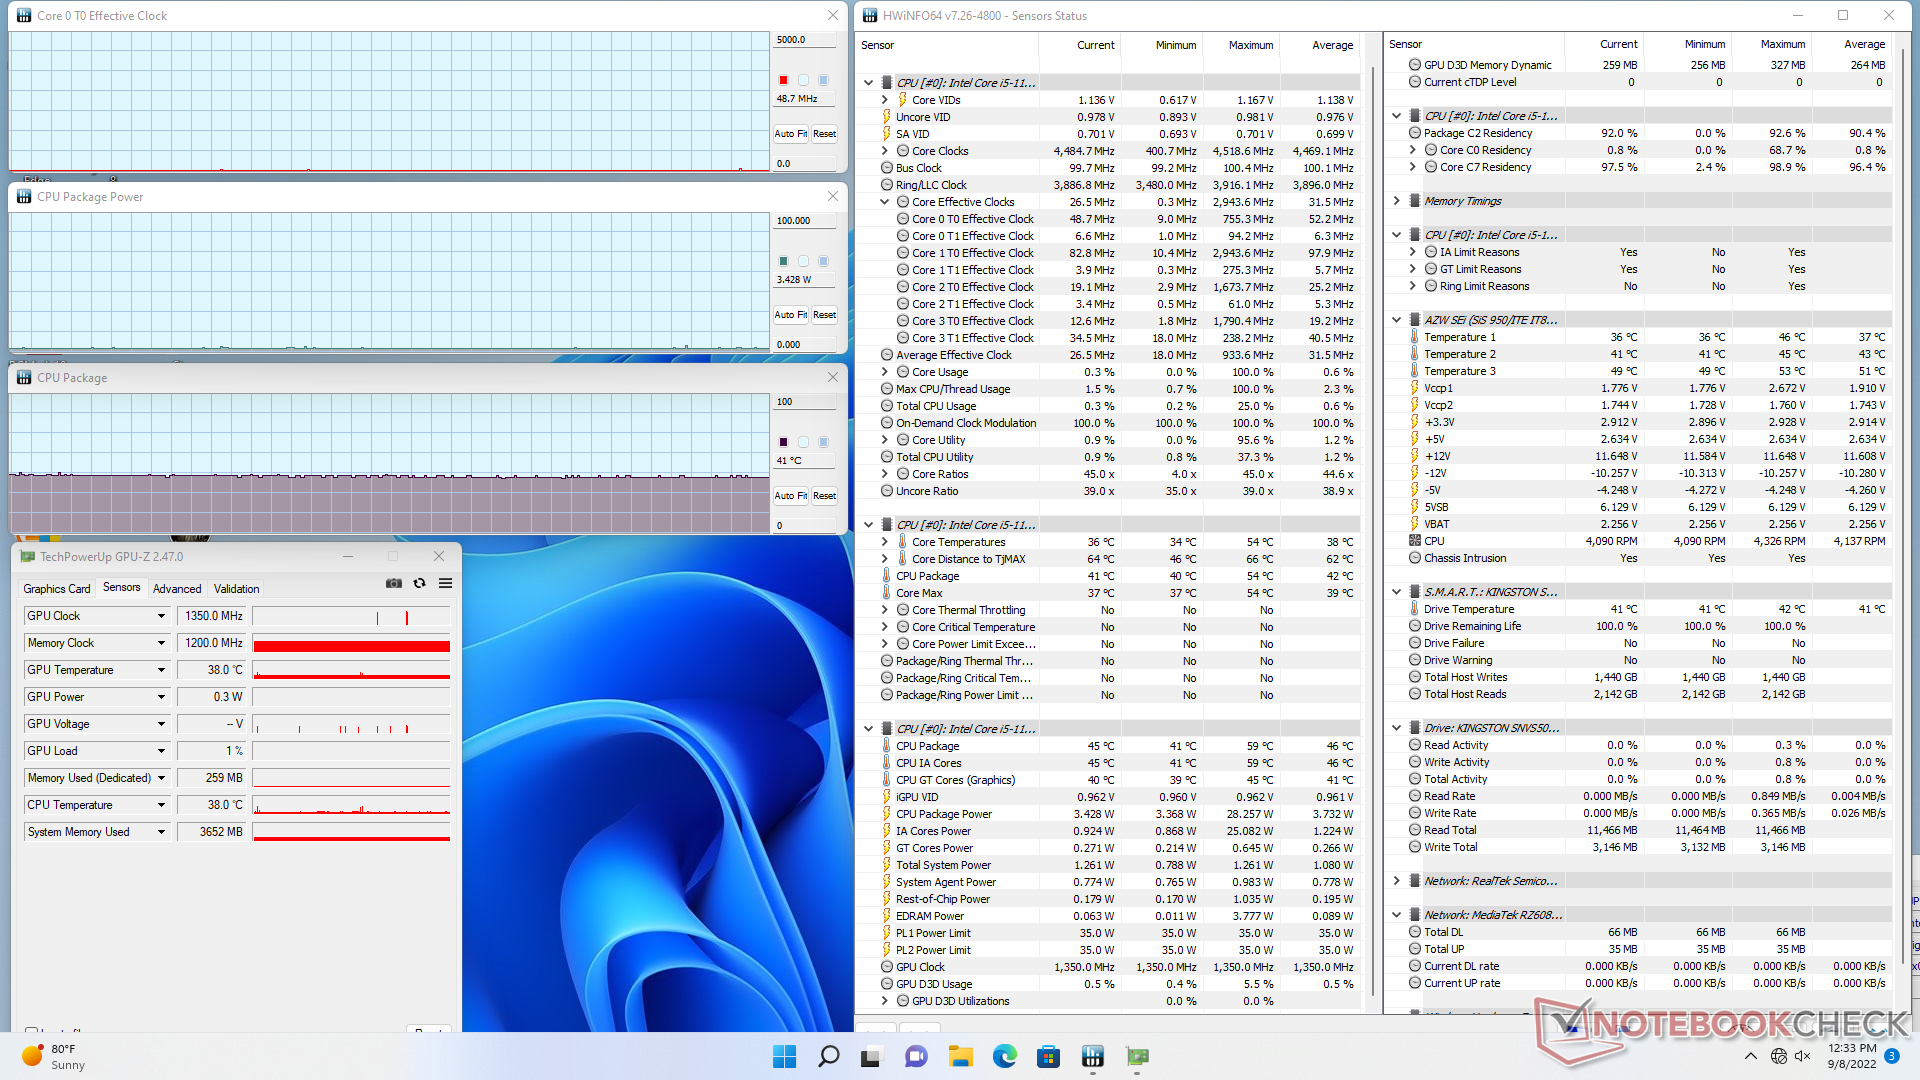
| ZegarCPU (GHz) | Zegar GPU (MHz) | Średnia temperatura CPU (°C) | |
| System w stanie bezczynności | -- | -- | 41 |
| Prime95 Stress | 2.9 | -- | 89 |
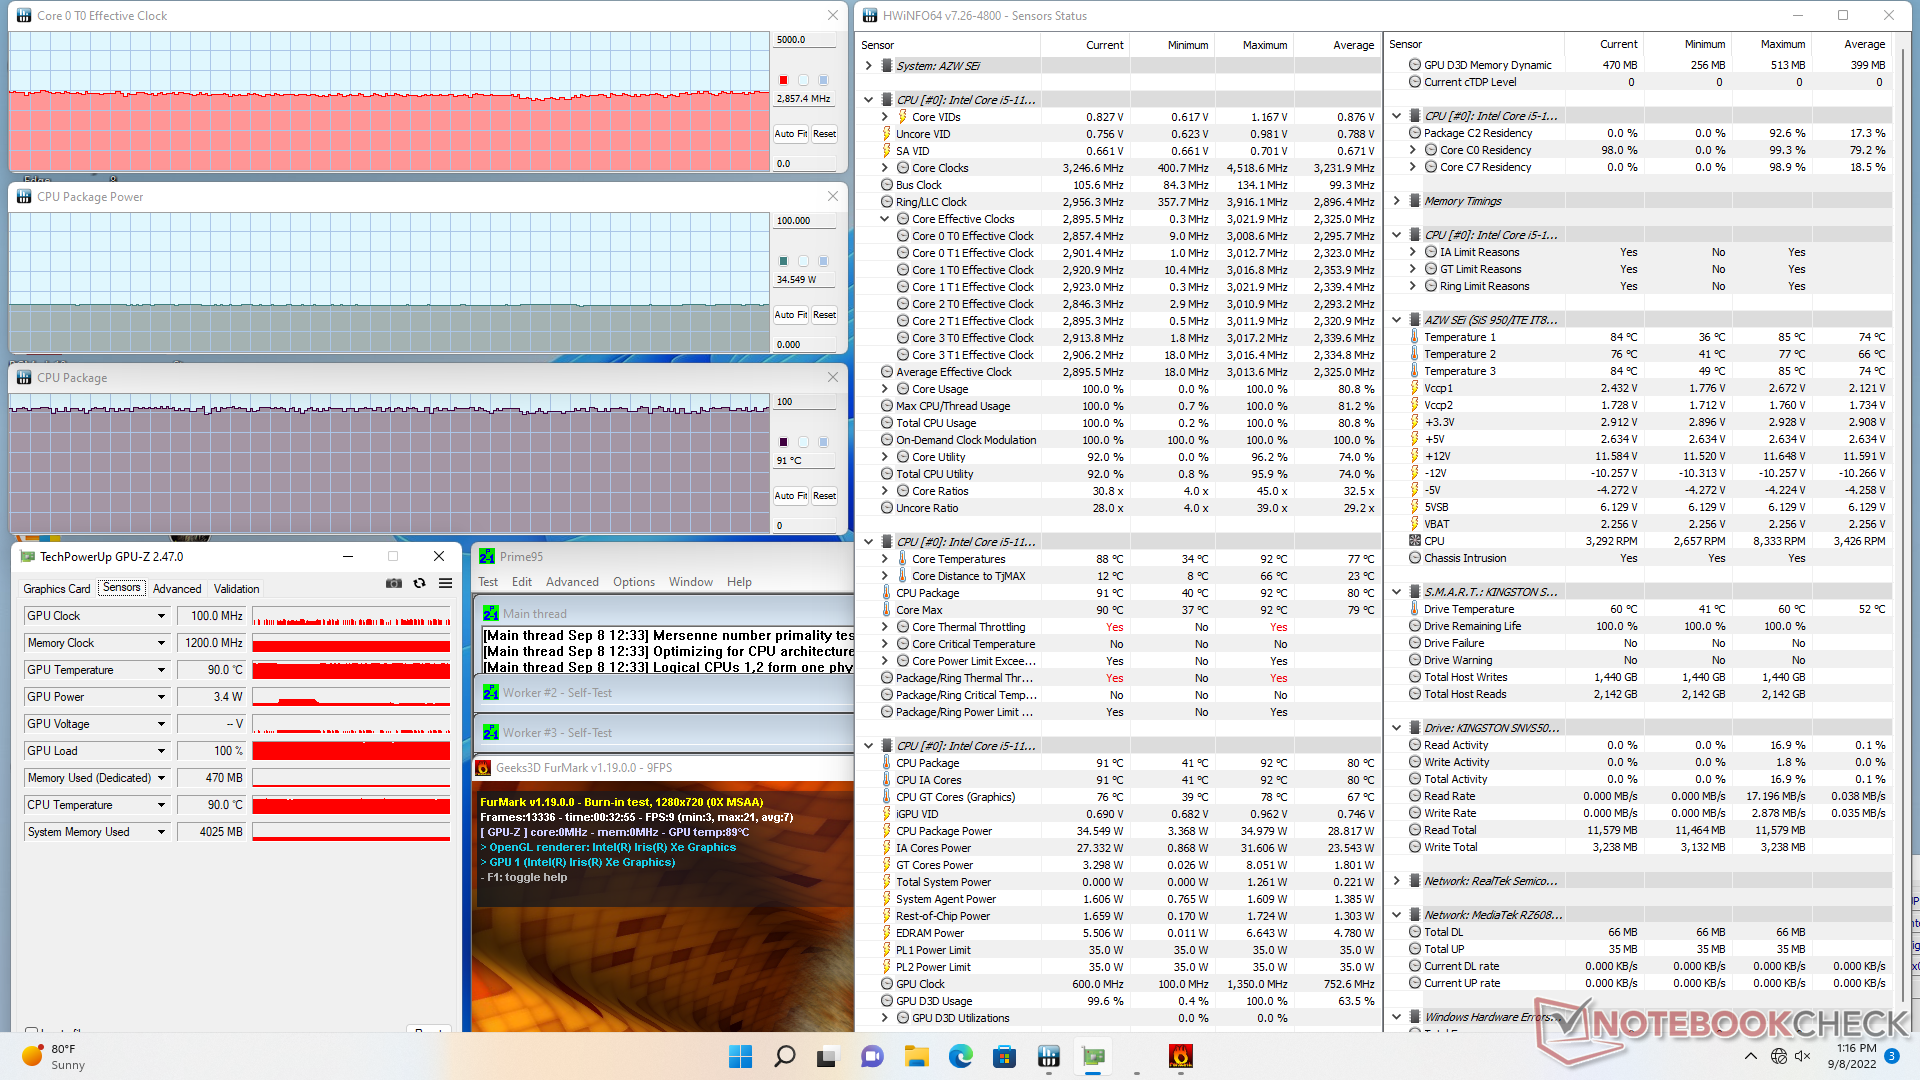
| Prime95 + FurMark Stress | ~2,9 | 600 | 91 |
| Witcher 3 Stress | ~1.8 | 1350 | 83 |
Zarządzanie energią
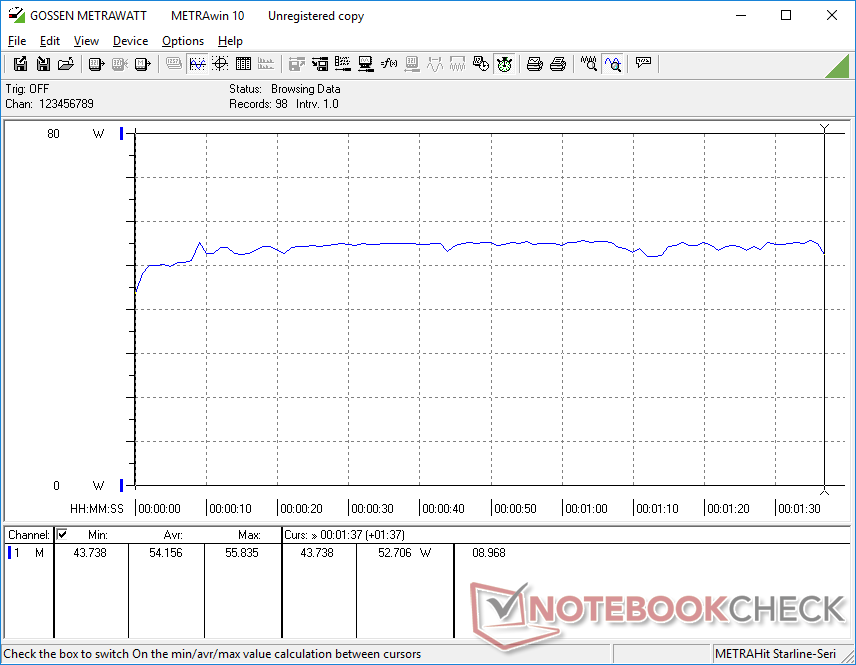
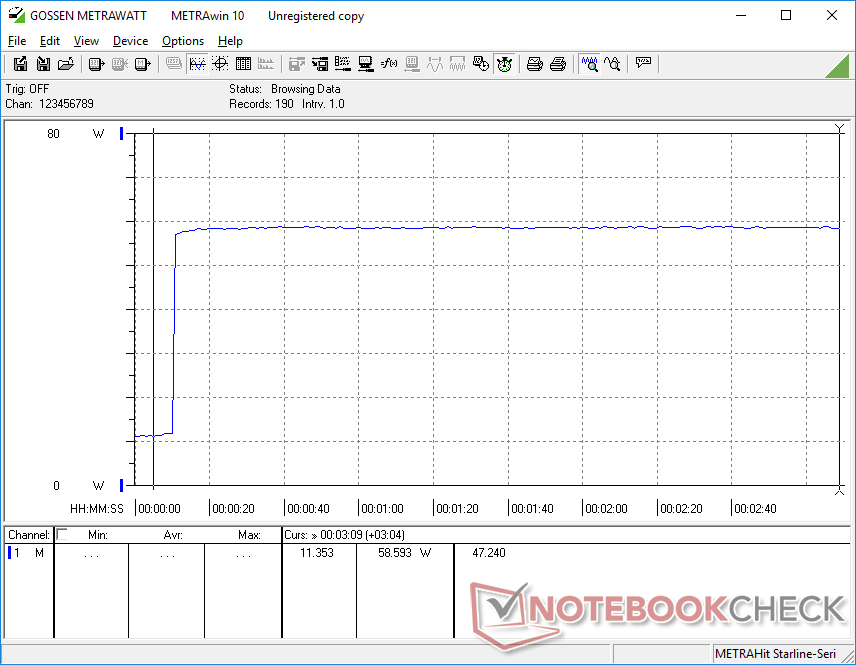
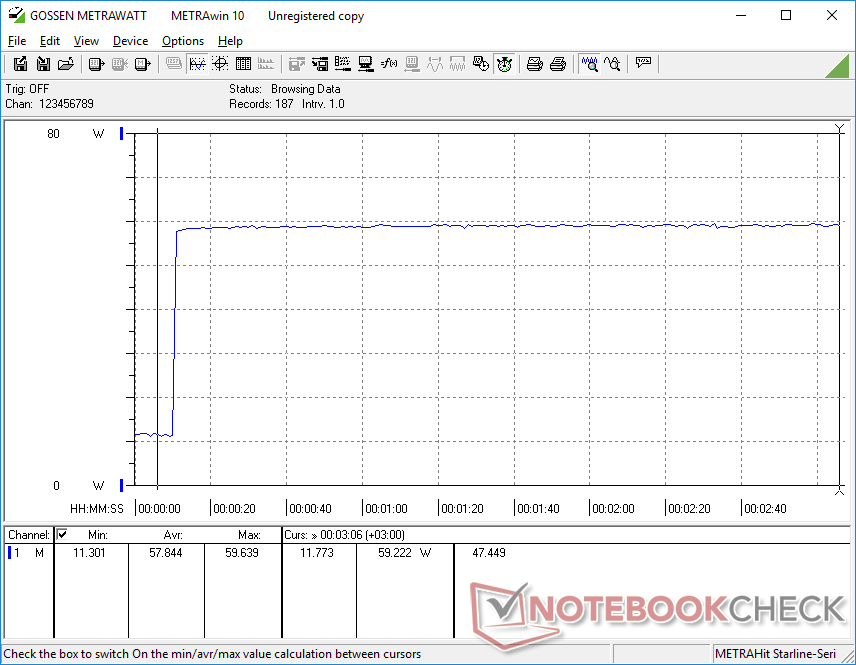
Pobór mocy
System jest bardziej wymagający niż mini PC z procesorami 11. generacji z serii Core U, jak GTI 11 czy Intel NUC11. Jeśli jednak cenisz sobie surową wydajność wielowątkową CPU, to SER4 może być lepszym wyborem, ponieważ oferuje szybszą wydajność wielowątkową, a jednocześnie zużywa o ponad 30 procent mniej energii niż nasz SEi11.
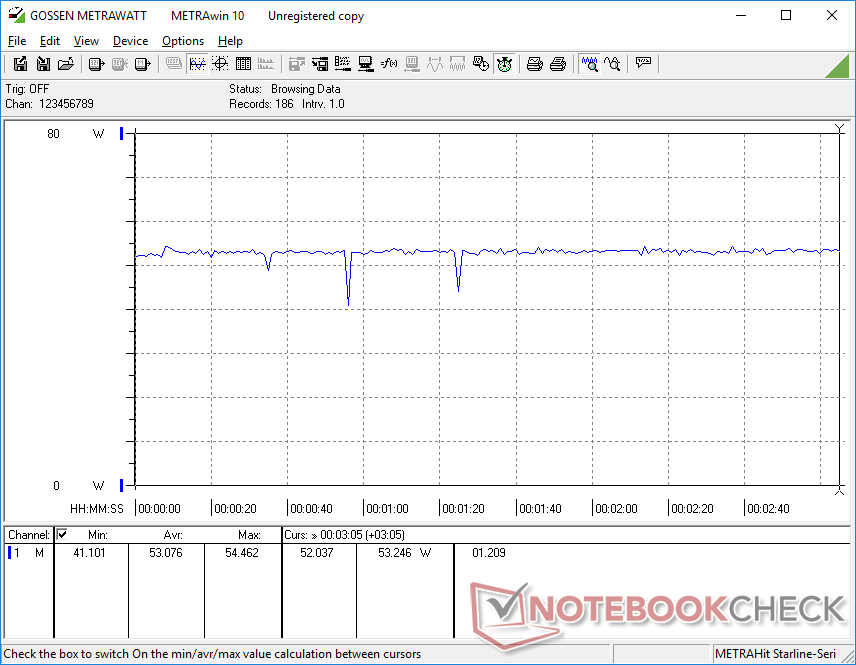
Jesteśmy w stanie zarejestrować maksymalny pobór 59 W ze stosunkowo małego (~10 x 4,3 x 4,8 cm) zasilacza AC o mocy 57 W (19 V, 3 A) podczas pracy z Prime95.
| wyłączony / stan wstrzymania | |
| luz | |
| obciążenie |
|
Legenda:
min: | |
| Beelink SEi11 Pro i5-11320H, Iris Xe G7 96EUs, Kingston NV1 SNVS/500GCN, , x, | Beelink GTR5 R9 5900HX, Vega 8, Kingston NV1 SNVS/500GCN, , x, | Beelink GTI 11 i5-1135G7, Iris Xe G7 80EUs, Kingston SA2000M8500G, , x, | Beelink SER4 R7 4800U, Vega 8, Intel SSD 660p SSDPEKNW512G8, , x, | Intel NUC11TNKi5 i5-1135G7, Iris Xe G7 80EUs, Transcend M.2 SSD 430S TS512GMTS430S, , x, | |
|---|---|---|---|---|---|
| Power Consumption | -2% | -38% | 46% | -7% | |
| Idle Minimum * (Watt) | 9.8 | 6.2 37% | 15.2 -55% | 4.1 58% | 11.5 -17% |
| Idle Average * (Watt) | 10.3 | 8.9 14% | 16 -55% | 4.1 60% | 12.4 -20% |
| Idle Maximum * (Watt) | 10.5 | 9 14% | 16 -52% | 4.6 56% | 12.9 -23% |
| Load Average * (Watt) | 54.2 | 66.8 -23% | 48.6 10% | 35.6 34% | 40.7 25% |
| Witcher 3 ultra * (Watt) | 53.1 | 62.6 -18% | 53.8 -1% | 35.6 33% | 43.9 17% |
| Load Maximum * (Watt) | 59 | 81.6 -38% | 104.3 -77% | 39.9 32% | 73.5 -25% |
* ... im mniej tym lepiej
Power Consumption Witcher 3 / Stresstest
Power Consumption external Monitor
Za
Przeciw
Werdykt - HTPC Core i5 Sweet Spot
W portfolio firmy Beelink znajduje się kilka "Intel NUC killerów", które oferują większość tych samych funkcji, ale za setki dolarów mniej. SEi11 to kolejny sukces firmy, który w dużej mierze zawdzięcza Core i5-11320H który, jak wykazaliśmy, jest porównywalny z Core i7-1165G7, jaki można znaleźć w modelach NUC kosztujących prawie dwa razy więcej. W skrócie, użytkownicy nie będą musieli zadowolić się wolniejszym Core i3, Ryzen 3, Celeron lub Atom tylko dlatego, że alternatywa NUC jest o wiele bardziej przystępna. Przystępna pamięć RAM, podwójna pamięć masowa i szeroki wybór portów powinny zadowolić większość użytkowników HTPC lub małych biur domowych
Beelink SEi11 działa prawie dokładnie tak samo jak Intel NUC11 z Core i7-1165G7 podczas sprzedaży detalicznej za znacznie mniej.
Jest jednak kilka cięć, na które należy uważać. W szczególności Thunderbolt i DisplayPort nie są obsługiwane, a WLAN jest słabszy niż oczekiwano. Standardowa gwarancja jest również krótsza niż 36-miesięczna gwarancja na Intel NUC. Szum wentylatorów jest generalnie cichszy niż w przypadku większości innych mini PC, aczkolwiek kosztem cieplejszych temperatur rdzenia. W przeciwnym razie, jest to tak blisko do doświadczenia Intel NUC można uzyskać bez płacenia tych cen NUC.
Cena i dostępność
Amazon ma Beelink SEi11 w magazynie w komplecie z Windows 11 Pro, 500 GB SSD i 16 GB RAM za 479 USD lub 419 USD po zastosowaniu kodu kuponu w tym momencie. Alternatywnie, użytkownicy mogą kupić bezpośrednio od producenta za 429 USD.
Price comparison

