Debiut Intel Core i5-8260U: Recenzja mini PC BMAX B5 Pro G7H8

Podobnie jak Chuwi, BMax specjalizuje się w niedrogich laptopach, monitorach i mini PC, które są zazwyczaj o setki dolarów tańsze niż nawet najbardziej podstawowe SKU od większych i bardziej znanych producentów. Ich sekretem jest wykorzystanie procesorów starszej generacji, które mogą znacznie obniżyć koszt urządzeń
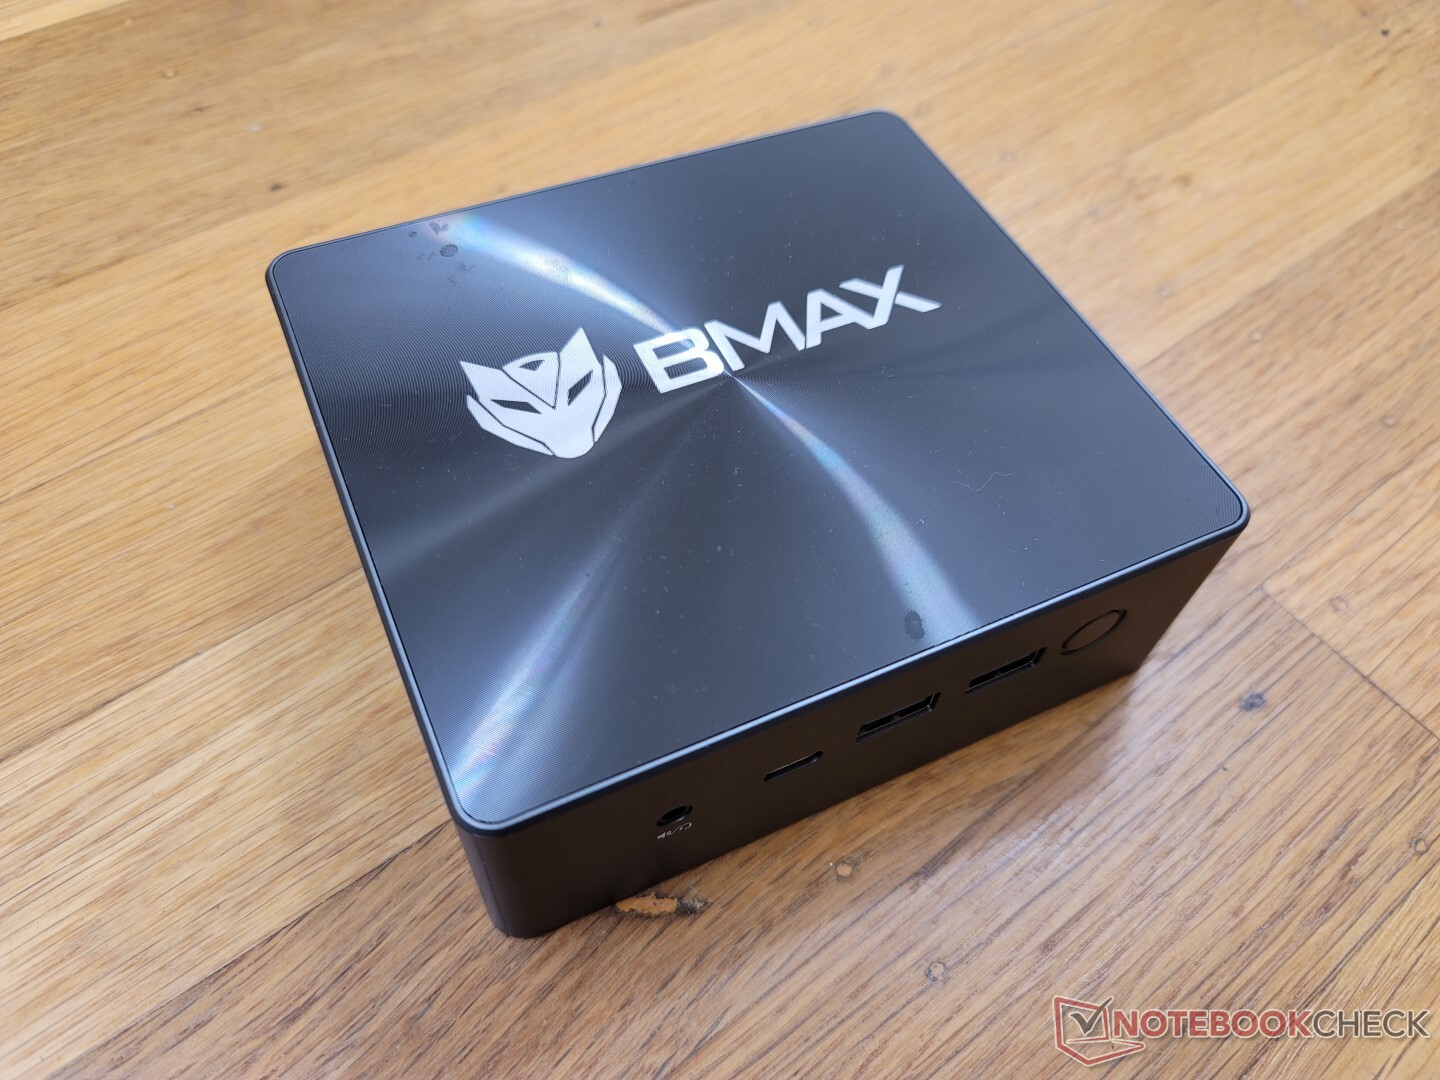
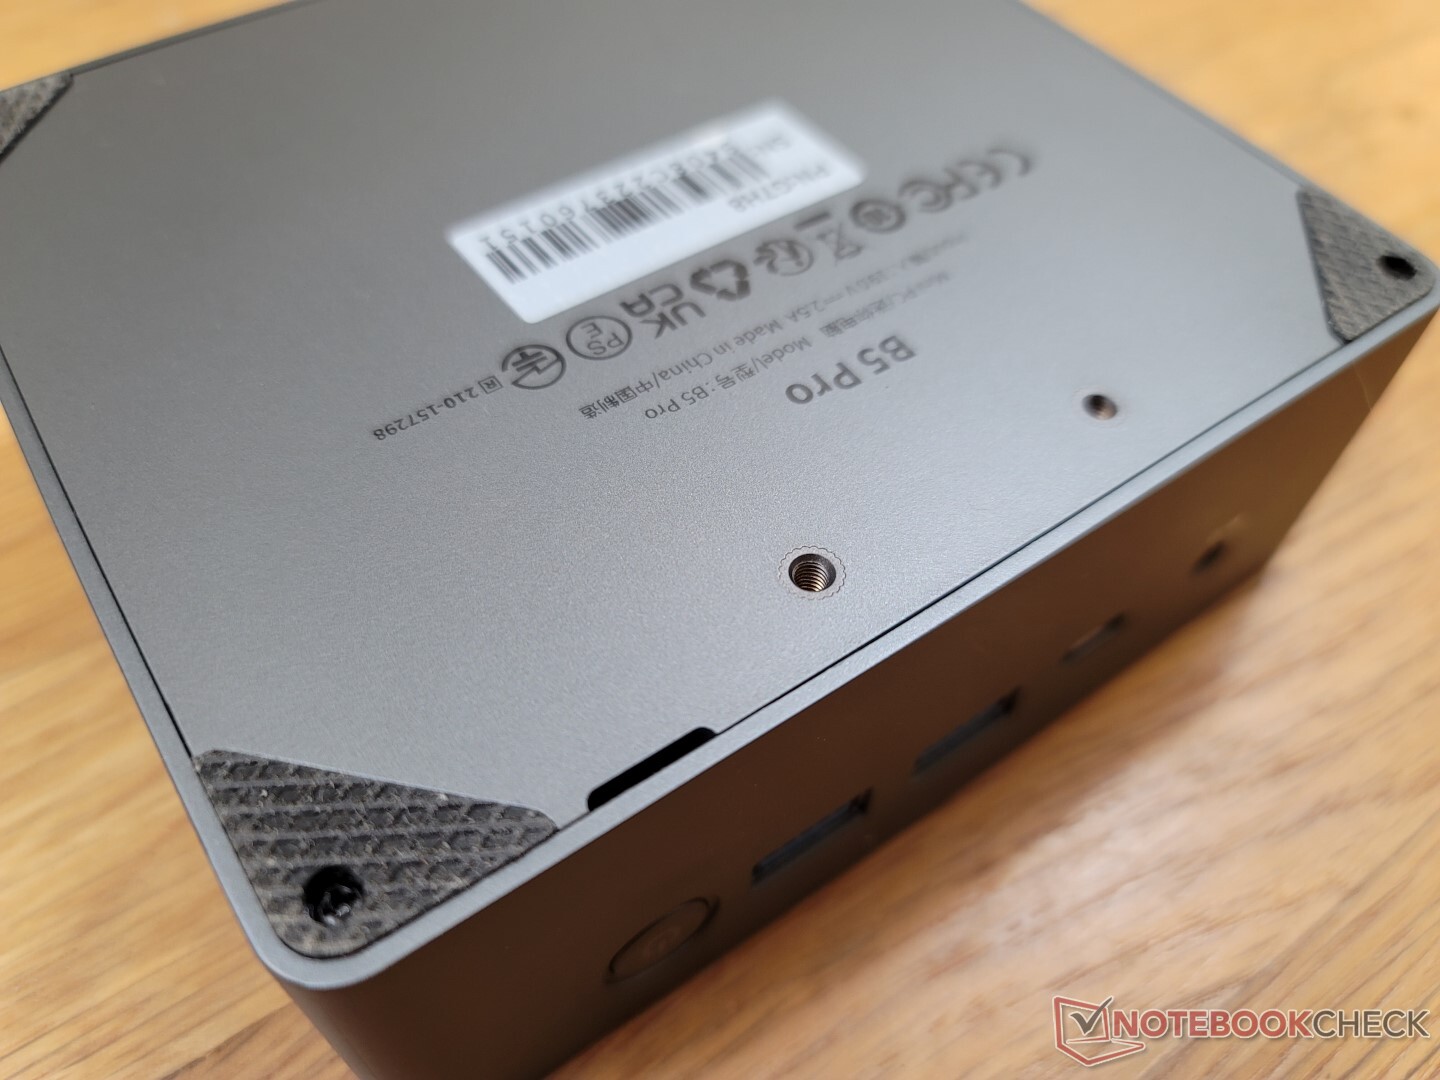
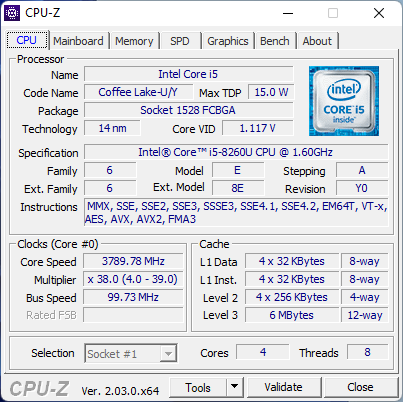
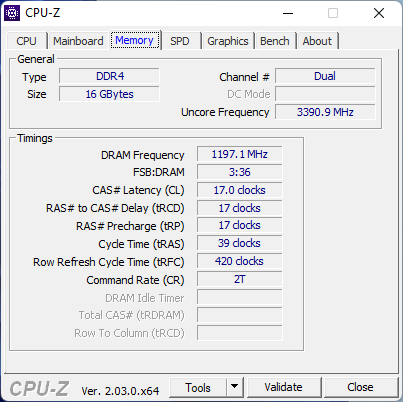
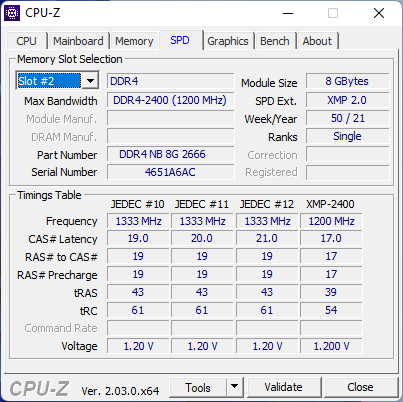
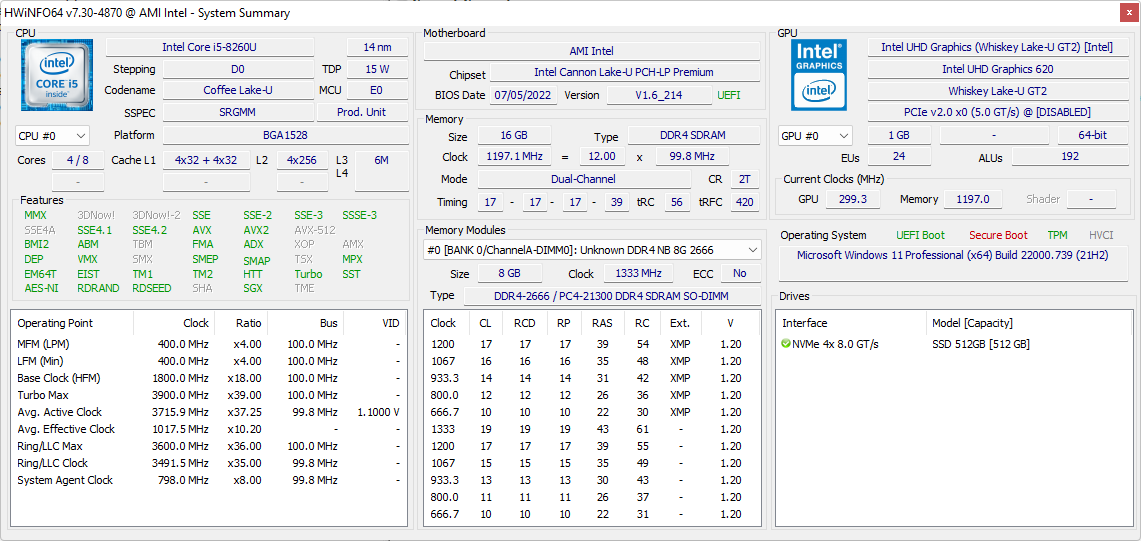
BMax B5 Pro to najnowszy mini PC od producenta skierowany do użytkowników HTPC z mniejszym budżetem. Warto zwrócić uwagę na starszy procesor 8 generacji Intel Core z serii U, podczas gdy najnowsze mini PC korzystają z opcji 12 generacji. Nasza konkretna konfiguracja jest wyposażona w nieczęsty procesor Coffee Lake Core i5-8260U z 16 GB pamięci RAM, 512 GB NVMe SSD i preinstalowanym systemem Windows 11 za jedyne 280 USD w momencie pisania tego tekstu. B5 Pro konkuruje bezpośrednio z innymi niedrogimi mini PC, takimi jak Beelink SEi8 lub GMK NucBox 2.
Więcej recenzji BMax:
Possíveis concorrentes em comparação
Ocena | Data | Model | Waga | Wysokość | Rozmiar | Rezolucja | Cena |
|---|---|---|---|---|---|---|---|
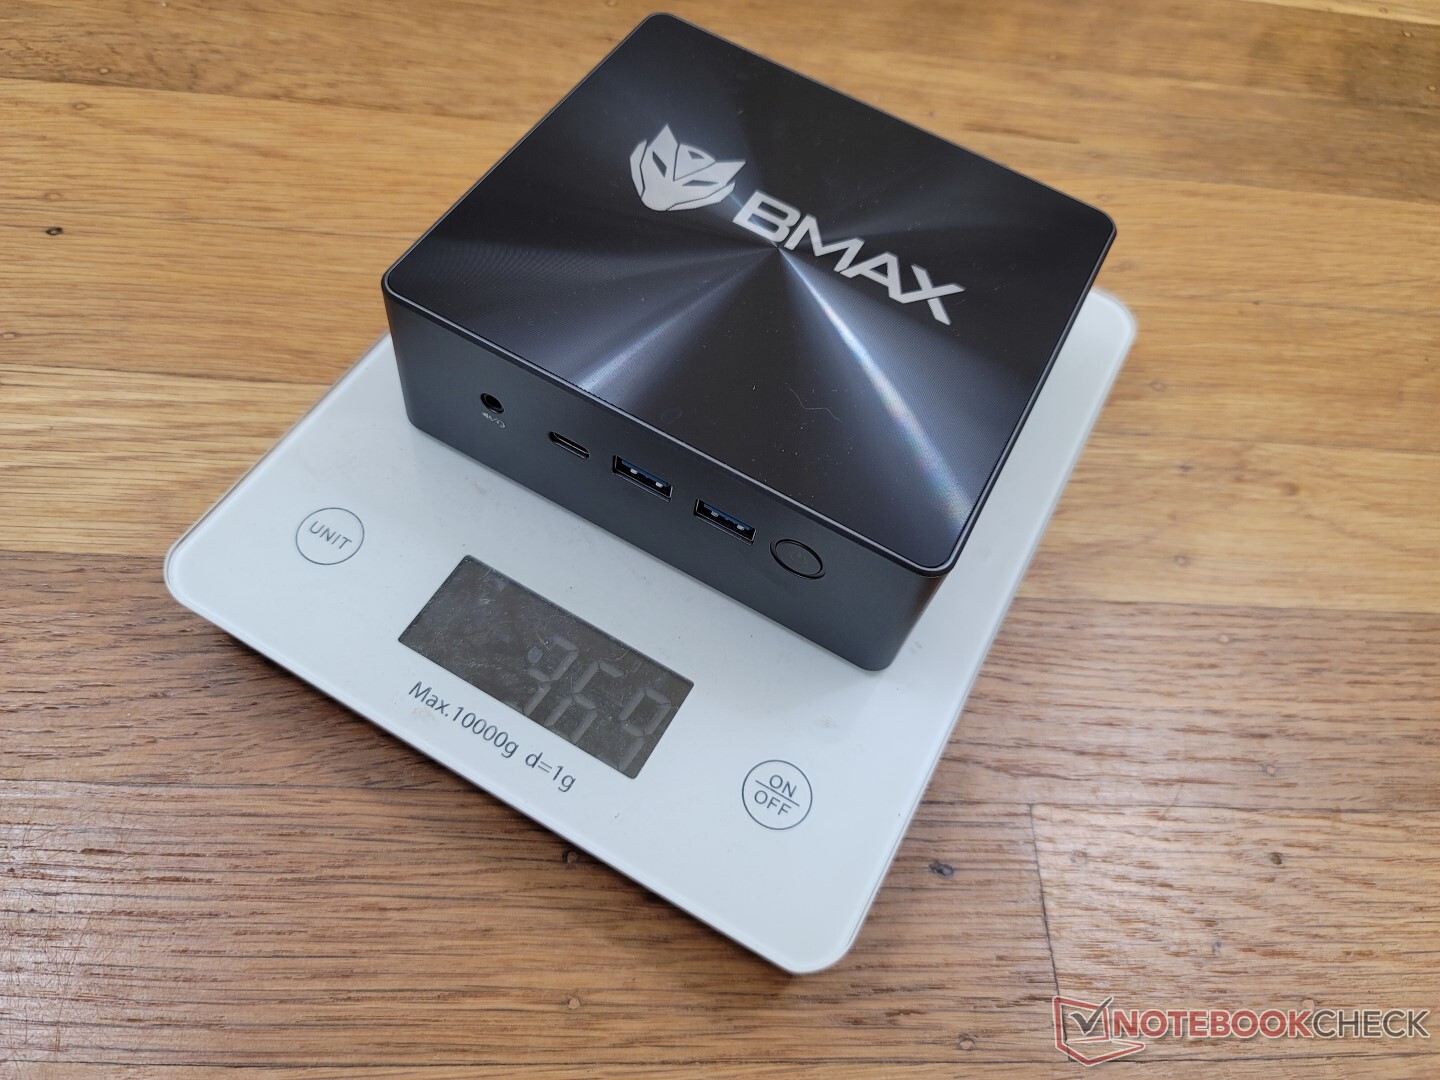
v (old) | 11/2022 | BMAX B5 Pro G7H8 i5-8260U, UHD Graphics 620 | 369 g | 43.2 mm | x | ||
v (old) | 10/2022 | Beelink SEi11 Pro i5-11320H, Iris Xe G7 96EUs | 440 g | 40 mm | x | ||
v (old) | 09/2022 | Beelink U59 N5105 Celeron N5105, UHD Graphics (Jasper Lake 24 EU) | 320 g | 42 mm | x | ||
v (old) | Beelink SEi8 i3-8109U, Iris Plus Graphics 655 | 346 g | 41 mm | x | |||
v (old) | 10/2022 | Beelink SER Pro Ryzen 5 5600H R5 5600H, Vega 7 | 498 g | 42 mm | x | ||
v (old) | Intel NUC11TNKi5 i5-1135G7, Iris Xe G7 80EUs | 504 g | 37 mm | x |
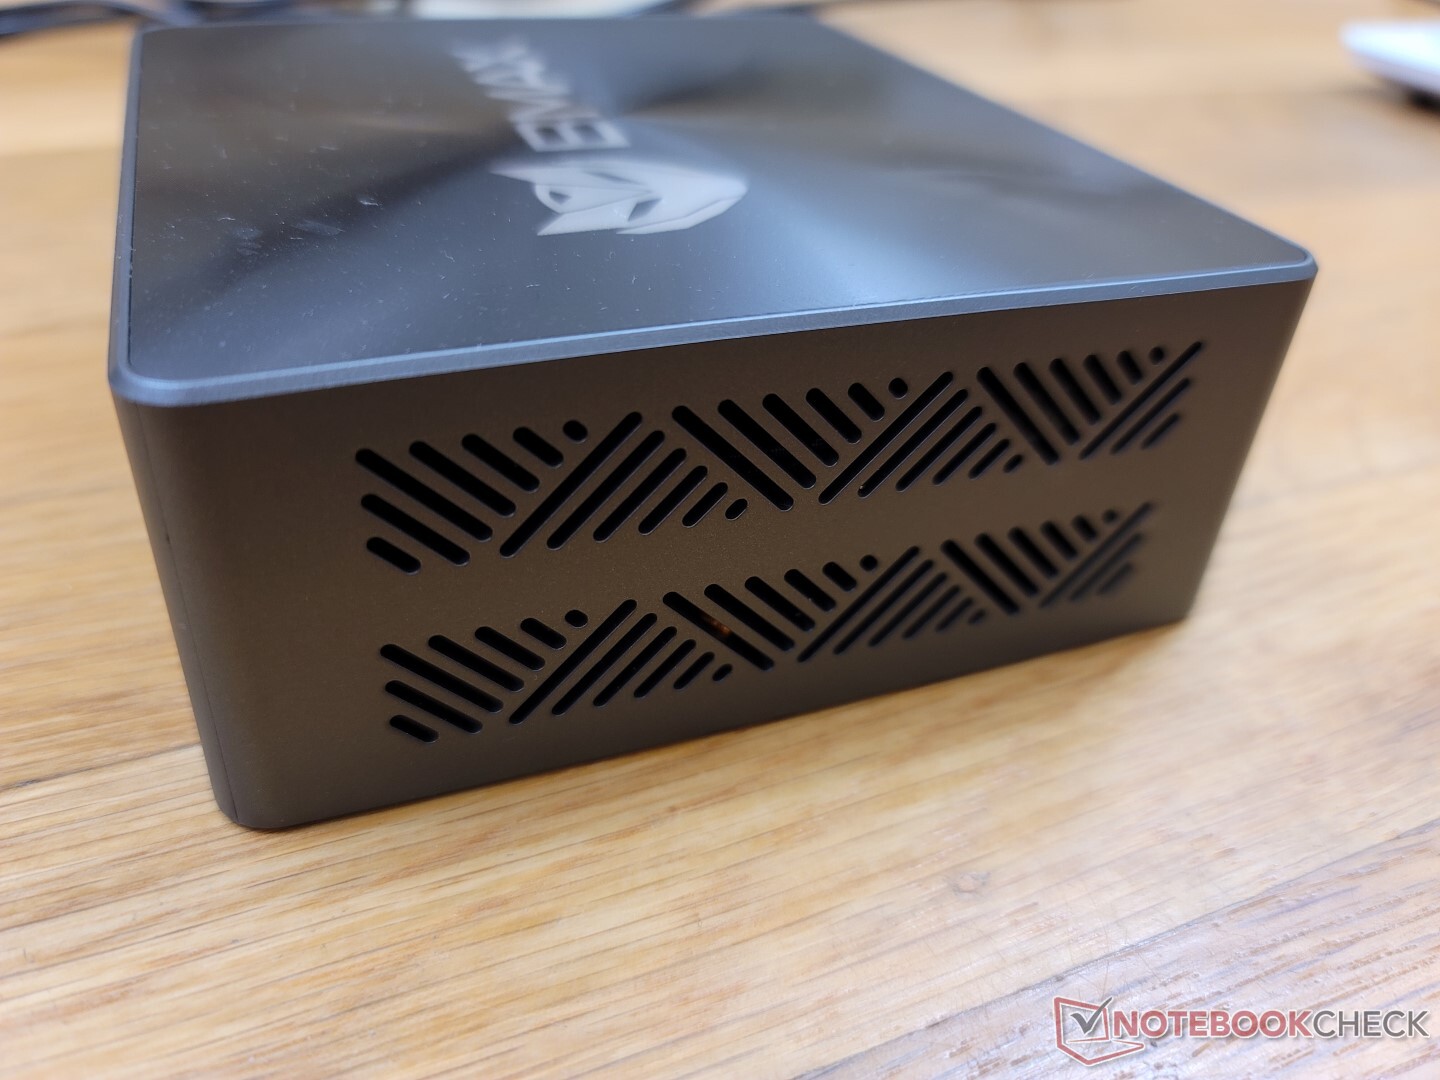
Case - Nothing Out of the Ordinary
Obudowa jest nieco grubsza niż np Intel NUC11TNKi5 by być niemal identyczną jak Beelink SEi8. Sztywność jest mocna wokół krawędzi i spodu, ponieważ te obszary są metalowe, podczas gdy góra jest tańszym plastikiem i bardziej podatnym na wypaczenia. To wciąż mocna konstrukcja bez widocznych wad, nawet jeśli nie jest tak ciężka jak Intel NUC.
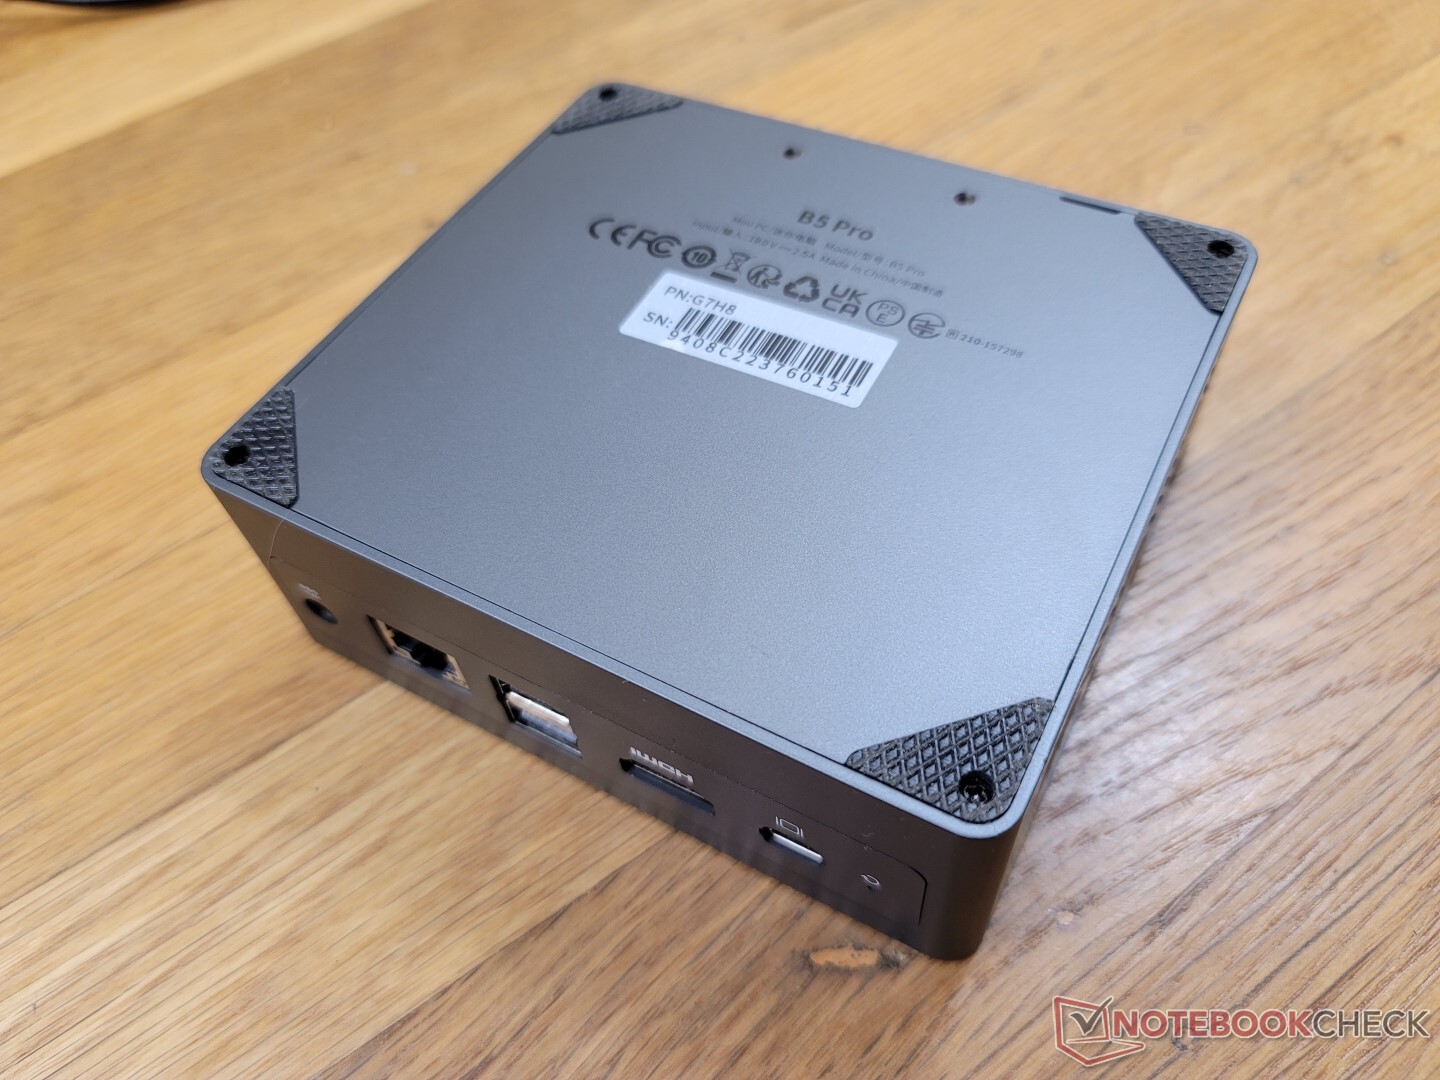
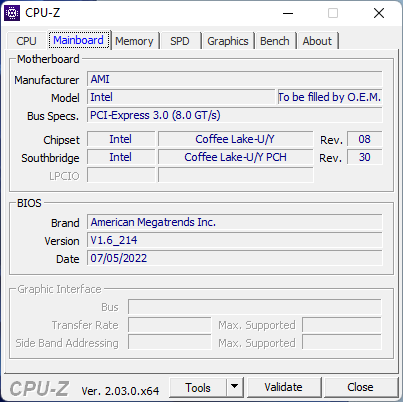
Łączność - Brak obsługi Thunderbolt
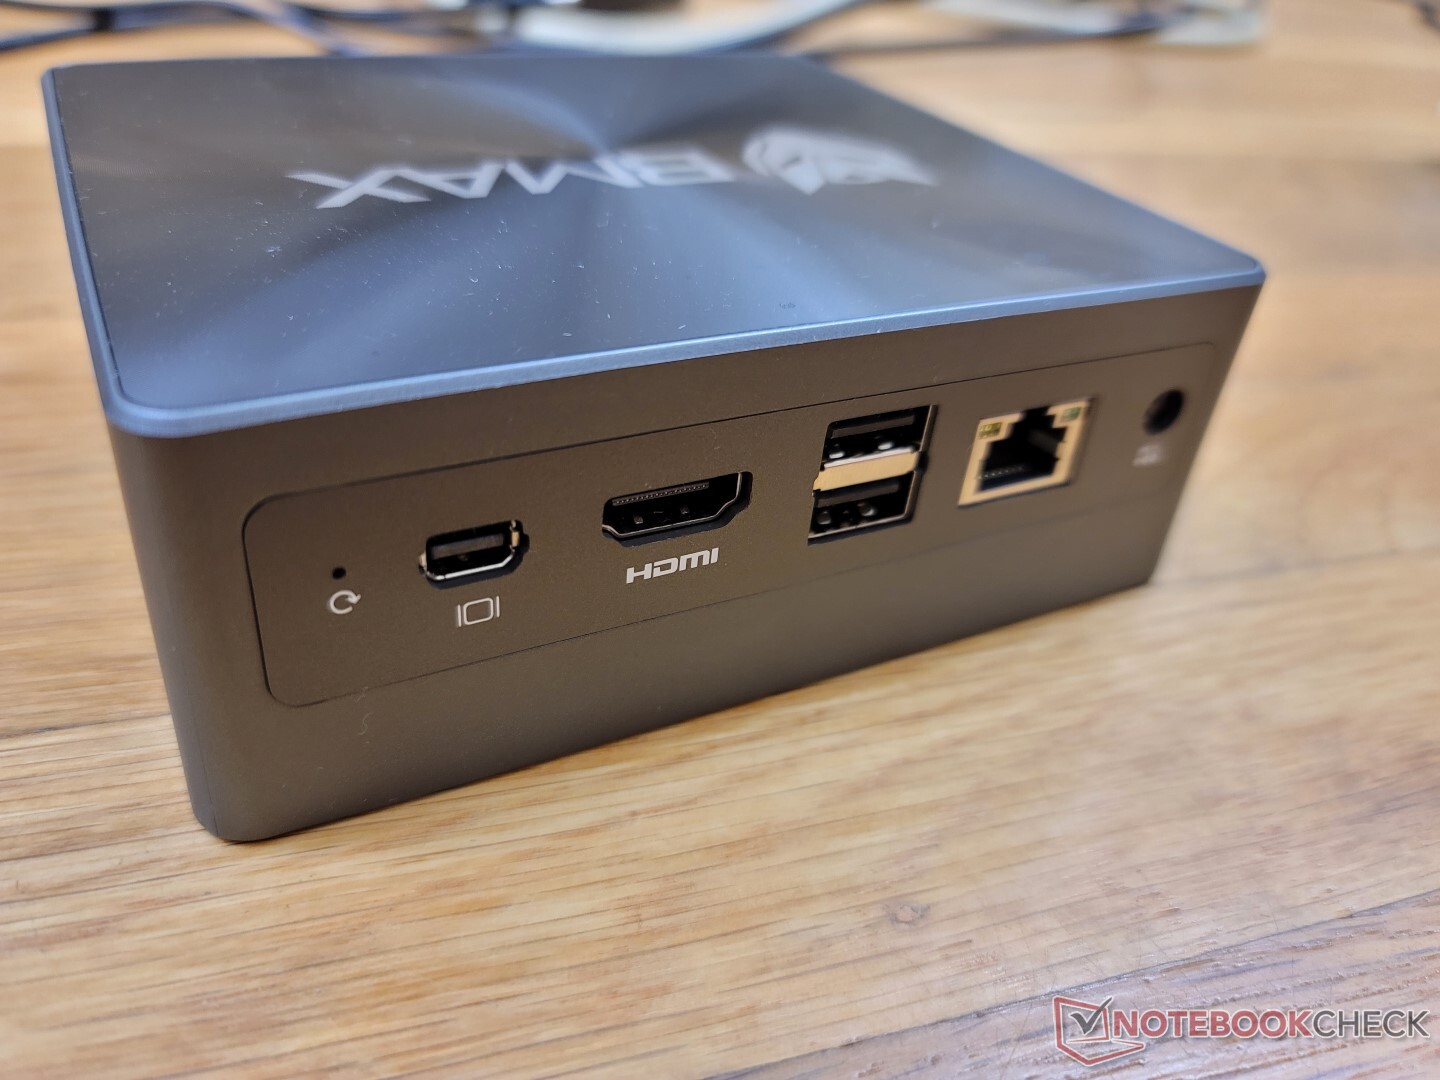
Najbardziej godnym uwagi portem w B5 Pro jest mini DisplayPort, gdyż większość innych mini PC w tym przedziale cenowym w ogóle nie posiada mini DisplayPort. monitory 4K przy 60 Hz nie są obsługiwane przez HDMI.
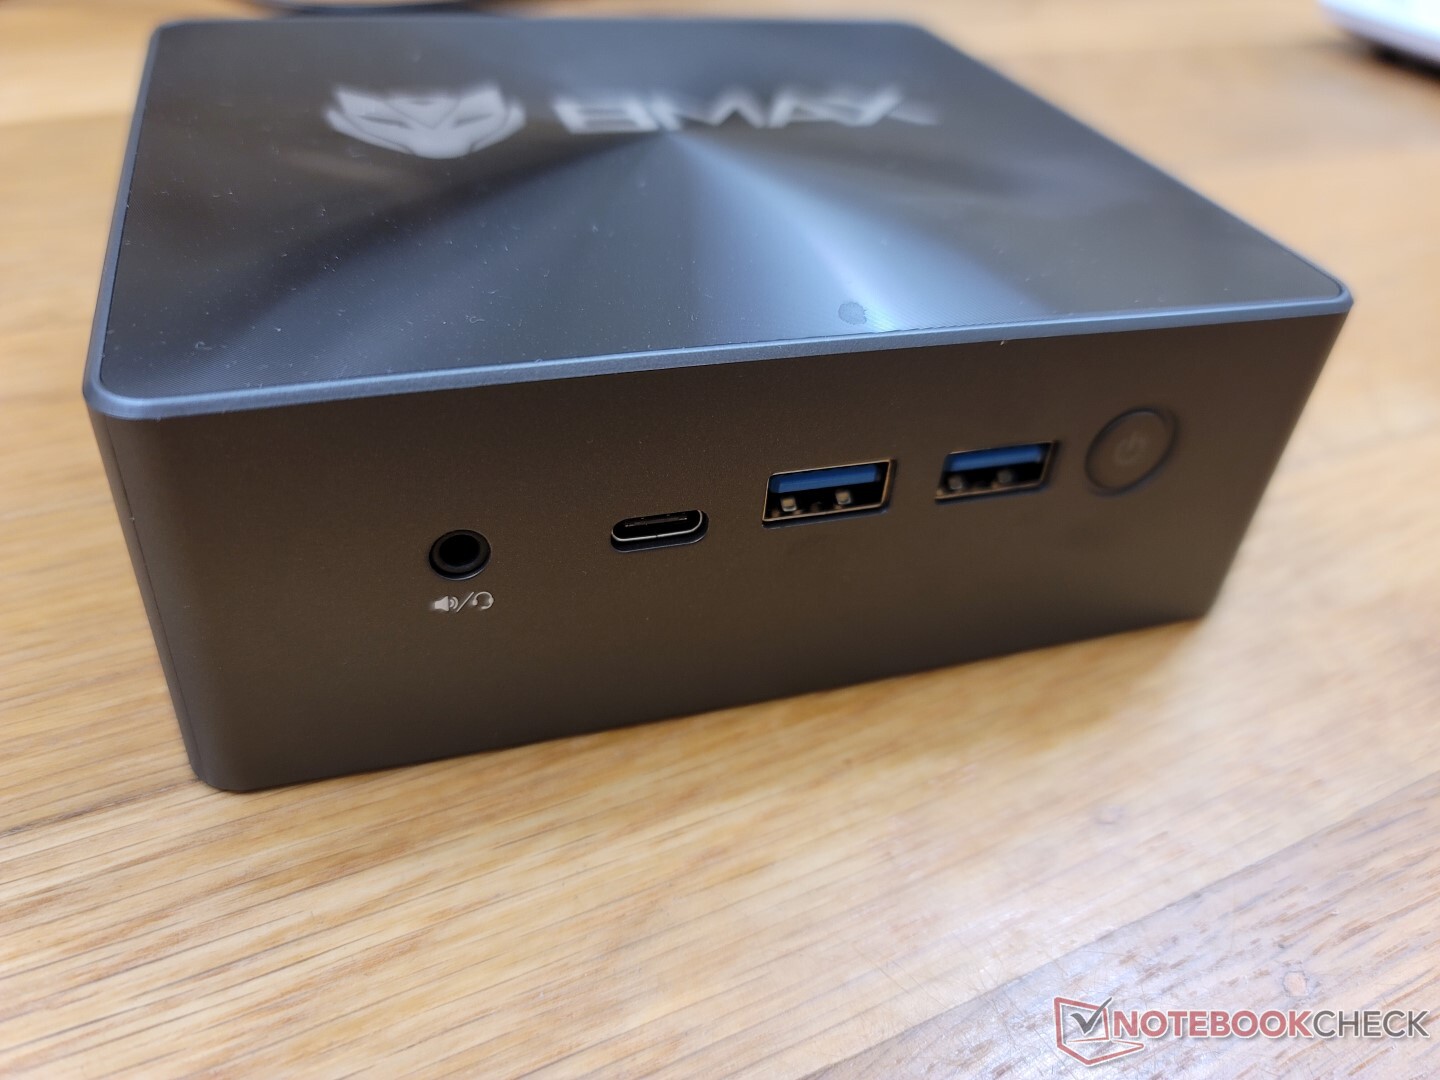
Port USB-C z przodu obsługuje zewnętrzne monitory, ale nie obsługuje Power-in ani Thunderbolt.
Komunikacja
RealTek RTL8852BE standardowo zapewnia łączność Wi-Fi 6 i Bluetooth 5.2. Nie ma obsługi Wi-Fi 6E, co prawdopodobnie ma na celu obniżenie kosztów. Transfer danych jest stabilny i bezproblemowy, nawet jeśli nie jest tak szybki jak w przypadku bardziej popularnej serii Intel AX200/201.
| Networking | |
| iperf3 transmit AX12 | |
| Intel NUC11TNKi5 | |
| Beelink SEi8 | |
| iperf3 receive AX12 | |
| Intel NUC11TNKi5 | |
| Beelink SEi8 | |
| iperf3 receive AXE11000 6GHz | |
| Beelink SER Pro Ryzen 5 5600H | |
| Beelink SEi11 Pro | |
| iperf3 receive AXE11000 | |
| BMAX B5 Pro G7H8 | |
| Beelink U59 N5105 | |
| iperf3 transmit AXE11000 6GHz | |
| Beelink SER Pro Ryzen 5 5600H | |
| Beelink SEi11 Pro | |
| iperf3 transmit AXE11000 | |
| BMAX B5 Pro G7H8 | |
| Beelink U59 N5105 | |
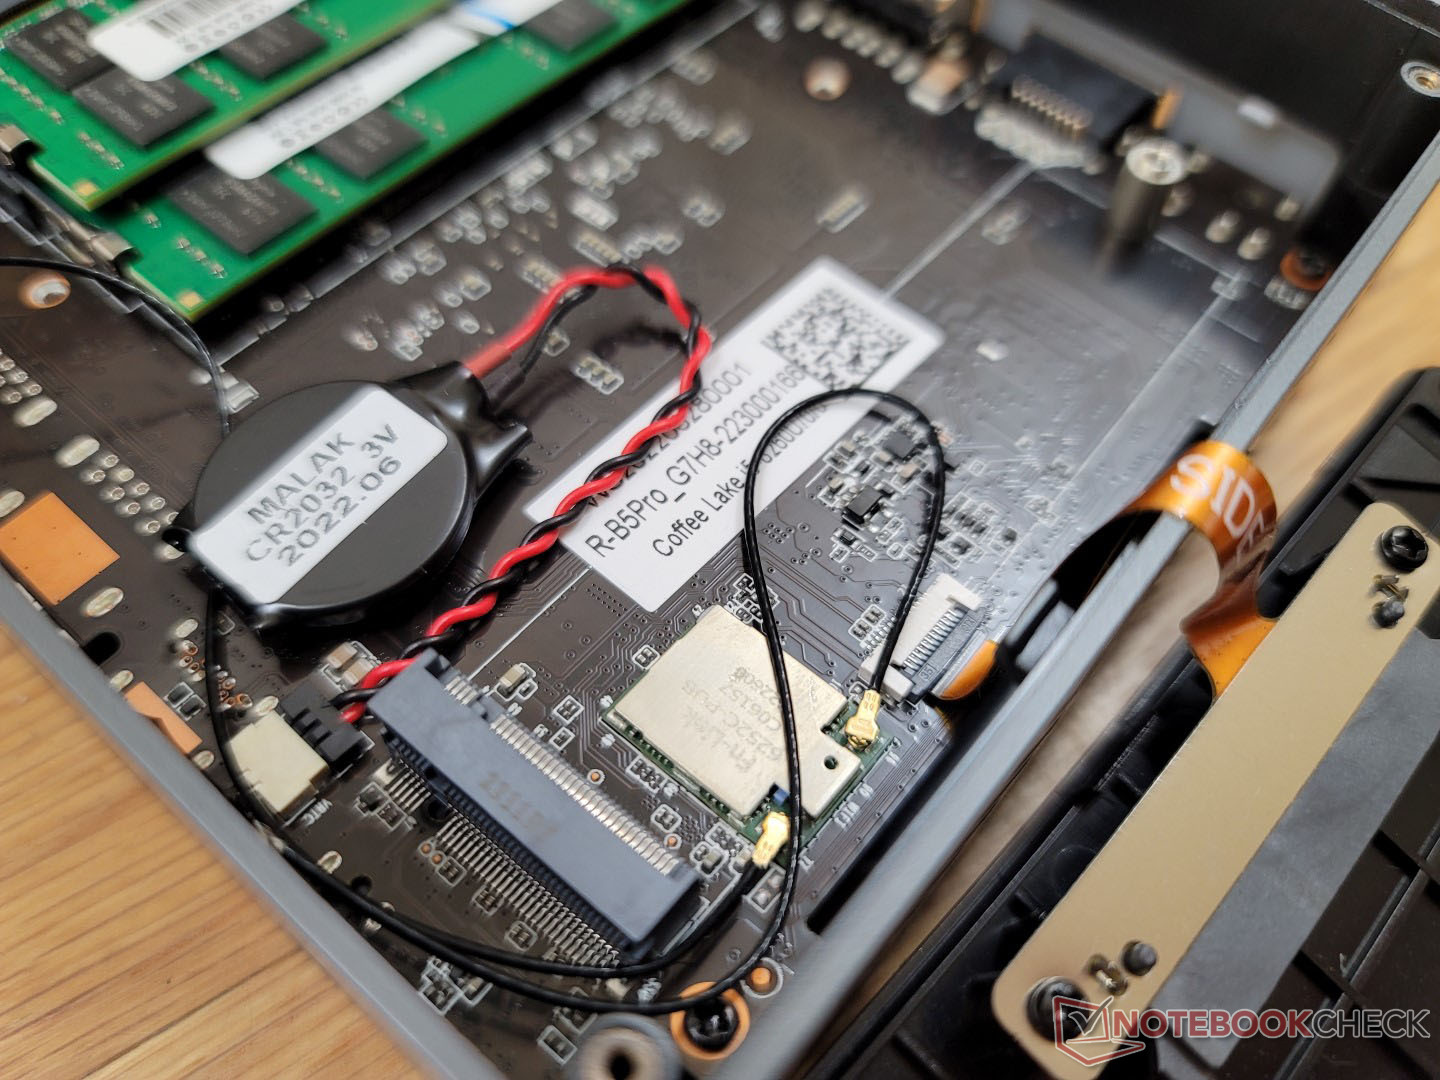
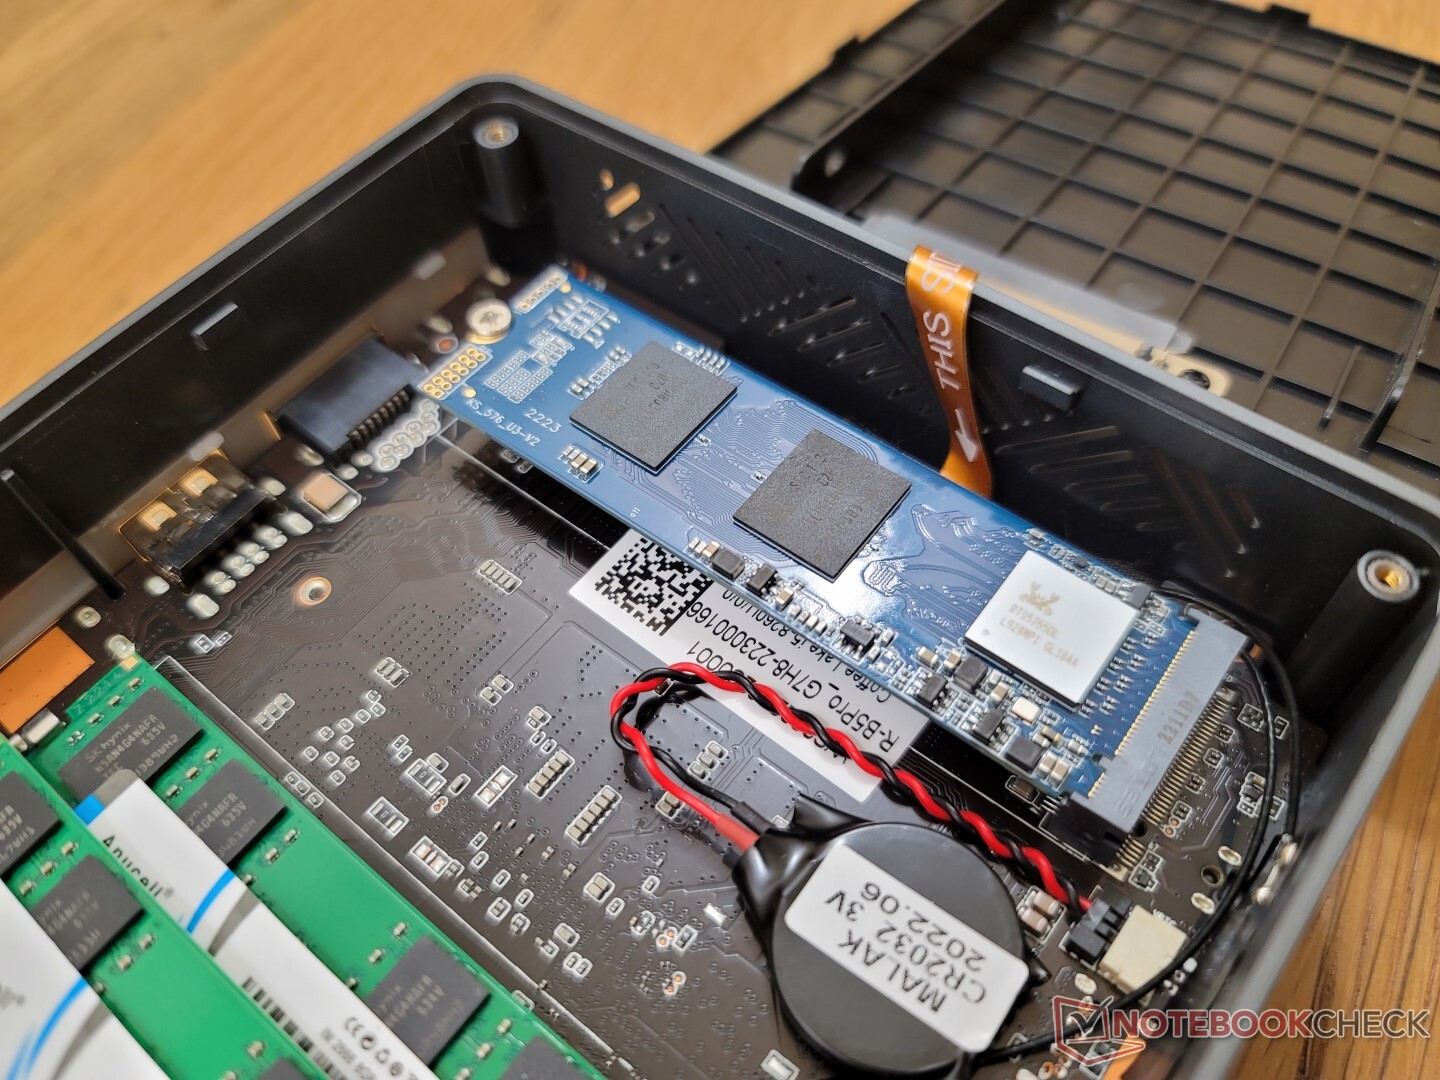
Konserwacja
Dolny panel jest zabezpieczony czterema śrubami Philipsa, co ułatwia serwisowanie. W przeciwieństwie do Beelink SEi8, dolny panel BMaxa ma małe rozcięcie wzdłuż krawędzi, co ułatwia chwytanie i zdejmowanie
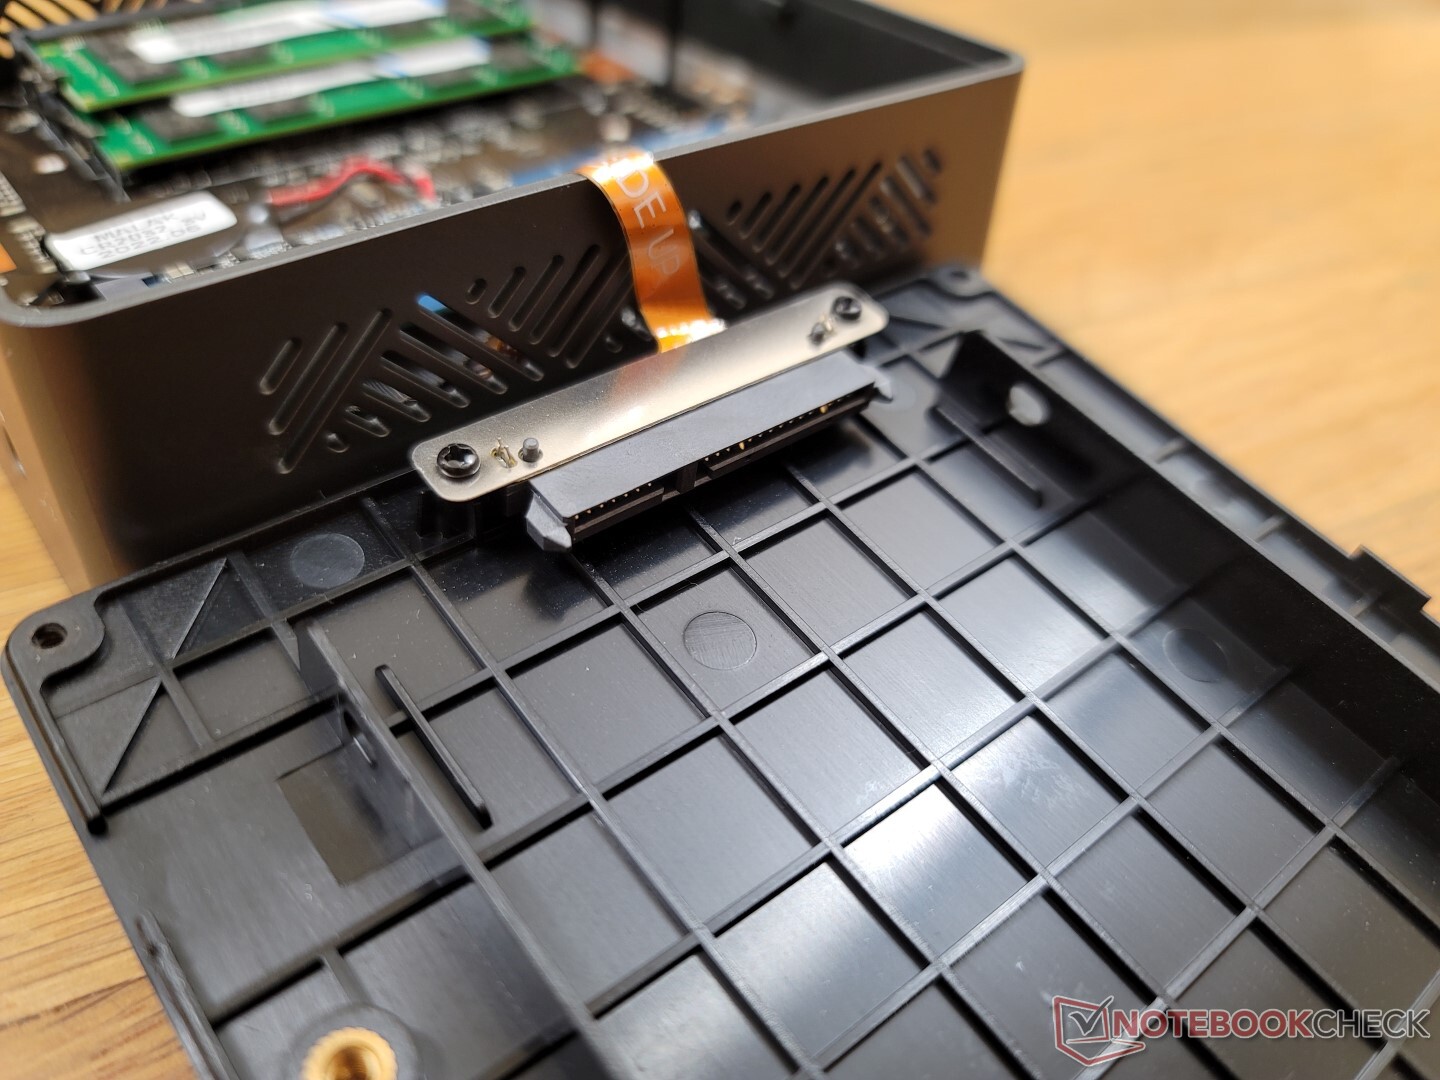
W środku można zainstalować do dwóch modułów DDR4 SODIMM oraz dwa dyski twarde.

Akcesoria i gwarancja
W pudełku detalicznym obok zasilacza sieciowego znajduje się kabel HDMI i zdejmowany uchwyt montażowy VESA ze śrubami. W przypadku zakupu w USA obowiązuje standardowa roczna ograniczona gwarancja.
Wydajność - 8. gen. vs. 12. gen
Warunki badania
Przed uruchomieniem poniższych benchmarków ustawiliśmy nasze urządzenie w trybie Performance za pośrednictwem systemu Windows, aby uzyskać jak najwyższe wyniki. Nie ma żadnych preinstalowanych aplikacji od producenta, aby zapewnić czyste doświadczenie użytkownika Windows.
Procesor
Surowa wydajność procesora jest ogólnie porównywalna do 10. generacji Core i7-1065G7 lubCore i5-8259U. Choć jest znacznie wolniejszy od 11 Core i5-1135G7 o nawet 50 procent, to nadal jest wystarczająco szybki do zwykłych celów multimedialnych, takich jak przeglądanie stron internetowych, strumieniowanie wideo i umiarkowana wielozadaniowość.
Procesor 12. generacji Core i5-1235Uktóry wyprzedza o kilka generacji nasz Core i5-8260U, oferuje o około 60 i 80 procent szybszą wydajność jednowątkową i wielowątkową.
Zrównoważona wydajność jest przyzwoita. Podczas pracy w pętli CineBench R15 xT wydajność spadała z czasem o około 11%.
Cinebench R15 Multi Loop
Cinebench R23: Multi Core | Single Core
Cinebench R15: CPU Multi 64Bit | CPU Single 64Bit
Blender: v2.79 BMW27 CPU
7-Zip 18.03: 7z b 4 | 7z b 4 -mmt1
Geekbench 5.5: Multi-Core | Single-Core
HWBOT x265 Benchmark v2.2: 4k Preset
LibreOffice : 20 Documents To PDF
R Benchmark 2.5: Overall mean
| Cinebench R20 / CPU (Multi Core) | |
| Beelink SER Pro Ryzen 5 5600H | |
| Beelink SEi11 Pro | |
| Asus Vivobook 15 K513EQ | |
| Intel NUC11TNKi5 | |
| BMAX B5 Pro G7H8 | |
| Geekom Mini IT8-GM08i5T | |
| Infinix INBook X2 | |
| Fujitsu Lifebook U939 i5 | |
| Beelink U59 N5105 | |
| Beelink SEi8 | |
| Cinebench R20 / CPU (Single Core) | |
| Asus Vivobook 15 K513EQ | |
| Beelink SEi11 Pro | |
| Beelink SER Pro Ryzen 5 5600H | |
| Intel NUC11TNKi5 | |
| Infinix INBook X2 | |
| BMAX B5 Pro G7H8 | |
| Fujitsu Lifebook U939 i5 | |
| Geekom Mini IT8-GM08i5T | |
| Beelink SEi8 | |
| Beelink U59 N5105 | |
| Cinebench R23 / Multi Core | |
| Beelink SER Pro Ryzen 5 5600H | |
| Beelink SEi11 Pro | |
| Asus Vivobook 15 K513EQ | |
| Intel NUC11TNKi5 | |
| Geekom Mini IT8-GM08i5T | |
| Infinix INBook X2 | |
| BMAX B5 Pro G7H8 | |
| Beelink U59 N5105 | |
| Beelink SEi8 | |
| Cinebench R23 / Single Core | |
| Asus Vivobook 15 K513EQ | |
| Beelink SEi11 Pro | |
| Intel NUC11TNKi5 | |
| Beelink SER Pro Ryzen 5 5600H | |
| Infinix INBook X2 | |
| Beelink SEi8 | |
| BMAX B5 Pro G7H8 | |
| Beelink U59 N5105 | |
| Cinebench R15 / CPU Multi 64Bit | |
| Beelink SER Pro Ryzen 5 5600H | |
| Asus Vivobook 15 K513EQ | |
| Beelink SEi11 Pro | |
| Intel NUC11TNKi5 | |
| BMAX B5 Pro G7H8 | |
| Geekom Mini IT8-GM08i5T | |
| Infinix INBook X2 | |
| Fujitsu Lifebook U939 i5 | |
| Beelink U59 N5105 | |
| Beelink SEi8 | |
| Cinebench R15 / CPU Single 64Bit | |
| Asus Vivobook 15 K513EQ | |
| Beelink SER Pro Ryzen 5 5600H | |
| Beelink SEi11 Pro | |
| Intel NUC11TNKi5 | |
| Fujitsu Lifebook U939 i5 | |
| BMAX B5 Pro G7H8 | |
| Infinix INBook X2 | |
| Geekom Mini IT8-GM08i5T | |
| Beelink SEi8 | |
| Beelink U59 N5105 | |
| Blender / v2.79 BMW27 CPU | |
| Beelink U59 N5105 | |
| Beelink SEi8 | |
| Fujitsu Lifebook U939 i5 | |
| Infinix INBook X2 | |
| BMAX B5 Pro G7H8 | |
| Geekom Mini IT8-GM08i5T | |
| Intel NUC11TNKi5 | |
| Asus Vivobook 15 K513EQ | |
| Beelink SEi11 Pro | |
| Beelink SER Pro Ryzen 5 5600H | |
| 7-Zip 18.03 / 7z b 4 | |
| Beelink SER Pro Ryzen 5 5600H | |
| Geekom Mini IT8-GM08i5T | |
| Asus Vivobook 15 K513EQ | |
| Beelink SEi11 Pro | |
| Intel NUC11TNKi5 | |
| BMAX B5 Pro G7H8 | |
| Infinix INBook X2 | |
| Fujitsu Lifebook U939 i5 | |
| Beelink U59 N5105 | |
| Beelink SEi8 | |
| 7-Zip 18.03 / 7z b 4 -mmt1 | |
| Beelink SER Pro Ryzen 5 5600H | |
| Asus Vivobook 15 K513EQ | |
| Beelink SEi11 Pro | |
| Intel NUC11TNKi5 | |
| BMAX B5 Pro G7H8 | |
| Fujitsu Lifebook U939 i5 | |
| Geekom Mini IT8-GM08i5T | |
| Beelink SEi8 | |
| Infinix INBook X2 | |
| Beelink U59 N5105 | |
| Geekbench 5.5 / Multi-Core | |
| Beelink SER Pro Ryzen 5 5600H | |
| Beelink SEi11 Pro | |
| Intel NUC11TNKi5 | |
| Geekom Mini IT8-GM08i5T | |
| Fujitsu Lifebook U939 i5 | |
| Infinix INBook X2 | |
| Beelink U59 N5105 | |
| Beelink SEi8 | |
| BMAX B5 Pro G7H8 | |
| Geekbench 5.5 / Single-Core | |
| Beelink SEi11 Pro | |
| Beelink SER Pro Ryzen 5 5600H | |
| Intel NUC11TNKi5 | |
| Infinix INBook X2 | |
| Fujitsu Lifebook U939 i5 | |
| Geekom Mini IT8-GM08i5T | |
| Beelink SEi8 | |
| Beelink U59 N5105 | |
| BMAX B5 Pro G7H8 | |
| HWBOT x265 Benchmark v2.2 / 4k Preset | |
| Beelink SER Pro Ryzen 5 5600H | |
| Beelink SEi11 Pro | |
| Asus Vivobook 15 K513EQ | |
| Intel NUC11TNKi5 | |
| Geekom Mini IT8-GM08i5T | |
| Infinix INBook X2 | |
| Fujitsu Lifebook U939 i5 | |
| Beelink SEi8 | |
| Beelink U59 N5105 | |
| BMAX B5 Pro G7H8 | |
| LibreOffice / 20 Documents To PDF | |
| BMAX B5 Pro G7H8 | |
| Beelink U59 N5105 | |
| Beelink SEi8 | |
| Geekom Mini IT8-GM08i5T | |
| Infinix INBook X2 | |
| Fujitsu Lifebook U939 i5 | |
| Beelink SER Pro Ryzen 5 5600H | |
| Intel NUC11TNKi5 | |
| Beelink SEi11 Pro | |
| Asus Vivobook 15 K513EQ | |
| R Benchmark 2.5 / Overall mean | |
| BMAX B5 Pro G7H8 | |
| Beelink U59 N5105 | |
| Beelink SEi8 | |
| Geekom Mini IT8-GM08i5T | |
| Infinix INBook X2 | |
| Fujitsu Lifebook U939 i5 | |
| Intel NUC11TNKi5 | |
| Beelink SEi11 Pro | |
| Asus Vivobook 15 K513EQ | |
| Beelink SER Pro Ryzen 5 5600H | |
* ... im mniej tym lepiej
AIDA64: FP32 Ray-Trace | FPU Julia | CPU SHA3 | CPU Queen | FPU SinJulia | FPU Mandel | CPU AES | CPU ZLib | FP64 Ray-Trace | CPU PhotoWorxx
| Performance rating | |
| Beelink SER Pro Ryzen 5 5600H | |
| Beelink SEi11 Pro | |
| Intel NUC11TNKi5 | |
| BMAX B5 Pro G7H8 | |
| Beelink SEi8 | |
| Beelink U59 N5105 | |
| AIDA64 / FP32 Ray-Trace | |
| Beelink SER Pro Ryzen 5 5600H | |
| Beelink SEi11 Pro | |
| Intel NUC11TNKi5 | |
| BMAX B5 Pro G7H8 | |
| Beelink SEi8 | |
| Beelink U59 N5105 | |
| AIDA64 / FPU Julia | |
| Beelink SER Pro Ryzen 5 5600H | |
| Beelink SEi11 Pro | |
| Intel NUC11TNKi5 | |
| BMAX B5 Pro G7H8 | |
| Beelink SEi8 | |
| Beelink U59 N5105 | |
| AIDA64 / CPU SHA3 | |
| Beelink SER Pro Ryzen 5 5600H | |
| Beelink SEi11 Pro | |
| Intel NUC11TNKi5 | |
| BMAX B5 Pro G7H8 | |
| Beelink SEi8 | |
| Beelink U59 N5105 | |
| AIDA64 / CPU Queen | |
| Beelink SER Pro Ryzen 5 5600H | |
| Beelink SEi11 Pro | |
| Intel NUC11TNKi5 | |
| BMAX B5 Pro G7H8 | |
| Beelink SEi8 | |
| Beelink U59 N5105 | |
| AIDA64 / FPU SinJulia | |
| Beelink SER Pro Ryzen 5 5600H | |
| Beelink SEi11 Pro | |
| Intel NUC11TNKi5 | |
| BMAX B5 Pro G7H8 | |
| Beelink SEi8 | |
| Beelink U59 N5105 | |
| AIDA64 / FPU Mandel | |
| Beelink SER Pro Ryzen 5 5600H | |
| Beelink SEi11 Pro | |
| Intel NUC11TNKi5 | |
| BMAX B5 Pro G7H8 | |
| Beelink SEi8 | |
| Beelink U59 N5105 | |
| AIDA64 / CPU AES | |
| Beelink SER Pro Ryzen 5 5600H | |
| Beelink SEi11 Pro | |
| Intel NUC11TNKi5 | |
| Beelink U59 N5105 | |
| BMAX B5 Pro G7H8 | |
| Beelink SEi8 | |
| AIDA64 / CPU ZLib | |
| Beelink SER Pro Ryzen 5 5600H | |
| Intel NUC11TNKi5 | |
| Beelink SEi11 Pro | |
| BMAX B5 Pro G7H8 | |
| Beelink U59 N5105 | |
| Beelink SEi8 | |
| AIDA64 / FP64 Ray-Trace | |
| Beelink SER Pro Ryzen 5 5600H | |
| Beelink SEi11 Pro | |
| Intel NUC11TNKi5 | |
| BMAX B5 Pro G7H8 | |
| Beelink SEi8 | |
| Beelink U59 N5105 | |
| AIDA64 / CPU PhotoWorxx | |
| Beelink SEi11 Pro | |
| Beelink SER Pro Ryzen 5 5600H | |
| BMAX B5 Pro G7H8 | |
| Intel NUC11TNKi5 | |
| Beelink SEi8 | |
| Beelink U59 N5105 | |
Wydajność systemu
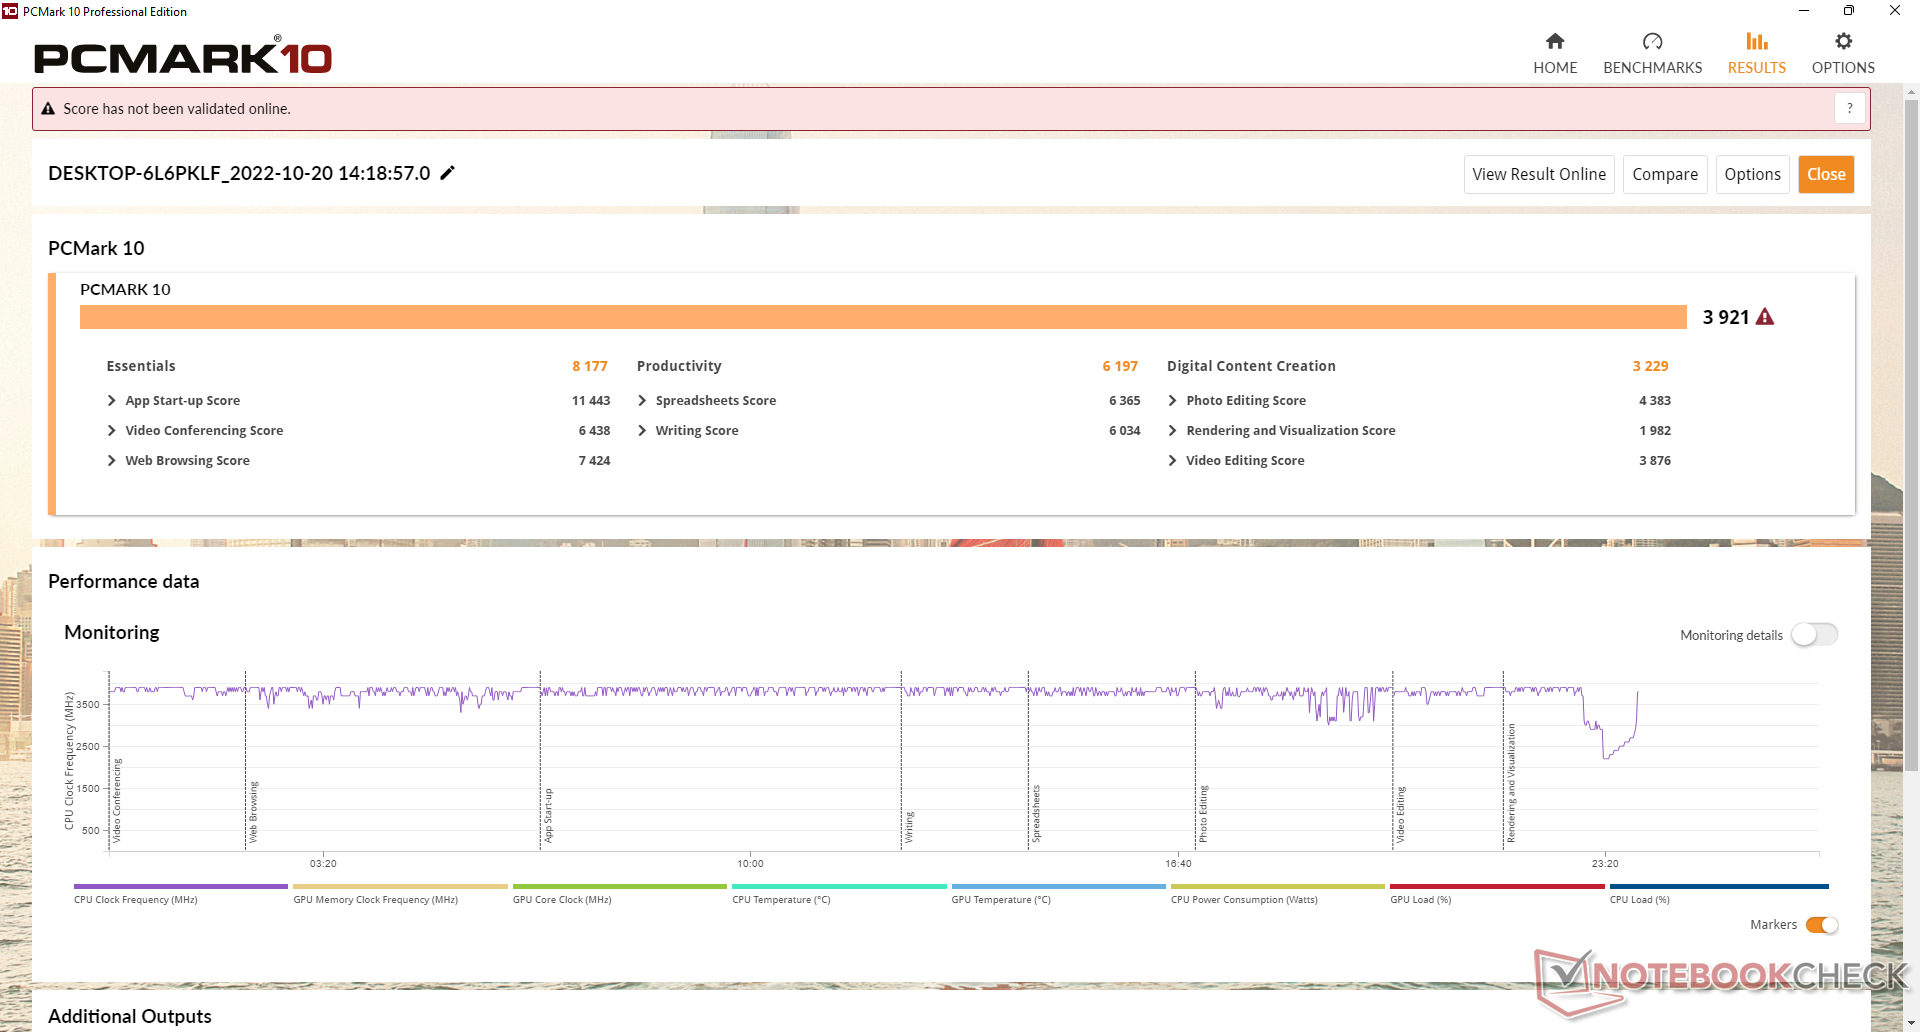
Wyniki PCMark 10 są porównywalne z Beelink SEi8, który również wykorzystuje starszy procesor Core 8. generacji. Mini PC z nowszymi procesorami 11 generacji, takimi jak Intel NUC11TNKi5, są w stanie zaoferować znacznie wyższe wyniki w zakresie Digital Content Creation ze względu na szybsze zintegrowane GPU.
CrossMark: Overall | Productivity | Creativity | Responsiveness
| PCMark 10 / Score | |
| Beelink SER Pro Ryzen 5 5600H | |
| Beelink SEi11 Pro | |
| Intel NUC11TNKi5 | |
| BMAX B5 Pro G7H8 | |
| Beelink SEi8 | |
| Beelink U59 N5105 | |
| PCMark 10 / Essentials | |
| Beelink SER Pro Ryzen 5 5600H | |
| Beelink SEi11 Pro | |
| Intel NUC11TNKi5 | |
| BMAX B5 Pro G7H8 | |
| Beelink SEi8 | |
| Beelink U59 N5105 | |
| PCMark 10 / Productivity | |
| Beelink SER Pro Ryzen 5 5600H | |
| Beelink SEi11 Pro | |
| BMAX B5 Pro G7H8 | |
| Intel NUC11TNKi5 | |
| Beelink SEi8 | |
| Beelink U59 N5105 | |
| PCMark 10 / Digital Content Creation | |
| Beelink SER Pro Ryzen 5 5600H | |
| Beelink SEi11 Pro | |
| Intel NUC11TNKi5 | |
| BMAX B5 Pro G7H8 | |
| Beelink SEi8 | |
| Beelink U59 N5105 | |
| CrossMark / Overall | |
| Beelink SEi11 Pro | |
| Beelink SER Pro Ryzen 5 5600H | |
| BMAX B5 Pro G7H8 | |
| Beelink U59 N5105 | |
| CrossMark / Productivity | |
| Beelink SEi11 Pro | |
| Beelink SER Pro Ryzen 5 5600H | |
| BMAX B5 Pro G7H8 | |
| Beelink U59 N5105 | |
| CrossMark / Creativity | |
| Beelink SER Pro Ryzen 5 5600H | |
| Beelink SEi11 Pro | |
| BMAX B5 Pro G7H8 | |
| Beelink U59 N5105 | |
| CrossMark / Responsiveness | |
| Beelink SEi11 Pro | |
| Beelink SER Pro Ryzen 5 5600H | |
| BMAX B5 Pro G7H8 | |
| Beelink U59 N5105 | |
| PCMark 10 Score | 3921 pkt. | |
Pomoc | ||
| AIDA64 / Memory Copy | |
| Beelink SER Pro Ryzen 5 5600H | |
| Beelink SEi11 Pro | |
| Beelink SEi8 | |
| BMAX B5 Pro G7H8 | |
| Beelink U59 N5105 | |
| Intel NUC11TNKi5 | |
| AIDA64 / Memory Read | |
| Beelink SER Pro Ryzen 5 5600H | |
| Beelink SEi11 Pro | |
| BMAX B5 Pro G7H8 | |
| Beelink SEi8 | |
| Intel NUC11TNKi5 | |
| Beelink U59 N5105 | |
| AIDA64 / Memory Write | |
| Beelink SEi11 Pro | |
| Beelink SER Pro Ryzen 5 5600H | |
| BMAX B5 Pro G7H8 | |
| Beelink U59 N5105 | |
| Intel NUC11TNKi5 | |
| Beelink SEi8 | |
| AIDA64 / Memory Latency | |
| BMAX B5 Pro G7H8 | |
| Intel NUC11TNKi5 | |
| Beelink SEi11 Pro | |
| Beelink SER Pro Ryzen 5 5600H | |
| Beelink U59 N5105 | |
| Beelink SEi8 | |
* ... im mniej tym lepiej
Opóźnienie DPC
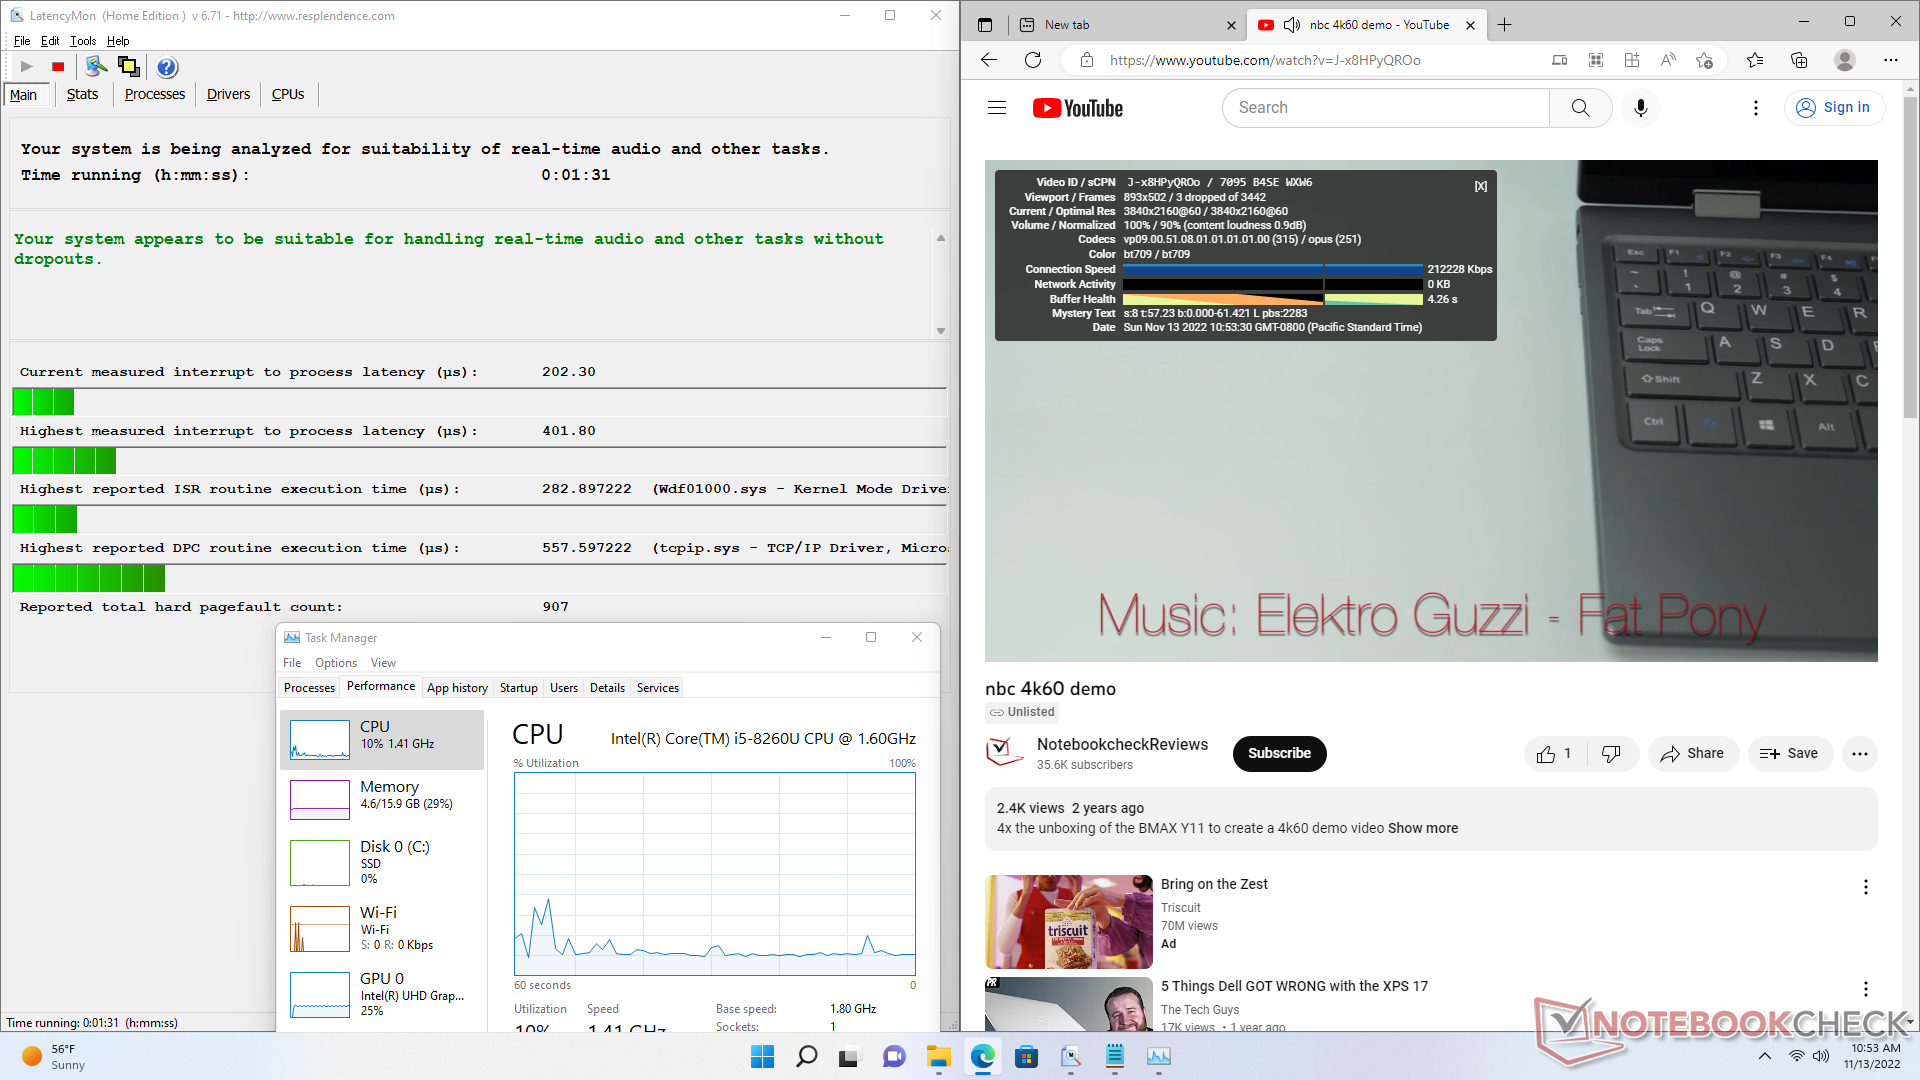
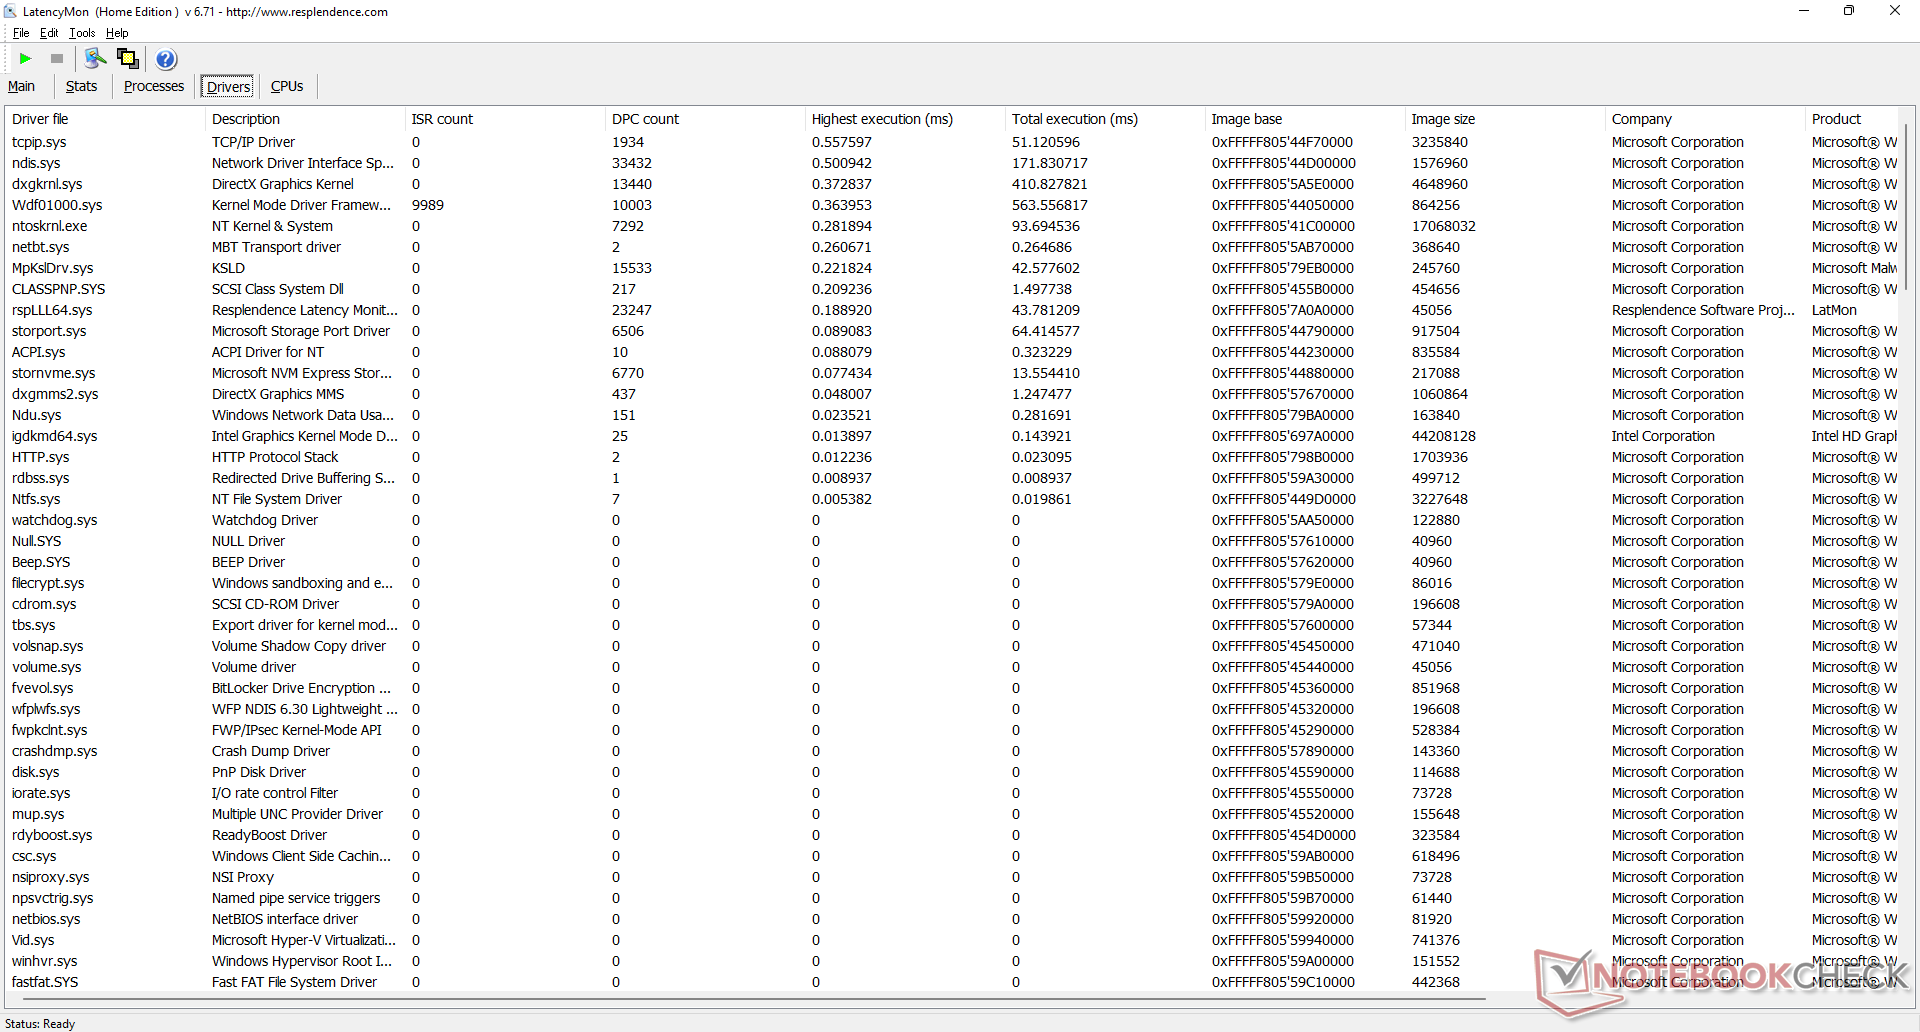
LatencyMon nie wykazał żadnych większych problemów z DPC podczas przeglądania stron internetowych. odtwarzanie wideo 4K przy 60 FPS jest również doskonałe - podczas naszego trwającego minutę testu padły tylko 3 klatki.
| DPC Latencies / LatencyMon - interrupt to process latency (max), Web, Youtube, Prime95 | |
| Beelink SEi8 | |
| Beelink U59 N5105 | |
| Beelink SER Pro Ryzen 5 5600H | |
| Intel NUC11TNKi5 | |
| BMAX B5 Pro G7H8 | |
| Beelink SEi11 Pro | |
* ... im mniej tym lepiej
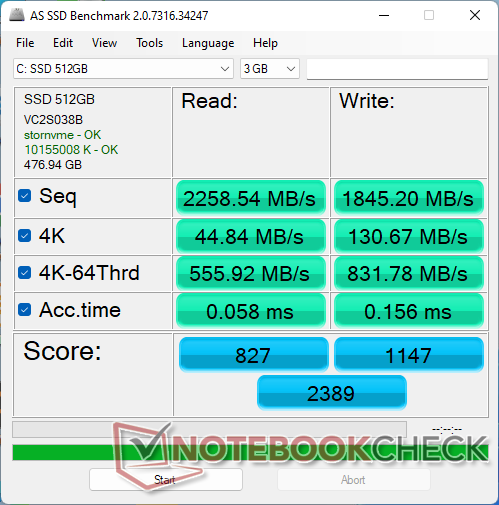
Urządzenia pamięci masowej - do dwóch dysków
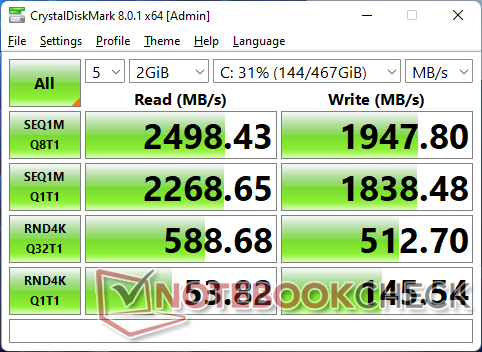
W B5 Pro zastosowano generyczny dysk SSD M.2 PCIe3 x4 z kontrolerem Kontrolerem RealTek RTS5763DL w celu obniżenia kosztów. Wydajność nie jest jednak optymalna, ponieważ szybkość odczytu spada z początkowego wysokiego poziomu ~2400 MB/s do zaledwie ~1700 MB/s, gdy dysk jest obciążony.

| Drive Performance rating - Percent | |
| Beelink SER Pro Ryzen 5 5600H -11! | |
| BMAX B5 Pro G7H8 | |
| Beelink SEi11 Pro | |
| Beelink SEi8 | |
| Beelink U59 N5105 | |
| Intel NUC11TNKi5 | |
| DiskSpd | |
| seq read | |
| BMAX B5 Pro G7H8 | |
| Beelink SER Pro Ryzen 5 5600H | |
| Beelink SEi11 Pro | |
| Beelink SEi8 | |
| Intel NUC11TNKi5 | |
| Beelink U59 N5105 | |
| seq write | |
| Beelink SER Pro Ryzen 5 5600H | |
| Beelink SEi11 Pro | |
| BMAX B5 Pro G7H8 | |
| Beelink SEi8 | |
| Intel NUC11TNKi5 | |
| Beelink U59 N5105 | |
| seq q8 t1 read | |
| Beelink SER Pro Ryzen 5 5600H | |
| BMAX B5 Pro G7H8 | |
| Beelink SEi11 Pro | |
| Beelink SEi8 | |
| Intel NUC11TNKi5 | |
| Beelink U59 N5105 | |
| seq q8 t1 write | |
| BMAX B5 Pro G7H8 | |
| Beelink SER Pro Ryzen 5 5600H | |
| Beelink SEi11 Pro | |
| Beelink SEi8 | |
| Intel NUC11TNKi5 | |
| Beelink U59 N5105 | |
| 4k q1 t1 read | |
| Beelink SEi8 | |
| Beelink SEi11 Pro | |
| BMAX B5 Pro G7H8 | |
| Beelink SER Pro Ryzen 5 5600H | |
| Beelink U59 N5105 | |
| Intel NUC11TNKi5 | |
| 4k q1 t1 write | |
| Beelink SEi11 Pro | |
| Beelink SER Pro Ryzen 5 5600H | |
| Beelink SEi8 | |
| BMAX B5 Pro G7H8 | |
| Beelink U59 N5105 | |
| Intel NUC11TNKi5 | |
| 4k q32 t16 read | |
| BMAX B5 Pro G7H8 | |
| Beelink SER Pro Ryzen 5 5600H | |
| Beelink SEi11 Pro | |
| Beelink SEi8 | |
| Intel NUC11TNKi5 | |
| Beelink U59 N5105 | |
| 4k q32 t16 write | |
| BMAX B5 Pro G7H8 | |
| Beelink SER Pro Ryzen 5 5600H | |
| Beelink SEi11 Pro | |
| Beelink SEi8 | |
| Intel NUC11TNKi5 | |
| Beelink U59 N5105 | |
| AS SSD | |
| Score Total | |
| Beelink SEi11 Pro | |
| BMAX B5 Pro G7H8 | |
| Beelink SEi8 | |
| Intel NUC11TNKi5 | |
| Beelink U59 N5105 | |
| Score Read | |
| Beelink SEi11 Pro | |
| BMAX B5 Pro G7H8 | |
| Beelink SEi8 | |
| Intel NUC11TNKi5 | |
| Beelink U59 N5105 | |
| Score Write | |
| Beelink SEi11 Pro | |
| BMAX B5 Pro G7H8 | |
| Beelink SEi8 | |
| Intel NUC11TNKi5 | |
| Beelink U59 N5105 | |
| Seq Read | |
| BMAX B5 Pro G7H8 | |
| Beelink SEi11 Pro | |
| Beelink SEi8 | |
| Intel NUC11TNKi5 | |
| Beelink U59 N5105 | |
| Seq Write | |
| BMAX B5 Pro G7H8 | |
| Beelink SEi11 Pro | |
| Beelink SEi8 | |
| Intel NUC11TNKi5 | |
| Beelink U59 N5105 | |
| 4K Read | |
| Beelink SEi8 | |
| BMAX B5 Pro G7H8 | |
| Beelink SEi11 Pro | |
| Intel NUC11TNKi5 | |
| Beelink U59 N5105 | |
| 4K Write | |
| Beelink SEi11 Pro | |
| BMAX B5 Pro G7H8 | |
| Beelink SEi8 | |
| Beelink U59 N5105 | |
| Intel NUC11TNKi5 | |
| 4K-64 Read | |
| Beelink SEi11 Pro | |
| BMAX B5 Pro G7H8 | |
| Beelink SEi8 | |
| Intel NUC11TNKi5 | |
| Beelink U59 N5105 | |
| 4K-64 Write | |
| Beelink SEi11 Pro | |
| BMAX B5 Pro G7H8 | |
| Beelink SEi8 | |
| Intel NUC11TNKi5 | |
| Beelink U59 N5105 | |
| Access Time Read | |
| Intel NUC11TNKi5 | |
| Beelink SEi8 | |
| Beelink U59 N5105 | |
| BMAX B5 Pro G7H8 | |
| Beelink SEi11 Pro | |
| Access Time Write | |
| Beelink SEi11 Pro | |
| Intel NUC11TNKi5 | |
| Beelink U59 N5105 | |
| BMAX B5 Pro G7H8 | |
| Beelink SEi8 | |
* ... im mniej tym lepiej
Disk Throttling: DiskSpd Read Loop, Queue Depth 8
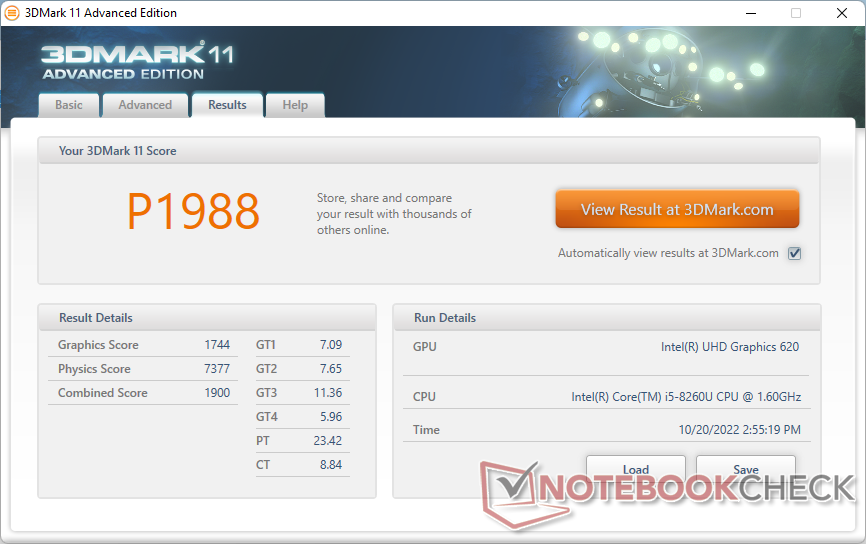
Wydajność GPU
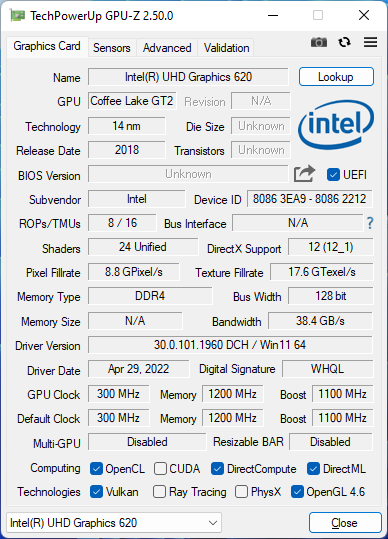
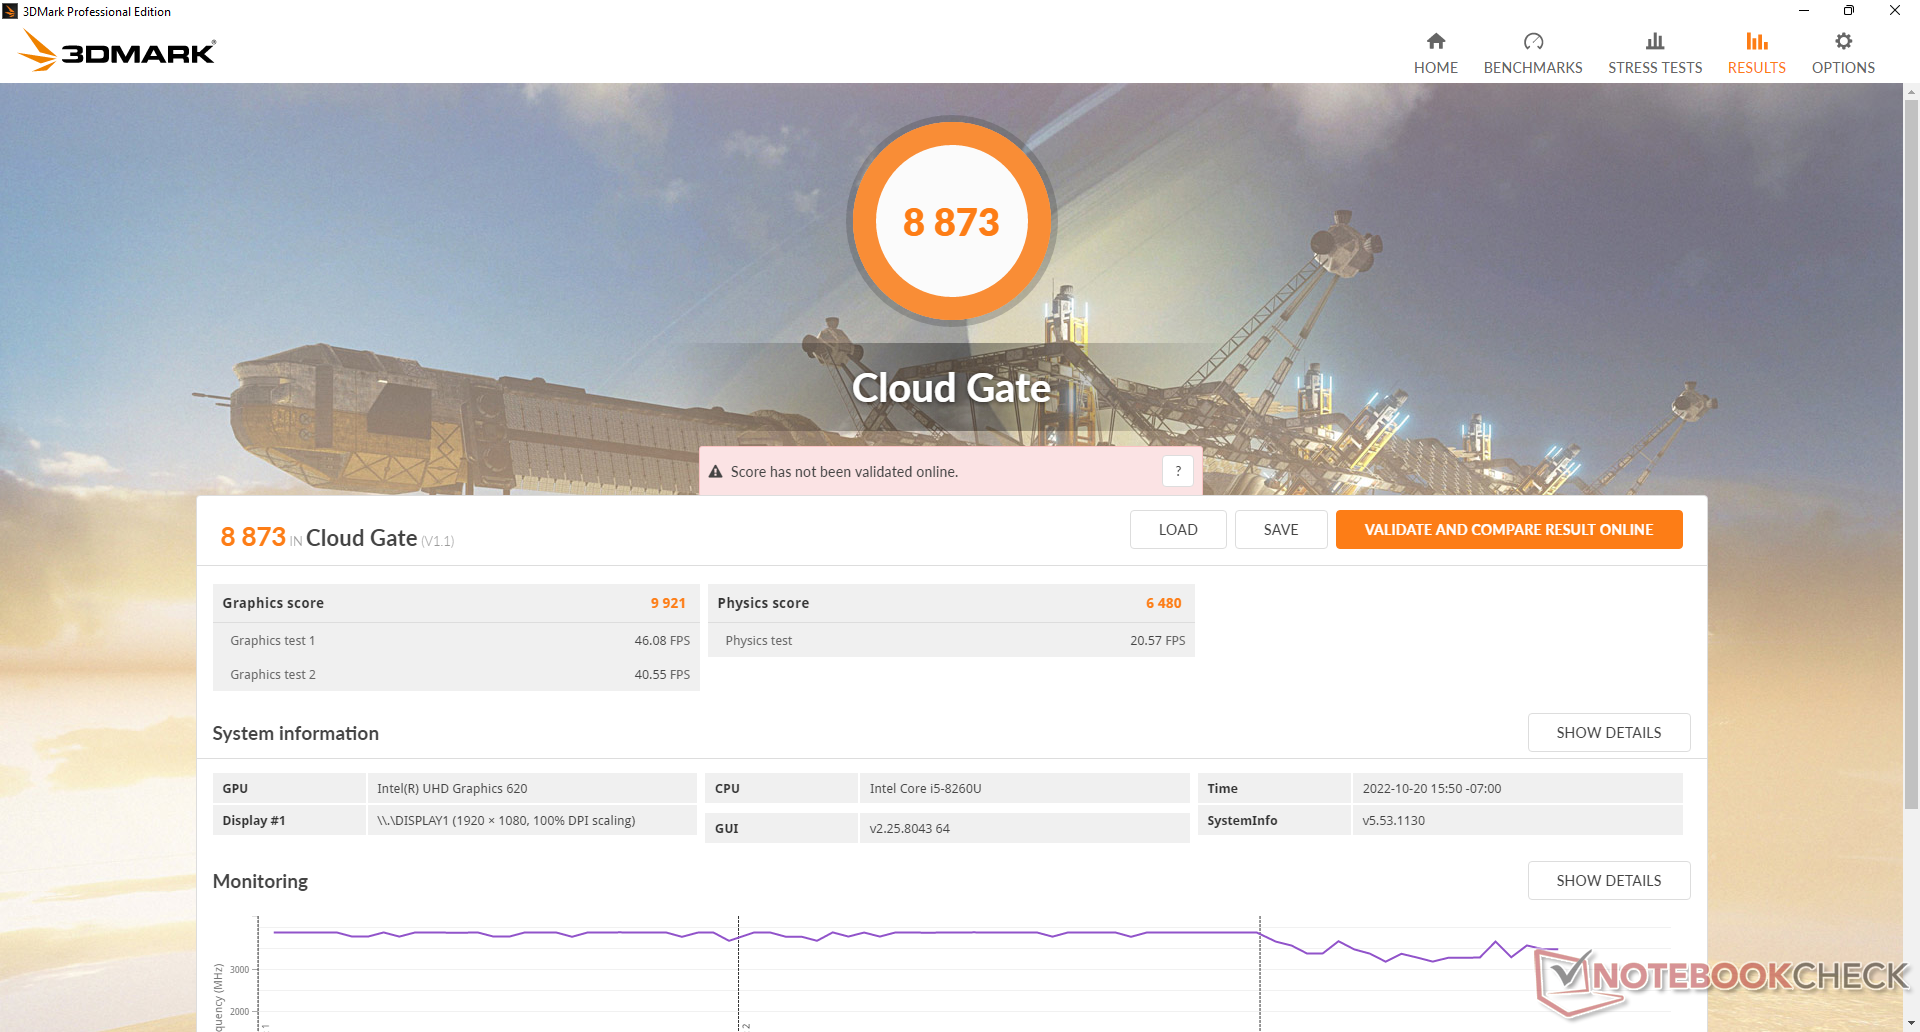
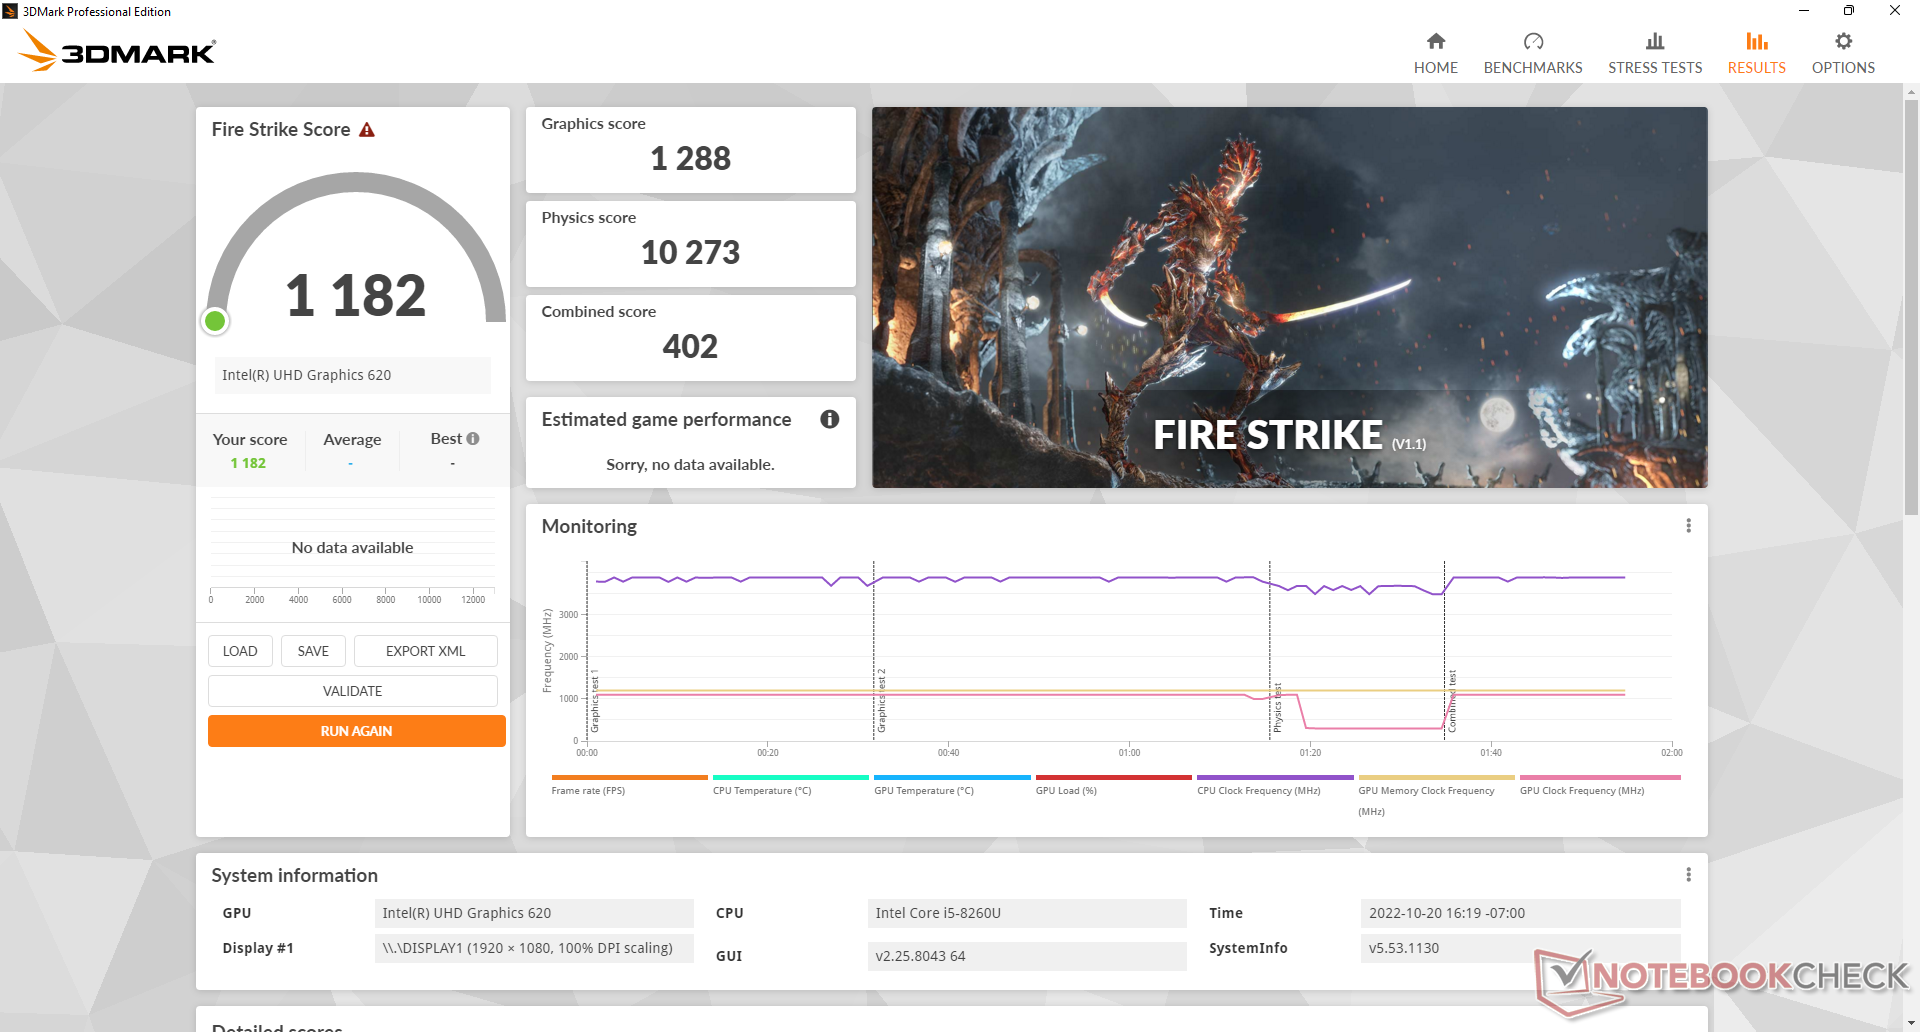
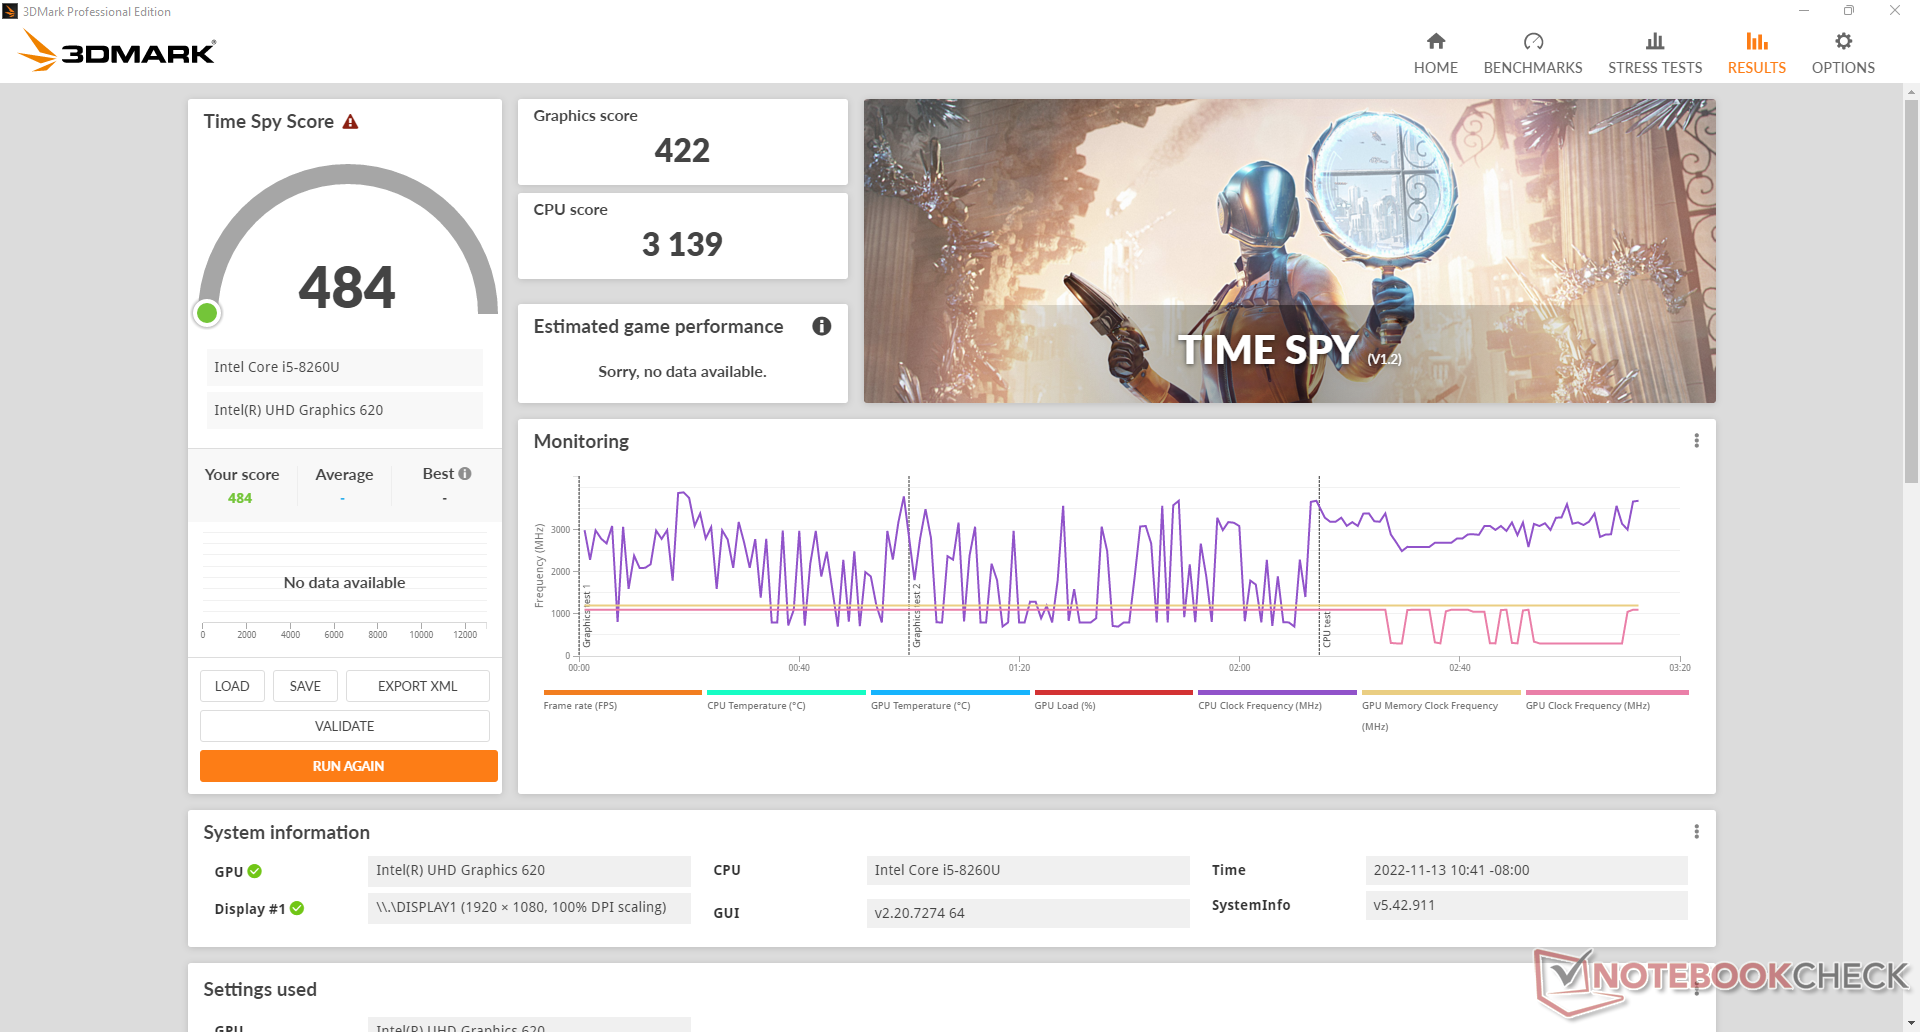
Wydajność grafiki jest słaba jak na dzisiejsze standardy. Na stronie Iris Xe 80 EUs w wielu nowoczesnych procesorach Core i5 z serii U, na przykład, oferuje 2x do 2,5x wyższą wydajność niż nasz starzejący się UHD Graphics 620. Większość gier jest nie do odtworzenia, a niektóre w ogóle się nie uruchamiają, w tym X-Plane.
| 3DMark | |
| 1920x1080 Fire Strike Graphics | |
| Beelink SEi11 Pro | |
| Asus Vivobook 15 K513EQ | |
| Beelink SER Pro Ryzen 5 5600H | |
| Intel NUC11TNKi5 | |
| Infinix INBook X2 | |
| Geekom Mini IT8-GM08i5T | |
| Beelink SEi8 | |
| BMAX B5 Pro G7H8 | |
| Beelink U59 N5105 | |
| 2560x1440 Time Spy Graphics | |
| Beelink SEi11 Pro | |
| Asus Vivobook 15 K513EQ | |
| Beelink SER Pro Ryzen 5 5600H | |
| Intel NUC11TNKi5 | |
| Infinix INBook X2 | |
| Geekom Mini IT8-GM08i5T | |
| Beelink SEi8 | |
| BMAX B5 Pro G7H8 | |
| Beelink U59 N5105 | |
| 2560x1440 Time Spy Score | |
| Beelink SEi11 Pro | |
| Asus Vivobook 15 K513EQ | |
| Beelink SER Pro Ryzen 5 5600H | |
| Intel NUC11TNKi5 | |
| Infinix INBook X2 | |
| Geekom Mini IT8-GM08i5T | |
| Beelink SEi8 | |
| BMAX B5 Pro G7H8 | |
| Beelink U59 N5105 | |
| 3DMark 11 - 1280x720 Performance GPU | |
| Beelink SEi11 Pro | |
| Asus Vivobook 15 K513EQ | |
| Beelink SER Pro Ryzen 5 5600H | |
| Intel NUC11TNKi5 | |
| Infinix INBook X2 | |
| Geekom Mini IT8-GM08i5T | |
| Beelink SEi8 | |
| BMAX B5 Pro G7H8 | |
| Fujitsu Lifebook U939 i5 | |
| Beelink U59 N5105 | |
| 3DMark 11 Performance | 1988 pkt. | |
| 3DMark Cloud Gate Standard Score | 8873 pkt. | |
| 3DMark Fire Strike Score | 1182 pkt. | |
| 3DMark Time Spy Score | 484 pkt. | |
Pomoc | ||
| Blender - v3.3 Classroom CPU (sortuj wg wyników) | |
| BMAX B5 Pro G7H8 | |
| Beelink SEi11 Pro | |
| Beelink U59 N5105 | |
| Beelink SER Pro Ryzen 5 5600H | |
* ... im mniej tym lepiej
| Performance rating - Percent | |
| Asus Vivobook 15 K513EQ | |
| Beelink SER Pro Ryzen 5 5600H | |
| Beelink SEi11 Pro -1! | |
| Intel NUC11TNKi5 -3! | |
| Infinix INBook X2 -2! | |
| Beelink SEi8 -3! | |
| Fujitsu Lifebook U939 i5 -4! | |
| Beelink U59 N5105 -3! | |
| BMAX B5 Pro G7H8 -5! | |
| The Witcher 3 - 1920x1080 Ultra Graphics & Postprocessing (HBAO+) | |
| Asus Vivobook 15 K513EQ | |
| Beelink SER Pro Ryzen 5 5600H | |
| Beelink SEi11 Pro | |
| Infinix INBook X2 | |
| Beelink U59 N5105 | |
| GTA V - 1920x1080 Highest AA:4xMSAA + FX AF:16x | |
| Asus Vivobook 15 K513EQ | |
| Beelink SER Pro Ryzen 5 5600H | |
| Final Fantasy XV Benchmark - 1920x1080 High Quality | |
| Beelink SEi11 Pro | |
| Asus Vivobook 15 K513EQ | |
| Beelink SER Pro Ryzen 5 5600H | |
| Intel NUC11TNKi5 | |
| Infinix INBook X2 | |
| Beelink SEi8 | |
| Strange Brigade - 1920x1080 ultra AA:ultra AF:16 | |
| Beelink SER Pro Ryzen 5 5600H | |
| Beelink SEi11 Pro | |
| Asus Vivobook 15 K513EQ | |
| Dota 2 Reborn - 1920x1080 ultra (3/3) best looking | |
| Asus Vivobook 15 K513EQ | |
| Beelink SER Pro Ryzen 5 5600H | |
| Beelink SEi11 Pro | |
| Intel NUC11TNKi5 | |
| Infinix INBook X2 | |
| Beelink SEi8 | |
| Fujitsu Lifebook U939 i5 | |
| Beelink U59 N5105 | |
| BMAX B5 Pro G7H8 | |
| X-Plane 11.11 - 1920x1080 high (fps_test=3) | |
| Asus Vivobook 15 K513EQ | |
| Beelink SEi11 Pro | |
| Beelink SER Pro Ryzen 5 5600H | |
| Intel NUC11TNKi5 | |
| Infinix INBook X2 | |
| Fujitsu Lifebook U939 i5 | |
| Beelink SEi8 | |
| Beelink U59 N5105 | |
| The Witcher 3 | |
| 1024x768 Low Graphics & Postprocessing | |
| Beelink SEi11 Pro | |
| Asus Vivobook 15 K513EQ | |
| Beelink SER Pro Ryzen 5 5600H | |
| Intel NUC11TNKi5 | |
| Infinix INBook X2 | |
| BMAX B5 Pro G7H8 | |
| Beelink U59 N5105 | |
| Fujitsu Lifebook U939 i5 | |
| 1366x768 Medium Graphics & Postprocessing | |
| Beelink SEi11 Pro | |
| Beelink SER Pro Ryzen 5 5600H | |
| Asus Vivobook 15 K513EQ | |
| Infinix INBook X2 | |
| Beelink U59 N5105 | |
| BMAX B5 Pro G7H8 | |
| 1920x1080 High Graphics & Postprocessing (Nvidia HairWorks Off) | |
| Asus Vivobook 15 K513EQ | |
| Beelink SEi11 Pro | |
| Beelink SER Pro Ryzen 5 5600H | |
| Infinix INBook X2 | |
| Beelink U59 N5105 | |
| BMAX B5 Pro G7H8 | |
| Final Fantasy XV Benchmark - 1280x720 Lite Quality | |
| Asus Vivobook 15 K513EQ | |
| Beelink SER Pro Ryzen 5 5600H | |
| Beelink SEi11 Pro | |
| Intel NUC11TNKi5 | |
| Infinix INBook X2 | |
| Geekom Mini IT8-GM08i5T | |
| Beelink SEi8 | |
| Beelink U59 N5105 | |
| BMAX B5 Pro G7H8 | |
| Dota 2 Reborn | |
| 1280x720 min (0/3) fastest | |
| Beelink SER Pro Ryzen 5 5600H | |
| Asus Vivobook 15 K513EQ | |
| Beelink SEi11 Pro | |
| Beelink SEi8 | |
| Infinix INBook X2 | |
| Intel NUC11TNKi5 | |
| Beelink U59 N5105 | |
| Fujitsu Lifebook U939 i5 | |
| BMAX B5 Pro G7H8 | |
| 1366x768 med (1/3) | |
| Asus Vivobook 15 K513EQ | |
| Beelink SER Pro Ryzen 5 5600H | |
| Beelink SEi11 Pro | |
| Infinix INBook X2 | |
| Intel NUC11TNKi5 | |
| Fujitsu Lifebook U939 i5 | |
| Beelink SEi8 | |
| Beelink U59 N5105 | |
| BMAX B5 Pro G7H8 | |
| 1920x1080 high (2/3) | |
| Asus Vivobook 15 K513EQ | |
| Beelink SER Pro Ryzen 5 5600H | |
| Beelink SEi11 Pro | |
| Intel NUC11TNKi5 | |
| Infinix INBook X2 | |
| Beelink SEi8 | |
| Fujitsu Lifebook U939 i5 | |
| Beelink U59 N5105 | |
| BMAX B5 Pro G7H8 | |
| 1920x1080 ultra (3/3) best looking | |
| Asus Vivobook 15 K513EQ | |
| Beelink SER Pro Ryzen 5 5600H | |
| Beelink SEi11 Pro | |
| Intel NUC11TNKi5 | |
| Infinix INBook X2 | |
| Beelink SEi8 | |
| Fujitsu Lifebook U939 i5 | |
| Beelink U59 N5105 | |
| BMAX B5 Pro G7H8 | |
Witcher 3 FPS Chart
| low | med. | high | ultra | |
|---|---|---|---|---|
| The Witcher 3 (2015) | 23.8 | 13.5 | 7.3 | |
| Dota 2 Reborn (2015) | 42.4 | 8.6 | 5.6 | 5.6 |
| Final Fantasy XV Benchmark (2018) | 5.61 |
Emisje
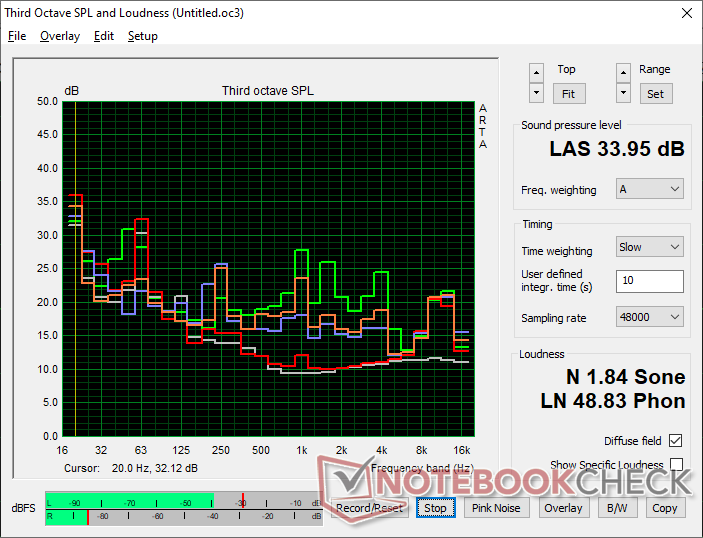
Szum systemu - wcale nie jest głośny
Wewnętrzny wentylator jest prawie zawsze aktywny i wynosi około 25 dB(A) na tle cichego tła 23 dB(A), nawet gdy nie są uruchomione żadne aplikacje. Na szczęście ten niski zakres jest wystarczająco cichy, by być niezauważalnym w większości scenariuszy. Uruchomienie większych obciążeń, takich jak gry, wywołuje hałas wentylatora w zakresie od 30 do 34 dB(A), co nadal jest bardzo cichym rozwiązaniem, zwłaszcza w środowiskach HTPC.
Hałas
| luz |
| 25.1 / 25.1 / 25.1 dB |
| obciążenie |
| 28.6 / 34 dB |
 | ||
30 dB cichy 40 dB(A) słyszalny 50 dB(A) irytujący |
||
min: | ||
| BMAX B5 Pro G7H8 UHD Graphics 620, i5-8260U | Beelink SEi11 Pro Iris Xe G7 96EUs, i5-11320H, Kingston NV1 SNVS/500GCN | Beelink U59 N5105 UHD Graphics (Jasper Lake 24 EU), Celeron N5105, Silicon Motion AZW 512G NV428 | Beelink SEi8 Iris Plus Graphics 655, i3-8109U, Intel SSD 660p SSDPEKNW512G8 | Beelink SER Pro Ryzen 5 5600H Vega 7, R5 5600H, Kingston NV1 SNVS/500GCN | Intel NUC11TNKi5 Iris Xe G7 80EUs, i5-1135G7, Transcend M.2 SSD 430S TS512GMTS430S | |
|---|---|---|---|---|---|---|
| Noise | -5% | 14% | -14% | -7% | -32% | |
| wyłączone / środowisko * (dB) | 23 | 22.8 1% | 21.5 7% | 24.5 -7% | 22.8 1% | 24.8 -8% |
| Idle Minimum * (dB) | 25.1 | 24.7 2% | 22.1 12% | 26.5 -6% | 26.1 -4% | 35.6 -42% |
| Idle Average * (dB) | 25.1 | 24.7 2% | 22.1 12% | 26.5 -6% | 26.1 -4% | 35.6 -42% |
| Idle Maximum * (dB) | 25.1 | 25.3 -1% | 22.1 12% | 31.1 -24% | 28.7 -14% | 35.6 -42% |
| Load Average * (dB) | 28.6 | 33.2 -16% | 23.9 16% | 37.7 -32% | 32.3 -13% | 36.2 -27% |
| Witcher 3 ultra * (dB) | 30.1 | 34.5 -15% | 24.4 19% | 32.8 -9% | 38 -26% | |
| Load Maximum * (dB) | 34 | 37.8 -11% | 26.8 21% | 37.5 -10% | 36.4 -7% | 47.6 -40% |
* ... im mniej tym lepiej
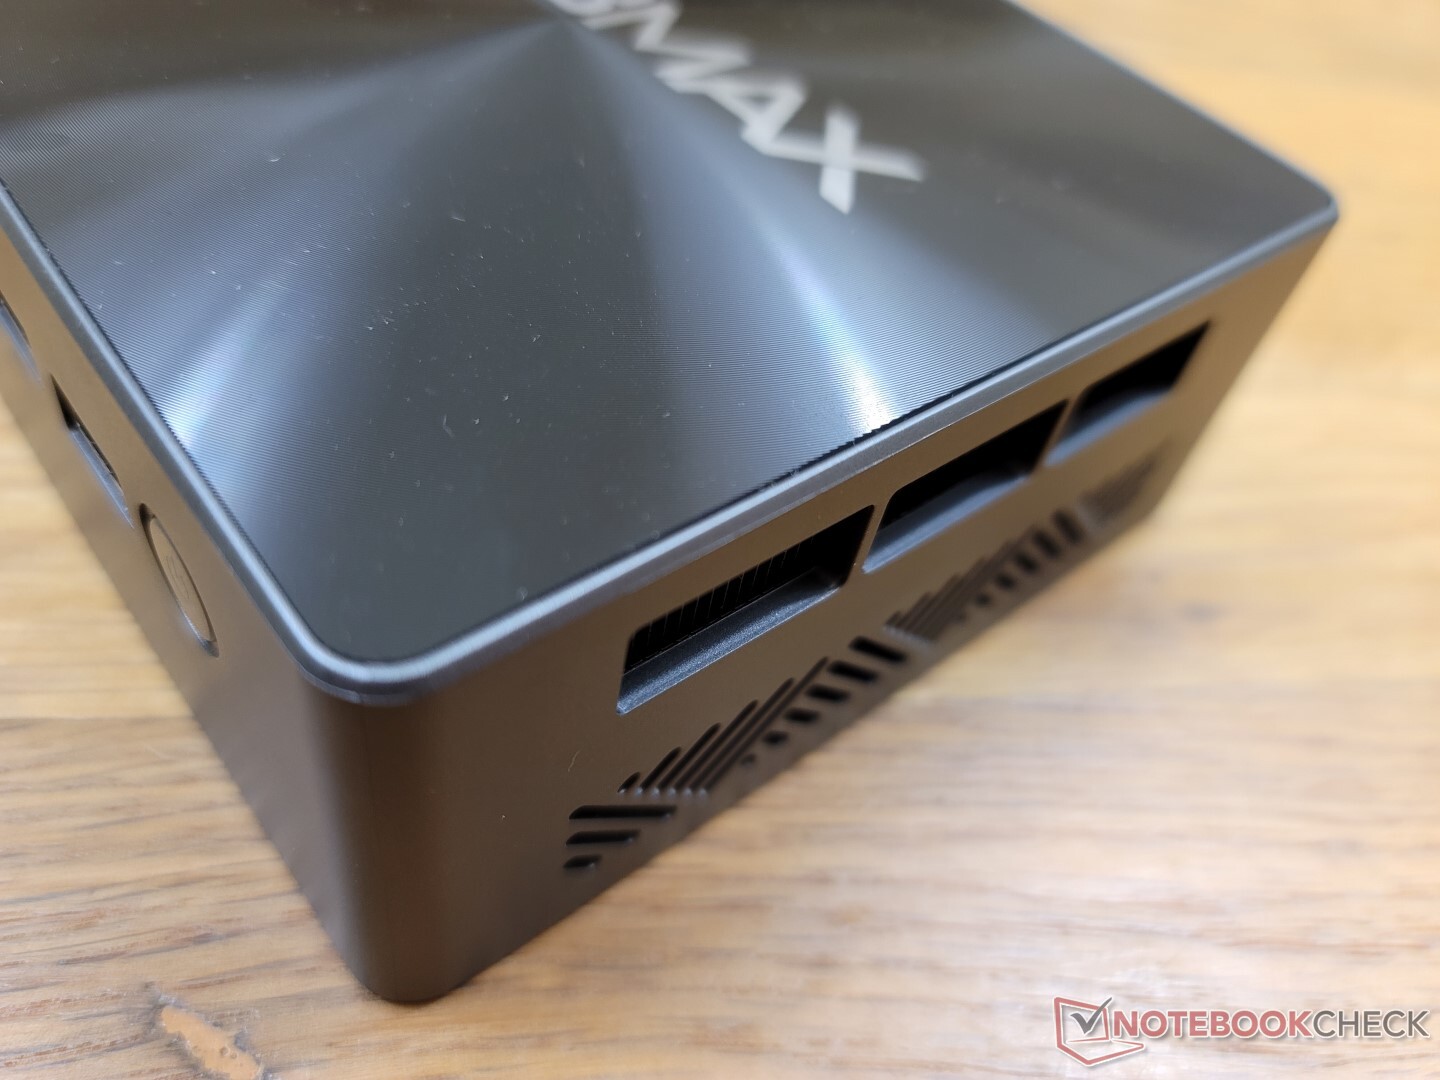
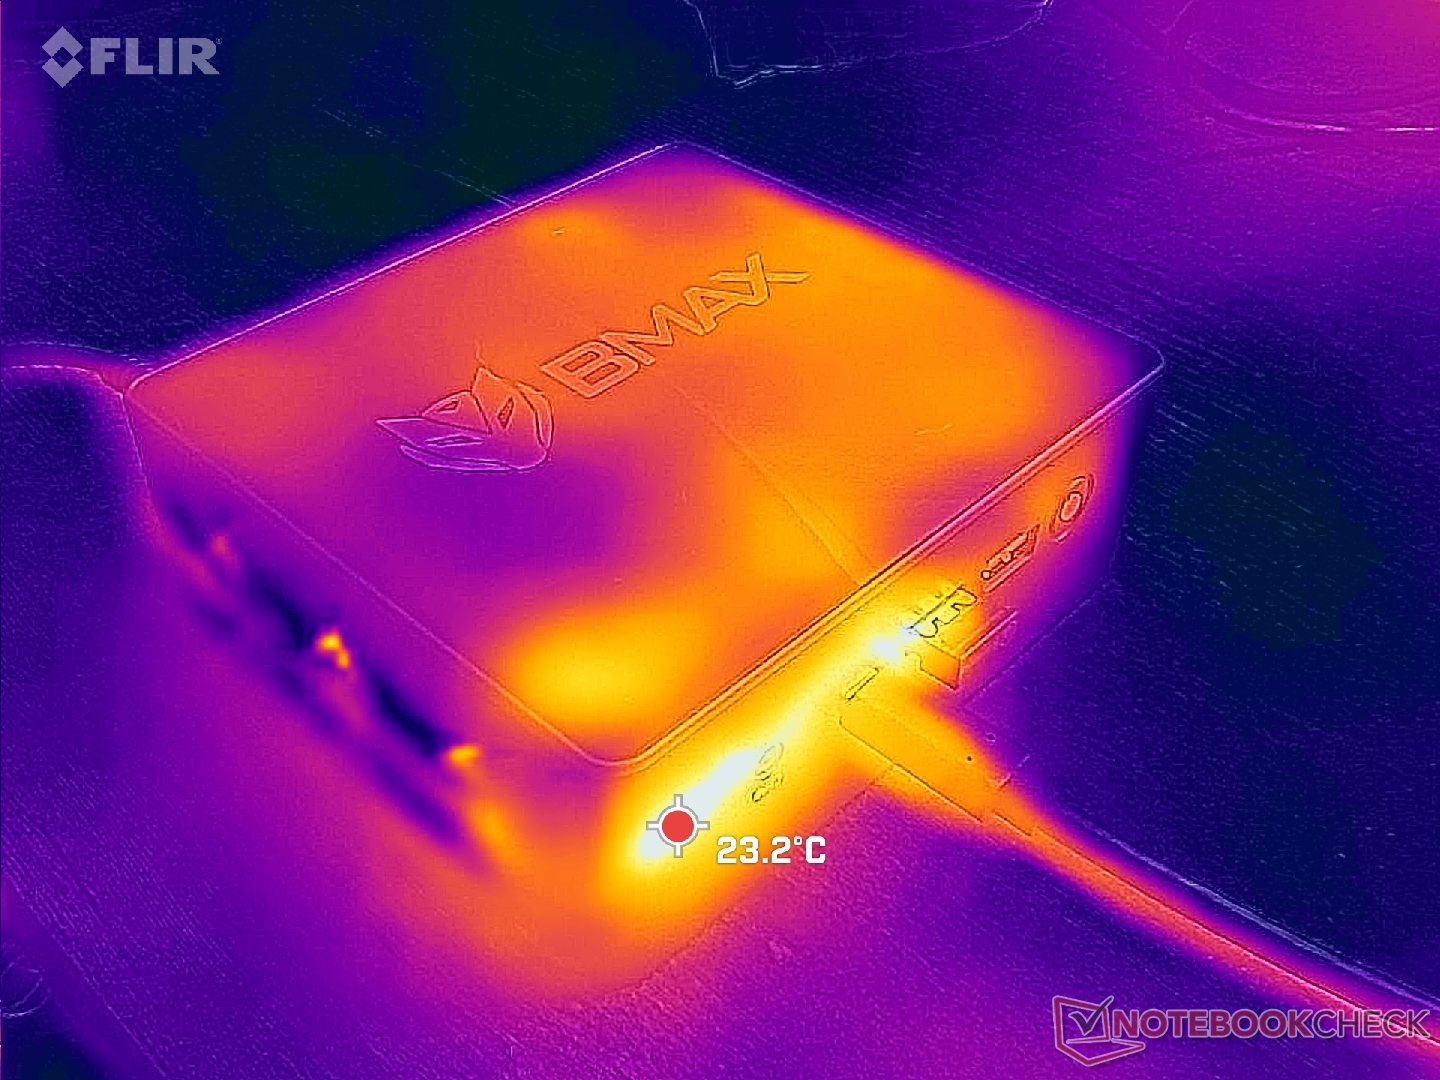
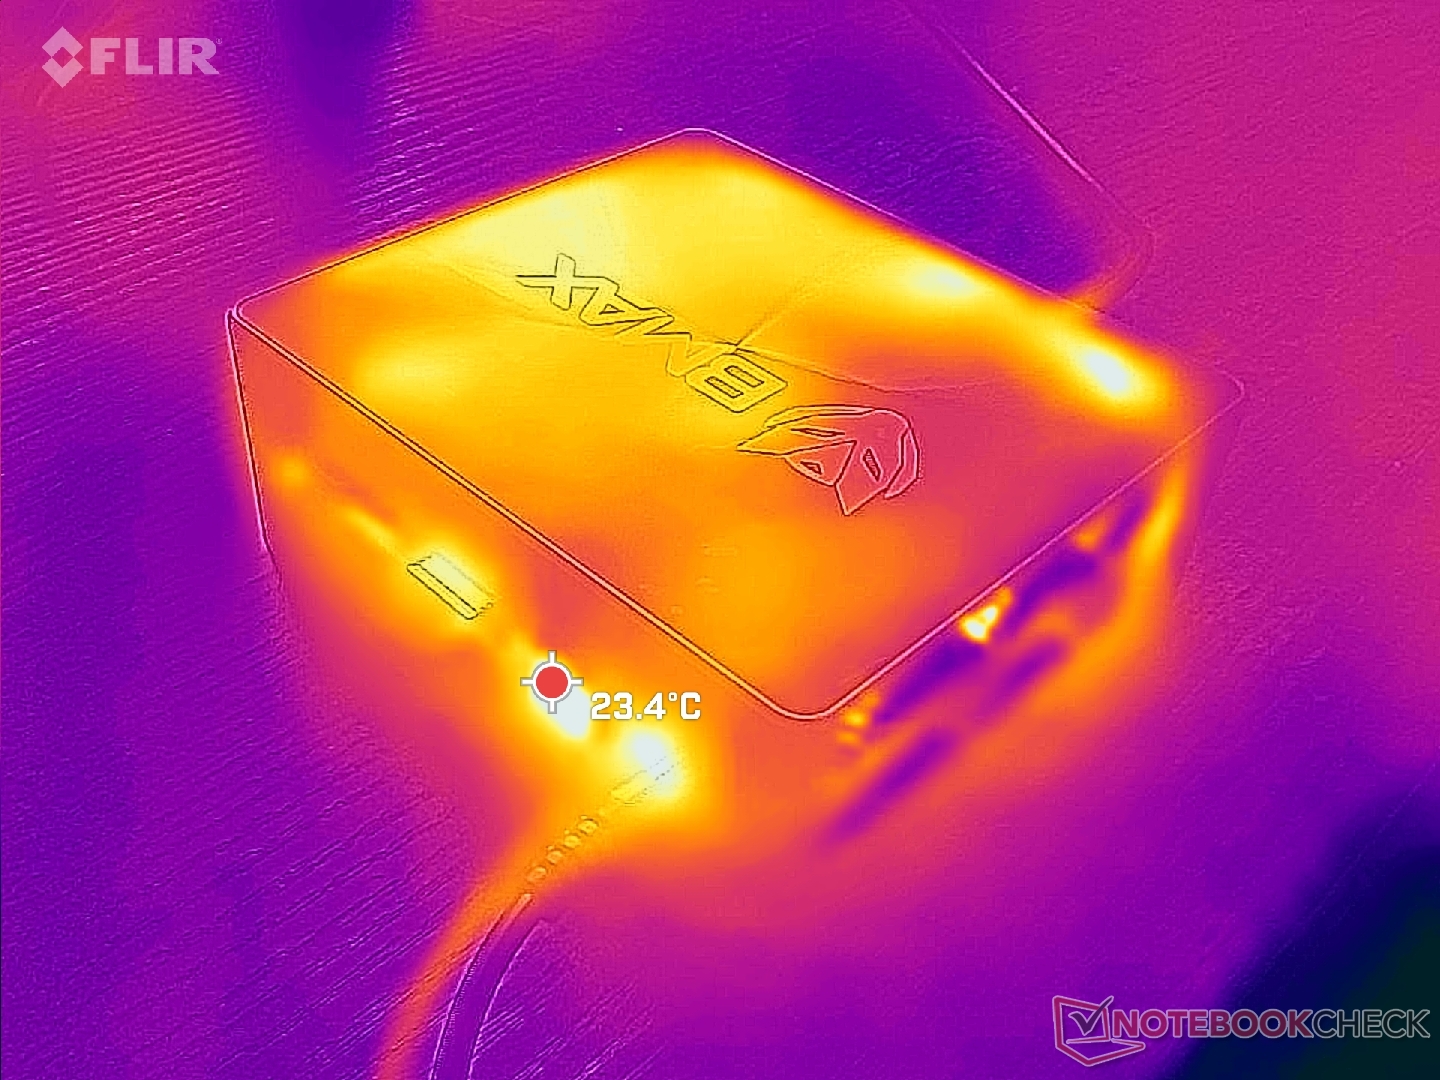
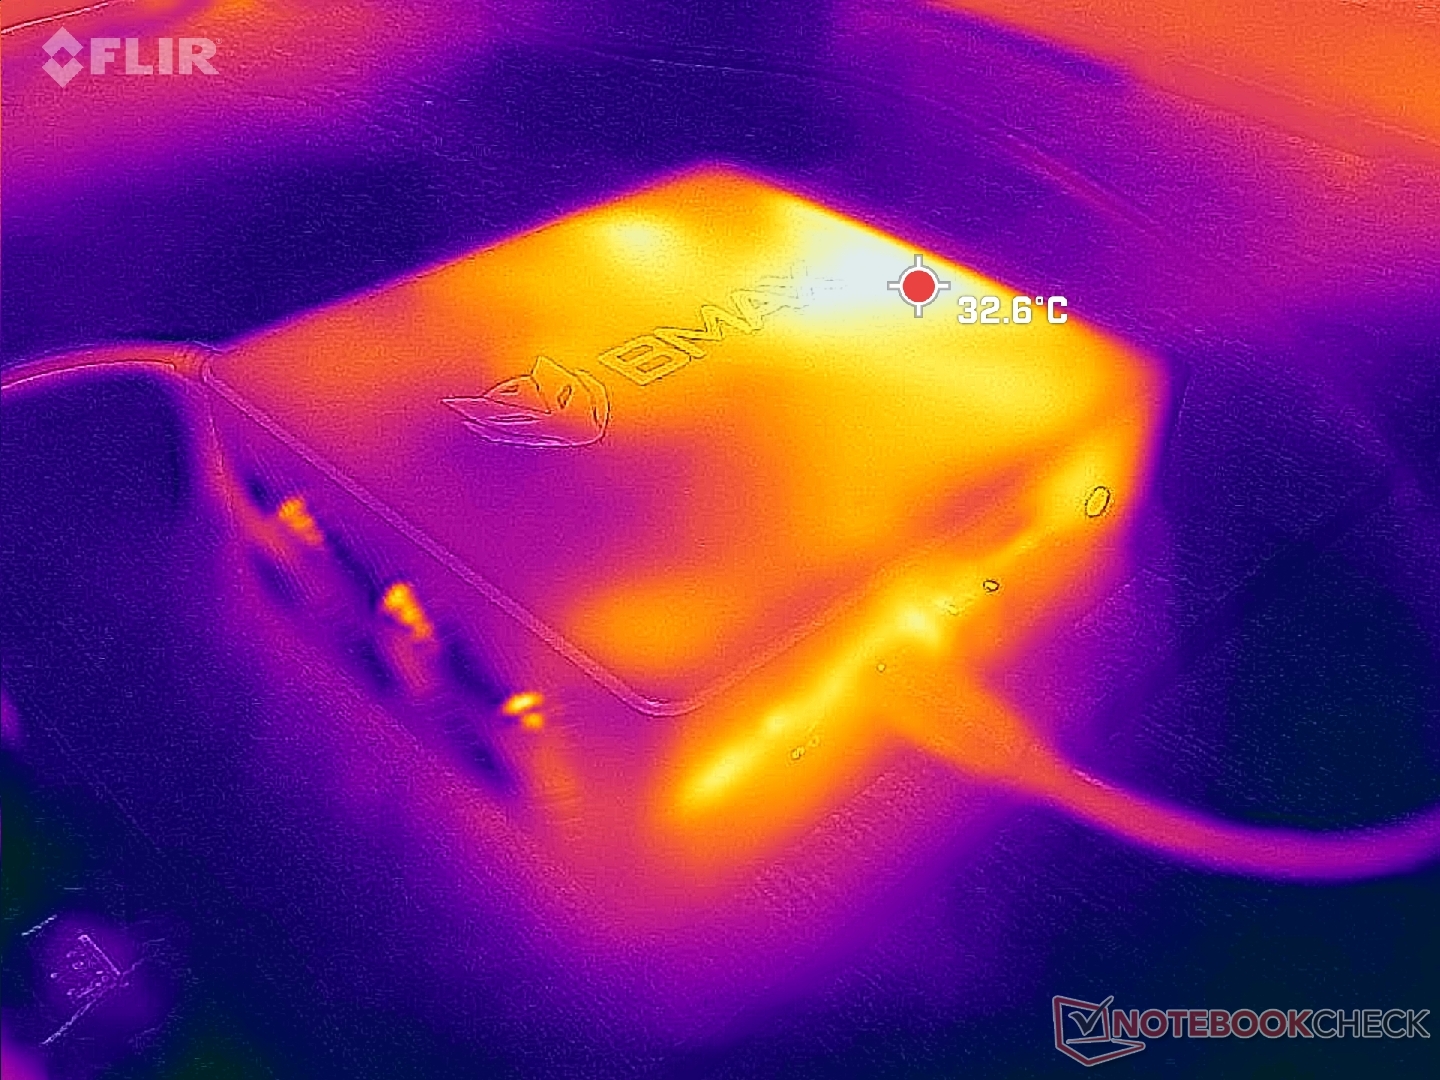
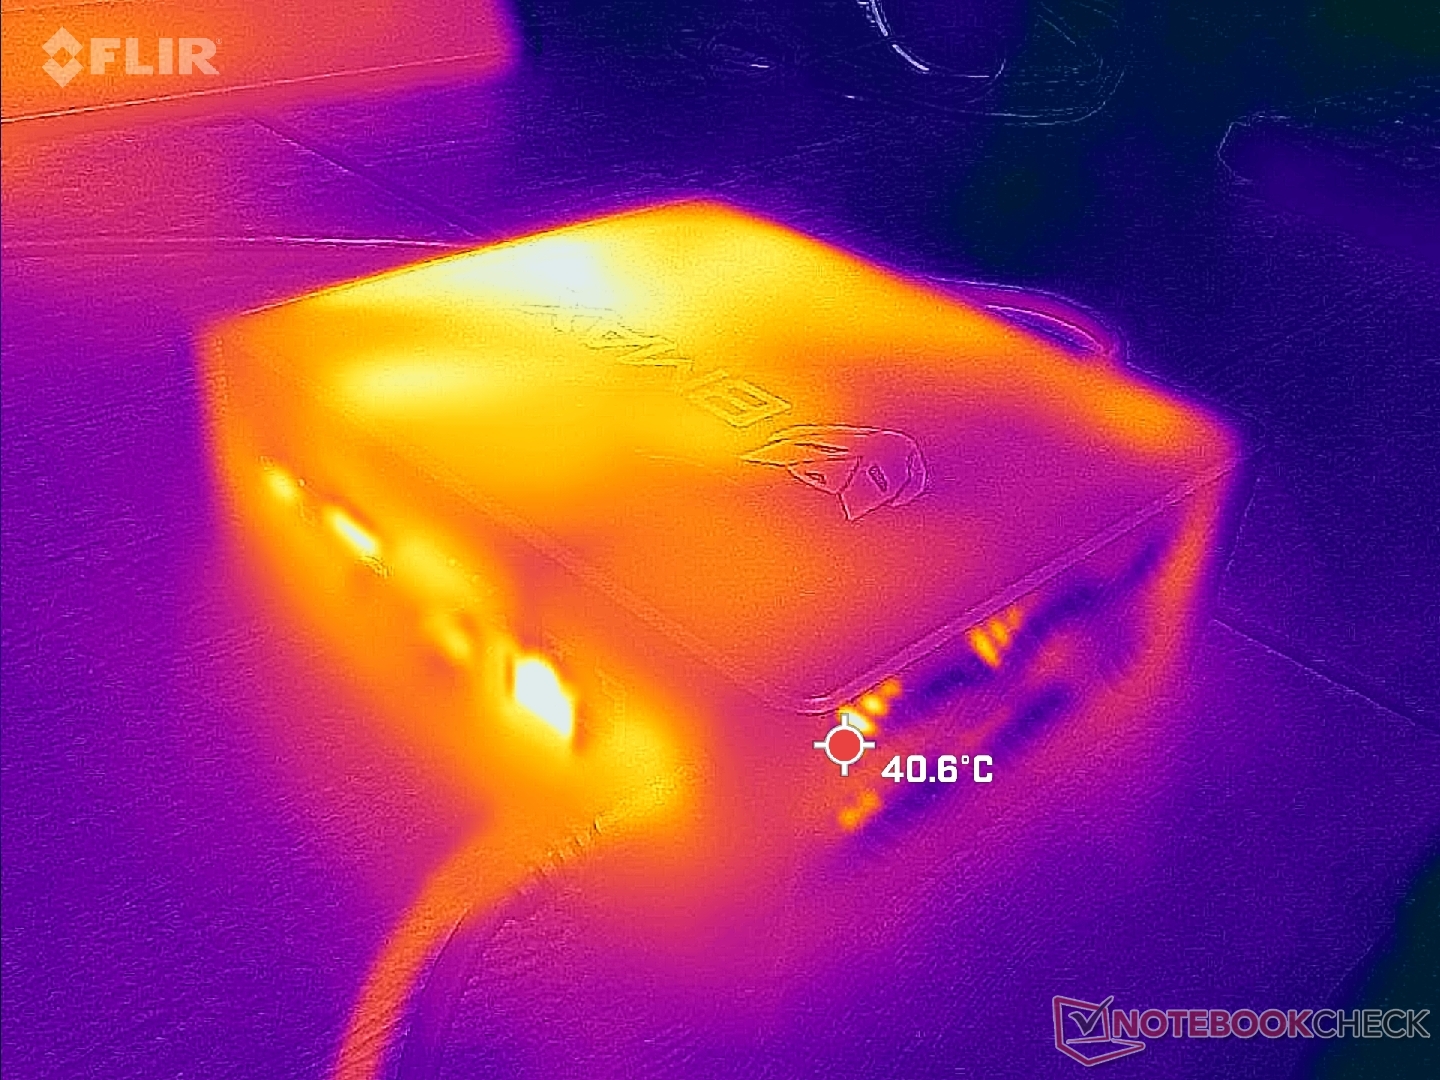
Temperatura
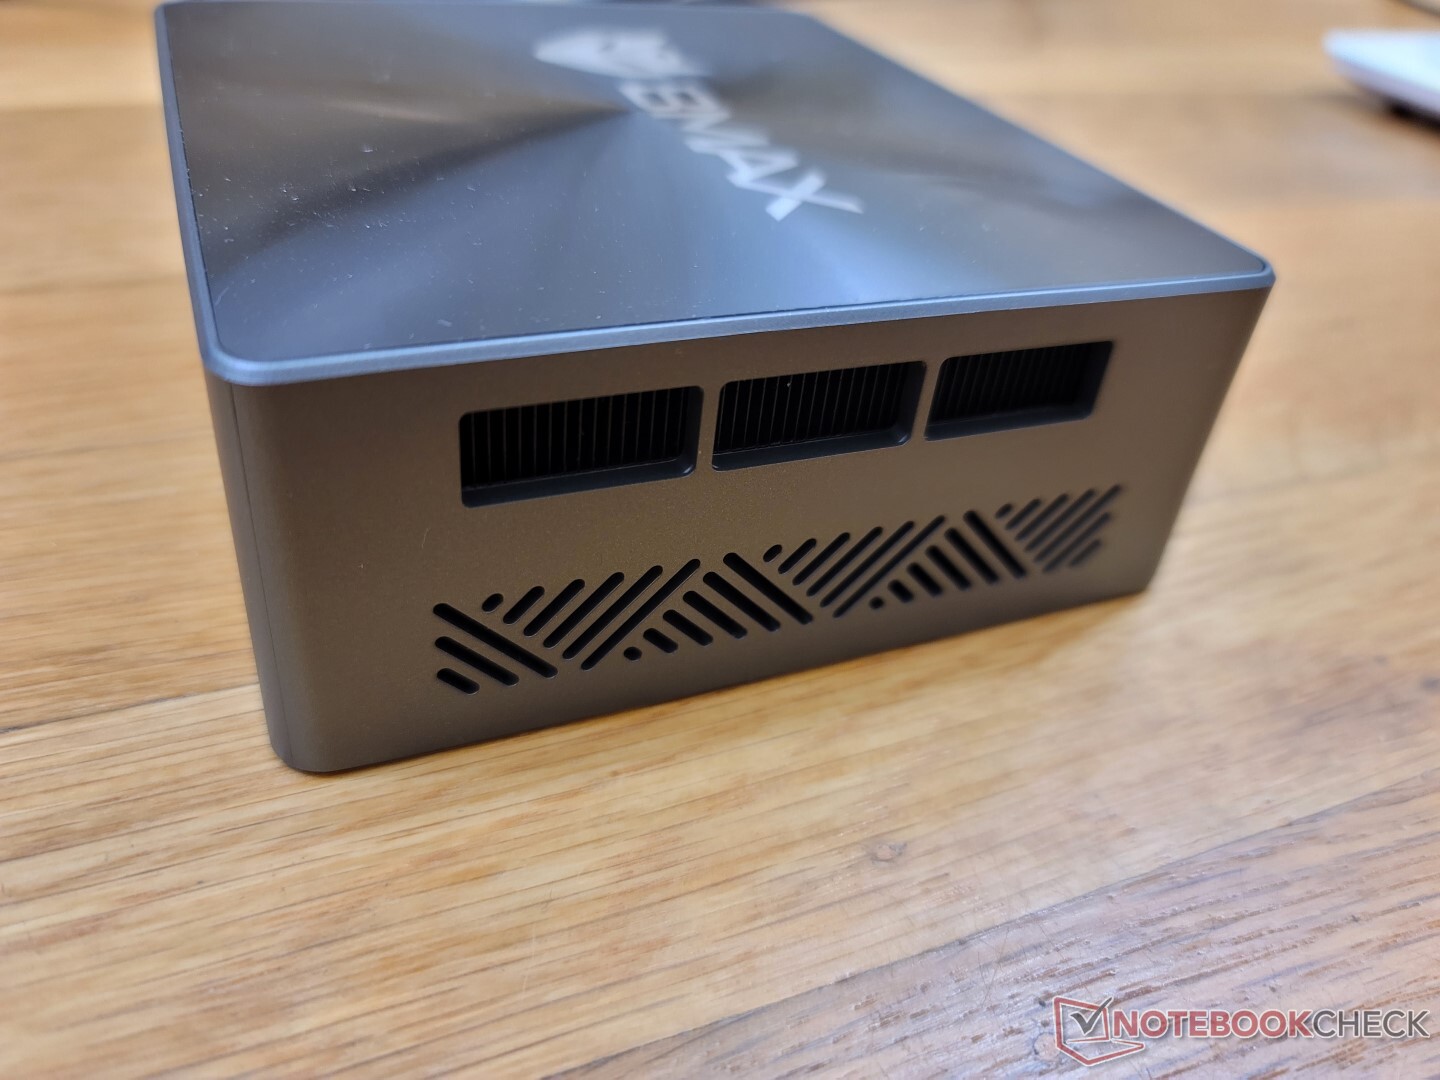
Temperatury powierzchni nigdy nie są nieprzyjemnie ciepłe. Na przykład gorący punkt na wierzchu osiąga około 33 C tylko przy dużym obciążeniu procesem. Ciepło ucieka z prawej strony obudowy, w przeciwieństwie do Intel NUC, gdzie ciepło ucieka z tyłu
Przedmioty można bezpiecznie umieścić na wierzchu urządzenia, ponieważ nie ma tam kratek wentylacyjnych.
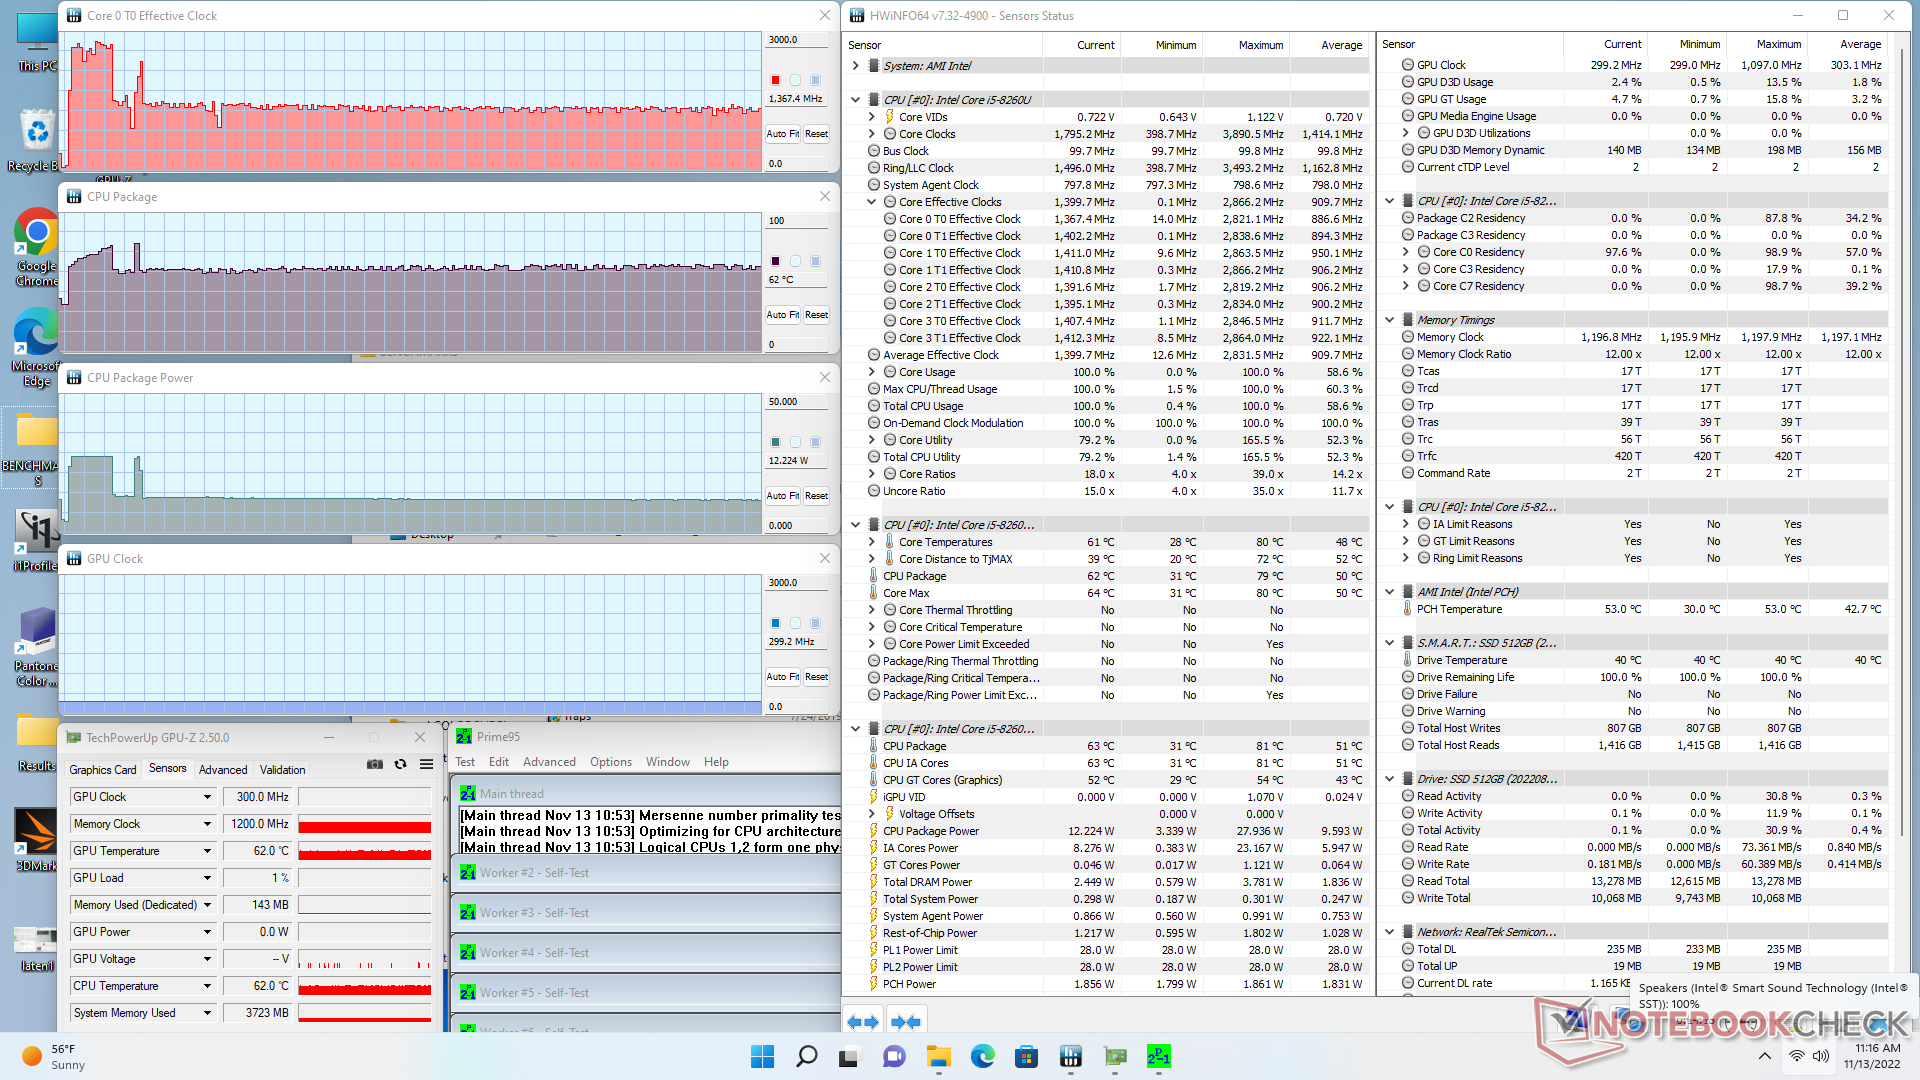
Stress Test
Przy obciążeniu pod Prime95 procesor zwiększał częstotliwość do 2,8 GHz i 28 W przez około 20 sekund lub do momentu, gdy temperatura rdzenia osiągnie 76 C. Częstotliwość taktowania i pobór mocy na płycie ustabilizowałyby się wtedy odpowiednio na poziomie 1,5 GHz i 12 W, w celu utrzymania chłodniejszej temperatury rdzenia 60 C. Powtarzając ten sam test na Beelink SEi8 przyniosłoby szybsze taktowanie rdzenia i cieplejsze temperatury, odpowiednio 2,8 GHz i 80 C. Potencjał Turbo Boost w B5 Pro jest więc ograniczony, co wynika z tego, co zaobserwowaliśmy podczas naszego powyższego testu obciążeniowego CineBench.
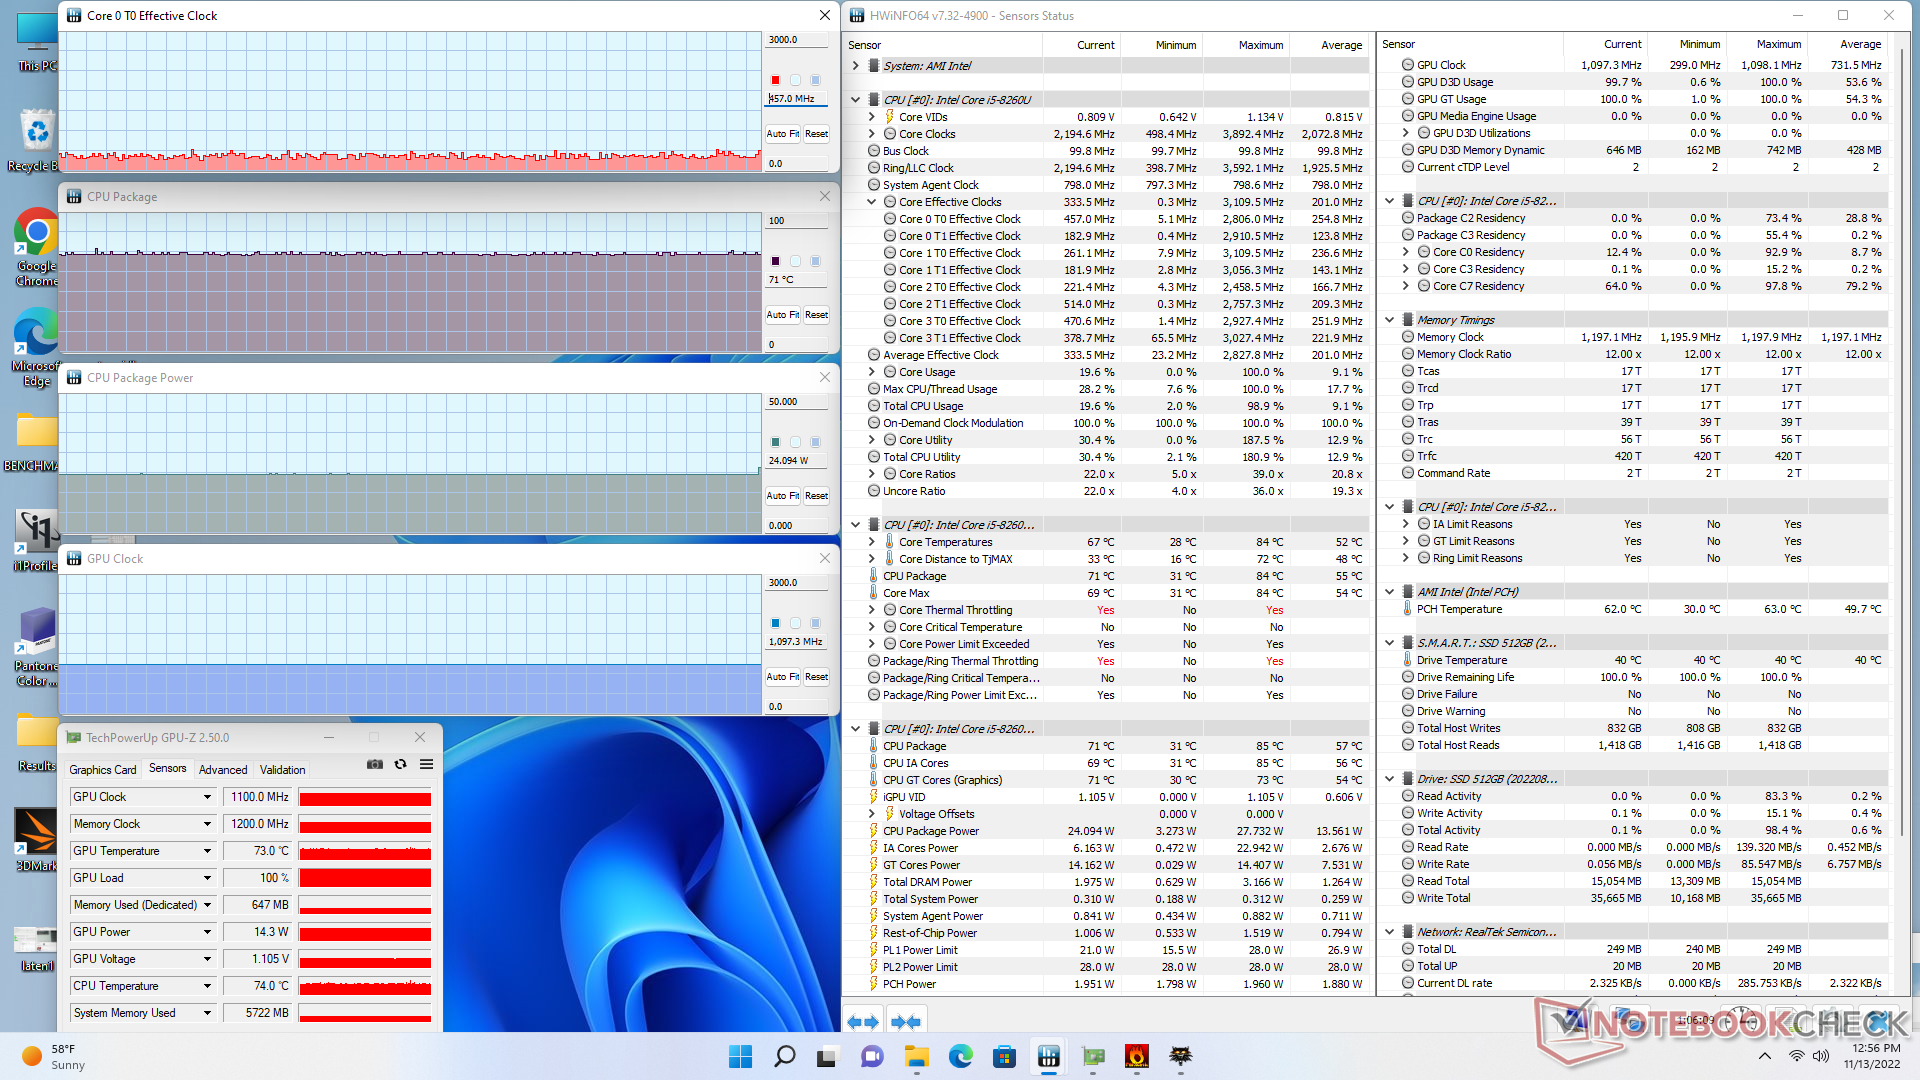
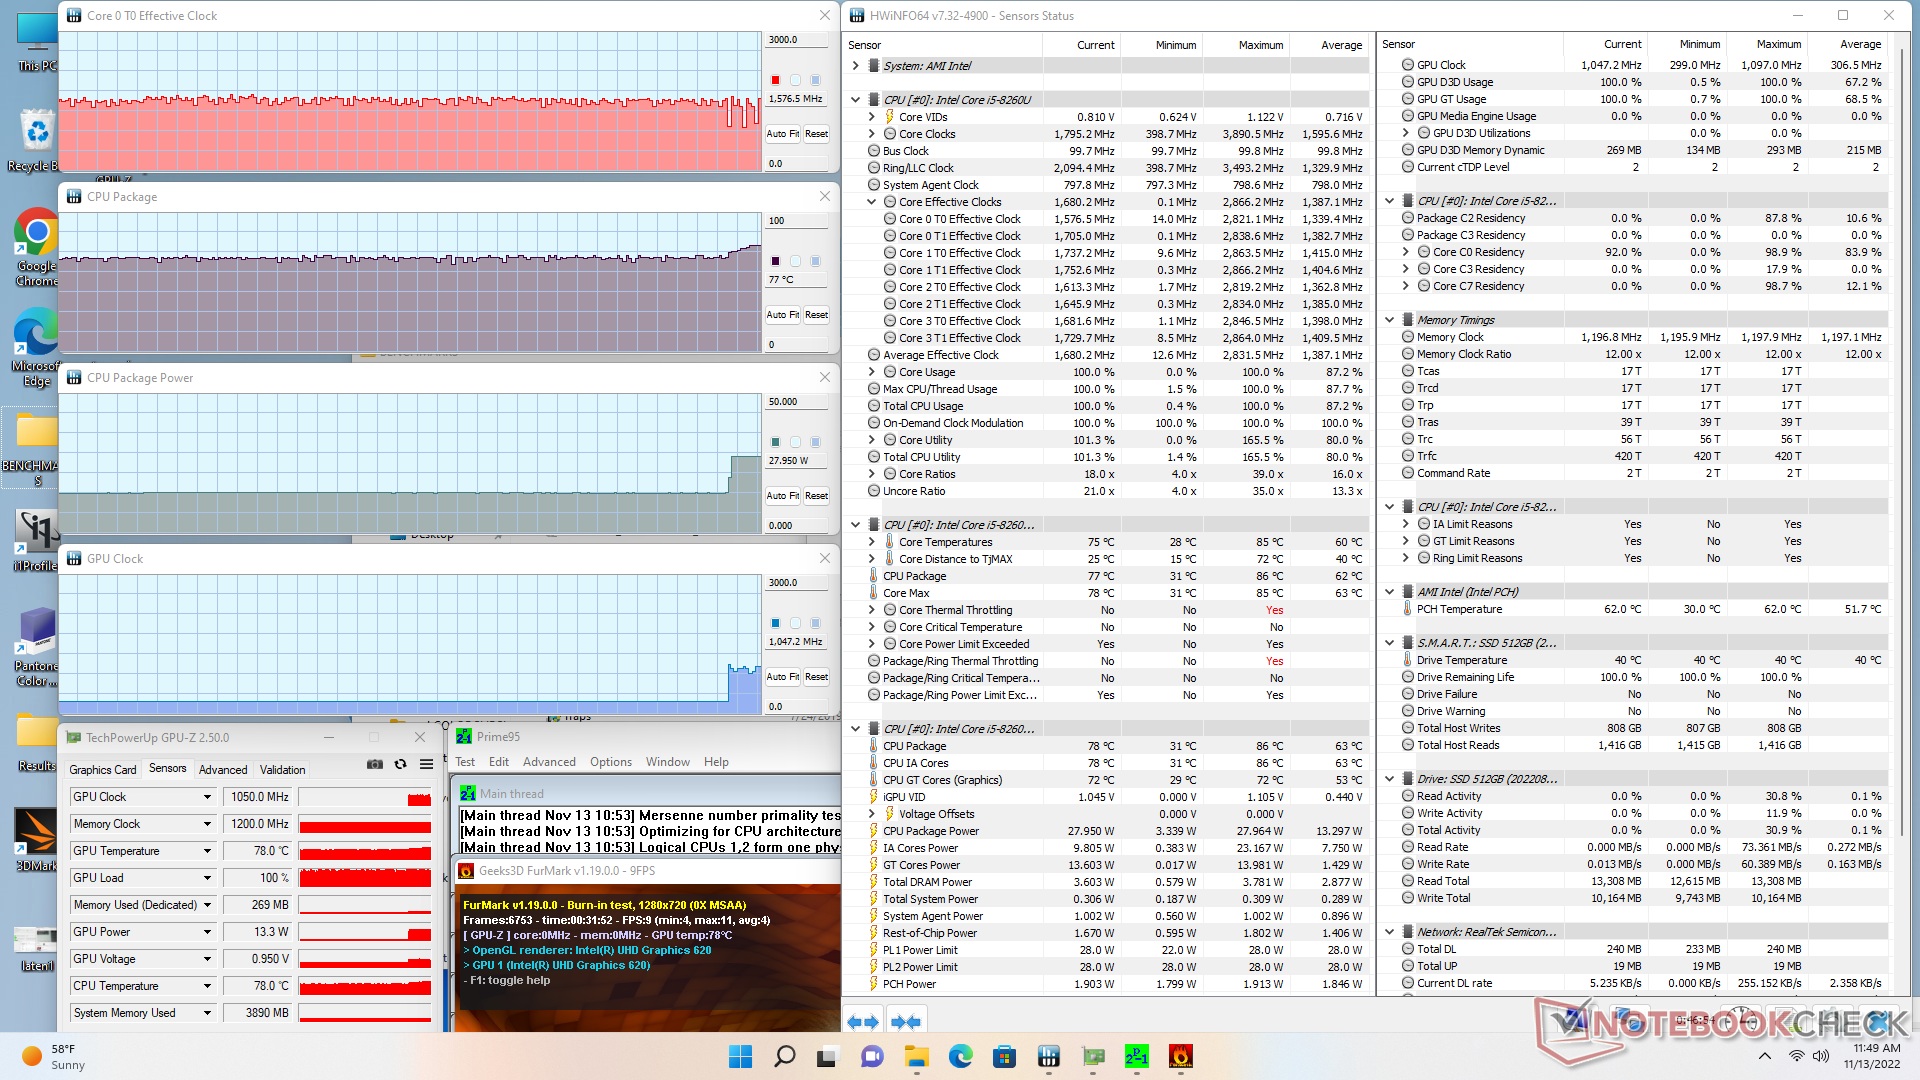
| ZegarCPU (GHz) | Zegar GPU (MHz) | Średnia temperatura CPU (°C) | |
| System w stanie bezczynności | -- | -- | 33 |
| Prime95 Stress | 1.3 | -- | 62 |
| Prime95+ FurMark Stress | 1.6 | 300 | 67 |
| Witcher 3 Stress | ~400 | 1100 | 71 |
Zarządzanie energią
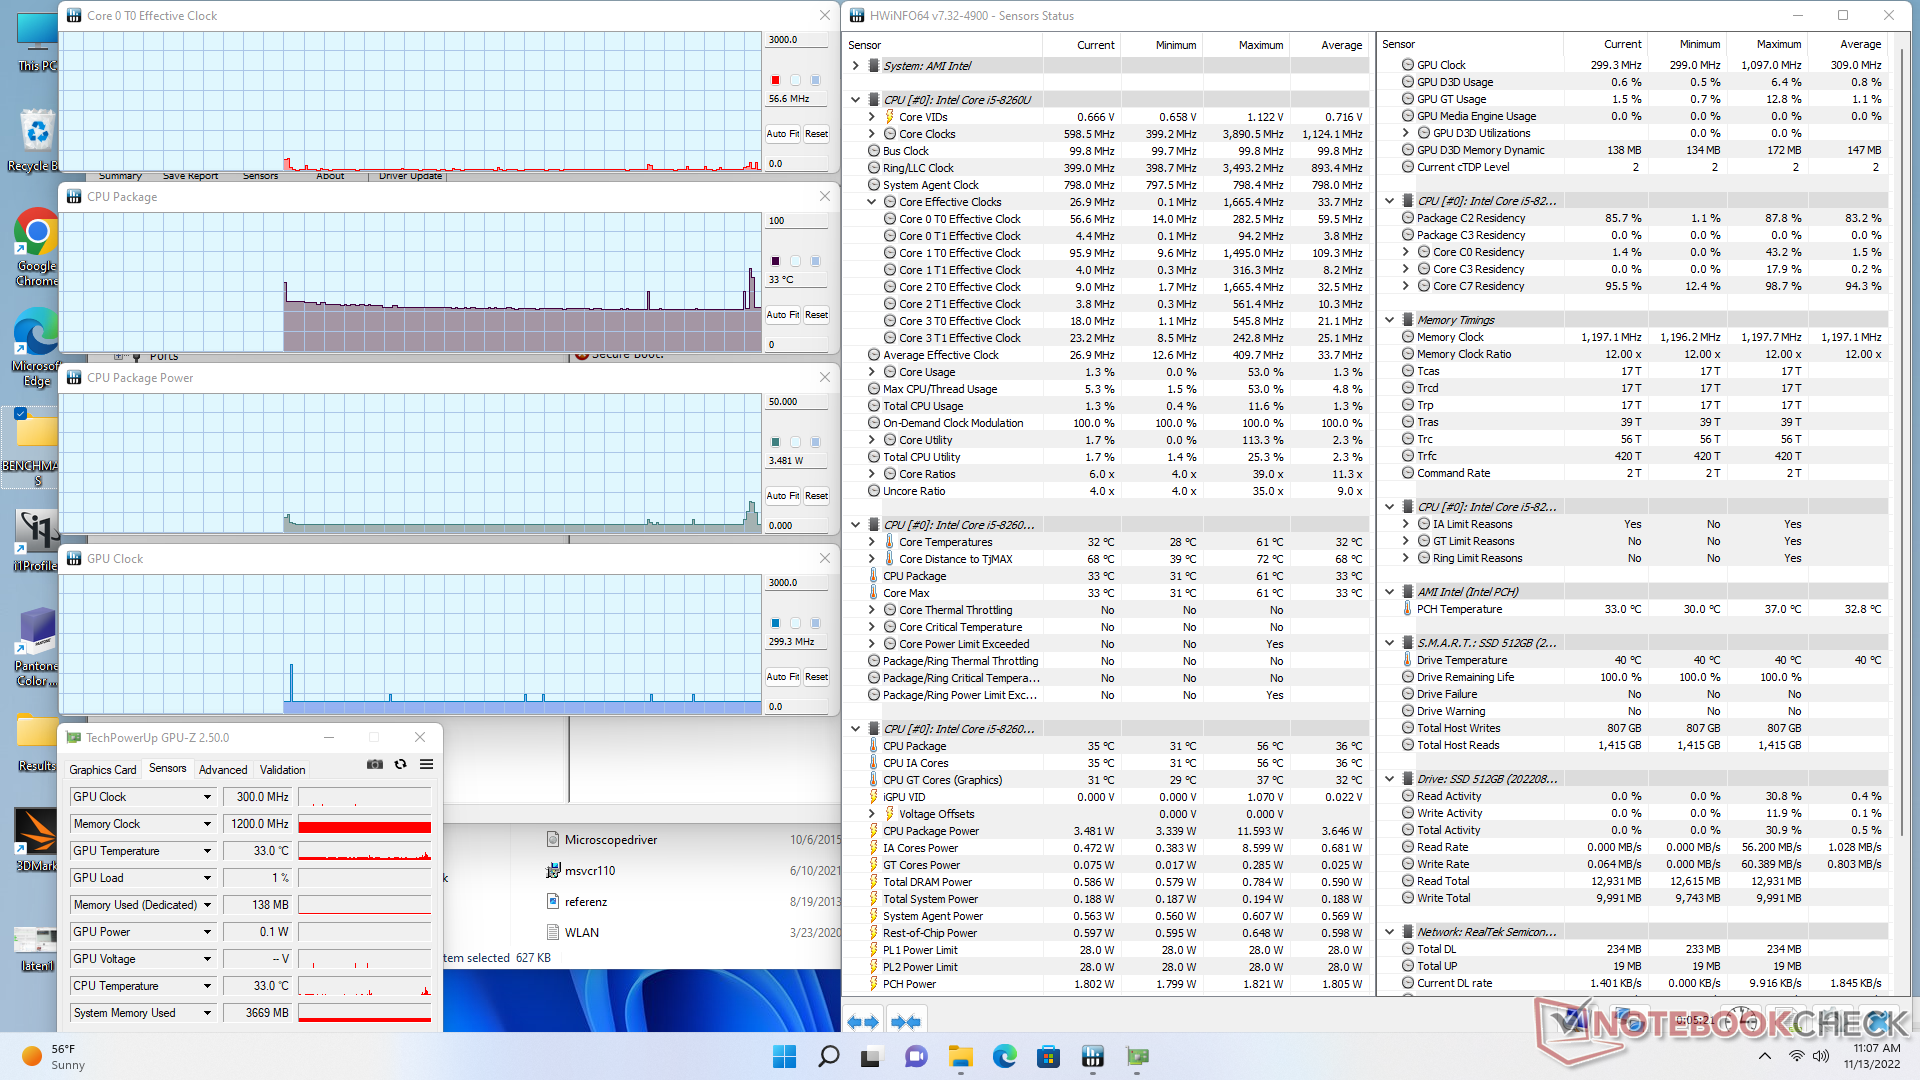
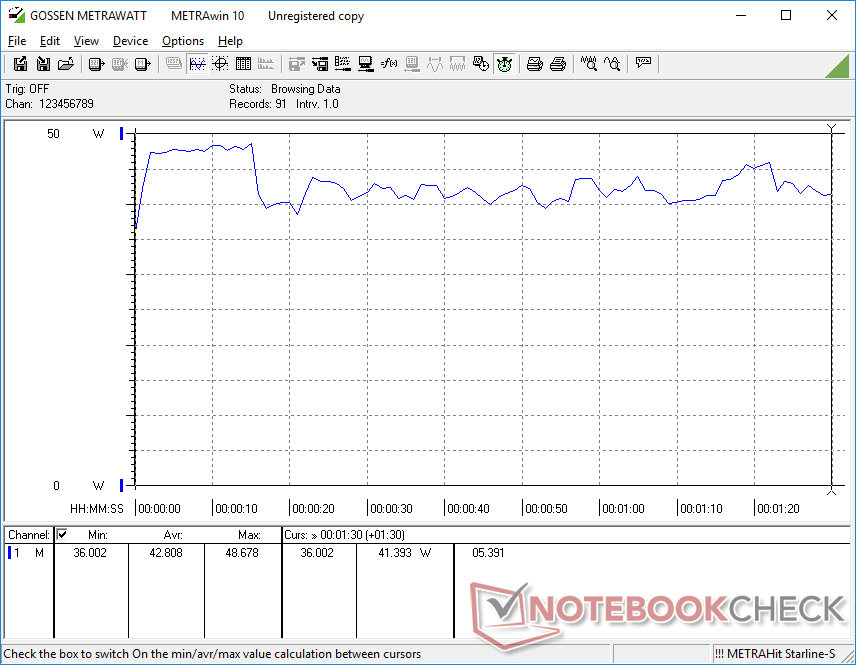
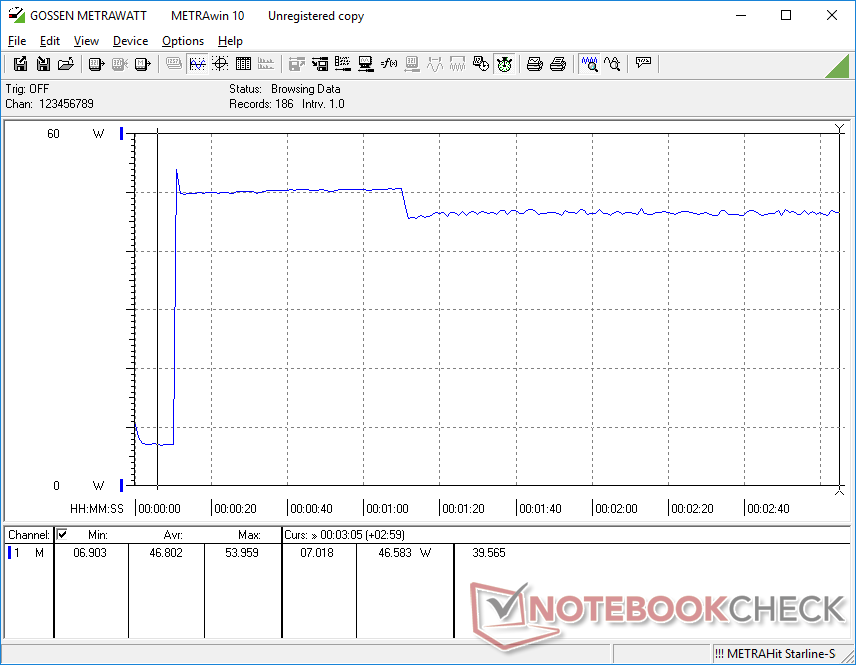
Pobór mocy - bardzo niski
Ogólne zużycie jest niższe niż w wielu mini komputerach z nowszymi procesorami, takimi jak Intel NUC11TNKi5 i jego Core i5-1135G7 11. generacji. Wydajność w przeliczeniu na wat znacznie faworyzuje jednak ten drugi model. Choć użytkownicy mogą zaoszczędzić kilka watów dzięki BMaxowi, mini PC z procesorami nowszej generacji, takimi jak wspomniany NUC, mogą zaoferować ponad dwukrotnie wyższą wydajność grafiki lub o 50 procent wyższą wydajność procesora
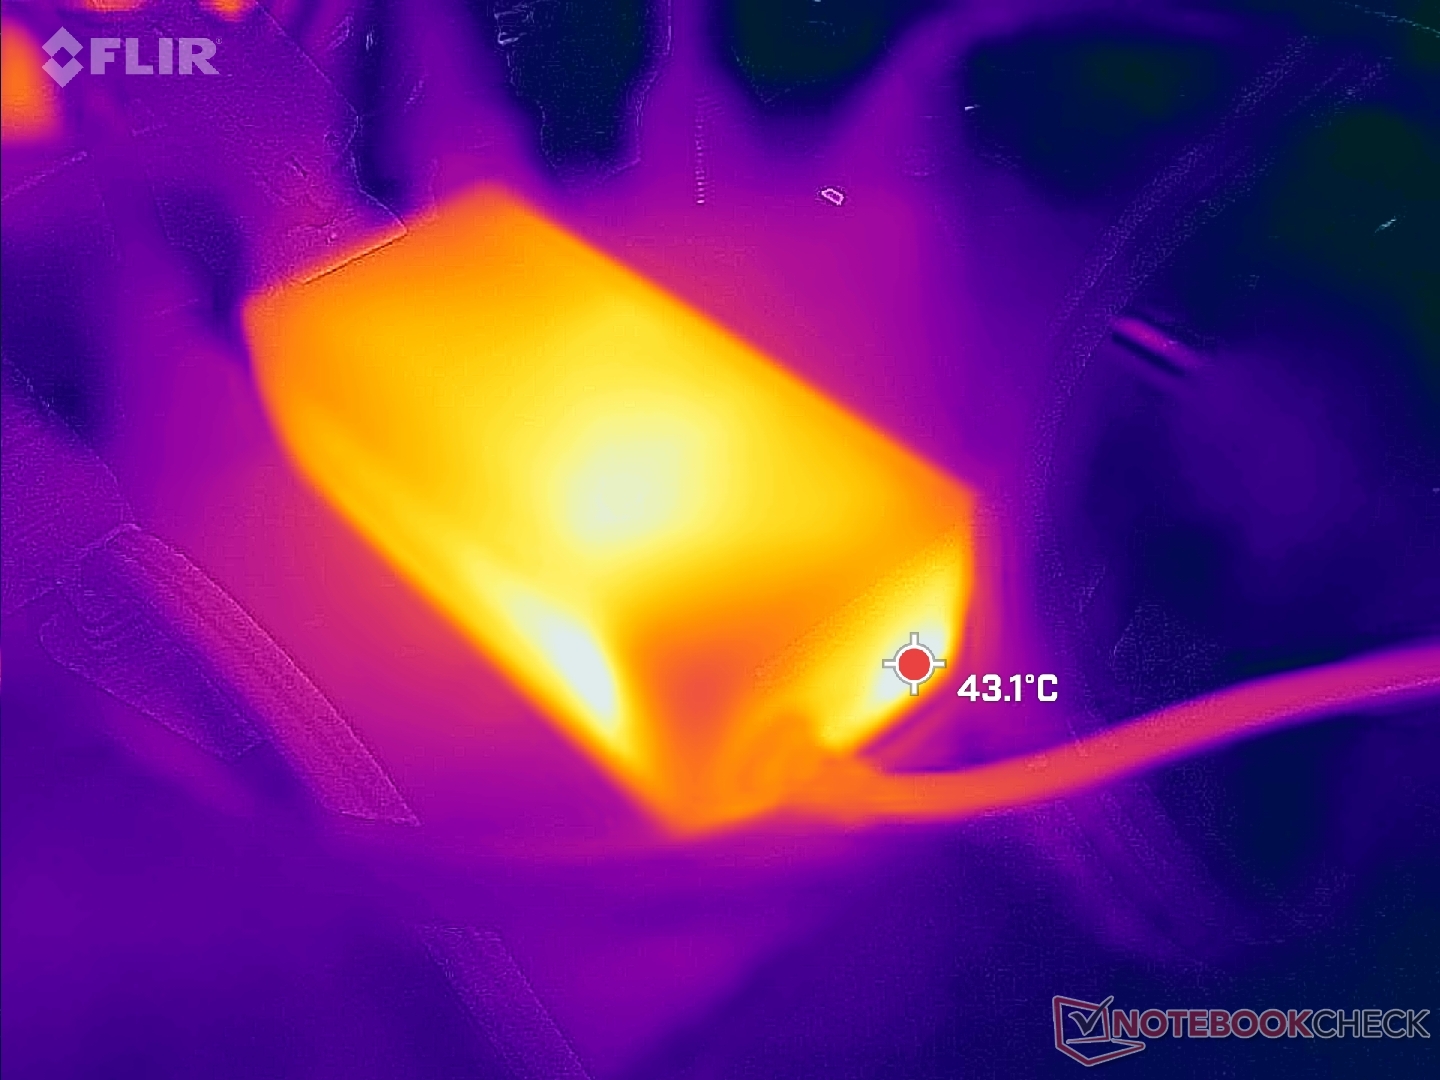
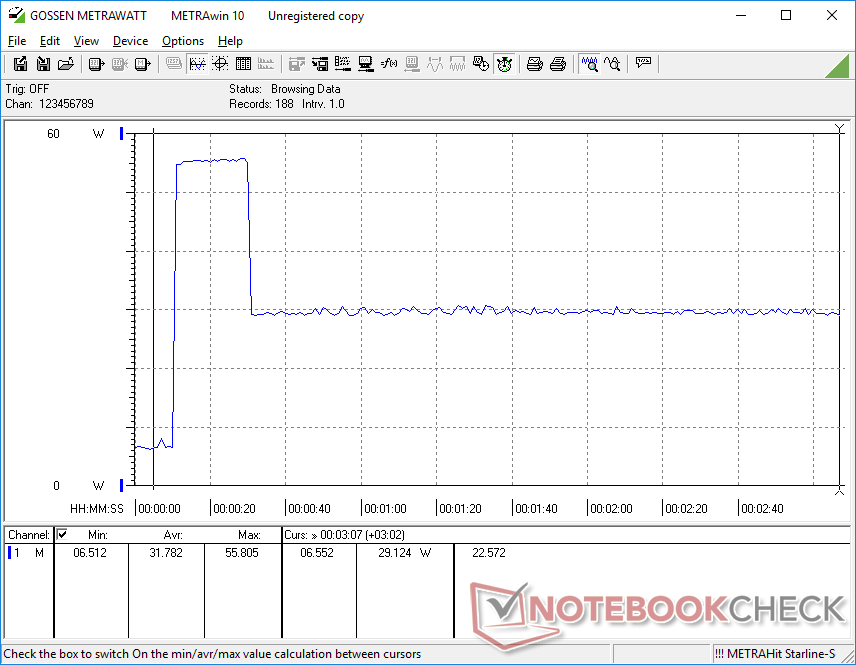
Udało nam się zarejestrować maksymalny pobór 55,9 W z małego (~9,8 x 4,3 x 3,7 cm) zasilacza 48 W, gdy procesor jest wykorzystywany w 100 procentach. Ten wskaźnik jest tylko chwilowy, jak pokazują nasze wykresy poniżej.
| wyłączony / stan wstrzymania | |
| luz | |
| obciążenie |
|
Legenda:
min: | |
| BMAX B5 Pro G7H8 i5-8260U, UHD Graphics 620, , , x, | Beelink SEi11 Pro i5-11320H, Iris Xe G7 96EUs, Kingston NV1 SNVS/500GCN, , x, | Beelink U59 N5105 Celeron N5105, UHD Graphics (Jasper Lake 24 EU), Silicon Motion AZW 512G NV428, , x, | Beelink SEi8 i3-8109U, Iris Plus Graphics 655, Intel SSD 660p SSDPEKNW512G8, , x, | Beelink SER Pro Ryzen 5 5600H R5 5600H, Vega 7, Kingston NV1 SNVS/500GCN, , x, | Intel NUC11TNKi5 i5-1135G7, Iris Xe G7 80EUs, Transcend M.2 SSD 430S TS512GMTS430S, , x, | |
|---|---|---|---|---|---|---|
| Power Consumption | -47% | 2% | -13% | -15% | -58% | |
| Idle Minimum * (Watt) | 6 | 9.8 -63% | 6.7 -12% | 7.5 -25% | 5.4 10% | 11.5 -92% |
| Idle Average * (Watt) | 6.2 | 10.3 -66% | 8.1 -31% | 7.6 -23% | 8.2 -32% | 12.4 -100% |
| Idle Maximum * (Watt) | 6.3 | 10.5 -67% | 11.6 -84% | 9.2 -46% | 8.3 -32% | 12.9 -105% |
| Load Average * (Watt) | 42.8 | 54.2 -27% | 23.9 44% | 41.1 4% | 49.3 -15% | 40.7 5% |
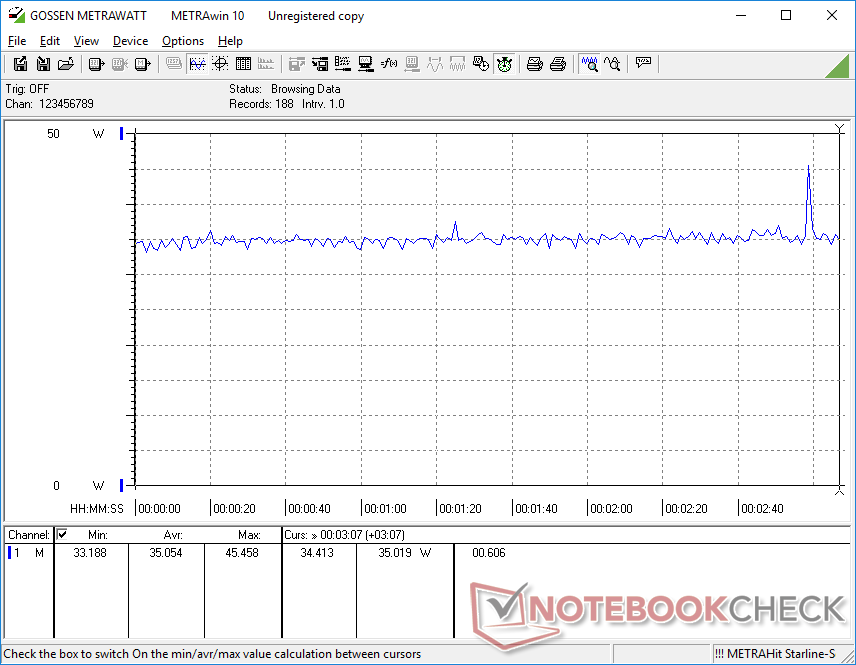
| Witcher 3 ultra * (Watt) | 35 | 53.1 -52% | 19.1 45% | 46.1 -32% | 43.9 -25% | |
| Load Maximum * (Watt) | 55.8 | 59 -6% | 28.8 48% | 41.4 26% | 50.2 10% | 73.5 -32% |
* ... im mniej tym lepiej
Power Consumption Witcher 3 / Stresstest
Power Consumption external Monitor
Za
Przeciw
Werdykt - Niedroga opcja dla podstawowych celów HTPC
Jeśli szukasz maksymalnego zysku za złotówkę, to BMax B5 Pro powinien być blisko szczytu Twojej listy. Oferuje pojemny dysk SSD NVMe o pojemności 512 GB, miejsce na drugi dysk SSD, 16 GB wymiennej pamięci RAM, licencjonowany system Windows 11 Pro już zainstalowany, cichy szum wentylatora i procesor, który jest porównywalny z 10. gen Core i7-1065G7 a wszystko to za mniej niż 300 USD. Procesor Core i5-8260U jest lepszy od Core i3, Celerona, Atoma lub Ryzena 3, które są zbyt powszechne w tym przedziale cenowym.
BMax B5 Pro jest kompletnym pakietem za prawie połowę ceny gołego Intel NUC bez konieczności osiedlania się na niskim poziomie procesorów Celeron lub Atom.
Główną wadą modelu jest słaba wydajność graficzna, która tak naprawdę nie powinna być problemem, ponieważ nikt nie powinien kupować B5 Pro do celów gier. Wydajność graficzna jest wciąż wystarczająca do komfortowego streamingu 4K60.
Chcielibyśmy zobaczyć więcej portów USB-C, wsparcie dla USB-C Power Delivery oraz port HDMI 2.0 lub lepszy w przyszłych rewizjach.
Cena i dostępność
Amazon obecnie wysyła naszą dokładną konfigurację BMax B5 Pro za 380 USD lub 280 USD po zastosowaniu kodu kuponu w momencie publikacji.
Price comparison

