Gigabyte G7 KE w recenzji: Niedrogi laptop do gier z potężnym RTX 3060
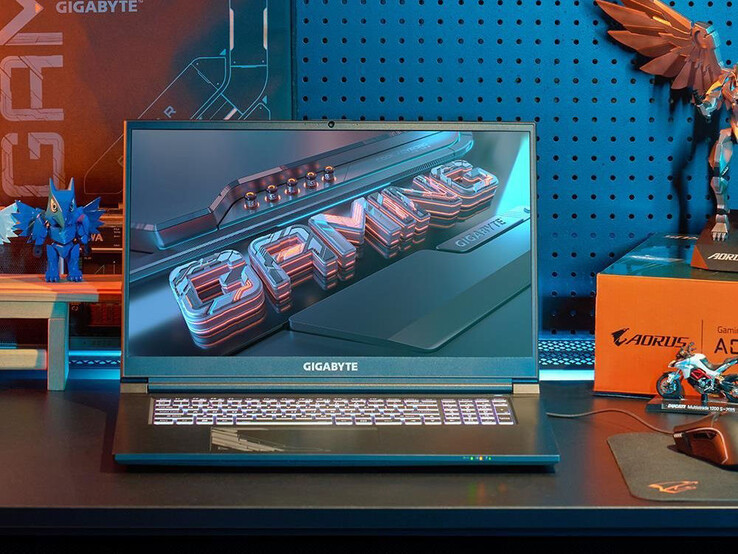
G7 KE to 17,3-calowy laptop gamingowy z niższej półki cenowej. Gigabyte połączył procesor Alder Lake Core i5 z RTX 3060 GPU za około 1200 euro (~1 300 USD). Tańsze modele z GeForce RTX 3050 (G7 GE) lub GeForce RTX 3050 Ti (G7 ME) są również dostępne. Wśród konkurentów są takie urządzenia jak np HP Pavilion Gaming 17, Acer Nitro 5 AN517-55, Lenovo IdeaPad Gaming 3 15IAH7 czy też Asus TUF Gaming F17 FX707Z.
Potencjalni konkurenci w porównaniu
Ocena | Data | Model | Waga | Wysokość | Rozmiar | Rezolucja | Cena |
|---|---|---|---|---|---|---|---|
| 83.3 % v7 (old) | 01/2023 | Gigabyte G7 KE i5-12500H, GeForce RTX 3060 Laptop GPU | 2.6 kg | 25 mm | 17.30" | 1920x1080 | |
| 82.7 % v7 (old) | 10/2022 | HP Pavilion Gaming 17-cd2146ng i5-11300H, GeForce RTX 3050 Ti Laptop GPU | 2.8 kg | 25 mm | 17.30" | 1920x1080 | |
| 83.9 % v7 (old) | Acer Nitro 5 AN517-55-738R i7-12700H, GeForce RTX 3060 Laptop GPU | 3.1 kg | 28.6 mm | 17.30" | 1920x1080 | ||
| 84.1 % v7 (old) | Asus TUF Gaming F17 FX707Z-HX011W i7-12700H, GeForce RTX 3060 Laptop GPU | 2.5 kg | 25 mm | 17.30" | 1920x1080 | ||
| 82.8 % v7 (old) | 10/2022 | Lenovo IdeaPad Gaming 3 15IAH7 i5-12500H, GeForce RTX 3050 Ti Laptop GPU | 2.4 kg | 26 mm | 15.60" | 1920x1080 |
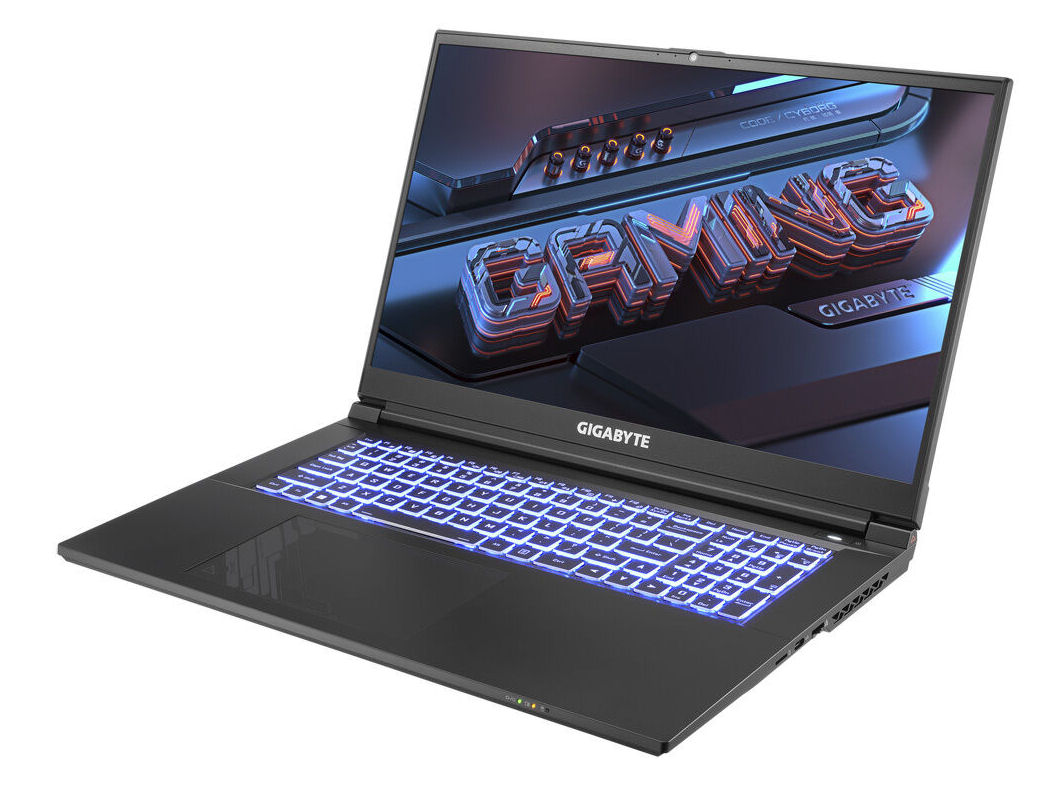
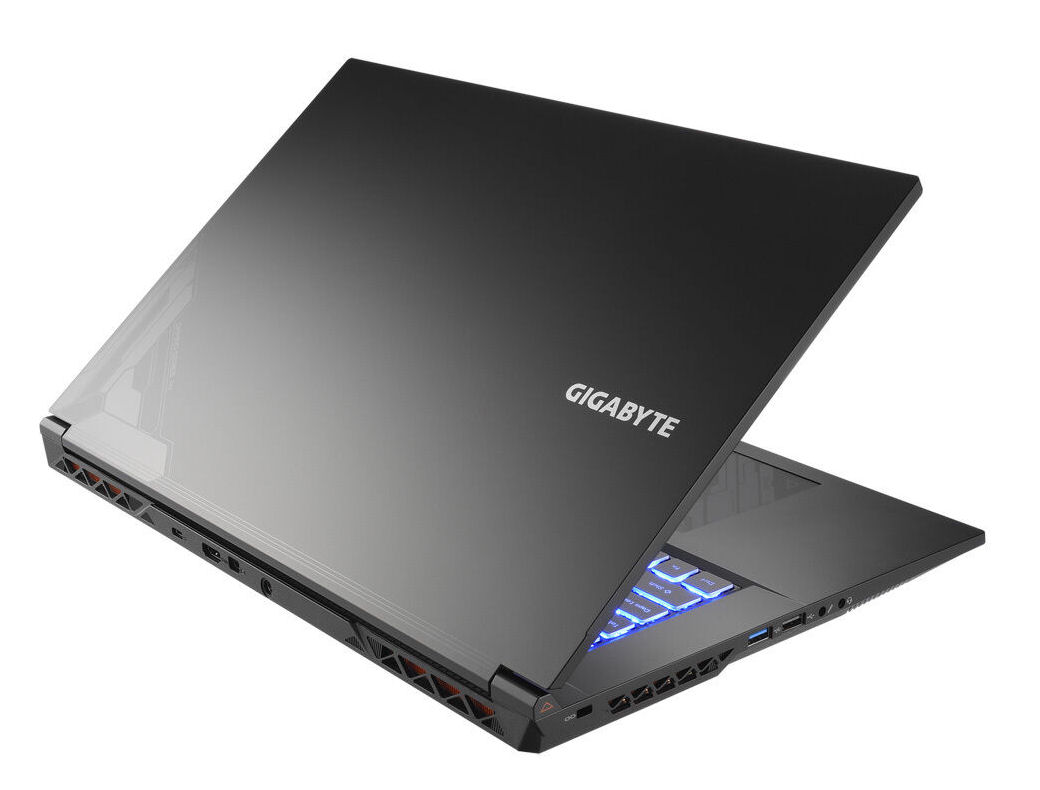
Obudowa - G7 z plastikową obudową
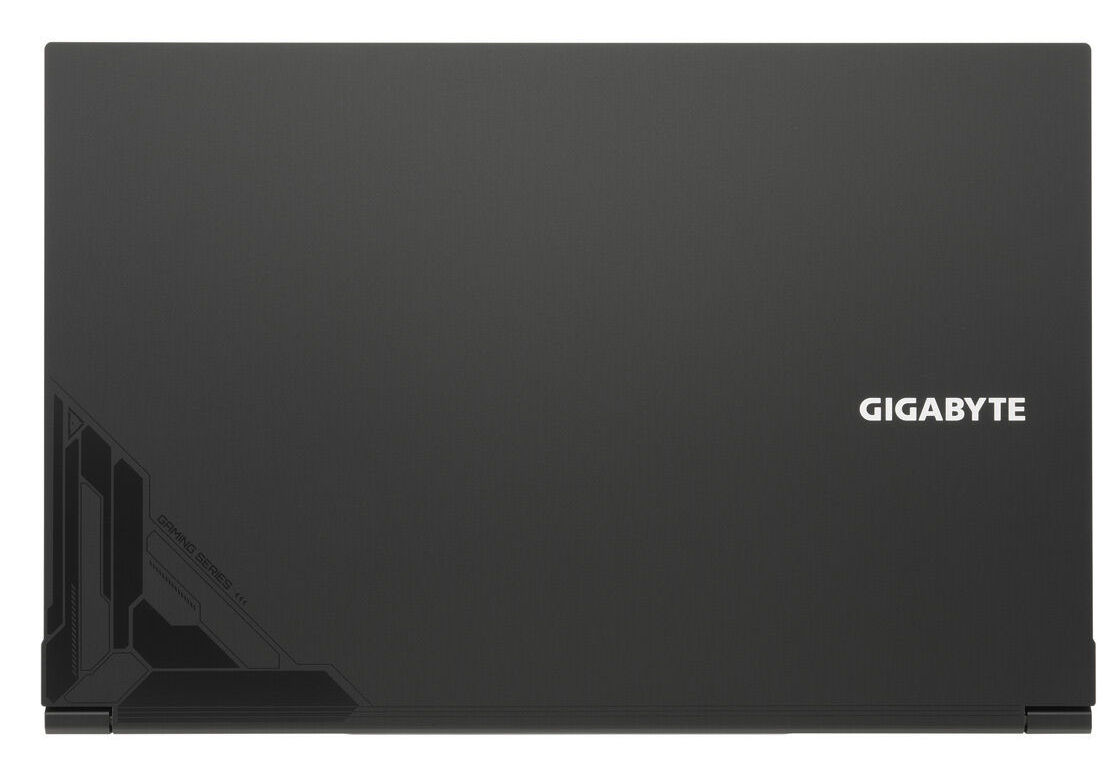
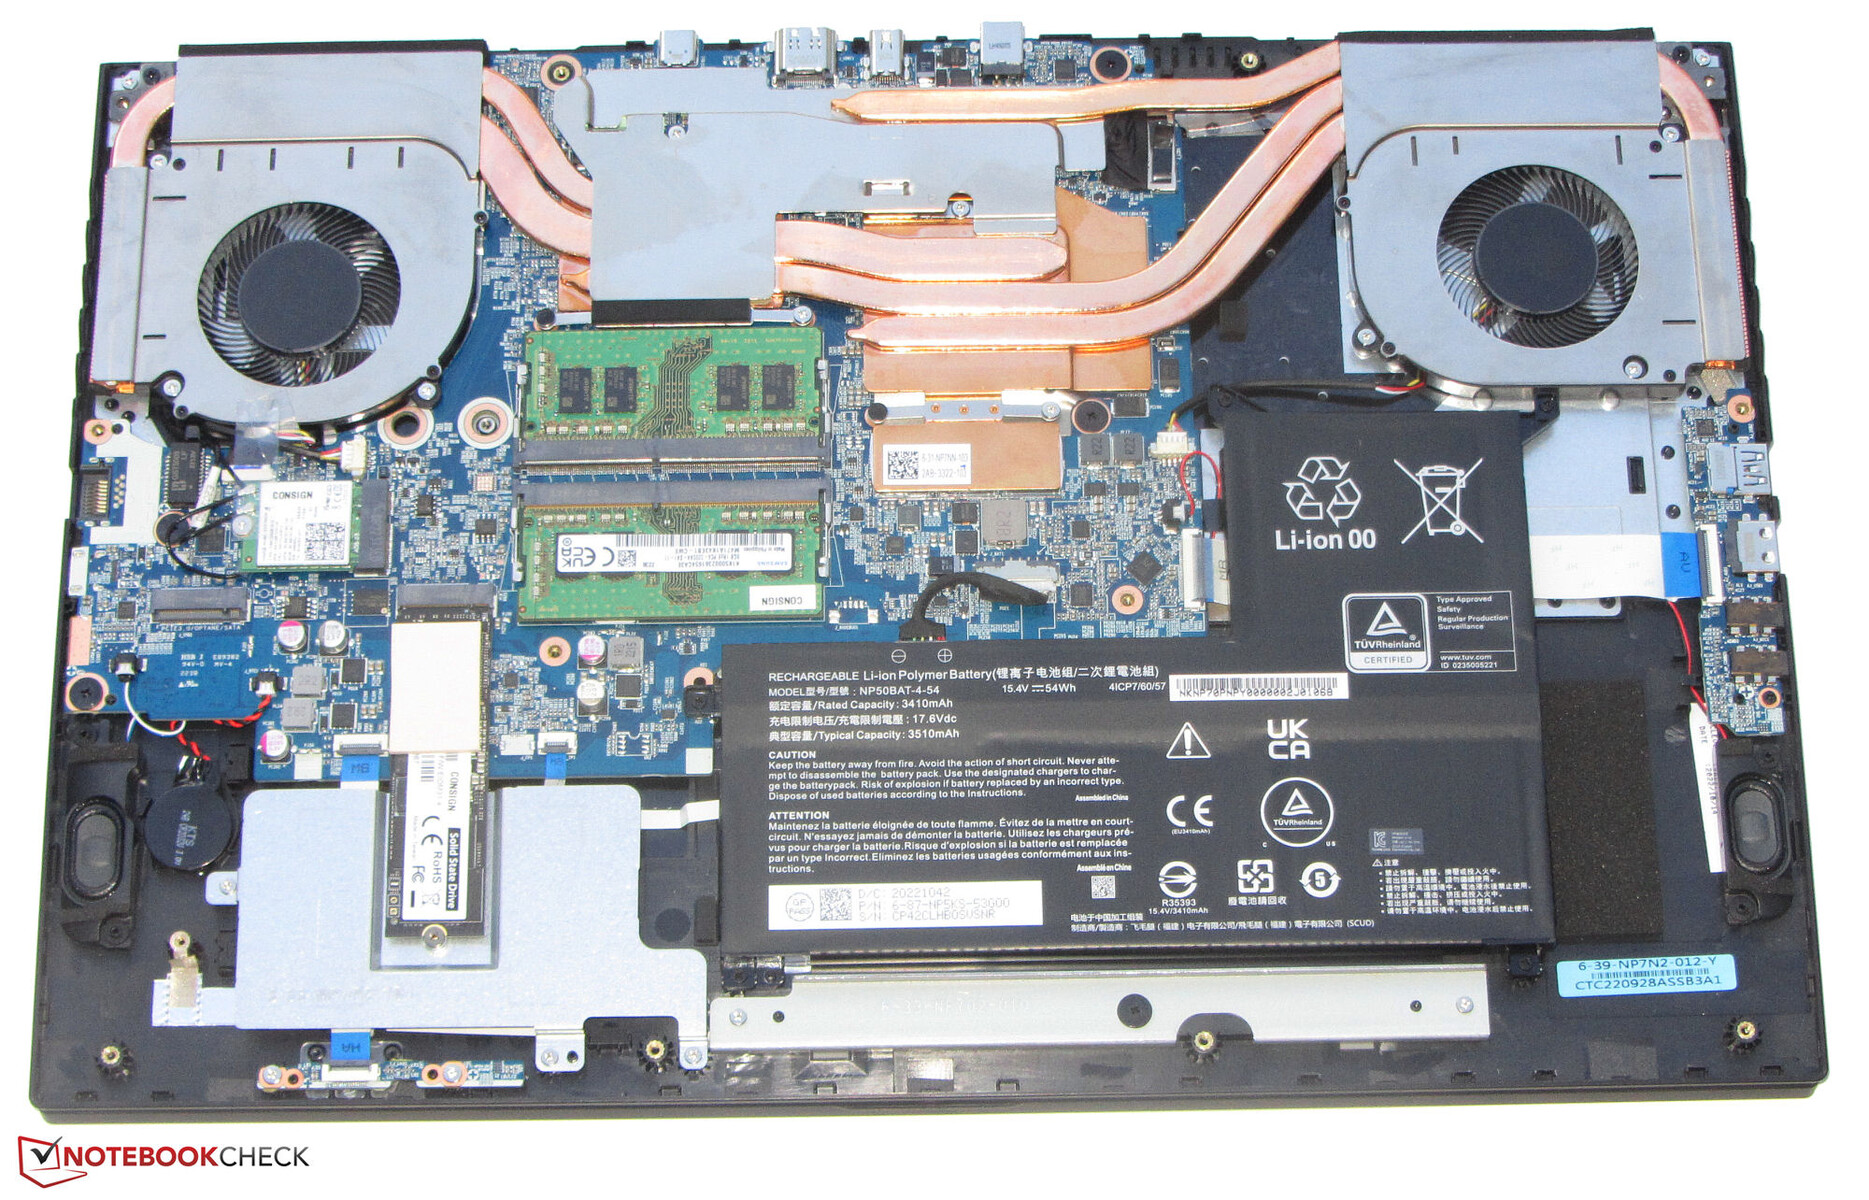
Gigabyte nie stosuje materiałów premium do wykonania obudowy modelu G7. Zamiast tego producent stawia na czarny plastik o gładkiej, matowej powierzchni. Jest kilka subtelnych, wizualnych, czarnych i szarych akcentów nadrukowanych na tylnej części pokrywy oraz na clickpadzie. Konstrukcja obudowy jest poza tym bardzo prosta i można ją określić jako "funkcjonalną". Akumulator (przykręcony, a nie przyklejony) oraz pozostałe elementy wewnętrzne są dostępne po zdjęciu spodniej płyty.
Jakość wykonania obudowy nie zasługuje na krytykę. Szczeliny są szczelne i nie ma wystających naddatków materiału. Co prawda jednostka zasadnicza daje się wykręcać z narożników, ale nie powinno to stanowić problemu podczas codziennego użytkowania. Sztywność pokrywy pozostawia jednak coś do życzenia. Zawiasy wprawdzie trzymają wyświetlacz solidnie, ale pozwalają na pewne przechylenia. Wyświetlacz można otworzyć do maksymalnego kąta około 140 stopni. Otwarcie pokrywy jedną ręką jest możliwe.
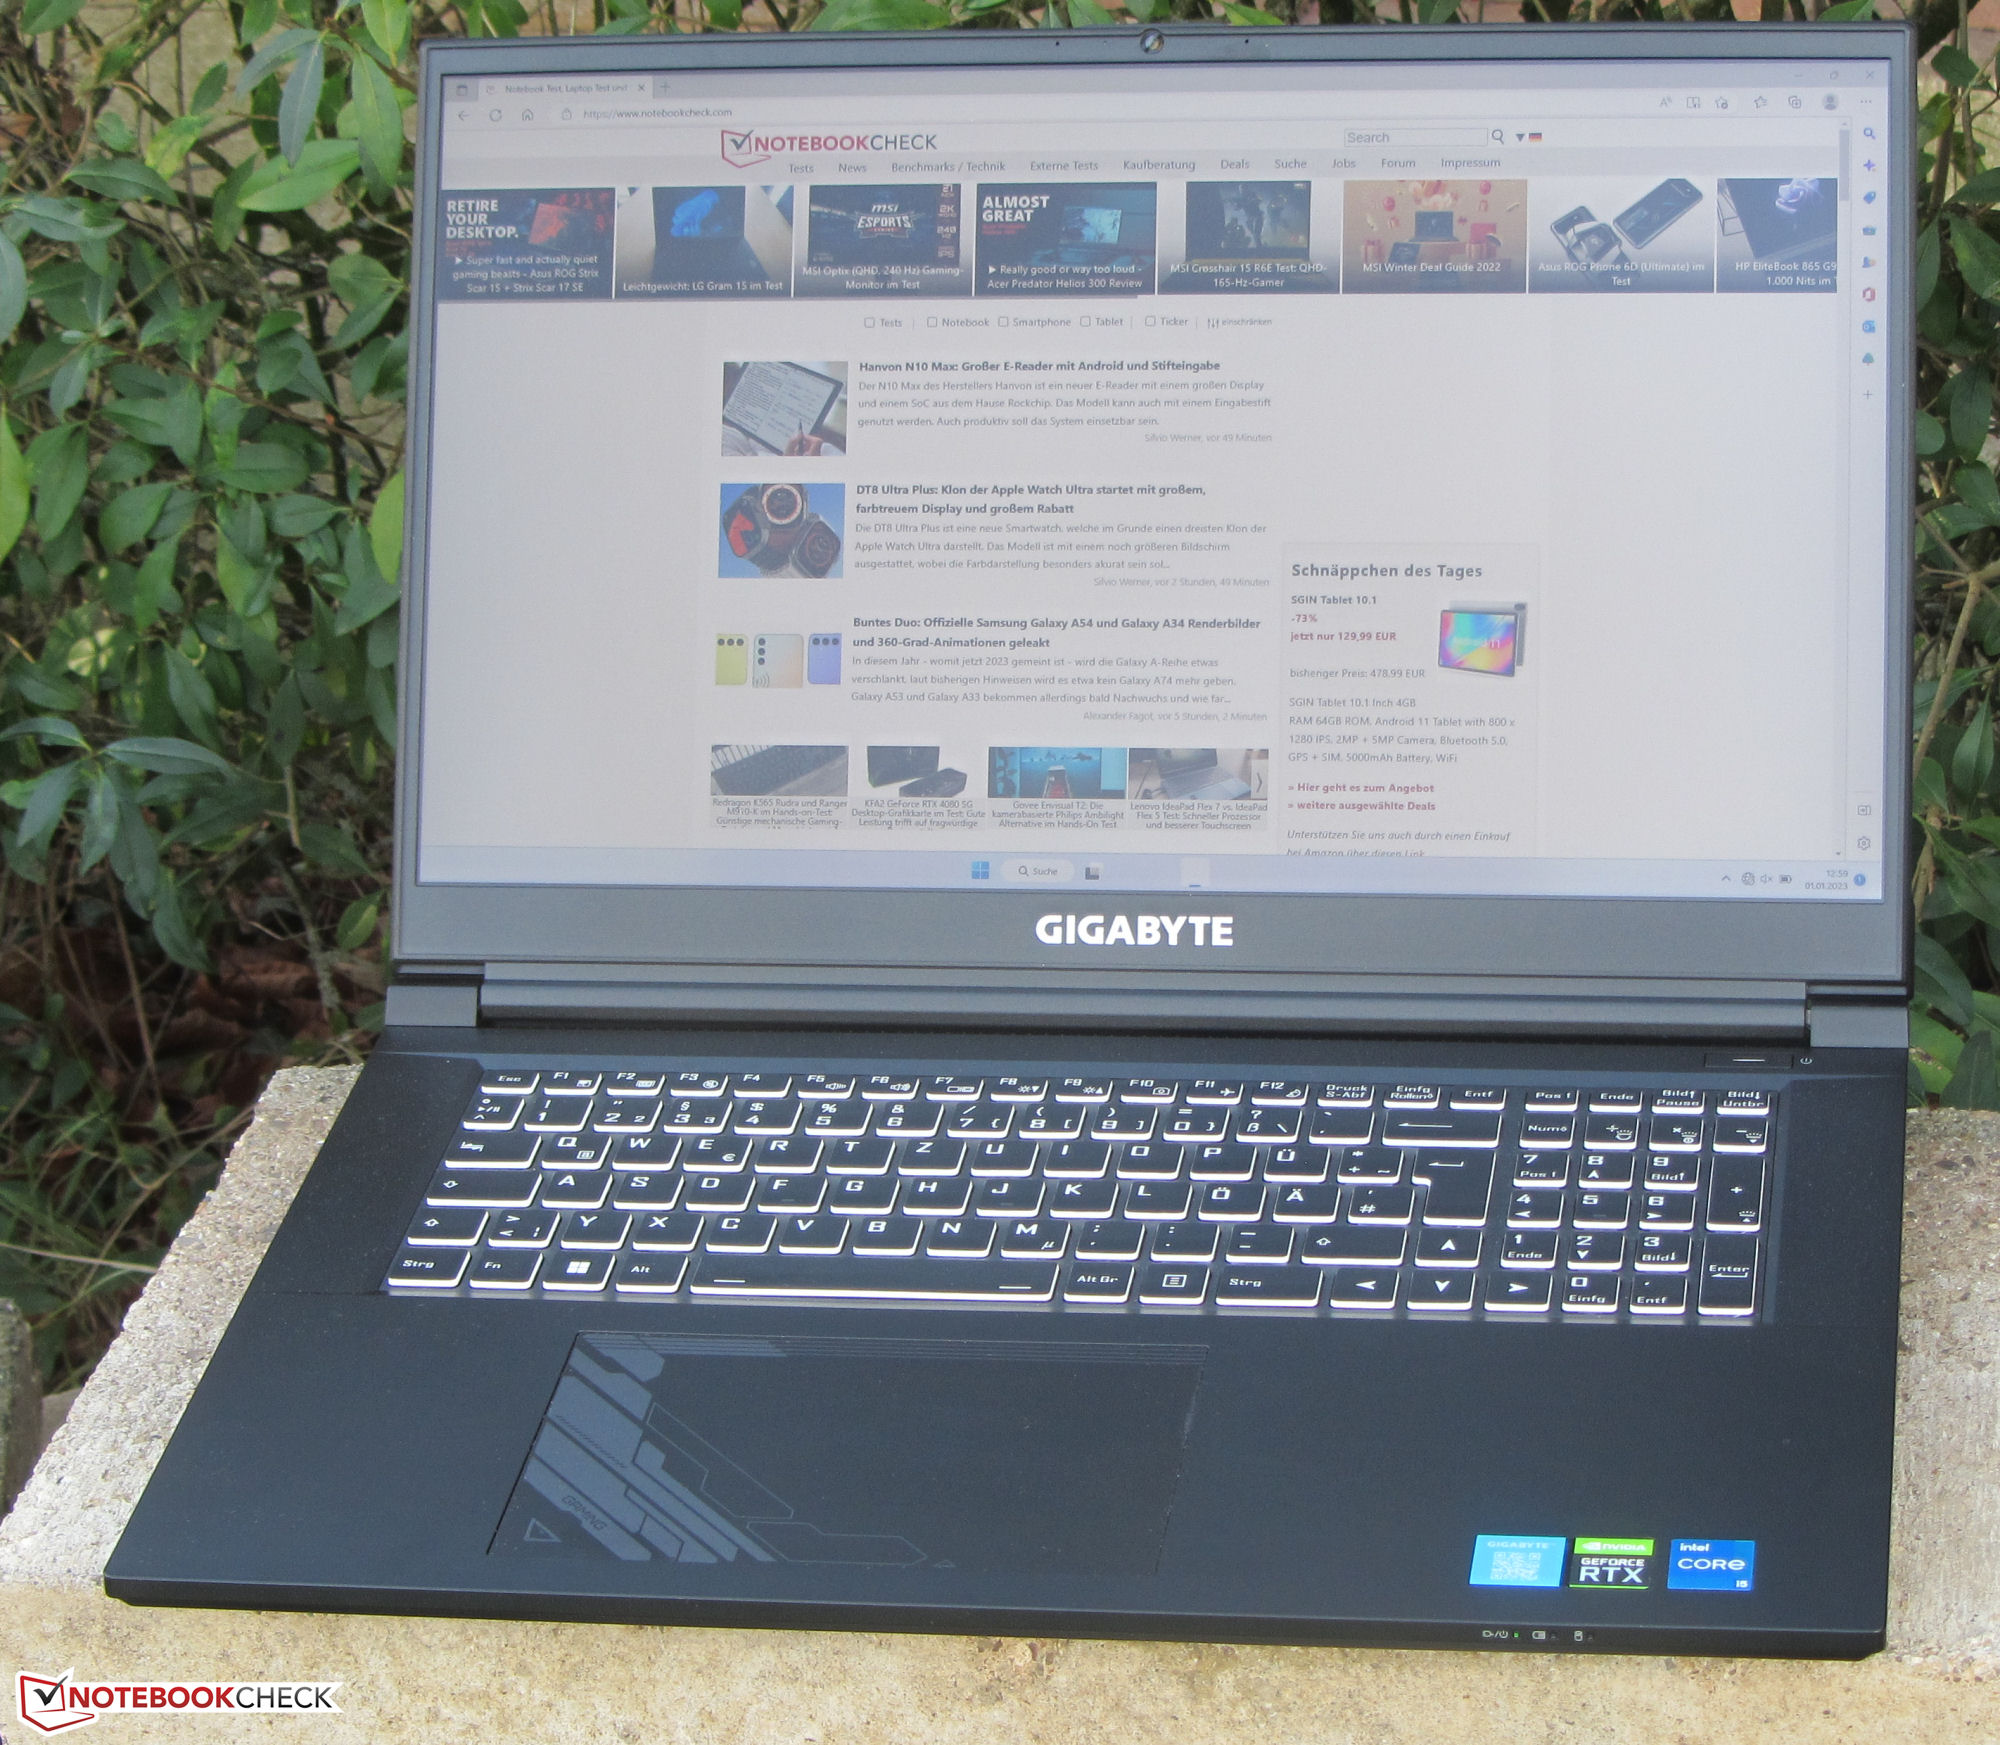

G7 jest jednym z najbardziej kompaktowych i lekkich 17,3-calowych urządzeń w naszym zestawieniu. Tylko np Asus TUF Gaming F17 udaje się go prześcignąć o niewielki margines.
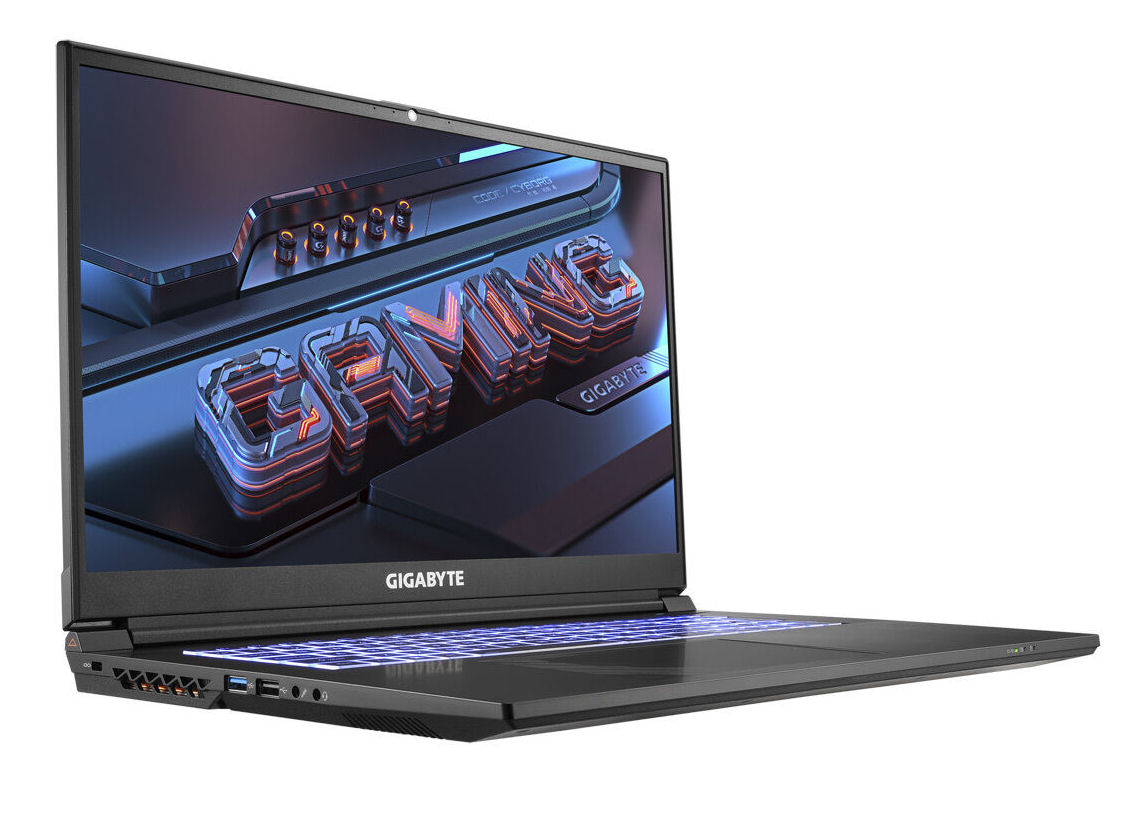
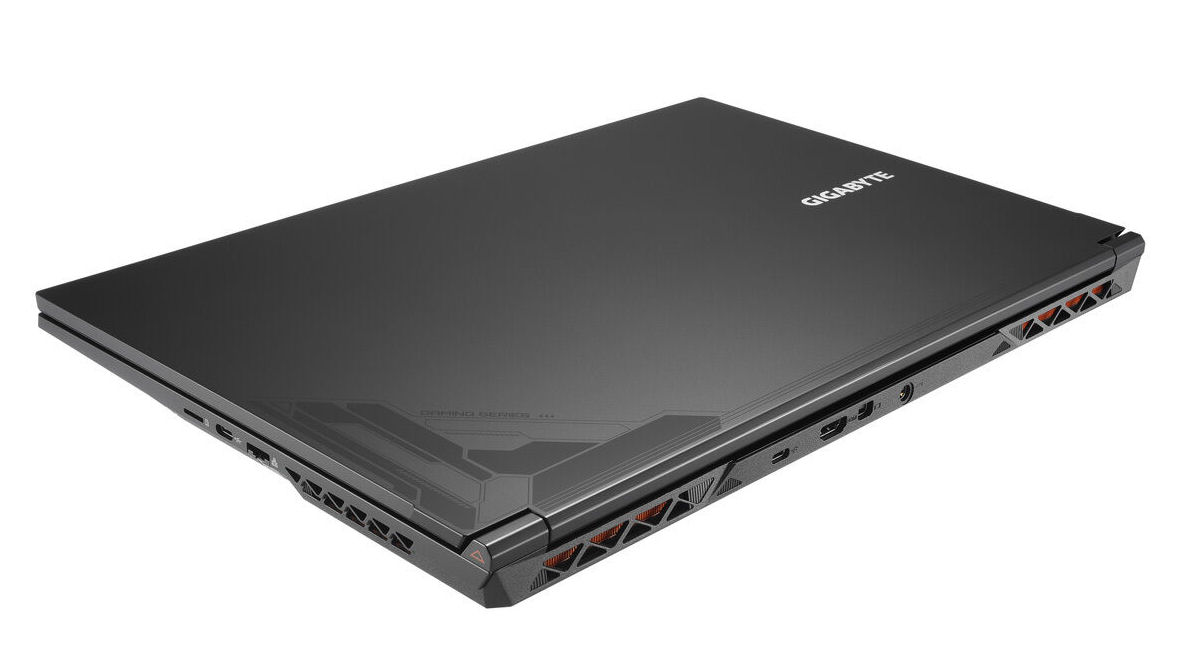
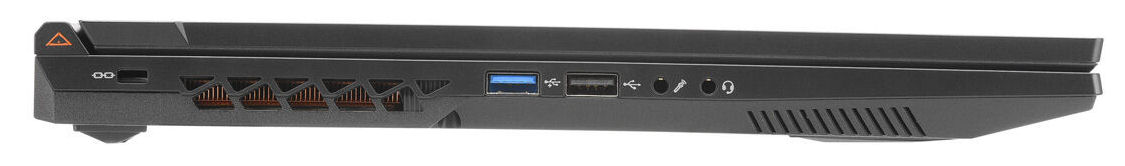
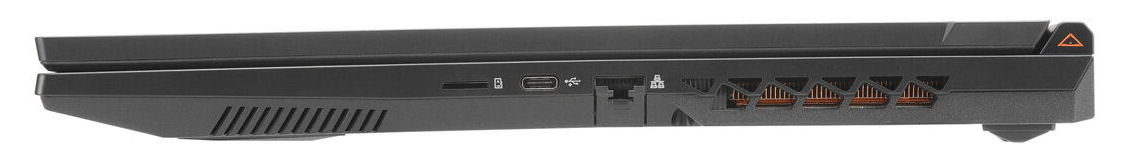
Łączność - Notebook Gigabyte z Thunderbolt 4
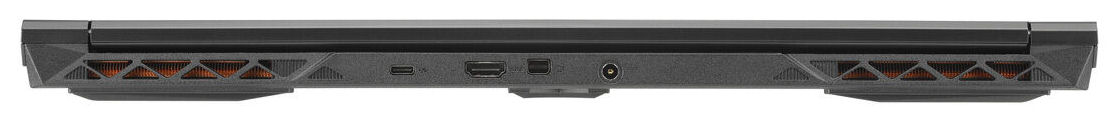
G7 posiada dwa porty USB-A (1x USB 2.0, 1x USB 3.2 gen. 1) i dwa porty USB-C (1x USB 3.2 gen. 2, 1x Thunderbolt 4). Interfejsy typu-C nie obsługują Power Delivery, a tylko port TB4 obsługuje DisplayPort przez USB-C. W połączeniu z portem HDMI (2.1) i dedykowanym Mini DisplayPort (1.4) daje to łącznie trzy wyjścia wideo.
Porty w G7 są rozmieszczone po trzech stronach laptopa. Dwa dedykowane wyjścia wideo znajdują się z tyłu urządzenia. Dzięki temu podłączone kable biegną wzdłuż tyłu i nie przeszkadzają. Podobnie nie jest w przypadku kabli Ethernet: Port ten znajdziemy na prawej krawędzi modelu.
Czytnik kart SD
Wydajność czytnika kart microSD (karta referencyjna: AV Pro SD microSD 128 GB V60) jest przeciętna, przy odczycie sekwencyjnym na poziomie około 89 MB/s.
| SD Card Reader | |
| average JPG Copy Test (av. of 3 runs) | |
| Średnia w klasie Gaming (20.9 - 210, n=55, ostatnie 2 lata) | |
| HP Pavilion Gaming 17-cd2146ng (AV PRO microSD 128 GB V60) | |
| maximum AS SSD Seq Read Test (1GB) | |
| Średnia w klasie Gaming (25.5 - 261, n=52, ostatnie 2 lata) | |
| Gigabyte G7 KE (AV PRO microSD 128 GB V60) | |
Komunikacja
W idealnych warunkach (brak innych urządzeń Wi-Fi w pobliżu, niewielka odległość między laptopem a serwerem) prędkości transferu Wi-Fi są znakomite i mniej więcej wyczerpują możliwości modułu Wi-Fi (Intel AX211; Wi-Fi 6E, 802.11ax). Tymczasem interfejs Gigabit Ethernet (I-219V) od Intela obsługuje sieć przewodową.
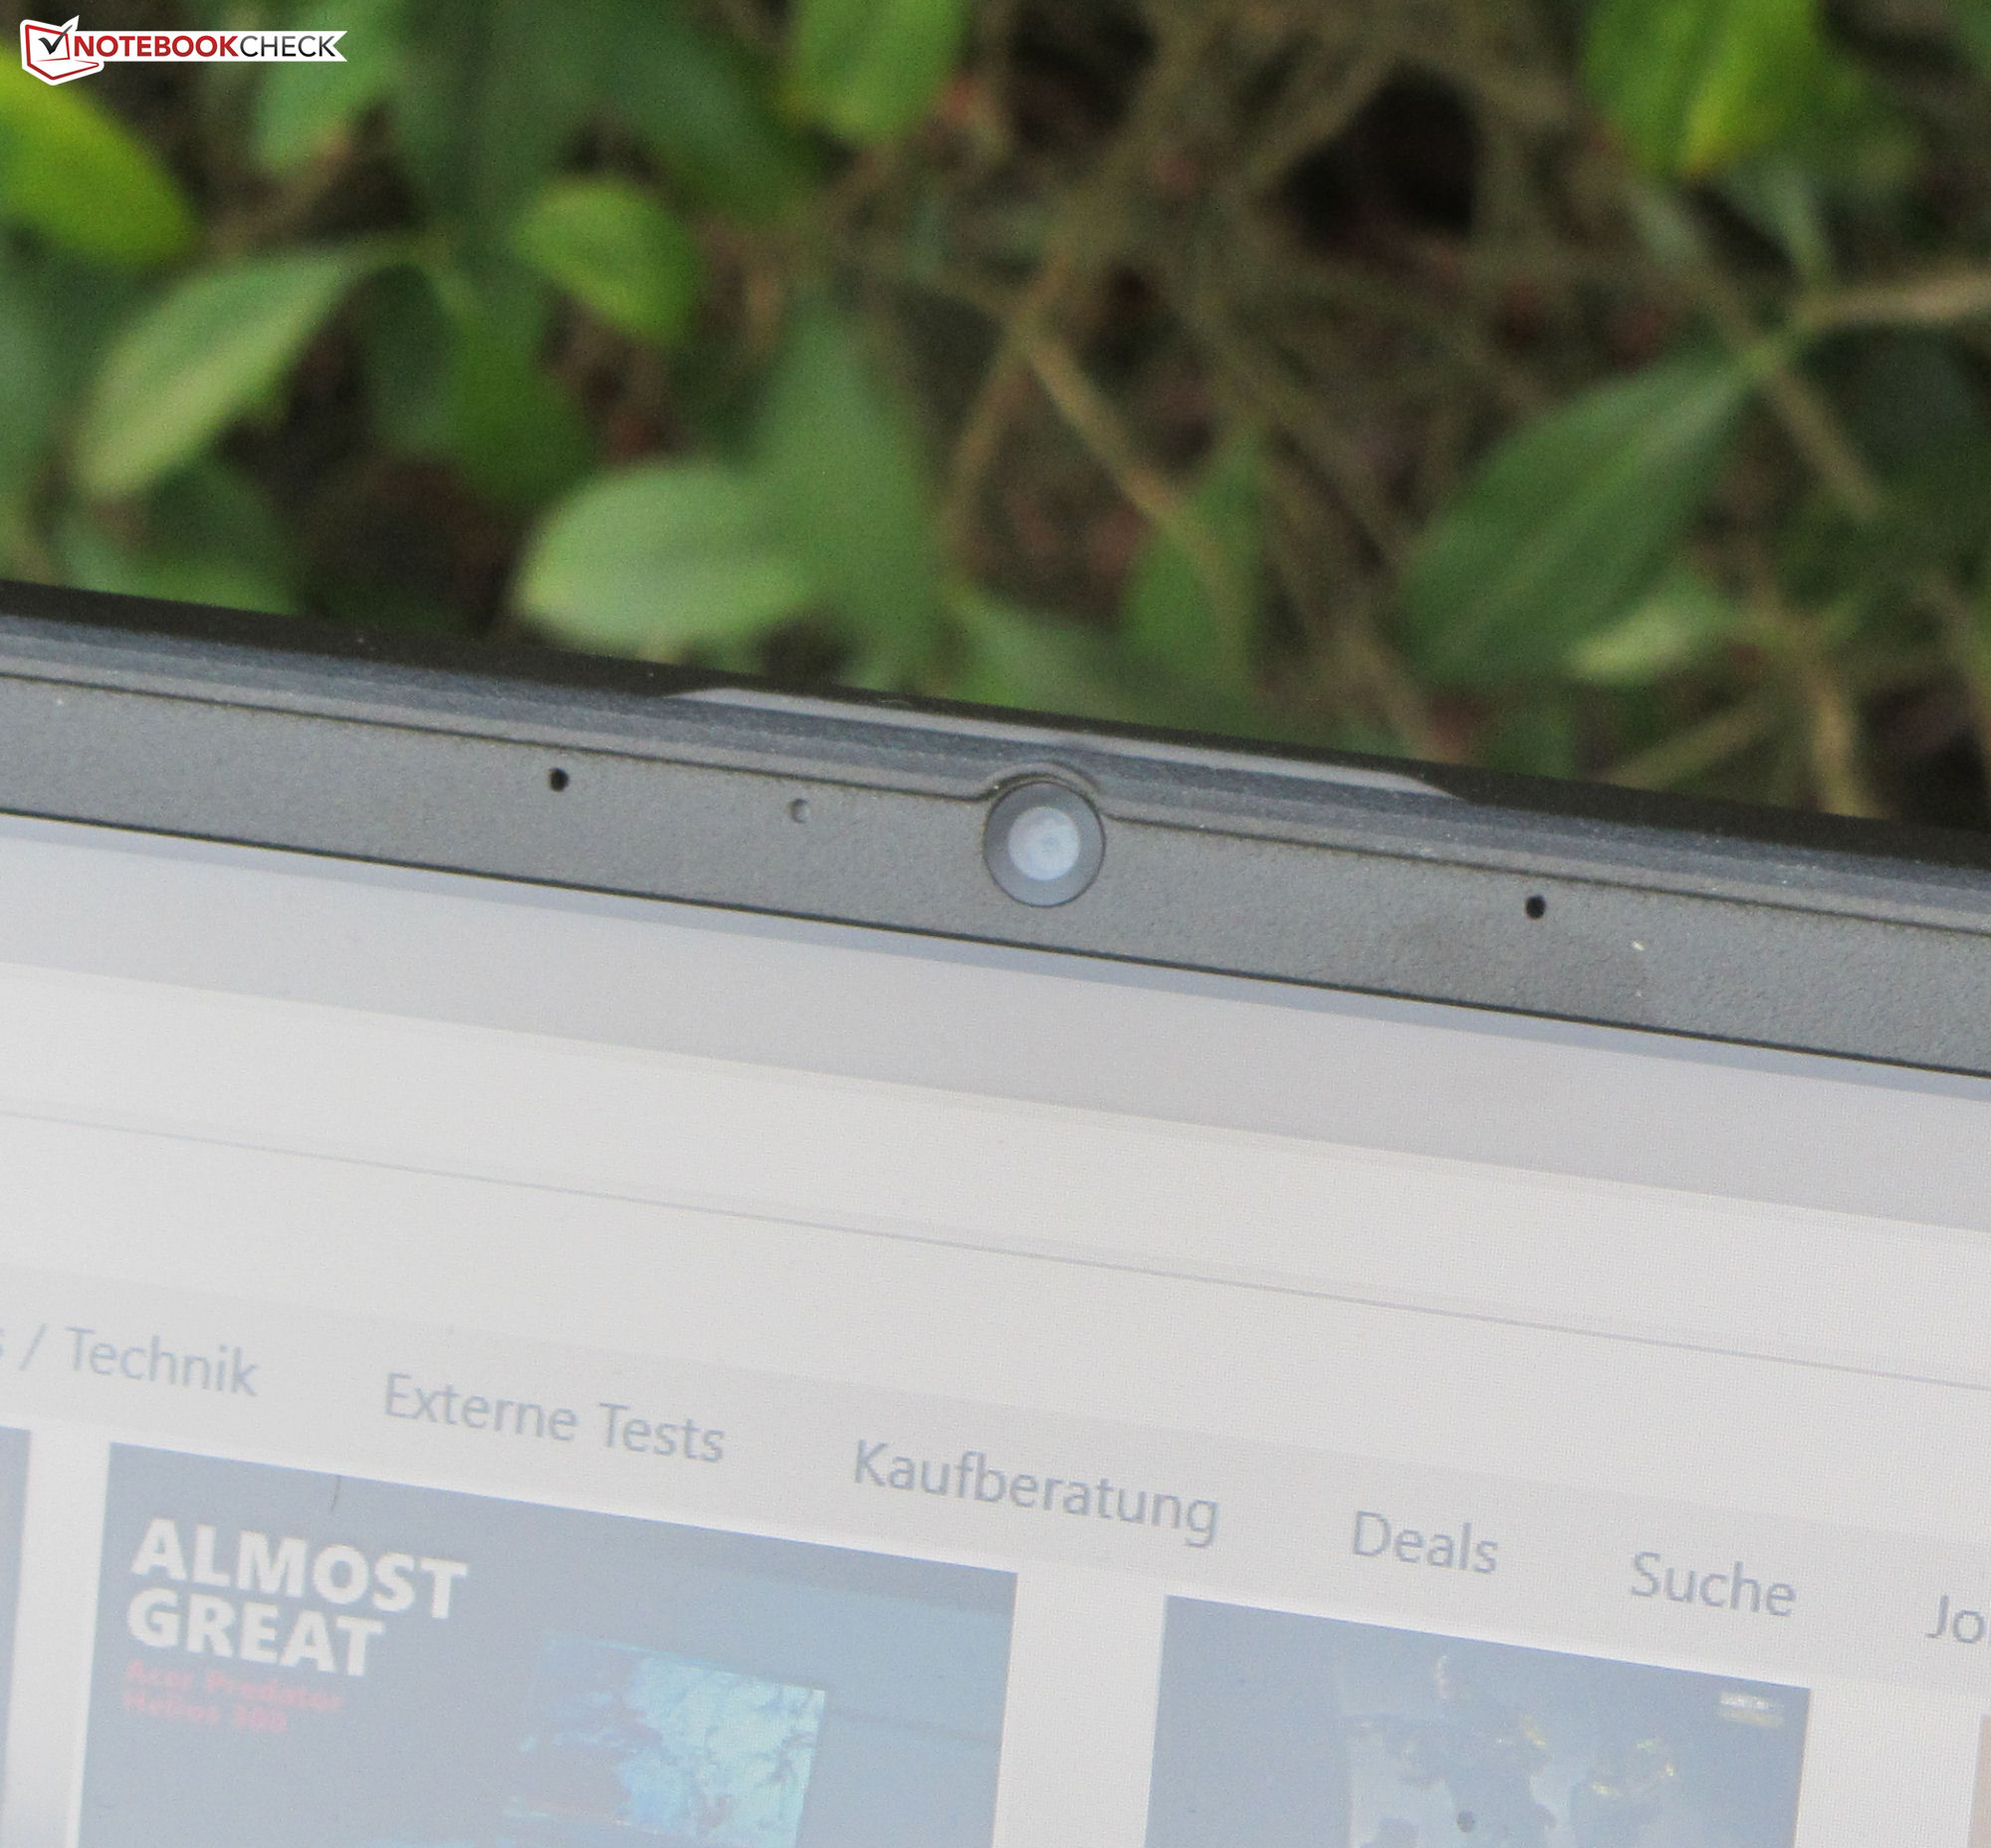
Kamera internetowa
Kamera internetowa (0,9 MP) rejestruje zdjęcia o maksymalnej rozdzielczości 1280 x 720 pikseli. Kamera daje przyzwoite rezultaty przy stosunkowo niskim ogólnym odchyleniu kolorów. Aparat nie jest wyposażony w mechaniczną migawkę kamerki internetowej.


Akcesoria
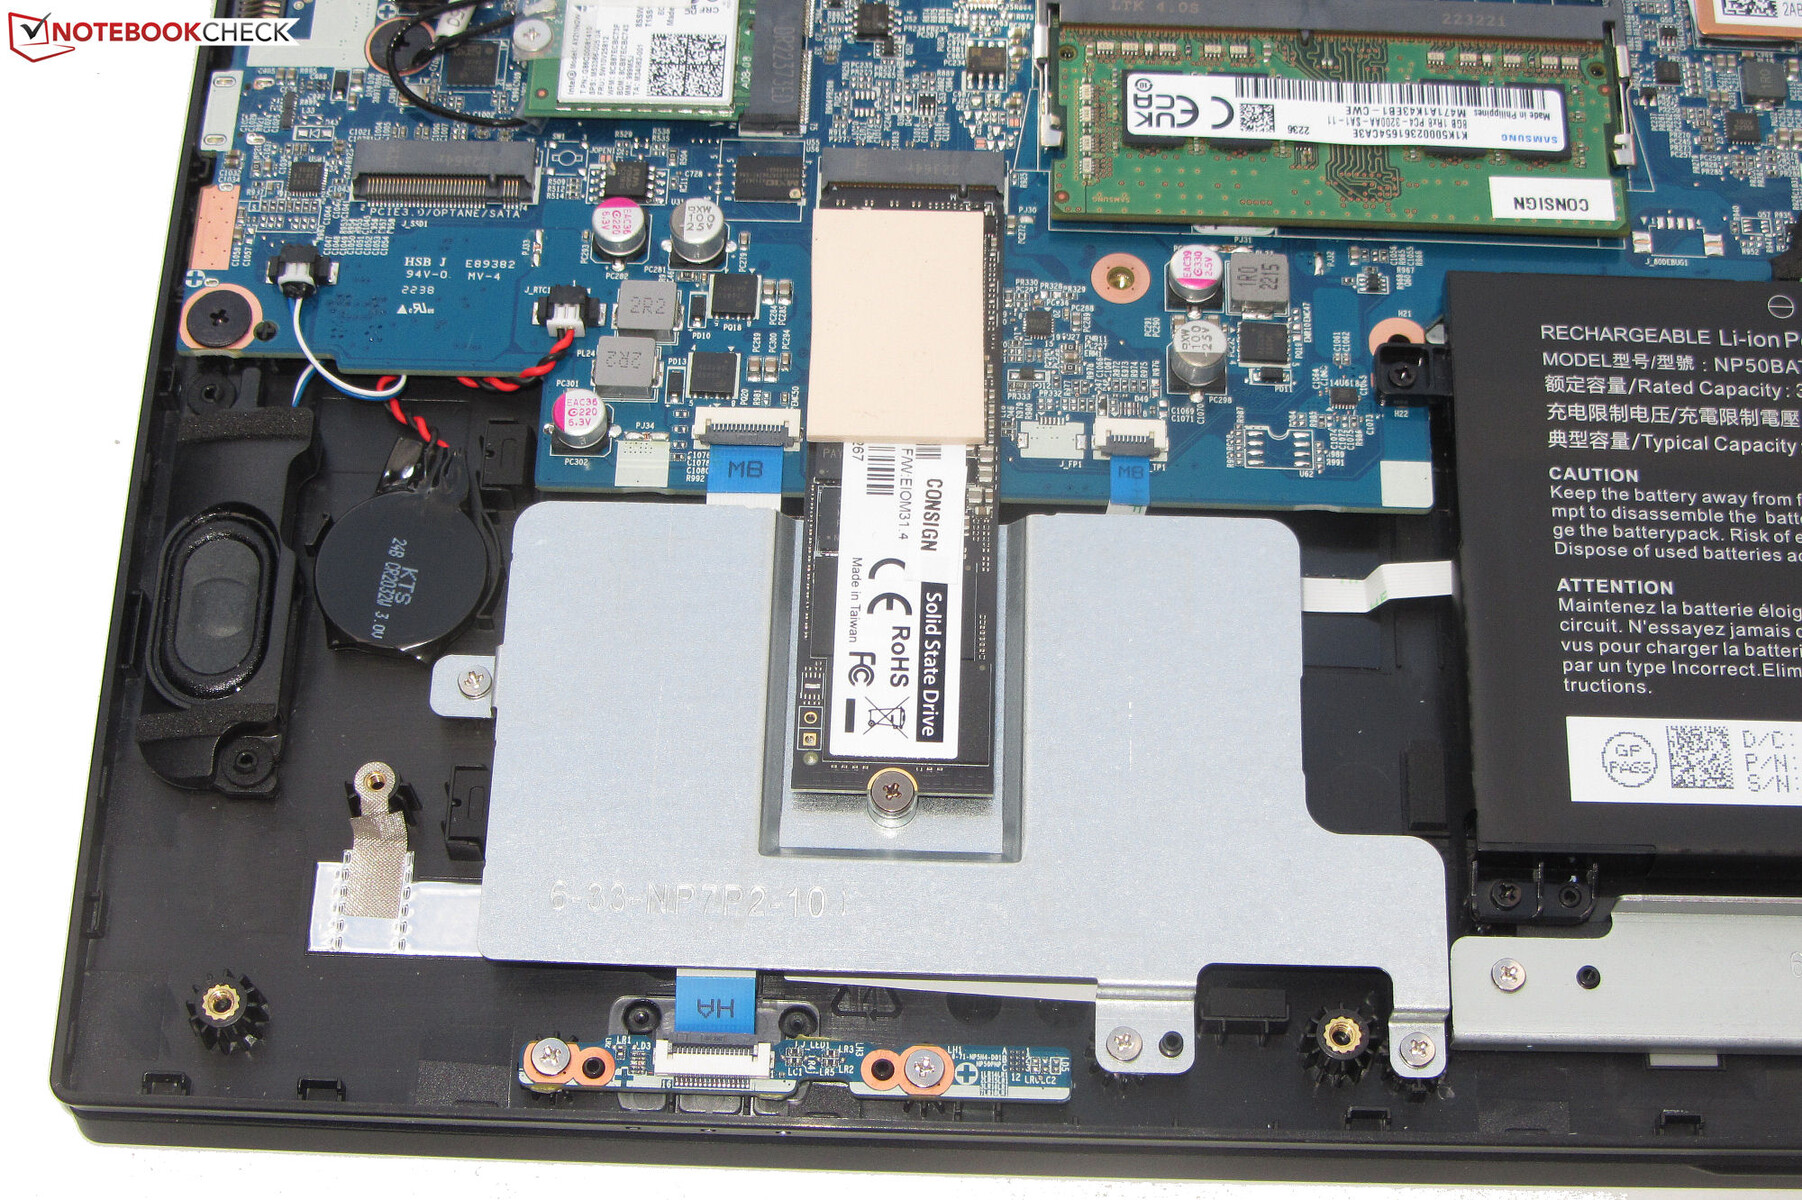
Poza zwykłymi papierkami (skrócona instrukcja obsługi i informacje gwarancyjne) laptop zawiera także śrubkę do montażu oraz podkładkę termiczną do chłodzenia dodatkowego dysku SSD.
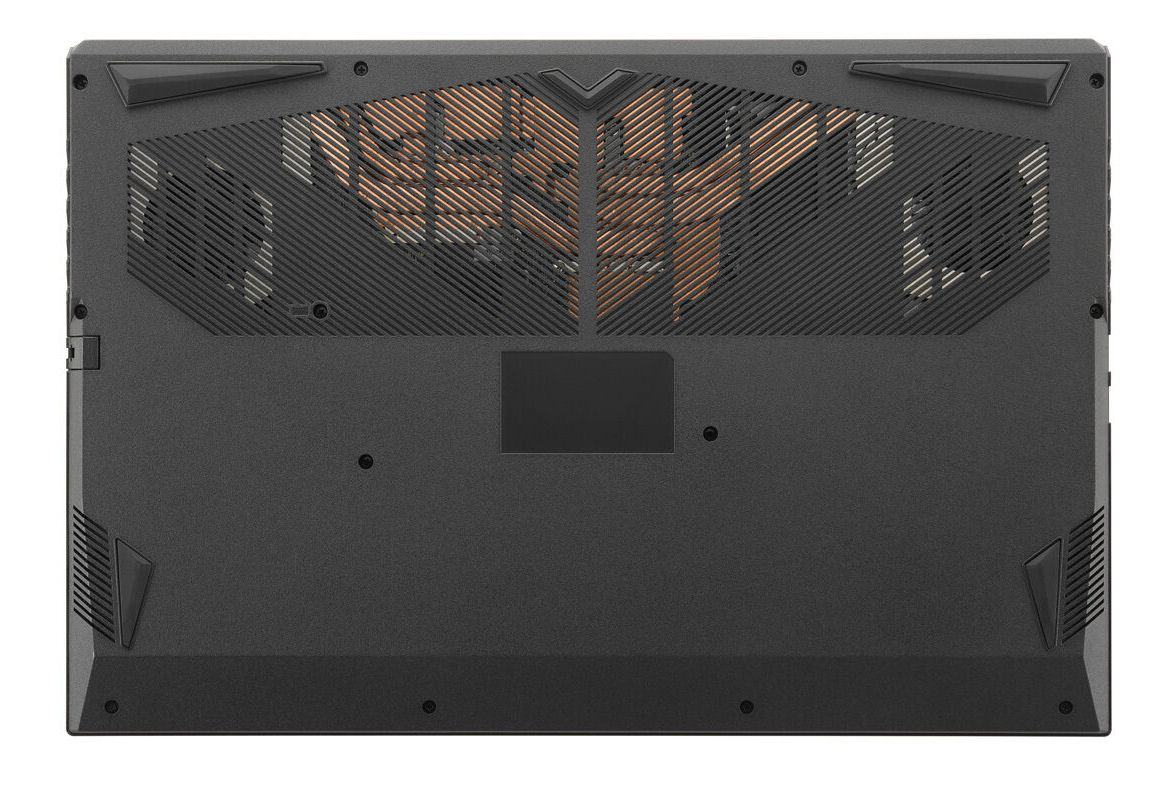
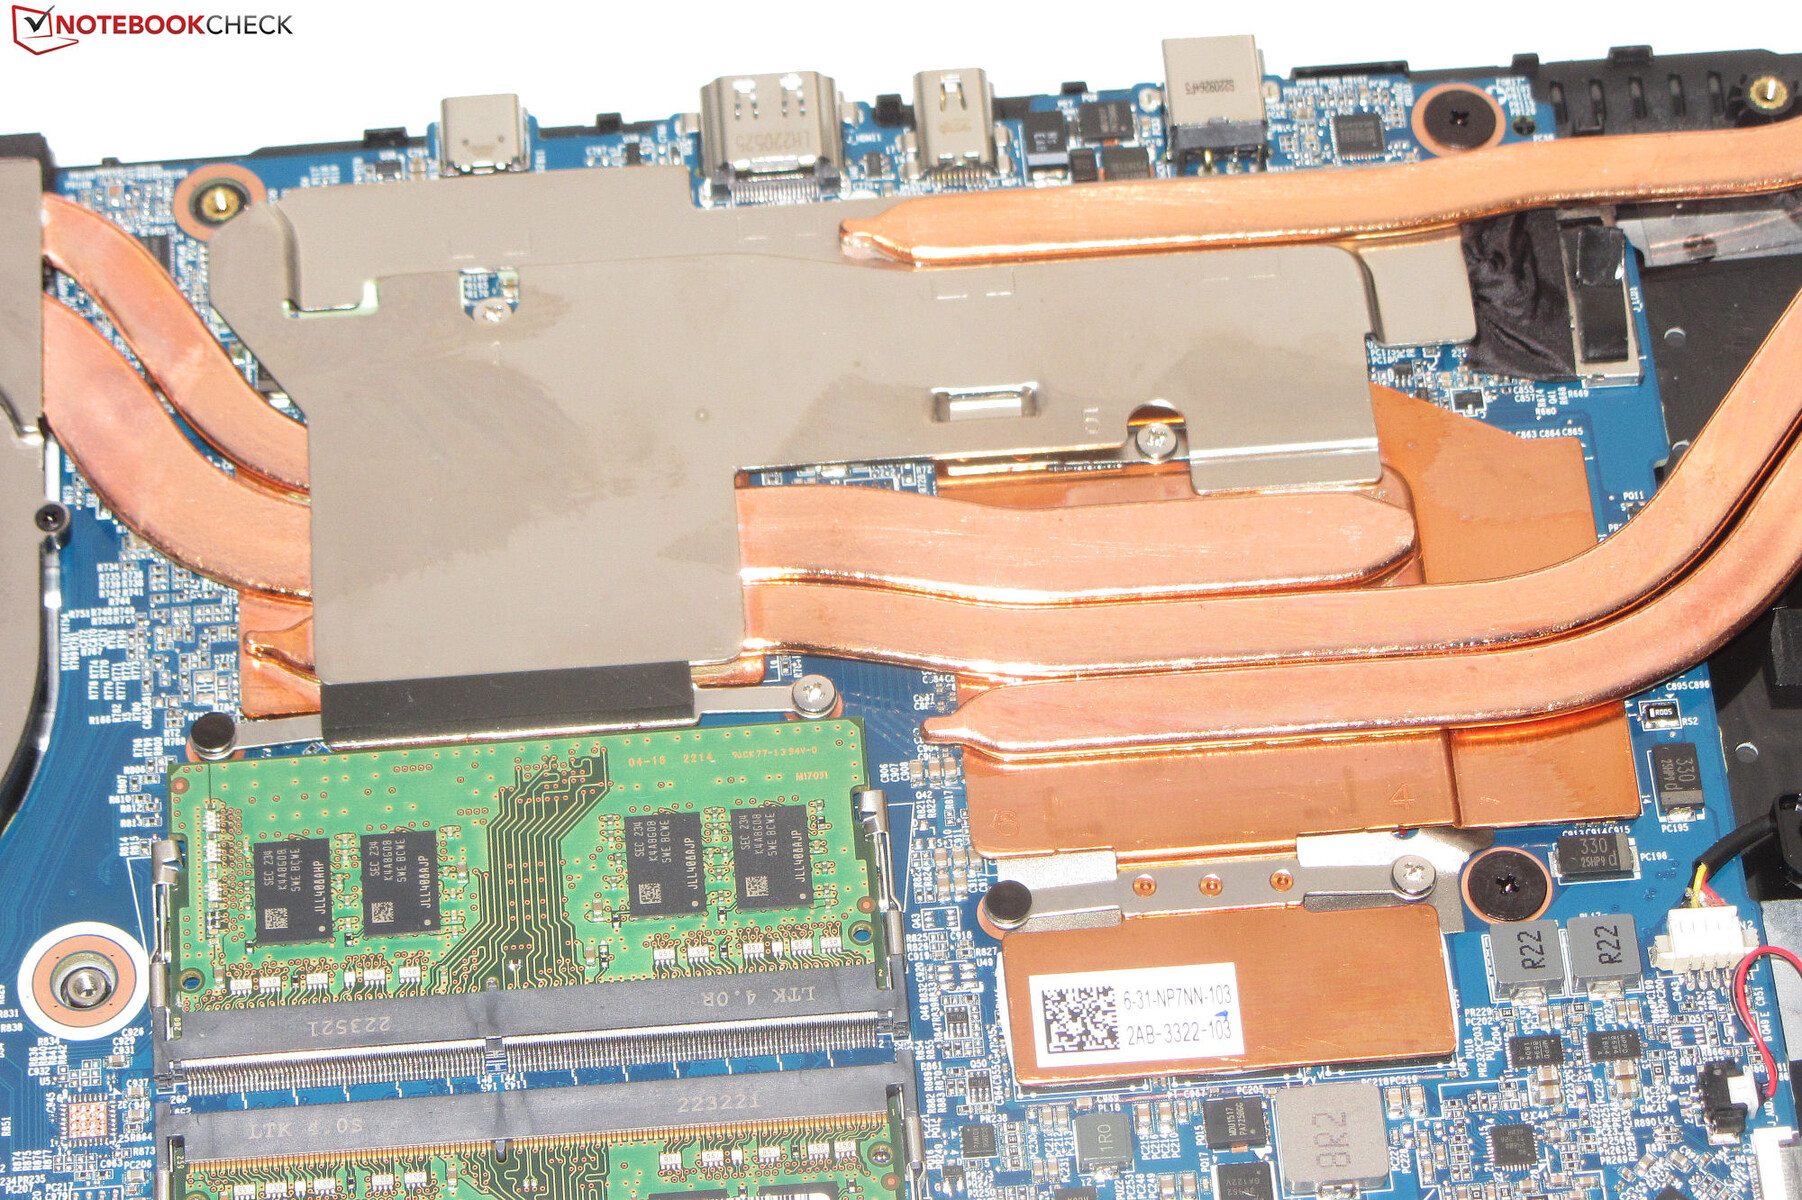
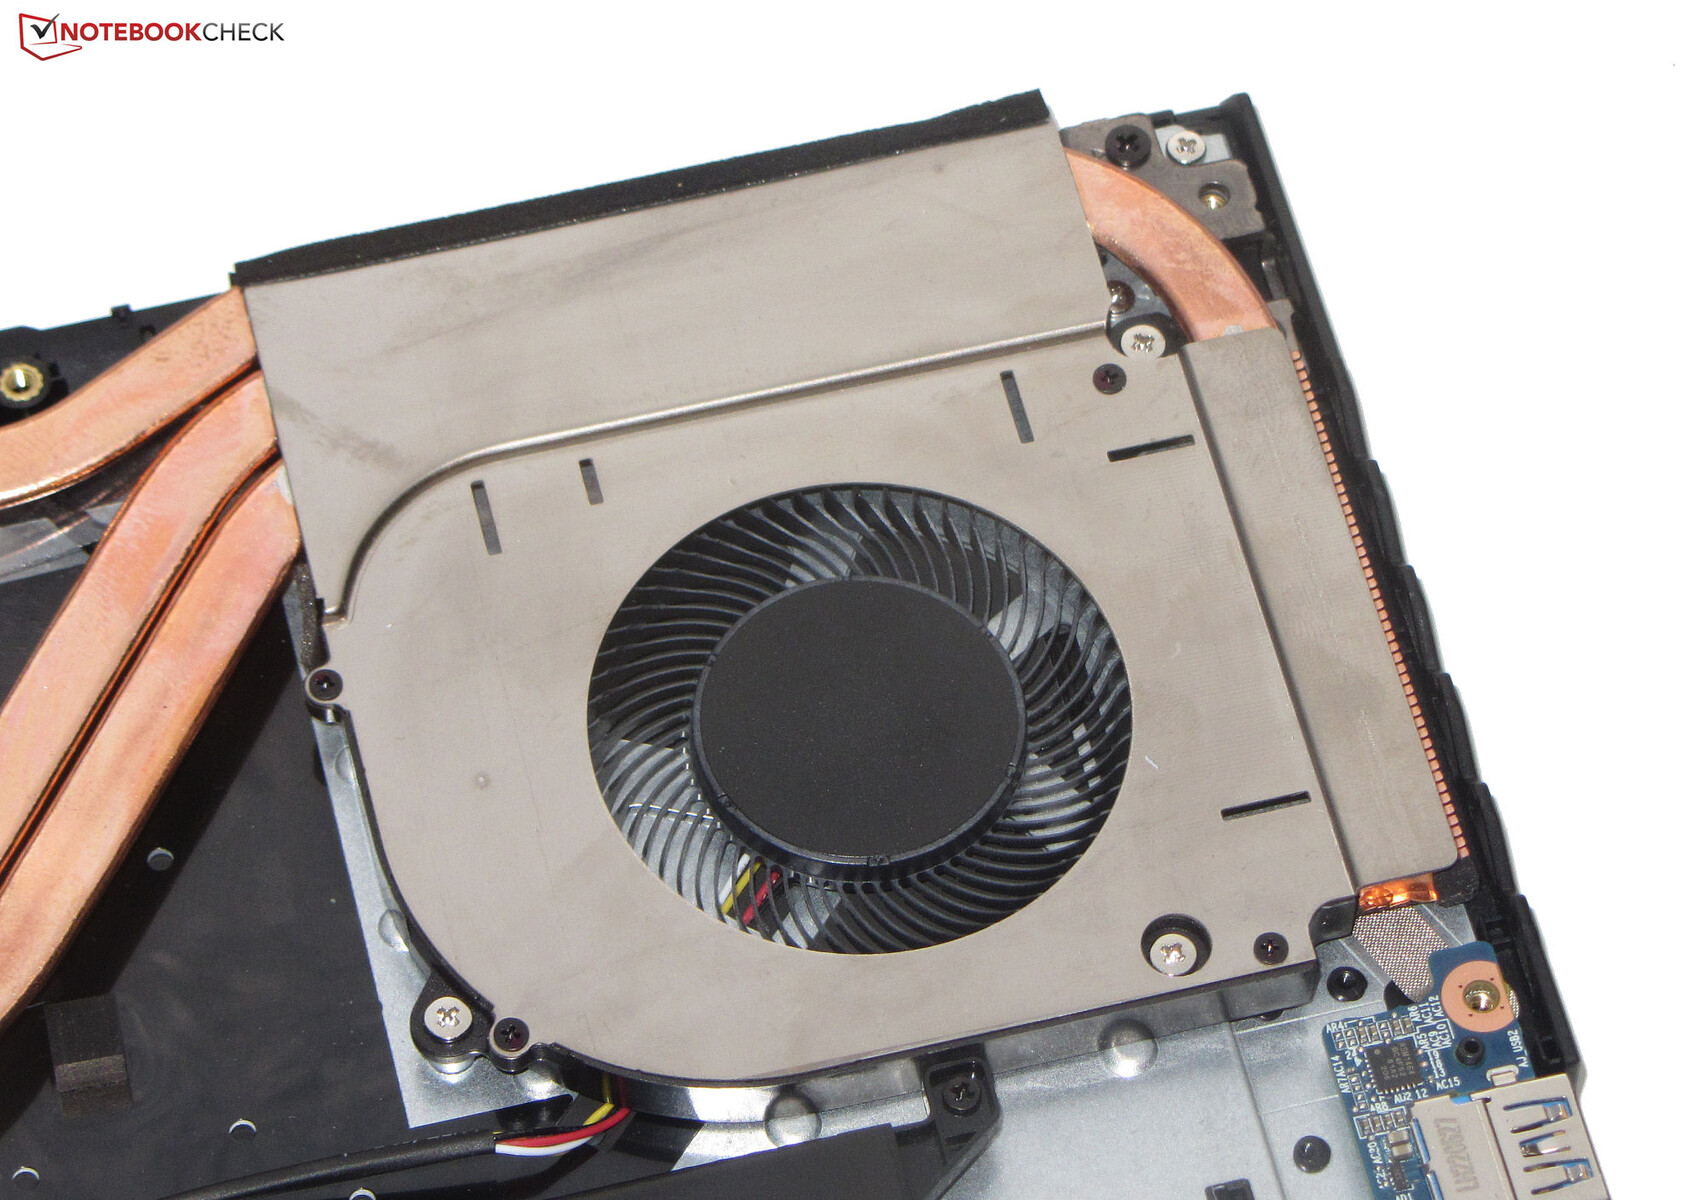
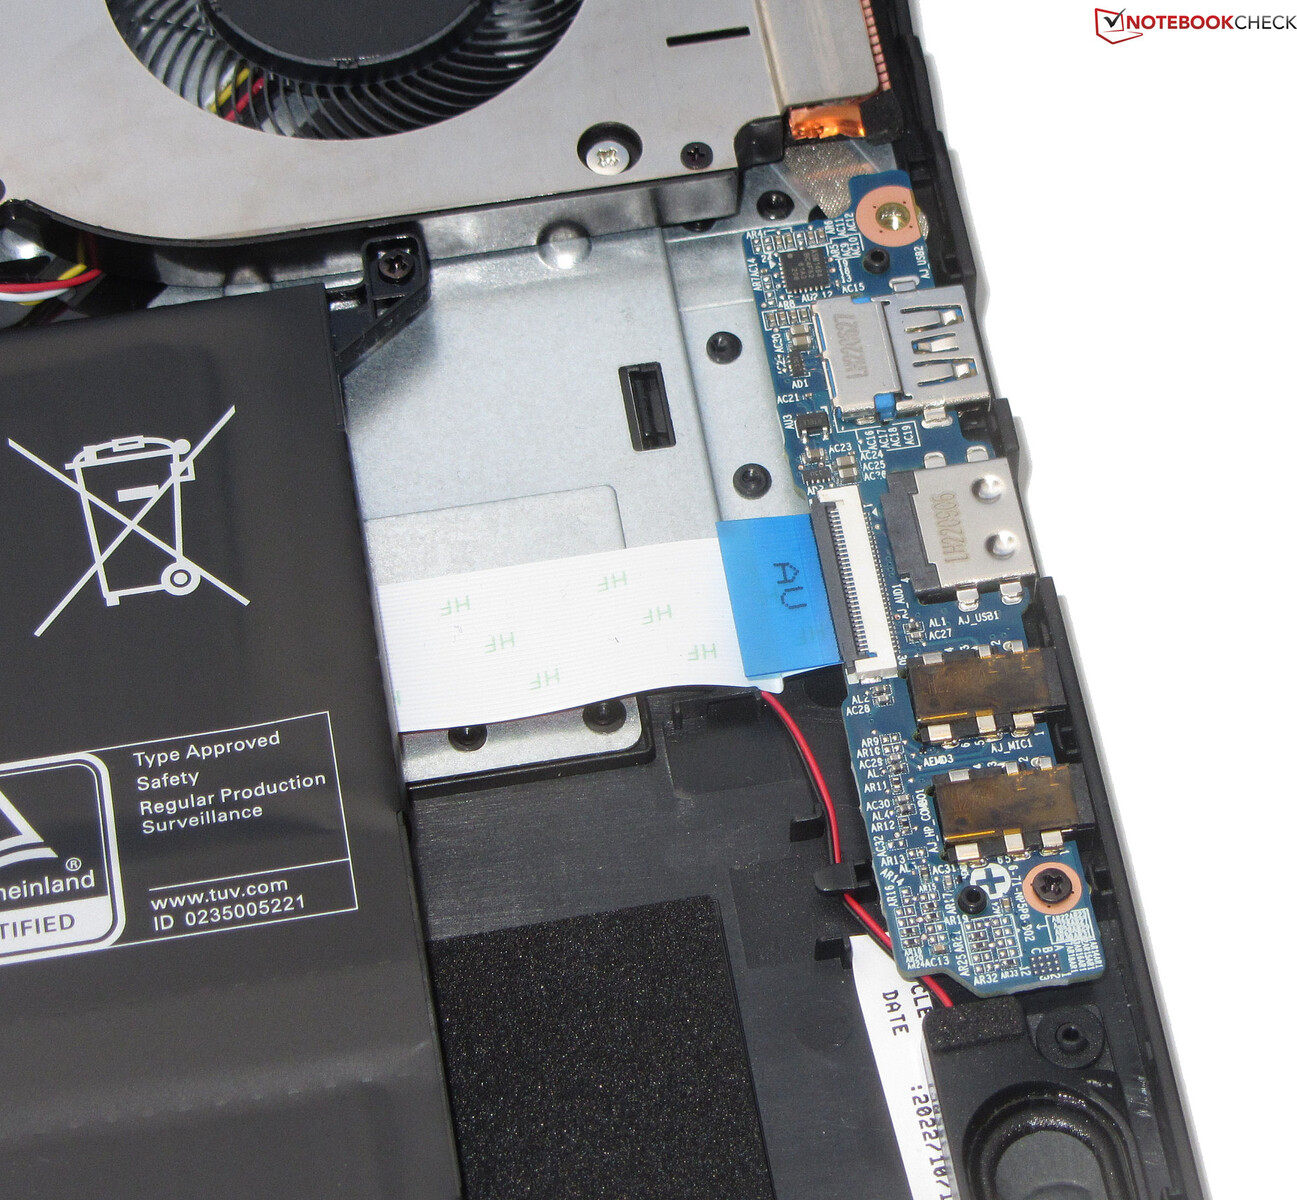
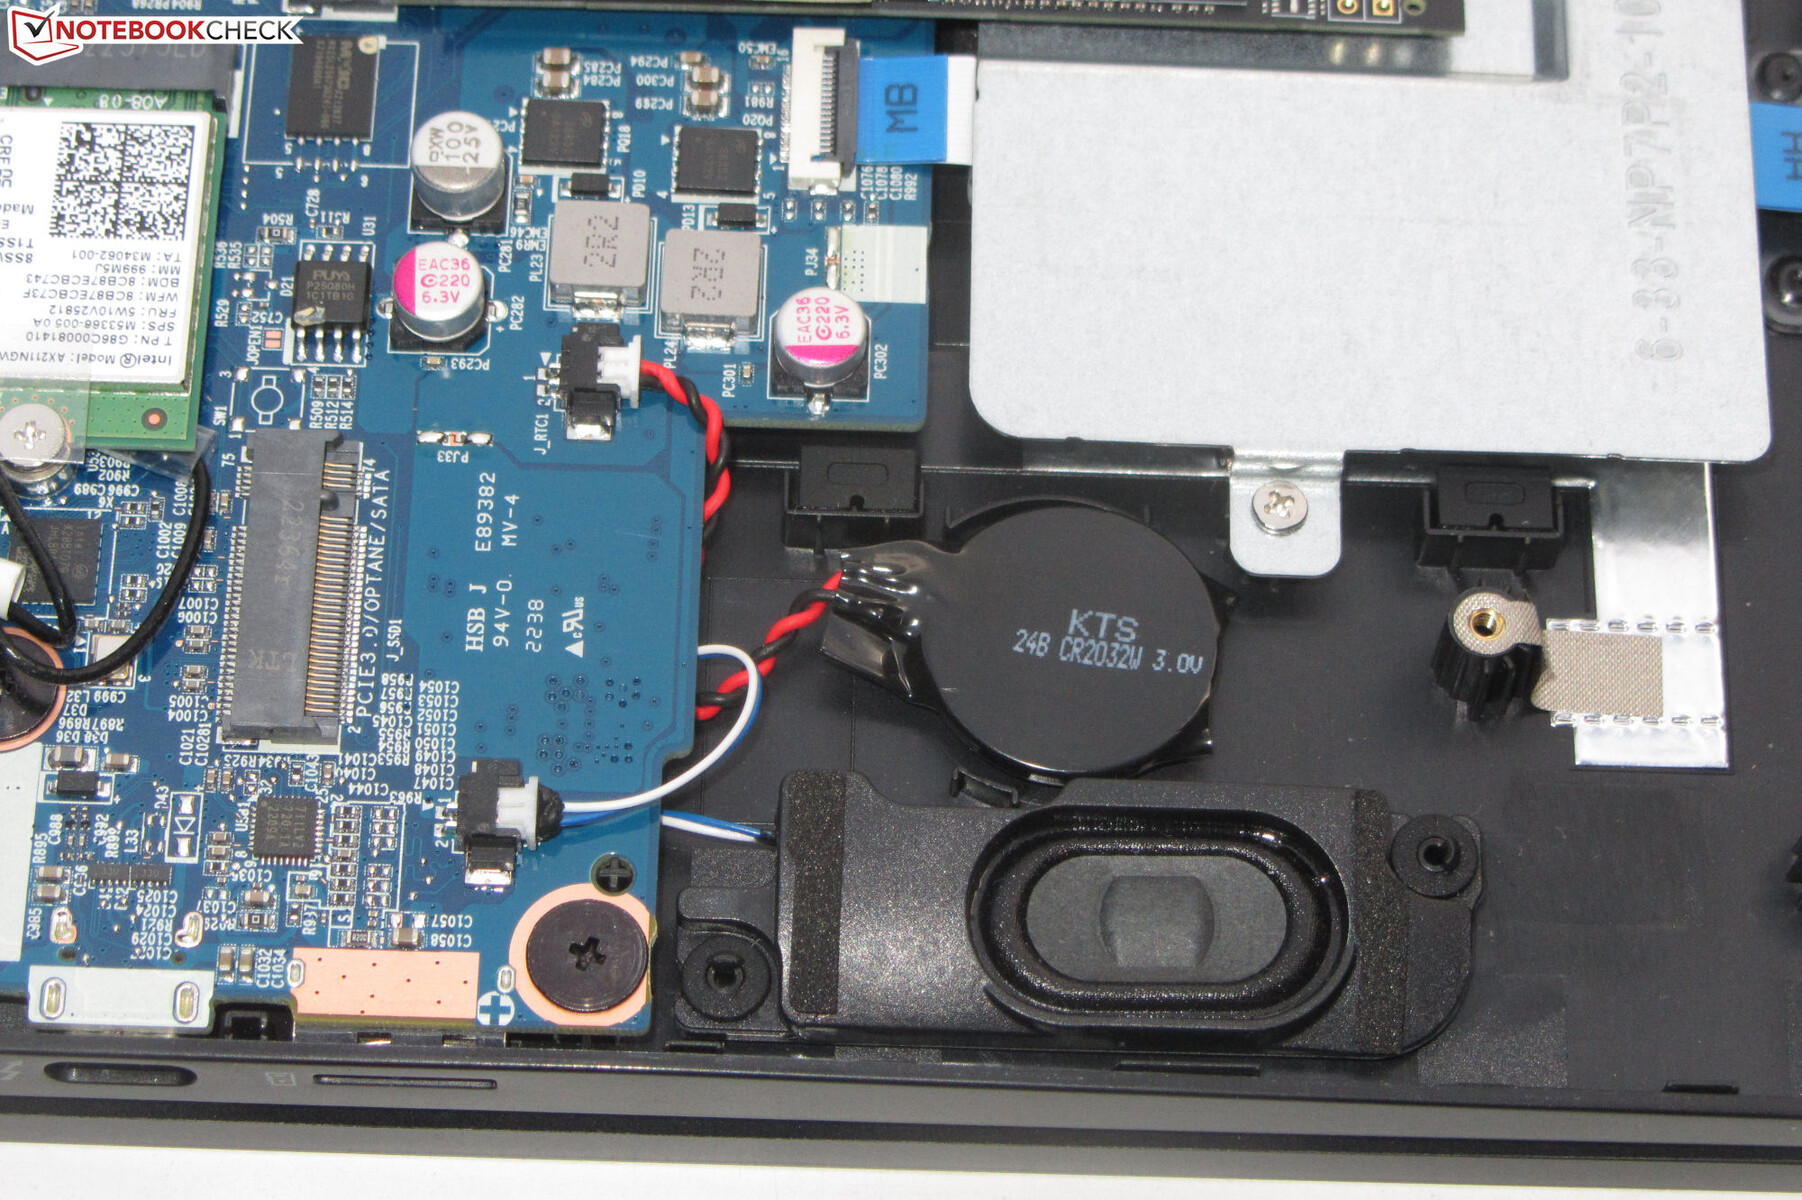
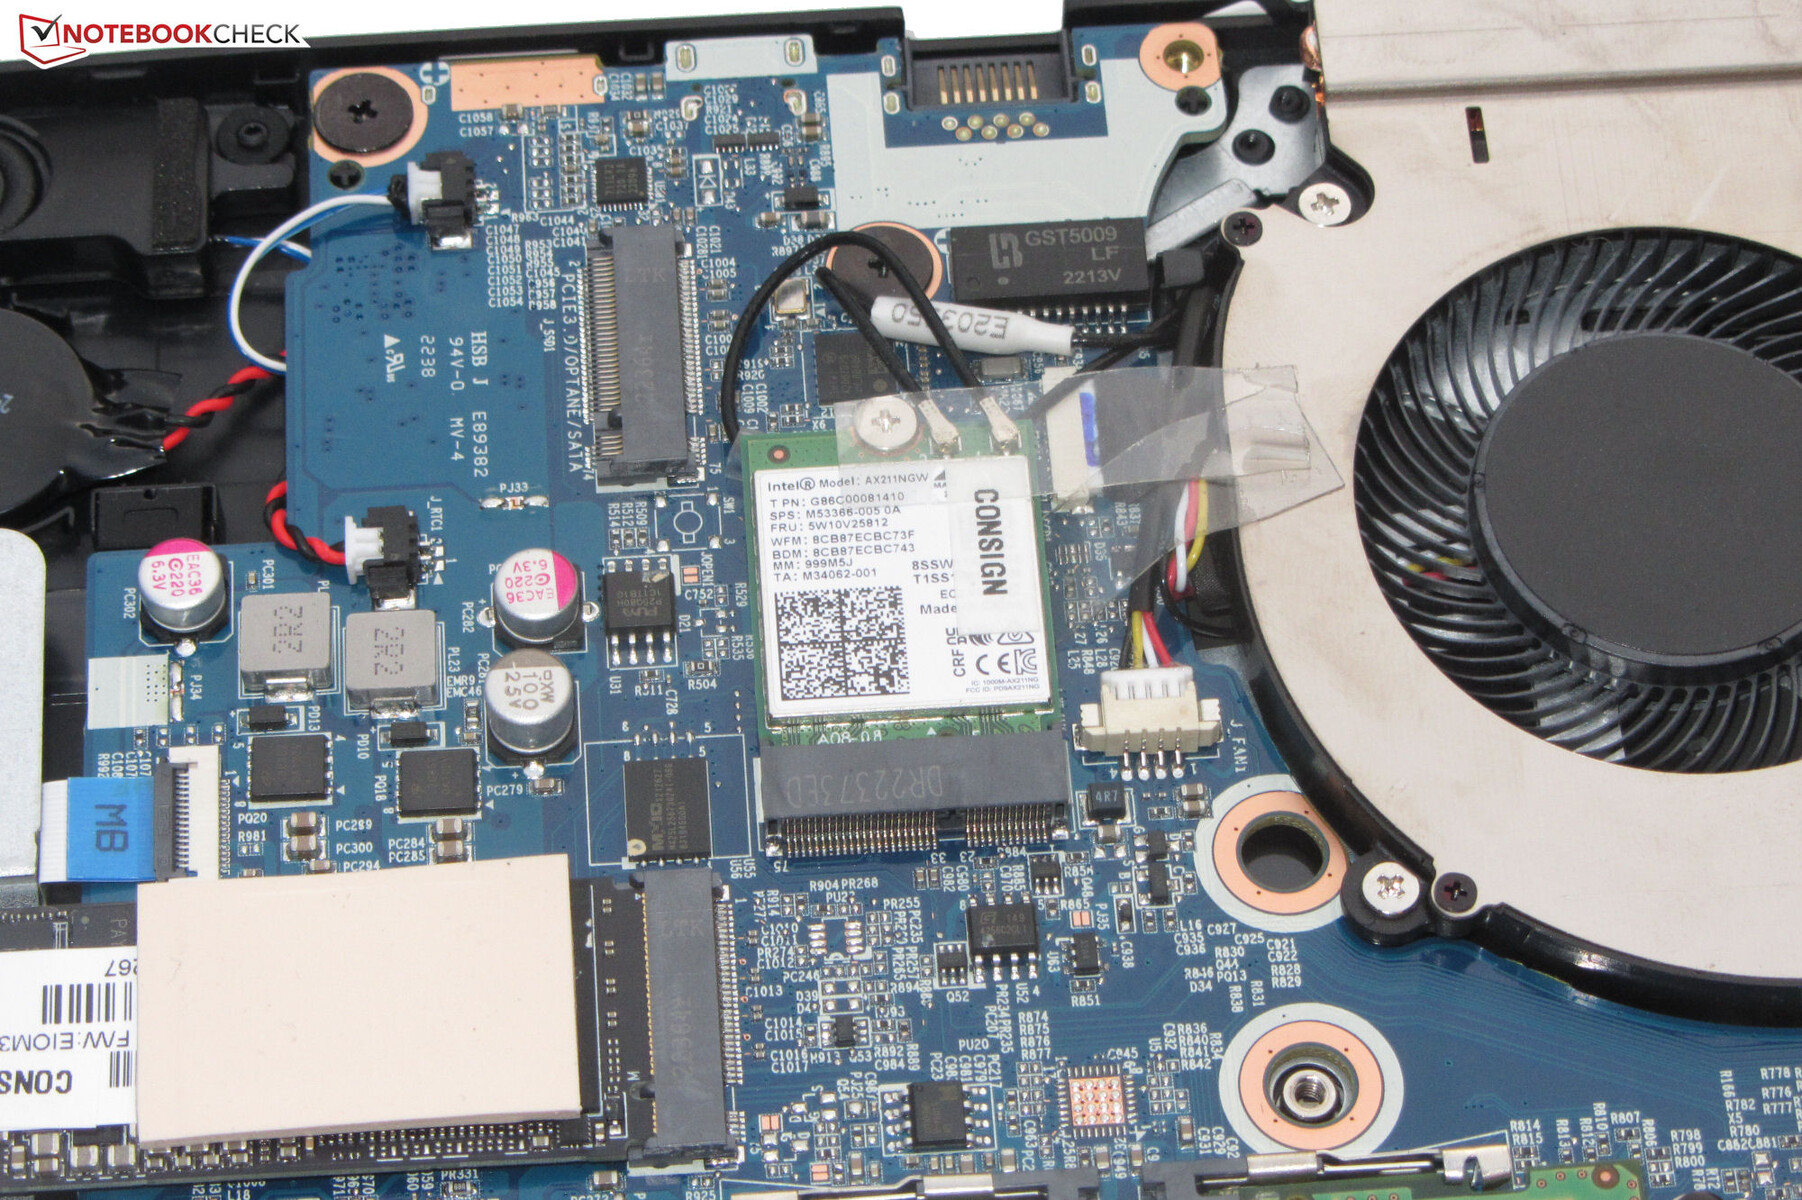
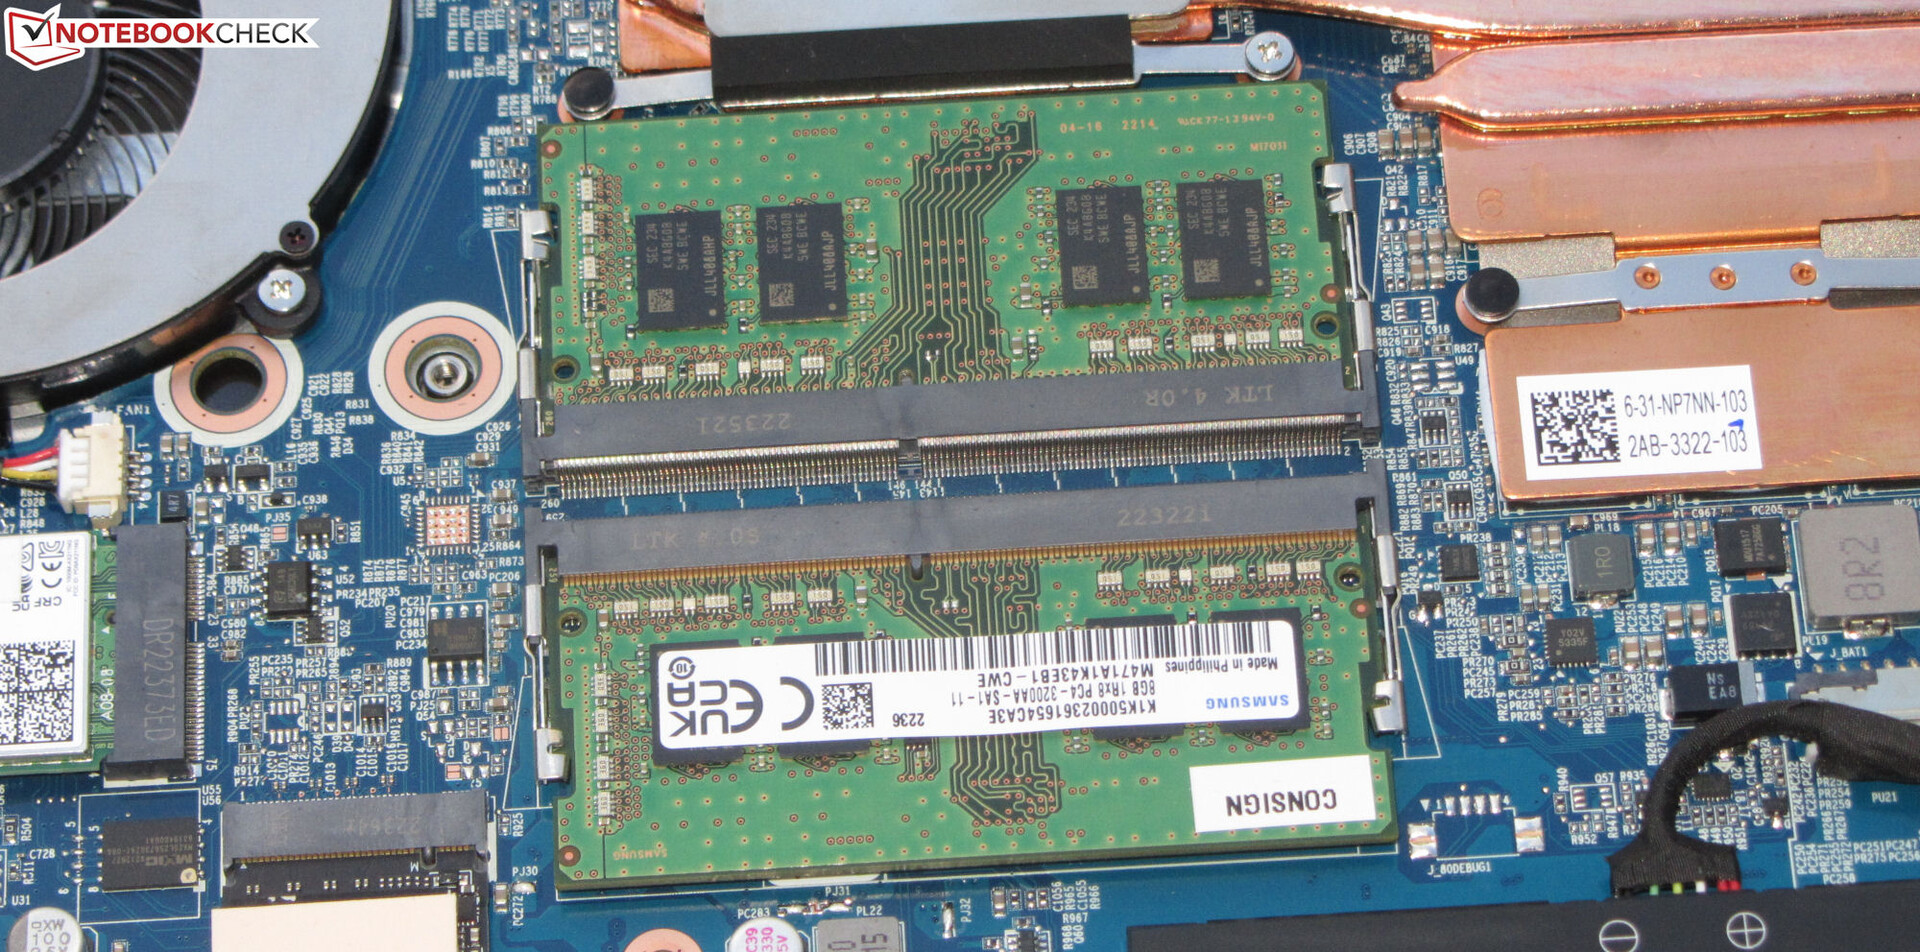
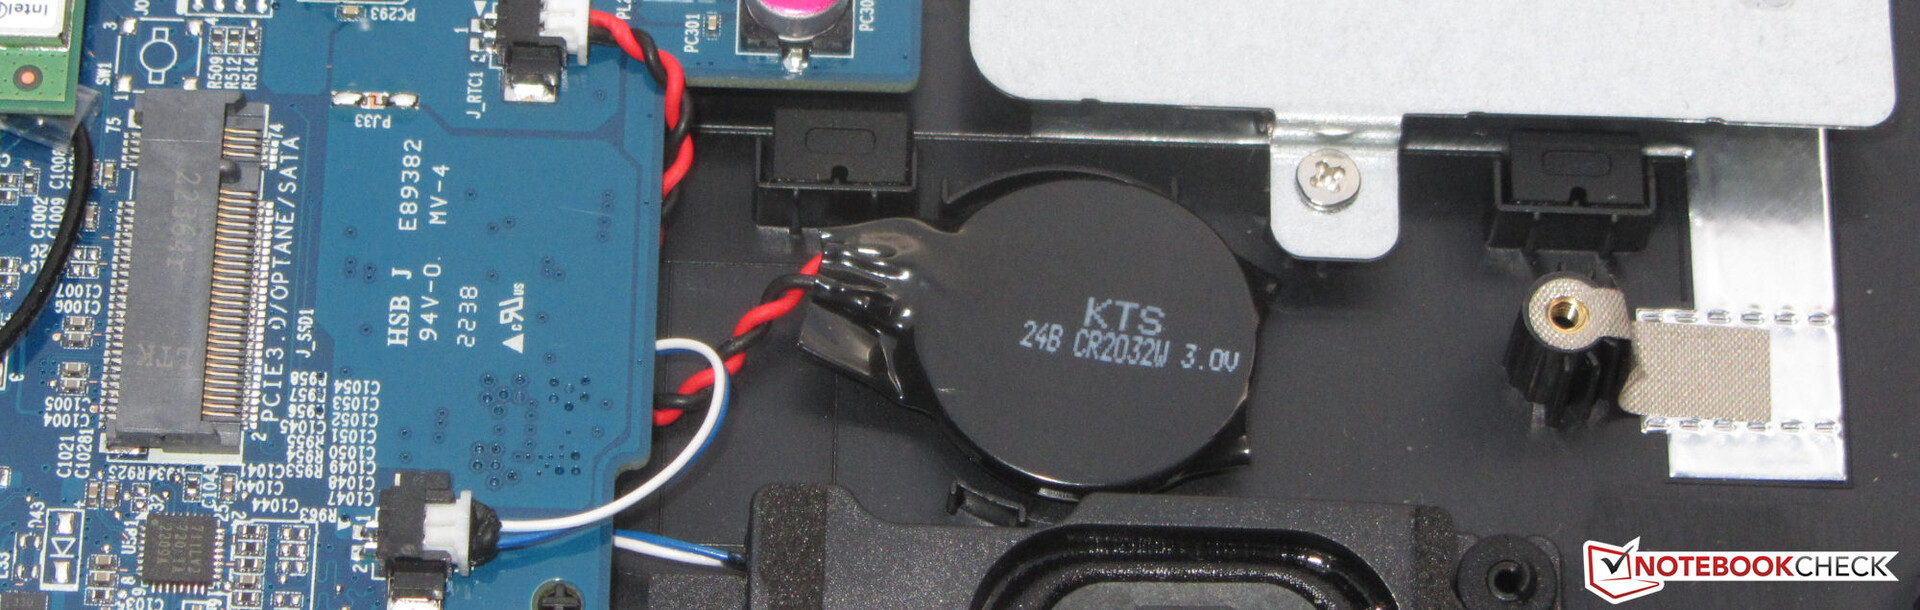
Konserwacja
Po odkręceniu wszystkich śrubek na spodzie urządzenia płytę spodnią można zdjąć przy pomocy ostrej krawędzi - w niektórych miejscach jest ona jednak przymocowana bardzo mocno. Wewnątrz użytkownicy mają dostęp do dysku SSD (PCIe 4), dodatkowego gniazda M.2 (PCIe 3), modułu Wi-Fi, gniazd pamięci RAM (oba są używane), baterii BIOS-u, wentylatorów i głównego akumulatora.
Gwarancja
17,3-calowy model Gigabyte jest objęty standardową, roczną ograniczoną gwarancją. Obecnie nie są dostępne rozszerzenia gwarancji.
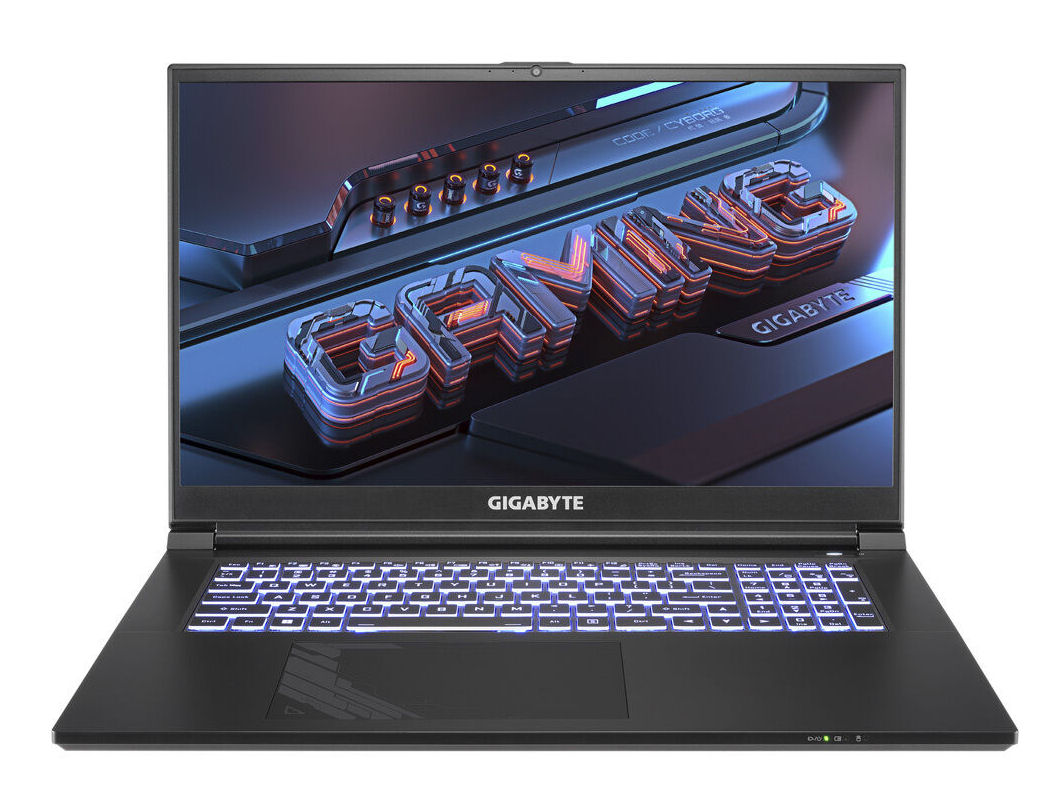
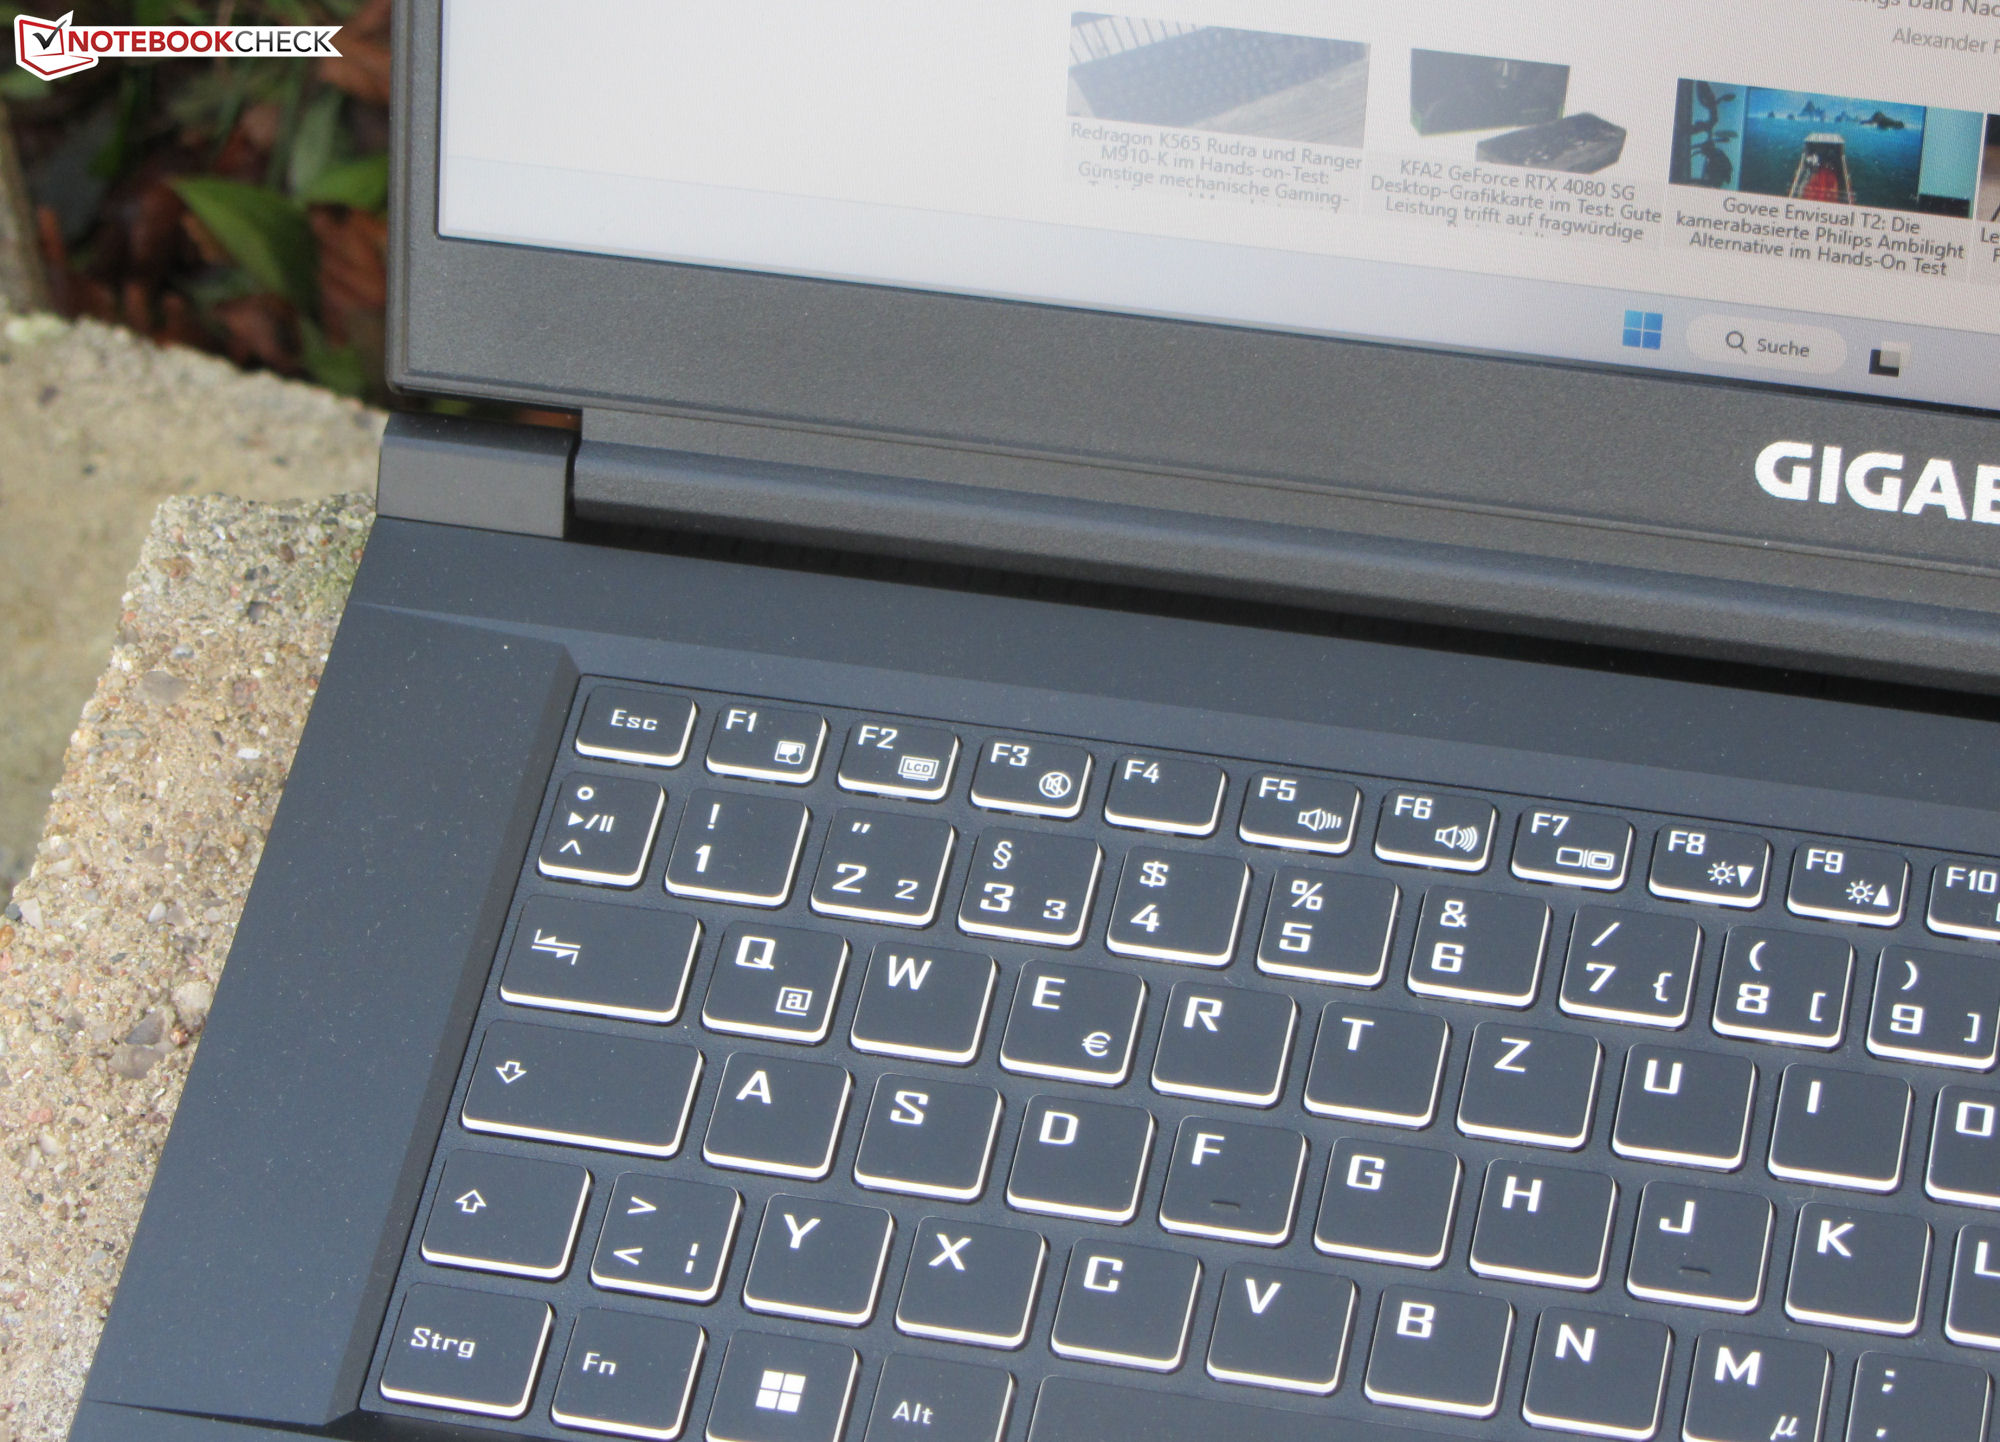
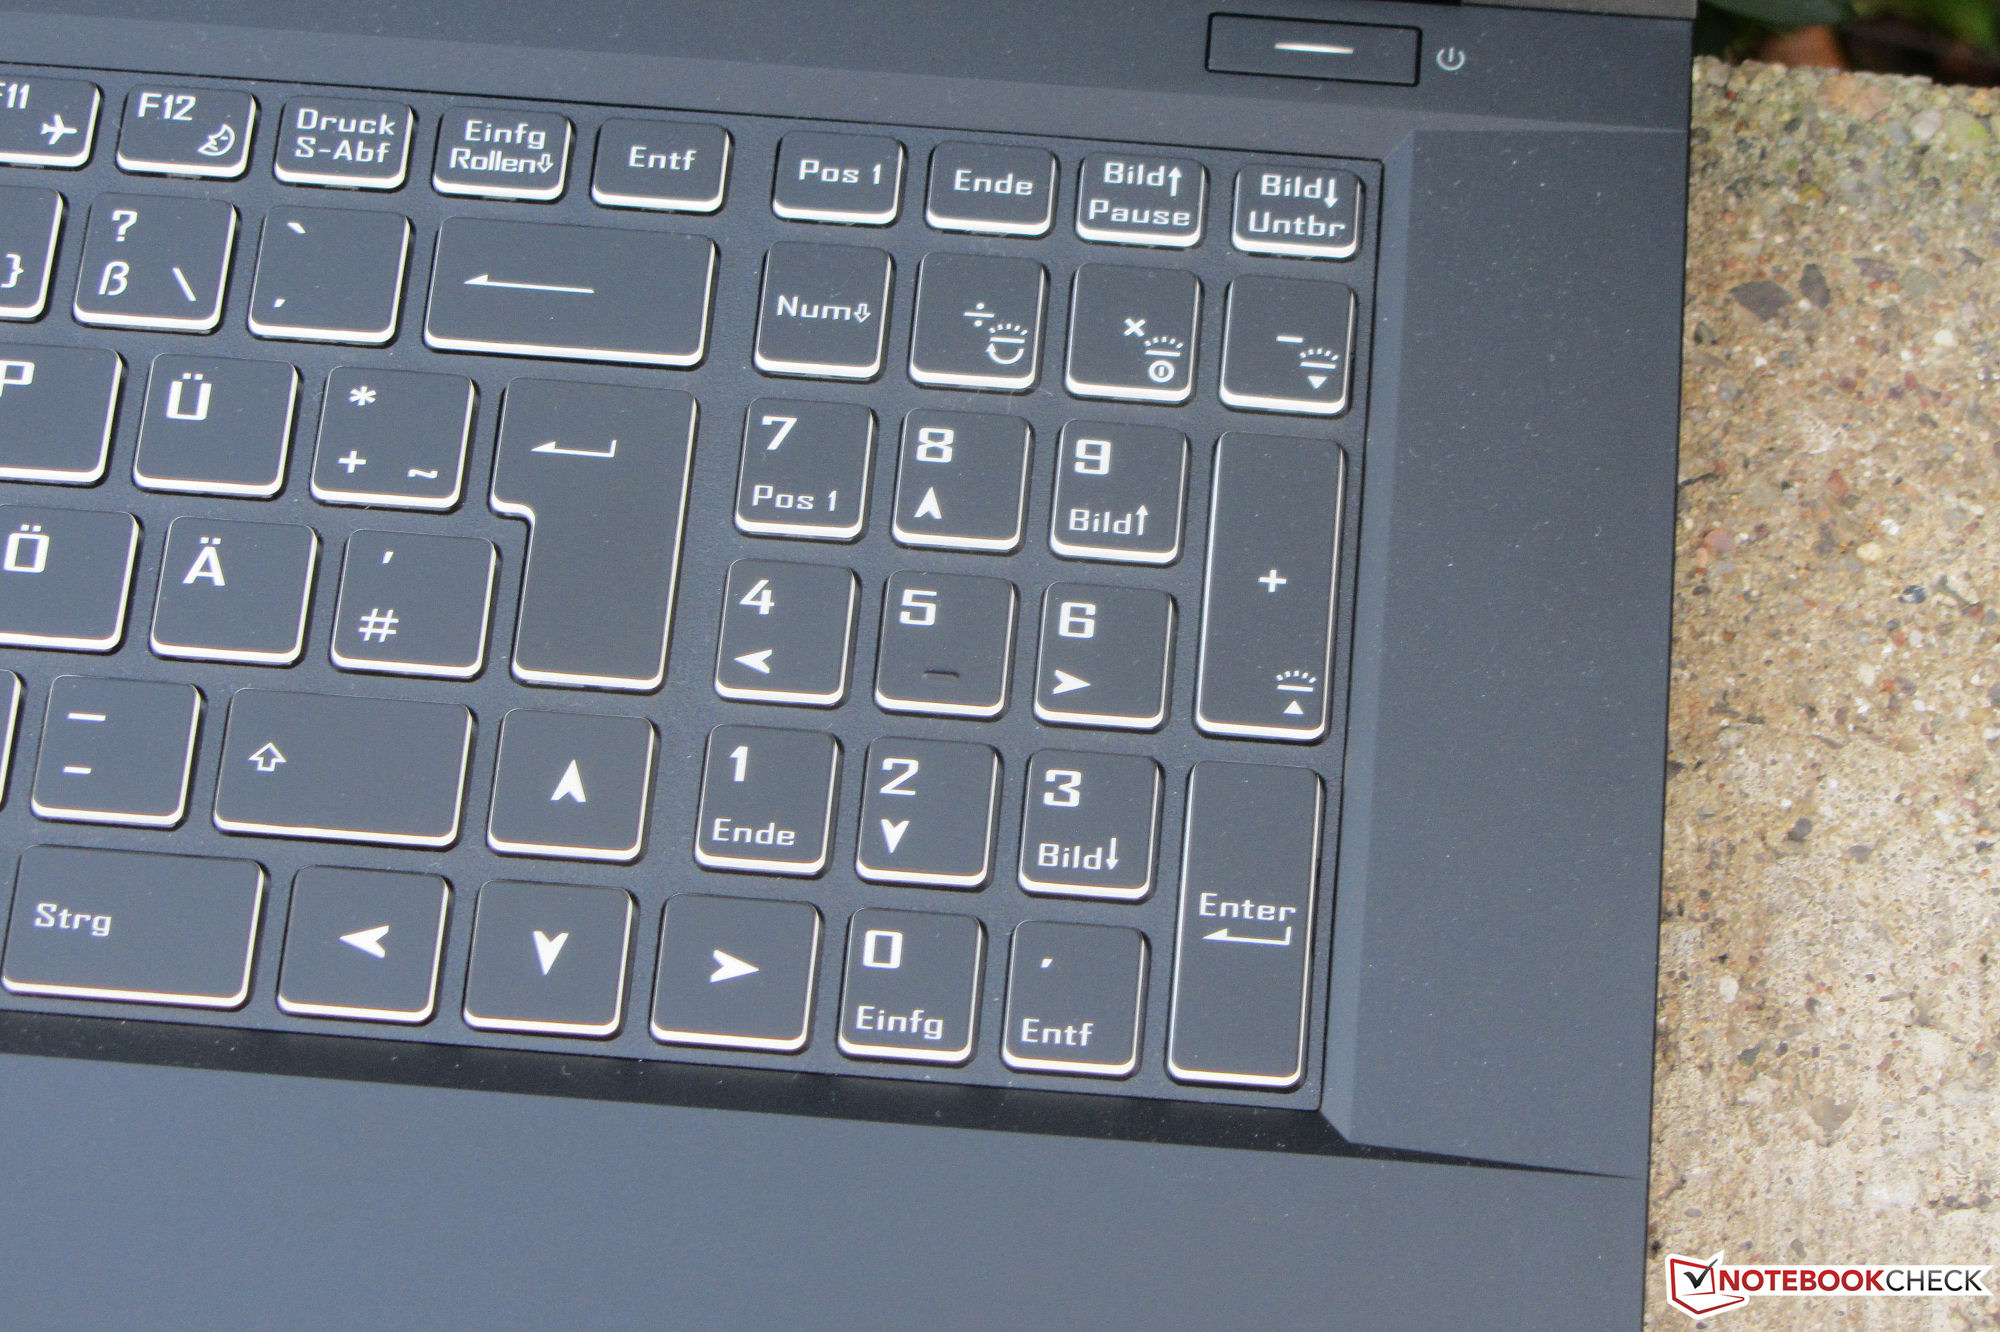
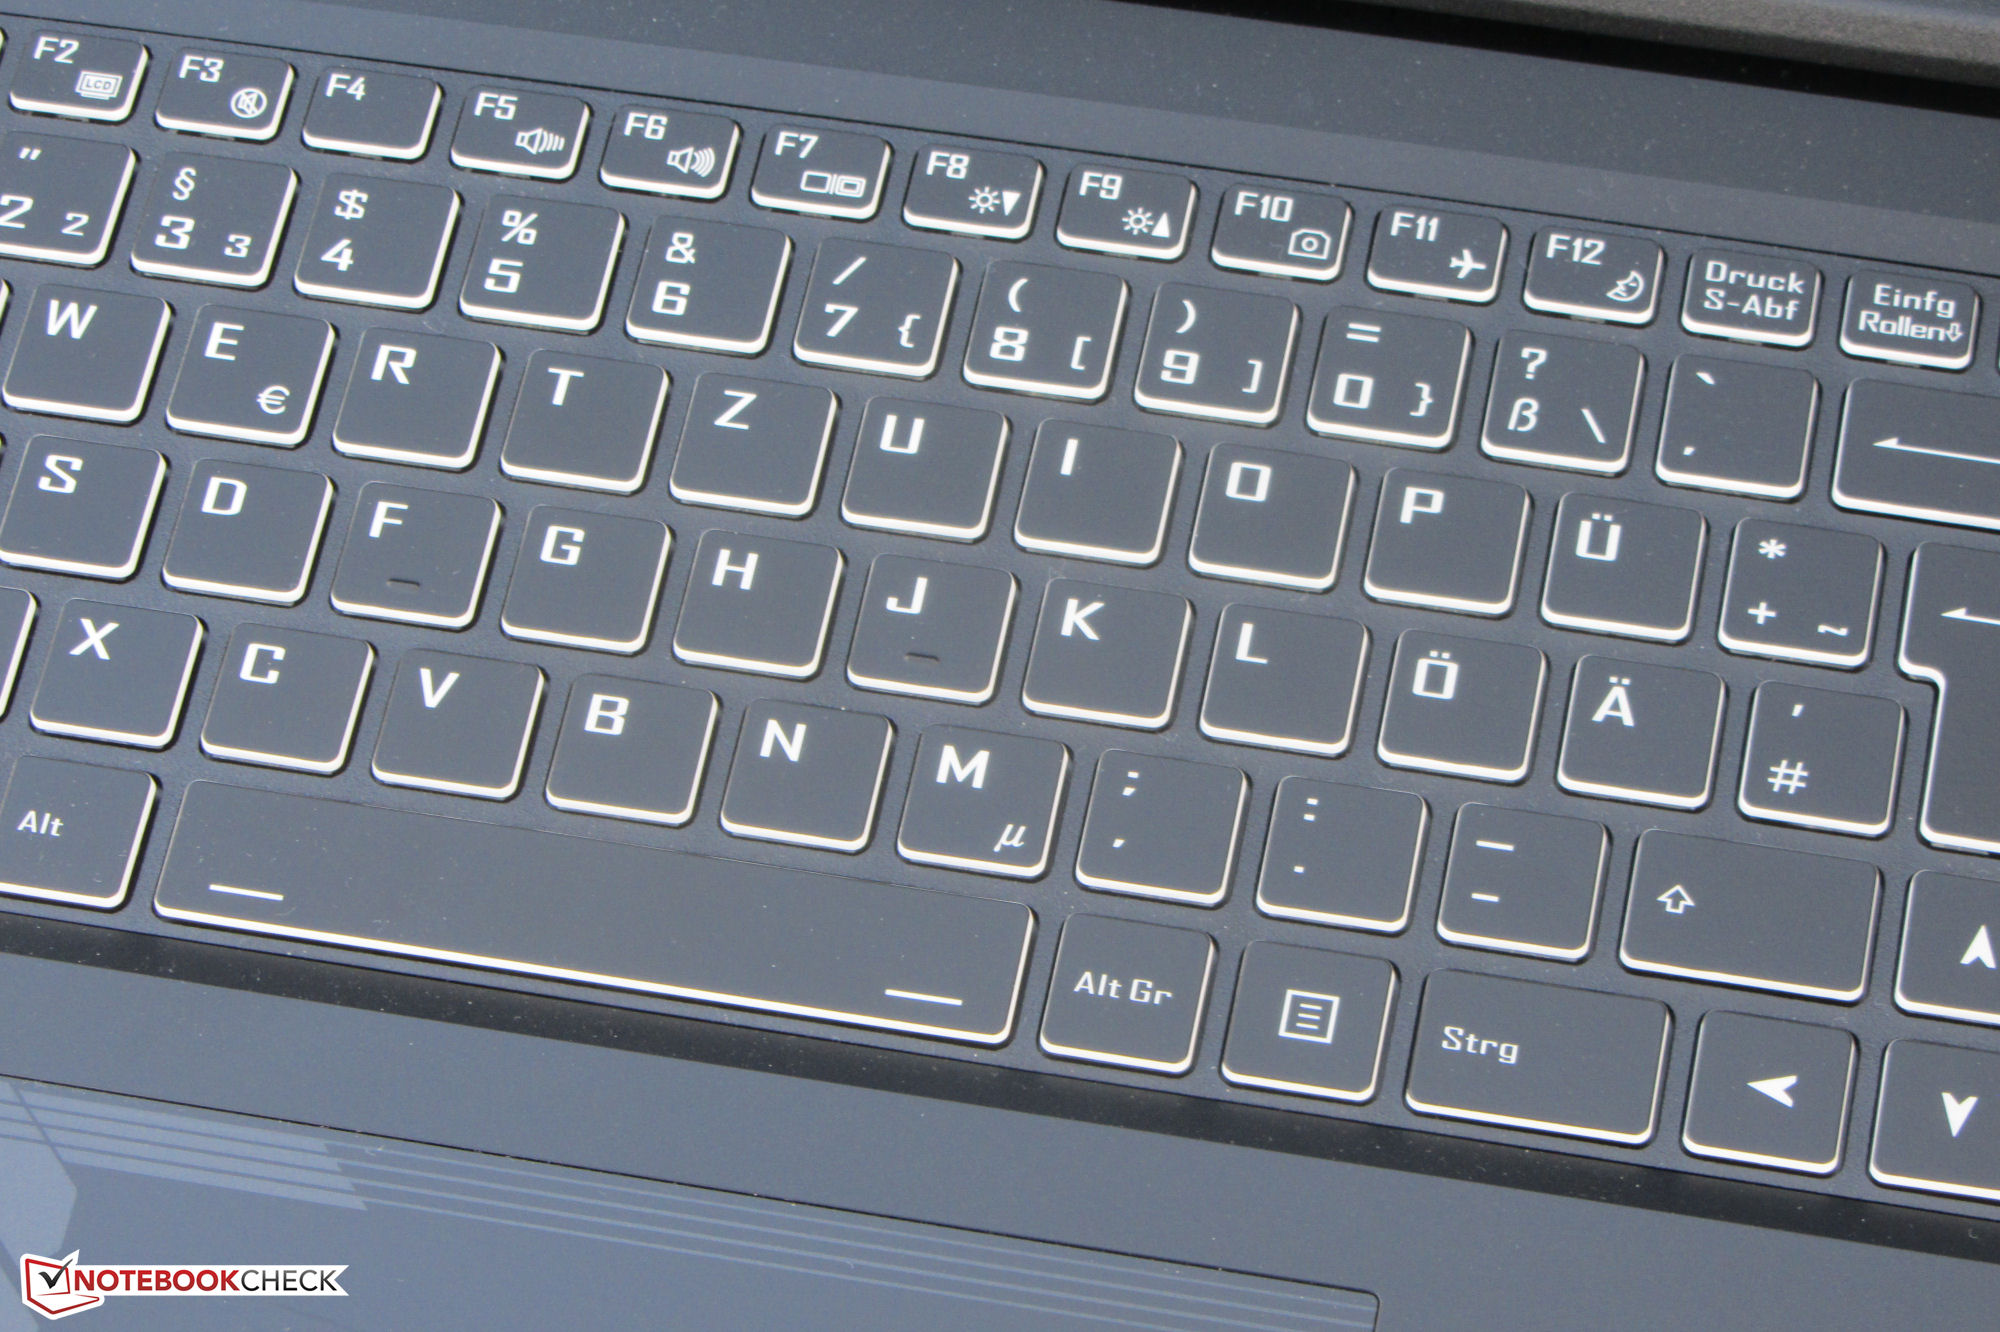
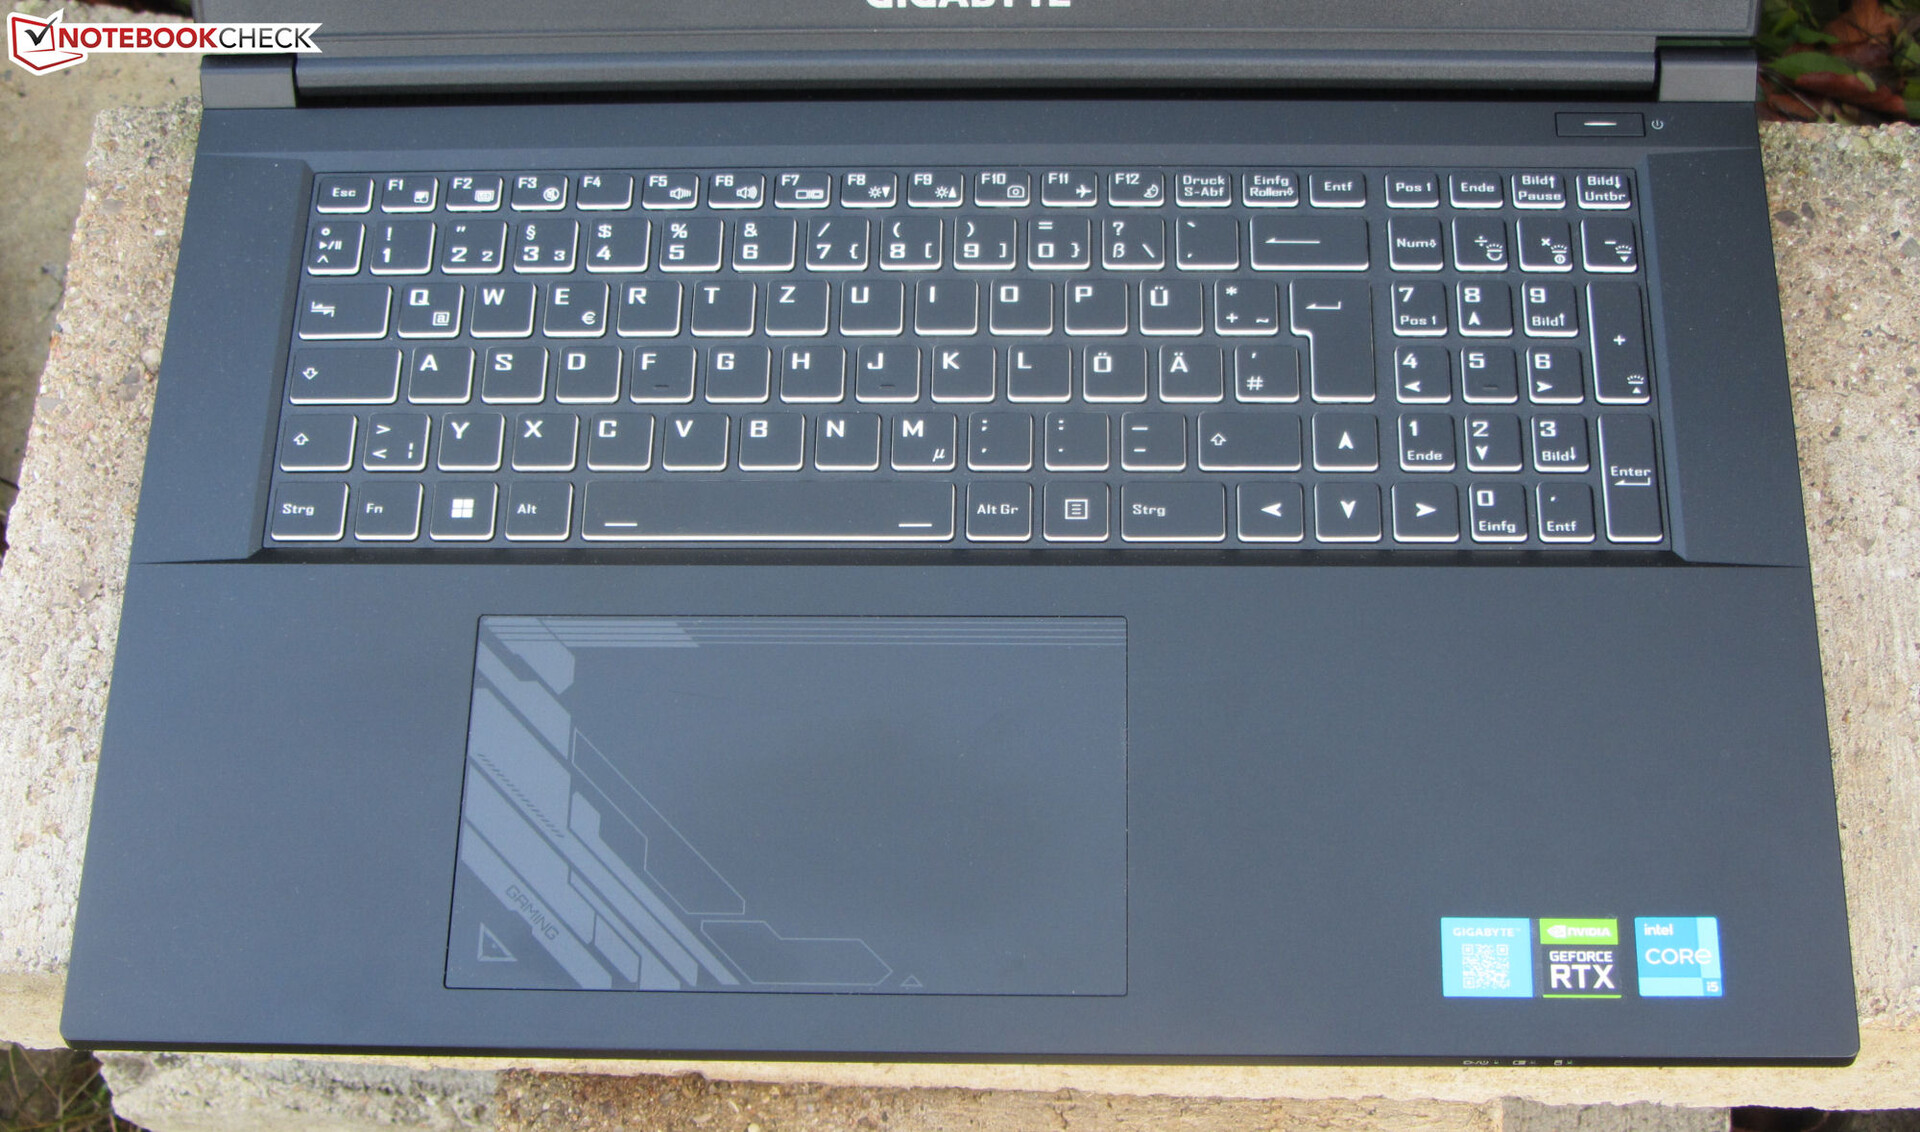
Urządzenia wejściowe - Klawiatura z podświetleniem RGB
Klawiatura
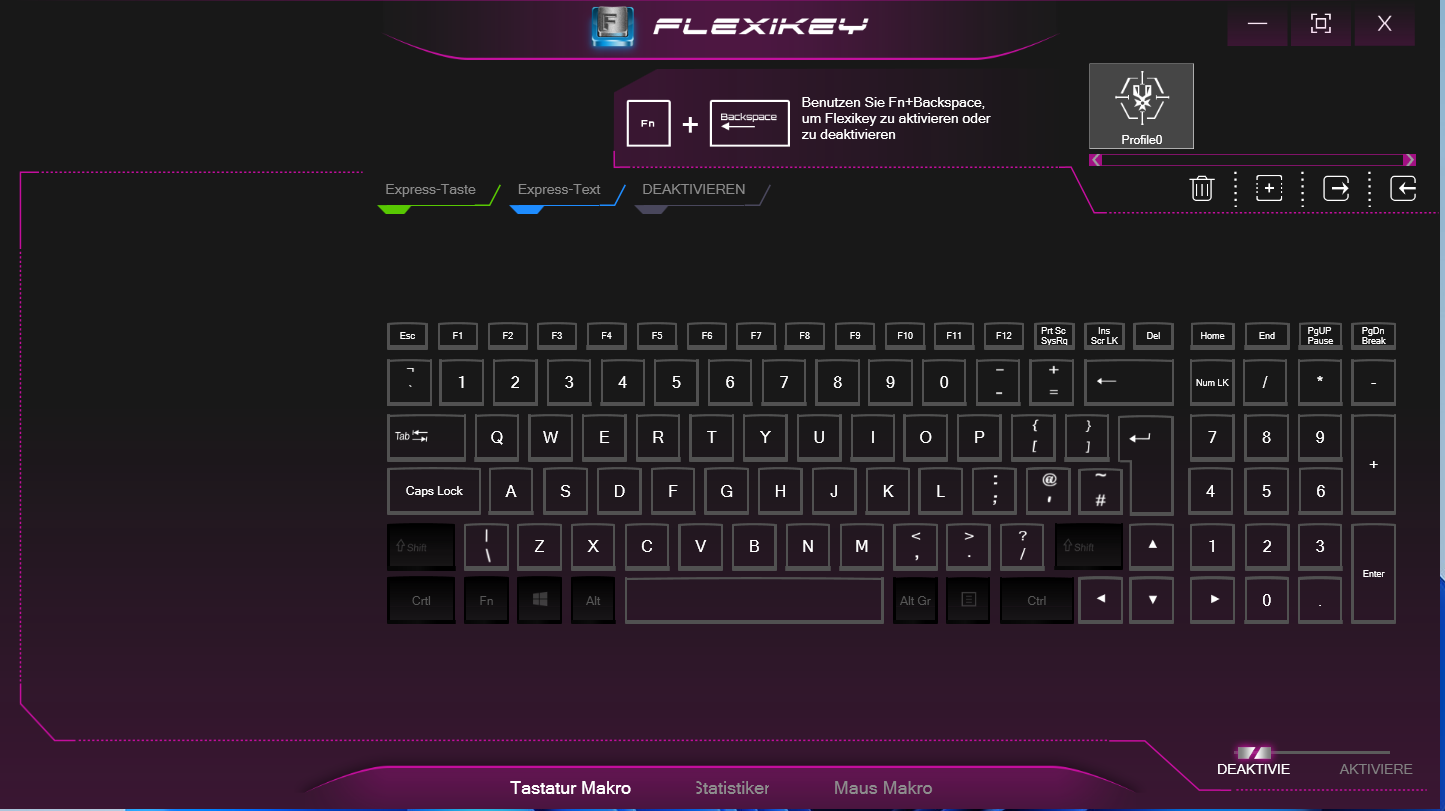
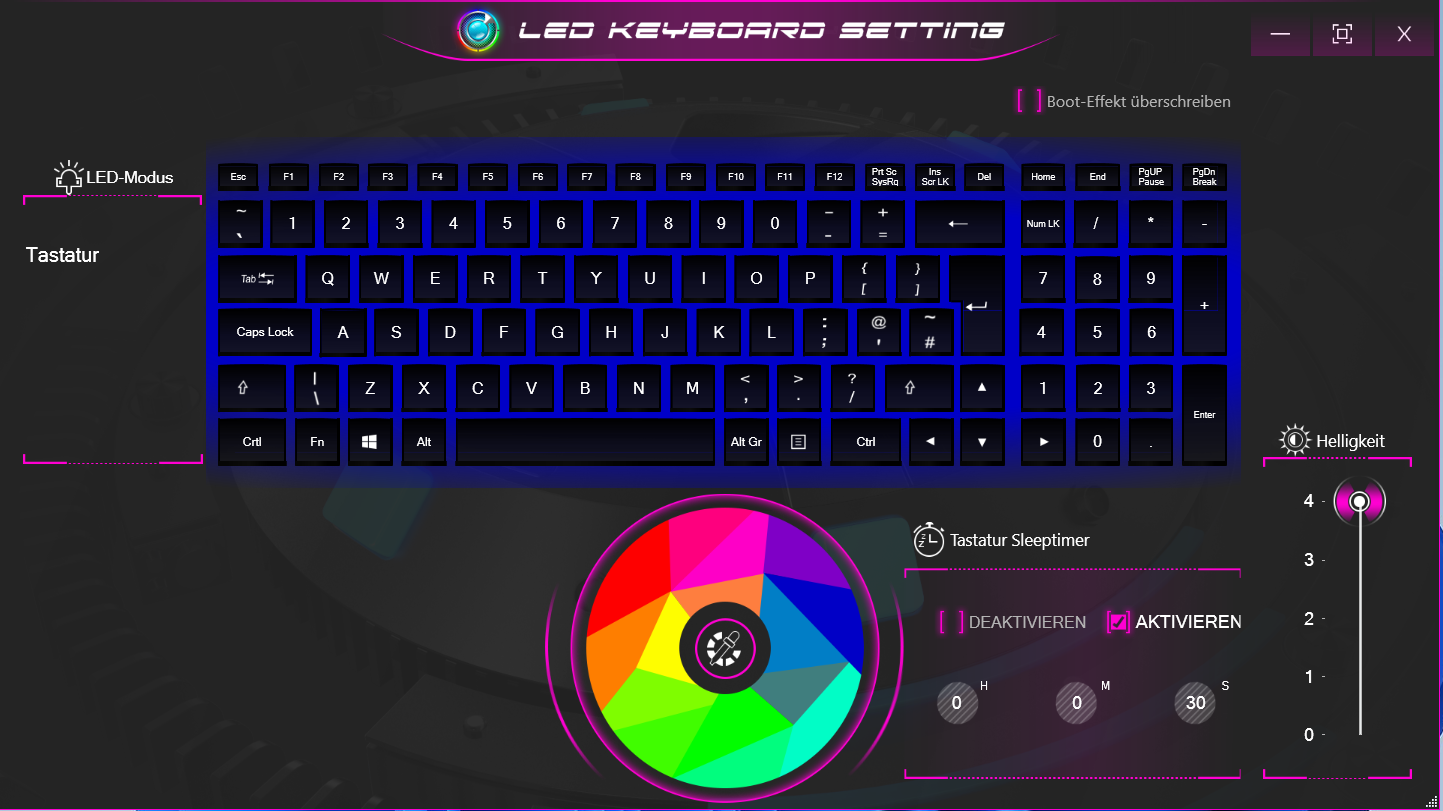
Płaskie, gładkie klawisze podświetlanej klawiatury chiclet oferują umiarkowany skok i wyraźny punkt aktywacji. Reakcja klawiszy mogłaby być bardziej zdecydowana. Obszar klawiatury lekko ugina się podczas pisania, ale w praktyce nie powinno to stanowić problemu. Dobrze: W klawiaturze zastosowano pełnowymiarowe klawisze strzałek. Podświetlenie RGB (cztery poziomy) można kontrolować za pomocą trzech przycisków funkcyjnych. Ogólnie rzecz biorąc, Gigabyte dostarcza dobrą klawiaturę do codziennego użytku.
Touchpad
Dzięki dużemu, wielodotykowemu gładzikowi (~ 15,2 x 9,1 cm) nie ma technicznej potrzeby stosowania zewnętrznej myszy, gdyż gładka powierzchnia oferuje dobre właściwości ślizgowe. Jest ona responsywna aż do narożników. Touchpad ma krótki skok i wyraźny punkt aktywacji.
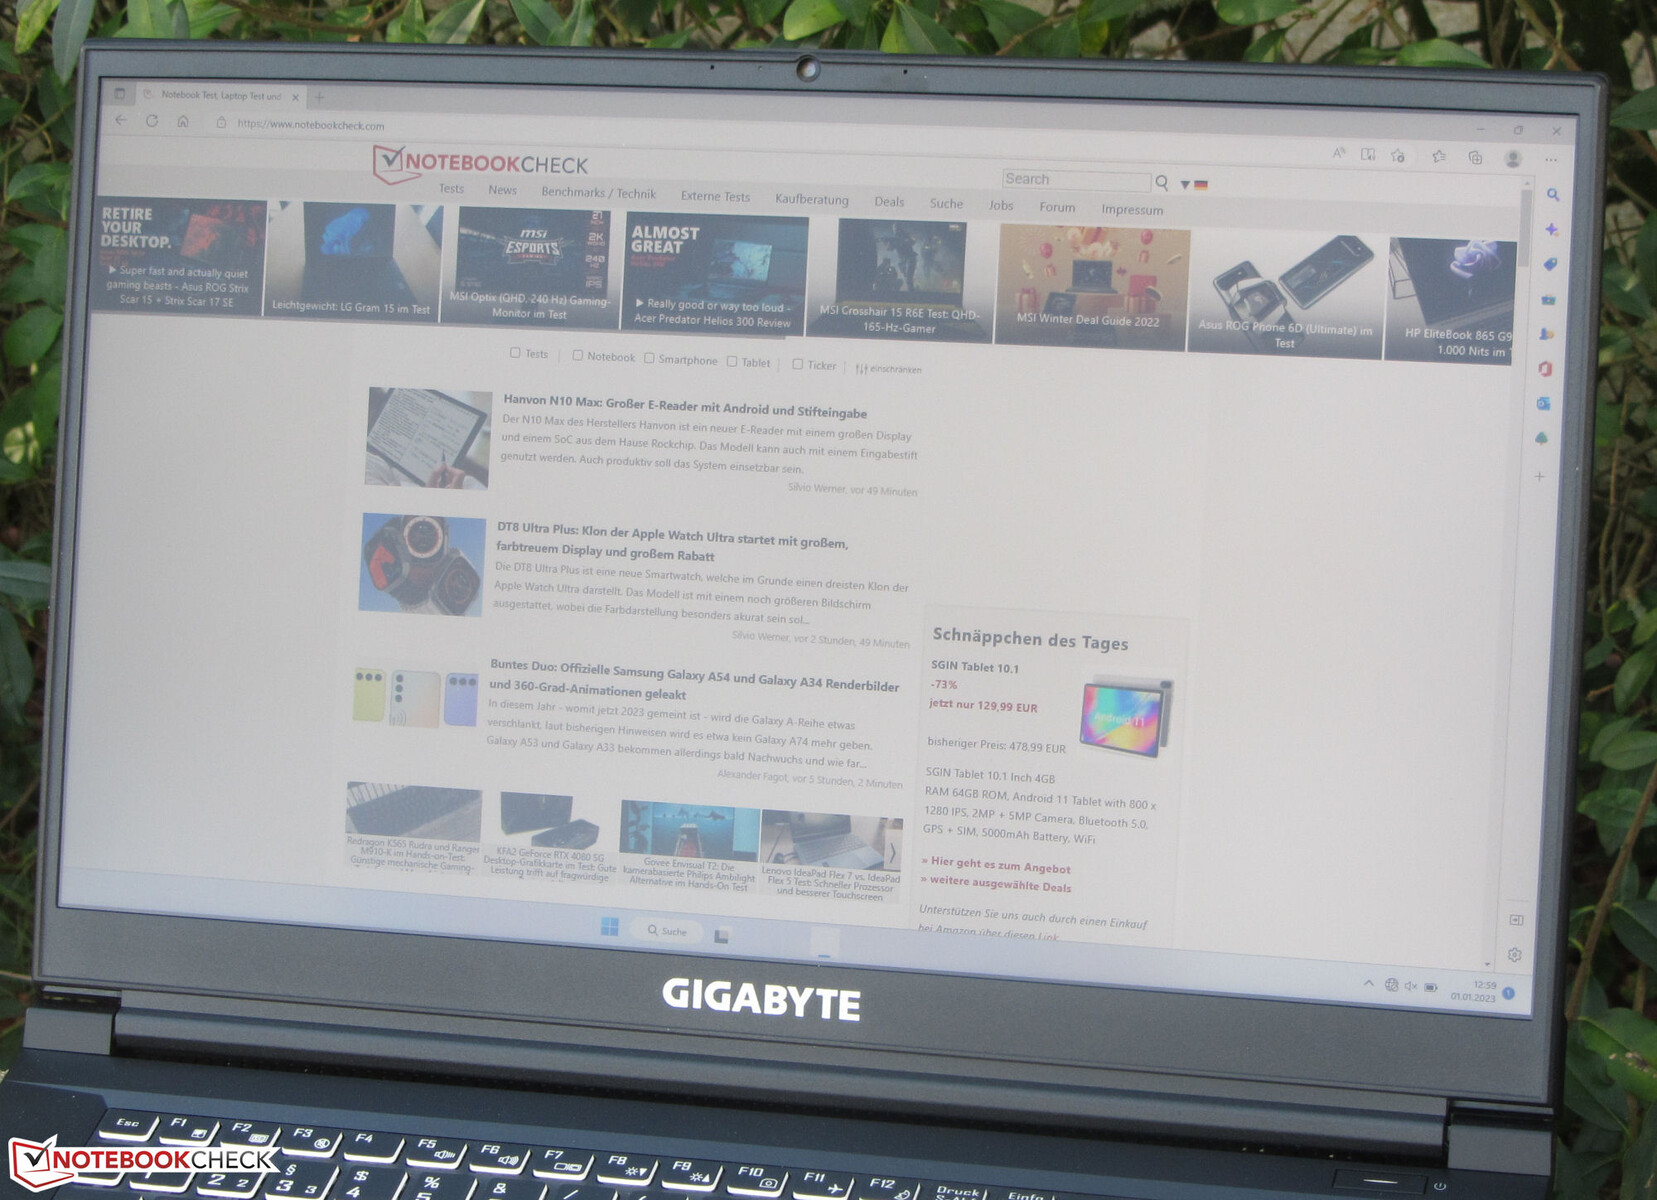
Wyświetlacz - 300-Hz IPS
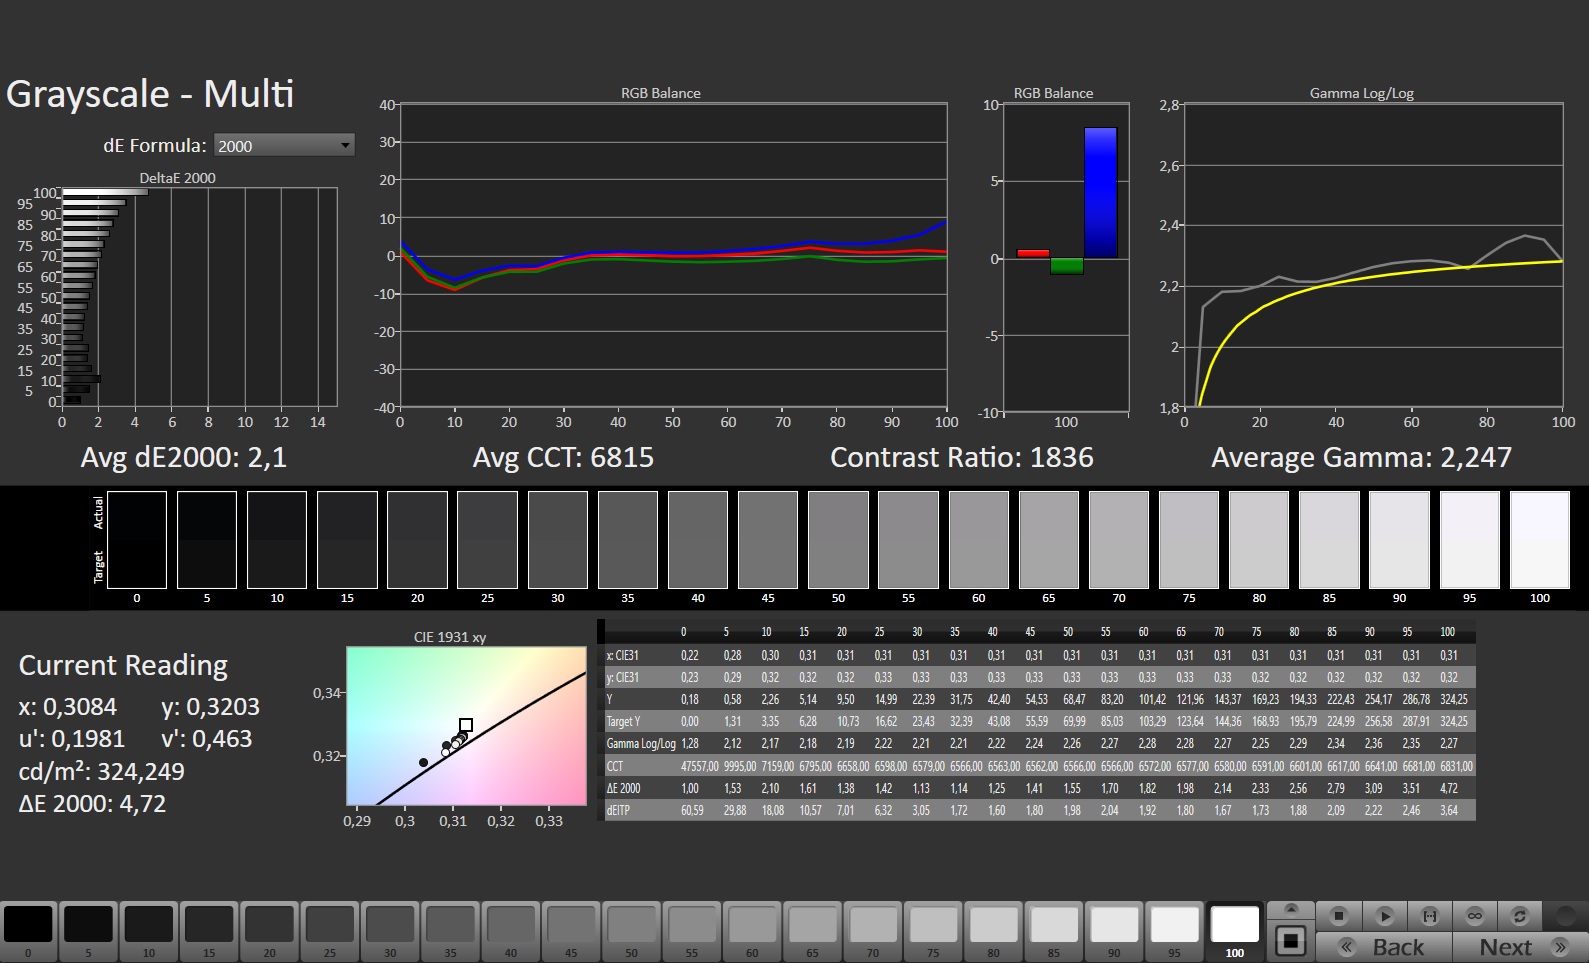
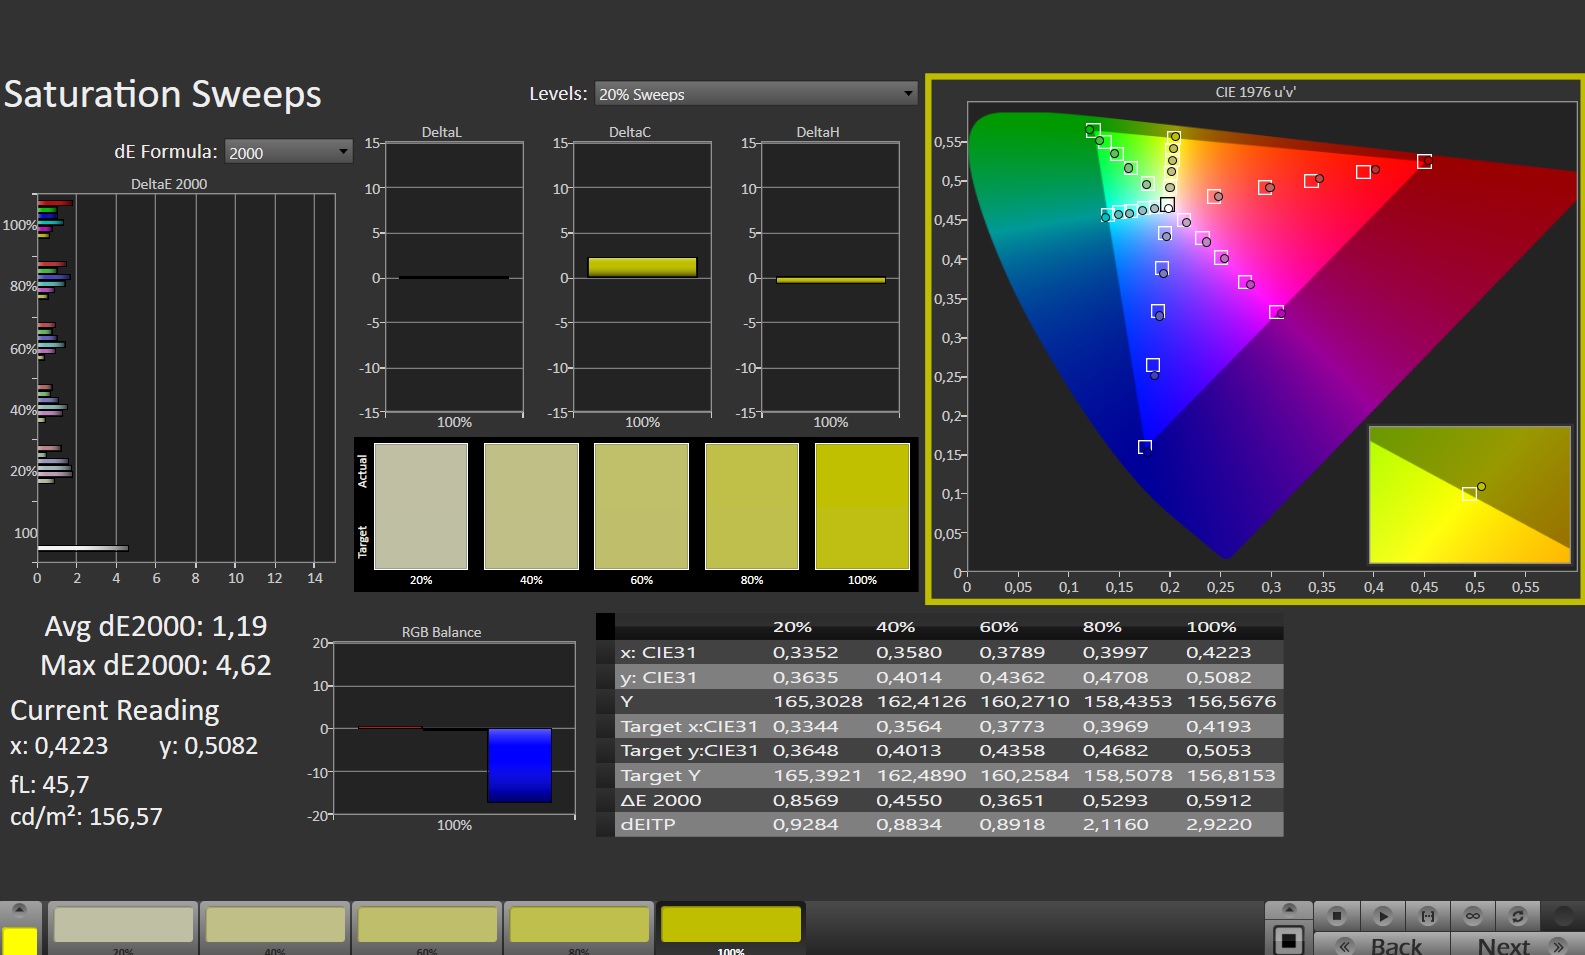
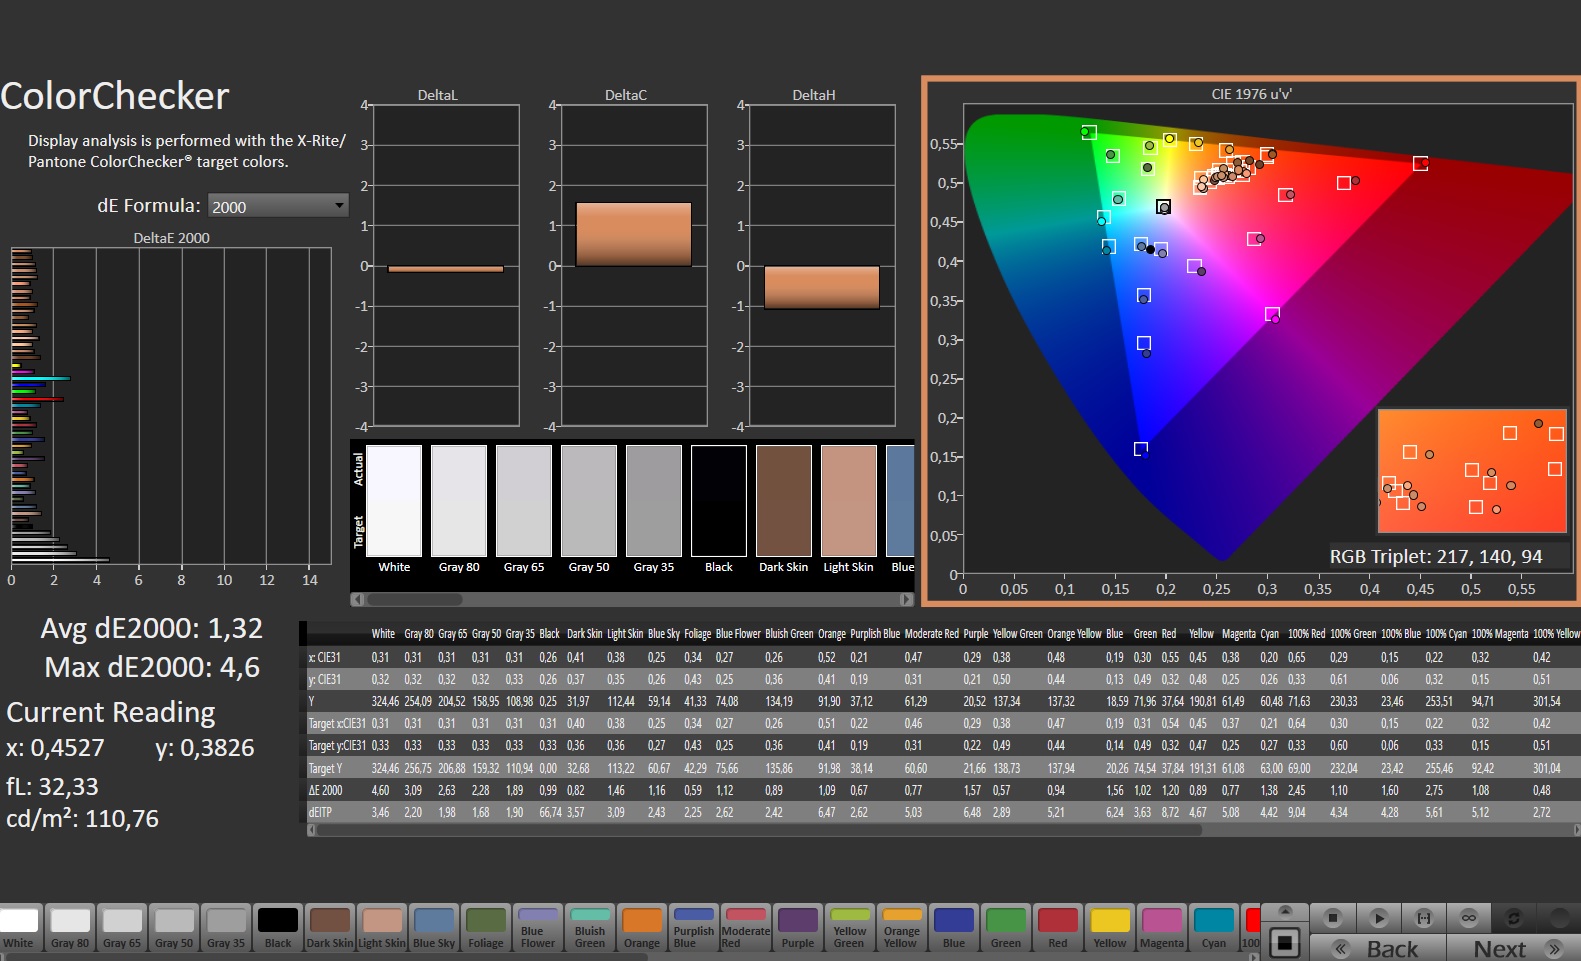
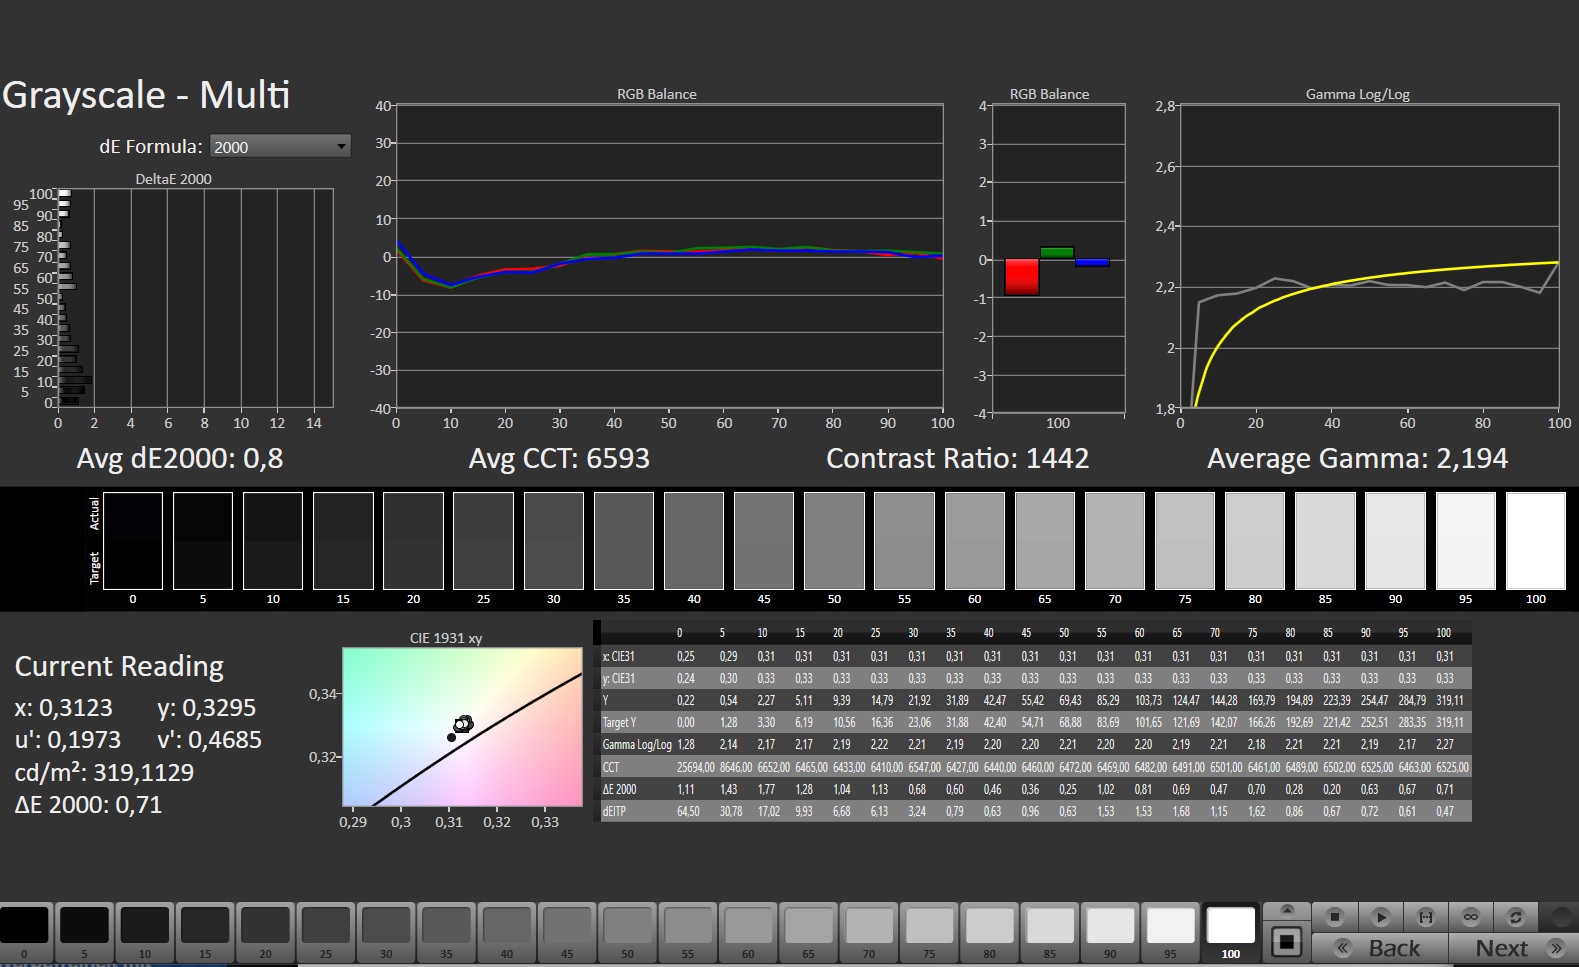
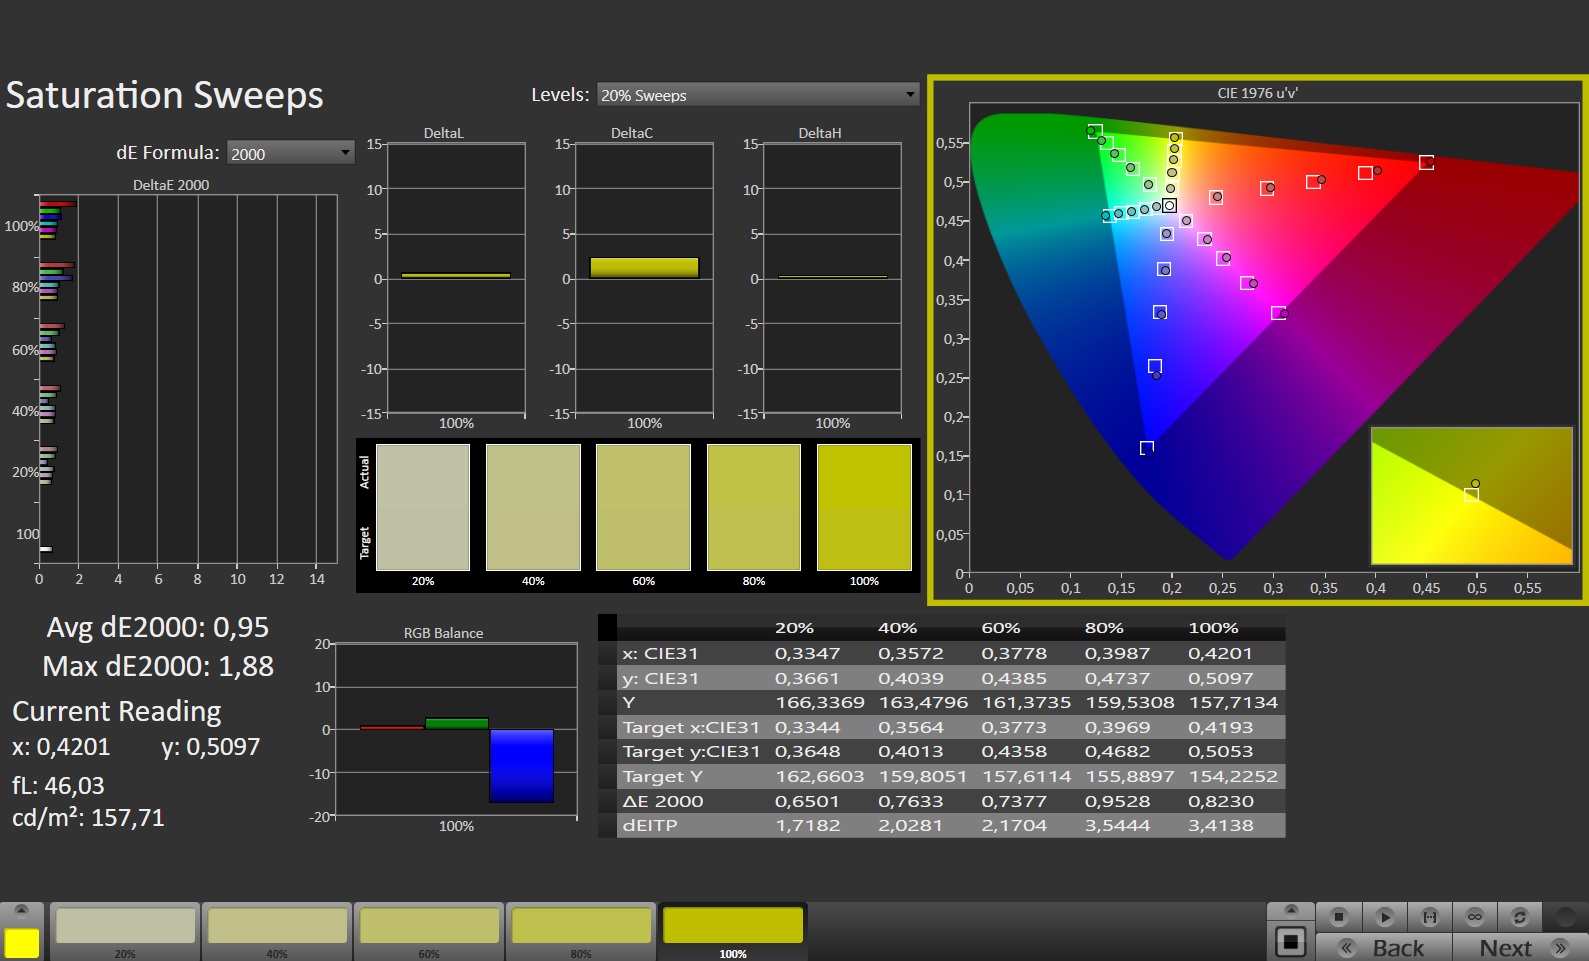
Gigabyte wyposaża G7 w matowy ekran o przekątnej 17,3 cala (1920 x 1080 pikseli). Jasność (300 nitów) i kontrast (1535:1) responsywnego panelu 300-Hz spełniają i przekraczają nasze oczekiwania (>300 nitów i 1000:1). Dodatkowo wyświetlacz nie cierpi z powodu migotania PWM na żadnym poziomie jasności.
| |||||||||||||||||||||||||
rozświetlenie: 93 %
na akumulatorze: 307 cd/m²
kontrast: 1535:1 (czerń: 0.2 cd/m²)
ΔE ColorChecker Calman: 1.32 | ∀{0.5-29.43 Ø4.73}
calibrated: 1.03
ΔE Greyscale Calman: 2.1 | ∀{0.09-98 Ø4.97}
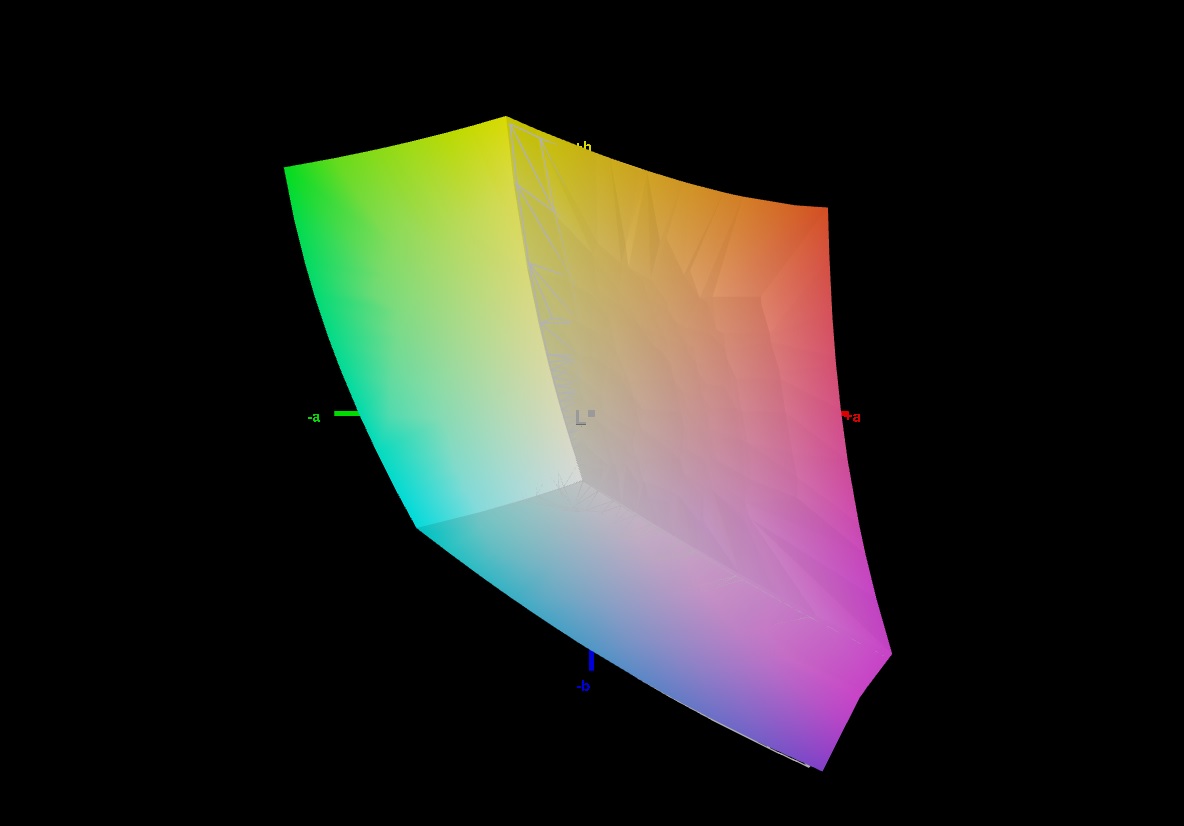
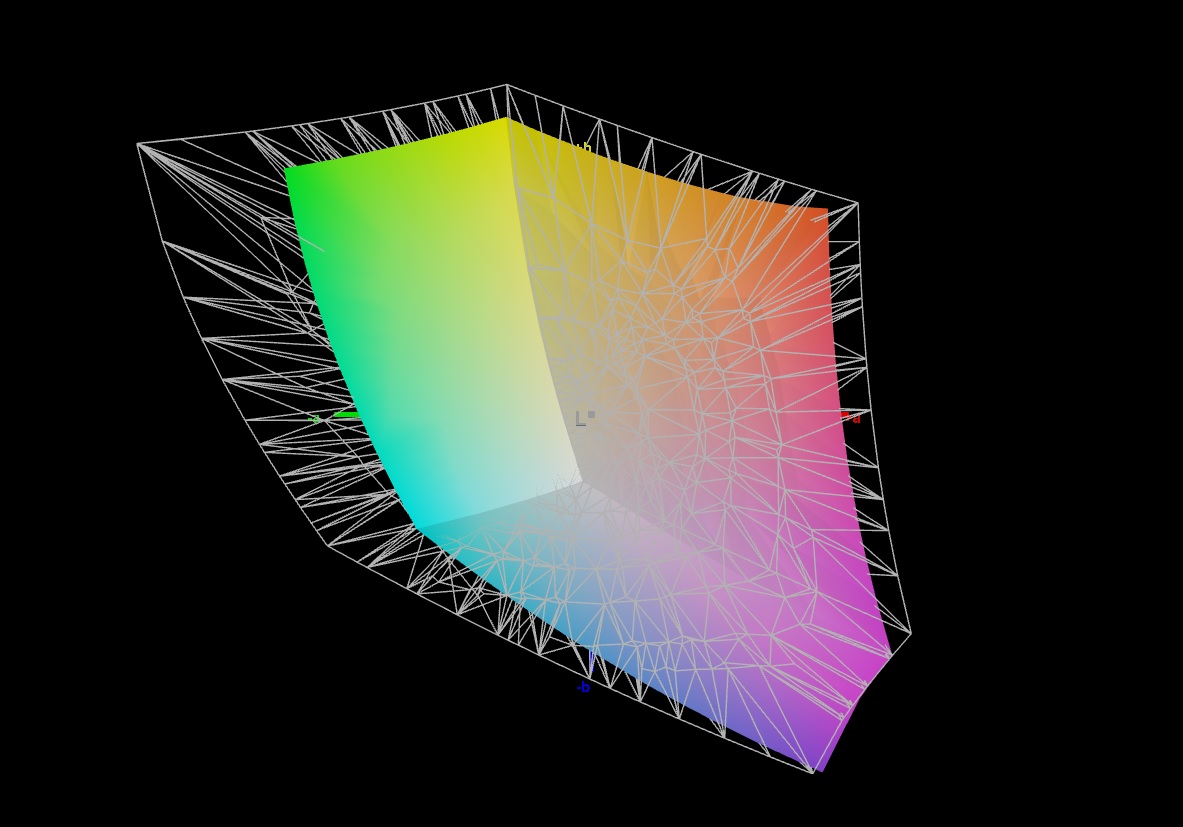
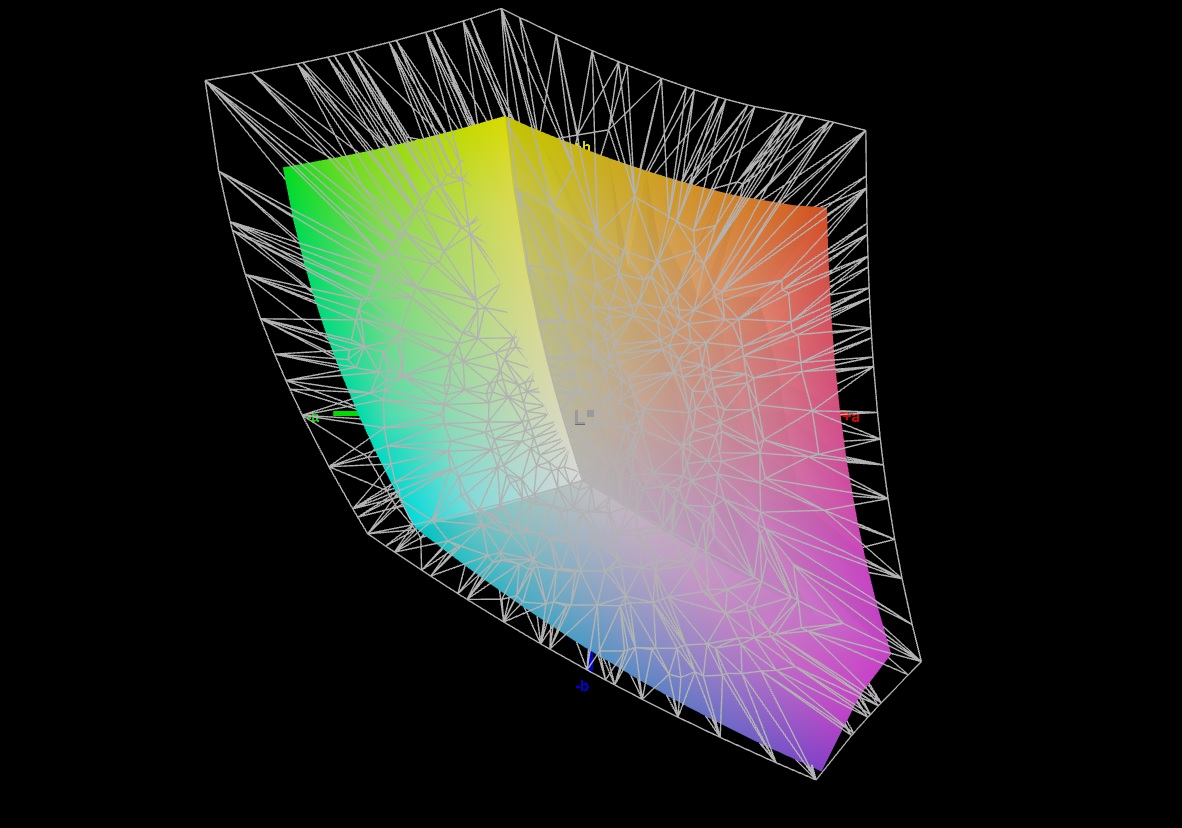
71.7% AdobeRGB 1998 (Argyll 3D)
99.8% sRGB (Argyll 3D)
70.4% Display P3 (Argyll 3D)
Gamma: 2.247
CCT: 6815 K
| Gigabyte G7 KE AU Optronics B173HAN05.1, IPS, 1920x1080, 17.3" | HP Pavilion Gaming 17-cd2146ng LGD0611, IPS, 1920x1080, 17.3" | Acer Nitro 5 AN517-55-738R B173HAN04.0, IPS, 1920x1080, 17.3" | Asus TUF Gaming F17 FX707Z-HX011W AU Optronics B173HAN04.9 (AUO4B9D), IPS, 1920x1080, 17.3" | Lenovo IdeaPad Gaming 3 15IAH7 Lenovo LEN156FHD, IPS, 1920x1080, 15.6" | |
|---|---|---|---|---|---|
| Display | -6% | -15% | -42% | -2% | |
| Display P3 Coverage (%) | 70.4 | 64.8 -8% | 58.9 -16% | 40.2 -43% | 69.1 -2% |
| sRGB Coverage (%) | 99.8 | 96.8 -3% | 86.4 -13% | 59.7 -40% | 99.2 -1% |
| AdobeRGB 1998 Coverage (%) | 71.7 | 66.5 -7% | 60.5 -16% | 41.5 -42% | 69.9 -3% |
| Response Times | -80% | -8% | -471% | -81% | |
| Response Time Grey 50% / Grey 80% * (ms) | 5 ? | 12.7 ? -154% | 6 ? -20% | 39.2 ? -684% | 13 ? -160% |
| Response Time Black / White * (ms) | 8.3 ? | 8.7 ? -5% | 8 ? 4% | 29.6 ? -257% | 8.4 ? -1% |
| PWM Frequency (Hz) | |||||
| Screen | -44% | -59% | -97% | -46% | |
| Brightness middle (cd/m²) | 307 | 328 7% | 286 -7% | 287 -7% | 338 10% |
| Brightness (cd/m²) | 301 | 317 5% | 278 -8% | 268 -11% | 329 9% |
| Brightness Distribution (%) | 93 | 94 1% | 89 -4% | 89 -4% | 92 -1% |
| Black Level * (cd/m²) | 0.2 | 0.23 -15% | 0.32 -60% | 0.17 15% | 0.27 -35% |
| Contrast (:1) | 1535 | 1426 -7% | 894 -42% | 1688 10% | 1252 -18% |
| Colorchecker dE 2000 * | 1.32 | 3.83 -190% | 3.05 -131% | 5.1 -286% | 2.88 -118% |
| Colorchecker dE 2000 max. * | 4.6 | 8.51 -85% | 5.83 -27% | 8.72 -90% | 9.35 -103% |
| Colorchecker dE 2000 calibrated * | 1.03 | 0.83 19% | 3.13 -204% | 5.1 -395% | 1.22 -18% |
| Greyscale dE 2000 * | 2.1 | 4.9 -133% | 3.17 -51% | 4.24 -102% | 5 -138% |
| Gamma | 2.247 98% | 2.177 101% | 2.29 96% | 2.44 90% | 2.162 102% |
| CCT | 6815 95% | 7881 82% | 6916 94% | 6008 108% | 7497 87% |
| Całkowita średnia (program / ustawienia) | -43% /
-41% | -27% /
-43% | -203% /
-138% | -43% /
-41% |
* ... im mniej tym lepiej
Dokładność odwzorowania kolorów jest bardzo dobra w warunkach fabrycznych: Z odchyleniem 1,32 mieści się komfortowo w idealnym zakresie (deltaE < 3). Po samodzielnym skalibrowaniu wyświetlacza odchylenie spada do 1,03, co zapewnia jeszcze dokładniejsze odwzorowanie skali szarości. Wyświetlacz jest w stanie odtworzyć całą przestrzeń barw sRGB (100 %), natomiast przestrzeni barw AdobeRGB (72 %) i DCI-P3 (70 %) nie da się wyświetlić w całości. Wyniki te są zbliżone do wyników większości konkurentów.

Wyświetl czasy reakcji
| ↔ Czas reakcji od czerni do bieli | ||
|---|---|---|
| 8.3 ms ... wzrost ↗ i spadek ↘ łącznie | ↗ 4.2 ms wzrost | 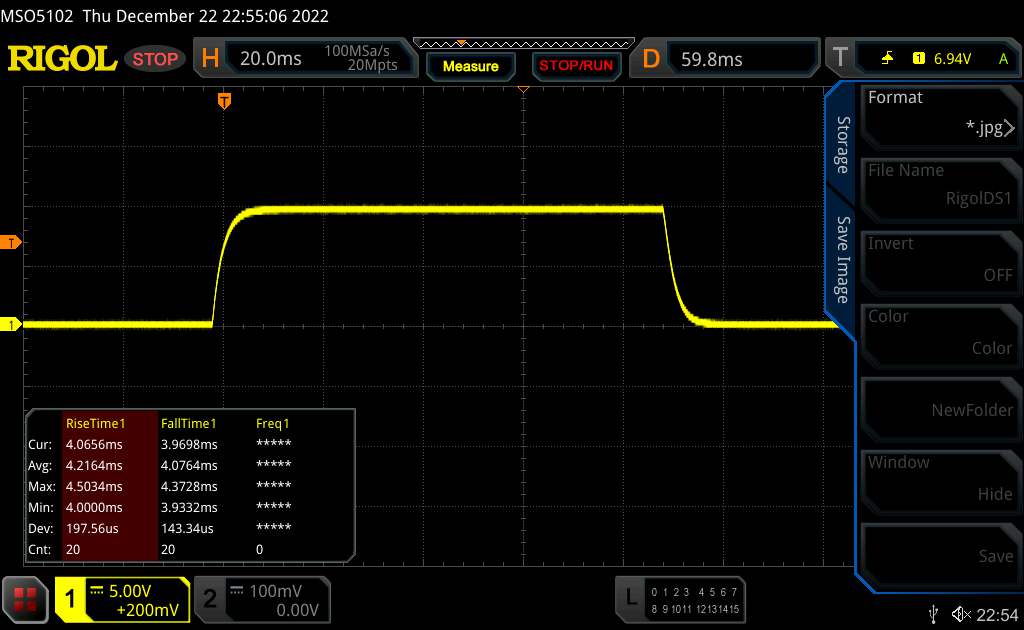 |
| ↘ 4.1 ms upadek | ||
| W naszych testach ekran wykazuje szybki czas reakcji i powinien nadawać się do gier. Dla porównania, wszystkie testowane urządzenia wahają się od 0.1 (minimum) do 240 (maksimum) ms. » 24 % wszystkich urządzeń jest lepszych. Oznacza to, że zmierzony czas reakcji jest lepszy od średniej wszystkich testowanych urządzeń (19.9 ms). | ||
| ↔ Czas reakcji 50% szarości do 80% szarości | ||
| 5 ms ... wzrost ↗ i spadek ↘ łącznie | ↗ 2.1 ms wzrost | 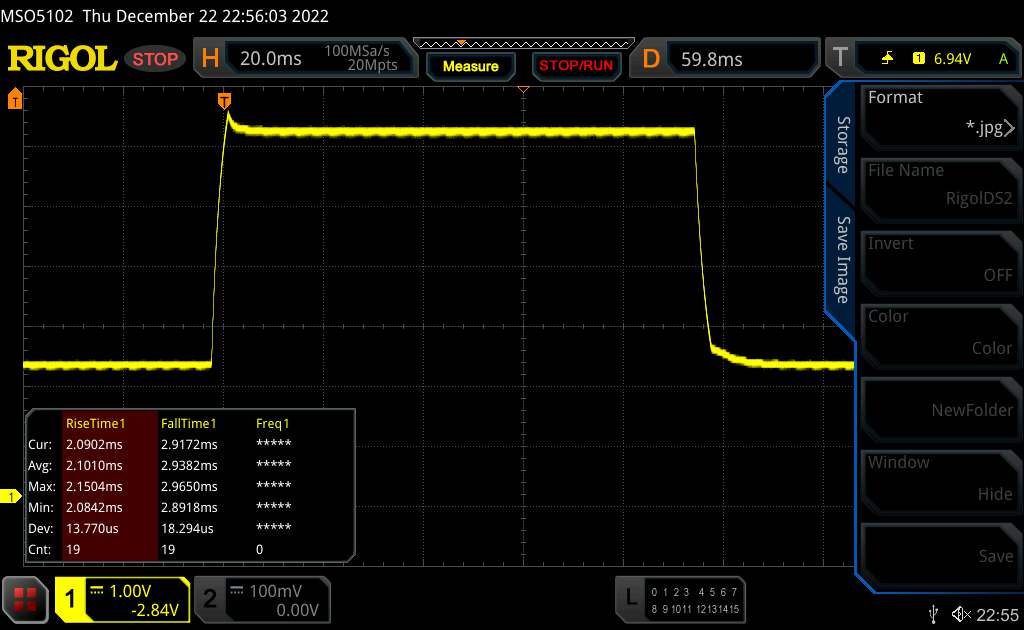 |
| ↘ 2.9 ms upadek | ||
| W naszych testach ekran wykazuje bardzo szybką reakcję i powinien bardzo dobrze nadawać się do szybkich gier. Dla porównania, wszystkie testowane urządzenia wahają się od 0.165 (minimum) do 636 (maksimum) ms. » 17 % wszystkich urządzeń jest lepszych. Oznacza to, że zmierzony czas reakcji jest lepszy od średniej wszystkich testowanych urządzeń (31.1 ms). | ||
Migotanie ekranu / PWM (modulacja szerokości impulsu)
| Migotanie ekranu/nie wykryto PWM | 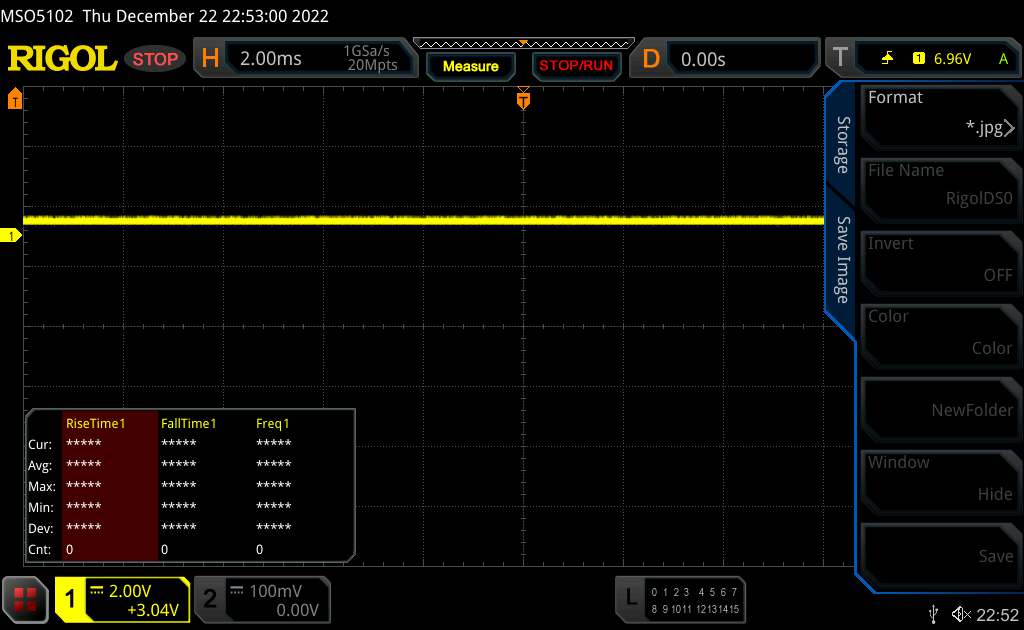 | ||
Dla porównania: 52 % wszystkich testowanych urządzeń nie używa PWM do przyciemniania wyświetlacza. Jeśli wykryto PWM, zmierzono średnio 7798 (minimum: 5 - maksimum: 343500) Hz. | |||
Panel IPS ma dobre kąty widzenia i można go czytać pod każdym kątem. Czytelność na zewnątrz też jest dobra, pod warunkiem, że słońce nie świeci zbyt mocno.

Wydajność - Gigabyte stawia na Alder Lake i Ampere
Gigabyte oferuje wraz z modelem G7 KE bardzo dobry notebook dla graczy, który sprawdzi się w grach w rozdzielczości FHD (wysokie lub maksymalne ustawienia), a także w takich dziedzinach jak obróbka wideo i renderowanie.
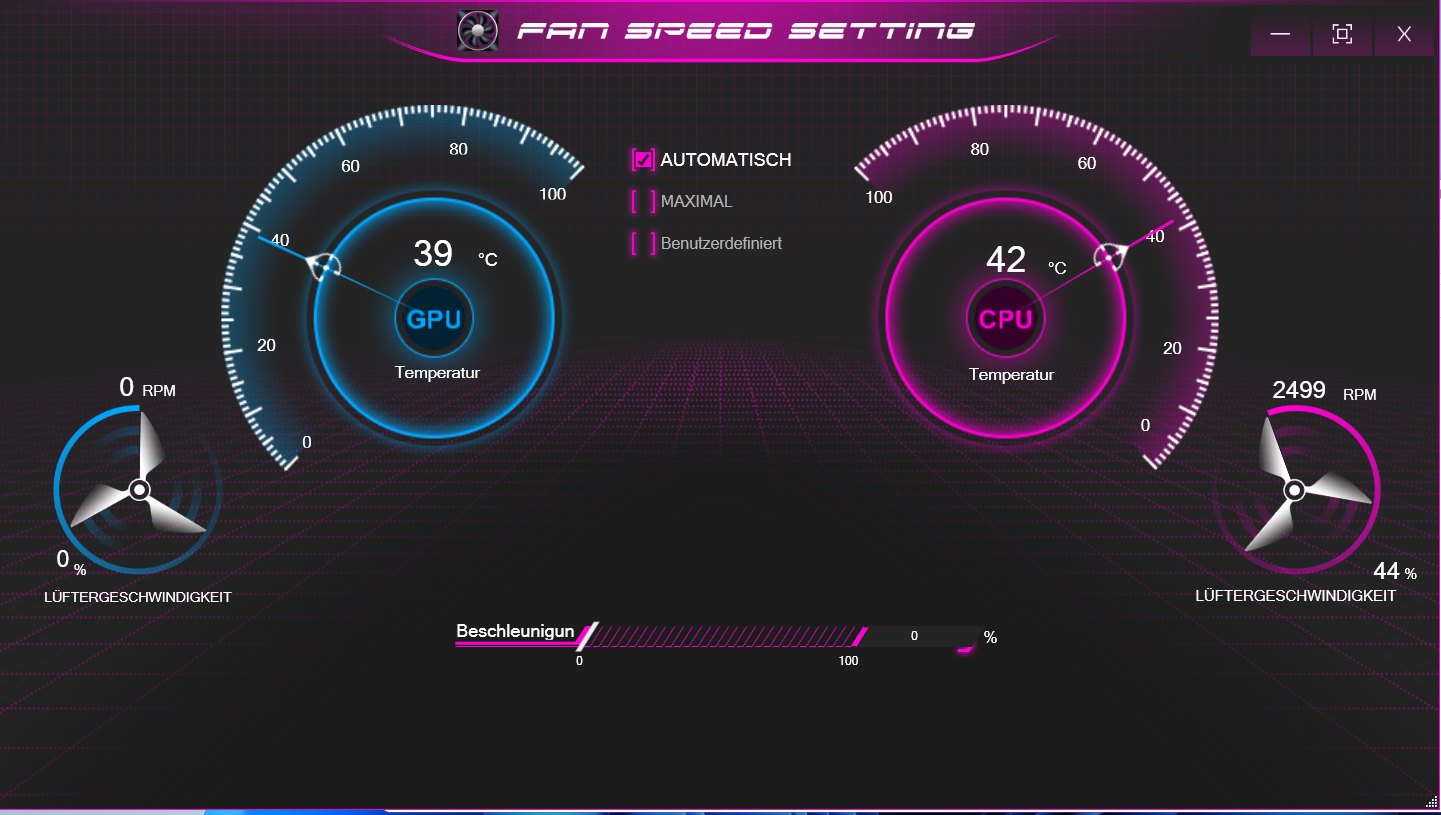
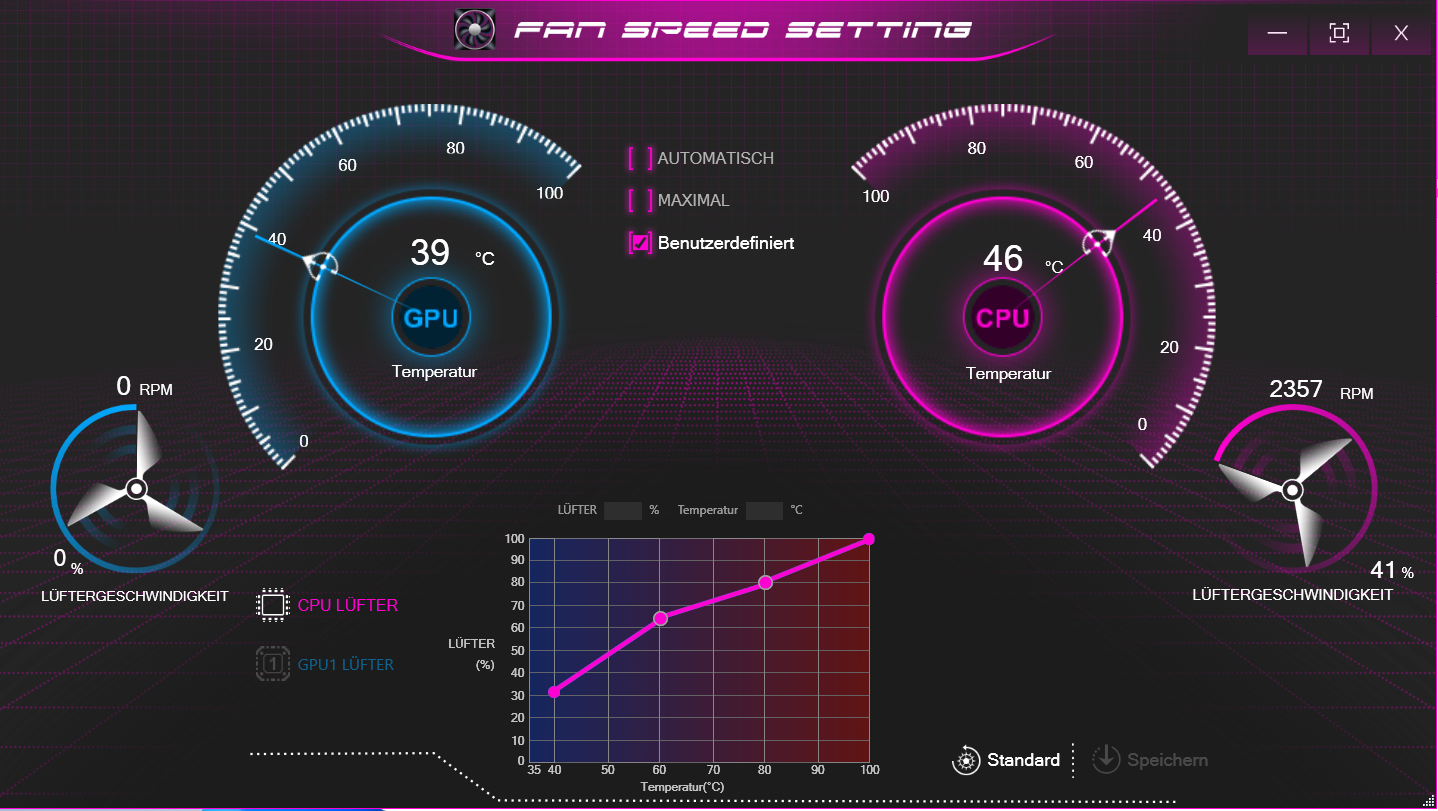
Warunki badania
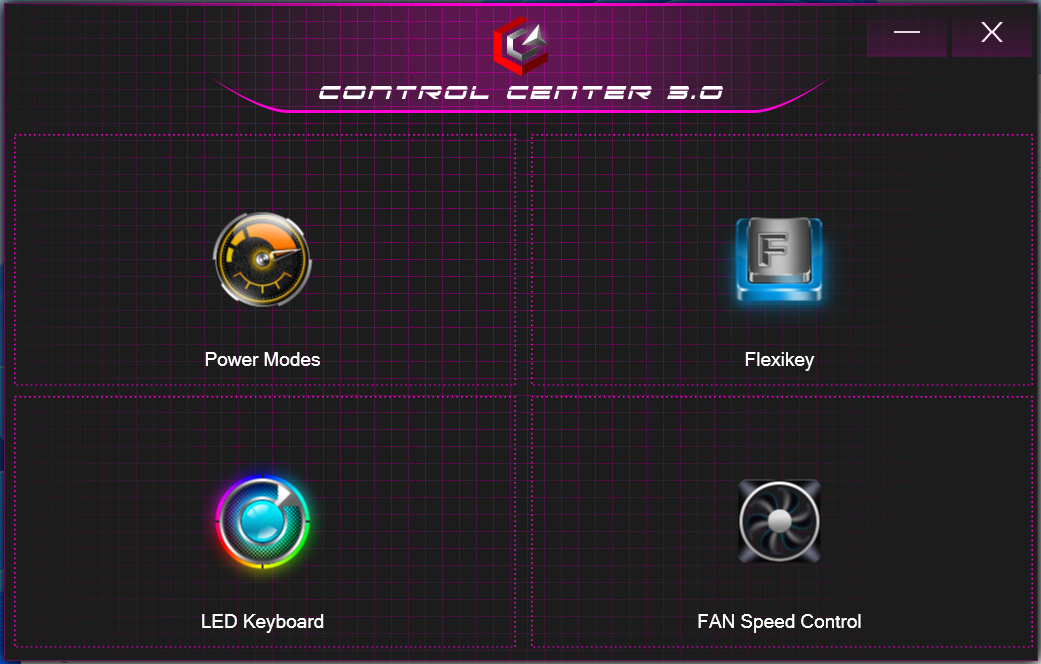
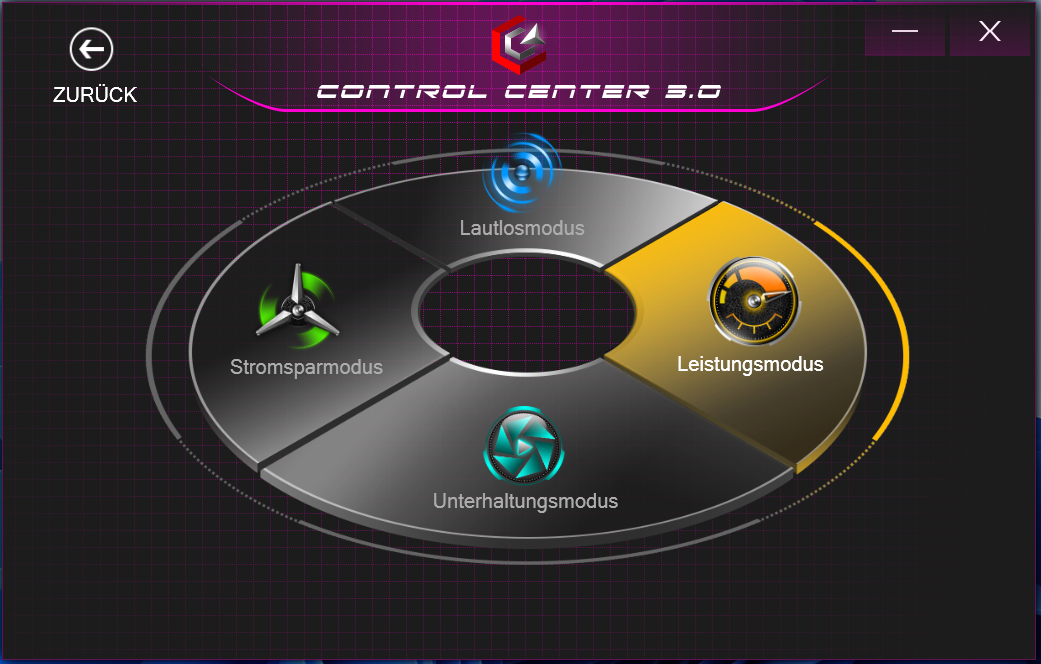
Preinstalowane Centrum Kontroli pozwala użytkownikom kontrolować różne parametry, takie jak wybór profilu zasilania (patrz tabela). My korzystaliśmy z profili "Performance" (benchmarki) i "energy saver" (testy na baterii).
| Power Profile | Tryb rozrywki | Tryb oszczędzania energii | Tryb cichy | |
|---|---|---|---|---|
| Limit mocy 1 | 80 watów | 45 watów | 15 watów | 15 watów |
| Power Limit 2 | 135 watów | 115 watów | 30 watów | 30 watów |
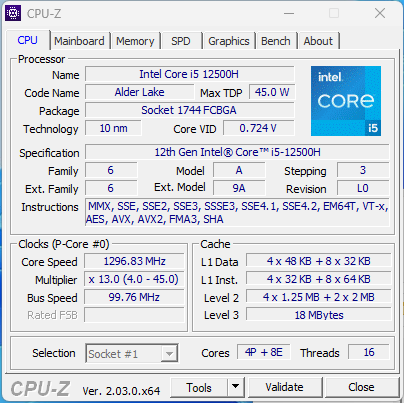
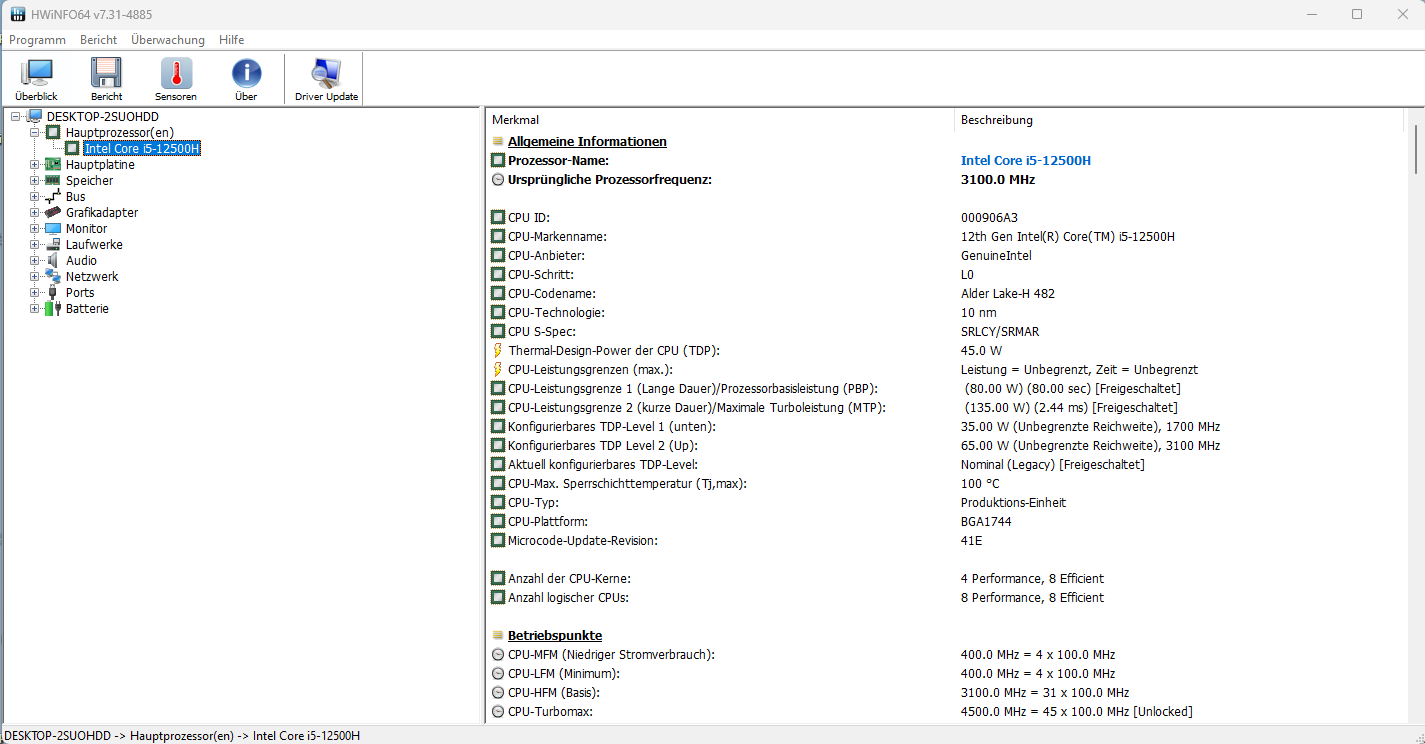
Procesor
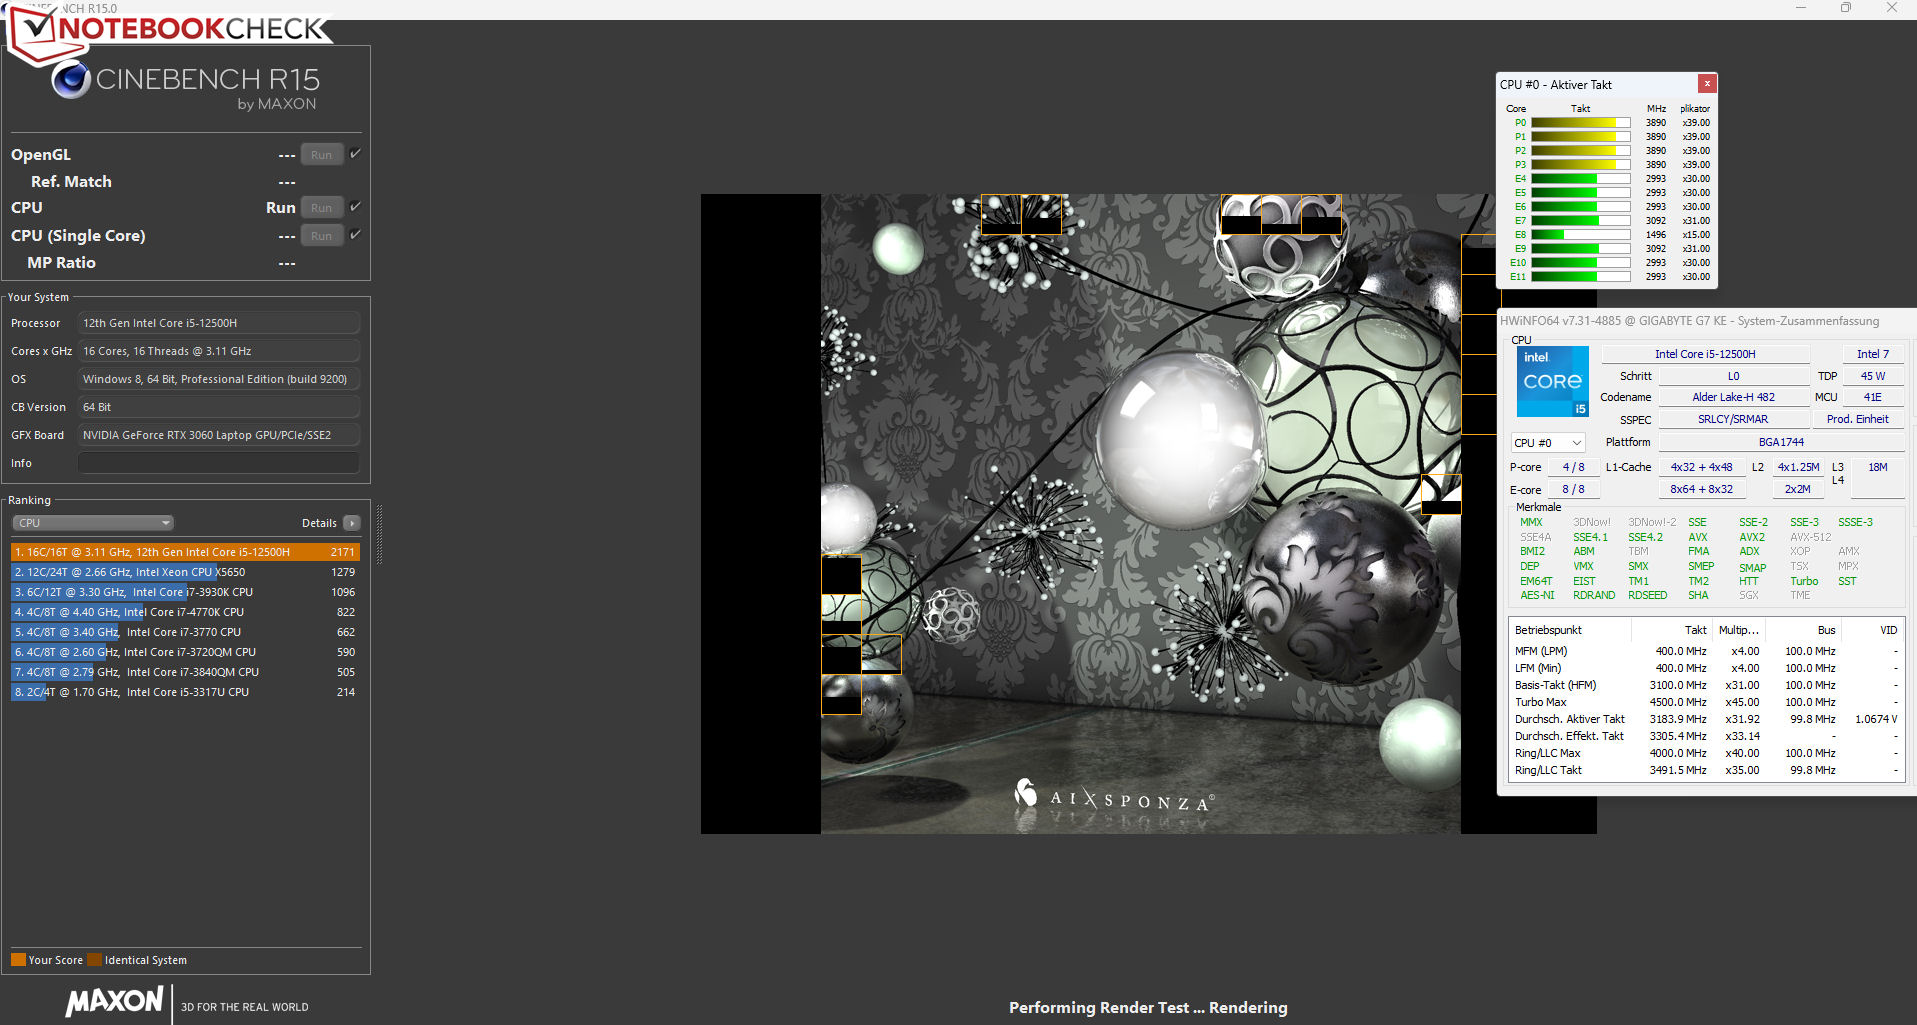
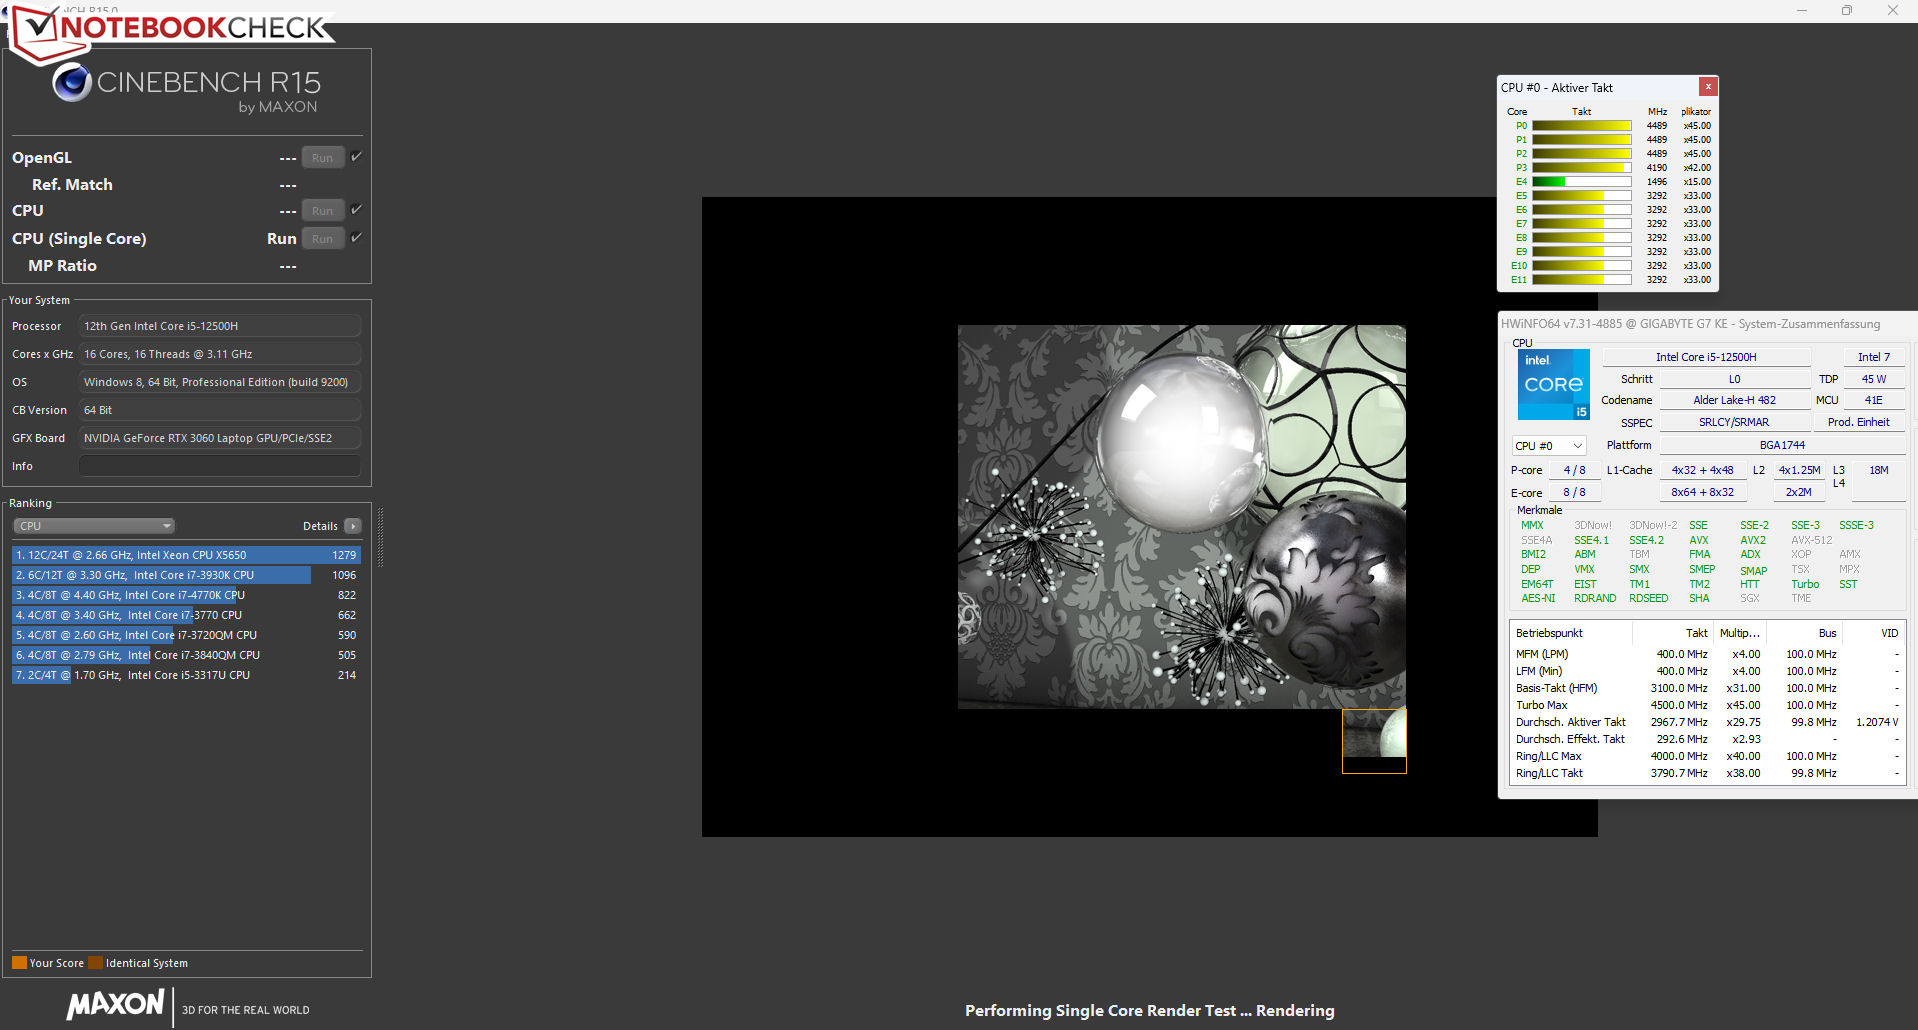
Na stronie Core i5-12500H procesor (Alder Lake) składa się z czterech rdzeni wydajnościowych (Hyper-Threading, 2,5 do 4,5 GHz) i ośmiu rdzeni efektywnościowych (bez Hyper-Threading, 1,8 do 3,3 GHz). Łącznie jest więc 16 logicznych rdzeni CPU.
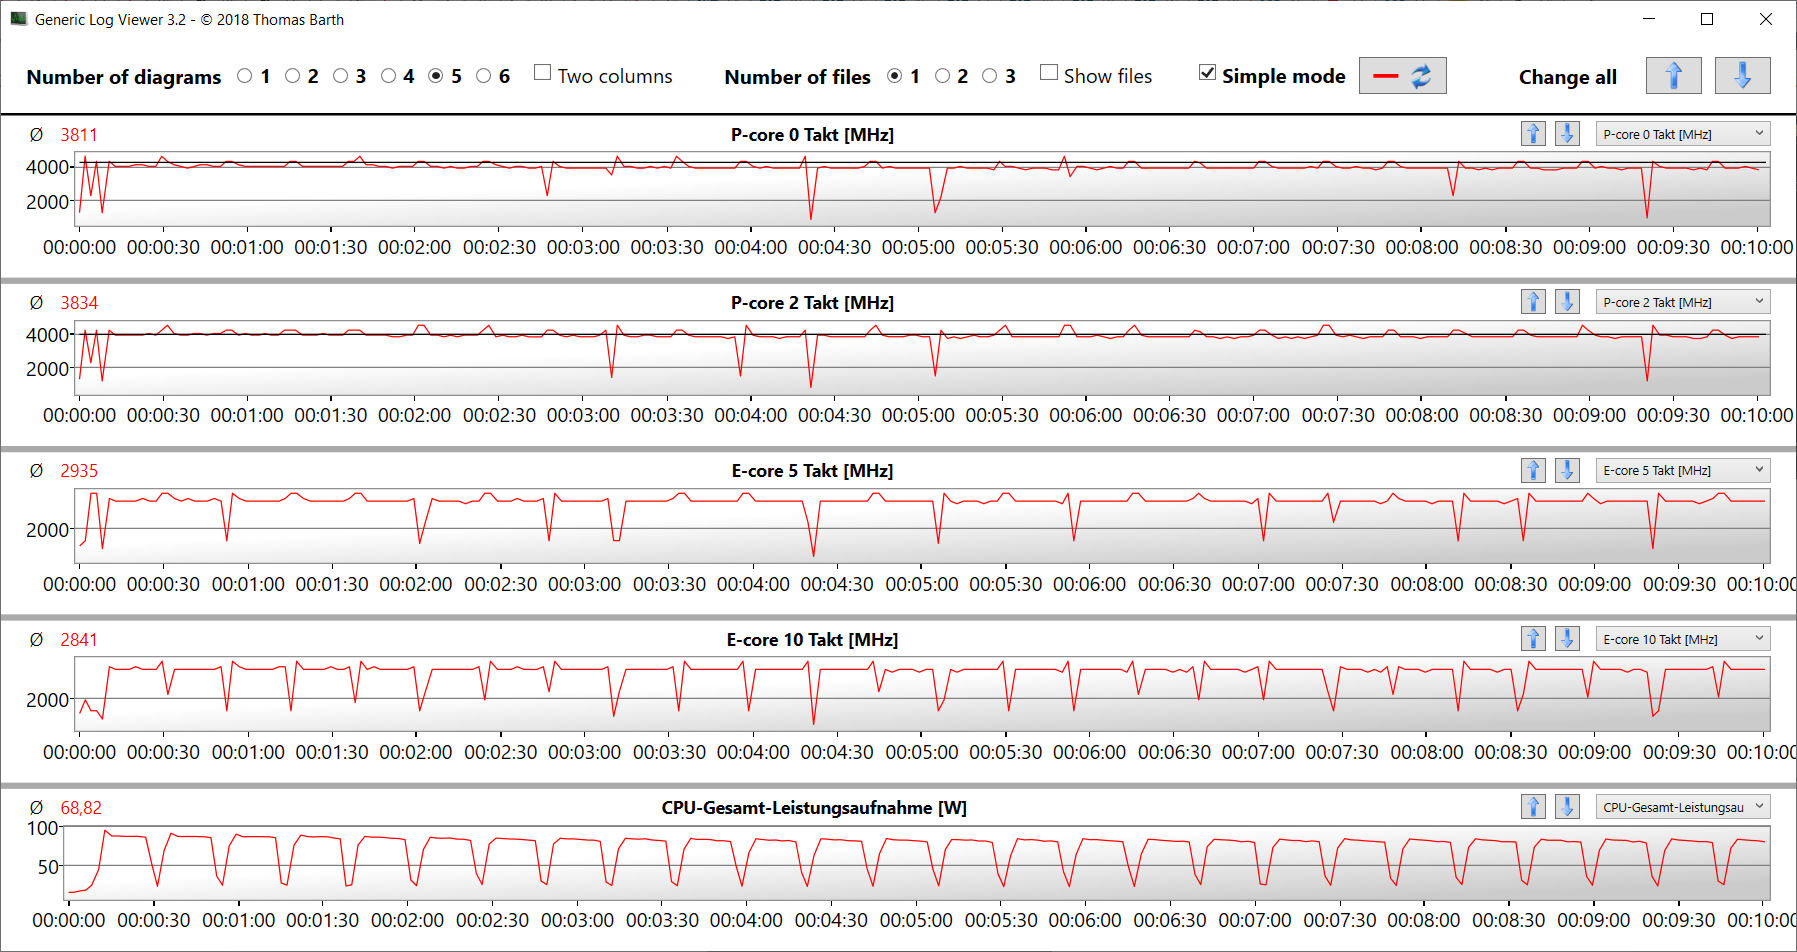
Średnie prędkości taktowania zarówno podczas benchmarków wielordzeniowych (rdzenie P: 3,9 do 4,2 GHz, rdzenie E: 1,5 do 3,1 GHz), jak i jednordzeniowych (rdzenie P: 4,2 do 4,5 GHz, rdzenie E: 1,5 do 3,3 GHz) są wysokie. W trybie akumulatorowym taktowania są obniżone. Dzięki naszej pętli CB15 mogliśmy potwierdzić ciągłe korzystanie z CPU Turbo. Wyniki benchmarków Core i5 są ogólnie nieco powyżej średniej.
Cinebench R15 Multi Loop
| CPU Performance rating - Percent | |
| Średnia w klasie Gaming | |
| Acer Nitro 5 AN517-55-738R | |
| Gigabyte G7 KE | |
| Asus TUF Gaming F17 FX707Z-HX011W | |
| Lenovo IdeaPad Gaming 3 15IAH7 | |
| Przeciętny Intel Core i5-12500H | |
| HP Pavilion Gaming 17-cd2146ng | |
| Cinebench R23 | |
| Multi Core | |
| Średnia w klasie Gaming (10488 - 40970, n=113, ostatnie 2 lata) | |
| Lenovo IdeaPad Gaming 3 15IAH7 | |
| Gigabyte G7 KE | |
| Asus TUF Gaming F17 FX707Z-HX011W | |
| Acer Nitro 5 AN517-55-738R | |
| Przeciętny Intel Core i5-12500H (11330 - 14686, n=9) | |
| HP Pavilion Gaming 17-cd2146ng | |
| Single Core | |
| Średnia w klasie Gaming (1166 - 2356, n=113, ostatnie 2 lata) | |
| Acer Nitro 5 AN517-55-738R | |
| Asus TUF Gaming F17 FX707Z-HX011W | |
| Gigabyte G7 KE | |
| Lenovo IdeaPad Gaming 3 15IAH7 | |
| Przeciętny Intel Core i5-12500H (1558 - 1701, n=9) | |
| HP Pavilion Gaming 17-cd2146ng | |
| Cinebench R20 | |
| CPU (Multi Core) | |
| Średnia w klasie Gaming (4029 - 16108, n=112, ostatnie 2 lata) | |
| Acer Nitro 5 AN517-55-738R | |
| Lenovo IdeaPad Gaming 3 15IAH7 | |
| Gigabyte G7 KE | |
| Przeciętny Intel Core i5-12500H (4687 - 5640, n=9) | |
| Asus TUF Gaming F17 FX707Z-HX011W | |
| HP Pavilion Gaming 17-cd2146ng | |
| CPU (Single Core) | |
| Średnia w klasie Gaming (442 - 895, n=112, ostatnie 2 lata) | |
| Acer Nitro 5 AN517-55-738R | |
| Asus TUF Gaming F17 FX707Z-HX011W | |
| Gigabyte G7 KE | |
| Lenovo IdeaPad Gaming 3 15IAH7 | |
| Przeciętny Intel Core i5-12500H (602 - 656, n=9) | |
| HP Pavilion Gaming 17-cd2146ng | |
| Cinebench R15 | |
| CPU Multi 64Bit | |
| Średnia w klasie Gaming (1578 - 6271, n=113, ostatnie 2 lata) | |
| Asus TUF Gaming F17 FX707Z-HX011W | |
| Acer Nitro 5 AN517-55-738R | |
| Lenovo IdeaPad Gaming 3 15IAH7 | |
| Gigabyte G7 KE | |
| Przeciętny Intel Core i5-12500H (1970 - 2283, n=10) | |
| HP Pavilion Gaming 17-cd2146ng | |
| CPU Single 64Bit | |
| Średnia w klasie Gaming (188.8 - 343, n=112, ostatnie 2 lata) | |
| Acer Nitro 5 AN517-55-738R | |
| Asus TUF Gaming F17 FX707Z-HX011W | |
| Gigabyte G7 KE | |
| Lenovo IdeaPad Gaming 3 15IAH7 | |
| Przeciętny Intel Core i5-12500H (220 - 250, n=9) | |
| HP Pavilion Gaming 17-cd2146ng | |
| Blender - v2.79 BMW27 CPU | |
| HP Pavilion Gaming 17-cd2146ng | |
| Asus TUF Gaming F17 FX707Z-HX011W | |
| Przeciętny Intel Core i5-12500H (223 - 288, n=9) | |
| Acer Nitro 5 AN517-55-738R | |
| Gigabyte G7 KE | |
| Lenovo IdeaPad Gaming 3 15IAH7 | |
| Średnia w klasie Gaming (80 - 330, n=110, ostatnie 2 lata) | |
| 7-Zip 18.03 | |
| 7z b 4 | |
| Średnia w klasie Gaming (33491 - 148086, n=111, ostatnie 2 lata) | |
| Asus TUF Gaming F17 FX707Z-HX011W | |
| Acer Nitro 5 AN517-55-738R | |
| Gigabyte G7 KE | |
| Przeciętny Intel Core i5-12500H (44105 - 54380, n=9) | |
| Lenovo IdeaPad Gaming 3 15IAH7 | |
| HP Pavilion Gaming 17-cd2146ng | |
| 7z b 4 -mmt1 | |
| Średnia w klasie Gaming (4199 - 7436, n=111, ostatnie 2 lata) | |
| Acer Nitro 5 AN517-55-738R | |
| Asus TUF Gaming F17 FX707Z-HX011W | |
| Gigabyte G7 KE | |
| Lenovo IdeaPad Gaming 3 15IAH7 | |
| Przeciętny Intel Core i5-12500H (5151 - 5563, n=9) | |
| HP Pavilion Gaming 17-cd2146ng | |
| Geekbench 5.5 | |
| Multi-Core | |
| Średnia w klasie Gaming (6460 - 27010, n=111, ostatnie 2 lata) | |
| Acer Nitro 5 AN517-55-738R | |
| Asus TUF Gaming F17 FX707Z-HX011W | |
| Gigabyte G7 KE | |
| Przeciętny Intel Core i5-12500H (7962 - 10828, n=9) | |
| Lenovo IdeaPad Gaming 3 15IAH7 | |
| HP Pavilion Gaming 17-cd2146ng | |
| Single-Core | |
| Średnia w klasie Gaming (986 - 2474, n=111, ostatnie 2 lata) | |
| Asus TUF Gaming F17 FX707Z-HX011W | |
| Acer Nitro 5 AN517-55-738R | |
| Gigabyte G7 KE | |
| Lenovo IdeaPad Gaming 3 15IAH7 | |
| Przeciętny Intel Core i5-12500H (1471 - 1693, n=9) | |
| HP Pavilion Gaming 17-cd2146ng | |
| HWBOT x265 Benchmark v2.2 - 4k Preset | |
| Średnia w klasie Gaming (11.5 - 44.3, n=111, ostatnie 2 lata) | |
| Gigabyte G7 KE | |
| Lenovo IdeaPad Gaming 3 15IAH7 | |
| Przeciętny Intel Core i5-12500H (12 - 16.6, n=9) | |
| Asus TUF Gaming F17 FX707Z-HX011W | |
| Acer Nitro 5 AN517-55-738R | |
| HP Pavilion Gaming 17-cd2146ng | |
| LibreOffice - 20 Documents To PDF | |
| Asus TUF Gaming F17 FX707Z-HX011W | |
| HP Pavilion Gaming 17-cd2146ng | |
| Acer Nitro 5 AN517-55-738R | |
| Średnia w klasie Gaming (19 - 88.8, n=111, ostatnie 2 lata) | |
| Lenovo IdeaPad Gaming 3 15IAH7 | |
| Przeciętny Intel Core i5-12500H (40.1 - 58.5, n=9) | |
| Gigabyte G7 KE | |
| R Benchmark 2.5 - Overall mean | |
| HP Pavilion Gaming 17-cd2146ng | |
| Lenovo IdeaPad Gaming 3 15IAH7 | |
| Przeciętny Intel Core i5-12500H (0.4748 - 0.535, n=9) | |
| Gigabyte G7 KE | |
| Acer Nitro 5 AN517-55-738R | |
| Asus TUF Gaming F17 FX707Z-HX011W | |
| Średnia w klasie Gaming (0.3439 - 0.759, n=112, ostatnie 2 lata) | |
* ... im mniej tym lepiej
AIDA64: FP32 Ray-Trace | FPU Julia | CPU SHA3 | CPU Queen | FPU SinJulia | FPU Mandel | CPU AES | CPU ZLib | FP64 Ray-Trace | CPU PhotoWorxx
| Performance rating | |
| Średnia w klasie Gaming | |
| Gigabyte G7 KE | |
| Lenovo IdeaPad Gaming 3 15IAH7 | |
| Przeciętny Intel Core i5-12500H | |
| Acer Nitro 5 AN517-55-738R | |
| Asus TUF Gaming F17 FX707Z-HX011W | |
| HP Pavilion Gaming 17-cd2146ng | |
| AIDA64 / FP32 Ray-Trace | |
| Średnia w klasie Gaming (10227 - 85542, n=110, ostatnie 2 lata) | |
| Lenovo IdeaPad Gaming 3 15IAH7 | |
| Gigabyte G7 KE | |
| Przeciętny Intel Core i5-12500H (6851 - 13947, n=9) | |
| Acer Nitro 5 AN517-55-738R | |
| HP Pavilion Gaming 17-cd2146ng | |
| Asus TUF Gaming F17 FX707Z-HX011W | |
| AIDA64 / FPU Julia | |
| Średnia w klasie Gaming (51376 - 238426, n=110, ostatnie 2 lata) | |
| Lenovo IdeaPad Gaming 3 15IAH7 | |
| Gigabyte G7 KE | |
| Przeciętny Intel Core i5-12500H (29874 - 68178, n=9) | |
| Acer Nitro 5 AN517-55-738R | |
| Asus TUF Gaming F17 FX707Z-HX011W | |
| HP Pavilion Gaming 17-cd2146ng | |
| AIDA64 / CPU SHA3 | |
| Średnia w klasie Gaming (2180 - 9817, n=110, ostatnie 2 lata) | |
| Lenovo IdeaPad Gaming 3 15IAH7 | |
| Gigabyte G7 KE | |
| Przeciętny Intel Core i5-12500H (2287 - 3337, n=9) | |
| Acer Nitro 5 AN517-55-738R | |
| Asus TUF Gaming F17 FX707Z-HX011W | |
| HP Pavilion Gaming 17-cd2146ng | |
| AIDA64 / CPU Queen | |
| Średnia w klasie Gaming (49785 - 173351, n=101, ostatnie 2 lata) | |
| Asus TUF Gaming F17 FX707Z-HX011W | |
| Acer Nitro 5 AN517-55-738R | |
| Lenovo IdeaPad Gaming 3 15IAH7 | |
| Gigabyte G7 KE | |
| Przeciętny Intel Core i5-12500H (77935 - 80703, n=9) | |
| HP Pavilion Gaming 17-cd2146ng | |
| AIDA64 / FPU SinJulia | |
| Średnia w klasie Gaming (4424 - 33636, n=110, ostatnie 2 lata) | |
| Acer Nitro 5 AN517-55-738R | |
| Asus TUF Gaming F17 FX707Z-HX011W | |
| Gigabyte G7 KE | |
| Lenovo IdeaPad Gaming 3 15IAH7 | |
| Przeciętny Intel Core i5-12500H (6590 - 7431, n=9) | |
| HP Pavilion Gaming 17-cd2146ng | |
| AIDA64 / FPU Mandel | |
| Średnia w klasie Gaming (25115 - 128721, n=110, ostatnie 2 lata) | |
| Lenovo IdeaPad Gaming 3 15IAH7 | |
| Gigabyte G7 KE | |
| Przeciętny Intel Core i5-12500H (18252 - 34041, n=9) | |
| Acer Nitro 5 AN517-55-738R | |
| Asus TUF Gaming F17 FX707Z-HX011W | |
| HP Pavilion Gaming 17-cd2146ng | |
| AIDA64 / CPU AES | |
| Lenovo IdeaPad Gaming 3 15IAH7 | |
| Gigabyte G7 KE | |
| Średnia w klasie Gaming (39258 - 247074, n=110, ostatnie 2 lata) | |
| Przeciętny Intel Core i5-12500H (50298 - 111567, n=9) | |
| Acer Nitro 5 AN517-55-738R | |
| Asus TUF Gaming F17 FX707Z-HX011W | |
| HP Pavilion Gaming 17-cd2146ng | |
| AIDA64 / CPU ZLib | |
| Średnia w klasie Gaming (574 - 2531, n=110, ostatnie 2 lata) | |
| Gigabyte G7 KE | |
| Acer Nitro 5 AN517-55-738R | |
| Lenovo IdeaPad Gaming 3 15IAH7 | |
| Przeciętny Intel Core i5-12500H (746 - 924, n=9) | |
| Asus TUF Gaming F17 FX707Z-HX011W | |
| HP Pavilion Gaming 17-cd2146ng | |
| AIDA64 / FP64 Ray-Trace | |
| Średnia w klasie Gaming (5509 - 45446, n=110, ostatnie 2 lata) | |
| Lenovo IdeaPad Gaming 3 15IAH7 | |
| Gigabyte G7 KE | |
| Przeciętny Intel Core i5-12500H (3848 - 7405, n=9) | |
| Acer Nitro 5 AN517-55-738R | |
| Asus TUF Gaming F17 FX707Z-HX011W | |
| HP Pavilion Gaming 17-cd2146ng | |
| AIDA64 / CPU PhotoWorxx | |
| Średnia w klasie Gaming (12271 - 89891, n=110, ostatnie 2 lata) | |
| Asus TUF Gaming F17 FX707Z-HX011W | |
| Przeciętny Intel Core i5-12500H (13686 - 43813, n=9) | |
| Gigabyte G7 KE | |
| HP Pavilion Gaming 17-cd2146ng | |
| Acer Nitro 5 AN517-55-738R | |
| Lenovo IdeaPad Gaming 3 15IAH7 | |
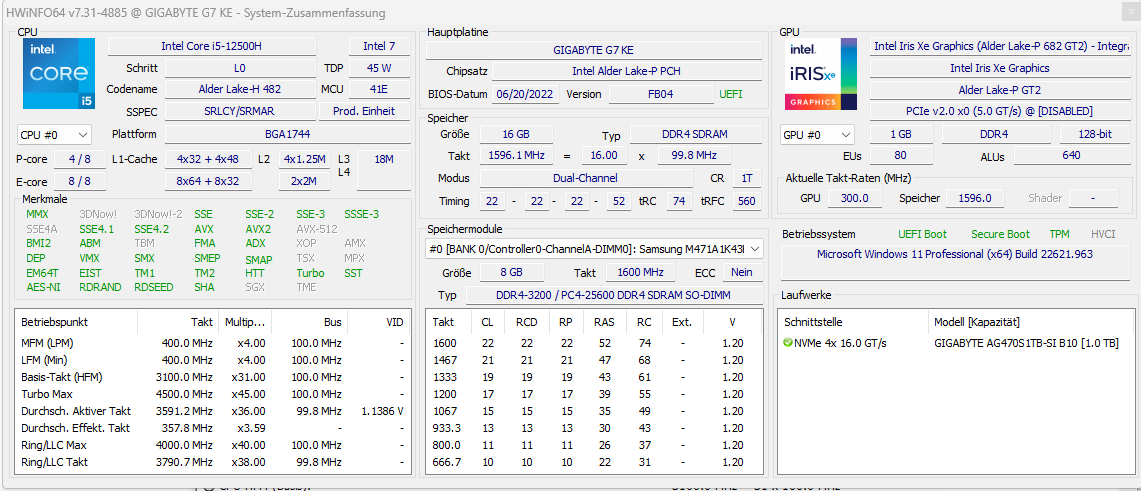
Wydajność systemu
System jest płynny i responsywny oraz zapewnia wystarczającą wydajność do celów renderingu, edycji wideo i gier. Wyniki testów PCMark są dobre. W przypadku pamięci DDR4-3200 transfery pamięci systemowej odpowiadają naszym oczekiwaniom.
CrossMark: Overall | Productivity | Creativity | Responsiveness
| PCMark 10 / Score | |
| Średnia w klasie Gaming (5828 - 11574, n=96, ostatnie 2 lata) | |
| Lenovo IdeaPad Gaming 3 15IAH7 | |
| Przeciętny Intel Core i5-12500H, NVIDIA GeForce RTX 3060 Laptop GPU (6126 - 7201, n=2) | |
| Acer Nitro 5 AN517-55-738R | |
| Gigabyte G7 KE | |
| Asus TUF Gaming F17 FX707Z-HX011W | |
| HP Pavilion Gaming 17-cd2146ng | |
| PCMark 10 / Essentials | |
| Przeciętny Intel Core i5-12500H, NVIDIA GeForce RTX 3060 Laptop GPU (10301 - 11150, n=2) | |
| Średnia w klasie Gaming (8810 - 12600, n=100, ostatnie 2 lata) | |
| Gigabyte G7 KE | |
| Lenovo IdeaPad Gaming 3 15IAH7 | |
| Acer Nitro 5 AN517-55-738R | |
| Asus TUF Gaming F17 FX707Z-HX011W | |
| HP Pavilion Gaming 17-cd2146ng | |
| PCMark 10 / Productivity | |
| Średnia w klasie Gaming (6845 - 18766, n=98, ostatnie 2 lata) | |
| Lenovo IdeaPad Gaming 3 15IAH7 | |
| Przeciętny Intel Core i5-12500H, NVIDIA GeForce RTX 3060 Laptop GPU (9038 - 9475, n=2) | |
| Acer Nitro 5 AN517-55-738R | |
| Gigabyte G7 KE | |
| HP Pavilion Gaming 17-cd2146ng | |
| Asus TUF Gaming F17 FX707Z-HX011W | |
| PCMark 10 / Digital Content Creation | |
| Średnia w klasie Gaming (7602 - 19657, n=98, ostatnie 2 lata) | |
| Asus TUF Gaming F17 FX707Z-HX011W | |
| Acer Nitro 5 AN517-55-738R | |
| Lenovo IdeaPad Gaming 3 15IAH7 | |
| Przeciętny Intel Core i5-12500H, NVIDIA GeForce RTX 3060 Laptop GPU (6703 - 9593, n=2) | |
| Gigabyte G7 KE | |
| HP Pavilion Gaming 17-cd2146ng | |
| CrossMark / Overall | |
| Średnia w klasie Gaming (1366 - 2409, n=98, ostatnie 2 lata) | |
| Gigabyte G7 KE | |
| Acer Nitro 5 AN517-55-738R | |
| Przeciętny Intel Core i5-12500H, NVIDIA GeForce RTX 3060 Laptop GPU (1752 - 1824, n=2) | |
| Asus TUF Gaming F17 FX707Z-HX011W | |
| CrossMark / Productivity | |
| Średnia w klasie Gaming (1386 - 2254, n=98, ostatnie 2 lata) | |
| Gigabyte G7 KE | |
| Acer Nitro 5 AN517-55-738R | |
| Przeciętny Intel Core i5-12500H, NVIDIA GeForce RTX 3060 Laptop GPU (1720 - 1804, n=2) | |
| Asus TUF Gaming F17 FX707Z-HX011W | |
| CrossMark / Creativity | |
| Średnia w klasie Gaming (1343 - 2729, n=98, ostatnie 2 lata) | |
| Asus TUF Gaming F17 FX707Z-HX011W | |
| Acer Nitro 5 AN517-55-738R | |
| Gigabyte G7 KE | |
| Przeciętny Intel Core i5-12500H, NVIDIA GeForce RTX 3060 Laptop GPU (1778 - 1800, n=2) | |
| CrossMark / Responsiveness | |
| Gigabyte G7 KE | |
| Przeciętny Intel Core i5-12500H, NVIDIA GeForce RTX 3060 Laptop GPU (1771 - 1966, n=2) | |
| Acer Nitro 5 AN517-55-738R | |
| Średnia w klasie Gaming (1226 - 2334, n=98, ostatnie 2 lata) | |
| Asus TUF Gaming F17 FX707Z-HX011W | |
| PCMark 8 Home Score Accelerated v2 | 4560 pkt. | |
| PCMark 8 Work Score Accelerated v2 | 6853 pkt. | |
| PCMark 10 Score | 6126 pkt. | |
Pomoc | ||
| AIDA64 / Memory Copy | |
| Średnia w klasie Gaming (21750 - 129946, n=110, ostatnie 2 lata) | |
| Asus TUF Gaming F17 FX707Z-HX011W | |
| Przeciętny Intel Core i5-12500H (23850 - 66598, n=9) | |
| Gigabyte G7 KE | |
| Acer Nitro 5 AN517-55-738R | |
| HP Pavilion Gaming 17-cd2146ng | |
| Lenovo IdeaPad Gaming 3 15IAH7 | |
| AIDA64 / Memory Read | |
| Średnia w klasie Gaming (22956 - 118858, n=110, ostatnie 2 lata) | |
| Asus TUF Gaming F17 FX707Z-HX011W | |
| Przeciętny Intel Core i5-12500H (24879 - 68013, n=9) | |
| Gigabyte G7 KE | |
| Acer Nitro 5 AN517-55-738R | |
| HP Pavilion Gaming 17-cd2146ng | |
| Lenovo IdeaPad Gaming 3 15IAH7 | |
| AIDA64 / Memory Write | |
| Średnia w klasie Gaming (22297 - 135096, n=110, ostatnie 2 lata) | |
| Asus TUF Gaming F17 FX707Z-HX011W | |
| Acer Nitro 5 AN517-55-738R | |
| Przeciętny Intel Core i5-12500H (23543 - 58797, n=9) | |
| Gigabyte G7 KE | |
| HP Pavilion Gaming 17-cd2146ng | |
| Lenovo IdeaPad Gaming 3 15IAH7 | |
| AIDA64 / Memory Latency | |
| Średnia w klasie Gaming (75.3 - 259, n=110, ostatnie 2 lata) | |
| Przeciętny Intel Core i5-12500H (83.8 - 114.7, n=9) | |
| Lenovo IdeaPad Gaming 3 15IAH7 | |
| Gigabyte G7 KE | |
| HP Pavilion Gaming 17-cd2146ng | |
| Asus TUF Gaming F17 FX707Z-HX011W | |
| Acer Nitro 5 AN517-55-738R | |
* ... im mniej tym lepiej
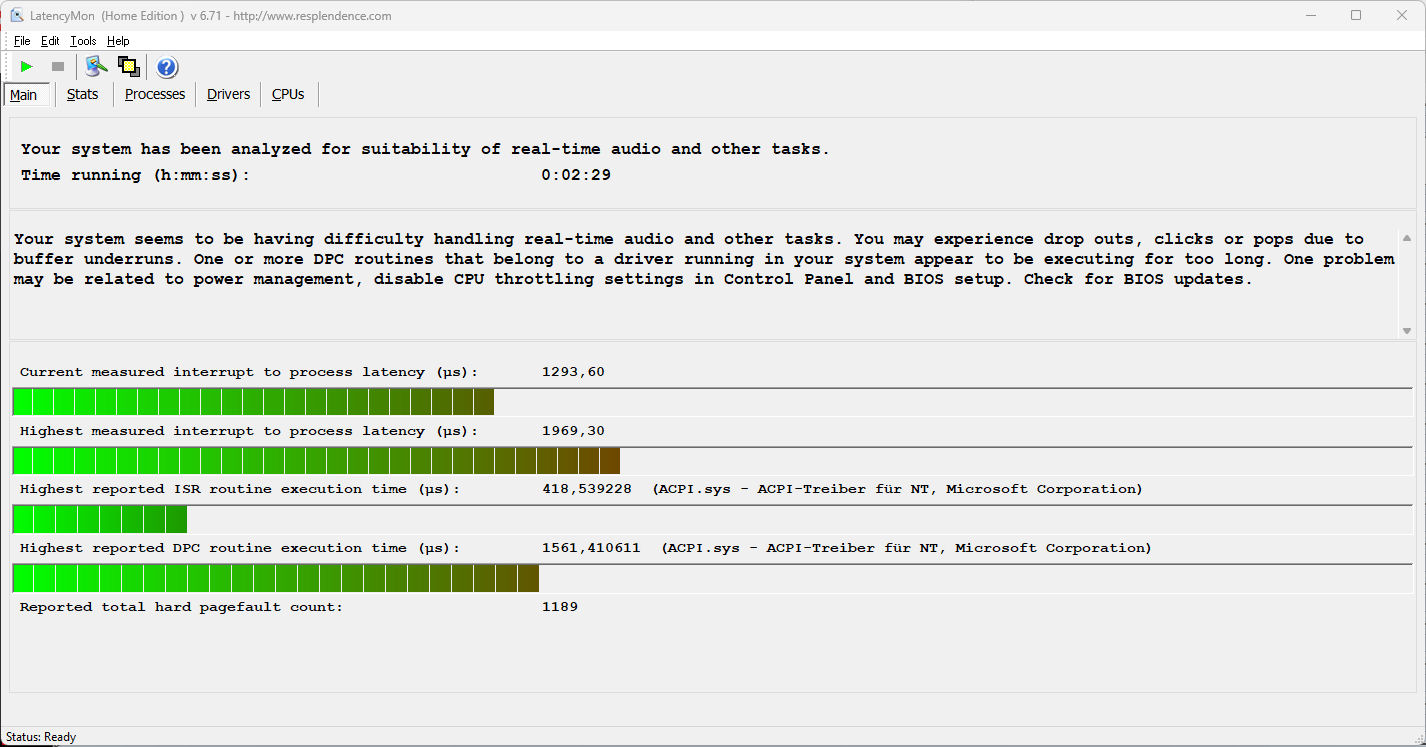
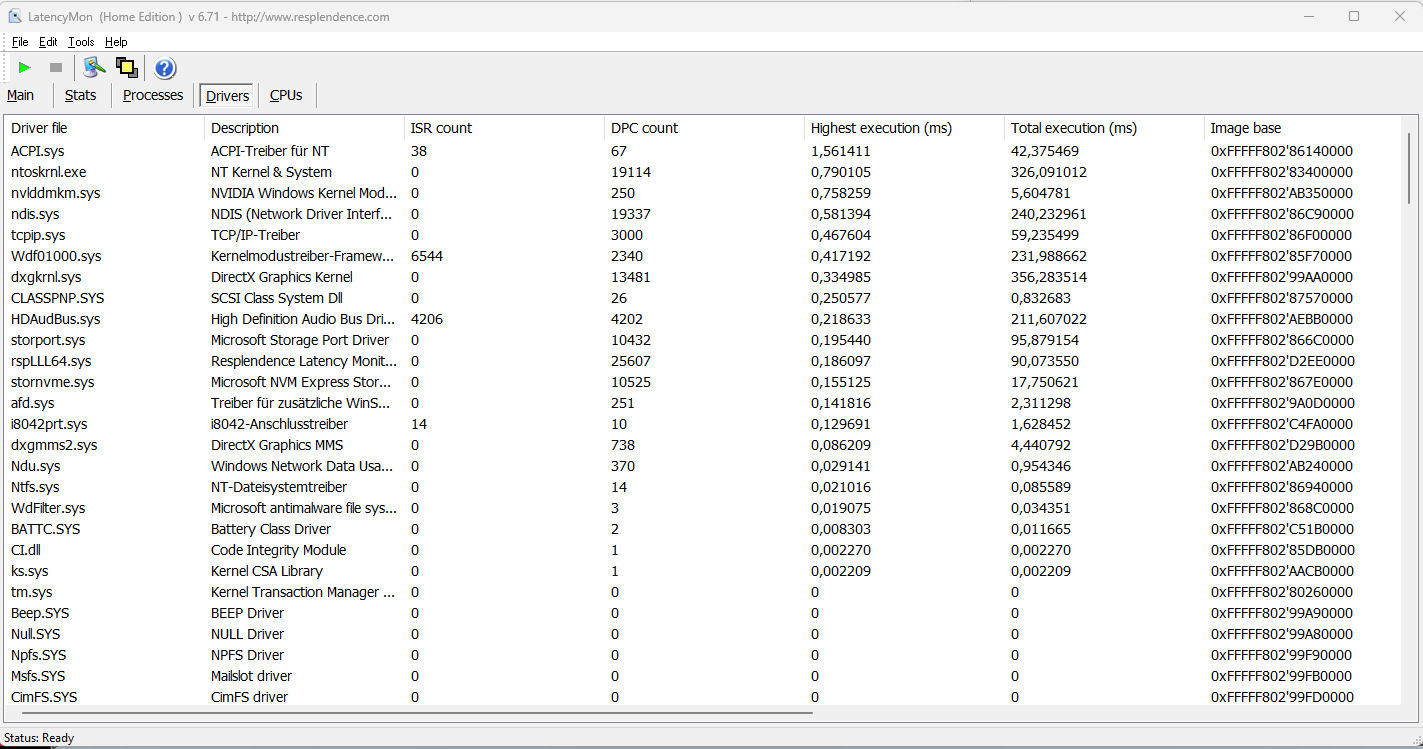
Opóźnienie DPC
Nasz standardowy test Latency Monitor (przeglądanie stron internetowych, odtwarzanie wideo 4K, wysokie obciążenie Prime95) ujawnił problematyczne opóźnienia DPC. Przy konfiguracji sprzętu i oprogramowania w momencie przeprowadzania testów, system wydaje się być nieodpowiedni do edycji audio i wideo w czasie rzeczywistym. Przyszłe aktualizacje oprogramowania mogą poprawić lub pogorszyć ten problem.
| DPC Latencies / LatencyMon - interrupt to process latency (max), Web, Youtube, Prime95 | |
| Asus TUF Gaming F17 FX707Z-HX011W | |
| Gigabyte G7 KE | |
| Lenovo IdeaPad Gaming 3 15IAH7 | |
| HP Pavilion Gaming 17-cd2146ng | |
| Acer Nitro 5 AN517-55-738R | |
* ... im mniej tym lepiej
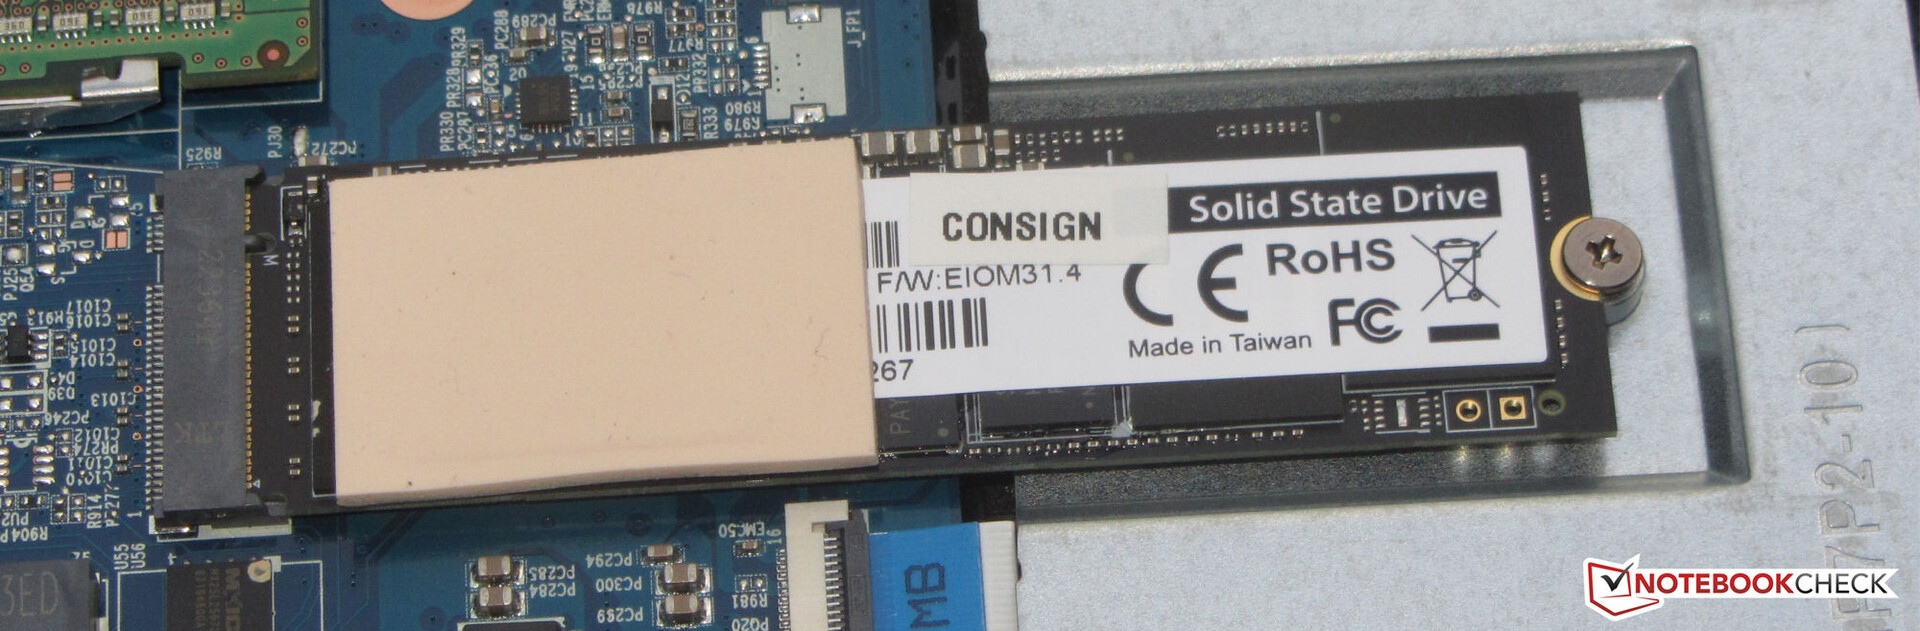
Rozwiązanie w zakresie przechowywania
Gigabyte wyposaża omawiany laptop we własny dysk SSD PCIe-4 (1 TB, M.2-2280), który osiąga znakomite prędkości transferu. Niestety dysk ten cierpi na throttling termiczny mimo metalowej blachy chłodzącej na wewnętrznej stronie płyty spodniej. Na spodzie płyty jest miejsce na łącznie dwa dyski SSD M.2-2280 (1x PCIe 4.0, 1x PCIe 3.0).

| Drive Performance rating - Percent | |
| Przeciętny Gigabyte AG470S1TB-SI B10 | |
| Gigabyte G7 KE | |
| Średnia w klasie Gaming | |
| Acer Nitro 5 AN517-55-738R | |
| HP Pavilion Gaming 17-cd2146ng | |
| Asus TUF Gaming F17 FX707Z-HX011W | |
| Lenovo IdeaPad Gaming 3 15IAH7 | |
* ... im mniej tym lepiej
Disk Throttling: DiskSpd Read Loop, Queue Depth 8
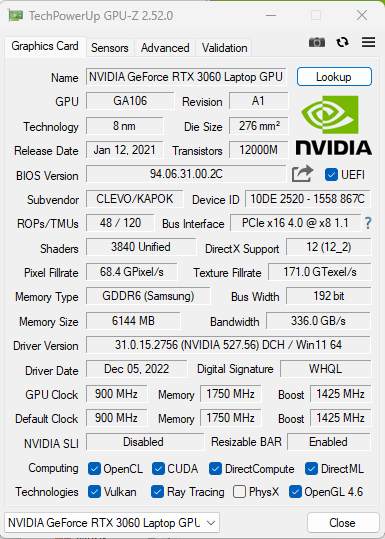
Wydajność GPU
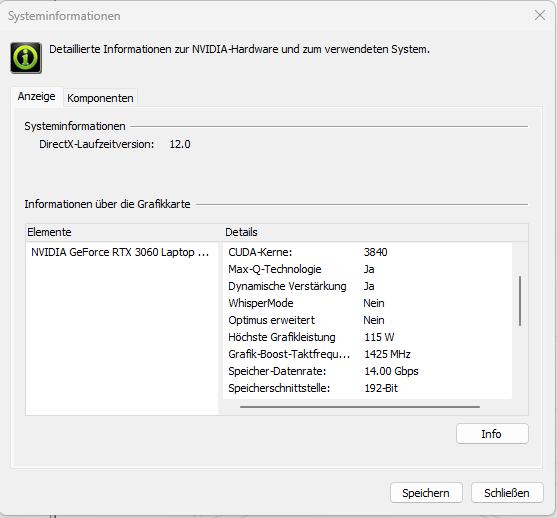
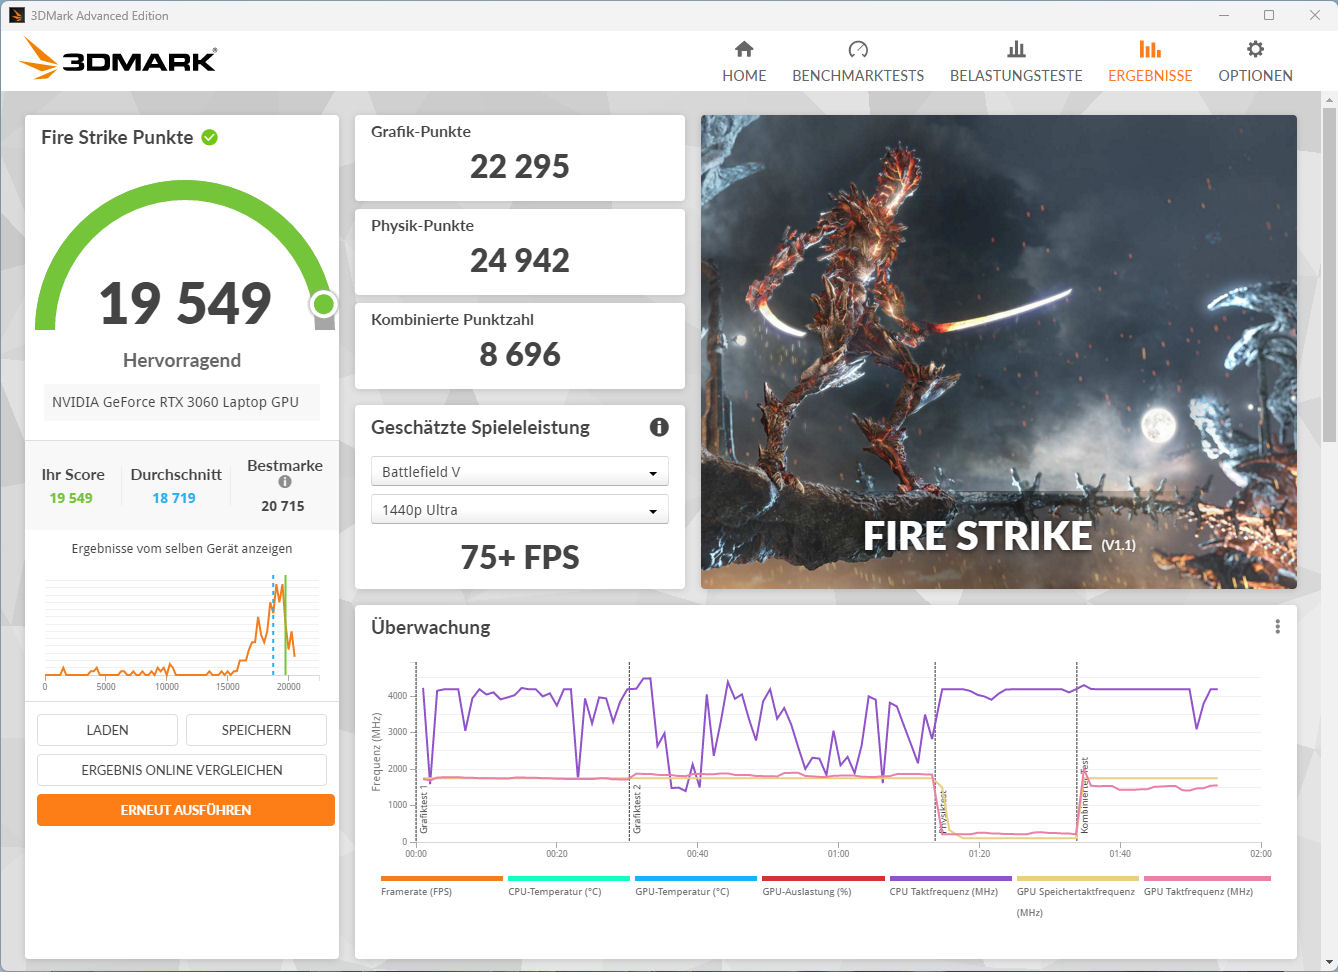
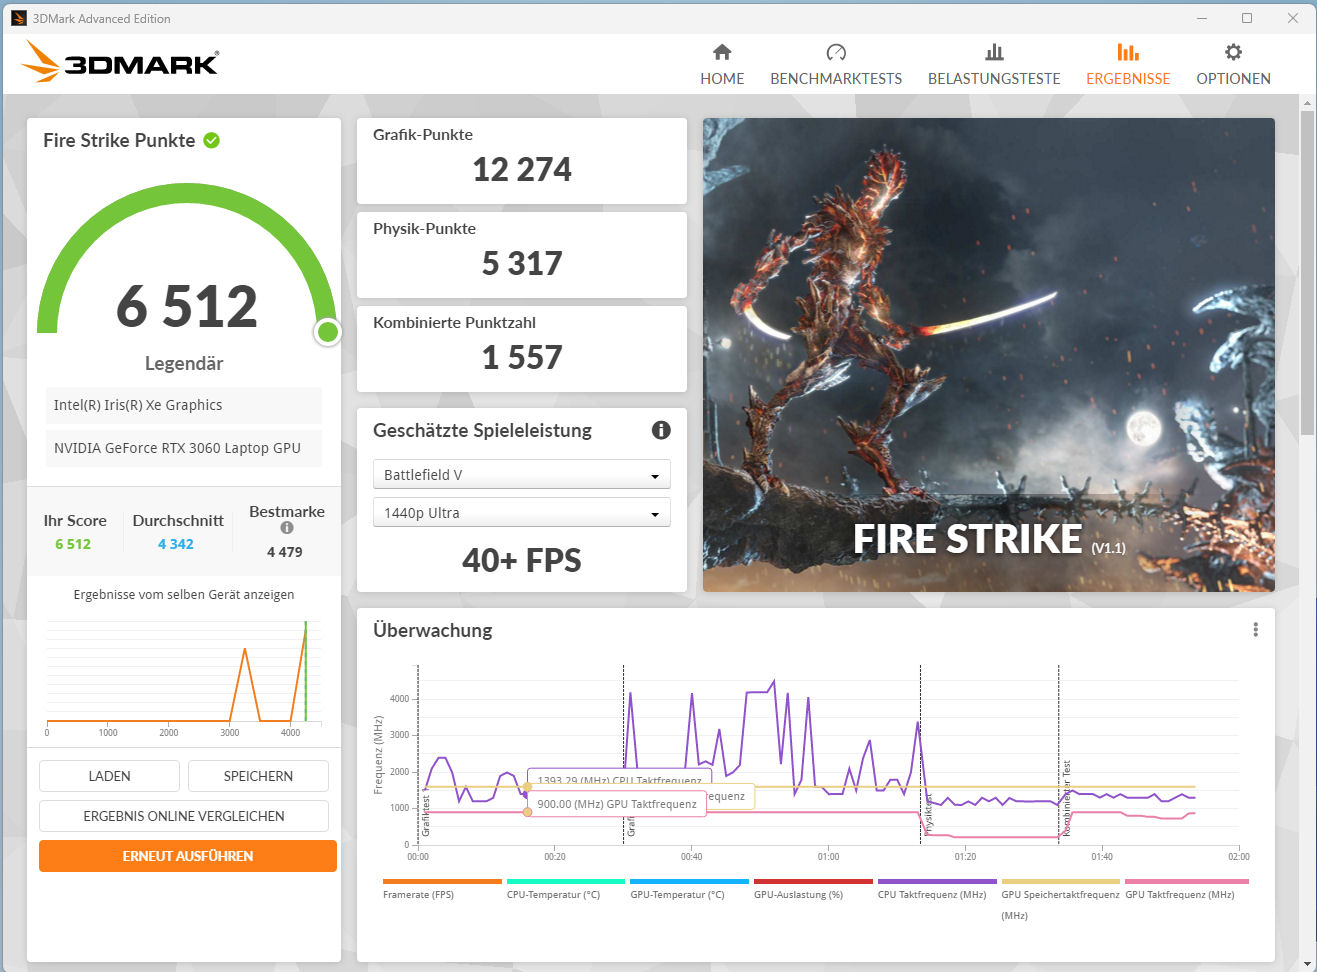
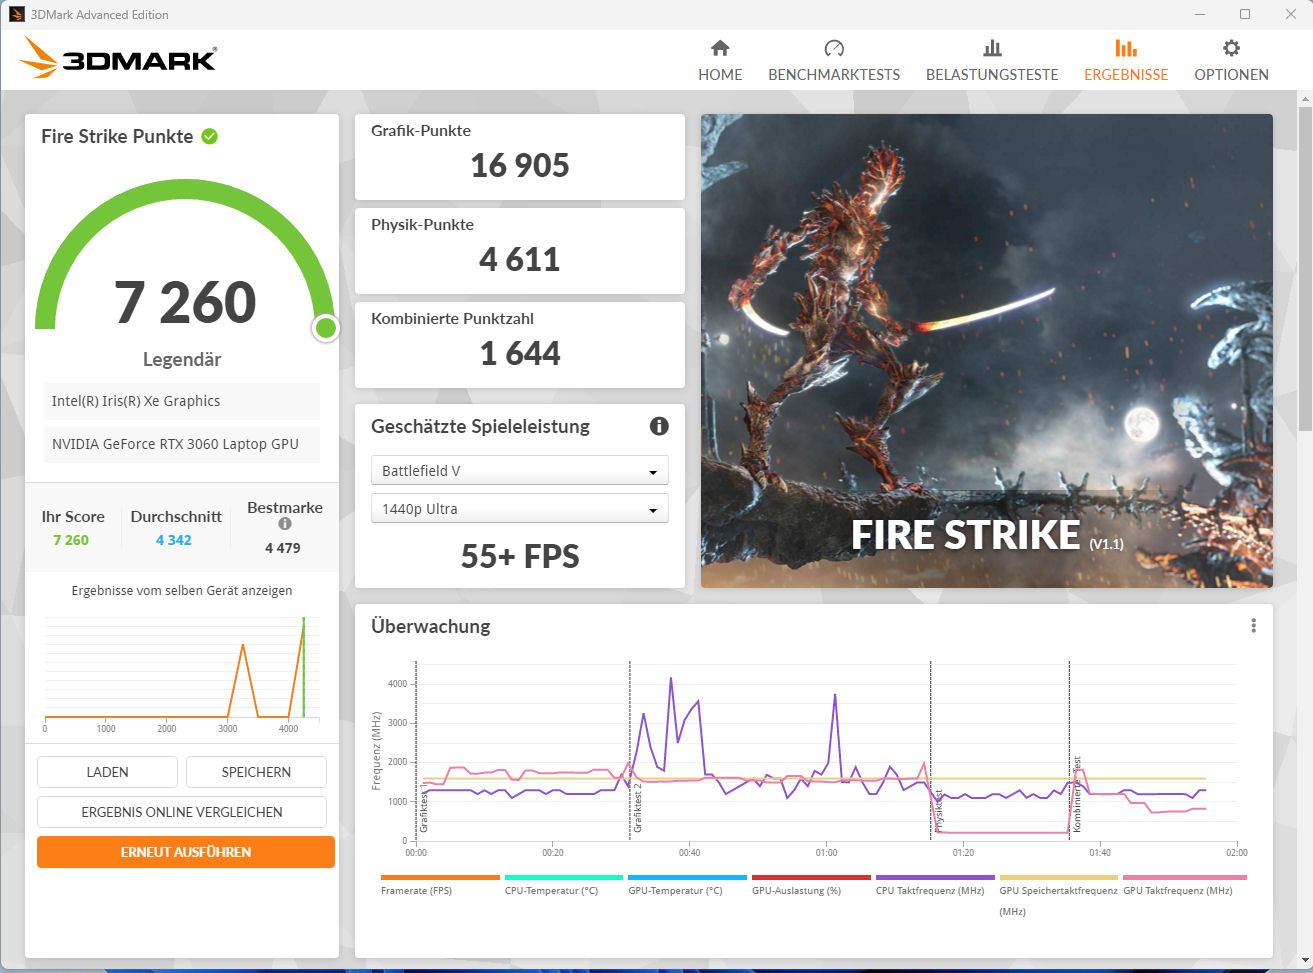
Wydajność GPU RTX-3000 zależy w praktyce od kilku czynników: Rozwiązania chłodzącego, konfiguracji pamięci oraz maksymalnego TGP, które jest ustalane przez producenta laptopa w określonym przez Nvidię zakresie. W tym przypadku Gigabyte ustawił maksymalne TGP dedykowanego m.in GeForce RTX 3060 w laptopie GPU do laptopa na 115 W. Jak pokazuje nasz Witcher 3 test pokazuje, ta wartość TGP nie jest jednak do końca osiągana.
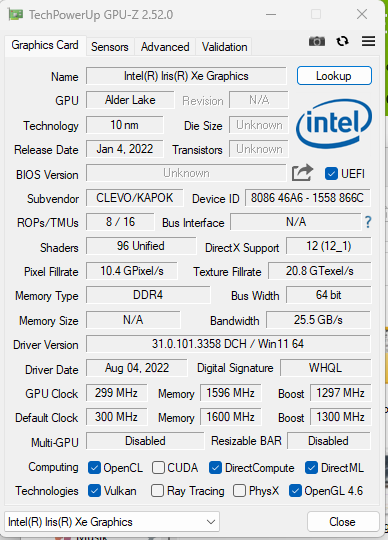
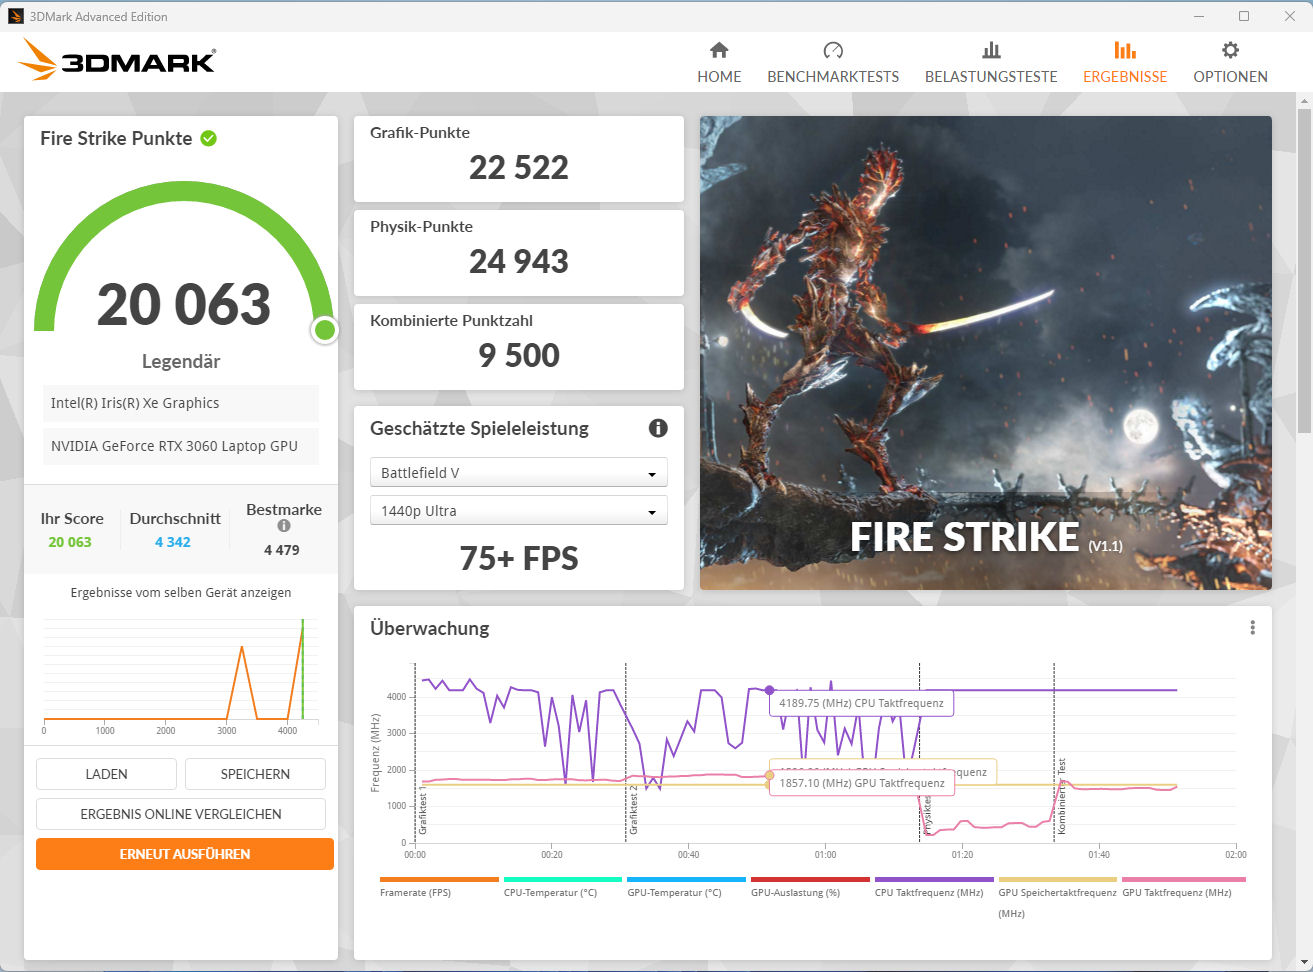
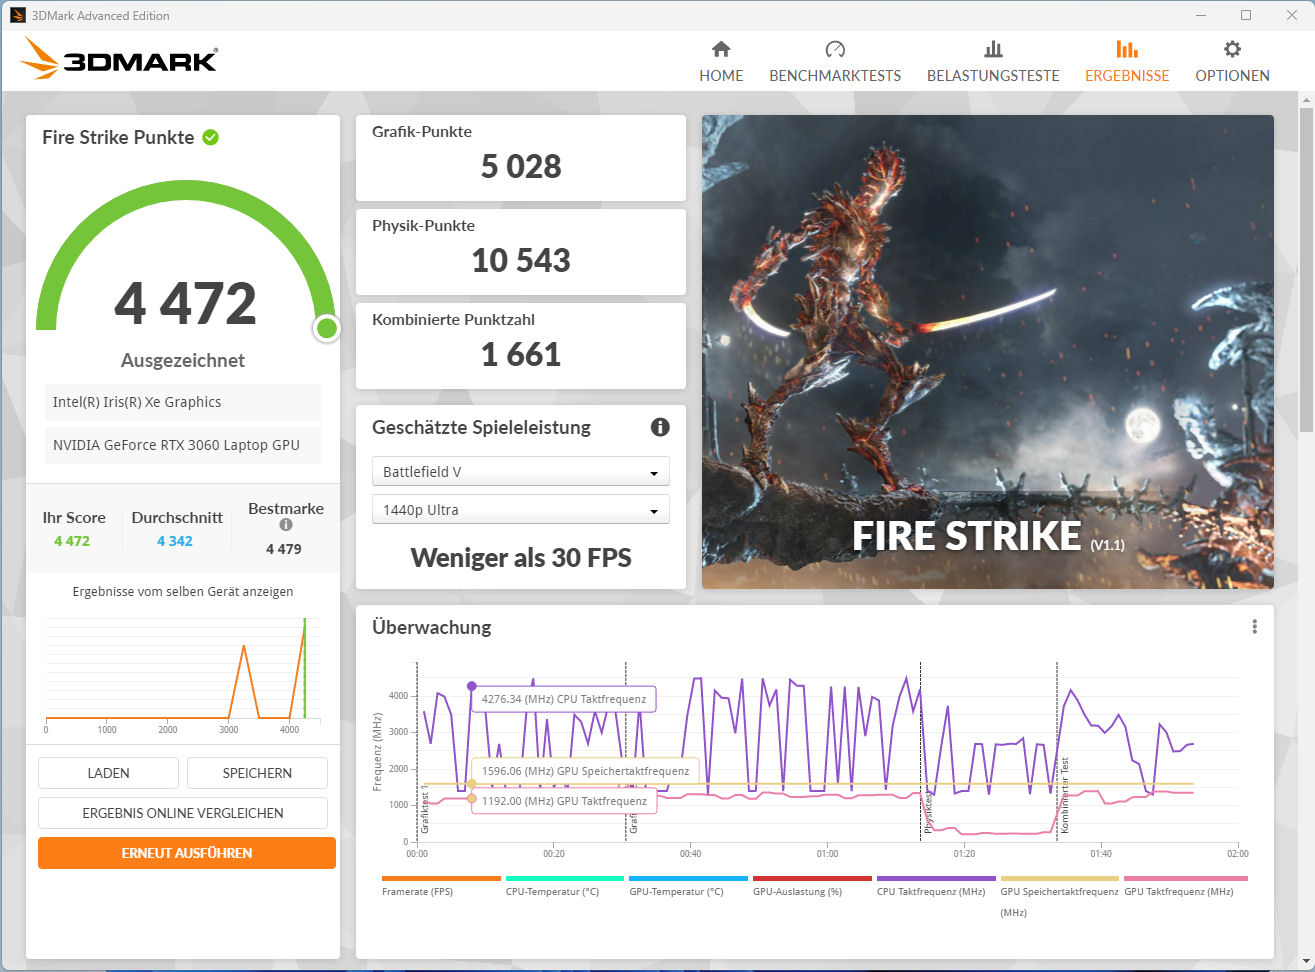
Wyniki w 3DMarku przewyższają średnią z wcześniej recenzowanych przez nas modeli RTX 3060. GPU ma dostęp do szybkiej pamięci wideo GDDR6 (6144 MB). Na stronie .Iris Xe Graphics G7 80EU zintegrowane rozwiązanie graficzne procesora jest aktywne a laptop wykorzystuje technologię przełączania grafiki Nvidii Optimus. Co prawda dostępny jest tryb dGPU, ale nie spowodował on poprawy wydajności.

| 3DMark Performance rating - Percent | |
| Średnia w klasie Gaming | |
| Asus TUF Gaming F17 FX707Z-HX011W | |
| Gigabyte G7 KE | |
| Acer Nitro 5 AN517-55-738R | |
| Przeciętny NVIDIA GeForce RTX 3060 Laptop GPU | |
| Lenovo IdeaPad Gaming 3 15IAH7 | |
| HP Pavilion Gaming 17-cd2146ng | |
| 3DMark 11 - 1280x720 Performance GPU | |
| Średnia w klasie Gaming (21841 - 80022, n=109, ostatnie 2 lata) | |
| Asus TUF Gaming F17 FX707Z-HX011W | |
| Gigabyte G7 KE | |
| Acer Nitro 5 AN517-55-738R | |
| Przeciętny NVIDIA GeForce RTX 3060 Laptop GPU (13799 - 30772, n=43) | |
| Lenovo IdeaPad Gaming 3 15IAH7 | |
| HP Pavilion Gaming 17-cd2146ng | |
| 3DMark | |
| 1920x1080 Fire Strike Graphics | |
| Średnia w klasie Gaming (12242 - 62849, n=121, ostatnie 2 lata) | |
| Asus TUF Gaming F17 FX707Z-HX011W | |
| Gigabyte G7 KE | |
| Acer Nitro 5 AN517-55-738R | |
| Przeciętny NVIDIA GeForce RTX 3060 Laptop GPU (16354 - 23109, n=49) | |
| Lenovo IdeaPad Gaming 3 15IAH7 | |
| HP Pavilion Gaming 17-cd2146ng | |
| 2560x1440 Time Spy Graphics | |
| Średnia w klasie Gaming (5012 - 26212, n=120, ostatnie 2 lata) | |
| Asus TUF Gaming F17 FX707Z-HX011W | |
| Gigabyte G7 KE | |
| Acer Nitro 5 AN517-55-738R | |
| Przeciętny NVIDIA GeForce RTX 3060 Laptop GPU (6285 - 9235, n=49) | |
| Lenovo IdeaPad Gaming 3 15IAH7 | |
| HP Pavilion Gaming 17-cd2146ng | |
| 3DMark 06 Standard Score | 47733 pkt. | |
| 3DMark 11 Performance | 26102 pkt. | |
| 3DMark Cloud Gate Standard Score | 37608 pkt. | |
| 3DMark Fire Strike Score | 20063 pkt. | |
| 3DMark Time Spy Score | 8799 pkt. | |
Pomoc | ||
| V-Ray 5 Benchmark | |
| GPU RTX | |
| Średnia w klasie Gaming (1146 - 4363, n=38, ostatnie 2 lata) | |
| Acer Nitro 5 AN517-55-738R | |
| Gigabyte G7 KE | |
| Przeciętny NVIDIA GeForce RTX 3060 Laptop GPU (658 - 1234, n=11) | |
| GPU CUDA | |
| Średnia w klasie Gaming (887 - 3288, n=38, ostatnie 2 lata) | |
| Gigabyte G7 KE | |
| Acer Nitro 5 AN517-55-738R | |
| Przeciętny NVIDIA GeForce RTX 3060 Laptop GPU (678 - 995, n=10) | |
| CPU | |
| Średnia w klasie Gaming (5864 - 30302, n=37, ostatnie 2 lata) | |
| Acer Nitro 5 AN517-55-738R | |
| Gigabyte G7 KE | |
| Przeciętny NVIDIA GeForce RTX 3060 Laptop GPU (4533 - 12868, n=24) | |
| V-Ray Benchmark Next 4.10 | |
| GPU | |
| Średnia w klasie Gaming (427 - 1333, n=106, ostatnie 2 lata) | |
| Asus TUF Gaming F17 FX707Z-HX011W | |
| Asus TUF Gaming F17 FX707Z-HX011W | |
| Acer Nitro 5 AN517-55-738R | |
| Gigabyte G7 KE | |
| Przeciętny NVIDIA GeForce RTX 3060 Laptop GPU (289 - 403, n=42) | |
| Lenovo IdeaPad Gaming 3 15IAH7 | |
| HP Pavilion Gaming 17-cd2146ng | |
| CPU | |
| Średnia w klasie Gaming (10048 - 45327, n=105, ostatnie 2 lata) | |
| Acer Nitro 5 AN517-55-738R | |
| Asus TUF Gaming F17 FX707Z-HX011W | |
| Asus TUF Gaming F17 FX707Z-HX011W | |
| Gigabyte G7 KE | |
| Lenovo IdeaPad Gaming 3 15IAH7 | |
| Przeciętny NVIDIA GeForce RTX 3060 Laptop GPU (6056 - 20177, n=42) | |
| HP Pavilion Gaming 17-cd2146ng | |
| GPUScore: Sacred Path | |
| 2560x1440 Official VRS | |
| Średnia w klasie Gaming (13.8 - 330, n=141, ostatnie 2 lata) | |
| Przeciętny NVIDIA GeForce RTX 3060 Laptop GPU (111.2 - 113.7, n=2) | |
| Gigabyte G7 KE | |
| 2560x1440 Official | |
| Średnia w klasie Gaming (11 - 331, n=235, ostatnie 2 lata) | |
| Przeciętny NVIDIA GeForce RTX 3060 Laptop GPU (2.34 - 110.1, n=3) | |
| Gigabyte G7 KE | |
| Geekbench 5.5 - Vulkan Score 5.5 | |
| Średnia w klasie Gaming (9296 - 246759, n=84, ostatnie 2 lata) | |
| Przeciętny NVIDIA GeForce RTX 3060 Laptop GPU (46619 - 81150, n=25) | |
| Gigabyte G7 KE | |
| Acer Nitro 5 AN517-55-738R | |
* ... im mniej tym lepiej
Wydajność w grach
Zainstalowane podzespoły pozwalają na grę w rozdzielczości FHD na ustawieniach wysokich do maksymalnych. Korzystanie z zewnętrznego monitora o wyższej rozdzielczości również jest możliwe, choć może to wymagać zmniejszenia ustawień. Liczba klatek na sekundę przekracza średnią dla RTX 3060 z naszej bazy danych.
| Performance rating - Percent | |
| Średnia w klasie Gaming | |
| Gigabyte G7 KE | |
| Asus TUF Gaming F17 FX707Z-HX011W | |
| Acer Nitro 5 AN517-55-738R | |
| Przeciętny NVIDIA GeForce RTX 3060 Laptop GPU | |
| Lenovo IdeaPad Gaming 3 15IAH7 | |
| HP Pavilion Gaming 17-cd2146ng | |
| The Witcher 3 - 1920x1080 Ultra Graphics & Postprocessing (HBAO+) | |
| Średnia w klasie Gaming (95 - 240, n=8, ostatnie 2 lata) | |
| Asus TUF Gaming F17 FX707Z-HX011W | |
| Acer Nitro 5 AN517-55-738R | |
| Gigabyte G7 KE | |
| Przeciętny NVIDIA GeForce RTX 3060 Laptop GPU (58.2 - 91.5, n=48) | |
| Lenovo IdeaPad Gaming 3 15IAH7 | |
| HP Pavilion Gaming 17-cd2146ng | |
| GTA V - 1920x1080 Highest AA:4xMSAA + FX AF:16x | |
| Średnia w klasie Gaming (48.3 - 186.9, n=103, ostatnie 2 lata) | |
| Gigabyte G7 KE | |
| Asus TUF Gaming F17 FX707Z-HX011W | |
| Przeciętny NVIDIA GeForce RTX 3060 Laptop GPU (69.2 - 109.8, n=46) | |
| Acer Nitro 5 AN517-55-738R | |
| Lenovo IdeaPad Gaming 3 15IAH7 | |
| HP Pavilion Gaming 17-cd2146ng | |
| Final Fantasy XV Benchmark - 1920x1080 High Quality | |
| Średnia w klasie Gaming (41 - 215, n=104, ostatnie 2 lata) | |
| Gigabyte G7 KE | |
| Przeciętny NVIDIA GeForce RTX 3060 Laptop GPU (55 - 100.9, n=42) | |
| Asus TUF Gaming F17 FX707Z-HX011W | |
| Acer Nitro 5 AN517-55-738R | |
| Lenovo IdeaPad Gaming 3 15IAH7 | |
| HP Pavilion Gaming 17-cd2146ng | |
| Strange Brigade - 1920x1080 ultra AA:ultra AF:16 | |
| Średnia w klasie Gaming (76.3 - 456, n=94, ostatnie 2 lata) | |
| Gigabyte G7 KE | |
| Acer Nitro 5 AN517-55-738R | |
| Asus TUF Gaming F17 FX707Z-HX011W | |
| Przeciętny NVIDIA GeForce RTX 3060 Laptop GPU (102.2 - 166.3, n=43) | |
| Lenovo IdeaPad Gaming 3 15IAH7 | |
| HP Pavilion Gaming 17-cd2146ng | |
| Dota 2 Reborn - 1920x1080 ultra (3/3) best looking | |
| Acer Nitro 5 AN517-55-738R | |
| Średnia w klasie Gaming (84.8 - 248, n=113, ostatnie 2 lata) | |
| Gigabyte G7 KE | |
| Asus TUF Gaming F17 FX707Z-HX011W | |
| Przeciętny NVIDIA GeForce RTX 3060 Laptop GPU (90.7 - 154.8, n=49) | |
| Lenovo IdeaPad Gaming 3 15IAH7 | |
| HP Pavilion Gaming 17-cd2146ng | |
| X-Plane 11.11 - 1920x1080 high (fps_test=3) | |
| Średnia w klasie Gaming (52.1 - 143.5, n=116, ostatnie 2 lata) | |
| Asus TUF Gaming F17 FX707Z-HX011W | |
| Gigabyte G7 KE | |
| Acer Nitro 5 AN517-55-738R | |
| Przeciętny NVIDIA GeForce RTX 3060 Laptop GPU (61.9 - 109.3, n=48) | |
| Lenovo IdeaPad Gaming 3 15IAH7 | |
| HP Pavilion Gaming 17-cd2146ng | |
Aby określić, czy liczba klatek na sekundę pozostaje stała przez dłuższy czas, uruchomiliśmy The Witcher 3 przez około 60 minut w rozdzielczości Full HD i maksymalnych ustawieniach jakości. Przez cały czas trwania gry postać nie jest poruszana. Nie zaobserwowaliśmy spadku wydajności.
Witcher 3 FPS Graph
| low | med. | high | ultra | |
|---|---|---|---|---|
| GTA V (2015) | 182.8 | 179.5 | 172.1 | 103 |
| The Witcher 3 (2015) | 339 | 233 | 137.1 | 82.4 |
| Dota 2 Reborn (2015) | 170.5 | 153 | 145.9 | 137.3 |
| Final Fantasy XV Benchmark (2018) | 180.4 | 112.4 | 84.7 | |
| X-Plane 11.11 (2018) | 120.5 | 106 | 86.8 | |
| Far Cry 5 (2018) | 168 | 131 | 122 | 115 |
| Strange Brigade (2018) | 369 | 211 | 168 | 146.4 |
| Flight Simulator 2020 (2020) | 135.7 | 85.1 | 62.8 | 45.9 |
| Guardians of the Galaxy (2021) | 120 | 114 | 114 | 110 |
| Cyberpunk 2077 1.6 (2022) | 96.7 | 75.5 | 66 | 60.7 |
| F1 22 (2022) | 190.5 | 186.3 | 149.6 | 54.4 |
| The Quarry (2022) | 126.9 | 97.2 | 80 | 64.1 |
| A Plague Tale Requiem (2022) | 87.5 | 73 | 62.8 | 52.8 |
| Uncharted Legacy of Thieves Collection (2022) | 72.2 | 69.8 | 65.6 | 62.3 |
| Call of Duty Modern Warfare 2 2022 (2022) | 111 | 99 | 77 | 72 |
| Spider-Man Miles Morales (2022) | 103.3 | 94.2 | 86.4 | 77.5 |
| The Callisto Protocol (2022) | 105.5 | 83.9 | 55.6 | 55.3 |
| Need for Speed Unbound (2022) | 114.9 | 106.7 | 88.6 | 76.6 |
| High On Life (2023) | 177.1 | 134.2 | 99.3 | 79.4 |
| The Witcher 3 v4 (2023) | 170.1 | 132.2 | 108.4 | 87.5 |
| Dead Space Remake (2023) | 69.2 | 66.5 | 59 | 54 |
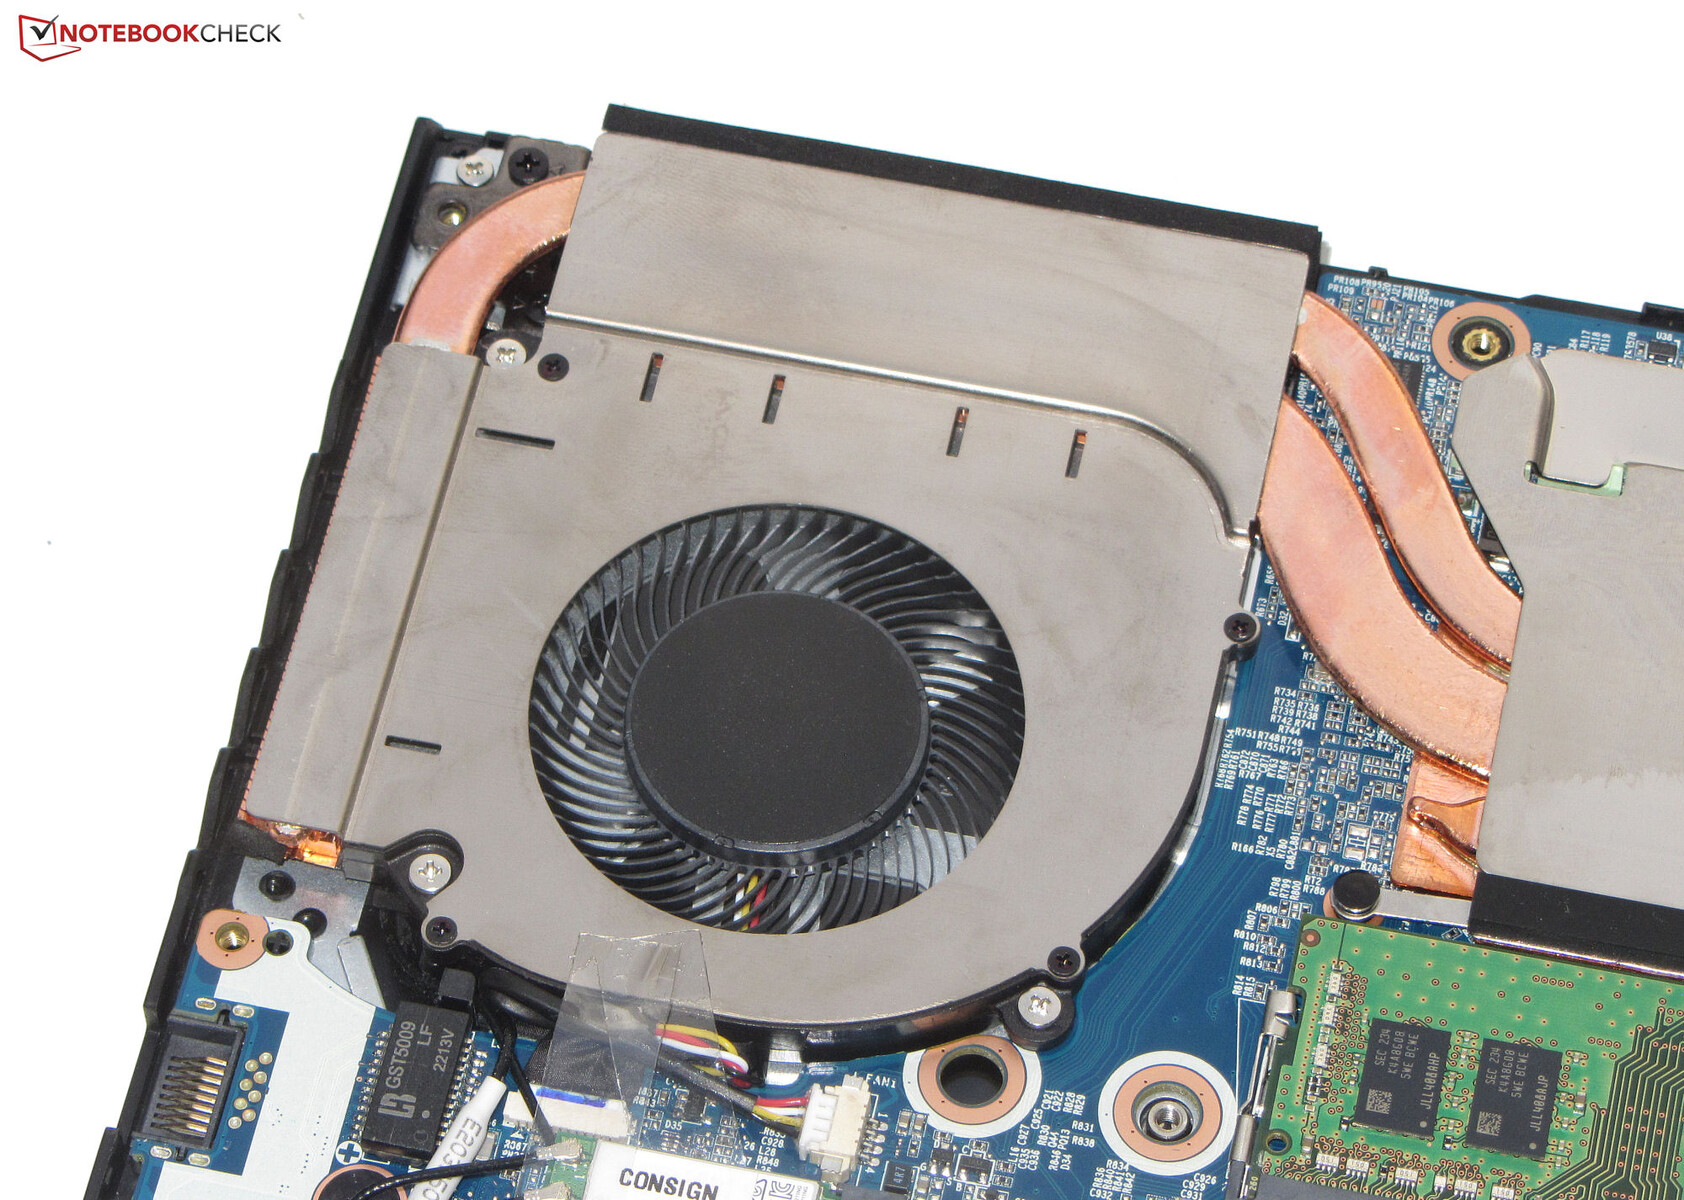
Emisje - System Gigabyte może być bardzo głośny
Emisja hałasu
Nawet podczas codziennego użytkowania (biuro, sieć) oba wentylatory są często wyczuwalne - możliwy jest hałas o natężeniu do 38 dB(A). Tylko z rzadka pracują one na biegu jałowym. Pod obciążeniem laptop może osiągnąć bardzo wysokie natężenie hałasu - do 59 dB(A) (stress test) i 56 dB(A) (Witcher 3) - to sprawia, że nasz model testowy jest w tych scenariuszach istotnie głośniejszy od większości konkurentów. Emisję hałasu można zmniejszyć, stosując jeden z trzech profili wydajności "Entertainment", "Energy Saver", "Quiet" - kosztem pewnej wydajności.
Hałas
| luz |
| 27 / 35 / 38 dB |
| obciążenie |
| 52 / 59 dB |
 | ||
30 dB cichy 40 dB(A) słyszalny 50 dB(A) irytujący |
||
min: | ||
| Gigabyte G7 KE i5-12500H, GeForce RTX 3060 Laptop GPU | HP Pavilion Gaming 17-cd2146ng i5-11300H, GeForce RTX 3050 Ti Laptop GPU | Acer Nitro 5 AN517-55-738R i7-12700H, GeForce RTX 3060 Laptop GPU | Asus TUF Gaming F17 FX707Z-HX011W i7-12700H, GeForce RTX 3060 Laptop GPU | Lenovo IdeaPad Gaming 3 15IAH7 i5-12500H, GeForce RTX 3050 Ti Laptop GPU | |
|---|---|---|---|---|---|
| Noise | 17% | 9% | 21% | 11% | |
| wyłączone / środowisko * (dB) | 27 | 25 7% | 25.5 6% | 24 11% | 25 7% |
| Idle Minimum * (dB) | 27 | 27 -0% | 25.5 6% | 24 11% | 29 -7% |
| Idle Average * (dB) | 35 | 28 20% | 25.5 27% | 24 31% | 30 14% |
| Idle Maximum * (dB) | 38 | 30 21% | 27 29% | 24 37% | 32 16% |
| Load Average * (dB) | 52 | 39 25% | 52.6 -1% | 42.6 18% | 42 19% |
| Witcher 3 ultra * (dB) | 56 | 44 21% | 46.84 16% | 46 18% | |
| Load Maximum * (dB) | 59 | 46 22% | 68.2 -16% | 46.84 21% | 54 8% |
* ... im mniej tym lepiej
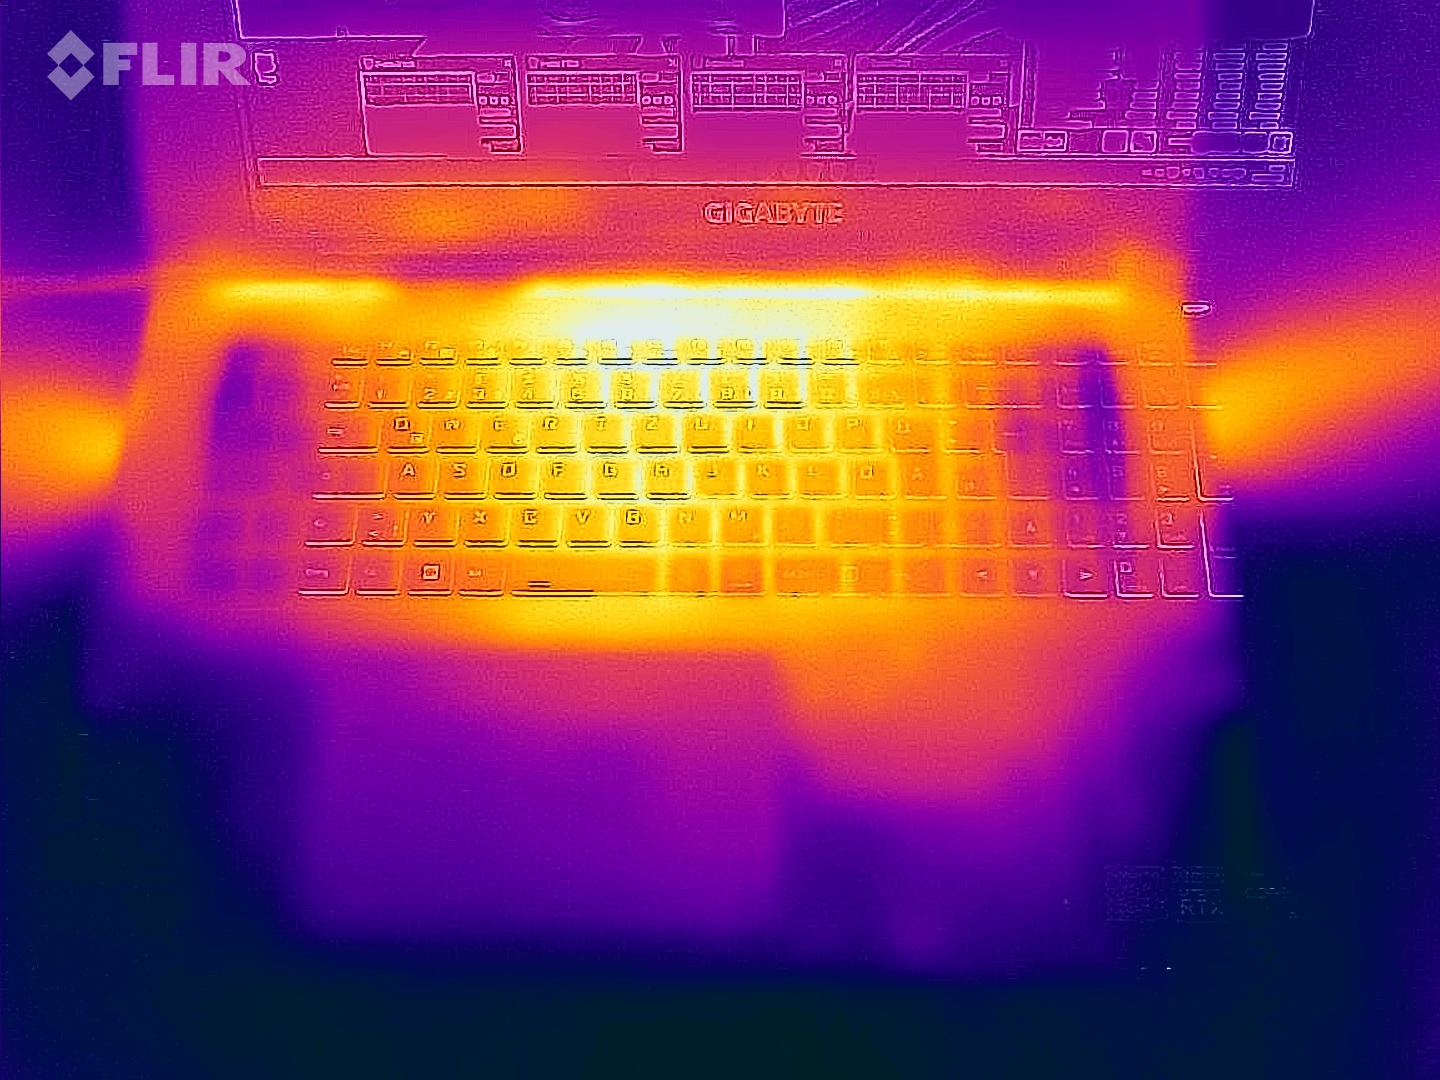
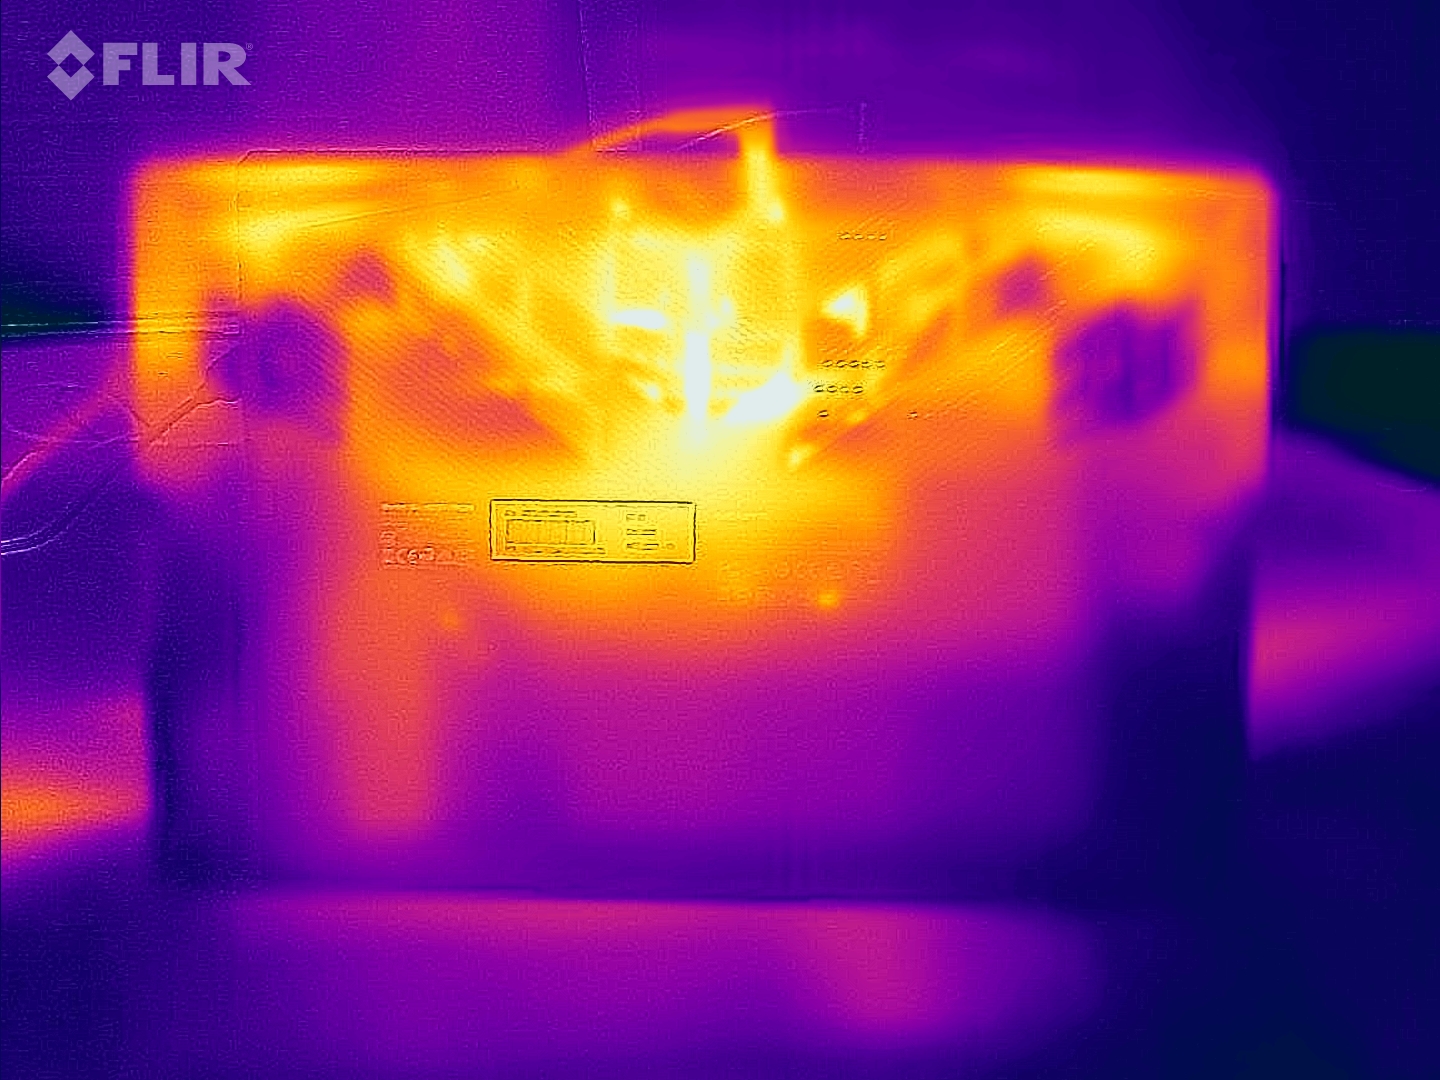
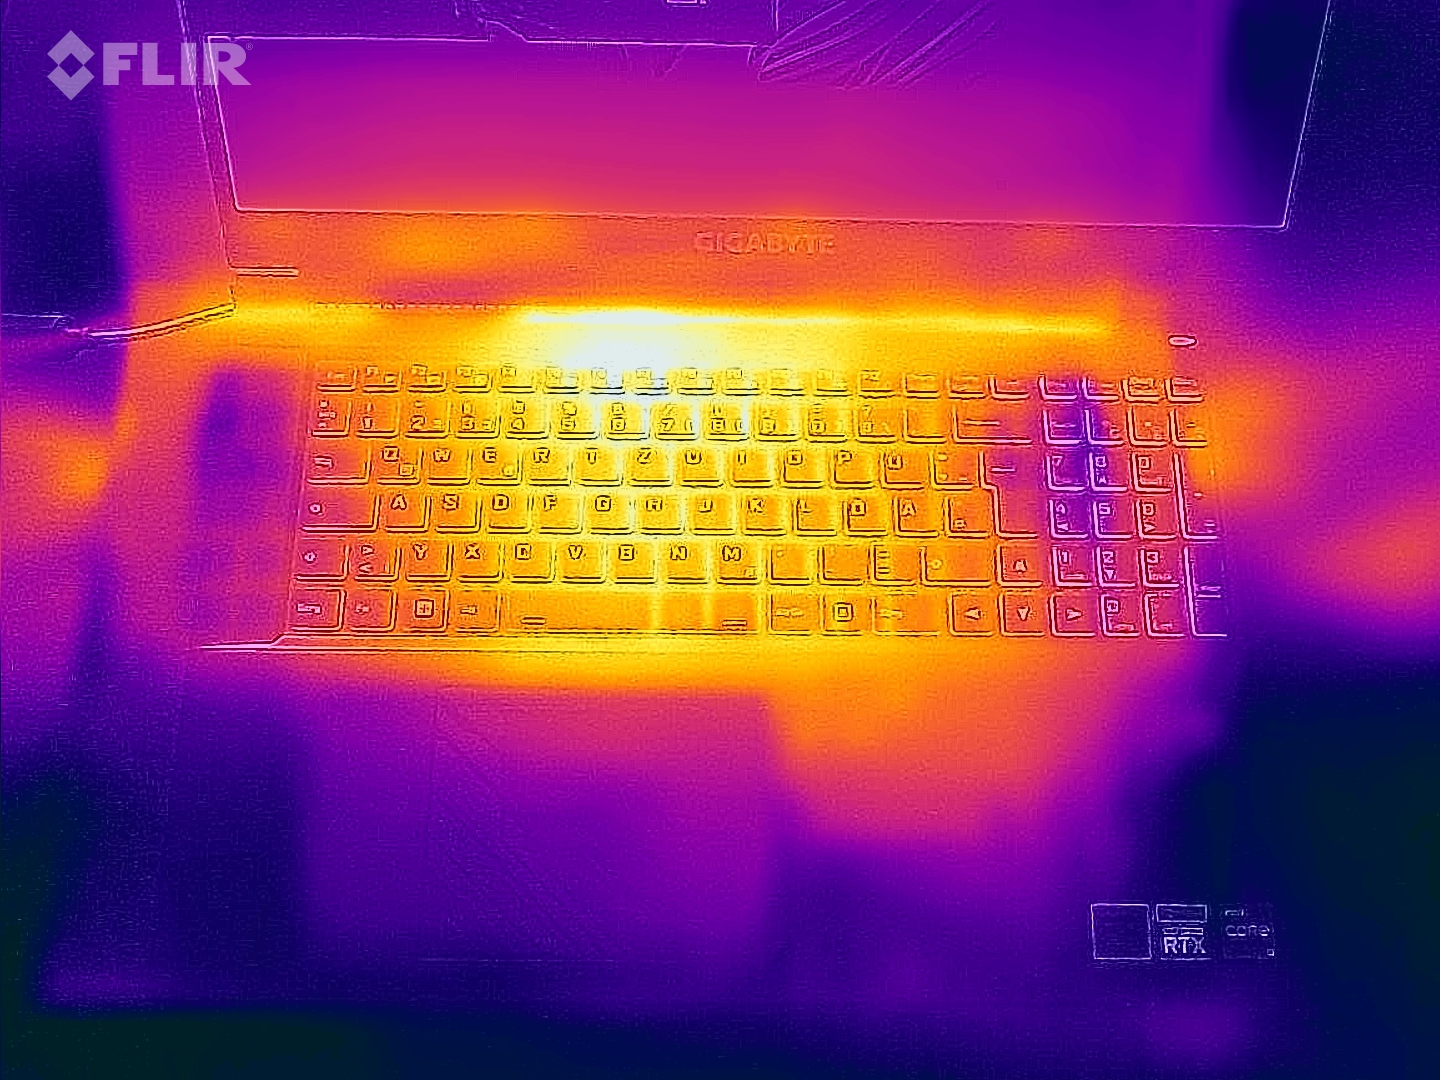
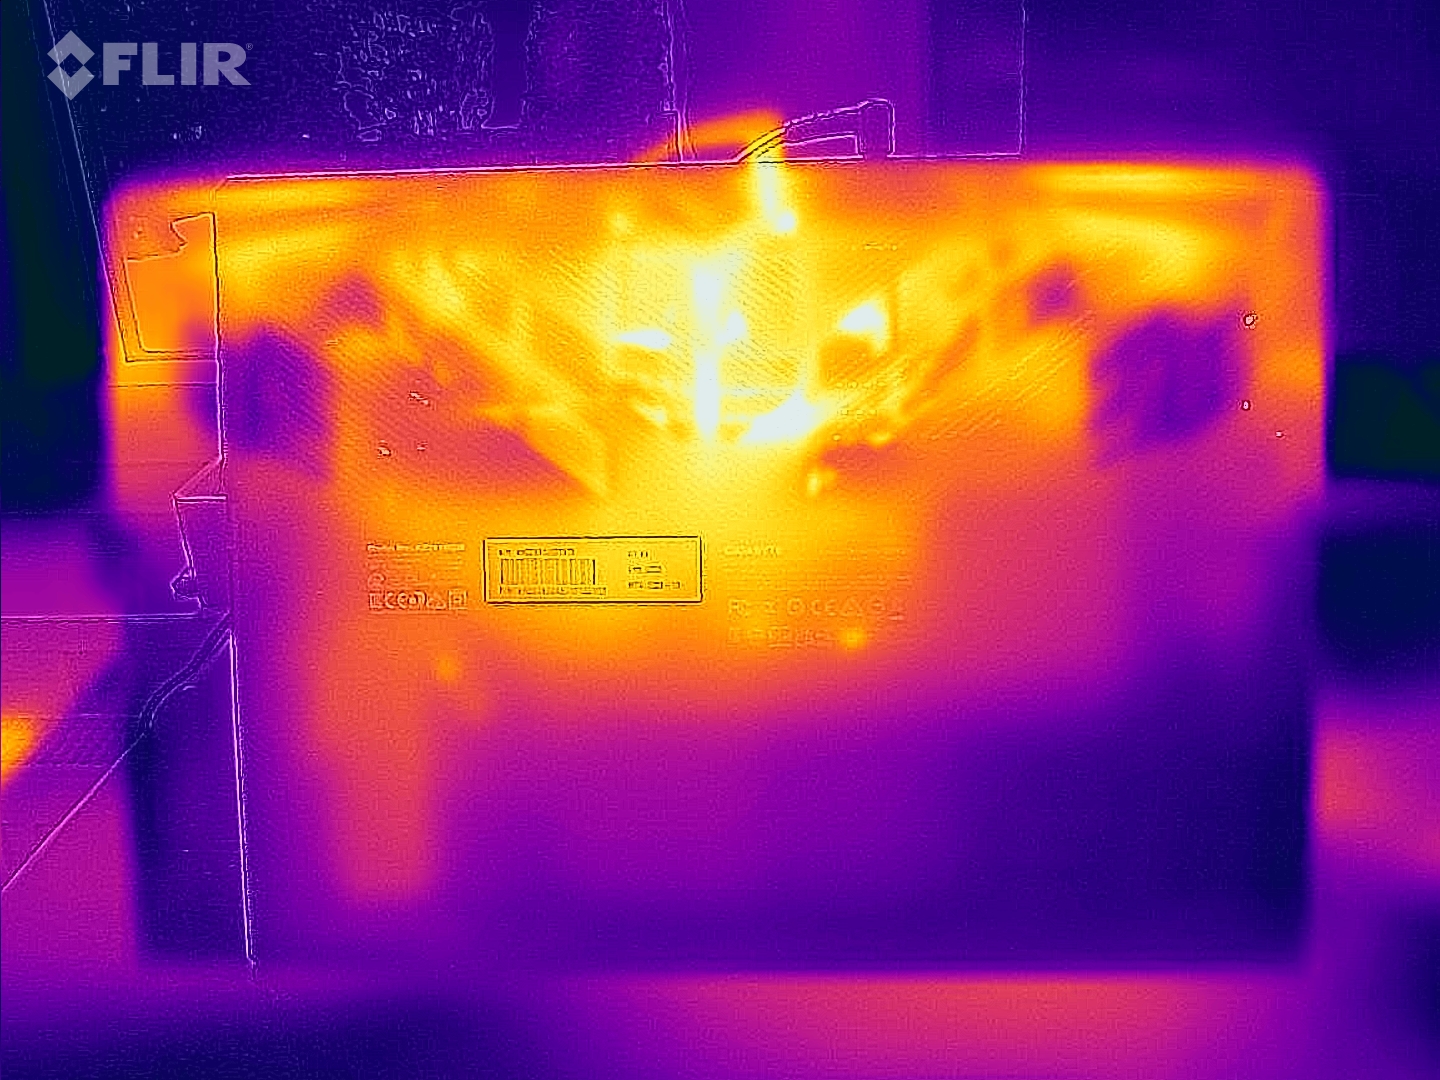
Temperatury
Podczas codziennego użytkowania (biuro, internet) temperatury powierzchni pozostają na rozsądnym poziomie. Choć rozwój ciepła pod obciążeniem (stress test, Witcher 3) jest znaczny, nie osiąga on poziomu krytycznego. Procesor osiąga temperatury zbliżone do swojej granicy 100°C.
(-) Maksymalna temperatura w górnej części wynosi 52 °C / 126 F, w porównaniu do średniej 40.4 °C / 105 F , począwszy od 21.2 do 68.8 °C dla klasy Gaming.
(-) Dno nagrzewa się maksymalnie do 54 °C / 129 F, w porównaniu do średniej 43.2 °C / 110 F
(+) W stanie bezczynności średnia temperatura górnej części wynosi 26.6 °C / 80 F, w porównaniu ze średnią temperaturą urządzenia wynoszącą 33.9 °C / ### class_avg_f### F.
(-) Podczas gry w Wiedźmina 3 średnia temperatura górnej części wynosi 40.6 °C / 105 F, w porównaniu do średniej temperatury urządzenia wynoszącej 33.9 °C / ## #class_avg_f### F.
(+) Podparcia dłoni i touchpad osiągają maksymalną temperaturę skóry (34 °C / 93.2 F) i dlatego nie są gorące.
(-) Średnia temperatura obszaru podparcia dłoni w podobnych urządzeniach wynosiła 28.8 °C / 83.8 F (-5.2 °C / -9.4 F).
| Gigabyte G7 KE Intel Core i5-12500H, NVIDIA GeForce RTX 3060 Laptop GPU | HP Pavilion Gaming 17-cd2146ng Intel Core i5-11300H, NVIDIA GeForce RTX 3050 Ti Laptop GPU | Acer Nitro 5 AN517-55-738R Intel Core i7-12700H, NVIDIA GeForce RTX 3060 Laptop GPU | Asus TUF Gaming F17 FX707Z-HX011W Intel Core i7-12700H, NVIDIA GeForce RTX 3060 Laptop GPU | Lenovo IdeaPad Gaming 3 15IAH7 Intel Core i5-12500H, NVIDIA GeForce RTX 3050 Ti Laptop GPU | |
|---|---|---|---|---|---|
| Heat | 12% | -6% | 1% | 13% | |
| Maximum Upper Side * (°C) | 52 | 44 15% | 48.3 7% | 52 -0% | 47 10% |
| Maximum Bottom * (°C) | 54 | 48 11% | 52 4% | 47 13% | 52 4% |
| Idle Upper Side * (°C) | 28 | 27 4% | 34.5 -23% | 31 -11% | 25 11% |
| Idle Bottom * (°C) | 32 | 27 16% | 35.8 -12% | 31 3% | 24 25% |
* ... im mniej tym lepiej
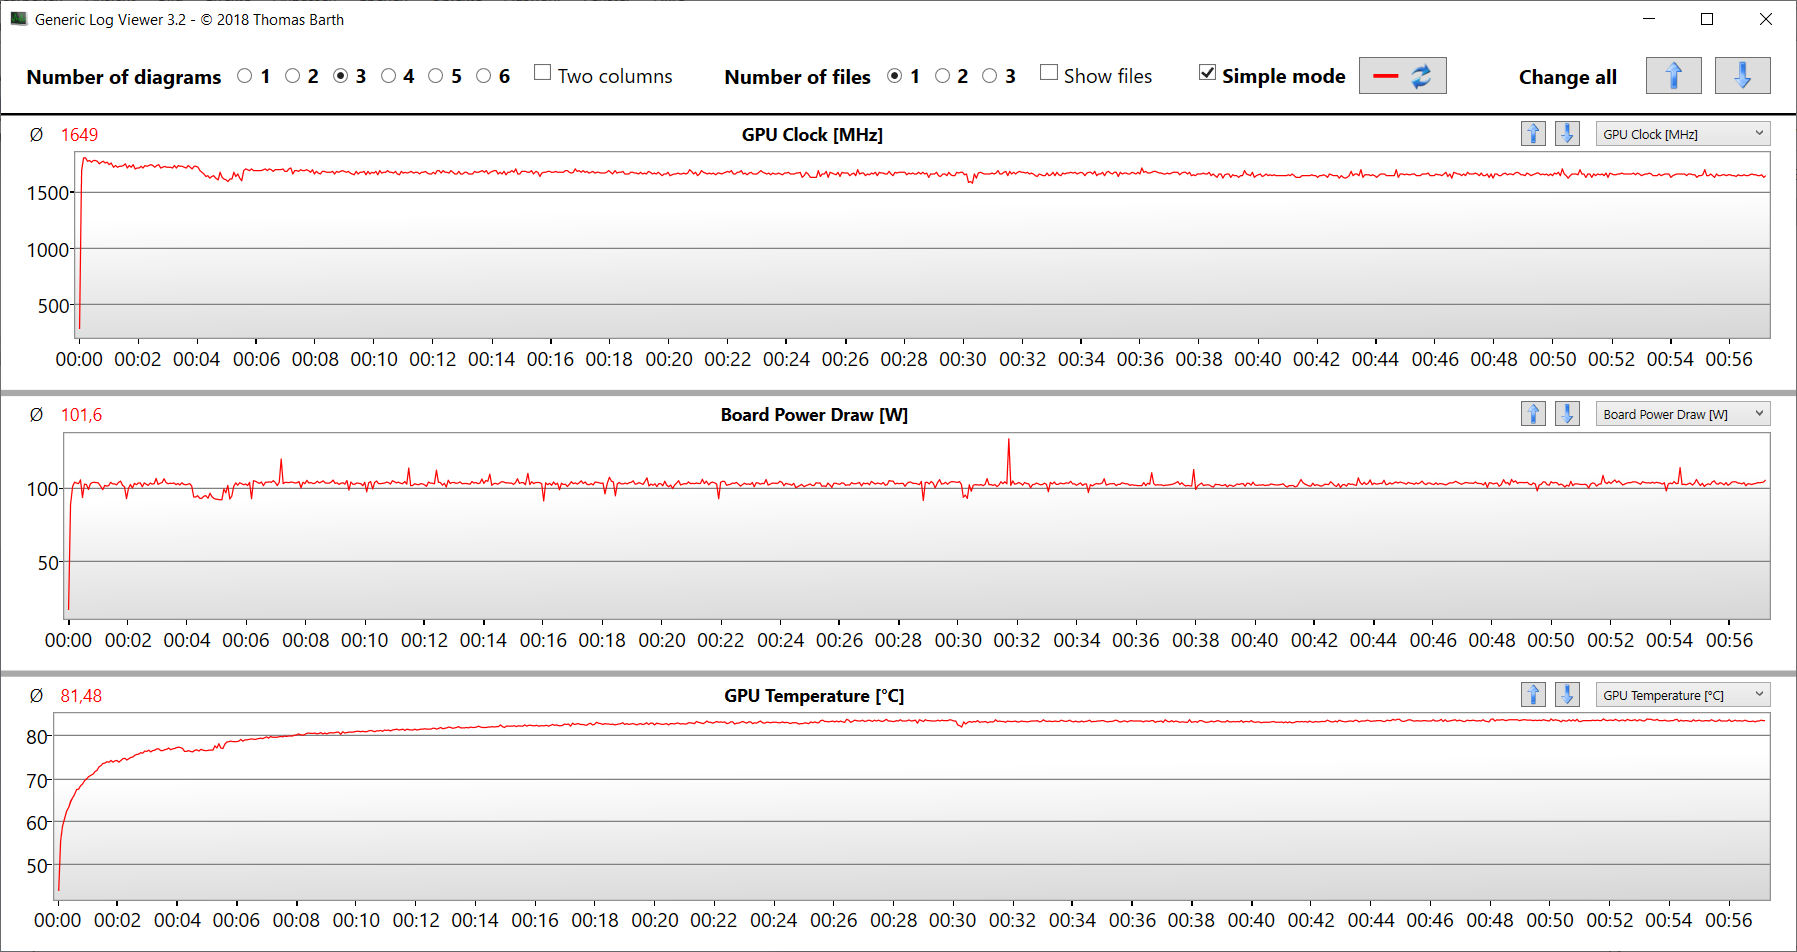
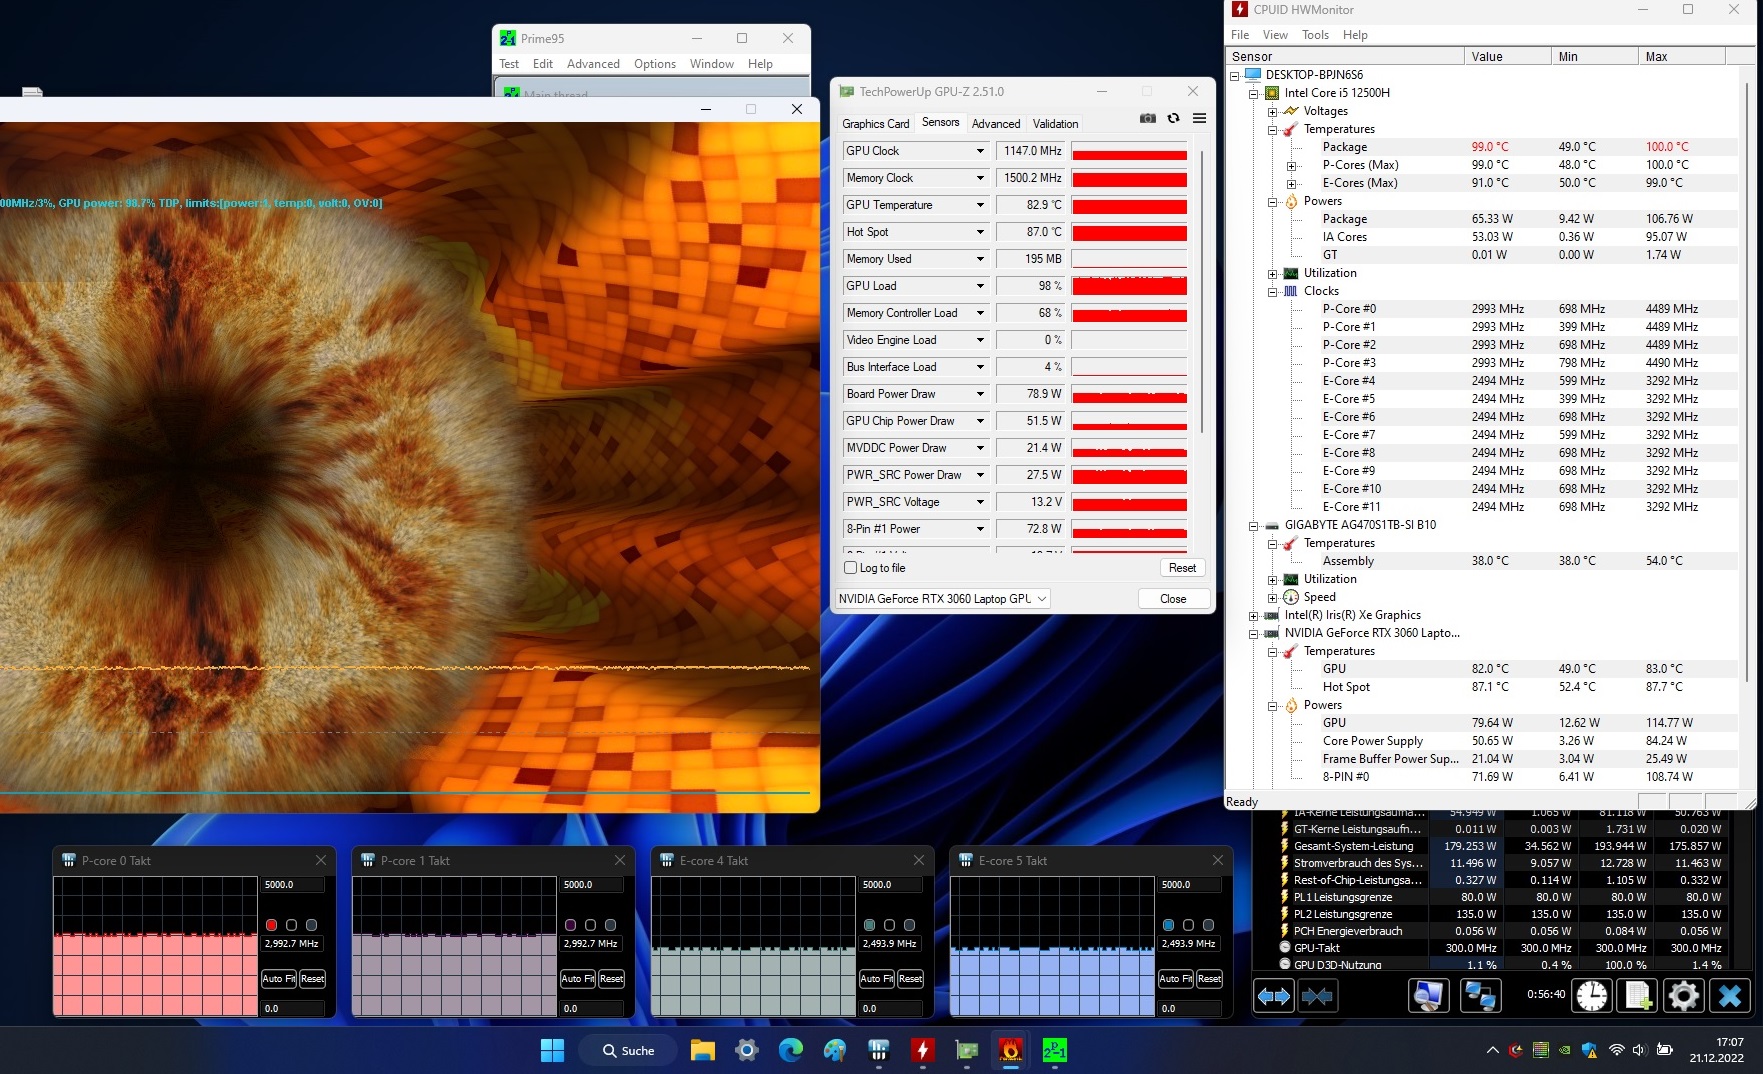
Stress Test
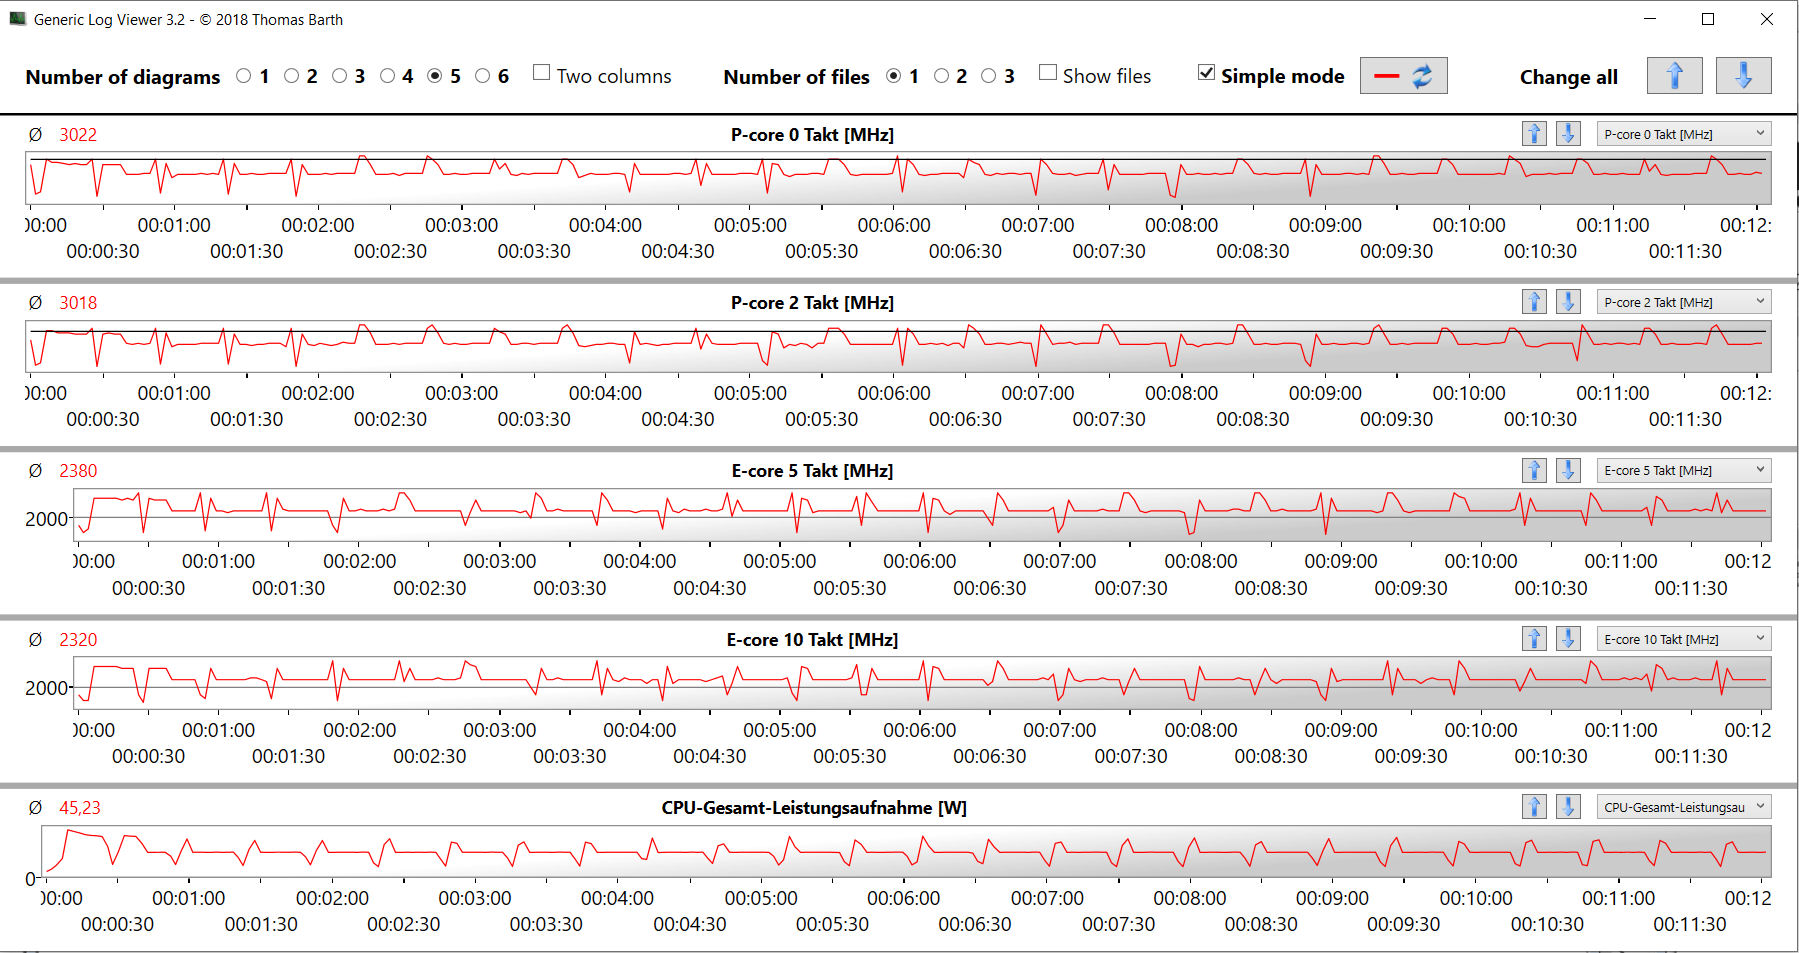
Nasz test obciążeniowy (ciągły stres Prime95 i FurMark) reprezentuje ekstremalny scenariusz i służy jako test stabilności, kiedy system jest obciążony w 100 %. Prędkość taktowania CPU spada z 4,1 GHz (rdzenie P) i 3,1 GHz (rdzenie E) do poziomu zbliżonego do zegara bazowego (P: 3 GHz, E: 2,5 GHz) w ciągu 15 minut, a następnie pozostaje na tym poziomie. Częstotliwość taktowania GPU początkowo waha się między 1200 MHz a 1500 MHz, po czym ostatecznie stabilizuje się na poziomie 1150 MHz.

Mówcy
Dźwięk wytwarzany przez głośniki stereo jest cienki i brakuje mu basów. Polecamy zewnętrzne słuchawki lub głośniki dla lepszego dźwięku.
Gigabyte G7 KE analiza dźwięku
(±) | głośność głośnika jest średnia, ale dobra (79 dB)
Bas 100 - 315 Hz
(-) | prawie brak basu - średnio 23.4% niższa od mediany
(±) | liniowość basu jest średnia (10.8% delta do poprzedniej częstotliwości)
Średnie 400 - 2000 Hz
(±) | wyższe średnie - średnio 11.1% wyższe niż mediana
(±) | liniowość środka jest średnia (10.6% delta do poprzedniej częstotliwości)
Wysokie 2–16 kHz
(±) | wyższe maksima - średnio 6.5% wyższe od mediany
(±) | liniowość wysokich wartości jest średnia (7.7% delta do poprzedniej częstotliwości)
Ogólnie 100 - 16.000 Hz
(-) | ogólny dźwięk nie jest liniowy (32% różnicy w stosunku do mediany)
W porównaniu do tej samej klasy
» 97% wszystkich testowanych urządzeń w tej klasie było lepszych, 1% podobnych, 2% gorszych
» Najlepszy miał deltę 6%, średnia wynosiła ###średnia###%, najgorsza wynosiła 132%
W porównaniu do wszystkich testowanych urządzeń
» 91% wszystkich testowanych urządzeń było lepszych, 2% podobnych, 7% gorszych
» Najlepszy miał deltę 4%, średnia wynosiła ###średnia###%, najgorsza wynosiła 134%
HP Pavilion Gaming 17-cd2146ng analiza dźwięku
(±) | głośność głośnika jest średnia, ale dobra (80 dB)
Bas 100 - 315 Hz
(-) | prawie brak basu - średnio 19.5% niższa od mediany
(±) | liniowość basu jest średnia (11.5% delta do poprzedniej częstotliwości)
Średnie 400 - 2000 Hz
(+) | zbalansowane środki średnie - tylko 3.2% od mediany
(+) | średnie są liniowe (3.8% delta do poprzedniej częstotliwości)
Wysokie 2–16 kHz
(±) | wyższe maksima - średnio 8.6% wyższe od mediany
(±) | liniowość wysokich wartości jest średnia (8% delta do poprzedniej częstotliwości)
Ogólnie 100 - 16.000 Hz
(±) | liniowość ogólnego dźwięku jest średnia (20.5% różnicy w stosunku do mediany)
W porównaniu do tej samej klasy
» 73% wszystkich testowanych urządzeń w tej klasie było lepszych, 5% podobnych, 22% gorszych
» Najlepszy miał deltę 6%, średnia wynosiła ###średnia###%, najgorsza wynosiła 132%
W porównaniu do wszystkich testowanych urządzeń
» 54% wszystkich testowanych urządzeń było lepszych, 8% podobnych, 38% gorszych
» Najlepszy miał deltę 4%, średnia wynosiła ###średnia###%, najgorsza wynosiła 134%
Zarządzanie energią - Laptop G7 z akceptowalnymi czasami pracy
Zużycie energii
W czasie bezczynności obserwujemy nieco większy pobór mocy przez laptop Gigabyte. Rzut oka na konkurencję pokazuje, gdzie mieści się normalny zakres dla laptopa Optimus. Podczas testu obciążeniowego i Witcher 3 testu pobór mocy pokrywa się z naszymi oczekiwaniami względem zainstalowanych podzespołów. Dołączony zasilacz sieciowy jest dobrze zwymiarowany i radzi sobie z krótkimi skokami poboru, które przekraczają jego moc znamionową (180 W).
| wyłączony / stan wstrzymania | |
| luz | |
| obciążenie |
|
Legenda:
min: | |
| Gigabyte G7 KE i5-12500H, GeForce RTX 3060 Laptop GPU | HP Pavilion Gaming 17-cd2146ng i5-11300H, GeForce RTX 3050 Ti Laptop GPU | Acer Nitro 5 AN517-55-738R i7-12700H, GeForce RTX 3060 Laptop GPU | Asus TUF Gaming F17 FX707Z-HX011W i7-12700H, GeForce RTX 3060 Laptop GPU | Lenovo IdeaPad Gaming 3 15IAH7 i5-12500H, GeForce RTX 3050 Ti Laptop GPU | Średnia w klasie Gaming | |
|---|---|---|---|---|---|---|
| Power Consumption | 35% | 3% | 25% | 28% | -4% | |
| Idle Minimum * (Watt) | 15 | 3 80% | 9.7 35% | 6.6 56% | 8 47% | 13.3 ? 11% |
| Idle Average * (Watt) | 17 | 8 53% | 14.6 14% | 8.3 51% | 10 41% | 19 ? -12% |
| Idle Maximum * (Watt) | 24 | 28 -17% | 16.7 30% | 11.8 51% | 16 33% | 24.5 ? -2% |
| Load Average * (Watt) | 111 | 88 21% | 166 -50% | 119 -7% | 99 11% | 108.1 ? 3% |
| Witcher 3 ultra * (Watt) | 174.1 | 98.2 44% | 169 3% | 144.6 17% | ||
| Load Maximum * (Watt) | 208 | 152 27% | 235 -13% | 222 -7% | 168 19% | 254 ? -22% |
* ... im mniej tym lepiej
Consumption Witcher 3 / Stress Test
Consumption external Monitor
Czas pracy na baterii
W naszym teście Wi-Fi (przeglądanie stron internetowych przez skrypt) i teście wideo (odtwarzanie w pętli filmu krótkometrażowego FHD Big Buck Bunny z kodekiem H.264) 17,3-calowy laptop osiągnął odpowiednio 5:17 h i 2:12 h. Przed przeprowadzeniem testów wyłączyliśmy funkcje oszczędzania energii w laptopie i ustawiliśmy jasność wyświetlacza na około 150 nitów. Ponadto na potrzeby testu wideo wyłączyliśmy moduły bezprzewodowe.
Czas działania wideo jest bardzo rozczarowujący. Zazwyczaj spodziewalibyśmy się co najmniej równego czasu działania Wi-Fi. Najwyraźniej system cierpi z powodu zwiększonego poboru mocy podczas odtwarzania. Aby wykluczyć problem z oprogramowaniem, przetestowaliśmy wiele różnych wersji sterownika dla procesora Intel iGPU, który był wykorzystywany do odtwarzania. Podobnie system operacyjny również nie wydaje się być winowajcą: obserwujemy krótki czas uruchamiania zarówno pod Windows 10, jak i Windows 11. Sugeruje to wewnętrzny problem, który tylko Gigabyte może być w stanie naprawić.
| Gigabyte G7 KE i5-12500H, GeForce RTX 3060 Laptop GPU, 54 Wh | HP Pavilion Gaming 17-cd2146ng i5-11300H, GeForce RTX 3050 Ti Laptop GPU, 52.5 Wh | Acer Nitro 5 AN517-55-738R i7-12700H, GeForce RTX 3060 Laptop GPU, 90.61 Wh | Asus TUF Gaming F17 FX707Z-HX011W i7-12700H, GeForce RTX 3060 Laptop GPU, 90 Wh | Lenovo IdeaPad Gaming 3 15IAH7 i5-12500H, GeForce RTX 3050 Ti Laptop GPU, 60 Wh | Średnia w klasie Gaming | |
|---|---|---|---|---|---|---|
| Czasy pracy | -6% | 69% | 130% | 11% | 86% | |
| Reader / Idle (h) | 7.1 | 11.7 65% | 8.71 ? 23% | |||
| H.264 (h) | 2.2 | 5.3 141% | 7.7 250% | 8.26 ? 275% | ||
| WiFi v1.3 (h) | 5.3 | 5 -6% | 6.5 23% | 8.7 64% | 5.9 11% | 7.01 ? 32% |
| Load (h) | 1.3 | 1.9 46% | 2.3 77% | 1.47 ? 13% |
Za
Przeciw
Werdykt - Niedrogi notebook do gier
Wraz z G7 KE, Gigabyte stworzył stosunkowo przystępny cenowo laptop do gier w rozdzielczości FHD, który dobrze radzi sobie również podczas edycji i renderowania wideo - jest to możliwe dzięki m.in Core i5-12500H CPU i GeForce RTX 3060 laptop GPU. Tymczasem piekielnie szybki dysk SSD PCIe-4 (1 TB) zapewnia krótkie czasy ładowania.
Gigabyte G7 KE to solidny laptop do gier. Wady, które znaleźliśmy, są dość drobne.
Wprawdzie wydzielanie ciepła przez system pod obciążeniem nie jest nadmierne, ale wynikający z tego hałas jest stosunkowo wysoki - wielu konkurentów wypada pod tym względem lepiej. Ogólnie byliśmy zadowoleni z jakości matowego wyświetlacza 17,3 cala (FHD, IPS, 300 Hz, sRGB).
G7 osiąga w miarę akceptowalne czasy pracy mimo akumulatora o małej pojemności (54 Wh). Niestety, akumulatora nie da się naładować za pomocą uniwersalnej ładowarki USB-C - żaden z portów USB-C (1x Thunderbolt 4, 1x USB 3.2 gen. 2) nie oferuje obsługi Power Delivery.
Brak dołączonego systemu operacyjnego Windows nie jest mało istotnym powodem stosunkowo taniej ceny. Jeśli nie posiadamy ważnej licencji Windows i nie chcemy jej nabywać, instalacja dystrybucji Linuksa również powinna być możliwa. Proces instalacji i konfiguracji alternatywnego OS-u może jednak stanowić dla niektórych użytkowników spore wyzwanie.
Strona Asus TUF Gaming F17 może być alternatywą dla G7 KE. Chociaż jest wyposażony w ten sam procesor graficzny, jego wydajność 3D jest nieco lepsza, a czas pracy na baterii jest również dłuższy. To powiedziawszy, system pochodzi z premii około 200-300 USD.
Cena i dostępność
Podczas gdy Gigabyte G7 KE w takiej konfiguracji nie jest jeszcze powszechnie dostępny u największych sprzedawców w USA, spodziewamy się, że wkrótce pojawią się modele w cenie około 1200 USD.
Gigabyte G7 KE
- 21/01/2023 v7 (old)
Sascha Mölck
Price comparison

