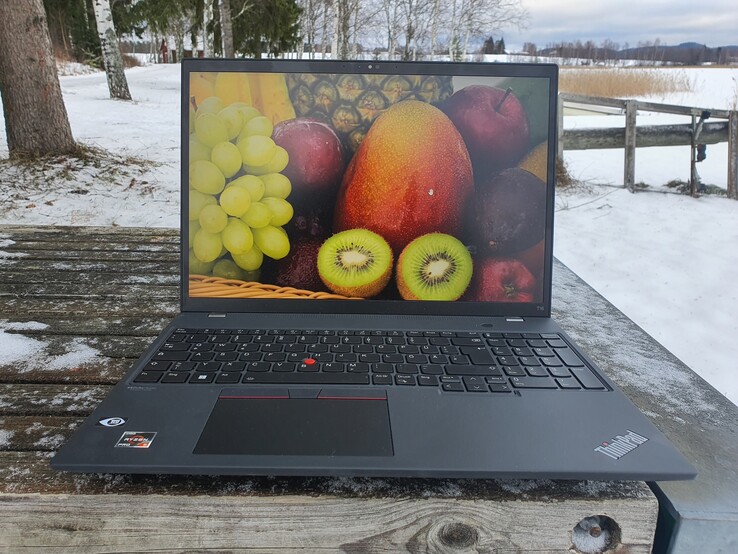
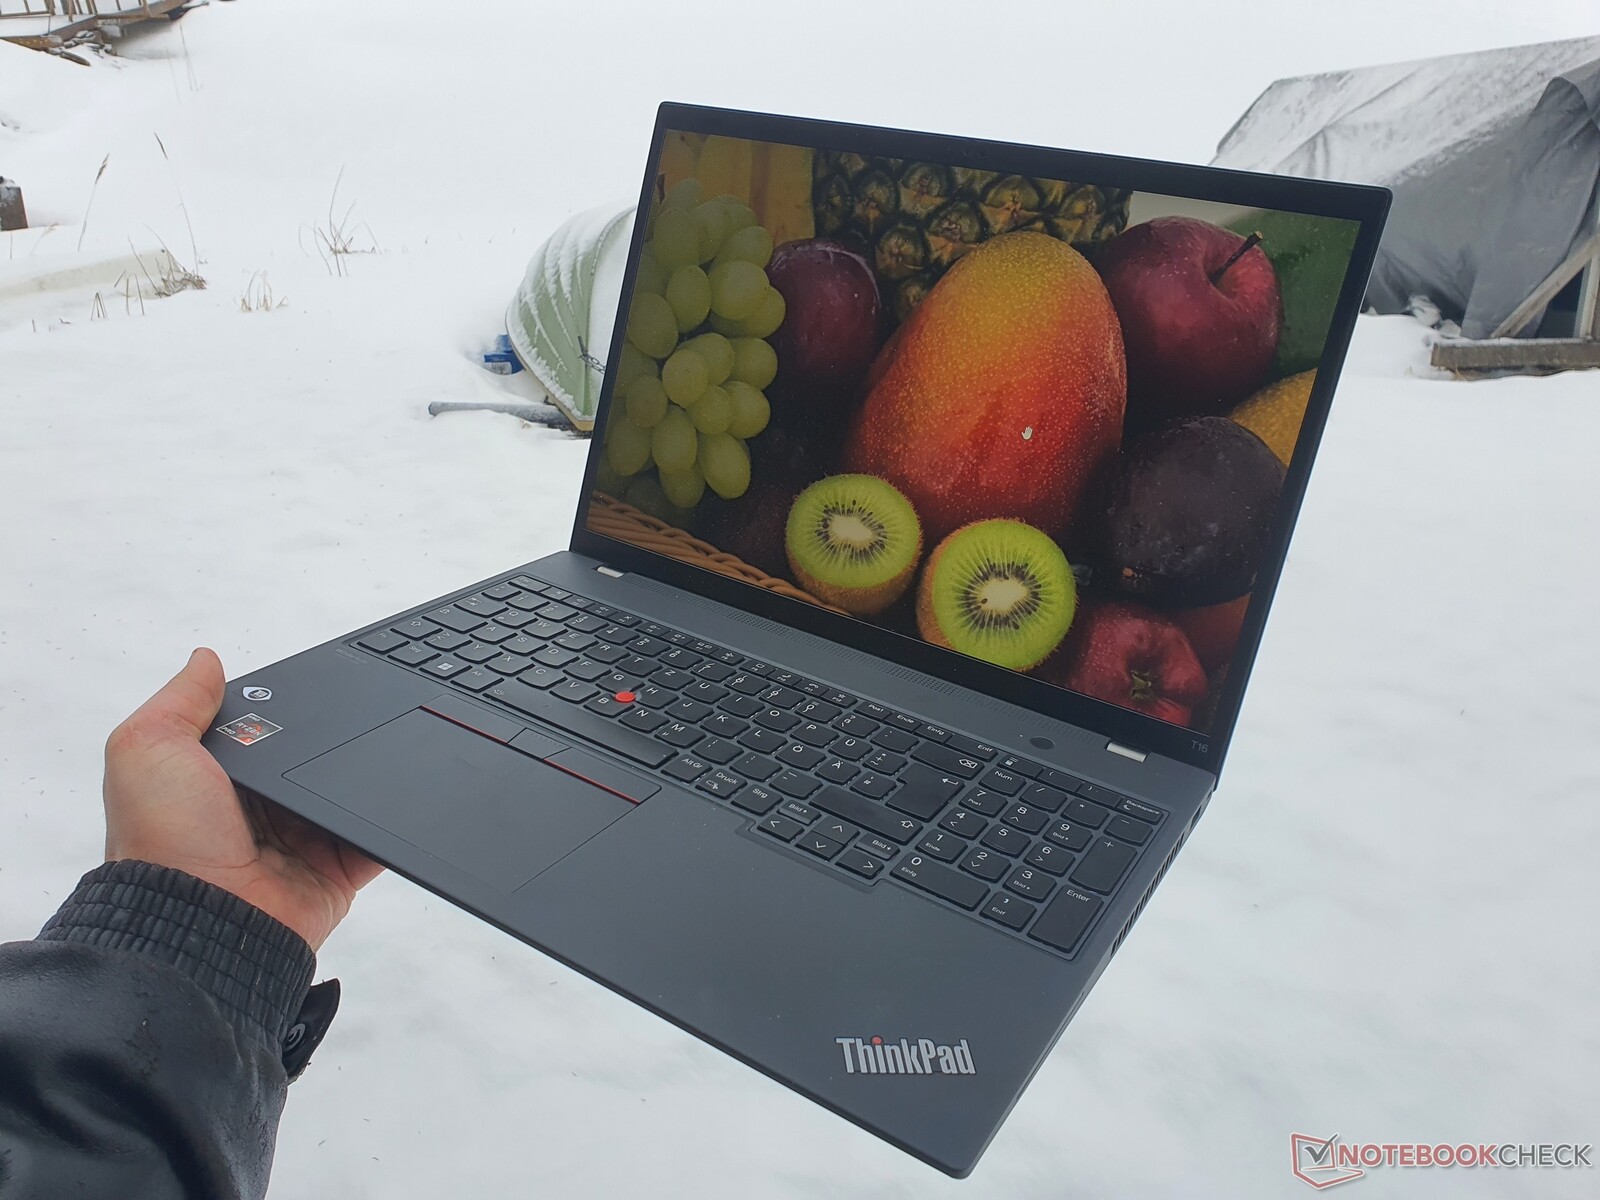
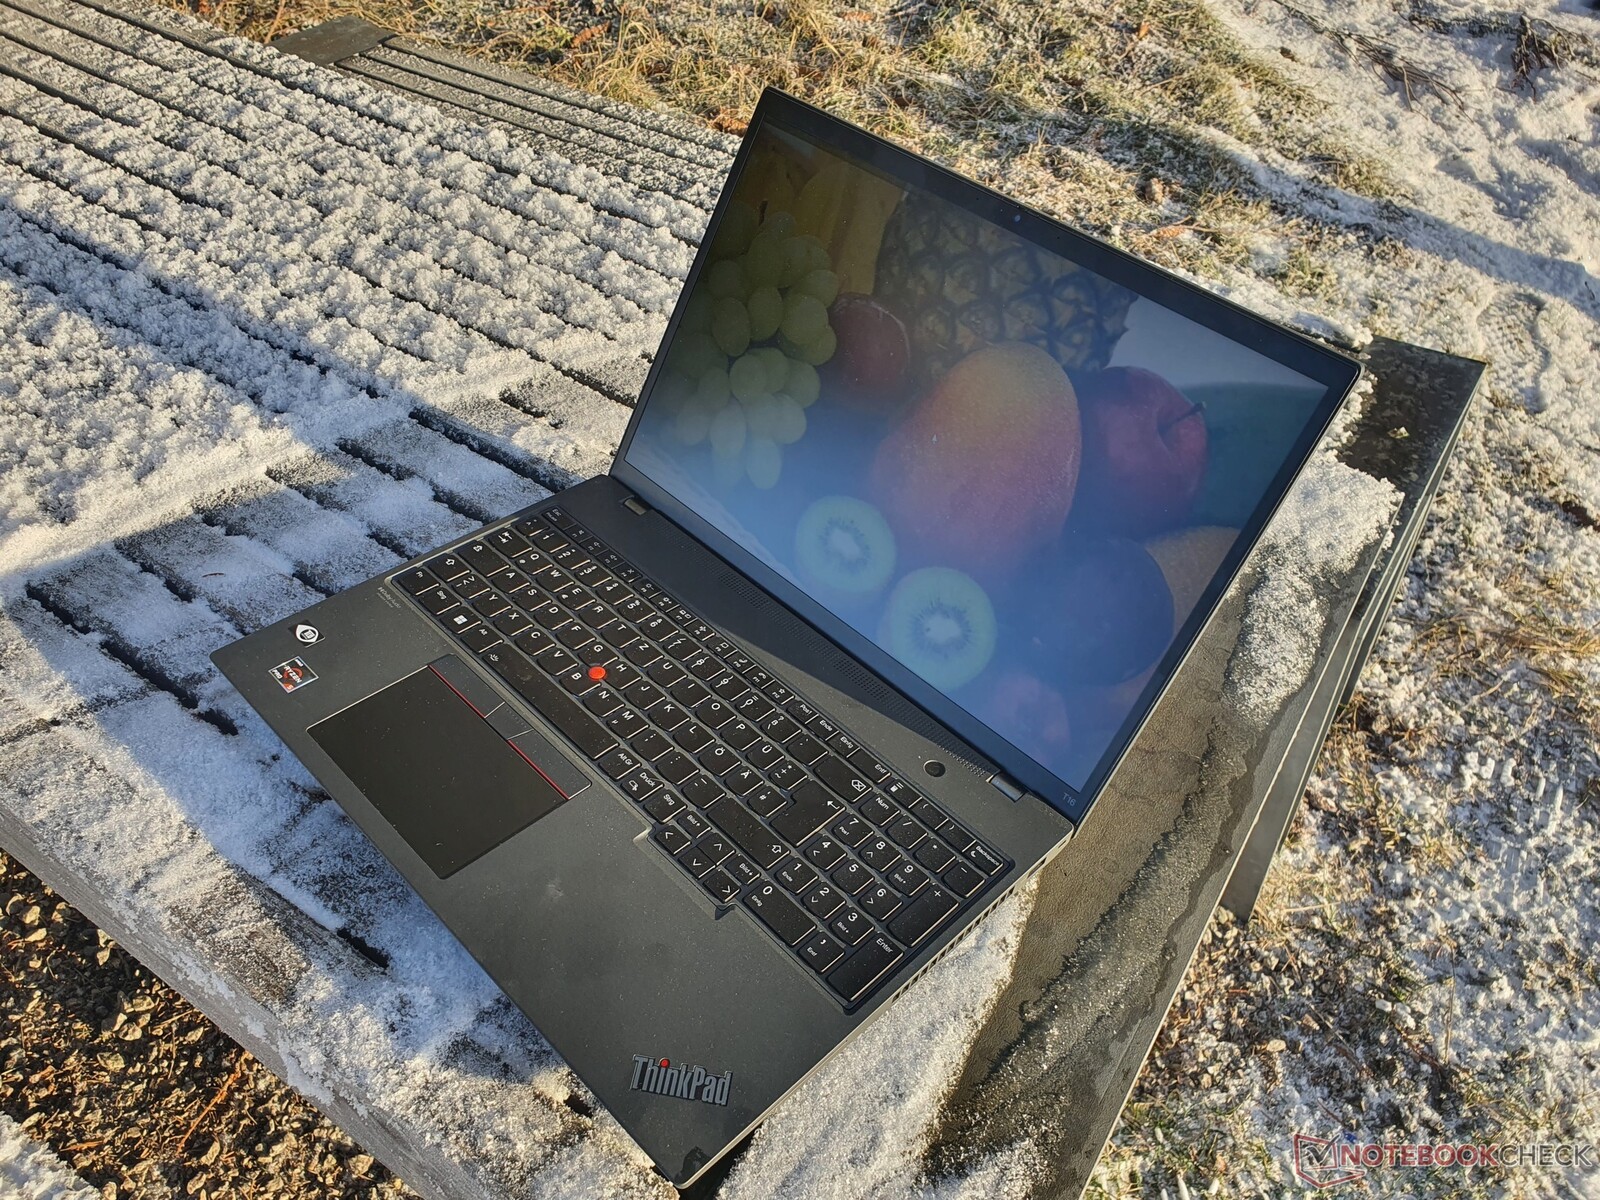
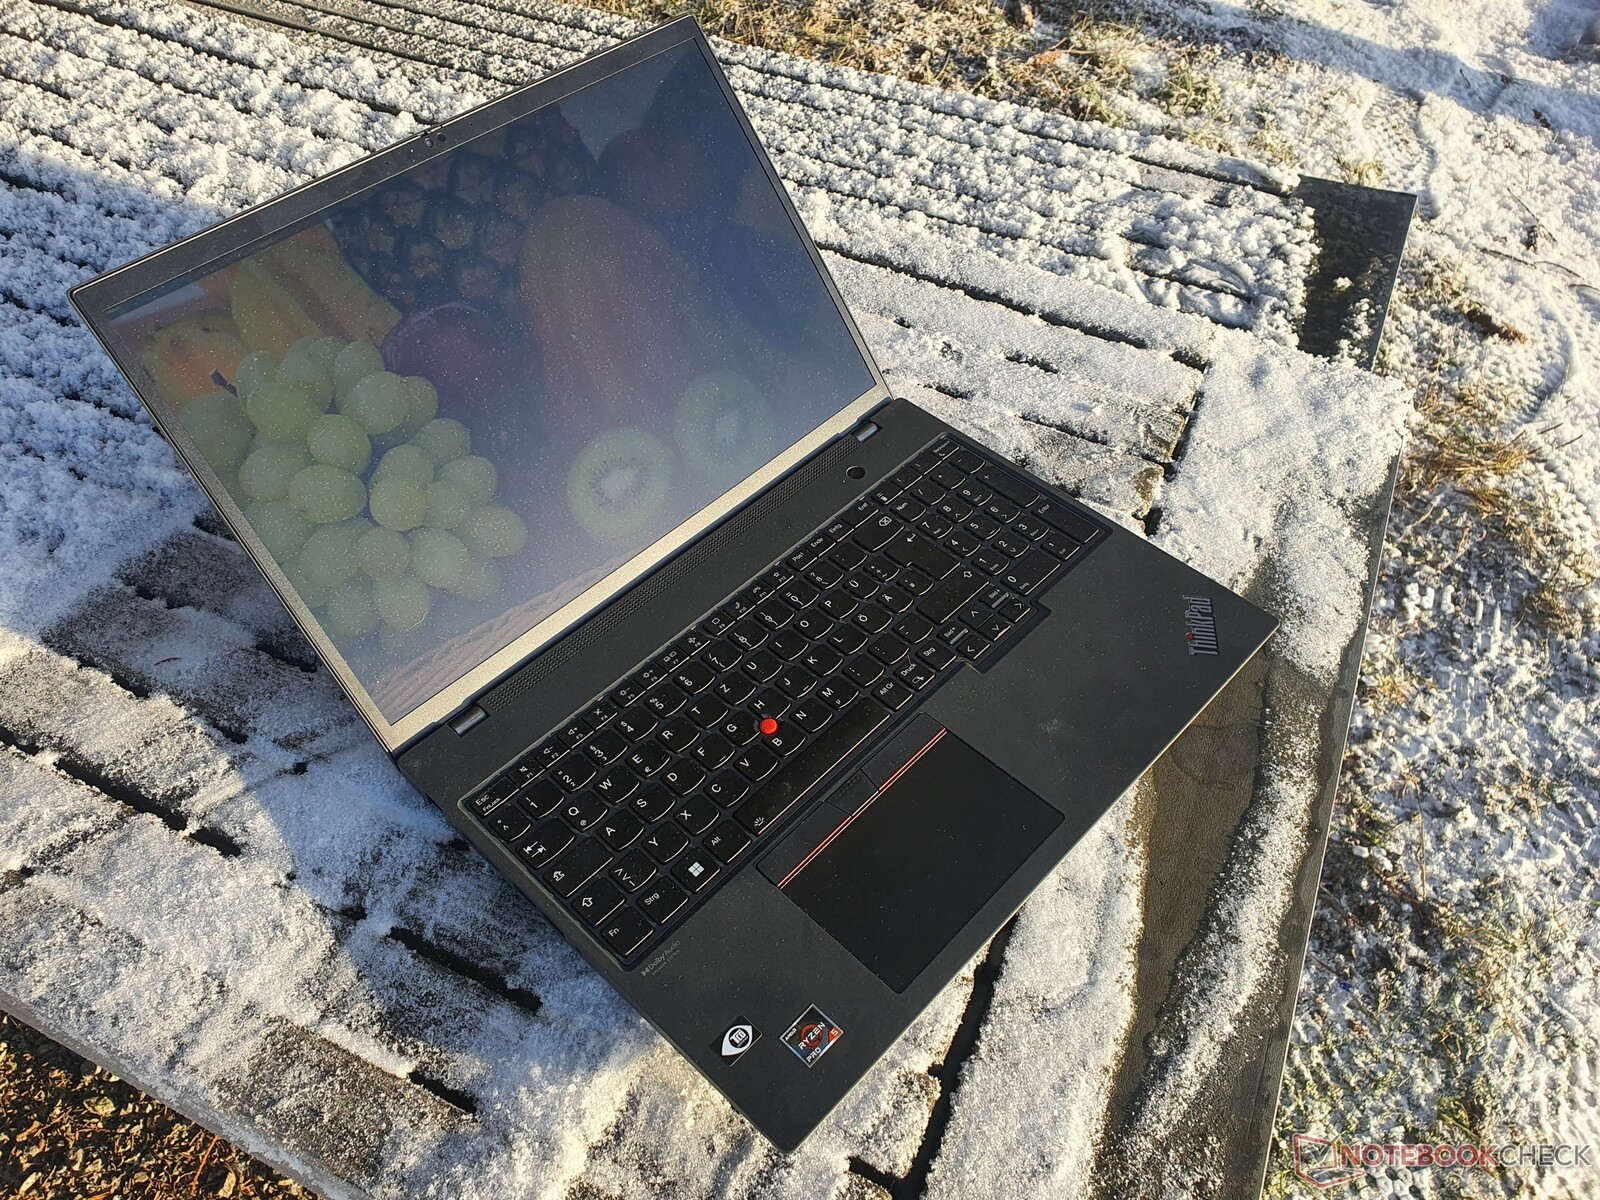
Recenzja laptopa Lenovo ThinkPad T16 G1 AMD: Wydajny i szybszy od Intela
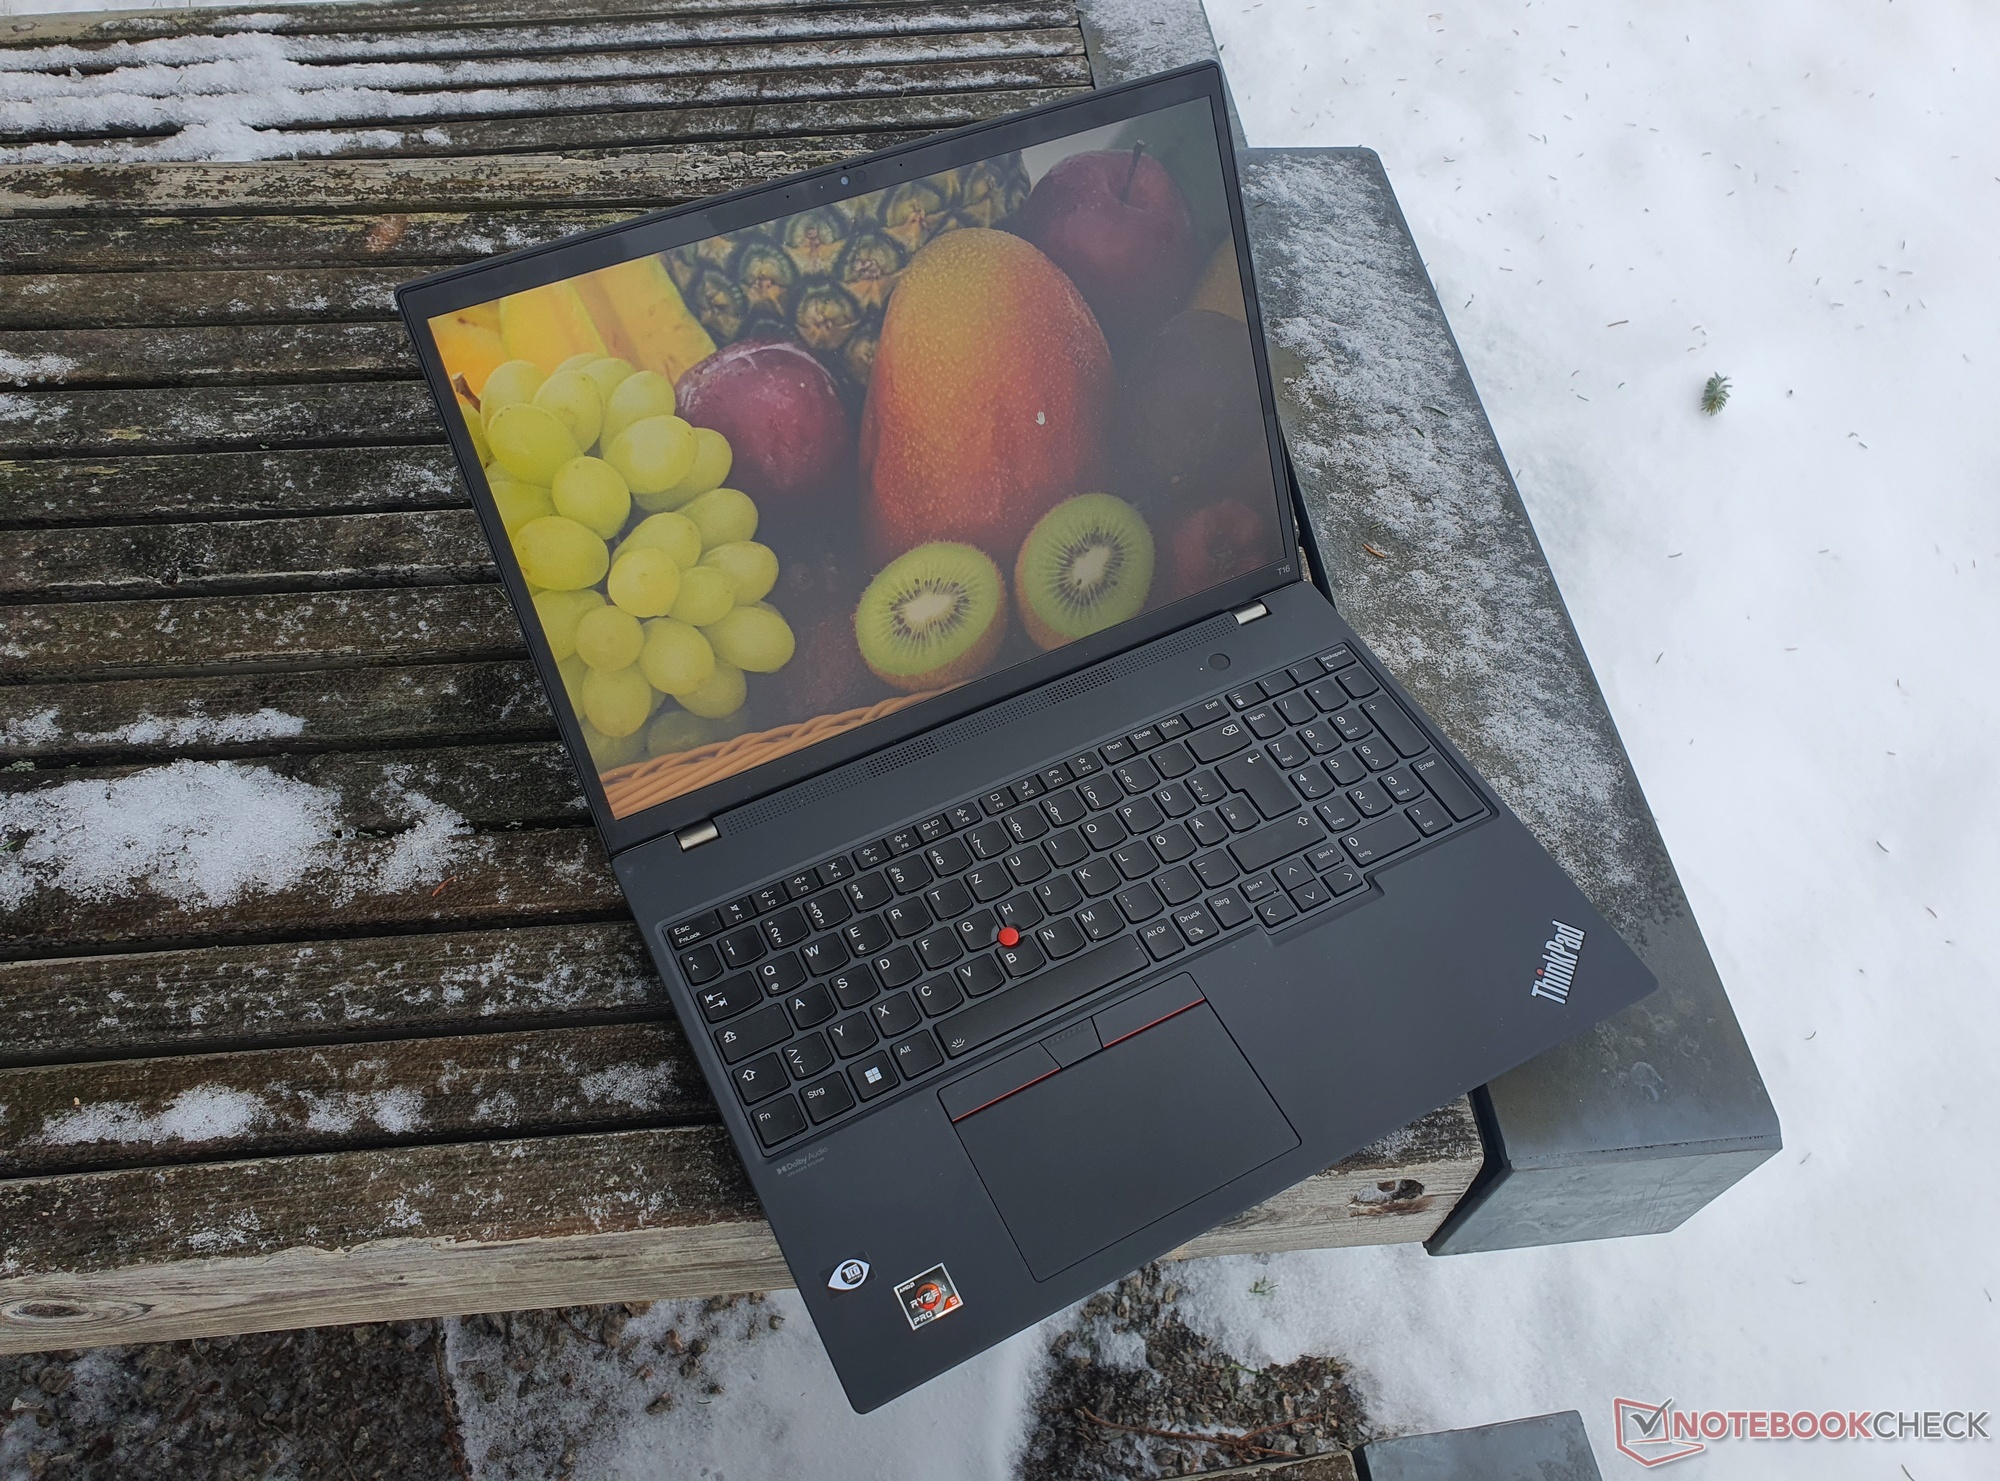
W tej recenzji przyglądamy się wersji AMD Lenovo ThinkPad T16, po tym jak już wcześniej przetestowaliśmy wersję Inteli dostrzegliśmy w niej wiele pozytywnych aspektów. Jednak nadal byliśmy rozczarowani jego wydajnością, co prowadzi nas do nadziei na więcej od obecnych procesorów Ryzen w największym ThinkPadzie serii T. Chcemy też sprawdzić, czy wysłużony T16 G1 będzie jeszcze wydajniejszy z procesorem AMD.
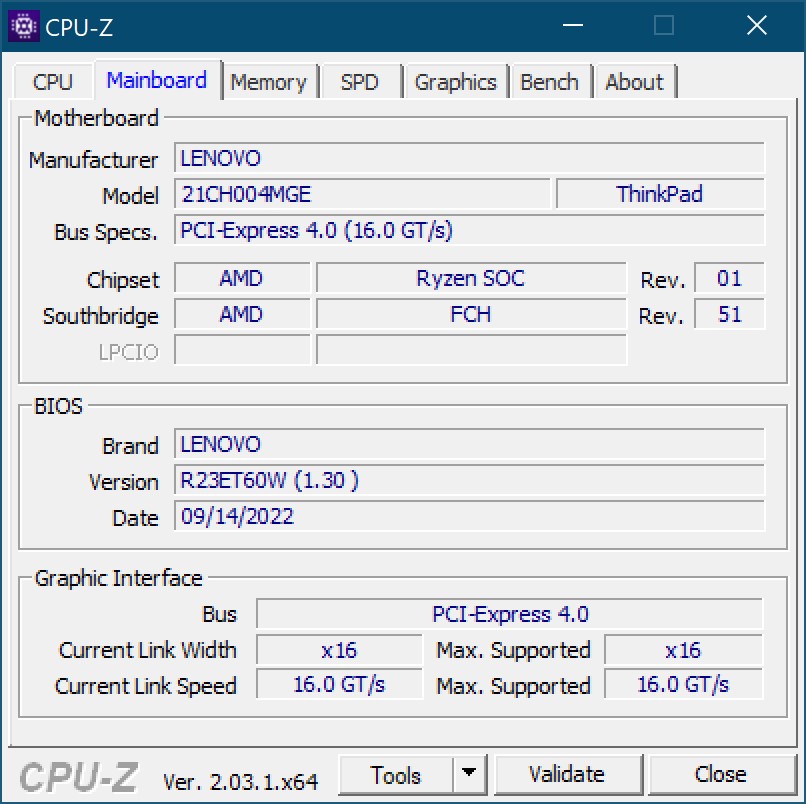
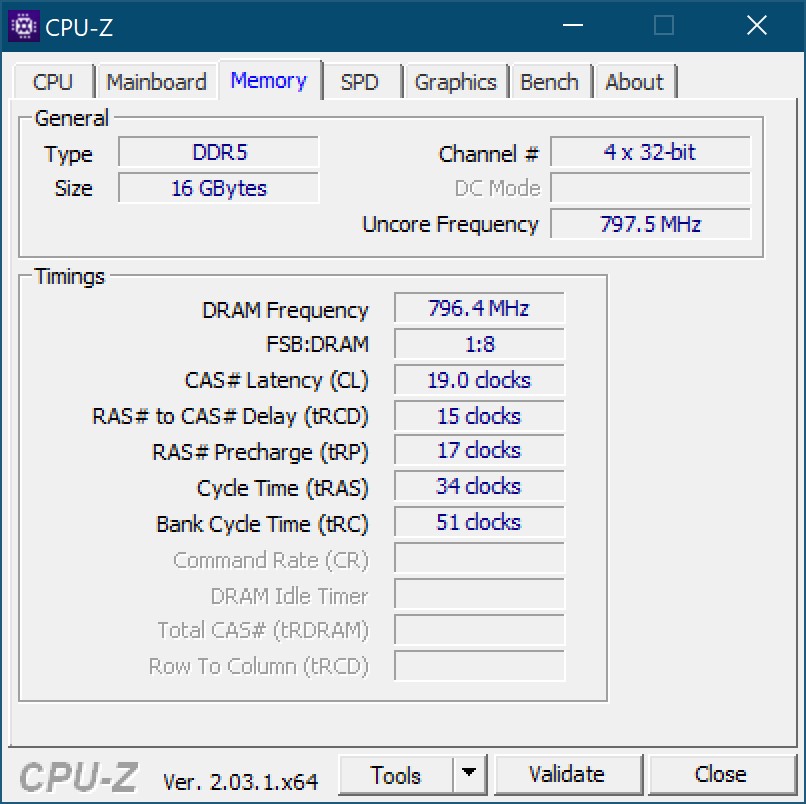
Testujemy wersję modelu z mniejszym akumulatorem 52,5 Wh, wyświetlaczem o wysokiej rozdzielczości WQXGA i sześciordzeniowym procesorem AMD Ryzen 5 PRO 6650U. Do tego dochodzi 16 GB pamięci LPDDR5-RAM, która jest całkowicie wlutowana w przypadku ThinkPadów T16 i T14, oraz dysk SSD PCIe 4.0 o pojemności 512 GB. Zintegrowany Radeon 660Mobsługuje operacje graficzne.
Do konkurentów zalicza się zwłaszcza HP EliteBook 865 G9, ale porównanie do innych 16-calowych ThinkPadów, np ThinkPad Z16 czy nawet np ThinkPad X1 Extremeteż powinno być naprawdę ciekawe. Zamieszczamy też kilka wyników testów dodatkowego modelu T16 z Ryzen 7 PRO 6850Ui skądinąd identycznym wyposażeniem.
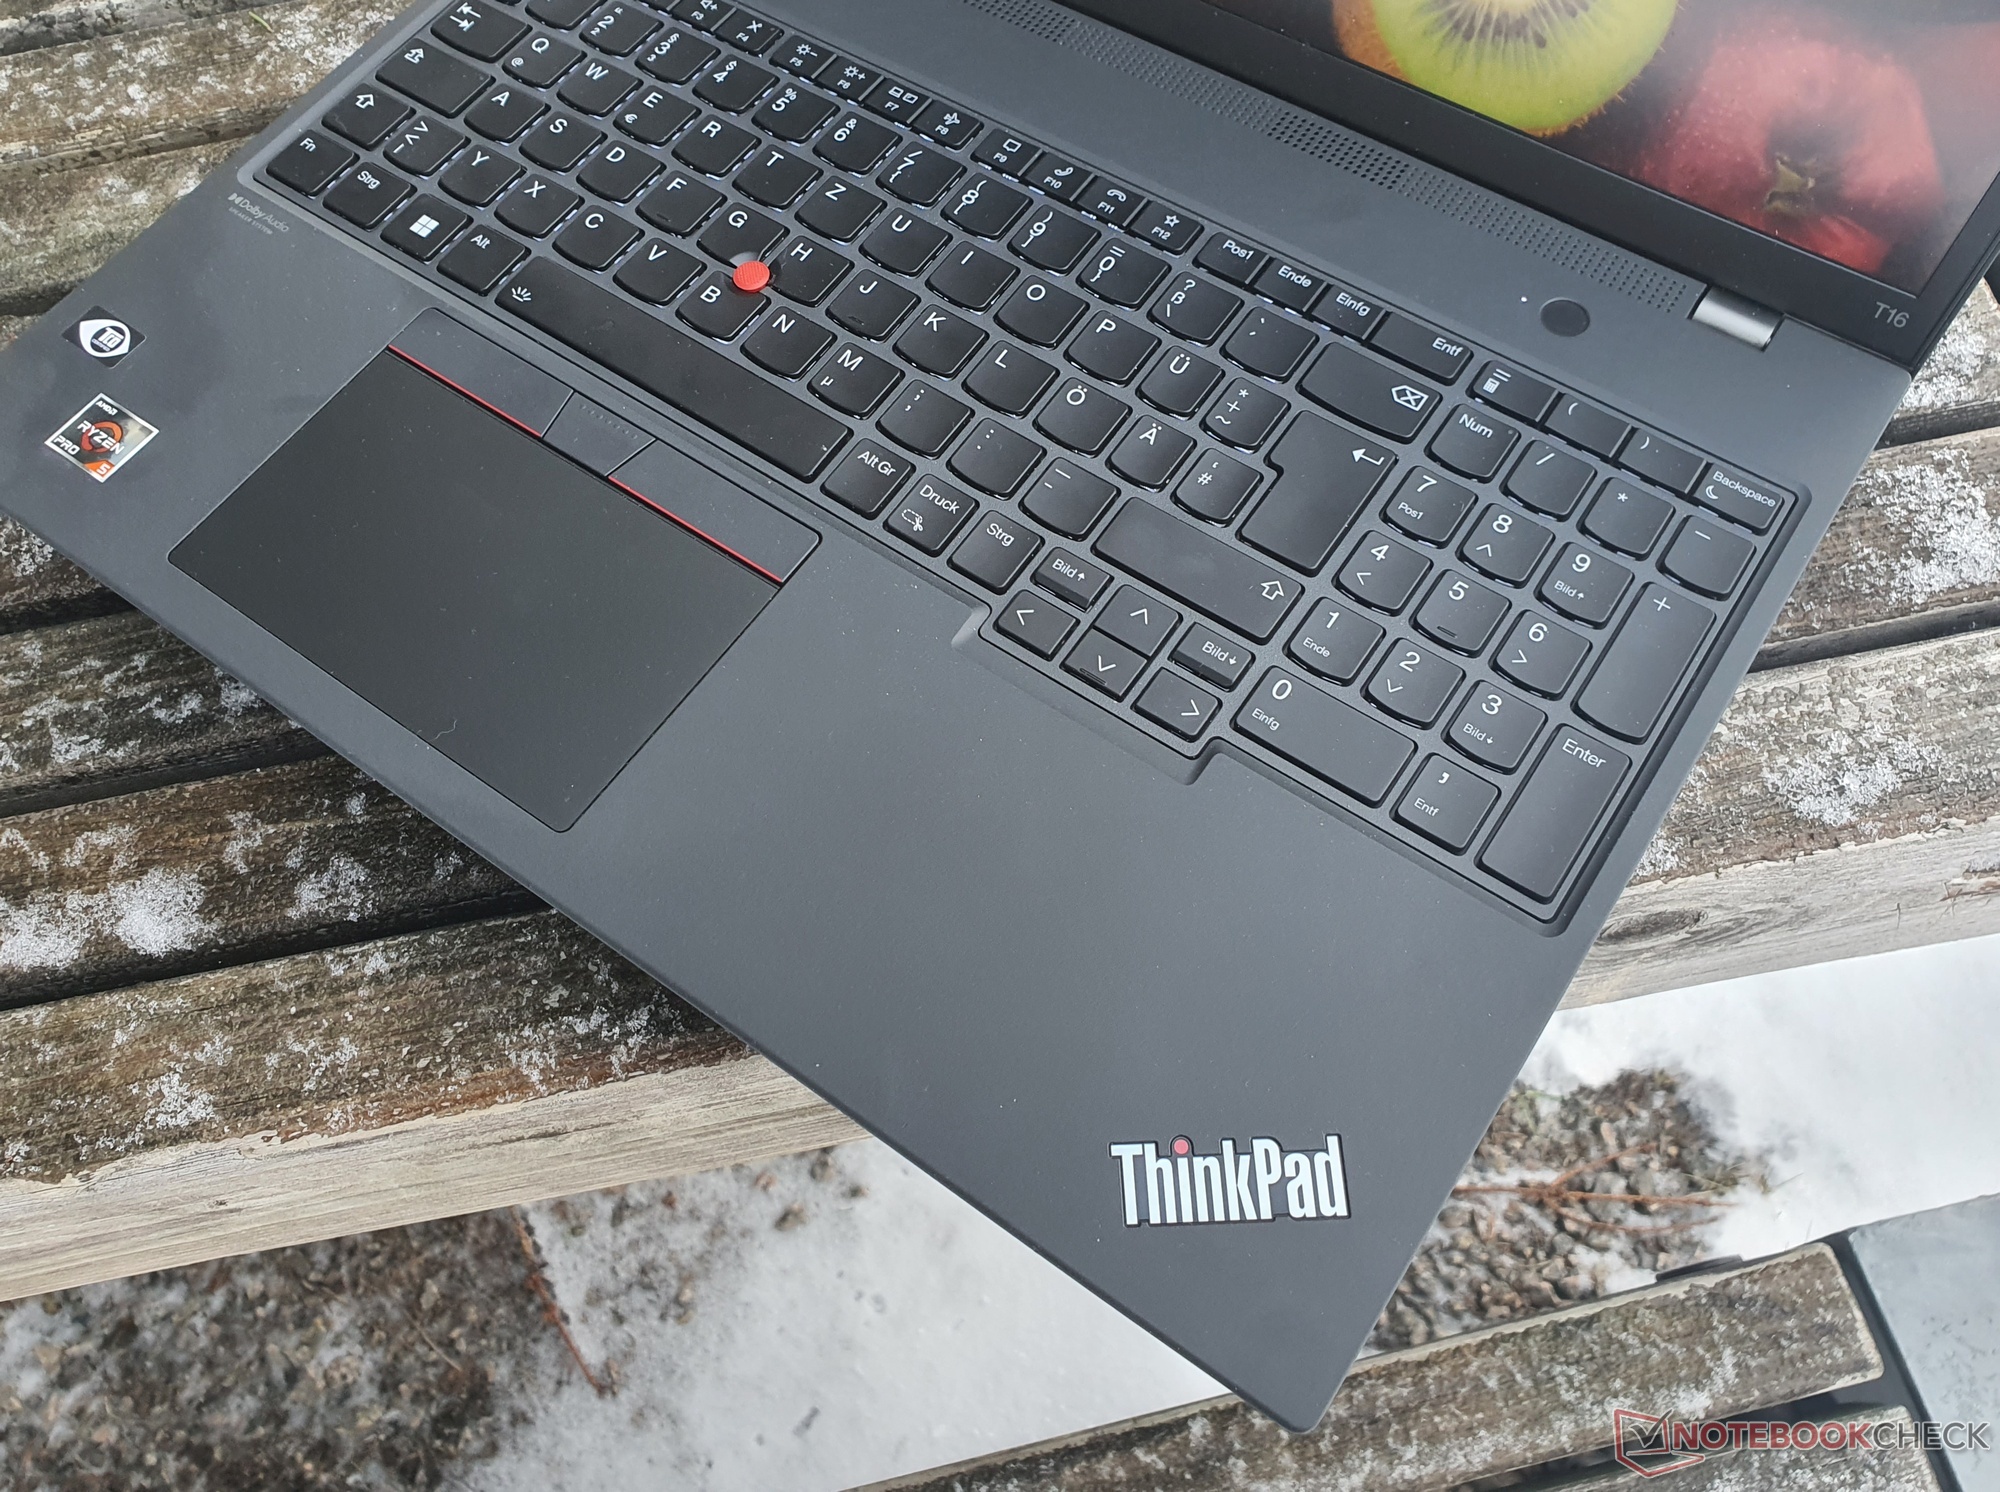
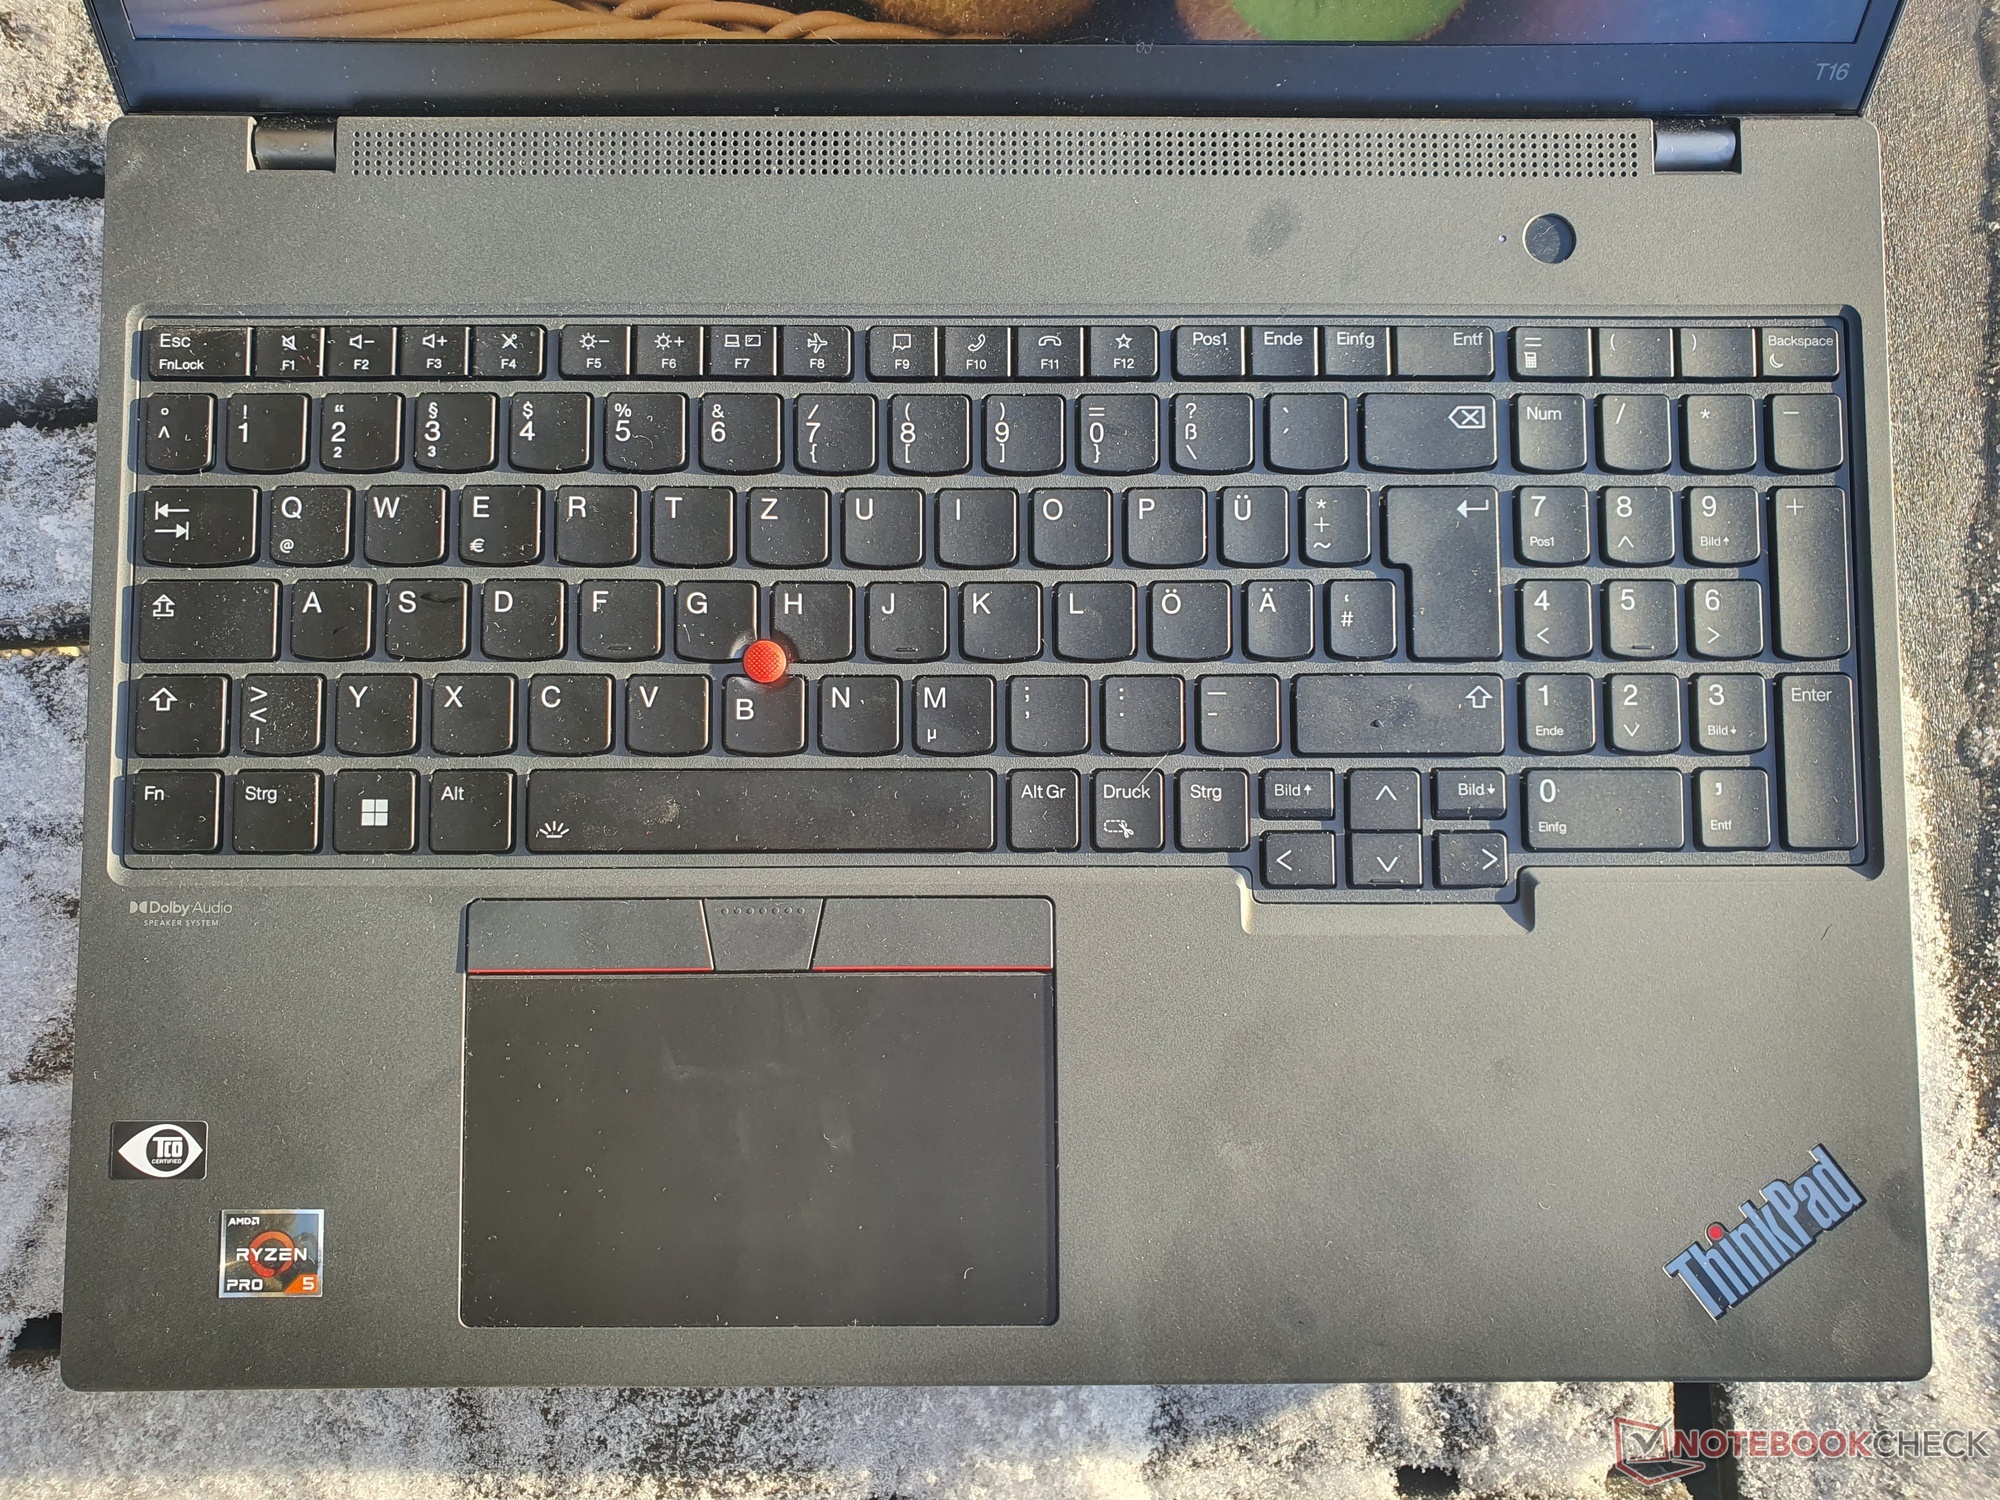
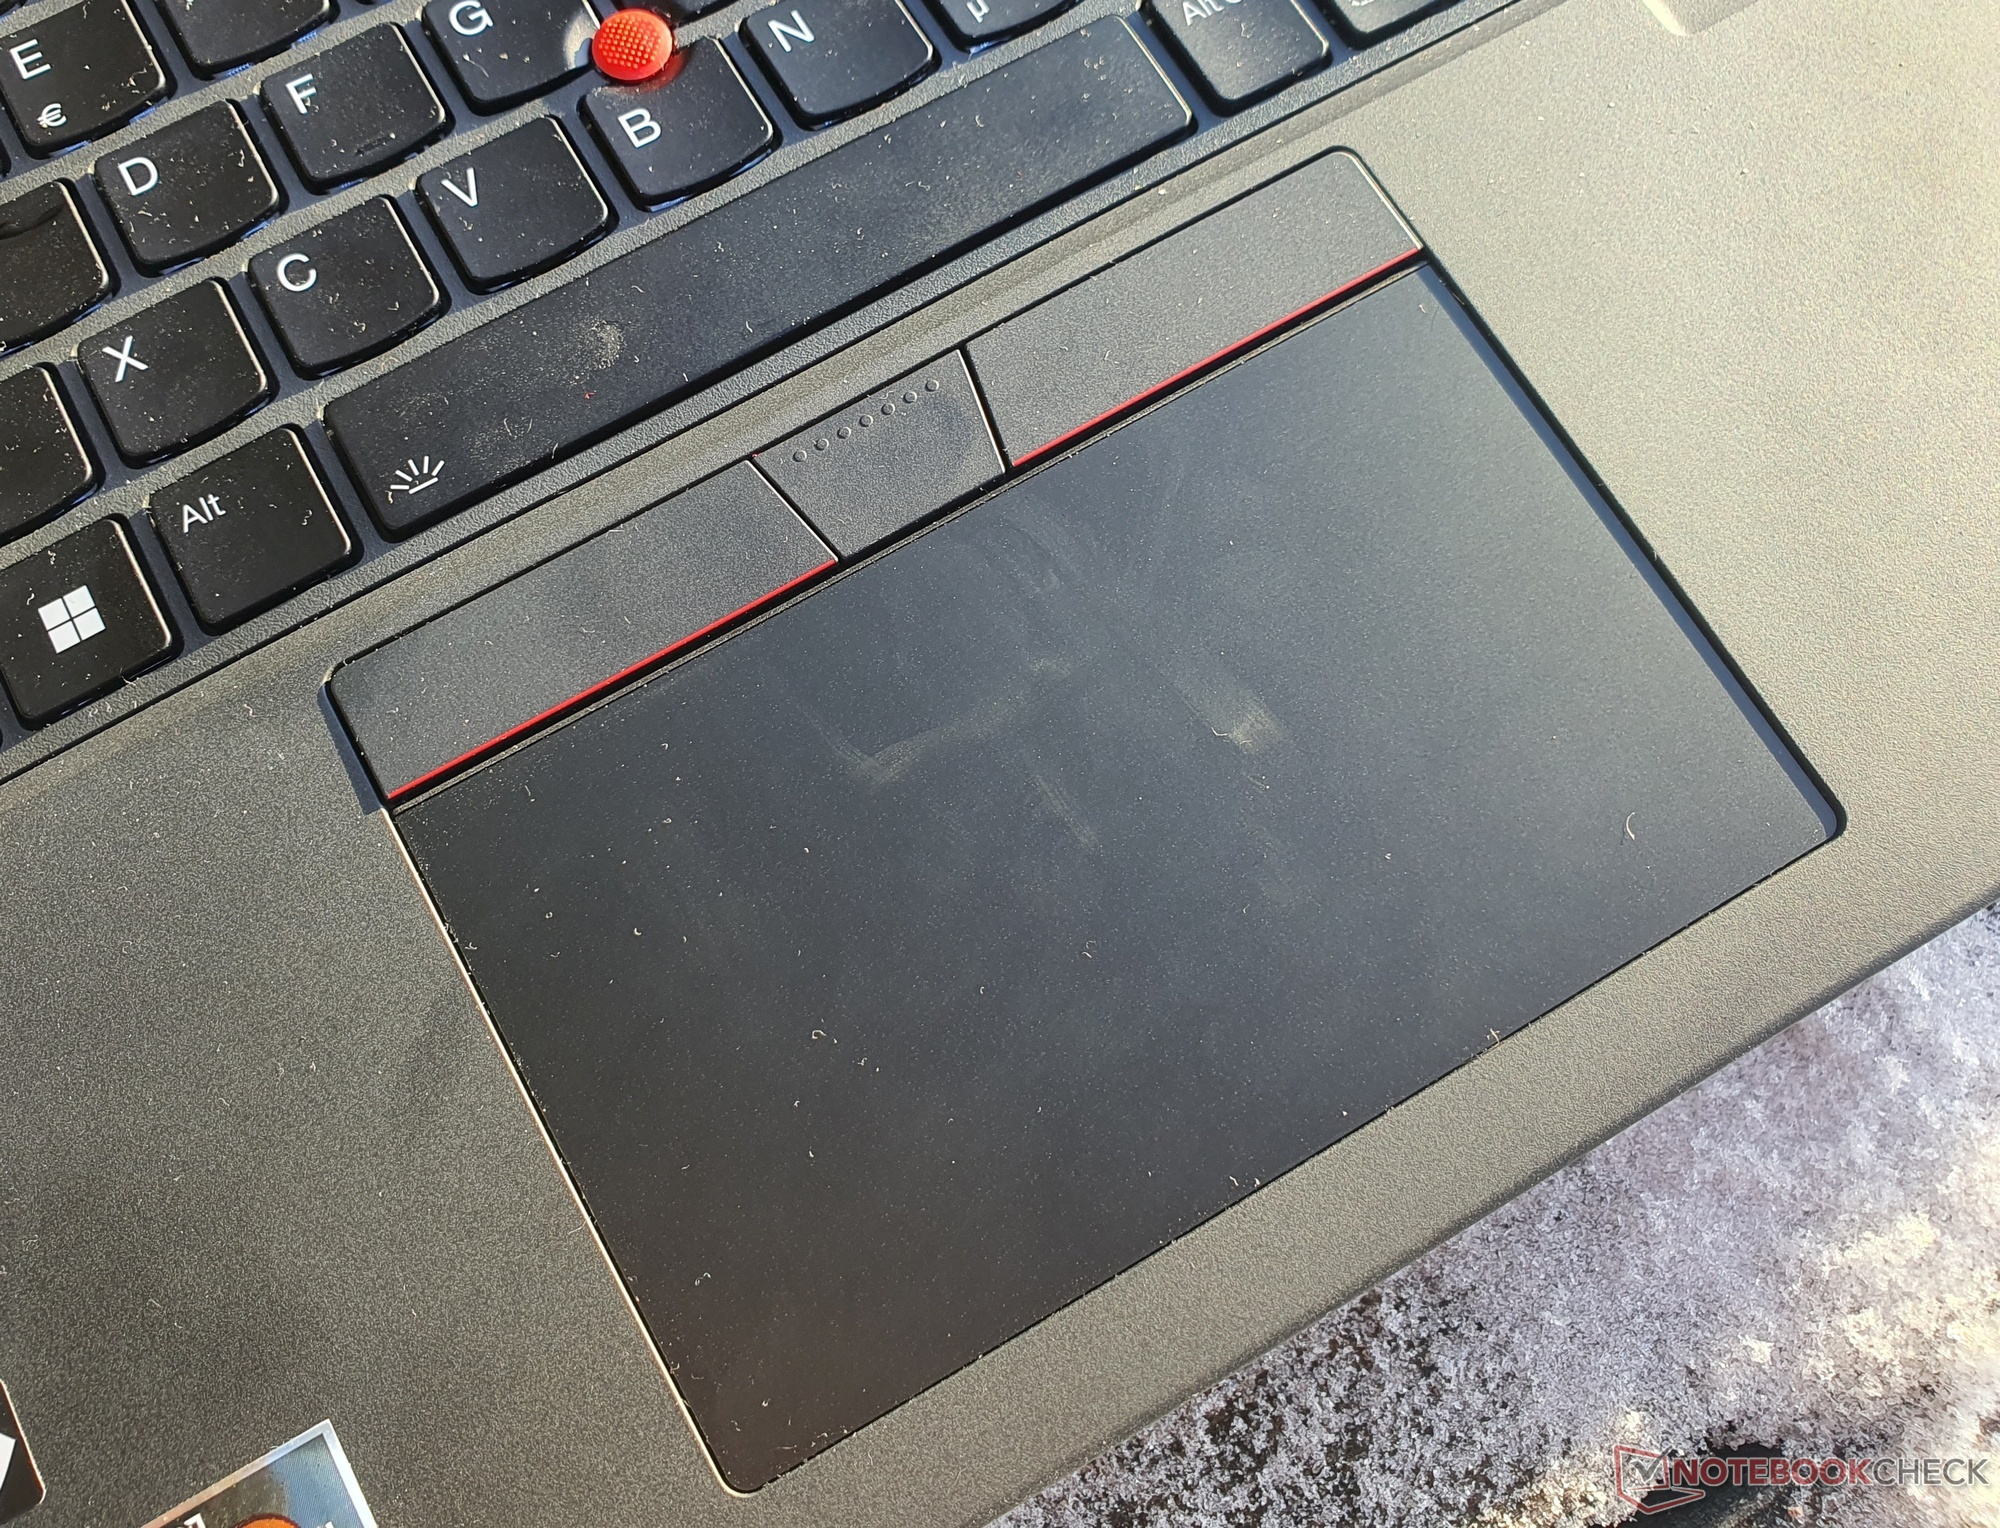
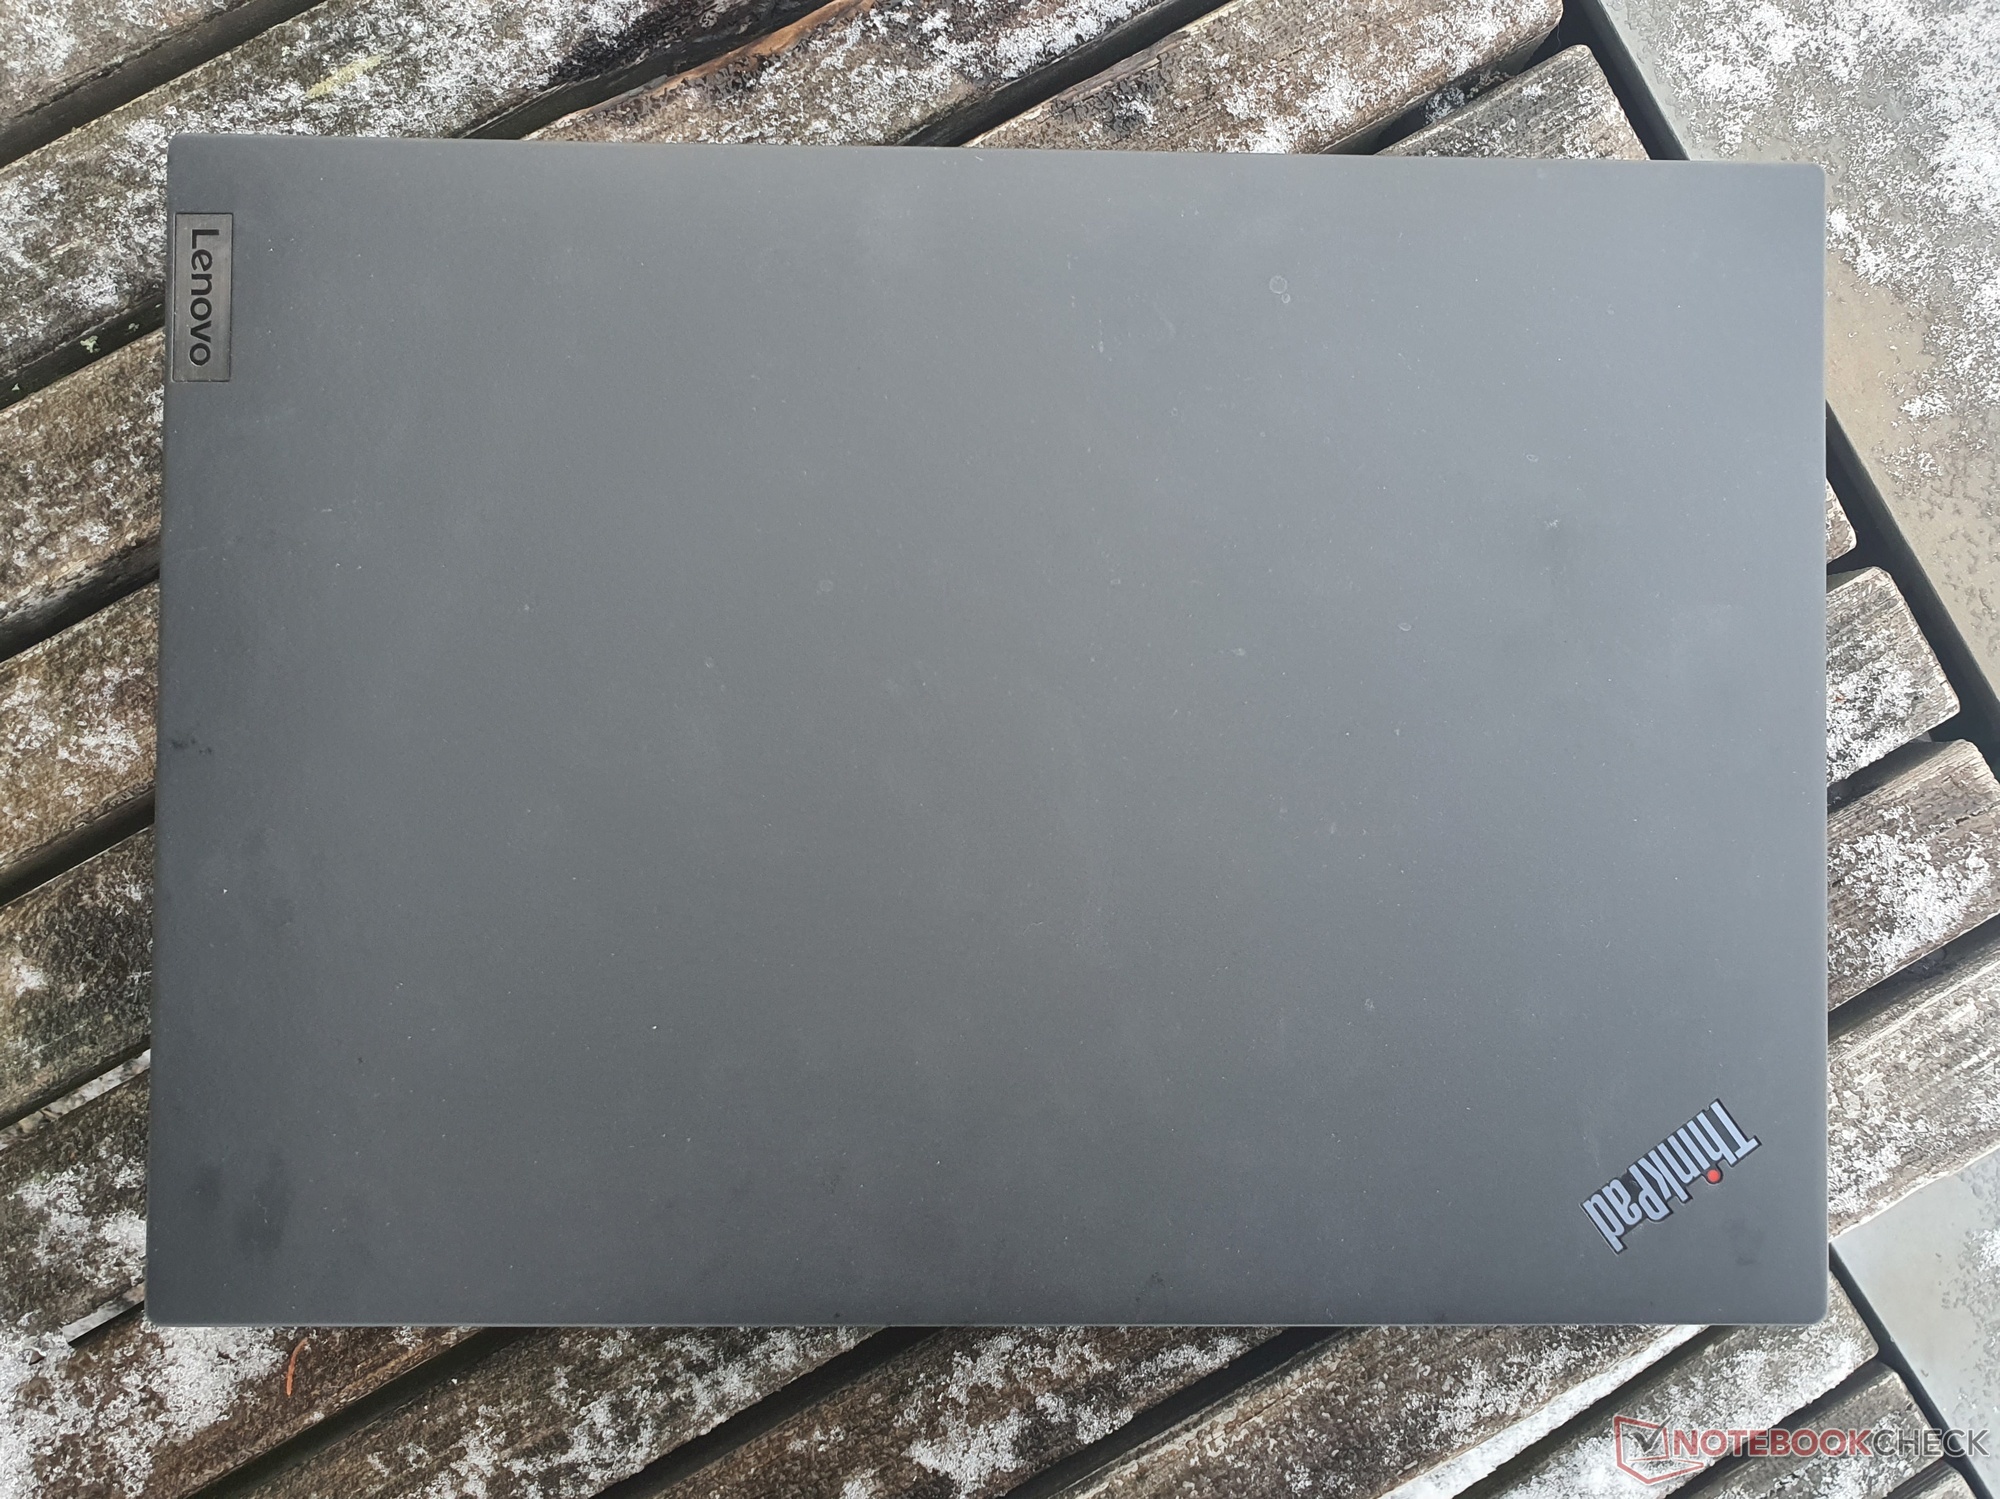
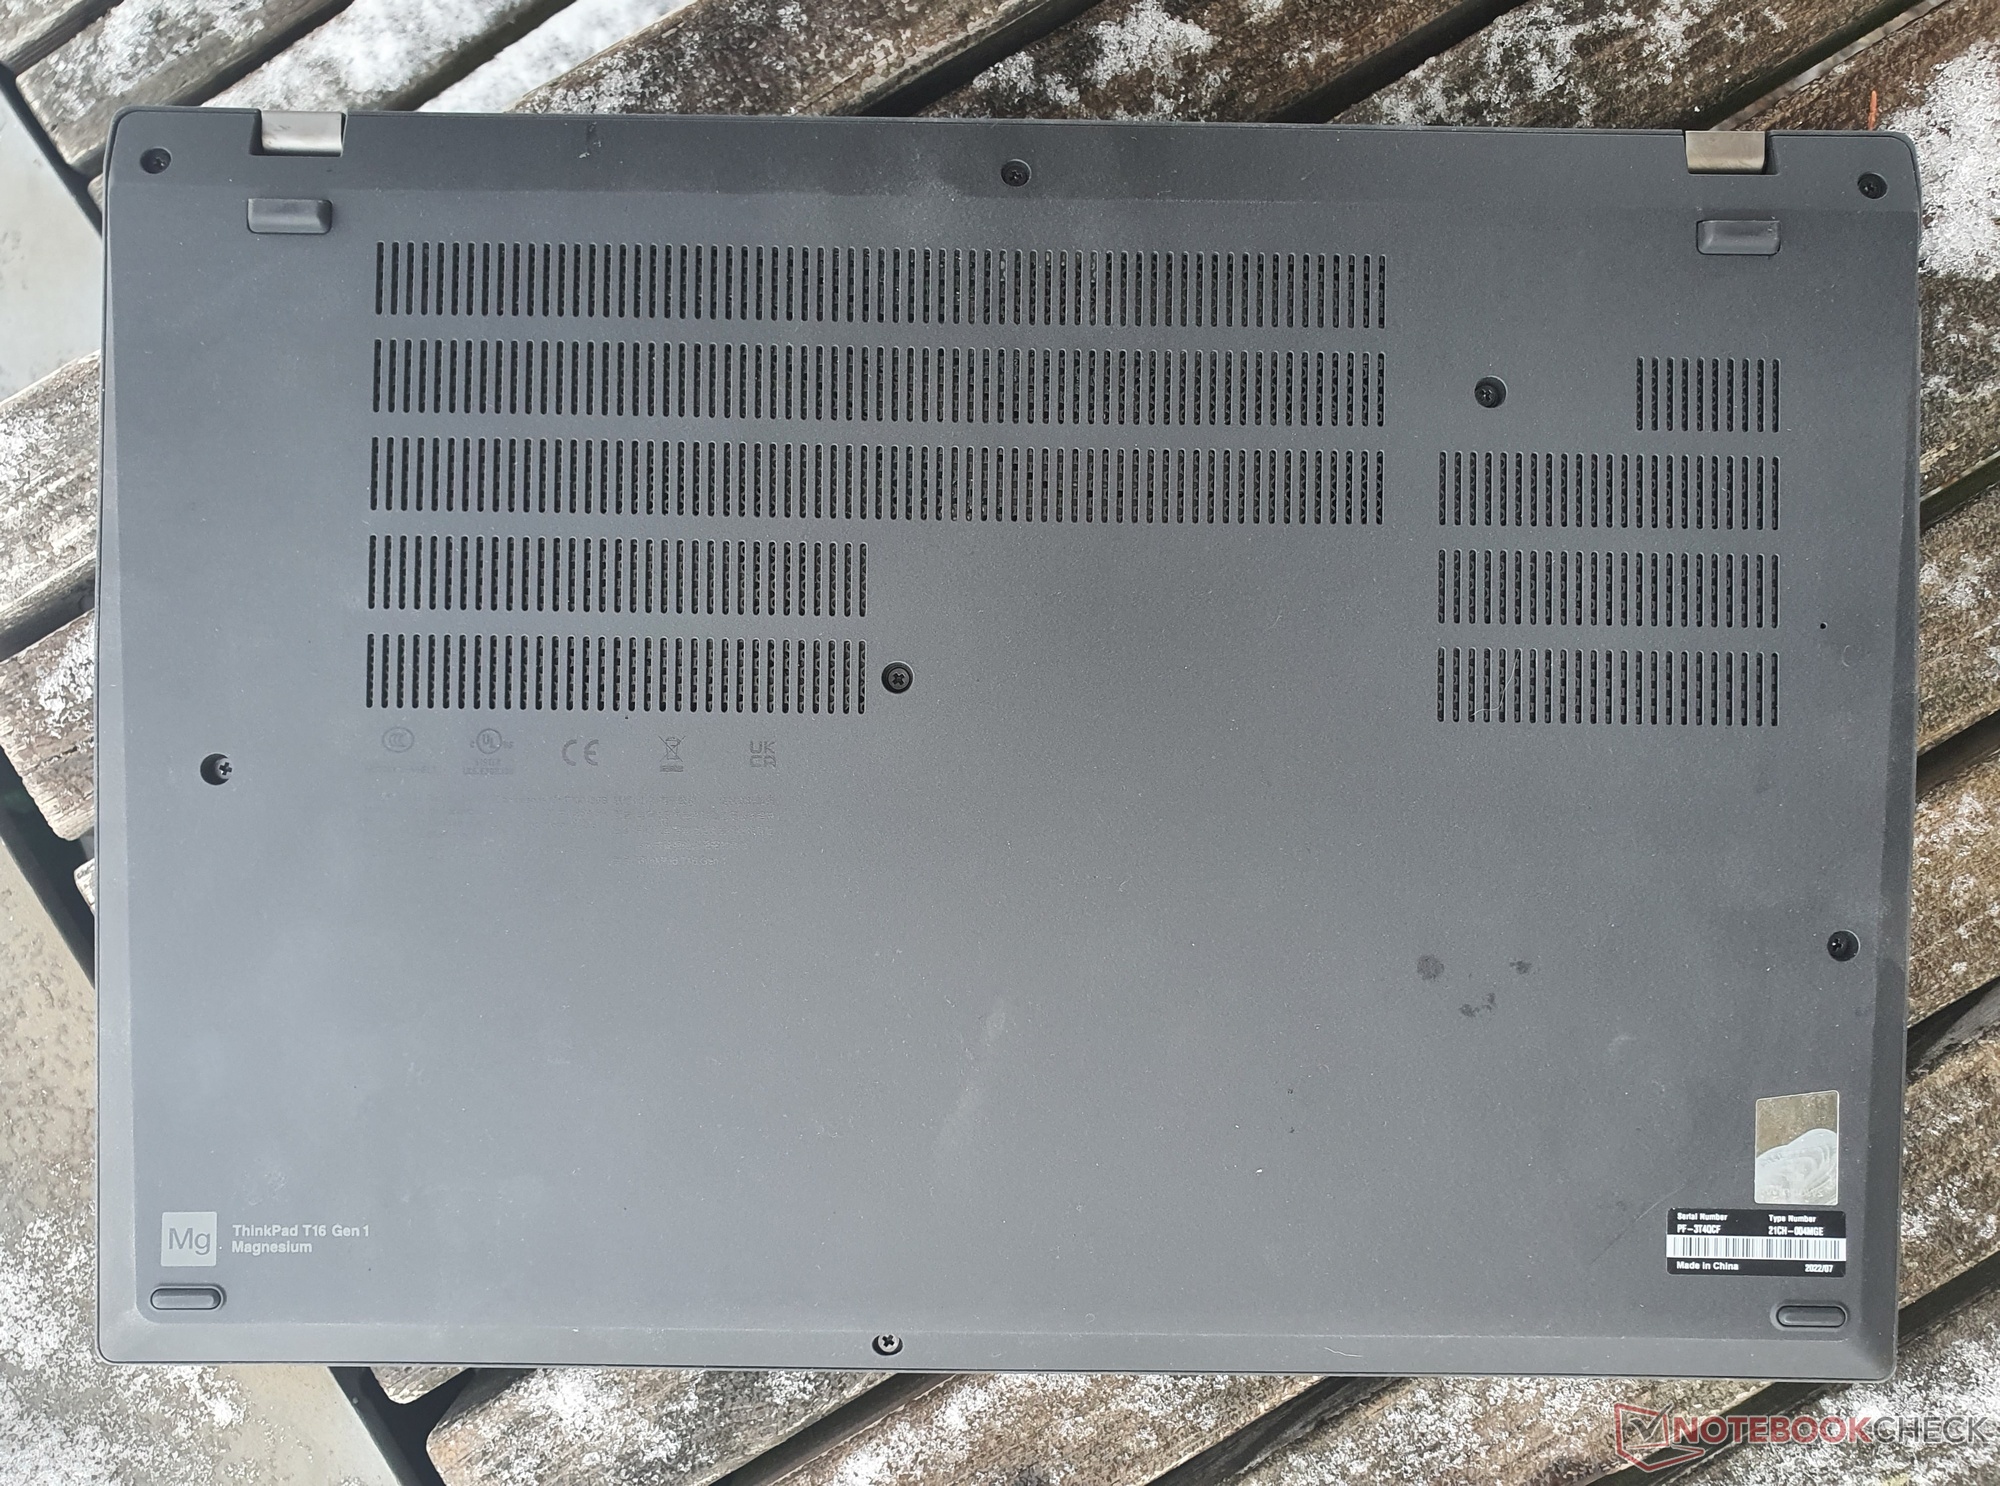
Ponieważ obudowa, sprzęt połączeniowy i urządzenia wejściowe są w zasadzie takie same, szczegółowe informacje na ten temat znajdziecie w naszej recenzji ThinkPada T16 G1 "Intel.
Dodatkowe recenzje Lenovo ThinkPad:
ThinkPad P16 G1
ThinkPad T14s G3 AMD
ThinkPad T14s G3 Intel
ThinkPad X1 Carbon G10
ThinkPad X13 G3 Intel
ThinkPad X13s G1
ThinkPad Z13 G1 OLED
Potencjalni konkurenci w porównaniu
Ocena | Data | Model | Waga | Wysokość | Rozmiar | Rezolucja | Cena |
|---|---|---|---|---|---|---|---|
| 90.2 % v7 (old) | 02/2023 | Lenovo ThinkPad T16 G1 21CH004MGE R5 PRO 6650U, Radeon 660M | 1.8 kg | 20.5 mm | 16.00" | 2560x1600 | |
| 89.3 % v7 (old) | 09/2022 | Lenovo ThinkPad T16 G1 21BWS00200 i5-1240P, Iris Xe G7 80EUs | 1.9 kg | 20.5 mm | 16.00" | 1920x1200 | |
| 87.2 % v7 (old) | 12/2022 | HP EliteBook 865 G9 R7 PRO 6850U, Radeon 680M | 1.9 kg | 19 mm | 16.00" | 1920x1200 | |
| 87.3 % v7 (old) | 10/2022 | Lenovo ThinkPad Z16 G1 21D5S00T00 R7 PRO 6850H, Radeon RX 6500M | 1.9 kg | 15.8 mm | 16.00" | 1920x1200 | |
| 88.7 % v7 (old) | 12/2022 | Lenovo ThinkPad X1 Extreme G5-21DE003RGE i7-12700H, GeForce RTX 3060 Laptop GPU | 2.1 kg | 17.9 mm | 16.00" | 3840x2400 | |
| 86.2 % v7 (old) | Lenovo ThinkPad P15v G2 21A9000XGE i7-11800H, T1200 Laptop GPU | 2.3 kg | 22.7 mm | 15.60" | 1920x1080 | ||
| 87.4 % v7 (old) | 01/2023 | HP ZBook Power 15 G9 6B8C4EA i7-12700H, RTX A2000 Laptop GPU | 2 kg | 22.8 mm | 15.60" | 3840x2160 |

Połączenia
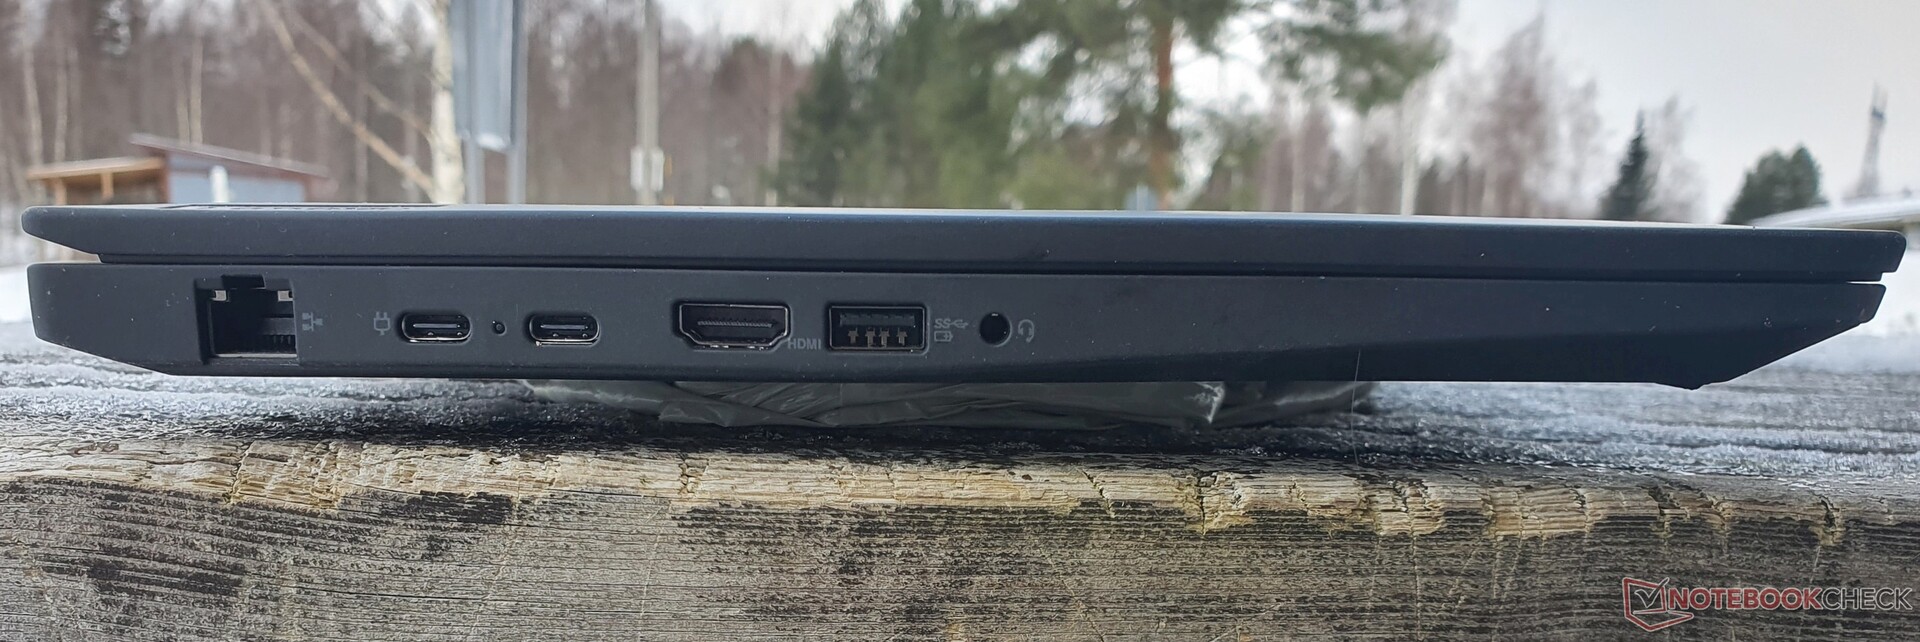
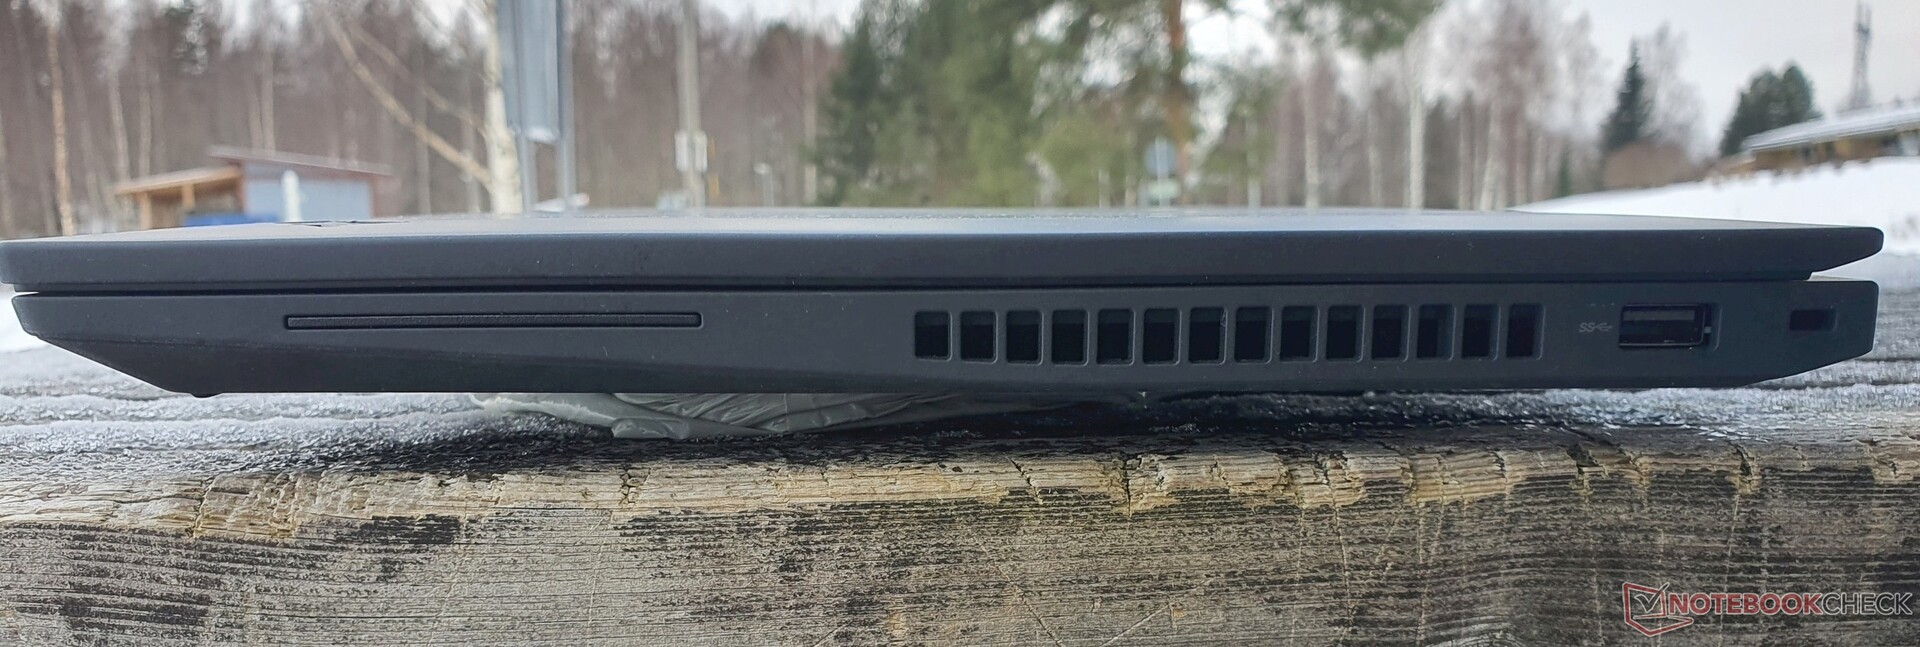
Połączenia są w zasadzie takie same jak w Modelu Intela, z tą tylko różnicą, że brakuje Thunderbolt 4 i USB 4.
Komunikacja
Podobnie jak w ThinkPad T14 AMDi ThinkPad Z16, zastosowano tu również moduł Wi-Fi 6E firmy Qualcomm WCN685x wraz z Bluetooth 5.2, co prowadzi do bardzo szybkich prędkości transferu. Na naszym polu porównawczym wszystkie urządzenia są pod tym względem podobnie szybkie. Mimo że nasz testowy egzemplarz nie posiada modułu WWAN, to i tak zawiera niezbędne anteny.
Kamera internetowa
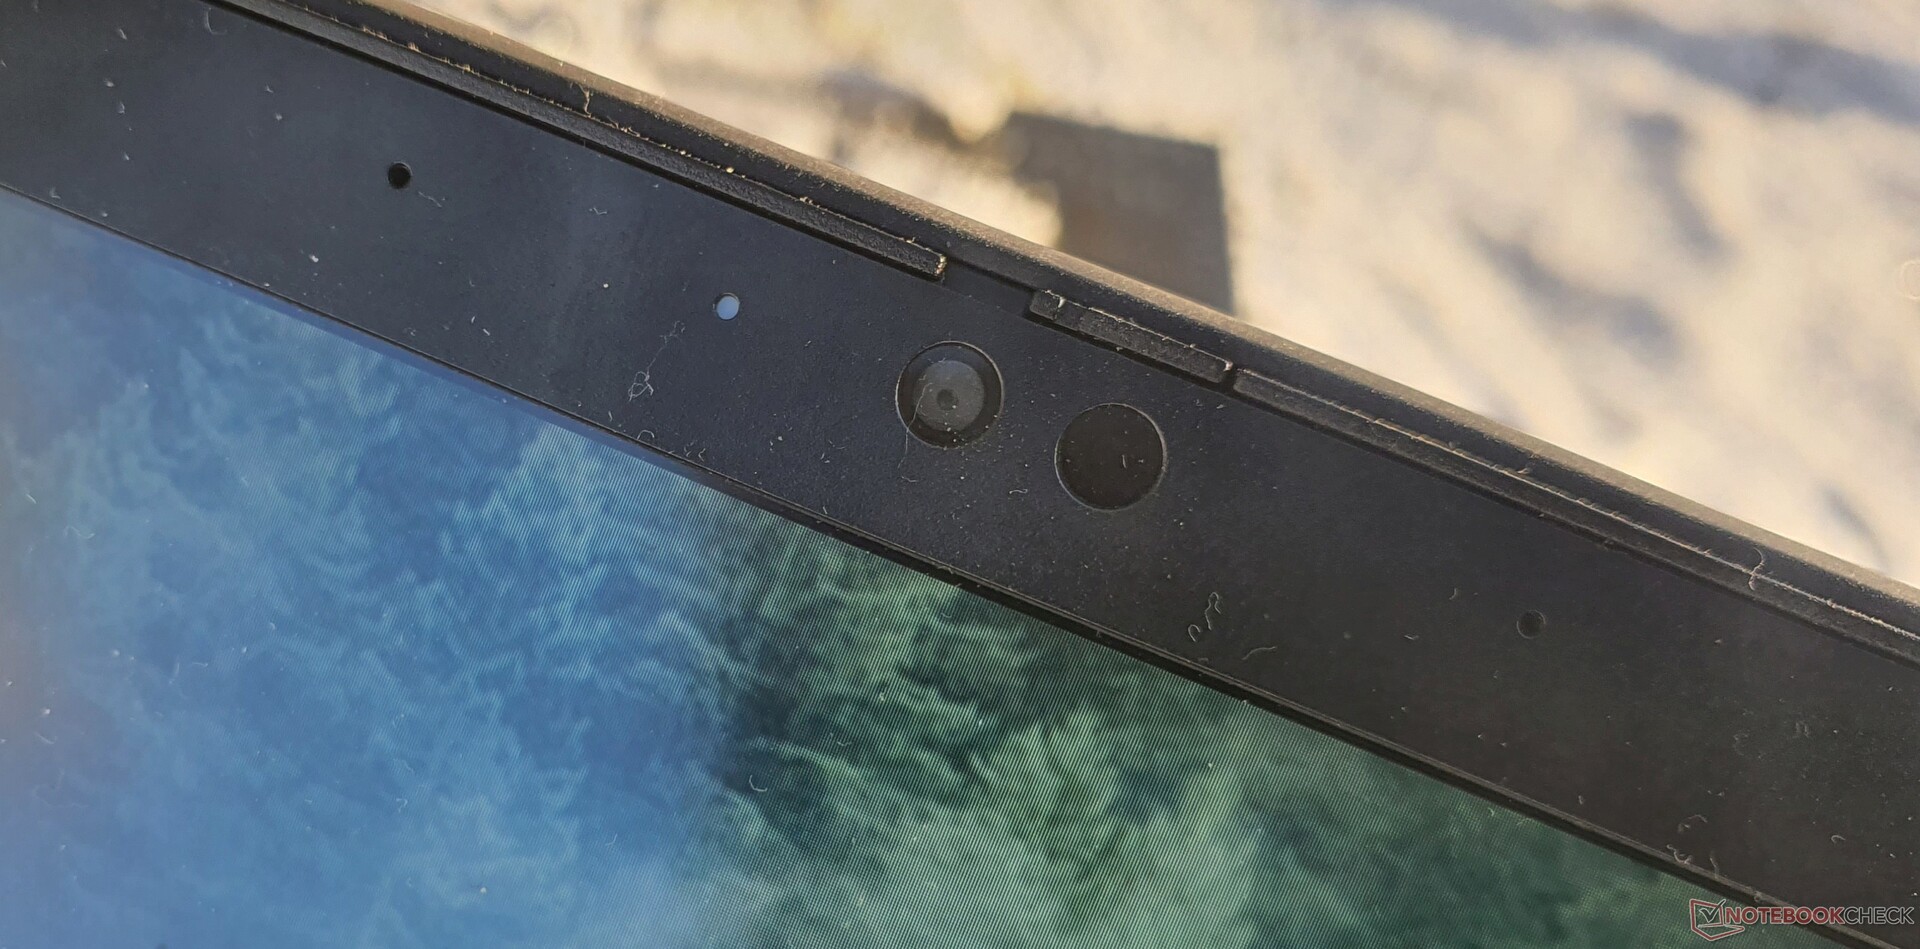
Kamera internetowa o rozdzielczości 1,080p jest identyczna jak ta w ThinkPad T16 Intel.


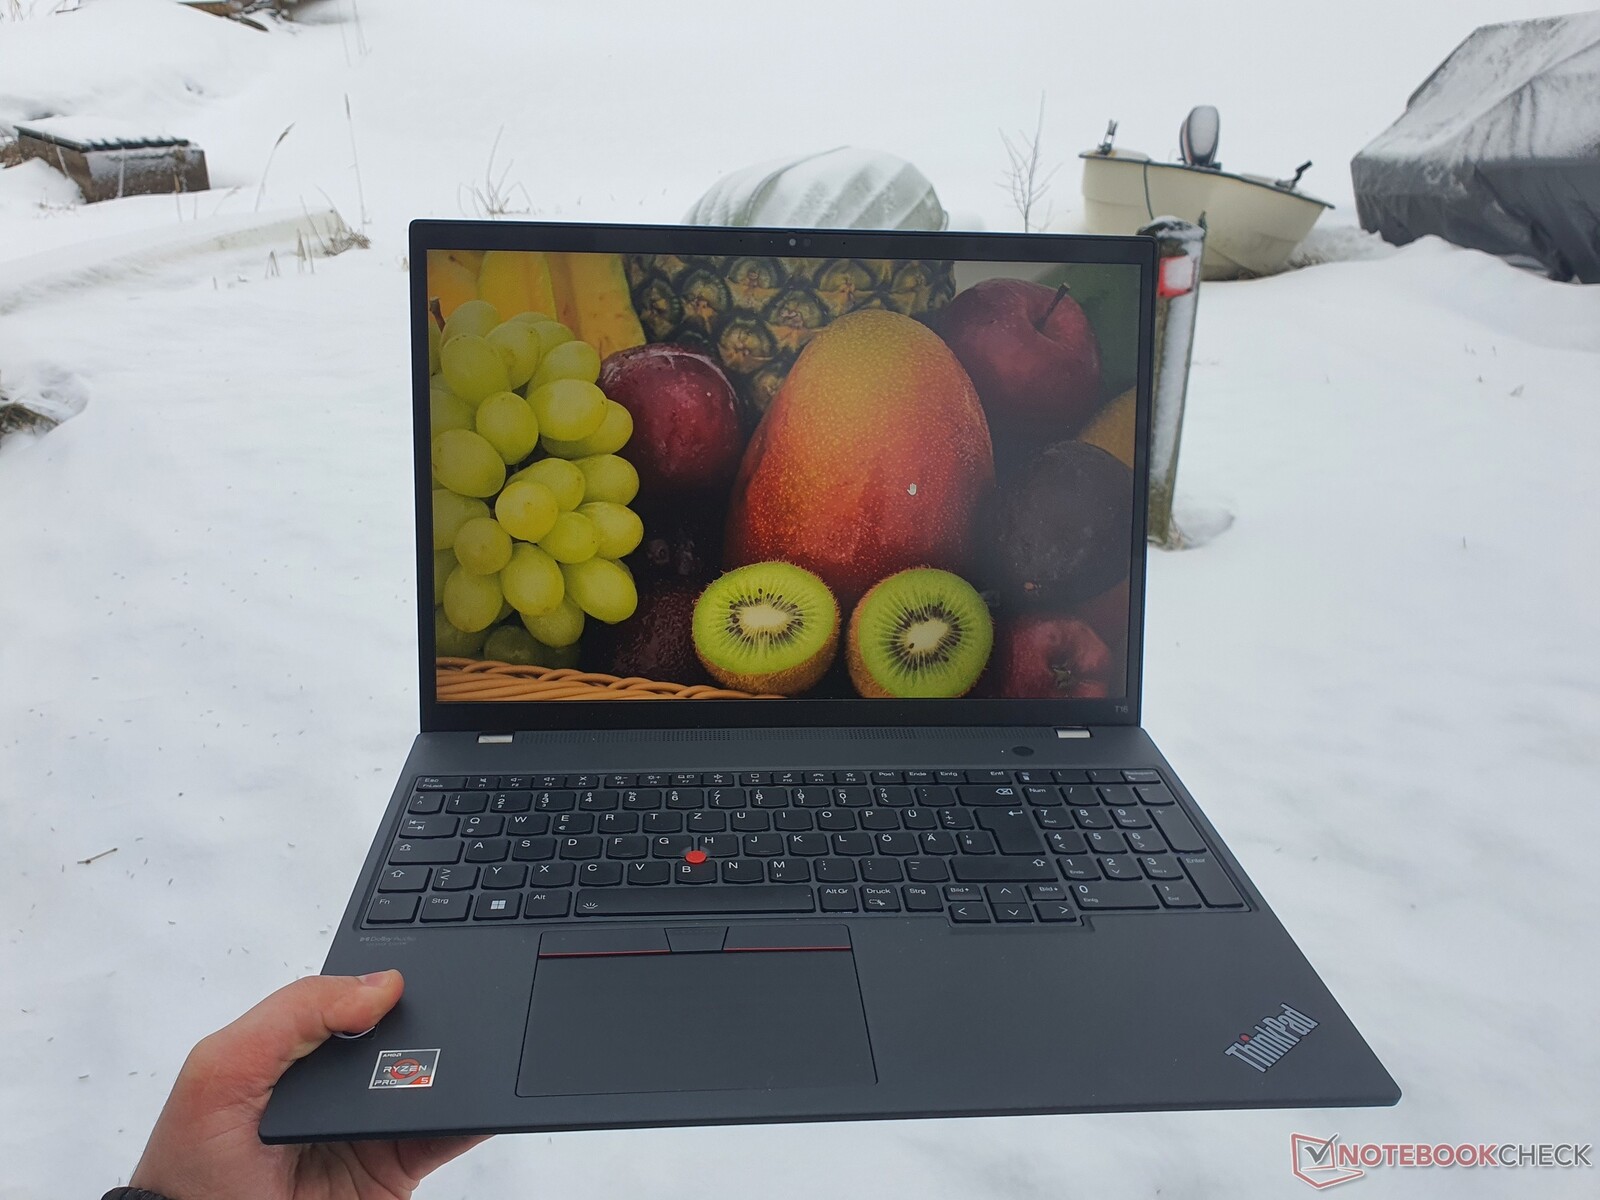
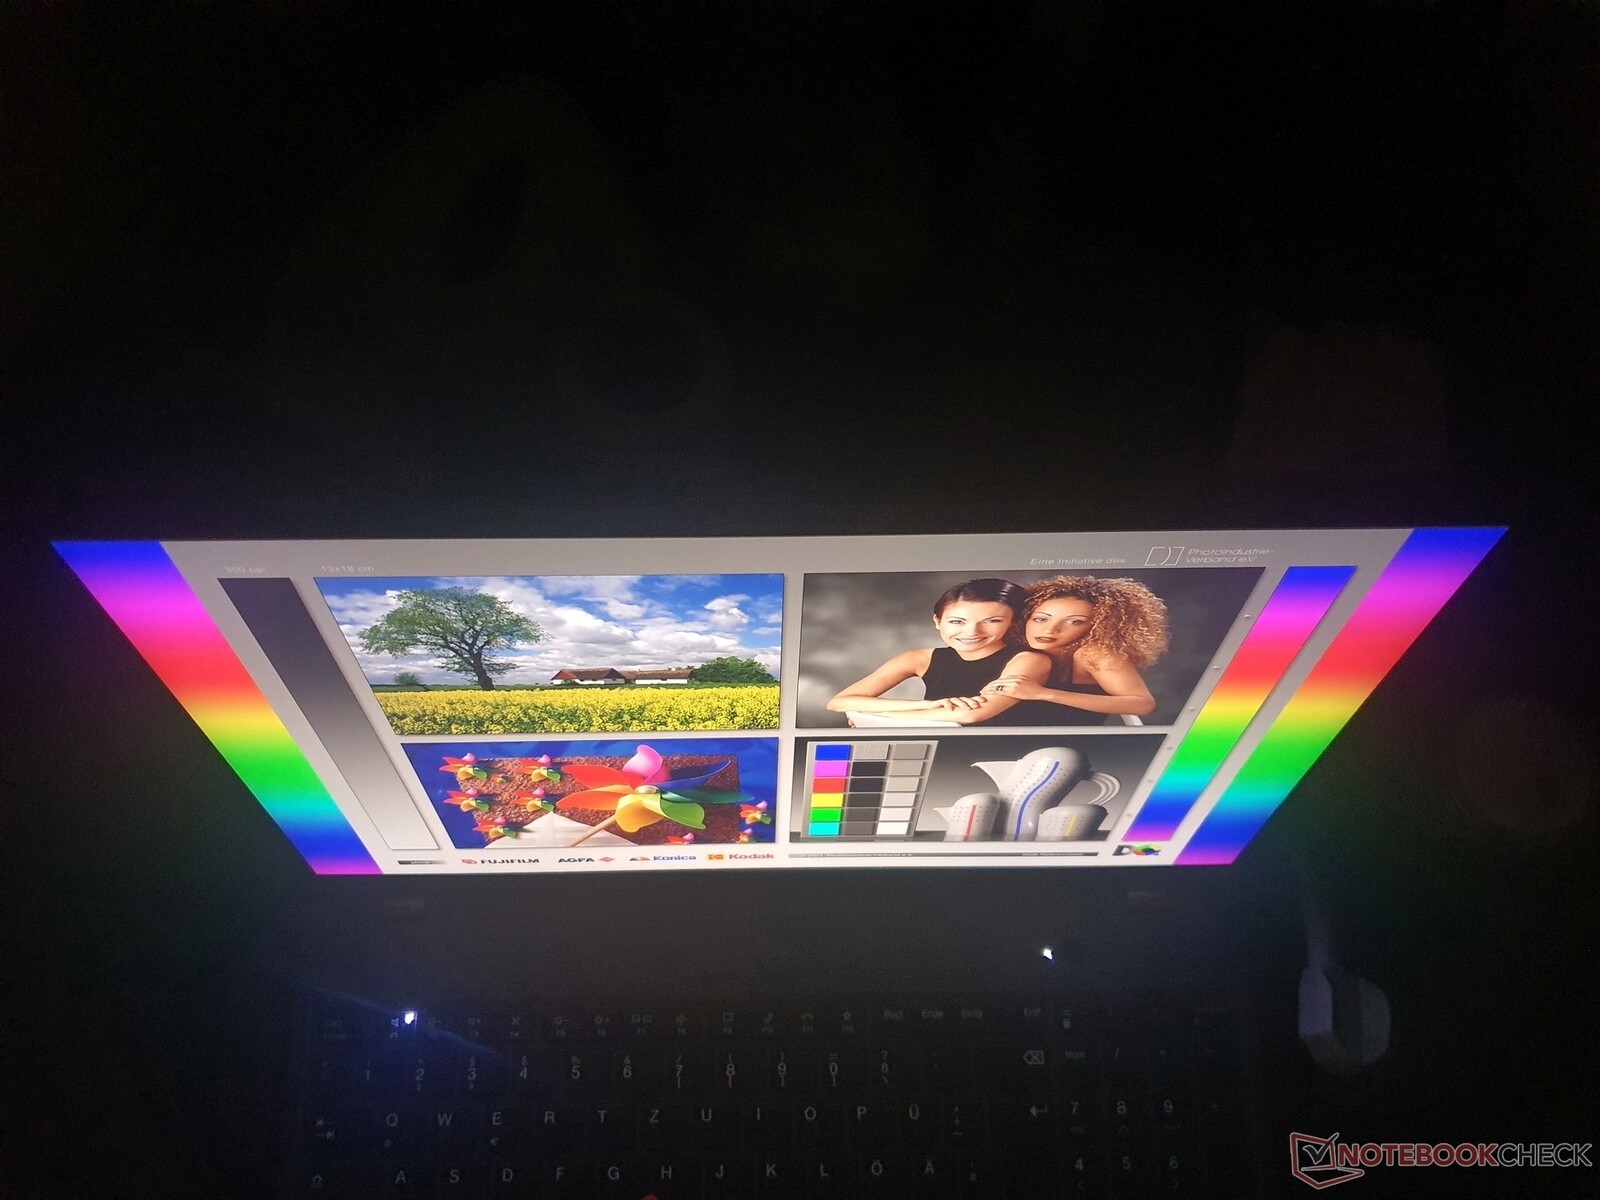
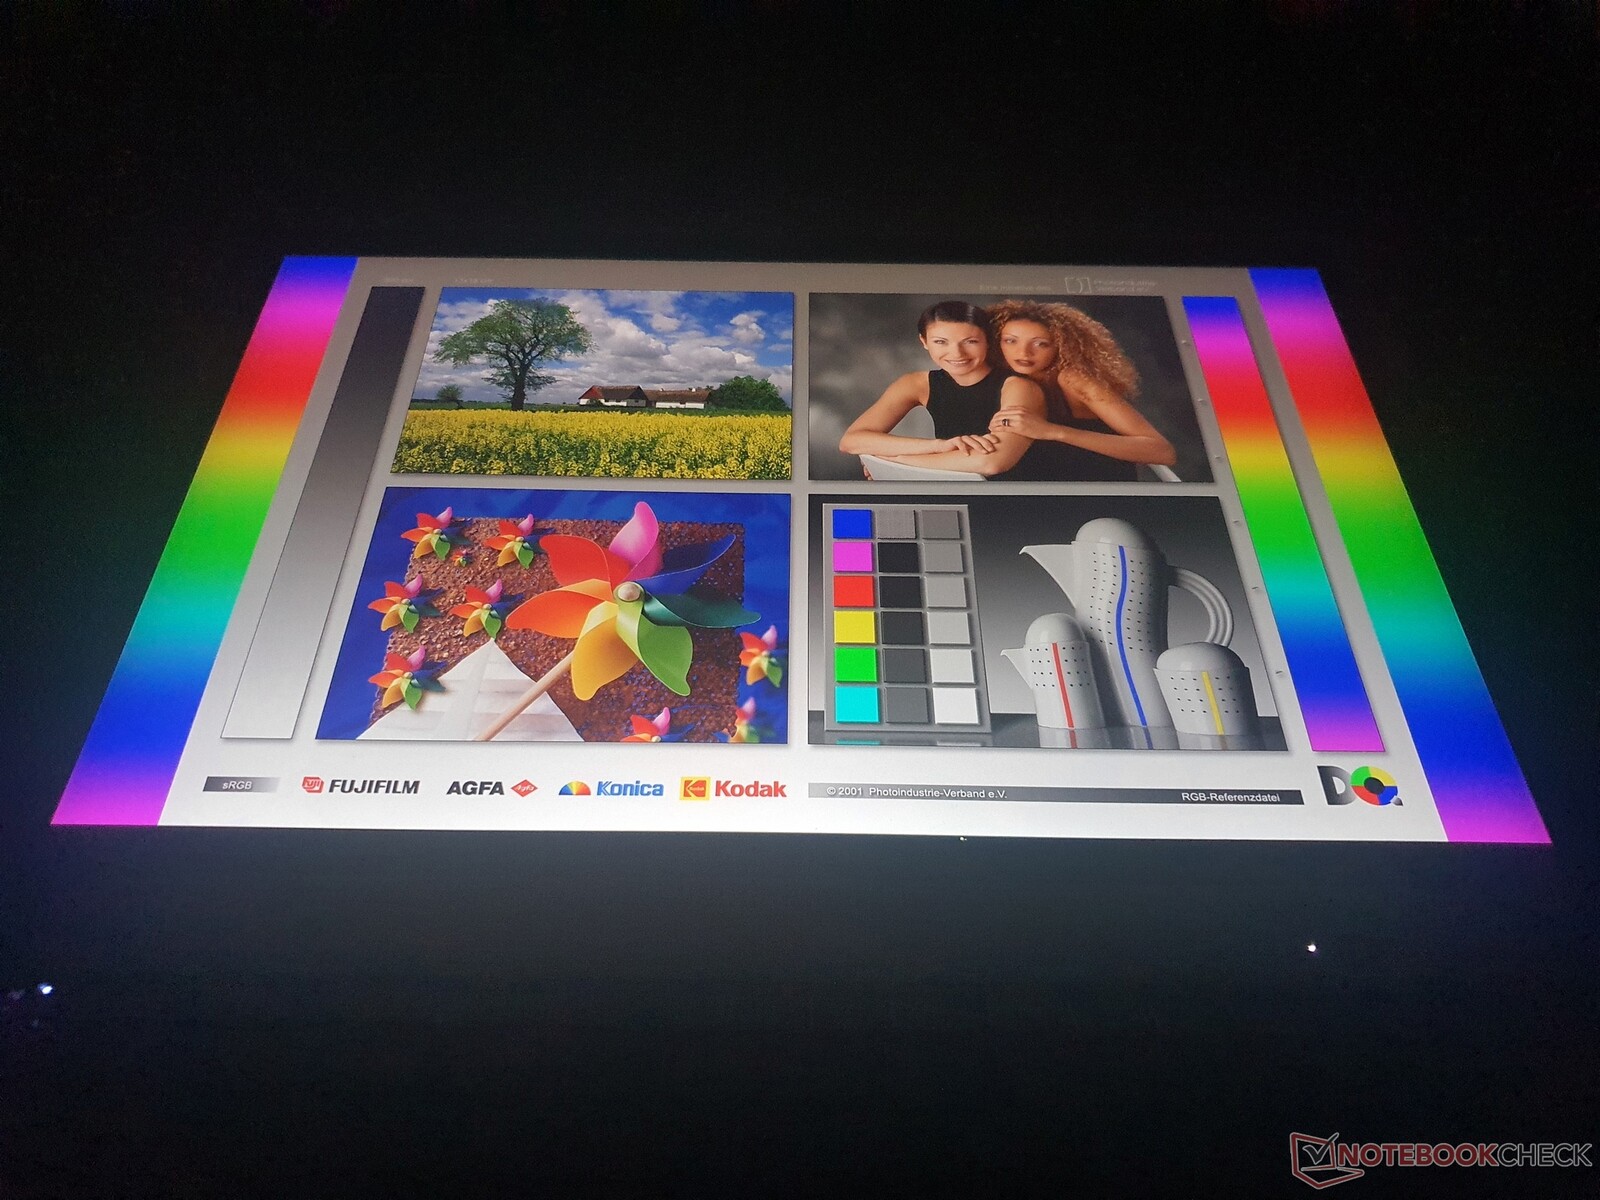
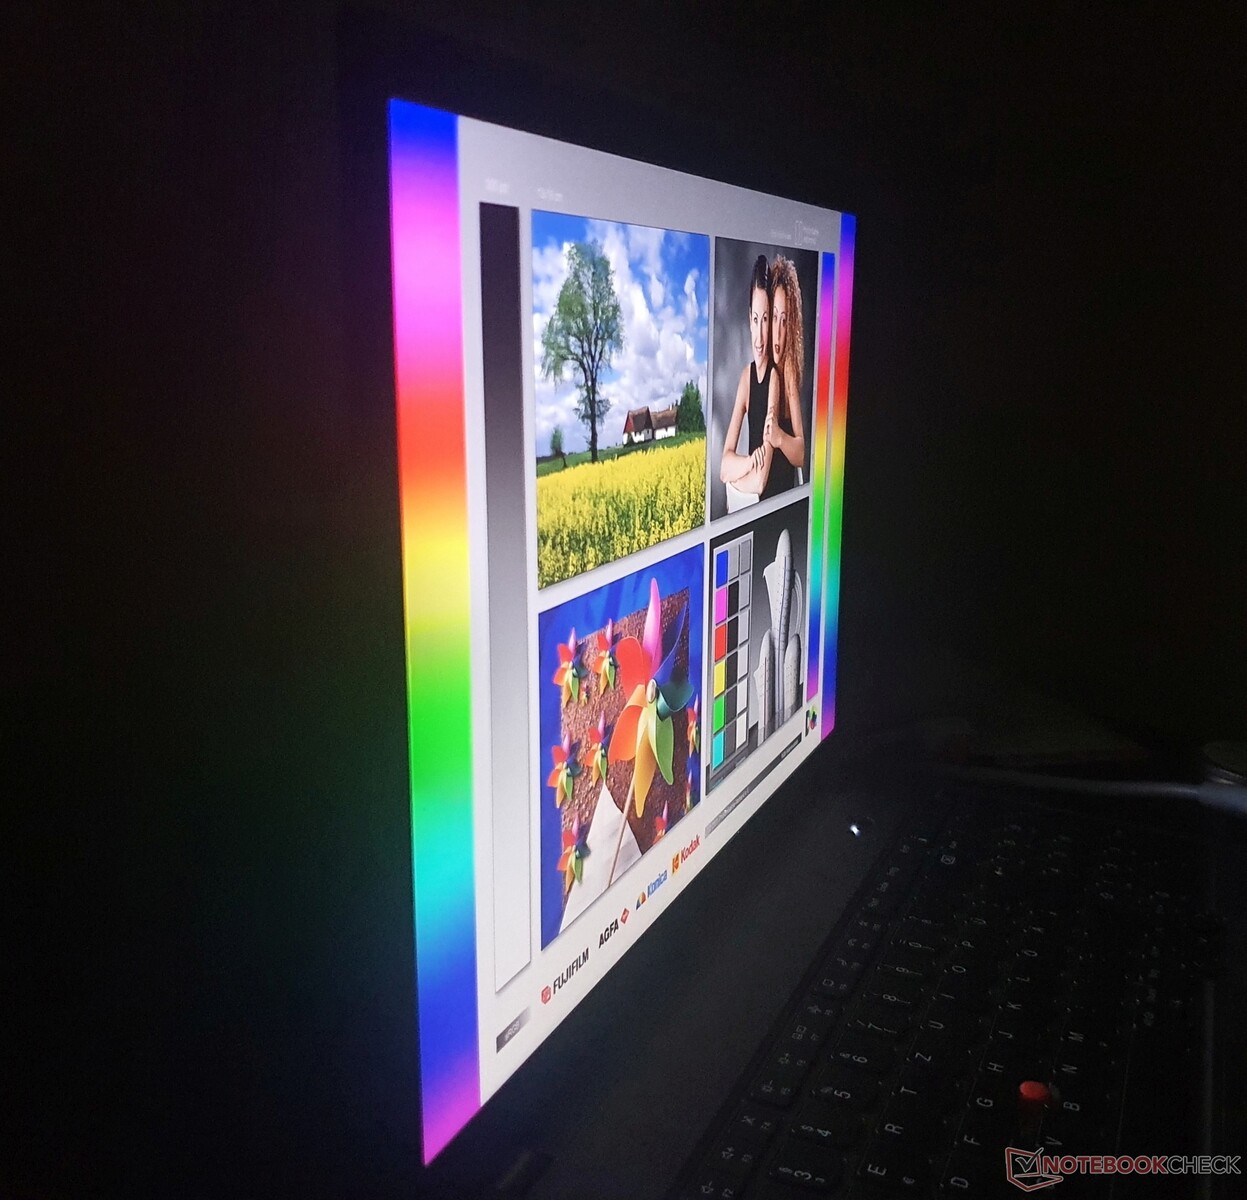
Wyświetlacz: Bogaty w kontrast, jasny i o wysokiej rozdzielczości w ThinkPad T16
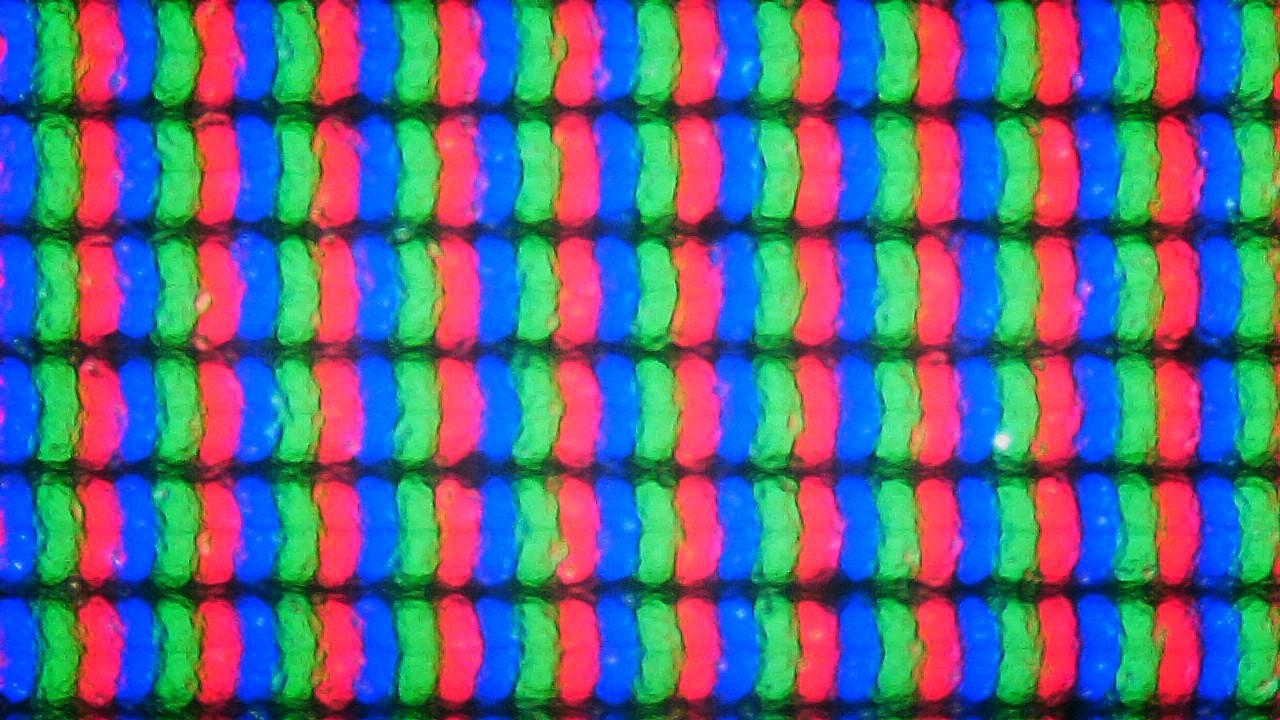

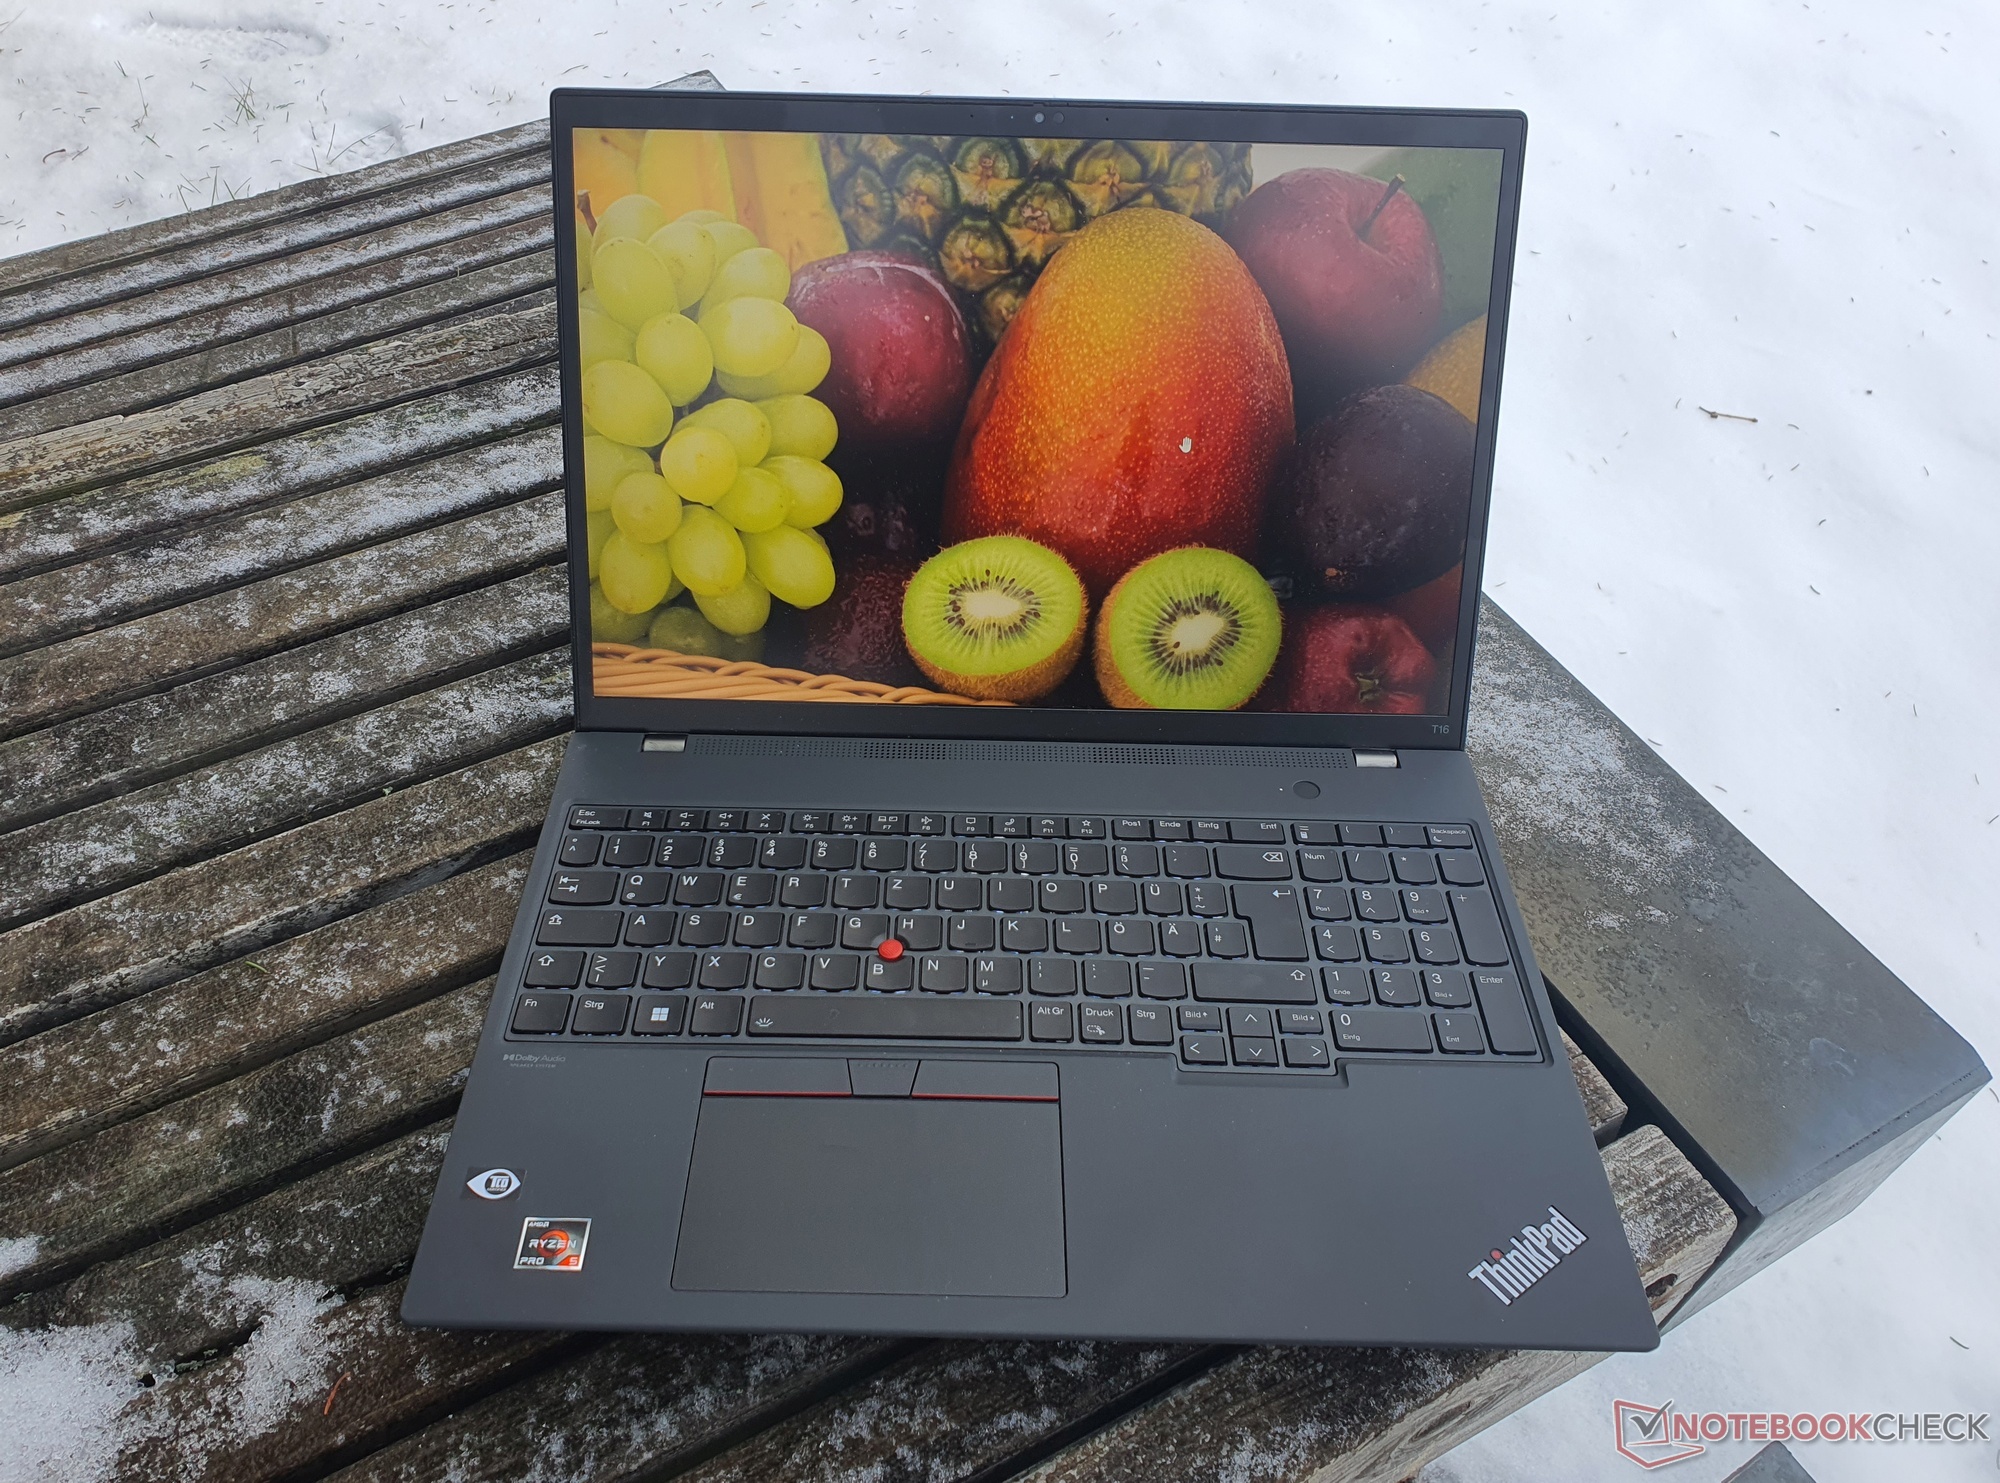
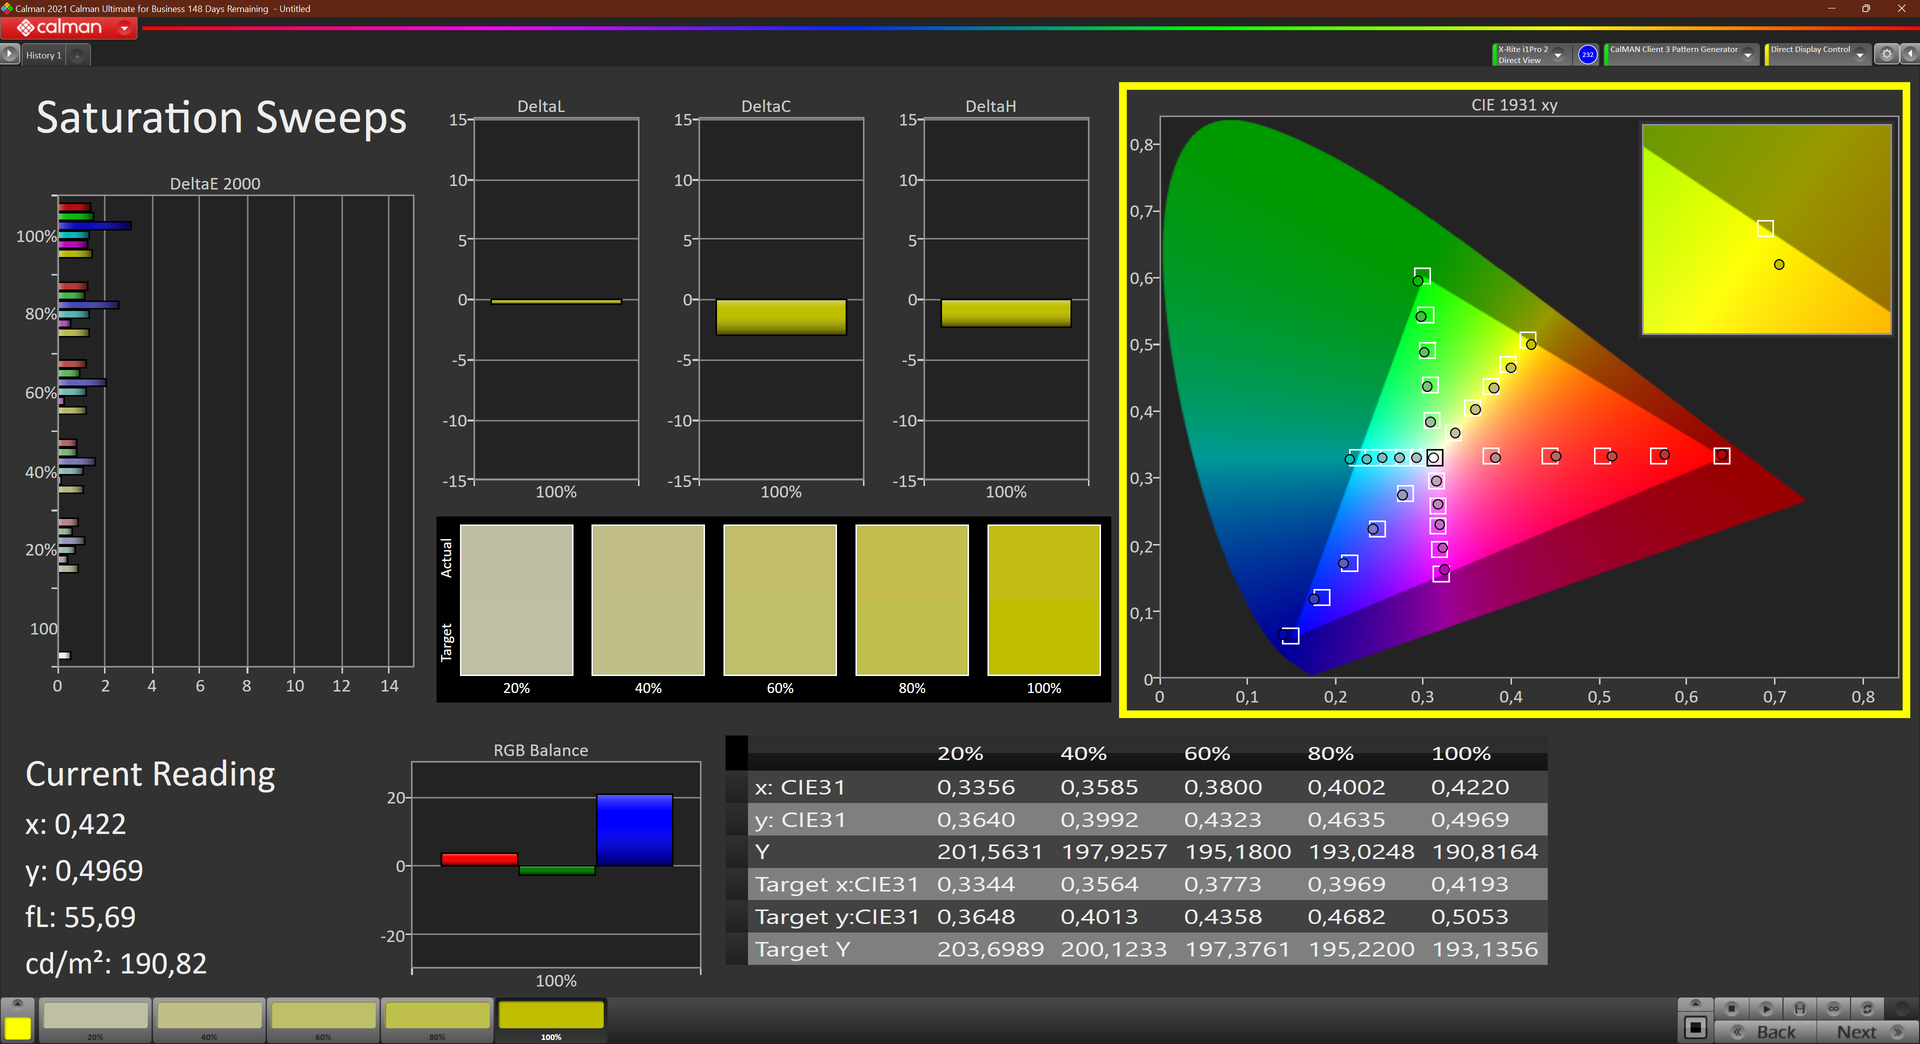
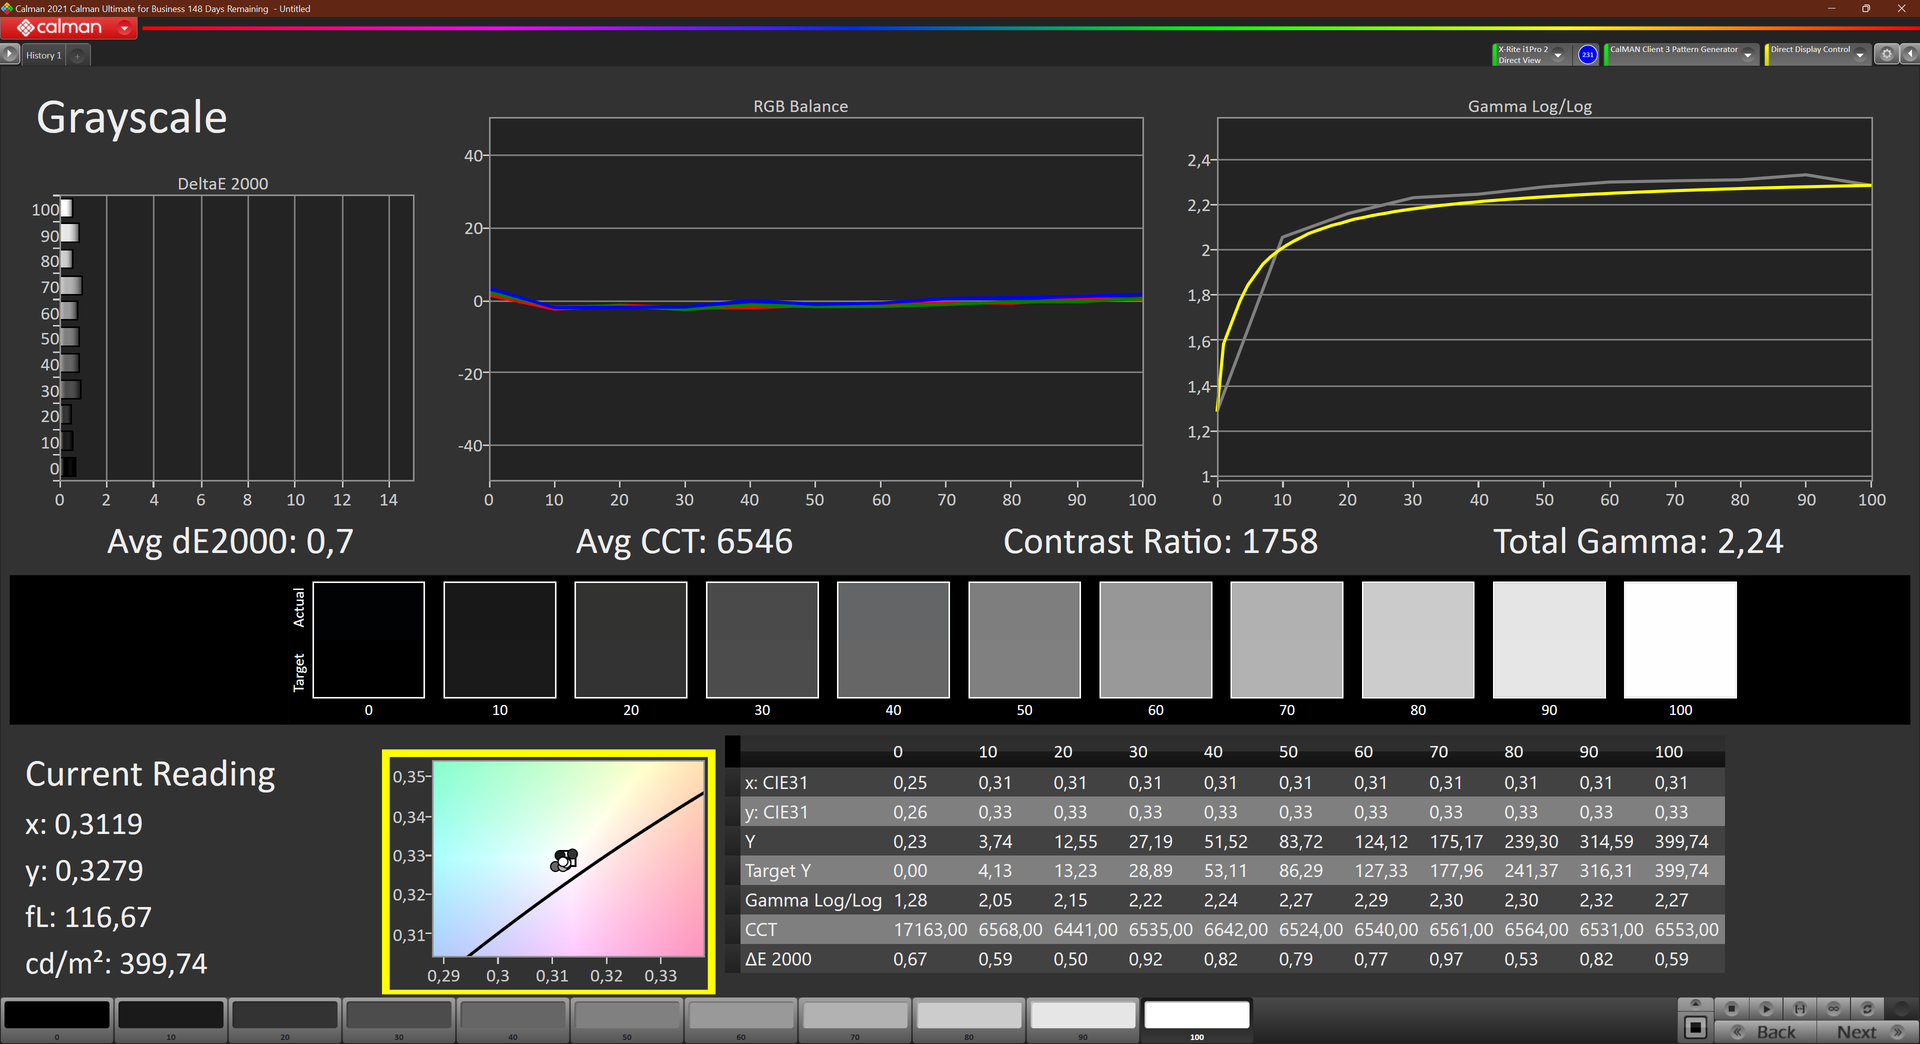
Lenovo wyposażyło nasz testowy egzemplarz ThinkPada T16 AMD w matowy, 16-calowy panel IPS firmy CSOT o rozdzielczości 2560 x 1600 pikseli w formacie 16:10.
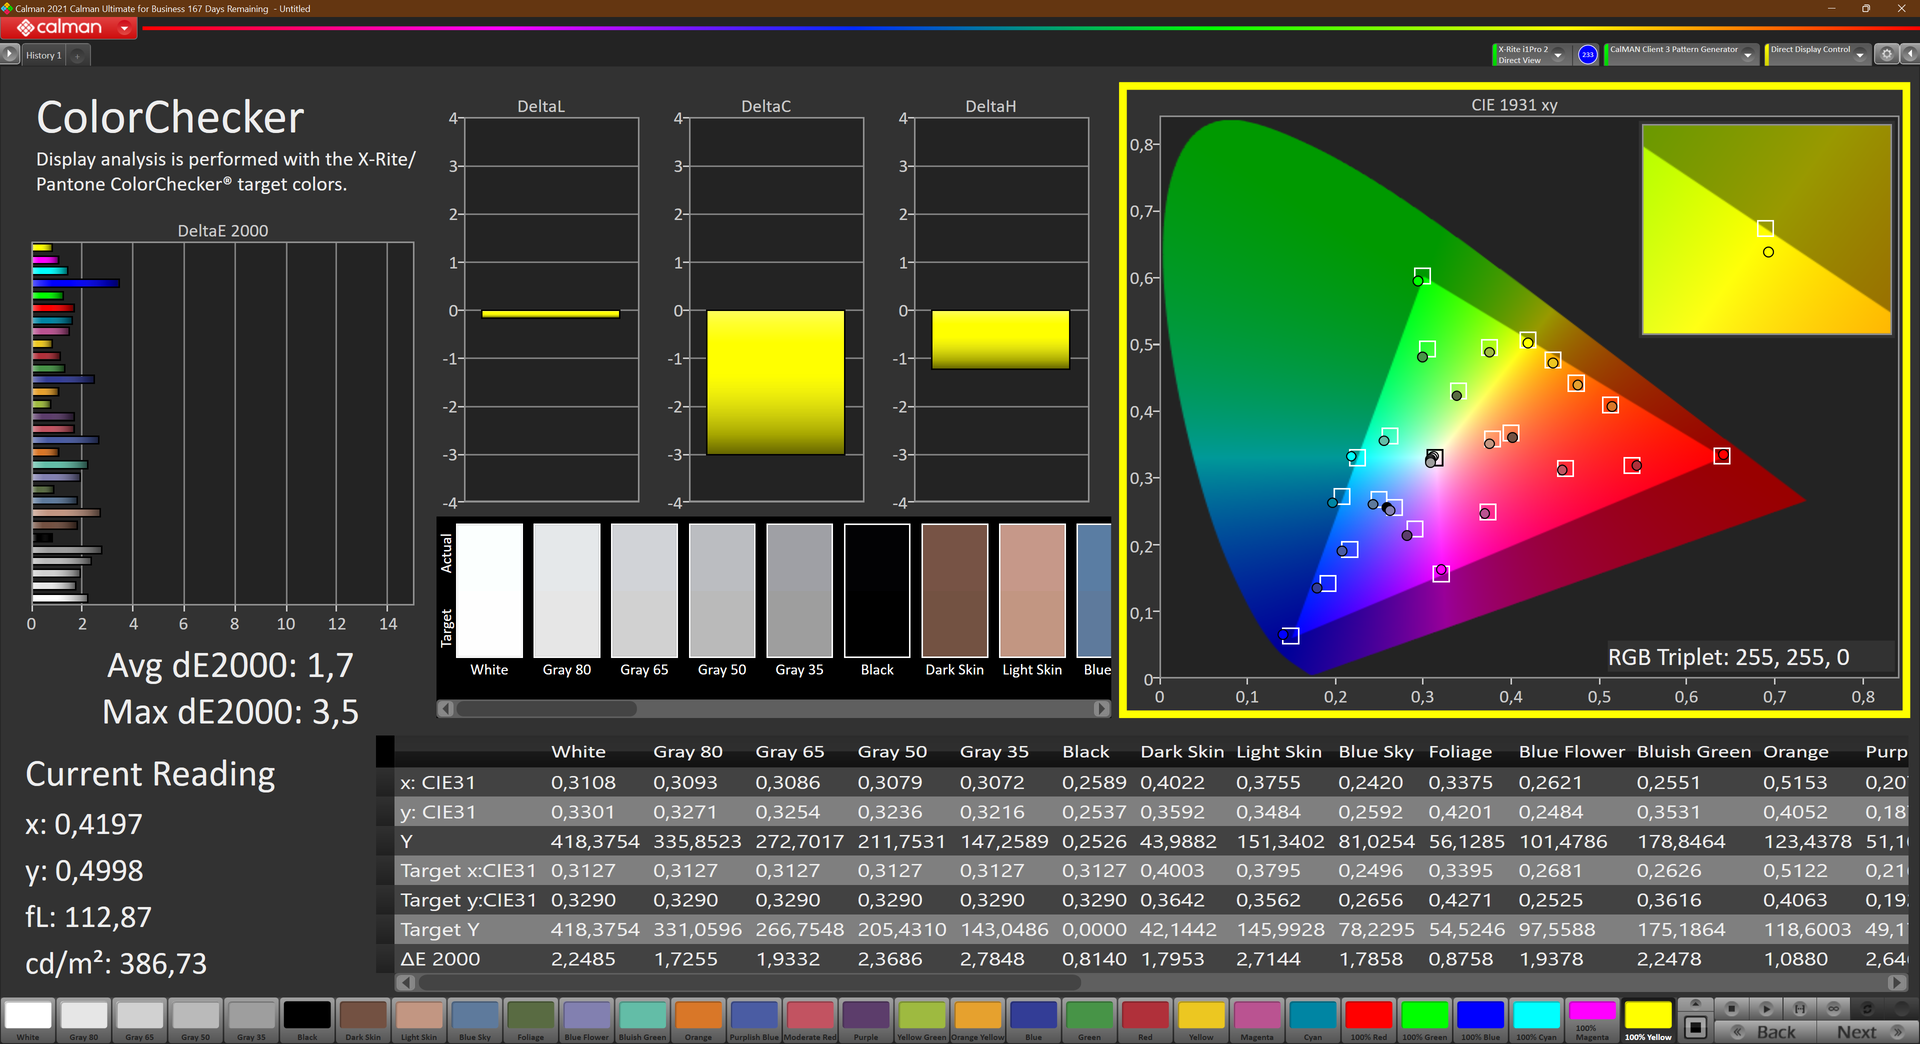
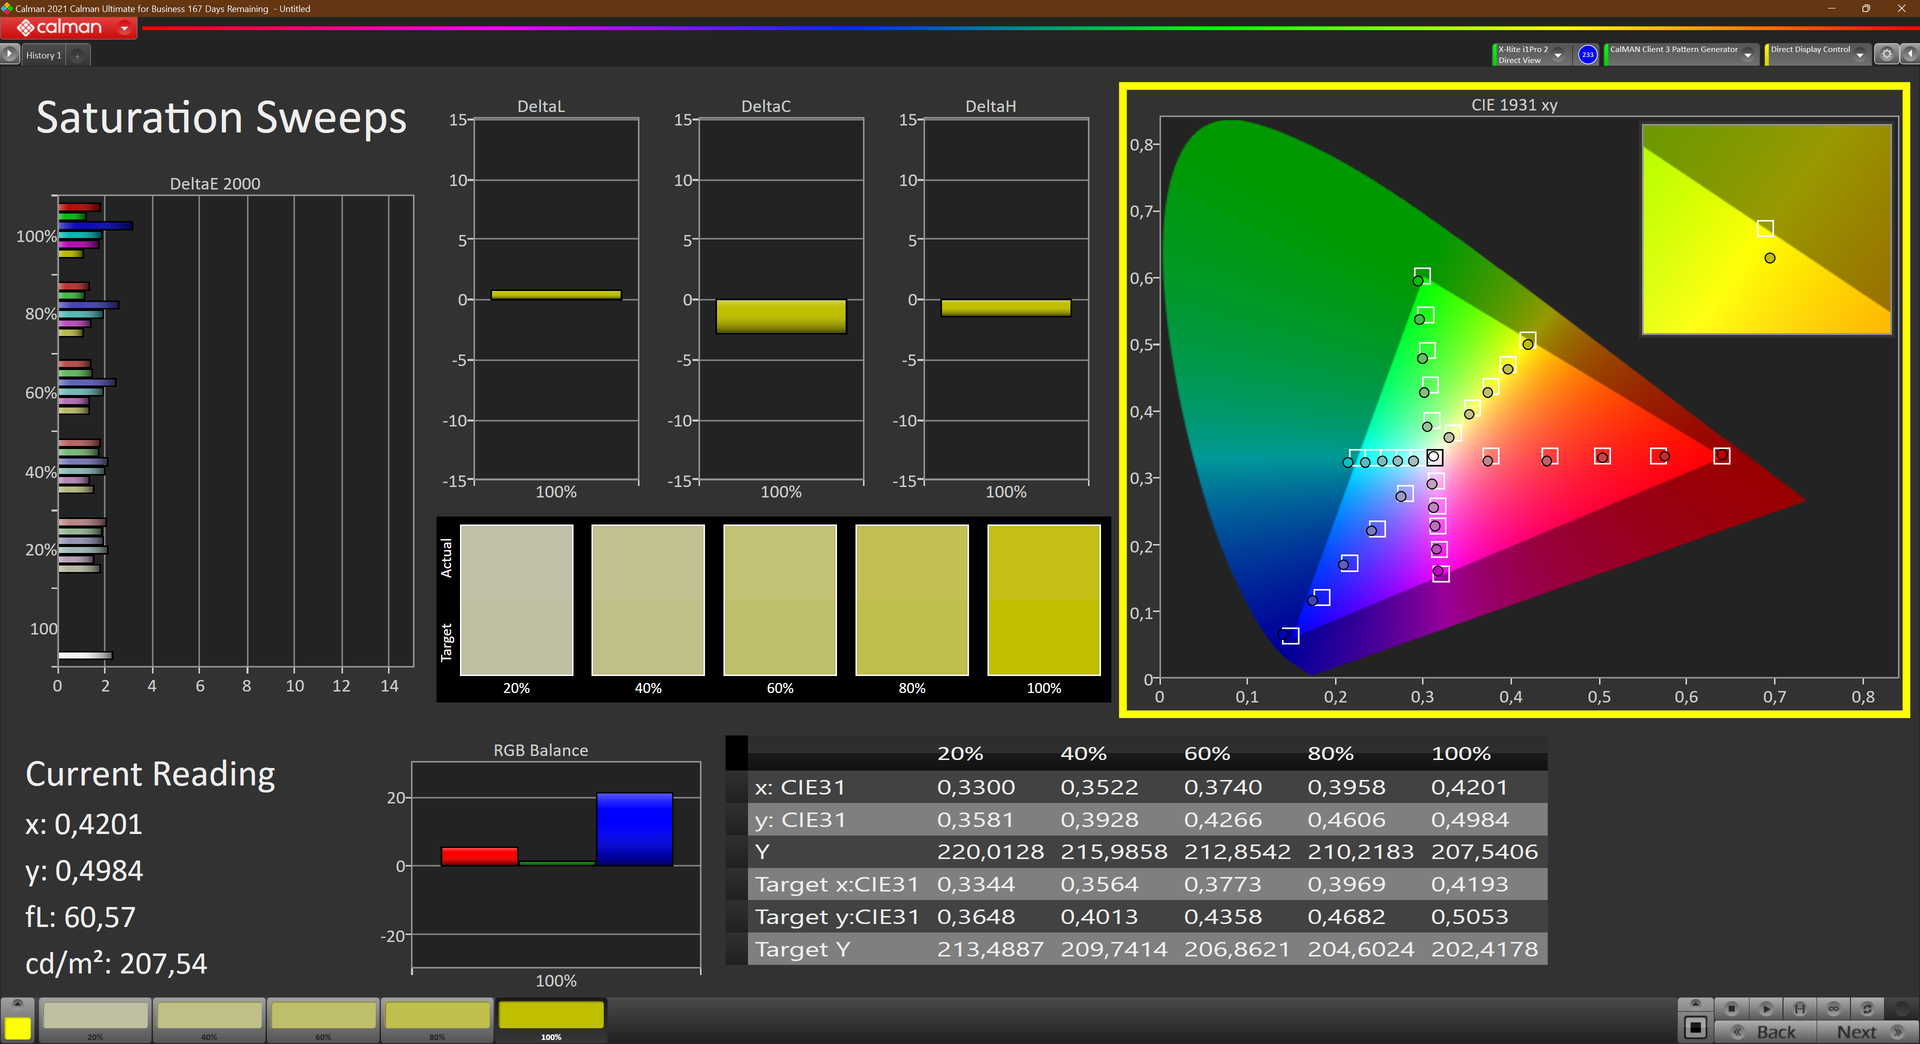
W przeciwieństwie do panelu WUXGA w modelu ThinkPad T16 Intel, ten wyświetlacz nie jest tzw. "low-power LCD" Zmierzone wartości obu paneli są dość zbliżone, pozostawiając głównie do wyróżnienia w stanie dostawy lepszą kalibrację panelu WQXGA, ale zauważamy też nieco niższe pokrycie przestrzeni barwnej.
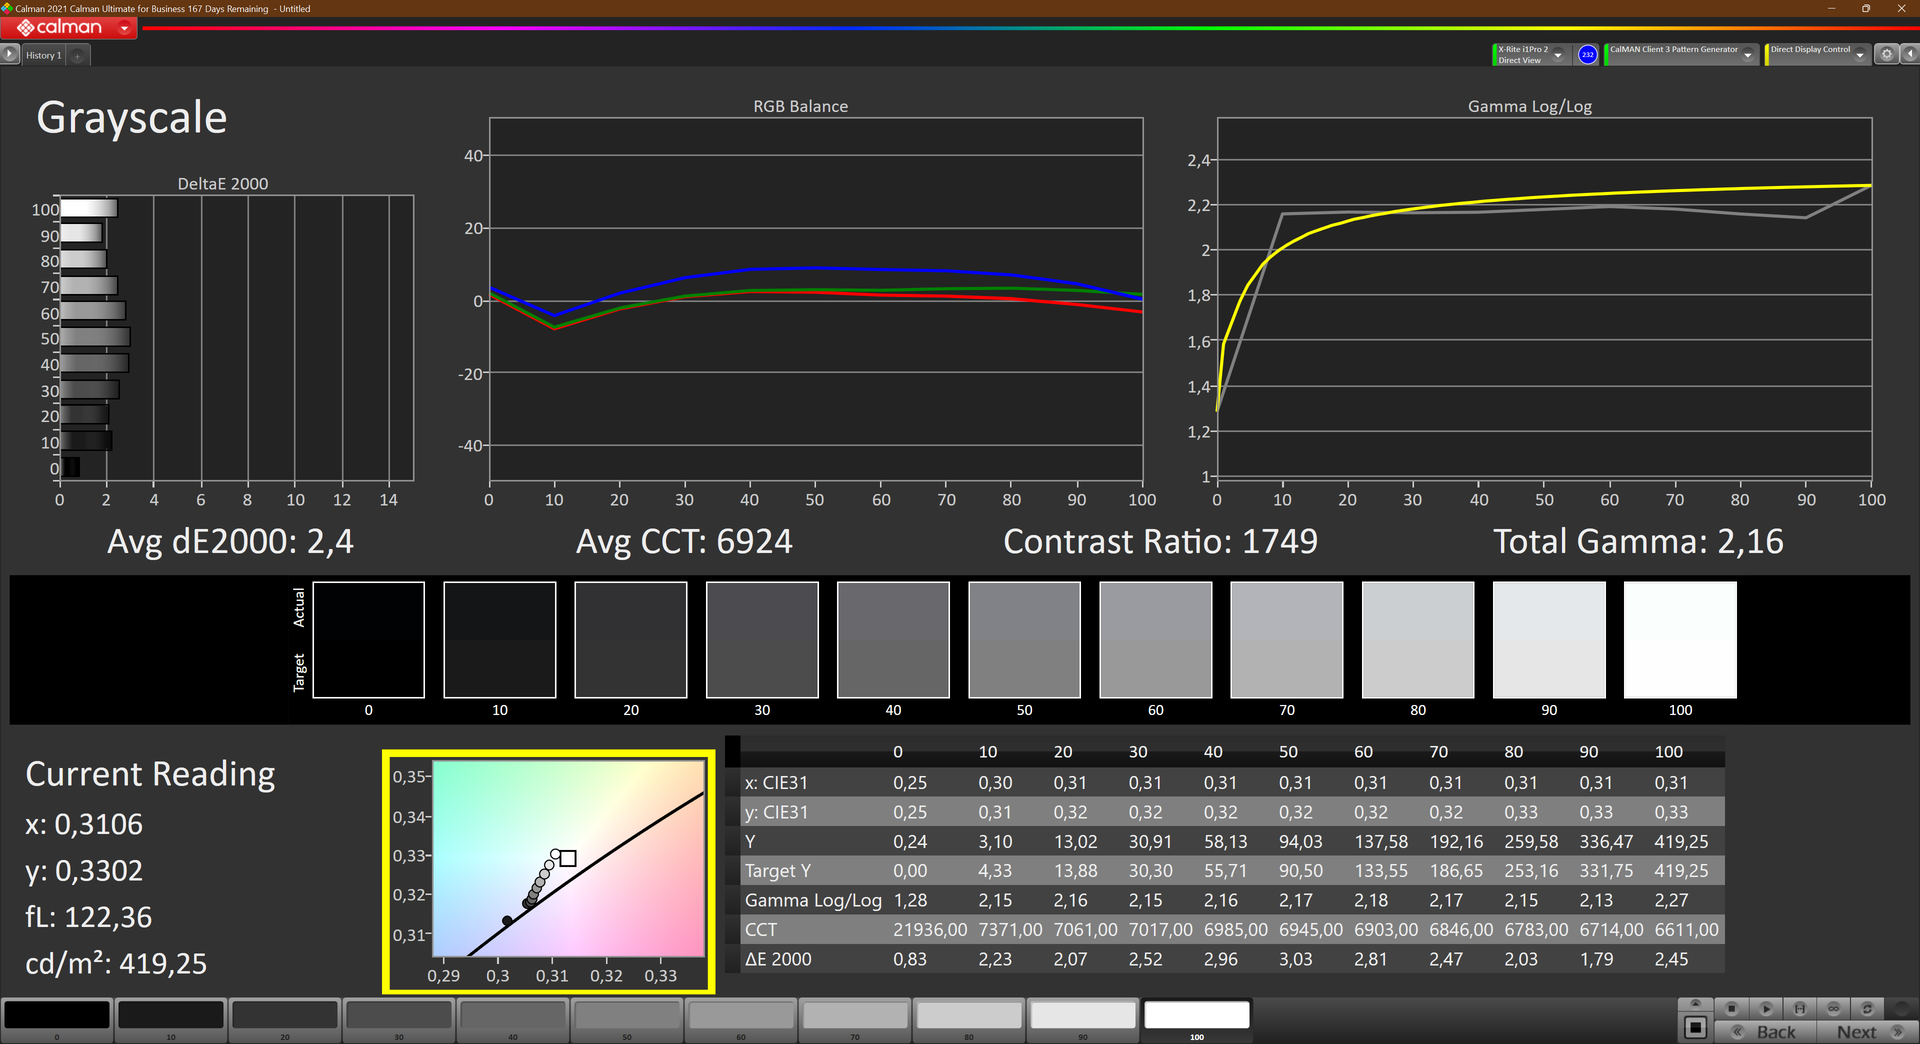
Jasność jest również taka sama i wynosi 388 cd/m², ale mierzony przez nas kontrast jest wyższy i wynosi 1738:1, a wartość czerni nieco niższa i wynosi dobre 0,24 cd/m². Dzięki temu czerń wydaje się bardzo nasycona, natomiast jakość obrazu wygląda ogólnie bardzo dobrze, a subiektywna różnica w stosunku do panelu FHD+ low-power nie wydaje się być bardzo wyraźna.
| |||||||||||||||||||||||||
rozświetlenie: 81 %
na akumulatorze: 417 cd/m²
kontrast: 1738:1 (czerń: 0.24 cd/m²)
ΔE ColorChecker Calman: 1.7 | ∀{0.5-29.43 Ø4.72}
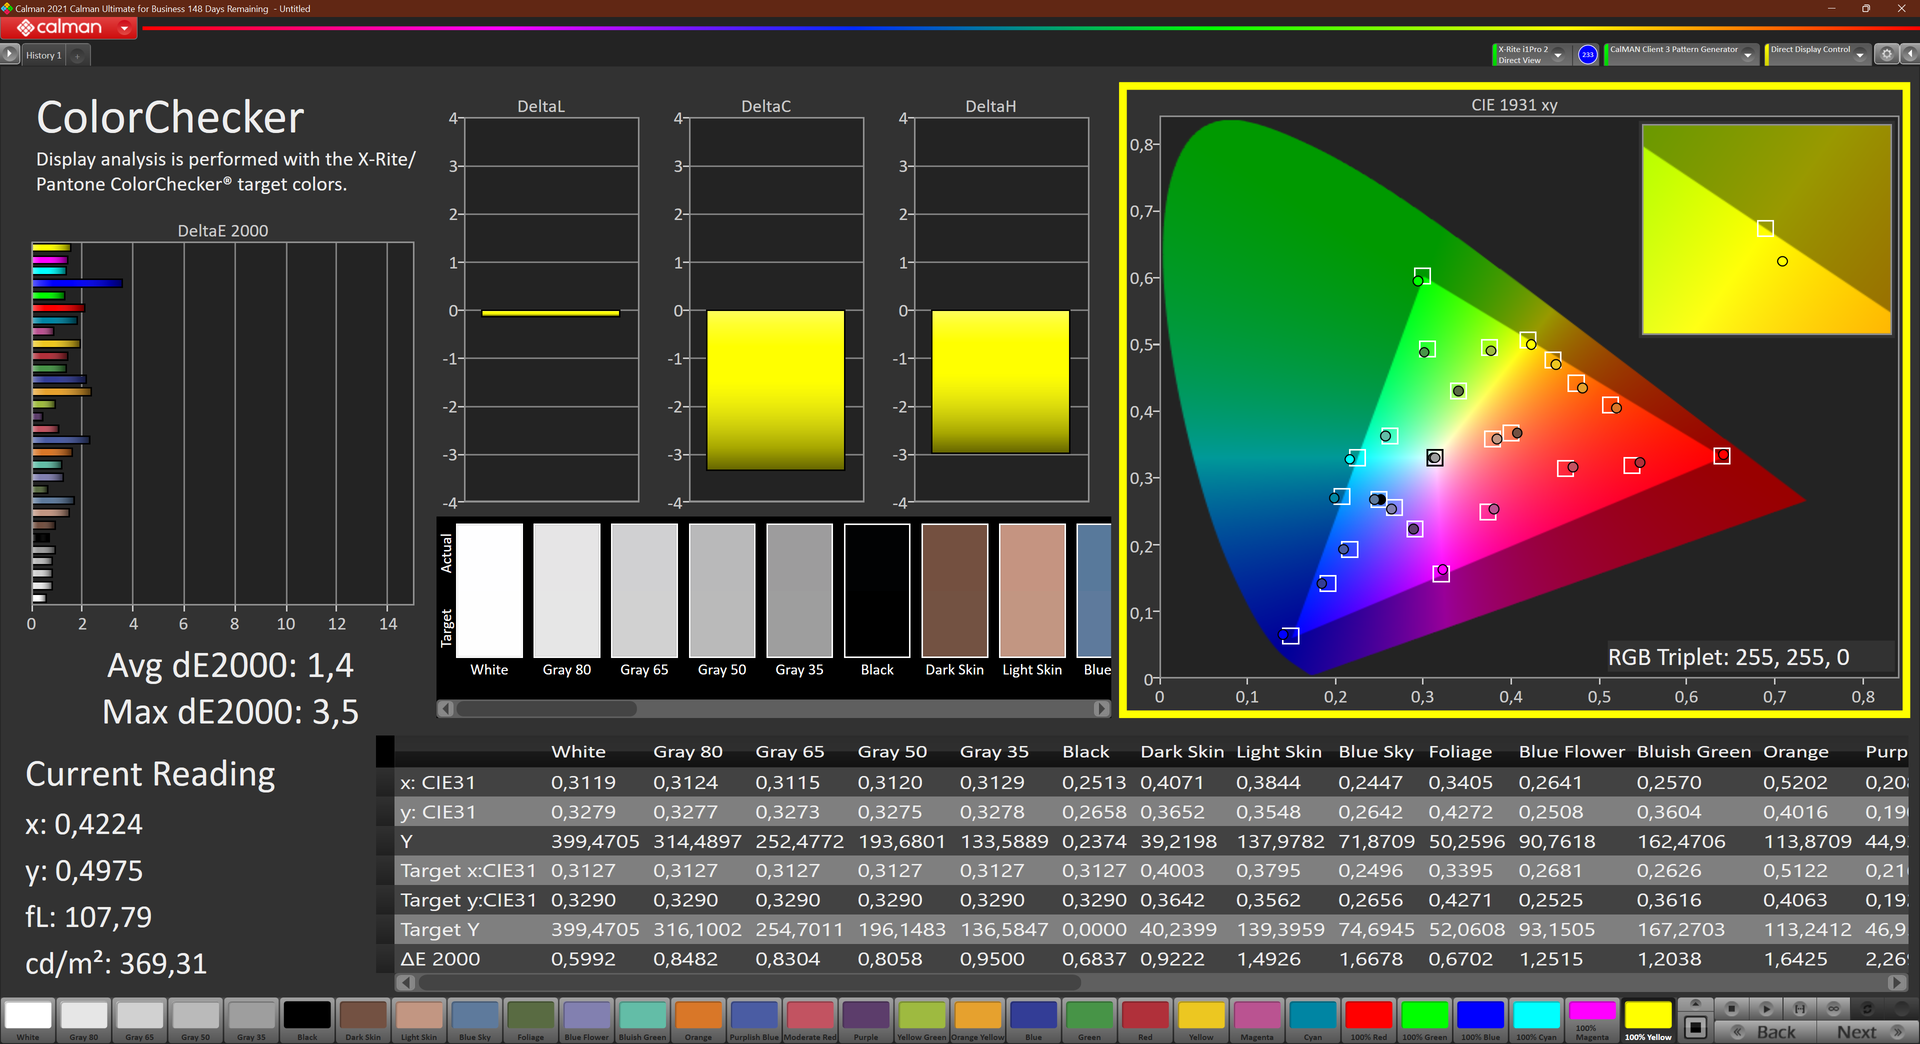
calibrated: 1.4
ΔE Greyscale Calman: 2.4 | ∀{0.09-98 Ø4.97}
69.1% AdobeRGB 1998 (Argyll 3D)
95.7% sRGB (Argyll 3D)
66.7% Display P3 (Argyll 3D)
Gamma: 2.16
CCT: 6924 K
| Lenovo ThinkPad T16 G1 21CH004MGE MNG007DA1-C, IPS-LED, 2560x1600, 16" | Lenovo ThinkPad T16 G1 21BWS00200 B160UAN01.K, IPS, 1920x1200, 16" | HP EliteBook 865 G9 X160NV42, IPS, 1920x1200, 16" | Lenovo ThinkPad Z16 G1 21D5S00T00 NE160WUM-N62 , IPS LED, 1920x1200, 16" | Lenovo ThinkPad X1 Extreme G5-21DE003RGE LP160UQ1-SPB1, IPS, 3840x2400, 16" | Lenovo ThinkPad P15v G2 21A9000XGE N156HCA-EAC, IPS LED, 1920x1080, 15.6" | HP ZBook Power 15 G9 6B8C4EA LGD073F, IPS, 3840x2160, 15.6" | |
|---|---|---|---|---|---|---|---|
| Display | 13% | 6% | 4% | 24% | -33% | 2% | |
| Display P3 Coverage (%) | 66.7 | 80.1 20% | 71.4 7% | 70 5% | 84.6 27% | 43.7 -34% | 69.1 4% |
| sRGB Coverage (%) | 95.7 | 100 4% | 99.3 4% | 99.7 4% | 99.2 4% | 65.1 -32% | 97.7 2% |
| AdobeRGB 1998 Coverage (%) | 69.1 | 80.5 16% | 73.2 6% | 72.1 4% | 97.7 41% | 45.3 -34% | 69.6 1% |
| Response Times | 13% | -18% | -29% | -23% | -49% | -47% | |
| Response Time Grey 50% / Grey 80% * (ms) | 32.1 ? | 27 ? 16% | 35.5 ? -11% | 40 ? -25% | 46 ? -43% | 48 ? -50% | 45.8 ? -43% |
| Response Time Black / White * (ms) | 18.9 ? | 17 ? 10% | 23.5 ? -24% | 25 ? -32% | 19.2 ? -2% | 28 ? -48% | 28.6 ? -51% |
| PWM Frequency (Hz) | 56.7 | ||||||
| Screen | -51% | 7% | 5% | -7% | -132% | -21% | |
| Brightness middle (cd/m²) | 417 | 404 -3% | 865 107% | 487 17% | 476 14% | 305 -27% | 392 -6% |
| Brightness (cd/m²) | 388 | 391 1% | 771 99% | 446 15% | 470 21% | 281 -28% | 388 0% |
| Brightness Distribution (%) | 81 | 80 -1% | 72 -11% | 83 2% | 90 11% | 88 9% | 88 9% |
| Black Level * (cd/m²) | 0.24 | 0.29 -21% | 0.3 -25% | 0.31 -29% | 0.35 -46% | 0.32 -33% | 0.15 37% |
| Contrast (:1) | 1738 | 1393 -20% | 2883 66% | 1571 -10% | 1360 -22% | 953 -45% | 2613 50% |
| Colorchecker dE 2000 * | 1.7 | 3.9 -129% | 2.4 -41% | 1.8 -6% | 1.9 -12% | 5.9 -247% | 3.2 -88% |
| Colorchecker dE 2000 max. * | 3.5 | 8.5 -143% | 5.8 -66% | 3.3 6% | 4.7 -34% | 20.1 -474% | 7 -100% |
| Colorchecker dE 2000 calibrated * | 1.4 | 1.7 -21% | 1.5 -7% | 0.8 43% | 1.3 7% | 4.5 -221% | 1.2 14% |
| Greyscale dE 2000 * | 2.4 | 5.4 -125% | 3.8 -58% | 2.3 4% | 2.4 -0% | 5.3 -121% | 4.9 -104% |
| Gamma | 2.16 102% | 2.21 100% | 2.36 93% | 2.16 102% | 2.24 98% | 2.1 105% | 2.13 103% |
| CCT | 6924 94% | 6242 104% | 6922 94% | 6867 95% | 6377 102% | 6307 103% | 5982 109% |
| Całkowita średnia (program / ustawienia) | -8% /
-28% | -2% /
3% | -7% /
-0% | -2% /
-2% | -71% /
-99% | -22% /
-20% |
* ... im mniej tym lepiej
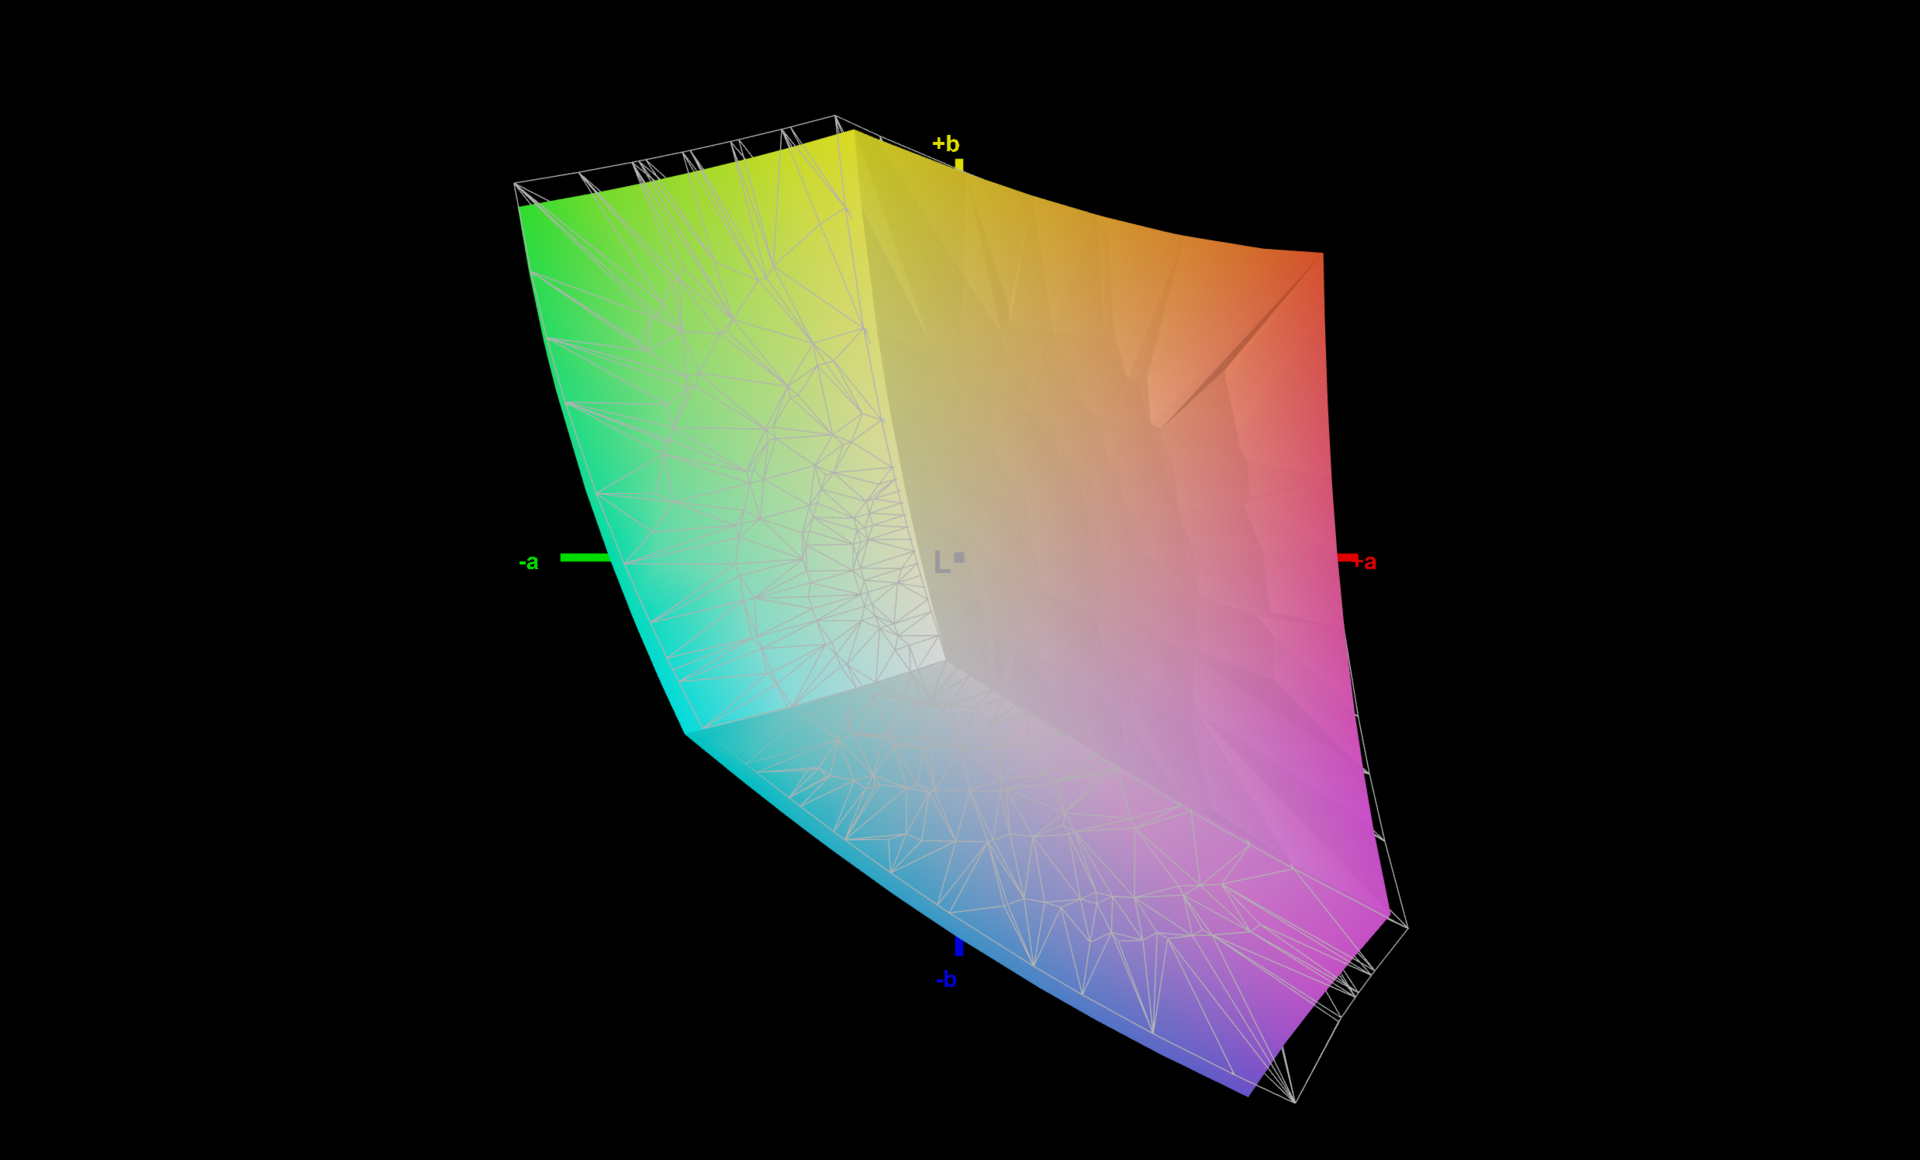
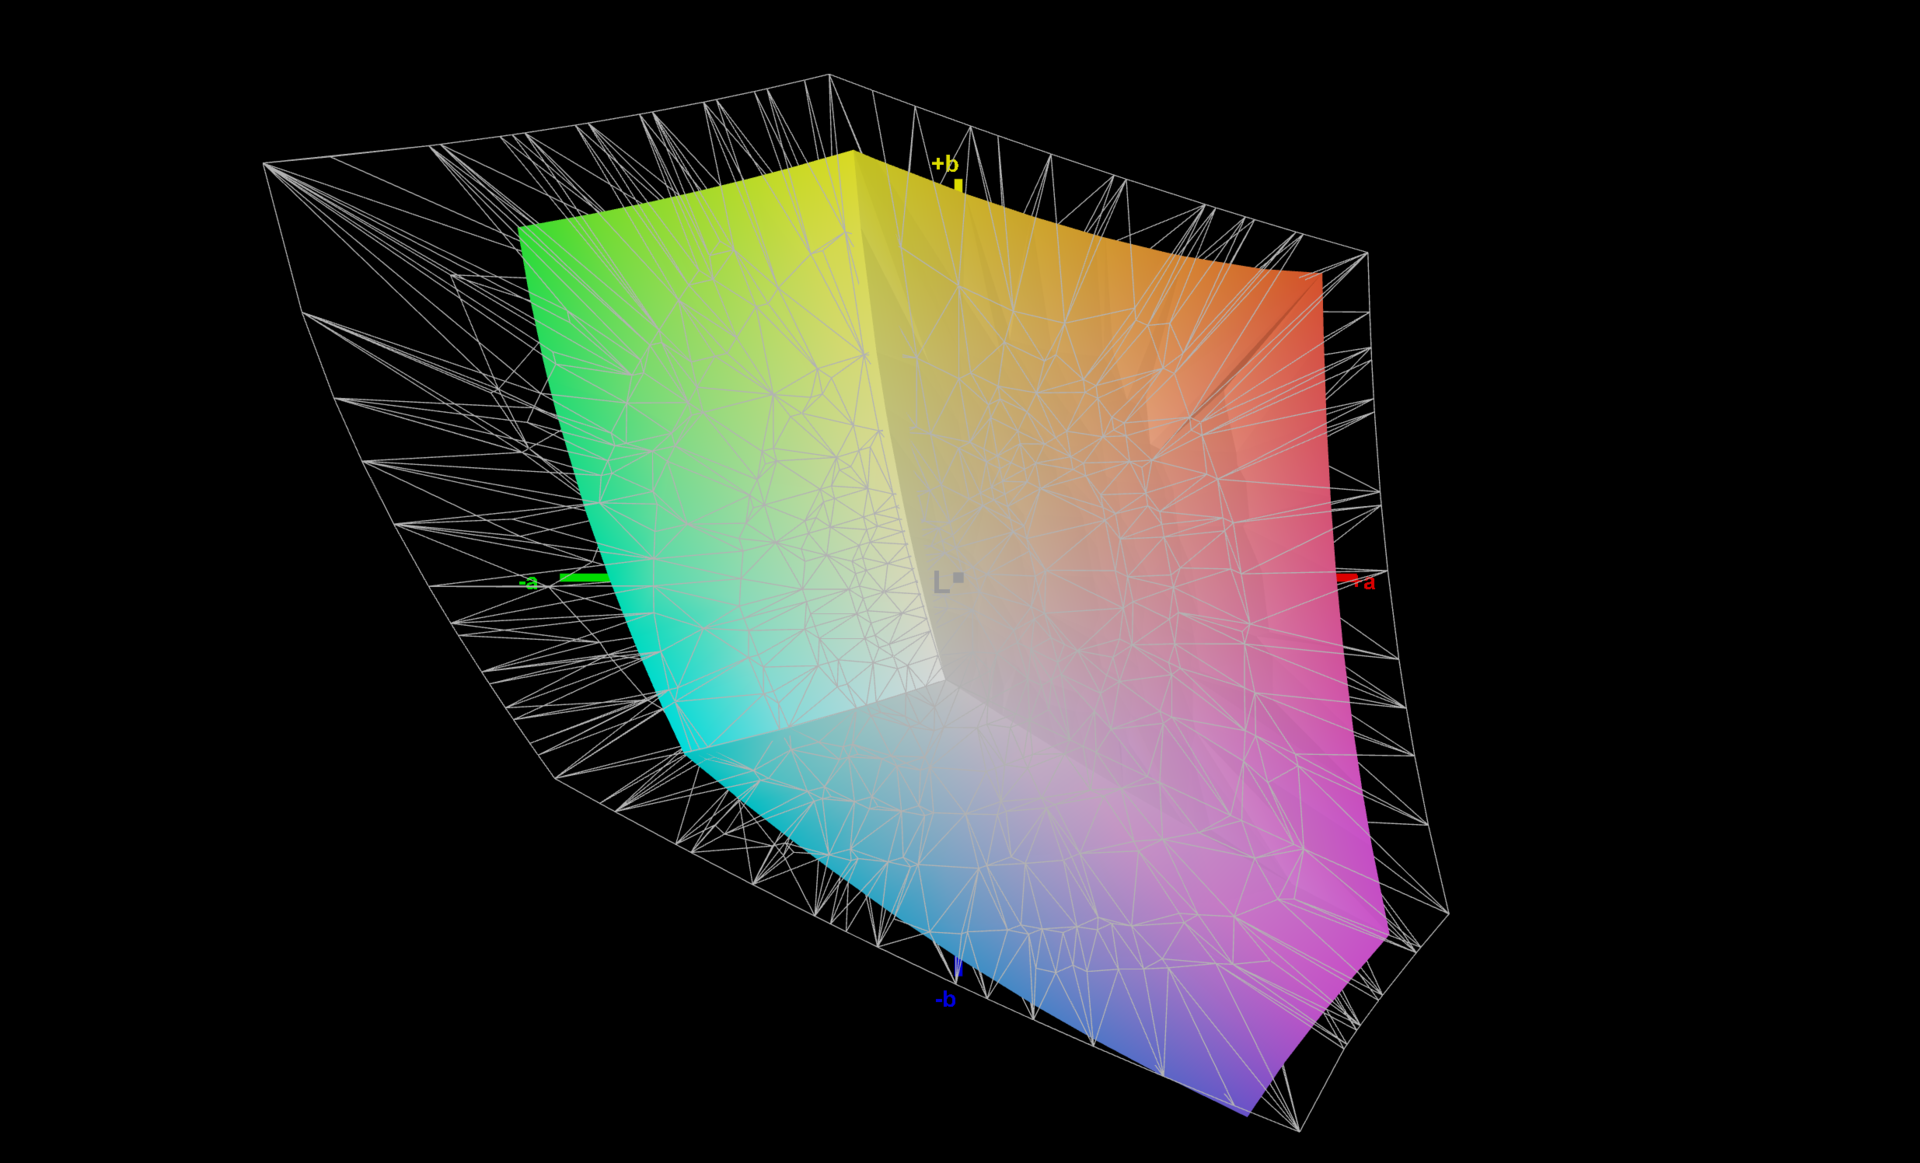
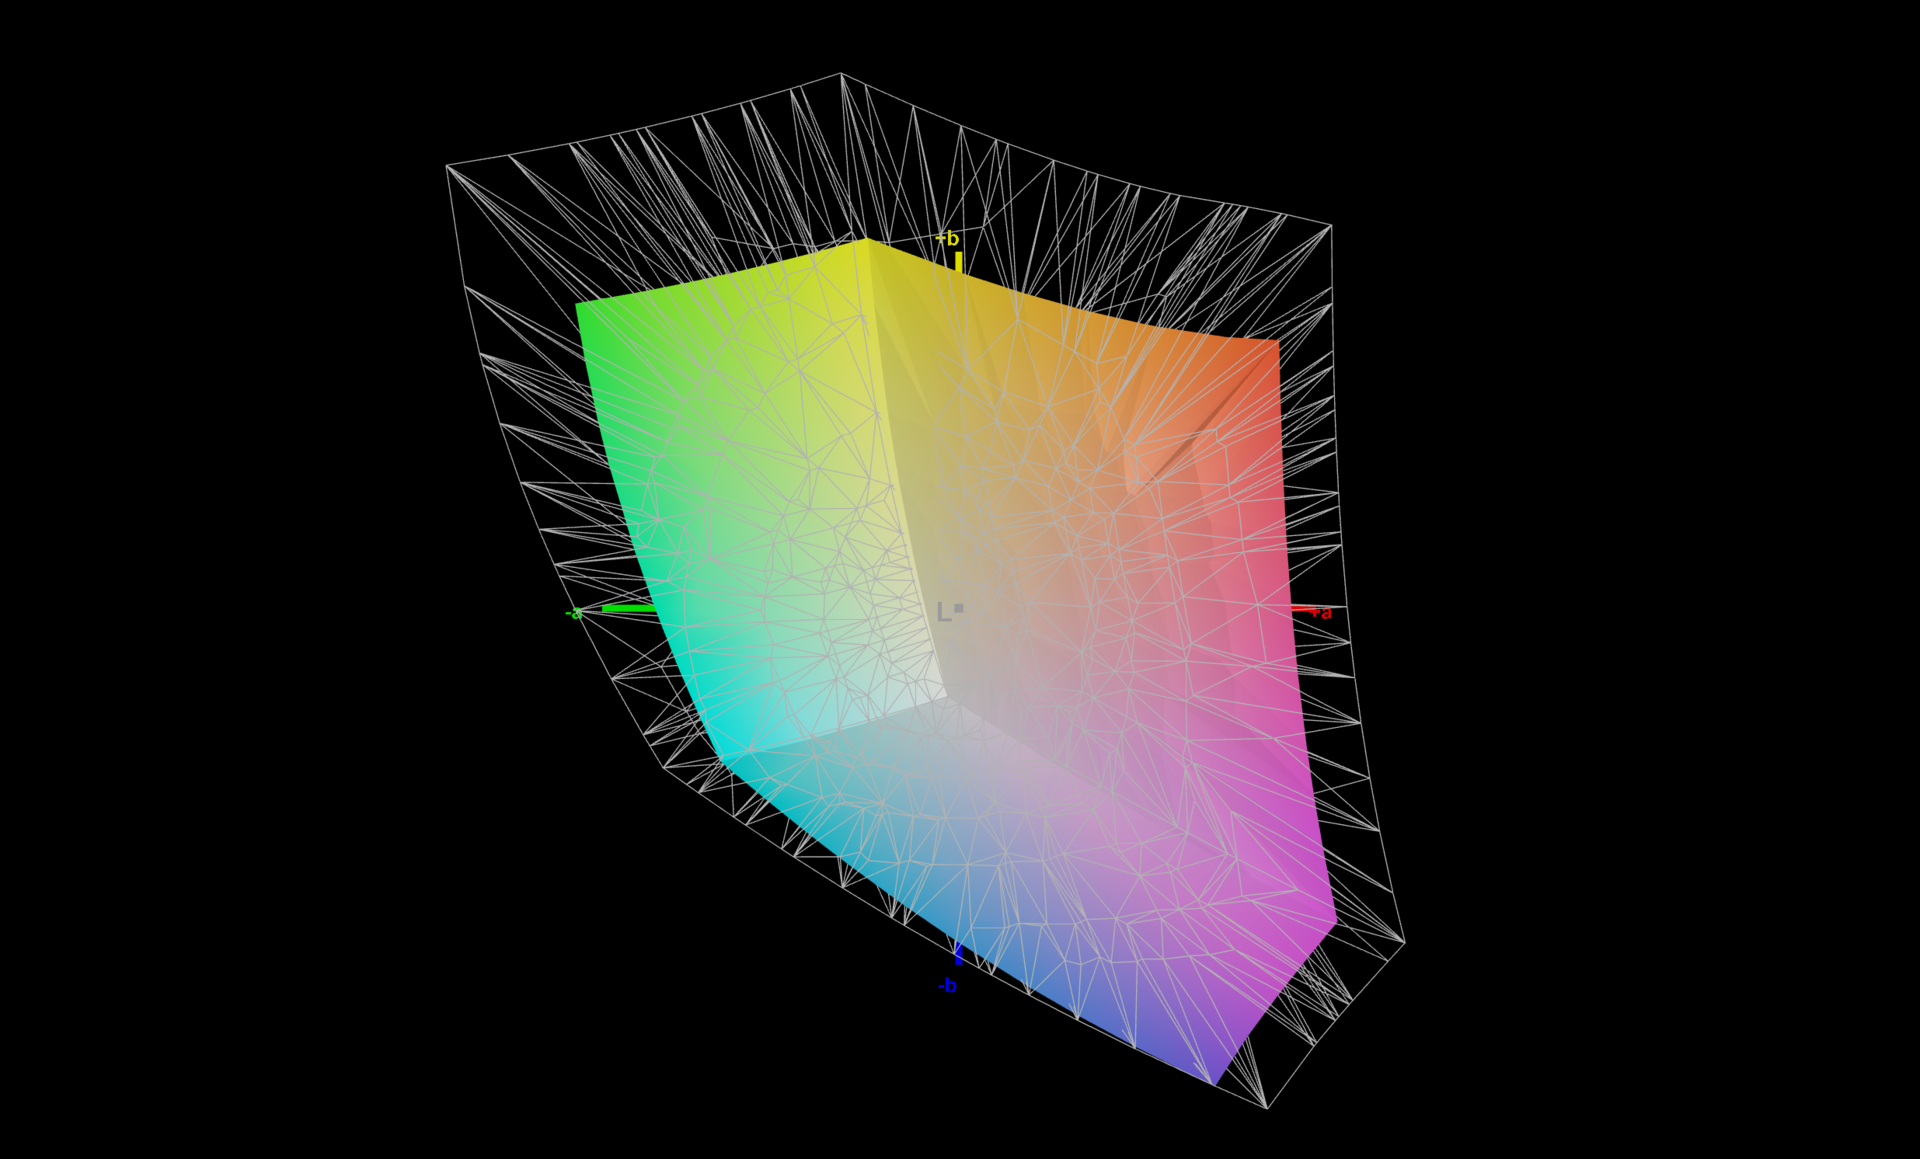
Przestrzeń kolorów sRGB jest wystarczająco pokryta w 95,7%, co powinno pozwolić na profesjonalną obróbkę obrazu w obszarze cyfrowym. Jednak nawet po naszej kalibracji kolor niebieski nadal odbiega od celu z wartością DeltaE 2000 wynoszącą 3,5, choć udało nam się zaradzić niebieskiemu odcieniowi. Jak zwykle, nasz skalibrowany profil kolorystyczny można pobrać z powyższego linku, na prawo od grafiki rozkładu jasności.
Wyświetl czasy reakcji
| ↔ Czas reakcji od czerni do bieli | ||
|---|---|---|
| 18.9 ms ... wzrost ↗ i spadek ↘ łącznie | ↗ 9.4 ms wzrost | 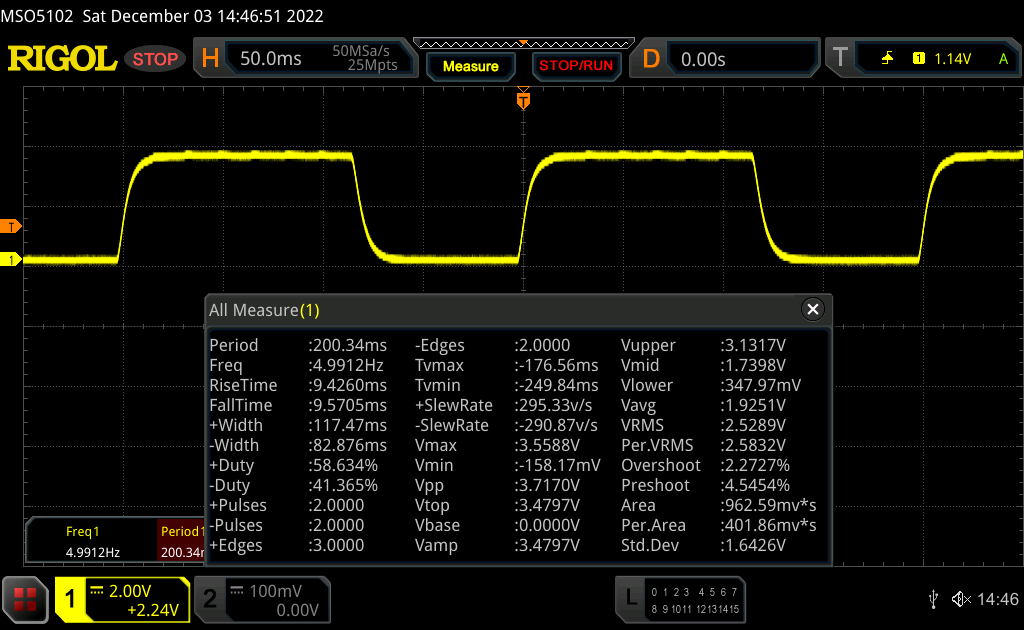 |
| ↘ 9.5 ms upadek | ||
| W naszych testach ekran wykazuje dobry współczynnik reakcji, ale może być zbyt wolny dla graczy rywalizujących ze sobą. Dla porównania, wszystkie testowane urządzenia wahają się od 0.1 (minimum) do 240 (maksimum) ms. » 42 % wszystkich urządzeń jest lepszych. Oznacza to, że zmierzony czas reakcji jest zbliżony do średniej wszystkich testowanych urządzeń (19.8 ms). | ||
| ↔ Czas reakcji 50% szarości do 80% szarości | ||
| 32.1 ms ... wzrost ↗ i spadek ↘ łącznie | ↗ 15.6 ms wzrost | 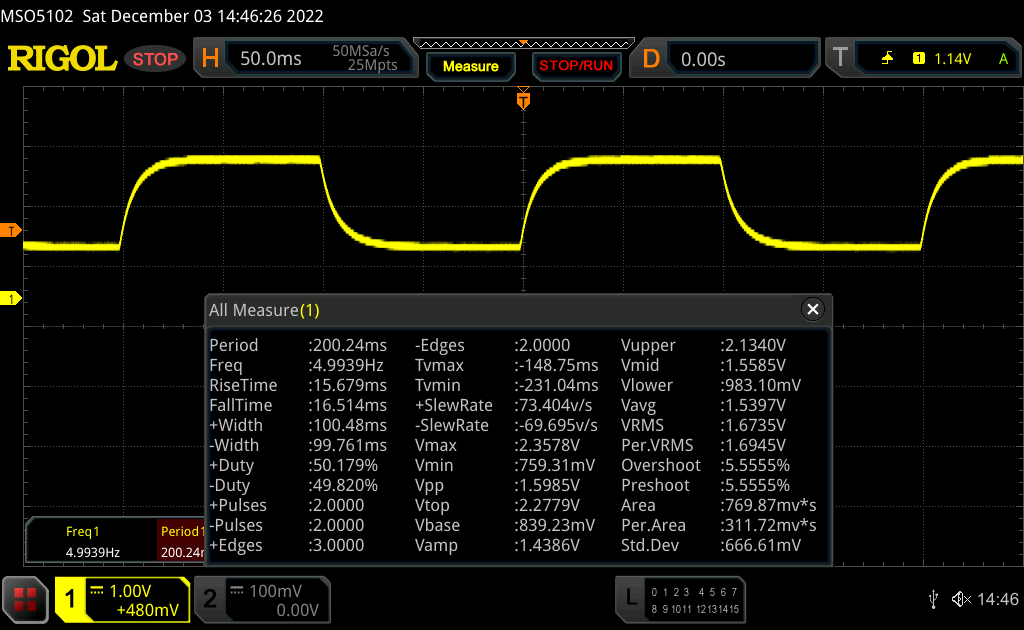 |
| ↘ 16.5 ms upadek | ||
| W naszych testach ekran wykazuje powolne tempo reakcji, co będzie niezadowalające dla graczy. Dla porównania, wszystkie testowane urządzenia wahają się od 0.165 (minimum) do 636 (maksimum) ms. » 44 % wszystkich urządzeń jest lepszych. Oznacza to, że zmierzony czas reakcji jest zbliżony do średniej wszystkich testowanych urządzeń (31 ms). | ||
Migotanie ekranu / PWM (modulacja szerokości impulsu)
| Migotanie ekranu/nie wykryto PWM | 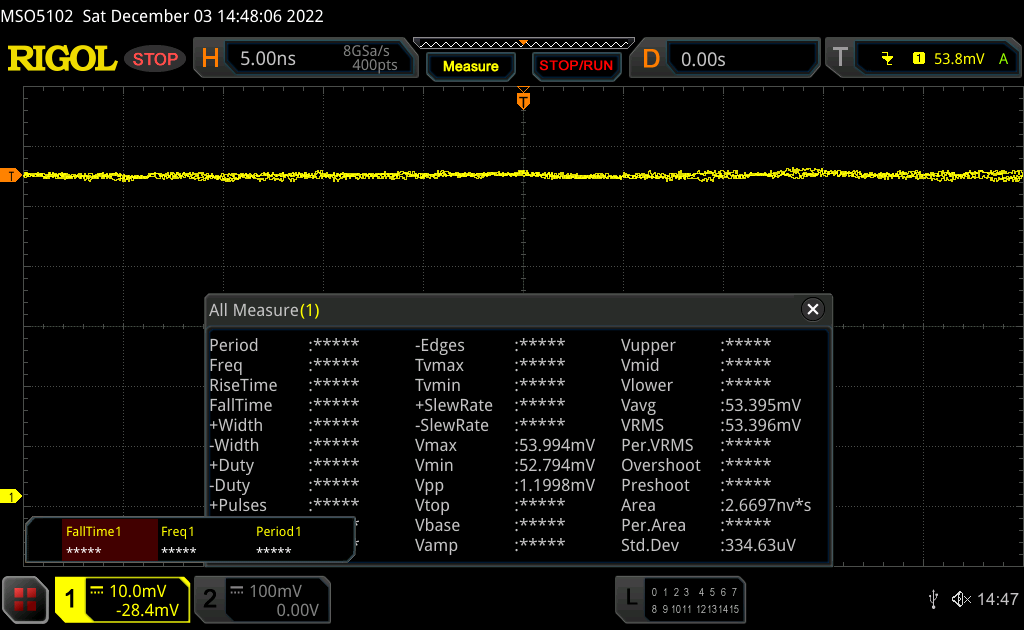 | ||
Dla porównania: 52 % wszystkich testowanych urządzeń nie używa PWM do przyciemniania wyświetlacza. Jeśli wykryto PWM, zmierzono średnio 7781 (minimum: 5 - maksimum: 343500) Hz. | |||
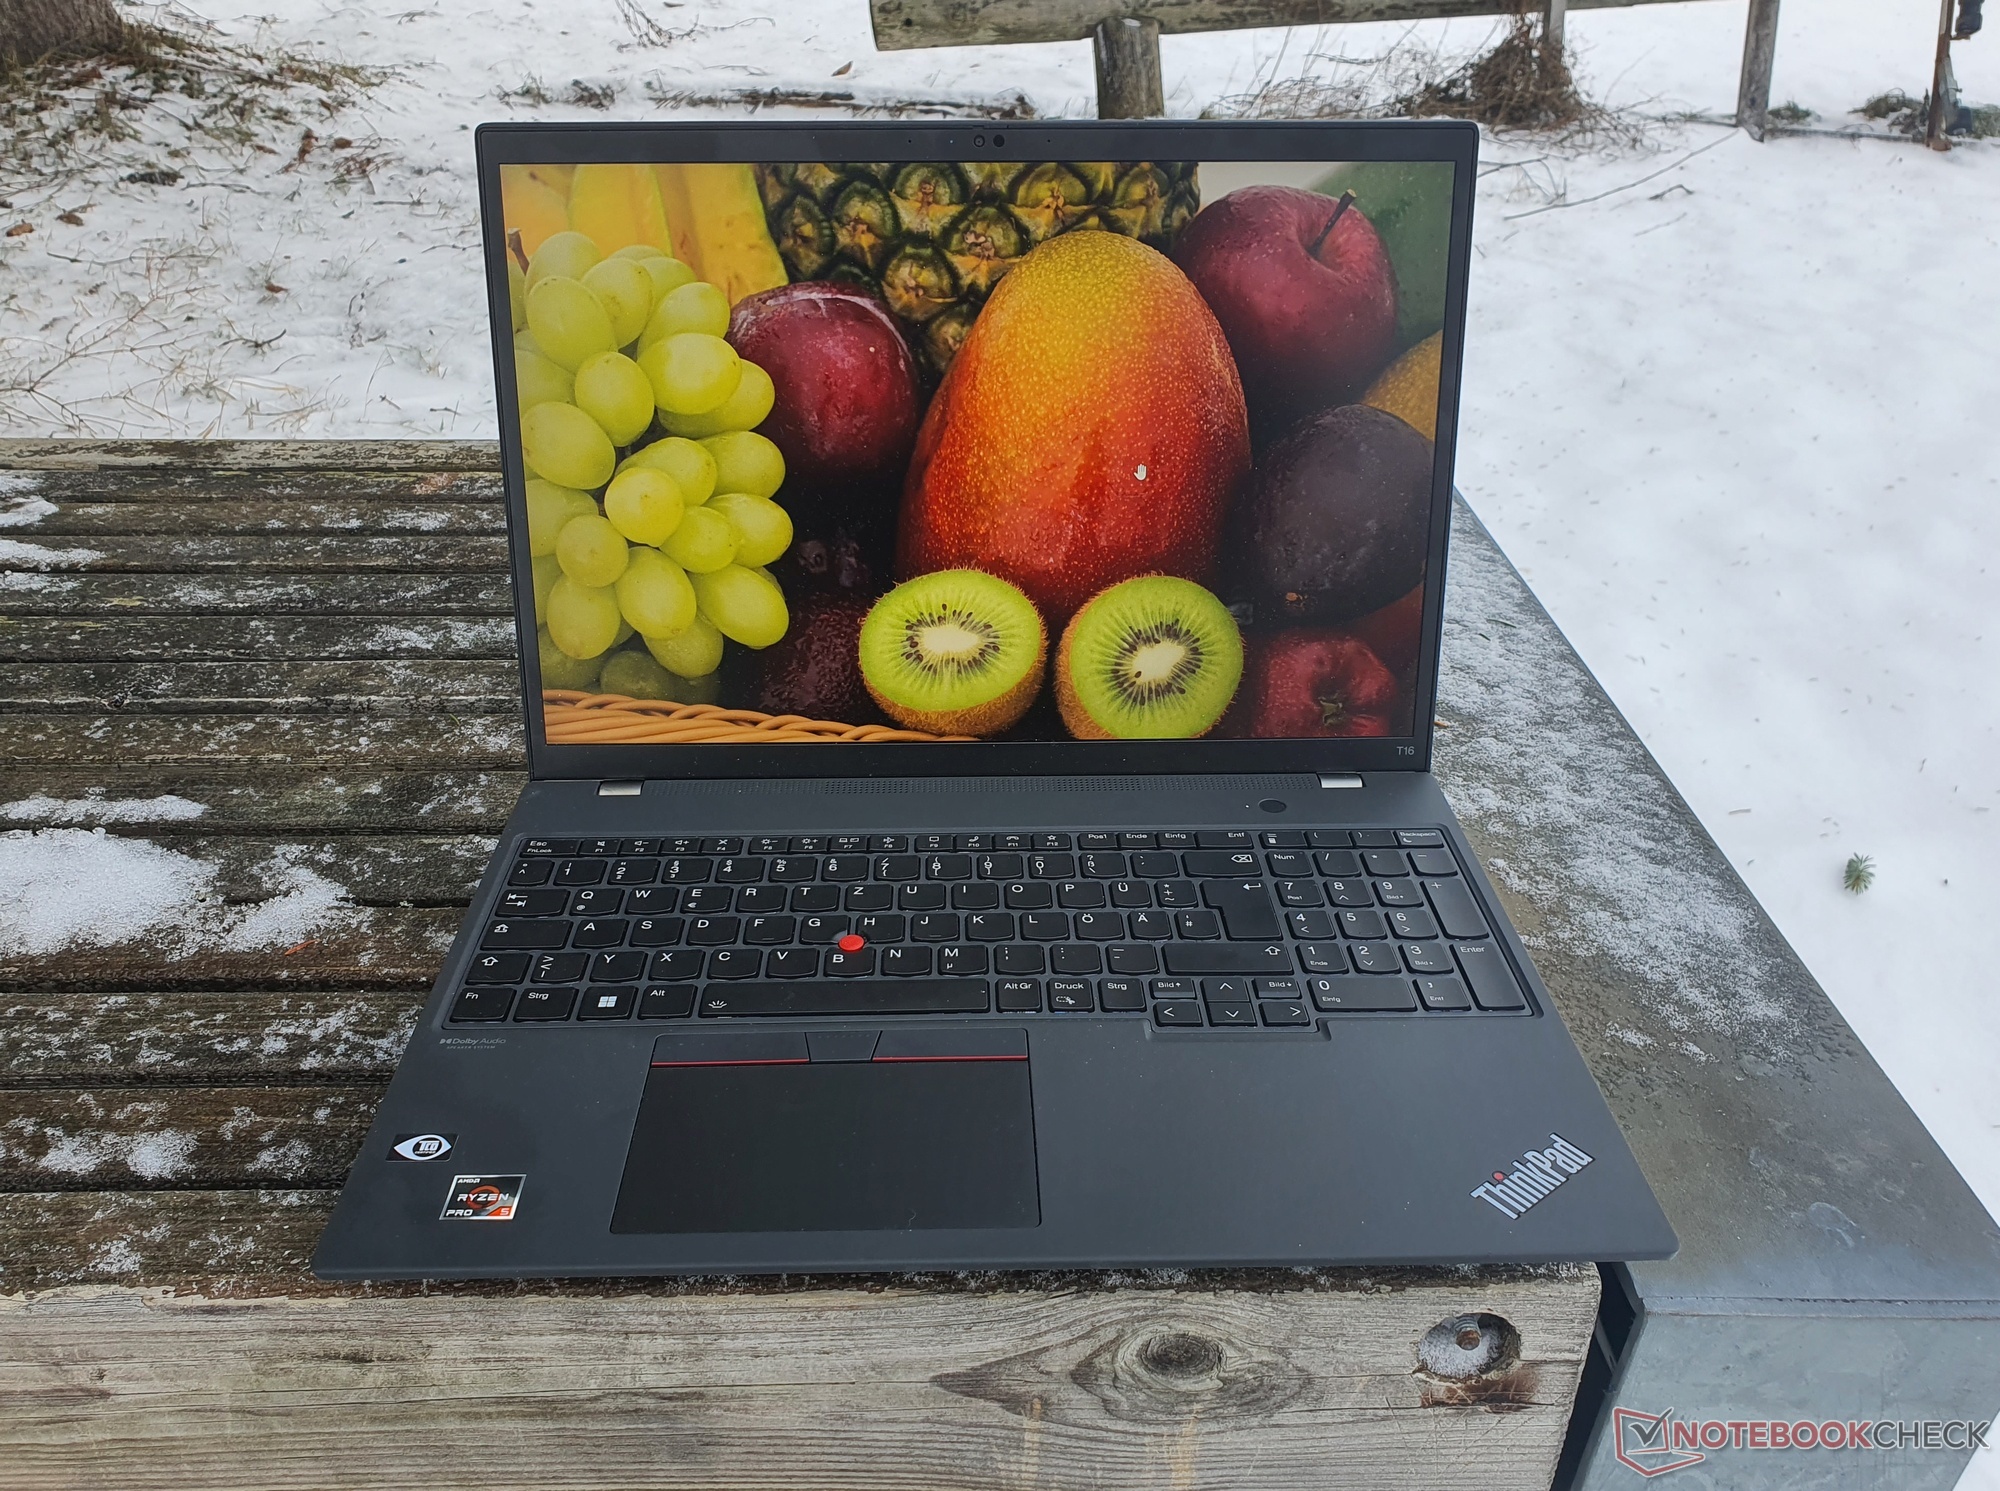
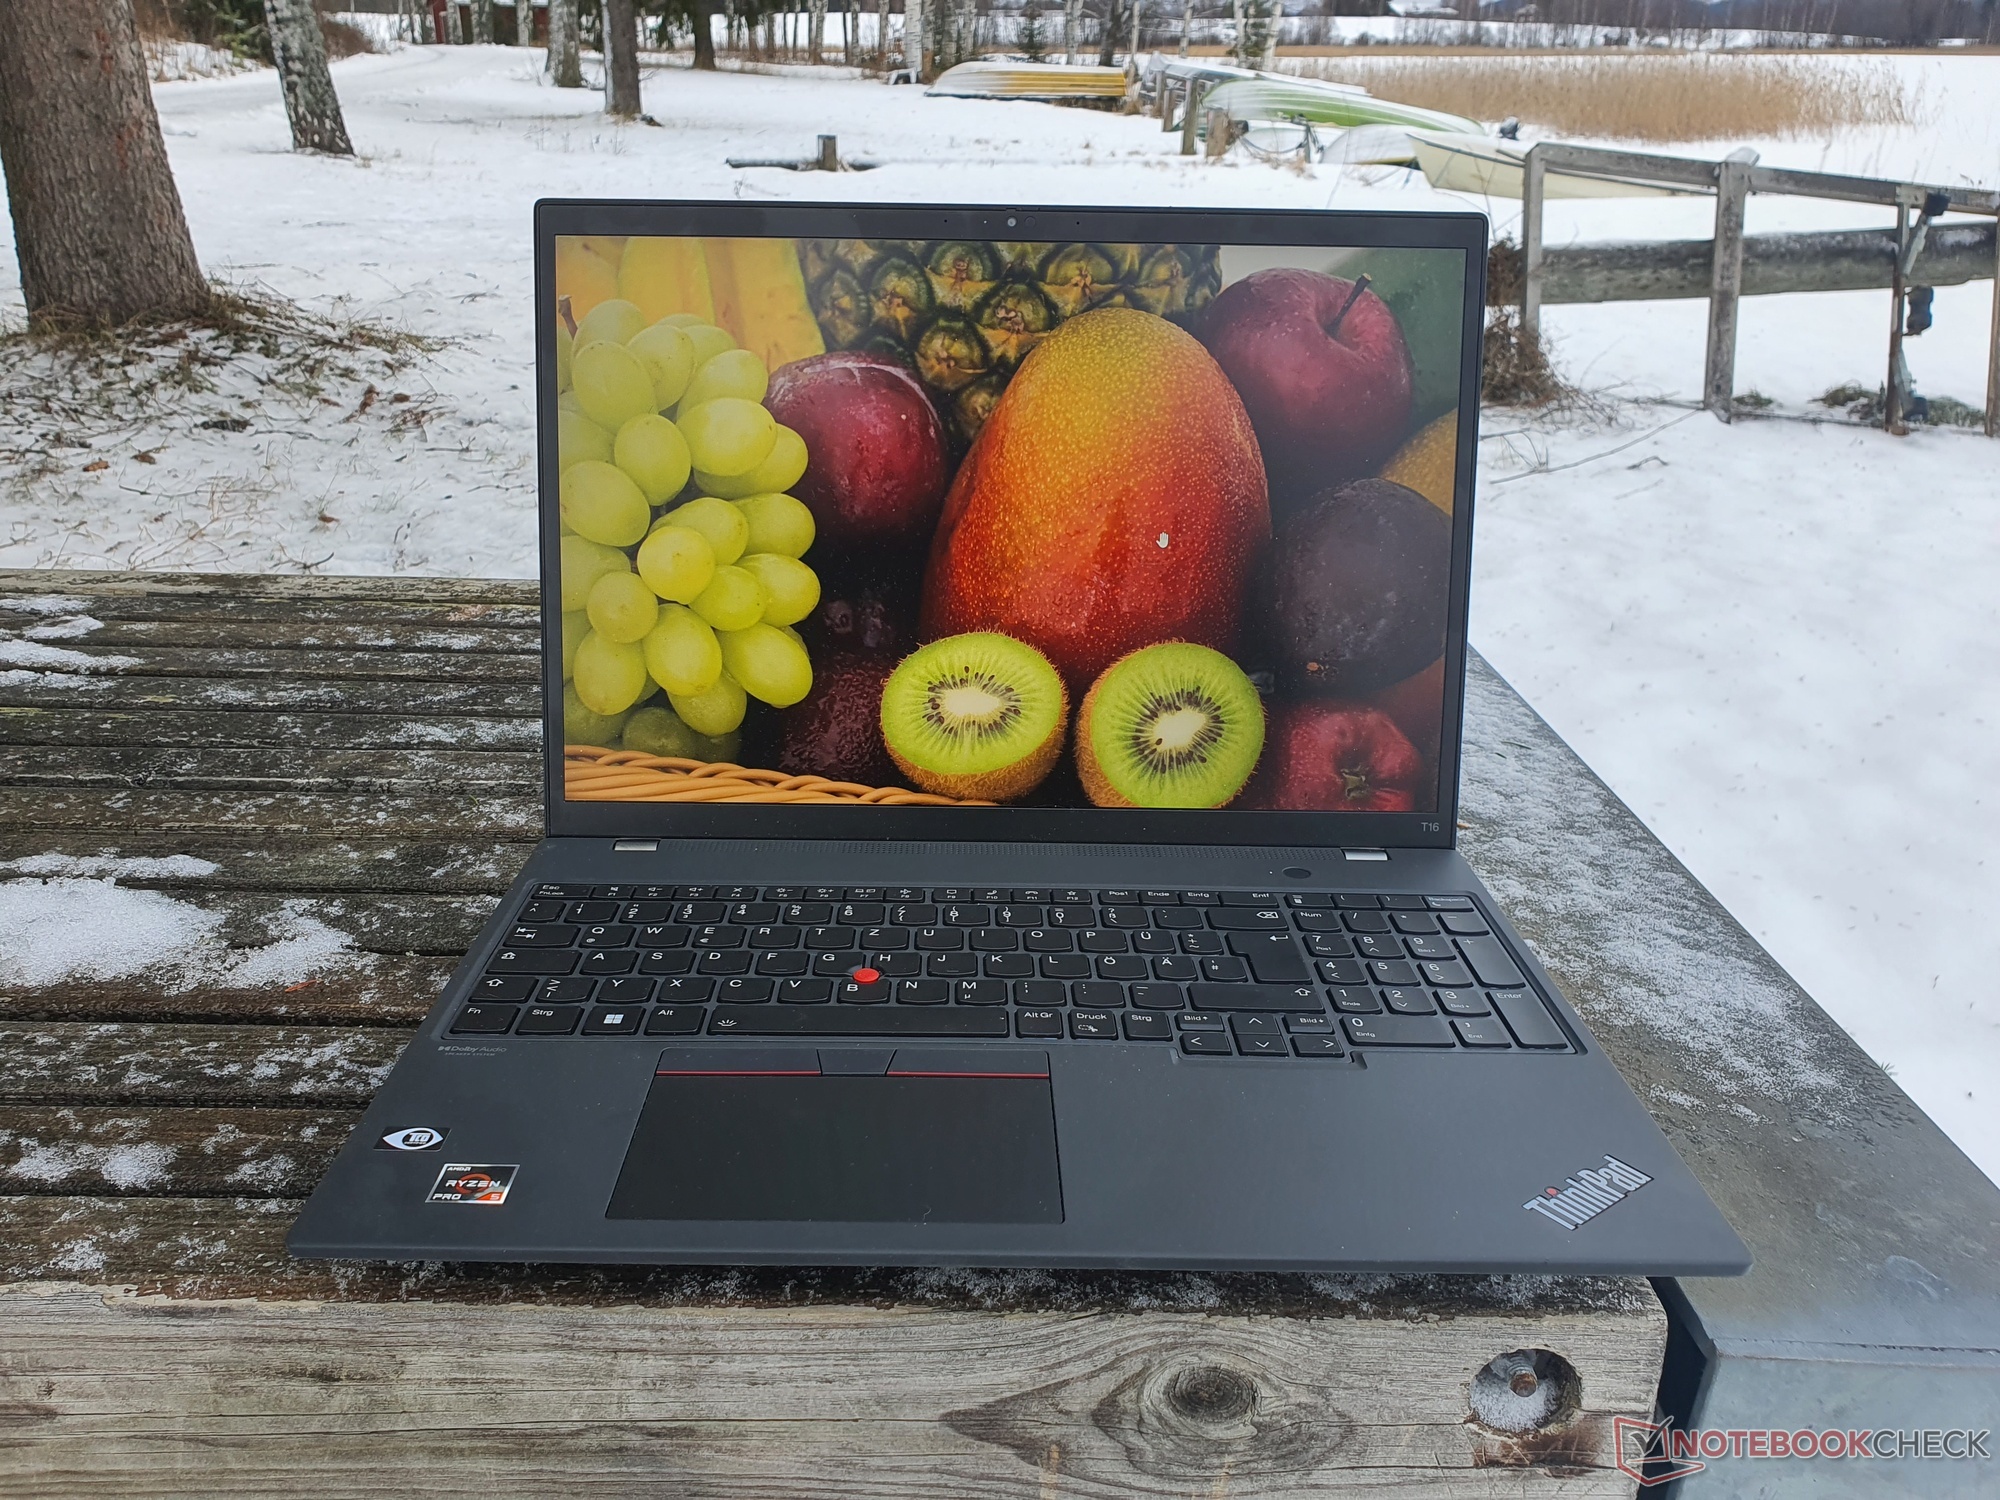
Dzięki dość wysokiej jasności ~390 cd/m², zawartość matowego wyświetlacza pozostaje łatwo czytelna na zewnątrz, o ile tylko unikamy bezpośredniego działania promieni słonecznych.

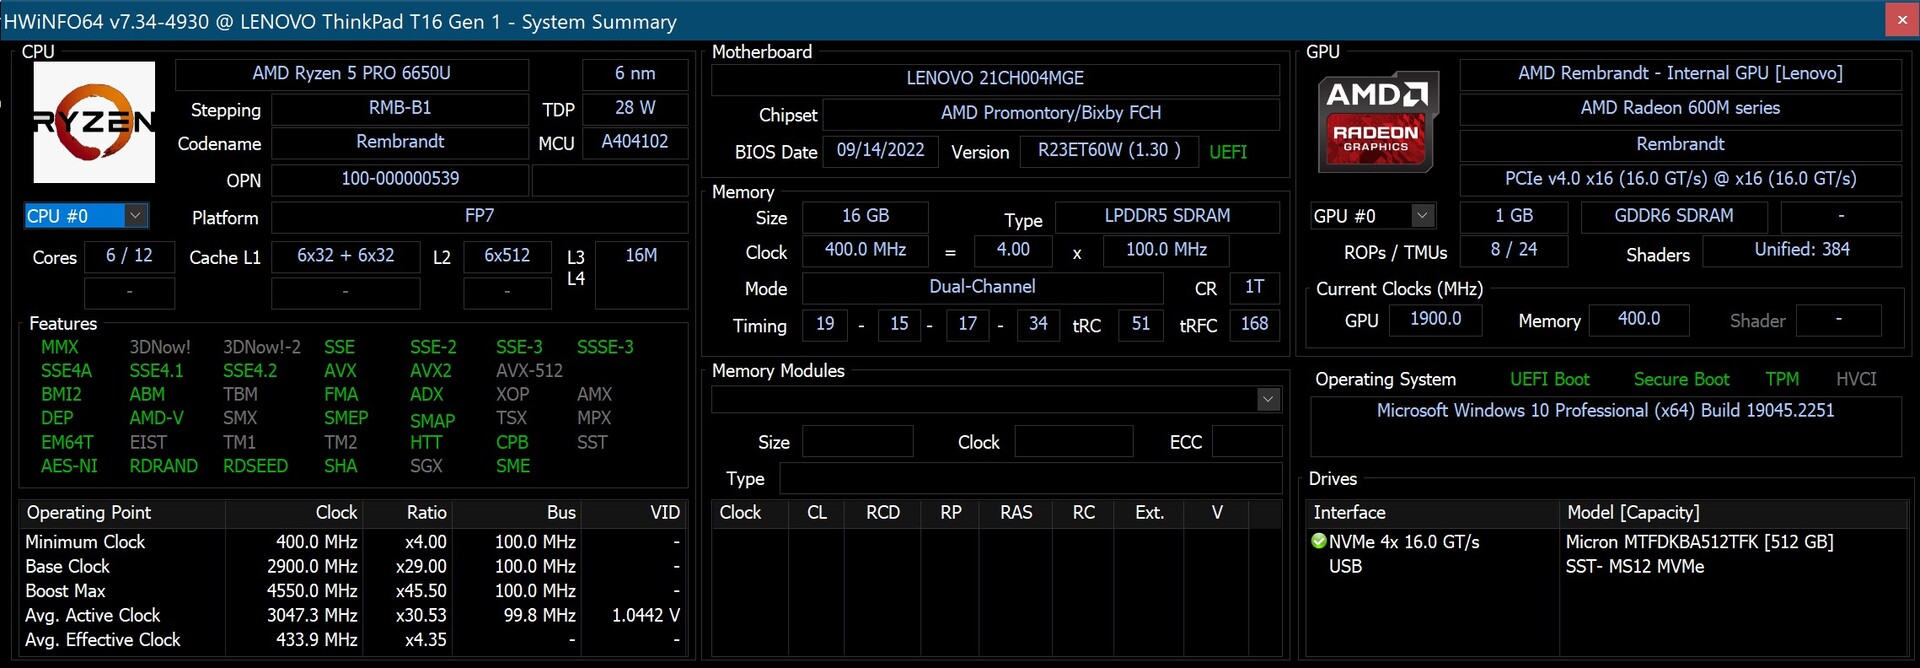
Wydajność: Hexa-core AMD już szybszy od T16 Intela
Nasz testowy egzemplarz ThinkPada T16 AMD jest wyposażony w 16 GB wlutowanej pamięci RAM LPDDR5-6400, natomiast model Intela oferuje gniazdo RAM na moduł DDR4-3200. Maksymalnie dostępne dla wersji AMD jest 32 GB, a dla wersji Intela - 48 GB.
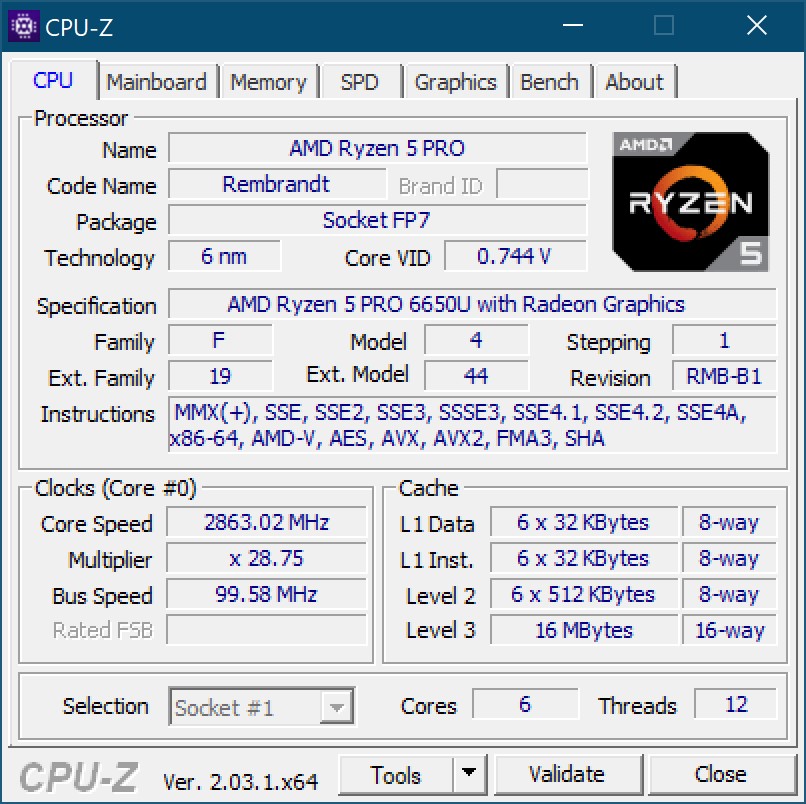
Sercem urządzenia jest procesor AMD Ryzen 5 PRO 6650Uze swoimi sześcioma rdzeniami, a mamy też T16 z ośmiordzeniowym Ryzen 7 PRO 6850Udostępny w kilku benchmarkach. Z 512-GB dyskiem SSD PCIe 4.0 i wyłącznie zintegrowanym rozwiązaniem graficznym (Radeon 660M lub Radeon 680M), docelowe zastosowanie znajduje się wyraźnie w obszarze biurowym.
Warunki badania
Lenovo nie oferuje w przypadku swoich ThinkPadów własnych kontrolek trybów wydajności, ale są one zintegrowane z ustawieniami zasilania systemu Windows. Pozwala to na wybór spośród trzech profili o różnych limitach mocy dla krótkotrwałego Turbo (PL2) i długotrwałego Boost (PL1):
- Najlepsza wydajność energetyczna: 20 W (PL2) / 18 W (PL1)
- Zrównoważony: 32 W (PL2) / 27 W (PL1)
- Najlepsza wydajność: 37 W (PL2) / 32 W (PL1)
Wszystkie nasze testy wydajnościowe przeprowadziliśmy z aktywnym trybem "Najlepsza wydajność". Czas pracy Wi-Fi i wideo na baterii został określony przy użyciu trybu "Zrównoważony".
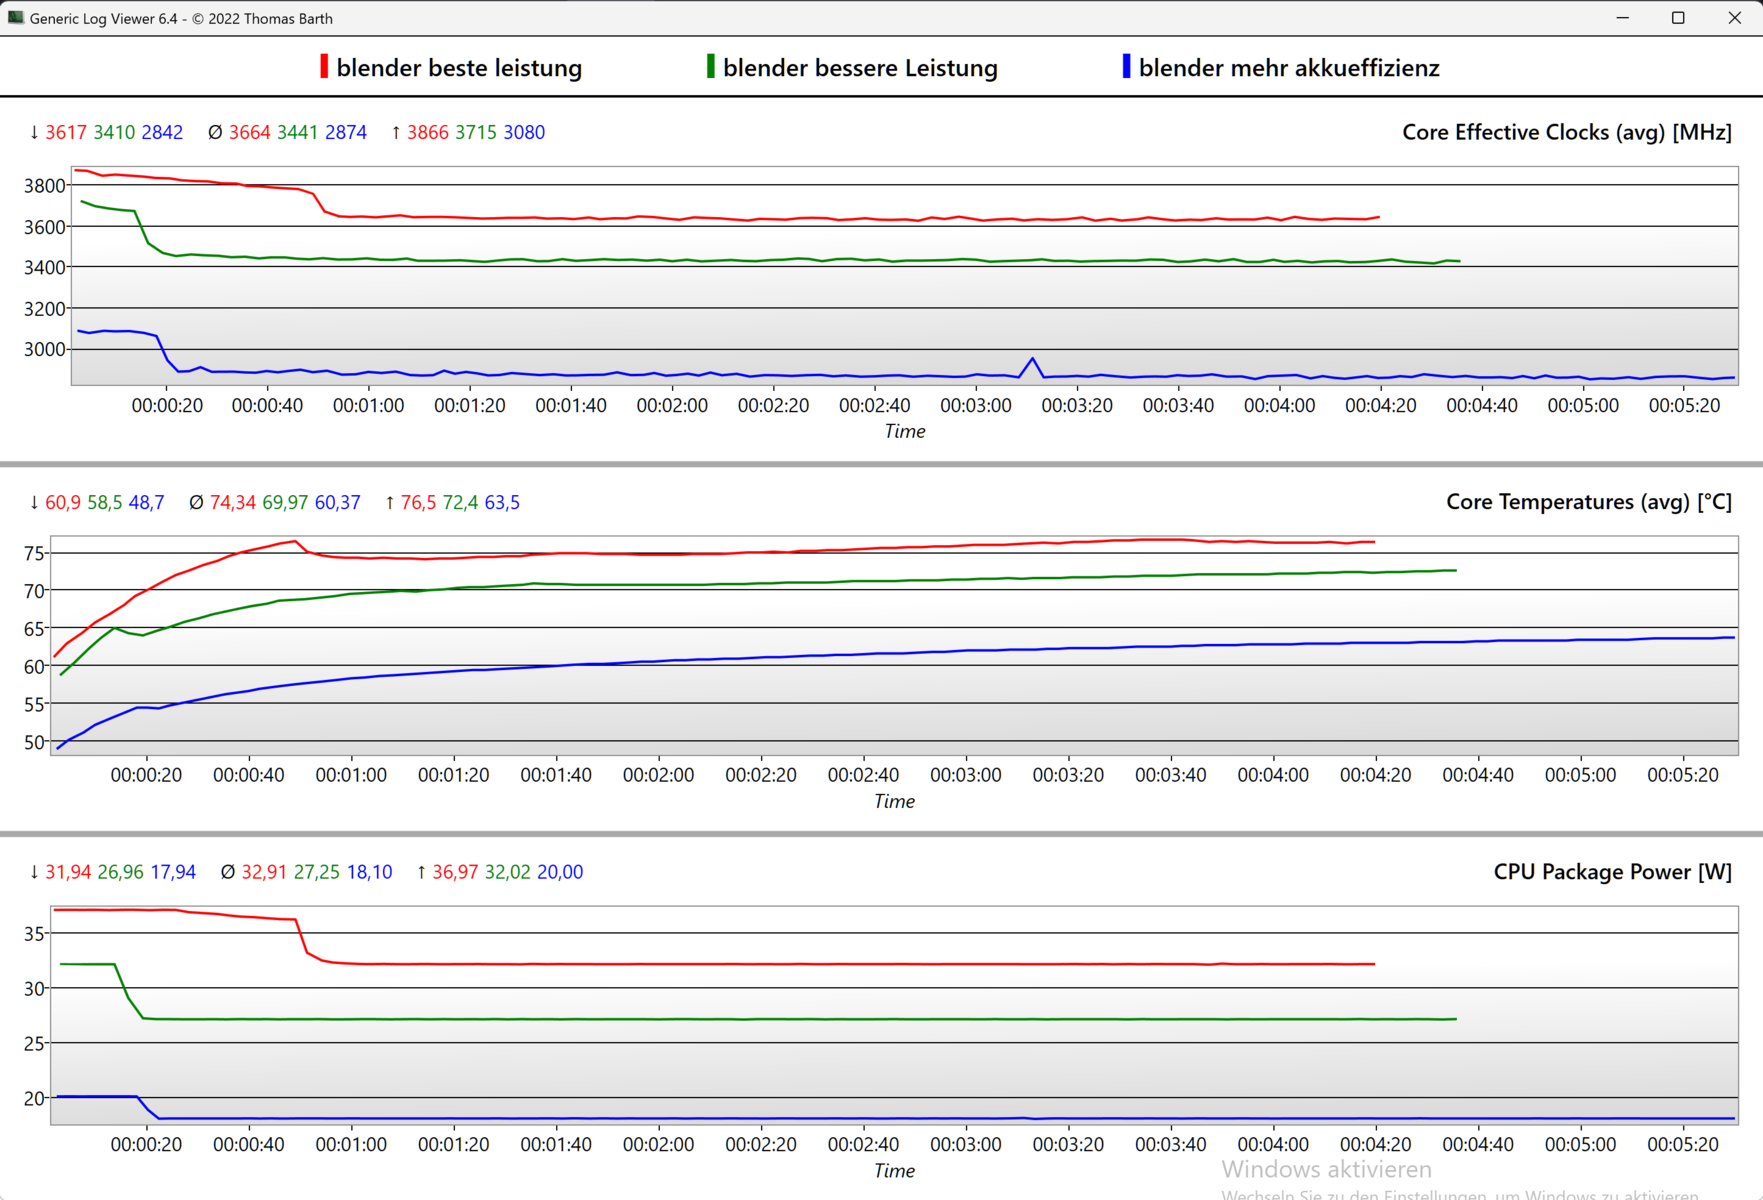
Procesor
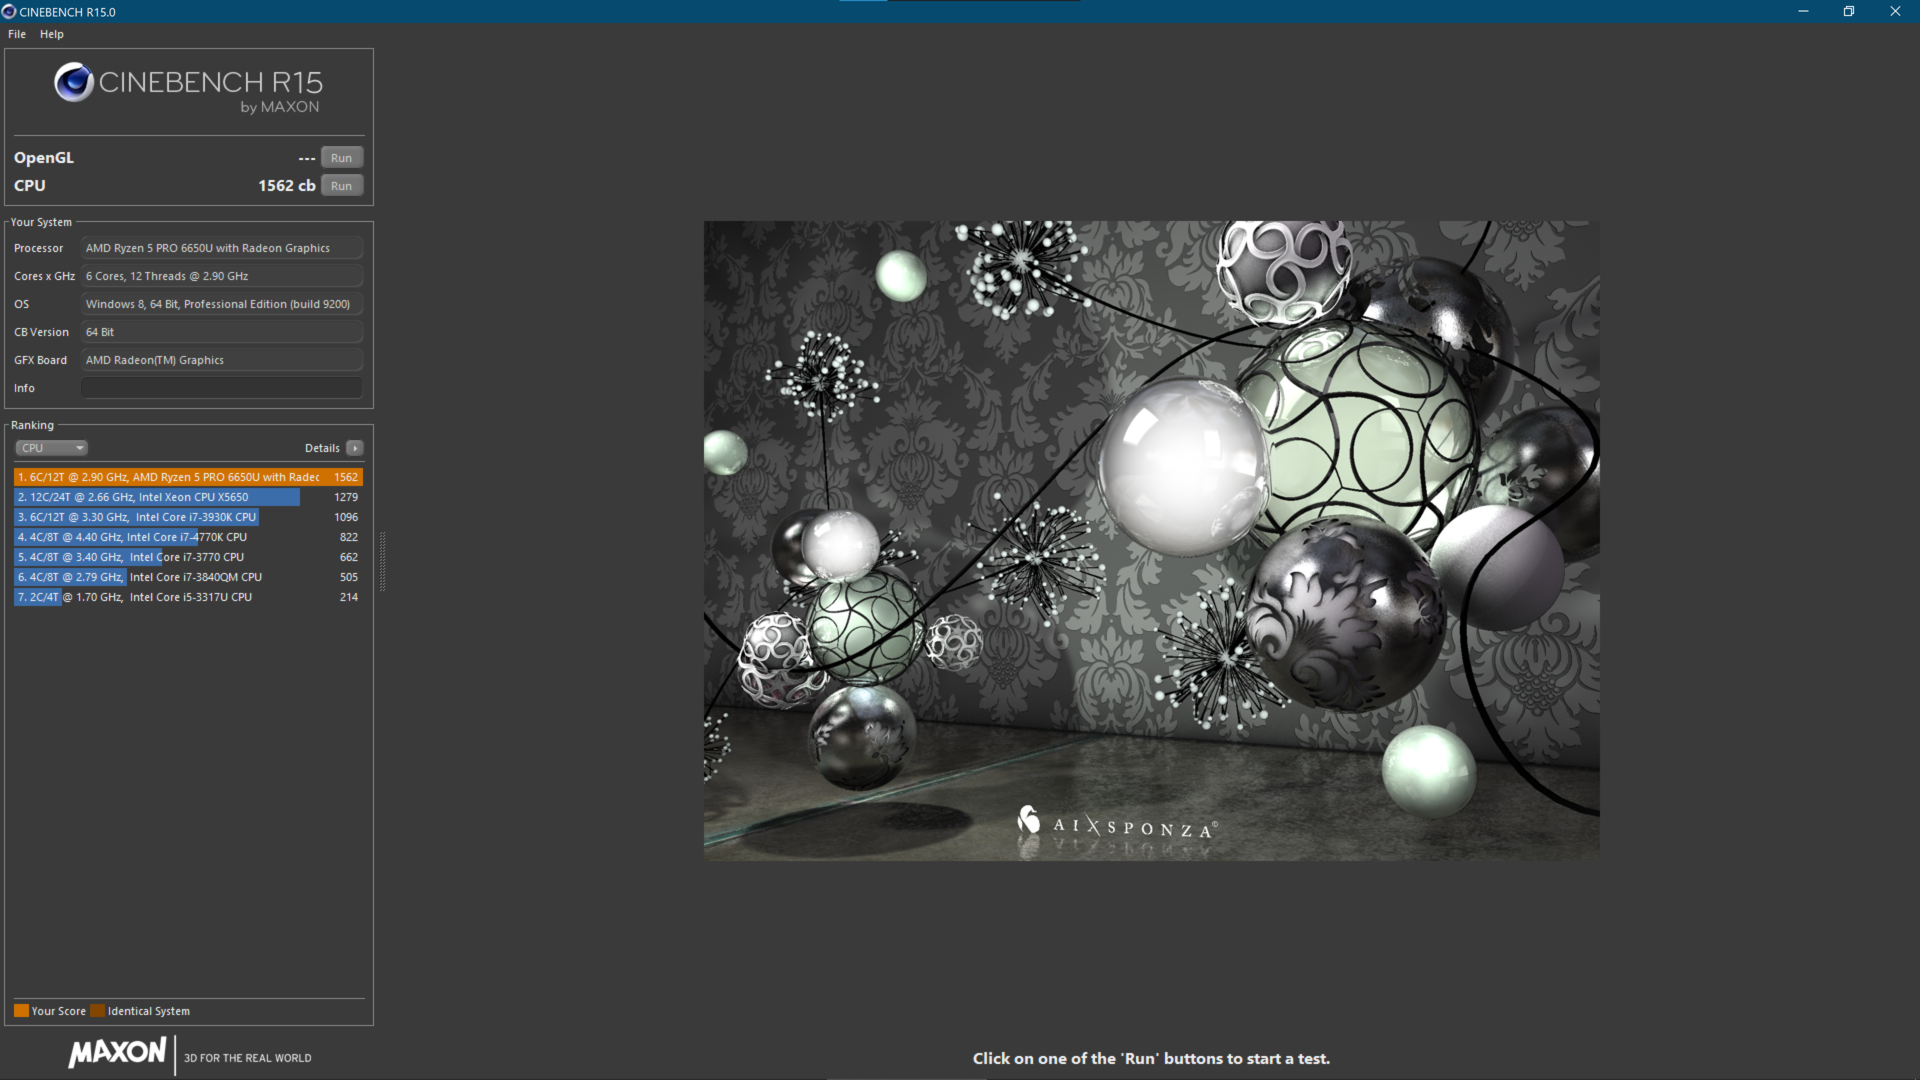
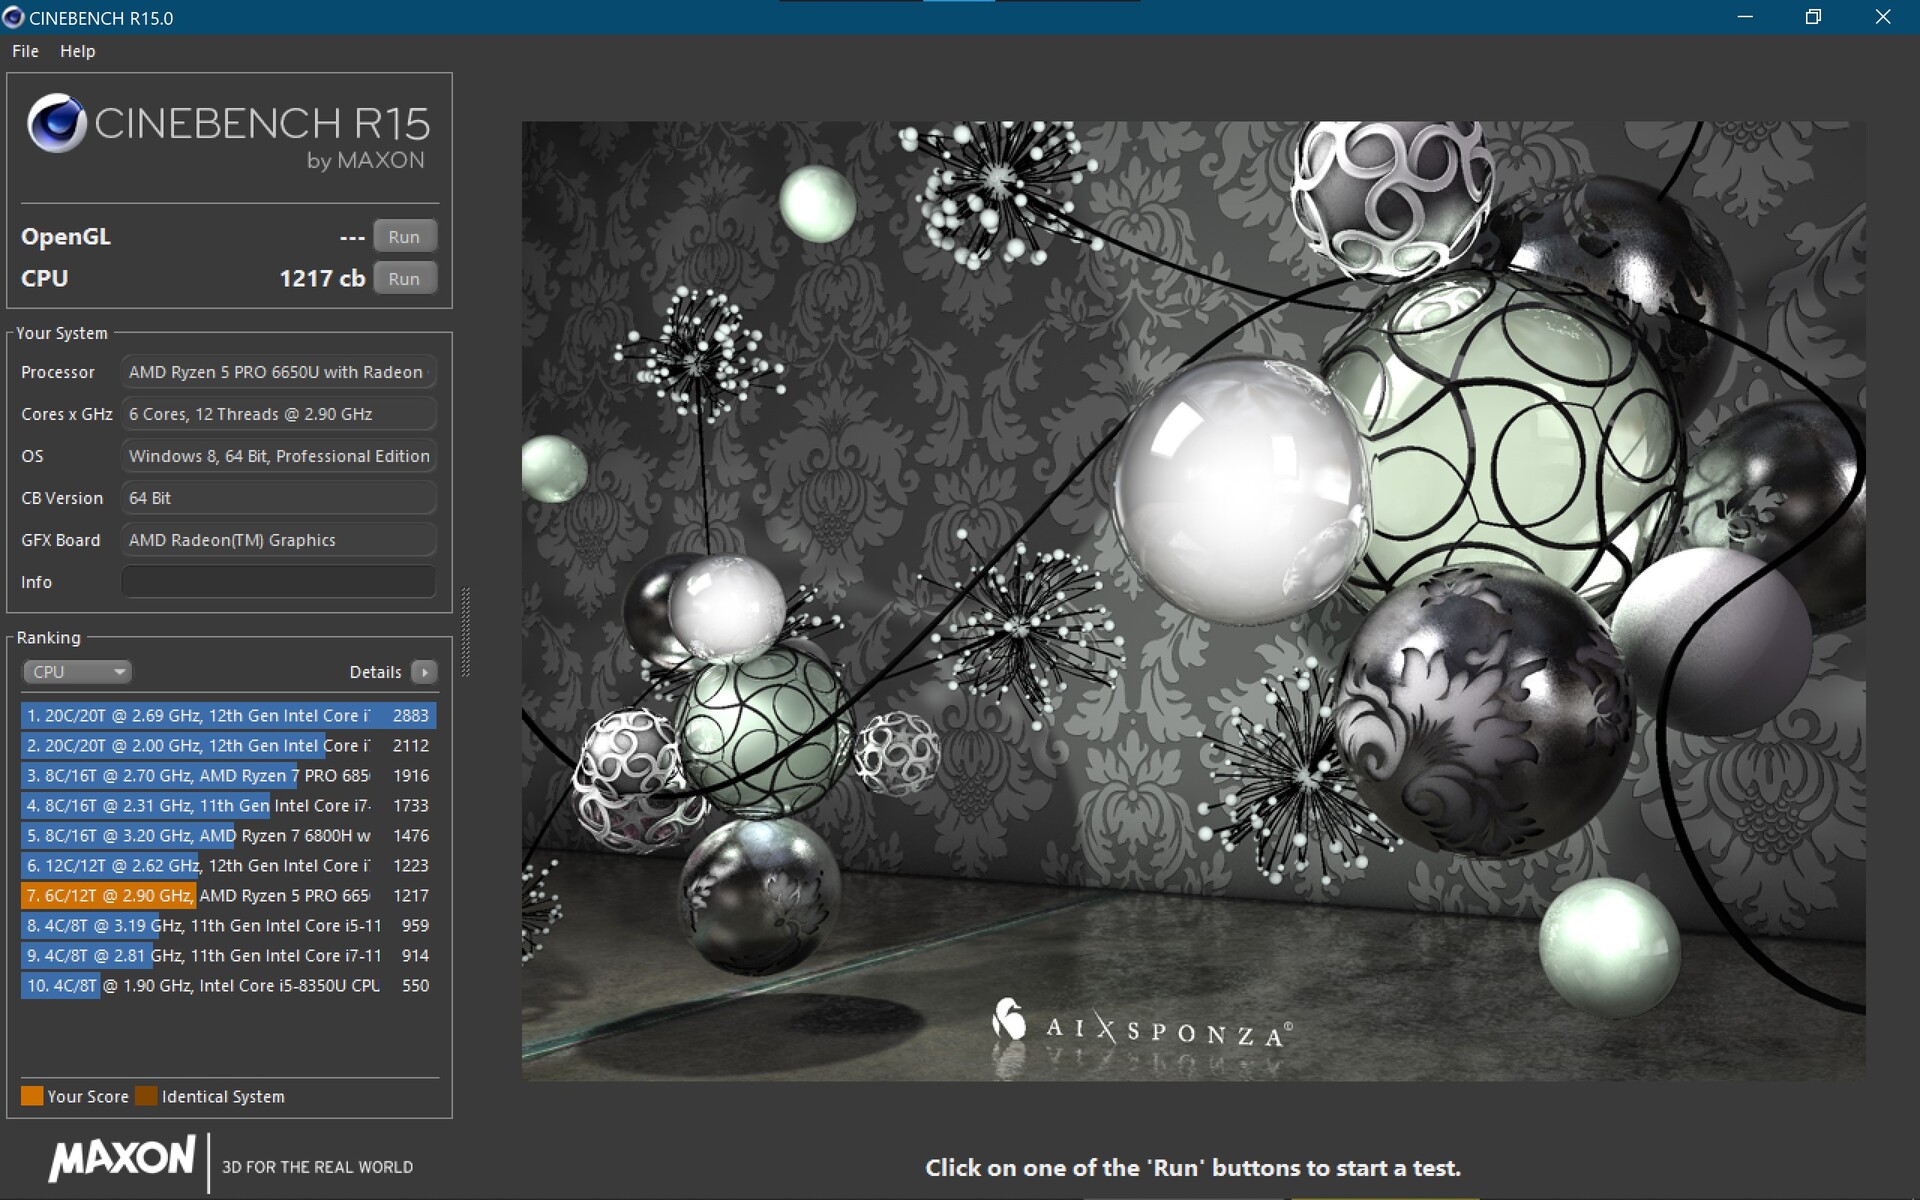
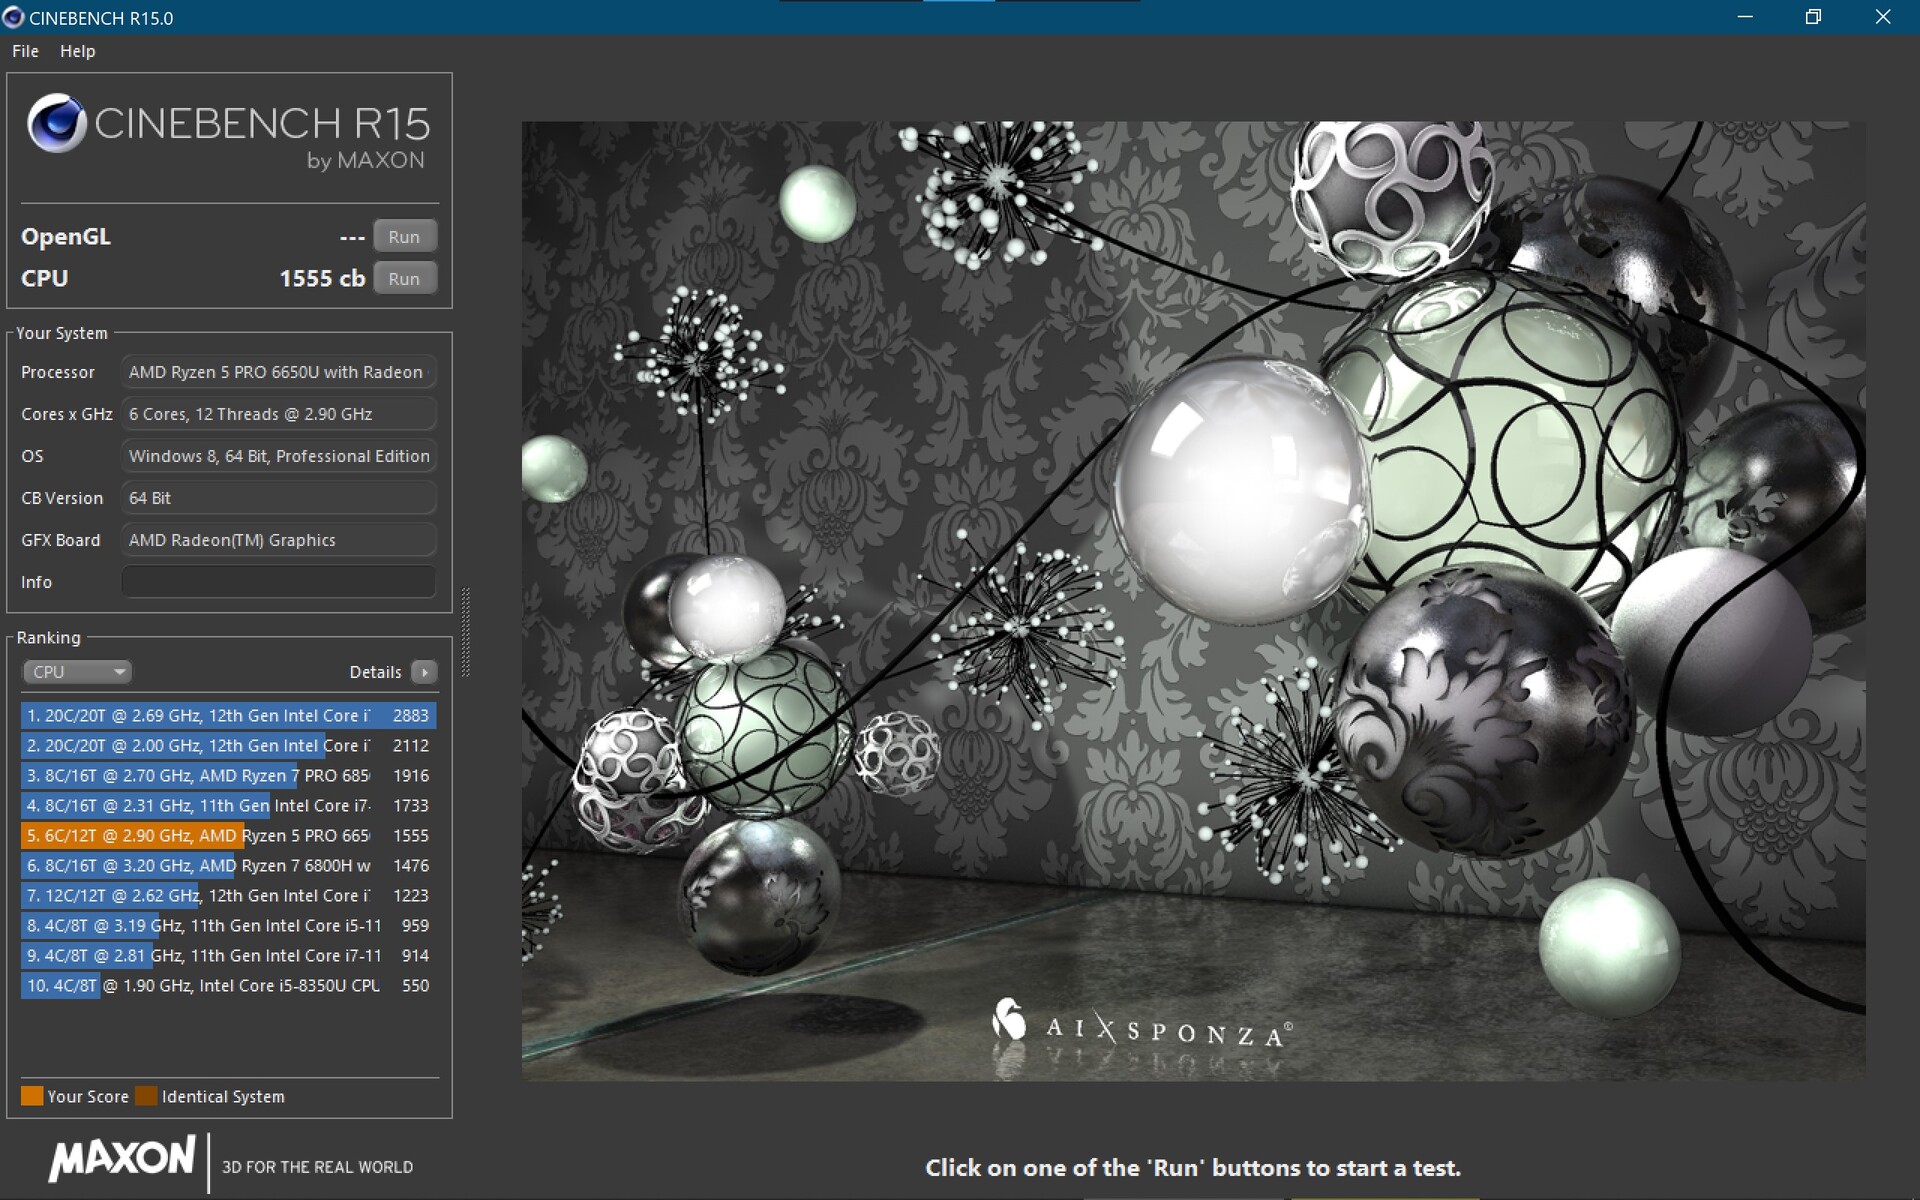
AMD Ryzen 5 Pro 6650U to procesor sześciordzeniowy. Jest on w stanie utrzymać swoje maksymalne taktowanie 3,8 GHz we wszystkich rdzeniach przez około 45 sekund w ThinkPadzie T16 G1, po czym wyrównuje się po tym czasie tylko nieznacznie poniżej tego poziomu przy 3,65 GHz.
Daje to znacznie wyższe wartości wydajności, niż w przypadkuModelu Intela, który Lenovo ogranicza do niskich 20 watów. W naszej pętli Cinebench R15 mierzymy wyniki, które są średnio o 50% wyższe niż w przypadku odpowiedniego modelu Intela Core i5-1240P, który przynajmniej wyprzedza w pierwszym przebiegu.
Nasz drugi egzemplarz testu T16 z Ryzen 7 Pro 6850U przynosi około 20% dodatkowej wydajności w tym benchmarku. Z drugiej strony EliteBook 865 G9z tym samym ośmiordzeniowym układem jest na tym samym poziomie co słabiej wyposażony T16 ze swoim R5 6650U. Intel's Core i7-12700H wThinkPad X1 Extreme G5był prawie dwa razy szybszy w benchmarkach wielordzeniowych od Ryzen 5 Pro 6650U, a w teście jednordzeniowym osiągał jeszcze wyniki o około 23% wyższe.
W pracy na akumulatorze wydajność nie uległa zmniejszeniu. W T16 z wydajniejszym procesorem ośmiordzeniowym obserwujemy jednak spadek wydajności o 20%.

Cinebench R15 Multi Constant Load Test
Cinebench R23: Multi Core | Single Core
Cinebench R20: CPU (Multi Core) | CPU (Single Core)
Cinebench R15: CPU Multi 64Bit | CPU Single 64Bit
Blender: v2.79 BMW27 CPU
7-Zip 18.03: 7z b 4 | 7z b 4 -mmt1
Geekbench 5.5: Multi-Core | Single-Core
HWBOT x265 Benchmark v2.2: 4k Preset
LibreOffice : 20 Documents To PDF
R Benchmark 2.5: Overall mean
| CPU Performance rating | |
| Lenovo ThinkPad X1 Extreme G5-21DE003RGE | |
| HP ZBook Power 15 G9 6B8C4EA | |
| Lenovo ThinkPad Z16 G1 21D5S00T00 | |
| Lenovo ThinkPad T16 G1 21CHCTO1WW | |
| Średnia w klasie Office | |
| HP EliteBook 865 G9 | |
| Lenovo ThinkPad T16 G1 21CH004MGE | |
| Lenovo ThinkPad T16 G1 21BWS00200 | |
| Przeciętny AMD Ryzen 5 PRO 6650U | |
| Cinebench R23 / Multi Core | |
| Lenovo ThinkPad X1 Extreme G5-21DE003RGE | |
| HP ZBook Power 15 G9 6B8C4EA | |
| Lenovo ThinkPad Z16 G1 21D5S00T00 | |
| Średnia w klasie Office (1673 - 22808, n=74, ostatnie 2 lata) | |
| Lenovo ThinkPad T16 G1 21CHCTO1WW | |
| HP EliteBook 865 G9 | |
| Lenovo ThinkPad T16 G1 21CH004MGE | |
| Przeciętny AMD Ryzen 5 PRO 6650U (7805 - 9534, n=4) | |
| Lenovo ThinkPad T16 G1 21BWS00200 | |
| Cinebench R23 / Single Core | |
| Lenovo ThinkPad X1 Extreme G5-21DE003RGE | |
| HP ZBook Power 15 G9 6B8C4EA | |
| Średnia w klasie Office (708 - 2130, n=74, ostatnie 2 lata) | |
| Lenovo ThinkPad T16 G1 21BWS00200 | |
| Lenovo ThinkPad T16 G1 21CHCTO1WW | |
| Lenovo ThinkPad Z16 G1 21D5S00T00 | |
| Lenovo ThinkPad T16 G1 21CH004MGE | |
| Przeciętny AMD Ryzen 5 PRO 6650U (1439 - 1476, n=4) | |
| HP EliteBook 865 G9 | |
| Cinebench R20 / CPU (Multi Core) | |
| Lenovo ThinkPad X1 Extreme G5-21DE003RGE | |
| HP ZBook Power 15 G9 6B8C4EA | |
| Lenovo ThinkPad Z16 G1 21D5S00T00 | |
| Lenovo ThinkPad T16 G1 21CHCTO1WW | |
| Średnia w klasie Office (648 - 8840, n=73, ostatnie 2 lata) | |
| HP EliteBook 865 G9 | |
| Lenovo ThinkPad T16 G1 21CH004MGE | |
| Przeciętny AMD Ryzen 5 PRO 6650U (3057 - 3684, n=4) | |
| Lenovo ThinkPad T16 G1 21BWS00200 | |
| Cinebench R20 / CPU (Single Core) | |
| Lenovo ThinkPad X1 Extreme G5-21DE003RGE | |
| HP ZBook Power 15 G9 6B8C4EA | |
| Średnia w klasie Office (345 - 816, n=73, ostatnie 2 lata) | |
| Lenovo ThinkPad T16 G1 21CHCTO1WW | |
| HP EliteBook 865 G9 | |
| Lenovo ThinkPad Z16 G1 21D5S00T00 | |
| Lenovo ThinkPad T16 G1 21BWS00200 | |
| Lenovo ThinkPad T16 G1 21CH004MGE | |
| Przeciętny AMD Ryzen 5 PRO 6650U (548 - 578, n=4) | |
| Cinebench R15 / CPU Multi 64Bit | |
| Lenovo ThinkPad X1 Extreme G5-21DE003RGE | |
| Lenovo ThinkPad Z16 G1 21D5S00T00 | |
| HP ZBook Power 15 G9 6B8C4EA | |
| Lenovo ThinkPad T16 G1 21CHCTO1WW | |
| Średnia w klasie Office (250 - 3380, n=75, ostatnie 2 lata) | |
| Lenovo ThinkPad T16 G1 21BWS00200 | |
| Lenovo ThinkPad T16 G1 21BWS00200 | |
| HP EliteBook 865 G9 | |
| Lenovo ThinkPad T16 G1 21CH004MGE | |
| Przeciętny AMD Ryzen 5 PRO 6650U (1299 - 1555, n=4) | |
| Cinebench R15 / CPU Single 64Bit | |
| Lenovo ThinkPad X1 Extreme G5-21DE003RGE | |
| HP ZBook Power 15 G9 6B8C4EA | |
| Średnia w klasie Office (99.5 - 312, n=75, ostatnie 2 lata) | |
| Lenovo ThinkPad Z16 G1 21D5S00T00 | |
| Lenovo ThinkPad T16 G1 21CHCTO1WW | |
| Lenovo ThinkPad T16 G1 21CH004MGE | |
| HP EliteBook 865 G9 | |
| Przeciętny AMD Ryzen 5 PRO 6650U (230 - 234, n=4) | |
| Lenovo ThinkPad T16 G1 21BWS00200 | |
| Blender / v2.79 BMW27 CPU | |
| Lenovo ThinkPad T16 G1 21BWS00200 | |
| Przeciętny AMD Ryzen 5 PRO 6650U (328 - 548, n=5) | |
| Średnia w klasie Office (158 - 1940, n=74, ostatnie 2 lata) | |
| Lenovo ThinkPad T16 G1 21CH004MGE | |
| HP EliteBook 865 G9 | |
| Lenovo ThinkPad T16 G1 21CHCTO1WW | |
| Lenovo ThinkPad Z16 G1 21D5S00T00 | |
| HP ZBook Power 15 G9 6B8C4EA | |
| Lenovo ThinkPad X1 Extreme G5-21DE003RGE | |
| 7-Zip 18.03 / 7z b 4 | |
| Lenovo ThinkPad X1 Extreme G5-21DE003RGE | |
| HP ZBook Power 15 G9 6B8C4EA | |
| Lenovo ThinkPad Z16 G1 21D5S00T00 | |
| Lenovo ThinkPad T16 G1 21CHCTO1WW | |
| HP EliteBook 865 G9 | |
| Średnia w klasie Office (7098 - 76886, n=75, ostatnie 2 lata) | |
| Lenovo ThinkPad T16 G1 21CH004MGE | |
| Przeciętny AMD Ryzen 5 PRO 6650U (32613 - 41530, n=4) | |
| Lenovo ThinkPad T16 G1 21BWS00200 | |
| 7-Zip 18.03 / 7z b 4 -mmt1 | |
| Lenovo ThinkPad X1 Extreme G5-21DE003RGE | |
| HP ZBook Power 15 G9 6B8C4EA | |
| HP EliteBook 865 G9 | |
| Średnia w klasie Office (3387 - 6469, n=75, ostatnie 2 lata) | |
| Lenovo ThinkPad Z16 G1 21D5S00T00 | |
| Lenovo ThinkPad T16 G1 21CHCTO1WW | |
| Lenovo ThinkPad T16 G1 21CH004MGE | |
| Przeciętny AMD Ryzen 5 PRO 6650U (5175 - 5427, n=4) | |
| Lenovo ThinkPad T16 G1 21BWS00200 | |
| Geekbench 5.5 / Multi-Core | |
| Lenovo ThinkPad X1 Extreme G5-21DE003RGE | |
| HP ZBook Power 15 G9 6B8C4EA | |
| Średnia w klasie Office (1483 - 16999, n=71, ostatnie 2 lata) | |
| Lenovo ThinkPad Z16 G1 21D5S00T00 | |
| Lenovo ThinkPad T16 G1 21CHCTO1WW | |
| Lenovo ThinkPad T16 G1 21CH004MGE | |
| Lenovo ThinkPad T16 G1 21BWS00200 | |
| HP EliteBook 865 G9 | |
| Przeciętny AMD Ryzen 5 PRO 6650U (6171 - 7227, n=4) | |
| Geekbench 5.5 / Single-Core | |
| Lenovo ThinkPad X1 Extreme G5-21DE003RGE | |
| Średnia w klasie Office (811 - 2128, n=71, ostatnie 2 lata) | |
| HP ZBook Power 15 G9 6B8C4EA | |
| Lenovo ThinkPad T16 G1 21BWS00200 | |
| Lenovo ThinkPad T16 G1 21CH004MGE | |
| Lenovo ThinkPad Z16 G1 21D5S00T00 | |
| Lenovo ThinkPad T16 G1 21CHCTO1WW | |
| Przeciętny AMD Ryzen 5 PRO 6650U (1433 - 1487, n=4) | |
| HP EliteBook 865 G9 | |
| HWBOT x265 Benchmark v2.2 / 4k Preset | |
| Lenovo ThinkPad X1 Extreme G5-21DE003RGE | |
| HP ZBook Power 15 G9 6B8C4EA | |
| Lenovo ThinkPad Z16 G1 21D5S00T00 | |
| Lenovo ThinkPad T16 G1 21CHCTO1WW | |
| Średnia w klasie Office (2.21 - 26, n=74, ostatnie 2 lata) | |
| Lenovo ThinkPad T16 G1 21CH004MGE | |
| HP EliteBook 865 G9 | |
| Przeciętny AMD Ryzen 5 PRO 6650U (8.71 - 11.8, n=4) | |
| Lenovo ThinkPad T16 G1 21BWS00200 | |
| LibreOffice / 20 Documents To PDF | |
| Przeciętny AMD Ryzen 5 PRO 6650U (50.3 - 63.2, n=4) | |
| Średnia w klasie Office (39.9 - 102.3, n=74, ostatnie 2 lata) | |
| HP EliteBook 865 G9 | |
| Lenovo ThinkPad Z16 G1 21D5S00T00 | |
| Lenovo ThinkPad T16 G1 21CH004MGE | |
| Lenovo ThinkPad T16 G1 21BWS00200 | |
| Lenovo ThinkPad T16 G1 21CHCTO1WW | |
| HP ZBook Power 15 G9 6B8C4EA | |
| Lenovo ThinkPad X1 Extreme G5-21DE003RGE | |
| R Benchmark 2.5 / Overall mean | |
| Przeciętny AMD Ryzen 5 PRO 6650U (0.521 - 0.59, n=4) | |
| Lenovo ThinkPad T16 G1 21CHCTO1WW | |
| Średnia w klasie Office (0.4098 - 0.888, n=74, ostatnie 2 lata) | |
| Lenovo ThinkPad T16 G1 21CH004MGE | |
| Lenovo ThinkPad T16 G1 21BWS00200 | |
| HP EliteBook 865 G9 | |
| Lenovo ThinkPad Z16 G1 21D5S00T00 | |
| HP ZBook Power 15 G9 6B8C4EA | |
| Lenovo ThinkPad X1 Extreme G5-21DE003RGE | |
* ... im mniej tym lepiej
AIDA64: FP32 Ray-Trace | FPU Julia | CPU SHA3 | CPU Queen | FPU SinJulia | FPU Mandel | CPU AES | CPU ZLib | FP64 Ray-Trace | CPU PhotoWorxx
| Performance rating | |
| Lenovo ThinkPad X1 Extreme G5-21DE003RGE | |
| Lenovo ThinkPad Z16 G1 21D5S00T00 | |
| HP ZBook Power 15 G9 6B8C4EA | |
| Lenovo ThinkPad T16 G1 21CHCTO1WW | |
| Lenovo ThinkPad T16 G1 21CH004MGE | |
| HP EliteBook 865 G9 | |
| Średnia w klasie Office | |
| Lenovo ThinkPad P15v G2 21A9000XGE | |
| Przeciętny AMD Ryzen 5 PRO 6650U | |
| Lenovo ThinkPad T16 G1 21BWS00200 | |
| AIDA64 / FP32 Ray-Trace | |
| Lenovo ThinkPad X1 Extreme G5-21DE003RGE | |
| Lenovo ThinkPad Z16 G1 21D5S00T00 | |
| Średnia w klasie Office (2083 - 31245, n=80, ostatnie 2 lata) | |
| HP ZBook Power 15 G9 6B8C4EA | |
| Lenovo ThinkPad T16 G1 21CHCTO1WW | |
| Lenovo ThinkPad P15v G2 21A9000XGE | |
| HP EliteBook 865 G9 | |
| Lenovo ThinkPad T16 G1 21CH004MGE | |
| Przeciętny AMD Ryzen 5 PRO 6650U (8854 - 10630, n=4) | |
| Lenovo ThinkPad T16 G1 21BWS00200 | |
| AIDA64 / FPU Julia | |
| Lenovo ThinkPad Z16 G1 21D5S00T00 | |
| Lenovo ThinkPad X1 Extreme G5-21DE003RGE | |
| Lenovo ThinkPad T16 G1 21CHCTO1WW | |
| HP EliteBook 865 G9 | |
| Lenovo ThinkPad T16 G1 21CH004MGE | |
| HP ZBook Power 15 G9 6B8C4EA | |
| Przeciętny AMD Ryzen 5 PRO 6650U (56214 - 68106, n=4) | |
| Średnia w klasie Office (8191 - 125394, n=80, ostatnie 2 lata) | |
| Lenovo ThinkPad P15v G2 21A9000XGE | |
| Lenovo ThinkPad T16 G1 21BWS00200 | |
| AIDA64 / CPU SHA3 | |
| Lenovo ThinkPad X1 Extreme G5-21DE003RGE | |
| Lenovo ThinkPad P15v G2 21A9000XGE | |
| HP ZBook Power 15 G9 6B8C4EA | |
| Lenovo ThinkPad Z16 G1 21D5S00T00 | |
| Średnia w klasie Office (433 - 5755, n=80, ostatnie 2 lata) | |
| Lenovo ThinkPad T16 G1 21CHCTO1WW | |
| HP EliteBook 865 G9 | |
| Lenovo ThinkPad T16 G1 21CH004MGE | |
| Przeciętny AMD Ryzen 5 PRO 6650U (1881 - 2326, n=4) | |
| Lenovo ThinkPad T16 G1 21BWS00200 | |
| AIDA64 / CPU Queen | |
| Lenovo ThinkPad Z16 G1 21D5S00T00 | |
| Lenovo ThinkPad X1 Extreme G5-21DE003RGE | |
| HP ZBook Power 15 G9 6B8C4EA | |
| Lenovo ThinkPad P15v G2 21A9000XGE | |
| Lenovo ThinkPad T16 G1 21CHCTO1WW | |
| HP EliteBook 865 G9 | |
| Lenovo ThinkPad T16 G1 21CH004MGE | |
| Lenovo ThinkPad T16 G1 21BWS00200 | |
| Przeciętny AMD Ryzen 5 PRO 6650U (69023 - 78797, n=4) | |
| Średnia w klasie Office (22784 - 115197, n=69, ostatnie 2 lata) | |
| AIDA64 / FPU SinJulia | |
| Lenovo ThinkPad Z16 G1 21D5S00T00 | |
| Lenovo ThinkPad T16 G1 21CHCTO1WW | |
| HP EliteBook 865 G9 | |
| Lenovo ThinkPad X1 Extreme G5-21DE003RGE | |
| Lenovo ThinkPad T16 G1 21CH004MGE | |
| Przeciętny AMD Ryzen 5 PRO 6650U (8320 - 9488, n=4) | |
| Lenovo ThinkPad P15v G2 21A9000XGE | |
| HP ZBook Power 15 G9 6B8C4EA | |
| Średnia w klasie Office (1378 - 18321, n=80, ostatnie 2 lata) | |
| Lenovo ThinkPad T16 G1 21BWS00200 | |
| AIDA64 / FPU Mandel | |
| Lenovo ThinkPad Z16 G1 21D5S00T00 | |
| Lenovo ThinkPad T16 G1 21CHCTO1WW | |
| HP EliteBook 865 G9 | |
| Lenovo ThinkPad X1 Extreme G5-21DE003RGE | |
| Lenovo ThinkPad T16 G1 21CH004MGE | |
| Przeciętny AMD Ryzen 5 PRO 6650U (30969 - 37461, n=4) | |
| HP ZBook Power 15 G9 6B8C4EA | |
| Lenovo ThinkPad P15v G2 21A9000XGE | |
| Średnia w klasie Office (4601 - 66922, n=80, ostatnie 2 lata) | |
| Lenovo ThinkPad T16 G1 21BWS00200 | |
| AIDA64 / CPU AES | |
| Lenovo ThinkPad T16 G1 21CH004MGE | |
| Lenovo ThinkPad X1 Extreme G5-21DE003RGE | |
| Lenovo ThinkPad P15v G2 21A9000XGE | |
| HP ZBook Power 15 G9 6B8C4EA | |
| Lenovo ThinkPad Z16 G1 21D5S00T00 | |
| Przeciętny AMD Ryzen 5 PRO 6650U (37259 - 93914, n=4) | |
| Średnia w klasie Office (4854 - 155900, n=80, ostatnie 2 lata) | |
| HP EliteBook 865 G9 | |
| Lenovo ThinkPad T16 G1 21CHCTO1WW | |
| Lenovo ThinkPad T16 G1 21BWS00200 | |
| AIDA64 / CPU ZLib | |
| Lenovo ThinkPad X1 Extreme G5-21DE003RGE | |
| HP ZBook Power 15 G9 6B8C4EA | |
| Lenovo ThinkPad Z16 G1 21D5S00T00 | |
| Średnia w klasie Office (114.6 - 1366, n=80, ostatnie 2 lata) | |
| Lenovo ThinkPad T16 G1 21CHCTO1WW | |
| Lenovo ThinkPad P15v G2 21A9000XGE | |
| HP EliteBook 865 G9 | |
| Lenovo ThinkPad T16 G1 21BWS00200 | |
| Lenovo ThinkPad T16 G1 21CH004MGE | |
| Przeciętny AMD Ryzen 5 PRO 6650U (504 - 602, n=4) | |
| AIDA64 / FP64 Ray-Trace | |
| Lenovo ThinkPad X1 Extreme G5-21DE003RGE | |
| Lenovo ThinkPad Z16 G1 21D5S00T00 | |
| Średnia w klasie Office (1109 - 17834, n=80, ostatnie 2 lata) | |
| HP ZBook Power 15 G9 6B8C4EA | |
| Lenovo ThinkPad P15v G2 21A9000XGE | |
| Lenovo ThinkPad T16 G1 21CHCTO1WW | |
| HP EliteBook 865 G9 | |
| Lenovo ThinkPad T16 G1 21CH004MGE | |
| Przeciętny AMD Ryzen 5 PRO 6650U (4620 - 5468, n=4) | |
| Lenovo ThinkPad T16 G1 21BWS00200 | |
| AIDA64 / CPU PhotoWorxx | |
| HP ZBook Power 15 G9 6B8C4EA | |
| Średnia w klasie Office (11090 - 65229, n=80, ostatnie 2 lata) | |
| Lenovo ThinkPad Z16 G1 21D5S00T00 | |
| Lenovo ThinkPad T16 G1 21CH004MGE | |
| Lenovo ThinkPad T16 G1 21CHCTO1WW | |
| Przeciętny AMD Ryzen 5 PRO 6650U (19643 - 26137, n=4) | |
| Lenovo ThinkPad X1 Extreme G5-21DE003RGE | |
| HP EliteBook 865 G9 | |
| Lenovo ThinkPad T16 G1 21BWS00200 | |
| Lenovo ThinkPad P15v G2 21A9000XGE | |
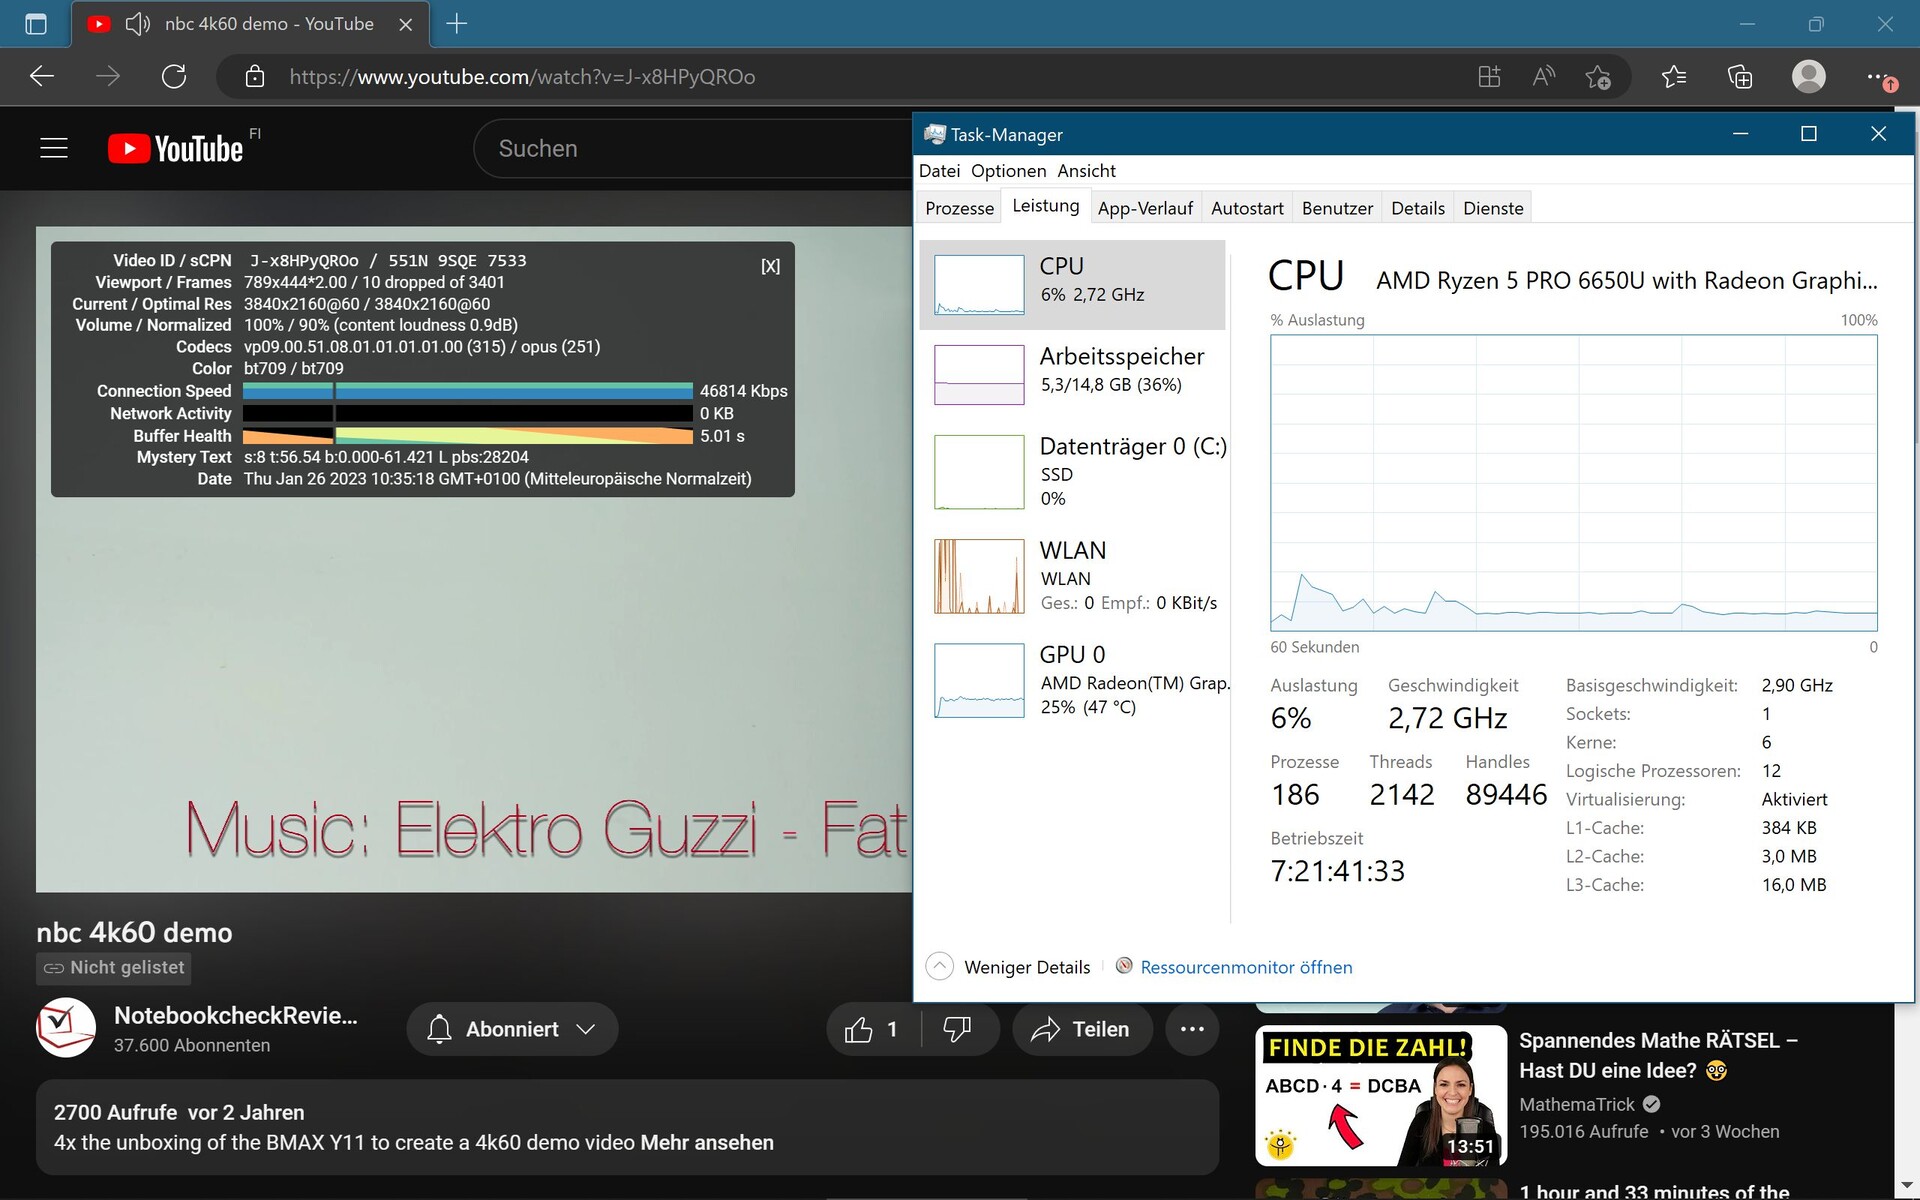
Wydajność systemu
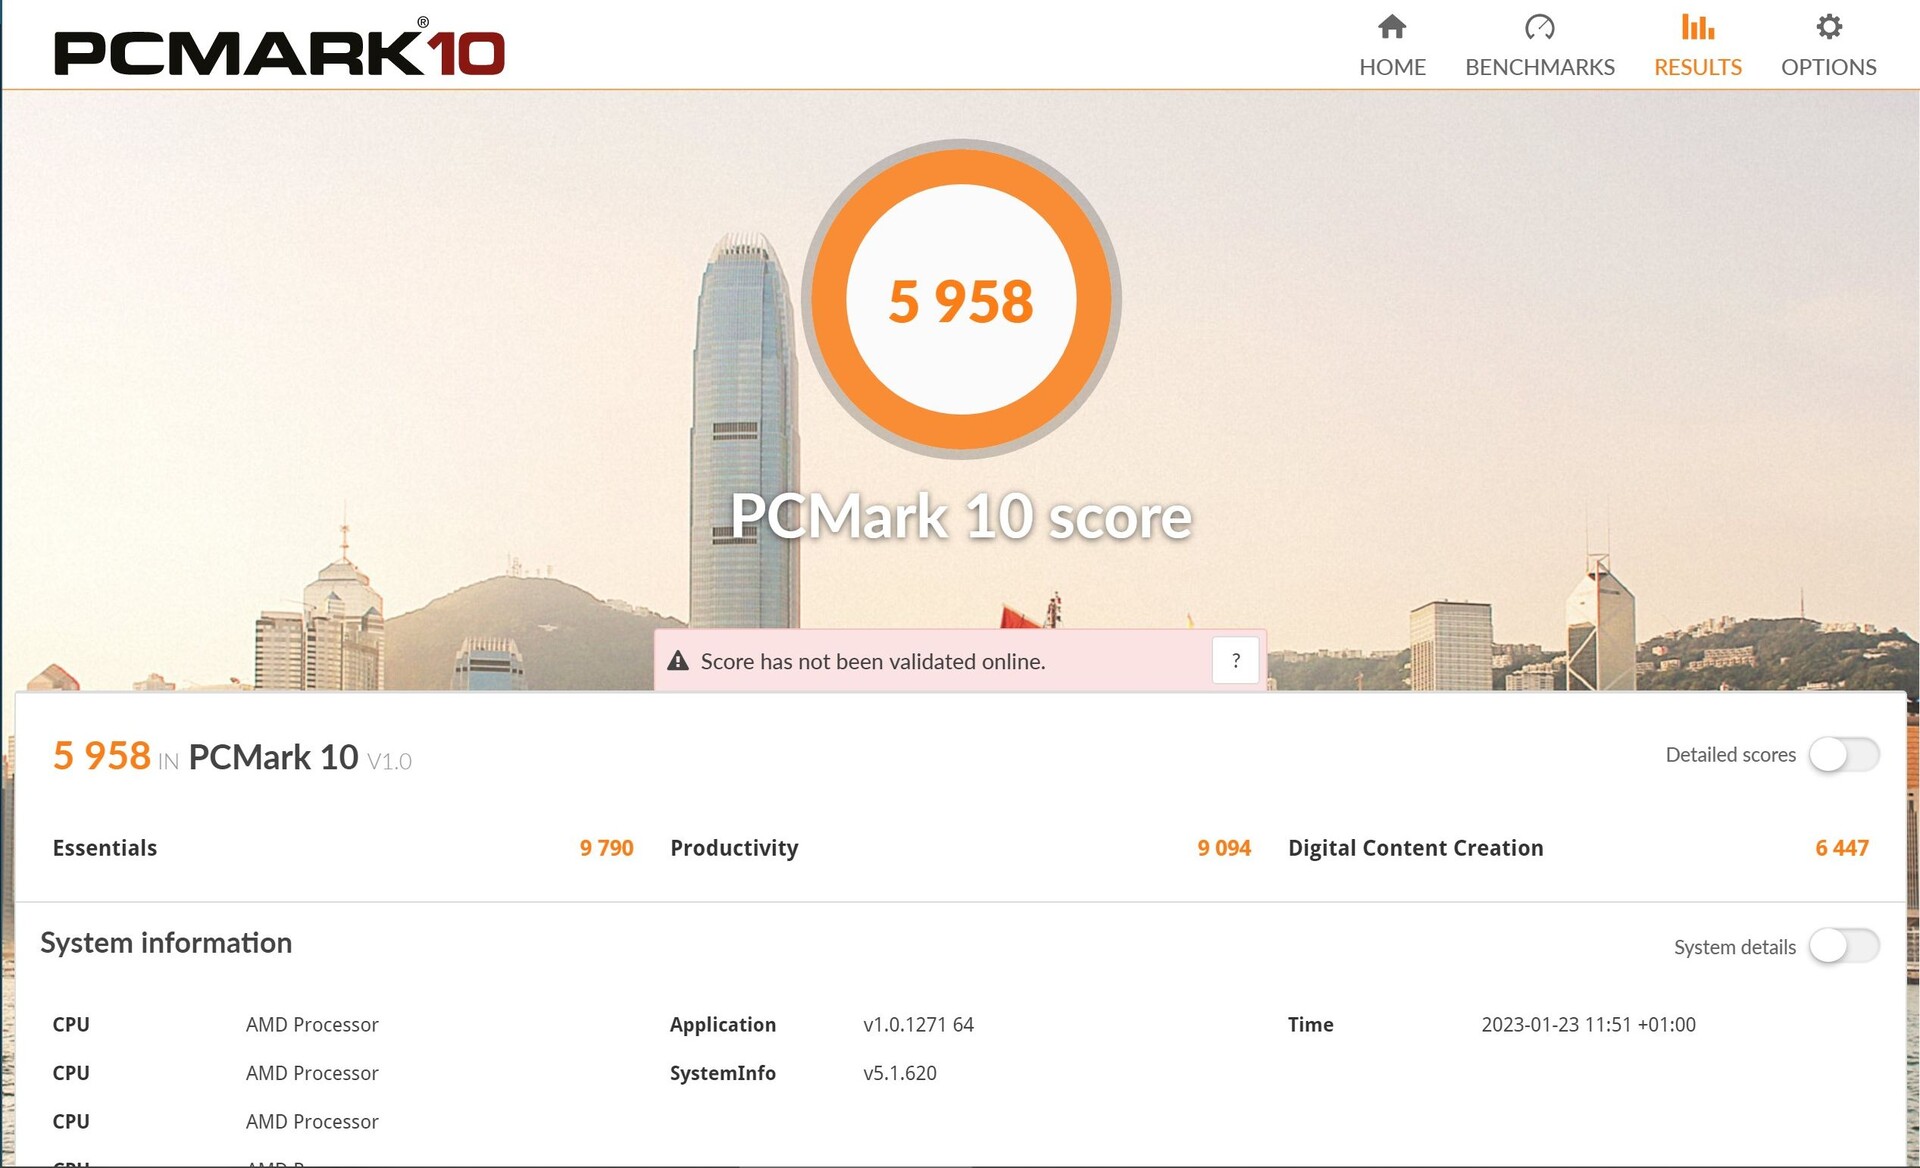
Płynne przeglądanie stron internetowych z kilkoma zakładkami i jednoczesne odtwarzanie filmów 4K z YouTube nie stanowi absolutnie żadnego problemu dla ThinkPada T16 AMD. Jednak ze względu na mocniejsze Turbo,...T16 Intelwciąż utrzymuje lekką przewagę w benchmarkach przeglądarkowych, takich jak Mozilla Kraken czy Octane v2. Z drugiej strony, wersja Intela jest mocno dławiona przez swoją jednokanałową konfigurację pamięci RAM w benchmarkach PCMark i Crossmark.
CrossMark: Overall | Productivity | Creativity | Responsiveness
Mozilla Kraken 1.1: Total
Speedometer 2.0: Result 2.0
Octane V2: Total Score
Jetstream 2: 2.0 Total
WebXPRT 3: Overall
WebXPRT 4: Overall
| PCMark 10 / Score | |
| Lenovo ThinkPad X1 Extreme G5-21DE003RGE | |
| Lenovo ThinkPad Z16 G1 21D5S00T00 | |
| Średnia w klasie Office (2601 - 9298, n=64, ostatnie 2 lata) | |
| HP ZBook Power 15 G9 6B8C4EA | |
| Lenovo ThinkPad T16 G1 21CHCTO1WW | |
| Lenovo ThinkPad T16 G1 21CH004MGE | |
| Lenovo ThinkPad P15v G2 21A9000XGE | |
| HP EliteBook 865 G9 | |
| Przeciętny AMD Ryzen 5 PRO 6650U, AMD Radeon 660M (5513 - 5958, n=4) | |
| Lenovo ThinkPad T16 G1 21BWS00200 | |
| PCMark 10 / Essentials | |
| Lenovo ThinkPad X1 Extreme G5-21DE003RGE | |
| Lenovo ThinkPad T16 G1 21CHCTO1WW | |
| Lenovo ThinkPad Z16 G1 21D5S00T00 | |
| Średnia w klasie Office (3245 - 11594, n=64, ostatnie 2 lata) | |
| HP ZBook Power 15 G9 6B8C4EA | |
| Lenovo ThinkPad T16 G1 21CH004MGE | |
| Lenovo ThinkPad P15v G2 21A9000XGE | |
| Przeciętny AMD Ryzen 5 PRO 6650U, AMD Radeon 660M (9578 - 9982, n=4) | |
| Lenovo ThinkPad T16 G1 21BWS00200 | |
| HP EliteBook 865 G9 | |
| PCMark 10 / Productivity | |
| Średnia w klasie Office (5336 - 17243, n=64, ostatnie 2 lata) | |
| Lenovo ThinkPad X1 Extreme G5-21DE003RGE | |
| Lenovo ThinkPad T16 G1 21CH004MGE | |
| Lenovo ThinkPad T16 G1 21CHCTO1WW | |
| HP EliteBook 865 G9 | |
| Przeciętny AMD Ryzen 5 PRO 6650U, AMD Radeon 660M (7848 - 9094, n=4) | |
| Lenovo ThinkPad Z16 G1 21D5S00T00 | |
| Lenovo ThinkPad P15v G2 21A9000XGE | |
| HP ZBook Power 15 G9 6B8C4EA | |
| Lenovo ThinkPad T16 G1 21BWS00200 | |
| PCMark 10 / Digital Content Creation | |
| Lenovo ThinkPad X1 Extreme G5-21DE003RGE | |
| Lenovo ThinkPad Z16 G1 21D5S00T00 | |
| HP ZBook Power 15 G9 6B8C4EA | |
| Średnia w klasie Office (2049 - 13541, n=64, ostatnie 2 lata) | |
| HP EliteBook 865 G9 | |
| Lenovo ThinkPad P15v G2 21A9000XGE | |
| Lenovo ThinkPad T16 G1 21CHCTO1WW | |
| Lenovo ThinkPad T16 G1 21CH004MGE | |
| Przeciętny AMD Ryzen 5 PRO 6650U, AMD Radeon 660M (5837 - 6447, n=4) | |
| Lenovo ThinkPad T16 G1 21BWS00200 | |
| CrossMark / Overall | |
| Lenovo ThinkPad X1 Extreme G5-21DE003RGE | |
| HP ZBook Power 15 G9 6B8C4EA | |
| Średnia w klasie Office (381 - 2010, n=73, ostatnie 2 lata) | |
| Lenovo ThinkPad Z16 G1 21D5S00T00 | |
| Lenovo ThinkPad T16 G1 21CH004MGE | |
| Przeciętny AMD Ryzen 5 PRO 6650U, AMD Radeon 660M (1338 - 1432, n=3) | |
| Lenovo ThinkPad T16 G1 21BWS00200 | |
| Lenovo ThinkPad P15v G2 21A9000XGE | |
| Lenovo ThinkPad T16 G1 21CHCTO1WW | |
| HP EliteBook 865 G9 | |
| CrossMark / Productivity | |
| Lenovo ThinkPad X1 Extreme G5-21DE003RGE | |
| HP ZBook Power 15 G9 6B8C4EA | |
| Lenovo ThinkPad Z16 G1 21D5S00T00 | |
| Lenovo ThinkPad T16 G1 21CH004MGE | |
| Średnia w klasie Office (464 - 1880, n=73, ostatnie 2 lata) | |
| Przeciętny AMD Ryzen 5 PRO 6650U, AMD Radeon 660M (1366 - 1440, n=3) | |
| Lenovo ThinkPad T16 G1 21BWS00200 | |
| Lenovo ThinkPad P15v G2 21A9000XGE | |
| HP EliteBook 865 G9 | |
| Lenovo ThinkPad T16 G1 21CHCTO1WW | |
| CrossMark / Creativity | |
| HP ZBook Power 15 G9 6B8C4EA | |
| Lenovo ThinkPad X1 Extreme G5-21DE003RGE | |
| Średnia w klasie Office (319 - 2361, n=73, ostatnie 2 lata) | |
| Lenovo ThinkPad Z16 G1 21D5S00T00 | |
| Lenovo ThinkPad T16 G1 21CH004MGE | |
| Przeciętny AMD Ryzen 5 PRO 6650U, AMD Radeon 660M (1397 - 1517, n=3) | |
| Lenovo ThinkPad T16 G1 21CHCTO1WW | |
| Lenovo ThinkPad P15v G2 21A9000XGE | |
| Lenovo ThinkPad T16 G1 21BWS00200 | |
| HP EliteBook 865 G9 | |
| CrossMark / Responsiveness | |
| Lenovo ThinkPad X1 Extreme G5-21DE003RGE | |
| HP ZBook Power 15 G9 6B8C4EA | |
| Lenovo ThinkPad T16 G1 21BWS00200 | |
| Lenovo ThinkPad Z16 G1 21D5S00T00 | |
| Średnia w klasie Office (360 - 1690, n=73, ostatnie 2 lata) | |
| Lenovo ThinkPad T16 G1 21CH004MGE | |
| Przeciętny AMD Ryzen 5 PRO 6650U, AMD Radeon 660M (1106 - 1229, n=3) | |
| Lenovo ThinkPad P15v G2 21A9000XGE | |
| HP EliteBook 865 G9 | |
| Lenovo ThinkPad T16 G1 21CHCTO1WW | |
| Mozilla Kraken 1.1 / Total | |
| Lenovo ThinkPad T16 G1 21CHCTO1WW | |
| Przeciętny AMD Ryzen 5 PRO 6650U, AMD Radeon 660M (615 - 707, n=4) | |
| Lenovo ThinkPad P15v G2 21A9000XGE | |
| Lenovo ThinkPad T16 G1 21CH004MGE | |
| HP EliteBook 865 G9 | |
| Lenovo ThinkPad T16 G1 21BWS00200 | |
| Lenovo ThinkPad Z16 G1 21D5S00T00 | |
| Średnia w klasie Office (391 - 1297, n=76, ostatnie 2 lata) | |
| HP ZBook Power 15 G9 6B8C4EA | |
| Lenovo ThinkPad X1 Extreme G5-21DE003RGE | |
| Speedometer 2.0 / Result 2.0 | |
| Średnia w klasie Office (173 - 640, n=17, ostatnie 2 lata) | |
| HP ZBook Power 15 G9 6B8C4EA | |
| Lenovo ThinkPad X1 Extreme G5-21DE003RGE | |
| Lenovo ThinkPad T16 G1 21BWS00200 | |
| HP EliteBook 865 G9 | |
| Lenovo ThinkPad T16 G1 21CH004MGE | |
| Przeciętny AMD Ryzen 5 PRO 6650U, AMD Radeon 660M (n=1) | |
| Octane V2 / Total Score | |
| Średnia w klasie Office (49011 - 122119, n=19, ostatnie 2 lata) | |
| Lenovo ThinkPad X1 Extreme G5-21DE003RGE | |
| HP ZBook Power 15 G9 6B8C4EA | |
| Lenovo ThinkPad T16 G1 21BWS00200 | |
| Lenovo ThinkPad T16 G1 21CH004MGE | |
| Przeciętny AMD Ryzen 5 PRO 6650U, AMD Radeon 660M (n=1) | |
| HP EliteBook 865 G9 | |
| Jetstream 2 / 2.0 Total | |
| Średnia w klasie Office (126.6 - 455, n=20, ostatnie 2 lata) | |
| HP ZBook Power 15 G9 6B8C4EA | |
| Lenovo ThinkPad T16 G1 21BWS00200 | |
| Lenovo ThinkPad X1 Extreme G5-21DE003RGE | |
| Przeciętny AMD Ryzen 5 PRO 6650U, AMD Radeon 660M (n=1) | |
| Lenovo ThinkPad T16 G1 21CH004MGE | |
| HP EliteBook 865 G9 | |
| WebXPRT 3 / Overall | |
| HP ZBook Power 15 G9 6B8C4EA | |
| Średnia w klasie Office (129.9 - 455, n=74, ostatnie 2 lata) | |
| Lenovo ThinkPad X1 Extreme G5-21DE003RGE | |
| HP EliteBook 865 G9 | |
| Lenovo ThinkPad T16 G1 21BWS00200 | |
| Lenovo ThinkPad P15v G2 21A9000XGE | |
| Lenovo ThinkPad Z16 G1 21D5S00T00 | |
| Lenovo ThinkPad T16 G1 21CH004MGE | |
| Przeciętny AMD Ryzen 5 PRO 6650U, AMD Radeon 660M (225 - 242, n=4) | |
| Lenovo ThinkPad T16 G1 21CHCTO1WW | |
| WebXPRT 4 / Overall | |
| HP ZBook Power 15 G9 6B8C4EA | |
| Średnia w klasie Office (104.2 - 313, n=75, ostatnie 2 lata) | |
| Lenovo ThinkPad X1 Extreme G5-21DE003RGE | |
| Lenovo ThinkPad T16 G1 21BWS00200 | |
| HP EliteBook 865 G9 | |
| Lenovo ThinkPad T16 G1 21CH004MGE | |
| Lenovo ThinkPad Z16 G1 21D5S00T00 | |
| Przeciętny AMD Ryzen 5 PRO 6650U, AMD Radeon 660M (176.4 - 206, n=4) | |
| Lenovo ThinkPad T16 G1 21CHCTO1WW | |
* ... im mniej tym lepiej
| PCMark 10 Score | 5958 pkt. | |
Pomoc | ||
| AIDA64 / Memory Copy | |
| Średnia w klasie Office (20075 - 110930, n=77, ostatnie 2 lata) | |
| HP ZBook Power 15 G9 6B8C4EA | |
| Lenovo ThinkPad Z16 G1 21D5S00T00 | |
| Lenovo ThinkPad T16 G1 21CHCTO1WW | |
| Lenovo ThinkPad T16 G1 21CH004MGE | |
| Przeciętny AMD Ryzen 5 PRO 6650U (31014 - 48558, n=4) | |
| Lenovo ThinkPad X1 Extreme G5-21DE003RGE | |
| HP EliteBook 865 G9 | |
| Lenovo ThinkPad P15v G2 21A9000XGE | |
| Lenovo ThinkPad T16 G1 21BWS00200 | |
| AIDA64 / Memory Read | |
| HP ZBook Power 15 G9 6B8C4EA | |
| Średnia w klasie Office (10084 - 128030, n=78, ostatnie 2 lata) | |
| Lenovo ThinkPad Z16 G1 21D5S00T00 | |
| Lenovo ThinkPad T16 G1 21CHCTO1WW | |
| Lenovo ThinkPad T16 G1 21CH004MGE | |
| Przeciętny AMD Ryzen 5 PRO 6650U (34690 - 39833, n=4) | |
| Lenovo ThinkPad X1 Extreme G5-21DE003RGE | |
| HP EliteBook 865 G9 | |
| Lenovo ThinkPad P15v G2 21A9000XGE | |
| Lenovo ThinkPad T16 G1 21BWS00200 | |
| AIDA64 / Memory Write | |
| Średnia w klasie Office (20073 - 119858, n=78, ostatnie 2 lata) | |
| HP ZBook Power 15 G9 6B8C4EA | |
| Lenovo ThinkPad Z16 G1 21D5S00T00 | |
| Lenovo ThinkPad T16 G1 21CH004MGE | |
| Lenovo ThinkPad T16 G1 21CHCTO1WW | |
| Przeciętny AMD Ryzen 5 PRO 6650U (34563 - 51117, n=4) | |
| HP EliteBook 865 G9 | |
| Lenovo ThinkPad X1 Extreme G5-21DE003RGE | |
| Lenovo ThinkPad T16 G1 21BWS00200 | |
| Lenovo ThinkPad P15v G2 21A9000XGE | |
| AIDA64 / Memory Latency | |
| Lenovo ThinkPad T16 G1 21CHCTO1WW | |
| Lenovo ThinkPad Z16 G1 21D5S00T00 | |
| Lenovo ThinkPad T16 G1 21CH004MGE | |
| Przeciętny AMD Ryzen 5 PRO 6650U (91.6 - 126.5, n=4) | |
| Średnia w klasie Office (7.6 - 162.9, n=73, ostatnie 2 lata) | |
| Lenovo ThinkPad P15v G2 21A9000XGE | |
| Lenovo ThinkPad T16 G1 21BWS00200 | |
| HP EliteBook 865 G9 | |
| HP ZBook Power 15 G9 6B8C4EA | |
| Lenovo ThinkPad X1 Extreme G5-21DE003RGE | |
* ... im mniej tym lepiej
Opóźnienia DPC
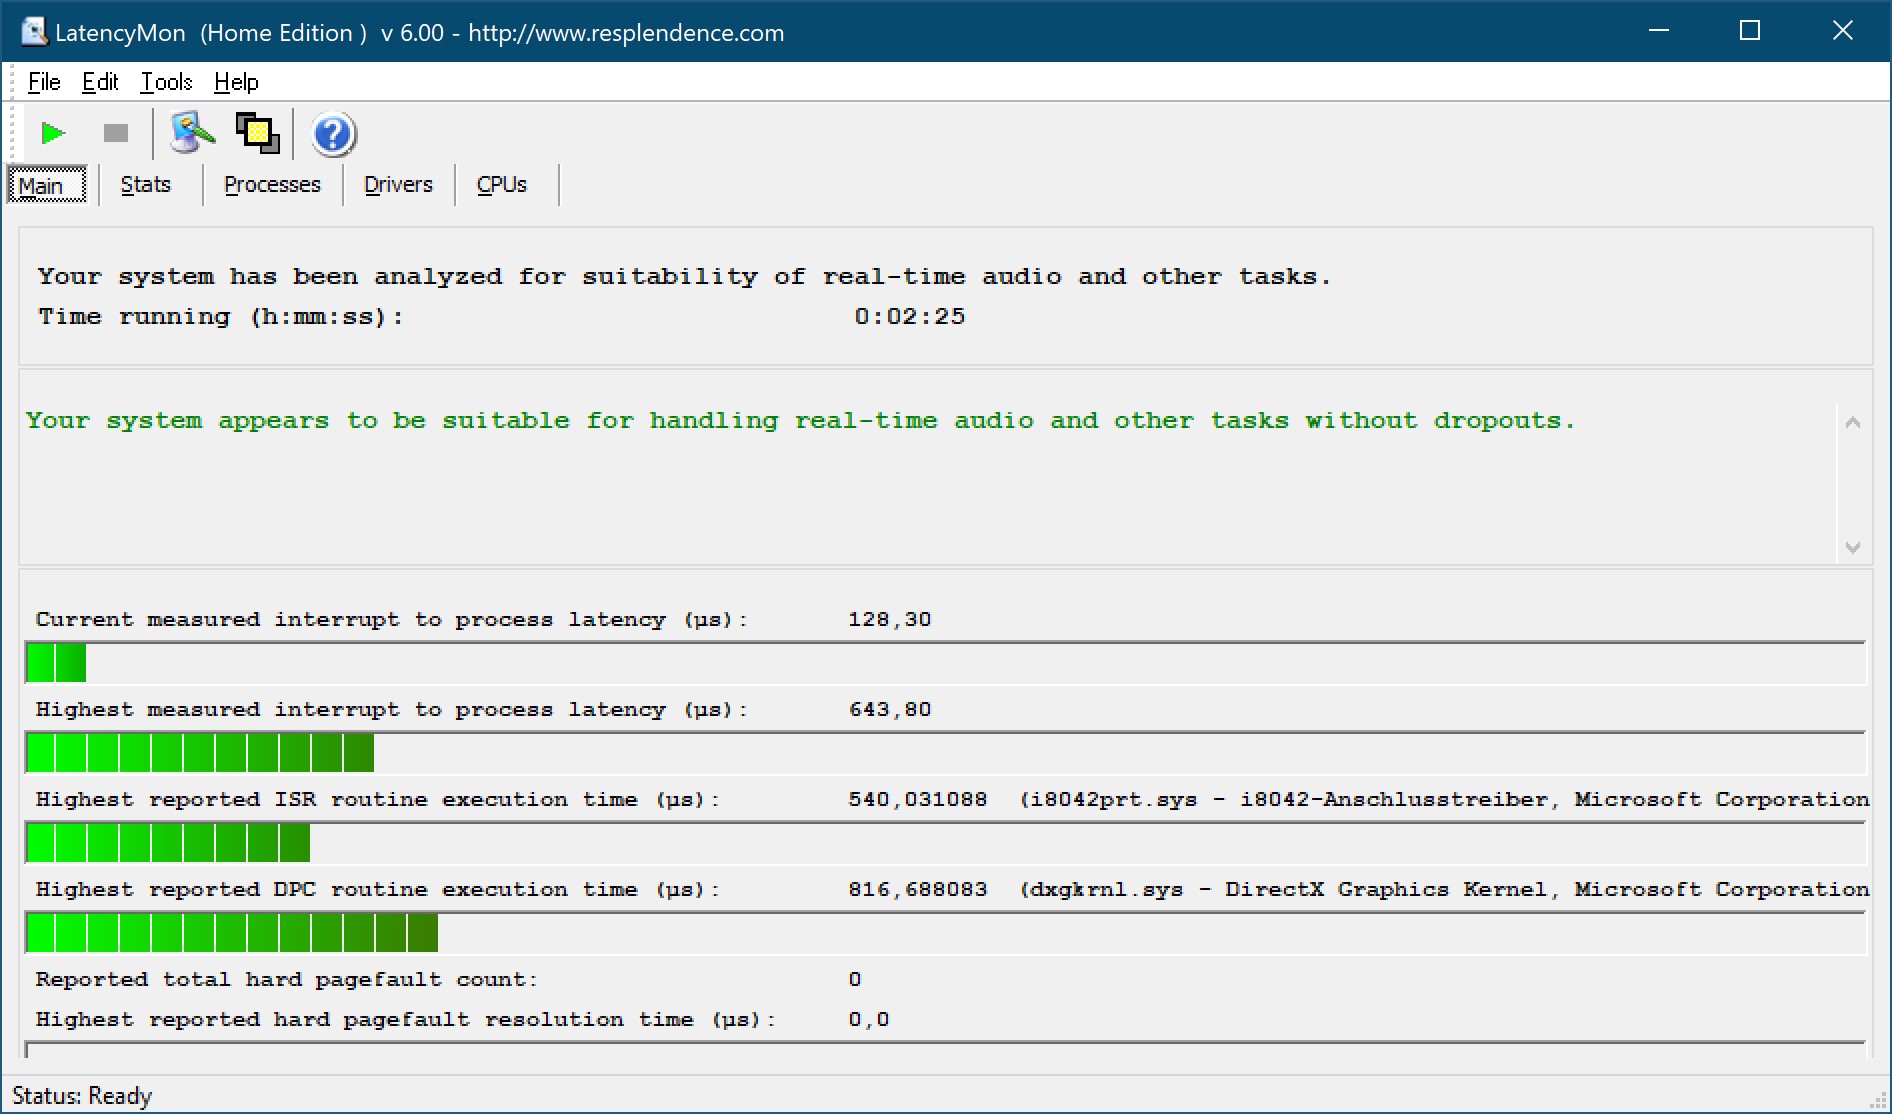
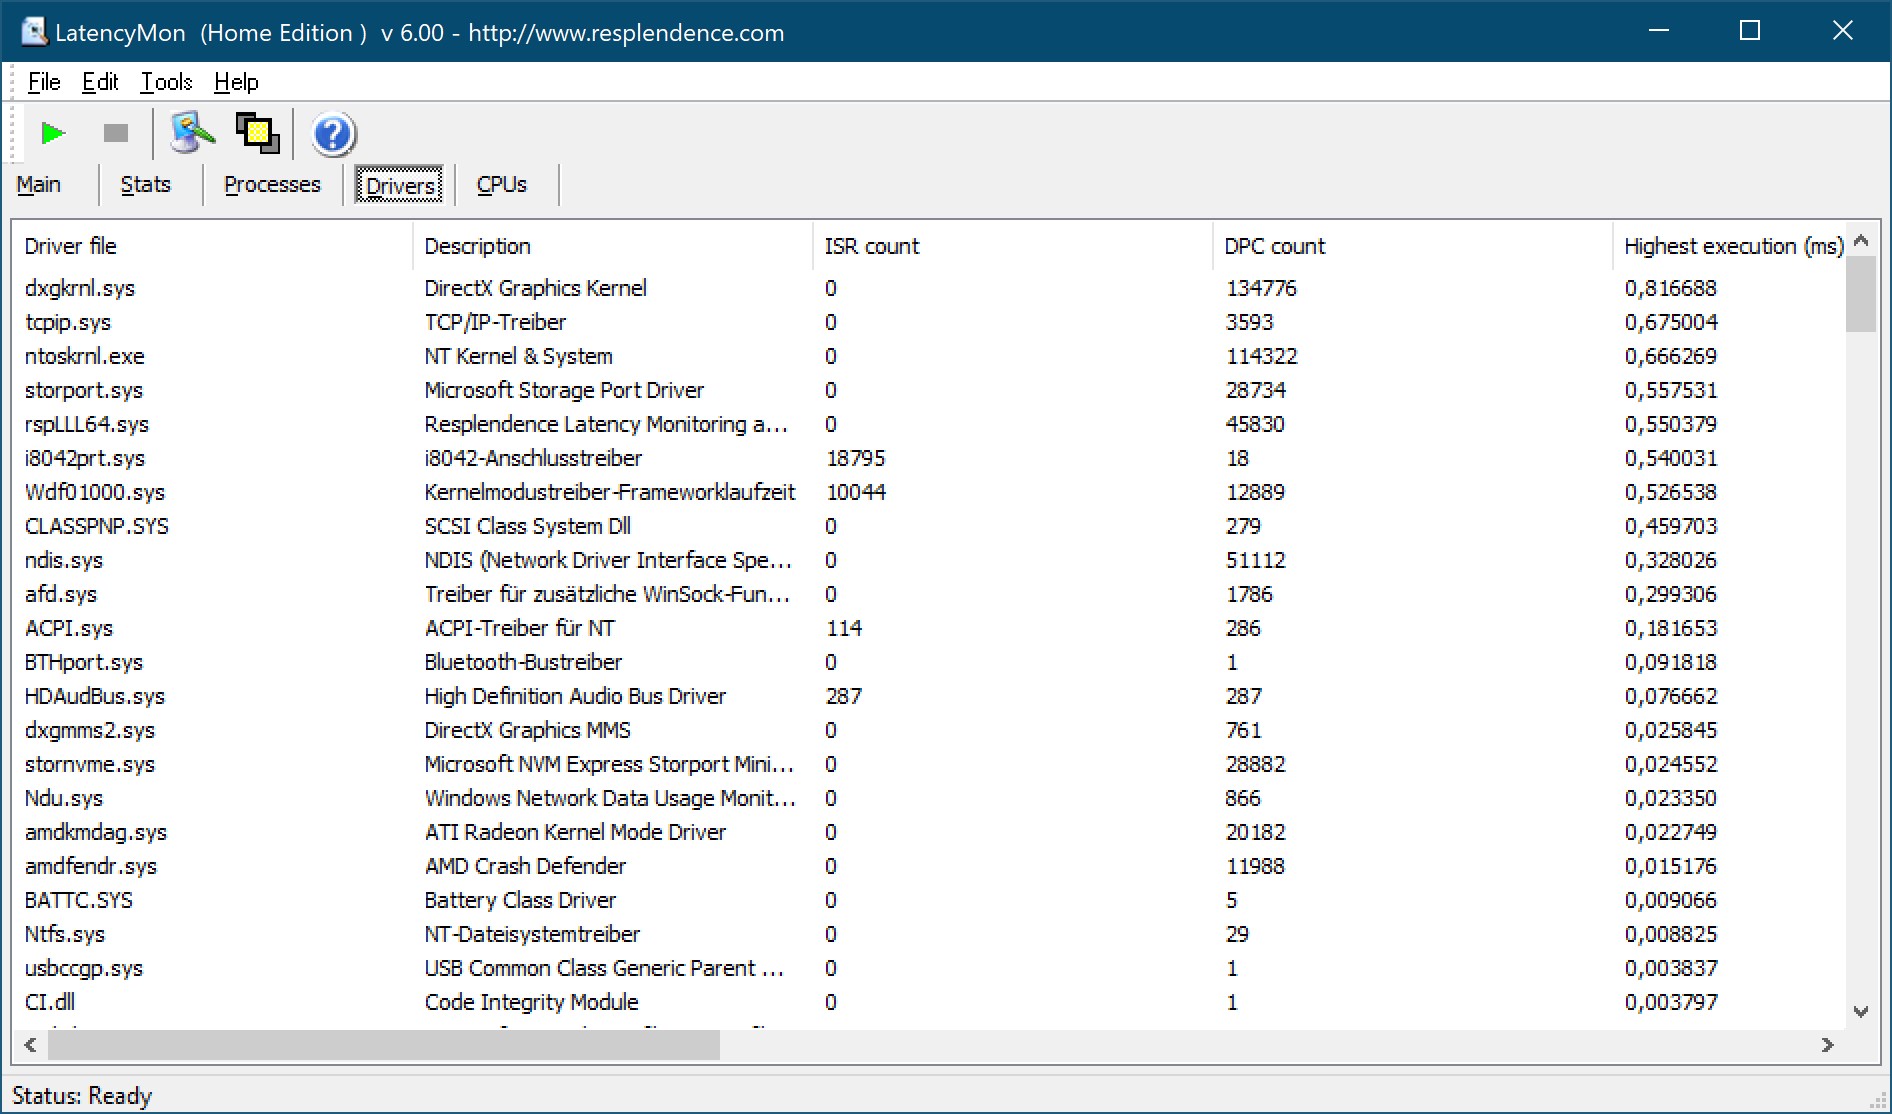
| DPC Latencies / LatencyMon - interrupt to process latency (max), Web, Youtube, Prime95 | |
| Lenovo ThinkPad T16 G1 21BWS00200 | |
| Lenovo ThinkPad X1 Extreme G5-21DE003RGE | |
| HP ZBook Power 15 G9 6B8C4EA | |
| Lenovo ThinkPad T16 G1 21CH004MGE | |
| Lenovo ThinkPad Z16 G1 21D5S00T00 | |
| HP EliteBook 865 G9 | |
* ... im mniej tym lepiej
Rozwiązanie w zakresie przechowywania
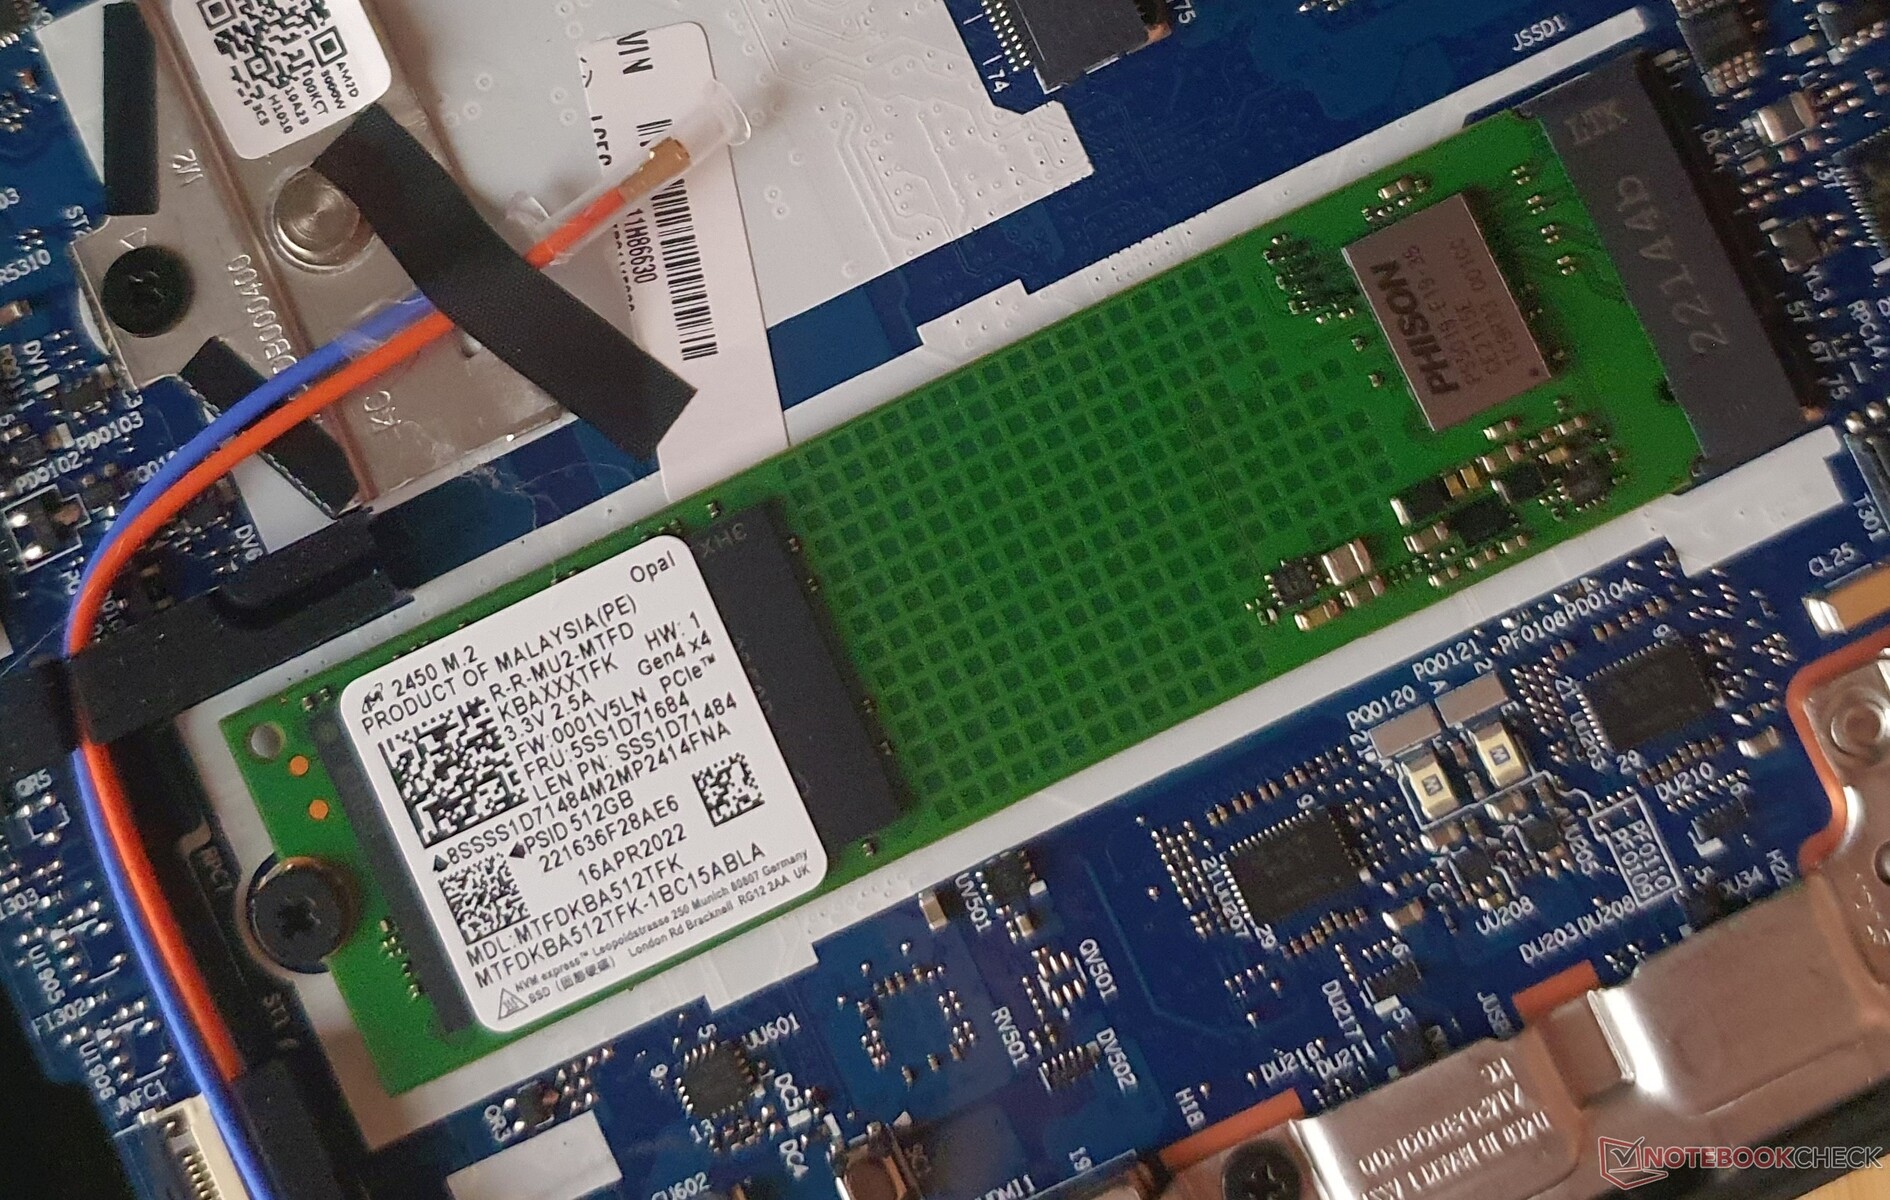
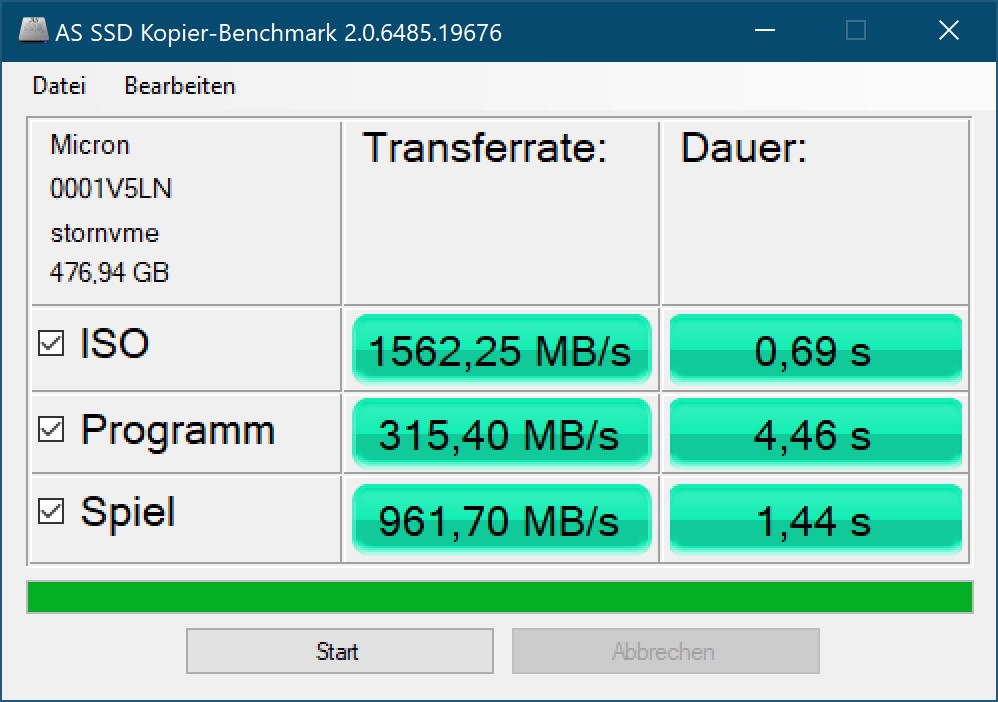
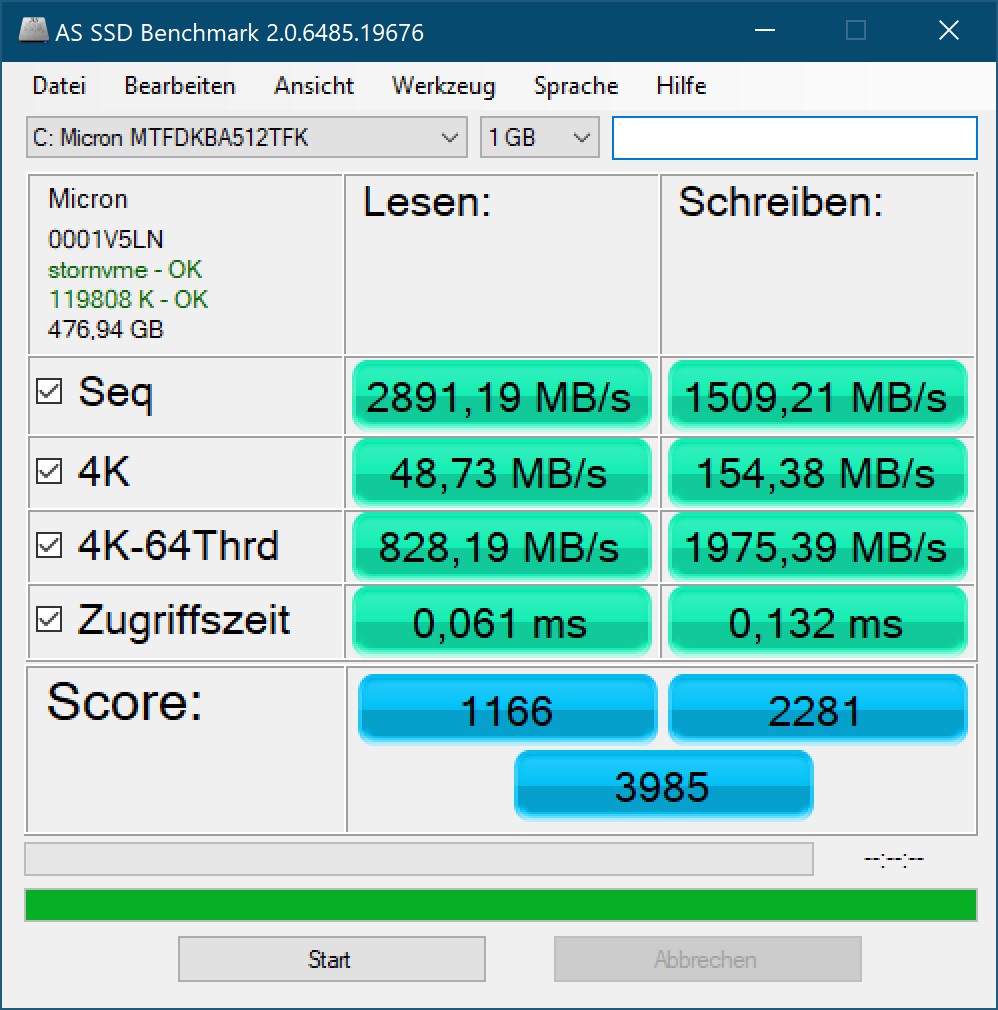
512-GB Micron 2450 PCIe 4.0 SSD odczytuje i zapisuje dane z prędkością odpowiadającą bardziej standardowi PCIe 3.0. Na stronieSamsung PM9A1 wIntelu w modelu T16czyta szybciej, ale w naszym teście stałego odczytu spada do podobnego poziomu, co dysk SSD Microna.
| Lenovo ThinkPad T16 G1 21CH004MGE Micron 2450 512GB MTFDKBA512TFK | Lenovo ThinkPad T16 G1 21BWS00200 Samsung PM9A1 MZVL2512HCJQ | Lenovo ThinkPad T16 G1 21CHCTO1WW Micron 2450 512GB MTFDKBA512TFK | HP EliteBook 865 G9 Samsung PM991 MZVLQ512HBLU | Lenovo ThinkPad Z16 G1 21D5S00T00 Samsung PM9A1 MZVL21T0HCLR | Lenovo ThinkPad X1 Extreme G5-21DE003RGE Micron 3400 1TB MTFDKBA1T0TFH | Lenovo ThinkPad P15v G2 21A9000XGE Toshiba XG6 KXG6AZNV512G | HP ZBook Power 15 G9 6B8C4EA Samsung PM9A1 MZVL21T0HCLR | |
|---|---|---|---|---|---|---|---|---|
| AS SSD | 16% | 20% | 2% | 32% | 38% | -8% | 50% | |
| Seq Read (MB/s) | 2891 | 3225 12% | 3107 7% | 2485 -14% | 4572.06 58% | 4766 65% | 2684 -7% | 5081 76% |
| Seq Write (MB/s) | 1509 | 1567 4% | 2965 96% | 1119 -26% | 2339.86 55% | 2159 43% | 1352 -10% | 1785 18% |
| 4K Read (MB/s) | 48.73 | 69.7 43% | 70 44% | 43.99 -10% | 63.1 29% | 44.61 -8% | 43.68 -10% | 76.86 58% |
| 4K Write (MB/s) | 154.38 | 170.9 11% | 166 8% | 117.89 -24% | 138.07 -11% | 141.69 -8% | 105.56 -32% | 197.01 28% |
| 4K-64 Read (MB/s) | 828 | 720 -13% | 1339 62% | 760.82 -8% | 863.66 4% | 877.37 6% | 976.92 18% | 912.6 10% |
| 4K-64 Write (MB/s) | 1975 | 2682 36% | 2101 6% | 1041.52 -47% | 2682.07 36% | 2594.6 31% | 1452.09 -26% | 3010.2 52% |
| Access Time Read * (ms) | 0.061 | 0.059 3% | 0.024 61% | 0.049 20% | 0.045 26% | 0.03 51% | 0.124 -103% | 0.02 67% |
| Access Time Write * (ms) | 0.132 | 0.024 82% | 0.171 -30% | 0.033 75% | 0.028 79% | 0.025 81% | 0.038 71% | 0.02 85% |
| Score Read (Points) | 1166 | 1112 -5% | 1719 47% | 1053 -10% | 1384 19% | 1399 20% | 1289 11% | 1498 28% |
| Score Write (Points) | 2281 | 3010 32% | 2563 12% | 1271 -44% | 3054 34% | 2952 29% | 1693 -26% | 3386 48% |
| Score Total (Points) | 3985 | 4630 16% | 5170 30% | 2805 -30% | 5050 27% | 4942 24% | 3582 -10% | 5506 38% |
| Copy ISO MB/s (MB/s) | 1562 | 1639 5% | 651 -58% | 1450.27 -7% | 2156.8 38% | 3591.64 130% | 1760.5 13% | 3596.51 130% |
| Copy Program MB/s (MB/s) | 315 | 326.8 4% | 408 30% | 681.41 116% | 426.1 35% | 422.46 34% | 355 13% | 418.84 33% |
| Copy Game MB/s (MB/s) | 962 | 942.7 -2% | 596 -38% | 1251.03 30% | 1157.07 20% | 1239.49 29% | 849 -12% | 1249.83 30% |
| DiskSpd | 22% | 57% | -24% | 32% | 21% | -13% | 37% | |
| seq read (MB/s) | 2012 | 3645 81% | 2309 15% | 1772 -12% | 3695 84% | 3210 60% | 2260 12% | 3945 96% |
| seq write (MB/s) | 2458 | 2809 14% | 3301 34% | 1535 -38% | 3294 34% | 2889 18% | 1837 -25% | 3039 24% |
| seq q8 t1 read (MB/s) | 3507 | 6524 86% | 3589 2% | 2741 -22% | 6628 89% | 6553 87% | 3290 -6% | 6481 85% |
| seq q8 t1 write (MB/s) | 3339 | 4812 44% | 3351 0% | 1606 -52% | 4957 48% | 4703 41% | 2902 -13% | 4914 47% |
| 4k q1 t1 read (MB/s) | 52.1 | 68.2 31% | 58.5 12% | 44.5 -15% | 65.4 26% | 48.7 -7% | 44.3 -15% | 78 50% |
| 4k q1 t1 write (MB/s) | 169.6 | 134.8 -21% | 66.6 -61% | 118 -30% | 134.8 -21% | 148.8 -12% | 113.3 -33% | 162.3 -4% |
| 4k q32 t16 read (MB/s) | 1066 | 683 -36% | 1445 36% | 814 -24% | 898 -16% | 883 -17% | 890 -17% | 866 -19% |
| 4k q32 t16 write (MB/s) | 365 | 293 -20% | 1877 414% | 361 -1% | 399 9% | 370 1% | 332 -9% | 426 17% |
| Całkowita średnia (program / ustawienia) | 19% /
19% | 39% /
33% | -11% /
-8% | 32% /
32% | 30% /
32% | -11% /
-10% | 44% /
45% |
* ... im mniej tym lepiej
| Drive Performance rating - Percent | |
| HP ZBook Power 15 G9 6B8C4EA | |
| Lenovo ThinkPad Z16 G1 21D5S00T00 | |
| Lenovo ThinkPad T16 G1 21CHCTO1WW | |
| Lenovo ThinkPad X1 Extreme G5-21DE003RGE | |
| Lenovo ThinkPad T16 G1 21BWS00200 | |
| Średnia w klasie Office | |
| Przeciętny Micron 2450 512GB MTFDKBA512TFK | |
| Lenovo ThinkPad T16 G1 21CH004MGE | |
| Lenovo ThinkPad P15v G2 21A9000XGE | |
| HP EliteBook 865 G9 | |
* ... im mniej tym lepiej
Disk Throttling: DiskSpd Read Loop, Queue Depth 8
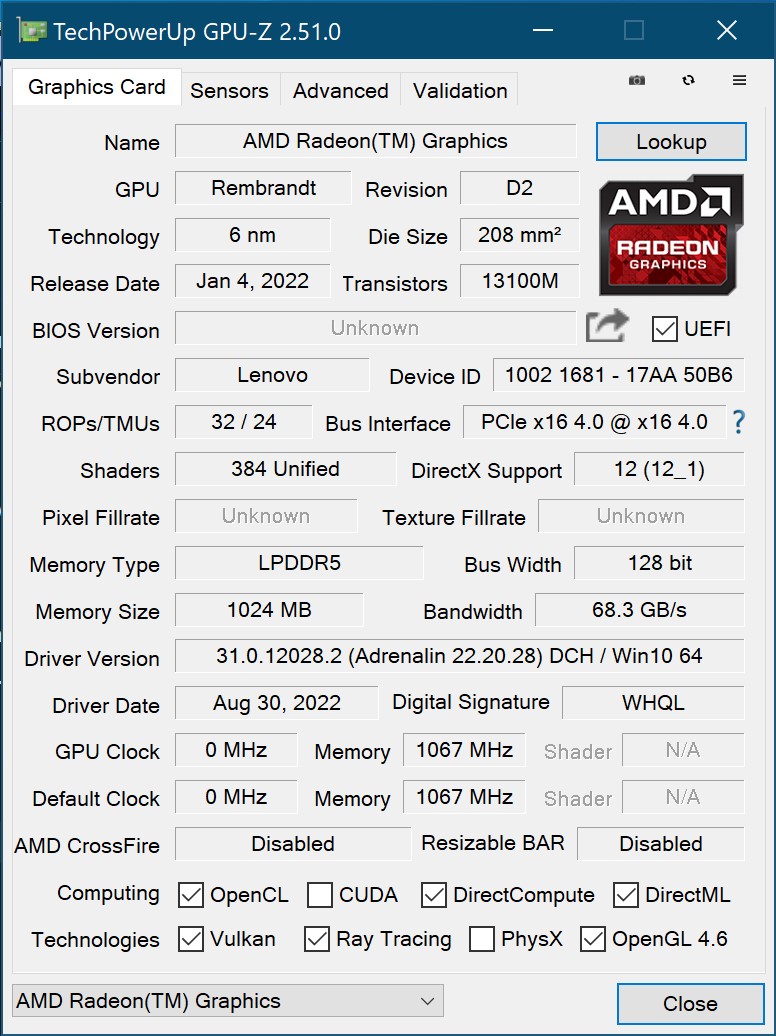
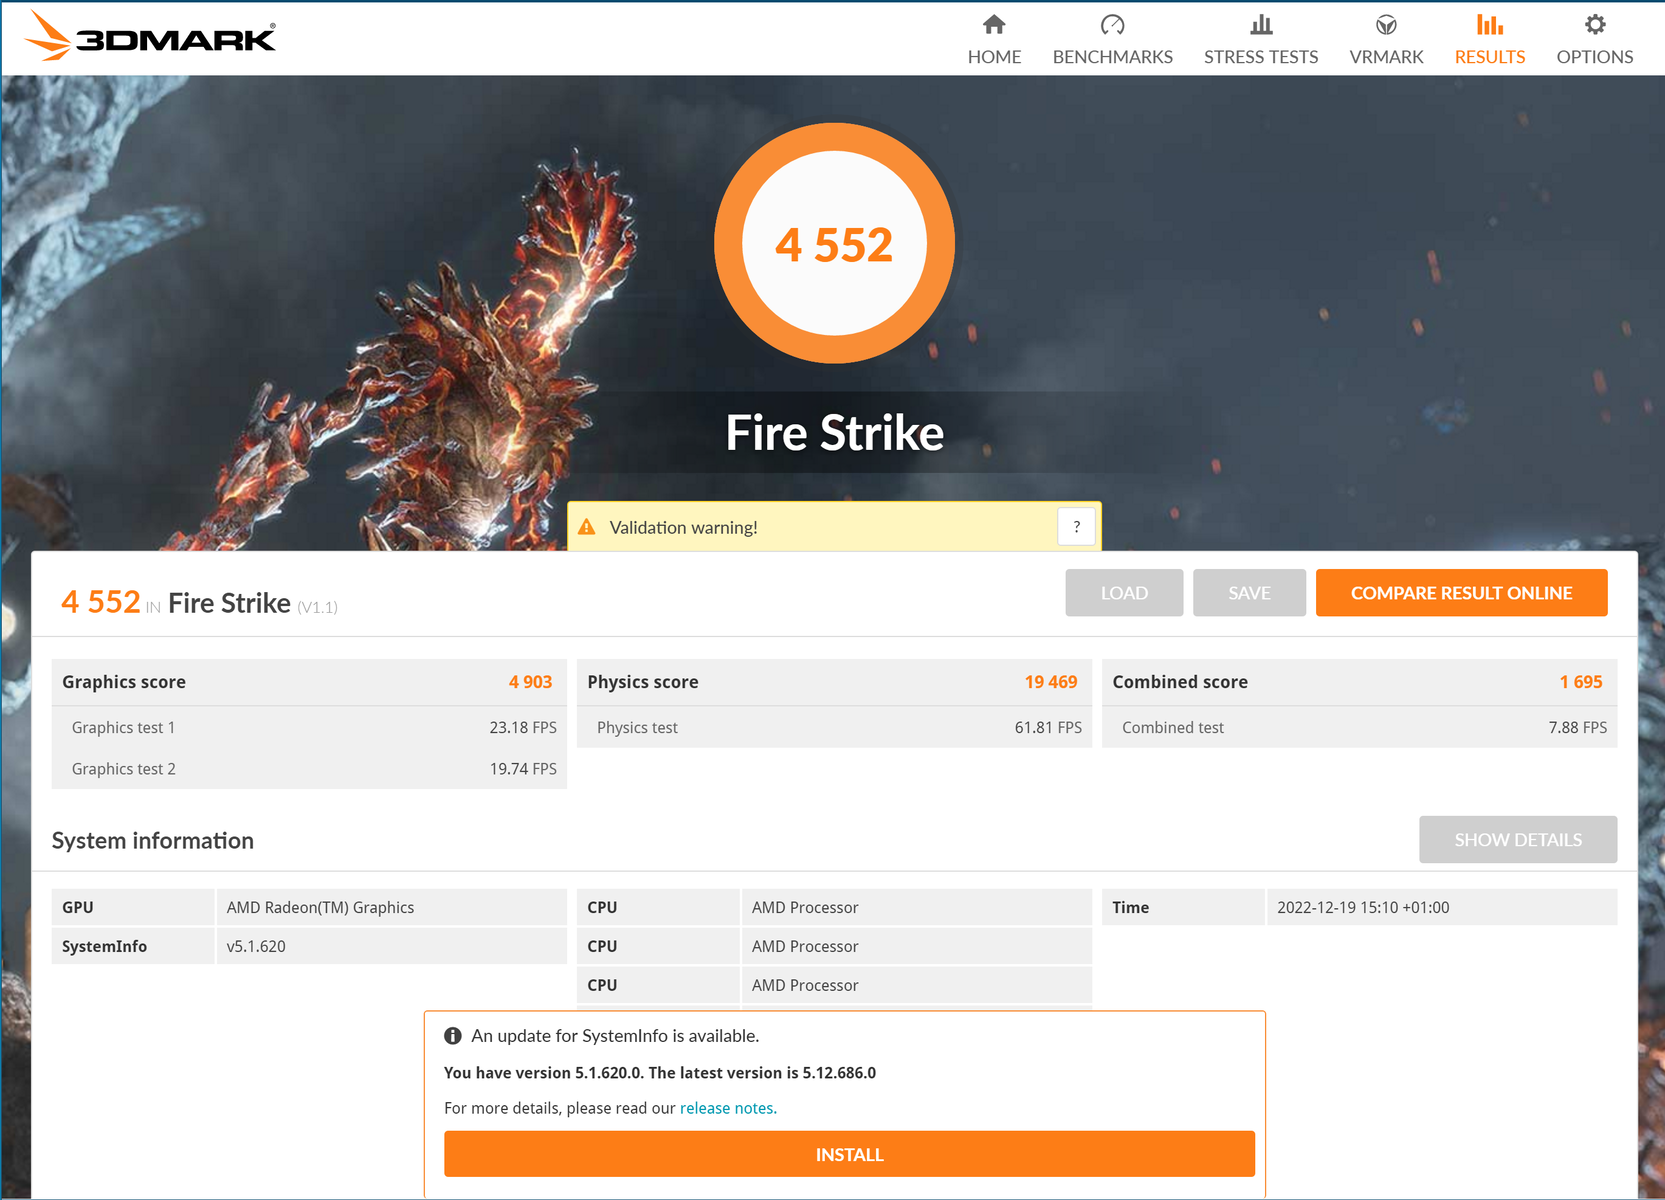
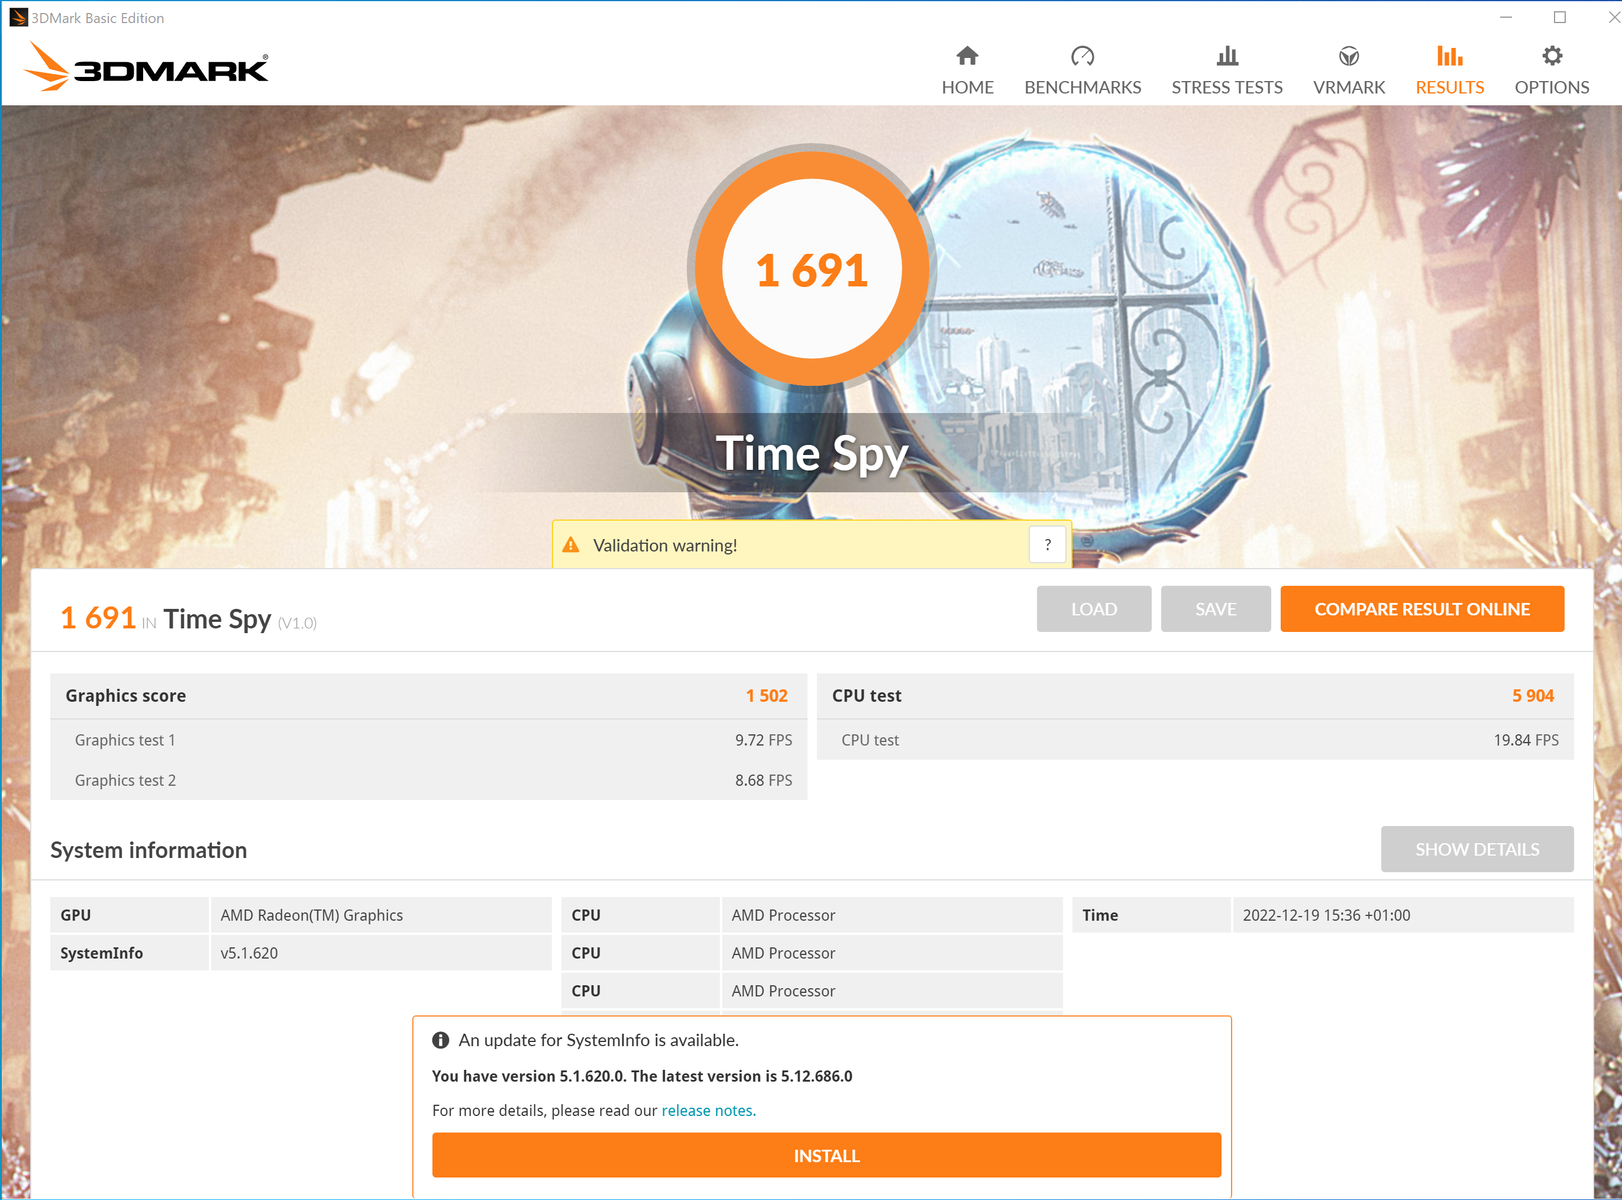
Karta graficzna


AMD Radeon 660Mz zastosowanego tu Ryzena 5 PRO jest słabszym z dwóch dostępnych wyłącznie w ThinkPadzie T16 AMD zintegrowanych rozwiązań graficznych. O ile w starsze gry można grać na średnich lub wysokich ustawieniach detali, o tyle nowe gry są co najwyżej ledwo grywalne na niskich ustawieniach, gdyż T16 nie jest przeznaczony do gier.
W czasie rozgrywek, np.Intel Xe7 (96EUs)pozostaje w tyle o około 20%, podczas gdy Radeon 680Moblicza około 45% szybciej. Podczas pracy na akumulatorze dostępna jest pełna wydajność grafiki.


| 3DMark Performance rating - Percent | |
| Lenovo ThinkPad Z16 G1 21D5S00T00 | |
| Lenovo ThinkPad P15v G2 21A9000XGE | |
| Lenovo ThinkPad T14 G3-21CF004NGE | |
| Średnia w klasie Office | |
| Lenovo ThinkPad T16 G1 21CH004MGE | |
| Przeciętny Intel Iris Xe Graphics G7 96EUs | |
| HP EliteBook 865 G9 | |
| Lenovo ThinkPad T16 Gen 1 Core i7-1270P | |
| Lenovo ThinkPad T16 G1 21BWS00200 | |
| 3DMark 11 - 1280x720 Performance GPU | |
| Lenovo ThinkPad Z16 G1 21D5S00T00 | |
| Lenovo ThinkPad P15v G2 21A9000XGE | |
| Lenovo ThinkPad T14 G3-21CF004NGE | |
| Średnia w klasie Office (2551 - 18313, n=68, ostatnie 2 lata) | |
| Lenovo ThinkPad T16 G1 21CH004MGE | |
| HP EliteBook 865 G9 | |
| Przeciętny Intel Iris Xe Graphics G7 96EUs (2867 - 7676, n=209) | |
| Lenovo ThinkPad T16 Gen 1 Core i7-1270P | |
| Lenovo ThinkPad T16 G1 21BWS00200 | |
| 3DMark 11 Performance | 7403 pkt. | |
| 3DMark Cloud Gate Standard Score | 24538 pkt. | |
| 3DMark Fire Strike Score | 4552 pkt. | |
| 3DMark Time Spy Score | 1691 pkt. | |
Pomoc | ||
| Blender | |
| v3.3 Classroom HIP/AMD | |
| Lenovo ThinkPad T16 G1 21CH004MGE | |
| HP EliteBook 865 G9 | |
| Przeciętny AMD Radeon 660M (438 - 755, n=8) | |
| Lenovo ThinkPad T16 G1 21CHCTO1WW | |
| Średnia w klasie Office (296 - 507, n=5, ostatnie 2 lata) | |
| Lenovo ThinkPad T14 G3-21CF004NGE | |
| Lenovo ThinkPad Z16 G1 21D5S00T00 | |
| v3.3 Classroom OPTIX/RTX | |
| Średnia w klasie Office (29 - 242, n=2, ostatnie 2 lata) | |
| HP ZBook Power 15 G9 6B8C4EA | |
| v3.3 Classroom CPU | |
| Lenovo ThinkPad T16 G1 21BWS00200 | |
| Lenovo ThinkPad T16 Gen 1 Core i7-1270P | |
| Przeciętny AMD Radeon 660M (323 - 968, n=13) | |
| Średnia w klasie Office (245 - 3219, n=72, ostatnie 2 lata) | |
| Lenovo ThinkPad T16 G1 21CH004MGE | |
| Lenovo ThinkPad Z16 G1 21D5S00T00 | |
| Lenovo ThinkPad T14 G3-21CF004NGE | |
| HP EliteBook 865 G9 | |
| Lenovo ThinkPad T16 G1 21CHCTO1WW | |
| HP ZBook Power 15 G9 6B8C4EA | |
| V-Ray Benchmark Next 4.10 - GPU | |
| Lenovo ThinkPad P15v G2 21A9000XGE | |
| Lenovo ThinkPad Z16 G1 21D5S00T00 | |
| Średnia w klasie Office (8 - 550, n=68, ostatnie 2 lata) | |
| Lenovo ThinkPad T14 G3-21CF004NGE | |
| HP EliteBook 865 G9 | |
| Lenovo ThinkPad T16 G1 21CH004MGE | |
| Przeciętny AMD Radeon 660M (33 - 61, n=11) | |
| Lenovo ThinkPad T16 G1 21BWS00200 | |
| Geekbench 5.5 - OpenCL Score | |
| HP ZBook Power 15 G9 6B8C4EA | |
| Lenovo ThinkPad Z16 G1 21D5S00T00 | |
| Lenovo ThinkPad P15v G2 21A9000XGE | |
| Lenovo ThinkPad T14 G3-21CF004NGE | |
| Lenovo ThinkPad T16 G1 21CHCTO1WW | |
| Średnia w klasie Office (3474 - 95841, n=69, ostatnie 2 lata) | |
| HP EliteBook 865 G9 | |
| Lenovo ThinkPad T16 G1 21CH004MGE | |
| Przeciętny AMD Radeon 660M (14671 - 19021, n=14) | |
| Lenovo ThinkPad T16 Gen 1 Core i7-1270P | |
| Lenovo ThinkPad T16 G1 21BWS00200 | |
* ... im mniej tym lepiej
| The Witcher 3 - 1920x1080 Ultra Graphics & Postprocessing (HBAO+) | |
| Lenovo ThinkPad X1 Extreme G5-21DE003RGE | |
| HP ZBook Power 15 G9 6B8C4EA | |
| Lenovo ThinkPad Z16 G1 21D5S00T00 | |
| Lenovo ThinkPad P15v G2 21A9000XGE | |
| Lenovo ThinkPad T14 G3-21CF004NGE | |
| Lenovo ThinkPad T16 G1 21CH004MGE | |
| Średnia w klasie Office (14.8 - 18.1, n=4, ostatnie 2 lata) | |
| HP EliteBook 865 G9 | |
| Przeciętny Intel Iris Xe Graphics G7 96EUs (8.79 - 20.1, n=181) | |
| Lenovo ThinkPad T16 G1 21BWS00200 | |
| GTA V - 1920x1080 High/On (Advanced Graphics Off) AA:2xMSAA + FX AF:8x | |
| Lenovo ThinkPad X1 Extreme G5-21DE003RGE | |
| HP ZBook Power 15 G9 6B8C4EA | |
| Lenovo ThinkPad T14 G3-21CF004NGE | |
| Lenovo ThinkPad Z16 G1 21D5S00T00 | |
| Lenovo ThinkPad P15v G2 21A9000XGE | |
| Średnia w klasie Office (11.4 - 163.1, n=67, ostatnie 2 lata) | |
| Lenovo ThinkPad T16 G1 21CH004MGE | |
| HP EliteBook 865 G9 | |
| Przeciętny Intel Iris Xe Graphics G7 96EUs (9.39 - 51.6, n=162) | |
| Lenovo ThinkPad T16 G1 21BWS00200 | |
| Final Fantasy XV Benchmark - 1920x1080 Standard Quality | |
| Lenovo ThinkPad X1 Extreme G5-21DE003RGE | |
| HP ZBook Power 15 G9 6B8C4EA | |
| Lenovo ThinkPad Z16 G1 21D5S00T00 | |
| Lenovo ThinkPad P15v G2 21A9000XGE | |
| Lenovo ThinkPad T14 G3-21CF004NGE | |
| Średnia w klasie Office (7.86 - 105.7, n=71, ostatnie 2 lata) | |
| Lenovo ThinkPad T16 G1 21CH004MGE | |
| Przeciętny Intel Iris Xe Graphics G7 96EUs (10.5 - 31.2, n=185) | |
| HP EliteBook 865 G9 | |
| Lenovo ThinkPad T16 G1 21BWS00200 | |
| Strange Brigade - 1920x1080 ultra AA:ultra AF:16 | |
| Lenovo ThinkPad X1 Extreme G5-21DE003RGE | |
| Lenovo ThinkPad Z16 G1 21D5S00T00 | |
| HP ZBook Power 15 G9 6B8C4EA | |
| Lenovo ThinkPad P15v G2 21A9000XGE | |
| Lenovo ThinkPad T14 G3-21CF004NGE | |
| Średnia w klasie Office (12.9 - 142.1, n=51, ostatnie 2 lata) | |
| Lenovo ThinkPad T16 G1 21CH004MGE | |
| Przeciętny Intel Iris Xe Graphics G7 96EUs (13.2 - 31.7, n=167) | |
| HP EliteBook 865 G9 | |
| Lenovo ThinkPad T16 G1 21BWS00200 | |
| Dota 2 Reborn - 1920x1080 ultra (3/3) best looking | |
| Lenovo ThinkPad X1 Extreme G5-21DE003RGE | |
| HP ZBook Power 15 G9 6B8C4EA | |
| Lenovo ThinkPad P15v G2 21A9000XGE | |
| Lenovo ThinkPad Z16 G1 21D5S00T00 | |
| Lenovo ThinkPad T14 G3-21CF004NGE | |
| Średnia w klasie Office (14.6 - 135, n=75, ostatnie 2 lata) | |
| Lenovo ThinkPad T16 G1 21CH004MGE | |
| Przeciętny Intel Iris Xe Graphics G7 96EUs (20.6 - 78.5, n=221) | |
| HP EliteBook 865 G9 | |
| Lenovo ThinkPad T16 G1 21BWS00200 | |
| X-Plane 11.11 - 1920x1080 high (fps_test=3) | |
| Lenovo ThinkPad X1 Extreme G5-21DE003RGE | |
| HP ZBook Power 15 G9 6B8C4EA | |
| Lenovo ThinkPad P15v G2 21A9000XGE | |
| Lenovo ThinkPad Z16 G1 21D5S00T00 | |
| Lenovo ThinkPad T14 G3-21CF004NGE | |
| Przeciętny Intel Iris Xe Graphics G7 96EUs (11.1 - 59.8, n=213) | |
| Średnia w klasie Office (12 - 82.4, n=66, ostatnie 2 lata) | |
| Lenovo ThinkPad T16 G1 21CH004MGE | |
| HP EliteBook 865 G9 | |
| Lenovo ThinkPad T16 G1 21BWS00200 | |
The Witcher 3 FPS Chart
| low | med. | high | ultra | |
|---|---|---|---|---|
| GTA V (2015) | 132.5 | 120 | 40.7 | 18 |
| The Witcher 3 (2015) | 90.5 | 52.5 | 27.1 | 17.9 |
| Dota 2 Reborn (2015) | 109.3 | 99.3 | 61 | 52.9 |
| Final Fantasy XV Benchmark (2018) | 51.6 | 24.3 | 17.4 | |
| X-Plane 11.11 (2018) | 49.1 | 33.7 | 29.3 | |
| Far Cry 5 (2018) | 61 | 31 | 26 | 25 |
| Strange Brigade (2018) | 120.7 | 44.5 | 35.3 | 29.7 |
| Shadow of the Tomb Raider (2018) | 77 | 29 | 27 | 23 |
| God of War (2022) | 23.9 | 18.9 | 16.1 | 10.8 |
Emisje: Przez większość czasu ThinkPad T16 AMD pozostaje bezgłośny
Poziomy hałasu
Podczas pracy na biegu jałowym oraz podczas wykonywania prostych czynności, takich jak przeglądanie stron internetowych, uruchamianie aplikacji czy praca biurowa, wentylator pozostaje przeważnie wyłączony lub ledwo słyszalny. Dopiero pod stałym lub połączonym obciążeniem (gry) po kilku minutach wentylator się rozkręca. Co prawda wtedy nie będzie już cichy przy maksymalnym poziomie 39 dB(A), ale wytwarza komfortową niską częstotliwość dźwięku.
Z drugiej strony nasz drugi testowy ThinkPad T16 AMD ma wentylator o bardzo wysokiej częstotliwości, o czym wspominają też inni użytkownicy T16/T14 i P16s/P14s.
Hałas
| luz |
| 23.1 / 23.1 / 23.1 dB |
| obciążenie |
| 25.4 / 39.1 dB |
 | ||
30 dB cichy 40 dB(A) słyszalny 50 dB(A) irytujący |
||
min: | ||
| Lenovo ThinkPad T16 G1 21CH004MGE Radeon 660M, R5 PRO 6650U, Micron 2450 512GB MTFDKBA512TFK | Lenovo ThinkPad T16 G1 21BWS00200 Iris Xe G7 80EUs, i5-1240P, Samsung PM9A1 MZVL2512HCJQ | HP EliteBook 865 G9 Radeon 680M, R7 PRO 6850U, Samsung PM991 MZVLQ512HBLU | Lenovo ThinkPad Z16 G1 21D5S00T00 Radeon RX 6500M, R7 PRO 6850H, Samsung PM9A1 MZVL21T0HCLR | Lenovo ThinkPad T14 G3-21CF004NGE Radeon 680M, R7 PRO 6850U, Kioxia BG5 KBG5AZNV512G | Lenovo ThinkPad P15v G2 21A9000XGE T1200 Laptop GPU, i7-11800H, Toshiba XG6 KXG6AZNV512G | HP ZBook Power 15 G9 6B8C4EA RTX A2000 Laptop GPU, i7-12700H, Samsung PM9A1 MZVL21T0HCLR | |
|---|---|---|---|---|---|---|---|
| Noise | 3% | 3% | -9% | -7% | -15% | -18% | |
| wyłączone / środowisko * (dB) | 23.1 | 23.3 -1% | 23 -0% | 23.7 -3% | 24.2 -5% | 25.21 -9% | 23.8 -3% |
| Idle Minimum * (dB) | 23.1 | 23.3 -1% | 23 -0% | 23.7 -3% | 24.2 -5% | 25.21 -9% | 23.8 -3% |
| Idle Average * (dB) | 23.1 | 23.3 -1% | 23 -0% | 23.7 -3% | 24.2 -5% | 25.21 -9% | 23.8 -3% |
| Idle Maximum * (dB) | 23.1 | 23.3 -1% | 23 -0% | 23.7 -3% | 25.8 -12% | 25.21 -9% | 23.8 -3% |
| Load Average * (dB) | 25.4 | 25.1 1% | 29.1 -15% | 25.9 -2% | 32.2 -27% | 39.09 -54% | 42.9 -69% |
| Witcher 3 ultra * (dB) | 35.93 | 32.1 11% | 29.1 19% | 46.9 -31% | 34.1 5% | 36.6 -2% | 44.5 -24% |
| Load Maximum * (dB) | 39.1 | 34 13% | 32.9 16% | 46.9 -20% | 38.8 1% | 43.53 -11% | 47.9 -23% |
* ... im mniej tym lepiej
Temperatury
Przez cały czas temperatury Lenovo ThinkPad T16 G1 AMD pozostają wyjątkowo niskie. Podczas największego obciążenia zmierzyliśmy maksymalnie 41,5 °C (106,7 °F) w jednym obszarze na spodzie obudowy. Przy 34,6°C (94,3°F) podczas scenariusza obciążenia góra obudowy pozostaje znacznie chłodniejsza, niż w przypadku modelu z procesorem Intela Modelu Intela z 45 °C (113 °F).
(+) Maksymalna temperatura w górnej części wynosi 34.6 °C / 94 F, w porównaniu do średniej 34.3 °C / 94 F , począwszy od 21.2 do 62.5 °C dla klasy Office.
(±) Dno nagrzewa się maksymalnie do 41.5 °C / 107 F, w porównaniu do średniej 36.8 °C / 98 F
(+) W stanie bezczynności średnia temperatura górnej części wynosi 21.9 °C / 71 F, w porównaniu ze średnią temperaturą urządzenia wynoszącą 29.5 °C / ### class_avg_f### F.
(+) Podczas gry w Wiedźmina 3 średnia temperatura górnej części wynosi 29.6 °C / 85 F, w porównaniu do średniej temperatury urządzenia wynoszącej 29.5 °C / ## #class_avg_f### F.
(+) Podpórki pod nadgarstki i touchpad są chłodniejsze niż temperatura skóry i maksymalnie 29 °C / 84.2 F i dlatego są chłodne w dotyku.
(±) Średnia temperatura obszaru podparcia dłoni w podobnych urządzeniach wynosiła 27.5 °C / 81.5 F (-1.5 °C / -2.7 F).
| Lenovo ThinkPad T16 G1 21CH004MGE AMD Ryzen 5 PRO 6650U, AMD Radeon 660M | Lenovo ThinkPad T16 G1 21BWS00200 Intel Core i5-1240P, Intel Iris Xe Graphics G7 80EUs | HP EliteBook 865 G9 AMD Ryzen 7 PRO 6850U, AMD Radeon 680M | Lenovo ThinkPad Z16 G1 21D5S00T00 AMD Ryzen 7 PRO 6850H, AMD Radeon RX 6500M | Lenovo ThinkPad T14 G3-21CF004NGE AMD Ryzen 7 PRO 6850U, AMD Radeon 680M | Lenovo ThinkPad P15v G2 21A9000XGE Intel Core i7-11800H, NVIDIA T1200 Laptop GPU | HP ZBook Power 15 G9 6B8C4EA Intel Core i7-12700H, NVIDIA RTX A2000 Laptop GPU | |
|---|---|---|---|---|---|---|---|
| Heat | -29% | -8% | -34% | -19% | -29% | -9% | |
| Maximum Upper Side * (°C) | 34.6 | 45 -30% | 39.4 -14% | 56.8 -64% | 48.2 -39% | 53.8 -55% | 40.3 -16% |
| Maximum Bottom * (°C) | 41.5 | 42.8 -3% | 47.6 -15% | 53.3 -28% | 52.8 -27% | 52.1 -26% | 48.3 -16% |
| Idle Upper Side * (°C) | 22.6 | 33 -46% | 23.6 -4% | 28.2 -25% | 24.4 -8% | 27.6 -22% | 23.7 -5% |
| Idle Bottom * (°C) | 24.5 | 33.6 -37% | 24.1 2% | 29.4 -20% | 24.5 -0% | 27.7 -13% | 23.8 3% |
* ... im mniej tym lepiej
Stress Test
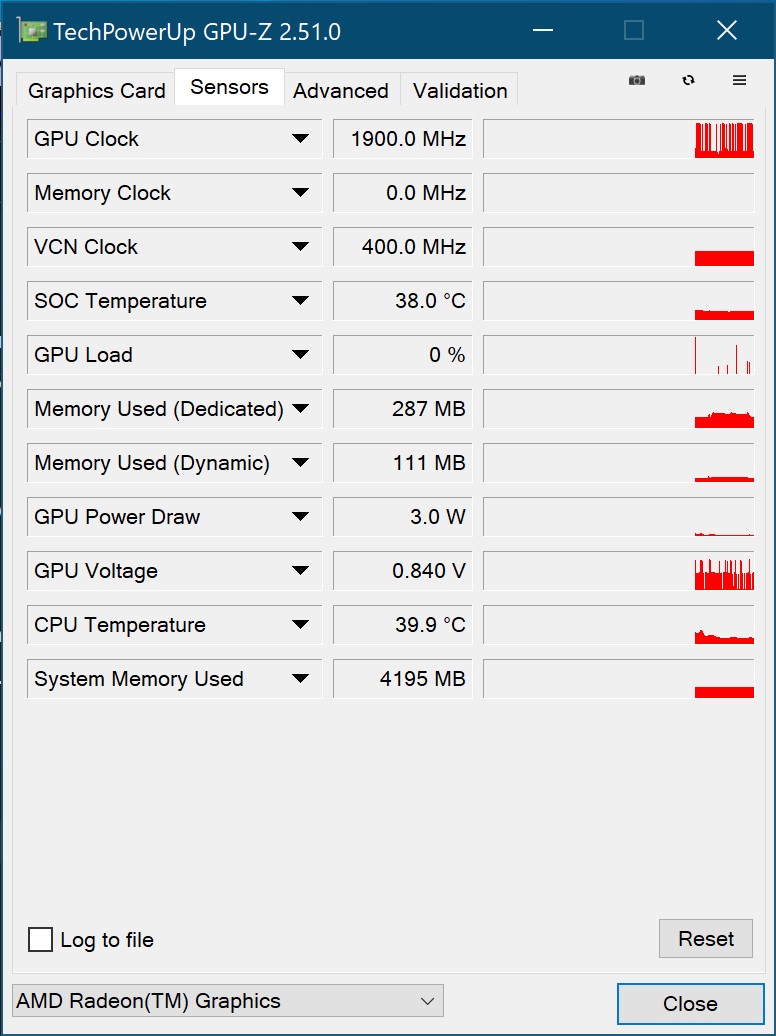
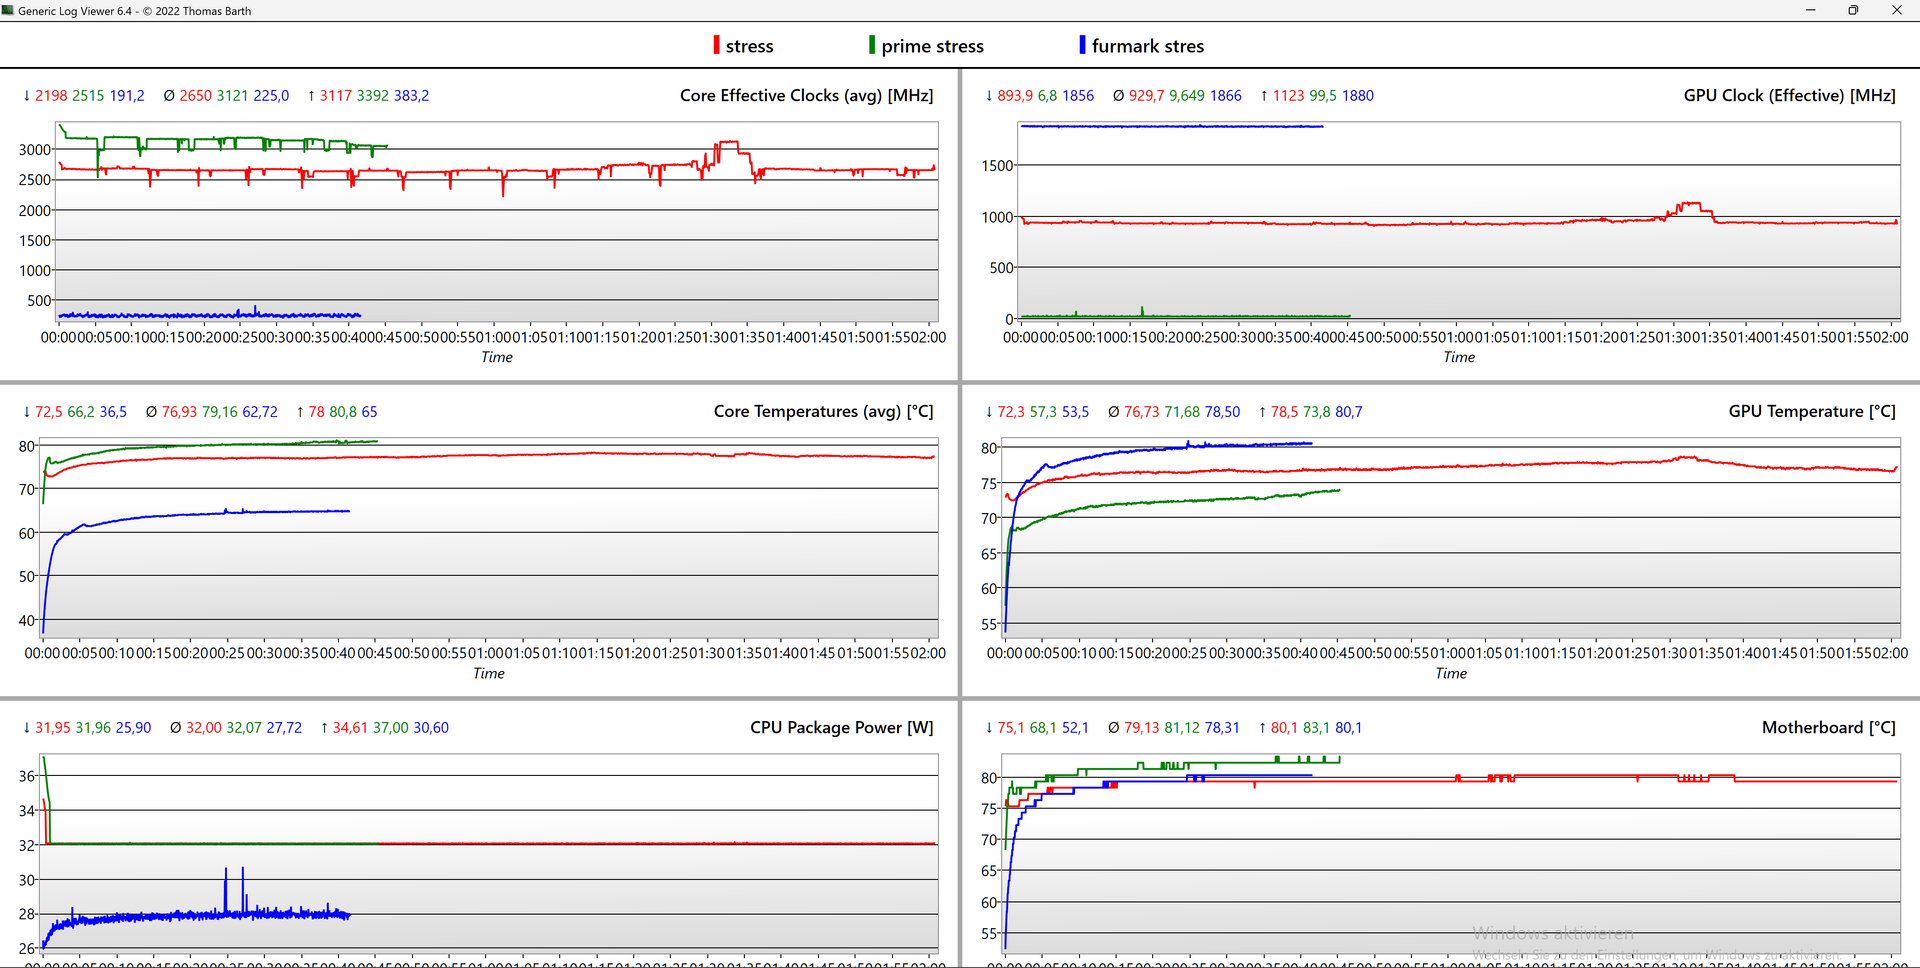
Przy 2,65 GHz pod połączonym obciążeniem (Prime95 + FurMark) prędkość procesora spada nieco poniżej podstawowego taktowania 2,9 GHz, a temperatury rdzenia osiągają tylko 77°C (171°F). W tym czasie iGPU pracuje tylko z około połową swojej maksymalnej prędkości, osiągając temperaturę 79°C (174°F).
Podczas czystego obciążenia CPU podstawowa prędkość zegara jest przekraczana o 200 MHz, a podczas czystego obciążenia GPU układ Radeon iGPU pracuje z pełną prędkością ~1900 MHz.
| ZegarCPU (GHz) | Zegar GPU (MHz) | Średnia temperatura CPU (°C) | Średnia temperatura GPU (°C) | |
| System Idle | 0.15 | 18 | 35 | 35 |
| Prime95 + FurMark Stress | 2.65 | 930 | 77 | 77 |
| Prime95 Stress | 3,12 | 10 | 79 | 72 |
| FurMark-Stress | 0,23 | 1,866 | 63 | 79 |
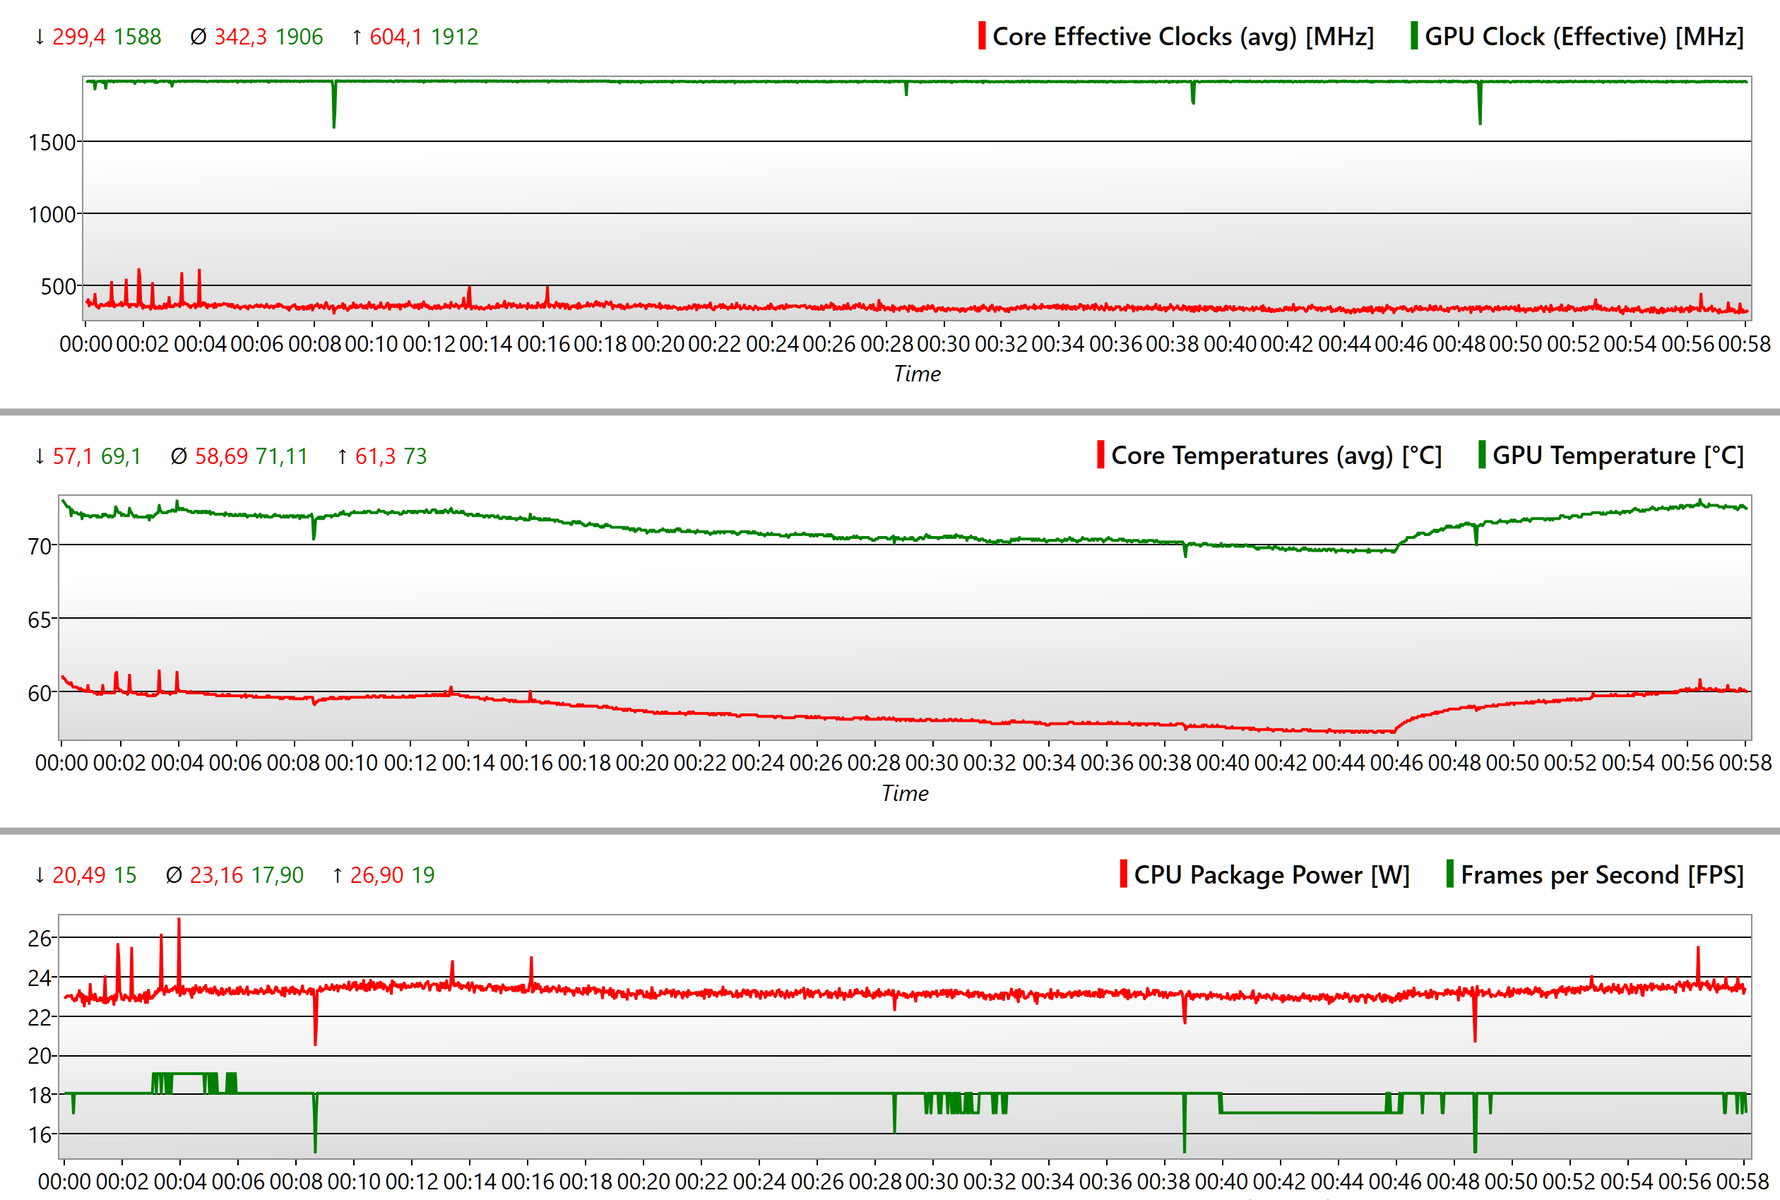
| The Witcher 3 Stress | 0.34 | 1.906 | 59 | 71 |
Mówcy
Skierowane ku górze głośniki stereo 16-calowego ThinkPada są ogólnie przeciętne. Brakuje im basów, a wysokie częstotliwości są zbyt wysokie. Nie można też oczekiwać dużej głośności.
Lenovo ThinkPad T16 G1 21CH004MGE analiza dźwięku
(-) | niezbyt głośne głośniki (###wartość### dB)
Bas 100 - 315 Hz
(-) | prawie brak basu - średnio 18.5% niższa od mediany
(±) | liniowość basu jest średnia (12.3% delta do poprzedniej częstotliwości)
Średnie 400 - 2000 Hz
(+) | zbalansowane środki średnie - tylko 4.5% od mediany
(±) | liniowość środka jest średnia (7.8% delta do poprzedniej częstotliwości)
Wysokie 2–16 kHz
(±) | wyższe maksima - średnio 5.3% wyższe od mediany
(±) | liniowość wysokich wartości jest średnia (7.5% delta do poprzedniej częstotliwości)
Ogólnie 100 - 16.000 Hz
(±) | liniowość ogólnego dźwięku jest średnia (22.5% różnicy w stosunku do mediany)
W porównaniu do tej samej klasy
» 60% wszystkich testowanych urządzeń w tej klasie było lepszych, 8% podobnych, 32% gorszych
» Najlepszy miał deltę 7%, średnia wynosiła ###średnia###%, najgorsza wynosiła 53%
W porównaniu do wszystkich testowanych urządzeń
» 66% wszystkich testowanych urządzeń było lepszych, 6% podobnych, 28% gorszych
» Najlepszy miał deltę 4%, średnia wynosiła ###średnia###%, najgorsza wynosiła 134%
HP EliteBook 865 G9 analiza dźwięku
(+) | głośniki mogą odtwarzać stosunkowo głośno (82.5 dB)
Bas 100 - 315 Hz
(-) | prawie brak basu - średnio 19.6% niższa od mediany
(±) | liniowość basu jest średnia (10.9% delta do poprzedniej częstotliwości)
Średnie 400 - 2000 Hz
(+) | zbalansowane środki średnie - tylko 1.2% od mediany
(+) | średnie są liniowe (2.2% delta do poprzedniej częstotliwości)
Wysokie 2–16 kHz
(+) | zrównoważone maksima - tylko 3.5% od mediany
(+) | wzloty są liniowe (4% delta do poprzedniej częstotliwości)
Ogólnie 100 - 16.000 Hz
(+) | ogólny dźwięk jest liniowy (13.8% różnicy w stosunku do mediany)
W porównaniu do tej samej klasy
» 8% wszystkich testowanych urządzeń w tej klasie było lepszych, 4% podobnych, 88% gorszych
» Najlepszy miał deltę 7%, średnia wynosiła ###średnia###%, najgorsza wynosiła 53%
W porównaniu do wszystkich testowanych urządzeń
» 15% wszystkich testowanych urządzeń było lepszych, 4% podobnych, 81% gorszych
» Najlepszy miał deltę 4%, średnia wynosiła ###średnia###%, najgorsza wynosiła 134%
Zarządzanie energią: T16 z długim czasem pracy na baterii pomimo małej baterii
Pobór mocy
Podczas pracy w trybie jałowym i pod obciążeniem zużycie energii przez ThinkPad T16 AMD pozostaje niższe niż w przypadku Modelu IntelaorazThinkPad T14 G3 AMDz tą samą płytą główną.
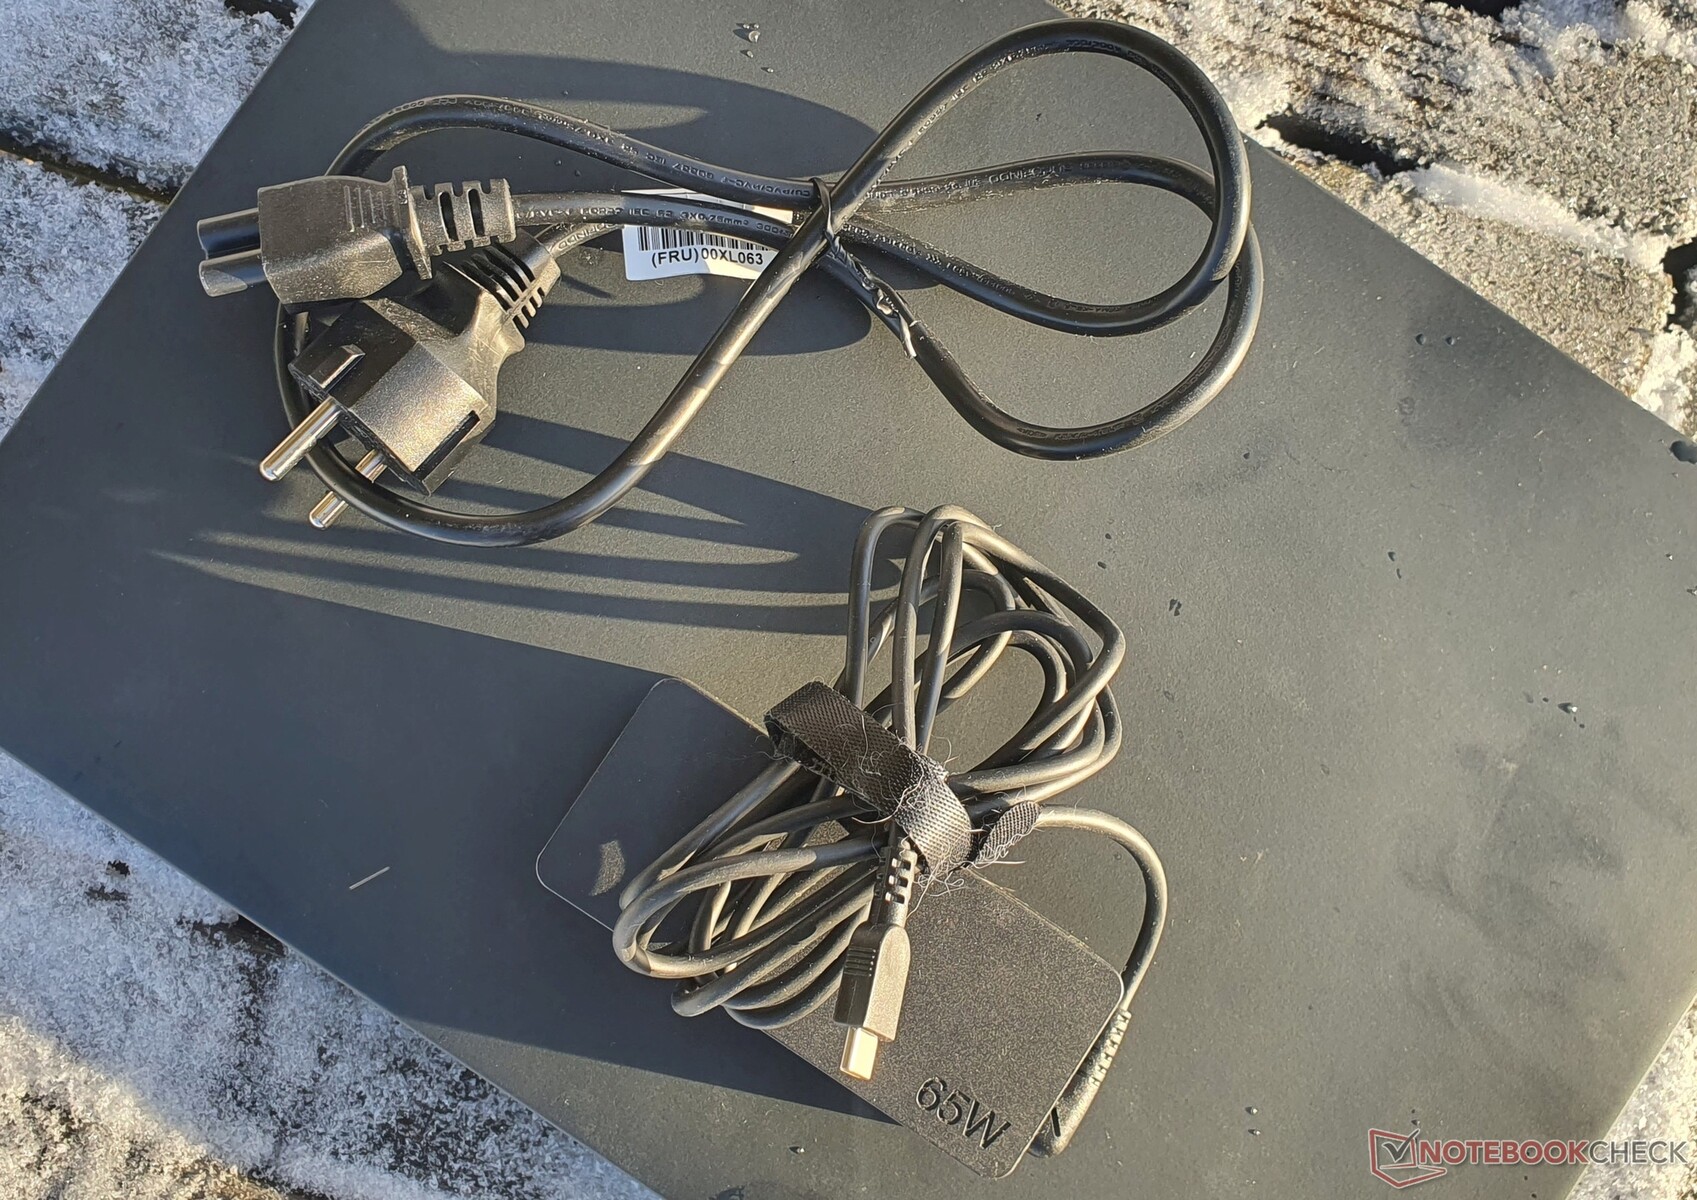
Przyczyn takiego stanu rzeczy można doszukiwać się w wyświetlaczu o wyższej rozdzielczości bez charakterystyki niskiego poboru mocy oraz w wyższych limitach wydajności procesora. Ponieważ krótkotrwałe Turbo procesora AMD okazuje się znacznie niższe, urządzenie zużywa maksymalnie tylko 59 W, co oznacza, że wystarczy ładowarka o mocy 65 W.
| wyłączony / stan wstrzymania | |
| luz | |
| obciążenie |
|
Legenda:
min: | |
| Lenovo ThinkPad T16 G1 21CH004MGE R5 PRO 6650U, Radeon 660M, Micron 2450 512GB MTFDKBA512TFK, IPS-LED, 2560x1600, 16" | Lenovo ThinkPad T16 G1 21BWS00200 i5-1240P, Iris Xe G7 80EUs, Samsung PM9A1 MZVL2512HCJQ, IPS, 1920x1200, 16" | Lenovo ThinkPad T14 G3-21CF004NGE R7 PRO 6850U, Radeon 680M, Kioxia BG5 KBG5AZNV512G, IPS, 1920x1200, 14" | HP EliteBook 865 G9 R7 PRO 6850U, Radeon 680M, Samsung PM991 MZVLQ512HBLU, IPS, 1920x1200, 16" | Lenovo ThinkPad Z16 G1 21D5S00T00 R7 PRO 6850H, Radeon RX 6500M, Samsung PM9A1 MZVL21T0HCLR, IPS LED, 1920x1200, 16" | Lenovo ThinkPad P15v G2 21A9000XGE i7-11800H, T1200 Laptop GPU, Toshiba XG6 KXG6AZNV512G, IPS LED, 1920x1080, 15.6" | HP ZBook Power 15 G9 6B8C4EA i7-12700H, RTX A2000 Laptop GPU, Samsung PM9A1 MZVL21T0HCLR, IPS, 3840x2160, 15.6" | Przeciętny AMD Radeon 660M | Średnia w klasie Office | |
|---|---|---|---|---|---|---|---|---|---|
| Power Consumption | 9% | 19% | -35% | -64% | -77% | -59% | -8% | -6% | |
| Idle Minimum * (Watt) | 3.2 | 2.9 9% | 2.4 25% | 5.3 -66% | 5.3 -66% | 5.96 -86% | 3.9 -22% | 4.68 ? -46% | 4.41 ? -38% |
| Idle Average * (Watt) | 8.1 | 6 26% | 5.3 35% | 12.8 -58% | 8.6 -6% | 8.37 -3% | 7.2 11% | 7.08 ? 13% | 7.37 ? 9% |
| Idle Maximum * (Watt) | 8.6 | 6.9 20% | 5.6 35% | 14.1 -64% | 9.5 -10% | 9.05 -5% | 8.5 1% | 9.12 ? -6% | 8.58 ? -0% |
| Load Average * (Watt) | 45.4 | 27.3 40% | 39.7 13% | 48.5 -7% | 65.2 -44% | 91.82 -102% | 87.2 -92% | 44.2 ? 3% | 43 ? 5% |
| Witcher 3 ultra * (Watt) | 40 | 42.6 -7% | 42.8 -7% | 48.7 -22% | 93.6 -134% | 102 -155% | 86.8 -117% | ||
| Load Maximum * (Watt) | 59.6 | 81.53 -37% | 50.6 15% | 56.6 5% | 133.81 -125% | 126.38 -112% | 139 -133% | 62.4 ? -5% | 64.6 ? -8% |
* ... im mniej tym lepiej
Power Consumption The Witcher 3 / Stress Test
Power Consumption With External Monitor
Czas pracy na baterii
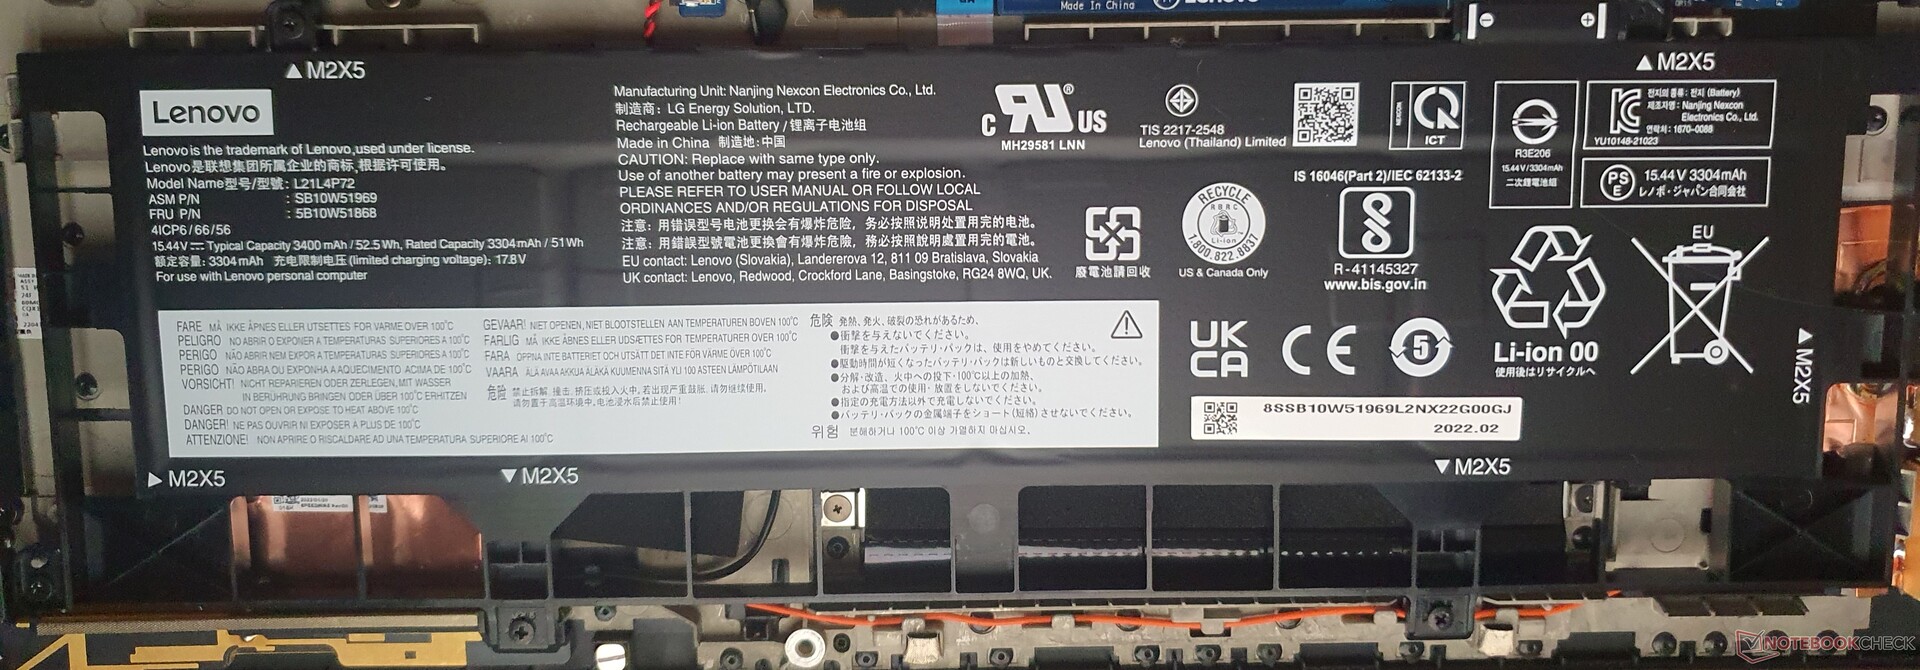
Mimo zastosowania w naszym testowym egzemplarzu znacznie mniejszej baterii o pojemności 52,5 Wh, w sieci można surfować przez 10:35 godziny. Na stronie Model Intelaz akumulatorem 86-Wh i wyświetlaczem oszczędzającym energię osiąga 14 godzin. Aby uzyskać długie czasy pracy na baterii, należy więc zaopatrzyć się w większy akumulator i wyświetlacz o niskim poborze mocy.
Sądząc po.ThinkPad T14 G3 AMDz tą samą płytą główną i wyświetlaczem o niskim poborze mocy, można by obliczyć, że w przypadku T16 AMD czas pracy na akumulatorze wyniesie do 20 godzin. Ze względu na brak rzeczywistych pomiarów nie jesteśmy jednak w stanie tego potwierdzić.
| Lenovo ThinkPad T16 G1 21CH004MGE R5 PRO 6650U, Radeon 660M, 52.5 Wh | Lenovo ThinkPad T16 G1 21BWS00200 i5-1240P, Iris Xe G7 80EUs, 86 Wh | Lenovo ThinkPad T14 G3-21CF004NGE R7 PRO 6850U, Radeon 680M, 52.5 Wh | HP EliteBook 865 G9 R7 PRO 6850U, Radeon 680M, 76 Wh | Lenovo ThinkPad Z16 G1 21D5S00T00 R7 PRO 6850H, Radeon RX 6500M, 72 Wh | Lenovo ThinkPad P15v G2 21A9000XGE i7-11800H, T1200 Laptop GPU, 68 Wh | HP ZBook Power 15 G9 6B8C4EA i7-12700H, RTX A2000 Laptop GPU, 83 Wh | Lenovo ThinkPad X1 Extreme G5-21DE003RGE i7-12700H, GeForce RTX 3060 Laptop GPU, 90 Wh | |
|---|---|---|---|---|---|---|---|---|
| Czasy pracy | 82% | 30% | 59% | 31% | -25% | -6% | -5% | |
| H.264 (h) | 10.9 | 10.4 -5% | 16.4 50% | 18.5 70% | 11.9 9% | 8 -27% | 7.3 -33% | |
| WiFi v1.3 (h) | 10.6 | 14.1 33% | 12.9 22% | 15 42% | 9.9 -7% | 7.5 -29% | 10 -6% | 6.7 -37% |
| Load (h) | 1.1 | 3.5 218% | 1.3 18% | 1.8 64% | 2.1 91% | 0.9 -18% | 1.7 55% |
Za
Przeciw
Werdykt: ThinkPad T16 AMD jest wydajny, chłodny i cichy

Dzięki APU od AMD, Lenovo ThinkPad T16 staje się jeszcze lepszy. Nie tylko otrzymujesz bardzo wydajny procesor z wyższymi limitami mocy niż w T16 Intel, ale także zintegrowany procesor graficzny Radeon jest bardziej przekonujący niż iGPU od Intela. Dzięki temu laptop biznesowy jest przygotowany także do wymagających, obciążających procesor zadań.
Zalecamy wybór większej baterii i wyświetlacza o niskim poborze mocy, aby uzyskać maksymalny czas pracy na baterii. Osoby, które szukają prawdziwej podstawowej stacji roboczej, powinny jednak wybrać ThinkPad P15v lub HP Zbook Power 15 G9. Z drugiej strony ThinkPad X1 Extreme G5oraz ThinkPad Z16stanowią dobry kompromis między smukłością a wydajnością.
Oprócz dobrego wyposażenia, solidny ThinkPad T16 AMD korzysta również z tego, że jest bardzo cichy i chłodny, ma dobre urządzenia wejściowe oraz jasny 16-calowy wyświetlacz o żywych kolorach.
HP EliteBook 865 G9, którego szczególnymi zaletami w porównaniu z T16 AMD za 1499 euro są rozszerzalna pamięć RAM i USB4, stanowi realną alternatywę.
Kontrola jakości serii T z 2022 roku również nie wydaje się być optymalna: Nie dość, że nasz drugi egzemplarz testowy cierpiał z powodu wentylatora o bardzo wysokiej częstotliwości, to jeszcze w okolicy podpórki pod dłonie wydawał wyraźne odgłosy skrzypienia, a lewy klawisz TrackPoint często nie dawał się uruchomić. Ponadto silny chemiczny zapach jest obecny nawet po tygodniu, a zawiasy już nieco się poluzowały. Z drugiej strony, testowany przez nas szerzej model nie wykazuje żadnego z tych często wymienianych przez użytkowników problemów.
Cena i dostępność
Lenovo sprzedaje różne konfiguracje ThinkPada T16 AMD od 969,50 USD, a Amazon również oferuje kilka wersji od 990 USD.
Lenovo ThinkPad T16 G1 21CH004MGE
- 31/01/2023 v7 (old)
Marvin Gollor
Przezroczystość
Wyboru urządzeń do recenzji dokonuje nasza redakcja. Próbka testowa została udostępniona autorowi jako pożyczka od producenta lub sprzedawcy detalicznego na potrzeby tej recenzji. Pożyczkodawca nie miał wpływu na tę recenzję, producent nie otrzymał też kopii tej recenzji przed publikacją. Nie było obowiązku publikowania tej recenzji. Jako niezależna firma medialna, Notebookcheck nie podlega władzy producentów, sprzedawców detalicznych ani wydawców.
Tak testuje Notebookcheck
Każdego roku Notebookcheck niezależnie sprawdza setki laptopów i smartfonów, stosując standardowe procedury, aby zapewnić porównywalność wszystkich wyników. Od około 20 lat stale rozwijamy nasze metody badawcze, ustanawiając przy tym standardy branżowe. W naszych laboratoriach testowych doświadczeni technicy i redaktorzy korzystają z wysokiej jakości sprzętu pomiarowego. Testy te obejmują wieloetapowy proces walidacji. Nasz kompleksowy system ocen opiera się na setkach uzasadnionych pomiarów i benchmarków, co pozwala zachować obiektywizm.Price comparison

