Recenzja laptopa Lenovo ThinkPad T14s G3 AMD: Cichy i wydajny koń roboczy z mocą Ryzen
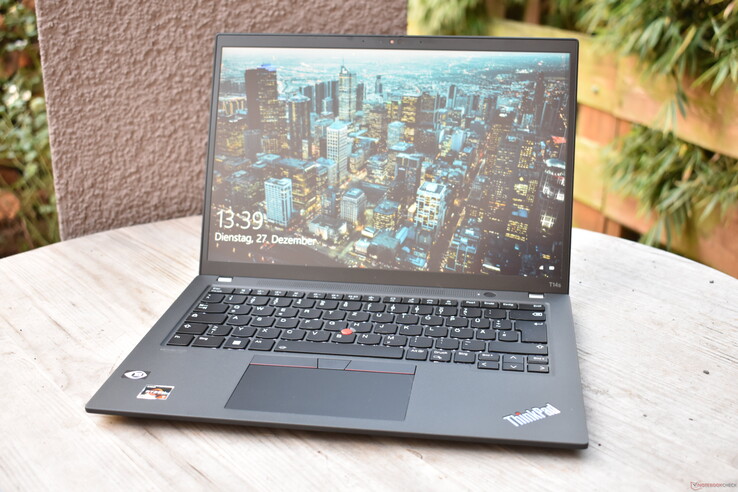
Linia Lenovo dla klientów biznesowych jest wyraźnie wyrównana: Standardowy laptop do biura to Lenovo ThinkPad T14 G3. Dla piętra kierowniczego i szczególnie mobilnych użytkowników Lenovo oferuje znacznie droższy ThinkPad X1 Carbon Gen 10. A jeśli to za drogo, ale mobilność nadal jest ważna, Lenovo ThinkPad T14s G3 stanowi kolejną opcję, która ma łączyć to, co najlepsze z obu modeli. Zaletą w porównaniu do ThinkPad X1 Carbon jest to, że T14s jest również dostępny z procesorami AMD, np AMD Ryzen Pro 6850Udołączony do naszego dzisiejszego egzemplarza testowego.
Ponieważ T14s G3 zawsze korzysta z tej samej obudowy, niezależnie od tego, czy mieści się w niej procesor Intela czy AMD, niniejsza recenzja jest aktualizacją testu. Informacje na temat obudowy i konstrukcji, wyposażenia i urządzeń wejściowych można znaleźć w naszej recenzji Lenovo ThinkPad T14s G3 Intel.
Potencjalni konkurenci w porównaniu
Ocena | Data | Model | Waga | Wysokość | Rozmiar | Rezolucja | Cena |
|---|---|---|---|---|---|---|---|
| 90.6 % v7 (old) | 01/2023 | Lenovo ThinkPad T14s G3 21CQ002LGE R7 PRO 6850U, Radeon 680M | 1.3 kg | 16.9 mm | 14.00" | 1920x1200 | |
| 89.1 % v7 (old) | 12/2022 | Lenovo ThinkPad T14s G3 21BR00CDGE i5-1235U, Iris Xe G7 80EUs | 1.3 kg | 16.9 mm | 14.00" | 1920x1200 | |
| 90.1 % v7 (old) | Lenovo ThinkPad T14s G2 20XGS01100 R7 PRO 5850U, Vega 8 | 1.3 kg | 16.14 mm | 14.00" | 1920x1080 | ||
| 89.8 % v7 (old) | Dell Latitude 9430 2-in-1 i7-1265U, Iris Xe G7 96EUs | 1.5 kg | 13.94 mm | 14.00" | 2560x1600 | ||
| 88.6 % v7 (old) | 11/2022 | HP EliteBook 845 G9 6F6H9EA R5 PRO 6650U, Radeon 660M | 1.4 kg | 19 mm | 14.00" | 1920x1200 |
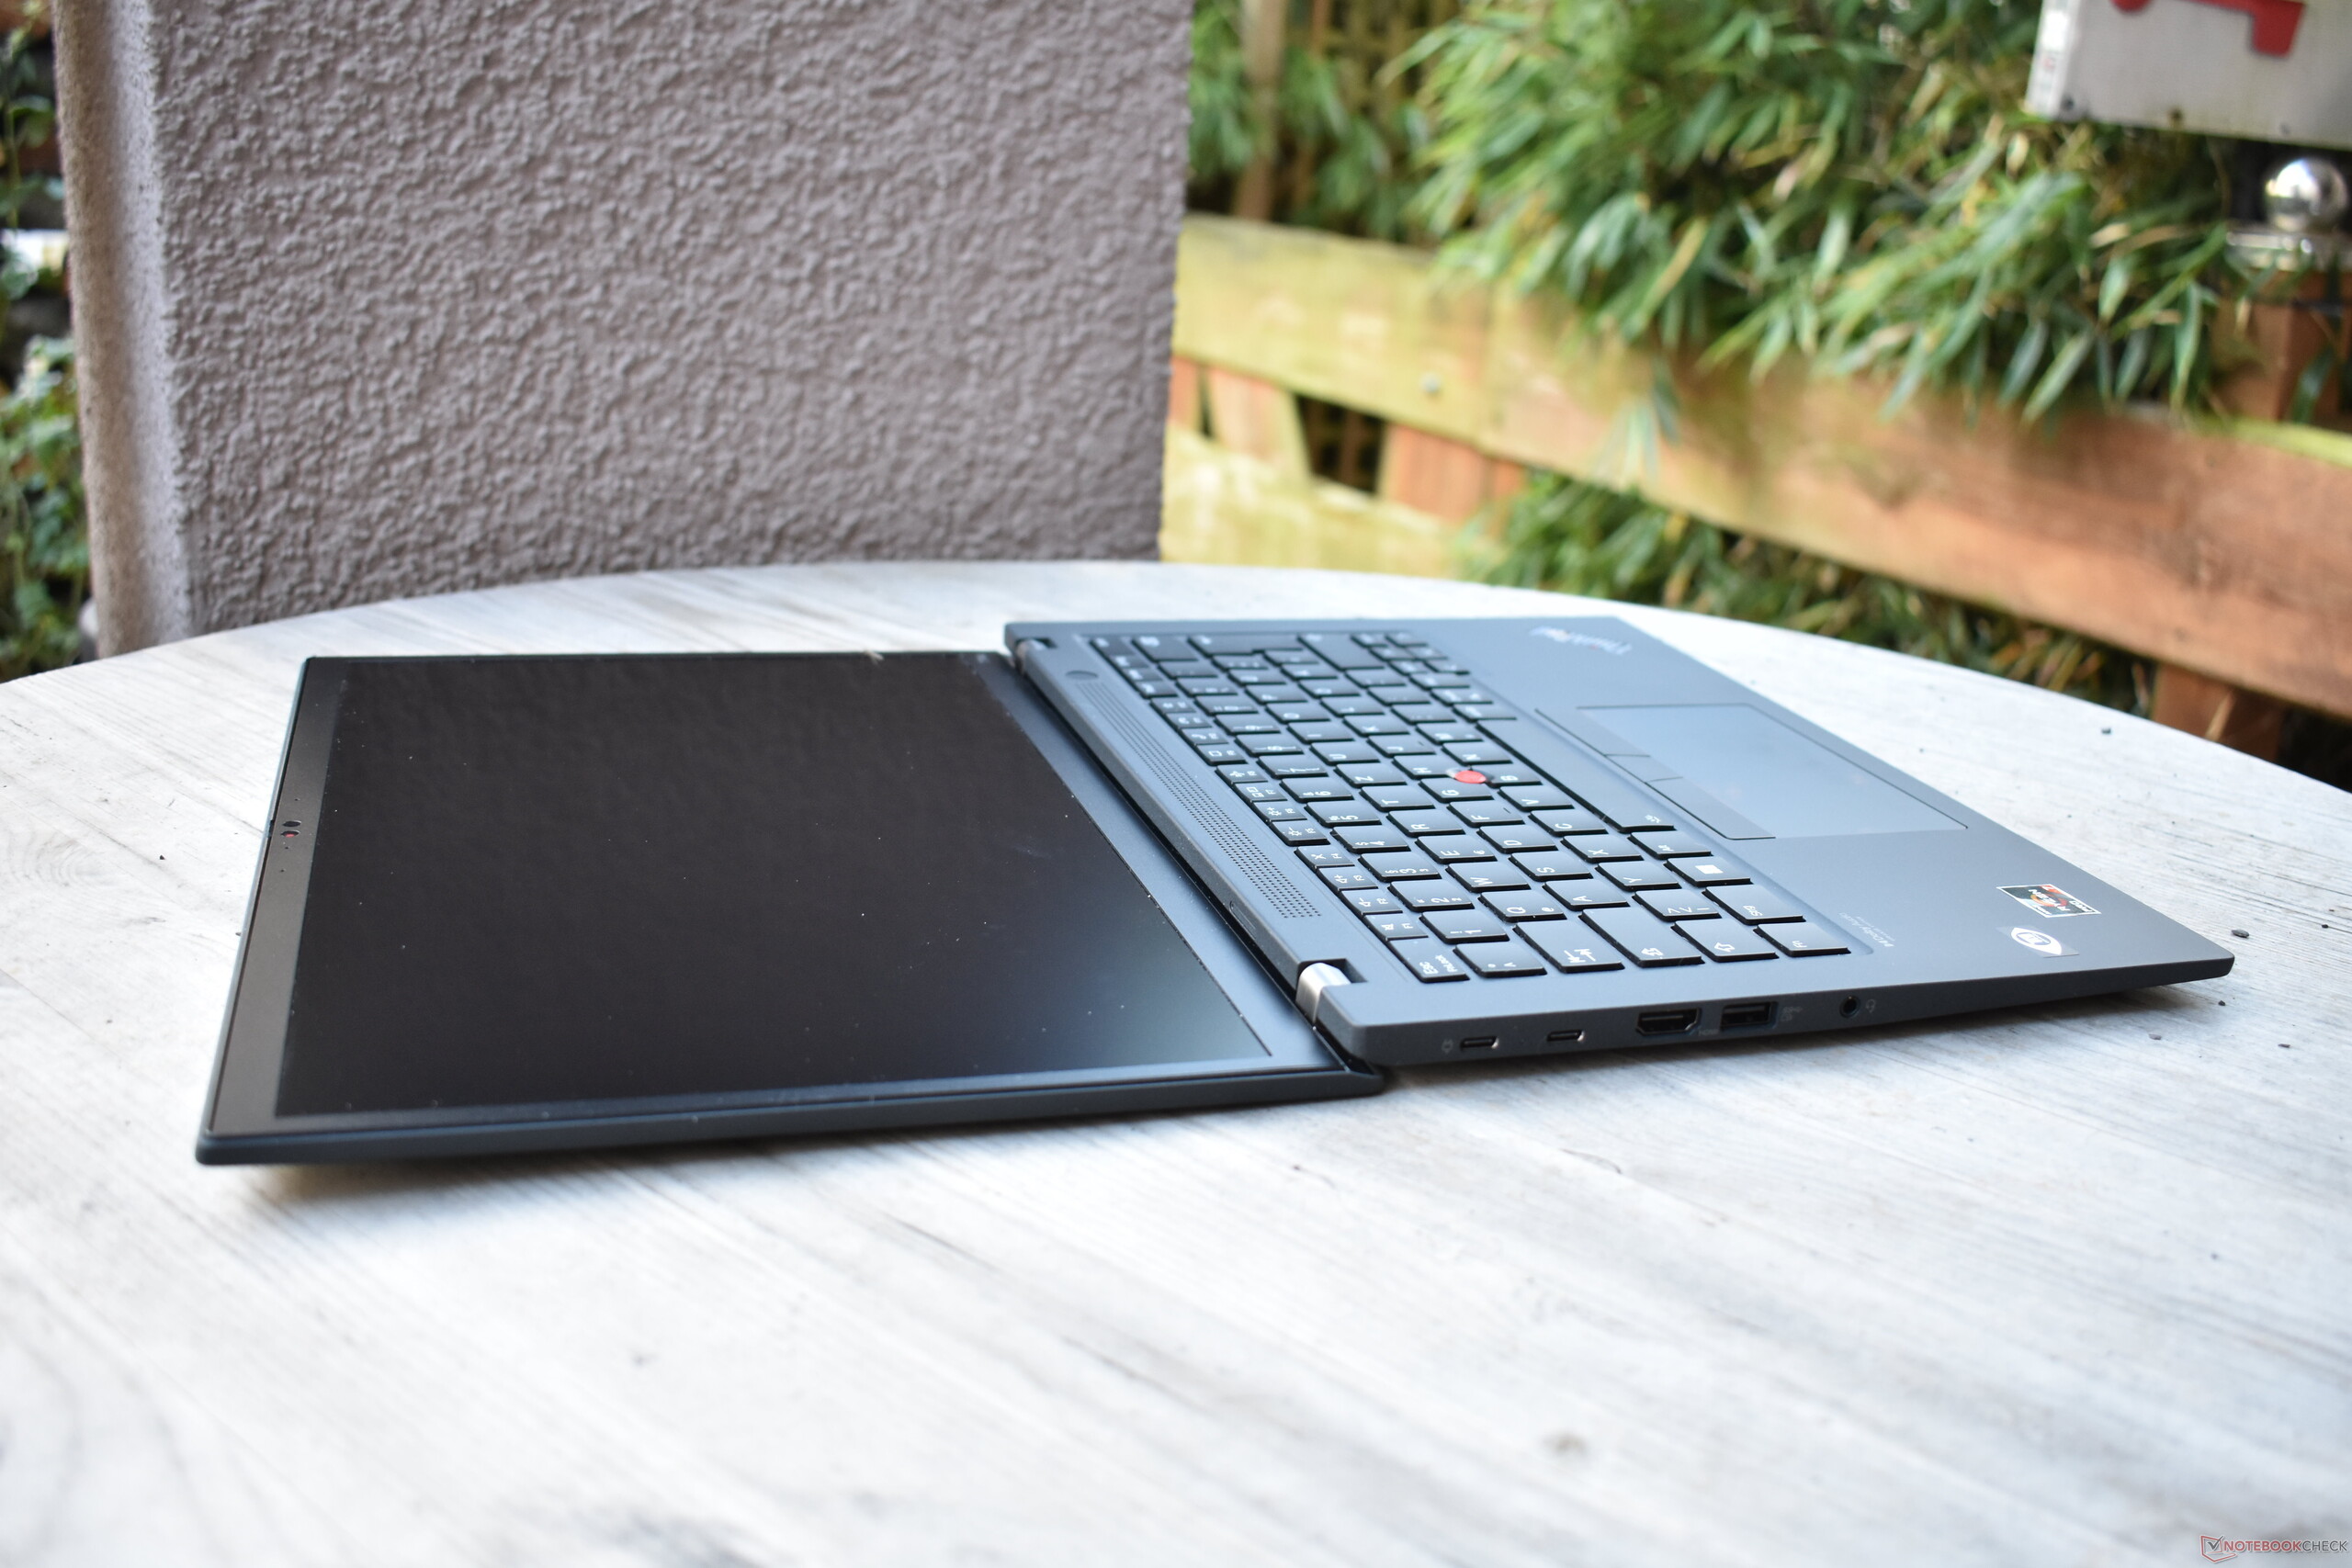
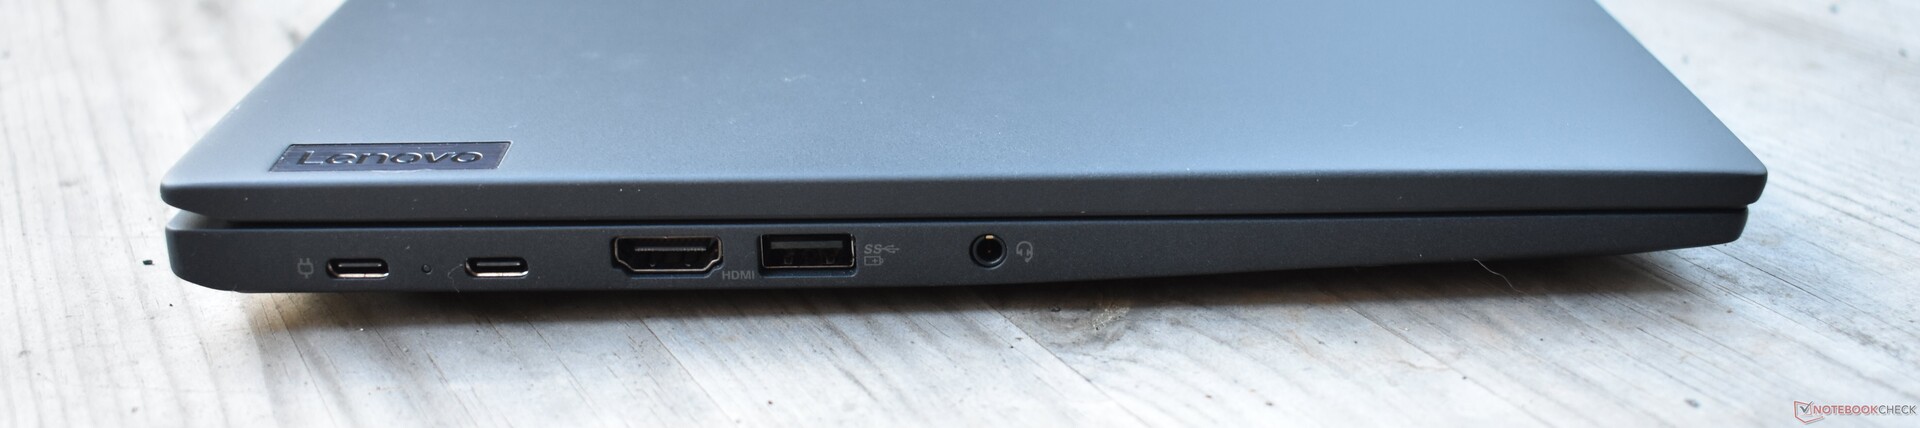
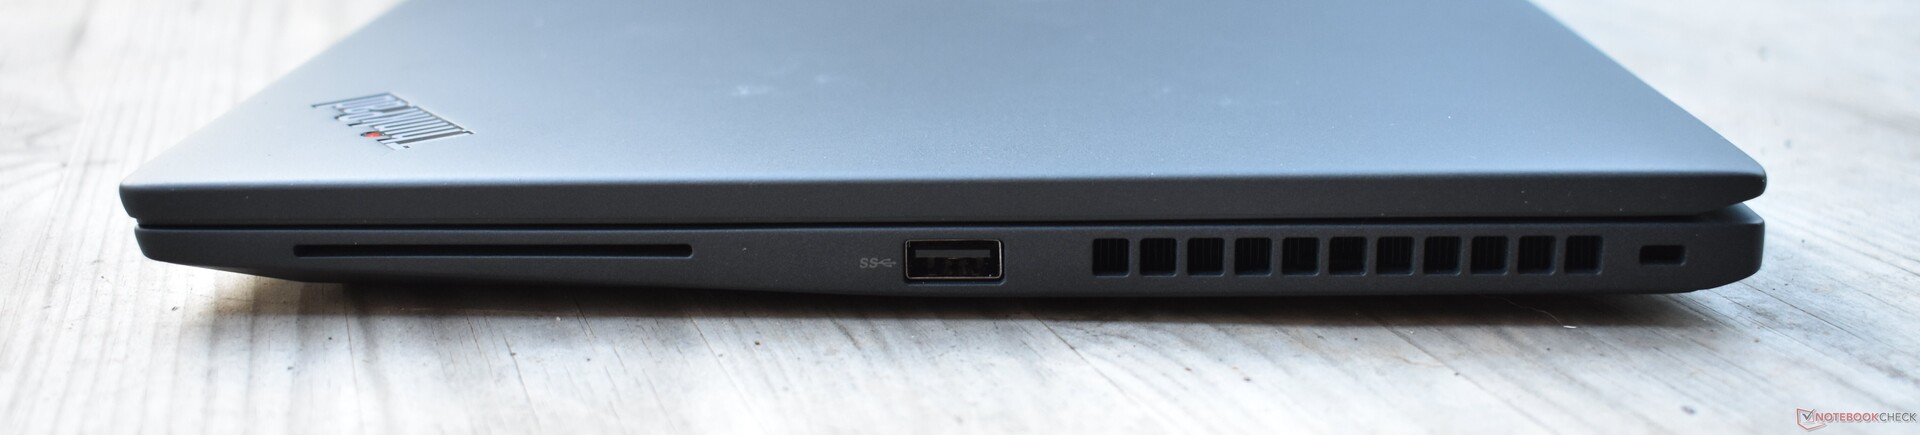
Połączenia
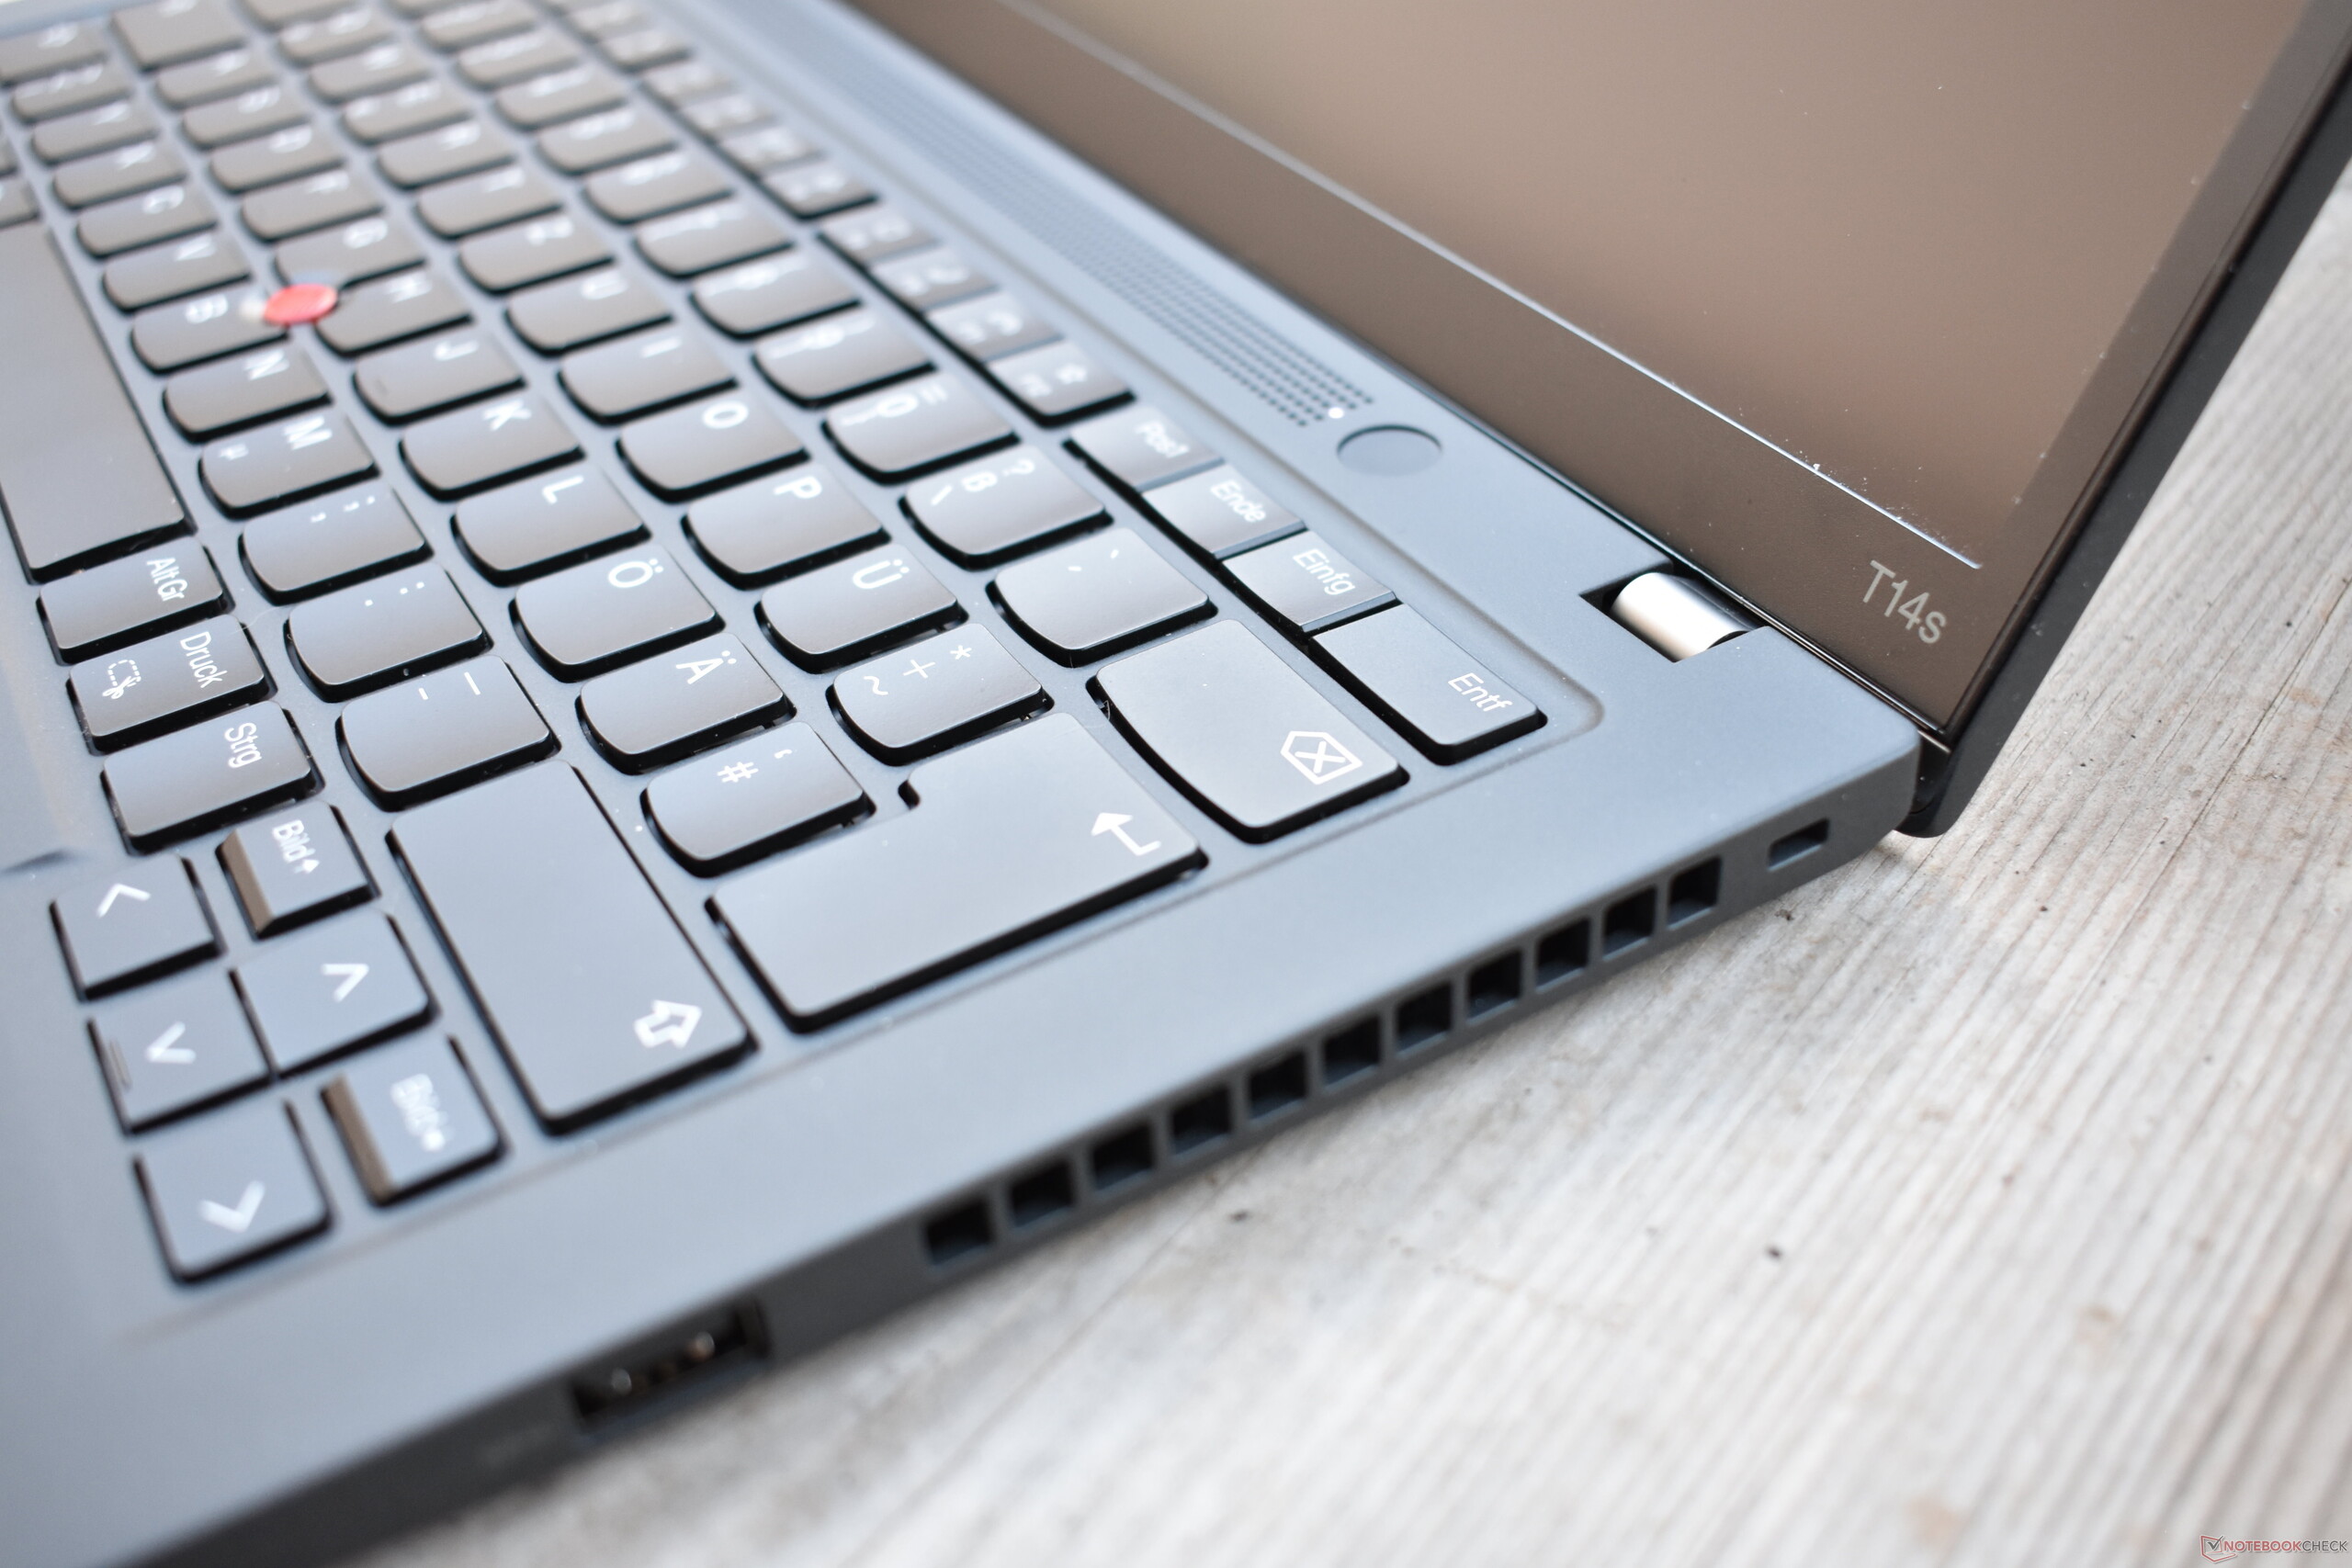
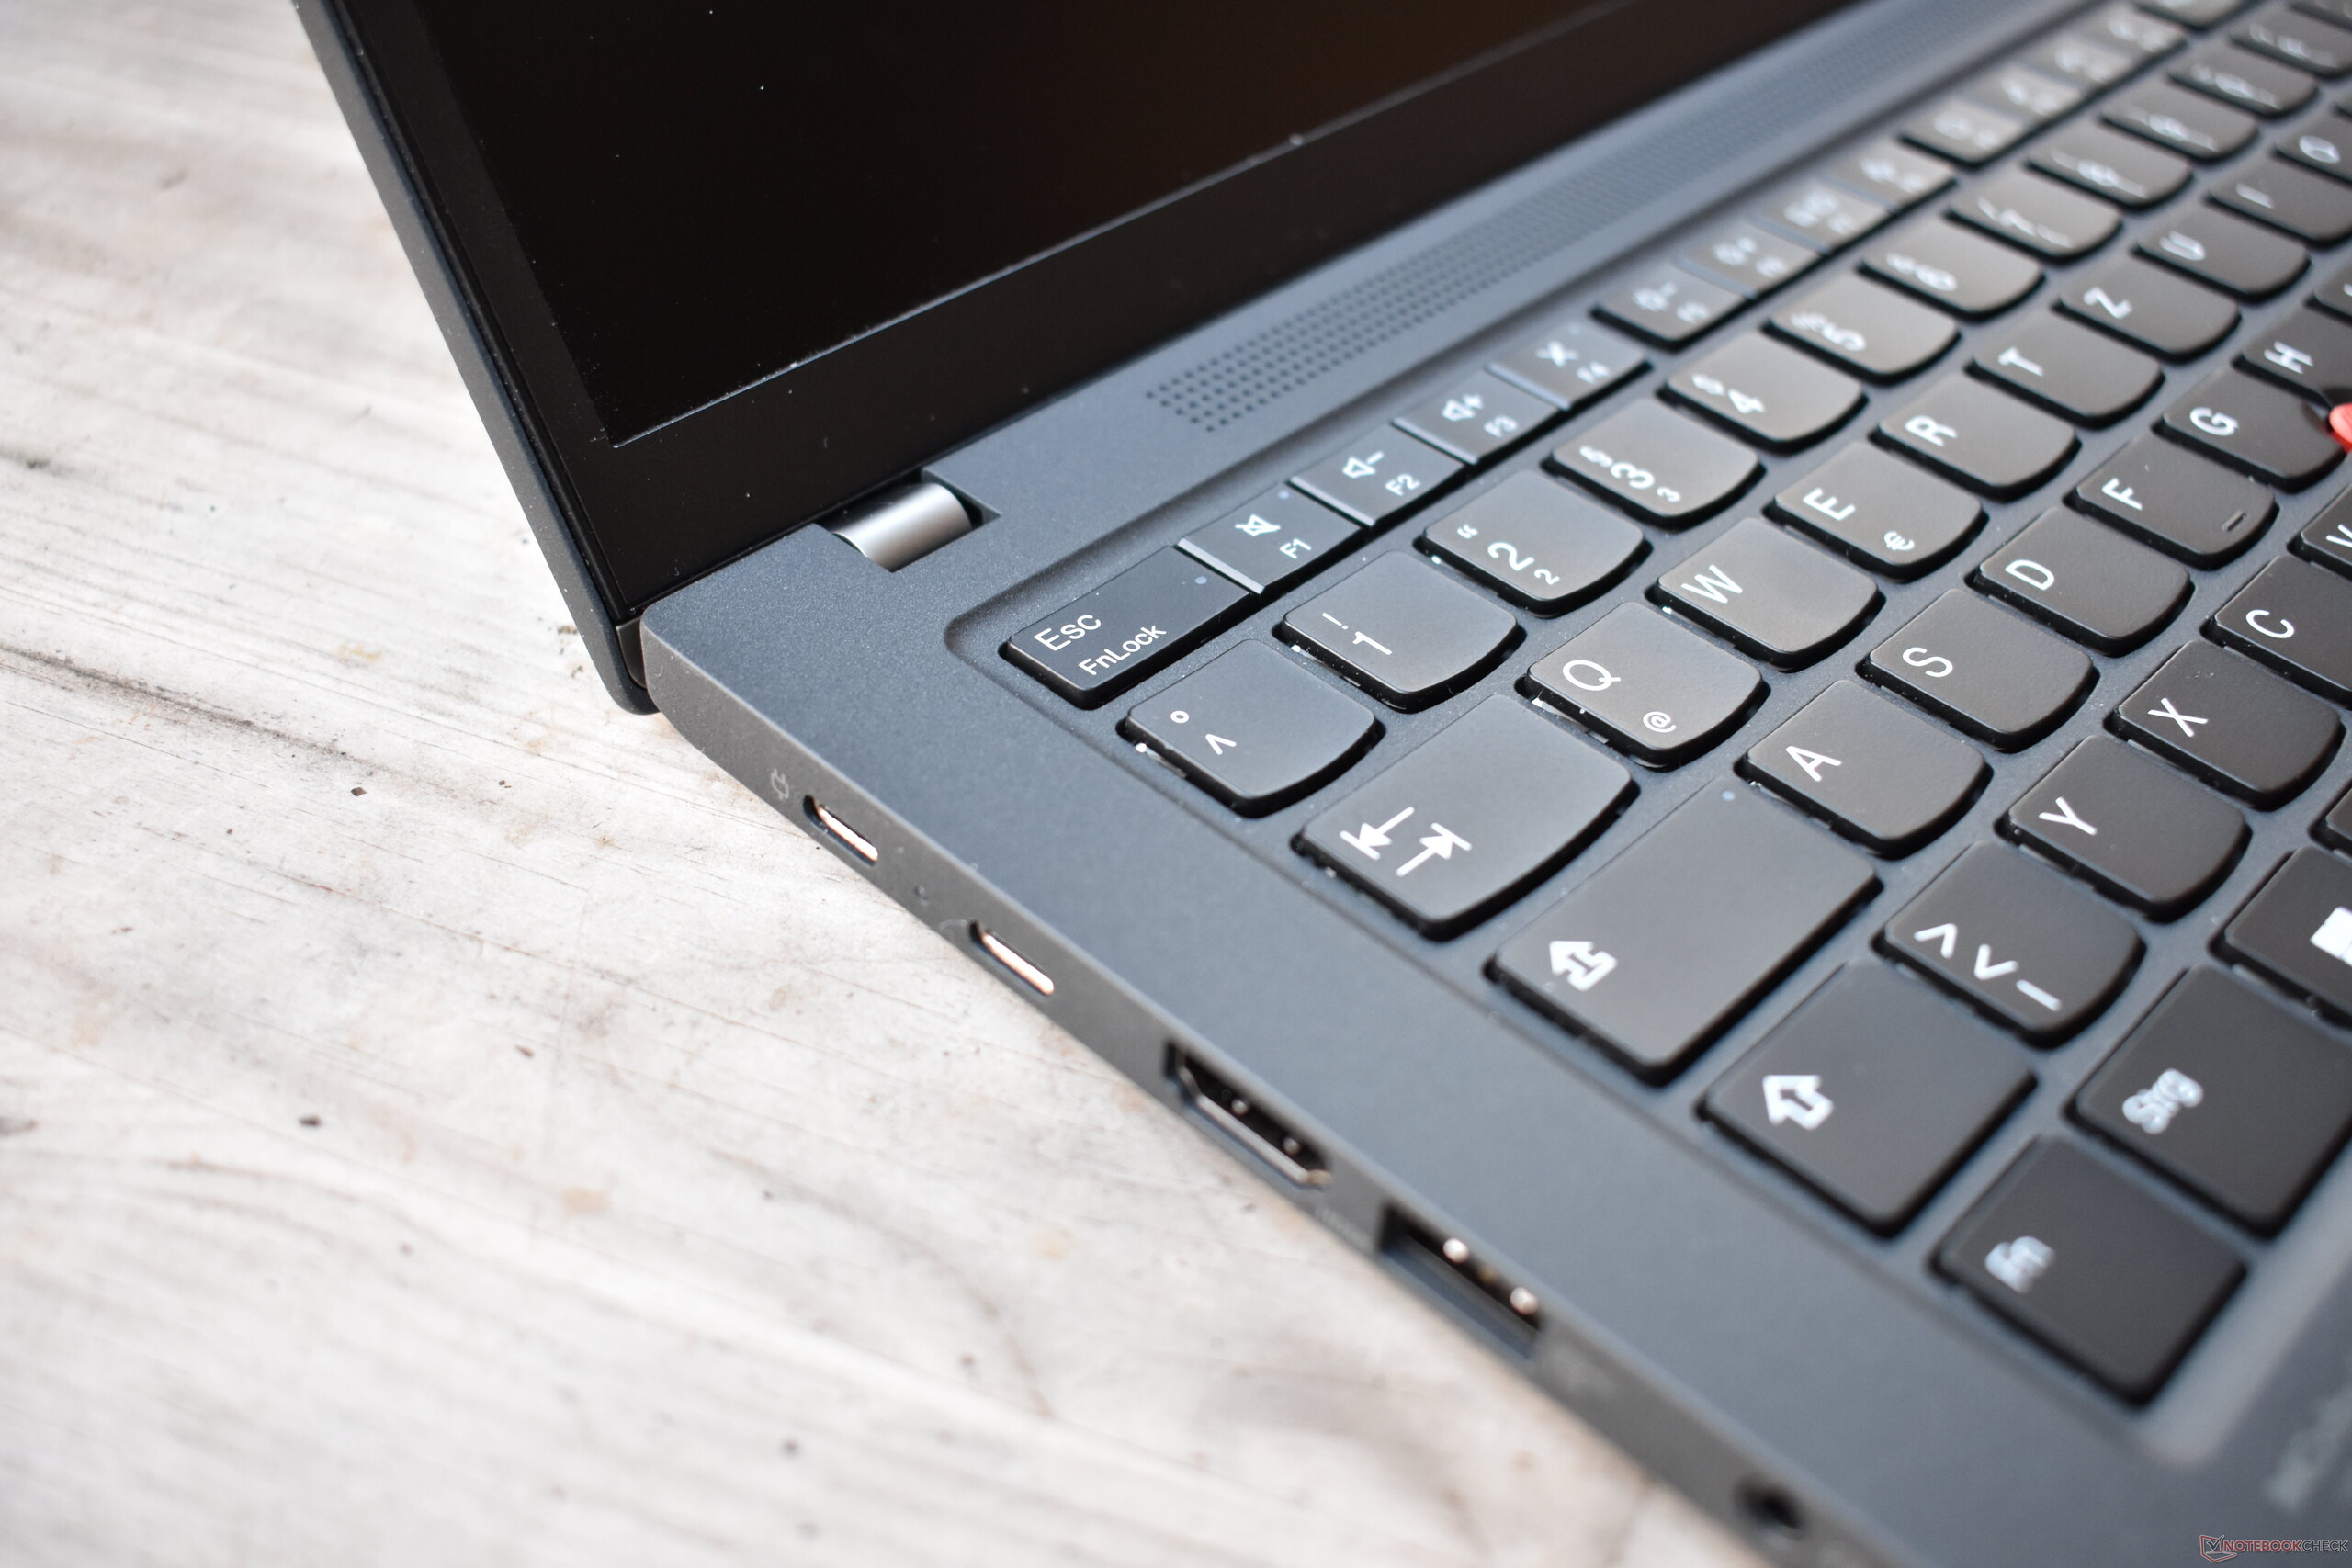
Połączenia są niemal identyczne jak w przypadku.Lenovo ThinkPad T14s G3 Intel. Jedyną różnicą jest to, że zamiast dwóch portów Thunderbolt 4, ThinkPad T14s G3 AMD oferuje jedno złącze USB 4 i jeden port USB-C, który obsługuje maksymalnie USB 3.2 Gen 2. Oba złącza mogą być używane do ładowania przez USB-C power delivery, a także oba mają tryb alternatywny DisplayPort. Aby to sprawdzić, podłączyliśmy do ThinkPada eGPU Thunderbolt 3 oraz wyświetlacz Thunderbolt i oba działały bez problemów z wykorzystaniem portu USB 4.
Komunikacja
Sprzęt do komunikacji jest identyczny, poza chipem WiFi: Podczas gdy np.T14s G3 Intelposiada moduł WiFi od Intela, w T14s G3 AMD zastosowano układ WiFi od Qualcomm. Specyfikacja wydajności jest niemal identyczna, a oba rozwiązania osiągają również podobne wyniki w benchmarkach.
Kamera internetowa
Kamera internetowa o rozdzielczości 1080p jest identyczna jak w ThinkPad T14s G3 Intel.


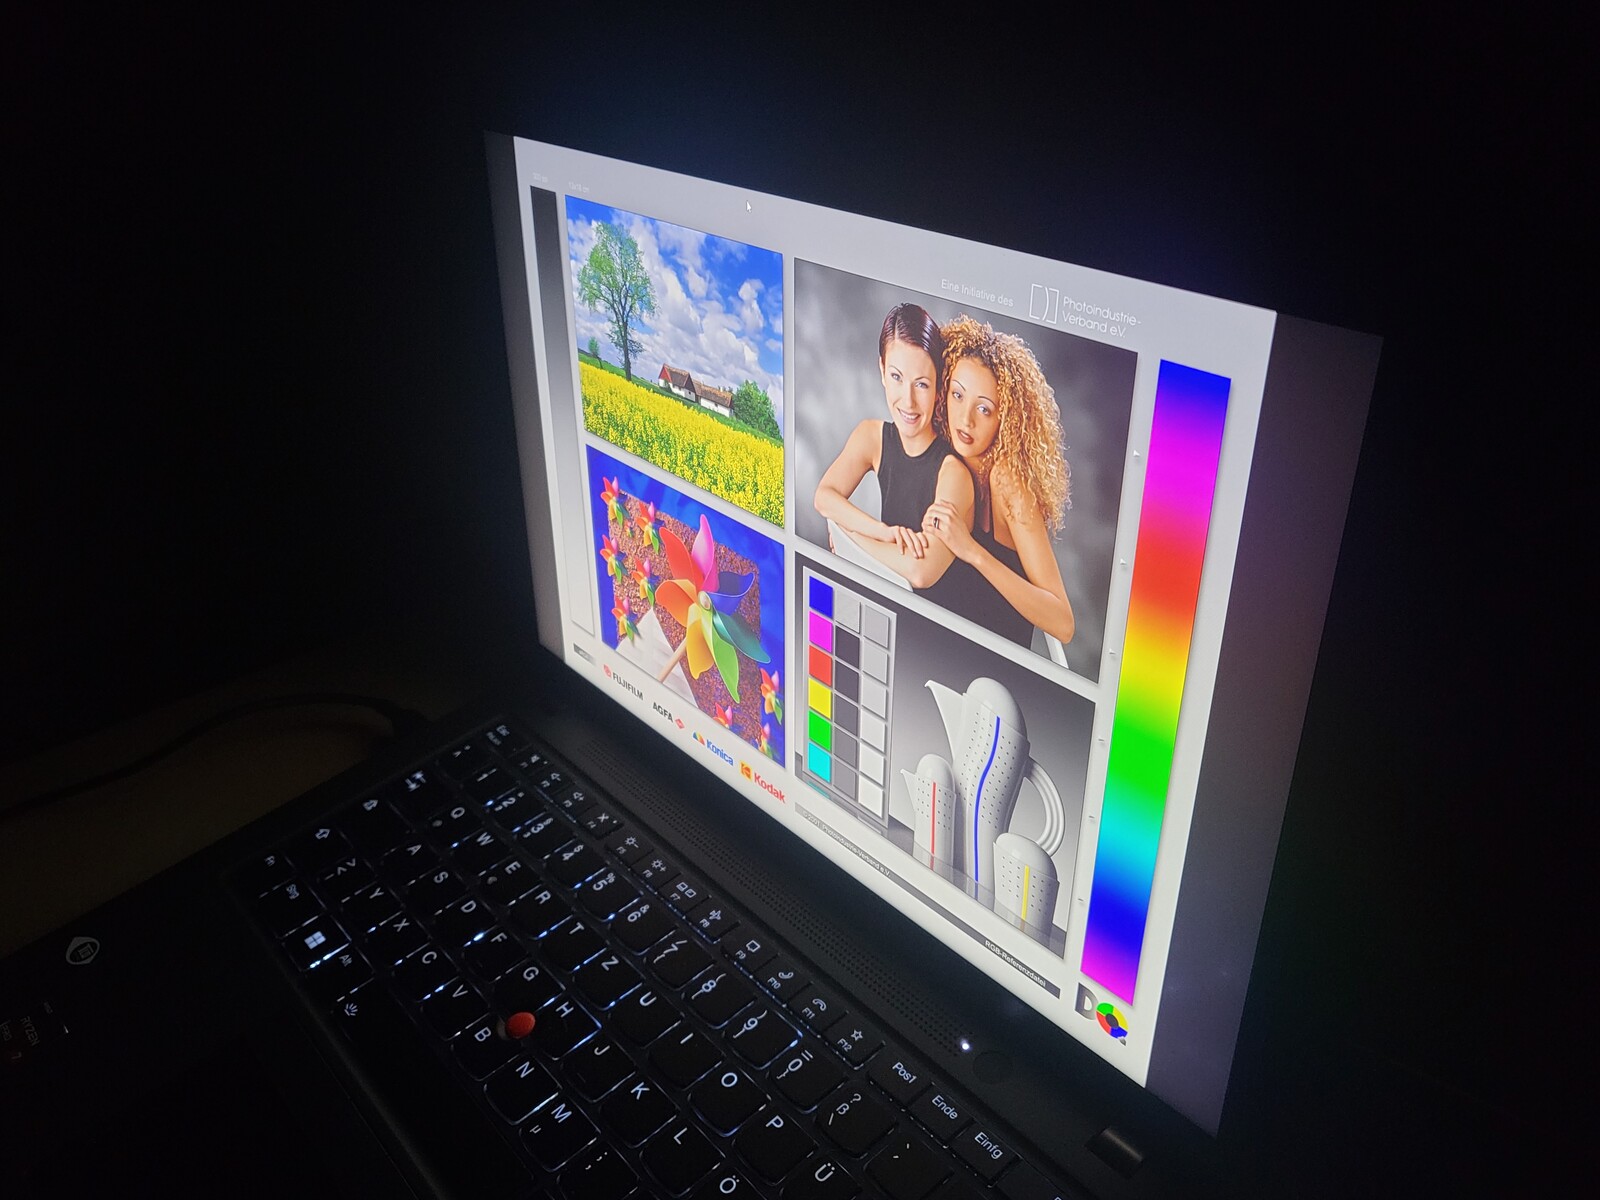
Wyświetlacz o niskim poborze mocy z matową powierzchnią
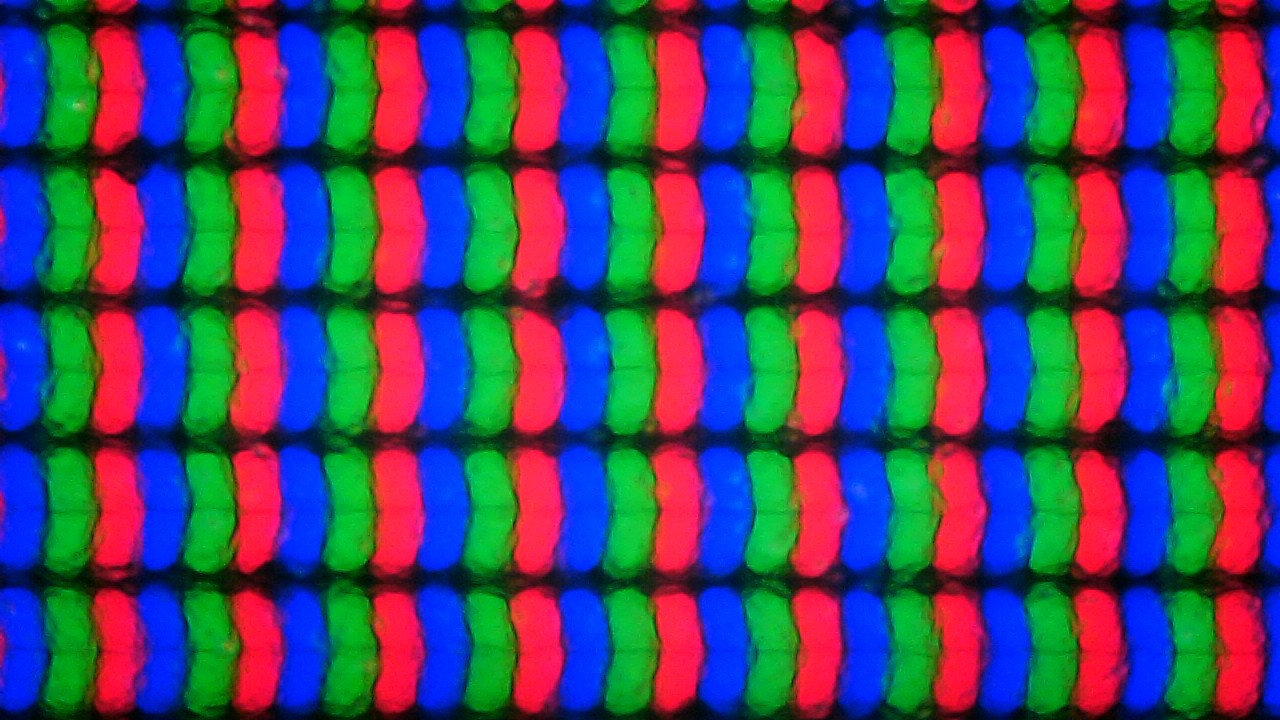
Pod względem wyświetlacza również można znaleźć wiele podobieństw do m.in.Lenovo ThinkPad T14s G3 "Intel. Dostępne opcje wyświetlacza, jak i model wyświetlacza zastosowany w naszym egzemplarzu testowym są identyczne. Nawet numery modeli 14-calowego wyświetlacza o proporcjach 16:10 są takie same: MNE007JA1-1. Jest to energooszczędny panel low-power na bazie IPS o rozdzielczości WUXGA (1.920 x 1.200).
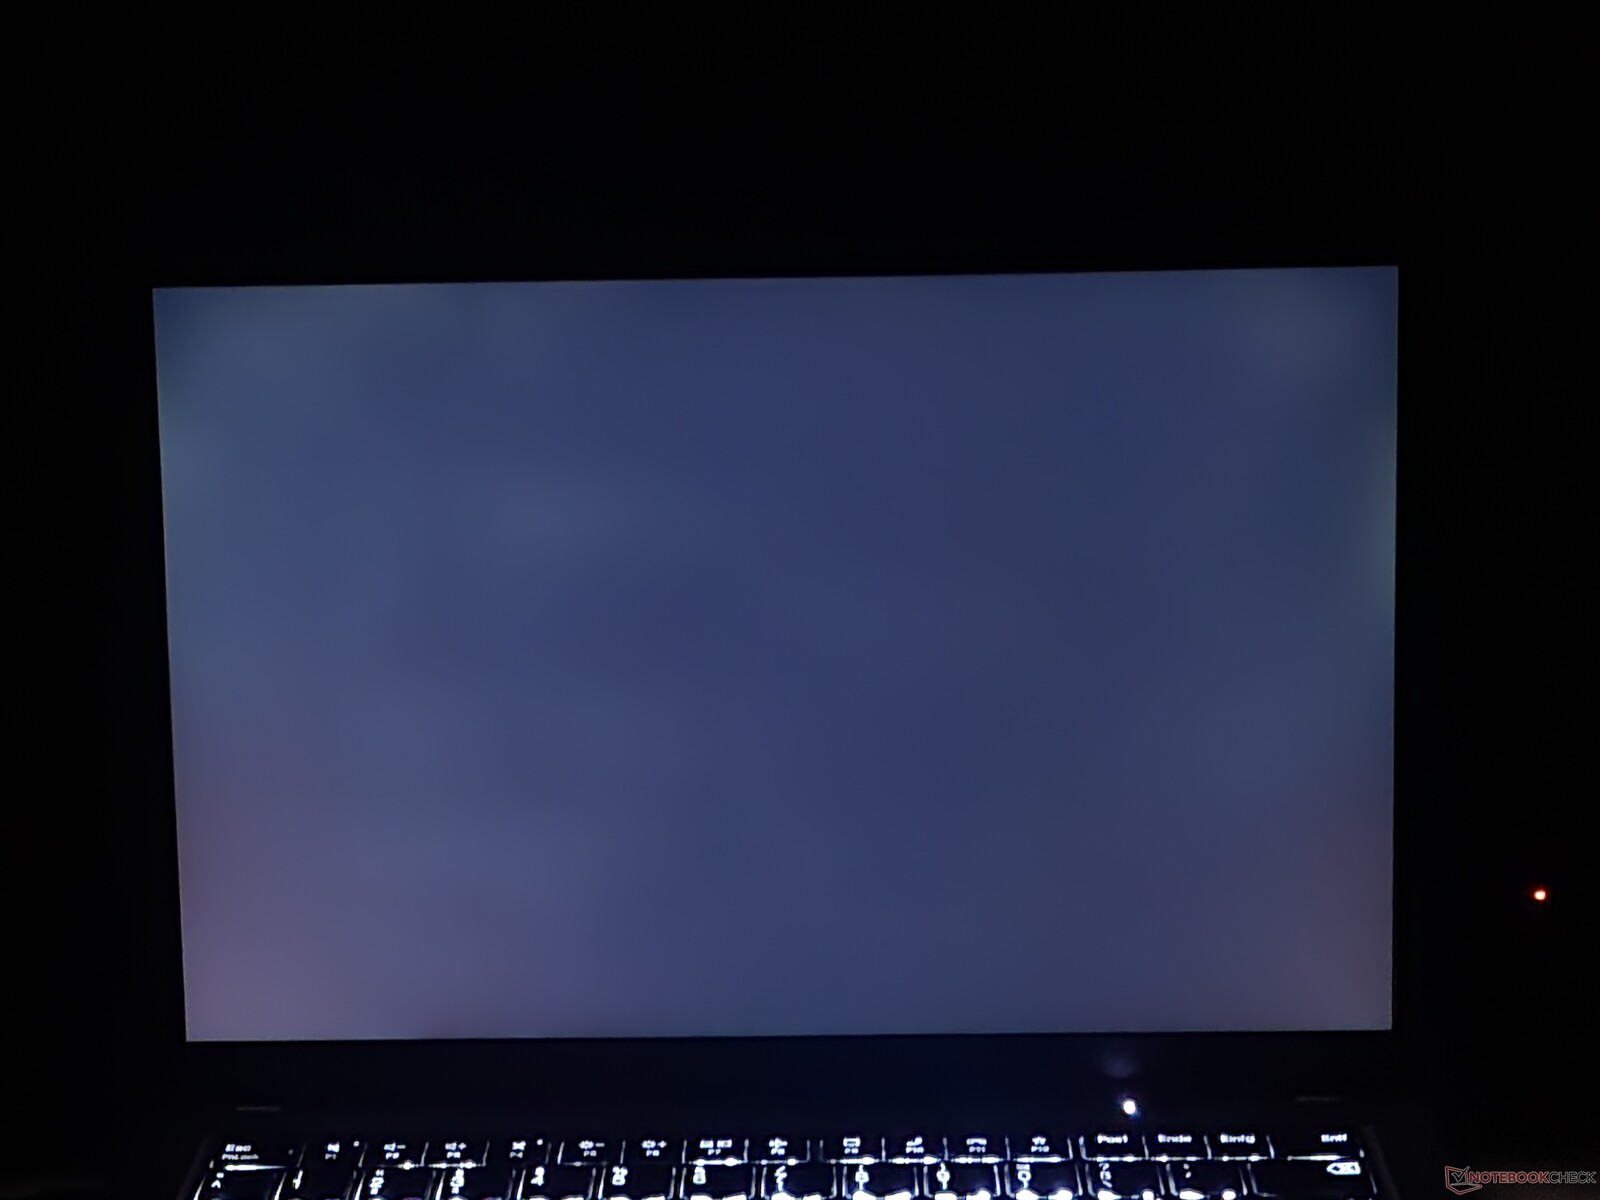
Lenovo podaje wartość jasności na poziomie 400 cd/m², ale wyświetlacz naszego egzemplarza testowego Intela utrzymywał się znacznie poniżej tej wartości. Na szczęście nasz egzemplarz testowy ThinkPada T14s G3 AMD nie potwierdza tego wyniku i przy średnio około 379 cd/m² jest znacznie bliższy wartości docelowej, niż T14s G3 Intela, który oferował tylko 301 cd/m².
| |||||||||||||||||||||||||
rozświetlenie: 92 %
na akumulatorze: 396 cd/m²
kontrast: 1523:1 (czerń: 0.26 cd/m²)
ΔE ColorChecker Calman: 1.3 | ∀{0.5-29.43 Ø4.73}
calibrated: 0.7
ΔE Greyscale Calman: 1.6 | ∀{0.09-98 Ø4.97}
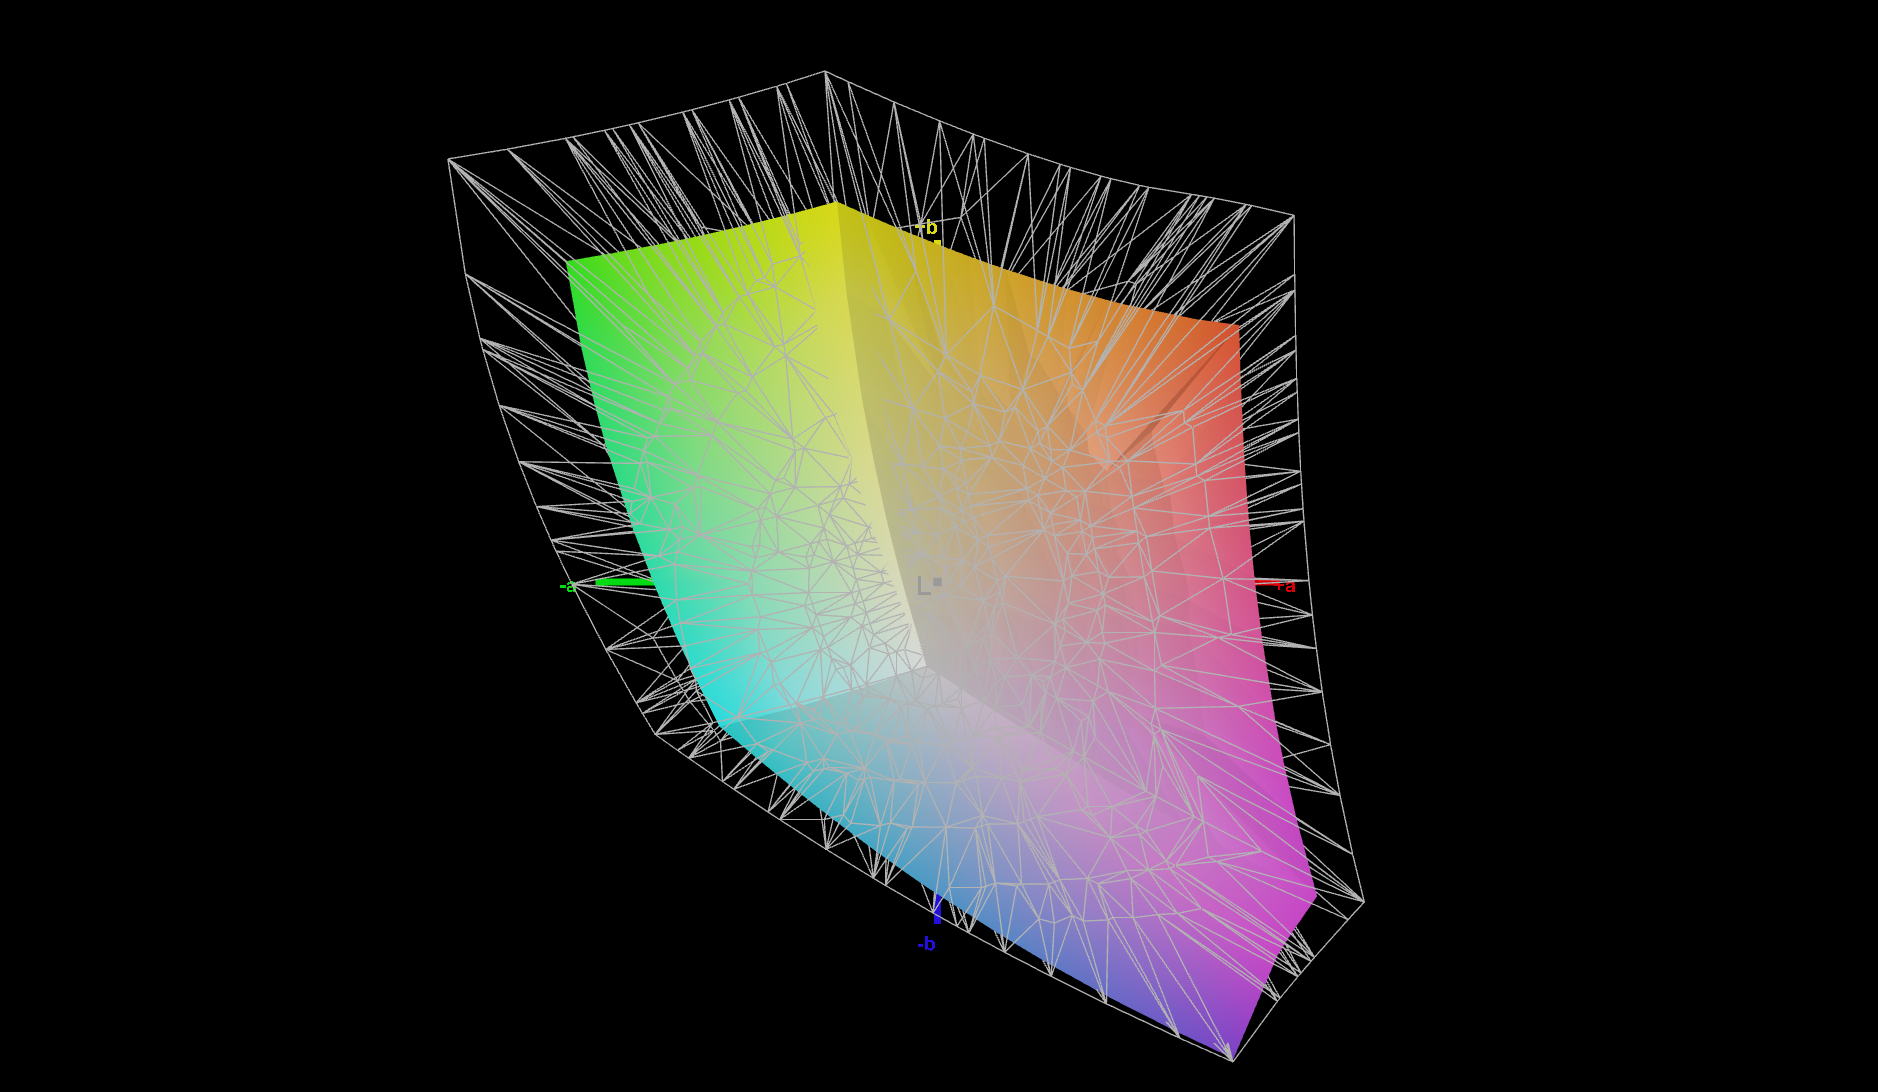
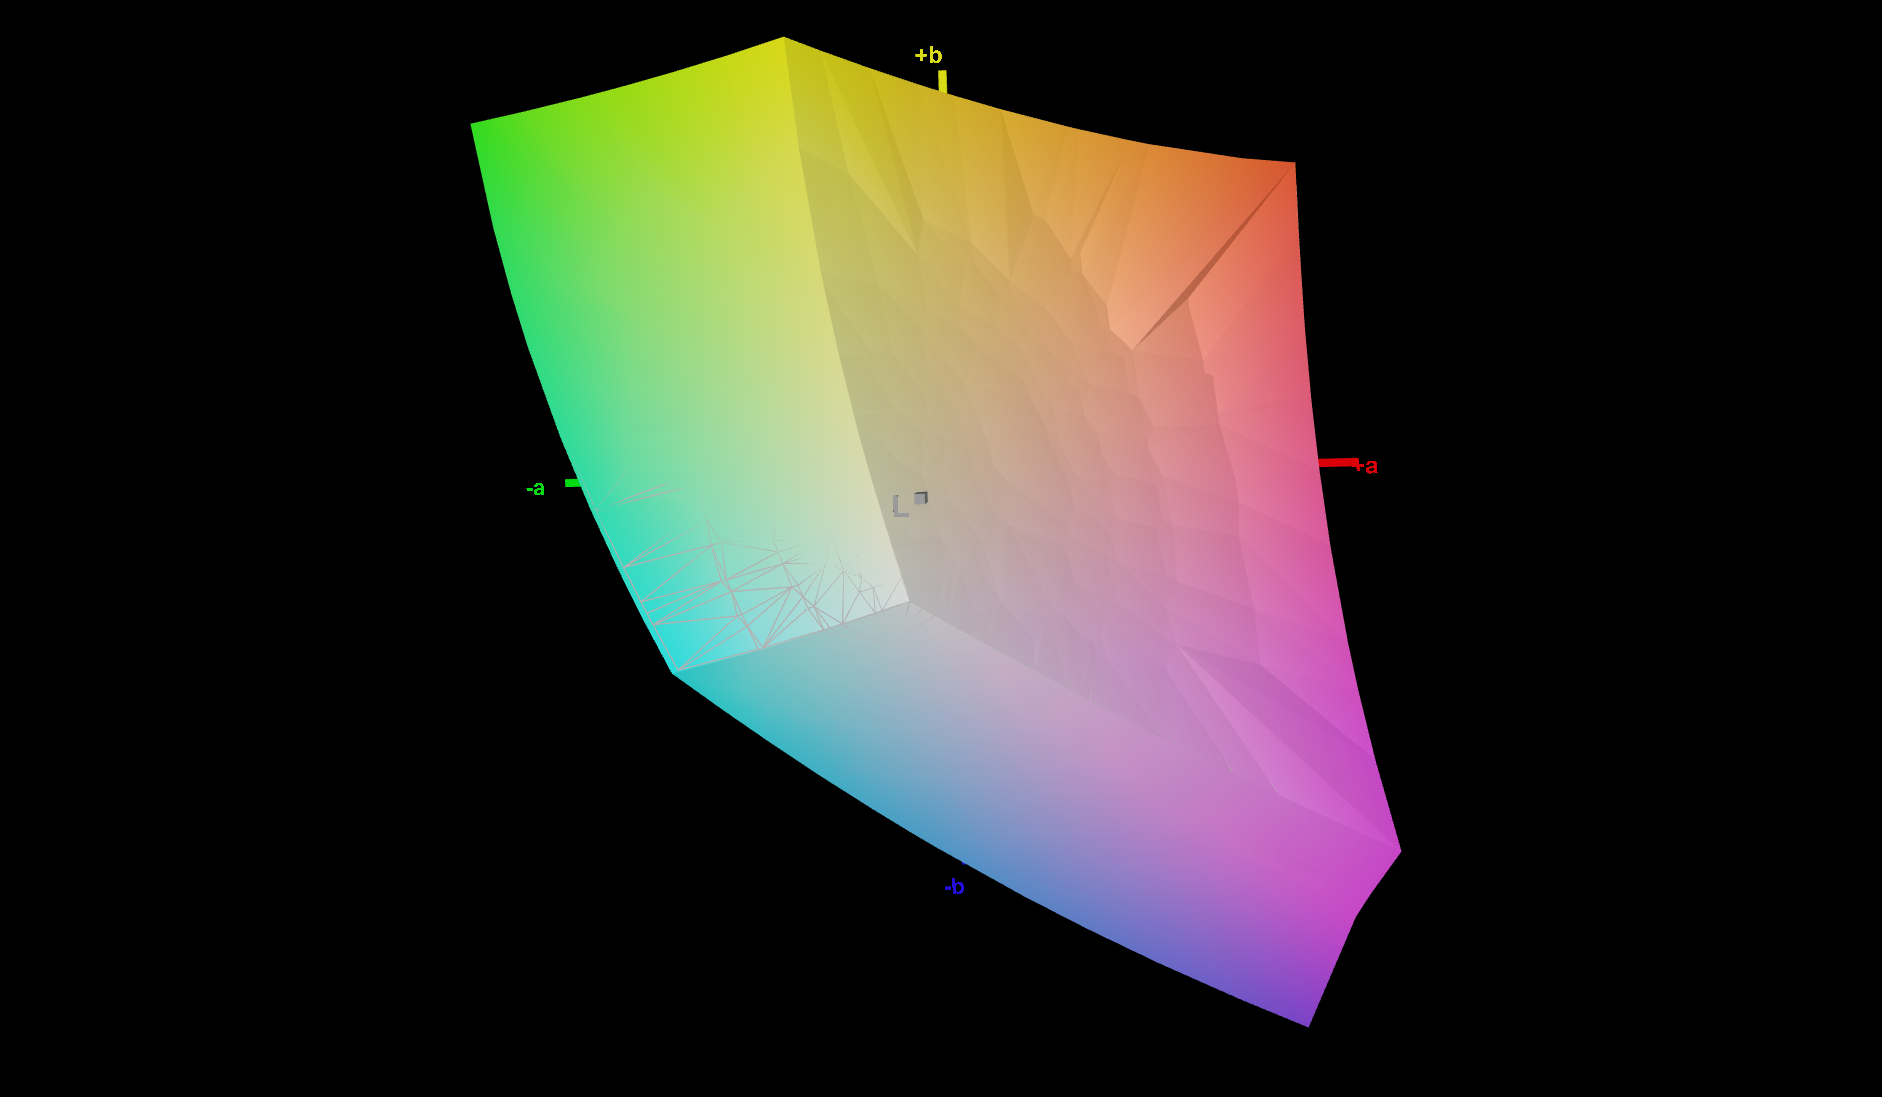
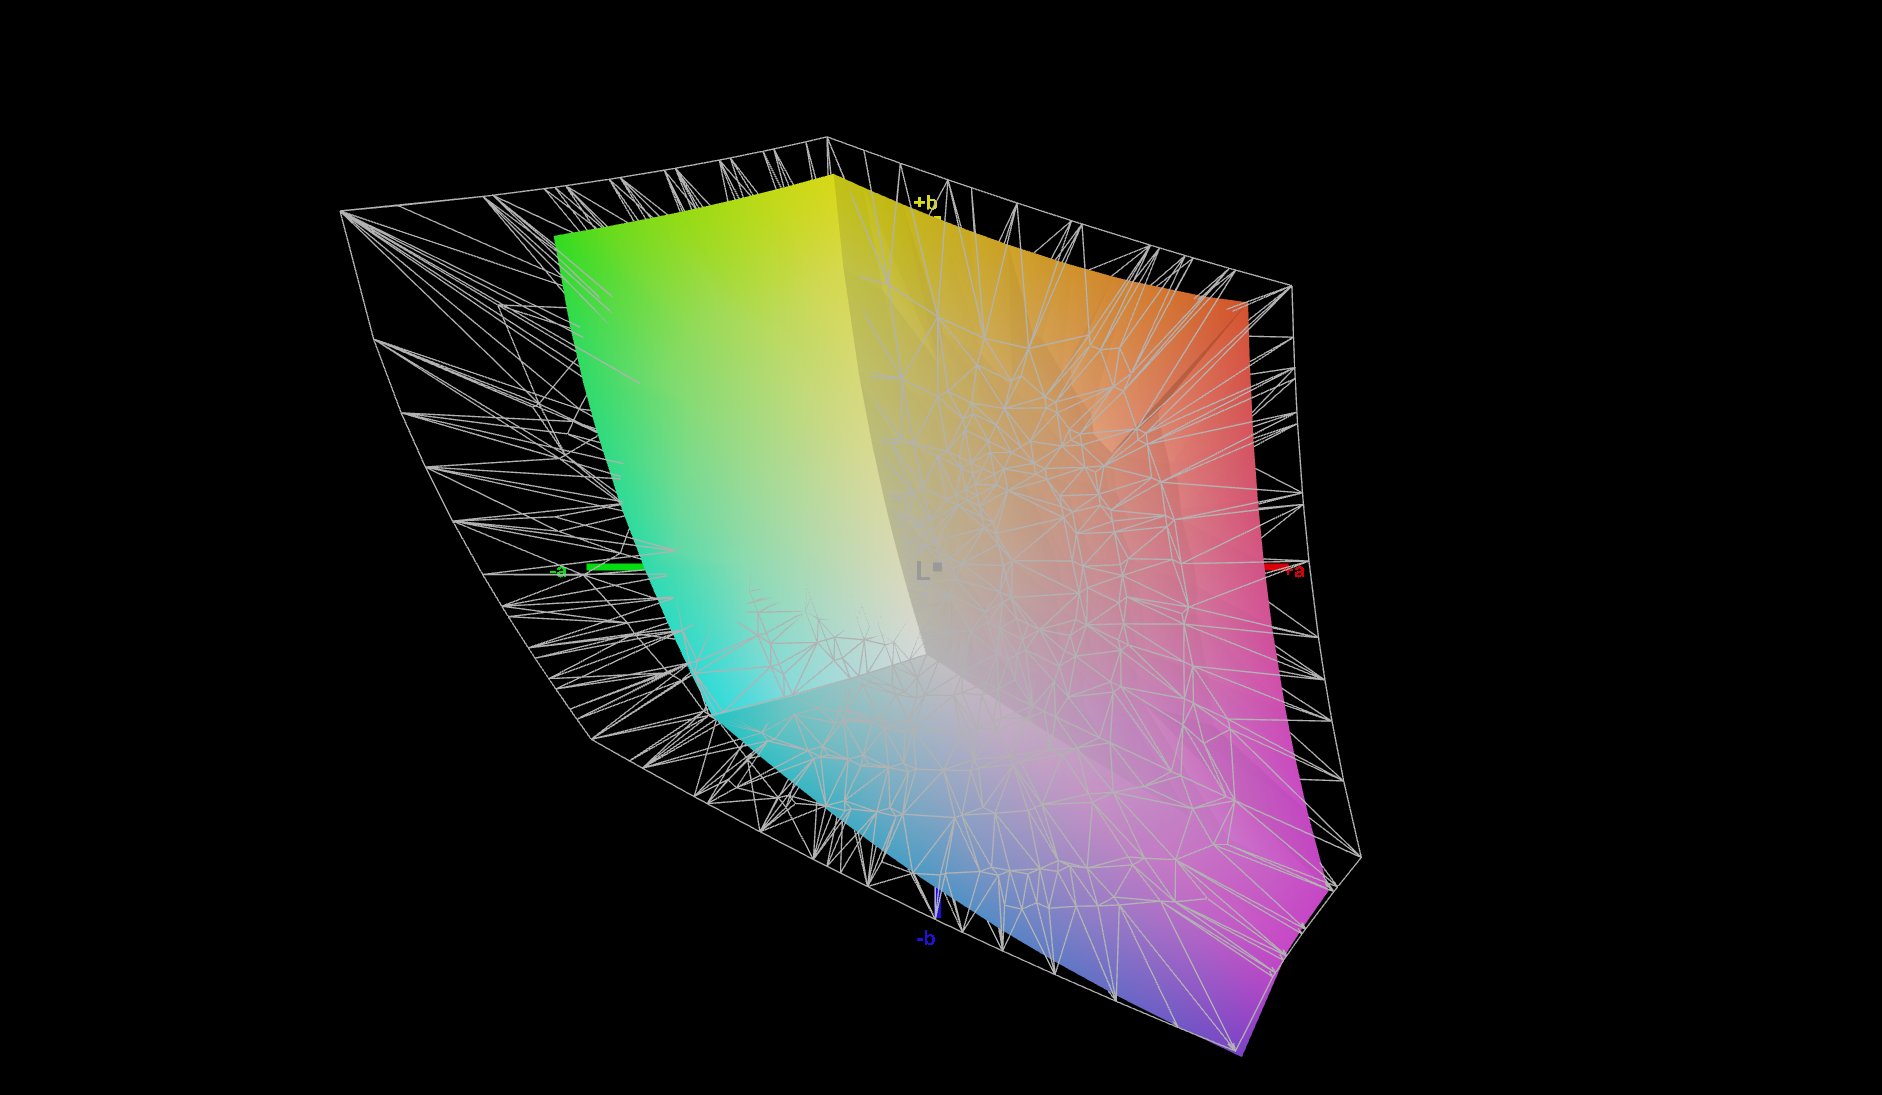
71.4% AdobeRGB 1998 (Argyll 3D)
99.8% sRGB (Argyll 3D)
69.4% Display P3 (Argyll 3D)
Gamma: 2.14
CCT: 6554 K
| Lenovo ThinkPad T14s G3 21CQ002LGE MNE007JA1-1, LTPS IPS LED, 1920x1200, 14" | Lenovo ThinkPad T14s G3 21BR00CDGE MNE007JA1-1, IPS LED, 1920x1200, 14" | Lenovo ThinkPad T14s G2 20XGS01100 NE140FHM-N61, IPS LED, 1920x1080, 14" | Dell Latitude 9430 2-in-1 AU Optronics B140QAN, IPS, 2560x1600, 14" | HP EliteBook 845 G9 6F6H9EA AUOA49A, IPS, 1920x1200, 14" | |
|---|---|---|---|---|---|
| Display | -2% | -5% | 8% | 5% | |
| Display P3 Coverage (%) | 69.4 | 67.8 -2% | 69.7 0% | 79.4 14% | 75.4 9% |
| sRGB Coverage (%) | 99.8 | 98.6 -1% | 91.8 -8% | 100 0% | 100 0% |
| AdobeRGB 1998 Coverage (%) | 71.4 | 70.1 -2% | 67.2 -6% | 79.4 11% | 76.6 7% |
| Response Times | -16% | -137% | -60% | -39% | |
| Response Time Grey 50% / Grey 80% * (ms) | 36.3 ? | 41.4 ? -14% | 84 ? -131% | 63.6 ? -75% | 58.8 ? -62% |
| Response Time Black / White * (ms) | 23.1 ? | 27.2 ? -18% | 56 ? -142% | 33.6 ? -45% | 26.7 ? -16% |
| PWM Frequency (Hz) | 2451 ? | ||||
| Screen | -34% | -147% | -41% | -28% | |
| Brightness middle (cd/m²) | 396 | 312 -21% | 397 0% | 517.7 31% | 408 3% |
| Brightness (cd/m²) | 379 | 301 -21% | 386 2% | 493 30% | 402 6% |
| Brightness Distribution (%) | 92 | 93 1% | 88 -4% | 90 -2% | 92 0% |
| Black Level * (cd/m²) | 0.26 | 0.16 38% | 0.28 -8% | 0.33 -27% | 0.24 8% |
| Contrast (:1) | 1523 | 1950 28% | 1418 -7% | 1569 3% | 1700 12% |
| Colorchecker dE 2000 * | 1.3 | 2.2 -69% | 5.8 -346% | 3.38 -160% | 2.09 -61% |
| Colorchecker dE 2000 max. * | 2.7 | 5.6 -107% | 12.6 -367% | 6.25 -131% | 5.09 -89% |
| Colorchecker dE 2000 calibrated * | 0.7 | 1.3 -86% | 1.9 -171% | 0.41 41% | 1.56 -123% |
| Greyscale dE 2000 * | 1.6 | 2.7 -69% | 8.3 -419% | 4 -150% | 1.7 -6% |
| Gamma | 2.14 103% | 2.11 104% | 2.07 106% | 2.13 103% | 2.138 103% |
| CCT | 6554 99% | 6196 105% | 6867 95% | 6186 105% | 6628 98% |
| Całkowita średnia (program / ustawienia) | -17% /
-25% | -96% /
-115% | -31% /
-33% | -21% /
-22% |
* ... im mniej tym lepiej
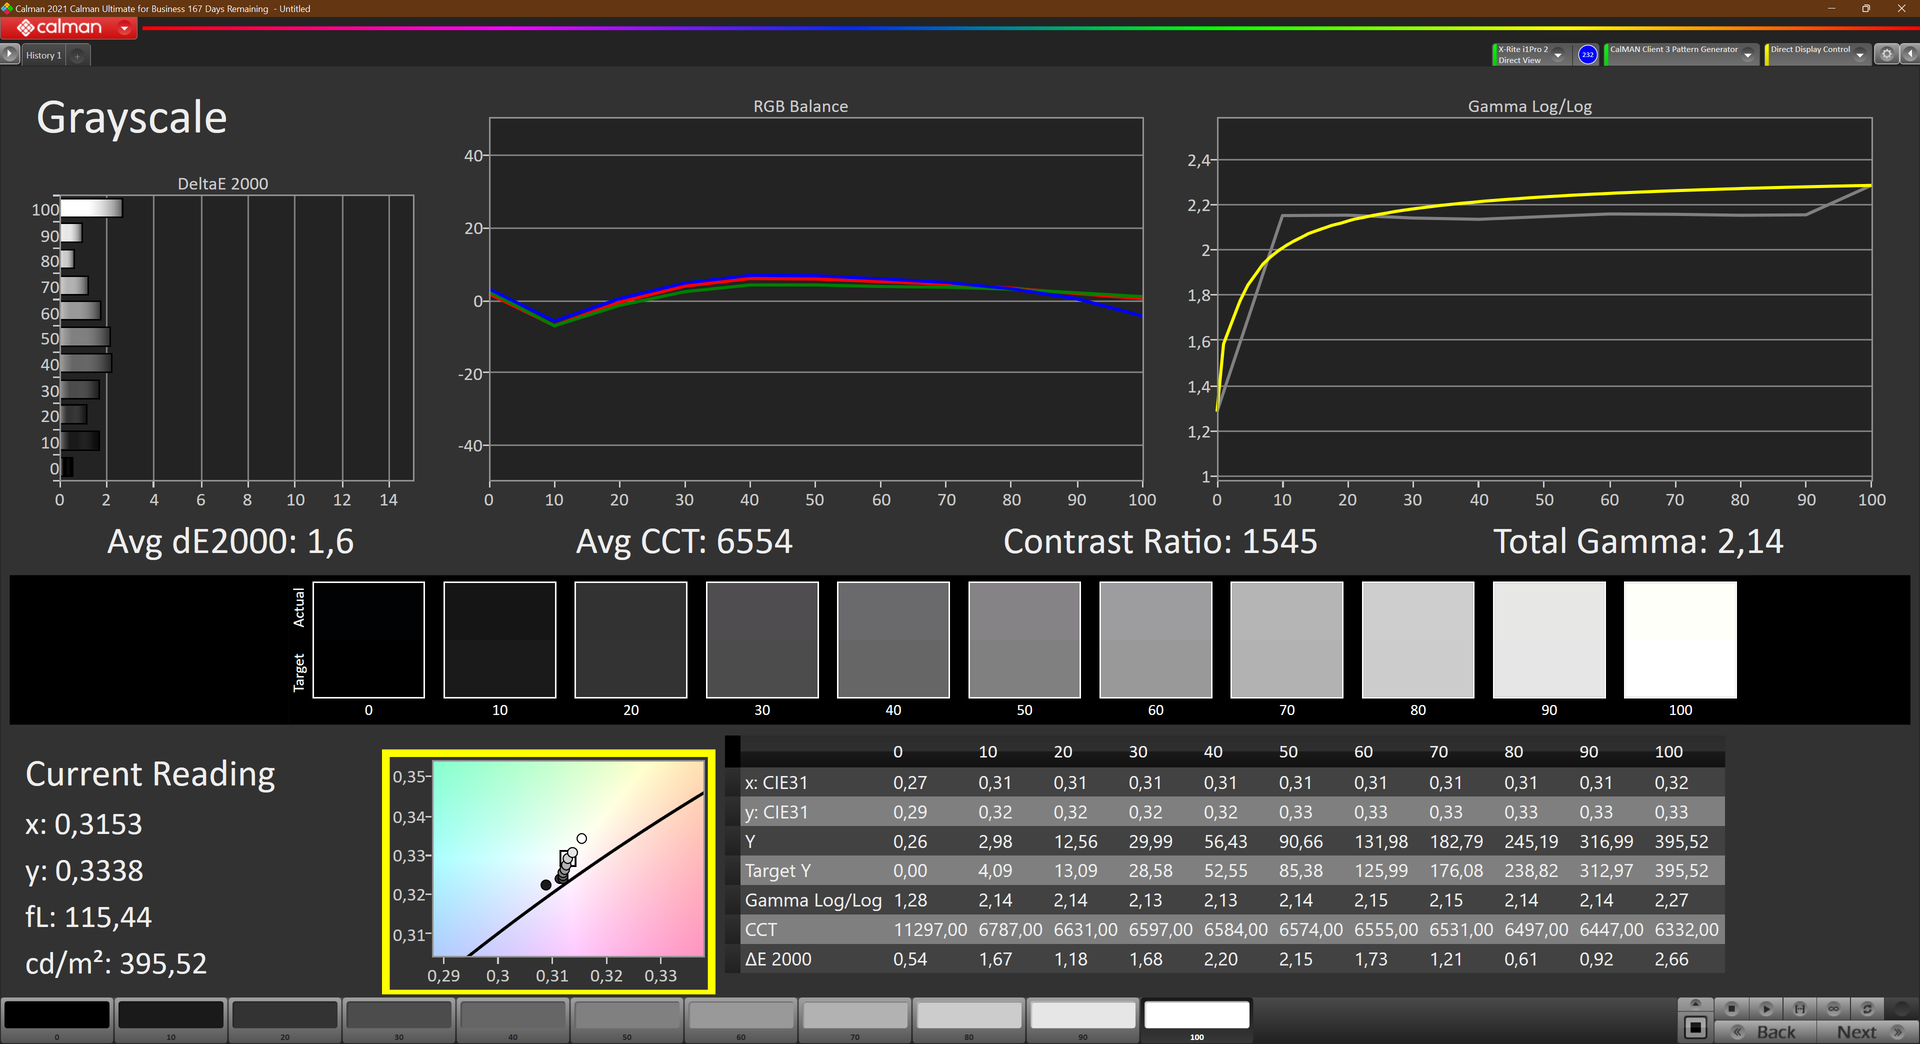
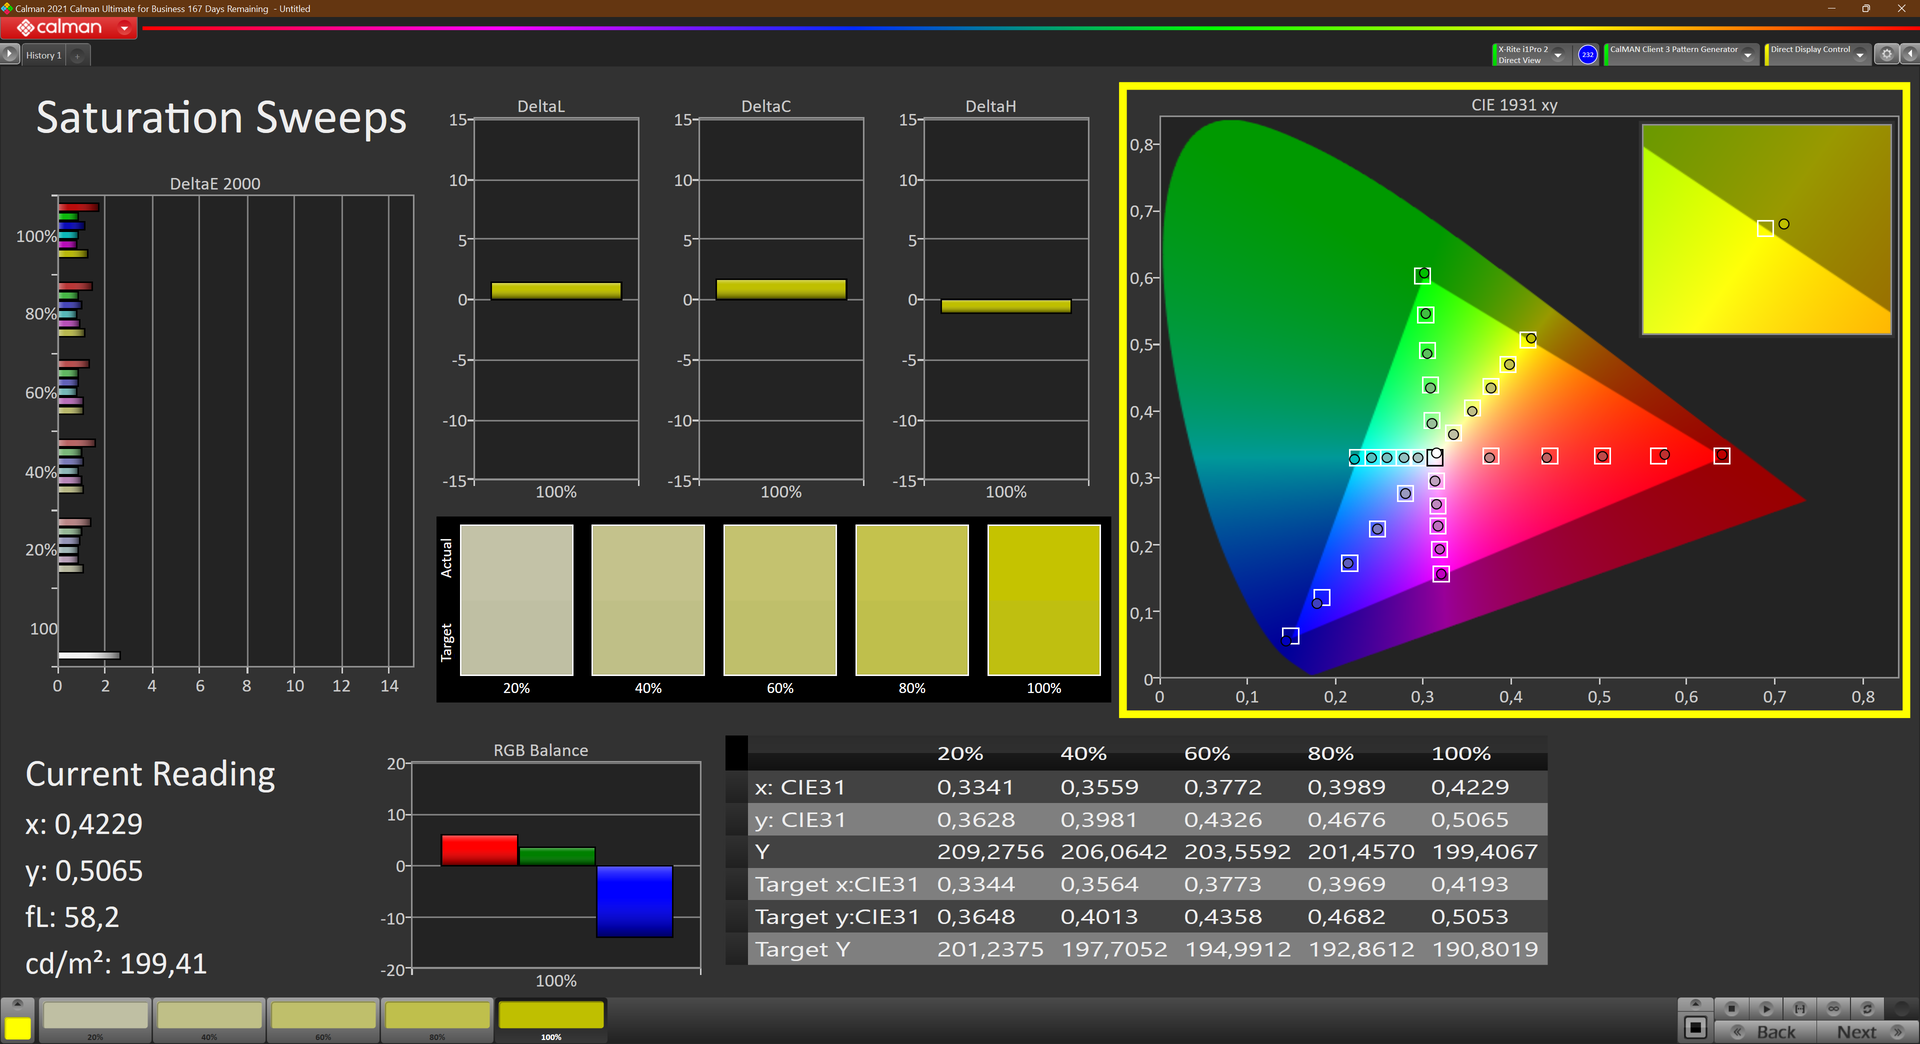
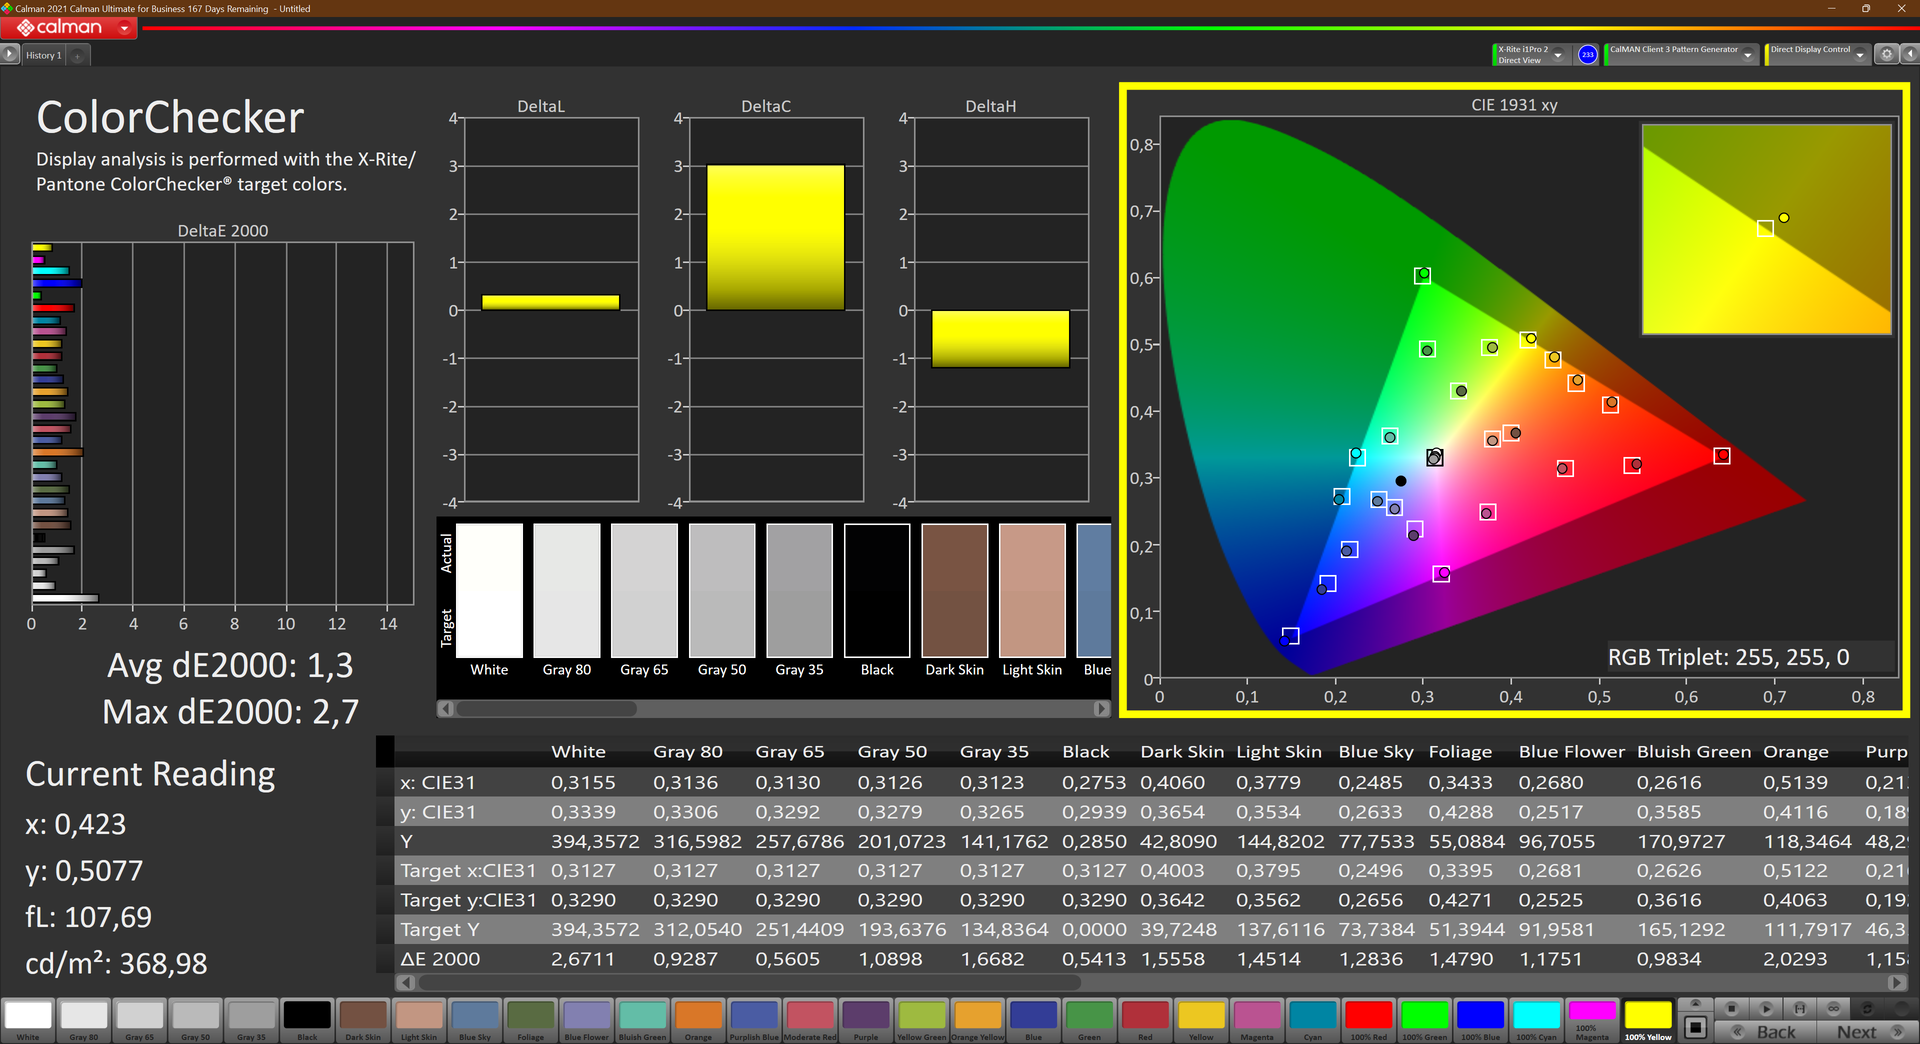
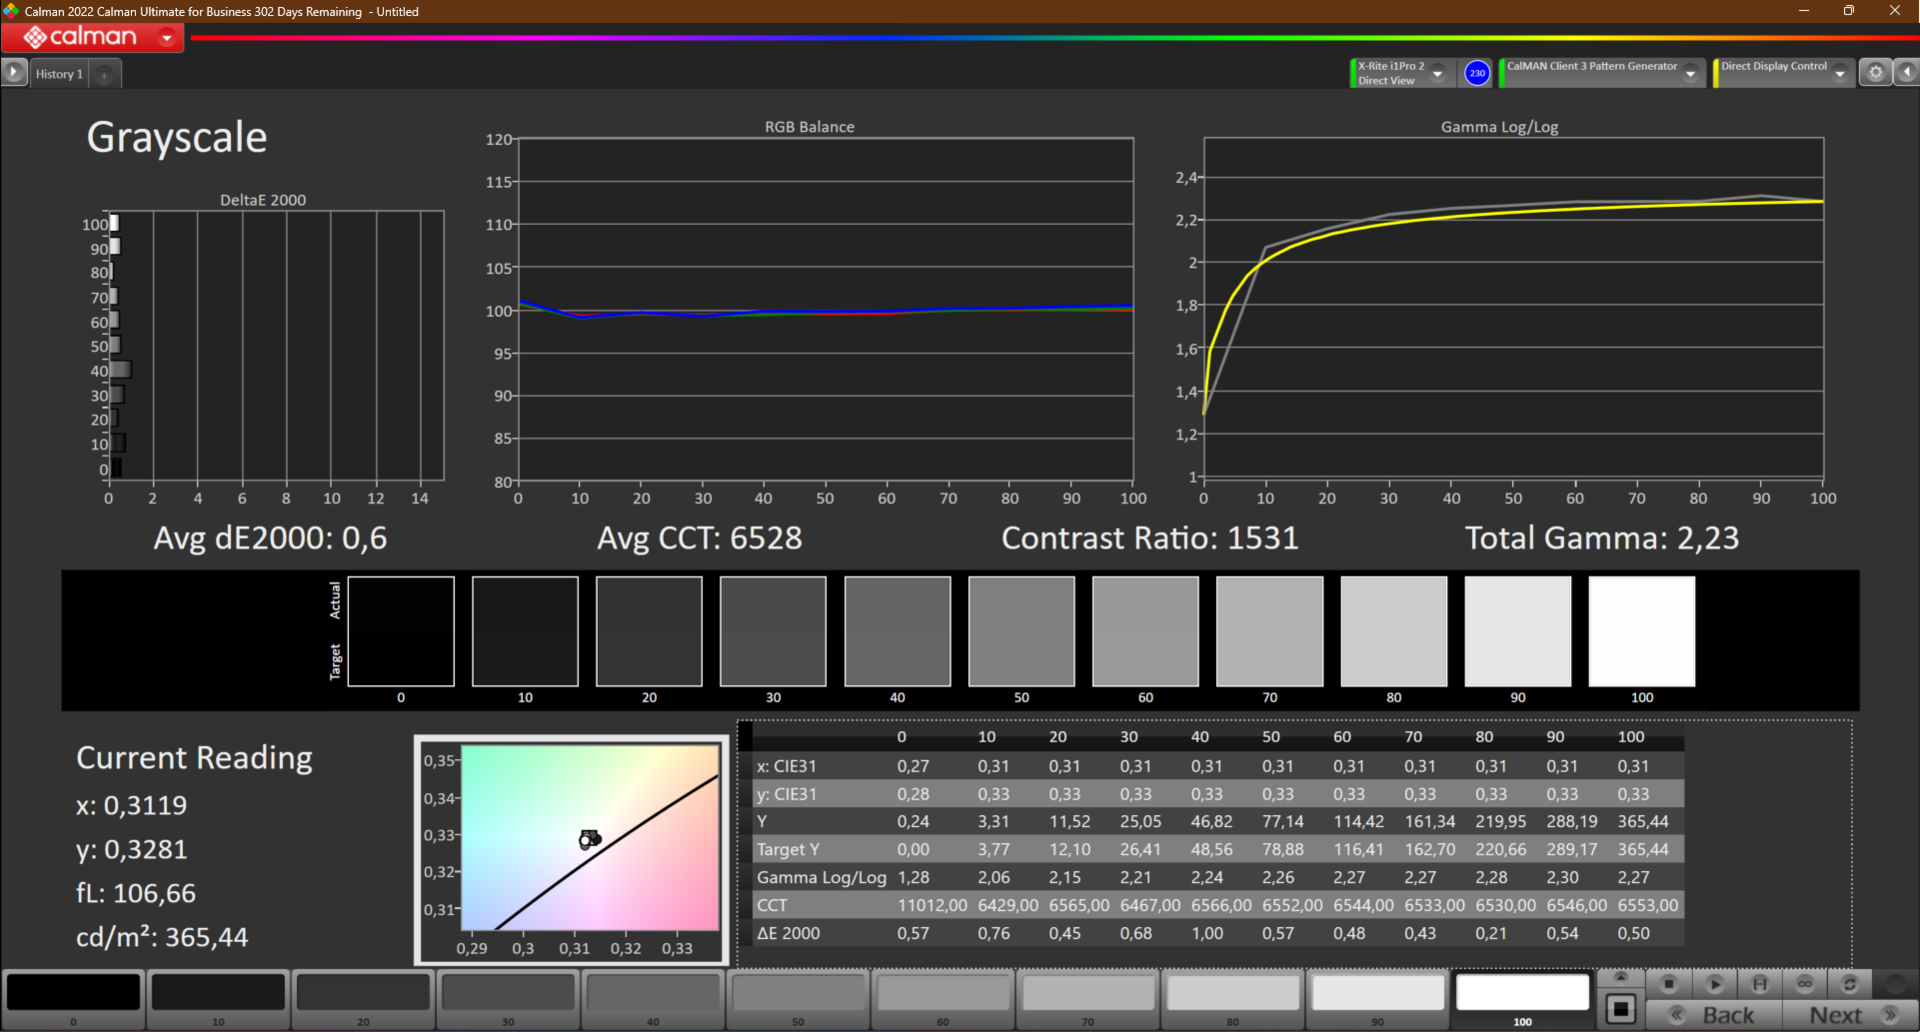
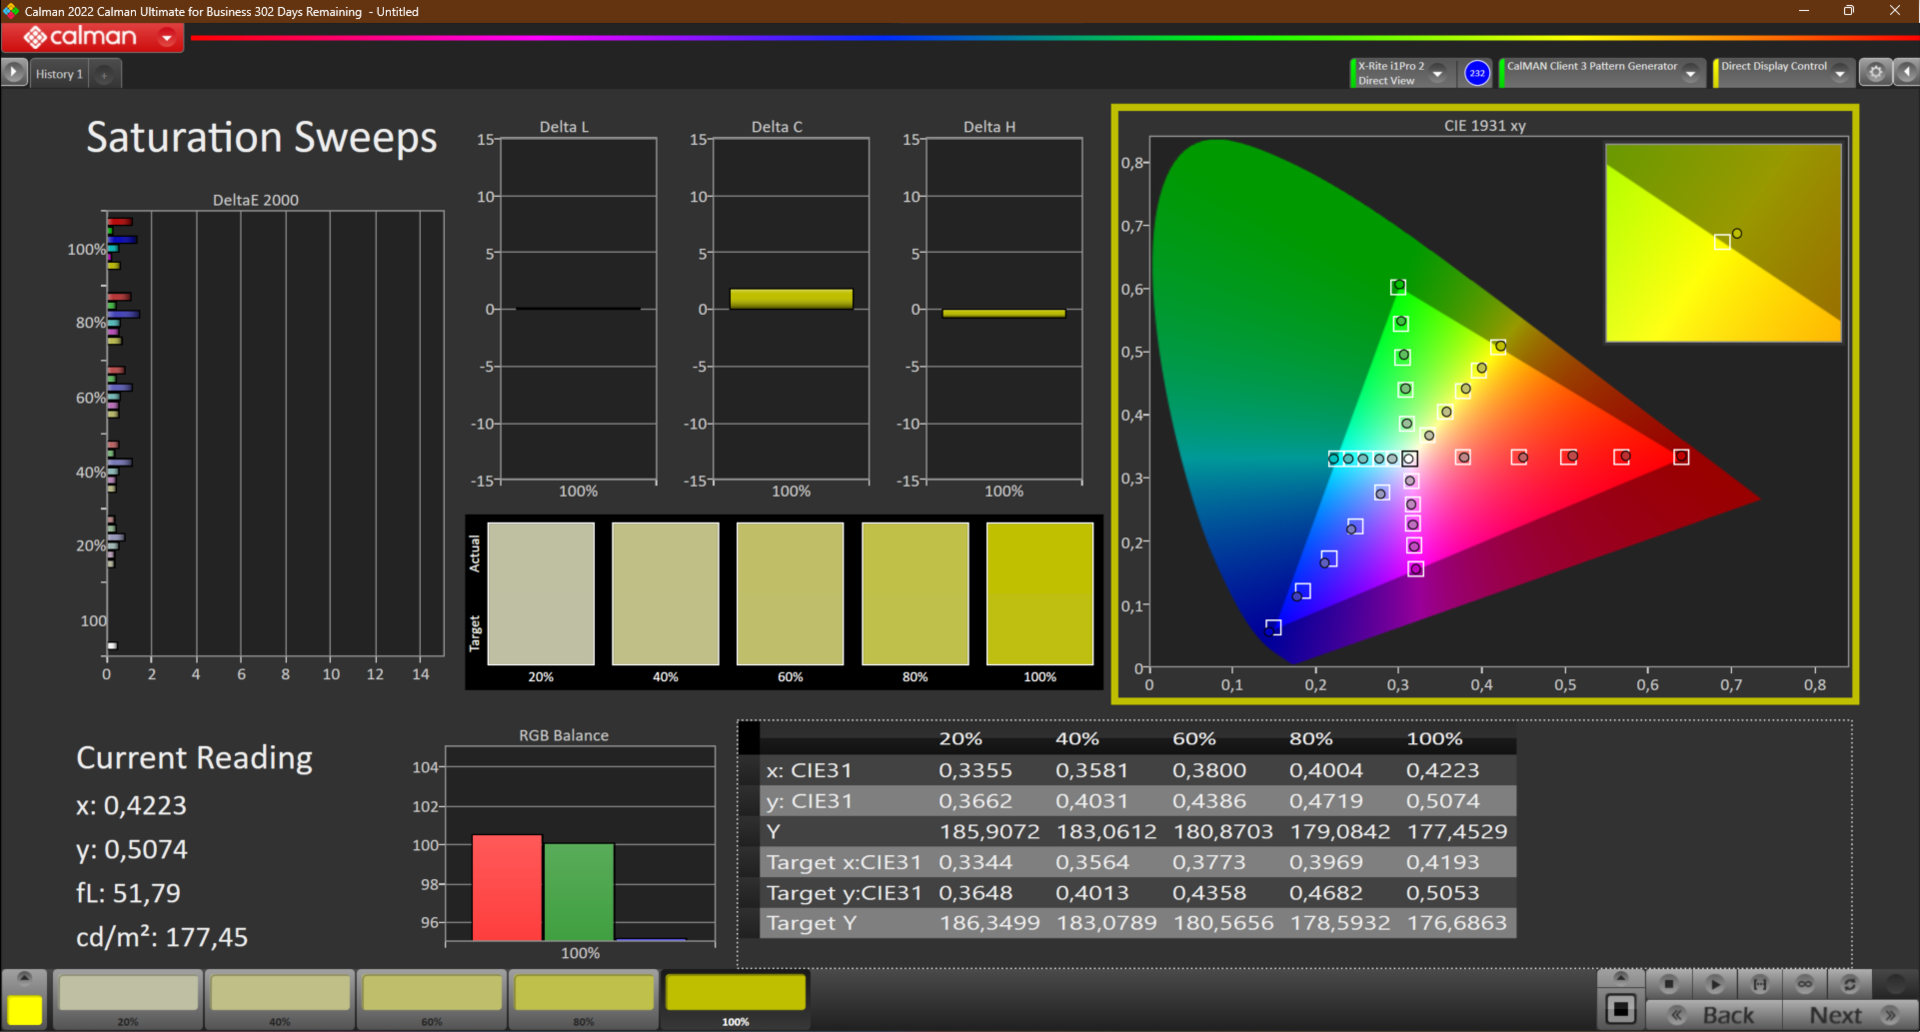
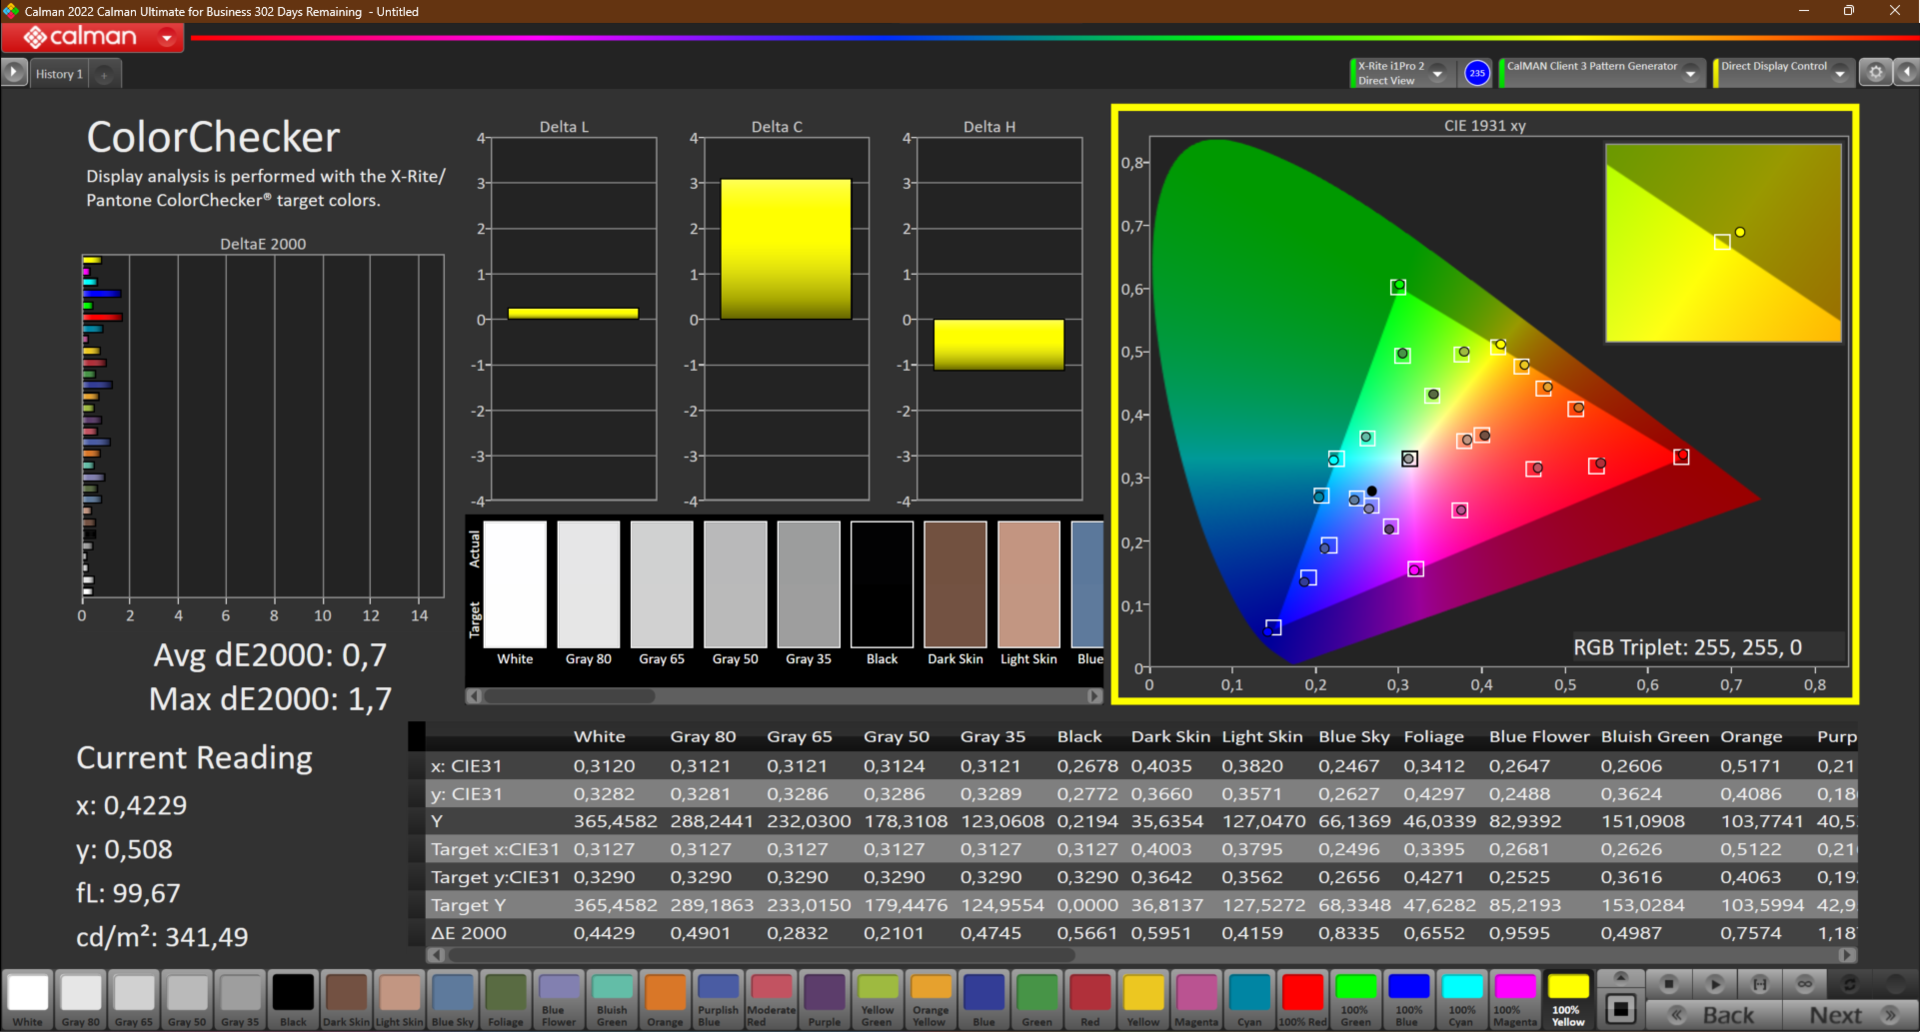
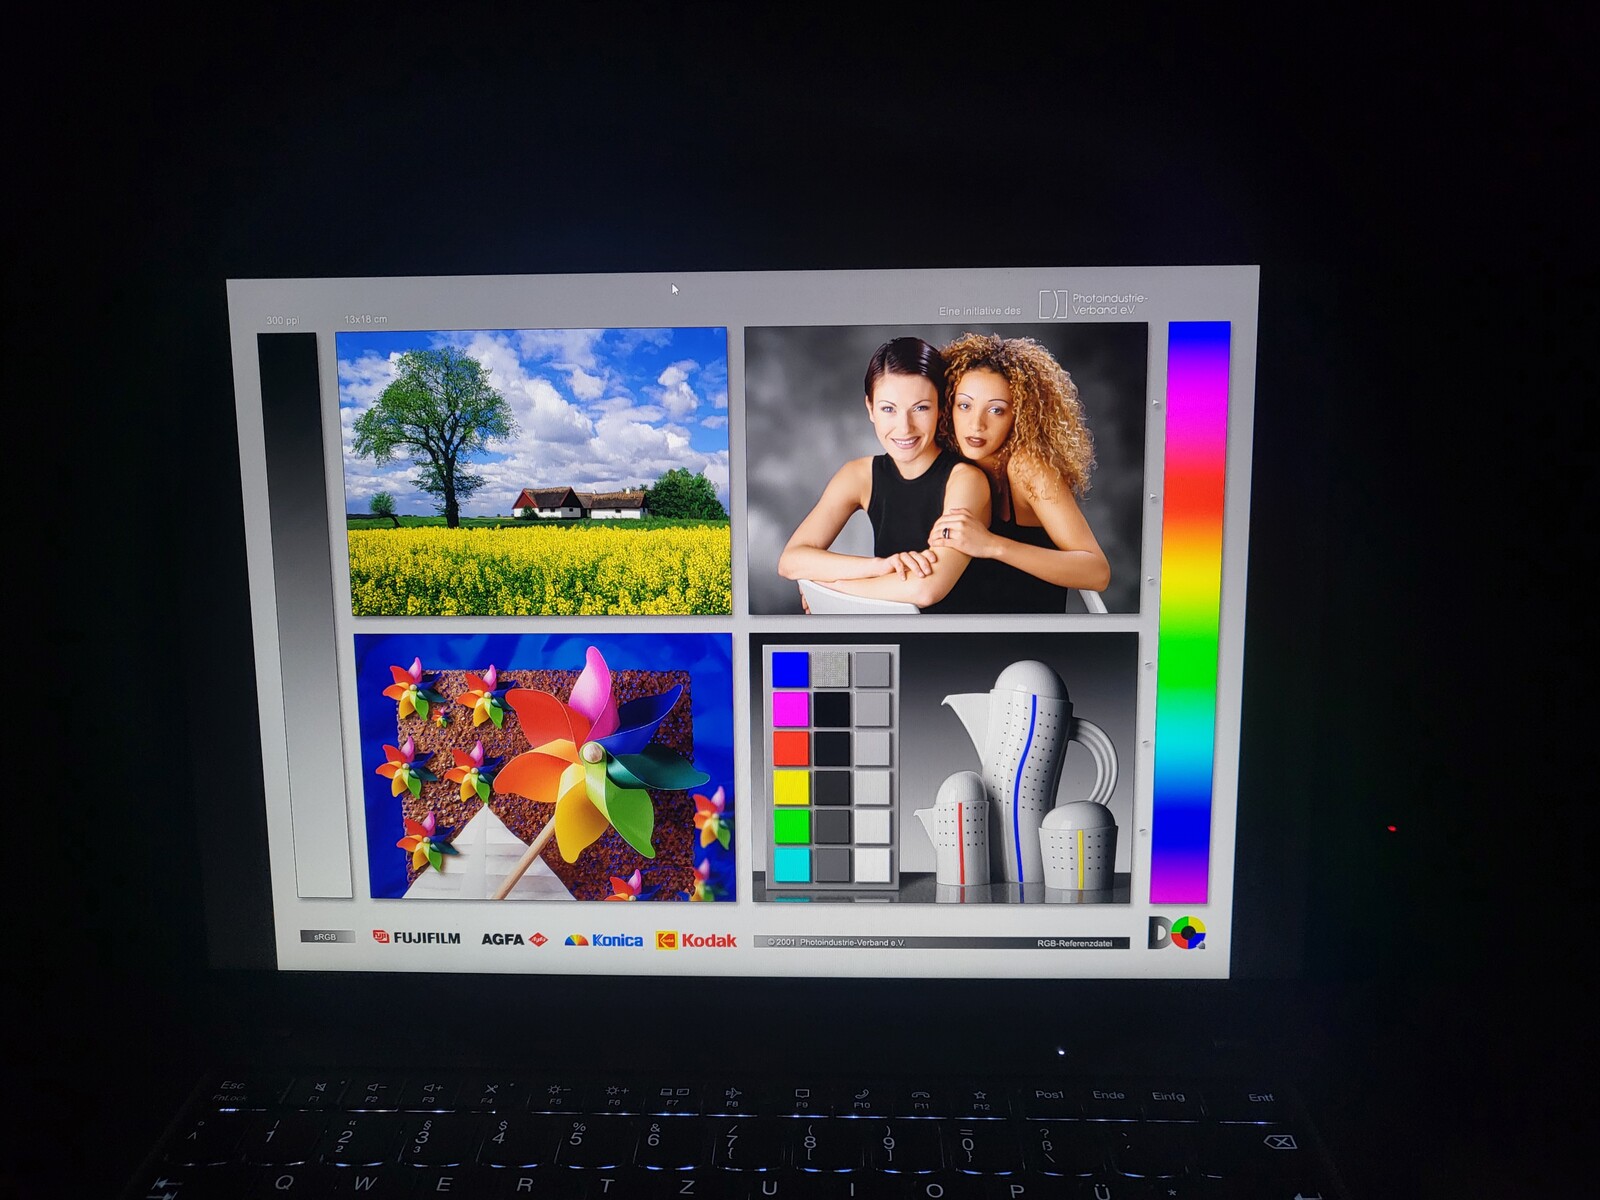
Wartości DeltaE już w stanie dostawy są bardzo niskie, a średnia 1,3 w programie Calman ColorChecker jest bardzo dobra. Dzięki kalibracji za pomocą kolorymetru X-Rite i1Pro 2 jesteśmy w stanie nawet jeszcze bardziej poprawić wartość ColorChecker DeltaE do doskonałego poziomu 0,7, co odpowiada dokładnemu wyświetlaniu kolorów bez żadnych odcieni. Jak zawsze, stworzony przez nas profil możecie pobrać za darmo z powyższego linku.
Lenovo reklamuje 100% sRGB dla panelu o niskiej mocy, a my mierzymy 99,8%. Oznacza to, że nic nie powinno przeszkodzić w wykorzystaniu go do zadań związanych z obróbką obrazu na prostym poziomie. Do wyświetlania szerszych przestrzeni barw AdobeRGB i DCI-P3 trzeba by jednak użyć zewnętrznego wyświetlacza.
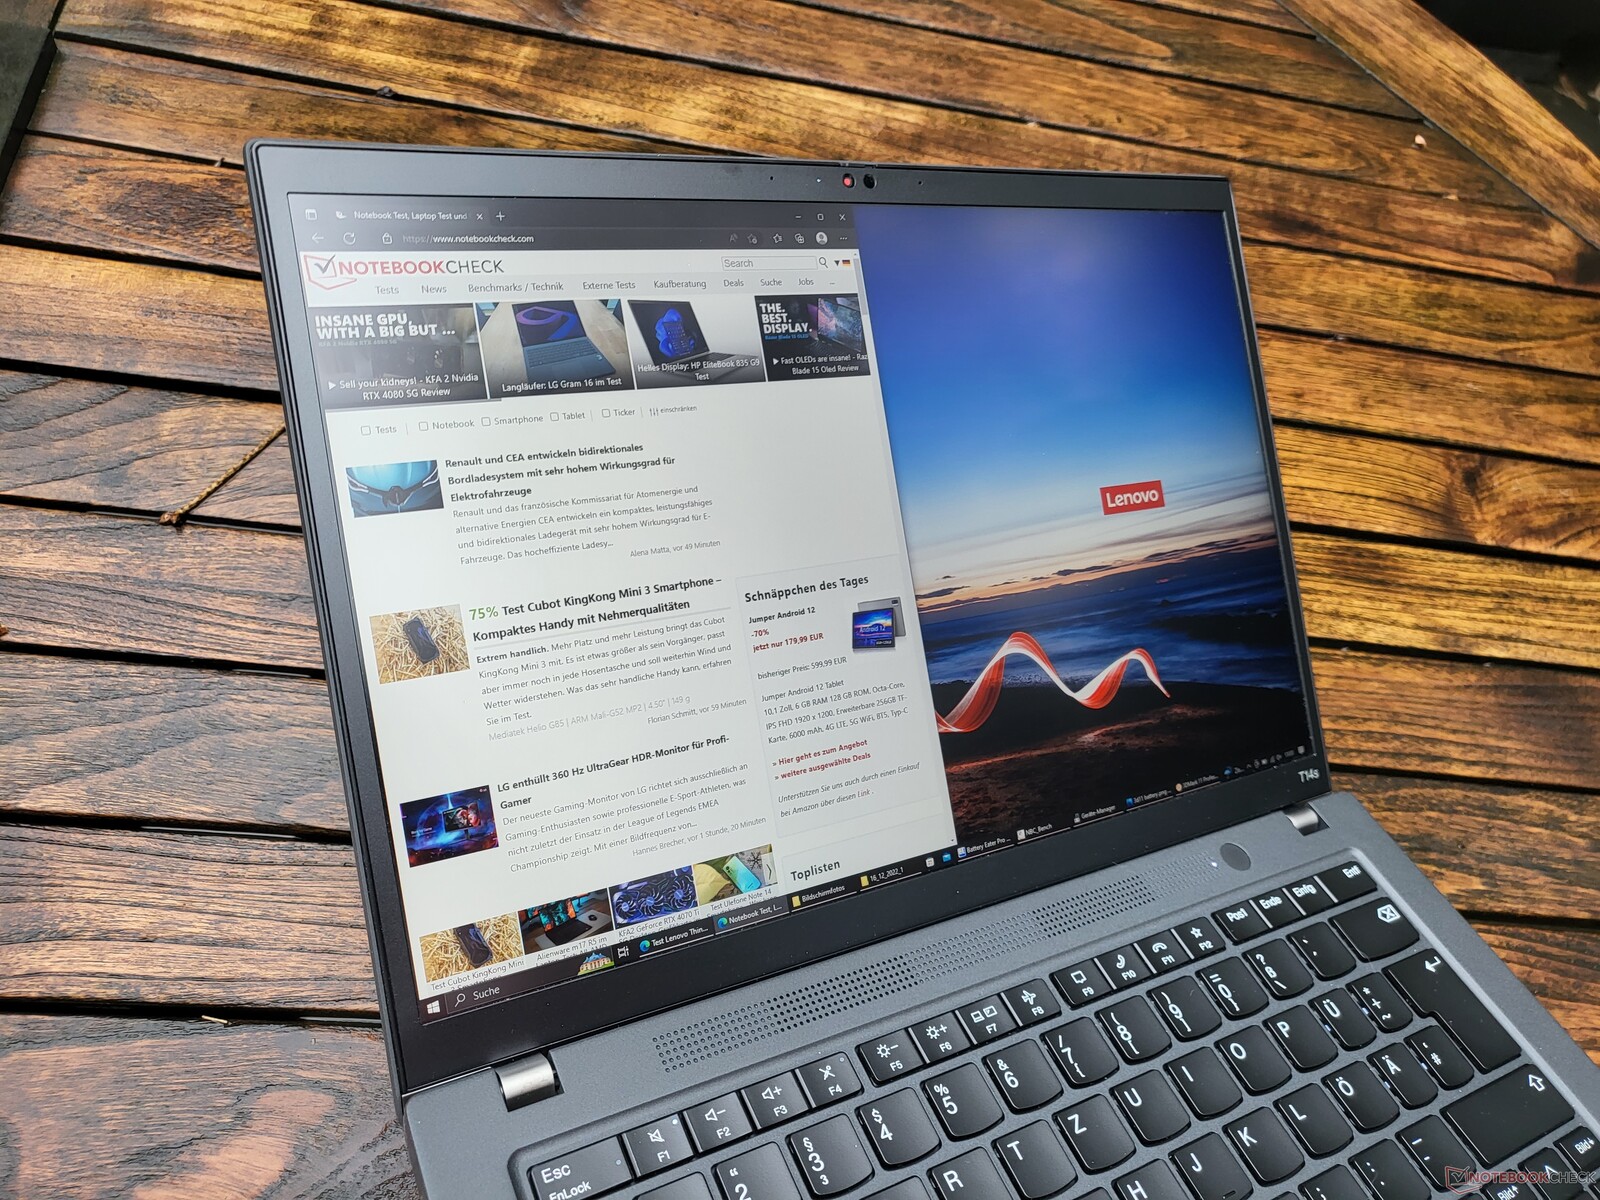
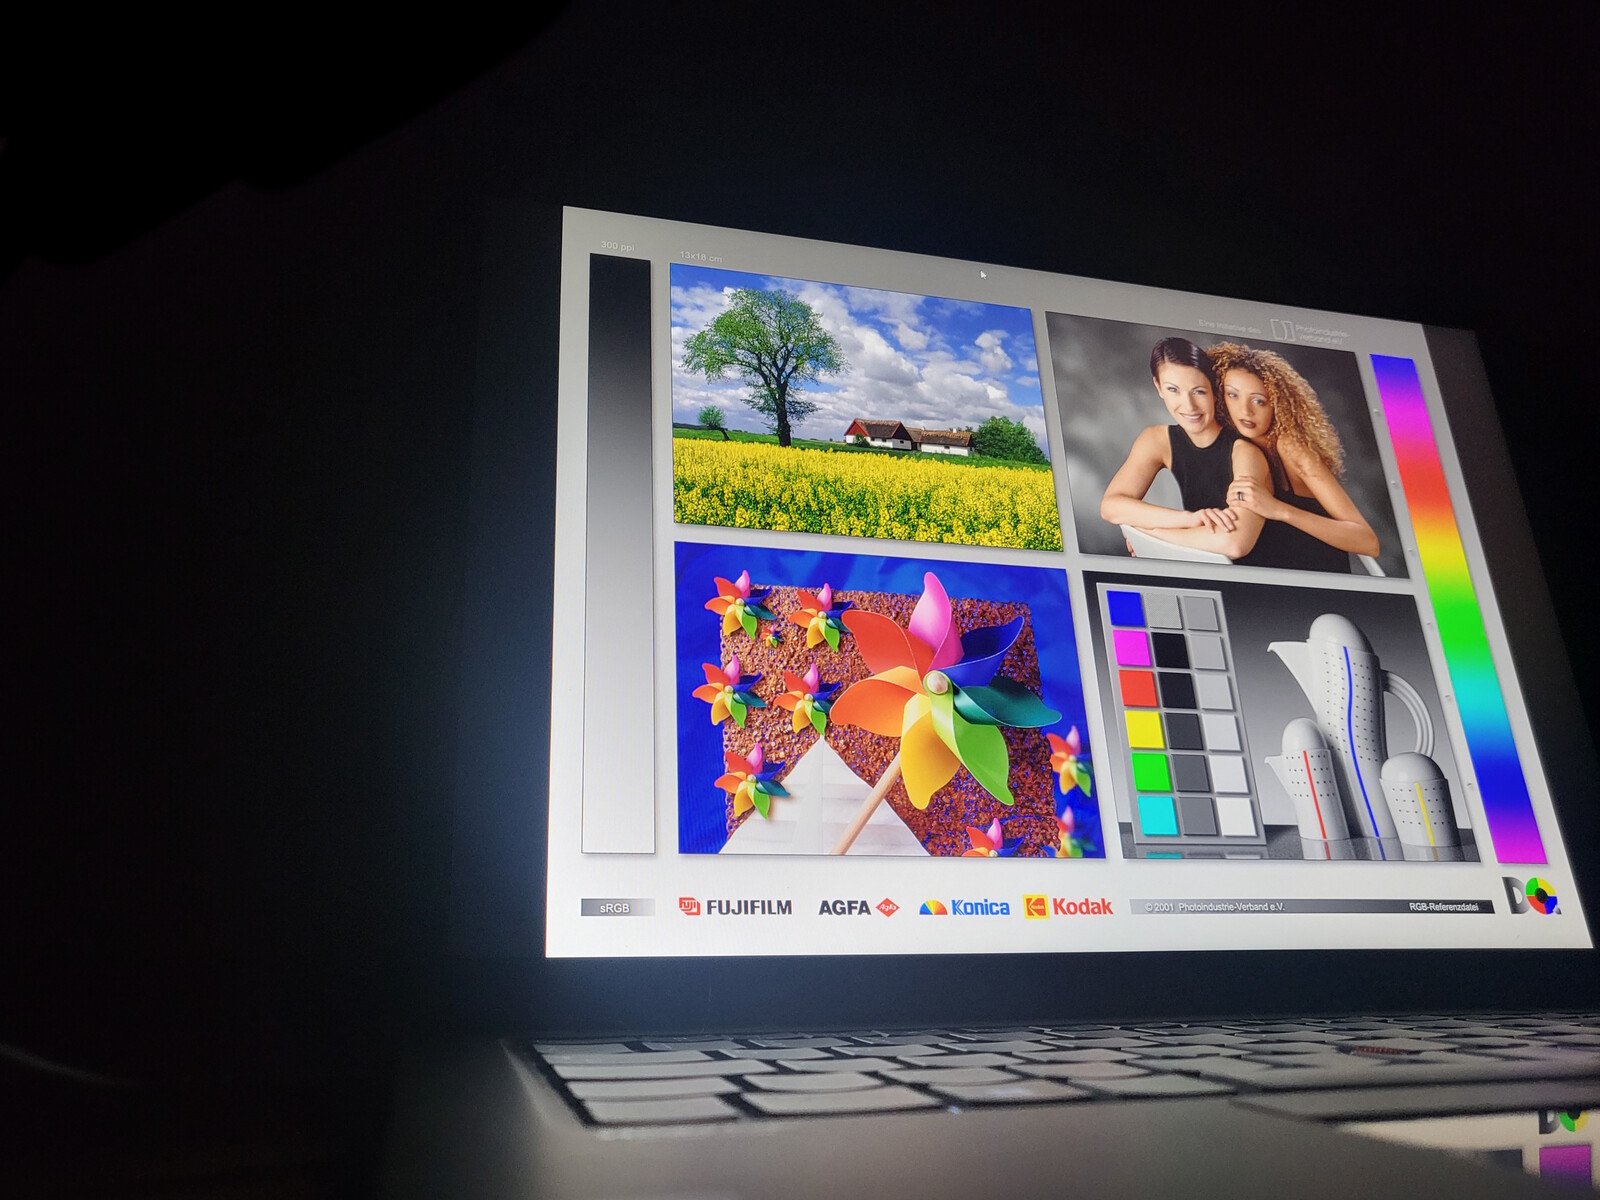
Lenovo ThinkPad T14s Gen 3 pokazuje się całkiem użytecznie na zewnątrz, ale nie jest to szczególnie zaskakujące, gdyż jasność jest stosunkowo wysoka i oferuje on matową powierzchnię wyświetlacza.
Wyświetl czasy reakcji
| ↔ Czas reakcji od czerni do bieli | ||
|---|---|---|
| 23.1 ms ... wzrost ↗ i spadek ↘ łącznie | ↗ 10.4 ms wzrost | 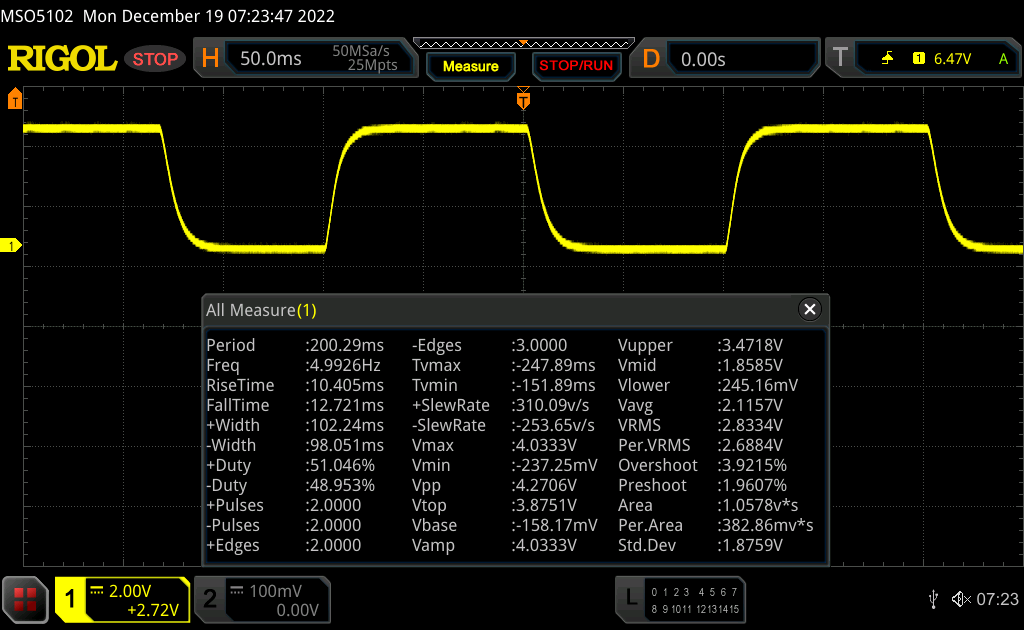 |
| ↘ 12.7 ms upadek | ||
| W naszych testach ekran wykazuje dobry współczynnik reakcji, ale może być zbyt wolny dla graczy rywalizujących ze sobą. Dla porównania, wszystkie testowane urządzenia wahają się od 0.1 (minimum) do 240 (maksimum) ms. » 53 % wszystkich urządzeń jest lepszych. Oznacza to, że zmierzony czas reakcji jest gorszy od średniej wszystkich testowanych urządzeń (19.9 ms). | ||
| ↔ Czas reakcji 50% szarości do 80% szarości | ||
| 36.3 ms ... wzrost ↗ i spadek ↘ łącznie | ↗ 16.4 ms wzrost | 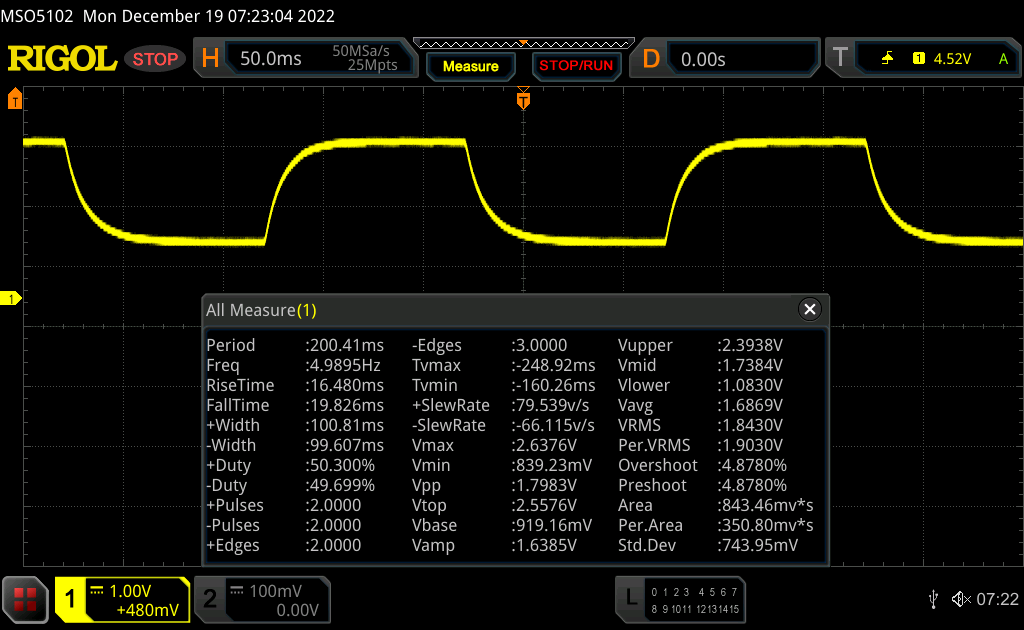 |
| ↘ 19.8 ms upadek | ||
| W naszych testach ekran wykazuje powolne tempo reakcji, co będzie niezadowalające dla graczy. Dla porównania, wszystkie testowane urządzenia wahają się od 0.165 (minimum) do 636 (maksimum) ms. » 52 % wszystkich urządzeń jest lepszych. Oznacza to, że zmierzony czas reakcji jest gorszy od średniej wszystkich testowanych urządzeń (31.1 ms). | ||
Migotanie ekranu / PWM (modulacja szerokości impulsu)
| Migotanie ekranu/nie wykryto PWM | 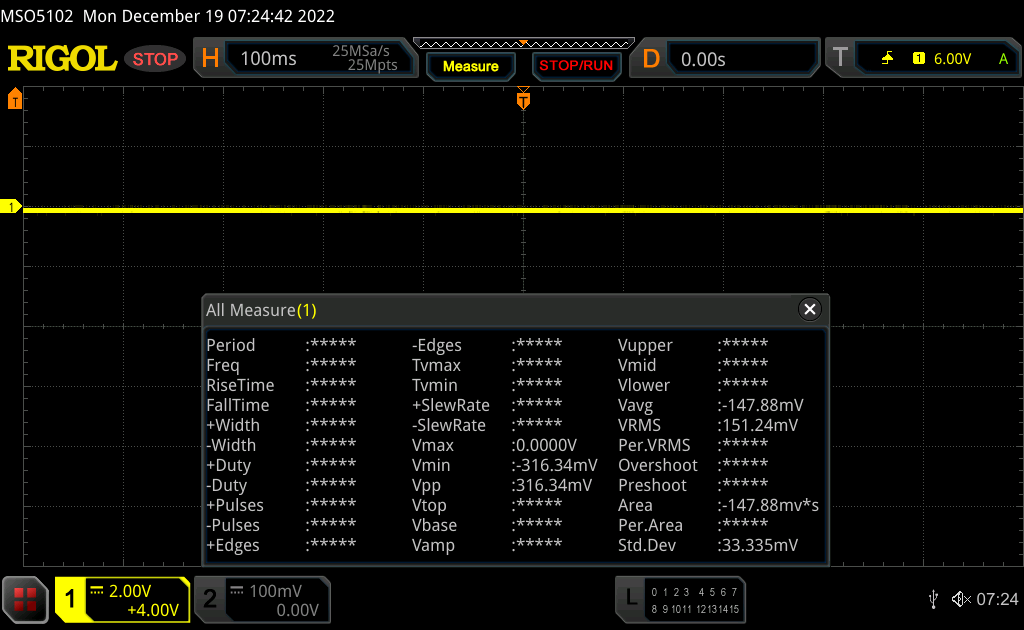 | ||
Dla porównania: 52 % wszystkich testowanych urządzeń nie używa PWM do przyciemniania wyświetlacza. Jeśli wykryto PWM, zmierzono średnio 7798 (minimum: 5 - maksimum: 343500) Hz. | |||
Wydajność: Ryzen 6000 znacząco bije Intela w wydajności wielordzeniowej
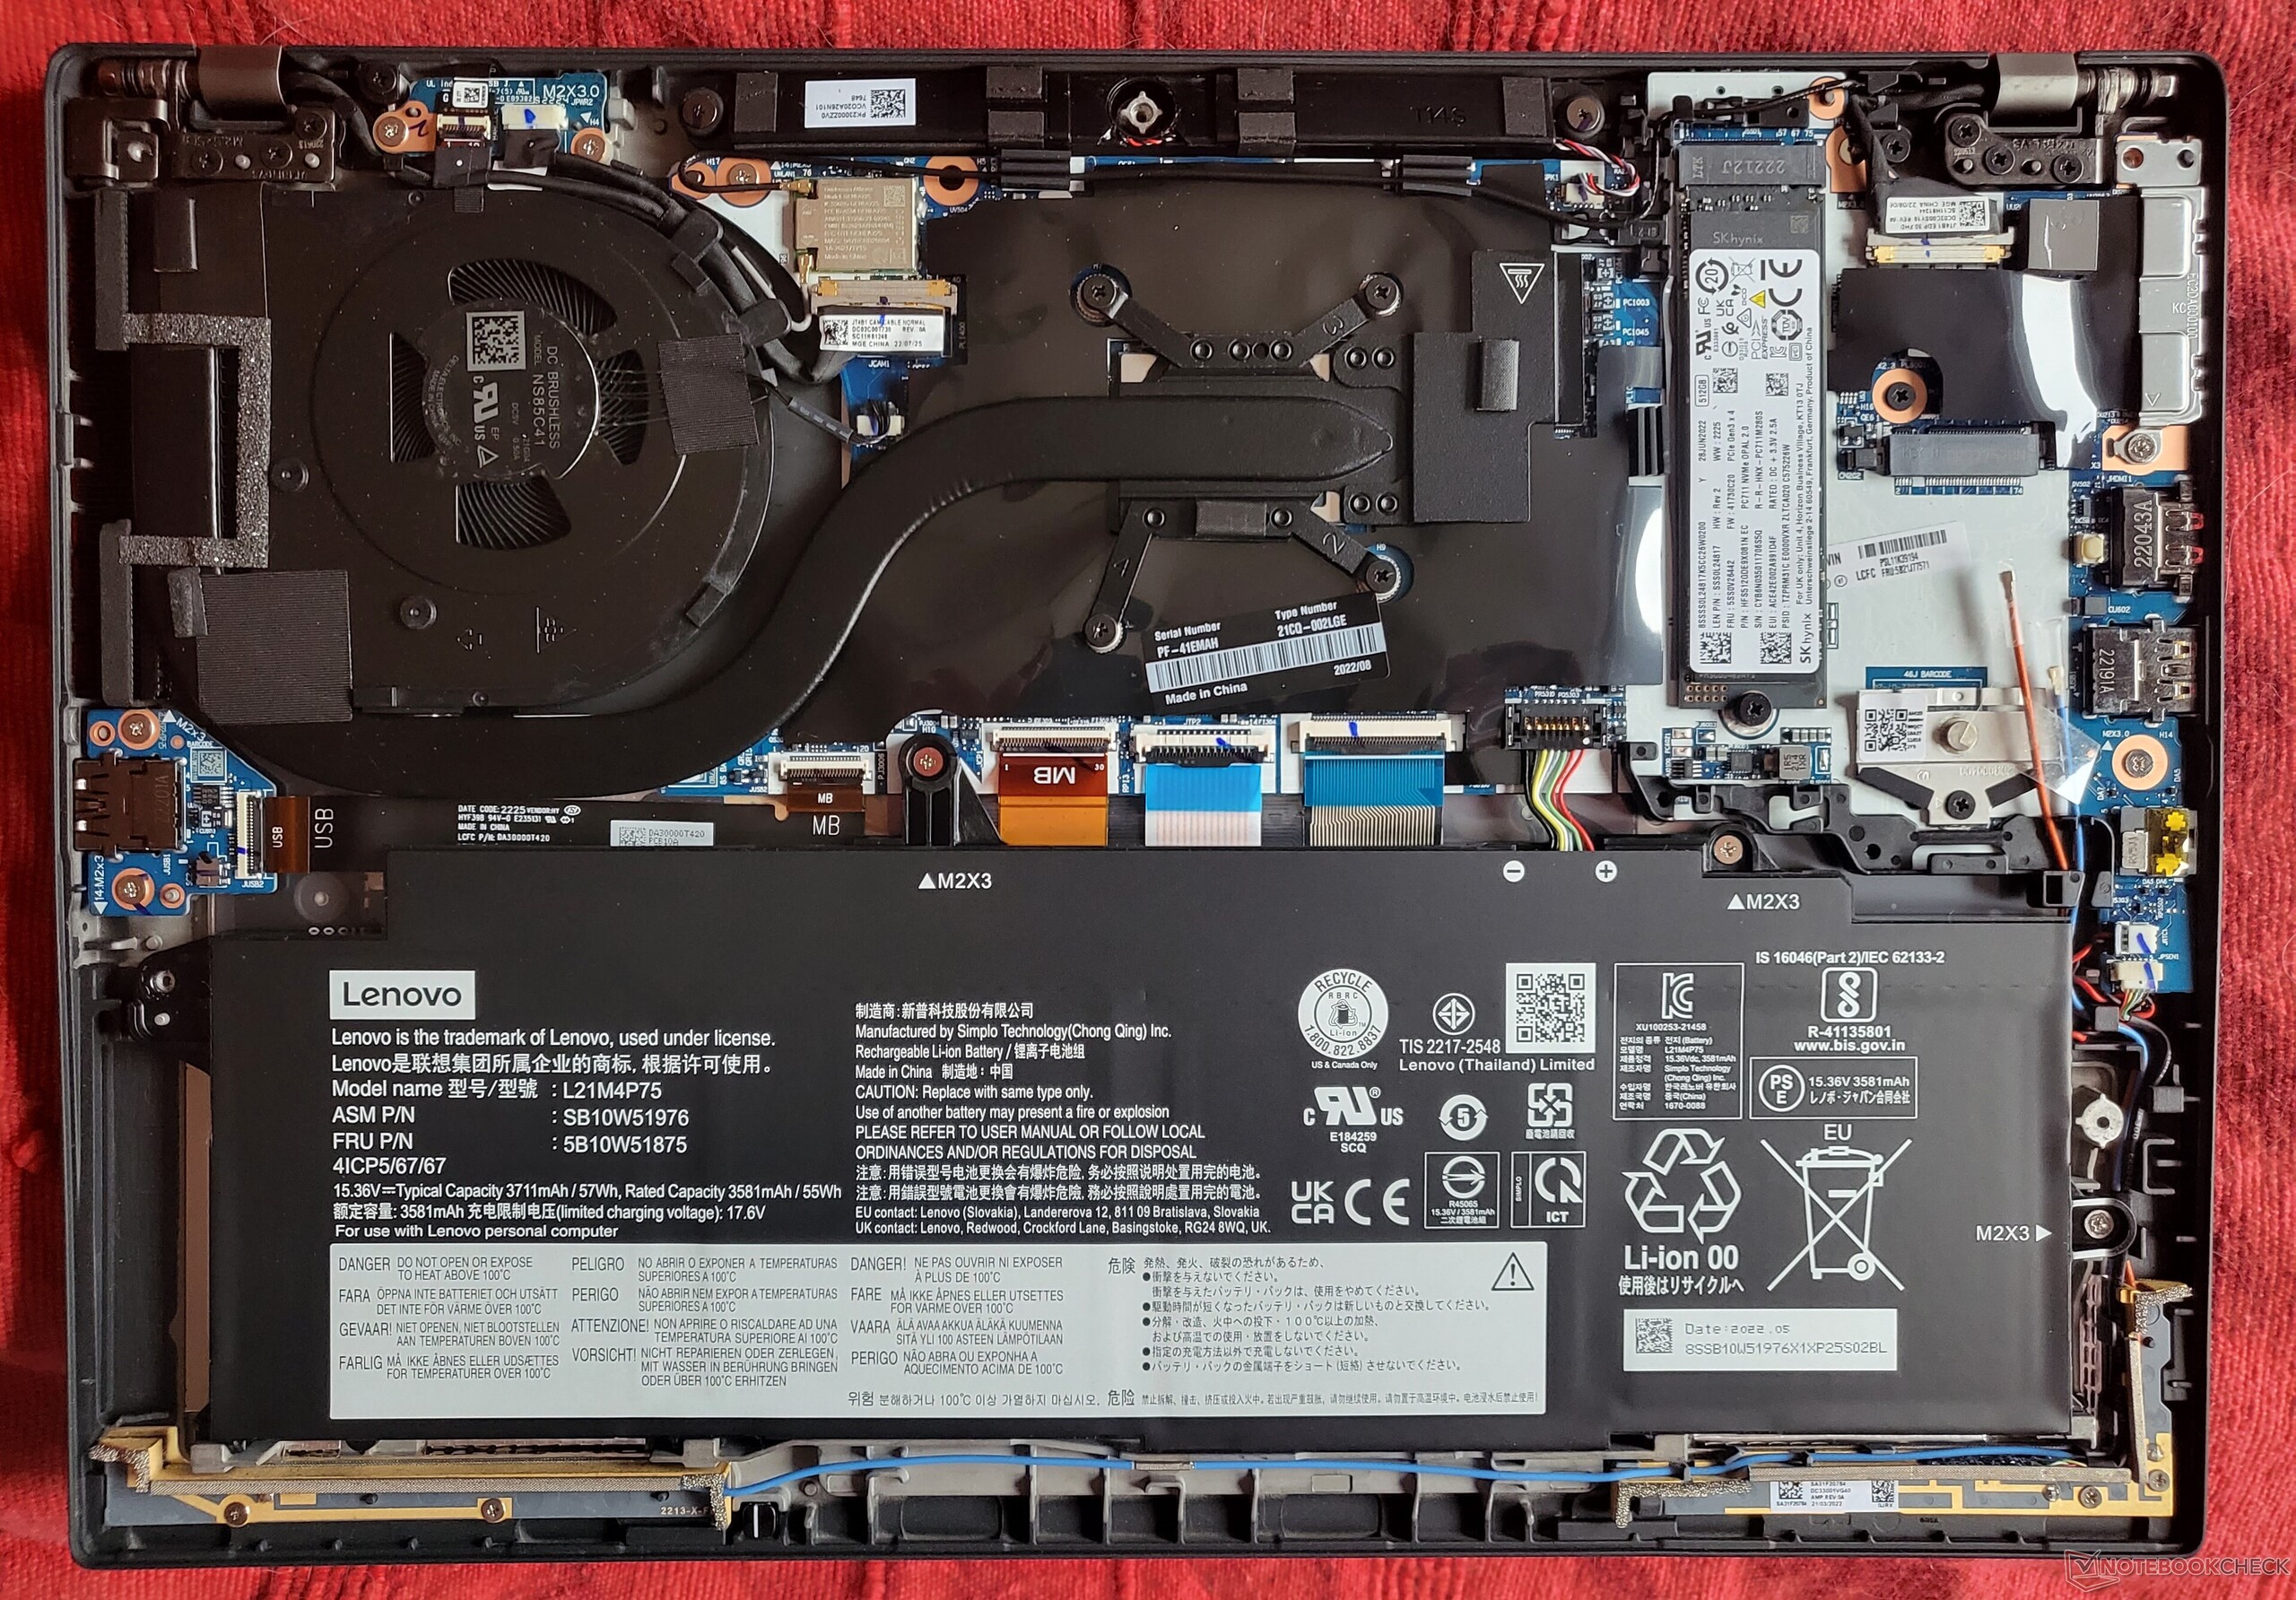
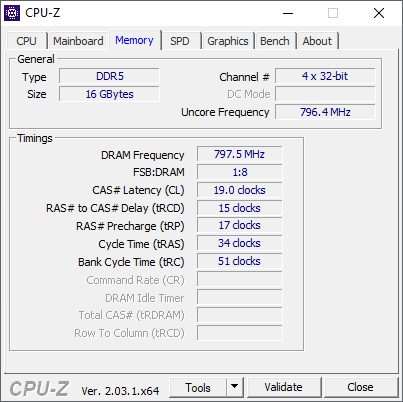
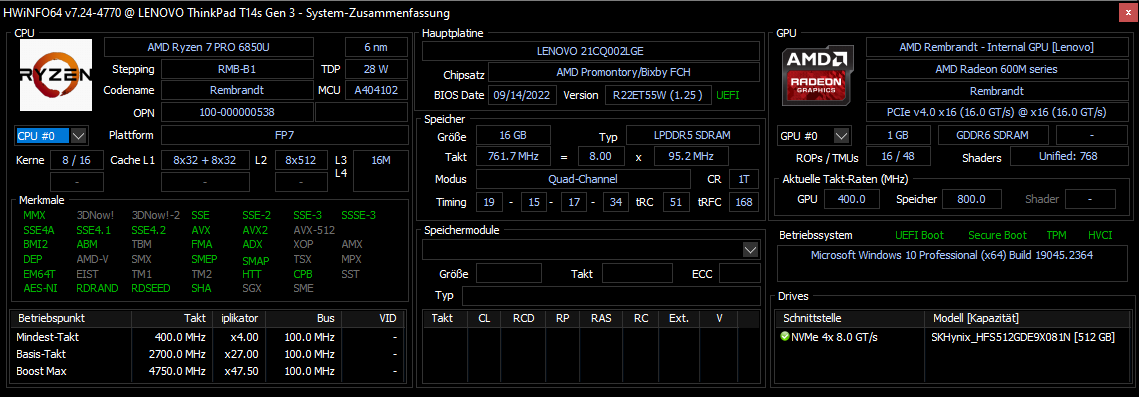
Lenovo sprzedaje ThinkPad T14s G3 AMD z dwoma różnymi opcjami procesora:.AMD Ryzen 7 Pro 6850Uoraz Ryzen 5 Pro 6650U. Nie ma dedykowanego GPU i trzeba korzystać ze zintegrowanego AMD Radeon, który jest wydajniejszy w Ryzen 7 (Radeon 680M) niż w Ryzen 5 (Radeon 660M). Pamięć robocza jest wlutowana. Lenovo stosuje najbardziej aktualne pamięci LPDDR5-6400. Maksymalnie dostępne jest 32 GB, ale dla mniej wymagających klientów oferowane są też 8 i 16 GB. Jako pamięć masowa występuje dysk SSD M.2-2280, który jest podłączany przez NVMe PCIe 4.0 x4.
Warunki badania
Lenovo nie stosuje w swoich laptopach ThinkPad własnego oprogramowania do zarządzania energią, ale tryby wydajności można wybrać bezpośrednio z poziomu ustawień systemu Windows. Istnieją trzy tryby różniące się limitami poboru mocy (PL2, czyli krótkoterminowy limit mocy, i PL1, czyli długoterminowy limit mocy):
- Best Power Efficiency: PL2 12 W, PL1 12 W
- Zrównoważony: PL2 24 W, PL1 16,5 W
- Najlepsza wydajność: PL2 30 W, PL1 24 W
Testy wydajności przeprowadzamy wyłącznie w trybie "Best Performance", a "Balanced" jest używany podczas testu baterii WiFi.
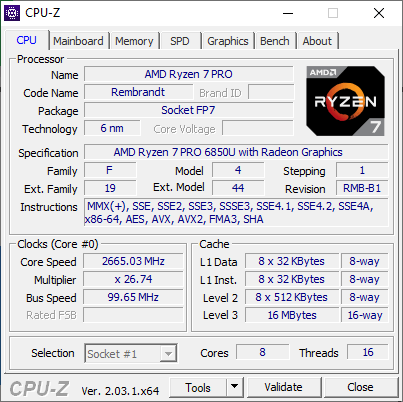
Procesor
Na stronie .AMD Ryzen 7 Pro 6850U to procesor z generacji Ryzen 6000 o nazwie kodowej "Rembrandt" Jest to układ Zen3+ o łącznej liczbie 8 rdzeni i 16 wątków. Maksymalne taktowanie wynosi 4,7 GHz, a podstawowe 2,7 GHz. AMD określa typowe TDP tego procesora na 15 do 28 W. Obszerniejsze porównania w benchmarkach można znaleźć w naszym Lista benchmarków dla procesorów.
W Lenovo ThinkPad T14s G3 Ryzen 7 zapewnia bardzo dobre wyniki. W benchmarkach wielordzeniowych T14s plasuje się powyżej wszystkich modeli konkurencji, nawet w wydajności pod stałym obciążeniem. Obraz zmienia się jednak w wydajności jednordzeniowej, gdzie obecny model Intela, a także Apple M2 wypadają nieco lepiej. Ponadto ogólna wydajność procesora jest minimalnie lepsza w m.in ThinkPad T14 G3z tym samym procesorem.
Wydajność procesora nie jest ograniczona podczas pracy na akumulatorze.
Cinebench R15 Multi Constant Load Test
Cinebench R23: Multi Core | Single Core
Cinebench R20: CPU (Multi Core) | CPU (Single Core)
Cinebench R15: CPU Multi 64Bit | CPU Single 64Bit
Blender: v2.79 BMW27 CPU
7-Zip 18.03: 7z b 4 | 7z b 4 -mmt1
Geekbench 5.5: Multi-Core | Single-Core
HWBOT x265 Benchmark v2.2: 4k Preset
LibreOffice : 20 Documents To PDF
R Benchmark 2.5: Overall mean
| CPU Performance rating | |
| Dell Latitude 9430 2-in-1 -1! | |
| Średnia w klasie Office | |
| Przeciętny AMD Ryzen 7 PRO 6850U | |
| Lenovo ThinkPad T14 G3-21CF004NGE | |
| Lenovo ThinkPad T14s G3 21CQ002LGE | |
| Lenovo ThinkPad T14s G3 21BR00CDGE | |
| Lenovo ThinkPad X1 Carbon G10 21CB00DCGE | |
| Apple MacBook Pro 13 2022 M2 -5! | |
| Lenovo ThinkPad T14s G2 20XGS01100 | |
| HP EliteBook 845 G9 6F6H9EA | |
| Cinebench R23 / Multi Core | |
| Średnia w klasie Office (1673 - 22808, n=73, ostatnie 2 lata) | |
| Przeciętny AMD Ryzen 7 PRO 6850U (9923 - 12945, n=7) | |
| Lenovo ThinkPad T14 G3-21CF004NGE | |
| Lenovo ThinkPad T14s G3 21CQ002LGE | |
| Lenovo ThinkPad X1 Carbon G10 21CB00DCGE | |
| Dell Latitude 9430 2-in-1 | |
| Lenovo ThinkPad T14s G3 21BR00CDGE | |
| Apple MacBook Pro 13 2022 M2 | |
| Lenovo ThinkPad T14s G2 20XGS01100 | |
| HP EliteBook 845 G9 6F6H9EA | |
| Cinebench R23 / Single Core | |
| Dell Latitude 9430 2-in-1 | |
| Lenovo ThinkPad T14s G3 21BR00CDGE | |
| Średnia w klasie Office (708 - 2130, n=73, ostatnie 2 lata) | |
| Lenovo ThinkPad X1 Carbon G10 21CB00DCGE | |
| Apple MacBook Pro 13 2022 M2 | |
| Lenovo ThinkPad T14s G3 21CQ002LGE | |
| Przeciętny AMD Ryzen 7 PRO 6850U (1409 - 1536, n=7) | |
| Lenovo ThinkPad T14 G3-21CF004NGE | |
| HP EliteBook 845 G9 6F6H9EA | |
| Lenovo ThinkPad T14s G2 20XGS01100 | |
| Cinebench R20 / CPU (Multi Core) | |
| Średnia w klasie Office (648 - 8840, n=72, ostatnie 2 lata) | |
| Przeciętny AMD Ryzen 7 PRO 6850U (3784 - 5022, n=7) | |
| Lenovo ThinkPad T14 G3-21CF004NGE | |
| Lenovo ThinkPad T14s G3 21CQ002LGE | |
| Lenovo ThinkPad X1 Carbon G10 21CB00DCGE | |
| Dell Latitude 9430 2-in-1 | |
| Lenovo ThinkPad T14s G3 21BR00CDGE | |
| Lenovo ThinkPad T14s G2 20XGS01100 | |
| HP EliteBook 845 G9 6F6H9EA | |
| Apple MacBook Pro 13 2022 M2 | |
| Cinebench R20 / CPU (Single Core) | |
| Dell Latitude 9430 2-in-1 | |
| Średnia w klasie Office (345 - 816, n=72, ostatnie 2 lata) | |
| Lenovo ThinkPad T14s G3 21BR00CDGE | |
| Lenovo ThinkPad X1 Carbon G10 21CB00DCGE | |
| Lenovo ThinkPad T14s G3 21CQ002LGE | |
| Przeciętny AMD Ryzen 7 PRO 6850U (587 - 596, n=7) | |
| Lenovo ThinkPad T14 G3-21CF004NGE | |
| HP EliteBook 845 G9 6F6H9EA | |
| Lenovo ThinkPad T14s G2 20XGS01100 | |
| Apple MacBook Pro 13 2022 M2 | |
| Cinebench R15 / CPU Multi 64Bit | |
| Przeciętny AMD Ryzen 7 PRO 6850U (1652 - 2092, n=7) | |
| Średnia w klasie Office (250 - 3380, n=74, ostatnie 2 lata) | |
| Lenovo ThinkPad T14 G3-21CF004NGE | |
| Lenovo ThinkPad T14s G3 21CQ002LGE | |
| Lenovo ThinkPad X1 Carbon G10 21CB00DCGE | |
| Lenovo ThinkPad T14s G3 21BR00CDGE | |
| Dell Latitude 9430 2-in-1 | |
| Lenovo ThinkPad T14s G2 20XGS01100 | |
| HP EliteBook 845 G9 6F6H9EA | |
| Apple MacBook Pro 13 2022 M2 | |
| Cinebench R15 / CPU Single 64Bit | |
| Dell Latitude 9430 2-in-1 | |
| Średnia w klasie Office (99.5 - 312, n=74, ostatnie 2 lata) | |
| Lenovo ThinkPad T14s G3 21BR00CDGE | |
| Lenovo ThinkPad T14s G3 21CQ002LGE | |
| Lenovo ThinkPad T14 G3-21CF004NGE | |
| Przeciętny AMD Ryzen 7 PRO 6850U (228 - 244, n=7) | |
| HP EliteBook 845 G9 6F6H9EA | |
| Lenovo ThinkPad T14s G2 20XGS01100 | |
| Apple MacBook Pro 13 2022 M2 | |
| Lenovo ThinkPad X1 Carbon G10 21CB00DCGE | |
| Blender / v2.79 BMW27 CPU | |
| Apple MacBook Pro 13 2022 M2 | |
| Lenovo ThinkPad T14s G3 21BR00CDGE | |
| HP EliteBook 845 G9 6F6H9EA | |
| Średnia w klasie Office (158 - 1940, n=73, ostatnie 2 lata) | |
| Lenovo ThinkPad X1 Carbon G10 21CB00DCGE | |
| Lenovo ThinkPad T14s G2 20XGS01100 | |
| Lenovo ThinkPad T14s G3 21CQ002LGE | |
| Lenovo ThinkPad T14 G3-21CF004NGE | |
| Przeciętny AMD Ryzen 7 PRO 6850U (241 - 307, n=7) | |
| 7-Zip 18.03 / 7z b 4 | |
| Lenovo ThinkPad T14 G3-21CF004NGE | |
| Przeciętny AMD Ryzen 7 PRO 6850U (44011 - 59045, n=7) | |
| Lenovo ThinkPad T14s G3 21CQ002LGE | |
| Lenovo ThinkPad T14s G2 20XGS01100 | |
| Średnia w klasie Office (7098 - 76886, n=75, ostatnie 2 lata) | |
| Lenovo ThinkPad X1 Carbon G10 21CB00DCGE | |
| Lenovo ThinkPad T14s G3 21BR00CDGE | |
| Dell Latitude 9430 2-in-1 | |
| HP EliteBook 845 G9 6F6H9EA | |
| 7-Zip 18.03 / 7z b 4 -mmt1 | |
| Dell Latitude 9430 2-in-1 | |
| HP EliteBook 845 G9 6F6H9EA | |
| Przeciętny AMD Ryzen 7 PRO 6850U (5057 - 5662, n=7) | |
| Średnia w klasie Office (3387 - 6469, n=74, ostatnie 2 lata) | |
| Lenovo ThinkPad T14s G3 21CQ002LGE | |
| Lenovo ThinkPad T14 G3-21CF004NGE | |
| Lenovo ThinkPad T14s G2 20XGS01100 | |
| Lenovo ThinkPad T14s G3 21BR00CDGE | |
| Lenovo ThinkPad X1 Carbon G10 21CB00DCGE | |
| Geekbench 5.5 / Multi-Core | |
| Dell Latitude 9430 2-in-1 | |
| Apple MacBook Pro 13 2022 M2 | |
| Średnia w klasie Office (1483 - 16999, n=71, ostatnie 2 lata) | |
| Lenovo ThinkPad X1 Carbon G10 21CB00DCGE | |
| Lenovo ThinkPad T14s G3 21BR00CDGE | |
| Przeciętny AMD Ryzen 7 PRO 6850U (7044 - 9241, n=7) | |
| Lenovo ThinkPad T14 G3-21CF004NGE | |
| Lenovo ThinkPad T14s G3 21CQ002LGE | |
| Lenovo ThinkPad T14s G2 20XGS01100 | |
| HP EliteBook 845 G9 6F6H9EA | |
| Geekbench 5.5 / Single-Core | |
| Apple MacBook Pro 13 2022 M2 | |
| Średnia w klasie Office (811 - 2128, n=71, ostatnie 2 lata) | |
| Dell Latitude 9430 2-in-1 | |
| Lenovo ThinkPad X1 Carbon G10 21CB00DCGE | |
| Lenovo ThinkPad T14s G3 21BR00CDGE | |
| Lenovo ThinkPad T14 G3-21CF004NGE | |
| Przeciętny AMD Ryzen 7 PRO 6850U (1433 - 1533, n=7) | |
| Lenovo ThinkPad T14s G3 21CQ002LGE | |
| HP EliteBook 845 G9 6F6H9EA | |
| Lenovo ThinkPad T14s G2 20XGS01100 | |
| HWBOT x265 Benchmark v2.2 / 4k Preset | |
| Lenovo ThinkPad T14 G3-21CF004NGE | |
| Przeciętny AMD Ryzen 7 PRO 6850U (11.7 - 16.3, n=7) | |
| Średnia w klasie Office (2.21 - 26, n=73, ostatnie 2 lata) | |
| Lenovo ThinkPad T14s G3 21CQ002LGE | |
| Lenovo ThinkPad T14s G2 20XGS01100 | |
| Dell Latitude 9430 2-in-1 | |
| HP EliteBook 845 G9 6F6H9EA | |
| Lenovo ThinkPad T14s G3 21BR00CDGE | |
| Lenovo ThinkPad X1 Carbon G10 21CB00DCGE | |
| LibreOffice / 20 Documents To PDF | |
| HP EliteBook 845 G9 6F6H9EA | |
| Średnia w klasie Office (41.5 - 102.3, n=73, ostatnie 2 lata) | |
| Przeciętny AMD Ryzen 7 PRO 6850U (46.3 - 74, n=7) | |
| Lenovo ThinkPad T14s G3 21CQ002LGE | |
| Lenovo ThinkPad T14 G3-21CF004NGE | |
| Lenovo ThinkPad T14s G2 20XGS01100 | |
| Lenovo ThinkPad X1 Carbon G10 21CB00DCGE | |
| Dell Latitude 9430 2-in-1 | |
| Lenovo ThinkPad T14s G3 21BR00CDGE | |
| R Benchmark 2.5 / Overall mean | |
| Lenovo ThinkPad T14s G2 20XGS01100 | |
| Średnia w klasie Office (0.4098 - 0.888, n=73, ostatnie 2 lata) | |
| Lenovo ThinkPad X1 Carbon G10 21CB00DCGE | |
| Lenovo ThinkPad T14 G3-21CF004NGE | |
| HP EliteBook 845 G9 6F6H9EA | |
| Przeciętny AMD Ryzen 7 PRO 6850U (0.4932 - 0.544, n=7) | |
| Lenovo ThinkPad T14s G3 21CQ002LGE | |
| Lenovo ThinkPad T14s G3 21BR00CDGE | |
| Dell Latitude 9430 2-in-1 | |
* ... im mniej tym lepiej
AIDA64: FP32 Ray-Trace | FPU Julia | CPU SHA3 | CPU Queen | FPU SinJulia | FPU Mandel | CPU AES | CPU ZLib | FP64 Ray-Trace | CPU PhotoWorxx
| Performance rating | |
| Przeciętny AMD Ryzen 7 PRO 6850U | |
| Lenovo ThinkPad T14s G3 21CQ002LGE | |
| Średnia w klasie Office | |
| Lenovo ThinkPad T14s G2 20XGS01100 | |
| HP EliteBook 845 G9 6F6H9EA | |
| Dell Latitude 9430 2-in-1 | |
| Lenovo ThinkPad T14s G3 21BR00CDGE | |
| Lenovo ThinkPad X1 Carbon G10 21CB00DCGE | |
| AIDA64 / FP32 Ray-Trace | |
| Średnia w klasie Office (2083 - 31245, n=79, ostatnie 2 lata) | |
| Przeciętny AMD Ryzen 7 PRO 6850U (11272 - 14704, n=8) | |
| Lenovo ThinkPad T14s G3 21CQ002LGE | |
| Lenovo ThinkPad T14s G2 20XGS01100 | |
| HP EliteBook 845 G9 6F6H9EA | |
| Dell Latitude 9430 2-in-1 | |
| Lenovo ThinkPad T14s G3 21BR00CDGE | |
| Lenovo ThinkPad X1 Carbon G10 21CB00DCGE | |
| AIDA64 / FPU Julia | |
| Przeciętny AMD Ryzen 7 PRO 6850U (72242 - 92957, n=8) | |
| Lenovo ThinkPad T14s G3 21CQ002LGE | |
| Lenovo ThinkPad T14s G2 20XGS01100 | |
| HP EliteBook 845 G9 6F6H9EA | |
| Średnia w klasie Office (8191 - 125394, n=79, ostatnie 2 lata) | |
| Dell Latitude 9430 2-in-1 | |
| Lenovo ThinkPad T14s G3 21BR00CDGE | |
| Lenovo ThinkPad X1 Carbon G10 21CB00DCGE | |
| AIDA64 / CPU SHA3 | |
| Średnia w klasie Office (433 - 5755, n=79, ostatnie 2 lata) | |
| Przeciętny AMD Ryzen 7 PRO 6850U (2419 - 3104, n=8) | |
| Lenovo ThinkPad T14s G3 21CQ002LGE | |
| Lenovo ThinkPad T14s G2 20XGS01100 | |
| Dell Latitude 9430 2-in-1 | |
| Lenovo ThinkPad T14s G3 21BR00CDGE | |
| HP EliteBook 845 G9 6F6H9EA | |
| Lenovo ThinkPad X1 Carbon G10 21CB00DCGE | |
| AIDA64 / CPU Queen | |
| Przeciętny AMD Ryzen 7 PRO 6850U (86644 - 96912, n=7) | |
| Lenovo ThinkPad T14s G3 21CQ002LGE | |
| Lenovo ThinkPad T14s G2 20XGS01100 | |
| Lenovo ThinkPad X1 Carbon G10 21CB00DCGE | |
| HP EliteBook 845 G9 6F6H9EA | |
| Dell Latitude 9430 2-in-1 | |
| Średnia w klasie Office (22784 - 115197, n=69, ostatnie 2 lata) | |
| Lenovo ThinkPad T14s G3 21BR00CDGE | |
| AIDA64 / FPU SinJulia | |
| Przeciętny AMD Ryzen 7 PRO 6850U (10917 - 12571, n=8) | |
| Lenovo ThinkPad T14s G3 21CQ002LGE | |
| Lenovo ThinkPad T14s G2 20XGS01100 | |
| HP EliteBook 845 G9 6F6H9EA | |
| Średnia w klasie Office (1378 - 18321, n=79, ostatnie 2 lata) | |
| Dell Latitude 9430 2-in-1 | |
| Lenovo ThinkPad X1 Carbon G10 21CB00DCGE | |
| Lenovo ThinkPad T14s G3 21BR00CDGE | |
| AIDA64 / FPU Mandel | |
| Przeciętny AMD Ryzen 7 PRO 6850U (39609 - 51296, n=8) | |
| Lenovo ThinkPad T14s G3 21CQ002LGE | |
| Lenovo ThinkPad T14s G2 20XGS01100 | |
| HP EliteBook 845 G9 6F6H9EA | |
| Średnia w klasie Office (4601 - 66922, n=79, ostatnie 2 lata) | |
| Dell Latitude 9430 2-in-1 | |
| Lenovo ThinkPad T14s G3 21BR00CDGE | |
| Lenovo ThinkPad X1 Carbon G10 21CB00DCGE | |
| AIDA64 / CPU AES | |
| Lenovo ThinkPad T14s G2 20XGS01100 | |
| Średnia w klasie Office (4854 - 155900, n=79, ostatnie 2 lata) | |
| Przeciętny AMD Ryzen 7 PRO 6850U (45568 - 60867, n=8) | |
| Lenovo ThinkPad T14s G3 21CQ002LGE | |
| Dell Latitude 9430 2-in-1 | |
| HP EliteBook 845 G9 6F6H9EA | |
| Lenovo ThinkPad T14s G3 21BR00CDGE | |
| Lenovo ThinkPad X1 Carbon G10 21CB00DCGE | |
| AIDA64 / CPU ZLib | |
| Średnia w klasie Office (114.6 - 1366, n=79, ostatnie 2 lata) | |
| Przeciętny AMD Ryzen 7 PRO 6850U (641 - 805, n=8) | |
| Lenovo ThinkPad T14s G3 21CQ002LGE | |
| Dell Latitude 9430 2-in-1 | |
| Lenovo ThinkPad T14s G3 21BR00CDGE | |
| Lenovo ThinkPad T14s G2 20XGS01100 | |
| HP EliteBook 845 G9 6F6H9EA | |
| Lenovo ThinkPad X1 Carbon G10 21CB00DCGE | |
| AIDA64 / FP64 Ray-Trace | |
| Średnia w klasie Office (1109 - 17834, n=79, ostatnie 2 lata) | |
| Przeciętny AMD Ryzen 7 PRO 6850U (5967 - 7821, n=8) | |
| Lenovo ThinkPad T14s G3 21CQ002LGE | |
| Lenovo ThinkPad T14s G2 20XGS01100 | |
| HP EliteBook 845 G9 6F6H9EA | |
| Dell Latitude 9430 2-in-1 | |
| Lenovo ThinkPad T14s G3 21BR00CDGE | |
| Lenovo ThinkPad X1 Carbon G10 21CB00DCGE | |
| AIDA64 / CPU PhotoWorxx | |
| Dell Latitude 9430 2-in-1 | |
| Lenovo ThinkPad T14s G3 21BR00CDGE | |
| Lenovo ThinkPad X1 Carbon G10 21CB00DCGE | |
| Średnia w klasie Office (11090 - 65229, n=79, ostatnie 2 lata) | |
| Lenovo ThinkPad T14s G3 21CQ002LGE | |
| Przeciętny AMD Ryzen 7 PRO 6850U (19707 - 27840, n=8) | |
| HP EliteBook 845 G9 6F6H9EA | |
| Lenovo ThinkPad T14s G2 20XGS01100 | |
Wydajność systemu
W PCMarku 10 Lenovo ThinkPad T14s G3 zajmuje czołowe miejsce. Co prawda w CrossMarku nie jest podobnie, ale i tam dystans do czołówki nie jest zbyt duży. Nie dziwi więc fakt, że Lenovo ThinkPad T14s Gen 3 w codziennej pracy działa bardzo szybko i płynnie.
CrossMark: Overall | Productivity | Creativity | Responsiveness
| PCMark 10 / Score | |
| Średnia w klasie Office (2601 - 9298, n=63, ostatnie 2 lata) | |
| Lenovo ThinkPad T14s G3 21CQ002LGE | |
| Przeciętny AMD Ryzen 7 PRO 6850U, AMD Radeon 680M (5873 - 6311, n=7) | |
| Lenovo ThinkPad T14s G2 20XGS01100 | |
| HP EliteBook 845 G9 6F6H9EA | |
| Dell Latitude 9430 2-in-1 | |
| Lenovo ThinkPad T14s G3 21BR00CDGE | |
| PCMark 10 / Essentials | |
| Dell Latitude 9430 2-in-1 | |
| Lenovo ThinkPad T14s G2 20XGS01100 | |
| Średnia w klasie Office (3245 - 11594, n=63, ostatnie 2 lata) | |
| Lenovo ThinkPad T14s G3 21BR00CDGE | |
| Lenovo ThinkPad T14s G3 21CQ002LGE | |
| HP EliteBook 845 G9 6F6H9EA | |
| Przeciętny AMD Ryzen 7 PRO 6850U, AMD Radeon 680M (9151 - 10263, n=7) | |
| PCMark 10 / Productivity | |
| Średnia w klasie Office (5336 - 17243, n=63, ostatnie 2 lata) | |
| Lenovo ThinkPad T14s G2 20XGS01100 | |
| Lenovo ThinkPad T14s G3 21CQ002LGE | |
| HP EliteBook 845 G9 6F6H9EA | |
| Przeciętny AMD Ryzen 7 PRO 6850U, AMD Radeon 680M (8435 - 8891, n=7) | |
| Dell Latitude 9430 2-in-1 | |
| Lenovo ThinkPad T14s G3 21BR00CDGE | |
| PCMark 10 / Digital Content Creation | |
| Średnia w klasie Office (2049 - 13541, n=63, ostatnie 2 lata) | |
| Przeciętny AMD Ryzen 7 PRO 6850U, AMD Radeon 680M (6796 - 8422, n=7) | |
| Lenovo ThinkPad T14s G3 21CQ002LGE | |
| Lenovo ThinkPad T14s G2 20XGS01100 | |
| Dell Latitude 9430 2-in-1 | |
| HP EliteBook 845 G9 6F6H9EA | |
| Lenovo ThinkPad T14s G3 21BR00CDGE | |
| CrossMark / Overall | |
| Dell Latitude 9430 2-in-1 | |
| Lenovo ThinkPad T14s G3 21BR00CDGE | |
| Średnia w klasie Office (381 - 2010, n=74, ostatnie 2 lata) | |
| Lenovo ThinkPad T14s G3 21CQ002LGE | |
| Przeciętny AMD Ryzen 7 PRO 6850U, AMD Radeon 680M (1154 - 1442, n=7) | |
| Lenovo ThinkPad T14s G2 20XGS01100 | |
| CrossMark / Productivity | |
| Dell Latitude 9430 2-in-1 | |
| Lenovo ThinkPad T14s G3 21BR00CDGE | |
| Lenovo ThinkPad T14s G3 21CQ002LGE | |
| Średnia w klasie Office (464 - 1880, n=74, ostatnie 2 lata) | |
| Przeciętny AMD Ryzen 7 PRO 6850U, AMD Radeon 680M (1188 - 1444, n=7) | |
| Lenovo ThinkPad T14s G2 20XGS01100 | |
| CrossMark / Creativity | |
| Dell Latitude 9430 2-in-1 | |
| Średnia w klasie Office (319 - 2361, n=74, ostatnie 2 lata) | |
| Lenovo ThinkPad T14s G3 21BR00CDGE | |
| Lenovo ThinkPad T14s G3 21CQ002LGE | |
| Lenovo ThinkPad T14s G2 20XGS01100 | |
| Przeciętny AMD Ryzen 7 PRO 6850U, AMD Radeon 680M (1180 - 1523, n=7) | |
| CrossMark / Responsiveness | |
| Dell Latitude 9430 2-in-1 | |
| Lenovo ThinkPad T14s G3 21BR00CDGE | |
| Średnia w klasie Office (360 - 1690, n=74, ostatnie 2 lata) | |
| Lenovo ThinkPad T14s G3 21CQ002LGE | |
| Przeciętny AMD Ryzen 7 PRO 6850U, AMD Radeon 680M (990 - 1282, n=7) | |
| Lenovo ThinkPad T14s G2 20XGS01100 | |
| PCMark 10 Score | 6152 pkt. | |
Pomoc | ||
| AIDA64 / Memory Copy | |
| Dell Latitude 9430 2-in-1 | |
| Średnia w klasie Office (20075 - 110930, n=76, ostatnie 2 lata) | |
| Lenovo ThinkPad T14s G3 21BR00CDGE | |
| Lenovo ThinkPad T14s G3 21CQ002LGE | |
| Przeciętny AMD Ryzen 7 PRO 6850U (31003 - 48605, n=8) | |
| Lenovo ThinkPad T14s G2 20XGS01100 | |
| HP EliteBook 845 G9 6F6H9EA | |
| AIDA64 / Memory Read | |
| Średnia w klasie Office (10084 - 128030, n=77, ostatnie 2 lata) | |
| Lenovo ThinkPad T14s G3 21BR00CDGE | |
| Dell Latitude 9430 2-in-1 | |
| Przeciętny AMD Ryzen 7 PRO 6850U (34682 - 45912, n=8) | |
| Lenovo ThinkPad T14s G3 21CQ002LGE | |
| Lenovo ThinkPad T14s G2 20XGS01100 | |
| HP EliteBook 845 G9 6F6H9EA | |
| AIDA64 / Memory Write | |
| Średnia w klasie Office (20073 - 119858, n=77, ostatnie 2 lata) | |
| Dell Latitude 9430 2-in-1 | |
| Lenovo ThinkPad T14s G3 21BR00CDGE | |
| Lenovo ThinkPad T14s G3 21CQ002LGE | |
| Przeciętny AMD Ryzen 7 PRO 6850U (34532 - 51096, n=8) | |
| Lenovo ThinkPad T14s G2 20XGS01100 | |
| HP EliteBook 845 G9 6F6H9EA | |
| AIDA64 / Memory Latency | |
| Lenovo ThinkPad T14s G3 21CQ002LGE | |
| Lenovo ThinkPad T14s G2 20XGS01100 | |
| Przeciętny AMD Ryzen 7 PRO 6850U (86.1 - 135.3, n=8) | |
| Dell Latitude 9430 2-in-1 | |
| Średnia w klasie Office (7.6 - 162.9, n=72, ostatnie 2 lata) | |
| HP EliteBook 845 G9 6F6H9EA | |
| Lenovo ThinkPad T14s G3 21BR00CDGE | |
* ... im mniej tym lepiej
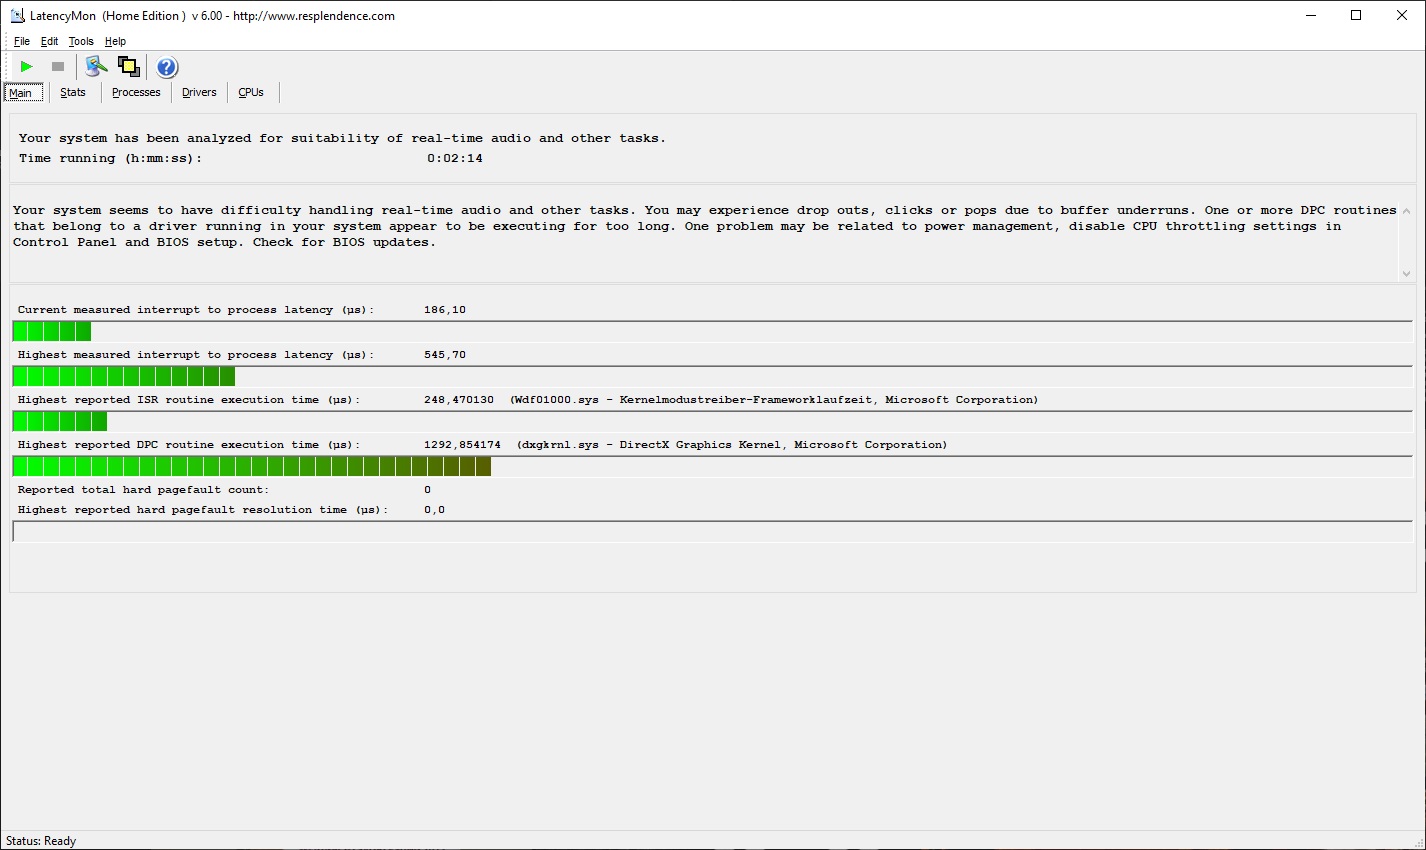
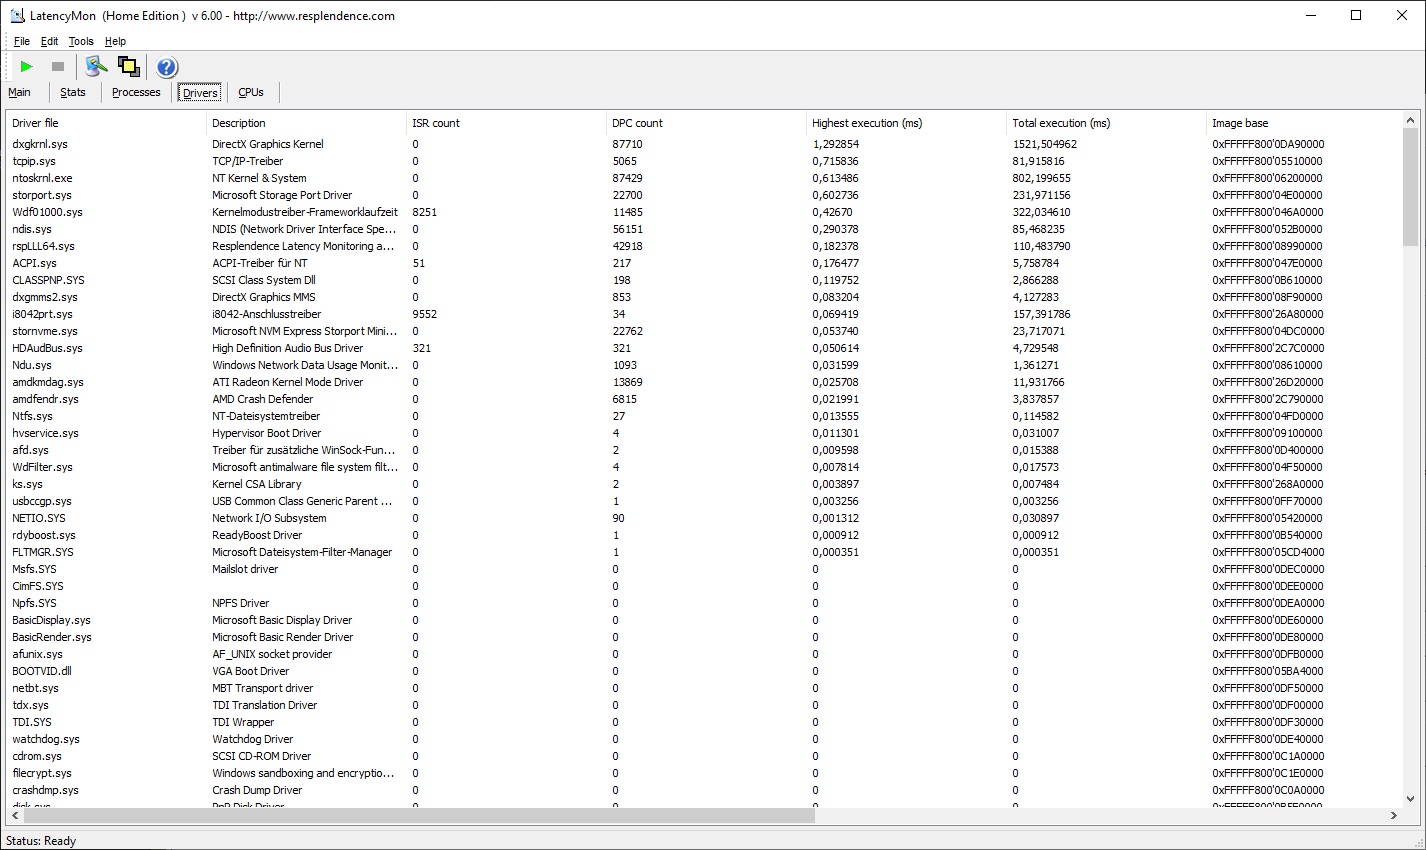
Opóźnienia DPC
Choć zmierzone opóźnienia DPC nie są szczególnie wysokie, to jednak przy aktualnym w momencie naszych testów stanie sterowników, przynajmniej w testowanej przez nas wersji, są problematyczne dla pracy z dźwiękiem i wideo w czasie rzeczywistym.
| DPC Latencies / LatencyMon - interrupt to process latency (max), Web, Youtube, Prime95 | |
| Lenovo ThinkPad T14s G2 20XGS01100 | |
| HP EliteBook 845 G9 6F6H9EA | |
| Lenovo ThinkPad T14s G3 21BR00CDGE | |
| Dell Latitude 9430 2-in-1 | |
| Lenovo ThinkPad T14s G3 21CQ002LGE | |
* ... im mniej tym lepiej
Rozwiązanie w zakresie przechowywania
Dysk SSD Hynix z naszego testowego egzemplarza Lenovo ThinkPad T14s G3 oferuje pojemność 512 GB. Dysk SSD M.2-2280 jest podłączany za pośrednictwem szybkiego standardu NVMe PCIe 4.0, osiągając lepsze wyniki w benchmarkach niż wszyscy konkurenci w naszym zestawieniu. Pod stałym obciążeniem mogą jednak wystąpić pewne spadki wydajności, co może być spowodowane pewnymi ograniczeniami termicznymi.

| Drive Performance rating - Percent | |
| Średnia w klasie Office | |
| Lenovo ThinkPad T14s G3 21CQ002LGE | |
| Przeciętny SK Hynix PC711 512GB HFS512GDE9X081N | |
| Lenovo ThinkPad T14s G2 20XGS01100 | |
| Lenovo ThinkPad T14s G3 21BR00CDGE | |
| Dell Latitude 9430 2-in-1 | |
| HP EliteBook 845 G9 6F6H9EA | |
* ... im mniej tym lepiej
Disk Throttling: DiskSpd Read Loop, Queue Depth 8
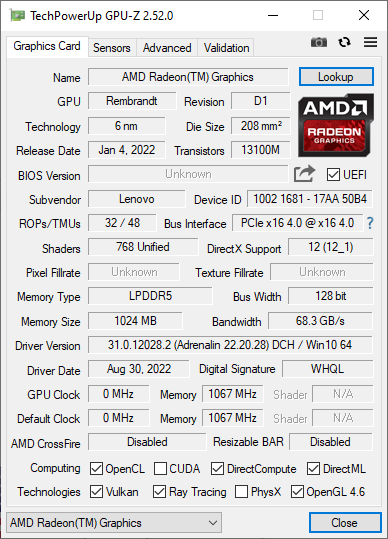
Karta graficzna
Na stronie .AMD Radeon 680M to zintegrowany procesor graficzny, który nie potrzebuje własnej pamięci masowej. Ten procesor RNDA2 w Lenovo ThinkPad T14s G3 osiąga w benchmarkach wyniki znacznie wyprzedzające konkurentów z procesorami Intela, niezależnie od tego, czy spojrzymy na testy 3DMark, czy na nasze benchmarki gier, choć przyznajemy, że te są mniej znaczące w przypadku laptopa biznesowego. Ciekawszy jest być może Blender v3.3, w którym Radeon 680M w Lenovo ThinkPad działa około dwa razy szybciej niż Radeon 660M z HP EliteBook 845 G9podczas testu HIP. Dzięki temu ThinkPad T14s G3 AMD może być również całkiem dobrze wykorzystany do renderingu.
| 3DMark Performance rating - Percent | |
| Lenovo ThinkPad T14 G3-21CF004NGE | |
| Przeciętny AMD Radeon 680M | |
| Lenovo ThinkPad T14s G3 21CQ002LGE | |
| Średnia w klasie Office | |
| Dell Latitude 9430 2-in-1 | |
| Lenovo ThinkPad T14s G2 20XGS01100 | |
| Lenovo ThinkPad X1 Carbon G10 21CB00DCGE | |
| Lenovo ThinkPad T14s G3 21BR00CDGE | |
| HP EliteBook 845 G9 6F6H9EA | |
| 3DMark 11 - 1280x720 Performance GPU | |
| Lenovo ThinkPad T14 G3-21CF004NGE | |
| Przeciętny AMD Radeon 680M (6858 - 11755, n=39) | |
| Lenovo ThinkPad T14s G3 21CQ002LGE | |
| Średnia w klasie Office (2551 - 18313, n=68, ostatnie 2 lata) | |
| Dell Latitude 9430 2-in-1 | |
| Lenovo ThinkPad T14s G2 20XGS01100 | |
| Lenovo ThinkPad X1 Carbon G10 21CB00DCGE | |
| Lenovo ThinkPad T14s G3 21BR00CDGE | |
| HP EliteBook 845 G9 6F6H9EA | |
| 3DMark 11 Performance | 9637 pkt. | |
| 3DMark Cloud Gate Standard Score | 29621 pkt. | |
| 3DMark Fire Strike Score | 5908 pkt. | |
| 3DMark Time Spy Score | 2171 pkt. | |
Pomoc | ||
* ... im mniej tym lepiej
| Performance rating - Percent | |
| Lenovo ThinkPad T14s G3 21CQ002LGE | |
| Średnia w klasie Office | |
| Dell Latitude 9430 2-in-1 | |
| Lenovo ThinkPad T14s G2 20XGS01100 -1! | |
| Lenovo ThinkPad T14s G3 21BR00CDGE | |
| HP EliteBook 845 G9 6F6H9EA | |
| The Witcher 3 - 1920x1080 Ultra Graphics & Postprocessing (HBAO+) | |
| Lenovo ThinkPad T14s G3 21CQ002LGE | |
| Średnia w klasie Office (14.8 - 18.1, n=4, ostatnie 2 lata) | |
| Dell Latitude 9430 2-in-1 | |
| Lenovo ThinkPad T14s G2 20XGS01100 | |
| Lenovo ThinkPad T14s G3 21BR00CDGE | |
| HP EliteBook 845 G9 6F6H9EA | |
| Final Fantasy XV Benchmark - 1920x1080 High Quality | |
| Średnia w klasie Office (8.09 - 79.5, n=67, ostatnie 2 lata) | |
| Lenovo ThinkPad T14s G3 21CQ002LGE | |
| Dell Latitude 9430 2-in-1 | |
| Lenovo ThinkPad T14s G3 21BR00CDGE | |
| HP EliteBook 845 G9 6F6H9EA | |
| Strange Brigade - 1920x1080 ultra AA:ultra AF:16 | |
| Lenovo ThinkPad T14s G3 21CQ002LGE | |
| Średnia w klasie Office (12.9 - 142.1, n=50, ostatnie 2 lata) | |
| Dell Latitude 9430 2-in-1 | |
| Lenovo ThinkPad T14s G2 20XGS01100 | |
| Lenovo ThinkPad T14s G3 21BR00CDGE | |
| HP EliteBook 845 G9 6F6H9EA | |
| Dota 2 Reborn - 1920x1080 ultra (3/3) best looking | |
| Dell Latitude 9430 2-in-1 | |
| Lenovo ThinkPad T14s G3 21CQ002LGE | |
| Średnia w klasie Office (14.6 - 135, n=73, ostatnie 2 lata) | |
| Lenovo ThinkPad T14s G2 20XGS01100 | |
| HP EliteBook 845 G9 6F6H9EA | |
| Lenovo ThinkPad T14s G3 21BR00CDGE | |
| X-Plane 11.11 - 1920x1080 high (fps_test=3) | |
| Dell Latitude 9430 2-in-1 | |
| Średnia w klasie Office (12 - 82.4, n=64, ostatnie 2 lata) | |
| Lenovo ThinkPad T14s G2 20XGS01100 | |
| Lenovo ThinkPad T14s G3 21CQ002LGE | |
| Lenovo ThinkPad T14s G3 21BR00CDGE | |
| HP EliteBook 845 G9 6F6H9EA | |
The Witcher 3 FPS Chart
| low | med. | high | ultra | |
|---|---|---|---|---|
| The Witcher 3 (2015) | 119.7 | 40.5 | 24.5 | |
| Dota 2 Reborn (2015) | 109.1 | 90.4 | 66.3 | 56.6 |
| Final Fantasy XV Benchmark (2018) | 58.7 | 30.4 | 21.7 | |
| X-Plane 11.11 (2018) | 50.7 | 38.6 | 31.2 | |
| Strange Brigade (2018) | 133.7 | 54.7 | 45.1 | 38.3 |
Emisja: ThinkPad T14s G3 z niemal bezgłośnym wentylatorem
Poziomy hałasu
Kiedy zaczęliśmy testować natężenie hałasu w ThinkPadzie T14s G3, najpierw zastanawialiśmy się, czy działa wentylator, gdyż laptop ThinkPad pozostawał bardzo cichy. Podczas pracy w trybie jałowym pozostaje przez cały czas zupełnie cichy i nawet nasz test dla średnich obciążeń nie powoduje uaktywnienia się wentylatora. Dopiero pod maksymalnym obciążeniem chłodzenie wreszcie się uaktywnia, ale nawet wtedy pozostaje praktycznie bezgłośne, osiągając zaledwie 27,3 dB(a). Wszystkie modele porównawcze bez wyjątku wykazują wyższy poziom hałasu wentylatora.
W T14s Gen 3 nie zauważamy żadnego wycieku cewki.
Hałas
| luz |
| 22.8 / 22.8 / 22.8 dB |
| obciążenie |
| 22.8 / 27.3 dB |
 | ||
30 dB cichy 40 dB(A) słyszalny 50 dB(A) irytujący |
||
min: | ||
| Lenovo ThinkPad T14s G3 21CQ002LGE Radeon 680M, R7 PRO 6850U, SK Hynix PC711 512GB HFS512GDE9X081N | Lenovo ThinkPad T14s G3 21BR00CDGE Iris Xe G7 80EUs, i5-1235U, SK Hynix HFS512 GDE9X081N | Lenovo ThinkPad T14s G2 20XGS01100 Vega 8, R7 PRO 5850U, Lenovo UMIS AM630 RPETJ1T24MGE2QDQ | Dell Latitude 9430 2-in-1 Iris Xe G7 96EUs, i7-1265U | HP EliteBook 845 G9 6F6H9EA Radeon 660M, R5 PRO 6650U, Samsung PM991 MZVLQ512HBLU | |
|---|---|---|---|---|---|
| Noise | -16% | -21% | -26% | -23% | |
| wyłączone / środowisko * (dB) | 22.8 | 24.6 -8% | 26.81 -18% | 23.7 -4% | 24 -5% |
| Idle Minimum * (dB) | 22.8 | 24.6 -8% | 26.81 -18% | 23.7 -4% | 24 -5% |
| Idle Average * (dB) | 22.8 | 24.6 -8% | 26.81 -18% | 23.7 -4% | 25 -10% |
| Idle Maximum * (dB) | 22.8 | 24.6 -8% | 26.81 -18% | 23.7 -4% | 26 -14% |
| Load Average * (dB) | 22.8 | 26.1 -14% | 30.16 -32% | 35.1 -54% | 34 -49% |
| Witcher 3 ultra * (dB) | 27.5 | 35.9 -31% | 43.3 -57% | 38 -38% | |
| Load Maximum * (dB) | 27.3 | 36.3 -33% | 33.98 -24% | 43 -58% | 38 -39% |
* ... im mniej tym lepiej
Temperatura
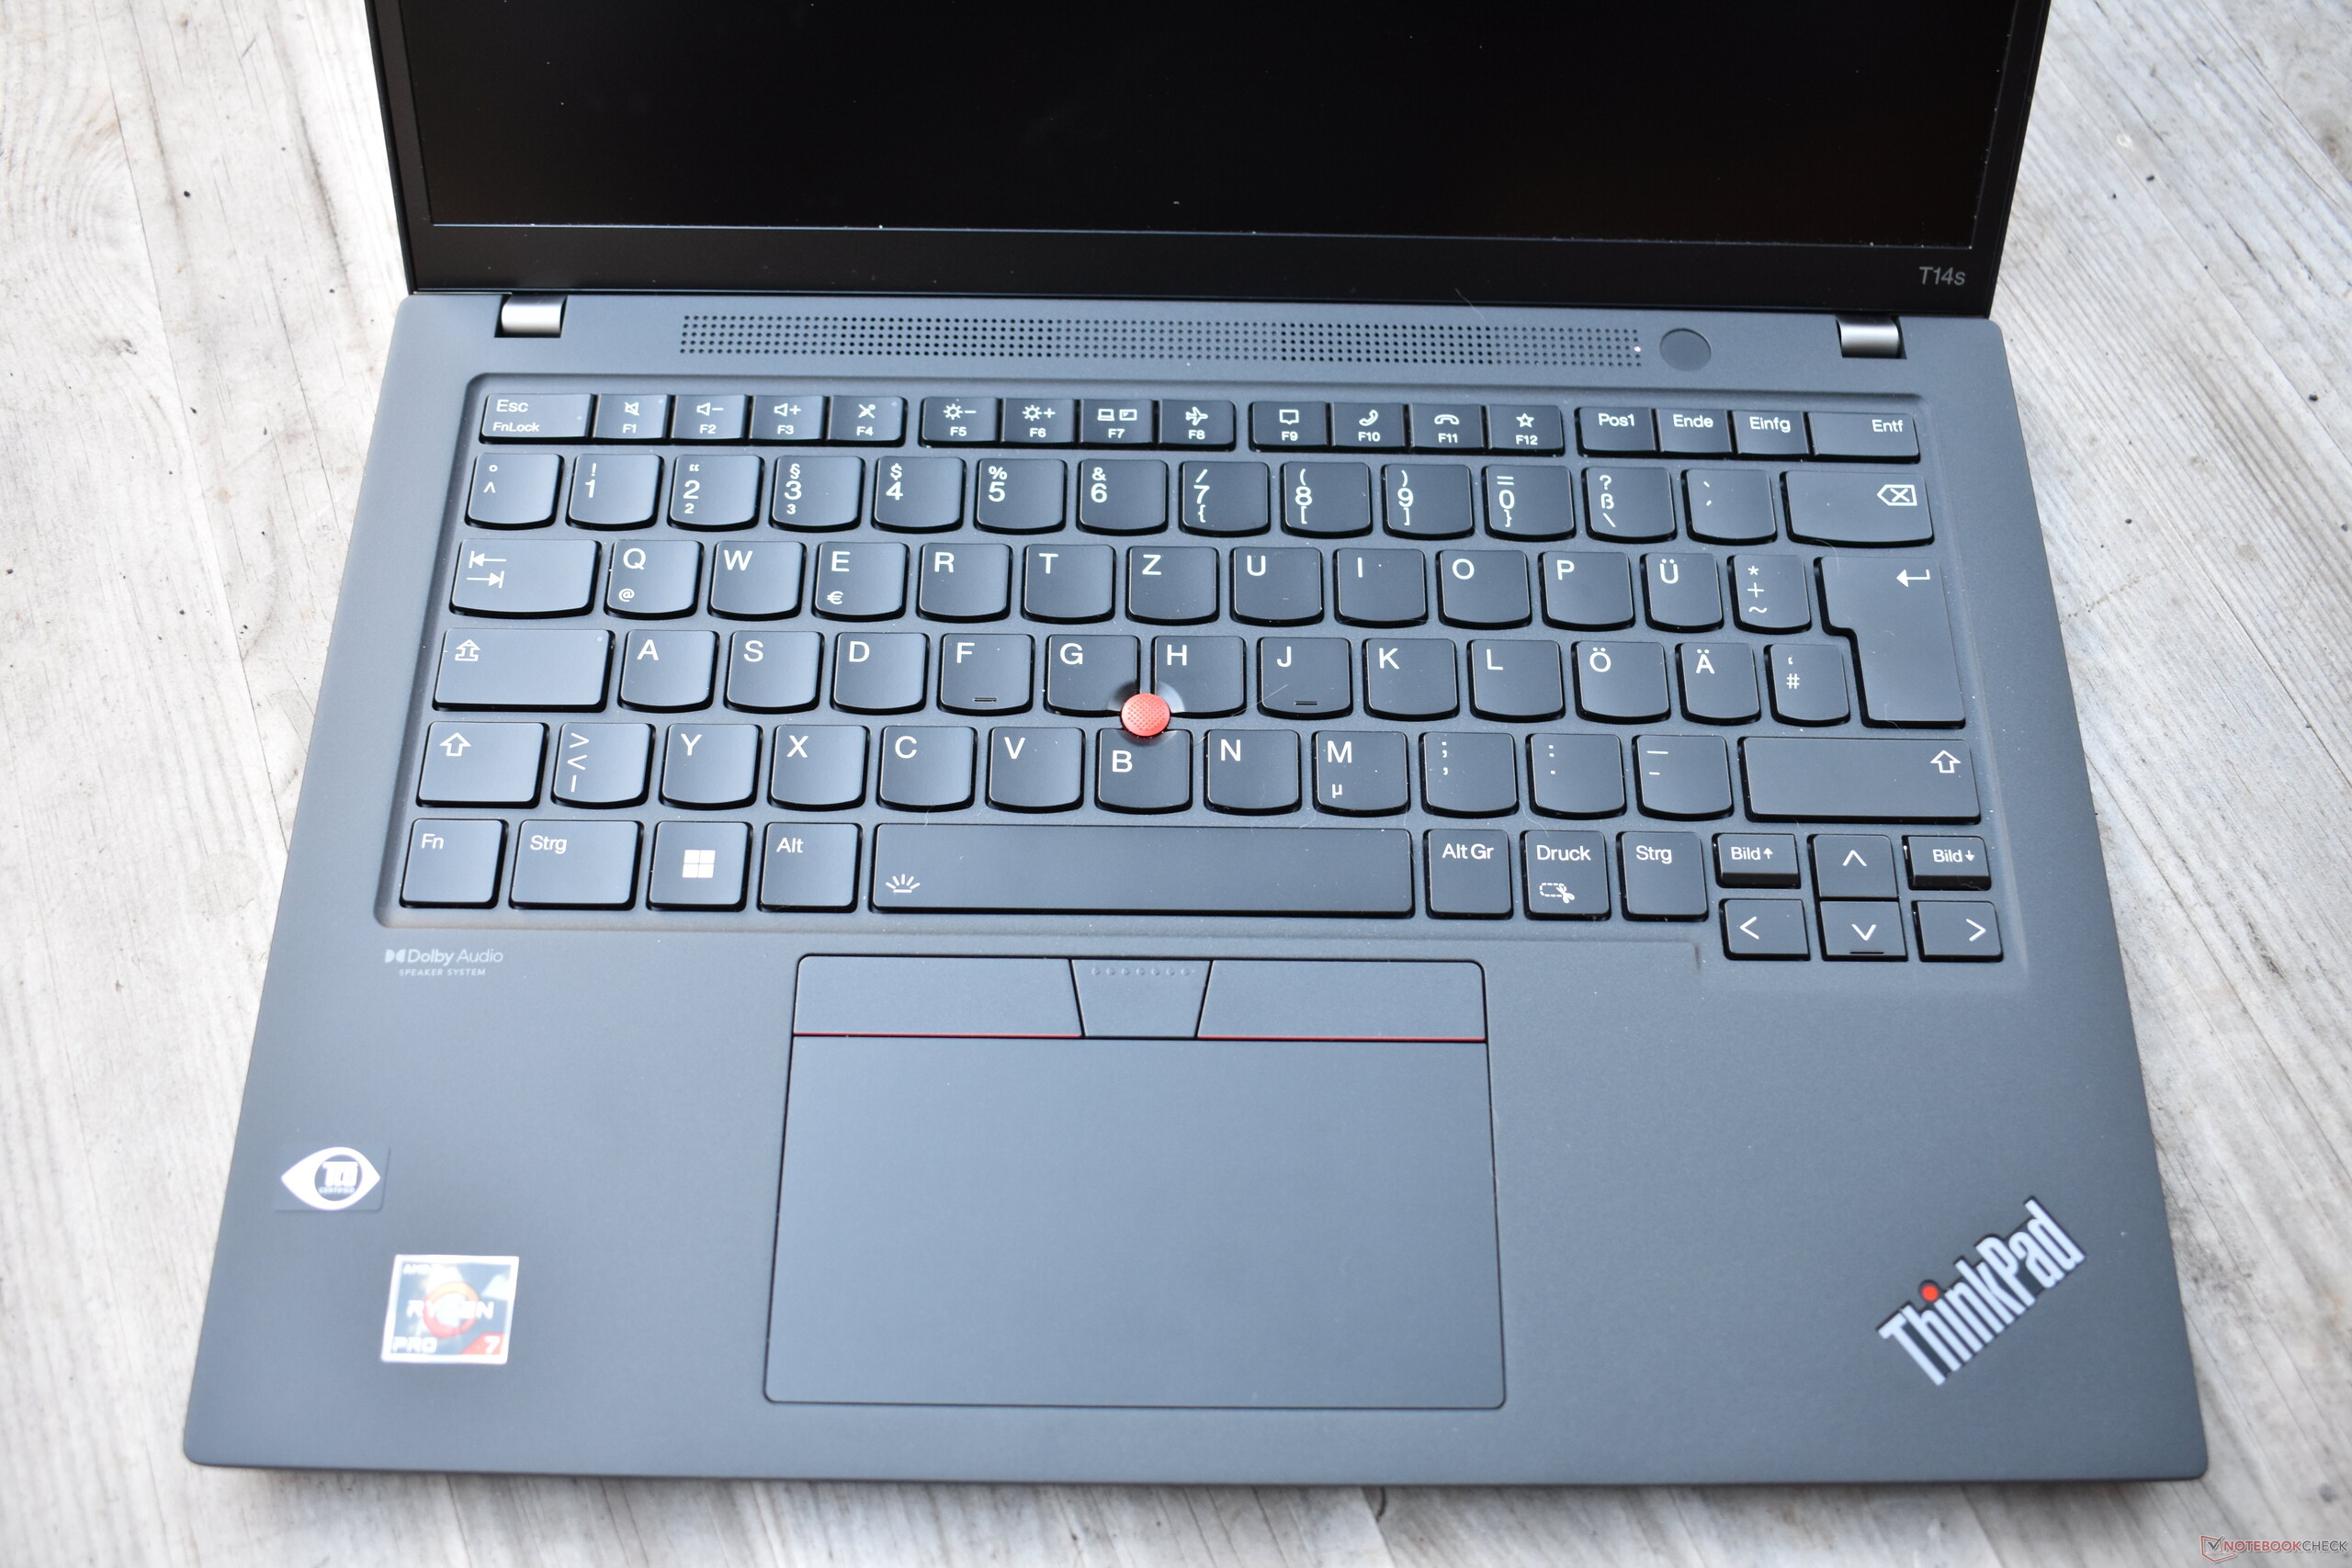
Generalnie Lenovo ThinkPad T14s Gen 3 pozostaje bardzo chłodny i nawet pod obciążeniem prawie żadne z miejsc pomiaru nie przekracza granicy 40 stopni Celsjusza (104 °F). Jedynym wyjątkiem jest obszar na środku klawiatury wokół TrackPointa, gdzie szczególnie szczelina między klawiszami osiąga temperatury w zakresie od 47,7 do 49,2°C (118-120°F). Pozytywnym aspektem jest to, że oparcie dłoni pozostaje komfortowo chłodne we wszystkich przypadkach.
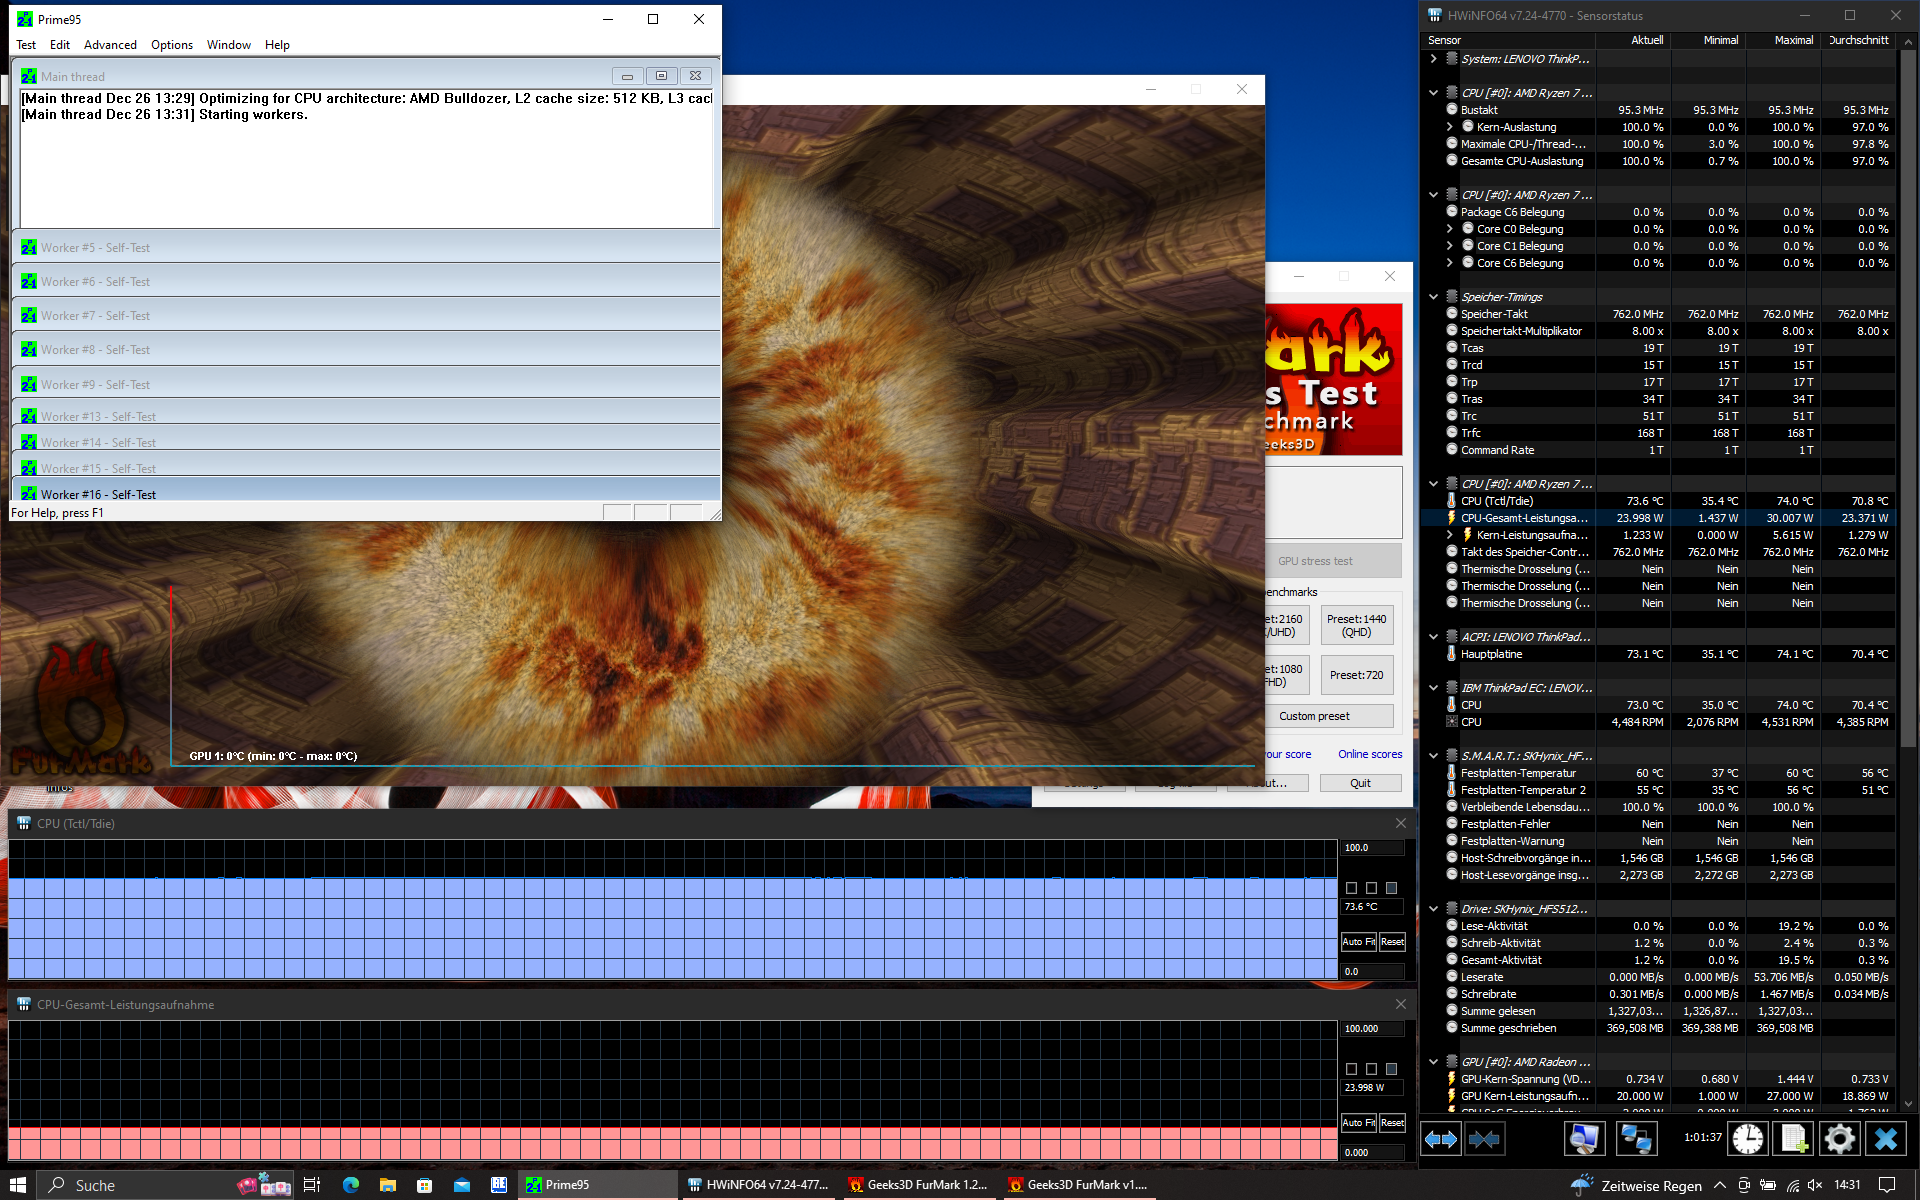
W teście obciążeniowym nie zaobserwowaliśmy żadnego dławienia. Nawet po godzinie procesor jest w stanie utrzymać swój długoterminowy limit mocy 24 W.
(-) Maksymalna temperatura w górnej części wynosi 49.2 °C / 121 F, w porównaniu do średniej 34.3 °C / 94 F , począwszy od 21.2 do 62.5 °C dla klasy Office.
(+) Dno nagrzewa się maksymalnie do 37.2 °C / 99 F, w porównaniu do średniej 36.8 °C / 98 F
(+) W stanie bezczynności średnia temperatura górnej części wynosi 25.2 °C / 77 F, w porównaniu ze średnią temperaturą urządzenia wynoszącą 29.5 °C / ### class_avg_f### F.
(±) Podczas gry w Wiedźmina 3 średnia temperatura górnej części wynosi 34.7 °C / 94 F, w porównaniu do średniej temperatury urządzenia wynoszącej 29.5 °C / ## #class_avg_f### F.
(+) Podpórki pod nadgarstki i touchpad są chłodniejsze niż temperatura skóry i maksymalnie 28.2 °C / 82.8 F i dlatego są chłodne w dotyku.
(±) Średnia temperatura obszaru podparcia dłoni w podobnych urządzeniach wynosiła 27.5 °C / 81.5 F (-0.7 °C / -1.3 F).
| Lenovo ThinkPad T14s G3 21CQ002LGE AMD Ryzen 7 PRO 6850U, AMD Radeon 680M | Lenovo ThinkPad T14s G3 21BR00CDGE Intel Core i5-1235U, Intel Iris Xe Graphics G7 80EUs | Lenovo ThinkPad T14s G2 20XGS01100 AMD Ryzen 7 PRO 5850U, AMD Radeon RX Vega 8 (Ryzen 4000/5000) | Dell Latitude 9430 2-in-1 Intel Core i7-1265U, Intel Iris Xe Graphics G7 96EUs | HP EliteBook 845 G9 6F6H9EA AMD Ryzen 5 PRO 6650U, AMD Radeon 660M | |
|---|---|---|---|---|---|
| Heat | -1% | 2% | 11% | -0% | |
| Maximum Upper Side * (°C) | 49.2 | 43.6 11% | 44.2 10% | 39.2 20% | 44 11% |
| Maximum Bottom * (°C) | 37.2 | 42 -13% | 38.9 -5% | 44.8 -20% | 45 -21% |
| Idle Upper Side * (°C) | 31.1 | 28.1 10% | 27.7 11% | 21.4 31% | 27 13% |
| Idle Bottom * (°C) | 26 | 28.9 -11% | 28.3 -9% | 22.4 14% | 27 -4% |
* ... im mniej tym lepiej
Mówcy
Głośniki to aspekt, w którym ThinkPad serii T wyraźnie ustępuje modelom z wyższej półki z serii X1. Umieszczone nad klawiaturą głośniki stereo wytwarzają dźwięk zrównoważony w zakresie średnich i wysokich tonów, ale też bardzo cichy, pozbawiony basów.
Lenovo ThinkPad T14s G3 21CQ002LGE analiza dźwięku
(-) | niezbyt głośne głośniki (###wartość### dB)
Bas 100 - 315 Hz
(-) | prawie brak basu - średnio 16.8% niższa od mediany
(±) | liniowość basu jest średnia (14.6% delta do poprzedniej częstotliwości)
Średnie 400 - 2000 Hz
(+) | zbalansowane środki średnie - tylko 2.3% od mediany
(+) | średnie są liniowe (5.4% delta do poprzedniej częstotliwości)
Wysokie 2–16 kHz
(+) | zrównoważone maksima - tylko 1.6% od mediany
(+) | wzloty są liniowe (3.5% delta do poprzedniej częstotliwości)
Ogólnie 100 - 16.000 Hz
(±) | liniowość ogólnego dźwięku jest średnia (15.7% różnicy w stosunku do mediany)
W porównaniu do tej samej klasy
» 17% wszystkich testowanych urządzeń w tej klasie było lepszych, 5% podobnych, 79% gorszych
» Najlepszy miał deltę 7%, średnia wynosiła ###średnia###%, najgorsza wynosiła 53%
W porównaniu do wszystkich testowanych urządzeń
» 24% wszystkich testowanych urządzeń było lepszych, 5% podobnych, 71% gorszych
» Najlepszy miał deltę 4%, średnia wynosiła ###średnia###%, najgorsza wynosiła 134%
Lenovo ThinkPad X1 Carbon G10 21CC001RGE analiza dźwięku
(±) | głośność głośnika jest średnia, ale dobra (75.09 dB)
Bas 100 - 315 Hz
(±) | zredukowany bas - średnio 13.2% niższy od mediany
(-) | bas nie jest liniowy (16% delta do poprzedniej częstotliwości)
Średnie 400 - 2000 Hz
(+) | zbalansowane środki średnie - tylko 2.8% od mediany
(+) | średnie są liniowe (3.6% delta do poprzedniej częstotliwości)
Wysokie 2–16 kHz
(+) | zrównoważone maksima - tylko 2.7% od mediany
(+) | wzloty są liniowe (4.1% delta do poprzedniej częstotliwości)
Ogólnie 100 - 16.000 Hz
(+) | ogólny dźwięk jest liniowy (13.7% różnicy w stosunku do mediany)
W porównaniu do tej samej klasy
» 8% wszystkich testowanych urządzeń w tej klasie było lepszych, 4% podobnych, 88% gorszych
» Najlepszy miał deltę 7%, średnia wynosiła ###średnia###%, najgorsza wynosiła 53%
W porównaniu do wszystkich testowanych urządzeń
» 15% wszystkich testowanych urządzeń było lepszych, 4% podobnych, 81% gorszych
» Najlepszy miał deltę 4%, średnia wynosiła ###średnia###%, najgorsza wynosiła 134%
Zarządzanie energią: AMD Ryzen 6000 zapewnia wysoką wydajność
Pobór mocy
Lenovo ThinkPad T14s G3 AMD to bardzo wydajny laptop. W porównaniu z ThinkPadem T14s G3 Intela jest on średnio o około 8% wydajniejszy. Jeszcze większy jest dystans do HP EliteBook 845 G9, który zużywa średnio o 22% więcej energii.
Laptop ThinkPad pobiera maksymalnie około 48,5 W, więc jego pobór mocy z nawiązką pokrywa 65-watowa ładowarka.
| wyłączony / stan wstrzymania | |
| luz | |
| obciążenie |
|
Legenda:
min: | |
| Lenovo ThinkPad T14s G3 21CQ002LGE R7 PRO 6850U, Radeon 680M, SK Hynix PC711 512GB HFS512GDE9X081N, LTPS IPS LED, 1920x1200, 14" | Lenovo ThinkPad T14s G3 21BR00CDGE i5-1235U, Iris Xe G7 80EUs, SK Hynix HFS512 GDE9X081N, IPS LED, 1920x1200, 14" | Lenovo ThinkPad T14s G2 20XGS01100 R7 PRO 5850U, Vega 8, Lenovo UMIS AM630 RPETJ1T24MGE2QDQ, IPS LED, 1920x1080, 14" | Dell Latitude 9430 2-in-1 i7-1265U, Iris Xe G7 96EUs, , IPS, 2560x1600, 14" | HP EliteBook 845 G9 6F6H9EA R5 PRO 6650U, Radeon 660M, Samsung PM991 MZVLQ512HBLU, IPS, 1920x1200, 14" | Przeciętny AMD Radeon 680M | Średnia w klasie Office | |
|---|---|---|---|---|---|---|---|
| Power Consumption | -8% | -15% | -27% | -22% | -106% | -59% | |
| Idle Minimum * (Watt) | 2.2 | 2.3 -5% | 3.16 -44% | 2.9 -32% | 3 -36% | 6.93 ? -215% | 4.4 ? -100% |
| Idle Average * (Watt) | 4.4 | 4.6 -5% | 5.6 -27% | 5.8 -32% | 5 -14% | 8.98 ? -104% | 7.32 ? -66% |
| Idle Maximum * (Watt) | 5.1 | 5.6 -10% | 7.13 -40% | 6.6 -29% | 9 -76% | 10.5 ? -106% | 8.56 ? -68% |
| Load Average * (Watt) | 33.3 | 37.1 -11% | 30.86 7% | 49.2 -48% | 41 -23% | 53.5 ? -61% | 42.5 ? -28% |
| Witcher 3 ultra * (Watt) | 40.1 | 32.8 18% | 37 8% | 35.3 12% | 32.6 19% | ||
| Load Maximum * (Watt) | 48.5 | 65.8 -36% | 46.55 4% | 63.1 -30% | 50 -3% | 70.5 ? -45% | 64.1 ? -32% |
* ... im mniej tym lepiej
Power Consumption The Witcher 3 / Stress Test
Power Consumption With External Monitor
Czas pracy na baterii
Wszystkie modele ThinkPad T14s, niezależnie od generacji i tego, jaki procesor jest w nich stosowany, mają akumulator o pojemności 57 Wh. Dzięki temu wewnętrznemu akumulatorowi laptop Lenovo osiąga w teście WiFi przy jasności wyświetlacza 150 cd/m² czas pracy około 12 godzin. Co ciekawe, jest to wynik gorszy, niż w przypadku m.in.ThinkPad T14s G2 AMDpoprzednika, ale też znacznie dłuższy, niż w przypadku m.in T14s G3 Intela, który wytrzymał niecałe 10 godzin.
| Lenovo ThinkPad T14s G3 21CQ002LGE R7 PRO 6850U, Radeon 680M, 57 Wh | Lenovo ThinkPad T14s G3 21BR00CDGE i5-1235U, Iris Xe G7 80EUs, 57 Wh | Lenovo ThinkPad T14s G2 20XGS01100 R7 PRO 5850U, Vega 8, 57 Wh | Dell Latitude 9430 2-in-1 i7-1265U, Iris Xe G7 96EUs, 60 Wh | HP EliteBook 845 G9 6F6H9EA R5 PRO 6650U, Radeon 660M, 51 Wh | Średnia w klasie Office | |
|---|---|---|---|---|---|---|
| Czasy pracy | -34% | -5% | 2% | 1% | -10% | |
| WiFi v1.3 (h) | 12 | 9.6 -20% | 14.6 22% | 12.8 7% | 12.1 1% | 12.9 ? 8% |
| Load (h) | 2.5 | 1.3 -48% | 1.7 -32% | 2.4 -4% | 1.807 ? -28% |
Za
Przeciw
Werdykt: Lenovo ThinkPad T14s G3 to zwycięzca

Gdyby istniał odpowiedni laptop dla ThinkPad X1 Carbon G10z procesorem AMD, Lenovo ThinkPad T14s Gen 3 AMD nie odbiegałby od tego. To właśnie ten model jest najbliższy tej idei.
Połączenie procesorów AMD Ryzen z serii 6000 i platformy T14s to strzał w dziesiątkę. Jest to laptop Lenovo, który praktycznie nie ma słabych punktów, poza możliwością rozbudowy i kilkoma słabościami w postaci wyświetlacza o niskiej mocy. Jest stosunkowo lekki i kompaktowy, a jednocześnie solidny, dzięki połączeniu metali lekkich i włókna węglowego. ThinkPad T14s G3 oferuje wyposażenie odpowiednie dla firm, w tym USB 4, bardzo dobre urządzenia wejścia oraz matowy i jasny wyświetlacz. Ryzen 7 Pro zapewnia wysoką wydajność bez zbytniego napędzania poboru mocy. Efektem są dobre czasy pracy na baterii i wentylator, który prawie zawsze pozostaje cichy.
Kompaktowy, solidny, szybki i z długim czasem pracy na baterii: Lenovo ThinkPad T14s Gen 3 AMD ma wiele pozytywnych cech
Nie jest więc zaskakujące, że Lenovo ThinkPad T14s G3 zdobywa bardzo dobrą ocenę około 91%. Dzięki temu jest dobrze pozycjonowany na rynku biznesowym. Najgorętsza konkurencja pochodzi od HP w postaci HP EliteBook 845 G9oraz od Della w postaciDell Latitude 9430 2-in-1. W zestawieniu z konkurentami ThinkPad imponuje zwłaszcza niższą wagą, dłuższym czasem pracy na baterii i wyraźnie cichszymi wentylatorami.
Cena i dostępność
Lenovo ThinkPad T14s G3 AMD jest dostępny bezpośrednio od Lenovo w cenie od około 984 dolarów. Konfiguracja podobna do naszego testowego egzemplarza jest również dostępna w sklepie B&H w cenie około 1999 dolarów, na przykład.
Lenovo ThinkPad T14s G3 21CQ002LGE
- 17/01/2023 v7 (old)
Benjamin Herzig
Price comparison

