Recenzja laptopa Lenovo ThinkPad T16 G1 Intel: 16-calowy maratończyk
W końcu ThinkPady Lenovo z klasycznej serii T również doczekały się redesignu. Wyświetlacz 16:10 w ThinkPadzie T16 G1, który został powiększony do 16 cali, będzie zapewne pierwszym, co przykuje uwagę. Opcja znacznie większej baterii budzi nadzieję na długie czasy pracy na akumulatorze, podobnie jak opcjonalny wyświetlacz o niskim poborze mocy. Inne zmiany zostaną wyjaśnione w tej recenzji, jak również ewentualne wady w porównaniu z poprzednikiem.w stosunku do poprzednika.
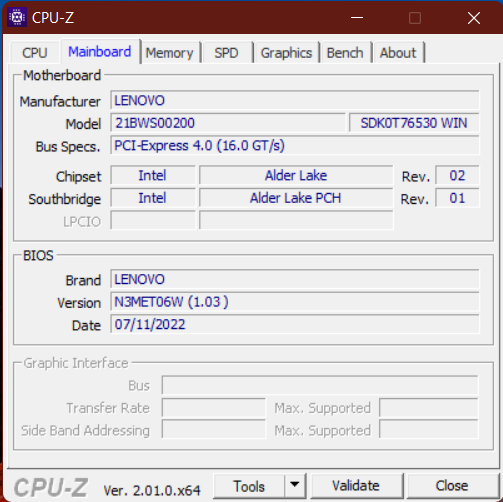
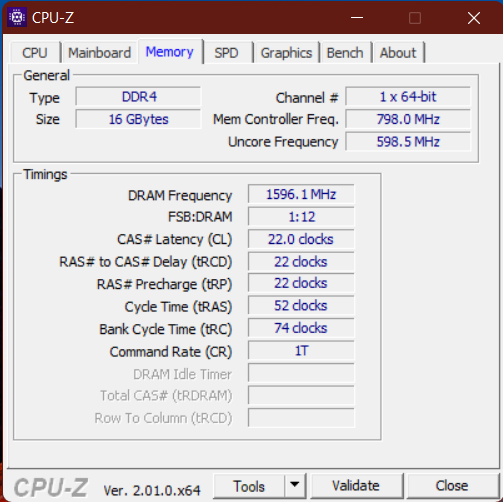
Nasz model jest wyposażony w procesor Intel Core i5-1240P, 16 GB pamięci RAM DDR4-3200, dysk SSD PCIe 4.0 o pojemności 512 GB, wyświetlacz FHD+ o niskim poborze mocy i duży akumulator o pojemności 86 Wh. Opcjonalne procesory Intel U wydają się być nieco bardziej ekonomiczne według naszych dotychczasowych recenzji. Dostępny jest również panel 2,5K, ale opcja 4K UHD z poprzednika ze 100% DCI-P3 nie jest już dostępna. Do wyboru jest też karta graficzna Nvidii GeForce MX550.
Do konkurencji ThinkPada T16 jako urządzenia biznesowego z wyższej półki wśród laptopów 15/16-calowych należą przede wszystkim Dell Latitude 15 5531 i HP EliteBook 865 G9. Z pewnością ciekawe jest jednak porównanie z laptopami ze średniej półki, w tym z multimedialnymi hybrydami biurowymi, takimi jak Huawei MateBook D 16 czy Asus Vivobook Pro 16X.
Potencjalni konkurenci w porównaniu
Ocena | Data | Model | Waga | Wysokość | Rozmiar | Rezolucja | Cena |
|---|---|---|---|---|---|---|---|
| 89.3 % v7 (old) | 09/2022 | Lenovo ThinkPad T16 G1 21BWS00200 i5-1240P, Iris Xe G7 80EUs | 1.9 kg | 20.5 mm | 16.00" | 1920x1200 | |
| 87.1 % v7 (old) | Lenovo ThinkPad T15 Gen2-20W5S00100 i7-1165G7, GeForce MX450 | 1.9 kg | 19.1 mm | 15.60" | 1920x1080 | ||
| 85.5 % v7 (old) | Lenovo ThinkPad E15 G3-20YG003UGE R7 5700U, Vega 8 | 1.8 kg | 18.9 mm | 15.60" | 1920x1080 | ||
| 85.1 % v7 (old) | Lenovo ThinkPad L15 G2 AMD R5 5600U, Vega 7 | 1.9 kg | 21 mm | 15.60" | 1920x1080 | ||
| 85 % v7 (old) | HP ProBook 450 G9 6A180EA i7-1255U, Iris Xe G7 96EUs | 1.7 kg | 19.9 mm | 15.60" | 1920x1080 | ||
| 87.7 % v7 (old) | HP ZBook Power 15 G8 313S5EA i7-11800H, T600 Laptop GPU | 2 kg | 22.8 mm | 15.60" | 1920x1080 | ||
v (old) | Dell Latitude 15 5531, i5-12600H MX550 i5-12600H, GeForce MX550 | 1.8 kg | 24.05 mm | 15.60" | 1920x1080 | ||
| 87.4 % v7 (old) | Dell Inspiron 16 Plus 7620 i7-12700H, GeForce RTX 3050 Ti Laptop GPU | 2.1 kg | 18.99 mm | 16.00" | 3072x1920 | ||
| 83.6 % v7 (old) | Huawei MateBook D 16 2022 i7-12700H, Iris Xe G7 96EUs | 1.7 kg | 18.4 mm | 16.00" | 1920x1200 | ||
v (old) | Asus Vivobook Pro 16X-M7600QE R9 5900HX, GeForce RTX 3050 Ti Laptop GPU | 1.9 kg | 19 mm | 16.10" | 3840x2400 |
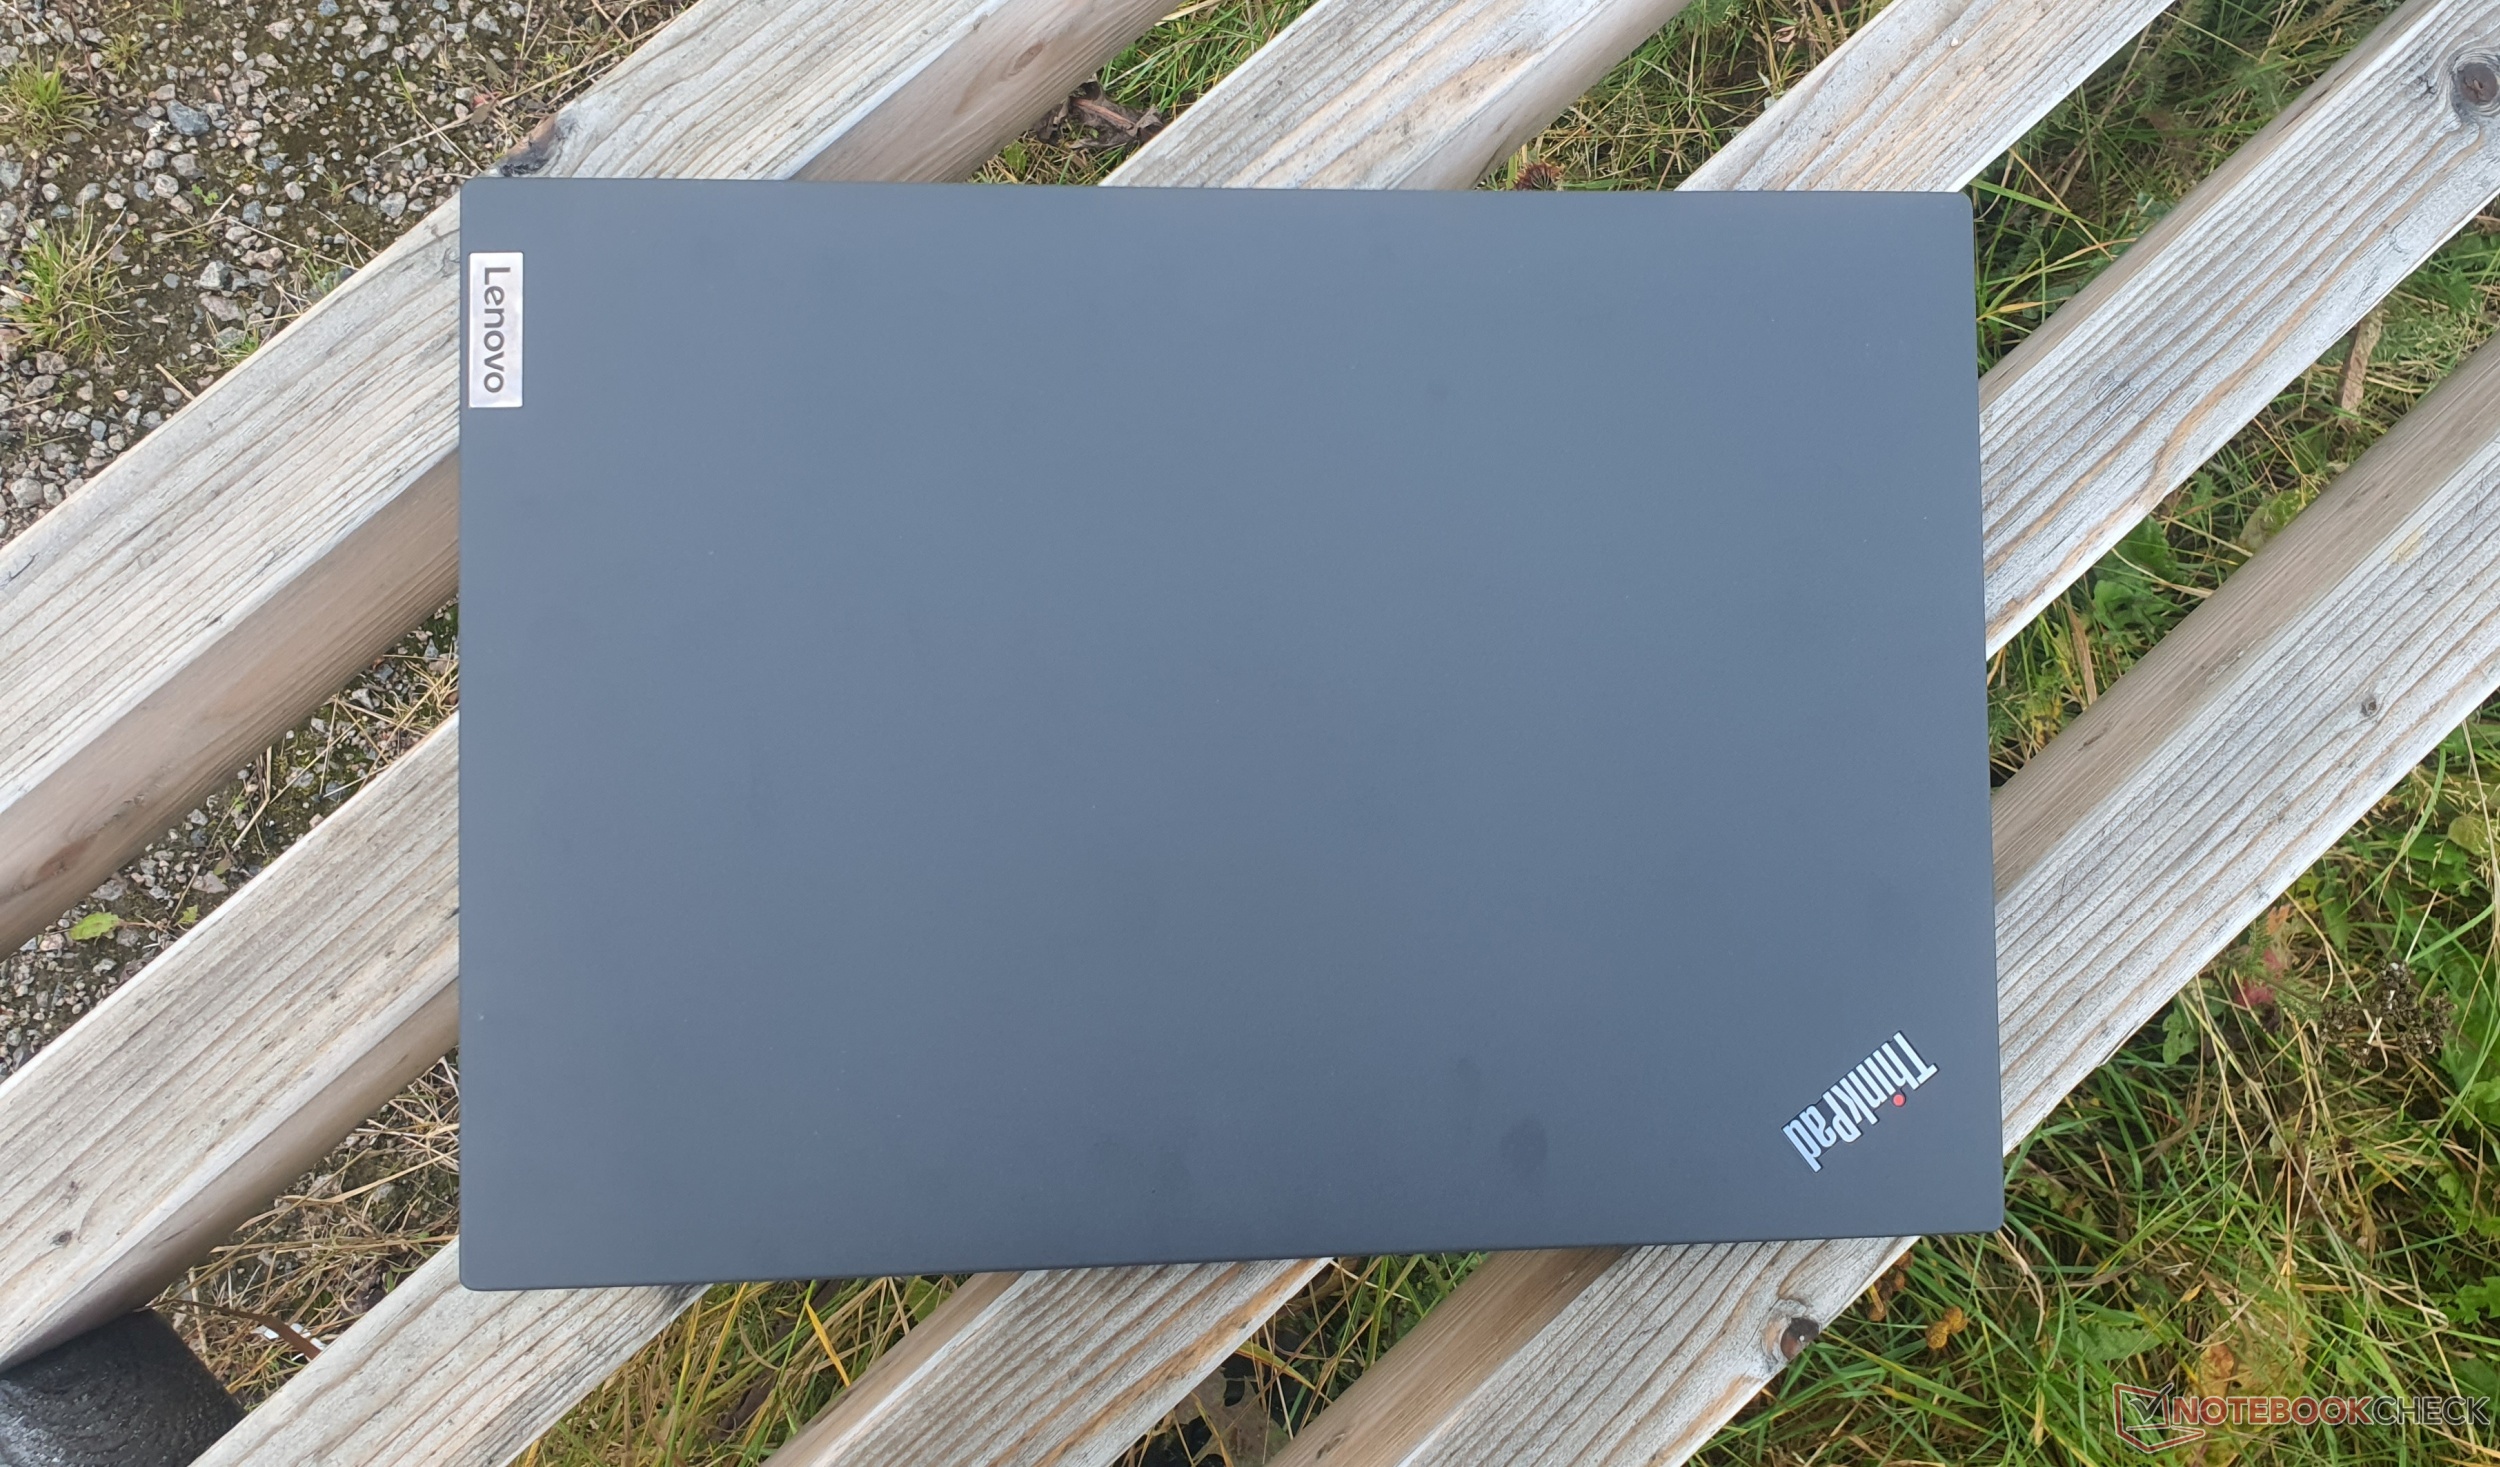
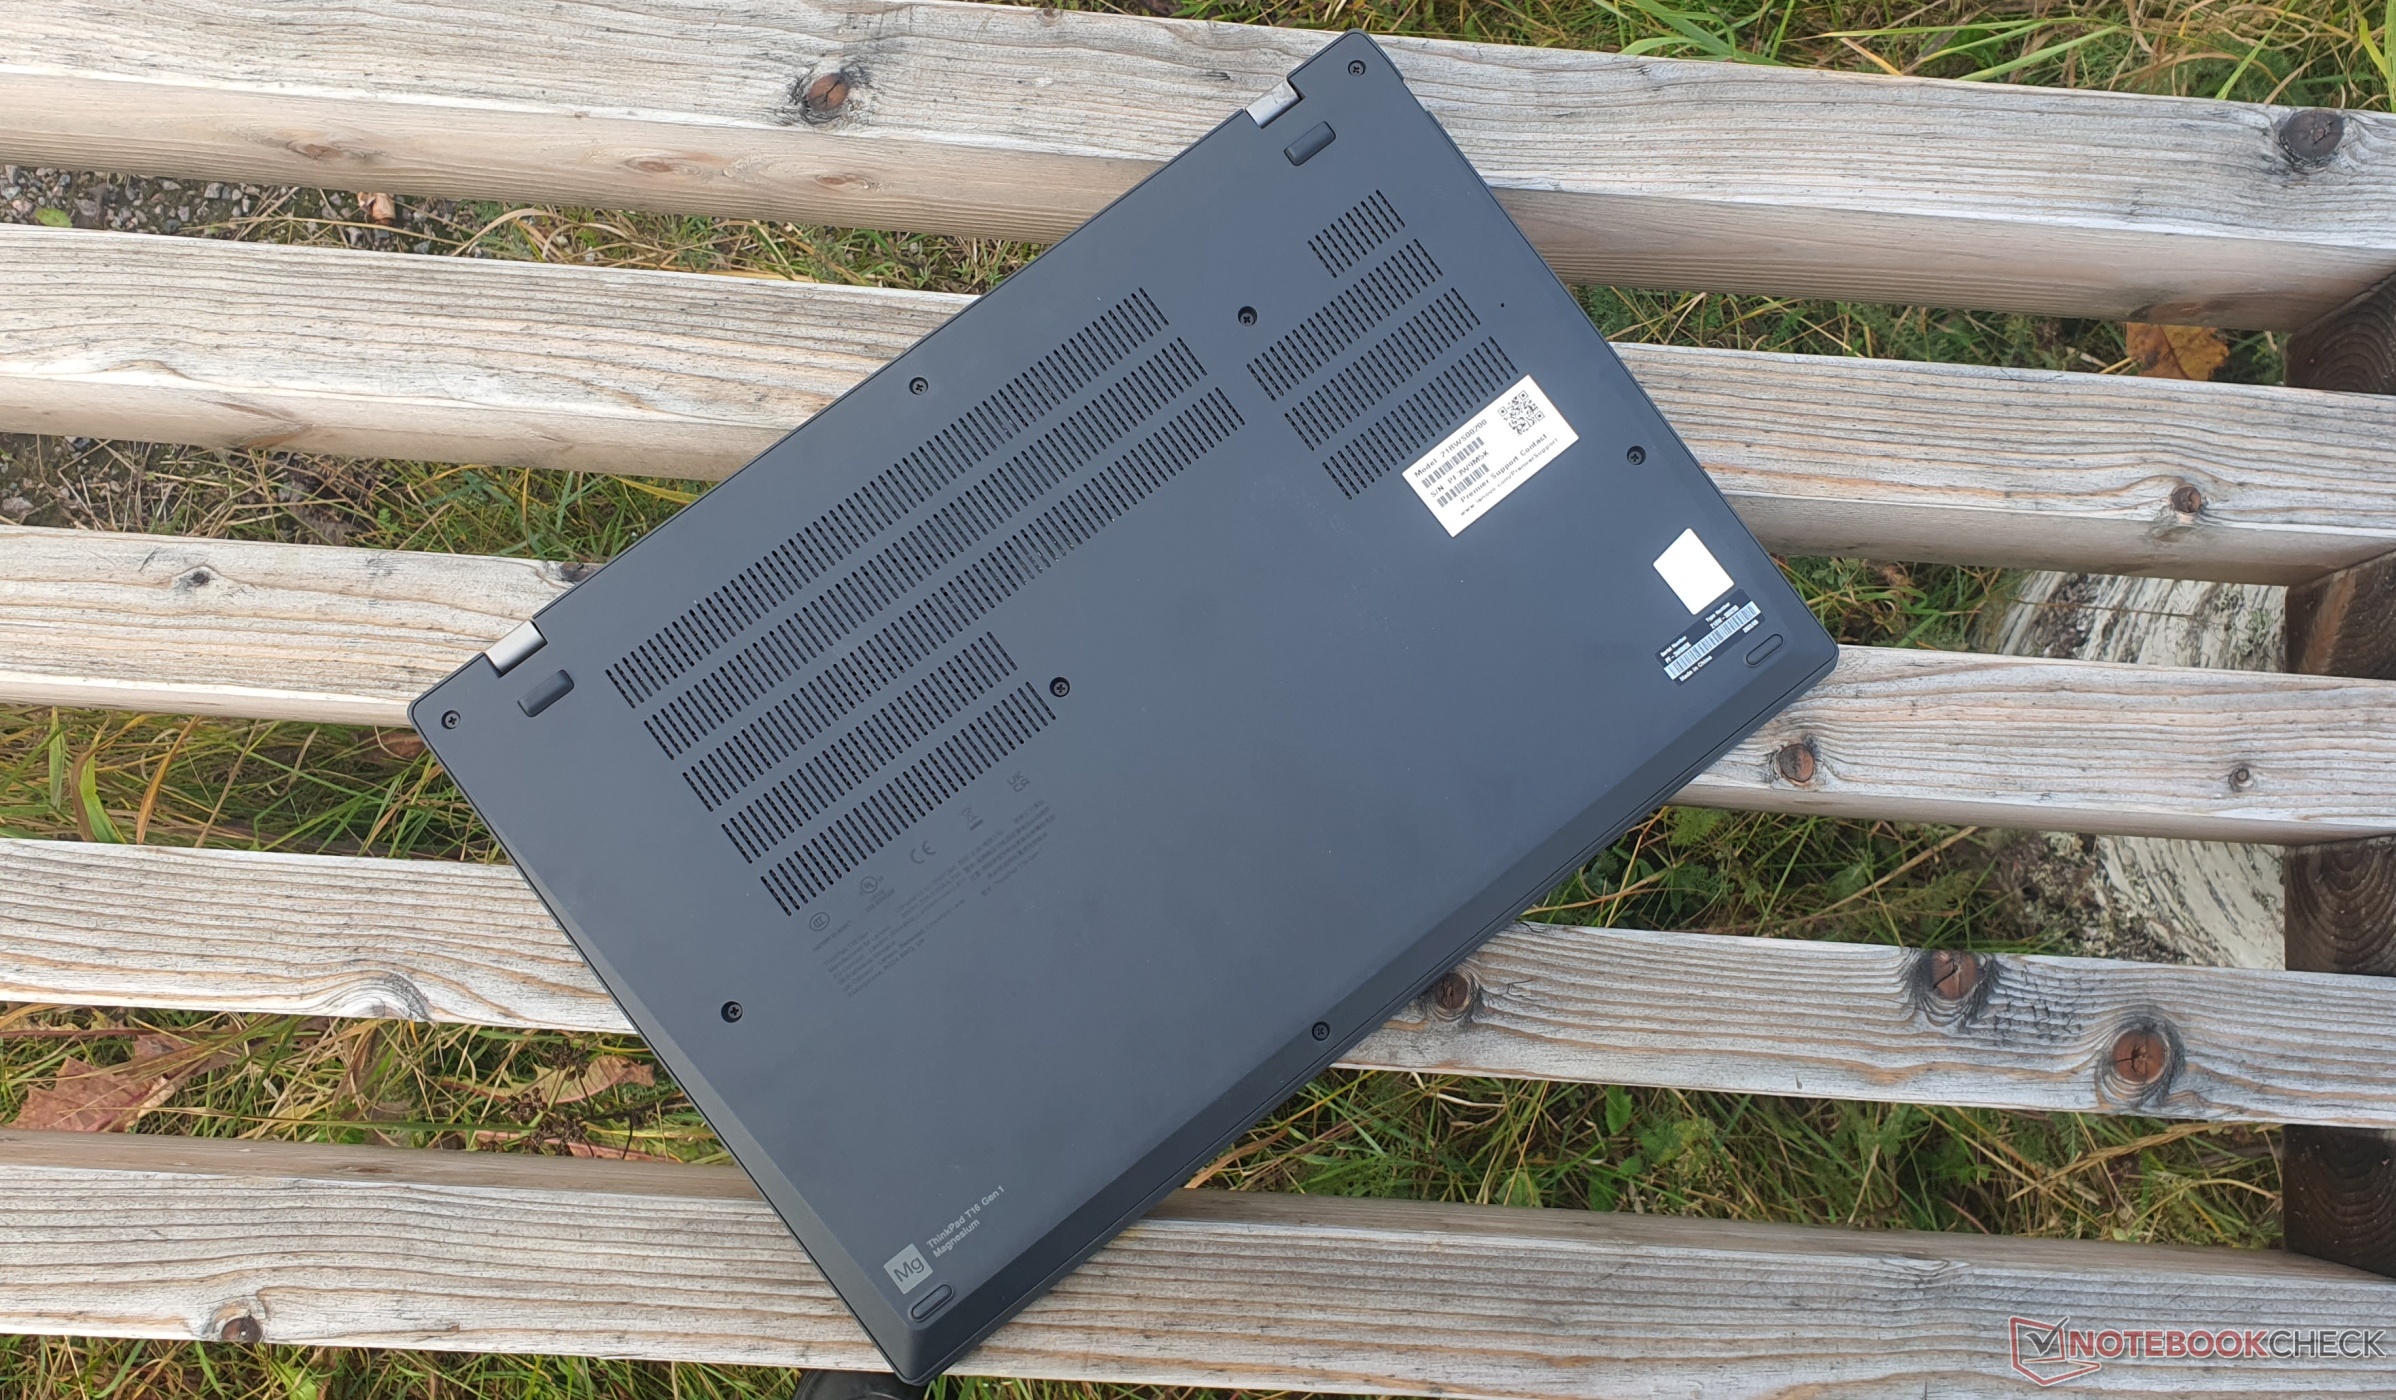
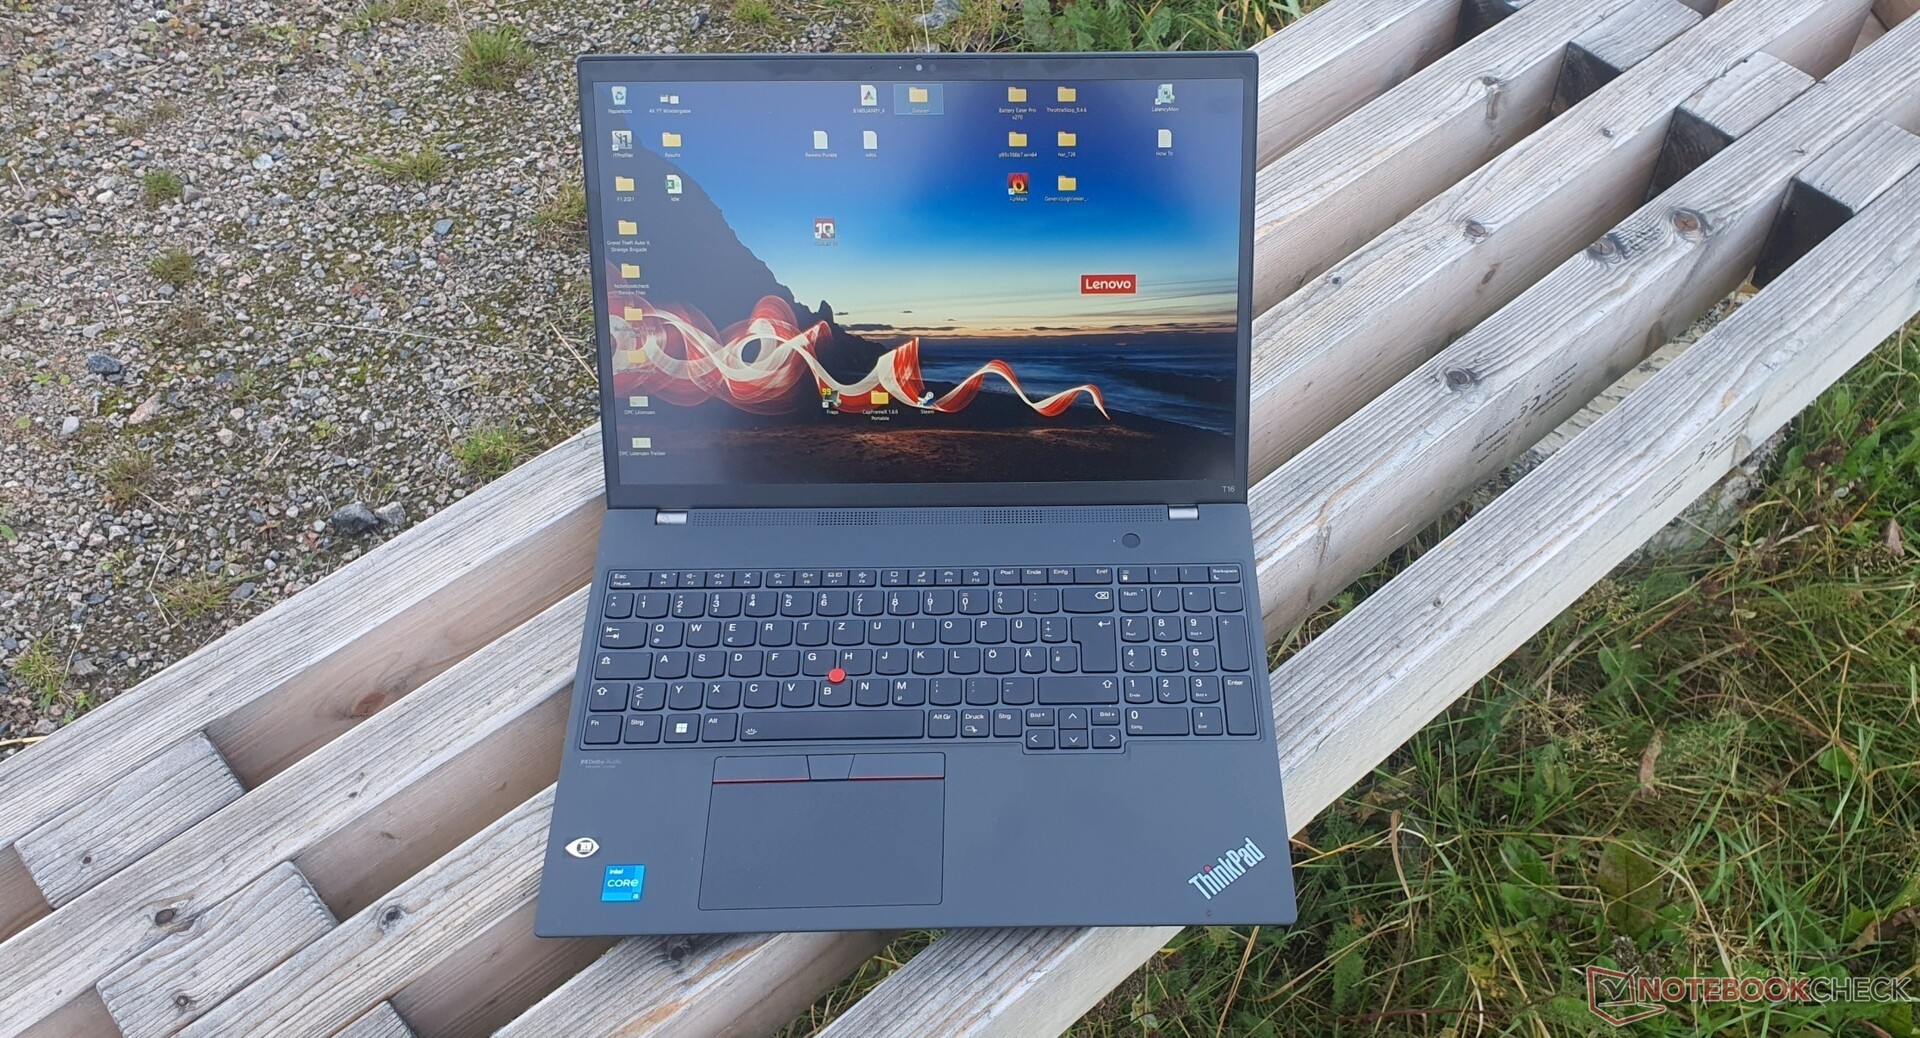
Obudowa - włókno węglowe po raz pierwszy zastosowane w wytrzymałym ThinkPadzie T16

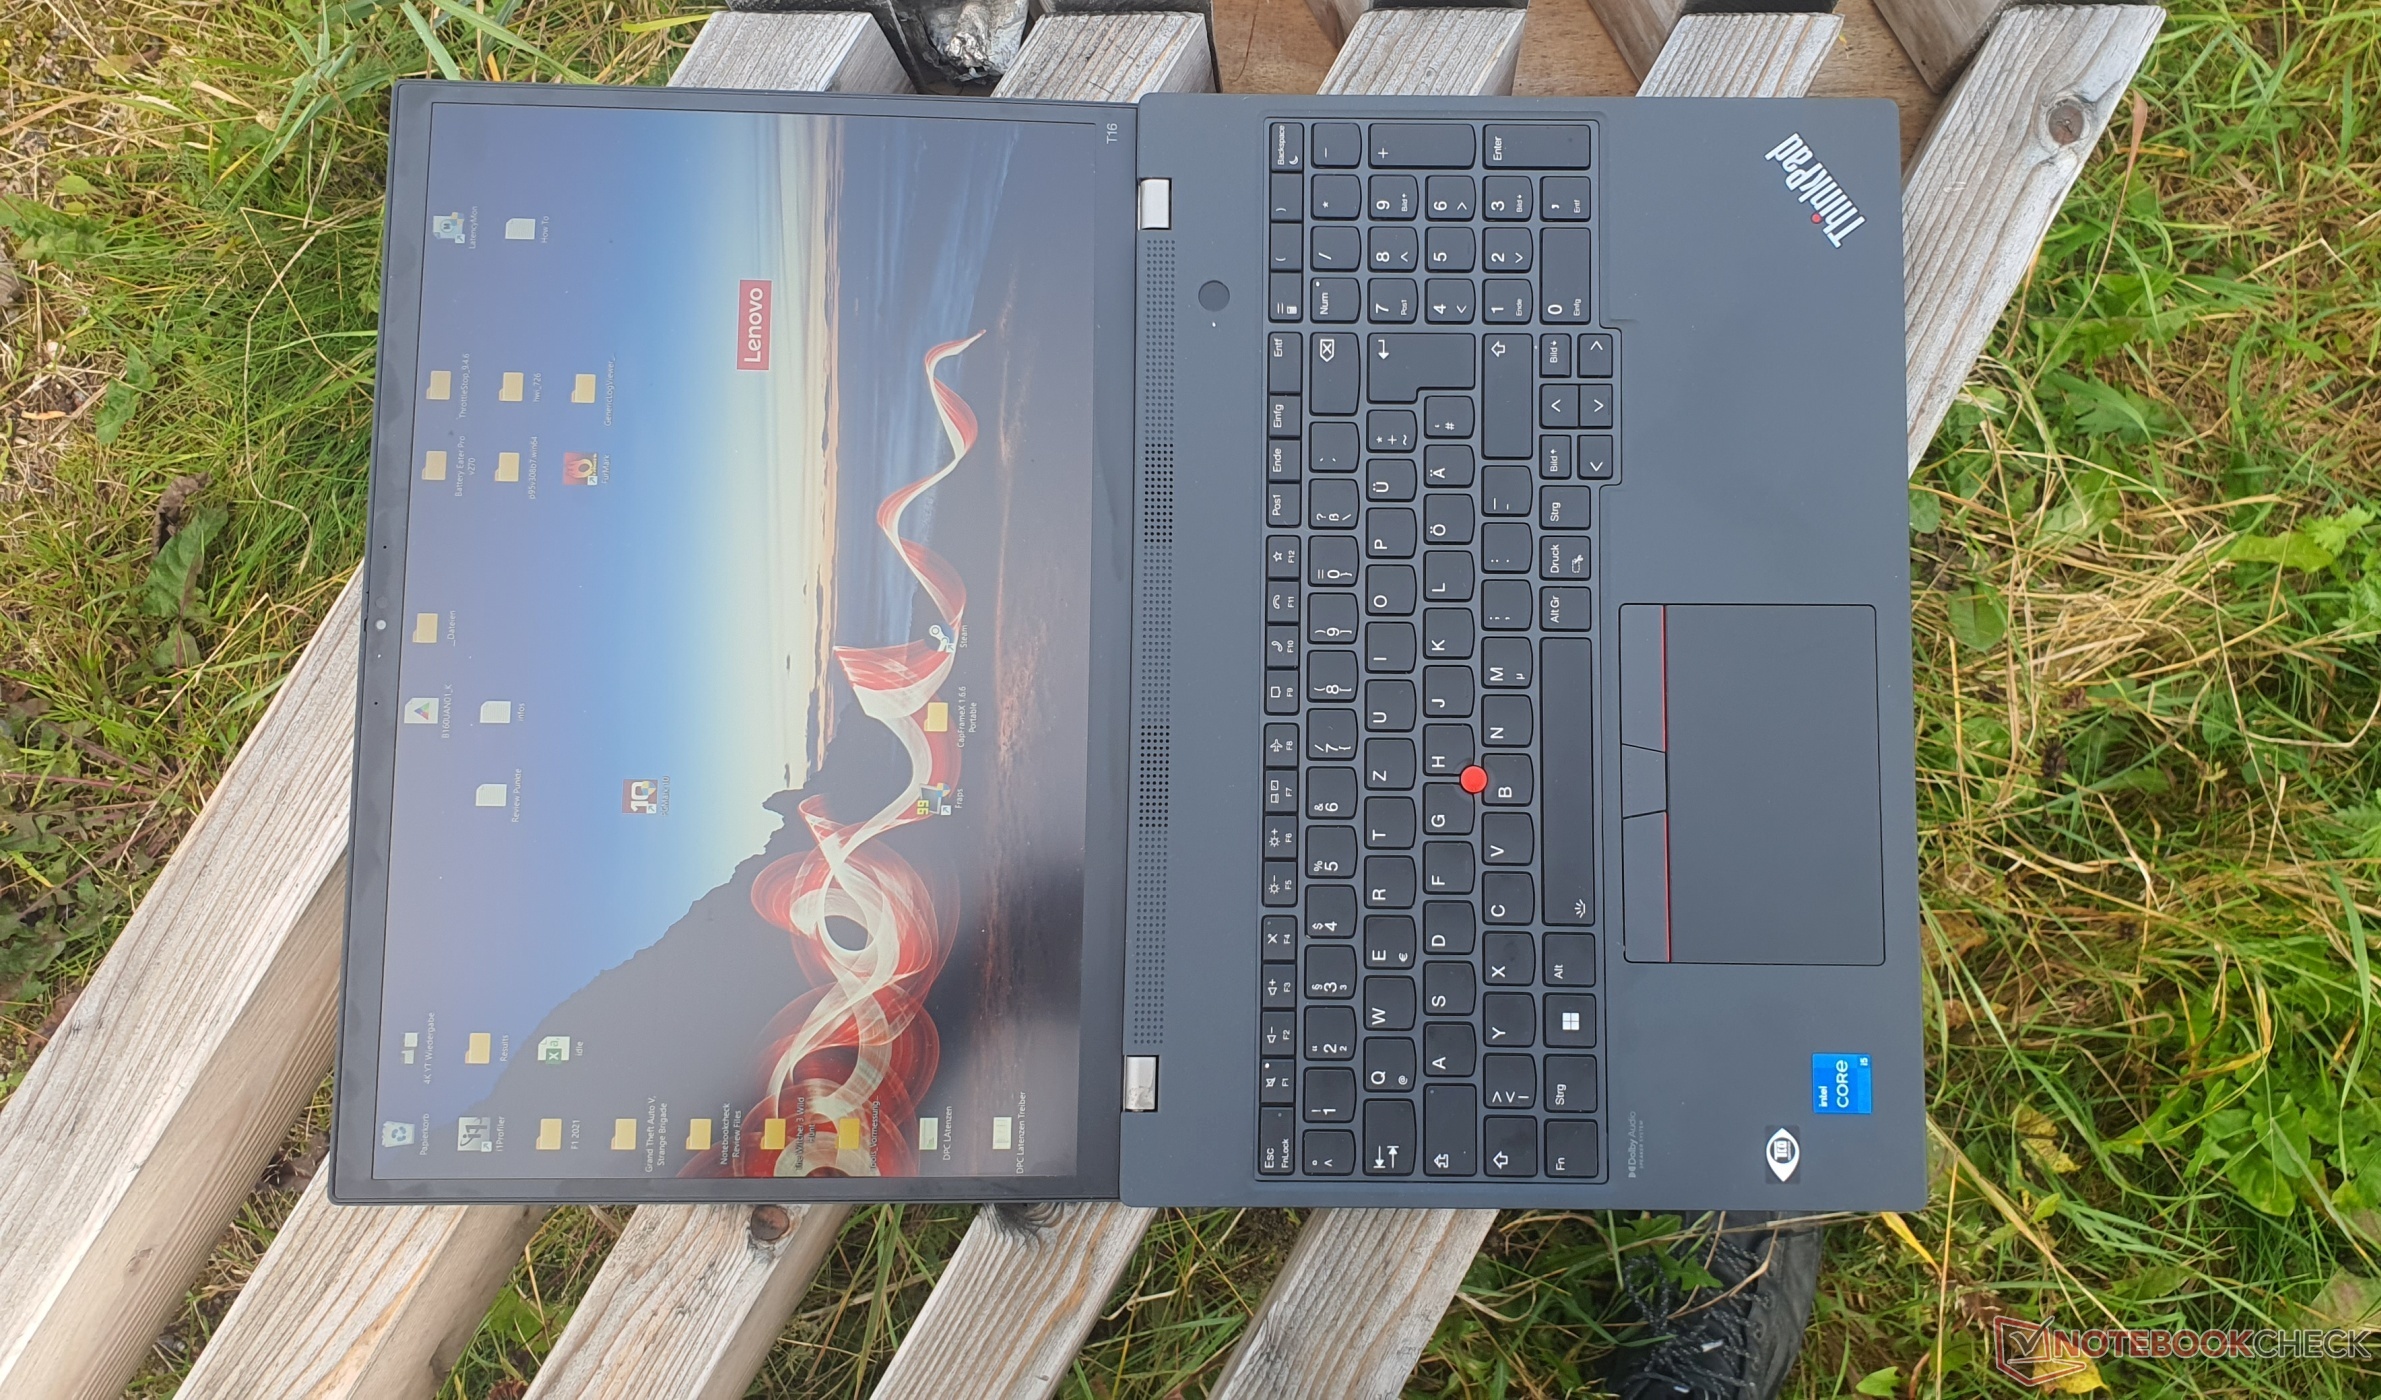
ThinkPad T16 ma antracytowy kolor, podobnie jak np.T14s G2lekko chropowate, gumowane powierzchnie są również takie same i mają bardzo wysoką jakość.
Odciski palców są widoczne, ale znacznie mniej niż poprzednio. Krawędzie ekranu są węższe ze względu na format 16:10, podczas gdy reszta konstrukcji pozostaje mniej więcej taka sama. Mimo to urządzenie jest grubsze o 1,4 mm, nieco krótsze, ale też nieco głębsze. Nasz model waży 1,95 kg, co jest głównie zasługą wybranej pojemności baterii.
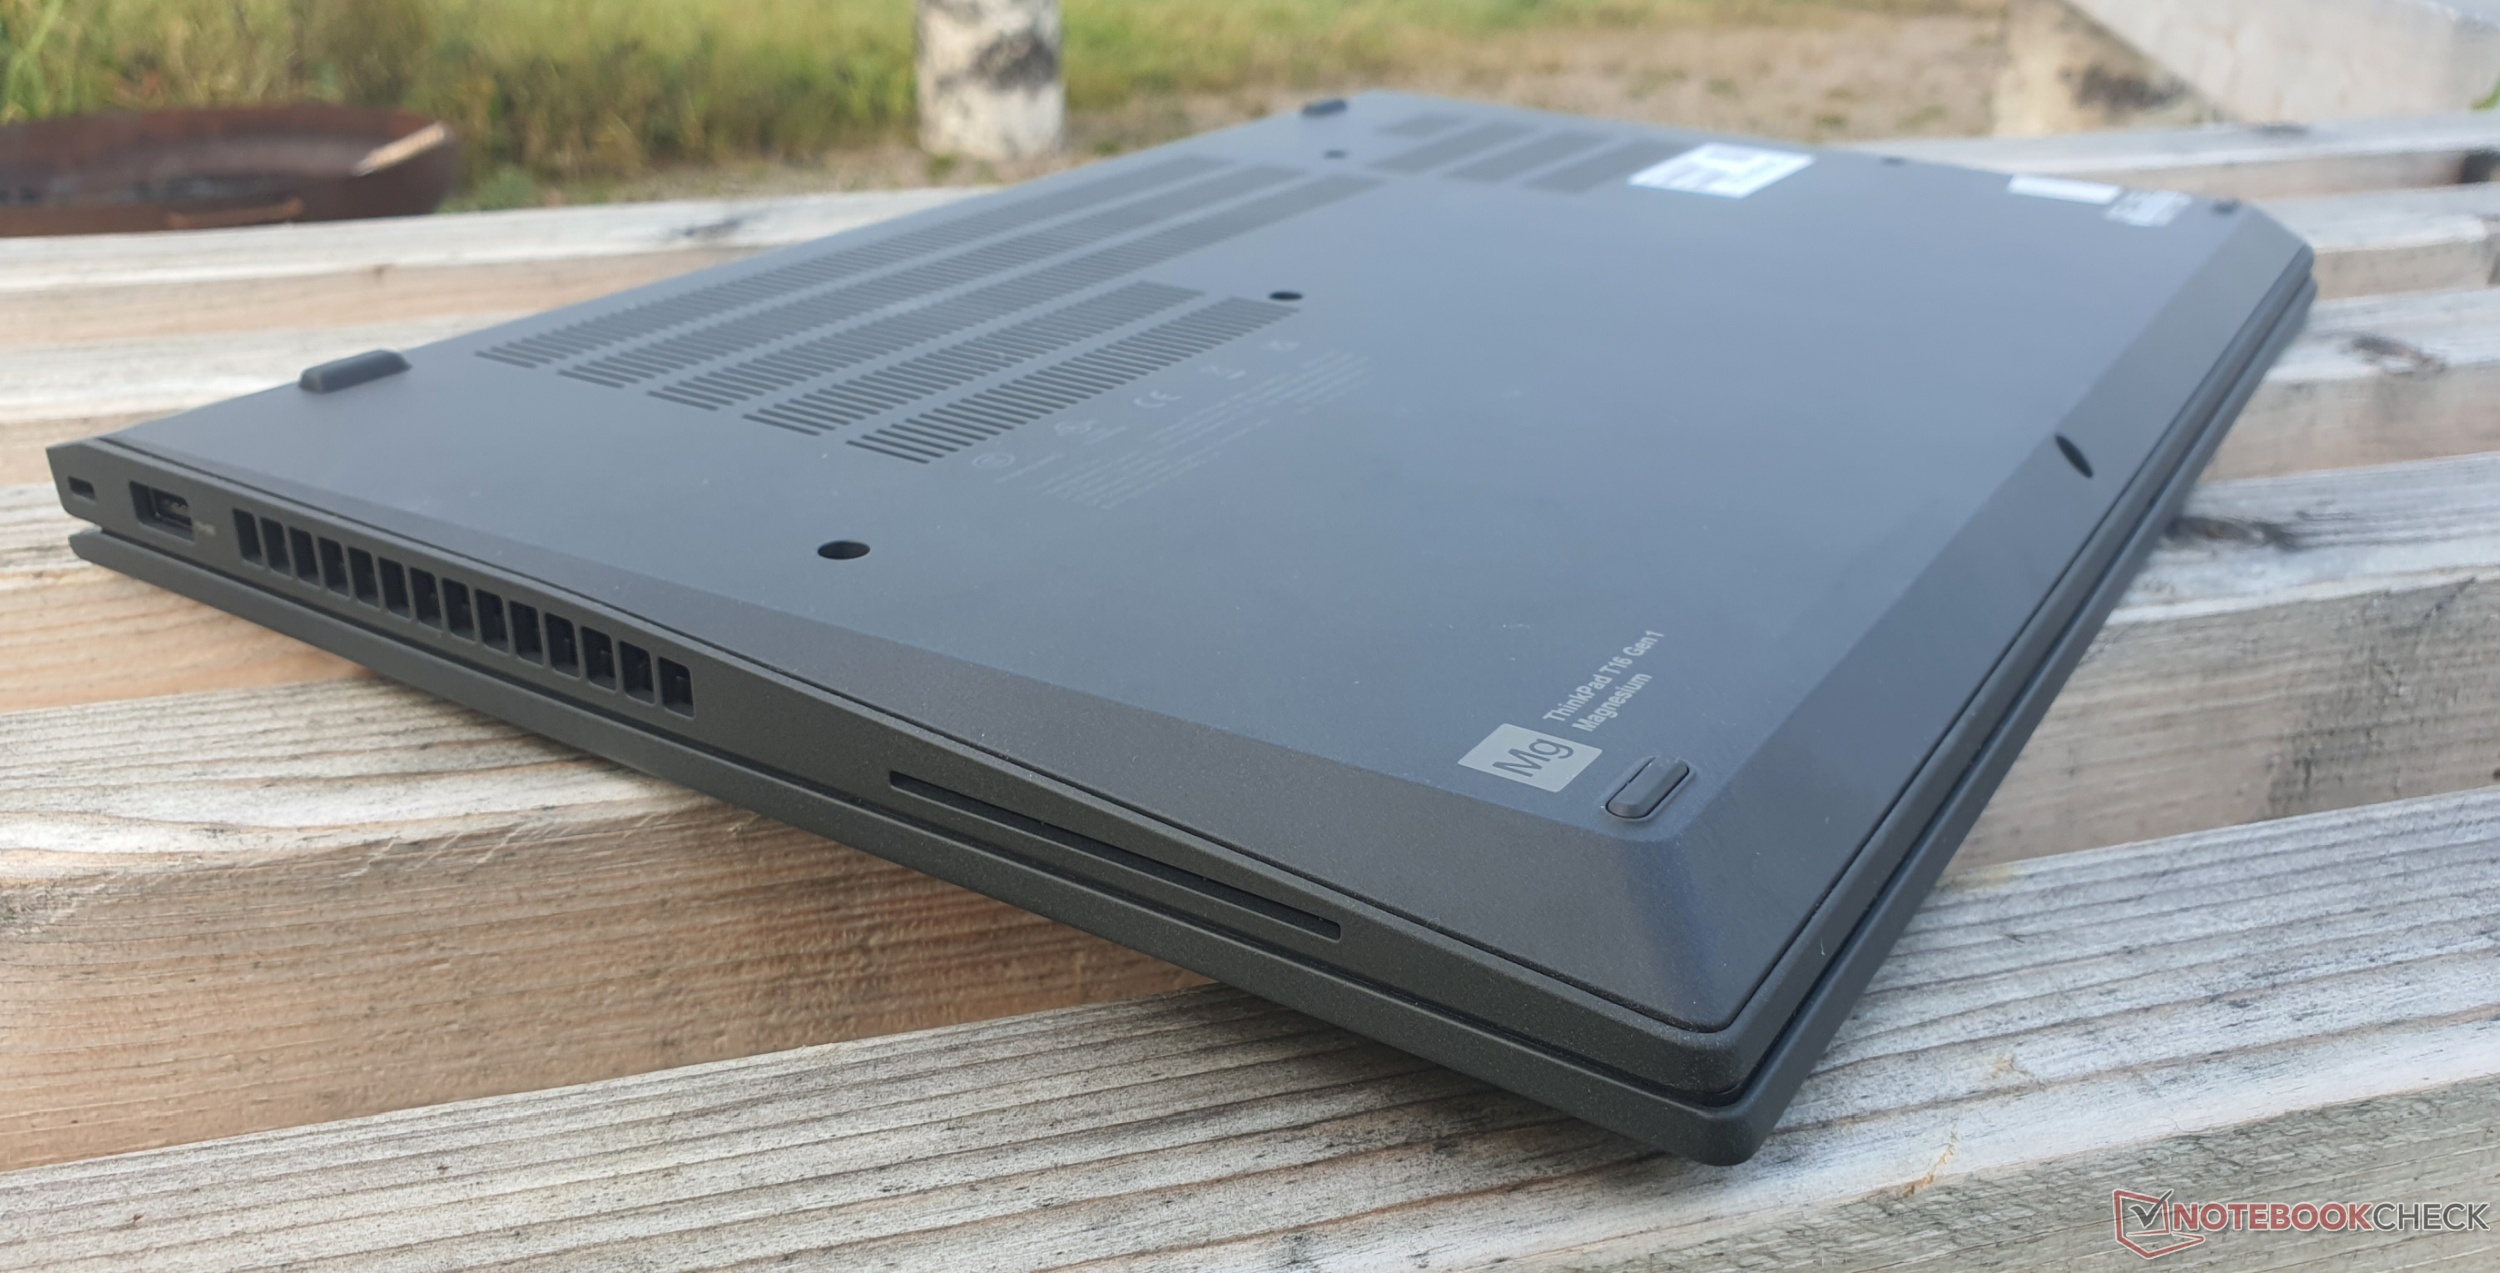
Jakość wykonania, pozbawiona szczelin, jest znakomita, podobnie jak stabilność. Pokrywę trudno wykręcić, a ukierunkowany nacisk na tylną pokrywę nie powoduje żadnych zniekształceń obrazu. Nic dziwnego, skoro pokrywa wykonana jest z mieszanki włókna węglowego, włókna szklanego i plastiku. Włókno węglowe było wcześniej i wyłącznie zarezerwowane dla droższych modeli z s-suffixem
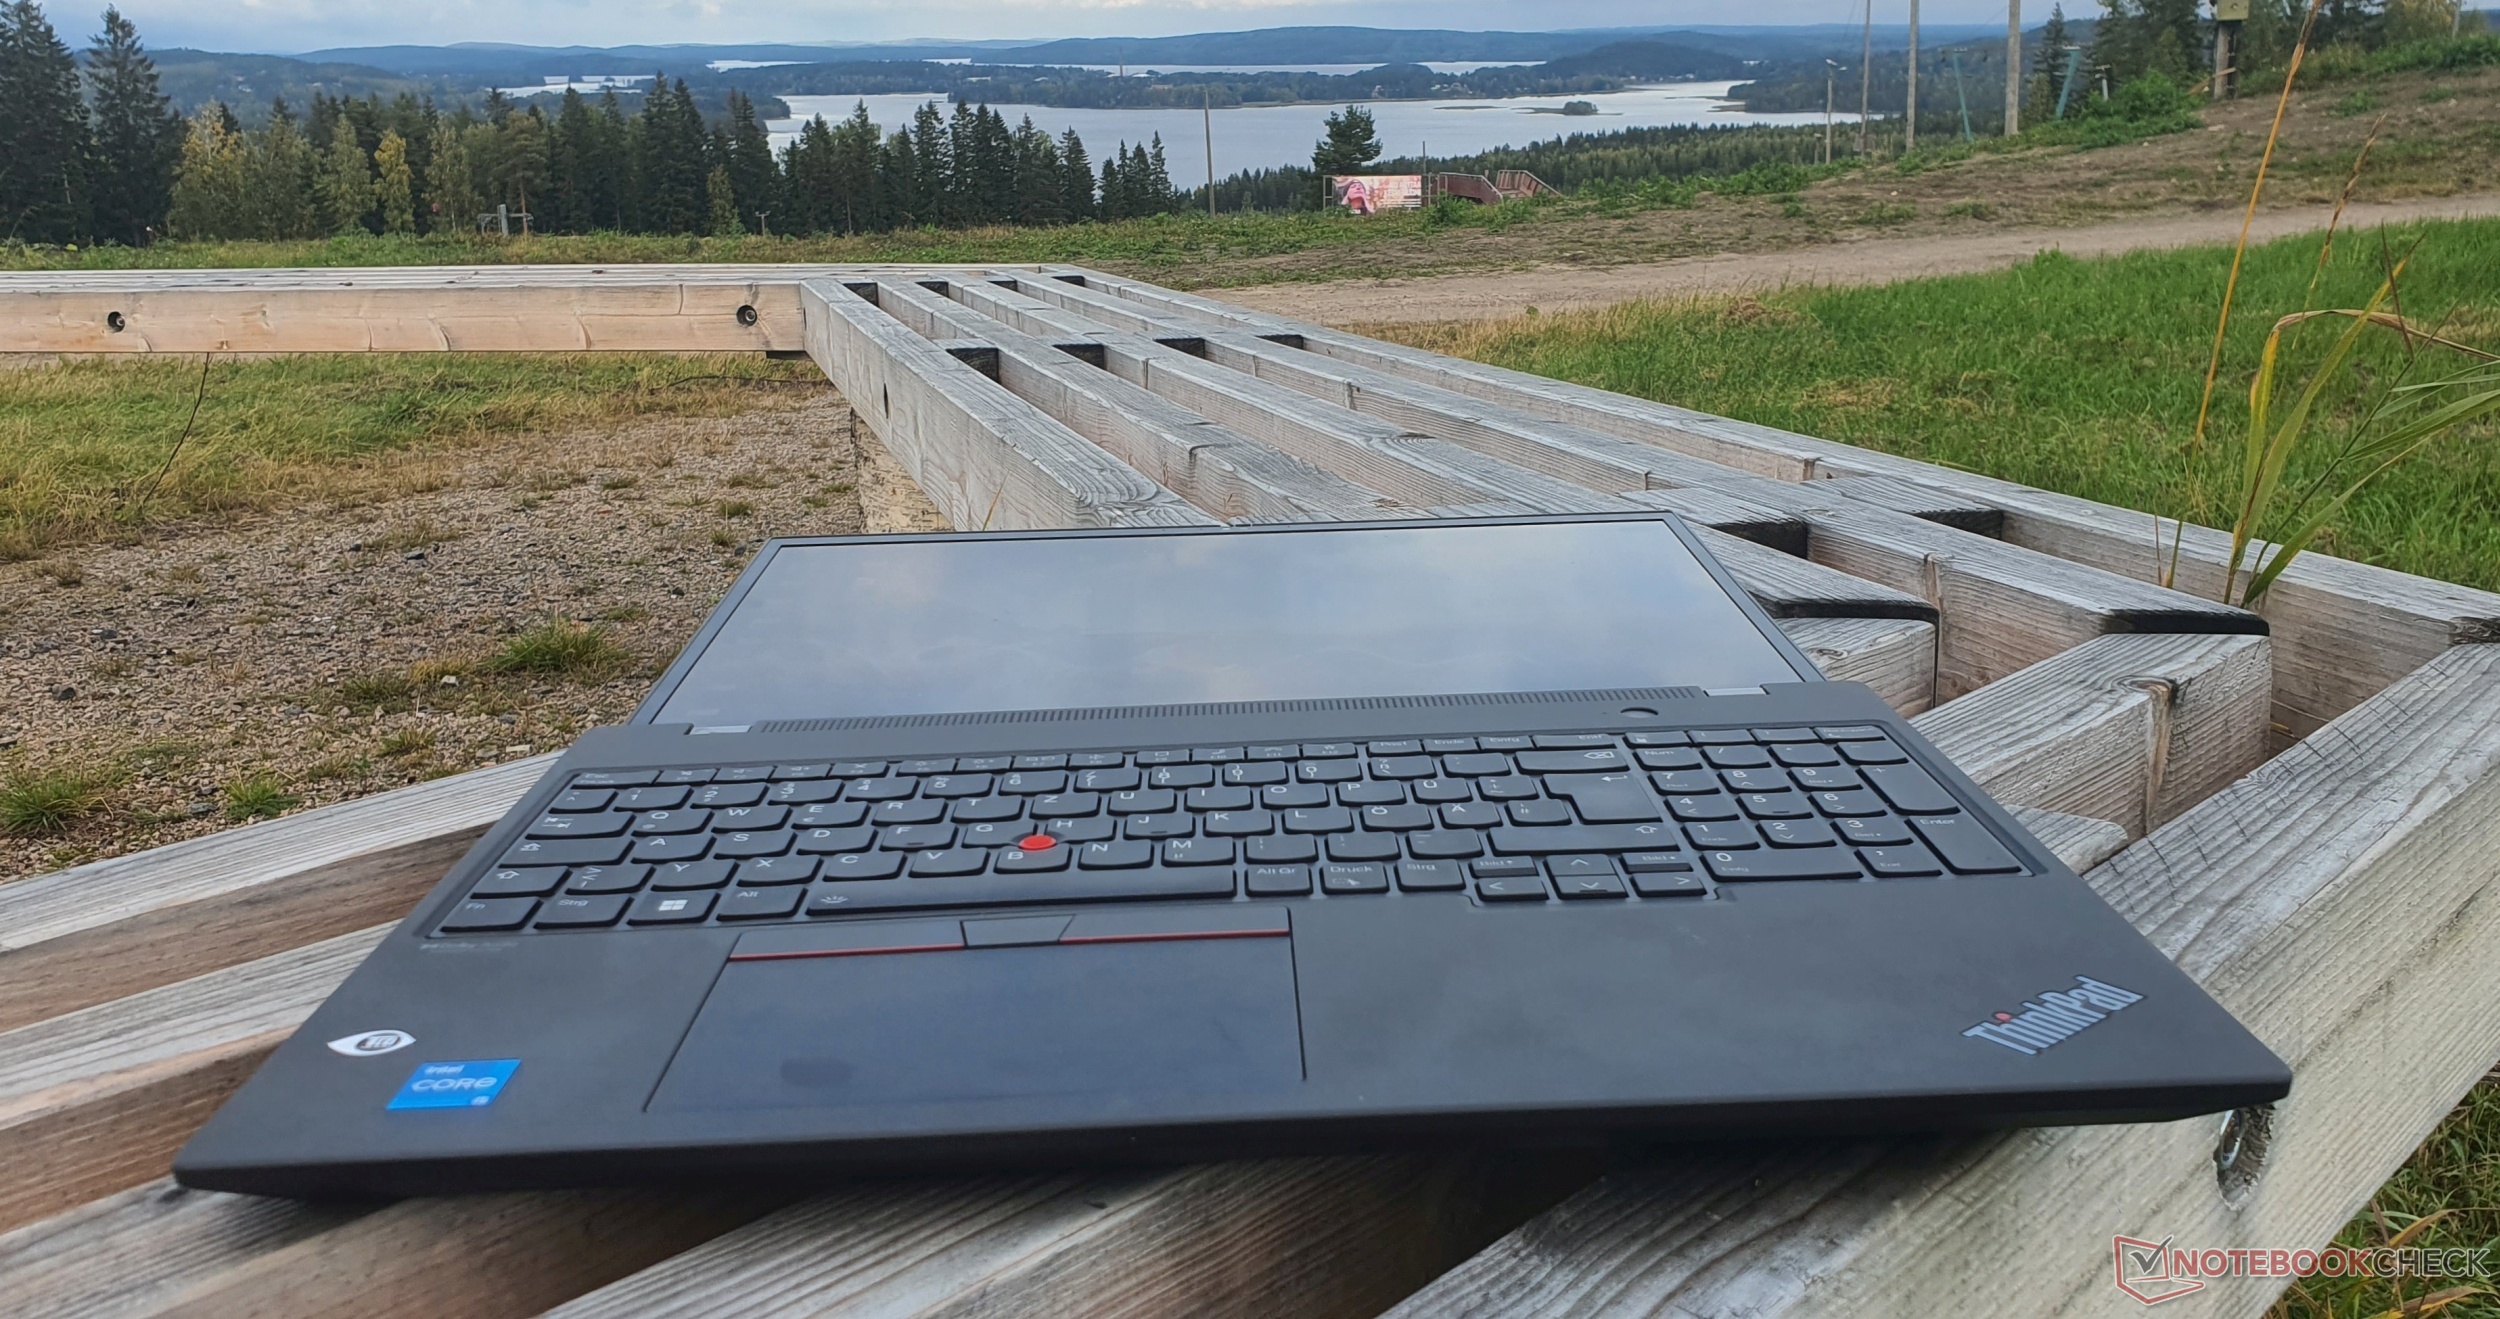
Podpórka dla dłoni wykonana jest z połączenia plastiku, włókna szklanego, magnezu i aluminium. Dzięki temu podstawa okazuje się być bardzo odporna na naprężenia skrętne. Spód jest wykonany w całości z termoplastiku. Solidne zawiasy są szczelne, ale mimo to możliwe jest otwarcie jedną ręką do 180°.
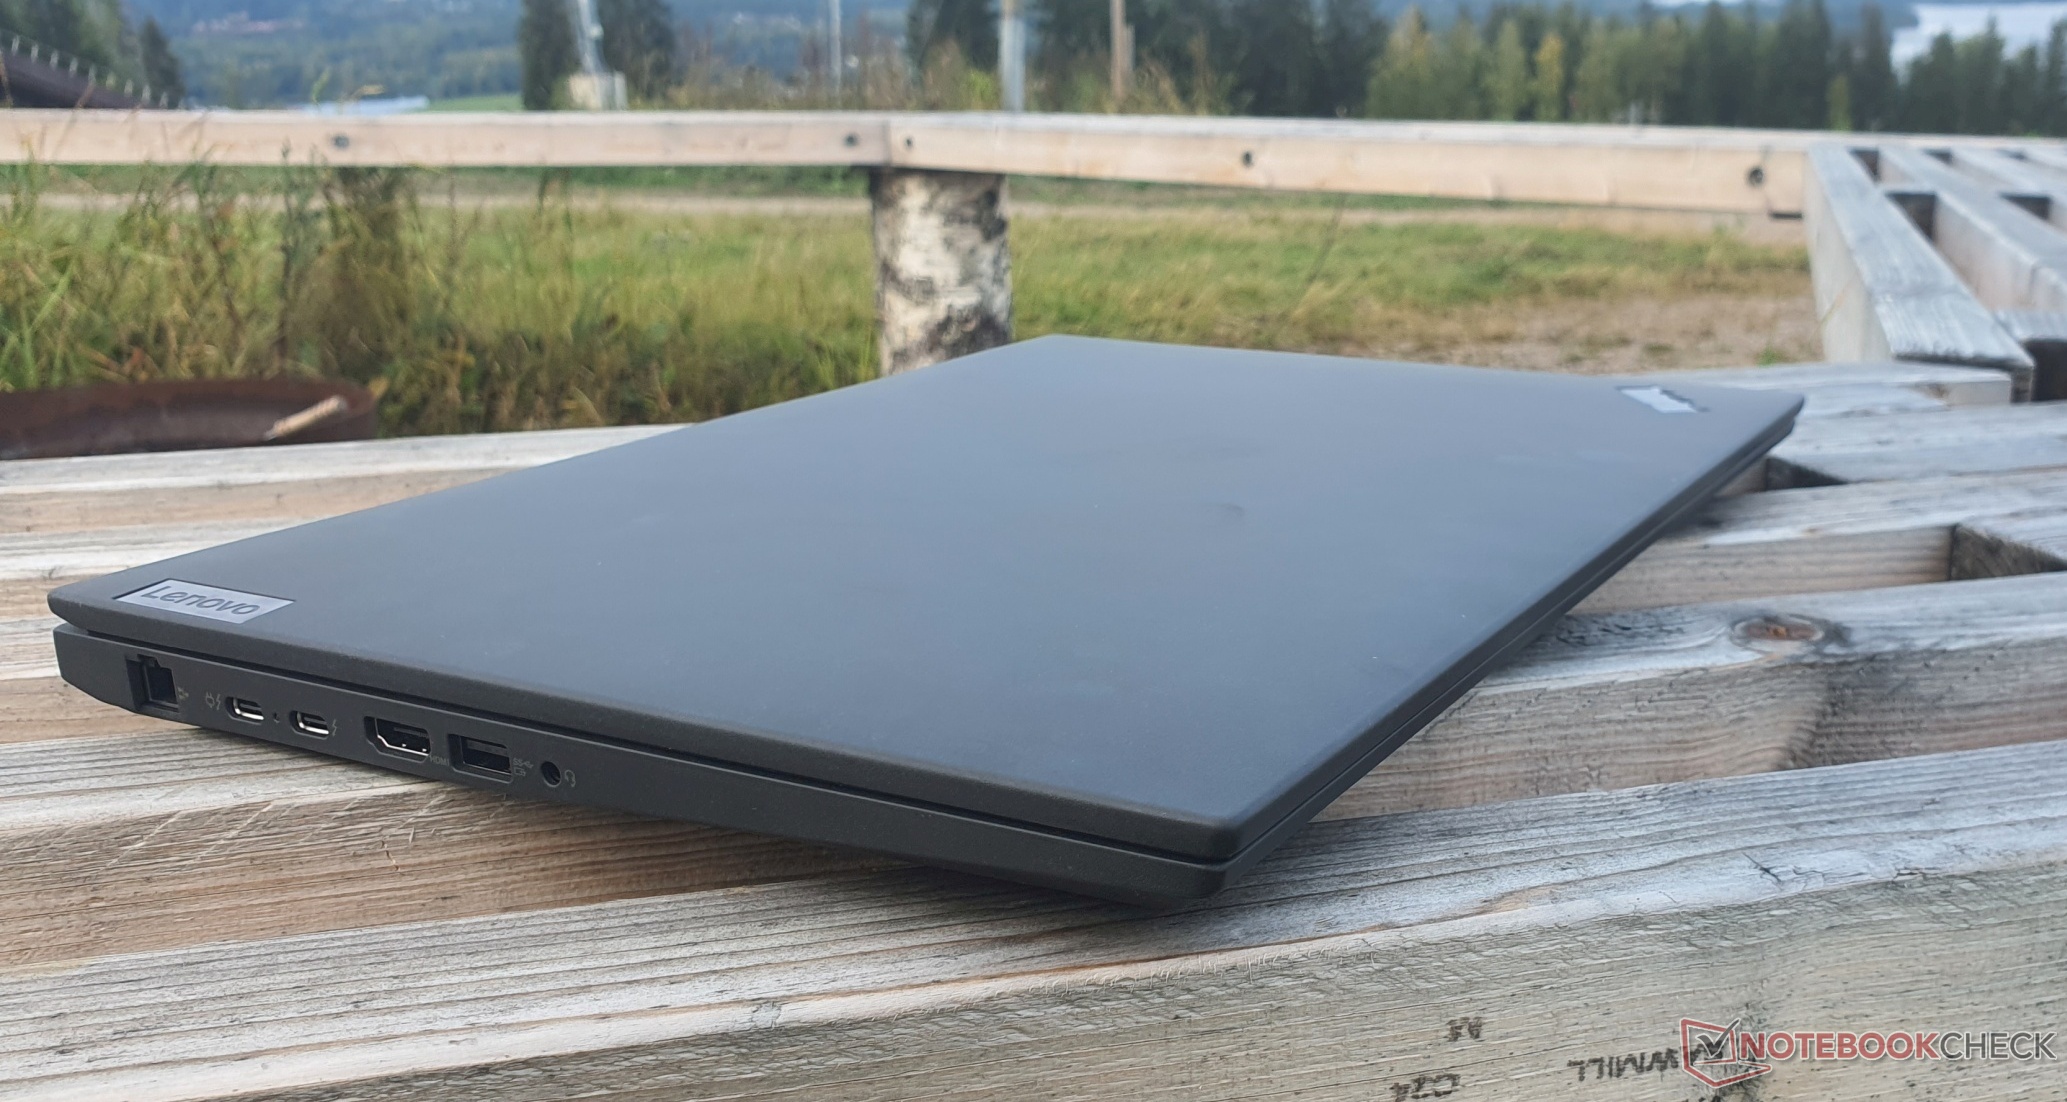

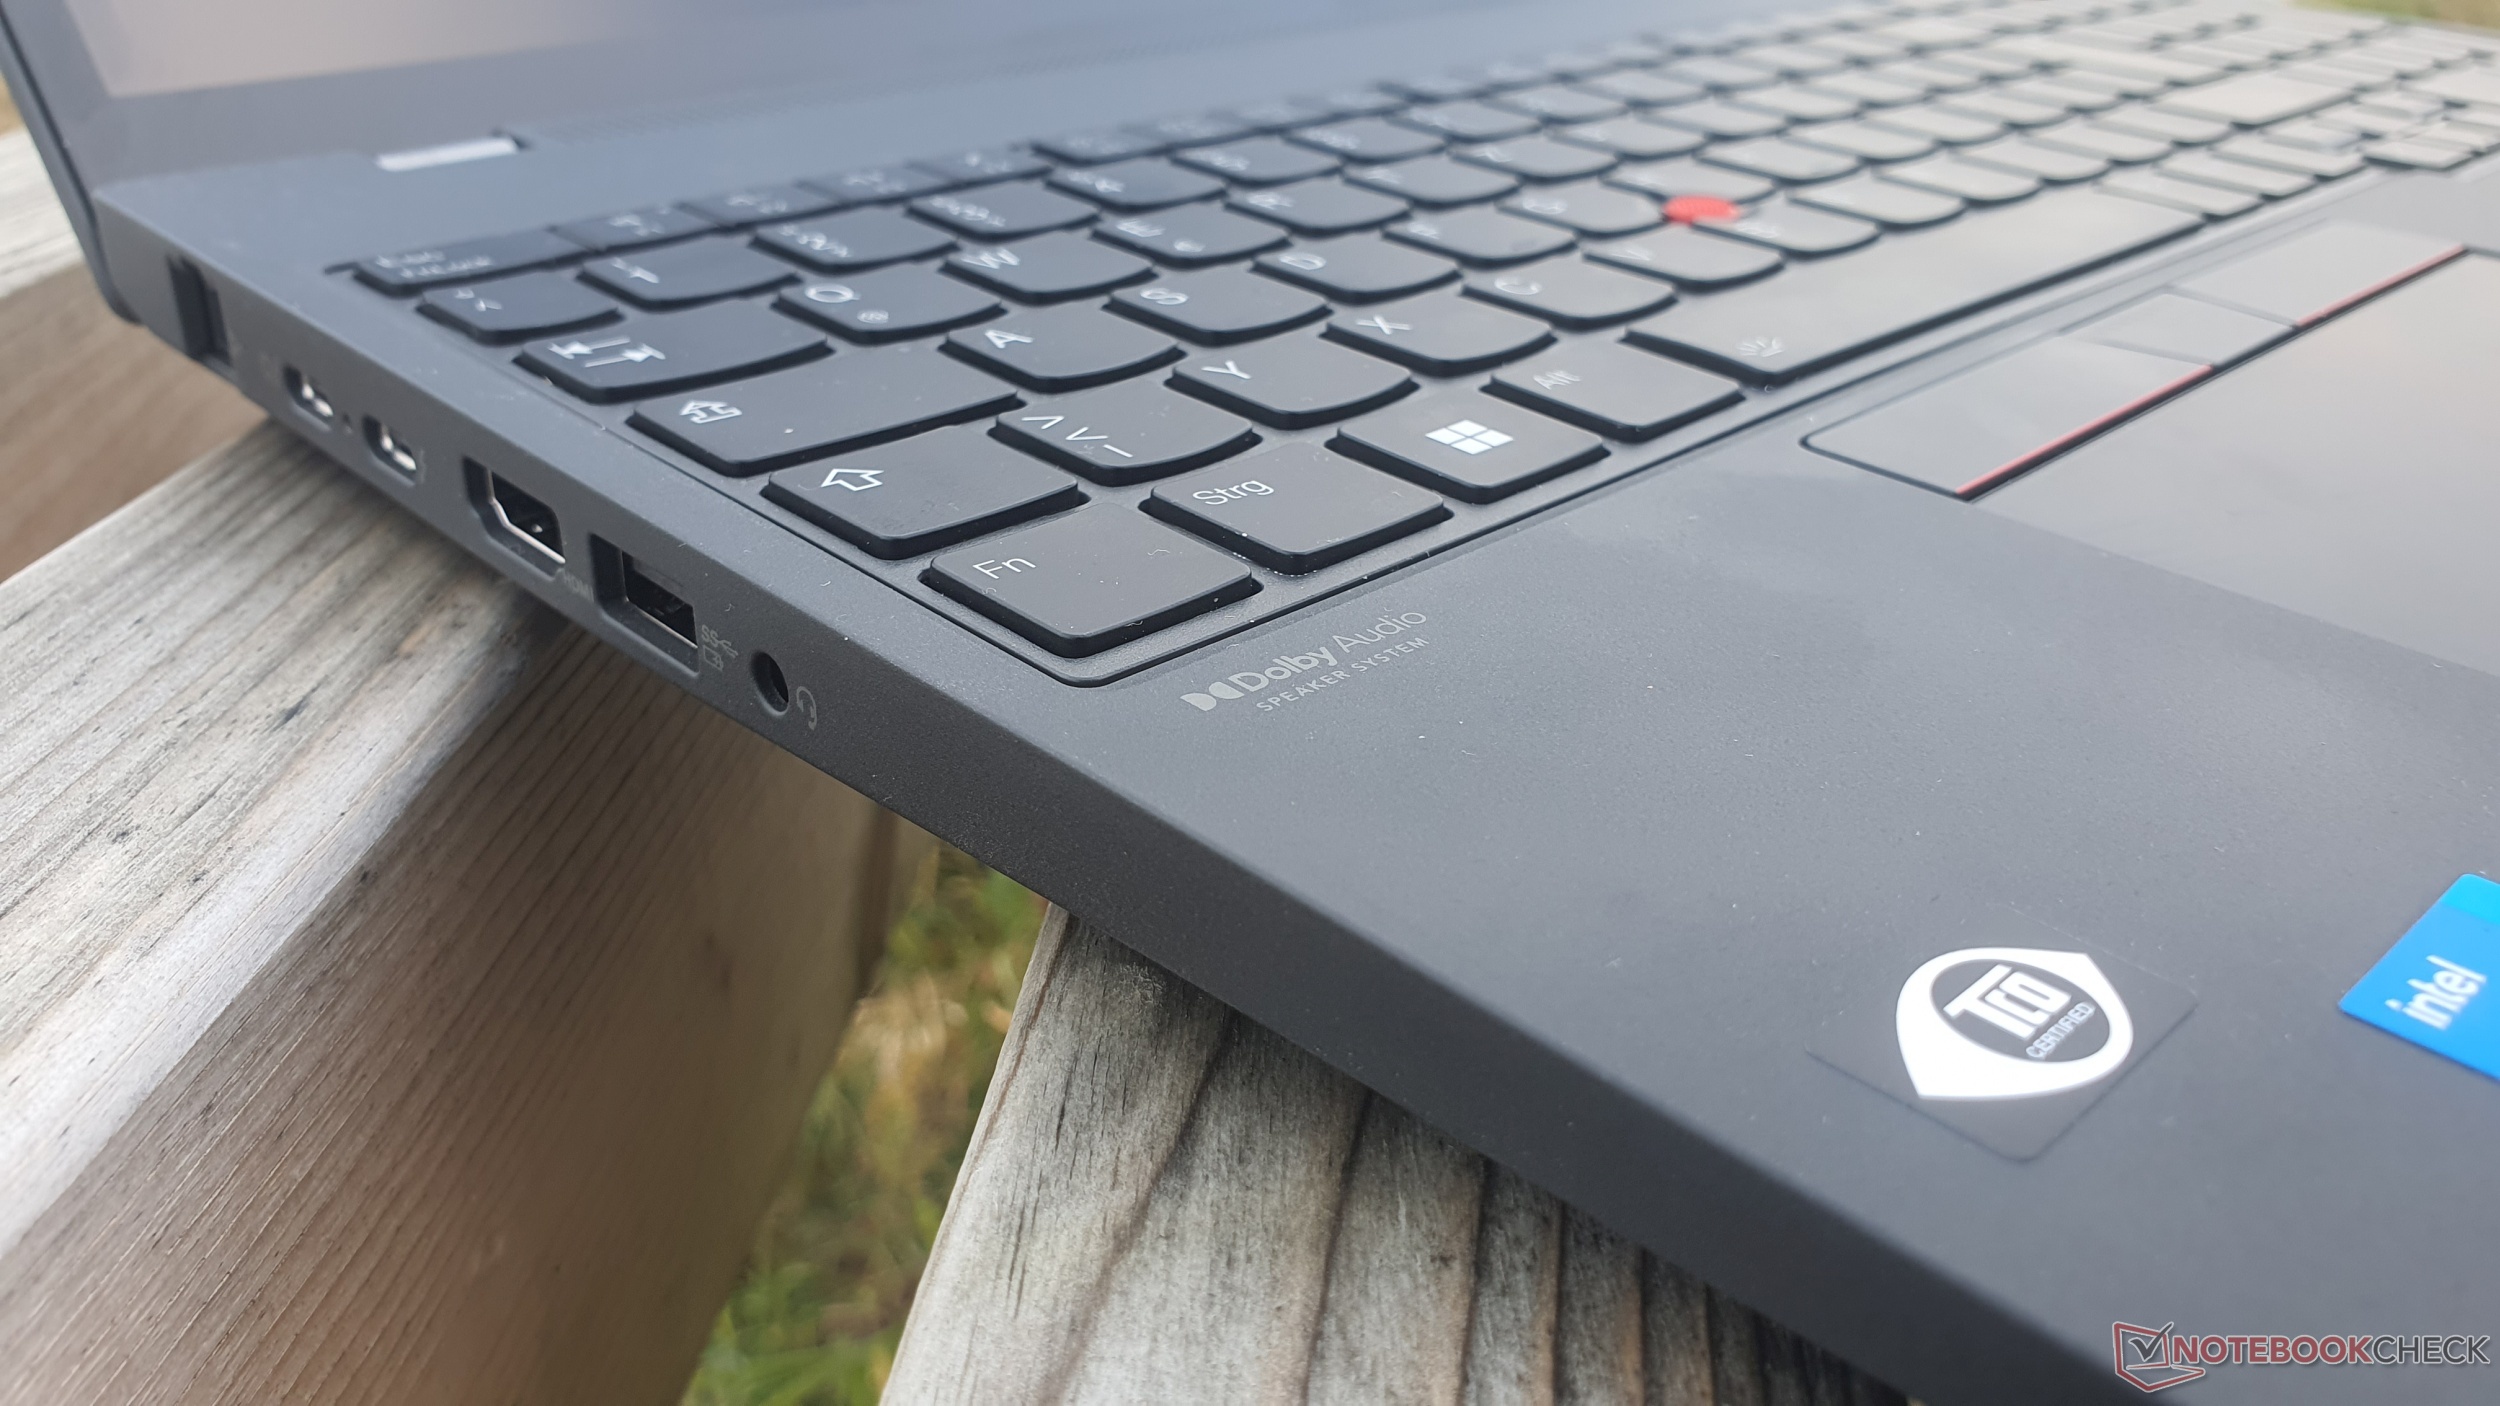
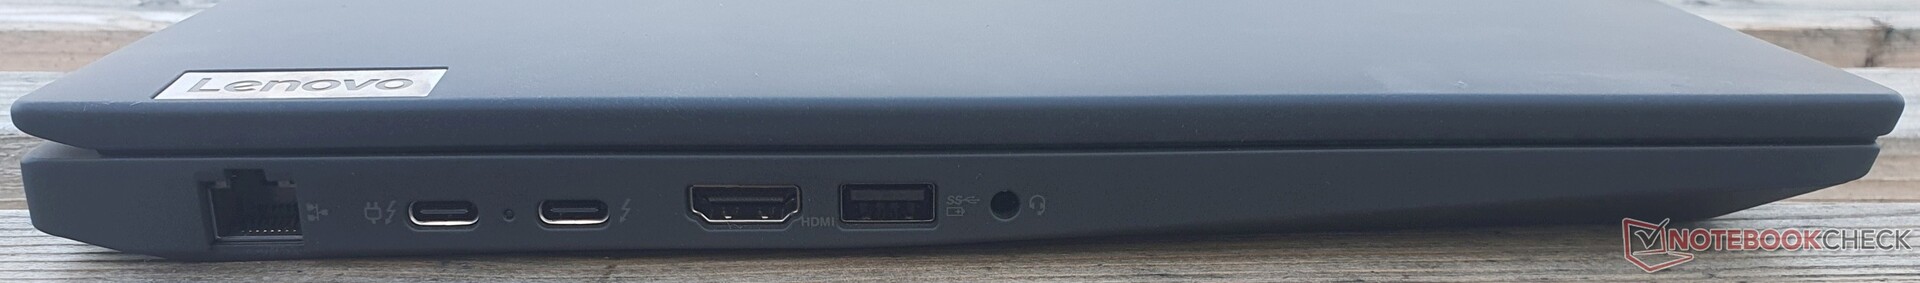
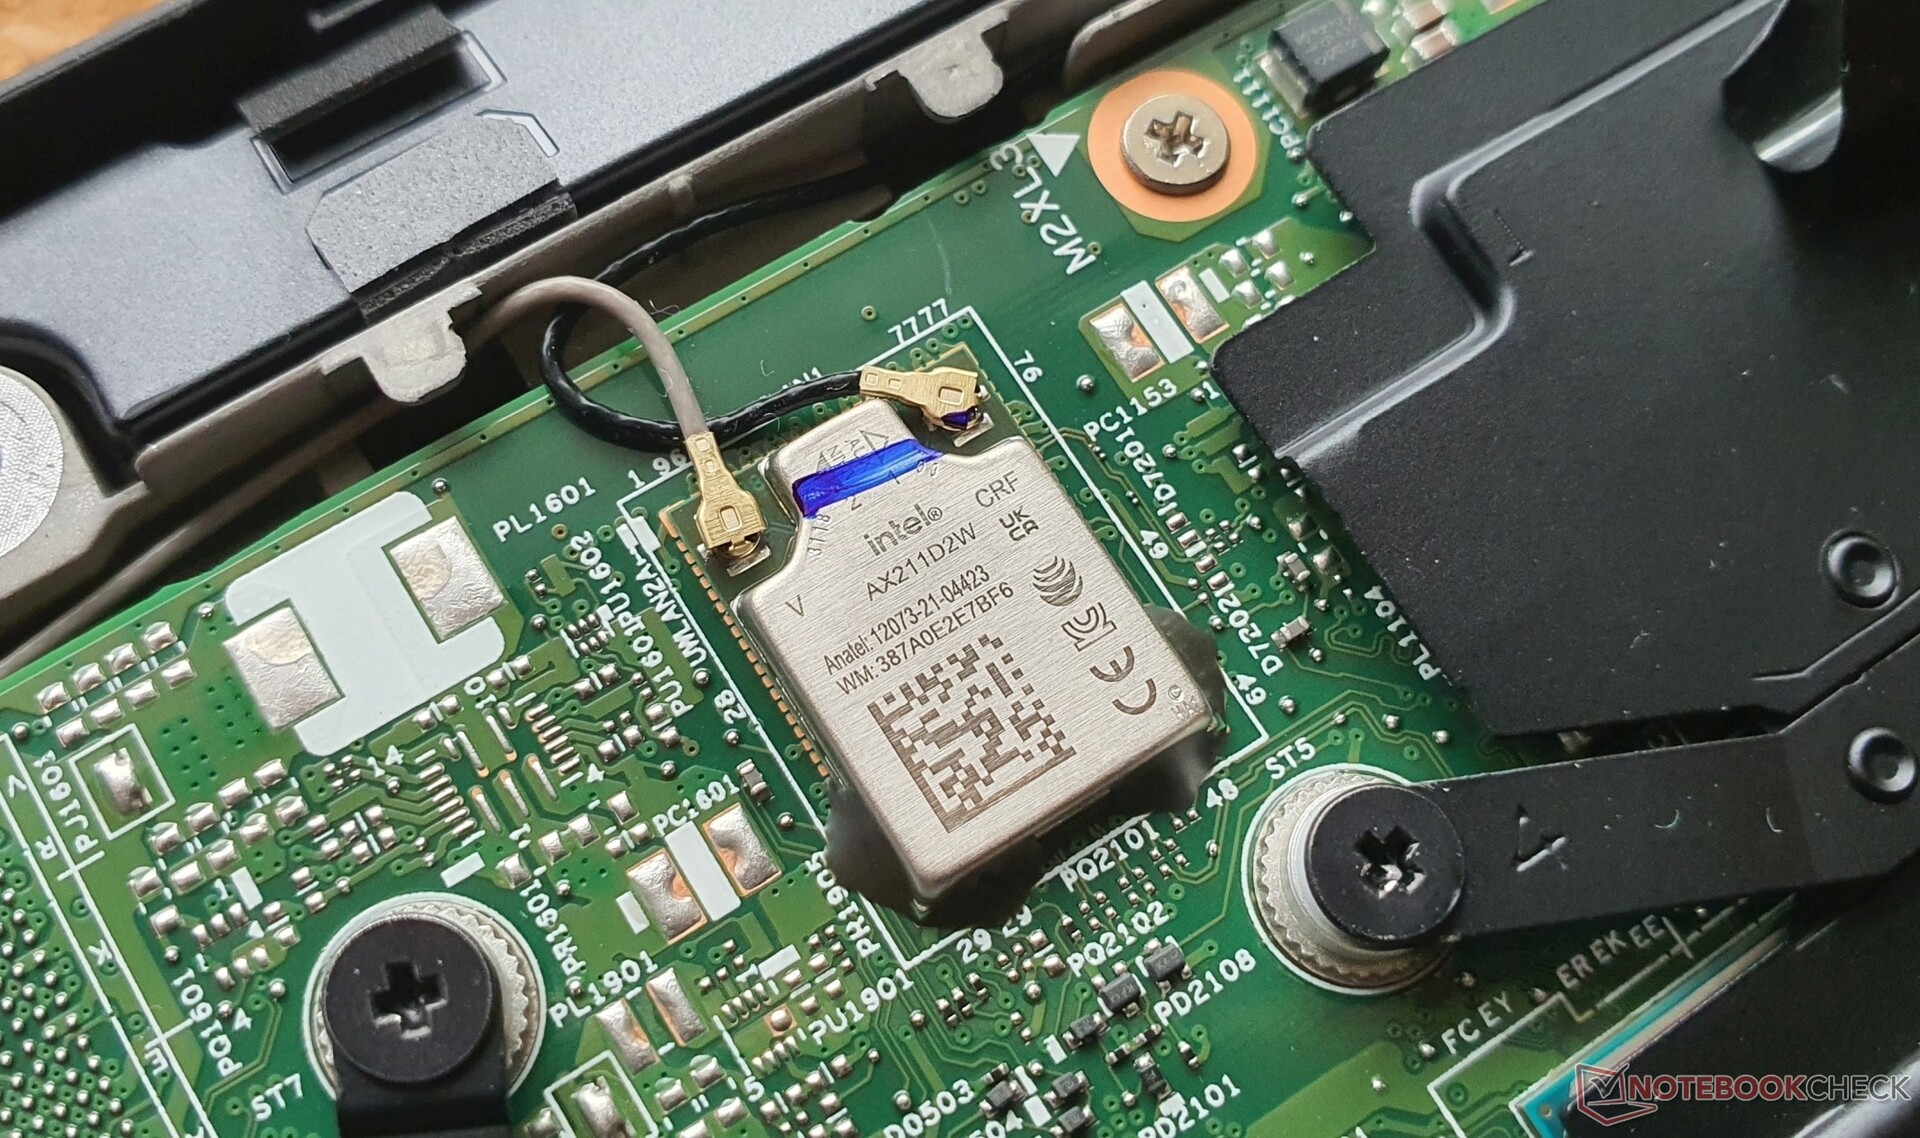
Wyposażenie - RJ45, TB4, lutowane Wi-Fi 6E i kamera 1080p
Dalsze wykorzystanie portu GBit LAN jest przyjemne, ale pominięcie czytnika kart microSD w serii T jest mniej. W przeciwnym razie ThinkPad oferuje wszystko, czego potrzeba, z 2x USB-A 3.2 Gen 1, HDMI 2.0b i 2x Thunderbolt 4, w tym 100-watowe ładowanie i DisplayPort 1.4. Oznacza to, że można podłączyć do trzech dodatkowych monitorów: 2x 5K60 @TB4 + 1x 4K60 @HDMI.
Komunikacja
Za Wi-Fi 6E odpowiada wlutowany przez Intela układ AX211. Zarejestrowaliśmy wzorowe prędkości ponad 1,6 GBit/s w obu kierunkach, dzięki czemu na naszym polu porównawczym bez problemu prowadzi Lenovo ThinkPad T16 G1.
Do dyspozycji jest również Bluetooth 5.2 oraz opcjonalnie WWAN z 4G. W naszym egzemplarzu recenzenckim jest wolne gniazdo M.2 2242, a anteny można rozbudować. NFC jest opcjonalne.
| Networking | |
| Lenovo ThinkPad T16 G1 21BWS00200 | |
| iperf3 transmit AXE11000 6GHz | |
| iperf3 receive AXE11000 6GHz | |
| Huawei MateBook D 16 2022 | |
| iperf3 receive AXE11000 | |
| iperf3 transmit AXE11000 | |
| Lenovo ThinkPad T15 Gen2-20W5S00100 | |
| iperf3 transmit AX12 | |
| iperf3 receive AX12 | |
| HP ZBook Power 15 G8 313S5EA | |
| iperf3 transmit AX12 | |
| iperf3 receive AX12 | |
| HP ProBook 450 G9 6A180EA | |
| iperf3 transmit AXE11000 6GHz | |
| iperf3 receive AXE11000 6GHz | |
| Lenovo ThinkPad X1 Extreme G4-20Y5CTO1WW (3050 Ti) | |
| iperf3 transmit AX12 | |
| iperf3 receive AX12 | |
| Dell Inspiron 16 Plus 7620 | |
| iperf3 transmit AXE11000 6GHz | |
| iperf3 receive AXE11000 6GHz | |
| Lenovo ThinkPad E15 G3-20YG003UGE | |
| iperf3 transmit AX12 | |
| iperf3 receive AX12 | |
| Lenovo ThinkPad L15 G2 AMD | |
| iperf3 transmit AX12 | |
| iperf3 receive AX12 | |
Kamera internetowa
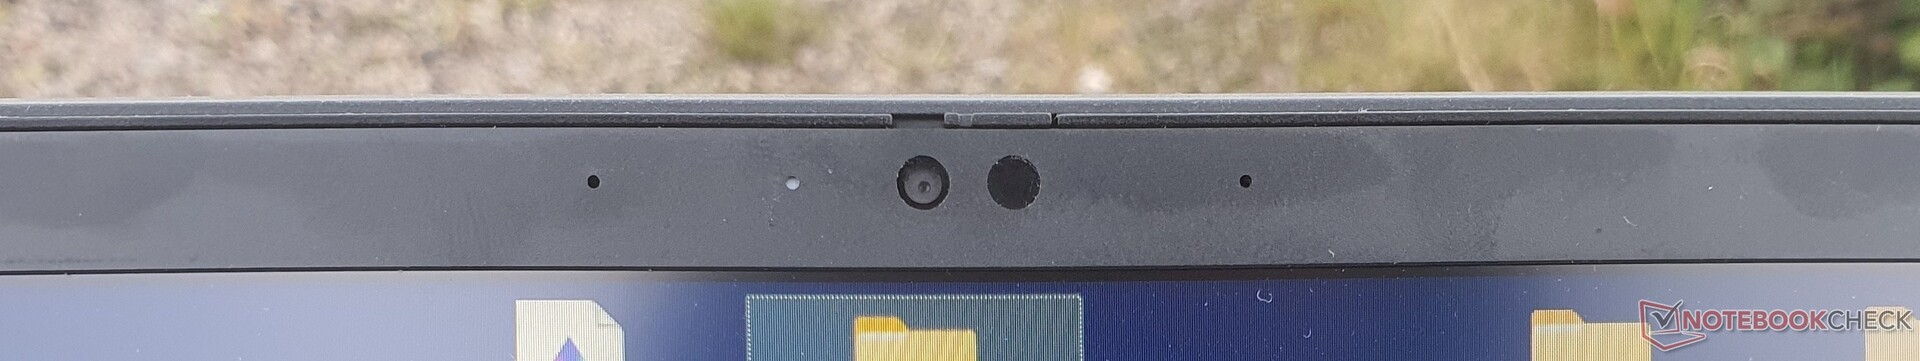
Kamera internetowa 1080p pozostaje bez zachwytu, ale jest znacznie mniej zaszumiona i wyprana. Poza tym są dwa mikrofony dwuszeregowe o dobrej jakości nagrywania, a także IR dla Windows Hello.


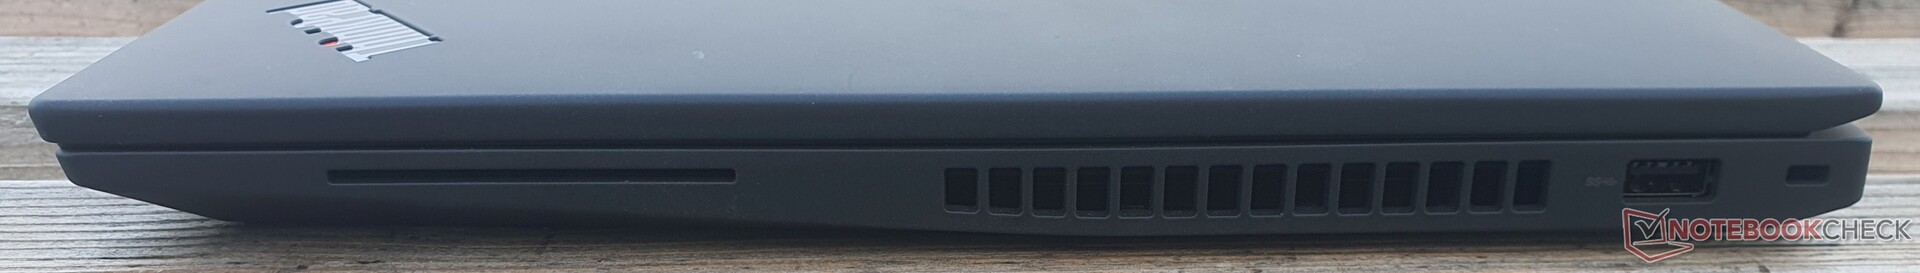
Bezpieczeństwo
W kwestii bezpieczeństwa Lenovo oferuje w ThinkPad T16 Gen. 1 opcjonalny czytnik kart inteligentnych, IR dla Windows Hello oraz fizyczną przysłonę kamery. Kolejne zabezpieczenia to TPM 2.0, blokada Kensington oraz opcjonalny skaner linii papilarnych. Human Presence Detection i Mirametrix Glance są wykorzystywane w oprogramowaniu.
Akcesoria
Nie ma portu dokującego, ale można stosować stacje dokujące USB-C. Zakres dostawy obejmuje tylko 135-watową ładowarkę USB-C Slim. Modele z procesorami z serii U muszą zadowolić się 65 watami. Z drugiej strony możliwe jest też korzystanie z własnej ładowarki o mocy 45 W. Opakowanie w 90% pochodzi z recyklingu lub jest wykonane ze zrównoważonego drewna.
Konserwacja
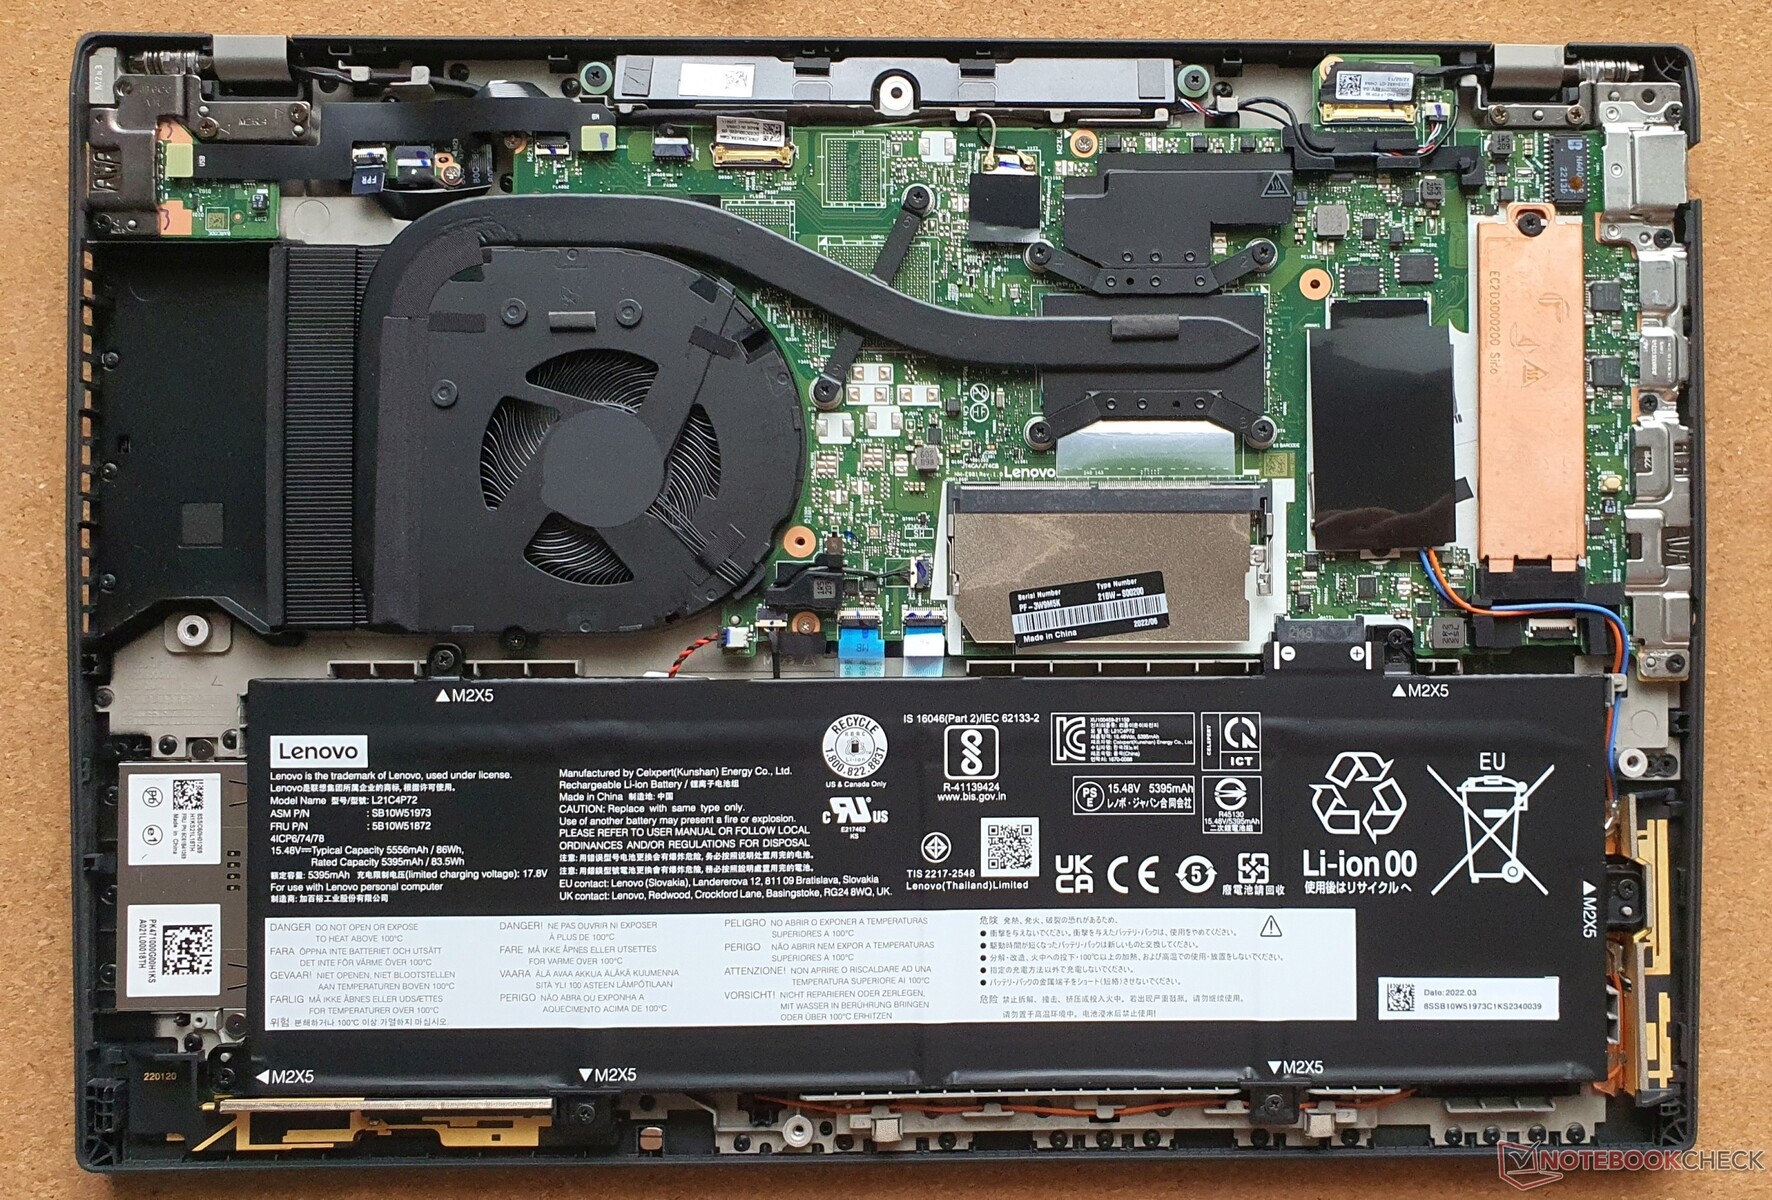
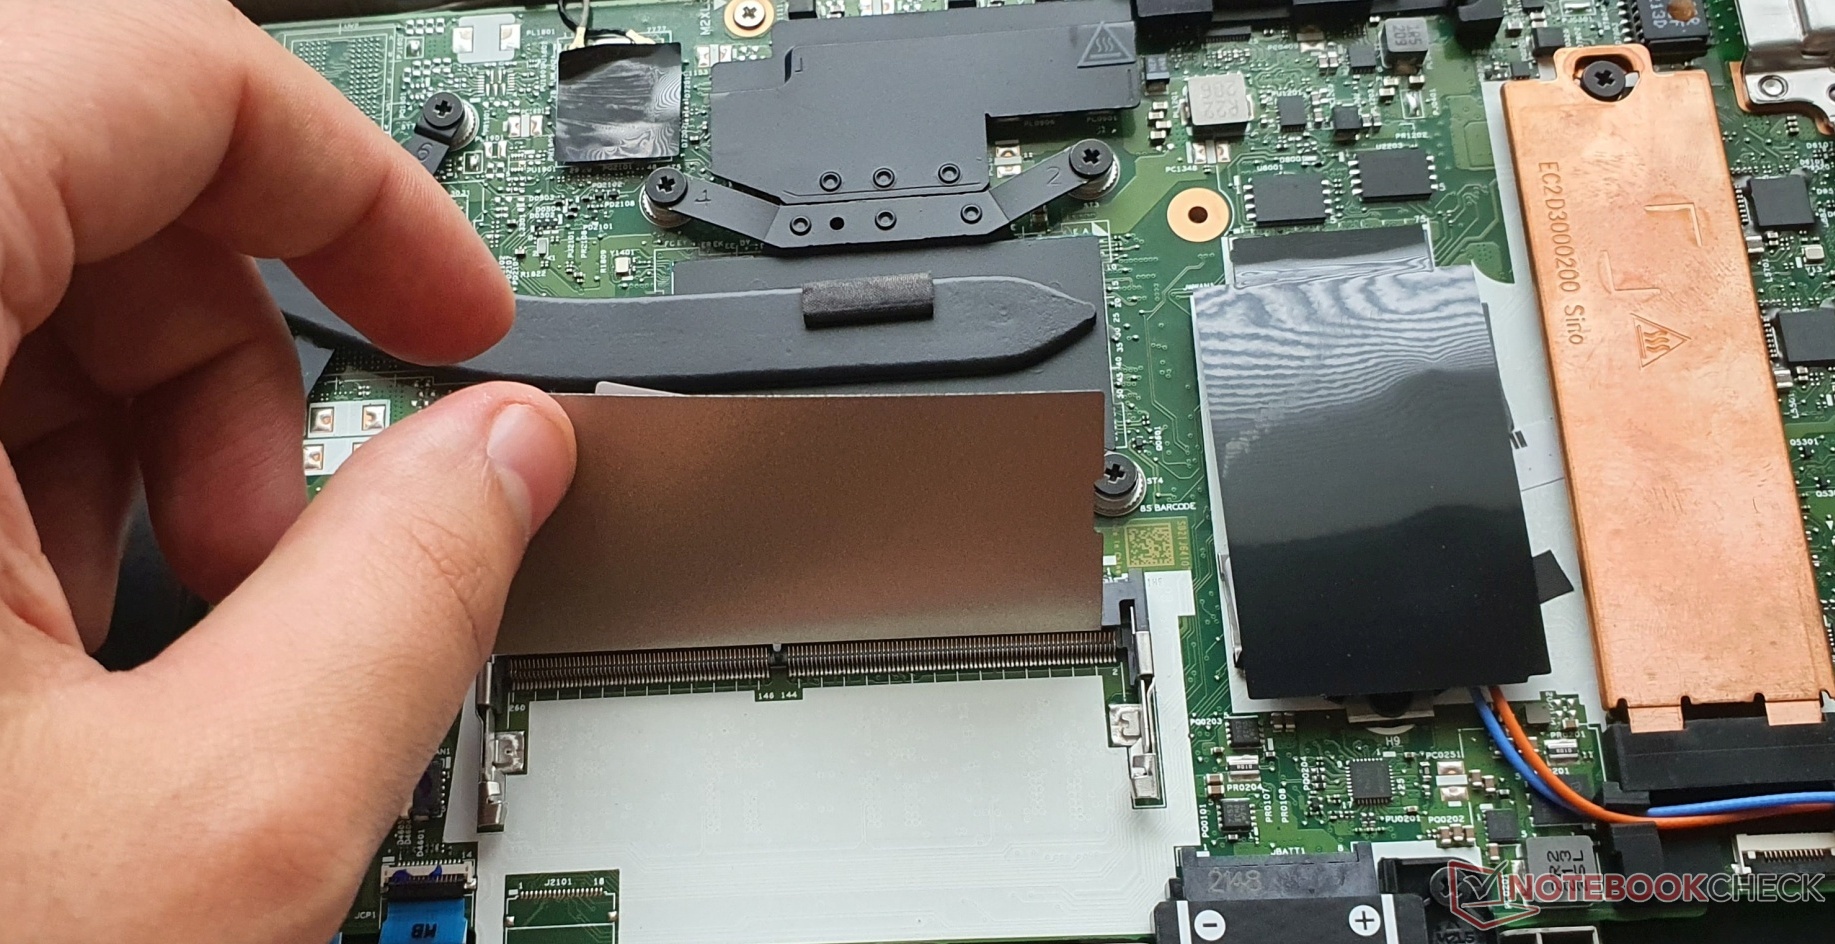
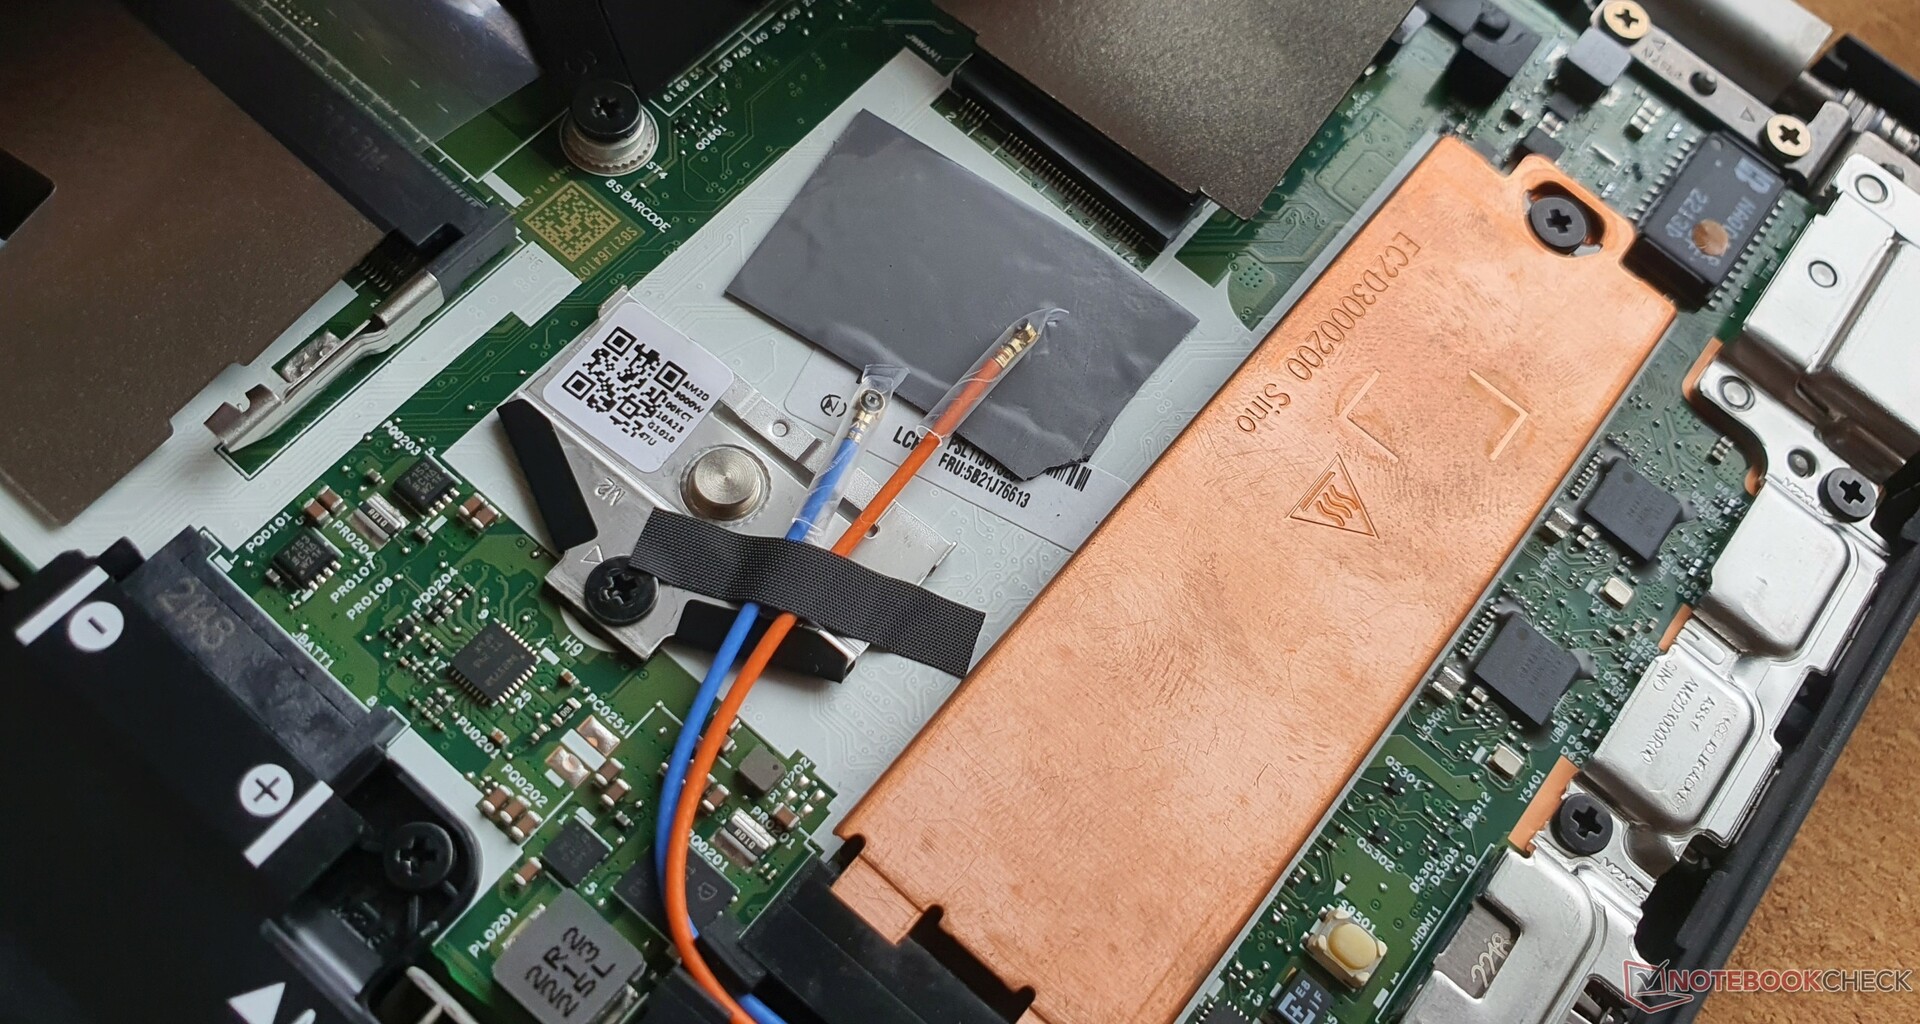
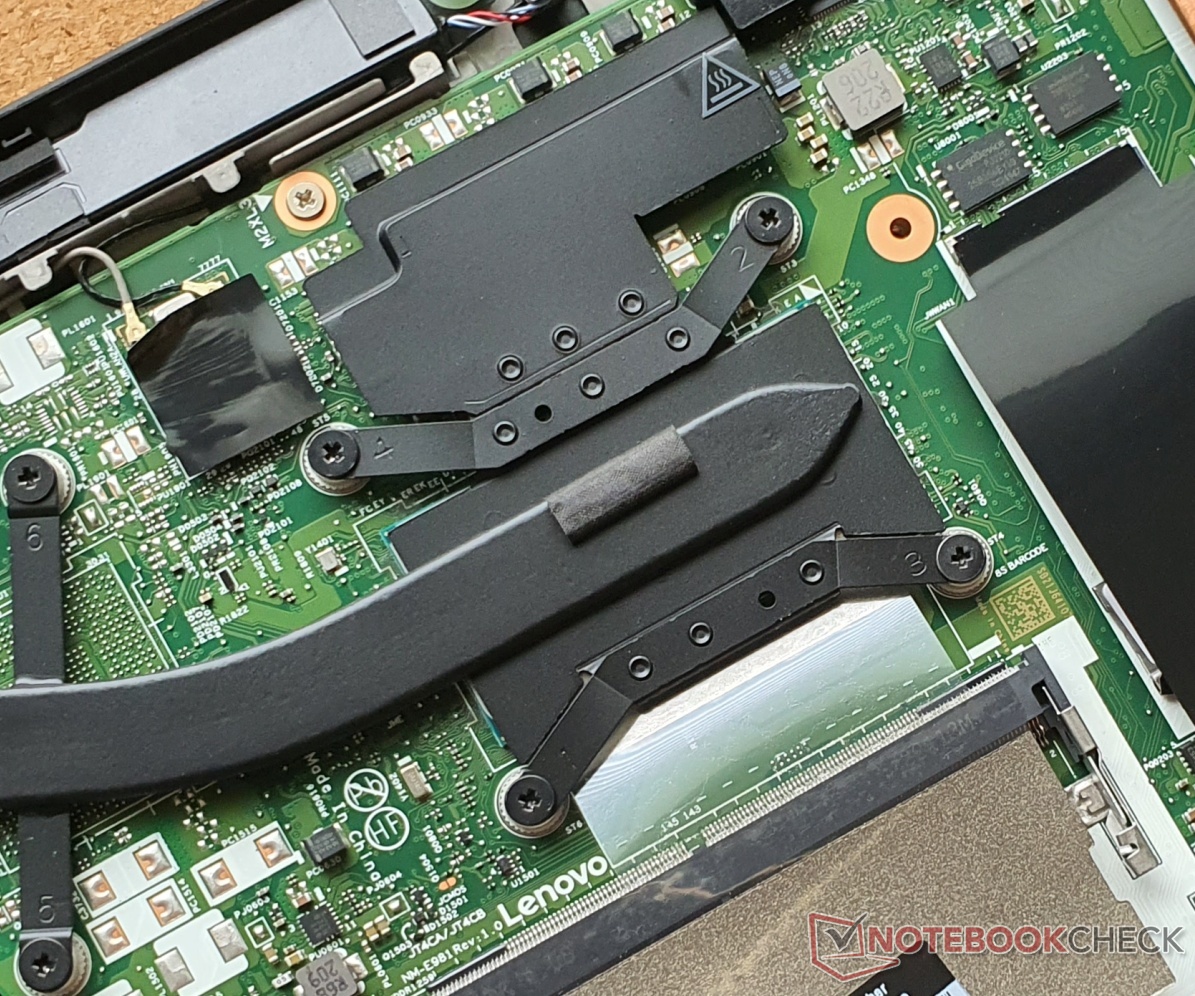
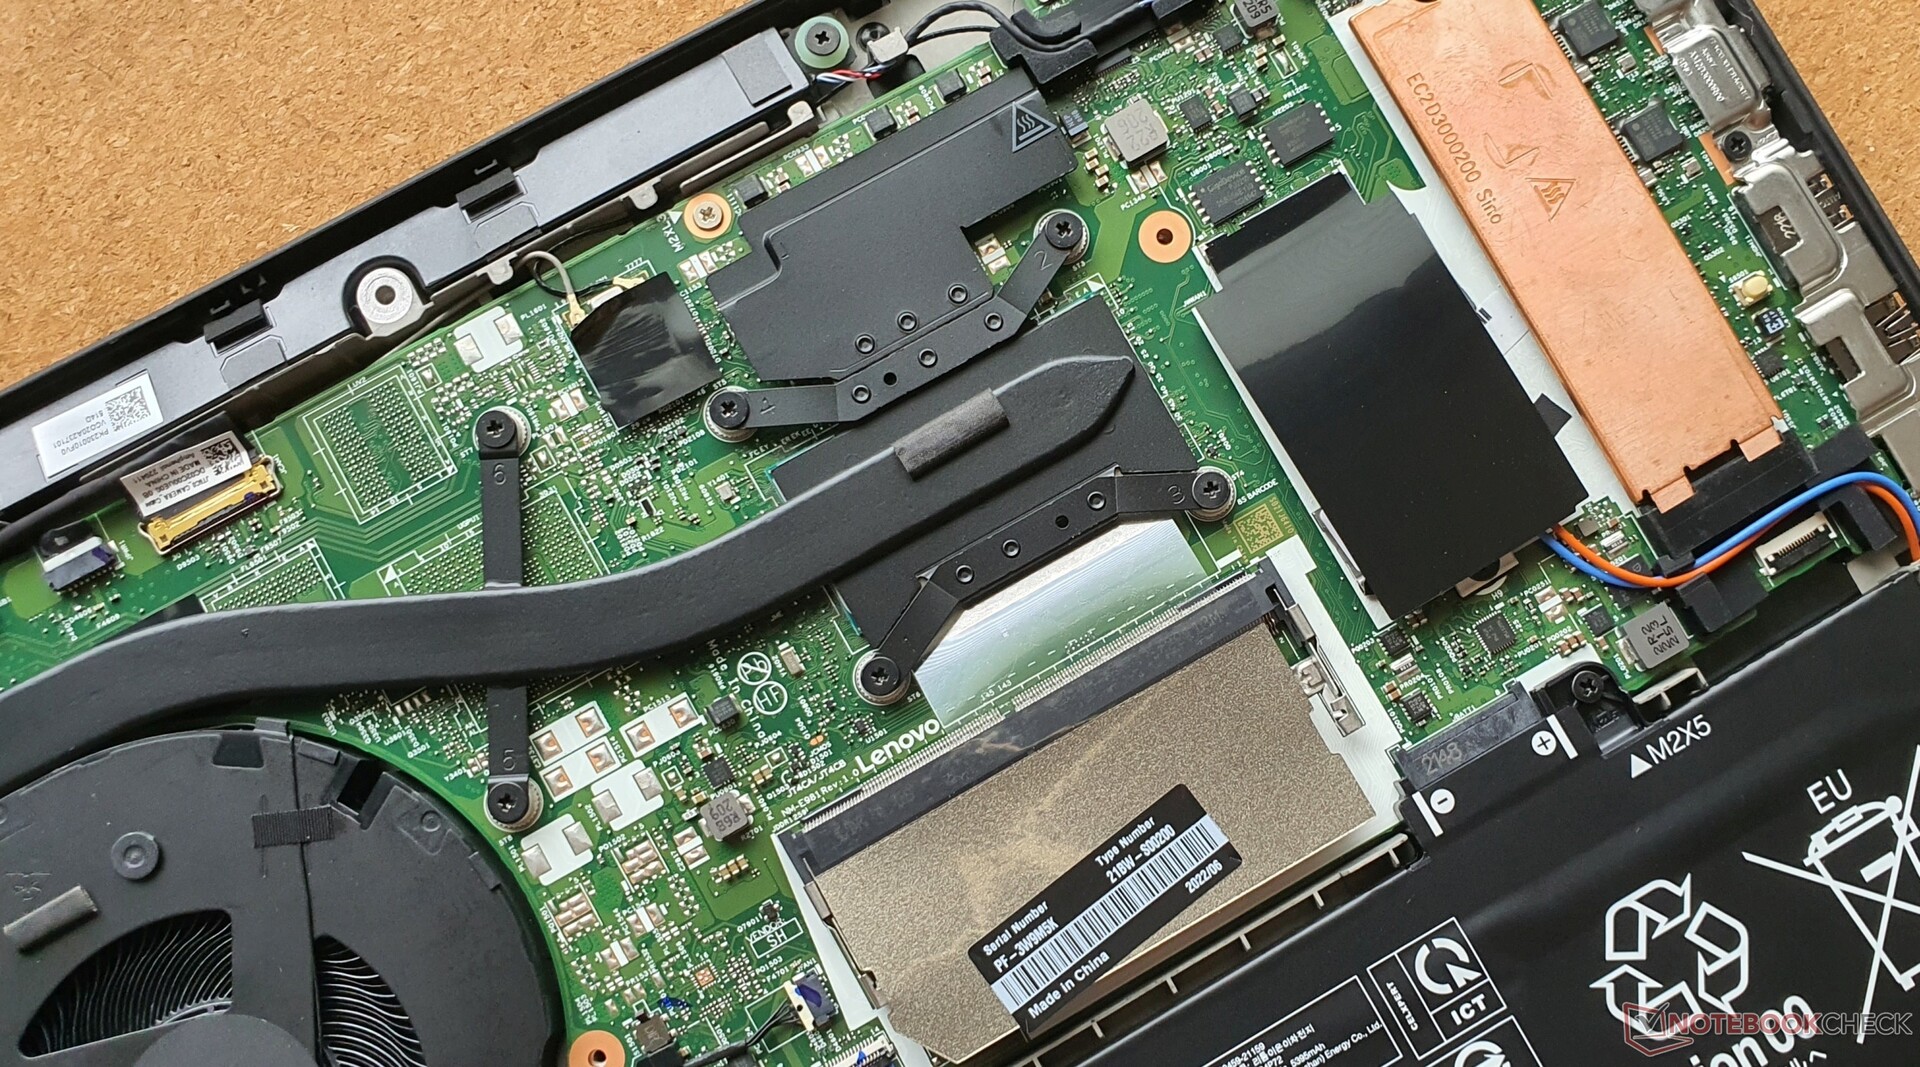
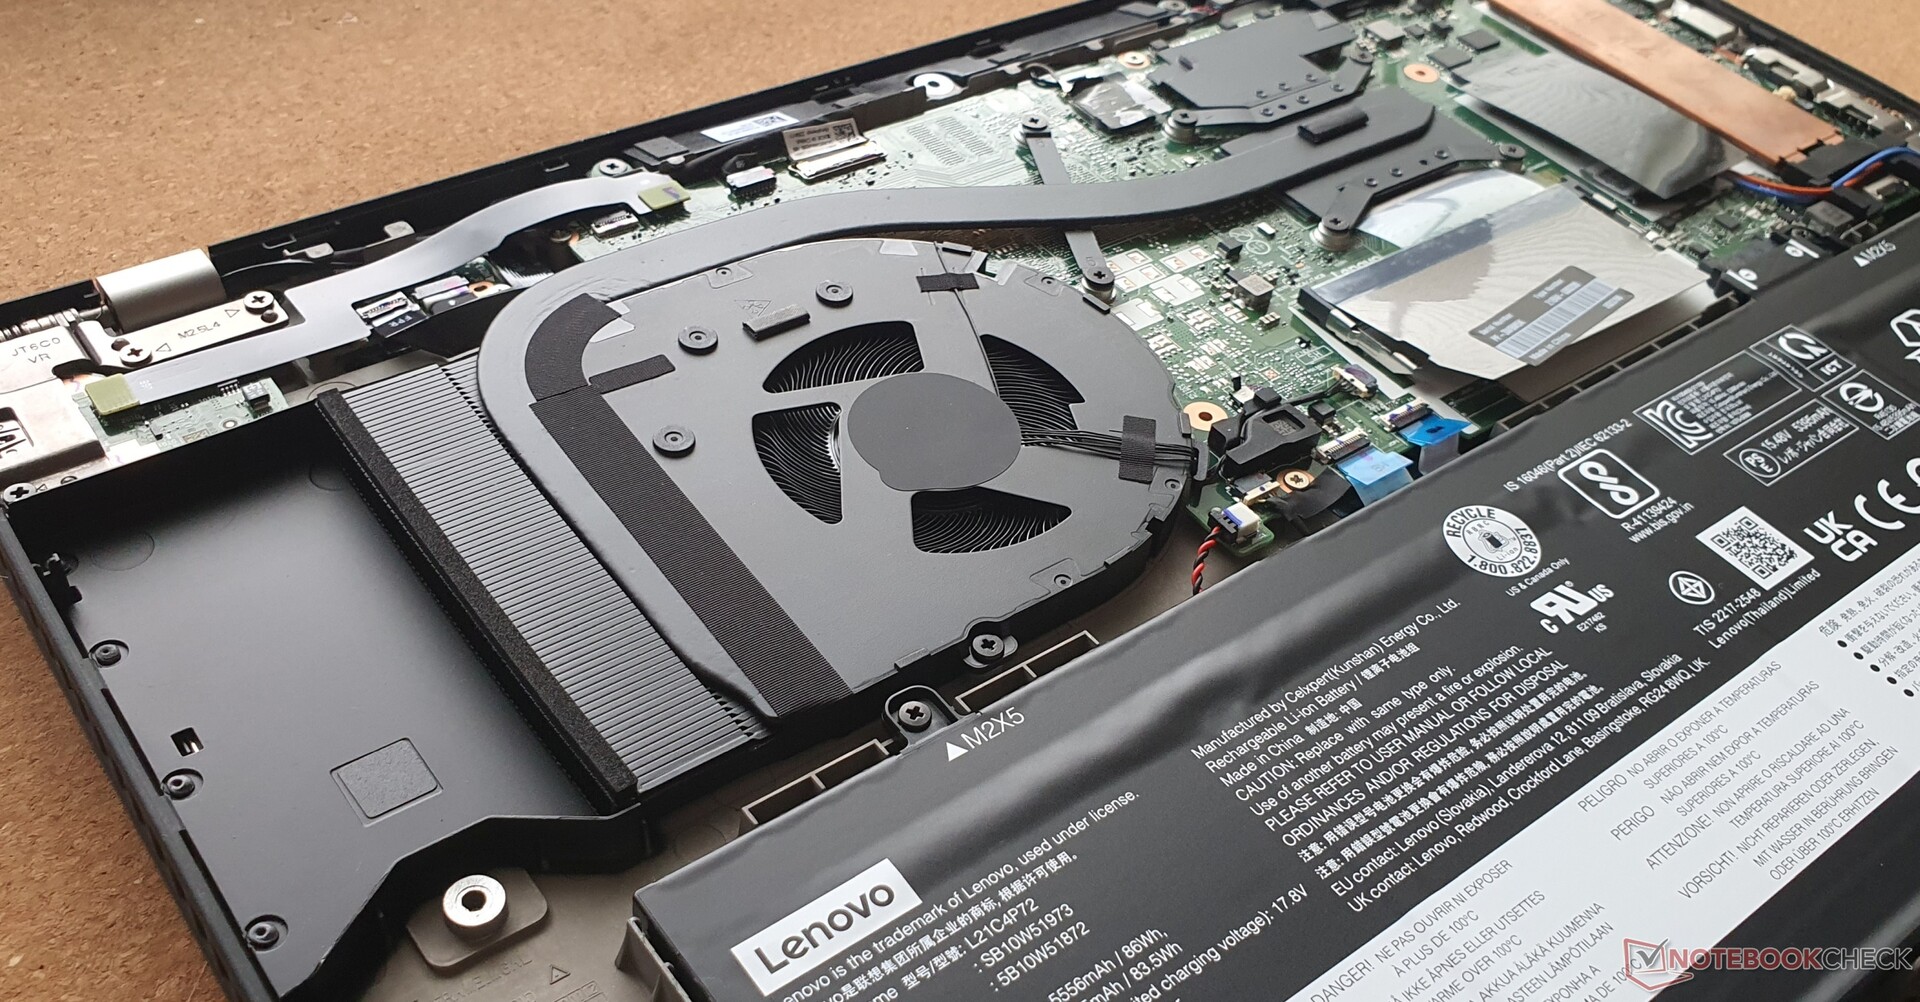
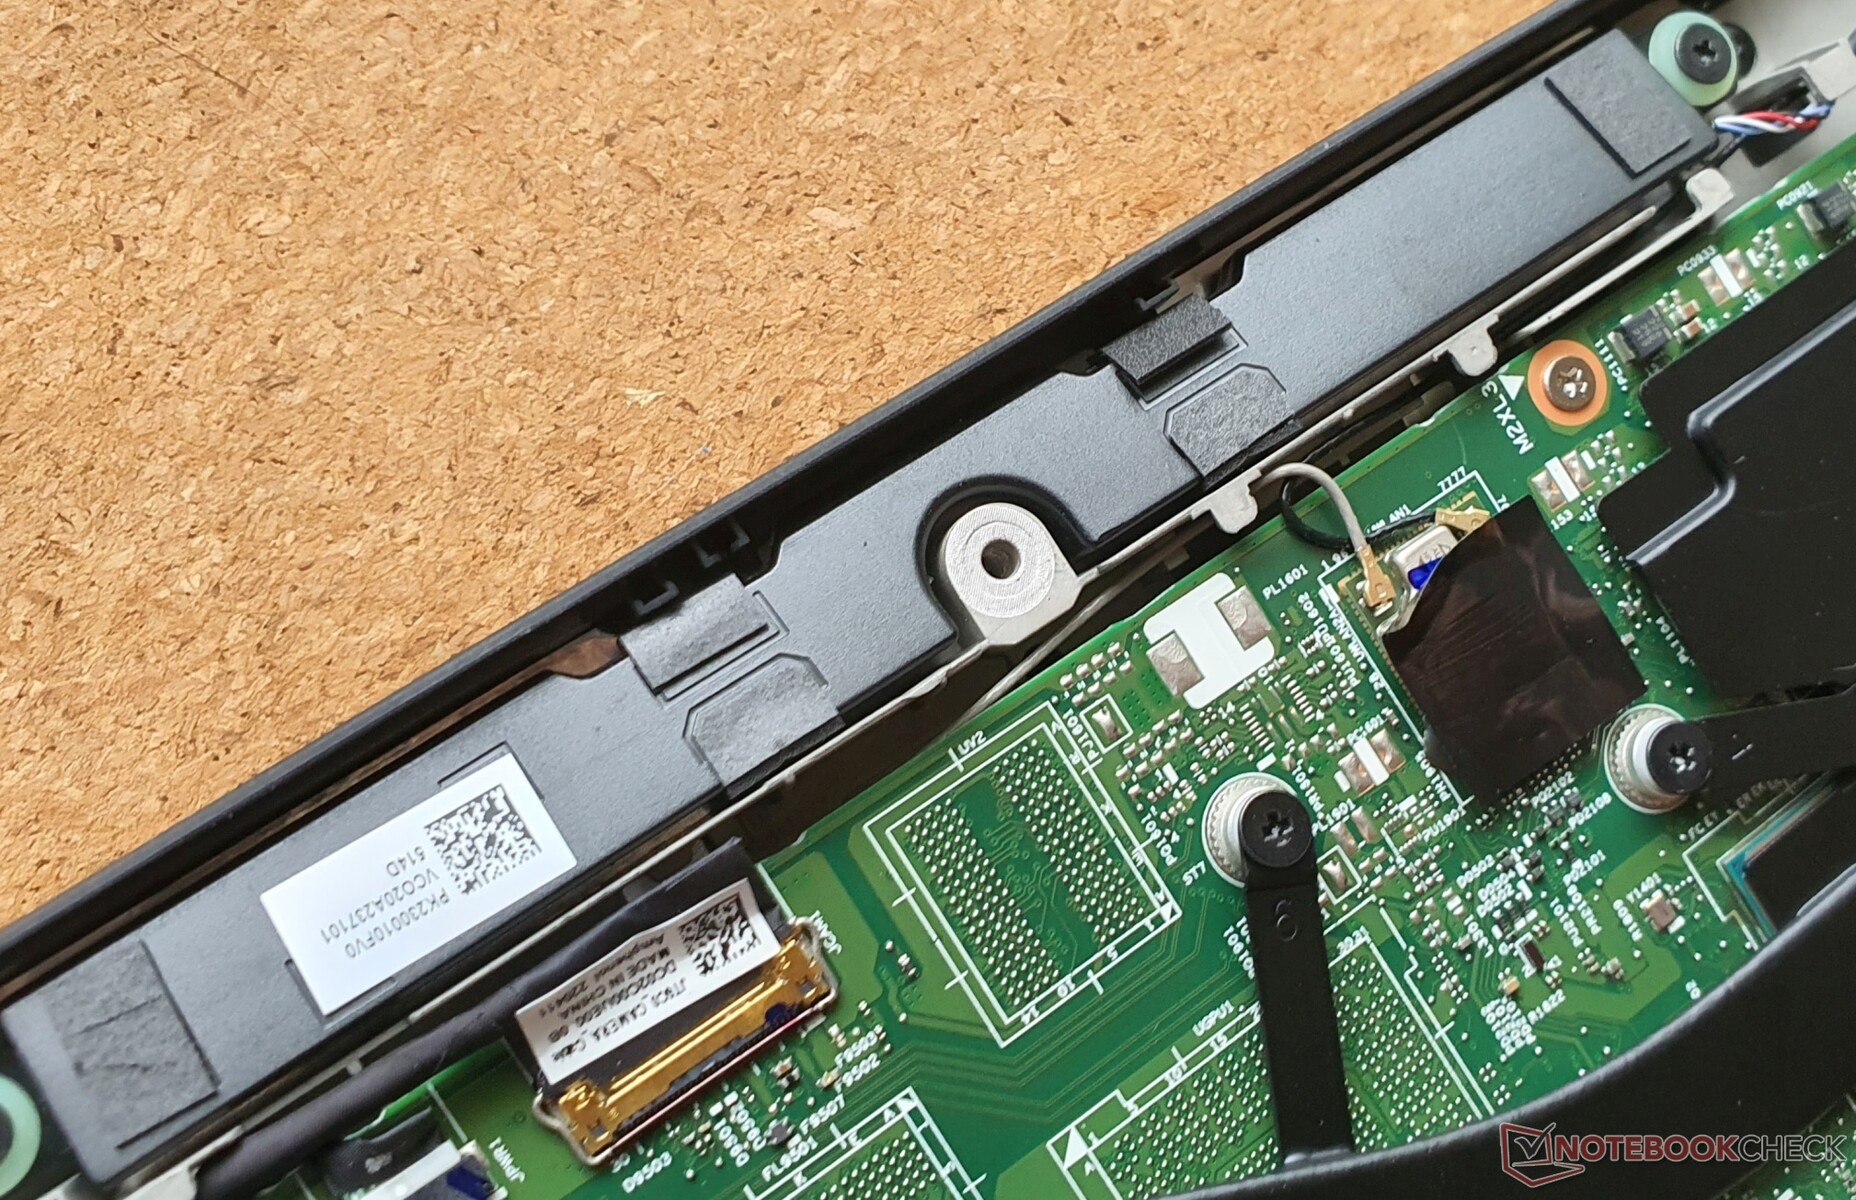
Przed otwarciem urządzenia należy wyłączyć w BIOS-ie wewnętrzną baterię. Po odkręceniu 8 śrubek Phillipsa trzeba jeszcze poluzować kilka zatrzasków przy pomocy spudera. Następnie ma się dostęp do włożonego dysku M.2-2280-SSD (PCIe 4.0), gniazda pamięci RAM (wolnego), gniazda WWAN, przykręconego akumulatora o pojemności 86 Wh oraz układu chłodzenia, który można wyczyścić.
Włożenie dysku SSD do gniazda WWAN nie jest możliwe.
Gwarancja
W Niemczech Lenovo udziela gwarancji na 3 lata (1 rok na akumulator). Nasz model wyposażony jest w Premier Support, który obejmuje serwis na miejscu. Standardem jest jednak usługa kuriera lub carry-in. Możliwe jest przedłużenie do 5 lat: 223 euro (~US$ 223) za pierwszy i 521 euro (~US$ 521) za dwa dodatkowe lata.
Powyższe warunki gwarancji mogą się różnić w innych krajach, dlatego przed zakupem upewnij się u swojego dostawcy.
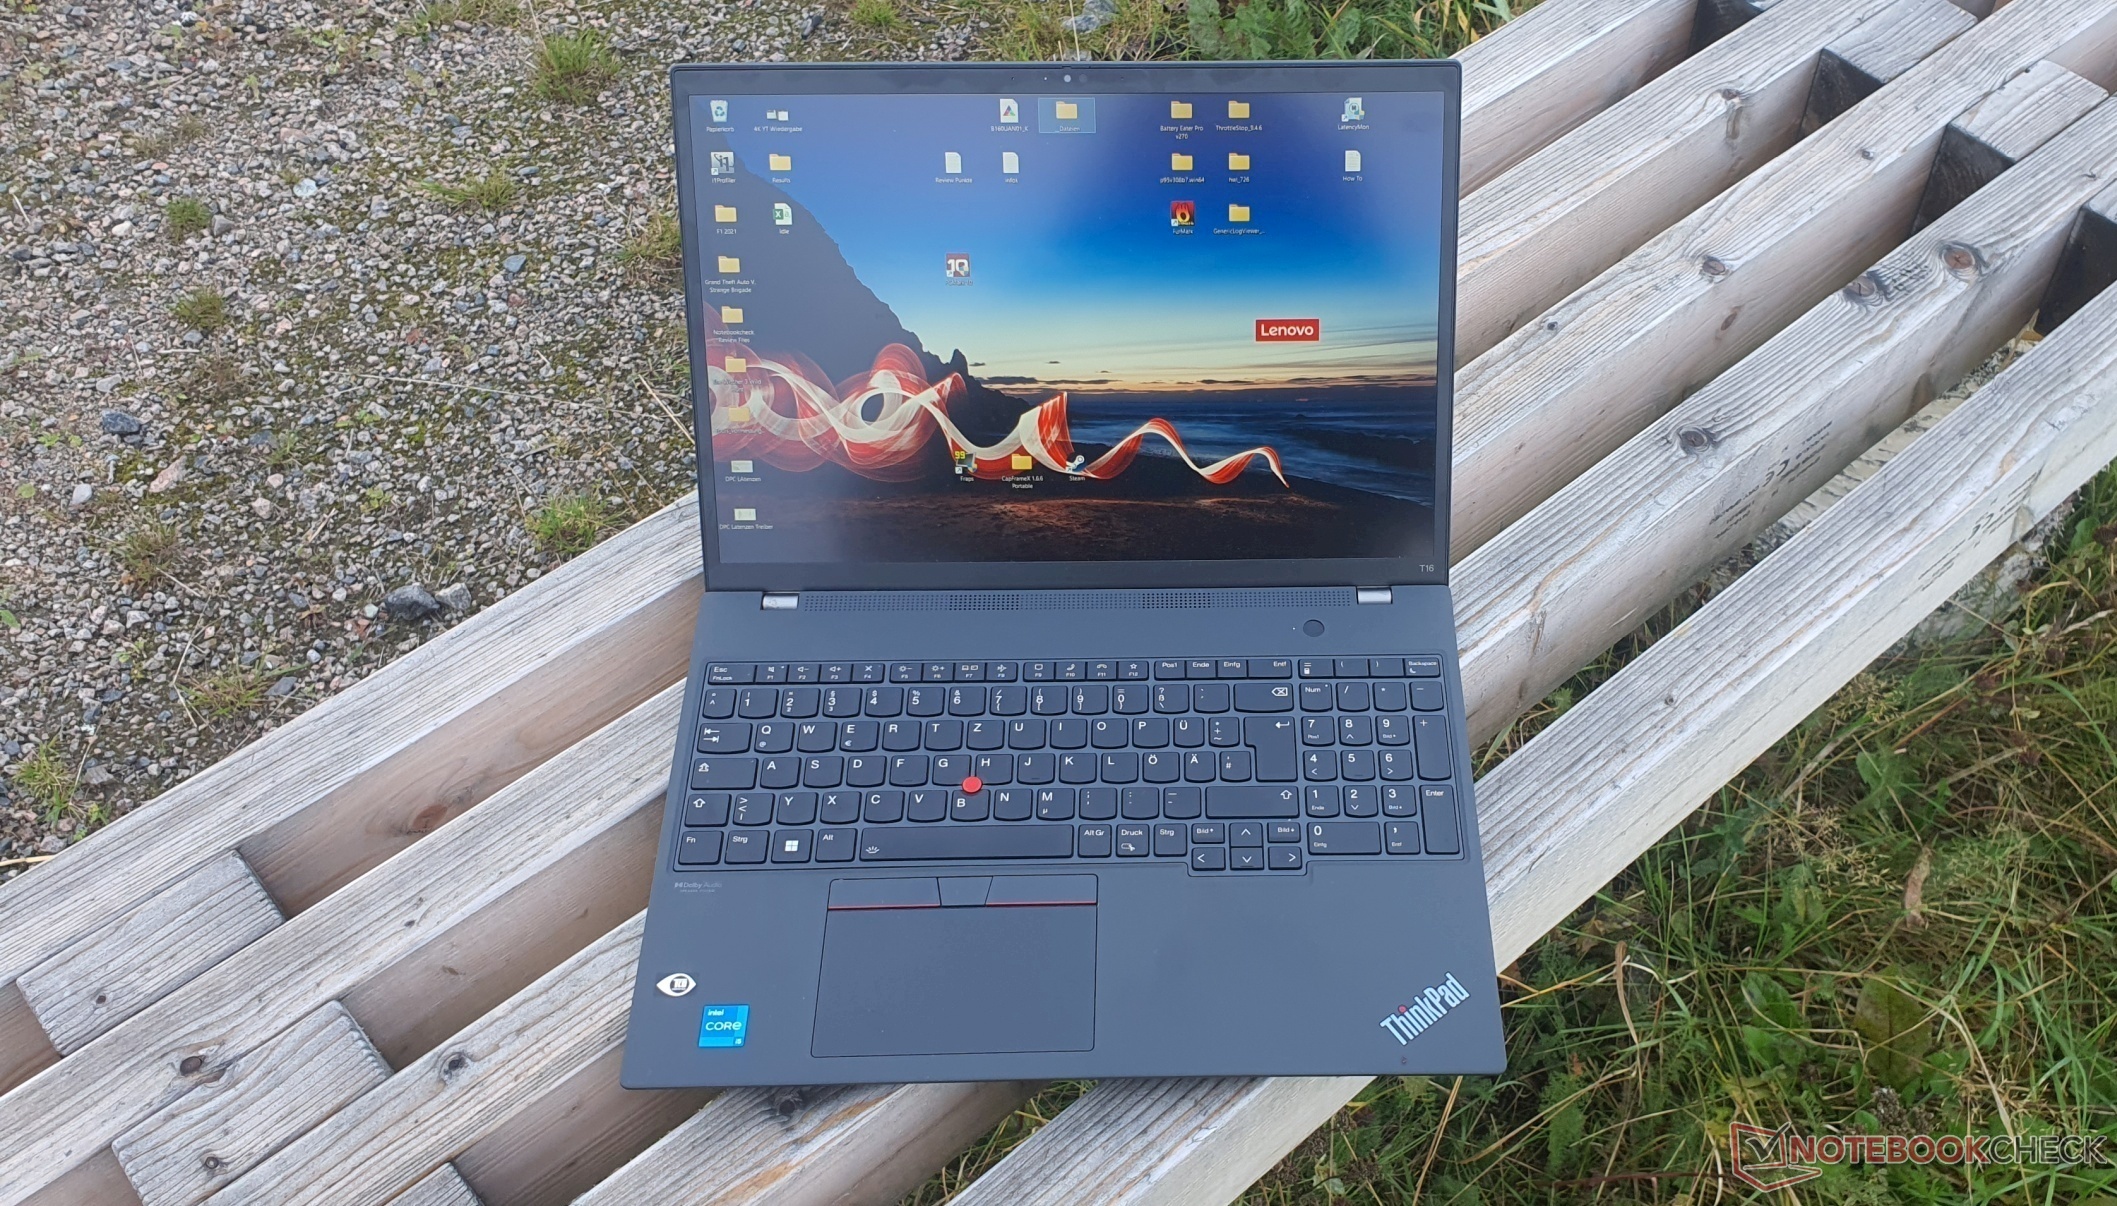
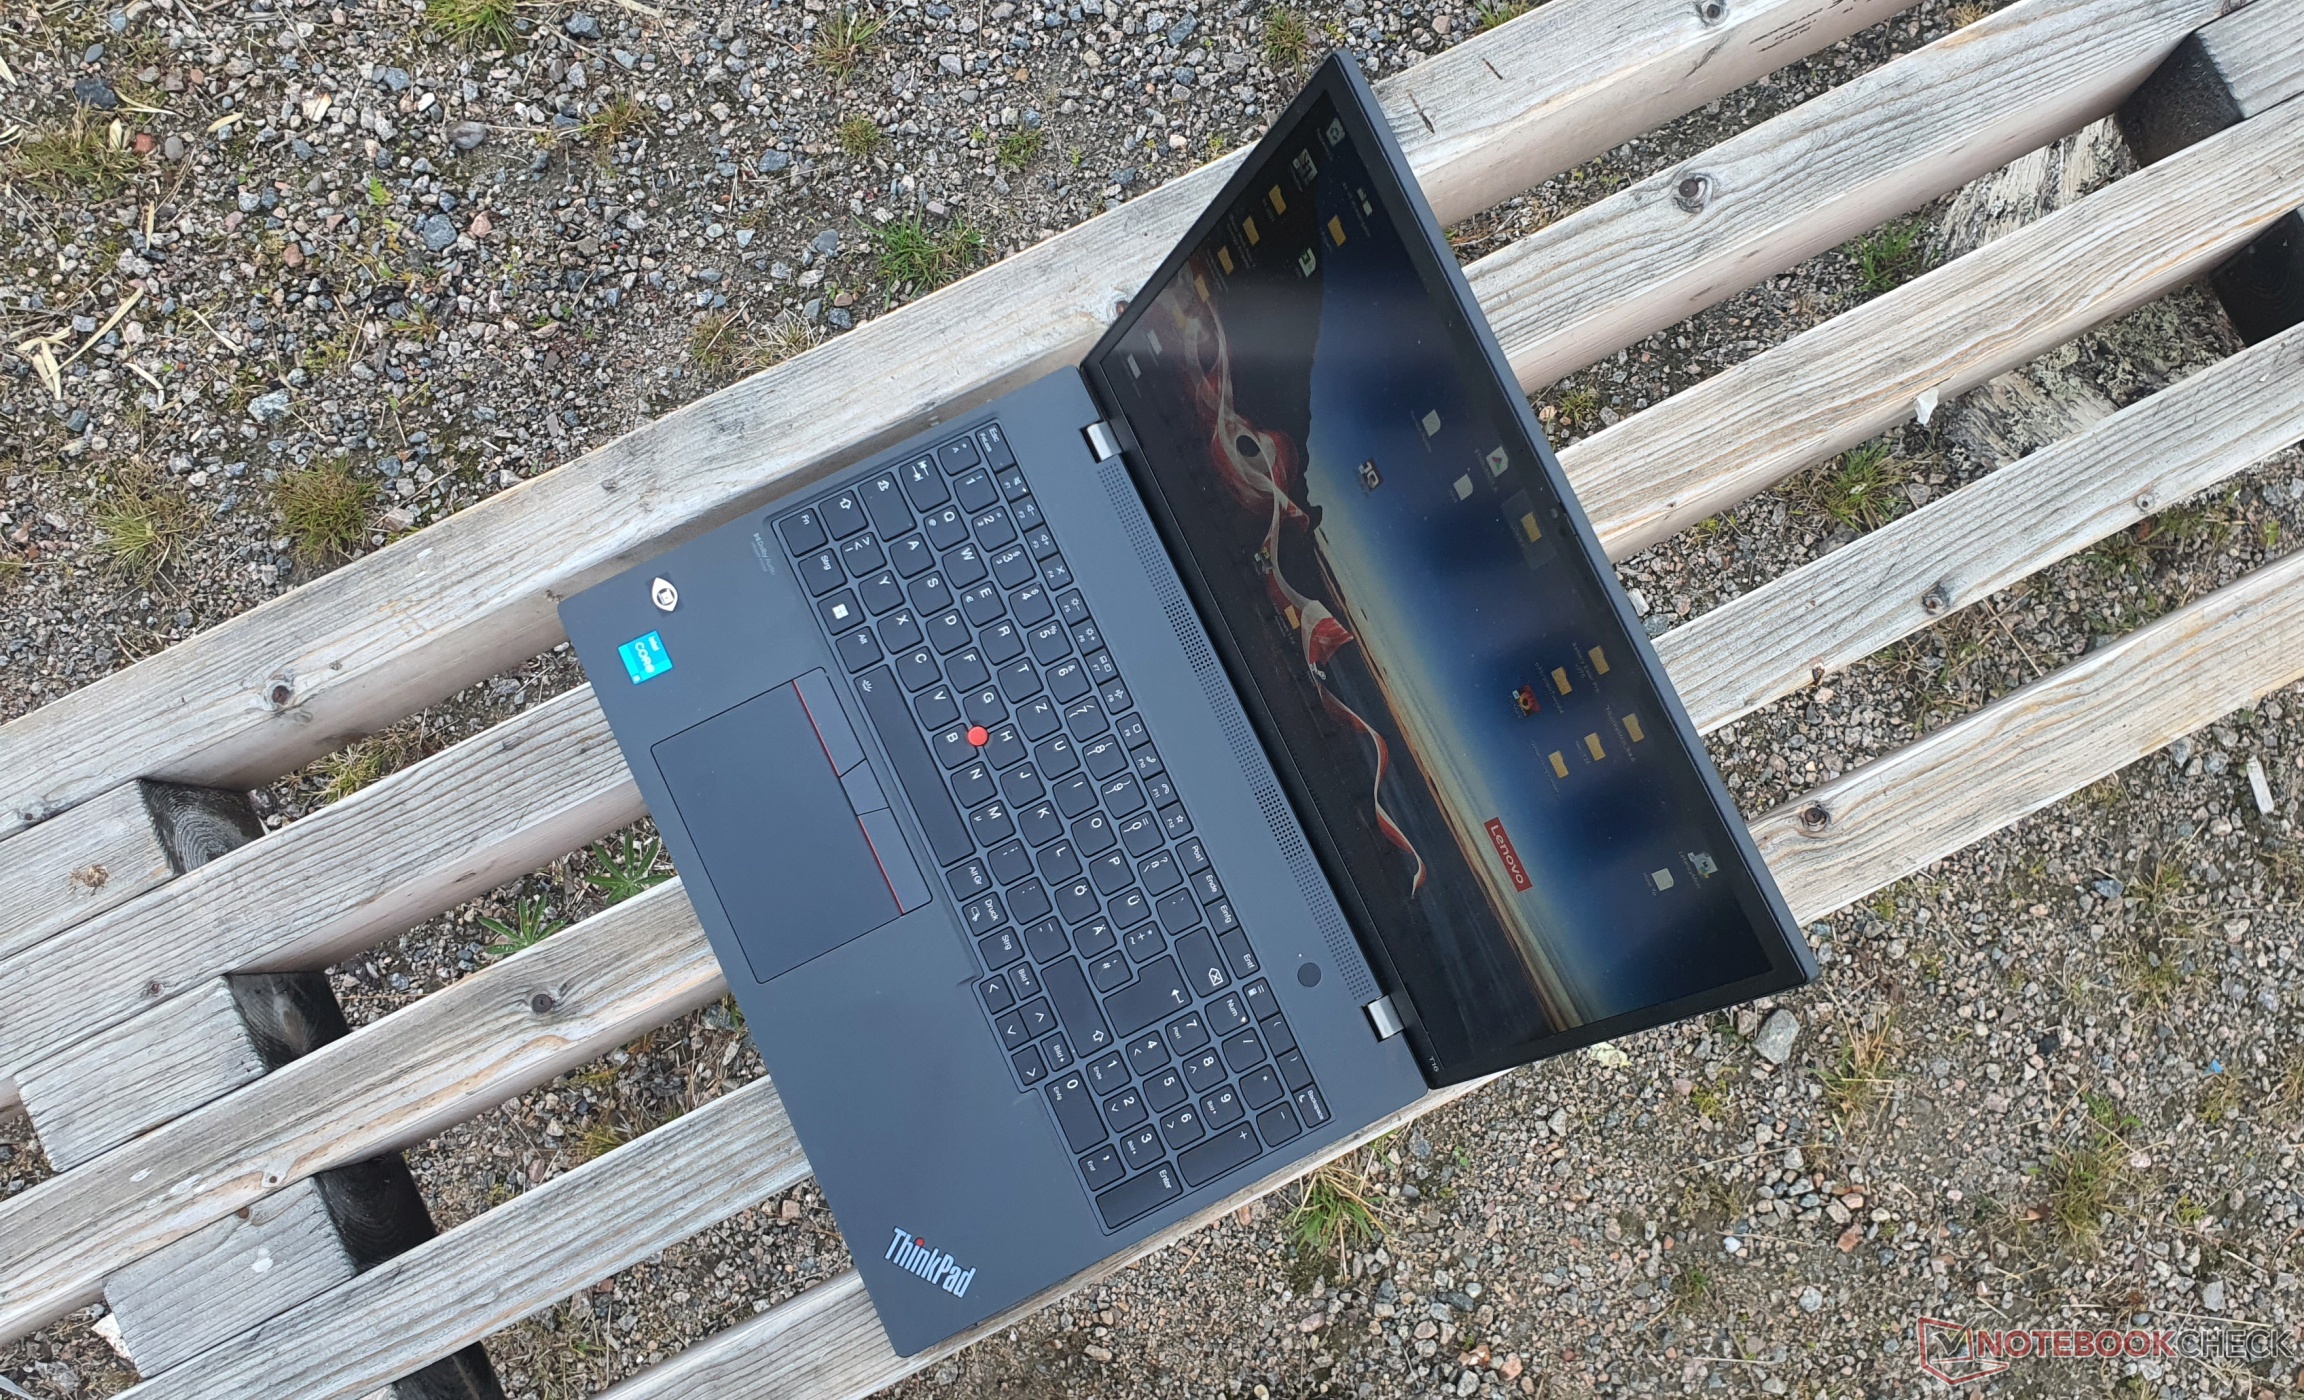
Urządzenia wejściowe - skok 1,5 mm z wymienną klawiaturą ThinkPad
Klawiatura
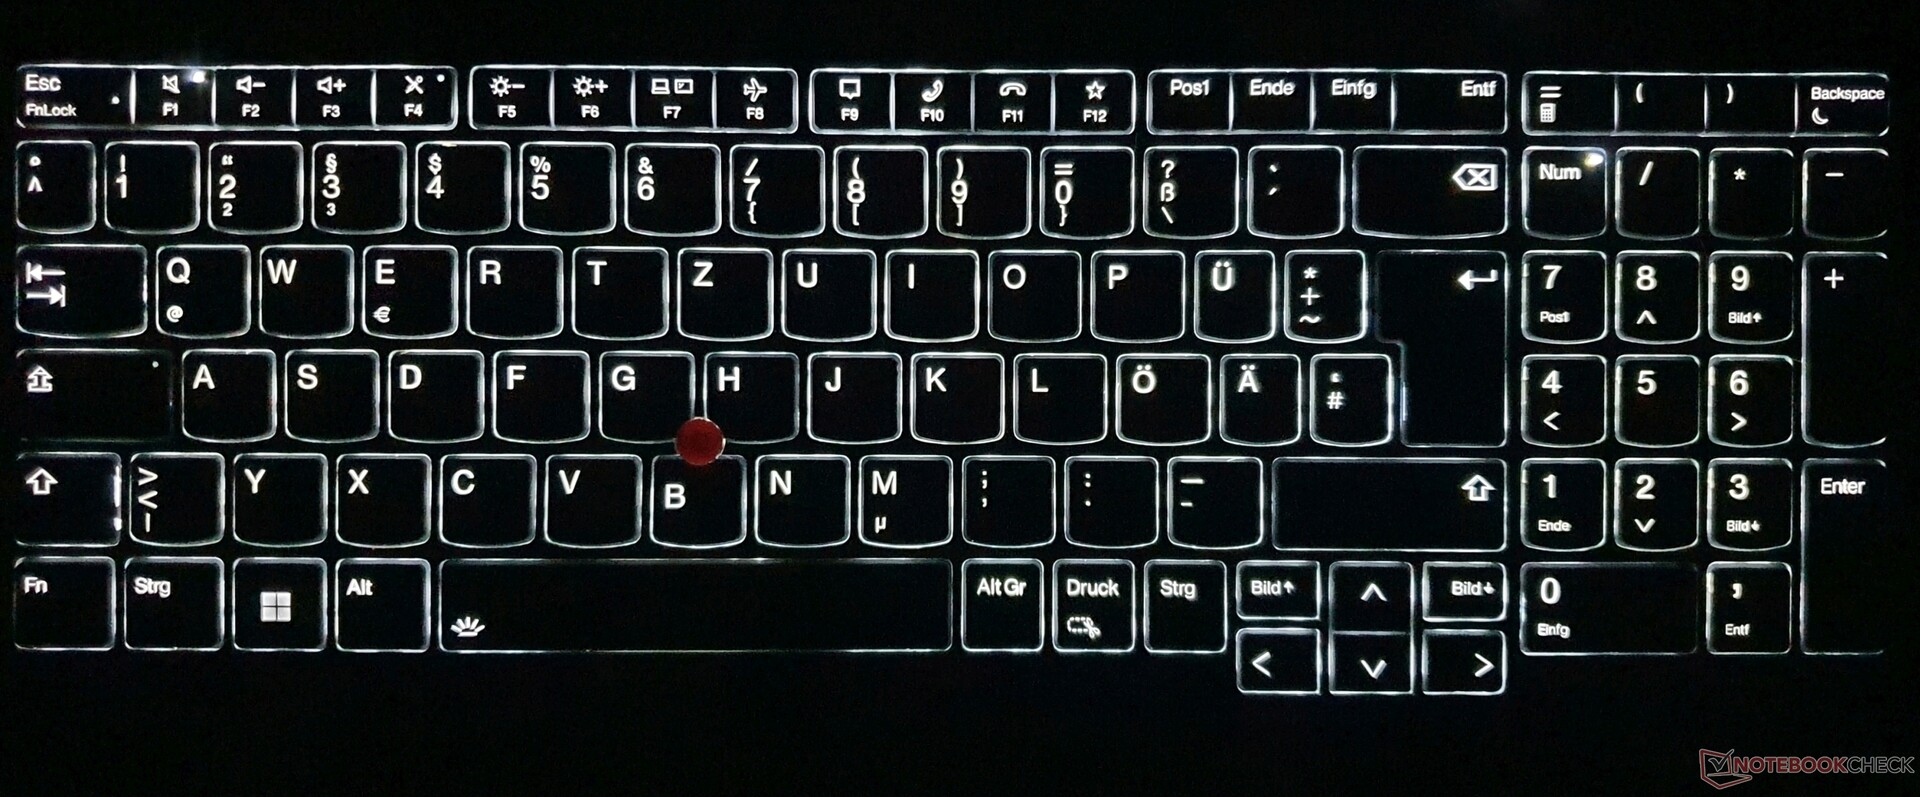
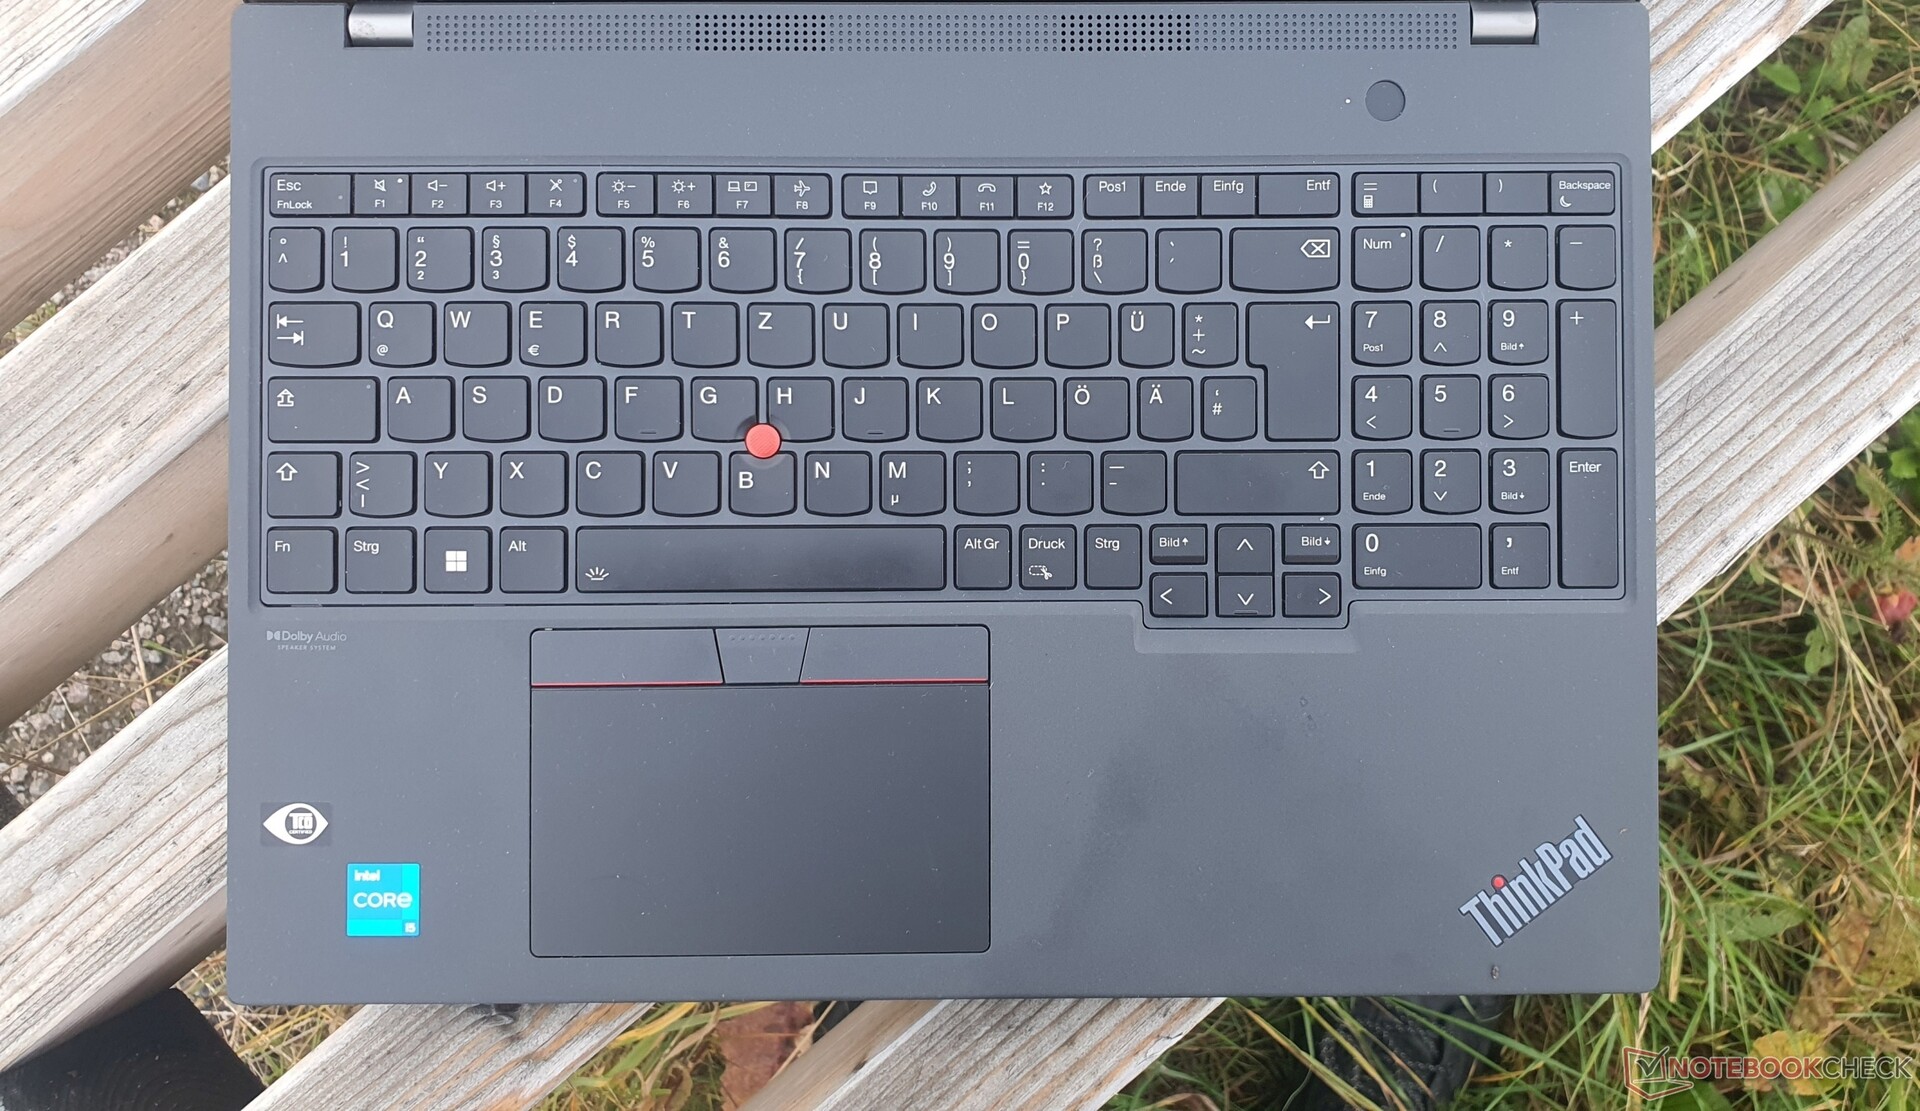
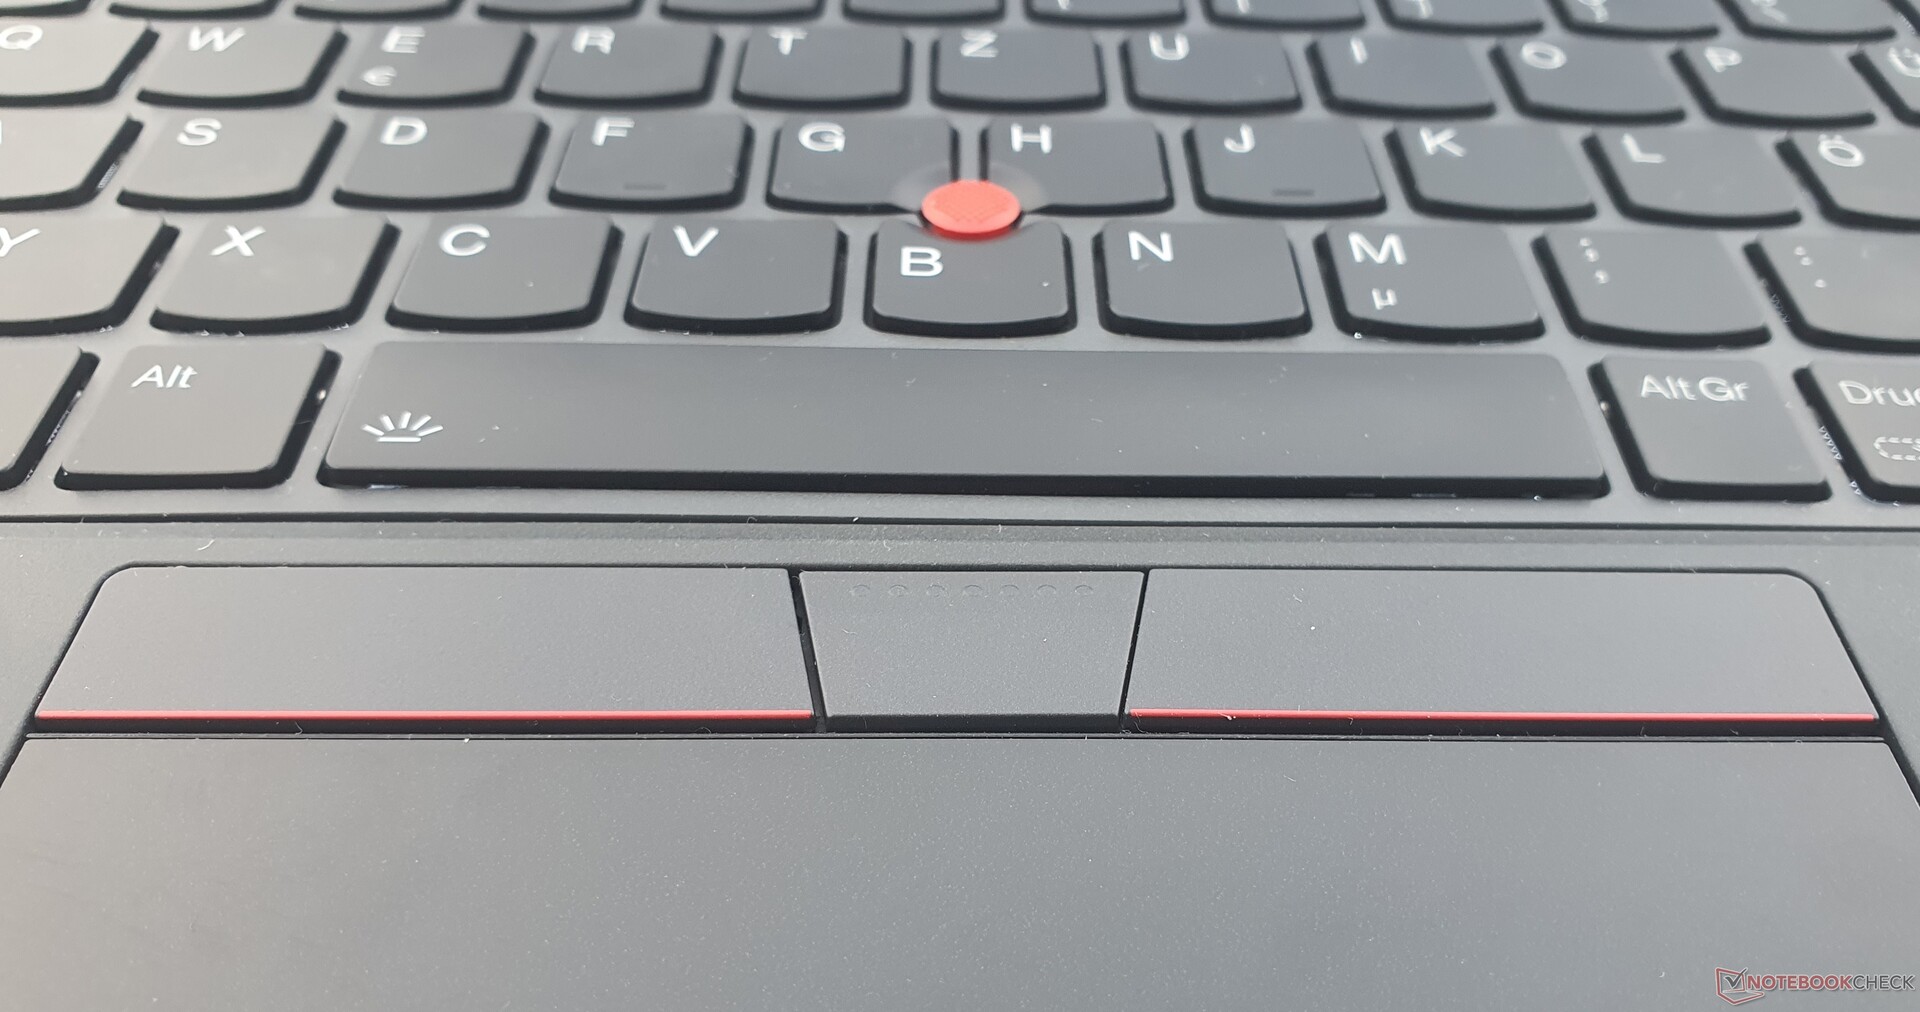
6-rzędowa, odporna na zachlapania klawiatura typu chiclet posiada klawisze o wymiarach 16x16 mm. Dolny rząd i klawisze shift są teraz kwadratowe. Niektóre klawisze zostały zmniejszone, jak NumPad i klawisze strzałek, ale nie zmniejszone o połowę (jak w niektórych innych modelach). Wszystkie ważne klawisze są też dedykowane.
Skok klawiszy, który został skrócony do 1,5 mm, trafił w tym roku do serii T bez sufiksu s. Ponieważ punkt nacisku jest bardzo zwięzły, a opór klawiszy dobrze zaimplementowany, zapewnia to szybsze, dokładniejsze, a także cichsze pisanie niż w przypadku niemal każdej innej klawiatury. Ponadto w przypadku zużycia lub uszkodzenia klawiatury można ją wymienić. Podstawa klawiatury ugina się tylko trochę pod ukierunkowanym naciskiem, co nie ma miejsca podczas pisania.
Touchpad i TrackPoint
Touchpad, który został powiększony do 11,5x6,7 cm z ulepszoną powierzchnią Mylar, jest o krok wyżej pod względem responsywności, ślizga się płynniej i sprawia wrażenie gładkiego szkła. Pinch-to-zoom oraz drag & drop działają wspaniale. Wejścia są realizowane precyzyjnie. Zintegrowane klawisze kliknięcia oferują krótki skok, ale bogate i wyraźne sprzężenie zwrotne.
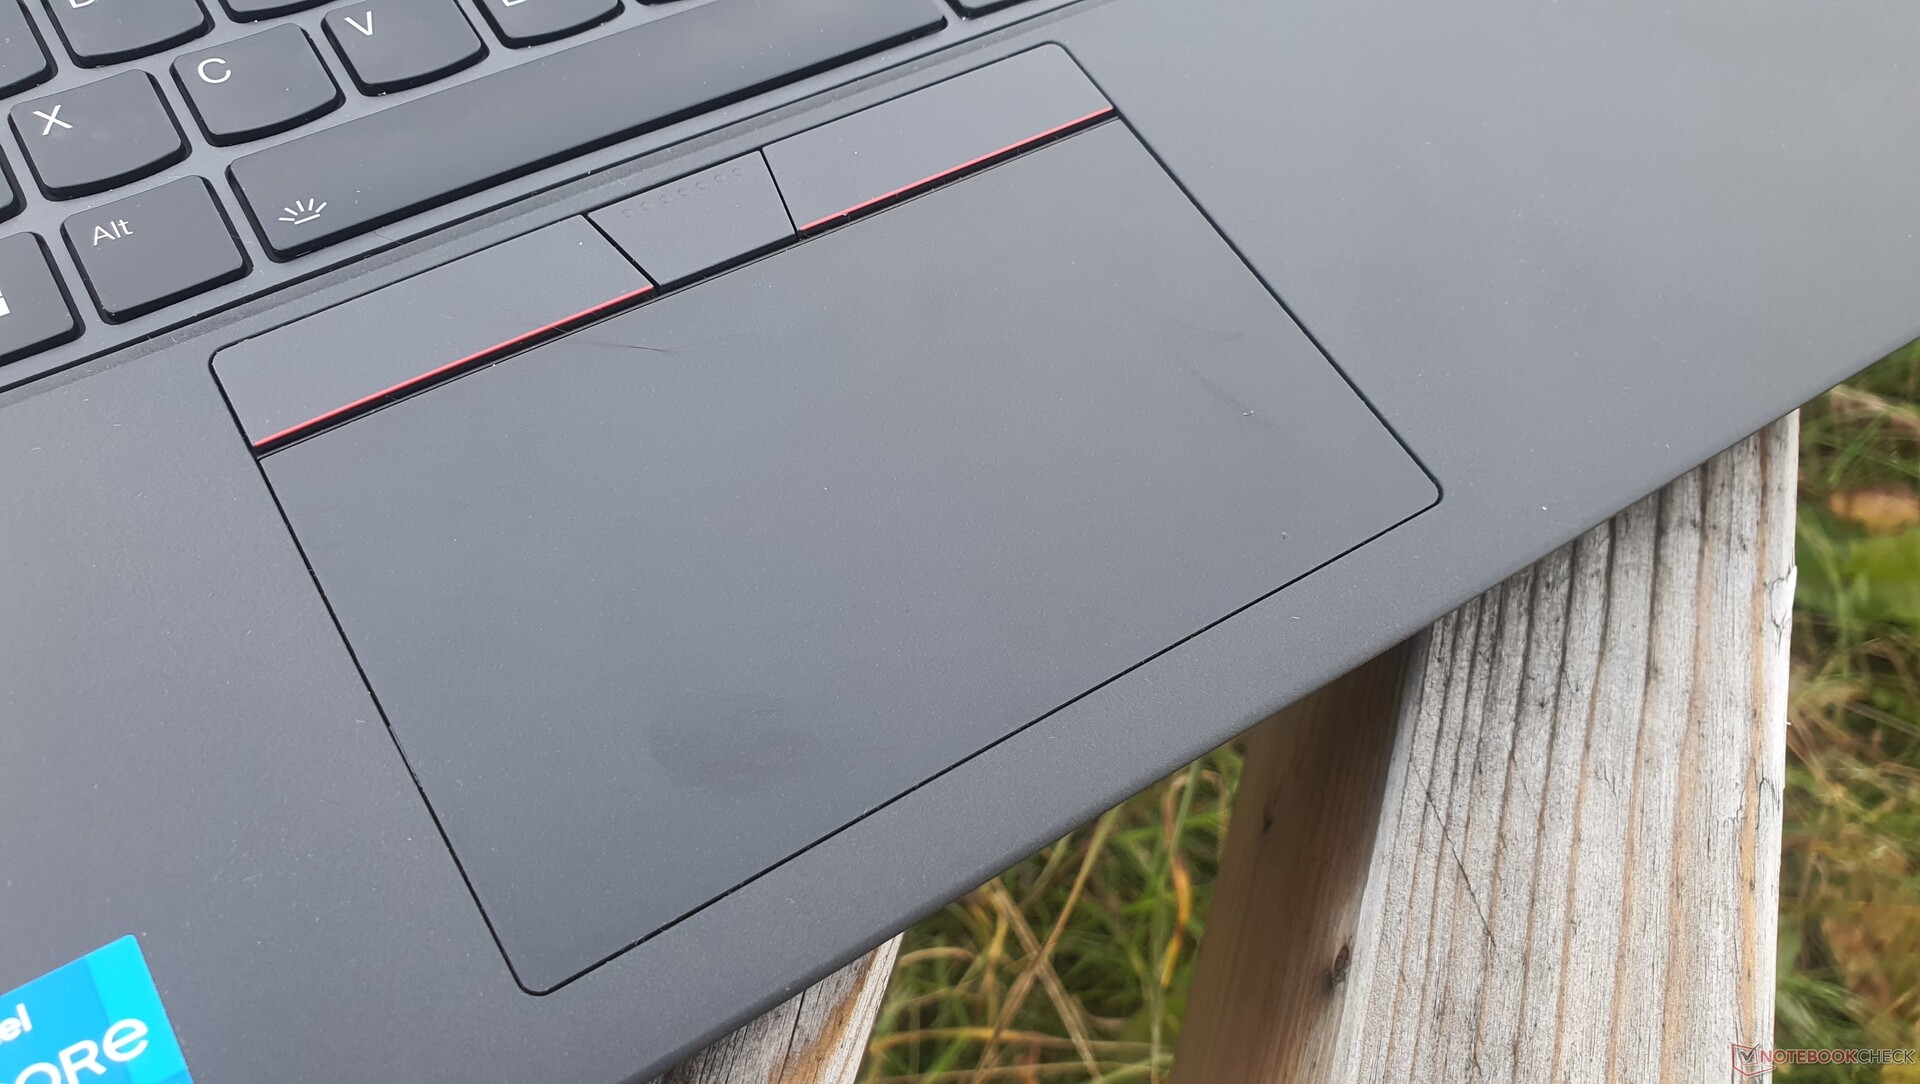
Fani TrackPointa mogą nadal korzystać z korzystnej metody sterowania myszką, dzięki której odrywanie dłoni od klawiatury jest zbędne. Trzy powiązane klawisze nad touchpadem są jednak teraz zupełnie płaskie, z mniejszym sprzężeniem zwrotnym i skokiem. Może to wymagać nieco przyzwyczajenia. Niemniej jednak nadal działają one precyzyjnie i niezawodnie.
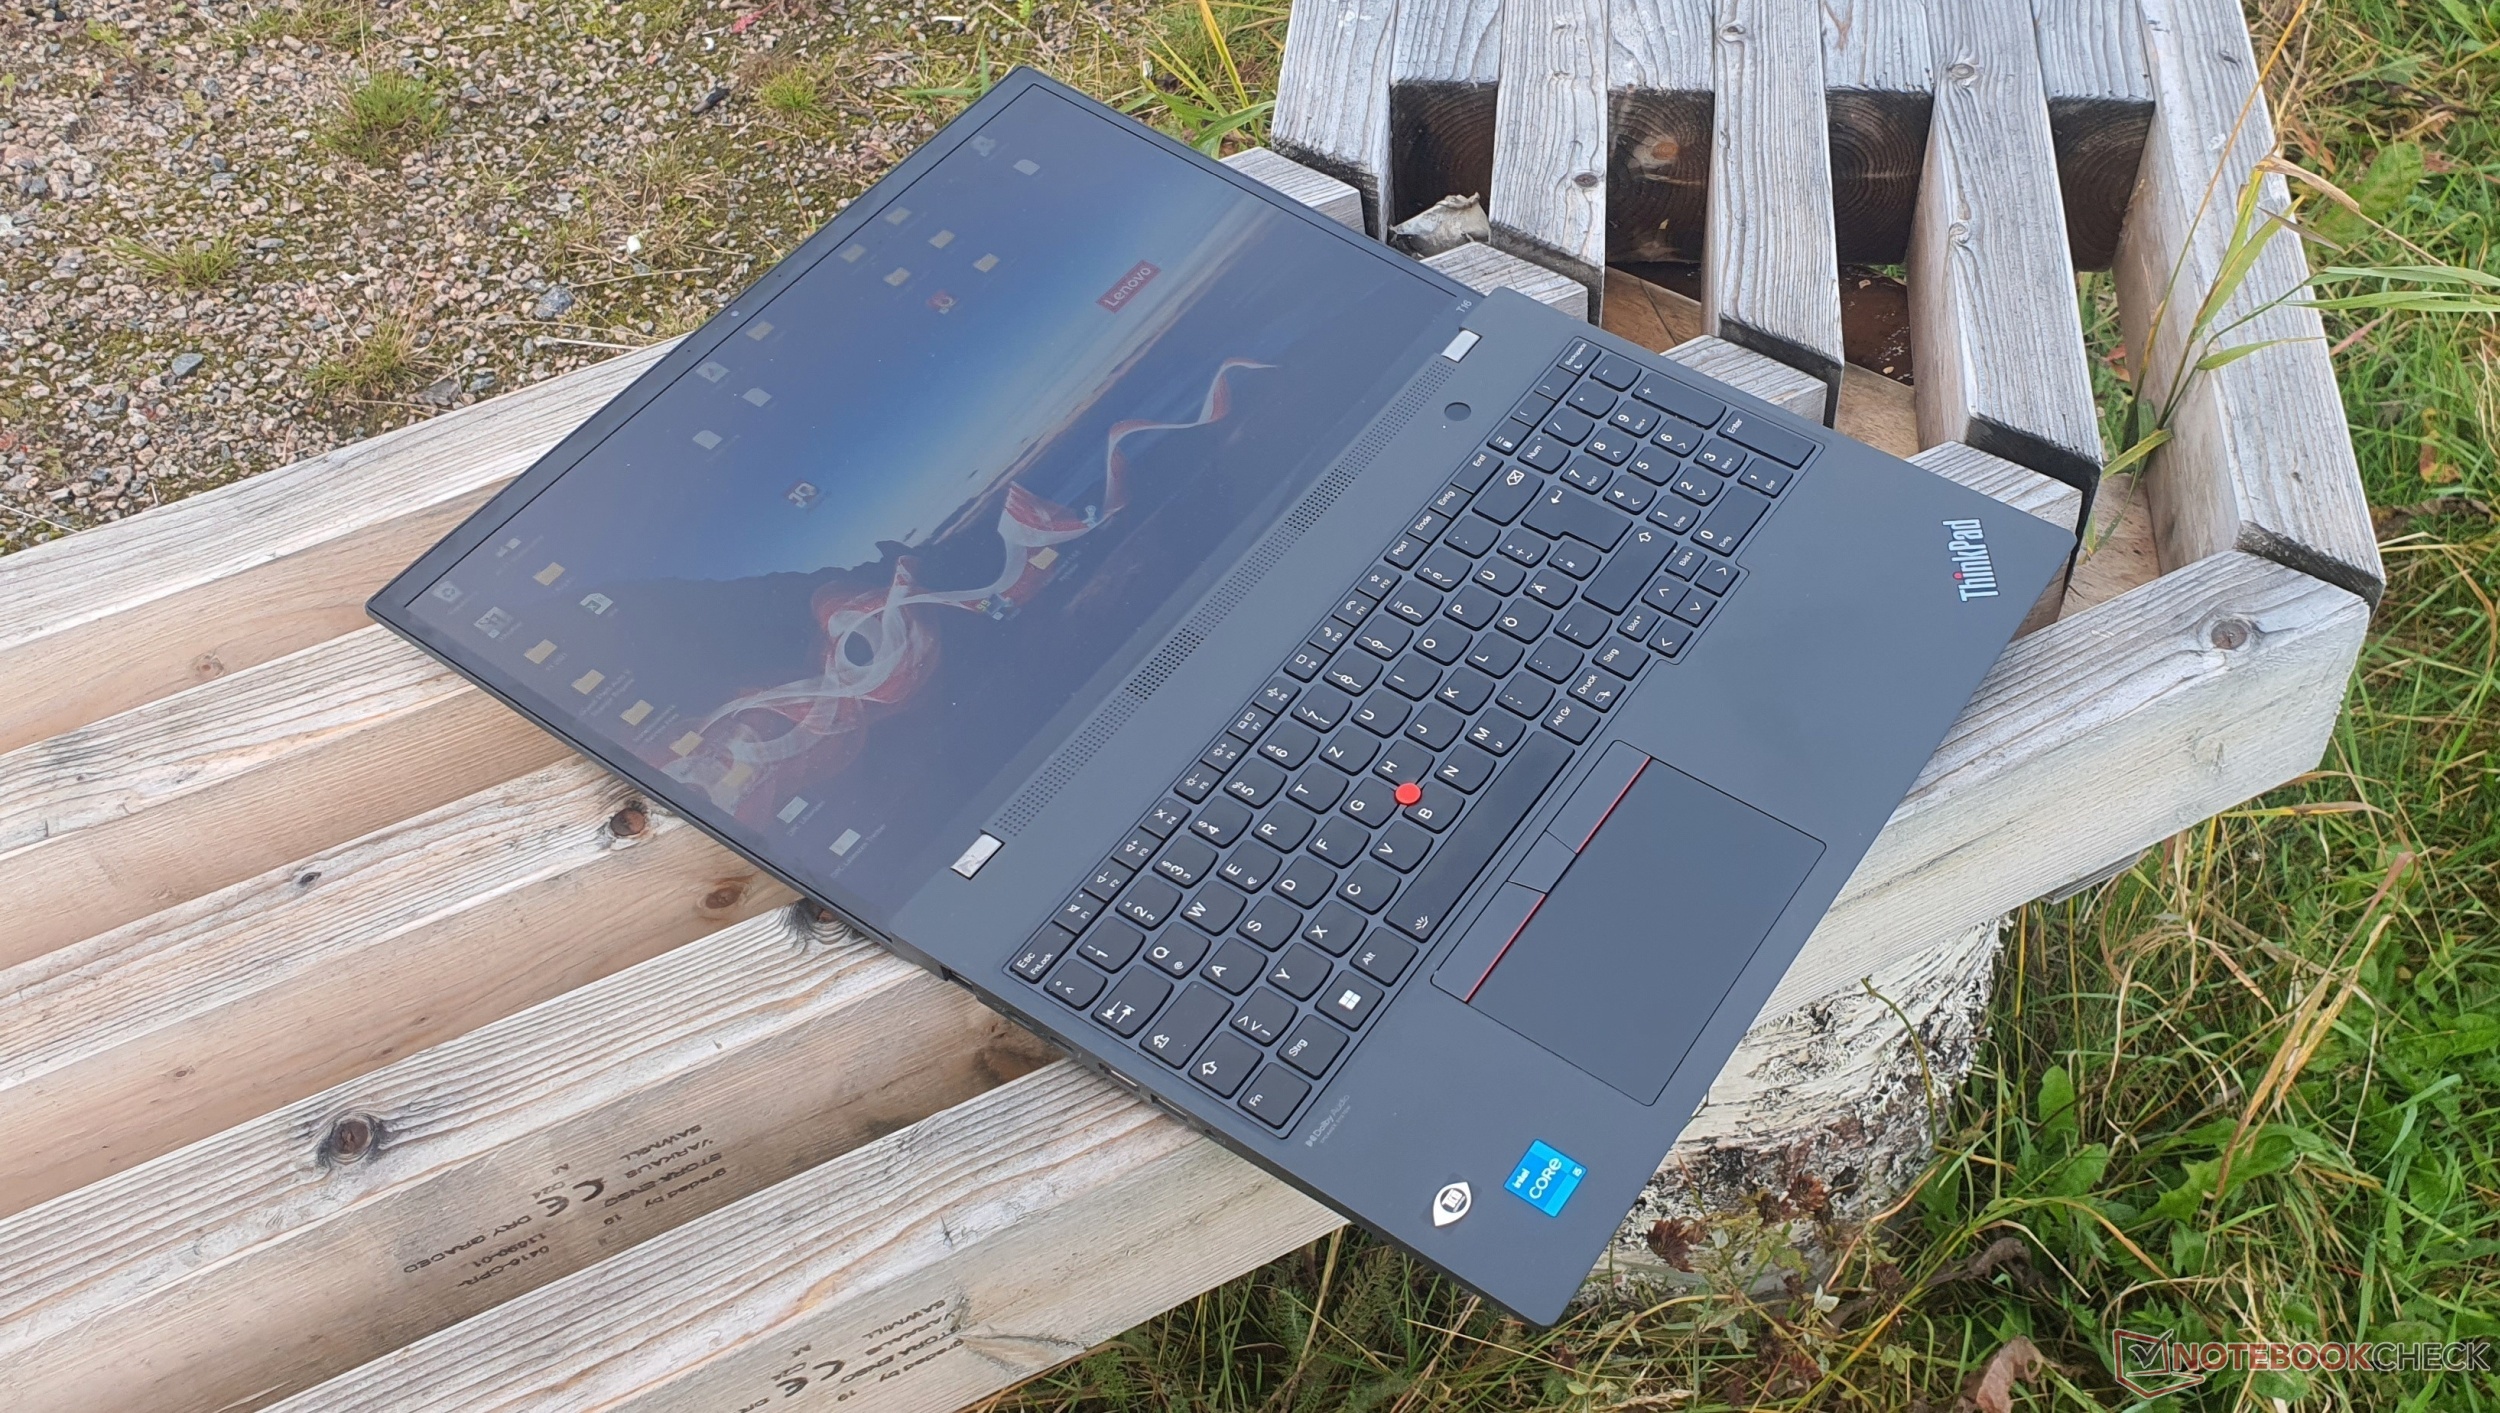
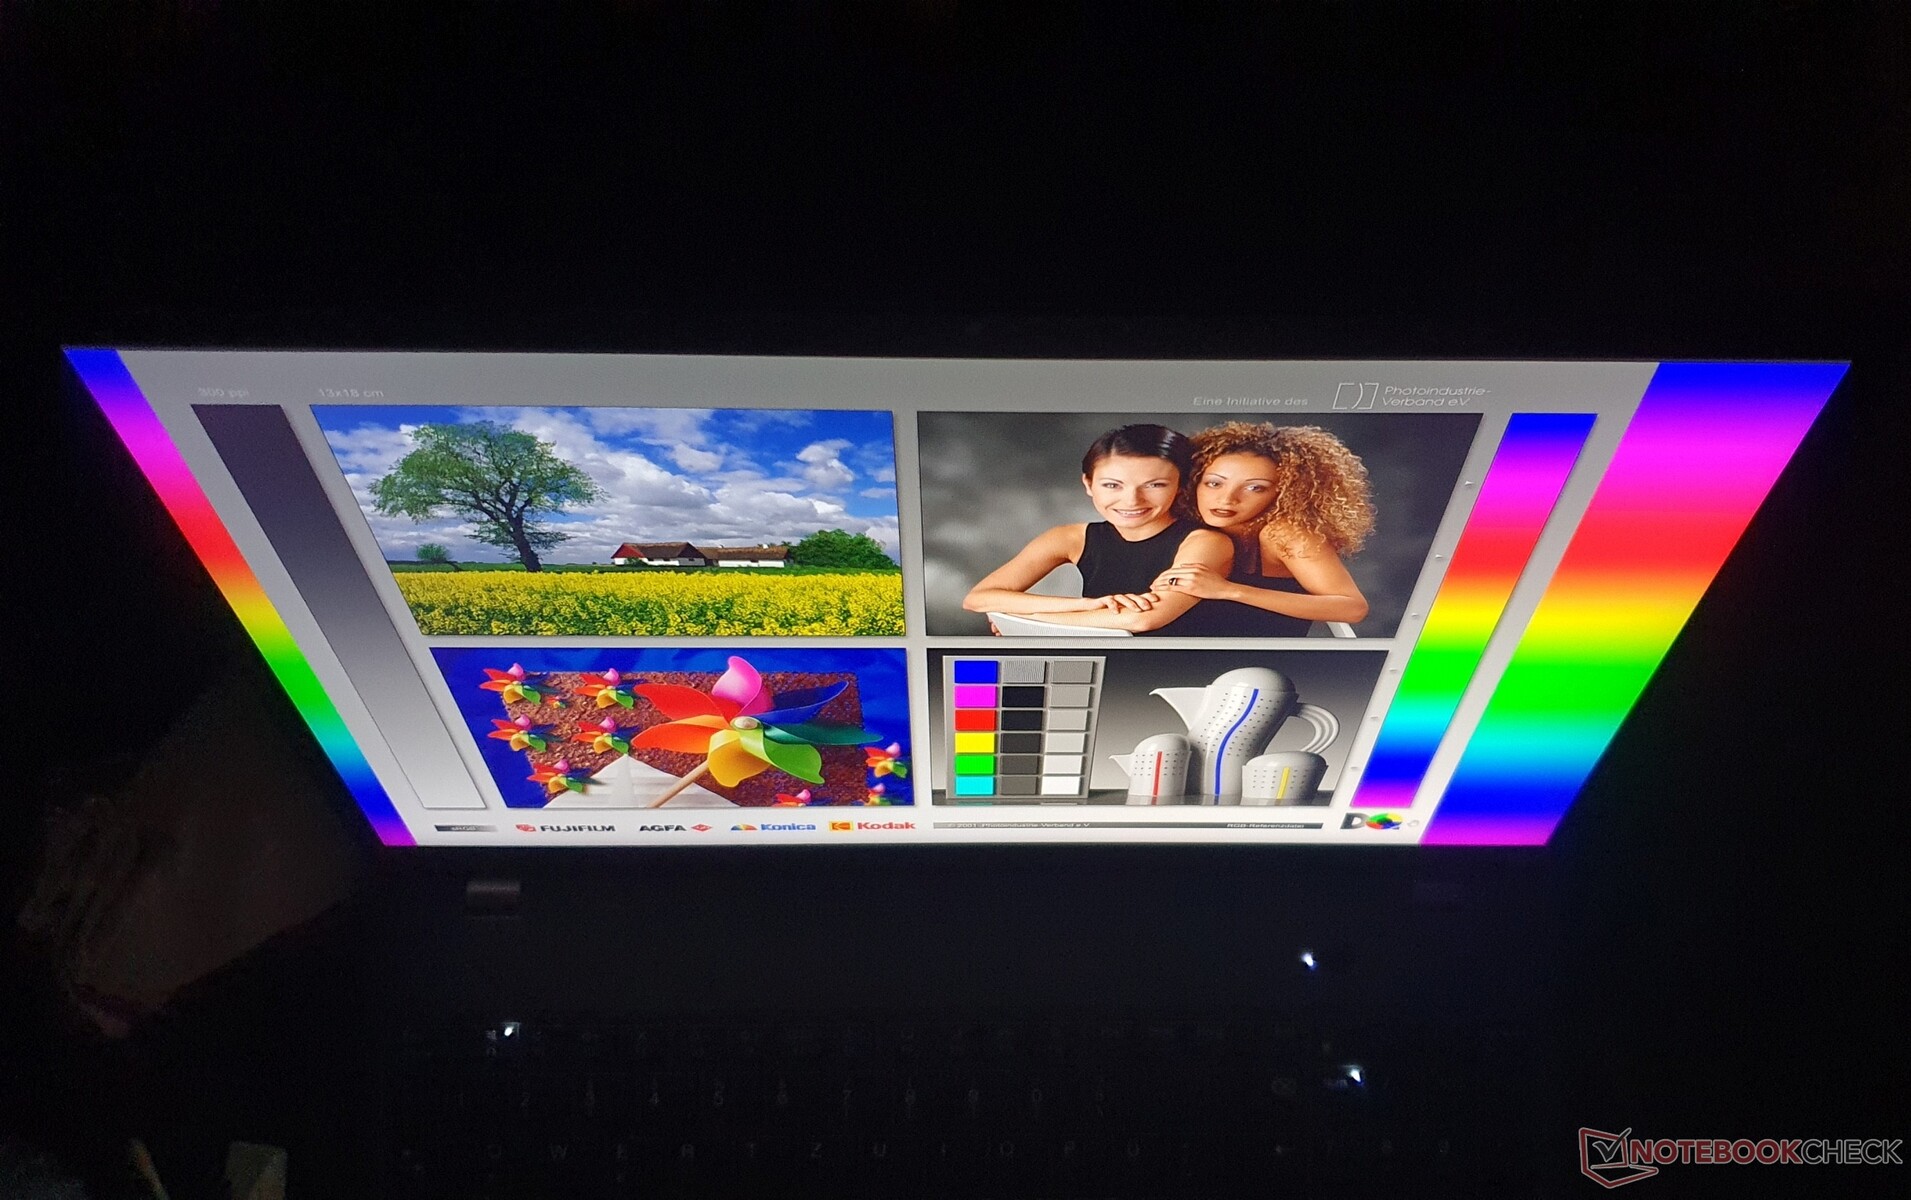
Wyświetlacz - wyświetlacz Sharp FHD+ o niskim poborze mocy w ThinkPad T16

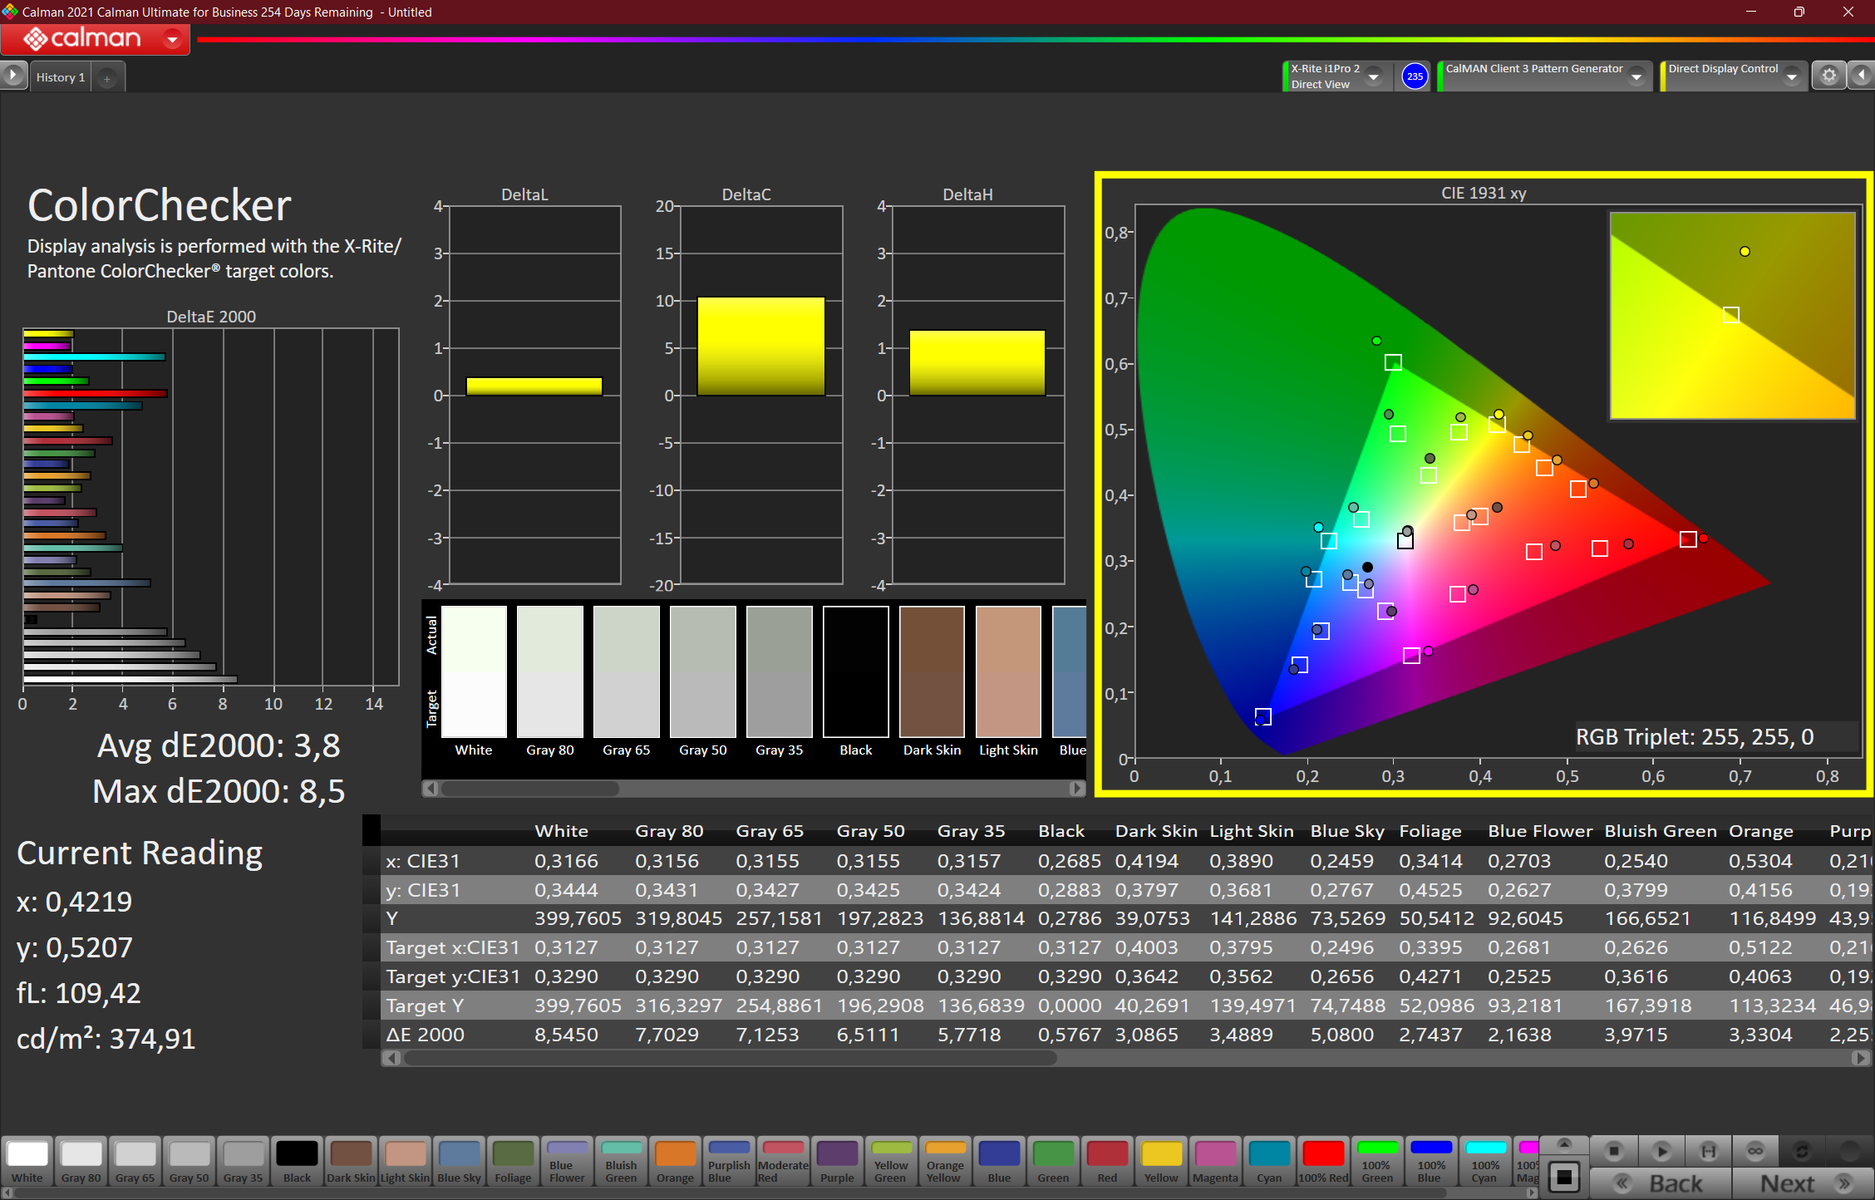
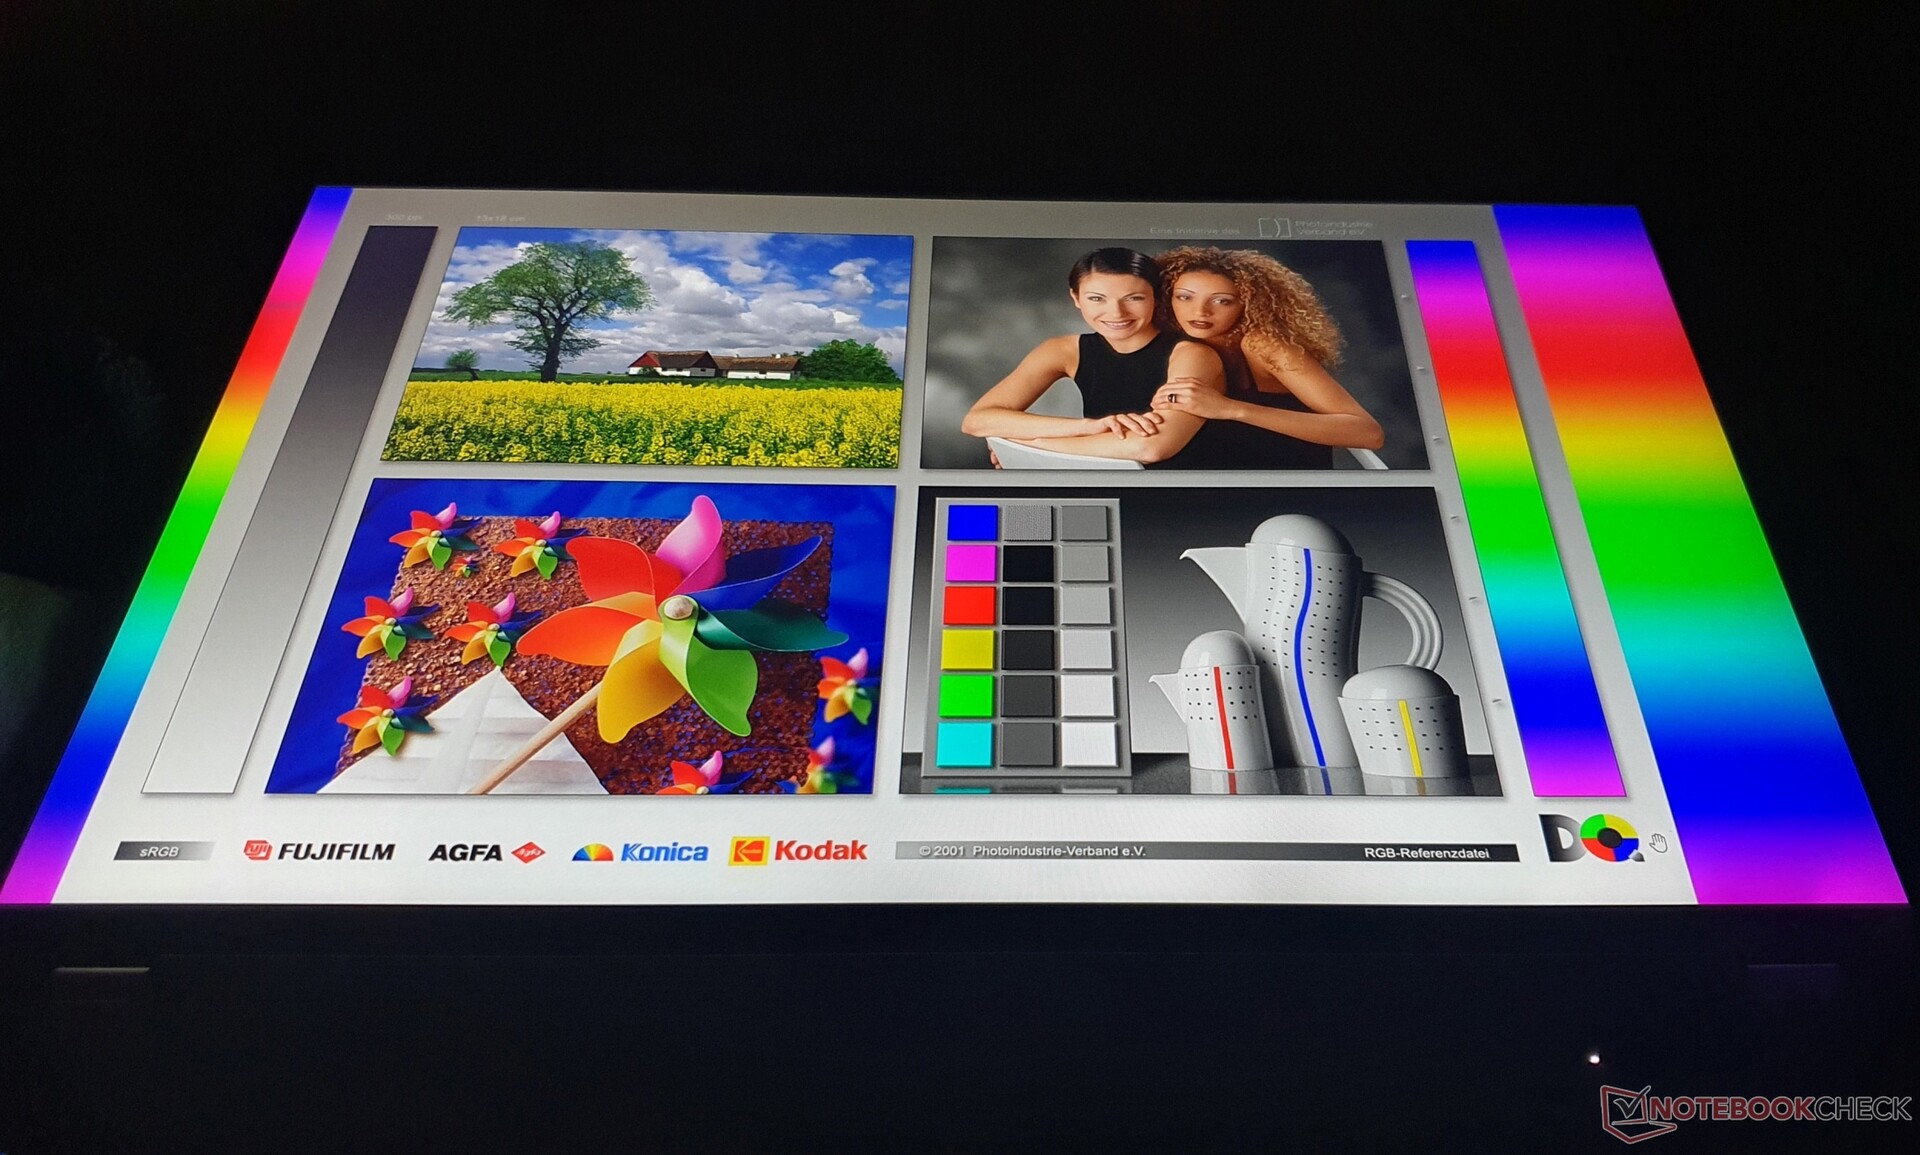
Matowy wyświetlacz o niskim poborze mocy w formacie 16:10 zainstalowany w naszym egzemplarzu testowym ma rozdzielczość 1920x1200 (WUXGA/FHD+) i oferuje dobrą ostrość na 16 calach. Jasność na poziomie dobrych 390 nitów jest niemal zgodna z podaną (400 nitów). Współczynnik kontrastu (1393:1) i wartość czerni (0,29 nits) są również na wysokim poziomie. Czarne treści obrazu wydają się w rezultacie bogate i głębokie.
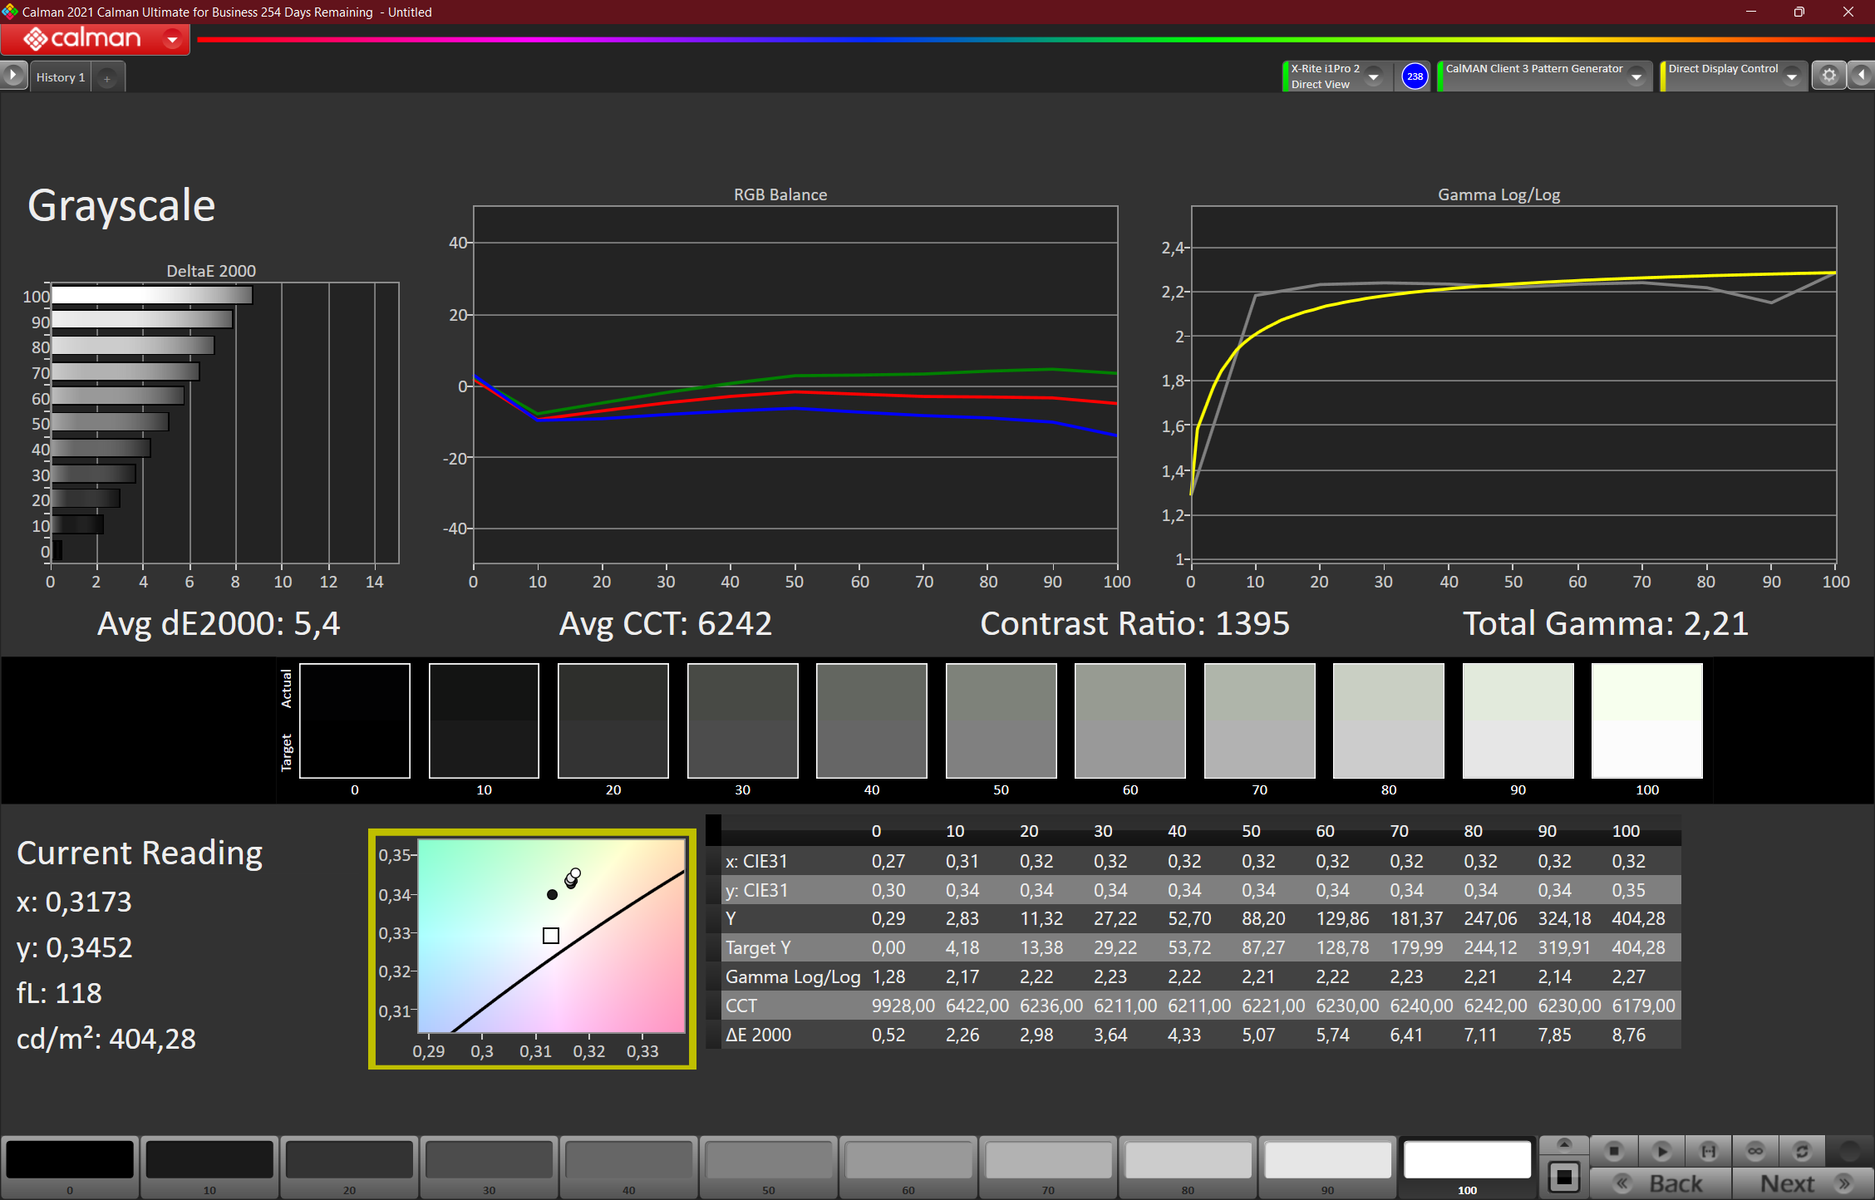
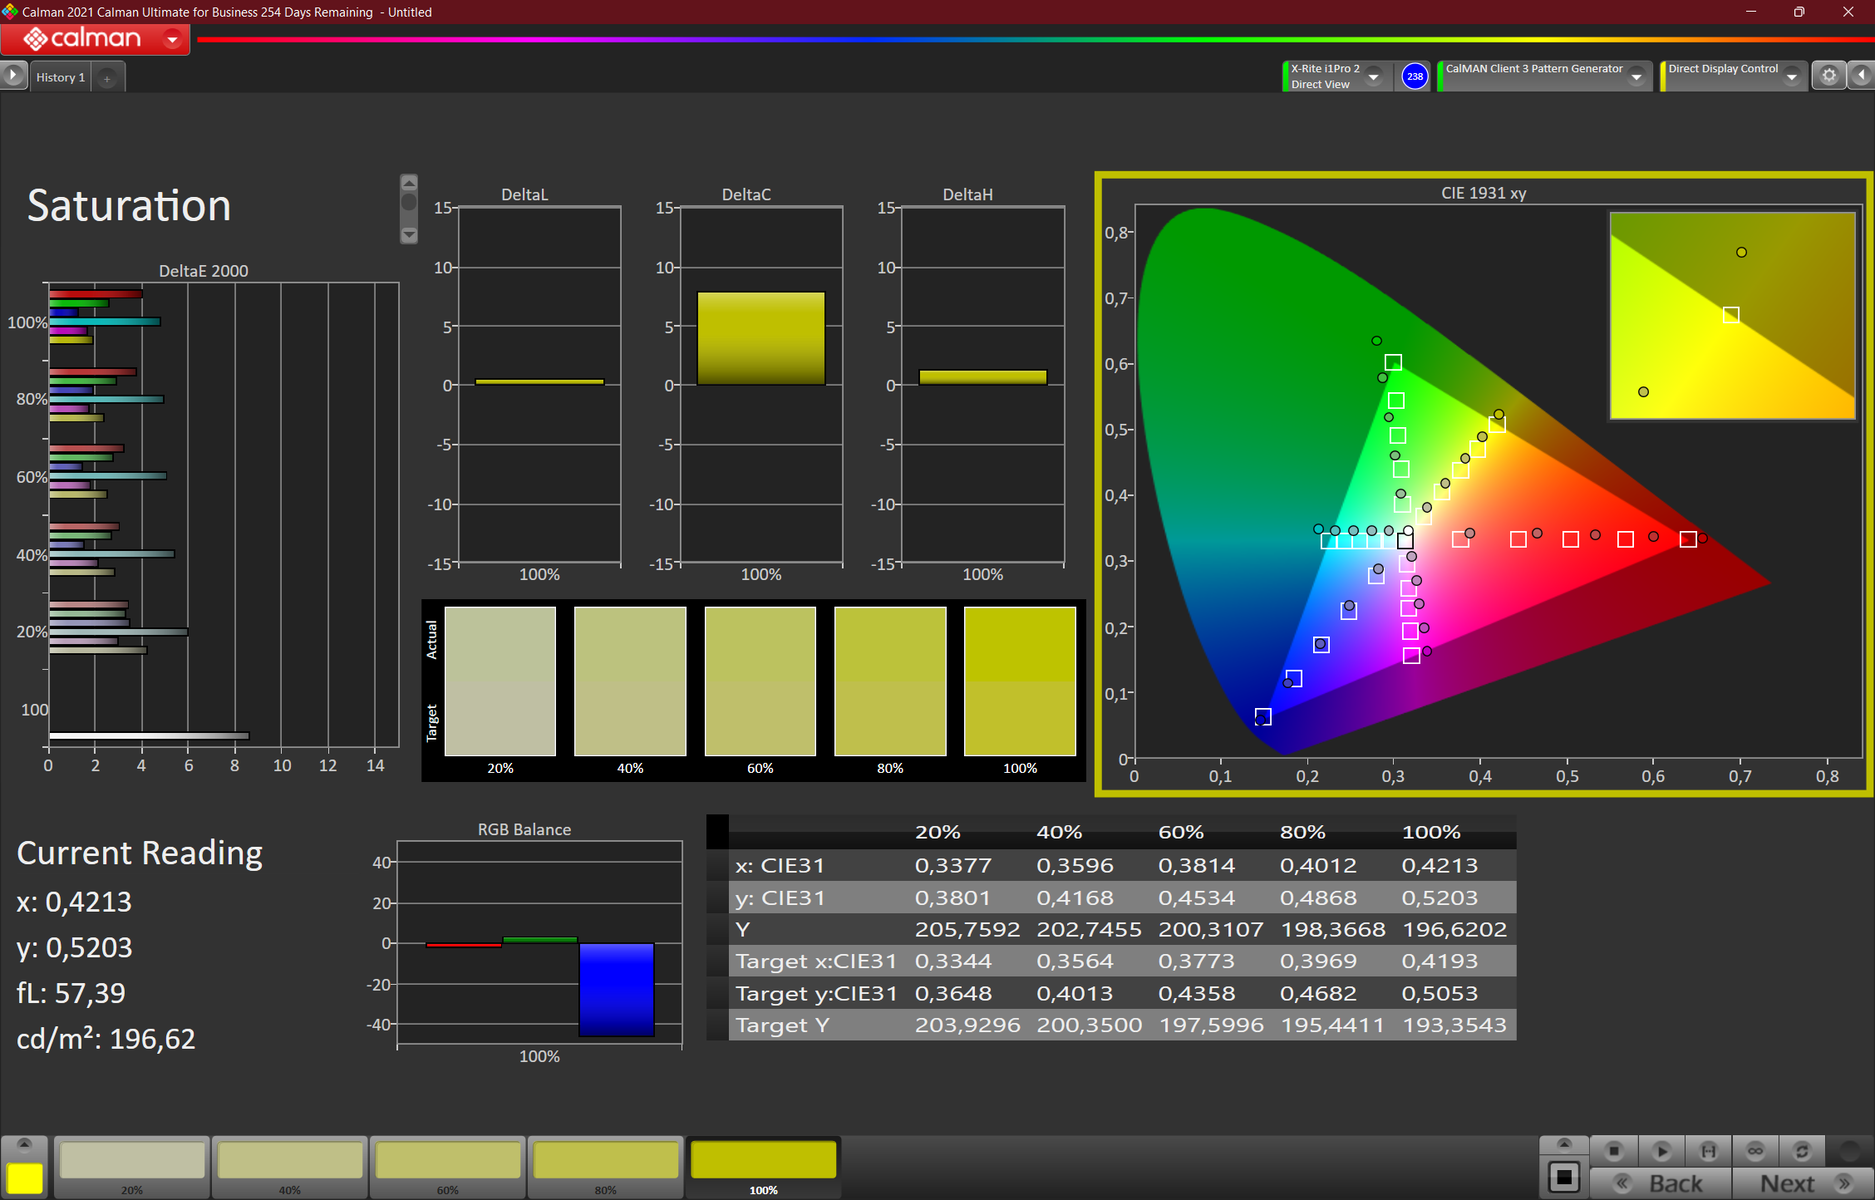
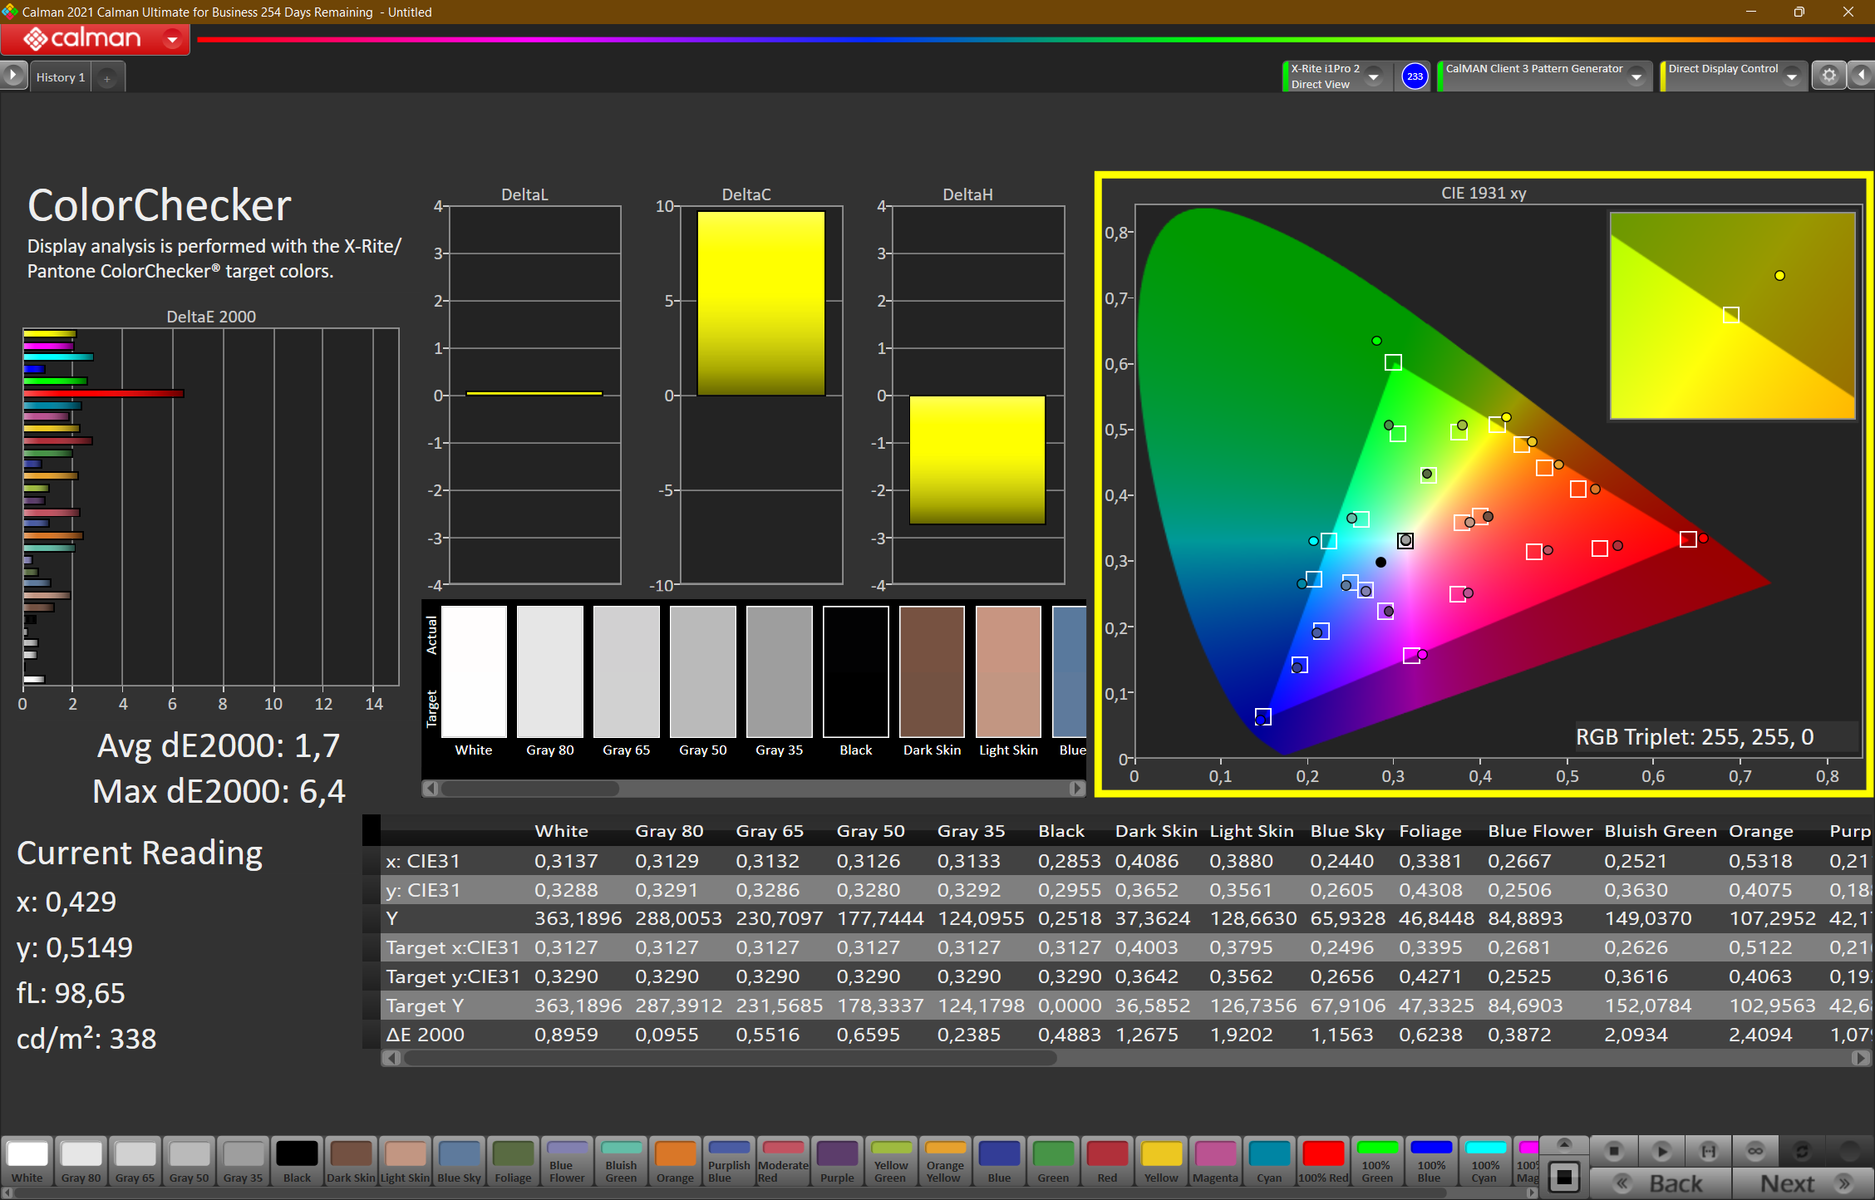
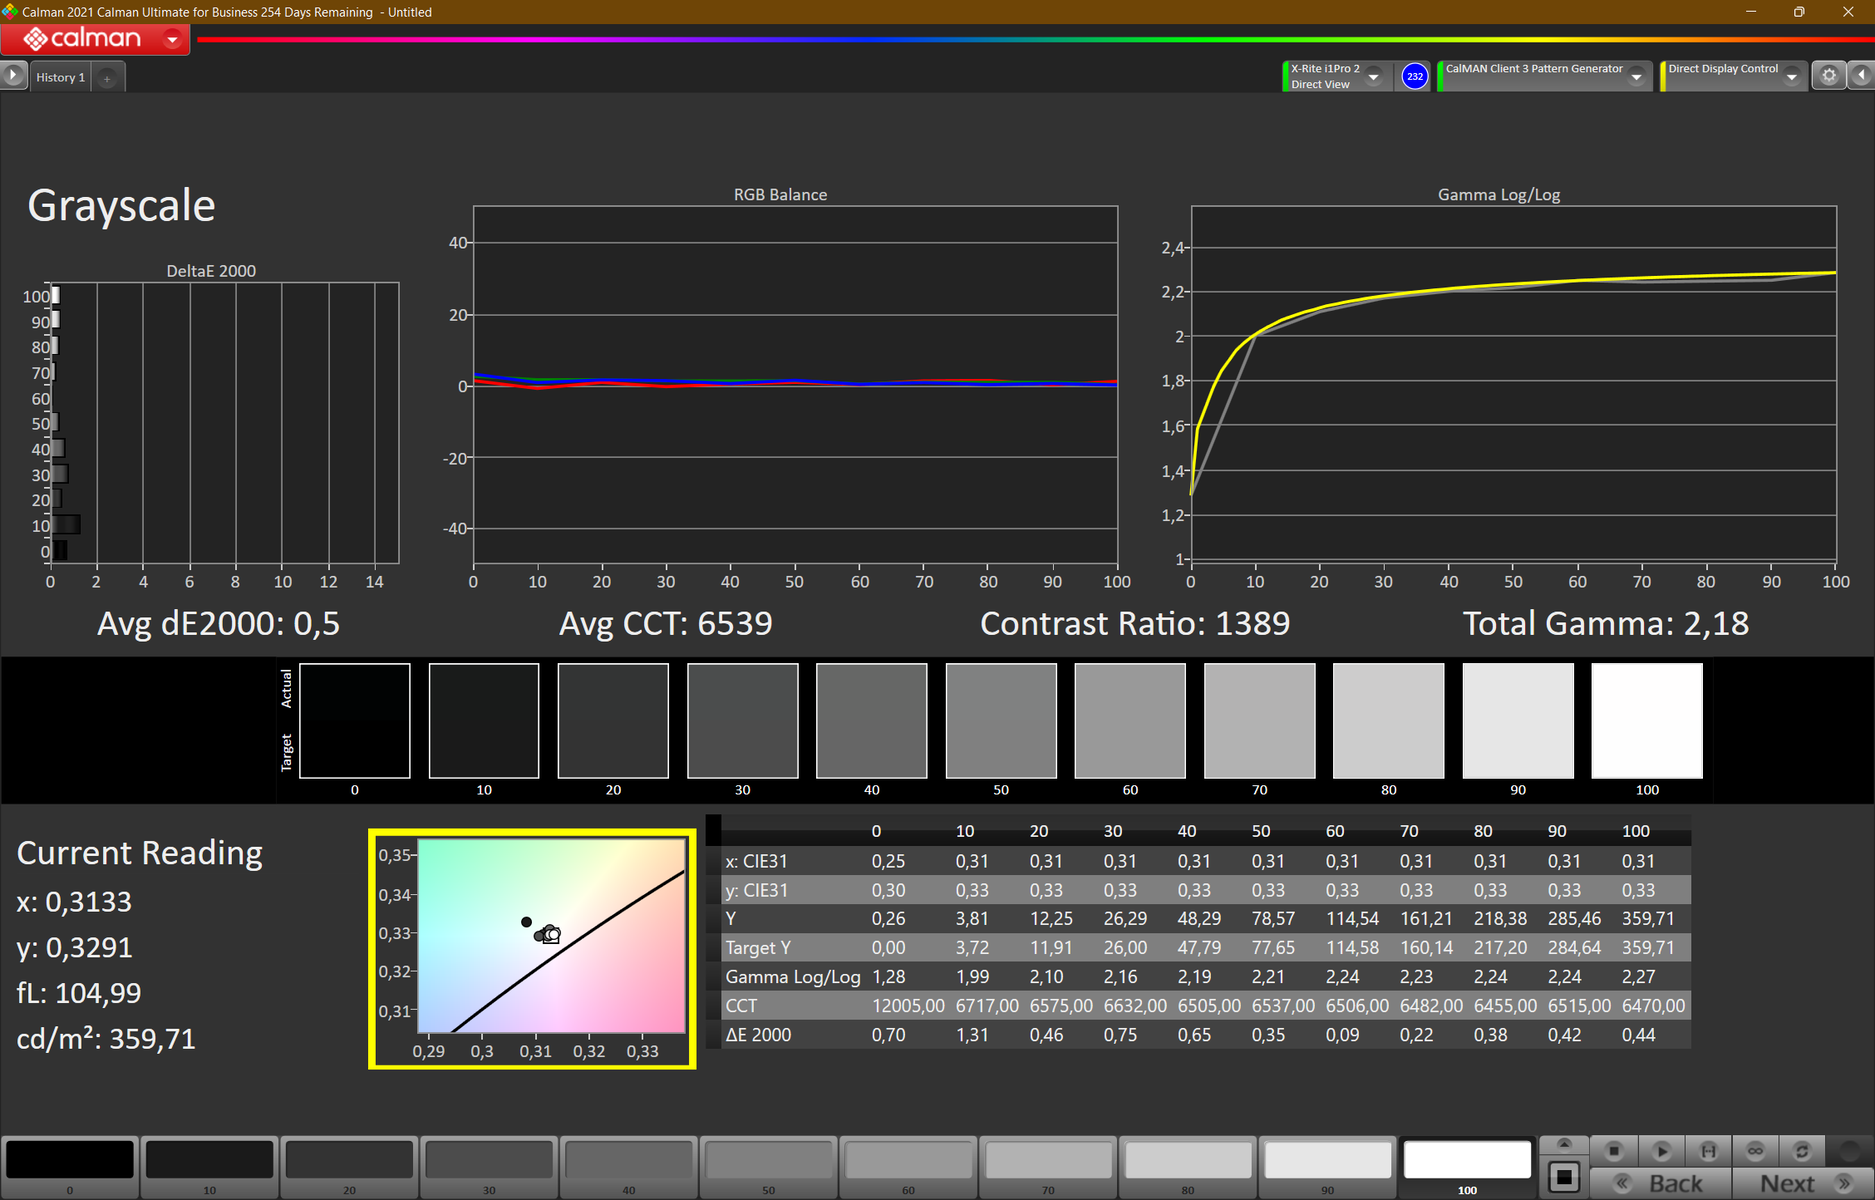
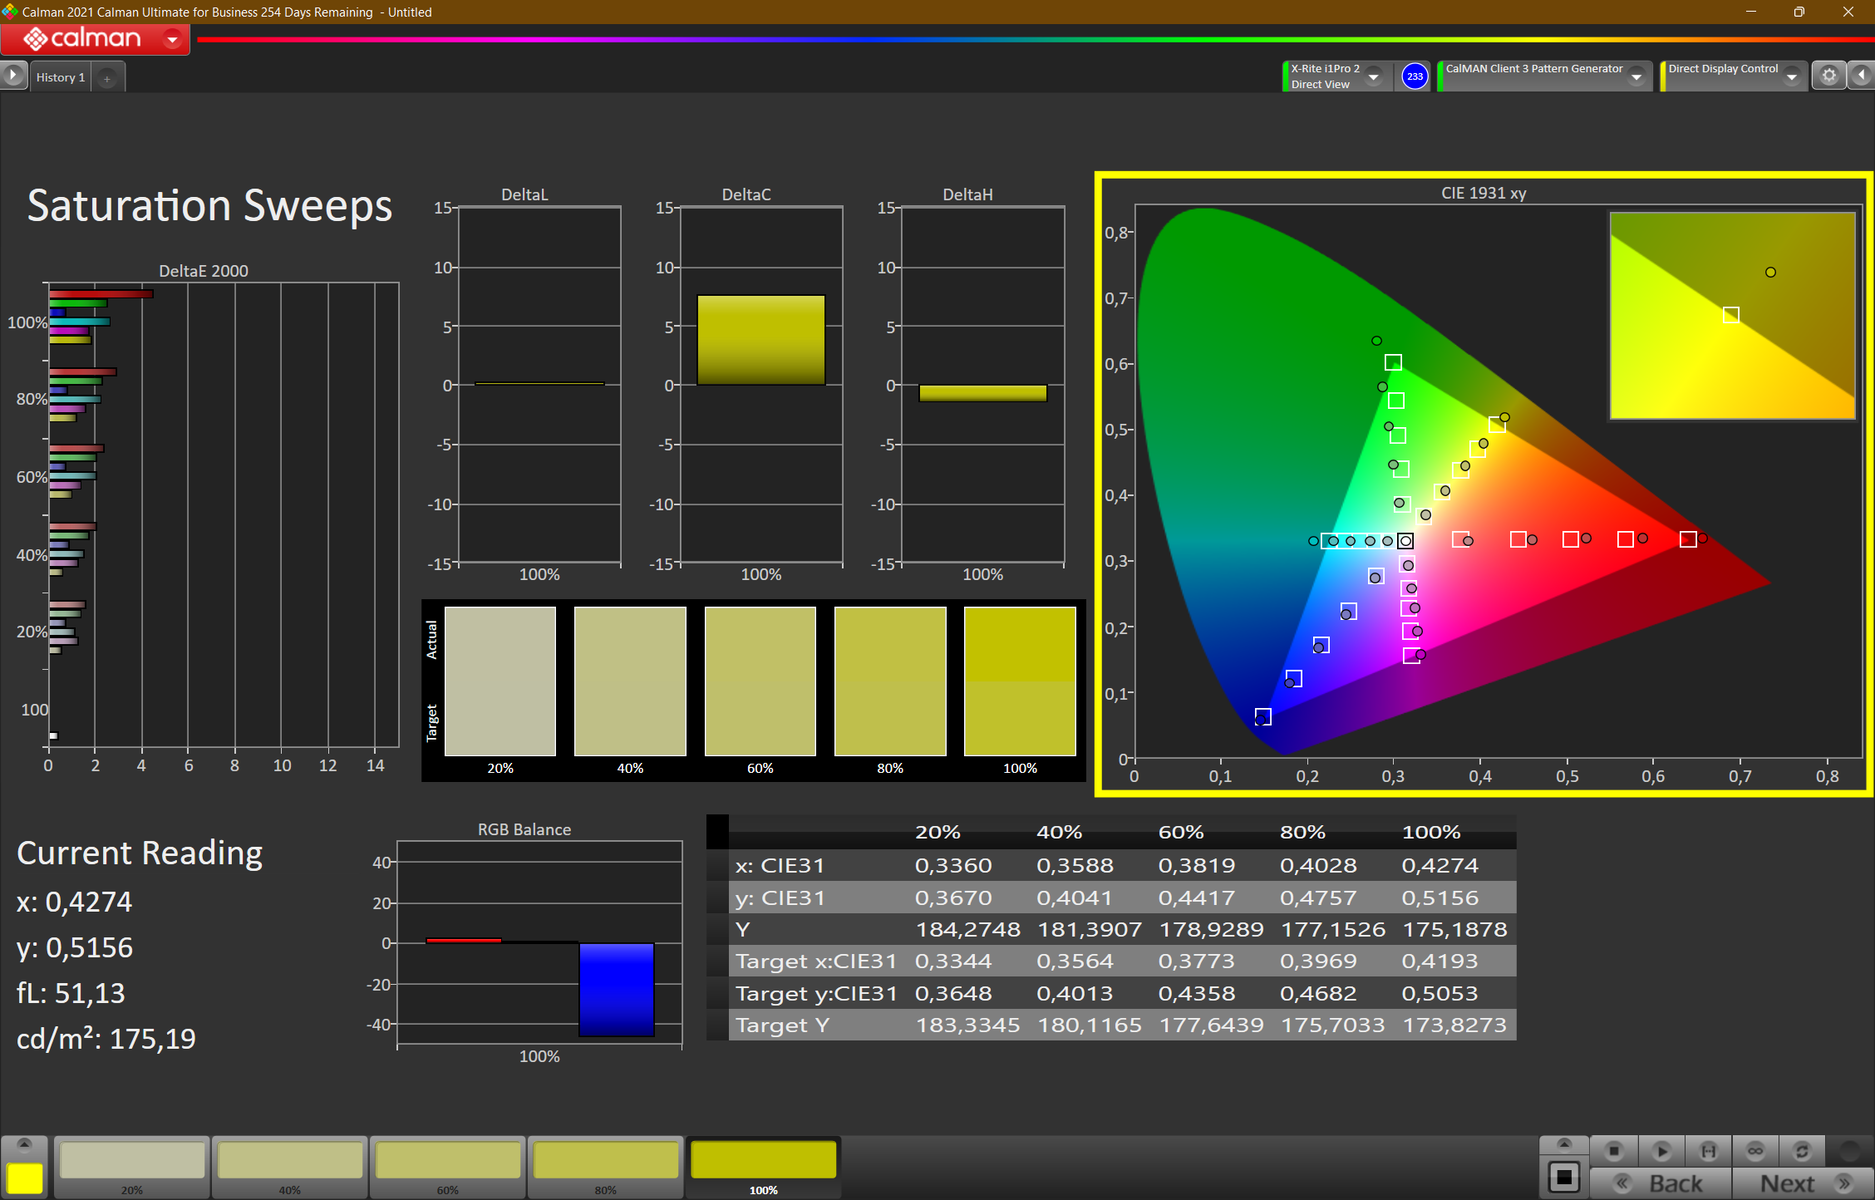
Przy 6.300K punkt bieli jest bliski optimum 6.500K. Kolory są również stosunkowo żywe i według naszej kalibracji dość zrównoważone. DeltaE-2000 spada w rezultacie z 3,9 do bardzo dobrego 1,7, choć czerwień nadal mocno odbiega od normy.
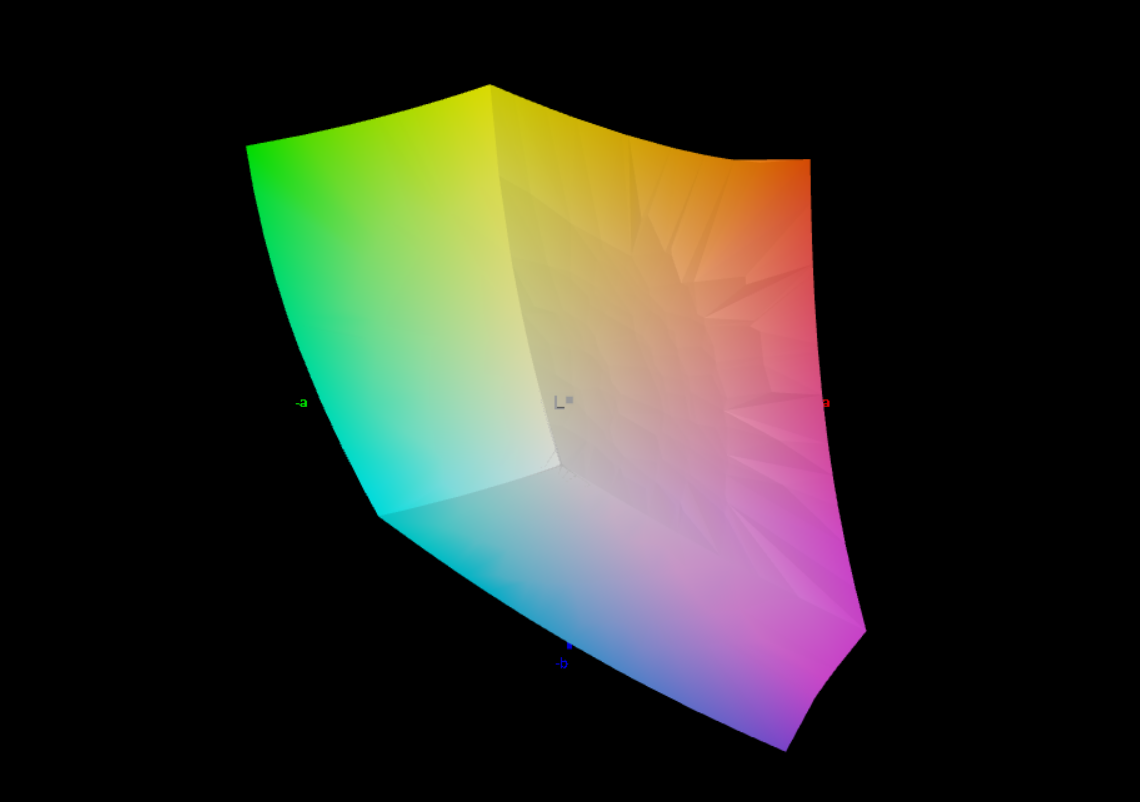
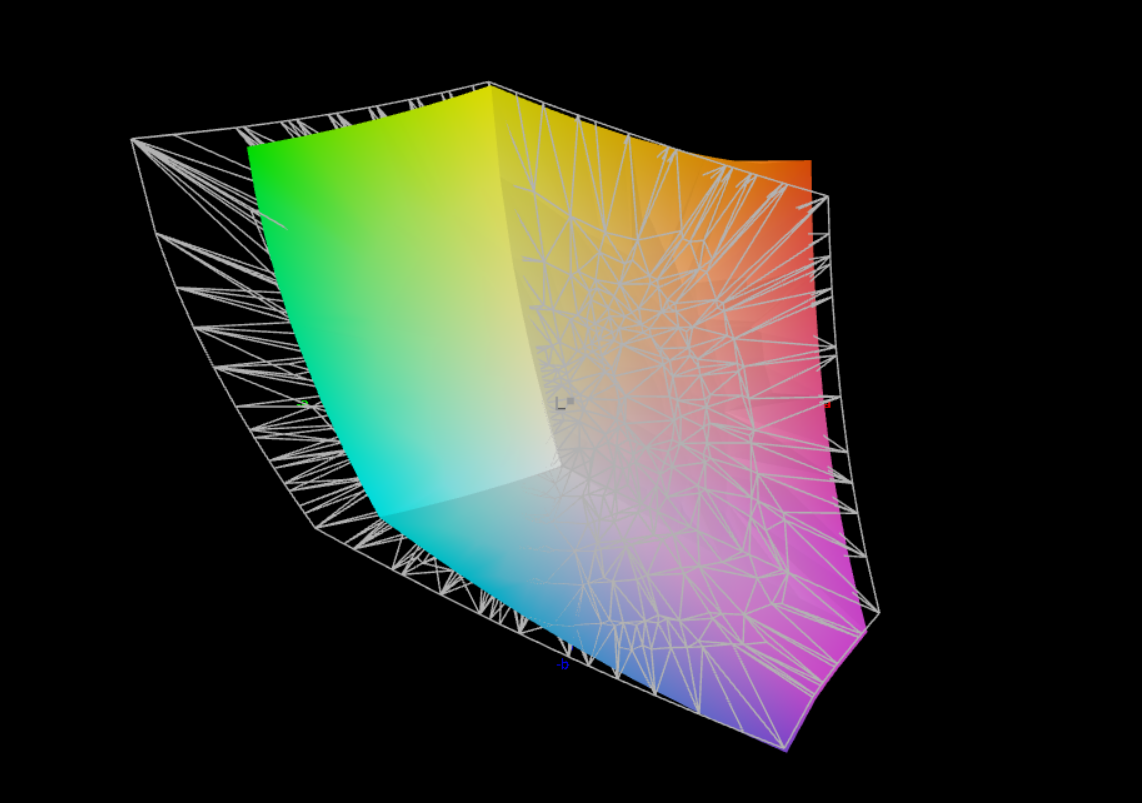
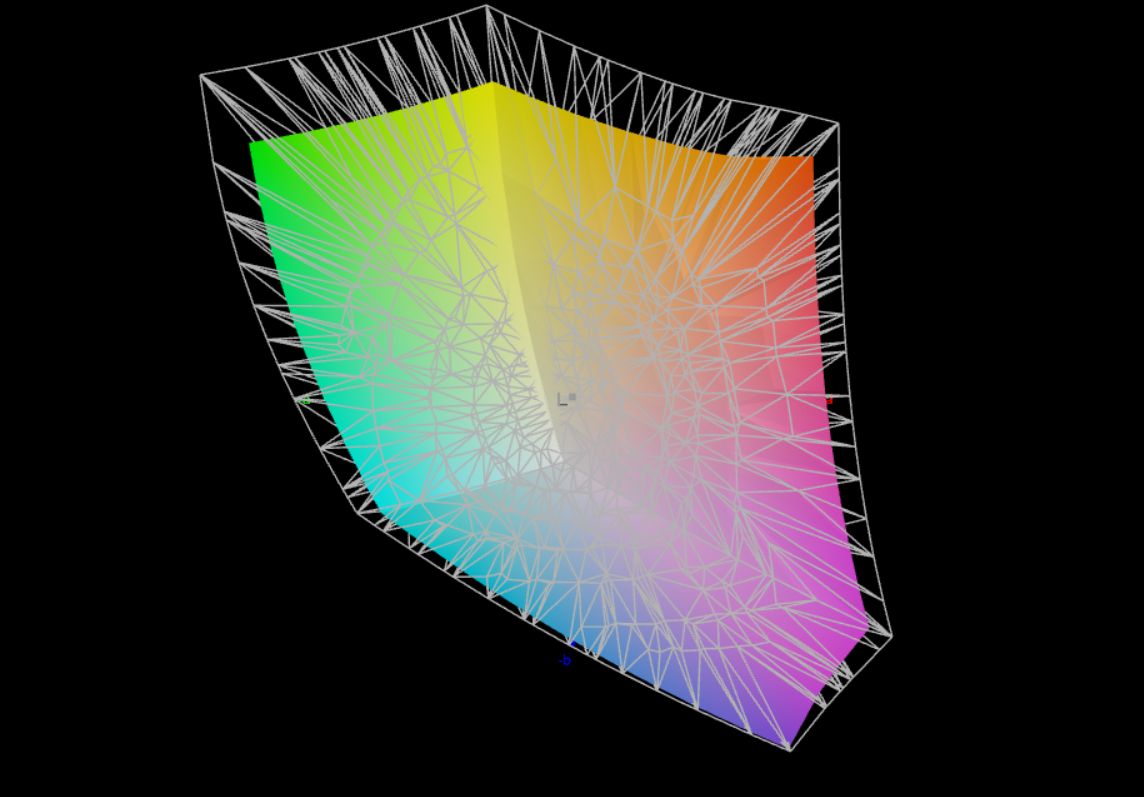
Przestrzeń kolorów sRGB jest pokryta w 100%, co jest wystarczające do mniej wymagającej edycji obrazu. Nie wykryto żadnego migotania PWM. Jak zawsze, nasz profil kolorów można pobrać na prawo od grafiki podświetlenia. Oferowane są trzy alternatywne wyświetlacze, przy czym nowością jest panel 2,5K. Niestety nie jest już dostępna opcja 4K UHD ze 100% DCI-P3. Na naszym polu porównawczym najlepiej wypada panel FHD+ LP.
- WUXGA (1920x1200) IPS, dotykowy, matowy, 300 cd/m², 45% NTSC
- WUXGA (1920x1200) IPS, niskie zużycie energii, matowy, 400 cd/m², 100% sRGB, niski poziom światła niebieskiego
- WUXGA (1920x1200) IPS, matowy, dotyk, PrivacyGuard, 500 cd/m², 100% sRGB
- WQXGA (2.560 x 1.600) IPS, matowy, niskie zużycie energii, 400 cd/m², 100% sRGB, niski poziom niebieskiego światła
| |||||||||||||||||||||||||
rozświetlenie: 80 %
na akumulatorze: 404 cd/m²
kontrast: 1393:1 (czerń: 0.29 cd/m²)
ΔE ColorChecker Calman: 3.9 | ∀{0.5-29.43 Ø4.72}
calibrated: 1.7
ΔE Greyscale Calman: 5.4 | ∀{0.09-98 Ø4.97}
80.5% AdobeRGB 1998 (Argyll 3D)
100% sRGB (Argyll 3D)
80.1% Display P3 (Argyll 3D)
Gamma: 2.21
CCT: 6242 K
| Lenovo ThinkPad T16 G1 21BWS00200 B160UAN01.K, IPS, 1920x1200, 16" | Lenovo ThinkPad T15 Gen2-20W5S00100 B156HAN02.1, IPS, 1920x1080, 15.6" | Huawei MateBook D 16 2022 BOE NV160WUM-NH0, IPS, 1920x1200, 16" | Dell Inspiron 16 Plus 7620 BOE NE16N41, IPS, 3072x1920, 16" | HP ZBook Power 15 G8 313S5EA AUOA08B, IPS LED, 1920x1080, 15.6" | HP ProBook 450 G9 6A180EA Chi Mei CMN1512, , 1920x1080, 15.6" | Lenovo ThinkPad E15 G3-20YG003UGE B156HAN02.1, IPS, 1920x1080, 15.6" | Lenovo ThinkPad L15 G2 AMD N156HCA-EAB, IPS LED, 1920x1080, 15.6" | |
|---|---|---|---|---|---|---|---|---|
| Display | -46% | -12% | -7% | -8% | -43% | -46% | -41% | |
| Display P3 Coverage (%) | 80.1 | 40.18 -50% | 66.2 -17% | 70.8 -12% | 70.5 -12% | 42.76 -47% | 40.3 -50% | 43.8 -45% |
| sRGB Coverage (%) | 100 | 60.2 -40% | 96.4 -4% | 99.5 0% | 99 -1% | 63.9 -36% | 60.2 -40% | 65.7 -34% |
| AdobeRGB 1998 Coverage (%) | 80.5 | 41.55 -48% | 68.3 -15% | 73.2 -9% | 71.3 -11% | 44.2 -45% | 41.6 -48% | 45.3 -44% |
| Response Times | -85% | -12% | -53% | -125% | -11% | -71% | -62% | |
| Response Time Grey 50% / Grey 80% * (ms) | 27 ? | 48.8 ? -81% | 30.5 ? -13% | 38 ? -41% | 61 -126% | 28 ? -4% | 44 ? -63% | 40 -48% |
| Response Time Black / White * (ms) | 17 ? | 32 ? -88% | 18.7 ? -10% | 28 ? -65% | 38 ? -124% | 20 ? -18% | 30.4 ? -79% | 30 -76% |
| PWM Frequency (Hz) | ||||||||
| Screen | -39% | 7% | 22% | 25% | -34% | -27% | -18% | |
| Brightness middle (cd/m²) | 404 | 353 -13% | 319 -21% | 288.9 -28% | 393 -3% | 234 -42% | 347 -14% | 298 -26% |
| Brightness (cd/m²) | 391 | 348 -11% | 317 -19% | 276 -29% | 385 -2% | 218 -44% | 329 -16% | 276 -29% |
| Brightness Distribution (%) | 80 | 95 19% | 90 13% | 92 15% | 78 -2% | 85 6% | 93 16% | 86 8% |
| Black Level * (cd/m²) | 0.29 | 0.2 31% | 0.23 21% | 0.26 10% | 0.25 14% | 0.17 41% | 0.25 14% | 0.26 10% |
| Contrast (:1) | 1393 | 1765 27% | 1387 0% | 1111 -20% | 1572 13% | 1376 -1% | 1388 0% | 1146 -18% |
| Colorchecker dE 2000 * | 3.9 | 6.1 -56% | 3.4 13% | 1.88 52% | 1.5 62% | 5.04 -29% | 4.7 -21% | 3.7 5% |
| Colorchecker dE 2000 max. * | 8.5 | 23.5 -176% | 8.1 5% | 4.37 49% | 4.3 49% | 18.04 -112% | 19.4 -128% | 15 -76% |
| Colorchecker dE 2000 calibrated * | 1.7 | 4.9 -188% | 0.8 53% | 0.42 75% | 1.4 18% | 4.13 -143% | 4.4 -159% | 3.5 -106% |
| Greyscale dE 2000 * | 5.4 | 4.6 15% | 5.7 -6% | 1.4 74% | 1.3 76% | 4.43 18% | 1.7 69% | 1.7 69% |
| Gamma | 2.21 100% | 2.26 97% | 2.1 105% | 2.3 96% | 2.26 97% | 2.41 91% | 2.2 100% | 2.21 100% |
| CCT | 6242 104% | 6732 97% | 7433 87% | 6634 98% | 6435 101% | 6350 102% | 6475 100% | 6588 99% |
| Color Space (Percent of AdobeRGB 1998) (%) | 38.2 | |||||||
| Color Space (Percent of sRGB) (%) | 59.8 | |||||||
| Całkowita średnia (program / ustawienia) | -57% /
-47% | -6% /
0% | -13% /
5% | -36% /
-4% | -29% /
-33% | -48% /
-37% | -40% /
-29% |
* ... im mniej tym lepiej
Wyświetl czasy reakcji
| ↔ Czas reakcji od czerni do bieli | ||
|---|---|---|
| 17 ms ... wzrost ↗ i spadek ↘ łącznie | ↗ 8 ms wzrost | 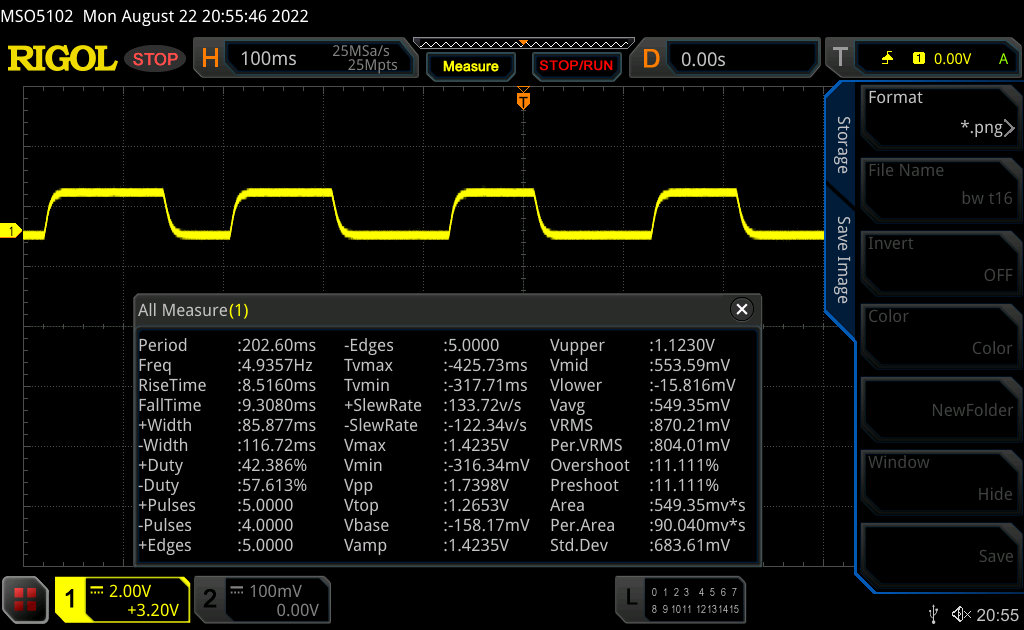 |
| ↘ 9 ms upadek | ||
| W naszych testach ekran wykazuje dobry współczynnik reakcji, ale może być zbyt wolny dla graczy rywalizujących ze sobą. Dla porównania, wszystkie testowane urządzenia wahają się od 0.1 (minimum) do 240 (maksimum) ms. » 39 % wszystkich urządzeń jest lepszych. Oznacza to, że zmierzony czas reakcji jest lepszy od średniej wszystkich testowanych urządzeń (19.8 ms). | ||
| ↔ Czas reakcji 50% szarości do 80% szarości | ||
| 27 ms ... wzrost ↗ i spadek ↘ łącznie | ↗ 12 ms wzrost | 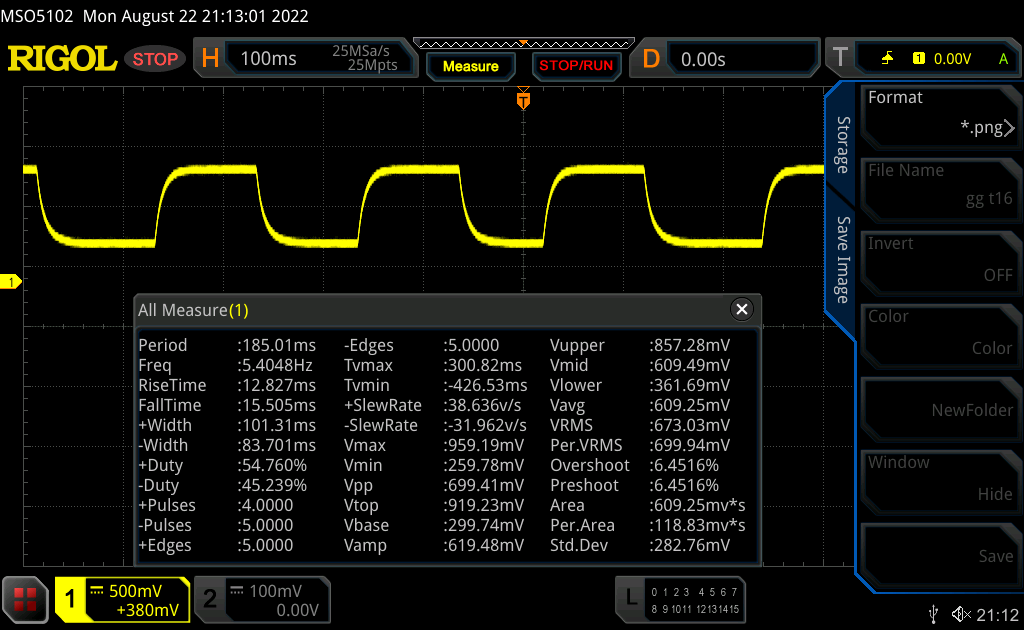 |
| ↘ 15 ms upadek | ||
| W naszych testach ekran wykazuje stosunkowo powolne tempo reakcji i może być zbyt wolny dla graczy. Dla porównania, wszystkie testowane urządzenia wahają się od 0.165 (minimum) do 636 (maksimum) ms. » 37 % wszystkich urządzeń jest lepszych. Oznacza to, że zmierzony czas reakcji jest lepszy od średniej wszystkich testowanych urządzeń (31 ms). | ||
Migotanie ekranu / PWM (modulacja szerokości impulsu)
| Migotanie ekranu/nie wykryto PWM | 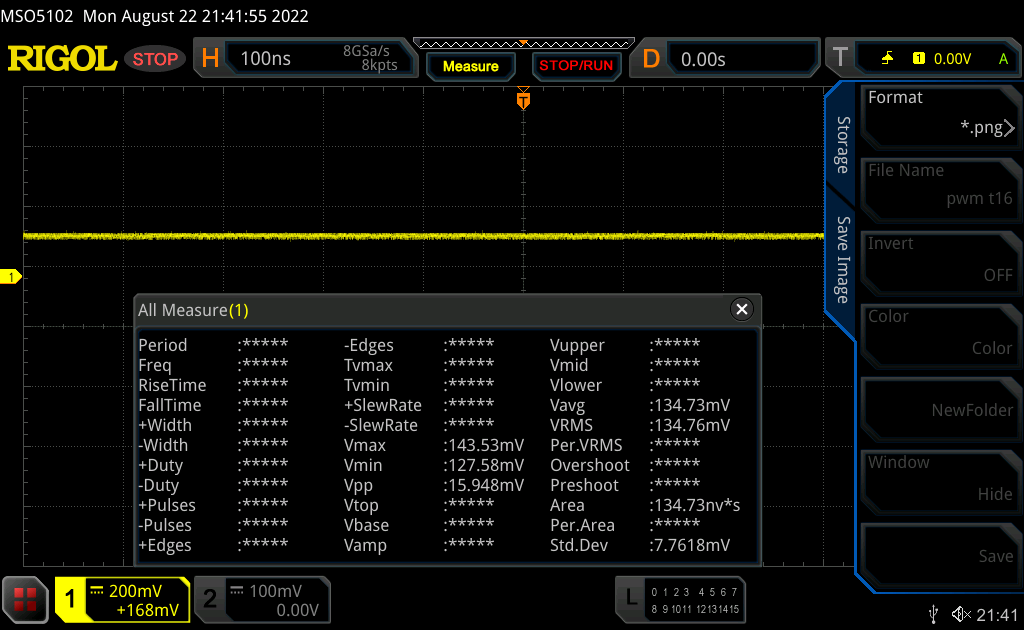 | ||
Dla porównania: 52 % wszystkich testowanych urządzeń nie używa PWM do przyciemniania wyświetlacza. Jeśli wykryto PWM, zmierzono średnio 7781 (minimum: 5 - maksimum: 343500) Hz. | |||
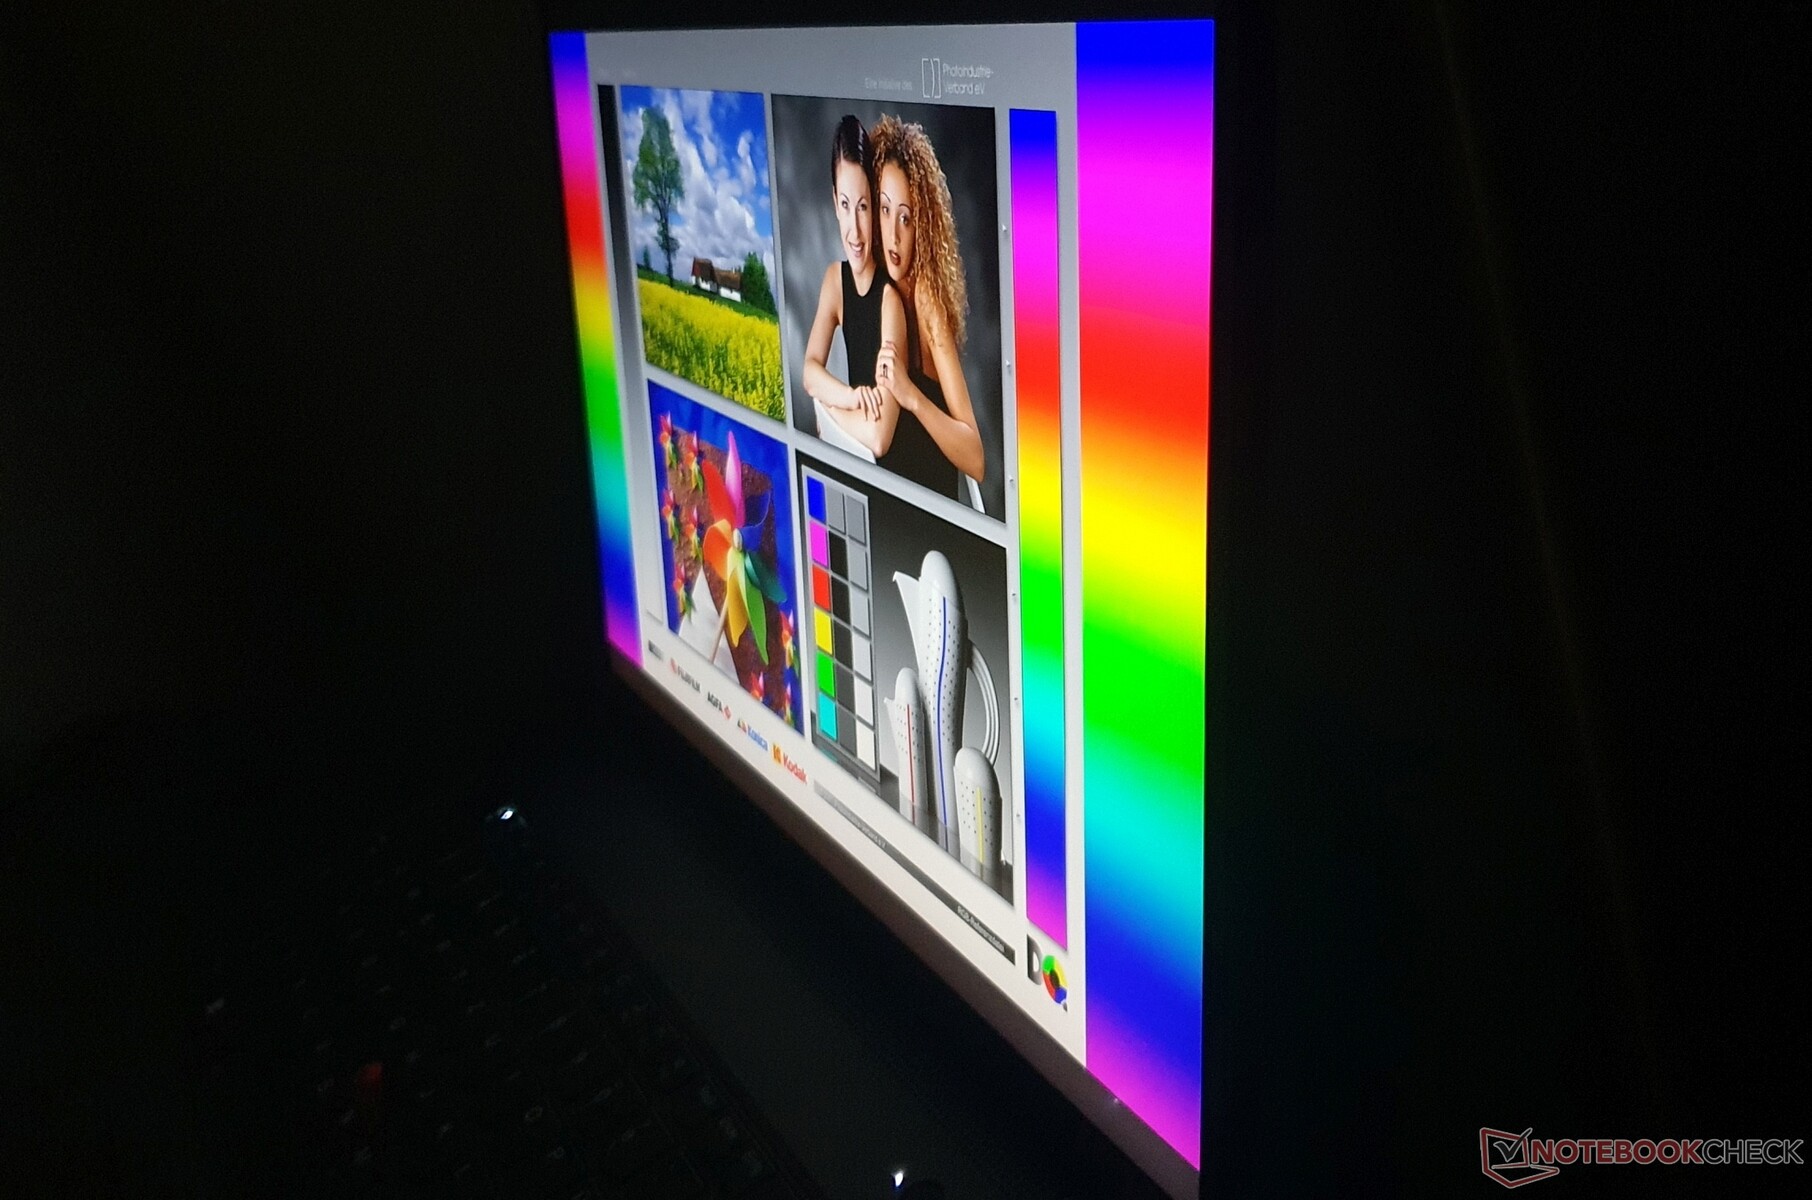
Na zewnątrz matowy wyświetlacz jest łatwy do odczytania przy średniej wartości 390 nitów. Należy jednak unikać bezpośredniego światła słonecznego.


Wydajność - Lenovo ogranicza za pomocą sztucznego throttlingu
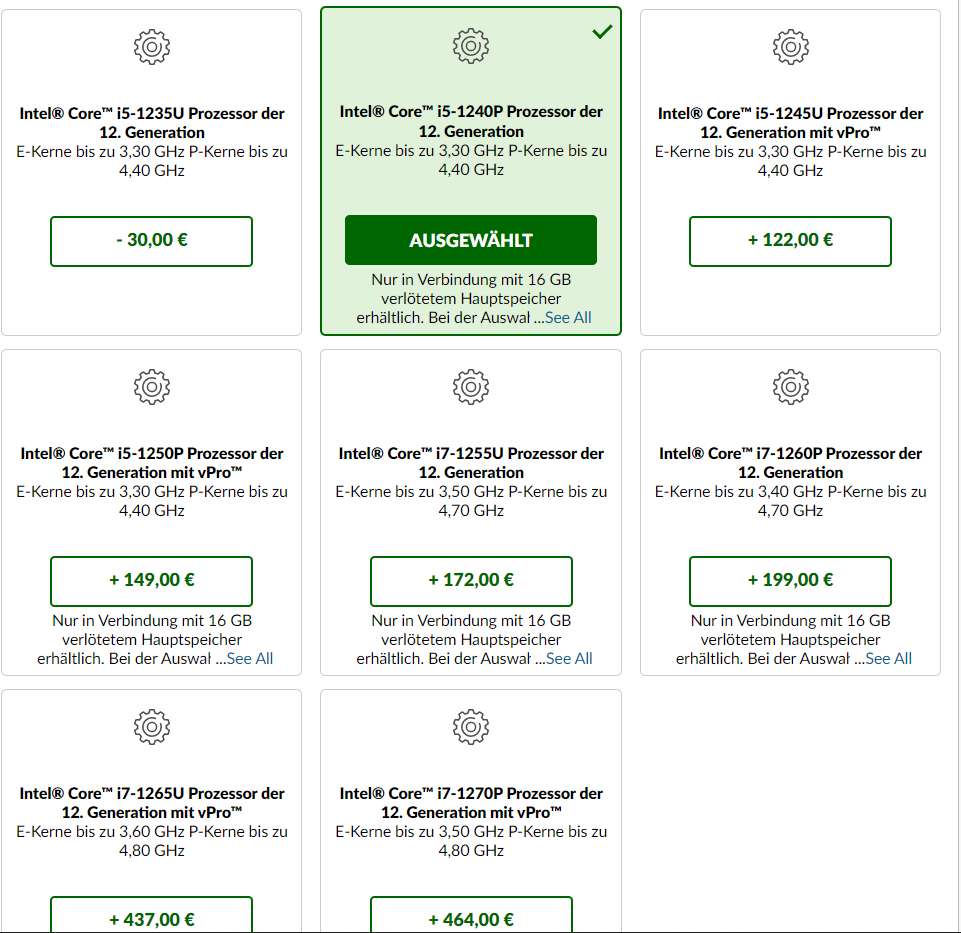
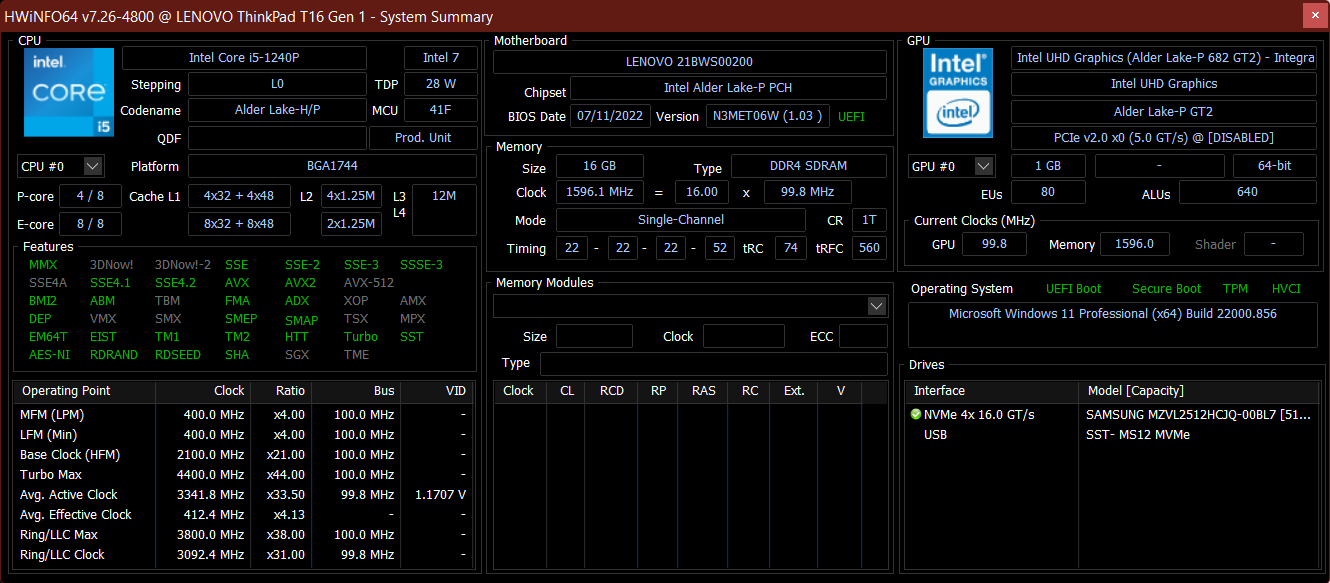
Nasz model wyposażony jest w 16 GB wlutowanej pamięci RAM DDR4-3200 (single channel) i napędzany jest przez procesor Intel Core i5-1240Pze zintegrowaną jednostką graficzną. Ponadto na wyposażeniu znajduje się dysk SSD o pojemności 512 GB w standardzie PCIe 4.0. System jest przeznaczony do zadań biurowych i innych typowych zadań biznesowych.
Nie jest przeznaczony do edycji wideo i gier i jest dostępny tylko w alternatywnych konfiguracjach z GeForce MX550, większą ilością pamięci RAM (w wolnym SODIMM) i ewentualnie mocniejszym procesorem (i7-1280P). Ponieważ w tym roku pojawią się również modele z AMD, warto rozważyć tę opcję. Postaramy się zrecenzować również taki model.
Warunki badania
Lenovo nie oferuje własnych profili zasilania dla swoich ThinkPadów, ale integruje je z ustawieniami energetycznymi systemu Windows. Tryb auto "inteligentnego chłodzenia" można wyłączyć za pomocą klawiszy "Fn+T". Benchmarki związane z wydajnością zostały przeprowadzone w ramach profilu maksymalnej wydajności z wyłączonym trybem Auto
Procesor
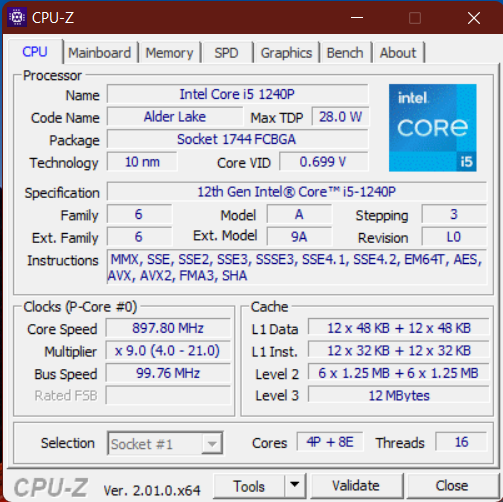
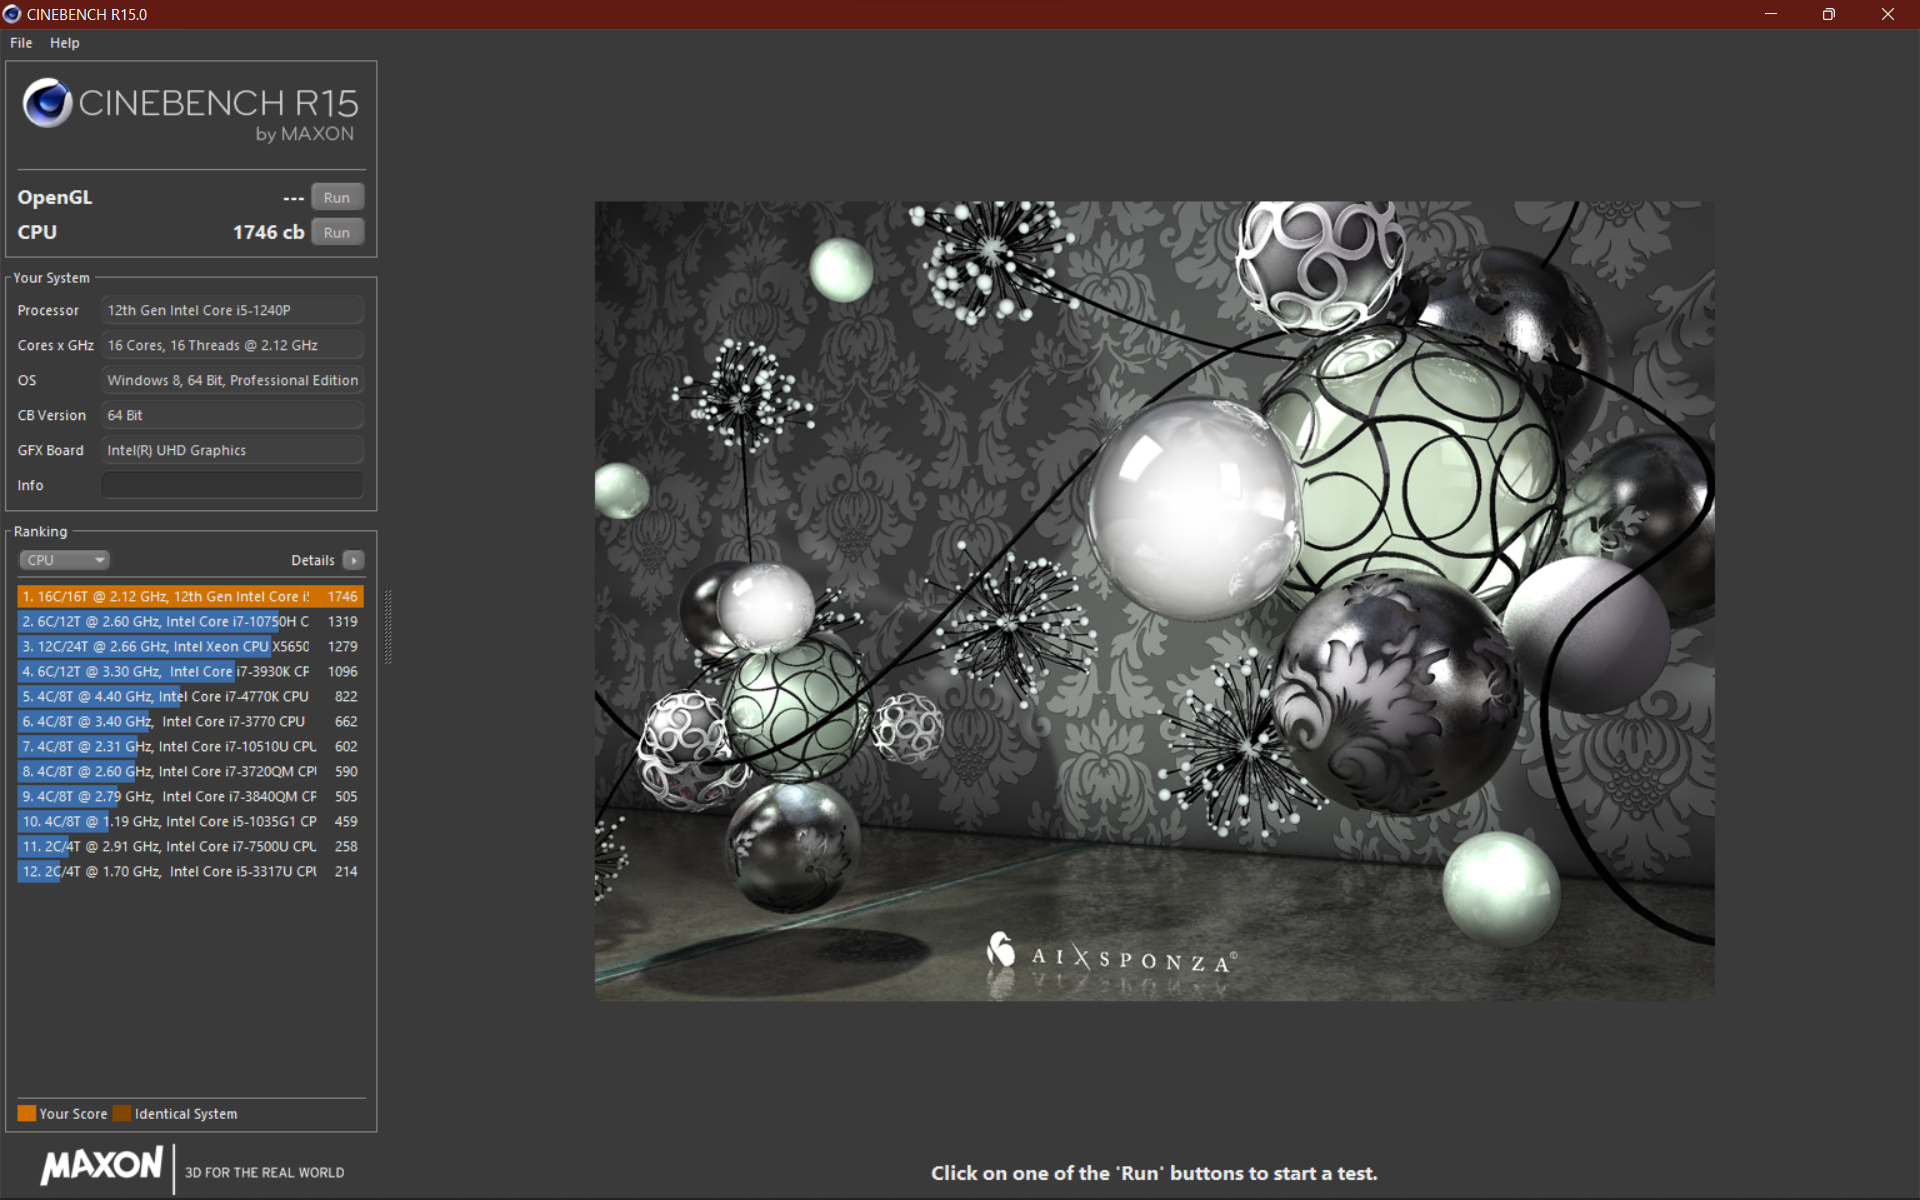
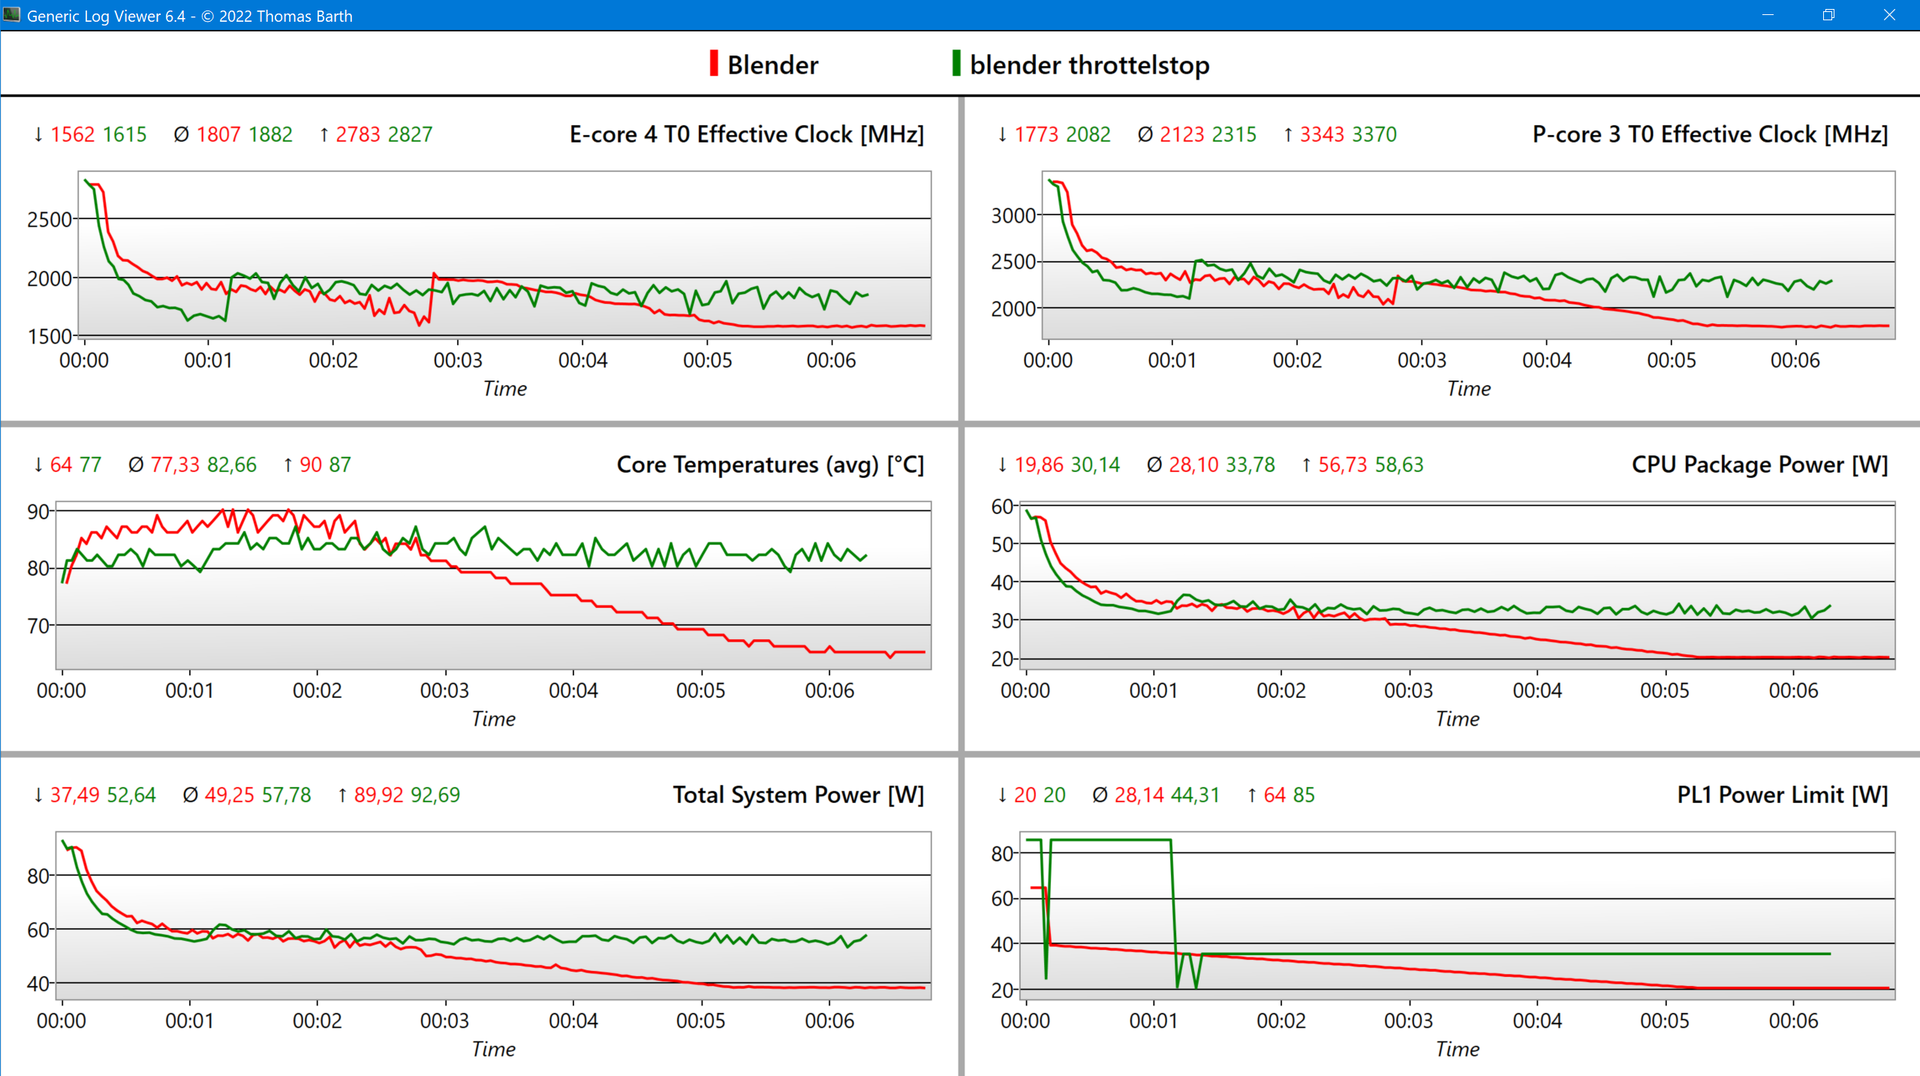
Intel Core i5-1240P to 12-rdzeniowy procesor z 4 rdzeniami wydajnościowymi i 8 wydajnymi. TDP na poziomie 28 W jest po raz pierwszy zastosowane w serii T Lenovo. Z naszych testów wynika jednak, że Lenovo ogranicza PL1 do 20 W, natomiast 12-sekundowe krótkie turbo (PL2) to 59 W.
Bardzo niskie temperatury 63°C dowodzą, że takie podejście niepotrzebnie ogranicza wydajność i wystarcza tylko do osiągnięcia bazowego taktowania 1,7 GHz. Jest to niezrozumiałe, gdyż poprzednik stale pracuje z mocą 35 W. W konsekwencji daje to trwałą wydajność tylko o 15% wyższą odpoprzednikiem, podczas gdy ThinkPad E15 z zeszłorocznym Ryzenem oblicza się o około 50% szybciej. Z drugiej strony T16 jest bardzo szybki w zadaniach wymagających krótkich impulsów.
Jeżeli throttling, który został potwierdzony przez wiele źródeł jako występujący również w T14 G3(ta sama płyta główna), nie zostanie w przyszłości naprawiony poprzez aktualizację BIOS-u, to prawdopodobnie lepszym wyborem będzie tutaj AMD, gdyż Ryzeny potrafią dostarczyć znacznie lepsze wyniki przy niewielkiej mocy.
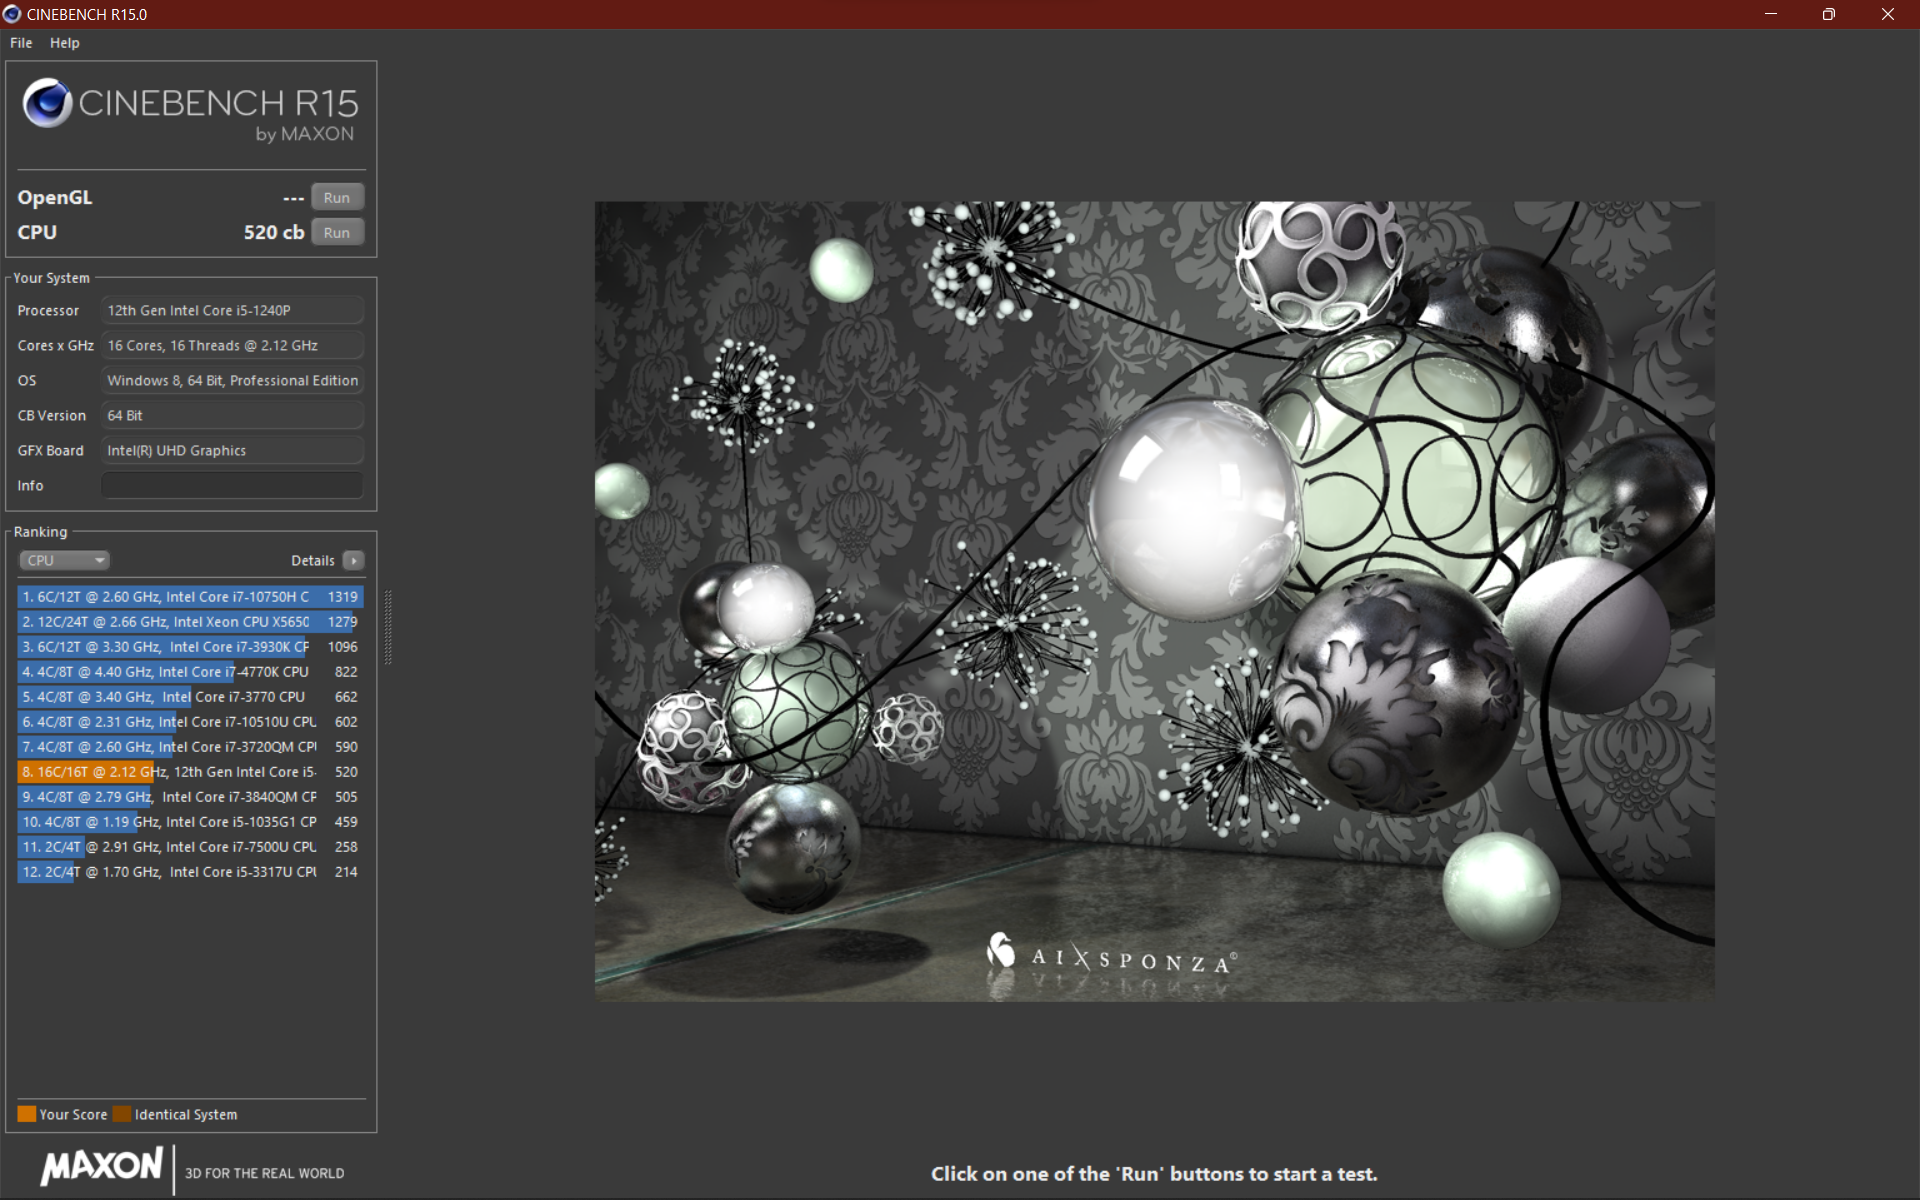
W trybie baterii moc jest dodatkowo ograniczona do 10 watów, ale "Max Performance on Battery" można ustawić w BIOS-ie, dzięki czemu wynik jest ponownie mniej więcej taki sam. Łącznie 30 watów można utrzymać za pomocą narzędzia "ThrottleStop", ale nadpisywanie ustawień wybranych przez producenta nie jest zalecane.
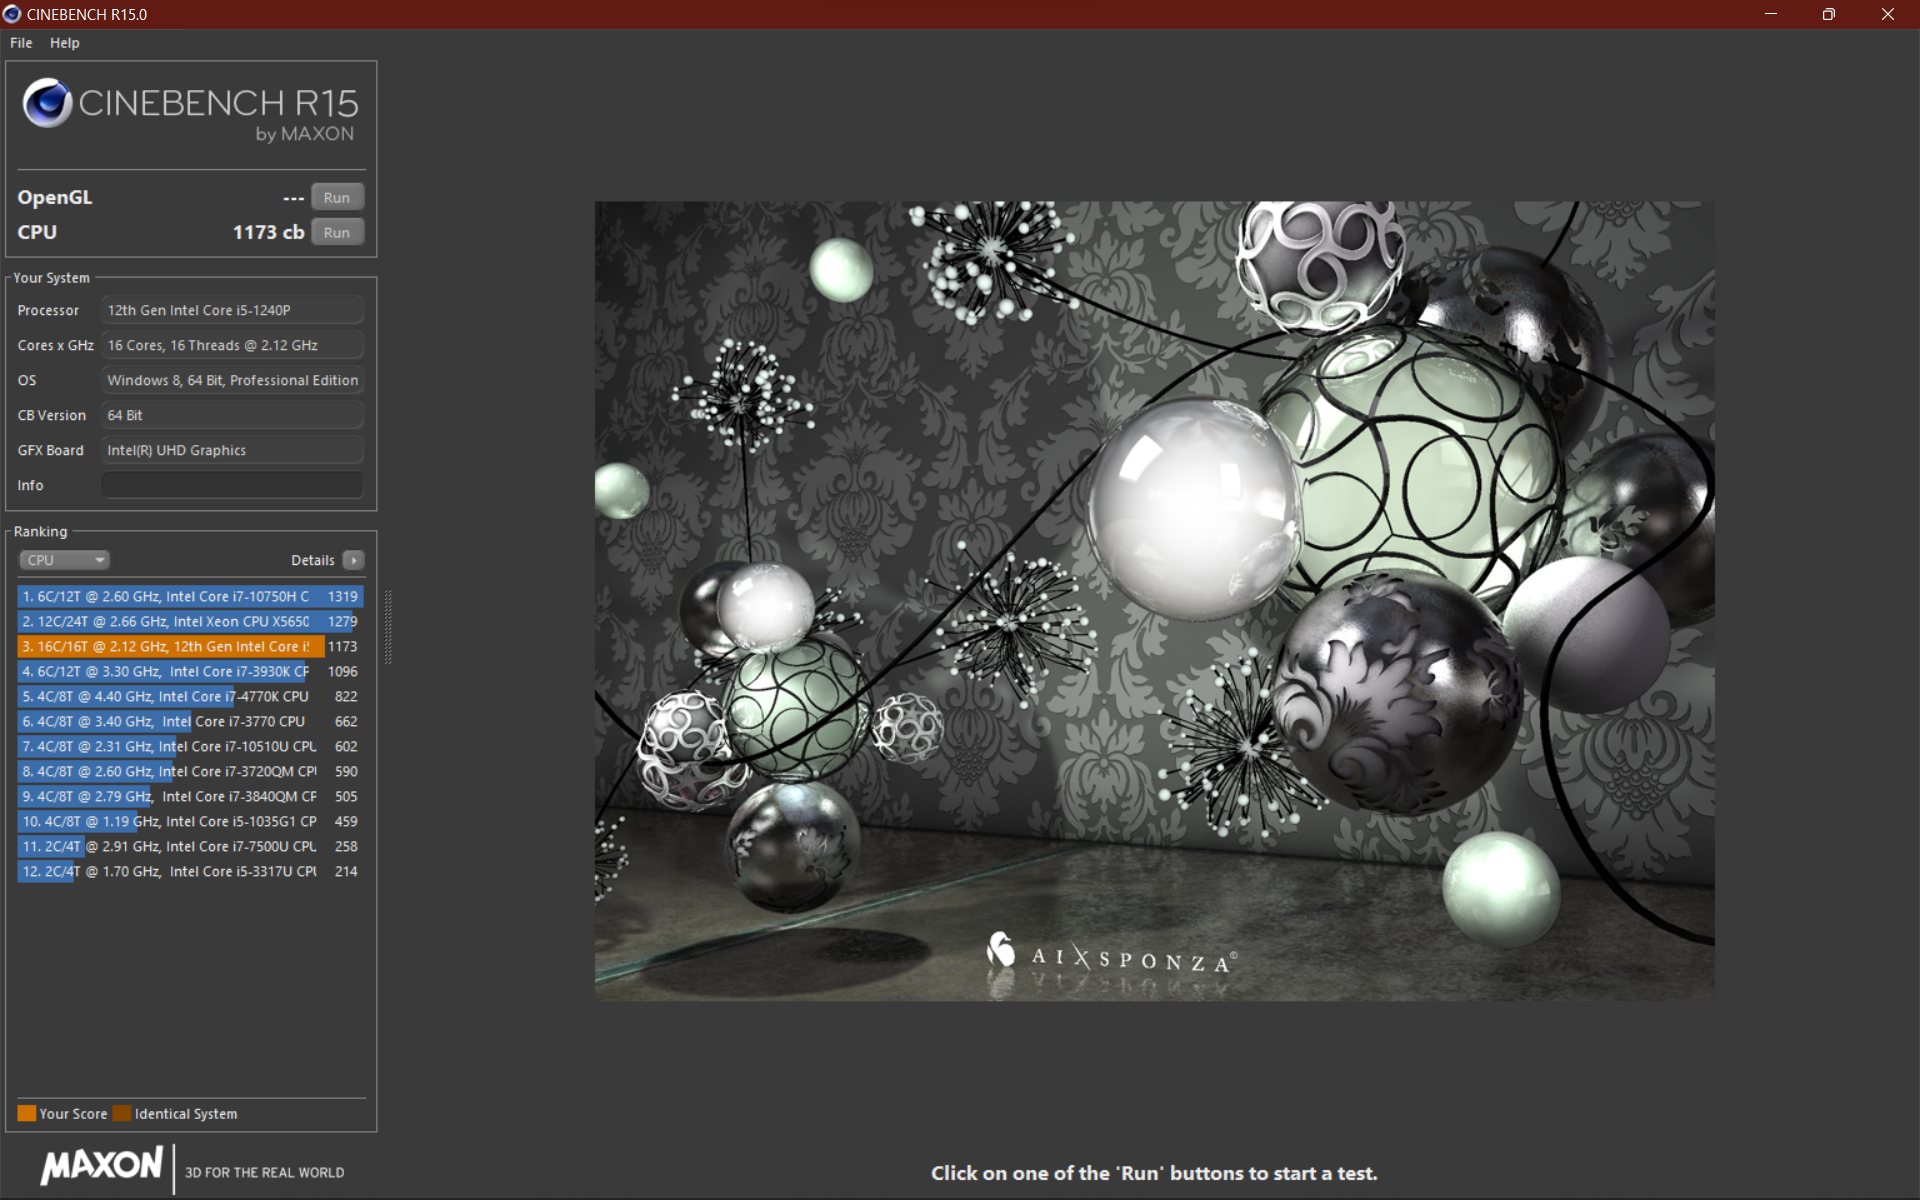

Cinebench R15 Multi Sustained Load
Cinebench R23: Multi Core | Single Core
Cinebench R20: CPU (Multi Core) | CPU (Single Core)
Cinebench R15: CPU Multi 64Bit | CPU Single 64Bit
Blender: v2.79 BMW27 CPU | v3.3 Classroom CPU
7-Zip 18.03: 7z b 4 | 7z b 4 -mmt1
Geekbench 5.5: Multi-Core | Single-Core
HWBOT x265 Benchmark v2.2: 4k Preset
LibreOffice : 20 Documents To PDF
R Benchmark 2.5: Overall mean
V-Ray 5 Benchmark: CPU
V-Ray Benchmark Next 4.10: CPU
| CPU Performance rating | |
| Dell Inspiron 16 Plus 7620 -1! | |
| Huawei MateBook D 16 2022 -1! | |
| Asus Vivobook Pro 16X-M7600QE -2! | |
| Lenovo ThinkPad X1 Extreme G4-20Y5CTO1WW (3050 Ti) -2! | |
| HP ZBook Power 15 G8 313S5EA -2! | |
| Średnia w klasie Office | |
| Lenovo ThinkPad T16 G1 21BWS00200 | |
| Lenovo ThinkPad E15 G3-20YG003UGE -2! | |
| Lenovo ThinkPad L15 G2 AMD -1! | |
| Przeciętny Intel Core i5-1240P | |
| Lenovo ThinkPad T15 Gen2-20W5S00100 -4! | |
| HP ProBook 450 G9 6A180EA | |
| Cinebench R23 / Multi Core | |
| Dell Inspiron 16 Plus 7620 | |
| HP ZBook Power 15 G8 313S5EA | |
| Lenovo ThinkPad X1 Extreme G4-20Y5CTO1WW (3050 Ti) | |
| Asus Vivobook Pro 16X-M7600QE | |
| Asus Vivobook Pro 16X-M7600QE | |
| Średnia w klasie Office (1673 - 22808, n=74, ostatnie 2 lata) | |
| Huawei MateBook D 16 2022 | |
| Lenovo ThinkPad E15 G3-20YG003UGE | |
| Przeciętny Intel Core i5-1240P (277 - 11556, n=20) | |
| Lenovo ThinkPad L15 G2 AMD | |
| Lenovo ThinkPad T16 G1 21BWS00200 | |
| HP ProBook 450 G9 6A180EA | |
| Cinebench R23 / Single Core | |
| Huawei MateBook D 16 2022 | |
| Dell Inspiron 16 Plus 7620 | |
| Średnia w klasie Office (708 - 2130, n=74, ostatnie 2 lata) | |
| Lenovo ThinkPad T16 G1 21BWS00200 | |
| HP ZBook Power 15 G8 313S5EA | |
| Lenovo ThinkPad X1 Extreme G4-20Y5CTO1WW (3050 Ti) | |
| Asus Vivobook Pro 16X-M7600QE | |
| Asus Vivobook Pro 16X-M7600QE | |
| Przeciętny Intel Core i5-1240P (640 - 1689, n=18) | |
| HP ProBook 450 G9 6A180EA | |
| Lenovo ThinkPad L15 G2 AMD | |
| Lenovo ThinkPad E15 G3-20YG003UGE | |
| Cinebench R20 / CPU (Multi Core) | |
| Dell Inspiron 16 Plus 7620 | |
| Asus Vivobook Pro 16X-M7600QE | |
| Asus Vivobook Pro 16X-M7600QE | |
| Lenovo ThinkPad X1 Extreme G4-20Y5CTO1WW (3050 Ti) | |
| Średnia w klasie Office (648 - 8840, n=73, ostatnie 2 lata) | |
| HP ZBook Power 15 G8 313S5EA | |
| Huawei MateBook D 16 2022 | |
| Lenovo ThinkPad E15 G3-20YG003UGE | |
| Przeciętny Intel Core i5-1240P (763 - 4456, n=16) | |
| Lenovo ThinkPad T16 G1 21BWS00200 | |
| Lenovo ThinkPad L15 G2 AMD | |
| Lenovo ThinkPad T15 Gen2-20W5S00100 | |
| HP ProBook 450 G9 6A180EA | |
| Cinebench R20 / CPU (Single Core) | |
| Dell Inspiron 16 Plus 7620 | |
| Huawei MateBook D 16 2022 | |
| Średnia w klasie Office (345 - 816, n=73, ostatnie 2 lata) | |
| Lenovo ThinkPad X1 Extreme G4-20Y5CTO1WW (3050 Ti) | |
| HP ZBook Power 15 G8 313S5EA | |
| Lenovo ThinkPad T15 Gen2-20W5S00100 | |
| Lenovo ThinkPad T16 G1 21BWS00200 | |
| Asus Vivobook Pro 16X-M7600QE | |
| Asus Vivobook Pro 16X-M7600QE | |
| HP ProBook 450 G9 6A180EA | |
| Przeciętny Intel Core i5-1240P (251 - 653, n=16) | |
| Lenovo ThinkPad L15 G2 AMD | |
| Lenovo ThinkPad E15 G3-20YG003UGE | |
| Cinebench R15 / CPU Multi 64Bit | |
| Dell Inspiron 16 Plus 7620 | |
| Huawei MateBook D 16 2022 | |
| Huawei MateBook D 16 2022 | |
| HP ZBook Power 15 G8 313S5EA | |
| HP ZBook Power 15 G8 313S5EA | |
| Asus Vivobook Pro 16X-M7600QE | |
| Asus Vivobook Pro 16X-M7600QE | |
| Lenovo ThinkPad X1 Extreme G4-20Y5CTO1WW (3050 Ti) | |
| Średnia w klasie Office (250 - 3380, n=75, ostatnie 2 lata) | |
| Lenovo ThinkPad T16 G1 21BWS00200 | |
| Lenovo ThinkPad T16 G1 21BWS00200 | |
| Lenovo ThinkPad E15 G3-20YG003UGE | |
| Przeciętny Intel Core i5-1240P (407 - 2007, n=19) | |
| Lenovo ThinkPad L15 G2 AMD | |
| Lenovo ThinkPad T15 Gen2-20W5S00100 | |
| HP ProBook 450 G9 6A180EA | |
| Cinebench R15 / CPU Single 64Bit | |
| Huawei MateBook D 16 2022 | |
| Dell Inspiron 16 Plus 7620 | |
| Średnia w klasie Office (99.5 - 312, n=75, ostatnie 2 lata) | |
| Asus Vivobook Pro 16X-M7600QE | |
| Asus Vivobook Pro 16X-M7600QE | |
| HP ZBook Power 15 G8 313S5EA | |
| Lenovo ThinkPad X1 Extreme G4-20Y5CTO1WW (3050 Ti) | |
| Lenovo ThinkPad T15 Gen2-20W5S00100 | |
| Lenovo ThinkPad T16 G1 21BWS00200 | |
| Lenovo ThinkPad L15 G2 AMD | |
| HP ProBook 450 G9 6A180EA | |
| Przeciętny Intel Core i5-1240P (91.8 - 243, n=18) | |
| Lenovo ThinkPad E15 G3-20YG003UGE | |
| Blender / v2.79 BMW27 CPU | |
| Lenovo ThinkPad T15 Gen2-20W5S00100 | |
| HP ProBook 450 G9 6A180EA | |
| Przeciętny Intel Core i5-1240P (285 - 1926, n=16) | |
| Lenovo ThinkPad T16 G1 21BWS00200 | |
| Lenovo ThinkPad L15 G2 AMD | |
| Średnia w klasie Office (158 - 1940, n=74, ostatnie 2 lata) | |
| Lenovo ThinkPad E15 G3-20YG003UGE | |
| Huawei MateBook D 16 2022 | |
| HP ZBook Power 15 G8 313S5EA | |
| Asus Vivobook Pro 16X-M7600QE | |
| Asus Vivobook Pro 16X-M7600QE | |
| Lenovo ThinkPad X1 Extreme G4-20Y5CTO1WW (3050 Ti) | |
| Dell Inspiron 16 Plus 7620 | |
| Blender / v3.3 Classroom CPU | |
| HP ProBook 450 G9 6A180EA | |
| Przeciętny Intel Core i5-1240P (552 - 3047, n=12) | |
| Lenovo ThinkPad T16 G1 21BWS00200 | |
| Średnia w klasie Office (245 - 3219, n=72, ostatnie 2 lata) | |
| Huawei MateBook D 16 2022 | |
| Dell Inspiron 16 Plus 7620 | |
| 7-Zip 18.03 / 7z b 4 | |
| Dell Inspiron 16 Plus 7620 | |
| Asus Vivobook Pro 16X-M7600QE | |
| Asus Vivobook Pro 16X-M7600QE | |
| Huawei MateBook D 16 2022 | |
| Lenovo ThinkPad X1 Extreme G4-20Y5CTO1WW (3050 Ti) | |
| HP ZBook Power 15 G8 313S5EA | |
| Średnia w klasie Office (7098 - 76886, n=75, ostatnie 2 lata) | |
| Lenovo ThinkPad E15 G3-20YG003UGE | |
| Lenovo ThinkPad L15 G2 AMD | |
| Przeciętny Intel Core i5-1240P (7254 - 47002, n=16) | |
| Lenovo ThinkPad T16 G1 21BWS00200 | |
| HP ProBook 450 G9 6A180EA | |
| Lenovo ThinkPad T15 Gen2-20W5S00100 | |
| 7-Zip 18.03 / 7z b 4 -mmt1 | |
| Asus Vivobook Pro 16X-M7600QE | |
| Asus Vivobook Pro 16X-M7600QE | |
| Huawei MateBook D 16 2022 | |
| HP ZBook Power 15 G8 313S5EA | |
| Lenovo ThinkPad X1 Extreme G4-20Y5CTO1WW (3050 Ti) | |
| Dell Inspiron 16 Plus 7620 | |
| Lenovo ThinkPad T15 Gen2-20W5S00100 | |
| Średnia w klasie Office (3387 - 6469, n=75, ostatnie 2 lata) | |
| Lenovo ThinkPad L15 G2 AMD | |
| HP ProBook 450 G9 6A180EA | |
| Lenovo ThinkPad T16 G1 21BWS00200 | |
| Przeciętny Intel Core i5-1240P (2197 - 5320, n=16) | |
| Lenovo ThinkPad E15 G3-20YG003UGE | |
| Geekbench 5.5 / Multi-Core | |
| Dell Inspiron 16 Plus 7620 | |
| Huawei MateBook D 16 2022 | |
| Średnia w klasie Office (1483 - 16999, n=71, ostatnie 2 lata) | |
| Asus Vivobook Pro 16X-M7600QE | |
| Asus Vivobook Pro 16X-M7600QE | |
| Lenovo ThinkPad X1 Extreme G4-20Y5CTO1WW (3050 Ti) | |
| HP ZBook Power 15 G8 313S5EA | |
| Przeciętny Intel Core i5-1240P (1763 - 10112, n=15) | |
| Lenovo ThinkPad T16 G1 21BWS00200 | |
| Lenovo ThinkPad E15 G3-20YG003UGE | |
| HP ProBook 450 G9 6A180EA | |
| Lenovo ThinkPad L15 G2 AMD | |
| Lenovo ThinkPad T15 Gen2-20W5S00100 | |
| Geekbench 5.5 / Single-Core | |
| Średnia w klasie Office (811 - 2128, n=71, ostatnie 2 lata) | |
| Huawei MateBook D 16 2022 | |
| Dell Inspiron 16 Plus 7620 | |
| HP ProBook 450 G9 6A180EA | |
| Lenovo ThinkPad X1 Extreme G4-20Y5CTO1WW (3050 Ti) | |
| Asus Vivobook Pro 16X-M7600QE | |
| Asus Vivobook Pro 16X-M7600QE | |
| Lenovo ThinkPad T16 G1 21BWS00200 | |
| HP ZBook Power 15 G8 313S5EA | |
| Przeciętny Intel Core i5-1240P (672 - 1658, n=15) | |
| Lenovo ThinkPad T15 Gen2-20W5S00100 | |
| Lenovo ThinkPad L15 G2 AMD | |
| Lenovo ThinkPad E15 G3-20YG003UGE | |
| HWBOT x265 Benchmark v2.2 / 4k Preset | |
| Dell Inspiron 16 Plus 7620 | |
| Asus Vivobook Pro 16X-M7600QE | |
| Asus Vivobook Pro 16X-M7600QE | |
| HP ZBook Power 15 G8 313S5EA | |
| Huawei MateBook D 16 2022 | |
| Lenovo ThinkPad X1 Extreme G4-20Y5CTO1WW (3050 Ti) | |
| Średnia w klasie Office (2.21 - 26, n=74, ostatnie 2 lata) | |
| Lenovo ThinkPad E15 G3-20YG003UGE | |
| Lenovo ThinkPad L15 G2 AMD | |
| Przeciętny Intel Core i5-1240P (1.99 - 12.9, n=16) | |
| Lenovo ThinkPad T16 G1 21BWS00200 | |
| Lenovo ThinkPad T15 Gen2-20W5S00100 | |
| HP ProBook 450 G9 6A180EA | |
| LibreOffice / 20 Documents To PDF | |
| Lenovo ThinkPad E15 G3-20YG003UGE | |
| Przeciętny Intel Core i5-1240P (46.4 - 120.5, n=16) | |
| Średnia w klasie Office (39.9 - 102.3, n=74, ostatnie 2 lata) | |
| Asus Vivobook Pro 16X-M7600QE | |
| Asus Vivobook Pro 16X-M7600QE | |
| HP ProBook 450 G9 6A180EA | |
| Lenovo ThinkPad L15 G2 AMD | |
| Lenovo ThinkPad T16 G1 21BWS00200 | |
| Dell Inspiron 16 Plus 7620 | |
| HP ZBook Power 15 G8 313S5EA | |
| Lenovo ThinkPad T15 Gen2-20W5S00100 | |
| Lenovo ThinkPad X1 Extreme G4-20Y5CTO1WW (3050 Ti) | |
| Huawei MateBook D 16 2022 | |
| R Benchmark 2.5 / Overall mean | |
| HP ZBook Power 15 G8 313S5EA | |
| Lenovo ThinkPad E15 G3-20YG003UGE | |
| Przeciętny Intel Core i5-1240P (0.4987 - 1.236, n=16) | |
| Lenovo ThinkPad T15 Gen2-20W5S00100 | |
| HP ProBook 450 G9 6A180EA | |
| Lenovo ThinkPad X1 Extreme G4-20Y5CTO1WW (3050 Ti) | |
| Lenovo ThinkPad L15 G2 AMD | |
| Średnia w klasie Office (0.4098 - 0.888, n=74, ostatnie 2 lata) | |
| Lenovo ThinkPad T16 G1 21BWS00200 | |
| Asus Vivobook Pro 16X-M7600QE | |
| Asus Vivobook Pro 16X-M7600QE | |
| Dell Inspiron 16 Plus 7620 | |
| Huawei MateBook D 16 2022 | |
| V-Ray 5 Benchmark / CPU | |
| Dell Inspiron 16 Plus 7620 | |
| Średnia w klasie Office (5027 - 13111, n=20, ostatnie 2 lata) | |
| Lenovo ThinkPad L15 G2 AMD | |
| Lenovo ThinkPad T16 G1 21BWS00200 | |
| Przeciętny Intel Core i5-1240P (1334 - 7321, n=6) | |
| HP ProBook 450 G9 6A180EA | |
| V-Ray Benchmark Next 4.10 / CPU | |
| HP ZBook Power 15 G8 313S5EA | |
| Lenovo ThinkPad X1 Extreme G4-20Y5CTO1WW (3050 Ti) | |
| Asus Vivobook Pro 16X-M7600QE | |
| Asus Vivobook Pro 16X-M7600QE | |
| Huawei MateBook D 16 2022 | |
| Średnia w klasie Office (1552 - 21751, n=68, ostatnie 2 lata) | |
| Lenovo ThinkPad E15 G3-20YG003UGE | |
| Lenovo ThinkPad L15 G2 AMD | |
| Lenovo ThinkPad T16 G1 21BWS00200 | |
| Przeciętny Intel Core i5-1240P (2018 - 11089, n=14) | |
| Lenovo ThinkPad T15 Gen2-20W5S00100 | |
| HP ProBook 450 G9 6A180EA | |
* ... im mniej tym lepiej
AIDA64: FP32 Ray-Trace | FPU Julia | CPU SHA3 | CPU Queen | FPU SinJulia | FPU Mandel | CPU AES | CPU ZLib | FP64 Ray-Trace | CPU PhotoWorxx
| Performance rating | |
| Lenovo ThinkPad X1 Extreme G4-20Y5CTO1WW (3050 Ti) | |
| HP ZBook Power 15 G8 313S5EA | |
| Dell Inspiron 16 Plus 7620 | |
| Huawei MateBook D 16 2022 | |
| Średnia w klasie Office | |
| Lenovo ThinkPad E15 G3-20YG003UGE | |
| Lenovo ThinkPad L15 G2 AMD | |
| Lenovo ThinkPad T16 G1 21BWS00200 | |
| Przeciętny Intel Core i5-1240P | |
| HP ProBook 450 G9 6A180EA | |
| AIDA64 / FP32 Ray-Trace | |
| HP ZBook Power 15 G8 313S5EA | |
| Lenovo ThinkPad X1 Extreme G4-20Y5CTO1WW (3050 Ti) | |
| Średnia w klasie Office (2083 - 31245, n=80, ostatnie 2 lata) | |
| Dell Inspiron 16 Plus 7620 | |
| Huawei MateBook D 16 2022 | |
| Lenovo ThinkPad E15 G3-20YG003UGE | |
| Lenovo ThinkPad L15 G2 AMD | |
| Lenovo ThinkPad T16 G1 21BWS00200 | |
| Przeciętny Intel Core i5-1240P (2405 - 9694, n=16) | |
| HP ProBook 450 G9 6A180EA | |
| AIDA64 / FPU Julia | |
| Dell Inspiron 16 Plus 7620 | |
| Lenovo ThinkPad E15 G3-20YG003UGE | |
| Lenovo ThinkPad X1 Extreme G4-20Y5CTO1WW (3050 Ti) | |
| HP ZBook Power 15 G8 313S5EA | |
| Średnia w klasie Office (8191 - 125394, n=80, ostatnie 2 lata) | |
| Huawei MateBook D 16 2022 | |
| Lenovo ThinkPad L15 G2 AMD | |
| Lenovo ThinkPad T16 G1 21BWS00200 | |
| Przeciętny Intel Core i5-1240P (7407 - 49934, n=16) | |
| HP ProBook 450 G9 6A180EA | |
| AIDA64 / CPU SHA3 | |
| Lenovo ThinkPad X1 Extreme G4-20Y5CTO1WW (3050 Ti) | |
| HP ZBook Power 15 G8 313S5EA | |
| Dell Inspiron 16 Plus 7620 | |
| Średnia w klasie Office (433 - 5755, n=80, ostatnie 2 lata) | |
| Huawei MateBook D 16 2022 | |
| Lenovo ThinkPad E15 G3-20YG003UGE | |
| Lenovo ThinkPad L15 G2 AMD | |
| Lenovo ThinkPad T16 G1 21BWS00200 | |
| Przeciętny Intel Core i5-1240P (415 - 2462, n=16) | |
| HP ProBook 450 G9 6A180EA | |
| AIDA64 / CPU Queen | |
| Huawei MateBook D 16 2022 | |
| Dell Inspiron 16 Plus 7620 | |
| Lenovo ThinkPad X1 Extreme G4-20Y5CTO1WW (3050 Ti) | |
| HP ZBook Power 15 G8 313S5EA | |
| Lenovo ThinkPad E15 G3-20YG003UGE | |
| Lenovo ThinkPad T16 G1 21BWS00200 | |
| Lenovo ThinkPad L15 G2 AMD | |
| Przeciętny Intel Core i5-1240P (29405 - 76736, n=16) | |
| Średnia w klasie Office (22784 - 115197, n=69, ostatnie 2 lata) | |
| HP ProBook 450 G9 6A180EA | |
| AIDA64 / FPU SinJulia | |
| Lenovo ThinkPad E15 G3-20YG003UGE | |
| HP ZBook Power 15 G8 313S5EA | |
| Lenovo ThinkPad X1 Extreme G4-20Y5CTO1WW (3050 Ti) | |
| Dell Inspiron 16 Plus 7620 | |
| Lenovo ThinkPad L15 G2 AMD | |
| Huawei MateBook D 16 2022 | |
| Średnia w klasie Office (1378 - 18321, n=80, ostatnie 2 lata) | |
| Lenovo ThinkPad T16 G1 21BWS00200 | |
| Przeciętny Intel Core i5-1240P (2135 - 6540, n=16) | |
| HP ProBook 450 G9 6A180EA | |
| AIDA64 / FPU Mandel | |
| HP ZBook Power 15 G8 313S5EA | |
| Lenovo ThinkPad X1 Extreme G4-20Y5CTO1WW (3050 Ti) | |
| Lenovo ThinkPad E15 G3-20YG003UGE | |
| Średnia w klasie Office (4601 - 66922, n=80, ostatnie 2 lata) | |
| Dell Inspiron 16 Plus 7620 | |
| Lenovo ThinkPad L15 G2 AMD | |
| Huawei MateBook D 16 2022 | |
| Lenovo ThinkPad T16 G1 21BWS00200 | |
| Przeciętny Intel Core i5-1240P (5113 - 23992, n=16) | |
| HP ProBook 450 G9 6A180EA | |
| AIDA64 / CPU AES | |
| Lenovo ThinkPad X1 Extreme G4-20Y5CTO1WW (3050 Ti) | |
| Huawei MateBook D 16 2022 | |
| HP ZBook Power 15 G8 313S5EA | |
| Lenovo ThinkPad L15 G2 AMD | |
| Dell Inspiron 16 Plus 7620 | |
| Lenovo ThinkPad E15 G3-20YG003UGE | |
| Średnia w klasie Office (4854 - 155900, n=80, ostatnie 2 lata) | |
| Lenovo ThinkPad T16 G1 21BWS00200 | |
| Przeciętny Intel Core i5-1240P (8849 - 90370, n=16) | |
| HP ProBook 450 G9 6A180EA | |
| AIDA64 / CPU ZLib | |
| Dell Inspiron 16 Plus 7620 | |
| Lenovo ThinkPad X1 Extreme G4-20Y5CTO1WW (3050 Ti) | |
| HP ZBook Power 15 G8 313S5EA | |
| Huawei MateBook D 16 2022 | |
| Średnia w klasie Office (114.6 - 1366, n=80, ostatnie 2 lata) | |
| Lenovo ThinkPad E15 G3-20YG003UGE | |
| Lenovo ThinkPad T16 G1 21BWS00200 | |
| Przeciętny Intel Core i5-1240P (101.6 - 812, n=16) | |
| Lenovo ThinkPad L15 G2 AMD | |
| HP ProBook 450 G9 6A180EA | |
| AIDA64 / FP64 Ray-Trace | |
| HP ZBook Power 15 G8 313S5EA | |
| Lenovo ThinkPad X1 Extreme G4-20Y5CTO1WW (3050 Ti) | |
| Średnia w klasie Office (1109 - 17834, n=80, ostatnie 2 lata) | |
| Dell Inspiron 16 Plus 7620 | |
| Lenovo ThinkPad E15 G3-20YG003UGE | |
| Huawei MateBook D 16 2022 | |
| Lenovo ThinkPad L15 G2 AMD | |
| Lenovo ThinkPad T16 G1 21BWS00200 | |
| Przeciętny Intel Core i5-1240P (1154 - 5258, n=16) | |
| HP ProBook 450 G9 6A180EA | |
| AIDA64 / CPU PhotoWorxx | |
| Huawei MateBook D 16 2022 | |
| Średnia w klasie Office (11090 - 65229, n=80, ostatnie 2 lata) | |
| Dell Inspiron 16 Plus 7620 | |
| Przeciętny Intel Core i5-1240P (11873 - 43661, n=16) | |
| Lenovo ThinkPad E15 G3-20YG003UGE | |
| Lenovo ThinkPad X1 Extreme G4-20Y5CTO1WW (3050 Ti) | |
| HP ProBook 450 G9 6A180EA | |
| Lenovo ThinkPad T16 G1 21BWS00200 | |
| HP ZBook Power 15 G8 313S5EA | |
| Lenovo ThinkPad L15 G2 AMD | |
Wydajność systemu
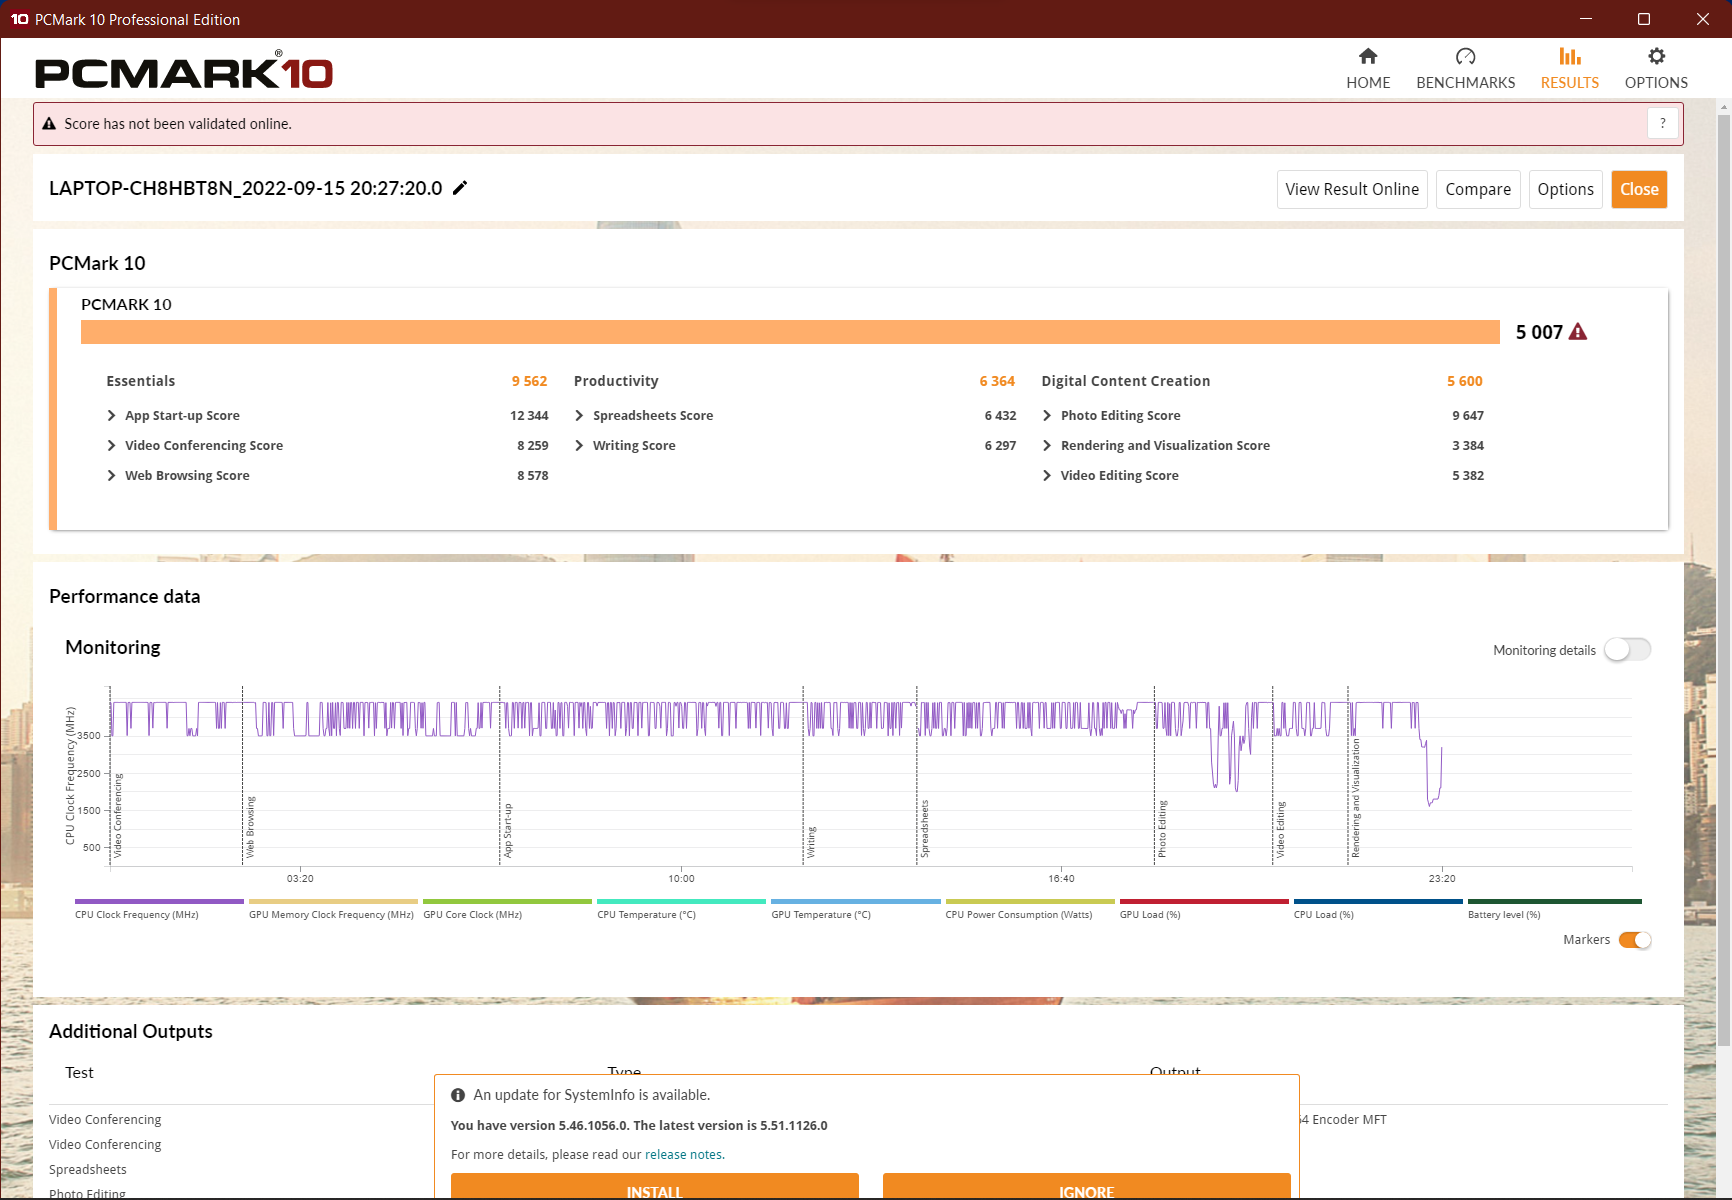
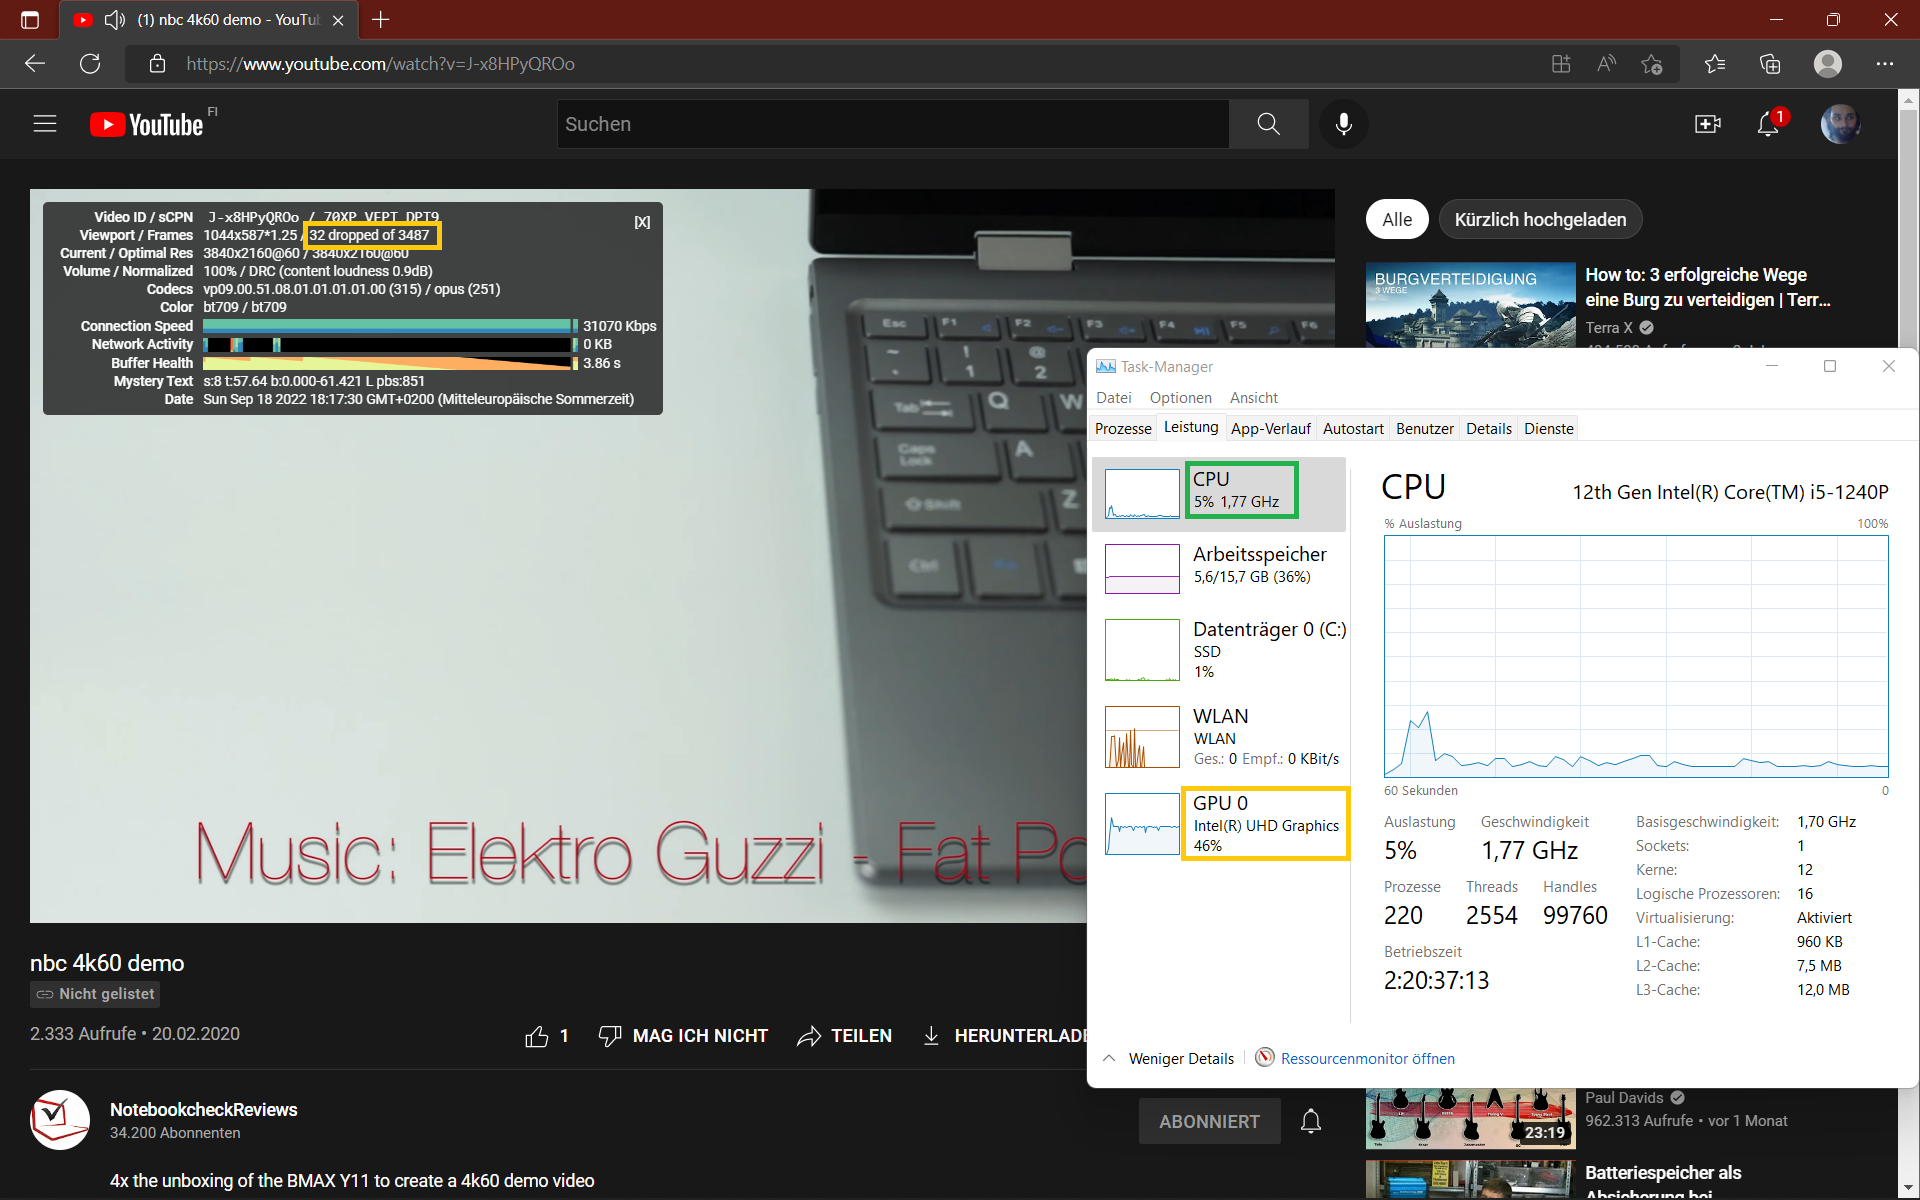
Dzięki mocnemu krótkoterminowemu turbo system jest bardzo responsywny mimo jednokanałowej pamięci RAM. Przeglądanie stron internetowych podczas odtwarzania YouTube 4K nie stanowi problemu, ale zdarzają się spadki klatek.
Z pewnością można by to naprawić poprzez wstawienie drugiego modułu RAM, jak również poprzez poprawę ogólnej wydajności systemu. Procesor Alder Lake wypada bardzo dobrze w benchmarkach internetowych dzięki turbo, ale wydajność w PCMarku jest przeciętna.
CrossMark: Overall | Productivity | Creativity | Responsiveness
Sunspider: 1.0 Total Score
Mozilla Kraken 1.1: Total
Speedometer 2.0: Result 2.0
Octane V2: Total Score
Jetstream 2: 2.0 Total
WebXPRT 3: Overall
WebXPRT 4: Overall
| PCMark 10 / Score | |
| Dell Inspiron 16 Plus 7620 | |
| Lenovo ThinkPad X1 Extreme G4-20Y5CTO1WW (3050 Ti) | |
| Średnia w klasie Office (2601 - 9298, n=64, ostatnie 2 lata) | |
| Huawei MateBook D 16 2022 | |
| Lenovo ThinkPad L15 G2 AMD | |
| Lenovo ThinkPad E15 G3-20YG003UGE | |
| Lenovo ThinkPad T15 Gen2-20W5S00100 | |
| Przeciętny Intel Core i5-1240P, Intel Iris Xe Graphics G7 80EUs (4881 - 5345, n=11) | |
| Lenovo ThinkPad T16 G1 21BWS00200 | |
| HP ZBook Power 15 G8 313S5EA | |
| HP ProBook 450 G9 6A180EA | |
| PCMark 10 / Essentials | |
| Huawei MateBook D 16 2022 | |
| Lenovo ThinkPad X1 Extreme G4-20Y5CTO1WW (3050 Ti) | |
| Dell Inspiron 16 Plus 7620 | |
| Lenovo ThinkPad L15 G2 AMD | |
| Średnia w klasie Office (3245 - 11594, n=64, ostatnie 2 lata) | |
| Przeciętny Intel Core i5-1240P, Intel Iris Xe Graphics G7 80EUs (8890 - 10652, n=11) | |
| Lenovo ThinkPad T16 G1 21BWS00200 | |
| HP ProBook 450 G9 6A180EA | |
| Lenovo ThinkPad E15 G3-20YG003UGE | |
| Lenovo ThinkPad T15 Gen2-20W5S00100 | |
| HP ZBook Power 15 G8 313S5EA | |
| PCMark 10 / Productivity | |
| Średnia w klasie Office (5336 - 17243, n=64, ostatnie 2 lata) | |
| Lenovo ThinkPad L15 G2 AMD | |
| Dell Inspiron 16 Plus 7620 | |
| Lenovo ThinkPad T15 Gen2-20W5S00100 | |
| Lenovo ThinkPad X1 Extreme G4-20Y5CTO1WW (3050 Ti) | |
| Lenovo ThinkPad E15 G3-20YG003UGE | |
| HP ZBook Power 15 G8 313S5EA | |
| Huawei MateBook D 16 2022 | |
| HP ProBook 450 G9 6A180EA | |
| Przeciętny Intel Core i5-1240P, Intel Iris Xe Graphics G7 80EUs (6118 - 7058, n=11) | |
| Lenovo ThinkPad T16 G1 21BWS00200 | |
| PCMark 10 / Digital Content Creation | |
| Dell Inspiron 16 Plus 7620 | |
| Lenovo ThinkPad X1 Extreme G4-20Y5CTO1WW (3050 Ti) | |
| Średnia w klasie Office (2049 - 13541, n=64, ostatnie 2 lata) | |
| Huawei MateBook D 16 2022 | |
| Przeciętny Intel Core i5-1240P, Intel Iris Xe Graphics G7 80EUs (5169 - 6213, n=11) | |
| Lenovo ThinkPad E15 G3-20YG003UGE | |
| Lenovo ThinkPad T16 G1 21BWS00200 | |
| Lenovo ThinkPad T15 Gen2-20W5S00100 | |
| HP ZBook Power 15 G8 313S5EA | |
| Lenovo ThinkPad L15 G2 AMD | |
| HP ProBook 450 G9 6A180EA | |
| CrossMark / Overall | |
| Huawei MateBook D 16 2022 | |
| Dell Inspiron 16 Plus 7620 | |
| Przeciętny Intel Core i5-1240P, Intel Iris Xe Graphics G7 80EUs (1392 - 1553, n=7) | |
| Średnia w klasie Office (381 - 2010, n=73, ostatnie 2 lata) | |
| HP ZBook Power 15 G8 313S5EA | |
| Lenovo ThinkPad T16 G1 21BWS00200 | |
| HP ProBook 450 G9 6A180EA | |
| CrossMark / Productivity | |
| Huawei MateBook D 16 2022 | |
| Dell Inspiron 16 Plus 7620 | |
| HP ZBook Power 15 G8 313S5EA | |
| Przeciętny Intel Core i5-1240P, Intel Iris Xe Graphics G7 80EUs (1393 - 1524, n=7) | |
| Średnia w klasie Office (464 - 1880, n=73, ostatnie 2 lata) | |
| Lenovo ThinkPad T16 G1 21BWS00200 | |
| HP ProBook 450 G9 6A180EA | |
| CrossMark / Creativity | |
| Huawei MateBook D 16 2022 | |
| Dell Inspiron 16 Plus 7620 | |
| Średnia w klasie Office (319 - 2361, n=73, ostatnie 2 lata) | |
| Przeciętny Intel Core i5-1240P, Intel Iris Xe Graphics G7 80EUs (1426 - 1647, n=7) | |
| HP ZBook Power 15 G8 313S5EA | |
| Lenovo ThinkPad T16 G1 21BWS00200 | |
| HP ProBook 450 G9 6A180EA | |
| CrossMark / Responsiveness | |
| Huawei MateBook D 16 2022 | |
| Dell Inspiron 16 Plus 7620 | |
| Przeciętny Intel Core i5-1240P, Intel Iris Xe Graphics G7 80EUs (1267 - 1545, n=7) | |
| Lenovo ThinkPad T16 G1 21BWS00200 | |
| Średnia w klasie Office (360 - 1690, n=73, ostatnie 2 lata) | |
| HP ZBook Power 15 G8 313S5EA | |
| HP ProBook 450 G9 6A180EA | |
| Sunspider / 1.0 Total Score | |
| Lenovo ThinkPad T16 G1 21BWS00200 | |
| Przeciętny Intel Core i5-1240P, Intel Iris Xe Graphics G7 80EUs (n=1) | |
| Średnia w klasie Office (87.2 - 111.8, n=2, ostatnie 2 lata) | |
| HP ProBook 450 G9 6A180EA | |
| Mozilla Kraken 1.1 / Total | |
| Lenovo ThinkPad E15 G3-20YG003UGE | |
| HP ProBook 450 G9 6A180EA | |
| Przeciętny Intel Core i5-1240P, Intel Iris Xe Graphics G7 80EUs (575 - 1422, n=12) | |
| HP ZBook Power 15 G8 313S5EA | |
| Lenovo ThinkPad L15 G2 AMD | |
| Lenovo ThinkPad T15 Gen2-20W5S00100 | |
| Lenovo ThinkPad X1 Extreme G4-20Y5CTO1WW (3050 Ti) | |
| Lenovo ThinkPad T16 G1 21BWS00200 | |
| Średnia w klasie Office (391 - 1297, n=76, ostatnie 2 lata) | |
| Dell Inspiron 16 Plus 7620 | |
| Huawei MateBook D 16 2022 | |
| Speedometer 2.0 / Result 2.0 | |
| Średnia w klasie Office (173 - 640, n=17, ostatnie 2 lata) | |
| Huawei MateBook D 16 2022 | |
| Przeciętny Intel Core i5-1240P, Intel Iris Xe Graphics G7 80EUs (241 - 266, n=3) | |
| Lenovo ThinkPad T16 G1 21BWS00200 | |
| HP ProBook 450 G9 6A180EA | |
| Octane V2 / Total Score | |
| Średnia w klasie Office (49011 - 122119, n=19, ostatnie 2 lata) | |
| Huawei MateBook D 16 2022 | |
| Lenovo ThinkPad T16 G1 21BWS00200 | |
| Przeciętny Intel Core i5-1240P, Intel Iris Xe Graphics G7 80EUs (70915 - 80743, n=5) | |
| HP ProBook 450 G9 6A180EA | |
| HP ZBook Power 15 G8 313S5EA | |
| Jetstream 2 / 2.0 Total | |
| Średnia w klasie Office (126.6 - 455, n=20, ostatnie 2 lata) | |
| Przeciętny Intel Core i5-1240P, Intel Iris Xe Graphics G7 80EUs (203 - 418, n=4) | |
| Dell Inspiron 16 Plus 7620 | |
| Huawei MateBook D 16 2022 | |
| Lenovo ThinkPad T16 G1 21BWS00200 | |
| HP ProBook 450 G9 6A180EA | |
| HP ZBook Power 15 G8 313S5EA | |
| WebXPRT 3 / Overall | |
| Huawei MateBook D 16 2022 | |
| Dell Inspiron 16 Plus 7620 | |
| Średnia w klasie Office (129.9 - 455, n=74, ostatnie 2 lata) | |
| Lenovo ThinkPad X1 Extreme G4-20Y5CTO1WW (3050 Ti) | |
| HP ZBook Power 15 G8 313S5EA | |
| Lenovo ThinkPad L15 G2 AMD | |
| Lenovo ThinkPad T16 G1 21BWS00200 | |
| Przeciętny Intel Core i5-1240P, Intel Iris Xe Graphics G7 80EUs (119.2 - 268, n=11) | |
| Lenovo ThinkPad E15 G3-20YG003UGE | |
| HP ProBook 450 G9 6A180EA | |
| WebXPRT 4 / Overall | |
| Huawei MateBook D 16 2022 | |
| Dell Inspiron 16 Plus 7620 | |
| Średnia w klasie Office (104.2 - 313, n=75, ostatnie 2 lata) | |
| Lenovo ThinkPad T16 G1 21BWS00200 | |
| Przeciętny Intel Core i5-1240P, Intel Iris Xe Graphics G7 80EUs (217 - 231, n=6) | |
| HP ProBook 450 G9 6A180EA | |
* ... im mniej tym lepiej
| PCMark 10 Score | 5007 pkt. | |
Pomoc | ||
| AIDA64 / Memory Copy | |
| Średnia w klasie Office (20075 - 110930, n=77, ostatnie 2 lata) | |
| Huawei MateBook D 16 2022 | |
| Dell Inspiron 16 Plus 7620 | |
| Przeciętny Intel Core i5-1240P (23312 - 70537, n=16) | |
| Lenovo ThinkPad X1 Extreme G4-20Y5CTO1WW (3050 Ti) | |
| Lenovo ThinkPad E15 G3-20YG003UGE | |
| HP ZBook Power 15 G8 313S5EA | |
| Lenovo ThinkPad T16 G1 21BWS00200 | |
| HP ProBook 450 G9 6A180EA | |
| Lenovo ThinkPad L15 G2 AMD | |
| AIDA64 / Memory Read | |
| Średnia w klasie Office (10084 - 128030, n=78, ostatnie 2 lata) | |
| Dell Inspiron 16 Plus 7620 | |
| Huawei MateBook D 16 2022 | |
| Przeciętny Intel Core i5-1240P (18989 - 70553, n=16) | |
| Lenovo ThinkPad E15 G3-20YG003UGE | |
| Lenovo ThinkPad X1 Extreme G4-20Y5CTO1WW (3050 Ti) | |
| HP ZBook Power 15 G8 313S5EA | |
| Lenovo ThinkPad T16 G1 21BWS00200 | |
| Lenovo ThinkPad L15 G2 AMD | |
| HP ProBook 450 G9 6A180EA | |
| AIDA64 / Memory Write | |
| Średnia w klasie Office (20073 - 119858, n=78, ostatnie 2 lata) | |
| Huawei MateBook D 16 2022 | |
| Dell Inspiron 16 Plus 7620 | |
| Przeciętny Intel Core i5-1240P (23454 - 62496, n=16) | |
| Lenovo ThinkPad X1 Extreme G4-20Y5CTO1WW (3050 Ti) | |
| Lenovo ThinkPad E15 G3-20YG003UGE | |
| Lenovo ThinkPad L15 G2 AMD | |
| Lenovo ThinkPad T16 G1 21BWS00200 | |
| HP ProBook 450 G9 6A180EA | |
| HP ZBook Power 15 G8 313S5EA | |
| AIDA64 / Memory Latency | |
| Przeciętny Intel Core i5-1240P (85.1 - 188.3, n=11) | |
| Huawei MateBook D 16 2022 | |
| Lenovo ThinkPad E15 G3-20YG003UGE | |
| Średnia w klasie Office (7.6 - 162.9, n=73, ostatnie 2 lata) | |
| Dell Inspiron 16 Plus 7620 | |
| Lenovo ThinkPad T16 G1 21BWS00200 | |
| Lenovo ThinkPad L15 G2 AMD | |
| Lenovo ThinkPad X1 Extreme G4-20Y5CTO1WW (3050 Ti) | |
| HP ProBook 450 G9 6A180EA | |
| HP ZBook Power 15 G8 313S5EA | |
* ... im mniej tym lepiej
Opóźnienie DPC
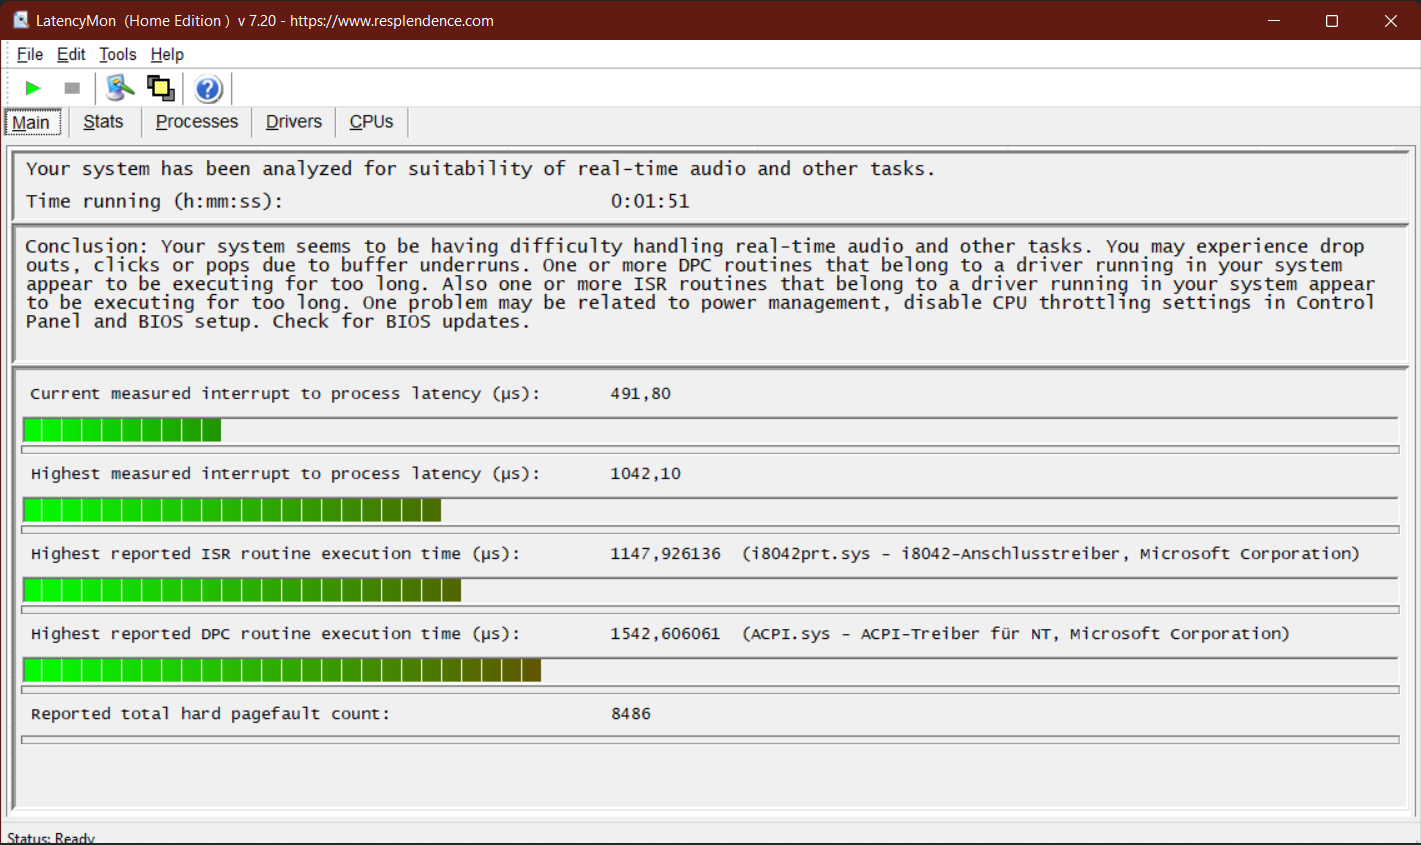
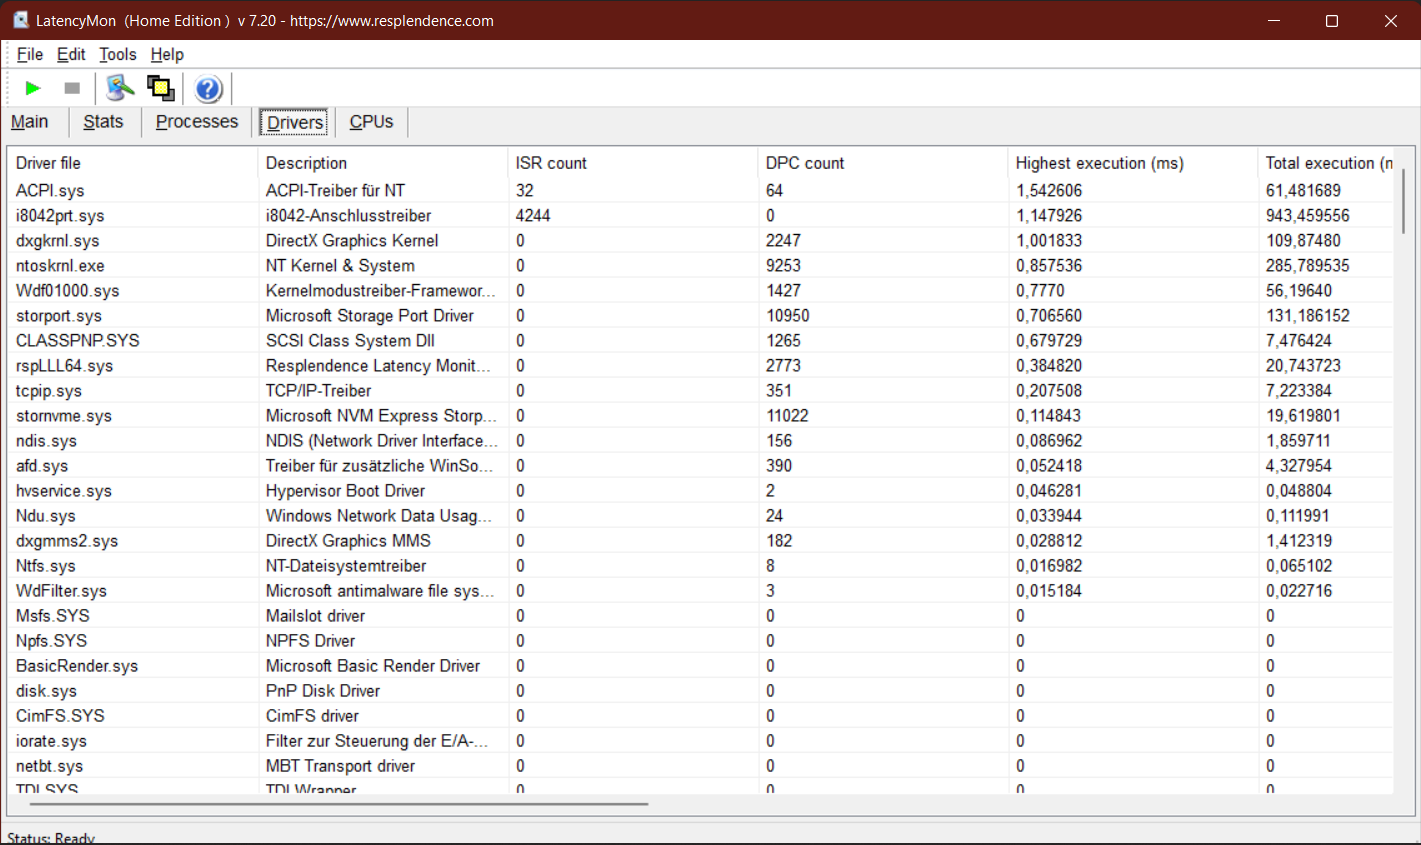
| DPC Latencies / LatencyMon - interrupt to process latency (max), Web, Youtube, Prime95 | |
| HP ProBook 450 G9 6A180EA | |
| Lenovo ThinkPad L15 G2 AMD | |
| Lenovo ThinkPad T16 G1 21BWS00200 | |
| Lenovo ThinkPad T15 Gen2-20W5S00100 | |
| Dell Inspiron 16 Plus 7620 | |
| Lenovo ThinkPad E15 G3-20YG003UGE | |
| Huawei MateBook D 16 2022 | |
| HP ZBook Power 15 G8 313S5EA | |
* ... im mniej tym lepiej
Urządzenia do przechowywania danych
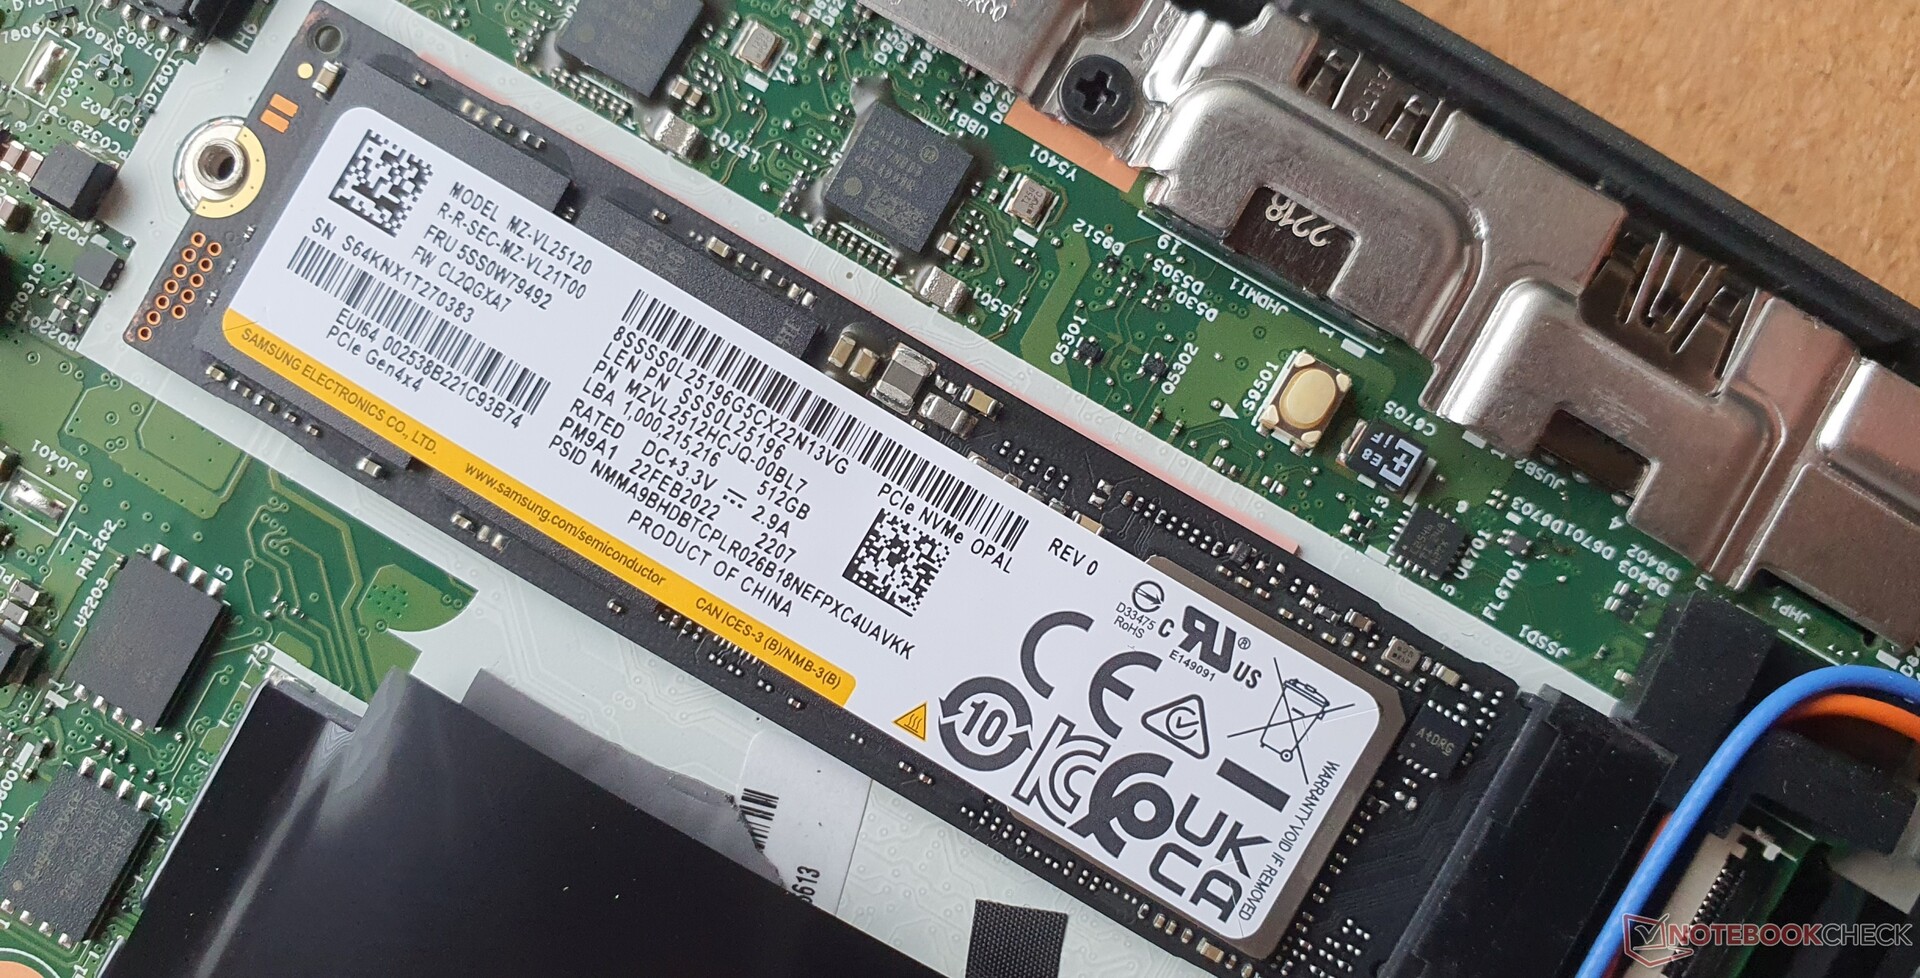
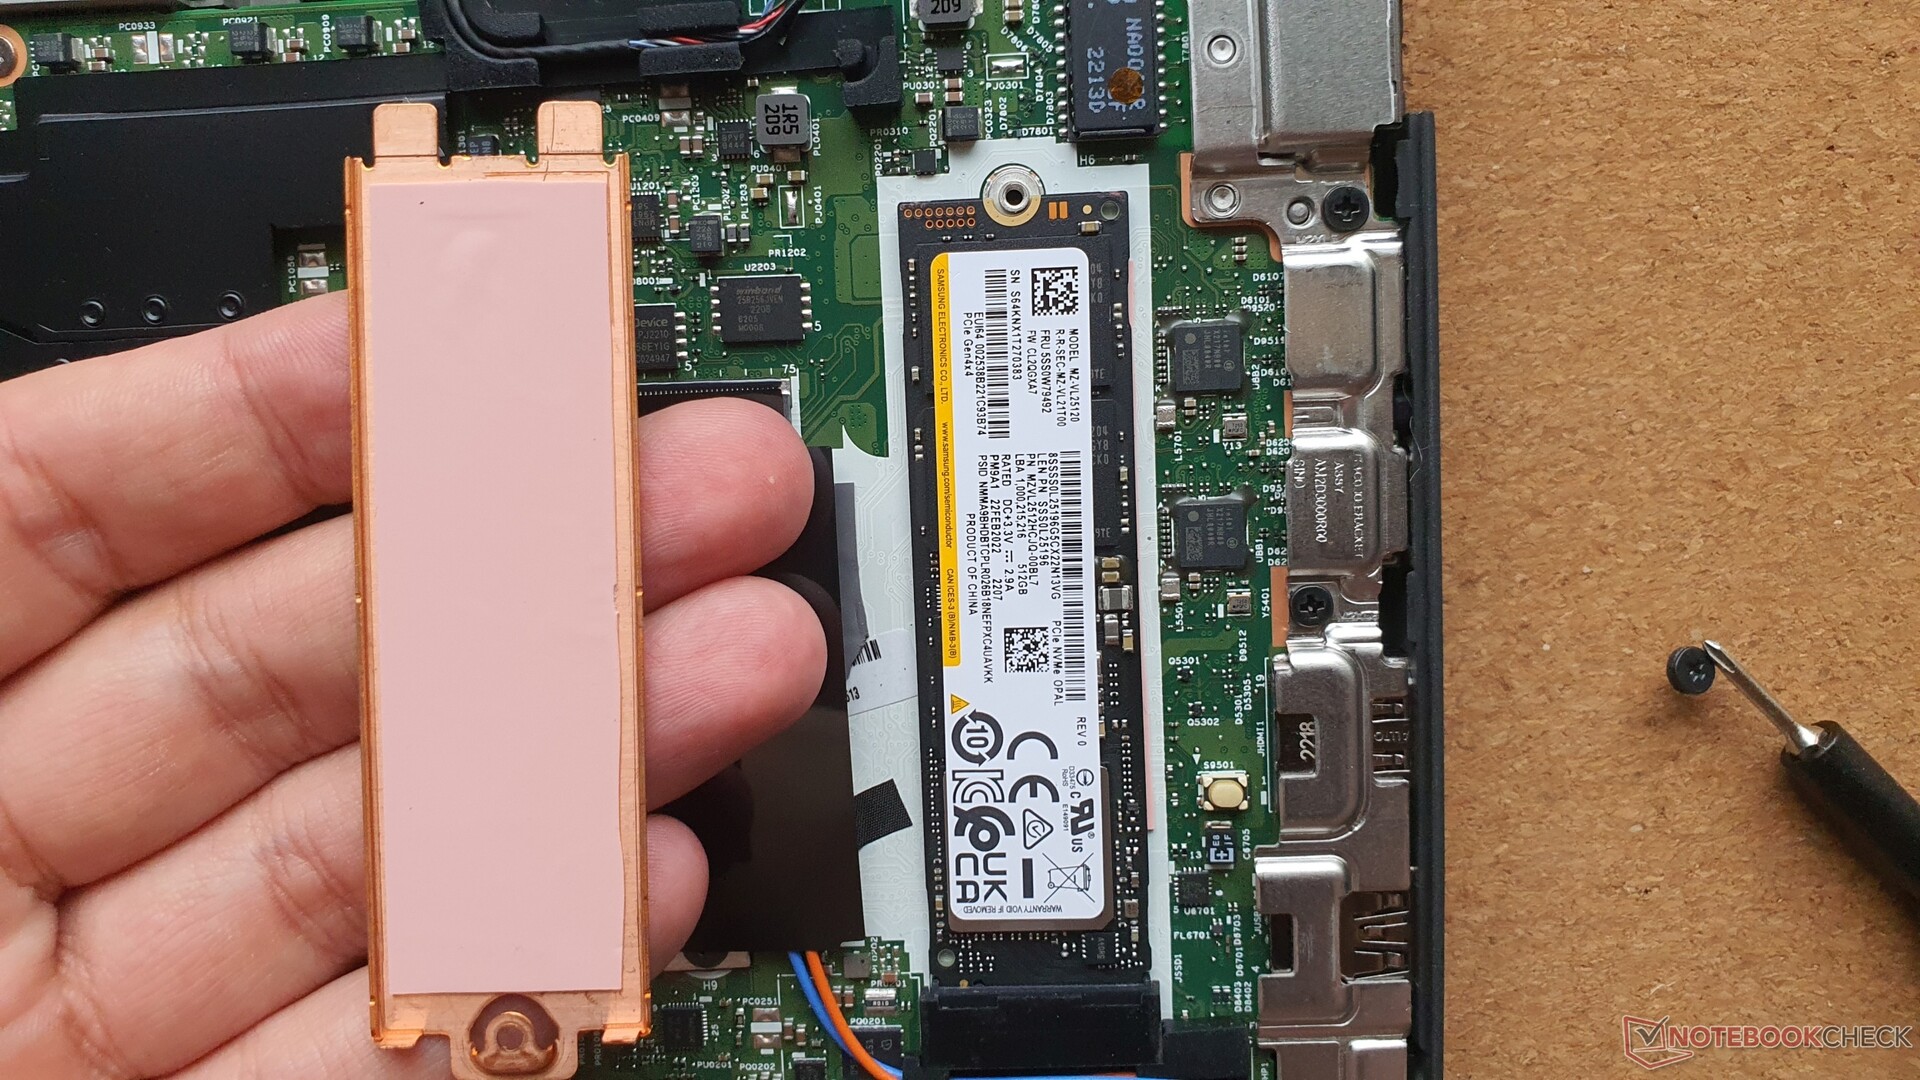
Samsung PM9A1 (PM9A1)jest dyskiem SSD PCIe 4.0 i ma pojemność 512 GB. Szybkość jest dobra, ale odczyt 4K 16/64 jest dość wolny, a w teście pętli odczytu szybko spada o połowę z powodu przegrzania. Poprzednik miał szybszy dysk SSD, a reszta naszego pola porównawczego wypada podobnie jak nasz próbka recenzencka.
| Lenovo ThinkPad T16 G1 21BWS00200 Samsung PM9A1 MZVL2512HCJQ | Lenovo ThinkPad T15 Gen2-20W5S00100 Samsung PM981a MZVLB1T0HBLR | Lenovo ThinkPad X1 Extreme G4-20Y5CTO1WW (3050 Ti) Samsung PM9A1 MZVL21T0HCLR | HP ZBook Power 15 G8 313S5EA Samsung PM9A1 MZVL2512HCJQ | HP ProBook 450 G9 6A180EA SK Hynix HFM512GD3JX013N | Huawei MateBook D 16 2022 Silicon Motion PCIe-8 SSD | Dell Inspiron 16 Plus 7620 Kioxia BG5 KBG50ZNS512G | Lenovo ThinkPad E15 G3-20YG003UGE SK Hynix PC711 1TB HFS001TDE9X084N | Lenovo ThinkPad L15 G2 AMD SK Hynix HFS512 GDE9X081N | |
|---|---|---|---|---|---|---|---|---|---|
| DiskSpd | 104% | 18% | 60% | -38% | 36% | -15% | 67% | -10% | |
| seq read (MB/s) | 3645 | 2090 -43% | 3285 -10% | 3354.8 -8% | 1914 -47% | 2012 -45% | 2355 -35% | 1624 -55% | 1688 -54% |
| seq write (MB/s) | 2809 | 2270 -19% | 2886 3% | 1353.3 -52% | 1762 -37% | 1438 -49% | 2020 -28% | 1901 -32% | 2072 -26% |
| seq q8 t1 read (MB/s) | 6524 | 3448 -47% | 6641 2% | 6230 -5% | 3463 -47% | 2883 -56% | 2569 -61% | 3269 -50% | 3582 -45% |
| seq q8 t1 write (MB/s) | 4812 | 2945 -39% | 4922 2% | 4757.9 -1% | 2600 -46% | 1911 -60% | 2752 -43% | 3250 -32% | 3072 -36% |
| 4k q1 t1 read (MB/s) | 68.2 | 74.4 9% | 78.4 15% | 51.8 -24% | 52.7 -23% | 43.1 -37% | 62.7 -8% | 57.4 -16% | 46.7 -32% |
| 4k q1 t1 write (MB/s) | 134.8 | 231 71% | 161 19% | 150.2 11% | 112.4 -17% | 273 103% | 162.6 21% | 128 -5% | 123 -9% |
| 4k q32 t16 read (MB/s) | 683 | 2506 267% | 1270 86% | 2187 220% | 328 -52% | 1391 104% | 652 -5% | 2037 198% | 983 44% |
| 4k q32 t16 write (MB/s) | 293 | 2137 629% | 373 27% | 1284.7 338% | 192.2 -34% | 1241 324% | 408 39% | 1833 526% | 521 78% |
| AS SSD | 11% | 28% | 22% | -21% | 11% | -23% | 12% | -8% | |
| Seq Read (MB/s) | 3225 | 2694 -16% | 4588 42% | 4951 54% | 2687 -17% | 2802 -13% | 2693.29 -16% | 2432 -25% | 2721 -16% |
| Seq Write (MB/s) | 1567 | 2370 51% | 1625 4% | 3725 138% | 1476.14 -6% | 1879 20% | 1683.46 7% | 1266 -19% | 1329 -15% |
| 4K Read (MB/s) | 69.7 | 68.4 -2% | 75.2 8% | 52.9 -24% | 60 -14% | 61.03 -12% | 65.01 -7% | 48.88 -30% | 51.5 -26% |
| 4K Write (MB/s) | 170.9 | 208.1 22% | 182.9 7% | 105.35 -38% | 176.81 3% | 248.56 45% | 197.81 16% | 128.4 -25% | 132.5 -22% |
| 4K-64 Read (MB/s) | 720 | 1961 172% | 1318 83% | 2200.26 206% | 696.46 -3% | 1135.53 58% | 855.48 19% | 1805 151% | 932 29% |
| 4K-64 Write (MB/s) | 2682 | 1935 -28% | 3056 14% | 2314.41 -14% | 1624.91 -39% | 1402.68 -48% | 395.8 -85% | 2470 -8% | 1856 -31% |
| Access Time Read * (ms) | 0.059 | 0.032 46% | 0.041 31% | 0.054 8% | 0.04 32% | 0.025 58% | 0.078 -32% | 0.044 25% | 0.038 36% |
| Access Time Write * (ms) | 0.024 | 0.081 -238% | 0.022 8% | 0.04 -67% | 0.028 -17% | 0.016 33% | 0.06 -150% | 0.038 -58% | 0.028 -17% |
| Score Read (Points) | 1112 | 2299 107% | 1852 67% | 2748 147% | 1025 -8% | 1477 33% | 1190 7% | 2097 89% | 1256 13% |
| Score Write (Points) | 3010 | 2380 -21% | 3402 13% | 2792 -7% | 1949 -35% | 1839 -39% | 762 -75% | 2725 -9% | 2122 -30% |
| Score Total (Points) | 4630 | 5846 26% | 6069 31% | 6880 49% | 3457 -25% | 4039 -13% | 2529 -45% | 5837 26% | 3961 -14% |
| Copy ISO MB/s (MB/s) | 1639 | 1287.6 -21% | 863.41 -47% | 1352.52 -17% | 1634.1 0% | 1301 -21% | |||
| Copy Program MB/s (MB/s) | 326.8 | 115.3 -65% | 127.34 -61% | 435.92 33% | 379.46 16% | 554 70% | |||
| Copy Game MB/s (MB/s) | 942.7 | 390.1 -59% | 384.67 -59% | 1058.52 12% | 1174.45 25% | 993 5% | |||
| Całkowita średnia (program / ustawienia) | 58% /
50% | 23% /
24% | 41% /
36% | -30% /
-27% | 24% /
20% | -19% /
-20% | 40% /
32% | -9% /
-9% |
* ... im mniej tym lepiej
| Drive Performance rating - Percent | |
| Przeciętny Samsung PM9A1 MZVL2512HCJQ | |
| Lenovo ThinkPad X1 Extreme G4-20Y5CTO1WW (3050 Ti) | |
| HP ZBook Power 15 G8 313S5EA | |
| Lenovo ThinkPad T15 Gen2-20W5S00100 | |
| Lenovo ThinkPad T16 G1 21BWS00200 | |
| Lenovo ThinkPad E15 G3-20YG003UGE | |
| Huawei MateBook D 16 2022 | |
| Średnia w klasie Office | |
| Lenovo ThinkPad L15 G2 AMD | |
| HP ProBook 450 G9 6A180EA | |
| Dell Inspiron 16 Plus 7620 | |
| DiskSpd | |
| seq read | |
| Lenovo ThinkPad T16 G1 21BWS00200 | |
| Przeciętny Samsung PM9A1 MZVL2512HCJQ (1472 - 4572, n=41) | |
| HP ZBook Power 15 G8 313S5EA | |
| Lenovo ThinkPad X1 Extreme G4-20Y5CTO1WW (3050 Ti) | |
| Średnia w klasie Office (1148 - 5202, n=73, ostatnie 2 lata) | |
| Dell Inspiron 16 Plus 7620 | |
| Lenovo ThinkPad T15 Gen2-20W5S00100 | |
| Huawei MateBook D 16 2022 | |
| HP ProBook 450 G9 6A180EA | |
| Lenovo ThinkPad L15 G2 AMD | |
| Lenovo ThinkPad E15 G3-20YG003UGE | |
| seq write | |
| Przeciętny Samsung PM9A1 MZVL2512HCJQ (1148 - 4434, n=41) | |
| Średnia w klasie Office (1097 - 5037, n=73, ostatnie 2 lata) | |
| Lenovo ThinkPad X1 Extreme G4-20Y5CTO1WW (3050 Ti) | |
| Lenovo ThinkPad T16 G1 21BWS00200 | |
| Lenovo ThinkPad T15 Gen2-20W5S00100 | |
| Lenovo ThinkPad L15 G2 AMD | |
| Dell Inspiron 16 Plus 7620 | |
| Lenovo ThinkPad E15 G3-20YG003UGE | |
| HP ProBook 450 G9 6A180EA | |
| Huawei MateBook D 16 2022 | |
| HP ZBook Power 15 G8 313S5EA | |
| seq q8 t1 read | |
| Lenovo ThinkPad X1 Extreme G4-20Y5CTO1WW (3050 Ti) | |
| Lenovo ThinkPad T16 G1 21BWS00200 | |
| HP ZBook Power 15 G8 313S5EA | |
| Przeciętny Samsung PM9A1 MZVL2512HCJQ (3387 - 6793, n=41) | |
| Średnia w klasie Office (1781 - 14067, n=73, ostatnie 2 lata) | |
| Lenovo ThinkPad L15 G2 AMD | |
| HP ProBook 450 G9 6A180EA | |
| Lenovo ThinkPad T15 Gen2-20W5S00100 | |
| Lenovo ThinkPad E15 G3-20YG003UGE | |
| Huawei MateBook D 16 2022 | |
| Dell Inspiron 16 Plus 7620 | |
| seq q8 t1 write | |
| Lenovo ThinkPad X1 Extreme G4-20Y5CTO1WW (3050 Ti) | |
| Lenovo ThinkPad T16 G1 21BWS00200 | |
| HP ZBook Power 15 G8 313S5EA | |
| Przeciętny Samsung PM9A1 MZVL2512HCJQ (1146 - 5091, n=41) | |
| Średnia w klasie Office (1369 - 9814, n=73, ostatnie 2 lata) | |
| Lenovo ThinkPad E15 G3-20YG003UGE | |
| Lenovo ThinkPad L15 G2 AMD | |
| Lenovo ThinkPad T15 Gen2-20W5S00100 | |
| Dell Inspiron 16 Plus 7620 | |
| HP ProBook 450 G9 6A180EA | |
| Huawei MateBook D 16 2022 | |
| 4k q1 t1 read | |
| Lenovo ThinkPad X1 Extreme G4-20Y5CTO1WW (3050 Ti) | |
| Lenovo ThinkPad T15 Gen2-20W5S00100 | |
| Przeciętny Samsung PM9A1 MZVL2512HCJQ (37.6 - 92.9, n=41) | |
| Lenovo ThinkPad T16 G1 21BWS00200 | |
| Dell Inspiron 16 Plus 7620 | |
| Średnia w klasie Office (6.27 - 93.1, n=73, ostatnie 2 lata) | |
| Lenovo ThinkPad E15 G3-20YG003UGE | |
| HP ProBook 450 G9 6A180EA | |
| HP ZBook Power 15 G8 313S5EA | |
| Lenovo ThinkPad L15 G2 AMD | |
| Huawei MateBook D 16 2022 | |
| 4k q1 t1 write | |
| Huawei MateBook D 16 2022 | |
| Lenovo ThinkPad T15 Gen2-20W5S00100 | |
| Przeciętny Samsung PM9A1 MZVL2512HCJQ (112.7 - 241, n=41) | |
| Dell Inspiron 16 Plus 7620 | |
| Lenovo ThinkPad X1 Extreme G4-20Y5CTO1WW (3050 Ti) | |
| HP ZBook Power 15 G8 313S5EA | |
| Średnia w klasie Office (22.6 - 281, n=73, ostatnie 2 lata) | |
| Lenovo ThinkPad T16 G1 21BWS00200 | |
| Lenovo ThinkPad E15 G3-20YG003UGE | |
| Lenovo ThinkPad L15 G2 AMD | |
| HP ProBook 450 G9 6A180EA | |
| 4k q32 t16 read | |
| Lenovo ThinkPad T15 Gen2-20W5S00100 | |
| HP ZBook Power 15 G8 313S5EA | |
| Lenovo ThinkPad E15 G3-20YG003UGE | |
| Przeciętny Samsung PM9A1 MZVL2512HCJQ (477 - 3426, n=41) | |
| Huawei MateBook D 16 2022 | |
| Lenovo ThinkPad X1 Extreme G4-20Y5CTO1WW (3050 Ti) | |
| Średnia w klasie Office (394 - 5684, n=73, ostatnie 2 lata) | |
| Lenovo ThinkPad L15 G2 AMD | |
| Lenovo ThinkPad T16 G1 21BWS00200 | |
| Dell Inspiron 16 Plus 7620 | |
| HP ProBook 450 G9 6A180EA | |
| 4k q32 t16 write | |
| Lenovo ThinkPad T15 Gen2-20W5S00100 | |
| Lenovo ThinkPad E15 G3-20YG003UGE | |
| Przeciętny Samsung PM9A1 MZVL2512HCJQ (253 - 3567, n=41) | |
| HP ZBook Power 15 G8 313S5EA | |
| Huawei MateBook D 16 2022 | |
| Średnia w klasie Office (185.3 - 3964, n=73, ostatnie 2 lata) | |
| Lenovo ThinkPad L15 G2 AMD | |
| Dell Inspiron 16 Plus 7620 | |
| Lenovo ThinkPad X1 Extreme G4-20Y5CTO1WW (3050 Ti) | |
| Lenovo ThinkPad T16 G1 21BWS00200 | |
| HP ProBook 450 G9 6A180EA | |
| AS SSD | |
| Score Total | |
| HP ZBook Power 15 G8 313S5EA | |
| Lenovo ThinkPad X1 Extreme G4-20Y5CTO1WW (3050 Ti) | |
| Lenovo ThinkPad T15 Gen2-20W5S00100 | |
| Lenovo ThinkPad E15 G3-20YG003UGE | |
| Przeciętny Samsung PM9A1 MZVL2512HCJQ (2563 - 8620, n=40) | |
| Lenovo ThinkPad T16 G1 21BWS00200 | |
| Średnia w klasie Office (1085 - 10473, n=72, ostatnie 2 lata) | |
| Huawei MateBook D 16 2022 | |
| Lenovo ThinkPad L15 G2 AMD | |
| HP ProBook 450 G9 6A180EA | |
| Dell Inspiron 16 Plus 7620 | |
| Score Read | |
| HP ZBook Power 15 G8 313S5EA | |
| Lenovo ThinkPad T15 Gen2-20W5S00100 | |
| Lenovo ThinkPad E15 G3-20YG003UGE | |
| Przeciętny Samsung PM9A1 MZVL2512HCJQ (879 - 3224, n=40) | |
| Lenovo ThinkPad X1 Extreme G4-20Y5CTO1WW (3050 Ti) | |
| Huawei MateBook D 16 2022 | |
| Średnia w klasie Office (438 - 3839, n=72, ostatnie 2 lata) | |
| Lenovo ThinkPad L15 G2 AMD | |
| Dell Inspiron 16 Plus 7620 | |
| Lenovo ThinkPad T16 G1 21BWS00200 | |
| HP ProBook 450 G9 6A180EA | |
| Score Write | |
| Lenovo ThinkPad X1 Extreme G4-20Y5CTO1WW (3050 Ti) | |
| Lenovo ThinkPad T16 G1 21BWS00200 | |
| HP ZBook Power 15 G8 313S5EA | |
| Przeciętny Samsung PM9A1 MZVL2512HCJQ (1258 - 4036, n=40) | |
| Lenovo ThinkPad E15 G3-20YG003UGE | |
| Lenovo ThinkPad T15 Gen2-20W5S00100 | |
| Lenovo ThinkPad L15 G2 AMD | |
| Średnia w klasie Office (437 - 4689, n=72, ostatnie 2 lata) | |
| HP ProBook 450 G9 6A180EA | |
| Huawei MateBook D 16 2022 | |
| Dell Inspiron 16 Plus 7620 | |
| Seq Read | |
| HP ZBook Power 15 G8 313S5EA | |
| Przeciętny Samsung PM9A1 MZVL2512HCJQ (2629 - 5546, n=40) | |
| Lenovo ThinkPad X1 Extreme G4-20Y5CTO1WW (3050 Ti) | |
| Średnia w klasie Office (781 - 8711, n=72, ostatnie 2 lata) | |
| Lenovo ThinkPad T16 G1 21BWS00200 | |
| Huawei MateBook D 16 2022 | |
| Lenovo ThinkPad L15 G2 AMD | |
| Lenovo ThinkPad T15 Gen2-20W5S00100 | |
| Dell Inspiron 16 Plus 7620 | |
| HP ProBook 450 G9 6A180EA | |
| Lenovo ThinkPad E15 G3-20YG003UGE | |
| Seq Write | |
| HP ZBook Power 15 G8 313S5EA | |
| Przeciętny Samsung PM9A1 MZVL2512HCJQ (1108 - 3925, n=40) | |
| Średnia w klasie Office (595 - 5704, n=72, ostatnie 2 lata) | |
| Lenovo ThinkPad T15 Gen2-20W5S00100 | |
| Huawei MateBook D 16 2022 | |
| Dell Inspiron 16 Plus 7620 | |
| Lenovo ThinkPad X1 Extreme G4-20Y5CTO1WW (3050 Ti) | |
| Lenovo ThinkPad T16 G1 21BWS00200 | |
| HP ProBook 450 G9 6A180EA | |
| Lenovo ThinkPad L15 G2 AMD | |
| Lenovo ThinkPad E15 G3-20YG003UGE | |
| 4K Read | |
| Lenovo ThinkPad X1 Extreme G4-20Y5CTO1WW (3050 Ti) | |
| Lenovo ThinkPad T16 G1 21BWS00200 | |
| Lenovo ThinkPad T15 Gen2-20W5S00100 | |
| Przeciętny Samsung PM9A1 MZVL2512HCJQ (39.2 - 85.1, n=40) | |
| Dell Inspiron 16 Plus 7620 | |
| Huawei MateBook D 16 2022 | |
| HP ProBook 450 G9 6A180EA | |
| Średnia w klasie Office (26.8 - 88.2, n=72, ostatnie 2 lata) | |
| HP ZBook Power 15 G8 313S5EA | |
| Lenovo ThinkPad L15 G2 AMD | |
| Lenovo ThinkPad E15 G3-20YG003UGE | |
| 4K Write | |
| Huawei MateBook D 16 2022 | |
| Lenovo ThinkPad T15 Gen2-20W5S00100 | |
| Dell Inspiron 16 Plus 7620 | |
| Lenovo ThinkPad X1 Extreme G4-20Y5CTO1WW (3050 Ti) | |
| HP ProBook 450 G9 6A180EA | |
| Przeciętny Samsung PM9A1 MZVL2512HCJQ (105.4 - 216, n=40) | |
| Lenovo ThinkPad T16 G1 21BWS00200 | |
| Średnia w klasie Office (59.6 - 245, n=72, ostatnie 2 lata) | |
| Lenovo ThinkPad L15 G2 AMD | |
| Lenovo ThinkPad E15 G3-20YG003UGE | |
| HP ZBook Power 15 G8 313S5EA | |
| 4K-64 Read | |
| HP ZBook Power 15 G8 313S5EA | |
| Lenovo ThinkPad T15 Gen2-20W5S00100 | |
| Lenovo ThinkPad E15 G3-20YG003UGE | |
| Przeciętny Samsung PM9A1 MZVL2512HCJQ (409 - 2783, n=40) | |
| Lenovo ThinkPad X1 Extreme G4-20Y5CTO1WW (3050 Ti) | |
| Huawei MateBook D 16 2022 | |
| Lenovo ThinkPad L15 G2 AMD | |
| Średnia w klasie Office (261 - 3209, n=72, ostatnie 2 lata) | |
| Dell Inspiron 16 Plus 7620 | |
| Lenovo ThinkPad T16 G1 21BWS00200 | |
| HP ProBook 450 G9 6A180EA | |
| 4K-64 Write | |
| Lenovo ThinkPad X1 Extreme G4-20Y5CTO1WW (3050 Ti) | |
| Lenovo ThinkPad T16 G1 21BWS00200 | |
| Lenovo ThinkPad E15 G3-20YG003UGE | |
| Przeciętny Samsung PM9A1 MZVL2512HCJQ (1010 - 3480, n=40) | |
| HP ZBook Power 15 G8 313S5EA | |
| Lenovo ThinkPad T15 Gen2-20W5S00100 | |
| Lenovo ThinkPad L15 G2 AMD | |
| HP ProBook 450 G9 6A180EA | |
| Średnia w klasie Office (147.4 - 3987, n=72, ostatnie 2 lata) | |
| Huawei MateBook D 16 2022 | |
| Dell Inspiron 16 Plus 7620 | |
| Access Time Read | |
| Średnia w klasie Office (0.025 - 0.211, n=71, ostatnie 2 lata) | |
| Dell Inspiron 16 Plus 7620 | |
| Lenovo ThinkPad T16 G1 21BWS00200 | |
| HP ZBook Power 15 G8 313S5EA | |
| Przeciętny Samsung PM9A1 MZVL2512HCJQ (0.023 - 0.089, n=39) | |
| Lenovo ThinkPad E15 G3-20YG003UGE | |
| Lenovo ThinkPad X1 Extreme G4-20Y5CTO1WW (3050 Ti) | |
| HP ProBook 450 G9 6A180EA | |
| Lenovo ThinkPad L15 G2 AMD | |
| Lenovo ThinkPad T15 Gen2-20W5S00100 | |
| Huawei MateBook D 16 2022 | |
| Access Time Write | |
| Lenovo ThinkPad T15 Gen2-20W5S00100 | |
| Dell Inspiron 16 Plus 7620 | |
| Średnia w klasie Office (0.016 - 0.307, n=72, ostatnie 2 lata) | |
| HP ZBook Power 15 G8 313S5EA | |
| Lenovo ThinkPad E15 G3-20YG003UGE | |
| Przeciętny Samsung PM9A1 MZVL2512HCJQ (0.02 - 0.087, n=40) | |
| Lenovo ThinkPad L15 G2 AMD | |
| HP ProBook 450 G9 6A180EA | |
| Lenovo ThinkPad T16 G1 21BWS00200 | |
| Lenovo ThinkPad X1 Extreme G4-20Y5CTO1WW (3050 Ti) | |
| Huawei MateBook D 16 2022 | |
* ... im mniej tym lepiej
Sustained Read Performance: DiskSpd Read Loop, Queue Depth 8
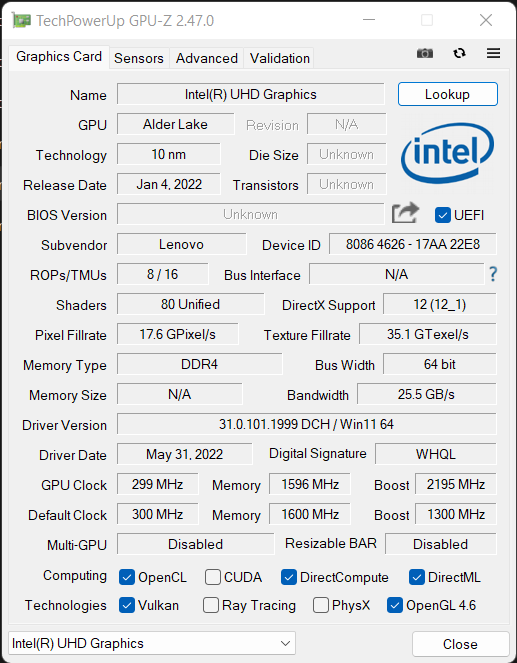
Karta graficzna
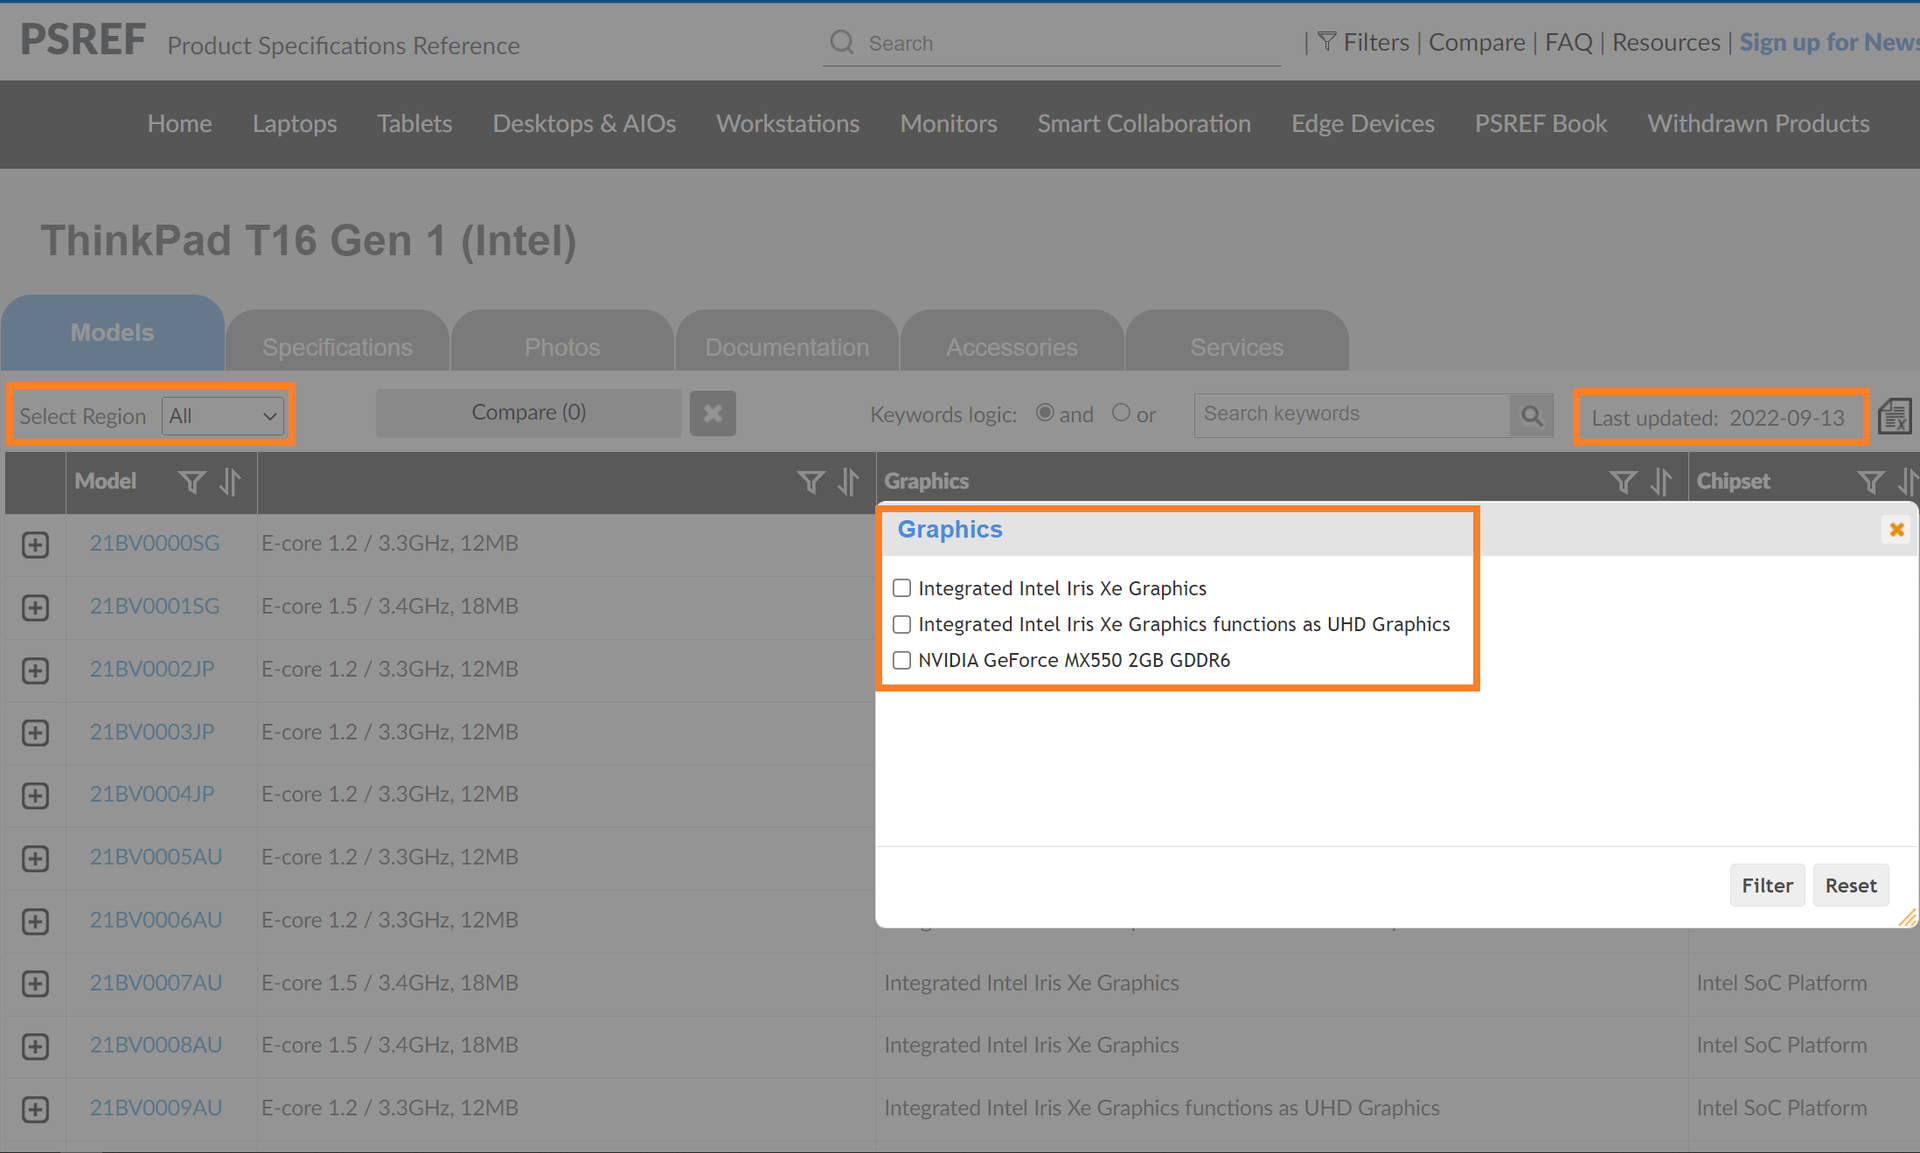
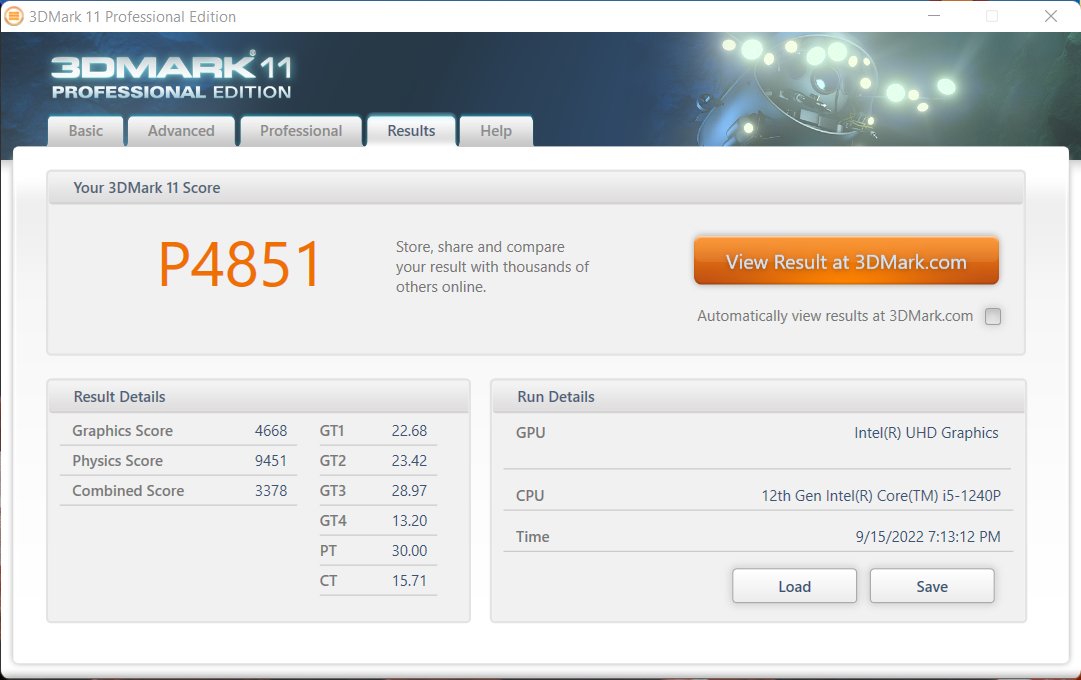
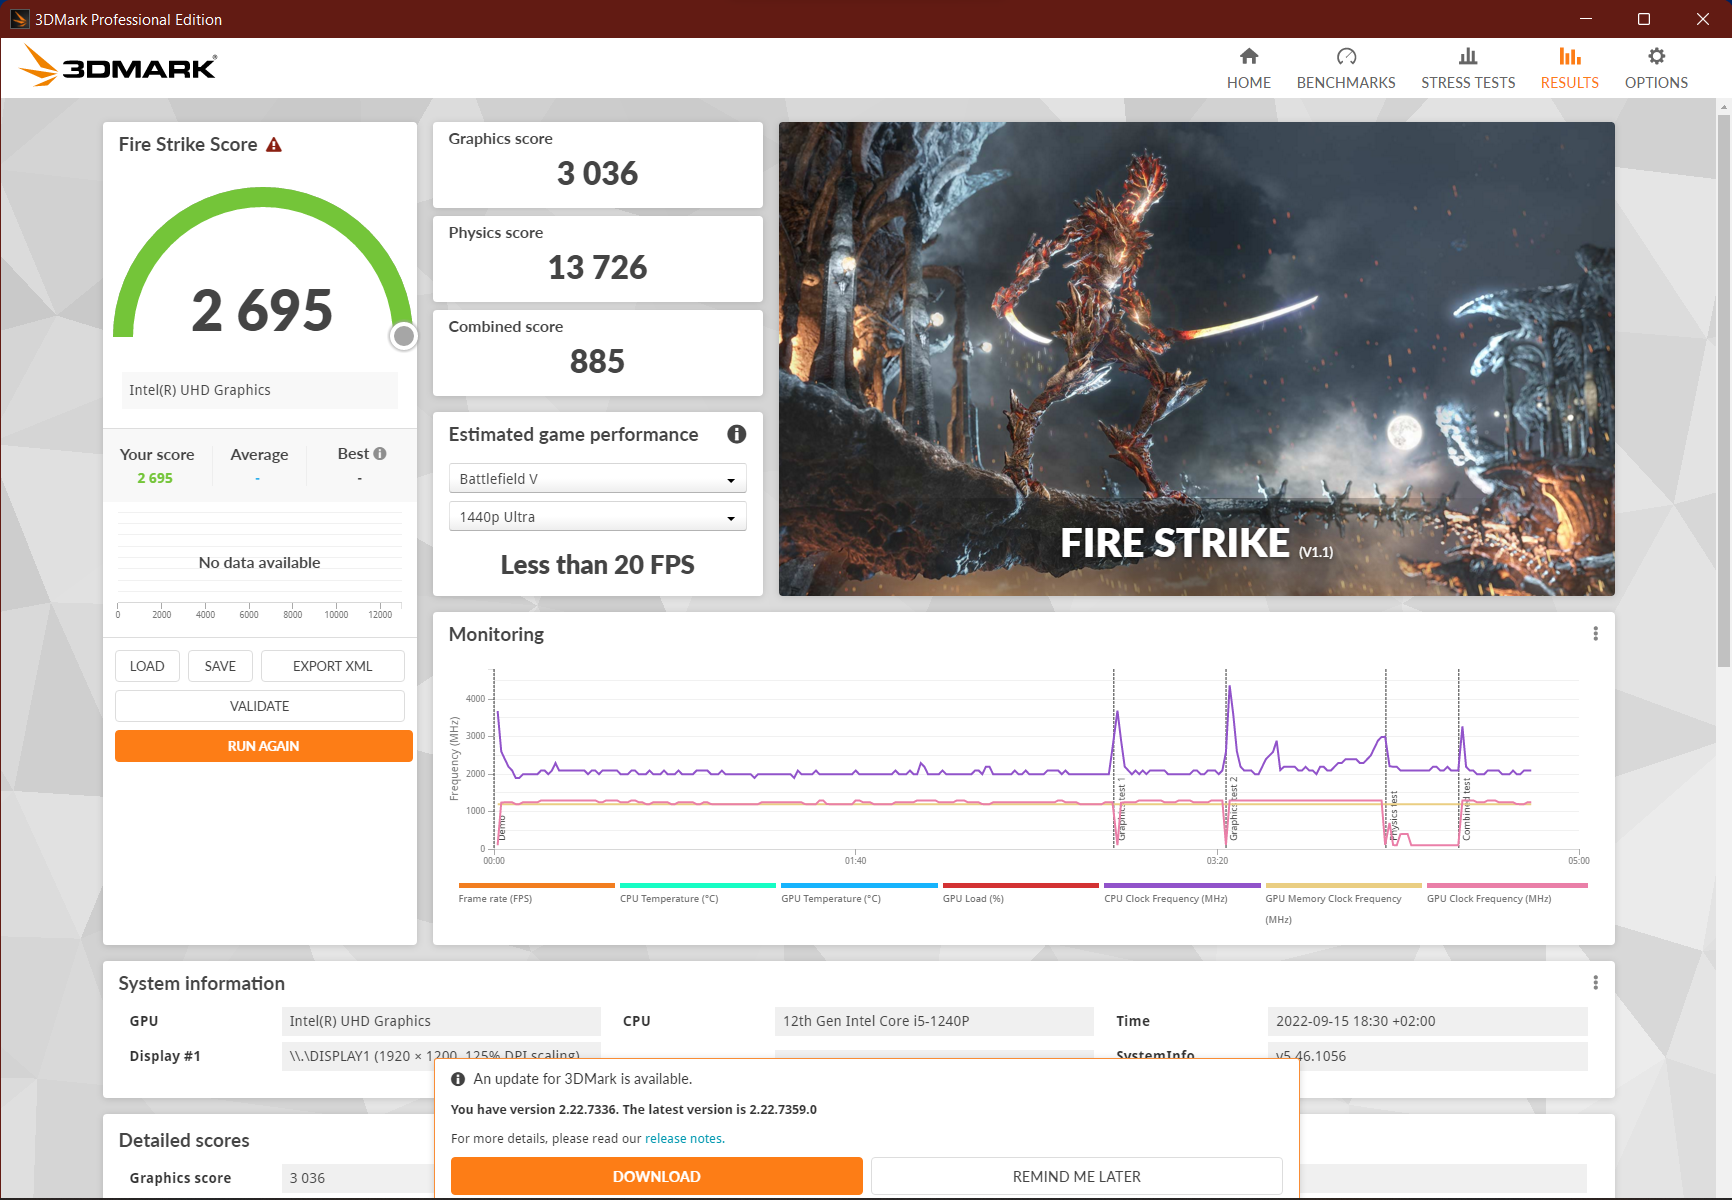
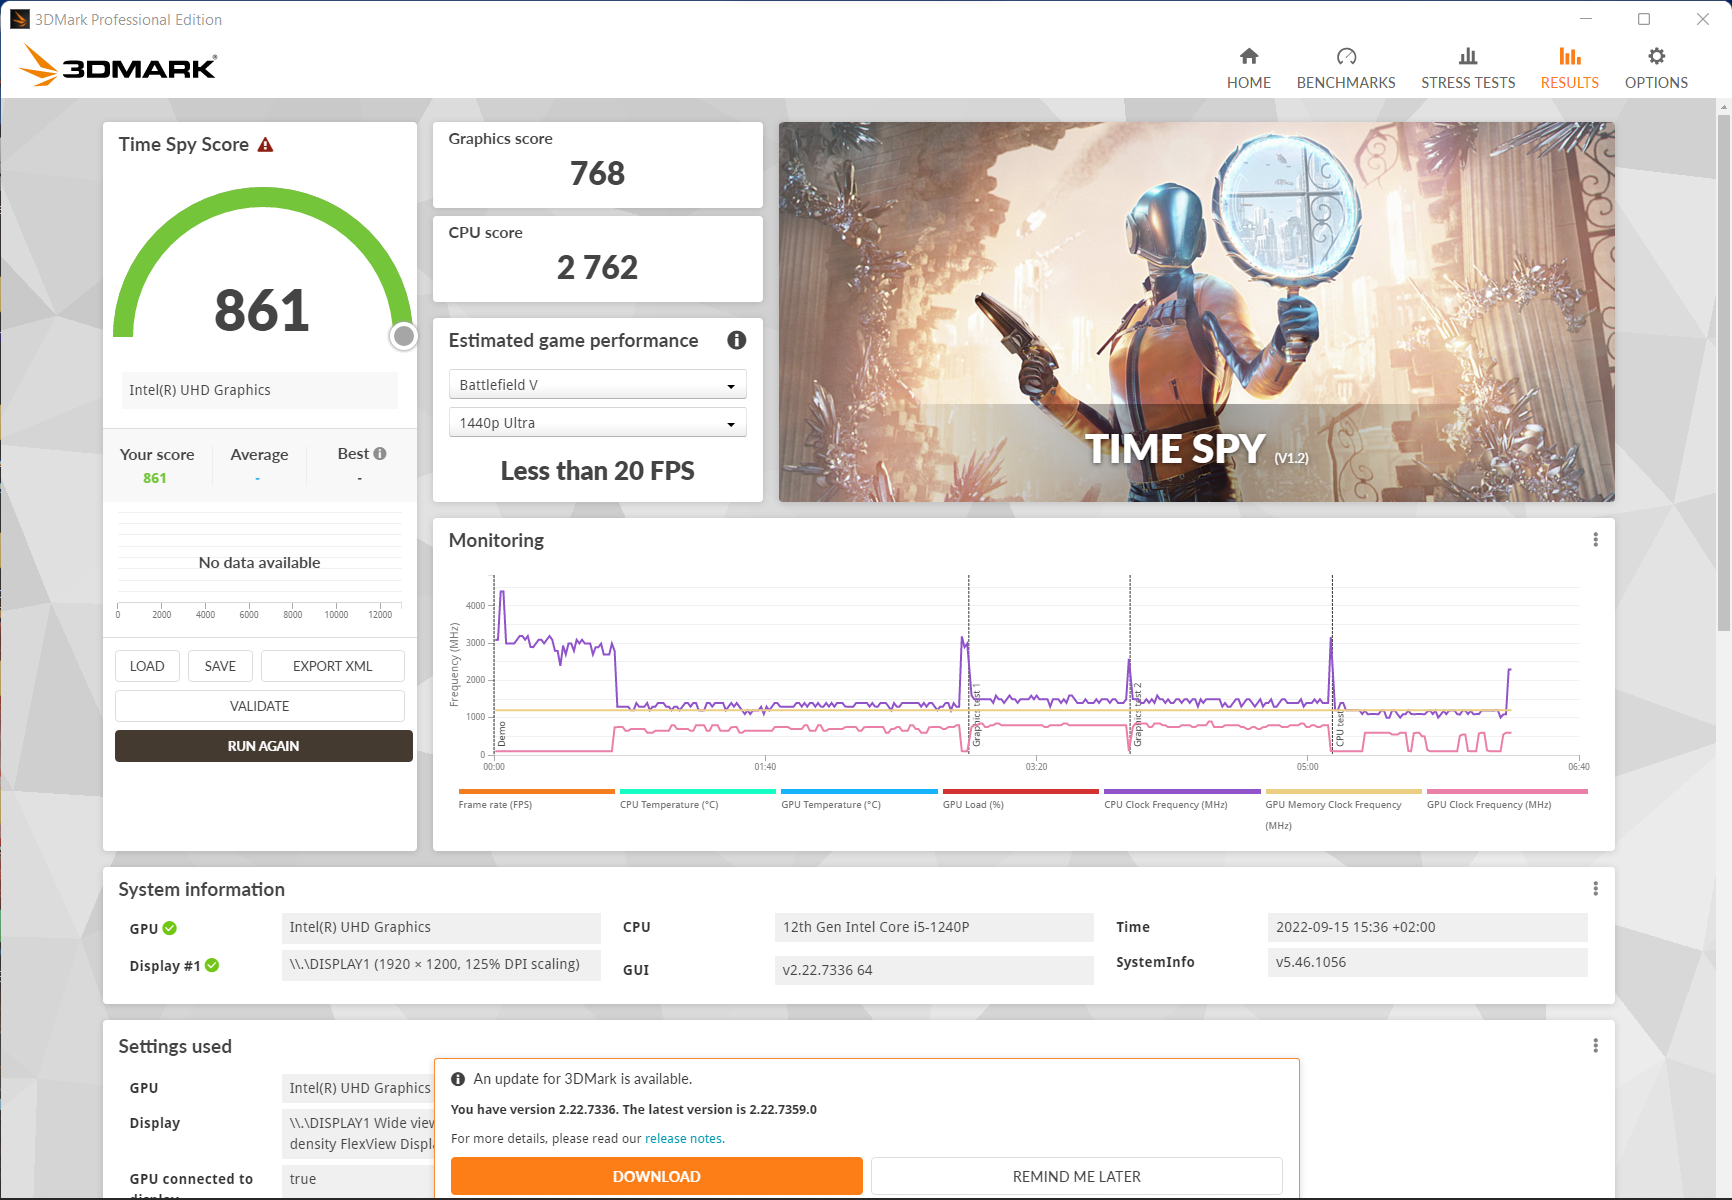
ZintegrowanyIntel UHD Graphics to technicznie Xe G7 (80 EUs), który jest związany z jednokanałową pamięcią RAM. W związku z tym jego wydajność jest ograniczona, a niskie poziomy detali są na porządku dziennym. Ponieważ notebook nie jest przeznaczony do gier, jest to do zniesienia i można to znacznie poprawić dzięki drugiemu modułowi RAM. Na stronie MX450poprzednika byłby również dobrym usprawnieniem towarzyszącym, natomiast opcjonalnie dostępny GeForce MX550 jest jeszcze szybszy.
Zapowiedziano również ThinkPada T16 z opcjonalnym układem graficznym NvidiaGeForce RTX 2050, która nie jest nawet wymieniona w specyfikacji, a jedynie jako informacja, że nie jest dostępna w regionie EMEA. W trybie bateryjnym fps-y w ustawieniach The Witcher 3 @Medium spadają z 32 do 24, co odpowiada throttlingowi na poziomie 25%. Pełne 1300 MHz spada do ~750 MHz.
| 3DMark Performance rating - Percent | |
| Dell Inspiron 16 Plus 7620 -2! | |
| HP ZBook Power 15 G8 313S5EA | |
| Średnia w klasie Office | |
| Huawei MateBook D 16 2022 -1! | |
| Lenovo ThinkPad T15 Gen2-20W5S00100 -1! | |
| Lenovo ThinkPad E15 G3-20YG003UGE -1! | |
| Lenovo ThinkPad T16 G1 21BWS00200 | |
| Przeciętny Intel Iris Xe Graphics G7 80EUs | |
| HP ProBook 450 G9 6A180EA | |
| Lenovo ThinkPad L15 G2 AMD -1! | |
| 3DMark 11 - 1280x720 Performance GPU | |
| Dell Inspiron 16 Plus 7620 | |
| HP ZBook Power 15 G8 313S5EA | |
| Średnia w klasie Office (2551 - 18313, n=69, ostatnie 2 lata) | |
| Huawei MateBook D 16 2022 | |
| Lenovo ThinkPad T15 Gen2-20W5S00100 | |
| Lenovo ThinkPad E15 G3-20YG003UGE | |
| Przeciętny Intel Iris Xe Graphics G7 80EUs (2246 - 6579, n=112) | |
| HP ProBook 450 G9 6A180EA | |
| Lenovo ThinkPad T16 G1 21BWS00200 | |
| Lenovo ThinkPad L15 G2 AMD | |
| 3DMark | |
| 1280x720 Cloud Gate Standard Graphics | |
| Dell Inspiron 16 Plus 7620 | |
| HP ZBook Power 15 G8 313S5EA | |
| Średnia w klasie Office (11640 - 118515, n=37, ostatnie 2 lata) | |
| Huawei MateBook D 16 2022 | |
| Lenovo ThinkPad T15 Gen2-20W5S00100 | |
| Lenovo ThinkPad E15 G3-20YG003UGE | |
| Przeciętny Intel Iris Xe Graphics G7 80EUs (6361 - 30894, n=96) | |
| Lenovo ThinkPad L15 G2 AMD | |
| HP ProBook 450 G9 6A180EA | |
| Lenovo ThinkPad T16 G1 21BWS00200 | |
| 1920x1080 Fire Strike Graphics | |
| Dell Inspiron 16 Plus 7620 | |
| HP ZBook Power 15 G8 313S5EA | |
| Średnia w klasie Office (736 - 21871, n=73, ostatnie 2 lata) | |
| Huawei MateBook D 16 2022 | |
| Lenovo ThinkPad T15 Gen2-20W5S00100 | |
| Przeciętny Intel Iris Xe Graphics G7 80EUs (1560 - 5398, n=114) | |
| Lenovo ThinkPad E15 G3-20YG003UGE | |
| HP ProBook 450 G9 6A180EA | |
| Lenovo ThinkPad T16 G1 21BWS00200 | |
| Lenovo ThinkPad L15 G2 AMD | |
| 2560x1440 Time Spy Graphics | |
| Dell Inspiron 16 Plus 7620 | |
| HP ZBook Power 15 G8 313S5EA | |
| Średnia w klasie Office (493 - 6679, n=68, ostatnie 2 lata) | |
| Huawei MateBook D 16 2022 | |
| Przeciętny Intel Iris Xe Graphics G7 80EUs (561 - 1576, n=111) | |
| Lenovo ThinkPad E15 G3-20YG003UGE | |
| HP ProBook 450 G9 6A180EA | |
| Lenovo ThinkPad T15 Gen2-20W5S00100 | |
| Lenovo ThinkPad T16 G1 21BWS00200 | |
| Lenovo ThinkPad L15 G2 AMD | |
| V-Ray 5 Benchmark - GPU CUDA | |
| Średnia w klasie Office (n=1ostatnie 2 lata) | |
| HP ZBook Power 15 G8 313S5EA | |
| Lenovo ThinkPad T16 G1 21BWS00200 | |
| Przeciętny Intel Iris Xe Graphics G7 80EUs (39 - 232, n=14) | |
| HP ProBook 450 G9 6A180EA | |
| V-Ray Benchmark Next 4.10 - GPU | |
| HP ZBook Power 15 G8 313S5EA | |
| Średnia w klasie Office (8 - 550, n=68, ostatnie 2 lata) | |
| Huawei MateBook D 16 2022 | |
| Lenovo ThinkPad E15 G3-20YG003UGE | |
| Lenovo ThinkPad L15 G2 AMD | |
| Lenovo ThinkPad T16 G1 21BWS00200 | |
| Lenovo ThinkPad T15 Gen2-20W5S00100 | |
| Przeciętny Intel Iris Xe Graphics G7 80EUs (9 - 71, n=89) | |
| HP ProBook 450 G9 6A180EA | |
| Geekbench 5.5 - OpenCL Score | |
| Dell Inspiron 16 Plus 7620 | |
| HP ZBook Power 15 G8 313S5EA | |
| Lenovo ThinkPad T15 Gen2-20W5S00100 | |
| Średnia w klasie Office (3474 - 95841, n=69, ostatnie 2 lata) | |
| Huawei MateBook D 16 2022 | |
| Lenovo ThinkPad E15 G3-20YG003UGE | |
| Przeciętny Intel Iris Xe Graphics G7 80EUs (7294 - 17602, n=112) | |
| HP ProBook 450 G9 6A180EA | |
| Lenovo ThinkPad L15 G2 AMD | |
| Lenovo ThinkPad T16 G1 21BWS00200 | |
| 3DMark 11 Performance | 4851 pkt. | |
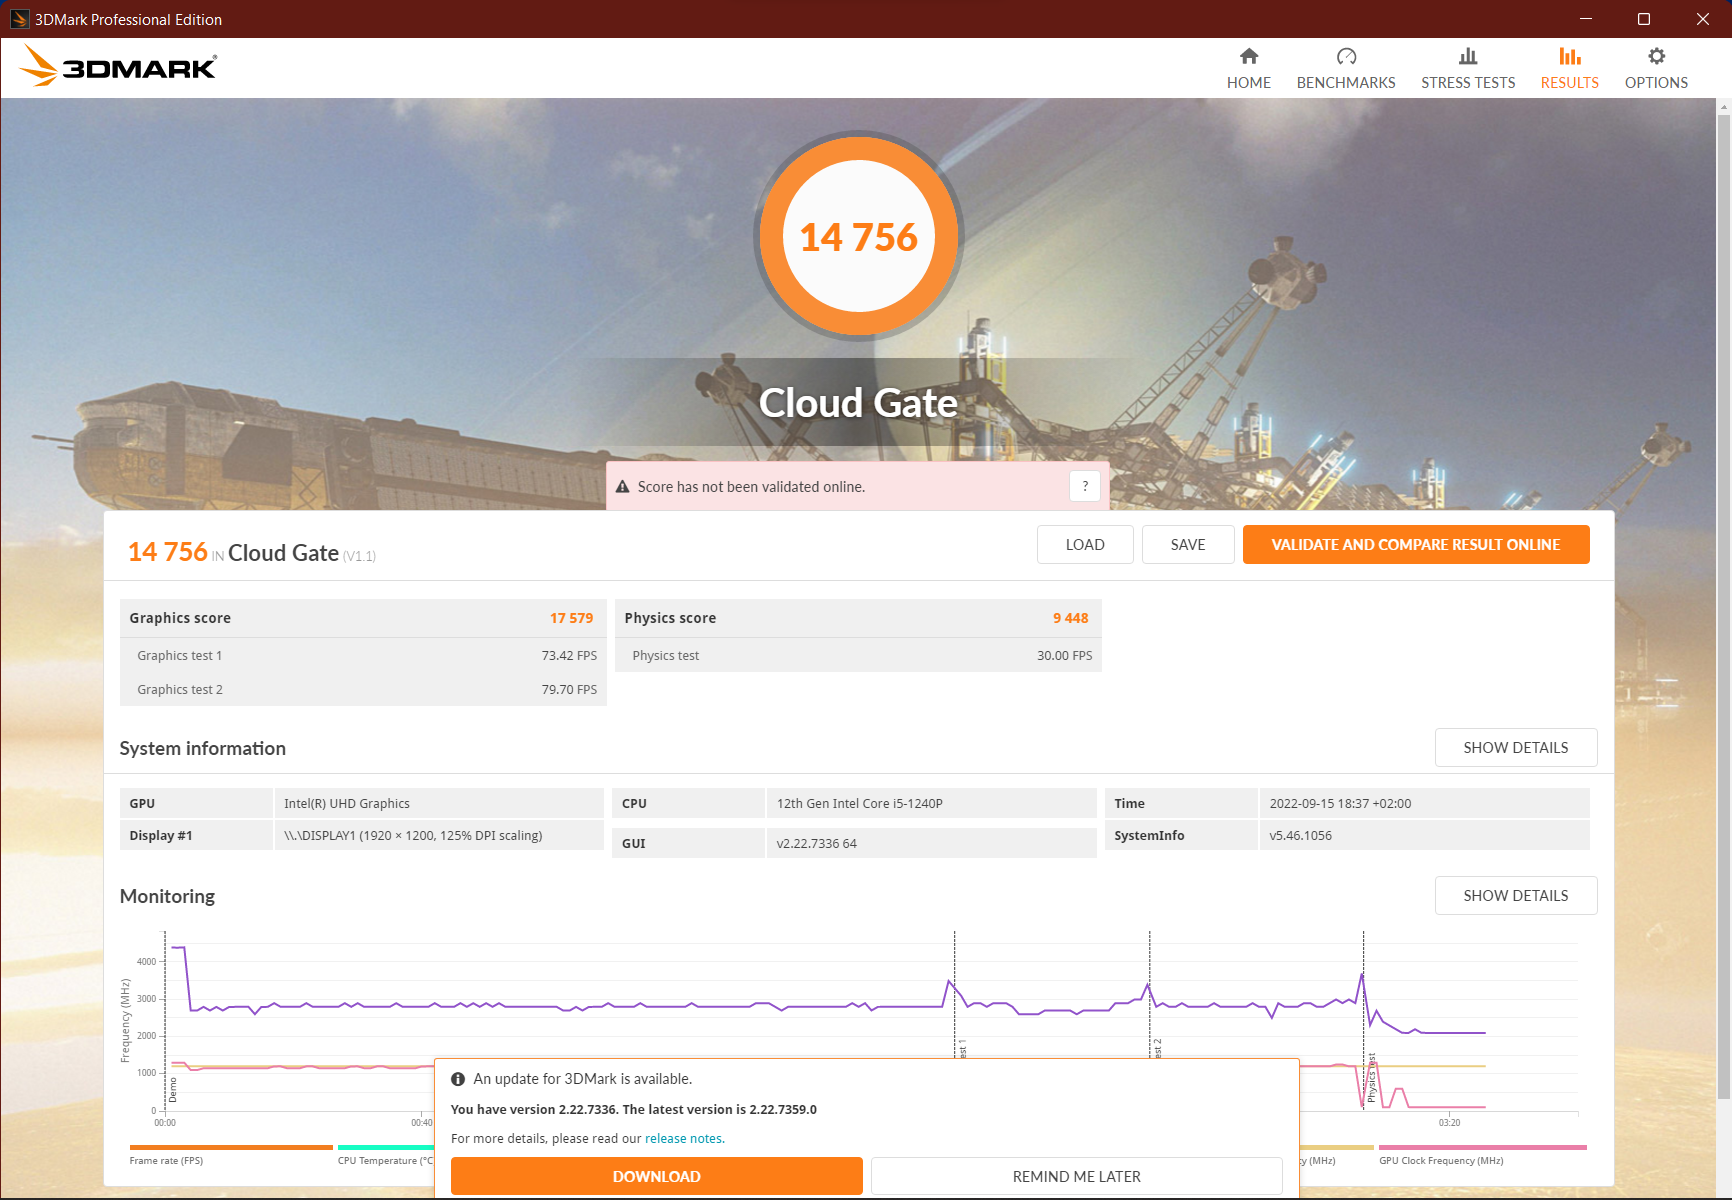
| 3DMark Cloud Gate Standard Score | 14756 pkt. | |
| 3DMark Fire Strike Score | 2695 pkt. | |
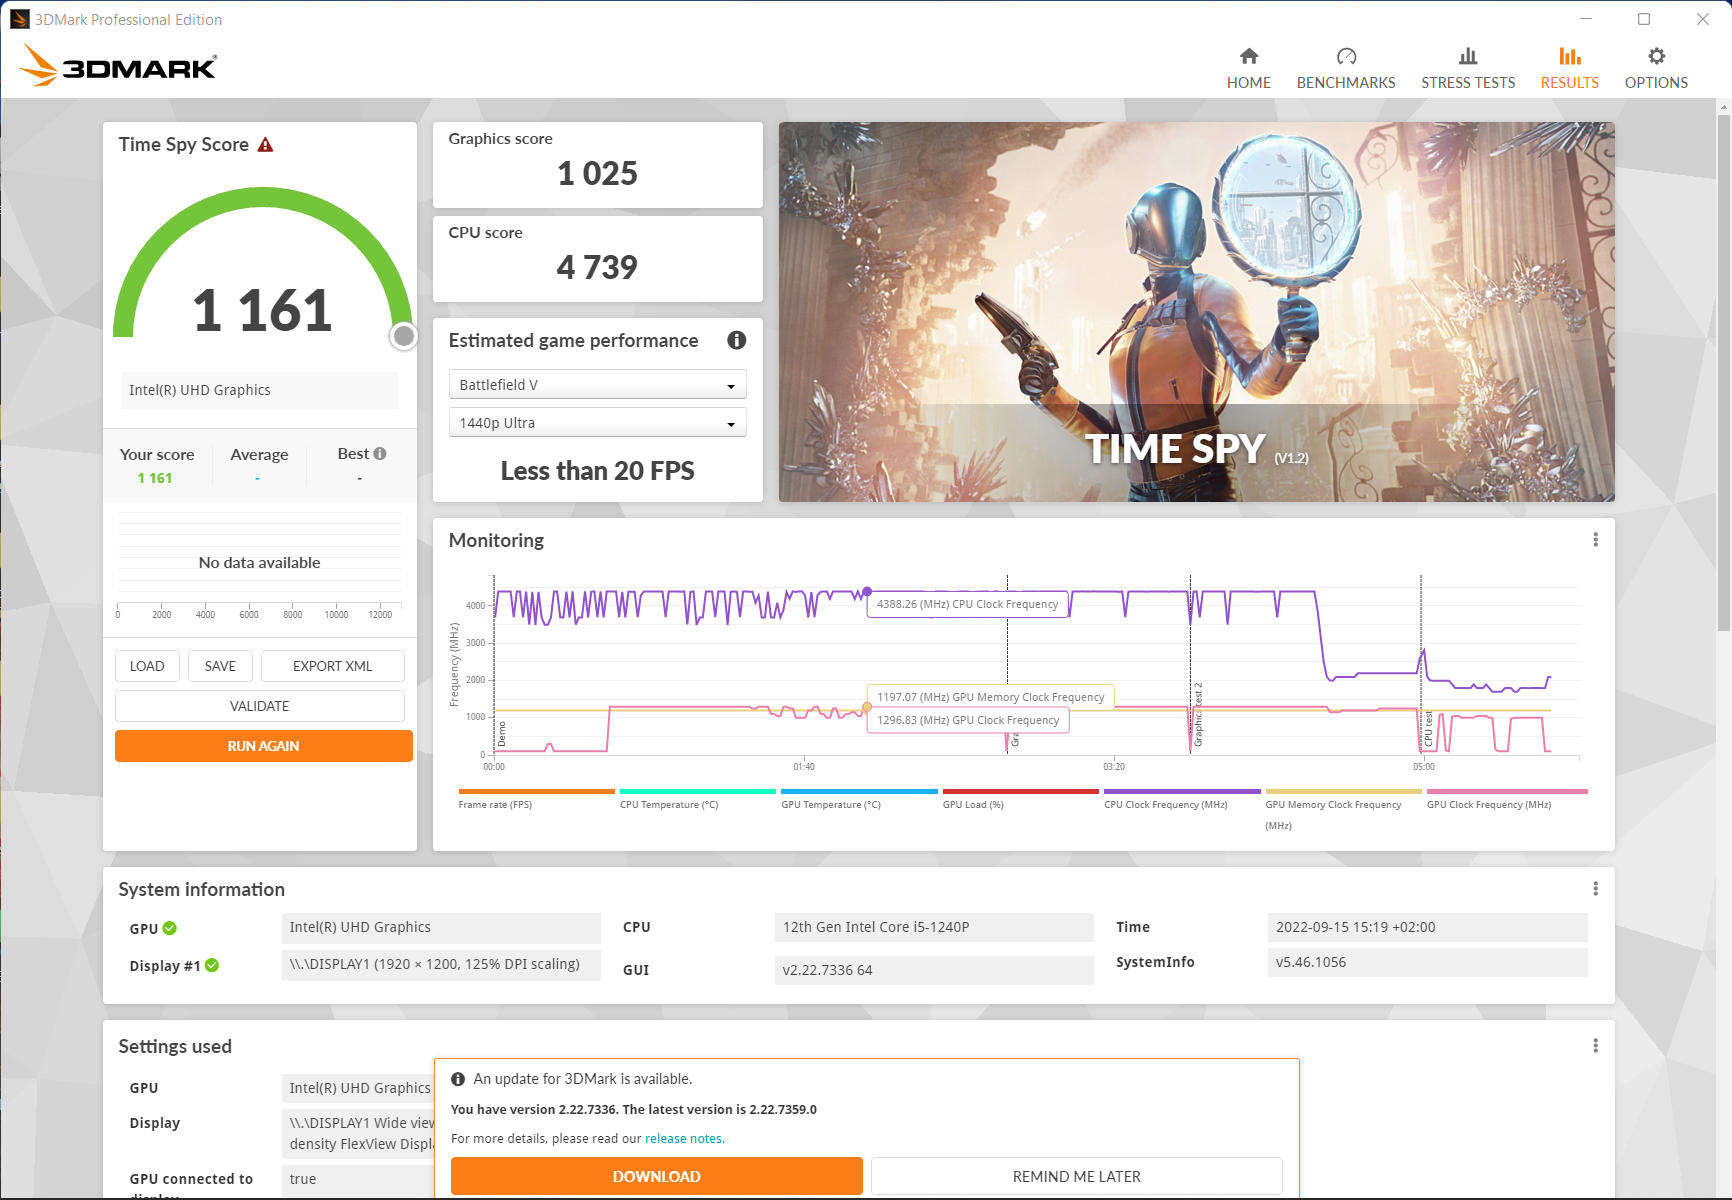
| 3DMark Time Spy Score | 1161 pkt. | |
Pomoc | ||
| The Witcher 3 - 1366x768 Medium Graphics & Postprocessing | |
| Dell Inspiron 16 Plus 7620 | |
| HP ZBook Power 15 G8 313S5EA | |
| Huawei MateBook D 16 2022 | |
| Lenovo ThinkPad T15 Gen2-20W5S00100 | |
| Średnia w klasie Office (44.7 - 63.9, n=4, ostatnie 2 lata) | |
| Przeciętny Intel Iris Xe Graphics G7 80EUs (21.8 - 56.9, n=103) | |
| HP ProBook 450 G9 6A180EA | |
| Lenovo ThinkPad T16 G1 21BWS00200 | |
| Lenovo ThinkPad L15 G2 AMD | |
| Final Fantasy XV Benchmark - 1280x720 Lite Quality | |
| Dell Inspiron 16 Plus 7620 | |
| HP ZBook Power 15 G8 313S5EA | |
| Średnia w klasie Office (16.5 - 171.2, n=71, ostatnie 2 lata) | |
| Lenovo ThinkPad T15 Gen2-20W5S00100 | |
| Huawei MateBook D 16 2022 | |
| Lenovo ThinkPad E15 G3-20YG003UGE | |
| Przeciętny Intel Iris Xe Graphics G7 80EUs (8.32 - 45.6, n=107) | |
| Lenovo ThinkPad T16 G1 21BWS00200 | |
| Lenovo ThinkPad L15 G2 AMD | |
| HP ProBook 450 G9 6A180EA | |
| GTA V - 1366x768 Normal/Off AF:4x | |
| Dell Inspiron 16 Plus 7620 | |
| HP ZBook Power 15 G8 313S5EA | |
| Średnia w klasie Office (51.9 - 174.4, n=65, ostatnie 2 lata) | |
| Huawei MateBook D 16 2022 | |
| Lenovo ThinkPad E15 G3-20YG003UGE | |
| Przeciętny Intel Iris Xe Graphics G7 80EUs (28.9 - 133.8, n=87) | |
| Lenovo ThinkPad L15 G2 AMD | |
| Lenovo ThinkPad T16 G1 21BWS00200 | |
| HP ProBook 450 G9 6A180EA | |
| Far Cry 5 - 1280x720 Low Preset AA:T | |
| HP ZBook Power 15 G8 313S5EA | |
| Lenovo ThinkPad T15 Gen2-20W5S00100 | |
| Średnia w klasie Office (35 - 99, n=14, ostatnie 2 lata) | |
| Przeciętny Intel Iris Xe Graphics G7 80EUs (14 - 63, n=50) | |
| Lenovo ThinkPad L15 G2 AMD | |
| Lenovo ThinkPad T16 G1 21BWS00200 | |
| HP ProBook 450 G9 6A180EA | |
| Shadow of the Tomb Raider - 1280x720 Lowest Preset | |
| HP ZBook Power 15 G8 313S5EA | |
| Średnia w klasie Office (16 - 105, n=2, ostatnie 2 lata) | |
| Przeciętny Intel Iris Xe Graphics G7 80EUs (31 - 62.8, n=6) | |
| HP ProBook 450 G9 6A180EA | |
| Lenovo ThinkPad T16 G1 21BWS00200 | |
| Strange Brigade - 1280x720 lowest AF:1 | |
| Dell Inspiron 16 Plus 7620 | |
| HP ZBook Power 15 G8 313S5EA | |
| Średnia w klasie Office (19.4 - 388, n=51, ostatnie 2 lata) | |
| Huawei MateBook D 16 2022 | |
| Lenovo ThinkPad E15 G3-20YG003UGE | |
| Przeciętny Intel Iris Xe Graphics G7 80EUs (22.7 - 98.7, n=84) | |
| Lenovo ThinkPad T16 G1 21BWS00200 | |
| Lenovo ThinkPad L15 G2 AMD | |
| HP ProBook 450 G9 6A180EA | |
| GRID Legends - 1920x1080 Medium Preset | |
| HP ZBook Power 15 G8 313S5EA | |
| Przeciętny Intel Iris Xe Graphics G7 80EUs (25.7 - 39.7, n=4) | |
| HP ProBook 450 G9 6A180EA | |
| Lenovo ThinkPad T16 G1 21BWS00200 | |
| Dota 2 Reborn - 1920x1080 ultra (3/3) best looking | |
| Dell Inspiron 16 Plus 7620 | |
| HP ZBook Power 15 G8 313S5EA | |
| Lenovo ThinkPad T15 Gen2-20W5S00100 | |
| Huawei MateBook D 16 2022 | |
| Średnia w klasie Office (14.6 - 135, n=75, ostatnie 2 lata) | |
| Lenovo ThinkPad E15 G3-20YG003UGE | |
| Przeciętny Intel Iris Xe Graphics G7 80EUs (7.8 - 66.1, n=114) | |
| Lenovo ThinkPad L15 G2 AMD | |
| Lenovo ThinkPad T16 G1 21BWS00200 | |
| HP ProBook 450 G9 6A180EA | |
| X-Plane 11.11 - 1920x1080 high (fps_test=3) | |
| Dell Inspiron 16 Plus 7620 | |
| HP ZBook Power 15 G8 313S5EA | |
| Huawei MateBook D 16 2022 | |
| Lenovo ThinkPad T15 Gen2-20W5S00100 | |
| Średnia w klasie Office (12 - 82.4, n=66, ostatnie 2 lata) | |
| Lenovo ThinkPad E15 G3-20YG003UGE | |
| Lenovo ThinkPad L15 G2 AMD | |
| Lenovo ThinkPad T16 G1 21BWS00200 | |
| Przeciętny Intel Iris Xe Graphics G7 80EUs (5.55 - 36.3, n=110) | |
| HP ProBook 450 G9 6A180EA | |
Witcher 3 FPS Chart
| low | med. | high | ultra | |
|---|---|---|---|---|
| GTA V (2015) | 61.9 | 50.1 | 9.54 | |
| The Witcher 3 (2015) | 50.7 | 32.1 | 15.7 | 8.36 |
| Dota 2 Reborn (2015) | 97.5 | 66.3 | 35.2 | 32.7 |
| Final Fantasy XV Benchmark (2018) | 24.9 | 13.5 | ||
| X-Plane 11.11 (2018) | 42.5 | 29.1 | 26.5 | |
| Far Cry 5 (2018) | 30 | 15 | 14 | 13 |
| Strange Brigade (2018) | 52.7 | 20.3 | 17 | 13.8 |
| Shadow of the Tomb Raider (2018) | 31 | 11 | ||
| GRID Legends (2022) | 36.2 | 25.7 | 21 |
Emisja - Przeważnie bezgłośny 16-calowy laptop od Lenovo
Hałas
W stanie bezczynności ThinkPad T16 pozostaje absolutnie bezgłośny. Nawet podczas intensywnego przeglądania stron internetowych i zadań wymagających użycia procesora wentylator pozostaje tak cichy przy średnio 25 dB(A), że trudno go odróżnić od hałasu otoczenia.
Dopiero pod połączonym obciążeniem, np. podczas grania, człowiek orientuje się, że nie jest to urządzenie chłodzone pasywnie - choć laptop nadal utrzymuje niski poziom głośności na poziomie 32 dB(A). Wentylator pracuje jednak wtedy na dość wysokich tonach. Przynajmniej nie ma tu irytujących elektronicznych szumów.
W porównaniu z nimi podobnie ciche są tylko ThinkPad L15 G2 AMD i HP ProBook 450 G9
Hałas
| luz |
| 23.3 / 23.3 / 23.3 dB |
| obciążenie |
| 25.1 / 34 dB |
 | ||
30 dB cichy 40 dB(A) słyszalny 50 dB(A) irytujący |
||
min: | ||
| Lenovo ThinkPad T16 G1 21BWS00200 Iris Xe G7 80EUs, i5-1240P, Samsung PM9A1 MZVL2512HCJQ | Lenovo ThinkPad T15 Gen2-20W5S00100 GeForce MX450, i7-1165G7, Samsung PM981a MZVLB1T0HBLR | Lenovo ThinkPad E15 G3-20YG003UGE Vega 8, R7 5700U, SK Hynix PC711 1TB HFS001TDE9X084N | Lenovo ThinkPad L15 G2 AMD Vega 7, R5 5600U, SK Hynix HFS512 GDE9X081N | HP ProBook 450 G9 6A180EA Iris Xe G7 96EUs, i7-1255U, SK Hynix HFM512GD3JX013N | HP ZBook Power 15 G8 313S5EA T600 Laptop GPU, i7-11800H, Samsung PM9A1 MZVL2512HCJQ | Dell Inspiron 16 Plus 7620 GeForce RTX 3050 Ti Laptop GPU, i7-12700H, Kioxia BG5 KBG50ZNS512G | Huawei MateBook D 16 2022 Iris Xe G7 96EUs, i7-12700H, Silicon Motion PCIe-8 SSD | Asus Vivobook Pro 16X-M7600QE GeForce RTX 3050 Ti Laptop GPU, R9 5900HX, SK Hynix HFM001TD3JX013N | |
|---|---|---|---|---|---|---|---|---|---|
| Noise | -12% | -10% | -4% | -5% | -33% | -34% | -21% | -27% | |
| wyłączone / środowisko * (dB) | 23.3 | 24.2 -4% | 23.8 -2% | 24.22 -4% | 25.5 -9% | 25.54 -10% | 23.3 -0% | 24.2 -4% | 26 -12% |
| Idle Minimum * (dB) | 23.3 | 24.2 -4% | 23.8 -2% | 24.22 -4% | 25.5 -9% | 25.54 -10% | 25.7 -10% | 24.2 -4% | 27 -16% |
| Idle Average * (dB) | 23.3 | 24.2 -4% | 23.8 -2% | 24.22 -4% | 25.5 -9% | 25.54 -10% | 26.1 -12% | 25.8 -11% | 27 -16% |
| Idle Maximum * (dB) | 23.3 | 24.2 -4% | 28 -20% | 24.22 -4% | 25.5 -9% | 25.54 -10% | 30.6 -31% | 30.5 -31% | 27.5 -18% |
| Load Average * (dB) | 25.1 | 34.5 -37% | 32.9 -31% | 25.84 -3% | 28 -12% | 48.85 -95% | 46.2 -84% | 39.8 -59% | 41.7 -66% |
| Witcher 3 ultra * (dB) | 32.1 | 37.6 -17% | 46.58 -45% | 49.2 -53% | 39.8 -24% | ||||
| Load Maximum * (dB) | 34 | 37.6 -11% | 35 -3% | 36.02 -6% | 27.7 19% | 50.98 -50% | 49.4 -45% | 39.8 -17% | 45.3 -33% |
* ... im mniej tym lepiej
Temperatura
ThinkPad T16 pozostaje chłodny w większości scenariuszy, nagrzewając się do normalnego stopnia tylko pod trwałym obciążeniem. Nie zauważa się tego zbytnio w obszarze klawiatury, a jedynie nad nią, a nawet to nie odczuwa się zbytnio gorąca przez dłuższy czas. Spód generalnie pozostaje chłodniejszy, więc można używać ThinkPada T16 na kolanach.
Strona bezpośredni poprzednik a także m.in ThinkPad E15nagrzewają się znacznie bardziej, osiągając na spodzie odpowiednio maksymalnie 55 i 60°C. Na stronie ZBook Power 15 oraz Vivobook Pro 16X, z drugiej strony, pozostają podobnie chłodne.
(±) Maksymalna temperatura w górnej części wynosi 45 °C / 113 F, w porównaniu do średniej 34.3 °C / 94 F , począwszy od 21.2 do 62.5 °C dla klasy Office.
(±) Dno nagrzewa się maksymalnie do 42.8 °C / 109 F, w porównaniu do średniej 36.8 °C / 98 F
(+) W stanie bezczynności średnia temperatura górnej części wynosi 30.4 °C / 87 F, w porównaniu ze średnią temperaturą urządzenia wynoszącą 29.5 °C / ### class_avg_f### F.
(±) Podczas gry w Wiedźmina 3 średnia temperatura górnej części wynosi 35.9 °C / 97 F, w porównaniu do średniej temperatury urządzenia wynoszącej 29.5 °C / ## #class_avg_f### F.
(+) Podparcia dłoni i touchpad osiągają maksymalną temperaturę skóry (33.4 °C / 92.1 F) i dlatego nie są gorące.
(-) Średnia temperatura obszaru podparcia dłoni w podobnych urządzeniach wynosiła 27.5 °C / 81.5 F (-5.9 °C / -10.6 F).
| Lenovo ThinkPad T16 G1 21BWS00200 Intel Core i5-1240P, Intel Iris Xe Graphics G7 80EUs | Lenovo ThinkPad T15 Gen2-20W5S00100 Intel Core i7-1165G7, NVIDIA GeForce MX450 | Lenovo ThinkPad E15 G3-20YG003UGE AMD Ryzen 7 5700U, AMD Radeon RX Vega 8 (Ryzen 4000/5000) | Lenovo ThinkPad L15 G2 AMD AMD Ryzen 5 5600U, AMD Radeon RX Vega 7 | HP ProBook 450 G9 6A180EA Intel Core i7-1255U, Intel Iris Xe Graphics G7 96EUs | HP ZBook Power 15 G8 313S5EA Intel Core i7-11800H, NVIDIA T600 Laptop GPU | Dell Inspiron 16 Plus 7620 Intel Core i7-12700H, NVIDIA GeForce RTX 3050 Ti Laptop GPU | Huawei MateBook D 16 2022 Intel Core i7-12700H, Intel Iris Xe Graphics G7 96EUs | Asus Vivobook Pro 16X-M7600QE AMD Ryzen 9 5900HX, NVIDIA GeForce RTX 3050 Ti Laptop GPU | |
|---|---|---|---|---|---|---|---|---|---|
| Heat | 8% | -2% | 6% | -1% | 16% | 3% | 5% | 11% | |
| Maximum Upper Side * (°C) | 45 | 42.2 6% | 46.4 -3% | 42.8 5% | 40.5 10% | 41.4 8% | 46 -2% | 41.8 7% | 39.4 12% |
| Maximum Bottom * (°C) | 42.8 | 55.1 -29% | 60.9 -42% | 46 -7% | 47.6 -11% | 41.5 3% | 45.8 -7% | 47.3 -11% | 43.6 -2% |
| Idle Upper Side * (°C) | 33 | 23.8 28% | 26.5 20% | 26.9 18% | 32.6 1% | 23.8 28% | 29.2 12% | 28.3 14% | 27.6 16% |
| Idle Bottom * (°C) | 33.6 | 25.1 25% | 27.5 18% | 31.1 7% | 34.2 -2% | 25 26% | 31 8% | 30.2 10% | 27.5 18% |
* ... im mniej tym lepiej
Testy warunków skrajnych
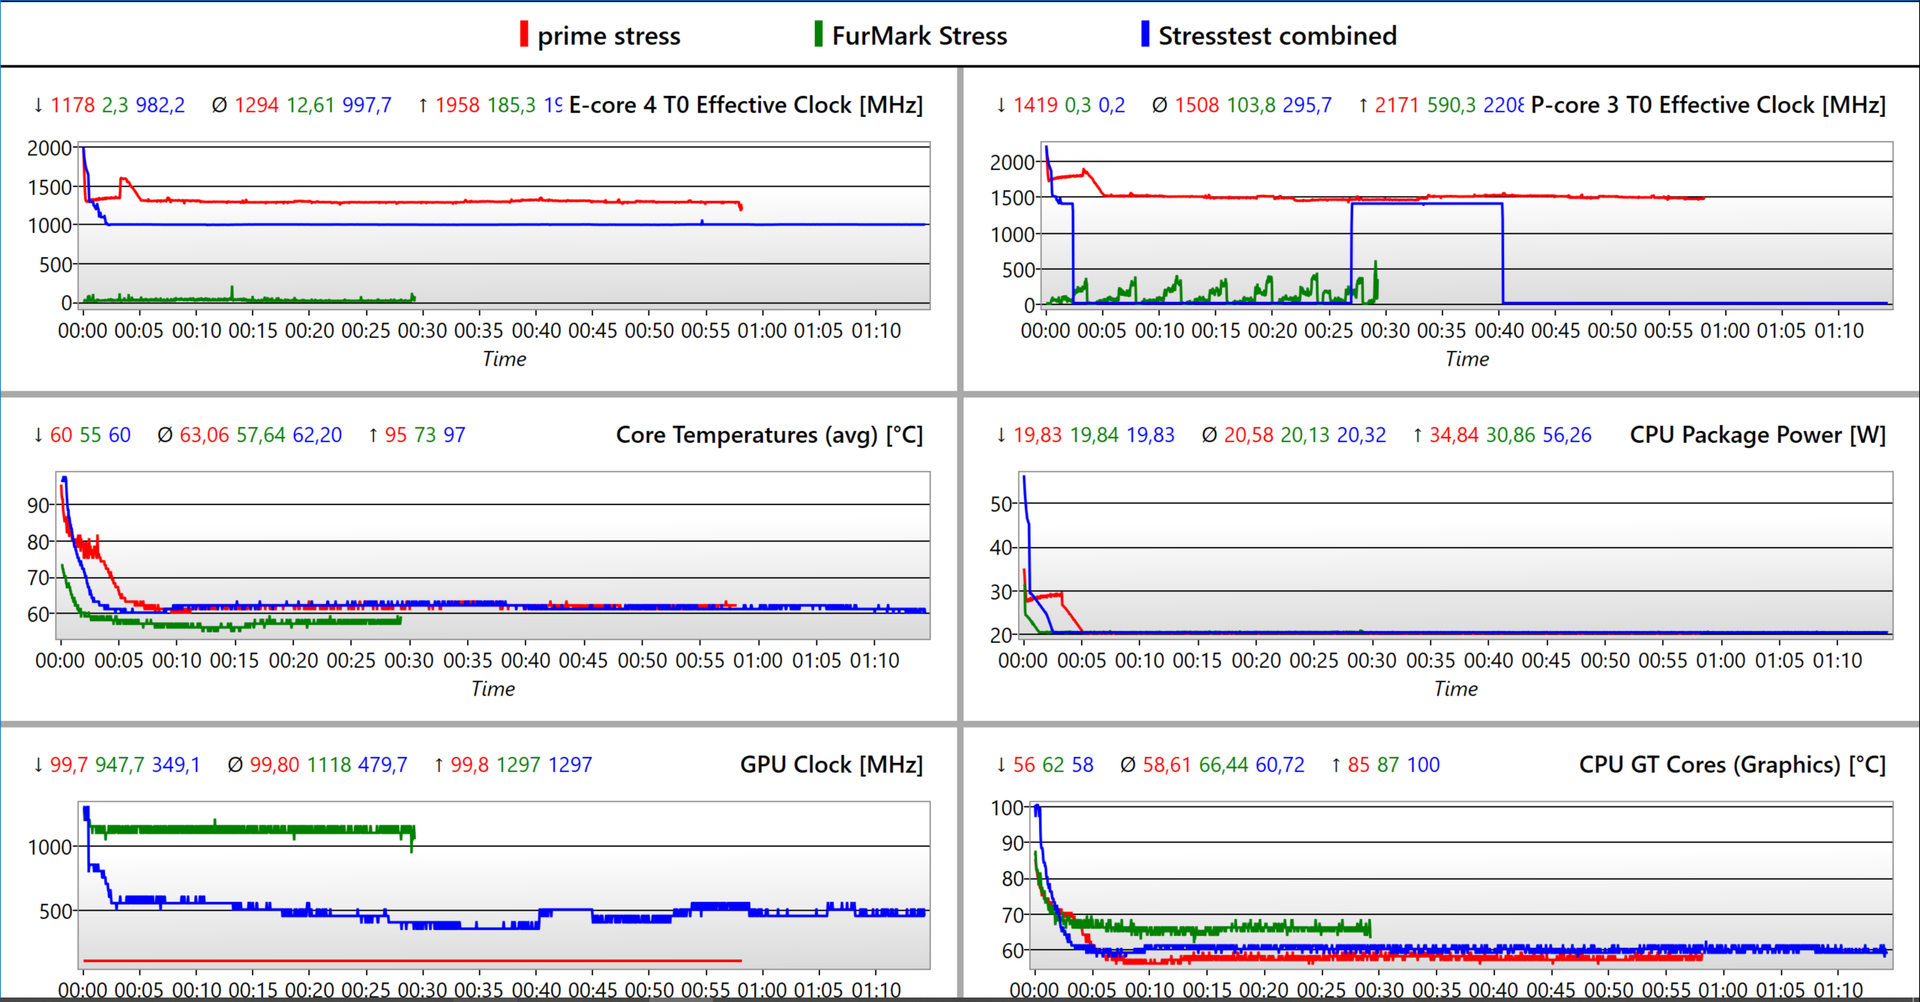
Pod połączonym obciążeniem (Prime95+FurMark) rdzenie P spadły po krótkim czasie z 2,2 do 1,4 GHz - nieco poniżej bazowego taktowania 1,7 GHz. Jeden z rdzeni (P-Core 0) wydaje się być przez większość czasu nieaktywny (0 MHz). Temperatura spada z początkowych 95°C do stabilnych 62°C. IGPU ślizga się z 1300 MHz do 480 MHz w temperaturze 61 °C. Ponownie problemem jest ustawiony limit mocy, wynoszący 20 W.
W warunkach czystego obciążenia CPU rdzenie P również nie osiągają swojego bazowego taktowania, ale taktują z częstotliwością 1,5 GHz (wszystkie rdzenie aktywne). Dopiero w stresie iGPU radzi sobie z 1 118 MHz w temperaturze 66°C.
| Zegar procesora P- i E-Cores (GHz) | Zegar GPU (MHz) | Średnia temperatura CPU (°C) | Średnia temperatura GPU (°C) | |
| System w stanie bezczynności | - | 100 | 34 | 36 |
| Prime95 + FurMark Stress | 1,4 / 1 | 480 | 62 | 61 |
| Prime95 Stress | 1,5 / 1,3 | 100 | 63 | 58 |
| FurMark Stress | 0,1 / 0,01 | 1.120 | 58 | 66 |
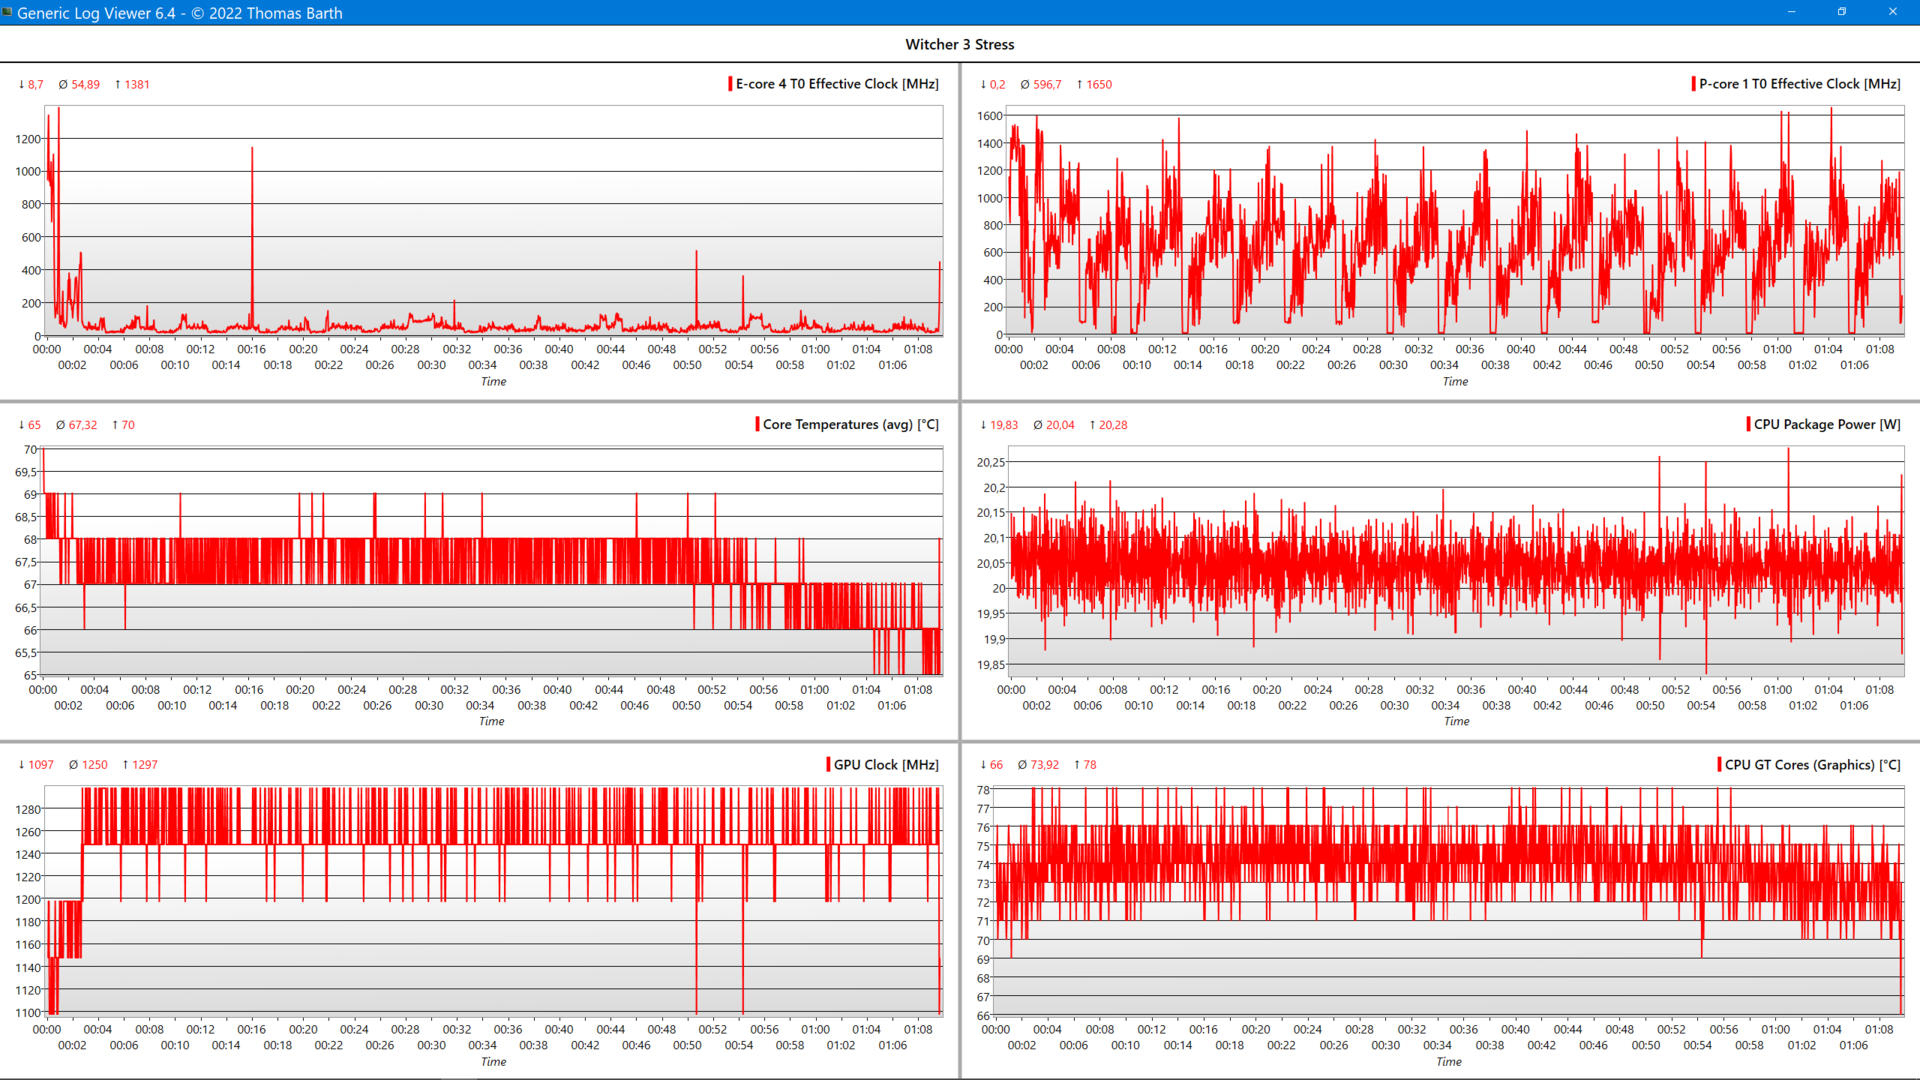
| Witcher 3 Stress | 0,6 / 0,05 | 1.250 | 67 | 74 |
Mówcy
Na szczęście głośniki z serii T zostały poprawione. Basu nadal brakuje, ale średnie i wysokie tony są zrównoważone i odtwarzane liniowo.
Jest to akceptowalne w przypadku filmów i teledysków, ale przyjemność z muzyki jest możliwa tylko przy użyciu zewnętrznego systemu nagłośnienia lub słuchawek podłączonych przez gniazdo jack lub Bluetooth. Przy maksymalnym poziomie 75 dB(A) można wypełnić dźwiękiem przeciętnej wielkości pokój.
Lenovo ThinkPad T16 G1 21BWS00200 analiza dźwięku
(±) | głośność głośnika jest średnia, ale dobra (75.16 dB)
Bas 100 - 315 Hz
(-) | prawie brak basu - średnio 20.5% niższa od mediany
(-) | bas nie jest liniowy (15.5% delta do poprzedniej częstotliwości)
Średnie 400 - 2000 Hz
(+) | zbalansowane środki średnie - tylko 2.3% od mediany
(+) | średnie są liniowe (4.1% delta do poprzedniej częstotliwości)
Wysokie 2–16 kHz
(+) | zrównoważone maksima - tylko 3.2% od mediany
(+) | wzloty są liniowe (5.5% delta do poprzedniej częstotliwości)
Ogólnie 100 - 16.000 Hz
(±) | liniowość ogólnego dźwięku jest średnia (17% różnicy w stosunku do mediany)
W porównaniu do tej samej klasy
» 24% wszystkich testowanych urządzeń w tej klasie było lepszych, 8% podobnych, 69% gorszych
» Najlepszy miał deltę 7%, średnia wynosiła ###średnia###%, najgorsza wynosiła 53%
W porównaniu do wszystkich testowanych urządzeń
» 30% wszystkich testowanych urządzeń było lepszych, 8% podobnych, 62% gorszych
» Najlepszy miał deltę 4%, średnia wynosiła ###średnia###%, najgorsza wynosiła 134%
Huawei MateBook D 16 2022 analiza dźwięku
(±) | głośność głośnika jest średnia, ale dobra (76 dB)
Bas 100 - 315 Hz
(-) | prawie brak basu - średnio 17.7% niższa od mediany
(±) | liniowość basu jest średnia (9.8% delta do poprzedniej częstotliwości)
Średnie 400 - 2000 Hz
(+) | zbalansowane środki średnie - tylko 1.9% od mediany
(+) | średnie są liniowe (5.6% delta do poprzedniej częstotliwości)
Wysokie 2–16 kHz
(+) | zrównoważone maksima - tylko 4.4% od mediany
(+) | wzloty są liniowe (3.1% delta do poprzedniej częstotliwości)
Ogólnie 100 - 16.000 Hz
(±) | liniowość ogólnego dźwięku jest średnia (16.2% różnicy w stosunku do mediany)
W porównaniu do tej samej klasy
» 41% wszystkich testowanych urządzeń w tej klasie było lepszych, 7% podobnych, 51% gorszych
» Najlepszy miał deltę 5%, średnia wynosiła ###średnia###%, najgorsza wynosiła 45%
W porównaniu do wszystkich testowanych urządzeń
» 26% wszystkich testowanych urządzeń było lepszych, 6% podobnych, 68% gorszych
» Najlepszy miał deltę 4%, średnia wynosiła ###średnia###%, najgorsza wynosiła 134%
Zarządzanie energią - 14-godzinna bateria w 16-calowym ThinkPadzie
Pobór mocy
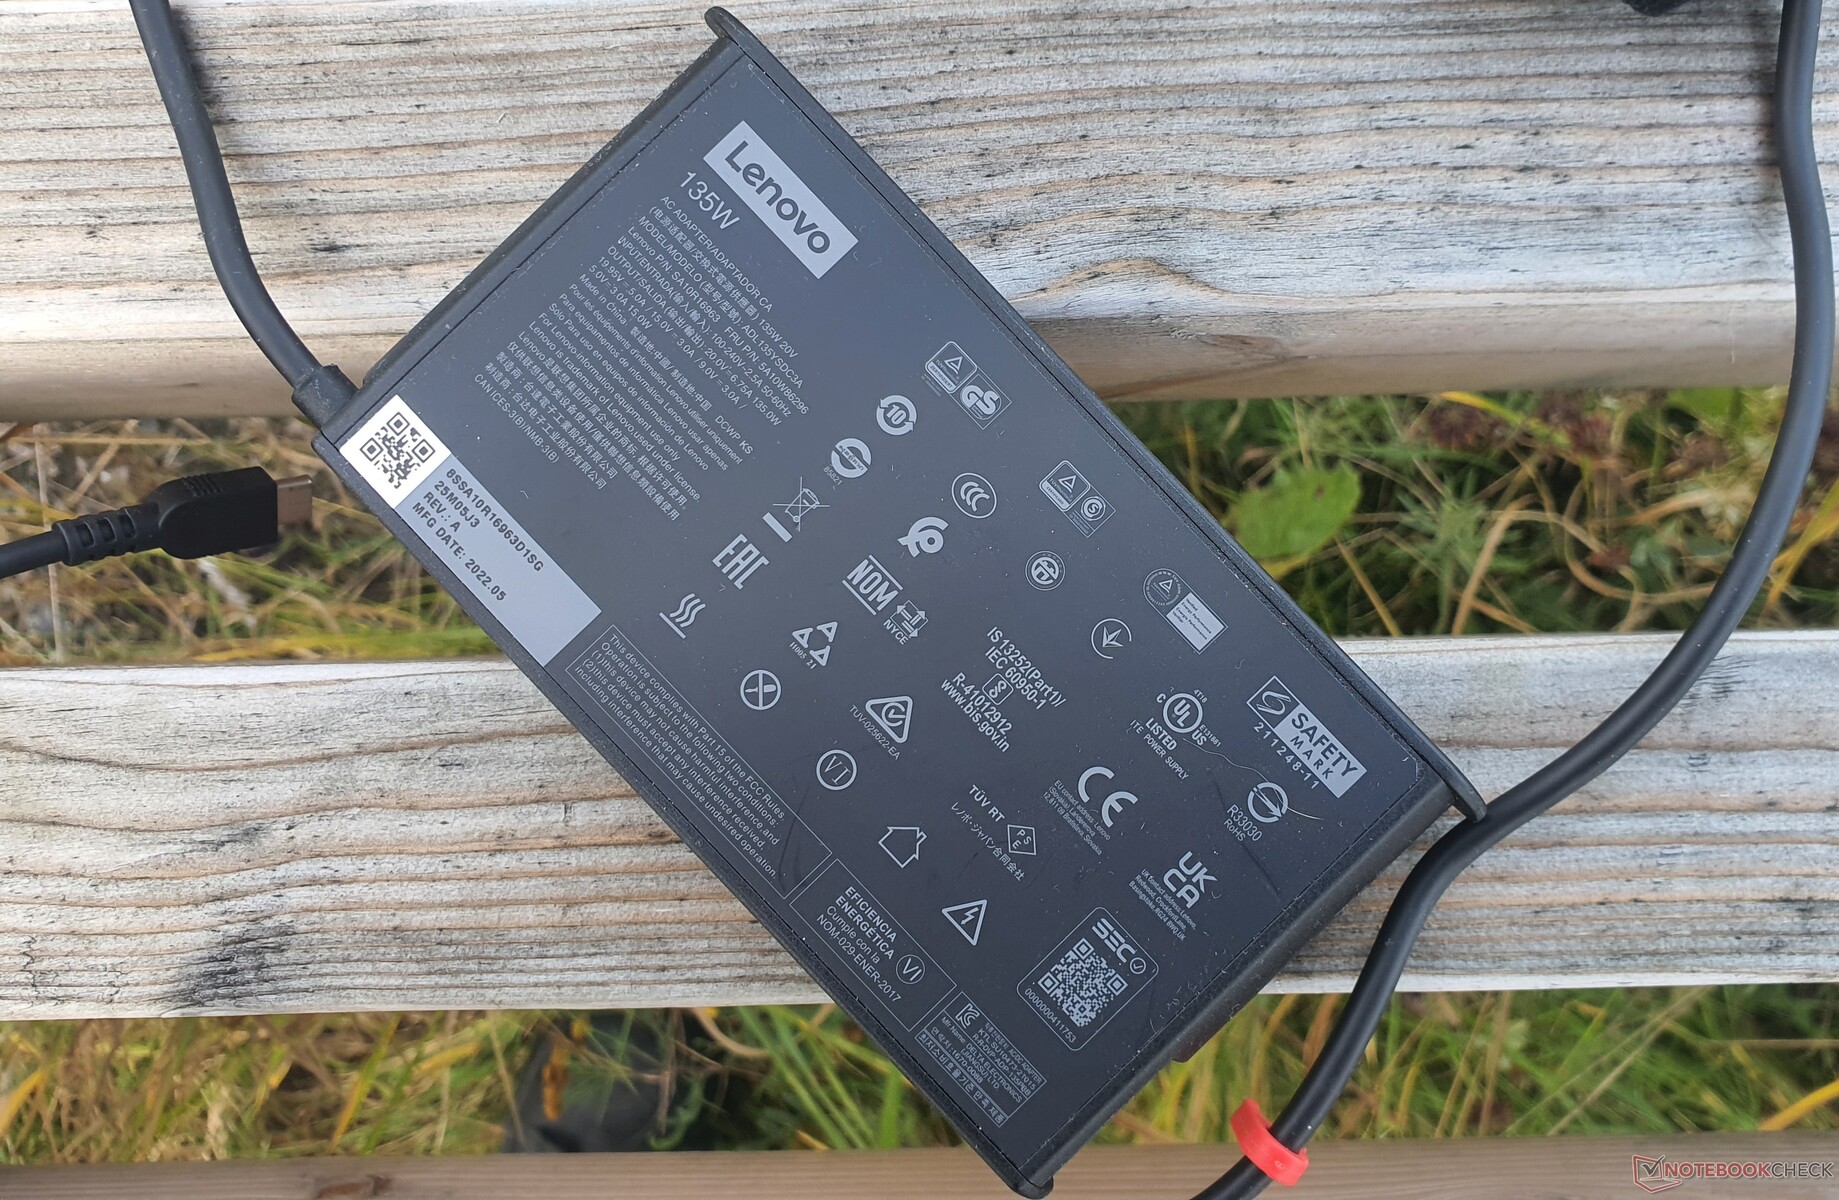
Zmierzyliśmy niski pobór mocy w stanie spoczynku na poziomie ~6 watów i minimalny na poziomie 2,9 wata. Nasze pole porównawcze, w tym pochodne AMD, nie ma sobie równych. Pod obciążeniem zmierzyliśmy średnio 27,9 W - to wartość, która wynika z throttlingu procesora. Łączne obciążenie (CPU+iGPU) daje wynik 42,6 watów.
Szczyty mocy do 90 watów, spowodowane krótkotrwałym turbo, mogą być dobrze absorbowane przez zasilacz 135 W. Ponadto zasilacz pozwala na szybkie naładowanie dużego akumulatora o pojemności 86 Wh do 80% w ciągu godziny. Pozostaje wątpliwe, czy 100-watowy zasilacz, który byłby nieco bardziej kompaktowy i jest oferowany z wersją AMD, spełniłby swoje zadanie równie dobrze.
| wyłączony / stan wstrzymania | |
| luz | |
| obciążenie |
|
Legenda:
min: | |
| Lenovo ThinkPad T16 G1 21BWS00200 i5-1240P, Iris Xe G7 80EUs, Samsung PM9A1 MZVL2512HCJQ, IPS, 1920x1200, 16" | Lenovo ThinkPad T15 Gen2-20W5S00100 i7-1165G7, GeForce MX450, Samsung PM981a MZVLB1T0HBLR, IPS, 1920x1080, 15.6" | Lenovo ThinkPad X1 Extreme G4-20Y5CTO1WW (3050 Ti) i7-11800H, GeForce RTX 3050 Ti Laptop GPU, Samsung PM9A1 MZVL21T0HCLR, IPS LED, 3840x2400, 16" | HP ProBook 450 G9 6A180EA i7-1255U, Iris Xe G7 96EUs, SK Hynix HFM512GD3JX013N, , 1920x1080, 15.6" | HP ZBook Power 15 G8 313S5EA i7-11800H, T600 Laptop GPU, Samsung PM9A1 MZVL2512HCJQ, IPS LED, 1920x1080, 15.6" | Huawei MateBook D 16 2022 i7-12700H, Iris Xe G7 96EUs, Silicon Motion PCIe-8 SSD, IPS, 1920x1200, 16" | Dell Inspiron 16 Plus 7620 i7-12700H, GeForce RTX 3050 Ti Laptop GPU, Kioxia BG5 KBG50ZNS512G, IPS, 3072x1920, 16" | Lenovo ThinkPad L15 G2 AMD R5 5600U, Vega 7, SK Hynix HFS512 GDE9X081N, IPS LED, 1920x1080, 15.6" | Średnia w klasie Office | |
|---|---|---|---|---|---|---|---|---|---|
| Power Consumption | -44% | -210% | -8% | -55% | -70% | -151% | -14% | -27% | |
| Idle Minimum * (Watt) | 2.9 | 4.5 -55% | 10.3 -255% | 4.5 -55% | 4.17 -44% | 6.1 -110% | 6.8 -134% | 4.57 -58% | 4.41 ? -52% |
| Idle Average * (Watt) | 6 | 8.8 -47% | 22.06 -268% | 7.3 -22% | 6.32 -5% | 10.6 -77% | 9.6 -60% | 8.2 -37% | 7.37 ? -23% |
| Idle Maximum * (Watt) | 6.9 | 11.6 -68% | 23 -233% | 8.1 -17% | 7.1 -3% | 11.5 -67% | 17 -146% | 9.3 -35% | 8.58 ? -24% |
| Load Average * (Watt) | 27.3 | 60 -120% | 102.57 -276% | 32.8 -20% | 80.41 -195% | 65.5 -140% | 117.5 -330% | 31.9 -17% | 43 ? -58% |
| Witcher 3 ultra * (Watt) | 42.6 | 39.2 8% | 106 -149% | 32 25% | 62.3 -46% | 61.2 -44% | 113.1 -165% | 34.5 19% | |
| Load Maximum * (Watt) | 81.53 | 68.5 16% | 147.8 -81% | 47 42% | 110.18 -35% | 68.4 16% | 137.4 -69% | 47.4 42% | 64.6 ? 21% |
* ... im mniej tym lepiej
Power consumption Witcher 3 / Stress test
Power consumption with an external monitor
Czas pracy na baterii
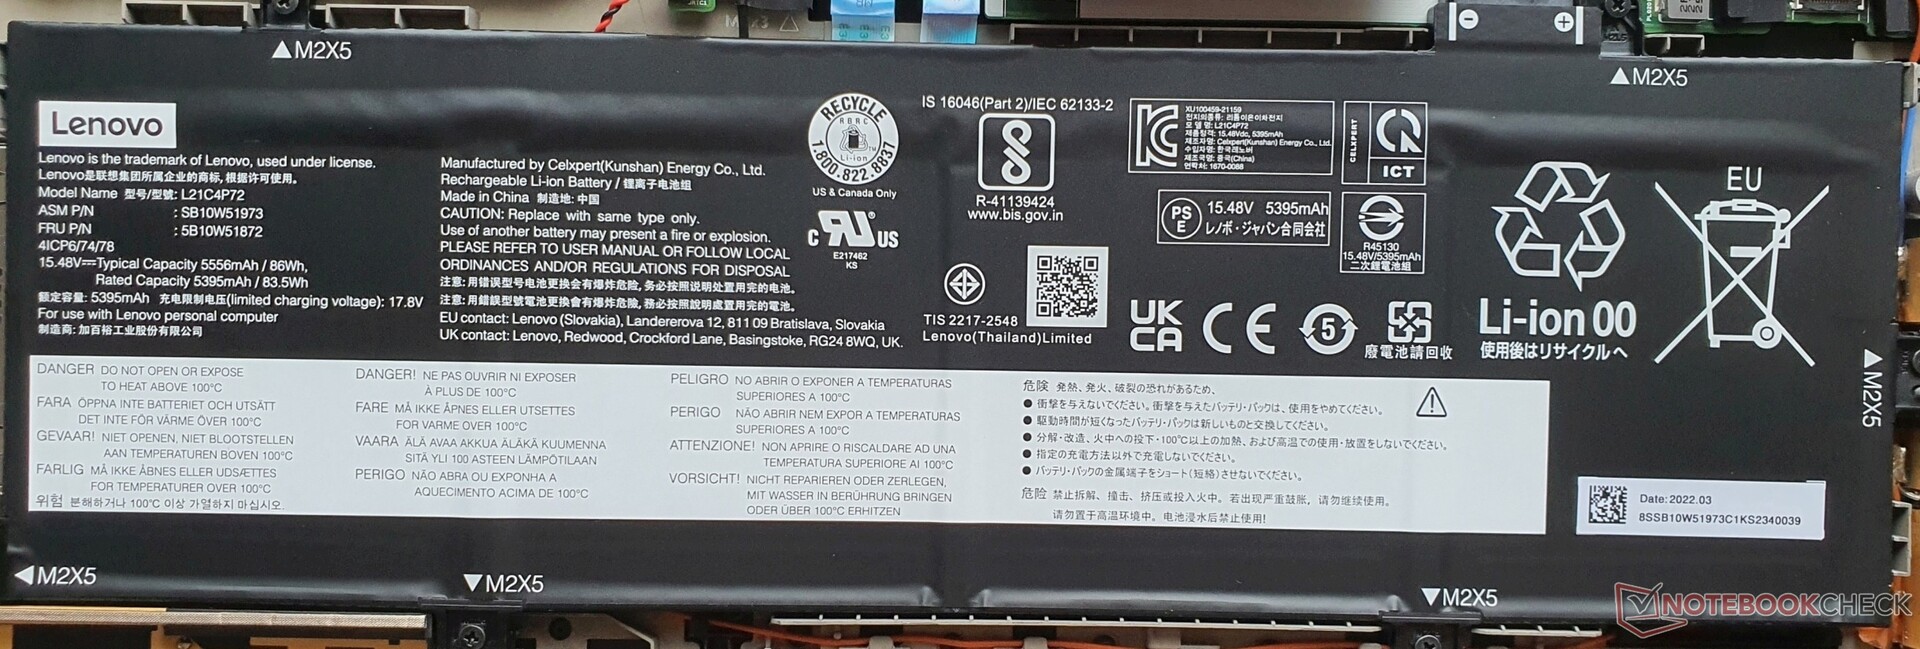
Mimo dużej baterii 86 Wh w naszym modelu nie spodziewaliśmy się, że test WLAN potrwa dłużej niż 14 godzin. Używamy skryptu, który symuluje przeglądanie stron internetowych przy stałej wartości 150 nitów, korzystając z profilu energetycznego "Balanced" w systemie Windows. StronaCore i5-1240P wydaje się bardziej ekonomiczny od Core i7-1280P, prawdopodobnie dlatego, że ten ostatni ma więcej rdzeni P. Pozytywny wpływ ma też mało energochłonny wyświetlacz o rozdzielczości FHD+, zwłaszcza przy pełnej jasności 390 nitów, gdzie ThinkPad osiąga prawie 11 godzin.
Ekscytującą perspektywą jest to, czy wariant AMD w T16 będzie w stanie zaoferować jeszcze więcej. Czas pracy na pełnym obciążeniu wynoszący 3,5 h jest odpowiednio długi ze względu na niski limit mocy wynoszący 20 W.
| Lenovo ThinkPad T16 G1 21BWS00200 i5-1240P, Iris Xe G7 80EUs, 86 Wh | Lenovo ThinkPad T15 Gen2-20W5S00100 i7-1165G7, GeForce MX450, 57 Wh | Lenovo ThinkPad E15 G3-20YG003UGE R7 5700U, Vega 8, 57 Wh | Lenovo ThinkPad L15 G2 AMD R5 5600U, Vega 7, 45 Wh | HP ProBook 450 G9 6A180EA i7-1255U, Iris Xe G7 96EUs, 51 Wh | HP ZBook Power 15 G8 313S5EA i7-11800H, T600 Laptop GPU, 83 Wh | Dell Inspiron 16 Plus 7620 i7-12700H, GeForce RTX 3050 Ti Laptop GPU, 86 Wh | Huawei MateBook D 16 2022 i7-12700H, Iris Xe G7 96EUs, 60 Wh | Asus Vivobook Pro 16X-M7600QE R9 5900HX, GeForce RTX 3050 Ti Laptop GPU, 96 Wh | |
|---|---|---|---|---|---|---|---|---|---|
| Czasy pracy | -44% | -29% | -45% | -17% | -19% | -49% | -50% | -45% | |
| H.264 (h) | 10.4 | 10.1 -3% | |||||||
| WiFi v1.3 (h) | 14.1 | 7.9 -44% | 10 -29% | 7.8 -45% | 10.1 -28% | 12.3 -13% | 9.6 -32% | 7.1 -50% | 11.3 -20% |
| Load (h) | 3.5 | 3.3 -6% | 2.1 -40% | 1.2 -66% | 1.1 -69% | ||||
| Witcher 3 ultra (h) | 2.7 |
Za
Przeciw
Werdykt - ThinkPad T16: mocny wyświetlacz, długie czasy pracy, dławiona wydajność
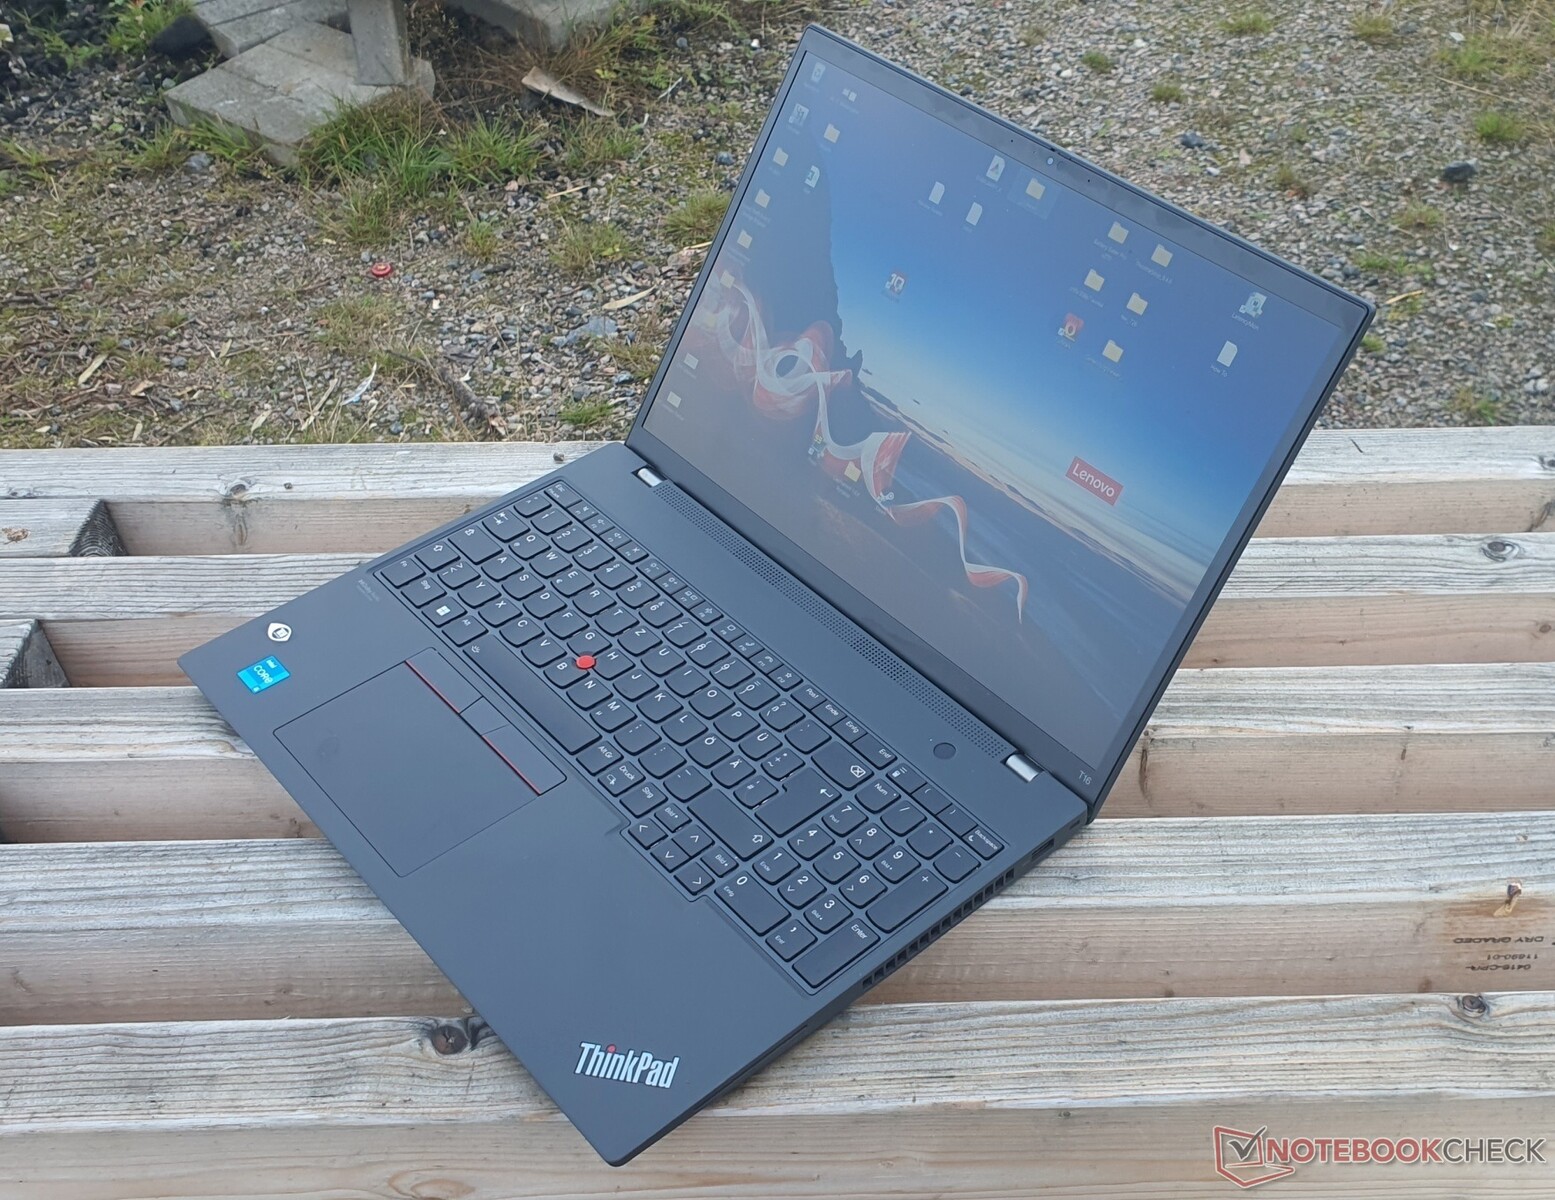

ThinkPad T16 G1 Intel oferuje wiele: 16-calowy, jasny wyświetlacz 16:10 o niskim zużyciu energii, bardzo długie czasy pracy na akumulatorze, zróżnicowane wyposażenie i przeważnie bezgłośną pracę. Do tego dochodzi solidna konstrukcja z wyższej półki
Ogólnie udany redesign, mimo krótszego skoku klawiszy i brakującej opcji 4K. Nieco irytujące jest ograniczenie PL1 do 20 W, które niepotrzebnie ogranicza skądinąd dobrą wydajność
Lenovo oferuje w ThinkPadzie T16 G1 solidny notebook biznesowy z bardzo długim czasem pracy na akumulatorze, jasnym wyświetlaczem 16:10 o niskim poborze mocy i niską emisją. Throttling procesora może jednak okazać się problematyczny poza zadaniami biurowymi.
Dla użytkowników biznesowych poszukujących kompaktowego urządzenia o dużej powierzchni ekranu i długich czasach pracy na akumulatorze, T16 wydaje się być bezkonkurencyjny pod względem dobrej klawiatury, funkcji i cichego zachowania. Mająca się wkrótce ukazać recenzja EliteBooka 865 G9 firmy HP jest więc ekscytującą perspektywą. Ekscytujące będzie też porównanie z wariantem AMD modelu T16, który ma potencjał, by zapewnić większą wydajność przy jeszcze niższej emisji i jeszcze wyższych czasach pracy, ale o tym przekonamy się w przyszłej recenzji
Ci, którzy potrzebują również GPU dla stacji roboczych, powinni spojrzeć na ZBook Power 15. Ci, którzy nie potrzebują najlepszych z najlepszych, znajdą lepszy stosunek ceny do wydajności w ThinkPad E15 AMD, który jest ponad dwukrotnie tańszy
Cena i dostępność
Laptop Lenovo ThinkPad T16 G1 Intel wydaje się być szeroko dostępny jako swobodnie konfigurowalny laptop za pośrednictwem oficjalnej strony internetowej Lenovo. Na przykład, znaleźliśmy laptopa w USA (od 1 099,50 USD), Wielkiej Brytanii (1 169,99 GBP), Indie (₹97,185), Francja (1.427,25€), Singapur (SG$1,494.58) oraz Australia (AU$ 2,229.00). Ta lista nie jest wyczerpująca.
Ceny są na dzień 23.09.22 i mogą ulec zmianie
Lenovo ThinkPad T16 G1 21BWS00200
- 21/09/2022 v7 (old)
Marvin Gollor
Price comparison

