Core i7-1265U vs Core i5-1250P: recenzja laptopa Lenovo ThinkPad X1 Carbon Gen 10
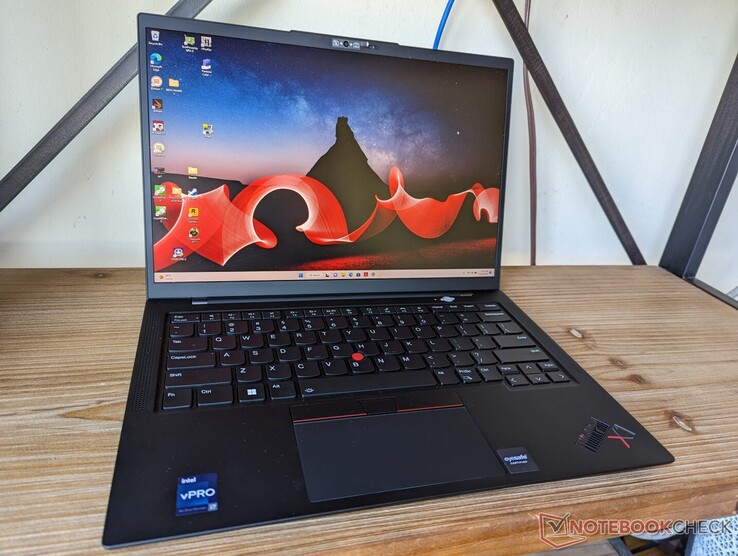
ThinkPad X1 Carbon G10 to najnowszy ultralekki laptop biznesowy od Lenovo wyposażony w procesory Intel Core-U i Core-P 12. generacji. Dostępne są modele od Core i5-1240P do Core i7-1280P lub od Core i5-1235U do Core i7-1265U
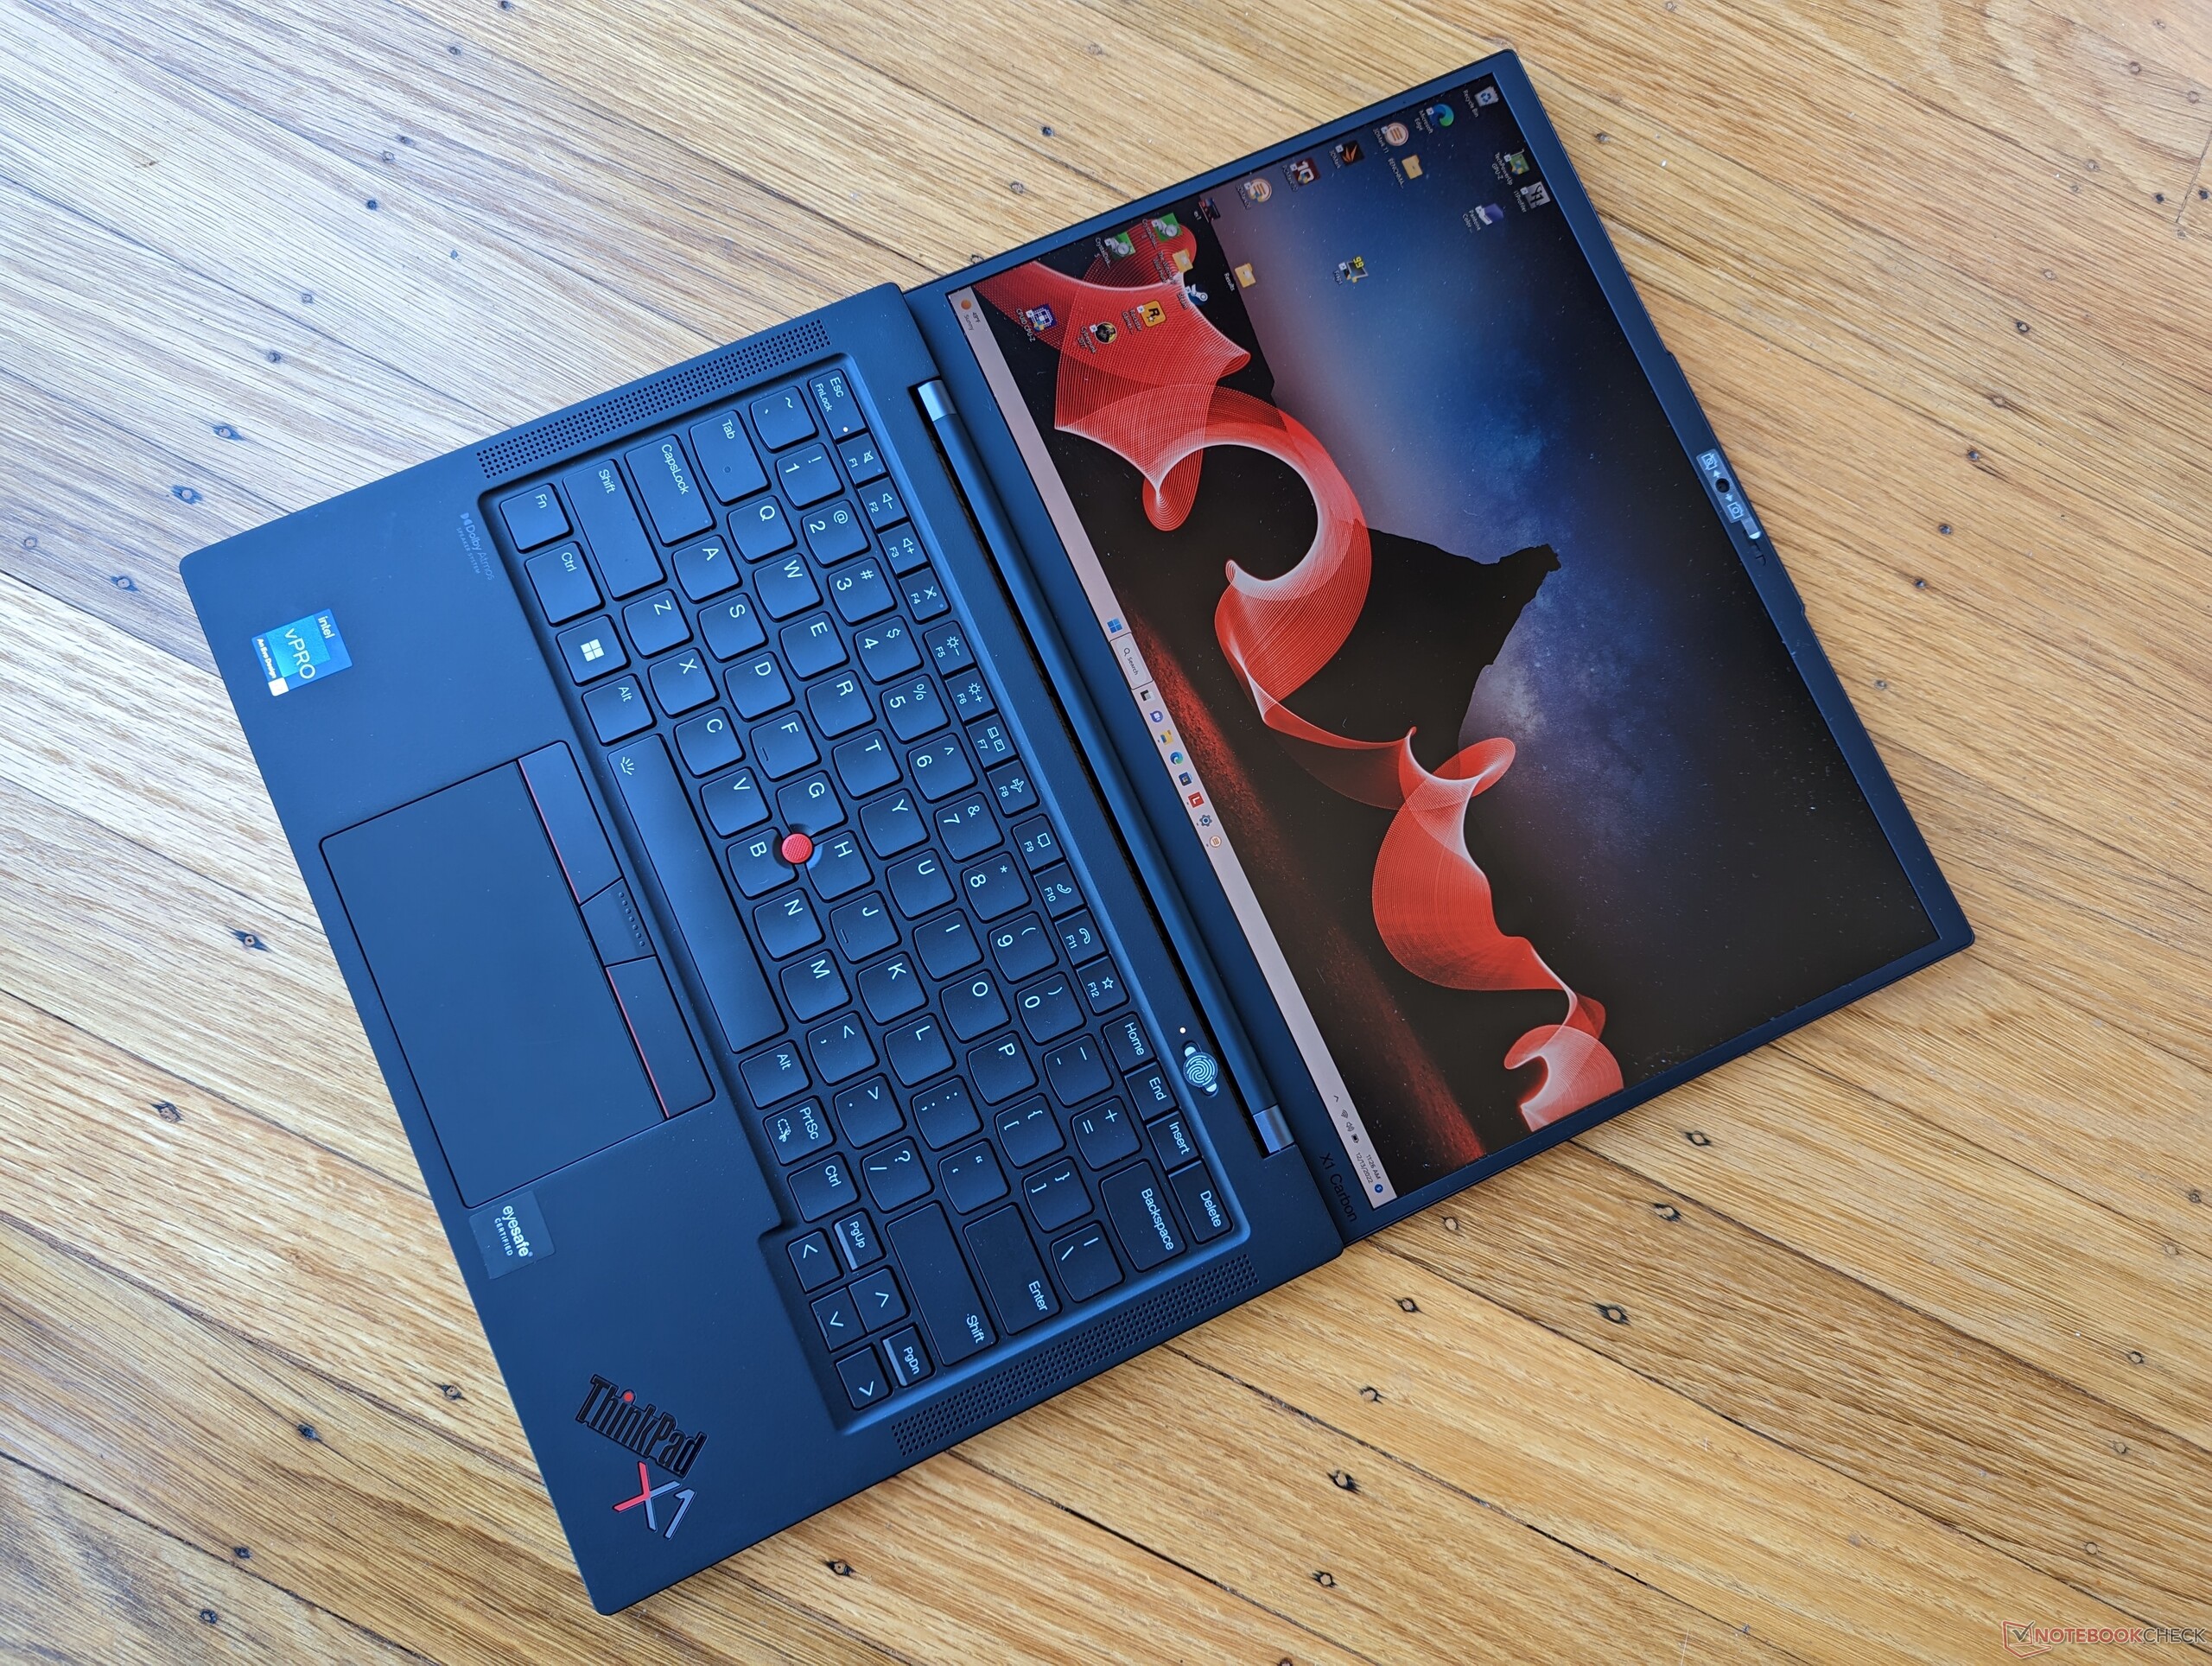
Niedawno recenzowaliśmy wersję Core i5-1250P, a teraz w tej recenzji skupimy się na wersji Core i7-1265U tego samego modelu ThinkPad X1 Carbon G10. Sprawdź naszą istniejący na wersji Core-P aby dowiedzieć się więcej o obudowie, portach, klawiaturze i innych cechach fizycznych tego modelu
Do konkurentów ThinkPada X1 Carbon G10 należą inne wysokiej klasy subnotebooki biznesowe, np.Dell Latitude 7420,Asus ExpertBook B1,HP EliteBook 845 G9lub MSI Summit
Więcej recenzji Lenovo
Potencjalni konkurenci w porównaniu
Ocena | Data | Model | Waga | Wysokość | Rozmiar | Rezolucja | Cena |
|---|---|---|---|---|---|---|---|
| 90.2 % v7 (old) | 12/2022 | Lenovo ThinkPad X1 Carbon G10 Core i7-1265U i7-1265U, Iris Xe G7 96EUs | 1.2 kg | 15.36 mm | 14.00" | 1920x1200 | |
| 90.2 % v7 (old) | Lenovo ThinkPad X1 Carbon G10 21CC001RGE i5-1250P, Iris Xe G7 80EUs | 1.2 kg | 15.36 mm | 14.00" | 1920x1200 | ||
| 88.6 % v7 (old) | 11/2022 | HP EliteBook 845 G9 6F6H9EA R5 PRO 6650U, Radeon 660M | 1.4 kg | 19 mm | 14.00" | 1920x1200 | |
| 86.6 % v7 (old) | 10/2022 | LG Gram 14Z90Q i5-1240P, Iris Xe G7 80EUs | 980 g | 16.8 mm | 14.00" | 1920x1200 | |
| 90.1 % v7 (old) | Dell Latitude 7420 JW6MH i5-1145G7, Iris Xe G7 80EUs | 1.3 kg | 17.3 mm | 14.00" | 1920x1080 | ||
| 83.9 % v7 (old) | Asus ExpertBook B1 B1400CEAE, i5-1135G7 i5-1135G7, Iris Xe G7 80EUs | 1.5 kg | 19.2 mm | 14.00" | 1920x1080 |
Sprawa
Komunikacja
| Networking | |
| iperf3 transmit AX12 | |
| Asus ExpertBook B1 B1400CEAE, i5-1135G7 | |
| Dell Latitude 7420 JW6MH | |
| iperf3 receive AX12 | |
| Dell Latitude 7420 JW6MH | |
| Asus ExpertBook B1 B1400CEAE, i5-1135G7 | |
| iperf3 receive AXE11000 6GHz | |
| LG Gram 14Z90Q | |
| Lenovo ThinkPad X1 Carbon G10 21CC001RGE | |
| Lenovo ThinkPad X1 Carbon G10 Core i7-1265U | |
| iperf3 receive AXE11000 | |
| HP EliteBook 845 G9 6F6H9EA | |
| Lenovo ThinkPad X1 Carbon G10 Core i7-1265U | |
| iperf3 transmit AXE11000 | |
| Lenovo ThinkPad X1 Carbon G10 Core i7-1265U | |
| iperf3 transmit AXE11000 6GHz | |
| Lenovo ThinkPad X1 Carbon G10 21CC001RGE | |
| Lenovo ThinkPad X1 Carbon G10 Core i7-1265U | |
Kamera internetowa


Akcesoria i gwarancja
W pudełku nie ma żadnych dodatków poza zasilaczem sieciowym. W przypadku zakupu w USA obowiązuje roczna gwarancja producenta na miejscu.
Wyświetl
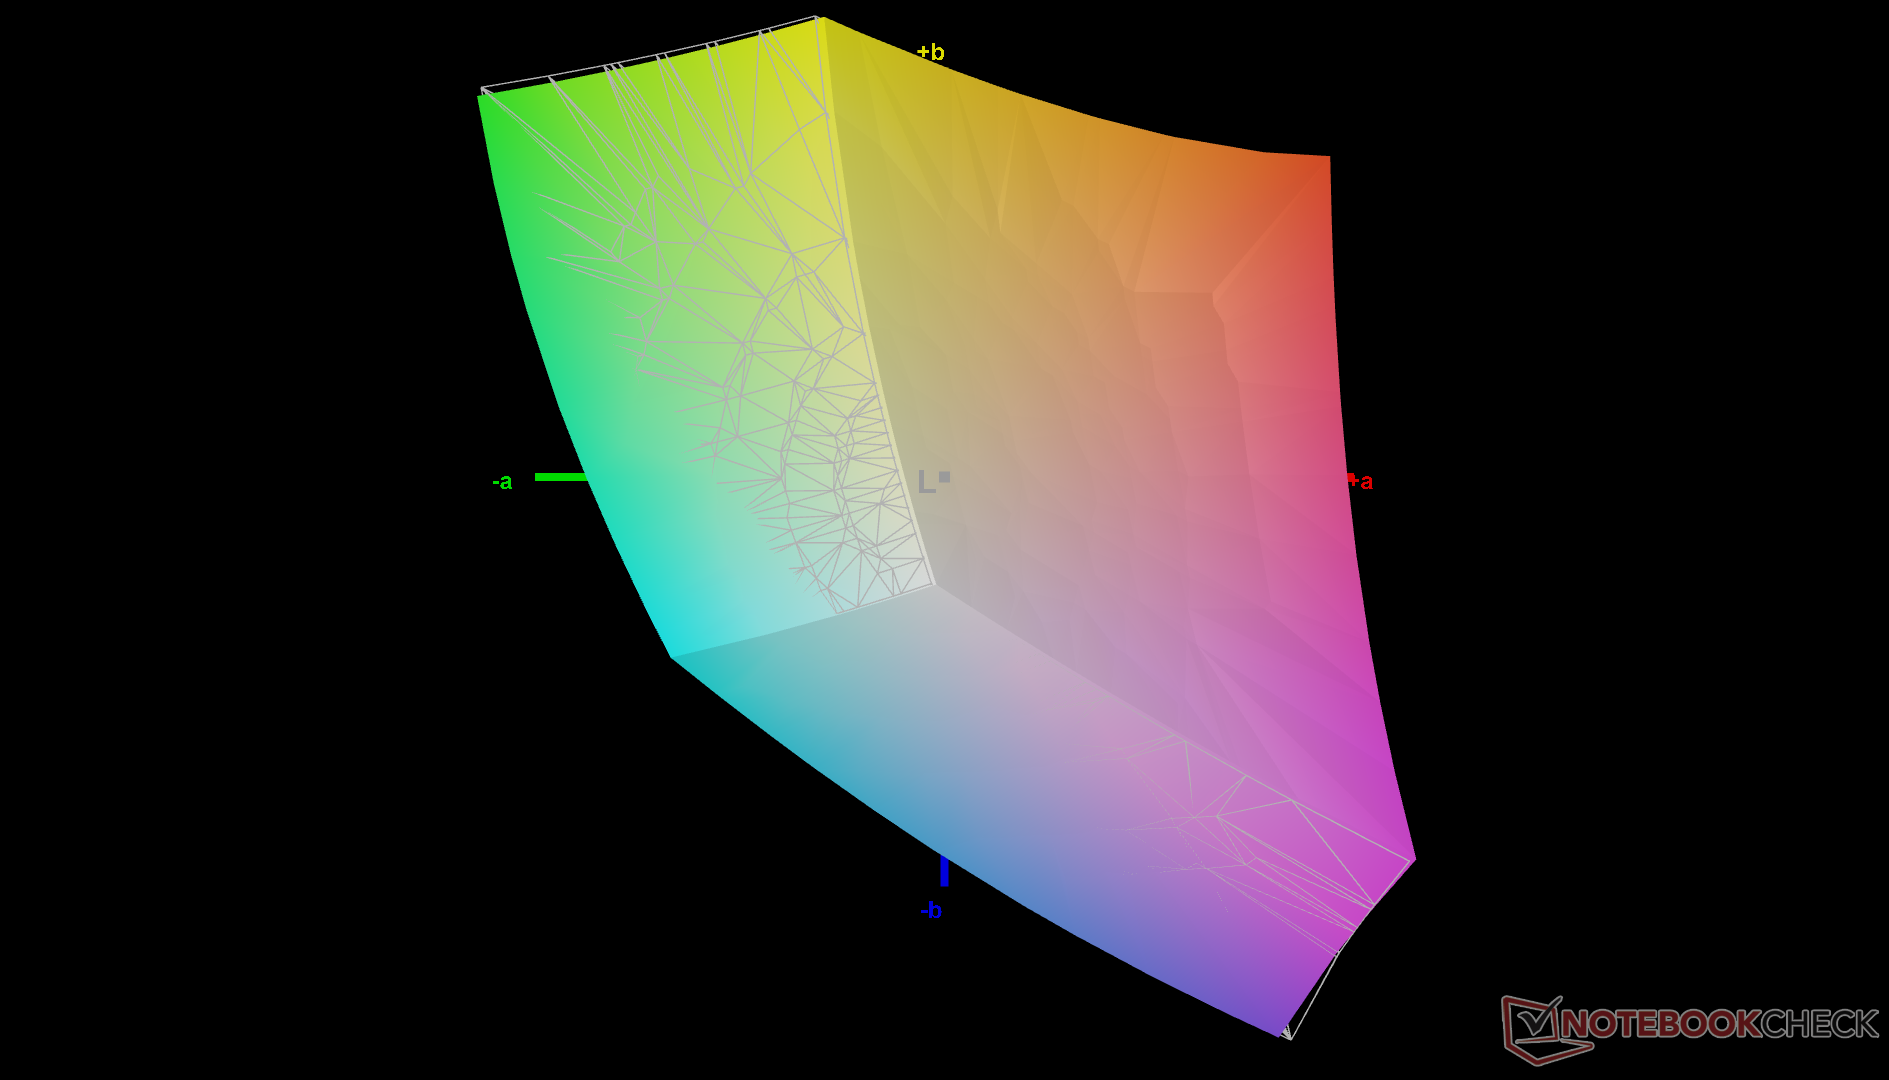
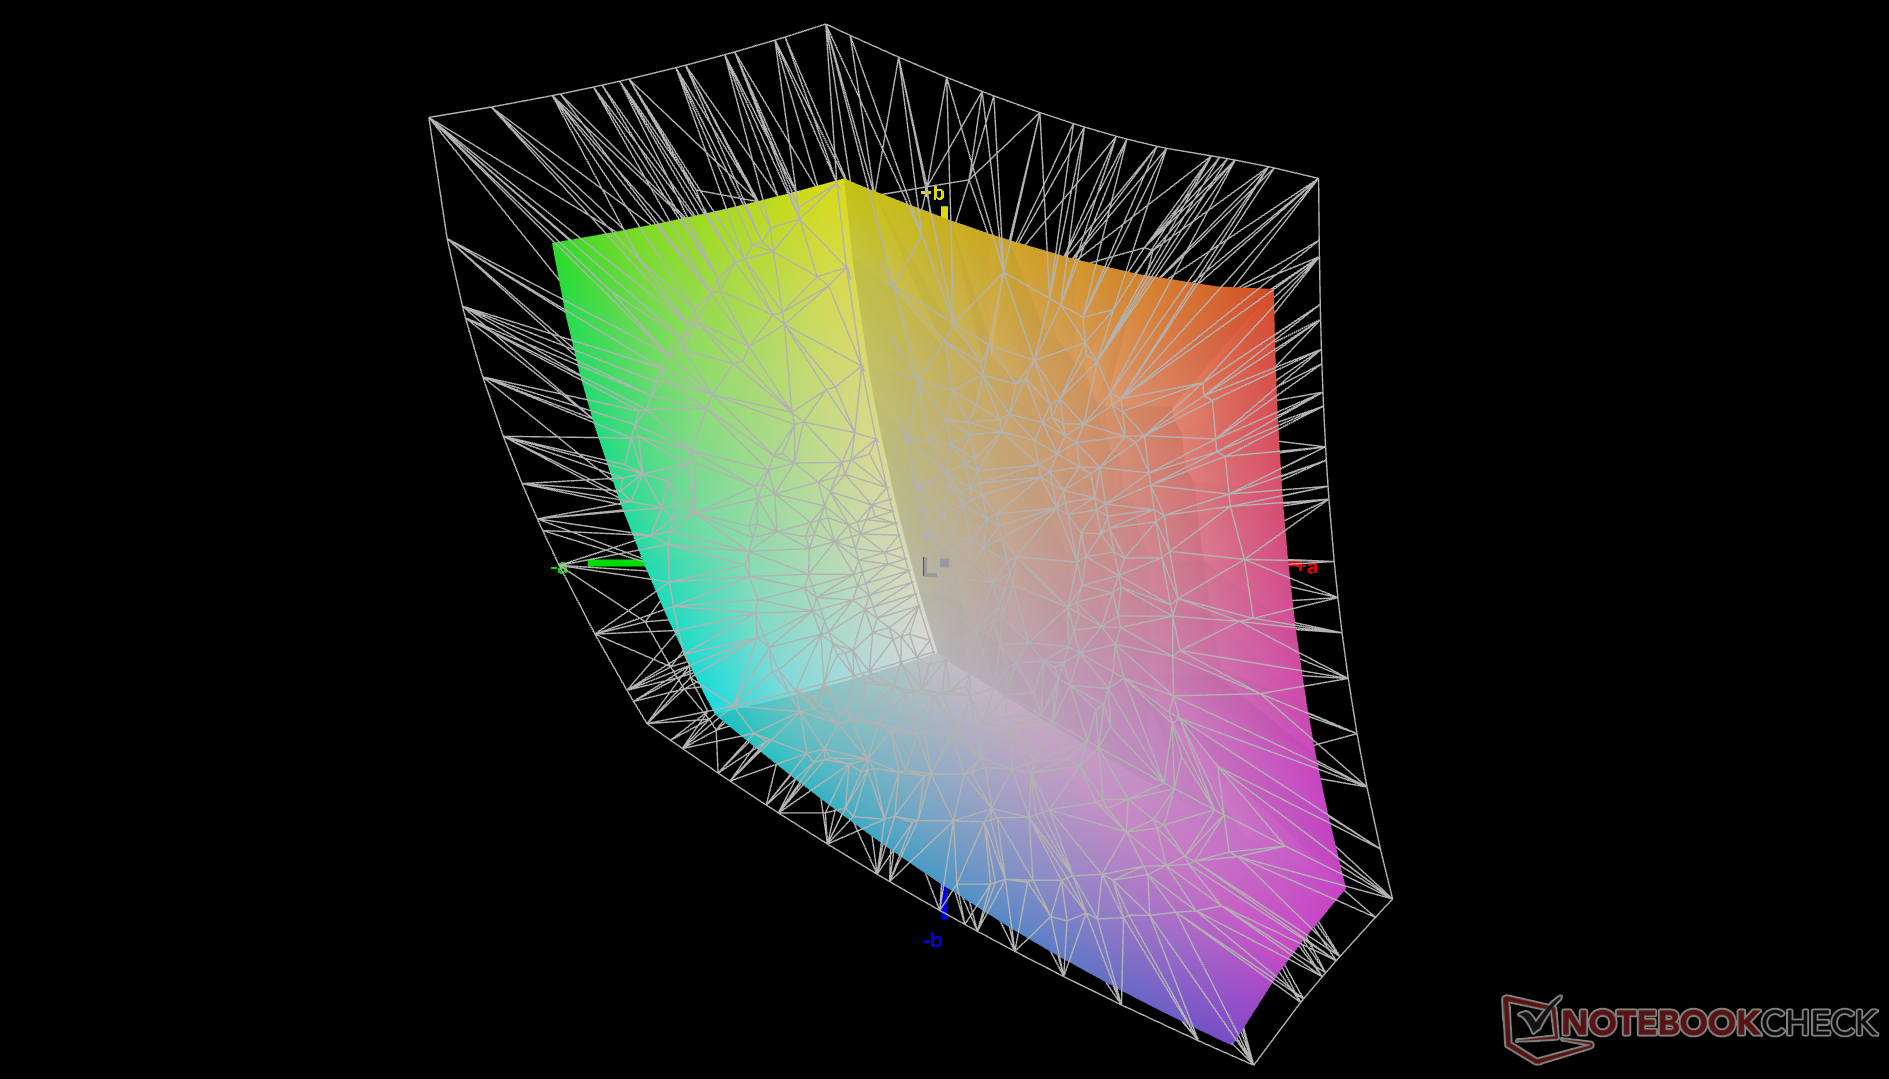
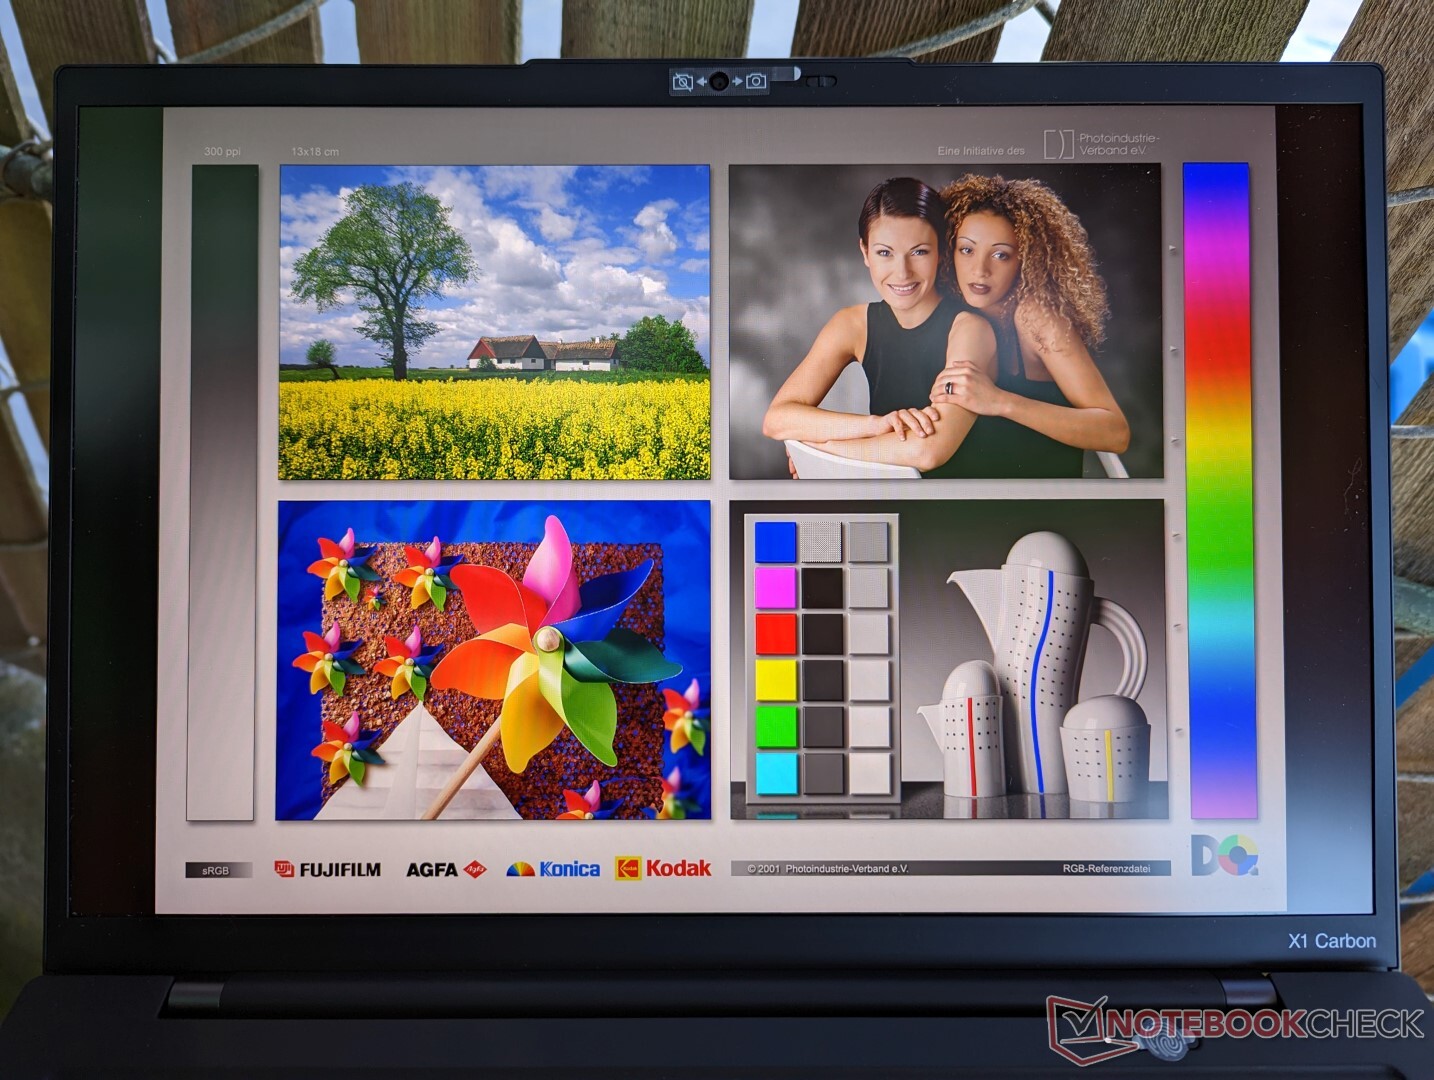
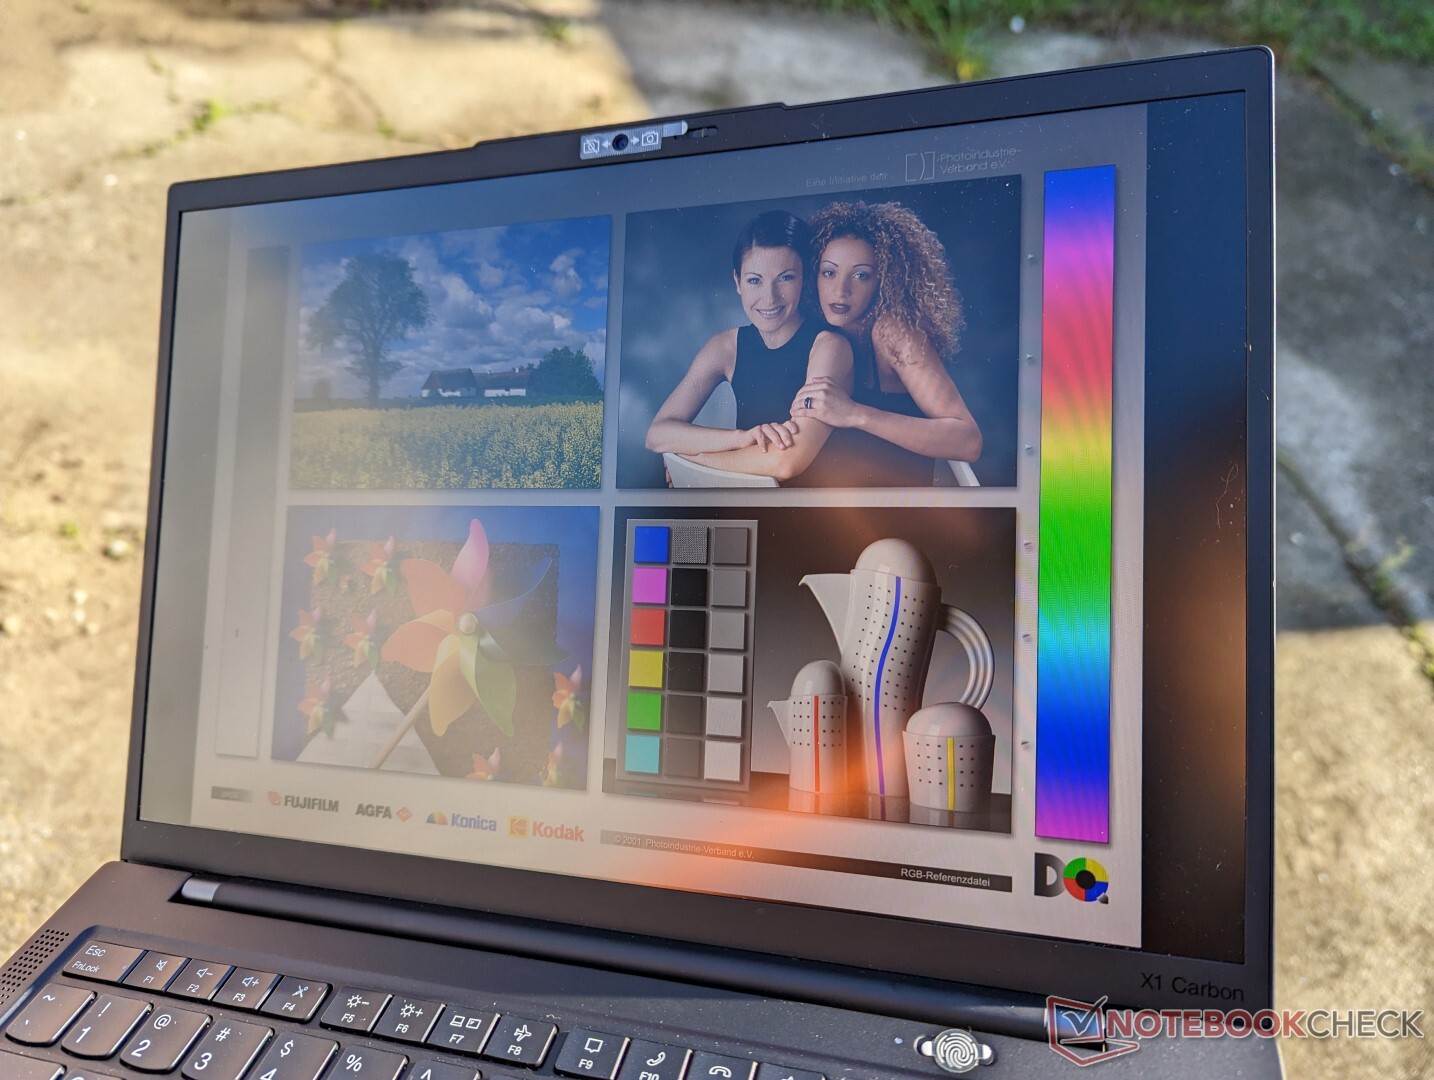
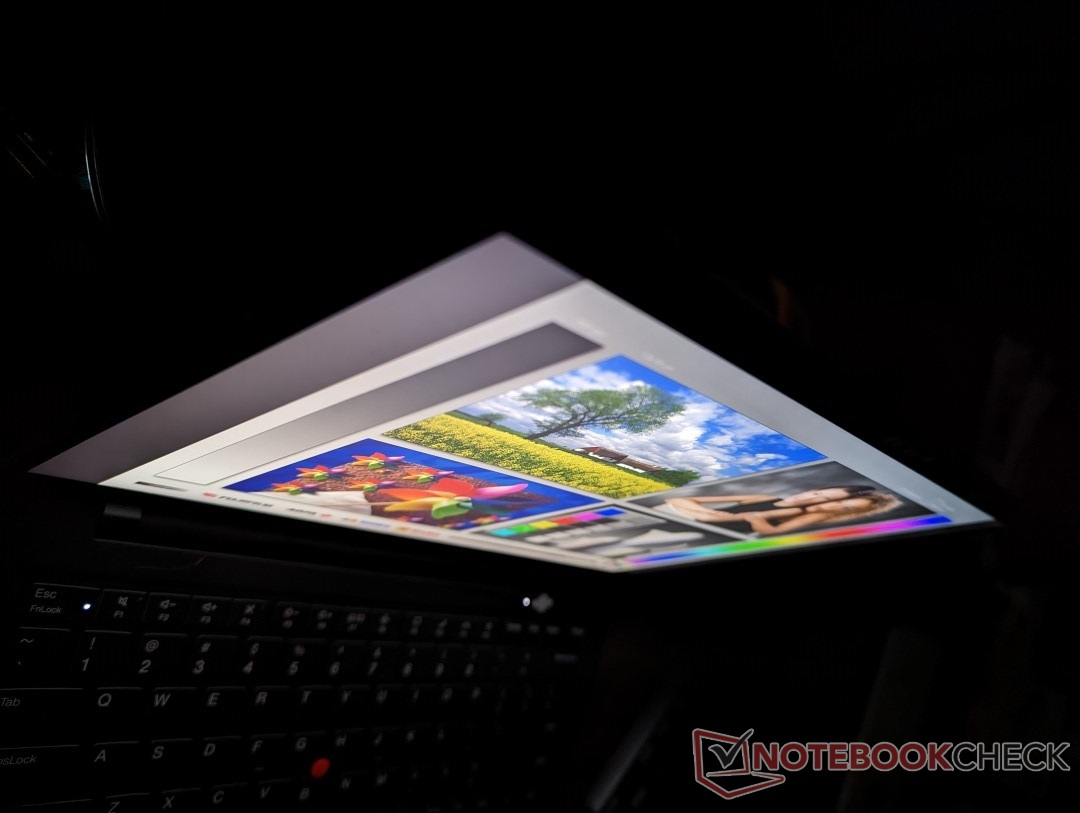
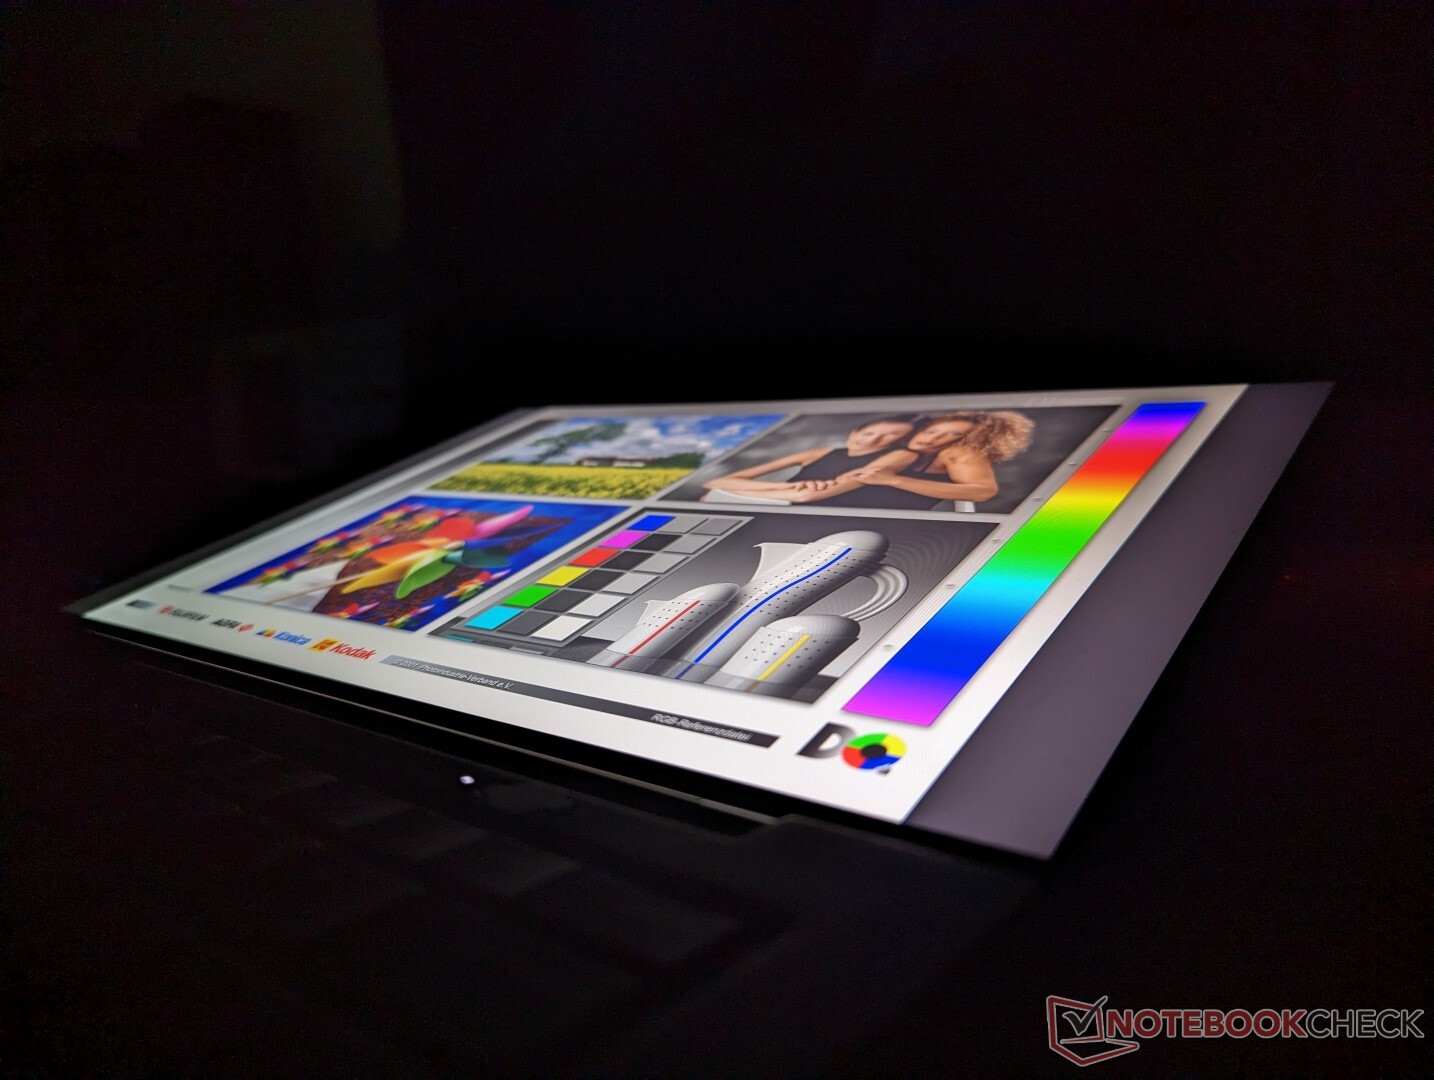
Co ciekawe, nasz Core-U wykorzystuje panel IPS 1200p od IVO zamiast panelu B140UAN02.1 od AU Optronics, który znajduje się w naszym Core-P. Choć oba panele w pełni pokrywają standard sRGB, panel IVO wydaje się oferować wolniejsze czasy reakcji i gorszy współczynnik kontrastu niż panel AUO, co pokazują nasze poniższe pomiary. W rezultacie, na panelu IVO bardziej widoczny jest efekt smużenia
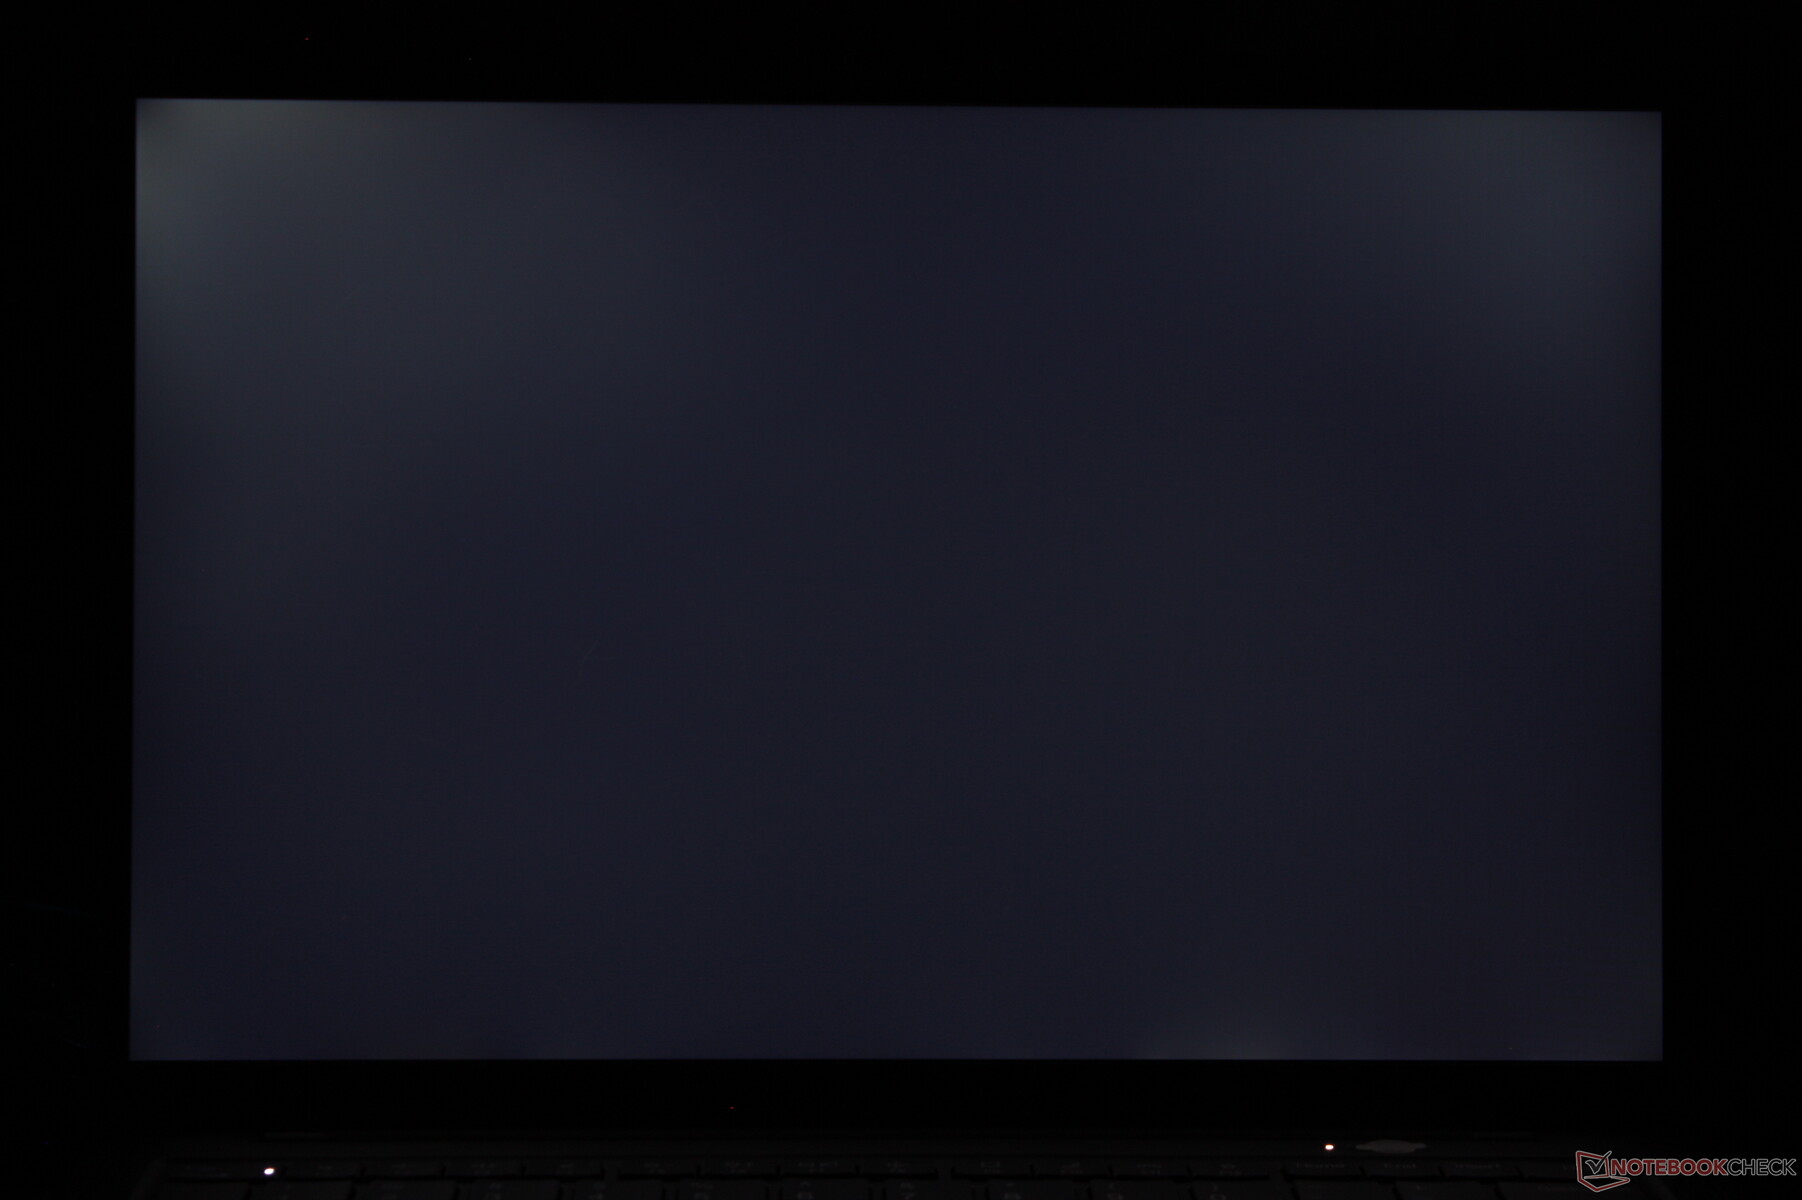
Panel IVO ma jednak kilka zalet. Podświetlenie w naszym egzemplarzu testowym jest średnio nieco jaśniejsze i nie wykazuje modulacji szerokości impulsu, w przeciwieństwie do panelu AUO w naszej konfiguracji Core-P. Użytkownicy, którzy mogą być wrażliwi na migotanie ekranu, mogą w związku z tym preferować panel IVO. Niestety, nie ma sposobu, aby wiedzieć lub zagwarantować, który z tych dwóch paneli otrzymasz, jeśli zamówisz online.
| |||||||||||||||||||||||||
rozświetlenie: 87 %
na akumulatorze: 421.9 cd/m²
kontrast: 1455:1 (czerń: 0.29 cd/m²)
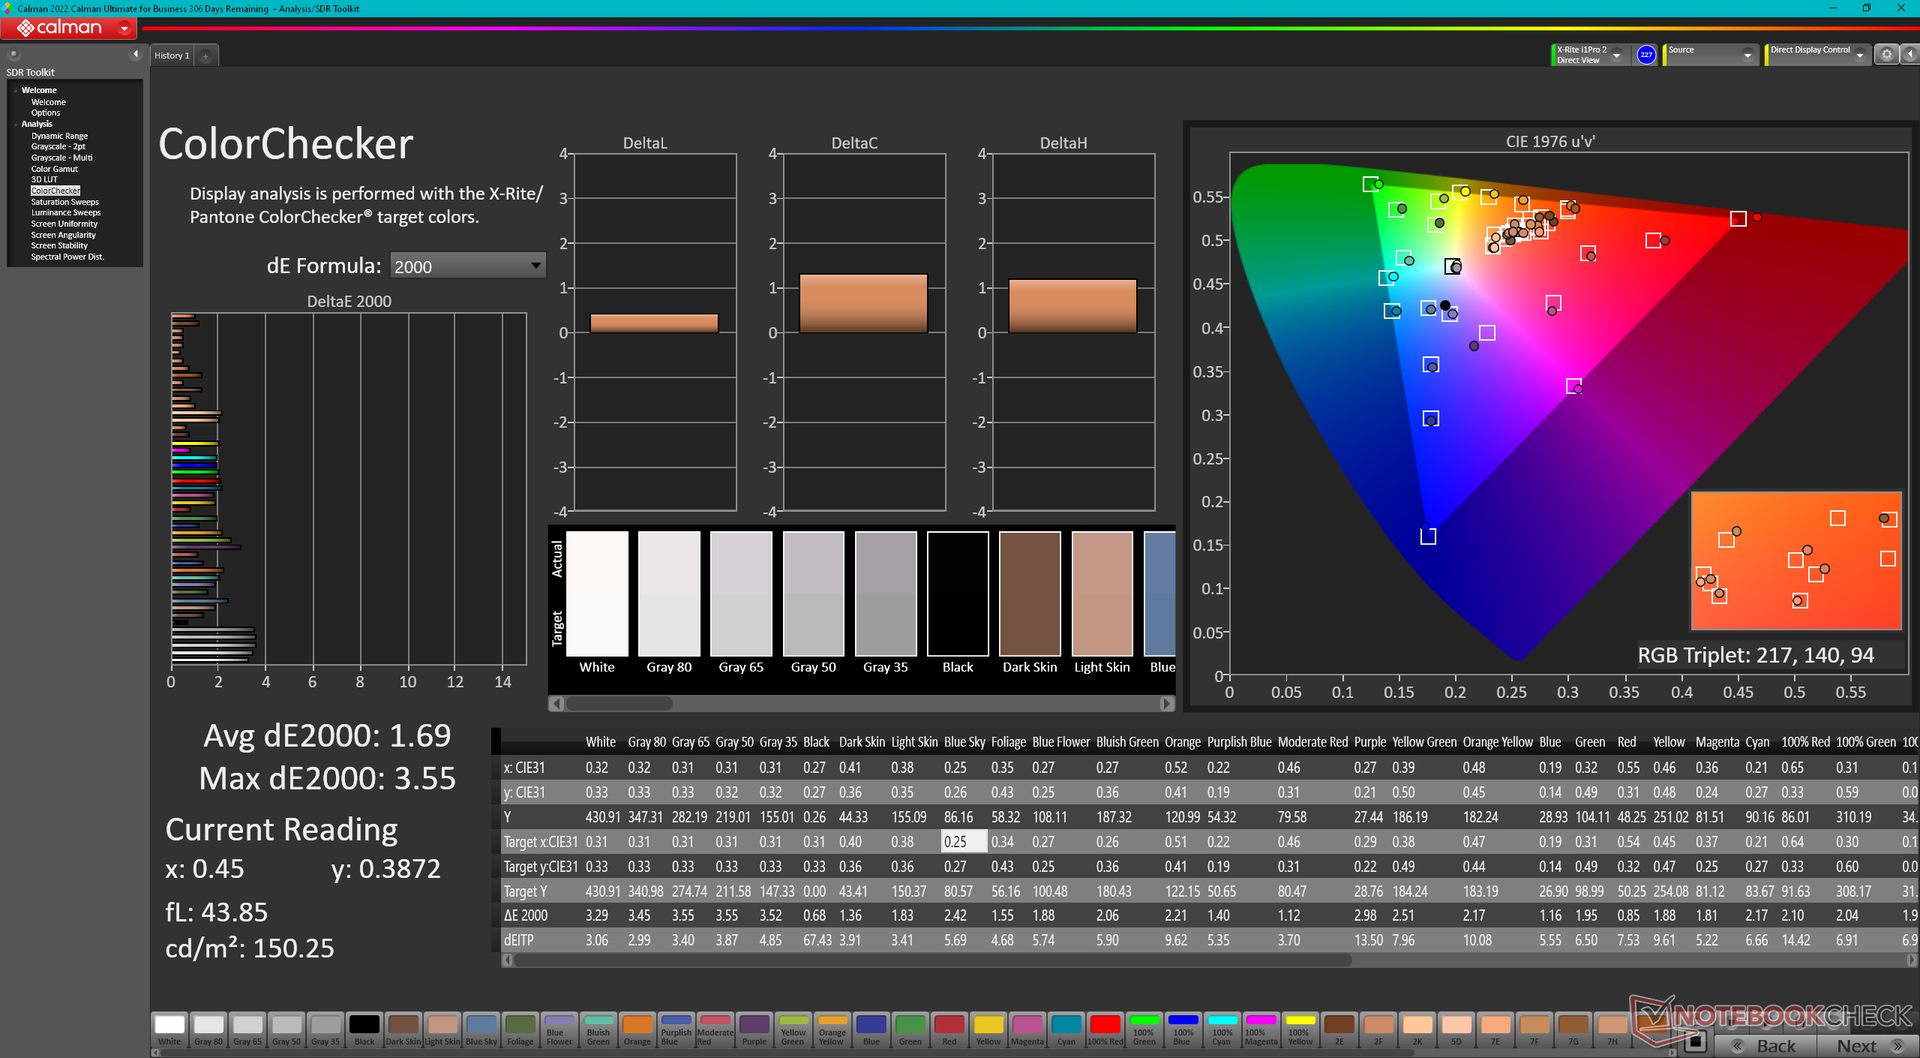
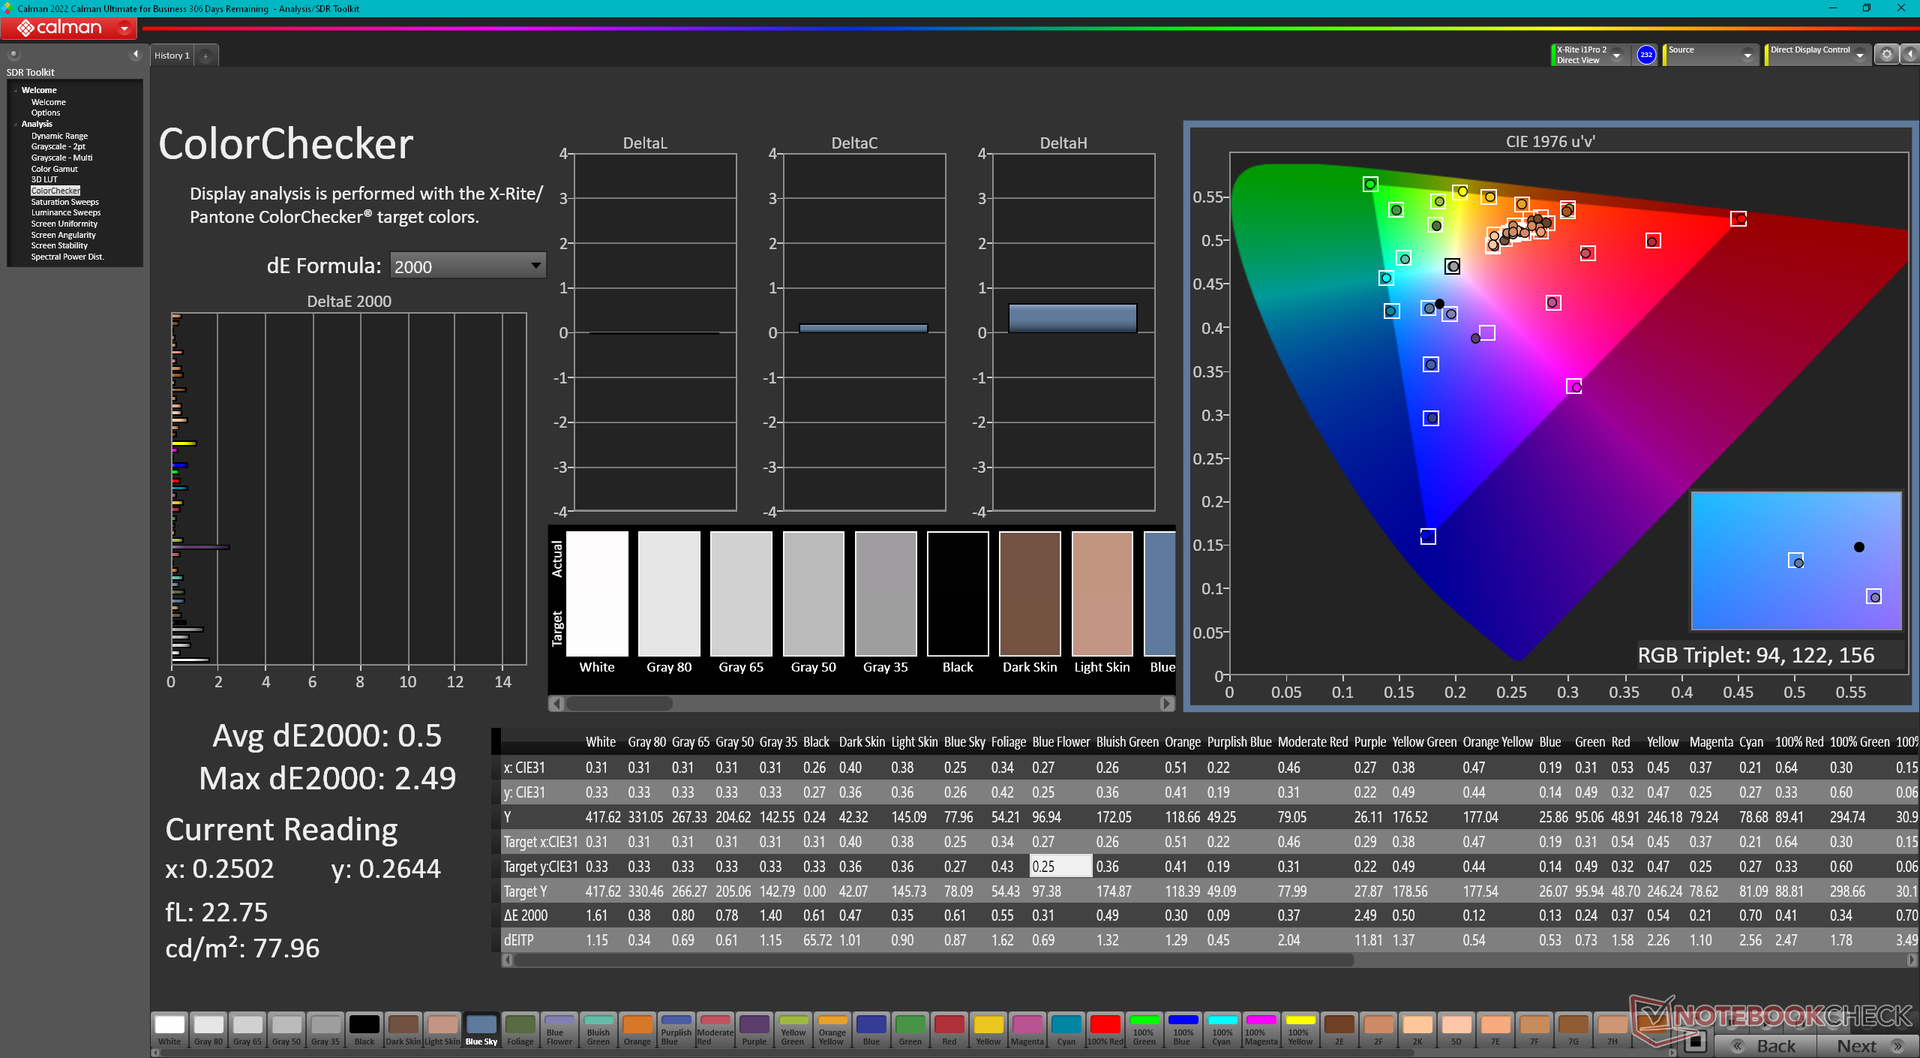
ΔE ColorChecker Calman: 1.69 | ∀{0.5-29.43 Ø4.73}
calibrated: 0.5
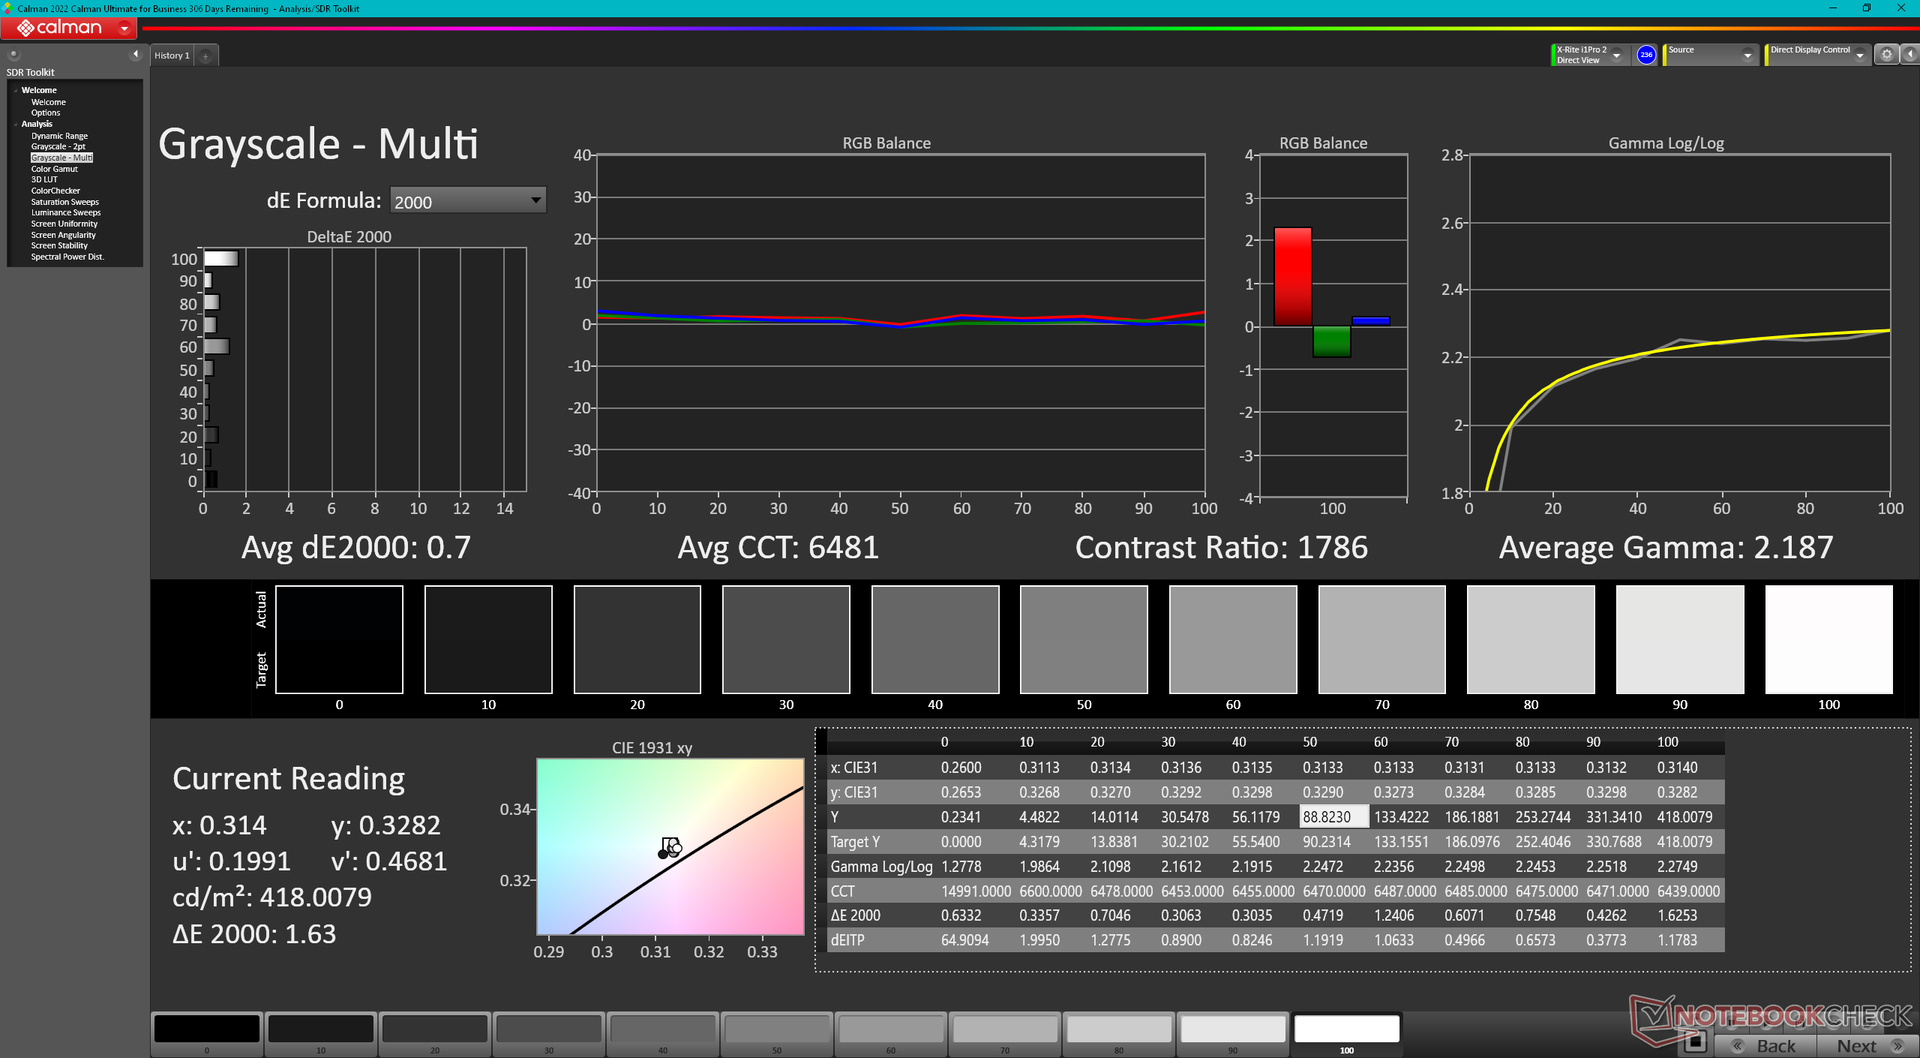
ΔE Greyscale Calman: 2.8 | ∀{0.09-98 Ø4.97}
70.2% AdobeRGB 1998 (Argyll 3D)
99.5% sRGB (Argyll 3D)
68.7% Display P3 (Argyll 3D)
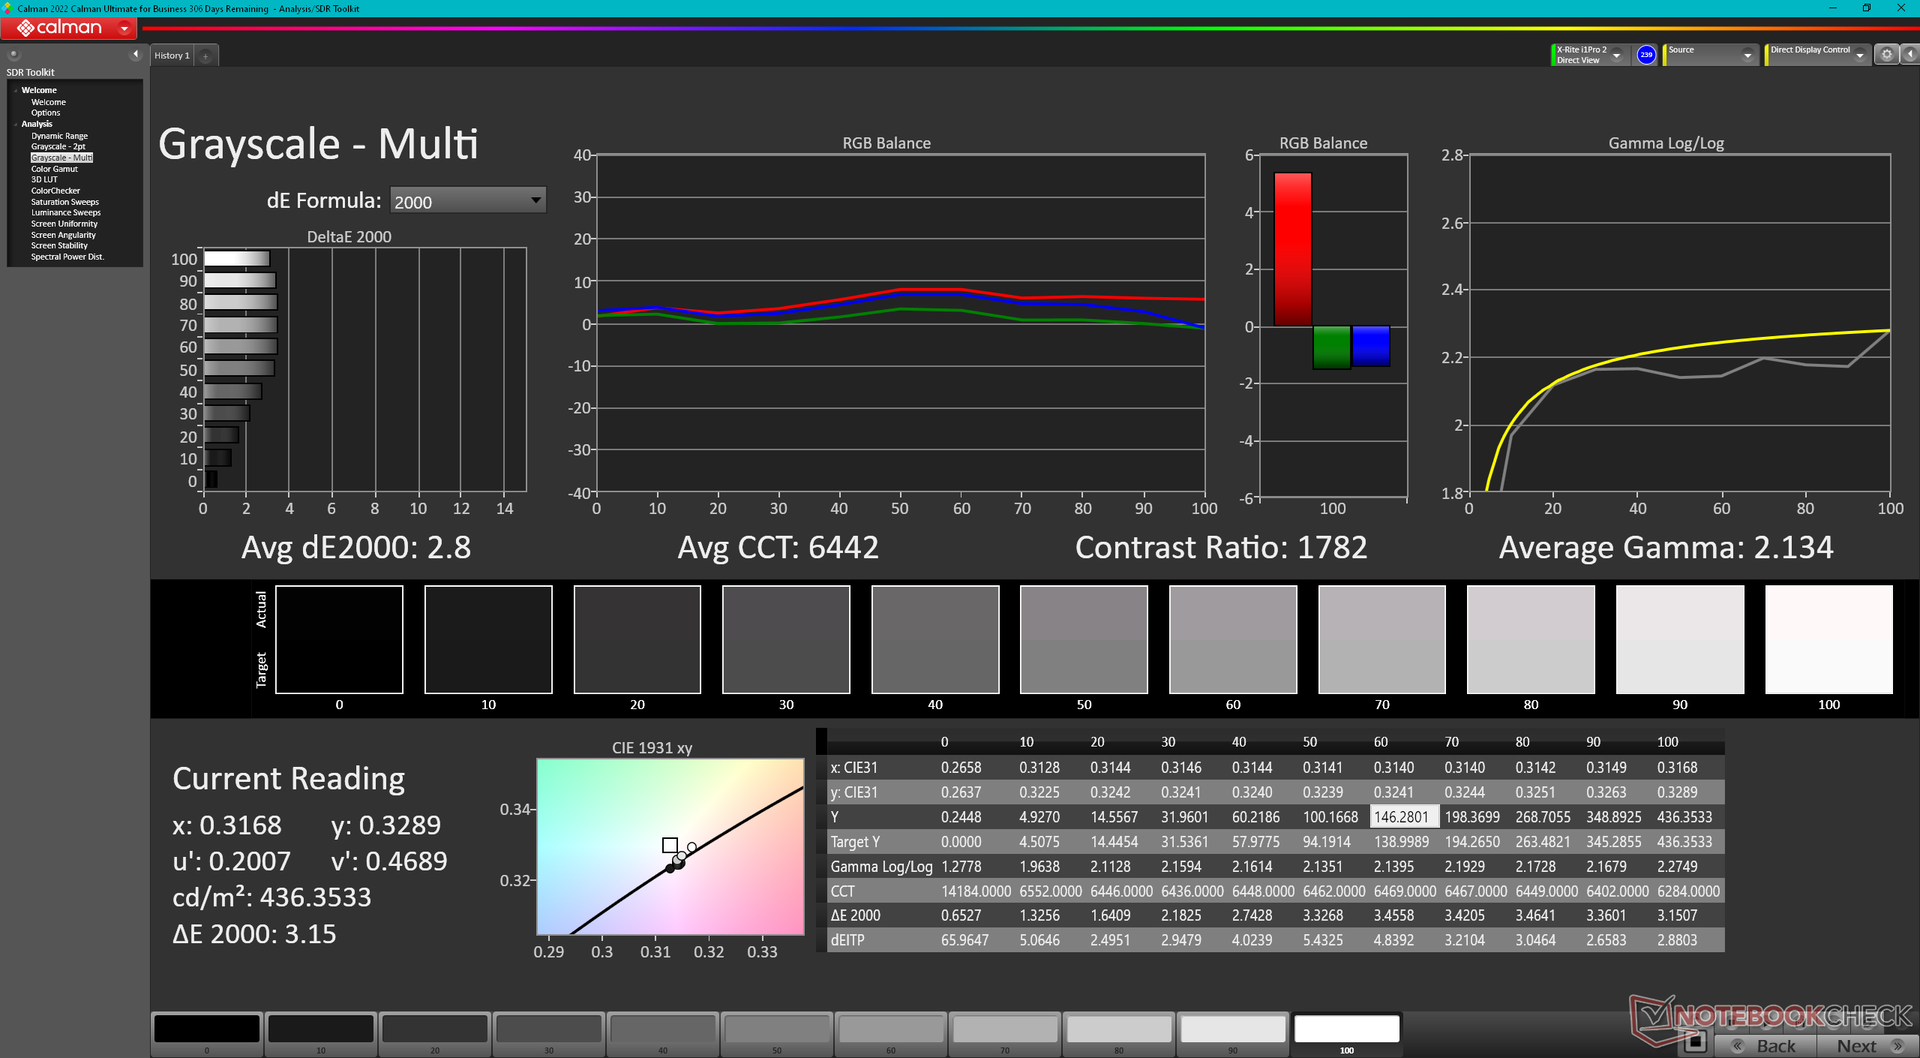
Gamma: 2.13
CCT: 6442 K
| Lenovo ThinkPad X1 Carbon G10 Core i7-1265U R140NW4D R0, IPS, 1920x1200, 14" | Lenovo ThinkPad X1 Carbon G10 21CC001RGE B140UAN02.1, IPS LED, 1920x1200, 14" | HP EliteBook 845 G9 6F6H9EA AUOA49A, IPS, 1920x1200, 14" | LG Gram 14Z90Q LG LP140WU1-SPF1, IPS, 1920x1200, 14" | Dell Latitude 7420 JW6MH Chi Mei CMN1416 CHF07 140HCG, IPS, 1920x1080, 14" | Asus ExpertBook B1 B1400CEAE, i5-1135G7 Chi Mei CMN14D4, IPS, 1920x1080, 14" | |
|---|---|---|---|---|---|---|
| Display | 6% | 7% | 22% | -1% | -37% | |
| Display P3 Coverage (%) | 68.7 | 74.6 9% | 75.4 10% | 98.4 43% | 68 -1% | 42.8 -38% |
| sRGB Coverage (%) | 99.5 | 98.6 -1% | 100 1% | 99.9 0% | 99 -1% | 63.9 -36% |
| AdobeRGB 1998 Coverage (%) | 70.2 | 76.5 9% | 76.6 9% | 85.9 22% | 70 0% | 44.3 -37% |
| Response Times | 31% | 16% | 29% | 20% | 41% | |
| Response Time Grey 50% / Grey 80% * (ms) | 55.2 ? | 45.5 ? 18% | 58.8 ? -7% | 47.5 ? 14% | 55 ? -0% | 35.2 ? 36% |
| Response Time Black / White * (ms) | 43.2 ? | 24 ? 44% | 26.7 ? 38% | 24.5 ? 43% | 26 ? 40% | 23.2 ? 46% |
| PWM Frequency (Hz) | 53050 ? | 25000 ? | ||||
| Screen | -49% | -23% | -47% | -2% | -168% | |
| Brightness middle (cd/m²) | 421.9 | 372 -12% | 408 -3% | 341 -19% | 408 -3% | 256 -39% |
| Brightness (cd/m²) | 420 | 362 -14% | 402 -4% | 305 -27% | 378 -10% | 239 -43% |
| Brightness Distribution (%) | 87 | 94 8% | 92 6% | 87 0% | 86 -1% | 83 -5% |
| Black Level * (cd/m²) | 0.29 | 0.18 38% | 0.24 17% | 0.26 10% | 0.22 24% | 0.23 21% |
| Contrast (:1) | 1455 | 2067 42% | 1700 17% | 1312 -10% | 1855 27% | 1113 -24% |
| Colorchecker dE 2000 * | 1.69 | 3.4 -101% | 2.09 -24% | 3.11 -84% | 1.54 9% | 6.2 -267% |
| Colorchecker dE 2000 max. * | 3.55 | 6.7 -89% | 5.09 -43% | 8.29 -134% | 2.72 23% | 18.2 -413% |
| Colorchecker dE 2000 calibrated * | 0.5 | 1.8 -260% | 1.56 -212% | 0.83 -66% | 1.08 -116% | 3.8 -660% |
| Greyscale dE 2000 * | 2.8 | 4.3 -54% | 1.7 39% | 5.3 -89% | 1.95 30% | 5 -79% |
| Gamma | 2.13 103% | 2.13 103% | 2.138 103% | 2.037 108% | 2.33 94% | 1.97 112% |
| CCT | 6442 101% | 6158 106% | 6628 98% | 7571 86% | 6806 96% | 7364 88% |
| Całkowita średnia (program / ustawienia) | -4% /
-26% | 0% /
-11% | 1% /
-21% | 6% /
2% | -55% /
-110% |
* ... im mniej tym lepiej
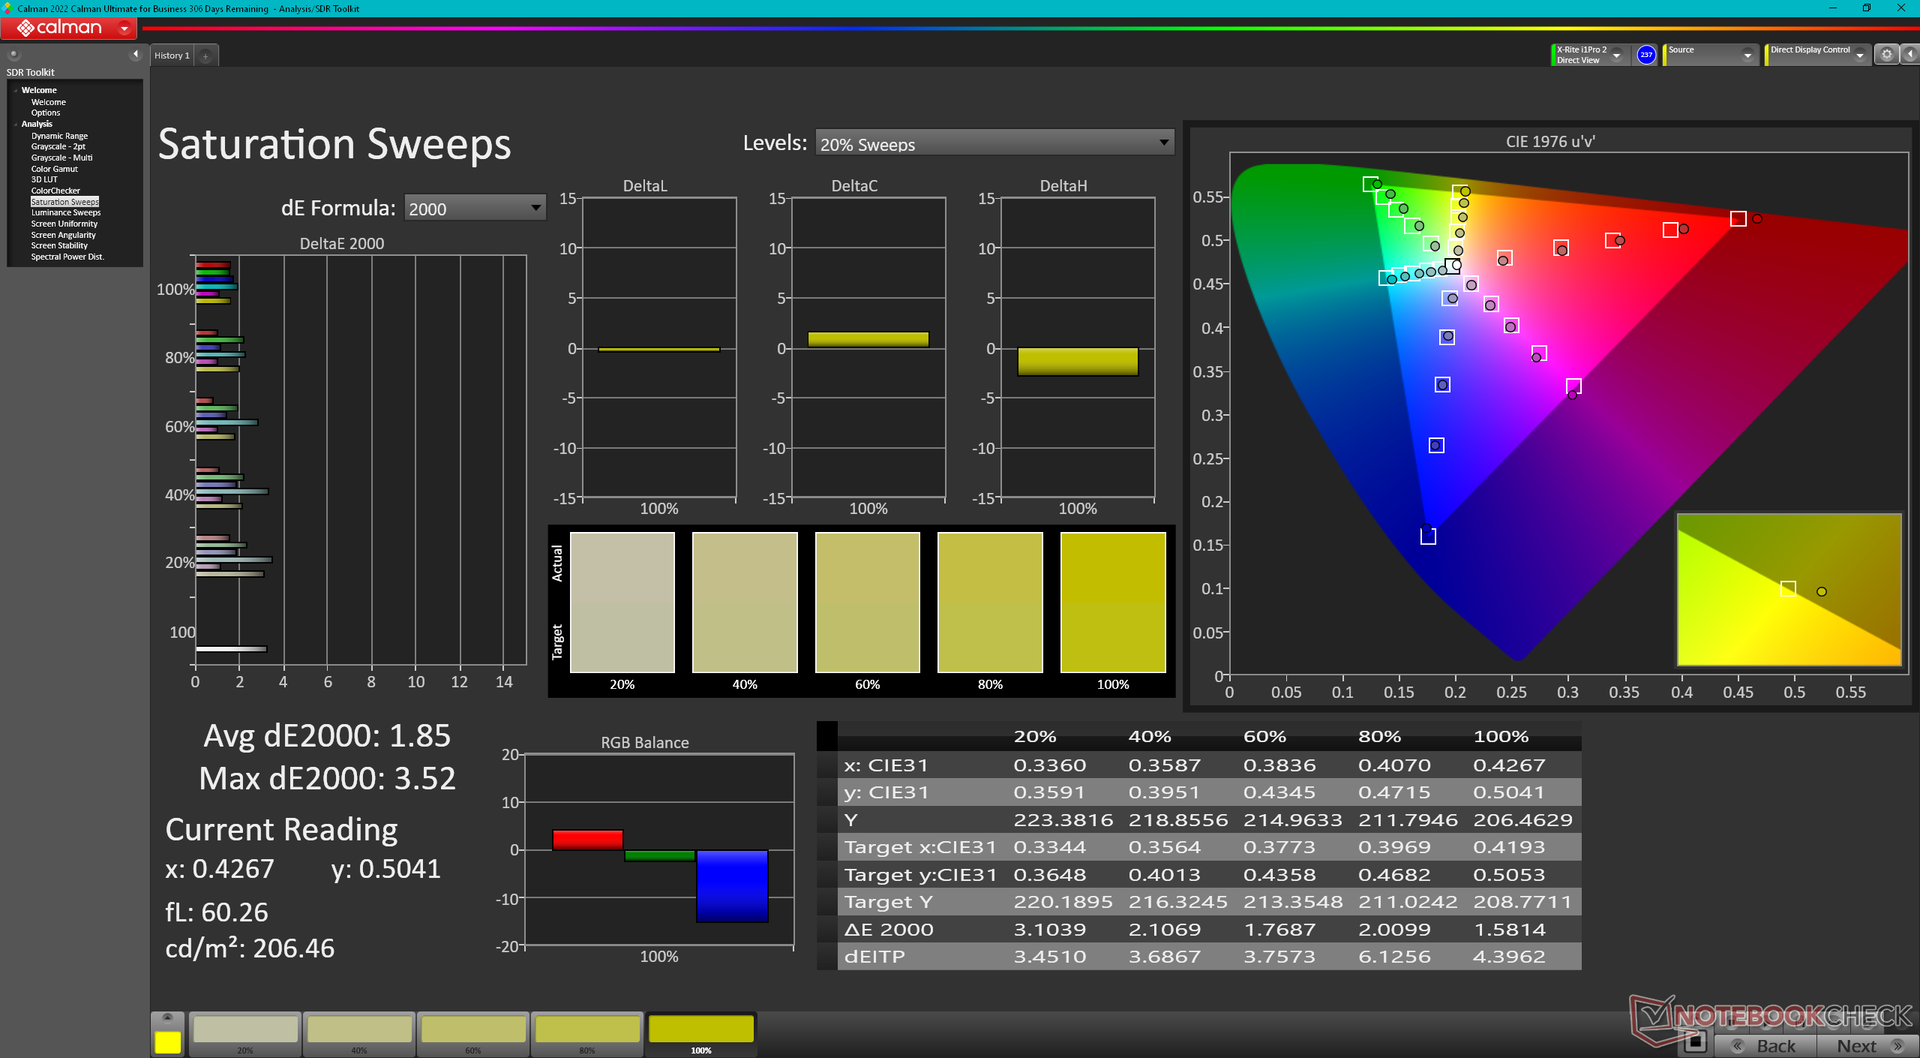
Panel jest już dobrze skalibrowany po wyjęciu z pudełka, a średnie wartości deltaE w skali szarości i kolorze wynoszą odpowiednio 2,8 i 1,69. Nasza własna kalibracja kolorymetrem X-Rite poprawiłaby te średnie jeszcze bardziej do <1 każda, ale nie będzie to konieczne dla większości użytkowników. Nasz skalibrowany profil ICM jest dostępny powyżej za darmo dla posiadaczy, którzy chcą spróbować.

Wyświetl czasy reakcji
| ↔ Czas reakcji od czerni do bieli | ||
|---|---|---|
| 43.2 ms ... wzrost ↗ i spadek ↘ łącznie | ↗ 22 ms wzrost | 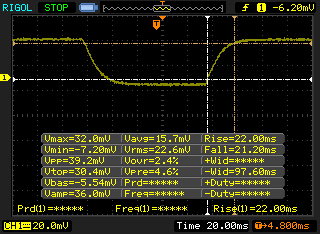 |
| ↘ 21.2 ms upadek | ||
| W naszych testach ekran wykazuje powolne tempo reakcji, co będzie niezadowalające dla graczy. Dla porównania, wszystkie testowane urządzenia wahają się od 0.1 (minimum) do 240 (maksimum) ms. » 98 % wszystkich urządzeń jest lepszych. Oznacza to, że zmierzony czas reakcji jest gorszy od średniej wszystkich testowanych urządzeń (19.9 ms). | ||
| ↔ Czas reakcji 50% szarości do 80% szarości | ||
| 55.2 ms ... wzrost ↗ i spadek ↘ łącznie | ↗ 28.4 ms wzrost | 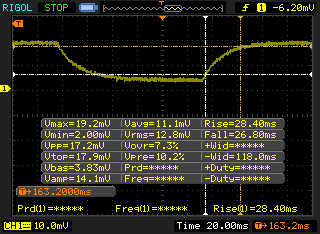 |
| ↘ 26.8 ms upadek | ||
| W naszych testach ekran wykazuje powolne tempo reakcji, co będzie niezadowalające dla graczy. Dla porównania, wszystkie testowane urządzenia wahają się od 0.165 (minimum) do 636 (maksimum) ms. » 92 % wszystkich urządzeń jest lepszych. Oznacza to, że zmierzony czas reakcji jest gorszy od średniej wszystkich testowanych urządzeń (31.1 ms). | ||
Migotanie ekranu / PWM (modulacja szerokości impulsu)
| Migotanie ekranu/nie wykryto PWM | 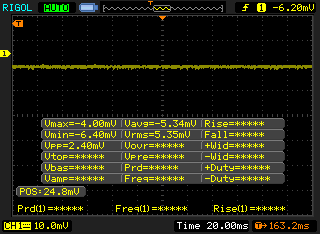 | ||
Dla porównania: 52 % wszystkich testowanych urządzeń nie używa PWM do przyciemniania wyświetlacza. Jeśli wykryto PWM, zmierzono średnio 7798 (minimum: 5 - maksimum: 343500) Hz. | |||


Wydajność - Intel 12. gen
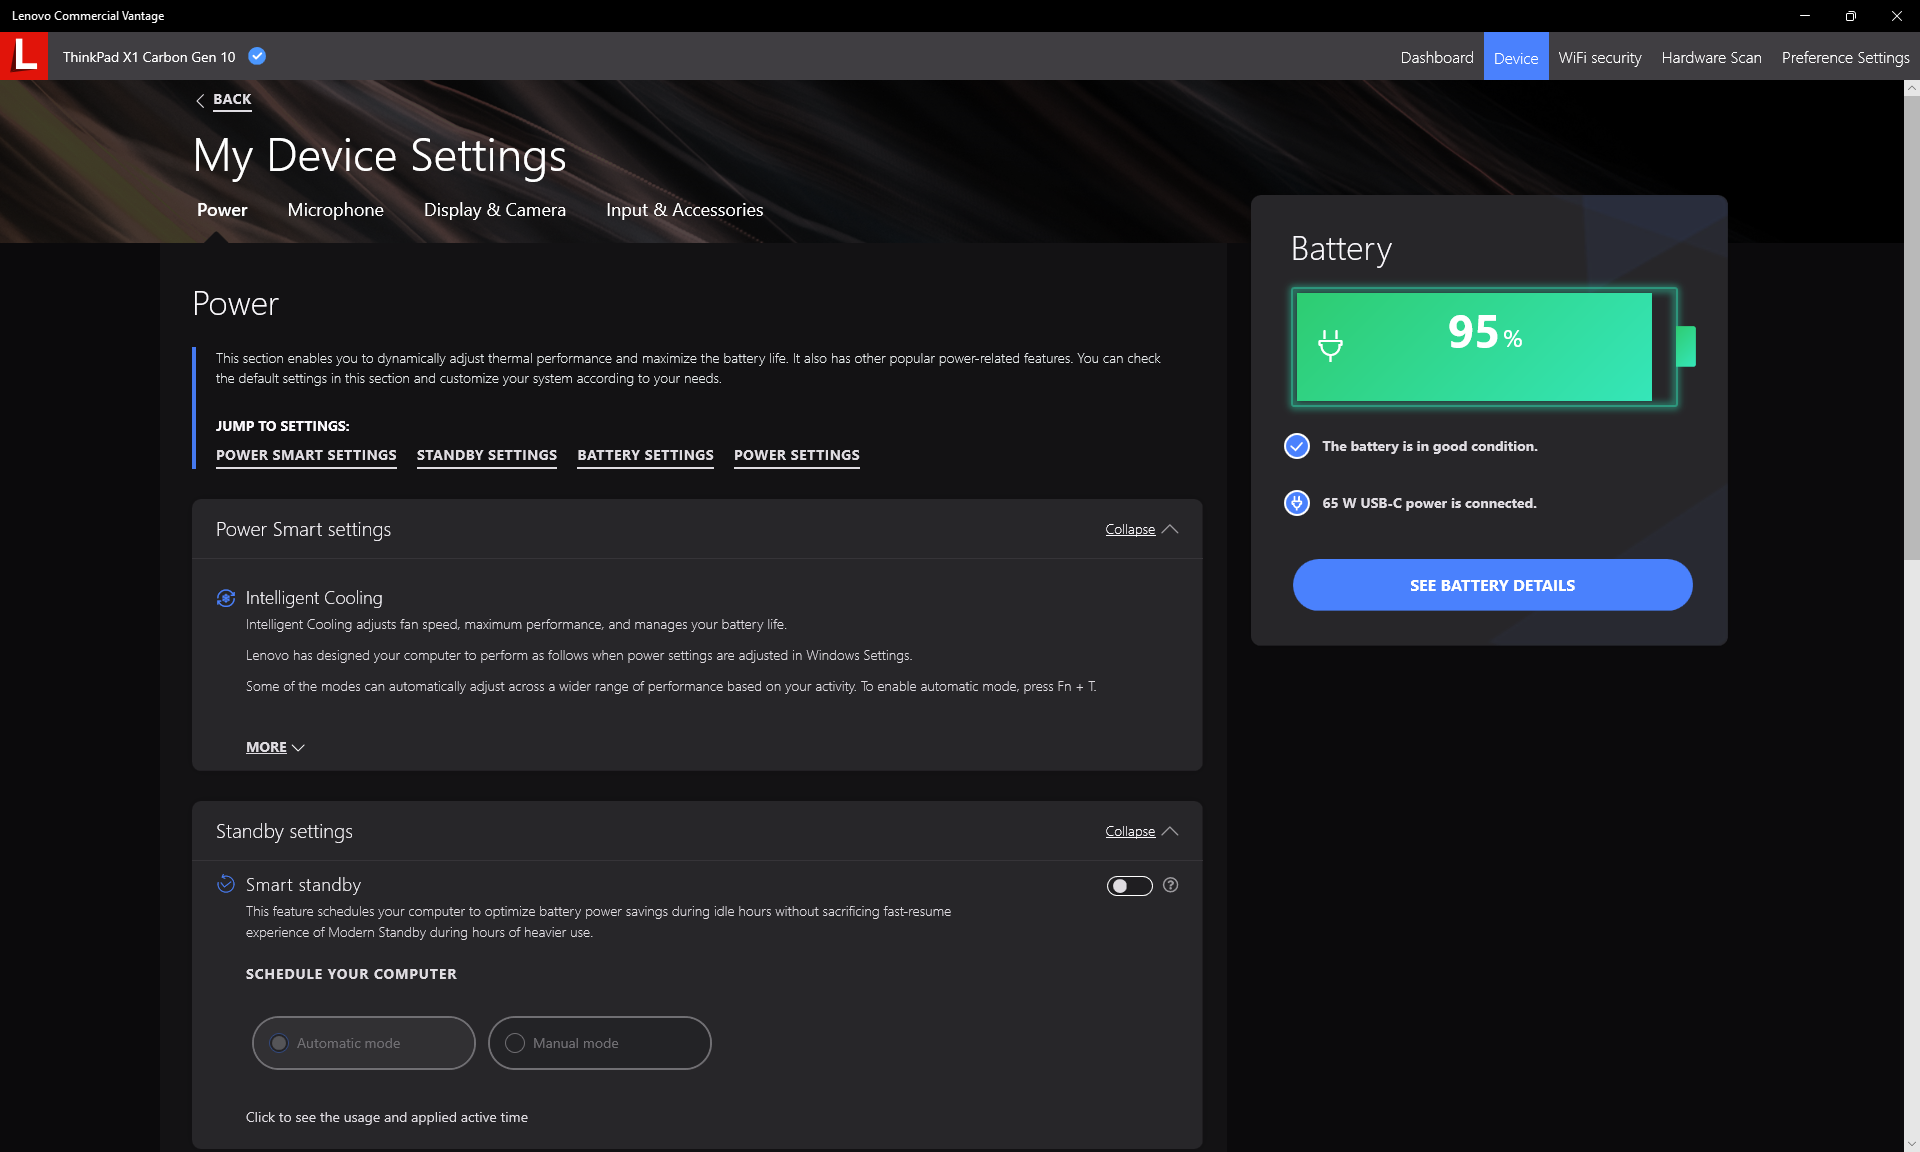
Warunki badania
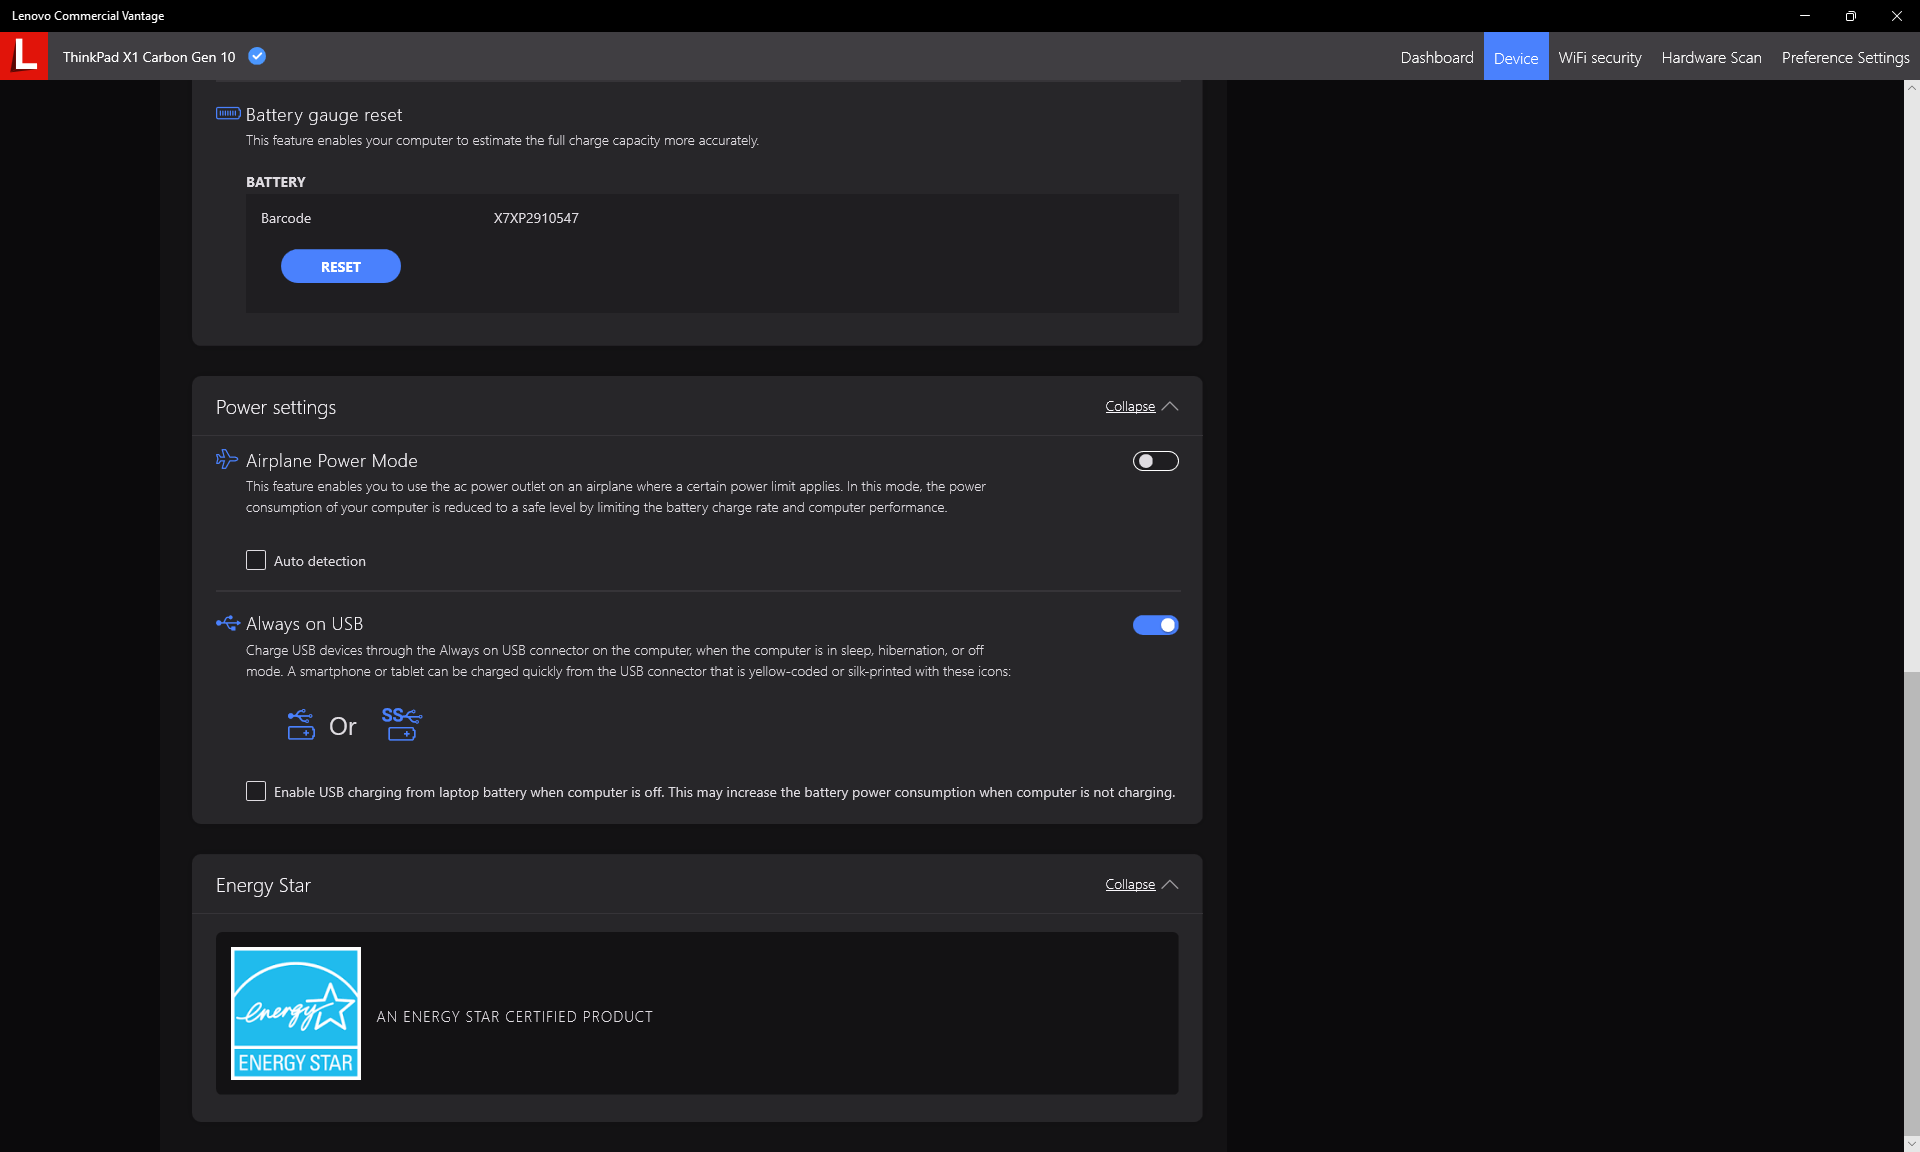
Przed przeprowadzeniem poniższych benchmarków, ustawiliśmy nasze urządzenie w trybie "Best performance" za pośrednictwem systemu Windows. Preinstalowane oprogramowanie Vantage nie zawiera żadnych opcji profilu zasilania z domyślnie włączonym inteligentnym chłodzeniem, jak pokazuje poniższy zrzut ekranu.
Procesor
Podczas uruchamiania CineBench R15 xT w pętli, nasz Core i7-1265U był nieco wolniejszy od Core i5-1250P na początku testu. W miarę postępów benchmarku w pętli, i7-1265U wyprzedzał jednak i5-1250P, co pokazuje nasz wykres porównawczy poniżej. Wyniki te sugerują, że Core i5-1250P może mieć wyższą początkową wydajność Turbo Boost niż nasz i7-1265U, ale zyski są krótkotrwałe.
Nie oznacza to, że należy unikać jednostek SKU Core-P. Na przykład aktualizacja do najwyższej konfiguracji Core i7-1280P może zwiększyć wydajność wielowątkową o 50-60% w stosunku do naszego Core i7-1265U, co wynika z naszych doświadczeń z Yoga Slim 9 14.
Cinebench R15 Multi Loop
Cinebench R23: Multi Core | Single Core
Cinebench R15: CPU Multi 64Bit | CPU Single 64Bit
Blender: v2.79 BMW27 CPU
7-Zip 18.03: 7z b 4 | 7z b 4 -mmt1
Geekbench 5.5: Multi-Core | Single-Core
HWBOT x265 Benchmark v2.2: 4k Preset
LibreOffice : 20 Documents To PDF
R Benchmark 2.5: Overall mean
| Cinebench R20 / CPU (Multi Core) | |
| Lenovo Yoga Slim 9 14IAP7 | |
| Lenovo Yoga 7-14ARB G7 | |
| Huawei MateBook X Pro 2022 | |
| Lenovo ThinkPad X1 Carbon G10 Core i7-1265U | |
| HP EliteBook 845 G9 6F6H9EA | |
| Przeciętny Intel Core i7-1265U (1669 - 3584, n=10) | |
| ADATA XPG Xenia 14 | |
| Lenovo ThinkPad X1 Carbon G10 21CC001RGE | |
| Acer TravelMate P6 TMP614P-52-724G | |
| Dell Latitude 7420 JW6MH | |
| Asus ExpertBook B1 B1400CEAE, i5-1135G7 | |
| Infinix INBook X2 | |
| LG Gram 14Z90Q | |
| Cinebench R20 / CPU (Single Core) | |
| Lenovo Yoga Slim 9 14IAP7 | |
| Huawei MateBook X Pro 2022 | |
| Lenovo ThinkPad X1 Carbon G10 Core i7-1265U | |
| Przeciętny Intel Core i7-1265U (528 - 701, n=10) | |
| Lenovo Yoga 7-14ARB G7 | |
| HP EliteBook 845 G9 6F6H9EA | |
| ADATA XPG Xenia 14 | |
| Acer TravelMate P6 TMP614P-52-724G | |
| Lenovo ThinkPad X1 Carbon G10 21CC001RGE | |
| Dell Latitude 7420 JW6MH | |
| Asus ExpertBook B1 B1400CEAE, i5-1135G7 | |
| LG Gram 14Z90Q | |
| Infinix INBook X2 | |
| Cinebench R23 / Multi Core | |
| Lenovo Yoga Slim 9 14IAP7 | |
| Lenovo Yoga 7-14ARB G7 | |
| Huawei MateBook X Pro 2022 | |
| Lenovo ThinkPad X1 Carbon G10 Core i7-1265U | |
| HP EliteBook 845 G9 6F6H9EA | |
| Przeciętny Intel Core i7-1265U (4332 - 9219, n=10) | |
| Lenovo ThinkPad X1 Carbon G10 21CC001RGE | |
| ADATA XPG Xenia 14 | |
| Acer TravelMate P6 TMP614P-52-724G | |
| Dell Latitude 7420 JW6MH | |
| Asus ExpertBook B1 B1400CEAE, i5-1135G7 | |
| Infinix INBook X2 | |
| LG Gram 14Z90Q | |
| Cinebench R23 / Single Core | |
| Lenovo Yoga Slim 9 14IAP7 | |
| Lenovo ThinkPad X1 Carbon G10 Core i7-1265U | |
| Huawei MateBook X Pro 2022 | |
| Przeciętny Intel Core i7-1265U (1144 - 1820, n=10) | |
| Lenovo ThinkPad X1 Carbon G10 21CC001RGE | |
| Lenovo Yoga 7-14ARB G7 | |
| ADATA XPG Xenia 14 | |
| HP EliteBook 845 G9 6F6H9EA | |
| Acer TravelMate P6 TMP614P-52-724G | |
| Dell Latitude 7420 JW6MH | |
| Asus ExpertBook B1 B1400CEAE, i5-1135G7 | |
| Infinix INBook X2 | |
| LG Gram 14Z90Q | |
| Cinebench R15 / CPU Multi 64Bit | |
| Lenovo Yoga Slim 9 14IAP7 | |
| Lenovo Yoga 7-14ARB G7 | |
| Huawei MateBook X Pro 2022 | |
| Huawei MateBook X Pro 2022 | |
| Lenovo ThinkPad X1 Carbon G10 21CC001RGE | |
| Lenovo ThinkPad X1 Carbon G10 Core i7-1265U | |
| HP EliteBook 845 G9 6F6H9EA | |
| Przeciętny Intel Core i7-1265U (706 - 1572, n=10) | |
| ADATA XPG Xenia 14 | |
| LG Gram 14Z90Q | |
| Acer TravelMate P6 TMP614P-52-724G | |
| Asus ExpertBook B1 B1400CEAE, i5-1135G7 | |
| Dell Latitude 7420 JW6MH | |
| Infinix INBook X2 | |
| Cinebench R15 / CPU Single 64Bit | |
| Lenovo Yoga Slim 9 14IAP7 | |
| Huawei MateBook X Pro 2022 | |
| Lenovo Yoga 7-14ARB G7 | |
| Lenovo ThinkPad X1 Carbon G10 Core i7-1265U | |
| HP EliteBook 845 G9 6F6H9EA | |
| Przeciętny Intel Core i7-1265U (165.3 - 260, n=10) | |
| ADATA XPG Xenia 14 | |
| Acer TravelMate P6 TMP614P-52-724G | |
| Dell Latitude 7420 JW6MH | |
| LG Gram 14Z90Q | |
| Asus ExpertBook B1 B1400CEAE, i5-1135G7 | |
| Lenovo ThinkPad X1 Carbon G10 21CC001RGE | |
| Infinix INBook X2 | |
| Blender / v2.79 BMW27 CPU | |
| Infinix INBook X2 | |
| Dell Latitude 7420 JW6MH | |
| Asus ExpertBook B1 B1400CEAE, i5-1135G7 | |
| Acer TravelMate P6 TMP614P-52-724G | |
| LG Gram 14Z90Q | |
| Lenovo ThinkPad X1 Carbon G10 21CC001RGE | |
| ADATA XPG Xenia 14 | |
| Przeciętny Intel Core i7-1265U (364 - 684, n=10) | |
| Lenovo ThinkPad X1 Carbon G10 Core i7-1265U | |
| HP EliteBook 845 G9 6F6H9EA | |
| Huawei MateBook X Pro 2022 | |
| Lenovo Yoga 7-14ARB G7 | |
| Lenovo Yoga Slim 9 14IAP7 | |
| 7-Zip 18.03 / 7z b 4 | |
| Lenovo Yoga 7-14ARB G7 | |
| Lenovo Yoga Slim 9 14IAP7 | |
| Huawei MateBook X Pro 2022 | |
| HP EliteBook 845 G9 6F6H9EA | |
| Lenovo ThinkPad X1 Carbon G10 Core i7-1265U | |
| Przeciętny Intel Core i7-1265U (20087 - 38715, n=10) | |
| LG Gram 14Z90Q | |
| ADATA XPG Xenia 14 | |
| Lenovo ThinkPad X1 Carbon G10 21CC001RGE | |
| Acer TravelMate P6 TMP614P-52-724G | |
| Asus ExpertBook B1 B1400CEAE, i5-1135G7 | |
| Dell Latitude 7420 JW6MH | |
| Infinix INBook X2 | |
| 7-Zip 18.03 / 7z b 4 -mmt1 | |
| Lenovo Yoga Slim 9 14IAP7 | |
| Lenovo Yoga 7-14ARB G7 | |
| HP EliteBook 845 G9 6F6H9EA | |
| Lenovo ThinkPad X1 Carbon G10 Core i7-1265U | |
| ADATA XPG Xenia 14 | |
| Huawei MateBook X Pro 2022 | |
| Przeciętny Intel Core i7-1265U (4614 - 5617, n=10) | |
| Acer TravelMate P6 TMP614P-52-724G | |
| Dell Latitude 7420 JW6MH | |
| Asus ExpertBook B1 B1400CEAE, i5-1135G7 | |
| LG Gram 14Z90Q | |
| Lenovo ThinkPad X1 Carbon G10 21CC001RGE | |
| Infinix INBook X2 | |
| Geekbench 5.5 / Multi-Core | |
| Lenovo Yoga Slim 9 14IAP7 | |
| Huawei MateBook X Pro 2022 | |
| Lenovo Yoga 7-14ARB G7 | |
| Lenovo ThinkPad X1 Carbon G10 Core i7-1265U | |
| LG Gram 14Z90Q | |
| Przeciętny Intel Core i7-1265U (5022 - 8981, n=10) | |
| Lenovo ThinkPad X1 Carbon G10 21CC001RGE | |
| HP EliteBook 845 G9 6F6H9EA | |
| Acer TravelMate P6 TMP614P-52-724G | |
| Dell Latitude 7420 JW6MH | |
| Asus ExpertBook B1 B1400CEAE, i5-1135G7 | |
| Infinix INBook X2 | |
| Geekbench 5.5 / Single-Core | |
| Lenovo ThinkPad X1 Carbon G10 Core i7-1265U | |
| Huawei MateBook X Pro 2022 | |
| Lenovo Yoga Slim 9 14IAP7 | |
| Przeciętny Intel Core i7-1265U (1429 - 1806, n=10) | |
| Lenovo ThinkPad X1 Carbon G10 21CC001RGE | |
| LG Gram 14Z90Q | |
| Lenovo Yoga 7-14ARB G7 | |
| Acer TravelMate P6 TMP614P-52-724G | |
| HP EliteBook 845 G9 6F6H9EA | |
| Dell Latitude 7420 JW6MH | |
| Asus ExpertBook B1 B1400CEAE, i5-1135G7 | |
| Infinix INBook X2 | |
| HWBOT x265 Benchmark v2.2 / 4k Preset | |
| Lenovo Yoga Slim 9 14IAP7 | |
| Lenovo Yoga 7-14ARB G7 | |
| Huawei MateBook X Pro 2022 | |
| HP EliteBook 845 G9 6F6H9EA | |
| Lenovo ThinkPad X1 Carbon G10 Core i7-1265U | |
| Przeciętny Intel Core i7-1265U (5.09 - 10.6, n=10) | |
| ADATA XPG Xenia 14 | |
| LG Gram 14Z90Q | |
| Lenovo ThinkPad X1 Carbon G10 21CC001RGE | |
| Acer TravelMate P6 TMP614P-52-724G | |
| Asus ExpertBook B1 B1400CEAE, i5-1135G7 | |
| Dell Latitude 7420 JW6MH | |
| Infinix INBook X2 | |
| LibreOffice / 20 Documents To PDF | |
| Infinix INBook X2 | |
| HP EliteBook 845 G9 6F6H9EA | |
| Lenovo Yoga 7-14ARB G7 | |
| Lenovo ThinkPad X1 Carbon G10 21CC001RGE | |
| Dell Latitude 7420 JW6MH | |
| Acer TravelMate P6 TMP614P-52-724G | |
| LG Gram 14Z90Q | |
| Lenovo Yoga Slim 9 14IAP7 | |
| Przeciętny Intel Core i7-1265U (44 - 61.6, n=10) | |
| Lenovo ThinkPad X1 Carbon G10 Core i7-1265U | |
| ADATA XPG Xenia 14 | |
| Asus ExpertBook B1 B1400CEAE, i5-1135G7 | |
| Huawei MateBook X Pro 2022 | |
| R Benchmark 2.5 / Overall mean | |
| Infinix INBook X2 | |
| Asus ExpertBook B1 B1400CEAE, i5-1135G7 | |
| Dell Latitude 7420 JW6MH | |
| Acer TravelMate P6 TMP614P-52-724G | |
| Lenovo ThinkPad X1 Carbon G10 21CC001RGE | |
| LG Gram 14Z90Q | |
| ADATA XPG Xenia 14 | |
| HP EliteBook 845 G9 6F6H9EA | |
| Lenovo Yoga 7-14ARB G7 | |
| Przeciętny Intel Core i7-1265U (0.4666 - 0.578, n=10) | |
| Lenovo ThinkPad X1 Carbon G10 Core i7-1265U | |
| Huawei MateBook X Pro 2022 | |
| Lenovo Yoga Slim 9 14IAP7 | |
Cinebench R23: Multi Core | Single Core
Cinebench R15: CPU Multi 64Bit | CPU Single 64Bit
Blender: v2.79 BMW27 CPU
7-Zip 18.03: 7z b 4 | 7z b 4 -mmt1
Geekbench 5.5: Multi-Core | Single-Core
HWBOT x265 Benchmark v2.2: 4k Preset
LibreOffice : 20 Documents To PDF
R Benchmark 2.5: Overall mean
* ... im mniej tym lepiej
* ... im mniej tym lepiej
AIDA64: FP32 Ray-Trace | FPU Julia | CPU SHA3 | CPU Queen | FPU SinJulia | FPU Mandel | CPU AES | CPU ZLib | FP64 Ray-Trace | CPU PhotoWorxx
| Performance rating | |
| HP EliteBook 845 G9 6F6H9EA | |
| Lenovo ThinkPad X1 Carbon G10 Core i7-1265U | |
| Dell Latitude 7420 JW6MH | |
| Przeciętny Intel Core i7-1265U | |
| Asus ExpertBook B1 B1400CEAE, i5-1135G7 | |
| Lenovo ThinkPad X1 Carbon G10 21CC001RGE | |
| LG Gram 14Z90Q | |
| AIDA64 / FP32 Ray-Trace | |
| HP EliteBook 845 G9 6F6H9EA | |
| Asus ExpertBook B1 B1400CEAE, i5-1135G7 | |
| Lenovo ThinkPad X1 Carbon G10 Core i7-1265U | |
| Dell Latitude 7420 JW6MH | |
| Przeciętny Intel Core i7-1265U (2619 - 8178, n=10) | |
| LG Gram 14Z90Q | |
| Lenovo ThinkPad X1 Carbon G10 21CC001RGE | |
| AIDA64 / FPU Julia | |
| HP EliteBook 845 G9 6F6H9EA | |
| Lenovo ThinkPad X1 Carbon G10 Core i7-1265U | |
| Przeciętny Intel Core i7-1265U (12909 - 41649, n=10) | |
| Asus ExpertBook B1 B1400CEAE, i5-1135G7 | |
| Dell Latitude 7420 JW6MH | |
| LG Gram 14Z90Q | |
| Lenovo ThinkPad X1 Carbon G10 21CC001RGE | |
| AIDA64 / CPU SHA3 | |
| HP EliteBook 845 G9 6F6H9EA | |
| Asus ExpertBook B1 B1400CEAE, i5-1135G7 | |
| Dell Latitude 7420 JW6MH | |
| Lenovo ThinkPad X1 Carbon G10 Core i7-1265U | |
| Przeciętny Intel Core i7-1265U (824 - 2183, n=10) | |
| Lenovo ThinkPad X1 Carbon G10 21CC001RGE | |
| LG Gram 14Z90Q | |
| AIDA64 / CPU Queen | |
| LG Gram 14Z90Q | |
| Lenovo ThinkPad X1 Carbon G10 21CC001RGE | |
| HP EliteBook 845 G9 6F6H9EA | |
| Przeciętny Intel Core i7-1265U (63615 - 67065, n=10) | |
| Lenovo ThinkPad X1 Carbon G10 Core i7-1265U | |
| Dell Latitude 7420 JW6MH | |
| Asus ExpertBook B1 B1400CEAE, i5-1135G7 | |
| AIDA64 / FPU SinJulia | |
| HP EliteBook 845 G9 6F6H9EA | |
| Lenovo ThinkPad X1 Carbon G10 21CC001RGE | |
| Dell Latitude 7420 JW6MH | |
| Lenovo ThinkPad X1 Carbon G10 Core i7-1265U | |
| Asus ExpertBook B1 B1400CEAE, i5-1135G7 | |
| Przeciętny Intel Core i7-1265U (3105 - 5135, n=10) | |
| LG Gram 14Z90Q | |
| AIDA64 / FPU Mandel | |
| HP EliteBook 845 G9 6F6H9EA | |
| Dell Latitude 7420 JW6MH | |
| Asus ExpertBook B1 B1400CEAE, i5-1135G7 | |
| Lenovo ThinkPad X1 Carbon G10 Core i7-1265U | |
| Przeciętny Intel Core i7-1265U (6967 - 20804, n=10) | |
| LG Gram 14Z90Q | |
| Lenovo ThinkPad X1 Carbon G10 21CC001RGE | |
| AIDA64 / CPU AES | |
| Asus ExpertBook B1 B1400CEAE, i5-1135G7 | |
| Dell Latitude 7420 JW6MH | |
| HP EliteBook 845 G9 6F6H9EA | |
| Lenovo ThinkPad X1 Carbon G10 Core i7-1265U | |
| Przeciętny Intel Core i7-1265U (19489 - 42966, n=10) | |
| Lenovo ThinkPad X1 Carbon G10 21CC001RGE | |
| LG Gram 14Z90Q | |
| AIDA64 / CPU ZLib | |
| HP EliteBook 845 G9 6F6H9EA | |
| Lenovo ThinkPad X1 Carbon G10 Core i7-1265U | |
| Lenovo ThinkPad X1 Carbon G10 21CC001RGE | |
| Przeciętny Intel Core i7-1265U (314 - 632, n=10) | |
| Dell Latitude 7420 JW6MH | |
| Asus ExpertBook B1 B1400CEAE, i5-1135G7 | |
| LG Gram 14Z90Q | |
| AIDA64 / FP64 Ray-Trace | |
| HP EliteBook 845 G9 6F6H9EA | |
| Lenovo ThinkPad X1 Carbon G10 Core i7-1265U | |
| Asus ExpertBook B1 B1400CEAE, i5-1135G7 | |
| Dell Latitude 7420 JW6MH | |
| Przeciętny Intel Core i7-1265U (1473 - 4376, n=10) | |
| LG Gram 14Z90Q | |
| Lenovo ThinkPad X1 Carbon G10 21CC001RGE | |
| AIDA64 / CPU PhotoWorxx | |
| Lenovo ThinkPad X1 Carbon G10 Core i7-1265U | |
| Dell Latitude 7420 JW6MH | |
| Przeciętny Intel Core i7-1265U (20213 - 47031, n=10) | |
| Lenovo ThinkPad X1 Carbon G10 21CC001RGE | |
| LG Gram 14Z90Q | |
| HP EliteBook 845 G9 6F6H9EA | |
| Asus ExpertBook B1 B1400CEAE, i5-1135G7 | |
Wydajność systemu
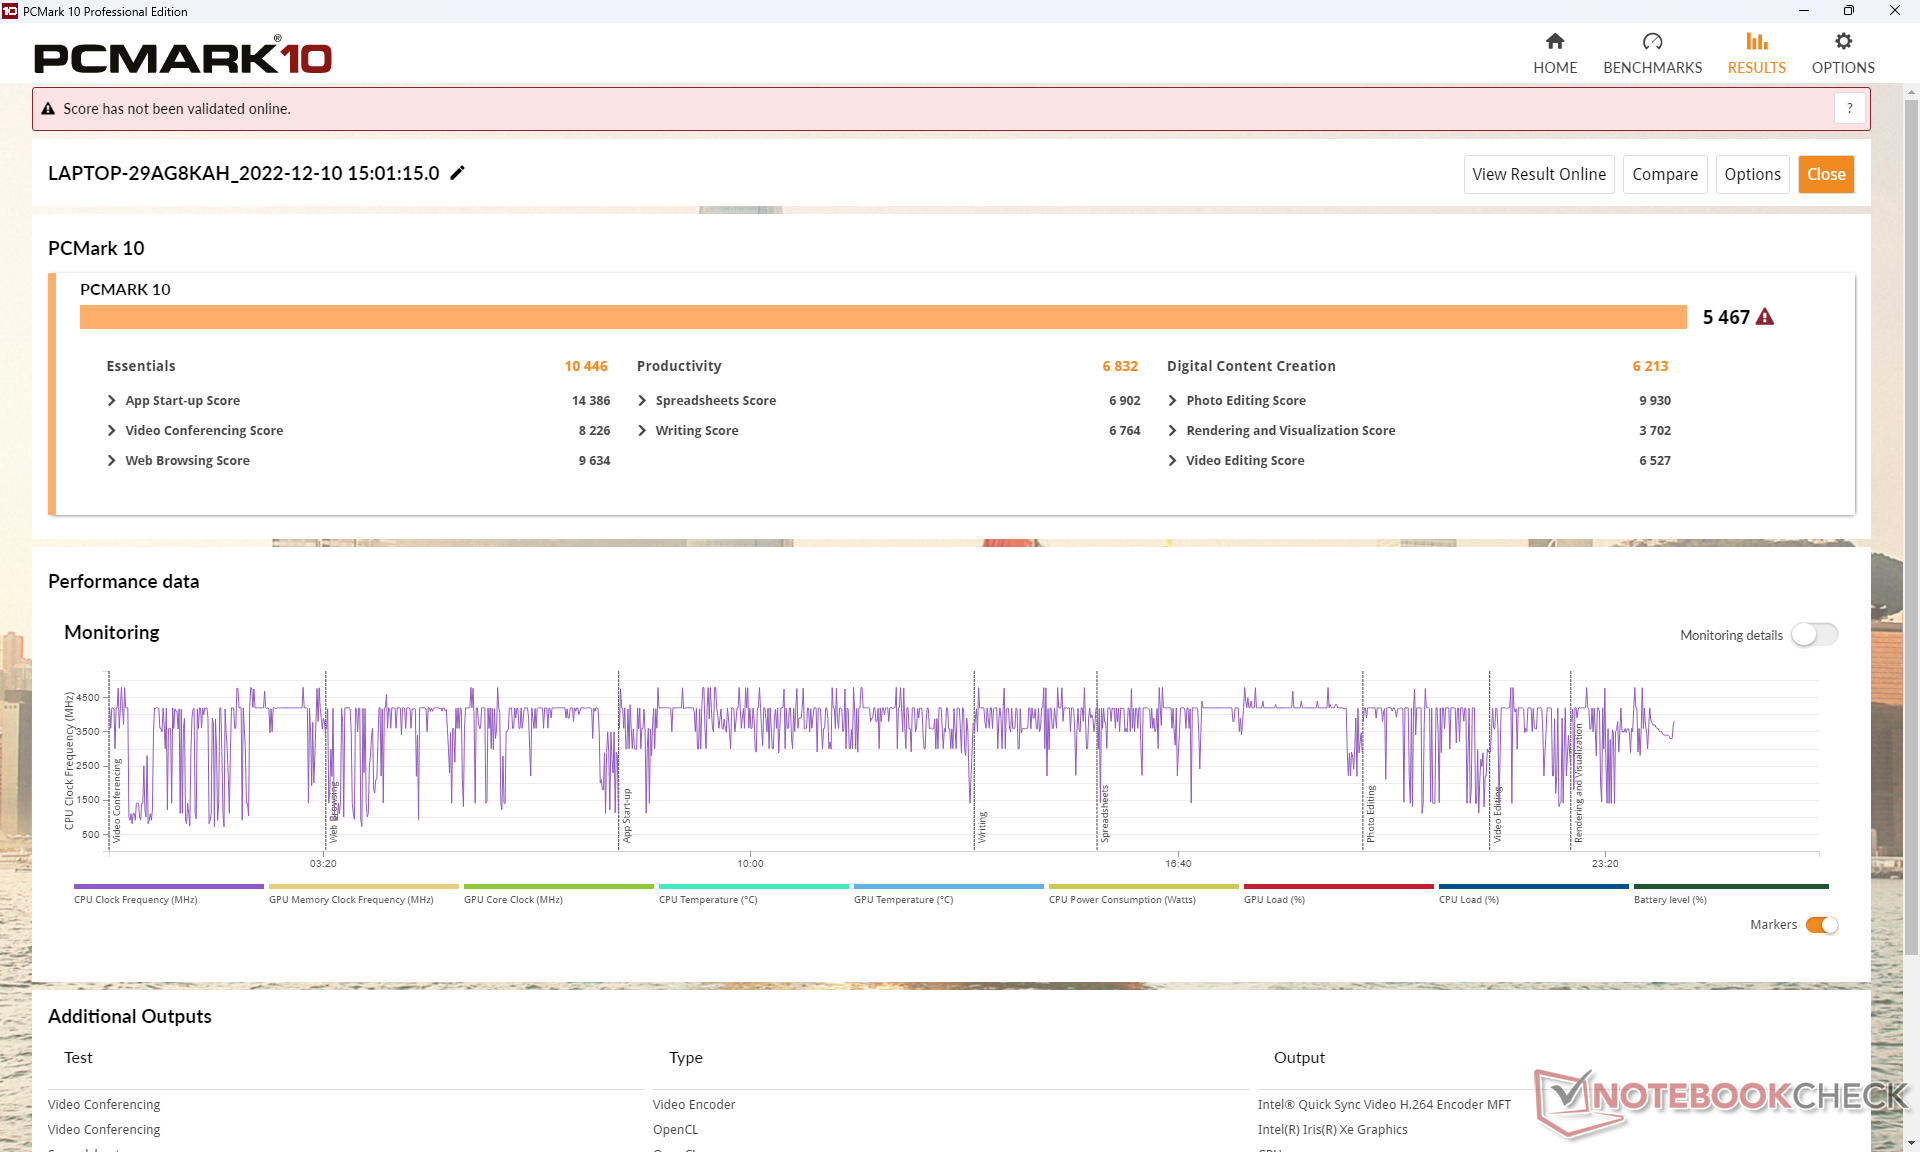
Wyniki PCMark 10 są konsekwentnie wyższe od naszego ThinkPada X1 Carbon G10 napędzanego procesorem Core-i5-P, zwłaszcza w podteście Digital Contention Creation, gdzie wydajność grafiki ma największe znaczenie.
CrossMark: Overall | Productivity | Creativity | Responsiveness
| PCMark 10 / Score | |
| HP EliteBook 845 G9 6F6H9EA | |
| Lenovo ThinkPad X1 Carbon G10 Core i7-1265U | |
| Przeciętny Intel Core i7-1265U, Intel Iris Xe Graphics G7 96EUs (4753 - 5766, n=7) | |
| Lenovo ThinkPad X1 Carbon G10 21CC001RGE | |
| LG Gram 14Z90Q | |
| Dell Latitude 7420 JW6MH | |
| Asus ExpertBook B1 B1400CEAE, i5-1135G7 | |
| PCMark 10 / Essentials | |
| Przeciętny Intel Core i7-1265U, Intel Iris Xe Graphics G7 96EUs (9278 - 11418, n=7) | |
| Lenovo ThinkPad X1 Carbon G10 Core i7-1265U | |
| Lenovo ThinkPad X1 Carbon G10 21CC001RGE | |
| Dell Latitude 7420 JW6MH | |
| HP EliteBook 845 G9 6F6H9EA | |
| LG Gram 14Z90Q | |
| Asus ExpertBook B1 B1400CEAE, i5-1135G7 | |
| PCMark 10 / Productivity | |
| HP EliteBook 845 G9 6F6H9EA | |
| Lenovo ThinkPad X1 Carbon G10 Core i7-1265U | |
| Przeciętny Intel Core i7-1265U, Intel Iris Xe Graphics G7 96EUs (5828 - 7311, n=7) | |
| Lenovo ThinkPad X1 Carbon G10 21CC001RGE | |
| Dell Latitude 7420 JW6MH | |
| LG Gram 14Z90Q | |
| Asus ExpertBook B1 B1400CEAE, i5-1135G7 | |
| PCMark 10 / Digital Content Creation | |
| Lenovo ThinkPad X1 Carbon G10 Core i7-1265U | |
| HP EliteBook 845 G9 6F6H9EA | |
| Przeciętny Intel Core i7-1265U, Intel Iris Xe Graphics G7 96EUs (5127 - 6330, n=7) | |
| LG Gram 14Z90Q | |
| Lenovo ThinkPad X1 Carbon G10 21CC001RGE | |
| Dell Latitude 7420 JW6MH | |
| Asus ExpertBook B1 B1400CEAE, i5-1135G7 | |
| CrossMark / Overall | |
| Lenovo ThinkPad X1 Carbon G10 Core i7-1265U | |
| Lenovo ThinkPad X1 Carbon G10 21CC001RGE | |
| Przeciętny Intel Core i7-1265U, Intel Iris Xe Graphics G7 96EUs (1301 - 1615, n=7) | |
| Dell Latitude 7420 JW6MH | |
| CrossMark / Productivity | |
| Lenovo ThinkPad X1 Carbon G10 Core i7-1265U | |
| Lenovo ThinkPad X1 Carbon G10 21CC001RGE | |
| Przeciętny Intel Core i7-1265U, Intel Iris Xe Graphics G7 96EUs (1230 - 1586, n=7) | |
| Dell Latitude 7420 JW6MH | |
| CrossMark / Creativity | |
| Lenovo ThinkPad X1 Carbon G10 21CC001RGE | |
| Lenovo ThinkPad X1 Carbon G10 Core i7-1265U | |
| Przeciętny Intel Core i7-1265U, Intel Iris Xe Graphics G7 96EUs (1413 - 1706, n=7) | |
| Dell Latitude 7420 JW6MH | |
| CrossMark / Responsiveness | |
| Lenovo ThinkPad X1 Carbon G10 Core i7-1265U | |
| Lenovo ThinkPad X1 Carbon G10 21CC001RGE | |
| Przeciętny Intel Core i7-1265U, Intel Iris Xe Graphics G7 96EUs (1193 - 1521, n=7) | |
| Dell Latitude 7420 JW6MH | |
| PCMark 10 Score | 5467 pkt. | |
Pomoc | ||
| AIDA64 / Memory Copy | |
| Lenovo ThinkPad X1 Carbon G10 Core i7-1265U | |
| Lenovo ThinkPad X1 Carbon G10 21CC001RGE | |
| Przeciętny Intel Core i7-1265U (40212 - 72204, n=10) | |
| Dell Latitude 7420 JW6MH | |
| LG Gram 14Z90Q | |
| HP EliteBook 845 G9 6F6H9EA | |
| Asus ExpertBook B1 B1400CEAE, i5-1135G7 | |
| AIDA64 / Memory Read | |
| LG Gram 14Z90Q | |
| Lenovo ThinkPad X1 Carbon G10 21CC001RGE | |
| Lenovo ThinkPad X1 Carbon G10 Core i7-1265U | |
| Przeciętny Intel Core i7-1265U (41808 - 69493, n=10) | |
| Dell Latitude 7420 JW6MH | |
| HP EliteBook 845 G9 6F6H9EA | |
| Asus ExpertBook B1 B1400CEAE, i5-1135G7 | |
| AIDA64 / Memory Write | |
| Lenovo ThinkPad X1 Carbon G10 Core i7-1265U | |
| LG Gram 14Z90Q | |
| Lenovo ThinkPad X1 Carbon G10 21CC001RGE | |
| Przeciętny Intel Core i7-1265U (41382 - 76027, n=10) | |
| Dell Latitude 7420 JW6MH | |
| HP EliteBook 845 G9 6F6H9EA | |
| Asus ExpertBook B1 B1400CEAE, i5-1135G7 | |
| AIDA64 / Memory Latency | |
| LG Gram 14Z90Q | |
| Dell Latitude 7420 JW6MH | |
| Przeciętny Intel Core i7-1265U (74.6 - 112.4, n=10) | |
| HP EliteBook 845 G9 6F6H9EA | |
| Lenovo ThinkPad X1 Carbon G10 Core i7-1265U | |
| Asus ExpertBook B1 B1400CEAE, i5-1135G7 | |
| Lenovo ThinkPad X1 Carbon G10 21CC001RGE | |
| Lenovo ThinkPad X1 Carbon G10 21CC001RGE | |
* ... im mniej tym lepiej
Opóźnienie DPC
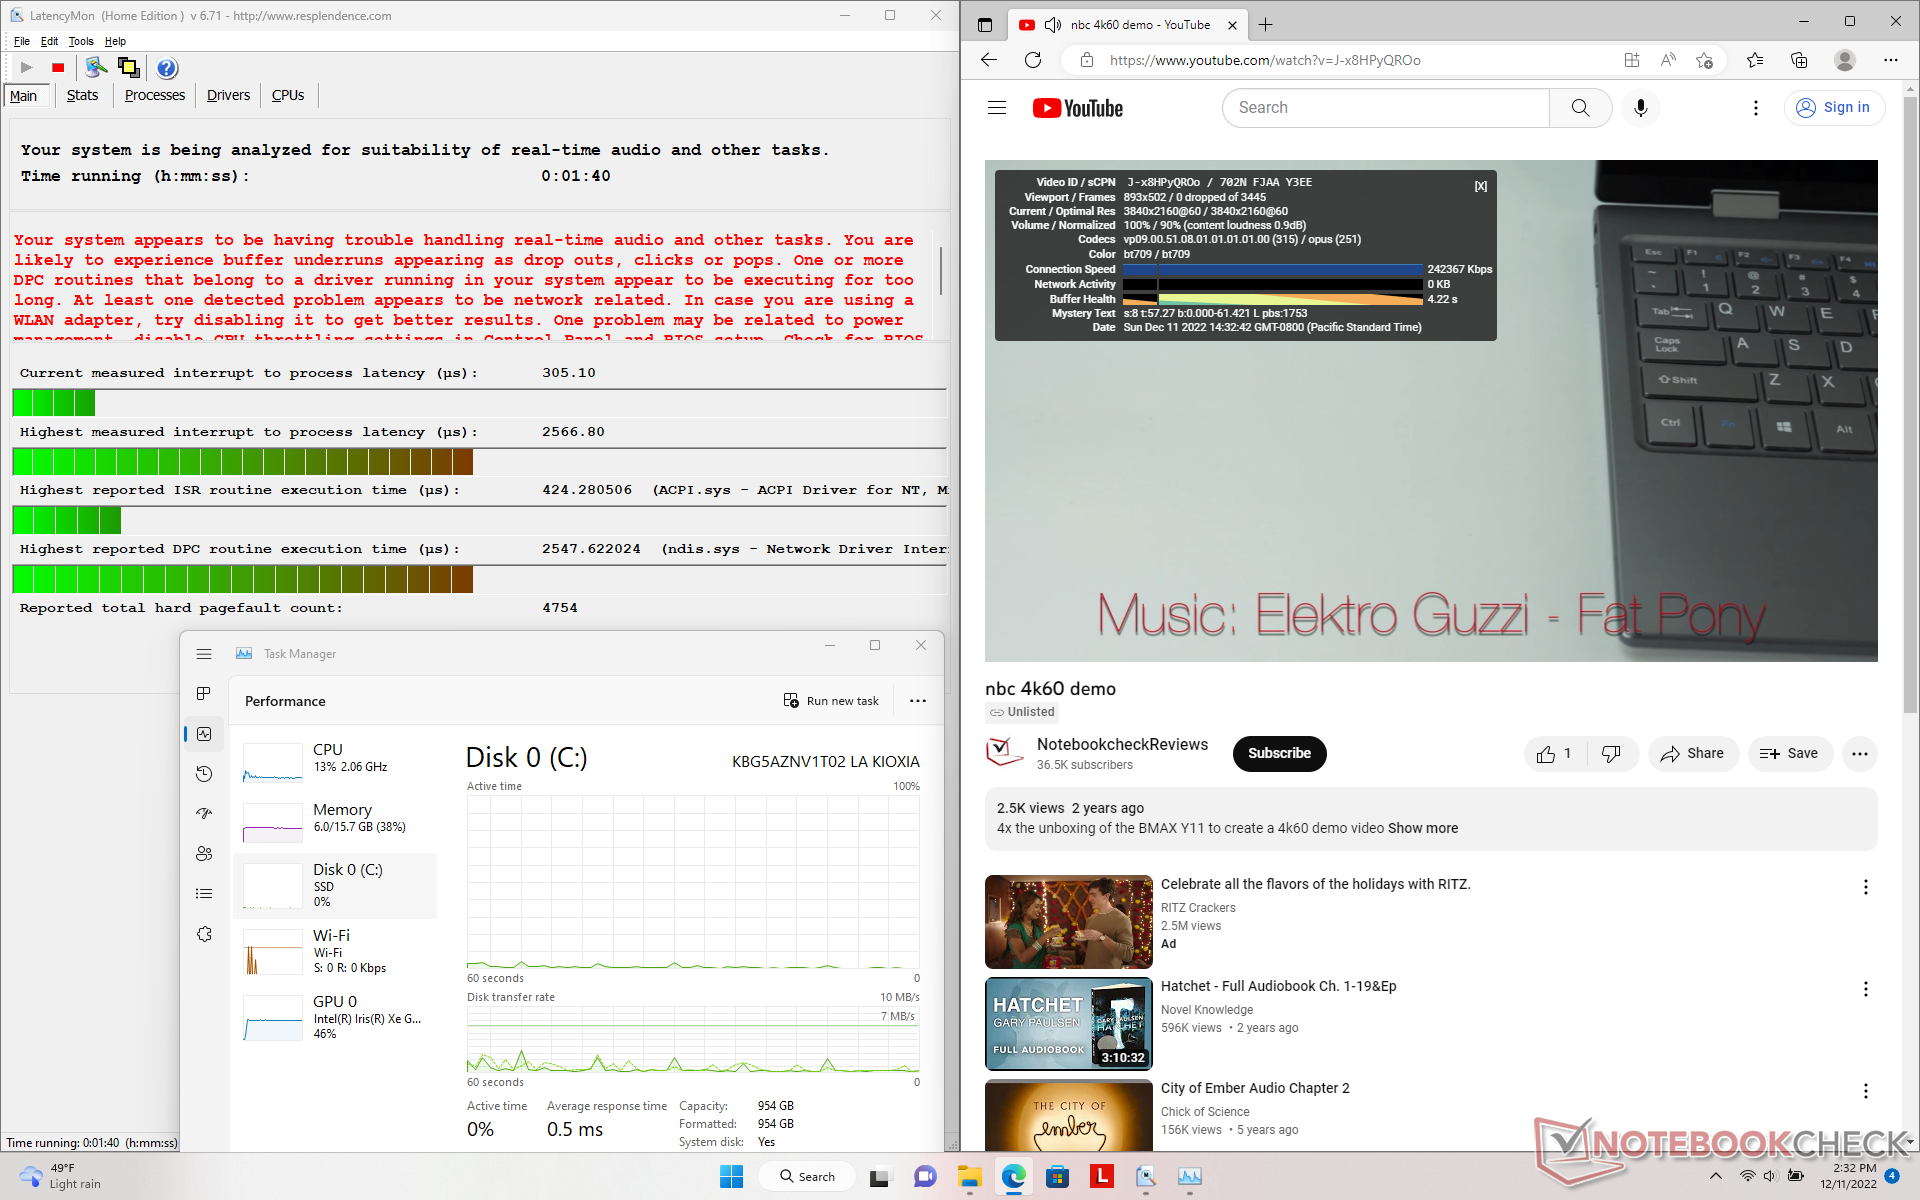
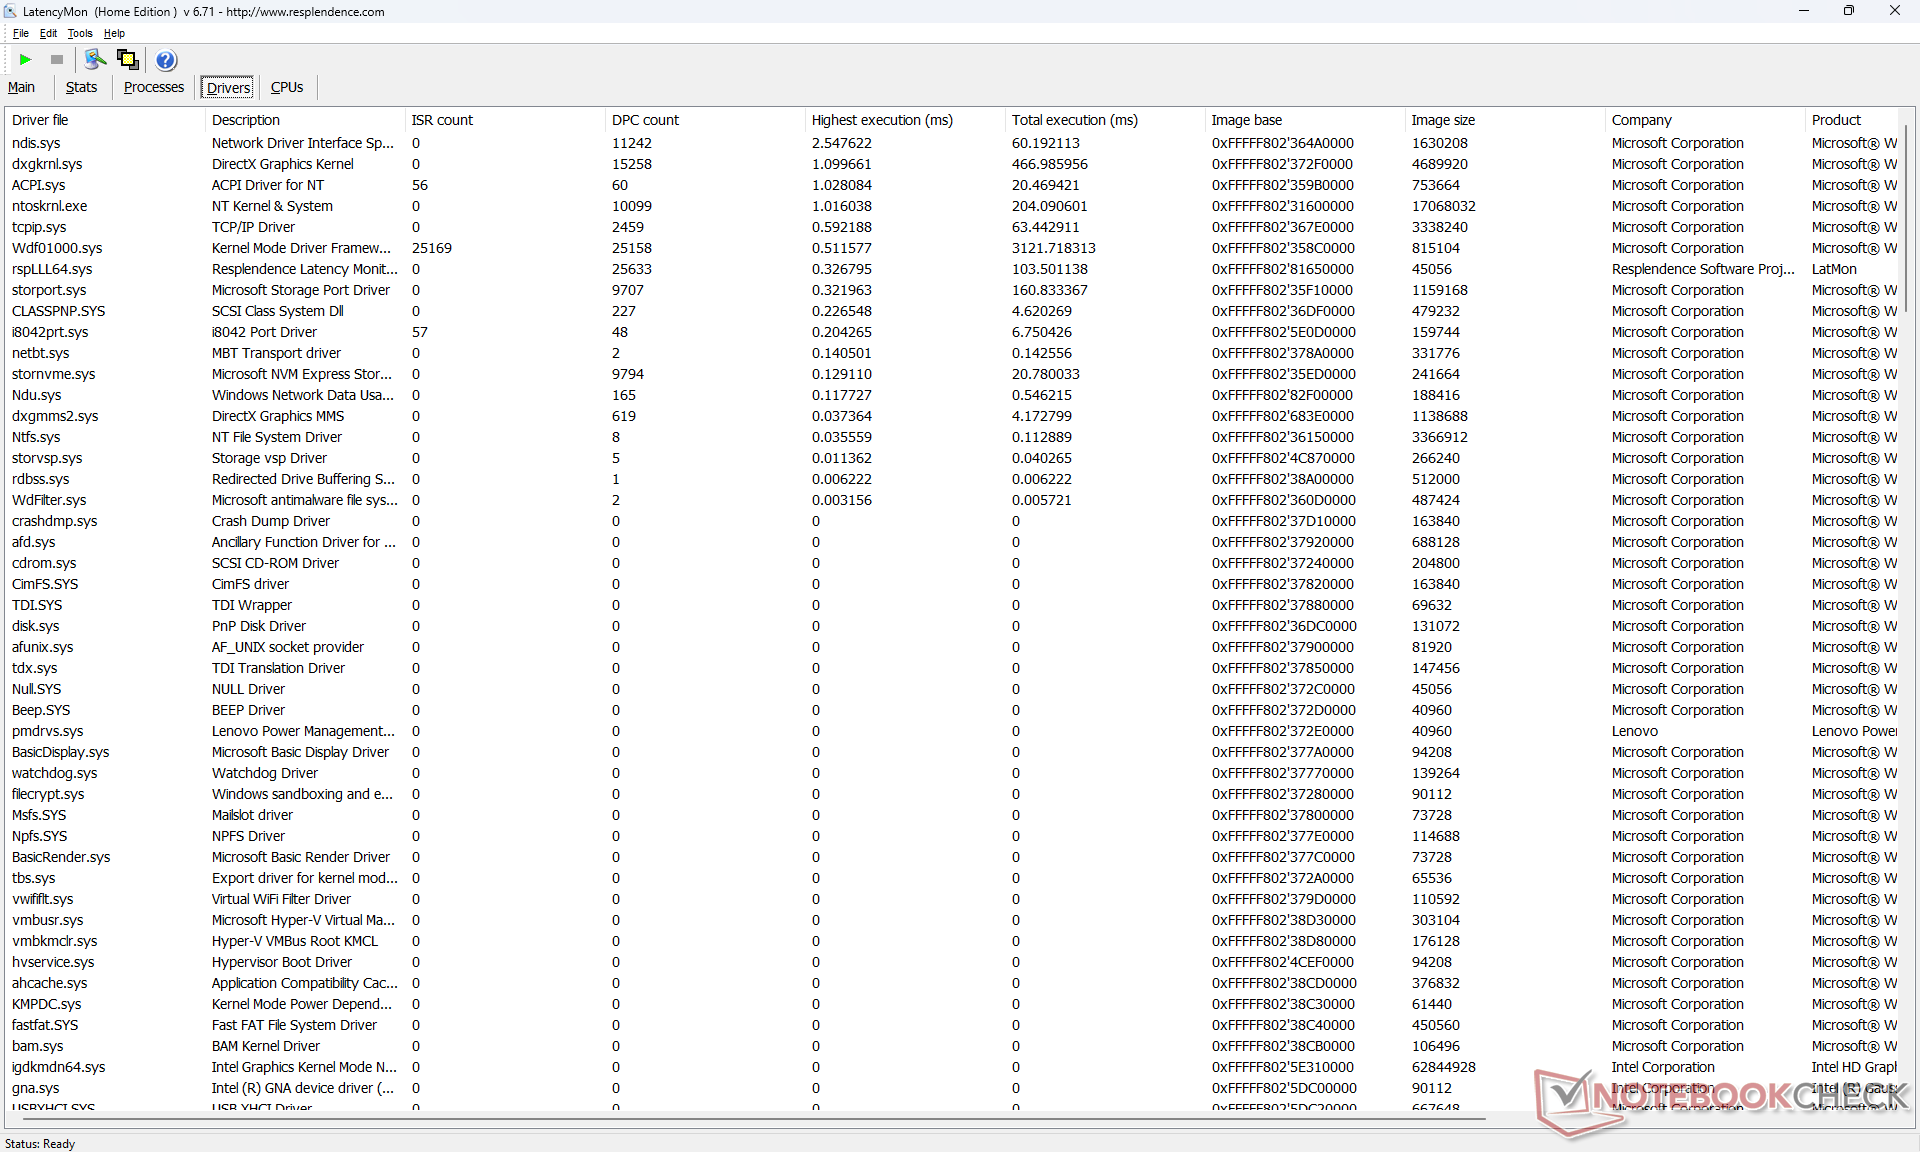
LatencyMon ujawnia problemy z DPC podczas otwierania wielu kart przeglądarki na naszej stronie głównej. odtwarzanie wideo w rozdzielczości 4K przy 60 FPS jest poza tym perfekcyjne, z niskim wykorzystaniem procesora i brakiem opuszczonych klatek.
| DPC Latencies / LatencyMon - interrupt to process latency (max), Web, Youtube, Prime95 | |
| Lenovo ThinkPad X1 Carbon G10 Core i7-1265U | |
| Lenovo ThinkPad X1 Carbon G10 21CC001RGE | |
| HP EliteBook 845 G9 6F6H9EA | |
| Asus ExpertBook B1 B1400CEAE, i5-1135G7 | |
| LG Gram 14Z90Q | |
| Dell Latitude 7420 JW6MH | |
* ... im mniej tym lepiej
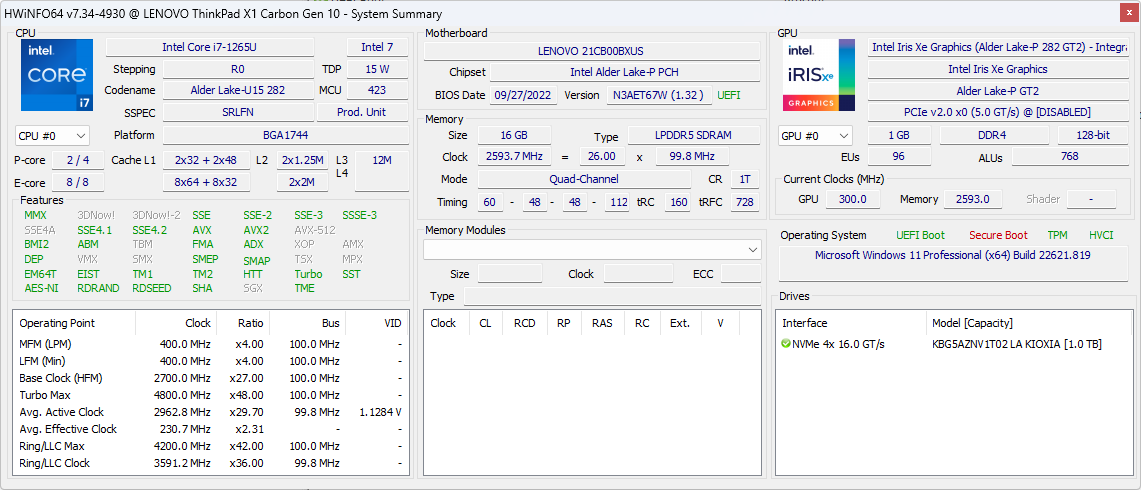
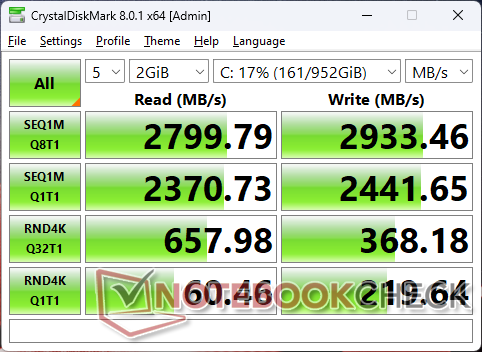
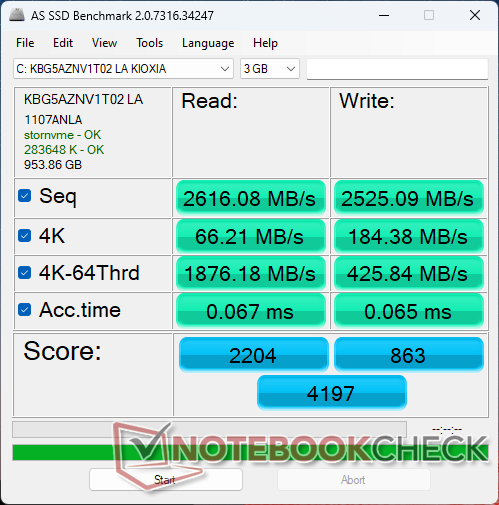
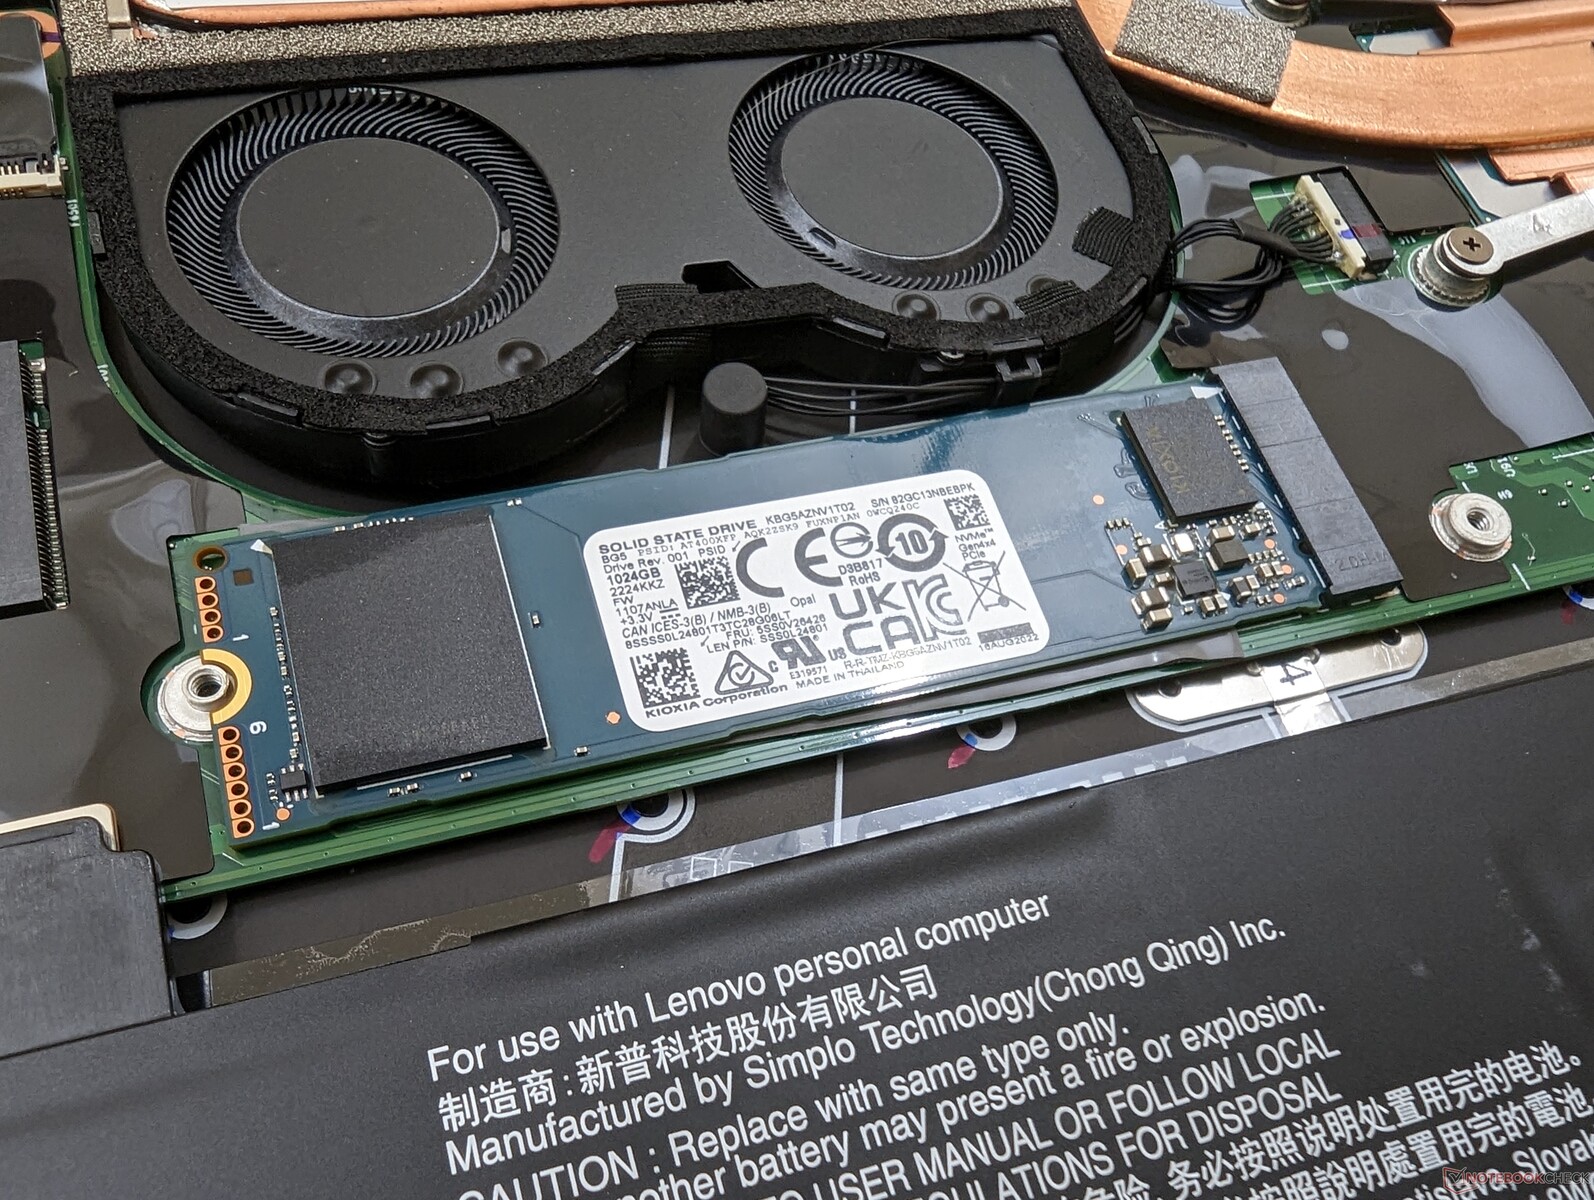
Urządzenia pamięci masowej - tylko jeden dysk
Nasze urządzenie jest dostarczane z 512 GB PCIe3 x4 Kioxia NVMe SSD mimo że system obsługuje dyski PCie4 x4. Szybkość transferu jest stała i bez większego dławienia wydajności, w przeciwieństwie do tego, co zaobserwowaliśmy na dysku Samsunga PCIe4 x4 w naszej konfiguracji Core-P. Sugeruje to, że większość dysków SSD PCIe4 x4 NVMe nie będzie w stanie pracować z najwyższą prędkością przez dłuższy czas wewnątrz tego ThinkPada ze względu na obawy związane z temperaturą.

| Drive Performance rating - Percent | |
| LG Gram 14Z90Q | |
| Lenovo ThinkPad X1 Carbon G10 21CC001RGE | |
| Lenovo ThinkPad X1 Carbon G10 Core i7-1265U | |
| Dell Latitude 7420 JW6MH | |
| Asus ExpertBook B1 B1400CEAE, i5-1135G7 | |
| HP EliteBook 845 G9 6F6H9EA | |
| DiskSpd | |
| seq read | |
| Lenovo ThinkPad X1 Carbon G10 21CC001RGE | |
| LG Gram 14Z90Q | |
| Dell Latitude 7420 JW6MH | |
| Lenovo ThinkPad X1 Carbon G10 Core i7-1265U | |
| HP EliteBook 845 G9 6F6H9EA | |
| Asus ExpertBook B1 B1400CEAE, i5-1135G7 | |
| seq write | |
| Lenovo ThinkPad X1 Carbon G10 21CC001RGE | |
| LG Gram 14Z90Q | |
| Lenovo ThinkPad X1 Carbon G10 Core i7-1265U | |
| Dell Latitude 7420 JW6MH | |
| Asus ExpertBook B1 B1400CEAE, i5-1135G7 | |
| HP EliteBook 845 G9 6F6H9EA | |
| seq q8 t1 read | |
| LG Gram 14Z90Q | |
| Lenovo ThinkPad X1 Carbon G10 21CC001RGE | |
| Dell Latitude 7420 JW6MH | |
| HP EliteBook 845 G9 6F6H9EA | |
| Asus ExpertBook B1 B1400CEAE, i5-1135G7 | |
| Lenovo ThinkPad X1 Carbon G10 Core i7-1265U | |
| seq q8 t1 write | |
| LG Gram 14Z90Q | |
| Lenovo ThinkPad X1 Carbon G10 21CC001RGE | |
| Lenovo ThinkPad X1 Carbon G10 Core i7-1265U | |
| Dell Latitude 7420 JW6MH | |
| Asus ExpertBook B1 B1400CEAE, i5-1135G7 | |
| HP EliteBook 845 G9 6F6H9EA | |
| 4k q1 t1 read | |
| LG Gram 14Z90Q | |
| Lenovo ThinkPad X1 Carbon G10 Core i7-1265U | |
| Lenovo ThinkPad X1 Carbon G10 21CC001RGE | |
| Dell Latitude 7420 JW6MH | |
| Asus ExpertBook B1 B1400CEAE, i5-1135G7 | |
| HP EliteBook 845 G9 6F6H9EA | |
| 4k q1 t1 write | |
| Lenovo ThinkPad X1 Carbon G10 Core i7-1265U | |
| Lenovo ThinkPad X1 Carbon G10 21CC001RGE | |
| LG Gram 14Z90Q | |
| Asus ExpertBook B1 B1400CEAE, i5-1135G7 | |
| Dell Latitude 7420 JW6MH | |
| HP EliteBook 845 G9 6F6H9EA | |
| 4k q32 t16 read | |
| LG Gram 14Z90Q | |
| Lenovo ThinkPad X1 Carbon G10 21CC001RGE | |
| Lenovo ThinkPad X1 Carbon G10 Core i7-1265U | |
| HP EliteBook 845 G9 6F6H9EA | |
| Asus ExpertBook B1 B1400CEAE, i5-1135G7 | |
| Dell Latitude 7420 JW6MH | |
| 4k q32 t16 write | |
| LG Gram 14Z90Q | |
| Lenovo ThinkPad X1 Carbon G10 21CC001RGE | |
| Lenovo ThinkPad X1 Carbon G10 Core i7-1265U | |
| Asus ExpertBook B1 B1400CEAE, i5-1135G7 | |
| Dell Latitude 7420 JW6MH | |
| HP EliteBook 845 G9 6F6H9EA | |
| AS SSD | |
| Score Total | |
| Lenovo ThinkPad X1 Carbon G10 21CC001RGE | |
| Lenovo ThinkPad X1 Carbon G10 Core i7-1265U | |
| LG Gram 14Z90Q | |
| Asus ExpertBook B1 B1400CEAE, i5-1135G7 | |
| Dell Latitude 7420 JW6MH | |
| HP EliteBook 845 G9 6F6H9EA | |
| Score Read | |
| Lenovo ThinkPad X1 Carbon G10 Core i7-1265U | |
| Lenovo ThinkPad X1 Carbon G10 21CC001RGE | |
| Asus ExpertBook B1 B1400CEAE, i5-1135G7 | |
| Dell Latitude 7420 JW6MH | |
| LG Gram 14Z90Q | |
| HP EliteBook 845 G9 6F6H9EA | |
| Score Write | |
| LG Gram 14Z90Q | |
| Lenovo ThinkPad X1 Carbon G10 21CC001RGE | |
| Asus ExpertBook B1 B1400CEAE, i5-1135G7 | |
| HP EliteBook 845 G9 6F6H9EA | |
| Dell Latitude 7420 JW6MH | |
| Lenovo ThinkPad X1 Carbon G10 Core i7-1265U | |
| Seq Read | |
| LG Gram 14Z90Q | |
| Lenovo ThinkPad X1 Carbon G10 21CC001RGE | |
| Dell Latitude 7420 JW6MH | |
| Lenovo ThinkPad X1 Carbon G10 Core i7-1265U | |
| HP EliteBook 845 G9 6F6H9EA | |
| Asus ExpertBook B1 B1400CEAE, i5-1135G7 | |
| Seq Write | |
| LG Gram 14Z90Q | |
| Lenovo ThinkPad X1 Carbon G10 Core i7-1265U | |
| Lenovo ThinkPad X1 Carbon G10 21CC001RGE | |
| Dell Latitude 7420 JW6MH | |
| HP EliteBook 845 G9 6F6H9EA | |
| Asus ExpertBook B1 B1400CEAE, i5-1135G7 | |
| 4K Read | |
| Dell Latitude 7420 JW6MH | |
| LG Gram 14Z90Q | |
| Lenovo ThinkPad X1 Carbon G10 Core i7-1265U | |
| Lenovo ThinkPad X1 Carbon G10 21CC001RGE | |
| Asus ExpertBook B1 B1400CEAE, i5-1135G7 | |
| HP EliteBook 845 G9 6F6H9EA | |
| 4K Write | |
| Asus ExpertBook B1 B1400CEAE, i5-1135G7 | |
| Lenovo ThinkPad X1 Carbon G10 Core i7-1265U | |
| Dell Latitude 7420 JW6MH | |
| Lenovo ThinkPad X1 Carbon G10 21CC001RGE | |
| LG Gram 14Z90Q | |
| HP EliteBook 845 G9 6F6H9EA | |
| 4K-64 Read | |
| Lenovo ThinkPad X1 Carbon G10 Core i7-1265U | |
| Lenovo ThinkPad X1 Carbon G10 21CC001RGE | |
| Asus ExpertBook B1 B1400CEAE, i5-1135G7 | |
| Dell Latitude 7420 JW6MH | |
| HP EliteBook 845 G9 6F6H9EA | |
| LG Gram 14Z90Q | |
| 4K-64 Write | |
| LG Gram 14Z90Q | |
| Lenovo ThinkPad X1 Carbon G10 21CC001RGE | |
| Asus ExpertBook B1 B1400CEAE, i5-1135G7 | |
| HP EliteBook 845 G9 6F6H9EA | |
| Dell Latitude 7420 JW6MH | |
| Lenovo ThinkPad X1 Carbon G10 Core i7-1265U | |
| Access Time Read | |
| HP EliteBook 845 G9 6F6H9EA | |
| Dell Latitude 7420 JW6MH | |
| Lenovo ThinkPad X1 Carbon G10 Core i7-1265U | |
| Lenovo ThinkPad X1 Carbon G10 21CC001RGE | |
| Asus ExpertBook B1 B1400CEAE, i5-1135G7 | |
| LG Gram 14Z90Q | |
| Access Time Write | |
| Lenovo ThinkPad X1 Carbon G10 Core i7-1265U | |
| Asus ExpertBook B1 B1400CEAE, i5-1135G7 | |
| HP EliteBook 845 G9 6F6H9EA | |
| Dell Latitude 7420 JW6MH | |
| LG Gram 14Z90Q | |
| Lenovo ThinkPad X1 Carbon G10 21CC001RGE | |
* ... im mniej tym lepiej
Disk Throttling: DiskSpd Read Loop, Queue Depth 8
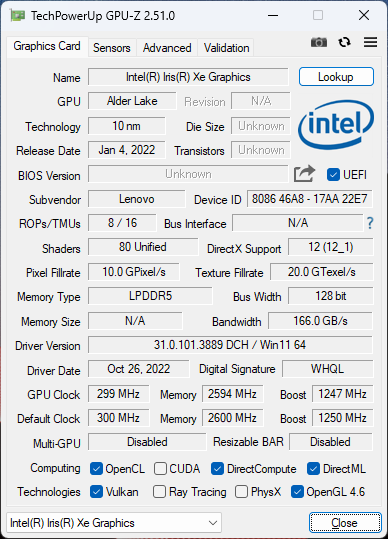
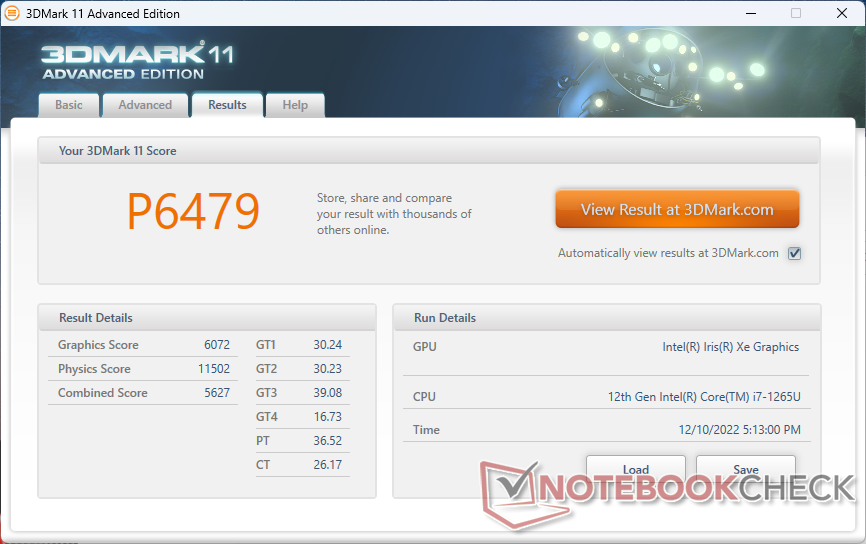
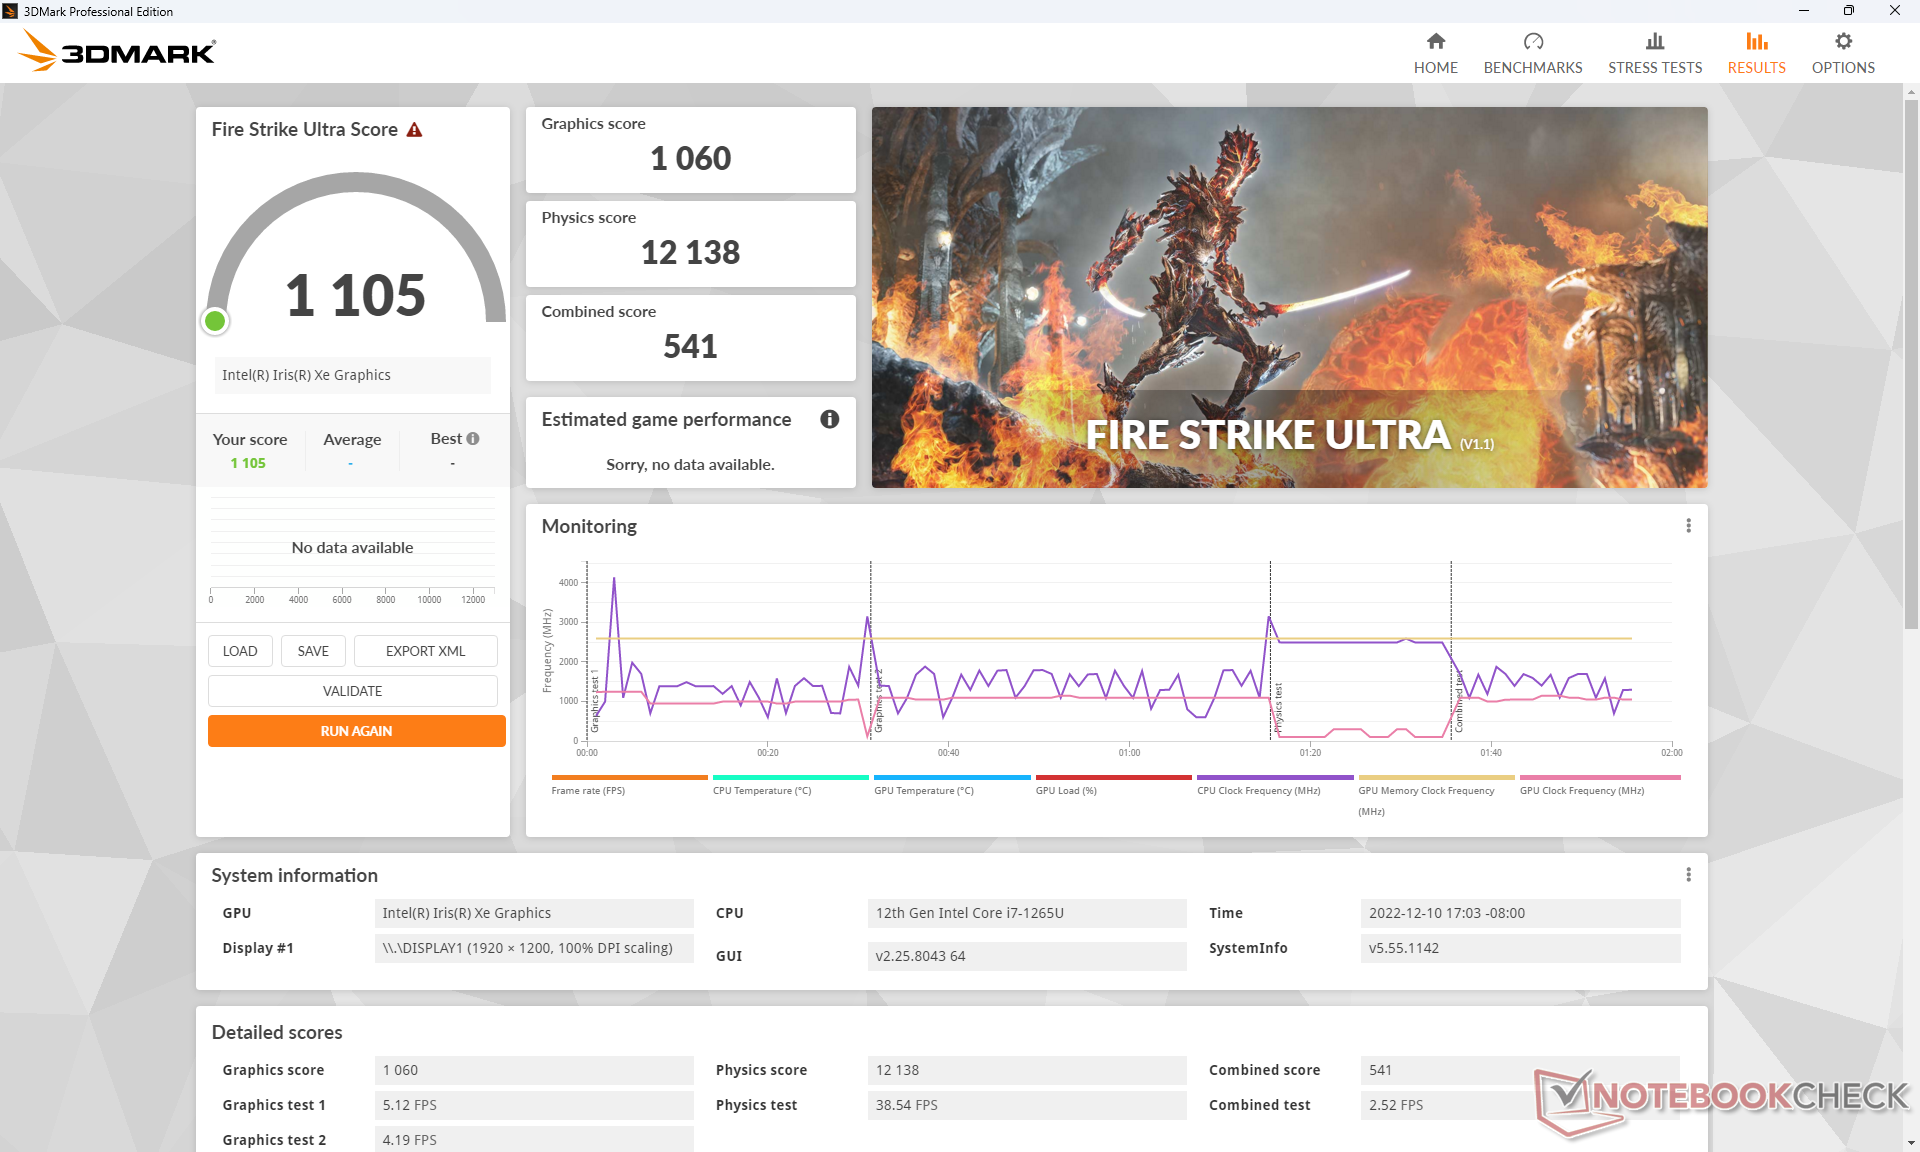
Wydajność GPU
Wydajność graficzna może być o 20 do 40 procent wyższa niż w przypadku Iris Xe 80 EUs w SKU Core i5-1250P tego samego modelu ThinkPad X1 Carbon G10.
| 3DMark 11 - 1280x720 Performance GPU | |
| Lenovo Yoga 7-14ARB G7 | |
| Lenovo Yoga Slim 9 14IAP7 | |
| Huawei MateBook X Pro 2022 | |
| ADATA XPG Xenia 14 | |
| Przeciętny Intel Iris Xe Graphics G7 96EUs (2867 - 7676, n=209) | |
| Lenovo ThinkPad X1 Carbon G10 Core i7-1265U | |
| Acer TravelMate P6 TMP614P-52-724G | |
| Dell Latitude 7420 JW6MH | |
| Lenovo ThinkPad X1 Carbon G10 21CC001RGE | |
| HP EliteBook 845 G9 6F6H9EA | |
| Asus ExpertBook B1 B1400CEAE, i5-1135G7 | |
| LG Gram 14Z90Q | |
| Infinix INBook X2 | |
| 3DMark 11 Performance | 6479 pkt. | |
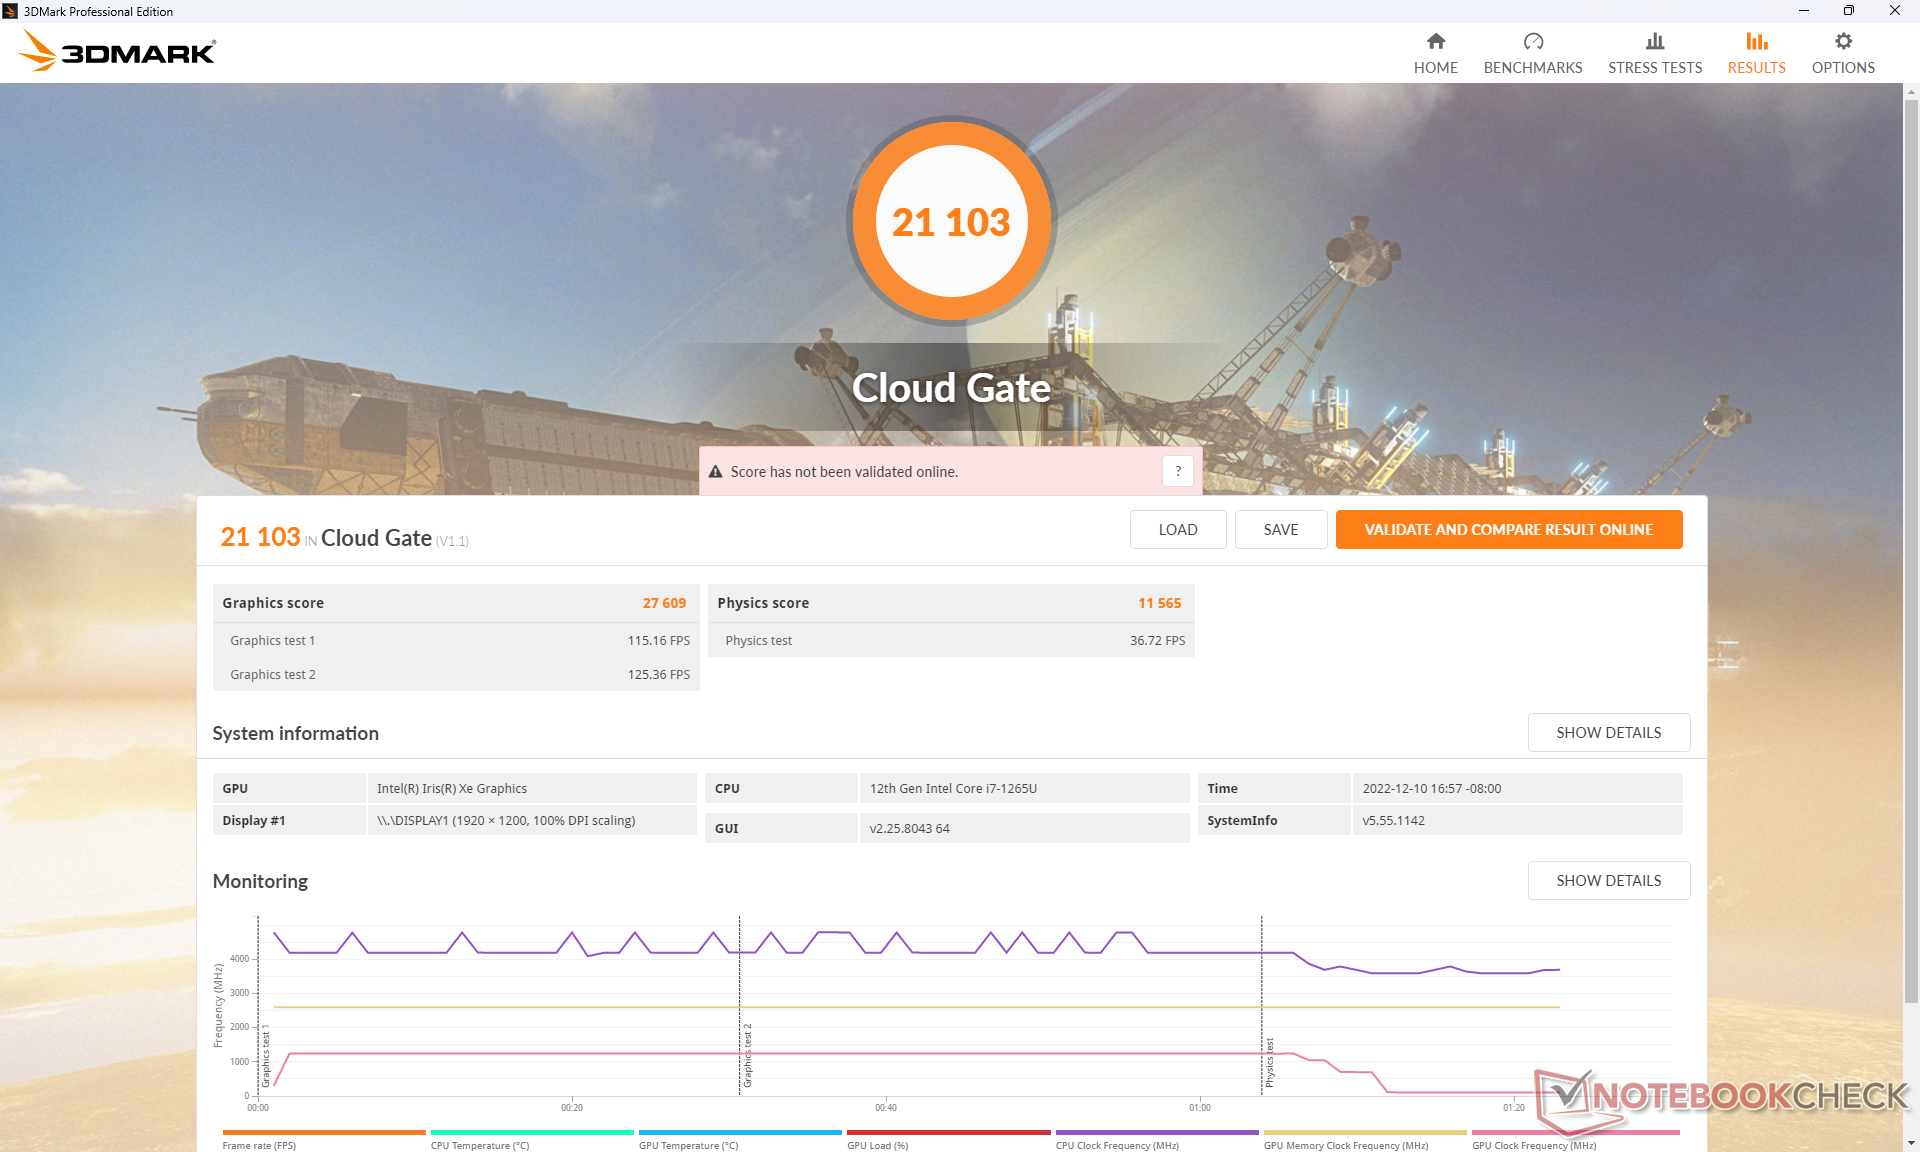
| 3DMark Cloud Gate Standard Score | 21103 pkt. | |
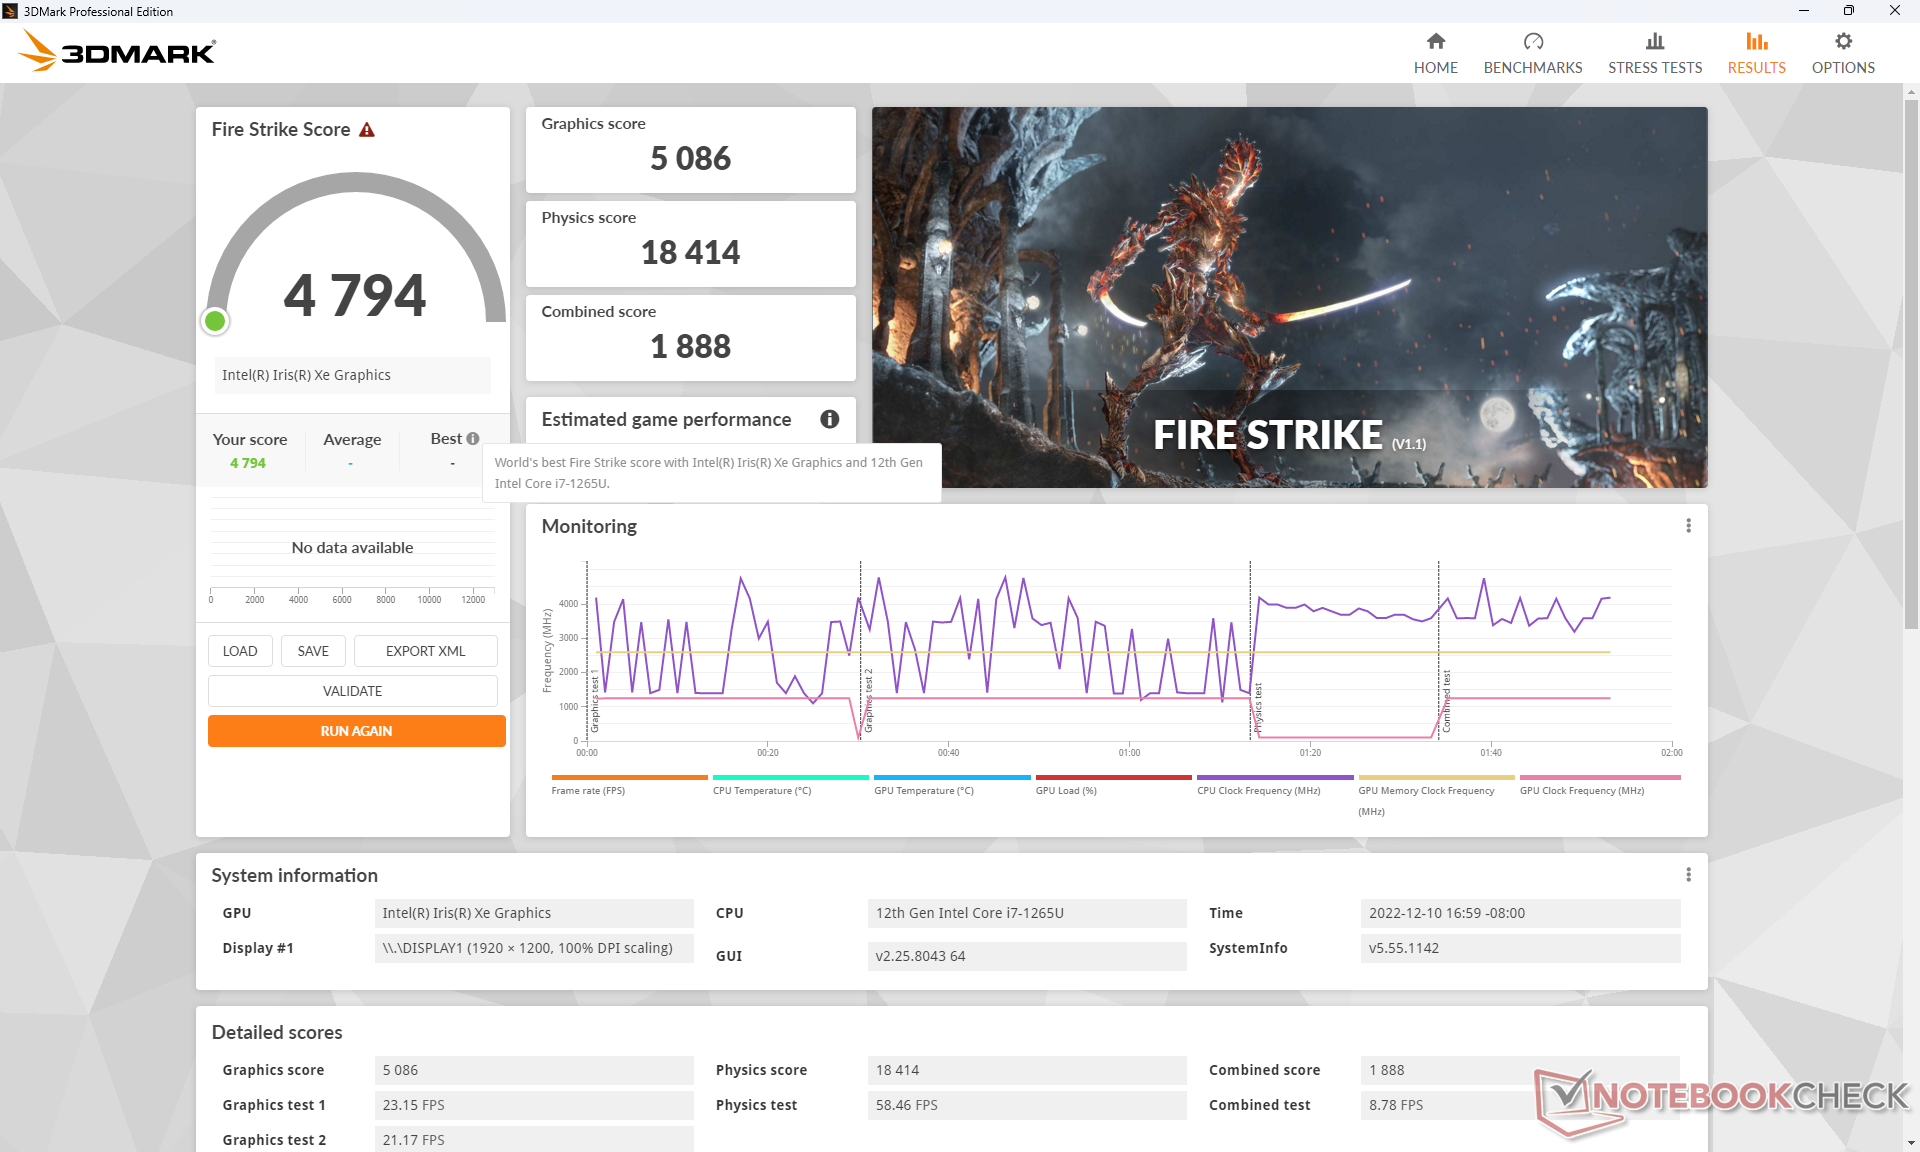
| 3DMark Fire Strike Score | 4794 pkt. | |
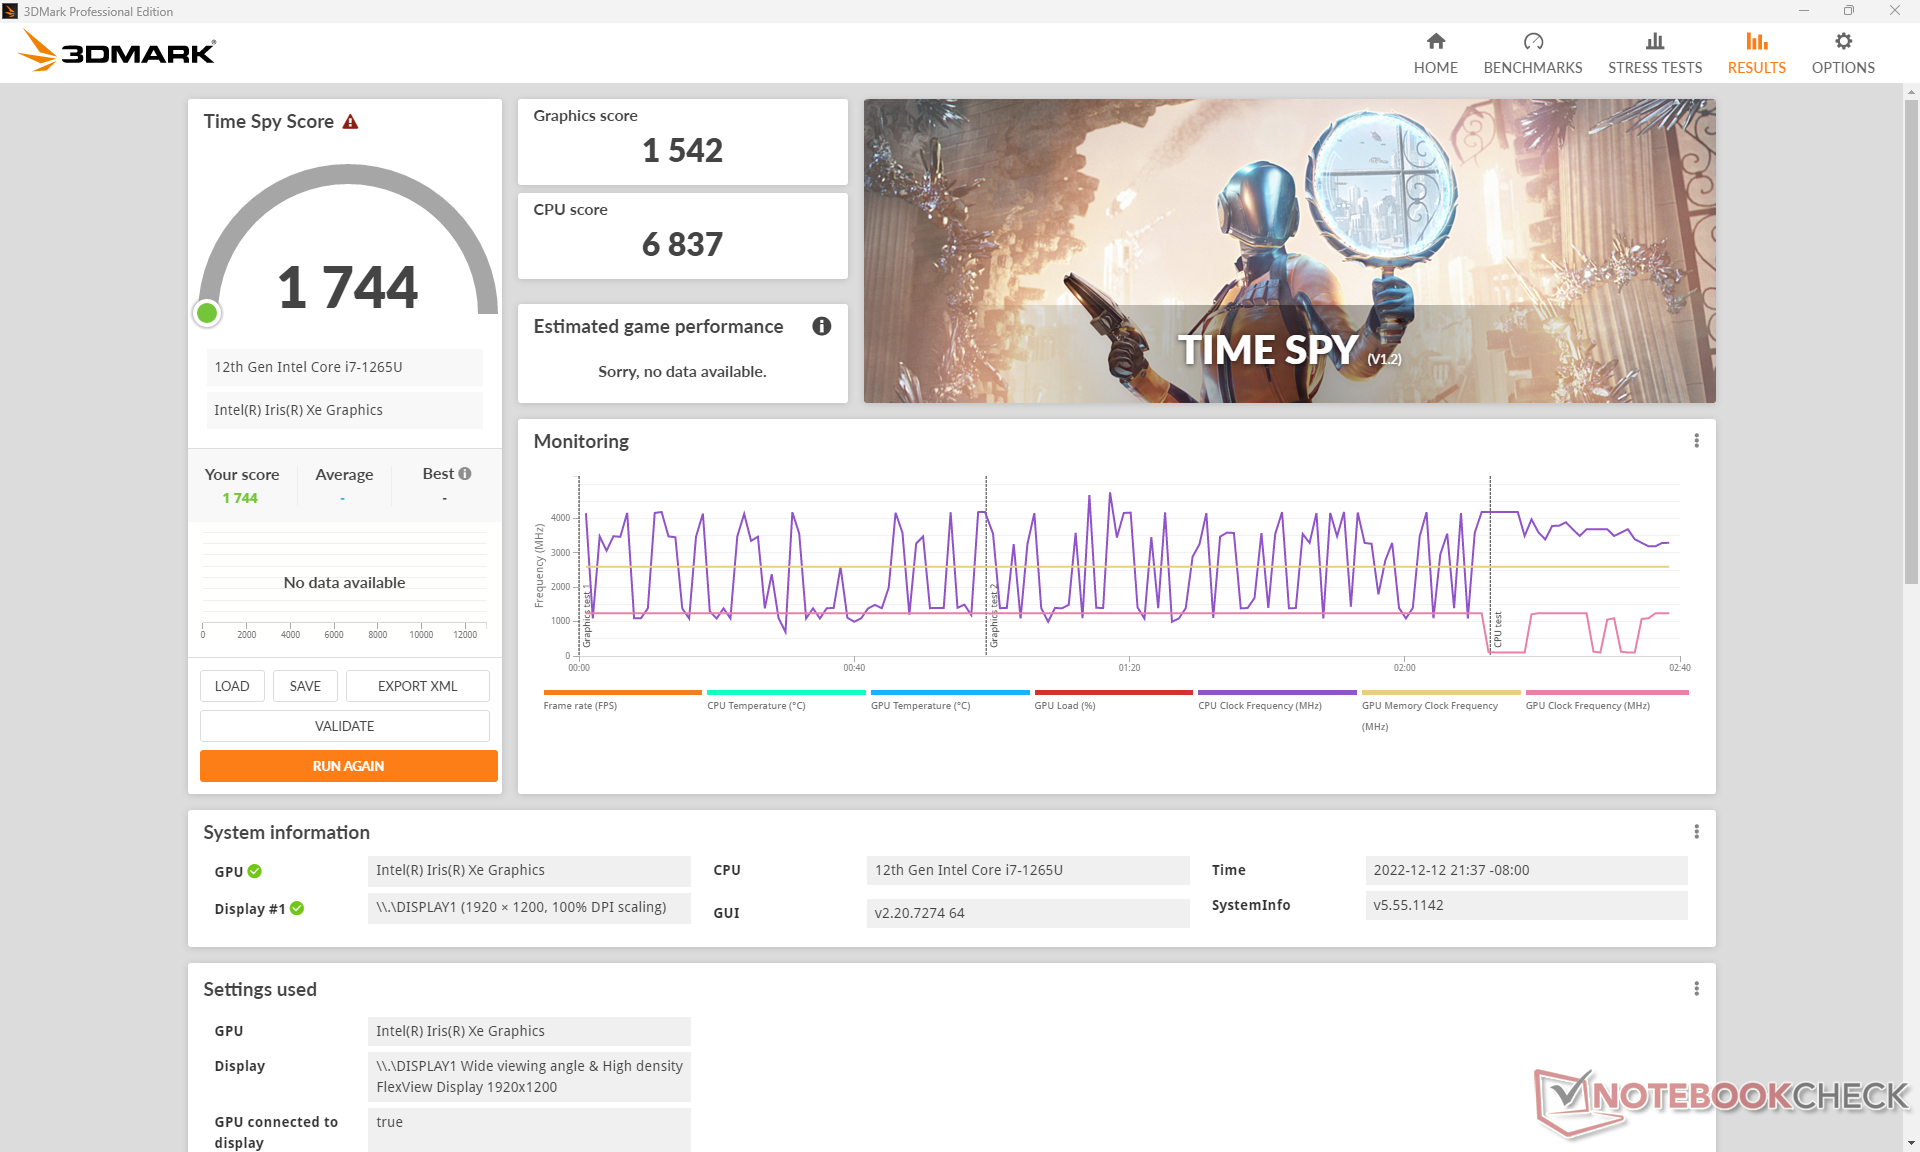
| 3DMark Time Spy Score | 1744 pkt. | |
Pomoc | ||
Witcher 3 FPS Chart
| low | med. | high | ultra | |
|---|---|---|---|---|
| GTA V (2015) | 108.4 | 88 | 22.2 | 9.7 |
| The Witcher 3 (2015) | 95.6 | 60.3 | 33.9 | 15.4 |
| Dota 2 Reborn (2015) | 106.8 | 82 | 65.9 | 59.8 |
| Final Fantasy XV Benchmark (2018) | 43.7 | 23.6 | 16.5 | |
| X-Plane 11.11 (2018) | 40.4 | 35 | 31.3 | |
| Strange Brigade (2018) | 89.6 | 38.5 | 30.3 | 24.3 |
| Cyberpunk 2077 1.6 (2022) | 21.9 | 18 | 13.6 | 10.9 |
Emisje
Szumy systemowe - nieco głośniejsze
Ogólny hałas wentylatorów jest głośniejszy od tego, który odnotowaliśmy w konfiguracji z Core i5 Core-P. Choć system świetnie radzi sobie z zachowaniem ciszy przy niższych obciążeniach, to jednak przy wyższych obciążeniach, takich jak 3DMark 06, dwa wewnętrzne wentylatory mają tendencję do szybszego zwiększania obrotów. W 3DMarku 06 udało nam się zarejestrować maksymalny hałas wentylatorów na poziomie prawie 39 dB(A) Witcher 3 w porównaniu do 36 dB(A) na SKU Core-P.
Hałas
| luz |
| 23.2 / 23.2 / 23.2 dB |
| obciążenie |
| 38.6 / 38.3 dB |
 | ||
30 dB cichy 40 dB(A) słyszalny 50 dB(A) irytujący |
||
min: | ||
| Lenovo ThinkPad X1 Carbon G10 Core i7-1265U Iris Xe G7 96EUs, i7-1265U, Kioxia BG5 KBG5AZNV1T02 | Lenovo ThinkPad X1 Carbon G10 21CC001RGE Iris Xe G7 80EUs, i5-1250P, Samsung PM9A1 MZVL2512HCJQ | HP EliteBook 845 G9 6F6H9EA Radeon 660M, R5 PRO 6650U, Samsung PM991 MZVLQ512HBLU | LG Gram 14Z90Q Iris Xe G7 80EUs, i5-1240P, Samsung PM9A1 MZVL2512HCJQ | Dell Latitude 7420 JW6MH Iris Xe G7 80EUs, i5-1145G7, SK Hynix BC711 HFM512GD3HX015N | Asus ExpertBook B1 B1400CEAE, i5-1135G7 Iris Xe G7 80EUs, i5-1135G7, WDC PC SN530 SDBPNPZ-512G | |
|---|---|---|---|---|---|---|
| Noise | 6% | -2% | -5% | -12% | 4% | |
| wyłączone / środowisko * (dB) | 23.2 | 22.81 2% | 24 -3% | 25 -8% | 25.3 -9% | 23.8 -3% |
| Idle Minimum * (dB) | 23.2 | 22.81 2% | 24 -3% | 26 -12% | 25.3 -9% | 23.8 -3% |
| Idle Average * (dB) | 23.2 | 22.81 2% | 25 -8% | 27 -16% | 25.3 -9% | 23.8 -3% |
| Idle Maximum * (dB) | 23.2 | 22.81 2% | 26 -12% | 28 -21% | 25.3 -9% | 26.5 -14% |
| Load Average * (dB) | 38.6 | 31.59 18% | 34 12% | 35 9% | 44.9 -16% | 28.6 26% |
| Witcher 3 ultra * (dB) | 38.5 | 35.59 8% | 38 1% | 36 6% | 30.6 21% | |
| Load Maximum * (dB) | 38.3 | 35.47 7% | 38 1% | 36 6% | 44.9 -17% | 37.4 2% |
* ... im mniej tym lepiej
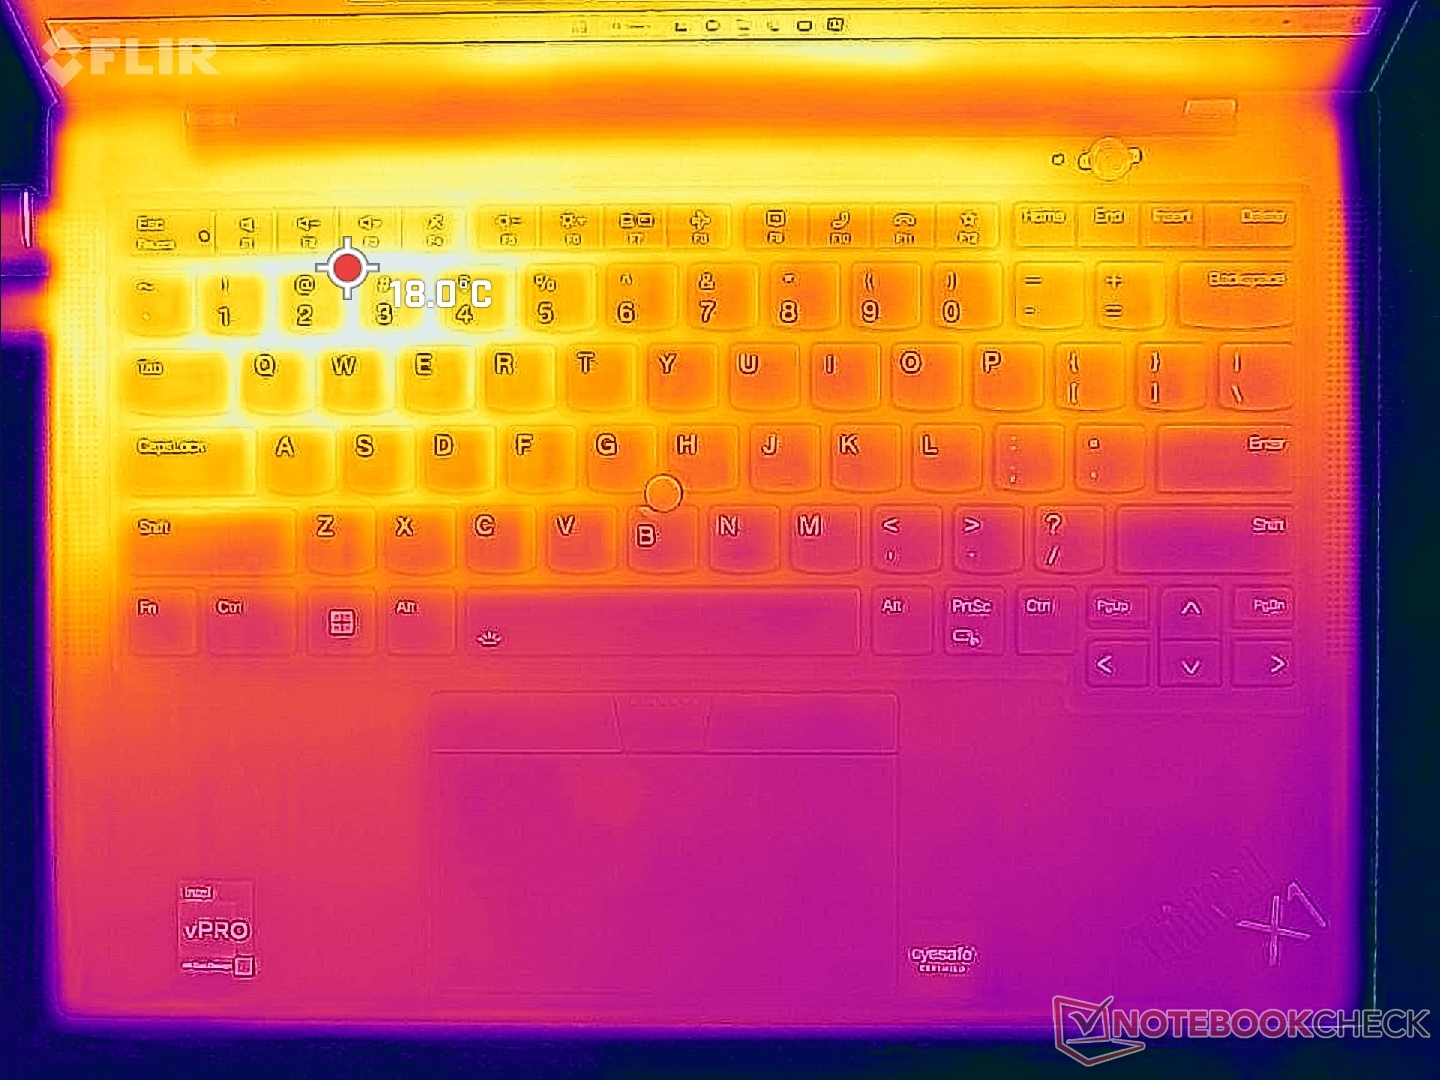
Temperatura
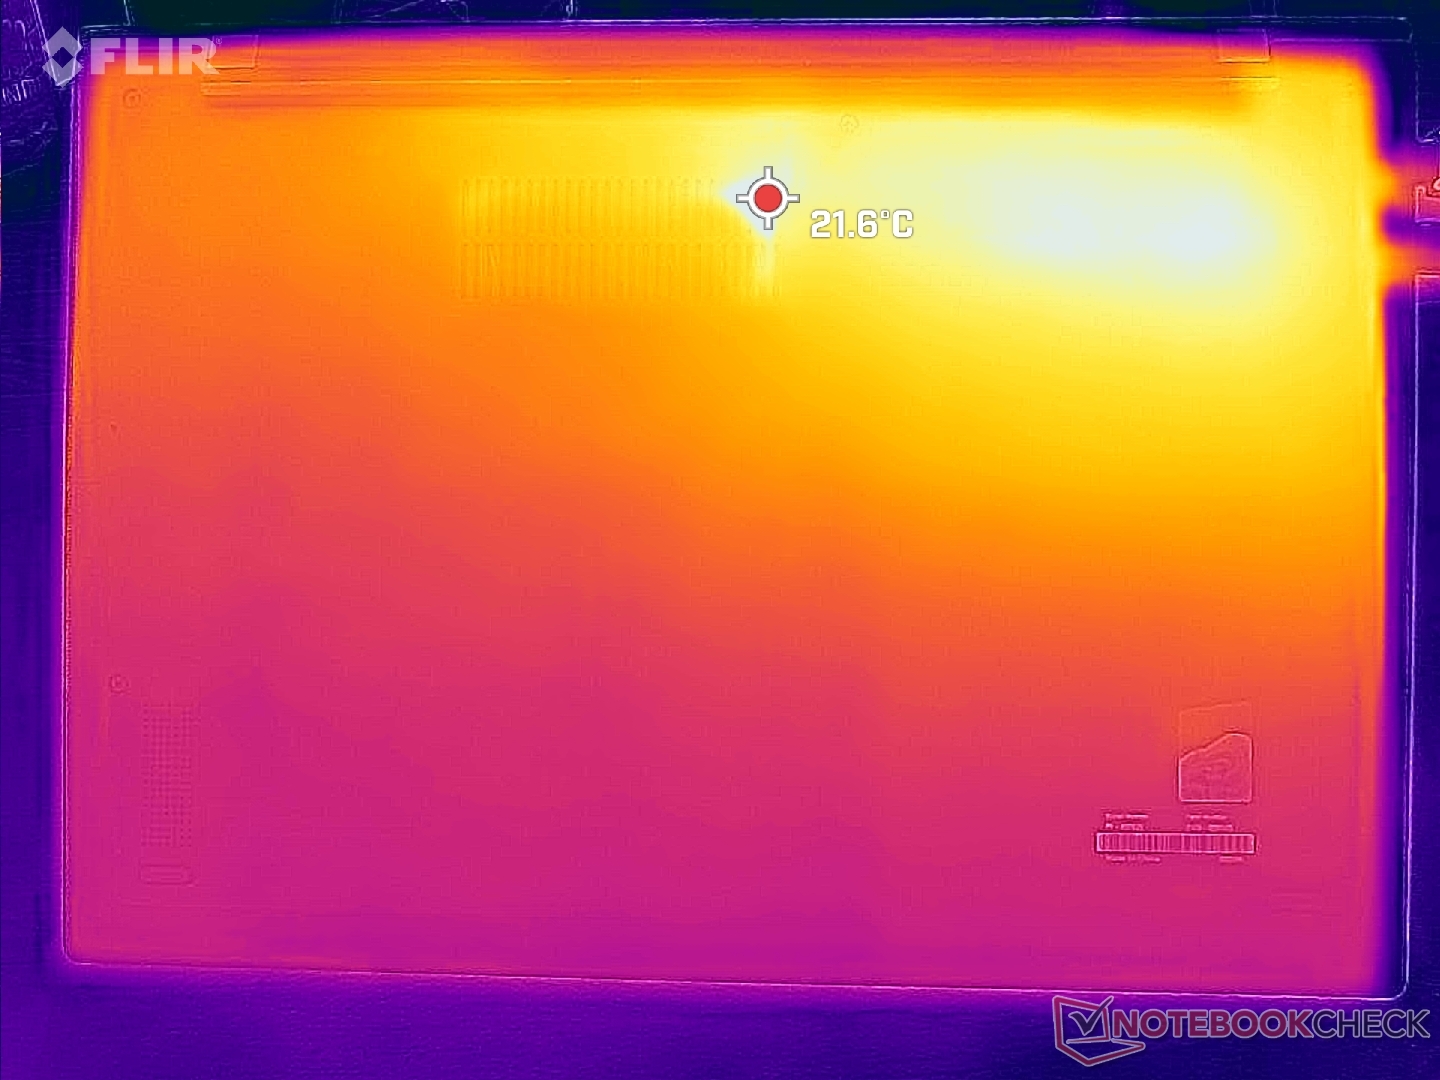
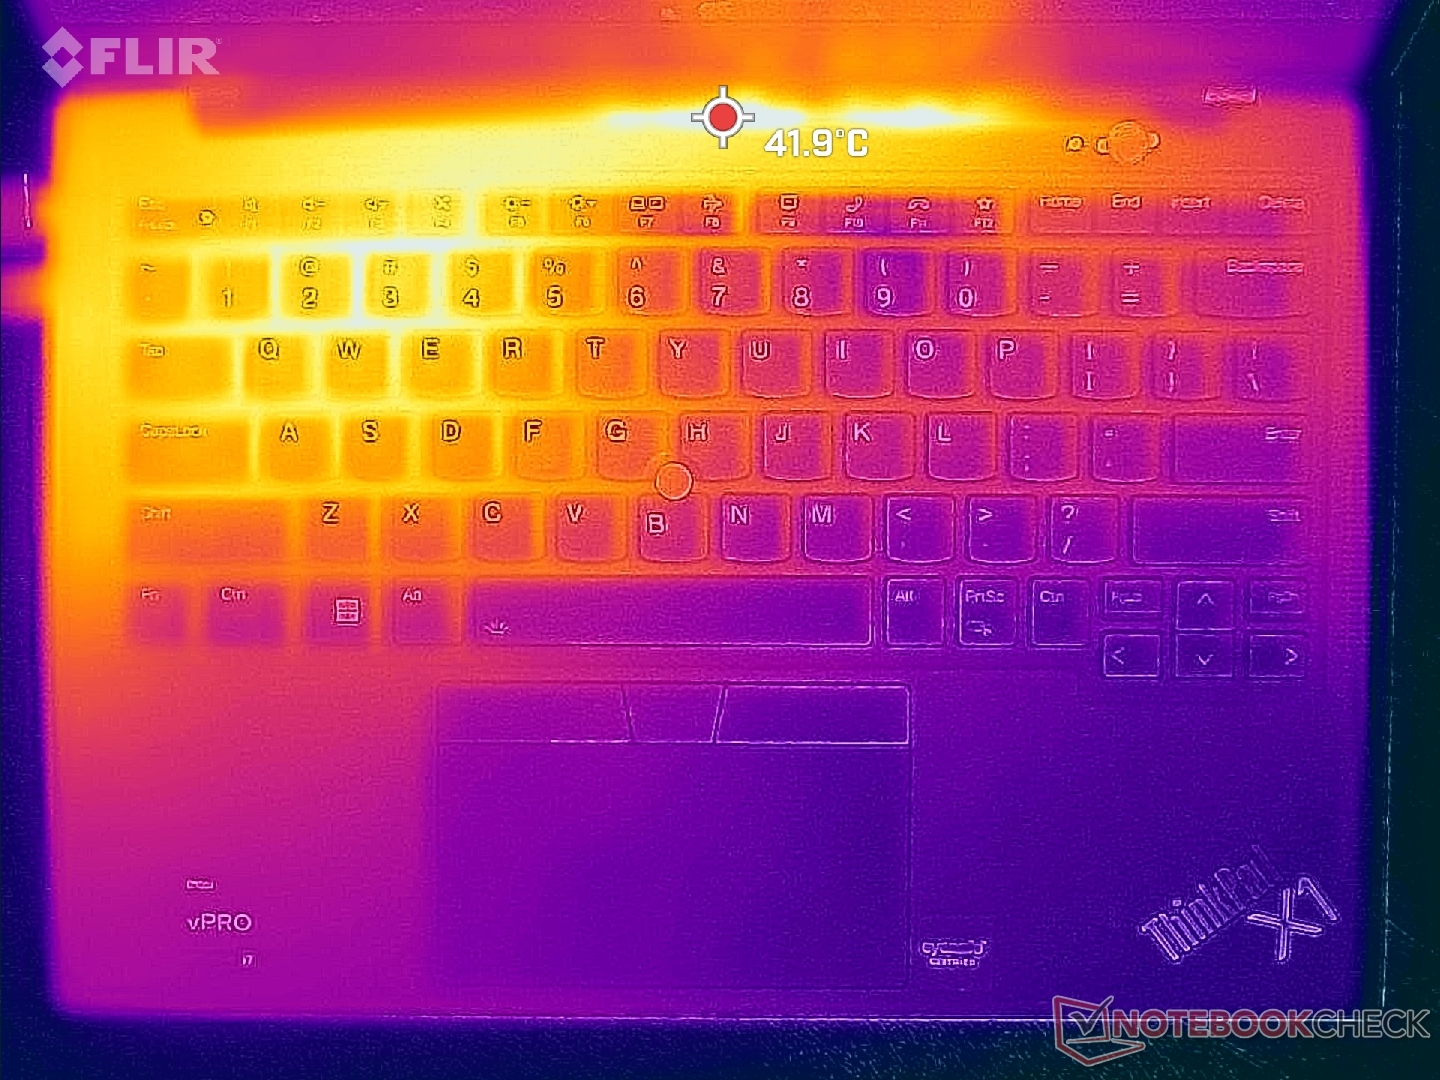
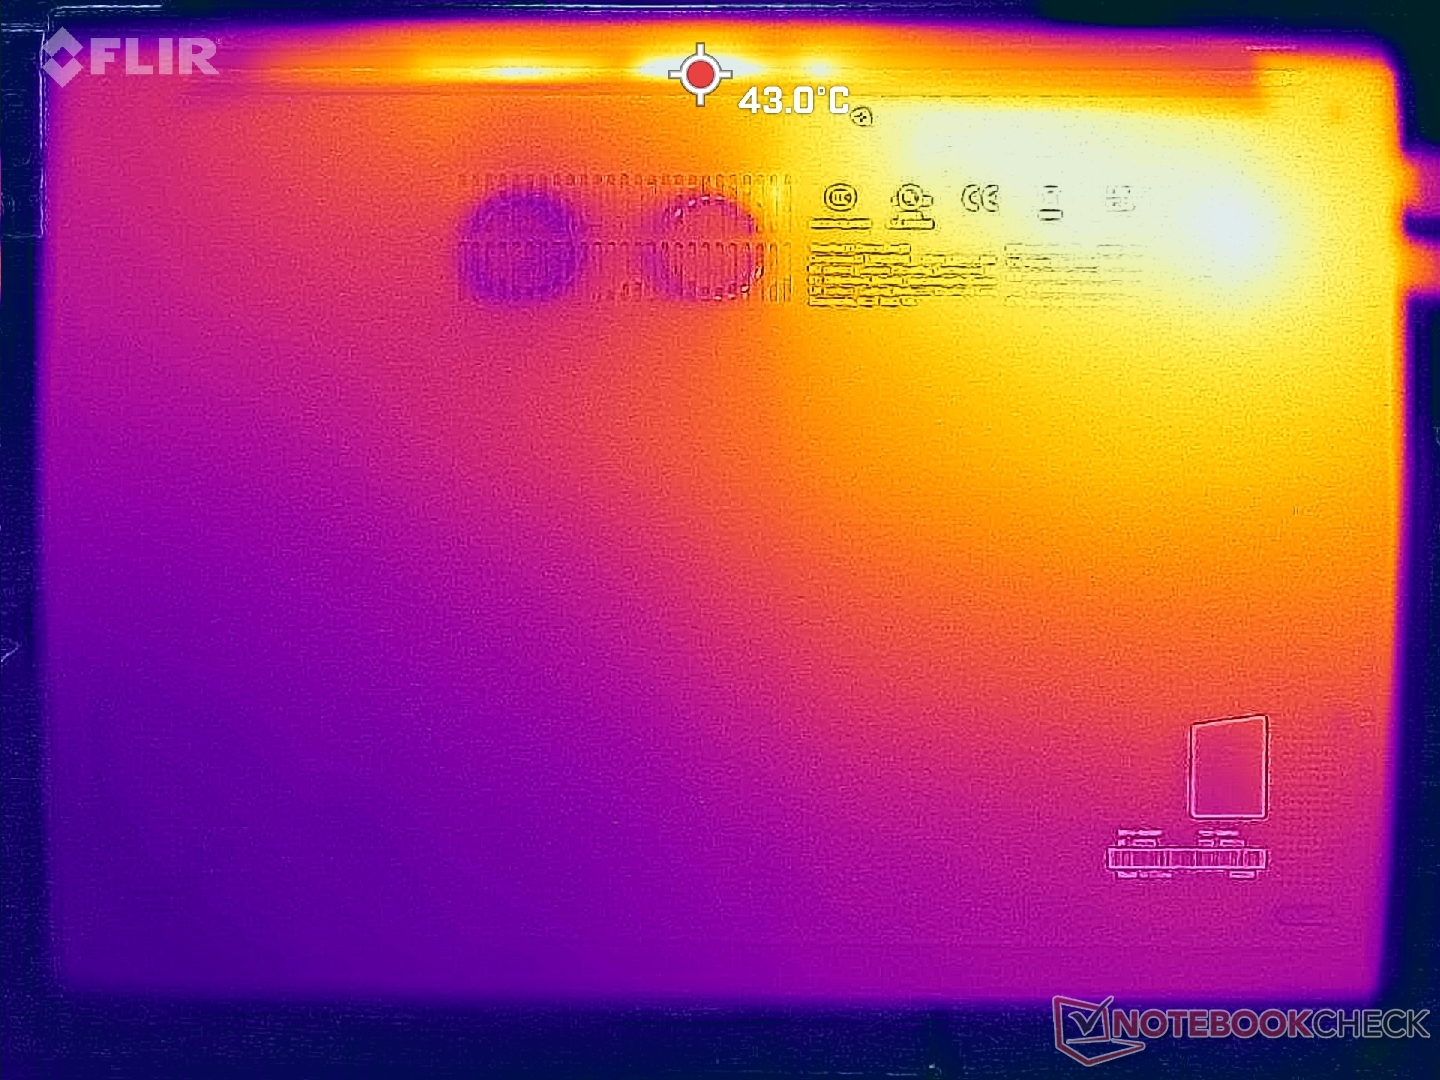
Temperatury powierzchni są zawsze cieplejsze na lewej połowie laptopa niż na prawej ze względu na umiejscowienie rozwiązania chłodzącego i procesora. W rzeczywistości gorący punkt na pokładzie klawiatury może mieć nawet 42 C w porównaniu z zaledwie 20 C na spodzie dłoni. Mimo różnic w wydajności temperatury są jednak porównywalne z X1 Carbon G10 z procesorem Core-P.
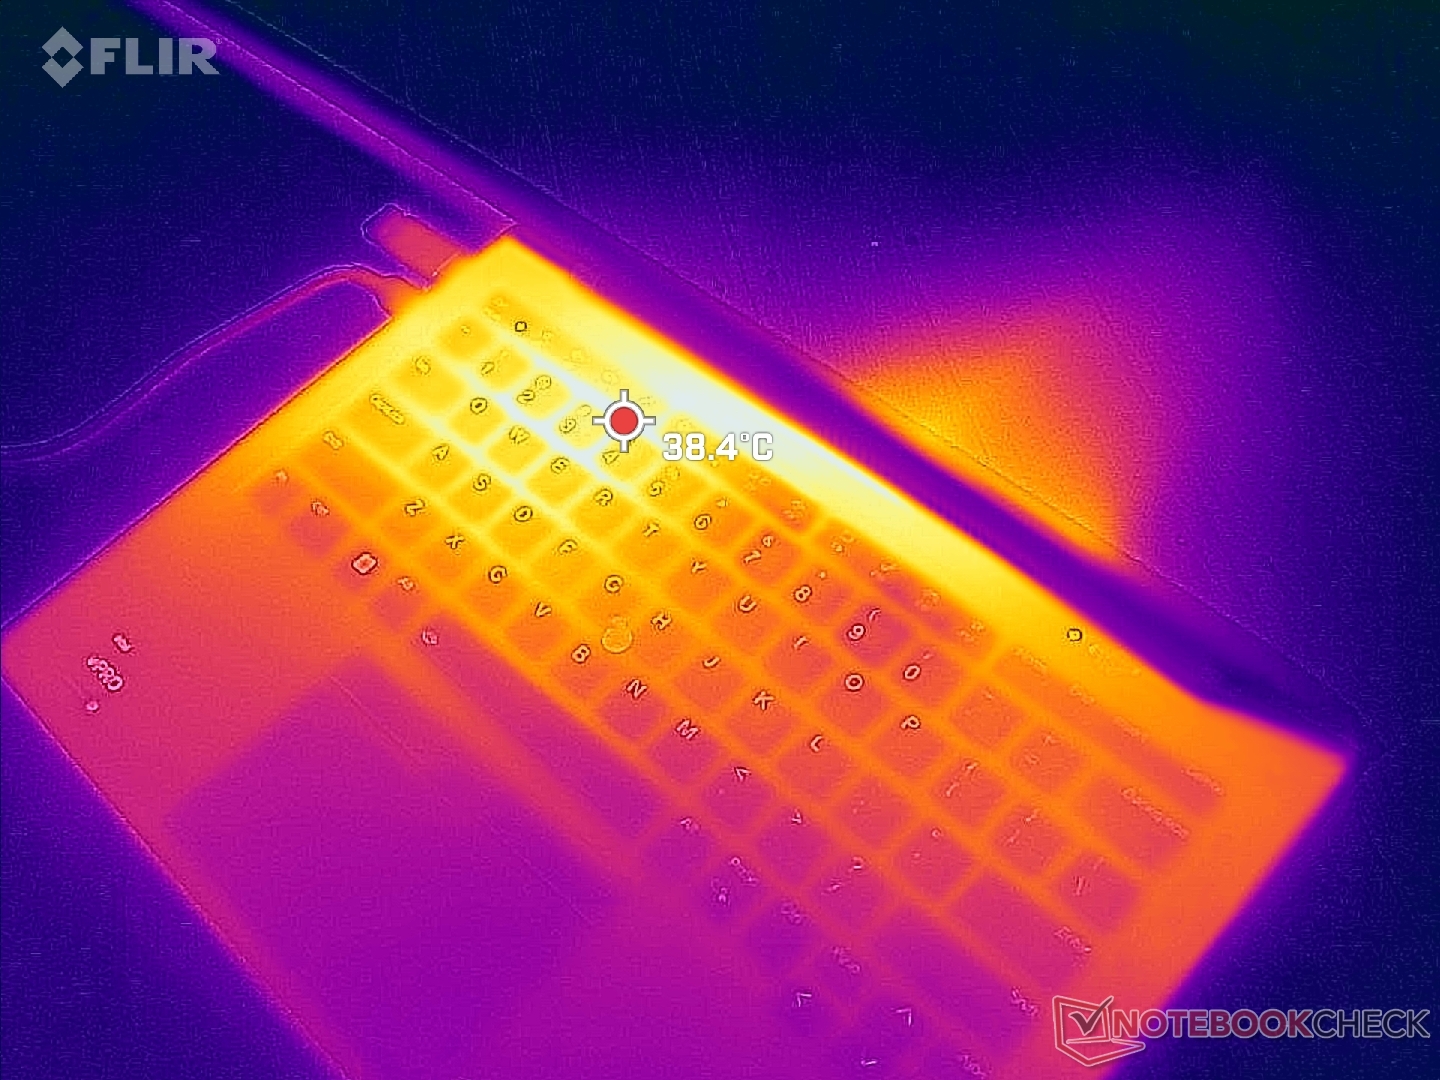
(±) Maksymalna temperatura w górnej części wynosi 41.2 °C / 106 F, w porównaniu do średniej 34.3 °C / 94 F , począwszy od 21.2 do 62.5 °C dla klasy Office.
(±) Dno nagrzewa się maksymalnie do 41 °C / 106 F, w porównaniu do średniej 36.8 °C / 98 F
(+) W stanie bezczynności średnia temperatura górnej części wynosi 21.4 °C / 71 F, w porównaniu ze średnią temperaturą urządzenia wynoszącą 29.5 °C / ### class_avg_f### F.
(+) Podpórki pod nadgarstki i touchpad są chłodniejsze niż temperatura skóry i maksymalnie 25.2 °C / 77.4 F i dlatego są chłodne w dotyku.
(+) Średnia temperatura obszaru podparcia dłoni w podobnych urządzeniach wynosiła 27.5 °C / 81.5 F (+2.3 °C / 4.1 F).
| Lenovo ThinkPad X1 Carbon G10 Core i7-1265U Intel Core i7-1265U, Intel Iris Xe Graphics G7 96EUs | Lenovo ThinkPad X1 Carbon G10 21CC001RGE Intel Core i5-1250P, Intel Iris Xe Graphics G7 80EUs | HP EliteBook 845 G9 6F6H9EA AMD Ryzen 5 PRO 6650U, AMD Radeon 660M | LG Gram 14Z90Q Intel Core i5-1240P, Intel Iris Xe Graphics G7 80EUs | Dell Latitude 7420 JW6MH Intel Core i5-1145G7, Intel Iris Xe Graphics G7 80EUs | Asus ExpertBook B1 B1400CEAE, i5-1135G7 Intel Core i5-1135G7, Intel Iris Xe Graphics G7 80EUs | |
|---|---|---|---|---|---|---|
| Heat | -23% | -12% | -13% | -6% | -15% | |
| Maximum Upper Side * (°C) | 41.2 | 45 -9% | 44 -7% | 43 -4% | 37.1 10% | 41.7 -1% |
| Maximum Bottom * (°C) | 41 | 44 -7% | 45 -10% | 45 -10% | 38.7 6% | 54.3 -32% |
| Idle Upper Side * (°C) | 23.2 | 31.2 -34% | 27 -16% | 27 -16% | 27.3 -18% | 26 -12% |
| Idle Bottom * (°C) | 23.4 | 33.2 -42% | 27 -15% | 28 -20% | 28.1 -20% | 27.1 -16% |
* ... im mniej tym lepiej
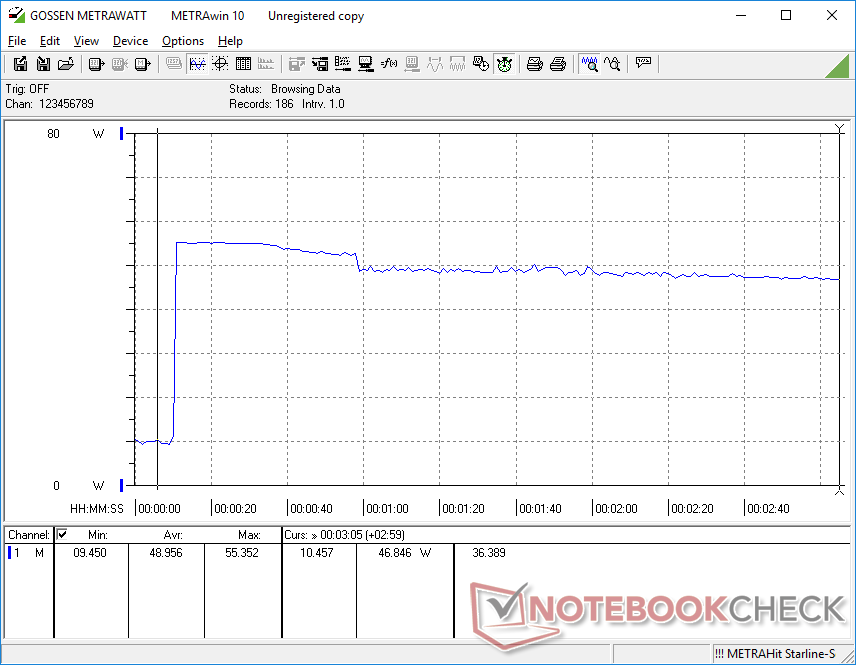
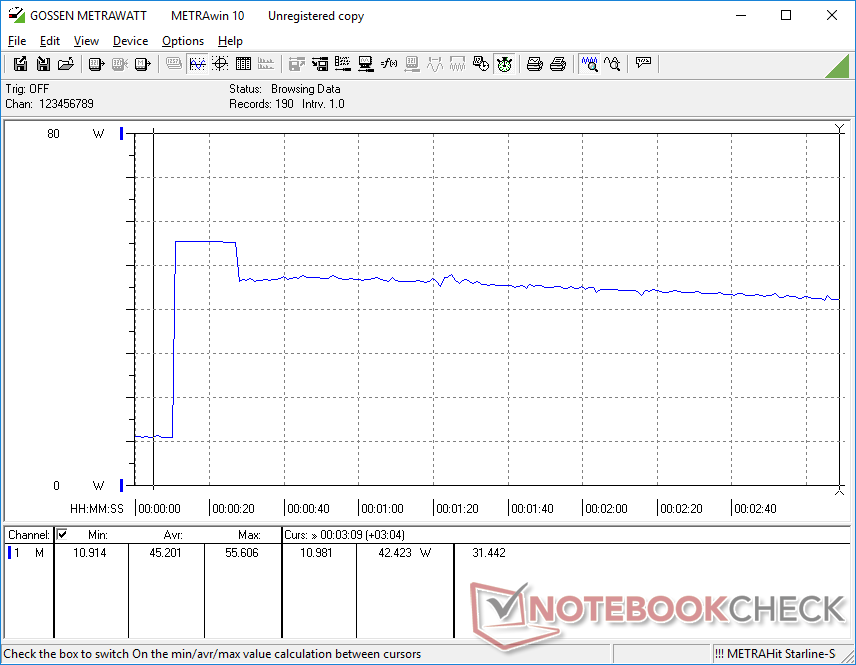
Stress Test
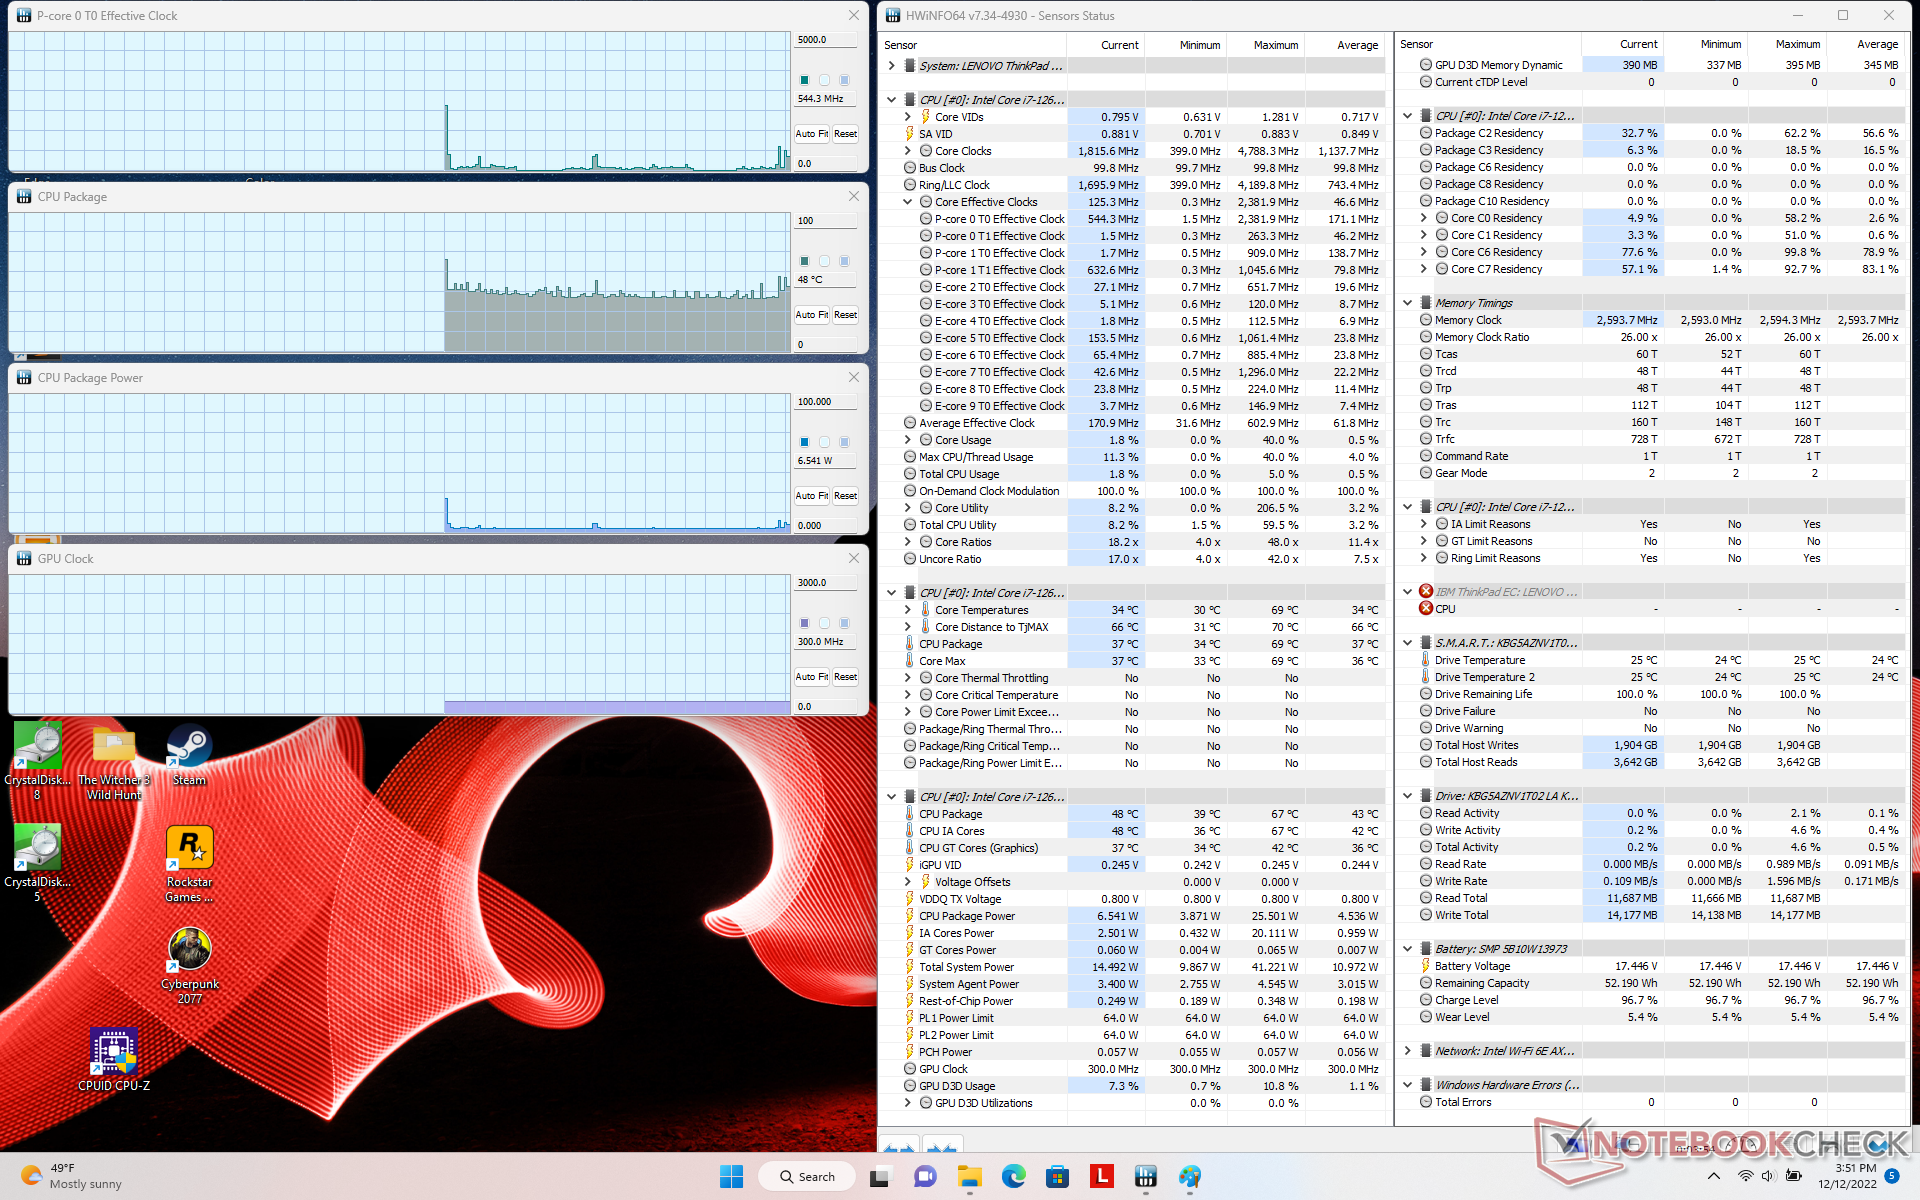
Poddany obciążeniu pod Prime95, procesor zwiększał taktowanie do 3,7 GHz, 51 W i 98 C tylko przez kilka sekund. Następnie częstotliwość taktowania i pobór mocy spadały odpowiednio do 2,7 GHz i 35 W, aż w końcu po kilku minutach ustabilizowały się na poziomie 2,3 GHz, 24 W i 82 C. Skok temperatury rdzenia do prawie 100 C pokazuje, że rozwiązanie chłodzące jest niewystarczające do maksymalizacji wydajności Turbo Boost.
Praca na zasilaniu akumulatorowym nie wydaje się mieć znaczącego wpływu na wydajność CPU i GPU. Test 3DMark 11 przeprowadzony na zasilaniu sieciowym, a następnie na akumulatorze nie wykazałby prawie żadnych różnic w wynikach końcowych.
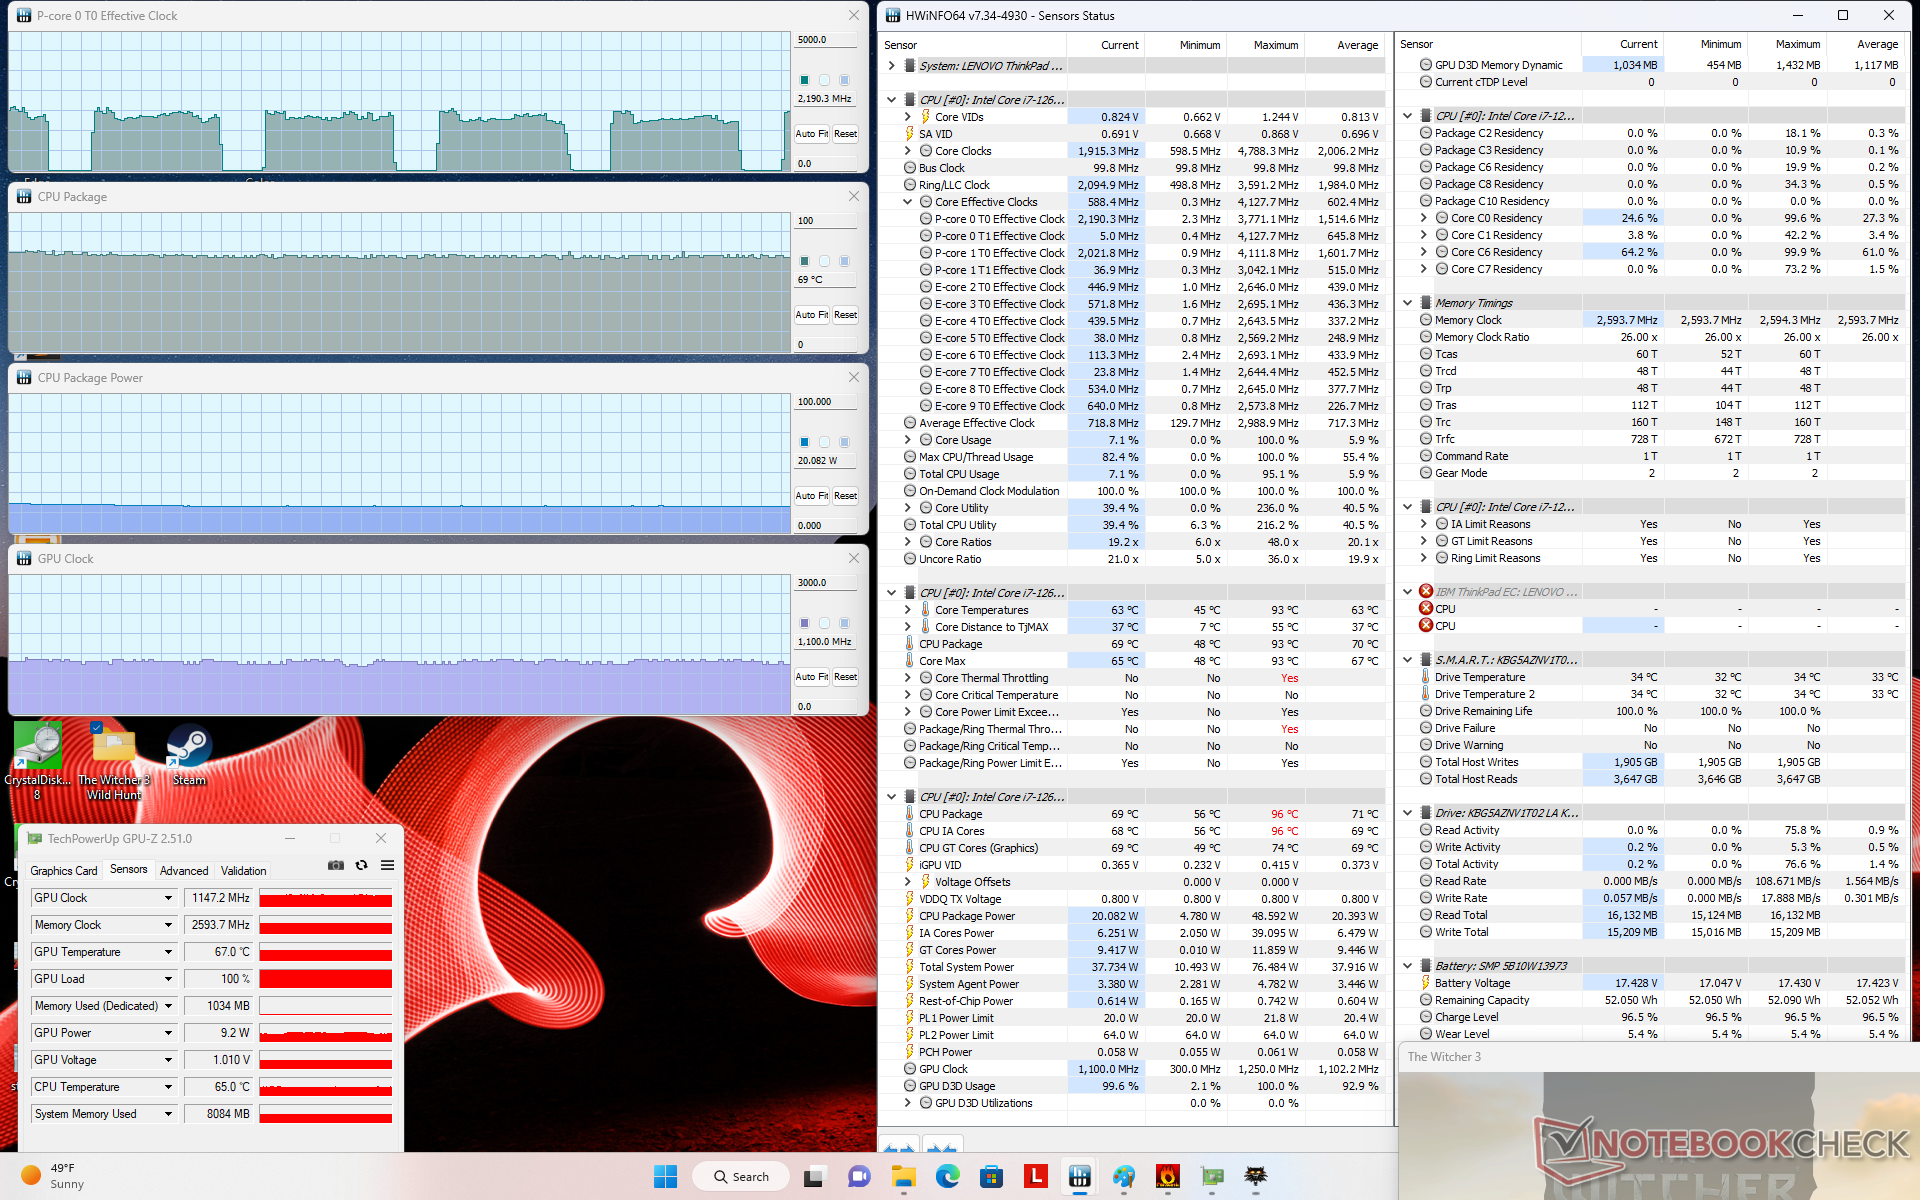
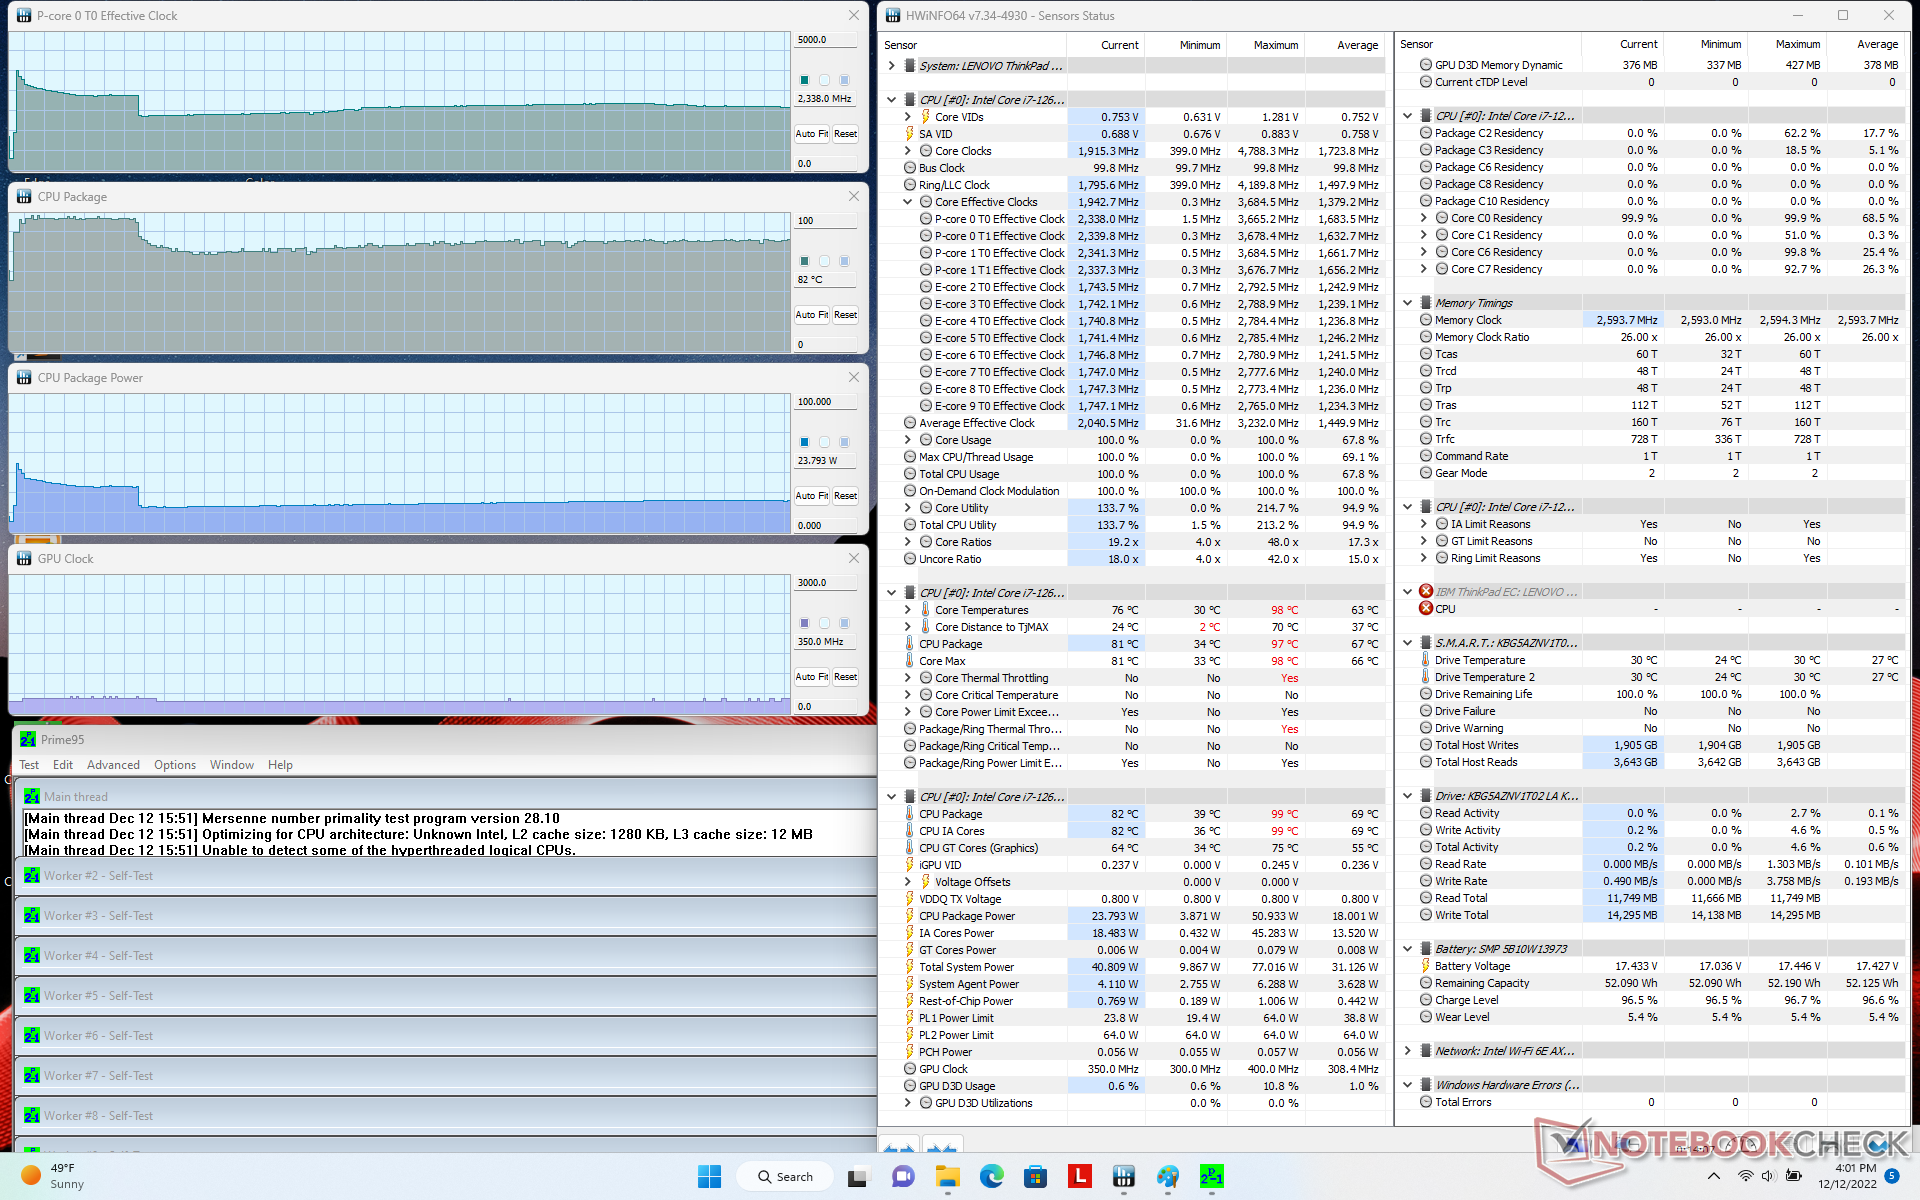
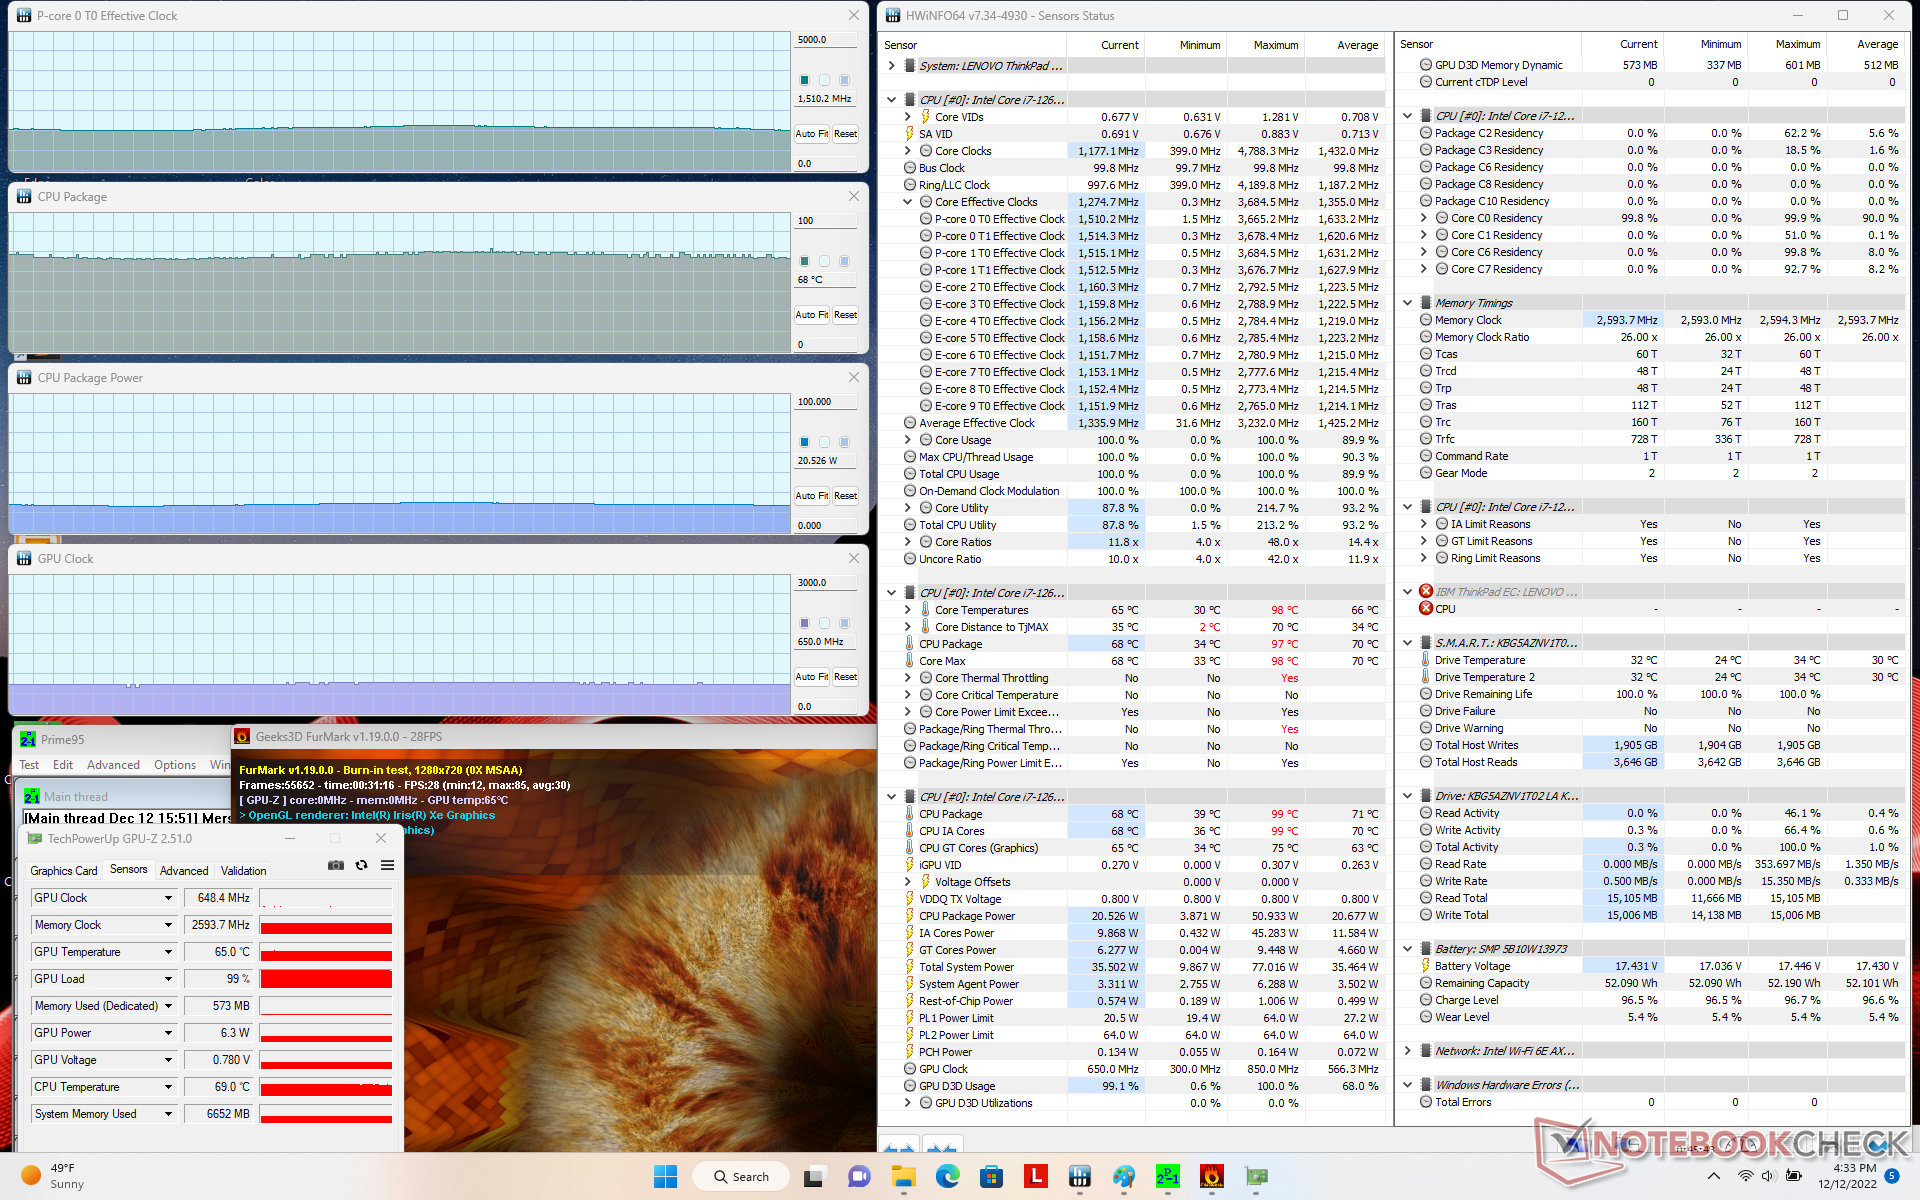
| ZegarCPU (GHz) | Zegar GPU (MHz) | Średnia temperatura CPU (°C) | |
| System w stanie bezczynności | -- | -- | 46 |
| Prime95 Stress | 2.3 | -- | 82 |
| Prime95 + FurMark Stress | 1.5 | 648 | 68 |
| Witcher 3 Stress | ~2.2 | 1147 | 69 |
Mówcy
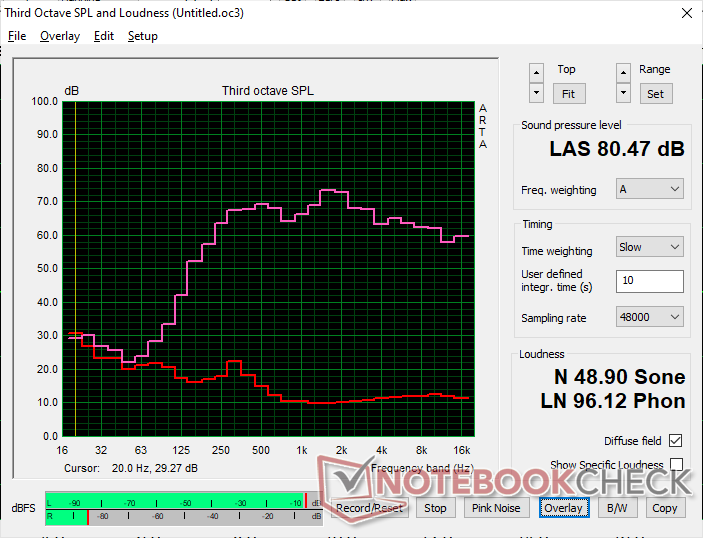
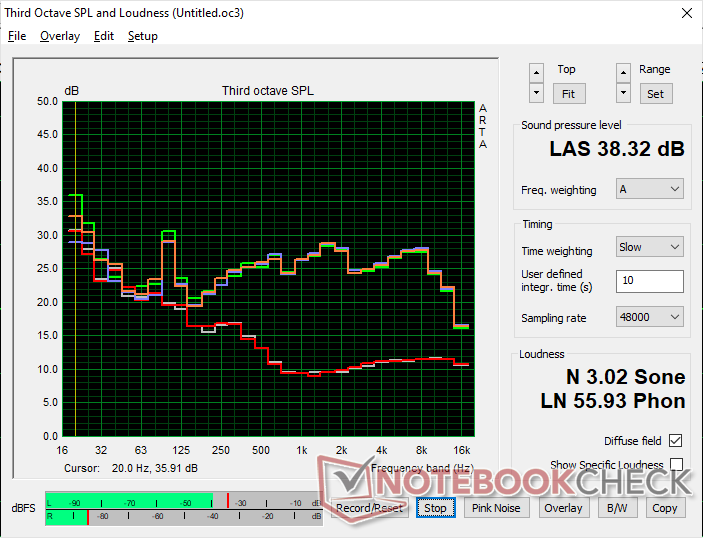
Lenovo ThinkPad X1 Carbon G10 Core i7-1265U analiza dźwięku
(+) | głośniki mogą odtwarzać stosunkowo głośno (85.5 dB)
Bas 100 - 315 Hz
(±) | zredukowany bas - średnio 13.4% niższy od mediany
(±) | liniowość basu jest średnia (11.3% delta do poprzedniej częstotliwości)
Średnie 400 - 2000 Hz
(+) | zbalansowane środki średnie - tylko 3.2% od mediany
(+) | średnie są liniowe (3.3% delta do poprzedniej częstotliwości)
Wysokie 2–16 kHz
(+) | zrównoważone maksima - tylko 2.7% od mediany
(+) | wzloty są liniowe (4.4% delta do poprzedniej częstotliwości)
Ogólnie 100 - 16.000 Hz
(+) | ogólny dźwięk jest liniowy (10.8% różnicy w stosunku do mediany)
W porównaniu do tej samej klasy
» 2% wszystkich testowanych urządzeń w tej klasie było lepszych, 1% podobnych, 97% gorszych
» Najlepszy miał deltę 7%, średnia wynosiła ###średnia###%, najgorsza wynosiła 53%
W porównaniu do wszystkich testowanych urządzeń
» 6% wszystkich testowanych urządzeń było lepszych, 2% podobnych, 92% gorszych
» Najlepszy miał deltę 4%, średnia wynosiła ###średnia###%, najgorsza wynosiła 134%
Apple MacBook Pro 16 2021 M1 Pro analiza dźwięku
(+) | głośniki mogą odtwarzać stosunkowo głośno (84.7 dB)
Bas 100 - 315 Hz
(+) | dobry bas - tylko 3.8% od mediany
(+) | bas jest liniowy (5.2% delta do poprzedniej częstotliwości)
Średnie 400 - 2000 Hz
(+) | zbalansowane środki średnie - tylko 1.3% od mediany
(+) | średnie są liniowe (2.1% delta do poprzedniej częstotliwości)
Wysokie 2–16 kHz
(+) | zrównoważone maksima - tylko 1.9% od mediany
(+) | wzloty są liniowe (2.7% delta do poprzedniej częstotliwości)
Ogólnie 100 - 16.000 Hz
(+) | ogólny dźwięk jest liniowy (4.6% różnicy w stosunku do mediany)
W porównaniu do tej samej klasy
» 0% wszystkich testowanych urządzeń w tej klasie było lepszych, 0% podobnych, 100% gorszych
» Najlepszy miał deltę 5%, średnia wynosiła ###średnia###%, najgorsza wynosiła 45%
W porównaniu do wszystkich testowanych urządzeń
» 0% wszystkich testowanych urządzeń było lepszych, 0% podobnych, 100% gorszych
» Najlepszy miał deltę 4%, średnia wynosiła ###średnia###%, najgorsza wynosiła 134%
Zarządzanie energią
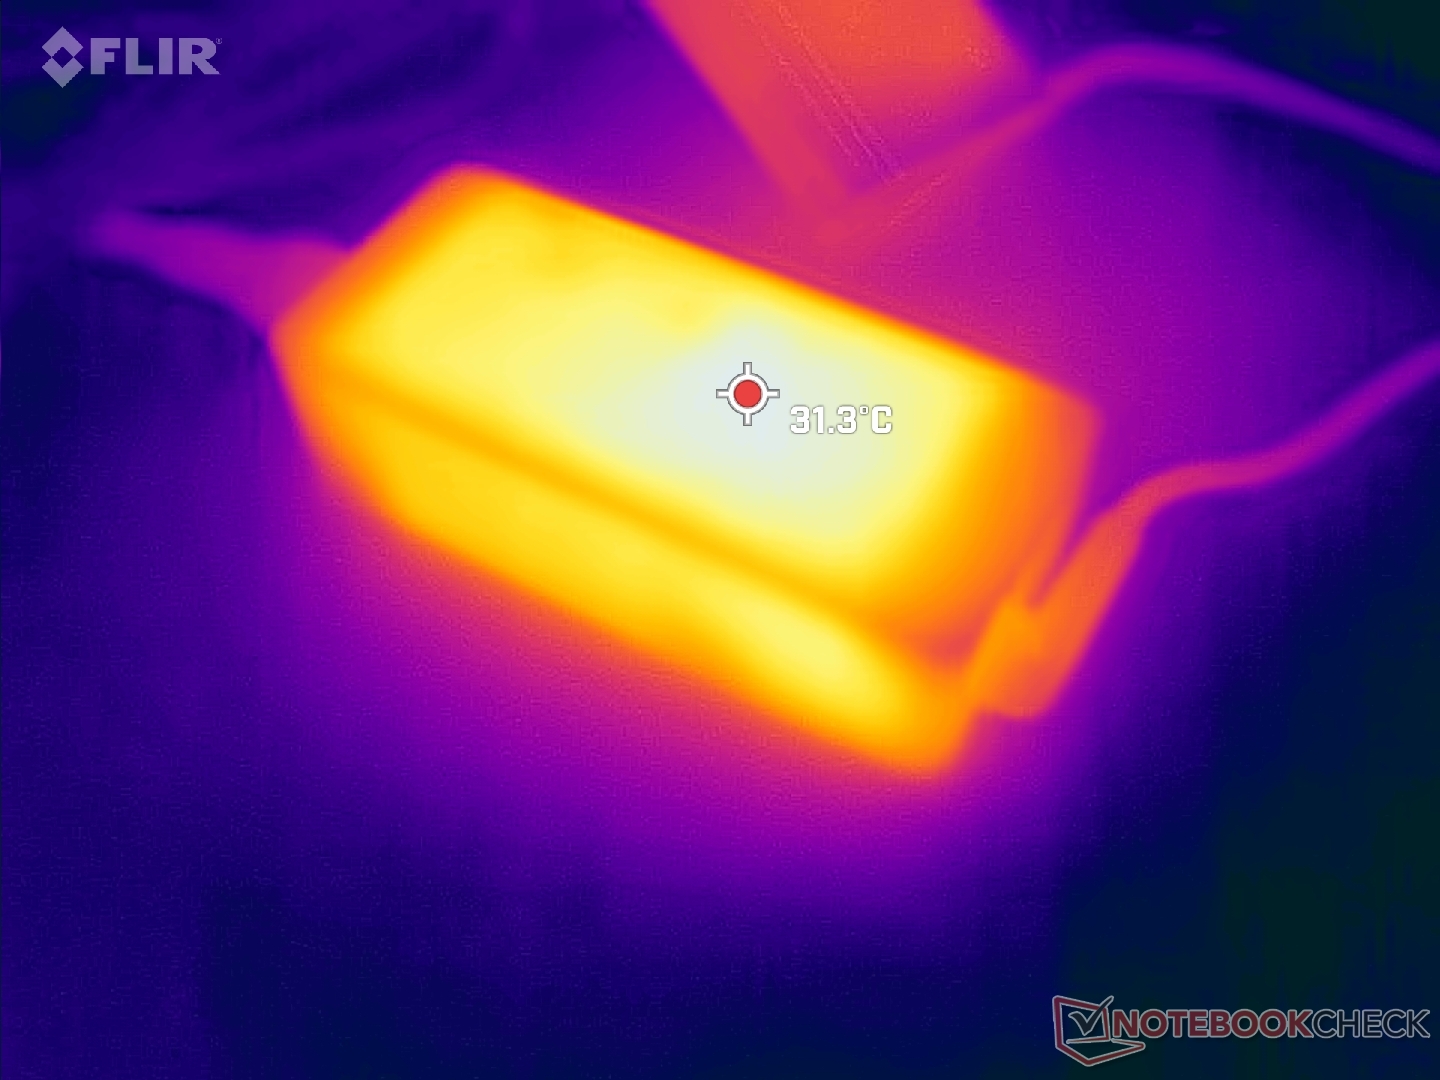
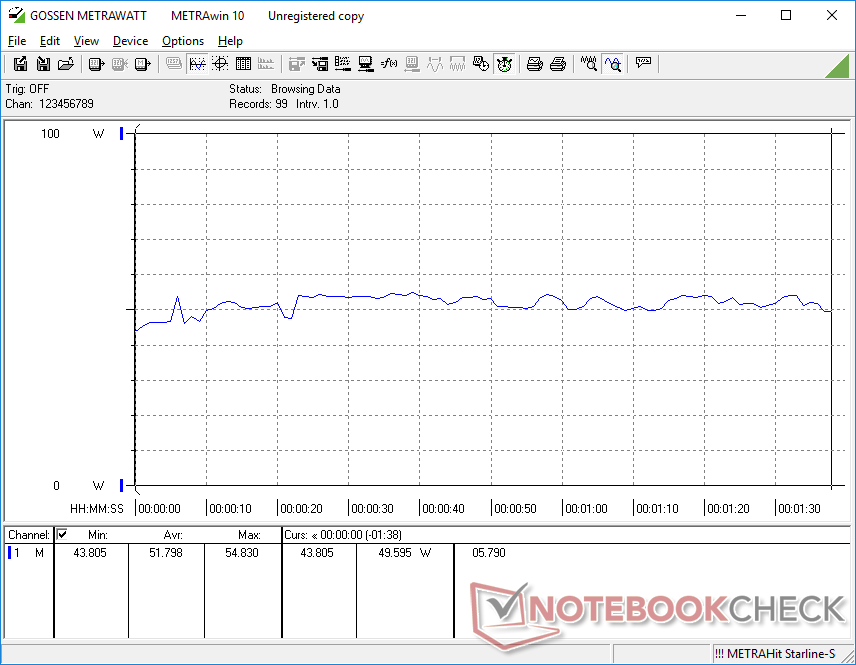
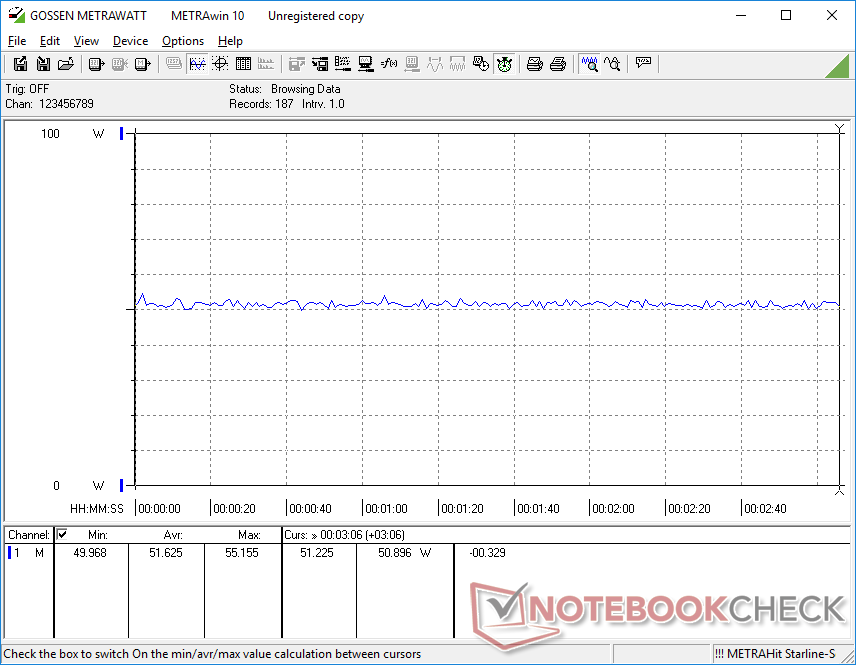
Pobór mocy - większe wymagania
Nasz procesor Core i7-1265U jest bardziej wymagający niż nasz procesor Core i5-1250P o około 40-80% podczas pracy pod większym obciążeniem, co zgadza się z naszymi wynikami dotyczącymi szybszych procesorów i kart graficznych odnotowanymi powyżej. W rzeczywistości ta konkretna konfiguracja Core-i7-U może być bardziej wymagająca niż większość 14-calowych laptopów biznesowych bez dyskretnej grafiki
Jesteśmy w stanie zarejestrować maksymalny pobór 56 W z małego (~10,8 x 4,7 x 3 cm) 65 W adaptera USB-C AC podczas inicjowania stresu Prime95, jak pokazują nasze zrzuty ekranu poniżej. Jest to mniej niż 63 W, które zarejestrowaliśmy na konfiguracji Core i5-1250P, ponieważ ten ostatni korzysta z wyższej początkowej wydajności Turbo Boost, jak pokazuje nasz wynik CineBench powyżej.
| wyłączony / stan wstrzymania | |
| luz | |
| obciążenie |
|
Legenda:
min: | |
| Lenovo ThinkPad X1 Carbon G10 Core i7-1265U i7-1265U, Iris Xe G7 96EUs, Kioxia BG5 KBG5AZNV1T02, IPS, 1920x1200, 14" | Lenovo ThinkPad X1 Carbon G10 21CC001RGE i5-1250P, Iris Xe G7 80EUs, Samsung PM9A1 MZVL2512HCJQ, IPS LED, 1920x1200, 14" | HP EliteBook 845 G9 6F6H9EA R5 PRO 6650U, Radeon 660M, Samsung PM991 MZVLQ512HBLU, IPS, 1920x1200, 14" | LG Gram 14Z90Q i5-1240P, Iris Xe G7 80EUs, Samsung PM9A1 MZVL2512HCJQ, IPS, 1920x1200, 14" | Dell Latitude 7420 JW6MH i5-1145G7, Iris Xe G7 80EUs, SK Hynix BC711 HFM512GD3HX015N, IPS, 1920x1080, 14" | Asus ExpertBook B1 B1400CEAE, i5-1135G7 i5-1135G7, Iris Xe G7 80EUs, WDC PC SN530 SDBPNPZ-512G, IPS, 1920x1080, 14" | |
|---|---|---|---|---|---|---|
| Power Consumption | 20% | 16% | 4% | 14% | 21% | |
| Idle Minimum * (Watt) | 2.8 | 2.9 -4% | 3 -7% | 3 -7% | 2.7 4% | 3.2 -14% |
| Idle Average * (Watt) | 6 | 4.9 18% | 5 17% | 6 -0% | 6 -0% | 5.2 13% |
| Idle Maximum * (Watt) | 10.9 | 6 45% | 9 17% | 12 -10% | 7.6 30% | 6.1 44% |
| Load Average * (Watt) | 51.8 | 29.3 43% | 41 21% | 40 23% | 37 29% | 25.2 51% |
| Witcher 3 ultra * (Watt) | 51.6 | 36.6 29% | 32.6 37% | 36.5 29% | 33.2 36% | 27.7 46% |
| Load Maximum * (Watt) | 55.6 | 63.3 -14% | 50 10% | 63 -13% | 65 -17% | 64.3 -16% |
* ... im mniej tym lepiej
Power Consumption Witcher 3 / Stresstest
Power Consumption external Monitor
Czas pracy na baterii - krótszy czas pracy
Czas działania sieci WLAN jest znacznie krótszy od tego, co zarejestrowaliśmy na ThinkPadzie X1 Carbon G10 w wersji z procesorem Core-P, kiedy oba urządzenia są ustawione na podobny profil zasilania Balanced i warunki jasności 150 nitów. Powtórzyliśmy nawet test, by się upewnić, ale wyniki nie uległy poprawie na naszym egzemplarzu testowym. Spodziewaj się zaledwie 6,5 godziny przeglądania stron internetowych w świecie rzeczywistym w porównaniu do ponad 10 godzin w przypadku jednostki SKU Core-P. Krótszy czas pracy zgadza się z naszymi odczytami dotyczącymi wyższego zużycia energii
Ładowanie od pustego do pełnego stanu jest wolniejsze niż się spodziewaliśmy i trwa około 2,5 godziny.
| Lenovo ThinkPad X1 Carbon G10 Core i7-1265U i7-1265U, Iris Xe G7 96EUs, 57 Wh | Lenovo ThinkPad X1 Carbon G10 21CC001RGE i5-1250P, Iris Xe G7 80EUs, 57 Wh | HP EliteBook 845 G9 6F6H9EA R5 PRO 6650U, Radeon 660M, 51 Wh | LG Gram 14Z90Q i5-1240P, Iris Xe G7 80EUs, 72 Wh | Dell Latitude 7420 JW6MH i5-1145G7, Iris Xe G7 80EUs, 63 Wh | Asus ExpertBook B1 B1400CEAE, i5-1135G7 i5-1135G7, Iris Xe G7 80EUs, 42 Wh | |
|---|---|---|---|---|---|---|
| Czasy pracy | 55% | 83% | 80% | 114% | 5% | |
| WiFi v1.3 (h) | 6.6 | 10.2 55% | 12.1 83% | 11.9 80% | 14.1 114% | 6.9 5% |
| H.264 (h) | 10.9 | |||||
| Load (h) | 2.4 | 2.8 | 2.6 | |||
| Reader / Idle (h) | 28.9 | 23.5 |
Za
Przeciw
Werdykt - Core i7 U pokonuje Core i5 P
Na stronie Core i7-1265U i Core i5-1250P kosztują około 1900 USD przy podobnych pojemnościach pamięci masowej i RAM. Jeśli szukasz szybszej ogólnej wydajności CPU i GPU, to zalecana jest opcja Core i7-1265U. Jego zalety nie są małe, gdyż sam zintegrowany procesor graficzny może być nawet o 40 procent szybszy, podczas gdy CPU z czasem dławi się znacznie mniej.
ThinkPad X1 Carbon G10 w wersji z procesorem Core i7-1265U jest szybszy od wersji z procesorem Core i5-1250P o zauważalne marginesy, ale odbywa się to kosztem krótszego czasu pracy na akumulatorze.
Dla dłuższych czasów pracy na akumulatorze, mniejszego poboru mocy i potencjalnie cichszego szumu wentylatora lepsza będzie jednak opcja z Core i5-1250P. System może działać o kilka godzin dłużej niż opcja Core i7-1265U, co niektórzy użytkownicy mogą docenić. W przeciwnym razie, jeśli czas pracy na baterii nie jest dla Ciebie najważniejszy, możesz wybrać opcję z procesorem Core i7-1265U.
Cena i dostępność
Nasza dokładna konfiguracja to obecnie wysyłana na Amazon za nieco poniżej 1900 USD. Lenovo nie oferuje konfiguracji Core i7-1265U za pośrednictwem swojej oficjalnej strony internetowej w tym momencie.
Lenovo ThinkPad X1 Carbon G10 Core i7-1265U
- 14/12/2022 v7 (old)
Allen Ngo
Price comparison

