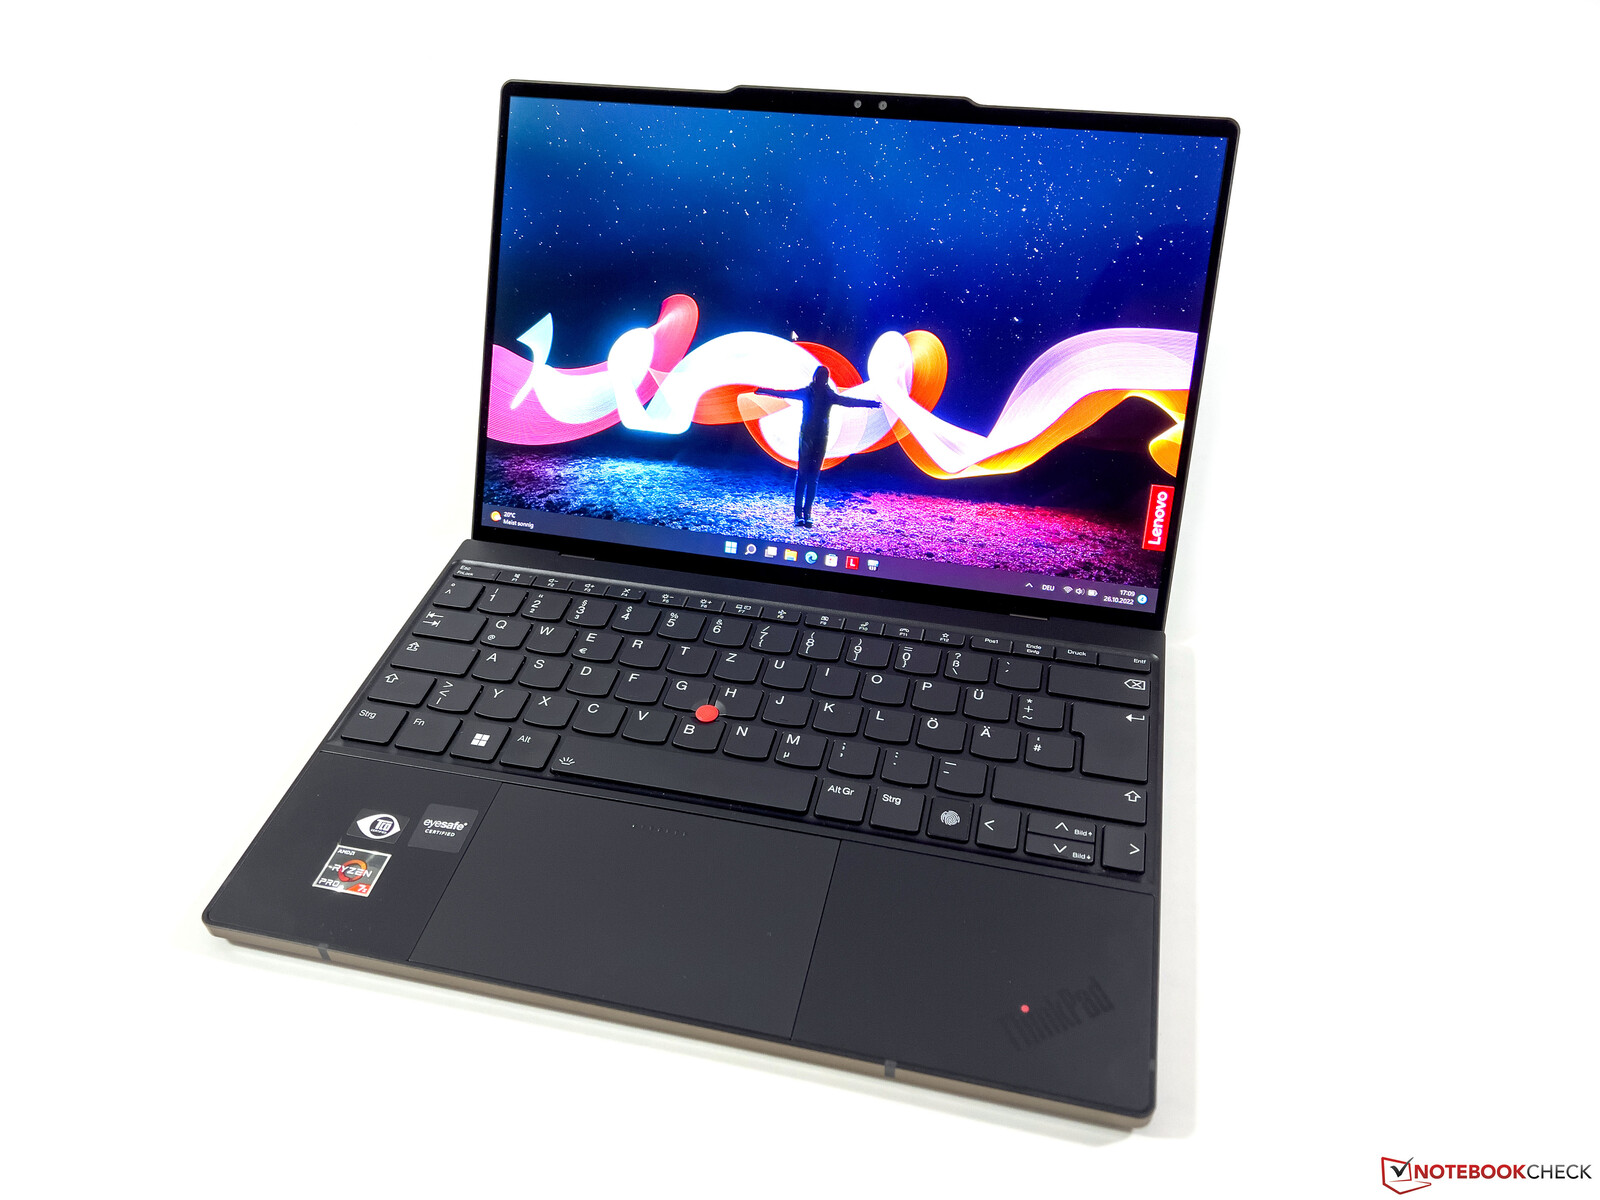
Lenovo ThinkPad Z13 G1 OLED Review - biznesowy laptop z procesorem AMD Ryzen 7 Pro 6860Z
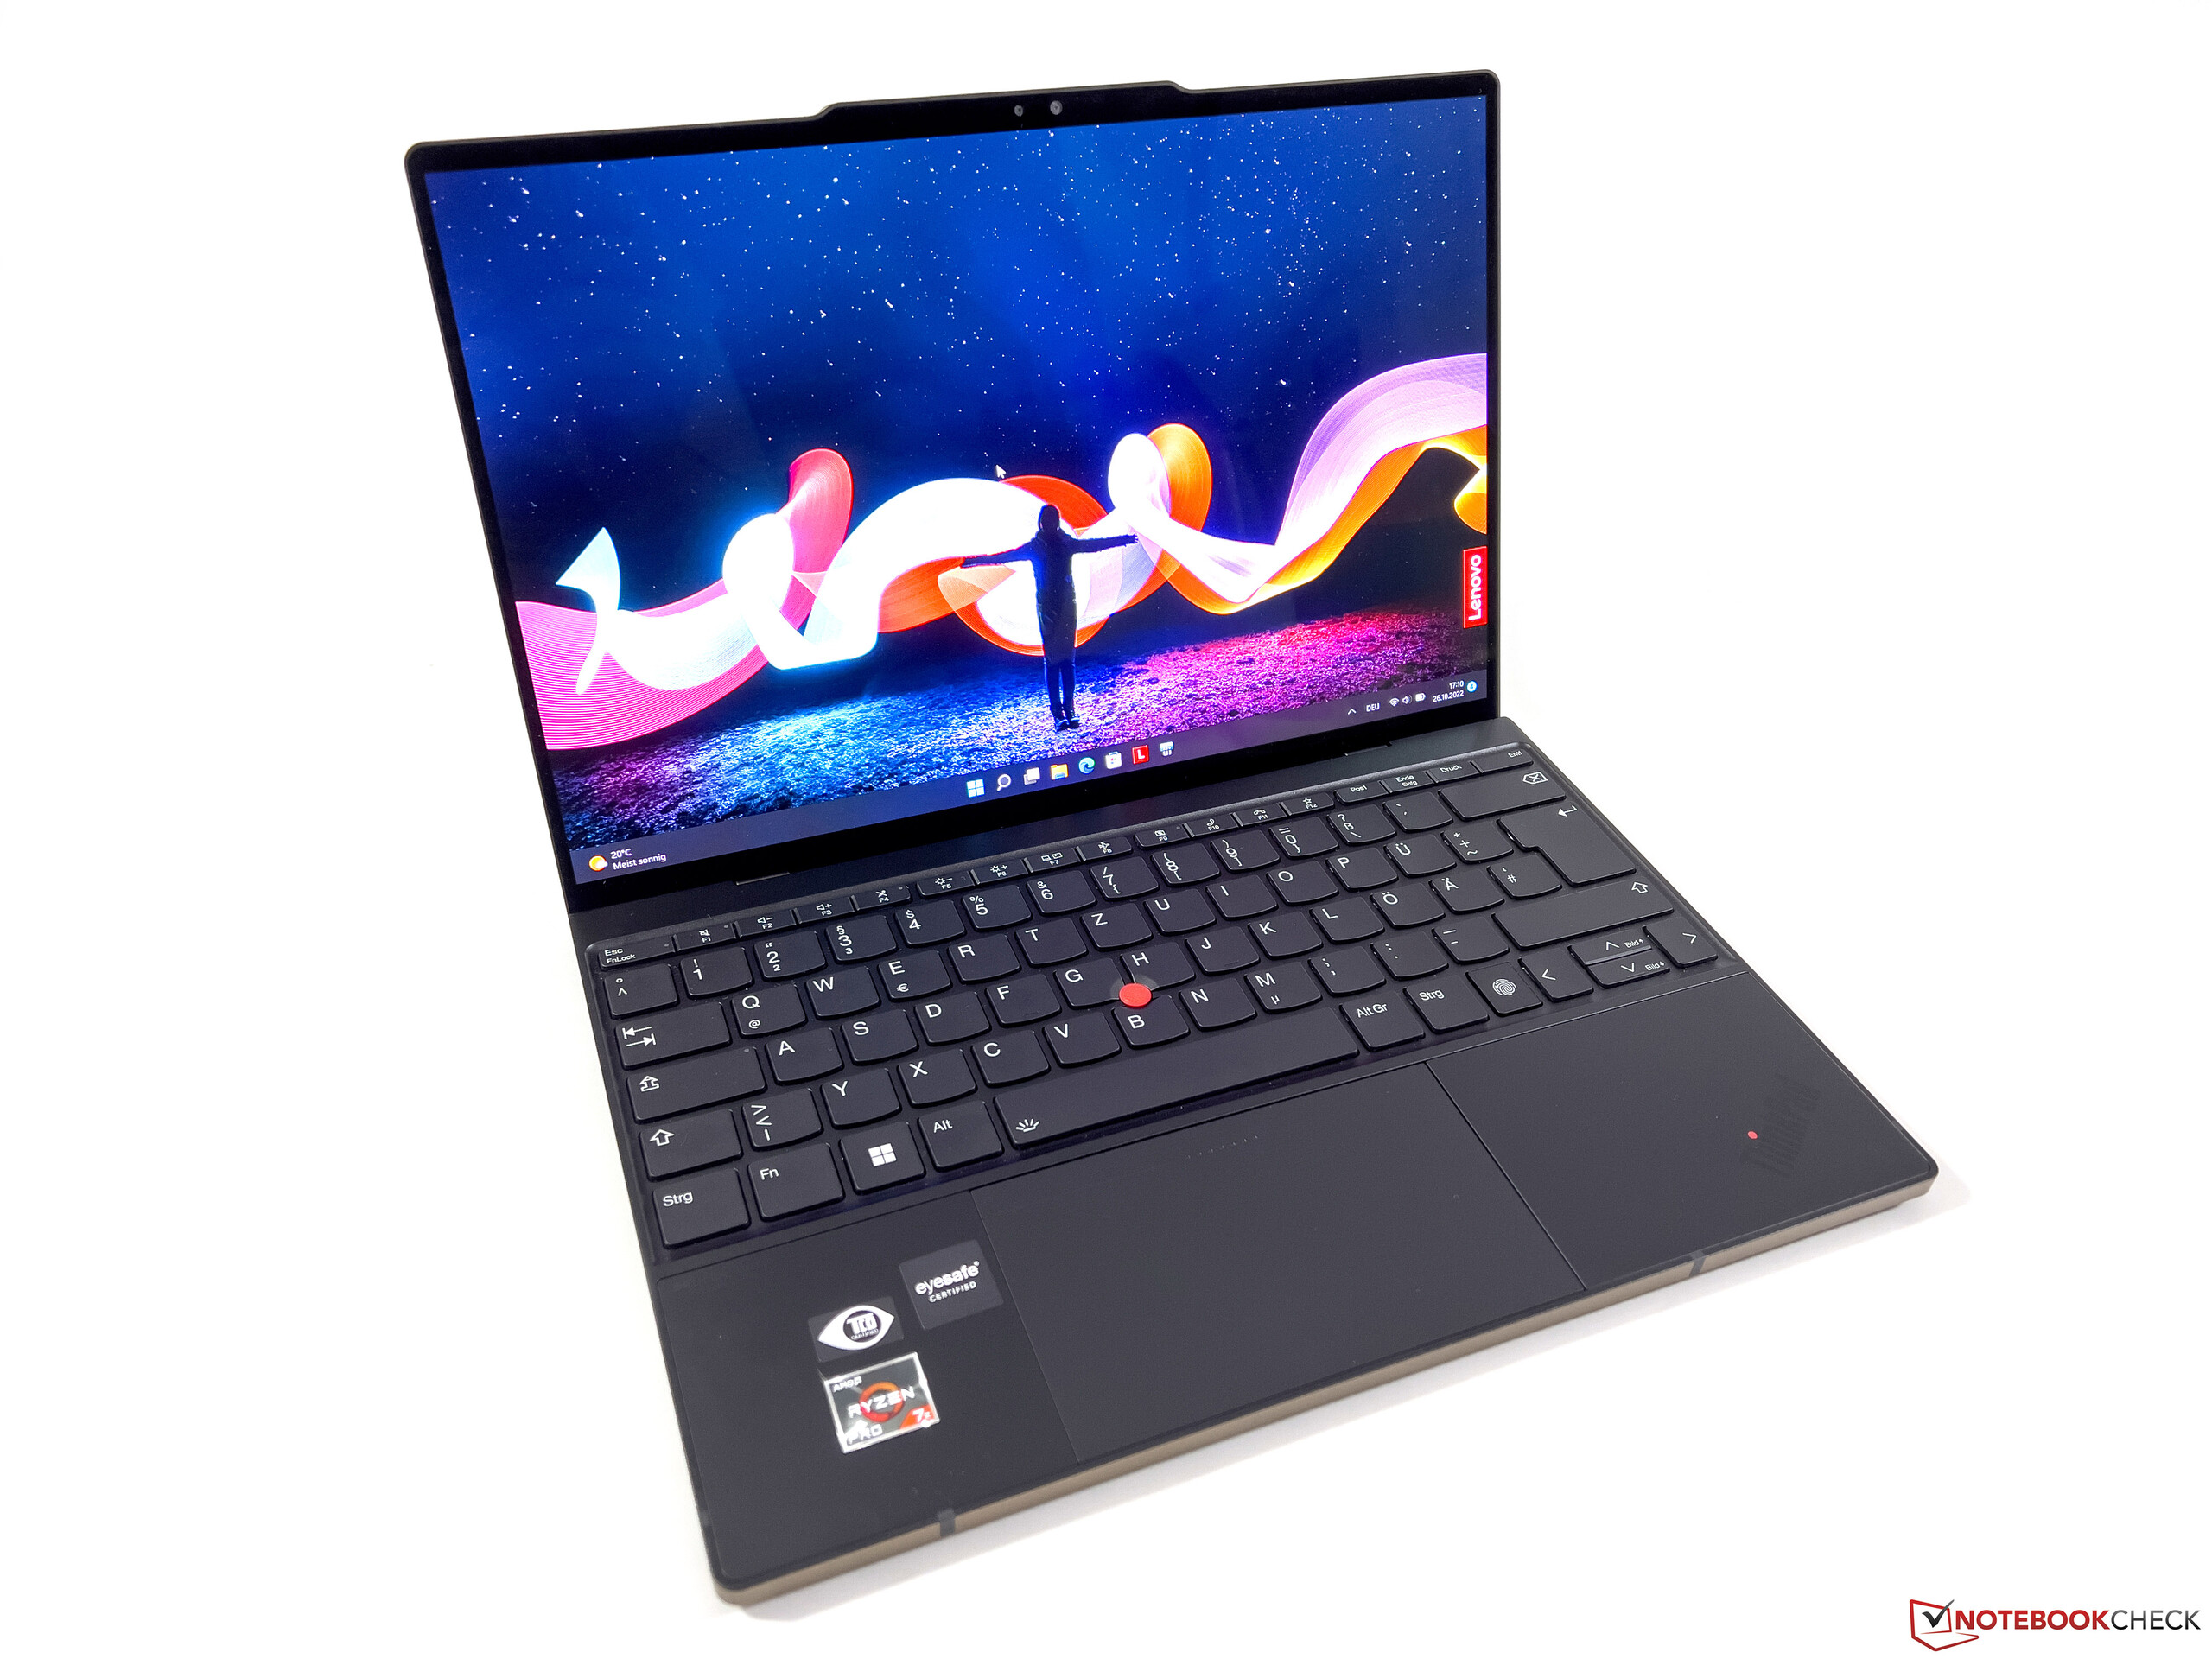
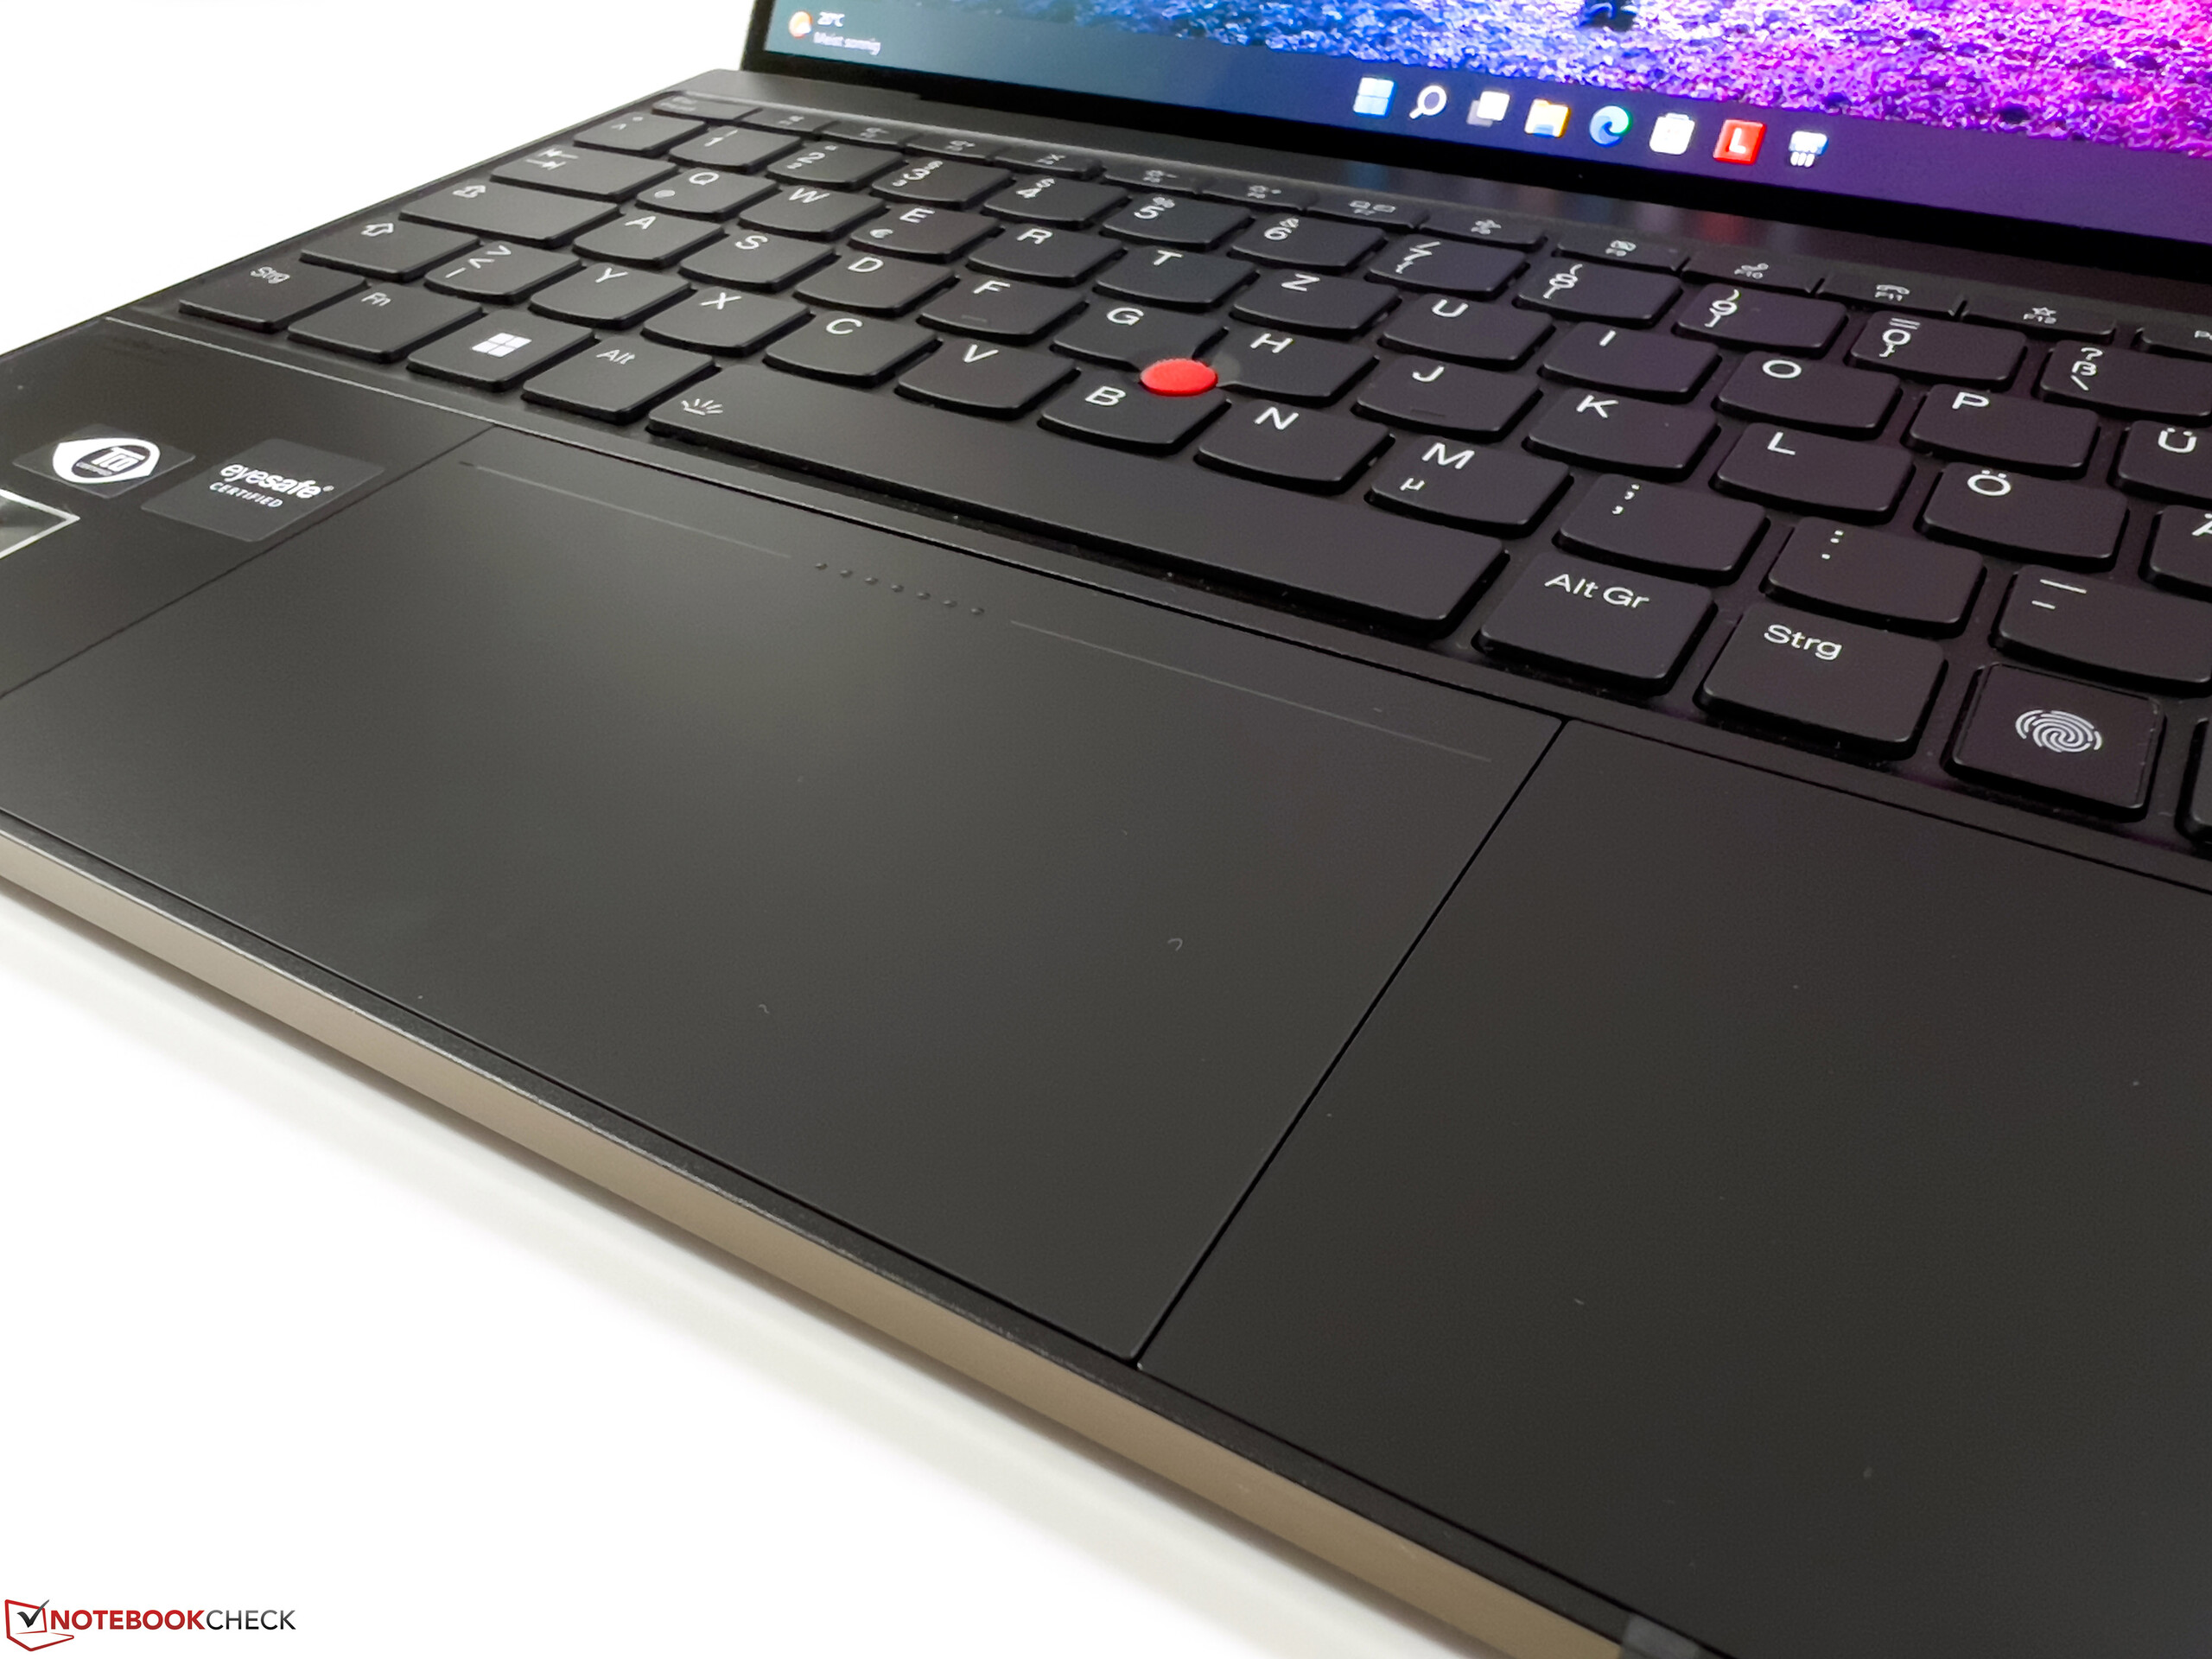
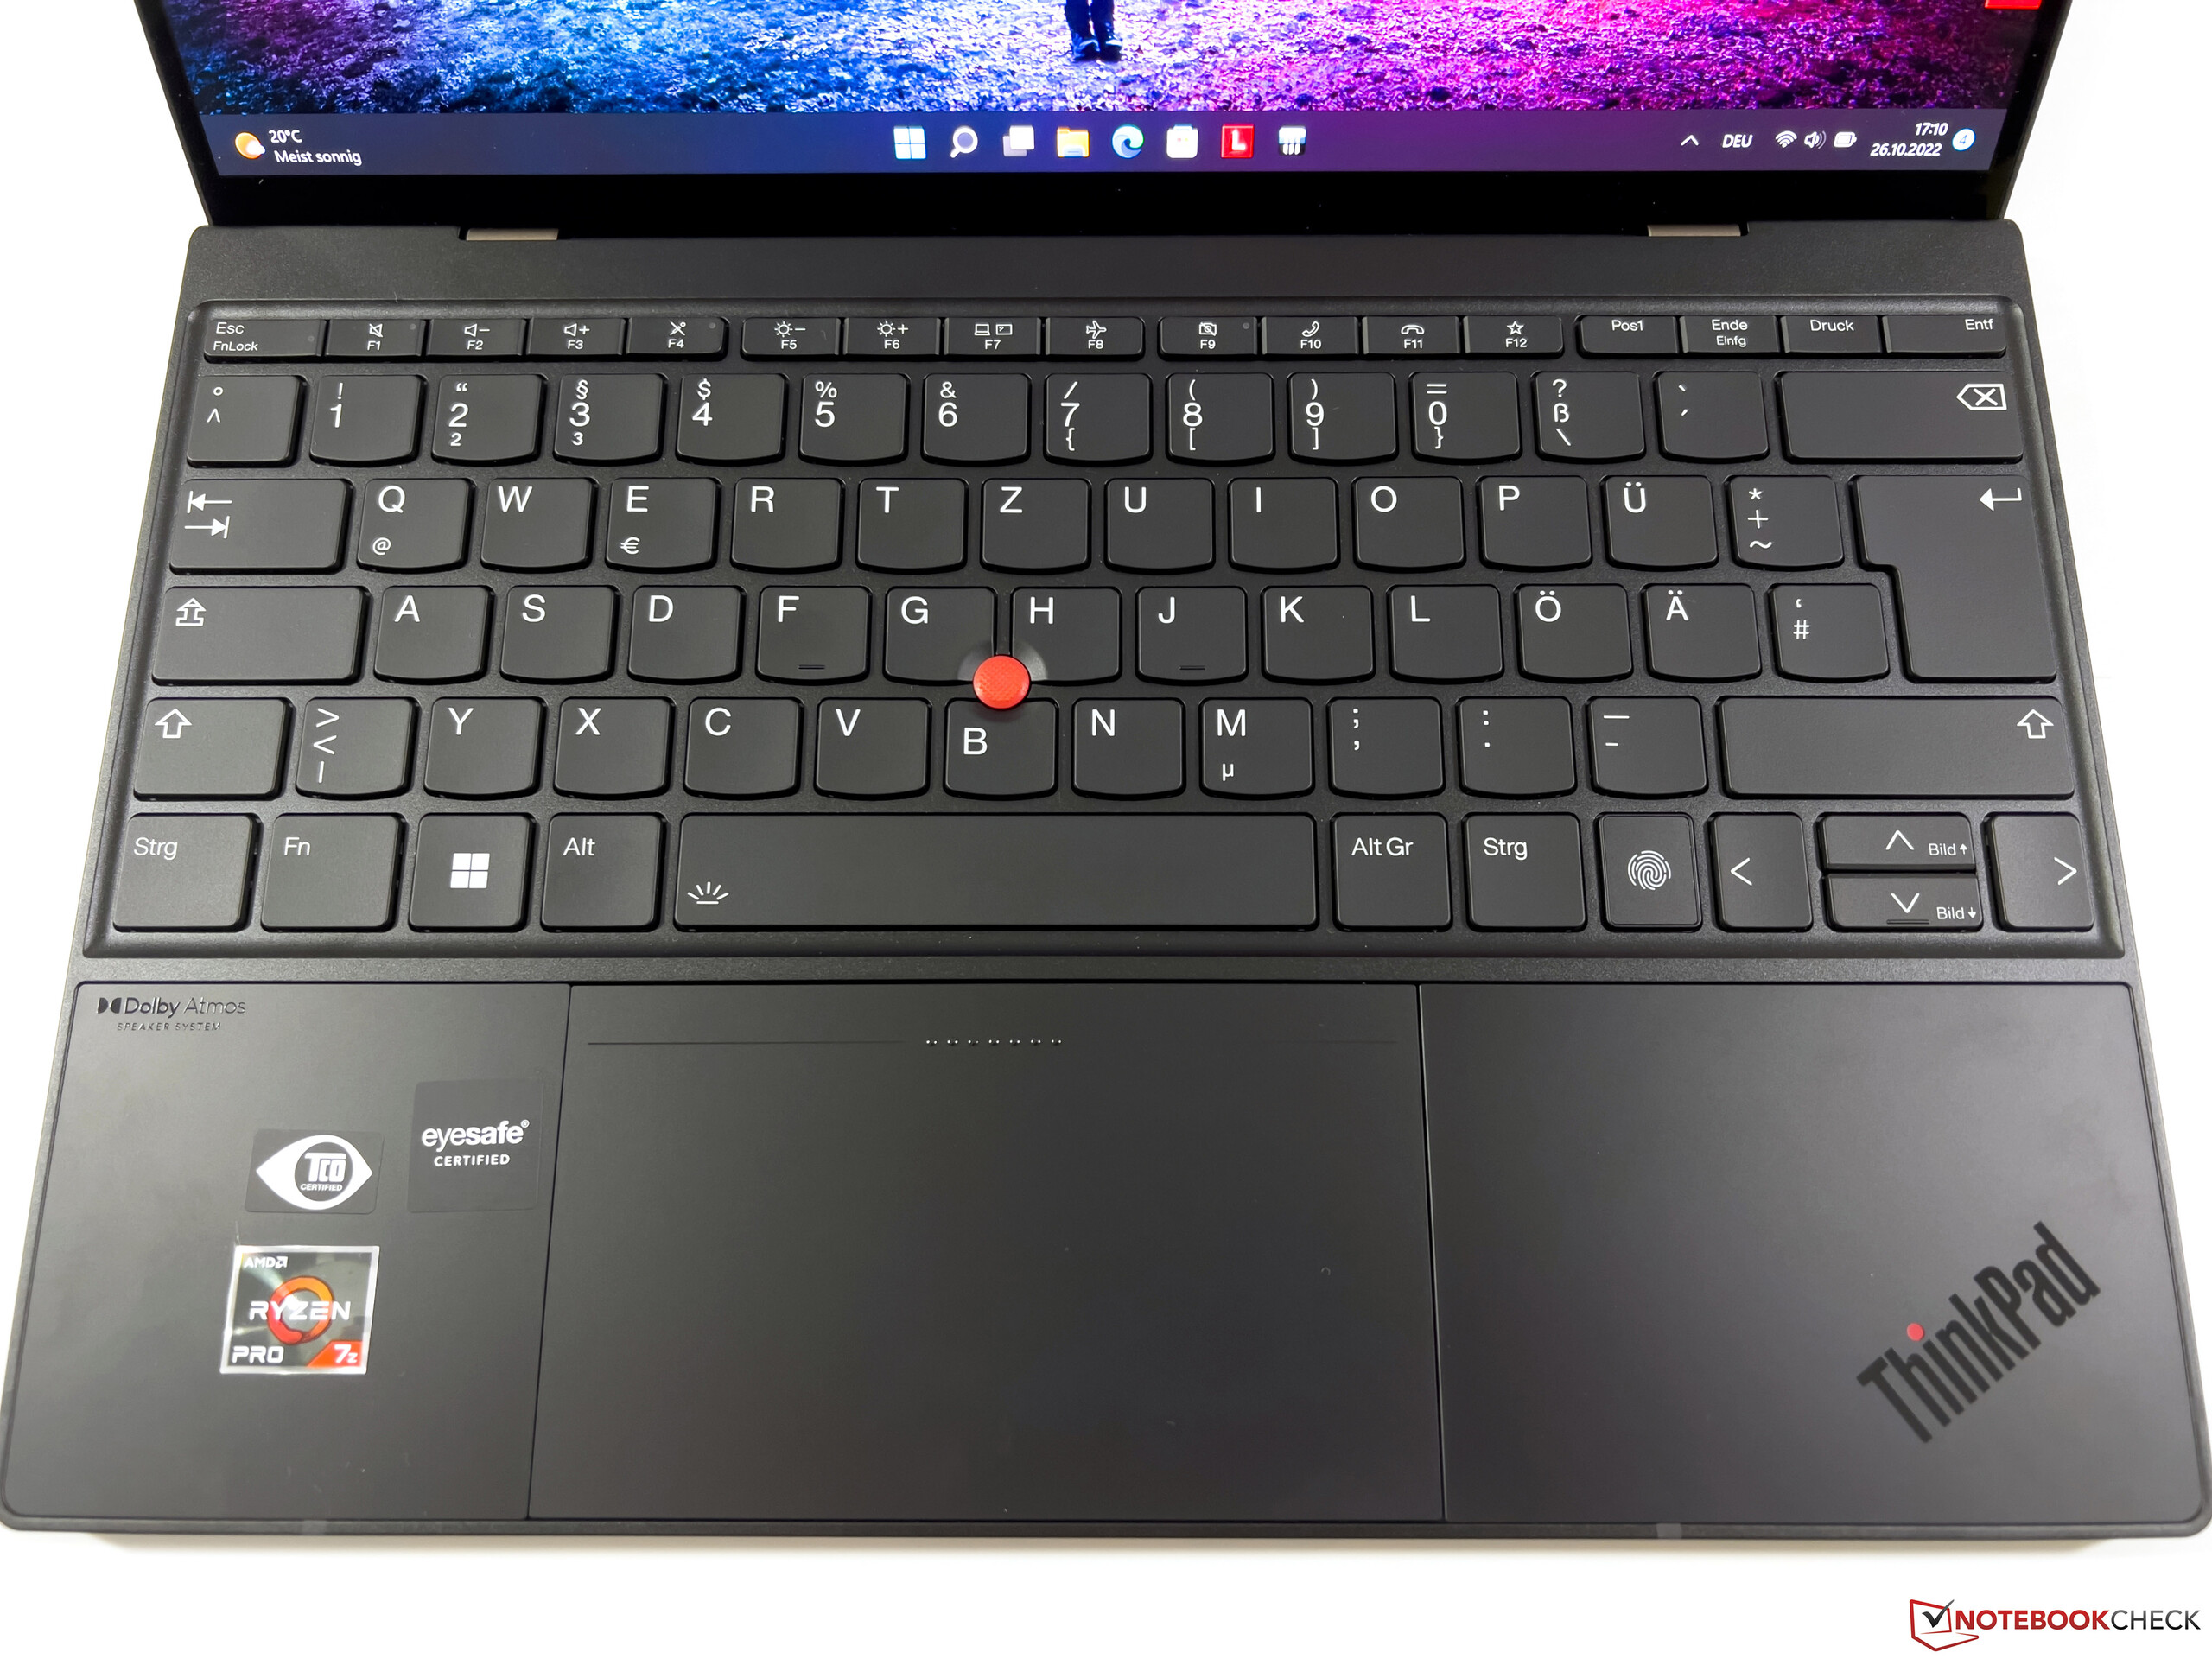
Dzięki serii ThinkPad Z, Lenovo od kilku miesięcy ma dedykowaną linię produktów dla swoich modeli z AMD. Przetestowaliśmy już obszernie m.in podstawowy model ThinkPad Z13 z procesorem Ryzen 5 Pro i zwykłym panelem IPS o rozdzielczości Full HD. Całkowicie nowa konstrukcja oferuje kilka nowych podejść i długoletni użytkownicy ThinkPadów będą musieli przyzwyczaić się do pewnych zmian (TrackPoint bez dedykowanych klawiszy, zawias otwiera się tylko do 135 stopni, zmiana położenia klawisza Fn, brak Kensington Lock).
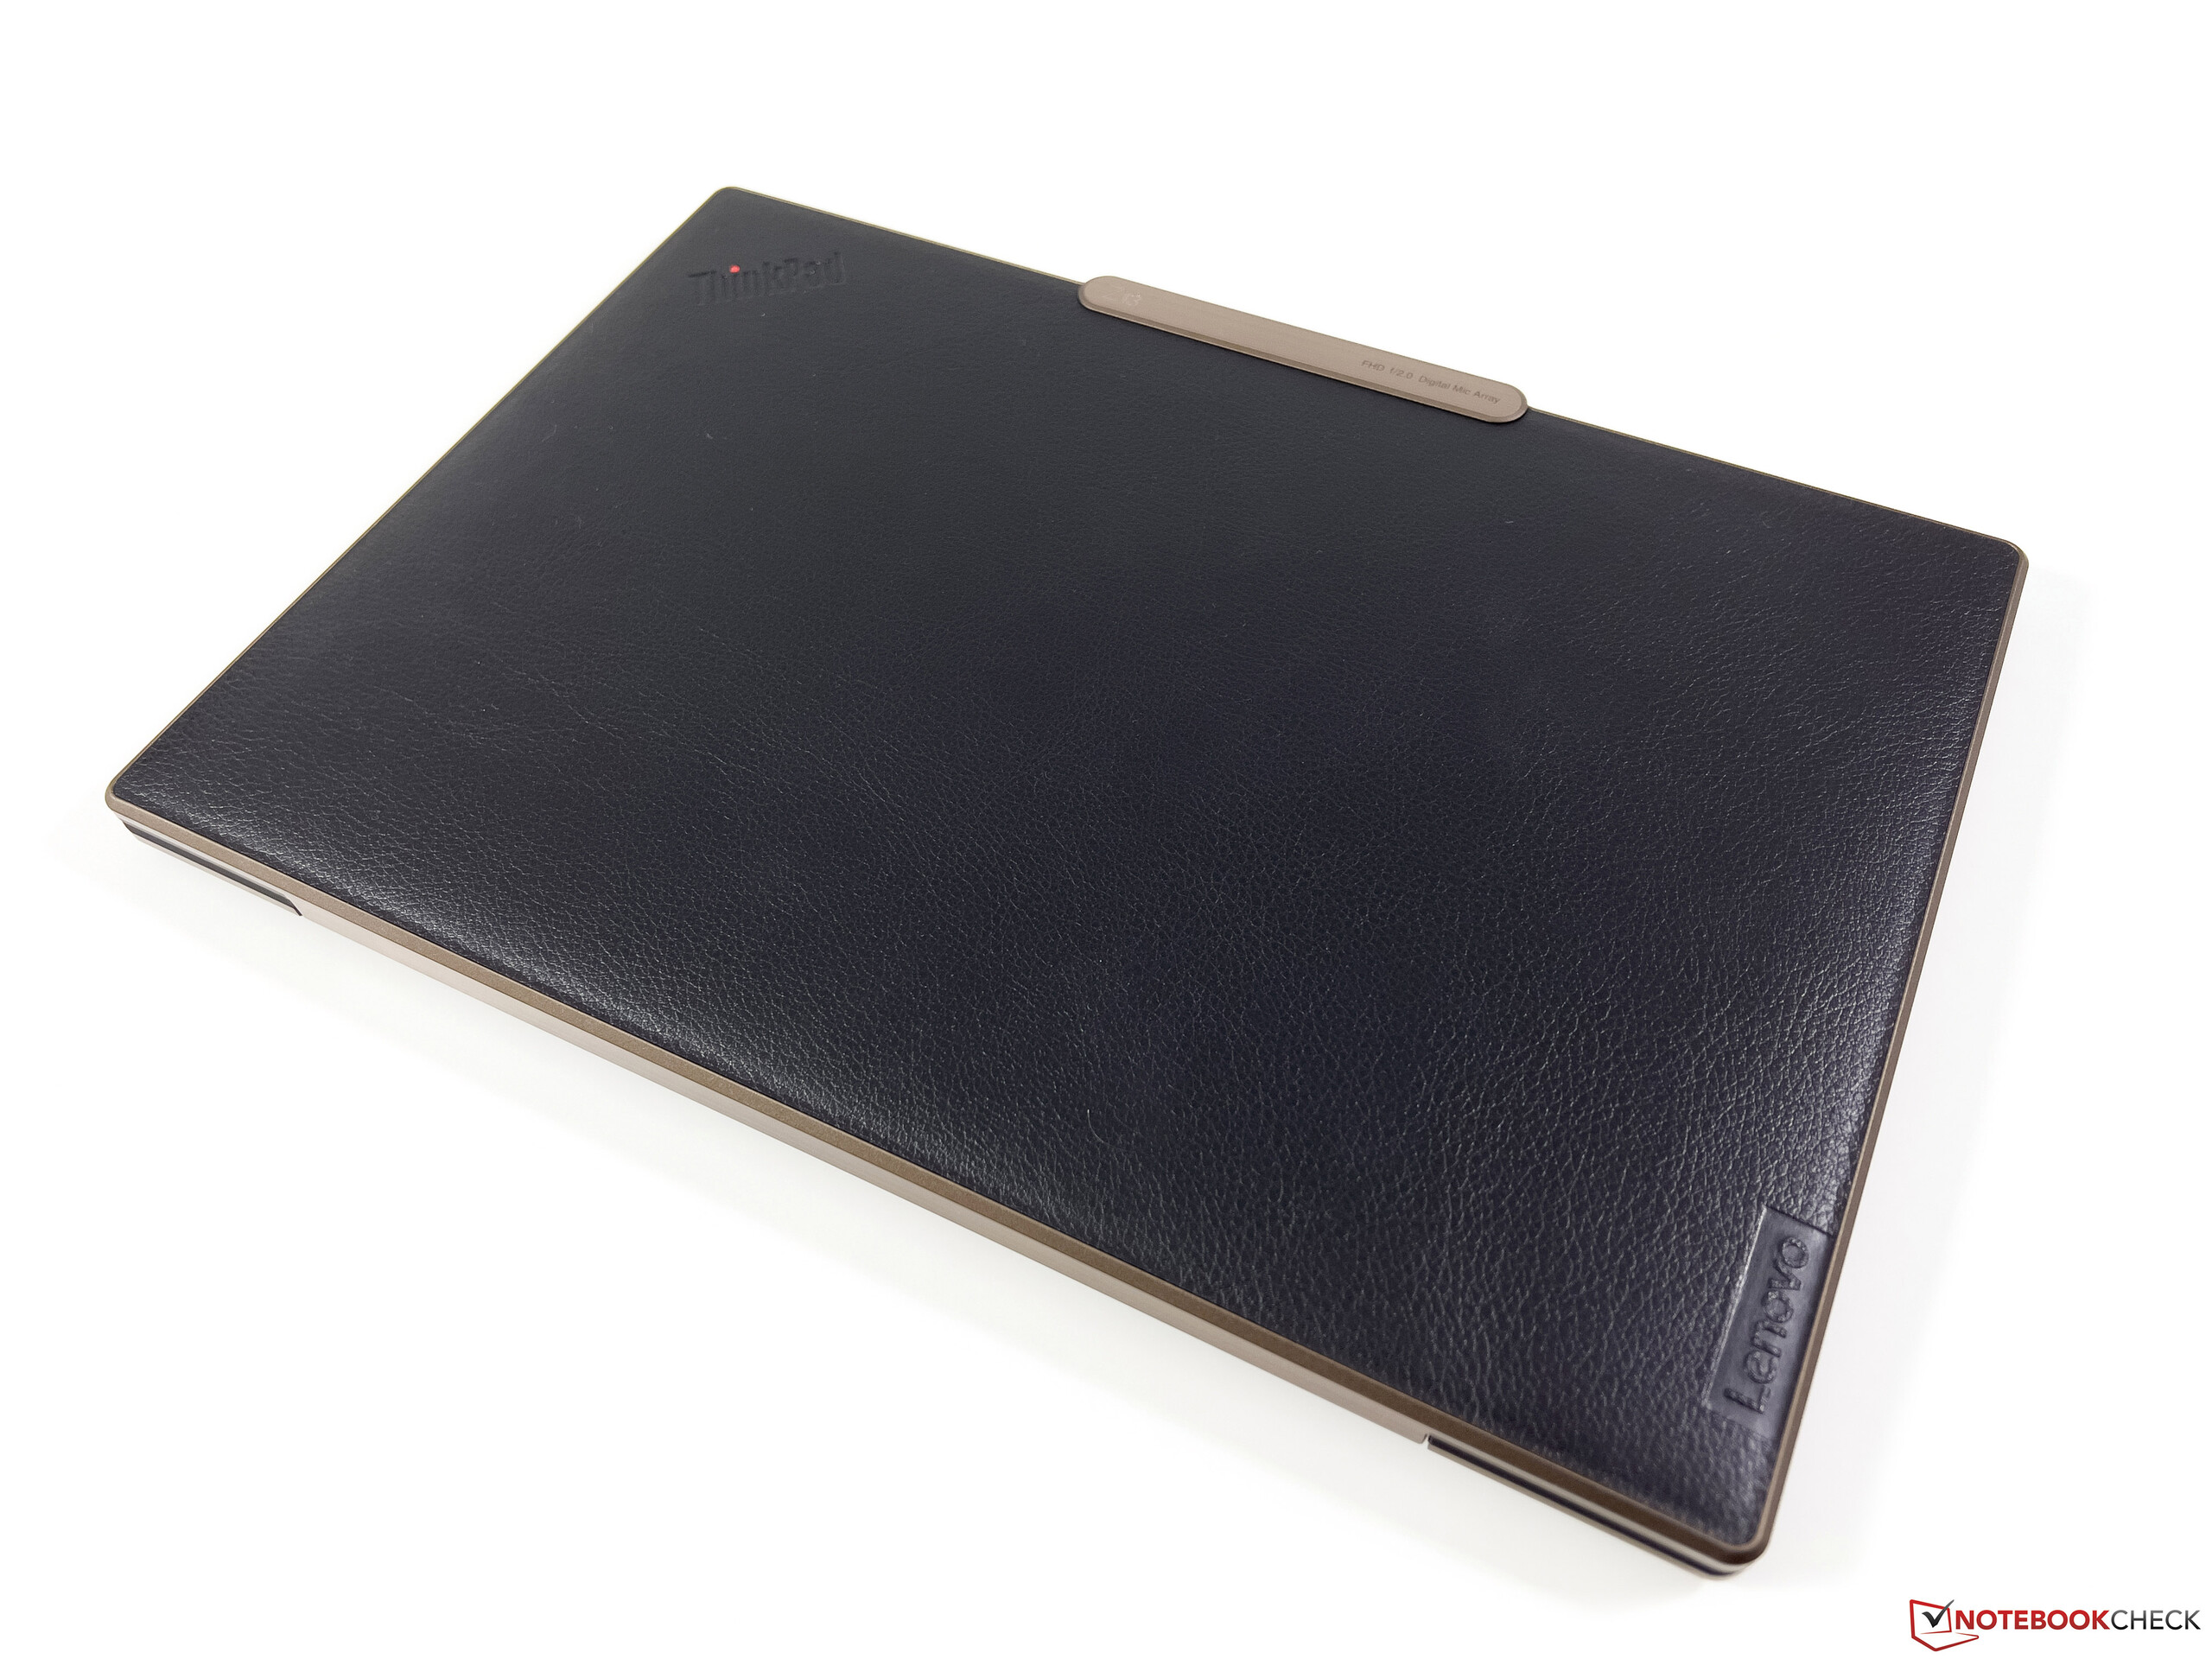
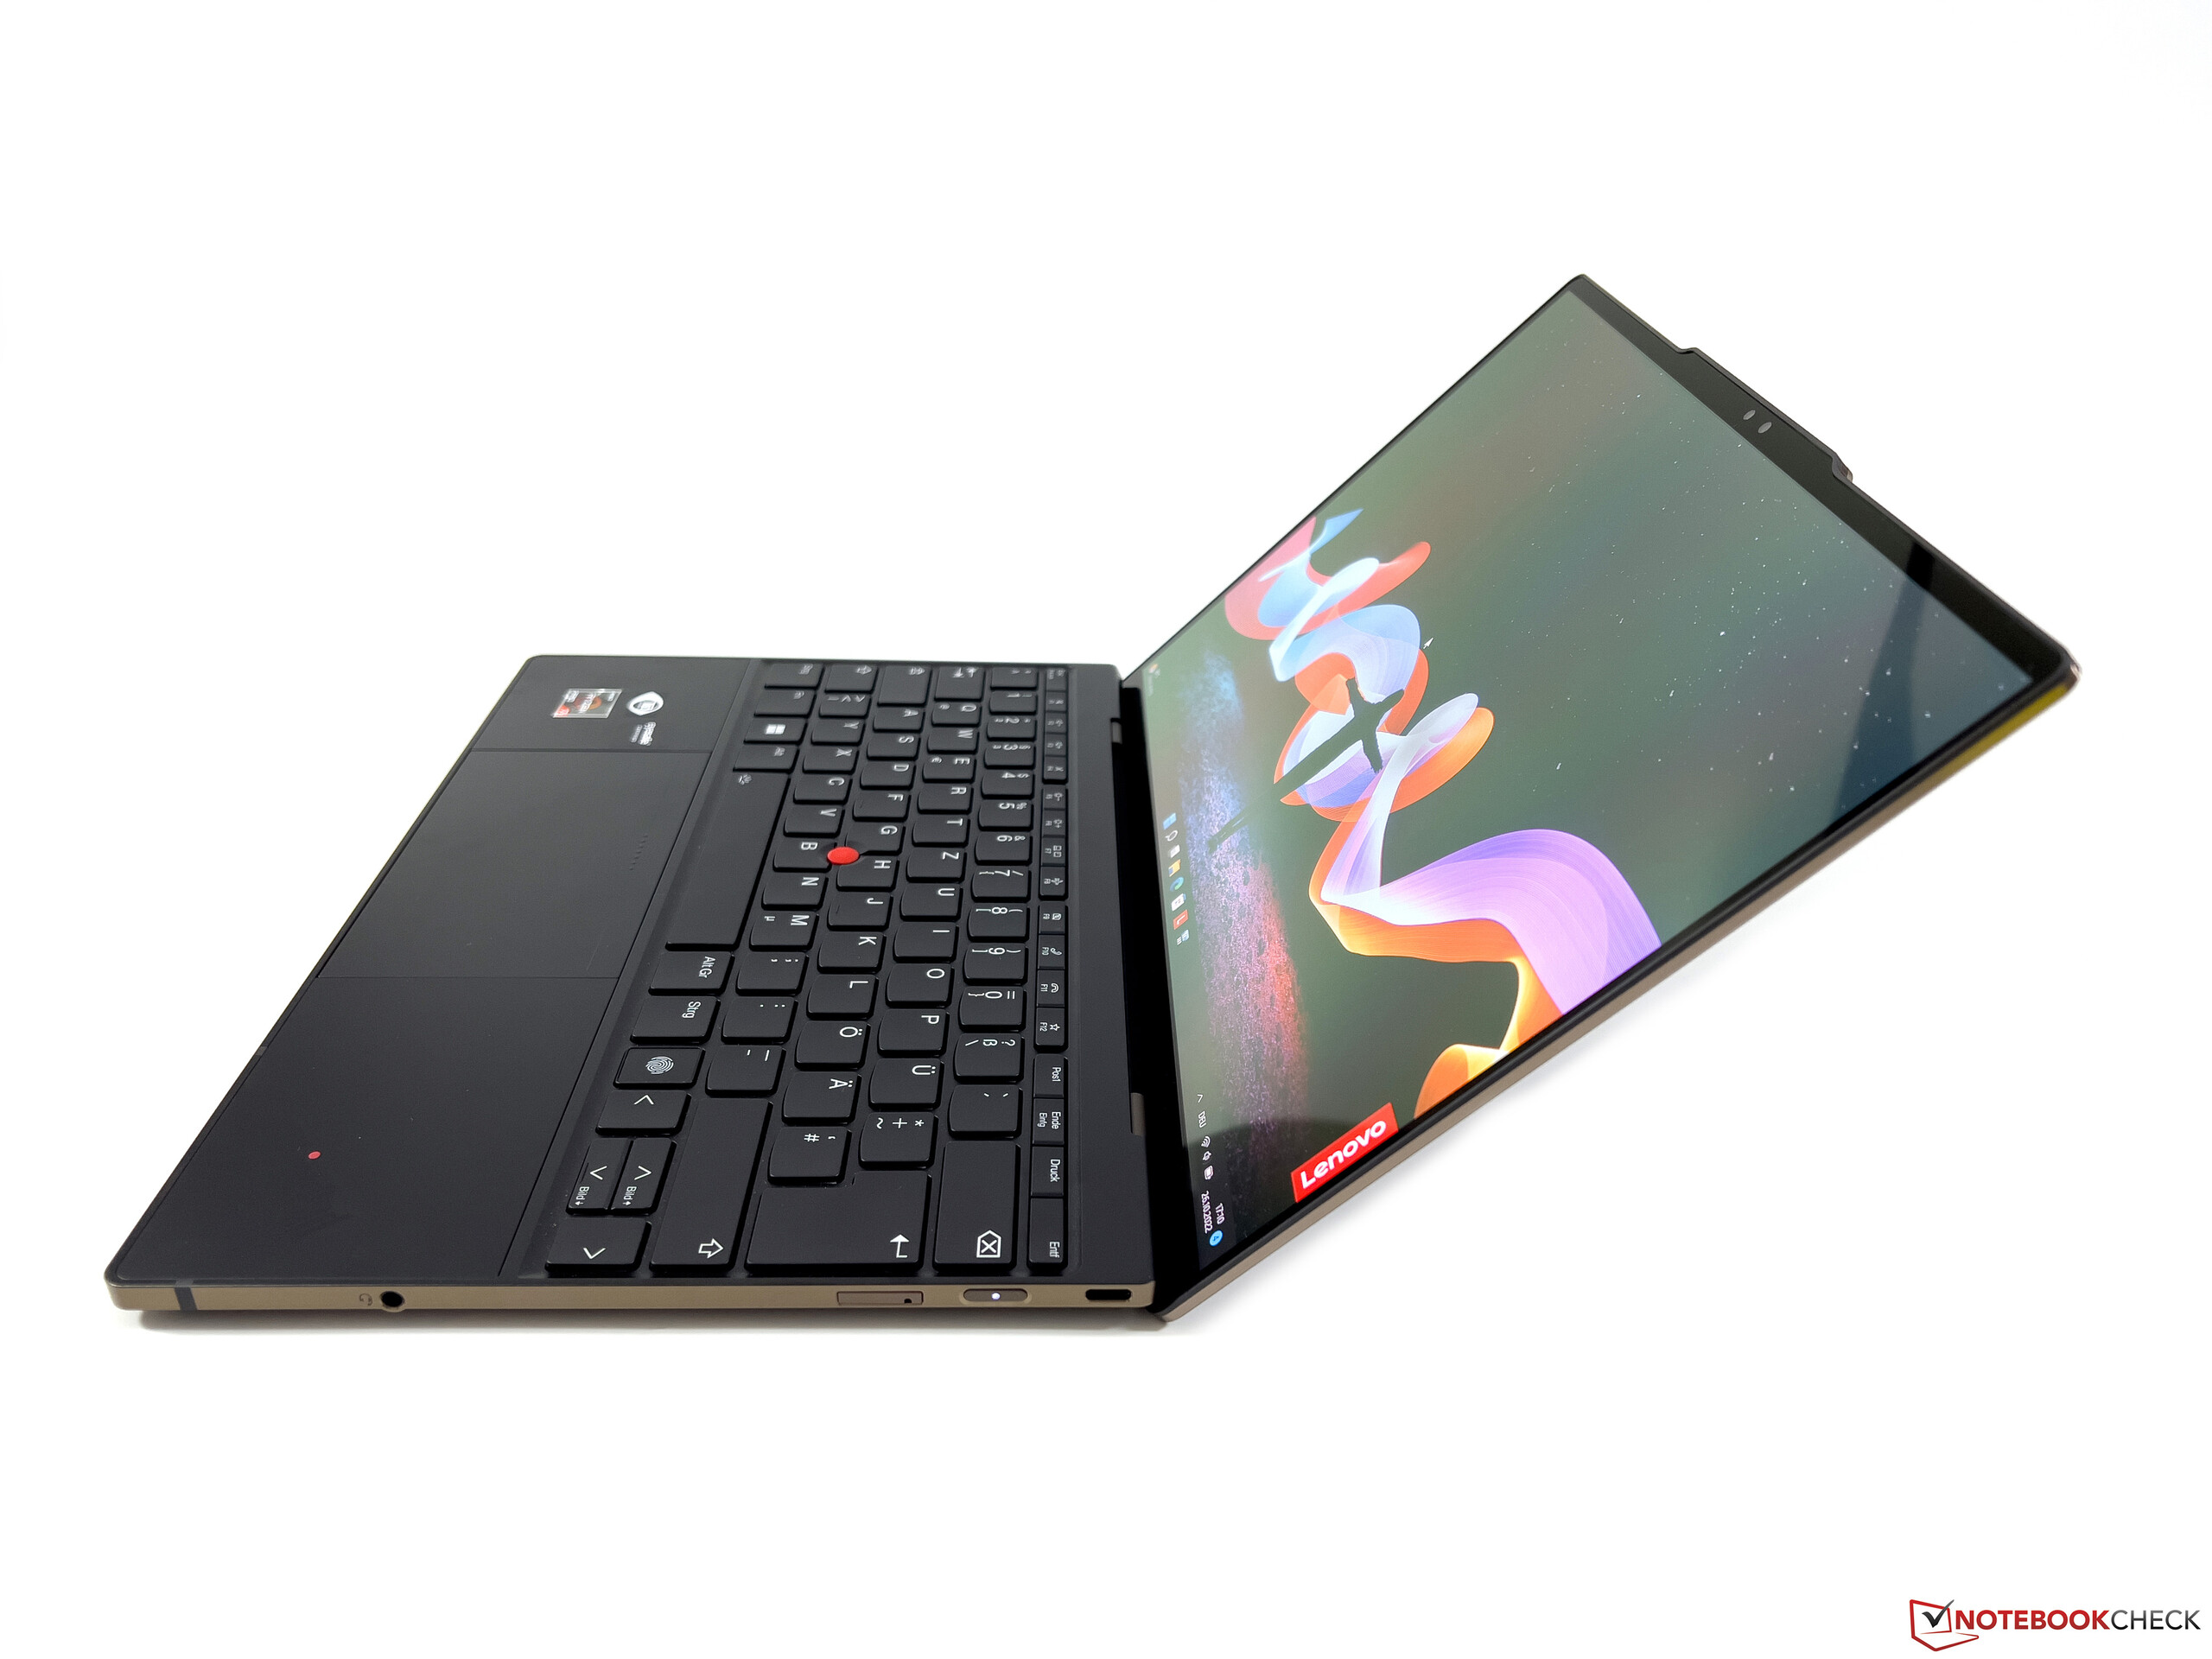
Dziś przyglądamy się high-endowemu modelowi ThinkPad Z13 z AMD Ryzen 7 Pro 6860Z który jest oferowany wyłącznie w ThinkPadzie Z13. Ta konfiguracja ma ekran OLED, moduł LTE i specjalne wzornictwo z pokrywą ekranu z imitacji skóry z akcentami w kolorze brązu. W niniejszym raporcie skupiamy się przede wszystkim na różnicach względem modelu podstawowego i nie będziemy się rozwodzić nad ich podobieństwami. Pertraktacyjne informacje są dostępne w naszej szczegółowej recenzji ThinkPada Z13 z Ryzen 5 Pro 6650U
- Recenzja laptopa "Lenovo ThinkPad Z13: ThinkPad premium AMD z długim czasem pracy na baterii
- Recenzja laptopa Lenovo ThinkPad Z16 G1: Wydajny flagowiec AMD z hiciorkiem
Potencjalni konkurenci w porównaniu
Ocena | Data | Model | Waga | Wysokość | Rozmiar | Rezolucja | Cena |
|---|---|---|---|---|---|---|---|
| 88.8 % v7 (old) | 10/2022 | Lenovo ThinkPad Z13 G1-21D20016GE R7 PRO 6860Z, Radeon 680M | 1.3 kg | 14 mm | 13.30" | 2880x1800 | |
| 90.1 % v7 (old) | Asus Zenbook S 13 OLED R7 6800U, Radeon 680M | 1.1 kg | 14.9 mm | 13.30" | 2880x1800 | ||
| 87.3 % v7 (old) | 09/2022 | Dell XPS 13 Plus 9320 i7-1280P OLED i7-1280P, Iris Xe G7 96EUs | 1.3 kg | 15.28 mm | 13.40" | 3456x2160 | |
| 92 % v7 (old) | 04/2023 | Apple MacBook Air M2 10C GPU M2, M2 10-Core GPU | 1.2 kg | 11.3 mm | 13.60" | 2560x1664 | |
| 90.5 % v7 (old) | 02/2023 | Lenovo ThinkPad Z13 21D2CTO1WW R5 PRO 6650U, Radeon 660M | 1.2 kg | 13.99 mm | 13.30" | 1920x1200 |
Sprawa
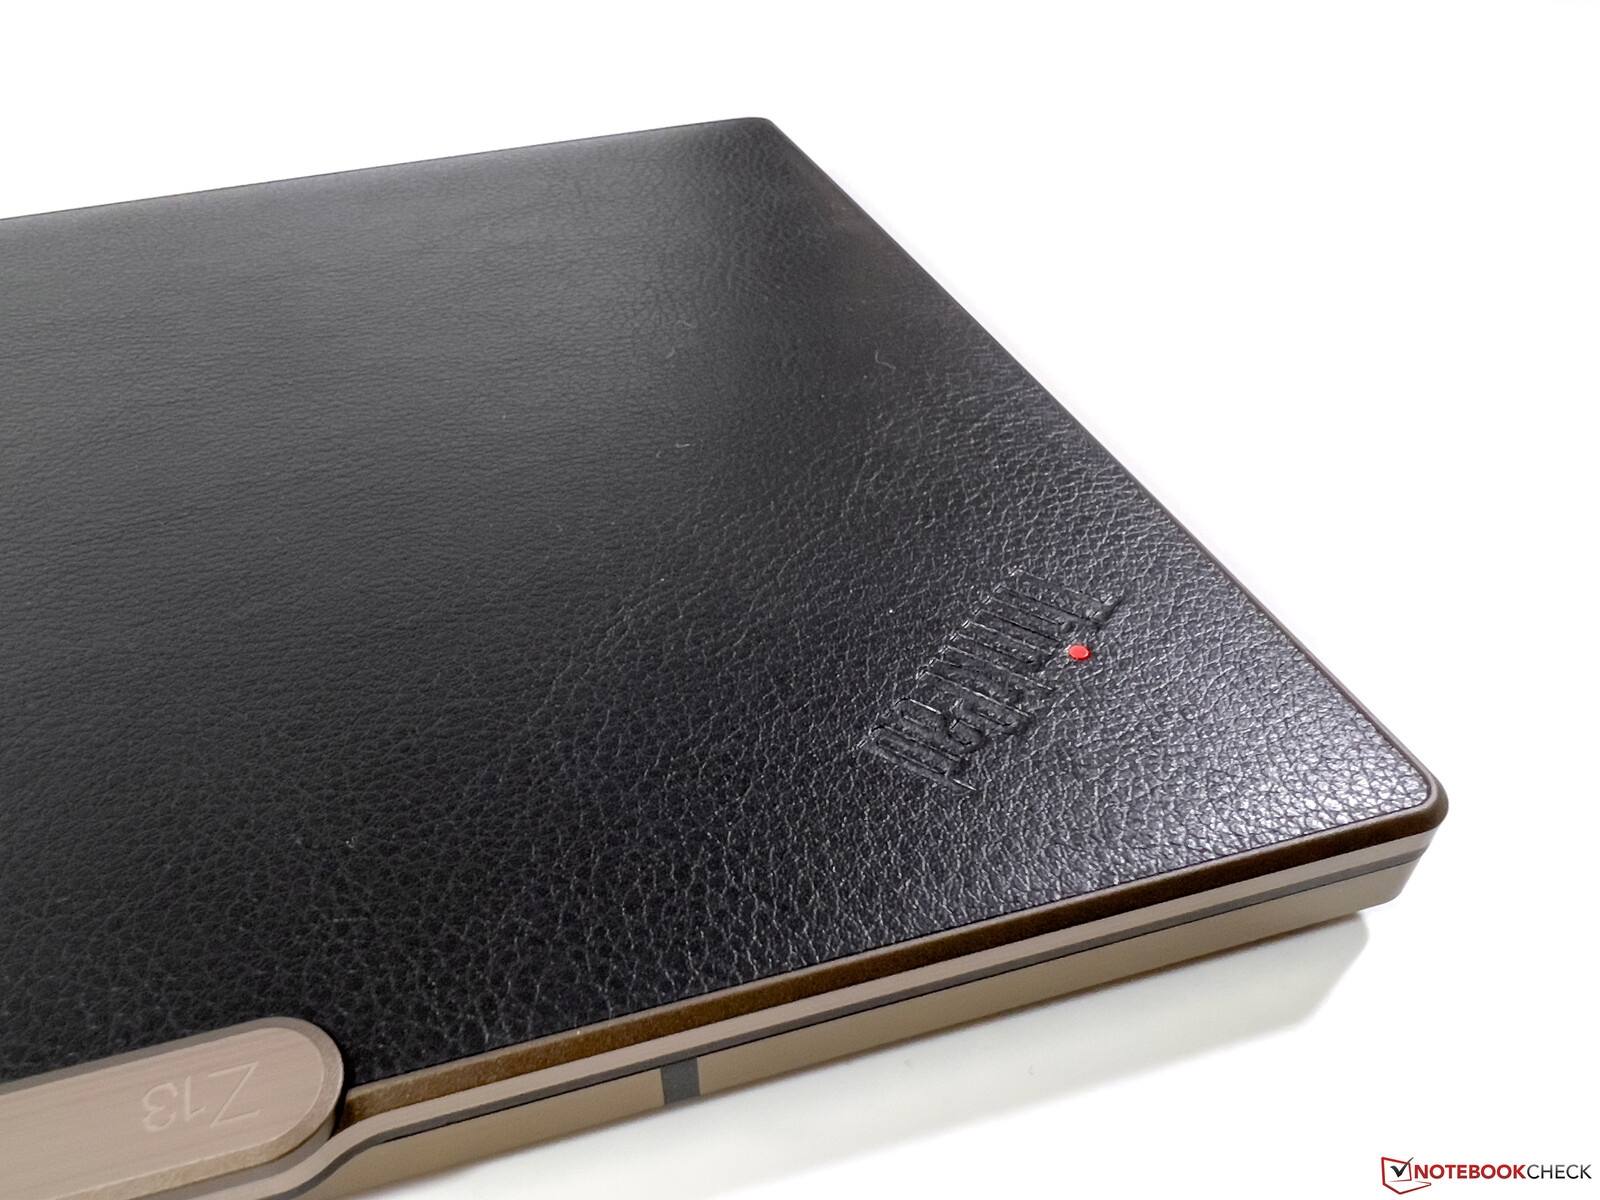
Obudowa jest w zasadzie identyczna jak w przypadku podstawowego modelu ThinkPad Z13, ale w wersji high-end występuje pokrywa ekranu o czarnej powierzchni z imitacji skóry z brązowymi akcentami. Jest to niewątpliwie kwestia osobistego gustu i Lenovo oferuje alternatywy, ale porównania z torebką trudno uniknąć. To, czy obecny Z13 stał się bardziej przedmiotem mody, czy też wizualnie nadal pasuje do środowiska biznesowego, jest kwestią osobistego wyboru. Z punktu widzenia jakości nie ma jednak nic złego w tej sprawie i ThinkPad Z13 jest rzeczywiście wyjątkowo wysokiej jakości.
Łączność - Z13 z Wi-Fi 6E i LTE
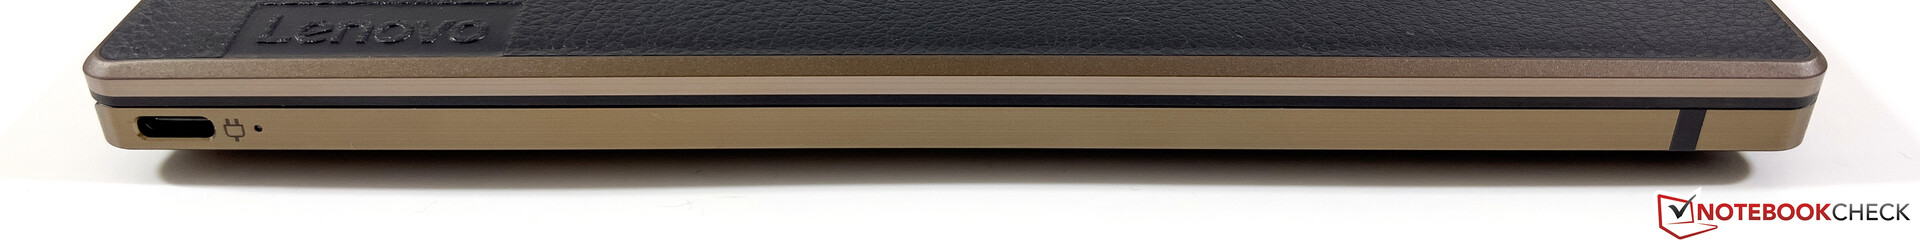
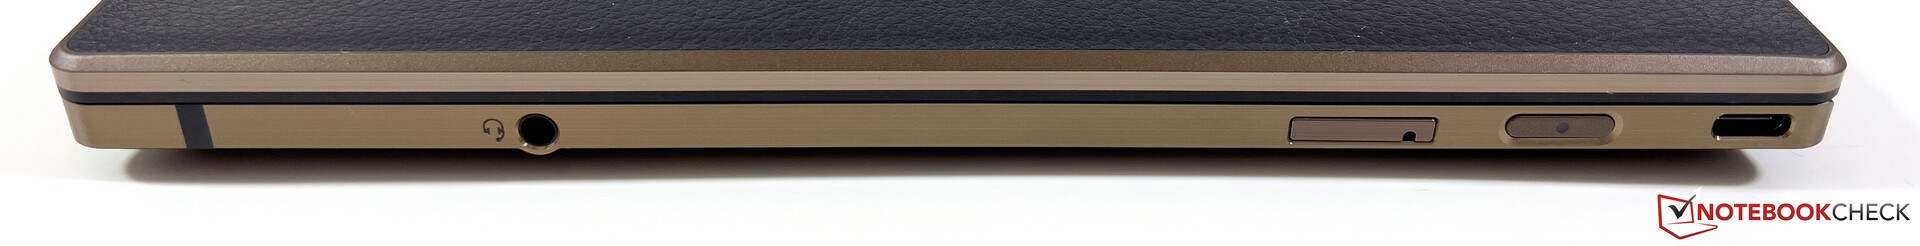
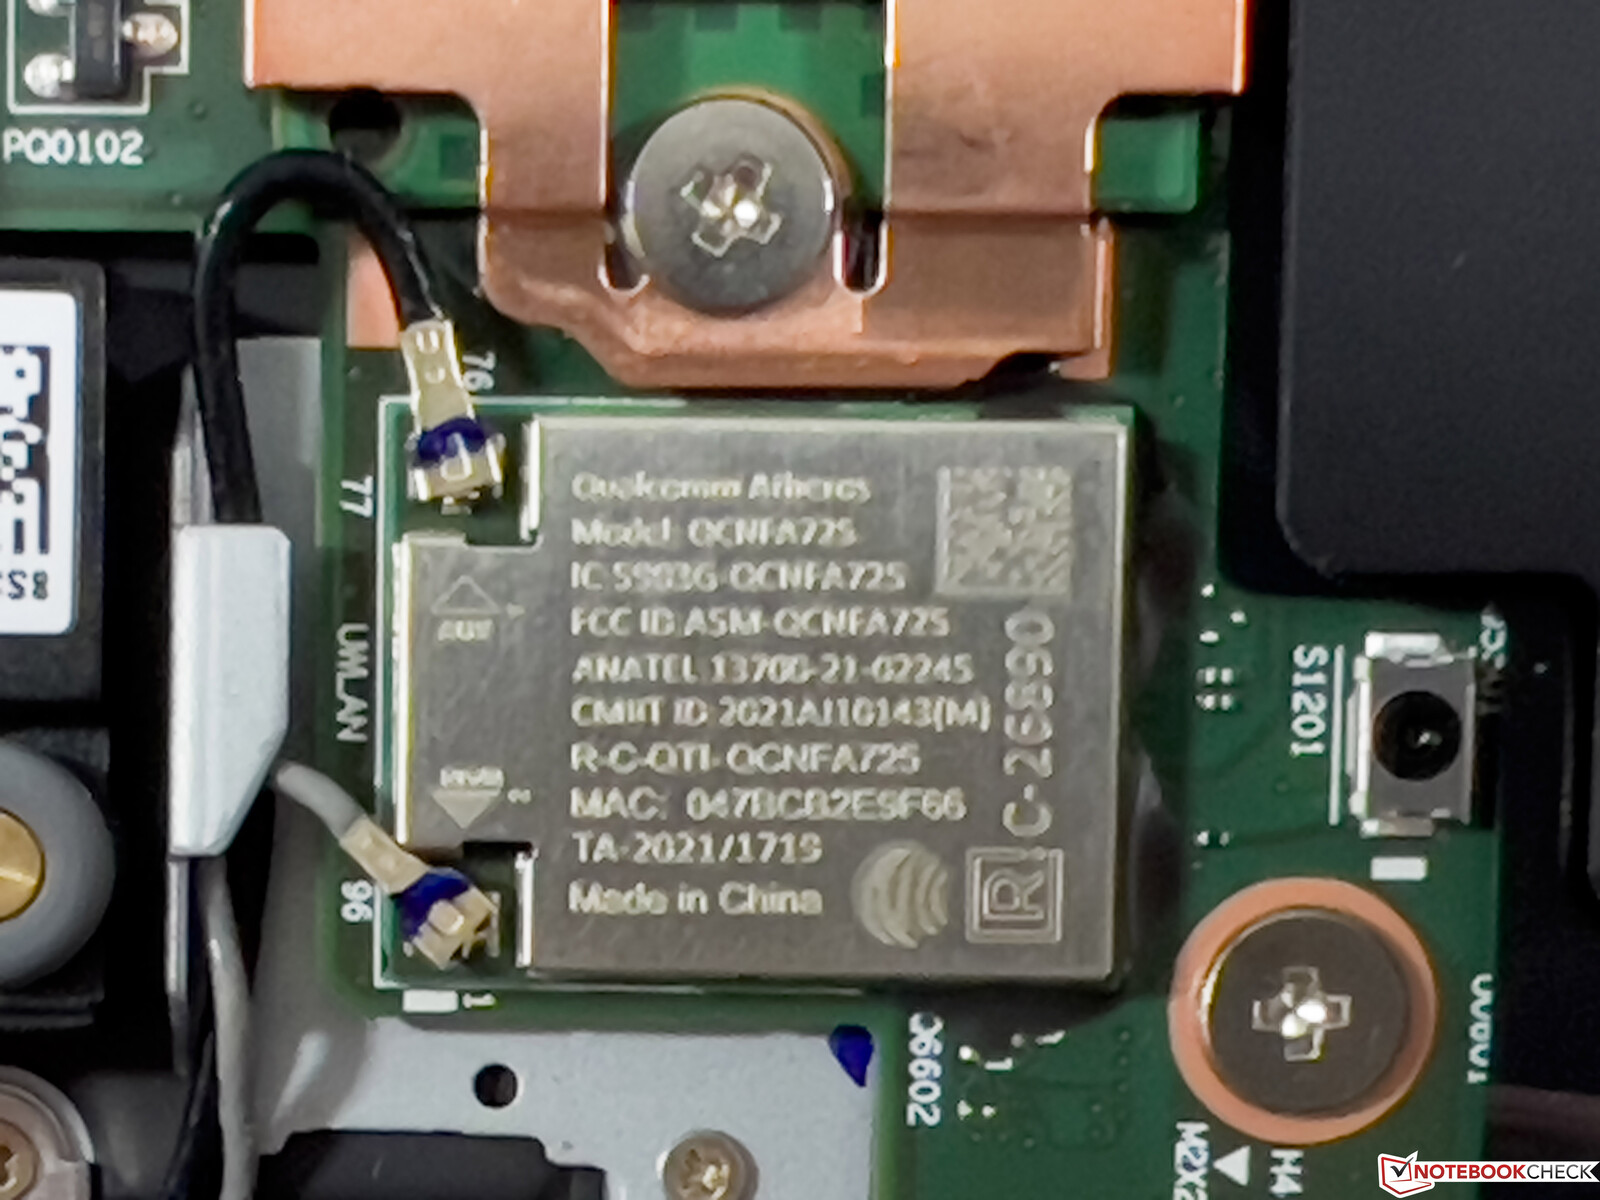
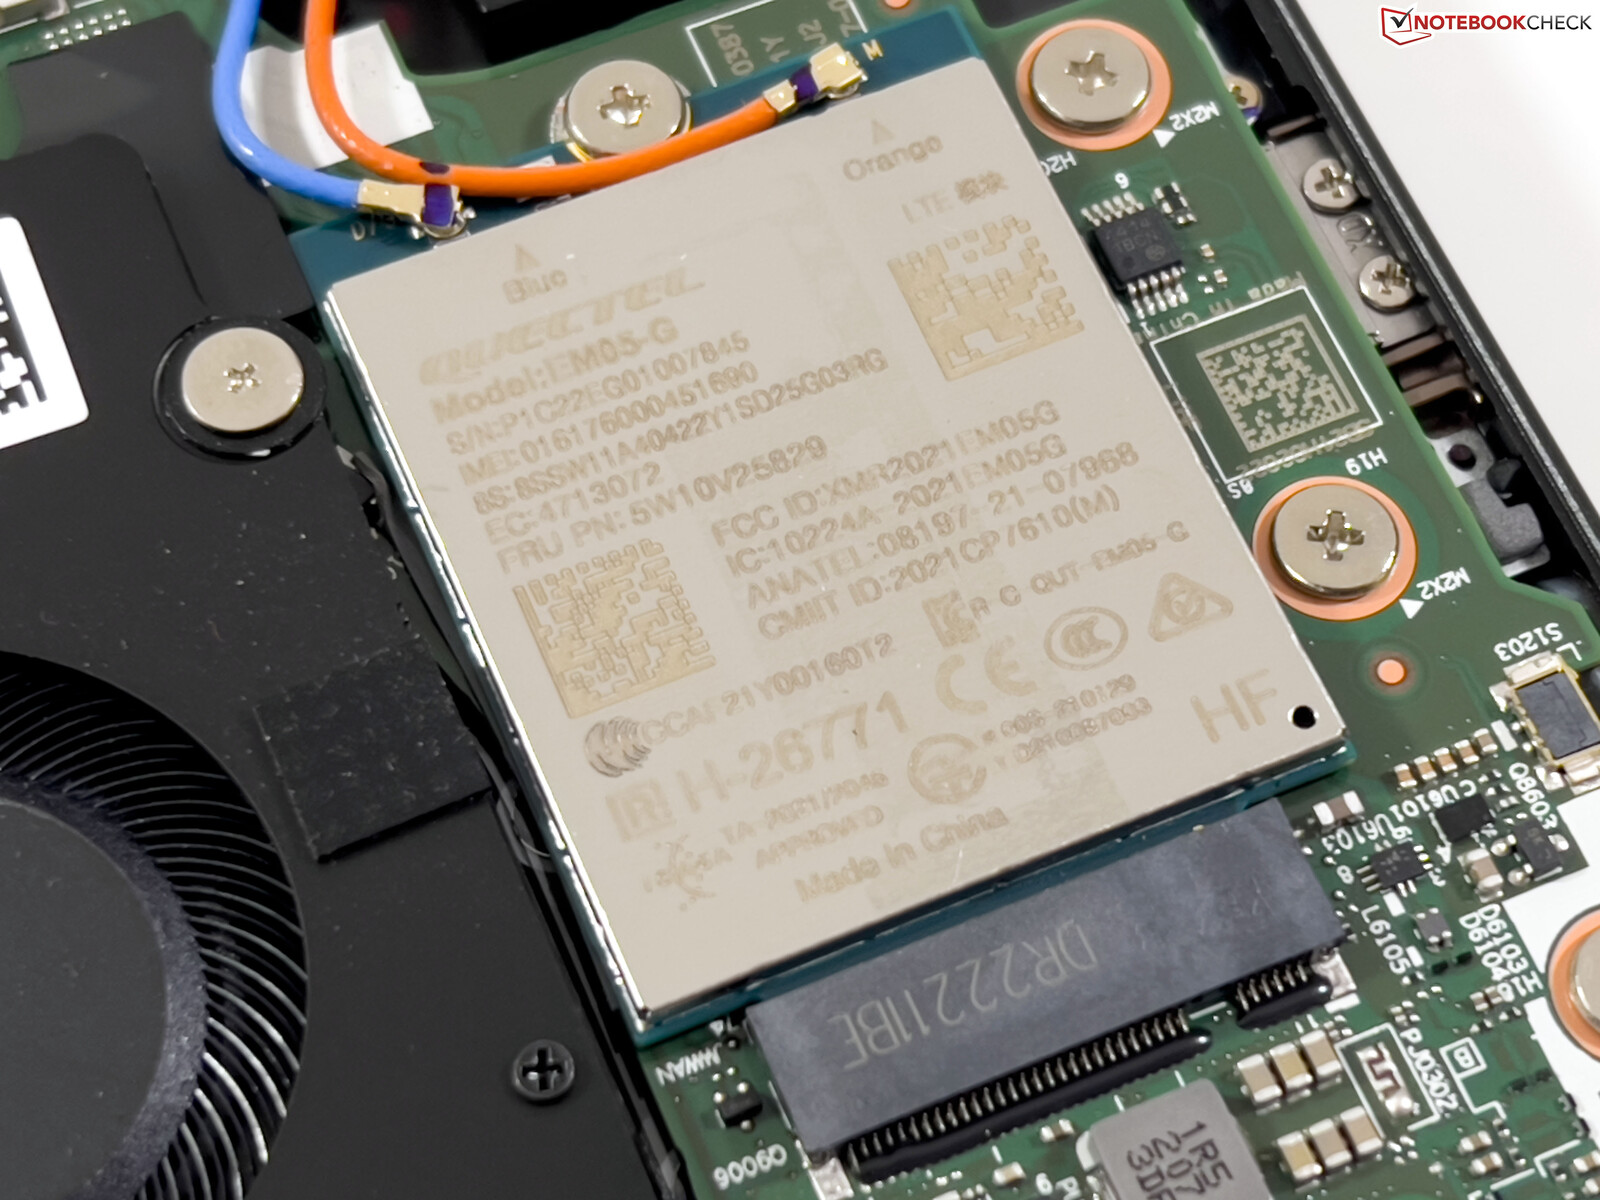
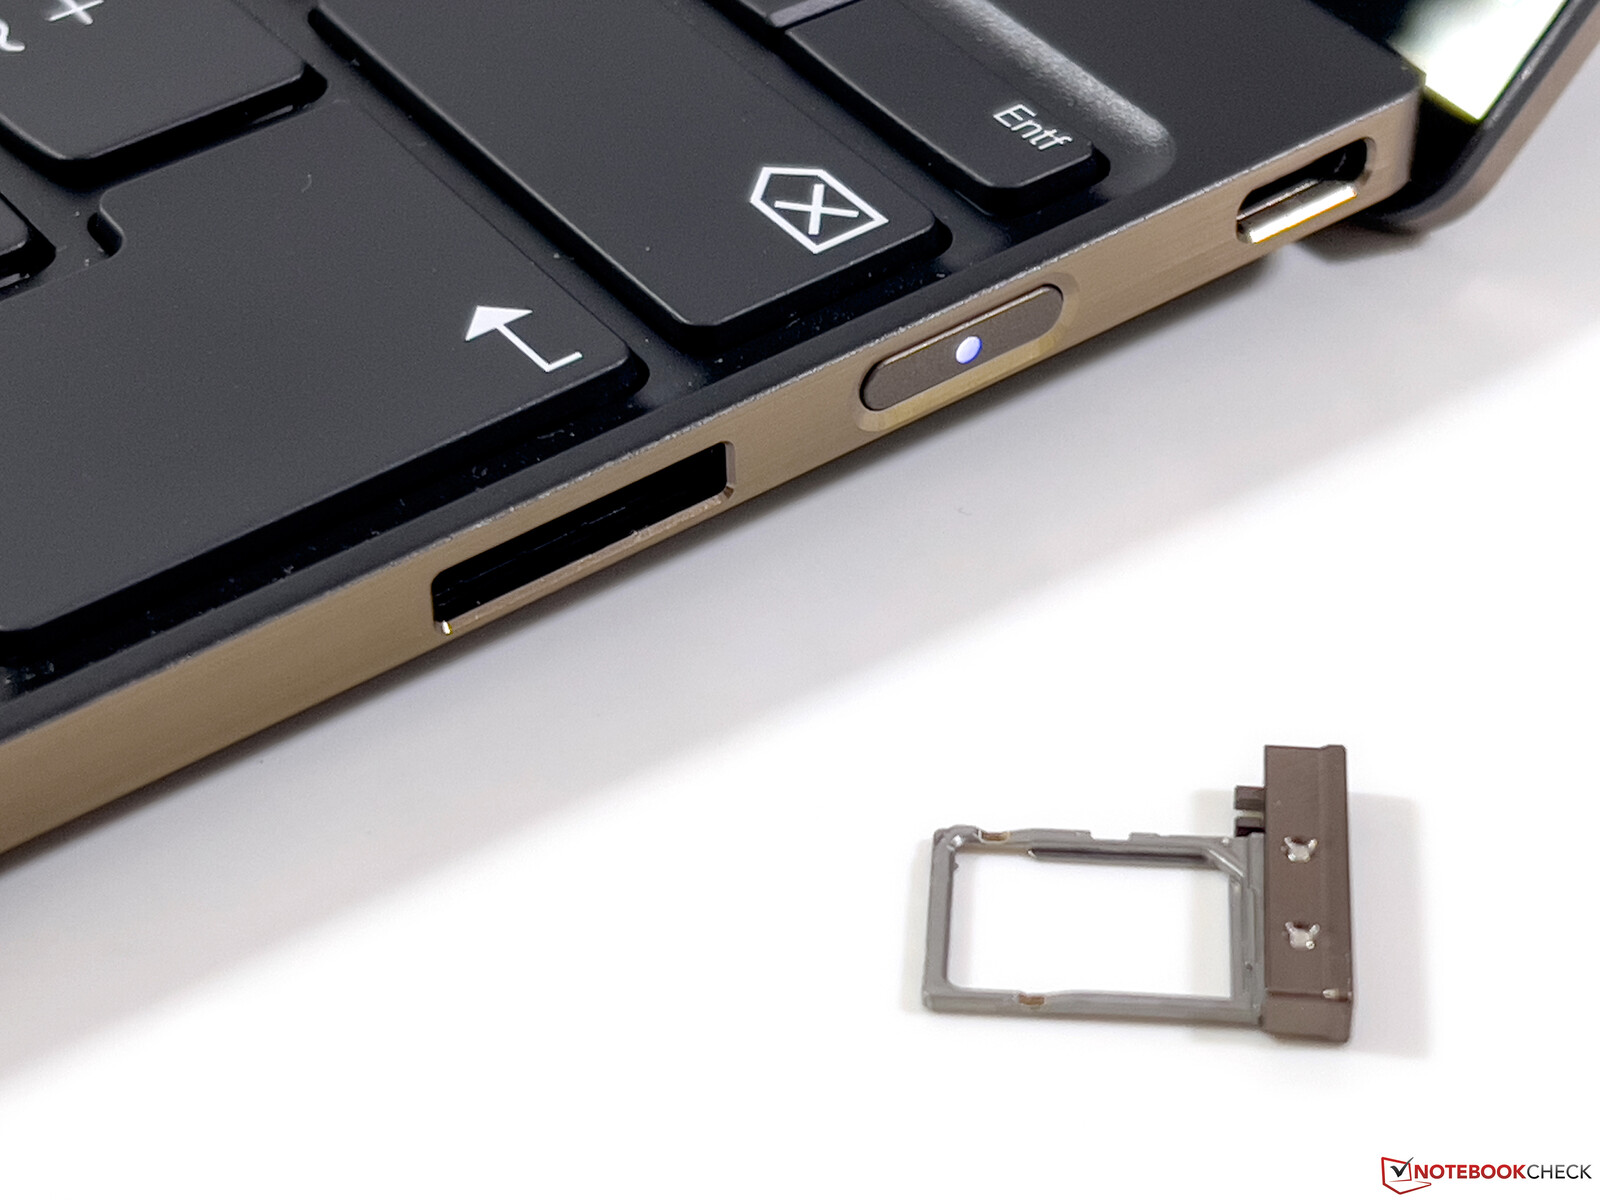
Nasz egzemplarz recenzencki był wyposażony w moduł Wi-Fi 6E (Qualcomm WCN685x) i bez problemu udało nam się połączyć z siecią 6 GHz na naszym referencyjnym routerze Asusa. Prędkości transferu w teście były bardzo wysokie, a także stabilne. W testowanym urządzeniu zainstalowany był także moduł WWAN od Quectela, który obsługuje tylko LTE Cat.4. Oprócz eSIM na prawej krawędzi można umieścić także kartę nano-SIM. Bez problemu mogliśmy korzystać z karty SIM Telekom (Niemcy) w sieci LTE. Moduł 5G nie jest jednak dostępny.
| Networking | |
| Lenovo ThinkPad Z13 G1-21D20016GE | |
| iperf3 receive AXE11000 6GHz | |
| iperf3 transmit AXE11000 6GHz | |
| Asus Zenbook S 13 OLED | |
| iperf3 receive AXE11000 | |
| iperf3 transmit AXE11000 | |
| Lenovo ThinkPad Z13 21D2CTO1WW | |
| iperf3 receive AXE11000 6GHz | |
| iperf3 transmit AXE11000 6GHz | |
| Apple MacBook Air M2 Entry | |
| iperf3 receive AXE11000 | |
| iperf3 transmit AXE11000 | |
| Dell XPS 13 Plus 9320 4K | |
| iperf3 receive AXE11000 | |
| iperf3 transmit AXE11000 | |
| Przeciętny Qualcomm WCN685x | |
| iperf3 receive AXE11000 6GHz | |
| iperf3 transmit AXE11000 6GHz | |
| iperf3 receive AXE11000 | |
| iperf3 transmit AXE11000 | |


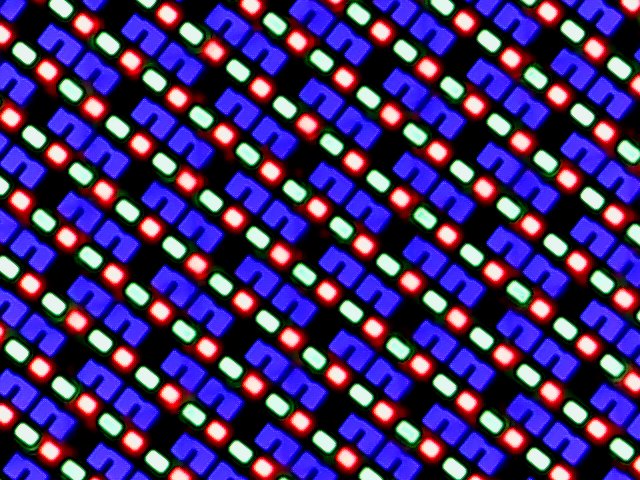
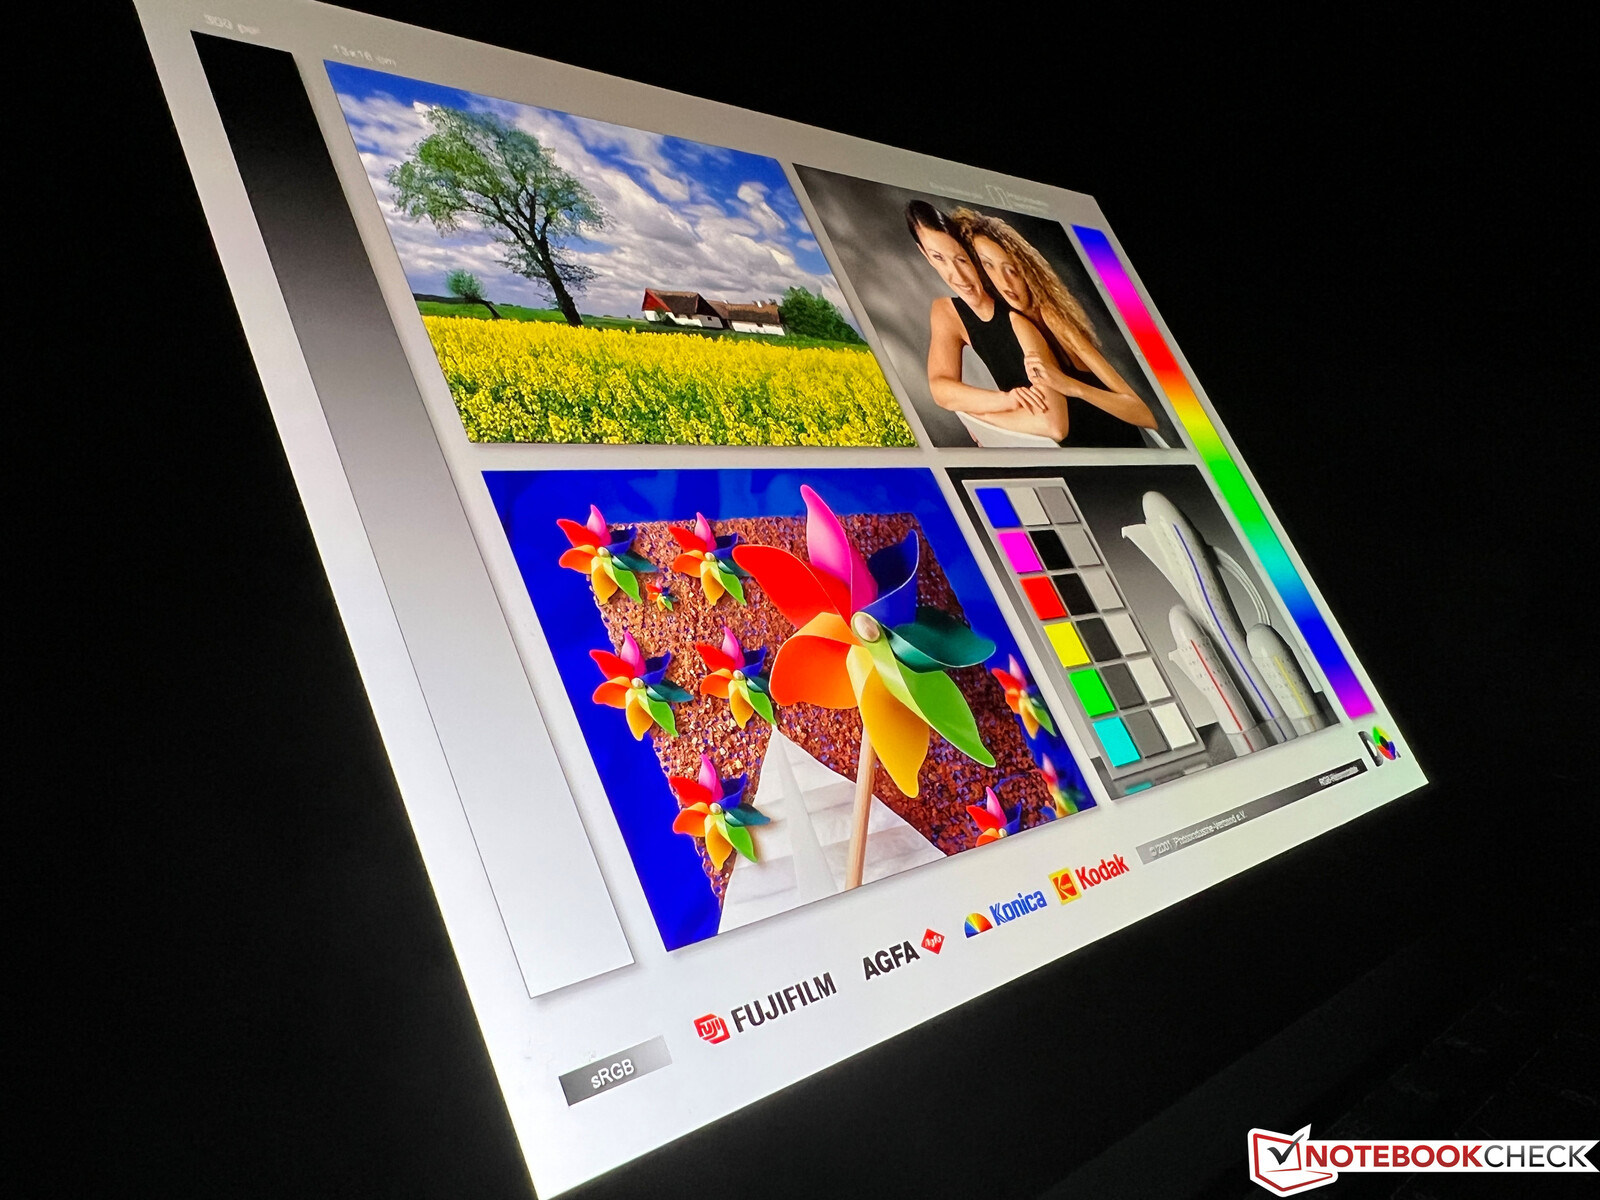
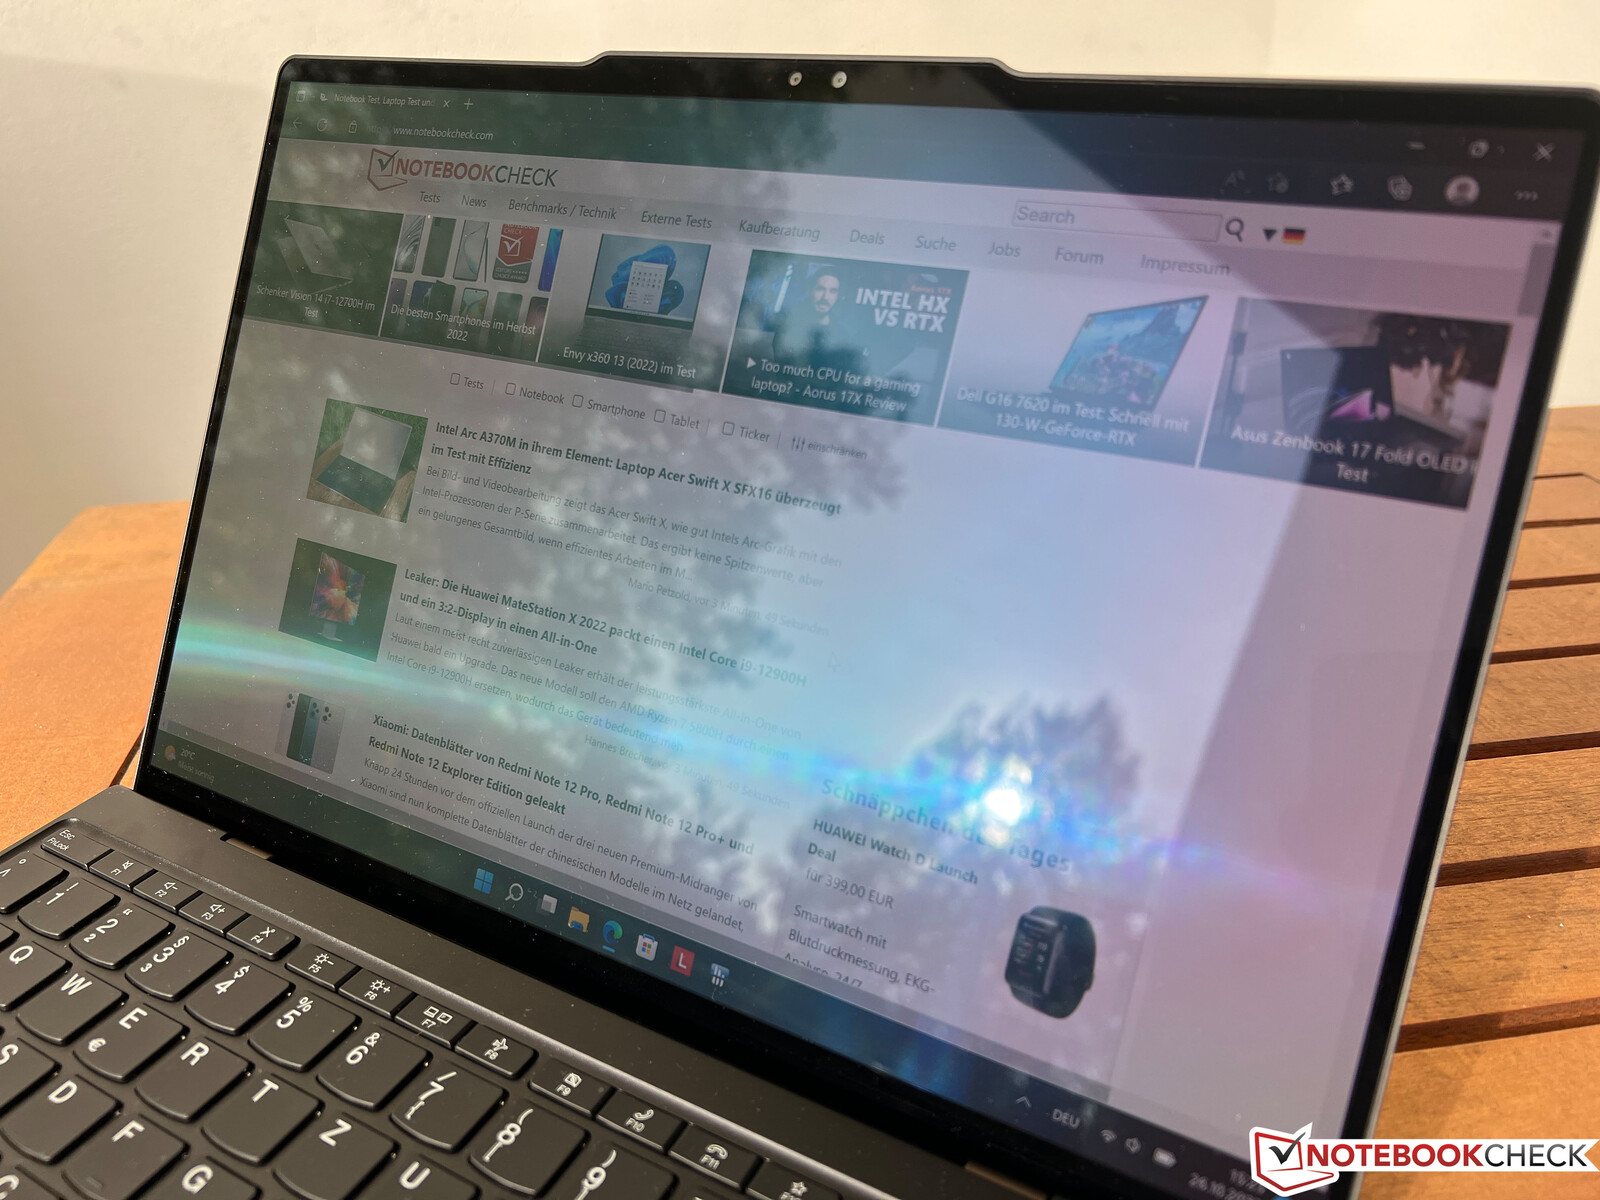
Wyświetlacz - ekran dotykowy OLED 2,8K
W naszym testowym urządzeniu zastosowano opcjonalny, 13,3-calowy ekran dotykowy OLED o rozdzielczości 2 880 x 1 800 pikseli. Subiektywnie rzecz biorąc, obraz z odblaskowego panelu robi w zasadzie dobre wrażenie. Treść jest wyświetlana bardzo ostro, a kolory są bardzo mocne. Przy jasnych treściach widoczny jest jednak efekt siatki (efekt mory), który wymaga siedzenia stosunkowo blisko wyświetlacza. Windows domyślnie korzysta z trybu ciemnych kolorów w celu oszczędzania energii, więc w praktyce efekt ten nie jest zauważalny.
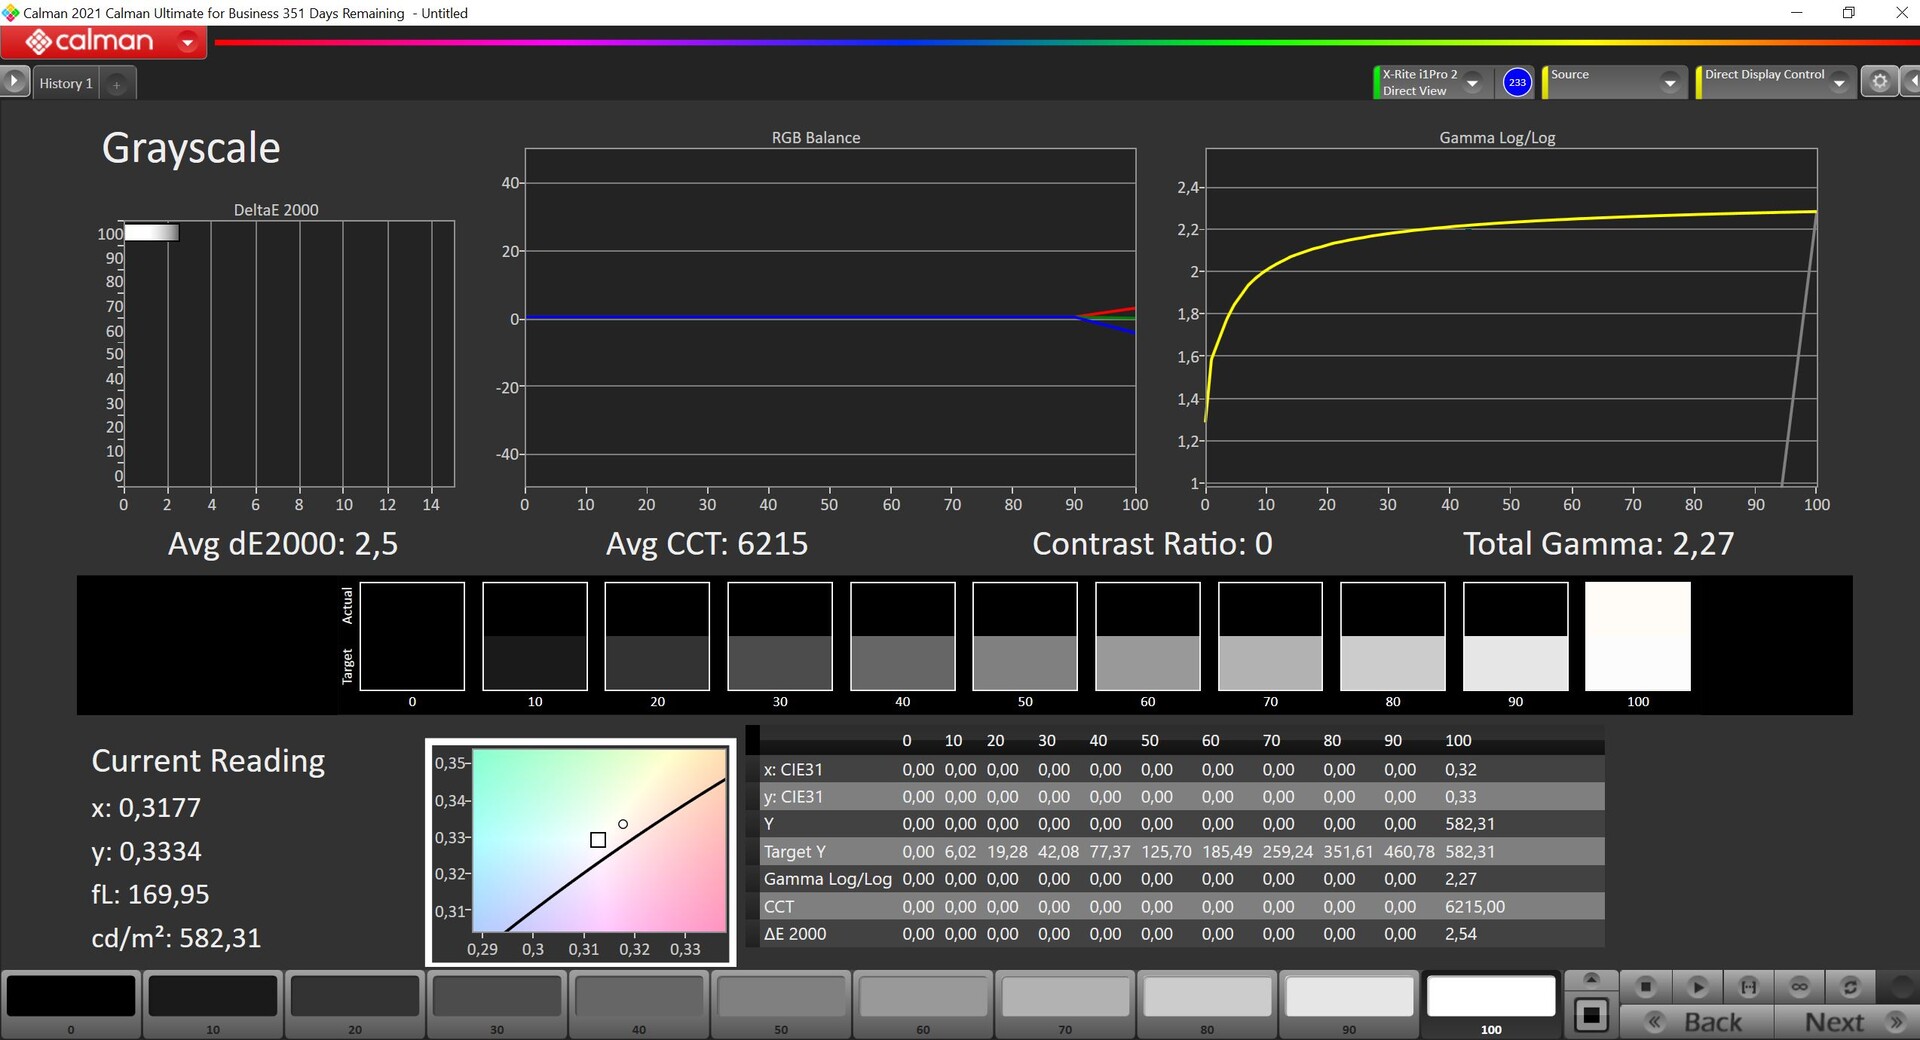
Lenovo reklamuje jasność na poziomie 400 cd/m², przy czym trzeba tu rozróżnić (co jest normą w przypadku paneli OLED) treści SDR i HDR. W normalnym trybie SDR określiliśmy jasność na około 380 cd/m² i w połączeniu z wyjątkowo niskim poziomem czerni uzyskujemy niezwykle wysoki współczynnik kontrastu. W trybie HDR (który trzeba aktywować ręcznie) osiąga on maksymalnie 582 cd/m² dla małych fragmentów obrazu i około 470 cd/m² dla niemal całkowicie jasnego obrazu. Stabilność kątów widzenia jest bardzo dobra, a czasy reakcji są wyjątkowo szybkie. Na panelach OLED nie występują aureole.
| |||||||||||||||||||||||||
rozświetlenie: 98 %
na akumulatorze: 373 cd/m²
kontrast: 9275:1 (czerń: 0.04 cd/m²)
ΔE ColorChecker Calman: 2.5 | ∀{0.5-29.43 Ø4.71}
calibrated: 1.9
ΔE Greyscale Calman: 2 | ∀{0.09-98 Ø4.96}
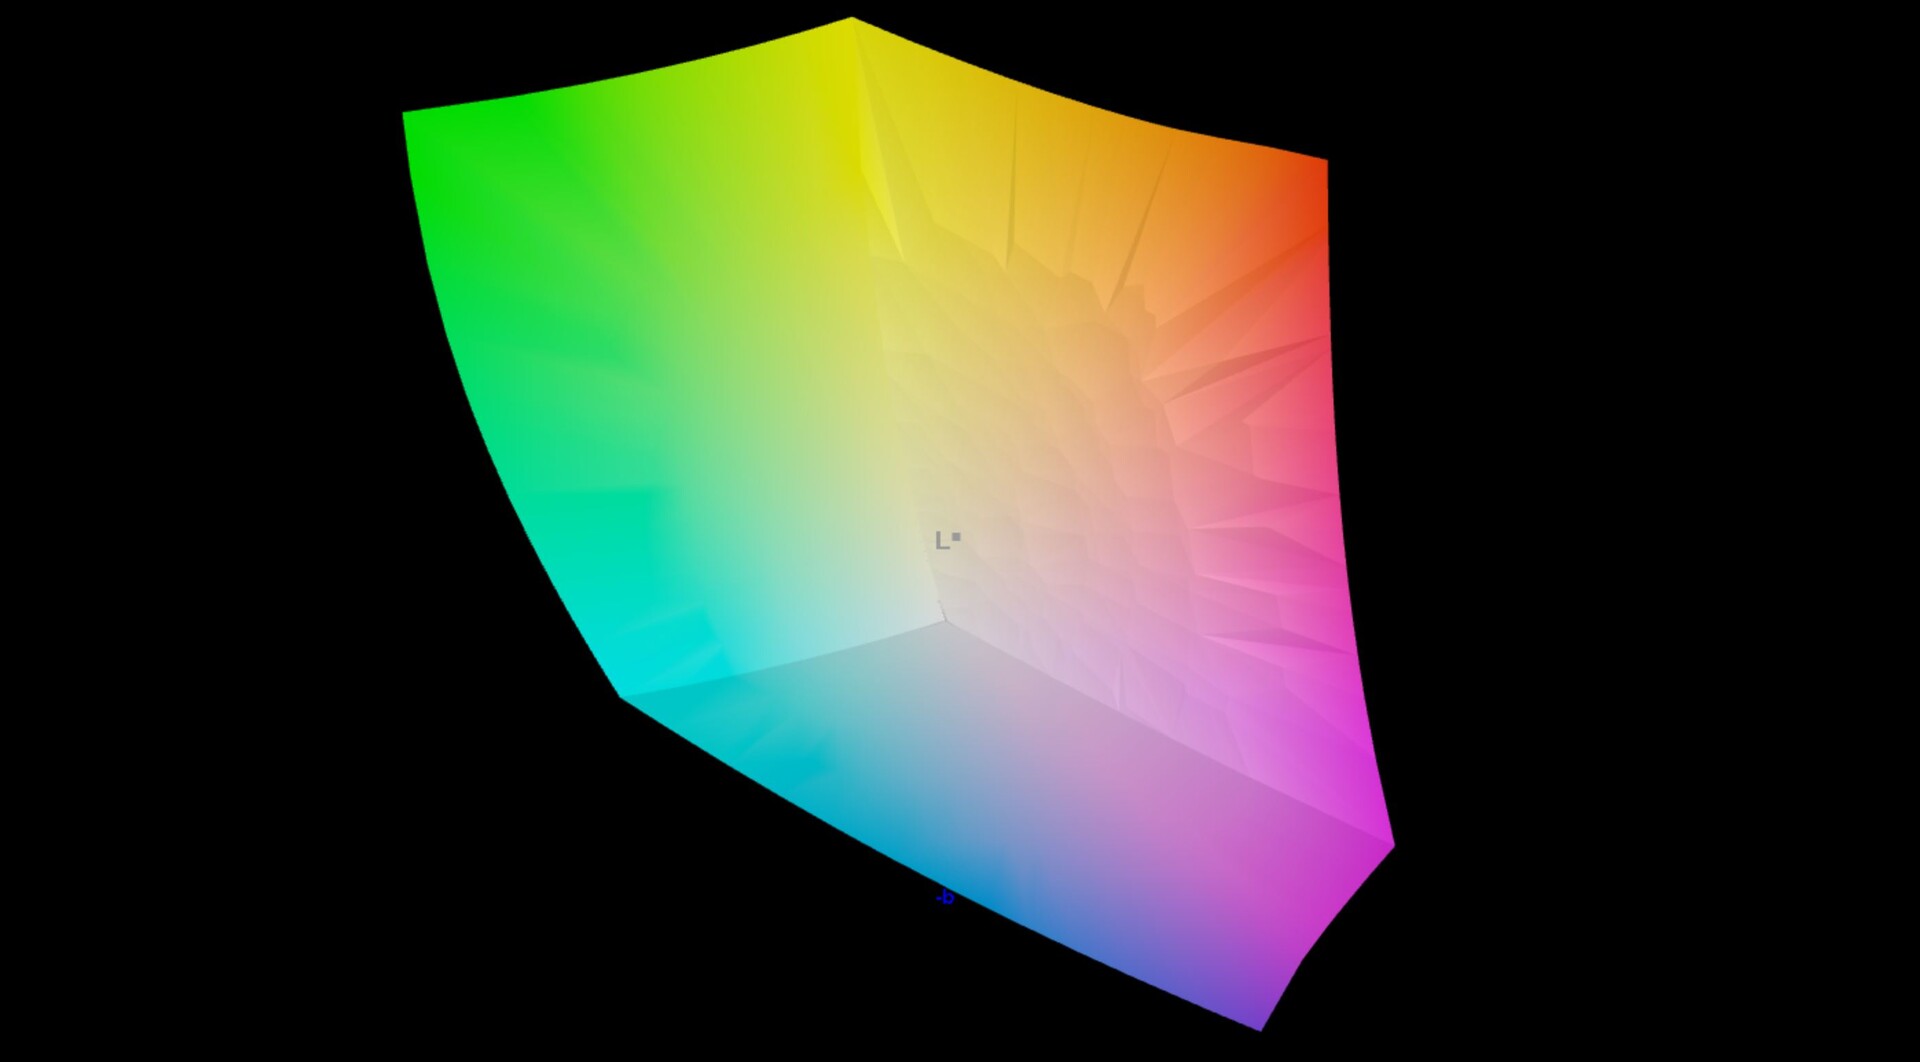
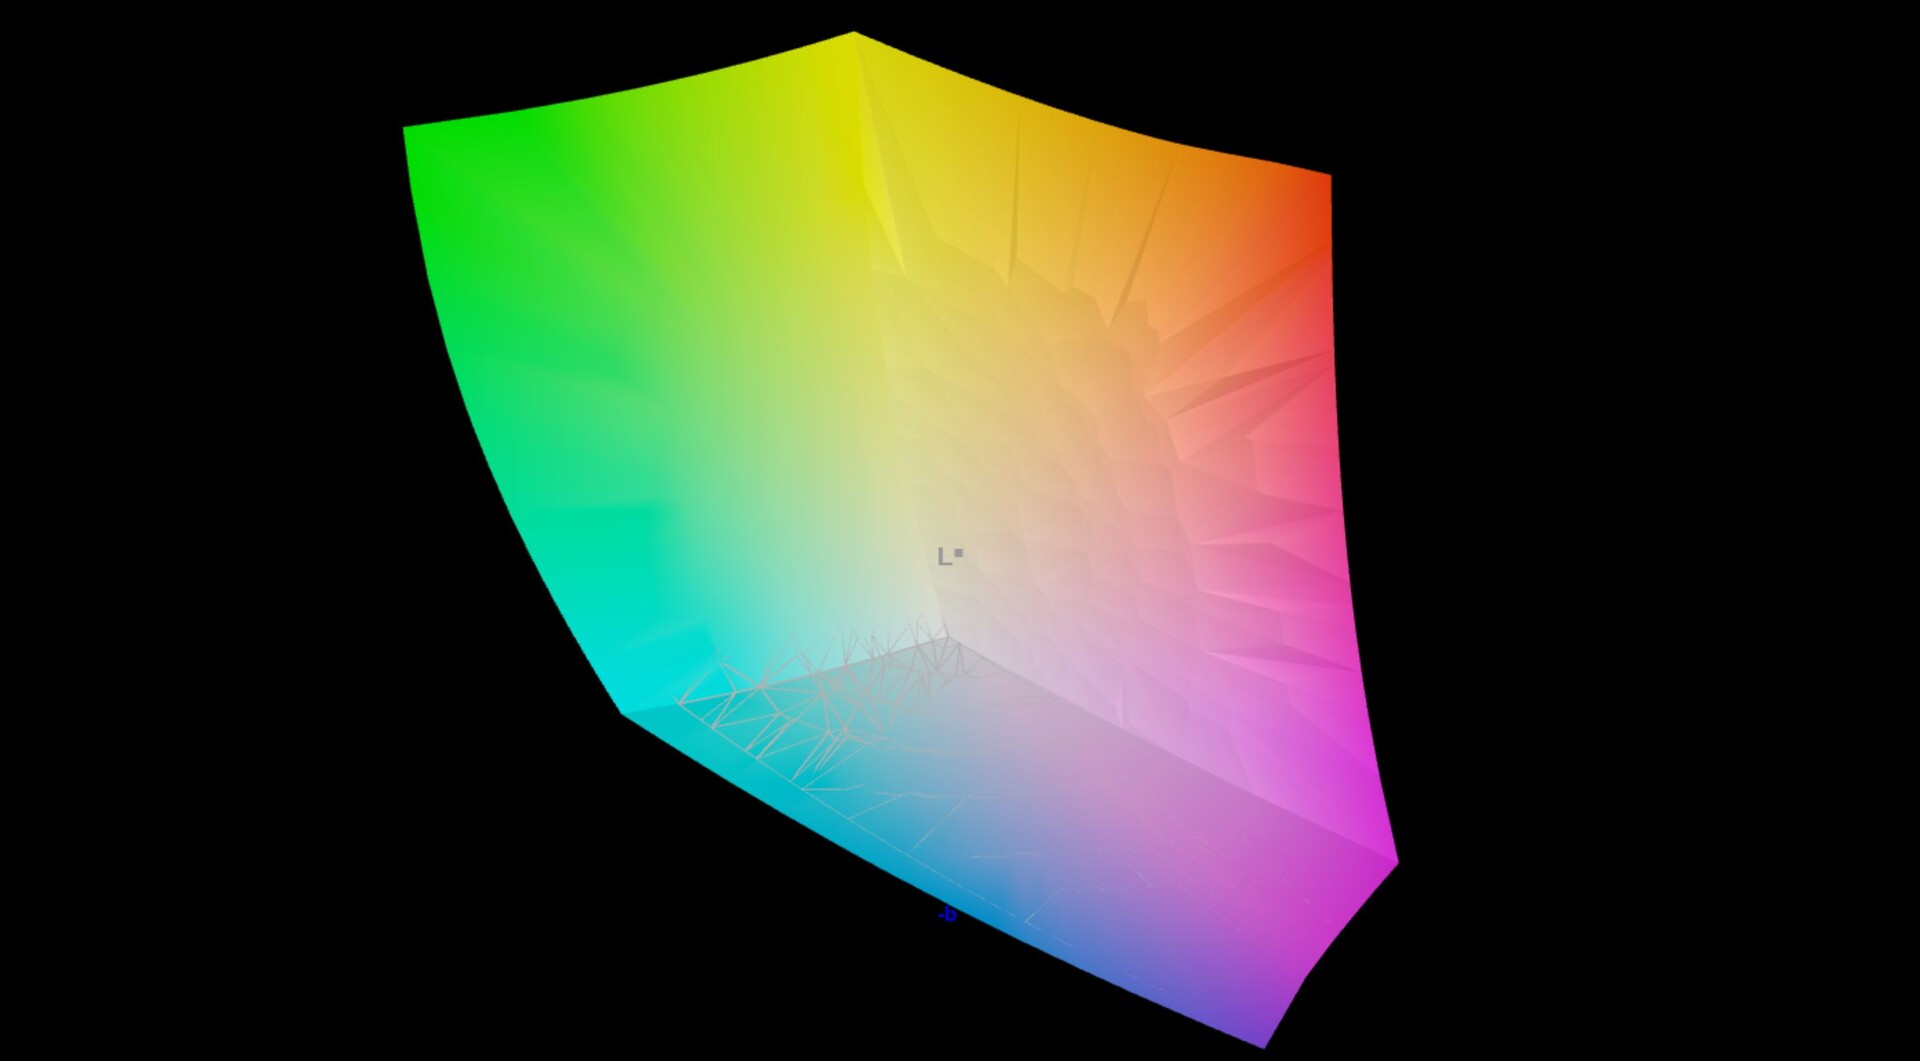
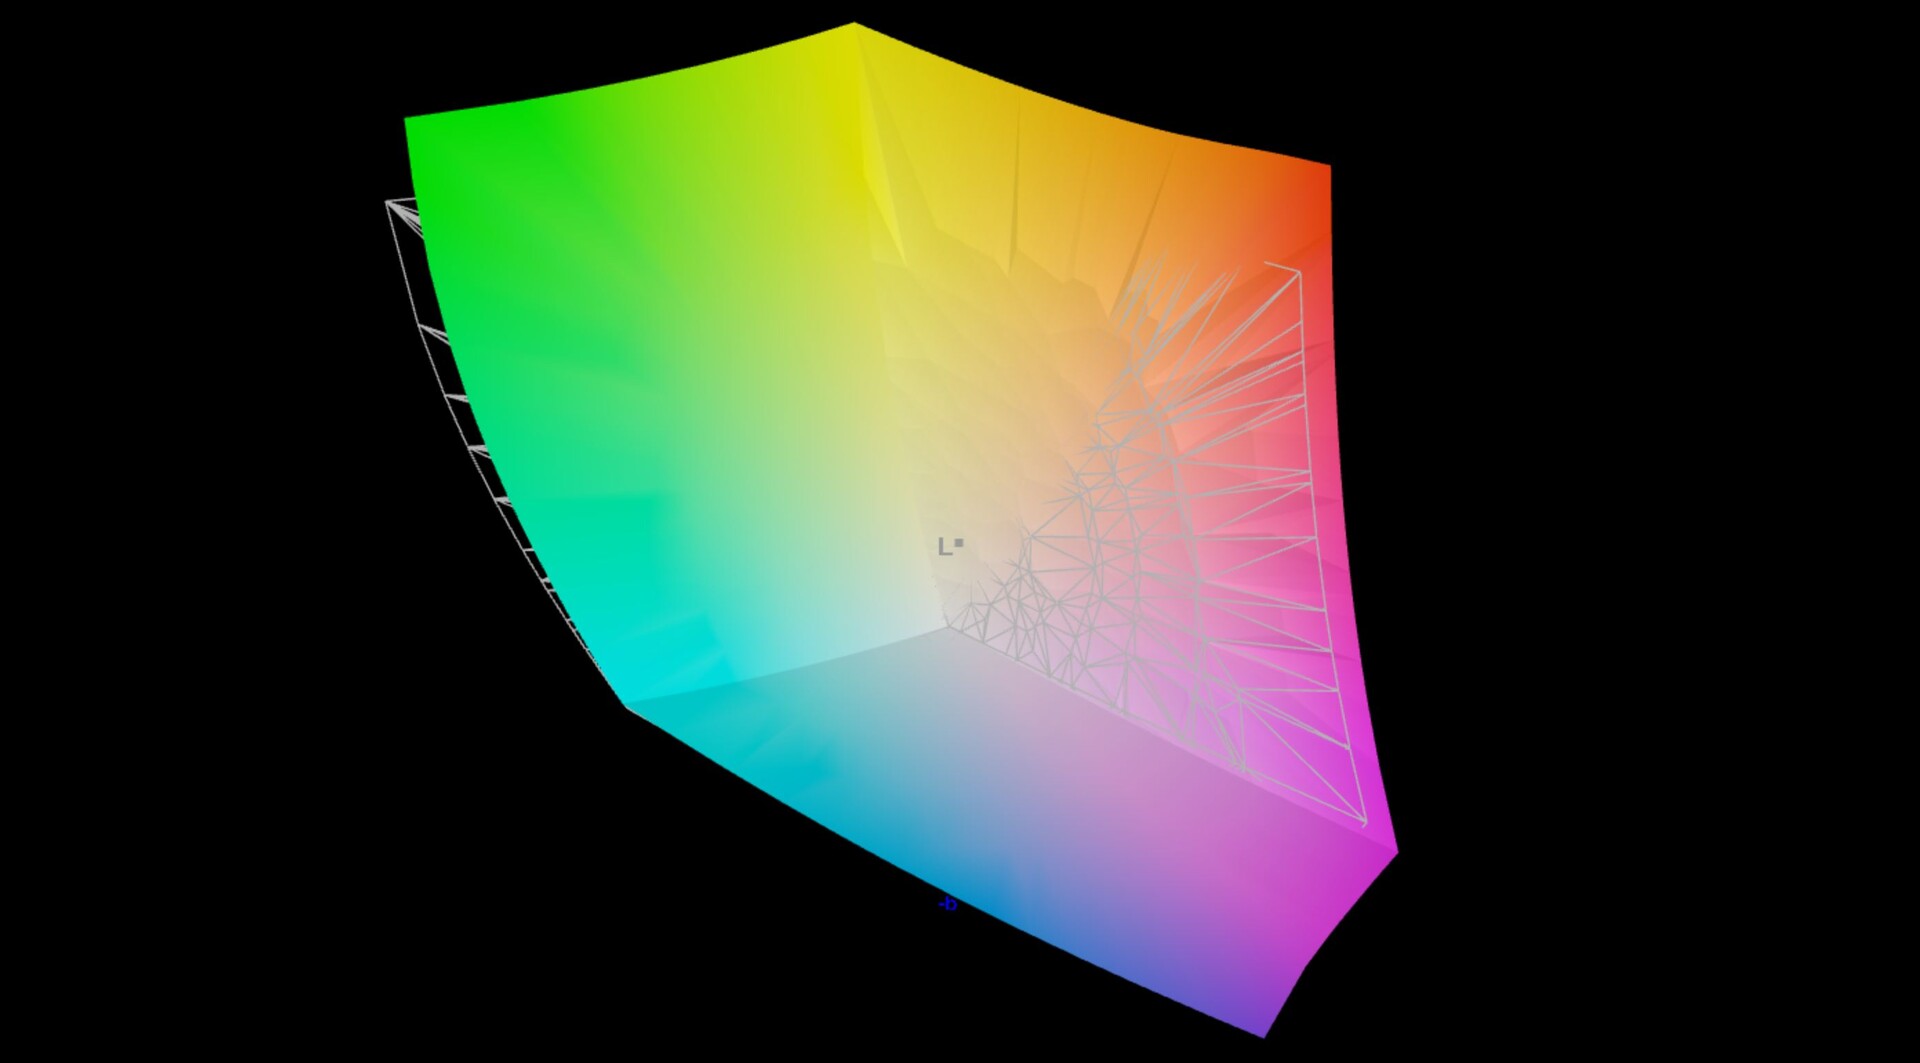
97.5% AdobeRGB 1998 (Argyll 3D)
100% sRGB (Argyll 3D)
99.9% Display P3 (Argyll 3D)
Gamma: 2.17
CCT: 6228 K
| Lenovo ThinkPad Z13 G1-21D20016GE ATNA33AA02-0, OLED, 2880x1800, 13.3" | Asus Zenbook S 13 OLED SDC4172, OLED, 2880x1800, 13.3" | Dell XPS 13 Plus 9320 i7-1280P OLED Samsung 134XK04, OLED, 3456x2160, 13.4" | Lenovo ThinkPad Z13 21D2CTO1WW NV133WUM-N63, IPS LED, 1920x1200, 13.3" | Apple MacBook Air M2 Entry IPS, 2560x1664, 13.6" | |
|---|---|---|---|---|---|
| Display | 0% | 0% | -21% | -4% | |
| Display P3 Coverage (%) | 99.9 | 99.8 0% | 99.5 0% | 67.7 -32% | 98.4 -2% |
| sRGB Coverage (%) | 100 | 100 0% | 100 0% | 96.5 -3% | 99.9 0% |
| AdobeRGB 1998 Coverage (%) | 97.5 | 97.8 0% | 98.4 1% | 69.7 -29% | 87.6 -10% |
| Response Times | -8% | -34% | -1909% | -1544% | |
| Response Time Grey 50% / Grey 80% * (ms) | 1.9 ? | 2.1 ? -11% | 2.6 ? -37% | 49 ? -2479% | 32.9 ? -1632% |
| Response Time Black / White * (ms) | 1.6 ? | 1.68 ? -5% | 2.1 ? -31% | 23 ? -1338% | 24.9 ? -1456% |
| PWM Frequency (Hz) | 240 ? | 240.4 ? | 59.5 | ||
| Screen | 24% | -6% | -81% | -81% | |
| Brightness middle (cd/m²) | 371 | 336 -9% | 371.8 0% | 418 13% | 526 42% |
| Brightness (cd/m²) | 378 | 338 -11% | 374 -1% | 379 0% | 486 29% |
| Brightness Distribution (%) | 98 | 99 1% | 98 0% | 81 -17% | 87 -11% |
| Black Level * (cd/m²) | 0.04 | 0.02 50% | 0.33 -725% | 0.38 -850% | |
| Contrast (:1) | 9275 | 16800 81% | 1267 -86% | 1384 -85% | |
| Colorchecker dE 2000 * | 2.5 | 1.8 28% | 2.37 5% | 1.7 32% | 1.3 48% |
| Colorchecker dE 2000 max. * | 4.4 | 3.8 14% | 6.1 -39% | 3.3 25% | 2.7 39% |
| Colorchecker dE 2000 calibrated * | 1.9 | 1.8 5% | 1.1 42% | 0.7 63% | |
| Greyscale dE 2000 * | 2 | 0.9 55% | 2 -0% | 2.3 -15% | 2 -0% |
| Gamma | 2.17 101% | 2.22 99% | 2.29 96% | 2.14 103% | 2.25 98% |
| CCT | 6228 104% | 6580 99% | 6261 104% | 6499 100% | 6858 95% |
| Całkowita średnia (program / ustawienia) | 5% /
14% | -13% /
-9% | -670% /
-329% | -543% /
-273% |
* ... im mniej tym lepiej
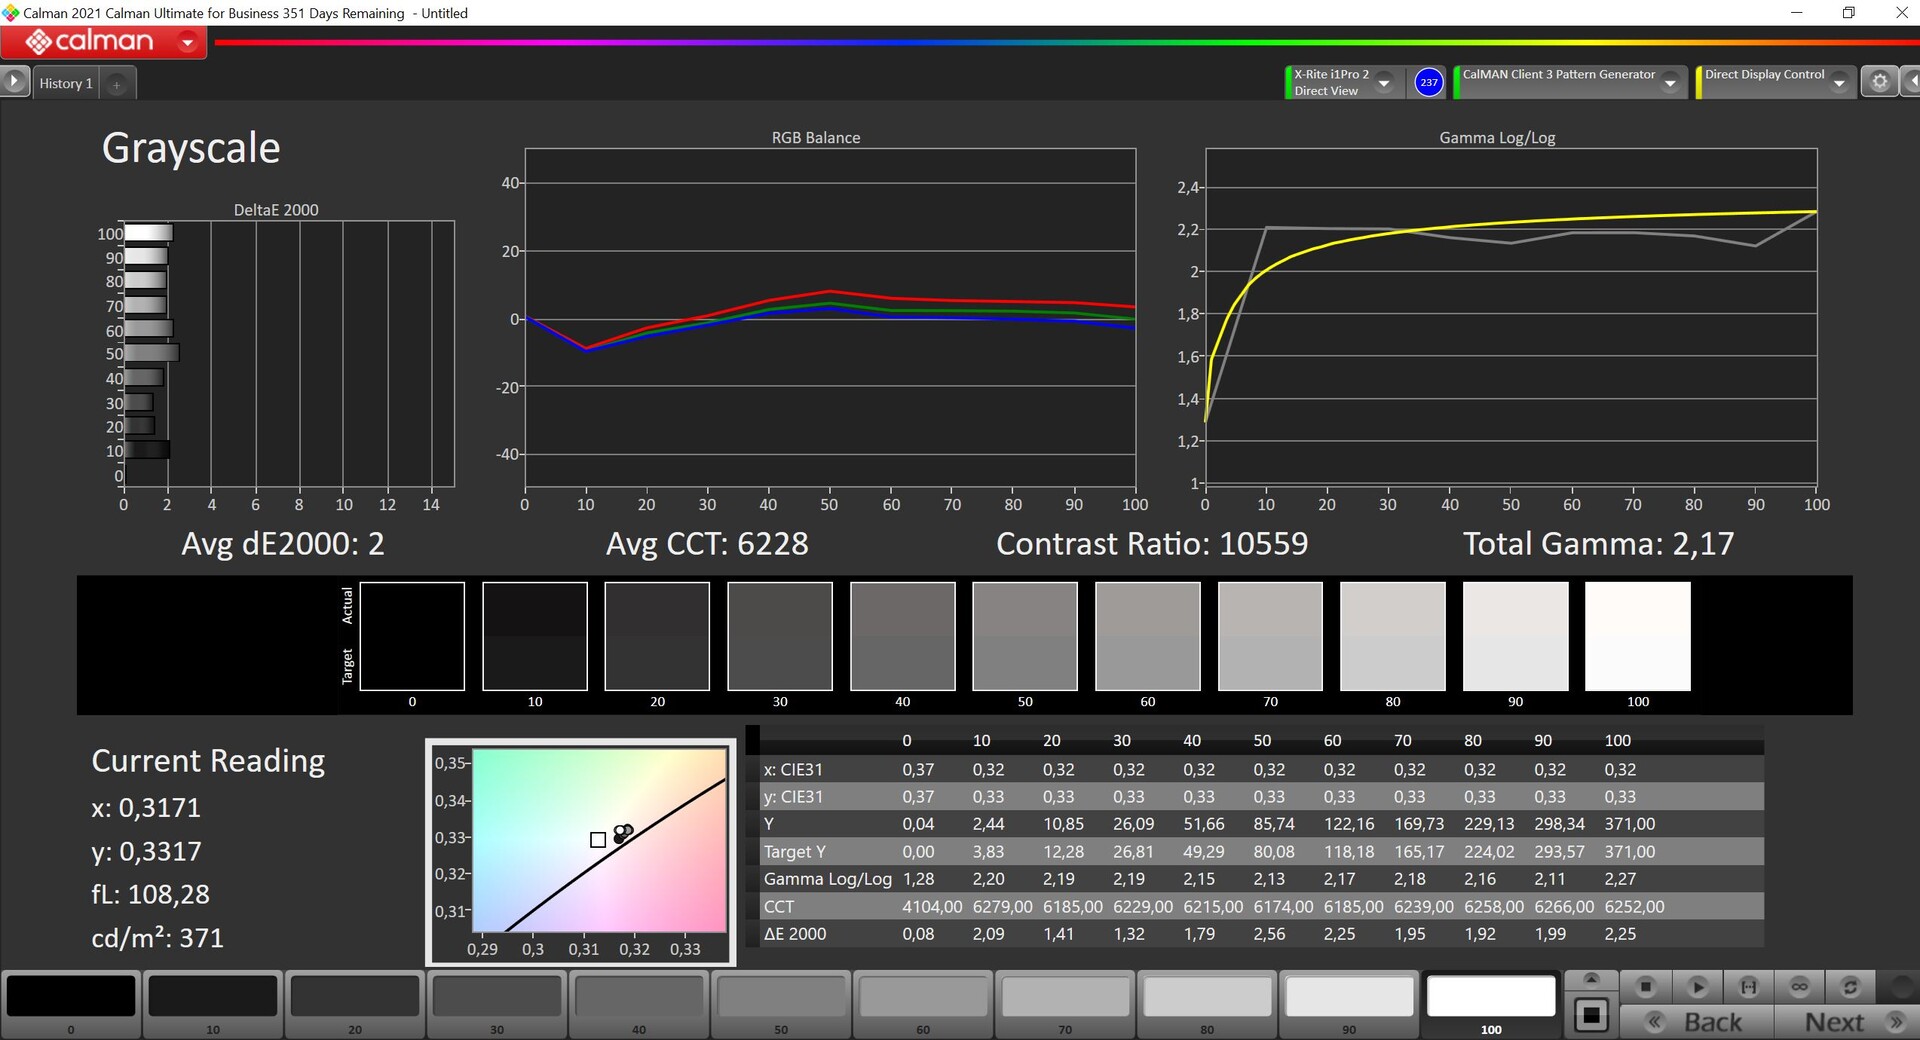
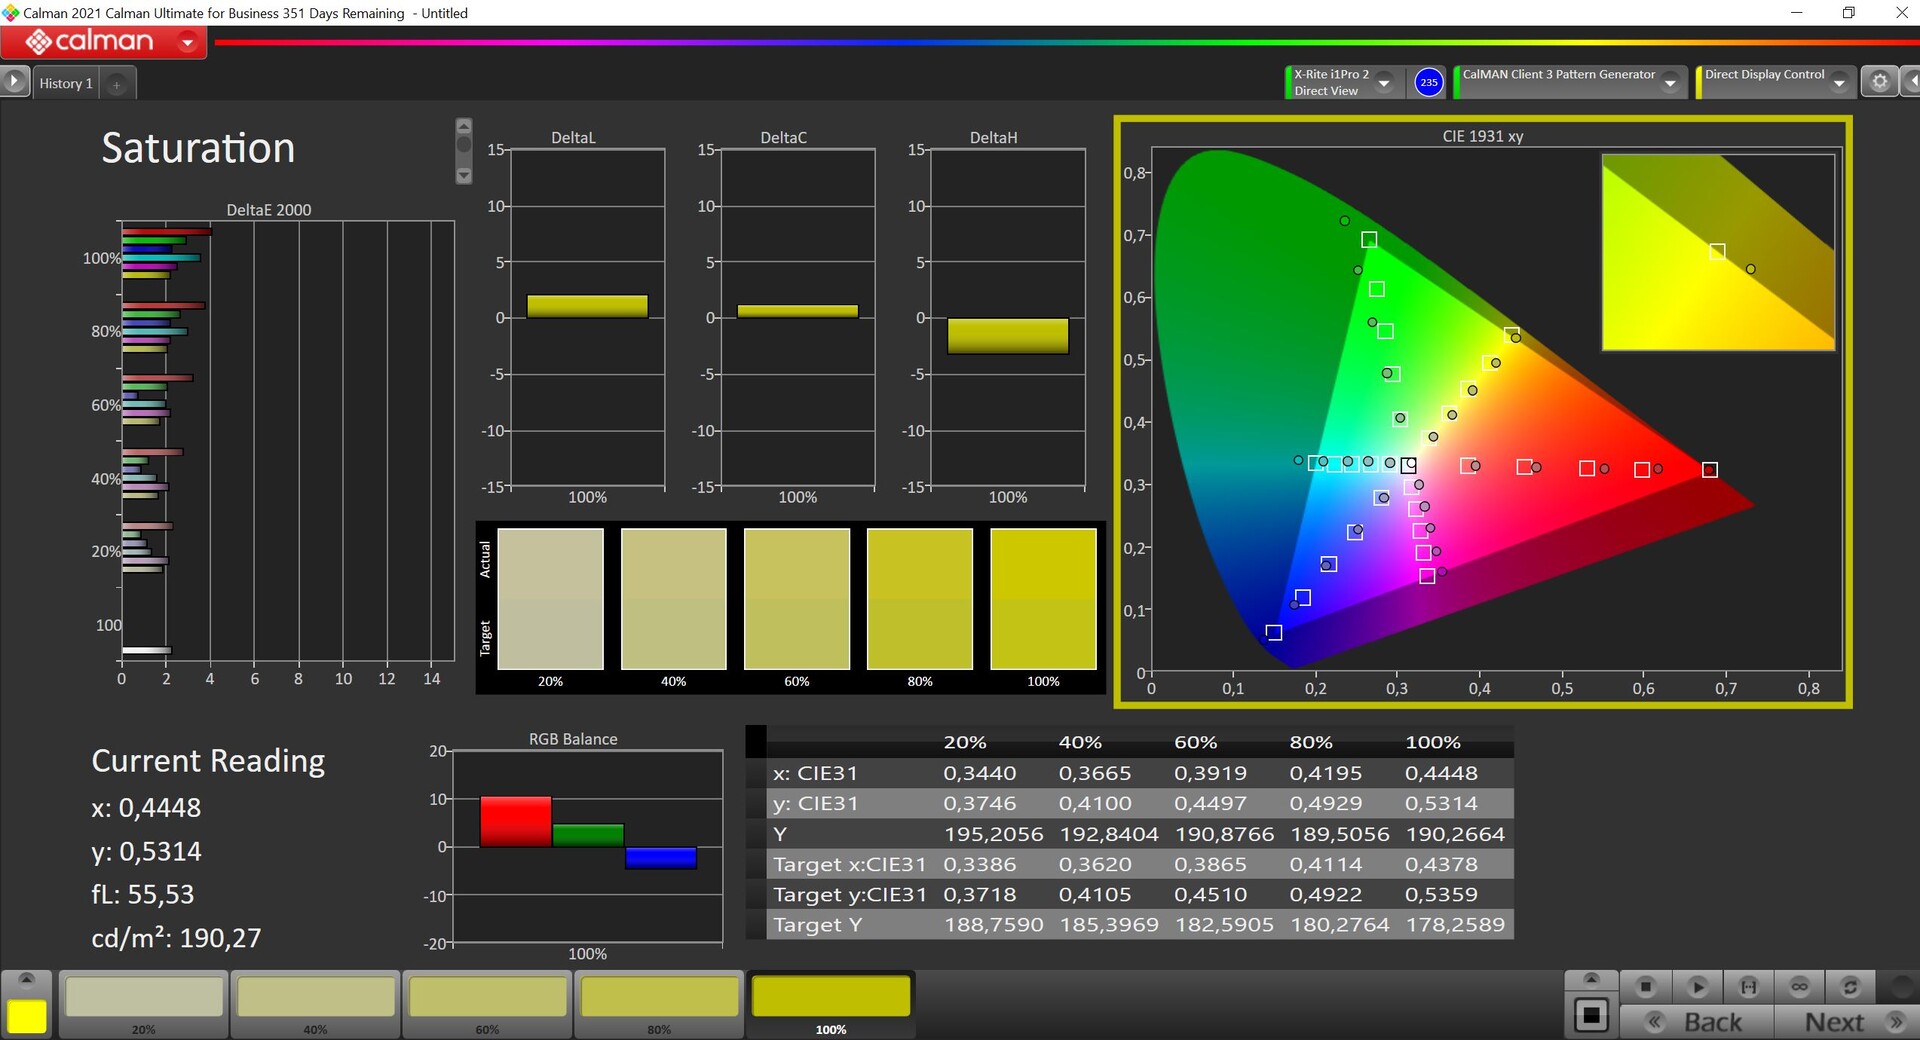
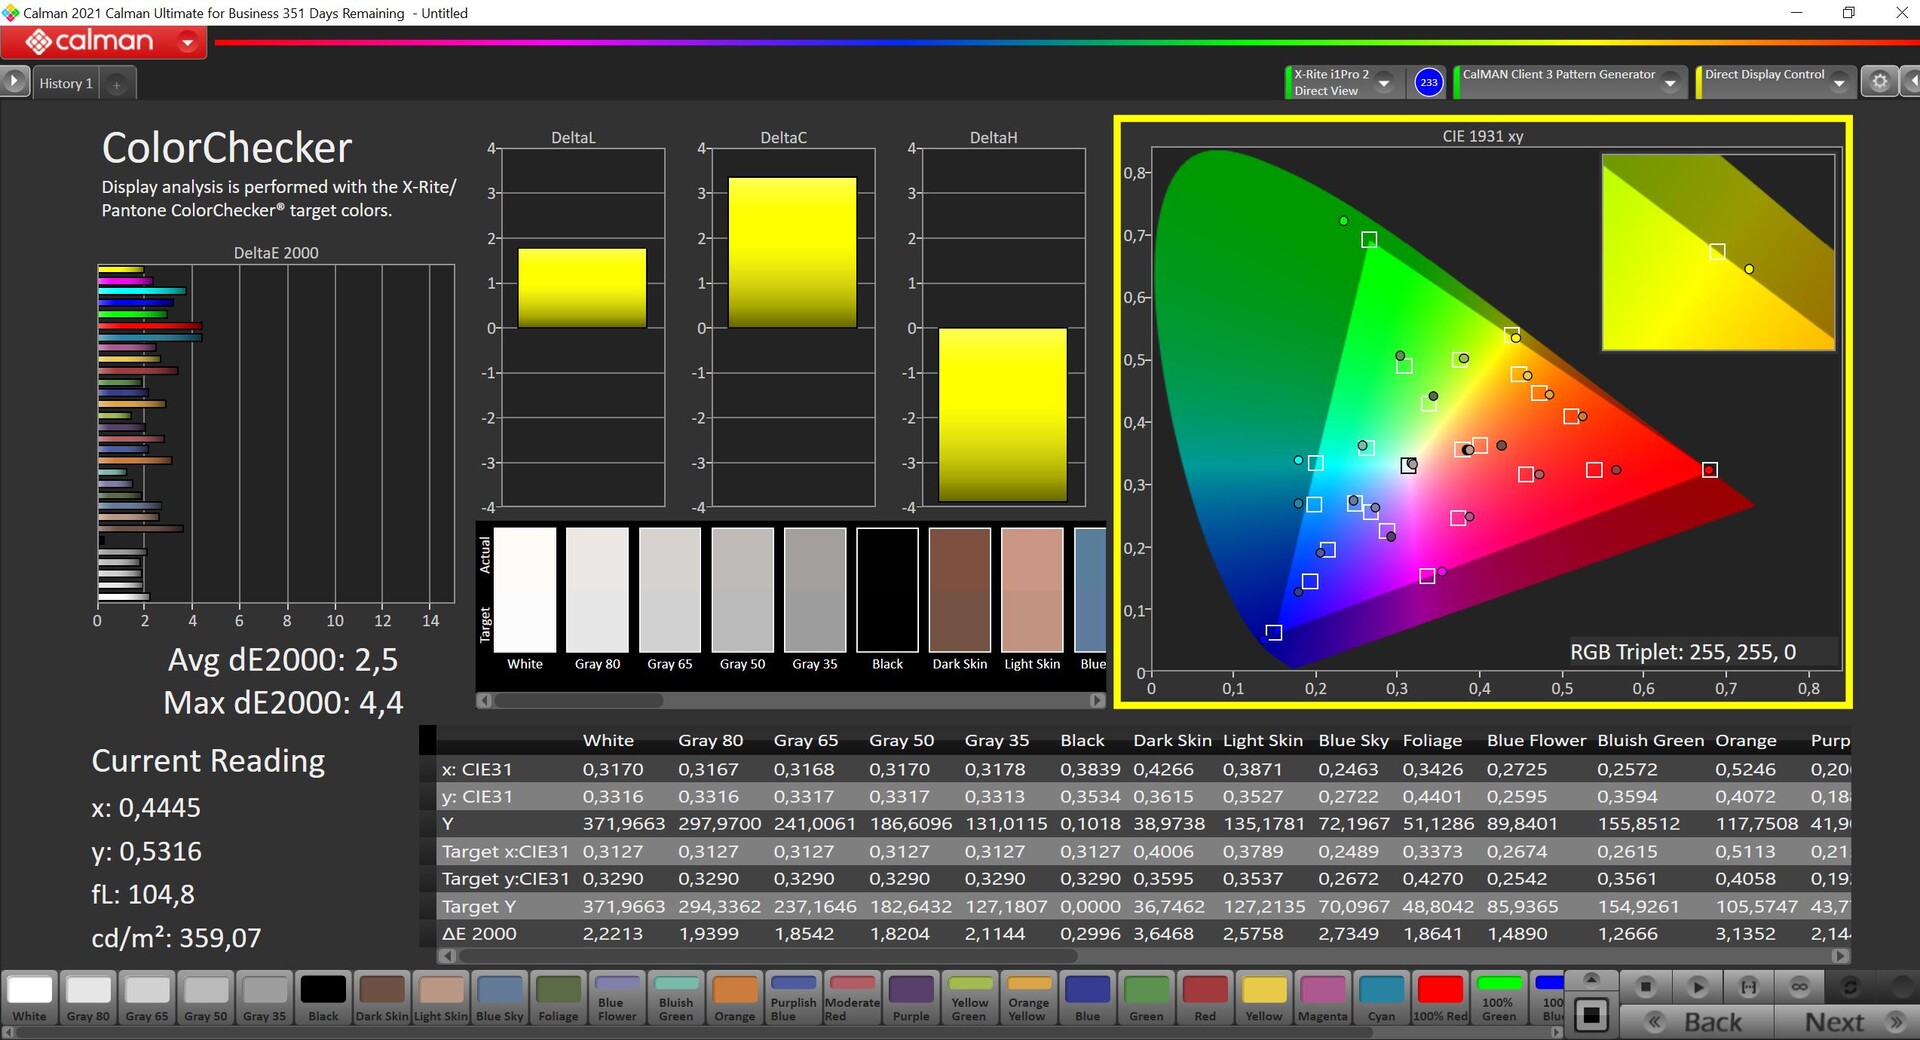
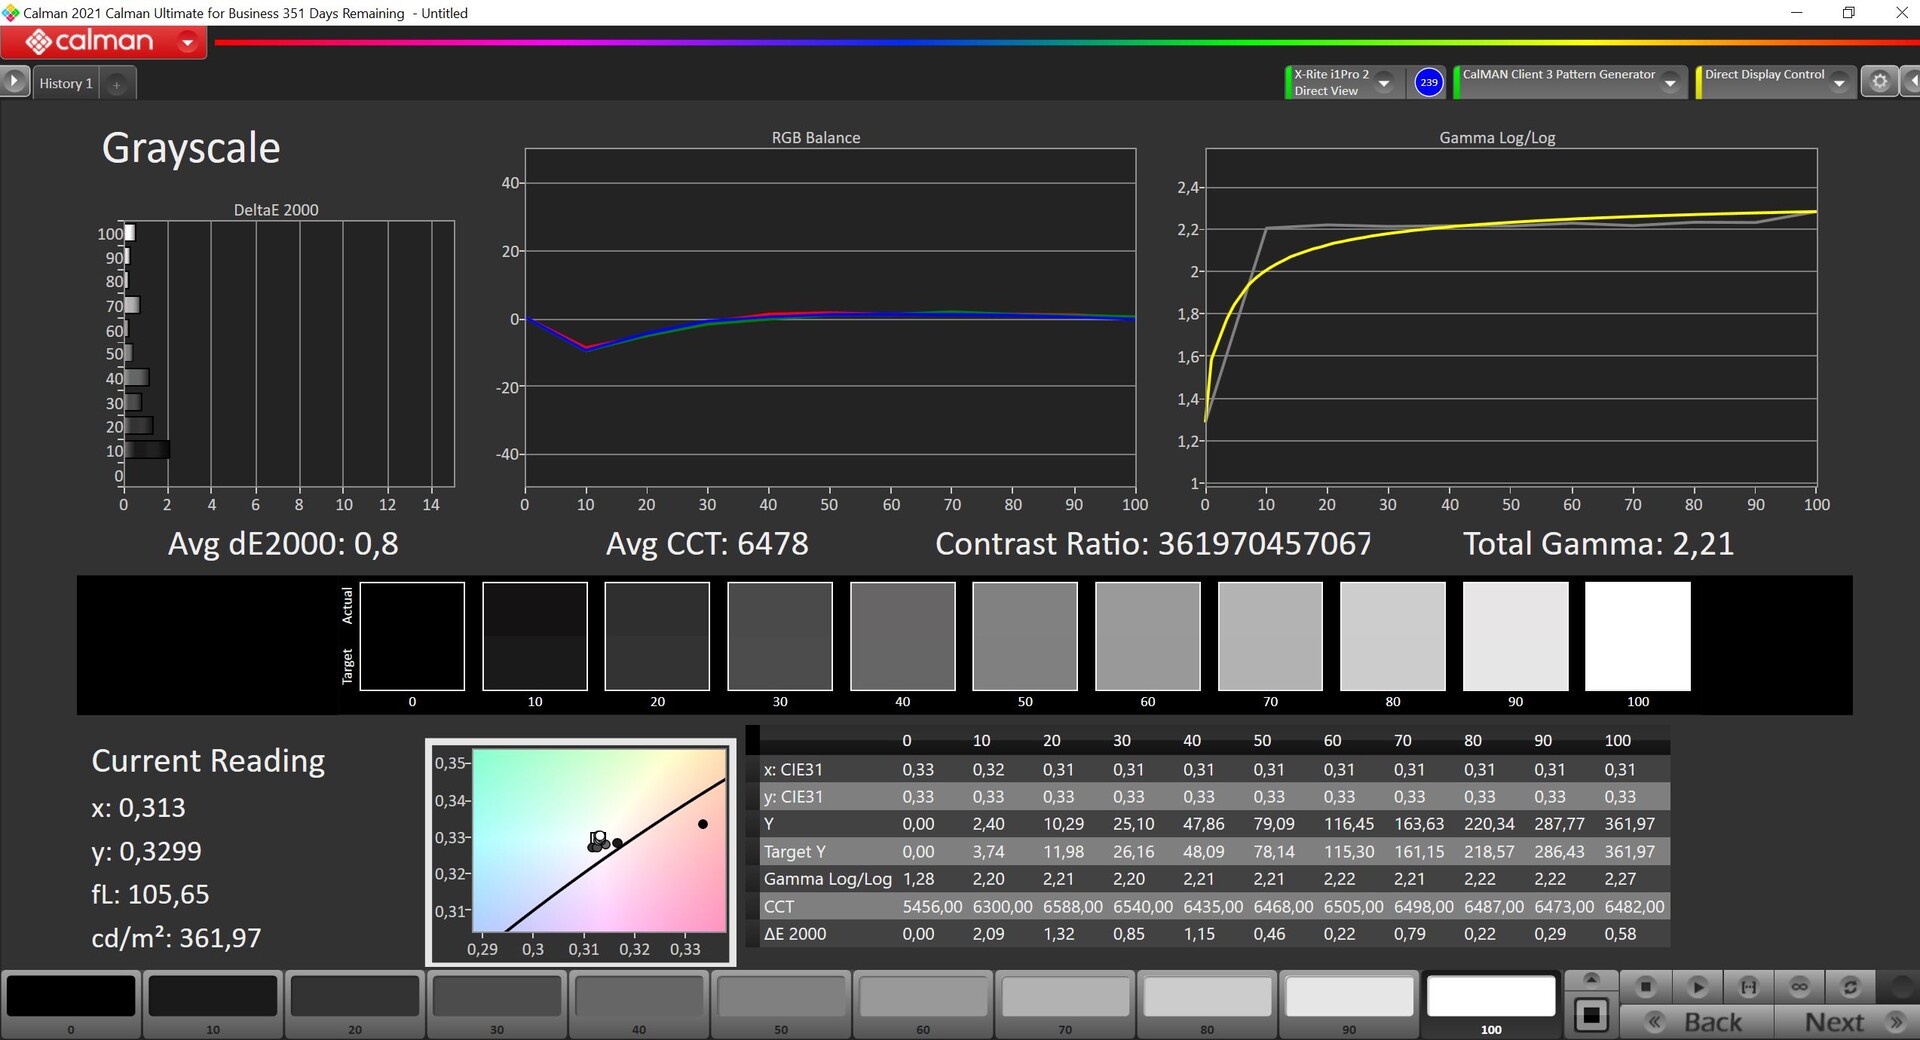
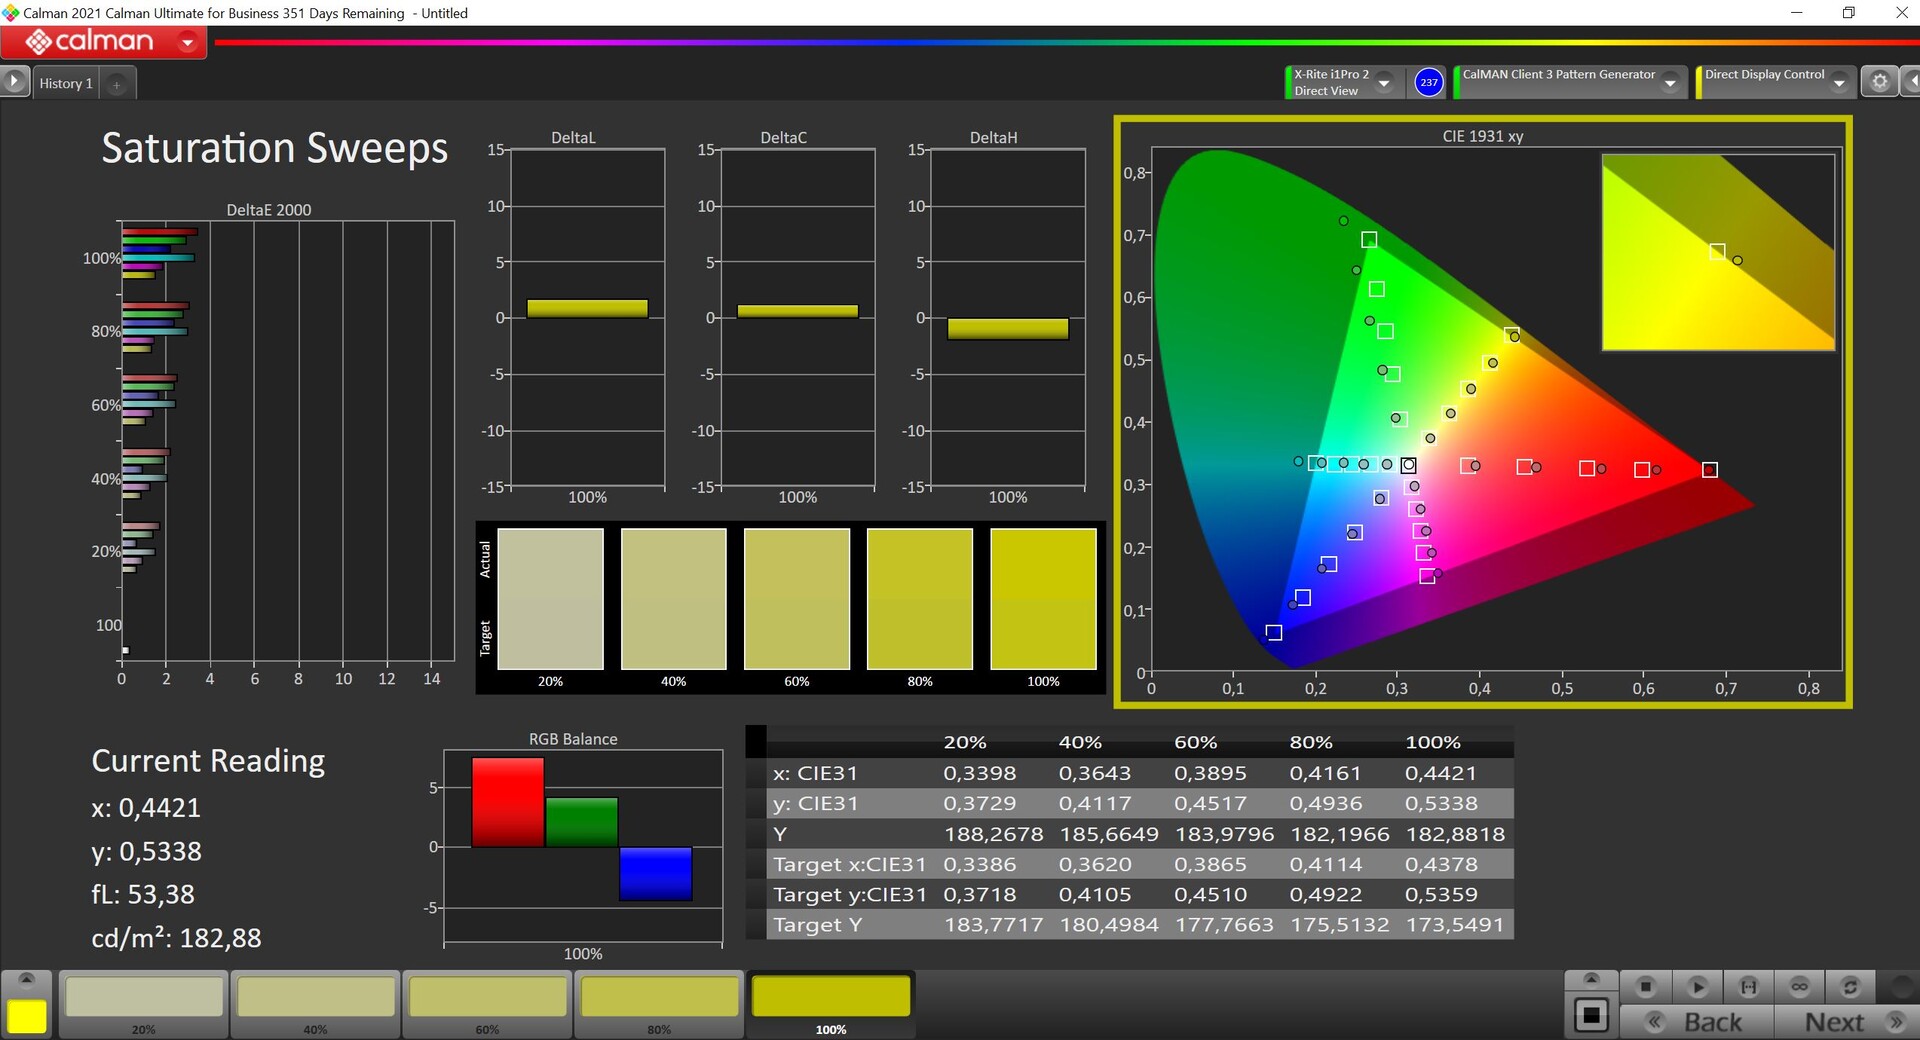
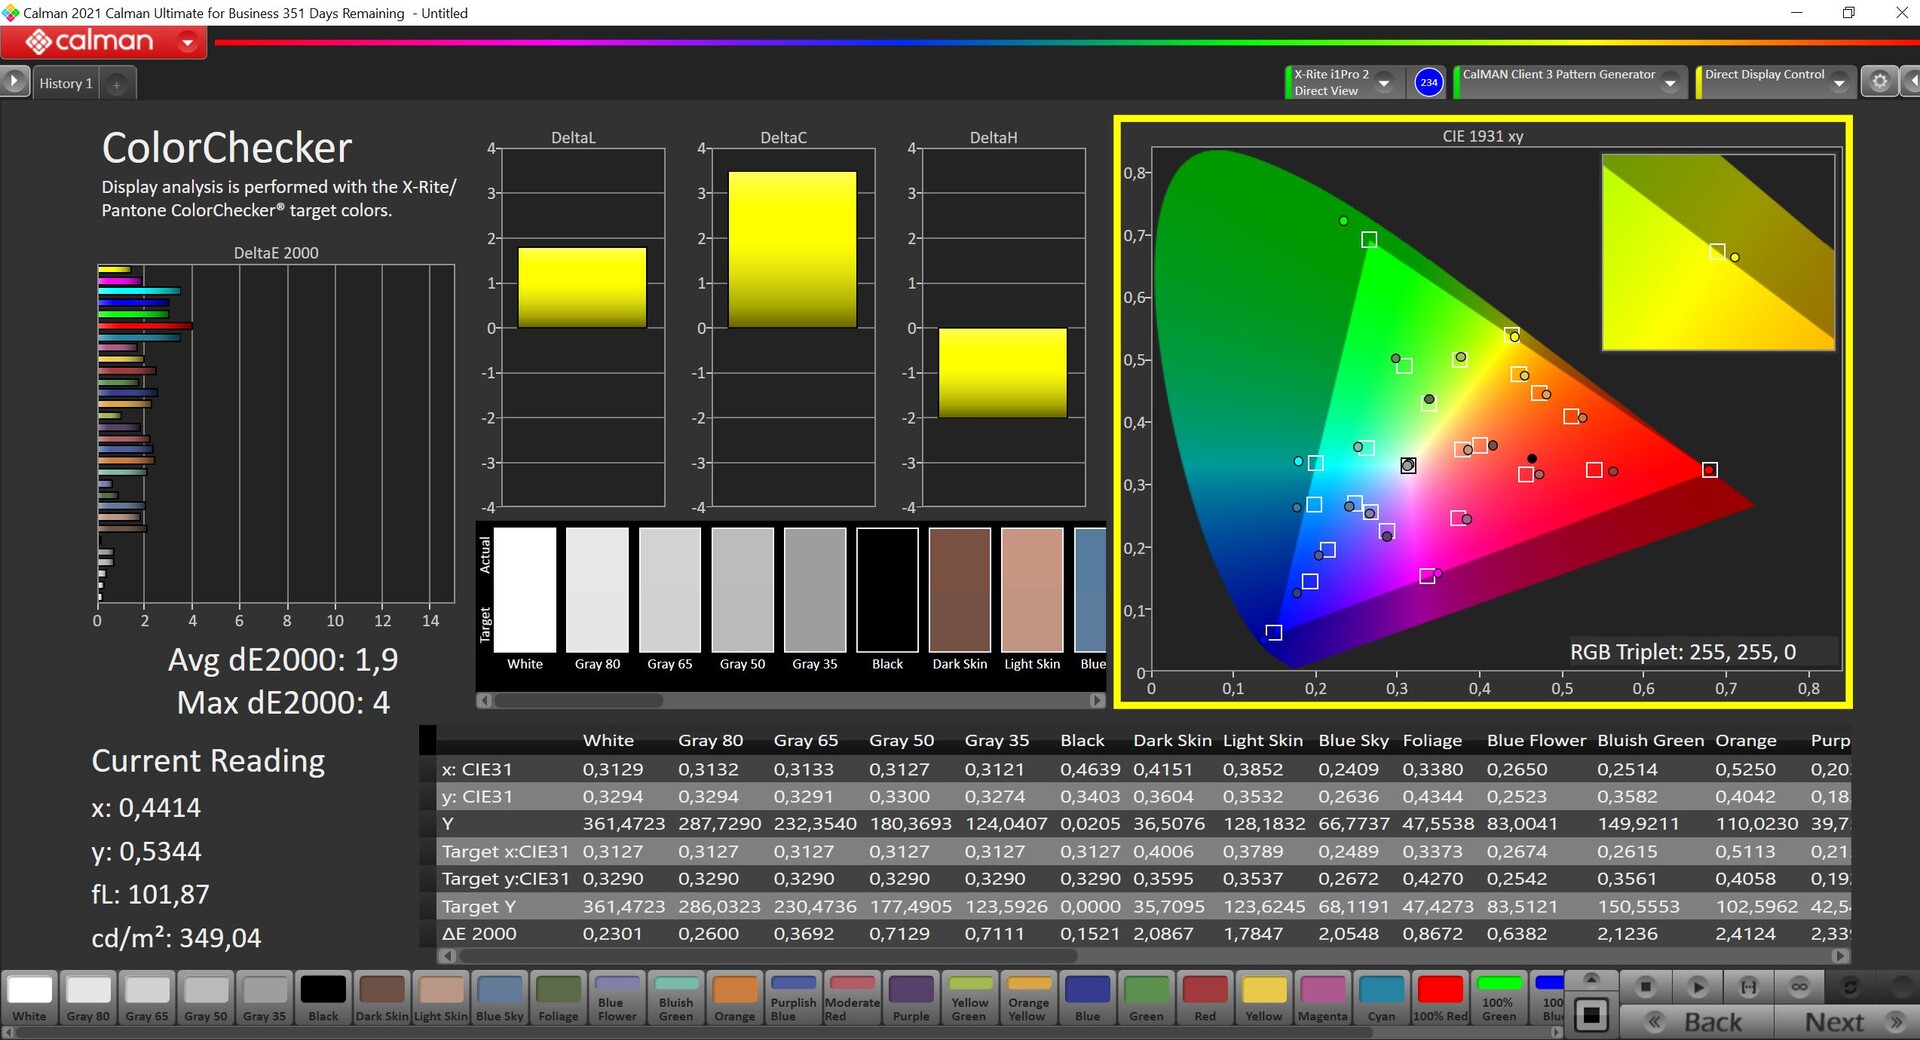
Nasza analiza przy użyciu profesjonalnego oprogramowania CalMAN (X-Rite i1 Pro 2) wykazała, że dostarczony ekran OLED jest już prawidłowo skalibrowany. Widoczne jest minimalne oddanie barw w prawdziwej czerwieni w połączeniu z temperaturą barwową, która jest nieco zbyt ciepła. Byliśmy w stanie jeszcze bardziej poprawić wyświetlacz za pomocą naszej własnej kalibracji (profil jest dostępny do pobrania powyżej) i większość kolorów jest poniżej ważnej granicy 3. Przestrzeń kolorów P3 jest w pełni pokryta
Wyświetl czasy reakcji
| ↔ Czas reakcji od czerni do bieli | ||
|---|---|---|
| 1.6 ms ... wzrost ↗ i spadek ↘ łącznie | ↗ 0.8 ms wzrost | 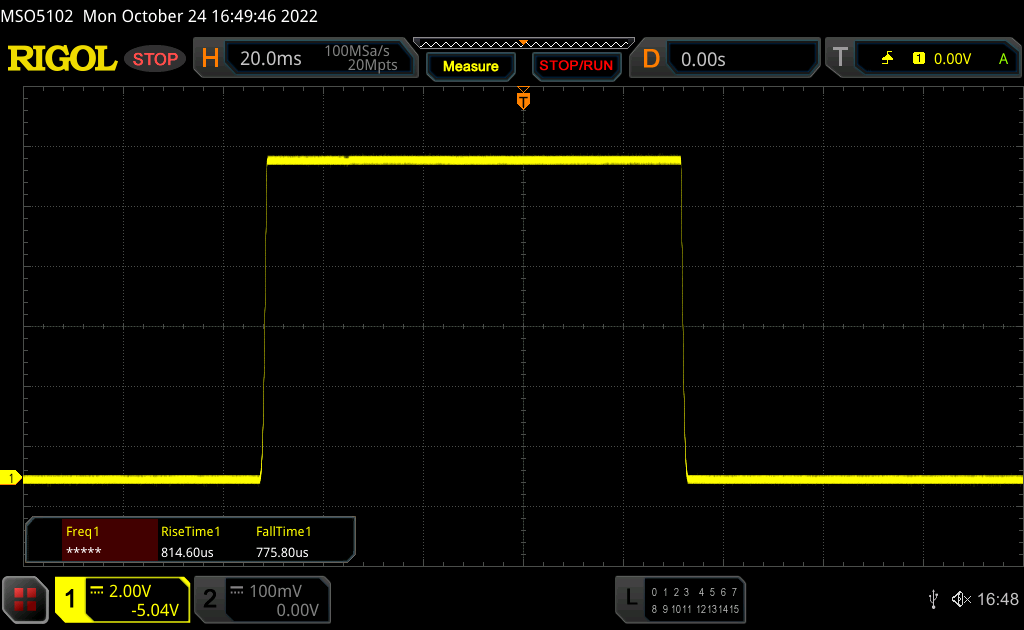 |
| ↘ 0.8 ms upadek | ||
| W naszych testach ekran wykazuje bardzo szybką reakcję i powinien bardzo dobrze nadawać się do szybkich gier. Dla porównania, wszystkie testowane urządzenia wahają się od 0.1 (minimum) do 240 (maksimum) ms. » 10 % wszystkich urządzeń jest lepszych. Oznacza to, że zmierzony czas reakcji jest lepszy od średniej wszystkich testowanych urządzeń (19.8 ms). | ||
| ↔ Czas reakcji 50% szarości do 80% szarości | ||
| 1.9 ms ... wzrost ↗ i spadek ↘ łącznie | ↗ 1 ms wzrost | 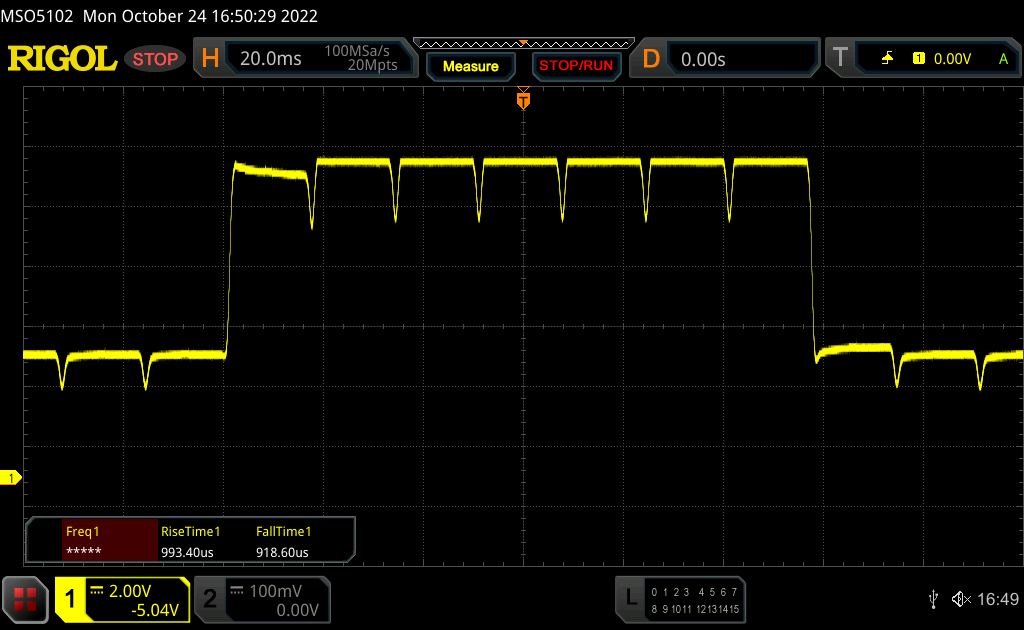 |
| ↘ 0.9 ms upadek | ||
| W naszych testach ekran wykazuje bardzo szybką reakcję i powinien bardzo dobrze nadawać się do szybkich gier. Dla porównania, wszystkie testowane urządzenia wahają się od 0.165 (minimum) do 636 (maksimum) ms. » 9 % wszystkich urządzeń jest lepszych. Oznacza to, że zmierzony czas reakcji jest lepszy od średniej wszystkich testowanych urządzeń (31 ms). | ||
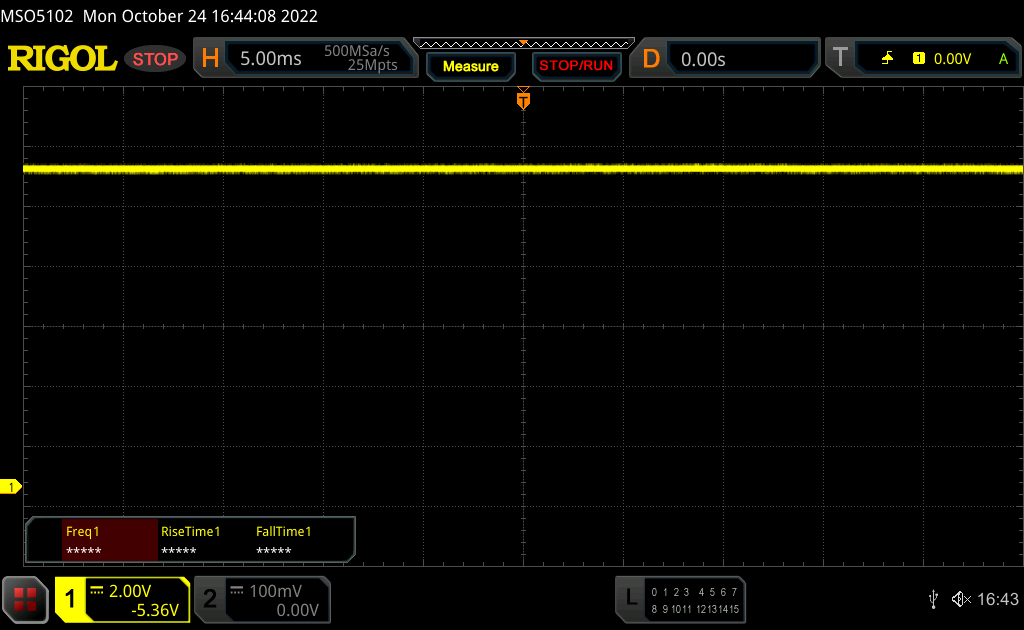
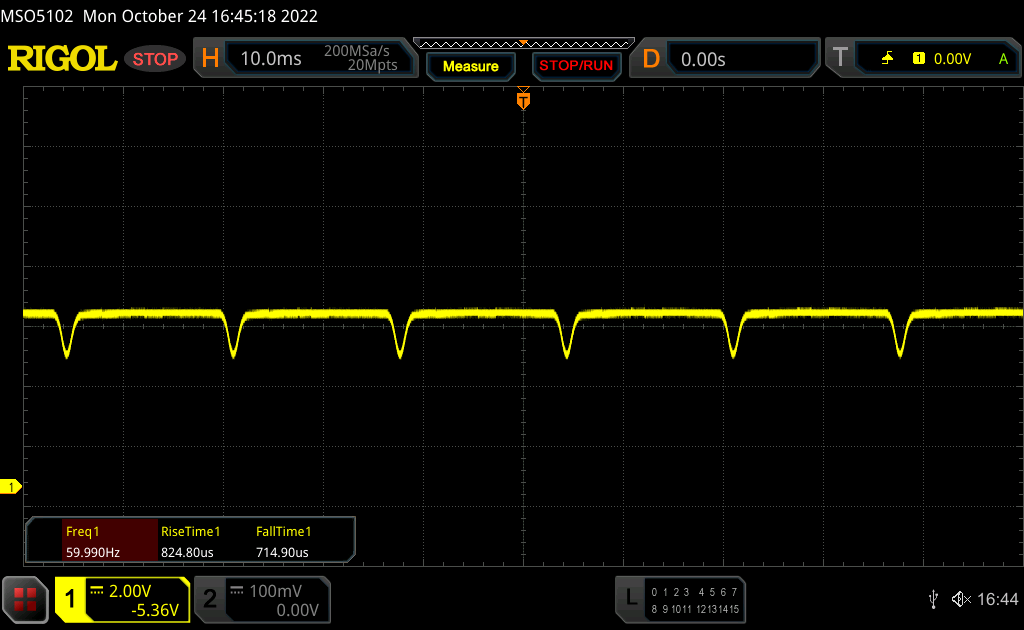
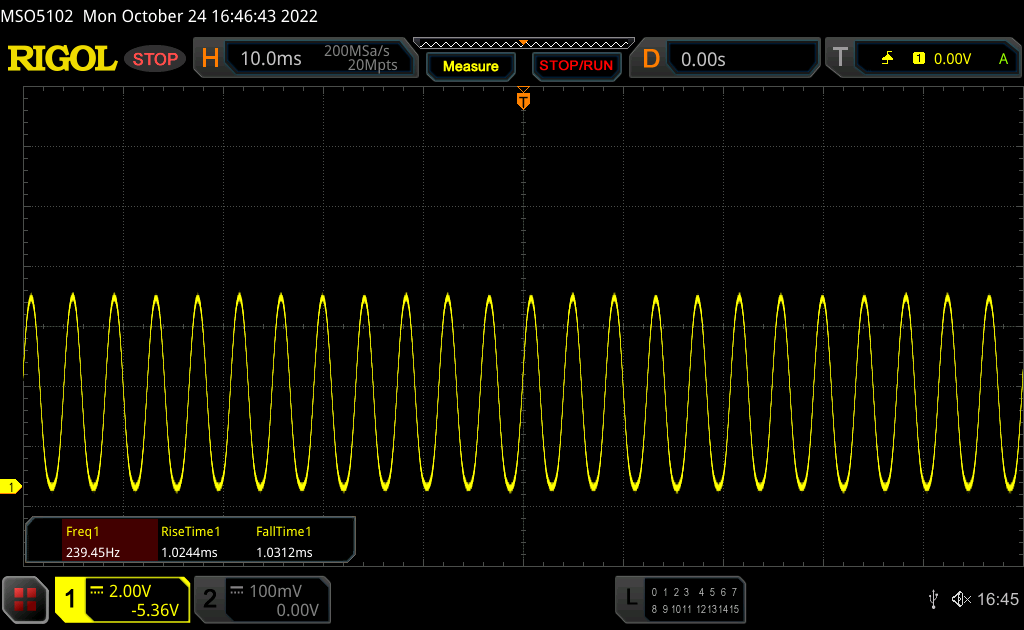
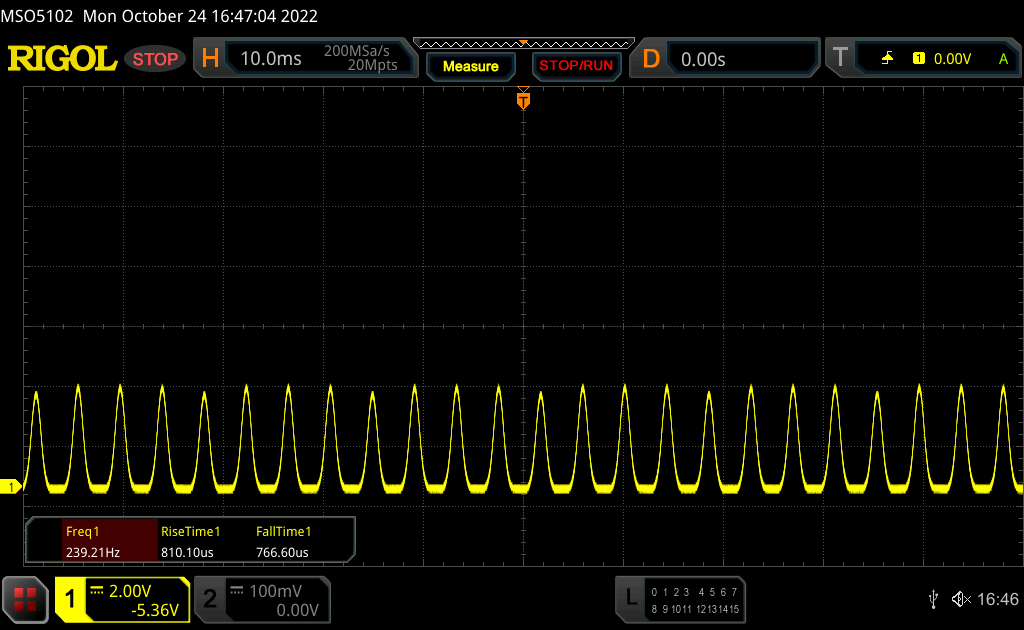
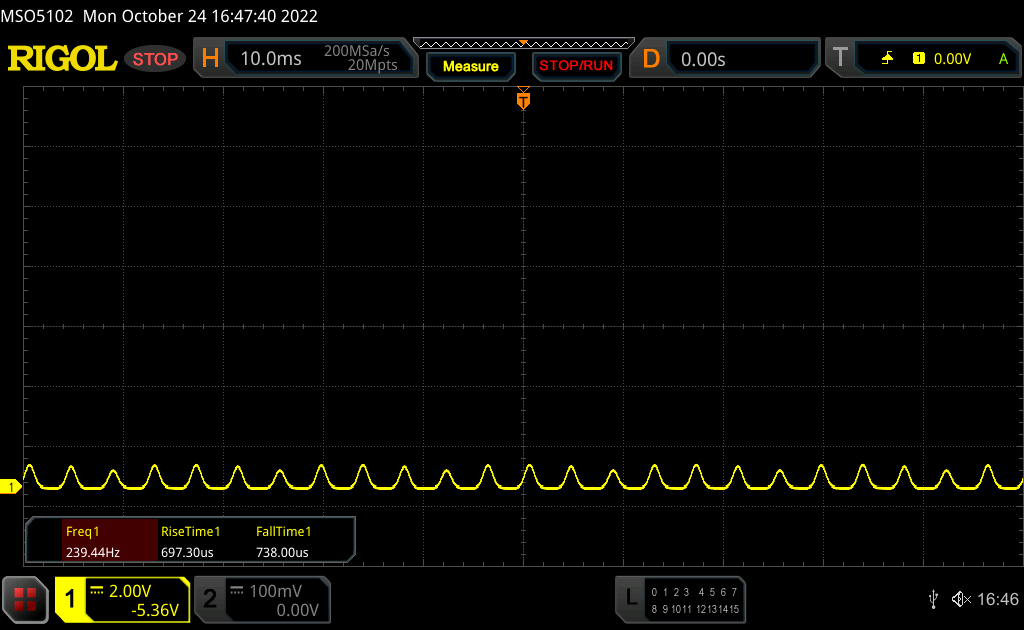
Migotanie ekranu / PWM (modulacja szerokości impulsu)
| Wykryto migotanie ekranu/wykryto PWM | 240 Hz | ≤ 50 % ustawienia jasności | 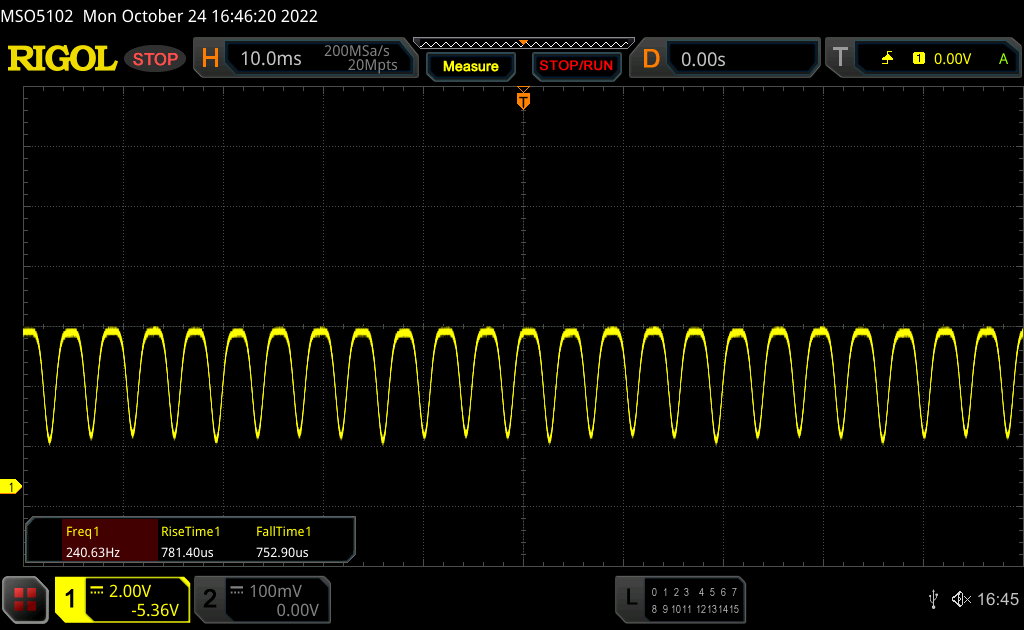 |
| ≤ 86 jasność cd/m² | |||
Podświetlenie wyświetlacza miga z częstotliwością 240 Hz (najgorszy przypadek, np. przy użyciu PWM) Wykryto migotanie przy ustawieniu jasności 50 % (86 cd/m²) i poniżej. Powyżej tego ustawienia jasności nie powinno być żadnego migotania ani PWM. Częstotliwość 240 Hz jest stosunkowo niska, więc wrażliwi użytkownicy prawdopodobnie zauważą migotanie i odczują zmęczenie oczu przy podanym ustawieniu jasności i poniżej. Migotanie występuje przy stosunkowo niskich ustawieniach jasności, dlatego długotrwałe użytkowanie przy tym ustawieniu jasności lub niższym może powodować zmęczenie oczu. Dla porównania: 52 % wszystkich testowanych urządzeń nie używa PWM do przyciemniania wyświetlacza. Jeśli wykryto PWM, zmierzono średnio 7754 (minimum: 5 - maksimum: 343500) Hz. | |||
W zakresie 51-90% jasności wdrażane jest ściemnianie DC z częstotliwością 60 Hz, ale ponieważ amplituda jest tu bardzo niska, nie powinno być z tym problemu. Począwszy od jasności 50% (~86 cd/m²) i mniej możemy wykryć dobrze znane migotanie PWM o częstotliwości 240 Hz. Lenovo nie oferuje rozwiązania programowego, takiego jak w Asusie Zenbook S 13, umożliwiającego przyciemnianie DC nawet przy niższych poziomach jasności.

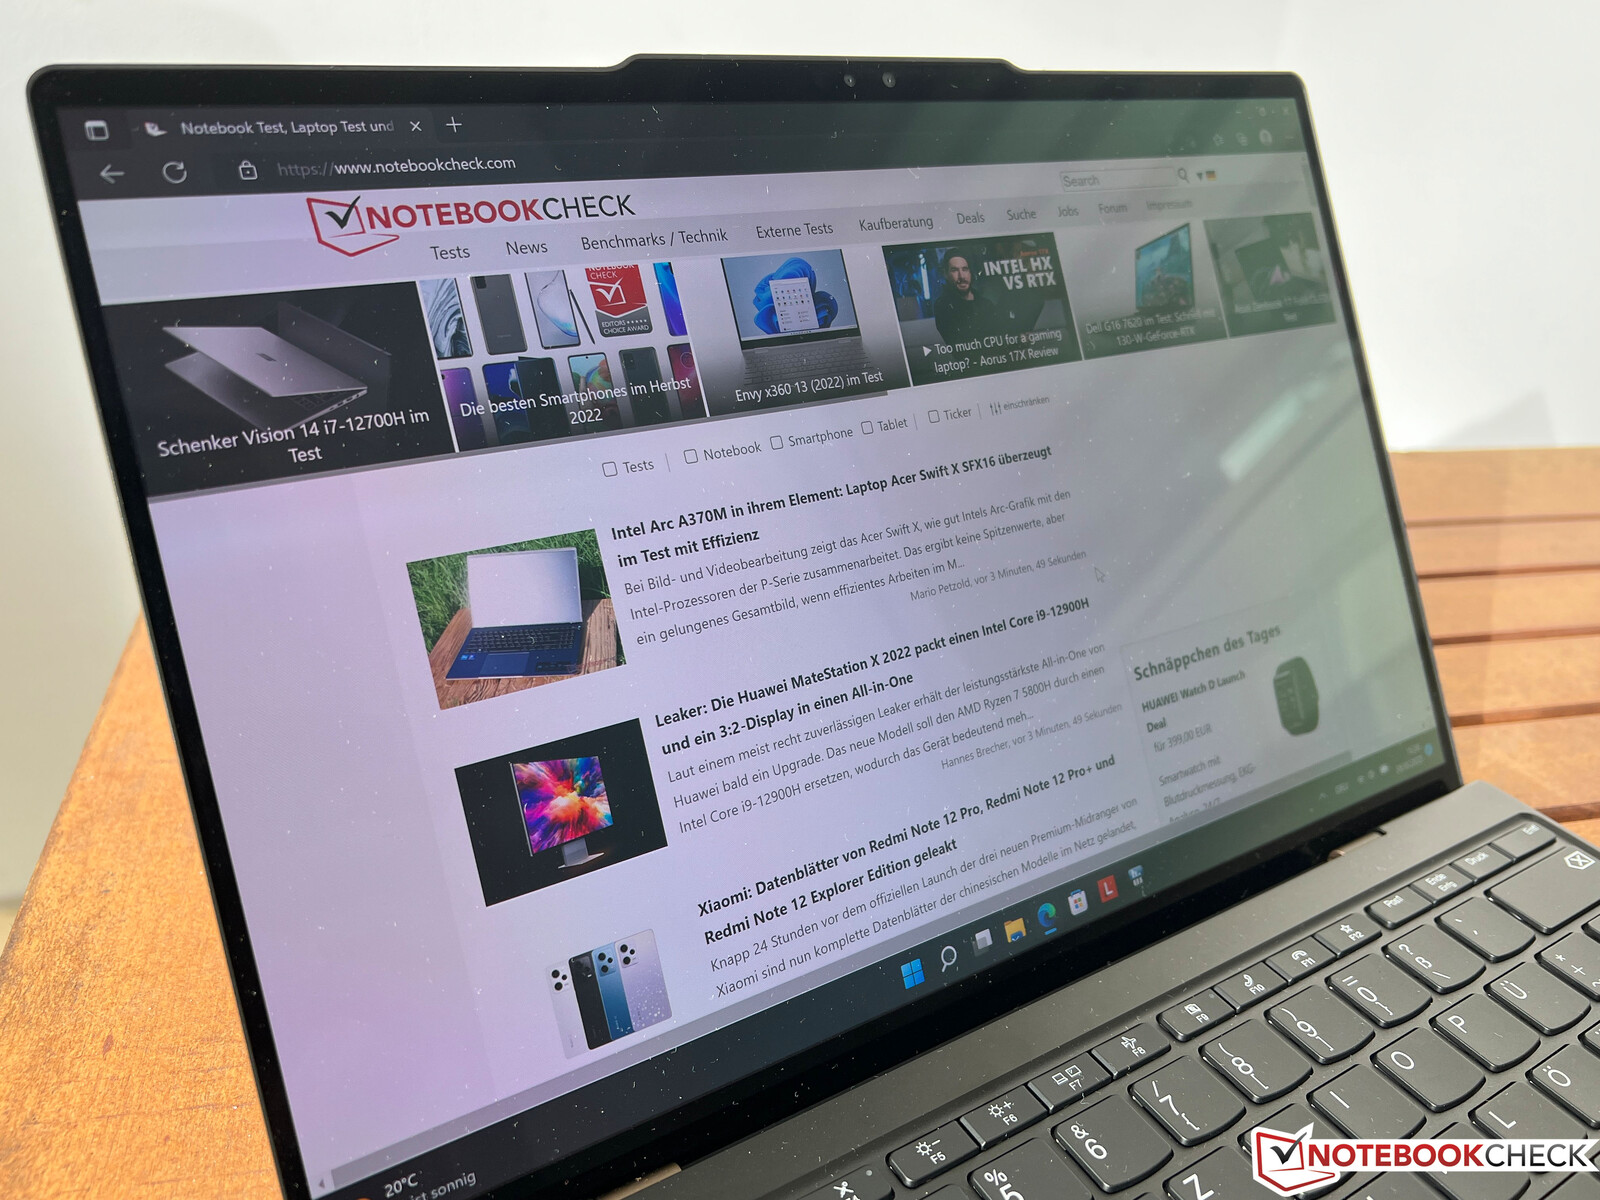
Odbicia są oczywiście problemem na odblaskowym wyświetlaczu, gdy się pojawią, ale o ile można ich uniknąć, zawartość ekranu może być prawidłowo odczytywana na zewnątrz dzięki niezwykle wysokiemu współczynnikowi kontrastu nawet w jasne dni.
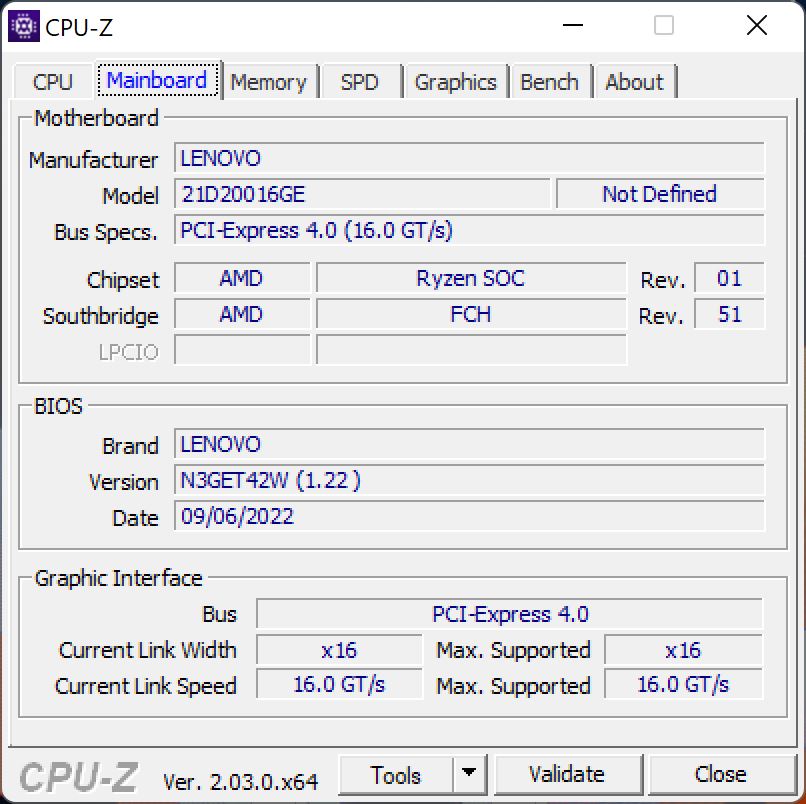
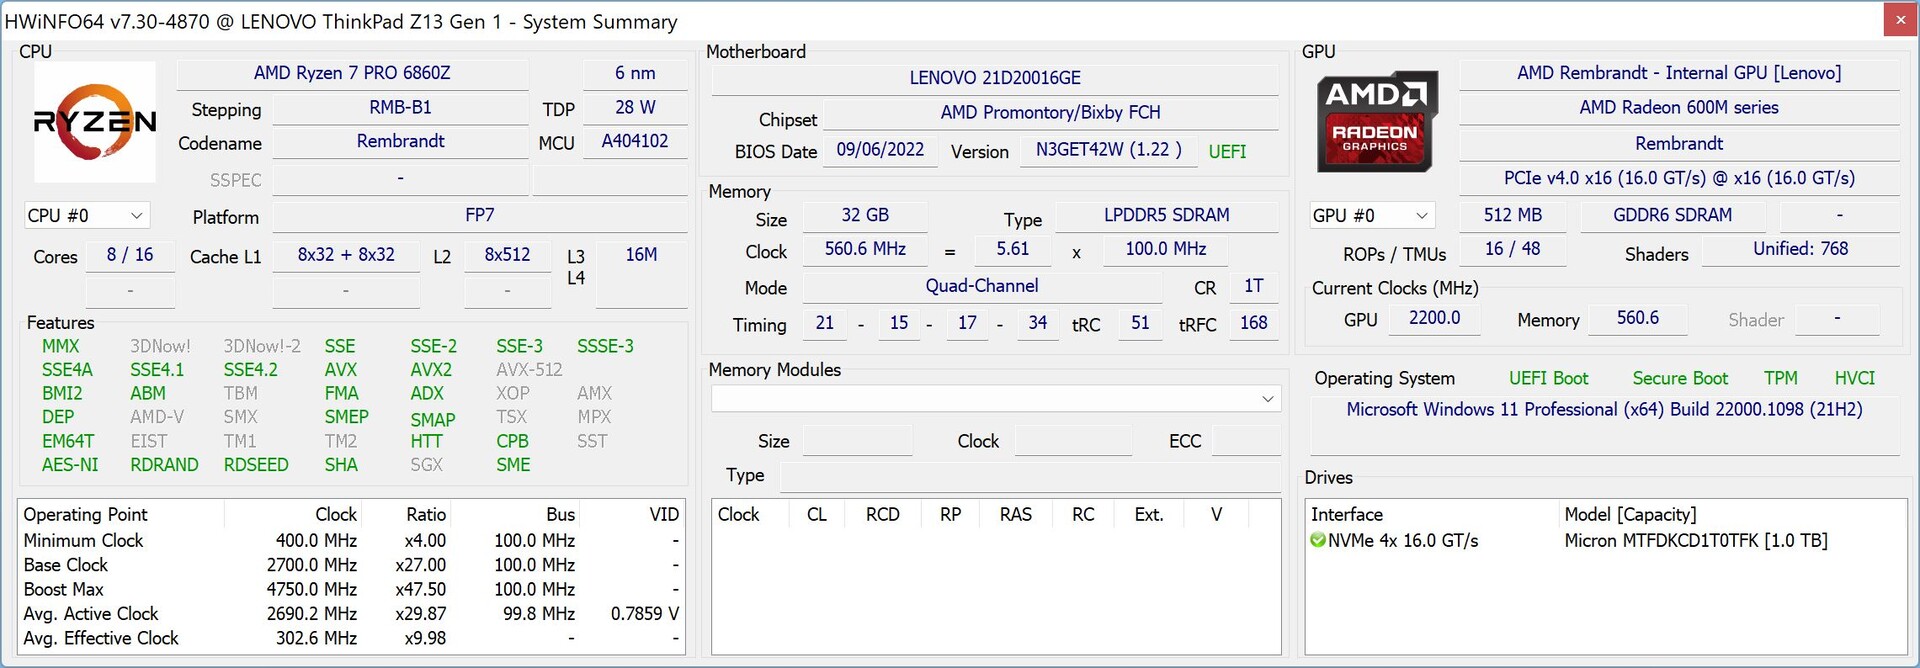
Wydajność - AMD Ryzen 7 Pro 6860Z
Warunki badania
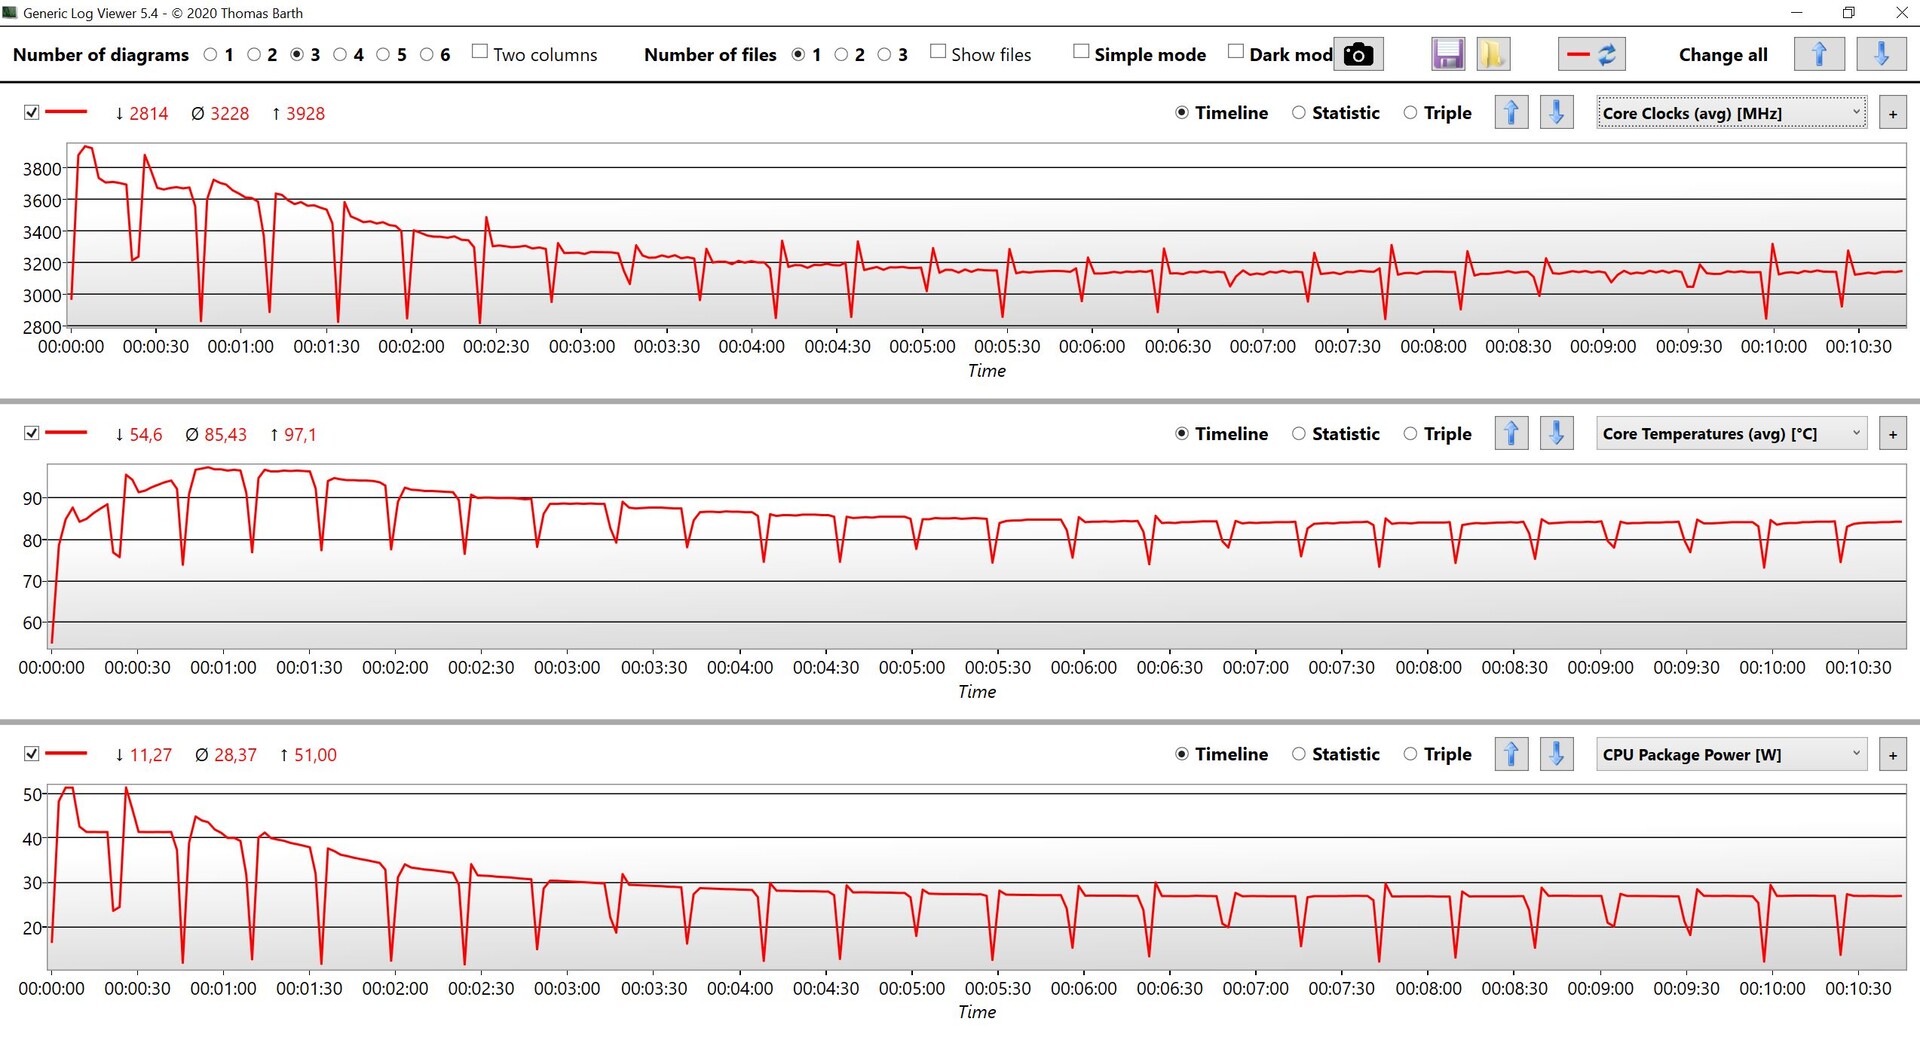
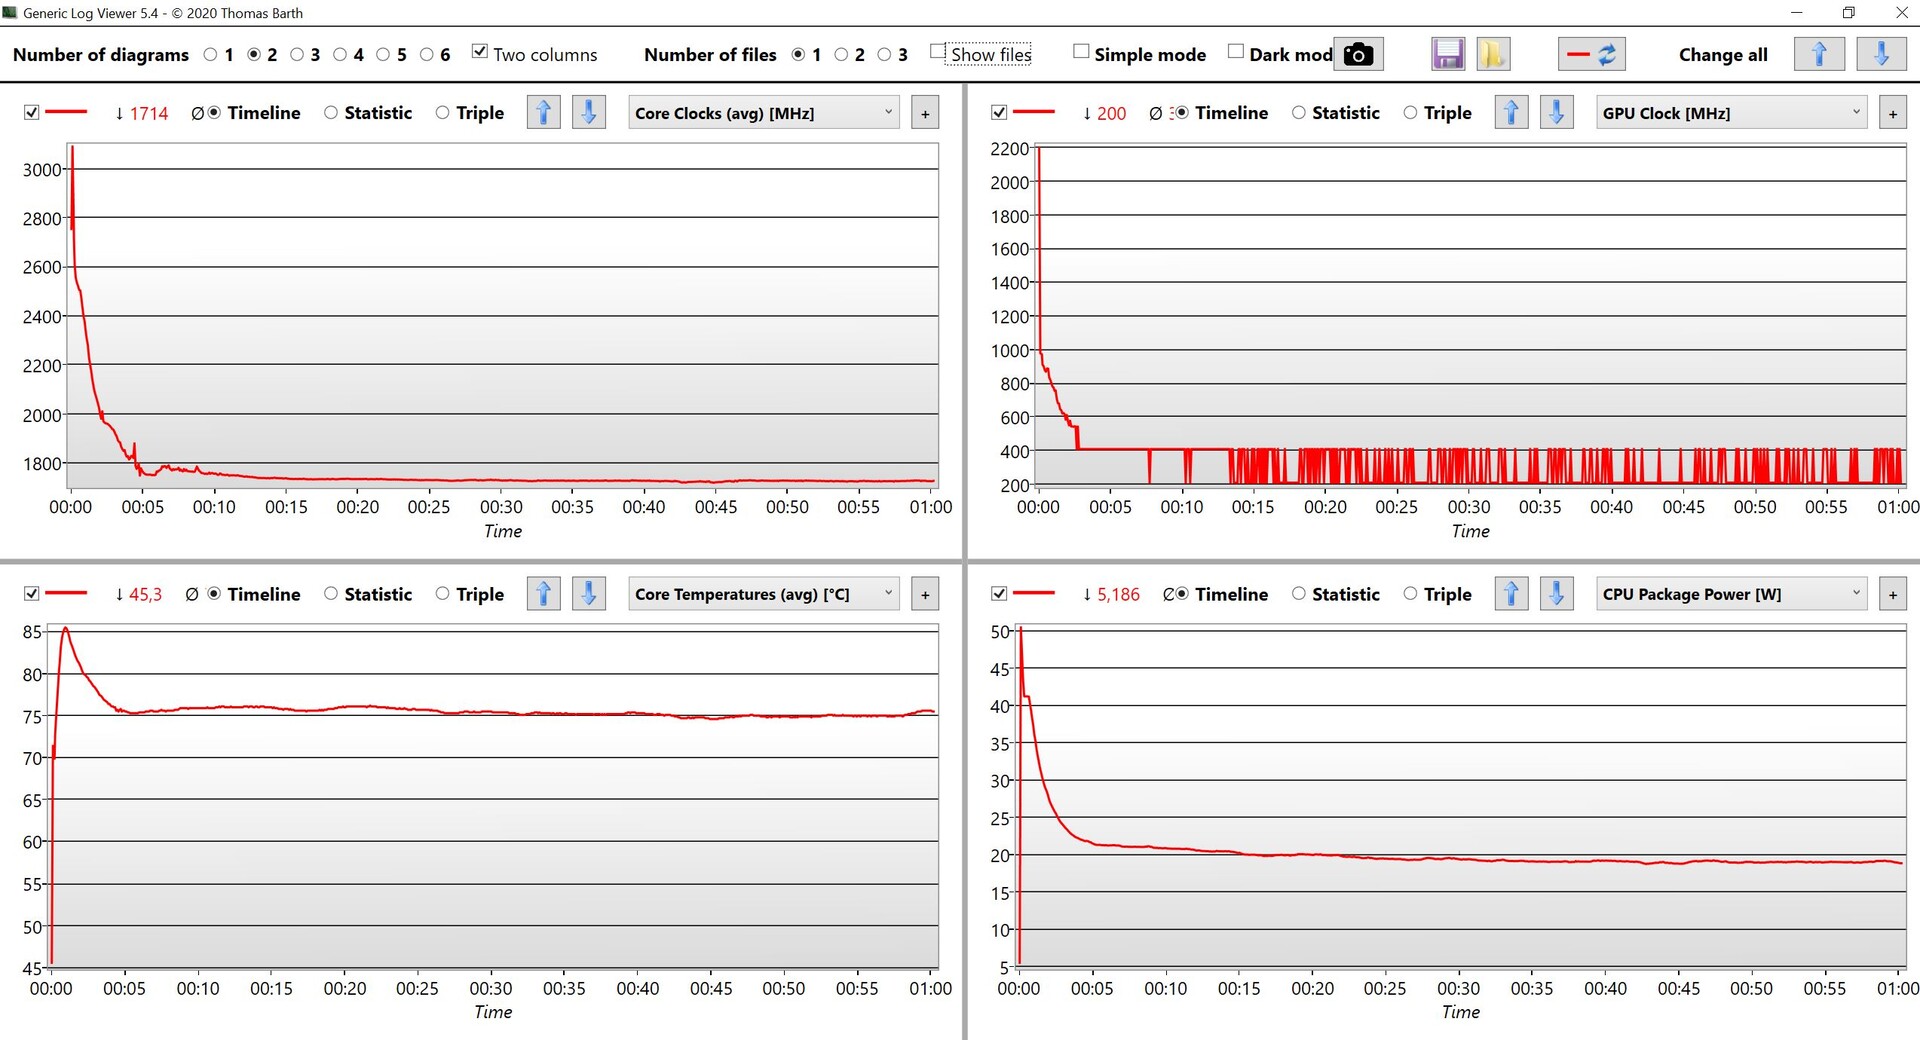
Oprócz normalnych ustawień wydajności systemu Windows ThinkPad AMD oferuje inteligentne chłodzenie, które można wyłączyć za pomocą kombinacji klawiszy Fn+T. W naszych testach z Ryzenem 7 Pro uzyskaliśmy nieco lepsze wyniki, gdy funkcja ta była aktywna. Zasadniczo procesorowi przez krótki czas przydzielane jest 51 W, a następnie osiada on do 27 W.
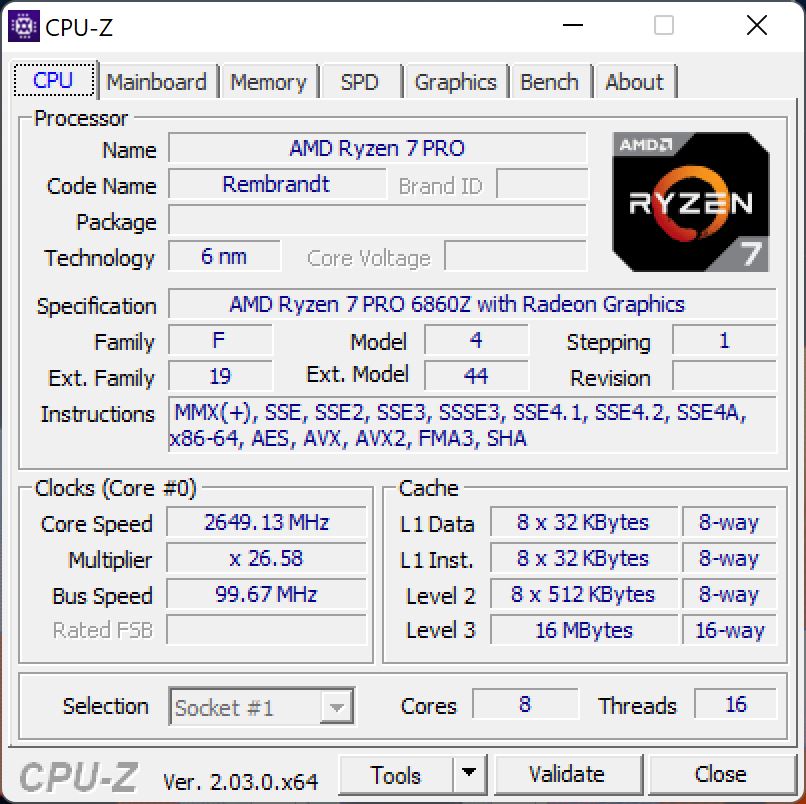
Procesor
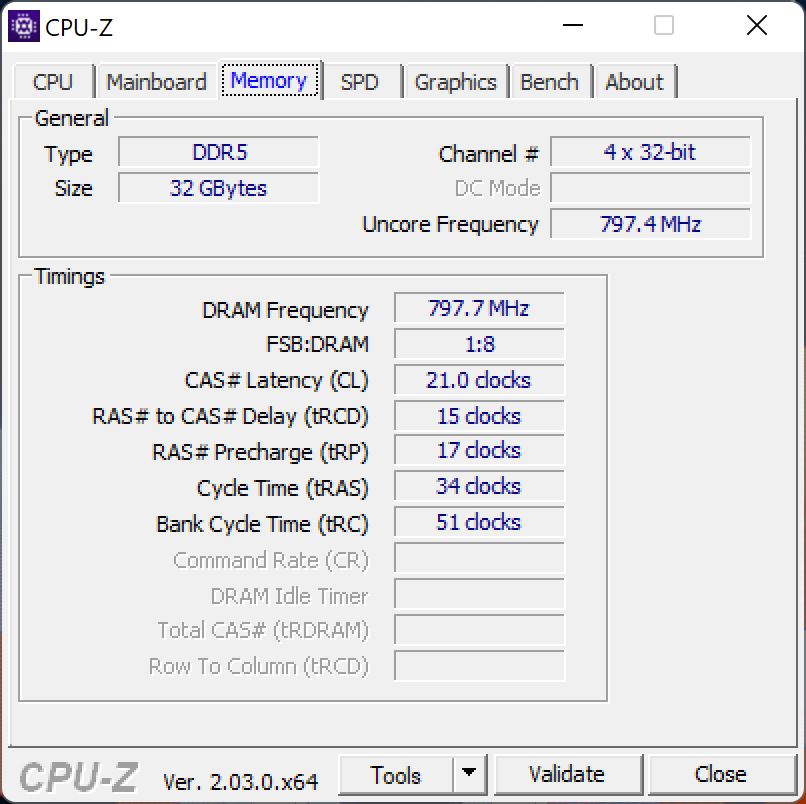
Lenovo wyposaża najwyższy model ThinkPada Z13 w procesor AMD Ryzen 7 Pro 6860Z, który jest ekskluzywny dla tego modelu. Dostępnych jest bardzo mało dokumentacji na temat regulacji dla tego układu i nawet po naszym teście nie jesteśmy zbytnio mądrzejsi. W zasadzie jest to standardowy Ryzen 7 Pro 6850U (który jest też dostępny dla modelu Z13), tylko maksymalne taktowanie boost jest ustawione o 50 MHz wyżej i wynosi 4,75 GHz. Oba modele Ryzen 7 Pro mogą być skonfigurowane z maksymalnie 32 GB pamięci RAM.
Wydajność procesora jest bardzo dobra, szczególnie w pierwszych minutach, gdyż pobór mocy nie spada od razu. Pod stałym obciążeniem Ryzen 7 Pro 6860Z dorównuje jednak Ryzenowi 7 Pro 6850U, a także konsumenckiemu Ryzenowi 7 6800U, o ile pracują one przy tym samym/podobnym TDP (na ogół 25 W). Ryzen 5 Pro 6650U w ThinkPadzie Z13 jest średnio o 19% wolniejszy we wszystkich naszych benchmarkach CPU.
Cinebench R15 score
Na zasilaniu bateryjnym wydajność wielordzeniowa jest o około 30% niższa, ale wydajność jednordzeniowa pozostaje stabilna. Więcej benchmarków CPU jest dostępnych w naszym dziale technicznym.
Cinebench R23: Multi Core | Single Core
Cinebench R20: CPU (Multi Core) | CPU (Single Core)
Cinebench R15: CPU Multi 64Bit | CPU Single 64Bit
Blender: v2.79 BMW27 CPU
7-Zip 18.03: 7z b 4 | 7z b 4 -mmt1
Geekbench 5.5: Multi-Core | Single-Core
HWBOT x265 Benchmark v2.2: 4k Preset
LibreOffice : 20 Documents To PDF
R Benchmark 2.5: Overall mean
| CPU Performance rating | |
| Średnia w klasie Subnotebook | |
| Lenovo ThinkPad Z16 G1 21D5S00T00 | |
| Dell XPS 13 Plus 9320 i7-1280P OLED | |
| Lenovo ThinkPad Z13 G1-21D20016GE | |
| Przeciętny AMD Ryzen 7 PRO 6860Z | |
| Lenovo ThinkPad T14 G3-21CF004NGE | |
| Asus Zenbook S 13 OLED | |
| Apple MacBook Air M2 10C GPU -5! | |
| Lenovo ThinkPad Z13 21D2CTO1WW | |
| Cinebench R23 / Multi Core | |
| Średnia w klasie Subnotebook (1555 - 21812, n=59, ostatnie 2 lata) | |
| Lenovo ThinkPad Z16 G1 21D5S00T00 | |
| Dell XPS 13 Plus 9320 i7-1280P OLED | |
| Lenovo ThinkPad Z13 G1-21D20016GE | |
| Przeciętny AMD Ryzen 7 PRO 6860Z (n=1) | |
| Asus Zenbook S 13 OLED | |
| Lenovo ThinkPad T14 G3-21CF004NGE | |
| Lenovo ThinkPad Z13 21D2CTO1WW | |
| Apple MacBook Air M2 10C GPU | |
| Cinebench R23 / Single Core | |
| Średnia w klasie Subnotebook (358 - 2213, n=60, ostatnie 2 lata) | |
| Dell XPS 13 Plus 9320 i7-1280P OLED | |
| Apple MacBook Air M2 10C GPU | |
| Lenovo ThinkPad T14 G3-21CF004NGE | |
| Lenovo ThinkPad Z16 G1 21D5S00T00 | |
| Asus Zenbook S 13 OLED | |
| Lenovo ThinkPad Z13 G1-21D20016GE | |
| Przeciętny AMD Ryzen 7 PRO 6860Z (n=1) | |
| Lenovo ThinkPad Z13 21D2CTO1WW | |
| Cinebench R20 / CPU (Multi Core) | |
| Lenovo ThinkPad Z16 G1 21D5S00T00 | |
| Średnia w klasie Subnotebook (579 - 8541, n=56, ostatnie 2 lata) | |
| Dell XPS 13 Plus 9320 i7-1280P OLED | |
| Lenovo ThinkPad Z13 G1-21D20016GE | |
| Przeciętny AMD Ryzen 7 PRO 6860Z (n=1) | |
| Lenovo ThinkPad T14 G3-21CF004NGE | |
| Asus Zenbook S 13 OLED | |
| Lenovo ThinkPad Z13 21D2CTO1WW | |
| Apple MacBook Air M2 10C GPU | |
| Cinebench R20 / CPU (Single Core) | |
| Średnia w klasie Subnotebook (128 - 832, n=56, ostatnie 2 lata) | |
| Dell XPS 13 Plus 9320 i7-1280P OLED | |
| Lenovo ThinkPad Z13 G1-21D20016GE | |
| Przeciętny AMD Ryzen 7 PRO 6860Z (n=1) | |
| Lenovo ThinkPad T14 G3-21CF004NGE | |
| Lenovo ThinkPad Z16 G1 21D5S00T00 | |
| Lenovo ThinkPad Z13 21D2CTO1WW | |
| Asus Zenbook S 13 OLED | |
| Apple MacBook Air M2 10C GPU | |
| Cinebench R15 / CPU Multi 64Bit | |
| Lenovo ThinkPad Z16 G1 21D5S00T00 | |
| Średnia w klasie Subnotebook (327 - 3345, n=56, ostatnie 2 lata) | |
| Lenovo ThinkPad Z13 G1-21D20016GE | |
| Przeciętny AMD Ryzen 7 PRO 6860Z (n=1) | |
| Dell XPS 13 Plus 9320 i7-1280P OLED | |
| Lenovo ThinkPad T14 G3-21CF004NGE | |
| Asus Zenbook S 13 OLED | |
| Lenovo ThinkPad Z13 21D2CTO1WW | |
| Apple MacBook Air M2 10C GPU | |
| Cinebench R15 / CPU Single 64Bit | |
| Średnia w klasie Subnotebook (72.4 - 322, n=56, ostatnie 2 lata) | |
| Lenovo ThinkPad Z16 G1 21D5S00T00 | |
| Asus Zenbook S 13 OLED | |
| Lenovo ThinkPad T14 G3-21CF004NGE | |
| Lenovo ThinkPad Z13 21D2CTO1WW | |
| Lenovo ThinkPad Z13 G1-21D20016GE | |
| Przeciętny AMD Ryzen 7 PRO 6860Z (n=1) | |
| Dell XPS 13 Plus 9320 i7-1280P OLED | |
| Apple MacBook Air M2 10C GPU | |
| Blender / v2.79 BMW27 CPU | |
| Apple MacBook Air M2 10C GPU | |
| Lenovo ThinkPad Z13 21D2CTO1WW | |
| Średnia w klasie Subnotebook (159 - 2271, n=57, ostatnie 2 lata) | |
| Asus Zenbook S 13 OLED | |
| Lenovo ThinkPad T14 G3-21CF004NGE | |
| Lenovo ThinkPad Z13 G1-21D20016GE | |
| Przeciętny AMD Ryzen 7 PRO 6860Z (n=1) | |
| Dell XPS 13 Plus 9320 i7-1280P OLED | |
| Lenovo ThinkPad Z16 G1 21D5S00T00 | |
| 7-Zip 18.03 / 7z b 4 | |
| Lenovo ThinkPad Z16 G1 21D5S00T00 | |
| Lenovo ThinkPad Z13 G1-21D20016GE | |
| Przeciętny AMD Ryzen 7 PRO 6860Z (n=1) | |
| Lenovo ThinkPad T14 G3-21CF004NGE | |
| Dell XPS 13 Plus 9320 i7-1280P OLED | |
| Asus Zenbook S 13 OLED | |
| Średnia w klasie Subnotebook (11668 - 77867, n=56, ostatnie 2 lata) | |
| Lenovo ThinkPad Z13 21D2CTO1WW | |
| 7-Zip 18.03 / 7z b 4 -mmt1 | |
| Średnia w klasie Subnotebook (2643 - 6699, n=58, ostatnie 2 lata) | |
| Asus Zenbook S 13 OLED | |
| Lenovo ThinkPad Z16 G1 21D5S00T00 | |
| Lenovo ThinkPad T14 G3-21CF004NGE | |
| Lenovo ThinkPad Z13 G1-21D20016GE | |
| Przeciętny AMD Ryzen 7 PRO 6860Z (n=1) | |
| Lenovo ThinkPad Z13 21D2CTO1WW | |
| Dell XPS 13 Plus 9320 i7-1280P OLED | |
| Geekbench 5.5 / Multi-Core | |
| Dell XPS 13 Plus 9320 i7-1280P OLED | |
| Średnia w klasie Subnotebook (2557 - 17218, n=48, ostatnie 2 lata) | |
| Apple MacBook Air M2 10C GPU | |
| Lenovo ThinkPad Z16 G1 21D5S00T00 | |
| Lenovo ThinkPad Z13 G1-21D20016GE | |
| Przeciętny AMD Ryzen 7 PRO 6860Z (n=1) | |
| Lenovo ThinkPad T14 G3-21CF004NGE | |
| Asus Zenbook S 13 OLED | |
| Lenovo ThinkPad Z13 21D2CTO1WW | |
| Geekbench 5.5 / Single-Core | |
| Apple MacBook Air M2 10C GPU | |
| Średnia w klasie Subnotebook (726 - 2224, n=48, ostatnie 2 lata) | |
| Dell XPS 13 Plus 9320 i7-1280P OLED | |
| Asus Zenbook S 13 OLED | |
| Lenovo ThinkPad T14 G3-21CF004NGE | |
| Lenovo ThinkPad Z16 G1 21D5S00T00 | |
| Lenovo ThinkPad Z13 21D2CTO1WW | |
| Lenovo ThinkPad Z13 G1-21D20016GE | |
| Przeciętny AMD Ryzen 7 PRO 6860Z (n=1) | |
| HWBOT x265 Benchmark v2.2 / 4k Preset | |
| Lenovo ThinkPad Z16 G1 21D5S00T00 | |
| Lenovo ThinkPad Z13 G1-21D20016GE | |
| Przeciętny AMD Ryzen 7 PRO 6860Z (n=1) | |
| Dell XPS 13 Plus 9320 i7-1280P OLED | |
| Średnia w klasie Subnotebook (0.97 - 25.1, n=56, ostatnie 2 lata) | |
| Lenovo ThinkPad T14 G3-21CF004NGE | |
| Asus Zenbook S 13 OLED | |
| Lenovo ThinkPad Z13 21D2CTO1WW | |
| LibreOffice / 20 Documents To PDF | |
| Lenovo ThinkPad Z13 21D2CTO1WW | |
| Średnia w klasie Subnotebook (39.9 - 220, n=55, ostatnie 2 lata) | |
| Asus Zenbook S 13 OLED | |
| Lenovo ThinkPad T14 G3-21CF004NGE | |
| Lenovo ThinkPad Z16 G1 21D5S00T00 | |
| Lenovo ThinkPad Z13 G1-21D20016GE | |
| Przeciętny AMD Ryzen 7 PRO 6860Z (n=1) | |
| Dell XPS 13 Plus 9320 i7-1280P OLED | |
| R Benchmark 2.5 / Overall mean | |
| Lenovo ThinkPad Z13 21D2CTO1WW | |
| Asus Zenbook S 13 OLED | |
| Lenovo ThinkPad T14 G3-21CF004NGE | |
| Lenovo ThinkPad Z13 G1-21D20016GE | |
| Przeciętny AMD Ryzen 7 PRO 6860Z (n=1) | |
| Średnia w klasie Subnotebook (0.4024 - 1.456, n=57, ostatnie 2 lata) | |
| Lenovo ThinkPad Z16 G1 21D5S00T00 | |
| Dell XPS 13 Plus 9320 i7-1280P OLED | |
* ... im mniej tym lepiej
Wysokie wartości poboru mocy mają jednak również negatywny wpływ na wydajność i wyraźnie widać, że procesory Ryzen 7 działają znacznie wydajniej w zakresie 25-30 W. W poniższej analizie przyglądamy się wydajności w dwóch benchmarkach CPU Cinebench R15 & Cinebench R23 Multi, z których każdy działa na zewnętrznym monitorze. W ten sposób możemy wykluczyć zmienną wydajność monitora jako czynnik wpływający na wydajność. Tutaj widać wyraźnie, że Ryzen 7 Pro 6860Z wypada gorzej od Asus Zenbook S 13 (Ryzen 7 6800U) i Lenovo ThinkPad T14 G3 (Ryzen 7 Pro 6850U).
| Power Consumption / Cinebench R23 Multi Power Efficiency - external Monitor | |
| Apple MacBook Air M2 10C GPU | |
| Lenovo ThinkPad T14 G3-21CF004NGE | |
| Lenovo Yoga 7-14ARB G7 | |
| Lenovo Yoga Slim 7 Carbon 13IAP7-82U9005FGE | |
| Lenovo ThinkPad Z13 G1-21D20016GE | |
| Schenker Vision 14 2022 RTX 3050 Ti | |
| Power Consumption / Cinebench R15 Multi Efficiency (external Monitor) | |
| Asus Zenbook S 13 OLED | |
| Lenovo ThinkPad T14 G3-21CF004NGE | |
| Lenovo Yoga 7-14ARB G7 | |
| Lenovo ThinkPad Z13 G1-21D20016GE | |
| Dell XPS 13 Plus 9320 i7-1280P OLED | |
| Lenovo Yoga Slim 7 Carbon 13IAP7-82U9005FGE | |
| Lenovo ThinkPad Z13 21D2CTO1WW | |
| Schenker Vision 14 2022 RTX 3050 Ti | |
| Lenovo ThinkPad Z16 G1 21D5S00T00 | |
AIDA64: FP32 Ray-Trace | FPU Julia | CPU SHA3 | CPU Queen | FPU SinJulia | FPU Mandel | CPU AES | CPU ZLib | FP64 Ray-Trace | CPU PhotoWorxx
| Performance rating | |
| Lenovo ThinkPad Z16 G1 21D5S00T00 | |
| Lenovo ThinkPad Z13 G1-21D20016GE | |
| Przeciętny AMD Ryzen 7 PRO 6860Z | |
| Asus Zenbook S 13 OLED | |
| Średnia w klasie Subnotebook | |
| Lenovo ThinkPad T14 G3-21CF004NGE | |
| Dell XPS 13 Plus 9320 i7-1280P OLED | |
| Lenovo ThinkPad Z13 21D2CTO1WW | |
| AIDA64 / FP32 Ray-Trace | |
| Lenovo ThinkPad Z16 G1 21D5S00T00 | |
| Średnia w klasie Subnotebook (1135 - 32888, n=57, ostatnie 2 lata) | |
| Lenovo ThinkPad Z13 G1-21D20016GE | |
| Przeciętny AMD Ryzen 7 PRO 6860Z (n=1) | |
| Lenovo ThinkPad T14 G3-21CF004NGE | |
| Asus Zenbook S 13 OLED | |
| Dell XPS 13 Plus 9320 i7-1280P OLED | |
| Lenovo ThinkPad Z13 21D2CTO1WW | |
| AIDA64 / FPU Julia | |
| Lenovo ThinkPad Z16 G1 21D5S00T00 | |
| Lenovo ThinkPad Z13 G1-21D20016GE | |
| Przeciętny AMD Ryzen 7 PRO 6860Z (n=1) | |
| Lenovo ThinkPad T14 G3-21CF004NGE | |
| Asus Zenbook S 13 OLED | |
| Średnia w klasie Subnotebook (5218 - 123315, n=57, ostatnie 2 lata) | |
| Lenovo ThinkPad Z13 21D2CTO1WW | |
| Dell XPS 13 Plus 9320 i7-1280P OLED | |
| AIDA64 / CPU SHA3 | |
| Lenovo ThinkPad Z16 G1 21D5S00T00 | |
| Średnia w klasie Subnotebook (444 - 5287, n=57, ostatnie 2 lata) | |
| Lenovo ThinkPad Z13 G1-21D20016GE | |
| Przeciętny AMD Ryzen 7 PRO 6860Z (n=1) | |
| Dell XPS 13 Plus 9320 i7-1280P OLED | |
| Lenovo ThinkPad T14 G3-21CF004NGE | |
| Asus Zenbook S 13 OLED | |
| Lenovo ThinkPad Z13 21D2CTO1WW | |
| AIDA64 / CPU Queen | |
| Lenovo ThinkPad Z16 G1 21D5S00T00 | |
| Lenovo ThinkPad Z13 G1-21D20016GE | |
| Przeciętny AMD Ryzen 7 PRO 6860Z (n=1) | |
| Dell XPS 13 Plus 9320 i7-1280P OLED | |
| Lenovo ThinkPad T14 G3-21CF004NGE | |
| Asus Zenbook S 13 OLED | |
| Lenovo ThinkPad Z13 21D2CTO1WW | |
| Średnia w klasie Subnotebook (10579 - 95002, n=48, ostatnie 2 lata) | |
| AIDA64 / FPU SinJulia | |
| Lenovo ThinkPad Z16 G1 21D5S00T00 | |
| Lenovo ThinkPad Z13 G1-21D20016GE | |
| Przeciętny AMD Ryzen 7 PRO 6860Z (n=1) | |
| Lenovo ThinkPad T14 G3-21CF004NGE | |
| Asus Zenbook S 13 OLED | |
| Lenovo ThinkPad Z13 21D2CTO1WW | |
| Dell XPS 13 Plus 9320 i7-1280P OLED | |
| Średnia w klasie Subnotebook (744 - 18418, n=57, ostatnie 2 lata) | |
| AIDA64 / FPU Mandel | |
| Lenovo ThinkPad Z16 G1 21D5S00T00 | |
| Lenovo ThinkPad Z13 G1-21D20016GE | |
| Przeciętny AMD Ryzen 7 PRO 6860Z (n=1) | |
| Lenovo ThinkPad T14 G3-21CF004NGE | |
| Asus Zenbook S 13 OLED | |
| Lenovo ThinkPad Z13 21D2CTO1WW | |
| Średnia w klasie Subnotebook (3341 - 65433, n=57, ostatnie 2 lata) | |
| Dell XPS 13 Plus 9320 i7-1280P OLED | |
| AIDA64 / CPU AES | |
| Asus Zenbook S 13 OLED | |
| Lenovo ThinkPad Z16 G1 21D5S00T00 | |
| Lenovo ThinkPad Z13 G1-21D20016GE | |
| Przeciętny AMD Ryzen 7 PRO 6860Z (n=1) | |
| Dell XPS 13 Plus 9320 i7-1280P OLED | |
| Średnia w klasie Subnotebook (638 - 96917, n=57, ostatnie 2 lata) | |
| Lenovo ThinkPad T14 G3-21CF004NGE | |
| Lenovo ThinkPad Z13 21D2CTO1WW | |
| AIDA64 / CPU ZLib | |
| Lenovo ThinkPad Z16 G1 21D5S00T00 | |
| Średnia w klasie Subnotebook (164.9 - 1379, n=57, ostatnie 2 lata) | |
| Dell XPS 13 Plus 9320 i7-1280P OLED | |
| Lenovo ThinkPad T14 G3-21CF004NGE | |
| Lenovo ThinkPad Z13 G1-21D20016GE | |
| Przeciętny AMD Ryzen 7 PRO 6860Z (n=1) | |
| Asus Zenbook S 13 OLED | |
| Lenovo ThinkPad Z13 21D2CTO1WW | |
| AIDA64 / FP64 Ray-Trace | |
| Lenovo ThinkPad Z16 G1 21D5S00T00 | |
| Średnia w klasie Subnotebook (610 - 17495, n=57, ostatnie 2 lata) | |
| Lenovo ThinkPad Z13 G1-21D20016GE | |
| Przeciętny AMD Ryzen 7 PRO 6860Z (n=1) | |
| Lenovo ThinkPad T14 G3-21CF004NGE | |
| Dell XPS 13 Plus 9320 i7-1280P OLED | |
| Asus Zenbook S 13 OLED | |
| Lenovo ThinkPad Z13 21D2CTO1WW | |
| AIDA64 / CPU PhotoWorxx | |
| Średnia w klasie Subnotebook (6569 - 85600, n=57, ostatnie 2 lata) | |
| Dell XPS 13 Plus 9320 i7-1280P OLED | |
| Lenovo ThinkPad Z16 G1 21D5S00T00 | |
| Lenovo ThinkPad Z13 21D2CTO1WW | |
| Lenovo ThinkPad T14 G3-21CF004NGE | |
| Asus Zenbook S 13 OLED | |
| Lenovo ThinkPad Z13 G1-21D20016GE | |
| Przeciętny AMD Ryzen 7 PRO 6860Z (n=1) | |
Wydajność systemu
ThinkPad Z13 jest urządzeniem bardzo responsywnym, a wyniki benchmarków syntetycznych są również bardzo dobre. Nie udało nam się wykryć żadnych problemów podczas przeprowadzania testów.
CrossMark: Overall | Productivity | Creativity | Responsiveness
| PCMark 10 / Score | |
| Średnia w klasie Subnotebook (4920 - 9939, n=45, ostatnie 2 lata) | |
| Lenovo ThinkPad Z16 G1 21D5S00T00 | |
| Asus Zenbook S 13 OLED | |
| Lenovo ThinkPad Z13 G1-21D20016GE | |
| Przeciętny AMD Ryzen 7 PRO 6860Z, AMD Radeon 680M (n=1) | |
| Lenovo ThinkPad T14 G3-21CF004NGE | |
| Dell XPS 13 Plus 9320 i7-1280P OLED | |
| Lenovo ThinkPad Z13 21D2CTO1WW | |
| PCMark 10 / Essentials | |
| Asus Zenbook S 13 OLED | |
| Dell XPS 13 Plus 9320 i7-1280P OLED | |
| Średnia w klasie Subnotebook (8552 - 11646, n=45, ostatnie 2 lata) | |
| Lenovo ThinkPad Z13 G1-21D20016GE | |
| Przeciętny AMD Ryzen 7 PRO 6860Z, AMD Radeon 680M (n=1) | |
| Lenovo ThinkPad Z16 G1 21D5S00T00 | |
| Lenovo ThinkPad T14 G3-21CF004NGE | |
| Lenovo ThinkPad Z13 21D2CTO1WW | |
| PCMark 10 / Productivity | |
| Średnia w klasie Subnotebook (5435 - 16606, n=45, ostatnie 2 lata) | |
| Asus Zenbook S 13 OLED | |
| Lenovo ThinkPad T14 G3-21CF004NGE | |
| Lenovo ThinkPad Z16 G1 21D5S00T00 | |
| Lenovo ThinkPad Z13 G1-21D20016GE | |
| Przeciętny AMD Ryzen 7 PRO 6860Z, AMD Radeon 680M (n=1) | |
| Lenovo ThinkPad Z13 21D2CTO1WW | |
| Dell XPS 13 Plus 9320 i7-1280P OLED | |
| PCMark 10 / Digital Content Creation | |
| Średnia w klasie Subnotebook (5722 - 13779, n=45, ostatnie 2 lata) | |
| Lenovo ThinkPad Z16 G1 21D5S00T00 | |
| Lenovo ThinkPad Z13 G1-21D20016GE | |
| Przeciętny AMD Ryzen 7 PRO 6860Z, AMD Radeon 680M (n=1) | |
| Lenovo ThinkPad T14 G3-21CF004NGE | |
| Asus Zenbook S 13 OLED | |
| Dell XPS 13 Plus 9320 i7-1280P OLED | |
| Lenovo ThinkPad Z13 21D2CTO1WW | |
| CrossMark / Overall | |
| Dell XPS 13 Plus 9320 i7-1280P OLED | |
| Średnia w klasie Subnotebook (365 - 2356, n=59, ostatnie 2 lata) | |
| Lenovo ThinkPad Z13 G1-21D20016GE | |
| Przeciętny AMD Ryzen 7 PRO 6860Z, AMD Radeon 680M (n=1) | |
| Apple MacBook Air M2 10C GPU | |
| Asus Zenbook S 13 OLED | |
| Lenovo ThinkPad Z16 G1 21D5S00T00 | |
| Lenovo ThinkPad Z13 21D2CTO1WW | |
| Lenovo ThinkPad T14 G3-21CF004NGE | |
| CrossMark / Productivity | |
| Dell XPS 13 Plus 9320 i7-1280P OLED | |
| Średnia w klasie Subnotebook (364 - 2277, n=59, ostatnie 2 lata) | |
| Lenovo ThinkPad Z13 G1-21D20016GE | |
| Przeciętny AMD Ryzen 7 PRO 6860Z, AMD Radeon 680M (n=1) | |
| Asus Zenbook S 13 OLED | |
| Lenovo ThinkPad Z16 G1 21D5S00T00 | |
| Lenovo ThinkPad Z13 21D2CTO1WW | |
| Lenovo ThinkPad T14 G3-21CF004NGE | |
| Apple MacBook Air M2 10C GPU | |
| CrossMark / Creativity | |
| Dell XPS 13 Plus 9320 i7-1280P OLED | |
| Średnia w klasie Subnotebook (372 - 2743, n=59, ostatnie 2 lata) | |
| Apple MacBook Air M2 10C GPU | |
| Lenovo ThinkPad Z16 G1 21D5S00T00 | |
| Lenovo ThinkPad Z13 G1-21D20016GE | |
| Przeciętny AMD Ryzen 7 PRO 6860Z, AMD Radeon 680M (n=1) | |
| Asus Zenbook S 13 OLED | |
| Lenovo ThinkPad Z13 21D2CTO1WW | |
| Lenovo ThinkPad T14 G3-21CF004NGE | |
| CrossMark / Responsiveness | |
| Dell XPS 13 Plus 9320 i7-1280P OLED | |
| Średnia w klasie Subnotebook (312 - 1854, n=59, ostatnie 2 lata) | |
| Asus Zenbook S 13 OLED | |
| Lenovo ThinkPad Z13 G1-21D20016GE | |
| Przeciętny AMD Ryzen 7 PRO 6860Z, AMD Radeon 680M (n=1) | |
| Lenovo ThinkPad Z16 G1 21D5S00T00 | |
| Lenovo ThinkPad T14 G3-21CF004NGE | |
| Lenovo ThinkPad Z13 21D2CTO1WW | |
| Apple MacBook Air M2 10C GPU | |
| PCMark 10 Score | 6240 pkt. | |
Pomoc | ||
| AIDA64 / Memory Copy | |
| Średnia w klasie Subnotebook (14554 - 131023, n=57, ostatnie 2 lata) | |
| Dell XPS 13 Plus 9320 i7-1280P OLED | |
| Lenovo ThinkPad T14 G3-21CF004NGE | |
| Lenovo ThinkPad Z13 21D2CTO1WW | |
| Lenovo ThinkPad Z16 G1 21D5S00T00 | |
| Lenovo ThinkPad Z13 G1-21D20016GE | |
| Przeciętny AMD Ryzen 7 PRO 6860Z (n=1) | |
| Asus Zenbook S 13 OLED | |
| AIDA64 / Memory Read | |
| Średnia w klasie Subnotebook (15948 - 127174, n=57, ostatnie 2 lata) | |
| Dell XPS 13 Plus 9320 i7-1280P OLED | |
| Lenovo ThinkPad Z16 G1 21D5S00T00 | |
| Lenovo ThinkPad T14 G3-21CF004NGE | |
| Lenovo ThinkPad Z13 21D2CTO1WW | |
| Asus Zenbook S 13 OLED | |
| Lenovo ThinkPad Z13 G1-21D20016GE | |
| Przeciętny AMD Ryzen 7 PRO 6860Z (n=1) | |
| AIDA64 / Memory Write | |
| Średnia w klasie Subnotebook (15709 - 135141, n=57, ostatnie 2 lata) | |
| Dell XPS 13 Plus 9320 i7-1280P OLED | |
| Lenovo ThinkPad Z16 G1 21D5S00T00 | |
| Lenovo ThinkPad Z13 21D2CTO1WW | |
| Lenovo ThinkPad Z13 G1-21D20016GE | |
| Przeciętny AMD Ryzen 7 PRO 6860Z (n=1) | |
| Lenovo ThinkPad T14 G3-21CF004NGE | |
| Asus Zenbook S 13 OLED | |
| AIDA64 / Memory Latency | |
| Lenovo ThinkPad Z16 G1 21D5S00T00 | |
| Lenovo ThinkPad Z13 21D2CTO1WW | |
| Lenovo ThinkPad Z13 G1-21D20016GE | |
| Przeciętny AMD Ryzen 7 PRO 6860Z (n=1) | |
| Asus Zenbook S 13 OLED | |
| Lenovo ThinkPad T14 G3-21CF004NGE | |
| Dell XPS 13 Plus 9320 i7-1280P OLED | |
| Średnia w klasie Subnotebook (6.1 - 159.9, n=55, ostatnie 2 lata) | |
* ... im mniej tym lepiej
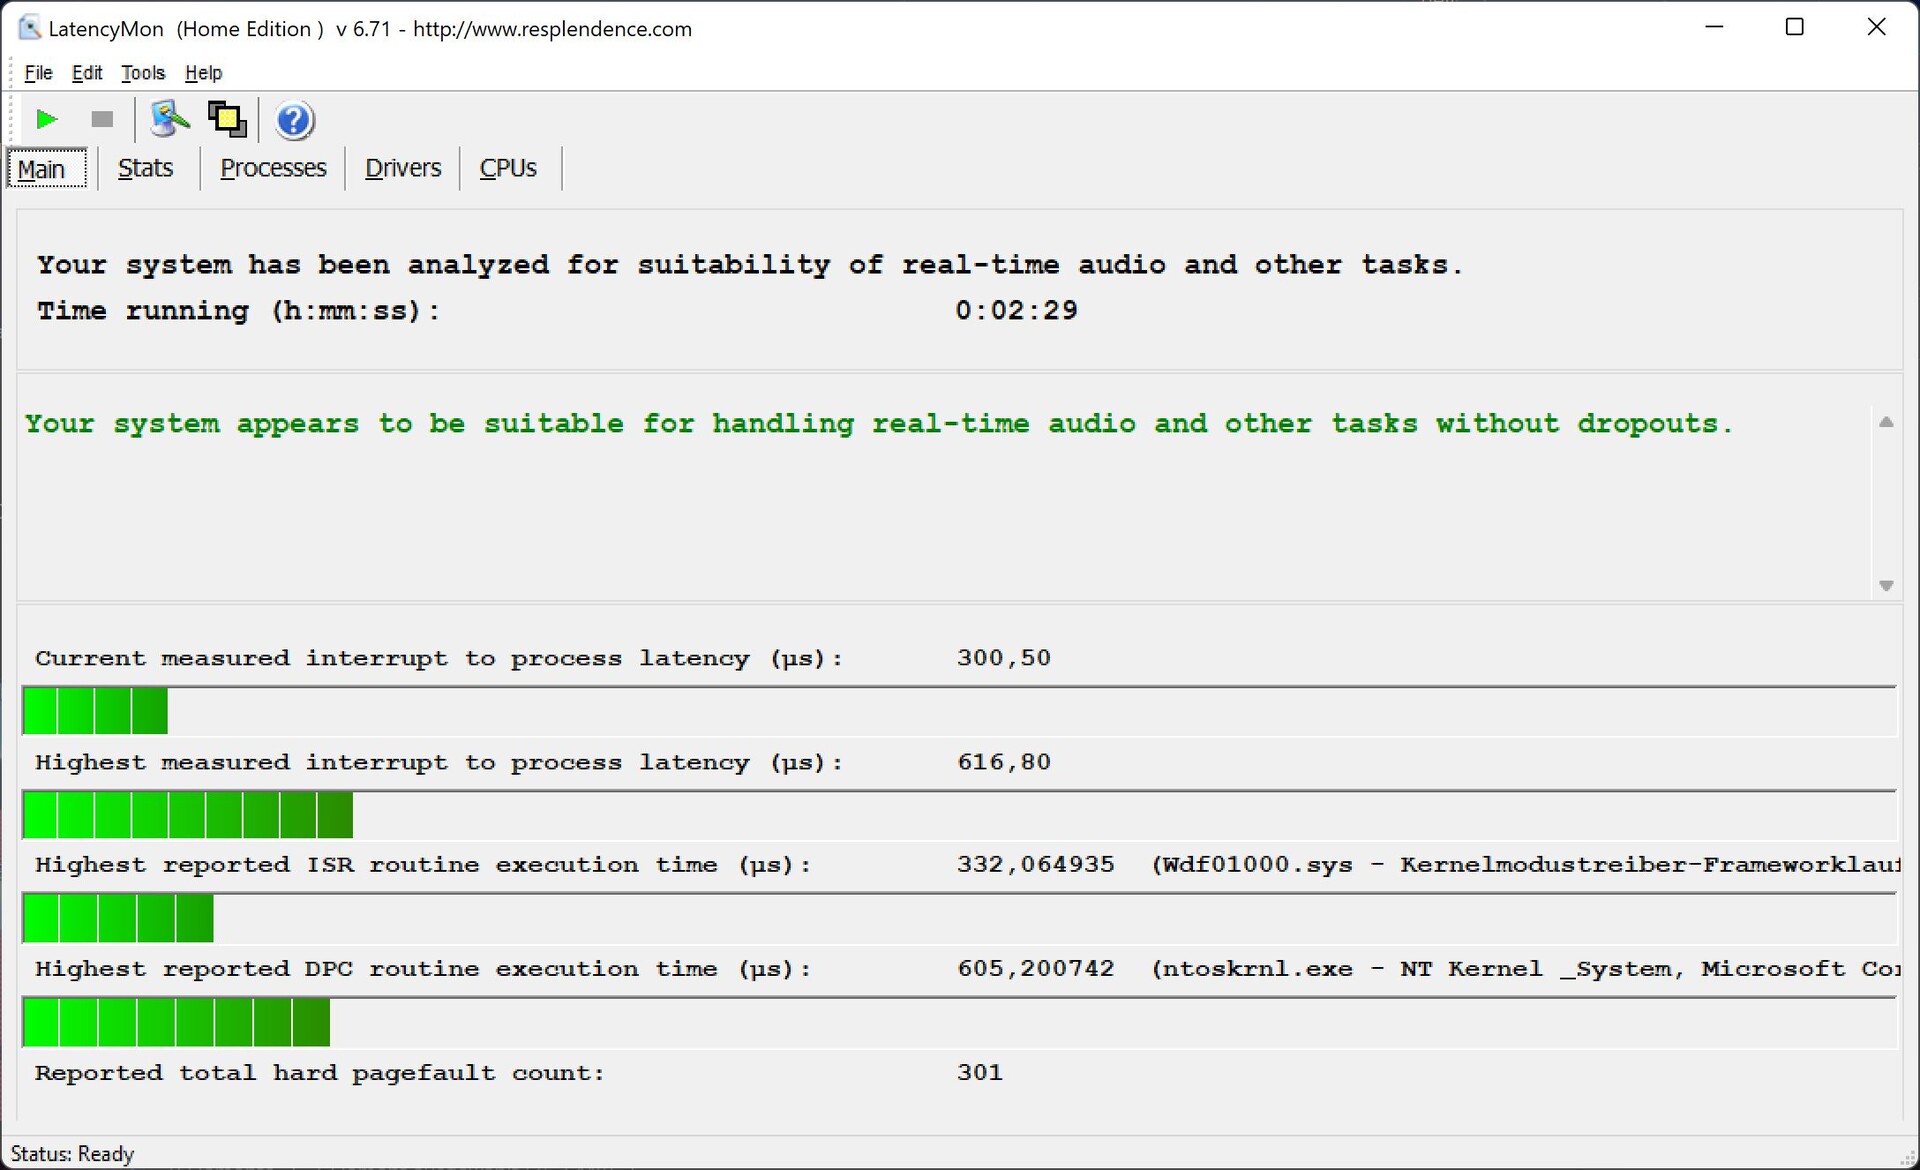
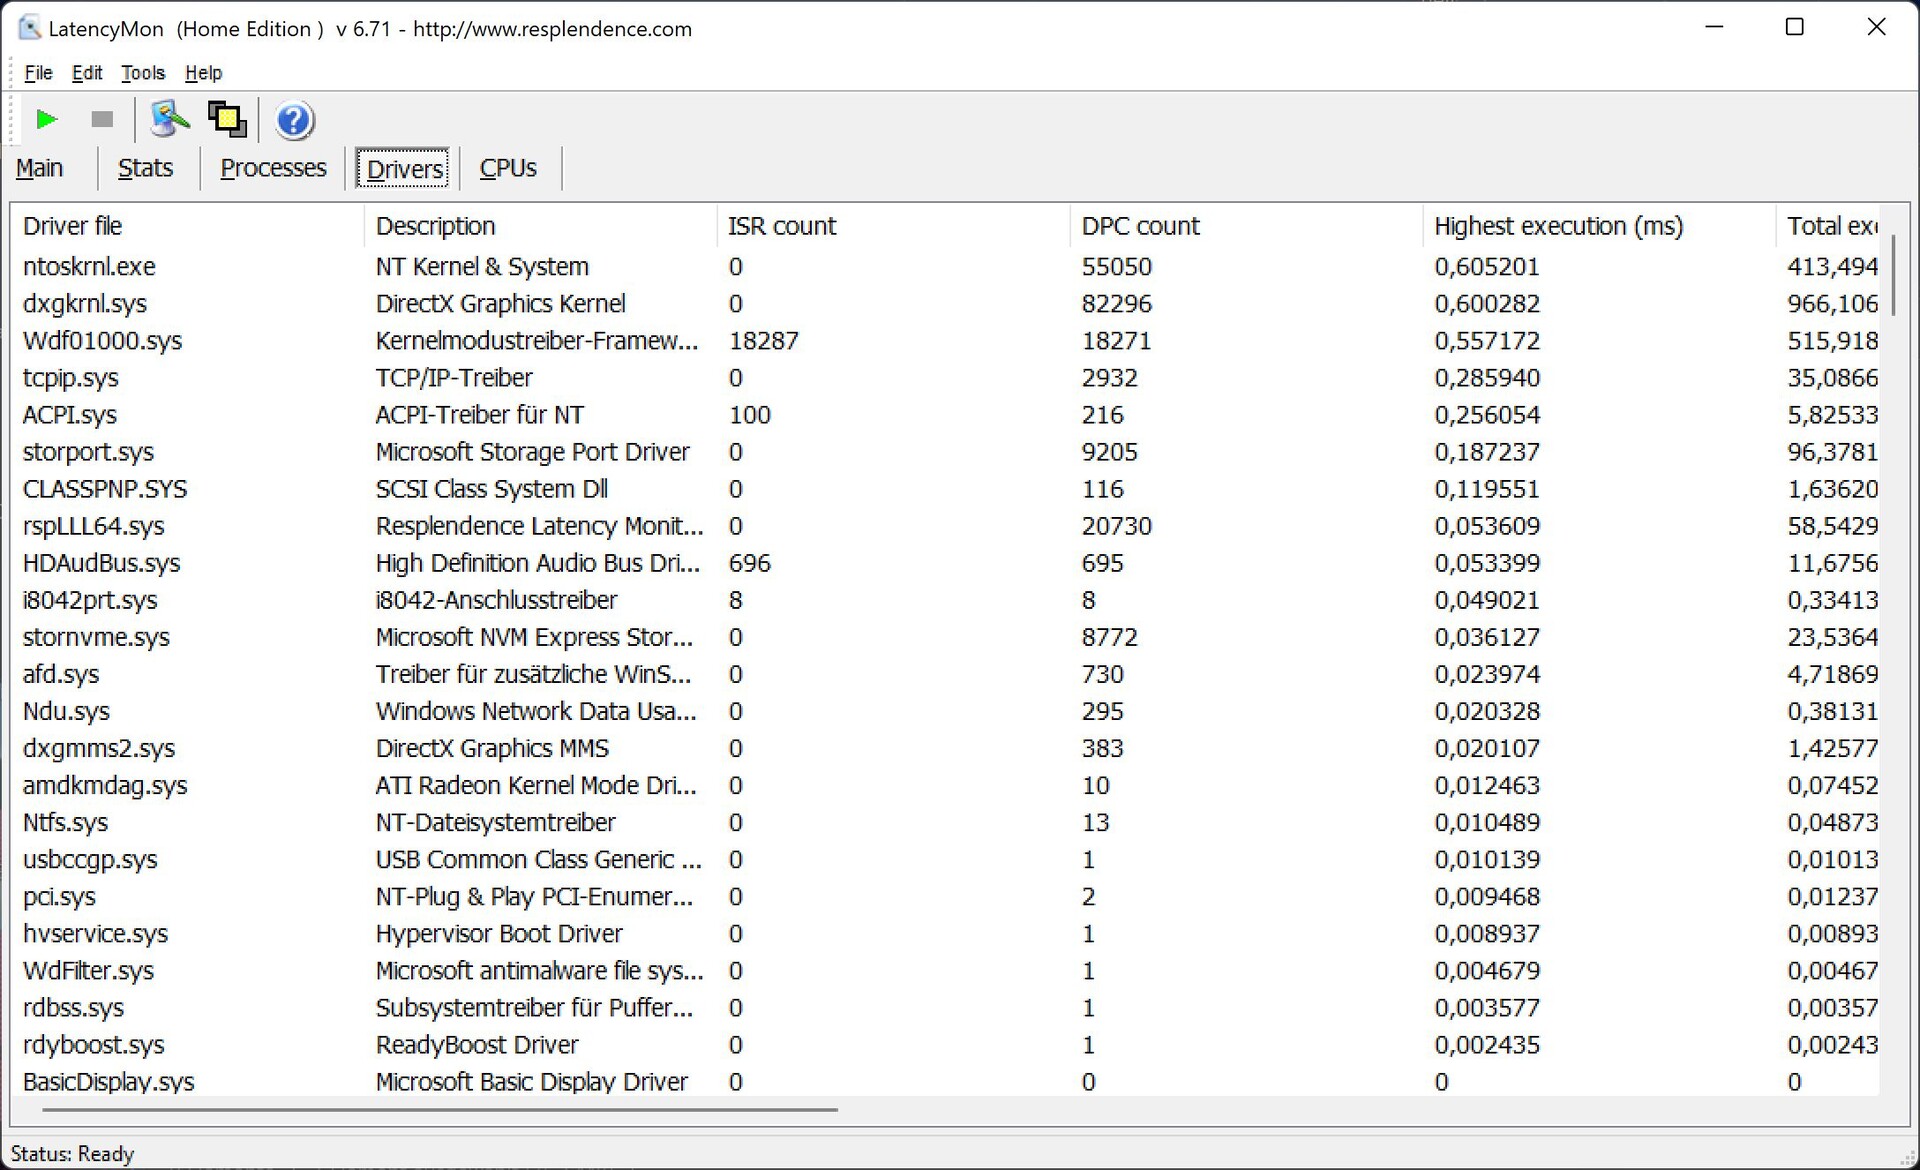
Opóźnienie DPC
W naszym standaryzowanym teście opóźnień (przeglądanie stron internetowych, odtwarzanie YouTube w rozdzielczości 4K, obciążenie procesora) urządzenie testowe wypadło bardzo dobrze na obecnej wersji BIOS-u i nie wykazało żadnych oznak niedostatków wydajności technicznej.
| DPC Latencies / LatencyMon - interrupt to process latency (max), Web, Youtube, Prime95 | |
| Lenovo ThinkPad Z13 21D2CTO1WW | |
| Lenovo ThinkPad T14 G3-21CF004NGE | |
| Lenovo ThinkPad Z16 G1 21D5S00T00 | |
| Lenovo ThinkPad Z13 G1-21D20016GE | |
| Asus Zenbook S 13 OLED | |
| Dell XPS 13 Plus 9320 i7-1280P OLED | |
* ... im mniej tym lepiej
Urządzenia do przechowywania danych
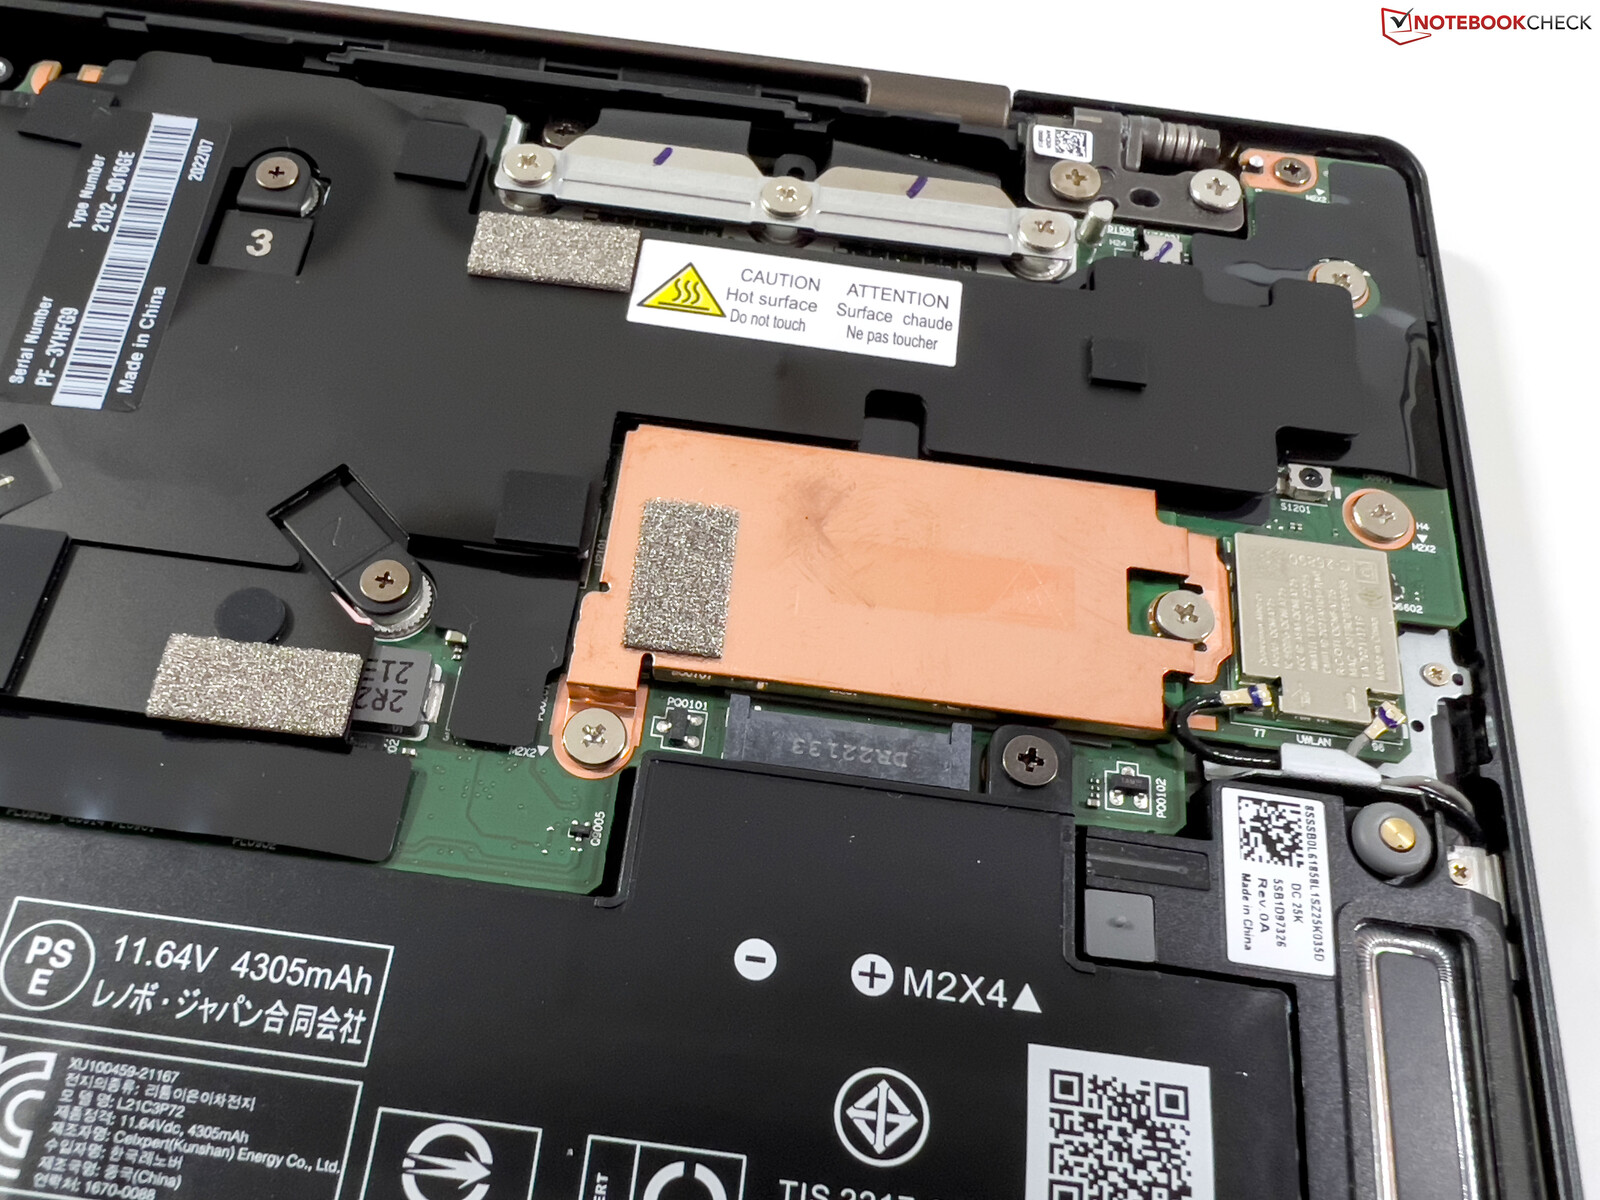
W ThinkPadzie Z13 znalazło się miejsce tylko dla kompaktowego dysku SSD M.2-2242, który jest przynajmniej podłączany przez obecny interfejs PCIe 4.0. Micron 2450, pozwala na zainstalowanie dysku SSD PCIe 4.0 o maksymalnym transferze około 3,3 GB/s. Może to zmarnować część potencjalnej pojemności, ale przynajmniej wydajność pozostaje stała nawet pod stałym obciążeniem. Z 1 TB około 900 GB jest jeszcze swobodnie dostępne dla użytkownika przy pierwszym użyciu laptopa. Więcej benchmarków SSD można znaleźć m.in tutaj.

| Drive Performance rating - Percent | |
| Asus Zenbook S 13 OLED | |
| Dell XPS 13 Plus 9320 i7-1280P OLED | |
| Średnia w klasie Subnotebook | |
| Przeciętny Micron 2450 1TB MTFDKCD1T0TFK | |
| Lenovo ThinkPad Z13 G1-21D20016GE | |
| Lenovo ThinkPad Z13 21D2CTO1WW | |
| Lenovo ThinkPad T14 G3-21CF004NGE | |
* ... im mniej tym lepiej
Disk Throttling: DiskSpd Read Loop, Queue Depth 8
Karta graficzna
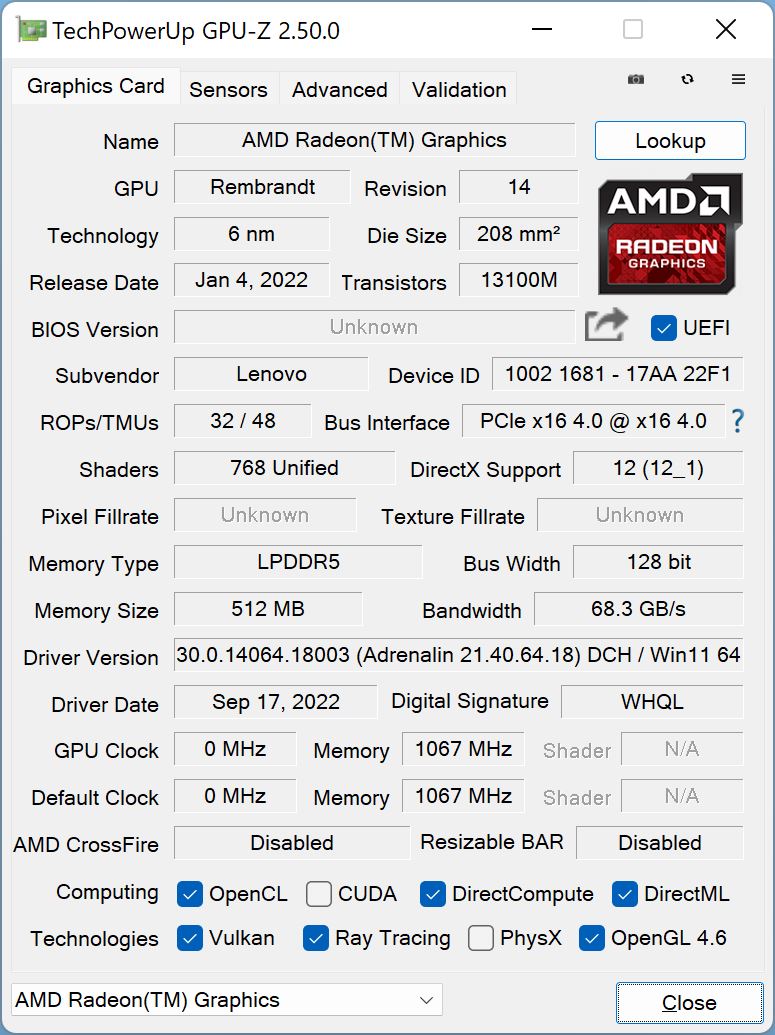
Ryzen 7 Pro 6860Z wykorzystuje znany zintegrowany układ graficzny Radeon 680M o maksymalnym taktowaniu 2,2 GHz, podobnie jak w konwencjonalnych procesorach Ryzen 7. W benchmarkach syntetycznych wyniki są początkowo również bardzo dobre, ale wydajność nie utrzymuje się na stałym poziomie. W teście obciążeniowym 3DMark (Time Spy) zawodzi w 82,7%, a podczas eksperymentowania (co byłoby całkiem możliwe w przypadku m.in Radeon 680M) z jednoczesnym obciążeniem procesora, układ był dławiony jeszcze bardziej (do łącznej mocy około 19 W). Asus Zenbook S 13 czy Lenovo (czyt ThinkPad T14 G3 radzą sobie znacznie lepiej pod jednoczesnym obciążeniem.
Na stronie Radeon 660M w podstawowym ThinkPadzie Z13 jest o około 35% wolniejszy i również dotknięty jest throttlingiem. Zasilanie z akumulatora nie zmniejsza wydajności grafiki. Więcej benchmarków GPU jest dostępnych tutaj
| 3DMark Performance rating - Percent | |
| Średnia w klasie Subnotebook | |
| Lenovo ThinkPad T14 G3-21CF004NGE | |
| Lenovo ThinkPad Z13 G1-21D20016GE | |
| Przeciętny AMD Radeon 680M | |
| Asus Zenbook S 13 OLED -1! | |
| Dell XPS 13 Plus 9320 i7-1280P OLED | |
| Lenovo ThinkPad Z13 21D2CTO1WW | |
| 3DMark 11 - 1280x720 Performance GPU | |
| Lenovo ThinkPad Z13 G1-21D20016GE | |
| Lenovo ThinkPad T14 G3-21CF004NGE | |
| Przeciętny AMD Radeon 680M (6858 - 11755, n=39) | |
| Średnia w klasie Subnotebook (995 - 18489, n=54, ostatnie 2 lata) | |
| Asus Zenbook S 13 OLED | |
| Dell XPS 13 Plus 9320 i7-1280P OLED | |
| Lenovo ThinkPad Z13 21D2CTO1WW | |
| 3DMark 11 Performance | 10387 pkt. | |
| 3DMark Cloud Gate Standard Score | 31075 pkt. | |
| 3DMark Fire Strike Score | 6287 pkt. | |
| 3DMark Time Spy Score | 2416 pkt. | |
Pomoc | ||
* ... im mniej tym lepiej
Witcher 3 FPS-Diagramm
| low | med. | high | ultra | QHD | |
|---|---|---|---|---|---|
| GTA V (2015) | 136.9 | 122.7 | 46.8 | 20.9 | |
| The Witcher 3 (2015) | 131 | 78 | 33 | 18.3 | |
| Dota 2 Reborn (2015) | 107.7 | 91.8 | 72.2 | 60.6 | |
| Final Fantasy XV Benchmark (2018) | 59.3 | 30.5 | 21.7 | ||
| X-Plane 11.11 (2018) | 51.8 | 40.6 | 34.3 | ||
| Far Cry 5 (2018) | 55 | 34 | 30 | 28 | |
| Strange Brigade (2018) | 133.5 | 55.3 | 44.8 | 38.9 | |
| F1 2021 (2021) | 155.3 | 75.1 | 54.9 | 23 | 15.8 |
| F1 22 (2022) | 71.4 | 61.1 | 44.5 | 9.35 |
Emisje i zużycie energii
Szum systemu
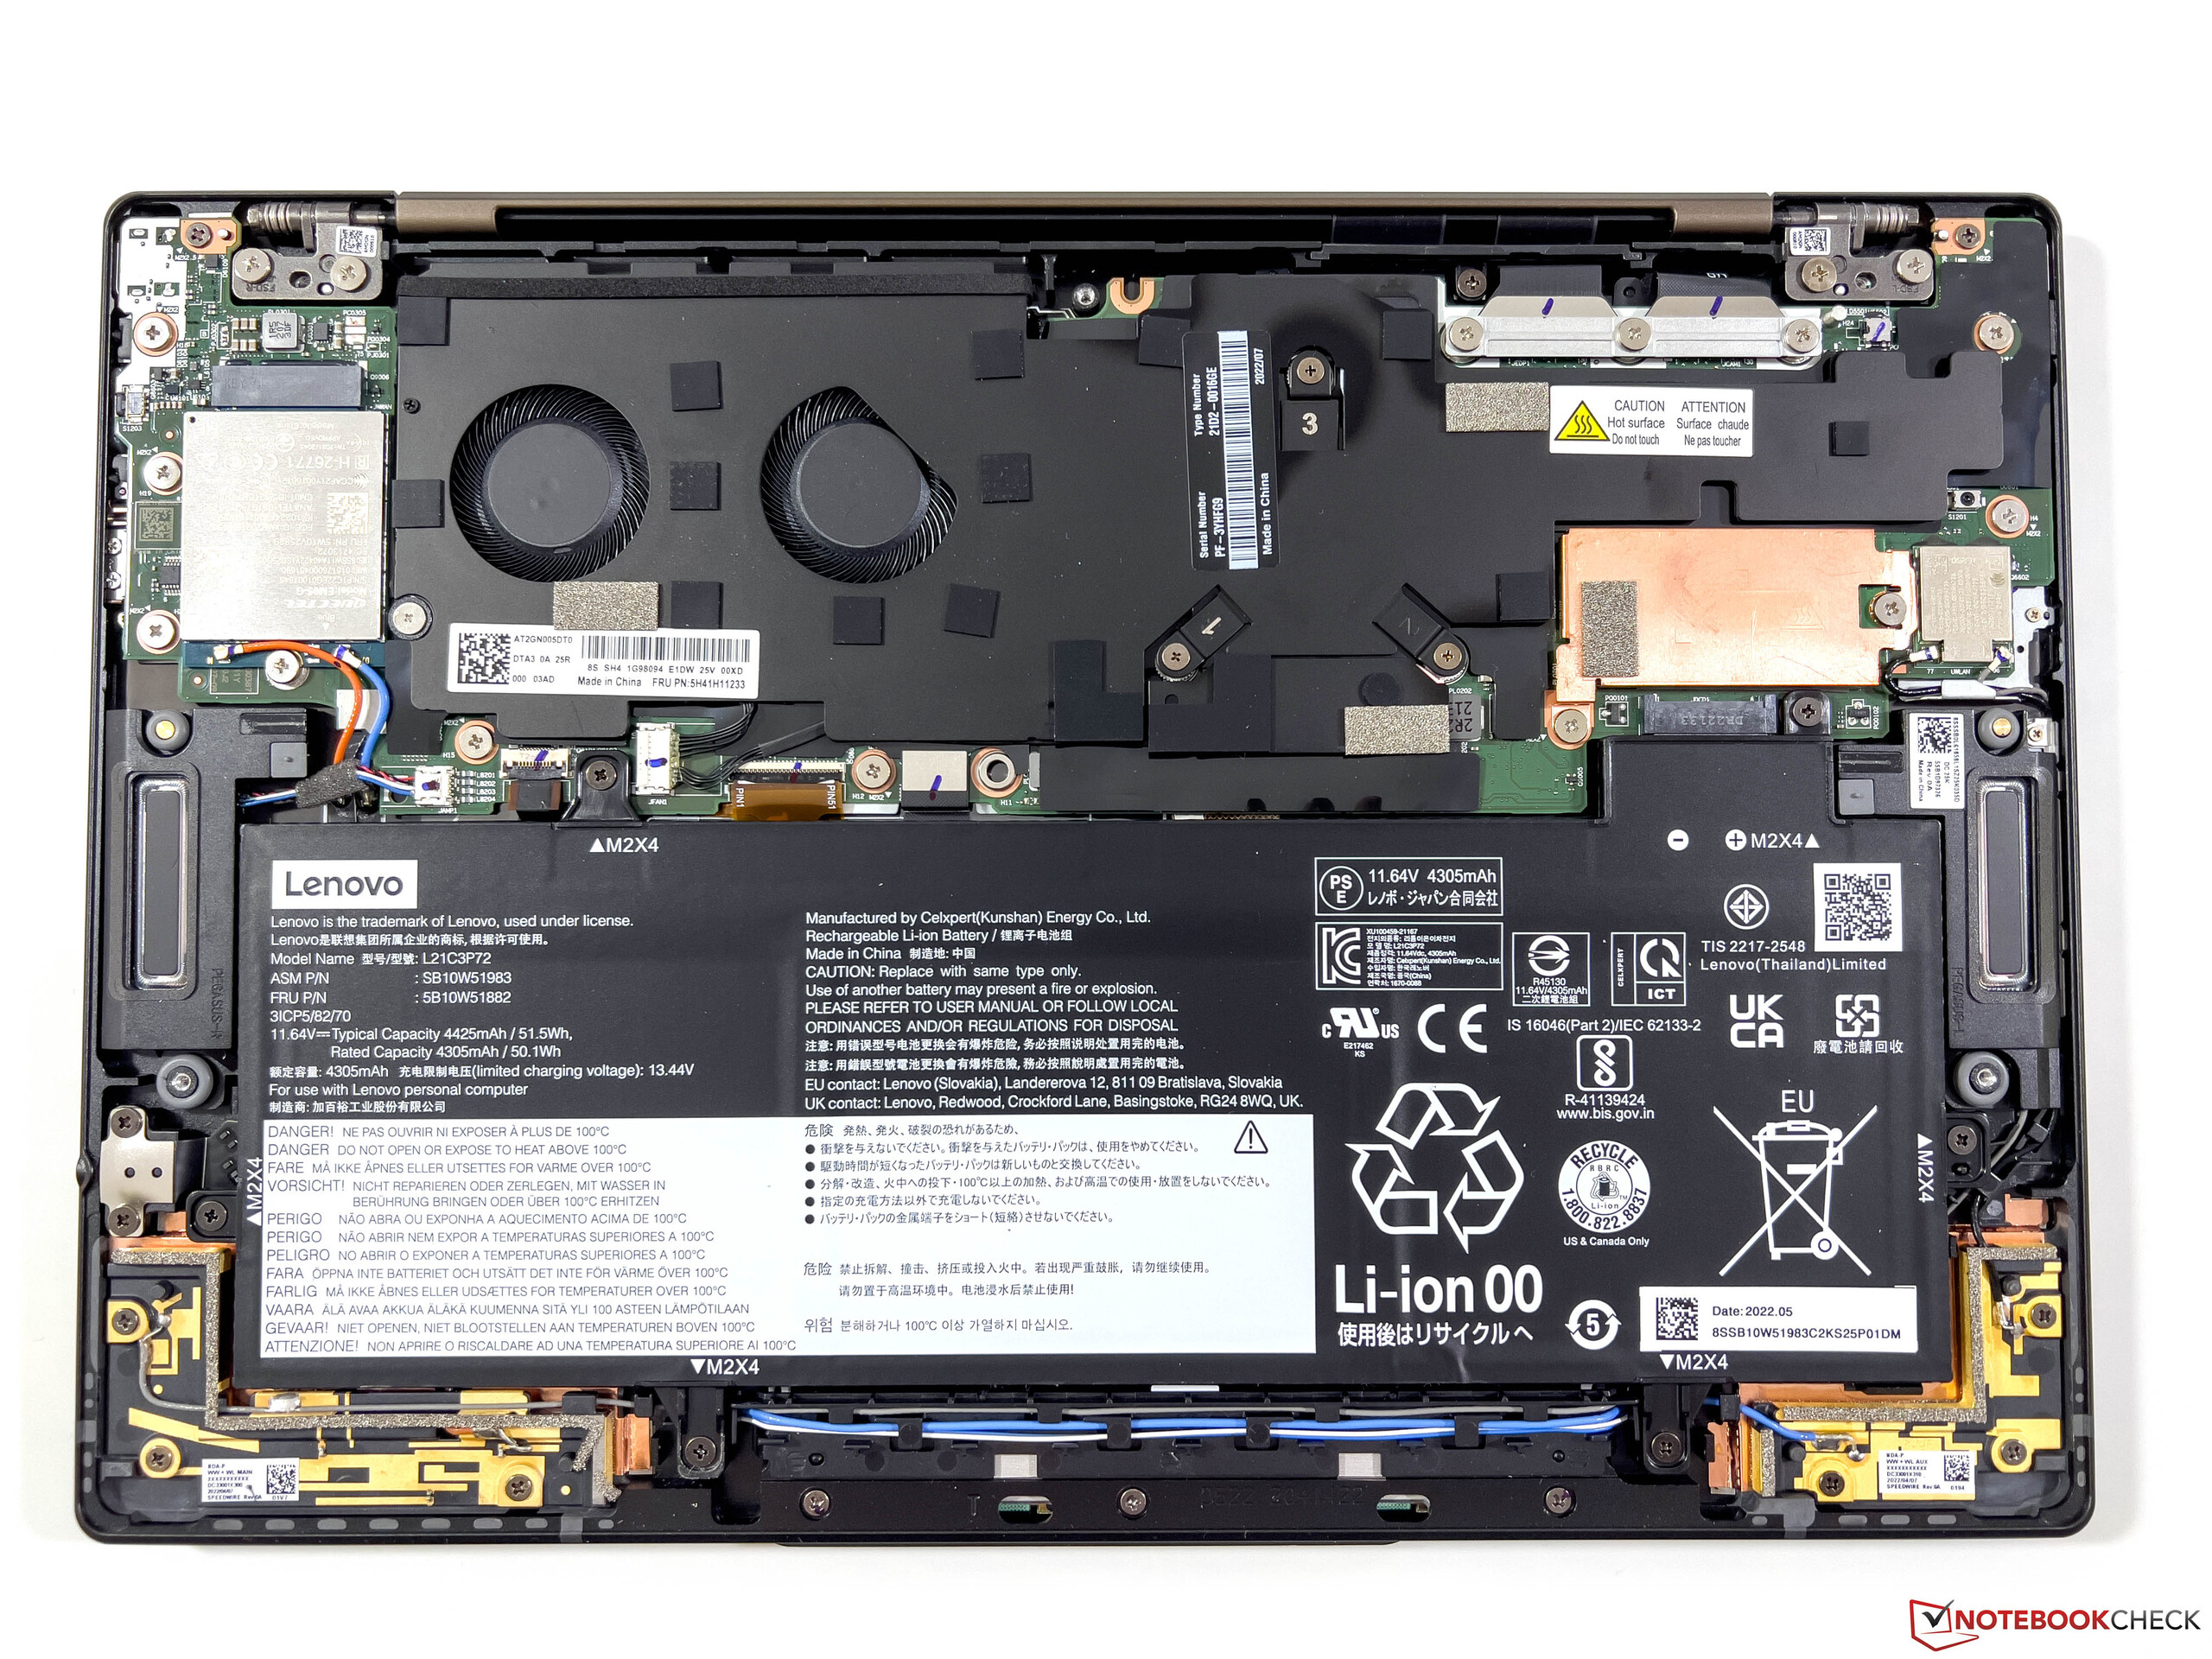
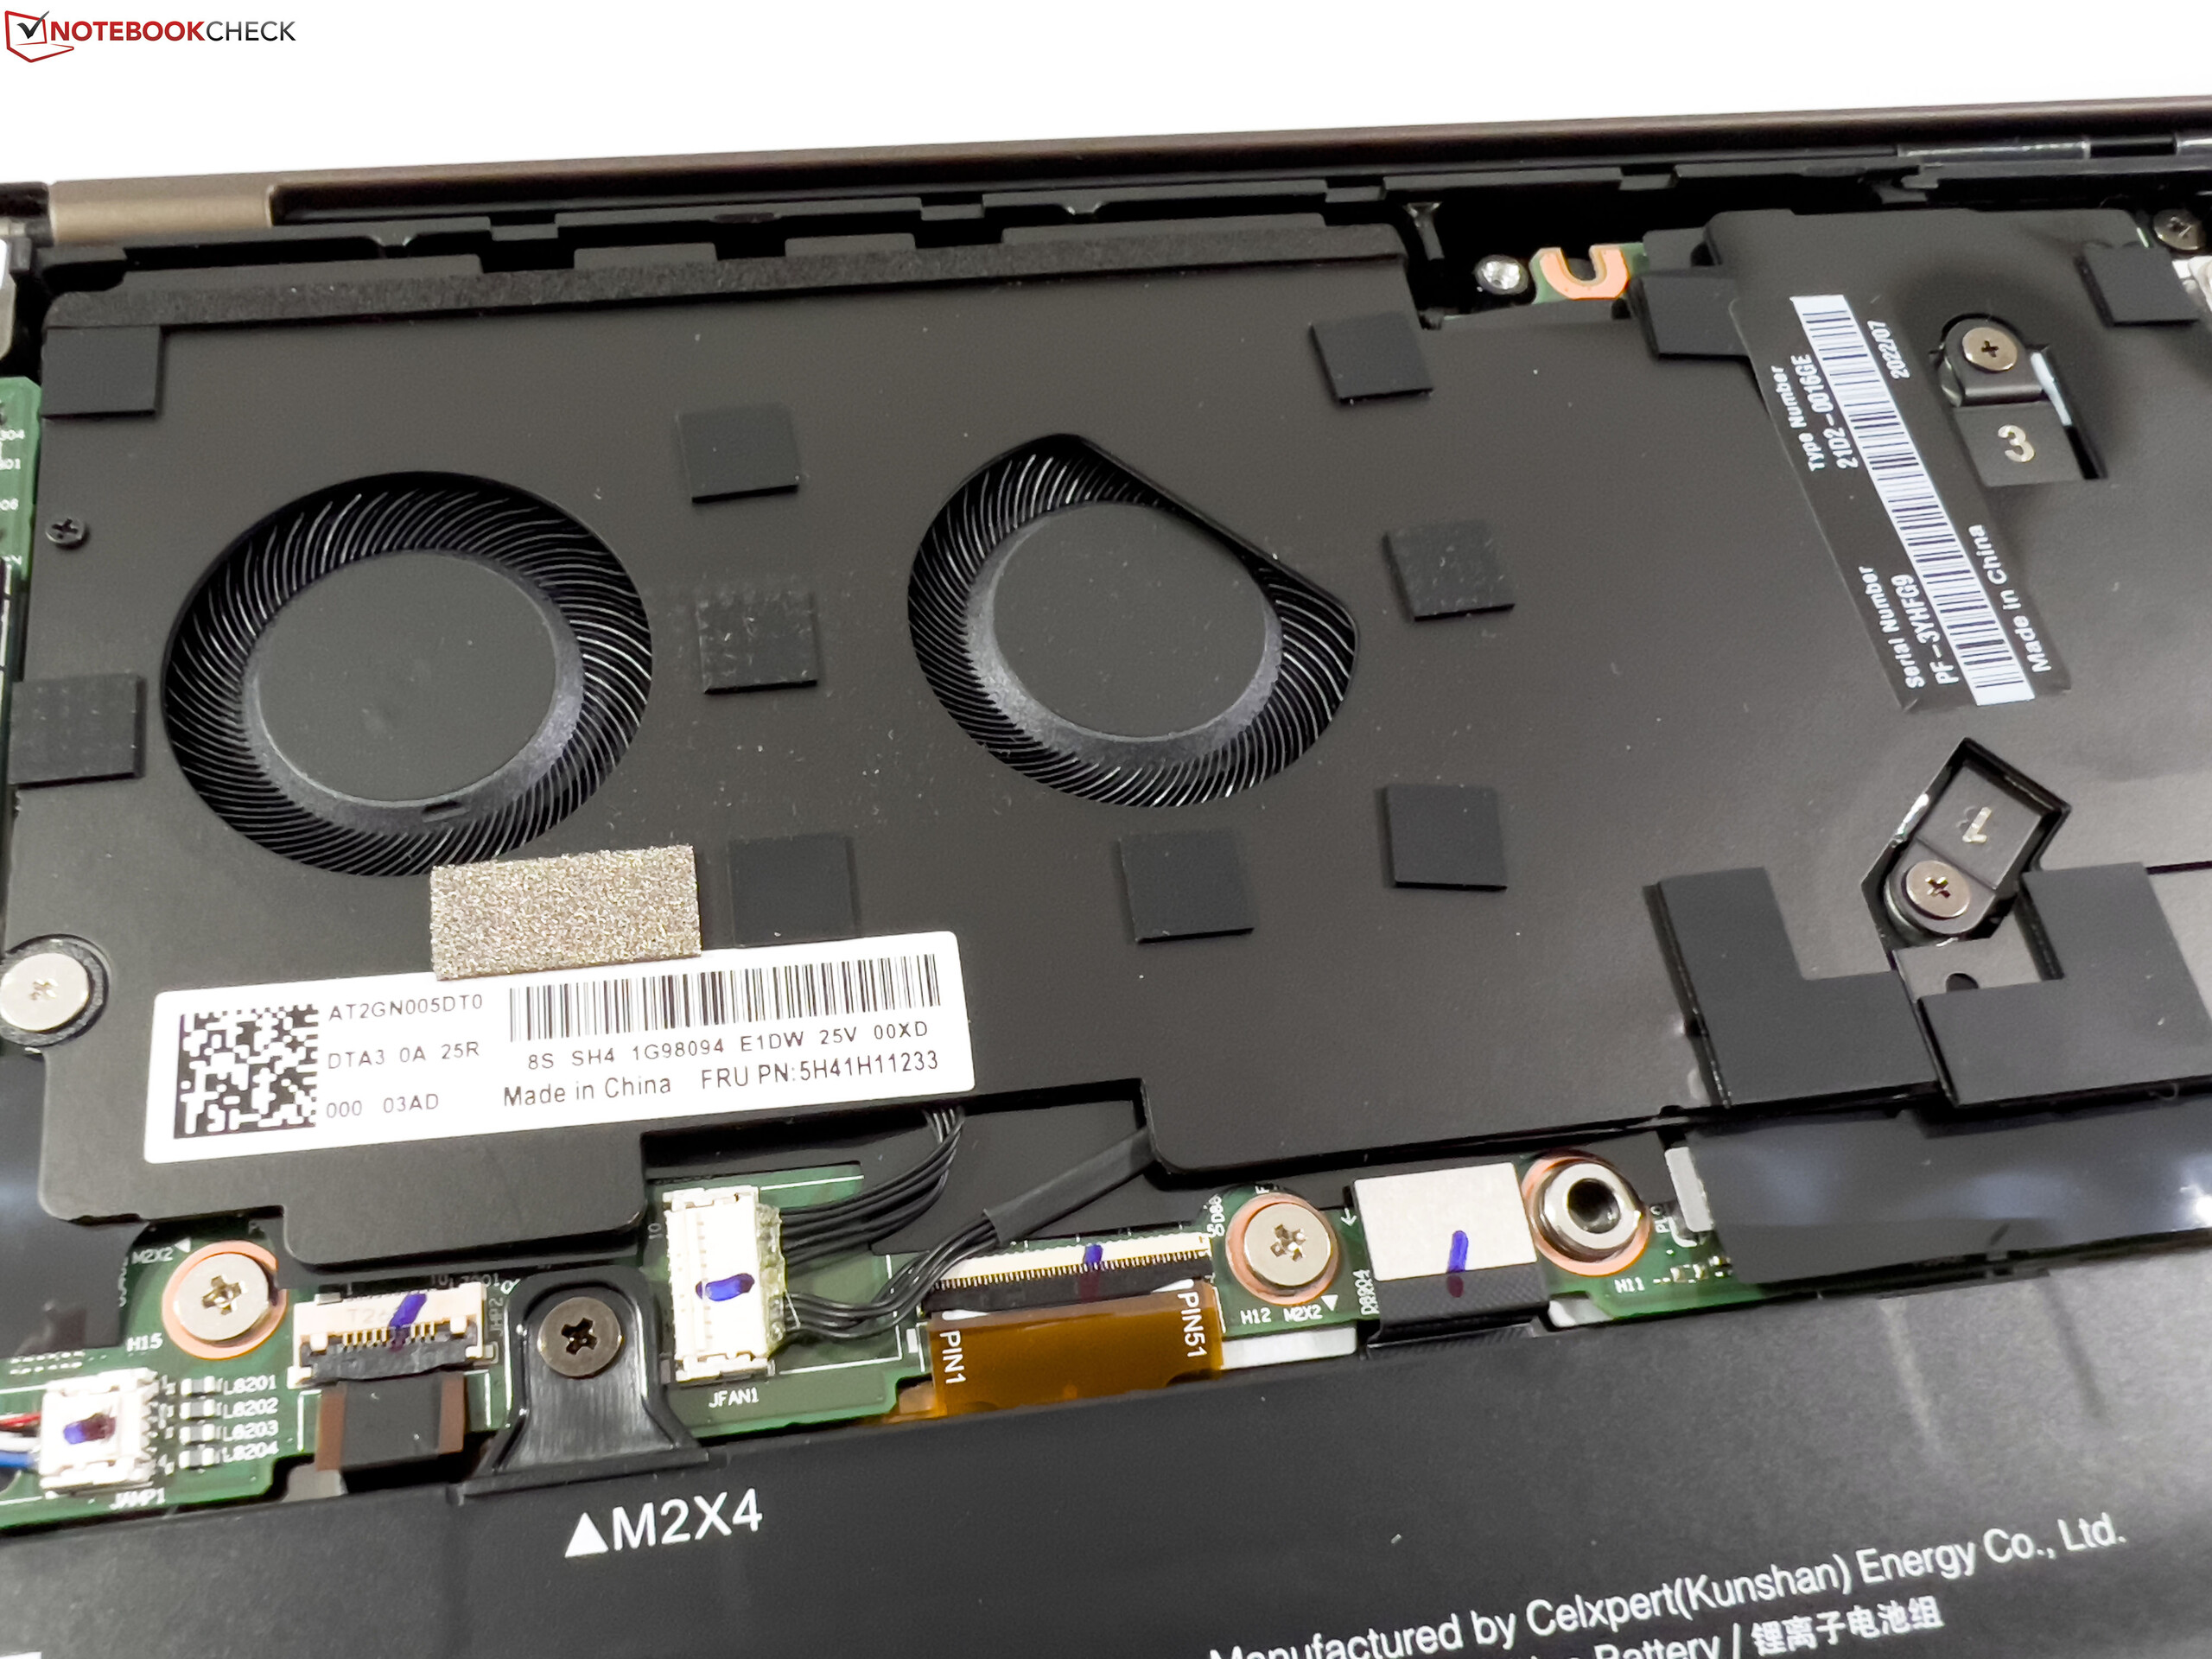
W ThinkPadzie Z13 zastosowano chłodzenie za pomocą dwóch niewielkich wentylatorów. Są one normalnie bezczynne i przy bardzo lekkich zadaniach są zwykle bezgłośne. Wentylatory uruchamiają się jednak czasem nawet podczas zwykłego przeglądania stron internetowych. Ze względu na wysokie wartości TDP wentylatory osiągają maksymalną prędkość obrotową niemal natychmiast pod zwiększonym obciążeniem, co odpowiada około 41 dB(A). Szum jest wyraźnie słyszalny, ale nie występują w nim irytujące częstotliwości. Nie udało nam się wykryć żadnych innych odgłosów pochodzenia elektronicznego.
Hałas
| luz |
| 24.3 / 24.3 / 24.3 dB |
| obciążenie |
| 41 / 41 dB |
 | ||
30 dB cichy 40 dB(A) słyszalny 50 dB(A) irytujący |
||
min: | ||
| Lenovo ThinkPad Z13 G1-21D20016GE Radeon 680M, R7 PRO 6860Z, Micron 2450 1TB MTFDKCD1T0TFK | Asus Zenbook S 13 OLED Radeon 680M, R7 6800U, Samsung PM9A1 MZVL21T0HCLR | Dell XPS 13 Plus 9320 i7-1280P OLED Iris Xe G7 96EUs, i7-1280P, WDC PC SN810 512GB | Lenovo ThinkPad Z13 21D2CTO1WW Radeon 660M, R5 PRO 6650U, Lenovo UMIS AM630 RPJTJ512MGE1QDQ | Lenovo ThinkPad T14 G3-21CF004NGE Radeon 680M, R7 PRO 6850U, Kioxia BG5 KBG5AZNV512G | |
|---|---|---|---|---|---|
| Noise | 3% | 5% | 5% | 5% | |
| wyłączone / środowisko * (dB) | 24.3 | 24 1% | 23.4 4% | 23.71 2% | 24.2 -0% |
| Idle Minimum * (dB) | 24.3 | 24 1% | 23.4 4% | 23.71 2% | 24.2 -0% |
| Idle Average * (dB) | 24.3 | 24 1% | 23.4 4% | 23.71 2% | 24.2 -0% |
| Idle Maximum * (dB) | 24.3 | 24 1% | 23.4 4% | 23.71 2% | 25.8 -6% |
| Load Average * (dB) | 41 | 33.1 19% | 35 15% | 32.35 21% | 32.2 21% |
| Witcher 3 ultra * (dB) | 41 | 40.2 2% | 41.6 -1% | 38.8 5% | 34.1 17% |
| Load Maximum * (dB) | 41 | 41.7 -2% | 39.9 3% | 39.53 4% | 38.8 5% |
* ... im mniej tym lepiej
Temperatura
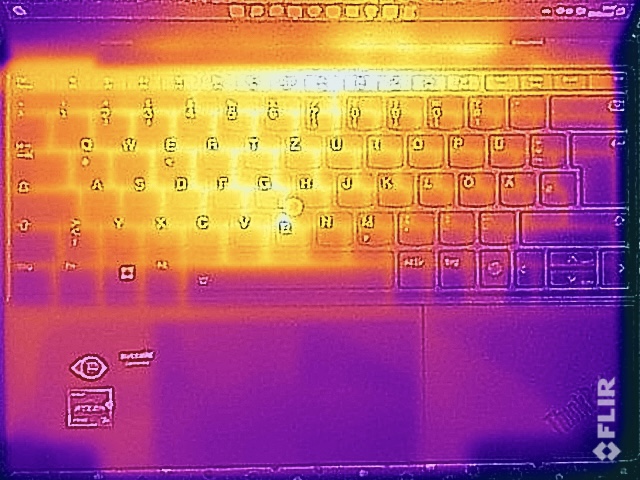
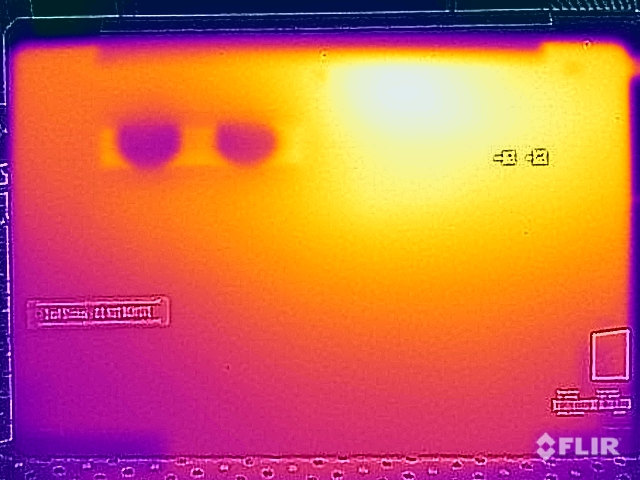
Temperatury powierzchni ThinkPada Z13 są pod niskim obciążeniem nieistotne, ale pod obciążeniem zmierzyliśmy wyższe wartości niż w przypadku model podstawowy. Nie jest to zaskakujące, gdyż chłodzenie jest identyczne i wentylatory również pracują na porównywalnym poziomie, ale TDP procesora jest wyższe. Temperatury na górnej powierzchni pokrywy mieszczą się w normalnych granicach nie przekraczając 45 °C i pozostają bezpieczne. W centralnym, górnym obszarze powierzchni spodniej zmierzyliśmy jednak ponad 50°C. Przy bezpośrednim kontakcie ze skórą może to szybko stać się niekomfortowe.
O ile pobór mocy Ryzena 7 Pro stabilizuje się na poziomie 27 W pod czystym obciążeniem procesora, o tyle w teście obciążeniowym z połączonym obciążeniem CPU/GPU wynosi tylko 19 W (w Z13 z Ryzenem 5 Pro było to około 14 W). Wobec tych niskich wartości temperatury powierzchni są już dość wysokie. Potrzeba kilku minut, zanim bezpośrednio po teście obciążeniowym znów będzie dostępna pełna moc.
(-) Maksymalna temperatura w górnej części wynosi 45.6 °C / 114 F, w porównaniu do średniej 35.9 °C / 97 F , począwszy od 21.4 do 59 °C dla klasy Subnotebook.
(-) Dno nagrzewa się maksymalnie do 51 °C / 124 F, w porównaniu do średniej 39.2 °C / 103 F
(+) W stanie bezczynności średnia temperatura górnej części wynosi 25.9 °C / 79 F, w porównaniu ze średnią temperaturą urządzenia wynoszącą 30.8 °C / ### class_avg_f### F.
(-) Podczas gry w Wiedźmina 3 średnia temperatura górnej części wynosi 38.9 °C / 102 F, w porównaniu do średniej temperatury urządzenia wynoszącej 30.8 °C / ## #class_avg_f### F.
(+) Podparcia dłoni i touchpad osiągają maksymalną temperaturę skóry (33 °C / 91.4 F) i dlatego nie są gorące.
(-) Średnia temperatura obszaru podparcia dłoni w podobnych urządzeniach wynosiła 28.2 °C / 82.8 F (-4.8 °C / -8.6 F).
| Lenovo ThinkPad Z13 G1-21D20016GE AMD Ryzen 7 PRO 6860Z, AMD Radeon 680M | Asus Zenbook S 13 OLED AMD Ryzen 7 6800U, AMD Radeon 680M | Apple MacBook Air M2 10C GPU Apple M2, Apple M2 10-Core GPU | Lenovo ThinkPad Z13 21D2CTO1WW AMD Ryzen 5 PRO 6650U, AMD Radeon 660M | Lenovo ThinkPad T14 G3-21CF004NGE AMD Ryzen 7 PRO 6850U, AMD Radeon 680M | Dell XPS 13 Plus 9320 4K Intel Core i7-1260P, Intel Iris Xe Graphics G7 96EUs | |
|---|---|---|---|---|---|---|
| Heat | -3% | 8% | -4% | 3% | 1% | |
| Maximum Upper Side * (°C) | 45.6 | 47.9 -5% | 44.7 2% | 44.9 2% | 48.2 -6% | 41.1 10% |
| Maximum Bottom * (°C) | 51 | 56.1 -10% | 44.6 13% | 44.3 13% | 52.8 -4% | 48.8 4% |
| Idle Upper Side * (°C) | 27 | 26.8 1% | 25.1 7% | 31.4 -16% | 24.4 10% | 28 -4% |
| Idle Bottom * (°C) | 27.9 | 27.3 2% | 25.3 9% | 31.5 -13% | 24.5 12% | 29.3 -5% |
* ... im mniej tym lepiej
Mówcy
Lenovo ThinkPad Z13 G1-21D20016GE analiza dźwięku
(±) | głośność głośnika jest średnia, ale dobra (77.6 dB)
Bas 100 - 315 Hz
(-) | prawie brak basu - średnio 15.4% niższa od mediany
(±) | liniowość basu jest średnia (9.5% delta do poprzedniej częstotliwości)
Średnie 400 - 2000 Hz
(+) | zbalansowane środki średnie - tylko 3.2% od mediany
(+) | średnie są liniowe (5.1% delta do poprzedniej częstotliwości)
Wysokie 2–16 kHz
(+) | zrównoważone maksima - tylko 3.1% od mediany
(+) | wzloty są liniowe (3.8% delta do poprzedniej częstotliwości)
Ogólnie 100 - 16.000 Hz
(+) | ogólny dźwięk jest liniowy (14.7% różnicy w stosunku do mediany)
W porównaniu do tej samej klasy
» 31% wszystkich testowanych urządzeń w tej klasie było lepszych, 5% podobnych, 64% gorszych
» Najlepszy miał deltę 5%, średnia wynosiła ###średnia###%, najgorsza wynosiła 53%
W porównaniu do wszystkich testowanych urządzeń
» 19% wszystkich testowanych urządzeń było lepszych, 4% podobnych, 77% gorszych
» Najlepszy miał deltę 4%, średnia wynosiła ###średnia###%, najgorsza wynosiła 134%
Apple MacBook Air M2 10C GPU analiza dźwięku
(+) | głośniki mogą odtwarzać stosunkowo głośno (82.7 dB)
Bas 100 - 315 Hz
(±) | zredukowany bas - średnio 12.2% niższy od mediany
(±) | liniowość basu jest średnia (12.6% delta do poprzedniej częstotliwości)
Średnie 400 - 2000 Hz
(+) | zbalansowane środki średnie - tylko 1.1% od mediany
(+) | średnie są liniowe (3.1% delta do poprzedniej częstotliwości)
Wysokie 2–16 kHz
(+) | zrównoważone maksima - tylko 2.4% od mediany
(+) | wzloty są liniowe (1.9% delta do poprzedniej częstotliwości)
Ogólnie 100 - 16.000 Hz
(+) | ogólny dźwięk jest liniowy (9.5% różnicy w stosunku do mediany)
W porównaniu do tej samej klasy
» 5% wszystkich testowanych urządzeń w tej klasie było lepszych, 2% podobnych, 93% gorszych
» Najlepszy miał deltę 5%, średnia wynosiła ###średnia###%, najgorsza wynosiła 53%
W porównaniu do wszystkich testowanych urządzeń
» 4% wszystkich testowanych urządzeń było lepszych, 1% podobnych, 95% gorszych
» Najlepszy miał deltę 4%, średnia wynosiła ###średnia###%, najgorsza wynosiła 134%
Pobór mocy
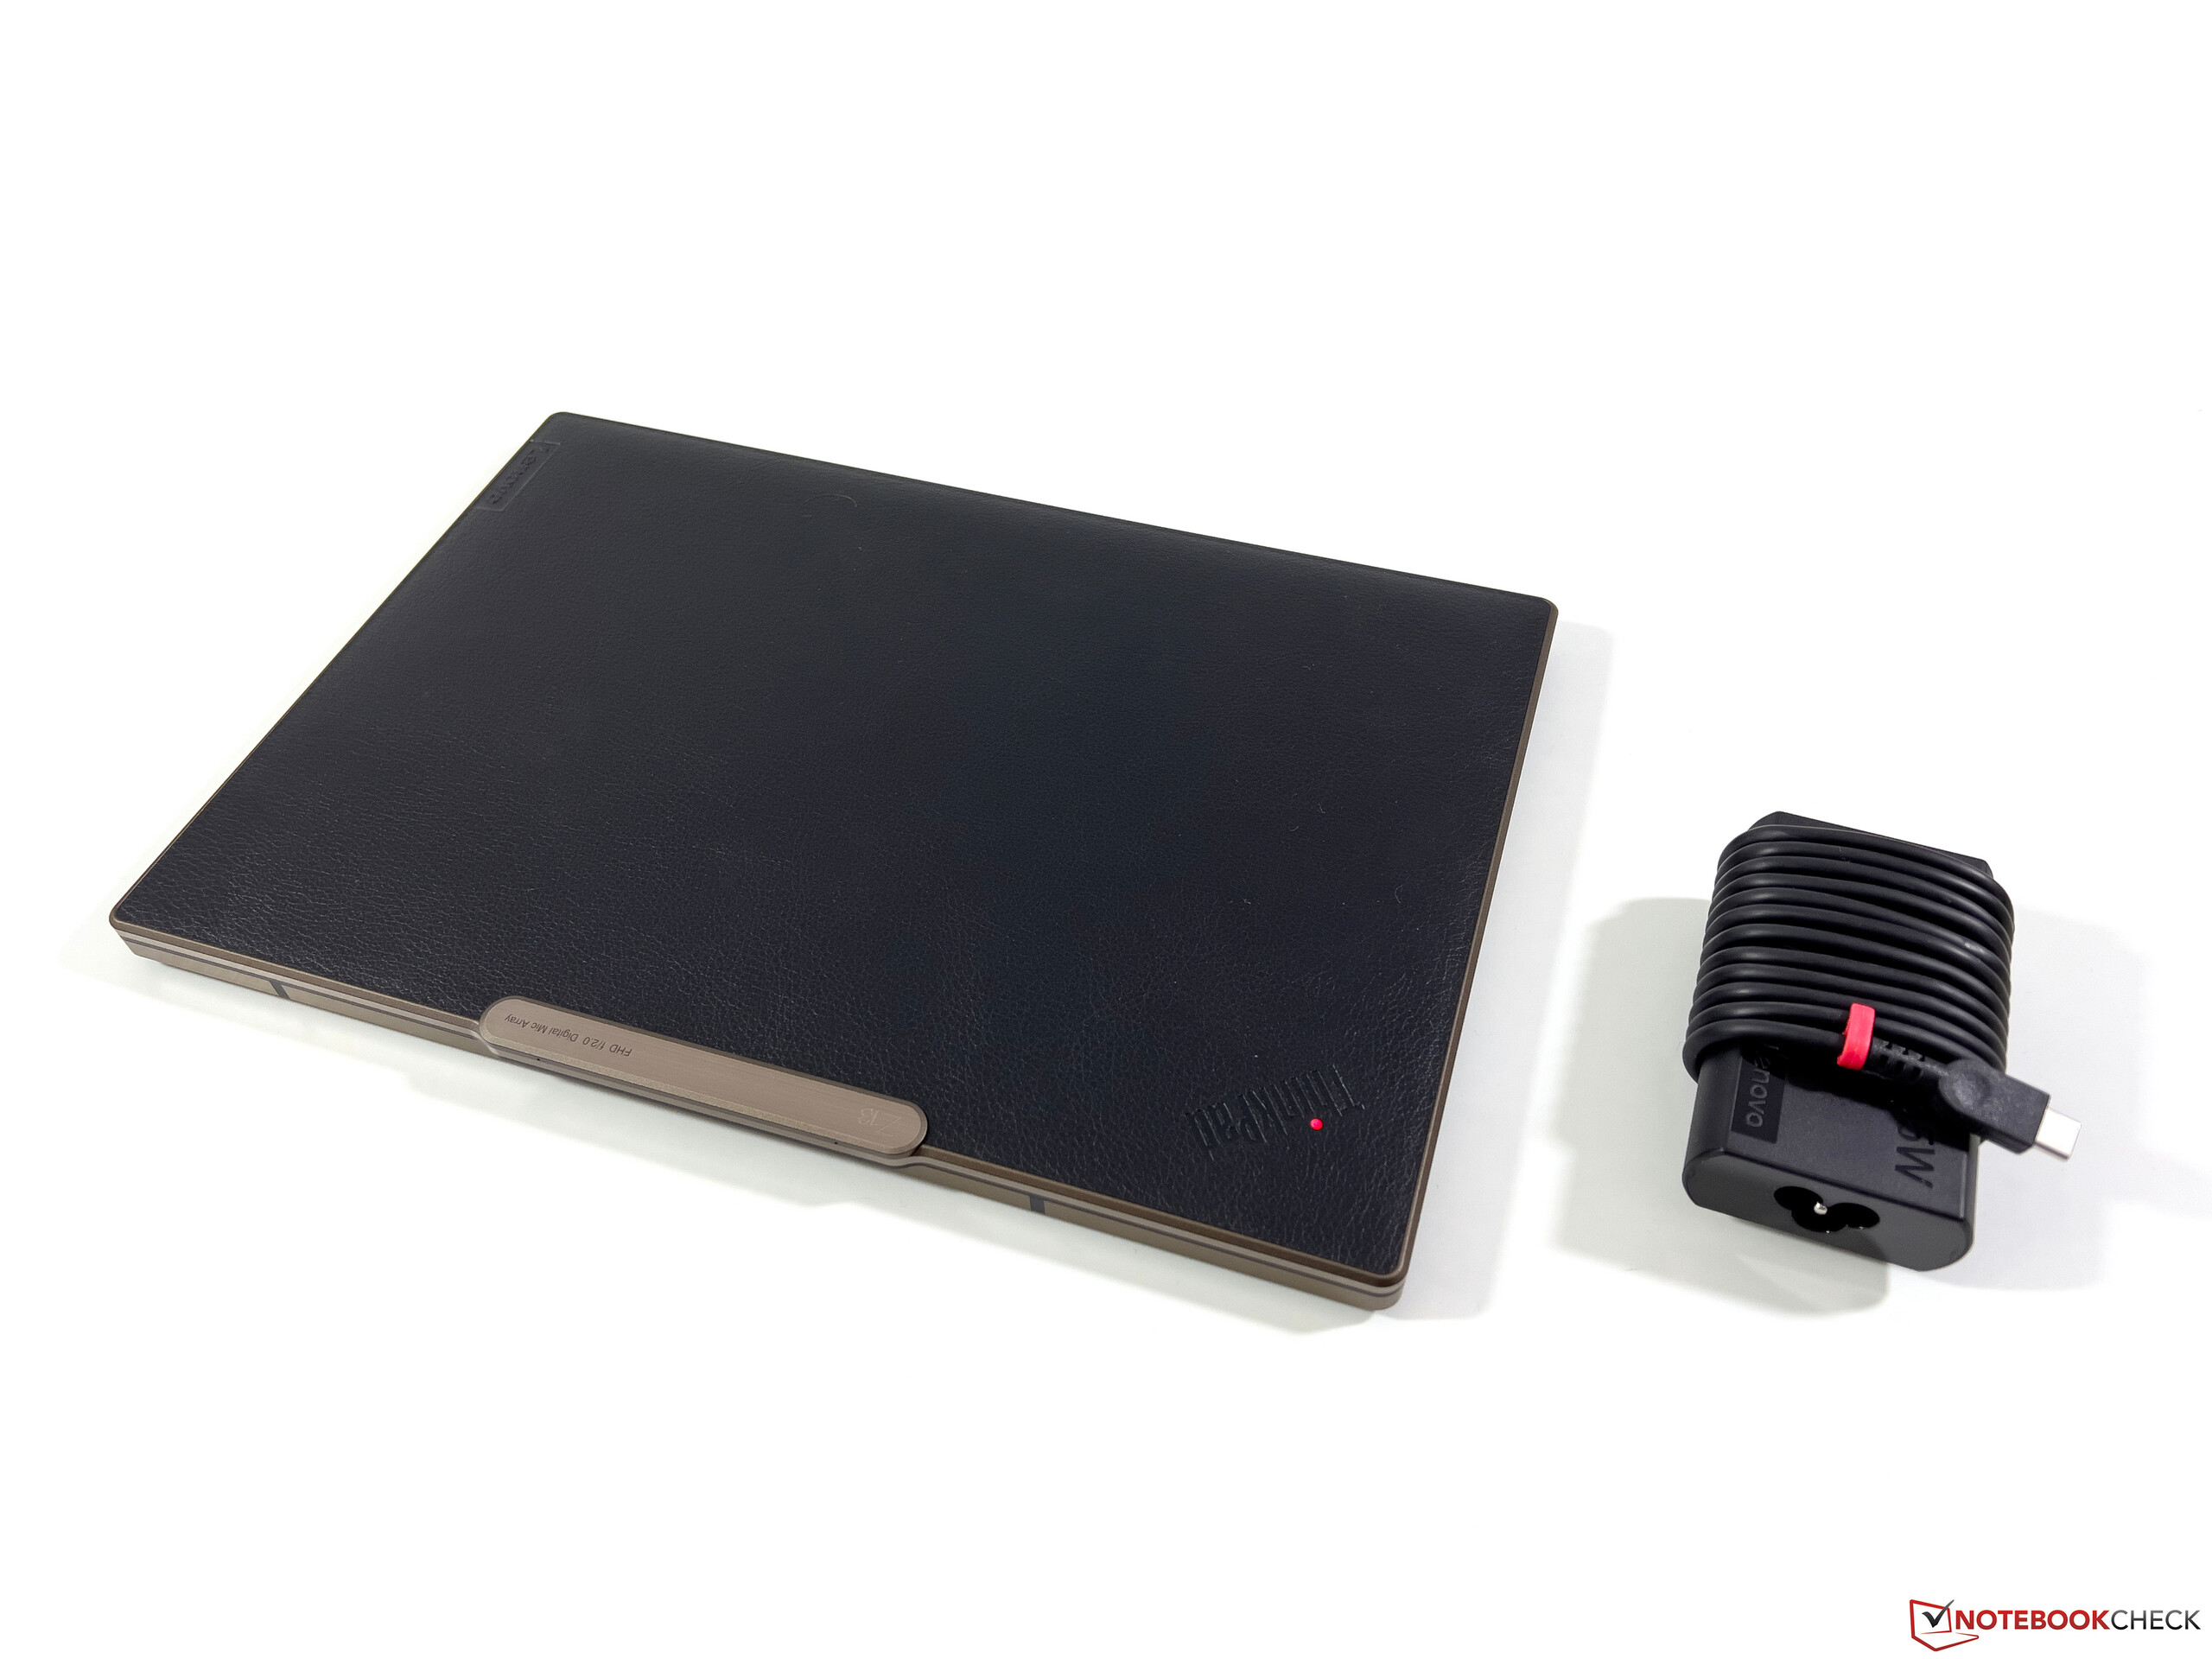
W pomiarach poboru mocy wpływ ekranu OLED jest wyraźnie zauważalny. Nawet przy dość ciemnym obrazie w tle zmierzyliśmy maksymalnie 8,4 W w stanie spoczynku, ale przy jasnym obrazie było to 11-12 W. Pod obciążeniem jest to maksymalnie około 63 W, choć wartość ta szybko spada do około 46 W przy ciągłym obciążeniu, a następnie stabilizuje się na poziomie około 30 W. Dołączony do zestawu 65-watowy zasilacz jest więc całkowicie wystarczający.
| wyłączony / stan wstrzymania | |
| luz | |
| obciążenie |
|
Legenda:
min: | |
Power Consumption Witcher 3 / Stresstest
Power Consumption external Monitor
Czas pracy na baterii
Ekran OLED znacznie skraca czas pracy na baterii, a nasz test WLAN obejmujący dużą liczbę stron internetowych przywołuje najgorszy scenariusz dla paneli OLED. Czasy pracy na akumulatorze są znacznie gorsze, niż w przypadku podstawowego modelu Z13 z panelem IPS, któremu udało się uzyskać ponad 10 godzin nawet przy pełnej jasności. Z kolei model OLED osiąga tylko 7,5 godziny przy 150 cd/m² i niecałe 6 godzin przy pełnej jasności SDR, a więc także znacznie krótszy czas pracy od Zenbooka S 13 z większym akumulatorem 67 Wh.
Pełne ładowanie trwa nieco ponad dwie godziny, gdy urządzenie jest włączone; 80% pojemności jest ponownie dostępne po około 64 minutach.
| Battery Runtime | |
| WiFi Websurfing | |
| Apple MacBook Air M2 10C GPU | |
| Lenovo ThinkPad Z13 21D2CTO1WW | |
| Średnia w klasie Subnotebook (7.25 - 26.4, n=59, ostatnie 2 lata) | |
| Asus Zenbook S 13 OLED | |
| Lenovo ThinkPad Z13 G1-21D20016GE | |
| Dell XPS 13 Plus 9320 i7-1280P OLED | |
| WiFi Websurfing max. Brightness | |
| Lenovo ThinkPad Z13 21D2CTO1WW | |
| Średnia w klasie Subnotebook (4.82 - 15.8, n=33, ostatnie 2 lata) | |
| Asus Zenbook S 13 OLED | |
| Apple MacBook Air M2 10C GPU | |
| Lenovo ThinkPad Z13 G1-21D20016GE | |
Za
Przeciw
Werdykt - ThinkPad Z13 stawia kilka pytań
Po przetestowaniu wysokowydajnej wersji ThinkPada Z13 zastanawiamy się, czy to rzeczywiście nadal laptop biznesowy, czy to rzeczywiście nadal ThinkPad. W konfiguracji z ekranem OLED i skórzaną pokrywą jest to w efekcie idealny konkurent dla konsumenckiego modelu Asus Zenbook S 13. Co więcej, trzeba się obejść bez niektórych cech typowych dla ThinkPadów. Należą do nich ograniczony kąt otwarcia wyświetlacza, pominięcie gniazda na blokadę Kensington Lock, a także zmieniony układ przycisków, w którym nie ma dedykowanych przycisków Page Up i Page Off. Największym problemem dla wieloletnich użytkowników ThinkPadów jest jednak eliminacja dedykowanych klawiszy TrackPoint. Możemy mieć tylko nadzieję, że Lenovo nie przyjmie tego rozwiązania do innych serii modelowych.
Sam notebook okazuje się przekonujący do codziennego użytku dzięki wysokiej jakości obudowie, świetnej klawiaturze i szklanemu touchpadowi, a także doskonałej wydajności systemu. Trzeba jednak poważnie zastanowić się, dlaczego Ryzen 7 Pro 6860Z w ogóle istnieje jako procesor, skoro w efekcie jest to zwykły 6850U. I choć wysoki limit mocy zapewnia dobre wyniki w benchmarkach, to prowadzi też do większej aktywności wentylatorów i niespójności wydajności. Przede wszystkim wydajność grafiki ma tendencję do bycia nieco nieregularną pod stałym obciążeniem, co nie dotyczy innych urządzeń, takich jak ThinkPad T14 G3 czy Asus Zenbook S 13. Ekran OLED o wyjątkowo wysokim współczynniku kontrastu zasadniczo zapewnia bardzo dobrą jakość obrazu, ale w jasnych miejscach zauważalny jest lekki efekt siatki. Występuje migotanie PWM, a ekran OLED mocno czerpie z akumulatora
Dzięki panelowi OLED i zastosowaniu imitacji skóry model ThinkPad Z13 z wyższej półki wygląda bardziej jak element mody niż laptop biznesowy. Ogólnie rzecz biorąc, jest to bardzo dobry subnotebook, ale niekoniecznie bardzo dobry notebook biznesowy.
Do produktywnych zastosowań ThinkPad Z13 z regularnym panelem IPS jest lepszym wyborem, gdyż pozwala na znacznie dłuższe czasy pracy na akumulatorze. Jeśli jako użytkownik ThinkPada korzystałeś i lubiłeś TrackPoint, powinieneś wypróbować nowego Z13 przed zakupem, gdyż pominięcie dedykowanych klawiszy TrackPoint będzie dla wielu użytkowników powodem do rezygnacji z zakupu. Z drugiej strony, jeśli szukacie subnotebooka z panelem OLED i procesorem AMD, powinniście przyjrzeć się modelowi Asus Zenbook S13, który ma dobrą klawiaturę, stabilniejszą wydajność i programowe rozwiązanie dla irytującego migotania PWM. To po prostu lepszy pakiet ogólny.
Cena i dostępność
ThinkPad Z13 z procesorem AMD Ryzen 7 Pro 6860Z może być skonfigurowany na stronie Lenovo przy czym ceny zaczynają się od około 2700 euro (2700 USD).
Lenovo ThinkPad Z13 G1-21D20016GE
- 28/10/2022 v7 (old)
Andreas Osthoff
Price comparison

