Recenzja Lenovo ThinkPad T14 G3: Biznesowy laptop jest lepszy dzięki AMD Ryzen Pro
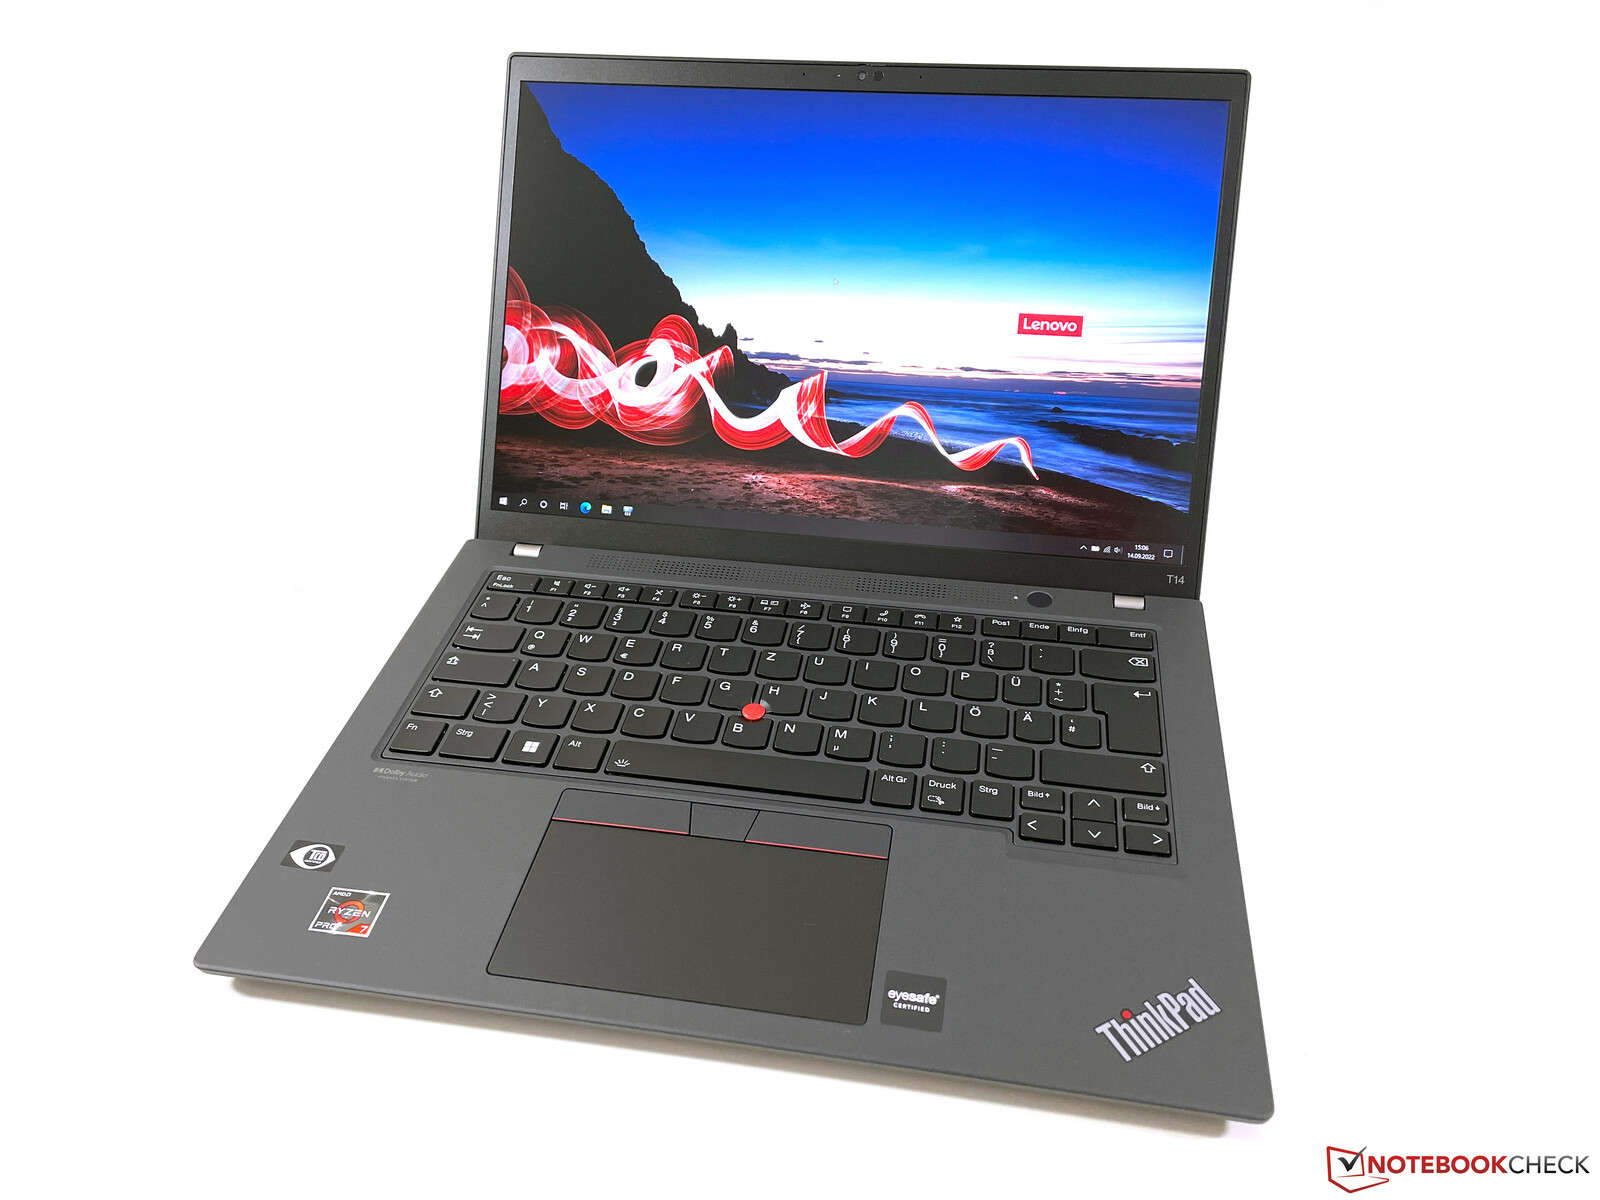
ThinkPad T14 i jego poprzednicy od wielu lat należą do najpopularniejszych i najlepszych 14-calowych laptopów biznesowych. Teraz Lenovo wprowadza gruntowny redesign w nowym T14 G3, w tym nową obudowę, która po raz kolejny została wyposażona w panel 16:10. Producent nadal oferuje modele z procesorami AMD i Intel, ale różnice sięgają nieco dalej, czego szczegóły techniczne poznamy w trakcie naszej recenzji.
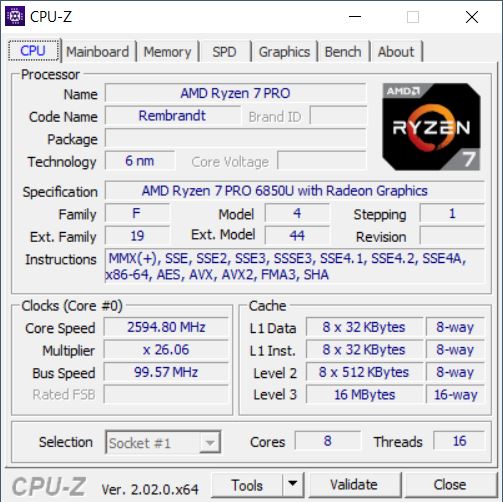
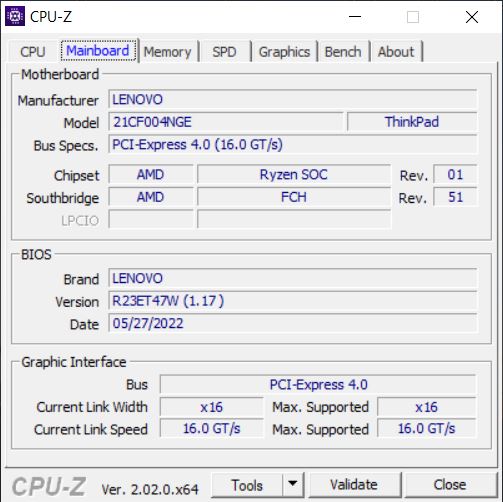
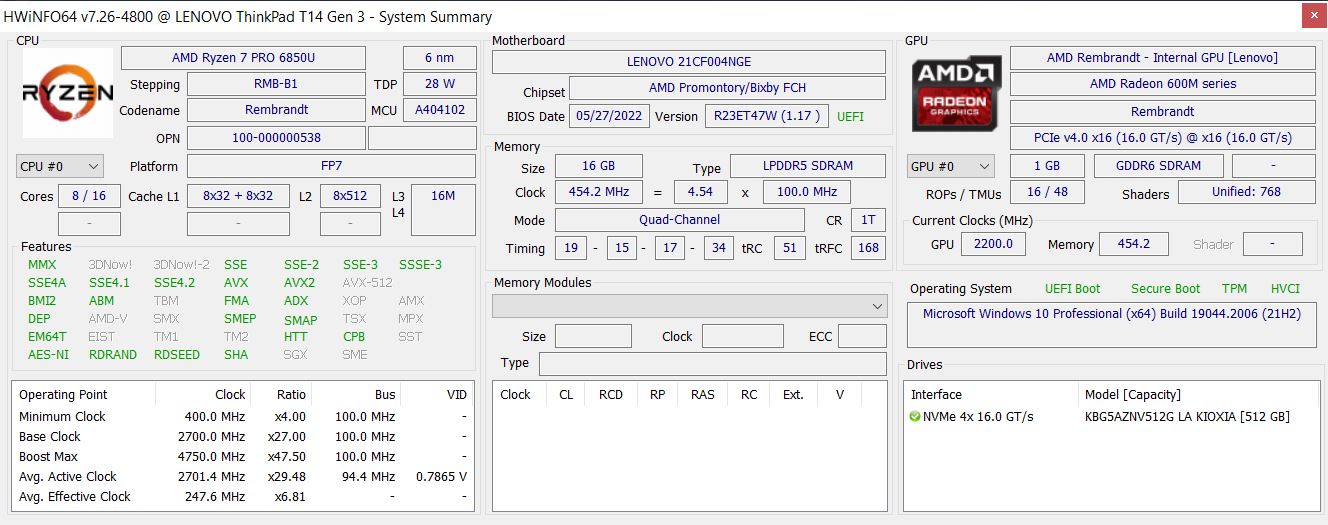
Naszym samplem recenzenckim jest model ThinkPad T14 G3-21CF004NGE z.AMD Ryzen 7 Pro 6850U, zintegrowanym Radeon-680M-GPU, 16 GB pamięci RAM LPDDR5-6400, dysk SSD PCIe 4.0 o pojemności 512 GB oraz 14-calowy wyświetlacz w formacie 16:10 o rozdzielczości 1920x1200. RRP dla tej konfiguracji wynosi 1,859 euro (~1,800 dolarów) lub 1,649 euro (~1,596 dolarów) za identyczny model Campus.
Ceny podstawowego modelu, czyli T14 G3 AMD z procesorem Ryzen 5 Pro 6650U, różnią się w zależności od kraju (więcej szczegółów w sekcji "Cena i dostępność" na końcu niniejszej recenzji). Na przykład w USA cena początkowa wynosi 1 038,95 USD. W przypadku wariantu Intela z procesorem Core i5-1235U, jest to 1 054,50 USD.
Potencjalni konkurenci w porównaniu
Ocena | Data | Model | Waga | Wysokość | Rozmiar | Rezolucja | Cena |
|---|---|---|---|---|---|---|---|
| 88.8 % v7 (old) | 09/2022 | Lenovo ThinkPad T14 G3-21CF004NGE R7 PRO 6850U, Radeon 680M | 1.4 kg | 17.9 mm | 14.00" | 1920x1200 | |
| 90.1 % v7 (old) | Dell Latitude 7420 JW6MH i5-1145G7, Iris Xe G7 80EUs | 1.3 kg | 17.3 mm | 14.00" | 1920x1080 | ||
| 90.3 % v7 (old) | 10/2022 | Huawei MateBook X Pro 2022 i7-1260P, Iris Xe G7 96EUs | 1.3 kg | 15.6 mm | 14.20" | 3120x2080 | |
| 88.6 % v7 (old) | HP EliteBook 845 G9 6F6H6EA R9 PRO 6950HS, Radeon 680M | 1.5 kg | 19.3 mm | 14.00" | 1920x1200 | ||
| 88.1 % v7 (old) | Lenovo ThinkPad T14 Gen2-20W1S00000 i7-1165G7, GeForce MX450 | 1.5 kg | 17.9 mm | 14.00" | 1920x1080 | ||
| 90.1 % v7 (old) | Lenovo ThinkPad T14s G2 20XGS01100 R7 PRO 5850U, Vega 8 | 1.3 kg | 16.14 mm | 14.00" | 1920x1080 |
Obudowa - ThinkPad z włókna węglowego i magnezu
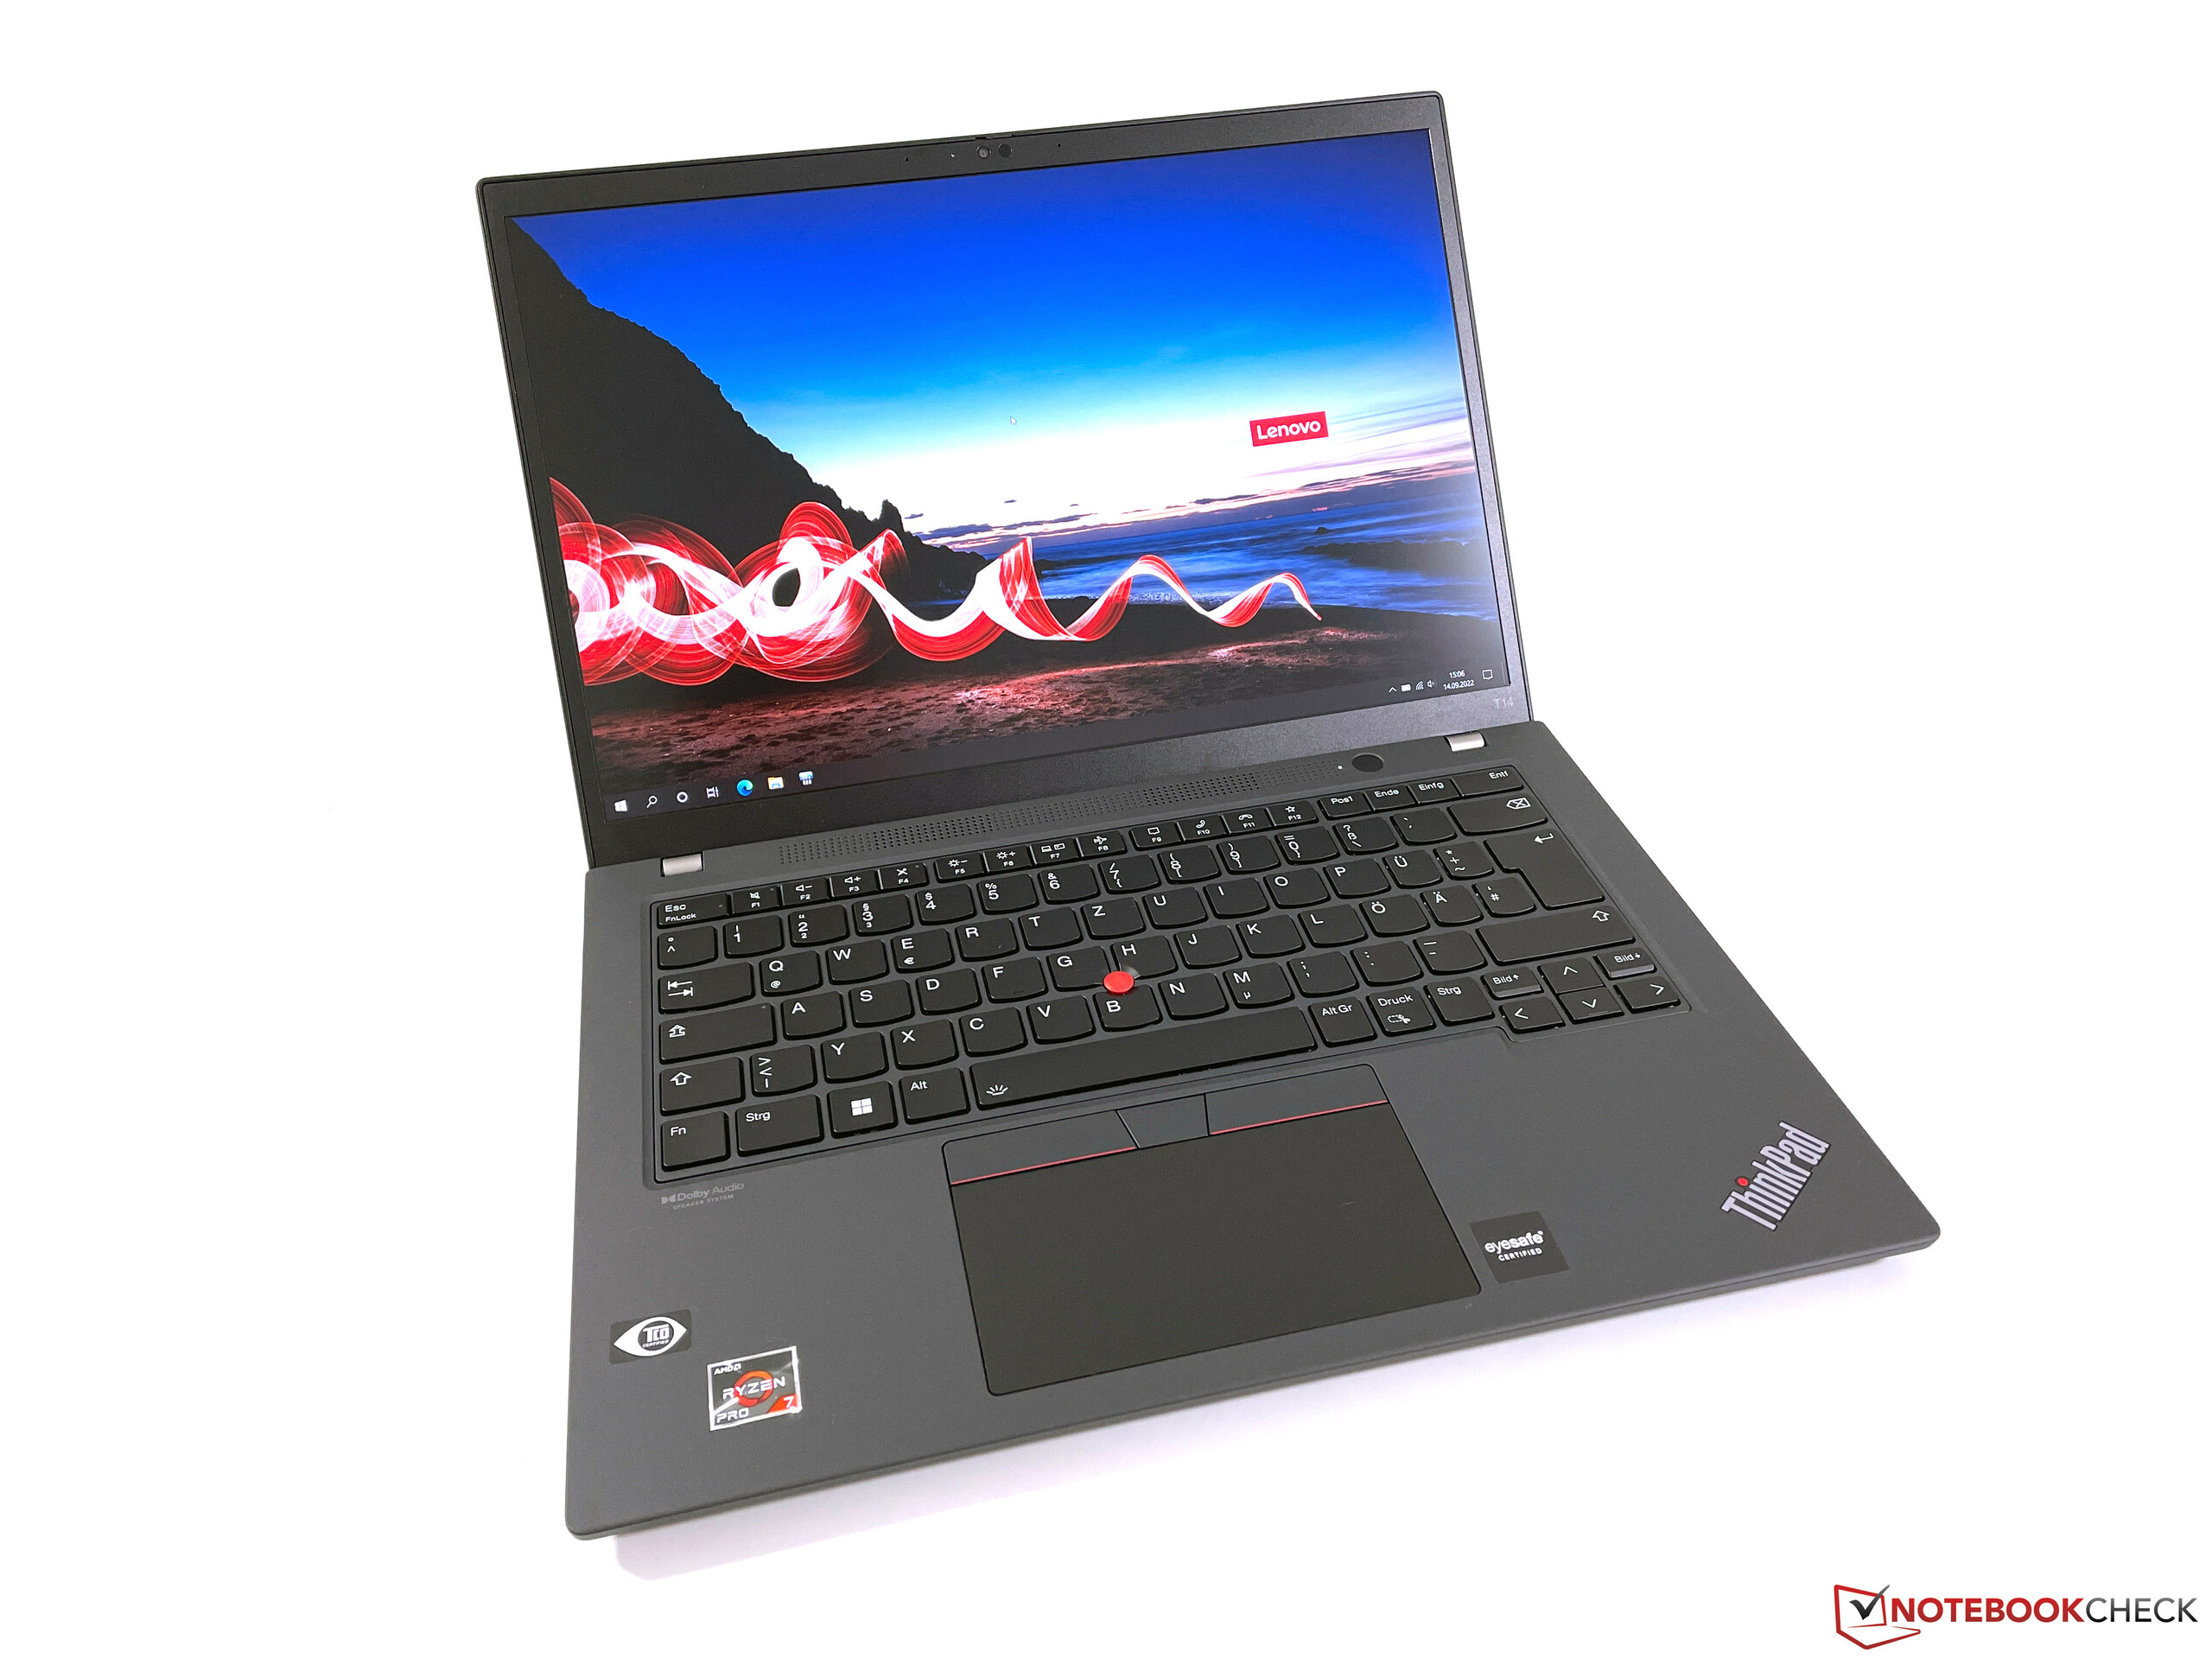
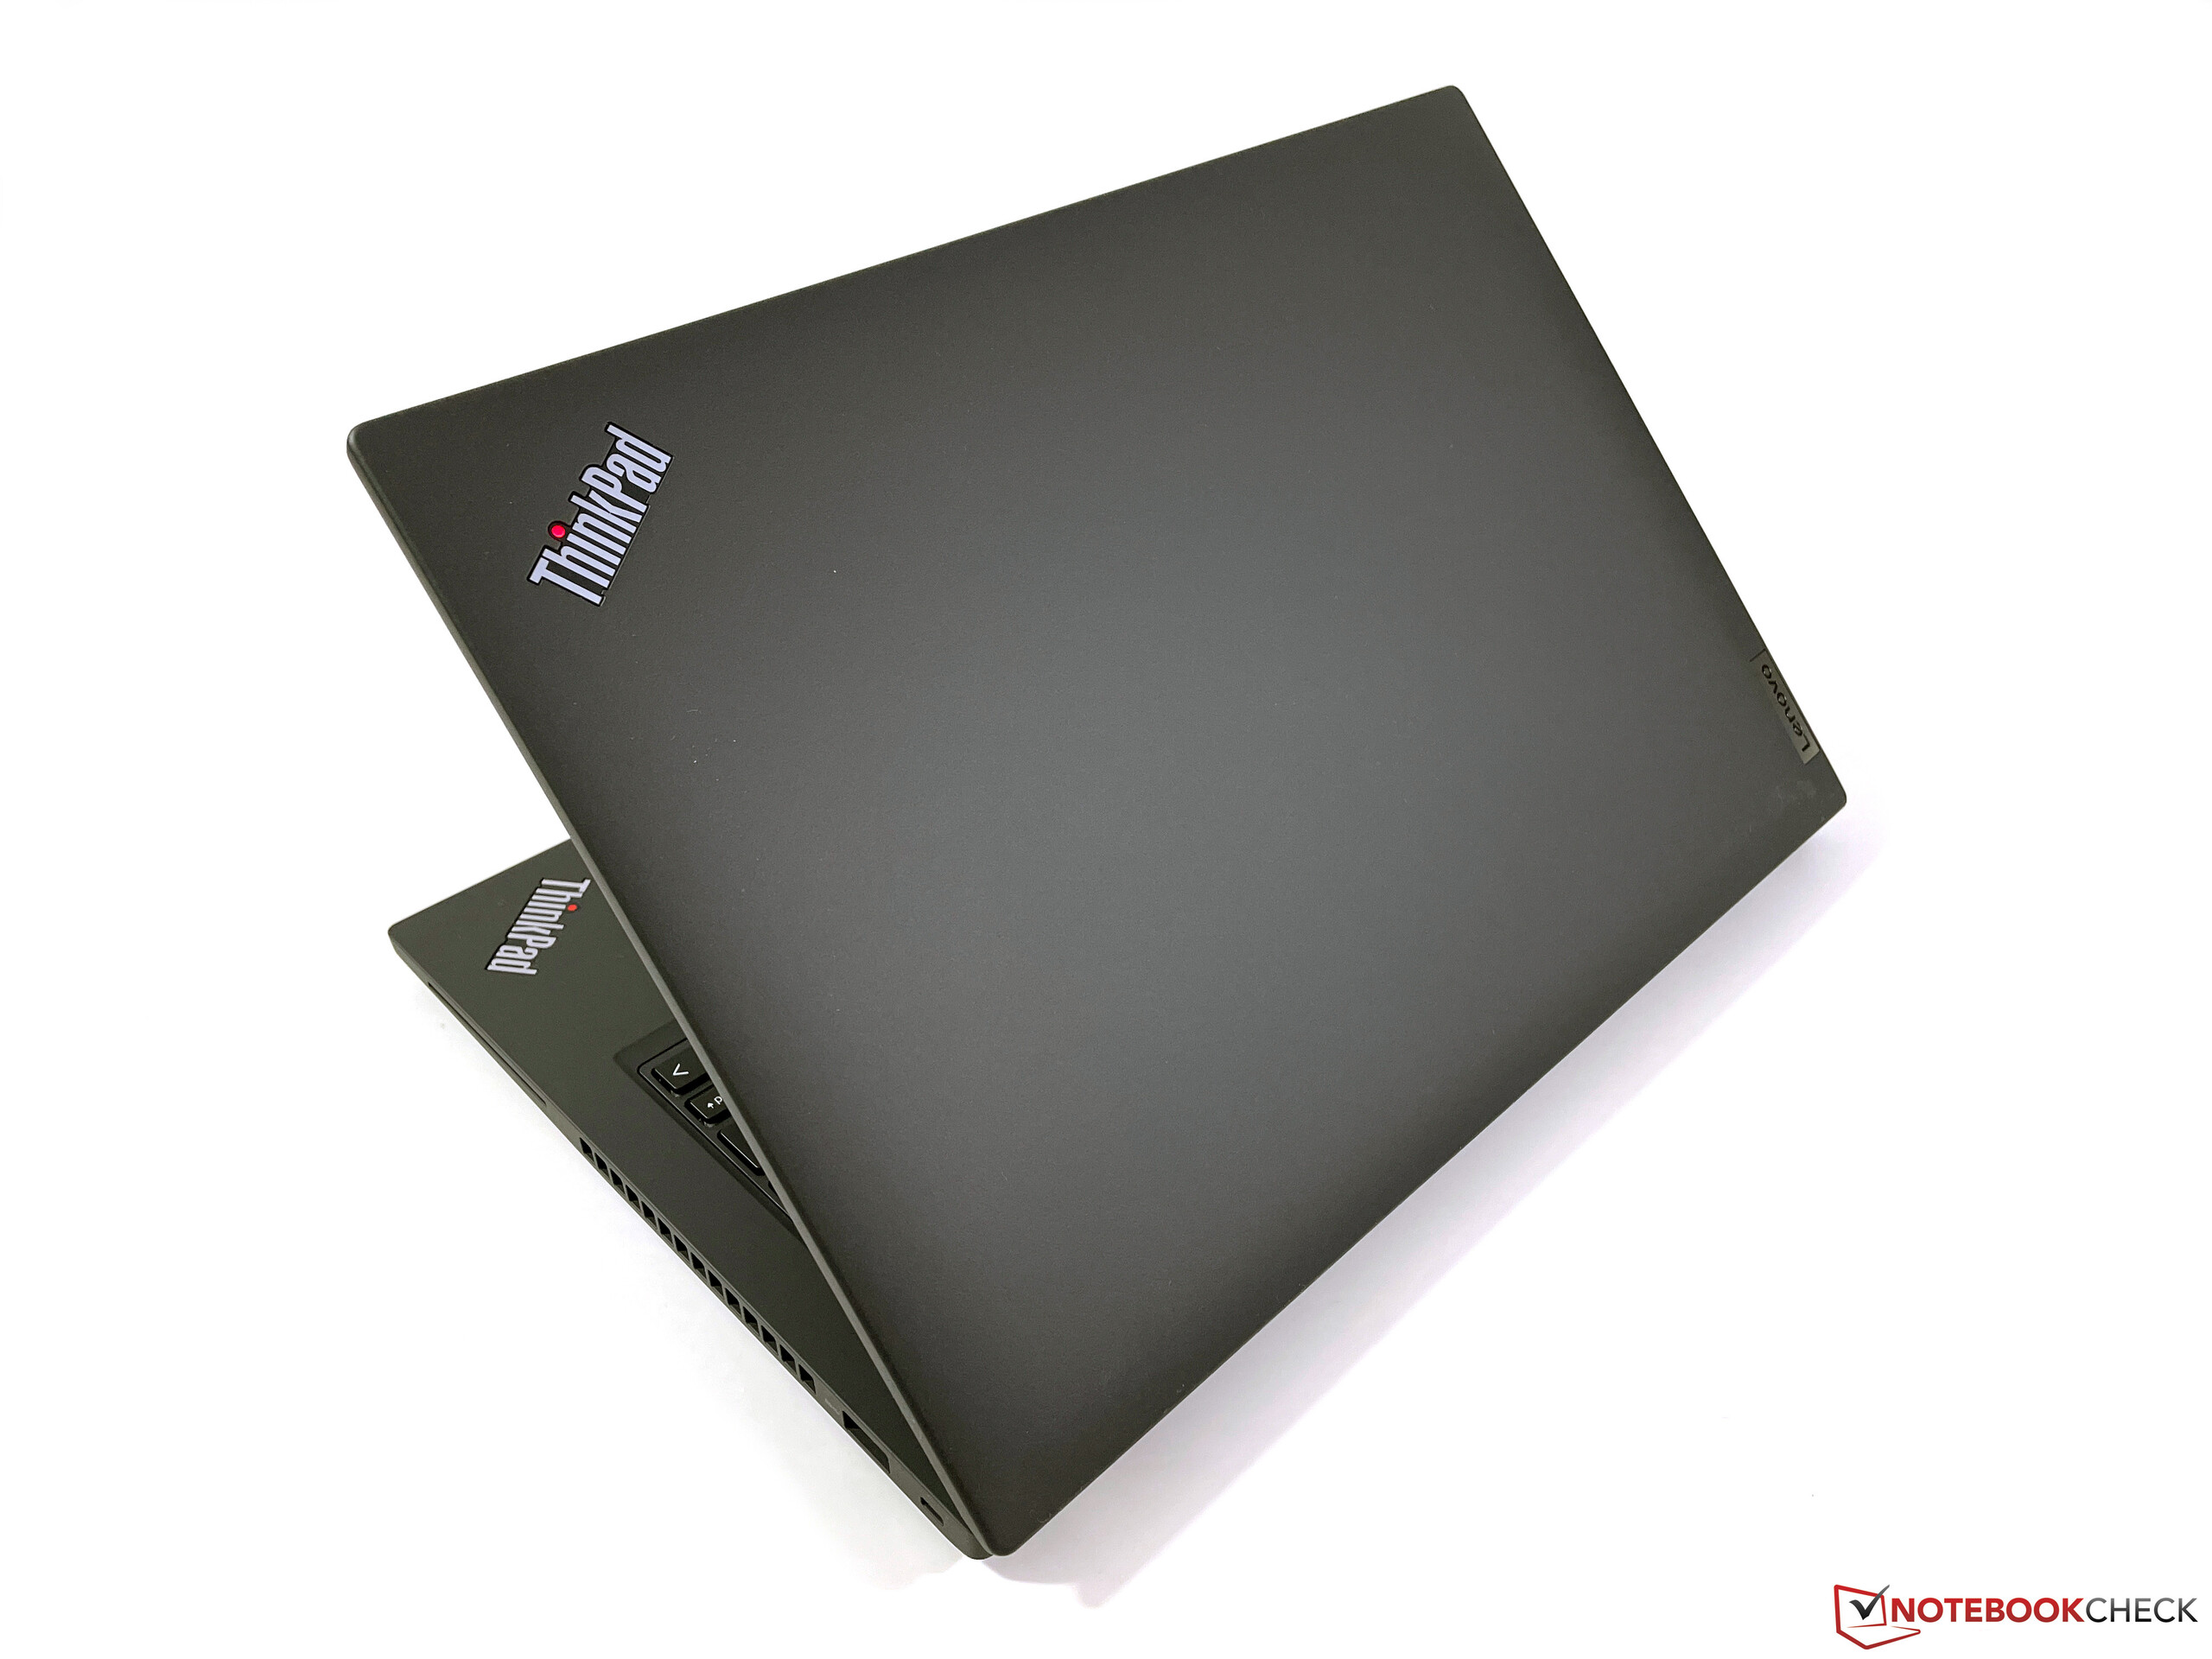
Mimo nowej obudowy, Lenovo nie zmieniło zasadniczej konstrukcji, dzięki czemu nowy T14 G3 jest od razu rozpoznawalny jako ThinkPad. Mimo to są dwie duże różnice w stosunku do poprzednika Lenovo ThinkPad T14 Gen 2 laptop review: Familiar benefits from Intel Tiger Lake : Obudowa ma teraz bardziej antracytowy kolor, czyli jest nieco jaśniejsza niż poprzednio, dzięki czemu widać kontrast z czarnymi urządzeniami wejścia. Ponadto od razu rzucają się w oczy cieńsze krawędzie ekranu; zwłaszcza bardzo szeroka dolna krawędź należy już do przeszłości. W porównaniu ze współczesnymi laptopami konsumenckimi krawędzie są nadal dość szerokie - 8 mm po bokach oraz 14 mm powyżej i poniżej panelu, ale urządzenie wygląda teraz ogólnie znacznie nowocześniej. Oprócz czarno-antracytowego wariantu kolorystycznego Lenovo oferuje również srebrny wariant ze srebrnymi urządzeniami wejściowymi.
Do wykonania obudowy użyto mieszanki materiałów. Na przykład w podstawie zastosowano połączenie włókna szklanego i magnezu, a w pokrywie - tworzywo sztuczne wzmocnione włóknem szklanym. Powierzchnie są minimalnie chropowate czy aksamitne, ale pozytywnym aspektem jest to, że podczas naszego przeglądu mieliśmy znacznie mniej problemów z odciskami palców niż w przypadku wielu innych ThinkPadów.
Stabilność jednostki zasadniczej jest dobra, ale nie wybitna. Środkowy obszar klawiatury można widocznie wcisnąć przy użyciu niewielkiej siły, ale w praktyce nie przekłada się to na ograniczenia, nawet w przypadku bardzo energicznych maszynistów. Lekkie odgłosy skrzypienia były słyszalne przy poddawaniu jednostki zasadniczej obciążeniom skrętnym. Dwa zawiasy zapewniają bardzo dobrą stabilność i skutecznie zapobiegają drżeniu ekranu, ale są też bardzo ciasne - zmiana kąta otwarcia (maksymalnie 180 stopni) jedną ręką jest praktycznie niemożliwa, nie mówiąc już o otwieraniu pokrywy jedną ręką. Stabilność samej pokrywy jest znakomita, bo praktycznie nie da się jej wygiąć (nie zarejestrowano tu żadnych odgłosów skrzypienia) i nie udało nam się wywołać żadnych błędów obrazu nawet przy selektywnym wywieraniu nacisku na plecy.
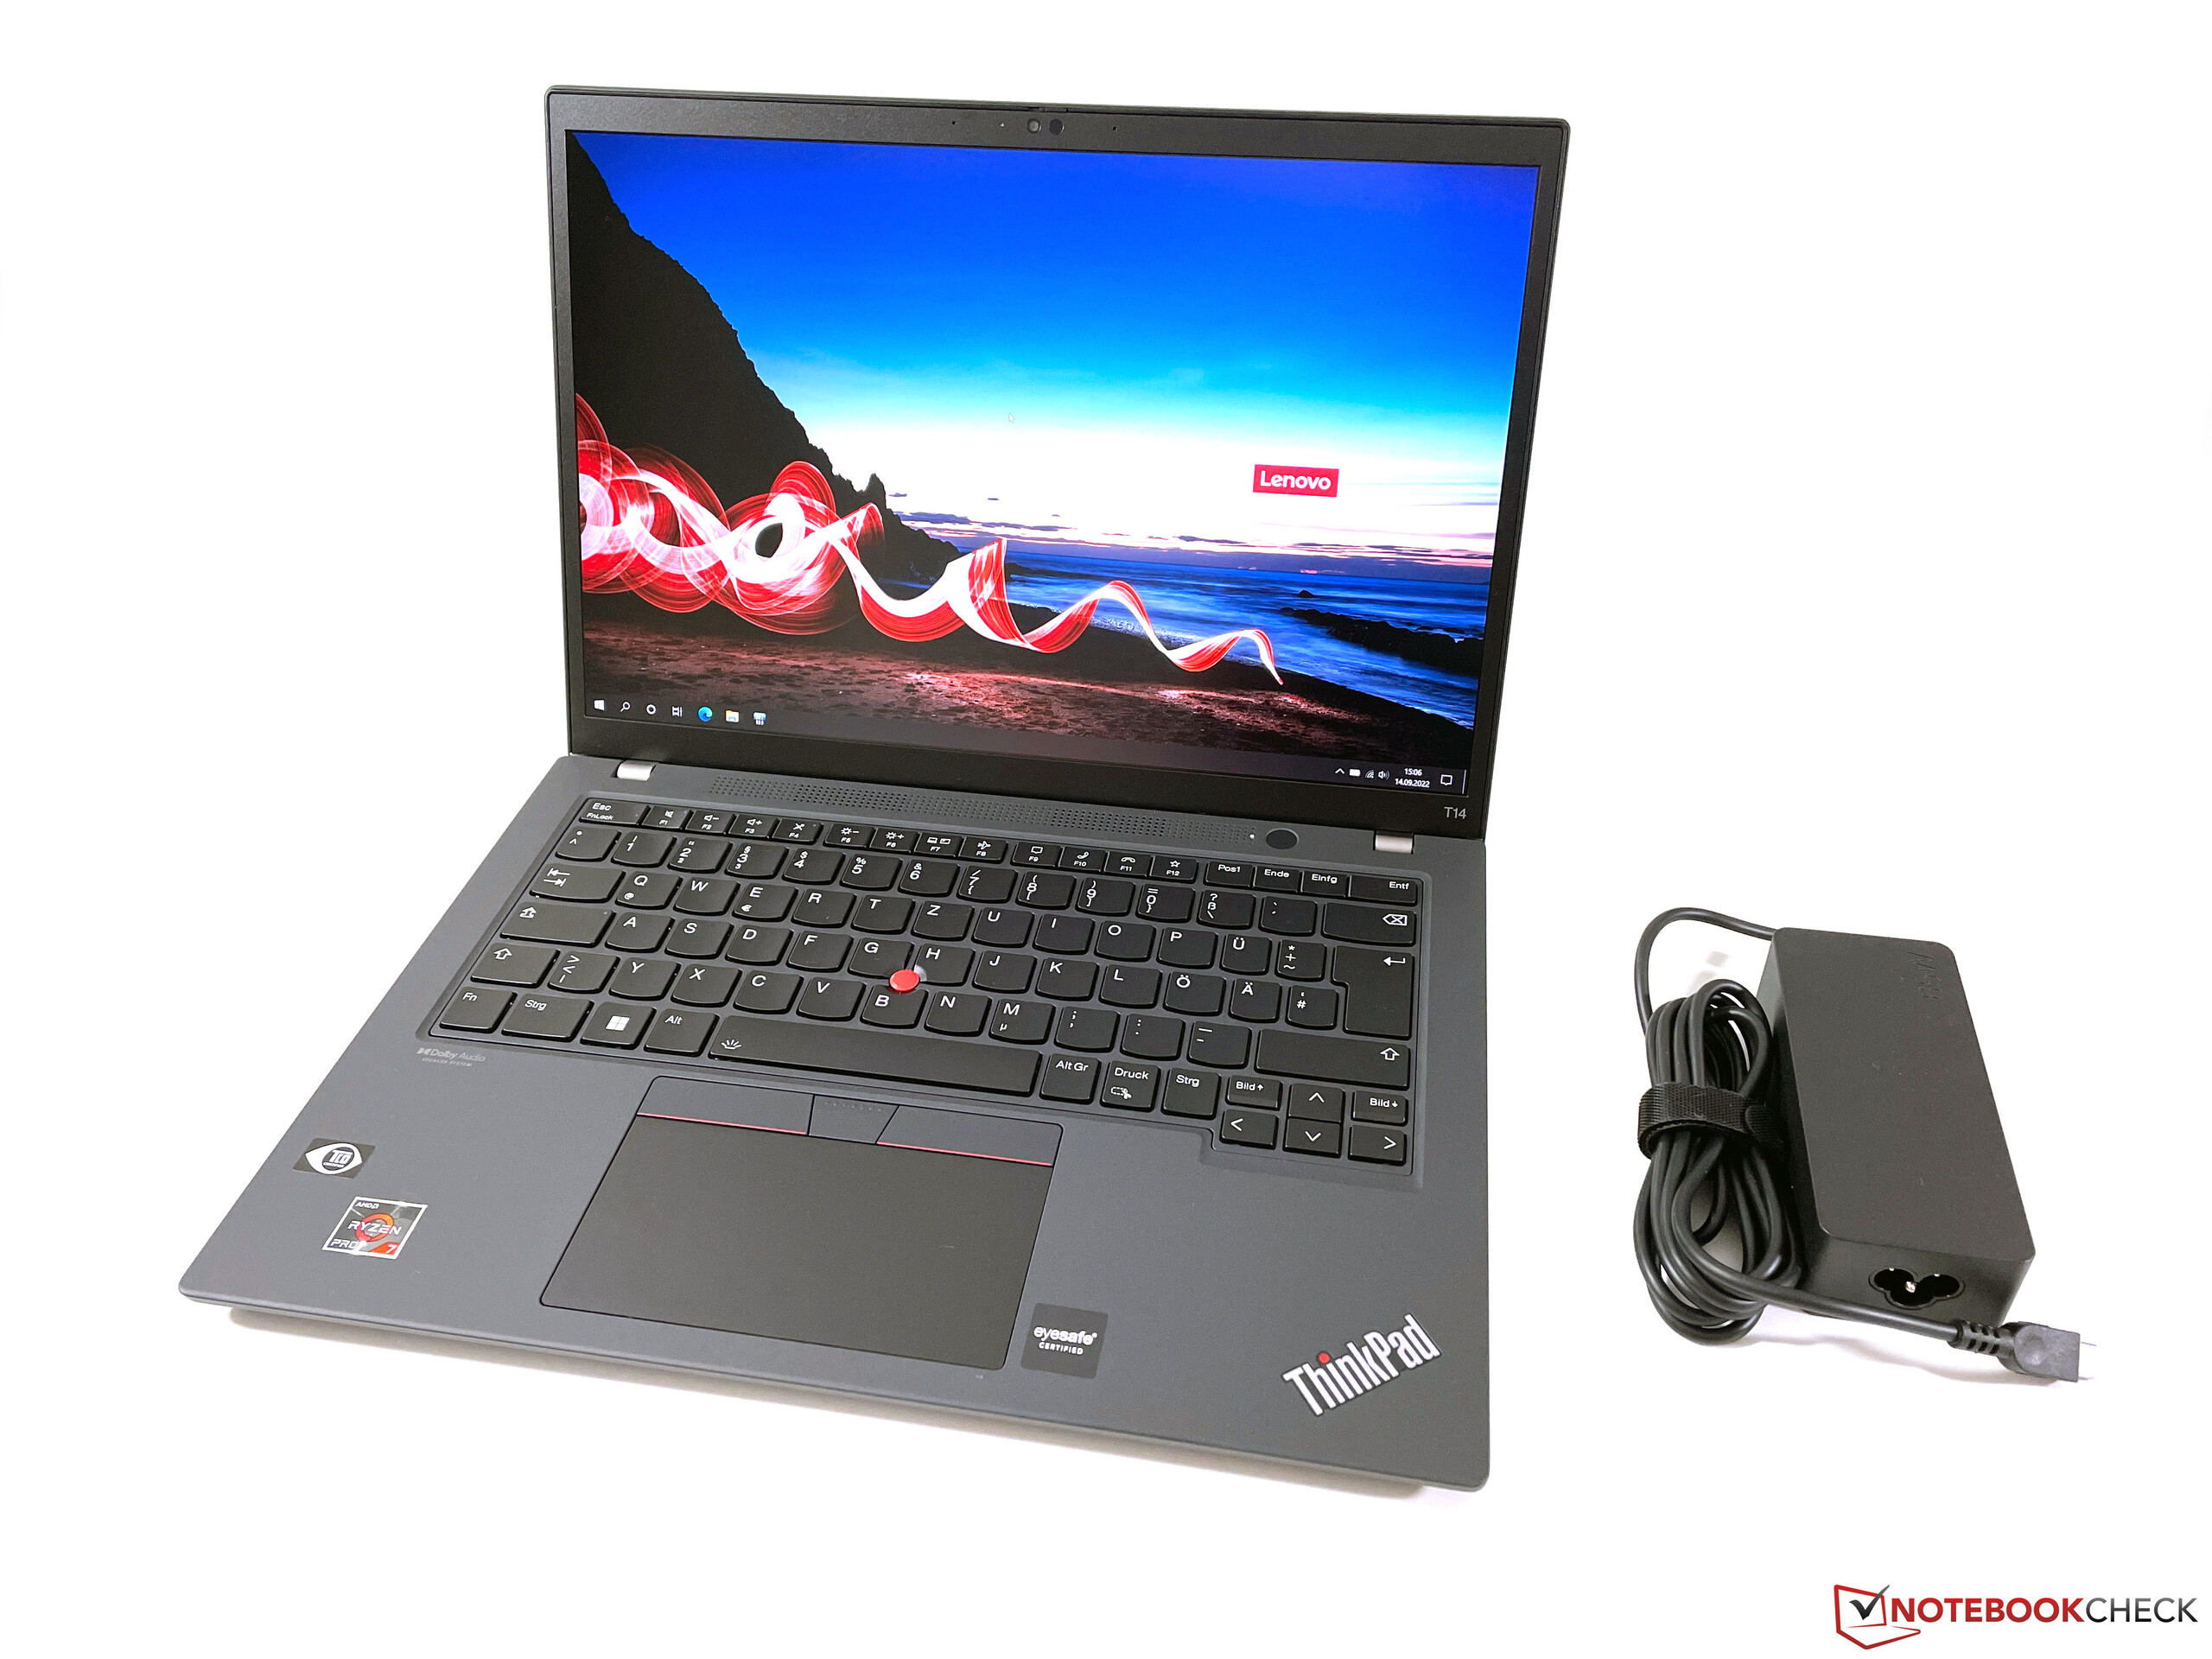
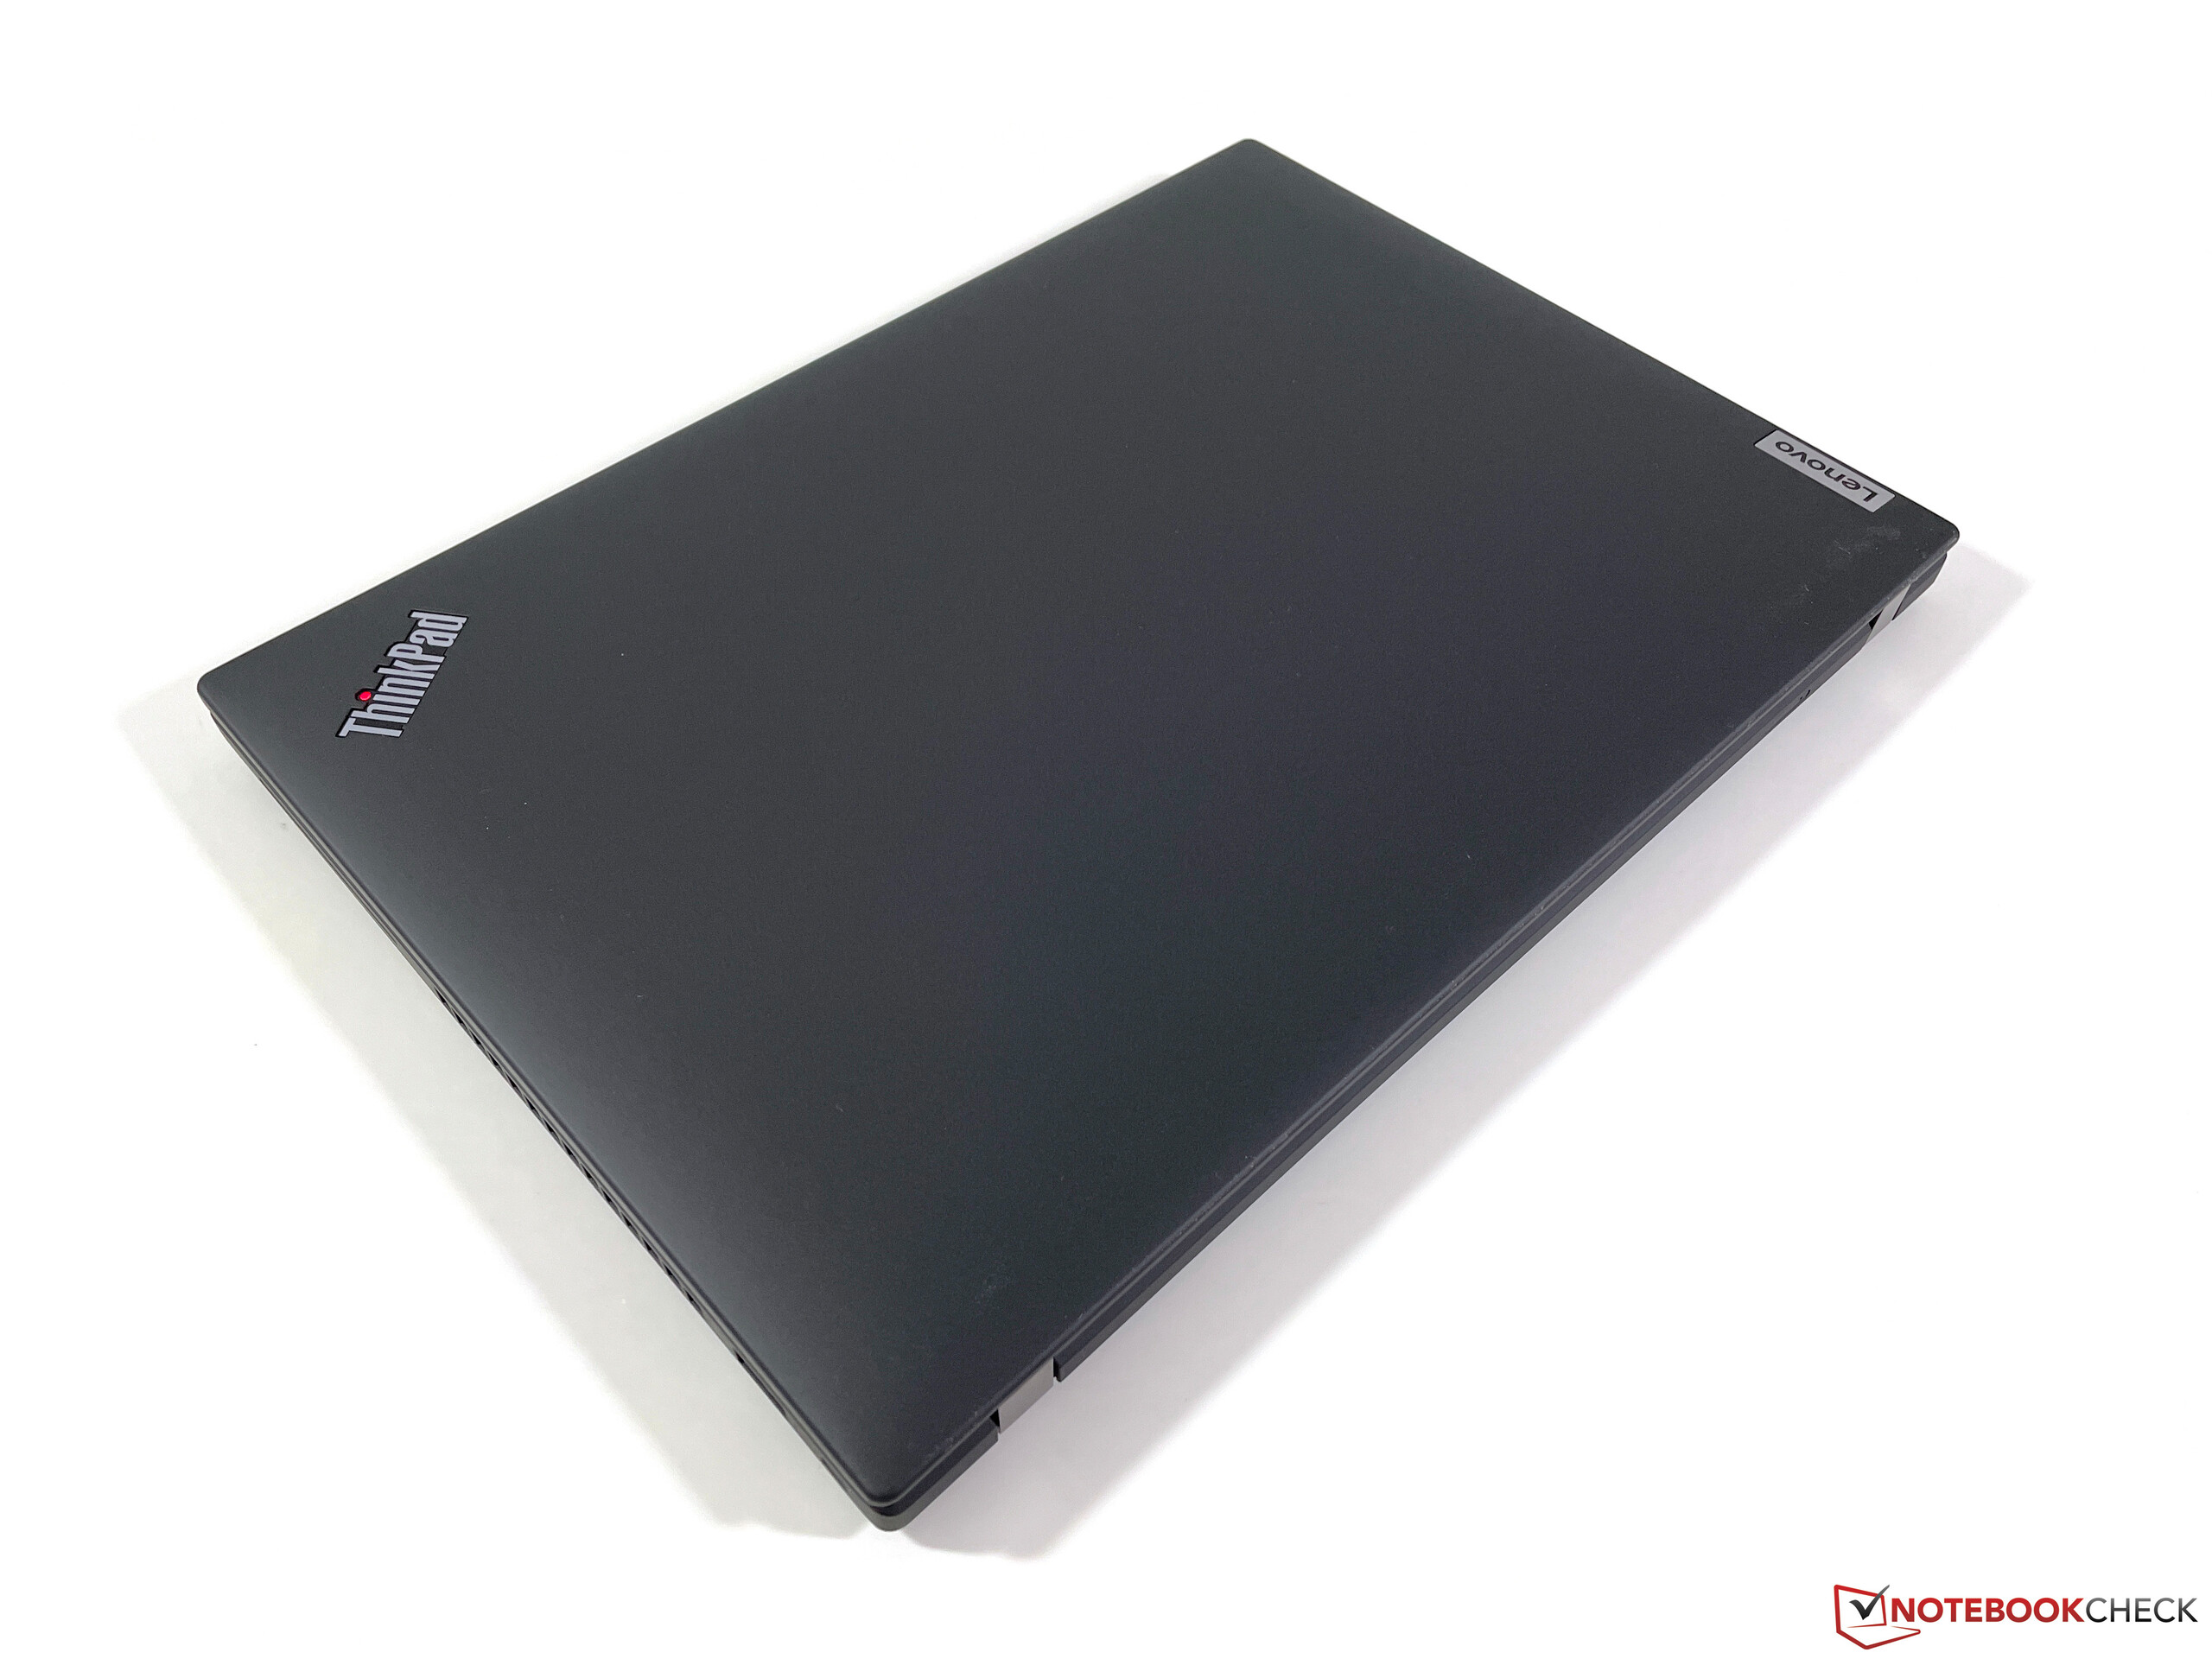
W porównaniu z poprzednika, nowy ThinkPad T14 G3 stał się nieco smuklejszy, ale jednocześnie ekran 16:10 nie spowodował pogłębienia obudowy. Waga również jest nieco niższa i wynosi nieco ponad 1,4 kg. Co ciekawe, Lenovo oferuje również wersję z mniejszą, 3-komorową baterią, która jest lżejsza o około 100 gramów. Znany 65-watowy zasilacz waży około 350 gramów i jest stosowany także w wersjach z Intelem, nawet w modelu z dedykowanym GeForce MX550, co było dla nas mocnym zaskoczeniem.
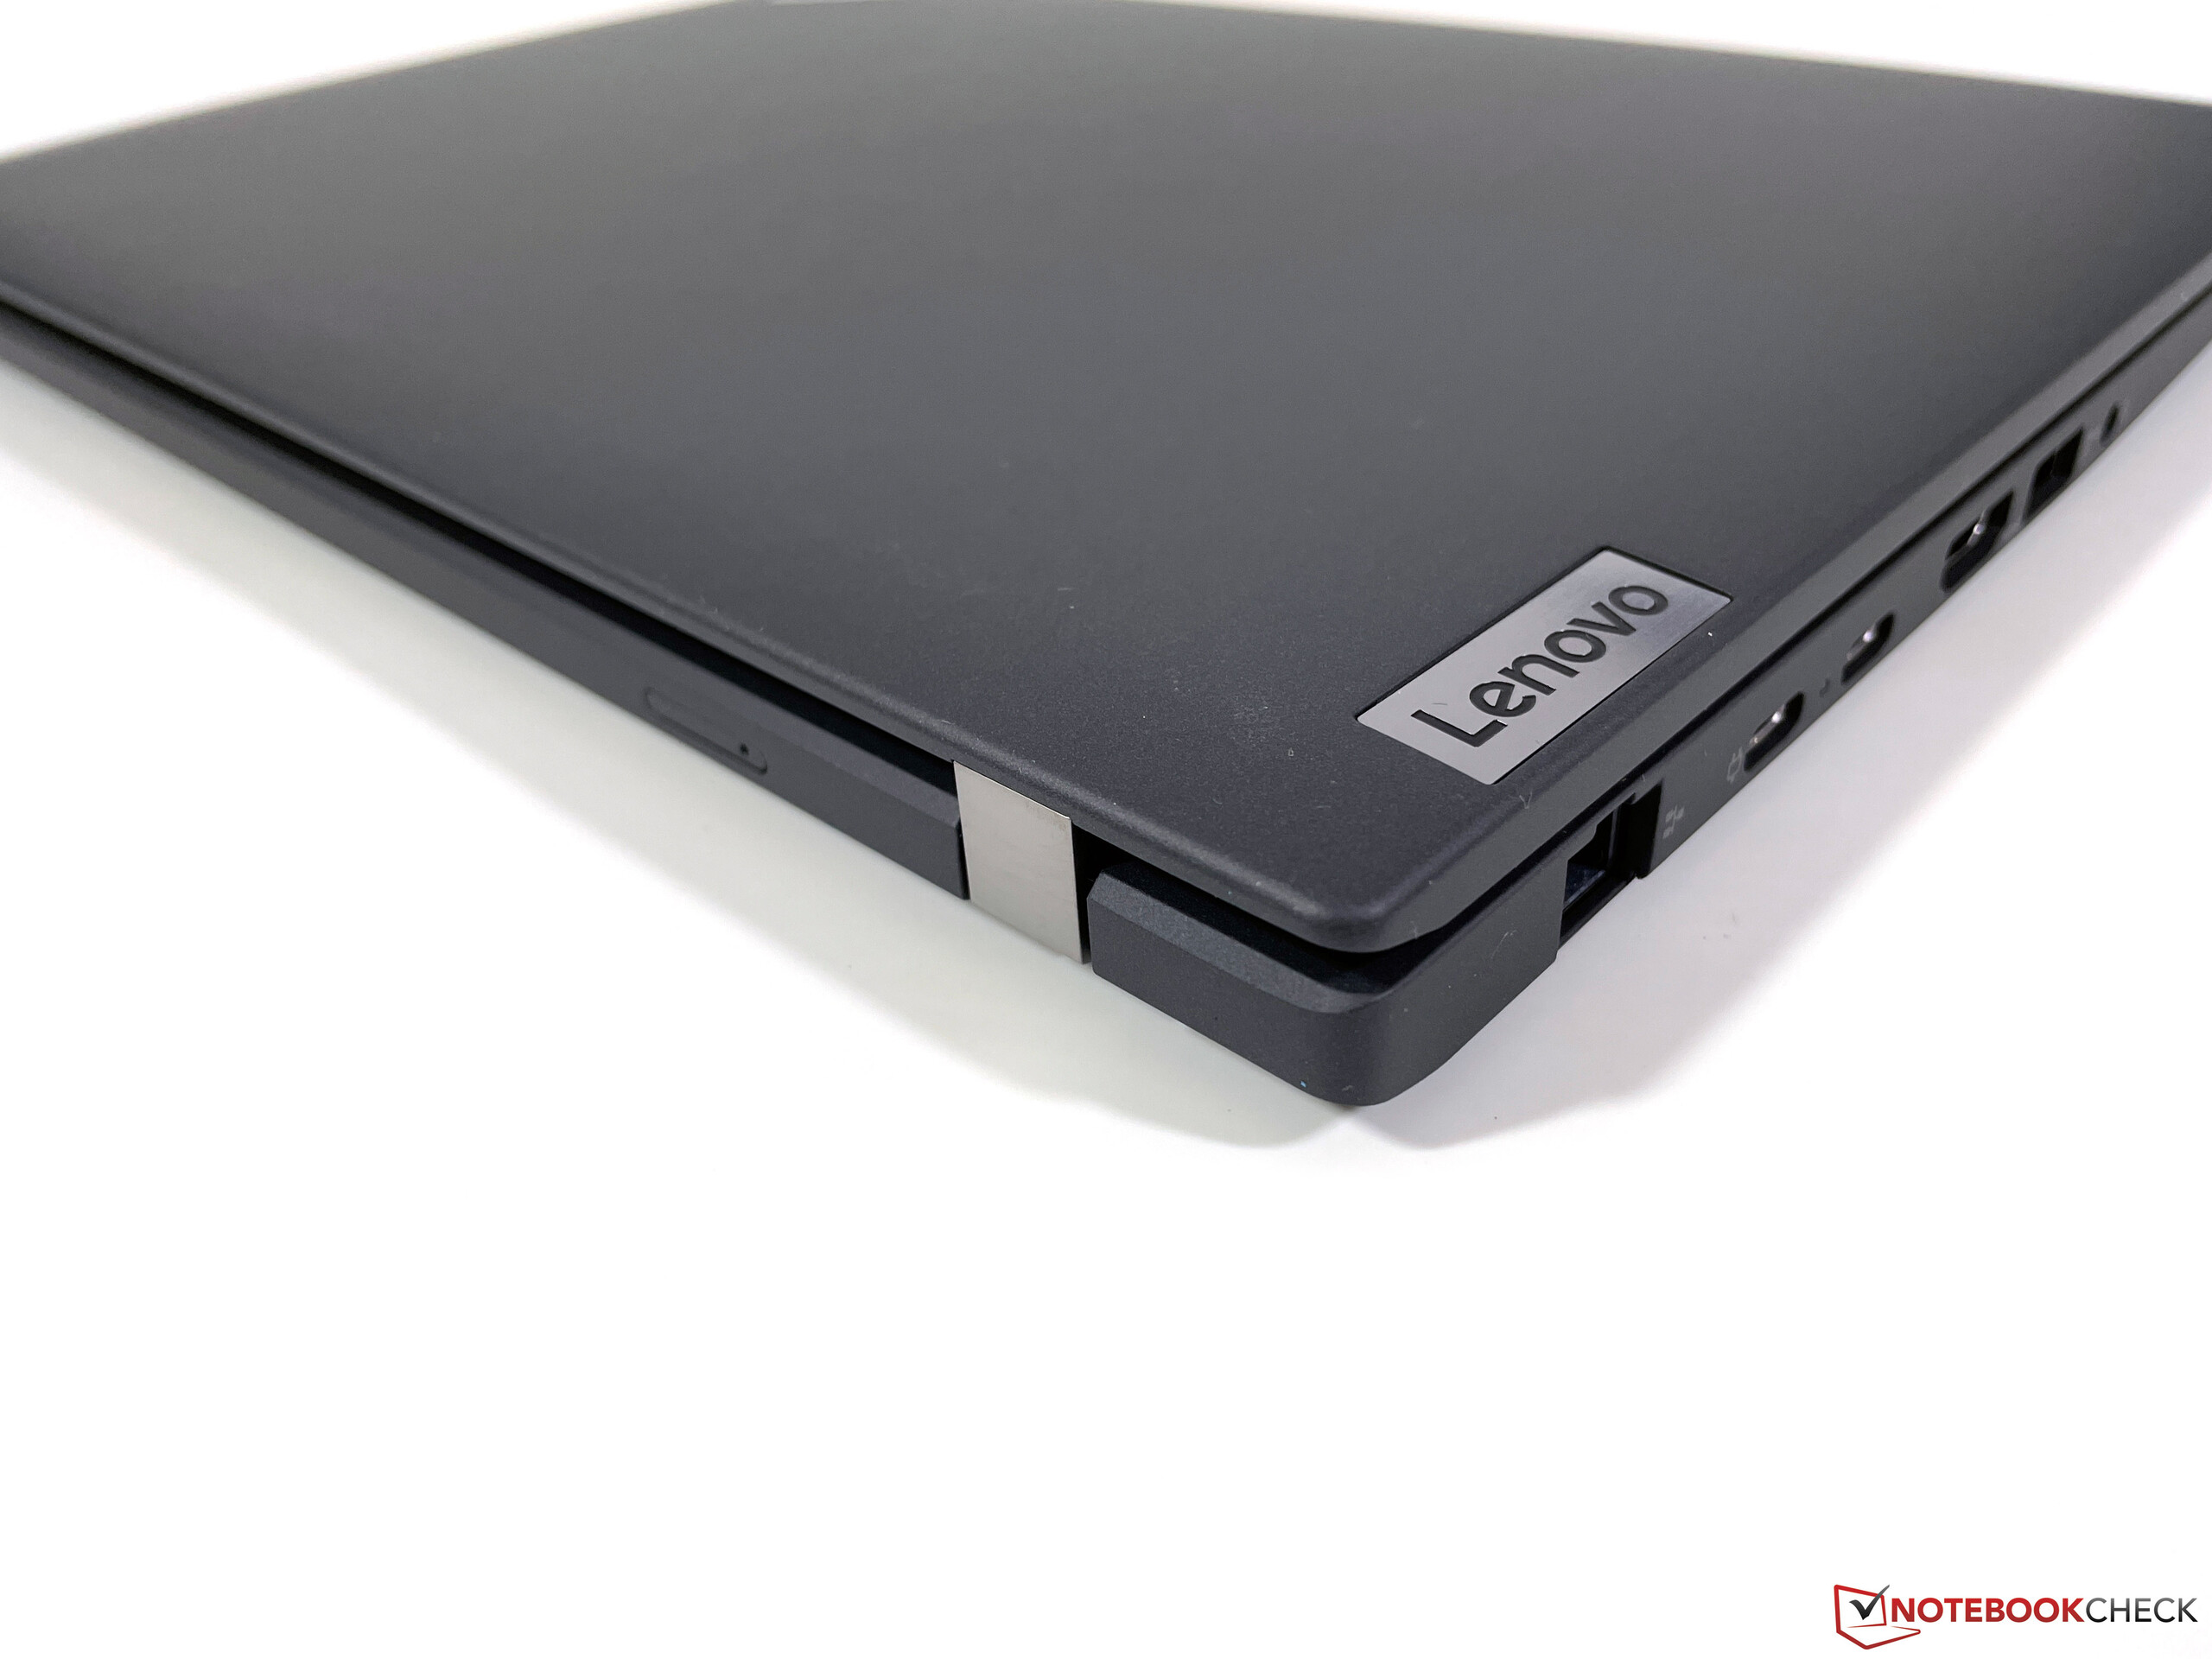
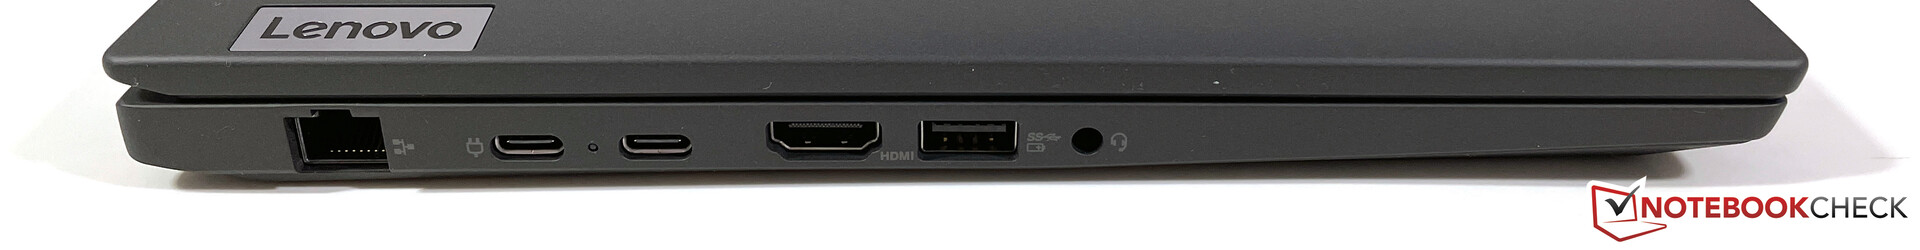
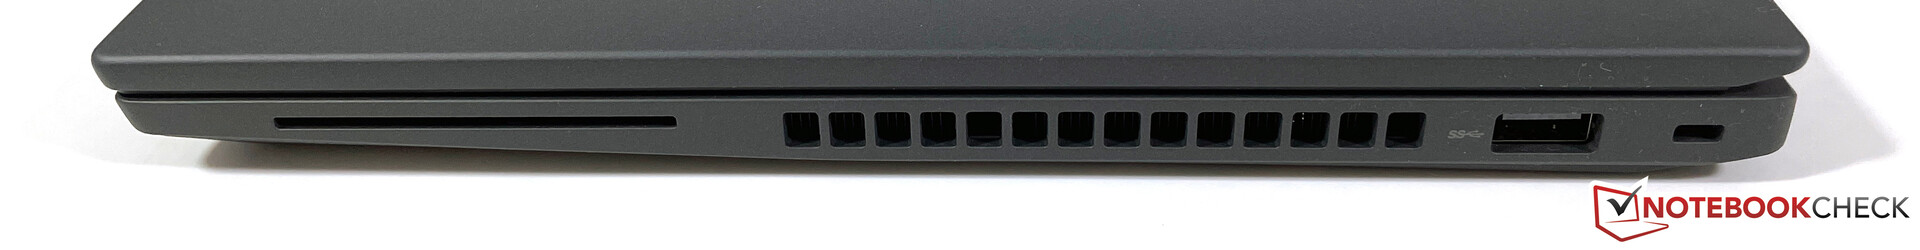
Sprzęt - Lenovo pomija USB 4
ThinkPad T14 G3 oferuje wiele portów, w tym normalne porty USB-A, wyjście HDMI i port Gigabit Ethernet. Zastanawiające jest jednak pominięcie USB 4, gdyż dwa porty USB-C po lewej stronie obsługują jedynie standard 3.2 Gen.2. Jest to niezrozumiałe i naszym zdaniem niepotrzebne ograniczenie, gdyż Lenovo oferuje obsługę USB 4 w konsumenckich modelach z procesorami AMD. Z przodu po prawej stronie znajduje się także opcjonalny czytnik SmartCard. Bez czytnika kart też trzeba będzie się obejść.
Komunikacja
W kwestii modułów komunikacyjnych użytkownik ma do dyspozycji niemal całe spektrum, ponieważ oprócz gigabitowego portu Ethernet zastosowano nowoczesny moduł Wi-Fi 6E firmy Qualcomm (NFA725A), który obok nowoczesnych sieci 6 GHz obsługuje również Bluetooth 5.2. Połączenie z siecią 6 GHz naszego referencyjnego routera Asusa funkcjonowało bez żadnych problemów i zarówno prędkość transferu, jak i jakość sygnału były znakomite. Nie było również problemów podczas korzystania z routera Wi-Fi 5 (Fritz!Box 7590).
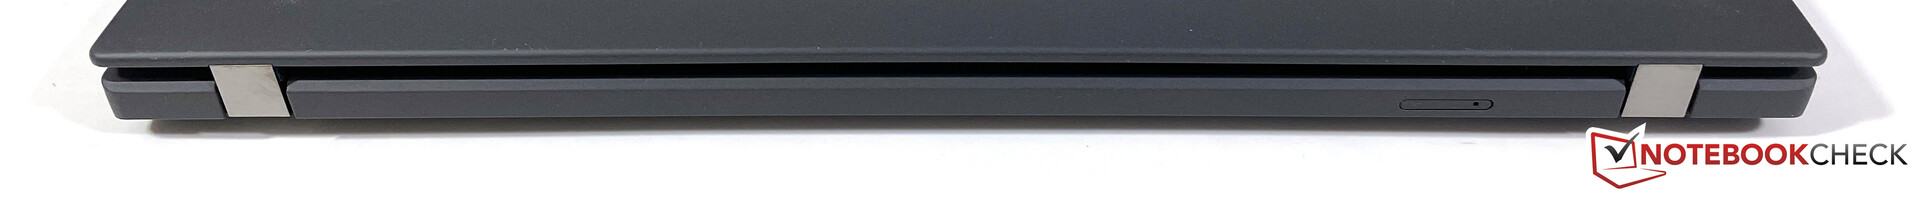
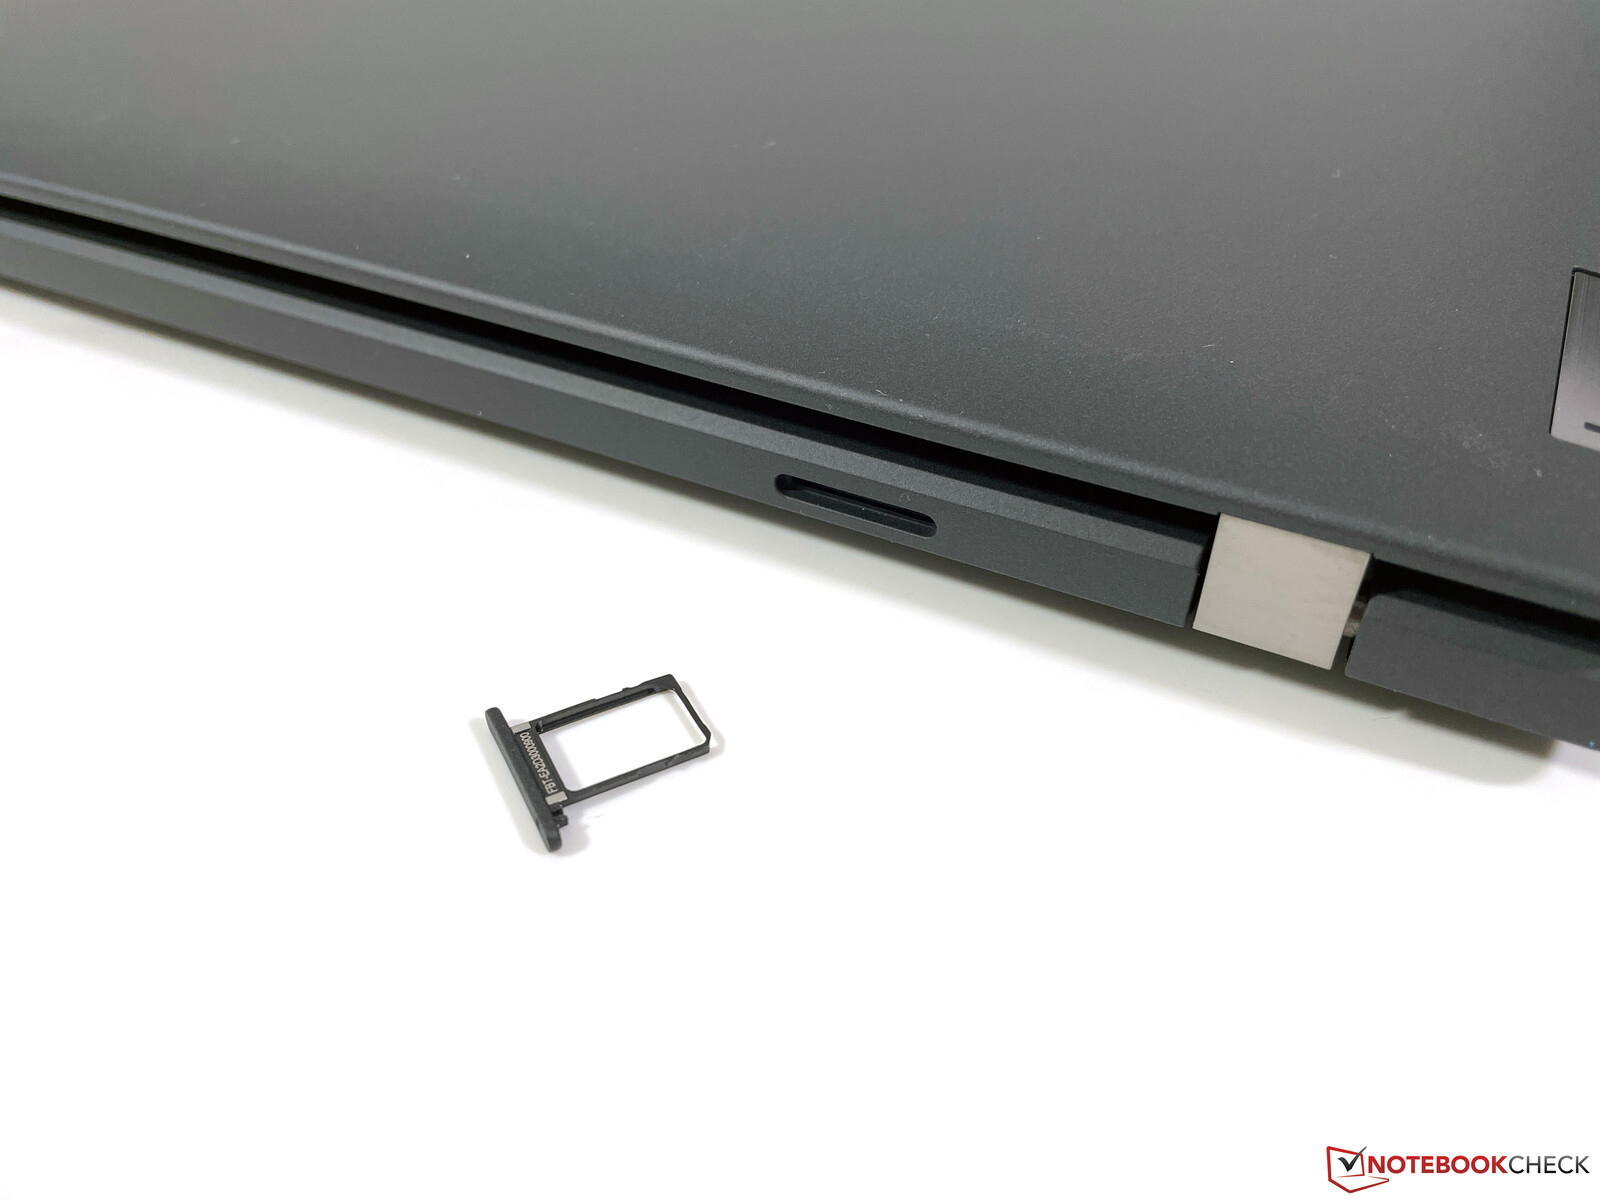
Osoby uzależnione od internetu mobilnego mają możliwość skonfigurowania T14 G3 z modułem WWAN, ale zastosowano tu "tylko" moduł 4G/LTE; moduły 5G nie są dostępne. Trzeba jednak uważać przy konfiguracji lub zakupie urządzenia, ponieważ większość konfiguracji nie jest przystosowana do obsługi WWAN, a więc nie ma anten, a także nie ma slotu nano-SIM z tyłu. Jest to niezrozumiałe, ponieważ Lenovo oferuje w konfiguratorze opcję WWAN-ready bez dodatkowych opłat. Tutaj można by po prostu dostarczyć wszystkie modele z WWAN, jak to miało miejsce w przeszłości.
Zarówno wersja T14 G3 z procesorem AMD jak i Intela jest opcjonalnie dostępna z modułem WWAN Quectel EM05-G (LTE Cat.4) i każda z nich oferuje eSIM jak i slot nano-SIM. W testach bez problemu mogliśmy korzystać z karty SIM Telekomu i bez problemu surfowaliśmy w sieci LTE. Siła sygnału była bardzo dobra w terenie miejskim, a także lepsza niż w przypadku smartfonów. Według oficjalnej karty specyfikacji, w urządzeniu powinien znaleźć się również moduł Fibocom L860 GL-16 (Cat.16).
| Networking | |
| iperf3 receive AXE11000 6GHz | |
| Lenovo ThinkPad T14 G3-21CF004NGE | |
| HP EliteBook 845 G9 6F6H6EA | |
| Przeciętny Qualcomm WCN685x (886 - 1790, n=22) | |
| Średnia w klasie Office (508 - 2328, n=41, ostatnie 2 lata) | |
| Huawei MateBook X Pro 2022 | |
| iperf3 transmit AXE11000 6GHz | |
| Lenovo ThinkPad T14 G3-21CF004NGE | |
| Huawei MateBook X Pro 2022 | |
| Przeciętny Qualcomm WCN685x (623 - 1961, n=22) | |
| HP EliteBook 845 G9 6F6H6EA | |
| Średnia w klasie Office (385 - 2341, n=39, ostatnie 2 lata) | |
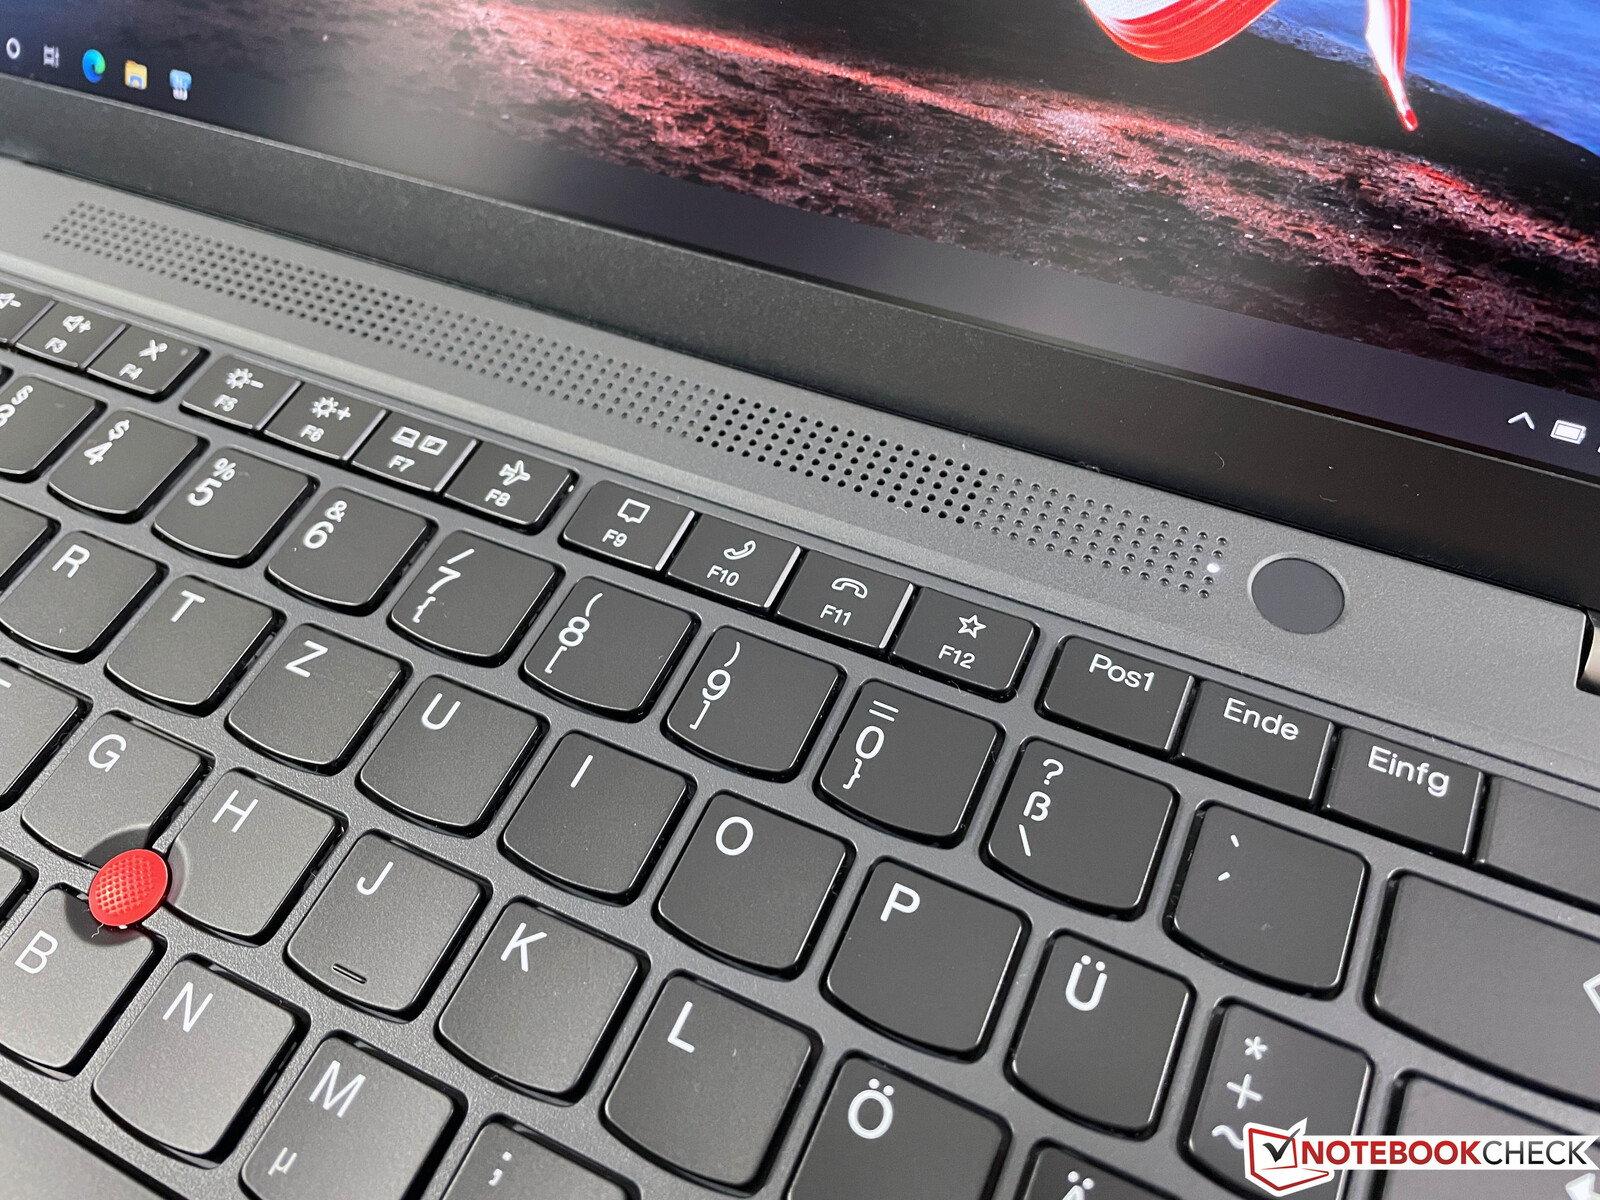
Kamera internetowa
Lenovo instaluje w górnej ramce ekranu kamerę internetową 1080p z mechaniczną migawką, która oferuje lepszą jakość obrazu w porównaniu ze starymi czujnikami 720p. Zainstalowano również kamerę IR do rozpoznawania twarzy za pomocą Windows Hello.


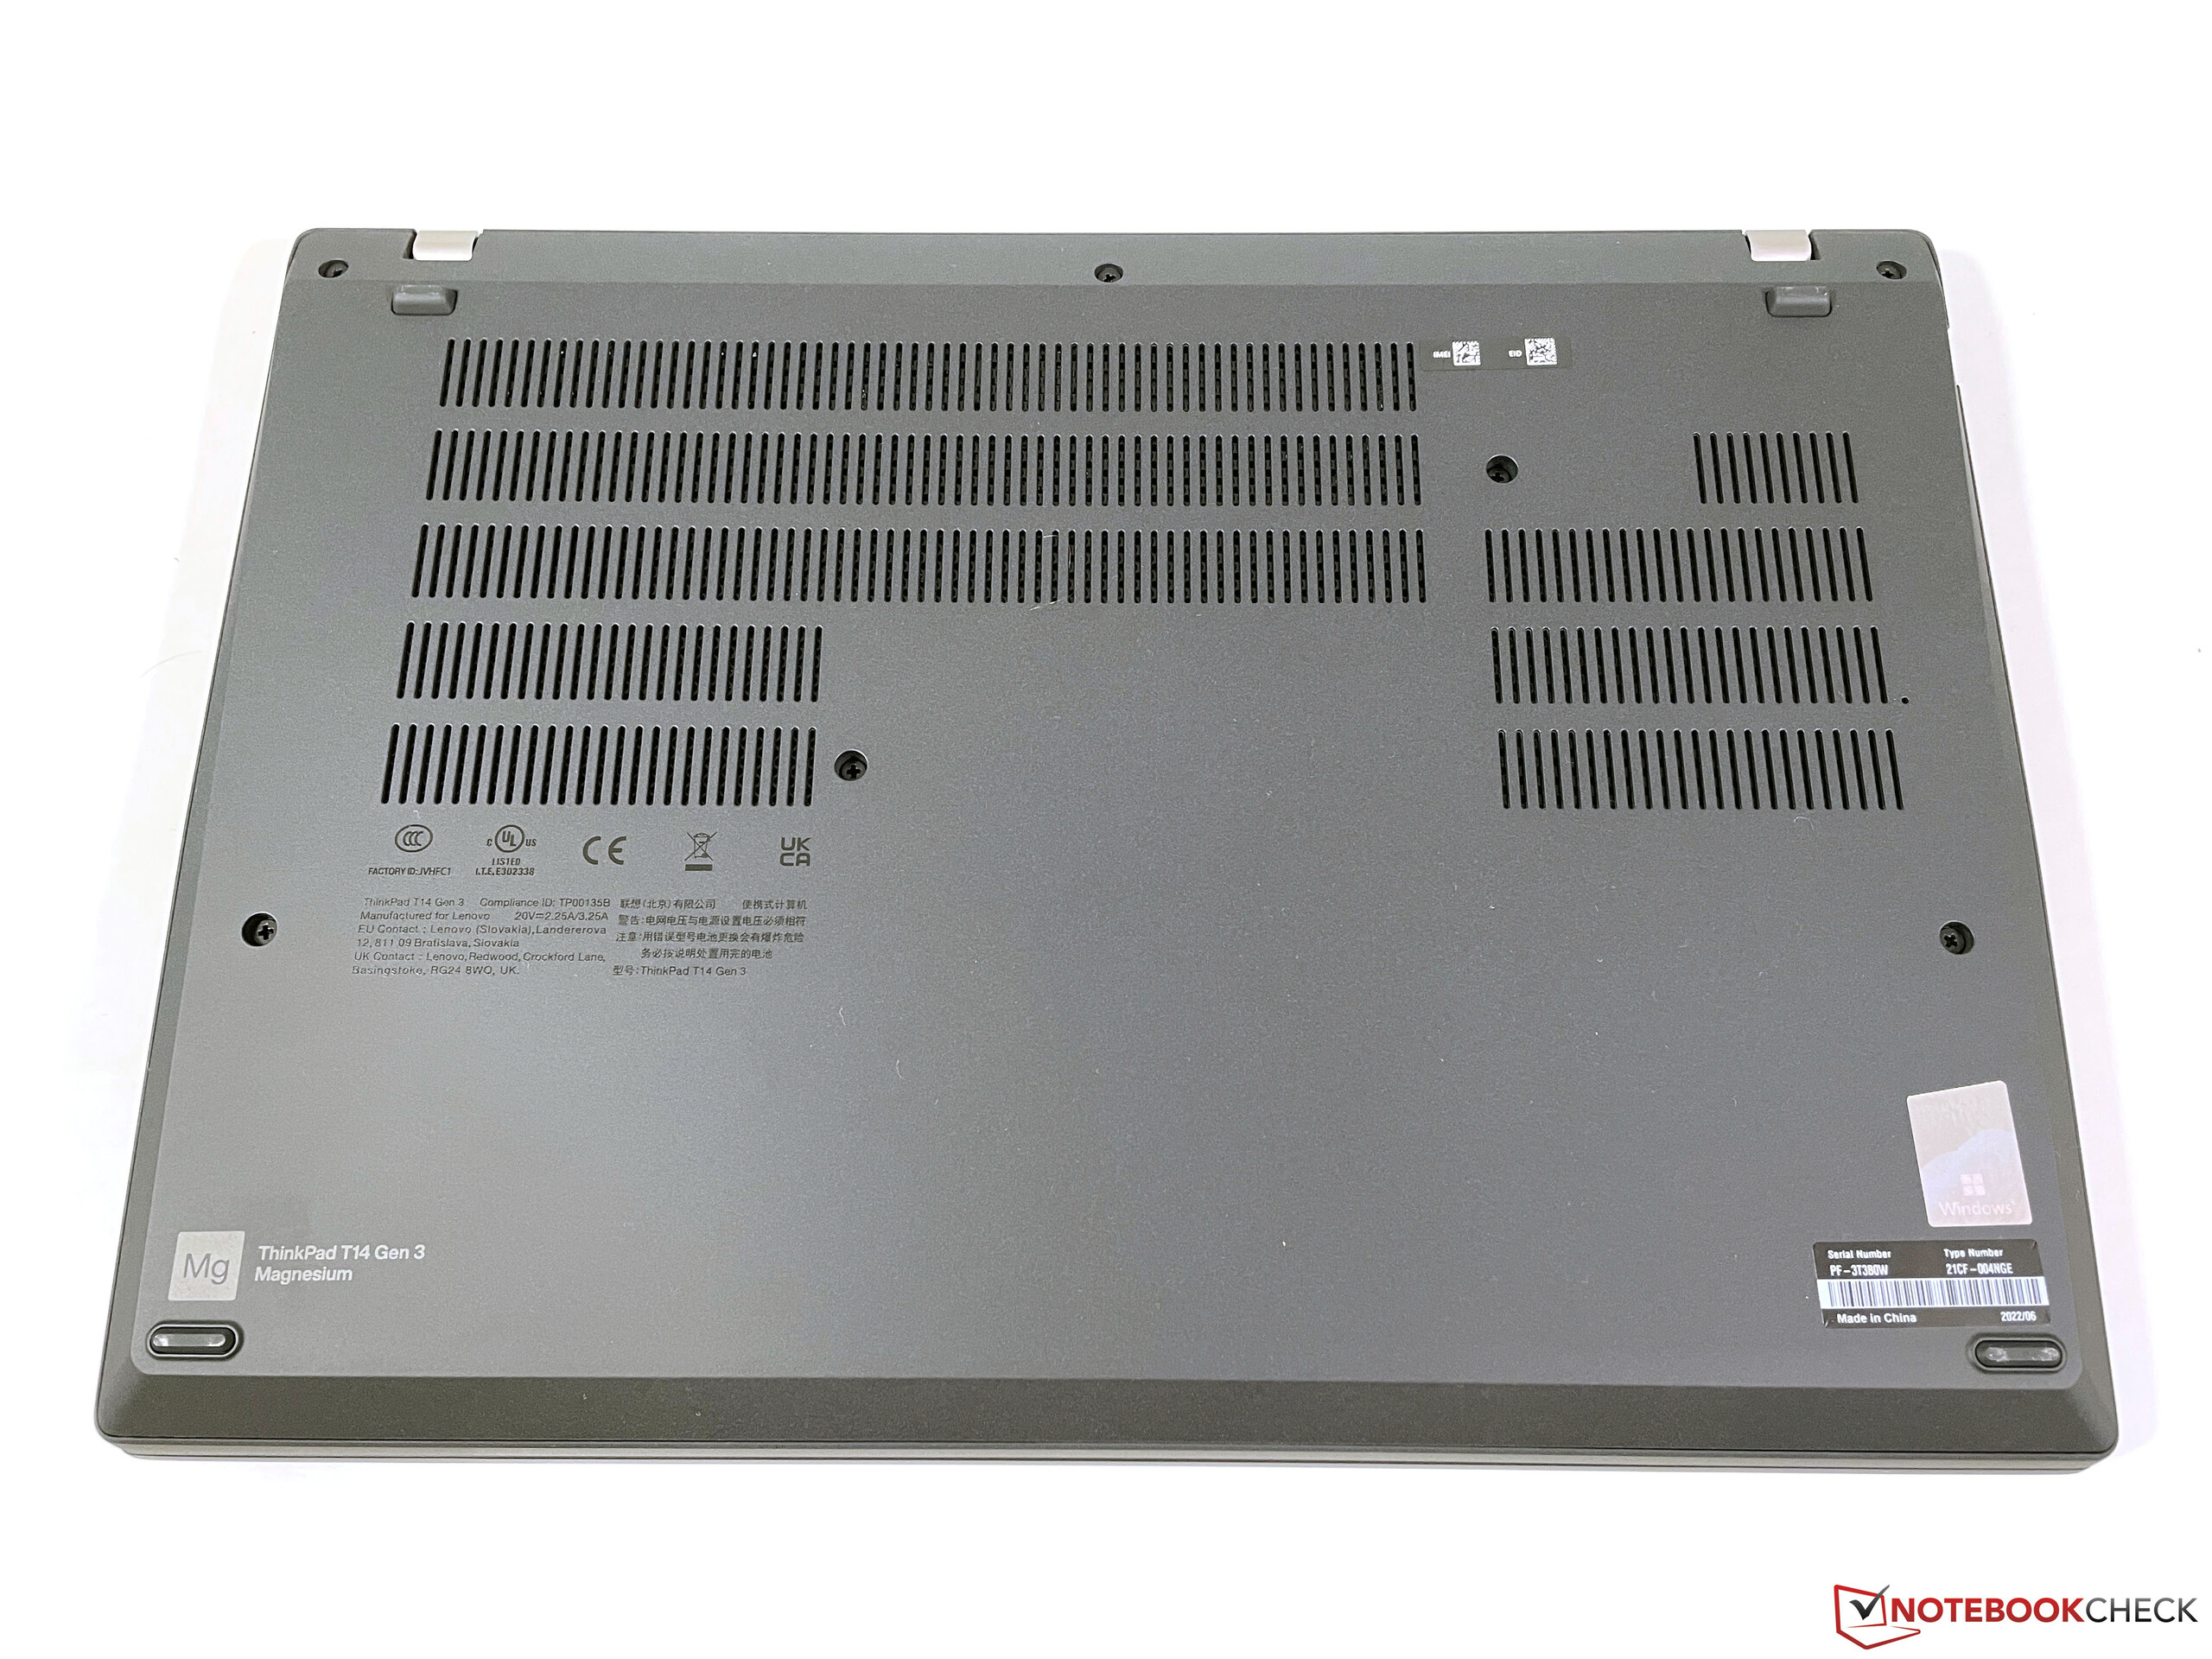
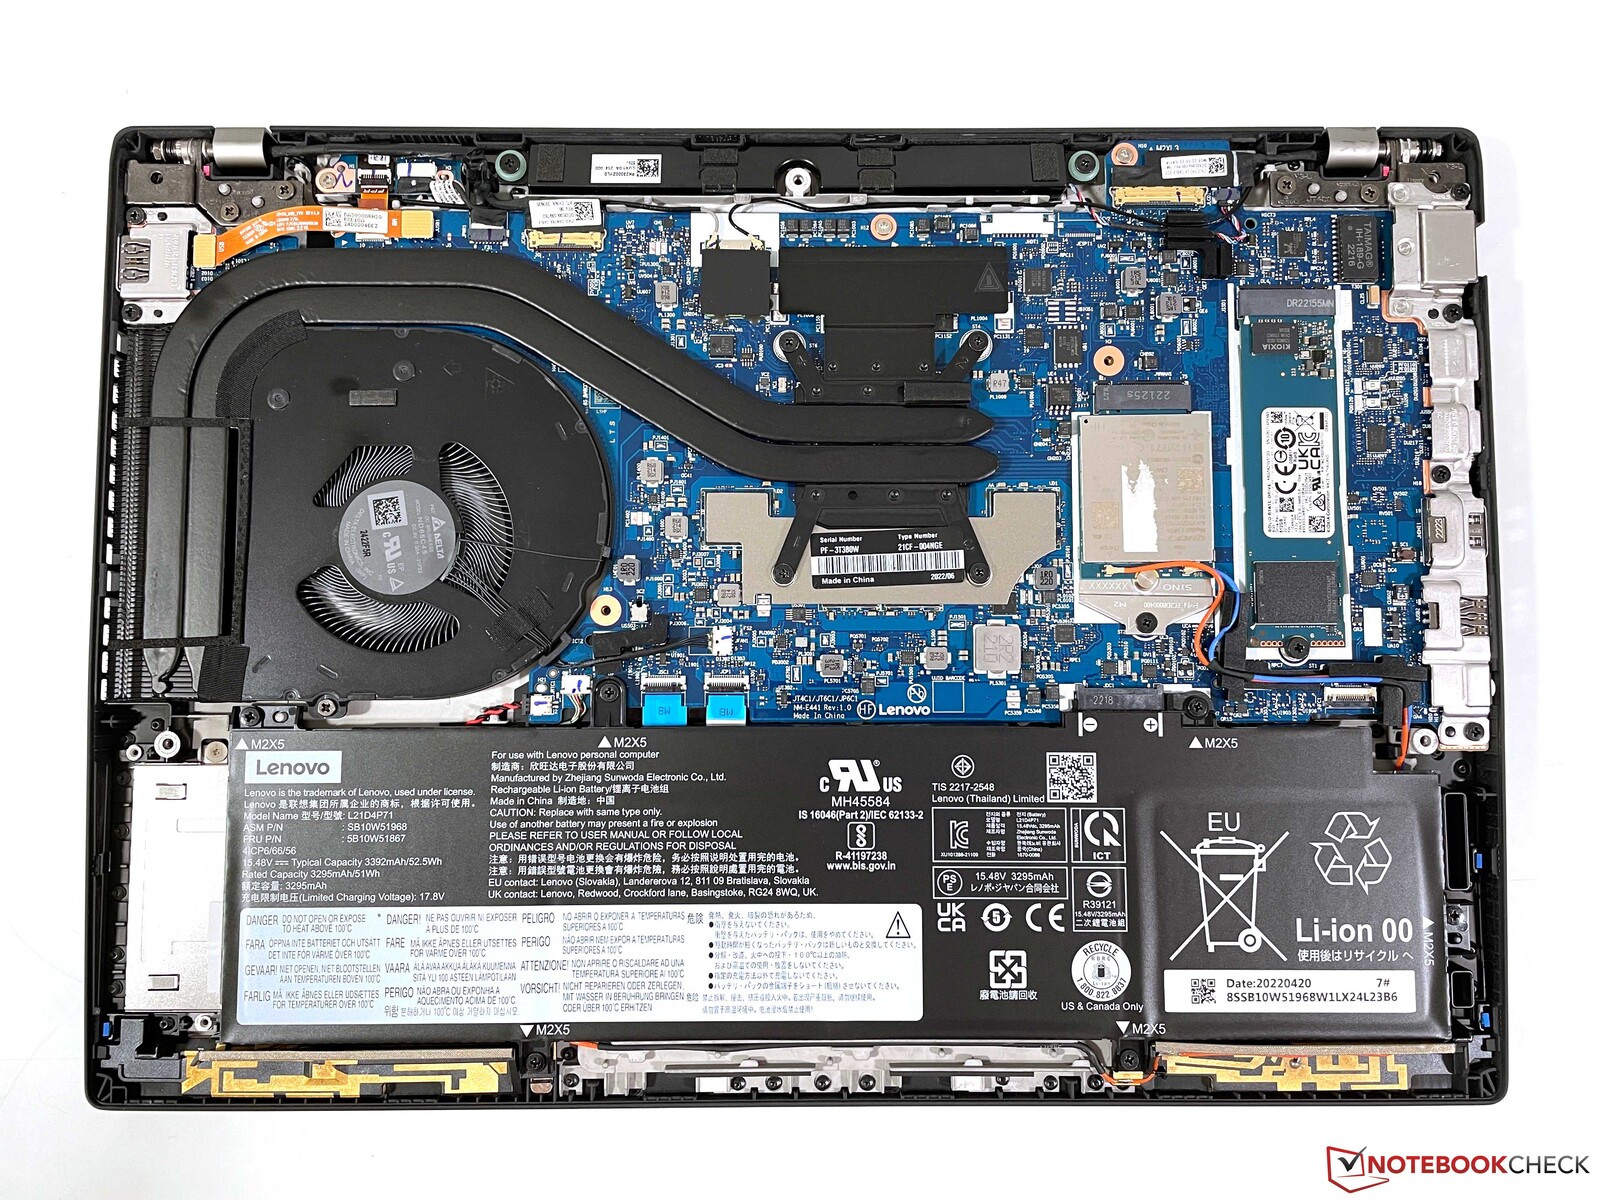
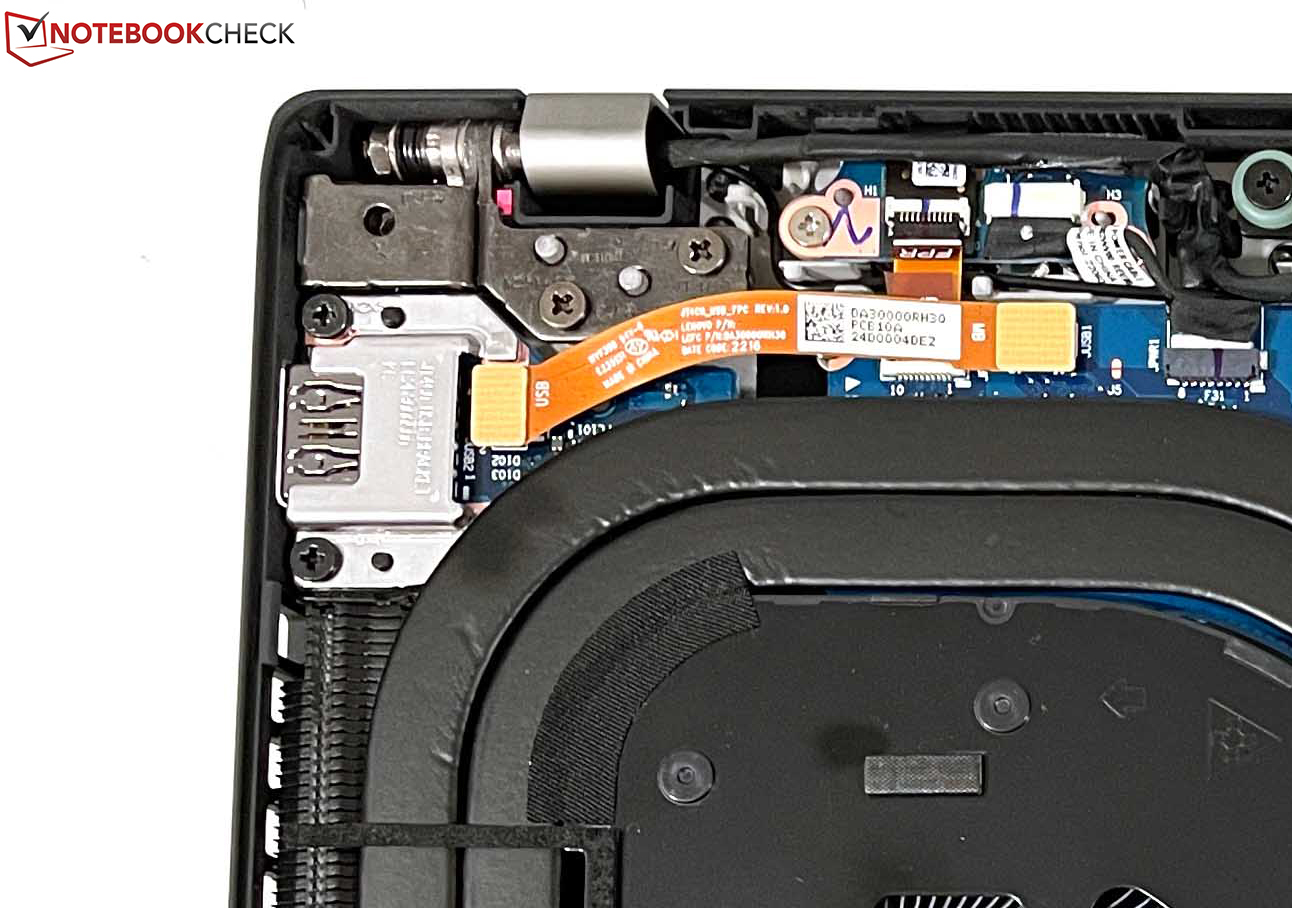
Konserwacja
Lenovo uprościło dostęp do podzespołów, gdyż nie ma teraz tylu plastikowych zaczepów. Po odkręceniu 7 zwykłych śrubek Philipsa można bardzo łatwo zdjąć pokrywę. Mamy tutaj dostęp do wentylatora, dysku SSD M.2-2280 a także modułu WWAN, ale moduł WLAN jest niewymienny. Pamięć RAM jest natomiast w modelu AMD wlutowana (maksymalnie 32 GB LPDDR5-6400), podczas gdy model Intela oferuje gniazdo RAM obok wlutowanego modułu, dlatego możliwe jest użycie maksymalnie 48 GB RAM (DDR4-3200). Akumulator jest tylko przykręcany i można go w razie potrzeby wymienić. Również klawiaturę można bardzo łatwo wymienić, odkręcając dwie śrubki na spodzie, a następnie przesuwając ją lekko do przodu i zdejmując.
Urządzenia wejściowe - ThinkPad T14 tylko ze spadkiem klawiszy 1,5 mm
Klawiatura
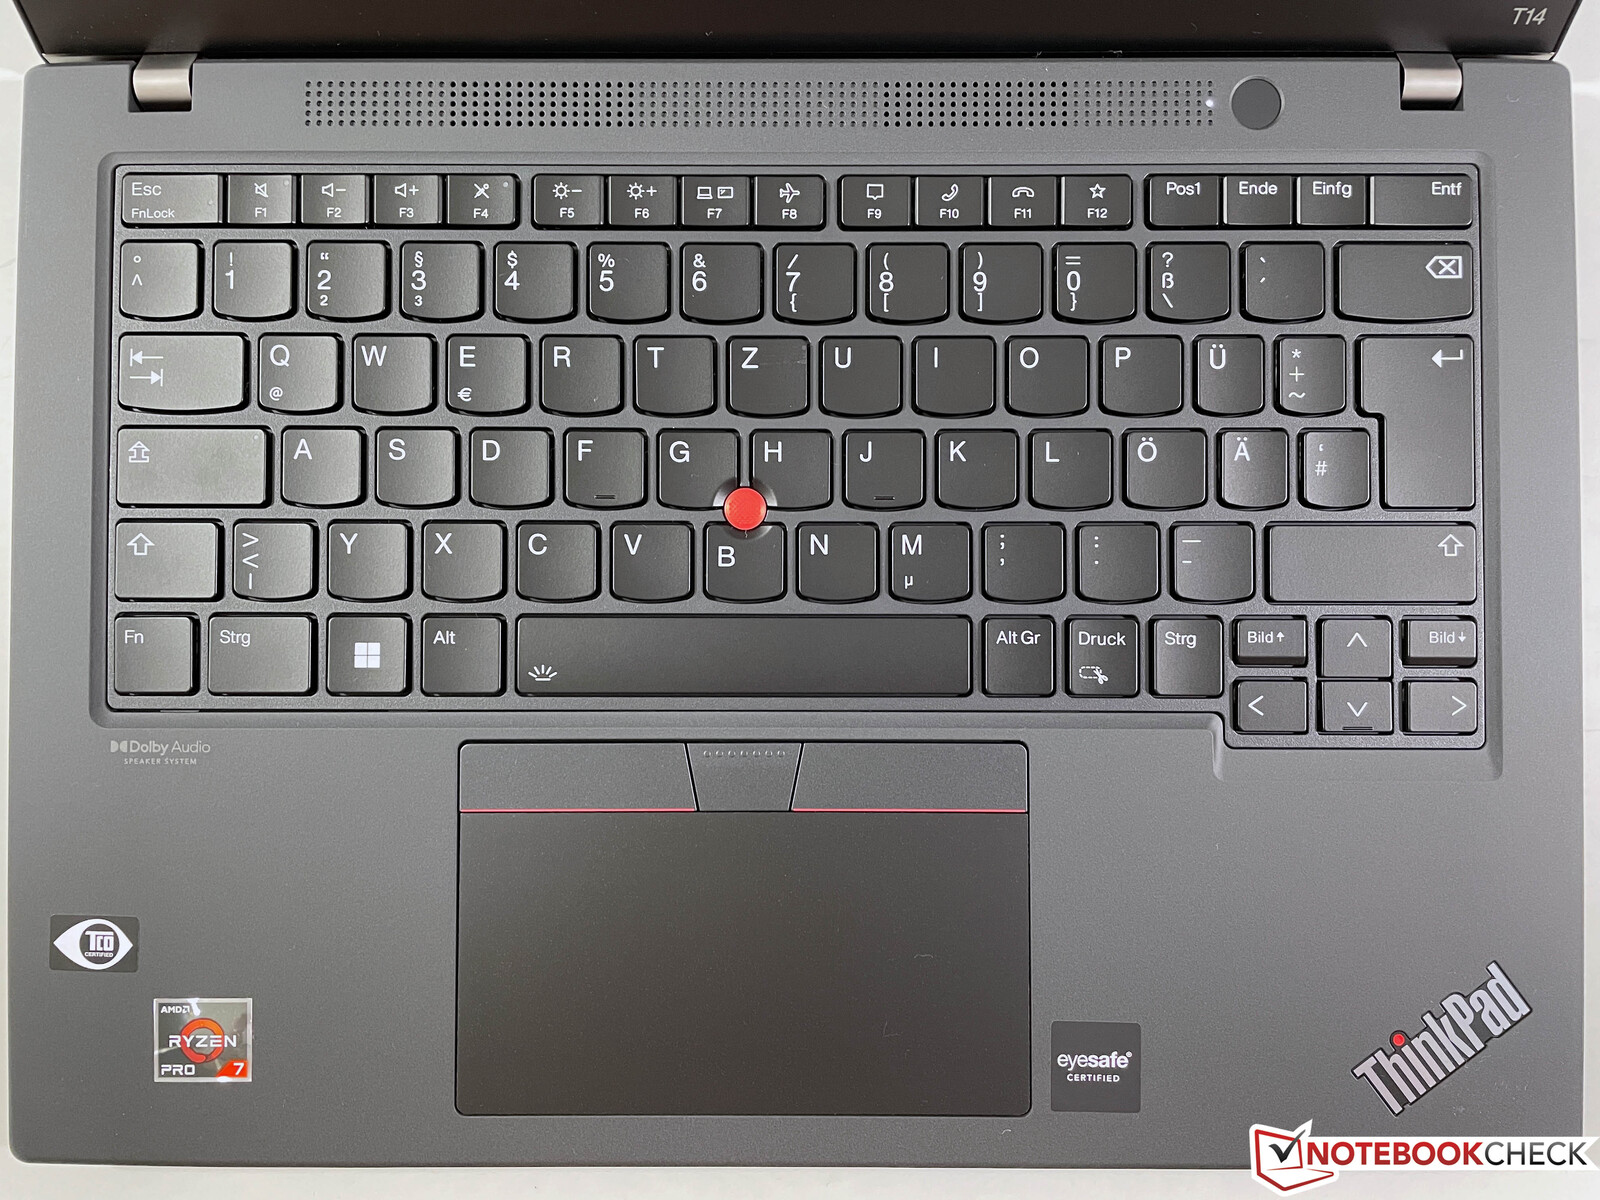
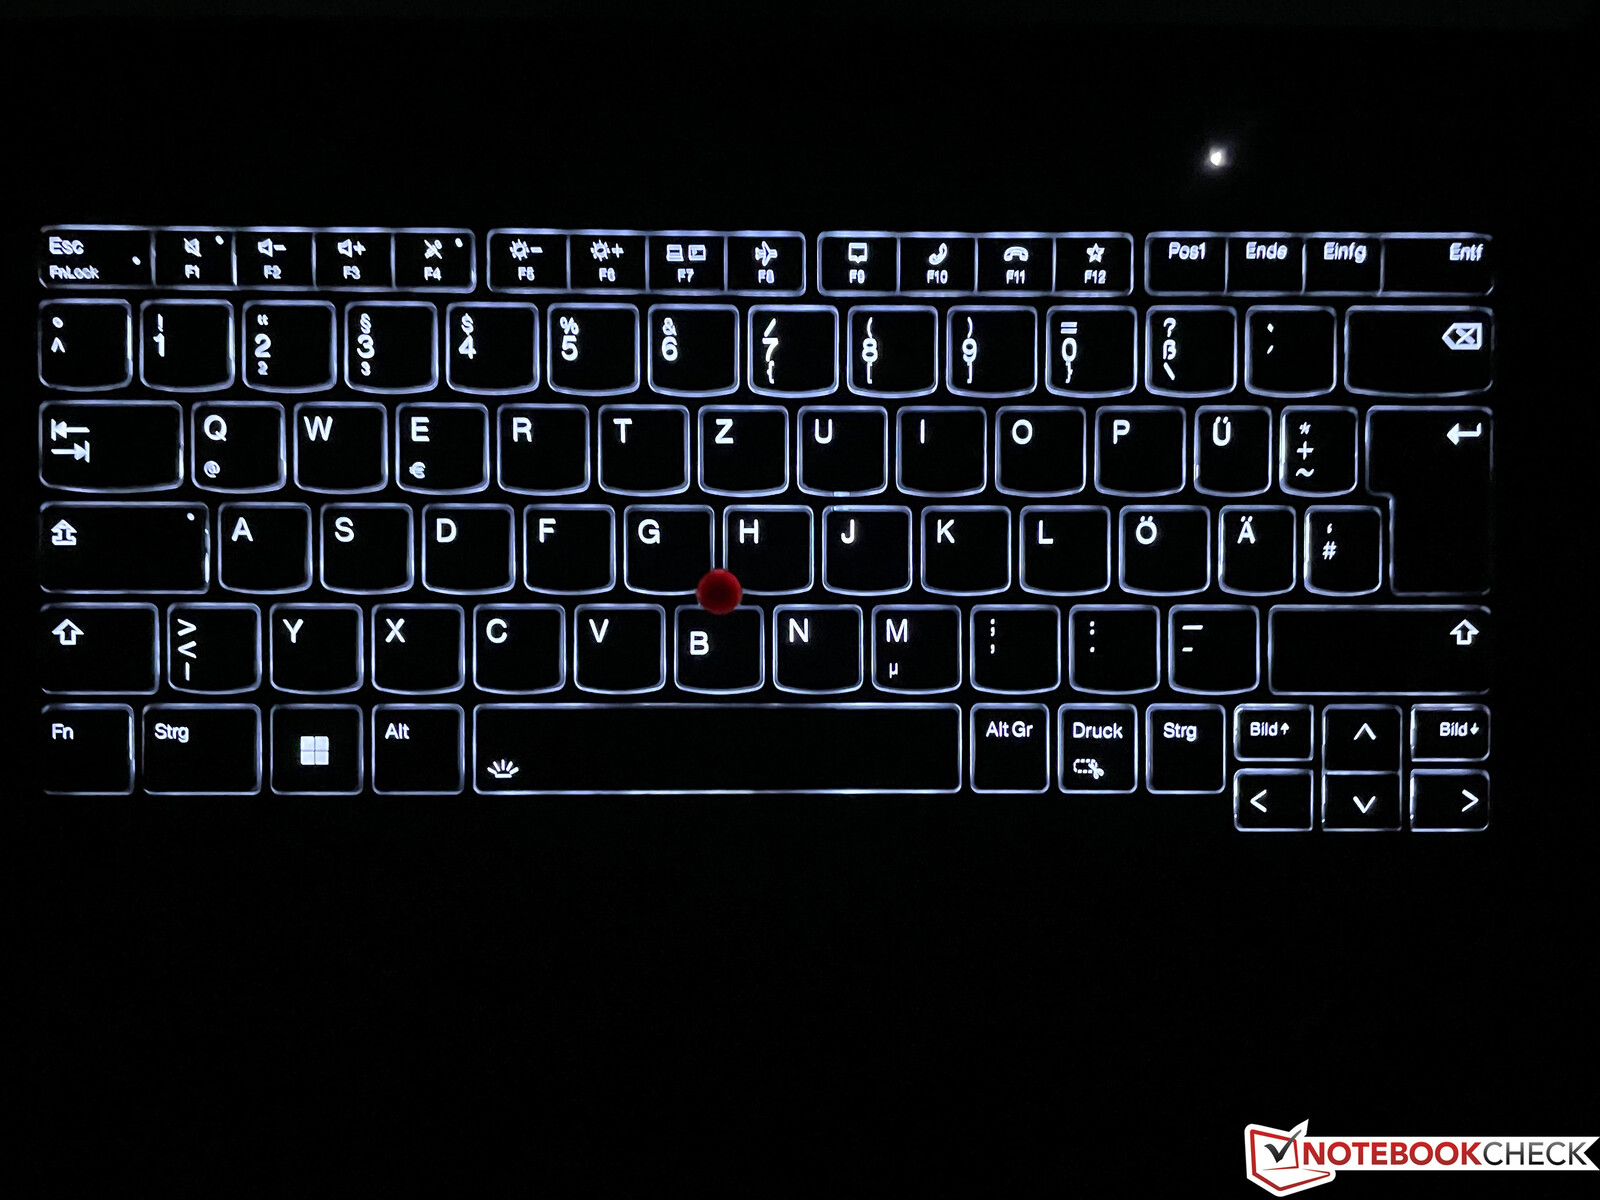
Podobnie jak w innych ThinkPadach, Lenovo zmniejszyło skok klawiszy w nowym modelu G3 T14 z 1,8 do 1,5 mm, co jest zauważalne w praktyce. Choć sprzężenie zwrotne klawiszy jest nadal zwięzłe i nie jest to zła klawiatura, stare modele były po prostu lepsze i wygodniejsze. W porównaniu z innymi laptopami biznesowymi Lenovo nie ma już tutaj przewagi i klawiatury od Della, a także HP są teraz na porównywalnym poziomie. Klawiatura oferuje także dwustopniowe białe podświetlenie, ale nie można go aktywować automatycznie poprzez czujnik jasności. Skaner linii papilarnych został zintegrowany z przyciskiem zasilania, który znajduje się nad klawiaturą.
Touchpad i TrackPoint
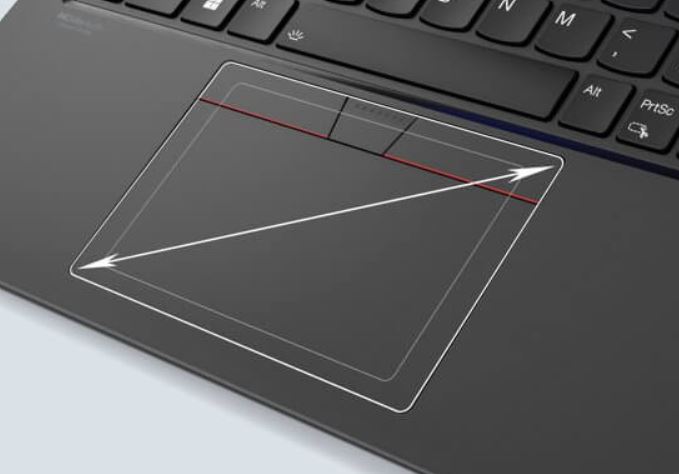
TouchPad jest większy niż wpoprzedniku i w praktyce sprawdza się bardzo dobrze. Nie mieliśmy problemów ani z normalnym sterowaniem wskaźnikiem, ani z testowanymi gestami do czterech palców. Dolny obszar podkładki można nacisnąć, co jest potwierdzane dość stłumionym dźwiękiem klikania.
Oczywiście TrackPoint w centrum klawiatury jest również dostępny dla ruchów wskaźnika i działa bardzo dobrze. Pozytywnie zaskoczyły nas nowe klawisze TrackPoint, które są teraz nieco szersze, podobnie jak touchpad. Te oferują teraz nieco większy skok i zostały doskonale zaimplementowane w naszej próbce recenzenckiej, więc nie ma mowy o niestabilności czy chybotaniu. Oferują one także bardzo bogaty i stłumiony odgłos kliknięcia.
Wyświetlacz - T14 G3 teraz z 16:10
Po ponownym wyposażeniu high-endowych urządzeń, jak np.ThinkPad X1 Carbon w panele 16:10 od ostatniej generacji, teraz konwersji doczekały się także modele ThinkPad T14 G3 i T14s G3. Lenovo oferuje łącznie 6 różnych 14-calowych paneli dla T14 G3 AMD (5 dla Europy), które mogą się znacznie różnić jakością obrazu i jasnością:
- WUXGA (1.920 x 1.200), 300 nitów, IPS, 700:1, 45% NTSC
- WUXGA (1.920 x 1.200), 400 nitów, IPS, 800:1, 100% sRGB, dopłata około 110 USD
- WUXGA (1.920 x 1.200), 300 nitów, IPS, Touch, 700:1, 45% NTSC, dopłata około 100 USD
- WUXGA (1.920 x 1.200), 500 nitów, IPS, Touch, Privacy Guard, 1000:1, 100% sRGB, dopłata około 360 USD
- 2.2K (2.240 x 1.400), 300 nitów, IPS, 1500:1, 100% sRGB
- WQUXGA (3.840 x 2.400), 500 Nitów, 1500:1, 100% DCI-P3, DolbyVision HDR 400, dopłata około 420 USD
Wyświetlacz 2,2K nie jest dostępny w Europie. Nasza próbka recenzencka ma wyświetlacz niedotykowy o jasności 400 nitów, który prawdopodobnie będzie najpopularniejszym wariantem do zastosowań produktywnych i, bazując na doświadczeniu, oferuje najlepszy kompromis między jakością obrazu a wydajnością. Podobnie jak w przypadku poprzedników Lenovo ThinkPad T14 Gen 2 laptop review: Familiar benefits from Intel Tiger Lake , prawdopodobnie znów będą różni dostawcy, więc nie można wykluczyć pewnej loterii paneli, dlatego minimalna specyfikacja z kontrastem 800:1 jest tak niska
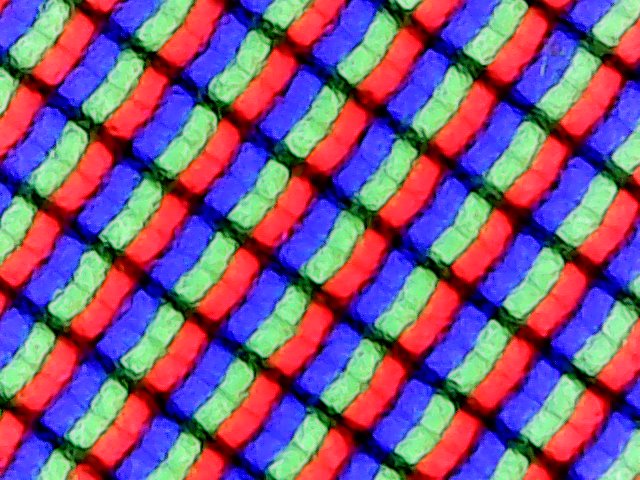
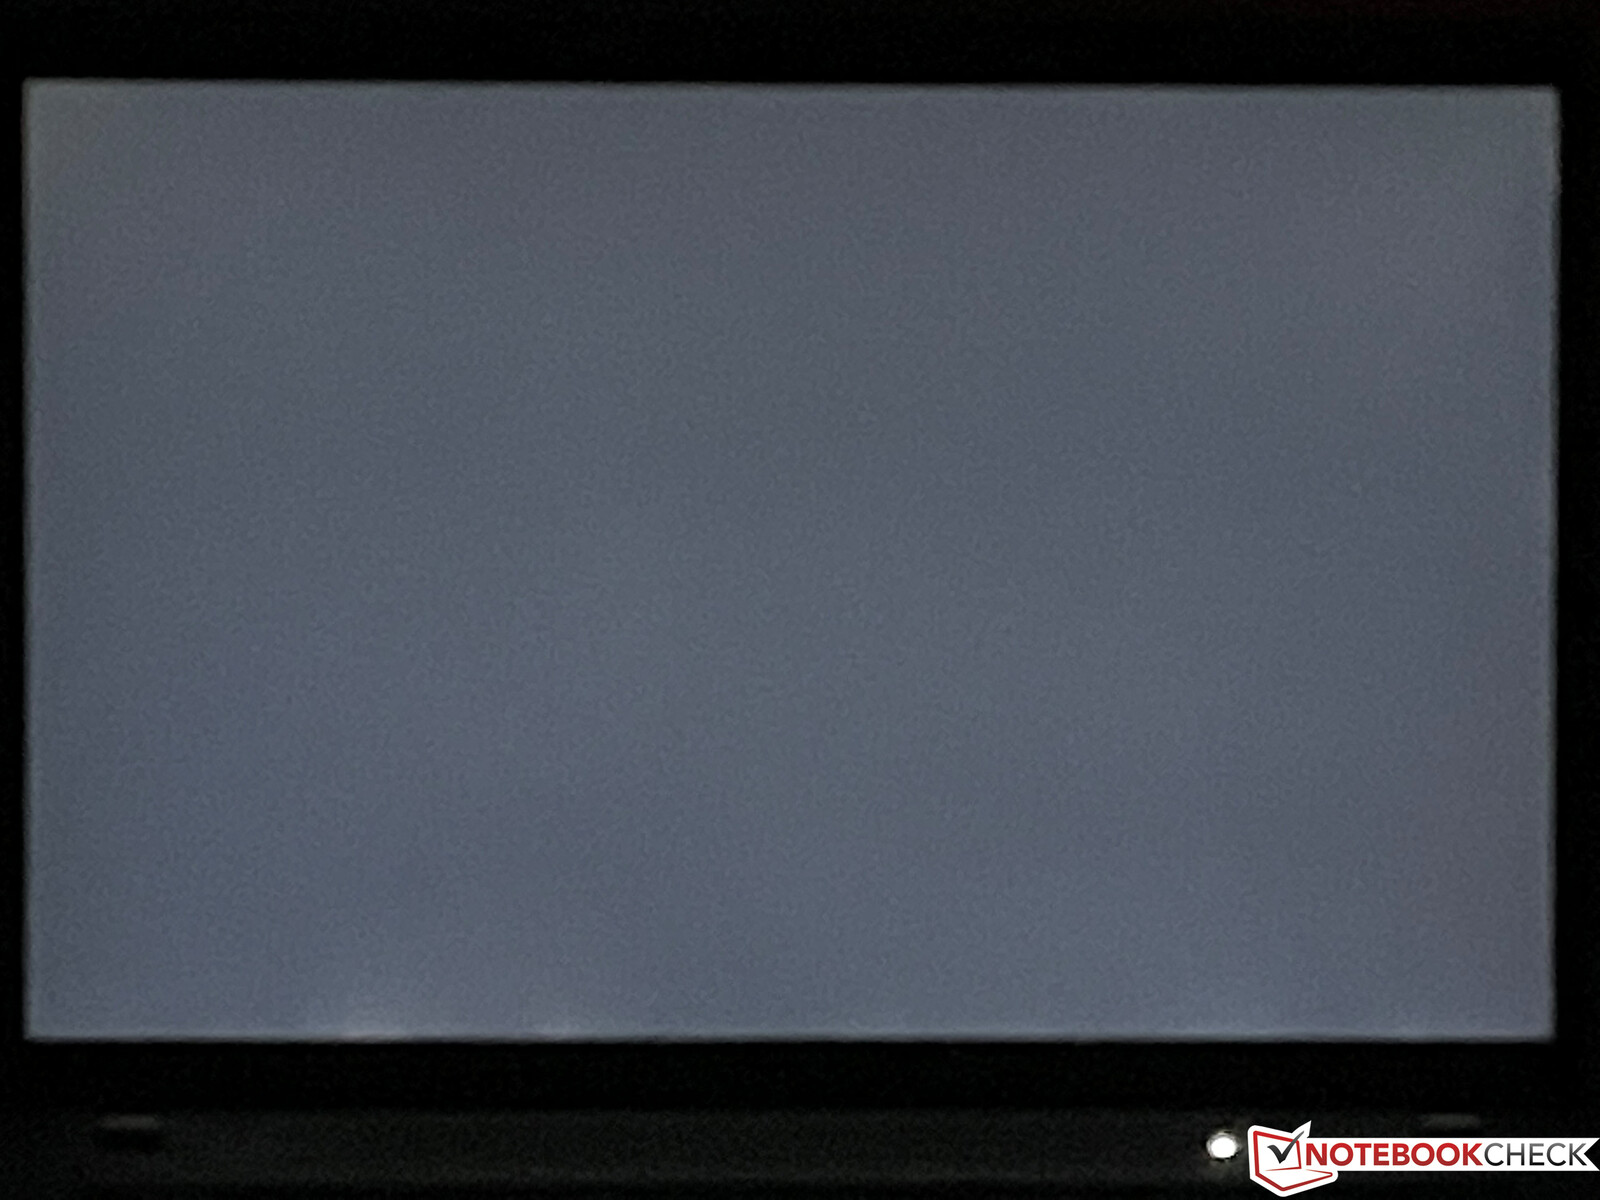
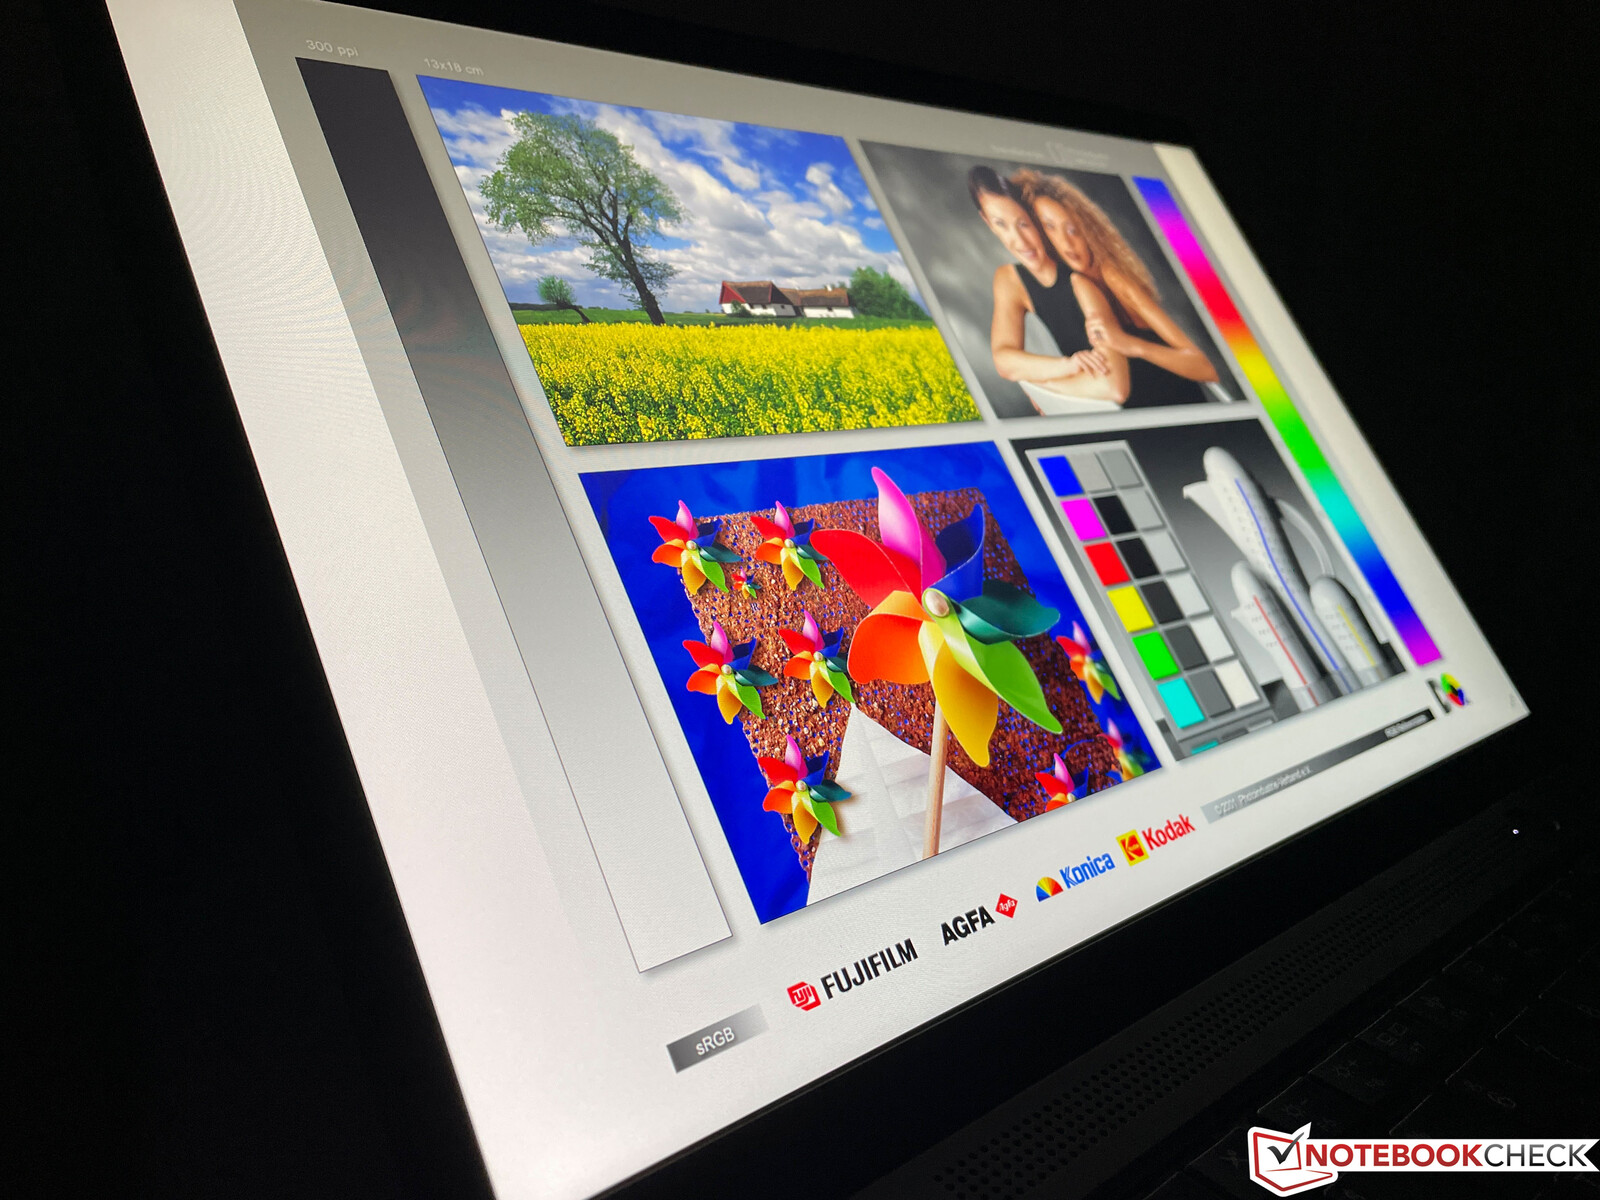
Nasz panel pochodzi od LG (LP140WU1-SPB2) i wypada dobrze praktycznie we wszystkich dziedzinach, biorąc pod uwagę przeznaczenie. Pomimo matowej powierzchni, jasne powierzchnie wcale nie wydają się ziarniste, treści są wystarczająco ostre pomimo normalnej rozdzielczości FHD, a kolory również wyglądają żywo. Spojrzenie na zmierzone wartości również pokazuje, dlaczego tak jest. Współczynnik kontrastu wynosi ponad 2100:1, co jest niezwykle dobrym wynikiem dla panelu IPS. Podana jasność 400 cd/m² została również przekroczona przez nasz próbkę testową ze średnią 432 cd/m². Jednocześnie wartość czerni wynosząca 0,21 jest bardzo niska. Przy maksymalnej jasności występują tylko minimalne aureole i nie stwierdzono migotania PWM. Ponadto stabilność kątów widzenia ekranu IPS jest bardzo dobra.
| |||||||||||||||||||||||||
rozświetlenie: 94 %
na akumulatorze: 451 cd/m²
kontrast: 2148:1 (czerń: 0.21 cd/m²)
ΔE ColorChecker Calman: 2.4 | ∀{0.5-29.43 Ø4.73}
calibrated: 1.3
ΔE Greyscale Calman: 3.3 | ∀{0.09-98 Ø4.97}
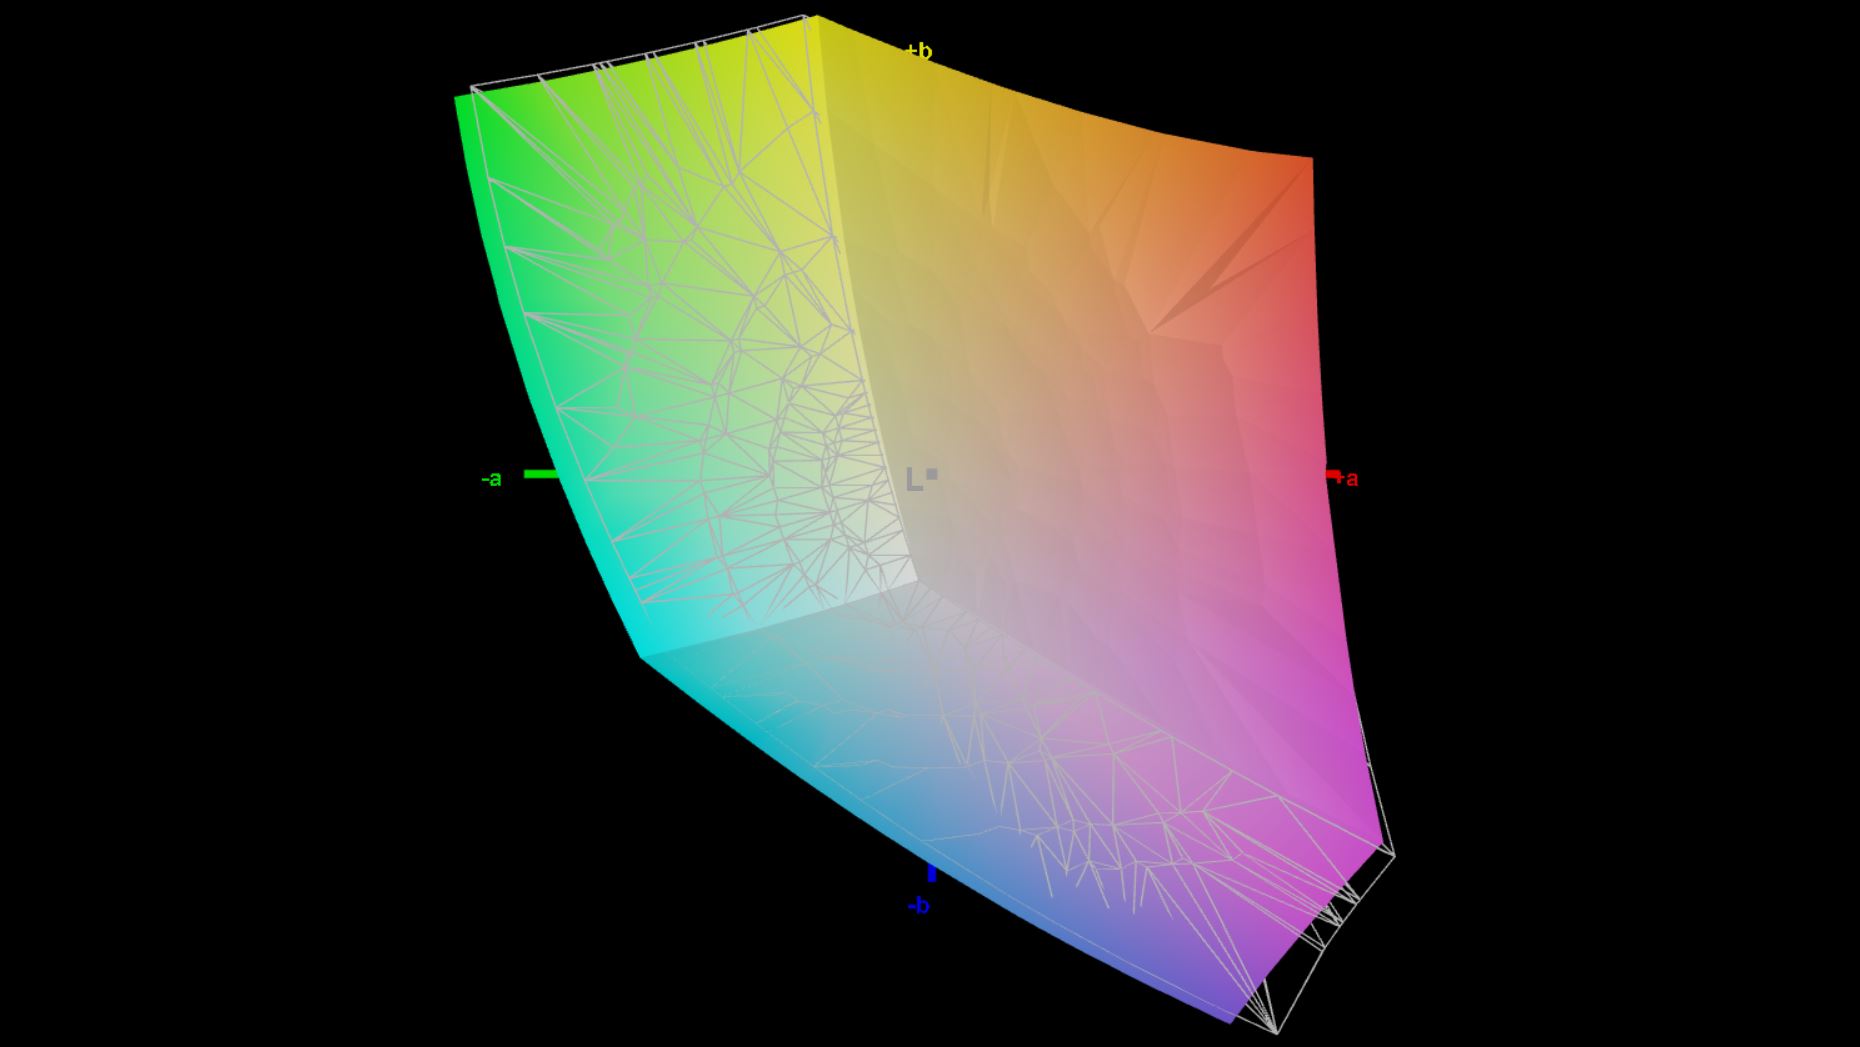
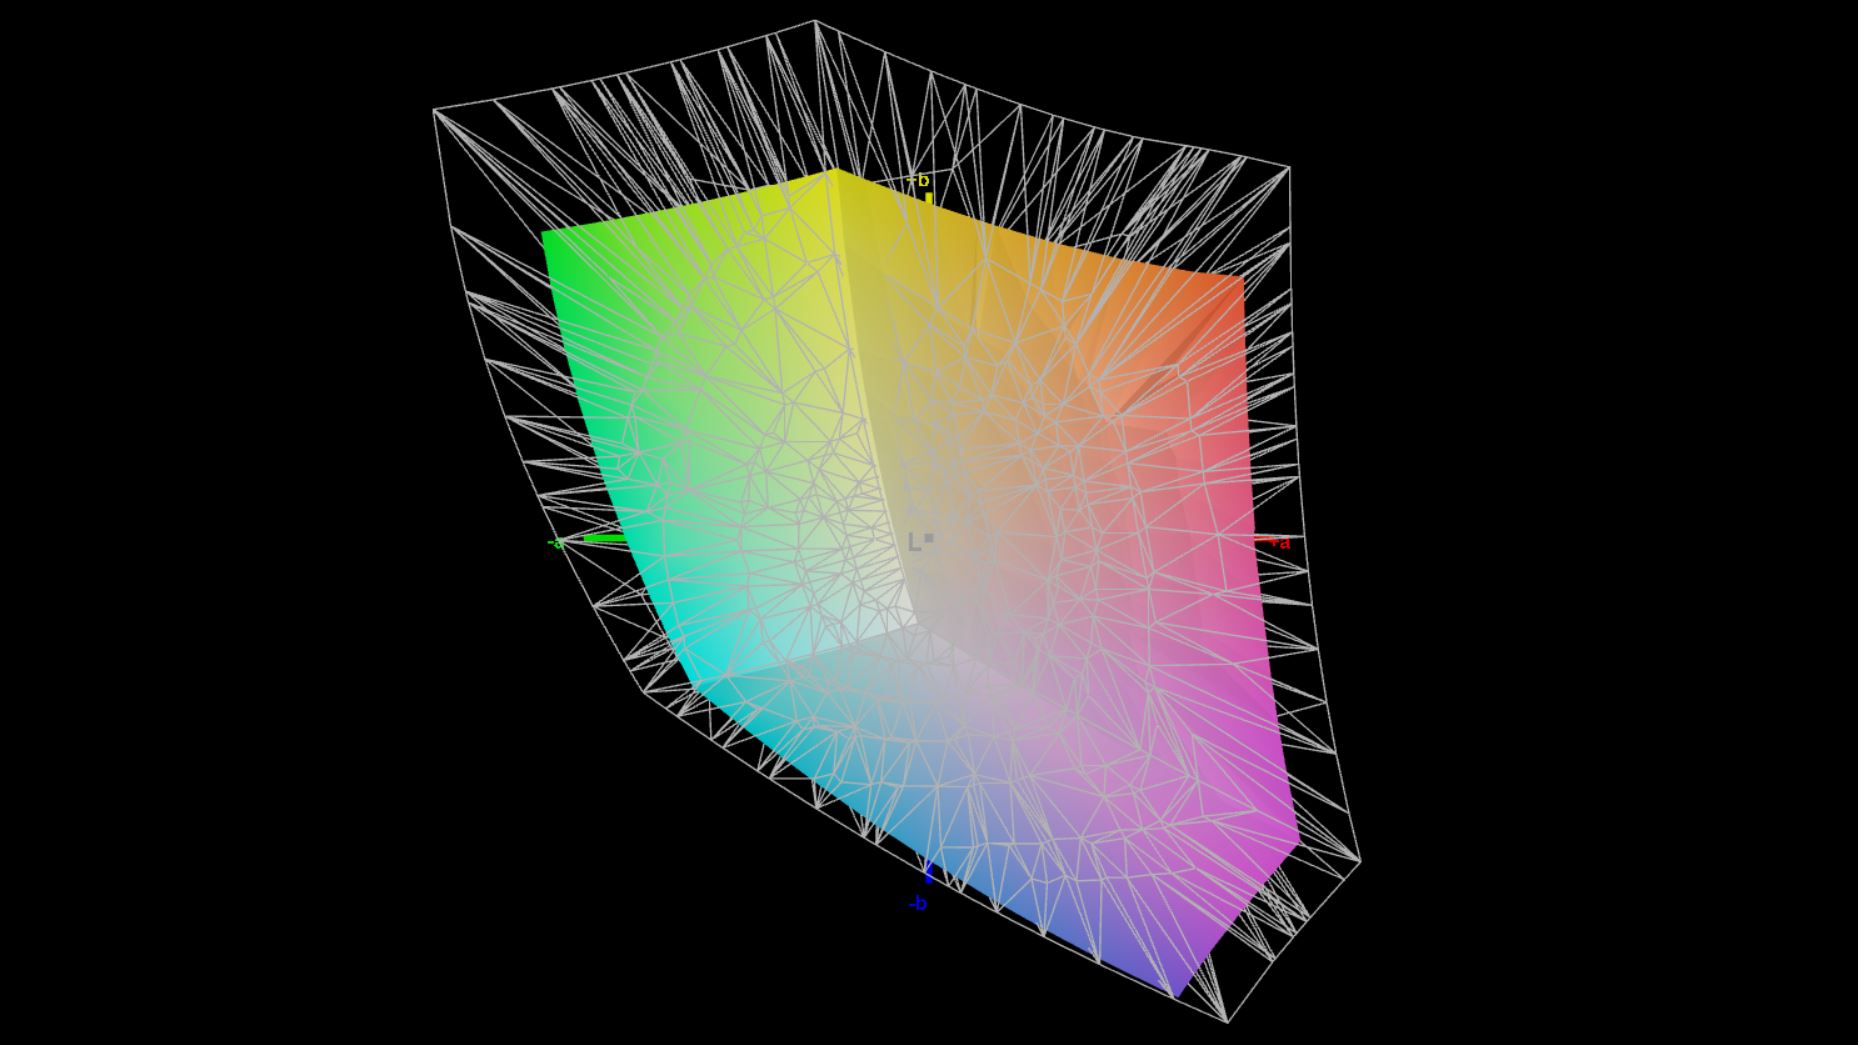
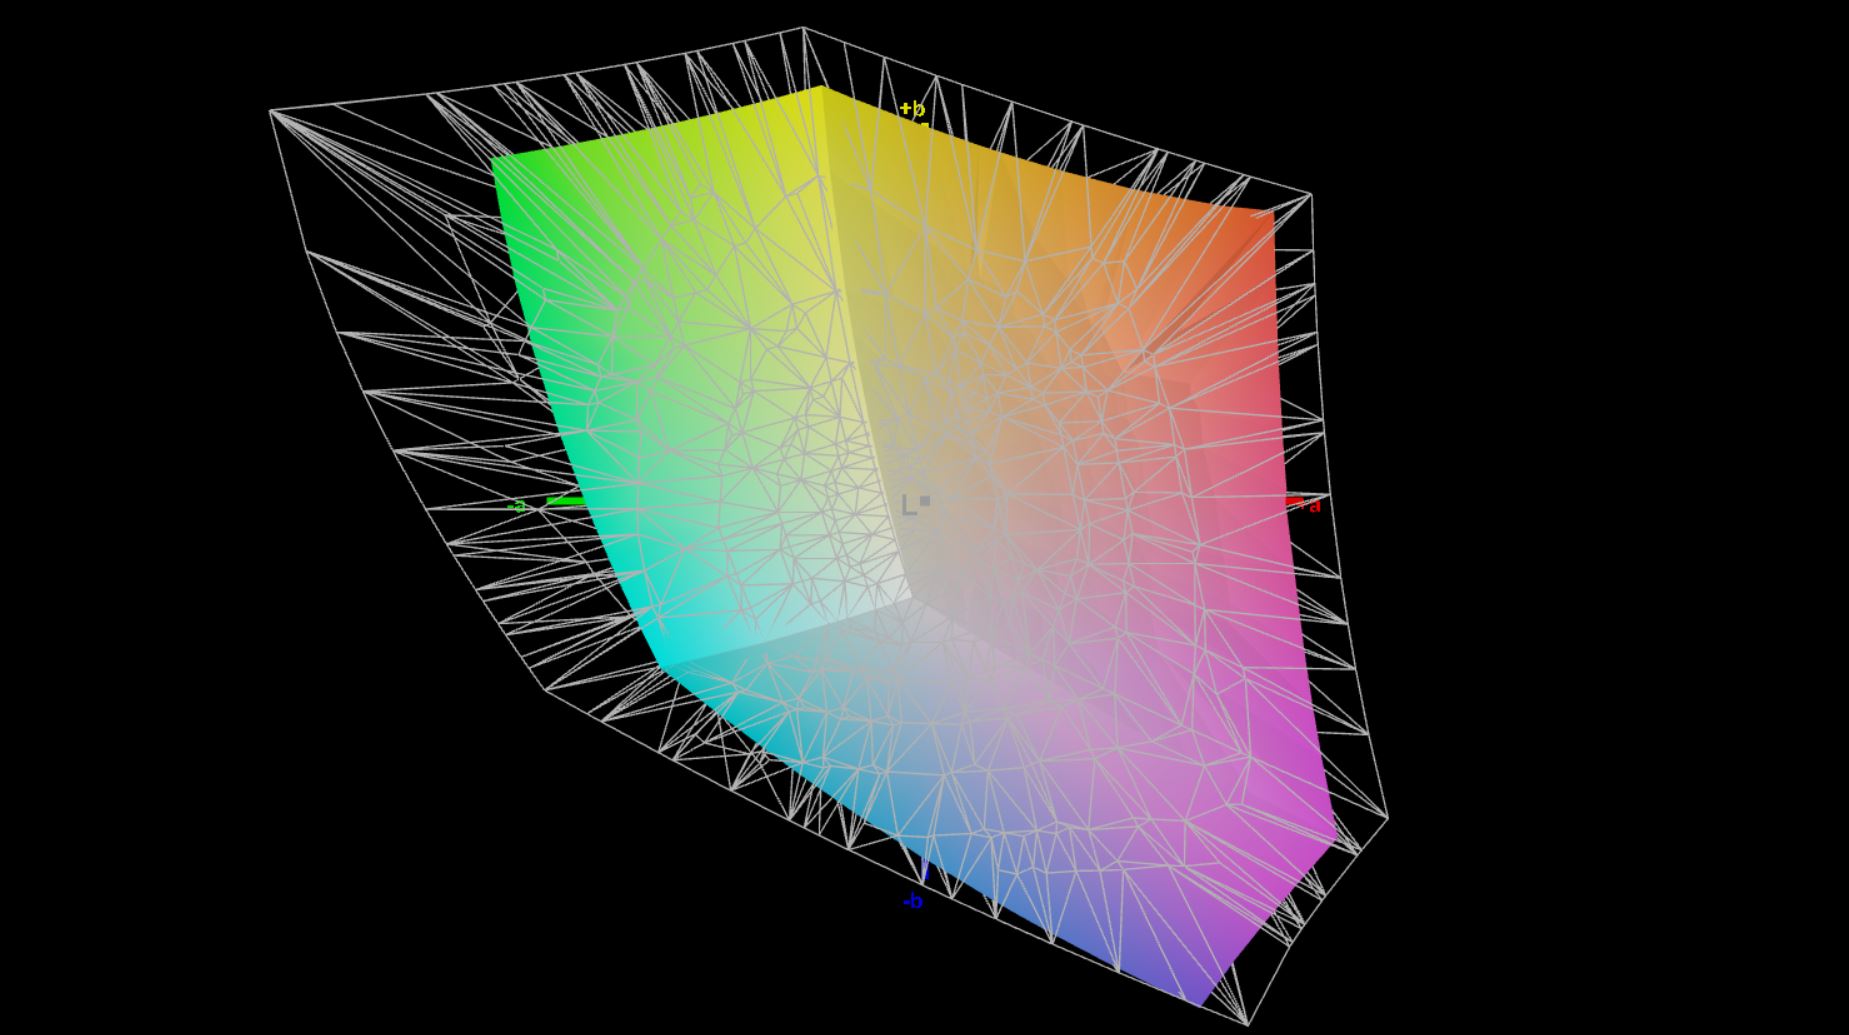
71.5% AdobeRGB 1998 (Argyll 3D)
97.4% sRGB (Argyll 3D)
69.2% Display P3 (Argyll 3D)
Gamma: 2.13
CCT: 6848 K
| Lenovo ThinkPad T14 G3-21CF004NGE LP140WU1-SPB2, IPS, 1920x1200, 14" | Dell Latitude 7420 JW6MH Chi Mei CMN1416 CHF07 140HCG, IPS, 1920x1080, 14" | Huawei MateBook X Pro 2022 TMX1422, IPS, 3120x2080, 14.2" | HP EliteBook 845 G9 6F6H6EA InfoVision X140NV4J, IPS, 1920x1200, 14" | Lenovo ThinkPad T14 Gen2-20W1S00000 LP140WF9-SPF2, IPS LED, 1920x1080, 14" | Lenovo ThinkPad T14s G2 20XGS01100 NE140FHM-N61, IPS LED, 1920x1080, 14" | |
|---|---|---|---|---|---|---|
| Display | -1% | 20% | 0% | -6% | -4% | |
| Display P3 Coverage (%) | 69.2 | 68 -2% | 94.6 37% | 69 0% | 64.3 -7% | 69.7 1% |
| sRGB Coverage (%) | 97.4 | 99 2% | 99.5 2% | 99 2% | 95.4 -2% | 91.8 -6% |
| AdobeRGB 1998 Coverage (%) | 71.5 | 70 -2% | 86.5 21% | 70 -2% | 65.5 -8% | 67.2 -6% |
| Response Times | -34% | 25% | 8% | -38% | -148% | |
| Response Time Grey 50% / Grey 80% * (ms) | 41.4 ? | 55 ? -33% | 25.4 ? 39% | 31 ? 25% | 57.2 ? -38% | 84 ? -103% |
| Response Time Black / White * (ms) | 19.2 ? | 26 ? -35% | 17.1 ? 11% | 21 ? -9% | 26.4 ? -38% | 56 ? -192% |
| PWM Frequency (Hz) | 2451 ? | |||||
| Screen | 9% | 13% | -13% | -20% | -71% | |
| Brightness middle (cd/m²) | 451 | 408 -10% | 603 34% | 678 50% | 382 -15% | 397 -12% |
| Brightness (cd/m²) | 435 | 378 -13% | 586 35% | 745 71% | 367 -16% | 386 -11% |
| Brightness Distribution (%) | 94 | 86 -9% | 91 -3% | 69 -27% | 88 -6% | 88 -6% |
| Black Level * (cd/m²) | 0.21 | 0.22 -5% | 0.39 -86% | 0.33 -57% | 0.14 33% | 0.28 -33% |
| Contrast (:1) | 2148 | 1855 -14% | 1546 -28% | 2055 -4% | 2729 27% | 1418 -34% |
| Colorchecker dE 2000 * | 2.4 | 1.54 36% | 1.1 54% | 3.56 -48% | 4.2 -75% | 5.8 -142% |
| Colorchecker dE 2000 max. * | 4.1 | 2.72 34% | 2.2 46% | 7.23 -76% | 7.9 -93% | 12.6 -207% |
| Colorchecker dE 2000 calibrated * | 1.3 | 1.08 17% | 1.2 8% | 1.05 19% | 0.9 31% | 1.9 -46% |
| Greyscale dE 2000 * | 3.3 | 1.95 41% | 1.5 55% | 4.93 -49% | 5.4 -64% | 8.3 -152% |
| Gamma | 2.13 103% | 2.33 94% | 2.17 101% | 2.63 84% | 2.31 95% | 2.07 106% |
| CCT | 6848 95% | 6806 96% | 6549 99% | 7114 91% | 7499 87% | 6867 95% |
| Color Space (Percent of AdobeRGB 1998) (%) | 60.6 | |||||
| Color Space (Percent of sRGB) (%) | 95.4 | |||||
| Całkowita średnia (program / ustawienia) | -9% /
1% | 19% /
16% | -2% /
-8% | -21% /
-19% | -74% /
-68% |
* ... im mniej tym lepiej
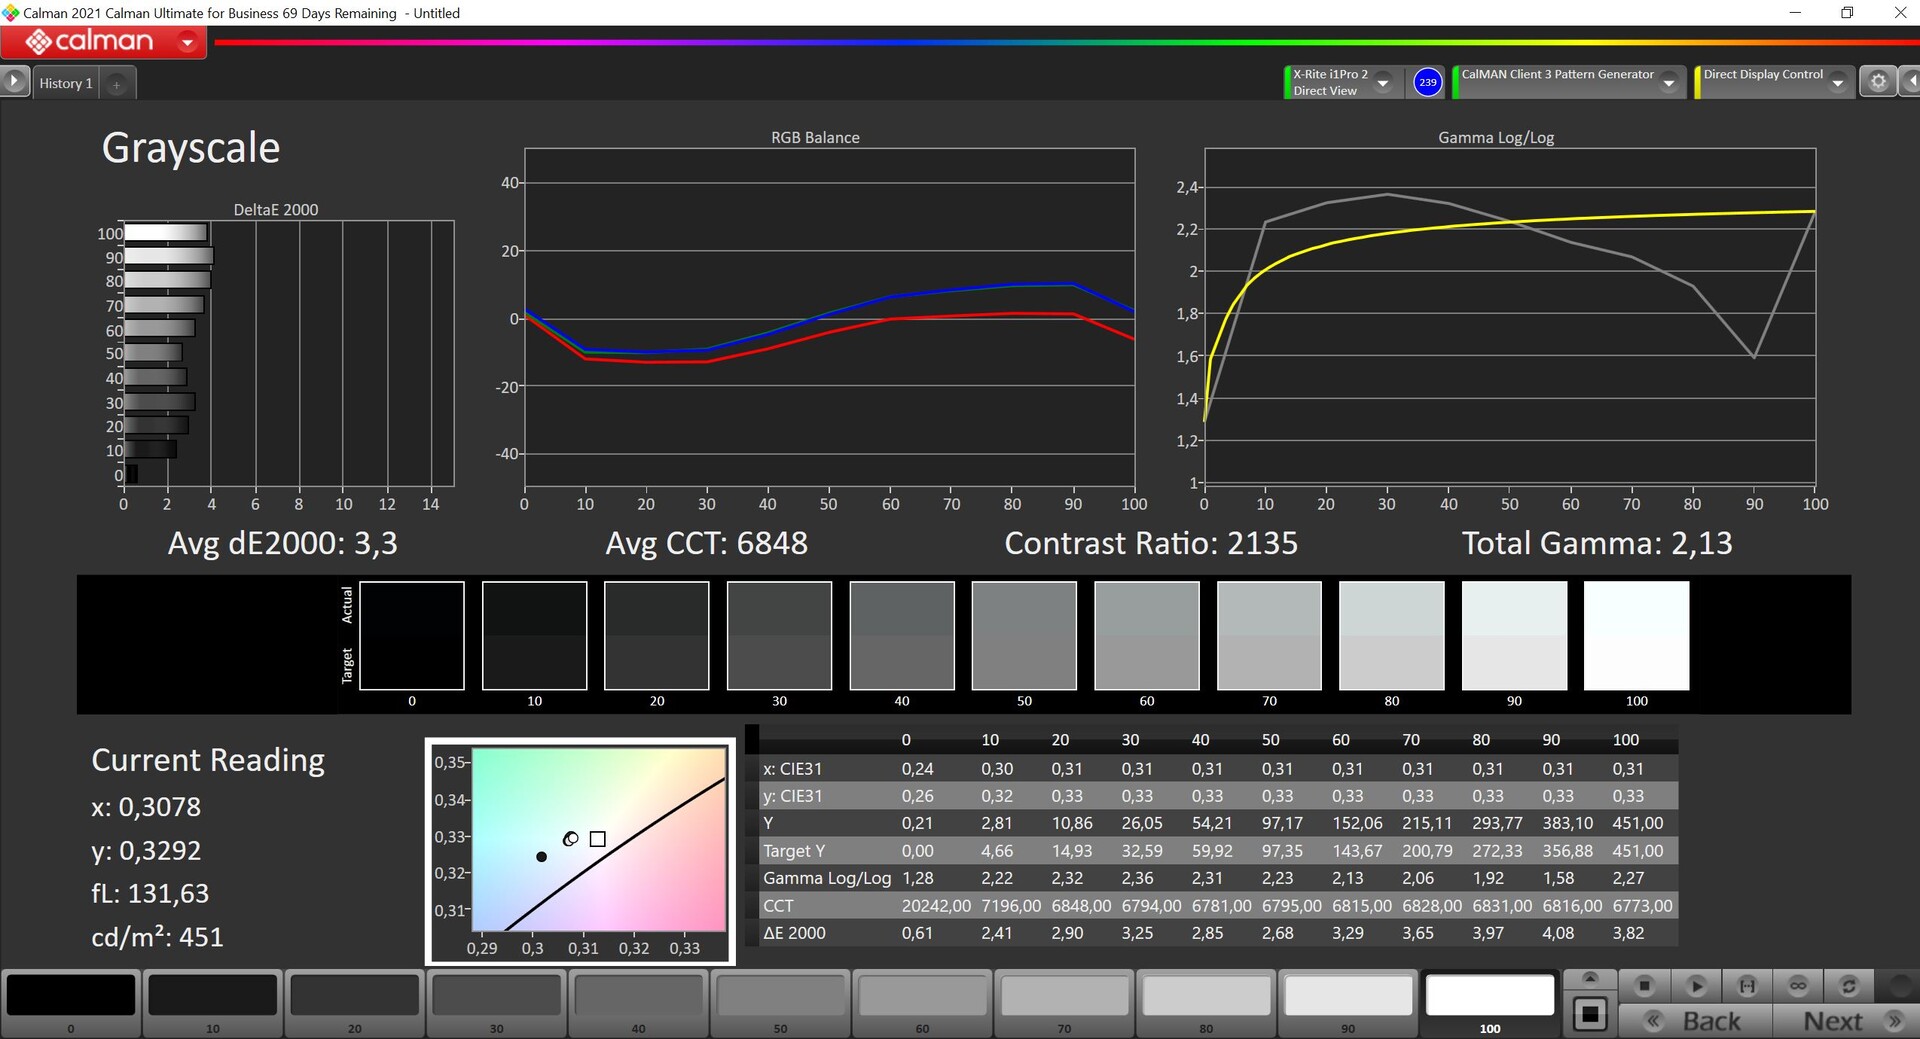
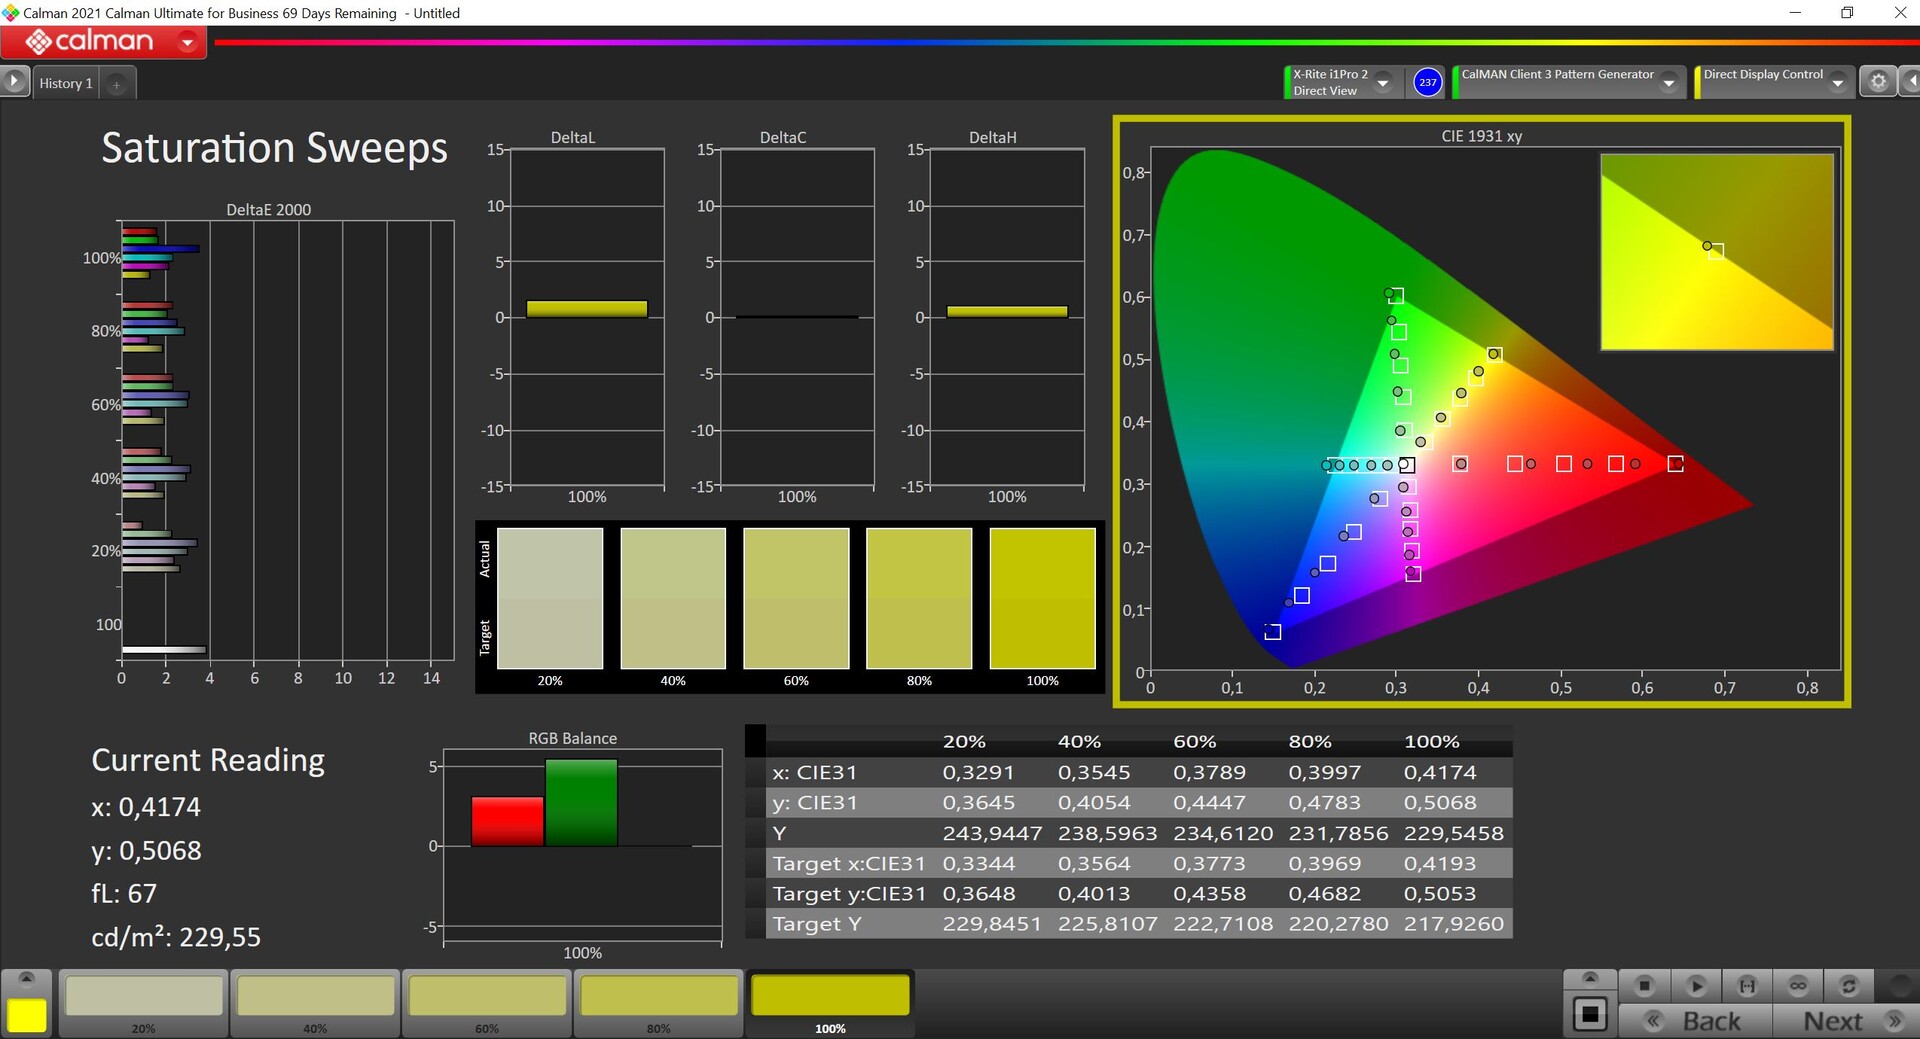
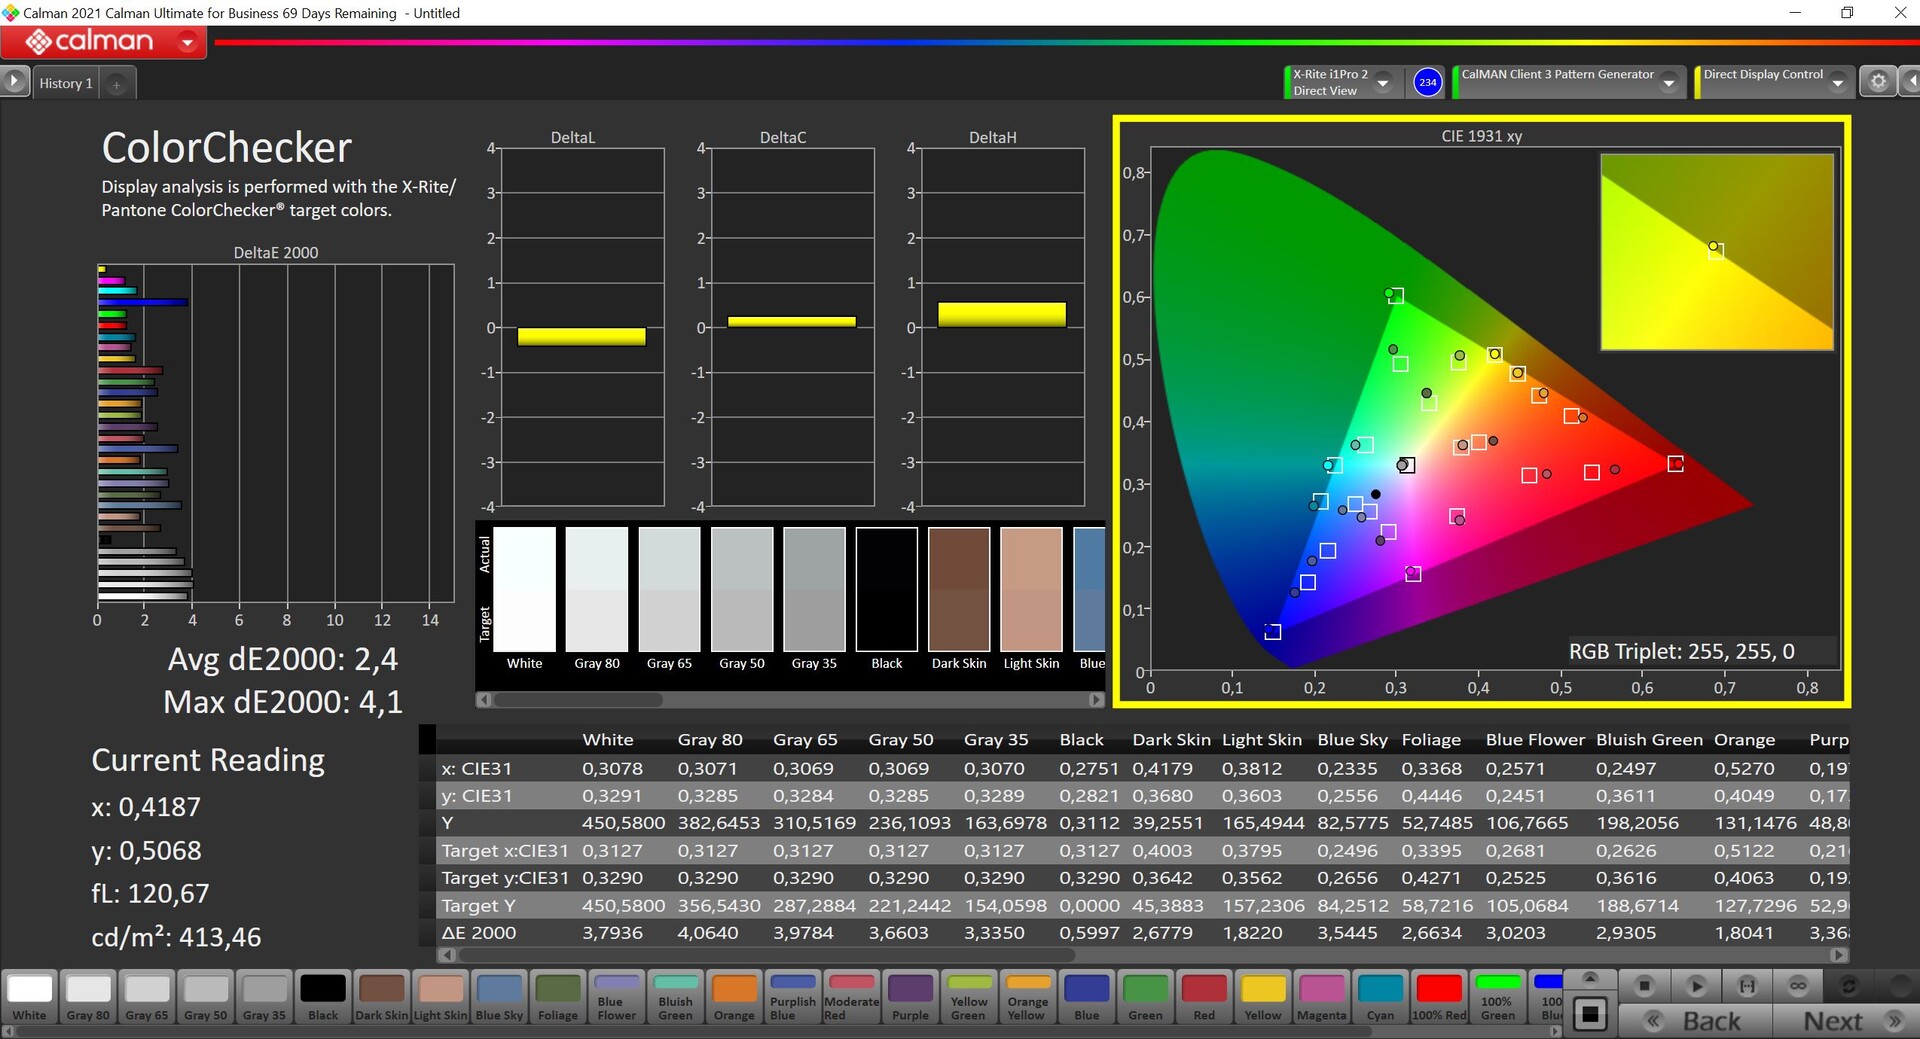

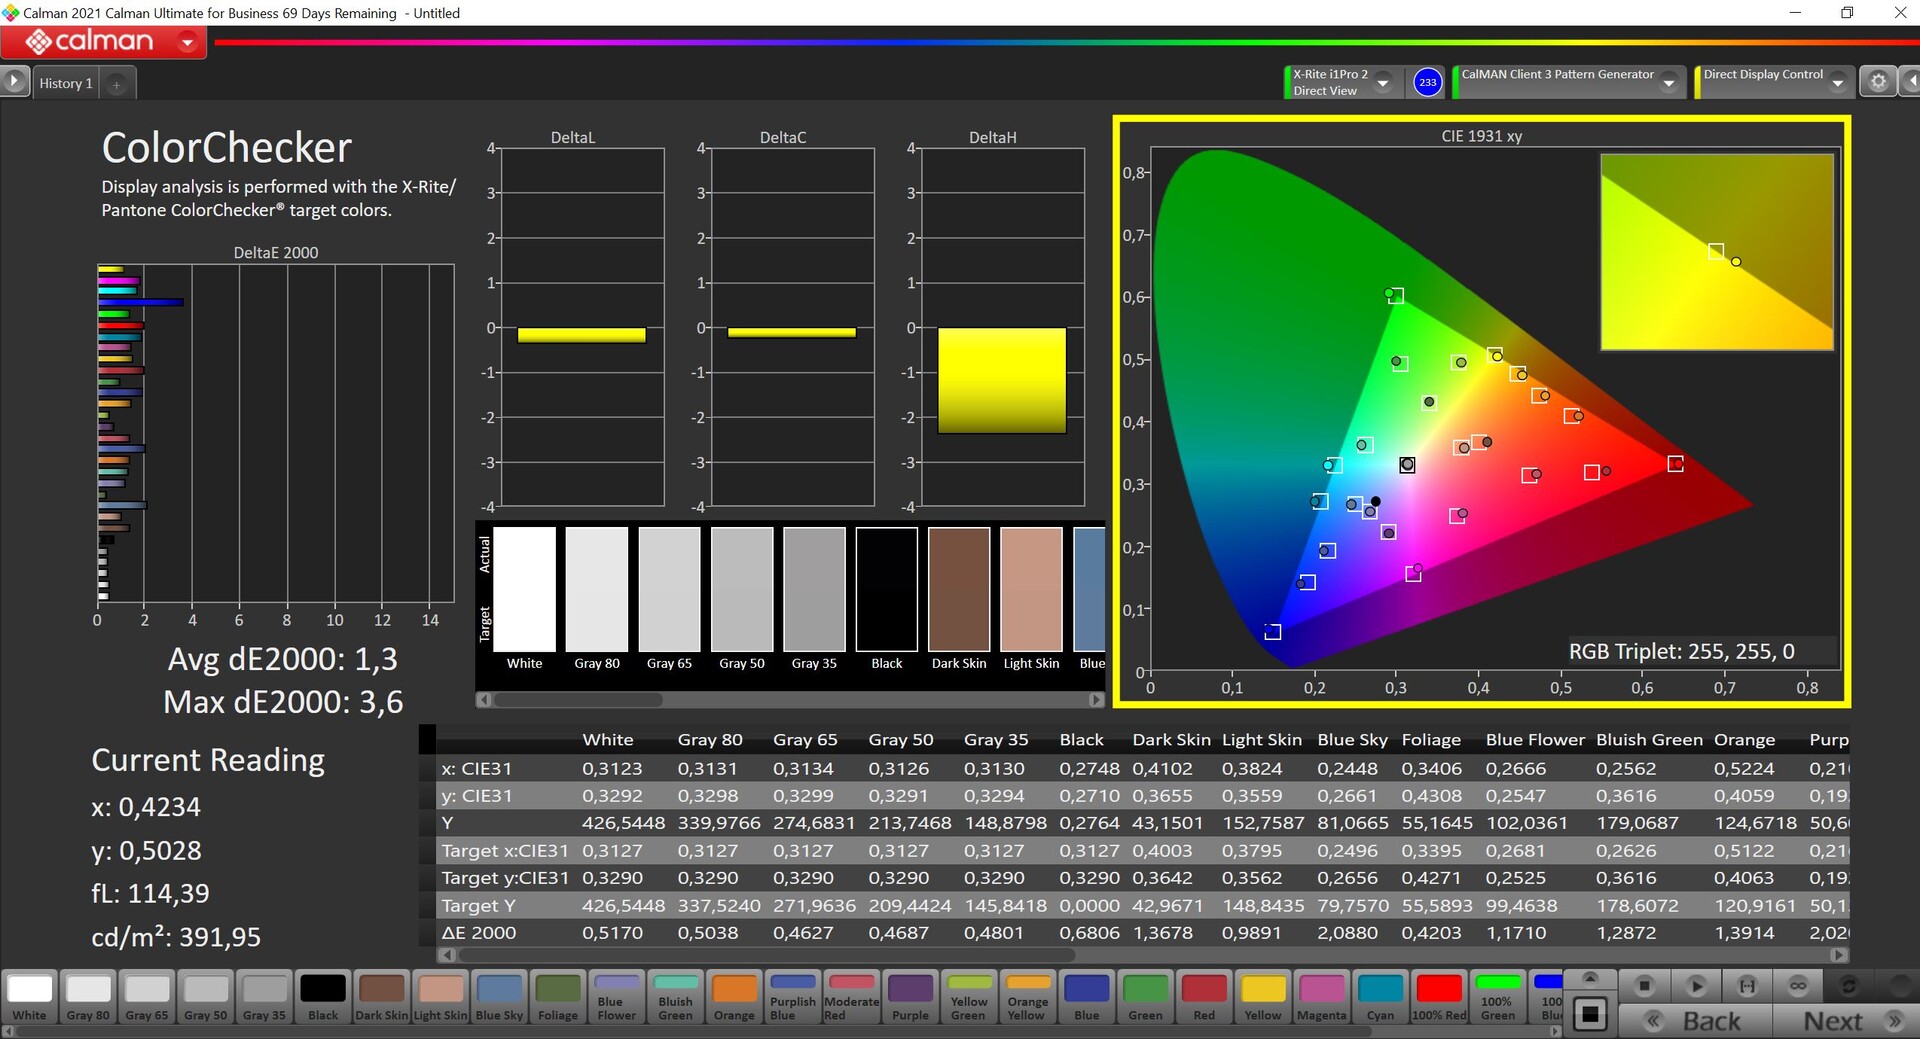
Po wyjęciu laptopa z pudełka nasza analiza przy użyciu profesjonalnego oprogramowania CalMAN (X-Rite i1 Pro 2) wykazała lekkie przesunięcie kolorów w stronę niebieskiego/zielonego w połączeniu z temperaturą barwową, która jest nieco zbyt chłodna. Z drugiej strony, nie ma dużych odchyleń od referencyjnej przestrzeni barw sRGB w zakresie skali szarości czy kolorów, więc panel nie musi być koniecznie kalibrowany do normalnych zastosowań biurowych.
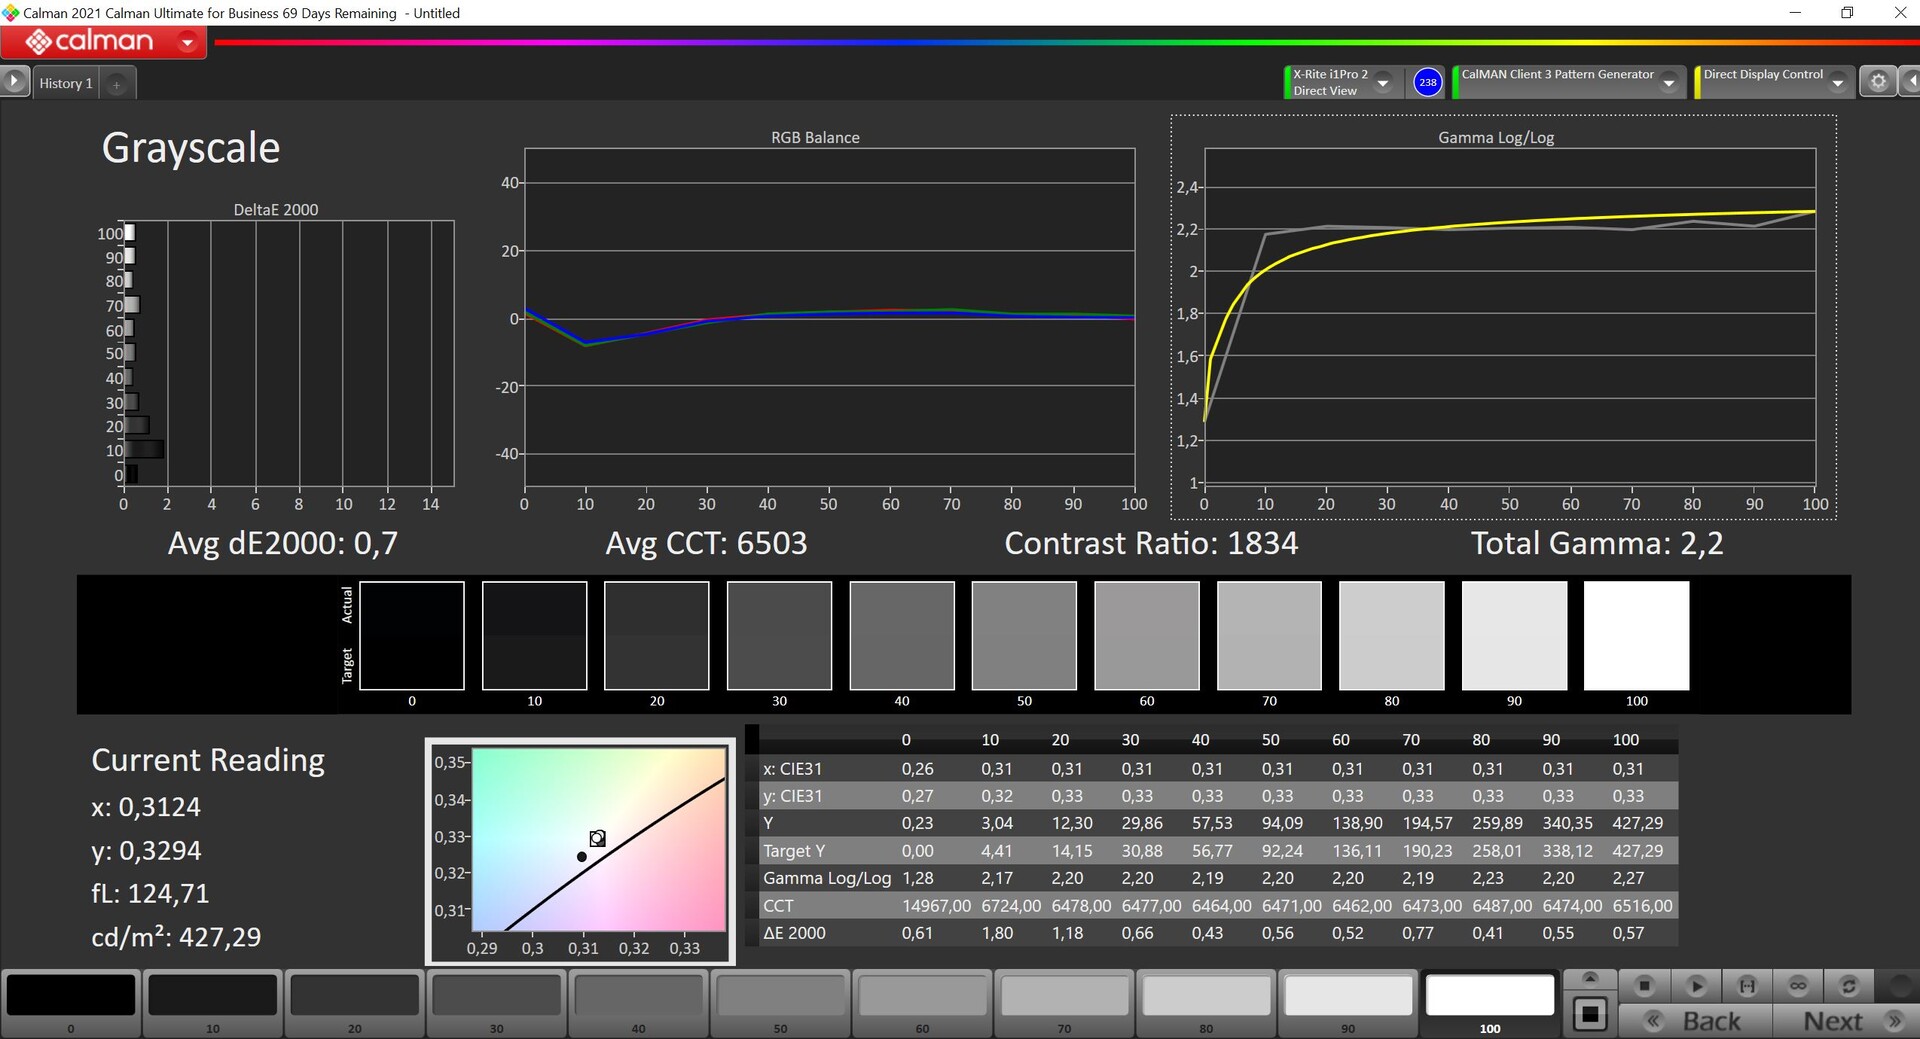
Nasza własna kalibracja (profil jest dostępny do pobrania za darmo powyżej) przynosi poprawę jakości wyświetlania i jeszcze bardziej zmniejsza odchylenia kolorystyczne. Tylko 100% niebieskiego znajduje się tuż powyżej ważnej granicy 3. Wraz z prawie całkowitym pokryciem sRGB, panel nadaje się więc bardzo dobrze do edycji wideo/obrazów w przestrzeni kolorów sRGB.
Wyświetl czasy reakcji
| ↔ Czas reakcji od czerni do bieli | ||
|---|---|---|
| 19.2 ms ... wzrost ↗ i spadek ↘ łącznie | ↗ 6.8 ms wzrost | 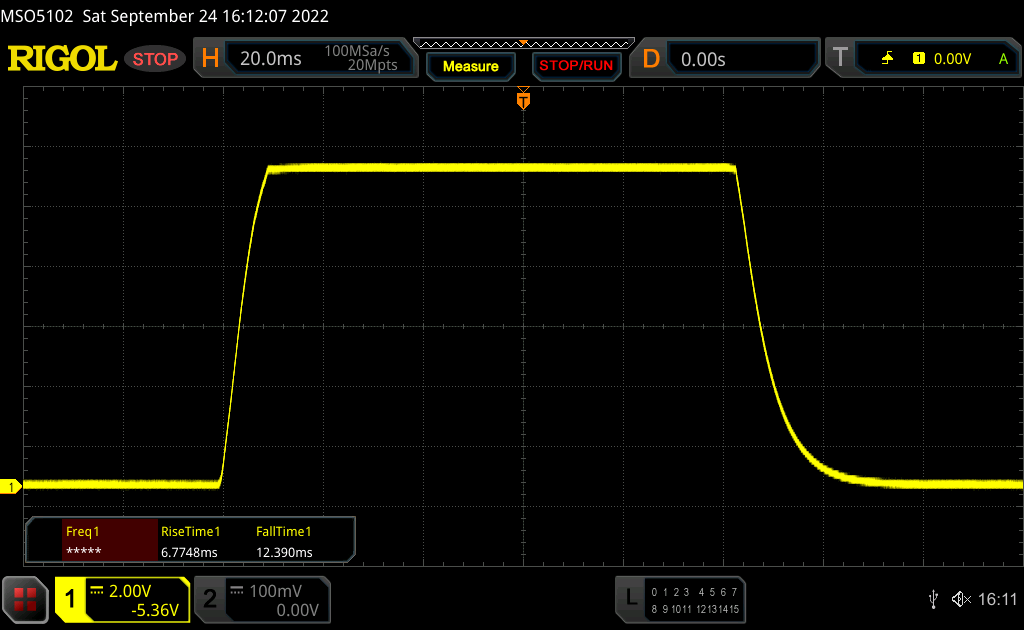 |
| ↘ 12.4 ms upadek | ||
| W naszych testach ekran wykazuje dobry współczynnik reakcji, ale może być zbyt wolny dla graczy rywalizujących ze sobą. Dla porównania, wszystkie testowane urządzenia wahają się od 0.1 (minimum) do 240 (maksimum) ms. » 42 % wszystkich urządzeń jest lepszych. Oznacza to, że zmierzony czas reakcji jest zbliżony do średniej wszystkich testowanych urządzeń (19.9 ms). | ||
| ↔ Czas reakcji 50% szarości do 80% szarości | ||
| 41.4 ms ... wzrost ↗ i spadek ↘ łącznie | ↗ 18.8 ms wzrost | 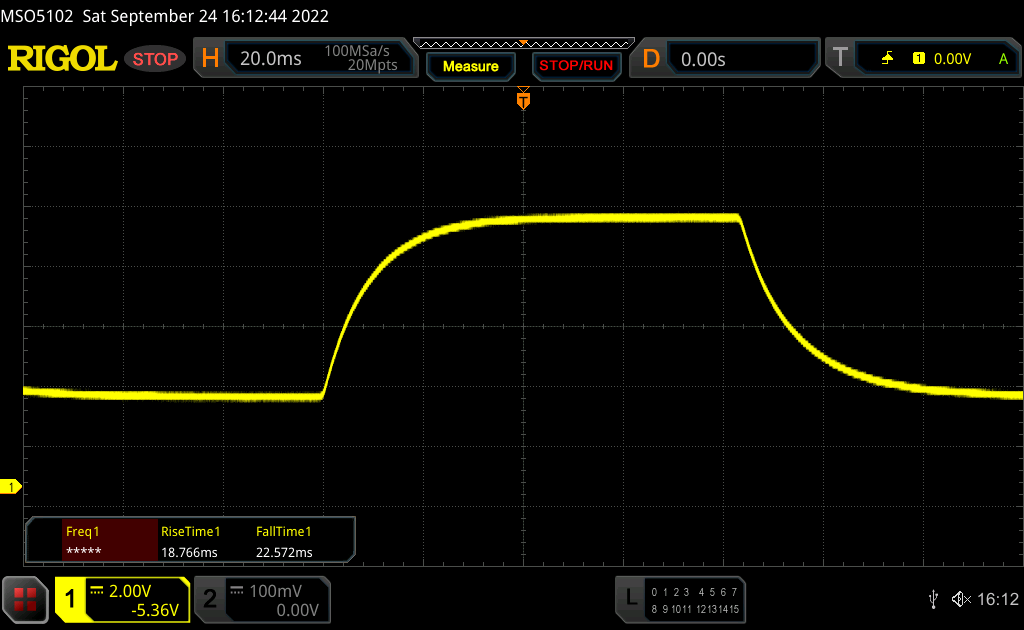 |
| ↘ 22.6 ms upadek | ||
| W naszych testach ekran wykazuje powolne tempo reakcji, co będzie niezadowalające dla graczy. Dla porównania, wszystkie testowane urządzenia wahają się od 0.165 (minimum) do 636 (maksimum) ms. » 67 % wszystkich urządzeń jest lepszych. Oznacza to, że zmierzony czas reakcji jest gorszy od średniej wszystkich testowanych urządzeń (31.1 ms). | ||
Migotanie ekranu / PWM (modulacja szerokości impulsu)
| Migotanie ekranu/nie wykryto PWM | 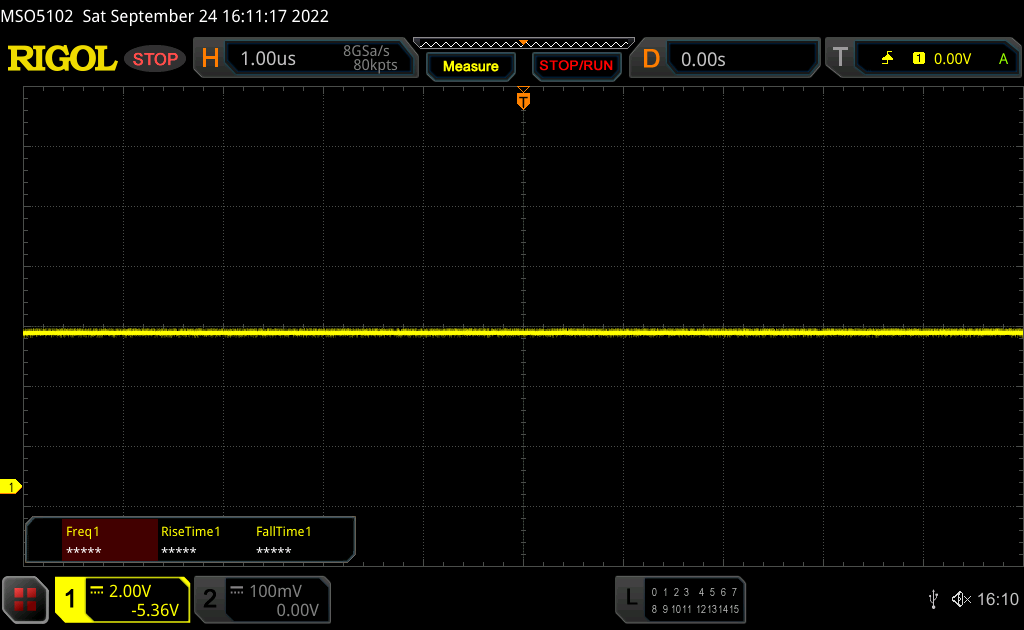 | ||
Dla porównania: 52 % wszystkich testowanych urządzeń nie używa PWM do przyciemniania wyświetlacza. Jeśli wykryto PWM, zmierzono średnio 7798 (minimum: 5 - maksimum: 343500) Hz. | |||
Użytkownicy mogą bez problemu pracować na zewnątrz z ThinkPadem T14 G3, o ile unika się bezpośrednich odbić od źródeł światła. Nawet w jasne dni z promieniami słońca na matowej powierzchni ekranu przy pełnej jasności dobrze widać treści. Może to być jednak nieco trudniejsze w przypadku standardowego panelu o jasności 300 cd/m².
Wydajność - AMD Ryzen Pro i PCIe 4.0
Pod względem konfiguracji istnieją duże różnice między wersjami ThinkPada T14 G3 z procesorami AMD i Intela. O ile model AMD oferuje wybór pomiędzy dwoma najnowszymi modelami Ryzen Pro z rozbudowanymi zabezpieczeniami i szybkimi układami iGPU, o tyle w przypadku wersji z procesorem Intela sprawa jest znacznie bardziej skomplikowana. Lenovo oferuje zarówno aktualne procesory Alder Lake U i P (vPro tylko za dopłatą), z odpowiednimi iGPU lub dedykowanąNvidia GeForce MX550. Niektóre dokumenty techniczne wymieniają nawet np GeForce RTX 2050, ale nie udało nam się znaleźć tutaj żadnych odpowiadających konfiguracji, a w świetle wysokiego wskaźnika TGP (zaczynającego się od 35 watów), RTX 2050 w T14 G3 również byłby dla nas zaskoczeniem.
| ThinkPad T14 G3 AMD | ThinkPad T14 G3 Intel | |
|---|---|---|
| CPU | AMD Ryzen 5 Pro 6650UAMD Ryzen 7 Pro 6850U |
Intel Alder Lake-U (i5-1235U, i5-1245U, i7-1255U, i7-1265U) Intel Alder Lake-P (i5-1240P, i5-1250P, i7-1260P, i7-1270P, i7-1280P) |
| GPU | AMD Radeon 660MAMD Radeon 680M |
Intel Iris Xe Graphics G7 (80 oder 96 EUs) Nvidia GeForce MX550 2 GB |
| RAM | max. 32 GB LPDDR5-6400 RAM na pokładzie | max. 48 GB DDR4-3200 RAM, 8/16 GB na płycie + 1 slot |
Warunki badania
W przeciwieństwie do innych laptopów Lenovo, ustawienia zasilania w modelach ThinkPad są od pewnego czasu bezpośrednio powiązane ze zwykłymi ustawieniami zasilania systemu Windows, co okazuje się bardzo wygodne w codziennym użytkowaniu. Poniższe benchmarki i pomiary przeprowadziliśmy w trybie Best Performance, w którym wartości TDP wynoszą 30 W przy krótkotrwałym obciążeniu i 25 W przy stałym obciążeniu. W trybie Better Performance jest to 26/22 watów, a przy aktywnym ustawieniu More Battery Efficiency spada jeszcze bardziej do 14 watów. Limity te są znacznie niższe niż w przypadku obecnych procesorów Alder Lake, gdzie układy z serii U mogą bez problemu pobierać ponad 50 watów podczas szczytowego obciążenia
Procesor - AMD Ryzen 7 Pro 6850U
Na stronie AMD Ryzen 7 Pro 6850Ujest zasadniczo taki sam jak znany Ryzen 7 6800U, ale wersja Pro oferuje dodatkowe funkcje zarządzania i bezpieczeństwa podobne do procesorów vPro Intela. Ryzen 7 Pro oferuje więc 8 nowoczesnych rdzeni Zen3+, które są produkowane w nowoczesnym procesie technologicznym 6 nm. Maksymalne taktowanie 8 rdzeni (16 wątków) wynosi 4,7 GHz. Szczegółowo analizowaliśmy już zwykłego Ryzena 7 6800U, dlatego odsyłamy do naszego specjalnego artykułu po dalsze szczegóły
Zasadniczo możemy powiedzieć, że obecne procesory Intel Alder Lake oferują większą wydajność jednordzeniową dzięki swojej hybrydowej architekturze (dotyczy zarówno Alder Lake-U, jak i Alder Lake-P), ale pobór mocy w trybie jednordzeniowym jest również wyższy. Pod względem wydajności jednordzeniowej układy Alder Lake-U są mniej więcej na równi, w zależności od ustawienia TDP. Z kolei w testach wielordzeniowych mobilne procesory Intela są naprawdę konkurencyjne dopiero przy bardzo wysokim poborze mocy (40 W lub więcej), ale wtedy nie są już szczególnie wydajne.
| Power Consumption / Cinebench R23 Single Power Efficiency - external Monitor | |
| Apple M2 | |
| Intel Core i7-1255U | |
| AMD Ryzen 7 PRO 6850U | |
| AMD Ryzen 7 6800U | |
| Intel Core i7-1260P | |
| Intel Core i7-1260P | |
| Power Consumption / Cinebench R23 Multi Power Efficiency - external Monitor | |
| Apple M2 | |
| AMD Ryzen 7 PRO 6850U | |
| AMD Ryzen 7 6800U | |
| Intel Core i7-1260P | |
| Intel Core i7-1255U | |
| Intel Core i7-1260P | |
Przy konfiguracji TDP 30/25 W, ThinkPad T14 G3 z Ryzenem 7 Pro 6850U doświadcza jedynie minimalnego spadku wydajności (stabilnie na poziomie ~1 650 punktów) pod trwałym obciążeniem, a w naszej pętli Cinebench R15, Ryzen 7 Pro jest pokonany jedynie przezRyzen 9 Pro 6950HS w HP EliteBook 845 G9, aczkolwiek o wyższym poborze mocy - 40 W. Procesory Intel Alder Lake P zazwyczaj potrafią dotrzymać kroku w testach wielordzeniowych pod krótkim obciążeniem, co widać na przykładzie m.in Core i7-1260P w Huawei MateBook X Pro. Uzyskuje on ~1 400 pkt. przy 30 W i nieco ponad 1 200 pkt. przy 25 W, co odpowiada naszej próbce recenzenckiej AMD. Zatem przy porównywalnym poborze mocy, układ Alder Lake P jest około 25% wolniejszy, gdy wszystkie rdzenie są pod obciążeniem. Na stronie Core i7-1255Urównież osiąga tylko około 1150 punktów przy 23 watach. Najszybszy mobilny procesor Intela, tj Core i7-1280Pz dwoma dodatkowymi rdzeniami wydajnościowymi, jest również pokonany przy 23 watach w ThinkPad X1 Nano Gen.2.
Cinebench R15 Multi Sustained Load
Jeśli założymy porównywalne wartości TDP dla procesorów Intela, dopłaty do szybszych układów właściwie się nie opłacają, bo nawet Core i7-1280P przy 23 watach nie jest szybszy od Core i7-1255U przy 23 watach, pomimo czterech dodatkowych rdzeni wydajnościowych.
W pozostałych dwóch trybach wydajności Ryzen 7 Pro 6850U jest nadal bardzo konkurencyjny z ~1 570 punktami przy 22 watach i ~1 220 punktami przy 14 watach i jest również wystarczająco szybki w codziennym użytkowaniu, podczas gdy użytkownik korzysta również z dużo cichszego wentylatora.
Wydajność nie jest zmniejszona w trybie baterii, ponieważ nie ma ekstremalnie wysokich limitów mocy w porównaniu do procesorów Intela. Więcej benchmarków CPU można znaleźć w naszym sekcja techniczna.
Cinebench R23: Multi Core | Single Core
Cinebench R20: CPU (Multi Core) | CPU (Single Core)
Cinebench R15: CPU Multi 64Bit | CPU Single 64Bit
Blender: v2.79 BMW27 CPU
7-Zip 18.03: 7z b 4 | 7z b 4 -mmt1
Geekbench 5.5: Multi-Core | Single-Core
HWBOT x265 Benchmark v2.2: 4k Preset
LibreOffice : 20 Documents To PDF
R Benchmark 2.5: Overall mean
| CPU Performance rating | |
| Huawei MateBook X Pro 2022 | |
| Średnia w klasie Office | |
| HP EliteBook 845 G9 6F6H6EA | |
| Przeciętny AMD Ryzen 7 PRO 6850U | |
| Lenovo ThinkPad T14 G3-21CF004NGE | |
| Lenovo ThinkPad T14s G2 20XGS01100 | |
| Dell Inspiron 14 7420 2-in-1 | |
| Lenovo ThinkPad Z13 21D2CTO1WW | |
| Lenovo ThinkPad T14 Gen2-20W1S00000 | |
| Dell Latitude 7420 JW6MH | |
| Cinebench R23 / Multi Core | |
| HP EliteBook 845 G9 6F6H6EA | |
| Średnia w klasie Office (1673 - 22808, n=73, ostatnie 2 lata) | |
| Przeciętny AMD Ryzen 7 PRO 6850U (9923 - 12945, n=7) | |
| Lenovo ThinkPad T14 G3-21CF004NGE | |
| Huawei MateBook X Pro 2022 | |
| Lenovo ThinkPad Z13 21D2CTO1WW | |
| Lenovo ThinkPad T14s G2 20XGS01100 | |
| Dell Inspiron 14 7420 2-in-1 | |
| Lenovo ThinkPad T14 Gen2-20W1S00000 | |
| Dell Latitude 7420 JW6MH | |
| Cinebench R23 / Single Core | |
| Dell Inspiron 14 7420 2-in-1 | |
| Huawei MateBook X Pro 2022 | |
| Średnia w klasie Office (708 - 2130, n=73, ostatnie 2 lata) | |
| HP EliteBook 845 G9 6F6H6EA | |
| Lenovo ThinkPad T14 Gen2-20W1S00000 | |
| Przeciętny AMD Ryzen 7 PRO 6850U (1409 - 1536, n=7) | |
| Lenovo ThinkPad T14 G3-21CF004NGE | |
| Lenovo ThinkPad Z13 21D2CTO1WW | |
| Lenovo ThinkPad T14s G2 20XGS01100 | |
| Dell Latitude 7420 JW6MH | |
| Cinebench R20 / CPU (Multi Core) | |
| HP EliteBook 845 G9 6F6H6EA | |
| Średnia w klasie Office (648 - 8840, n=72, ostatnie 2 lata) | |
| Przeciętny AMD Ryzen 7 PRO 6850U (3784 - 5022, n=7) | |
| Lenovo ThinkPad T14 G3-21CF004NGE | |
| Huawei MateBook X Pro 2022 | |
| Lenovo ThinkPad Z13 21D2CTO1WW | |
| Lenovo ThinkPad T14s G2 20XGS01100 | |
| Dell Inspiron 14 7420 2-in-1 | |
| Lenovo ThinkPad T14 Gen2-20W1S00000 | |
| Dell Latitude 7420 JW6MH | |
| Cinebench R20 / CPU (Single Core) | |
| Dell Inspiron 14 7420 2-in-1 | |
| Huawei MateBook X Pro 2022 | |
| Średnia w klasie Office (345 - 816, n=72, ostatnie 2 lata) | |
| HP EliteBook 845 G9 6F6H6EA | |
| Przeciętny AMD Ryzen 7 PRO 6850U (587 - 596, n=7) | |
| Lenovo ThinkPad T14 G3-21CF004NGE | |
| Lenovo ThinkPad T14 Gen2-20W1S00000 | |
| Lenovo ThinkPad Z13 21D2CTO1WW | |
| Lenovo ThinkPad T14s G2 20XGS01100 | |
| Dell Latitude 7420 JW6MH | |
| Cinebench R15 / CPU Multi 64Bit | |
| Huawei MateBook X Pro 2022 | |
| Huawei MateBook X Pro 2022 | |
| HP EliteBook 845 G9 6F6H6EA | |
| Przeciętny AMD Ryzen 7 PRO 6850U (1652 - 2092, n=7) | |
| Średnia w klasie Office (250 - 3380, n=74, ostatnie 2 lata) | |
| Lenovo ThinkPad T14 G3-21CF004NGE | |
| Lenovo ThinkPad Z13 21D2CTO1WW | |
| Lenovo ThinkPad T14s G2 20XGS01100 | |
| Dell Inspiron 14 7420 2-in-1 | |
| Lenovo ThinkPad T14 Gen2-20W1S00000 | |
| Dell Latitude 7420 JW6MH | |
| Cinebench R15 / CPU Single 64Bit | |
| Dell Inspiron 14 7420 2-in-1 | |
| Średnia w klasie Office (99.5 - 312, n=74, ostatnie 2 lata) | |
| Huawei MateBook X Pro 2022 | |
| HP EliteBook 845 G9 6F6H6EA | |
| Lenovo ThinkPad T14 G3-21CF004NGE | |
| Przeciętny AMD Ryzen 7 PRO 6850U (228 - 244, n=7) | |
| Lenovo ThinkPad Z13 21D2CTO1WW | |
| Lenovo ThinkPad T14s G2 20XGS01100 | |
| Lenovo ThinkPad T14 Gen2-20W1S00000 | |
| Dell Latitude 7420 JW6MH | |
| Blender / v2.79 BMW27 CPU | |
| Dell Latitude 7420 JW6MH | |
| Lenovo ThinkPad T14 Gen2-20W1S00000 | |
| Lenovo ThinkPad Z13 21D2CTO1WW | |
| Dell Inspiron 14 7420 2-in-1 | |
| Średnia w klasie Office (158 - 1940, n=73, ostatnie 2 lata) | |
| Lenovo ThinkPad T14s G2 20XGS01100 | |
| Huawei MateBook X Pro 2022 | |
| Lenovo ThinkPad T14 G3-21CF004NGE | |
| Przeciętny AMD Ryzen 7 PRO 6850U (241 - 307, n=7) | |
| HP EliteBook 845 G9 6F6H6EA | |
| 7-Zip 18.03 / 7z b 4 | |
| Lenovo ThinkPad T14 G3-21CF004NGE | |
| Przeciętny AMD Ryzen 7 PRO 6850U (44011 - 59045, n=7) | |
| HP EliteBook 845 G9 6F6H6EA | |
| Lenovo ThinkPad T14s G2 20XGS01100 | |
| Huawei MateBook X Pro 2022 | |
| Średnia w klasie Office (7098 - 76886, n=75, ostatnie 2 lata) | |
| Lenovo ThinkPad Z13 21D2CTO1WW | |
| Dell Inspiron 14 7420 2-in-1 | |
| Lenovo ThinkPad T14 Gen2-20W1S00000 | |
| Dell Latitude 7420 JW6MH | |
| 7-Zip 18.03 / 7z b 4 -mmt1 | |
| Dell Inspiron 14 7420 2-in-1 | |
| HP EliteBook 845 G9 6F6H6EA | |
| Przeciętny AMD Ryzen 7 PRO 6850U (5057 - 5662, n=7) | |
| Średnia w klasie Office (3387 - 6469, n=74, ostatnie 2 lata) | |
| Lenovo ThinkPad T14 Gen2-20W1S00000 | |
| Huawei MateBook X Pro 2022 | |
| Lenovo ThinkPad T14 G3-21CF004NGE | |
| Lenovo ThinkPad T14s G2 20XGS01100 | |
| Lenovo ThinkPad Z13 21D2CTO1WW | |
| Dell Latitude 7420 JW6MH | |
| Geekbench 5.5 / Multi-Core | |
| Huawei MateBook X Pro 2022 | |
| Średnia w klasie Office (1483 - 16999, n=71, ostatnie 2 lata) | |
| Przeciętny AMD Ryzen 7 PRO 6850U (7044 - 9241, n=7) | |
| Lenovo ThinkPad T14 G3-21CF004NGE | |
| HP EliteBook 845 G9 6F6H6EA | |
| Lenovo ThinkPad T14s G2 20XGS01100 | |
| Dell Inspiron 14 7420 2-in-1 | |
| Lenovo ThinkPad Z13 21D2CTO1WW | |
| Dell Latitude 7420 JW6MH | |
| Lenovo ThinkPad T14 Gen2-20W1S00000 | |
| Geekbench 5.5 / Single-Core | |
| Średnia w klasie Office (811 - 2128, n=71, ostatnie 2 lata) | |
| Huawei MateBook X Pro 2022 | |
| Dell Inspiron 14 7420 2-in-1 | |
| HP EliteBook 845 G9 6F6H6EA | |
| Lenovo ThinkPad T14 G3-21CF004NGE | |
| Przeciętny AMD Ryzen 7 PRO 6850U (1433 - 1533, n=7) | |
| Lenovo ThinkPad T14 Gen2-20W1S00000 | |
| Lenovo ThinkPad Z13 21D2CTO1WW | |
| Lenovo ThinkPad T14s G2 20XGS01100 | |
| Dell Latitude 7420 JW6MH | |
| HWBOT x265 Benchmark v2.2 / 4k Preset | |
| Lenovo ThinkPad T14 G3-21CF004NGE | |
| Przeciętny AMD Ryzen 7 PRO 6850U (11.7 - 16.3, n=7) | |
| HP EliteBook 845 G9 6F6H6EA | |
| Średnia w klasie Office (2.21 - 26, n=73, ostatnie 2 lata) | |
| Huawei MateBook X Pro 2022 | |
| Lenovo ThinkPad T14s G2 20XGS01100 | |
| Dell Inspiron 14 7420 2-in-1 | |
| Lenovo ThinkPad Z13 21D2CTO1WW | |
| Lenovo ThinkPad T14 Gen2-20W1S00000 | |
| Dell Latitude 7420 JW6MH | |
| LibreOffice / 20 Documents To PDF | |
| HP EliteBook 845 G9 6F6H6EA | |
| Średnia w klasie Office (41.5 - 102.3, n=73, ostatnie 2 lata) | |
| Lenovo ThinkPad Z13 21D2CTO1WW | |
| Przeciętny AMD Ryzen 7 PRO 6850U (46.3 - 74, n=7) | |
| Dell Latitude 7420 JW6MH | |
| Lenovo ThinkPad T14 G3-21CF004NGE | |
| Dell Inspiron 14 7420 2-in-1 | |
| Lenovo ThinkPad T14s G2 20XGS01100 | |
| Lenovo ThinkPad T14 Gen2-20W1S00000 | |
| Huawei MateBook X Pro 2022 | |
| R Benchmark 2.5 / Overall mean | |
| Dell Latitude 7420 JW6MH | |
| Lenovo ThinkPad T14 Gen2-20W1S00000 | |
| Lenovo ThinkPad Z13 21D2CTO1WW | |
| Lenovo ThinkPad T14s G2 20XGS01100 | |
| Średnia w klasie Office (0.4098 - 0.888, n=73, ostatnie 2 lata) | |
| Lenovo ThinkPad T14 G3-21CF004NGE | |
| Przeciętny AMD Ryzen 7 PRO 6850U (0.4932 - 0.544, n=7) | |
| HP EliteBook 845 G9 6F6H6EA | |
| Huawei MateBook X Pro 2022 | |
| Dell Inspiron 14 7420 2-in-1 | |
* ... im mniej tym lepiej
AIDA64: FP32 Ray-Trace | FPU Julia | CPU SHA3 | CPU Queen | FPU SinJulia | FPU Mandel | CPU AES | CPU ZLib | FP64 Ray-Trace | CPU PhotoWorxx
| Performance rating | |
| HP EliteBook 845 G9 6F6H6EA | |
| Przeciętny AMD Ryzen 7 PRO 6850U | |
| Lenovo ThinkPad T14 G3-21CF004NGE | |
| Średnia w klasie Office | |
| Lenovo ThinkPad T14s G2 20XGS01100 | |
| Huawei MateBook X Pro 2022 | |
| Dell Latitude 7420 JW6MH | |
| Lenovo ThinkPad T14 Gen2-20W1S00000 | |
| AIDA64 / FP32 Ray-Trace | |
| HP EliteBook 845 G9 6F6H6EA | |
| Średnia w klasie Office (2083 - 31245, n=79, ostatnie 2 lata) | |
| Przeciętny AMD Ryzen 7 PRO 6850U (11272 - 14704, n=8) | |
| Lenovo ThinkPad T14 G3-21CF004NGE | |
| Lenovo ThinkPad T14s G2 20XGS01100 | |
| Lenovo ThinkPad T14 Gen2-20W1S00000 | |
| Dell Latitude 7420 JW6MH | |
| Huawei MateBook X Pro 2022 | |
| AIDA64 / FPU Julia | |
| HP EliteBook 845 G9 6F6H6EA | |
| Przeciętny AMD Ryzen 7 PRO 6850U (72242 - 92957, n=8) | |
| Lenovo ThinkPad T14 G3-21CF004NGE | |
| Lenovo ThinkPad T14s G2 20XGS01100 | |
| Średnia w klasie Office (8191 - 125394, n=79, ostatnie 2 lata) | |
| Lenovo ThinkPad T14 Gen2-20W1S00000 | |
| Dell Latitude 7420 JW6MH | |
| Huawei MateBook X Pro 2022 | |
| AIDA64 / CPU SHA3 | |
| HP EliteBook 845 G9 6F6H6EA | |
| Średnia w klasie Office (433 - 5755, n=79, ostatnie 2 lata) | |
| Przeciętny AMD Ryzen 7 PRO 6850U (2419 - 3104, n=8) | |
| Lenovo ThinkPad T14 G3-21CF004NGE | |
| Lenovo ThinkPad T14s G2 20XGS01100 | |
| Lenovo ThinkPad T14 Gen2-20W1S00000 | |
| Dell Latitude 7420 JW6MH | |
| Huawei MateBook X Pro 2022 | |
| AIDA64 / CPU Queen | |
| HP EliteBook 845 G9 6F6H6EA | |
| Przeciętny AMD Ryzen 7 PRO 6850U (86644 - 96912, n=7) | |
| Lenovo ThinkPad T14 G3-21CF004NGE | |
| Lenovo ThinkPad T14s G2 20XGS01100 | |
| Huawei MateBook X Pro 2022 | |
| Średnia w klasie Office (22784 - 115197, n=69, ostatnie 2 lata) | |
| Lenovo ThinkPad T14 Gen2-20W1S00000 | |
| Dell Latitude 7420 JW6MH | |
| AIDA64 / FPU SinJulia | |
| HP EliteBook 845 G9 6F6H6EA | |
| Przeciętny AMD Ryzen 7 PRO 6850U (10917 - 12571, n=8) | |
| Lenovo ThinkPad T14 G3-21CF004NGE | |
| Lenovo ThinkPad T14s G2 20XGS01100 | |
| Średnia w klasie Office (1378 - 18321, n=79, ostatnie 2 lata) | |
| Huawei MateBook X Pro 2022 | |
| Lenovo ThinkPad T14 Gen2-20W1S00000 | |
| Dell Latitude 7420 JW6MH | |
| AIDA64 / FPU Mandel | |
| HP EliteBook 845 G9 6F6H6EA | |
| Przeciętny AMD Ryzen 7 PRO 6850U (39609 - 51296, n=8) | |
| Lenovo ThinkPad T14 G3-21CF004NGE | |
| Lenovo ThinkPad T14s G2 20XGS01100 | |
| Średnia w klasie Office (4601 - 66922, n=79, ostatnie 2 lata) | |
| Lenovo ThinkPad T14 Gen2-20W1S00000 | |
| Dell Latitude 7420 JW6MH | |
| Huawei MateBook X Pro 2022 | |
| AIDA64 / CPU AES | |
| Lenovo ThinkPad T14s G2 20XGS01100 | |
| Lenovo ThinkPad T14 Gen2-20W1S00000 | |
| Dell Latitude 7420 JW6MH | |
| Huawei MateBook X Pro 2022 | |
| HP EliteBook 845 G9 6F6H6EA | |
| Średnia w klasie Office (4854 - 155900, n=79, ostatnie 2 lata) | |
| Przeciętny AMD Ryzen 7 PRO 6850U (45568 - 60867, n=8) | |
| Lenovo ThinkPad T14 G3-21CF004NGE | |
| AIDA64 / CPU ZLib | |
| HP EliteBook 845 G9 6F6H6EA | |
| Średnia w klasie Office (114.6 - 1366, n=79, ostatnie 2 lata) | |
| Przeciętny AMD Ryzen 7 PRO 6850U (641 - 805, n=8) | |
| Lenovo ThinkPad T14 G3-21CF004NGE | |
| Huawei MateBook X Pro 2022 | |
| Lenovo ThinkPad T14s G2 20XGS01100 | |
| Lenovo ThinkPad T14 Gen2-20W1S00000 | |
| Dell Latitude 7420 JW6MH | |
| AIDA64 / FP64 Ray-Trace | |
| Średnia w klasie Office (1109 - 17834, n=79, ostatnie 2 lata) | |
| HP EliteBook 845 G9 6F6H6EA | |
| Przeciętny AMD Ryzen 7 PRO 6850U (5967 - 7821, n=8) | |
| Lenovo ThinkPad T14 G3-21CF004NGE | |
| Lenovo ThinkPad T14s G2 20XGS01100 | |
| Lenovo ThinkPad T14 Gen2-20W1S00000 | |
| Dell Latitude 7420 JW6MH | |
| Huawei MateBook X Pro 2022 | |
| AIDA64 / CPU PhotoWorxx | |
| Huawei MateBook X Pro 2022 | |
| Średnia w klasie Office (11090 - 65229, n=79, ostatnie 2 lata) | |
| Dell Latitude 7420 JW6MH | |
| Przeciętny AMD Ryzen 7 PRO 6850U (19707 - 27840, n=8) | |
| Lenovo ThinkPad T14 G3-21CF004NGE | |
| Lenovo ThinkPad T14s G2 20XGS01100 | |
| HP EliteBook 845 G9 6F6H6EA | |
| Lenovo ThinkPad T14 Gen2-20W1S00000 | |
Wydajność systemu
ThinkPad T14 G3 jest laptopem bardzo responsywnym i w naszych testach nie zaobserwowaliśmy szarpania, zawieszania się czy innych problemów. Potwierdzają to dodatkowo dobre wyniki w benchmarkach syntetycznych. Nasze urządzenie recenzenckie zostało dostarczone z systemem Windows 10 Professional, ale można też bez problemu przejść na Windows 11 Pro.
CrossMark: Overall | Productivity | Creativity | Responsiveness
| PCMark 10 / Score | |
| Średnia w klasie Office (2601 - 9298, n=63, ostatnie 2 lata) | |
| Przeciętny AMD Ryzen 7 PRO 6850U, AMD Radeon 680M (5873 - 6311, n=7) | |
| Huawei MateBook X Pro 2022 | |
| Lenovo ThinkPad T14 G3-21CF004NGE | |
| Lenovo ThinkPad T14s G2 20XGS01100 | |
| HP EliteBook 845 G9 6F6H6EA | |
| Lenovo ThinkPad T14 Gen2-20W1S00000 | |
| Dell Inspiron 14 7420 2-in-1 | |
| Dell Latitude 7420 JW6MH | |
| PCMark 10 / Essentials | |
| Huawei MateBook X Pro 2022 | |
| Lenovo ThinkPad T14s G2 20XGS01100 | |
| Dell Inspiron 14 7420 2-in-1 | |
| Średnia w klasie Office (3245 - 11594, n=63, ostatnie 2 lata) | |
| Lenovo ThinkPad T14 Gen2-20W1S00000 | |
| Dell Latitude 7420 JW6MH | |
| Lenovo ThinkPad T14 G3-21CF004NGE | |
| Przeciętny AMD Ryzen 7 PRO 6850U, AMD Radeon 680M (9151 - 10263, n=7) | |
| HP EliteBook 845 G9 6F6H6EA | |
| PCMark 10 / Productivity | |
| Średnia w klasie Office (5336 - 17243, n=63, ostatnie 2 lata) | |
| Lenovo ThinkPad T14s G2 20XGS01100 | |
| Lenovo ThinkPad T14 Gen2-20W1S00000 | |
| Huawei MateBook X Pro 2022 | |
| Przeciętny AMD Ryzen 7 PRO 6850U, AMD Radeon 680M (8435 - 8891, n=7) | |
| Lenovo ThinkPad T14 G3-21CF004NGE | |
| HP EliteBook 845 G9 6F6H6EA | |
| Dell Latitude 7420 JW6MH | |
| Dell Inspiron 14 7420 2-in-1 | |
| PCMark 10 / Digital Content Creation | |
| Średnia w klasie Office (2049 - 13541, n=63, ostatnie 2 lata) | |
| Przeciętny AMD Ryzen 7 PRO 6850U, AMD Radeon 680M (6796 - 8422, n=7) | |
| HP EliteBook 845 G9 6F6H6EA | |
| Lenovo ThinkPad T14 G3-21CF004NGE | |
| Huawei MateBook X Pro 2022 | |
| Lenovo ThinkPad T14s G2 20XGS01100 | |
| Dell Inspiron 14 7420 2-in-1 | |
| Lenovo ThinkPad T14 Gen2-20W1S00000 | |
| Dell Latitude 7420 JW6MH | |
| CrossMark / Overall | |
| Huawei MateBook X Pro 2022 | |
| Średnia w klasie Office (381 - 2010, n=74, ostatnie 2 lata) | |
| Dell Inspiron 14 7420 2-in-1 | |
| Lenovo ThinkPad T14 G3-21CF004NGE | |
| Przeciętny AMD Ryzen 7 PRO 6850U, AMD Radeon 680M (1154 - 1442, n=7) | |
| Lenovo ThinkPad T14s G2 20XGS01100 | |
| HP EliteBook 845 G9 6F6H6EA | |
| Dell Latitude 7420 JW6MH | |
| CrossMark / Productivity | |
| Huawei MateBook X Pro 2022 | |
| Dell Inspiron 14 7420 2-in-1 | |
| Średnia w klasie Office (464 - 1880, n=74, ostatnie 2 lata) | |
| Lenovo ThinkPad T14 G3-21CF004NGE | |
| HP EliteBook 845 G9 6F6H6EA | |
| Przeciętny AMD Ryzen 7 PRO 6850U, AMD Radeon 680M (1188 - 1444, n=7) | |
| Lenovo ThinkPad T14s G2 20XGS01100 | |
| Dell Latitude 7420 JW6MH | |
| CrossMark / Creativity | |
| Huawei MateBook X Pro 2022 | |
| Średnia w klasie Office (319 - 2361, n=74, ostatnie 2 lata) | |
| Dell Inspiron 14 7420 2-in-1 | |
| Lenovo ThinkPad T14 G3-21CF004NGE | |
| Lenovo ThinkPad T14s G2 20XGS01100 | |
| Przeciętny AMD Ryzen 7 PRO 6850U, AMD Radeon 680M (1180 - 1523, n=7) | |
| HP EliteBook 845 G9 6F6H6EA | |
| Dell Latitude 7420 JW6MH | |
| CrossMark / Responsiveness | |
| Huawei MateBook X Pro 2022 | |
| Średnia w klasie Office (360 - 1690, n=74, ostatnie 2 lata) | |
| Dell Inspiron 14 7420 2-in-1 | |
| Dell Latitude 7420 JW6MH | |
| Lenovo ThinkPad T14 G3-21CF004NGE | |
| Przeciętny AMD Ryzen 7 PRO 6850U, AMD Radeon 680M (990 - 1282, n=7) | |
| HP EliteBook 845 G9 6F6H6EA | |
| Lenovo ThinkPad T14s G2 20XGS01100 | |
| PCMark 10 Score | 6060 pkt. | |
Pomoc | ||
| AIDA64 / Memory Copy | |
| Średnia w klasie Office (20075 - 110930, n=76, ostatnie 2 lata) | |
| Huawei MateBook X Pro 2022 | |
| Dell Latitude 7420 JW6MH | |
| Lenovo ThinkPad T14 G3-21CF004NGE | |
| Przeciętny AMD Ryzen 7 PRO 6850U (31003 - 48605, n=8) | |
| Lenovo ThinkPad T14s G2 20XGS01100 | |
| HP EliteBook 845 G9 6F6H6EA | |
| Lenovo ThinkPad T14 Gen2-20W1S00000 | |
| AIDA64 / Memory Read | |
| Huawei MateBook X Pro 2022 | |
| Średnia w klasie Office (10084 - 128030, n=77, ostatnie 2 lata) | |
| Dell Latitude 7420 JW6MH | |
| Przeciętny AMD Ryzen 7 PRO 6850U (34682 - 45912, n=8) | |
| Lenovo ThinkPad T14 G3-21CF004NGE | |
| Lenovo ThinkPad T14s G2 20XGS01100 | |
| HP EliteBook 845 G9 6F6H6EA | |
| Lenovo ThinkPad T14 Gen2-20W1S00000 | |
| AIDA64 / Memory Write | |
| Średnia w klasie Office (20073 - 119858, n=77, ostatnie 2 lata) | |
| Huawei MateBook X Pro 2022 | |
| Dell Latitude 7420 JW6MH | |
| Lenovo ThinkPad T14 G3-21CF004NGE | |
| Przeciętny AMD Ryzen 7 PRO 6850U (34532 - 51096, n=8) | |
| Lenovo ThinkPad T14s G2 20XGS01100 | |
| HP EliteBook 845 G9 6F6H6EA | |
| Lenovo ThinkPad T14 Gen2-20W1S00000 | |
| AIDA64 / Memory Latency | |
| Lenovo ThinkPad T14 G3-21CF004NGE | |
| Huawei MateBook X Pro 2022 | |
| Lenovo ThinkPad T14s G2 20XGS01100 | |
| Przeciętny AMD Ryzen 7 PRO 6850U (86.1 - 135.3, n=8) | |
| Średnia w klasie Office (7.6 - 162.9, n=72, ostatnie 2 lata) | |
| HP EliteBook 845 G9 6F6H6EA | |
| Dell Latitude 7420 JW6MH | |
| Lenovo ThinkPad T14 Gen2-20W1S00000 | |
* ... im mniej tym lepiej
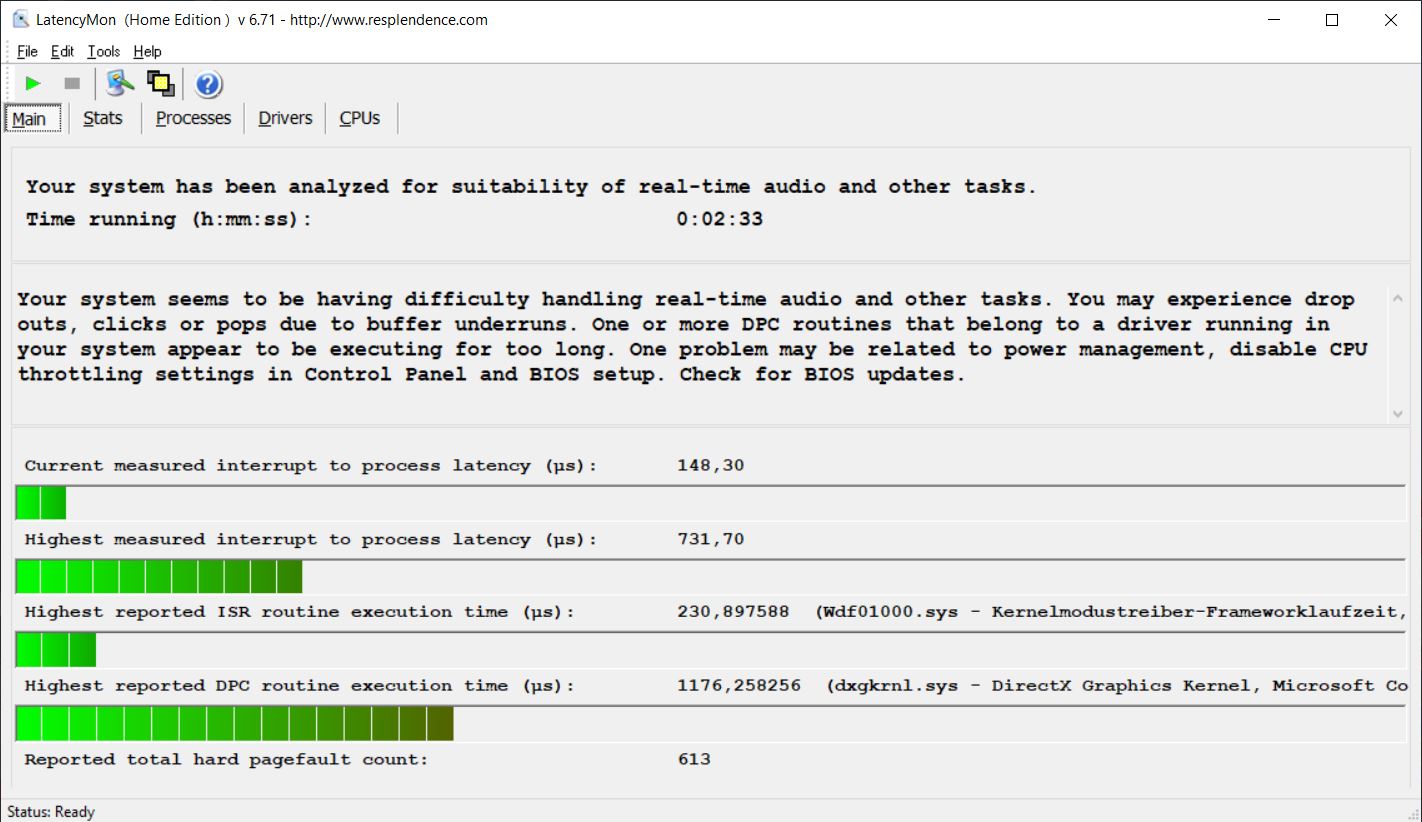
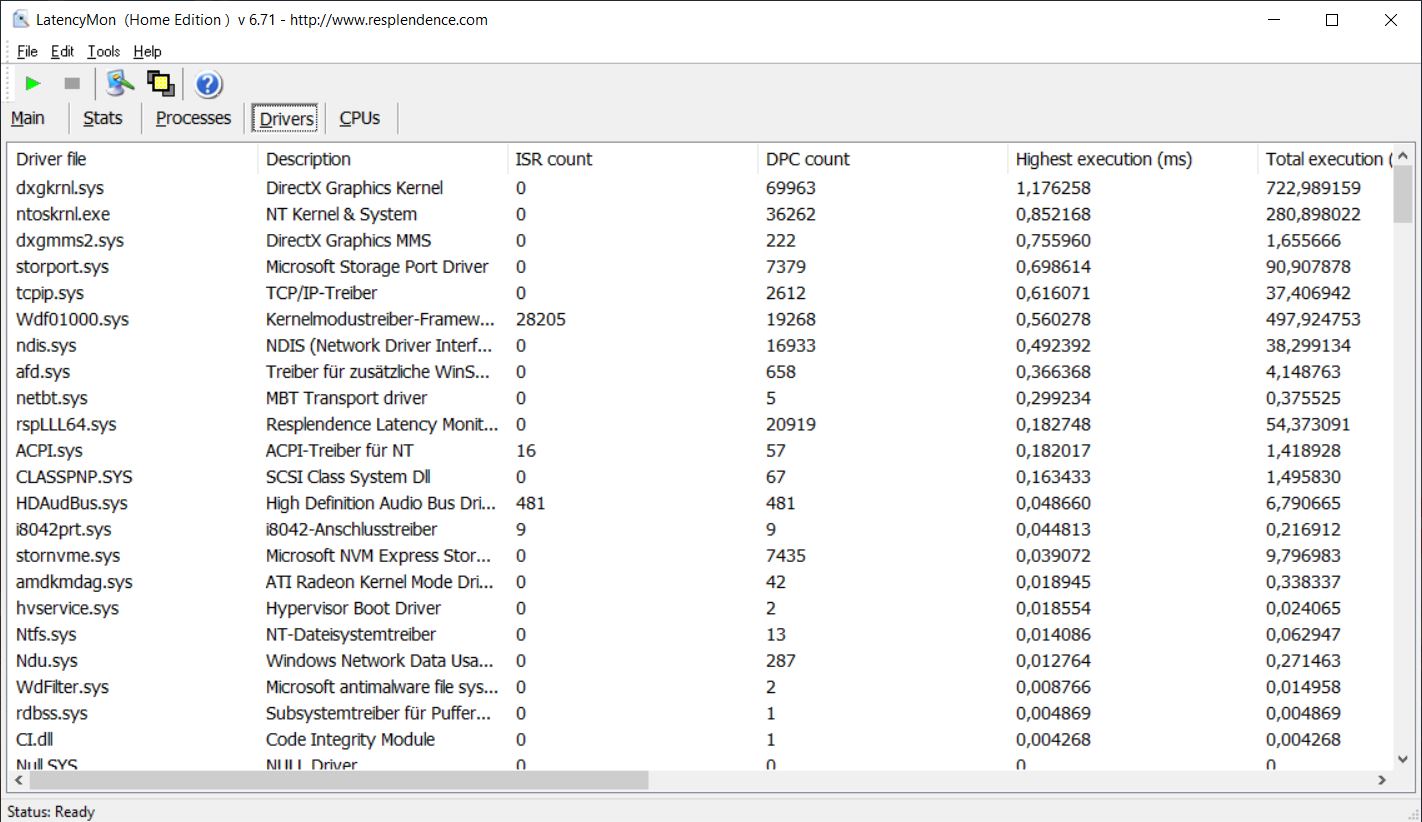
Opóźnienie DPC
W naszym standaryzowanym teście opóźnień (przeglądanie stron internetowych, odtwarzanie YouTube'a w rozdzielczości 4K, obciążenie procesora) ThinkPad T14 G3 nie wykazał zasadniczych ograniczeń pod obecną wersją BIOS-u, ale sterownik (DirectX Graphics Kernel) powodował nieco zwiększone opóźnienia. Mimo to recenzowane urządzenie nadal uzyskuje bardzo dobre wyniki na polu porównawczym.
| DPC Latencies / LatencyMon - interrupt to process latency (max), Web, Youtube, Prime95 | |
| Lenovo ThinkPad T14 Gen2-20W1S00000 | |
| Lenovo ThinkPad T14s G2 20XGS01100 | |
| HP EliteBook 845 G9 6F6H6EA | |
| Dell Latitude 7420 JW6MH | |
| Huawei MateBook X Pro 2022 | |
| Lenovo ThinkPad T14 G3-21CF004NGE | |
* ... im mniej tym lepiej
Urządzenia do przechowywania danych
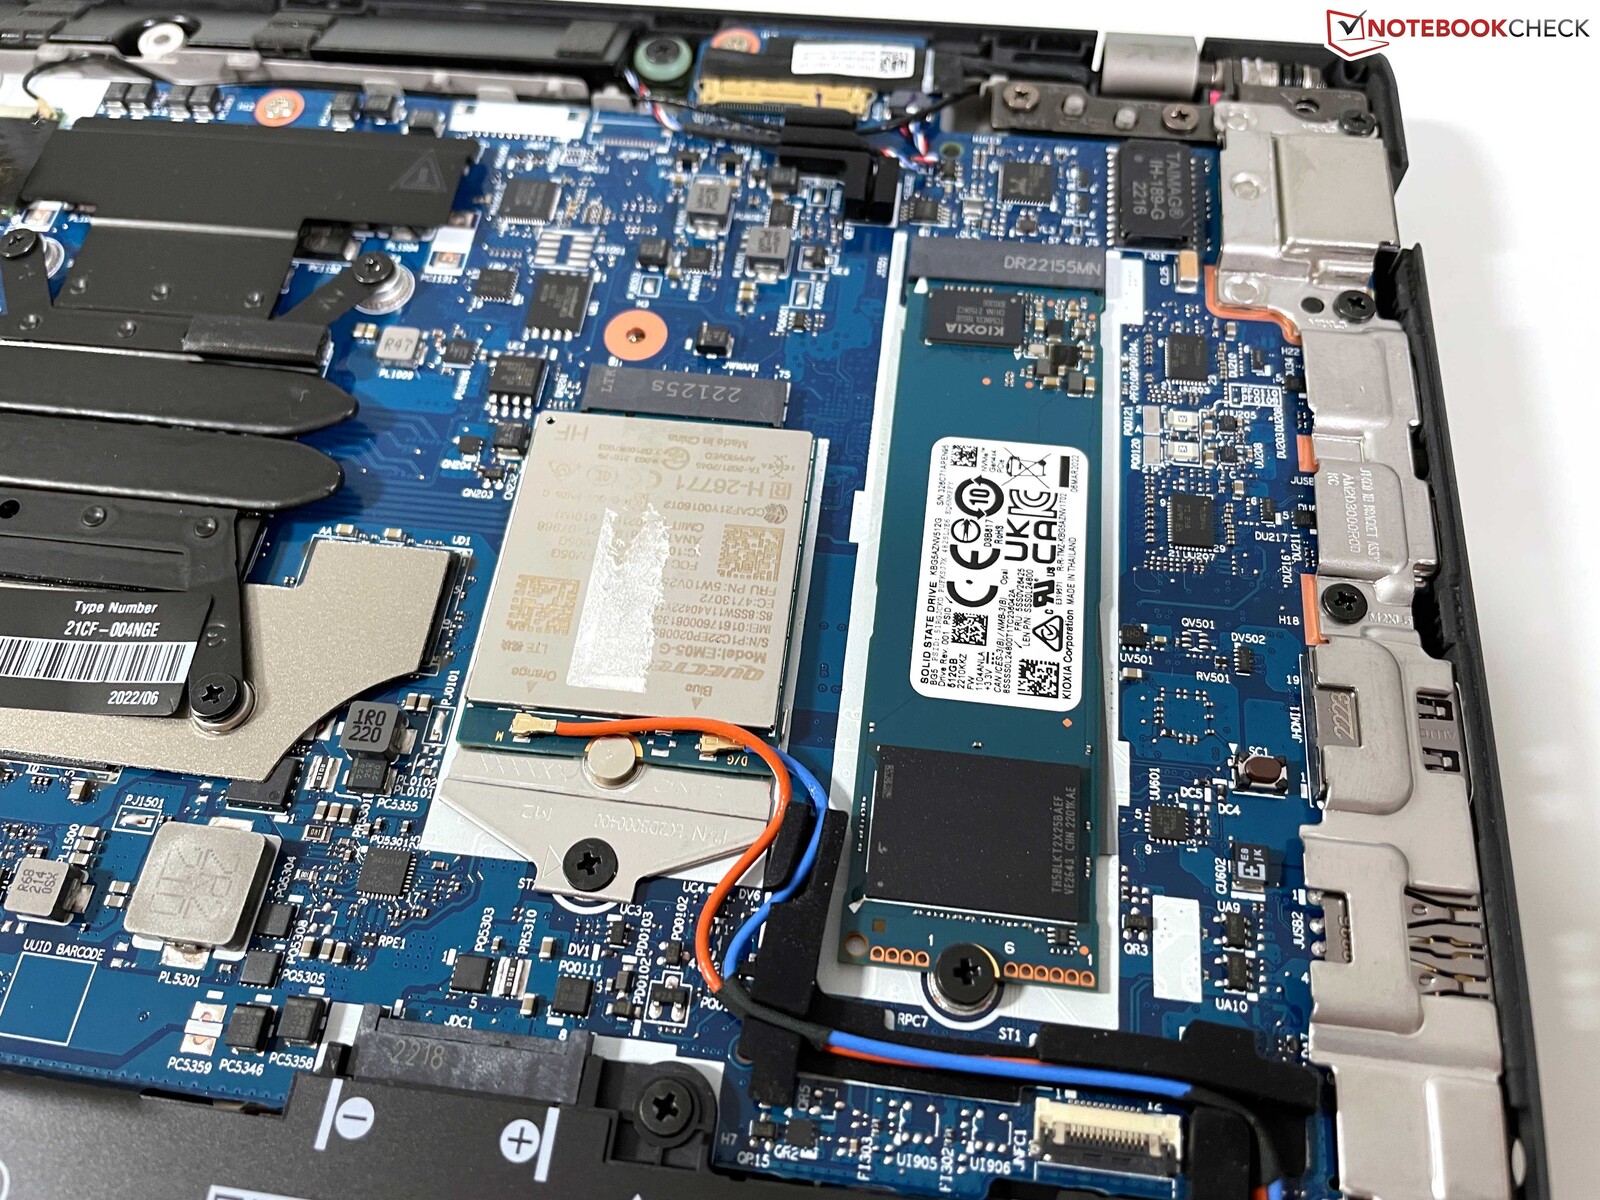
ThinkPad T14 G3 w wersji AMD oferuje szybkie gniazdo PCIe 4.0 dla dysków M.2-2280-SSD, w które w naszym egzemplarzu recenzenckim wyposażono Kioxia BG5. Jest to nowoczesny dysk PCIe 4.0-SSD, ale nie należy do najszybszych modułów i jego maksymalny transfer określono na 3,5 GB/s. W naszych benchmarkach wyniki są przyzwoite w okolicach 3 GB/s, ale można tu osiągnąć znacznie więcej. Przynajmniej wydajność pozostaje dość stabilna pod dłuższym obciążeniem i nie spada z powodu problemów z temperaturą. Nasza konfiguracja recenzencka oferuje 512 GB pamięci masowej, z czego 434 GB jest dostępne po pierwszym uruchomieniu. Więcej benchmarków SSD znajduje się m.in.tutaj.

| Drive Performance rating - Percent | |
| Lenovo ThinkPad T14 Gen2-20W1S00000 | |
| Huawei MateBook X Pro 2022 | |
| HP EliteBook 845 G9 6F6H6EA | |
| Średnia w klasie Office | |
| Lenovo ThinkPad T14s G2 20XGS01100 | |
| Dell Latitude 7420 JW6MH | |
| Lenovo ThinkPad T14 G3-21CF004NGE | |
| Przeciętny Kioxia BG5 KBG5AZNV512G | |
* ... im mniej tym lepiej
Sustained Read Performance: DiskSpd Read Loop, Queue Depth 8
Karta graficzna
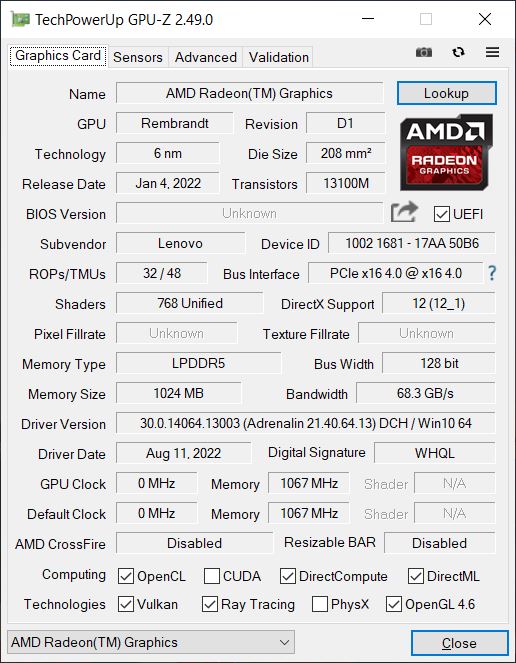
Na stronie Radeon 680Mjest obecnie najszybszą zintegrowaną kartą graficzną na rynku i jest w stanie konkurować z kartami graficznymi klasy podstawowej np GeForce MX450i nie odstaje również od GeForce MX550, która jest opcjonalnie dostępna dla modelu Intela. Mamy jednak tylko wyniki dla MX550 z bardzo wysokim TGP wynoszącym 35 W; w przypadku T14 G3 spodziewamy się 25 W. Może się więc okazać, że MX550 w ThinkPadzie T14 nie oferuje większej wydajności niż 680M. Zintegrowana Intel Xe Graphics G7jest wyraźnie poobijany i jest mniej więcej na równi z mniejszym Radeonem 660M w Radeon 660M w Ryzen 5 Pro 6650U.
Oprócz wysokiej wydajności graficznej, która pozostaje stabilna nawet przy długotrwałym obciążeniu i w trybie bateryjnym, zintegrowany dekoder wideo jest również niezwykle wydajny. Na przykład w naszym teście wideo 4K YouTube obciążenie GPU wynosi tylko 1-2 procent, w porównaniu z 43-44 procentami z Iris Xe Graphics G7 obecnych procesorów Alder Lake. Więcej benchmarków GPU jest dostępnychtutaj.
| 3DMark Performance rating - Percent | |
| Lenovo IdeaCentre AIO 3 24IAP7 | |
| Lenovo ThinkPad T14 G3-21CF004NGE | |
| Przeciętny AMD Radeon 680M | |
| Średnia w klasie Office | |
| Huawei MateBook X Pro 2022 | |
| HP EliteBook 845 G9 6F6H6EA | |
| Lenovo ThinkPad T14 Gen2-20W1S00000 -1! | |
| Lenovo ThinkPad Z13 21D2CTO1WW | |
| Lenovo ThinkPad T14s G2 20XGS01100 | |
| Dell Inspiron 14 7420 2-in-1 -1! | |
| Dell Latitude 7420 JW6MH | |
| 3DMark 11 - 1280x720 Performance GPU | |
| Lenovo ThinkPad T14 G3-21CF004NGE | |
| Lenovo IdeaCentre AIO 3 24IAP7 | |
| Przeciętny AMD Radeon 680M (6858 - 11755, n=39) | |
| Średnia w klasie Office (2551 - 18313, n=68, ostatnie 2 lata) | |
| HP EliteBook 845 G9 6F6H6EA | |
| Huawei MateBook X Pro 2022 | |
| Lenovo ThinkPad Z13 21D2CTO1WW | |
| Lenovo ThinkPad T14 Gen2-20W1S00000 | |
| Lenovo ThinkPad T14s G2 20XGS01100 | |
| Dell Inspiron 14 7420 2-in-1 | |
| Dell Latitude 7420 JW6MH | |
| 3DMark | |
| 1280x720 Cloud Gate Standard Graphics | |
| Lenovo ThinkPad T14 G3-21CF004NGE | |
| Przeciętny AMD Radeon 680M (24634 - 50120, n=31) | |
| Lenovo IdeaCentre AIO 3 24IAP7 | |
| Średnia w klasie Office (11640 - 118515, n=37, ostatnie 2 lata) | |
| Lenovo ThinkPad Z13 21D2CTO1WW | |
| Lenovo ThinkPad T14s G2 20XGS01100 | |
| Huawei MateBook X Pro 2022 | |
| HP EliteBook 845 G9 6F6H6EA | |
| Dell Latitude 7420 JW6MH | |
| Dell Inspiron 14 7420 2-in-1 | |
| 1920x1080 Fire Strike Graphics | |
| Lenovo ThinkPad T14 G3-21CF004NGE | |
| Przeciętny AMD Radeon 680M (3791 - 7706, n=41) | |
| Lenovo IdeaCentre AIO 3 24IAP7 | |
| Średnia w klasie Office (736 - 21871, n=72, ostatnie 2 lata) | |
| Huawei MateBook X Pro 2022 | |
| Dell Latitude 7420 JW6MH | |
| Lenovo ThinkPad Z13 21D2CTO1WW | |
| Lenovo ThinkPad T14 Gen2-20W1S00000 | |
| Lenovo ThinkPad T14s G2 20XGS01100 | |
| Dell Inspiron 14 7420 2-in-1 | |
| HP EliteBook 845 G9 6F6H6EA | |
| 2560x1440 Time Spy Graphics | |
| Lenovo IdeaCentre AIO 3 24IAP7 | |
| Lenovo ThinkPad T14 G3-21CF004NGE | |
| Średnia w klasie Office (493 - 6679, n=67, ostatnie 2 lata) | |
| Przeciętny AMD Radeon 680M (1359 - 2607, n=41) | |
| Huawei MateBook X Pro 2022 | |
| Lenovo ThinkPad T14 Gen2-20W1S00000 | |
| Lenovo ThinkPad Z13 21D2CTO1WW | |
| Dell Latitude 7420 JW6MH | |
| HP EliteBook 845 G9 6F6H6EA | |
| Dell Inspiron 14 7420 2-in-1 | |
| Lenovo ThinkPad T14s G2 20XGS01100 | |
| Geekbench 5.5 - OpenCL Score | |
| Lenovo IdeaCentre AIO 3 24IAP7 | |
| Lenovo ThinkPad T14 G3-21CF004NGE | |
| Przeciętny AMD Radeon 680M (13008 - 34368, n=41) | |
| Lenovo ThinkPad T14 Gen2-20W1S00000 | |
| Średnia w klasie Office (3474 - 95841, n=68, ostatnie 2 lata) | |
| HP EliteBook 845 G9 6F6H6EA | |
| Huawei MateBook X Pro 2022 | |
| Lenovo ThinkPad Z13 21D2CTO1WW | |
| Lenovo ThinkPad T14s G2 20XGS01100 | |
| Dell Inspiron 14 7420 2-in-1 | |
| Dell Latitude 7420 JW6MH | |
| V-Ray Benchmark Next 4.10 - GPU | |
| Lenovo IdeaCentre AIO 3 24IAP7 | |
| Średnia w klasie Office (8 - 550, n=67, ostatnie 2 lata) | |
| HP EliteBook 845 G9 6F6H6EA | |
| Przeciętny AMD Radeon 680M (29 - 78, n=27) | |
| Lenovo ThinkPad T14 G3-21CF004NGE | |
| Huawei MateBook X Pro 2022 | |
| Lenovo ThinkPad T14s G2 20XGS01100 | |
| Lenovo ThinkPad Z13 21D2CTO1WW | |
| Lenovo ThinkPad T14 Gen2-20W1S00000 | |
| Dell Latitude 7420 JW6MH | |
| 3DMark 11 Performance | 10275 pkt. | |
| 3DMark Cloud Gate Standard Score | 32012 pkt. | |
| 3DMark Fire Strike Score | 6486 pkt. | |
| 3DMark Time Spy Score | 2555 pkt. | |
Pomoc | ||
W benchmarku Blender, Radeon 680M ma również przewagę nad Iris Xe Graphics G7. Ponieważ Blender od wersji 3.0 nie obsługuje już OpenCL, AMD ponownie wspiera renderowanie na GPU za pośrednictwem HIP (Heterogeneous-computing Interface for Portability), który jest konkurentem technologii CUDA firmy Nvidia. Skraca to czas renderowania w benchmarku Classroom z 525 sekund (CPU) do 335 sekund (HIP). Nie mamy jeszcze wielu wyników dla GPU CUDA, ale zarówno RTX A1000, jak i RTX 3050 są co najmniej trzykrotnie szybsze. Jesteśmy zatem ciekawi, jak wypada tutaj GeForce MX550.
| Blender / v3.3 Classroom CPU | |
| Beelink SEi11 Pro | |
| Lenovo ThinkPad Z13 21D2CTO1WW | |
| Asus VivoBook Pro 16X OLED N7600PC-L2026X (3.3.0) | |
| Huawei MateBook X Pro 2022 | |
| Średnia w klasie Office (245 - 3219, n=72, ostatnie 2 lata) | |
| Lenovo ThinkPad T14 G3-21CF004NGE (3.2.0) | |
| HP Envy 16 h0112nr (3.2.0) | |
| Dell Precision 5000 5470 | |
| Blender / v3.3 Classroom HIP/AMD | |
| Lenovo ThinkPad Z13 21D2CTO1WW | |
| Średnia w klasie Office (296 - 507, n=5, ostatnie 2 lata) | |
| Lenovo ThinkPad T14 G3-21CF004NGE (3.2.0) | |
| Blender / v3.3 Classroom OPTIX/RTX | |
| Średnia w klasie Office (29 - 242, n=2, ostatnie 2 lata) | |
| Dell Precision 5000 5470 | |
| Asus VivoBook Pro 16X OLED N7600PC-L2026X (3.3.0) | |
| HP Envy 16 h0112nr (3.2.0) | |
| Blender / v3.3 Classroom CUDA | |
| Dell Precision 5000 5470 | |
| Asus VivoBook Pro 16X OLED N7600PC-L2026X (3.3.0) | |
| Średnia w klasie Office (53 - 214, n=3, ostatnie 2 lata) | |
| HP Envy 16 h0112nr (3.2.0) | |
* ... im mniej tym lepiej
Choć ThinkPad T14 G3 nie jest stacją roboczą, Radeon 680M i tak wypada dość dobrze w profesjonalnych benchmarkach SPECviewperf. Intel Xe Graphics G7 jest wyraźnie lepszy w niemal wszystkich testach, natomiast porównanie z dedykowanym GeForce MX550 zależy od scenariusza. W niektórych przypadkach szybszy jest 680M, w innych GeForce. W każdym razie mniejsze projekty można realizować na ThinkPadzie T14 G3 AMD.
| SPECviewperf 13 | |
| Solidworks (sw-04) | |
| Dell Precision 5000 5470 | |
| Lenovo ThinkPad P15v G2 21A9000XGE | |
| HP ZBook Power 15 G8 313S5EA | |
| Lenovo ThinkPad T14 G3-21CF004NGE | |
| Prime Computer Primestation Pulsar | |
| Lenovo IdeaCentre AIO 3 24IAP7 | |
| Samsung Galaxy Book2 15 | |
| Minisforum EliteMini TH50 | |
| Siemens NX (snx-03) | |
| Dell Precision 5000 5470 | |
| Lenovo ThinkPad P15v G2 21A9000XGE | |
| HP ZBook Power 15 G8 313S5EA | |
| Lenovo ThinkPad T14 G3-21CF004NGE | |
| Prime Computer Primestation Pulsar | |
| Lenovo IdeaCentre AIO 3 24IAP7 | |
| Minisforum EliteMini TH50 | |
| Samsung Galaxy Book2 15 | |
| Showcase (showcase-02) | |
| Dell Precision 5000 5470 | |
| Lenovo ThinkPad P15v G2 21A9000XGE | |
| HP ZBook Power 15 G8 313S5EA | |
| Lenovo IdeaCentre AIO 3 24IAP7 | |
| Samsung Galaxy Book2 15 | |
| Lenovo ThinkPad T14 G3-21CF004NGE | |
| Minisforum EliteMini TH50 | |
| Prime Computer Primestation Pulsar | |
| Medical (medical-02) | |
| Dell Precision 5000 5470 | |
| Lenovo ThinkPad P15v G2 21A9000XGE | |
| HP ZBook Power 15 G8 313S5EA | |
| Lenovo ThinkPad T14 G3-21CF004NGE | |
| Lenovo IdeaCentre AIO 3 24IAP7 | |
| Prime Computer Primestation Pulsar | |
| Samsung Galaxy Book2 15 | |
| Minisforum EliteMini TH50 | |
| Maya (maya-05) | |
| Dell Precision 5000 5470 | |
| Lenovo ThinkPad P15v G2 21A9000XGE | |
| HP ZBook Power 15 G8 313S5EA | |
| Lenovo IdeaCentre AIO 3 24IAP7 | |
| Lenovo ThinkPad T14 G3-21CF004NGE | |
| Samsung Galaxy Book2 15 | |
| Prime Computer Primestation Pulsar | |
| Minisforum EliteMini TH50 | |
| Energy (energy-02) | |
| Dell Precision 5000 5470 | |
| Lenovo ThinkPad P15v G2 21A9000XGE | |
| HP ZBook Power 15 G8 313S5EA | |
| Samsung Galaxy Book2 15 | |
| Prime Computer Primestation Pulsar | |
| Minisforum EliteMini TH50 | |
| Lenovo ThinkPad T14 G3-21CF004NGE | |
| Lenovo IdeaCentre AIO 3 24IAP7 | |
| Creo (creo-02) | |
| Dell Precision 5000 5470 | |
| Lenovo ThinkPad P15v G2 21A9000XGE | |
| HP ZBook Power 15 G8 313S5EA | |
| Lenovo IdeaCentre AIO 3 24IAP7 | |
| Lenovo ThinkPad T14 G3-21CF004NGE | |
| Samsung Galaxy Book2 15 | |
| Prime Computer Primestation Pulsar | |
| Minisforum EliteMini TH50 | |
| Catia (catia-05) | |
| Dell Precision 5000 5470 | |
| Lenovo ThinkPad P15v G2 21A9000XGE | |
| HP ZBook Power 15 G8 313S5EA | |
| Lenovo ThinkPad T14 G3-21CF004NGE | |
| Samsung Galaxy Book2 15 | |
| Prime Computer Primestation Pulsar | |
| Minisforum EliteMini TH50 | |
| Lenovo IdeaCentre AIO 3 24IAP7 | |
| 3ds Max (3dsmax-06) | |
| Dell Precision 5000 5470 | |
| Lenovo ThinkPad P15v G2 21A9000XGE | |
| HP ZBook Power 15 G8 313S5EA | |
| Lenovo ThinkPad T14 G3-21CF004NGE | |
| Samsung Galaxy Book2 15 | |
| Lenovo IdeaCentre AIO 3 24IAP7 | |
| Prime Computer Primestation Pulsar | |
| Minisforum EliteMini TH50 | |
| SPECviewperf 2020 | |
| 1920x1080 Solidworks (solidworks-05) | |
| Dell Precision 5000 5470 | |
| Lenovo ThinkPad P15v G2 21A9000XGE | |
| HP ZBook Power 15 G8 313S5EA | |
| Lenovo IdeaCentre AIO 3 24IAP7 | |
| Lenovo ThinkPad T14 G3-21CF004NGE | |
| Samsung Galaxy Book2 15 | |
| 1920x1080 Siemens NX (snx-04) | |
| Dell Precision 5000 5470 | |
| Lenovo ThinkPad P15v G2 21A9000XGE | |
| HP ZBook Power 15 G8 313S5EA | |
| Lenovo ThinkPad T14 G3-21CF004NGE | |
| Lenovo IdeaCentre AIO 3 24IAP7 | |
| Lenovo Yoga Slim 7 Carbon 13IAP7-82U9005FGE | |
| Samsung Galaxy Book2 15 | |
| 1920x1080 Medical (medical-03) | |
| Dell Precision 5000 5470 | |
| Lenovo ThinkPad P15v G2 21A9000XGE | |
| HP ZBook Power 15 G8 313S5EA | |
| Lenovo ThinkPad T14 G3-21CF004NGE | |
| Lenovo IdeaCentre AIO 3 24IAP7 | |
| Samsung Galaxy Book2 15 | |
| Lenovo Yoga Slim 7 Carbon 13IAP7-82U9005FGE | |
| 1920x1080 Maya (maya-06) | |
| Dell Precision 5000 5470 | |
| Lenovo ThinkPad P15v G2 21A9000XGE | |
| HP ZBook Power 15 G8 313S5EA | |
| Lenovo IdeaCentre AIO 3 24IAP7 | |
| Lenovo ThinkPad T14 G3-21CF004NGE | |
| Samsung Galaxy Book2 15 | |
| Lenovo Yoga Slim 7 Carbon 13IAP7-82U9005FGE | |
| 1920x1080 Energy (energy-03) | |
| Dell Precision 5000 5470 | |
| Lenovo ThinkPad P15v G2 21A9000XGE | |
| HP ZBook Power 15 G8 313S5EA | |
| Samsung Galaxy Book2 15 | |
| Lenovo Yoga Slim 7 Carbon 13IAP7-82U9005FGE | |
| Lenovo ThinkPad T14 G3-21CF004NGE | |
| Lenovo IdeaCentre AIO 3 24IAP7 | |
| 1920x1080 Creo (creo-03) | |
| Dell Precision 5000 5470 | |
| Lenovo ThinkPad P15v G2 21A9000XGE | |
| HP ZBook Power 15 G8 313S5EA | |
| Lenovo IdeaCentre AIO 3 24IAP7 | |
| Lenovo ThinkPad T14 G3-21CF004NGE | |
| Samsung Galaxy Book2 15 | |
| Lenovo Yoga Slim 7 Carbon 13IAP7-82U9005FGE | |
| 1920x1080 CATIA (catia-06) | |
| Dell Precision 5000 5470 | |
| Lenovo ThinkPad P15v G2 21A9000XGE | |
| HP ZBook Power 15 G8 313S5EA | |
| Lenovo IdeaCentre AIO 3 24IAP7 | |
| Lenovo ThinkPad T14 G3-21CF004NGE | |
| Samsung Galaxy Book2 15 | |
| Lenovo Yoga Slim 7 Carbon 13IAP7-82U9005FGE | |
| 1920x1080 3ds Max (3dsmax-07) | |
| Dell Precision 5000 5470 | |
| Lenovo ThinkPad P15v G2 21A9000XGE | |
| HP ZBook Power 15 G8 313S5EA | |
| Lenovo ThinkPad T14 G3-21CF004NGE | |
| Samsung Galaxy Book2 15 | |
| Lenovo IdeaCentre AIO 3 24IAP7 | |
| Lenovo Yoga Slim 7 Carbon 13IAP7-82U9005FGE | |
Wydajność w grach
ThinkPad T14 G3 to przede wszystkim laptop biznesowy, ale dzięki szybkiemu, zintegrowanemu procesorowi graficznemu z pewnością można w nim także pograć. Na stronie .Radeon 680Mczęsto radzi sobie z płynną rozgrywką na średnich i wysokich detalach w rozdzielczości 1080p, o ile tytuły nie są zbyt wymagające. W benchmarkach gamingowych szybka, 35-watowa wersja tj GeForce MX550 jest często nieco szybsza, ale różnica względem MX550 w ThinkPadzie T14 G3 jest właściwie niewarta wzmianki.
| The Witcher 3 | |
| 1920x1080 High Graphics & Postprocessing (Nvidia HairWorks Off) | |
| Lenovo IdeaCentre AIO 3 24IAP7 | |
| Lenovo ThinkPad T14 G3-21CF004NGE | |
| Przeciętny AMD Radeon 680M (22.3 - 48, n=33) | |
| Huawei MateBook X Pro 2022 | |
| Lenovo ThinkPad T14 Gen2-20W1S00000 | |
| Średnia w klasie Office (23.7 - 39.9, n=4, ostatnie 2 lata) | |
| Dell Inspiron 14 7420 2-in-1 | |
| HP EliteBook 845 G9 6F6H6EA | |
| Lenovo ThinkPad T14s G2 20XGS01100 | |
| Dell Latitude 7420 JW6MH | |
| 1920x1080 Ultra Graphics & Postprocessing (HBAO+) | |
| Lenovo IdeaCentre AIO 3 24IAP7 | |
| Lenovo ThinkPad T14 G3-21CF004NGE | |
| Przeciętny AMD Radeon 680M (14.3 - 27.1, n=33) | |
| Lenovo ThinkPad T14 Gen2-20W1S00000 | |
| Lenovo ThinkPad T14 Gen2-20W1S00000 | |
| Średnia w klasie Office (14.8 - 18.1, n=4, ostatnie 2 lata) | |
| HP EliteBook 845 G9 6F6H6EA | |
| Huawei MateBook X Pro 2022 | |
| Lenovo ThinkPad T14s G2 20XGS01100 | |
| Dell Inspiron 14 7420 2-in-1 | |
| Dell Latitude 7420 JW6MH | |
| F1 2021 | |
| 1920x1080 High Preset AA:T AF:16x | |
| Przeciętny AMD Radeon 680M (26.8 - 69, n=21) | |
| Lenovo ThinkPad T14 G3-21CF004NGE (874931) | |
| Lenovo IdeaCentre AIO 3 24IAP7 (874931) | |
| Huawei MateBook X Pro 2022 (874931) | |
| 1920x1080 Ultra High Preset + Raytracing AA:T AF:16x | |
| Lenovo IdeaCentre AIO 3 24IAP7 (874931) | |
| Huawei MateBook X Pro 2022 (874931) | |
| Przeciętny AMD Radeon 680M (16.1 - 29.1, n=18) | |
| Lenovo ThinkPad T14 G3-21CF004NGE (874931) | |
| GTA V | |
| 1920x1080 High/On (Advanced Graphics Off) AA:2xMSAA + FX AF:8x | |
| Lenovo ThinkPad T14 G3-21CF004NGE | |
| Lenovo IdeaCentre AIO 3 24IAP7 | |
| HP EliteBook 845 G9 6F6H6EA | |
| Przeciętny AMD Radeon 680M (25.9 - 99.1, n=37) | |
| Średnia w klasie Office (11.4 - 163.1, n=67, ostatnie 2 lata) | |
| Dell Latitude 7420 JW6MH | |
| Huawei MateBook X Pro 2022 | |
| Dell Inspiron 14 7420 2-in-1 | |
| 1920x1080 Highest AA:4xMSAA + FX AF:16x | |
| Lenovo IdeaCentre AIO 3 24IAP7 | |
| Lenovo ThinkPad T14 G3-21CF004NGE | |
| Przeciętny AMD Radeon 680M (11.3 - 25.3, n=37) | |
| HP EliteBook 845 G9 6F6H6EA | |
| Średnia w klasie Office (5.77 - 45.3, n=65, ostatnie 2 lata) | |
| Huawei MateBook X Pro 2022 | |
| Dell Latitude 7420 JW6MH | |
| Dell Inspiron 14 7420 2-in-1 | |
| Dota 2 Reborn | |
| 1920x1080 high (2/3) | |
| Lenovo IdeaCentre AIO 3 24IAP7 | |
| Lenovo ThinkPad T14 Gen2-20W1S00000 | |
| Lenovo ThinkPad T14 G3-21CF004NGE | |
| Przeciętny AMD Radeon 680M (33.2 - 89.1, n=41) | |
| Huawei MateBook X Pro 2022 | |
| Średnia w klasie Office (16.2 - 143.3, n=73, ostatnie 2 lata) | |
| Dell Latitude 7420 JW6MH | |
| Lenovo ThinkPad T14s G2 20XGS01100 | |
| HP EliteBook 845 G9 6F6H6EA | |
| Dell Inspiron 14 7420 2-in-1 | |
| 1920x1080 ultra (3/3) best looking | |
| Lenovo IdeaCentre AIO 3 24IAP7 | |
| Lenovo ThinkPad T14 Gen2-20W1S00000 | |
| Lenovo ThinkPad T14 G3-21CF004NGE | |
| Przeciętny AMD Radeon 680M (33.2 - 84.9, n=41) | |
| Huawei MateBook X Pro 2022 | |
| Średnia w klasie Office (14.6 - 135, n=73, ostatnie 2 lata) | |
| Lenovo ThinkPad T14s G2 20XGS01100 | |
| Dell Latitude 7420 JW6MH | |
| HP EliteBook 845 G9 6F6H6EA | |
| Dell Inspiron 14 7420 2-in-1 | |
| Final Fantasy XV Benchmark | |
| 1920x1080 Standard Quality | |
| Lenovo IdeaCentre AIO 3 24IAP7 (1.3) | |
| Lenovo ThinkPad T14 G3-21CF004NGE (1.3) | |
| Przeciętny AMD Radeon 680M (18.3 - 36.9, n=40) | |
| Średnia w klasie Office (7.86 - 105.7, n=70, ostatnie 2 lata) | |
| Huawei MateBook X Pro 2022 (1.3) | |
| HP EliteBook 845 G9 6F6H6EA (1.3) | |
| Dell Latitude 7420 JW6MH (1.3) | |
| Dell Inspiron 14 7420 2-in-1 (1.3) | |
| 1920x1080 High Quality | |
| Lenovo IdeaCentre AIO 3 24IAP7 (1.3) | |
| Lenovo ThinkPad T14 G3-21CF004NGE (1.3) | |
| Średnia w klasie Office (8.09 - 79.5, n=67, ostatnie 2 lata) | |
| Przeciętny AMD Radeon 680M (12.9 - 26.2, n=40) | |
| Huawei MateBook X Pro 2022 (1.3) | |
| HP EliteBook 845 G9 6F6H6EA (1.3) | |
| Dell Inspiron 14 7420 2-in-1 (1.3) | |
| Far Cry 5 | |
| 1920x1080 High Preset AA:T | |
| Lenovo IdeaCentre AIO 3 24IAP7 | |
| Lenovo ThinkPad T14 G3-21CF004NGE | |
| Przeciętny AMD Radeon 680M (18 - 41, n=28) | |
| Średnia w klasie Office (19 - 54, n=14, ostatnie 2 lata) | |
| Huawei MateBook X Pro 2022 | |
| Lenovo ThinkPad T14s G2 20XGS01100 | |
| Dell Latitude 7420 JW6MH | |
| HP EliteBook 845 G9 6F6H6EA | |
| 1920x1080 Ultra Preset AA:T | |
| Lenovo IdeaCentre AIO 3 24IAP7 | |
| Przeciętny AMD Radeon 680M (20 - 40, n=27) | |
| Lenovo ThinkPad T14 G3-21CF004NGE | |
| Średnia w klasie Office (18 - 52, n=14, ostatnie 2 lata) | |
| Huawei MateBook X Pro 2022 | |
| Strange Brigade | |
| 1920x1080 high AA:high AF:8 | |
| Lenovo IdeaCentre AIO 3 24IAP7 (1.47.22.14 D3D12) | |
| Lenovo ThinkPad T14 G3-21CF004NGE | |
| Przeciętny AMD Radeon 680M (25.3 - 53.1, n=38) | |
| Średnia w klasie Office (9.8 - 164.3, n=51, ostatnie 2 lata) | |
| Huawei MateBook X Pro 2022 (1.47.22.14 D3D12) | |
| Lenovo ThinkPad T14s G2 20XGS01100 (1.47.22.14 D3D12) | |
| HP EliteBook 845 G9 6F6H6EA (1.47.22.14 D3D12) | |
| Dell Inspiron 14 7420 2-in-1 (1.47.22.14 D3D12) | |
| Dell Latitude 7420 JW6MH (1.47.22.14 D3D12) | |
| 1920x1080 ultra AA:ultra AF:16 | |
| Lenovo ThinkPad T14 G3-21CF004NGE | |
| Lenovo IdeaCentre AIO 3 24IAP7 (1.47.22.14 D3D12) | |
| Przeciętny AMD Radeon 680M (22 - 46, n=38) | |
| Średnia w klasie Office (12.9 - 142.1, n=50, ostatnie 2 lata) | |
| Huawei MateBook X Pro 2022 (1.47.22.14 D3D12) | |
| Lenovo ThinkPad T14s G2 20XGS01100 (1.47.22.14 D3D12) | |
| HP EliteBook 845 G9 6F6H6EA (1.47.22.14 D3D12) | |
| Dell Inspiron 14 7420 2-in-1 (1.47.22.14 D3D12) | |
| Dell Latitude 7420 JW6MH (1.47.22.14 D3D12) | |
| Farming Simulator 22 | |
| 1920x1080 High Preset | |
| Lenovo IdeaCentre AIO 3 24IAP7 | |
| Przeciętny AMD Radeon 680M (30 - 72.5, n=4) | |
| Lenovo ThinkPad T14 G3-21CF004NGE | |
| Huawei MateBook X Pro 2022 | |
| 1920x1080 Very High Preset | |
| Lenovo ThinkPad T14 G3-21CF004NGE | |
| Lenovo IdeaCentre AIO 3 24IAP7 | |
| Przeciętny AMD Radeon 680M (27 - 53, n=4) | |
| Huawei MateBook X Pro 2022 | |
Wydajność w grach pozostaje stabilna także pod dłuższym obciążeniem, co dobrze ilustruje nasza pętla Witcher 3. Oceniając zużycie energii na zewnętrznym ekranie (by wykluczyć zróżnicowane panele wewnętrzne urządzeń recenzenckich jako czynniki wpływające), ponownie widać znakomitą wydajność w porównaniu z MX550, a zwłaszcza Iris Xe Graphics G7. Pod względem wydajności w grach szkoda jednak, że Lenovo pominęło USB 4, gdyż skutecznie oznacza to brak możliwości podłączenia zewnętrznej karty graficznej, która w przeciwnym razie działałaby bardzo dobrze ze względu na mocny procesor. W trybie bateryjnym wydajność pozostaje stabilna. Więcej benchmarków gamingowych dostępnych jest tutaj.
Witcher 3 FPS-Diagramm
| Power Consumption - Witcher 3 ultra Efficiency (external Monitor) | |
| AMD Radeon 680M | |
| AMD Radeon 680M | |
| NVIDIA GeForce MX550 | |
| AMD Radeon RX Vega 8 (Ryzen 4000/5000) | |
| Intel Iris Xe Graphics G7 80EUs | |
| Intel Iris Xe Graphics G7 96EUs | |
| Intel Iris Xe Graphics G7 96EUs | |
| Intel Iris Xe Graphics G7 96EUs | |
| low | med. | high | ultra | |
|---|---|---|---|---|
| GTA V (2015) | 133.6 | 120.1 | 99.1 | 22.2 |
| The Witcher 3 (2015) | 117 | 79 | 41 | 23.9 |
| Dota 2 Reborn (2015) | 111.4 | 96 | 72.8 | 63.1 |
| Final Fantasy XV Benchmark (2018) | 62 | 32.4 | 23 | |
| X-Plane 11.11 (2018) | 48.9 | 39.5 | 33.5 | |
| Far Cry 5 (2018) | 58 | 36 | 34 | 32 |
| Strange Brigade (2018) | 139 | 58 | 48 | 41 |
| F1 2021 (2021) | 140.5 | 70.8 | 55.1 | 21.2 |
| Farming Simulator 22 (2021) | 121 | 61 | 49 | 43 |
| F1 22 (2022) | 66.5 | 60.3 | 42.3 | 9.16 |
Emisje - AMD ThinkPad pozostaje przyjemnie cichy
Hałas
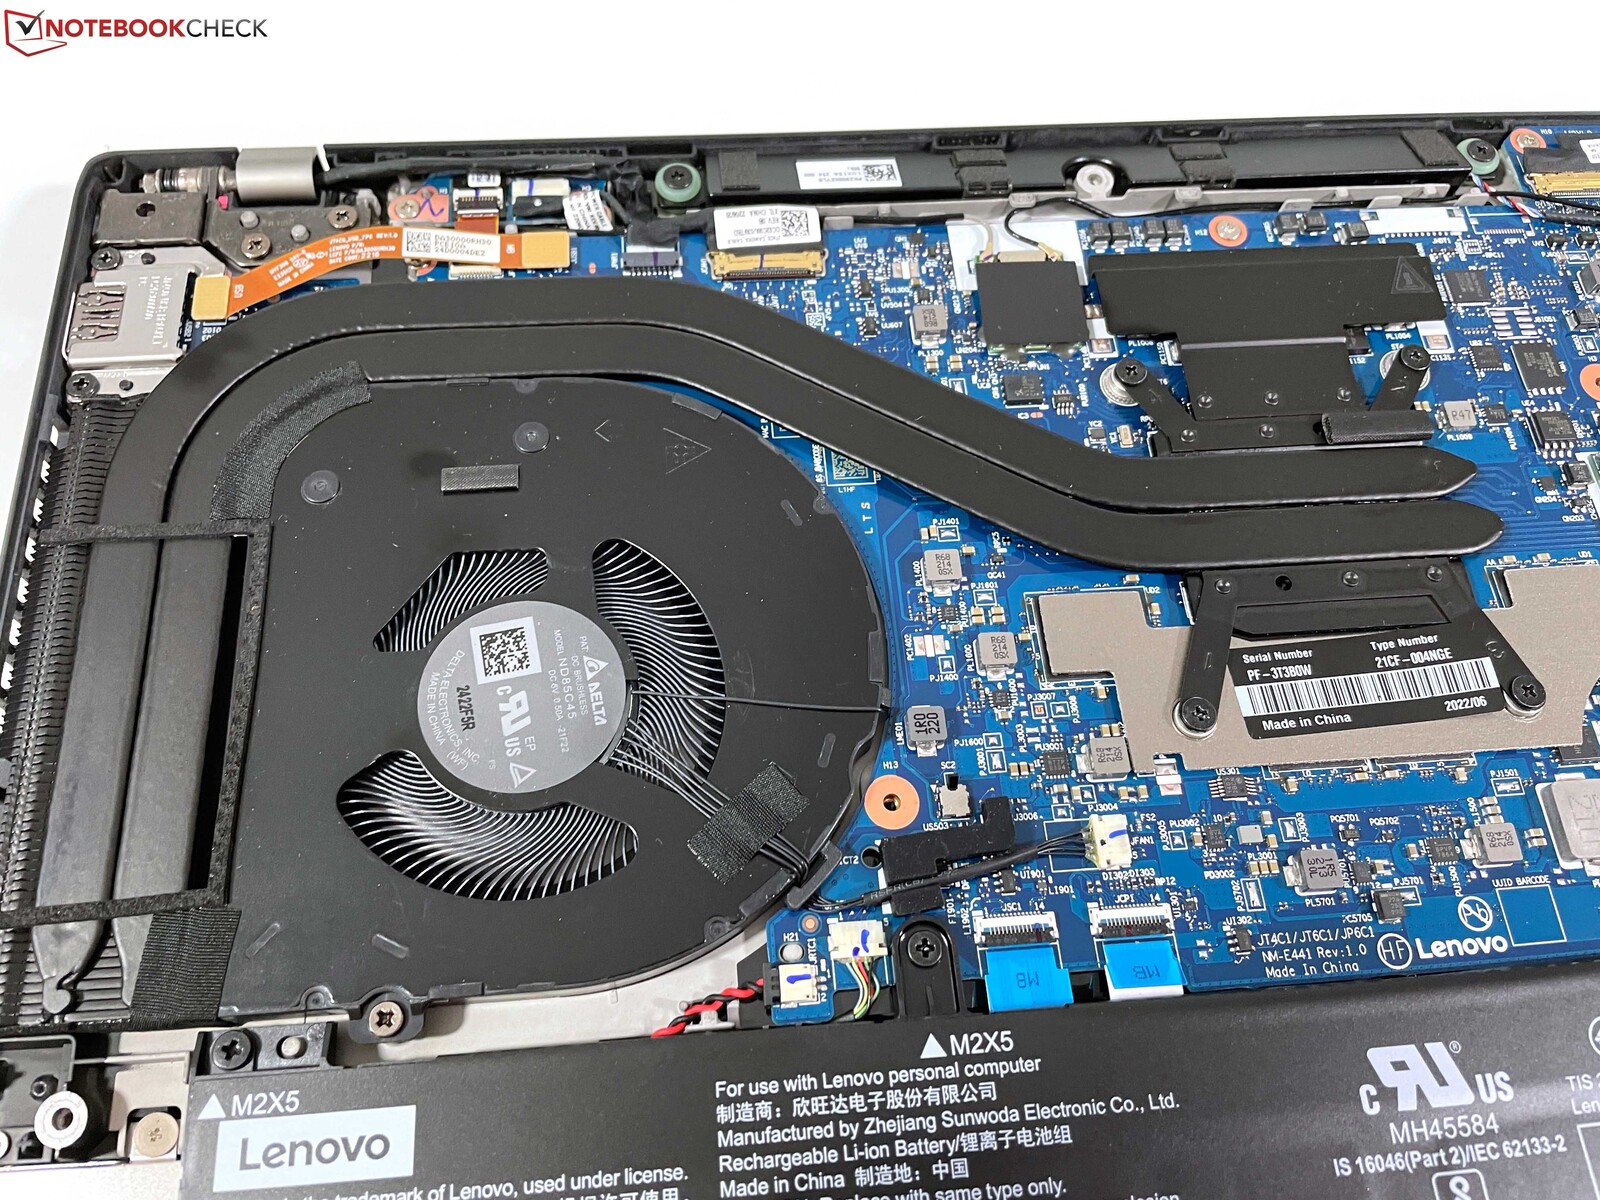
Pojedynczy wentylator pozostaje przyjemnie cichy w codziennym użytkowaniu i często jest wyłączany podczas prostych zadań lub występuje tylko bardzo cichy szum, który jest ledwo słyszalny. Pod obciążeniem wentylator osiąga maksymalnie 38 dB(A), ale szum nie jest wysoki ani denerwujący. Gdy tylko TDP się ustabilizuje, szum wentylatora spada ponownie do około 34 dB(A), co zmierzyliśmy również podczas grania. Ogólnie rzecz biorąc, czyni to ThinkPada T14 G3 jednym z najcichszych urządzeń na polu porównawczym, a jeśli wybierzemy najbardziej wydajny tryb zasilania, wentylator jest praktycznie niesłyszalny, nawet pod obciążeniem. Nie wykryto żadnych innych elektronicznych odgłosów, takich jak wycie cewek.
Hałas
| luz |
| 24.2 / 24.2 / 25.8 dB |
| obciążenie |
| 32.2 / 38.8 dB |
 | ||
30 dB cichy 40 dB(A) słyszalny 50 dB(A) irytujący |
||
min: | ||
| Lenovo ThinkPad T14 G3-21CF004NGE Radeon 680M, R7 PRO 6850U, Kioxia BG5 KBG5AZNV512G | Dell Latitude 7420 JW6MH Iris Xe G7 80EUs, i5-1145G7, SK Hynix BC711 HFM512GD3HX015N | Huawei MateBook X Pro 2022 Iris Xe G7 96EUs, i7-1260P, Silicon Motion PCIe-8 SSD 1TB | HP EliteBook 845 G9 6F6H6EA Radeon 680M, R9 PRO 6950HS, WDC PC SN810 1TB | Lenovo ThinkPad T14 Gen2-20W1S00000 GeForce MX450, i7-1165G7, Samsung PM981a MZVLB1T0HBLR | Lenovo ThinkPad T14s G2 20XGS01100 Vega 8, R7 PRO 5850U, Lenovo UMIS AM630 RPETJ1T24MGE2QDQ | |
|---|---|---|---|---|---|---|
| Noise | -11% | -1% | -8% | -4% | -3% | |
| wyłączone / środowisko * (dB) | 24.2 | 25.3 -5% | 23.5 3% | 25.5 -5% | 24.2 -0% | 26.81 -11% |
| Idle Minimum * (dB) | 24.2 | 25.3 -5% | 23.5 3% | 25.5 -5% | 24.2 -0% | 26.81 -11% |
| Idle Average * (dB) | 24.2 | 25.3 -5% | 23.5 3% | 25.5 -5% | 24.2 -0% | 26.81 -11% |
| Idle Maximum * (dB) | 25.8 | 25.3 2% | 25.9 -0% | 25.5 1% | 24.2 6% | 26.81 -4% |
| Load Average * (dB) | 32.2 | 44.9 -39% | 33.8 -5% | 38.1 -18% | 35.4 -10% | 30.16 6% |
| Witcher 3 ultra * (dB) | 34.1 | 35.4 -4% | 40.1 -18% | |||
| Load Maximum * (dB) | 38.8 | 44.9 -16% | 40.6 -5% | 44 -13% | 40.1 -3% | 33.98 12% |
* ... im mniej tym lepiej
Temperatura
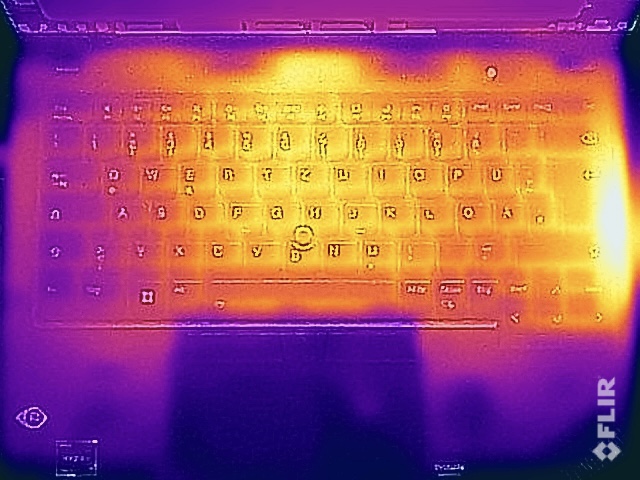
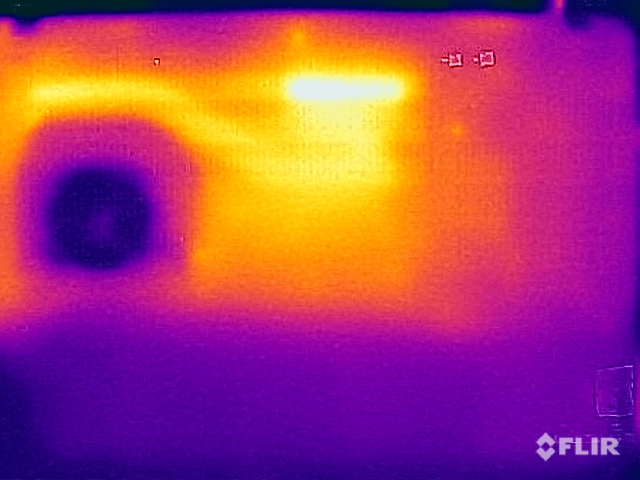
Obudowa ThinkPada T14 G3 prawie nie nagrzewa się pod małym obciążeniem, ale pod obciążeniem sprawy wyglądają inaczej. W szczególności bardzo mocno nagrzewa się centralny obszar tylny na spodzie oraz pokrywa nad wylotem wentylatora obok klawiatury. Ciepłe powierzchnie obok klawiatury znamy już z poprzedników. Pod obciążeniem ThinkPad T14 G3 nie powinien być kładziony na kolanach, ewentualnie przełączany w tryb oszczędzania akumulatora. Może to być problematyczne w przypadku konfiguracji T14 G3 z dedykowanym GeForce MX550, którym naturalnie towarzyszy zwiększone obciążenie termiczne.
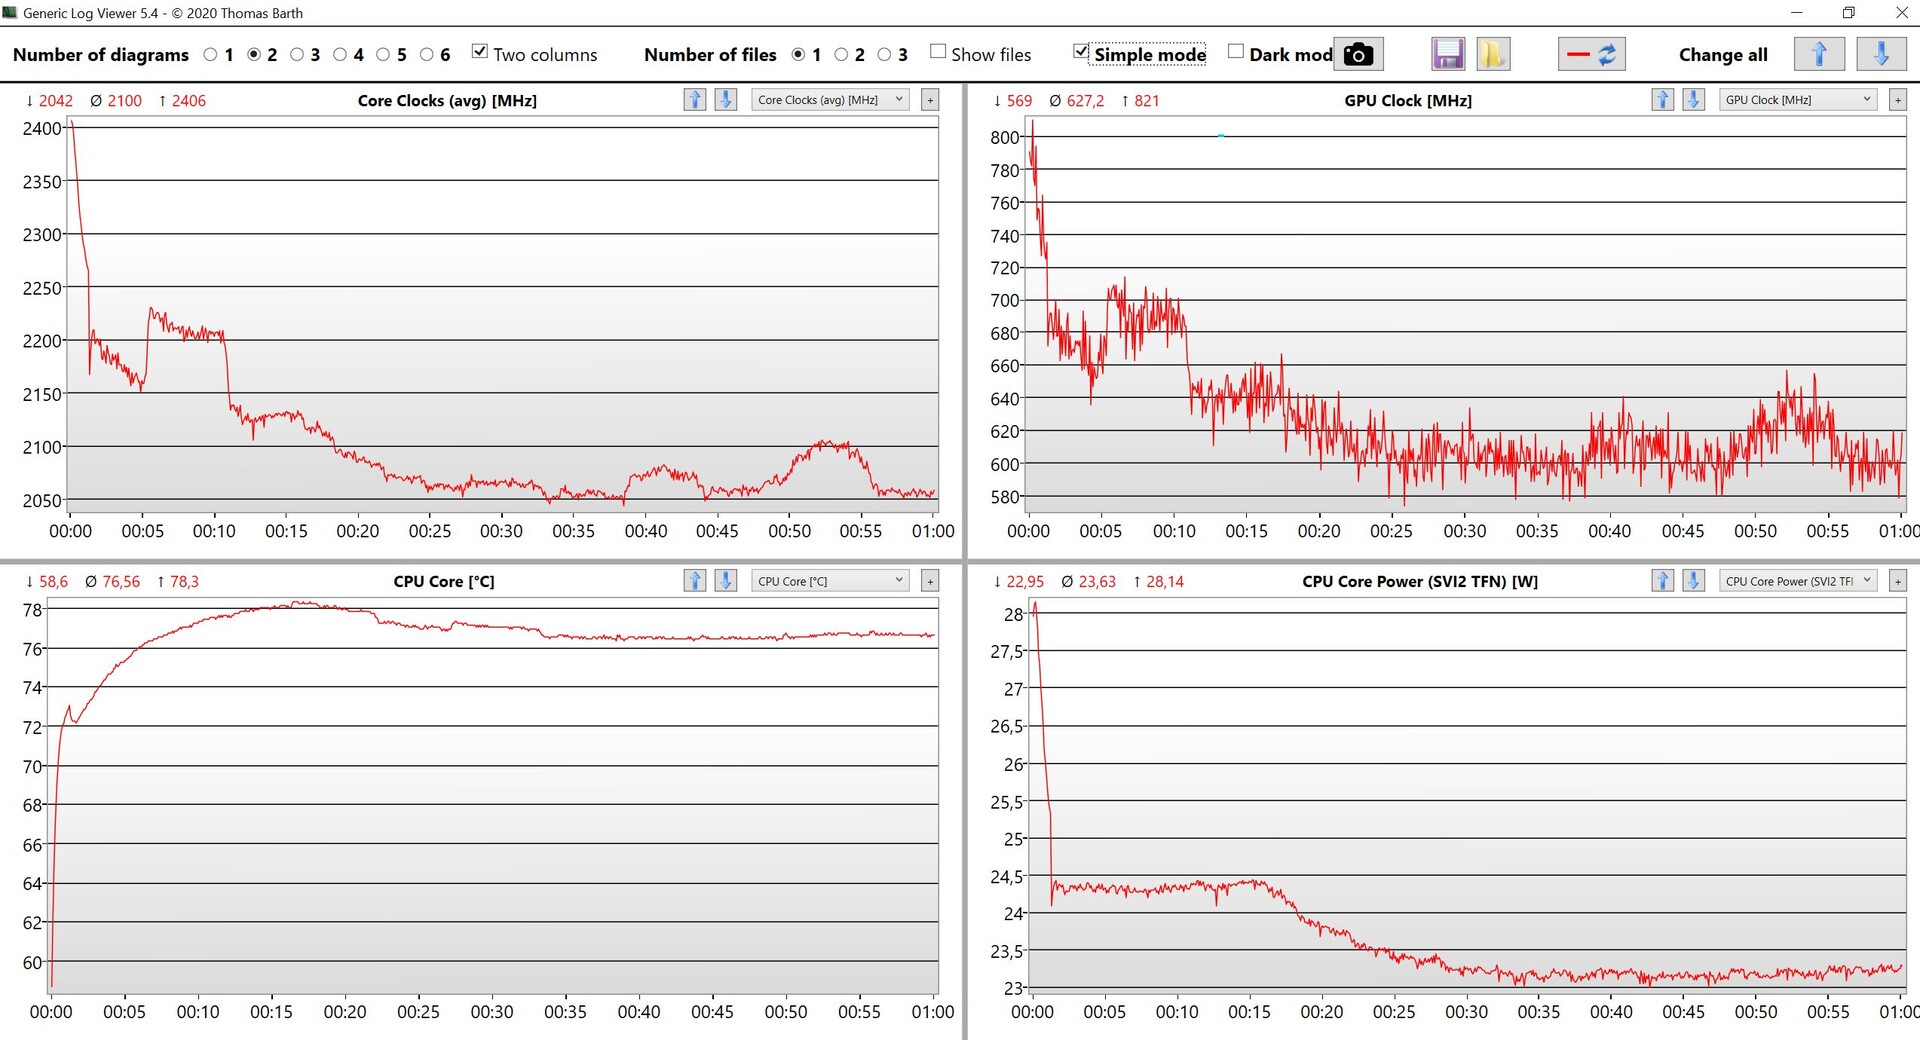
W teście obciążeniowym z połączonym obciążeniem CPU/GPU pobór mocy SoC przez pierwsze 15 minut oscyluje wokół 25 W, po czym stabilizuje się na poziomie 23 W. Po zakończeniu testu obciążeniowego nie zaobserwowano dalszego spadku wydajności
(-) Maksymalna temperatura w górnej części wynosi 48.2 °C / 119 F, w porównaniu do średniej 34.3 °C / 94 F , począwszy od 21.2 do 62.5 °C dla klasy Office.
(-) Dno nagrzewa się maksymalnie do 52.8 °C / 127 F, w porównaniu do średniej 36.8 °C / 98 F
(+) W stanie bezczynności średnia temperatura górnej części wynosi 23.9 °C / 75 F, w porównaniu ze średnią temperaturą urządzenia wynoszącą 29.5 °C / ### class_avg_f### F.
(±) Podczas gry w Wiedźmina 3 średnia temperatura górnej części wynosi 37.8 °C / 100 F, w porównaniu do średniej temperatury urządzenia wynoszącej 29.5 °C / ## #class_avg_f### F.
(+) Podpórki pod nadgarstki i touchpad są chłodniejsze niż temperatura skóry i maksymalnie 29.8 °C / 85.6 F i dlatego są chłodne w dotyku.
(-) Średnia temperatura obszaru podparcia dłoni w podobnych urządzeniach wynosiła 27.5 °C / 81.5 F (-2.3 °C / -4.1 F).
| Lenovo ThinkPad T14 G3-21CF004NGE AMD Ryzen 7 PRO 6850U, AMD Radeon 680M | Dell Latitude 7420 JW6MH Intel Core i5-1145G7, Intel Iris Xe Graphics G7 80EUs | Huawei MateBook X Pro 2022 Intel Core i7-1260P, Intel Iris Xe Graphics G7 96EUs | HP EliteBook 845 G9 6F6H6EA AMD Ryzen 9 PRO 6950HS, AMD Radeon 680M | Lenovo ThinkPad T14 Gen2-20W1S00000 Intel Core i7-1165G7, NVIDIA GeForce MX450 | Lenovo ThinkPad T14s G2 20XGS01100 AMD Ryzen 7 PRO 5850U, AMD Radeon RX Vega 8 (Ryzen 4000/5000) | |
|---|---|---|---|---|---|---|
| Heat | 6% | -2% | -12% | -7% | 1% | |
| Maximum Upper Side * (°C) | 48.2 | 37.1 23% | 43.1 11% | 49.4 -2% | 47 2% | 44.2 8% |
| Maximum Bottom * (°C) | 52.8 | 38.7 27% | 42 20% | 48 9% | 58.4 -11% | 38.9 26% |
| Idle Upper Side * (°C) | 24.4 | 27.3 -12% | 29.4 -20% | 30.8 -26% | 25.3 -4% | 27.7 -14% |
| Idle Bottom * (°C) | 24.5 | 28.1 -15% | 29.4 -20% | 31.4 -28% | 27.7 -13% | 28.3 -16% |
* ... im mniej tym lepiej
Mówcy
Dwa głośniki stereo znajdują się nad klawiaturą i kierują dźwięk w stronę użytkownika. Ponieważ jednak oba moduły są umieszczone bardzo blisko siebie, nie ma efektu stereofonii i ogólne brzmienie jest dość cienkie. Mocną stroną są liniowe tony wysokie, które sprzyjają odtwarzaniu głosu podczas konferencji. Poza jakąś muzyką w tle lub okazjonalnym wideo lepiej jednak będzie skorzystać z zewnętrznych głośników lub słuchawek.
Lenovo ThinkPad T14 G3-21CF004NGE analiza dźwięku
(±) | głośność głośnika jest średnia, ale dobra (77.2 dB)
Bas 100 - 315 Hz
(-) | prawie brak basu - średnio 24.6% niższa od mediany
(±) | liniowość basu jest średnia (10.1% delta do poprzedniej częstotliwości)
Średnie 400 - 2000 Hz
(+) | zbalansowane środki średnie - tylko 2.6% od mediany
(+) | średnie są liniowe (4.6% delta do poprzedniej częstotliwości)
Wysokie 2–16 kHz
(+) | zrównoważone maksima - tylko 3.3% od mediany
(+) | wzloty są liniowe (3.8% delta do poprzedniej częstotliwości)
Ogólnie 100 - 16.000 Hz
(±) | liniowość ogólnego dźwięku jest średnia (18.8% różnicy w stosunku do mediany)
W porównaniu do tej samej klasy
» 34% wszystkich testowanych urządzeń w tej klasie było lepszych, 7% podobnych, 58% gorszych
» Najlepszy miał deltę 7%, średnia wynosiła ###średnia###%, najgorsza wynosiła 53%
W porównaniu do wszystkich testowanych urządzeń
» 43% wszystkich testowanych urządzeń było lepszych, 8% podobnych, 49% gorszych
» Najlepszy miał deltę 4%, średnia wynosiła ###średnia###%, najgorsza wynosiła 134%
Dell Latitude 7420 JW6MH analiza dźwięku
(+) | głośniki mogą odtwarzać stosunkowo głośno (82.7 dB)
Bas 100 - 315 Hz
(-) | prawie brak basu - średnio 15.6% niższa od mediany
(±) | liniowość basu jest średnia (12.8% delta do poprzedniej częstotliwości)
Średnie 400 - 2000 Hz
(+) | zbalansowane środki średnie - tylko 2.9% od mediany
(+) | średnie są liniowe (4% delta do poprzedniej częstotliwości)
Wysokie 2–16 kHz
(+) | zrównoważone maksima - tylko 2.5% od mediany
(+) | wzloty są liniowe (4.3% delta do poprzedniej częstotliwości)
Ogólnie 100 - 16.000 Hz
(+) | ogólny dźwięk jest liniowy (12.5% różnicy w stosunku do mediany)
W porównaniu do tej samej klasy
» 5% wszystkich testowanych urządzeń w tej klasie było lepszych, 2% podobnych, 93% gorszych
» Najlepszy miał deltę 7%, średnia wynosiła ###średnia###%, najgorsza wynosiła 53%
W porównaniu do wszystkich testowanych urządzeń
» 11% wszystkich testowanych urządzeń było lepszych, 2% podobnych, 87% gorszych
» Najlepszy miał deltę 4%, średnia wynosiła ###średnia###%, najgorsza wynosiła 134%
Zarządzanie energią - AMD ThinkPad jest bardzo wydajny
Pobór mocy
Dzięki wyświetlaczowi o rozdzielczości 400 nitów i procesorowi AMD, ThinkPad T14 G3 jest niezwykle energooszczędny. Nawet przy pełnej jasności zużycie energii w stanie spoczynku wynosi mniej niż 6 watów. Pod obciążeniem wyraźnie widzimy różnice w stosunku do obecnych układów Intela, które podczas szczytowych obciążeń często osiągają limit 65-watowego zasilacza i od czasu do czasu zmuszone są czerpać energię z akumulatora. Z kolei procesor AMD pod obciążeniem pobiera tylko maksymalnie 50 watów, więc 65-watowy zasilacz jest całkowicie wystarczający.
| wyłączony / stan wstrzymania | |
| luz | |
| obciążenie |
|
Legenda:
min: | |
| Lenovo ThinkPad T14 G3-21CF004NGE R7 PRO 6850U, Radeon 680M, Kioxia BG5 KBG5AZNV512G, IPS, 1920x1200, 14" | Dell Latitude 7420 JW6MH i5-1145G7, Iris Xe G7 80EUs, SK Hynix BC711 HFM512GD3HX015N, IPS, 1920x1080, 14" | Huawei MateBook X Pro 2022 i7-1260P, Iris Xe G7 96EUs, Silicon Motion PCIe-8 SSD 1TB, IPS, 3120x2080, 14.2" | HP EliteBook 845 G9 6F6H6EA R9 PRO 6950HS, Radeon 680M, WDC PC SN810 1TB, IPS, 1920x1200, 14" | Lenovo ThinkPad T14 Gen2-20W1S00000 i7-1165G7, GeForce MX450, Samsung PM981a MZVLB1T0HBLR, IPS LED, 1920x1080, 14" | Lenovo ThinkPad T14s G2 20XGS01100 R7 PRO 5850U, Vega 8, Lenovo UMIS AM630 RPETJ1T24MGE2QDQ, IPS LED, 1920x1080, 14" | Przeciętny AMD Radeon 680M | Średnia w klasie Office | |
|---|---|---|---|---|---|---|---|---|
| Power Consumption | -10% | -111% | -111% | -47% | -4% | -84% | -42% | |
| Idle Minimum * (Watt) | 2.4 | 2.7 -13% | 6.5 -171% | 6.4 -167% | 3.8 -58% | 3.16 -32% | 6.93 ? -189% | 4.4 ? -83% |
| Idle Average * (Watt) | 5.3 | 6 -13% | 13.7 -158% | 12.4 -134% | 7.3 -38% | 5.6 -6% | 8.98 ? -69% | 7.32 ? -38% |
| Idle Maximum * (Watt) | 5.6 | 7.6 -36% | 14.4 -157% | 18 -221% | 11.2 -100% | 7.13 -27% | 10.5 ? -88% | 8.56 ? -53% |
| Load Average * (Watt) | 39.7 | 37 7% | 64.6 -63% | 63 -59% | 61.2 -54% | 30.86 22% | 53.5 ? -35% | 42.5 ? -7% |
| Witcher 3 ultra * (Watt) | 42.8 | 33.2 22% | 57.2 -34% | 63.6 -49% | 41.2 4% | 37 14% | ||
| Load Maximum * (Watt) | 50.6 | 65 -28% | 90.9 -80% | 68 -34% | 67.5 -33% | 46.55 8% | 70.5 ? -39% | 64.1 ? -27% |
* ... im mniej tym lepiej
Power consumption Witcher 3 / Stress test
Power consumption with an external monitor
Czas pracy na baterii
Akumulator o pojemności 52,5 Wh zapewnia wyjątkowo dobre czasy pracy. Przy ustawionej jasności 150 cd/m² (co odpowiada 65% maksymalnej jasności w naszym egzemplarzu testowym) nasz test wideo trwa prawie 16,5 h, co jest ponownie potwierdzeniem bardzo wydajnego dekodera wideo. Test WLAN trwa prawie 13 godzin, a przy maksymalnej jasności - prawie 10 godzin. Powtórzyliśmy też test WLAN (150 cd/m²) z aktywnym połączeniem LTE i wynik wyniósł 10:18 min.
Dzięki 65-watowemu zasilaczowi ThinkPad obsługuje technologię RapidCharge i pełne naładowanie trwa niespełna 100 minut przy włączonym urządzeniu; 50% jest dostępne już po 30 minutach a 80% po 53 minutach.
| Lenovo ThinkPad T14 G3-21CF004NGE R7 PRO 6850U, Radeon 680M, 52.5 Wh | Dell Latitude 7420 JW6MH i5-1145G7, Iris Xe G7 80EUs, 63 Wh | Huawei MateBook X Pro 2022 i7-1260P, Iris Xe G7 96EUs, 60 Wh | HP EliteBook 845 G9 6F6H6EA R9 PRO 6950HS, Radeon 680M, 51 Wh | Lenovo ThinkPad T14 Gen2-20W1S00000 i7-1165G7, GeForce MX450, 50 Wh | Lenovo ThinkPad T14s G2 20XGS01100 R7 PRO 5850U, Vega 8, 57 Wh | Średnia w klasie Office | |
|---|---|---|---|---|---|---|---|
| Czasy pracy | 55% | -22% | -14% | -15% | 12% | 10% | |
| H.264 (h) | 16.4 | 7.6 -54% | 14 -15% | 14.9 -9% | 15 ? -9% | ||
| WiFi v1.3 (h) | 12.9 | 14.1 9% | 7.5 -42% | 9.3 -28% | 9 -30% | 14.6 13% | 12.9 ? 0% |
| Load (h) | 1.3 | 2.6 100% | 1.7 31% | 1.3 0% | 1.3 0% | 1.7 31% | 1.807 ? 39% |
Za
Przeciw
Werdykt - ThinkPad T3 G3 jest bardzo dobry, ale wiąże się z niepotrzebnymi ograniczeniami

ThinkPad T14 to bardzo dobry notebook biznesowy. Nie jest ani najcieńszym, ani najlżejszym 14-calowym notebookiem, nie stara się nim być, ale takie podejście ma swoje zalety w codziennym użytkowaniu, takie jak bogate możliwości połączeń. W nowym T14 G3 Lenovo wprowadziło gruntowne zmiany w wyglądzie, co również jest sukcesem w wielu dziedzinach. Ekran 16:10 harmonijnie wpisuje się w ogólną koncepcję, a niezwykle szeroka dolna krawędź ekranu wreszcie zniknęła. Większy touchpad jest również przyjemny, a klawisze TrackPoint należą do najlepszych, z jakimi mieliśmy do czynienia w ThinkPadzie, ze swoimi bogatymi i cichymi klikami
Negatywny aspekt dotyczy jednak klawiatury. Tutaj Lenovo podąża za podejściem innych ThinkPadów, takich jak np X1 Carbon, zmniejszając spadek klawiszy z 1,8 do 1,5 mm, co jest niepotrzebne, biorąc pod uwagę grubość obudowy. A różnica jest zauważalna podczas pisania na klawiaturze. Naprawdę szkoda, że Lenovo dalej przyćmiewa to, co wcześniej było mocną atrakcją, celowo zadowalając się gorszą jakością. Klawiatura nowego T14 G3 nie jest w żadnym wypadku zła, ale nie ma już przewagi nad innymi biznesowymi konkurentami, takimi jak HP. Lenovo powinno ponownie przemyśleć swoją strategię w tym zakresie
Nowy ThinkPad T14 G3 to bardzo dobry laptop biznesowy, który jest ogólnie dobrze dopracowanym urządzeniem z szybkim i wydajnym procesorem AMD Ryzen 7 Pro, który w wielu obszarach ma przewagę nad wariantem Intela.
Przy wyborze między ThinkPadem T14 G3 z procesorami AMD i Intela faworytem jest wyraźnie AMD, gdyż oprócz wysokich wyników w testach wielordzeniowych i zintegrowanego GPU imponuje przede wszystkim wydajnością. Nasze doświadczenia z poprzednimi laptopami z procesorem Alder Lake pokazały, że bardzo wysokie limity mocy prowadzą często do bardzo czułych wentylatorów i wyższego zużycia energii w codziennym użytkowaniu, co zwykle wymaga mocniejszych zasilaczy. Układ AMD jest przyjemnie cichy nawet pod obciążeniem, a czasy pracy na baterii również okazują się bardzo dobre. Wersja dla Intela dostępna jest z dedykowanym
GeForce MX550, ale raczej nie będzie on szybszy od zintegrowanego Radeon 680M, nie mówiąc już o dodatkowym obciążeniu termicznym. Jedyną realną zaletą wersji Intela jest obsługa Thunderbolt, choć trzeba krytycznie zastanowić się, dlaczego Lenovo postanowiło zrezygnować z implementacji USB 4, skoro jest to możliwe w modelach konsumenckich, np Yoga 7 14. Ponadto w modelu AMD nie można rozbudować pamięci RAM, ale w zamian zastosowano szybszą pamięć roboczą (LPDDR5-6400 vs DDR4-3200)
Brak USB 4 w wersji AMD jest niepotrzebnym ograniczeniem ze strony Lenovo, a ponadto zalecamy, by producent ponownie przemyślał swoją strategię dotyczącą klawiatury. Tutaj jakość ciągle spada, a dawna przewaga lepszych klawiatur już nie istnieje.
Nabywcy powinni być nieco ostrożni przy wyborze wyświetlacza, ponieważ podstawowy panel nie daje wiele radości. Nasz wariant recenzencki, o jasności 400 cd/m², jest najlepszym kompromisem między jakością obrazu a poborem mocy, co miało miejsce również we wcześniejszych wersjach. Jasność jest bardzo dobra, współczynnik kontrastu wyjątkowo wysoki, a ostrość obrazu również doskonale wystarczająca - to po prostu bardzo dobry wyświetlacz do zastosowań biznesowych. Co więcej, jest on niezwykle wydajny i zapewnia bardzo dobre czasy pracy na baterii. Opcjonalny panel 4K z pokryciem DCI-P3 zaoferuje lepszą jakość obrazu, ale będzie też wymagał znacznie więcej mocy
Najsilniejszym konkurentem dla ThinkPada T14 G3 jest zapewne EliteBook 845 G9, ponieważ wykorzystuje jeszcze mocniejszy procesor AMD Ryzen 9 Pro 6950HS, ale należy unikać panelu Sure View. Z kolei Dell Latitude 7420, dzięki procesorowi Tiger Lake oferuje znacznie mniejszą wydajność i jest zauważalnie głośniejszy. W najbliższych tygodniach zostaną zrecenzowane inne aktualne laptopy biznesowe, w tym nowy ThinkPad T14s G3, a także wariant Intel/Nvidia.
Cena i dostępność
Zainteresowanym nabywcom zaleca się sprawdzenie dostępności bezpośrednio na oficjalnej stronie Lenovo. Zarówno warianty AMD, jak i Intel komputera Lenovo ThinkPad T14 G3 wydają się być szeroko dostępne, przy czym dokładna konfiguracja (a tym samym cena) zależy od kraju zakupu. Na przykład wariant AMD znaleźliśmy na stronie USA (1 038,95 USD), Kanada (1 319,45 CAD), Wielka Brytania (£896,00), Francja (1.616,00€), Włochy (1.359,00€), Indie (₹98,952) Singapur (SG$1 602,55), Australia (AU$ 2,289.00), Zjednoczone Emiraty Arabskie oraz RPA. Lista ta nie jest wyczerpująca, a ceny te stanowią jedynie ceny wyjściowe, które niezmiennie wzrastają po wybraniu mocniejszych komponentów.
Ceny są aktualne na dzień 26.09 i mogą ulec zmianie
Lenovo ThinkPad T14 G3-21CF004NGE
- 23/09/2022 v7 (old)
Andreas Osthoff
Price comparison

