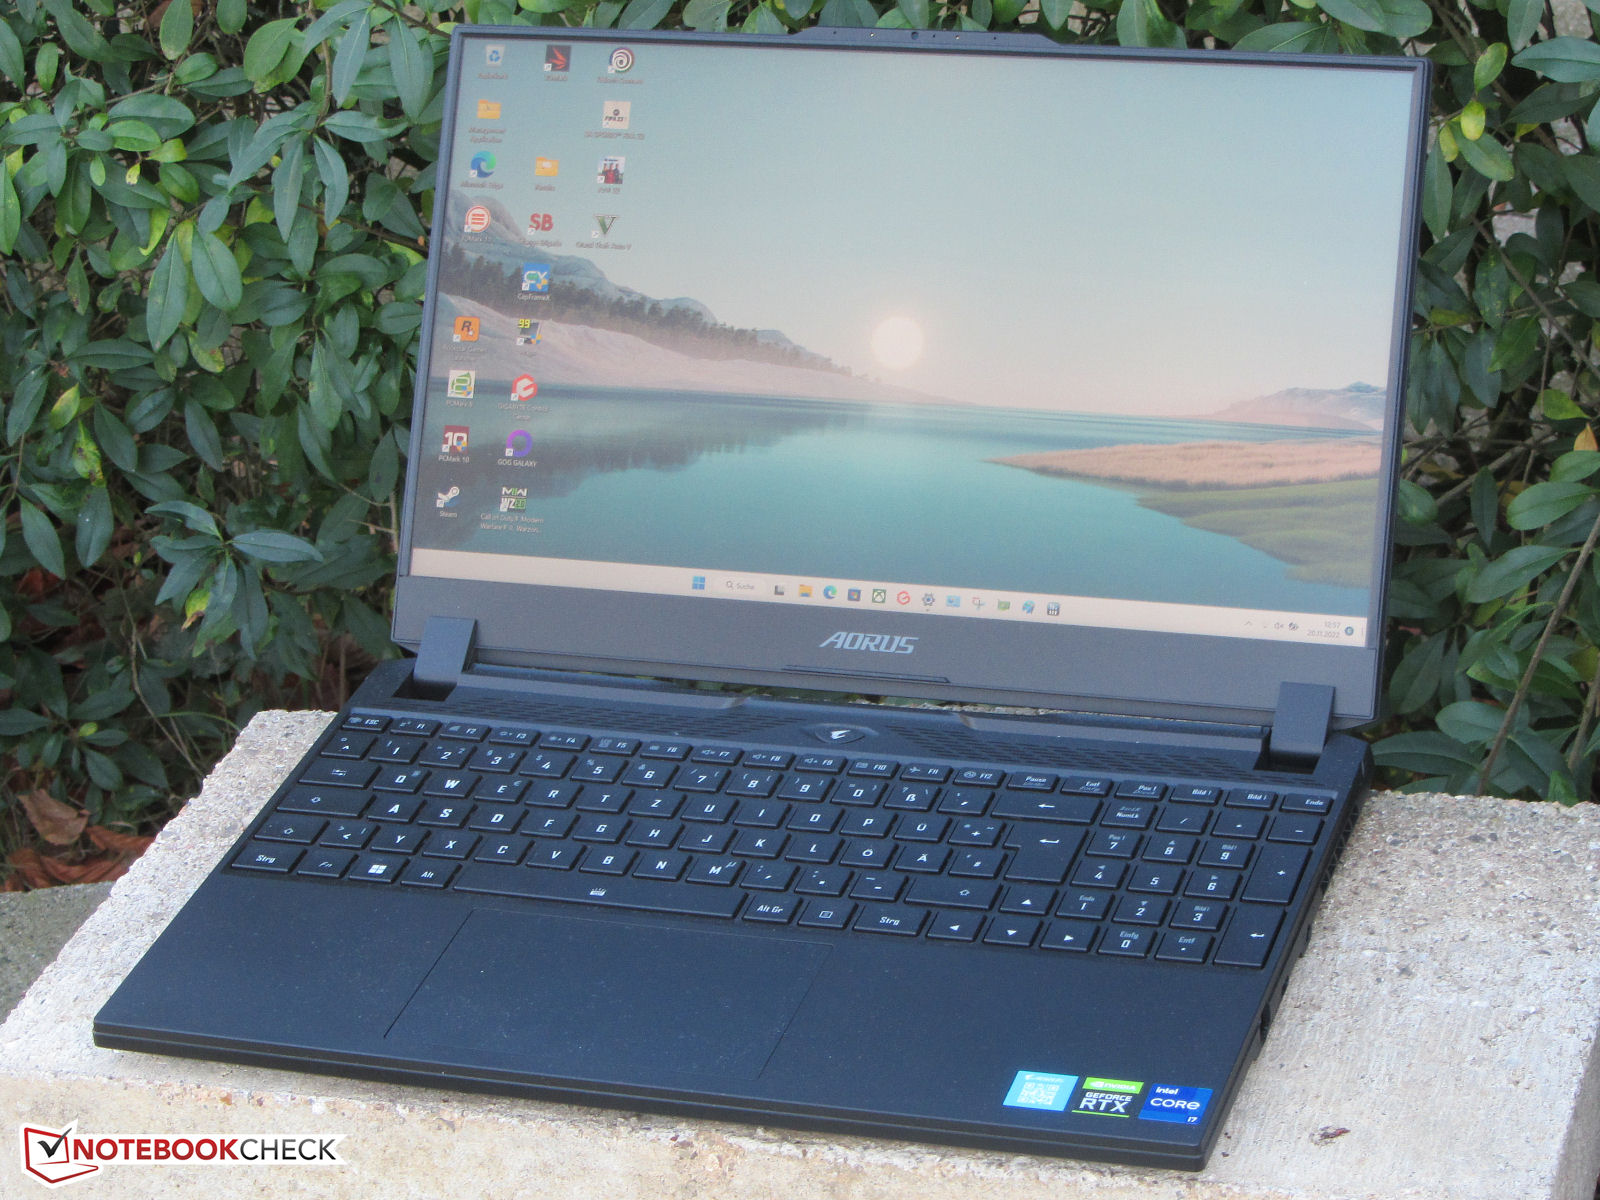
Recenzja Aorus 15 XE5: Kompaktowy laptop do gier o rozdzielczości QHD z Thunderbolt 4
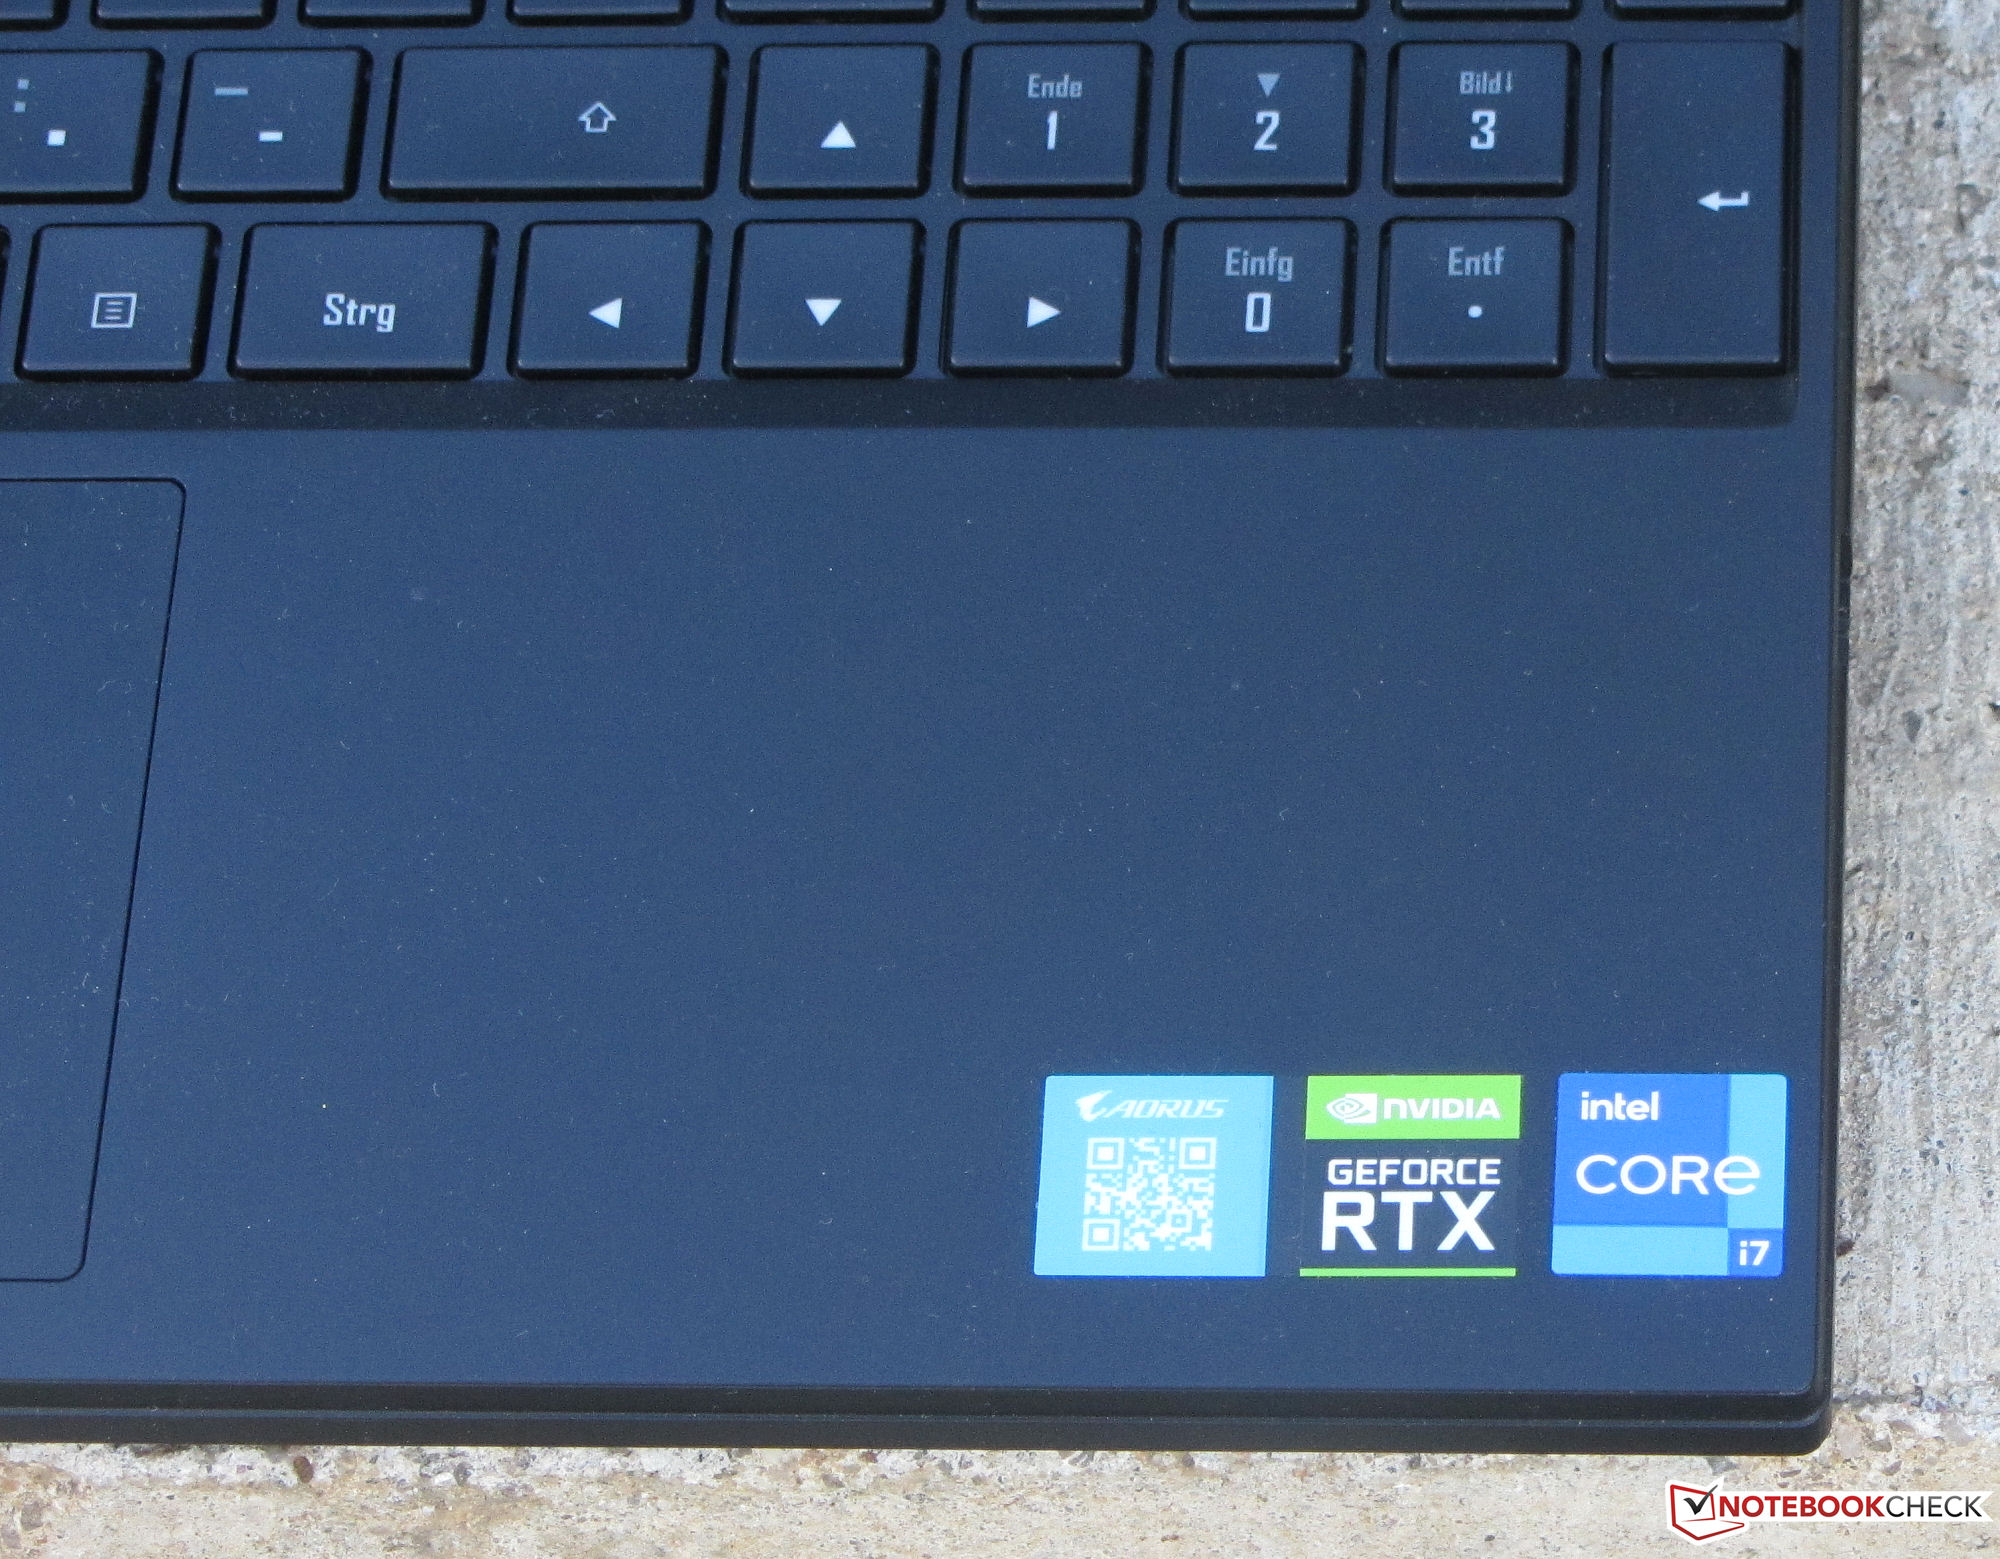
15,6-calowy Aorus 15 XE5 dołącza do grona kompaktowych laptopów dla graczy i jest napędzany przez Core i7-12700H oraz GeForce RTX 3070 Ti Laptop. Maszyna konkuruje z takimi urządzeniami jak np Acer Nitro 5 AN515-46, the MSI Katana GF66 12UGS, the Schenker XMG Fusion 15 (Mid 22) , a także Asus TUF DASH F15 FX517ZR.
Potencjalni konkurenci w porównaniu
Ocena | Data | Model | Waga | Wysokość | Rozmiar | Rezolucja | Cena |
|---|---|---|---|---|---|---|---|
| 85.5 % v7 (old) | 12/2022 | Aorus 15 XE5 i7-12700H, GeForce RTX 3070 Ti Laptop GPU | 2.3 kg | 24 mm | 15.60" | 2560x1440 | |
| 83.9 % v7 (old) | 11/2022 | Acer Nitro 5 AN515-46-R1A1 R7 6800H, GeForce RTX 3070 Ti Laptop GPU | 2.5 kg | 26.8 mm | 15.60" | 1920x1080 | |
| 87.4 % v7 (old) | Schenker XMG Fusion 15 (Mid 22) i7-11800H, GeForce RTX 3070 Laptop GPU | 1.9 kg | 21.65 mm | 15.60" | 2560x1440 | ||
| 85.8 % v7 (old) | Asus TUF Dash F15 FX517ZR i7-12650H, GeForce RTX 3070 Laptop GPU | 2 kg | 20.7 mm | 15.60" | 2560x1440 | ||
| 80.3 % v7 (old) | MSI Katana GF66 12UGS i7-12700H, GeForce RTX 3070 Ti Laptop GPU | 2.3 kg | 27.5 mm | 15.60" | 1920x1080 |
Obudowa - Aorus jest imponująco kompaktowy
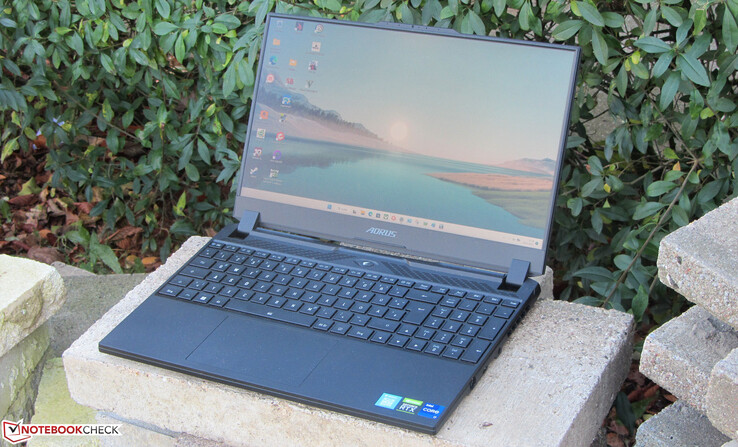
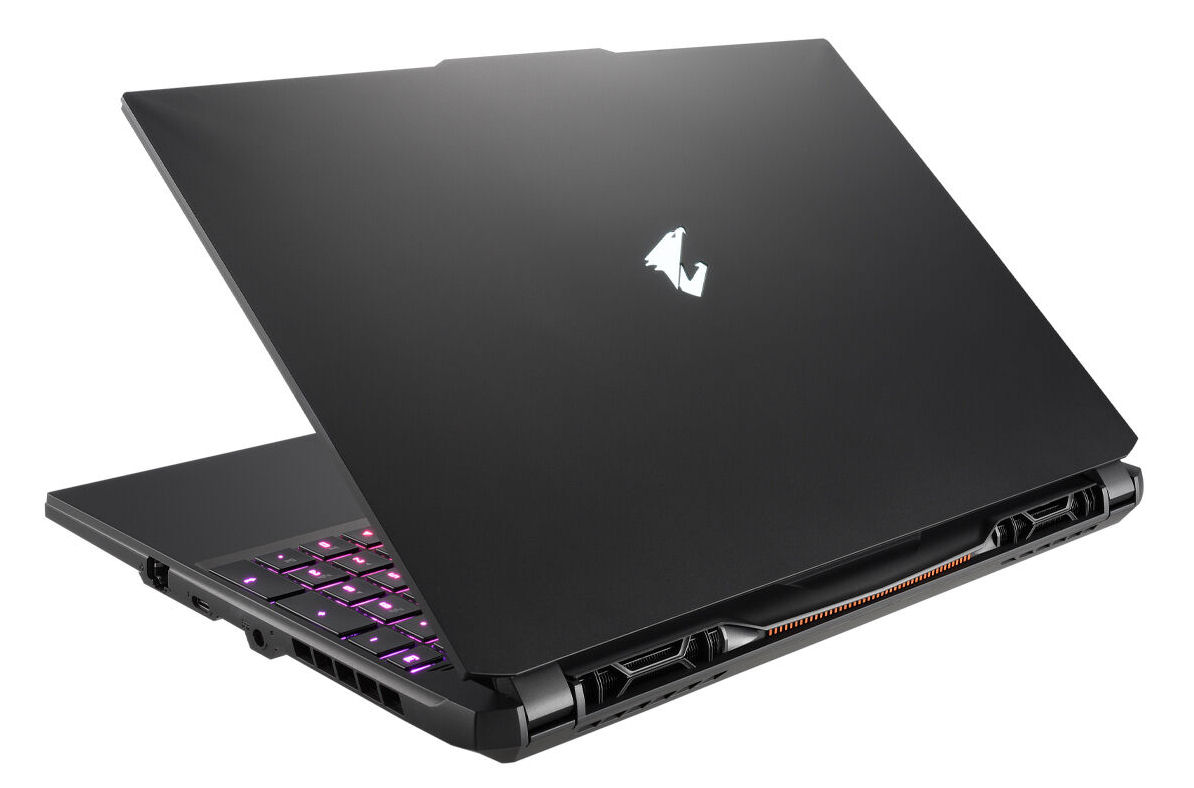
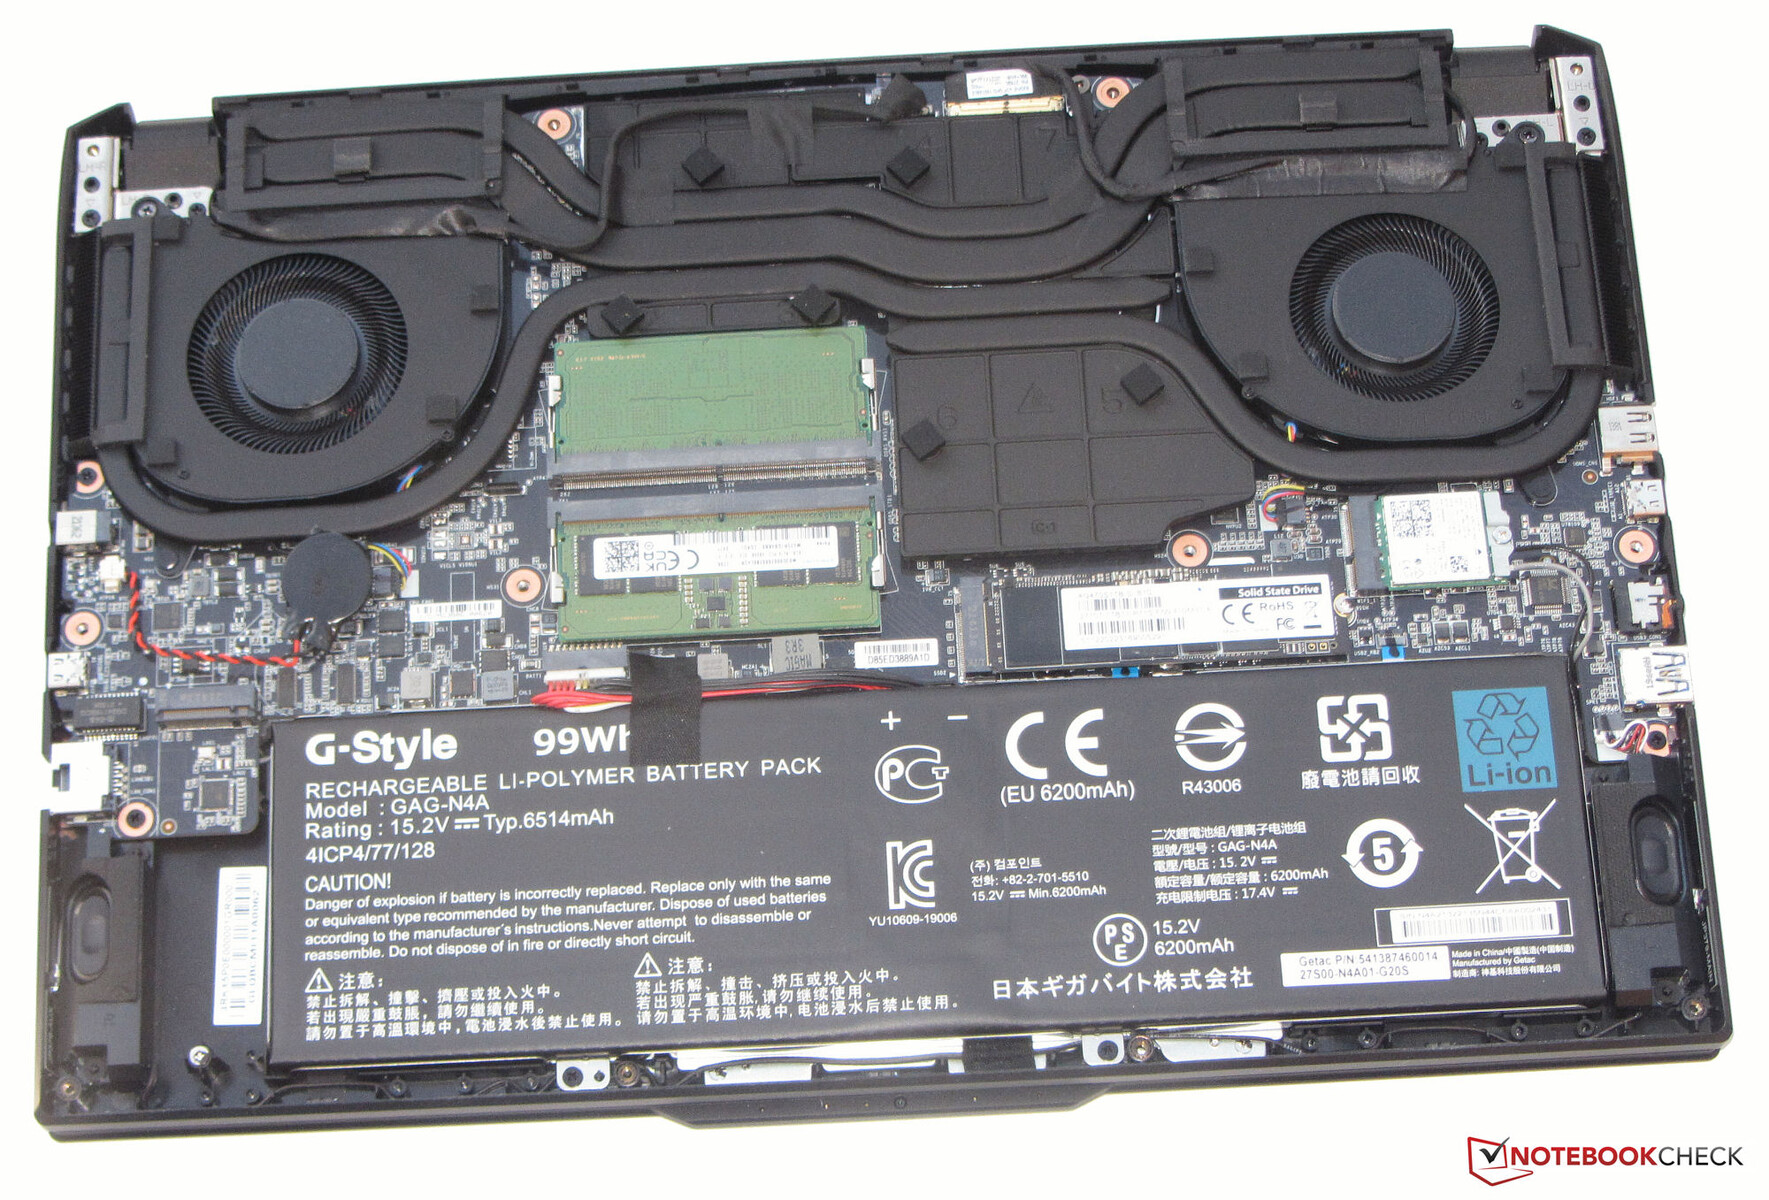
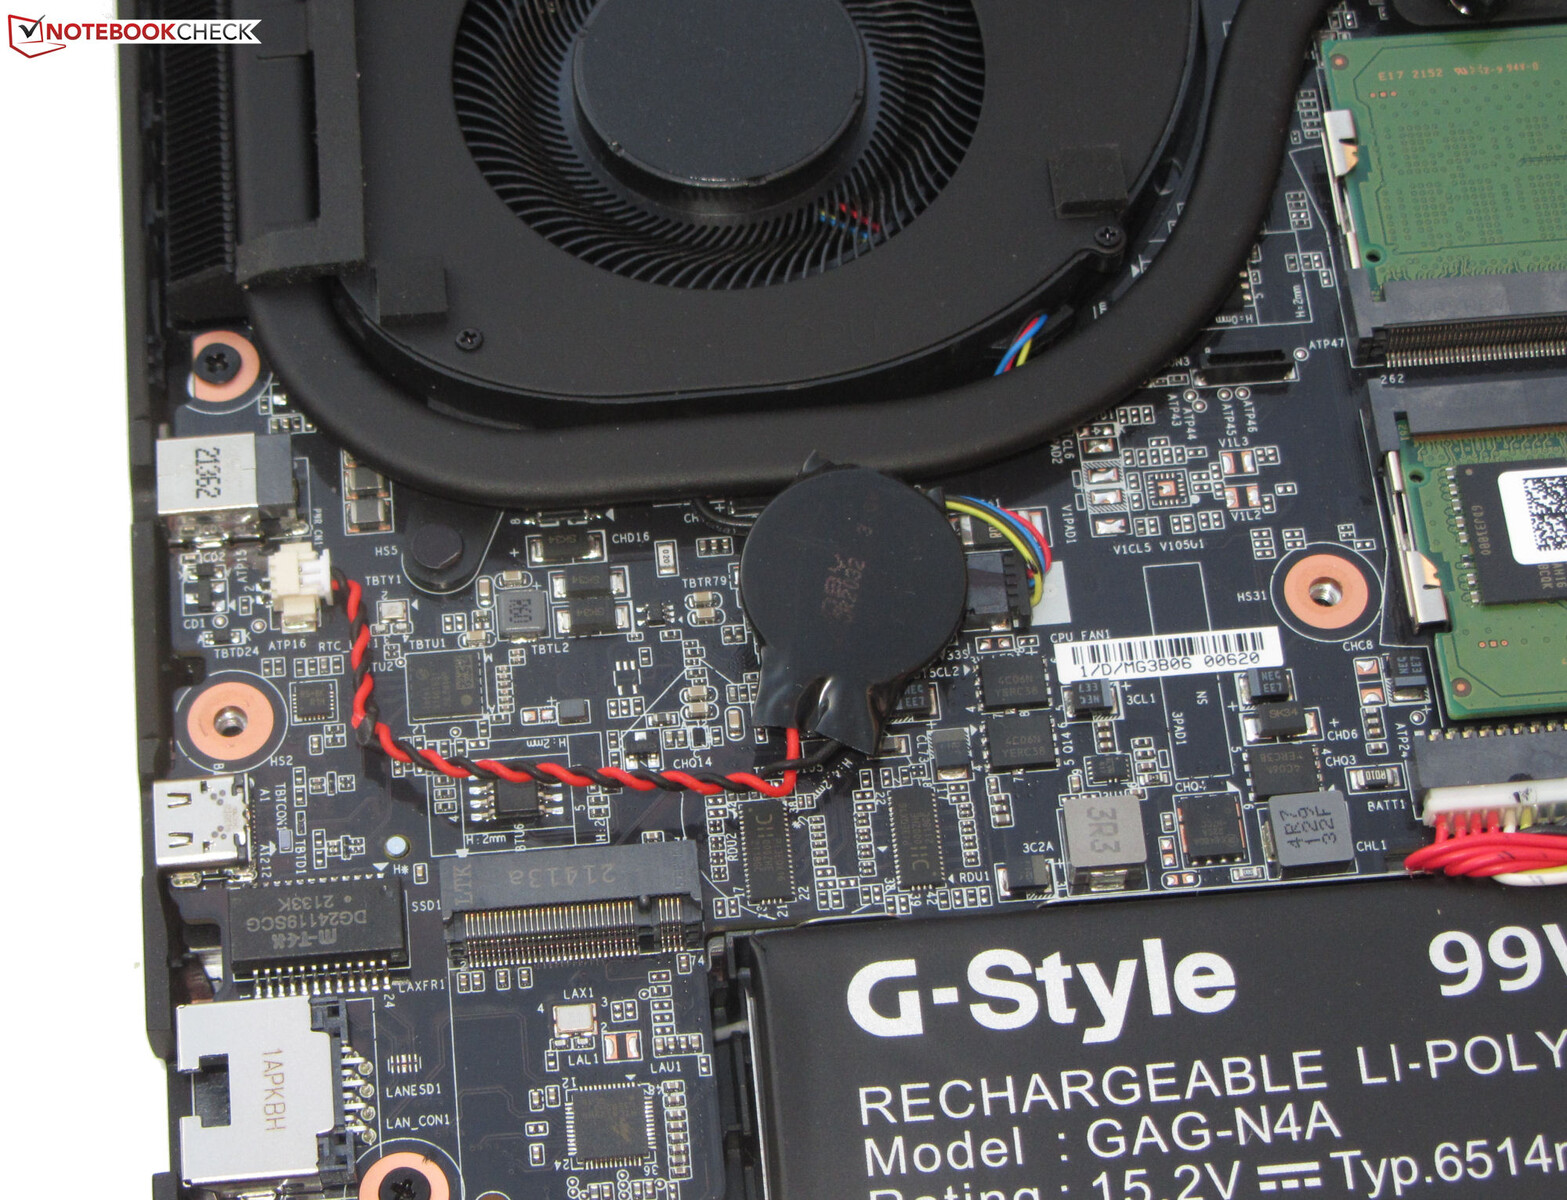
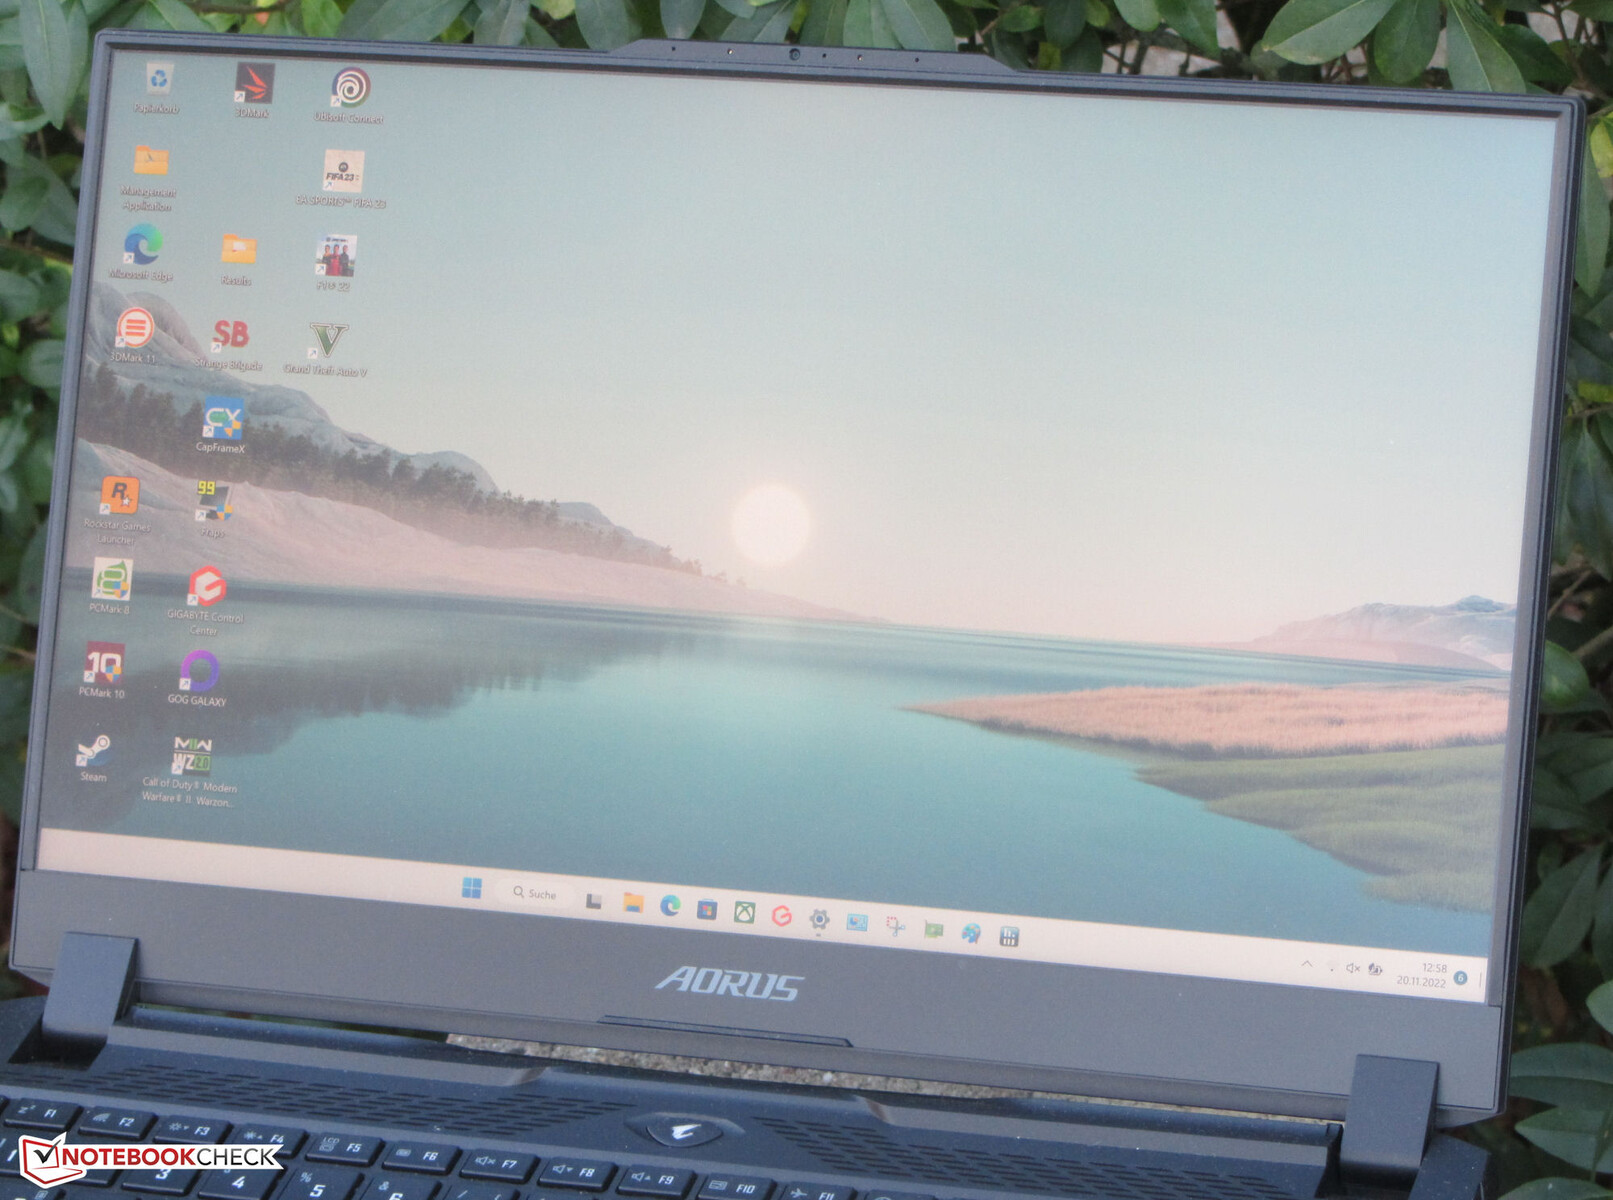
Gigabyte Aorus 15 XE5 posiada czarną, plastikową obudowę o gładkich, matowych powierzchniach. Urządzenie nie posiada żadnych ekstrawaganckich elementów konstrukcyjnych. Cienka ramka wokół wyświetlacza nadaje laptopowi pewien powiew elegancji. Design laptopa podkreśla podświetlane logo Aorus na tylnej części pokrywy. Po zdjęciu dolnej ścianki uzyskuje się dostęp do akumulatora (przykręconego, a nie przyklejonego) i reszty podzespołów wewnętrznych.
Nasz egzemplarz recenzencki nie wydaje się mieć żadnych problemów z jakością wykonania. Szczeliny w obudowie są szczelne, a z laptopa nie wystaje nadmiar materiałów. Część zasadnicza prawie nie rusza się przy skręcaniu, ale wieko wykazuje znacznie większe ugięcia. Wieko jest utrzymywane w miejscu przez dwa zawiasy, które umożliwiają odchylenie wyświetlacza o około 150 stopni. Laptop można otworzyć przy użyciu jednej ręki.
15 XE5 to jeden z bardziej kompaktowych laptopów w naszym porównaniu. Przy wadze około 2,3 kg (5,07 lb) jest jednak cięższy od konkurencyjnych urządzeń, np XMG Fusion 15 i TUF Dash F15.
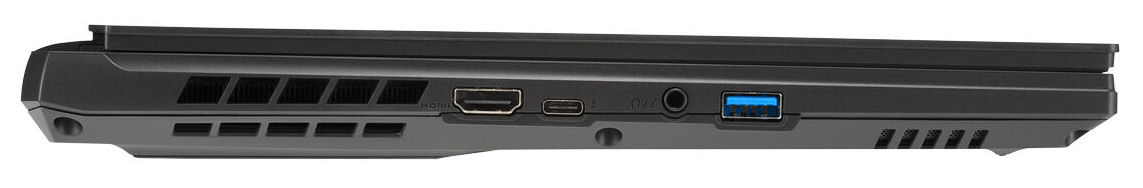
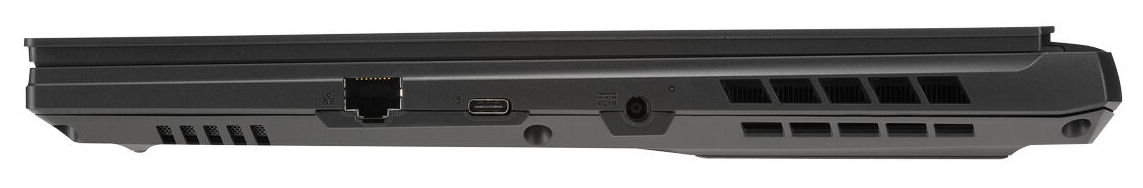
Specyfikacja - Obsługa Thunderbolt 4
Dwa porty USB-C (1x Thunderbolt 4, 1x USB 3.2 Gen 1) obsługują DisplayPort przez USB-C, a złącze Thunderbolt 4 oferuje też Power Delivery. Szkoda, że w urządzeniu jest tylko jeden port USB-A (USB 3.2 Gen 1). Osoby, które potrzebują więcej zewnętrznych złączy, musiałyby skorzystać z adaptera lub stacji dokującej. Do laptopa można podłączyć maksymalnie trzy wyświetlacze (2x DP, 1x HDMI). Dopełnieniem wyboru portów są combo jack audio i port Gigabit Ethernet. Aorus 15 XE5 nie posiada wbudowanego czytnika kart pamięci.
Łączność
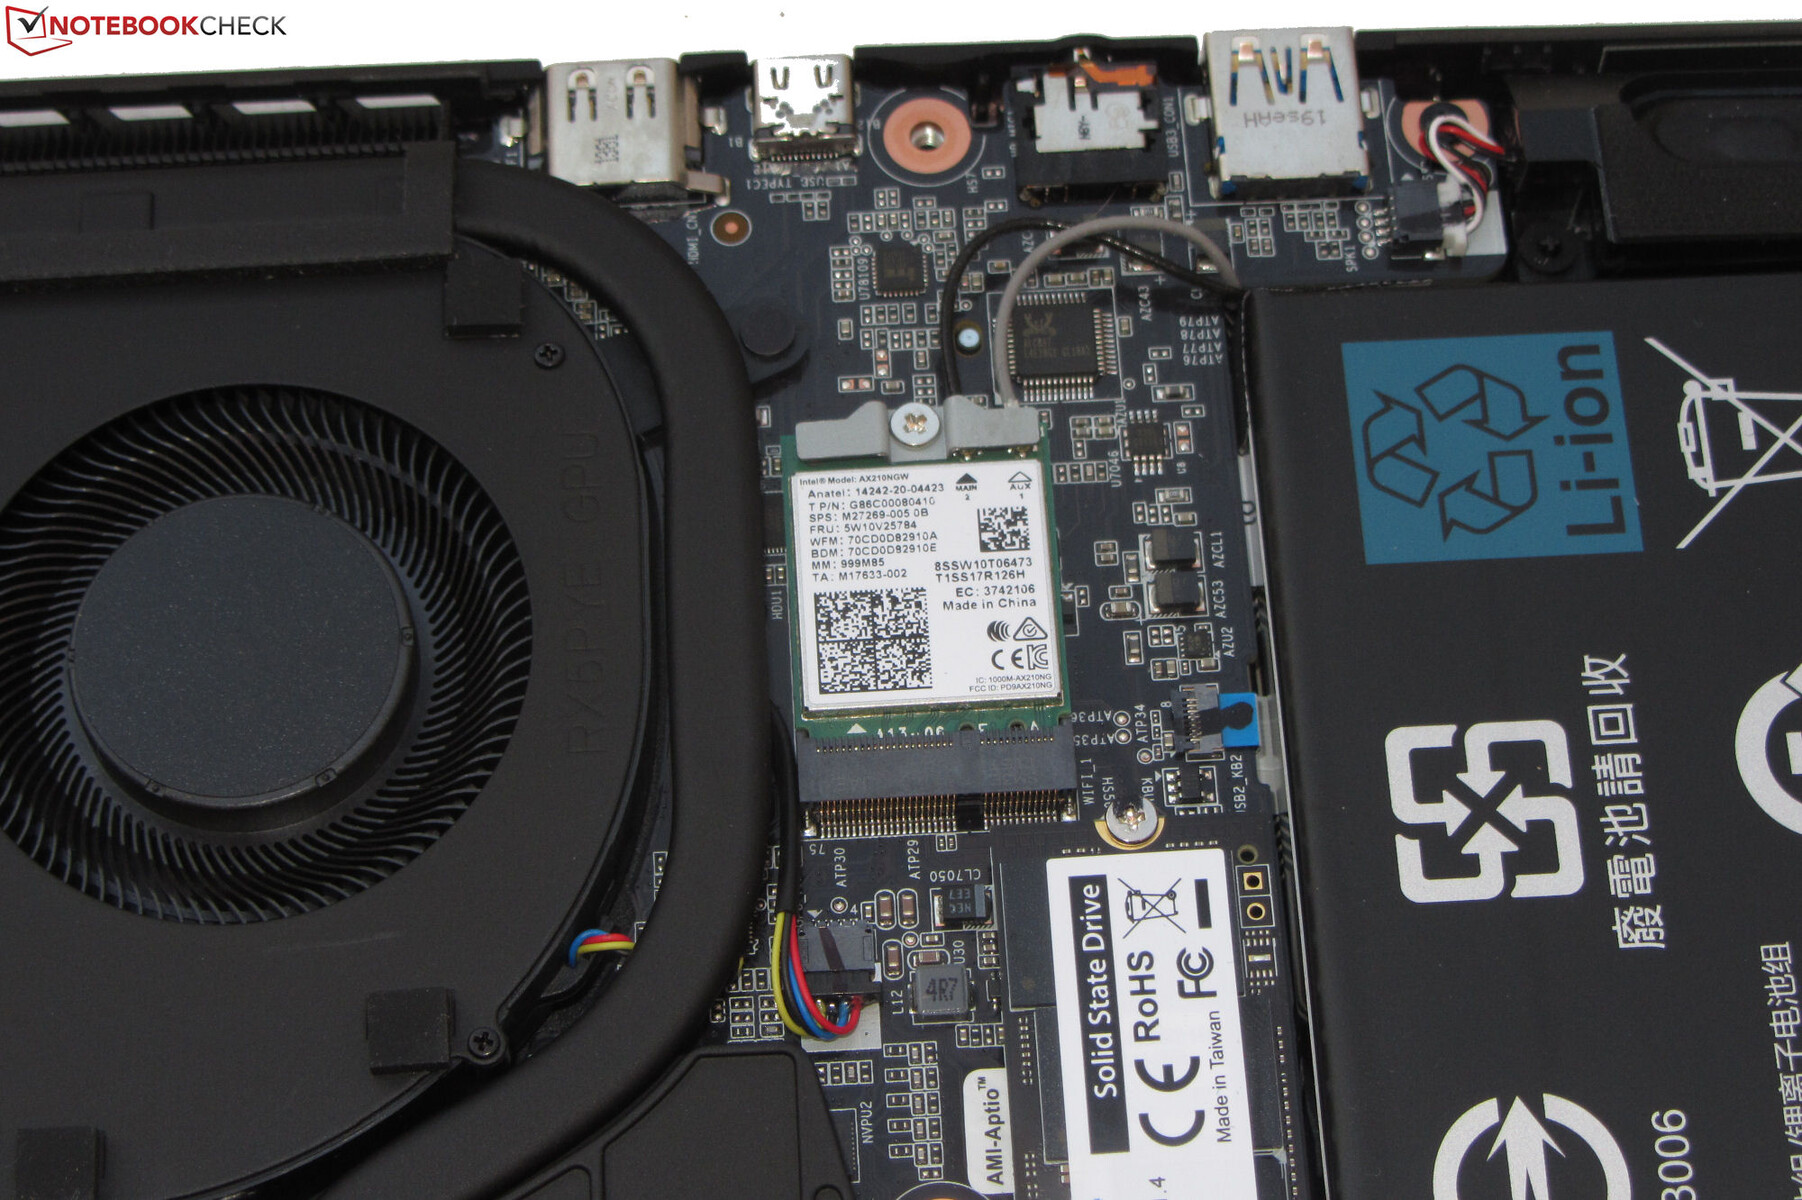
W optymalnych warunkach (brak innych urządzeń Wi-Fi w pobliżu, niewielka odległość między laptopem a komputerem serwerowym) zmierzyliśmy doskonałe prędkości transferu Wi-Fi, które odpowiadają temu, do czego zdolny jest znajdujący się wewnątrz moduł Wi-Fi (Intel AX210, 802.11ax). Za przewodowe połączenia sieciowe odpowiada układ Gigabit Ethernet firmy Realtek (RTL8125, 2,5 Gbit).
| Networking | |
| iperf3 receive AXE11000 6GHz | |
| Aorus 15 XE5 | |
| Średnia w klasie Gaming (975 - 1775, n=37, ostatnie 2 lata) | |
| Przeciętny Intel Wi-Fi 6E AX210 (729 - 1827, n=29) | |
| iperf3 receive AXE11000 | |
| MSI Katana GF66 12UGS | |
| Acer Nitro 5 AN515-46-R1A1 | |
| Asus TUF Dash F15 FX517ZR | |
| Schenker XMG Fusion 15 (Mid 22) | |
| Średnia w klasie Gaming (680 - 1745, n=95, ostatnie 2 lata) | |
| Przeciętny Intel Wi-Fi 6E AX210 (715 - 1774, n=34) | |
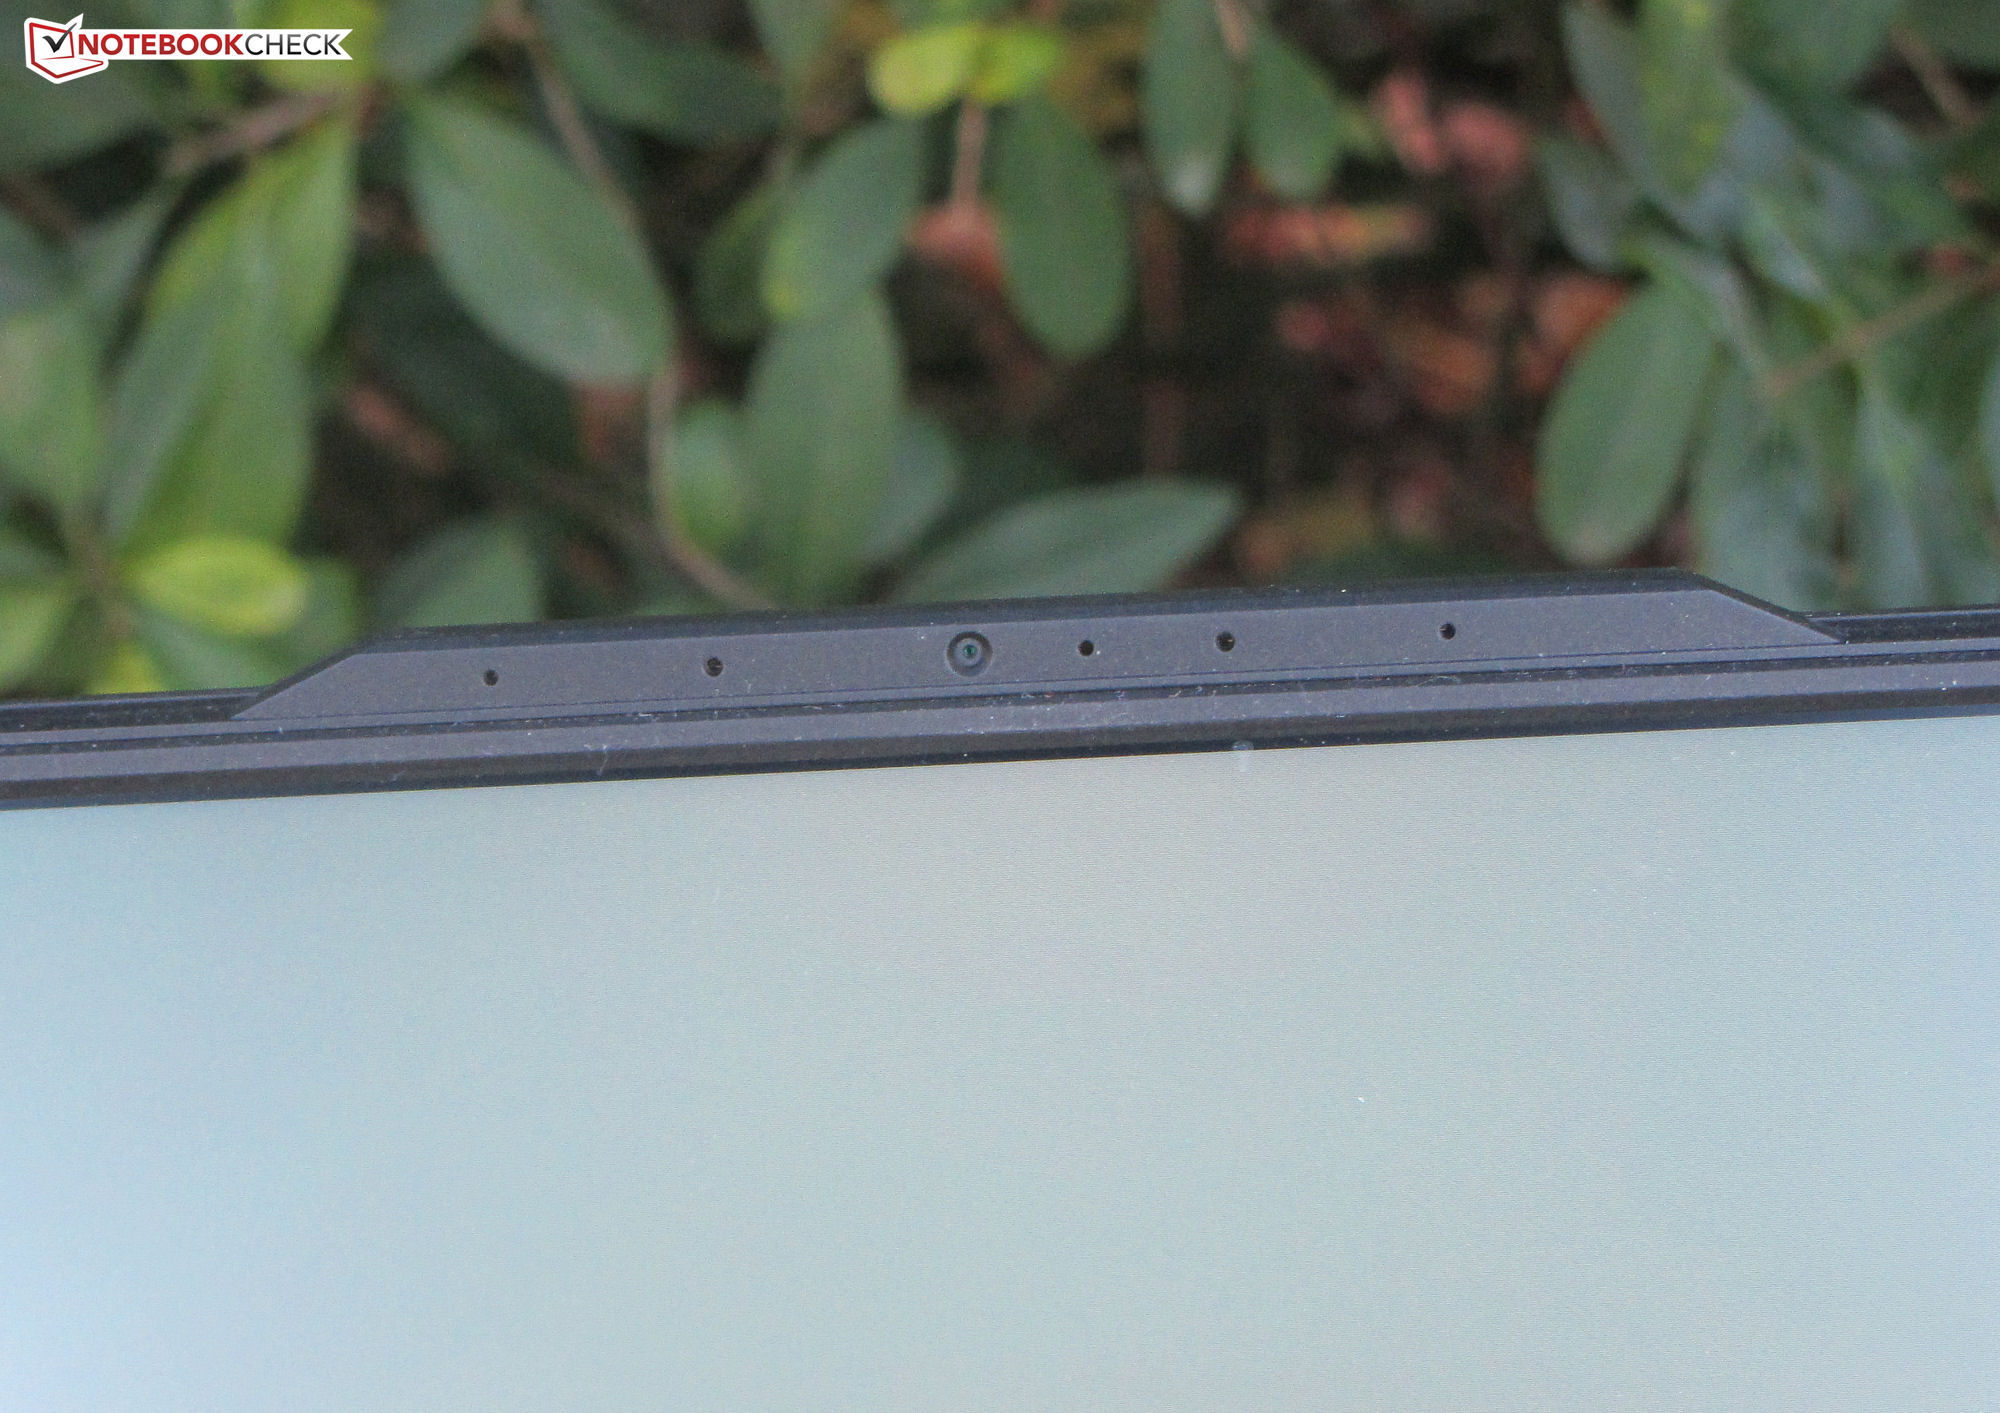
Kamera internetowa
Kamera internetowa (0,9 MP) może rejestrować obrazy o rozdzielczości do 1280 x 720 pikseli. Brakuje jej dokładności odwzorowania kolorów, wytwarzając barwy znacznie odbiegające od wartości referencyjnych. W kamerce nie ma też mechanicznej migawki prywatności.


Akcesoria
Do Aorus 15 XE5 nie dołączono żadnych innych akcesoriów poza ładowarką i zwykłymi dokumentami (skrócona instrukcja obsługi i informacje o gwarancji).
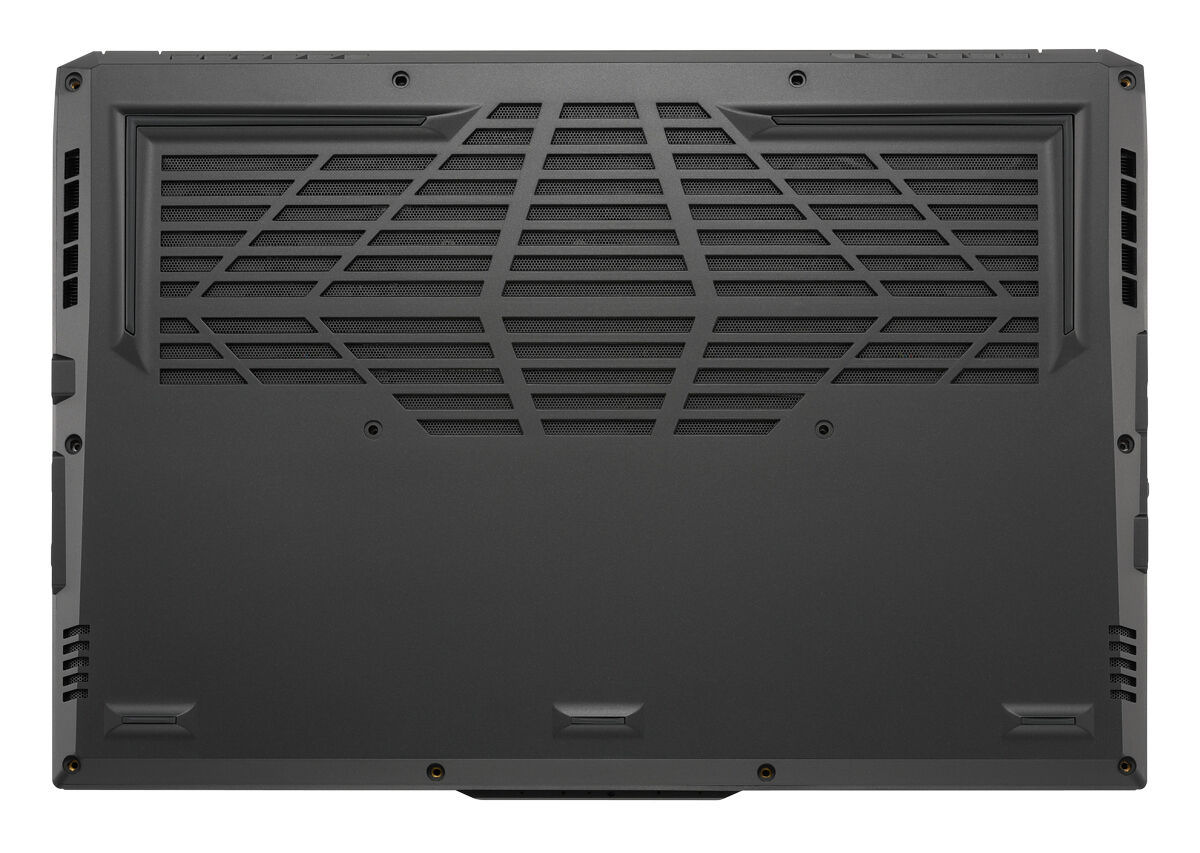
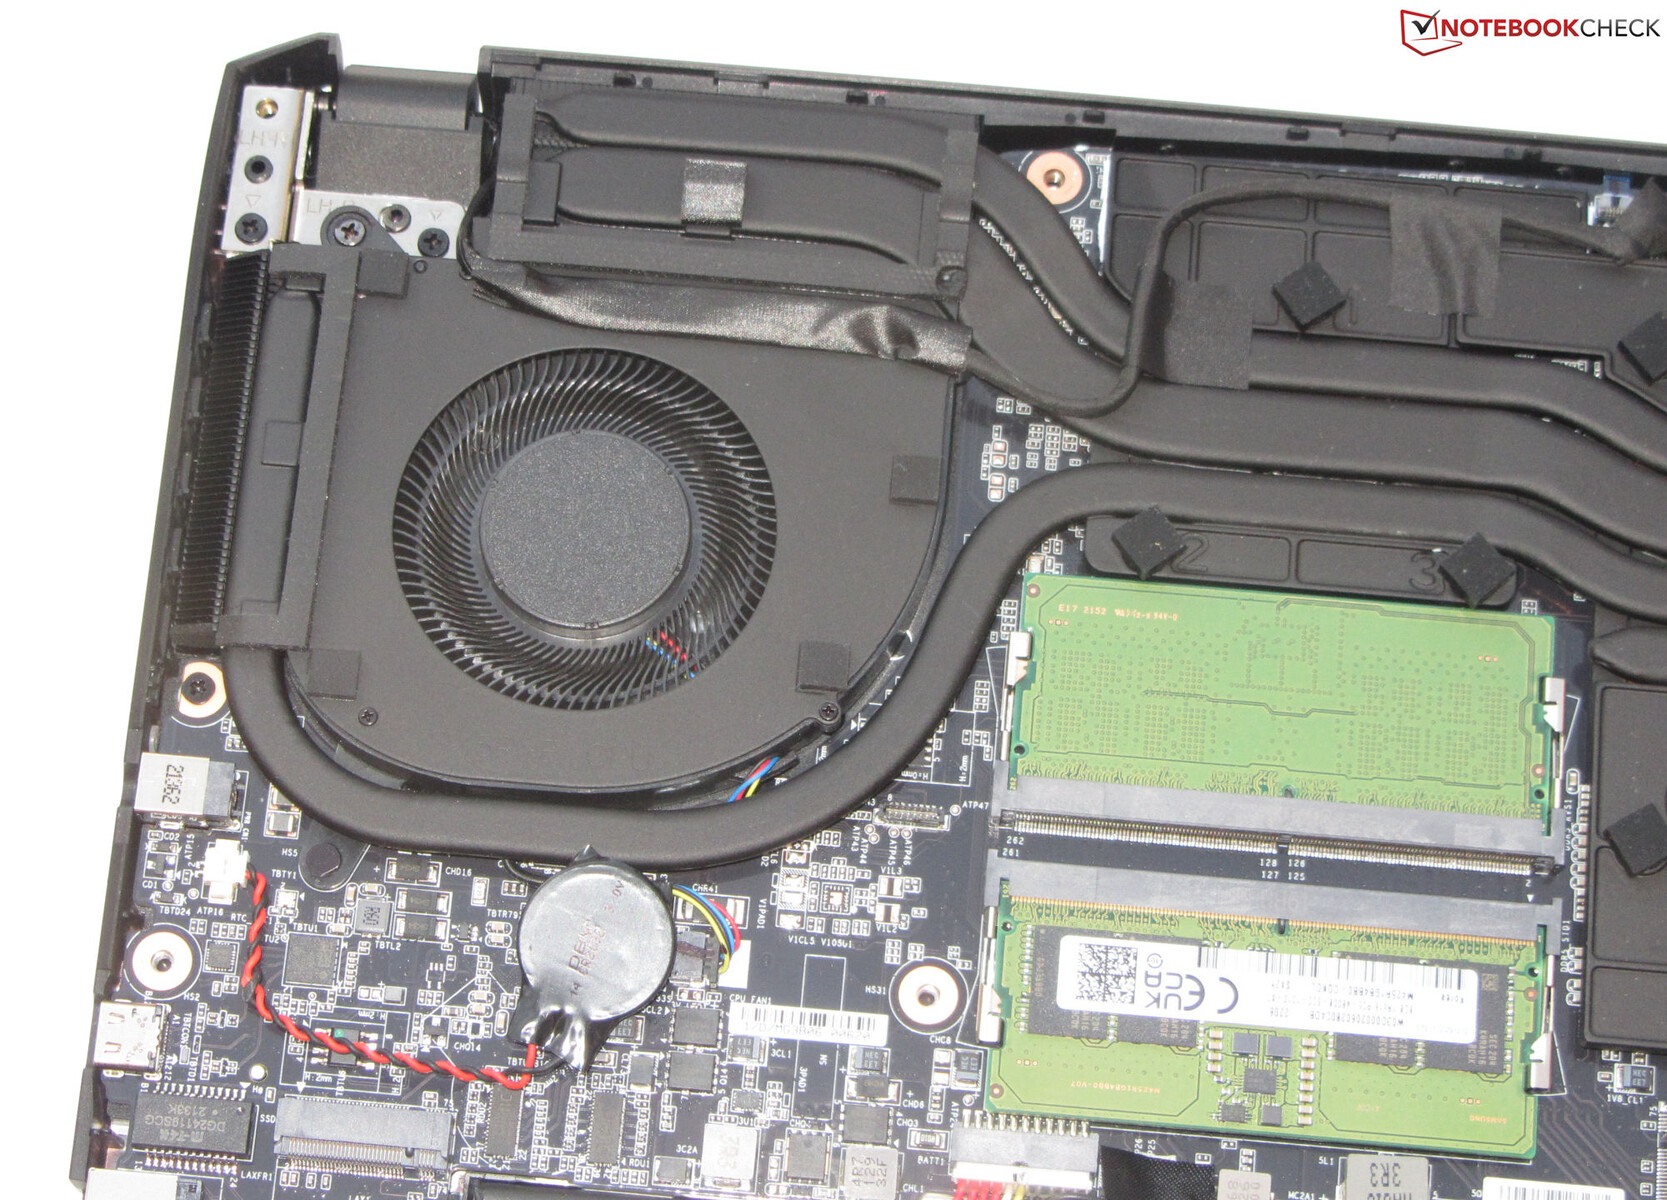
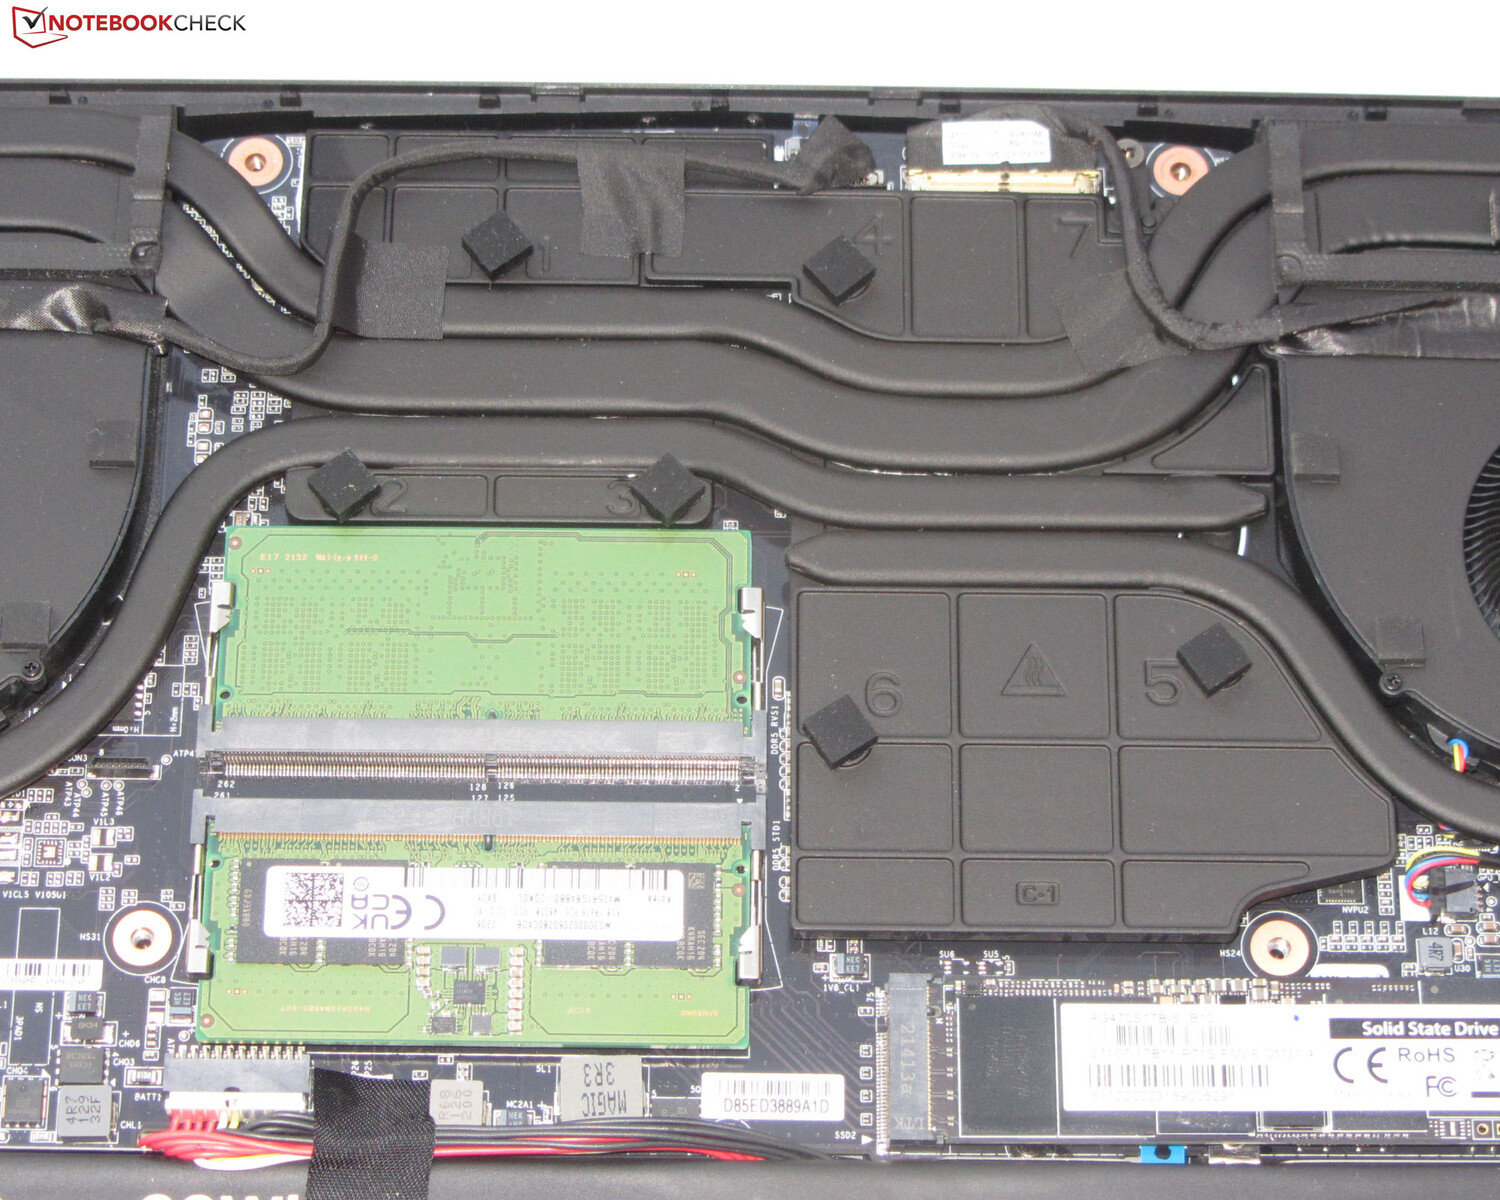
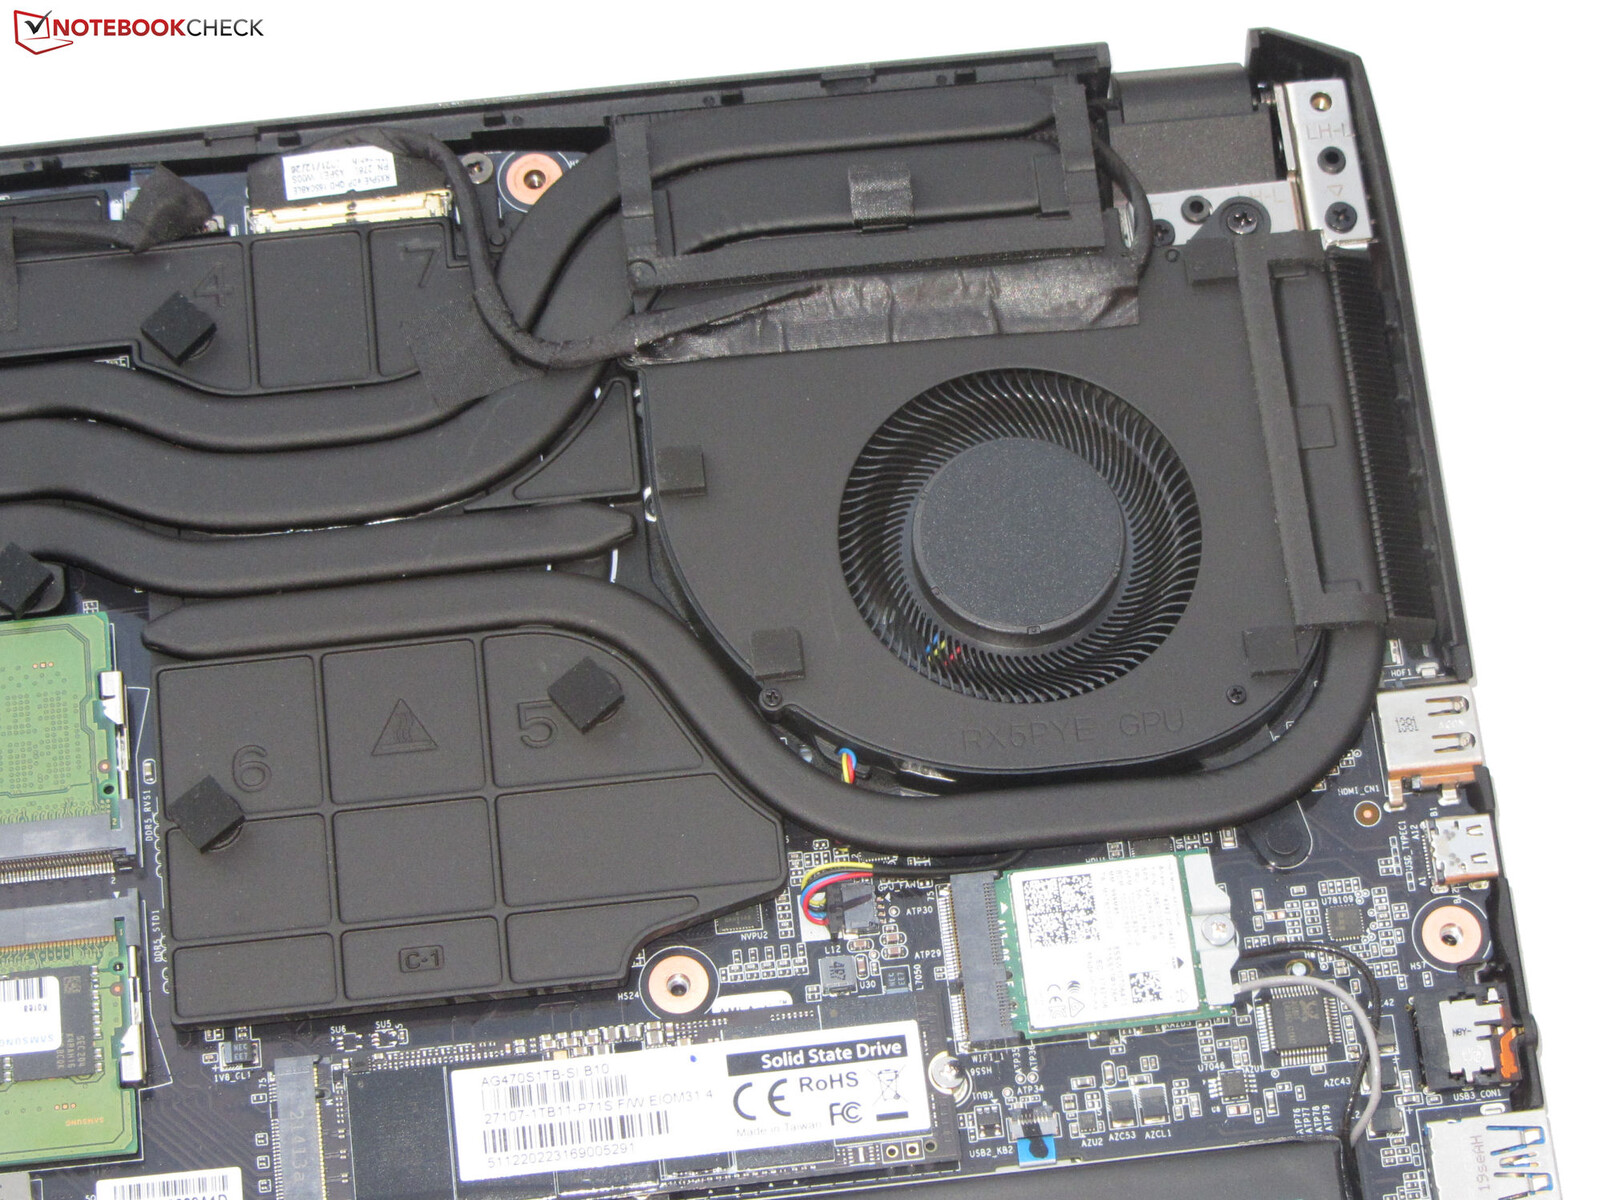
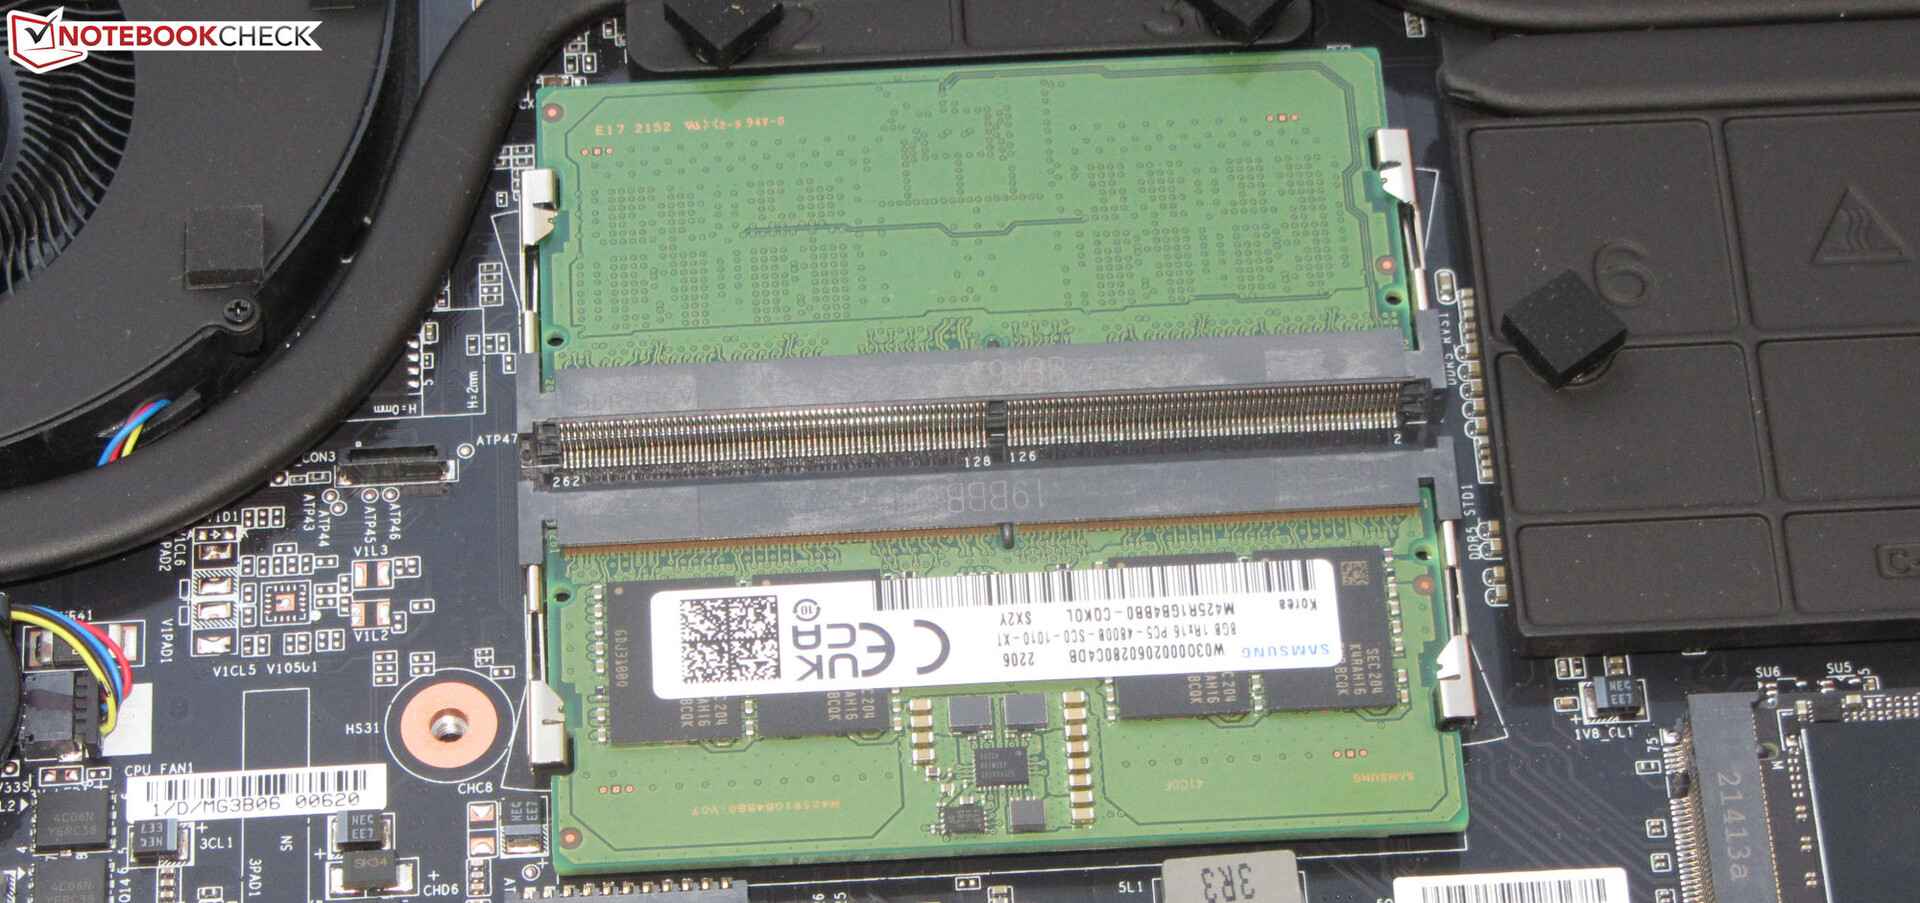
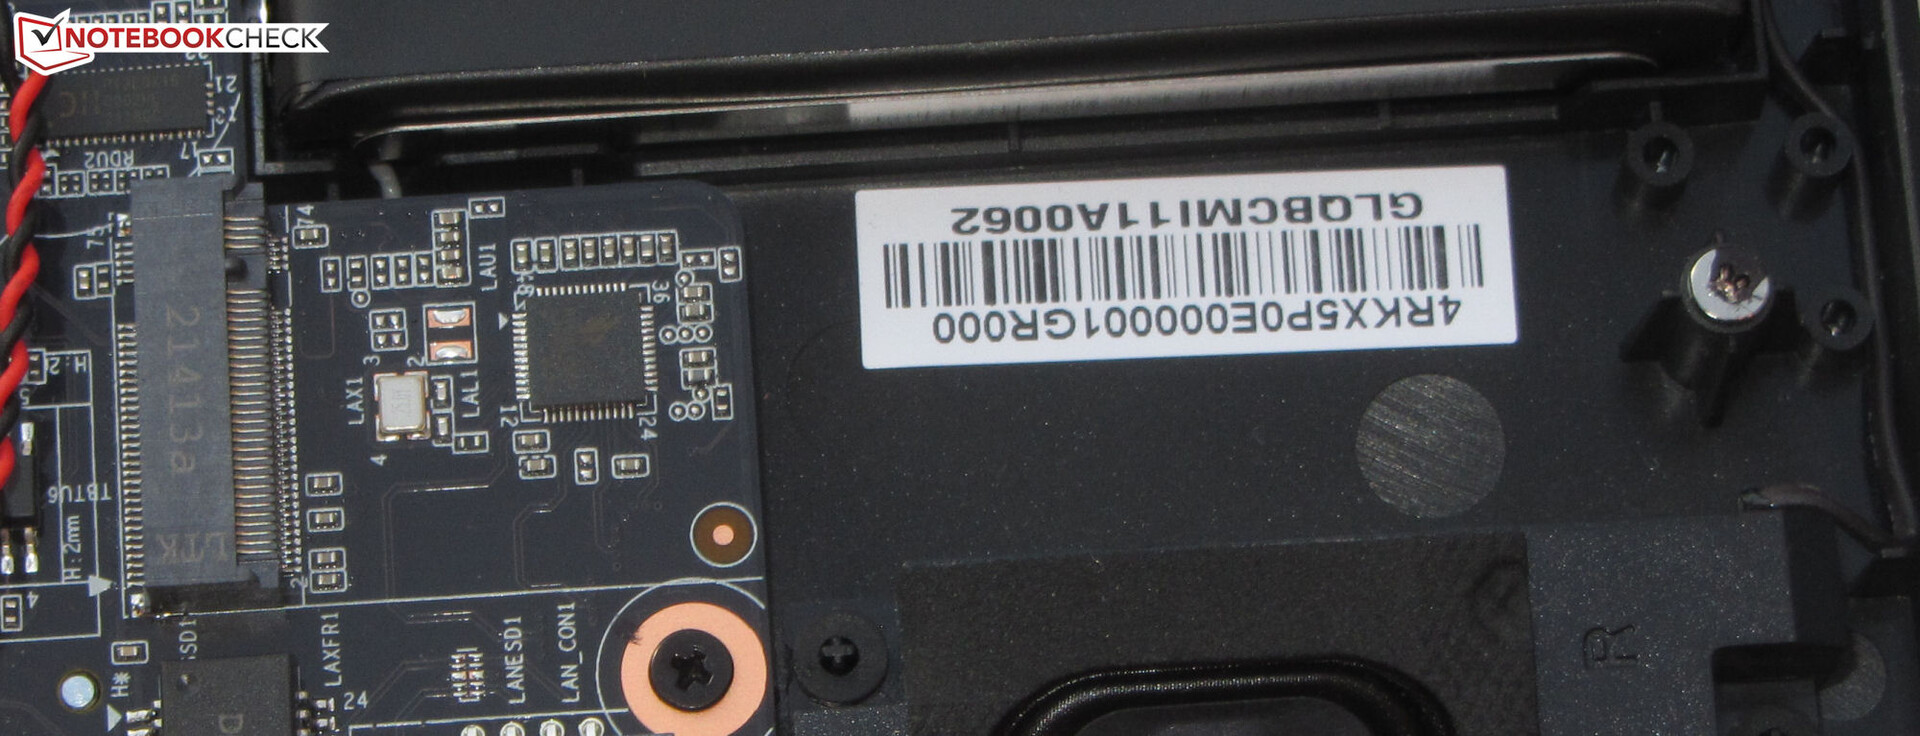
Konserwacja
Po odkręceniu wszystkich śrubek na spodzie można otworzyć dolny panel za pomocą płaskiego szpachli lub skrobaka do uszczelniania. Po zdjęciu panelu uzyskamy dostęp do dwóch gniazd pamięci RAM (oba zajęte), dysku SSD PCIe 4.0, drugiego gniazda M.2 2280 (PCIe 4.0), baterii BIOS-u, modułu Wi-Fi, dwóch wentylatorów, głośników i akumulatora.
Gwarancja
W Niemczech Gigabyte udziela na 15,6-calowy laptop dwuletniej gwarancji bez możliwości jej przedłużenia. Zakres i okres gwarancji może się różnić w zależności od regionu.
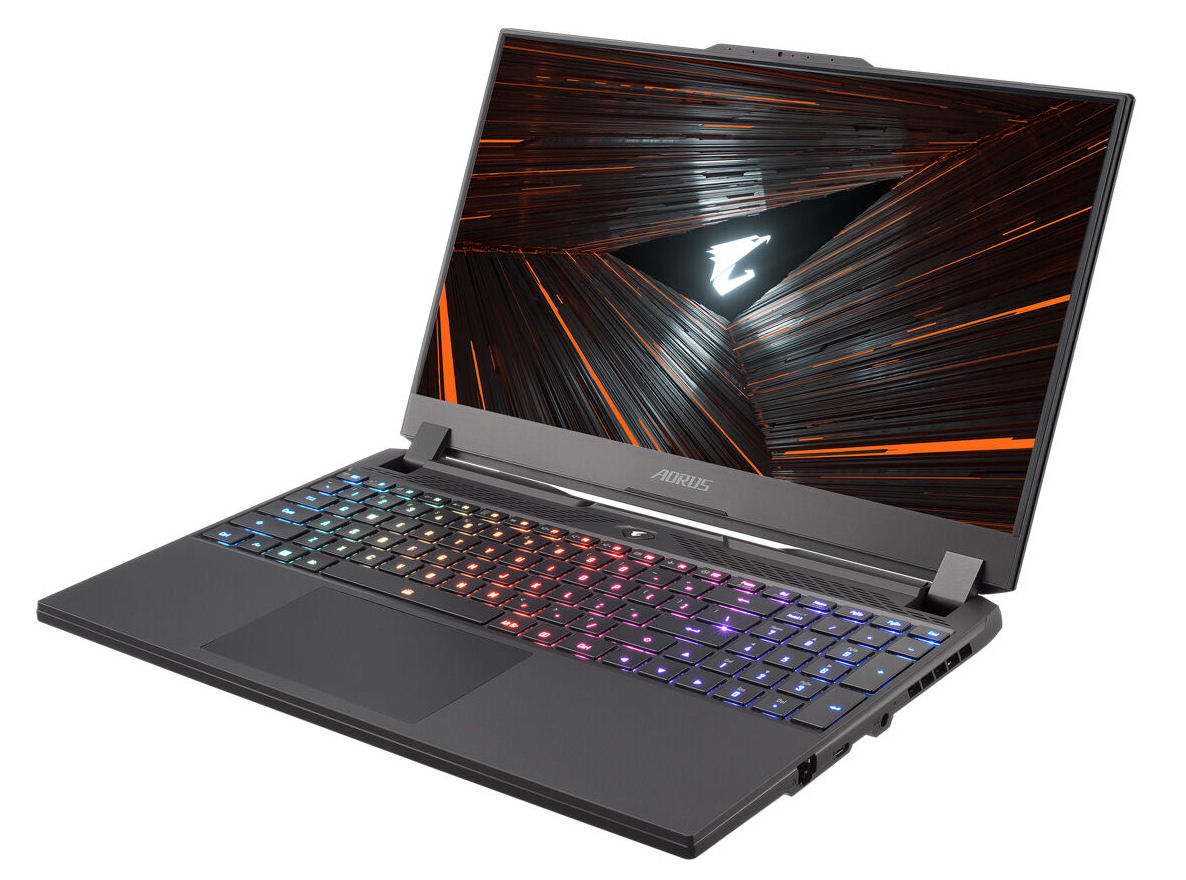
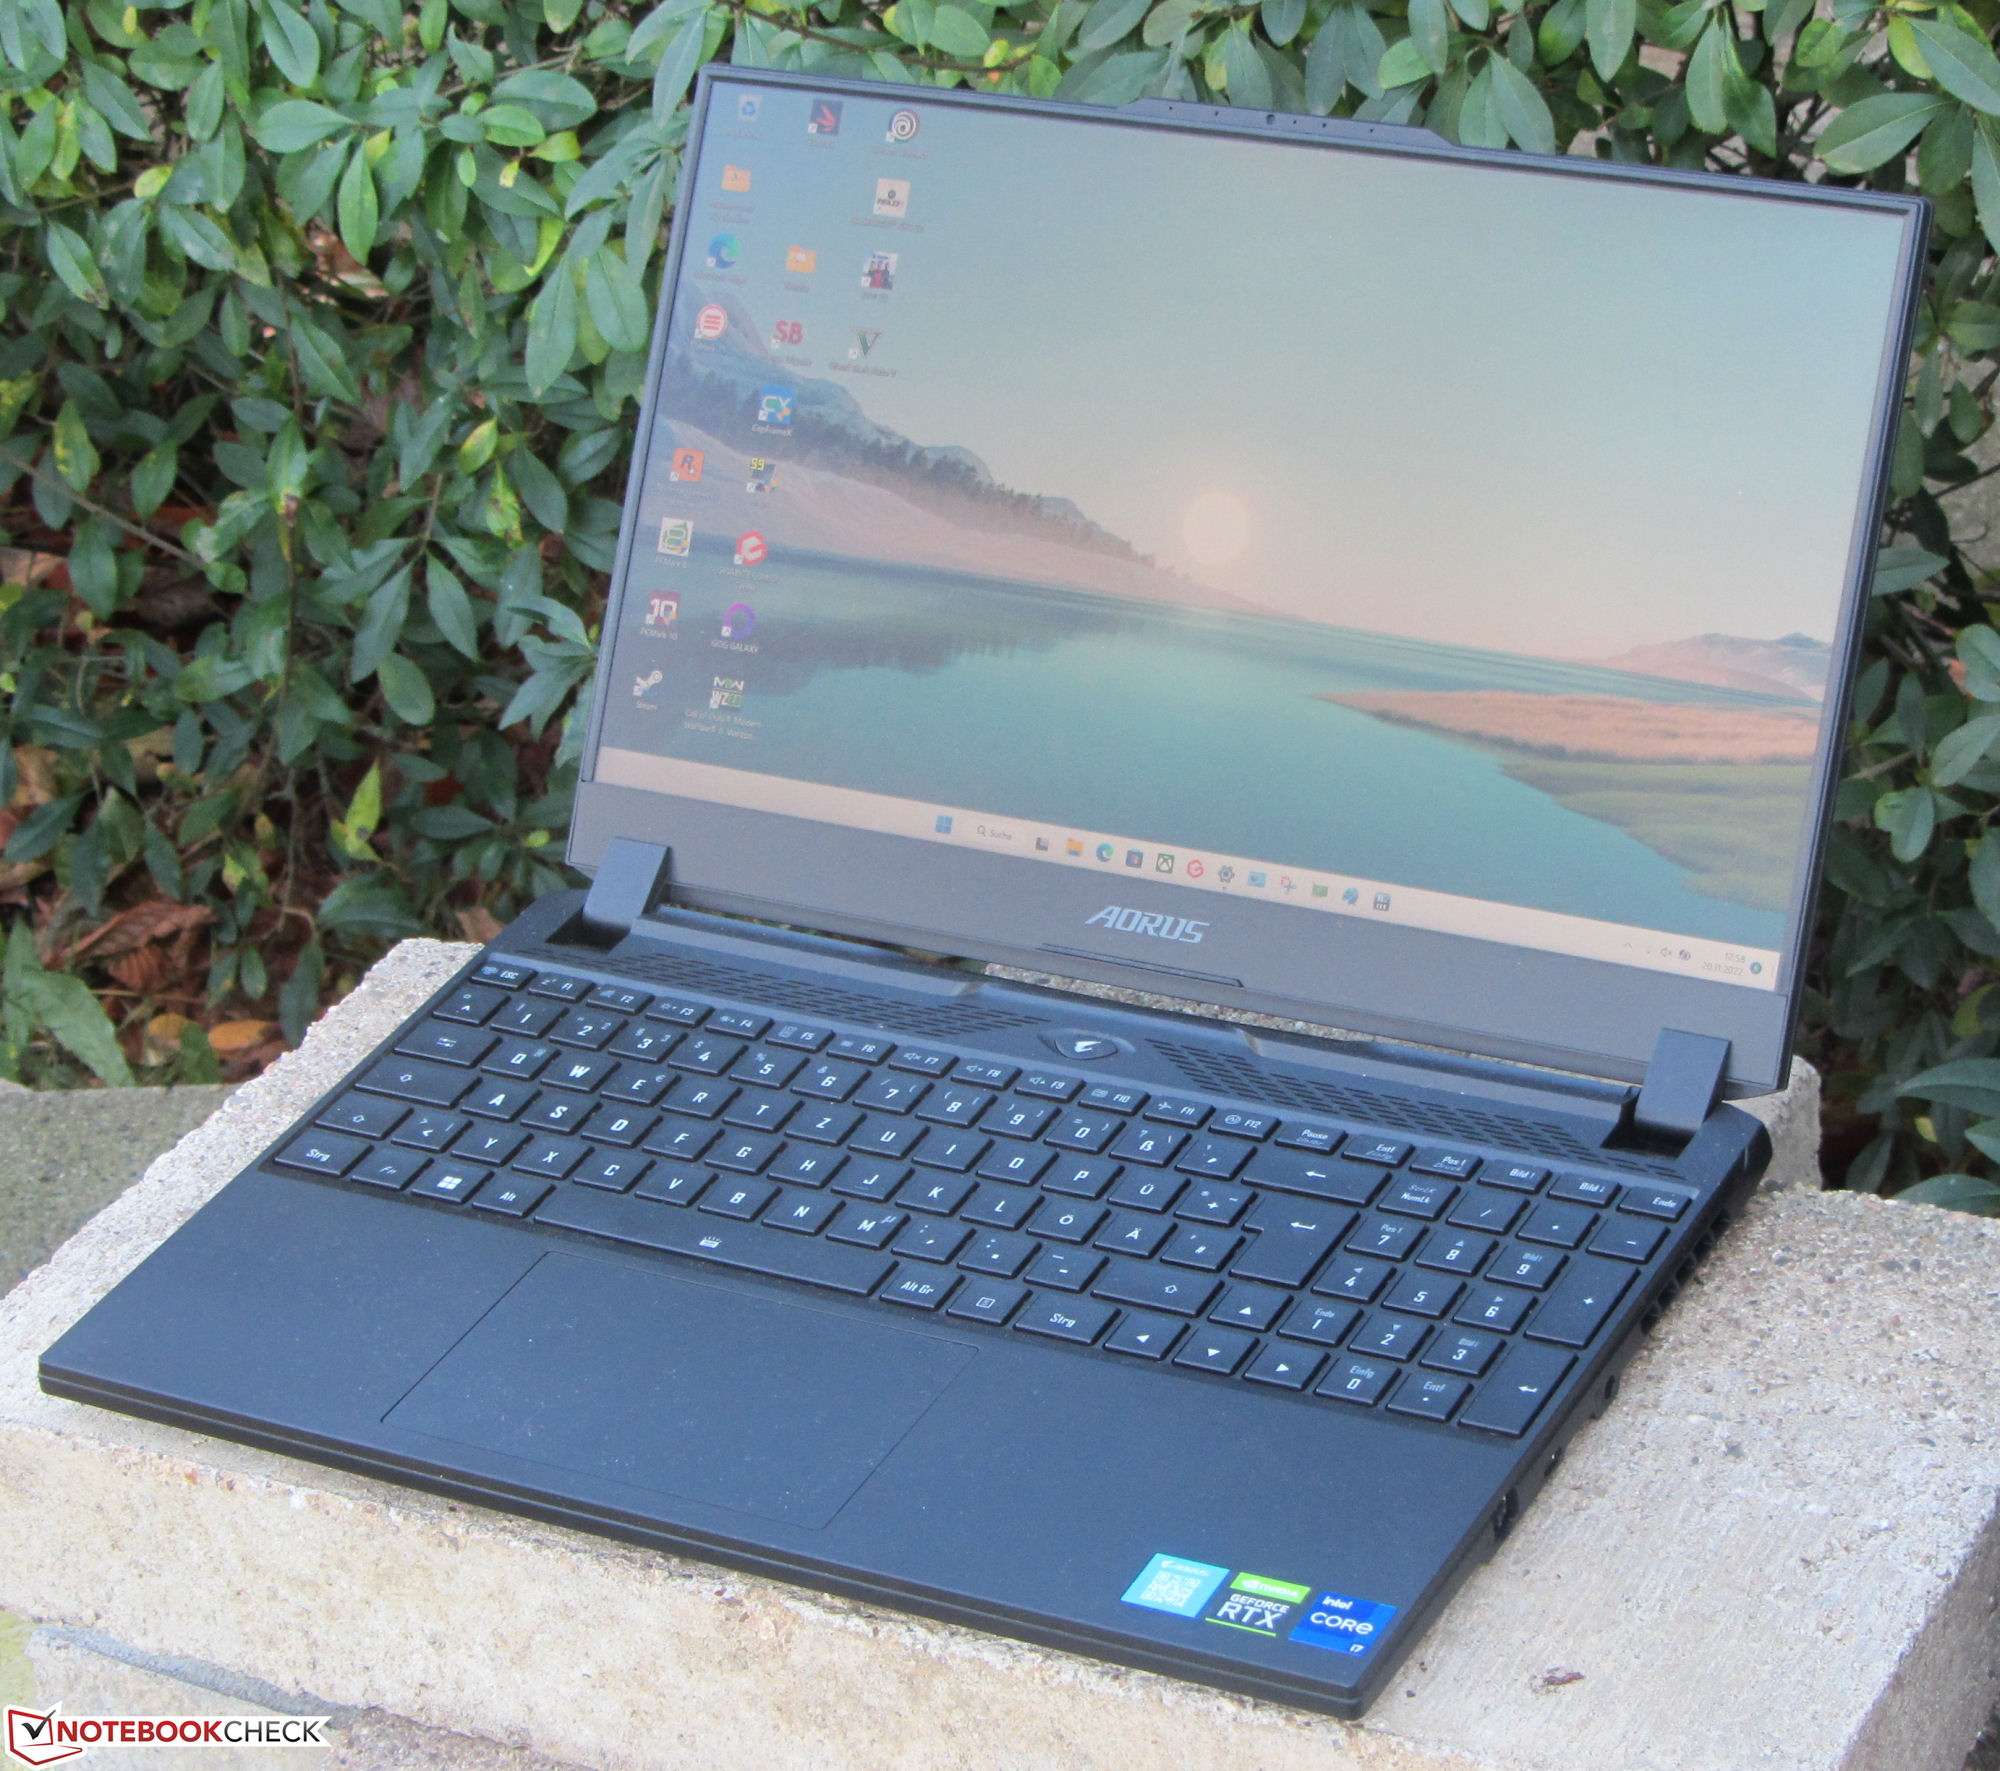
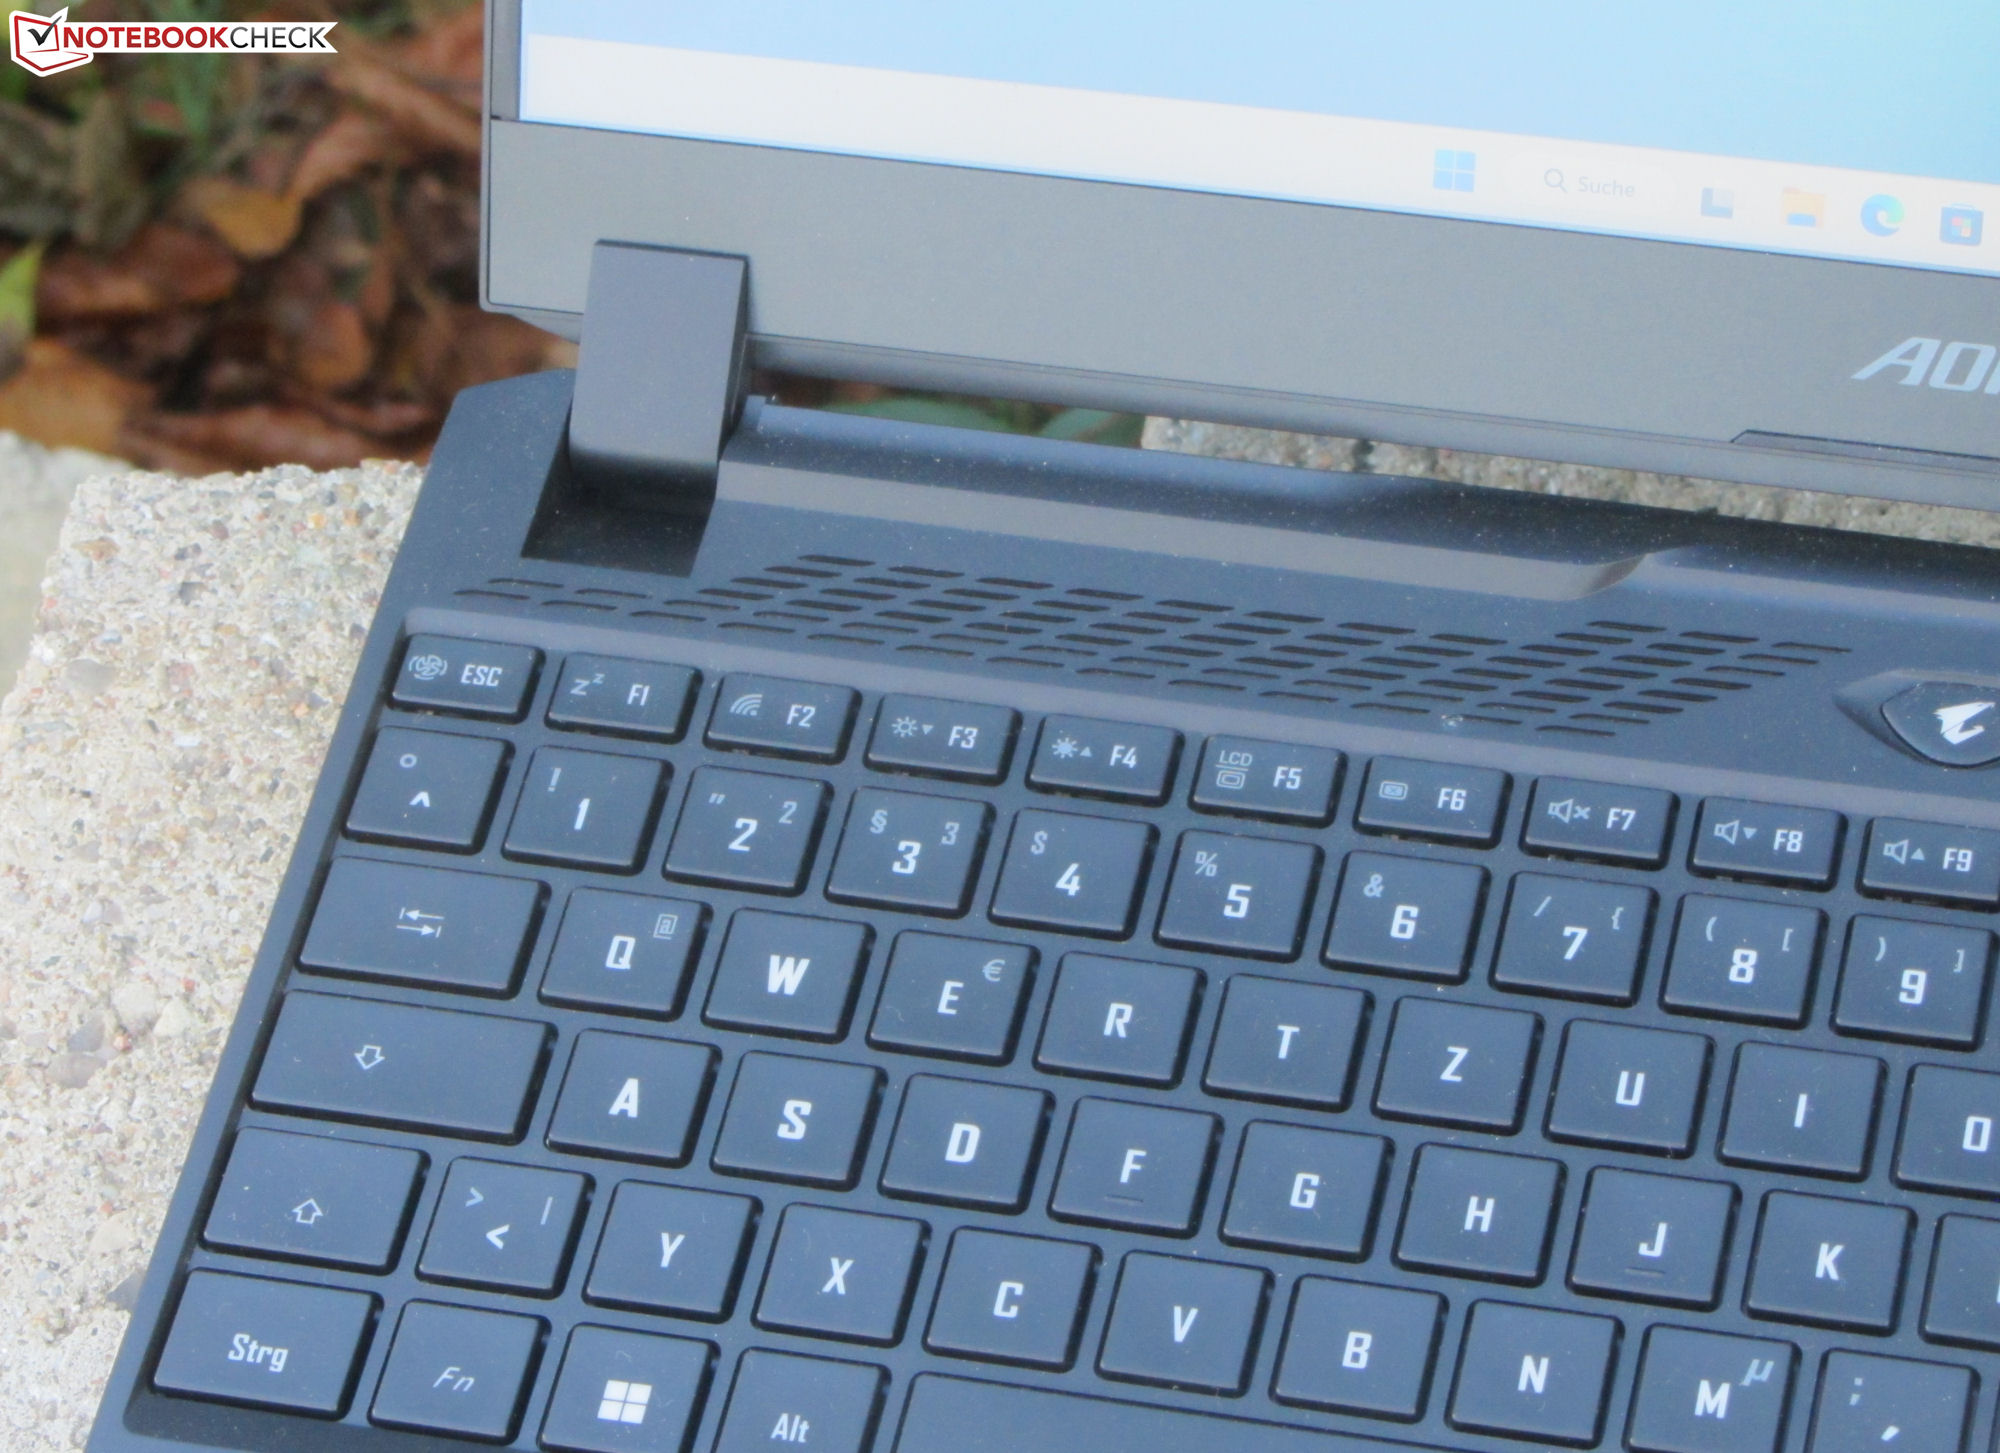
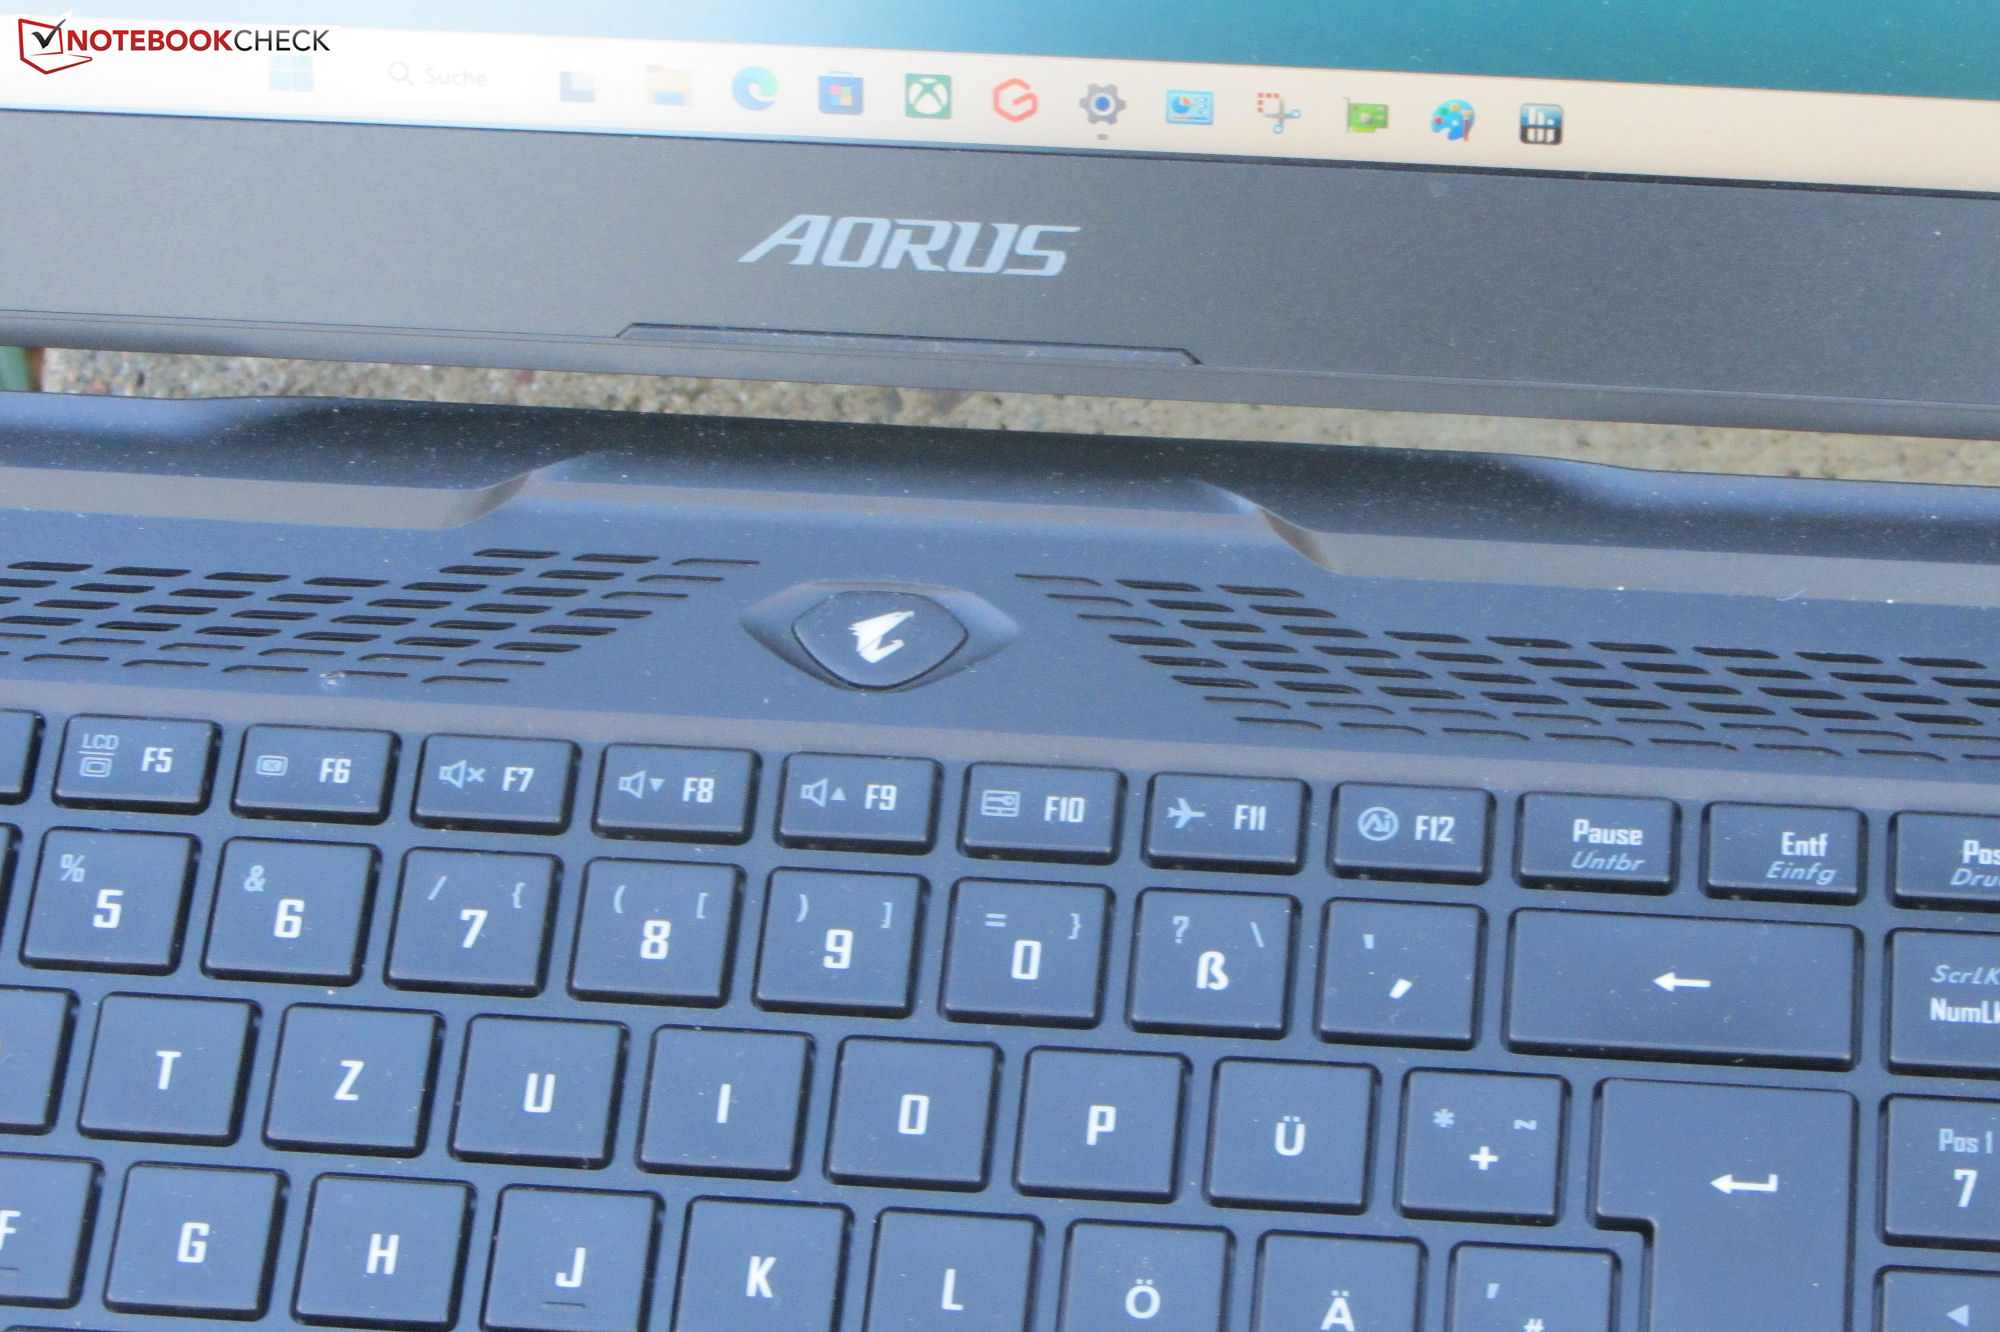
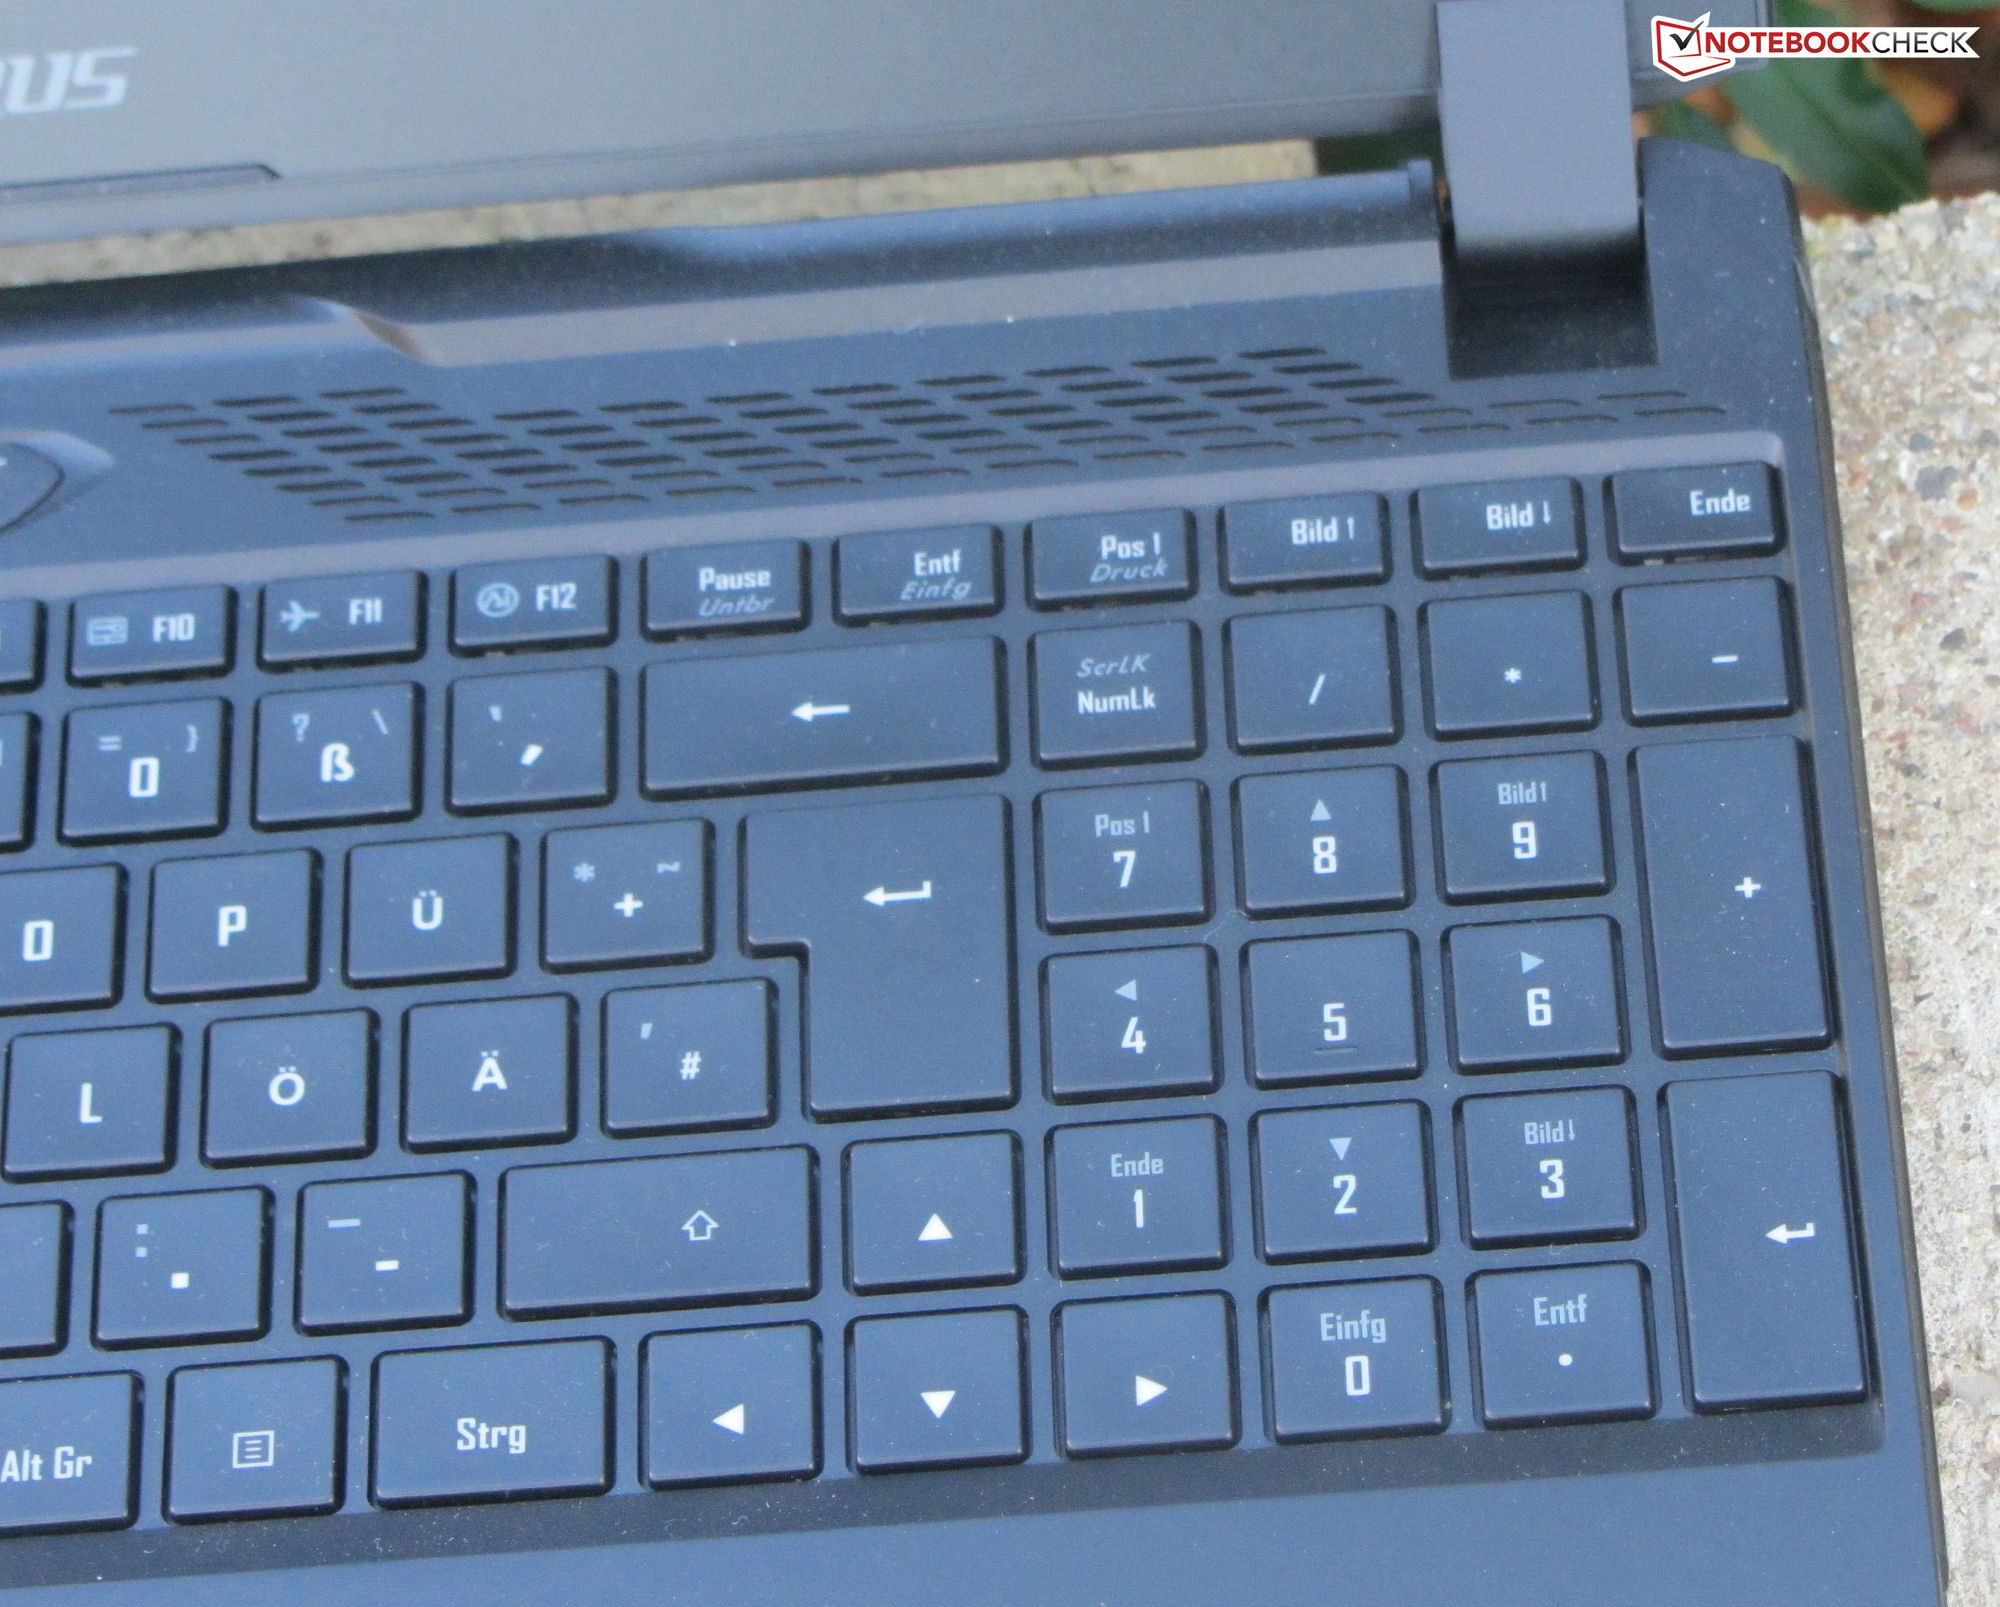
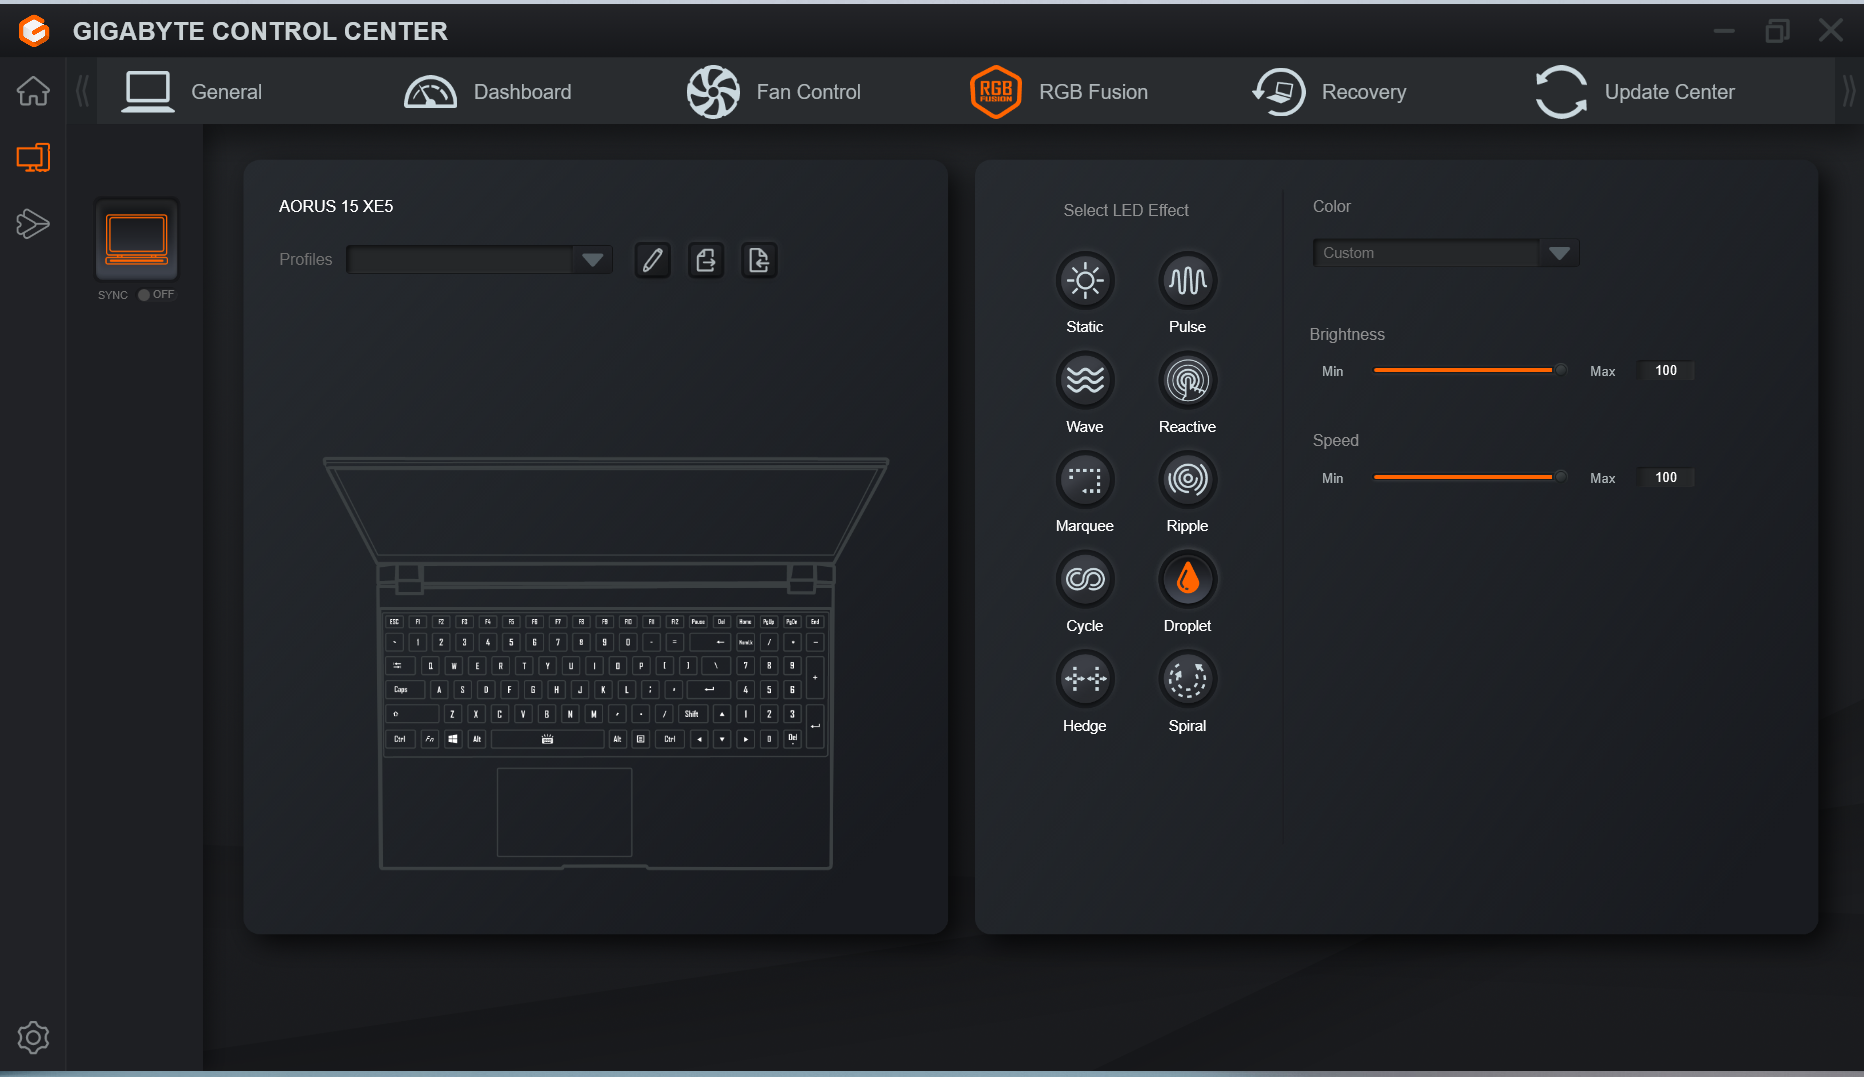
Urządzenia wejściowe - Indywidualnie podświetlane klawisze RGB
Klawiatura
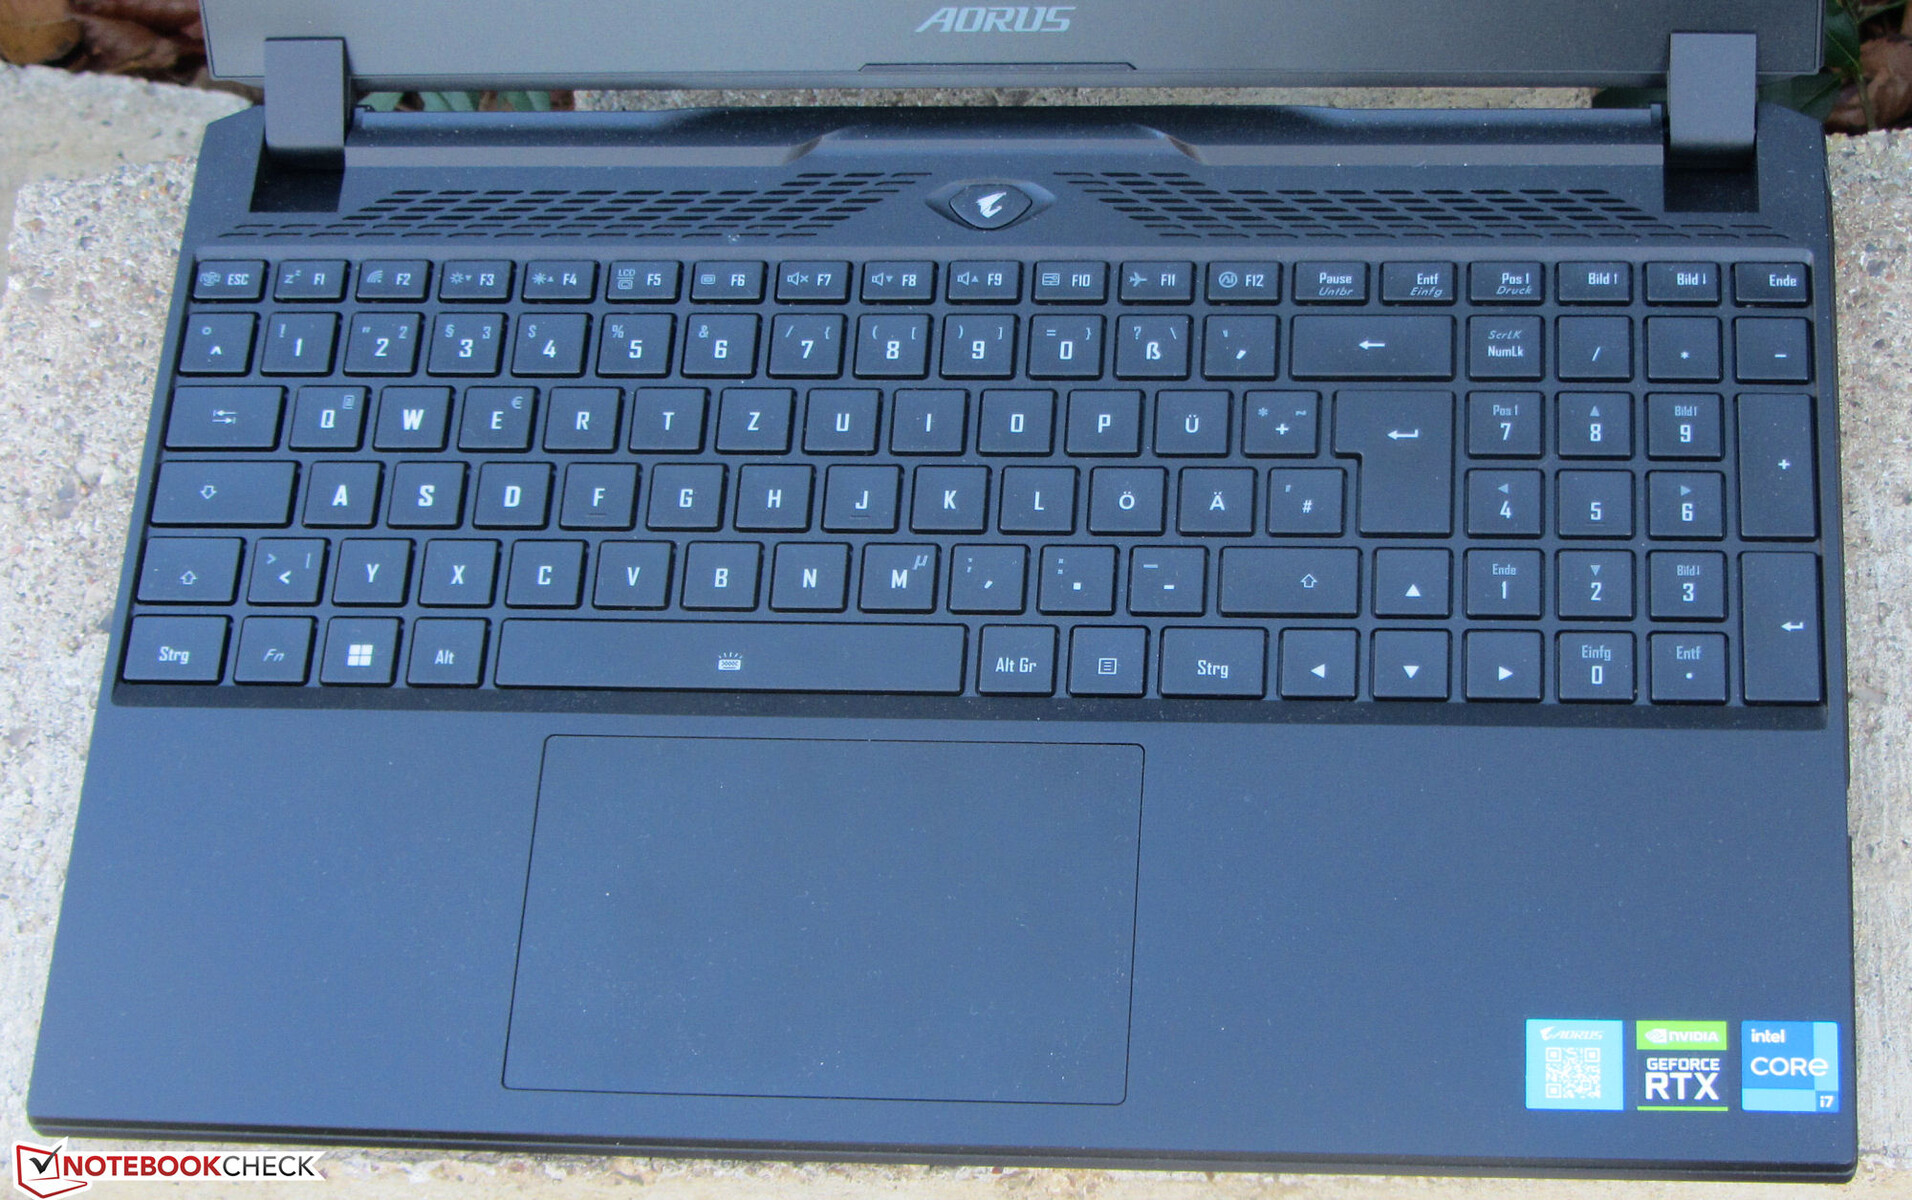
Laptop do gier jest wyposażony w klawiaturę typu chiclet, która zawiera blok numeryczny. Gładkie klawisze oferują umiarkowany zasięg i wyraźny punkt aktywacji. Klawiatura nie wygina się podczas pisania. Każdy klawisz jest indywidualnie podświetlany i posiada dwa poziomy jasności. Ogólnie rzecz biorąc, Gigabyte dostarczył klawiaturę, która nadaje się do codziennego użytku.
Touchpad
Wielodotykowy gładzik w laptopie (około 12,1 x 7,6 cm, czyli 4,8 x 3,0") ma gładką powierzchnię, po której łatwo przesuwać palce. Jest czuły na dotyk nawet w narożnikach, ma płytki klik i wyraźny punkt aktywacji.
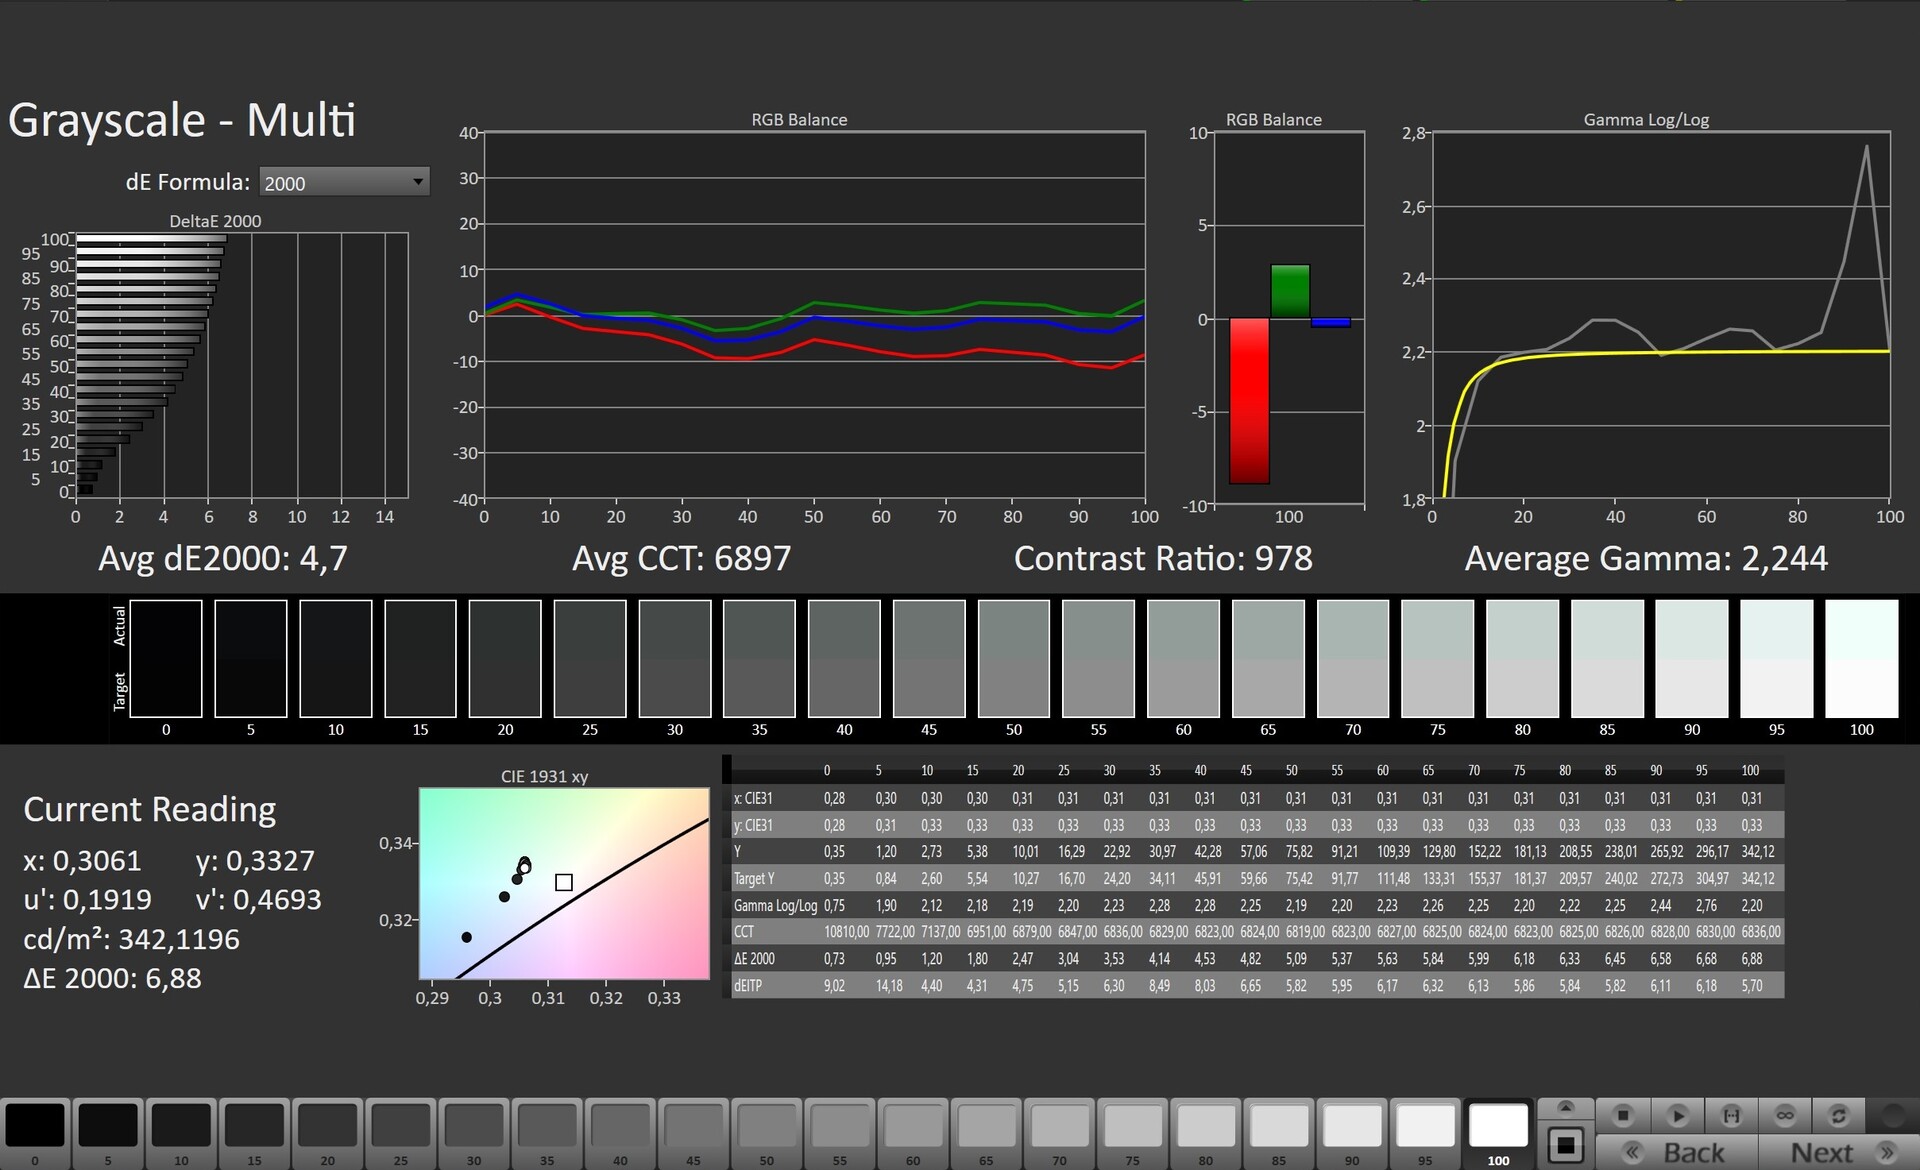
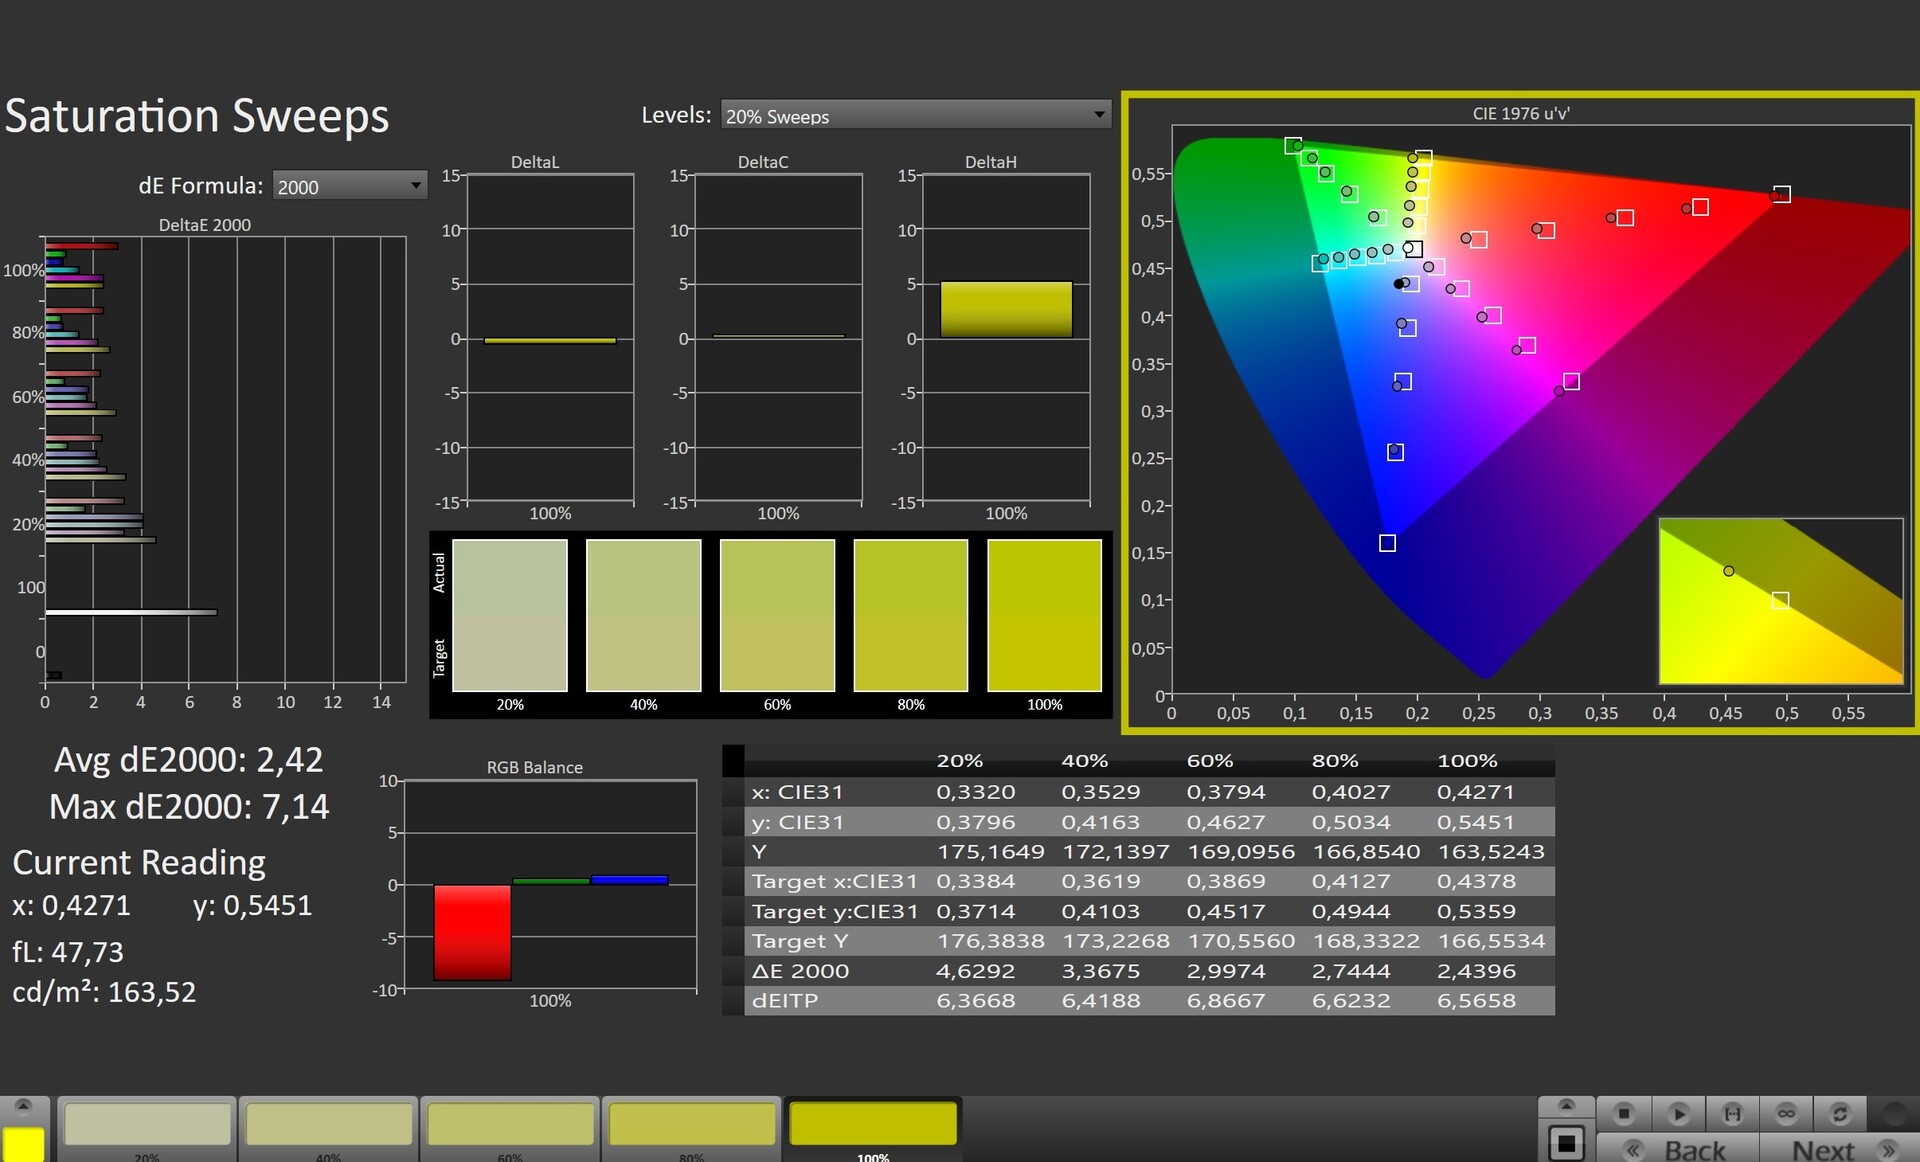
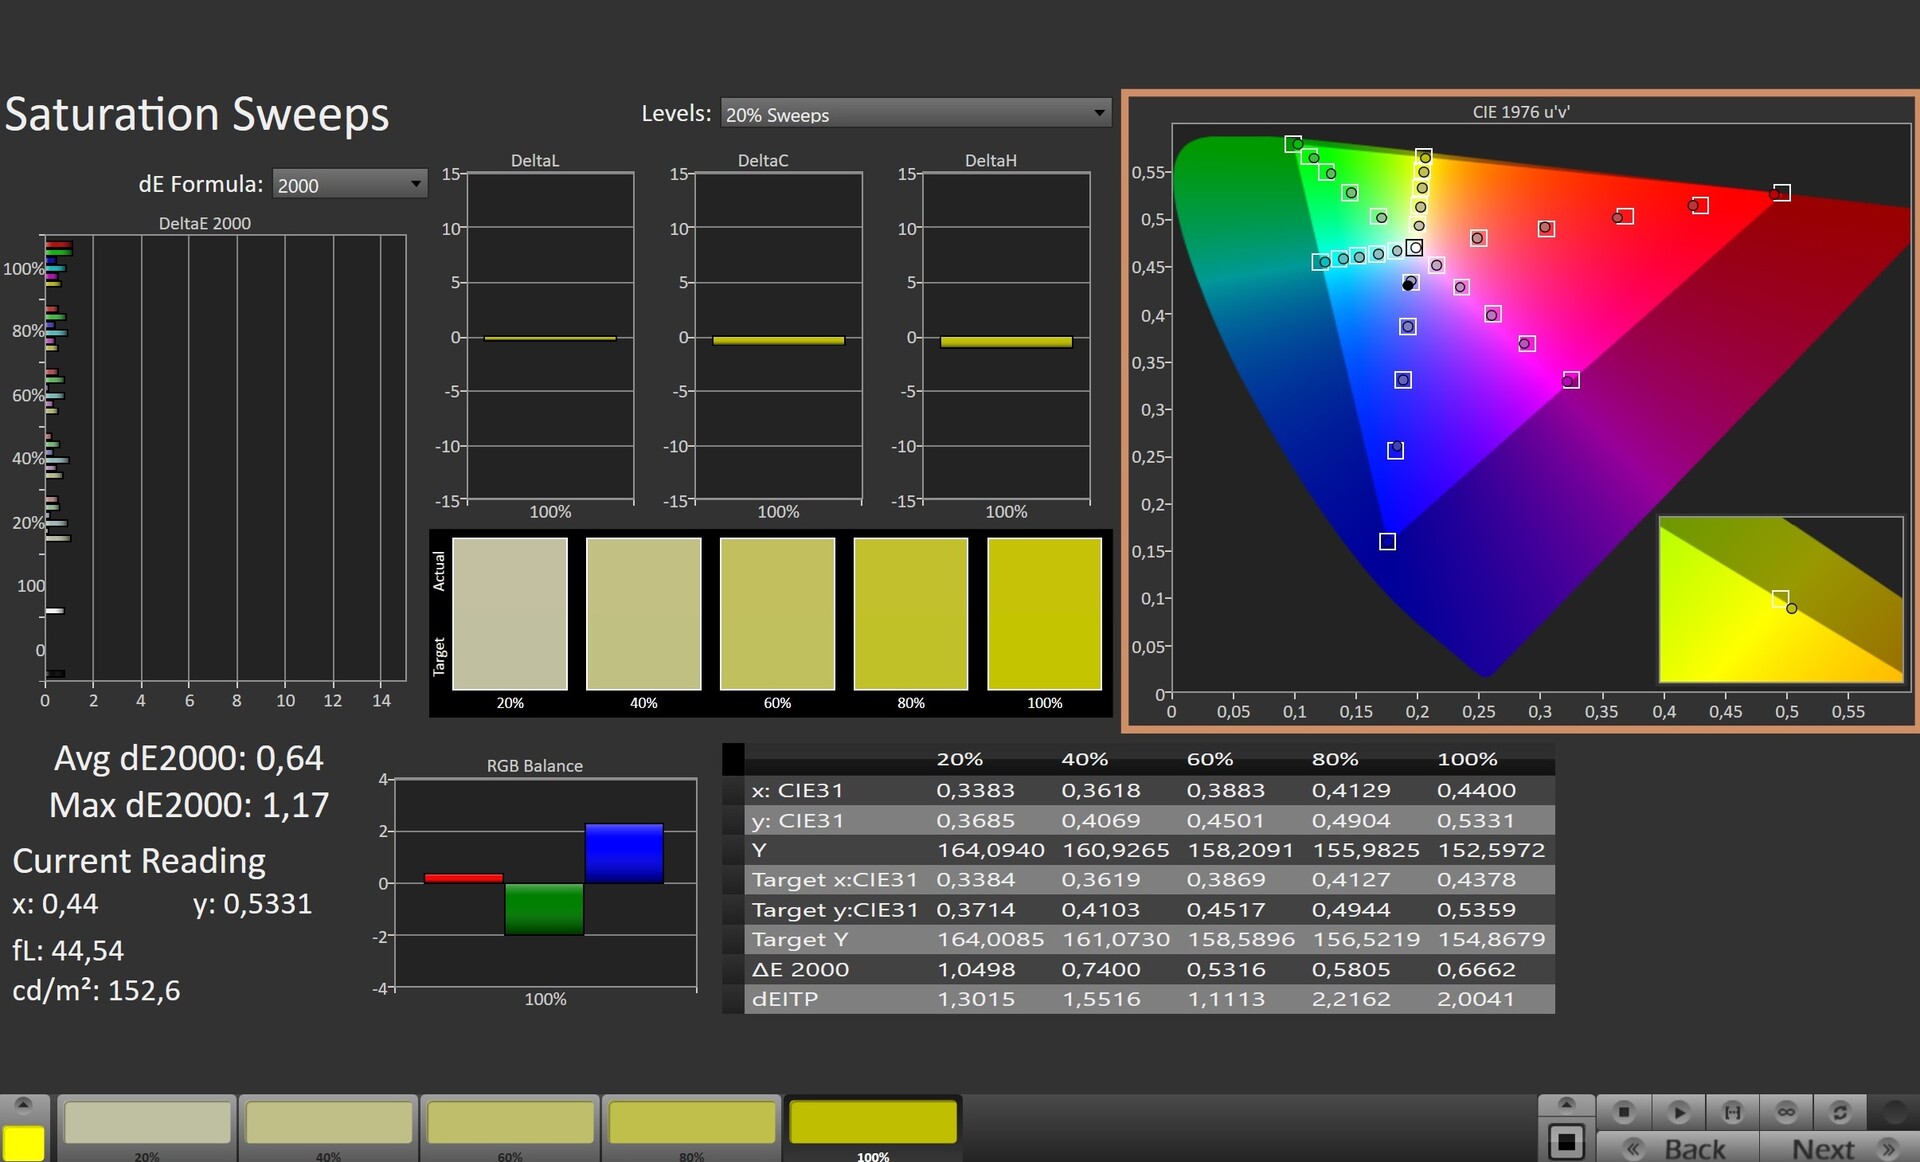
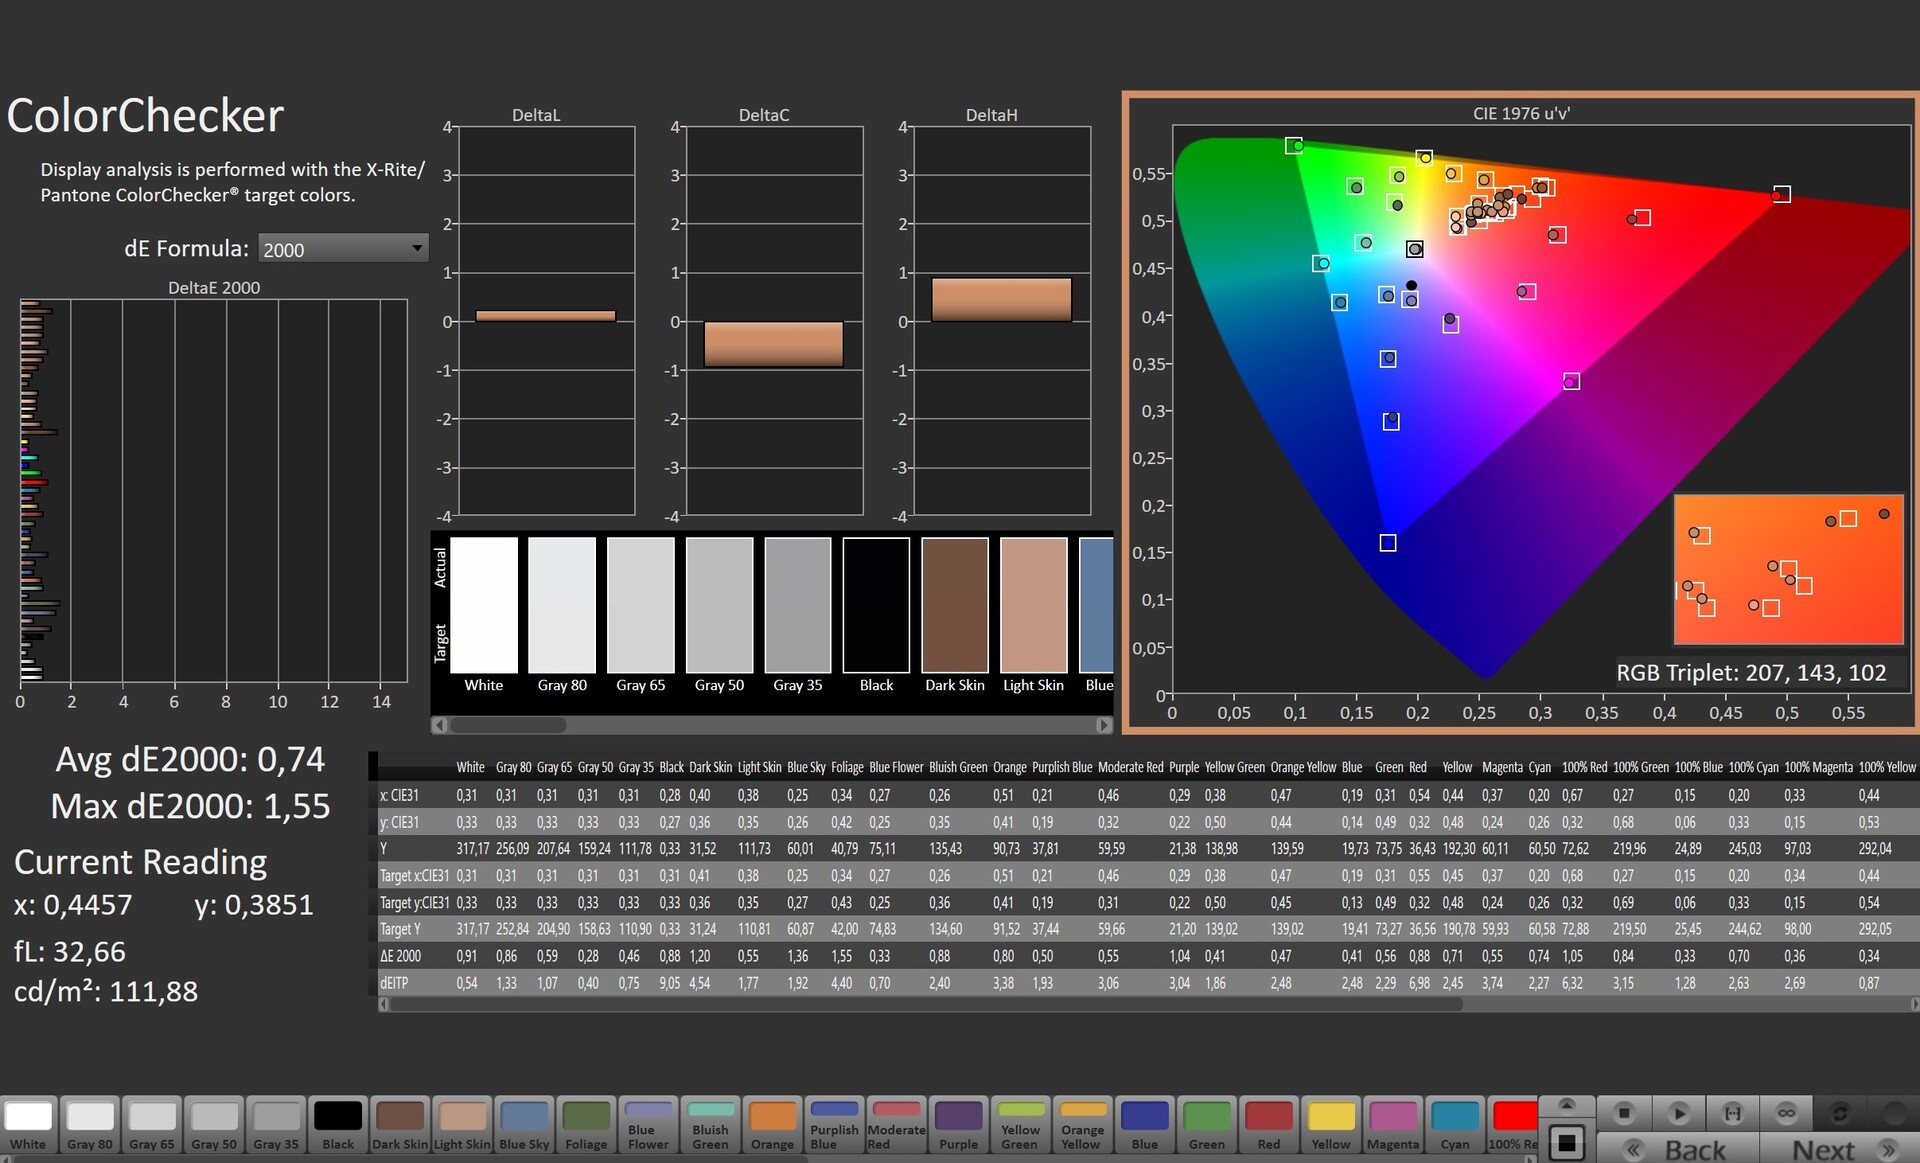
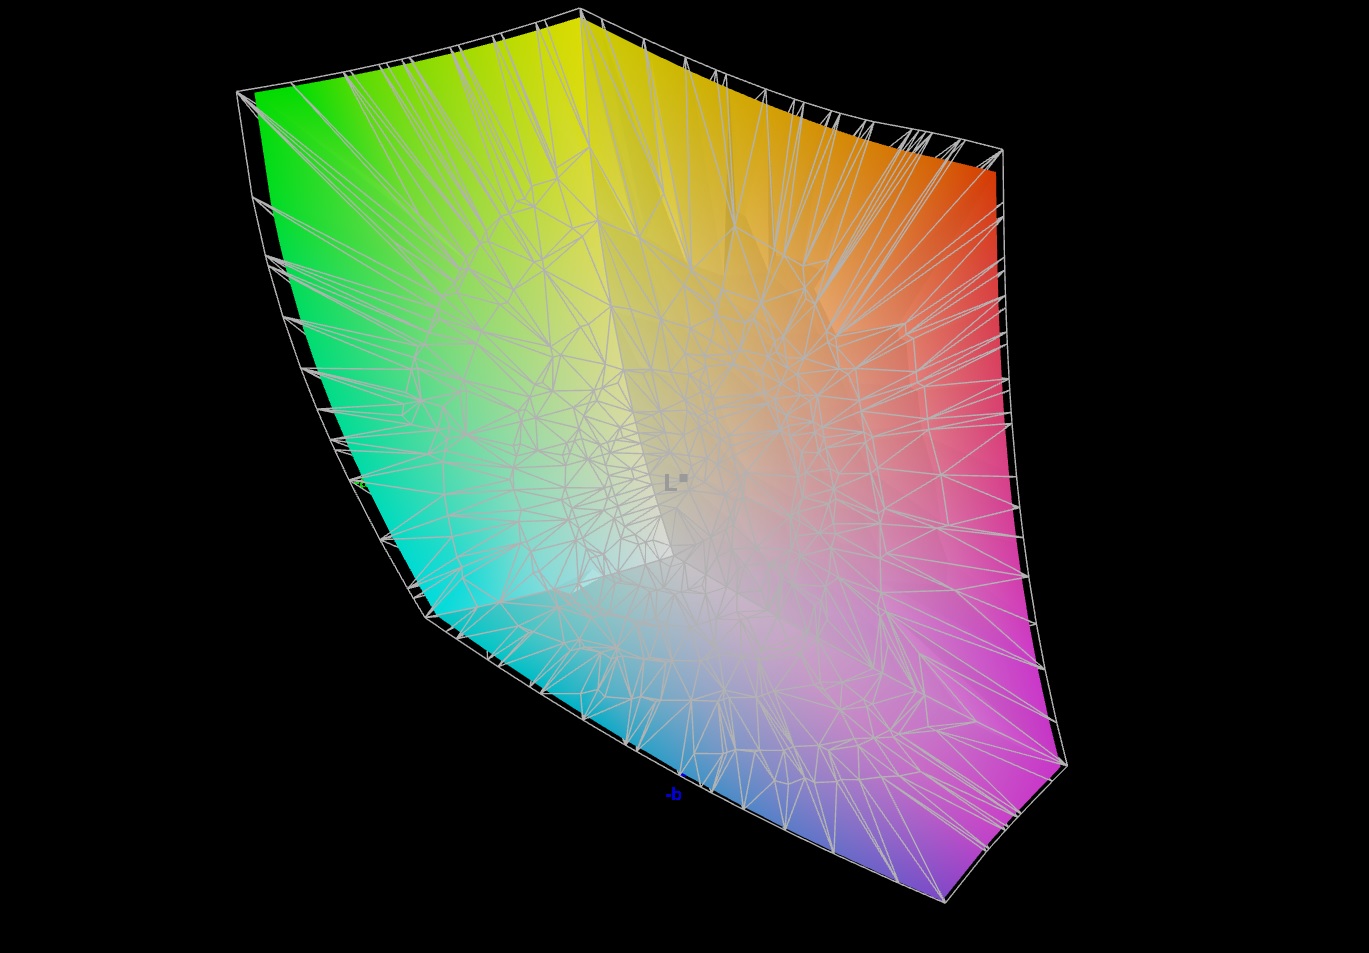
Wyświetlacz - Świetne pokrycie kolorystyczne
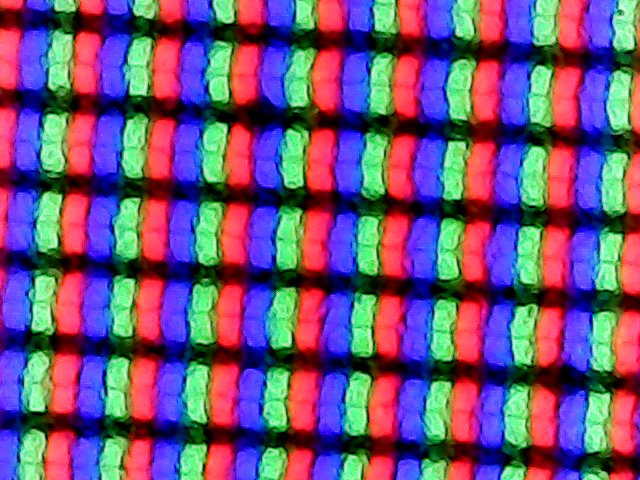
Laptop jest wyposażony w bardzo czuły panel 165 Hz, który nie wykazuje migotania PWM. Matowy wyświetlacz o przekątnej 15,6 cala (2560 x 1440 pikseli) potrafi uzyskać akceptowalną jasność (>300 cd/m²), ale jego kontrast (988:1) jest poniżej poziomu uznawanego za dobry (>1000:1). Z niektórymi konkurentami sytuacja jest odwrotna. Tylko w przypadku Nitro ma ekran, który radzi sobie dobrze w obu działach.
| |||||||||||||||||||||||||
rozświetlenie: 89 %
na akumulatorze: 336 cd/m²
kontrast: 988:1 (czerń: 0.34 cd/m²)
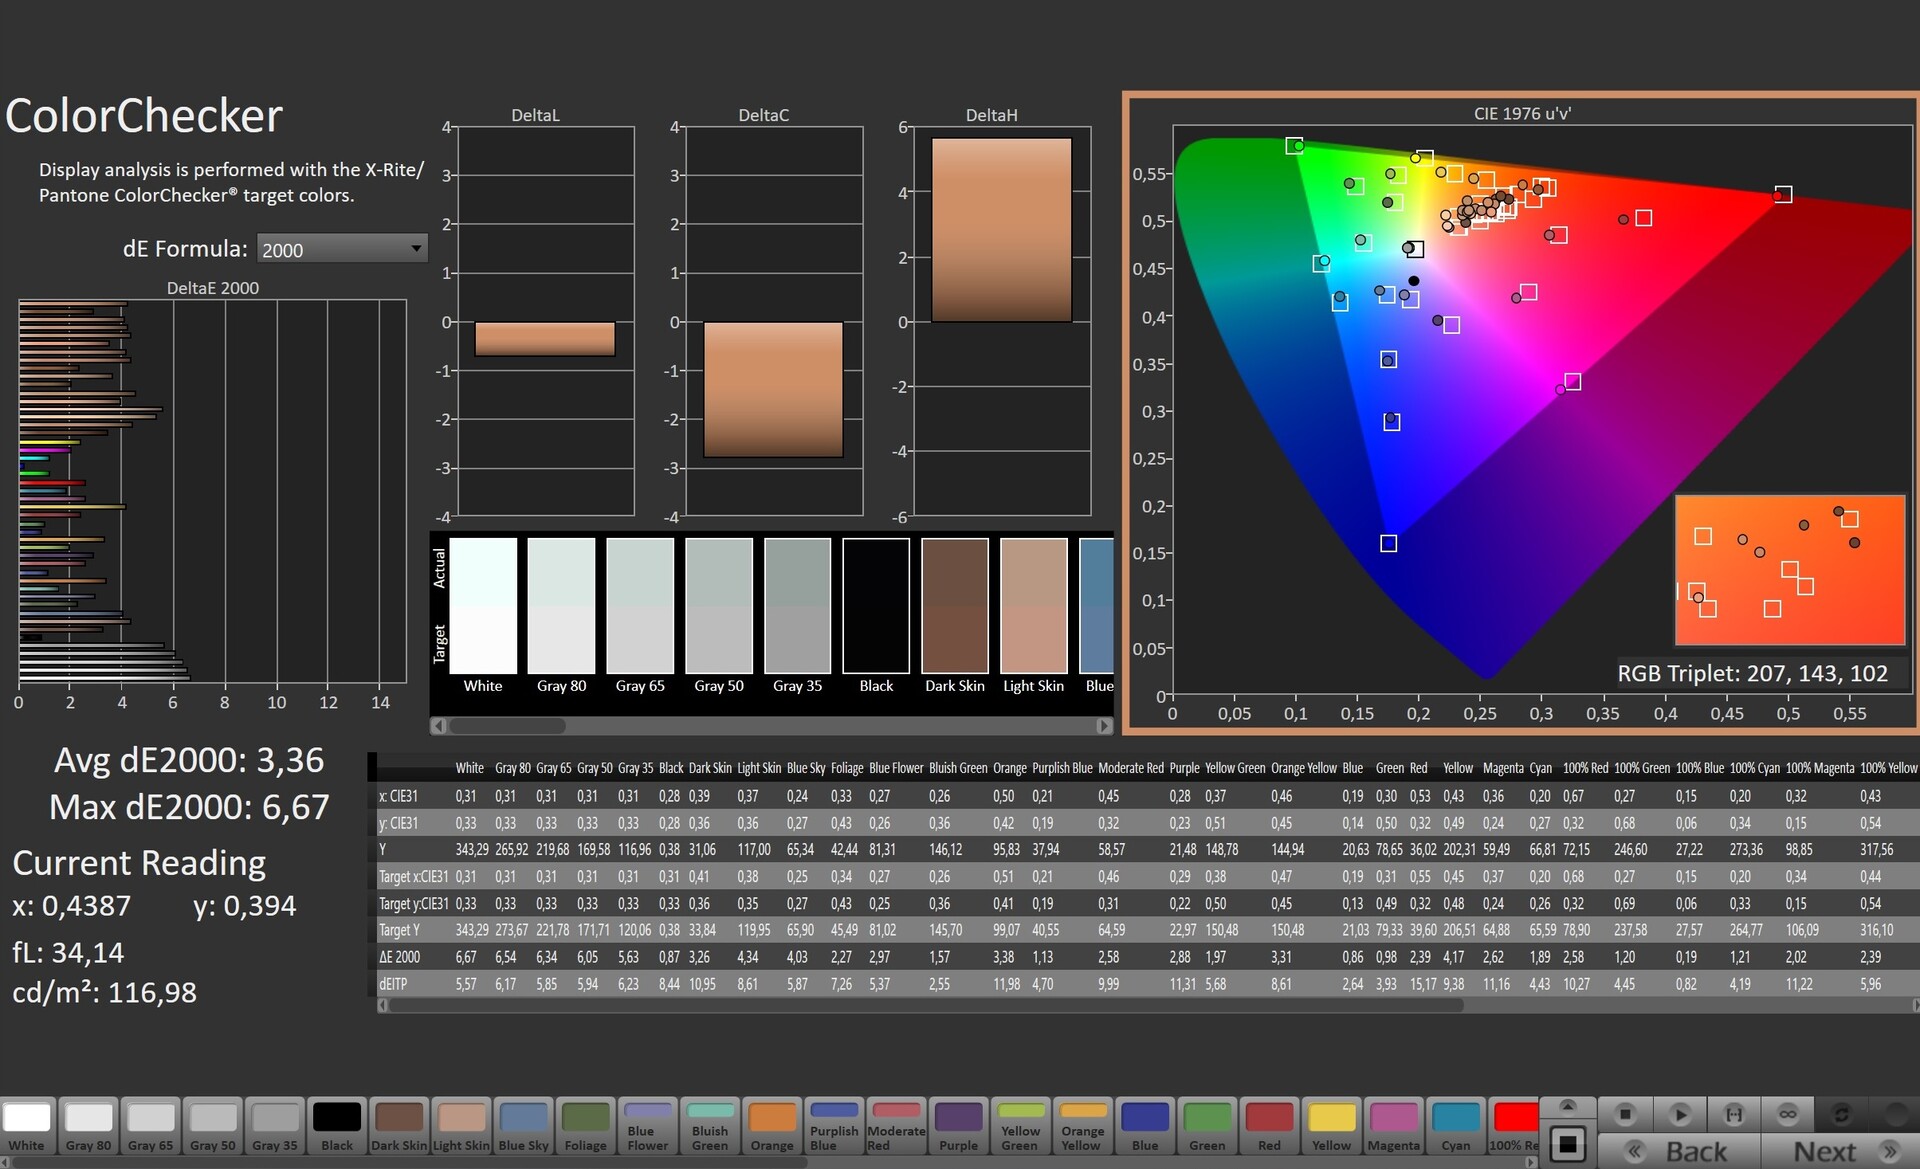
ΔE ColorChecker Calman: 3.36 | ∀{0.5-29.43 Ø4.73}
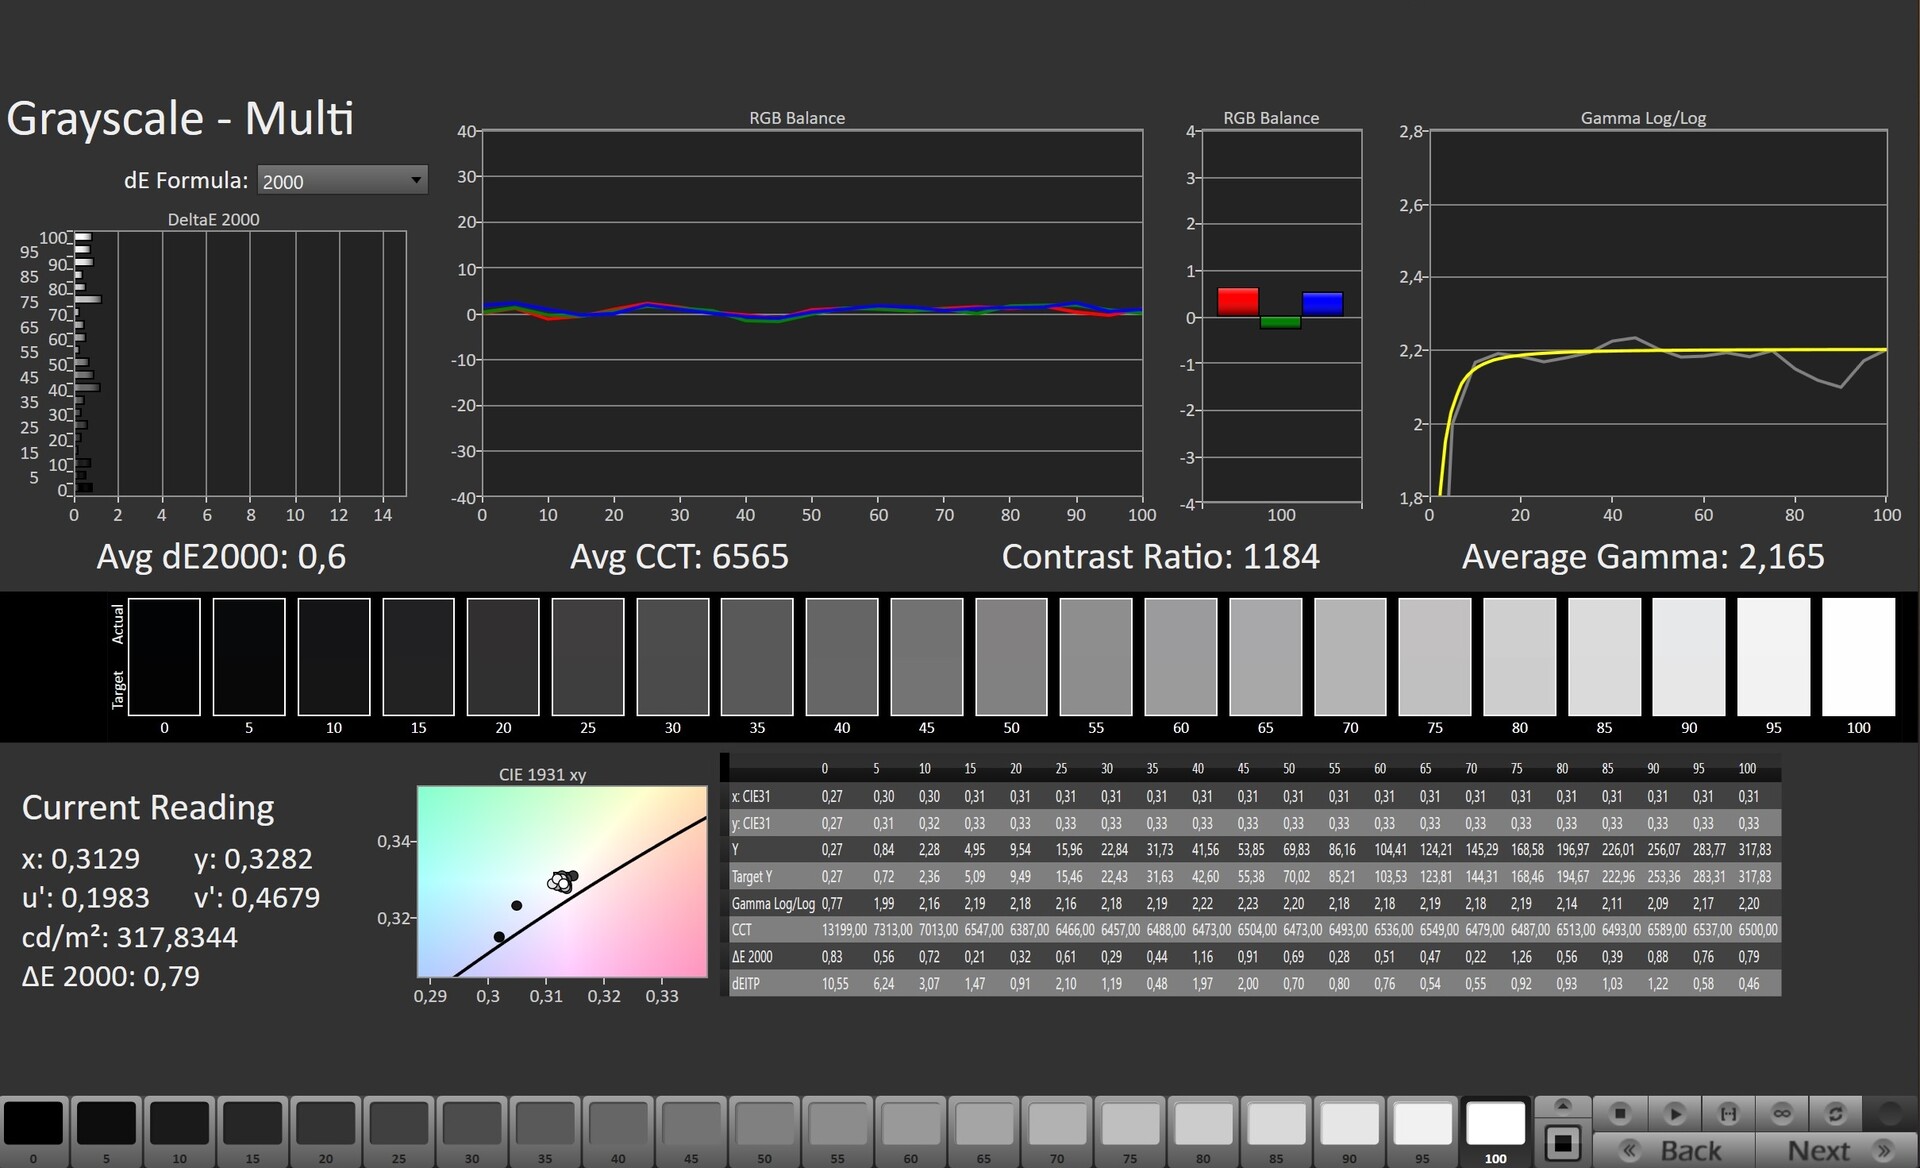
calibrated: 0.74
ΔE Greyscale Calman: 4.7 | ∀{0.09-98 Ø4.97}
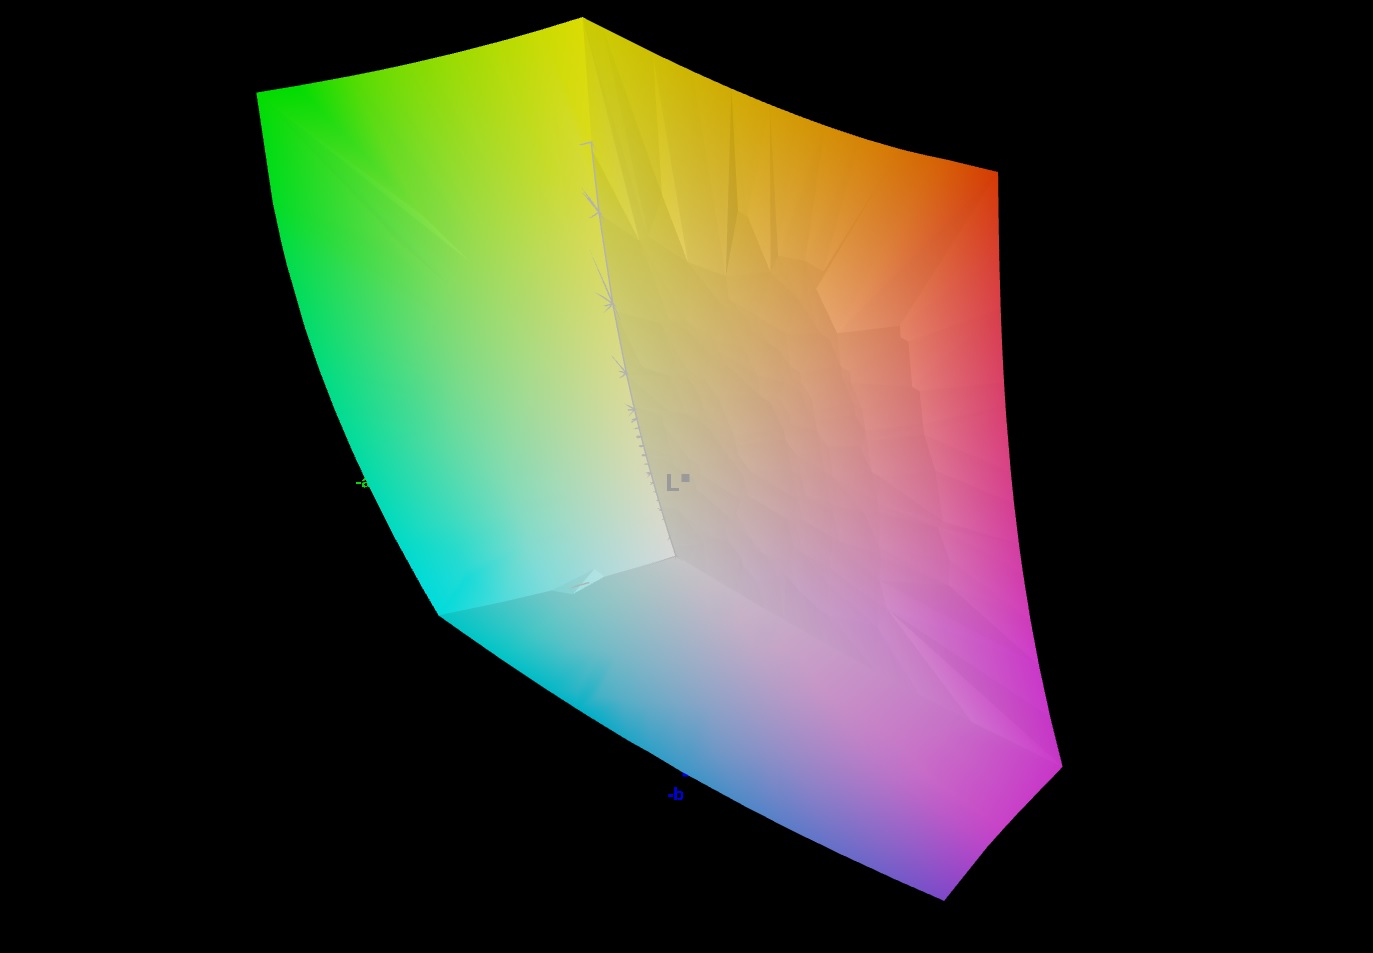
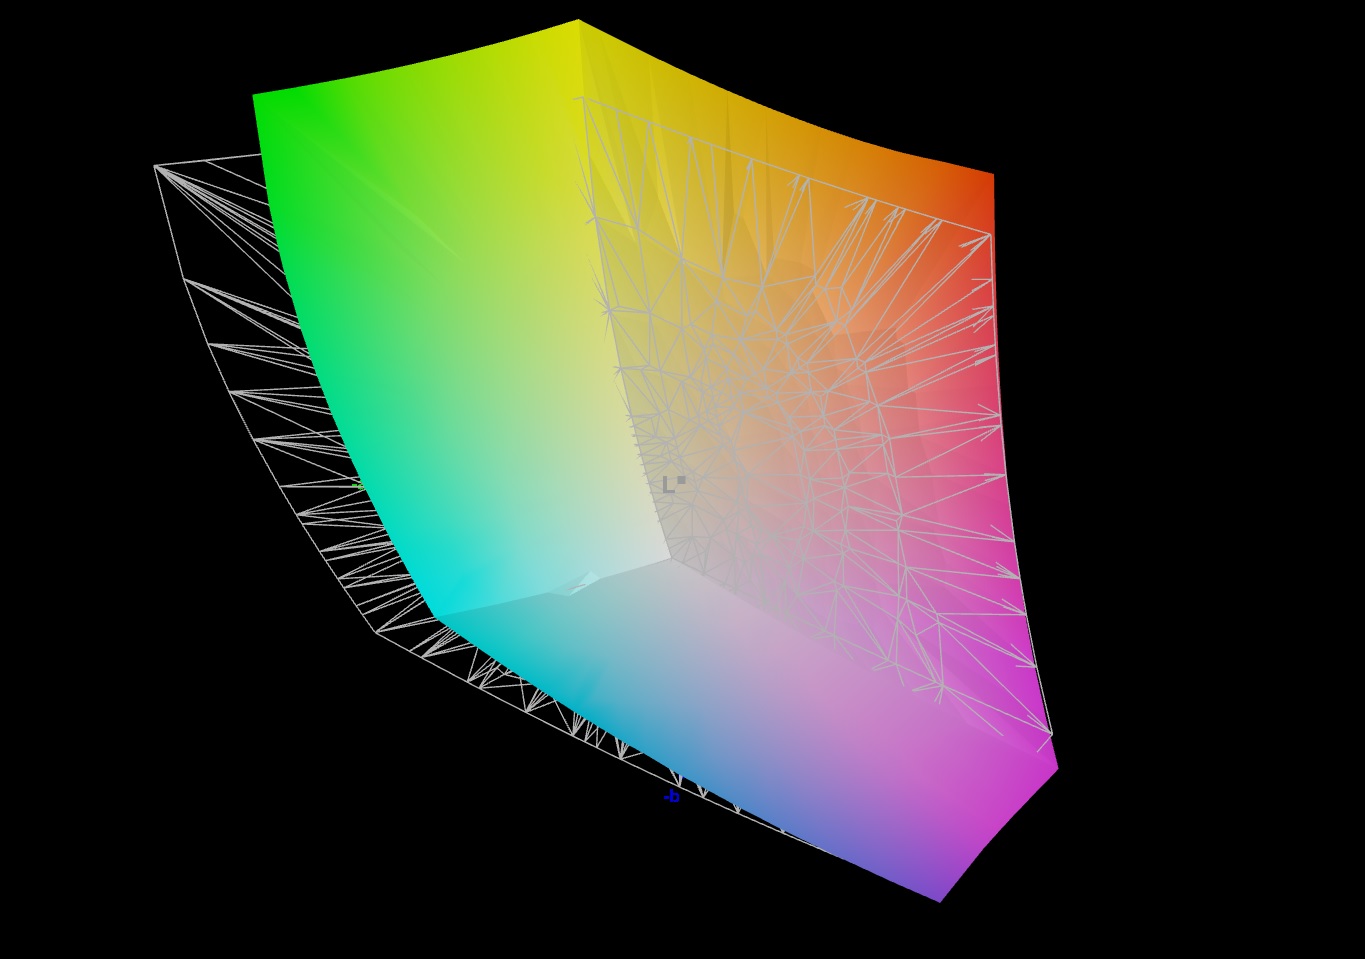
84.5% AdobeRGB 1998 (Argyll 3D)
99.9% sRGB (Argyll 3D)
95.2% Display P3 (Argyll 3D)
Gamma: 2.244
CCT: 6897 K
| Aorus 15 XE5 Chi Mei N156KME-GNA, IPS, 2560x1440, 15.6" | Acer Nitro 5 AN515-46-R1A1 AU Optronics B156HAN12.H, IPS, 1920x1080, 15.6" | Schenker XMG Fusion 15 (Mid 22) BOE CQ NE156QHM-NY2, IPS, 2560x1440, 15.6" | Asus TUF Dash F15 FX517ZR BOE CQ NE156QHM-NY1, IPS, 2560x1440, 15.6" | MSI Katana GF66 12UGS AU Optronics AUOAF90, IPS, 1920x1080, 15.6" | |
|---|---|---|---|---|---|
| Display | -16% | -17% | 2% | -51% | |
| Display P3 Coverage (%) | 95.2 | 68.8 -28% | 67.3 -29% | 98.4 3% | 39.1 -59% |
| sRGB Coverage (%) | 99.9 | 98.1 -2% | 96.7 -3% | 99.9 0% | 58.3 -42% |
| AdobeRGB 1998 Coverage (%) | 84.5 | 69.7 -18% | 68.2 -19% | 85.9 2% | 40.4 -52% |
| Response Times | 9% | 19% | 26% | -204% | |
| Response Time Grey 50% / Grey 80% * (ms) | 14.4 ? | 13 ? 10% | 11.6 ? 19% | 5.6 ? 61% | 40 ? -178% |
| Response Time Black / White * (ms) | 8.6 ? | 8 ? 7% | 7 ? 19% | 9.4 ? -9% | 28.4 ? -230% |
| PWM Frequency (Hz) | |||||
| Screen | 2% | -14% | 13% | -64% | |
| Brightness middle (cd/m²) | 336 | 327 -3% | 326 -3% | 286 -15% | 227 -32% |
| Brightness (cd/m²) | 316 | 320 1% | 303 -4% | 266 -16% | 225 -29% |
| Brightness Distribution (%) | 89 | 93 4% | 89 0% | 87 -2% | 90 1% |
| Black Level * (cd/m²) | 0.34 | 0.24 29% | 0.33 3% | 0.25 26% | 0.21 38% |
| Contrast (:1) | 988 | 1363 38% | 988 0% | 1144 16% | 1081 9% |
| Colorchecker dE 2000 * | 3.36 | 3.26 3% | 2.73 19% | 2.14 36% | 4.19 -25% |
| Colorchecker dE 2000 max. * | 6.67 | 8.73 -31% | 9.54 -43% | 5.22 22% | 17.45 -162% |
| Colorchecker dE 2000 calibrated * | 0.74 | 0.87 -18% | 1.36 -84% | 0.67 9% | 3.81 -415% |
| Greyscale dE 2000 * | 4.7 | 4.87 -4% | 5.2 -11% | 2.8 40% | 2.7 43% |
| Gamma | 2.244 98% | 2.3 96% | 2.074 106% | 2.23 99% | 2.208 100% |
| CCT | 6897 94% | 7070 92% | 6911 94% | 7092 92% | 6176 105% |
| Całkowita średnia (program / ustawienia) | -2% /
-1% | -4% /
-10% | 14% /
12% | -106% /
-81% |
* ... im mniej tym lepiej
Wyświetlacz ma przyzwoite odwzorowanie kolorów zaraz po wyjęciu z pudełka. Jego różnica kolorów wynosząca 3,36 znajduje się nieco poza idealnym zakresem (DeltaE <3). Kalibracja ekranu zmniejszyła różnicę kolorów do 0,74 i sprawiła, że odcienie szarości wyglądają płynniej. Wyświetlacz w pełni pokrywa przestrzeń barw sRGB (100%) i prawie udaje mu się odtworzyć całą gamę DCI-P3 (95%). Charakteryzuje się również pokryciem przestrzeni AdobeRGB na poziomie 85%.
Stworzony przez nas profil kolorystyczny można pobrać i używać za darmo. Link do pobrania znajdziesz w infoboxie dotyczącym wyświetlacza.
Wyświetl czasy reakcji
| ↔ Czas reakcji od czerni do bieli | ||
|---|---|---|
| 8.6 ms ... wzrost ↗ i spadek ↘ łącznie | ↗ 5.1 ms wzrost | 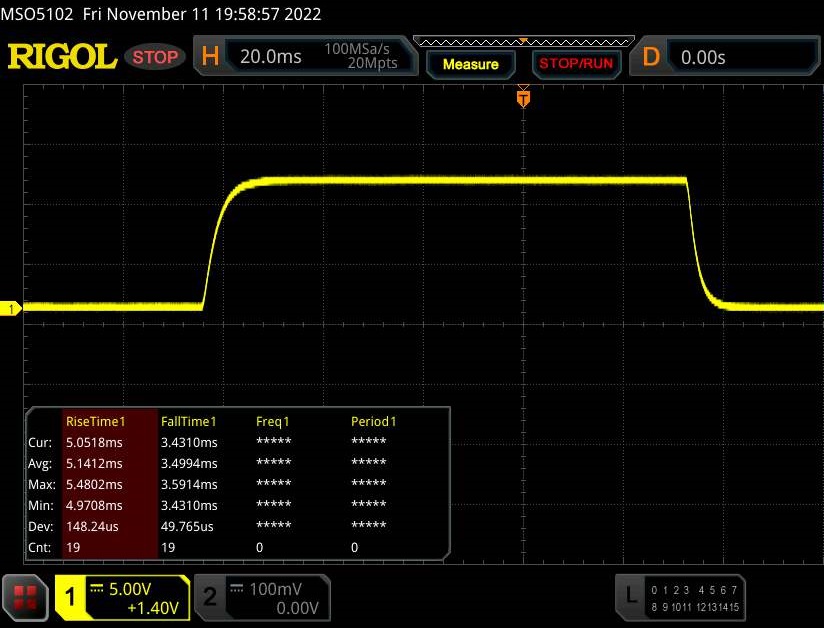 |
| ↘ 3.5 ms upadek | ||
| W naszych testach ekran wykazuje szybki czas reakcji i powinien nadawać się do gier. Dla porównania, wszystkie testowane urządzenia wahają się od 0.1 (minimum) do 240 (maksimum) ms. » 24 % wszystkich urządzeń jest lepszych. Oznacza to, że zmierzony czas reakcji jest lepszy od średniej wszystkich testowanych urządzeń (19.9 ms). | ||
| ↔ Czas reakcji 50% szarości do 80% szarości | ||
| 14.4 ms ... wzrost ↗ i spadek ↘ łącznie | ↗ 6.9 ms wzrost | 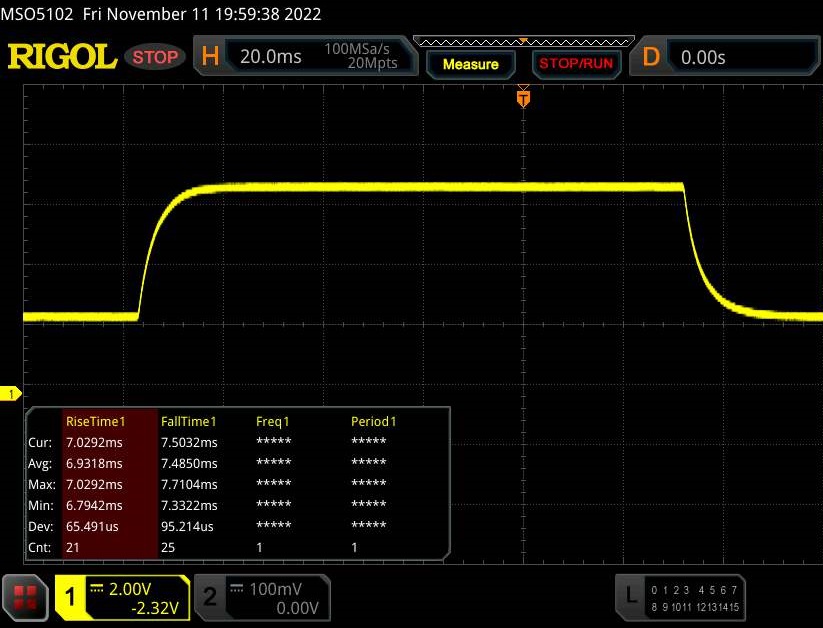 |
| ↘ 7.5 ms upadek | ||
| W naszych testach ekran wykazuje dobry współczynnik reakcji, ale może być zbyt wolny dla graczy rywalizujących ze sobą. Dla porównania, wszystkie testowane urządzenia wahają się od 0.165 (minimum) do 636 (maksimum) ms. » 28 % wszystkich urządzeń jest lepszych. Oznacza to, że zmierzony czas reakcji jest lepszy od średniej wszystkich testowanych urządzeń (31.1 ms). | ||
Migotanie ekranu / PWM (modulacja szerokości impulsu)
| Migotanie ekranu/nie wykryto PWM | 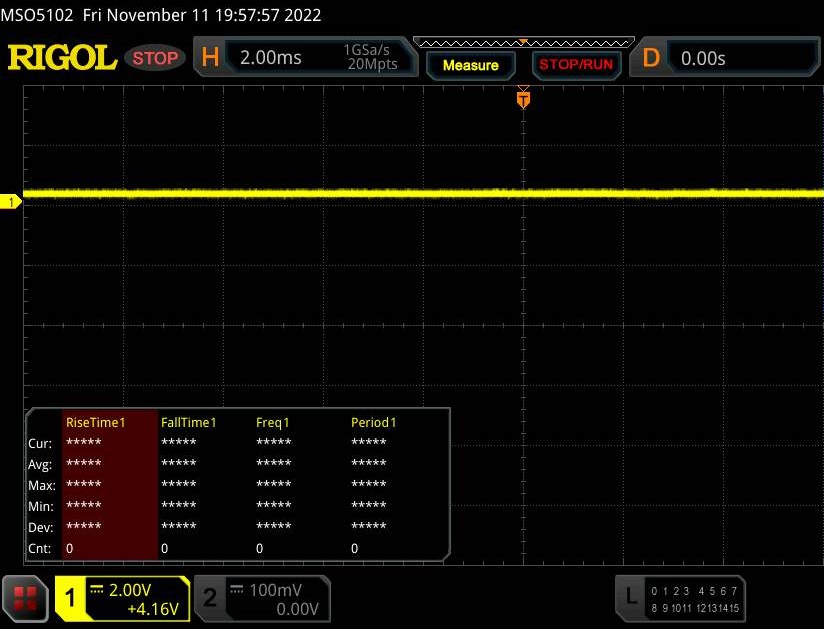 | ||
Dla porównania: 52 % wszystkich testowanych urządzeń nie używa PWM do przyciemniania wyświetlacza. Jeśli wykryto PWM, zmierzono średnio 7794 (minimum: 5 - maksimum: 343500) Hz. | |||
Wyświetlacz IPS ma szerokie kąty widzenia i jest czytelny z każdej pozycji. Możliwe jest również korzystanie z wyświetlacza na zewnątrz, pod warunkiem, że słońce nie jest zbyt silne.

Wydajność - Duża moc dzięki Alder Lake i Ampere
Gigabyte Aorus 15 XE5 to wydajny 15,6-calowy laptop, który dobrze radzi sobie w każdym wymagającym scenariuszu użytkowania. Poza recenzowaną konfiguracją, Gigabyte oferuje również dwa inne modele: jeden z RTX 3080 Ti Laptop (Aorus 15 YE5) oraz drugi z RTX 3060 Laptop (Aorus 15 KE5).
Warunki badania
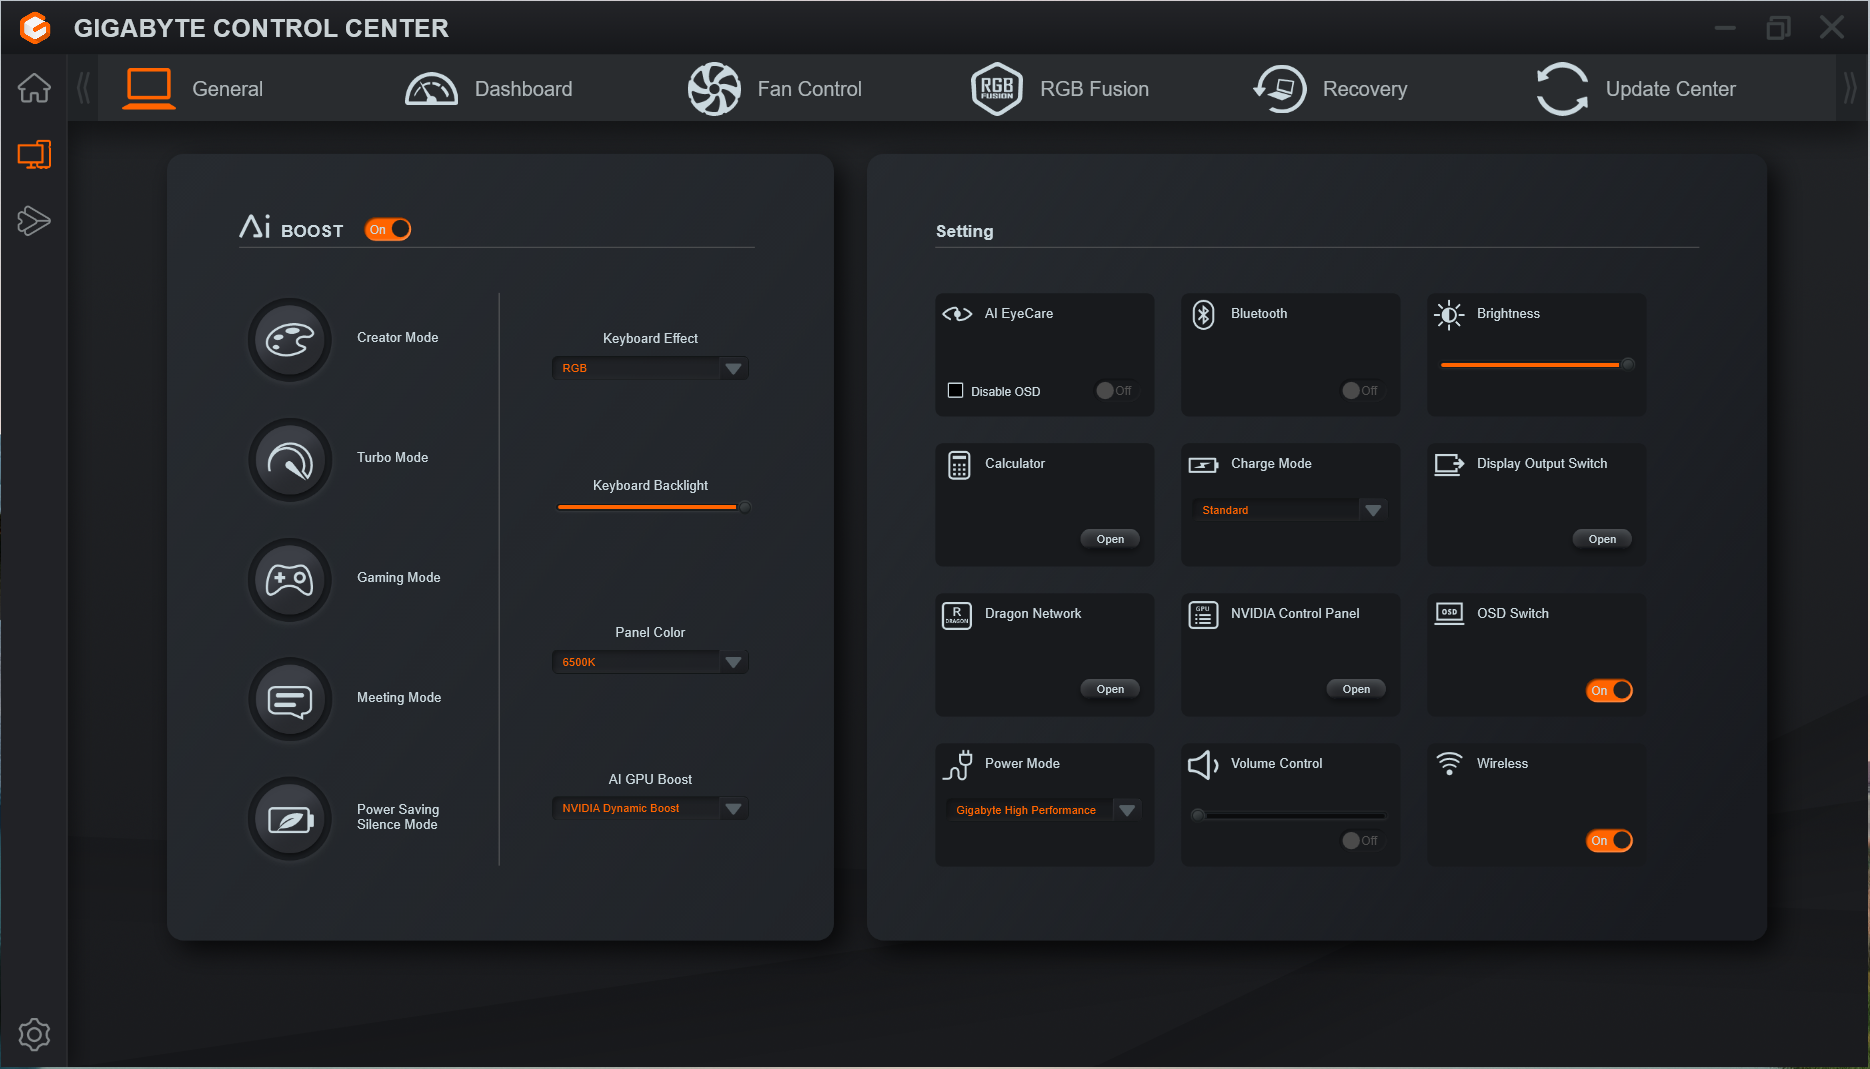
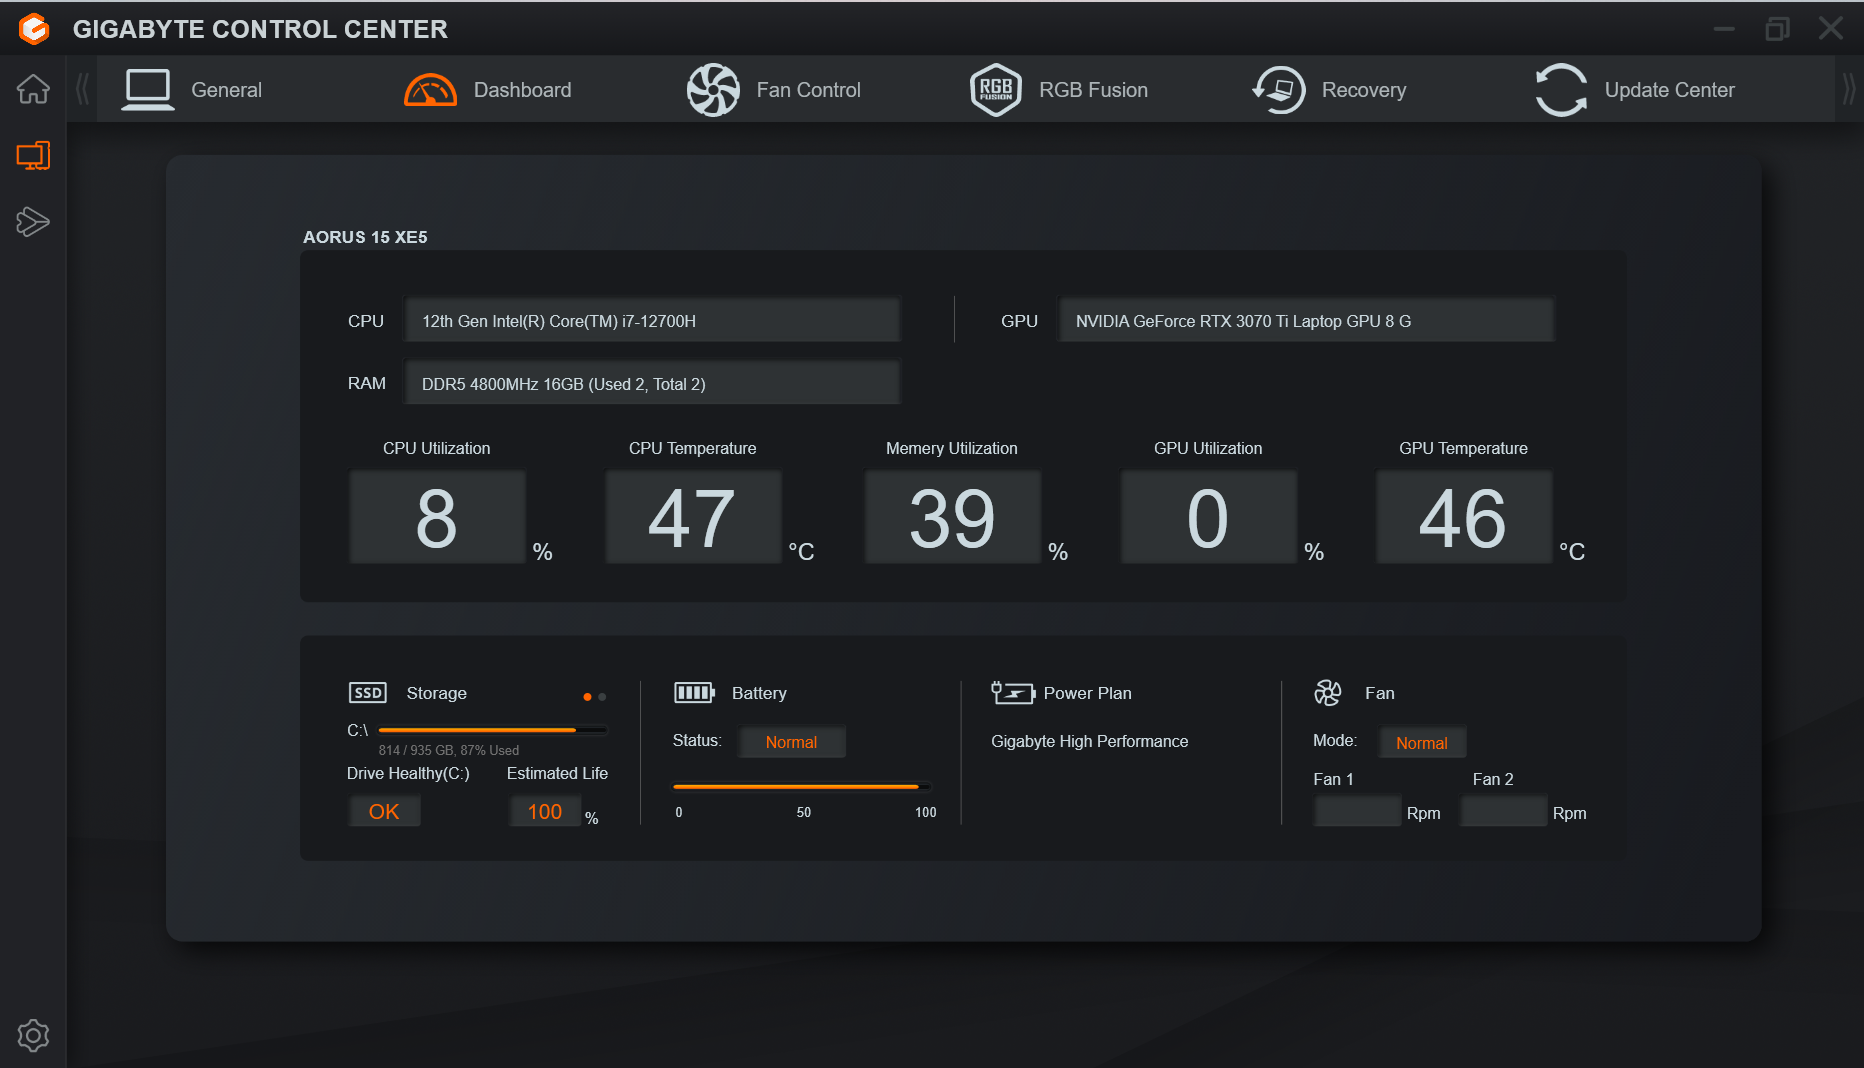
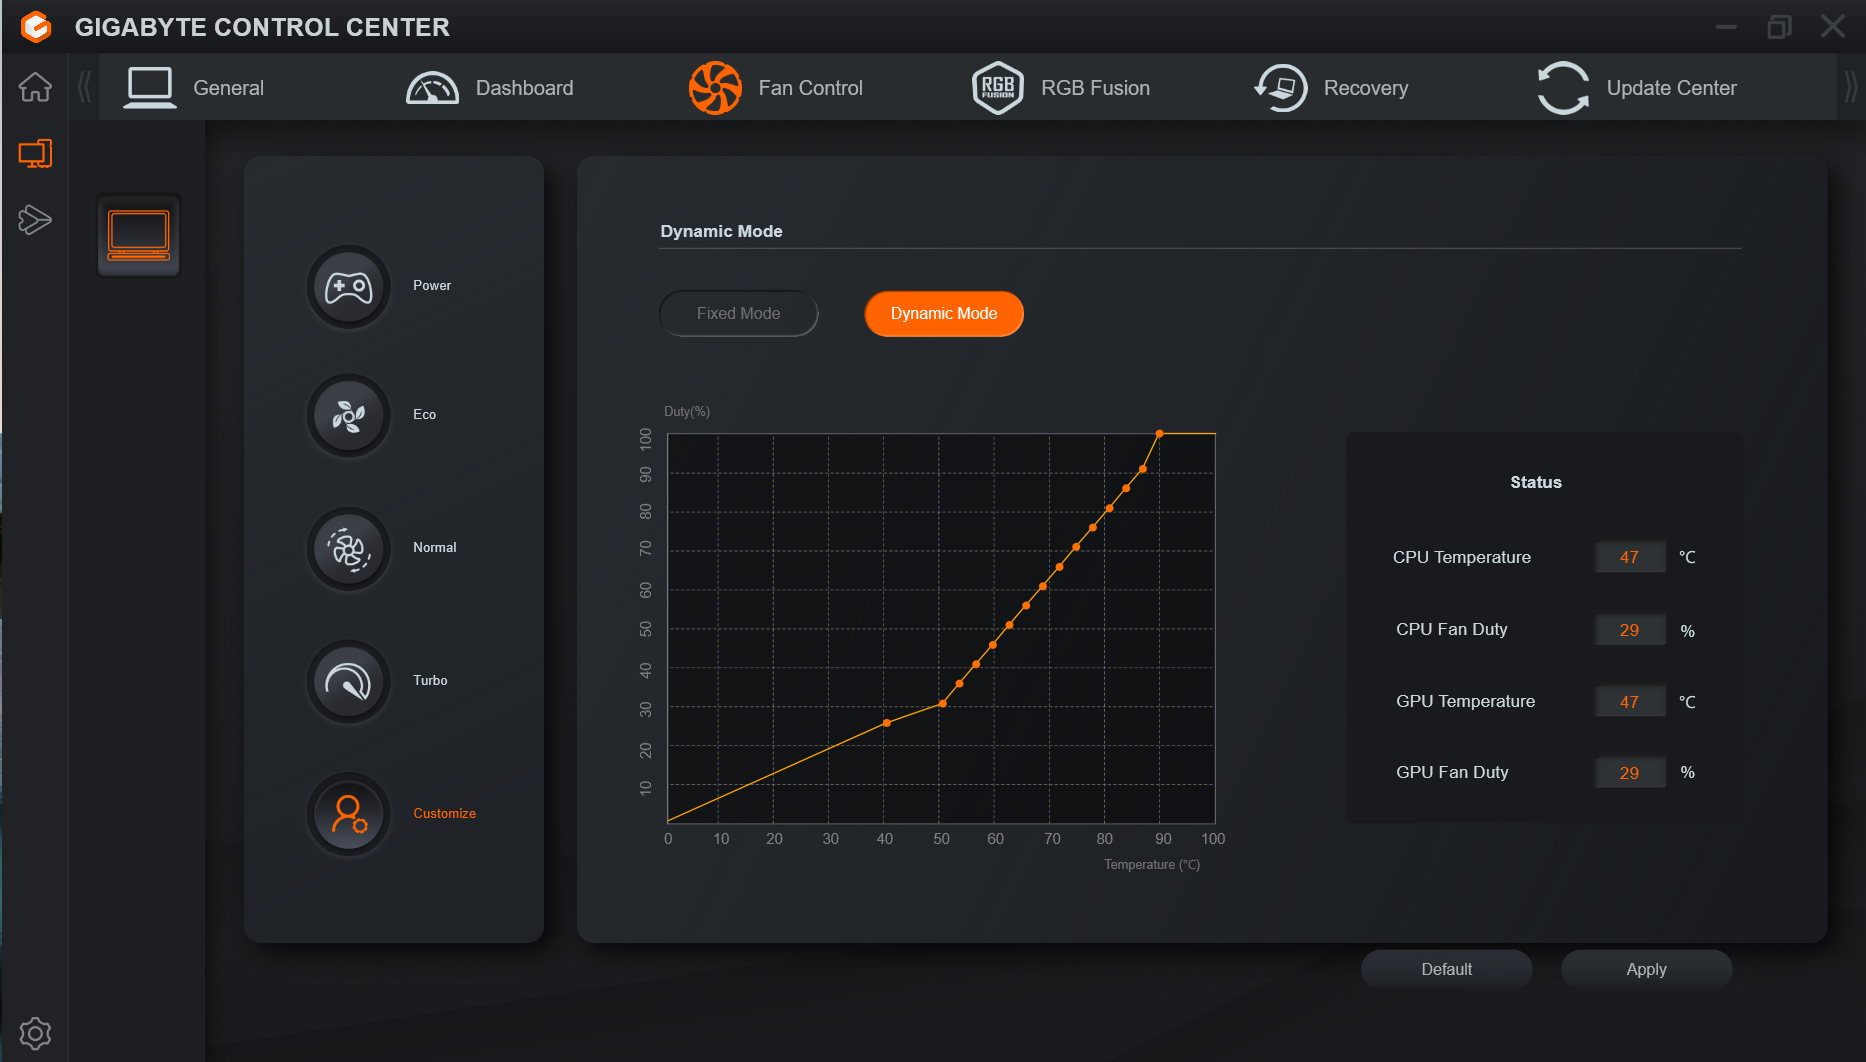
Preinstalowane Centrum Kontroli Gigabyte posiada różne profile wydajności, które pozwalają skonfigurować wydajność CPU i GPU, aktywność wentylatorów, jasność ekranu i temperaturę kolorów itd. Do naszych testów wykorzystaliśmy funkcję AI Boost, która unieważnia wszelkie ręczne ustawienia wydajności i pozwala Centrum Kontroli wybrać odpowiedni profil.
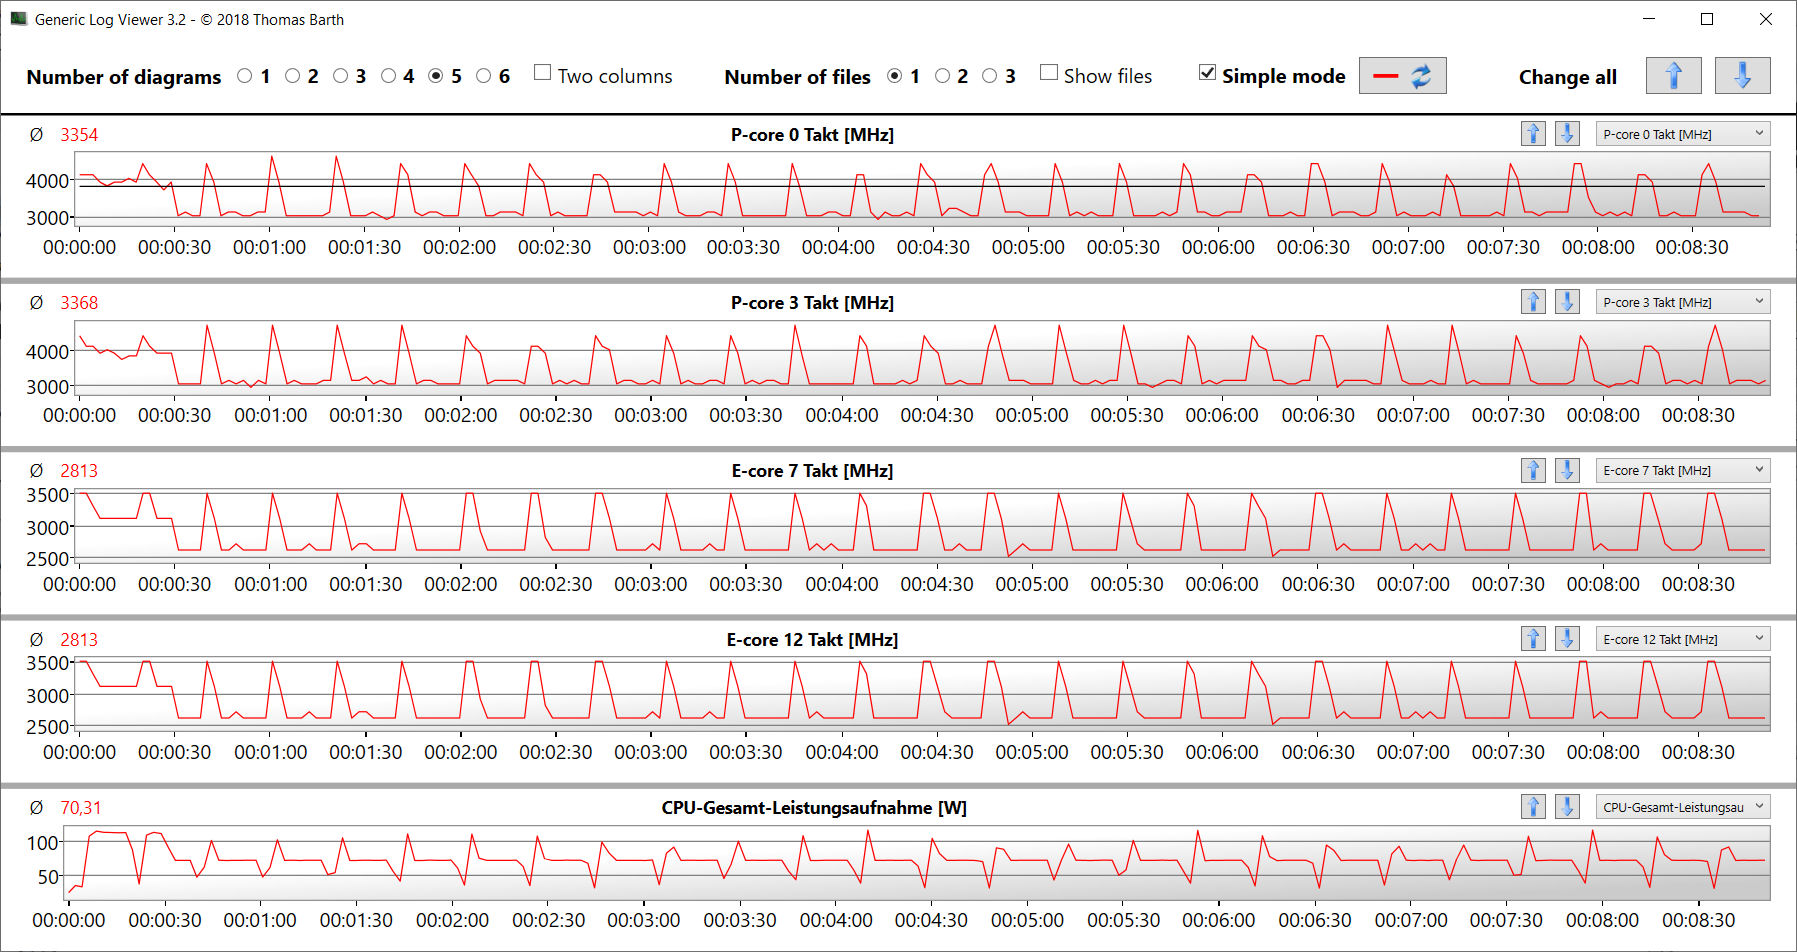
Zastosowanie "trybu Turbo" praktycznie nie poprawiło szczytowej wydajności, ale zaowocowało wyższą trwałą wydajnością pod stałym obciążeniem (patrz wyniki pętli CB15). Niemniej jednak zysk ten ma swoją cenę - wentylatory pracowały bez przerwy na pełnych obrotach.
| Tryb kreatora | Tryb Turbo | Tryb gier | Tryb spotkań | Tryb oszczędzania energii Cisza | |
|---|---|---|---|---|---|
| Limit mocy 1 | 70 watów | 70 watów | 55 watów | 15 watów | 15 watów |
| Power Limit 2 | 115 watów | 115 watów | 115 watów | 30 watów | 30 watów |
Procesor
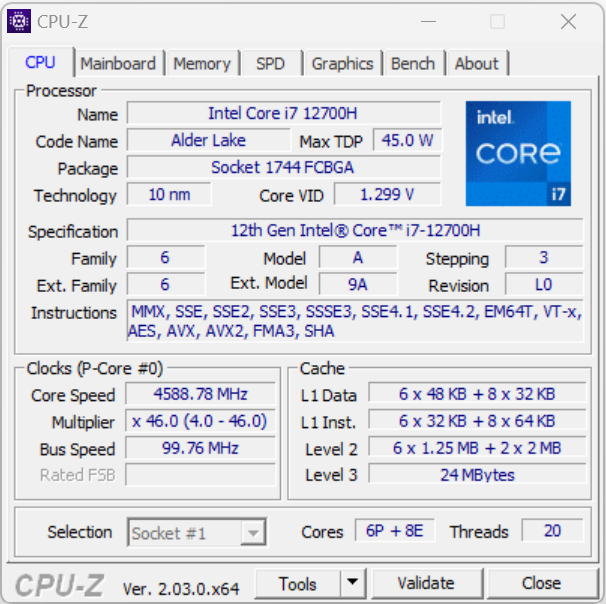
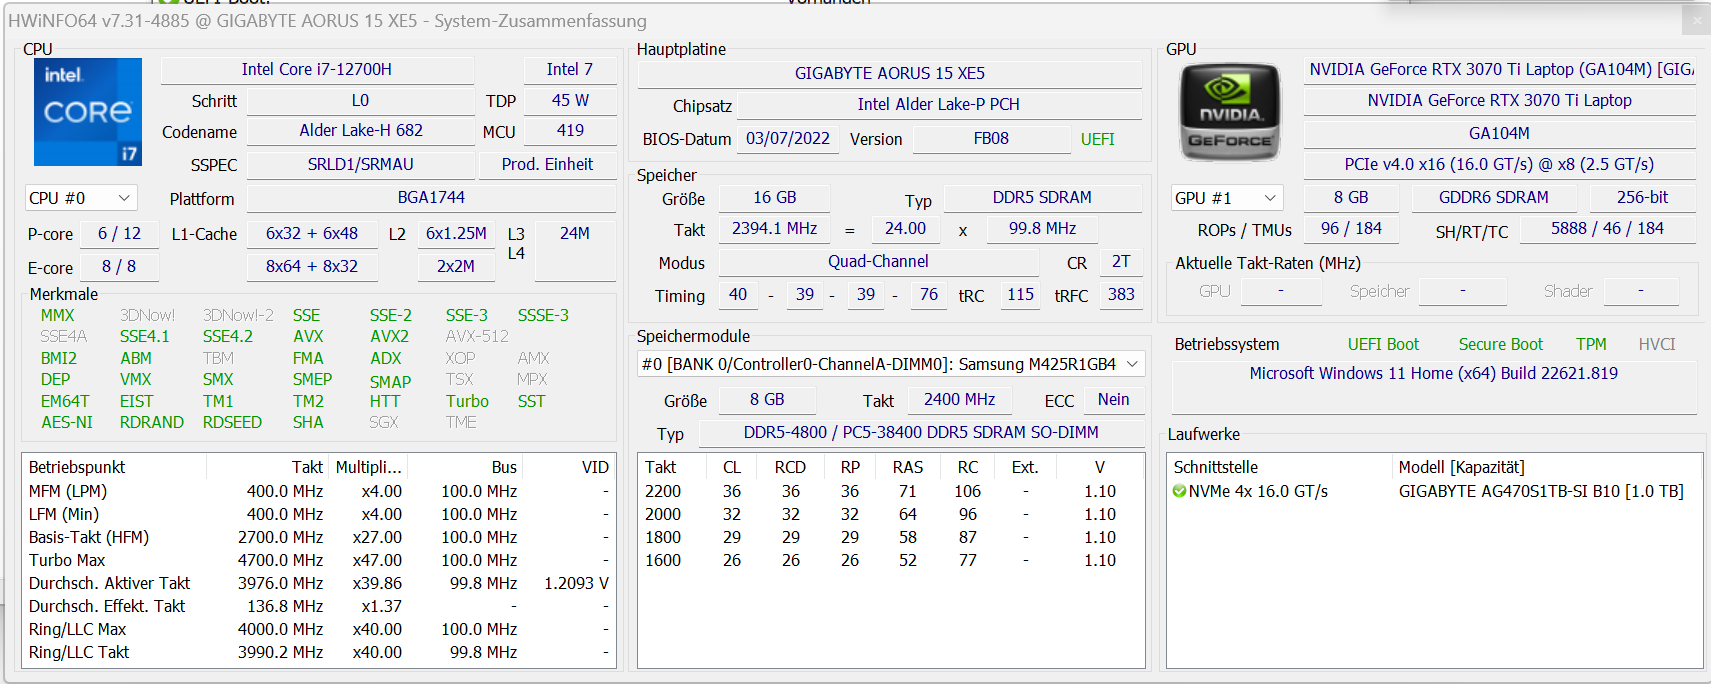
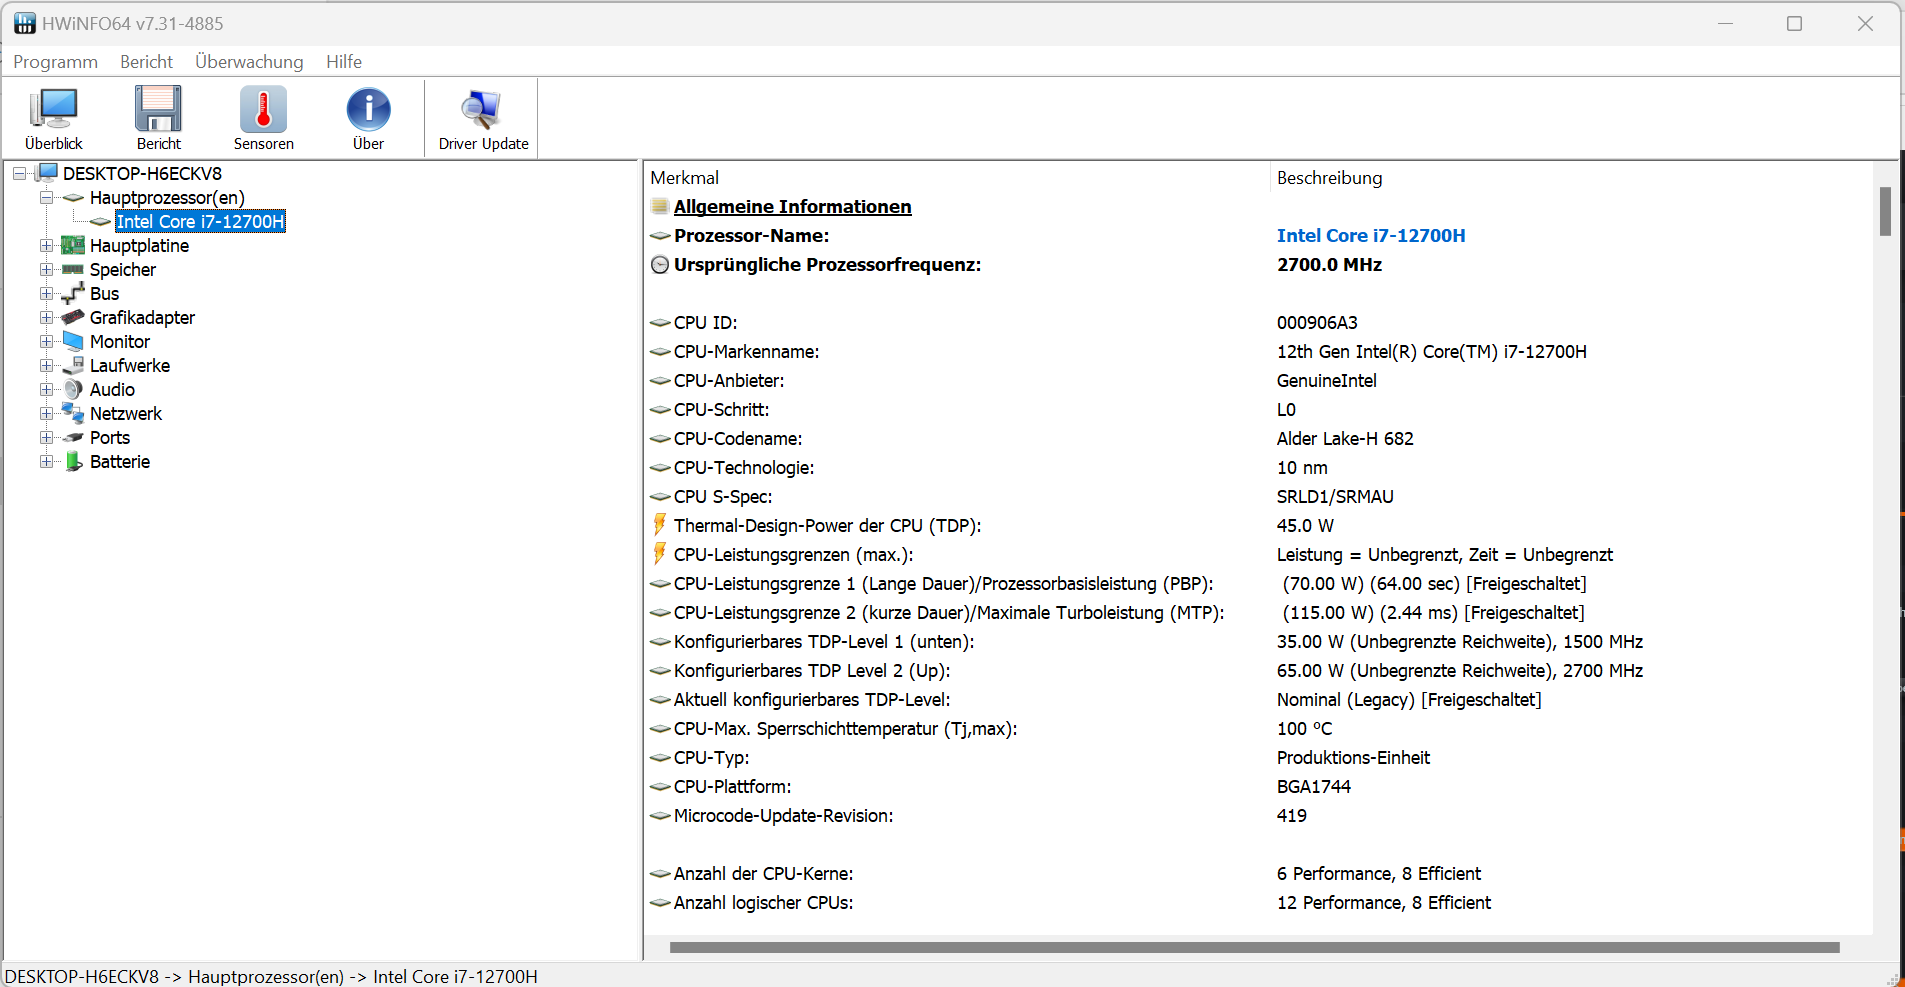
Na stronie Core i7-12700H (procesor Alder Lake) zawiera sześć rdzeni wydajnościowych (hyper-threading, 2,4 do 4,7 GHz) i osiem rdzeni efektywnościowych (bez hyper-threadingu, 1,8 do 3,5 GHz), co daje łącznie 20 logicznych rdzeni CPU.
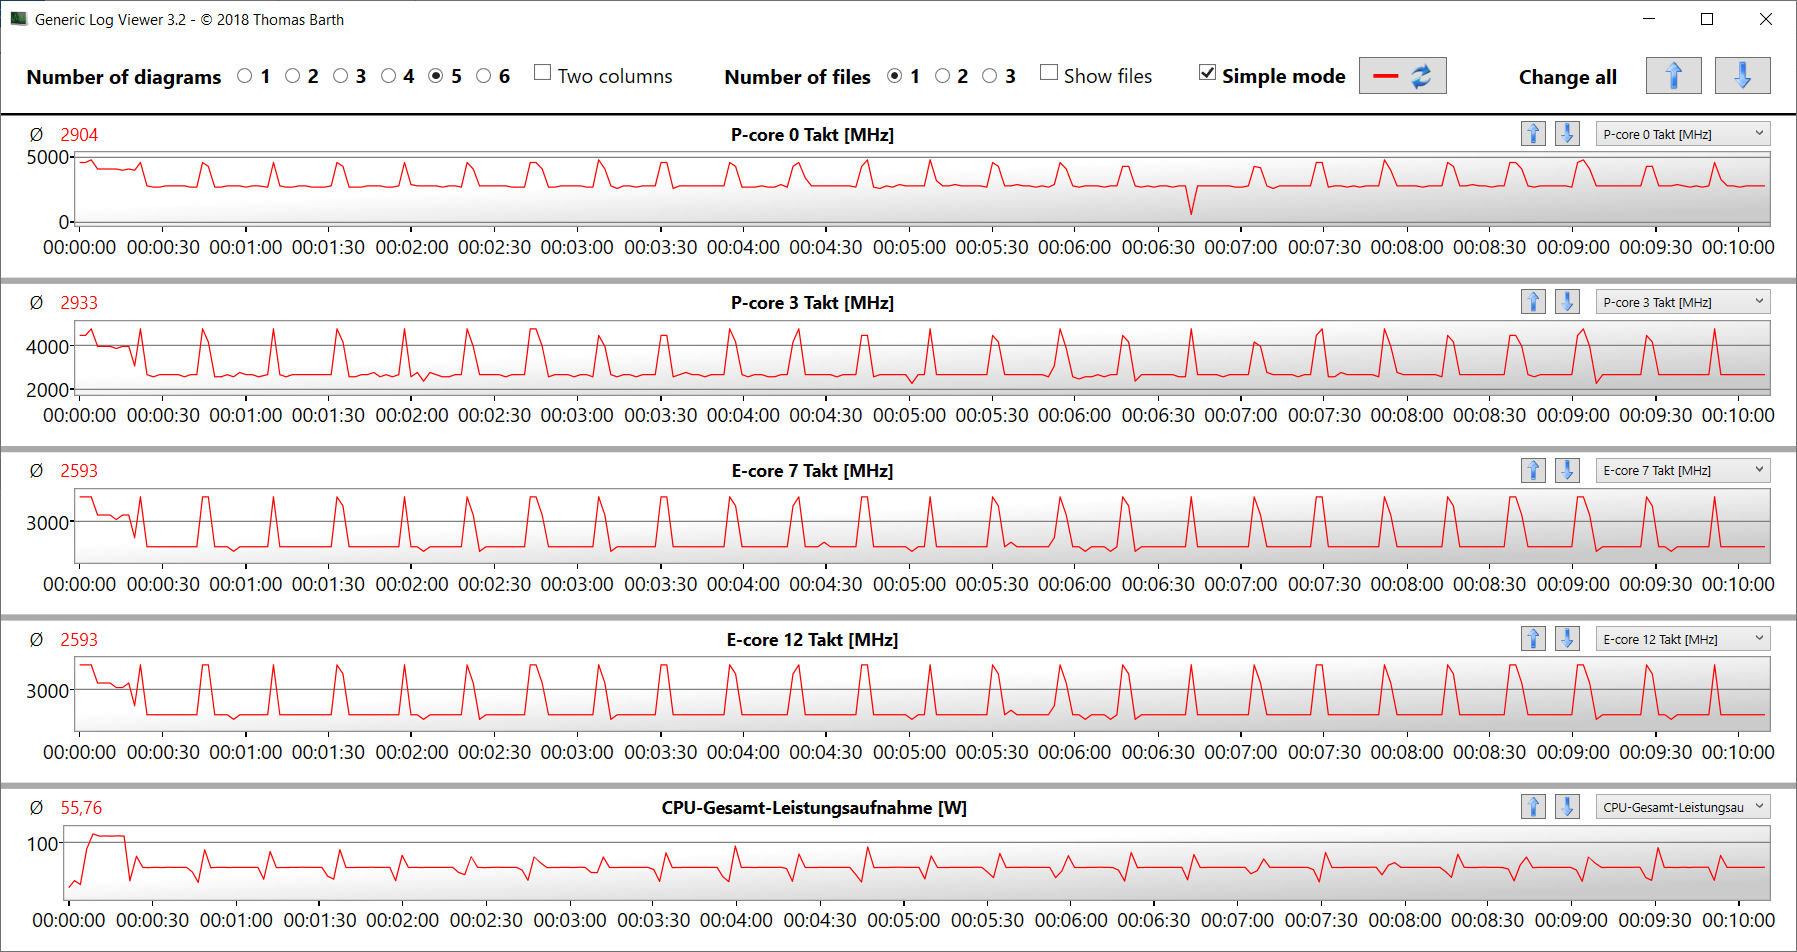
W teście wielowątkowym Cinebench R15 procesor działał krótko na wysokich obrotach (rdzenie P: 4,4 GHz, rdzenie E: 3,5 GHz), po czym ustabilizował się na nieco niższych częstotliwościach (rdzenie P: 3,5 do 3,8 GHz, rdzenie E: 3 do 3,2 GHz). Podczas testu jednowątkowego rdzenie P pracowały z częstotliwością od 4,4 do 4,7 GHz, a rdzenie E - z 3,5 GHz. Prędkości taktowania były znacznie niższe, kiedy laptop był na zasilaniu akumulatorowym. Ogólnie rzecz biorąc, Core i7 w Aorusie 15 XE5 uzyskał nieco ponadprzeciętne wyniki w benchmarkach.
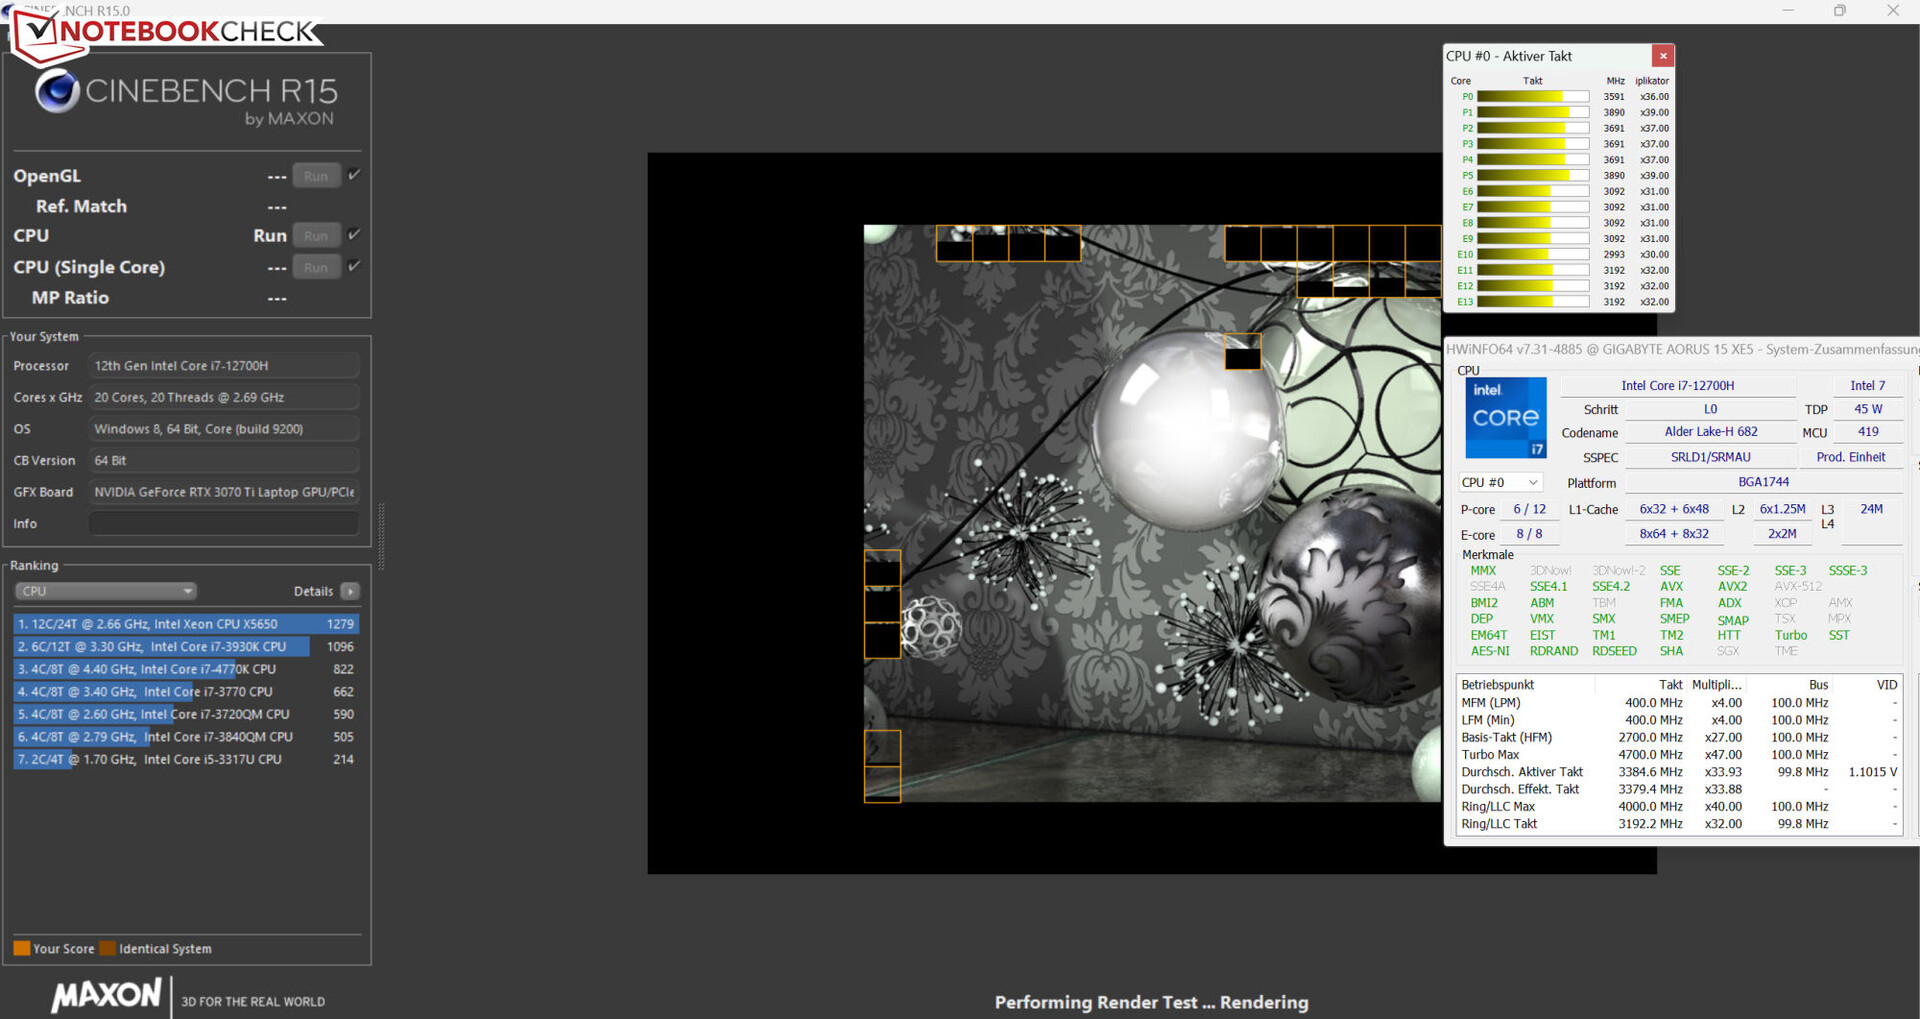
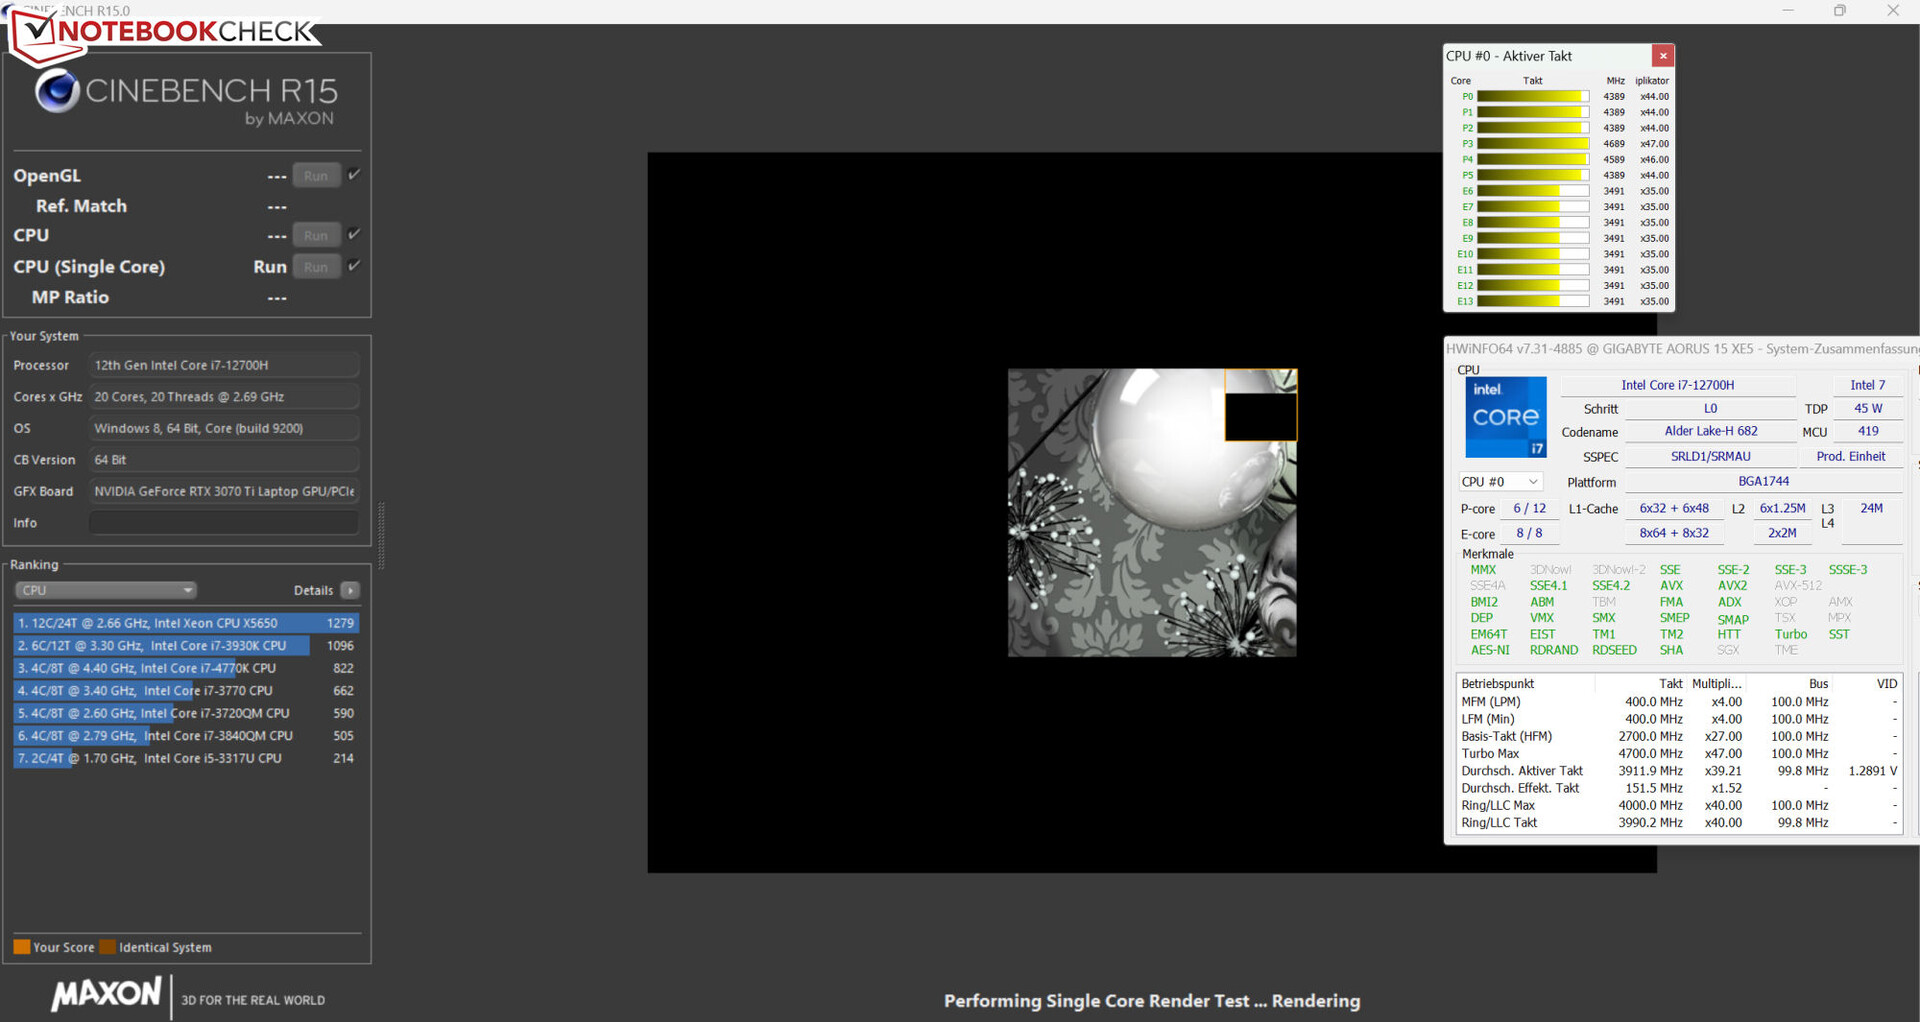
Uruchomiliśmy też w pętli test wielowątkowy w Cinebench R15, by ustalić, czy procesor jest w stanie utrzymać swoją prędkość turbo przez dłuższy czas. Procesor był w stanie utrzymać wysokie taktowanie tylko przez krótką chwilę. Następnie to przede wszystkim rdzenie P działały w środku zakresu turbo. Włączenie "trybu Turbo" powodowało niewielki wzrost wydajności procesora - nie w szczytowym momencie, a raczej średnio.
Cinebench R15 Multi Sustained Load
| CPU Performance rating - Percent | |
| Średnia w klasie Gaming | |
| Aorus 15 XE5 | |
| Aorus 15 XE5 | |
| MSI Katana GF66 12UGS | |
| Przeciętny Intel Core i7-12700H | |
| Asus TUF Dash F15 FX517ZR | |
| Acer Nitro 5 AN515-46-R1A1 | |
| Schenker XMG Fusion 15 (Mid 22) | |
| Cinebench R23 | |
| Multi Core | |
| Średnia w klasie Gaming (10488 - 40970, n=112, ostatnie 2 lata) | |
| MSI Katana GF66 12UGS | |
| Aorus 15 XE5 | |
| Aorus 15 XE5 (Turbo Mode) | |
| Przeciętny Intel Core i7-12700H (4032 - 19330, n=64) | |
| Acer Nitro 5 AN515-46-R1A1 | |
| Asus TUF Dash F15 FX517ZR | |
| Schenker XMG Fusion 15 (Mid 22) | |
| Single Core | |
| Średnia w klasie Gaming (1166 - 2356, n=112, ostatnie 2 lata) | |
| MSI Katana GF66 12UGS | |
| Asus TUF Dash F15 FX517ZR | |
| Aorus 15 XE5 | |
| Przeciętny Intel Core i7-12700H (778 - 1826, n=63) | |
| Aorus 15 XE5 (Turbo Mode) | |
| Acer Nitro 5 AN515-46-R1A1 | |
| Schenker XMG Fusion 15 (Mid 22) | |
| Cinebench R20 | |
| CPU (Multi Core) | |
| Średnia w klasie Gaming (4029 - 16108, n=111, ostatnie 2 lata) | |
| MSI Katana GF66 12UGS | |
| Aorus 15 XE5 (Turbo Mode) | |
| Aorus 15 XE5 | |
| Przeciętny Intel Core i7-12700H (1576 - 7407, n=64) | |
| Asus TUF Dash F15 FX517ZR | |
| Acer Nitro 5 AN515-46-R1A1 | |
| Schenker XMG Fusion 15 (Mid 22) | |
| CPU (Single Core) | |
| Średnia w klasie Gaming (442 - 895, n=111, ostatnie 2 lata) | |
| MSI Katana GF66 12UGS | |
| Asus TUF Dash F15 FX517ZR | |
| Aorus 15 XE5 | |
| Przeciętny Intel Core i7-12700H (300 - 704, n=64) | |
| Aorus 15 XE5 (Turbo Mode) | |
| Acer Nitro 5 AN515-46-R1A1 | |
| Schenker XMG Fusion 15 (Mid 22) | |
| Cinebench R15 | |
| CPU Multi 64Bit | |
| Średnia w klasie Gaming (1578 - 6271, n=111, ostatnie 2 lata) | |
| MSI Katana GF66 12UGS | |
| MSI Katana GF66 12UGS | |
| Aorus 15 XE5 | |
| Aorus 15 XE5 (Turbo Mode) | |
| Przeciętny Intel Core i7-12700H (1379 - 2916, n=70) | |
| Acer Nitro 5 AN515-46-R1A1 | |
| Asus TUF Dash F15 FX517ZR | |
| Schenker XMG Fusion 15 (Mid 22) | |
| CPU Single 64Bit | |
| Średnia w klasie Gaming (188.8 - 343, n=111, ostatnie 2 lata) | |
| MSI Katana GF66 12UGS | |
| MSI Katana GF66 12UGS | |
| Asus TUF Dash F15 FX517ZR | |
| Aorus 15 XE5 | |
| Aorus 15 XE5 (Turbo Mode) | |
| Przeciętny Intel Core i7-12700H (113 - 263, n=65) | |
| Acer Nitro 5 AN515-46-R1A1 | |
| Schenker XMG Fusion 15 (Mid 22) | |
| Blender - v2.79 BMW27 CPU | |
| Schenker XMG Fusion 15 (Mid 22) | |
| MSI Katana GF66 12UGS | |
| Aorus 15 XE5 | |
| Acer Nitro 5 AN515-46-R1A1 | |
| Asus TUF Dash F15 FX517ZR | |
| Przeciętny Intel Core i7-12700H (168 - 732, n=63) | |
| Aorus 15 XE5 (Turbo Mode) | |
| Średnia w klasie Gaming (80 - 330, n=109, ostatnie 2 lata) | |
| 7-Zip 18.03 | |
| 7z b 4 | |
| Średnia w klasie Gaming (33491 - 148086, n=110, ostatnie 2 lata) | |
| Aorus 15 XE5 (Turbo Mode) | |
| Acer Nitro 5 AN515-46-R1A1 | |
| Przeciętny Intel Core i7-12700H (22844 - 73067, n=63) | |
| Aorus 15 XE5 | |
| Asus TUF Dash F15 FX517ZR | |
| MSI Katana GF66 12UGS | |
| Schenker XMG Fusion 15 (Mid 22) | |
| 7z b 4 -mmt1 | |
| Średnia w klasie Gaming (4199 - 7436, n=110, ostatnie 2 lata) | |
| MSI Katana GF66 12UGS | |
| Asus TUF Dash F15 FX517ZR | |
| Aorus 15 XE5 | |
| Acer Nitro 5 AN515-46-R1A1 | |
| Przeciętny Intel Core i7-12700H (2743 - 5972, n=63) | |
| Aorus 15 XE5 (Turbo Mode) | |
| Schenker XMG Fusion 15 (Mid 22) | |
| Geekbench 5.5 | |
| Multi-Core | |
| Średnia w klasie Gaming (6460 - 27010, n=110, ostatnie 2 lata) | |
| Aorus 15 XE5 | |
| Aorus 15 XE5 (Turbo Mode) | |
| MSI Katana GF66 12UGS | |
| Przeciętny Intel Core i7-12700H (5144 - 13745, n=64) | |
| Asus TUF Dash F15 FX517ZR | |
| Acer Nitro 5 AN515-46-R1A1 | |
| Schenker XMG Fusion 15 (Mid 22) | |
| Single-Core | |
| Średnia w klasie Gaming (986 - 2474, n=110, ostatnie 2 lata) | |
| Asus TUF Dash F15 FX517ZR | |
| MSI Katana GF66 12UGS | |
| Przeciętny Intel Core i7-12700H (803 - 1851, n=64) | |
| Aorus 15 XE5 | |
| Aorus 15 XE5 (Turbo Mode) | |
| Schenker XMG Fusion 15 (Mid 22) | |
| Acer Nitro 5 AN515-46-R1A1 | |
| HWBOT x265 Benchmark v2.2 - 4k Preset | |
| Średnia w klasie Gaming (11.5 - 44.3, n=110, ostatnie 2 lata) | |
| Aorus 15 XE5 (Turbo Mode) | |
| Acer Nitro 5 AN515-46-R1A1 | |
| Asus TUF Dash F15 FX517ZR | |
| Przeciętny Intel Core i7-12700H (4.67 - 21.8, n=64) | |
| Aorus 15 XE5 | |
| MSI Katana GF66 12UGS | |
| Schenker XMG Fusion 15 (Mid 22) | |
| LibreOffice - 20 Documents To PDF | |
| Acer Nitro 5 AN515-46-R1A1 | |
| Średnia w klasie Gaming (19 - 88.8, n=110, ostatnie 2 lata) | |
| Schenker XMG Fusion 15 (Mid 22) | |
| Przeciętny Intel Core i7-12700H (34.2 - 95.3, n=63) | |
| Asus TUF Dash F15 FX517ZR | |
| Aorus 15 XE5 (Turbo Mode) | |
| Aorus 15 XE5 | |
| MSI Katana GF66 12UGS | |
| R Benchmark 2.5 - Overall mean | |
| Schenker XMG Fusion 15 (Mid 22) | |
| Acer Nitro 5 AN515-46-R1A1 | |
| Aorus 15 XE5 (Turbo Mode) | |
| Przeciętny Intel Core i7-12700H (0.4441 - 1.052, n=63) | |
| Aorus 15 XE5 | |
| Asus TUF Dash F15 FX517ZR | |
| MSI Katana GF66 12UGS | |
| Średnia w klasie Gaming (0.3439 - 0.759, n=111, ostatnie 2 lata) | |
* ... im mniej tym lepiej
AIDA64: FP32 Ray-Trace | FPU Julia | CPU SHA3 | CPU Queen | FPU SinJulia | FPU Mandel | CPU AES | CPU ZLib | FP64 Ray-Trace | CPU PhotoWorxx
| Performance rating | |
| Średnia w klasie Gaming | |
| Acer Nitro 5 AN515-46-R1A1 | |
| Aorus 15 XE5 | |
| Aorus 15 XE5 | |
| Schenker XMG Fusion 15 (Mid 22) | |
| Asus TUF Dash F15 FX517ZR | |
| Przeciętny Intel Core i7-12700H | |
| MSI Katana GF66 12UGS | |
| AIDA64 / FP32 Ray-Trace | |
| Średnia w klasie Gaming (10227 - 85542, n=109, ostatnie 2 lata) | |
| Acer Nitro 5 AN515-46-R1A1 (v6.75.6100) | |
| Aorus 15 XE5 (v6.75.6100, Turbo Mode) | |
| Asus TUF Dash F15 FX517ZR (v6.70.6000) | |
| Aorus 15 XE5 (v6.75.6100) | |
| Schenker XMG Fusion 15 (Mid 22) (v6.70.6000) | |
| Przeciętny Intel Core i7-12700H (2585 - 17957, n=64) | |
| MSI Katana GF66 12UGS (v6.50.5800) | |
| AIDA64 / FPU Julia | |
| Średnia w klasie Gaming (51376 - 238426, n=109, ostatnie 2 lata) | |
| Acer Nitro 5 AN515-46-R1A1 (v6.75.6100) | |
| Aorus 15 XE5 (v6.75.6100, Turbo Mode) | |
| Asus TUF Dash F15 FX517ZR (v6.70.6000) | |
| Aorus 15 XE5 (v6.75.6100) | |
| Schenker XMG Fusion 15 (Mid 22) (v6.70.6000) | |
| Przeciętny Intel Core i7-12700H (12439 - 90760, n=64) | |
| MSI Katana GF66 12UGS (v6.50.5800) | |
| AIDA64 / CPU SHA3 | |
| Średnia w klasie Gaming (2180 - 9817, n=109, ostatnie 2 lata) | |
| Schenker XMG Fusion 15 (Mid 22) (v6.70.6000) | |
| Aorus 15 XE5 (v6.75.6100, Turbo Mode) | |
| Acer Nitro 5 AN515-46-R1A1 (v6.75.6100) | |
| Przeciętny Intel Core i7-12700H (833 - 4242, n=64) | |
| MSI Katana GF66 12UGS (v6.50.5800) | |
| Aorus 15 XE5 (v6.75.6100) | |
| Asus TUF Dash F15 FX517ZR (v6.70.6000) | |
| AIDA64 / CPU Queen | |
| Średnia w klasie Gaming (49785 - 173351, n=100, ostatnie 2 lata) | |
| Acer Nitro 5 AN515-46-R1A1 (v6.75.6100) | |
| Aorus 15 XE5 (v6.75.6100) | |
| Aorus 15 XE5 (v6.75.6100, Turbo Mode) | |
| MSI Katana GF66 12UGS (v6.50.5800) | |
| Przeciętny Intel Core i7-12700H (57923 - 103202, n=63) | |
| Asus TUF Dash F15 FX517ZR (v6.70.6000) | |
| Schenker XMG Fusion 15 (Mid 22) | |
| AIDA64 / FPU SinJulia | |
| Średnia w klasie Gaming (4424 - 33636, n=109, ostatnie 2 lata) | |
| Acer Nitro 5 AN515-46-R1A1 (v6.75.6100) | |
| MSI Katana GF66 12UGS (v6.50.5800) | |
| Aorus 15 XE5 (v6.75.6100, Turbo Mode) | |
| Przeciętny Intel Core i7-12700H (3249 - 9939, n=64) | |
| Schenker XMG Fusion 15 (Mid 22) (v6.70.6000) | |
| Asus TUF Dash F15 FX517ZR (v6.70.6000) | |
| Aorus 15 XE5 (v6.75.6100) | |
| AIDA64 / FPU Mandel | |
| Średnia w klasie Gaming (25115 - 128721, n=109, ostatnie 2 lata) | |
| Acer Nitro 5 AN515-46-R1A1 (v6.75.6100) | |
| Schenker XMG Fusion 15 (Mid 22) (v6.70.6000) | |
| Aorus 15 XE5 (v6.75.6100, Turbo Mode) | |
| Asus TUF Dash F15 FX517ZR (v6.70.6000) | |
| Aorus 15 XE5 (v6.75.6100) | |
| Przeciętny Intel Core i7-12700H (7135 - 44760, n=64) | |
| MSI Katana GF66 12UGS (v6.50.5800) | |
| AIDA64 / CPU AES | |
| Schenker XMG Fusion 15 (Mid 22) (v6.70.6000) | |
| Acer Nitro 5 AN515-46-R1A1 | |
| Aorus 15 XE5 (v6.75.6100, Turbo Mode) | |
| Aorus 15 XE5 (v6.75.6100) | |
| Średnia w klasie Gaming (39258 - 247074, n=109, ostatnie 2 lata) | |
| MSI Katana GF66 12UGS (v6.50.5800) | |
| Przeciętny Intel Core i7-12700H (31839 - 144360, n=64) | |
| Asus TUF Dash F15 FX517ZR (v6.70.6000) | |
| AIDA64 / CPU ZLib | |
| Średnia w klasie Gaming (574 - 2531, n=109, ostatnie 2 lata) | |
| MSI Katana GF66 12UGS (v6.50.5800) | |
| Aorus 15 XE5 (v6.75.6100, Turbo Mode) | |
| Przeciętny Intel Core i7-12700H (305 - 1171, n=64) | |
| Asus TUF Dash F15 FX517ZR (v6.70.6000) | |
| Acer Nitro 5 AN515-46-R1A1 (v6.75.6100) | |
| Aorus 15 XE5 (v6.75.6100) | |
| Schenker XMG Fusion 15 (Mid 22) (v6.70.6000) | |
| AIDA64 / FP64 Ray-Trace | |
| Średnia w klasie Gaming (5509 - 45446, n=109, ostatnie 2 lata) | |
| Acer Nitro 5 AN515-46-R1A1 (v6.75.6100) | |
| Aorus 15 XE5 (v6.75.6100, Turbo Mode) | |
| Asus TUF Dash F15 FX517ZR (v6.70.6000) | |
| Schenker XMG Fusion 15 (Mid 22) (v6.70.6000) | |
| Aorus 15 XE5 (v6.75.6100) | |
| Przeciętny Intel Core i7-12700H (1437 - 9692, n=64) | |
| MSI Katana GF66 12UGS (v6.50.5800) | |
| AIDA64 / CPU PhotoWorxx | |
| Średnia w klasie Gaming (12271 - 89891, n=109, ostatnie 2 lata) | |
| Aorus 15 XE5 (v6.75.6100, Turbo Mode) | |
| Aorus 15 XE5 (v6.75.6100) | |
| Asus TUF Dash F15 FX517ZR (v6.70.6000) | |
| Przeciętny Intel Core i7-12700H (12863 - 52207, n=64) | |
| Acer Nitro 5 AN515-46-R1A1 | |
| MSI Katana GF66 12UGS (v6.50.5800) | |
| Schenker XMG Fusion 15 (Mid 22) (v6.70.6000) | |
Wydajność systemu
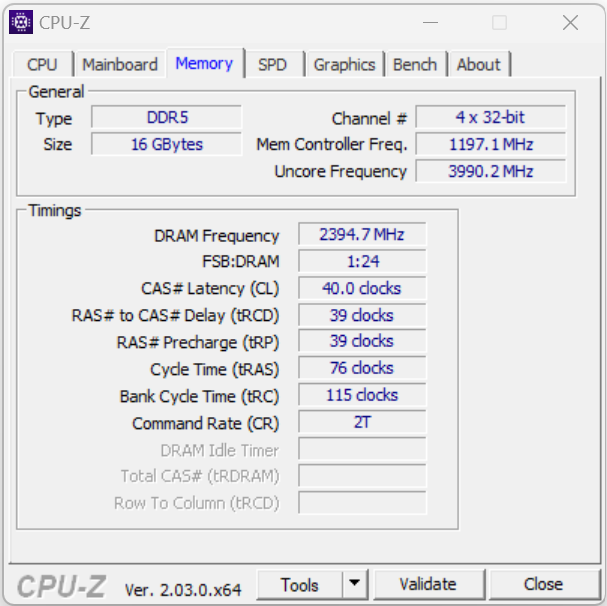
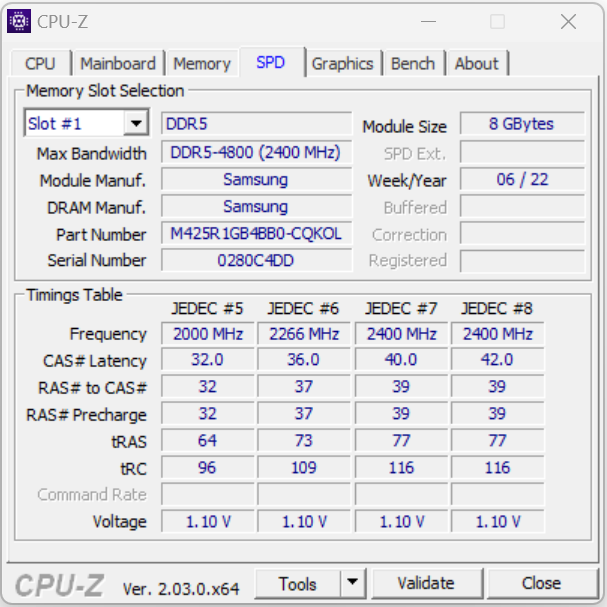
System działa płynnie i oferuje wystarczającą moc obliczeniową do wymagających zastosowań, takich jak renderowanie, edycja wideo i gry. Laptopowi udało się uzyskać świetne wyniki w programie PCMark. Szybkość transferu danych w pamięci RAM jest dość typowa dla pamięci DDR5-4800.
CrossMark: Overall | Productivity | Creativity | Responsiveness
| PCMark 10 / Score | |
| Średnia w klasie Gaming (5828 - 11574, n=95, ostatnie 2 lata) | |
| Aorus 15 XE5 | |
| Przeciętny Intel Core i7-12700H, NVIDIA GeForce RTX 3070 Ti Laptop GPU (6941 - 7947, n=11) | |
| MSI Katana GF66 12UGS | |
| Asus TUF Dash F15 FX517ZR | |
| Acer Nitro 5 AN515-46-R1A1 | |
| Schenker XMG Fusion 15 (Mid 22) | |
| PCMark 10 / Essentials | |
| Aorus 15 XE5 | |
| Średnia w klasie Gaming (8810 - 12600, n=99, ostatnie 2 lata) | |
| Przeciętny Intel Core i7-12700H, NVIDIA GeForce RTX 3070 Ti Laptop GPU (9892 - 10935, n=11) | |
| MSI Katana GF66 12UGS | |
| Acer Nitro 5 AN515-46-R1A1 | |
| Asus TUF Dash F15 FX517ZR | |
| Schenker XMG Fusion 15 (Mid 22) | |
| PCMark 10 / Productivity | |
| Średnia w klasie Gaming (6845 - 18766, n=97, ostatnie 2 lata) | |
| Aorus 15 XE5 | |
| MSI Katana GF66 12UGS | |
| Przeciętny Intel Core i7-12700H, NVIDIA GeForce RTX 3070 Ti Laptop GPU (9024 - 10638, n=11) | |
| Asus TUF Dash F15 FX517ZR | |
| Acer Nitro 5 AN515-46-R1A1 | |
| Schenker XMG Fusion 15 (Mid 22) | |
| PCMark 10 / Digital Content Creation | |
| Średnia w klasie Gaming (7602 - 19657, n=97, ostatnie 2 lata) | |
| Przeciętny Intel Core i7-12700H, NVIDIA GeForce RTX 3070 Ti Laptop GPU (10165 - 12546, n=11) | |
| Aorus 15 XE5 | |
| MSI Katana GF66 12UGS | |
| Asus TUF Dash F15 FX517ZR | |
| Acer Nitro 5 AN515-46-R1A1 | |
| Schenker XMG Fusion 15 (Mid 22) | |
| CrossMark / Overall | |
| Średnia w klasie Gaming (1366 - 2409, n=97, ostatnie 2 lata) | |
| Aorus 15 XE5 | |
| MSI Katana GF66 12UGS | |
| Przeciętny Intel Core i7-12700H, NVIDIA GeForce RTX 3070 Ti Laptop GPU (974 - 2000, n=12) | |
| Asus TUF Dash F15 FX517ZR | |
| Schenker XMG Fusion 15 (Mid 22) | |
| Acer Nitro 5 AN515-46-R1A1 | |
| CrossMark / Productivity | |
| MSI Katana GF66 12UGS | |
| Aorus 15 XE5 | |
| Średnia w klasie Gaming (1386 - 2254, n=97, ostatnie 2 lata) | |
| Przeciętny Intel Core i7-12700H, NVIDIA GeForce RTX 3070 Ti Laptop GPU (907 - 1962, n=12) | |
| Asus TUF Dash F15 FX517ZR | |
| Schenker XMG Fusion 15 (Mid 22) | |
| Acer Nitro 5 AN515-46-R1A1 | |
| CrossMark / Creativity | |
| Średnia w klasie Gaming (1343 - 2729, n=97, ostatnie 2 lata) | |
| Asus TUF Dash F15 FX517ZR | |
| Aorus 15 XE5 | |
| MSI Katana GF66 12UGS | |
| Przeciętny Intel Core i7-12700H, NVIDIA GeForce RTX 3070 Ti Laptop GPU (1027 - 2057, n=12) | |
| Schenker XMG Fusion 15 (Mid 22) | |
| Acer Nitro 5 AN515-46-R1A1 | |
| CrossMark / Responsiveness | |
| MSI Katana GF66 12UGS | |
| Aorus 15 XE5 | |
| Przeciętny Intel Core i7-12700H, NVIDIA GeForce RTX 3070 Ti Laptop GPU (1029 - 2142, n=12) | |
| Średnia w klasie Gaming (1226 - 2334, n=97, ostatnie 2 lata) | |
| Schenker XMG Fusion 15 (Mid 22) | |
| Asus TUF Dash F15 FX517ZR | |
| Acer Nitro 5 AN515-46-R1A1 | |
| PCMark 8 Home Score Accelerated v2 | 5280 pkt. | |
| PCMark 8 Work Score Accelerated v2 | 6287 pkt. | |
| PCMark 10 Score | 7695 pkt. | |
Pomoc | ||
| AIDA64 / Memory Copy | |
| Średnia w klasie Gaming (21750 - 129946, n=109, ostatnie 2 lata) | |
| Przeciętny Intel Core i7-12700H (25615 - 80511, n=64) | |
| Asus TUF Dash F15 FX517ZR | |
| Aorus 15 XE5 | |
| Acer Nitro 5 AN515-46-R1A1 | |
| Schenker XMG Fusion 15 (Mid 22) | |
| MSI Katana GF66 12UGS | |
| AIDA64 / Memory Read | |
| Średnia w klasie Gaming (22956 - 118858, n=109, ostatnie 2 lata) | |
| Asus TUF Dash F15 FX517ZR | |
| Aorus 15 XE5 | |
| Przeciętny Intel Core i7-12700H (25586 - 79442, n=64) | |
| Acer Nitro 5 AN515-46-R1A1 | |
| Schenker XMG Fusion 15 (Mid 22) | |
| MSI Katana GF66 12UGS | |
| AIDA64 / Memory Write | |
| Średnia w klasie Gaming (22297 - 135096, n=109, ostatnie 2 lata) | |
| Asus TUF Dash F15 FX517ZR | |
| Aorus 15 XE5 | |
| Acer Nitro 5 AN515-46-R1A1 | |
| Przeciętny Intel Core i7-12700H (23679 - 88660, n=64) | |
| MSI Katana GF66 12UGS | |
| Schenker XMG Fusion 15 (Mid 22) | |
| AIDA64 / Memory Latency | |
| Średnia w klasie Gaming (75.3 - 259, n=109, ostatnie 2 lata) | |
| MSI Katana GF66 12UGS | |
| Asus TUF Dash F15 FX517ZR | |
| Aorus 15 XE5 | |
| Schenker XMG Fusion 15 (Mid 22) | |
| Acer Nitro 5 AN515-46-R1A1 | |
| Przeciętny Intel Core i7-12700H (76.2 - 133.9, n=62) | |
* ... im mniej tym lepiej
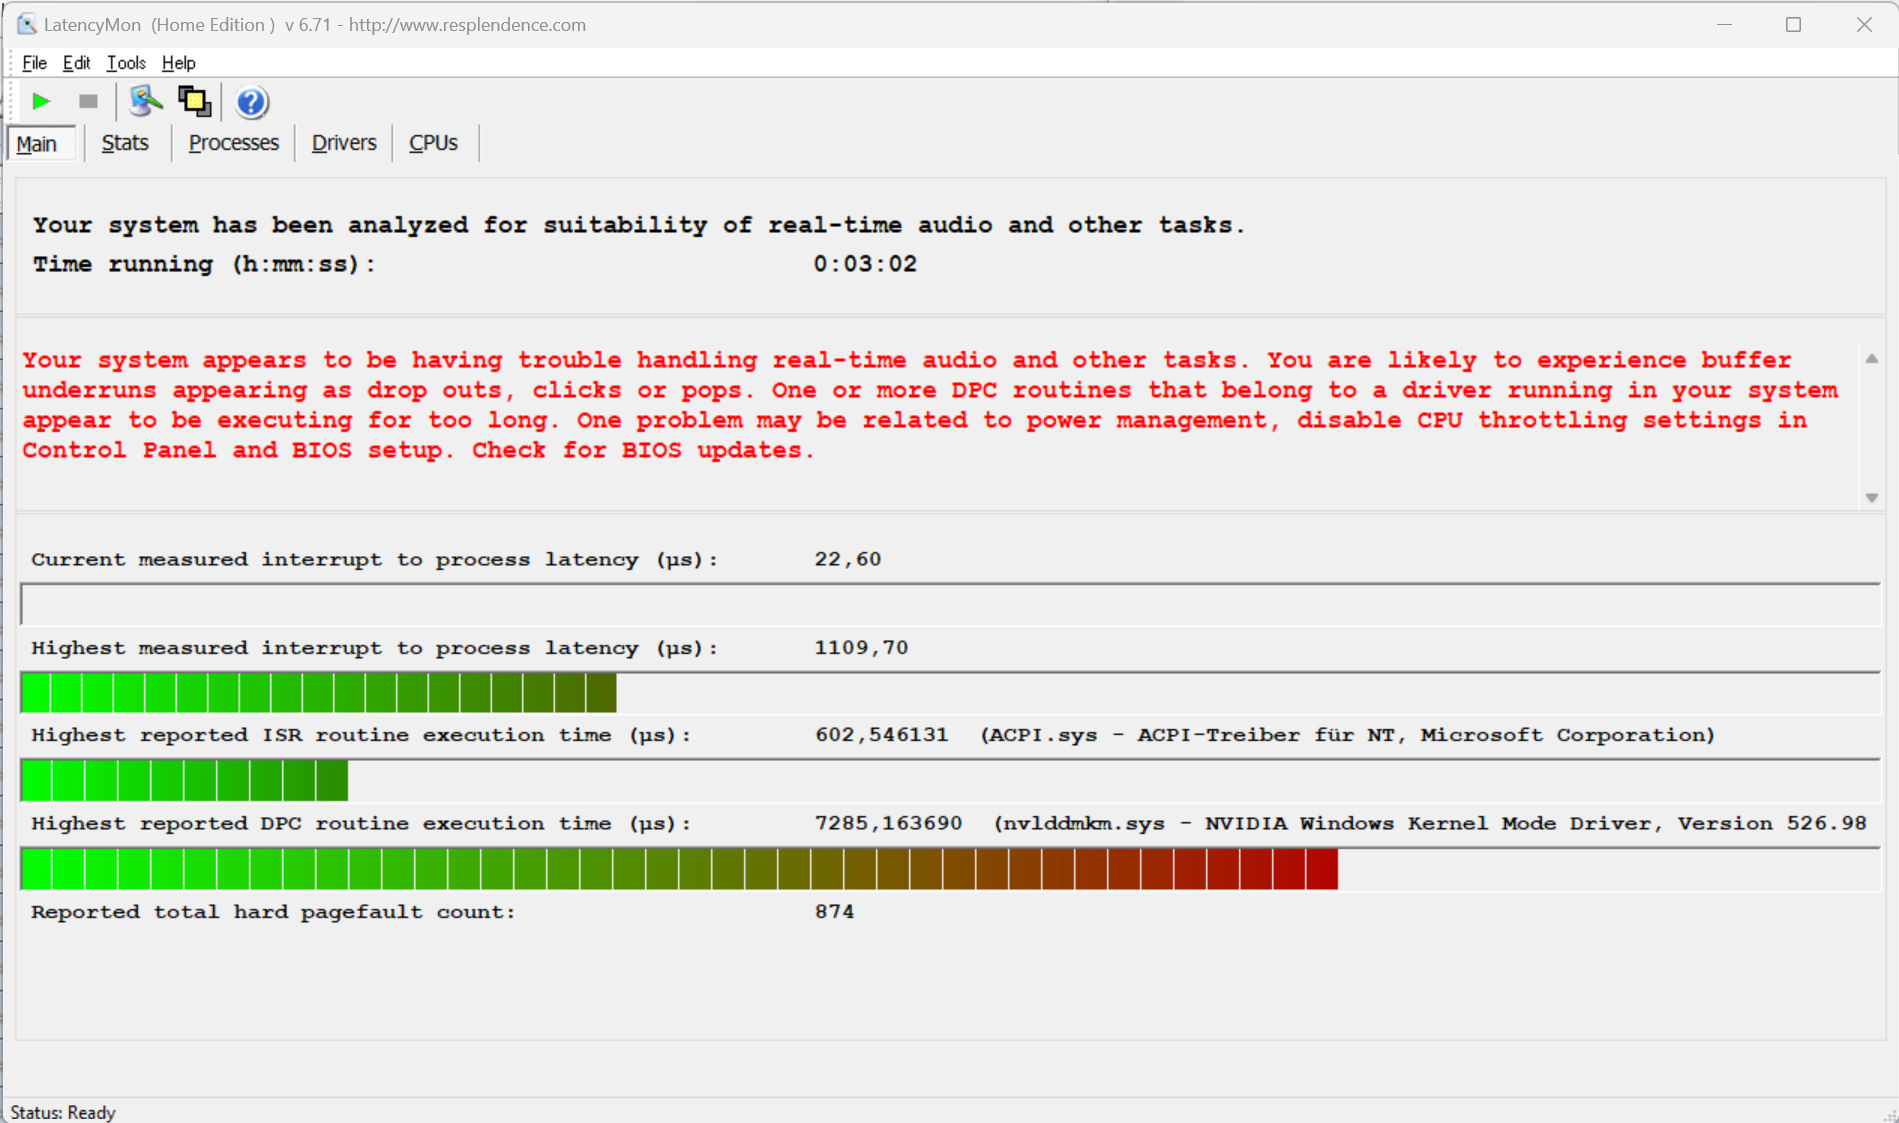
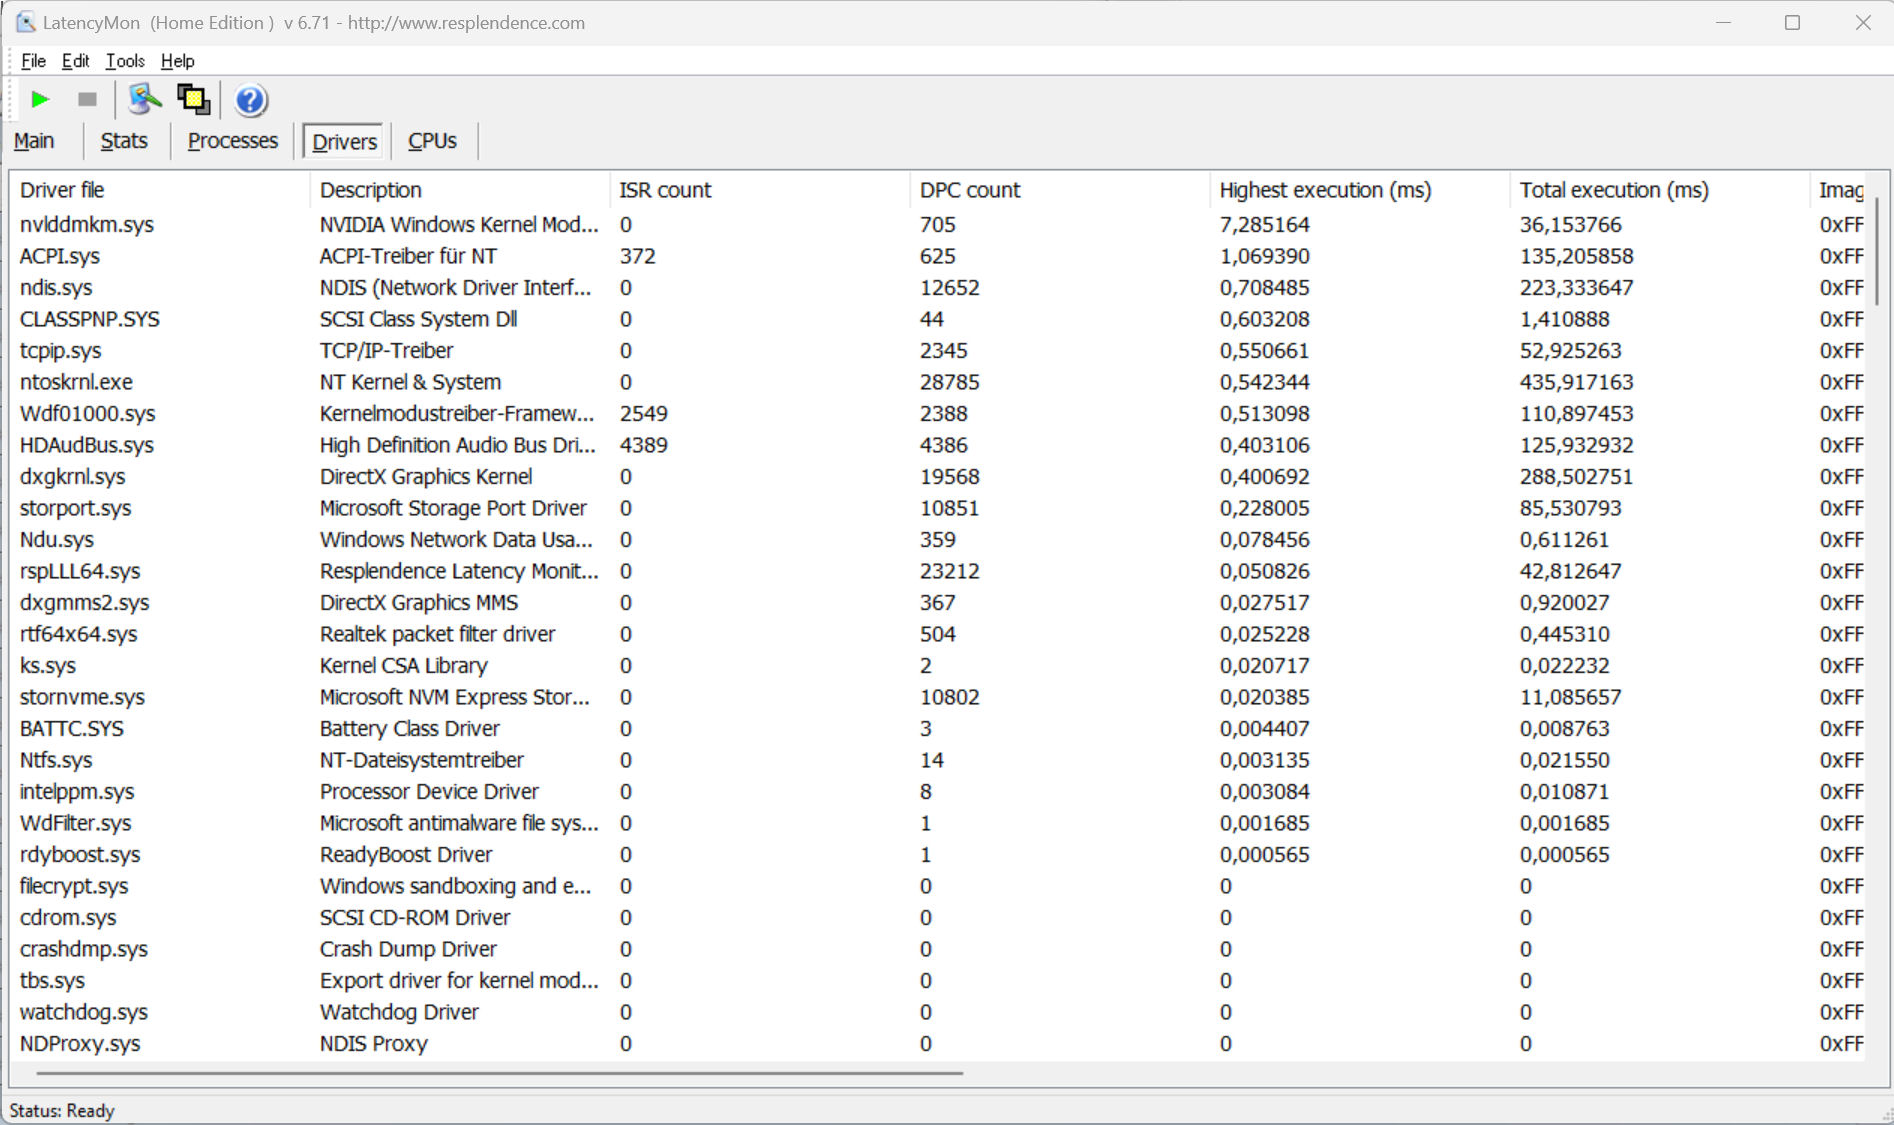
Opóźnienie DPC
Nasz standardowy test monitora latencji (przeglądanie stron internetowych, odtwarzanie wideo w 4K, Prime95 na wysokim obciążeniu) ujawnił pewne problemy z systemem. Choć laptop nie ma przesadnie wysokiej latencji, wydaje się, że ma problem ze sterownikami. Miejmy nadzieję, że przyszłe aktualizacje oprogramowania wyprasują ten problem.
| DPC Latencies / LatencyMon - interrupt to process latency (max), Web, Youtube, Prime95 | |
| Acer Nitro 5 AN515-46-R1A1 | |
| Schenker XMG Fusion 15 (Mid 22) | |
| Aorus 15 XE5 | |
| MSI Katana GF66 12UGS | |
| Asus TUF Dash F15 FX517ZR | |
* ... im mniej tym lepiej
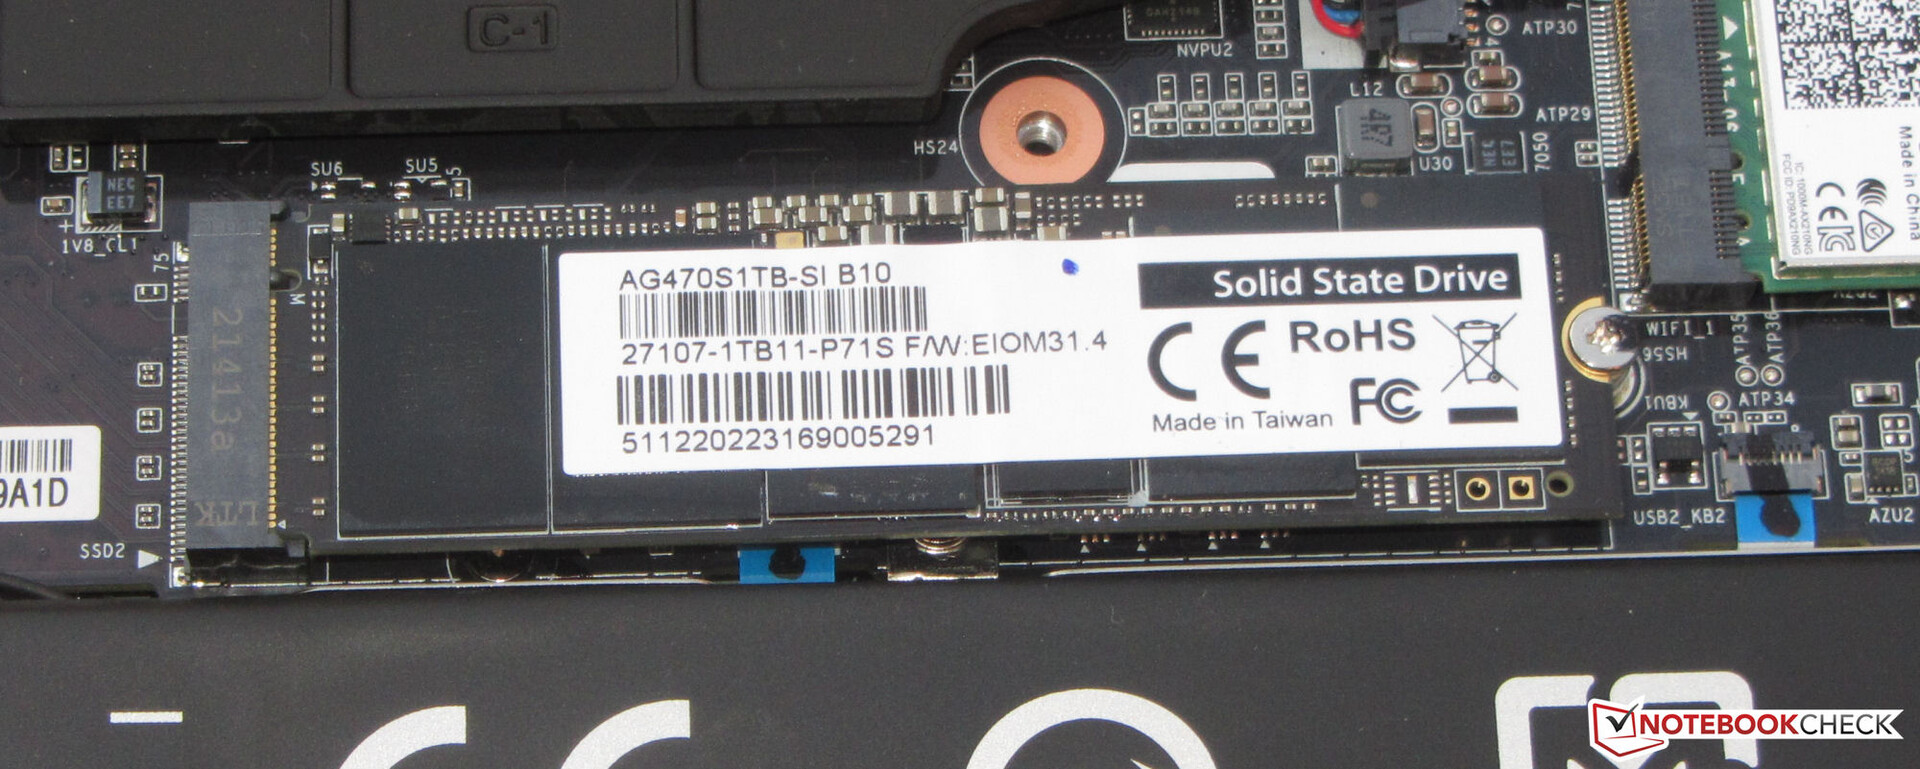
Pamięć masowa
Gigabyte wyposażył model Aorus 15 XE5 w dysk SSD PCIe 4.0 (1 TB, M.2 2280) własnej produkcji. Ten dysk magazynowy zapewnia doskonałe prędkości transferu. Laptop posiada też wolne gniazdo M.2 2280, do którego można dołożyć drugi dysk SSD PCIe 4.0.

| Drive Performance rating - Percent | |
| Aorus 15 XE5 | |
| Przeciętny Gigabyte AG470S1TB-SI B10 | |
| Schenker XMG Fusion 15 (Mid 22) | |
| Średnia w klasie Gaming | |
| Acer Nitro 5 AN515-46-R1A1 | |
| MSI Katana GF66 12UGS | |
| Asus TUF Dash F15 FX517ZR | |
* ... im mniej tym lepiej
Sustained Read: DiskSpd Read Loop, Queue Depth 8
Karta graficzna
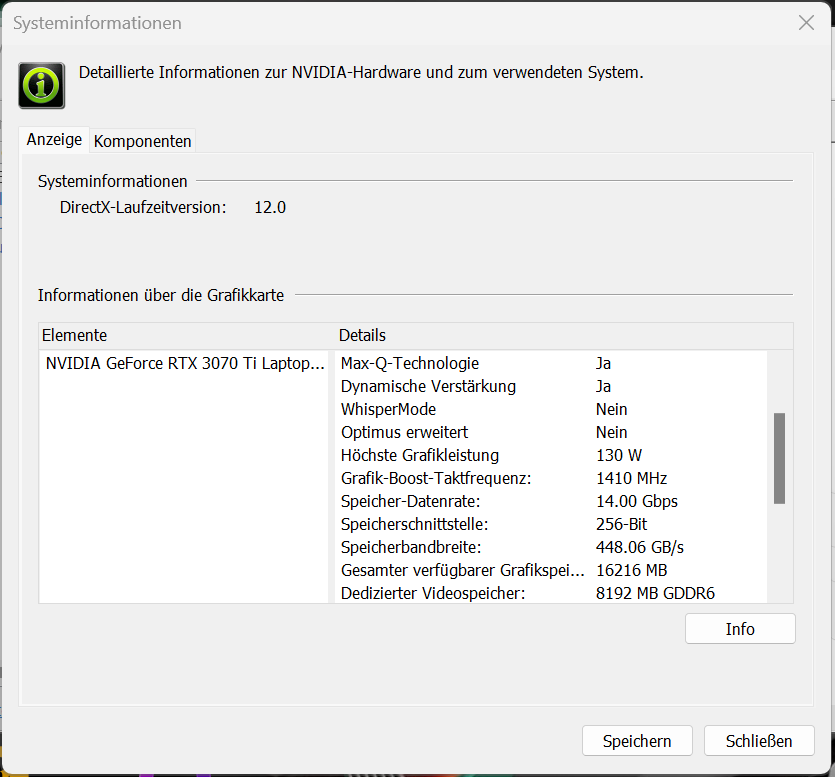
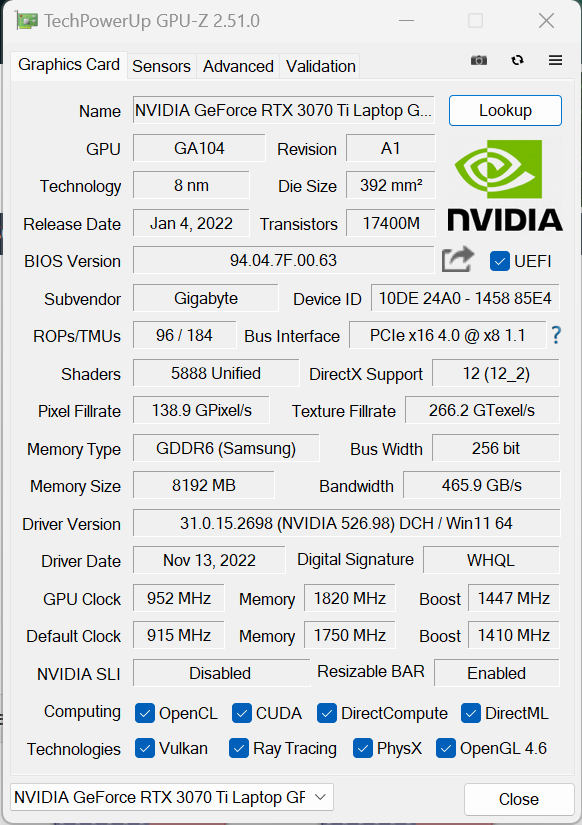
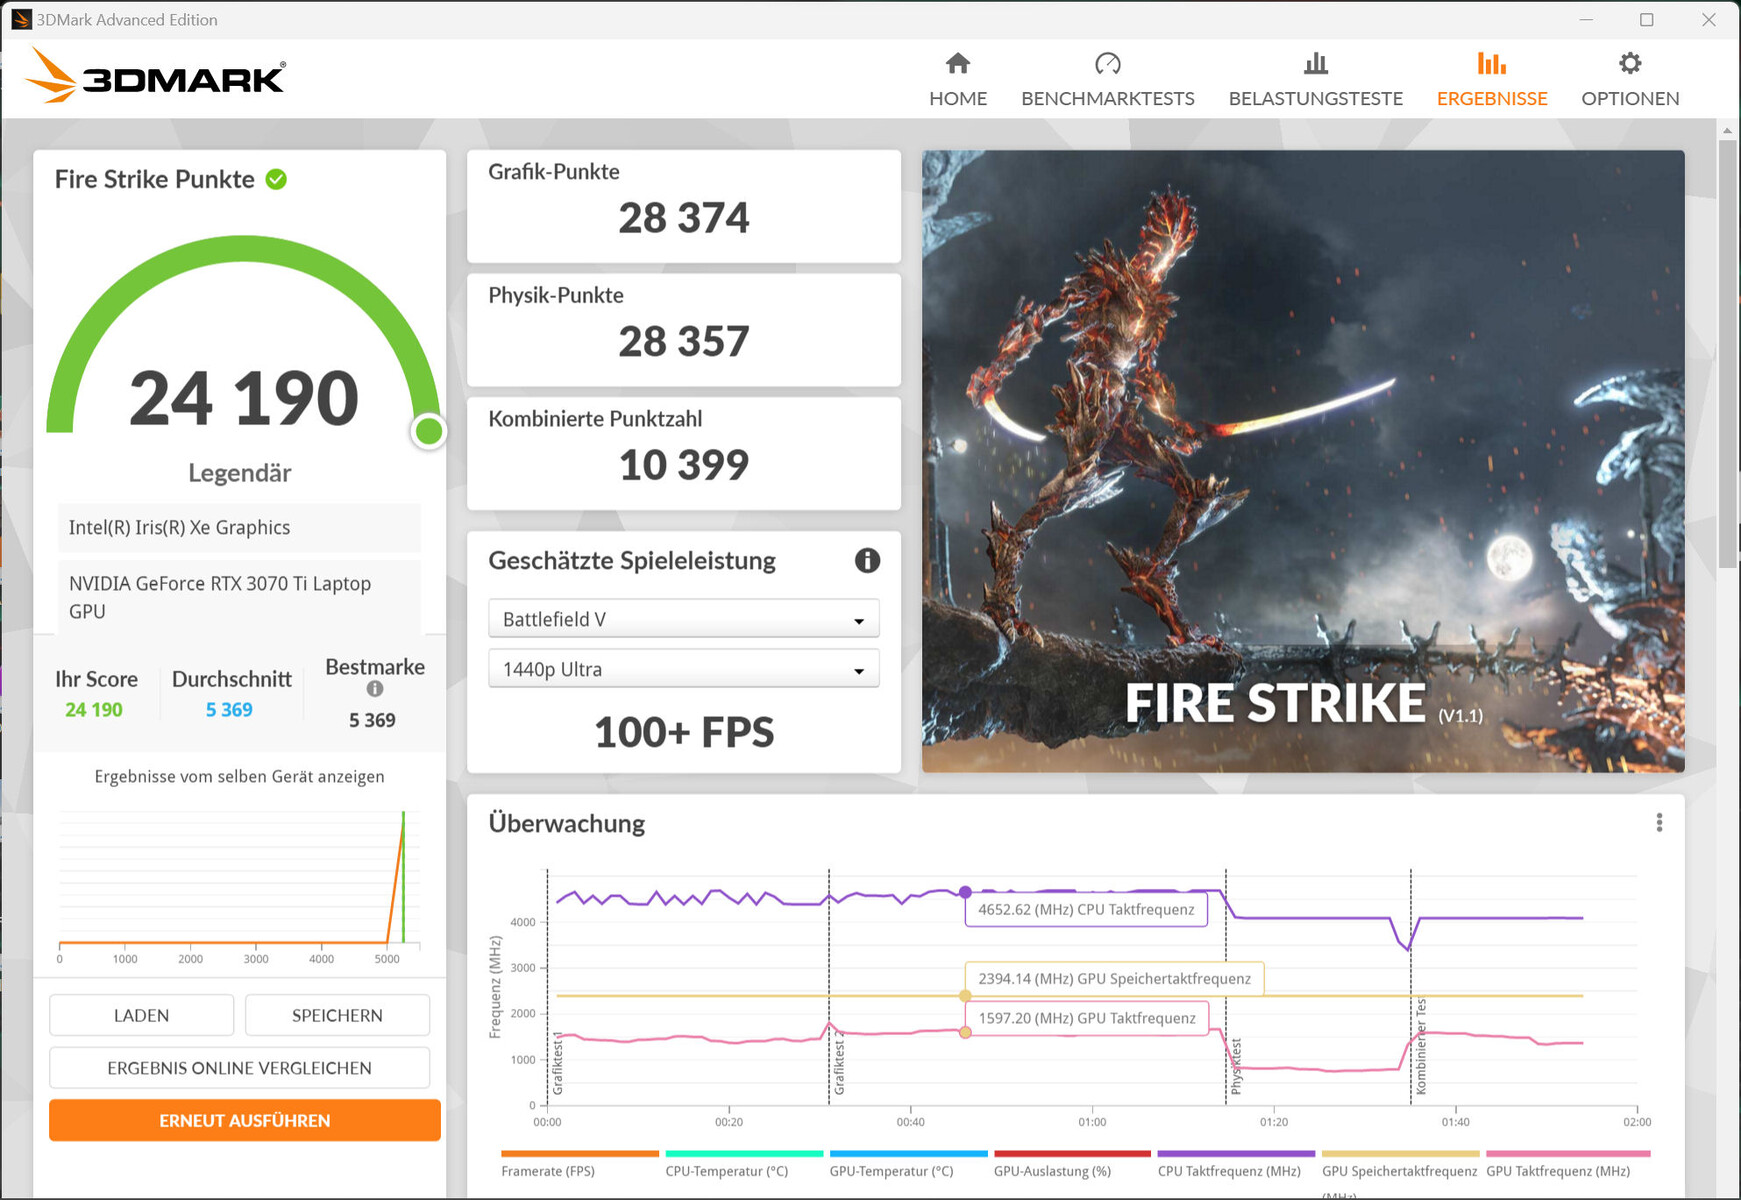
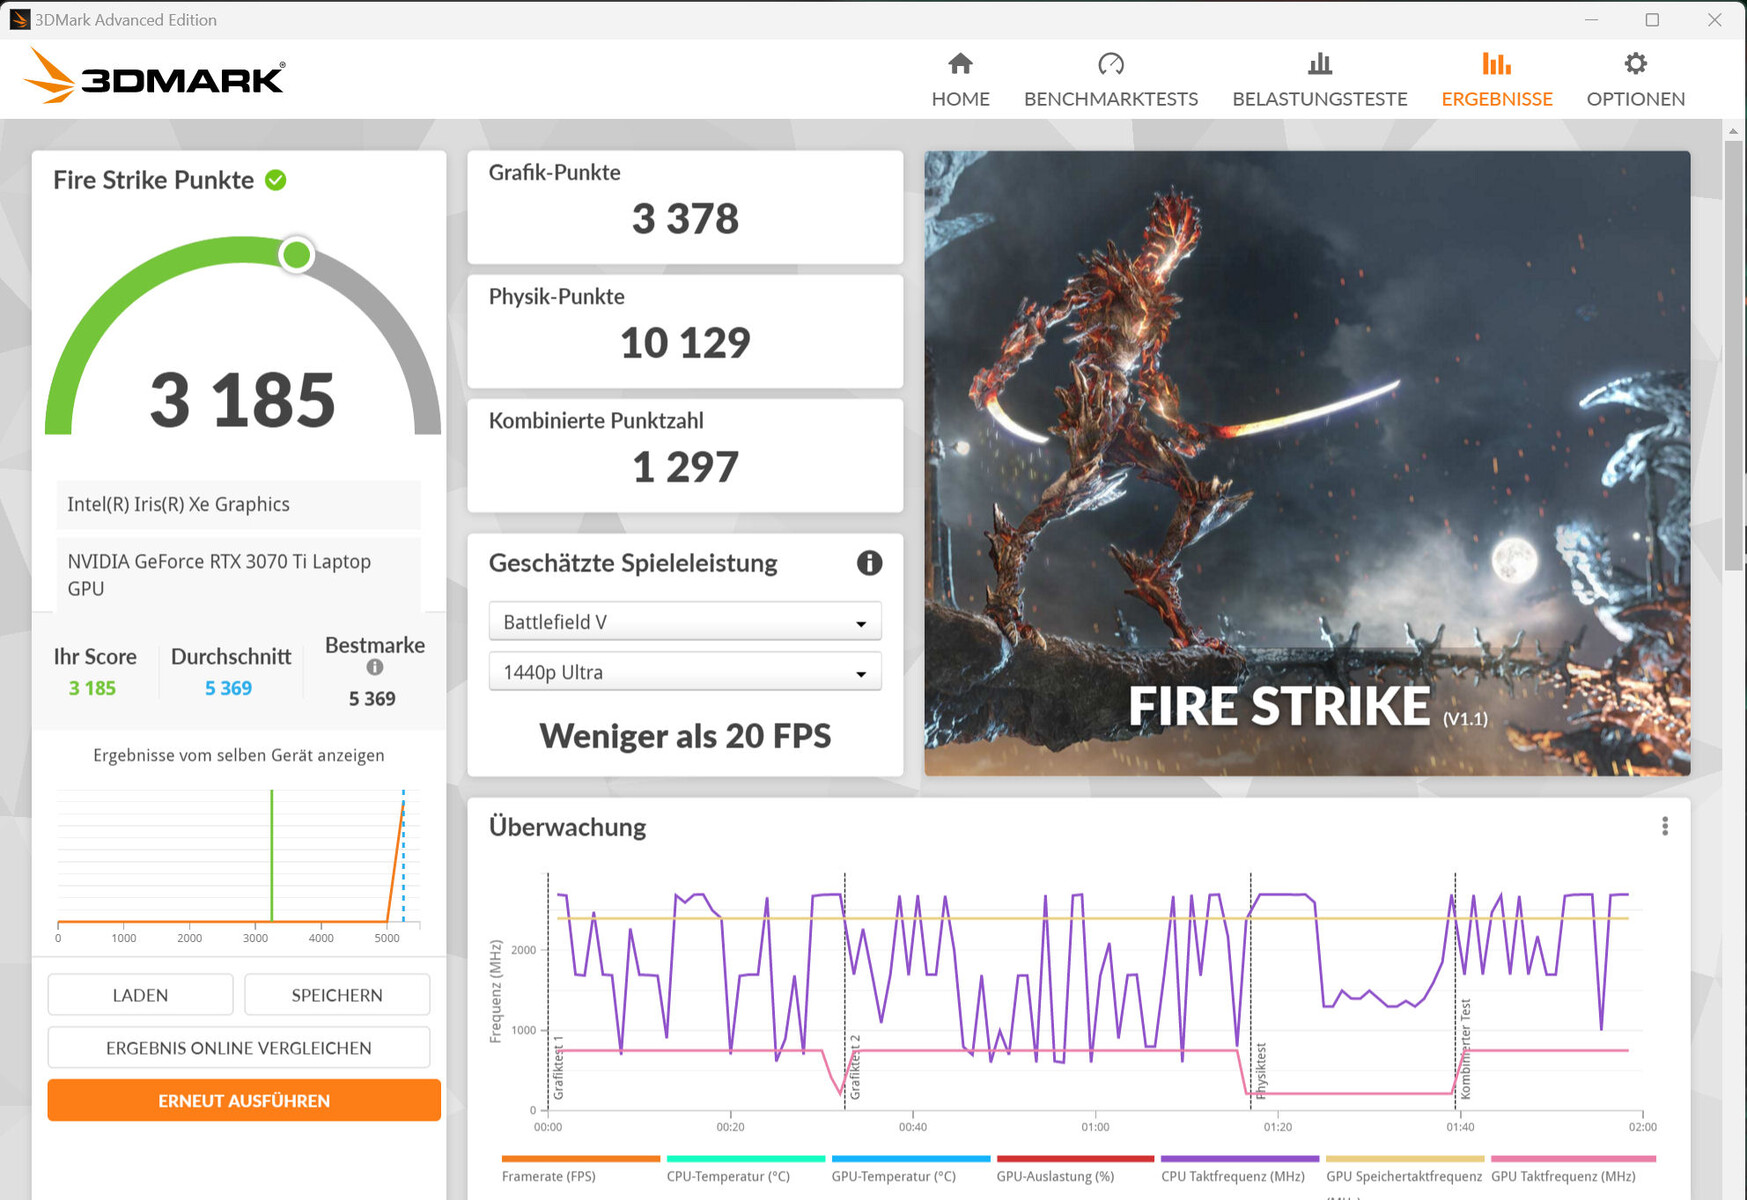
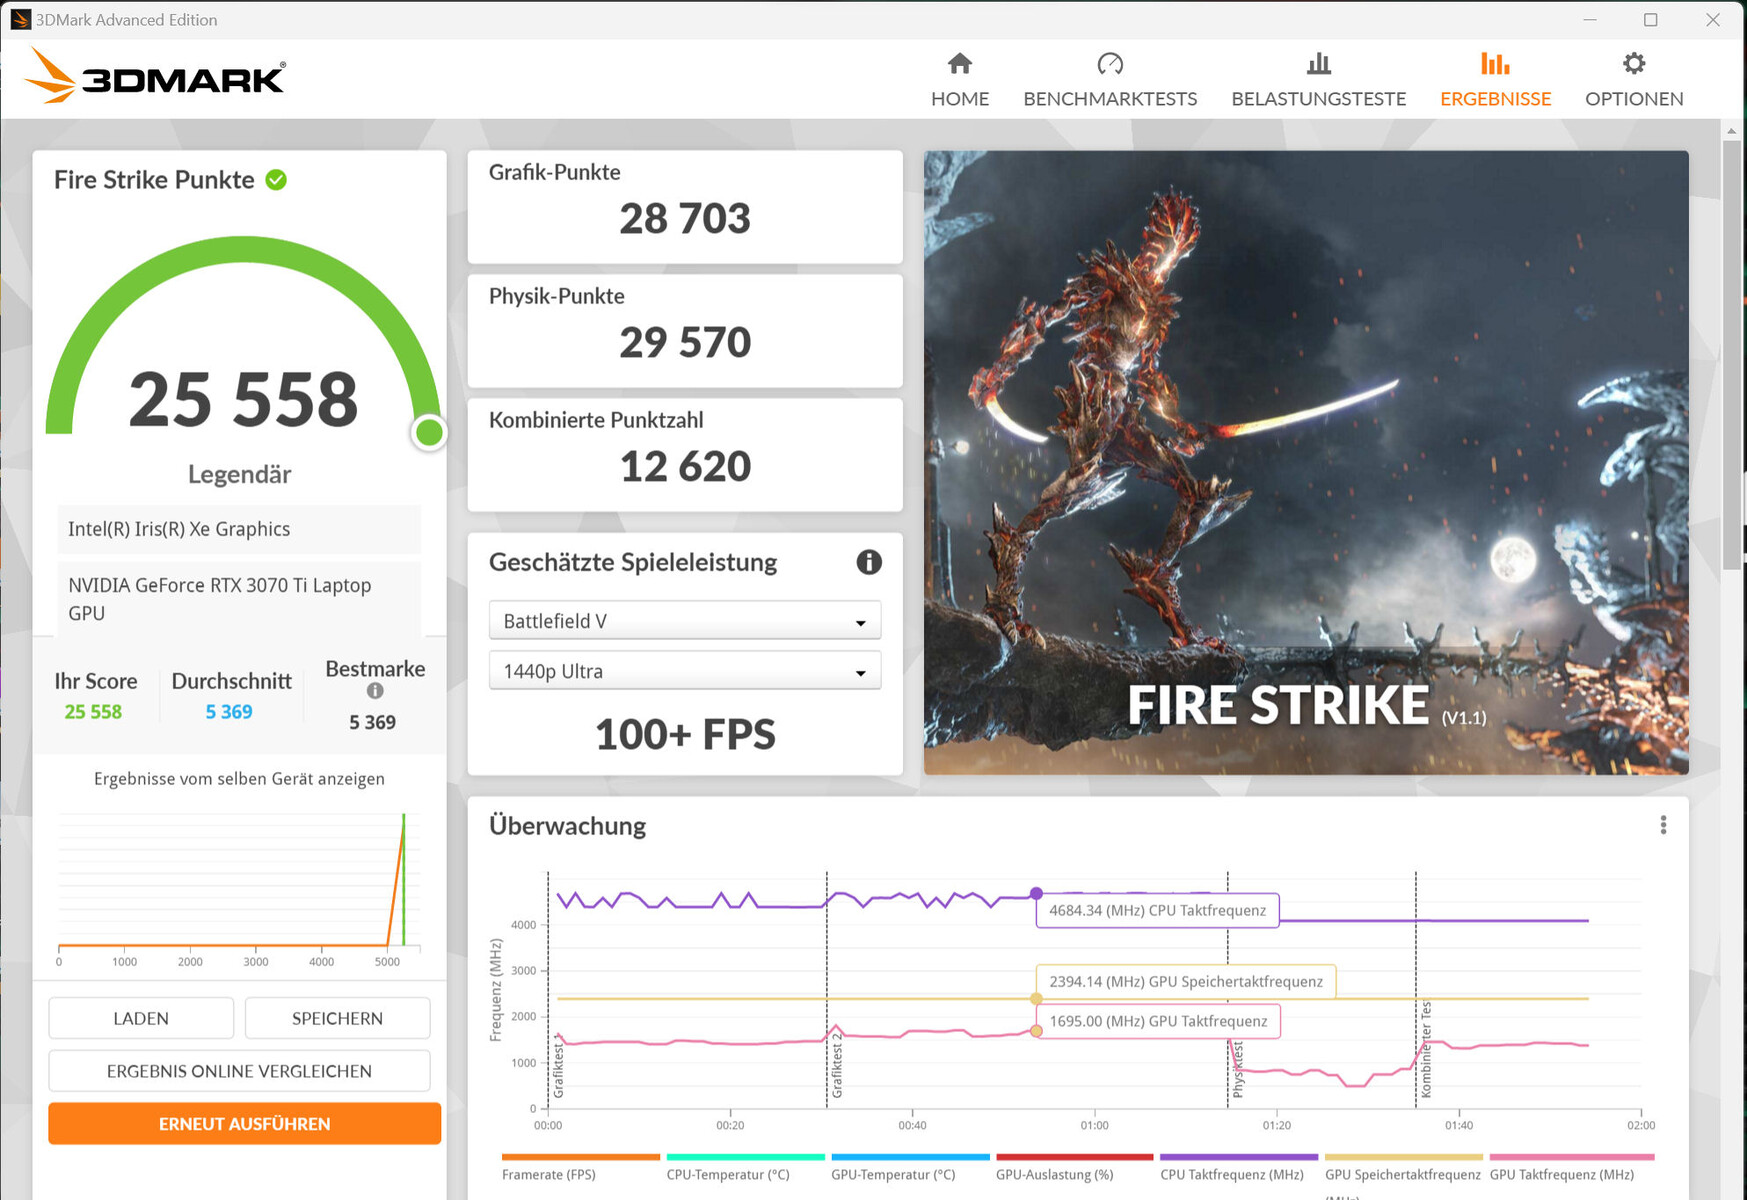
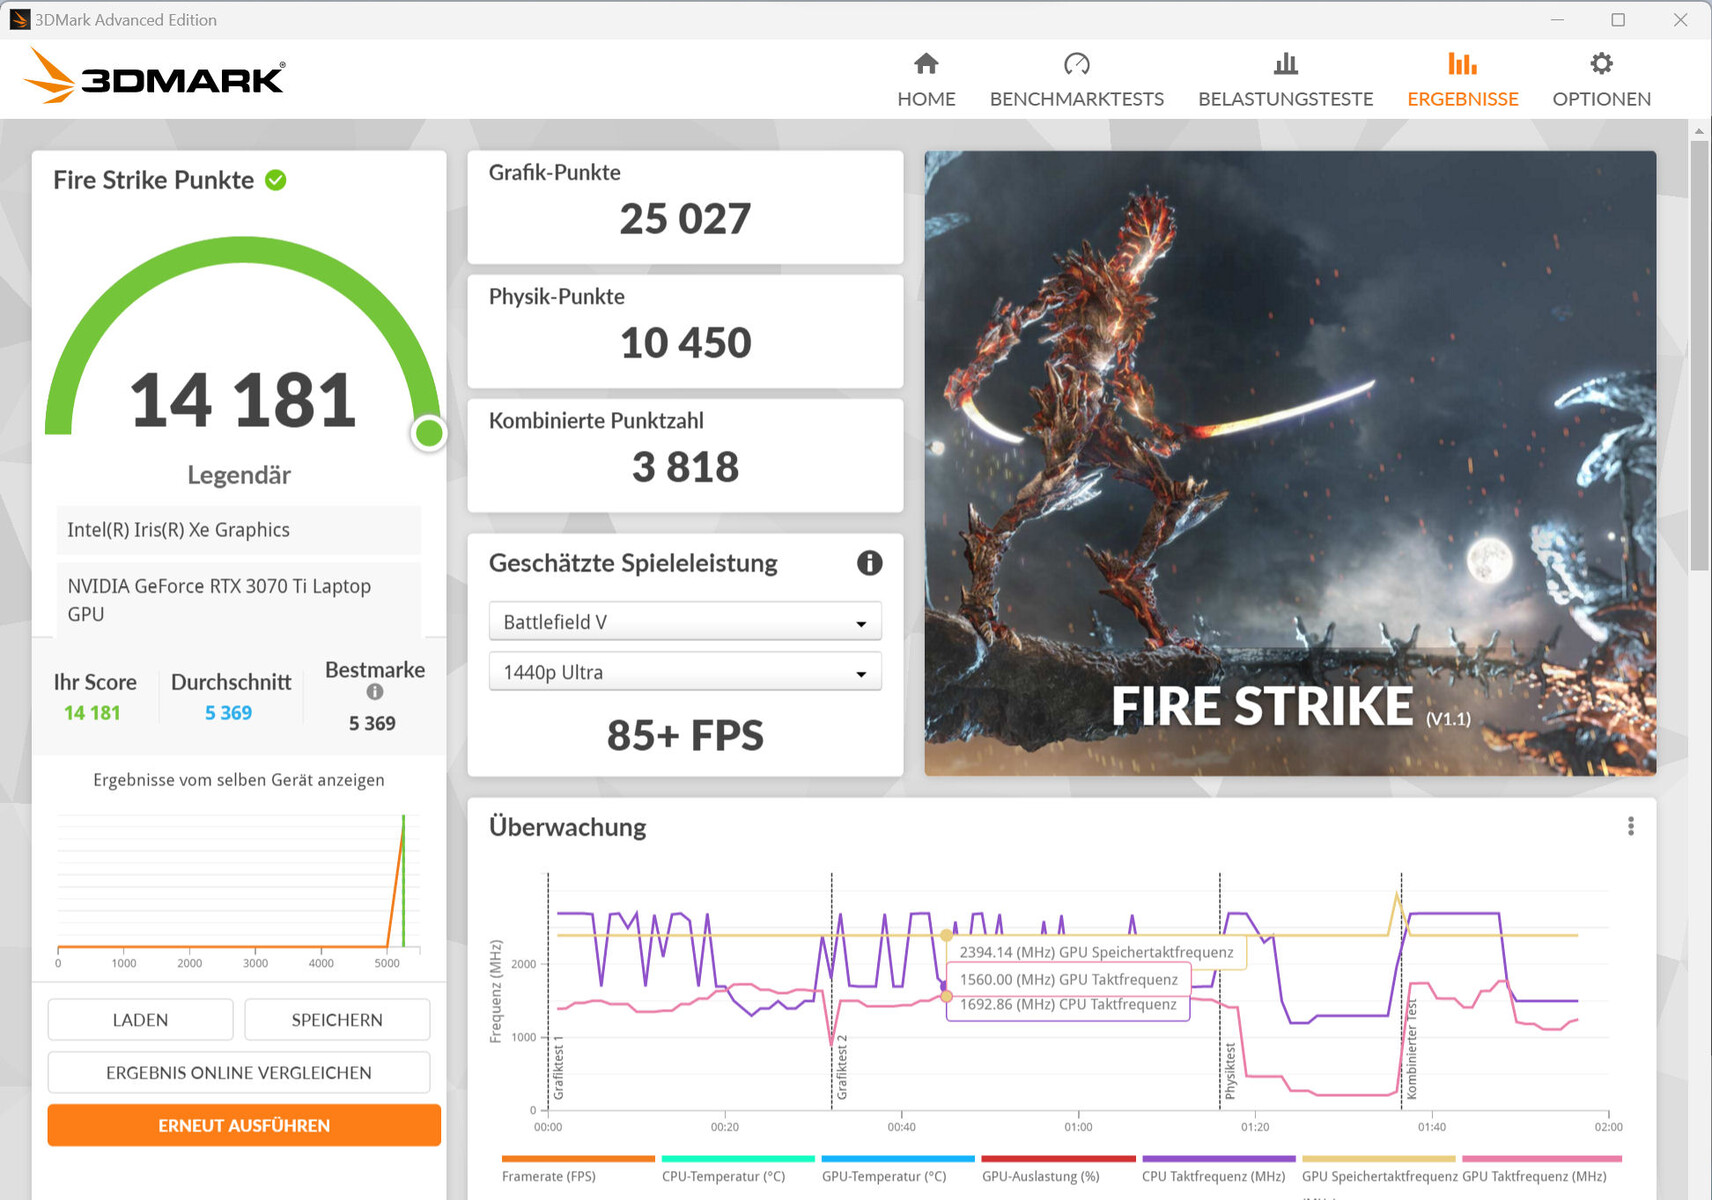
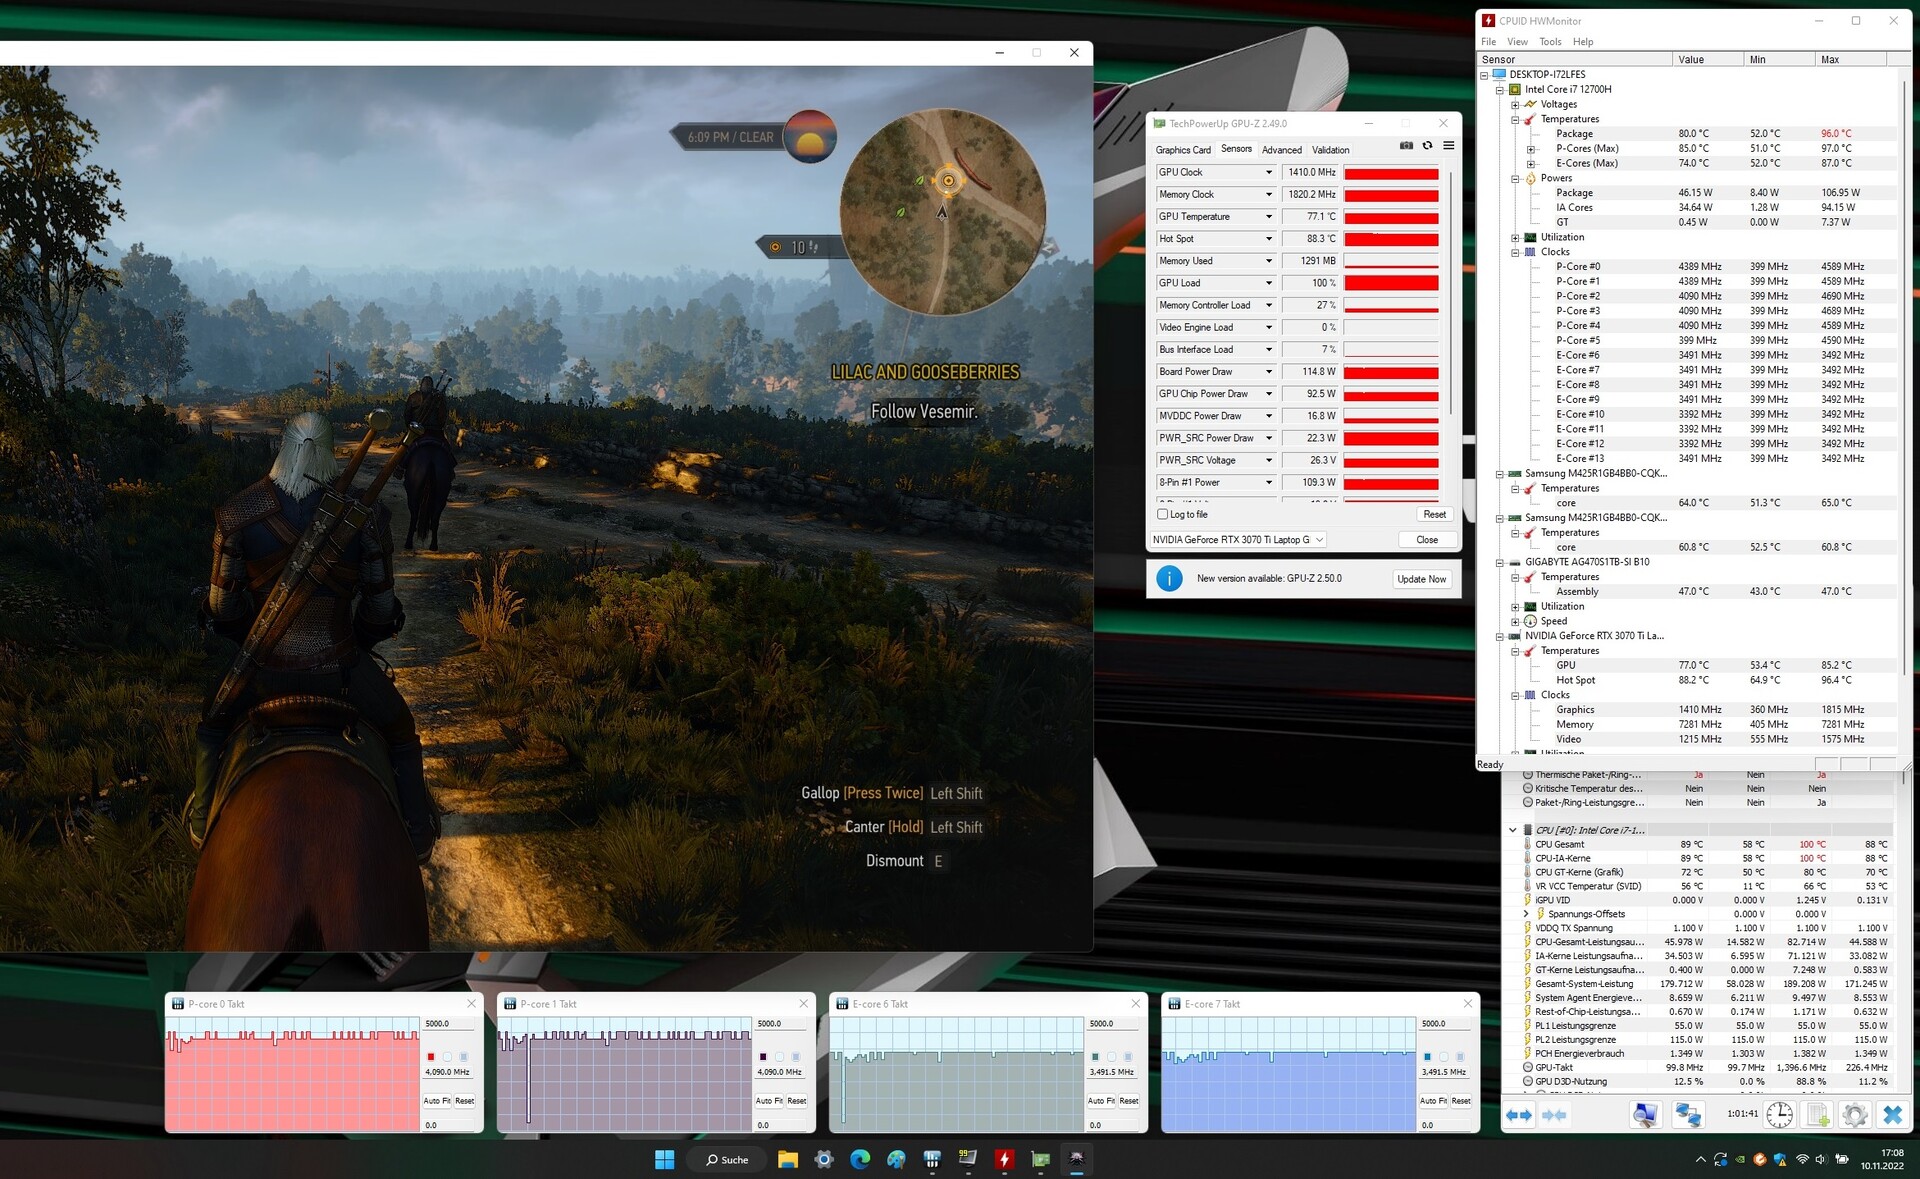
Rzeczywista wydajność GPU z serii RTX 30 zależy od kilku czynników: chłodzenia, konfiguracji pamięci RAM i podanego przez producenta laptopa TGP (w granicach określonych przez Nvidię). Gigabyte zdecydował się dać m.in RTX 3070 Ti Laptop tGP na poziomie 130 W. Nasz test Witcher 3 pokazuje jednak, że system nie wykorzystuje w pełni tego TGP.
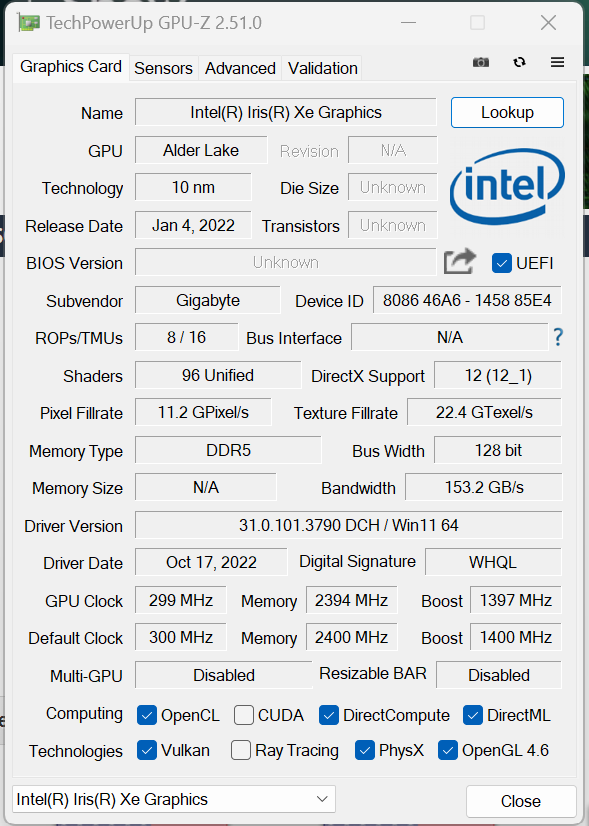
Procesor graficzny w Aorusie ma dostęp do 8 192 MB szybkiej pamięci GDDR6 VRAM i dostarczył nieco lepsze wyniki w 3DMarku niż to, co średnio widzieliśmy z RTX 3070 Ti. Zintegrowany Iris Xe Graphics G7 96EU jest aktywny; laptop wykorzystuje technologię przełączania grafiki Optimus firmy Nvidia i nie oferuje trybu dGPU.
| 3DMark Performance rating - Percent | |
| Średnia w klasie Gaming | |
| Acer Nitro 5 AN515-46-R1A1 | |
| Aorus 15 XE5 | |
| Aorus 15 XE5 | |
| Przeciętny NVIDIA GeForce RTX 3070 Ti Laptop GPU | |
| MSI Katana GF66 12UGS | |
| Schenker XMG Fusion 15 (Mid 22) | |
| Asus TUF Dash F15 FX517ZR | |
| 3DMark 11 - 1280x720 Performance GPU | |
| Średnia w klasie Gaming (21841 - 80022, n=108, ostatnie 2 lata) | |
| Aorus 15 XE5 (Turbo Mode) | |
| Aorus 15 XE5 | |
| Acer Nitro 5 AN515-46-R1A1 | |
| Przeciętny NVIDIA GeForce RTX 3070 Ti Laptop GPU (13799 - 42569, n=36) | |
| MSI Katana GF66 12UGS | |
| Schenker XMG Fusion 15 (Mid 22) | |
| Asus TUF Dash F15 FX517ZR | |
| 3DMark | |
| 1920x1080 Fire Strike Graphics | |
| Średnia w klasie Gaming (12242 - 62849, n=120, ostatnie 2 lata) | |
| Acer Nitro 5 AN515-46-R1A1 | |
| Aorus 15 XE5 (Turbo Mode) | |
| Aorus 15 XE5 | |
| Przeciętny NVIDIA GeForce RTX 3070 Ti Laptop GPU (22612 - 32550, n=37) | |
| MSI Katana GF66 12UGS | |
| Schenker XMG Fusion 15 (Mid 22) | |
| Asus TUF Dash F15 FX517ZR | |
| 2560x1440 Time Spy Graphics | |
| Średnia w klasie Gaming (5012 - 26212, n=119, ostatnie 2 lata) | |
| Acer Nitro 5 AN515-46-R1A1 | |
| Aorus 15 XE5 | |
| Aorus 15 XE5 (Turbo Mode) | |
| Przeciętny NVIDIA GeForce RTX 3070 Ti Laptop GPU (8142 - 12324, n=37) | |
| MSI Katana GF66 12UGS | |
| Schenker XMG Fusion 15 (Mid 22) | |
| Asus TUF Dash F15 FX517ZR | |
| 2560x1440 Port Royal Graphics | |
| Średnia w klasie Gaming (4395 - 17286, n=70, ostatnie 2 lata) | |
| Acer Nitro 5 AN515-46-R1A1 | |
| Aorus 15 XE5 (Turbo Mode) | |
| Aorus 15 XE5 | |
| Przeciętny NVIDIA GeForce RTX 3070 Ti Laptop GPU (5091 - 7510, n=23) | |
| MSI Katana GF66 12UGS | |
| Schenker XMG Fusion 15 (Mid 22) | |
| Asus TUF Dash F15 FX517ZR | |
| 3DMark 06 Standard Score | 51253 pkt. | |
| 3DMark 11 Performance | 32155 pkt. | |
| 3DMark Fire Strike Score | 24190 pkt. | |
| 3DMark Time Spy Score | 10840 pkt. | |
Pomoc | ||
| Blender | |
| v3.3 Classroom OPTIX/RTX | |
| Asus TUF Dash F15 FX517ZR | |
| Przeciętny NVIDIA GeForce RTX 3070 Ti Laptop GPU (22 - 30, n=15) | |
| Acer Nitro 5 AN515-46-R1A1 (3.3.0) | |
| Aorus 15 XE5 (3.3.0) | |
| Aorus 15 XE5 (3.3.0, Turbo Mode) | |
| Średnia w klasie Gaming (9 - 32, n=111, ostatnie 2 lata) | |
| v3.3 Classroom CUDA | |
| Asus TUF Dash F15 FX517ZR | |
| Przeciętny NVIDIA GeForce RTX 3070 Ti Laptop GPU (36 - 46, n=16) | |
| Acer Nitro 5 AN515-46-R1A1 (3.3.0) | |
| Aorus 15 XE5 (3.3.0) | |
| Aorus 15 XE5 (3.3.0, Turbo Mode) | |
| Średnia w klasie Gaming (15 - 228, n=111, ostatnie 2 lata) | |
| v3.3 Classroom CPU | |
| Schenker XMG Fusion 15 (Mid 22) | |
| Asus TUF Dash F15 FX517ZR | |
| Aorus 15 XE5 (3.3.0) | |
| Acer Nitro 5 AN515-46-R1A1 (3.3.0) | |
| Przeciętny NVIDIA GeForce RTX 3070 Ti Laptop GPU (285 - 459, n=16) | |
| Aorus 15 XE5 (3.3.0, Turbo Mode) | |
| Średnia w klasie Gaming (122 - 565, n=107, ostatnie 2 lata) | |
* ... im mniej tym lepiej
Wydajność w grach
Sprzęt w laptopie jest w stanie uruchomić gry w rozdzielczości QHD i ustawieniach wysokich do maksymalnych. Można też grać w gry w wyższych rozdzielczościach, jeśli podłączy się urządzenie do odpowiedniego wyświetlacza - choć może to czasem wymagać obniżenia ustawień. Na Aorusie 15 XE5 gry, których używaliśmy do testów, zazwyczaj działały z wyższą liczbą klatek na sekundę niż to, co RTX 3070 Ti może średnio wyprodukować. W niektórych przypadkach włączenie "trybu Turbo" prowadziło do niewielkiego wzrostu liczby klatek na sekundę.
| Performance rating - Percent | |
| Średnia w klasie Gaming | |
| Aorus 15 XE5 | |
| MSI Katana GF66 12UGS | |
| Schenker XMG Fusion 15 (Mid 22) | |
| Acer Nitro 5 AN515-46-R1A1 | |
| Asus TUF Dash F15 FX517ZR | |
| The Witcher 3 - 1920x1080 Ultra Graphics & Postprocessing (HBAO+) | |
| Średnia w klasie Gaming (95 - 240, n=8, ostatnie 2 lata) | |
| Acer Nitro 5 AN515-46-R1A1 | |
| Aorus 15 XE5 | |
| MSI Katana GF66 12UGS | |
| Schenker XMG Fusion 15 (Mid 22) | |
| Asus TUF Dash F15 FX517ZR | |
| GTA V - 1920x1080 Highest AA:4xMSAA + FX AF:16x | |
| Średnia w klasie Gaming (48.3 - 186.9, n=102, ostatnie 2 lata) | |
| Aorus 15 XE5 | |
| Asus TUF Dash F15 FX517ZR | |
| MSI Katana GF66 12UGS | |
| Schenker XMG Fusion 15 (Mid 22) | |
| Acer Nitro 5 AN515-46-R1A1 | |
| Final Fantasy XV Benchmark - 1920x1080 High Quality | |
| Średnia w klasie Gaming (41 - 215, n=103, ostatnie 2 lata) | |
| Acer Nitro 5 AN515-46-R1A1 | |
| Aorus 15 XE5 | |
| Schenker XMG Fusion 15 (Mid 22) | |
| MSI Katana GF66 12UGS | |
| Asus TUF Dash F15 FX517ZR | |
| Strange Brigade - 1920x1080 ultra AA:ultra AF:16 | |
| Średnia w klasie Gaming (76.3 - 456, n=93, ostatnie 2 lata) | |
| Aorus 15 XE5 | |
| Acer Nitro 5 AN515-46-R1A1 | |
| MSI Katana GF66 12UGS | |
| Schenker XMG Fusion 15 (Mid 22) | |
| Asus TUF Dash F15 FX517ZR | |
| Dota 2 Reborn - 1920x1080 ultra (3/3) best looking | |
| Średnia w klasie Gaming (84.8 - 248, n=112, ostatnie 2 lata) | |
| Aorus 15 XE5 | |
| MSI Katana GF66 12UGS | |
| Schenker XMG Fusion 15 (Mid 22) | |
| Asus TUF Dash F15 FX517ZR | |
| Acer Nitro 5 AN515-46-R1A1 | |
| X-Plane 11.11 - 1920x1080 high (fps_test=3) | |
| Aorus 15 XE5 | |
| MSI Katana GF66 12UGS | |
| Asus TUF Dash F15 FX517ZR | |
| Średnia w klasie Gaming (52.1 - 143.5, n=115, ostatnie 2 lata) | |
| Schenker XMG Fusion 15 (Mid 22) | |
| Acer Nitro 5 AN515-46-R1A1 | |
| Performance rating - Percent | |
| Średnia w klasie Gaming -5! | |
| Aorus 15 XE5 | |
| Przeciętny NVIDIA GeForce RTX 3070 Ti Laptop GPU | |
| Aorus 15 XE5 -6! | |
| Acer Nitro 5 AN515-46-R1A1 -4! | |
| MSI Katana GF66 12UGS -6! | |
| Schenker XMG Fusion 15 (Mid 22) -6! | |
| Asus TUF Dash F15 FX517ZR -6! | |
| The Witcher 3 - 1920x1080 Ultra Graphics & Postprocessing (HBAO+) | |
| Średnia w klasie Gaming (95 - 240, n=8, ostatnie 2 lata) | |
| Acer Nitro 5 AN515-46-R1A1 | |
| Aorus 15 XE5 (Turbo Mode) | |
| Przeciętny NVIDIA GeForce RTX 3070 Ti Laptop GPU (76.8 - 124.1, n=39) | |
| Aorus 15 XE5 | |
| MSI Katana GF66 12UGS | |
| Schenker XMG Fusion 15 (Mid 22) | |
| Asus TUF Dash F15 FX517ZR | |
| GTA V - 1920x1080 Highest AA:4xMSAA + FX AF:16x | |
| Średnia w klasie Gaming (48.3 - 186.9, n=102, ostatnie 2 lata) | |
| Aorus 15 XE5 (Turbo Mode) | |
| Aorus 15 XE5 | |
| Przeciętny NVIDIA GeForce RTX 3070 Ti Laptop GPU (44 - 123.9, n=36) | |
| Asus TUF Dash F15 FX517ZR | |
| MSI Katana GF66 12UGS | |
| Schenker XMG Fusion 15 (Mid 22) | |
| Acer Nitro 5 AN515-46-R1A1 | |
| Final Fantasy XV Benchmark - 1920x1080 High Quality | |
| Średnia w klasie Gaming (41 - 215, n=103, ostatnie 2 lata) | |
| Acer Nitro 5 AN515-46-R1A1 (1.3) | |
| Aorus 15 XE5 (1.3, Turbo Mode) | |
| Aorus 15 XE5 (1.3) | |
| Przeciętny NVIDIA GeForce RTX 3070 Ti Laptop GPU (49.5 - 122.4, n=35) | |
| Schenker XMG Fusion 15 (Mid 22) (1.3) | |
| MSI Katana GF66 12UGS (1.3) | |
| Asus TUF Dash F15 FX517ZR (1.3) | |
| Strange Brigade - 1920x1080 ultra AA:ultra AF:16 | |
| Średnia w klasie Gaming (76.3 - 456, n=93, ostatnie 2 lata) | |
| Aorus 15 XE5 (1.47.22.14 D3D12, Turbo Mode) | |
| Aorus 15 XE5 (1.47.22.14 D3D12) | |
| Przeciętny NVIDIA GeForce RTX 3070 Ti Laptop GPU (109 - 221, n=37) | |
| Acer Nitro 5 AN515-46-R1A1 (1.47.22.14 D3D12) | |
| MSI Katana GF66 12UGS (1.47.22.14 D3D12) | |
| Schenker XMG Fusion 15 (Mid 22) (1.47.22.14 D3D12) | |
| Asus TUF Dash F15 FX517ZR (1.47.22.14 D3D12) | |
| Dota 2 Reborn - 1920x1080 ultra (3/3) best looking | |
| Średnia w klasie Gaming (84.8 - 248, n=112, ostatnie 2 lata) | |
| Aorus 15 XE5 | |
| Aorus 15 XE5 (Turbo Mode) | |
| MSI Katana GF66 12UGS | |
| Przeciętny NVIDIA GeForce RTX 3070 Ti Laptop GPU (68.7 - 160.5, n=38) | |
| Schenker XMG Fusion 15 (Mid 22) | |
| Asus TUF Dash F15 FX517ZR | |
| Acer Nitro 5 AN515-46-R1A1 | |
| X-Plane 11.11 - 1920x1080 high (fps_test=3) | |
| Aorus 15 XE5 | |
| Aorus 15 XE5 (Turbo Mode) | |
| MSI Katana GF66 12UGS | |
| Asus TUF Dash F15 FX517ZR | |
| Średnia w klasie Gaming (52.1 - 143.5, n=115, ostatnie 2 lata) | |
| Przeciętny NVIDIA GeForce RTX 3070 Ti Laptop GPU (51.6 - 116.9, n=37) | |
| Schenker XMG Fusion 15 (Mid 22) | |
| Acer Nitro 5 AN515-46-R1A1 | |
| Far Cry 5 - 1920x1080 Ultra Preset AA:T | |
| Aorus 15 XE5 | |
| Przeciętny NVIDIA GeForce RTX 3070 Ti Laptop GPU (91 - 138, n=25) | |
| Średnia w klasie Gaming (70 - 151, n=10, ostatnie 2 lata) | |
| MSI Katana GF66 12UGS | |
| Schenker XMG Fusion 15 (Mid 22) | |
| Acer Nitro 5 AN515-46-R1A1 | |
| Asus TUF Dash F15 FX517ZR | |
| F1 22 - 1920x1080 Ultra High Preset AA:T AF:16x | |
| Średnia w klasie Gaming (40.1 - 121.2, n=5, ostatnie 2 lata) | |
| Acer Nitro 5 AN515-46-R1A1 (923662) | |
| Przeciętny NVIDIA GeForce RTX 3070 Ti Laptop GPU (58.1 - 80, n=8) | |
| Aorus 15 XE5 (928484, Turbo Mode) | |
| Aorus 15 XE5 (928484) | |
| The Quarry - 1920x1080 Ultra Preset | |
| Acer Nitro 5 AN515-46-R1A1 | |
| Przeciętny NVIDIA GeForce RTX 3070 Ti Laptop GPU (80 - 81.5, n=2) | |
| Aorus 15 XE5 | |
| A Plague Tale Requiem - 1920x1080 Ultra Preset | |
| Przeciętny NVIDIA GeForce RTX 3070 Ti Laptop GPU (61.9 - 62.9, n=2) | |
| Aorus 15 XE5 | |
| Uncharted Legacy of Thieves Collection - 1920x1080 Ultra Preset | |
| Aorus 15 XE5 | |
| Przeciętny NVIDIA GeForce RTX 3070 Ti Laptop GPU (69.3 - 72.4, n=2) | |
| Call of Duty Modern Warfare 2 2022 - 1920x1080 Extreme Quality Preset AA:T2X Filmic SM | |
| Aorus 15 XE5 | |
| Przeciętny NVIDIA GeForce RTX 3070 Ti Laptop GPU (84 - 86, n=3) | |
| Spider-Man Miles Morales - 1920x1080 Very High Preset AA:T | |
| Przeciętny NVIDIA GeForce RTX 3070 Ti Laptop GPU (91 - 93.2, n=2) | |
| Aorus 15 XE5 | |
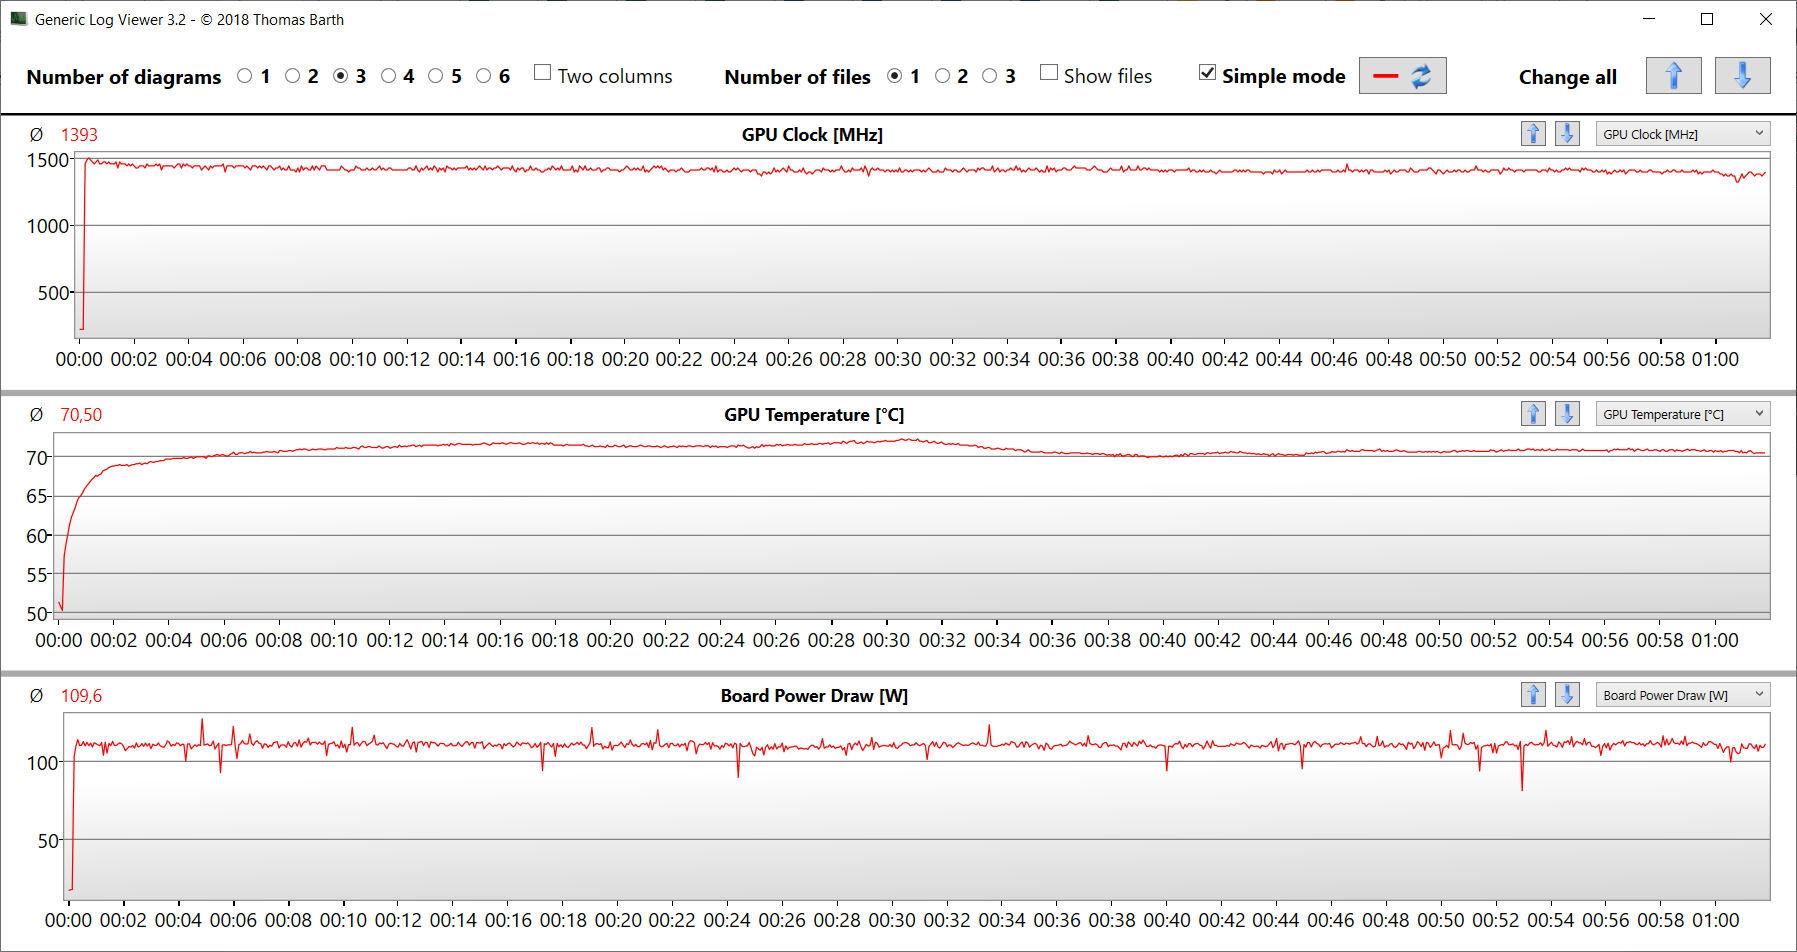
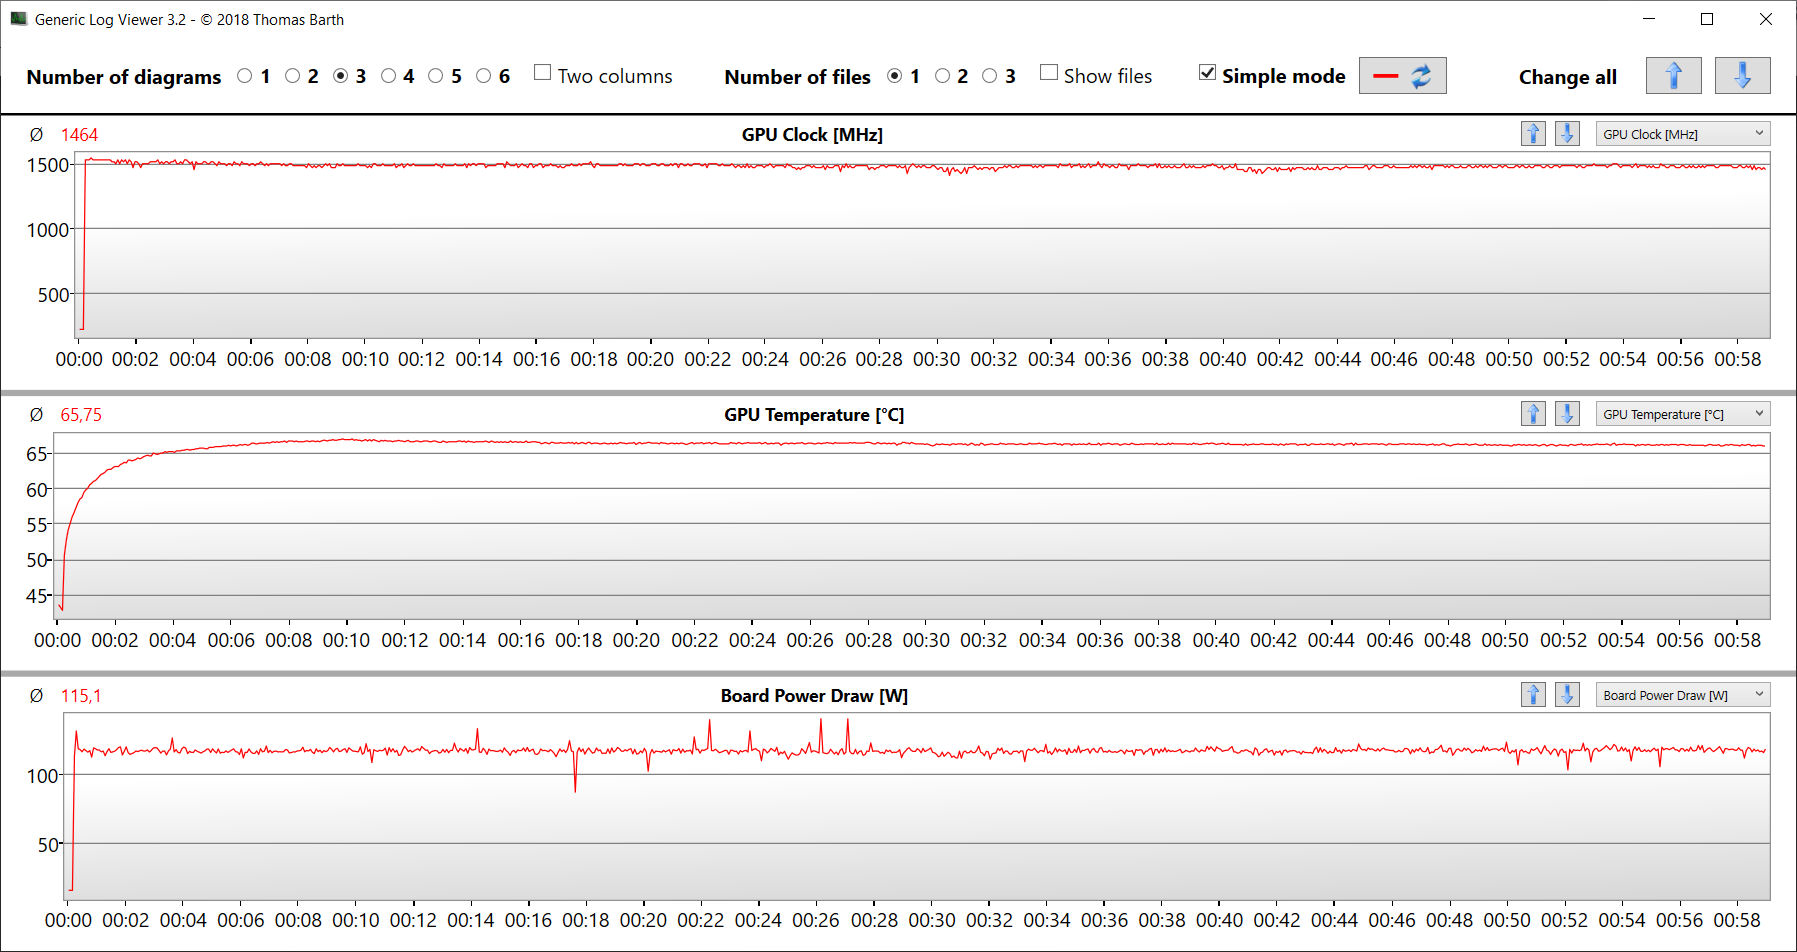
Aby przekonać się, czy laptop może przez dłuższy czas uruchamiać gry z przeważnie stałą liczbą klatek na sekundę, uruchomiliśmy grę "The Witcher 3" przez około 60 minut w rozdzielczości Full HD i na maksymalnych ustawieniach jakości, bez poruszania postacią gracza. Wynik: nie było żadnych spadków liczby klatek na sekundę.
Witcher 3 FPS chart
| low | med. | high | ultra | QHD | |
|---|---|---|---|---|---|
| GTA V (2015) | 186.4 | 182.3 | 176.4 | 115.6 | 99.9 |
| The Witcher 3 (2015) | 357 | 300 | 183.2 | 100.1 | |
| Dota 2 Reborn (2015) | 168.4 | 158 | 148.4 | 140.8 | |
| Final Fantasy XV Benchmark (2018) | 196.3 | 138.8 | 104.6 | 79.2 | |
| X-Plane 11.11 (2018) | 142 | 130.7 | 105.3 | ||
| Far Cry 5 (2018) | 166 | 144 | 137 | 129 | 103 |
| Strange Brigade (2018) | 445 | 255 | 212 | 188.5 | 140.9 |
| F1 22 (2022) | 220 | 215 | 181.3 | 64.2 | 42.7 |
| The Quarry (2022) | 156.2 | 119.1 | 98.4 | 80 | 56.1 |
| A Plague Tale Requiem (2022) | 93.8 | 81.8 | 71.1 | 61.9 | 48.6 |
| Uncharted Legacy of Thieves Collection (2022) | 81 | 80.2 | 75.4 | 72.4 | 55.5 |
| Call of Duty Modern Warfare 2 2022 (2022) | 127 | 111 | 87 | 86 | 61 |
| Spider-Man Miles Morales (2022) | 108.2 | 103.8 | 93 | 91 | 73.5 |
Emisje - wymagane jest pewne dopracowanie
Emisja hałasu
W codziennym użytkowaniu (np. aplikacje biurowe, przeglądanie stron internetowych) i w stanie bezczynności dwa wentylatory w omawianym laptopie są stosunkowo ciche, a czasem nawet w ogóle się nie kręcą. Pod średnim i dużym obciążeniem system stawał się dość głośny, a poziom hałasu podczas stress testu i testu Witcher 3 osiągnął nawet 52 dB(A). Centrum sterowania Gigabyte pozwala użytkownikom na regulację prędkości wentylatorów i konfigurację krzywych wentylatorów.
Hałas
| luz |
| 26 / 28 / 30 dB |
| obciążenie |
| 48 / 52 dB |
 | ||
30 dB cichy 40 dB(A) słyszalny 50 dB(A) irytujący |
||
min: | ||
| Aorus 15 XE5 i7-12700H, GeForce RTX 3070 Ti Laptop GPU | Acer Nitro 5 AN515-46-R1A1 R7 6800H, GeForce RTX 3070 Ti Laptop GPU | Schenker XMG Fusion 15 (Mid 22) i7-11800H, GeForce RTX 3070 Laptop GPU | Asus TUF Dash F15 FX517ZR i7-12650H, GeForce RTX 3070 Laptop GPU | MSI Katana GF66 12UGS i7-12700H, GeForce RTX 3070 Ti Laptop GPU | |
|---|---|---|---|---|---|
| Noise | -9% | 2% | -2% | 3% | |
| wyłączone / środowisko * (dB) | 24 | 25 -4% | 26 -8% | 26 -8% | 26 -8% |
| Idle Minimum * (dB) | 26 | 25 4% | 26 -0% | 26 -0% | 27 -4% |
| Idle Average * (dB) | 28 | 28.6 -2% | 28 -0% | 32 -14% | 28 -0% |
| Idle Maximum * (dB) | 30 | 44.3 -48% | 31 -3% | 33 -10% | 31 -3% |
| Load Average * (dB) | 48 | 47.6 1% | 45 6% | 48 -0% | 44 8% |
| Witcher 3 ultra * (dB) | 52 | 46 12% | 47 10% | 44 15% | |
| Load Maximum * (dB) | 52 | 53.6 -3% | 48 8% | 49 6% | 45 13% |
* ... im mniej tym lepiej
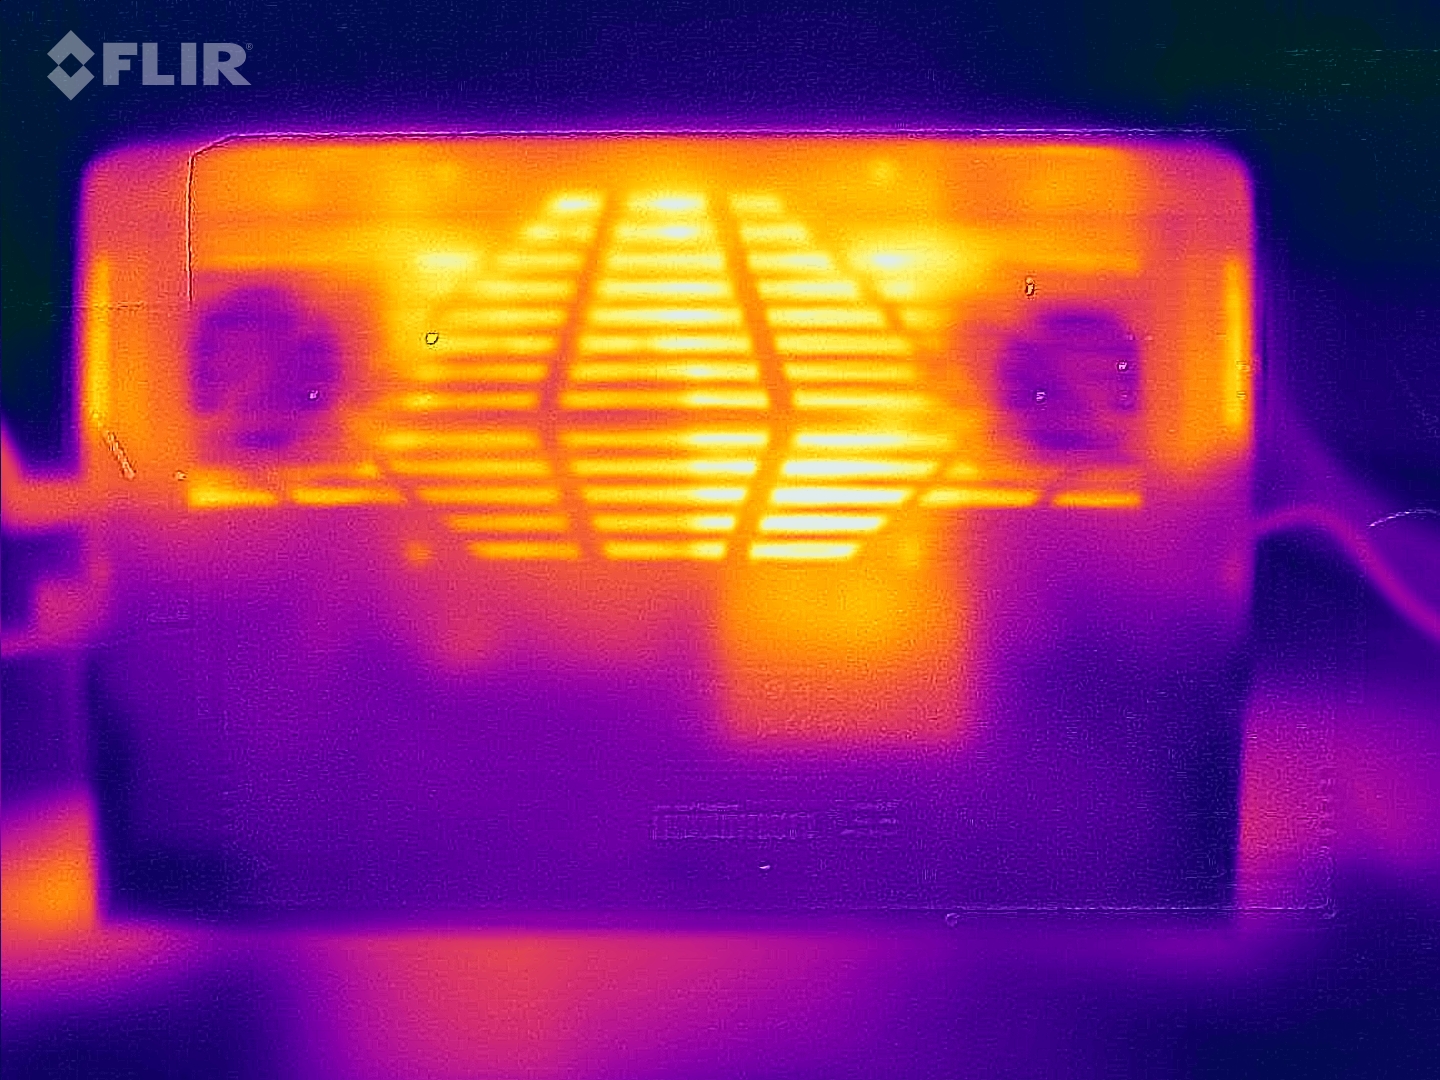
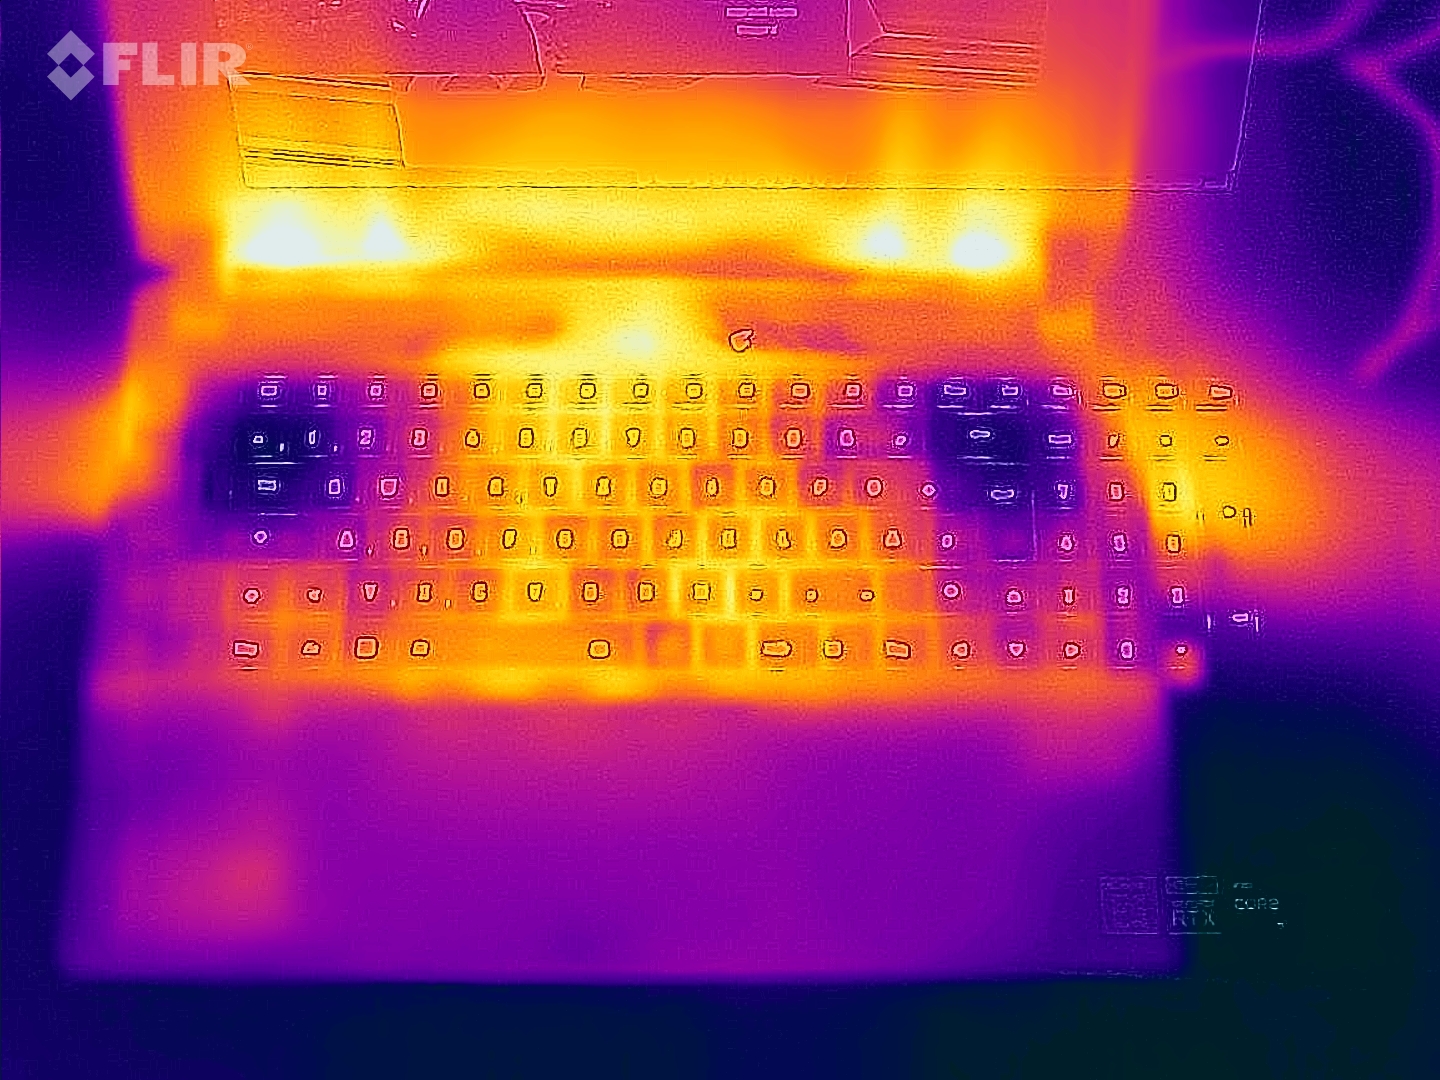
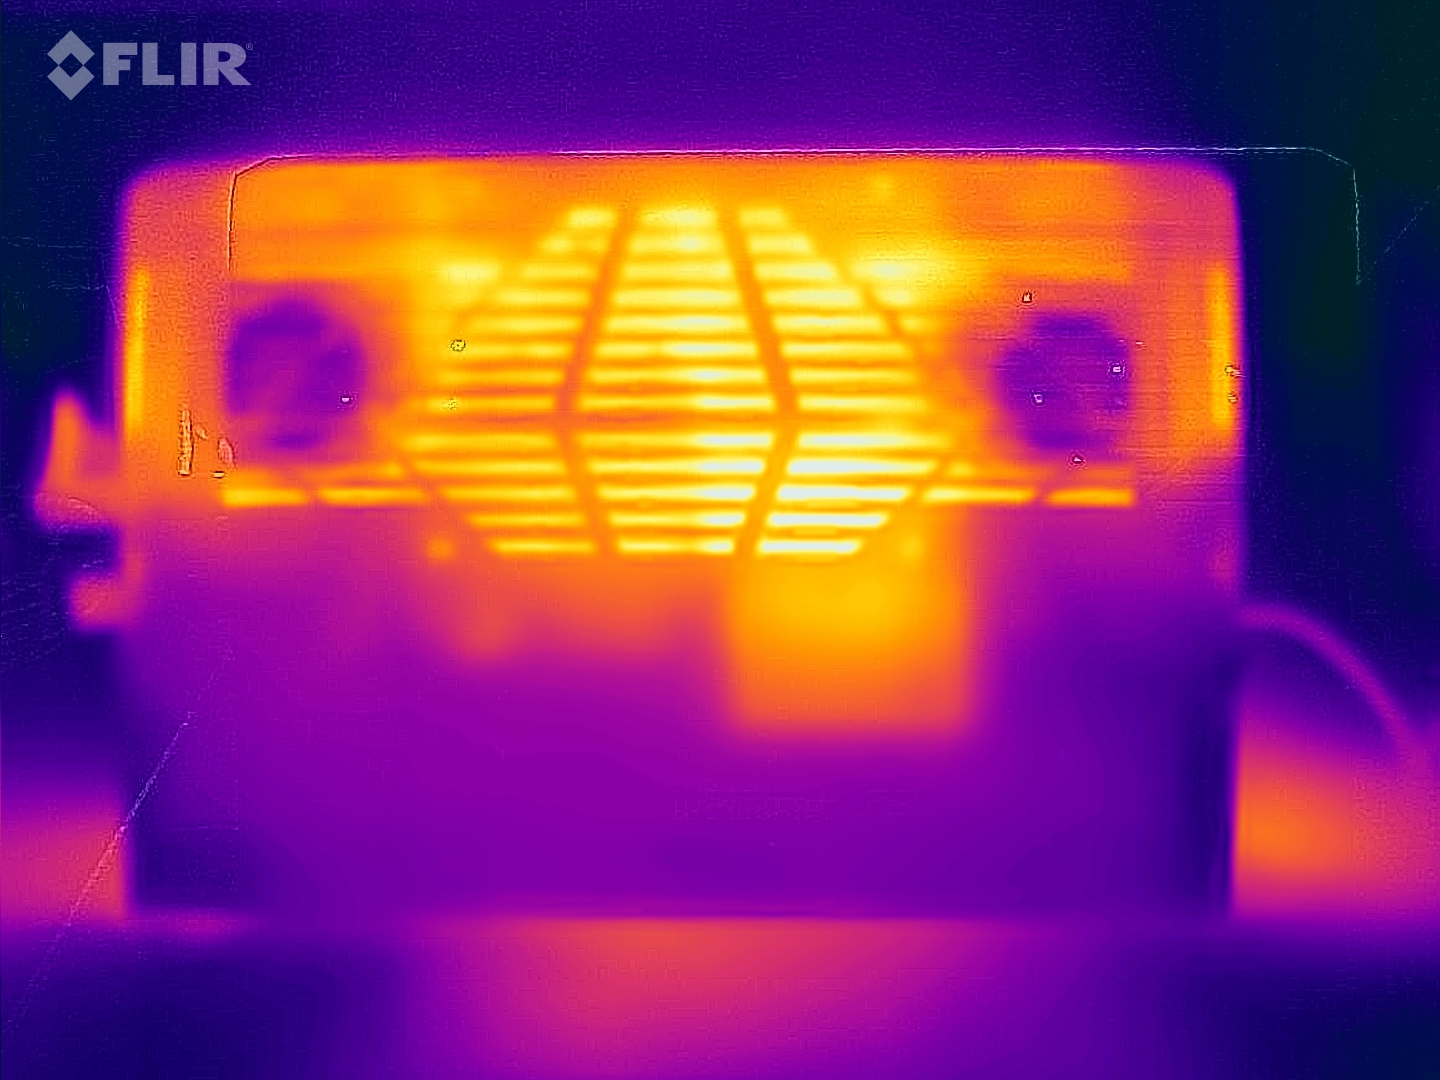
Temperatury
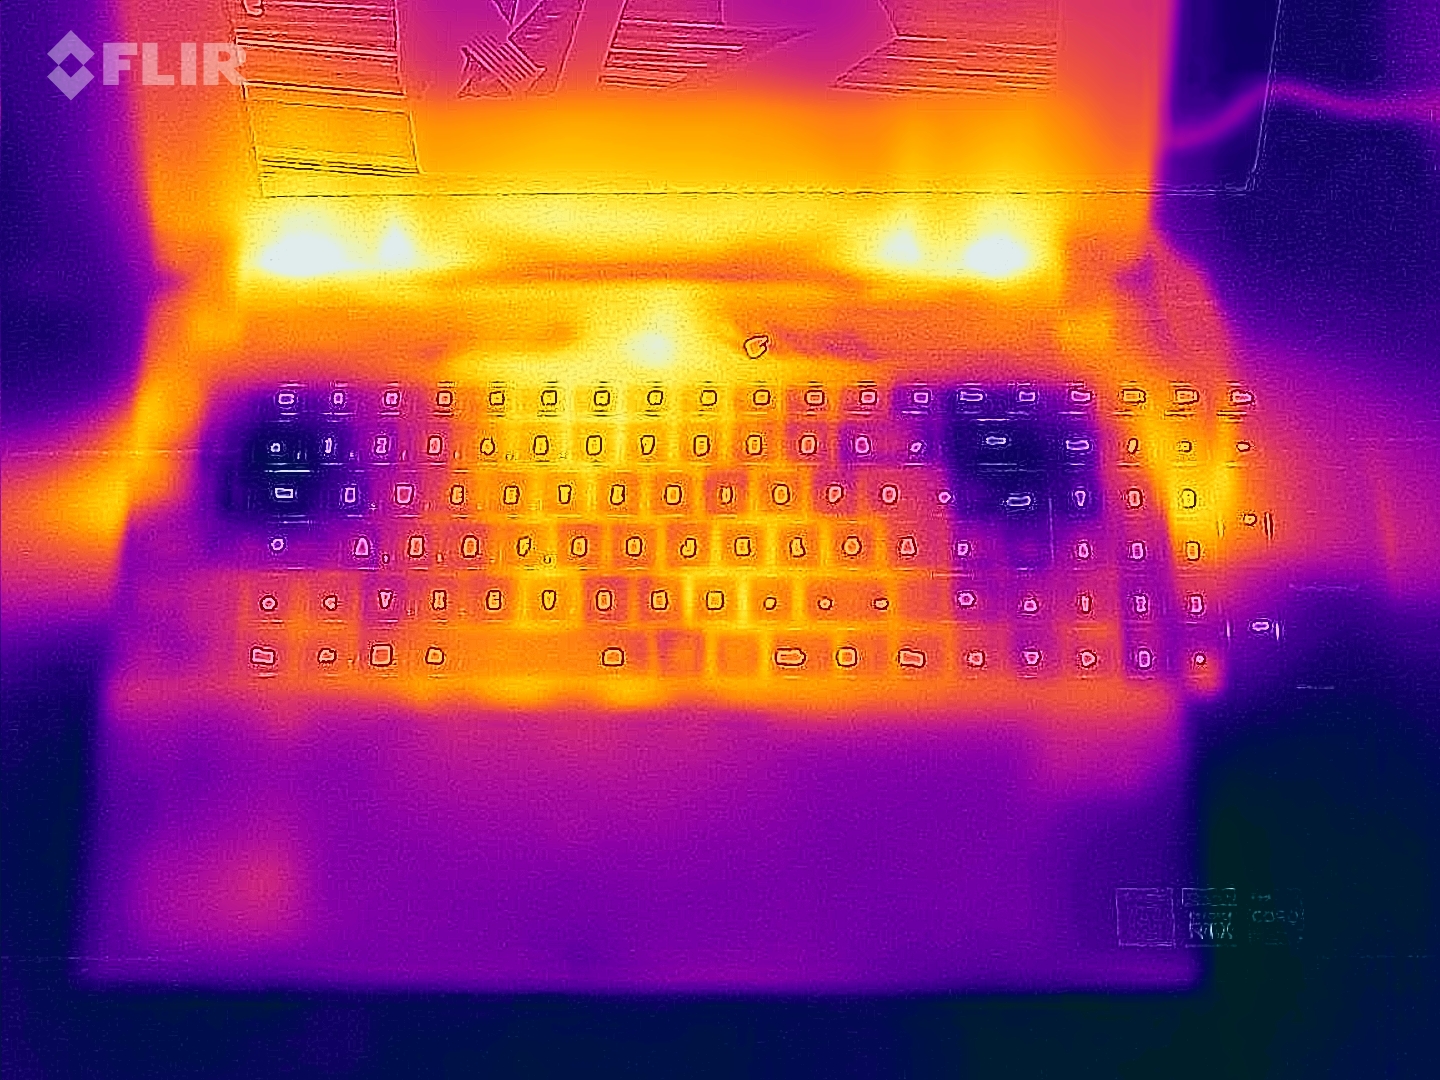
Kiedy laptop zajmuje się codziennymi zadaniami, obudowa może się stosunkowo mocno nagrzewać, ale jej temperatury mieszczą się jeszcze w akceptowalnym zakresie. Pod obciążeniem (stress test, Witcher 3) laptop staje się średnio ciepły na całym urządzeniu, ale są pewne bardzo zauważalne punkty gorąca. Temperatury CPU nie dają jednak powodów do obaw.
(-) Maksymalna temperatura w górnej części wynosi 46 °C / 115 F, w porównaniu do średniej 40.4 °C / 105 F , począwszy od 21.2 do 68.8 °C dla klasy Gaming.
(-) Dno nagrzewa się maksymalnie do 57 °C / 135 F, w porównaniu do średniej 43.2 °C / 110 F
(±) W stanie bezczynności średnia temperatura górnej części wynosi 32.4 °C / 90 F, w porównaniu ze średnią temperaturą urządzenia wynoszącą 33.9 °C / ### class_avg_f### F.
(±) Podczas gry w Wiedźmina 3 średnia temperatura górnej części wynosi 37.6 °C / 100 F, w porównaniu do średniej temperatury urządzenia wynoszącej 33.9 °C / ## #class_avg_f### F.
(+) Podparcia dłoni i touchpad osiągają maksymalną temperaturę skóry (35 °C / 95 F) i dlatego nie są gorące.
(-) Średnia temperatura obszaru podparcia dłoni w podobnych urządzeniach wynosiła 28.8 °C / 83.8 F (-6.2 °C / -11.2 F).
| Aorus 15 XE5 Intel Core i7-12700H, NVIDIA GeForce RTX 3070 Ti Laptop GPU | Acer Nitro 5 AN515-46-R1A1 AMD Ryzen 7 6800H, NVIDIA GeForce RTX 3070 Ti Laptop GPU | Schenker XMG Fusion 15 (Mid 22) Intel Core i7-11800H, NVIDIA GeForce RTX 3070 Laptop GPU | Asus TUF Dash F15 FX517ZR Intel Core i7-12650H, NVIDIA GeForce RTX 3070 Laptop GPU | MSI Katana GF66 12UGS Intel Core i7-12700H, NVIDIA GeForce RTX 3070 Ti Laptop GPU | |
|---|---|---|---|---|---|
| Heat | 14% | -3% | 6% | -8% | |
| Maximum Upper Side * (°C) | 46 | 48.1 -5% | 52 -13% | 52 -13% | 61 -33% |
| Maximum Bottom * (°C) | 57 | 49.7 13% | 63 -11% | 52 9% | 55 4% |
| Idle Upper Side * (°C) | 38 | 30 21% | 37 3% | 33 13% | 43 -13% |
| Idle Bottom * (°C) | 42 | 31.7 25% | 38 10% | 36 14% | 38 10% |
* ... im mniej tym lepiej
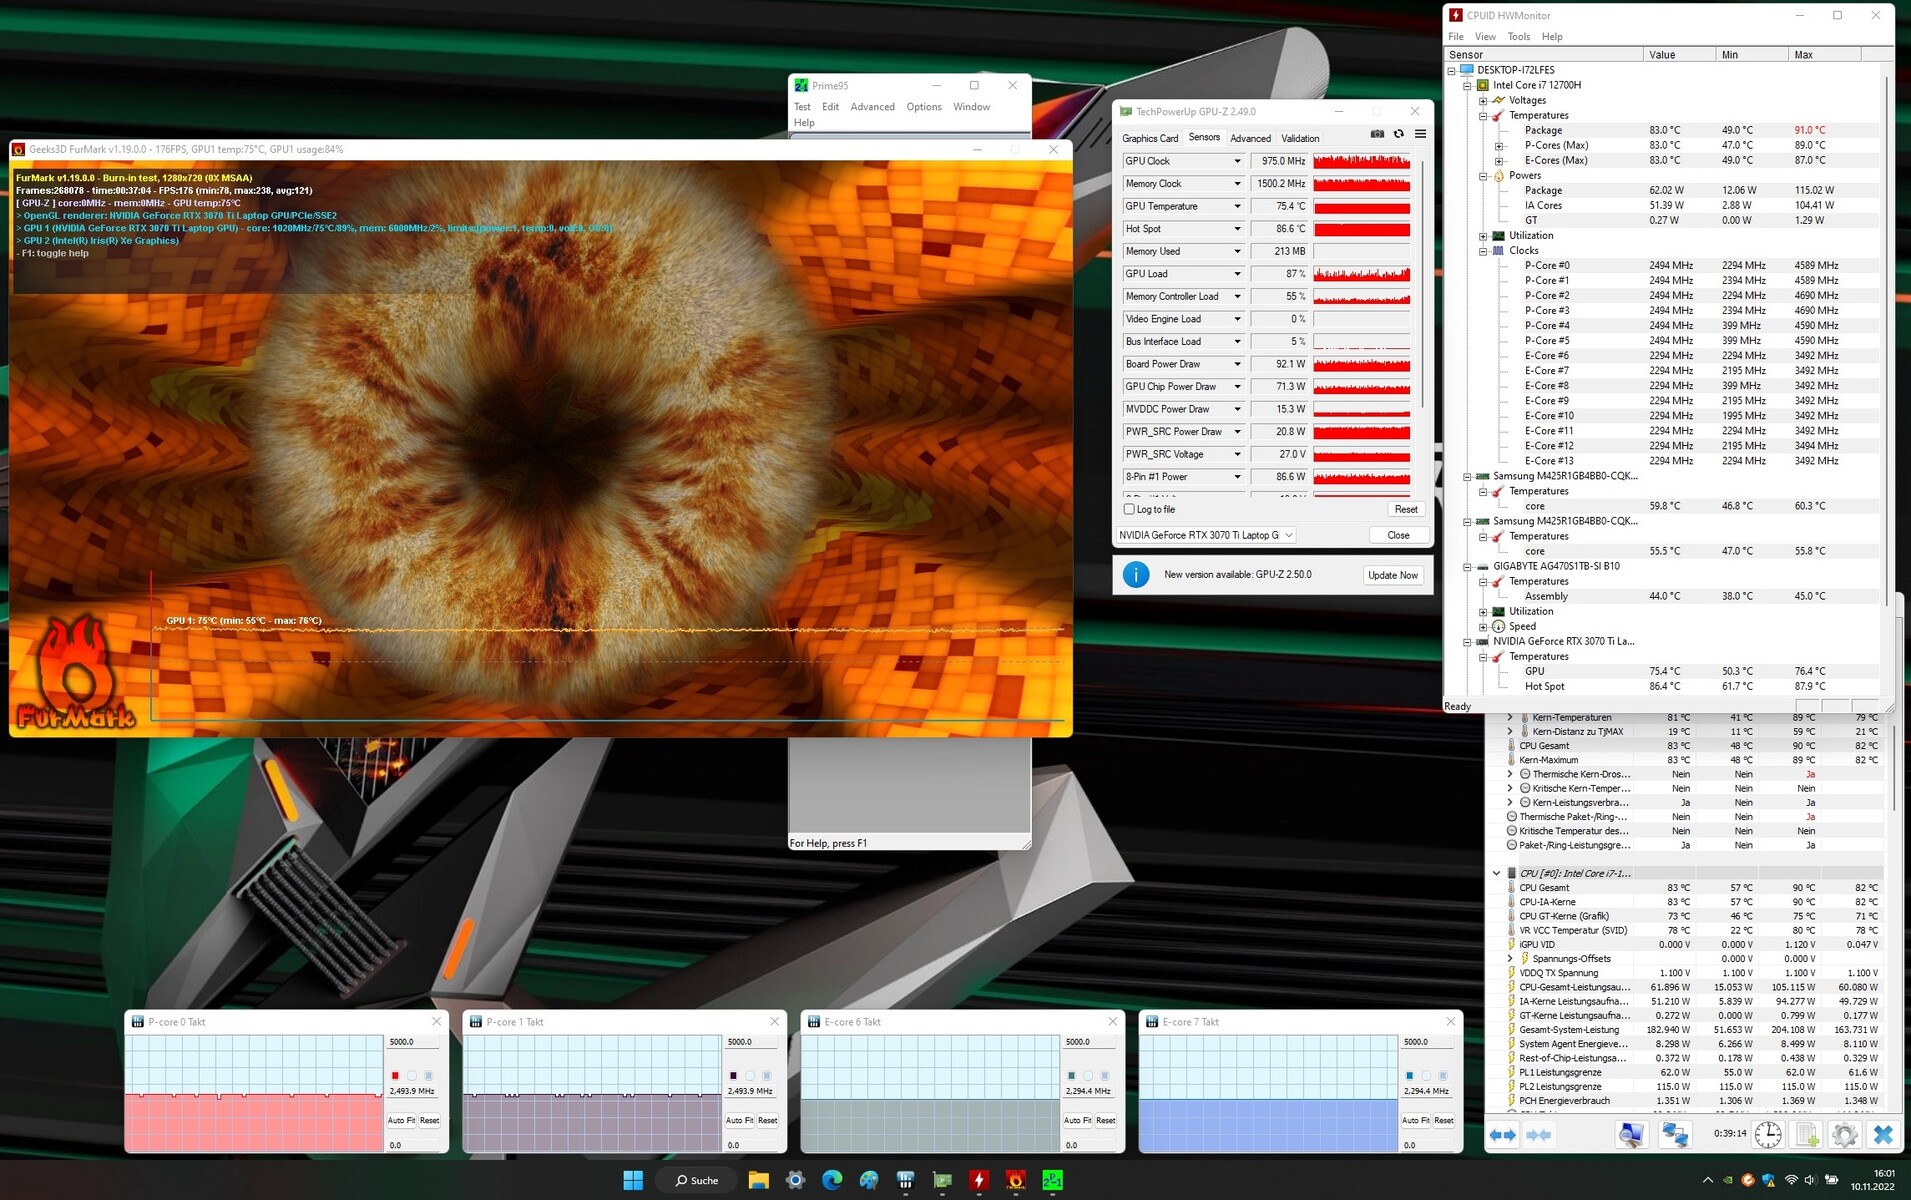
Test na stres
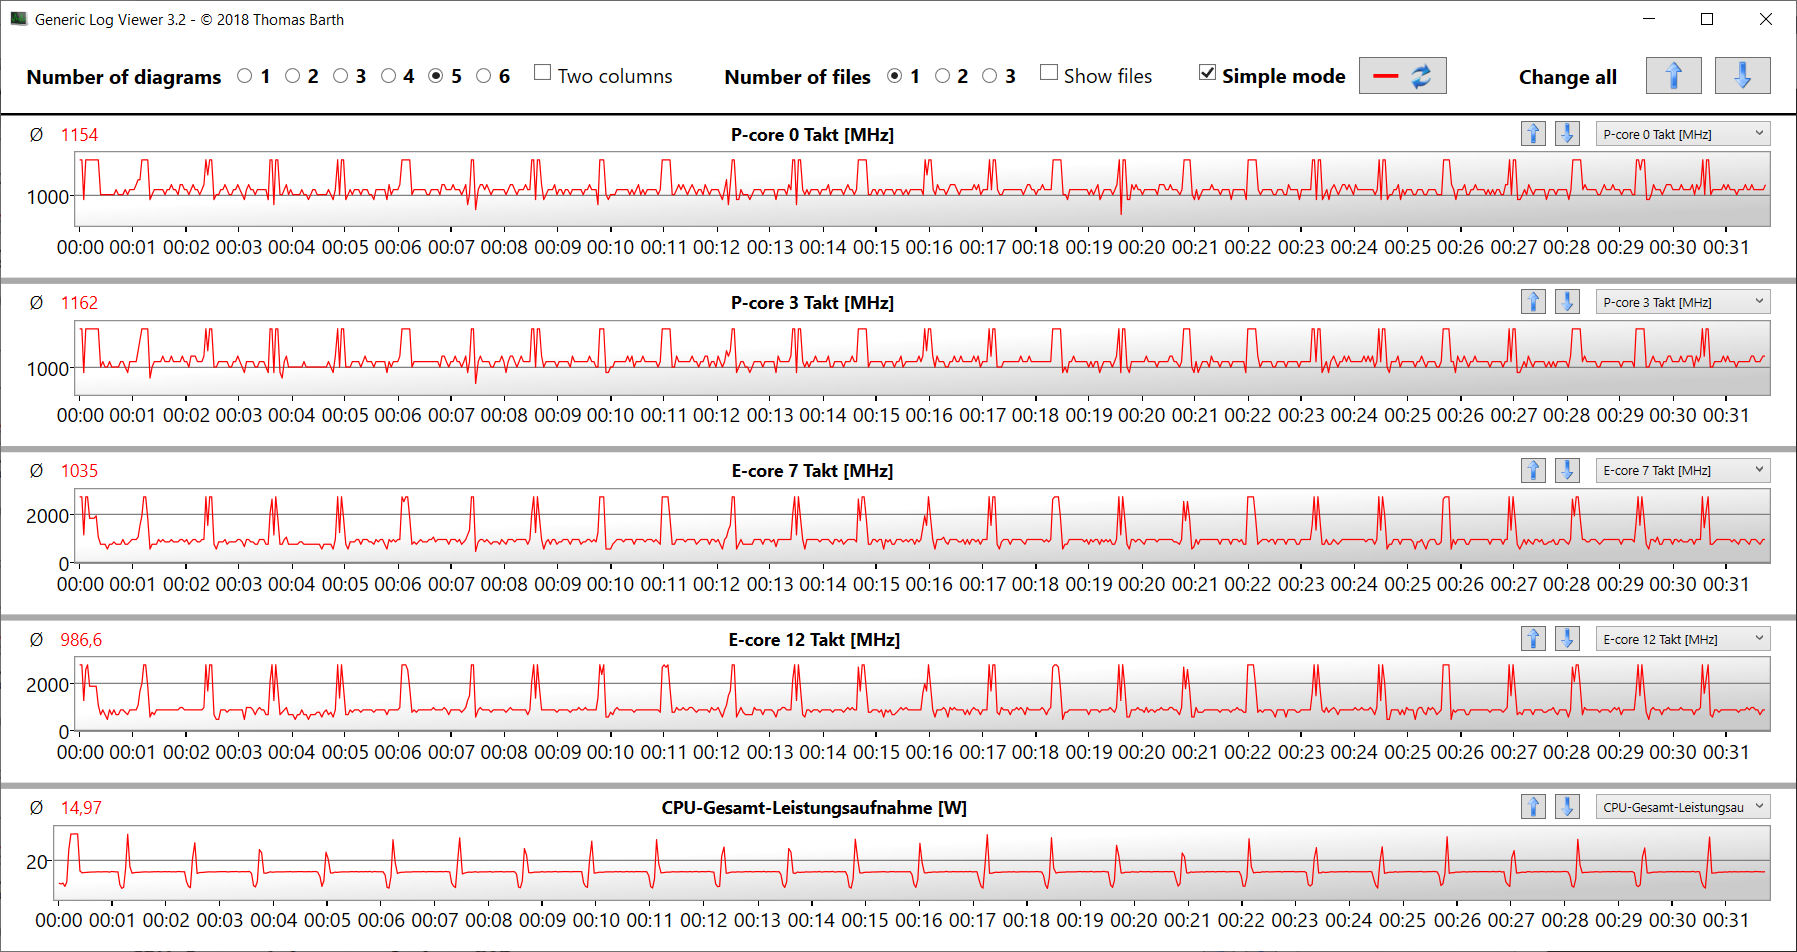
Nasz test obciążeniowy, polegający na ciągłym uruchamianiu programów Prime95 i FurMark, reprezentuje ekstremalny scenariusz mający na celu ocenę stabilności systemu pod pełnym obciążeniem. Podczas testu (trwającego co najmniej godzinę) CPU pracował z umiarkowanymi prędkościami zegara (rdzenie P: ok. 2,5 GHz; rdzenie E: ok. 2,3 GHz), podczas gdy GPU wahało się między 1000 a 1500 MHz.
Mówcy
Głośniki stereo brzmią przyzwoicie, ale nie mają prawie żadnych basów. Zalecamy korzystanie ze słuchawek lub głośników zewnętrznych dla lepszych wrażeń słuchowych.
Aorus 15 XE5 analiza dźwięku
(+) | głośniki mogą odtwarzać stosunkowo głośno (85 dB)
Bas 100 - 315 Hz
(-) | prawie brak basu - średnio 27.9% niższa od mediany
(±) | liniowość basu jest średnia (11.4% delta do poprzedniej częstotliwości)
Średnie 400 - 2000 Hz
(+) | zbalansowane środki średnie - tylko 4.9% od mediany
(+) | średnie są liniowe (4.4% delta do poprzedniej częstotliwości)
Wysokie 2–16 kHz
(+) | zrównoważone maksima - tylko 3.5% od mediany
(+) | wzloty są liniowe (2.9% delta do poprzedniej częstotliwości)
Ogólnie 100 - 16.000 Hz
(±) | liniowość ogólnego dźwięku jest średnia (19.4% różnicy w stosunku do mediany)
W porównaniu do tej samej klasy
» 67% wszystkich testowanych urządzeń w tej klasie było lepszych, 7% podobnych, 26% gorszych
» Najlepszy miał deltę 6%, średnia wynosiła ###średnia###%, najgorsza wynosiła 132%
W porównaniu do wszystkich testowanych urządzeń
» 48% wszystkich testowanych urządzeń było lepszych, 7% podobnych, 45% gorszych
» Najlepszy miał deltę 4%, średnia wynosiła ###średnia###%, najgorsza wynosiła 134%
Asus TUF Dash F15 FX517ZR analiza dźwięku
(±) | głośność głośnika jest średnia, ale dobra (79 dB)
Bas 100 - 315 Hz
(-) | prawie brak basu - średnio 19.2% niższa od mediany
(±) | liniowość basu jest średnia (9.6% delta do poprzedniej częstotliwości)
Średnie 400 - 2000 Hz
(+) | zbalansowane środki średnie - tylko 2.7% od mediany
(+) | średnie są liniowe (5% delta do poprzedniej częstotliwości)
Wysokie 2–16 kHz
(+) | zrównoważone maksima - tylko 2.2% od mediany
(±) | liniowość wysokich wartości jest średnia (7.7% delta do poprzedniej częstotliwości)
Ogólnie 100 - 16.000 Hz
(±) | liniowość ogólnego dźwięku jest średnia (15.3% różnicy w stosunku do mediany)
W porównaniu do tej samej klasy
» 34% wszystkich testowanych urządzeń w tej klasie było lepszych, 6% podobnych, 60% gorszych
» Najlepszy miał deltę 6%, średnia wynosiła ###średnia###%, najgorsza wynosiła 132%
W porównaniu do wszystkich testowanych urządzeń
» 22% wszystkich testowanych urządzeń było lepszych, 4% podobnych, 74% gorszych
» Najlepszy miał deltę 4%, średnia wynosiła ###średnia###%, najgorsza wynosiła 134%
Zarządzanie energią - XE5 wymaga zbyt wiele mocy
Pobór mocy
Aorus 15 XE5 jest zbyt prądożerny w stanie bezczynności, pobierając około 31 do 46 W, a w najgorszym przypadku czasem nawet do 80 W. Porównanie XE5 z konkurentami ujawnia mniej więcej, ile mocy powinien pobierać w stanie spoczynku laptop z obsługą Optimusa. Tak wysoki pobór mocy jest prawdopodobnie spowodowany błędem. Problem utrzymuje się nawet po wyłączeniu funkcji AI Boost. Będziemy więc musieli poczekać i zobaczyć, czy Gigabyte jest w stanie naprawić ten problem poprzez aktualizację oprogramowania lub BIOS-u.
Przez cały czas trwania stress testu oraz testu Witcher 3 pobór mocy laptopa utrzymywał się na poziomie normalnym dla tego sprzętu. Dołączona do zestawu ładowarka ma wystarczającą pojemność, by zasilić laptopa, a także jest w stanie poradzić sobie z przejściowymi skokami napięcia powyżej swojej mocy znamionowej (240 W).
| wyłączony / stan wstrzymania | |
| luz | |
| obciążenie |
|
Legenda:
min: | |
| Aorus 15 XE5 i7-12700H, GeForce RTX 3070 Ti Laptop GPU | Acer Nitro 5 AN515-46-R1A1 R7 6800H, GeForce RTX 3070 Ti Laptop GPU | Schenker XMG Fusion 15 (Mid 22) i7-11800H, GeForce RTX 3070 Laptop GPU | Asus TUF Dash F15 FX517ZR i7-12650H, GeForce RTX 3070 Laptop GPU | MSI Katana GF66 12UGS i7-12700H, GeForce RTX 3070 Ti Laptop GPU | Przeciętny NVIDIA GeForce RTX 3070 Ti Laptop GPU | Średnia w klasie Gaming | |
|---|---|---|---|---|---|---|---|
| Power Consumption | 28% | 36% | 41% | 43% | 28% | 33% | |
| Idle Minimum * (Watt) | 31 | 7 77% | 12 61% | 10 68% | 9 71% | 14.2 ? 54% | 13.2 ? 57% |
| Idle Average * (Watt) | 35 | 8.9 75% | 17 51% | 14 60% | 13 63% | 19.9 ? 43% | 18.9 ? 46% |
| Idle Maximum * (Watt) | 46 | 14.4 69% | 24 48% | 20 57% | 20 57% | 26.2 ? 43% | 24.3 ? 47% |
| Load Average * (Watt) | 120 | 202 -68% | 106 12% | 122 -2% | 100 17% | 125.8 ? -5% | 108 ? 10% |
| Witcher 3 ultra * (Watt) | 202 | 203 -0% | 159.9 21% | 138.6 31% | 149 26% | ||
| Load Maximum * (Watt) | 268 | 230 14% | 208 22% | 189 29% | 212 21% | 248 ? 7% | 254 ? 5% |
* ... im mniej tym lepiej
Power consumption Witcher 3 / Stress test
Power consumption with external monitor
Żywotność baterii
15,6-calowe urządzenie wytrzymało odpowiednio 6h 50m i 6h 11m w naszym teście Wi-Fi (dostęp do stron internetowych przy użyciu skryptu) i teście wideo (odtwarzanie w pętli krótkiego filmu "Big Buck Bunny" w rozdzielczości FHD, zakodowanego w H.264). Podczas obu testów wszystkie funkcje oszczędzania energii w laptopie były wyłączone, a jasność wyświetlacza była ustawiona na mniej więcej 150 cd/m². Ponadto na potrzeby testu wideo wyłączony był także moduł łączności bezprzewodowej.
Podsumowując, XE5 zdecydowanie zapewnia świetne czasy pracy na akumulatorze jak na notebook do gier z matrycą QHD. Niemniej jednak nie dziwi fakt, że Aorus nie wyprzedza znacząco konkurenta takiego jak np Nitro 5pod względem czasu pracy na akumulatorze, mimo że ma on prawie dwukrotnie większą pojemność (99 Wh vs 57,5 Wh). Wynika to z faktu, że laptop Acer jest wyposażony w bardziej energooszczędny procesor i wyświetlacz FHD.
| Aorus 15 XE5 i7-12700H, GeForce RTX 3070 Ti Laptop GPU, 99 Wh | Acer Nitro 5 AN515-46-R1A1 R7 6800H, GeForce RTX 3070 Ti Laptop GPU, 57.5 Wh | Schenker XMG Fusion 15 (Mid 22) i7-11800H, GeForce RTX 3070 Laptop GPU, 93.48 Wh | Asus TUF Dash F15 FX517ZR i7-12650H, GeForce RTX 3070 Laptop GPU, 76 Wh | MSI Katana GF66 12UGS i7-12700H, GeForce RTX 3070 Ti Laptop GPU, 52 Wh | Średnia w klasie Gaming | |
|---|---|---|---|---|---|---|
| Czasy pracy | -13% | 20% | 7% | -46% | 0% | |
| Reader / Idle (h) | 10 | 10.5 5% | 15.5 55% | 10.8 8% | 8.71 ? -13% | |
| H.264 (h) | 6.2 | 5.7 -8% | 7.5 21% | 5.8 -6% | 8.26 ? 33% | |
| WiFi v1.3 (h) | 6.8 | 5.8 -15% | 7.4 9% | 7 3% | 2.4 -65% | 7.02 ? 3% |
| Load (h) | 1.9 | 1.3 -32% | 1.8 -5% | 2.3 21% | 1.4 -26% | 1.47 ? -23% |
Za
Przeciw
Werdykt - Żądna mocy bestia gamingowa
Aorus 15 XE5 został zaprojektowany do uruchamiania gier w rozdzielczości QHD i ustawieniach wysokich do maksymalnych. Ale dobrze wycina także w innych wymagających zastosowaniach, takich jak edycja i renderowanie wideo. Jest to możliwe dzięki zastosowaniu Core i7 12700H oraz GeForce RTX 3070 Ti Laptop wewnątrz maszyny. Błyskawiczny dysk SSD PCIe 4.0 (1 TB) pozwala na krótkie czasy ładowania.
Aorus 15 XE5 robi to, co ma robić: płynnie uruchamia gry na swoim płynnym ekranie. Jego zużycie energii jest jednak zbyt wysokie.
Procesor i karta grafiki omawianego laptopa potrafią działać ze stale wysokim taktowaniem. Choć ilość hałasu wytwarzanego przez Aorus 15 XE5 jest typowa dla laptopa do gier, generuje on zbyt dużo ciepła w stanie spoczynku. Podobnie jest z jego poborem mocy w spoczynku i przy niskim obciążeniu - można mieć tylko nadzieję, że Gigabyte wypuści aktualizację, która rozwiąże ten problem. Laptop nie ma jednak tego problemu podczas pracy na baterii, wytrzymując około 6 do 7 godzin w codziennym użytkowaniu - co jest całkiem godne szacunku
Matowy wyświetlacz QHD (15,6 cala, IPS, odświeżanie 165 Hz) w większości pozostawia pozytywne wrażenie, choć z pewnością przydałoby się mu nieco więcej kontrastu. Port Thunderbolt 4 pozwala na podłączenie różnych opcji rozbudowy, takich jak rozwiązanie dokujące czy zewnętrzna karta graficzna. Obsługuje też Power Delivery, co oznacza, że laptop może być ładowany przez ten port (adapter USB-C, min. 65 W, 20 V).
Na stronie Schenker XMG Fusion 15 (Mid 22) oraz Asus TUF Dash F15to dwie alternatywy dla Aorus 15 XE5. Choć te dwa laptopy oferują mniejszą wydajność i robią się naprawdę ciepłe pod obciążeniem, są lżejsze i w niektórych przypadkach mają dłuższy czas pracy na baterii.
Cena i dostępność
Aorus 15 XE5
- 06/12/2022 v7 (old)
Sascha Mölck
Price comparison

