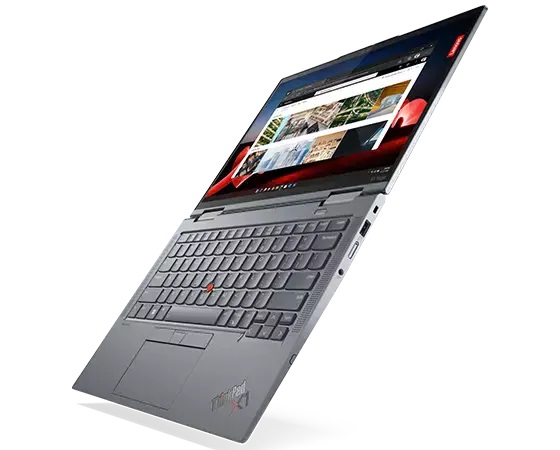
Nowy procesor, te same problemy: Recenzja konwertowalnego Lenovo ThinkPad X1 Yoga G8

ThinkPad X1 Yoga G8 zastępuje opcje procesorów Alder Lake 12. generacji w ThinkPad X1 Yoga G7 nowszymi opcjami Raptor Lake 13. generacji. Poza tym oba modele mają tę samą konstrukcję obudowy i cechy zewnętrzne. Zalecamy sprawdzenie naszych recenzji zeszłorocznego modelu i starszego modelu ThinkPad X1 Yoga G6 aby dowiedzieć się więcej o fizycznych cechach ThinkPad X1 Yoga G8.
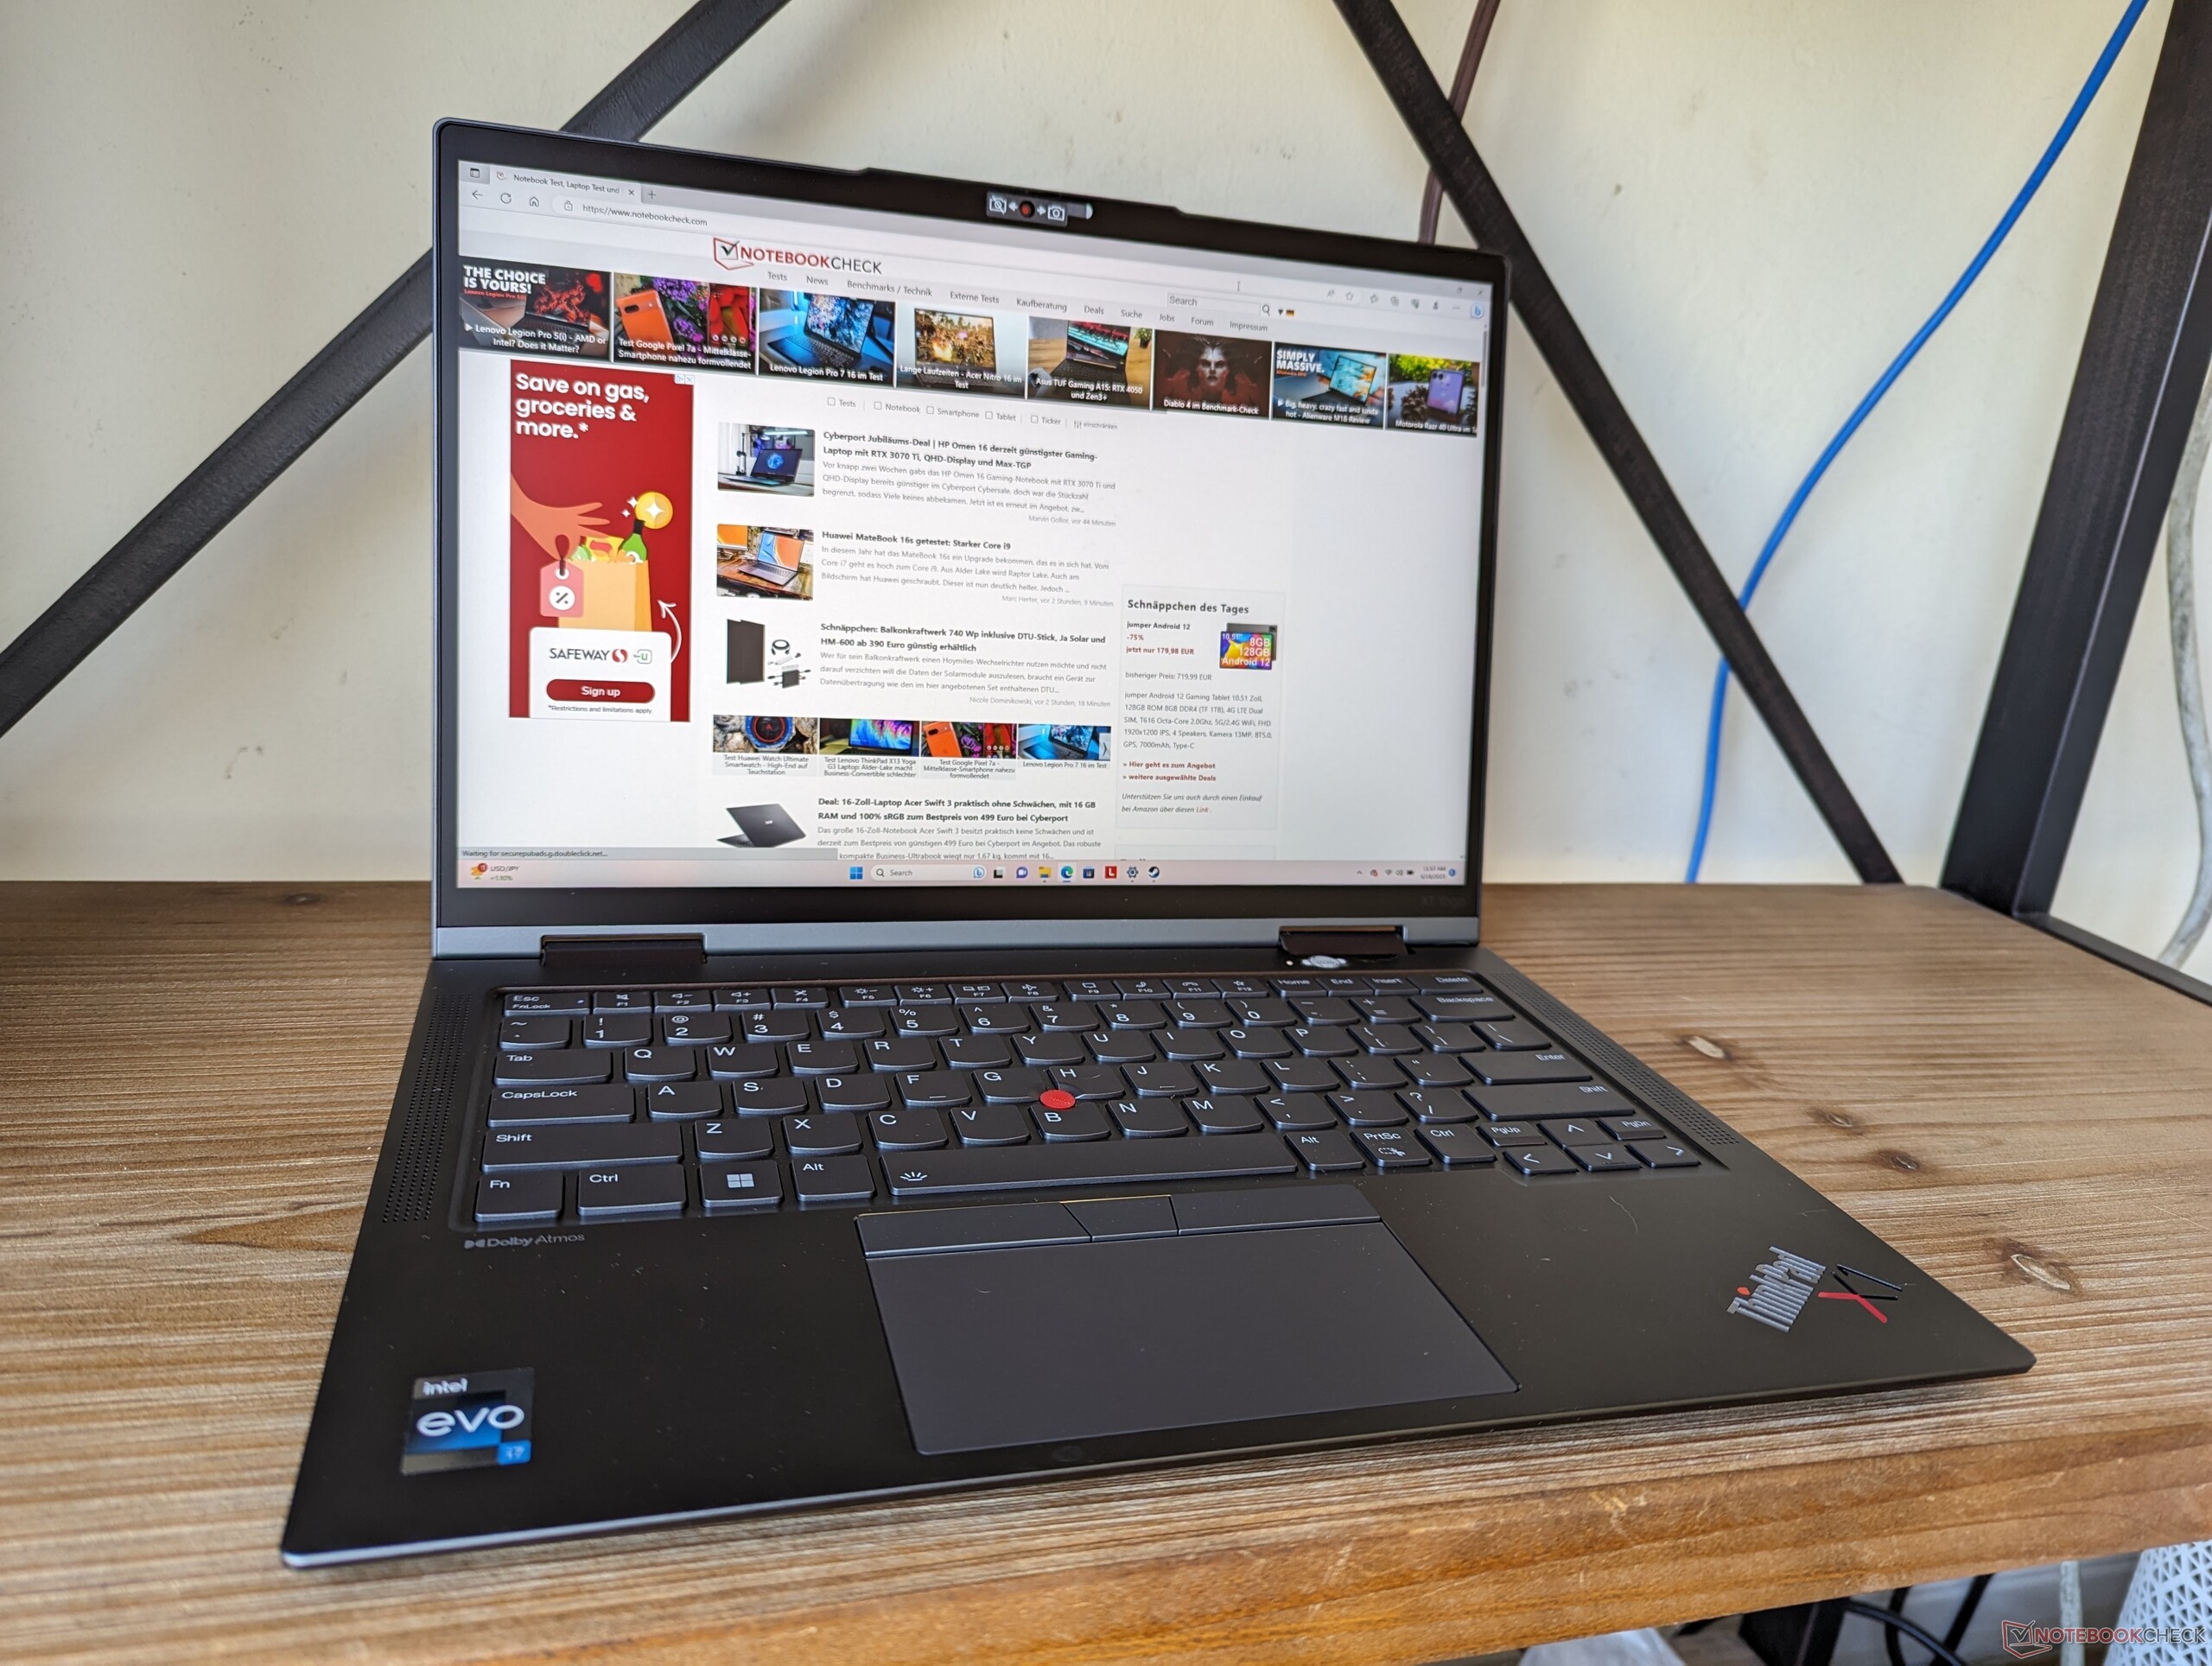
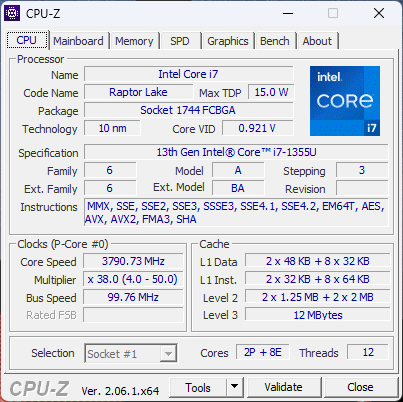
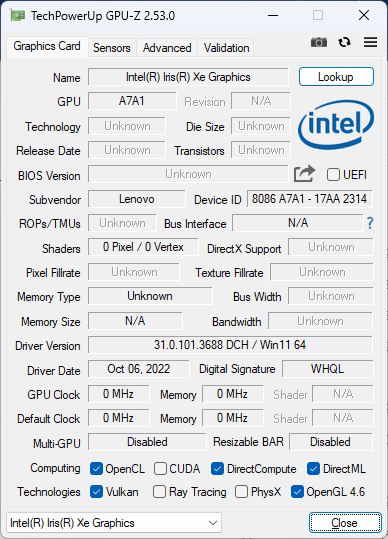
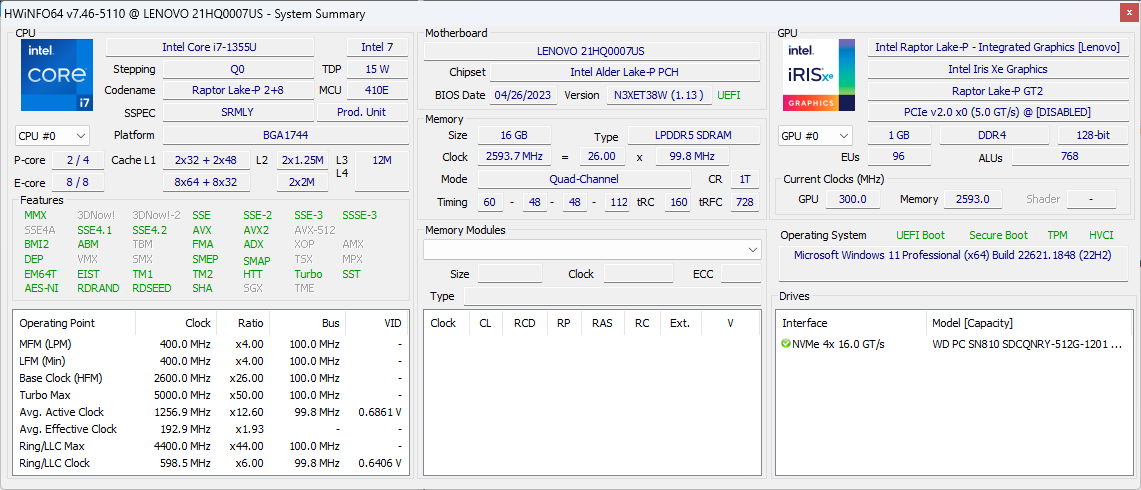
Nasza jednostka testowa to konfiguracja średniej klasy z procesorem Core i7-1355U i matowym ekranem dotykowym IPS 16:10 1920 x 1200p za około 2100 USD. Niższe opcje z Core i5-1335U są dostępne oprócz wyższych opcji z Core i7-1370P, panelem OLED 2400p i łącznością nano-SIM od 1600 USD do ponad 2600 USD. Wszystkie jednostki SKU są dostarczane wyłącznie ze zintegrowaną grafiką Iris Xe.
Alternatywy dla ThinkPada X1 Yoga G8 obejmują inne wysokiej klasy 14-calowe konwertowalne komputery biznesowe, takie jak HP EliteBook x360 1040, Dell Latitude 9430 2-w-1 lub MSI Summit E14 Flip.
Więcej recenzji Lenovo:
Potencjalni konkurenci w porównaniu
Ocena | Data | Model | Waga | Wysokość | Rozmiar | Rezolucja | Cena |
|---|---|---|---|---|---|---|---|
| 90 % v7 (old) | 06/2023 | Lenovo ThinkPad X1 Yoga G8 i7-1355U i7-1355U, Iris Xe G7 96EUs | 1.4 kg | 15.53 mm | 14.00" | 1920x1200 | |
| 89.4 % v7 (old) | Lenovo ThinkPad X1 Yoga G7 21CE002HGE i7-1270P, Iris Xe G7 96EUs | 1.5 kg | 15.53 mm | 14.00" | 1920x1200 | ||
| 89.8 % v7 (old) | Dell Latitude 9430 2-in-1 i7-1265U, Iris Xe G7 96EUs | 1.5 kg | 13.94 mm | 14.00" | 2560x1600 | ||
| 87.5 % v7 (old) | LG Gram 14T90P i5-1135G7, Iris Xe G7 80EUs | 1.2 kg | 17 mm | 14.00" | 1900x1200 | ||
| 86.5 % v7 (old) | Asus ZenBook Flip 14 UN5401QA-KN085W R7 5800H, Vega 8 | 1.4 kg | 15.9 mm | 14.00" | 2880x1800 | ||
| 90.6 % v7 (old) | HP EliteBook x360 1040 G7, i7-10810U i7-10810U, UHD Graphics 620 | 1.4 kg | 16.5 mm | 14.00" | 1920x1080 |
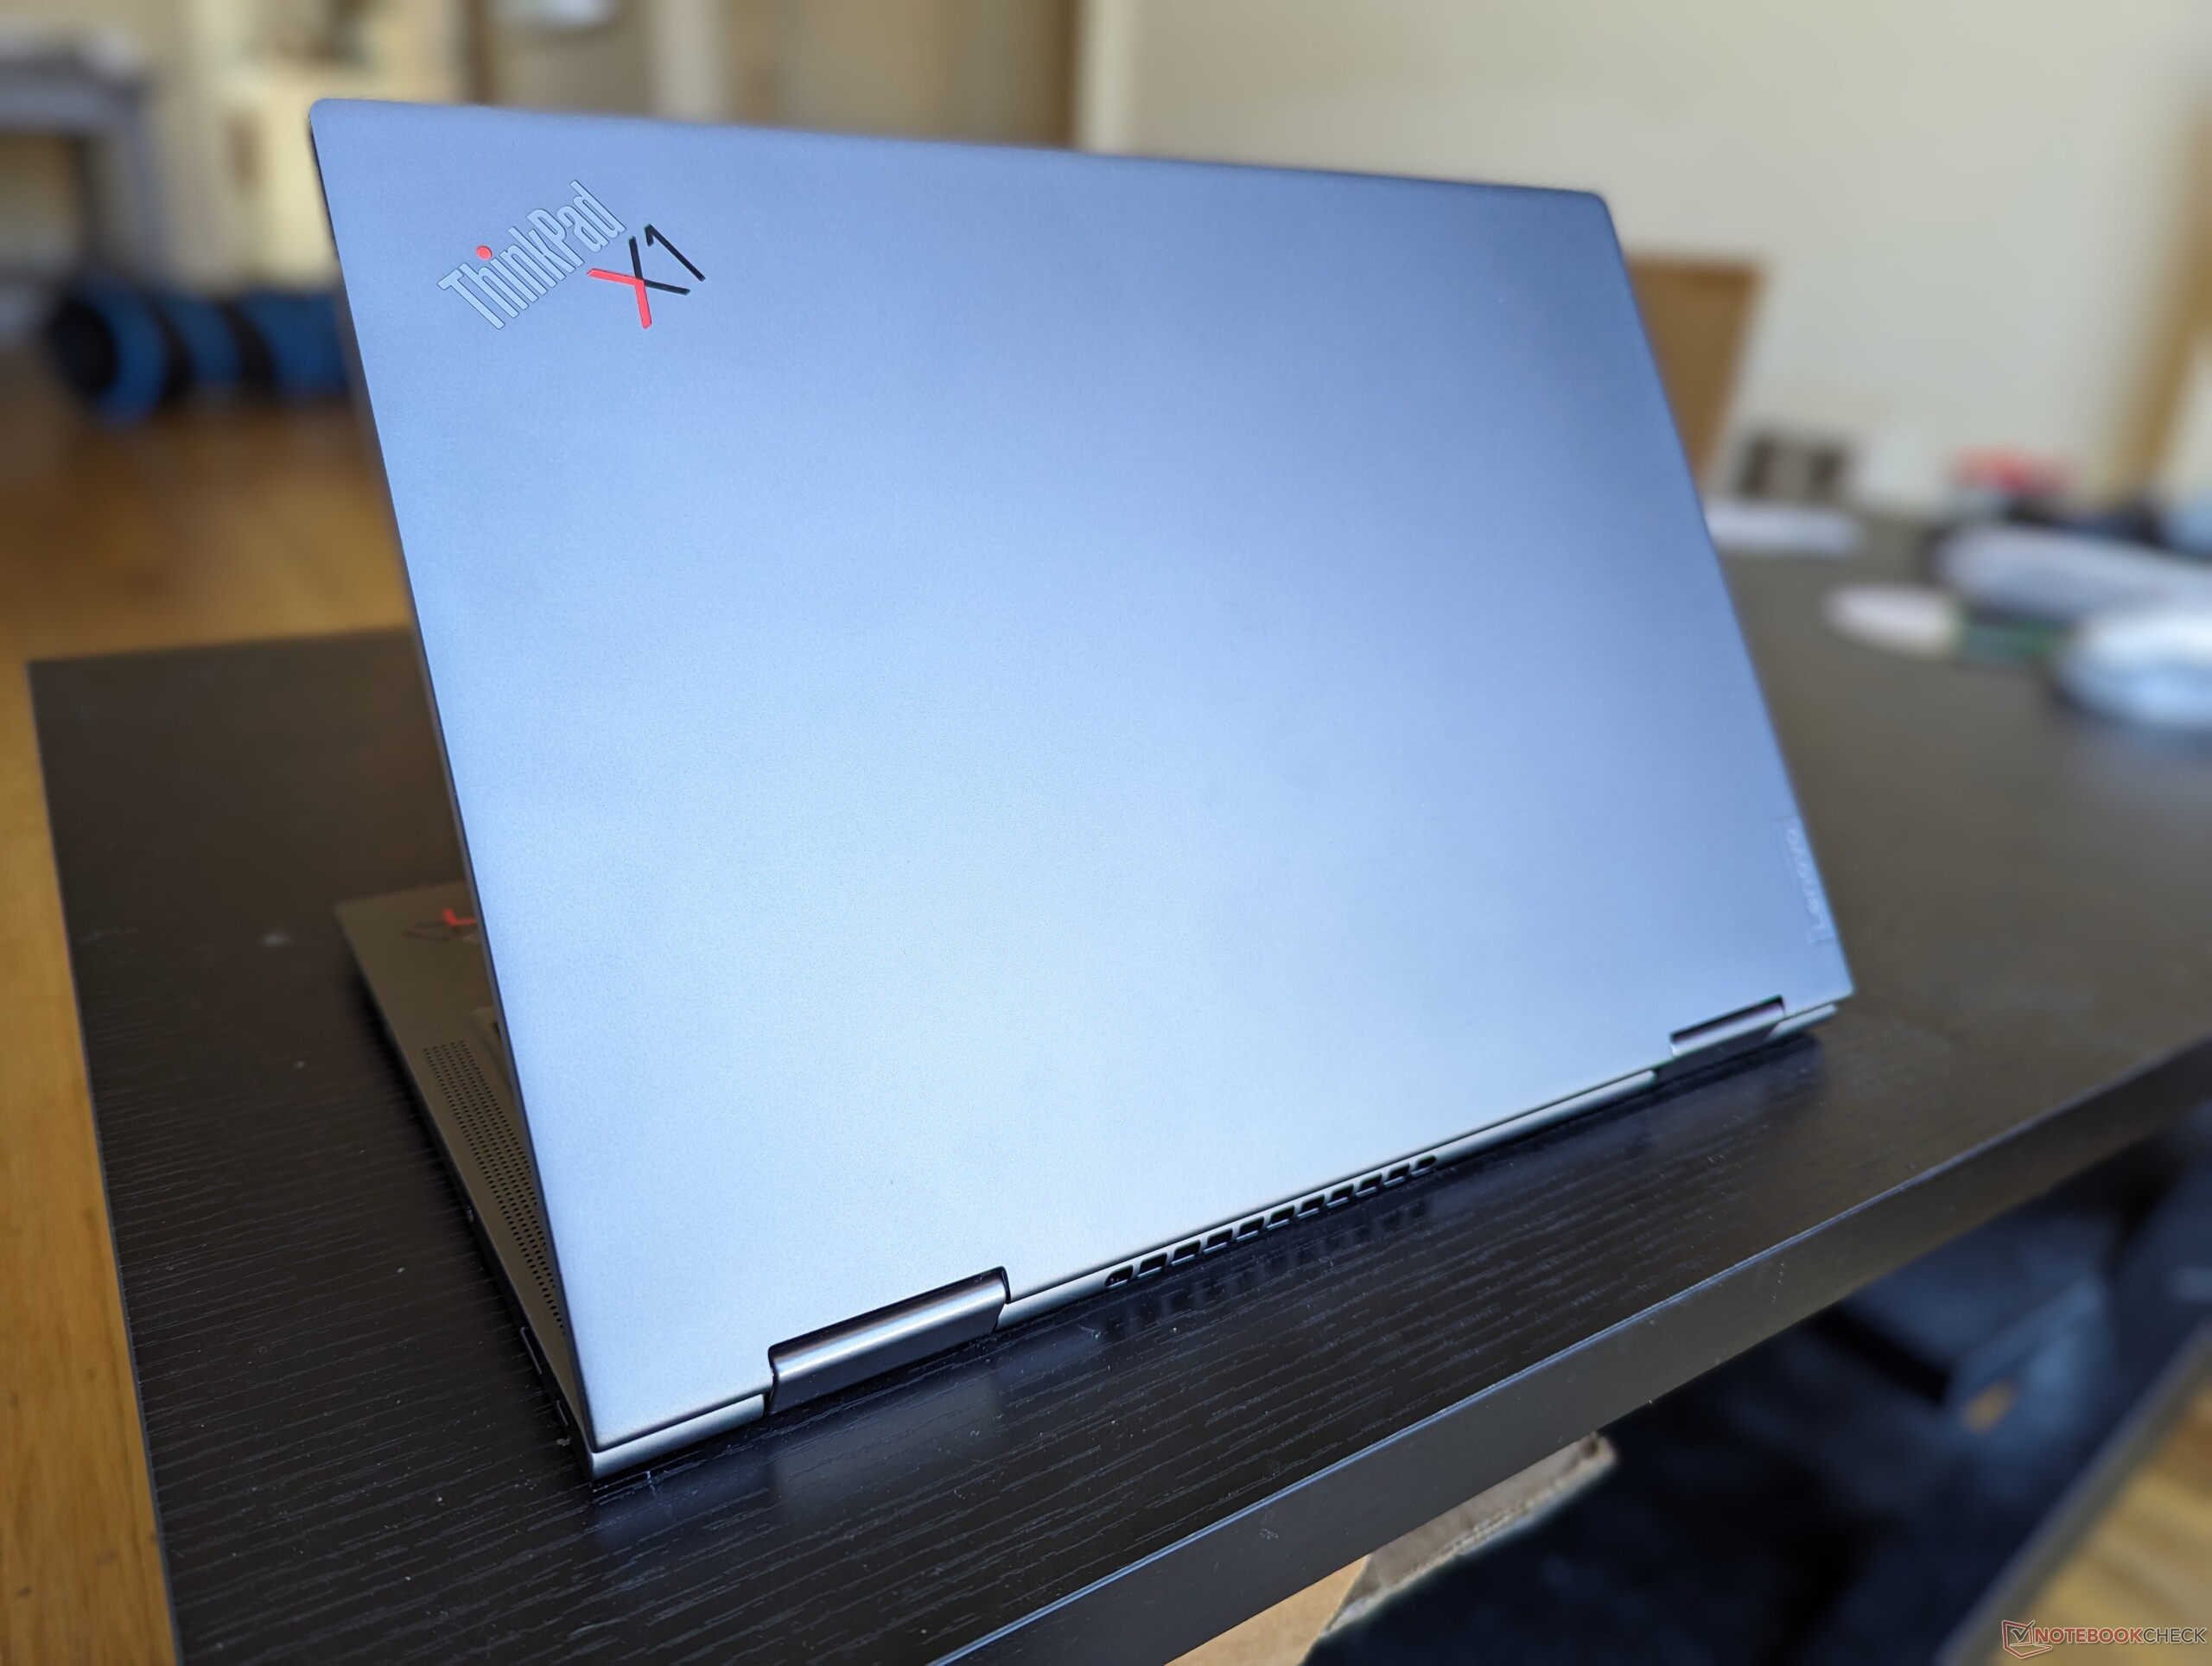
Przypadek - dokładnie ten sam projekt od trzech lat
Komunikacja
| Networking | |
| iperf3 transmit AX12 | |
| Asus ZenBook Flip 14 UN5401QA-KN085W | |
| HP EliteBook x360 1040 G7, i7-10810U | |
| iperf3 receive AX12 | |
| Asus ZenBook Flip 14 UN5401QA-KN085W | |
| HP EliteBook x360 1040 G7, i7-10810U | |
| iperf3 transmit AXE11000 | |
| Lenovo ThinkPad X1 Yoga G8 i7-1355U | |
| LG Gram 14T90P | |
| iperf3 receive AXE11000 | |
| Lenovo ThinkPad X1 Yoga G8 i7-1355U | |
| LG Gram 14T90P | |
| iperf3 transmit AXE11000 6GHz | |
| Lenovo ThinkPad X1 Yoga G7 21CE002HGE | |
| Dell Latitude 9430 2-in-1 | |
| Lenovo ThinkPad X1 Yoga G8 i7-1355U | |
| iperf3 receive AXE11000 6GHz | |
| Lenovo ThinkPad X1 Yoga G7 21CE002HGE | |
| Dell Latitude 9430 2-in-1 | |
| Lenovo ThinkPad X1 Yoga G8 i7-1355U | |
Kamera internetowa
Model jest nadal dostarczany z aparatem 2 MP, podczas gdy HP Spectre i EliteBook są wyposażone w czujniki 5 MP lub 8 MP.


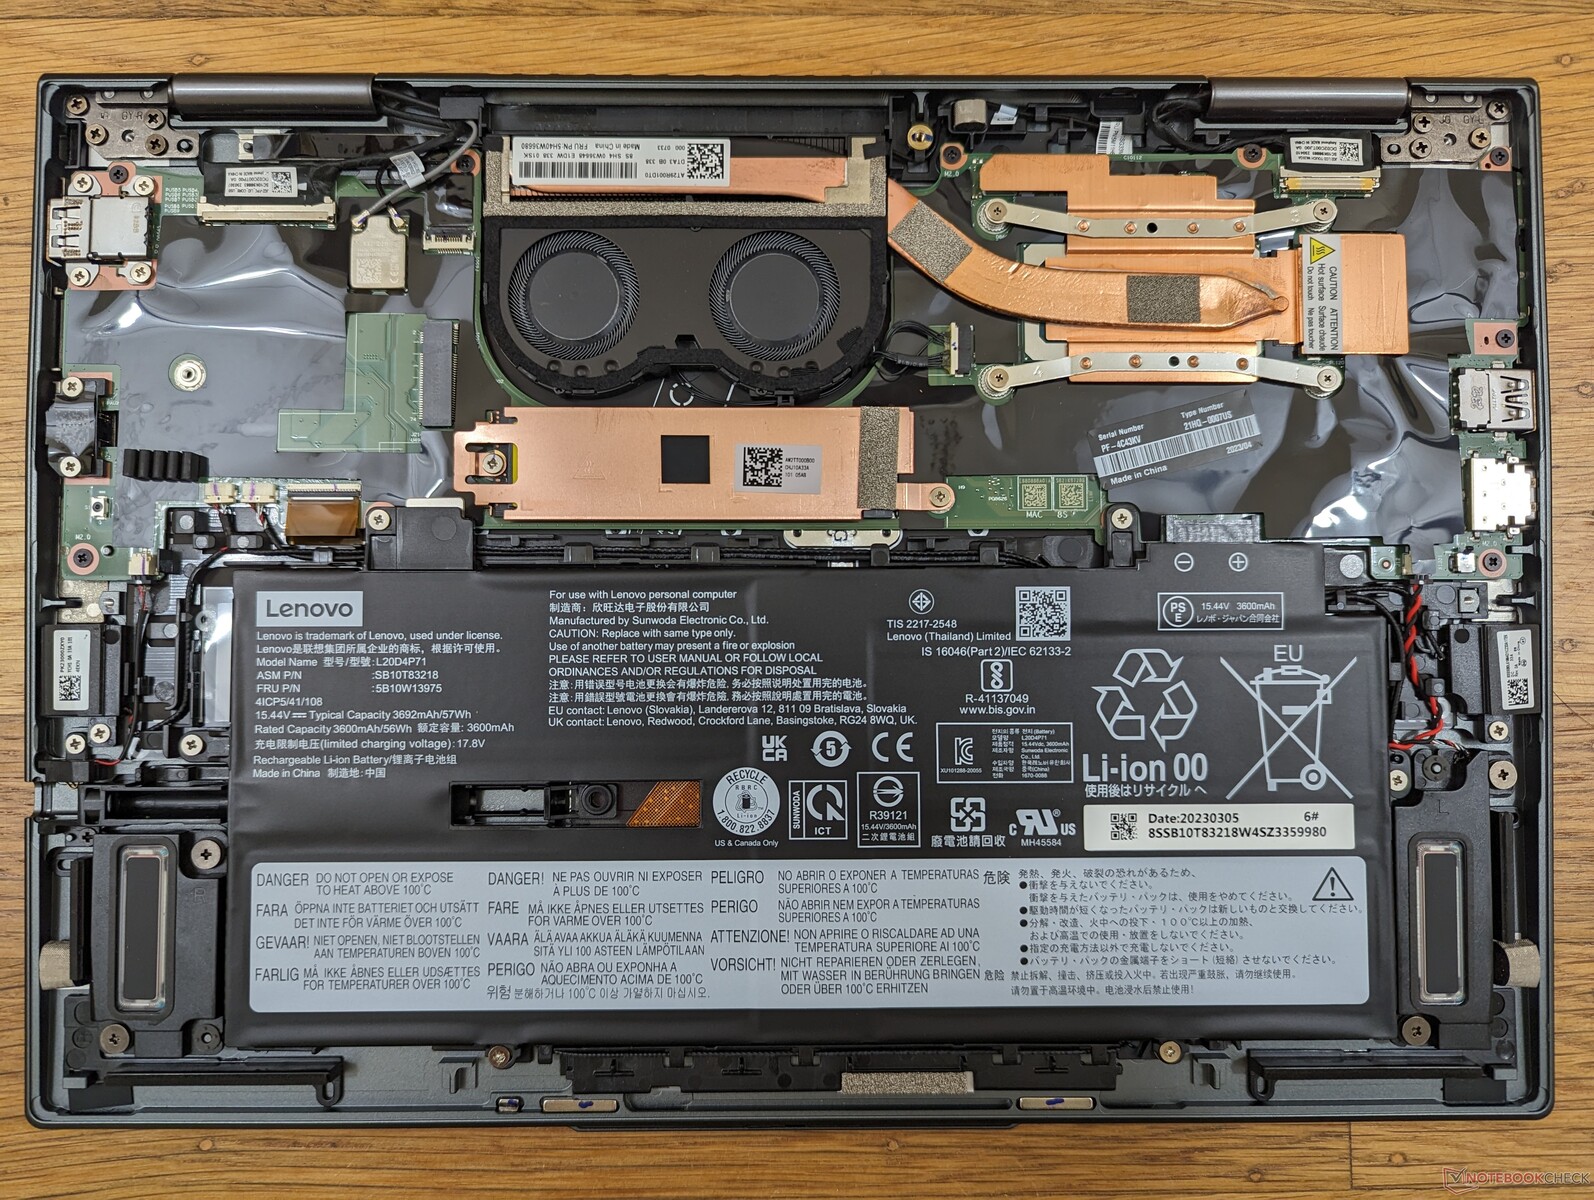
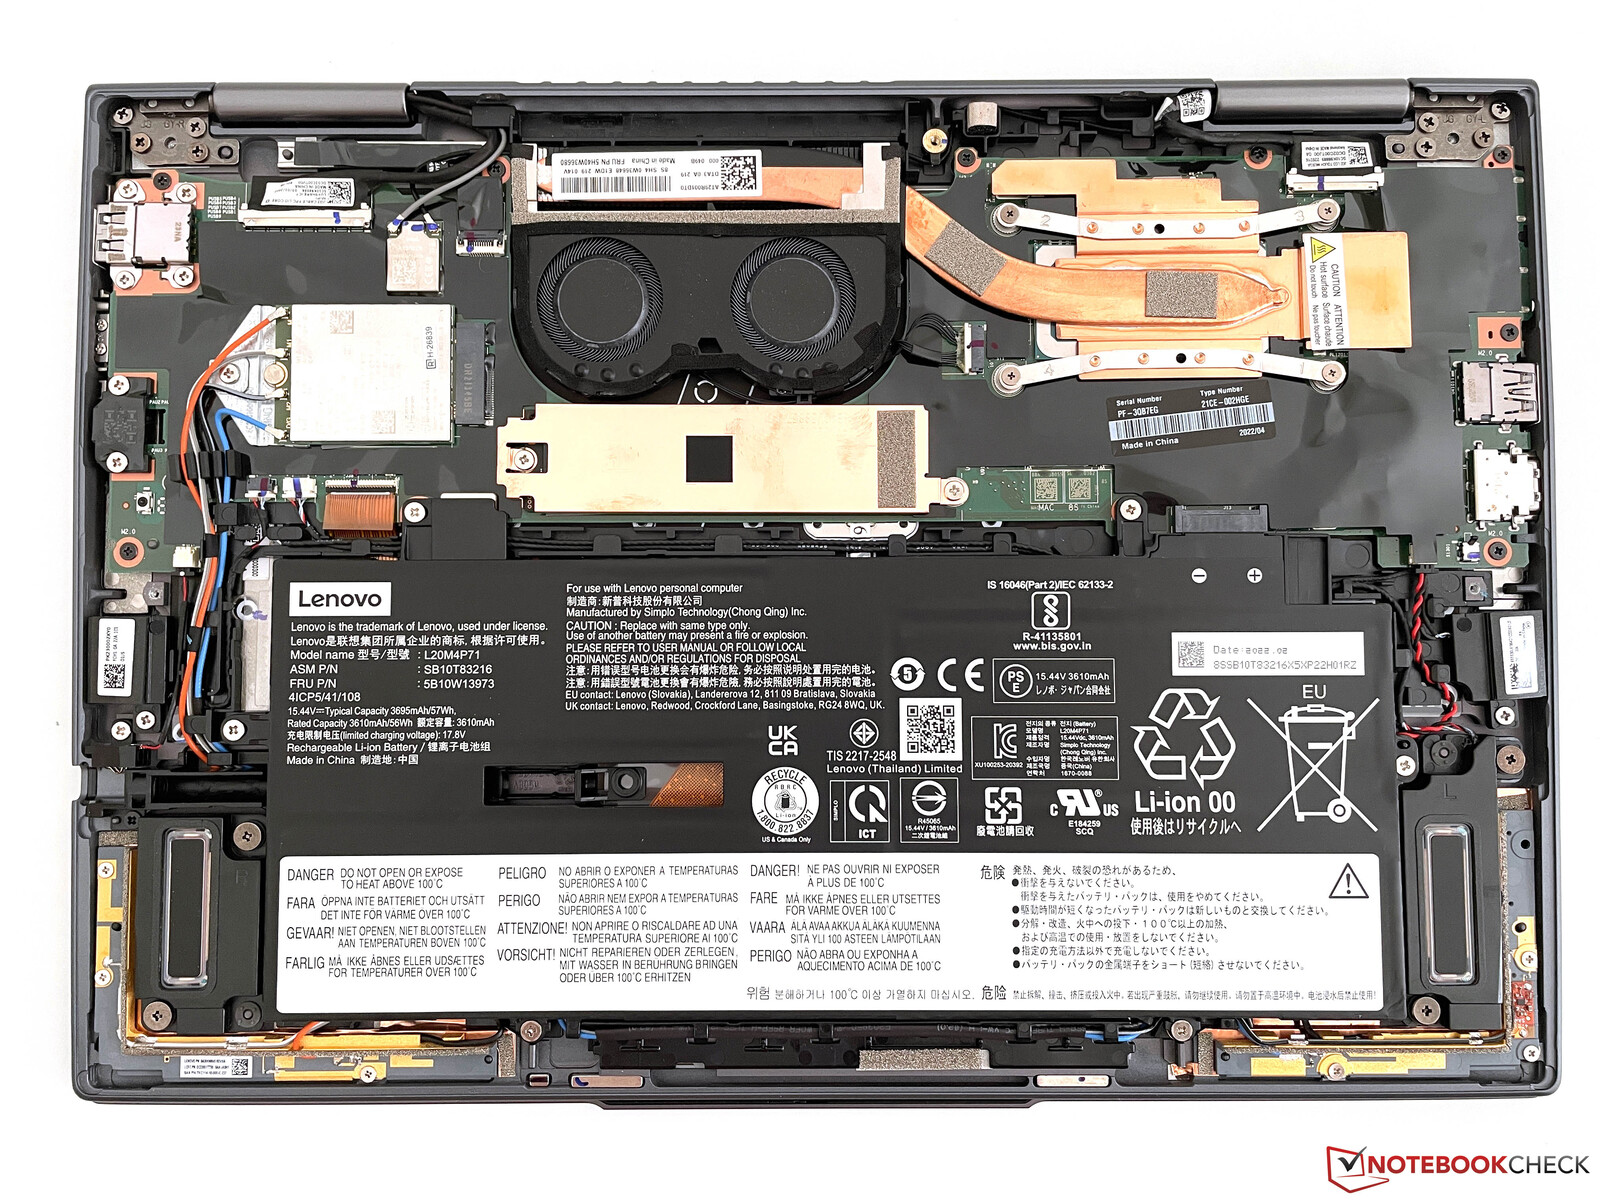
Konserwacja
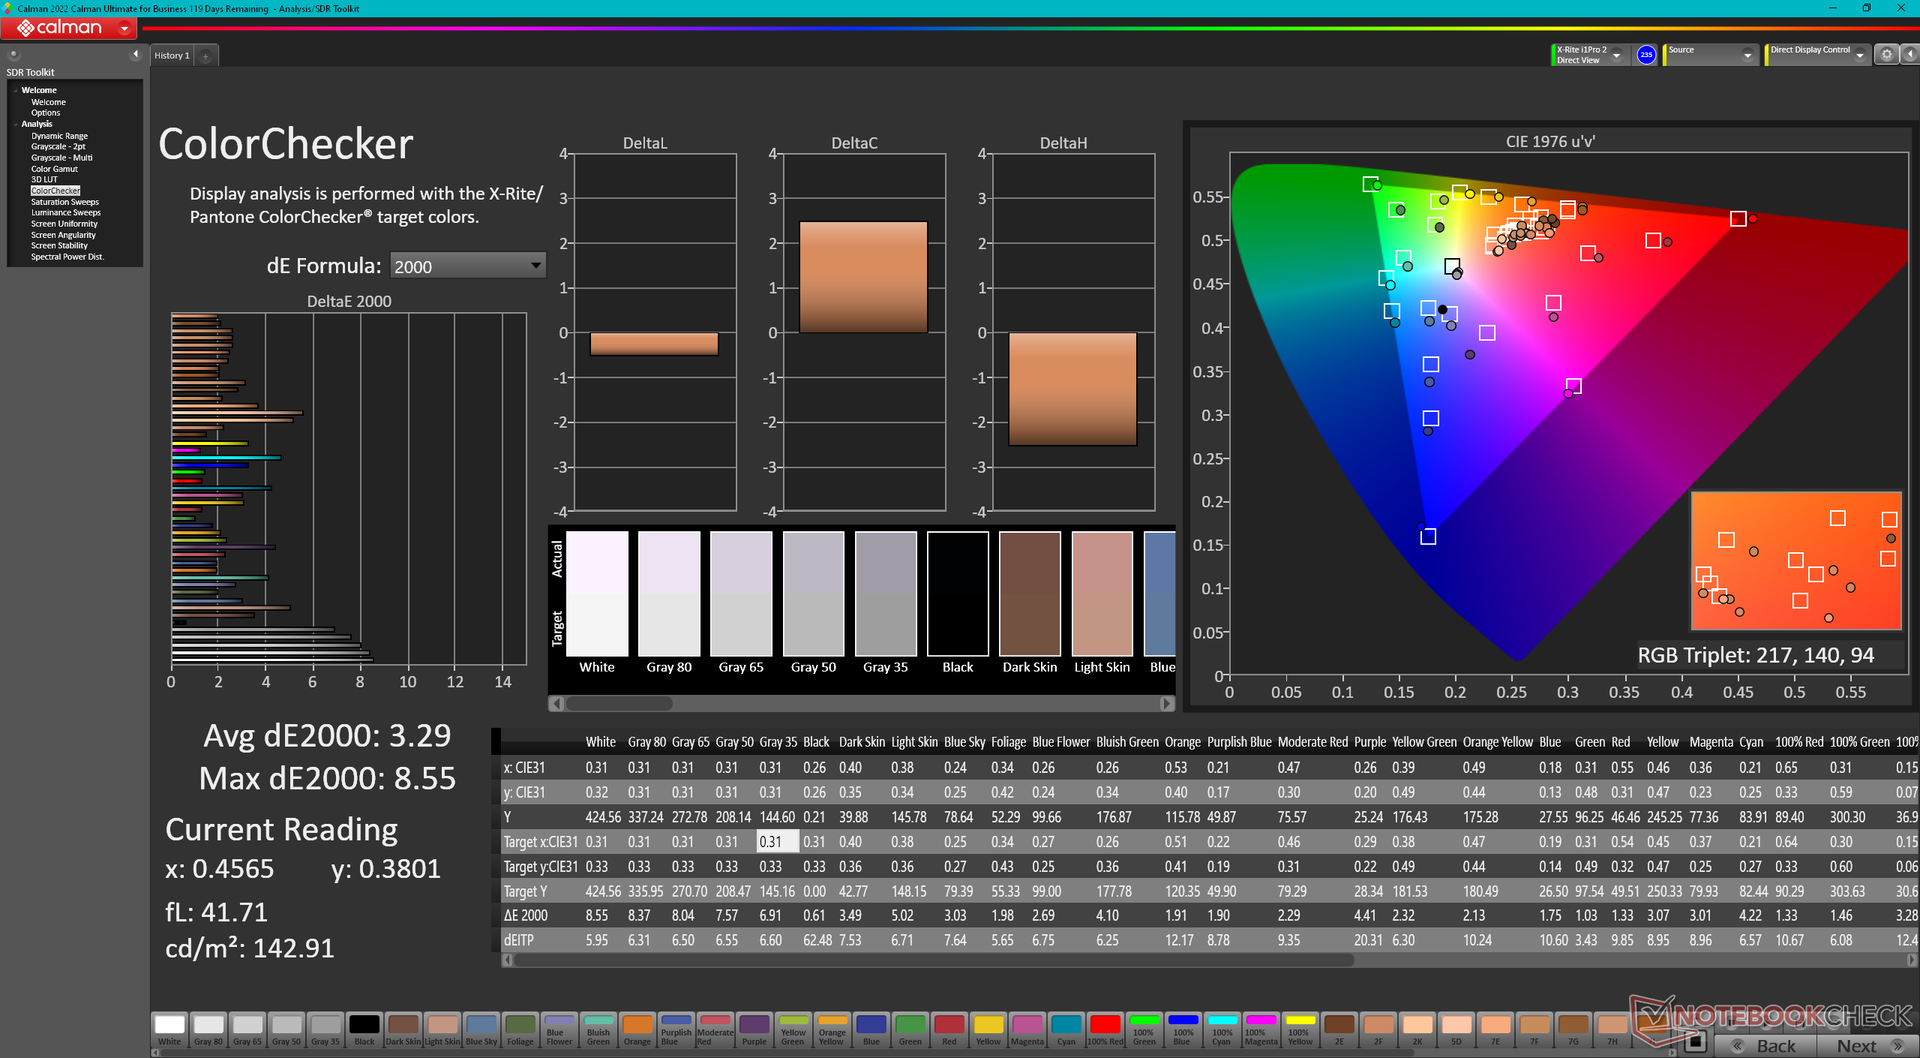
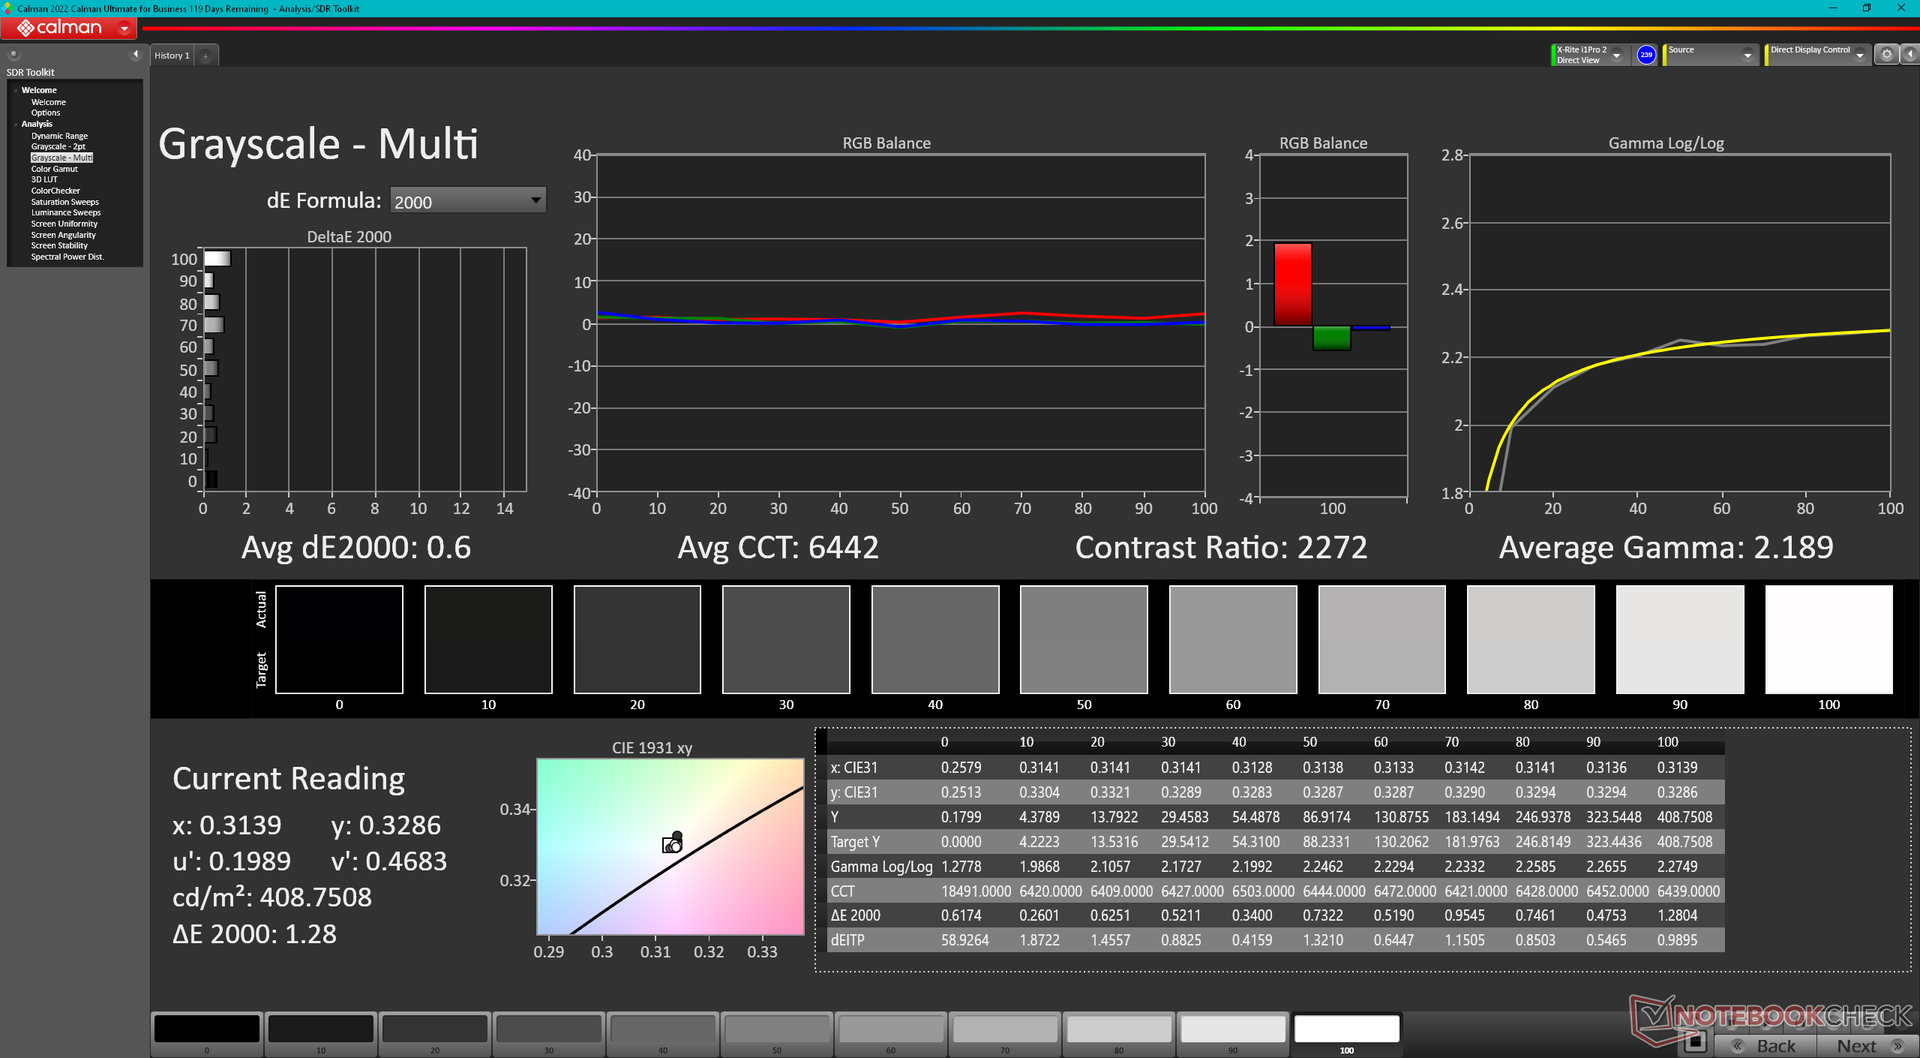
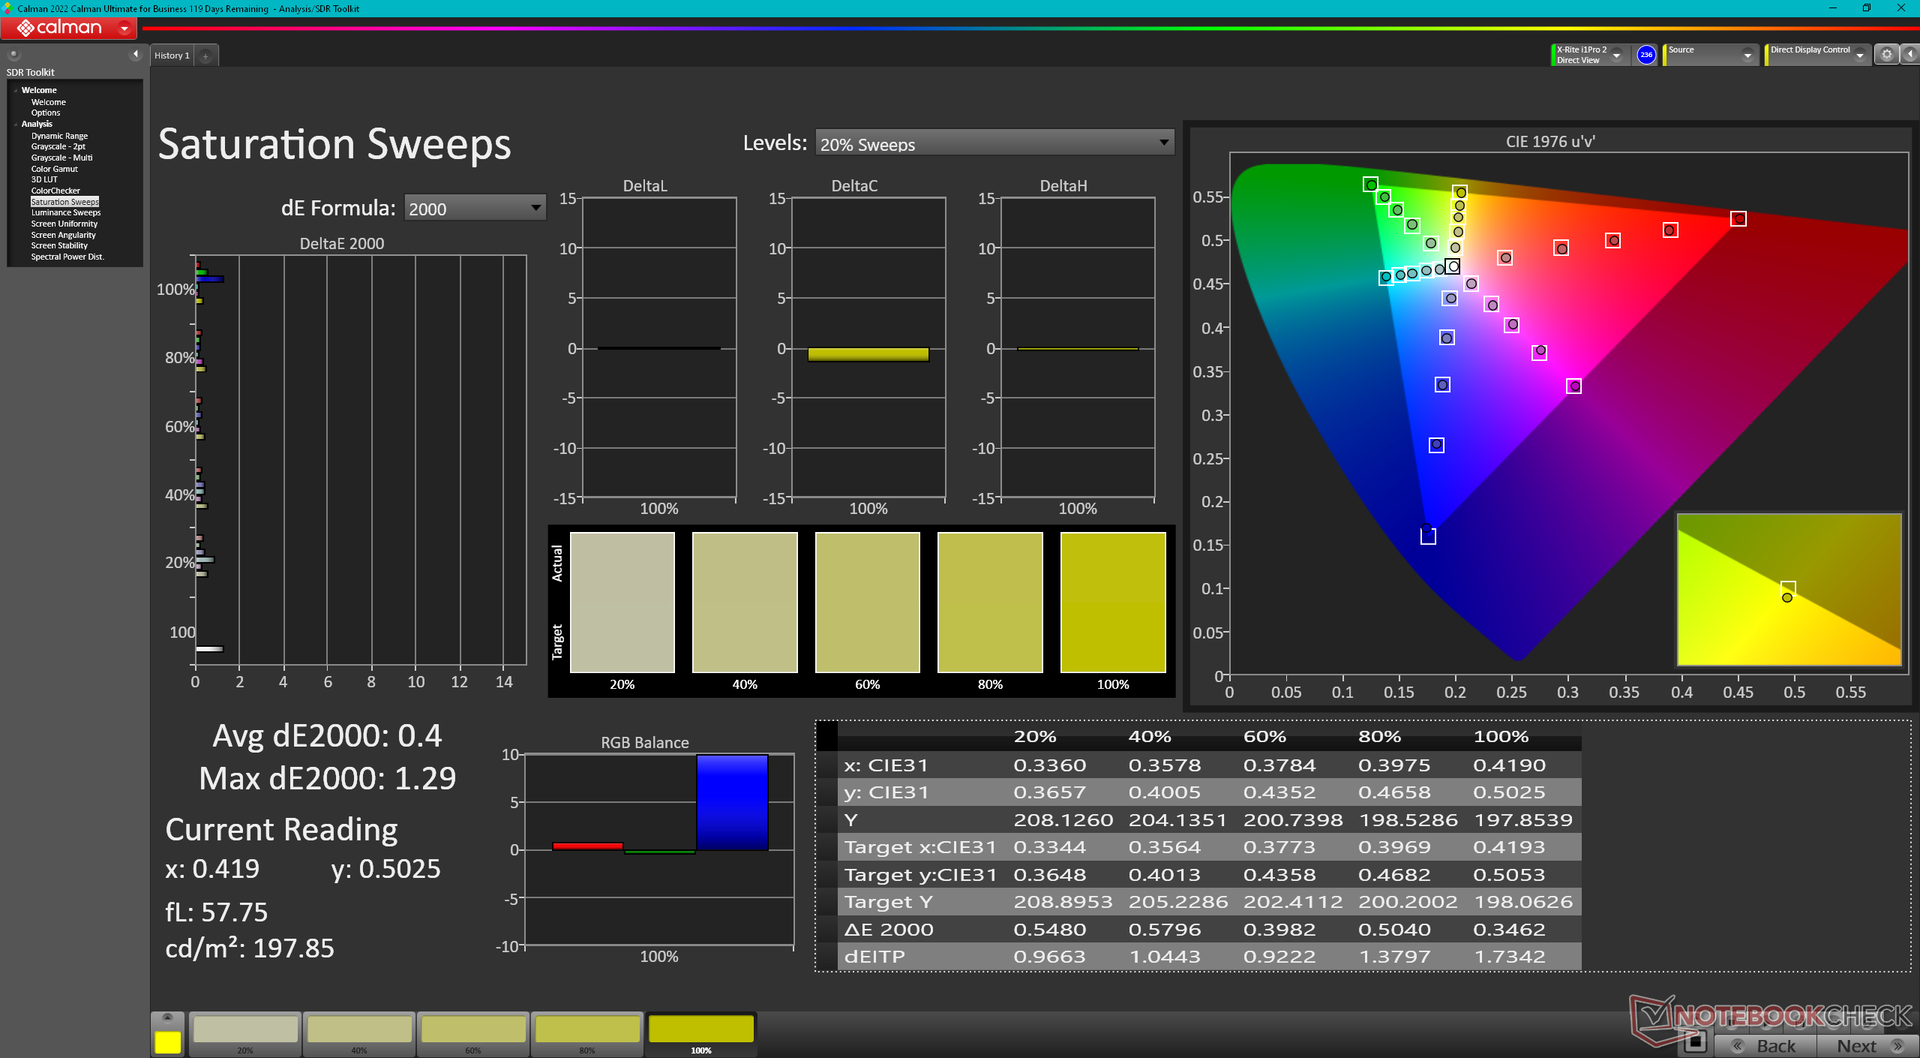
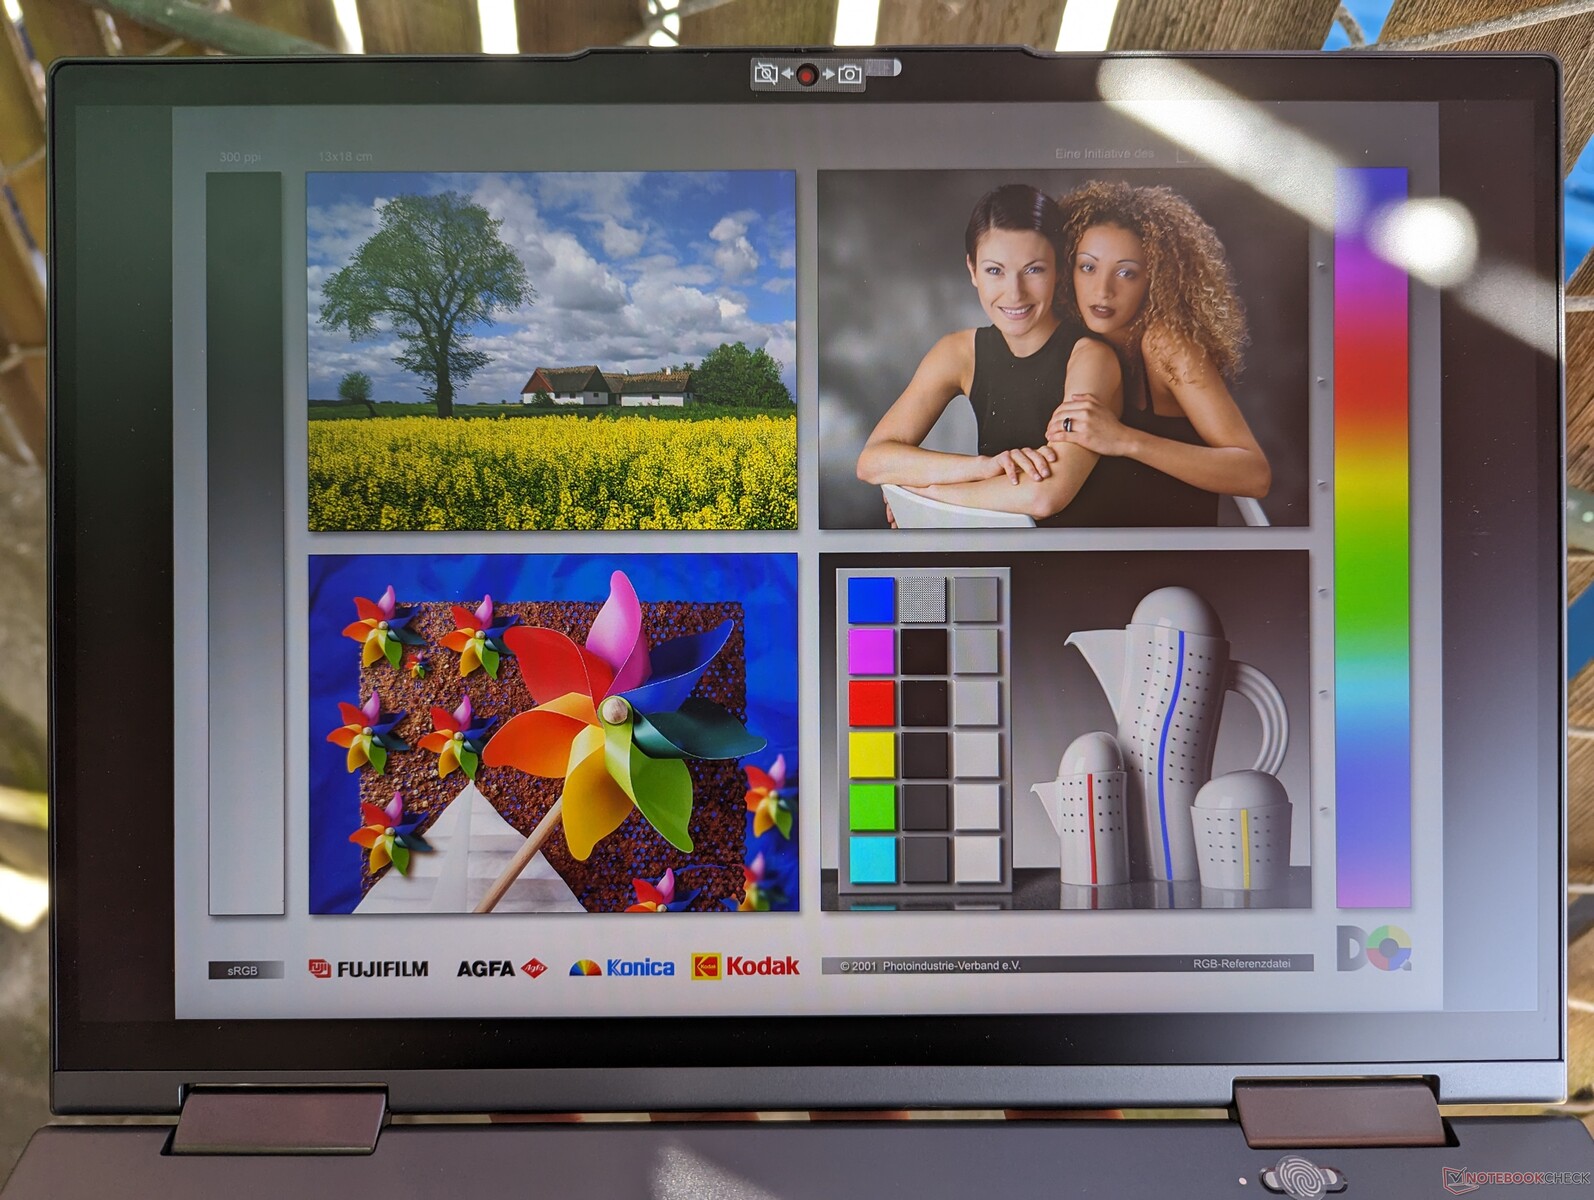
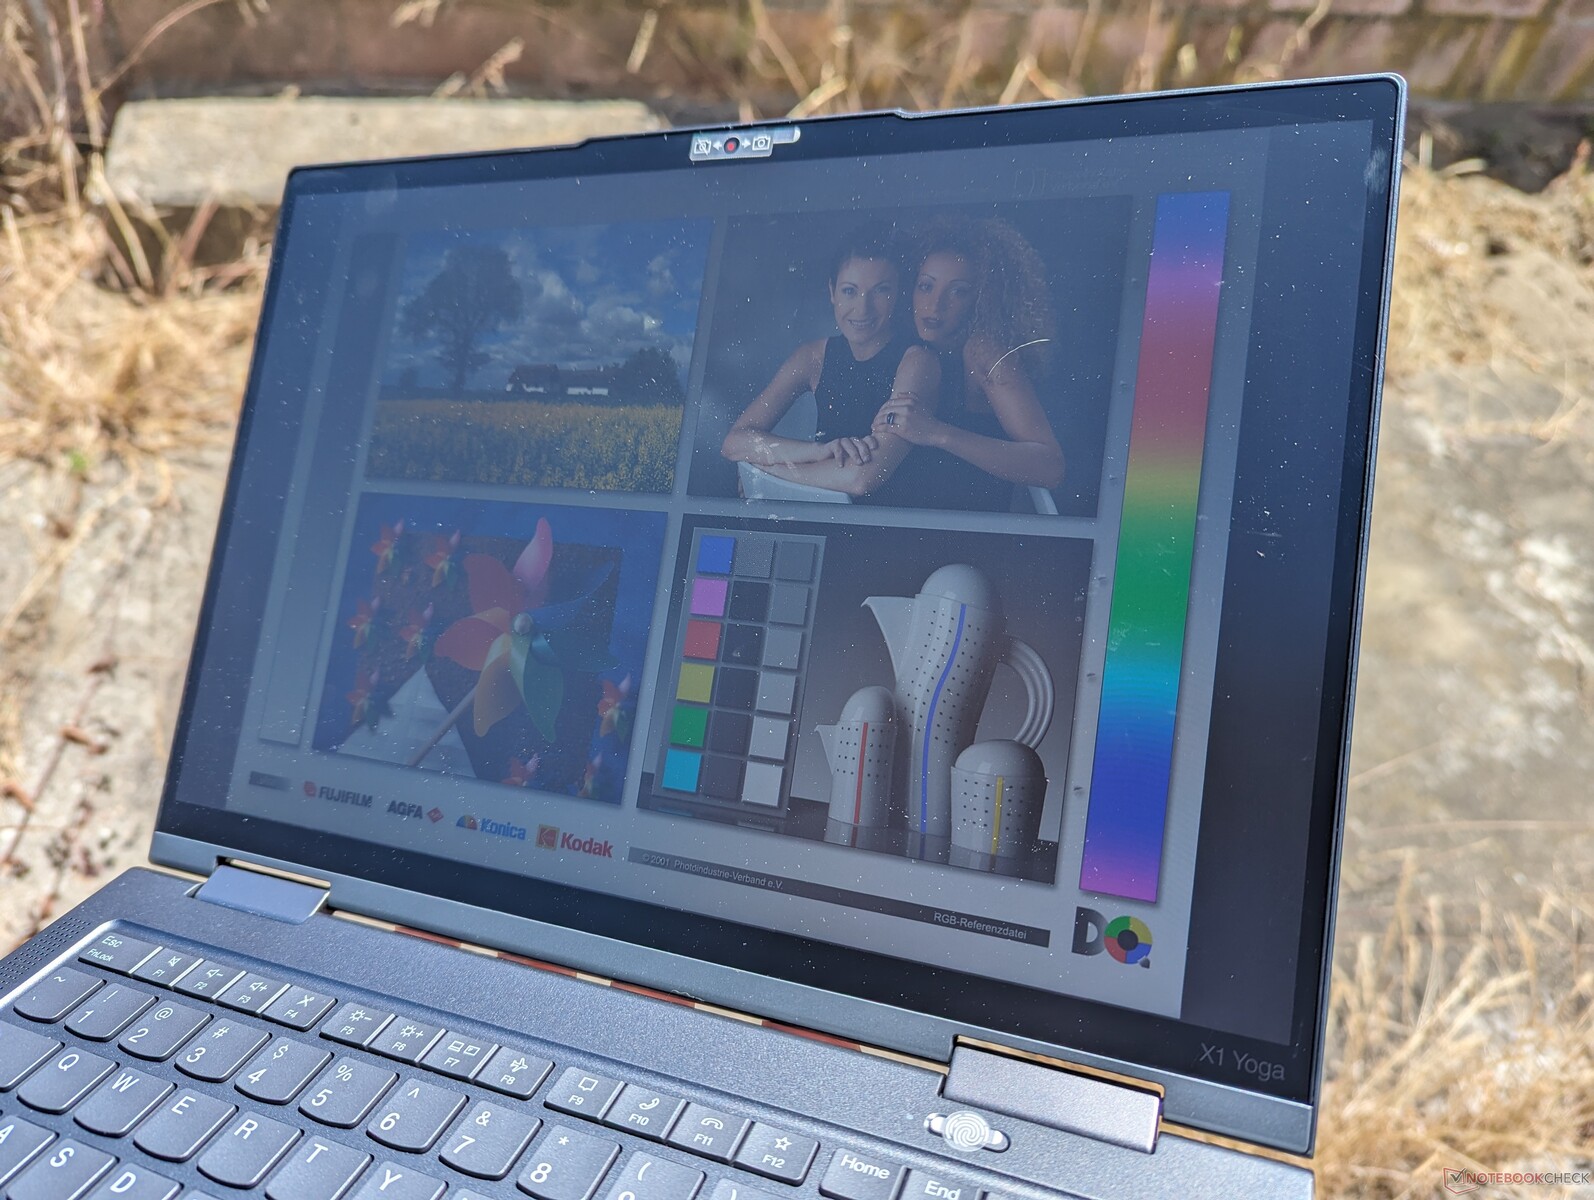
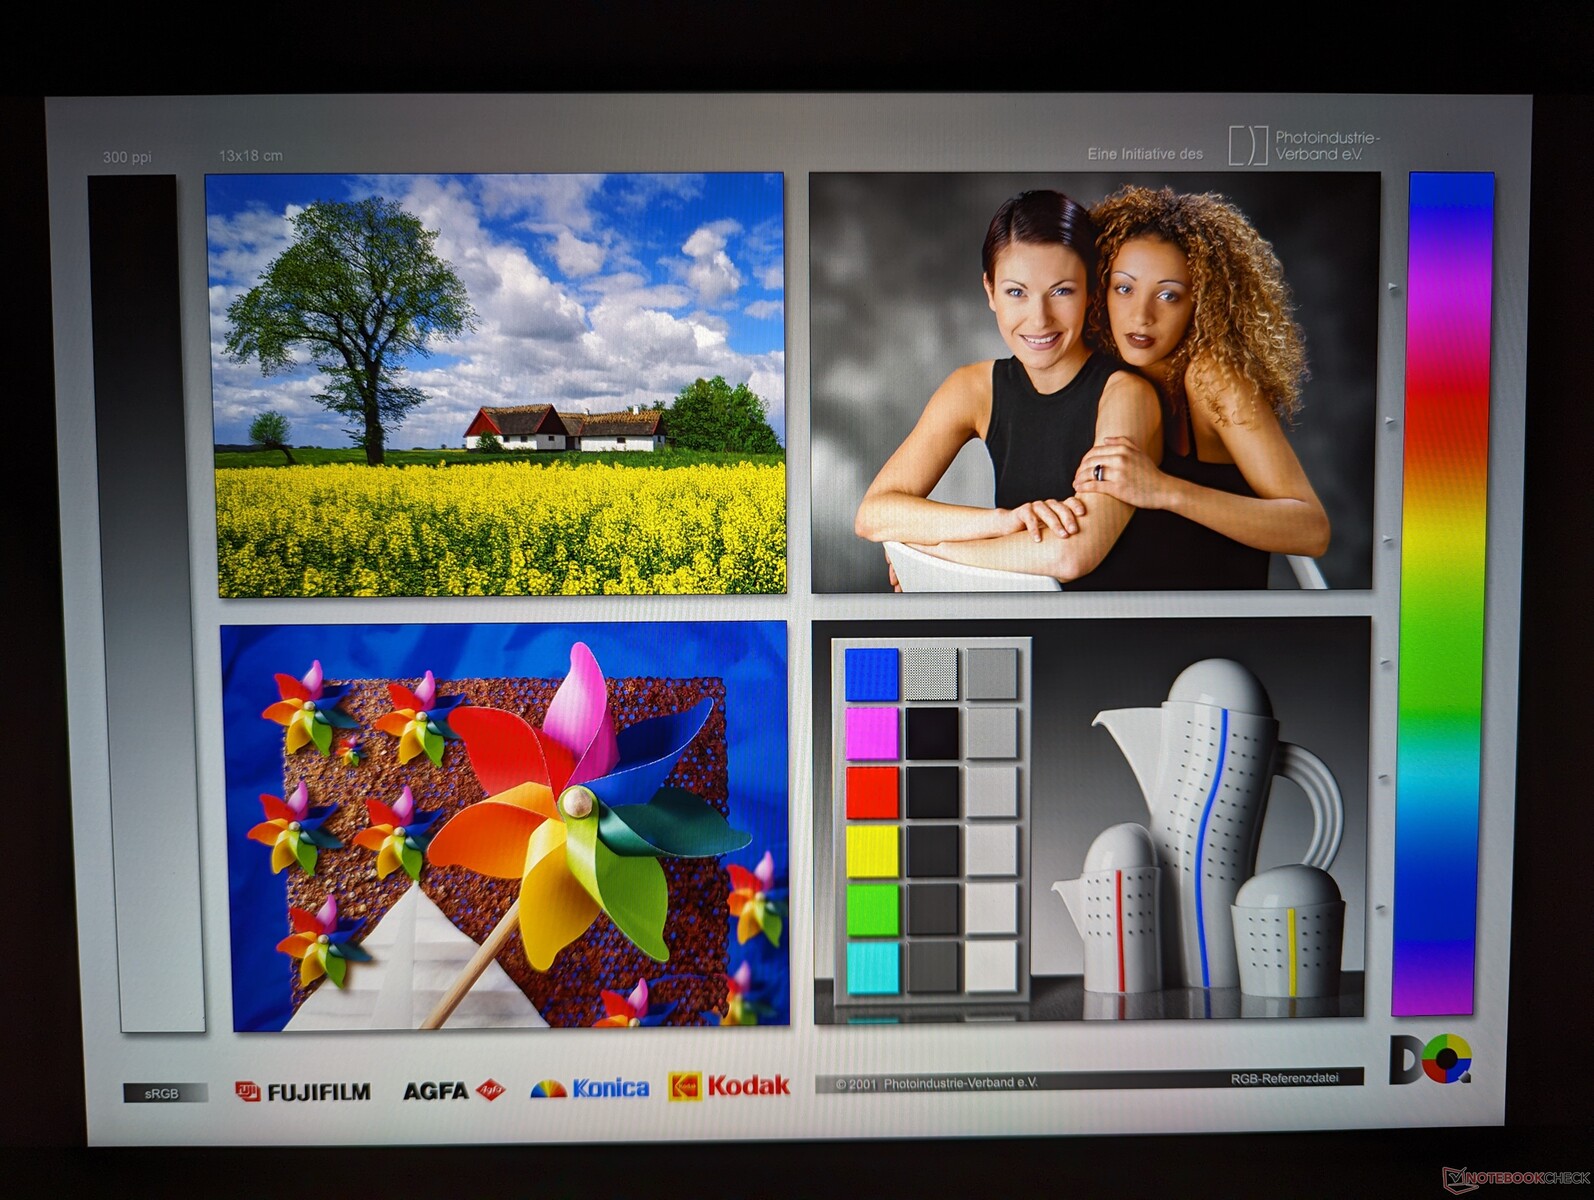
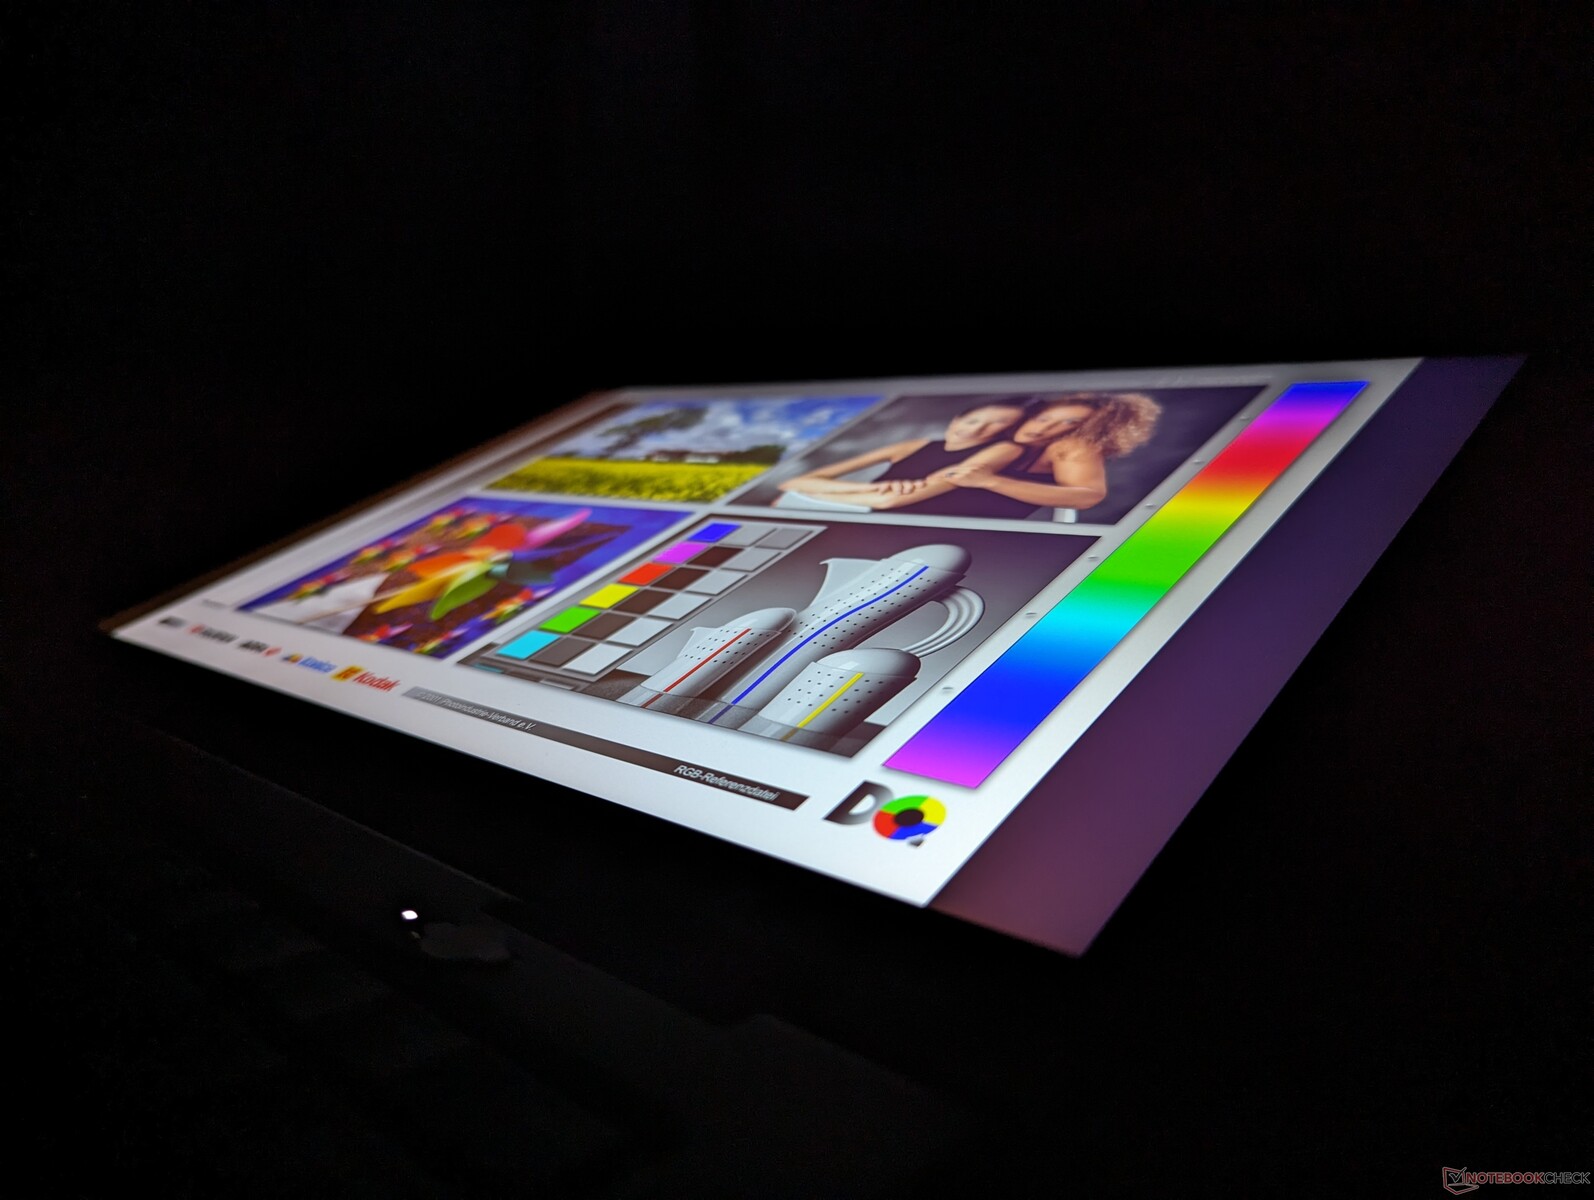
Wyświetlacz - 1200p IPS lub 2400p OLED
Yoga G8 wykorzystuje inny panel niż ten znaleziony w Yoga G7 (BOE NE140WUM-N62 vs. MNE007JA1-1). Jednak poza różnicą w nazwie, podstawowe atrybuty pozostają niemal identyczne między nimi, w tym ich czasy reakcji, poziomy jasności, współczynnik kontrastu i pokrycie kolorów.
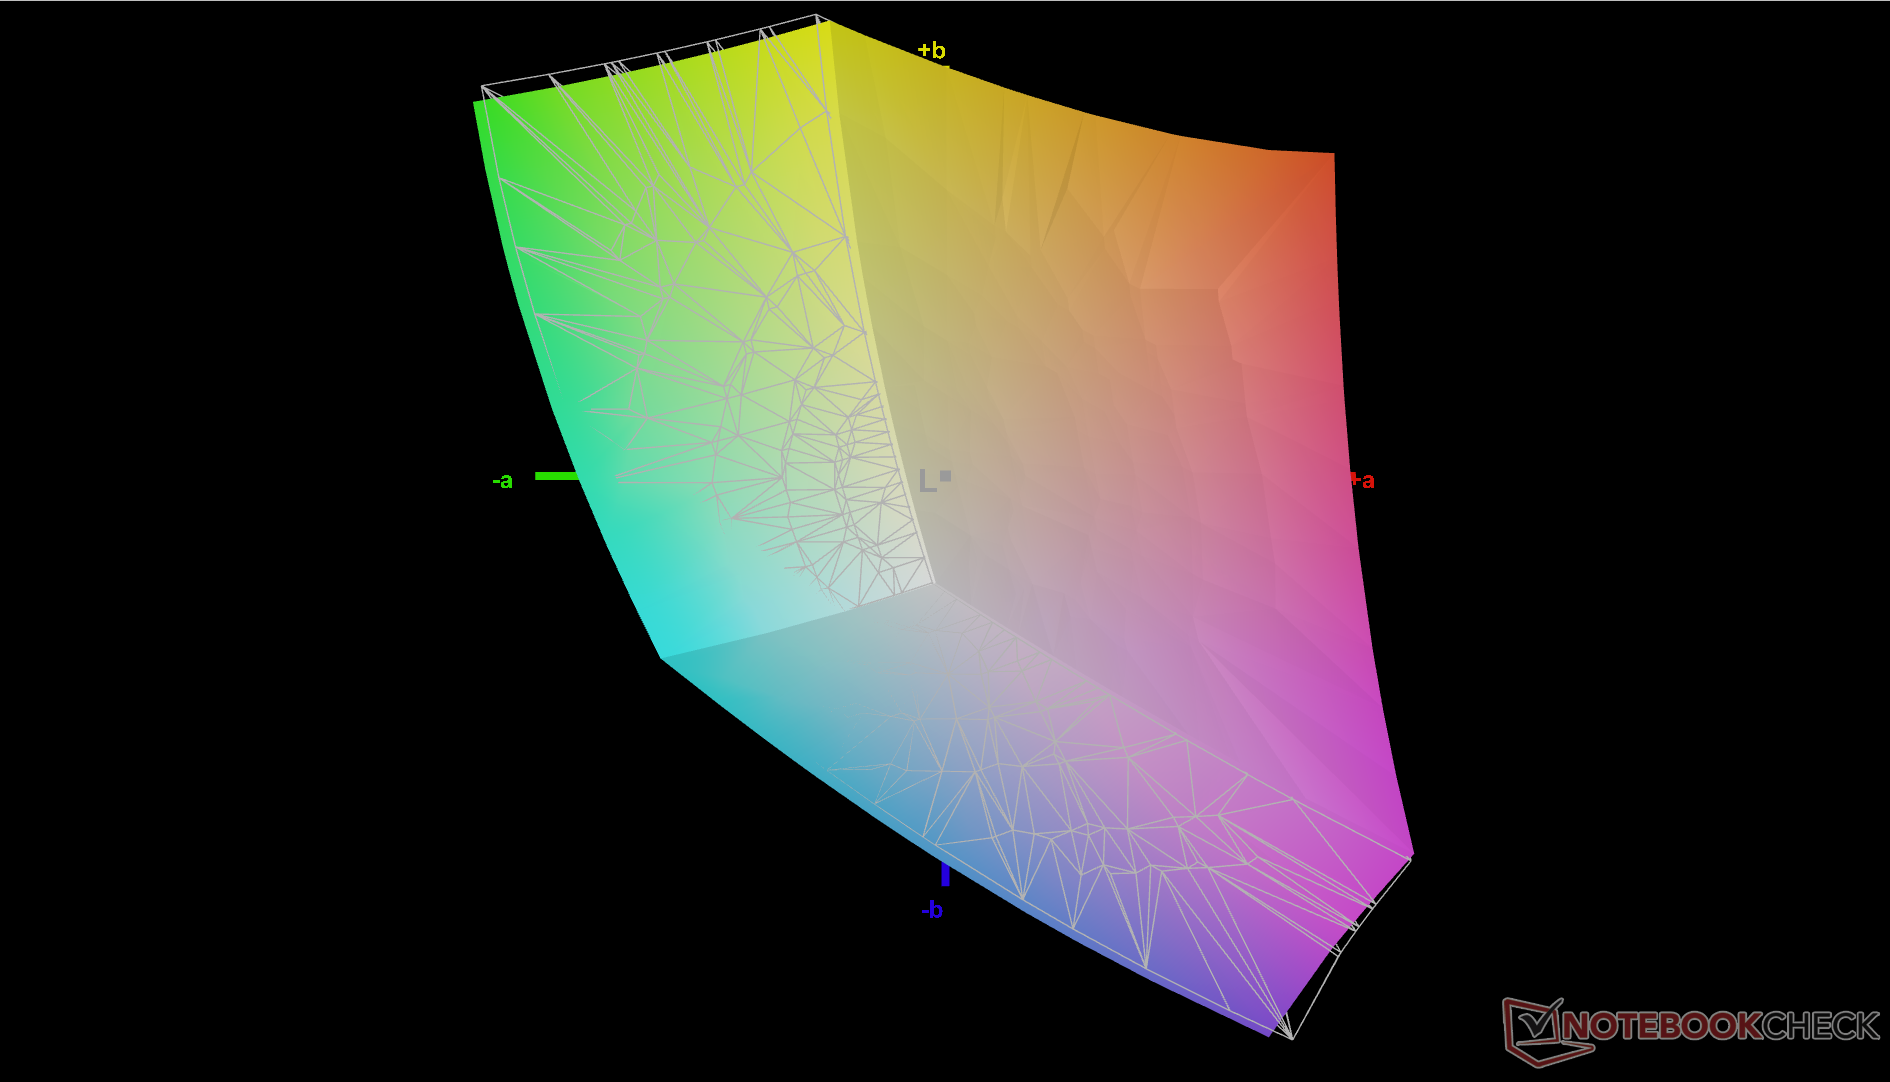
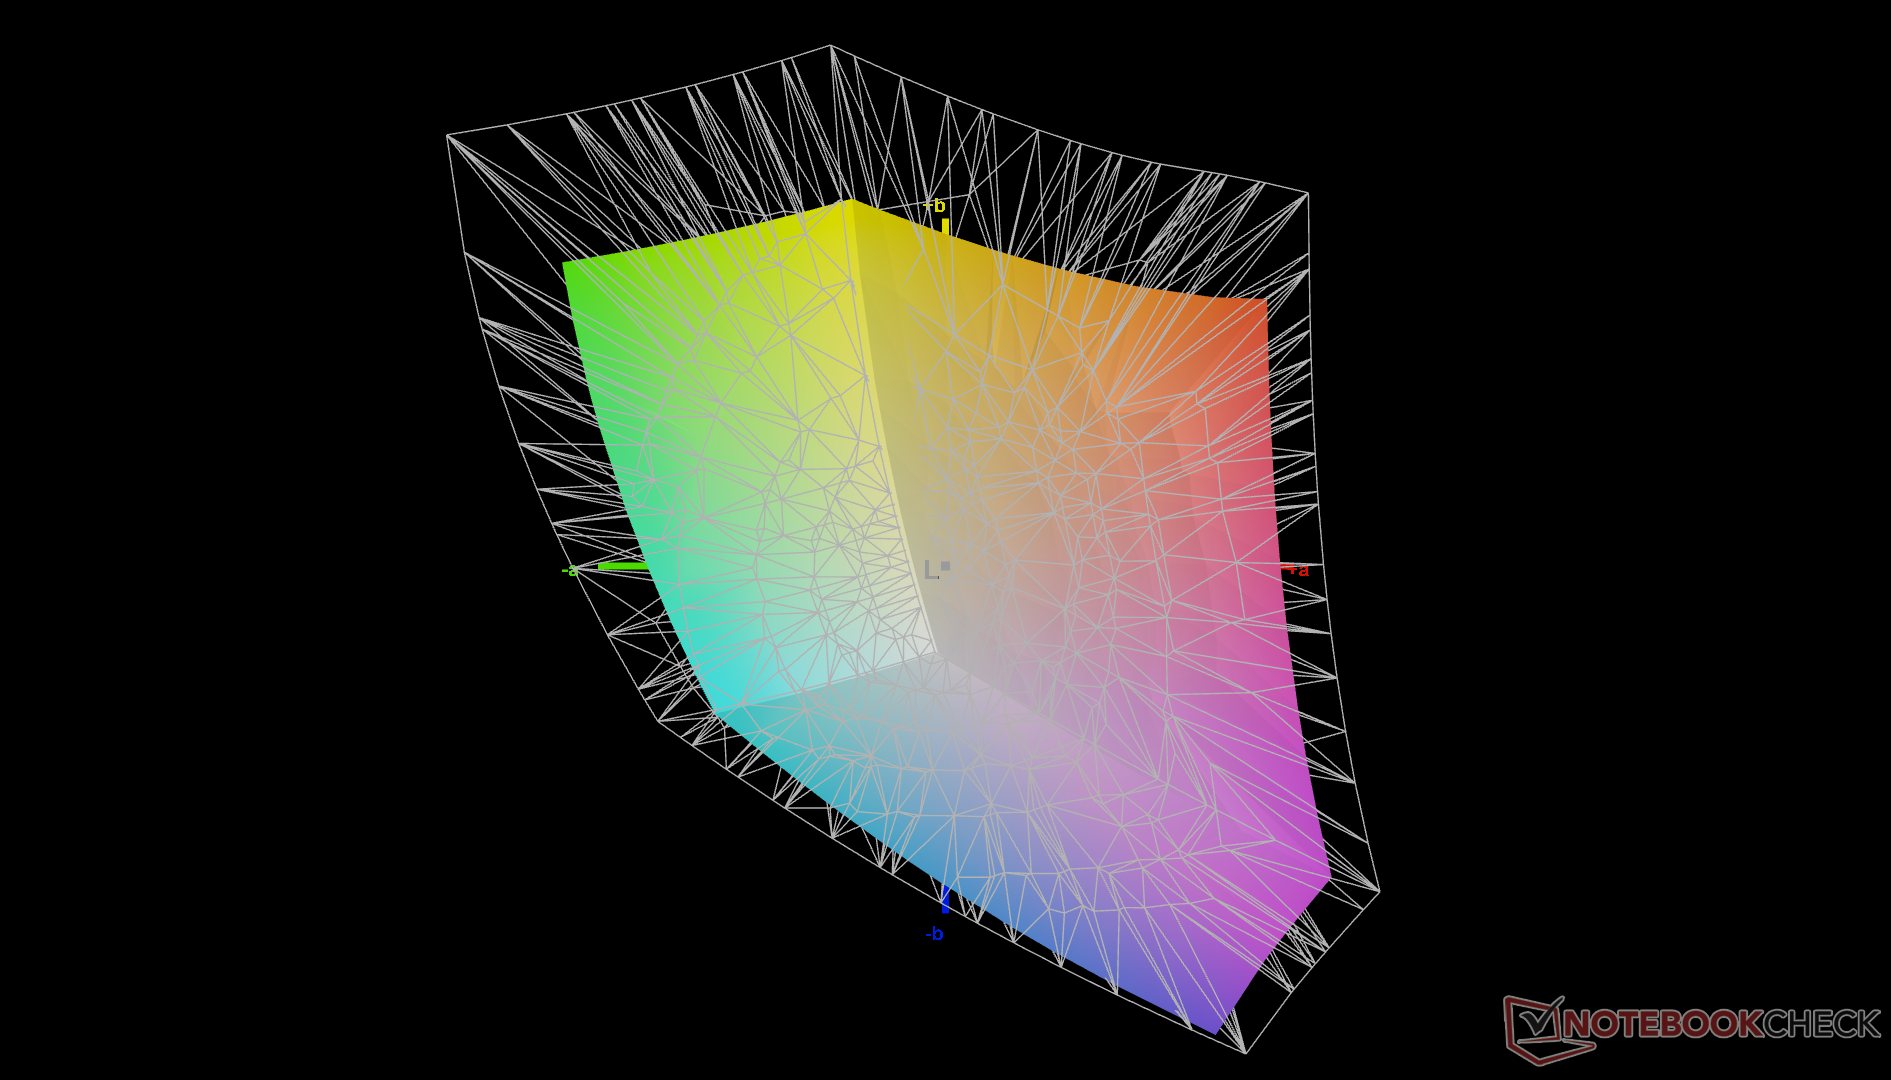
Przejście na opcję OLED podwaja rozdzielczość ekranu z 1200p do 2400p, jednocześnie poszerzając gamę z sRGB do DCI-P3.
| |||||||||||||||||||||||||
rozświetlenie: 87 %
na akumulatorze: 425.2 cd/m²
kontrast: 1849:1 (czerń: 0.23 cd/m²)
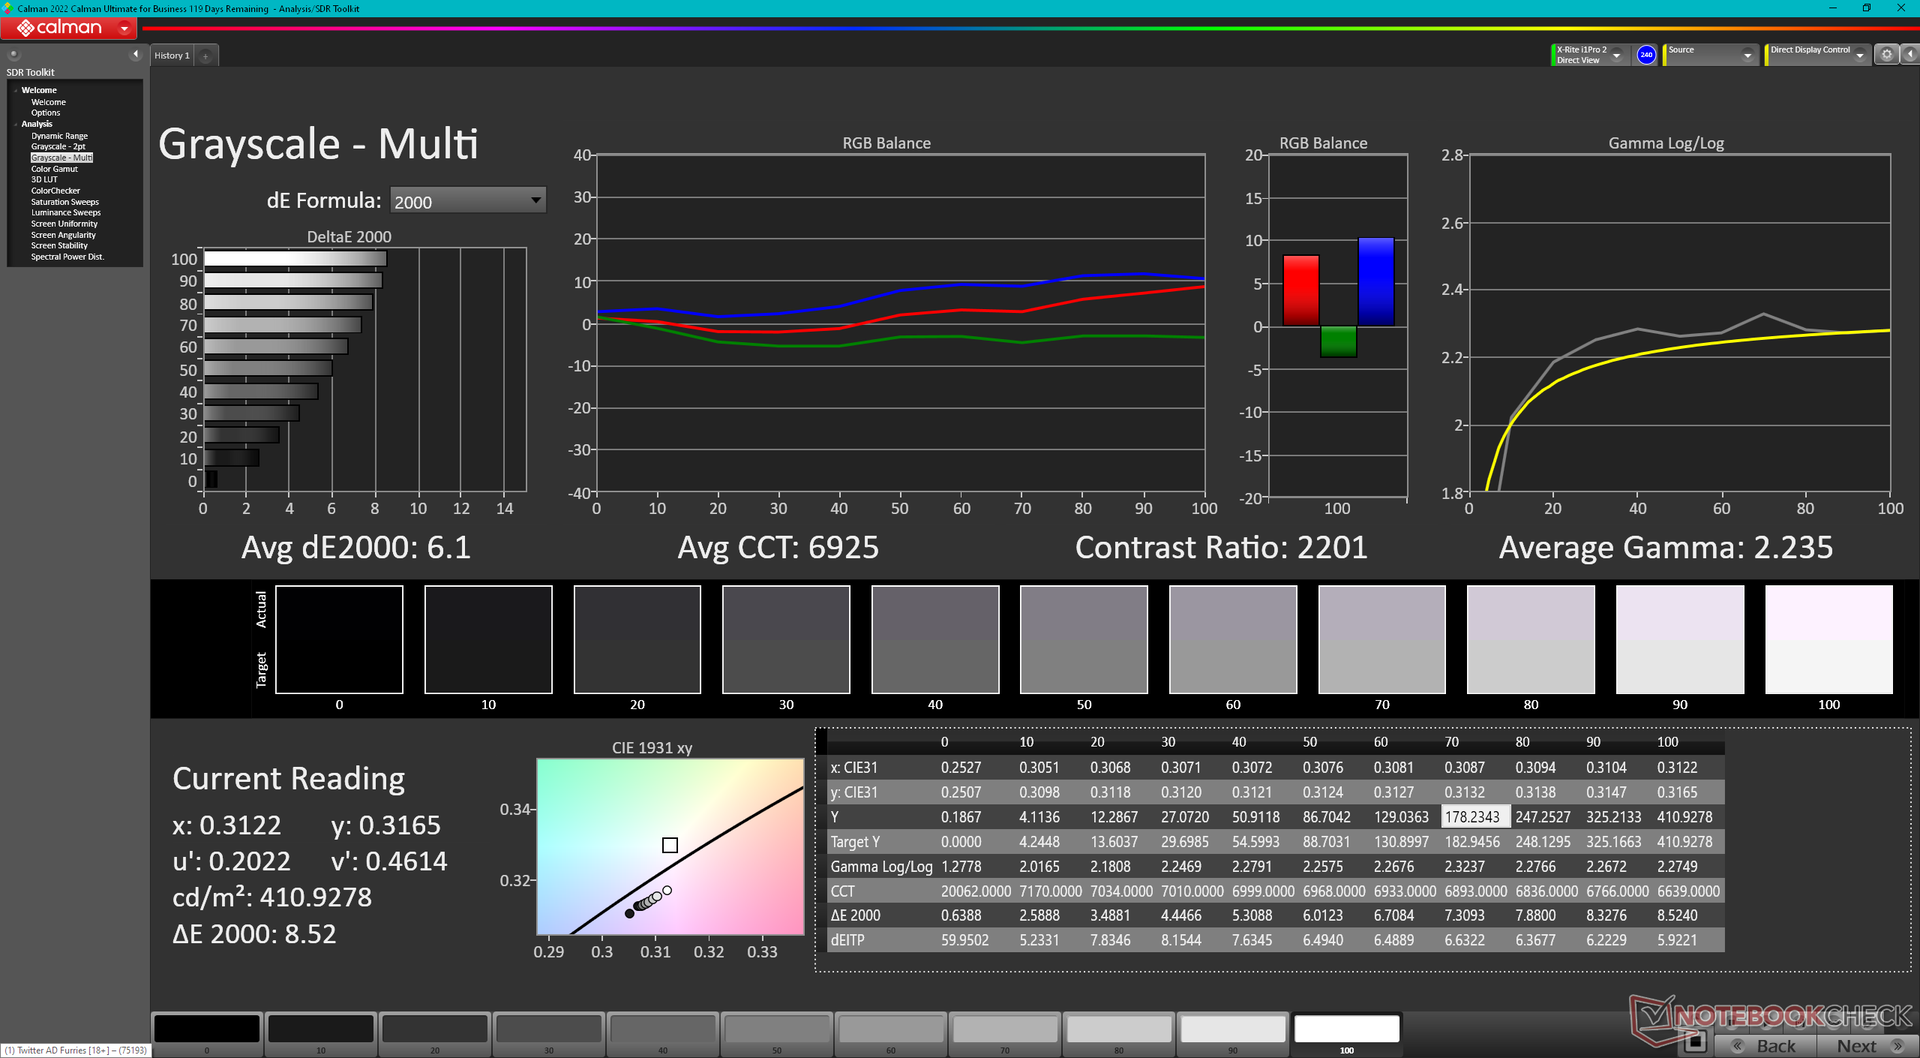
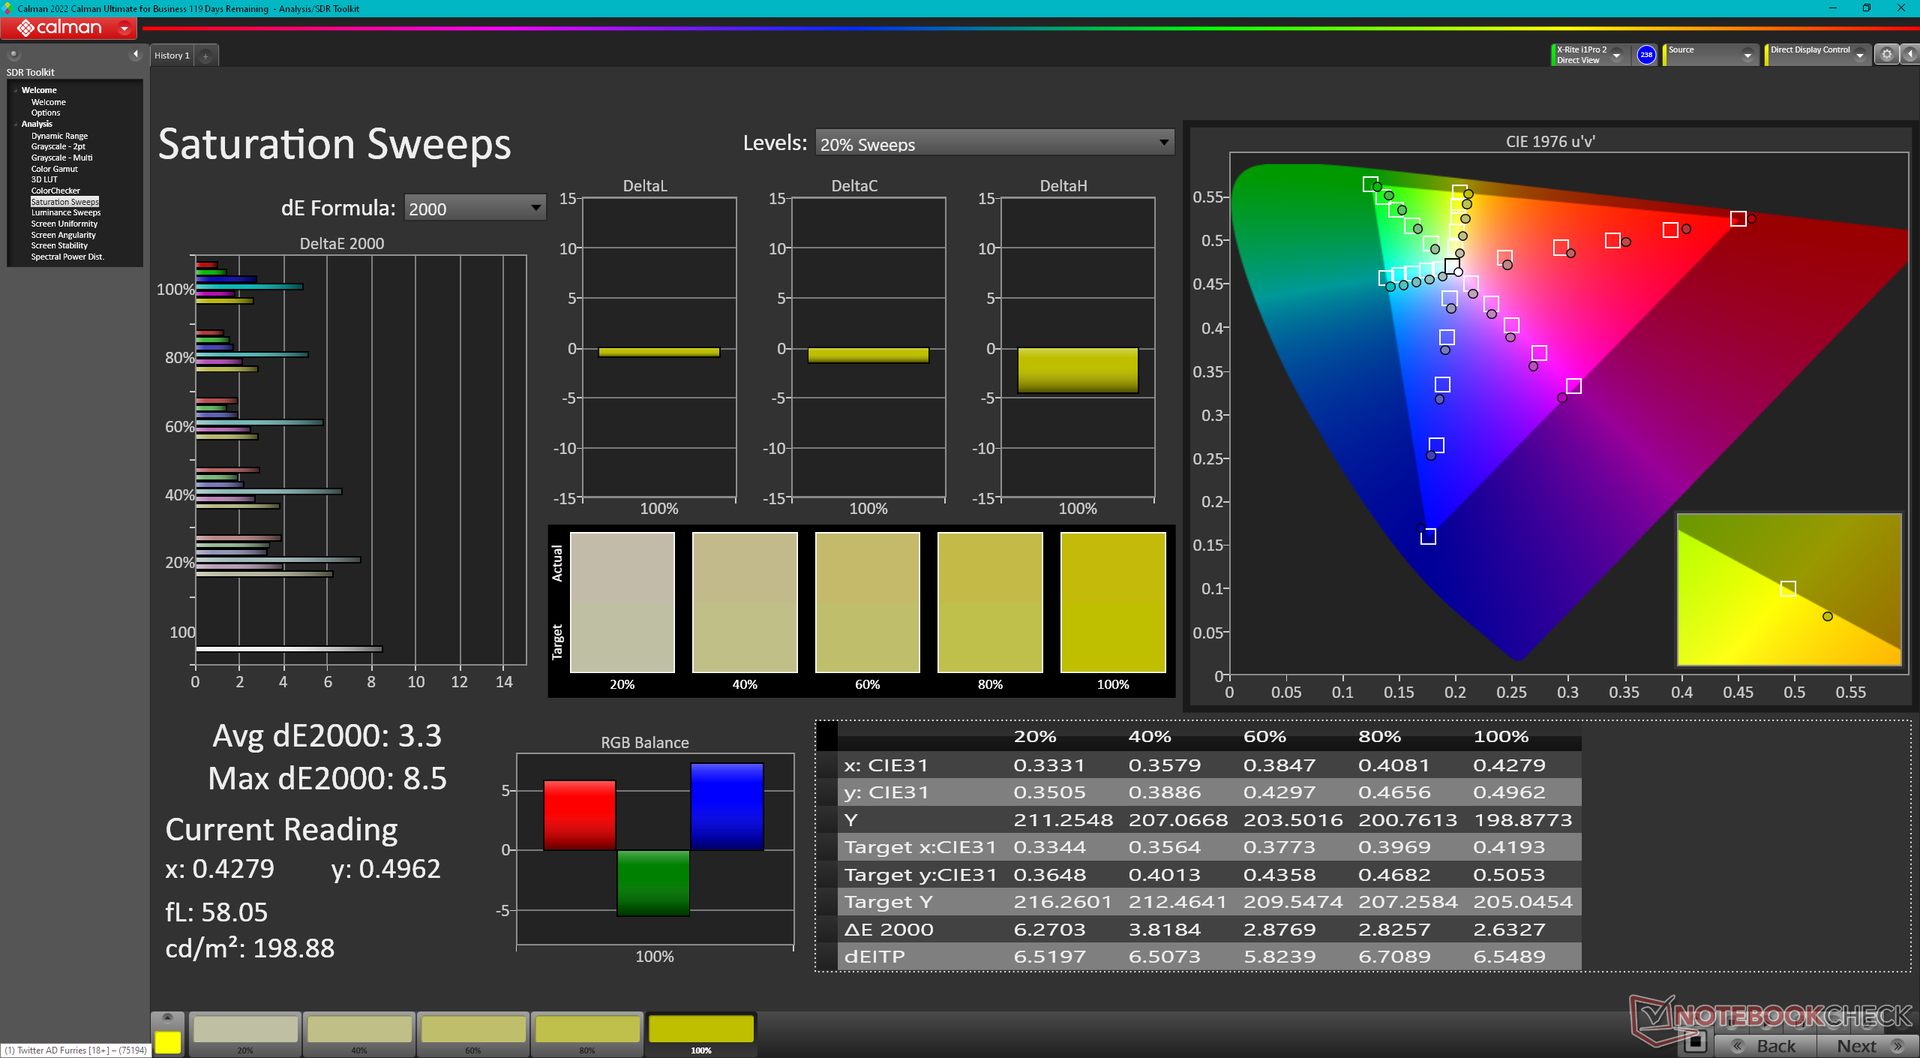
ΔE ColorChecker Calman: 3.29 | ∀{0.5-29.43 Ø4.72}
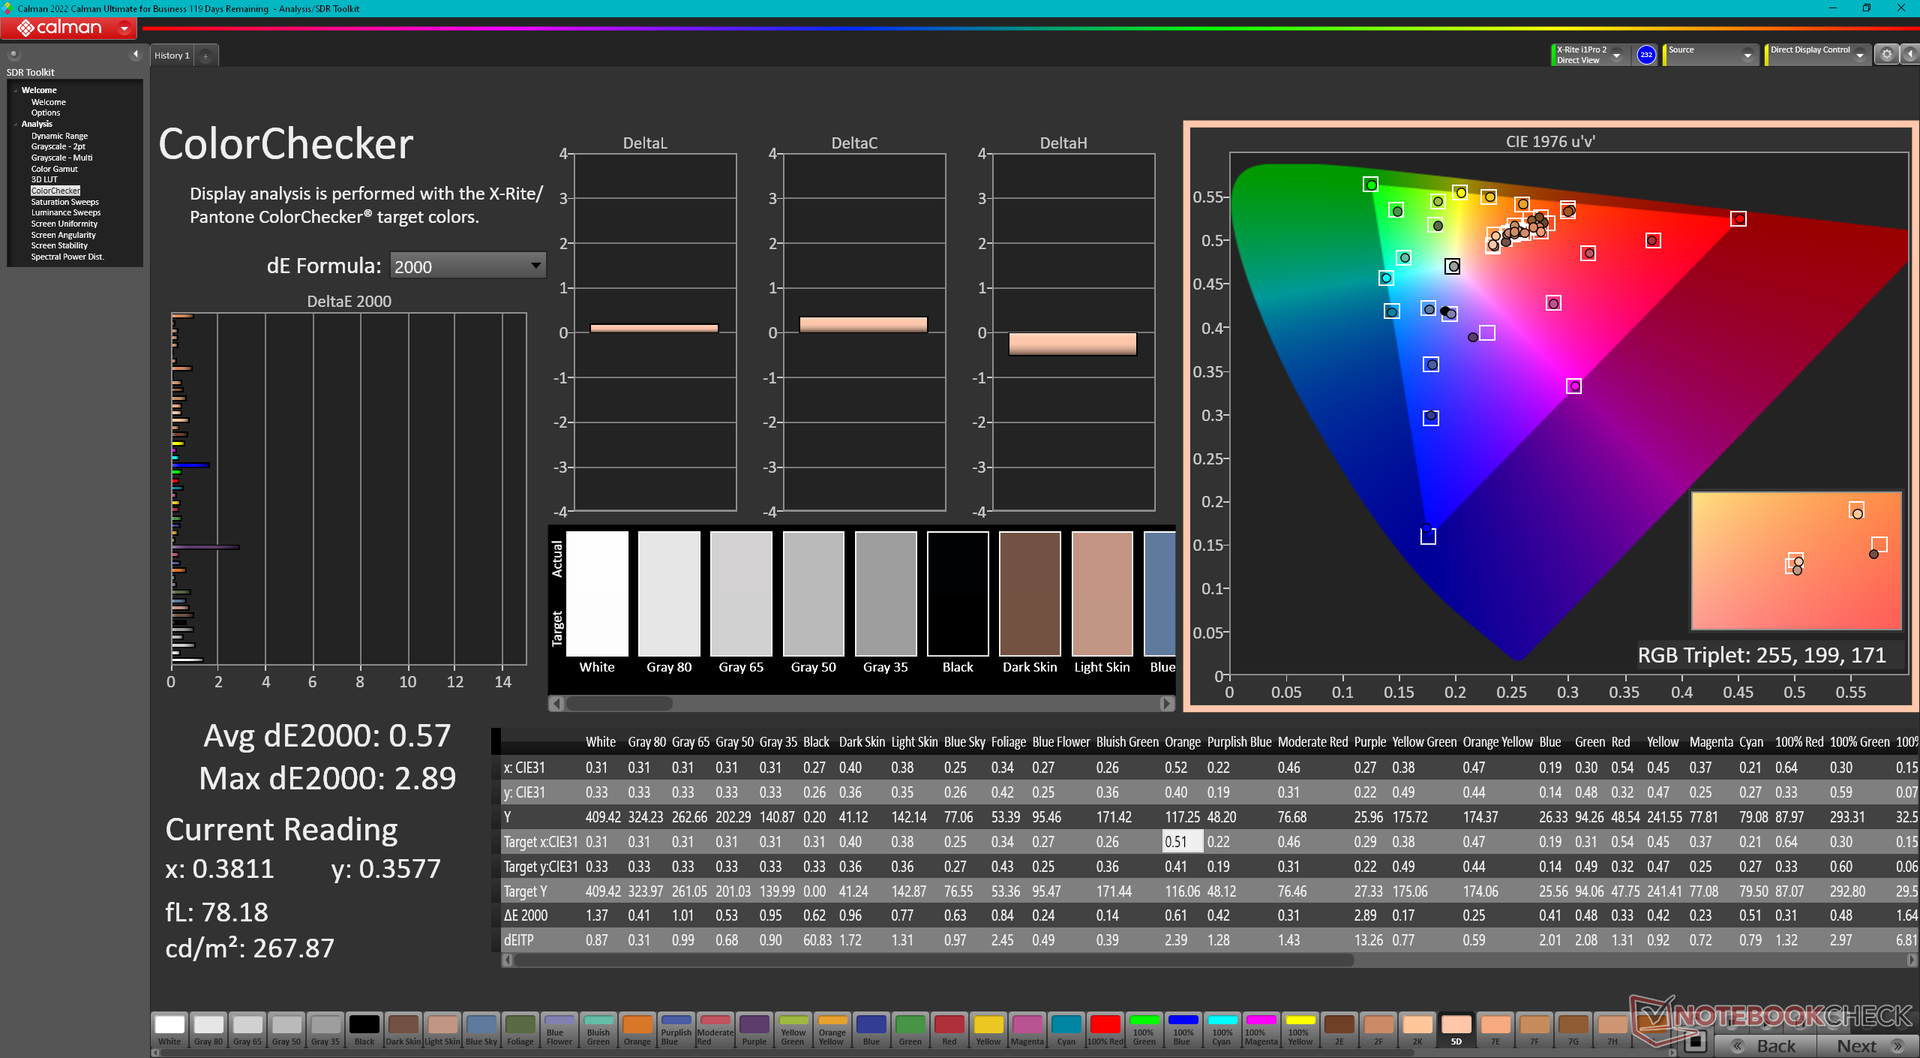
calibrated: 0.57
ΔE Greyscale Calman: 6.1 | ∀{0.09-98 Ø4.97}
71.1% AdobeRGB 1998 (Argyll 3D)
98.6% sRGB (Argyll 3D)
69.3% Display P3 (Argyll 3D)
Gamma: 2.24
CCT: 6925 K
| Lenovo ThinkPad X1 Yoga G8 i7-1355U BOE NE140WUM-N62, IPS, 1920x1200, 14" | Lenovo ThinkPad X1 Yoga G7 21CE002HGE MNE007JA1-1, IPS, 1920x1200, 14" | Dell Latitude 9430 2-in-1 AU Optronics B140QAN, IPS, 2560x1600, 14" | LG Gram 14T90P LG Philips LP140WU1-SPA1, IPS, 1900x1200, 14" | Asus ZenBook Flip 14 UN5401QA-KN085W SDC4154, OLED, 2880x1800, 14" | HP EliteBook x360 1040 G7, i7-10810U BOE08A3, IPS, 1920x1080, 14" | |
|---|---|---|---|---|---|---|
| Display | 0% | 9% | 22% | 28% | -4% | |
| Display P3 Coverage (%) | 69.3 | 69.3 0% | 79.4 15% | 98.8 43% | 99.7 44% | 66.1 -5% |
| sRGB Coverage (%) | 98.6 | 99.7 1% | 100 1% | 100 1% | 100 1% | 95.5 -3% |
| AdobeRGB 1998 Coverage (%) | 71.1 | 71.3 0% | 79.4 12% | 98.6 39% | 68.1 -4% | |
| Response Times | 7% | -42% | -11% | 94% | -26% | |
| Response Time Grey 50% / Grey 80% * (ms) | 43.1 ? | 42 ? 3% | 63.6 ? -48% | 44 ? -2% | 2 ? 95% | 52.4 ? -22% |
| Response Time Black / White * (ms) | 24.9 ? | 22.4 ? 10% | 33.6 ? -35% | 30 ? -20% | 2 ? 92% | 32 ? -29% |
| PWM Frequency (Hz) | ||||||
| Screen | 17% | 9% | -2% | -41% | -31% | |
| Brightness middle (cd/m²) | 425.2 | 371 -13% | 517.7 22% | 305.5 -28% | 366 -14% | 406.7 -4% |
| Brightness (cd/m²) | 381 | 363 -5% | 493 29% | 289 -24% | 369 -3% | 382 0% |
| Brightness Distribution (%) | 87 | 92 6% | 90 3% | 87 0% | 96 10% | 88 1% |
| Black Level * (cd/m²) | 0.23 | 0.21 9% | 0.33 -43% | 0.27 -17% | 0.28 -22% | |
| Contrast (:1) | 1849 | 1767 -4% | 1569 -15% | 1131 -39% | 1452 -21% | |
| Colorchecker dE 2000 * | 3.29 | 1.3 60% | 3.38 -3% | 3.31 -1% | 2.84 14% | 3.74 -14% |
| Colorchecker dE 2000 max. * | 8.55 | 2.6 70% | 6.25 27% | 6.12 28% | 5.29 38% | 5.92 31% |
| Colorchecker dE 2000 calibrated * | 0.57 | 0.8 -40% | 0.41 28% | 2.81 -393% | 2.18 -282% | |
| Greyscale dE 2000 * | 6.1 | 2.1 66% | 4 34% | 1.9 69% | 2.32 62% | 4.3 30% |
| Gamma | 2.24 98% | 2.15 102% | 2.13 103% | 2.04 108% | 2.44 90% | 2.19 100% |
| CCT | 6925 94% | 6759 96% | 6186 105% | 6706 97% | 6170 105% | 6781 96% |
| Color Space (Percent of AdobeRGB 1998) (%) | 61.6 | |||||
| Color Space (Percent of sRGB) (%) | 95.1 | |||||
| Całkowita średnia (program / ustawienia) | 8% /
12% | -8% /
2% | 3% /
1% | 27% /
-1% | -20% /
-25% |
* ... im mniej tym lepiej
Wyświetlacz nie jest skalibrowany po wyjęciu z pudełka. Skalibrowanie go za pomocą naszego kolorymetru X-Rite poprawiłoby średnie wartości deltaE skali szarości i kolorów z odpowiednio 6,1 i 3,29 do zaledwie 0,6 i 0,57. Zalecamy zastosowanie naszego skalibrowanego profilu ICM powyżej, aby w pełni wykorzystać możliwości wyświetlacza.
Wyświetl czasy reakcji
| ↔ Czas reakcji od czerni do bieli | ||
|---|---|---|
| 24.9 ms ... wzrost ↗ i spadek ↘ łącznie | ↗ 14.2 ms wzrost | 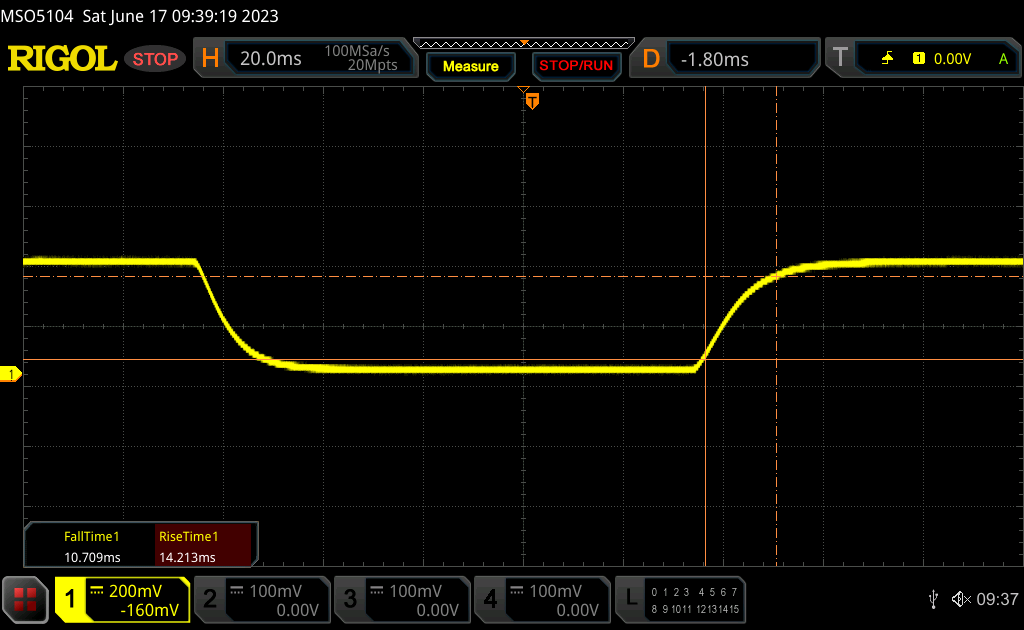 |
| ↘ 10.7 ms upadek | ||
| W naszych testach ekran wykazuje dobry współczynnik reakcji, ale może być zbyt wolny dla graczy rywalizujących ze sobą. Dla porównania, wszystkie testowane urządzenia wahają się od 0.1 (minimum) do 240 (maksimum) ms. » 59 % wszystkich urządzeń jest lepszych. Oznacza to, że zmierzony czas reakcji jest gorszy od średniej wszystkich testowanych urządzeń (19.8 ms). | ||
| ↔ Czas reakcji 50% szarości do 80% szarości | ||
| 43.1 ms ... wzrost ↗ i spadek ↘ łącznie | ↗ 20.7 ms wzrost | 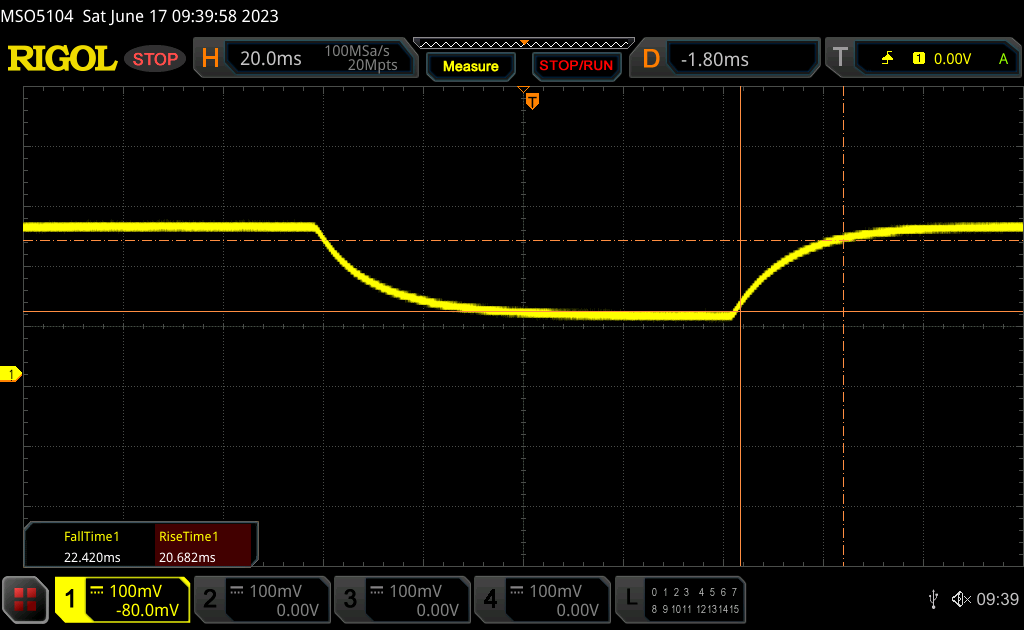 |
| ↘ 22.4 ms upadek | ||
| W naszych testach ekran wykazuje powolne tempo reakcji, co będzie niezadowalające dla graczy. Dla porównania, wszystkie testowane urządzenia wahają się od 0.165 (minimum) do 636 (maksimum) ms. » 72 % wszystkich urządzeń jest lepszych. Oznacza to, że zmierzony czas reakcji jest gorszy od średniej wszystkich testowanych urządzeń (31 ms). | ||
Migotanie ekranu / PWM (modulacja szerokości impulsu)
| Migotanie ekranu/nie wykryto PWM | 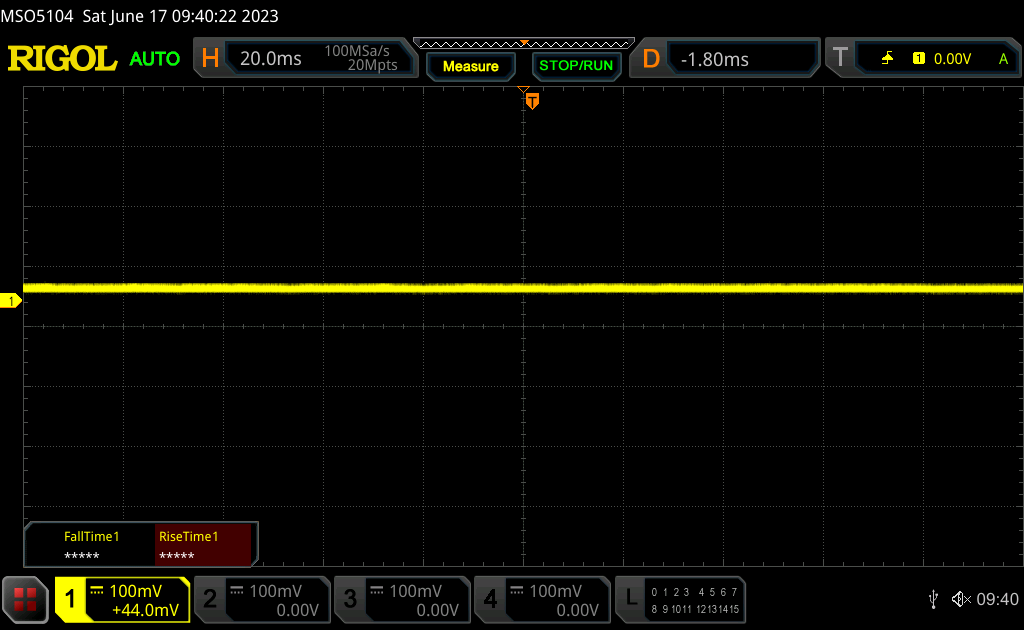 | ||
Dla porównania: 52 % wszystkich testowanych urządzeń nie używa PWM do przyciemniania wyświetlacza. Jeśli wykryto PWM, zmierzono średnio 7778 (minimum: 5 - maksimum: 343500) Hz. | |||
Wydajność
Warunki testowania
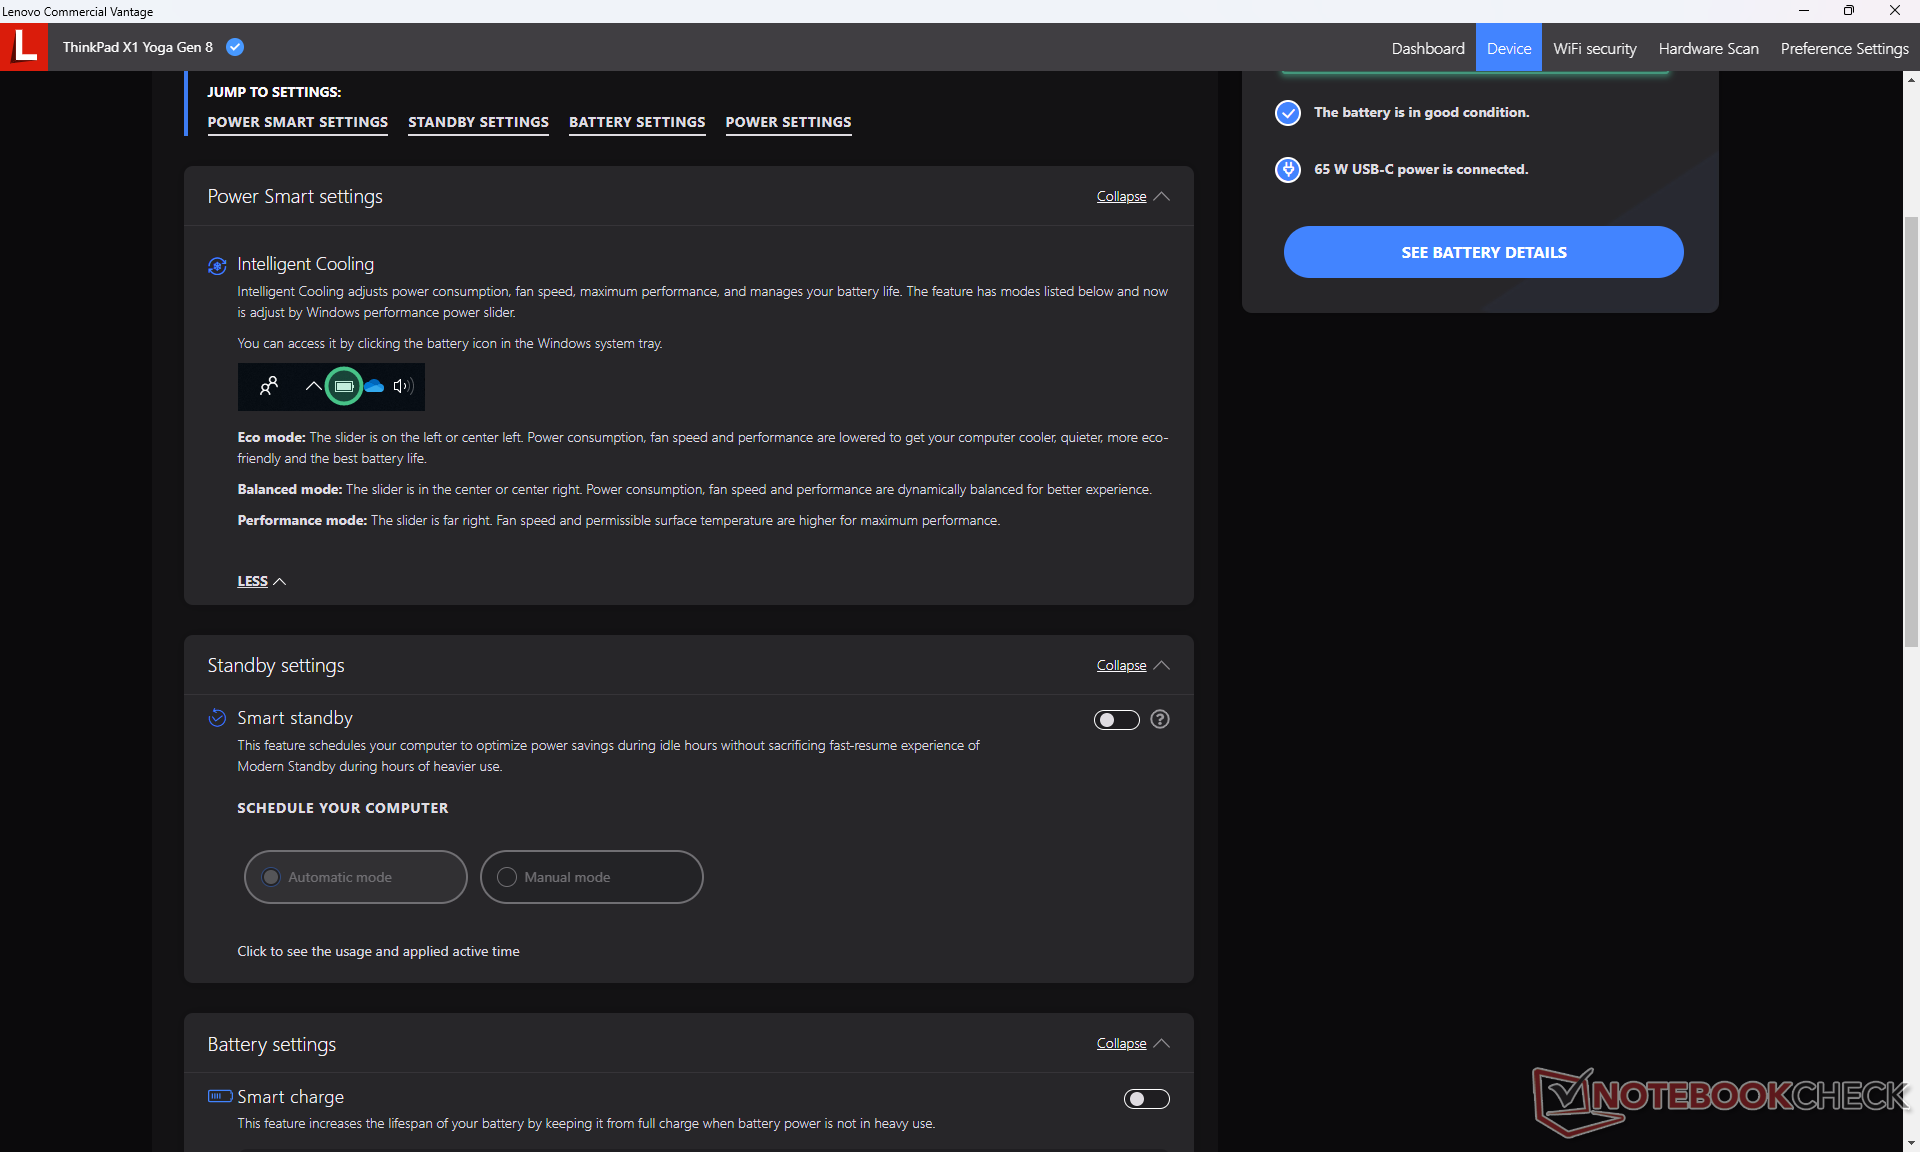
Przed uruchomieniem poniższych testów porównawczych ustawiliśmy system Windows na tryb wydajności. W przeciwieństwie do większości innych producentów OEM, model ten nie oferuje wyspecjalizowanych profili zasilania oprócz tych już dostępnych w systemie Windows, aby uprościć liczbę ustawień dla użytkownika końcowego.
Procesor
Wydajność procesora jest o około 15 do 20 procent wyższa niż rozczarowującego Core i7-1270P w zeszłorocznej Yodze G7, mimo że nasza Yoga G8 jest napędzana procesorem Core z serii U. Przechodząc do Core i7-1370P może zwiększyć wydajność wielowątkową nawet o 35 procent w oparciu o nasze doświadczenia z Framework Laptop podczas gdy przejście w dół doCore i5-1335U może wiązać się z 20-procentowym deficytem wydajności w oparciu o nasze doświadczenia zAcer Aspire 5 Spin 14. Jest jednak mało prawdopodobne, aby wyższa opcja Core i7-1370P przyniosła znaczące korzyści w tym konkretnym modelu ze względu na problemy z dławieniem, których doświadczyliśmy w naszym komputerze Core i7-1355U jak opisano w sekcji testów obciążeniowych poniżej.
Cinebench R15 Multi Loop
Cinebench R20: CPU (Multi Core) | CPU (Single Core)
Cinebench R23: Multi Core | Single Core
Cinebench R15: CPU Multi 64Bit | CPU Single 64Bit
Blender: v2.79 BMW27 CPU
7-Zip 18.03: 7z b 4 | 7z b 4 -mmt1
Geekbench 5.5: Multi-Core | Single-Core
HWBOT x265 Benchmark v2.2: 4k Preset
LibreOffice : 20 Documents To PDF
R Benchmark 2.5: Overall mean
| CPU Performance rating | |
| Framework Laptop 13.5 13th Gen Intel | |
| HP EliteBook 840 G9 | |
| Lenovo ThinkPad T14 G3-21AJS00400 | |
| Lenovo Yoga 7-14ARB G7 | |
| Lenovo ThinkPad X1 Yoga G8 i7-1355U -1! | |
| Dell Latitude 9430 2-in-1 -1! | |
| Lenovo ThinkPad P14s G3 AMD 21J6S05000 | |
| Asus ZenBook Flip 14 UN5401QA-KN085W | |
| Przeciętny Intel Core i7-1355U | |
| Lenovo ThinkPad X1 Yoga G7 21CE002HGE | |
| Acer Aspire 5 Spin 14 | |
| Asus ExpertBook B3 Flip B3402FEA | |
| LG Gram 14T90P | |
| HP EliteBook x360 1040 G7, i7-10810U | |
| Cinebench R20 / CPU (Multi Core) | |
| Framework Laptop 13.5 13th Gen Intel | |
| Lenovo ThinkPad T14 G3-21AJS00400 | |
| Lenovo Yoga 7-14ARB G7 | |
| Lenovo ThinkPad P14s G3 AMD 21J6S05000 | |
| HP EliteBook 840 G9 | |
| Asus ZenBook Flip 14 UN5401QA-KN085W | |
| Lenovo ThinkPad X1 Yoga G8 i7-1355U | |
| Dell Latitude 9430 2-in-1 | |
| Przeciętny Intel Core i7-1355U (2849 - 3907, n=18) | |
| Lenovo ThinkPad X1 Yoga G7 21CE002HGE | |
| Acer Aspire 5 Spin 14 | |
| Asus ExpertBook B3 Flip B3402FEA | |
| LG Gram 14T90P | |
| HP EliteBook x360 1040 G7, i7-10810U | |
| Cinebench R20 / CPU (Single Core) | |
| Framework Laptop 13.5 13th Gen Intel | |
| Lenovo ThinkPad X1 Yoga G8 i7-1355U | |
| Dell Latitude 9430 2-in-1 | |
| Lenovo ThinkPad T14 G3-21AJS00400 | |
| Przeciętny Intel Core i7-1355U (654 - 725, n=18) | |
| HP EliteBook 840 G9 | |
| Lenovo Yoga 7-14ARB G7 | |
| Lenovo ThinkPad P14s G3 AMD 21J6S05000 | |
| Lenovo ThinkPad X1 Yoga G7 21CE002HGE | |
| Acer Aspire 5 Spin 14 | |
| Asus ExpertBook B3 Flip B3402FEA | |
| Asus ZenBook Flip 14 UN5401QA-KN085W | |
| LG Gram 14T90P | |
| HP EliteBook x360 1040 G7, i7-10810U | |
| Cinebench R23 / Multi Core | |
| Framework Laptop 13.5 13th Gen Intel | |
| Lenovo ThinkPad T14 G3-21AJS00400 | |
| Lenovo Yoga 7-14ARB G7 | |
| Lenovo ThinkPad P14s G3 AMD 21J6S05000 | |
| Asus ZenBook Flip 14 UN5401QA-KN085W | |
| HP EliteBook 840 G9 | |
| Lenovo ThinkPad X1 Yoga G8 i7-1355U | |
| Dell Latitude 9430 2-in-1 | |
| Przeciętny Intel Core i7-1355U (6936 - 10252, n=18) | |
| Lenovo ThinkPad X1 Yoga G7 21CE002HGE | |
| Acer Aspire 5 Spin 14 | |
| Asus ExpertBook B3 Flip B3402FEA | |
| LG Gram 14T90P | |
| HP EliteBook x360 1040 G7, i7-10810U | |
| Cinebench R23 / Single Core | |
| Framework Laptop 13.5 13th Gen Intel | |
| Dell Latitude 9430 2-in-1 | |
| Przeciętny Intel Core i7-1355U (1687 - 1889, n=18) | |
| Lenovo ThinkPad X1 Yoga G8 i7-1355U | |
| Lenovo ThinkPad T14 G3-21AJS00400 | |
| HP EliteBook 840 G9 | |
| Acer Aspire 5 Spin 14 | |
| Lenovo ThinkPad X1 Yoga G7 21CE002HGE | |
| Lenovo Yoga 7-14ARB G7 | |
| Lenovo ThinkPad P14s G3 AMD 21J6S05000 | |
| Asus ExpertBook B3 Flip B3402FEA | |
| Asus ZenBook Flip 14 UN5401QA-KN085W | |
| LG Gram 14T90P | |
| HP EliteBook x360 1040 G7, i7-10810U | |
| Cinebench R15 / CPU Multi 64Bit | |
| Framework Laptop 13.5 13th Gen Intel | |
| HP EliteBook 840 G9 | |
| Lenovo Yoga 7-14ARB G7 | |
| Lenovo ThinkPad T14 G3-21AJS00400 | |
| Lenovo ThinkPad P14s G3 AMD 21J6S05000 | |
| Asus ZenBook Flip 14 UN5401QA-KN085W | |
| Lenovo ThinkPad X1 Yoga G7 21CE002HGE | |
| Lenovo ThinkPad X1 Yoga G8 i7-1355U | |
| Dell Latitude 9430 2-in-1 | |
| Przeciętny Intel Core i7-1355U (1206 - 1735, n=18) | |
| Acer Aspire 5 Spin 14 | |
| Asus ExpertBook B3 Flip B3402FEA | |
| LG Gram 14T90P | |
| HP EliteBook x360 1040 G7, i7-10810U | |
| Cinebench R15 / CPU Single 64Bit | |
| Framework Laptop 13.5 13th Gen Intel | |
| Lenovo ThinkPad X1 Yoga G8 i7-1355U | |
| Dell Latitude 9430 2-in-1 | |
| HP EliteBook 840 G9 | |
| Przeciętny Intel Core i7-1355U (237 - 267, n=18) | |
| Lenovo ThinkPad T14 G3-21AJS00400 | |
| Lenovo Yoga 7-14ARB G7 | |
| Lenovo ThinkPad P14s G3 AMD 21J6S05000 | |
| Lenovo ThinkPad X1 Yoga G7 21CE002HGE | |
| Asus ZenBook Flip 14 UN5401QA-KN085W | |
| Acer Aspire 5 Spin 14 | |
| Asus ExpertBook B3 Flip B3402FEA | |
| HP EliteBook x360 1040 G7, i7-10810U | |
| LG Gram 14T90P | |
| Blender / v2.79 BMW27 CPU | |
| LG Gram 14T90P | |
| HP EliteBook x360 1040 G7, i7-10810U | |
| Asus ExpertBook B3 Flip B3402FEA | |
| Przeciętny Intel Core i7-1355U (328 - 503, n=18) | |
| Acer Aspire 5 Spin 14 | |
| Lenovo ThinkPad X1 Yoga G7 21CE002HGE | |
| Lenovo ThinkPad T14 G3-21AJS00400 | |
| Lenovo ThinkPad P14s G3 AMD 21J6S05000 | |
| HP EliteBook 840 G9 | |
| Asus ZenBook Flip 14 UN5401QA-KN085W | |
| Lenovo Yoga 7-14ARB G7 | |
| Framework Laptop 13.5 13th Gen Intel | |
| 7-Zip 18.03 / 7z b 4 | |
| Framework Laptop 13.5 13th Gen Intel | |
| Lenovo Yoga 7-14ARB G7 | |
| Asus ZenBook Flip 14 UN5401QA-KN085W | |
| HP EliteBook 840 G9 | |
| Lenovo ThinkPad P14s G3 AMD 21J6S05000 | |
| Lenovo ThinkPad X1 Yoga G8 i7-1355U | |
| Lenovo ThinkPad T14 G3-21AJS00400 | |
| Dell Latitude 9430 2-in-1 | |
| Lenovo ThinkPad X1 Yoga G7 21CE002HGE | |
| Przeciętny Intel Core i7-1355U (30255 - 42092, n=18) | |
| Acer Aspire 5 Spin 14 | |
| HP EliteBook x360 1040 G7, i7-10810U | |
| Asus ExpertBook B3 Flip B3402FEA | |
| LG Gram 14T90P | |
| 7-Zip 18.03 / 7z b 4 -mmt1 | |
| Framework Laptop 13.5 13th Gen Intel | |
| HP EliteBook 840 G9 | |
| Lenovo ThinkPad X1 Yoga G8 i7-1355U | |
| Lenovo ThinkPad T14 G3-21AJS00400 | |
| Przeciętny Intel Core i7-1355U (5301 - 5911, n=18) | |
| Lenovo Yoga 7-14ARB G7 | |
| Dell Latitude 9430 2-in-1 | |
| Asus ZenBook Flip 14 UN5401QA-KN085W | |
| Asus ExpertBook B3 Flip B3402FEA | |
| Acer Aspire 5 Spin 14 | |
| Lenovo ThinkPad P14s G3 AMD 21J6S05000 | |
| Lenovo ThinkPad X1 Yoga G7 21CE002HGE | |
| LG Gram 14T90P | |
| HP EliteBook x360 1040 G7, i7-10810U | |
| Geekbench 5.5 / Multi-Core | |
| Framework Laptop 13.5 13th Gen Intel | |
| HP EliteBook 840 G9 | |
| Lenovo ThinkPad X1 Yoga G8 i7-1355U | |
| Dell Latitude 9430 2-in-1 | |
| Lenovo Yoga 7-14ARB G7 | |
| Lenovo ThinkPad X1 Yoga G7 21CE002HGE | |
| Przeciętny Intel Core i7-1355U (7507 - 9328, n=18) | |
| Lenovo ThinkPad P14s G3 AMD 21J6S05000 | |
| Acer Aspire 5 Spin 14 | |
| Asus ZenBook Flip 14 UN5401QA-KN085W | |
| Lenovo ThinkPad T14 G3-21AJS00400 | |
| HP EliteBook x360 1040 G7, i7-10810U | |
| LG Gram 14T90P | |
| Asus ExpertBook B3 Flip B3402FEA | |
| Geekbench 5.5 / Single-Core | |
| Framework Laptop 13.5 13th Gen Intel | |
| Przeciętny Intel Core i7-1355U (1678 - 1872, n=18) | |
| Dell Latitude 9430 2-in-1 | |
| Lenovo ThinkPad X1 Yoga G8 i7-1355U | |
| HP EliteBook 840 G9 | |
| Acer Aspire 5 Spin 14 | |
| Lenovo ThinkPad T14 G3-21AJS00400 | |
| Lenovo ThinkPad X1 Yoga G7 21CE002HGE | |
| Lenovo Yoga 7-14ARB G7 | |
| Lenovo ThinkPad P14s G3 AMD 21J6S05000 | |
| Asus ExpertBook B3 Flip B3402FEA | |
| LG Gram 14T90P | |
| Asus ZenBook Flip 14 UN5401QA-KN085W | |
| HP EliteBook x360 1040 G7, i7-10810U | |
| HWBOT x265 Benchmark v2.2 / 4k Preset | |
| Framework Laptop 13.5 13th Gen Intel | |
| Lenovo Yoga 7-14ARB G7 | |
| Lenovo ThinkPad T14 G3-21AJS00400 | |
| Lenovo ThinkPad P14s G3 AMD 21J6S05000 | |
| Asus ZenBook Flip 14 UN5401QA-KN085W | |
| HP EliteBook 840 G9 | |
| Dell Latitude 9430 2-in-1 | |
| Lenovo ThinkPad X1 Yoga G8 i7-1355U | |
| Lenovo ThinkPad X1 Yoga G7 21CE002HGE | |
| Przeciętny Intel Core i7-1355U (7.83 - 11.4, n=18) | |
| Acer Aspire 5 Spin 14 | |
| HP EliteBook x360 1040 G7, i7-10810U | |
| LG Gram 14T90P | |
| Asus ExpertBook B3 Flip B3402FEA | |
| LibreOffice / 20 Documents To PDF | |
| HP EliteBook x360 1040 G7, i7-10810U | |
| Lenovo ThinkPad P14s G3 AMD 21J6S05000 | |
| Asus ZenBook Flip 14 UN5401QA-KN085W | |
| LG Gram 14T90P | |
| Lenovo Yoga 7-14ARB G7 | |
| Przeciętny Intel Core i7-1355U (41.1 - 108.6, n=18) | |
| Lenovo ThinkPad X1 Yoga G7 21CE002HGE | |
| Acer Aspire 5 Spin 14 | |
| Lenovo ThinkPad X1 Yoga G8 i7-1355U | |
| Asus ExpertBook B3 Flip B3402FEA | |
| Dell Latitude 9430 2-in-1 | |
| HP EliteBook 840 G9 | |
| Lenovo ThinkPad T14 G3-21AJS00400 | |
| Framework Laptop 13.5 13th Gen Intel | |
| R Benchmark 2.5 / Overall mean | |
| HP EliteBook x360 1040 G7, i7-10810U | |
| LG Gram 14T90P | |
| Lenovo ThinkPad X1 Yoga G7 21CE002HGE | |
| Asus ExpertBook B3 Flip B3402FEA | |
| Asus ZenBook Flip 14 UN5401QA-KN085W | |
| Lenovo ThinkPad P14s G3 AMD 21J6S05000 | |
| Acer Aspire 5 Spin 14 | |
| Lenovo Yoga 7-14ARB G7 | |
| Przeciętny Intel Core i7-1355U (0.4481 - 0.832, n=18) | |
| Lenovo ThinkPad T14 G3-21AJS00400 | |
| Lenovo ThinkPad X1 Yoga G8 i7-1355U | |
| Dell Latitude 9430 2-in-1 | |
| HP EliteBook 840 G9 | |
| Framework Laptop 13.5 13th Gen Intel | |
Cinebench R20: CPU (Multi Core) | CPU (Single Core)
Cinebench R23: Multi Core | Single Core
Cinebench R15: CPU Multi 64Bit | CPU Single 64Bit
Blender: v2.79 BMW27 CPU
7-Zip 18.03: 7z b 4 | 7z b 4 -mmt1
Geekbench 5.5: Multi-Core | Single-Core
HWBOT x265 Benchmark v2.2: 4k Preset
LibreOffice : 20 Documents To PDF
R Benchmark 2.5: Overall mean
* ... im mniej tym lepiej
| Blender | |
| v3.3 Classroom HIP/AMD | |
| Lenovo Yoga 7-14ARB G7 | |
| v3.3 Classroom OPTIX/RTX | |
| Lenovo ThinkPad T14 G3-21AJS00400 | |
| v3.3 Classroom CUDA | |
| Lenovo ThinkPad T14 G3-21AJS00400 | |
| v3.3 Classroom CPU | |
| Dell Latitude 9430 2-in-1 | |
| Przeciętny Intel Iris Xe Graphics G7 96EUs (336 - 1259, n=109) | |
| HP EliteBook 840 G9 | |
| Lenovo ThinkPad T14 G3-21AJS00400 | |
| Lenovo ThinkPad X1 Yoga G8 i7-1355U | |
| Lenovo Yoga 7-14ARB G7 | |
| Asus ROG Zephyrus G14 GA402XY | |
* ... im mniej tym lepiej
AIDA64: FP32 Ray-Trace | FPU Julia | CPU SHA3 | CPU Queen | FPU SinJulia | FPU Mandel | CPU AES | CPU ZLib | FP64 Ray-Trace | CPU PhotoWorxx
| Performance rating | |
| Asus ZenBook Flip 14 UN5401QA-KN085W | |
| Dell Latitude 9430 2-in-1 | |
| Lenovo ThinkPad X1 Yoga G8 i7-1355U | |
| Przeciętny Intel Core i7-1355U | |
| LG Gram 14T90P | |
| Lenovo ThinkPad X1 Yoga G7 21CE002HGE | |
| AIDA64 / FP32 Ray-Trace | |
| Asus ZenBook Flip 14 UN5401QA-KN085W | |
| Dell Latitude 9430 2-in-1 | |
| Lenovo ThinkPad X1 Yoga G8 i7-1355U | |
| Przeciętny Intel Core i7-1355U (5673 - 8424, n=18) | |
| LG Gram 14T90P | |
| Lenovo ThinkPad X1 Yoga G7 21CE002HGE | |
| AIDA64 / FPU Julia | |
| Asus ZenBook Flip 14 UN5401QA-KN085W | |
| Lenovo ThinkPad X1 Yoga G8 i7-1355U | |
| Dell Latitude 9430 2-in-1 | |
| Przeciętny Intel Core i7-1355U (29580 - 42706, n=18) | |
| LG Gram 14T90P | |
| Lenovo ThinkPad X1 Yoga G7 21CE002HGE | |
| AIDA64 / CPU SHA3 | |
| Asus ZenBook Flip 14 UN5401QA-KN085W | |
| Dell Latitude 9430 2-in-1 | |
| Lenovo ThinkPad X1 Yoga G8 i7-1355U | |
| Przeciętny Intel Core i7-1355U (1529 - 2200, n=18) | |
| LG Gram 14T90P | |
| Lenovo ThinkPad X1 Yoga G7 21CE002HGE | |
| AIDA64 / CPU Queen | |
| Asus ZenBook Flip 14 UN5401QA-KN085W | |
| Dell Latitude 9430 2-in-1 | |
| Lenovo ThinkPad X1 Yoga G8 i7-1355U | |
| Przeciętny Intel Core i7-1355U (21547 - 66907, n=18) | |
| Lenovo ThinkPad X1 Yoga G7 21CE002HGE | |
| LG Gram 14T90P | |
| AIDA64 / FPU SinJulia | |
| Asus ZenBook Flip 14 UN5401QA-KN085W | |
| Lenovo ThinkPad X1 Yoga G7 21CE002HGE | |
| Dell Latitude 9430 2-in-1 | |
| Lenovo ThinkPad X1 Yoga G8 i7-1355U | |
| Przeciętny Intel Core i7-1355U (4045 - 5426, n=18) | |
| LG Gram 14T90P | |
| AIDA64 / FPU Mandel | |
| Asus ZenBook Flip 14 UN5401QA-KN085W | |
| Dell Latitude 9430 2-in-1 | |
| Lenovo ThinkPad X1 Yoga G8 i7-1355U | |
| Przeciętny Intel Core i7-1355U (14596 - 21627, n=18) | |
| LG Gram 14T90P | |
| Lenovo ThinkPad X1 Yoga G7 21CE002HGE | |
| AIDA64 / CPU AES | |
| Asus ZenBook Flip 14 UN5401QA-KN085W | |
| LG Gram 14T90P | |
| Dell Latitude 9430 2-in-1 | |
| Przeciętny Intel Core i7-1355U (31432 - 75408, n=18) | |
| Lenovo ThinkPad X1 Yoga G8 i7-1355U | |
| Lenovo ThinkPad X1 Yoga G7 21CE002HGE | |
| AIDA64 / CPU ZLib | |
| Asus ZenBook Flip 14 UN5401QA-KN085W | |
| Lenovo ThinkPad X1 Yoga G8 i7-1355U | |
| Dell Latitude 9430 2-in-1 | |
| Przeciętny Intel Core i7-1355U (454 - 684, n=18) | |
| Lenovo ThinkPad X1 Yoga G7 21CE002HGE | |
| LG Gram 14T90P | |
| AIDA64 / FP64 Ray-Trace | |
| Asus ZenBook Flip 14 UN5401QA-KN085W | |
| Dell Latitude 9430 2-in-1 | |
| Lenovo ThinkPad X1 Yoga G8 i7-1355U | |
| Przeciętny Intel Core i7-1355U (2991 - 4453, n=18) | |
| LG Gram 14T90P | |
| Lenovo ThinkPad X1 Yoga G7 21CE002HGE | |
| AIDA64 / CPU PhotoWorxx | |
| Dell Latitude 9430 2-in-1 | |
| Lenovo ThinkPad X1 Yoga G8 i7-1355U | |
| LG Gram 14T90P | |
| Przeciętny Intel Core i7-1355U (21800 - 46154, n=18) | |
| Lenovo ThinkPad X1 Yoga G7 21CE002HGE | |
| Asus ZenBook Flip 14 UN5401QA-KN085W | |
Wydajność systemu
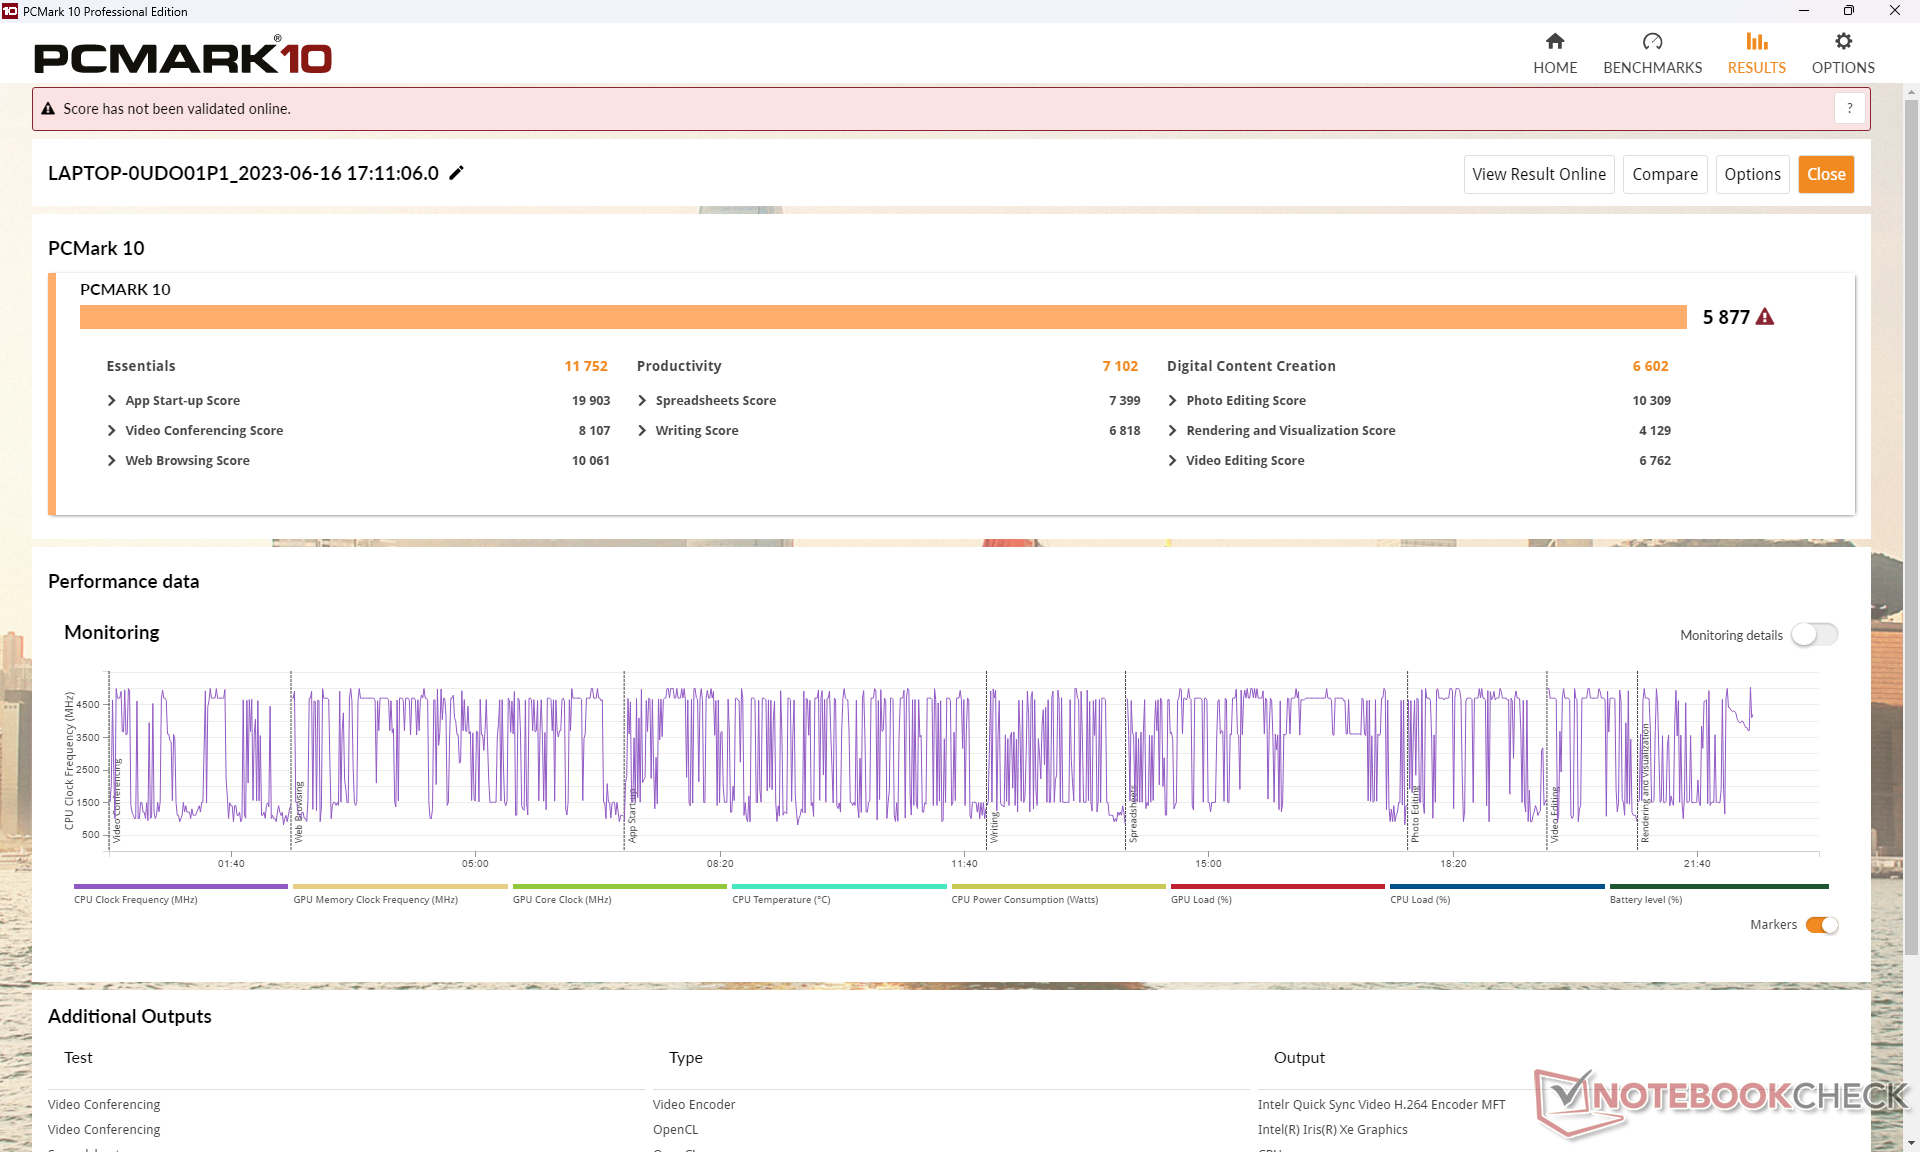
CrossMark: Overall | Productivity | Creativity | Responsiveness
| PCMark 10 / Score | |
| Asus ZenBook Flip 14 UN5401QA-KN085W | |
| Lenovo ThinkPad X1 Yoga G8 i7-1355U | |
| Przeciętny Intel Core i7-1355U, Intel Iris Xe Graphics G7 96EUs (5455 - 5933, n=15) | |
| Lenovo ThinkPad X1 Yoga G7 21CE002HGE | |
| Dell Latitude 9430 2-in-1 | |
| LG Gram 14T90P | |
| HP EliteBook x360 1040 G7, i7-10810U | |
| PCMark 10 / Essentials | |
| Lenovo ThinkPad X1 Yoga G8 i7-1355U | |
| Lenovo ThinkPad X1 Yoga G7 21CE002HGE | |
| Przeciętny Intel Core i7-1355U, Intel Iris Xe Graphics G7 96EUs (10203 - 11822, n=15) | |
| Dell Latitude 9430 2-in-1 | |
| Asus ZenBook Flip 14 UN5401QA-KN085W | |
| LG Gram 14T90P | |
| HP EliteBook x360 1040 G7, i7-10810U | |
| PCMark 10 / Productivity | |
| Asus ZenBook Flip 14 UN5401QA-KN085W | |
| Przeciętny Intel Core i7-1355U, Intel Iris Xe Graphics G7 96EUs (6763 - 7536, n=15) | |
| HP EliteBook x360 1040 G7, i7-10810U | |
| Lenovo ThinkPad X1 Yoga G8 i7-1355U | |
| Dell Latitude 9430 2-in-1 | |
| Lenovo ThinkPad X1 Yoga G7 21CE002HGE | |
| LG Gram 14T90P | |
| PCMark 10 / Digital Content Creation | |
| Lenovo ThinkPad X1 Yoga G8 i7-1355U | |
| Lenovo ThinkPad X1 Yoga G7 21CE002HGE | |
| Asus ZenBook Flip 14 UN5401QA-KN085W | |
| Przeciętny Intel Core i7-1355U, Intel Iris Xe Graphics G7 96EUs (5723 - 6712, n=15) | |
| Dell Latitude 9430 2-in-1 | |
| LG Gram 14T90P | |
| HP EliteBook x360 1040 G7, i7-10810U | |
| CrossMark / Overall | |
| Lenovo ThinkPad X1 Yoga G7 21CE002HGE | |
| Lenovo ThinkPad X1 Yoga G8 i7-1355U | |
| Dell Latitude 9430 2-in-1 | |
| Przeciętny Intel Core i7-1355U, Intel Iris Xe Graphics G7 96EUs (1478 - 1643, n=15) | |
| LG Gram 14T90P | |
| CrossMark / Productivity | |
| Lenovo ThinkPad X1 Yoga G7 21CE002HGE | |
| Lenovo ThinkPad X1 Yoga G8 i7-1355U | |
| Dell Latitude 9430 2-in-1 | |
| Przeciętny Intel Core i7-1355U, Intel Iris Xe Graphics G7 96EUs (1444 - 1665, n=15) | |
| LG Gram 14T90P | |
| CrossMark / Creativity | |
| Lenovo ThinkPad X1 Yoga G7 21CE002HGE | |
| Lenovo ThinkPad X1 Yoga G8 i7-1355U | |
| Dell Latitude 9430 2-in-1 | |
| Przeciętny Intel Core i7-1355U, Intel Iris Xe Graphics G7 96EUs (1563 - 1732, n=15) | |
| LG Gram 14T90P | |
| CrossMark / Responsiveness | |
| Lenovo ThinkPad X1 Yoga G7 21CE002HGE | |
| Dell Latitude 9430 2-in-1 | |
| Przeciętny Intel Core i7-1355U, Intel Iris Xe Graphics G7 96EUs (1217 - 1681, n=15) | |
| Lenovo ThinkPad X1 Yoga G8 i7-1355U | |
| LG Gram 14T90P | |
| PCMark 10 Score | 5877 pkt. | |
Pomoc | ||
| AIDA64 / Memory Copy | |
| Dell Latitude 9430 2-in-1 | |
| Lenovo ThinkPad X1 Yoga G8 i7-1355U | |
| LG Gram 14T90P | |
| Lenovo ThinkPad X1 Yoga G7 21CE002HGE | |
| Przeciętny Intel Core i7-1355U (35017 - 71600, n=18) | |
| Asus ZenBook Flip 14 UN5401QA-KN085W | |
| AIDA64 / Memory Read | |
| Lenovo ThinkPad X1 Yoga G7 21CE002HGE | |
| LG Gram 14T90P | |
| Dell Latitude 9430 2-in-1 | |
| Lenovo ThinkPad X1 Yoga G8 i7-1355U | |
| Przeciętny Intel Core i7-1355U (38551 - 73377, n=18) | |
| Asus ZenBook Flip 14 UN5401QA-KN085W | |
| AIDA64 / Memory Write | |
| Lenovo ThinkPad X1 Yoga G8 i7-1355U | |
| Przeciętny Intel Core i7-1355U (35910 - 93342, n=18) | |
| LG Gram 14T90P | |
| Dell Latitude 9430 2-in-1 | |
| Lenovo ThinkPad X1 Yoga G7 21CE002HGE | |
| Asus ZenBook Flip 14 UN5401QA-KN085W | |
| AIDA64 / Memory Latency | |
| Przeciętny Intel Core i7-1355U (72.2 - 346, n=18) | |
| Asus ZenBook Flip 14 UN5401QA-KN085W | |
| Dell Latitude 9430 2-in-1 | |
| Lenovo ThinkPad X1 Yoga G8 i7-1355U | |
| LG Gram 14T90P | |
| Lenovo ThinkPad X1 Yoga G7 21CE002HGE | |
* ... im mniej tym lepiej
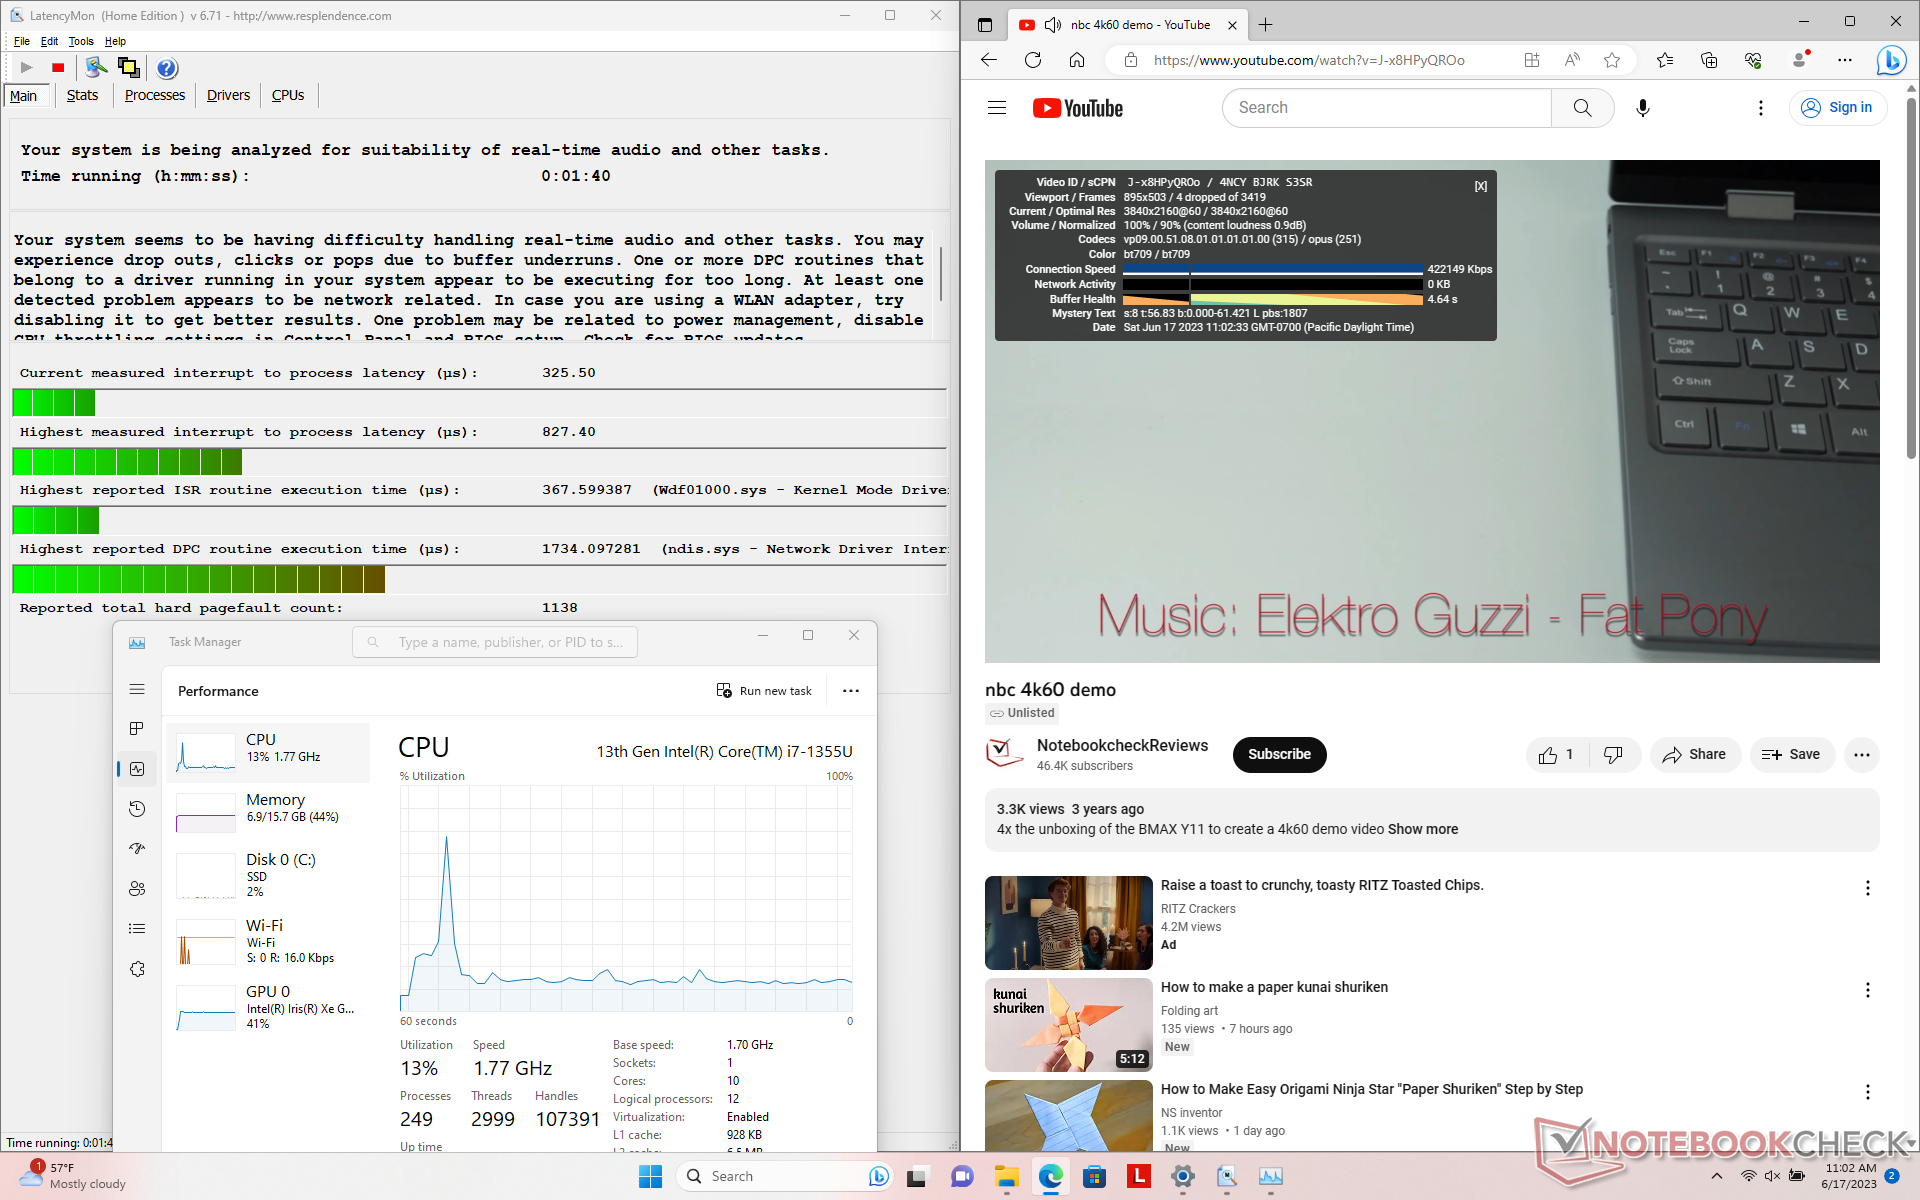
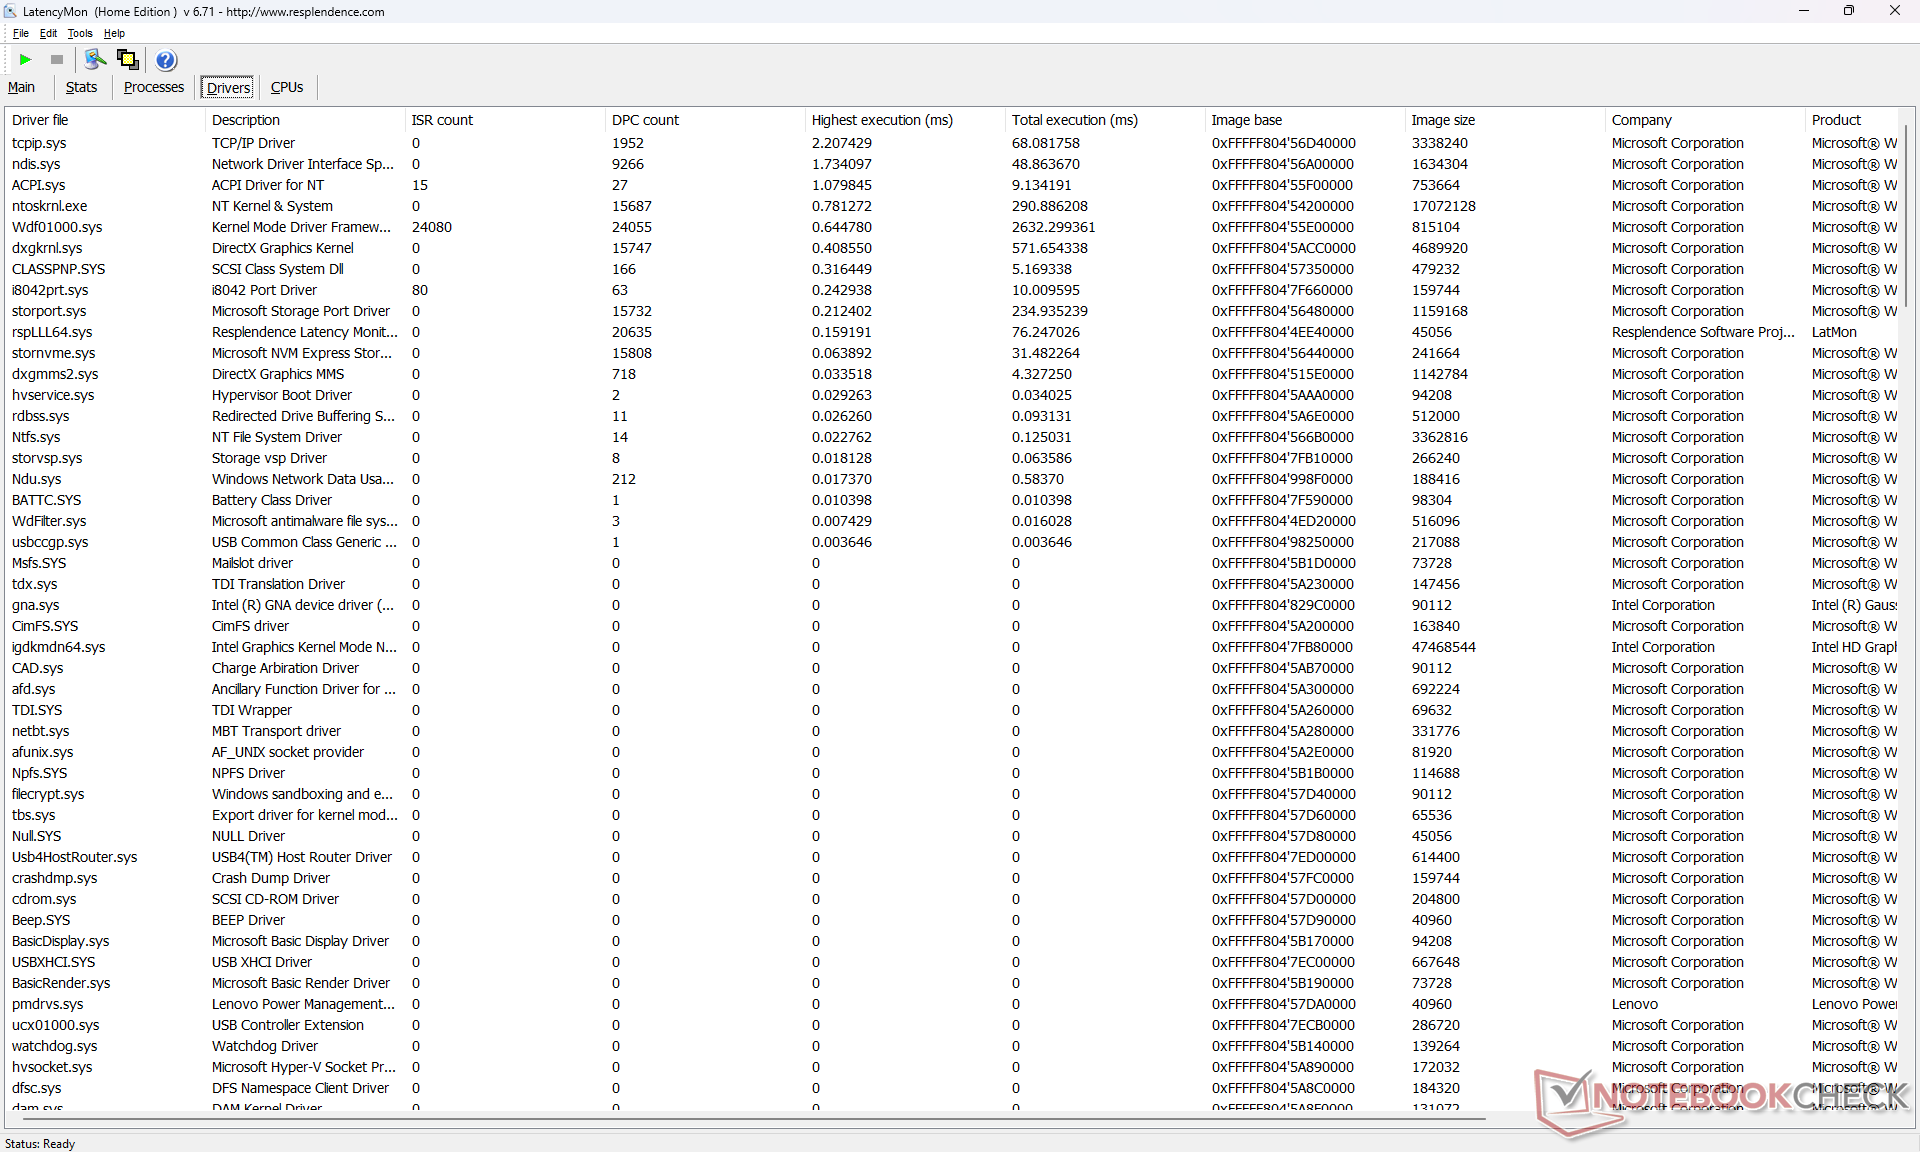
Opóźnienie DPC
LatencyMon ujawnia problemy z DPC podczas otwierania wielu kart przeglądarki na naszej stronie głównej. odtwarzanie wideo 4K przy 60 FPS jest również niedoskonałe, z 4 upuszczonymi klatkami podczas minutowego filmu testowego.
| DPC Latencies / LatencyMon - interrupt to process latency (max), Web, Youtube, Prime95 | |
| HP EliteBook x360 1040 G7, i7-10810U | |
| Lenovo ThinkPad X1 Yoga G7 21CE002HGE | |
| LG Gram 14T90P | |
| Asus ZenBook Flip 14 UN5401QA-KN085W | |
| Lenovo ThinkPad X1 Yoga G8 i7-1355U | |
| Dell Latitude 9430 2-in-1 | |
* ... im mniej tym lepiej
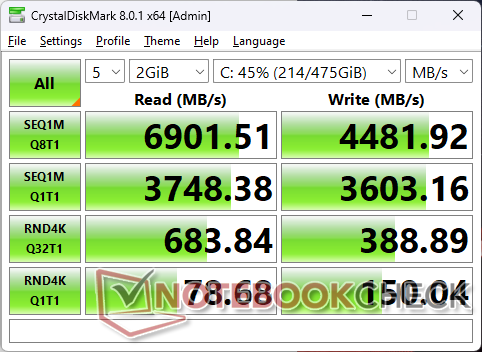
Urządzenia pamięci masowej
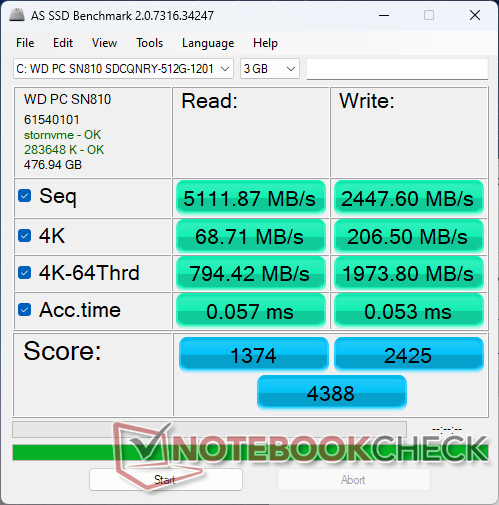
Nasza jednostka testowa została skonfigurowana zWestern Digital SN810 zamiast Samsung PM9A1 z zeszłorocznego ThinkPada X1 Yoga G7. Wydajność jest ogólnie wolniejsza niż w przypadku dysku Samsung, szczególnie podczas odczytu i zapisu mniejszych rozmiarów bloków.

| Drive Performance rating - Percent | |
| Lenovo ThinkPad X1 Yoga G7 21CE002HGE | |
| Lenovo ThinkPad X1 Yoga G8 i7-1355U | |
| LG Gram 14T90P | |
| HP EliteBook x360 1040 G7, i7-10810U | |
| Dell Latitude 9430 2-in-1 | |
| Asus ZenBook Flip 14 UN5401QA-KN085W | |
| DiskSpd | |
| seq read | |
| Lenovo ThinkPad X1 Yoga G7 21CE002HGE | |
| Lenovo ThinkPad X1 Yoga G8 i7-1355U | |
| Dell Latitude 9430 2-in-1 | |
| HP EliteBook x360 1040 G7, i7-10810U | |
| Asus ZenBook Flip 14 UN5401QA-KN085W | |
| LG Gram 14T90P | |
| seq write | |
| Lenovo ThinkPad X1 Yoga G7 21CE002HGE | |
| Lenovo ThinkPad X1 Yoga G8 i7-1355U | |
| Dell Latitude 9430 2-in-1 | |
| LG Gram 14T90P | |
| HP EliteBook x360 1040 G7, i7-10810U | |
| Asus ZenBook Flip 14 UN5401QA-KN085W | |
| seq q8 t1 read | |
| Lenovo ThinkPad X1 Yoga G8 i7-1355U | |
| Lenovo ThinkPad X1 Yoga G7 21CE002HGE | |
| Dell Latitude 9430 2-in-1 | |
| HP EliteBook x360 1040 G7, i7-10810U | |
| LG Gram 14T90P | |
| Asus ZenBook Flip 14 UN5401QA-KN085W | |
| seq q8 t1 write | |
| Lenovo ThinkPad X1 Yoga G7 21CE002HGE | |
| Lenovo ThinkPad X1 Yoga G8 i7-1355U | |
| HP EliteBook x360 1040 G7, i7-10810U | |
| LG Gram 14T90P | |
| Dell Latitude 9430 2-in-1 | |
| Asus ZenBook Flip 14 UN5401QA-KN085W | |
| 4k q1 t1 read | |
| Lenovo ThinkPad X1 Yoga G7 21CE002HGE | |
| Lenovo ThinkPad X1 Yoga G8 i7-1355U | |
| Dell Latitude 9430 2-in-1 | |
| Asus ZenBook Flip 14 UN5401QA-KN085W | |
| LG Gram 14T90P | |
| HP EliteBook x360 1040 G7, i7-10810U | |
| 4k q1 t1 write | |
| Lenovo ThinkPad X1 Yoga G7 21CE002HGE | |
| LG Gram 14T90P | |
| Dell Latitude 9430 2-in-1 | |
| Lenovo ThinkPad X1 Yoga G8 i7-1355U | |
| Asus ZenBook Flip 14 UN5401QA-KN085W | |
| HP EliteBook x360 1040 G7, i7-10810U | |
| 4k q32 t16 read | |
| Lenovo ThinkPad X1 Yoga G7 21CE002HGE | |
| LG Gram 14T90P | |
| HP EliteBook x360 1040 G7, i7-10810U | |
| Lenovo ThinkPad X1 Yoga G8 i7-1355U | |
| Dell Latitude 9430 2-in-1 | |
| Asus ZenBook Flip 14 UN5401QA-KN085W | |
| 4k q32 t16 write | |
| LG Gram 14T90P | |
| Lenovo ThinkPad X1 Yoga G7 21CE002HGE | |
| Asus ZenBook Flip 14 UN5401QA-KN085W | |
| Lenovo ThinkPad X1 Yoga G8 i7-1355U | |
| Dell Latitude 9430 2-in-1 | |
| HP EliteBook x360 1040 G7, i7-10810U | |
| AS SSD | |
| Score Total | |
| Lenovo ThinkPad X1 Yoga G7 21CE002HGE | |
| LG Gram 14T90P | |
| Lenovo ThinkPad X1 Yoga G8 i7-1355U | |
| HP EliteBook x360 1040 G7, i7-10810U | |
| Asus ZenBook Flip 14 UN5401QA-KN085W | |
| Dell Latitude 9430 2-in-1 | |
| Score Read | |
| Lenovo ThinkPad X1 Yoga G7 21CE002HGE | |
| LG Gram 14T90P | |
| Lenovo ThinkPad X1 Yoga G8 i7-1355U | |
| HP EliteBook x360 1040 G7, i7-10810U | |
| Dell Latitude 9430 2-in-1 | |
| Asus ZenBook Flip 14 UN5401QA-KN085W | |
| Score Write | |
| Lenovo ThinkPad X1 Yoga G7 21CE002HGE | |
| Lenovo ThinkPad X1 Yoga G8 i7-1355U | |
| LG Gram 14T90P | |
| HP EliteBook x360 1040 G7, i7-10810U | |
| Asus ZenBook Flip 14 UN5401QA-KN085W | |
| Dell Latitude 9430 2-in-1 | |
| Seq Read | |
| Lenovo ThinkPad X1 Yoga G7 21CE002HGE | |
| Lenovo ThinkPad X1 Yoga G8 i7-1355U | |
| HP EliteBook x360 1040 G7, i7-10810U | |
| LG Gram 14T90P | |
| Dell Latitude 9430 2-in-1 | |
| Asus ZenBook Flip 14 UN5401QA-KN085W | |
| Seq Write | |
| Lenovo ThinkPad X1 Yoga G7 21CE002HGE | |
| Lenovo ThinkPad X1 Yoga G8 i7-1355U | |
| LG Gram 14T90P | |
| HP EliteBook x360 1040 G7, i7-10810U | |
| Dell Latitude 9430 2-in-1 | |
| Asus ZenBook Flip 14 UN5401QA-KN085W | |
| 4K Read | |
| Lenovo ThinkPad X1 Yoga G7 21CE002HGE | |
| Lenovo ThinkPad X1 Yoga G8 i7-1355U | |
| LG Gram 14T90P | |
| Dell Latitude 9430 2-in-1 | |
| Asus ZenBook Flip 14 UN5401QA-KN085W | |
| HP EliteBook x360 1040 G7, i7-10810U | |
| 4K Write | |
| Lenovo ThinkPad X1 Yoga G8 i7-1355U | |
| Lenovo ThinkPad X1 Yoga G7 21CE002HGE | |
| Dell Latitude 9430 2-in-1 | |
| Asus ZenBook Flip 14 UN5401QA-KN085W | |
| HP EliteBook x360 1040 G7, i7-10810U | |
| LG Gram 14T90P | |
| 4K-64 Read | |
| Lenovo ThinkPad X1 Yoga G7 21CE002HGE | |
| LG Gram 14T90P | |
| Lenovo ThinkPad X1 Yoga G8 i7-1355U | |
| HP EliteBook x360 1040 G7, i7-10810U | |
| Dell Latitude 9430 2-in-1 | |
| Asus ZenBook Flip 14 UN5401QA-KN085W | |
| 4K-64 Write | |
| Lenovo ThinkPad X1 Yoga G7 21CE002HGE | |
| Lenovo ThinkPad X1 Yoga G8 i7-1355U | |
| LG Gram 14T90P | |
| HP EliteBook x360 1040 G7, i7-10810U | |
| Asus ZenBook Flip 14 UN5401QA-KN085W | |
| Dell Latitude 9430 2-in-1 | |
| Access Time Read | |
| Asus ZenBook Flip 14 UN5401QA-KN085W | |
| Dell Latitude 9430 2-in-1 | |
| Lenovo ThinkPad X1 Yoga G8 i7-1355U | |
| LG Gram 14T90P | |
| HP EliteBook x360 1040 G7, i7-10810U | |
| Lenovo ThinkPad X1 Yoga G7 21CE002HGE | |
| Access Time Write | |
| Dell Latitude 9430 2-in-1 | |
| LG Gram 14T90P | |
| HP EliteBook x360 1040 G7, i7-10810U | |
| Asus ZenBook Flip 14 UN5401QA-KN085W | |
| Lenovo ThinkPad X1 Yoga G8 i7-1355U | |
| Lenovo ThinkPad X1 Yoga G7 21CE002HGE | |
* ... im mniej tym lepiej
Disk Throttling: DiskSpd Read Loop, Queue Depth 8
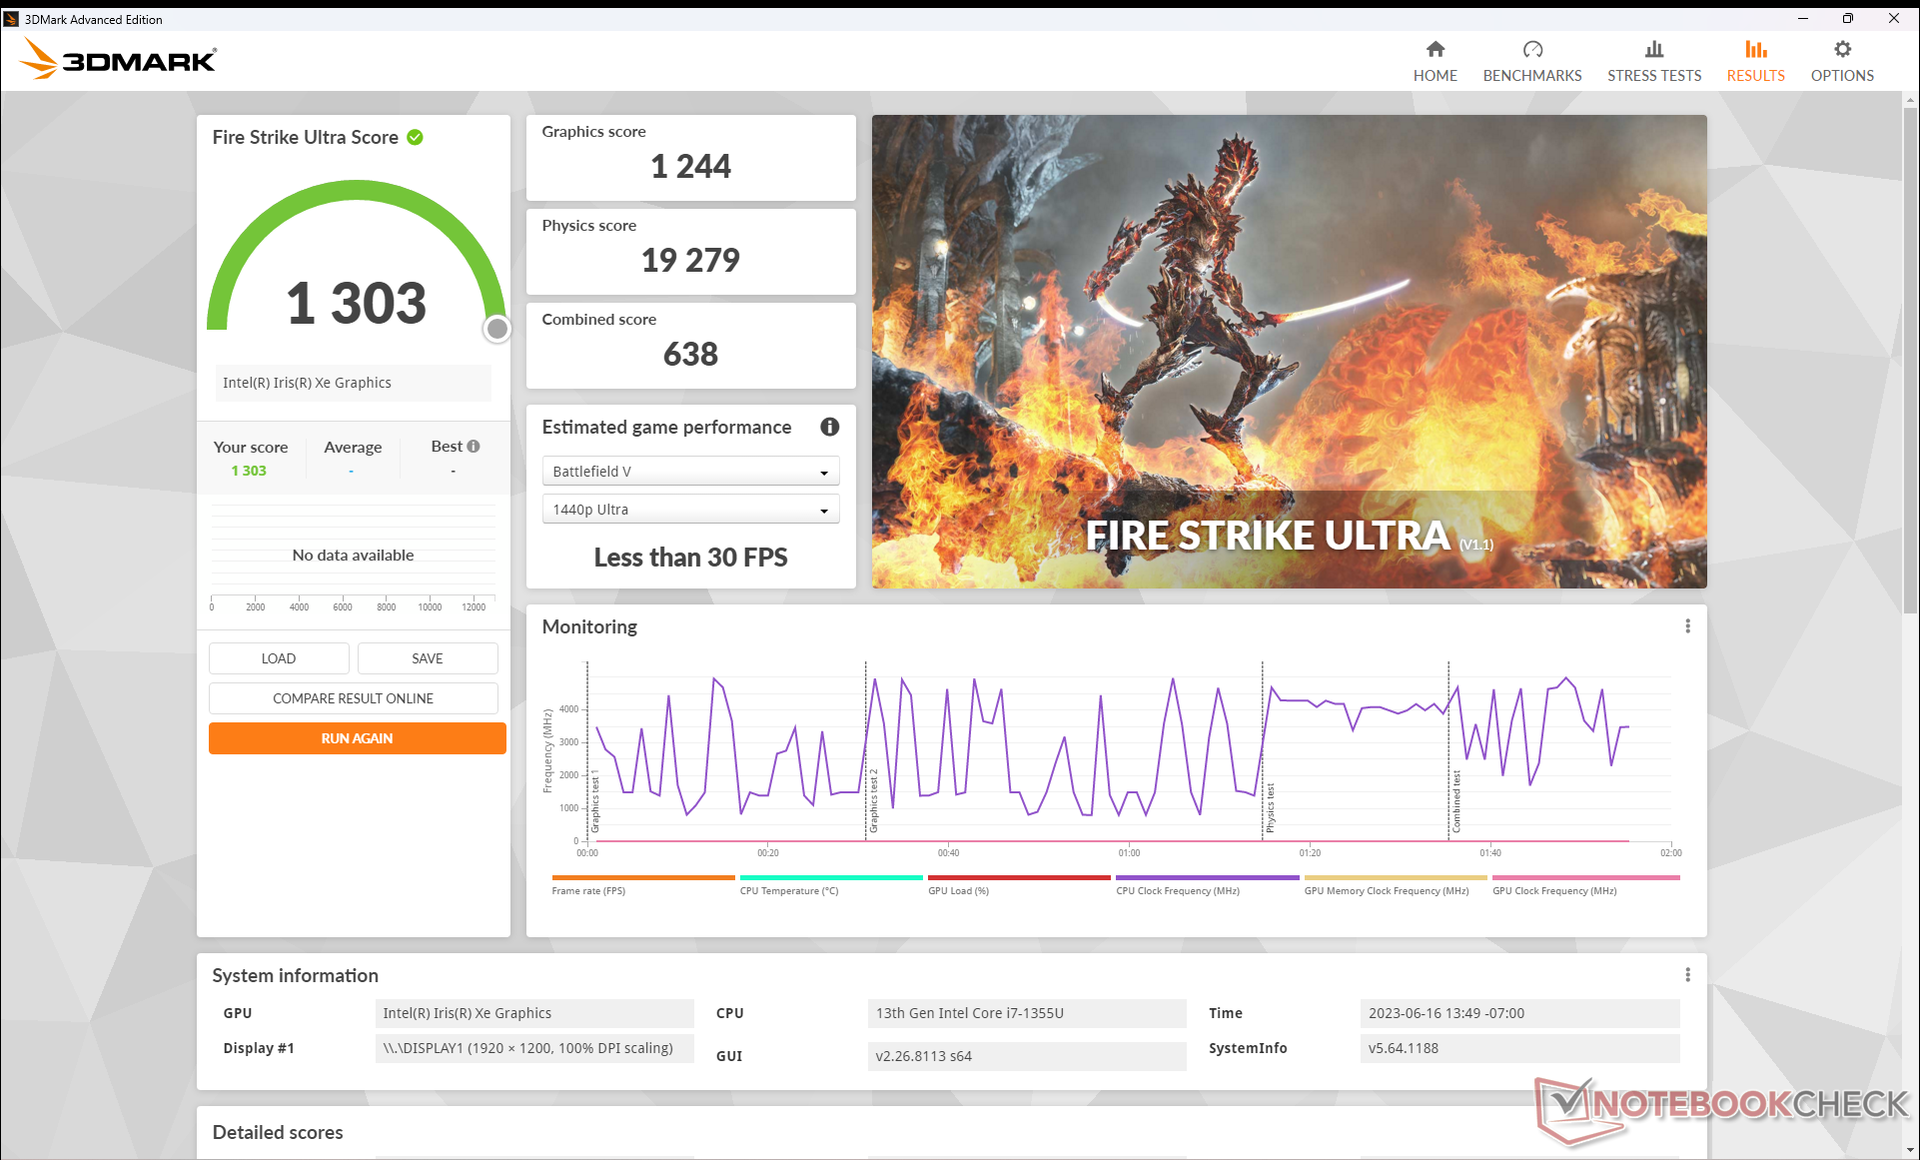
Wydajność GPU - starzejący się Iris Xe
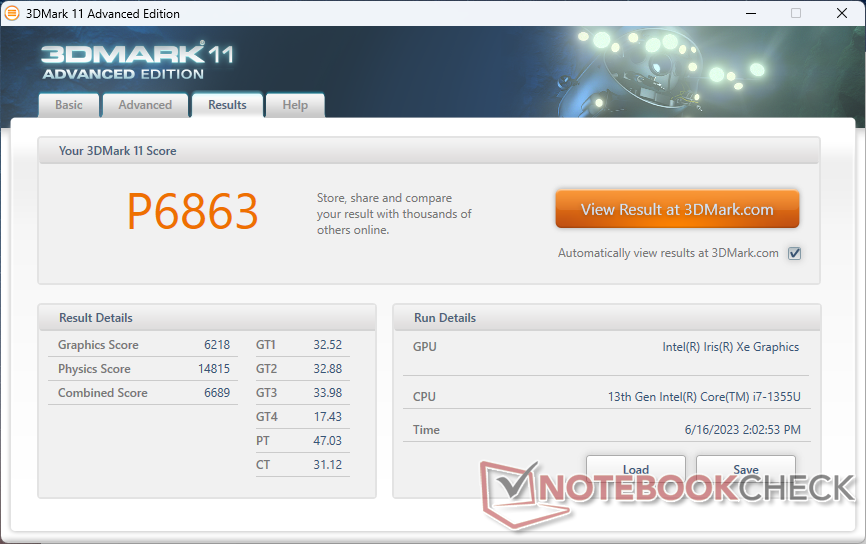
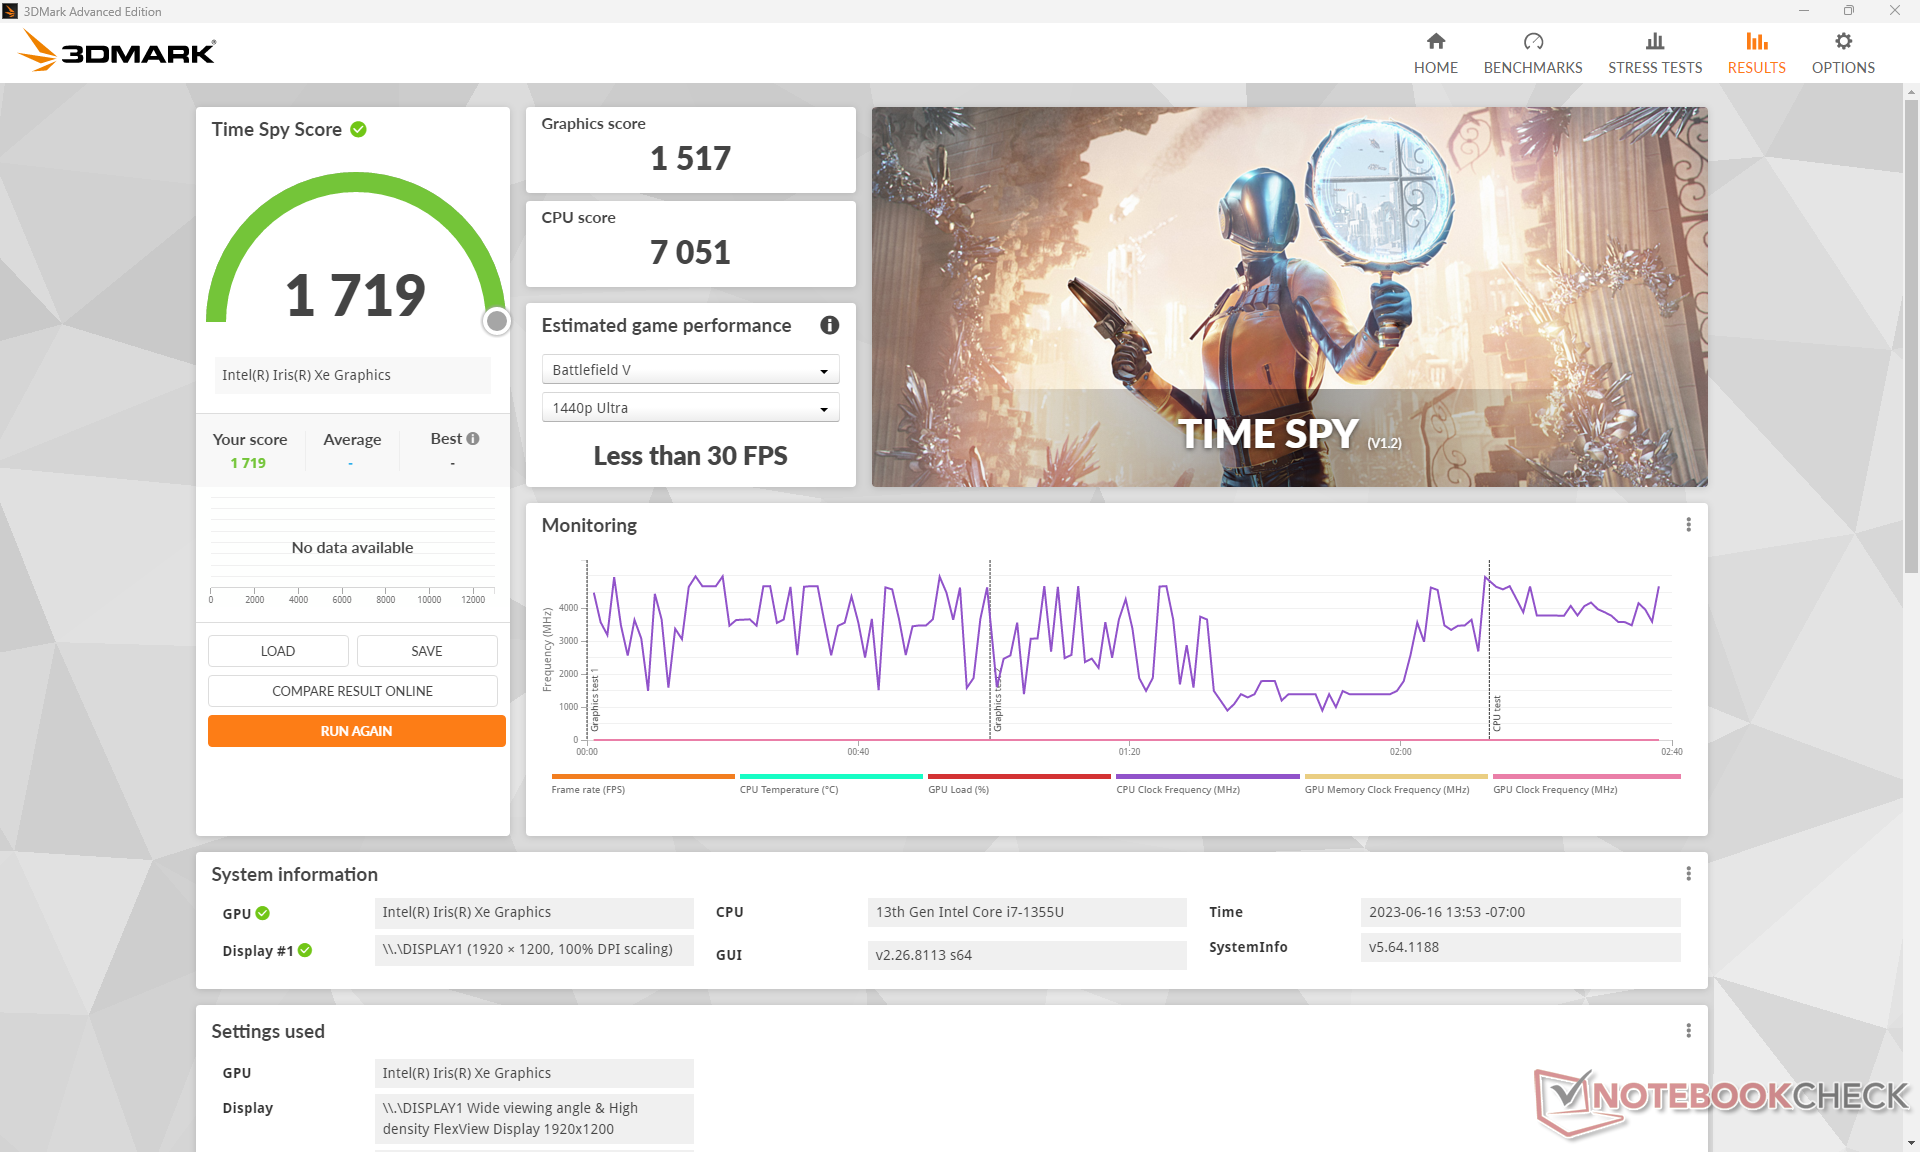
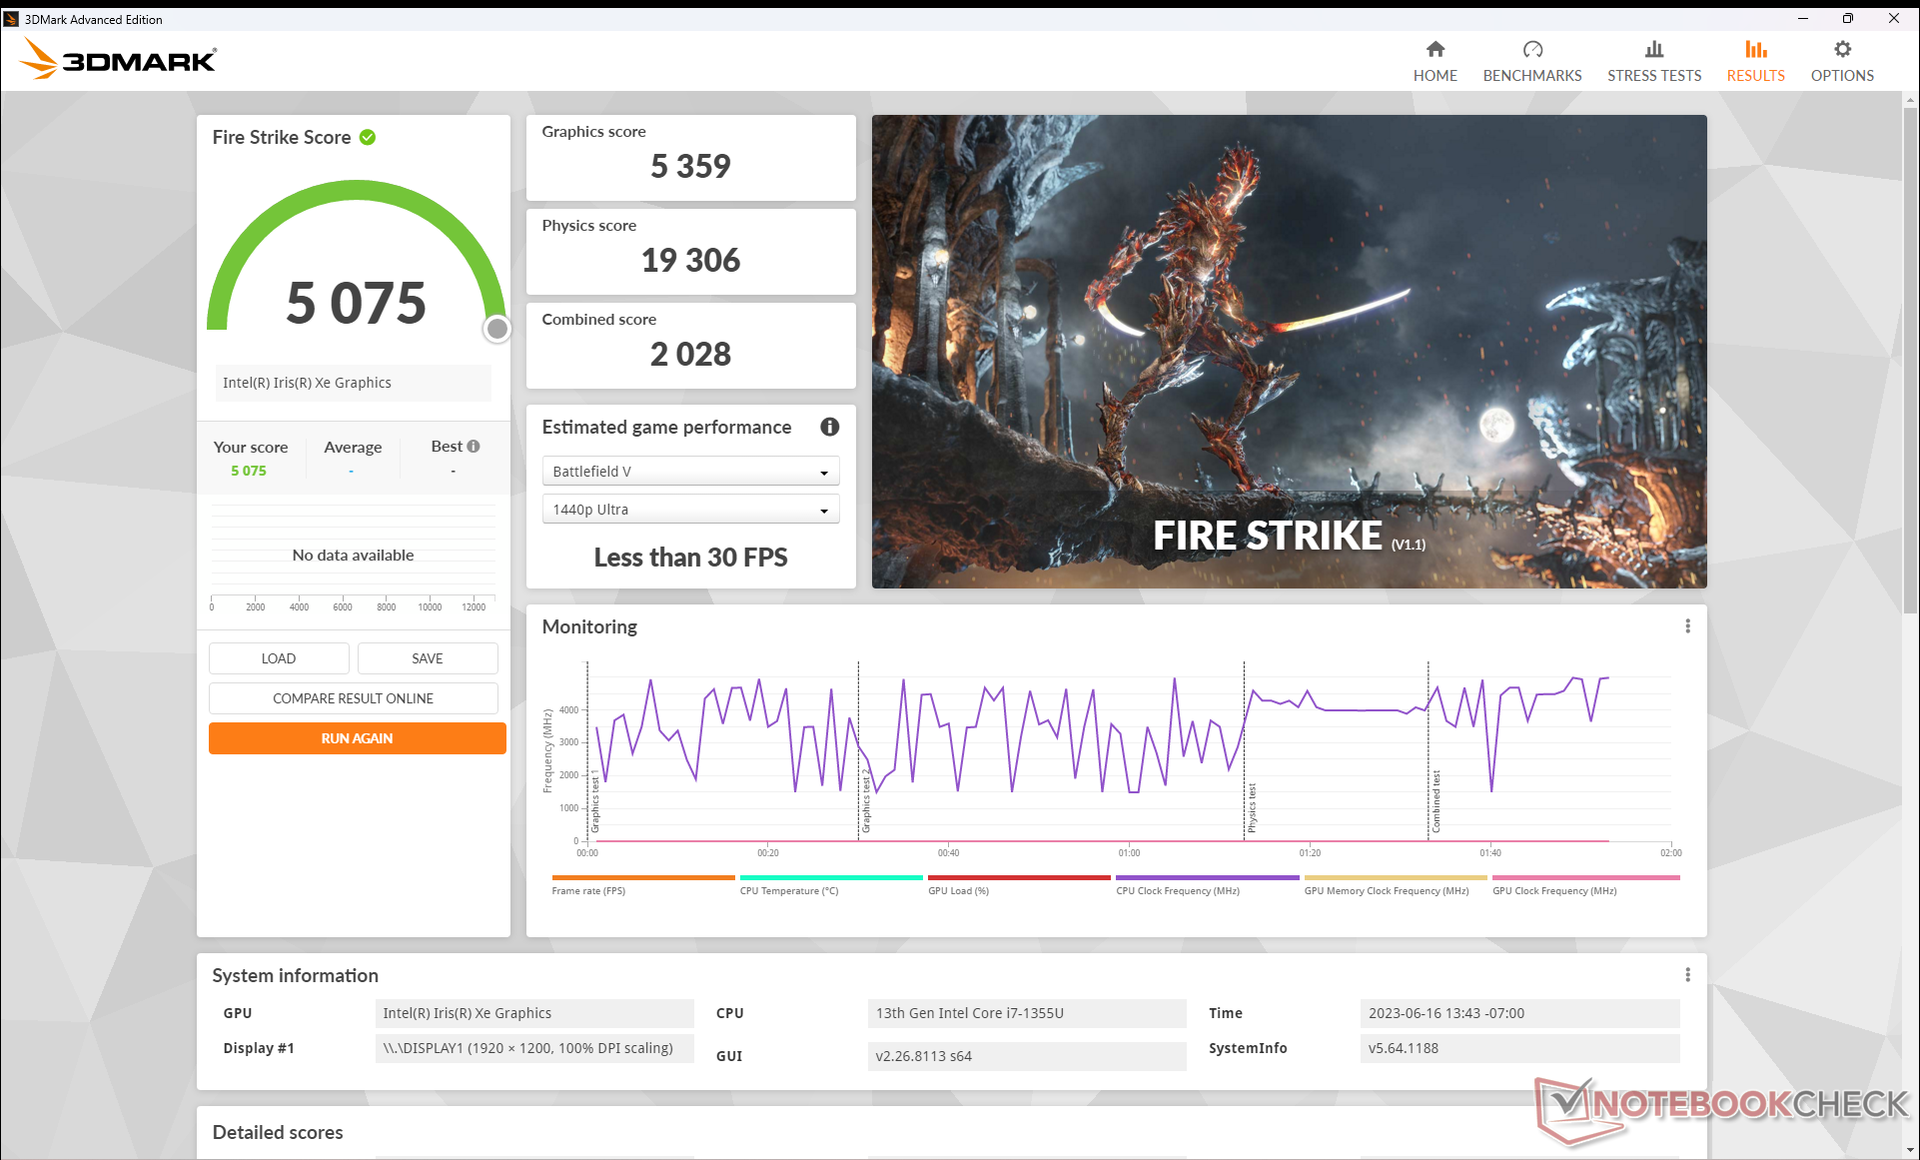
Wydajność graficzna pozostaje taka sama jak w zeszłorocznym modelu, ponieważ zintegrowany układ Iris Xe 96 EUs GPU nie uległ zmianie. Jednak wydajność może być gorsza w nowszym modelu, ponieważ system ma tendencję do dławienia. Na przykład na biegu jałowym Witcher 3liczba klatek na sekundę często wahała się między 50 a 90 FPS ze względu na niestabilne taktowanie GPU.
Niektóre tytuły, takie jak Returnal , nie uruchamiały się.
| 3DMark Performance rating - Percent | |
| Asus ROG Zephyrus G14 GA402XY | |
| Lenovo ThinkPad P14s G3 AMD 21J6S05000 | |
| Lenovo Yoga 7-14ARB G7 | |
| Lenovo ThinkPad T14 G3-21AJS00400 | |
| HP EliteBook 840 G9 | |
| Lenovo ThinkPad X1 Yoga G7 21CE002HGE | |
| Lenovo ThinkPad X1 Yoga G8 i7-1355U | |
| Dell Latitude 9430 2-in-1 | |
| Przeciętny Intel Iris Xe Graphics G7 96EUs | |
| LG Gram 14T90P | |
| Acer Aspire 5 Spin 14 | |
| Asus ZenBook Flip 14 UN5401QA-KN085W | |
| Asus ExpertBook B3 Flip B3402FEA | |
| HP EliteBook x360 1040 G7, i7-10810U | |
| 3DMark 11 - 1280x720 Performance GPU | |
| Asus ROG Zephyrus G14 GA402XY | |
| Lenovo ThinkPad P14s G3 AMD 21J6S05000 | |
| Lenovo ThinkPad T14 G3-21AJS00400 | |
| Lenovo Yoga 7-14ARB G7 | |
| HP EliteBook 840 G9 | |
| Lenovo ThinkPad X1 Yoga G7 21CE002HGE | |
| Przeciętny Intel Iris Xe Graphics G7 96EUs (2867 - 7676, n=209) | |
| Dell Latitude 9430 2-in-1 | |
| Lenovo ThinkPad X1 Yoga G8 i7-1355U | |
| LG Gram 14T90P | |
| Asus ZenBook Flip 14 UN5401QA-KN085W | |
| Acer Aspire 5 Spin 14 | |
| Asus ExpertBook B3 Flip B3402FEA | |
| HP EliteBook x360 1040 G7, i7-10810U | |
| 3DMark 11 Performance | 6863 pkt. | |
| 3DMark Fire Strike Score | 5075 pkt. | |
| 3DMark Time Spy Score | 1719 pkt. | |
Pomoc | ||
| Performance rating - Percent | |
| Lenovo ThinkPad T14 G3-21AJS00400 | |
| Asus ROG Zephyrus G14 GA402XY | |
| Lenovo Yoga 7-14ARB G7 | |
| Lenovo ThinkPad P14s G3 AMD 21J6S05000 | |
| HP EliteBook 840 G9 | |
| Dell Latitude 9430 2-in-1 | |
| Lenovo ThinkPad X1 Yoga G7 21CE002HGE | |
| Lenovo ThinkPad X1 Yoga G8 i7-1355U | |
| Asus ZenBook Flip 14 UN5401QA-KN085W | |
| LG Gram 14T90P | |
| Acer Aspire 5 Spin 14 | |
| Asus ExpertBook B3 Flip B3402FEA | |
| HP EliteBook x360 1040 G7, i7-10810U -3! | |
| The Witcher 3 - 1920x1080 Ultra Graphics & Postprocessing (HBAO+) | |
| Lenovo ThinkPad P14s G3 AMD 21J6S05000 | |
| Asus ROG Zephyrus G14 GA402XY | |
| Lenovo Yoga 7-14ARB G7 | |
| Lenovo ThinkPad T14 G3-21AJS00400 | |
| HP EliteBook 840 G9 | |
| Asus ZenBook Flip 14 UN5401QA-KN085W | |
| Dell Latitude 9430 2-in-1 | |
| LG Gram 14T90P | |
| Acer Aspire 5 Spin 14 | |
| Lenovo ThinkPad X1 Yoga G7 21CE002HGE | |
| Lenovo ThinkPad X1 Yoga G8 i7-1355U | |
| Asus ExpertBook B3 Flip B3402FEA | |
| GTA V - 1920x1080 Highest AA:4xMSAA + FX AF:16x | |
| Lenovo ThinkPad T14 G3-21AJS00400 | |
| Lenovo ThinkPad P14s G3 AMD 21J6S05000 | |
| Lenovo Yoga 7-14ARB G7 | |
| Asus ROG Zephyrus G14 GA402XY | |
| LG Gram 14T90P | |
| Dell Latitude 9430 2-in-1 | |
| Asus ZenBook Flip 14 UN5401QA-KN085W | |
| HP EliteBook 840 G9 | |
| Lenovo ThinkPad X1 Yoga G8 i7-1355U | |
| Lenovo ThinkPad X1 Yoga G7 21CE002HGE | |
| Acer Aspire 5 Spin 14 | |
| Asus ExpertBook B3 Flip B3402FEA | |
| Final Fantasy XV Benchmark - 1920x1080 High Quality | |
| Asus ROG Zephyrus G14 GA402XY | |
| Lenovo ThinkPad P14s G3 AMD 21J6S05000 | |
| Lenovo Yoga 7-14ARB G7 | |
| Lenovo ThinkPad T14 G3-21AJS00400 | |
| HP EliteBook 840 G9 | |
| Dell Latitude 9430 2-in-1 | |
| Lenovo ThinkPad X1 Yoga G8 i7-1355U | |
| LG Gram 14T90P | |
| Acer Aspire 5 Spin 14 | |
| Lenovo ThinkPad X1 Yoga G7 21CE002HGE | |
| Asus ZenBook Flip 14 UN5401QA-KN085W | |
| Asus ExpertBook B3 Flip B3402FEA | |
| HP EliteBook x360 1040 G7, i7-10810U | |
| Strange Brigade - 1920x1080 ultra AA:ultra AF:16 | |
| Lenovo ThinkPad T14 G3-21AJS00400 | |
| Lenovo Yoga 7-14ARB G7 | |
| Asus ROG Zephyrus G14 GA402XY | |
| Lenovo ThinkPad P14s G3 AMD 21J6S05000 | |
| HP EliteBook 840 G9 | |
| Dell Latitude 9430 2-in-1 | |
| Lenovo ThinkPad X1 Yoga G7 21CE002HGE | |
| Asus ZenBook Flip 14 UN5401QA-KN085W | |
| LG Gram 14T90P | |
| Lenovo ThinkPad X1 Yoga G8 i7-1355U | |
| Acer Aspire 5 Spin 14 | |
| Asus ExpertBook B3 Flip B3402FEA | |
| Dota 2 Reborn - 1920x1080 ultra (3/3) best looking | |
| Lenovo ThinkPad T14 G3-21AJS00400 | |
| Asus ROG Zephyrus G14 GA402XY | |
| Lenovo ThinkPad X1 Yoga G8 i7-1355U | |
| Lenovo Yoga 7-14ARB G7 | |
| HP EliteBook 840 G9 | |
| Lenovo ThinkPad X1 Yoga G7 21CE002HGE | |
| Lenovo ThinkPad P14s G3 AMD 21J6S05000 | |
| Dell Latitude 9430 2-in-1 | |
| Asus ZenBook Flip 14 UN5401QA-KN085W | |
| Acer Aspire 5 Spin 14 | |
| LG Gram 14T90P | |
| Asus ExpertBook B3 Flip B3402FEA | |
| HP EliteBook x360 1040 G7, i7-10810U | |
| X-Plane 11.11 - 1920x1080 high (fps_test=3) | |
| Lenovo ThinkPad T14 G3-21AJS00400 | |
| Dell Latitude 9430 2-in-1 | |
| Lenovo ThinkPad X1 Yoga G7 21CE002HGE | |
| Lenovo Yoga 7-14ARB G7 | |
| Asus ZenBook Flip 14 UN5401QA-KN085W | |
| HP EliteBook 840 G9 | |
| Asus ROG Zephyrus G14 GA402XY | |
| Lenovo ThinkPad P14s G3 AMD 21J6S05000 | |
| Lenovo ThinkPad X1 Yoga G8 i7-1355U | |
| LG Gram 14T90P | |
| Asus ExpertBook B3 Flip B3402FEA | |
| Acer Aspire 5 Spin 14 | |
| HP EliteBook x360 1040 G7, i7-10810U | |
| Cyberpunk 2077 1.6 | |
| 1280x720 Low Preset | |
| Przeciętny Intel Iris Xe Graphics G7 96EUs (20.6 - 44.7, n=17) | |
| Lenovo ThinkPad X1 Yoga G8 i7-1355U | |
| 1920x1080 Low Preset | |
| Asus ROG Zephyrus G14 GA402XY | |
| Lenovo Yoga 7-14ARB G7 | |
| Dell Latitude 9430 2-in-1 | |
| HP EliteBook 840 G9 | |
| Przeciętny Intel Iris Xe Graphics G7 96EUs (13 - 25.9, n=42) | |
| Lenovo ThinkPad X1 Yoga G8 i7-1355U | |
| 1920x1080 Medium Preset | |
| Asus ROG Zephyrus G14 GA402XY | |
| Lenovo Yoga 7-14ARB G7 | |
| Dell Latitude 9430 2-in-1 | |
| HP EliteBook 840 G9 | |
| Przeciętny Intel Iris Xe Graphics G7 96EUs (10.8 - 21.7, n=37) | |
| Lenovo ThinkPad X1 Yoga G8 i7-1355U | |
| 1920x1080 High Preset | |
| Asus ROG Zephyrus G14 GA402XY | |
| Lenovo Yoga 7-14ARB G7 | |
| Dell Latitude 9430 2-in-1 | |
| HP EliteBook 840 G9 | |
| Przeciętny Intel Iris Xe Graphics G7 96EUs (9.8 - 16.9, n=34) | |
| Lenovo ThinkPad X1 Yoga G8 i7-1355U | |
| 1920x1080 Ultra Preset | |
| Asus ROG Zephyrus G14 GA402XY | |
| Lenovo Yoga 7-14ARB G7 | |
| Dell Latitude 9430 2-in-1 | |
| HP EliteBook 840 G9 | |
| Przeciętny Intel Iris Xe Graphics G7 96EUs (7.4 - 16.8, n=32) | |
| Lenovo ThinkPad X1 Yoga G8 i7-1355U | |
| Tiny Tina's Wonderlands | |
| 1280x720 Lowest Preset (DX12) | |
| Asus ROG Zephyrus G14 GA402XY | |
| Przeciętny Intel Iris Xe Graphics G7 96EUs (25.9 - 67.3, n=32) | |
| Lenovo ThinkPad X1 Yoga G8 i7-1355U | |
| 1920x1080 Low Preset (DX12) | |
| Asus ROG Zephyrus G14 GA402XY | |
| Przeciętny Intel Iris Xe Graphics G7 96EUs (22.3 - 53, n=32) | |
| Lenovo ThinkPad X1 Yoga G8 i7-1355U | |
| 1920x1080 Medium Preset (DX12) | |
| Asus ROG Zephyrus G14 GA402XY | |
| Przeciętny Intel Iris Xe Graphics G7 96EUs (17 - 40.1, n=30) | |
| Lenovo ThinkPad X1 Yoga G8 i7-1355U | |
| 1920x1080 High Preset (DX12) | |
| Asus ROG Zephyrus G14 GA402XY | |
| Przeciętny Intel Iris Xe Graphics G7 96EUs (10.6 - 24.1, n=29) | |
| Lenovo ThinkPad X1 Yoga G8 i7-1355U | |
| 1920x1080 Badass Preset (DX12) | |
| Asus ROG Zephyrus G14 GA402XY | |
| Przeciętny Intel Iris Xe Graphics G7 96EUs (8.4 - 18.4, n=26) | |
| Lenovo ThinkPad X1 Yoga G8 i7-1355U | |
Witcher 3 FPS Chart
| low | med. | high | ultra | |
|---|---|---|---|---|
| GTA V (2015) | 100.1 | 88.7 | 23.4 | 10 |
| The Witcher 3 (2015) | 96.8 | 35 | 35.9 | 10.2 |
| Dota 2 Reborn (2015) | 112.7 | 91.3 | 51.4 | 65.6 |
| Final Fantasy XV Benchmark (2018) | 40.5 | 23.9 | 16.2 | |
| X-Plane 11.11 (2018) | 46.2 | 34.4 | 31.4 | |
| Strange Brigade (2018) | 83.5 | 36.6 | 29 | 22.7 |
| Cyberpunk 2077 1.6 (2022) | 16.8 | 13.7 | 10.3 | 9.2 |
| Tiny Tina's Wonderlands (2022) | 24.2 | 19.5 | 13 | 10.3 |
| F1 22 (2022) | 40.1 | 36.9 | 26.5 | 20.1 |
Emisje
Hałas systemowy
Hałas wentylatora jest mniej więcej taki sam jak w zeszłorocznym modelu. Wewnętrzny wentylator jest cichy przy niskich lub niewymagających obciążeniach, ale ma tendencję do oscylowania wokół cichego poziomu 25,6 dB(A) na cichym tle 22,7 dB(A) podczas przeglądania stron internetowych lub strumieniowania wideo. Bardziej wymagające obciążenia, takie jak gry, powodowałyby hałas wentylatora na poziomie 36 dB(A) do 42 dB(A) w przypadku profilu zasilania High Performance, który jest podobny do maksymalnego Latitude 9430 2-w-1.
Hałas
| luz |
| 22.8 / 22.8 / 22.8 dB |
| obciążenie |
| 29.4 / 42 dB |
 | ||
30 dB cichy 40 dB(A) słyszalny 50 dB(A) irytujący |
||
min: | ||
| Lenovo ThinkPad X1 Yoga G8 i7-1355U Iris Xe G7 96EUs, i7-1355U, WDC PC SN810 512GB | Lenovo ThinkPad X1 Yoga G7 21CE002HGE Iris Xe G7 96EUs, i7-1270P, Samsung PM9A1 MZVL2512HCJQ | Dell Latitude 9430 2-in-1 Iris Xe G7 96EUs, i7-1265U | LG Gram 14T90P Iris Xe G7 80EUs, i5-1135G7, Samsung SSD PM981a MZVLB512HBJQ | Asus ZenBook Flip 14 UN5401QA-KN085W Vega 8, R7 5800H, Intel SSD 600p SSDPEKKW512G7 | HP EliteBook x360 1040 G7, i7-10810U UHD Graphics 620, i7-10810U, Samsung SSD PM981a MZVLB512HBJQ | |
|---|---|---|---|---|---|---|
| Noise | -4% | -8% | -4% | -17% | -6% | |
| wyłączone / środowisko * (dB) | 22.7 | 22.7 -0% | 23.7 -4% | 25.4 -12% | 26 -15% | 25.2 -11% |
| Idle Minimum * (dB) | 22.8 | 22.7 -0% | 23.7 -4% | 25.5 -12% | 26 -14% | 25.2 -11% |
| Idle Average * (dB) | 22.8 | 22.7 -0% | 23.7 -4% | 25.5 -12% | 26 -14% | 25.2 -11% |
| Idle Maximum * (dB) | 22.8 | 27.1 -19% | 23.7 -4% | 25.5 -12% | 27.3 -20% | 25.2 -11% |
| Load Average * (dB) | 29.4 | 34.5 -17% | 35.1 -19% | 28.3 4% | 39.8 -35% | 30 -2% |
| Witcher 3 ultra * (dB) | 35.5 | 34.5 3% | 43.3 -22% | 35 1% | ||
| Load Maximum * (dB) | 42 | 38.7 8% | 43 -2% | 35 17% | 42.4 -1% | 38.1 9% |
* ... im mniej tym lepiej
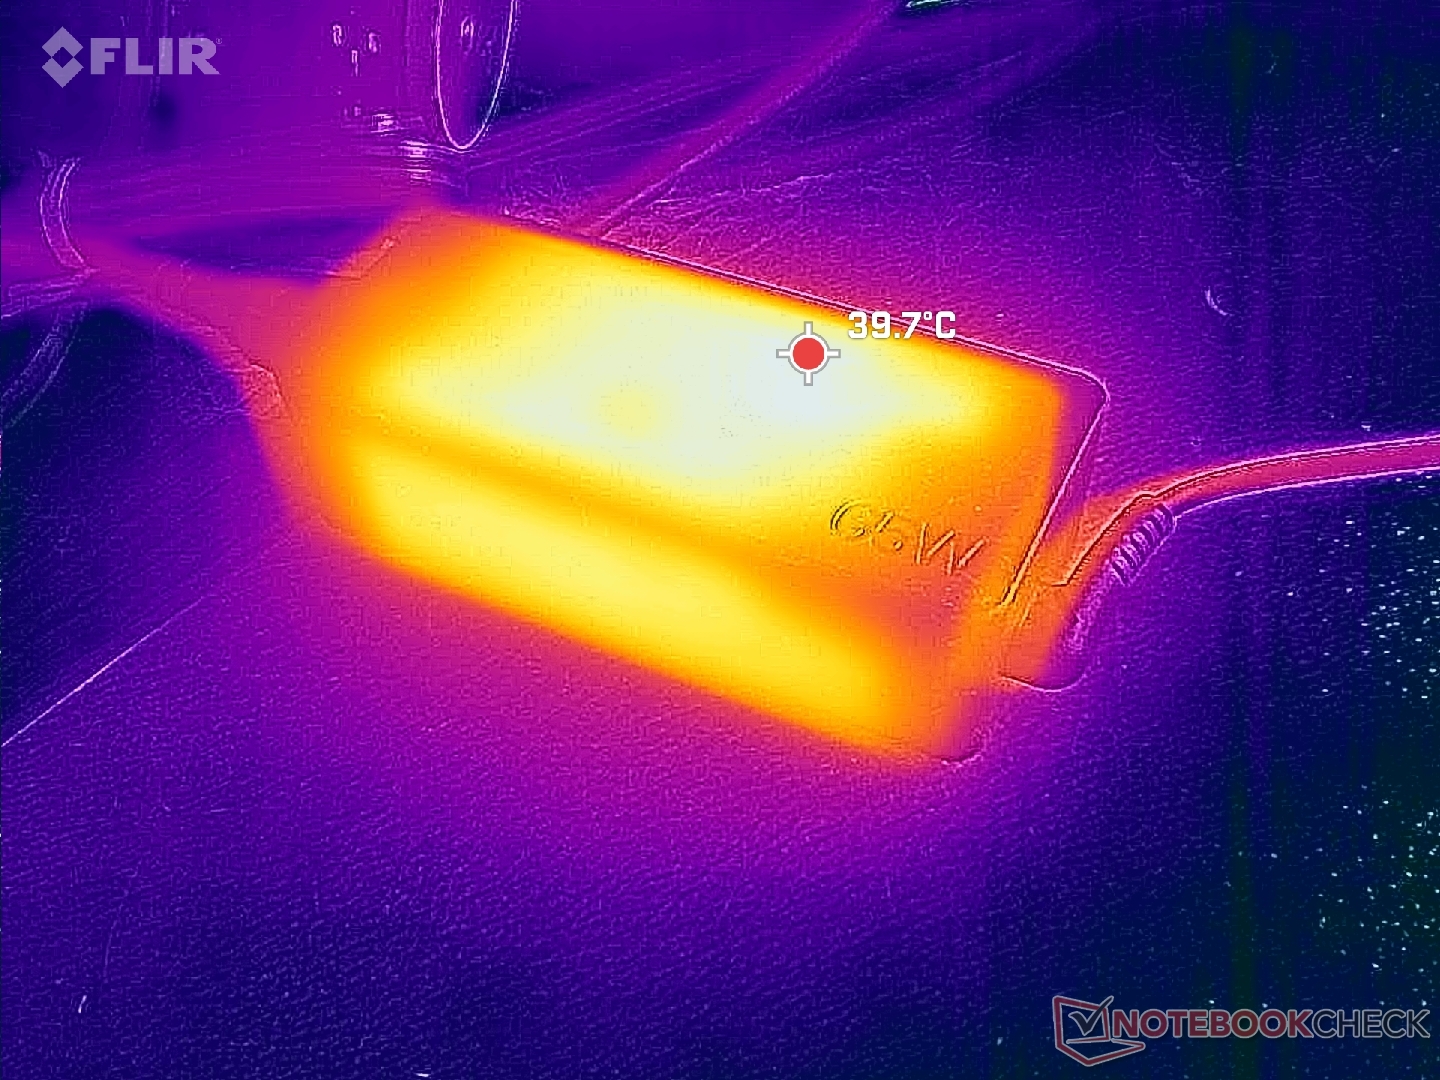
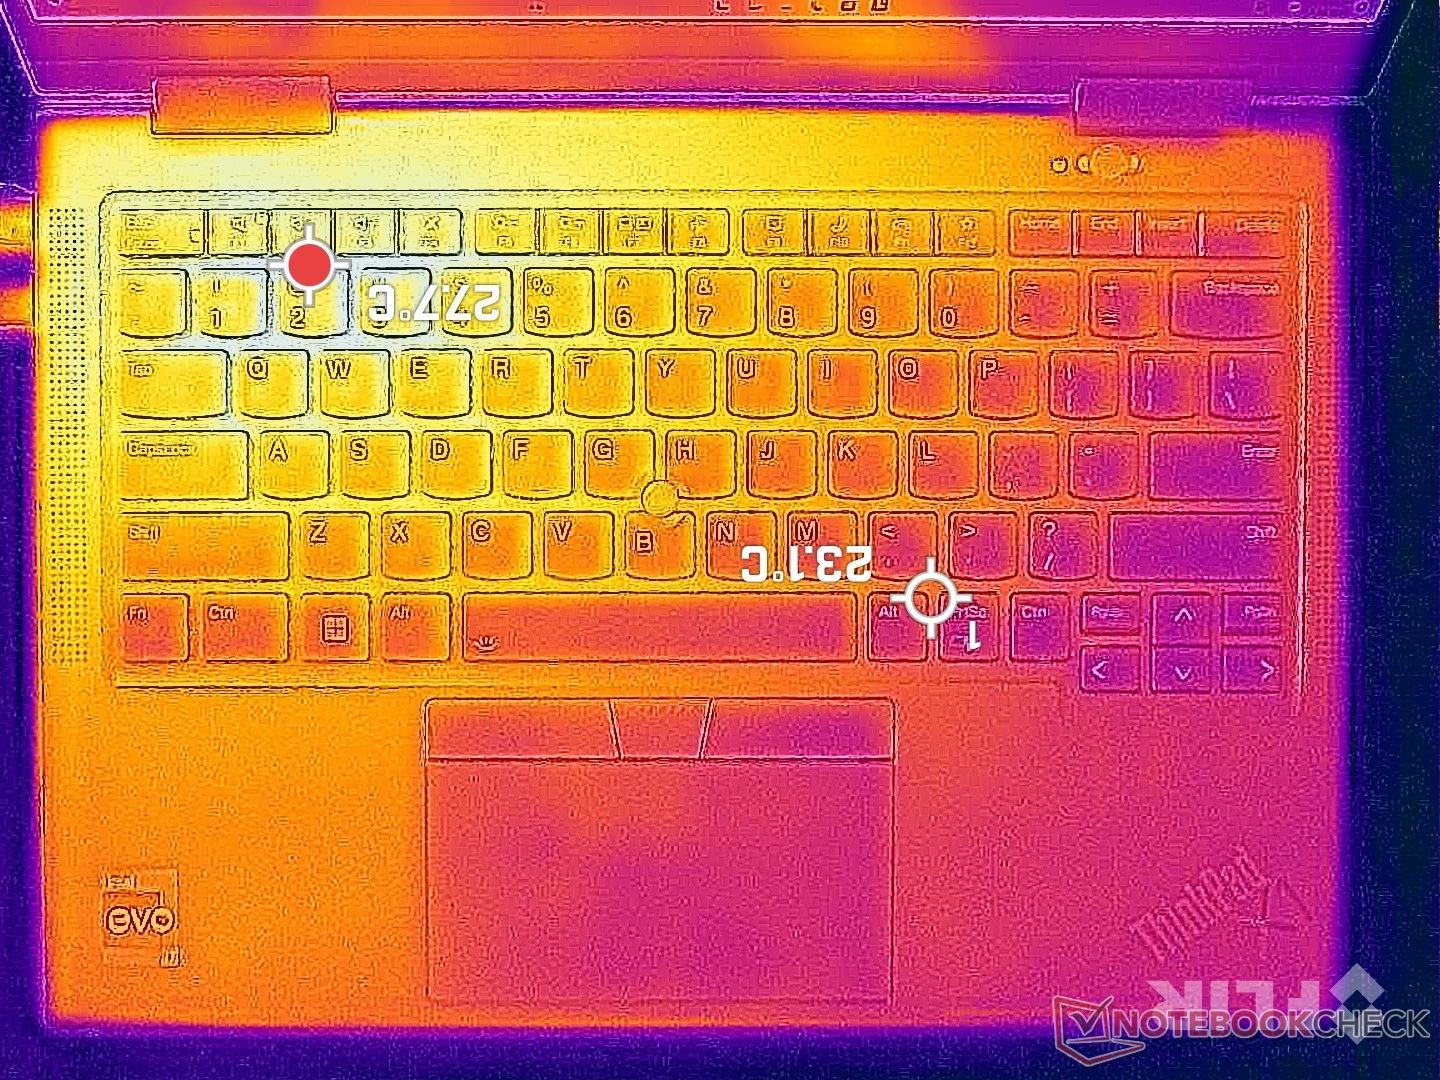
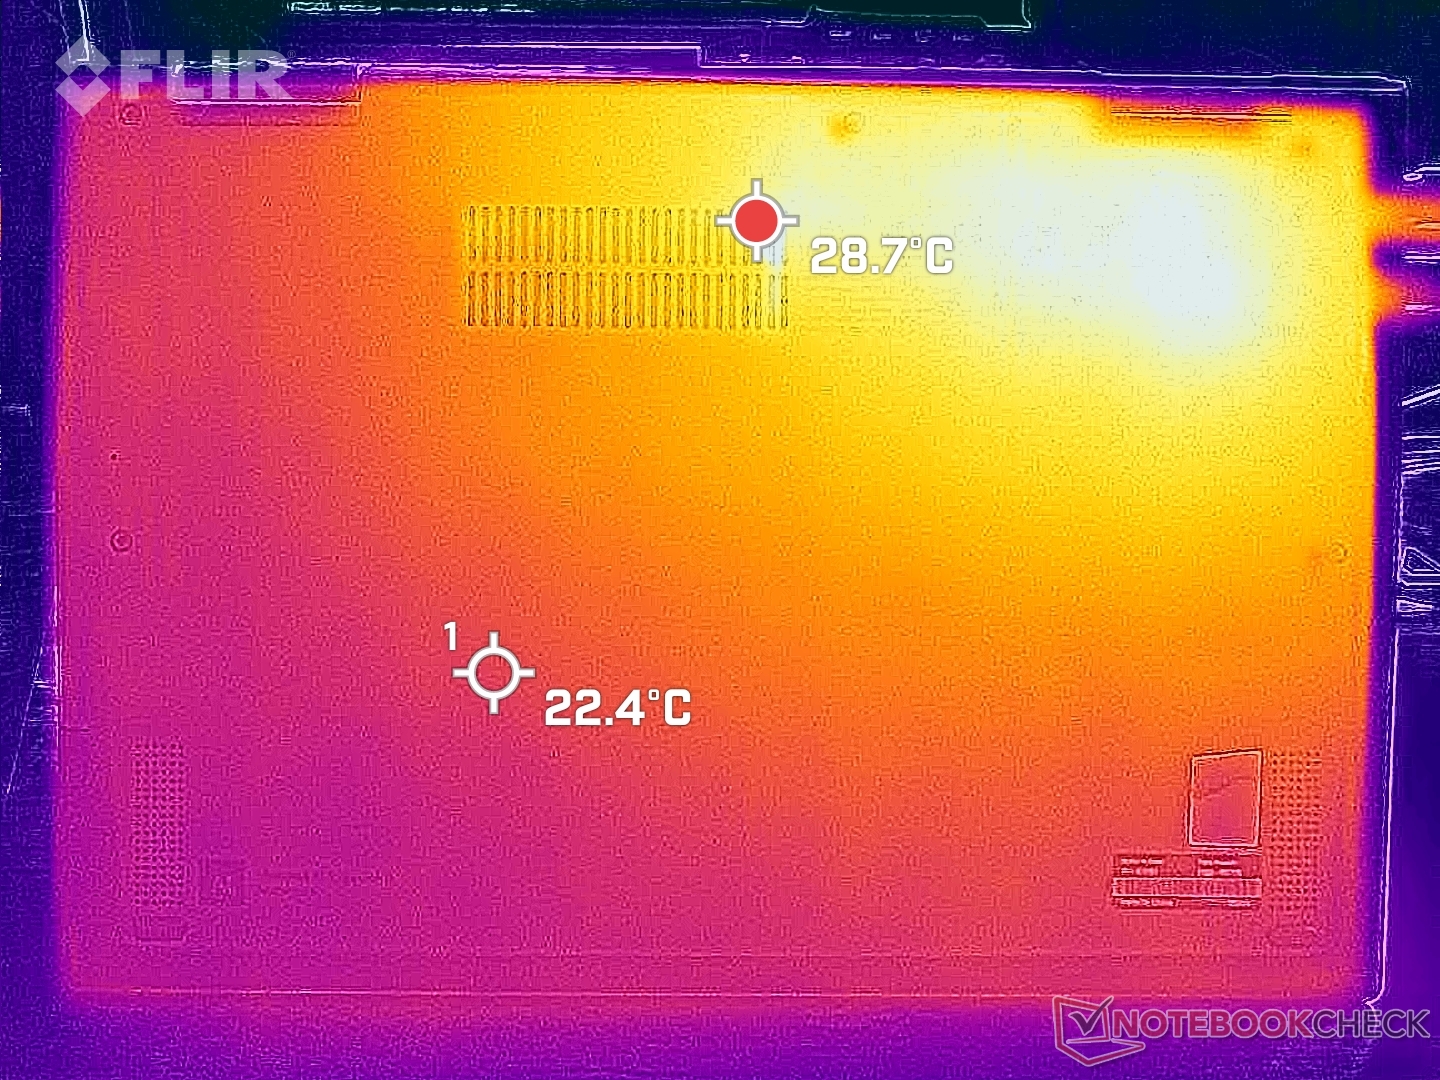
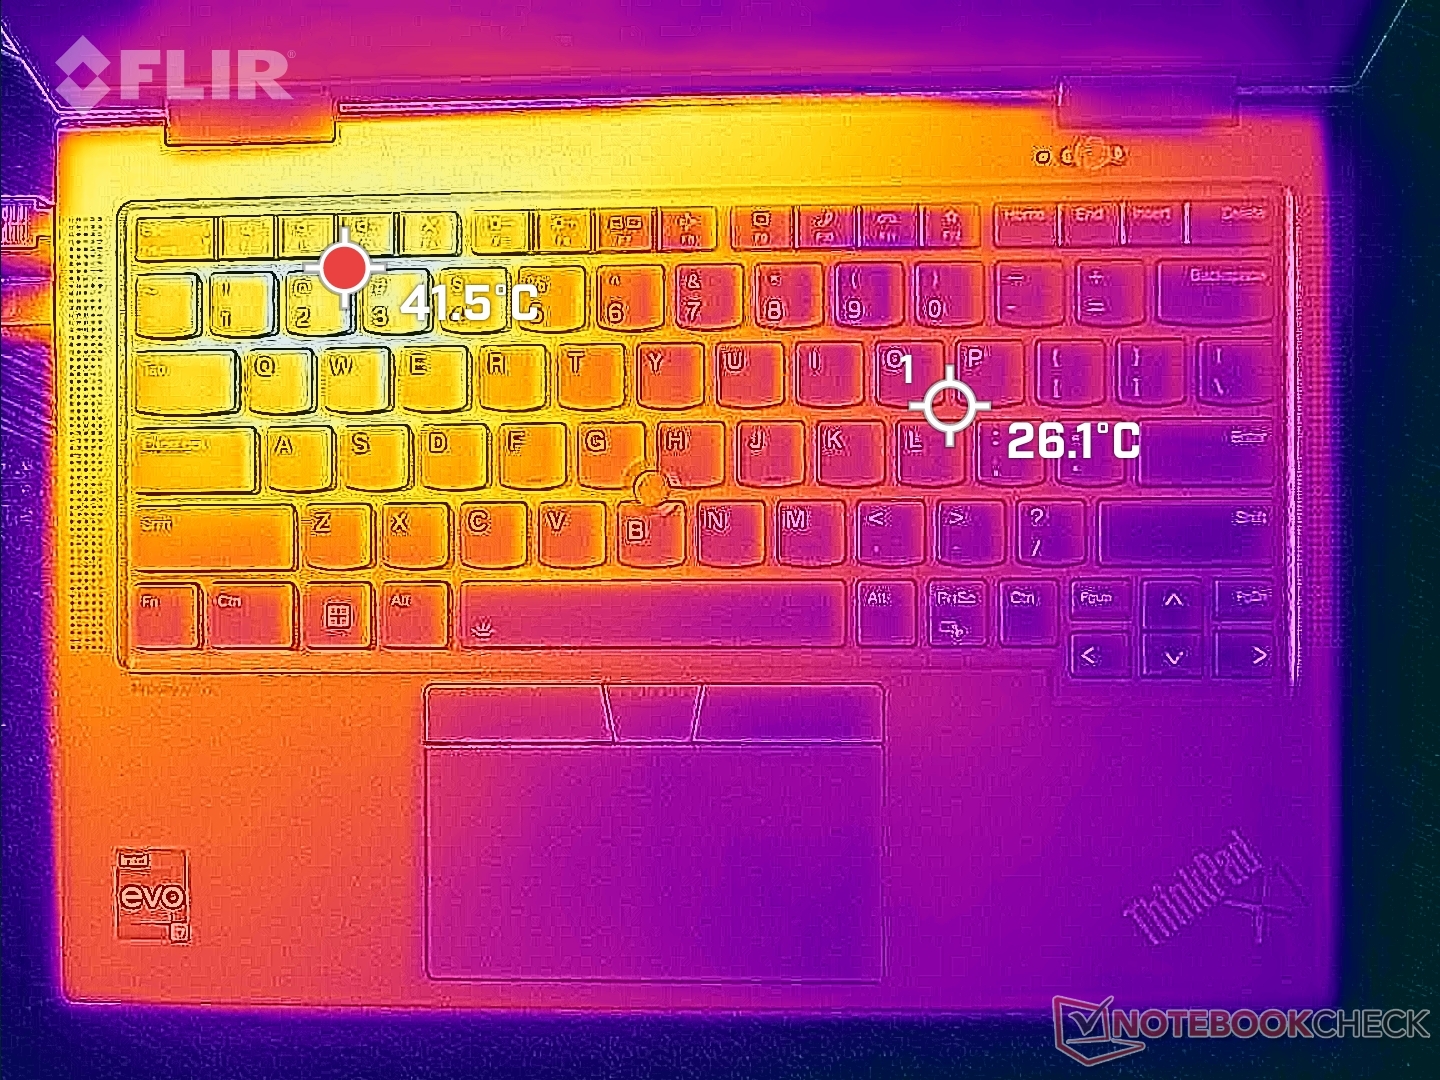
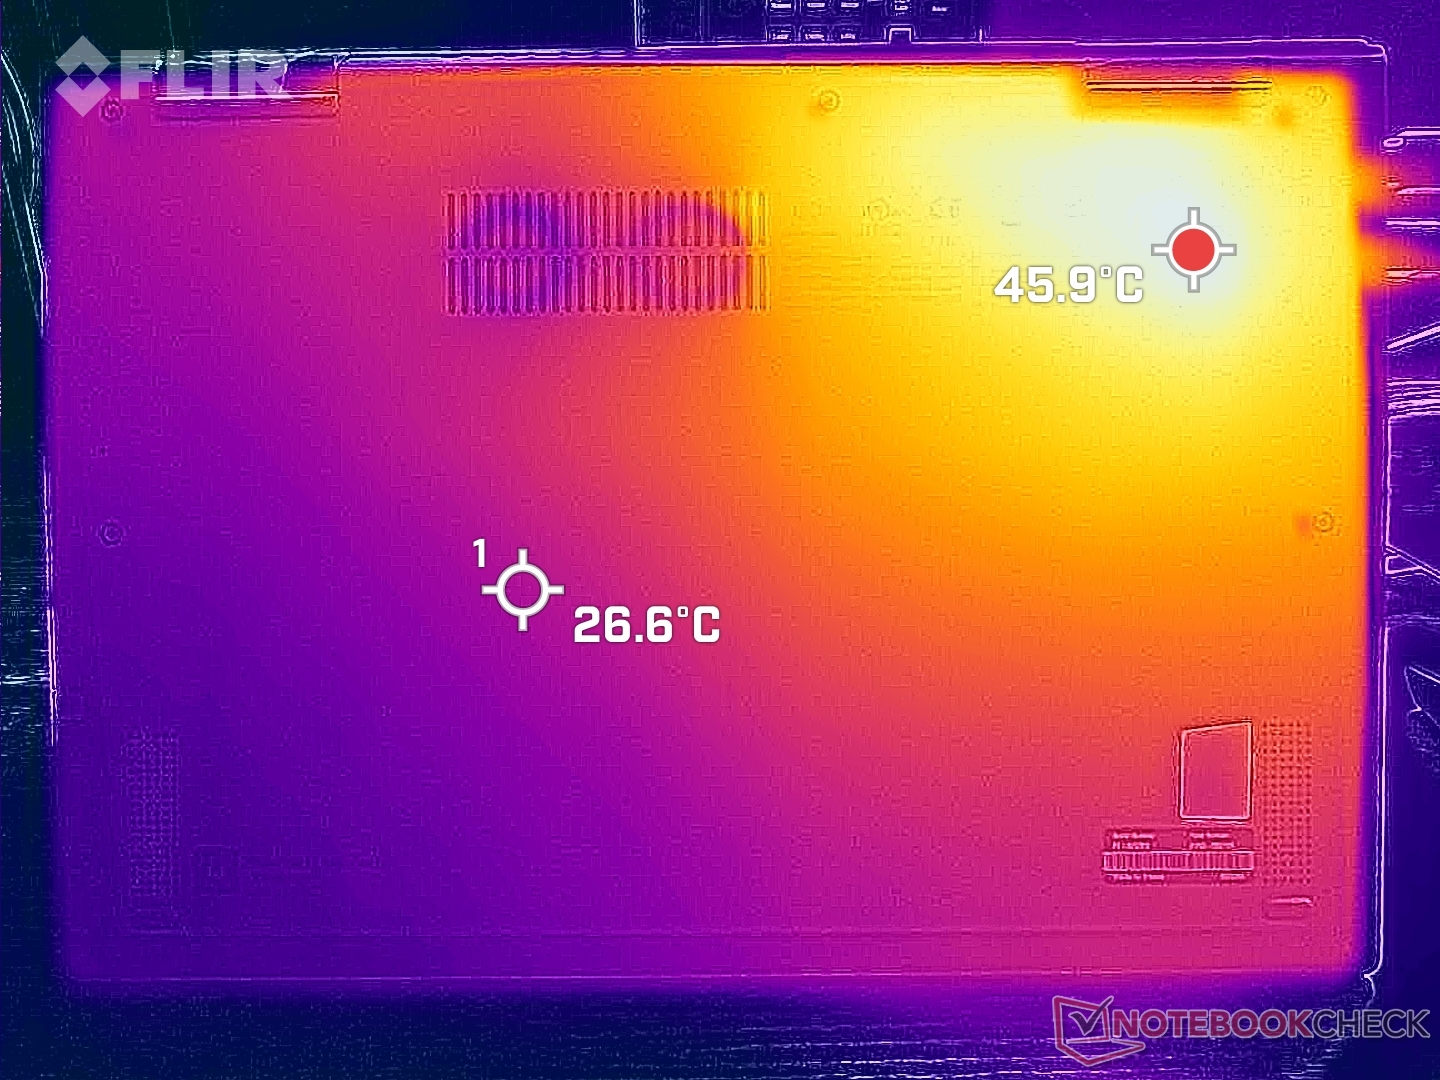
Temperatura
Lewa połowa laptopa zawsze będzie cieplejsza niż prawa ze względu na umiejscowienie rozwiązania chłodzącego wewnątrz. Gorące punkty mogą osiągnąć do 42 C i 46 C odpowiednio na górze i na dole, w porównaniu do 40 C po obu stronach laptopa Dell Latitude 9430 2-w-1.
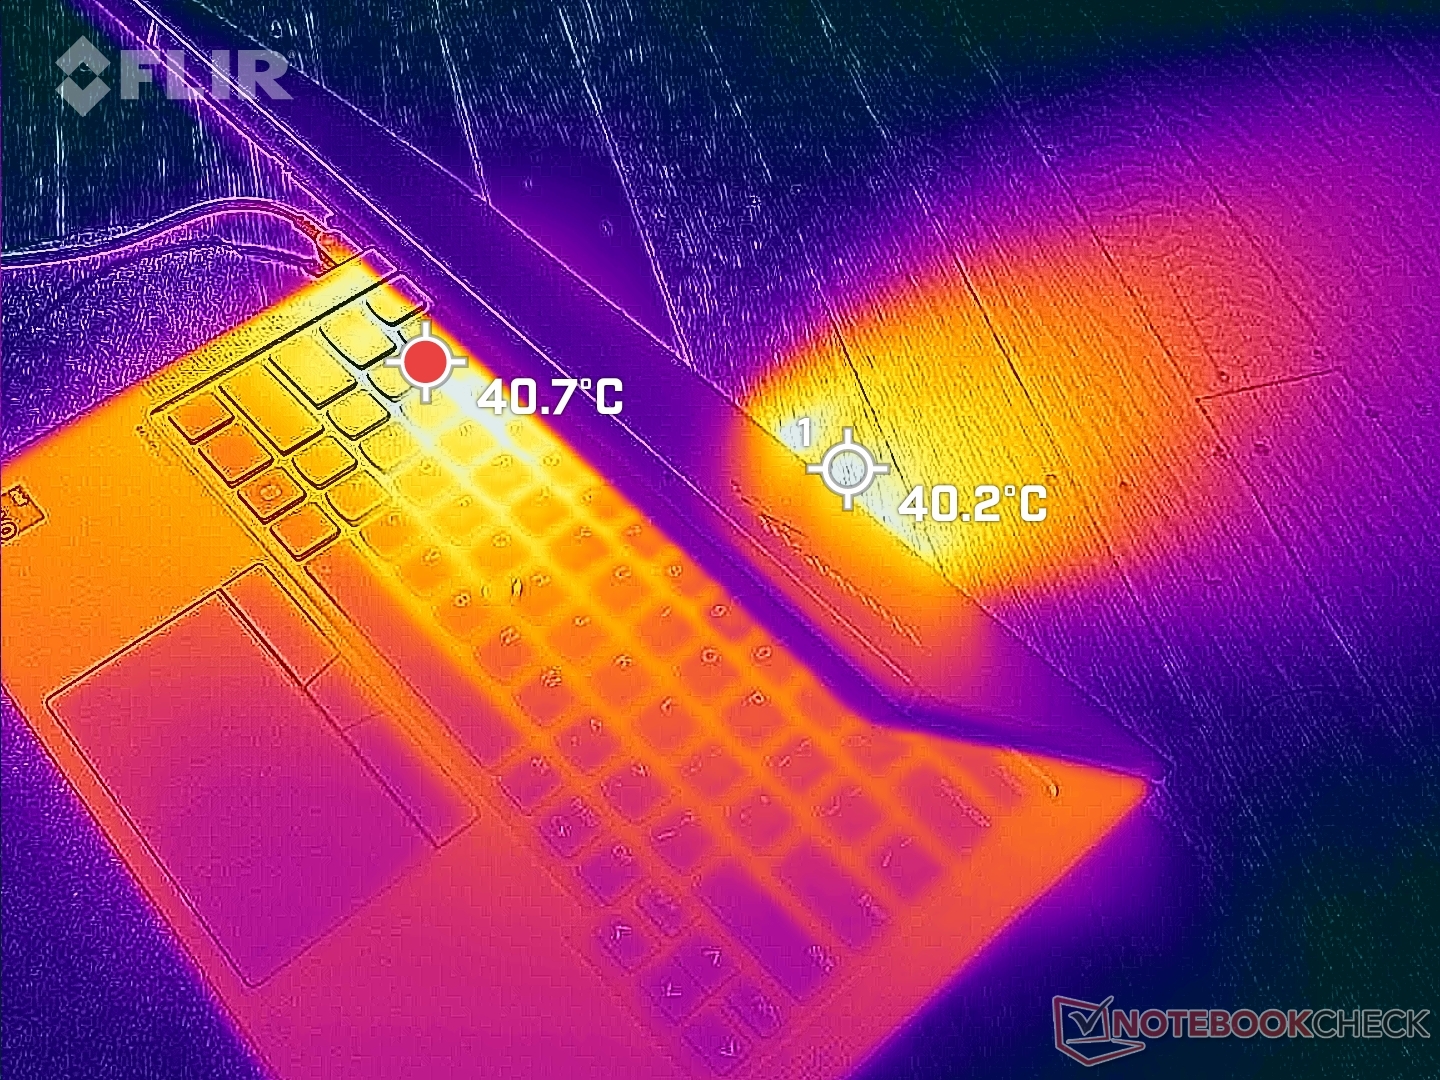
(±) Maksymalna temperatura w górnej części wynosi 41.6 °C / 107 F, w porównaniu do średniej 35.4 °C / 96 F , począwszy od 19.6 do 60 °C dla klasy Convertible.
(-) Dno nagrzewa się maksymalnie do 47.6 °C / 118 F, w porównaniu do średniej 36.9 °C / 98 F
(+) W stanie bezczynności średnia temperatura górnej części wynosi 28.4 °C / 83 F, w porównaniu ze średnią temperaturą urządzenia wynoszącą 30.3 °C / ### class_avg_f### F.
(+) Podparcia dłoni i touchpad osiągają maksymalną temperaturę skóry (32 °C / 89.6 F) i dlatego nie są gorące.
(-) Średnia temperatura obszaru podparcia dłoni w podobnych urządzeniach wynosiła 28 °C / 82.4 F (-4 °C / -7.2 F).
| Lenovo ThinkPad X1 Yoga G8 i7-1355U Intel Core i7-1355U, Intel Iris Xe Graphics G7 96EUs | Lenovo ThinkPad X1 Yoga G7 21CE002HGE Intel Core i7-1270P, Intel Iris Xe Graphics G7 96EUs | Dell Latitude 9430 2-in-1 Intel Core i7-1265U, Intel Iris Xe Graphics G7 96EUs | LG Gram 14T90P Intel Core i5-1135G7, Intel Iris Xe Graphics G7 80EUs | Asus ZenBook Flip 14 UN5401QA-KN085W AMD Ryzen 7 5800H, AMD Radeon RX Vega 8 (Ryzen 4000/5000) | HP EliteBook x360 1040 G7, i7-10810U Intel Core i7-10810U, Intel UHD Graphics 620 | |
|---|---|---|---|---|---|---|
| Heat | 8% | 19% | 15% | -7% | 10% | |
| Maximum Upper Side * (°C) | 41.6 | 43.3 -4% | 39.2 6% | 41.6 -0% | 42.7 -3% | 36.6 12% |
| Maximum Bottom * (°C) | 47.6 | 45.1 5% | 44.8 6% | 46.2 3% | 53.1 -12% | 46.2 3% |
| Idle Upper Side * (°C) | 30.6 | 26.5 13% | 21.4 30% | 22.6 26% | 32.9 -8% | 25.8 16% |
| Idle Bottom * (°C) | 33.2 | 27.6 17% | 22.4 33% | 23.2 30% | 35.2 -6% | 29.8 10% |
* ... im mniej tym lepiej
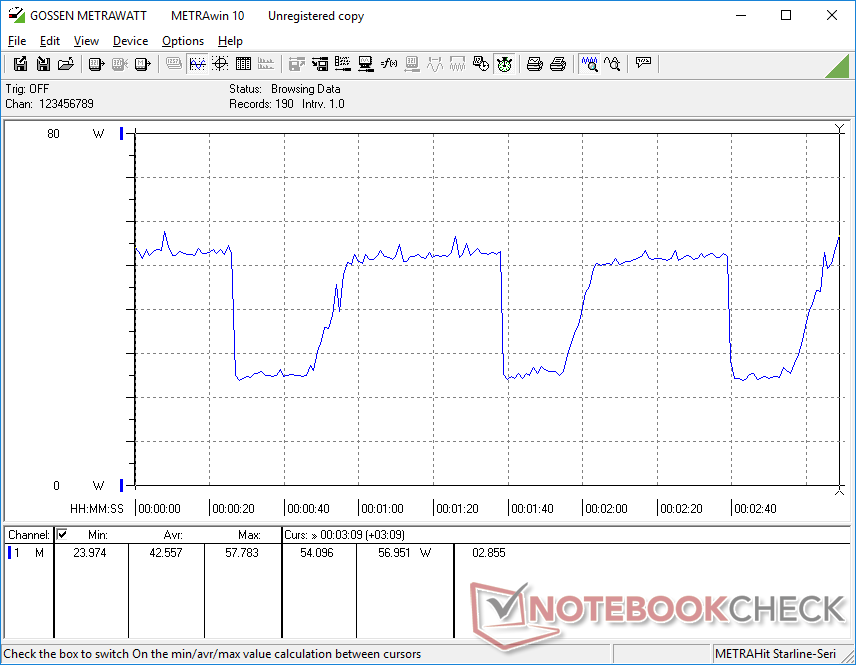
Test warunków skrajnych
Po zainicjowaniu stresu Prime95, procesor zwiększyłby częstotliwość taktowania do 4 GHz i 53 W tylko przez około sekundę, zanim zbliżyłby się do temperatury rdzenia 100 C. Następnie częstotliwości taktowania, pobór mocy płyty i temperatura ostatecznie zaczęłyby zmieniać się odpowiednio od 1,4 do 3,5 GHz, od 13 do 44 W i od 74 do 100 C. Zachowanie to różni się od większości innych laptopów z serii Core U, w których stabilne częstotliwości taktowania i temperatury są znacznie bardziej powszechne.
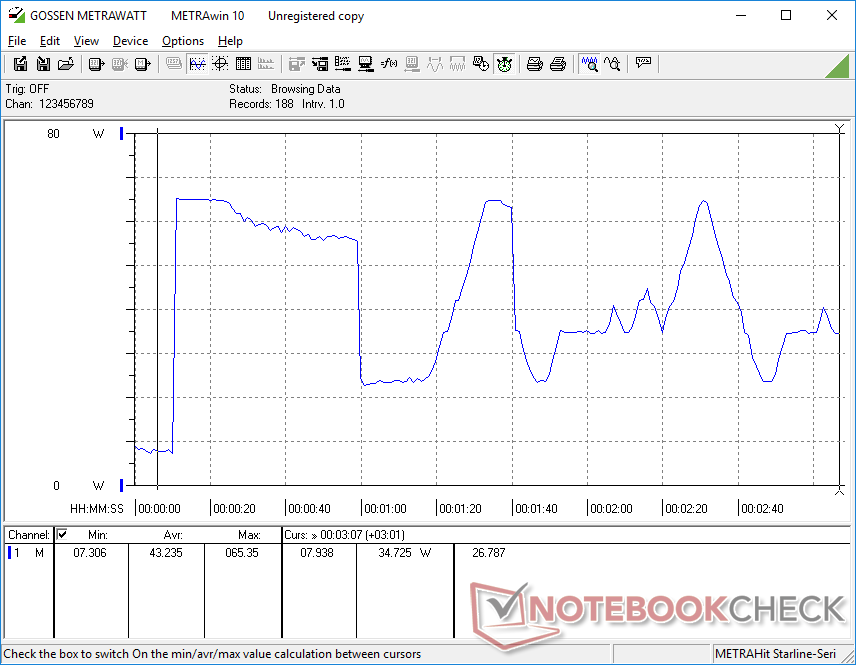
Podczas pracy Witcher 3częstotliwość taktowania GPU i temperatura zmieniały się odpowiednio od 800 do 1300 MHz i od 73 do 91 C. To cykliczne zachowanie prowadzi do niestabilnej liczby klatek na sekundę podczas grania, czego przykładem jest nasz Witcher 3 powyżej.
Wydajność nie jest ograniczana podczas grania na zasilaniu bateryjnym. Uruchomienie 3DMark 11 na baterii zwróciłoby zasadniczo identyczne wyniki jak na zasilaniu sieciowym.
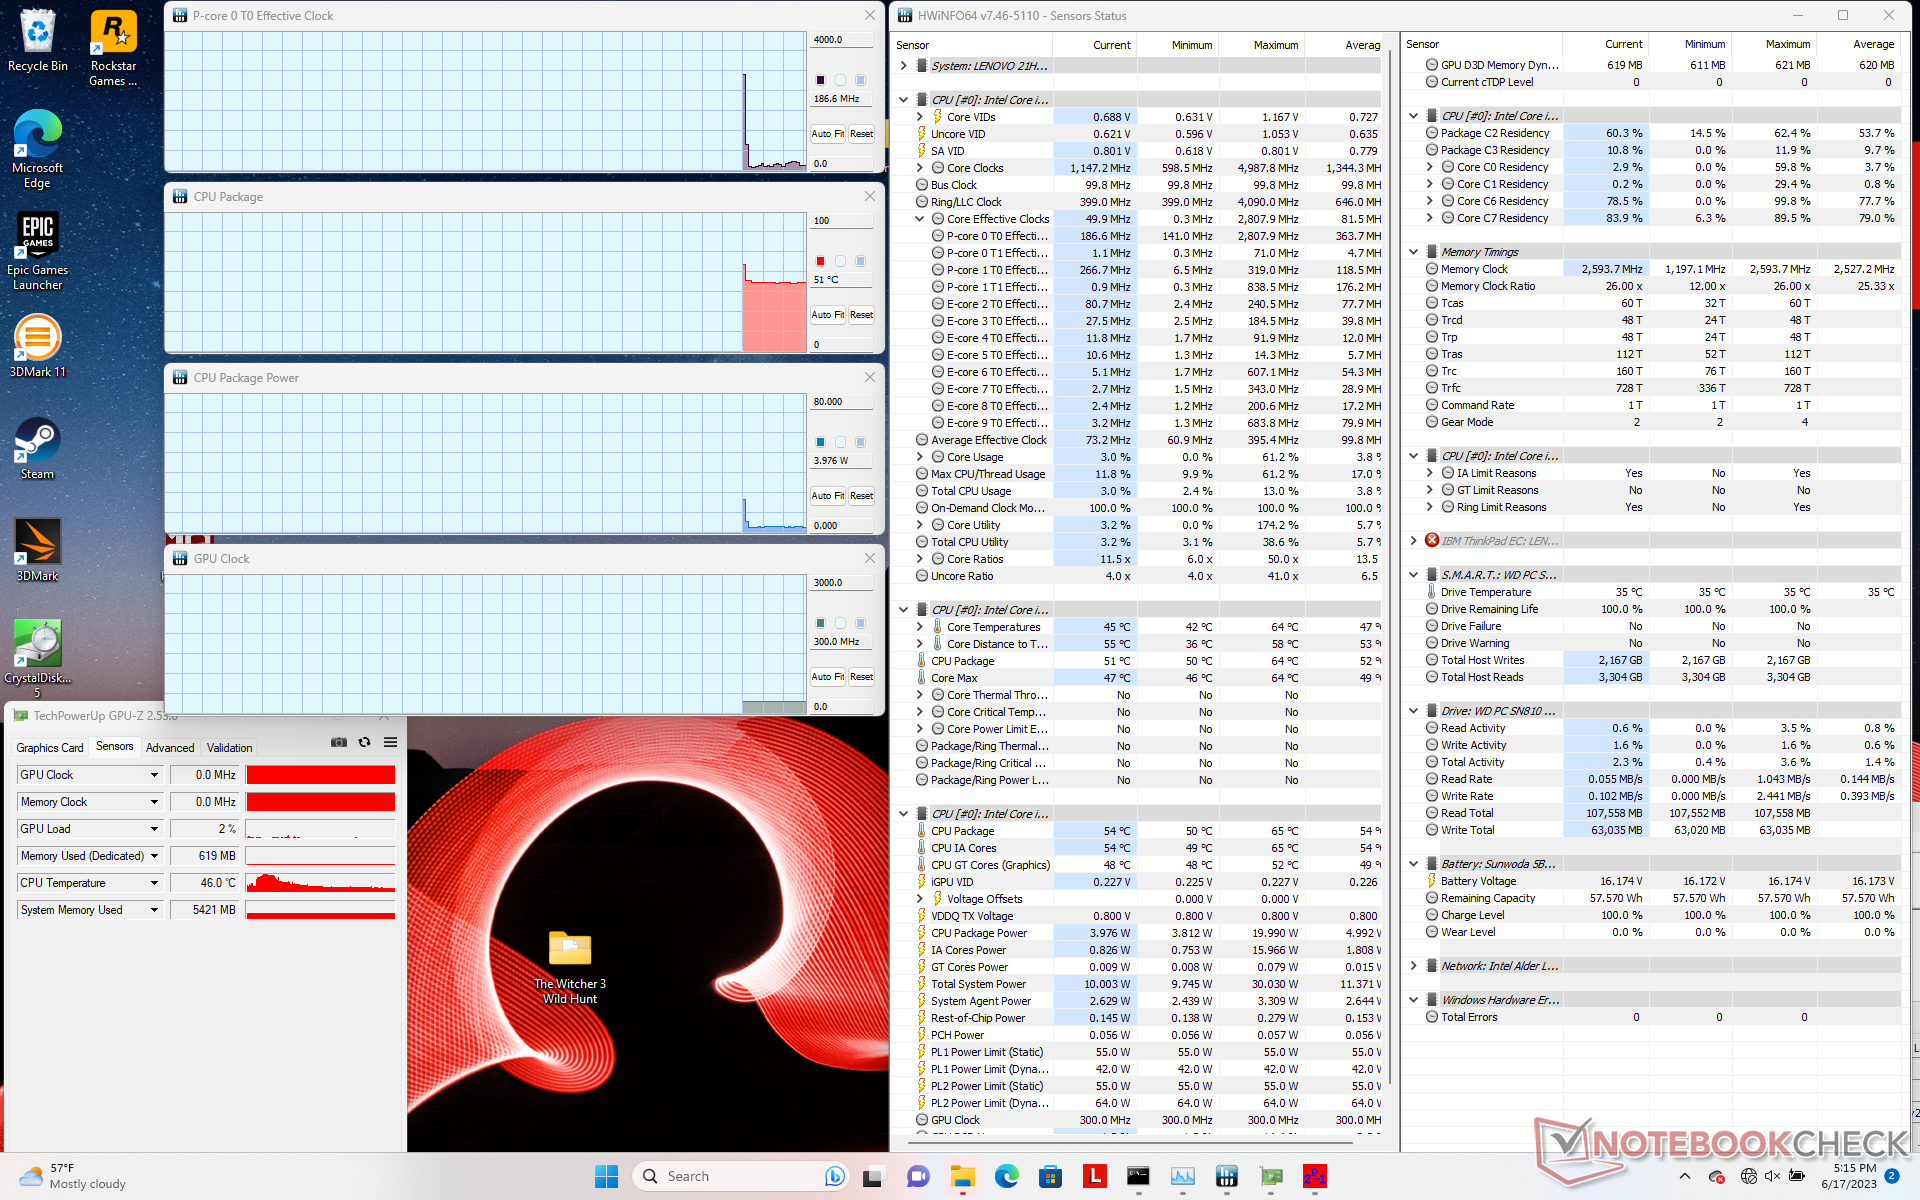
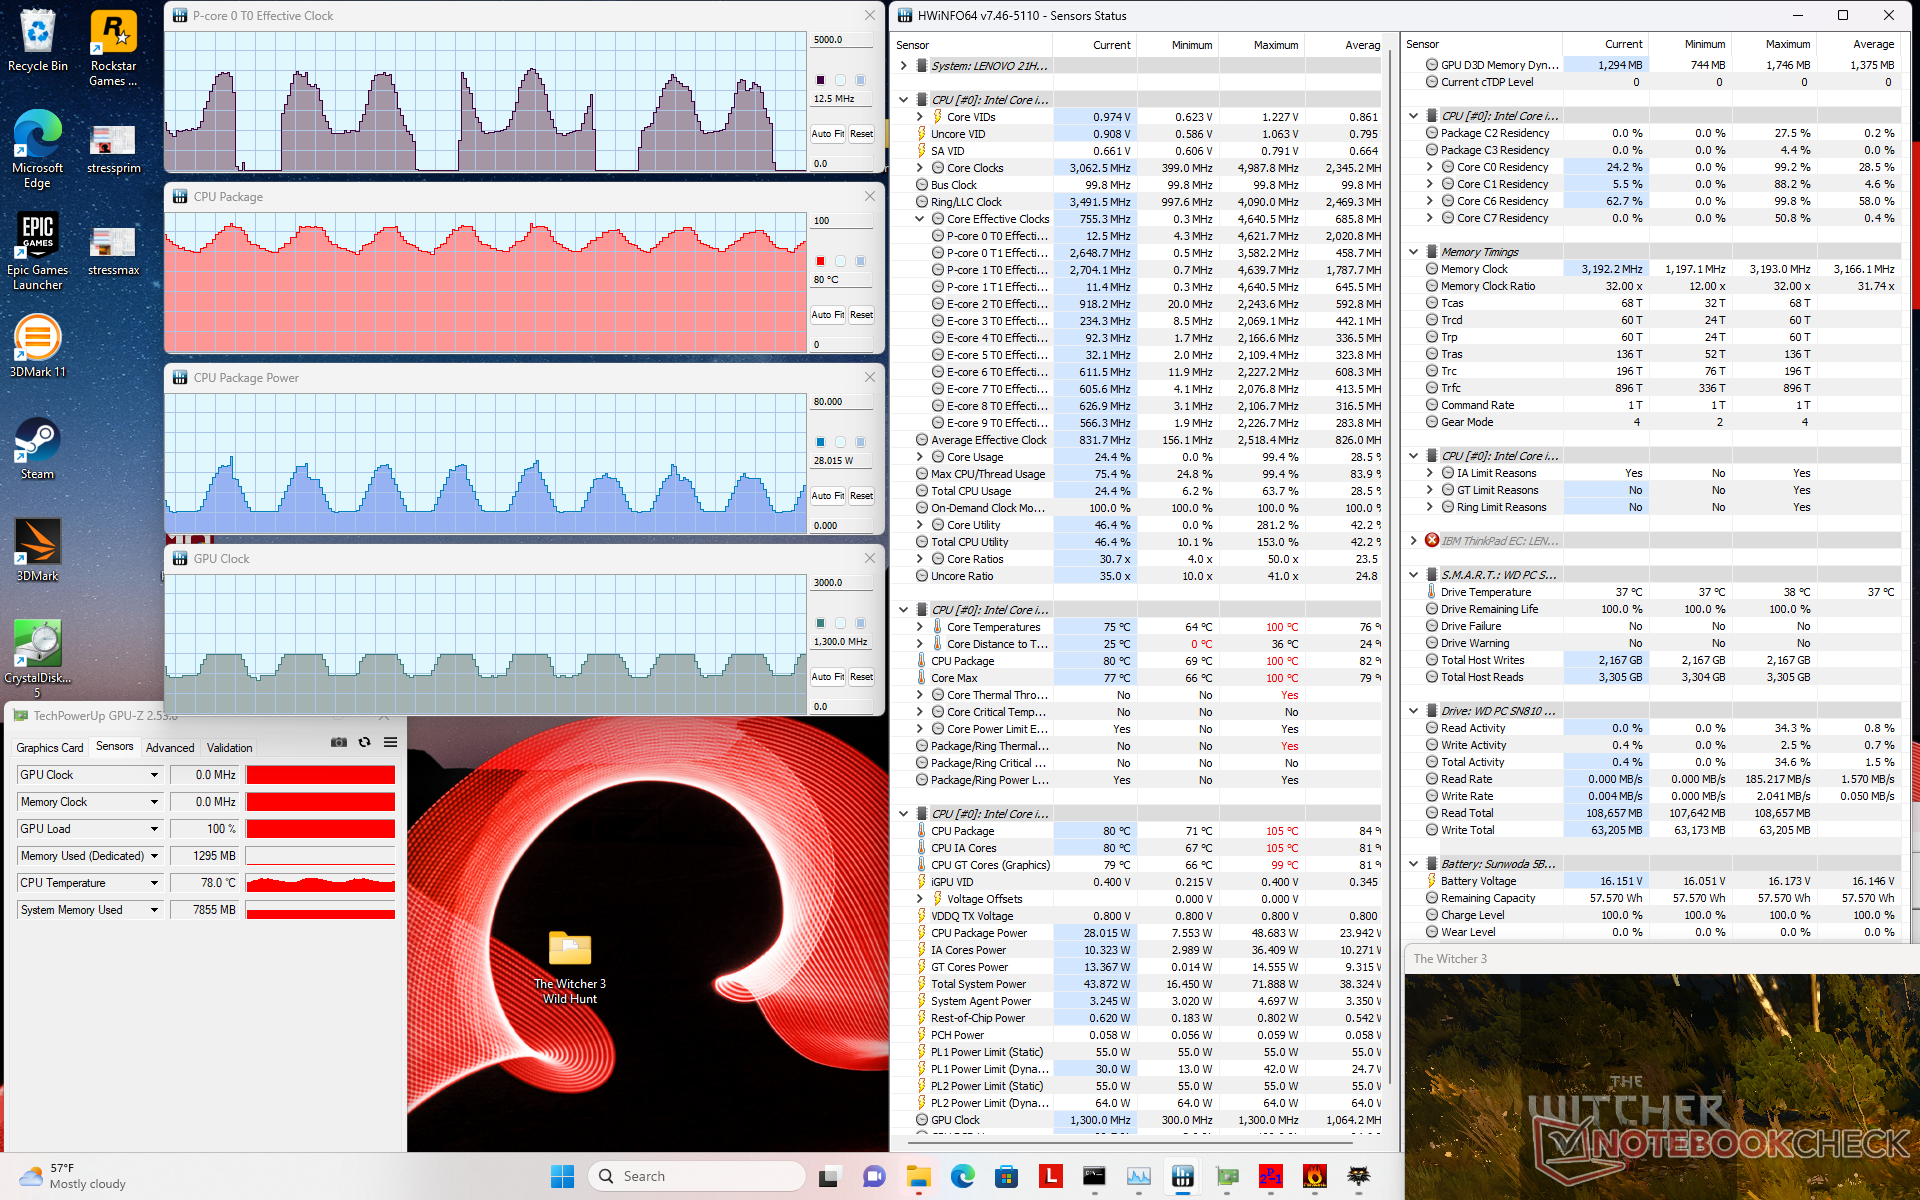
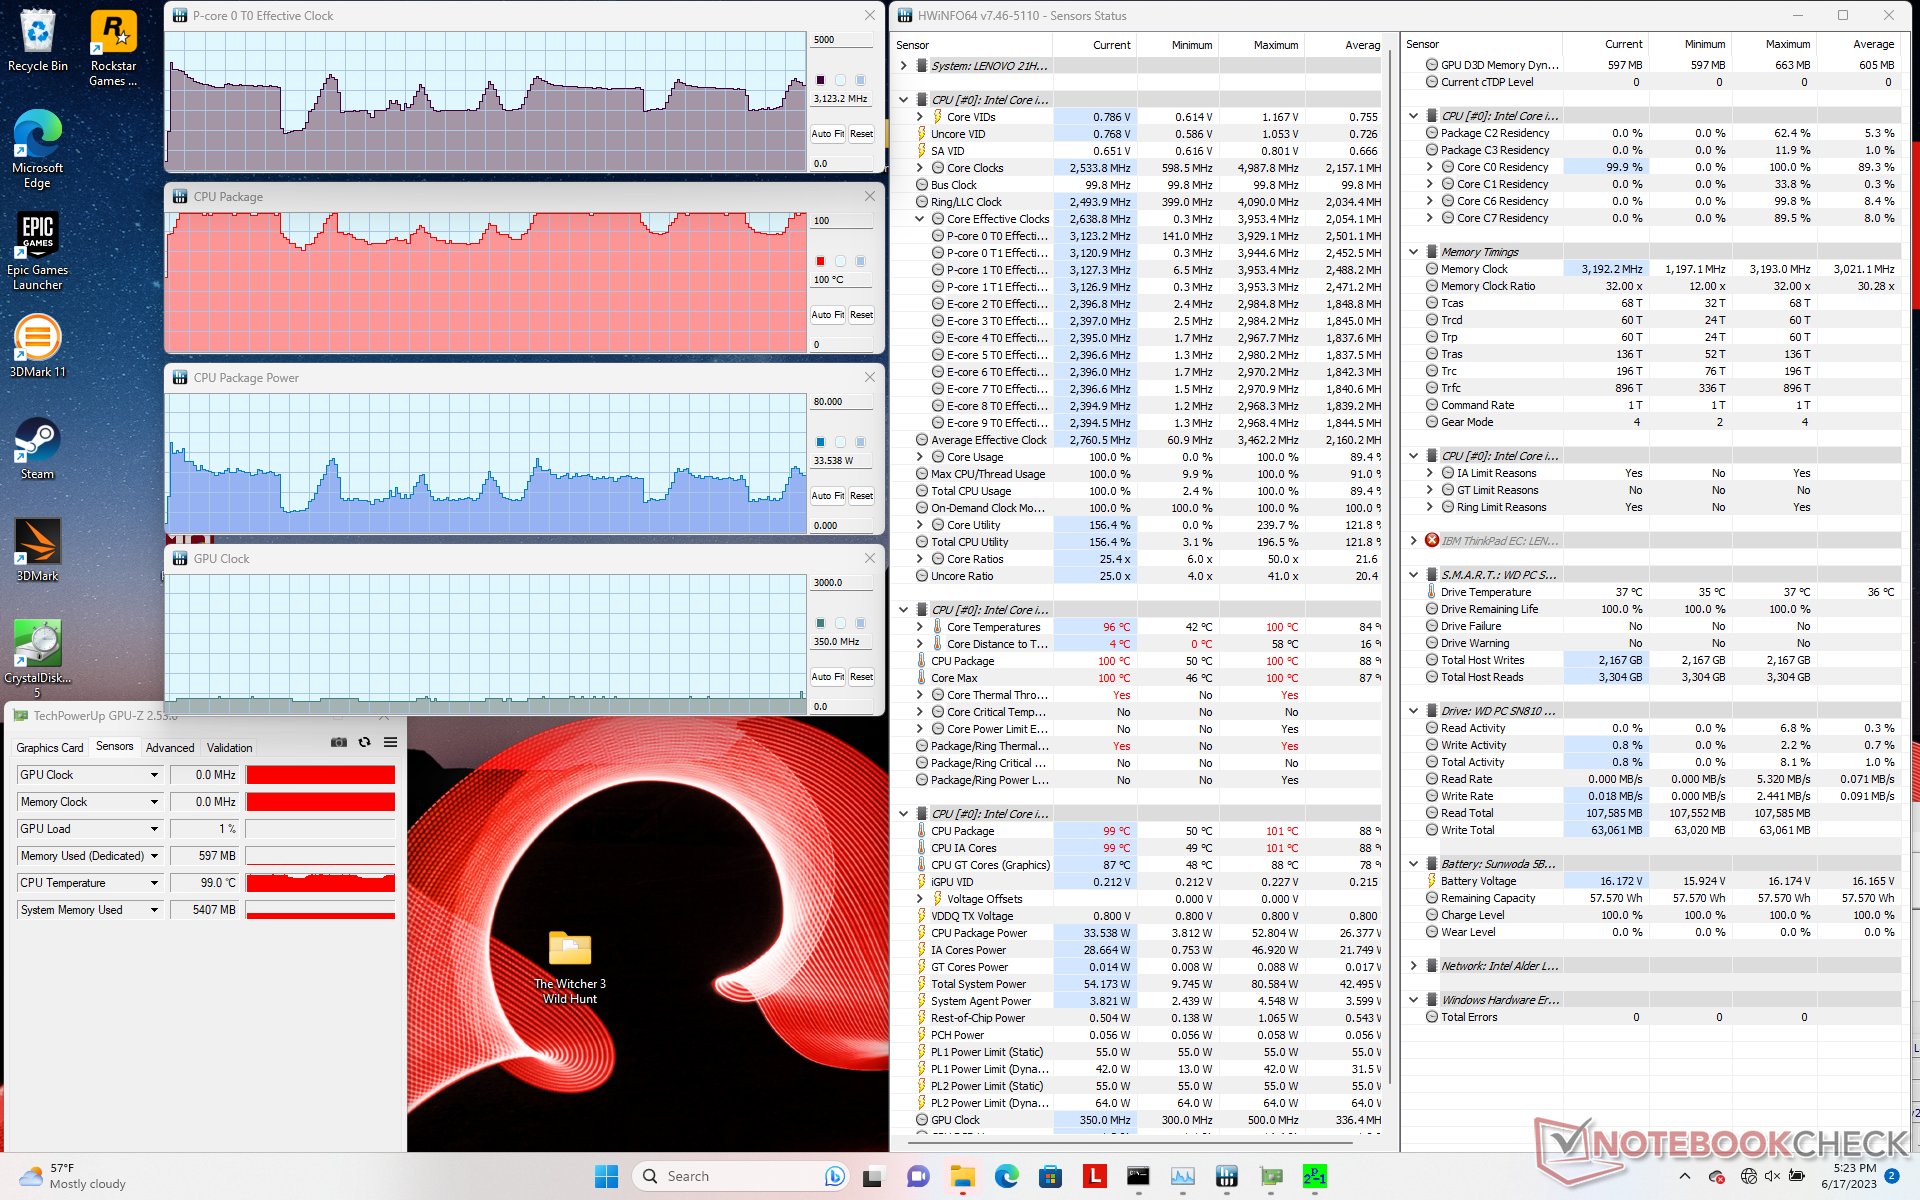
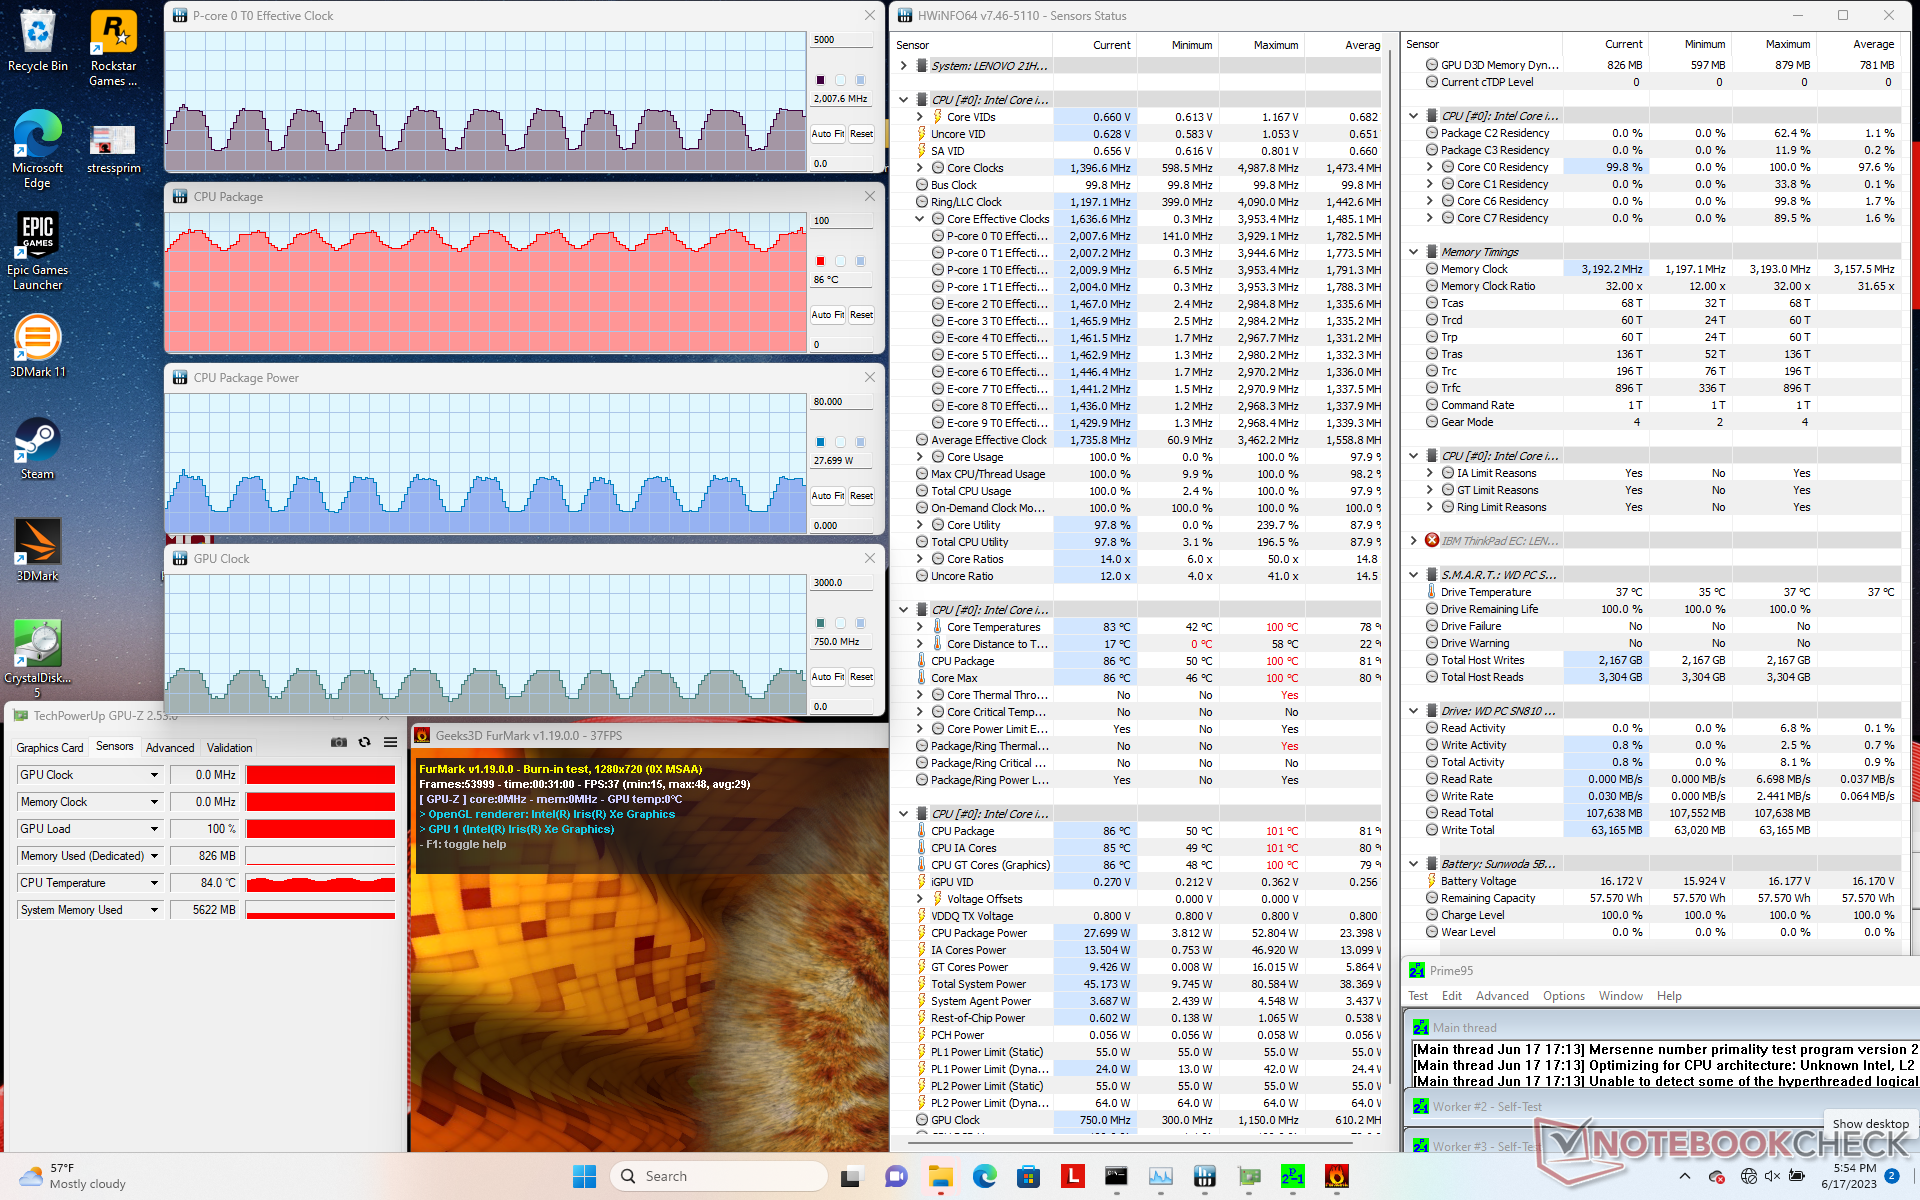
| Taktowanie CPU (GHz) | Taktowanie GPU (MHz) | Średnia temperatura CPU (°C) | |
| System bezczynności | -- | -- | 51 |
| Prime95Stress | 1.4 - 3.5 | -- | 74 - 100 |
| Prime95+ FurMark Stress | 0.8 - 2.6 | 350 - 1000 | 73 - 91 |
| Witcher 3 Stres | 1,5 - 3,7 | 800 - 1300 | 73 - 91 |
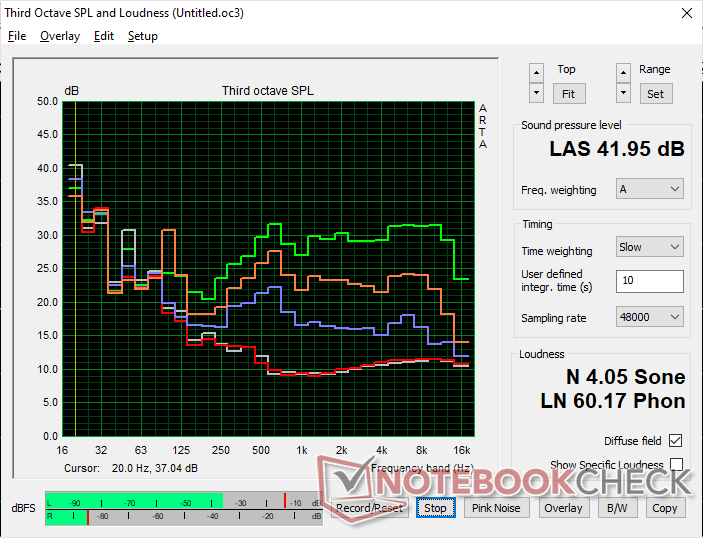
Głośniki
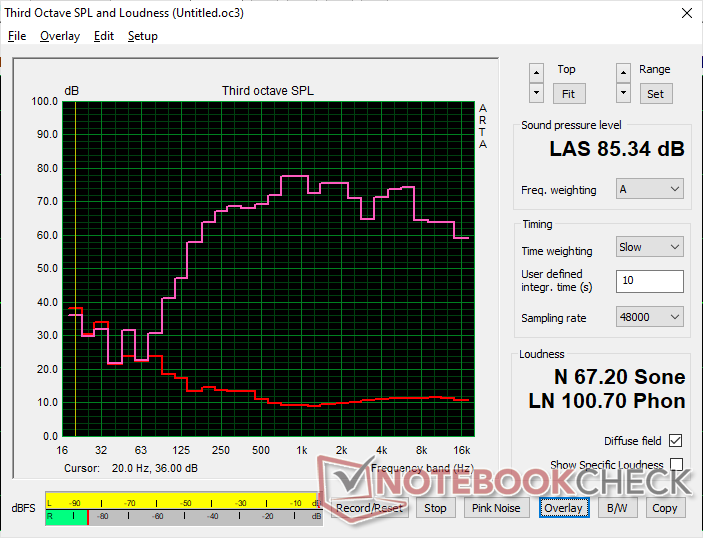
Lenovo ThinkPad X1 Yoga G8 i7-1355U analiza dźwięku
(+) | głośniki mogą odtwarzać stosunkowo głośno (85.3 dB)
Bas 100 - 315 Hz
(±) | zredukowany bas - średnio 10.9% niższy od mediany
(±) | liniowość basu jest średnia (11% delta do poprzedniej częstotliwości)
Średnie 400 - 2000 Hz
(±) | wyższe średnie - średnio 5.1% wyższe niż mediana
(+) | średnie są liniowe (4% delta do poprzedniej częstotliwości)
Wysokie 2–16 kHz
(+) | zrównoważone maksima - tylko 4.1% od mediany
(±) | liniowość wysokich wartości jest średnia (7.7% delta do poprzedniej częstotliwości)
Ogólnie 100 - 16.000 Hz
(+) | ogólny dźwięk jest liniowy (11.7% różnicy w stosunku do mediany)
W porównaniu do tej samej klasy
» 10% wszystkich testowanych urządzeń w tej klasie było lepszych, 4% podobnych, 86% gorszych
» Najlepszy miał deltę 6%, średnia wynosiła ###średnia###%, najgorsza wynosiła 57%
W porównaniu do wszystkich testowanych urządzeń
» 8% wszystkich testowanych urządzeń było lepszych, 3% podobnych, 89% gorszych
» Najlepszy miał deltę 4%, średnia wynosiła ###średnia###%, najgorsza wynosiła 134%
Apple MacBook Pro 16 2021 M1 Pro analiza dźwięku
(+) | głośniki mogą odtwarzać stosunkowo głośno (84.7 dB)
Bas 100 - 315 Hz
(+) | dobry bas - tylko 3.8% od mediany
(+) | bas jest liniowy (5.2% delta do poprzedniej częstotliwości)
Średnie 400 - 2000 Hz
(+) | zbalansowane środki średnie - tylko 1.3% od mediany
(+) | średnie są liniowe (2.1% delta do poprzedniej częstotliwości)
Wysokie 2–16 kHz
(+) | zrównoważone maksima - tylko 1.9% od mediany
(+) | wzloty są liniowe (2.7% delta do poprzedniej częstotliwości)
Ogólnie 100 - 16.000 Hz
(+) | ogólny dźwięk jest liniowy (4.6% różnicy w stosunku do mediany)
W porównaniu do tej samej klasy
» 0% wszystkich testowanych urządzeń w tej klasie było lepszych, 0% podobnych, 100% gorszych
» Najlepszy miał deltę 5%, średnia wynosiła ###średnia###%, najgorsza wynosiła 45%
W porównaniu do wszystkich testowanych urządzeń
» 0% wszystkich testowanych urządzeń było lepszych, 0% podobnych, 100% gorszych
» Najlepszy miał deltę 4%, średnia wynosiła ###średnia###%, najgorsza wynosiła 134%
Zarządzanie energią
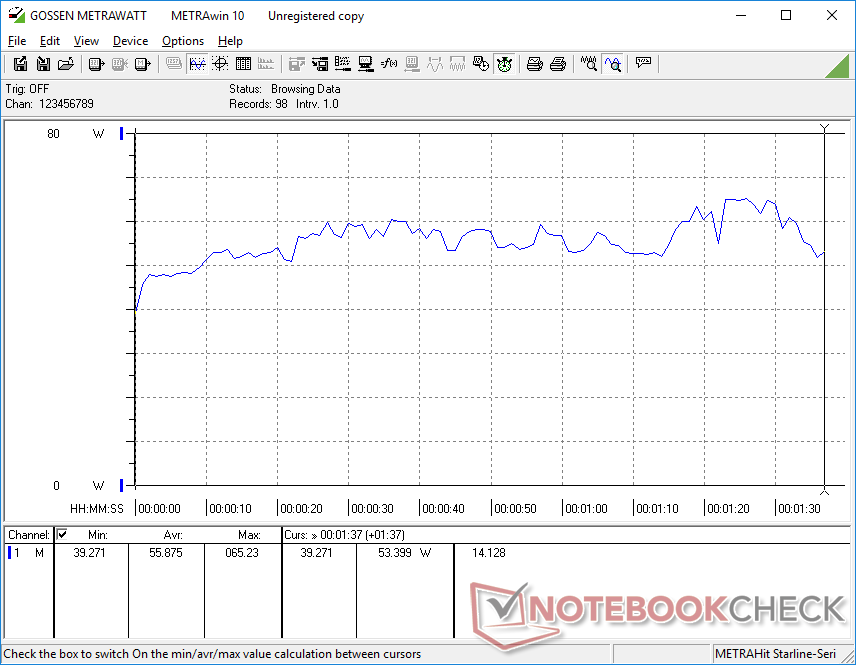
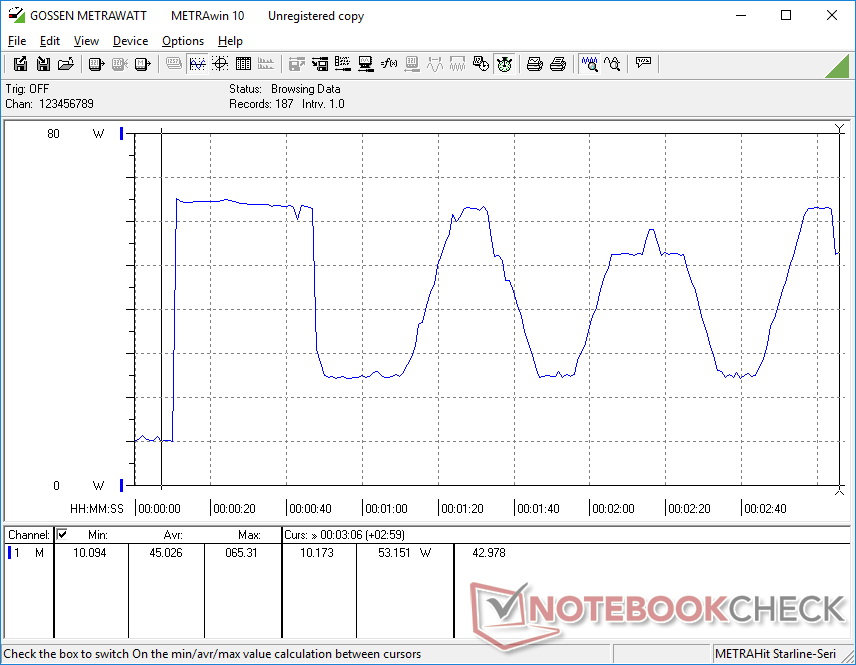
Zużycie energii
Zużycie energii przy niskich obciążeniach jest w dużej mierze takie samo jak w zeszłorocznym modelu, pomimo bardziej energooszczędnego procesora Core z serii U w naszym ThinkPadzie X1 Yoga G8. Podczas uruchamiania bardziej wymagających obciążeń, takich jak gry lub Prime95, zużycie energii zmieniało się cyklicznie, jak pokazano na poniższych wykresach, podczas gdy zużycie było stabilniejsze w ThinkPad X1 Yoga G7. Zachowanie cykliczne odzwierciedla nasze obserwacje dotyczące częstotliwości taktowania i poboru mocy przez płytę główną w naszej sekcji Stress Test powyżej.
| wyłączony / stan wstrzymania | |
| luz | |
| obciążenie |
|
Legenda:
min: | |
| Lenovo ThinkPad X1 Yoga G8 i7-1355U i7-1355U, Iris Xe G7 96EUs, WDC PC SN810 512GB, IPS, 1920x1200, 14" | Lenovo ThinkPad X1 Yoga G7 21CE002HGE i7-1270P, Iris Xe G7 96EUs, Samsung PM9A1 MZVL2512HCJQ, IPS, 1920x1200, 14" | Dell Latitude 9430 2-in-1 i7-1265U, Iris Xe G7 96EUs, , IPS, 2560x1600, 14" | LG Gram 14T90P i5-1135G7, Iris Xe G7 80EUs, Samsung SSD PM981a MZVLB512HBJQ, IPS, 1900x1200, 14" | Asus ZenBook Flip 14 UN5401QA-KN085W R7 5800H, Vega 8, Intel SSD 600p SSDPEKKW512G7, OLED, 2880x1800, 14" | HP EliteBook x360 1040 G7, i7-10810U i7-10810U, UHD Graphics 620, Samsung SSD PM981a MZVLB512HBJQ, IPS, 1920x1080, 14" | |
|---|---|---|---|---|---|---|
| Power Consumption | -3% | 9% | 12% | -38% | 25% | |
| Idle Minimum * (Watt) | 2.9 | 4.2 -45% | 2.9 -0% | 2.8 3% | 6.4 -121% | 1.6 45% |
| Idle Average * (Watt) | 5.4 | 6.9 -28% | 5.8 -7% | 5.5 -2% | 9.4 -74% | 4.5 17% |
| Idle Maximum * (Watt) | 9.6 | 7.6 21% | 6.6 31% | 6.4 33% | 10.7 -11% | 5.2 46% |
| Load Average * (Watt) | 55.9 | 36.2 35% | 49.2 12% | 45.4 19% | 52.2 7% | 41.7 25% |
| Witcher 3 ultra * (Watt) | 42.6 | 43.2 -1% | 35.3 17% | 34 20% | 53 -24% | |
| Load Maximum * (Watt) | 65.3 | 63.5 3% | 63.1 3% | 65.9 -1% | 69 -6% | 70.8 -8% |
* ... im mniej tym lepiej
Power Consumption Witcher 3 / Stresstest
Power Consumption external Monitor
Żywotność baterii
Czas pracy nie uległ poprawie w stosunku do zeszłorocznego modelu, a nawet może być krótszy. Nasz rzeczywisty test WLAN trwałby prawie 7 godzin w porównaniu do prawie 9 godzin w zeszłorocznym ThinkPad X1 Yoga G7.
Ładowanie od stanu pustego do pełnej pojemności jest nadal stosunkowo szybkie i trwa około 90 minut.
| Lenovo ThinkPad X1 Yoga G8 i7-1355U i7-1355U, Iris Xe G7 96EUs, 57 Wh | Lenovo ThinkPad X1 Yoga G7 21CE002HGE i7-1270P, Iris Xe G7 96EUs, 57 Wh | Dell Latitude 9430 2-in-1 i7-1265U, Iris Xe G7 96EUs, 60 Wh | LG Gram 14T90P i5-1135G7, Iris Xe G7 80EUs, 72 Wh | Asus ZenBook Flip 14 UN5401QA-KN085W R7 5800H, Vega 8, 63 Wh | HP EliteBook x360 1040 G7, i7-10810U i7-10810U, UHD Graphics 620, 78.6 Wh | |
|---|---|---|---|---|---|---|
| Czasy pracy | 33% | 91% | 81% | 30% | 181% | |
| WiFi v1.3 (h) | 6.7 | 8.9 33% | 12.8 91% | 12.1 81% | 8.7 30% | 18.8 181% |
| H.264 (h) | 12.2 | 9 | ||||
| Load (h) | 1.7 | 2.4 | 2.3 | 2.1 | 5.6 | |
| Reader / Idle (h) | 27.8 | 62.8 |
Za
Przeciw
Werdykt - Thinkpad X1 Yoga - rok do pominięcia
Coroczne aktualizacje mogą być czasami znaczące, takie jak przeskok z thinkPad X1 Yoga 2020 do 2021 ThinkPad X1 Yoga G6. Niestety, ThinkPad X1 Yoga G8 z 2023 roku jest krokiem w bok w porównaniu do 2022 ThinkPad X1 Yoga G7. Wzrost wydajności procesora jest doceniany, ale niestabilne częstotliwości taktowania Turbo Boost i wydajność grafiki mogą być niekorzystne dla użytkowników.
ThinkPad X1 Yoga G8 niewiele robi, aby ulepszyć i tak już doskonały ThinkPad X1 Yoga G7.
Nie ma innych znaczących zmian poza wymianą procesora z 12. na 13. generację. Jeśli doładowanie procesora nie jest potrzebne do wykonywania zadań, można uzyskać zasadniczo takie samo doświadczenie z ThinkPad X1 Yoga G7 za mniej. Nie oznacza to, że ThinkPad X1 Yoga G8 jest słabym urządzeniem konwertowalnym, ponieważ Yoga G7 jest nadal bardzo dobra, ale spodziewaliśmy się nieco odświeżenia, takiego jak kamera internetowa o wyższej rozdzielczości, dłuższa żywotność baterii, czytnik kart SD i opcje paneli 1000-nit, aby lepiej konkurować zDell Latitude 9430 2-w-1 lubHP Elite.
Cena i dostępność
Lenovo dostarcza obecnie swojego ThinkPada X1 Yoga G8 w cenie od 1600 USD za podstawowy model z procesorem Core i5 do ponad 2400 USD w przypadku pełnej konfiguracji.
Lenovo ThinkPad X1 Yoga G8 i7-1355U
- 19/06/2023 v7 (old)
Allen Ngo
Przezroczystość
Wyboru urządzeń do recenzji dokonuje nasza redakcja. Próbka testowa została udostępniona autorowi jako pożyczka od producenta lub sprzedawcy detalicznego na potrzeby tej recenzji. Pożyczkodawca nie miał wpływu na tę recenzję, producent nie otrzymał też kopii tej recenzji przed publikacją. Nie było obowiązku publikowania tej recenzji. Jako niezależna firma medialna, Notebookcheck nie podlega władzy producentów, sprzedawców detalicznych ani wydawców.
Tak testuje Notebookcheck
Każdego roku Notebookcheck niezależnie sprawdza setki laptopów i smartfonów, stosując standardowe procedury, aby zapewnić porównywalność wszystkich wyników. Od około 20 lat stale rozwijamy nasze metody badawcze, ustanawiając przy tym standardy branżowe. W naszych laboratoriach testowych doświadczeni technicy i redaktorzy korzystają z wysokiej jakości sprzętu pomiarowego. Testy te obejmują wieloetapowy proces walidacji. Nasz kompleksowy system ocen opiera się na setkach uzasadnionych pomiarów i benchmarków, co pozwala zachować obiektywizm.Price comparison

