Recenzja Asus Zenbook 14 OLED - ważący 1,2 kg subnotebook z ekranem OLED 120 Hz i procesorem Core Ultra 7
Zenbook 14 OLED firmy Asus to lekki i kompaktowy subnotebook. Wersja 2024 wyposażona jest w nowe mobilne procesory Meteor-Lake od Intela, w tym ich szybsze iGPU Arc, a także nowy 120-Hz wyświetlacz OLED.
Obecnie w ofercie dostępne są trzy konfiguracje nowego Zenbooka 14: Z procesorem Core Ultra 5 125H, 16 GB pamięci RAM, dyskiem 1-TB SSD i wyświetlaczem FHD OLED (60 Hz), z procesorem Core Ultra 7 155H, 16 GB pamięci RAM, dyskiem 1-TB SSD i wyświetlaczem 3K OLED (120 Hz) oraz z procesorem Core Ultra 9 185H, 32 GB pamięci RAM, dyskiem 1-TB SSD i wyświetlaczem 3K OLED (120 Hz). W momencie przeprowadzania testów nasza konfiguracja testowa nie została jeszcze wymieniona. Wyposażono ją w procesor Core Ultra 7 155H, 32 GB pamięci RAM i wyświetlacz OLED 3K.
Potencjalni konkurenci w porównaniu
Ocena | Data | Model | Waga | Wysokość | Rozmiar | Rezolucja | Cena |
|---|---|---|---|---|---|---|---|
| 86.7 % v7 (old) | 02/2024 | Asus ZenBook 14 UX3405MA Ultra 7 155H, Arc 8-Core | 1.2 kg | 14.9 mm | 14.00" | 2880x1800 | |
| 89 % v7 (old) | 01/2024 | Tuxedo Pulse 14 Gen3 R7 7840HS, Radeon 780M | 1.4 kg | 18 mm | 14.00" | 2880x1800 | |
v (old) | 12/2023 | Acer Swift Go 14 SFG14-72 Ultra 7 155H, Arc 8-Core | 1.3 kg | 14.9 mm | 14.00" | 2880x1800 | |
| 88.9 % v7 (old) | 10/2023 | Schenker Vision 14 2023 i7-13700H, Iris Xe G7 96EUs | 1.3 kg | 16.6 mm | 14.00" | 2880x1800 | |
| 87.4 % v7 (old) | 07/2023 | Dell XPS 13 Plus 9320 Core i7-1360P i7-1360P, Iris Xe G7 96EUs | 1.3 kg | 15.3 mm | 13.40" | 3456x2160 | |
| 92 % v7 (old) | 04/2023 | Apple MacBook Air M2 10C GPU M2, M2 10-Core GPU | 1.2 kg | 11.3 mm | 13.60" | 2560x1664 |
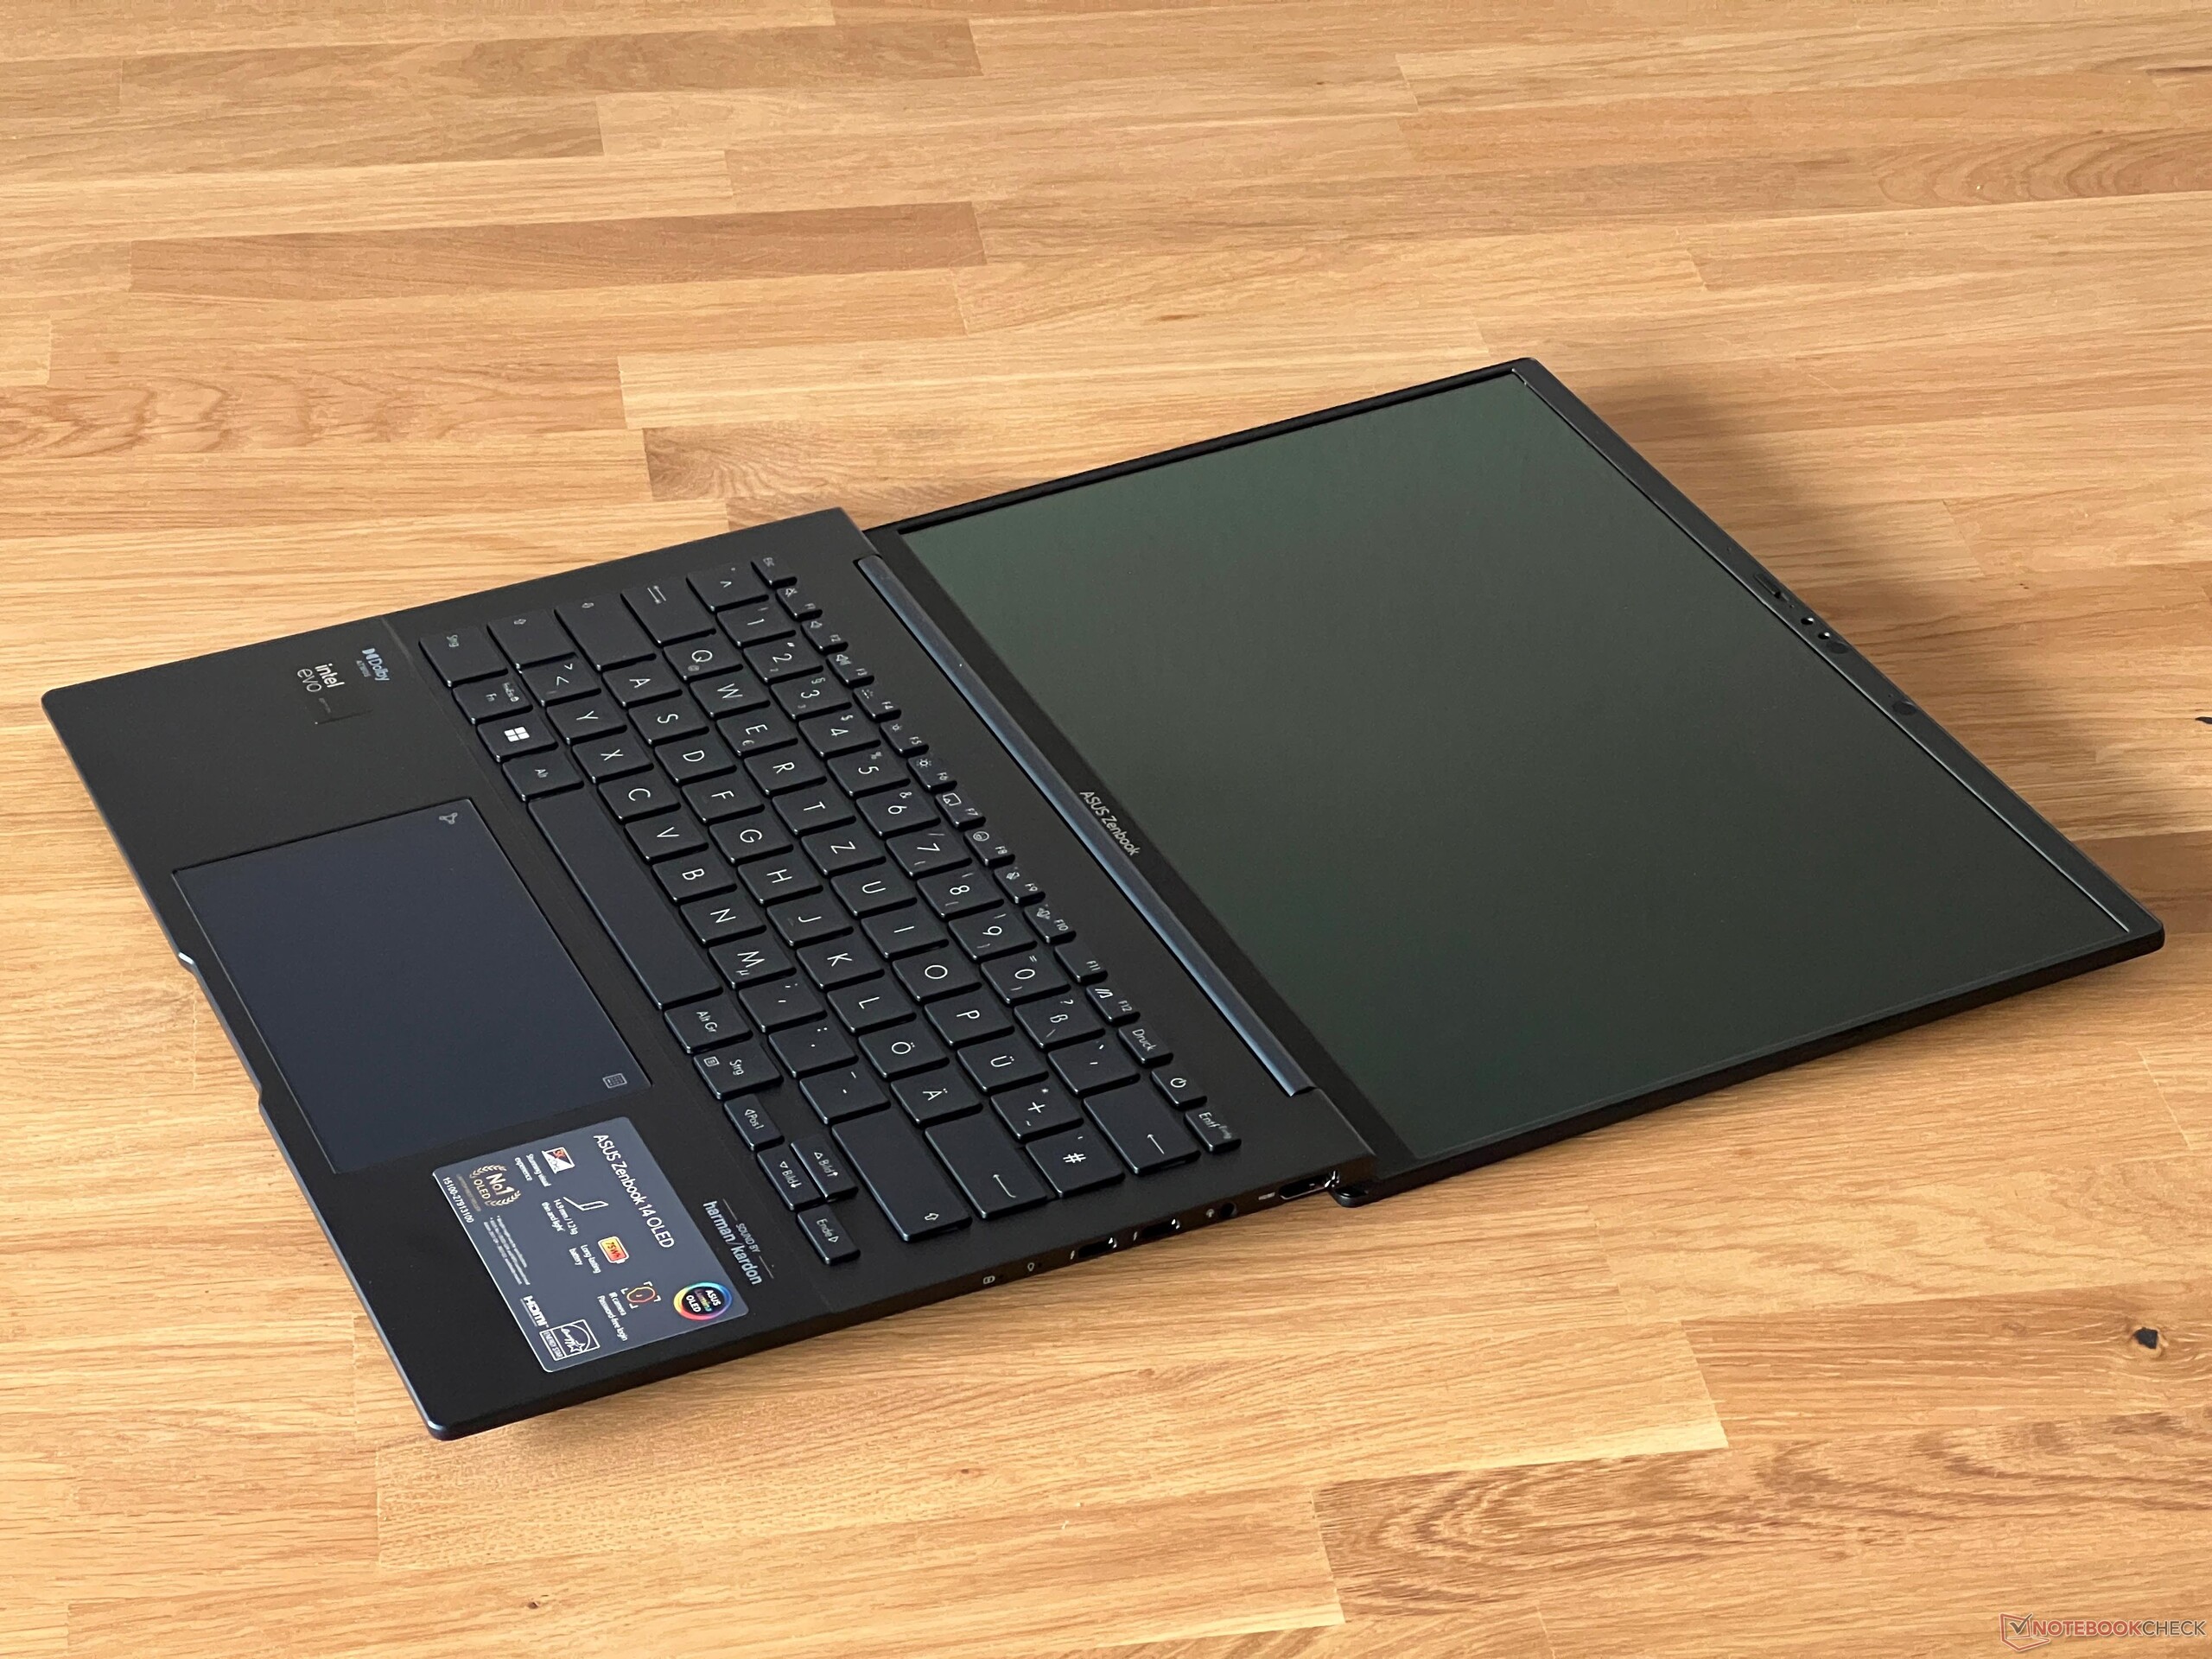
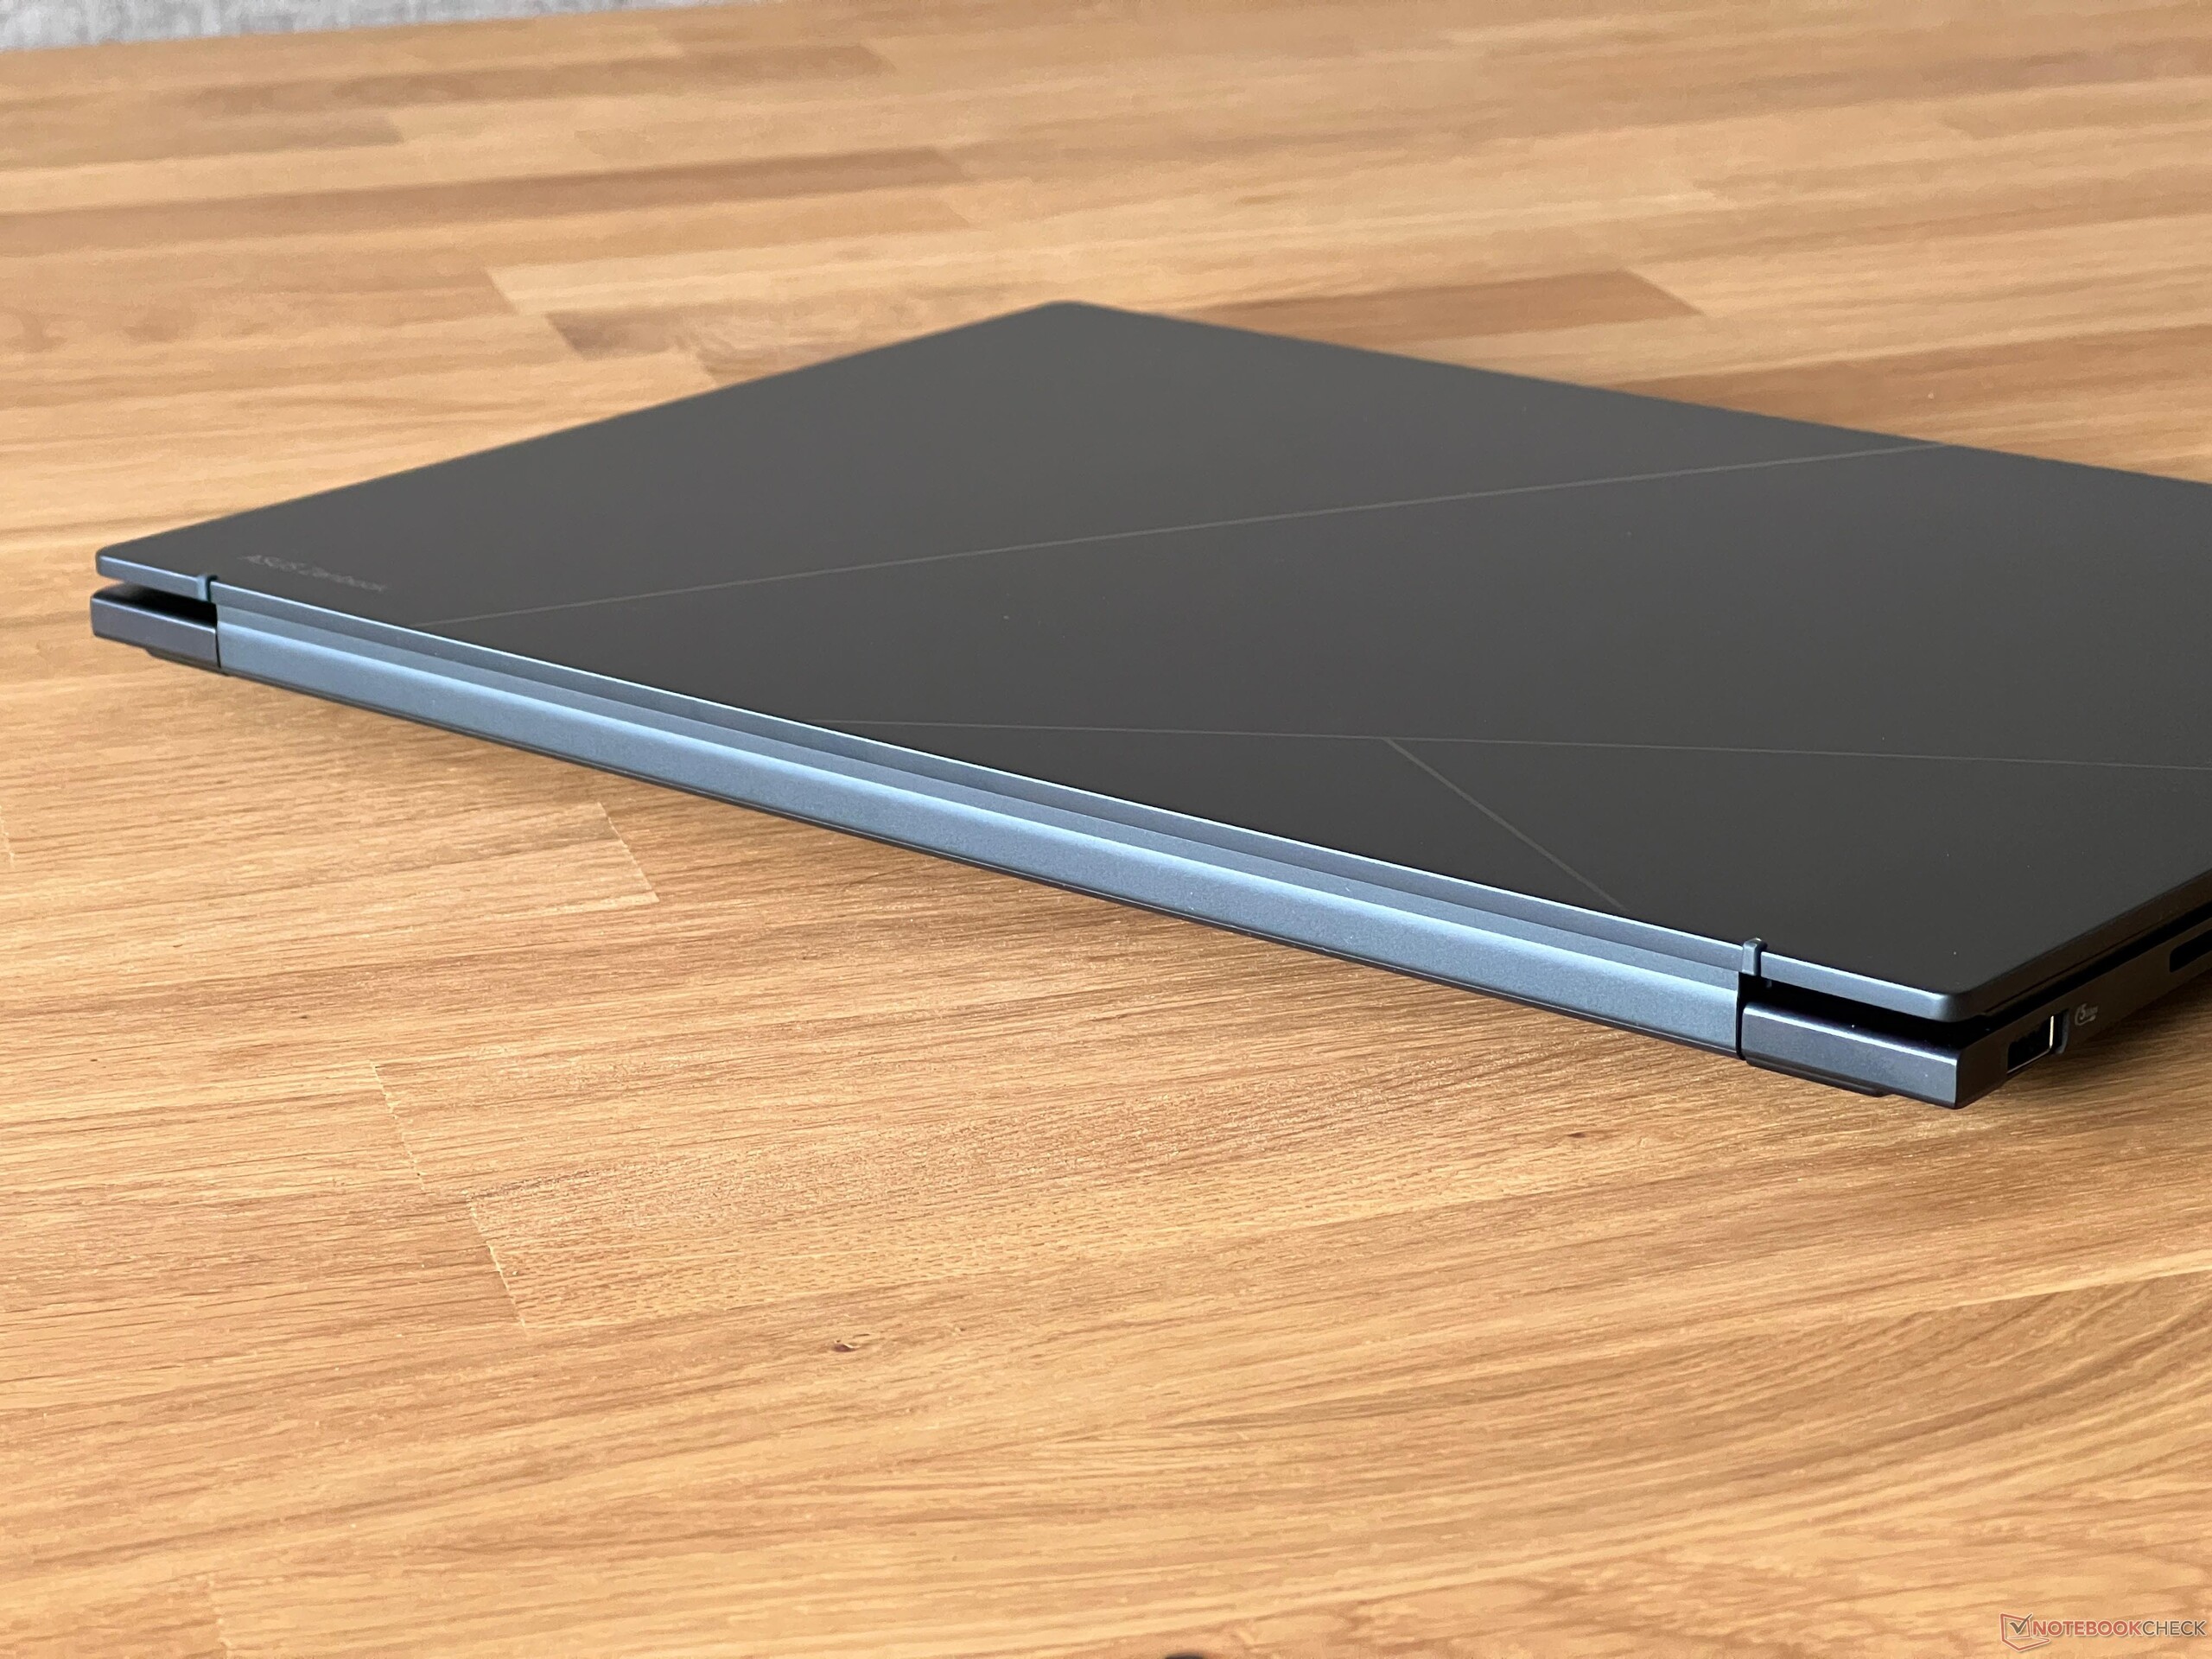
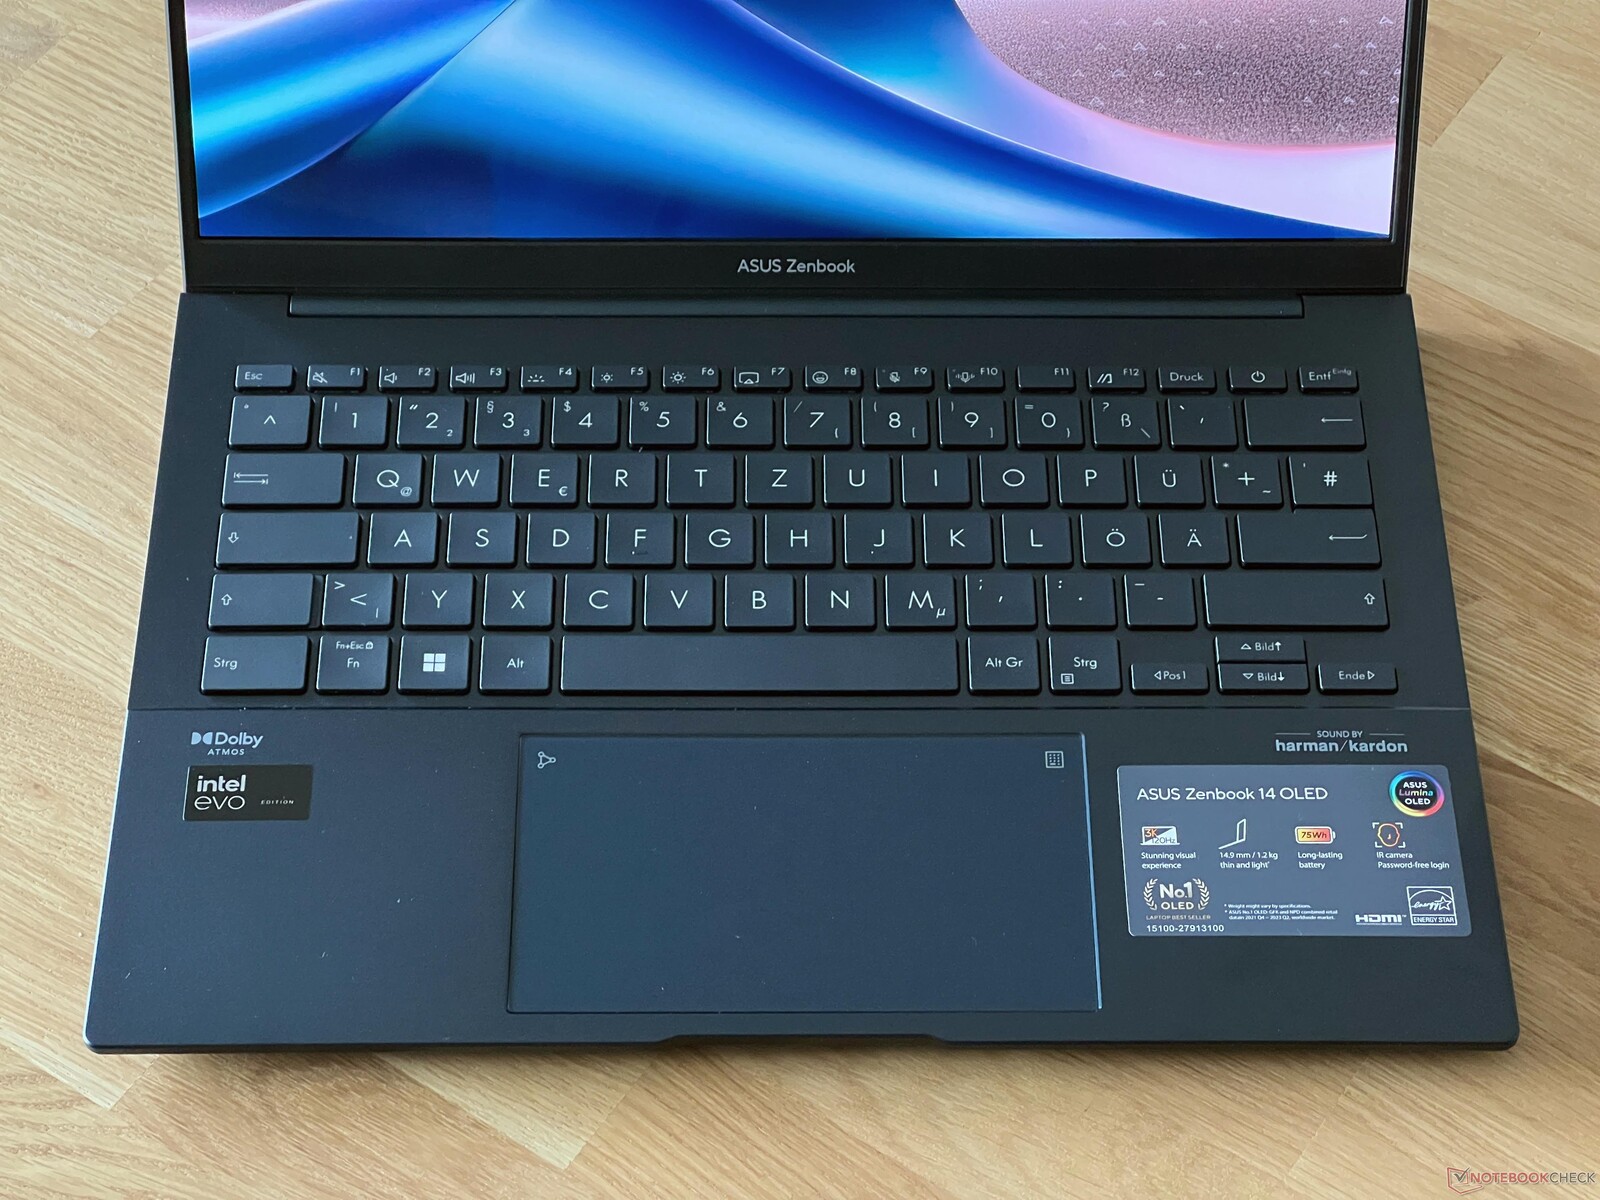
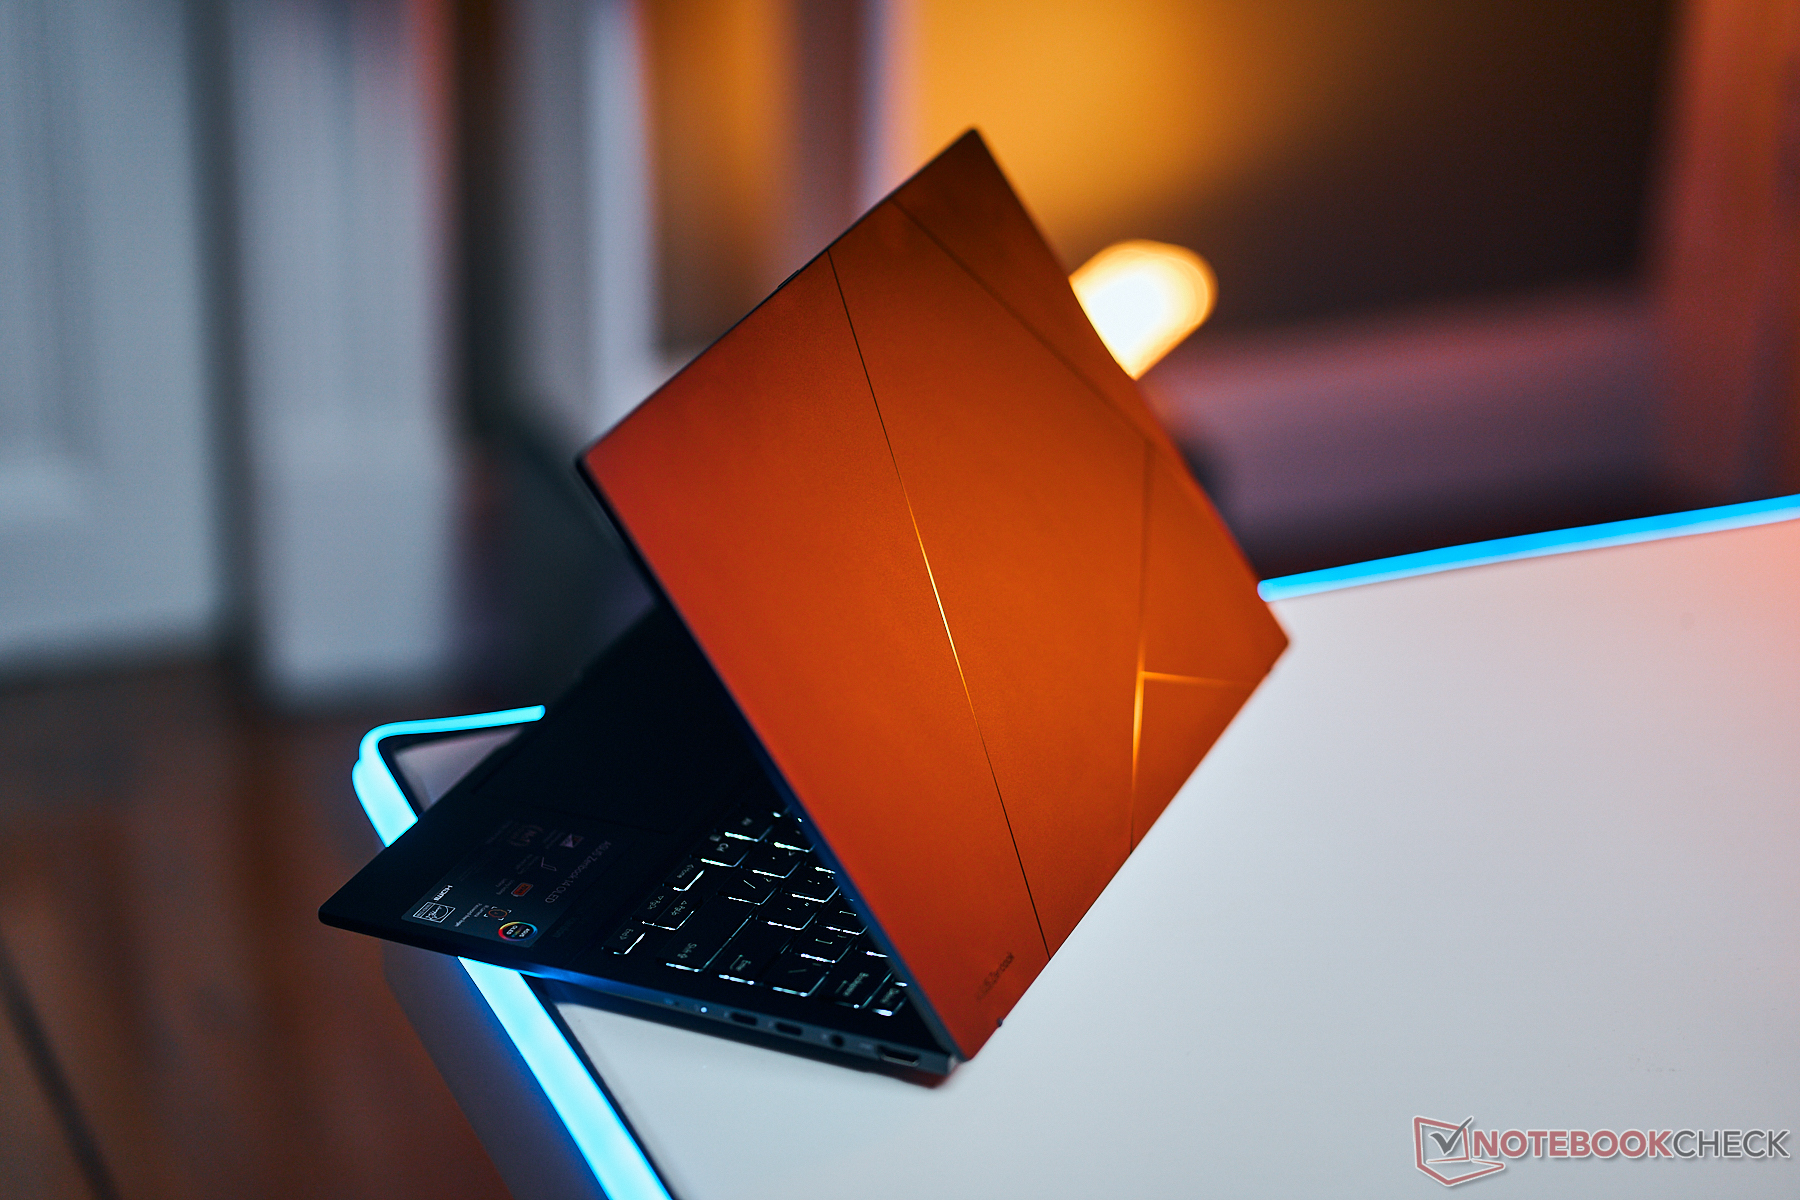
Obudowa - Zenbook jest pokryty metalem
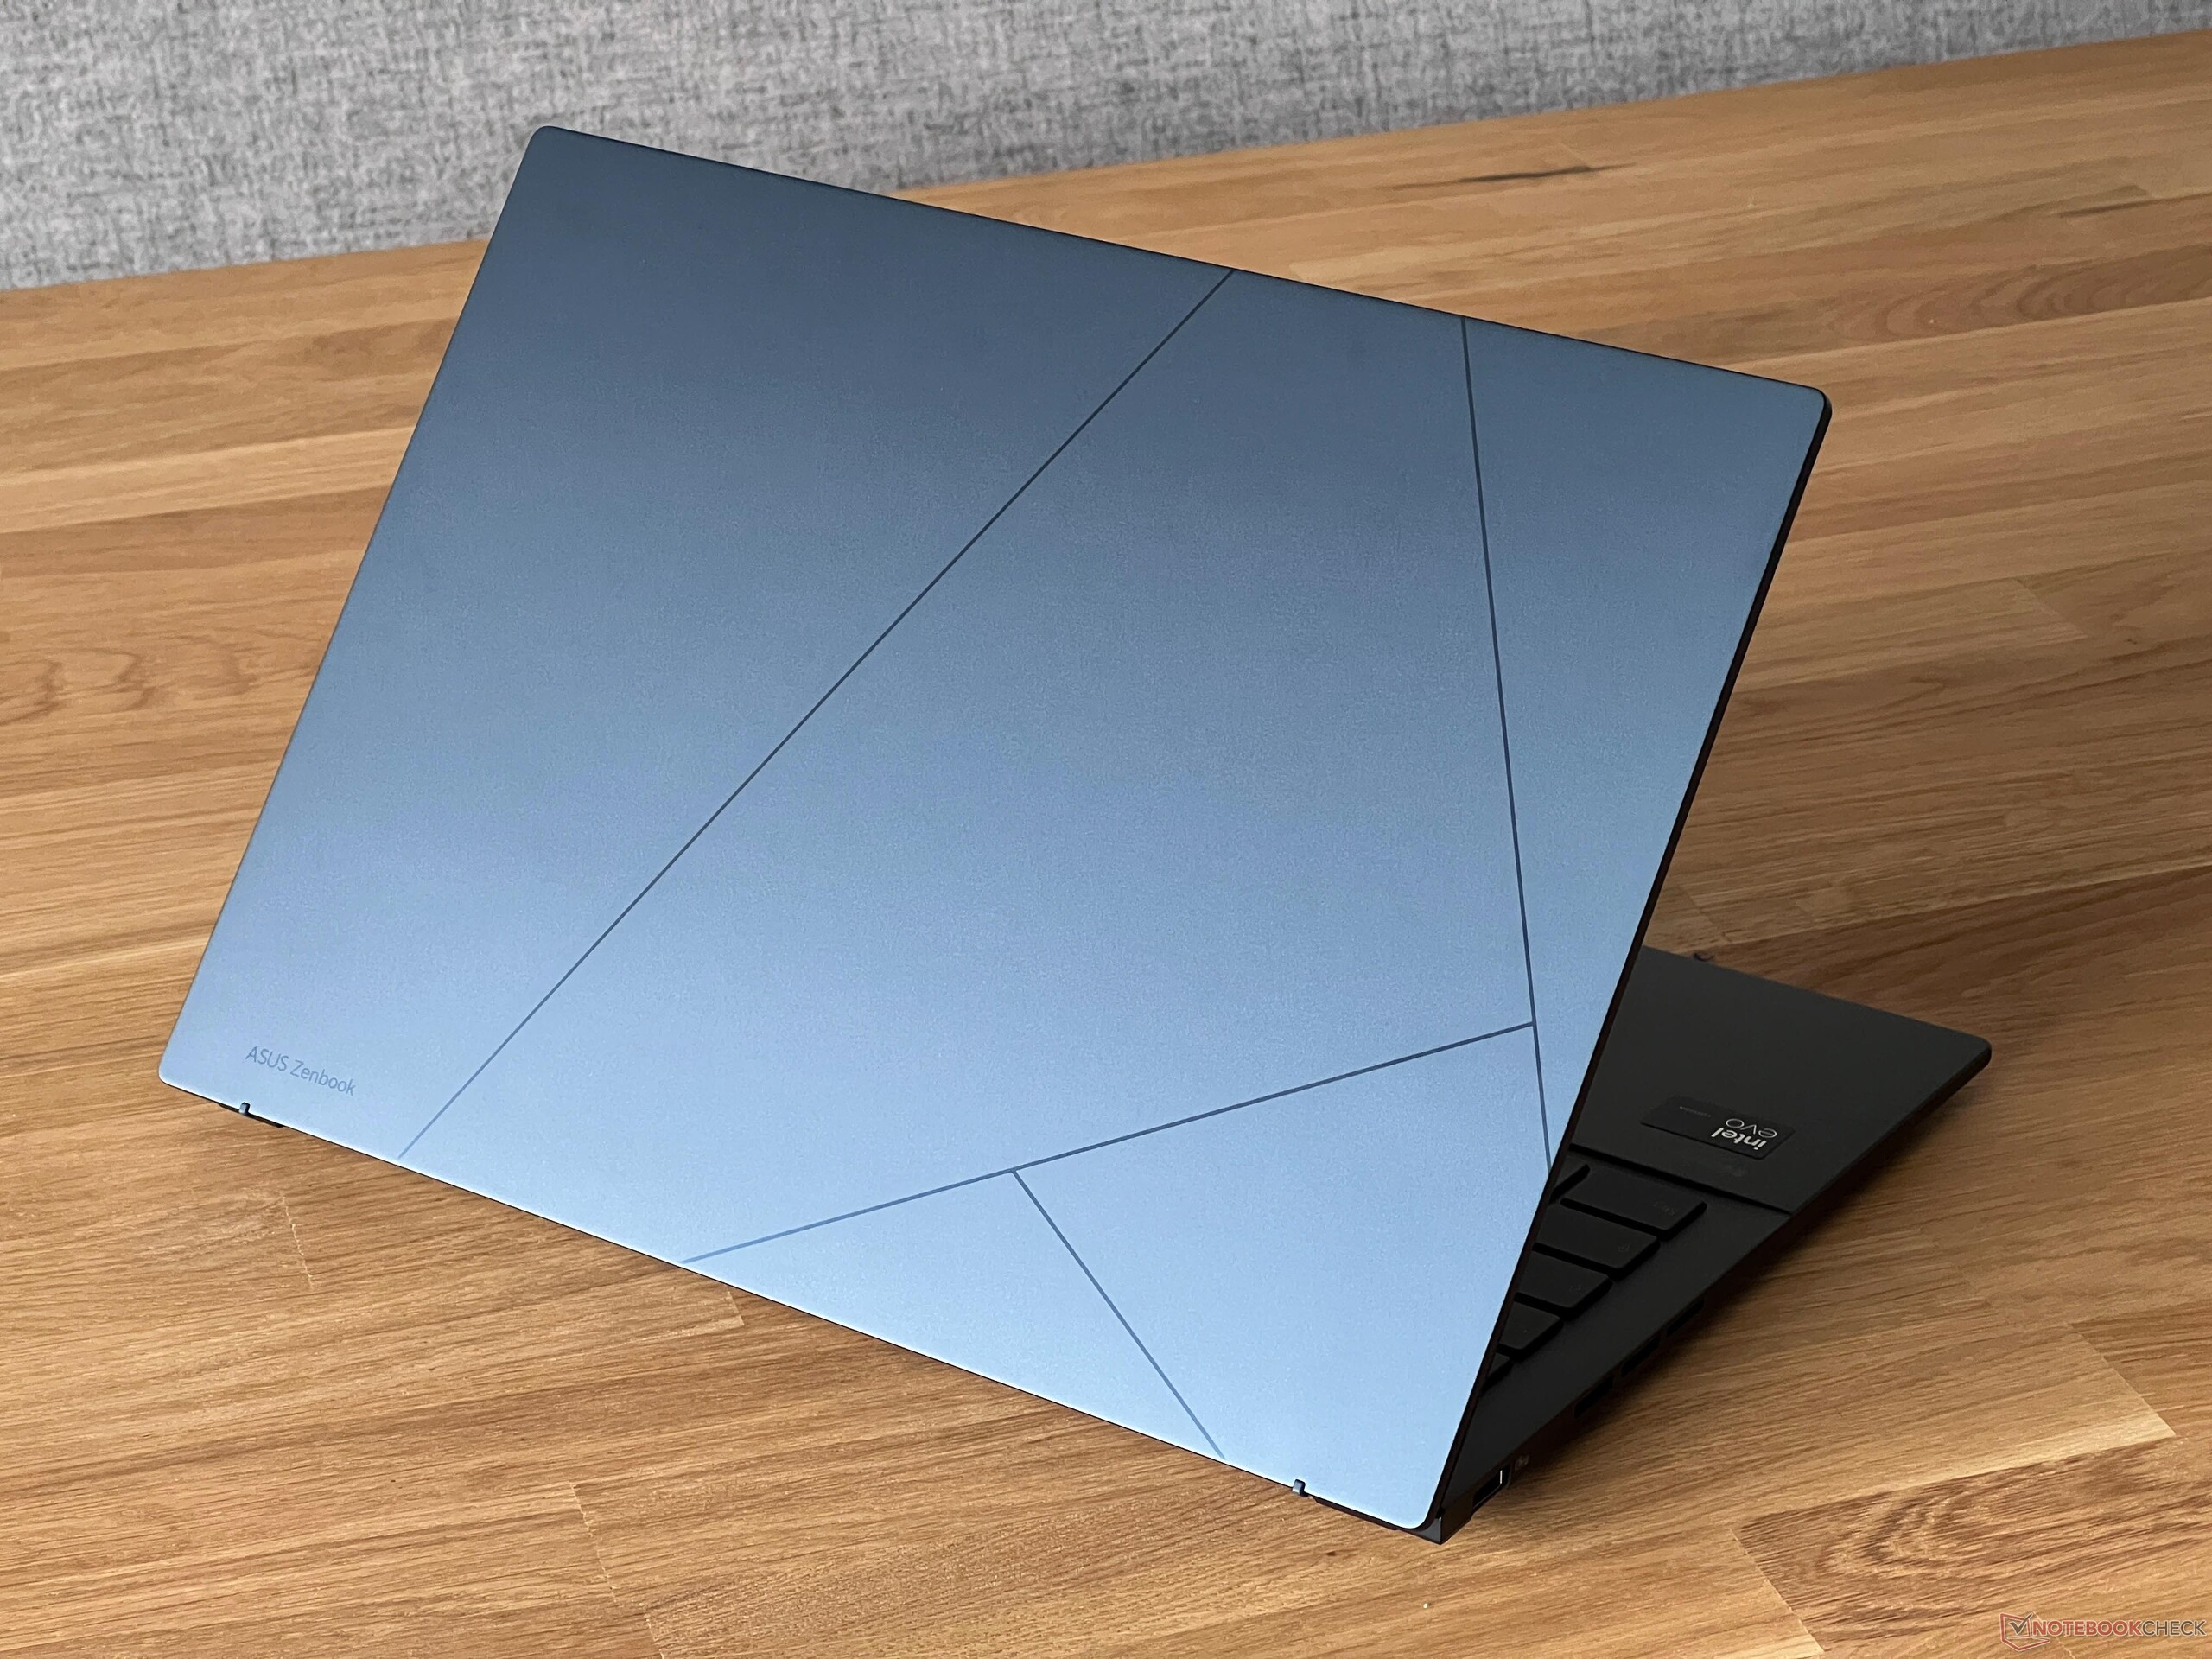
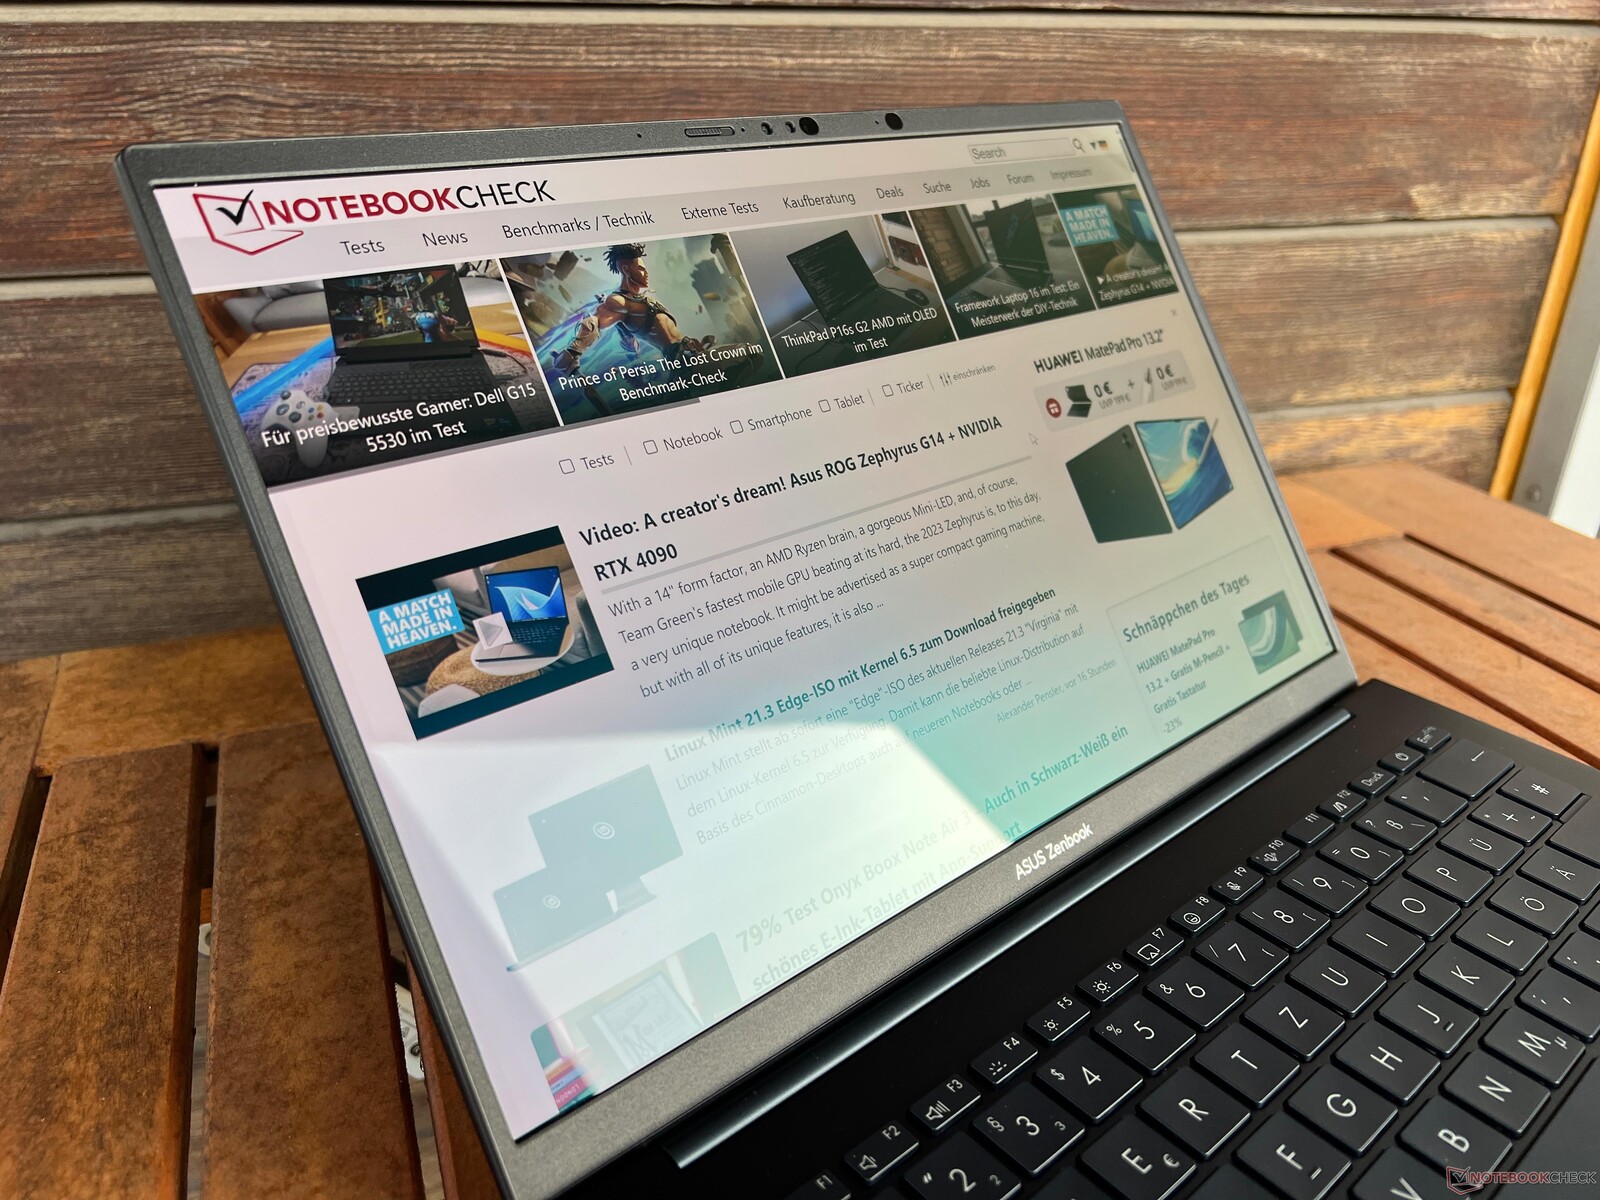
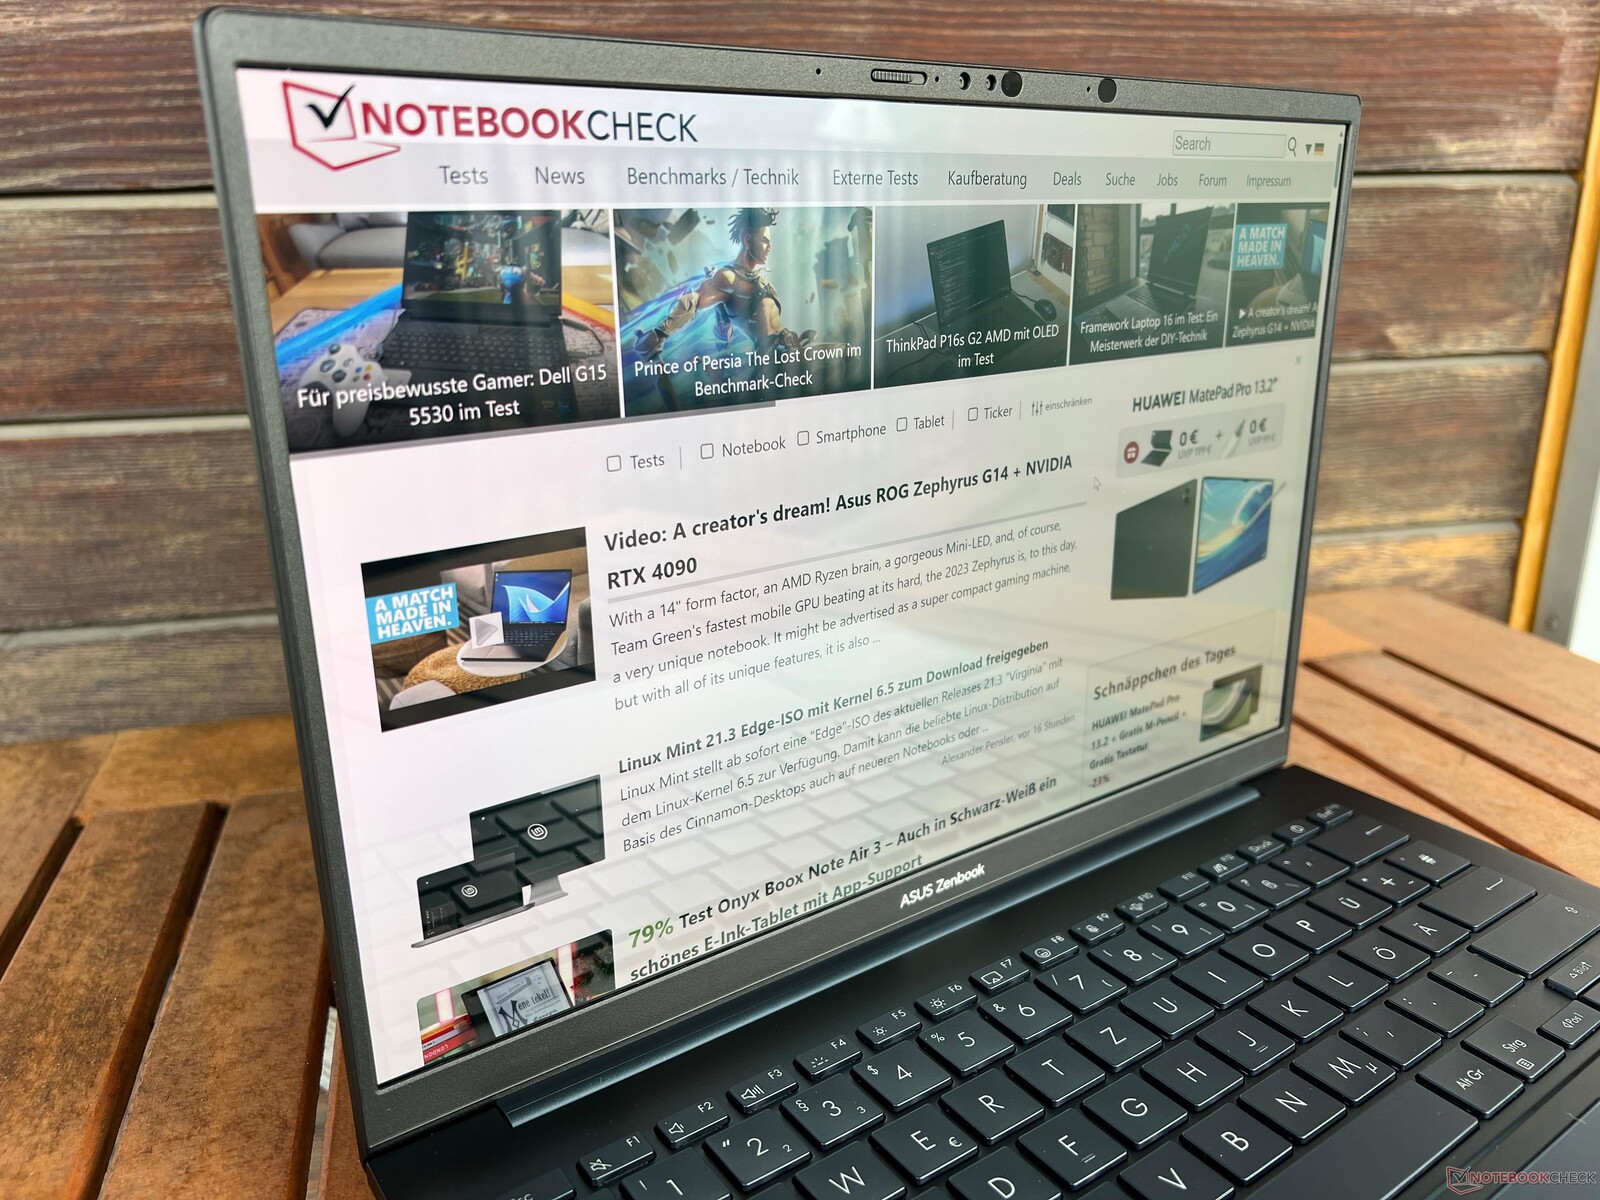
Nowy Zenbook 14 OLED dostępny jest w kolorze niebieskim (Ponder Blue) lub srebrnym (Foggy Silver), a jego design mocno przypomina ten z poprzednich modeli Zenbook. Dyskretne logo Pro Art i niewielki napis Zenbook umieszczono na pokrywie, a ten ostatni znalazł się także pod wyświetlaczem laptopa. Poza tym, producent zrezygnował z jakichkolwiek innych elementów wzornictwa (poza kolorowymi naklejkami reklamowymi) i w sumie nowy Zenbook jest dość powściągliwy. Nasze niebieskie urządzenie testowe w szczególności przyciąga sporo śladów odcisków palców. Ramki po bokach są bardzo wąskie, ale ramka wzdłuż dolnej części jest bardzo szeroka.
Pierwszą rzeczą, którą można zauważyć po podniesieniu urządzenia, jest jego niewielka waga (1,21 kg). Nadal charakteryzuje się dużą stabilnością dzięki metalowej konstrukcji i nie udało nam się wydobyć z niego żadnych skrzypiących dźwięków. Środkowa część klawiatury może być lekko wciśnięta przy dużym nacisku, ale nie powinno to stanowić problemu w codziennym użytkowaniu. Pokrywa wyświetlacza jest równie stabilna i bardzo podobają nam się jej zawiasy. Pokrywę można łatwo otworzyć jedną ręką i nie chwieje się ona zbytnio po puszczeniu. Maksymalny kąt otwarcia wynosi 180 stopni.
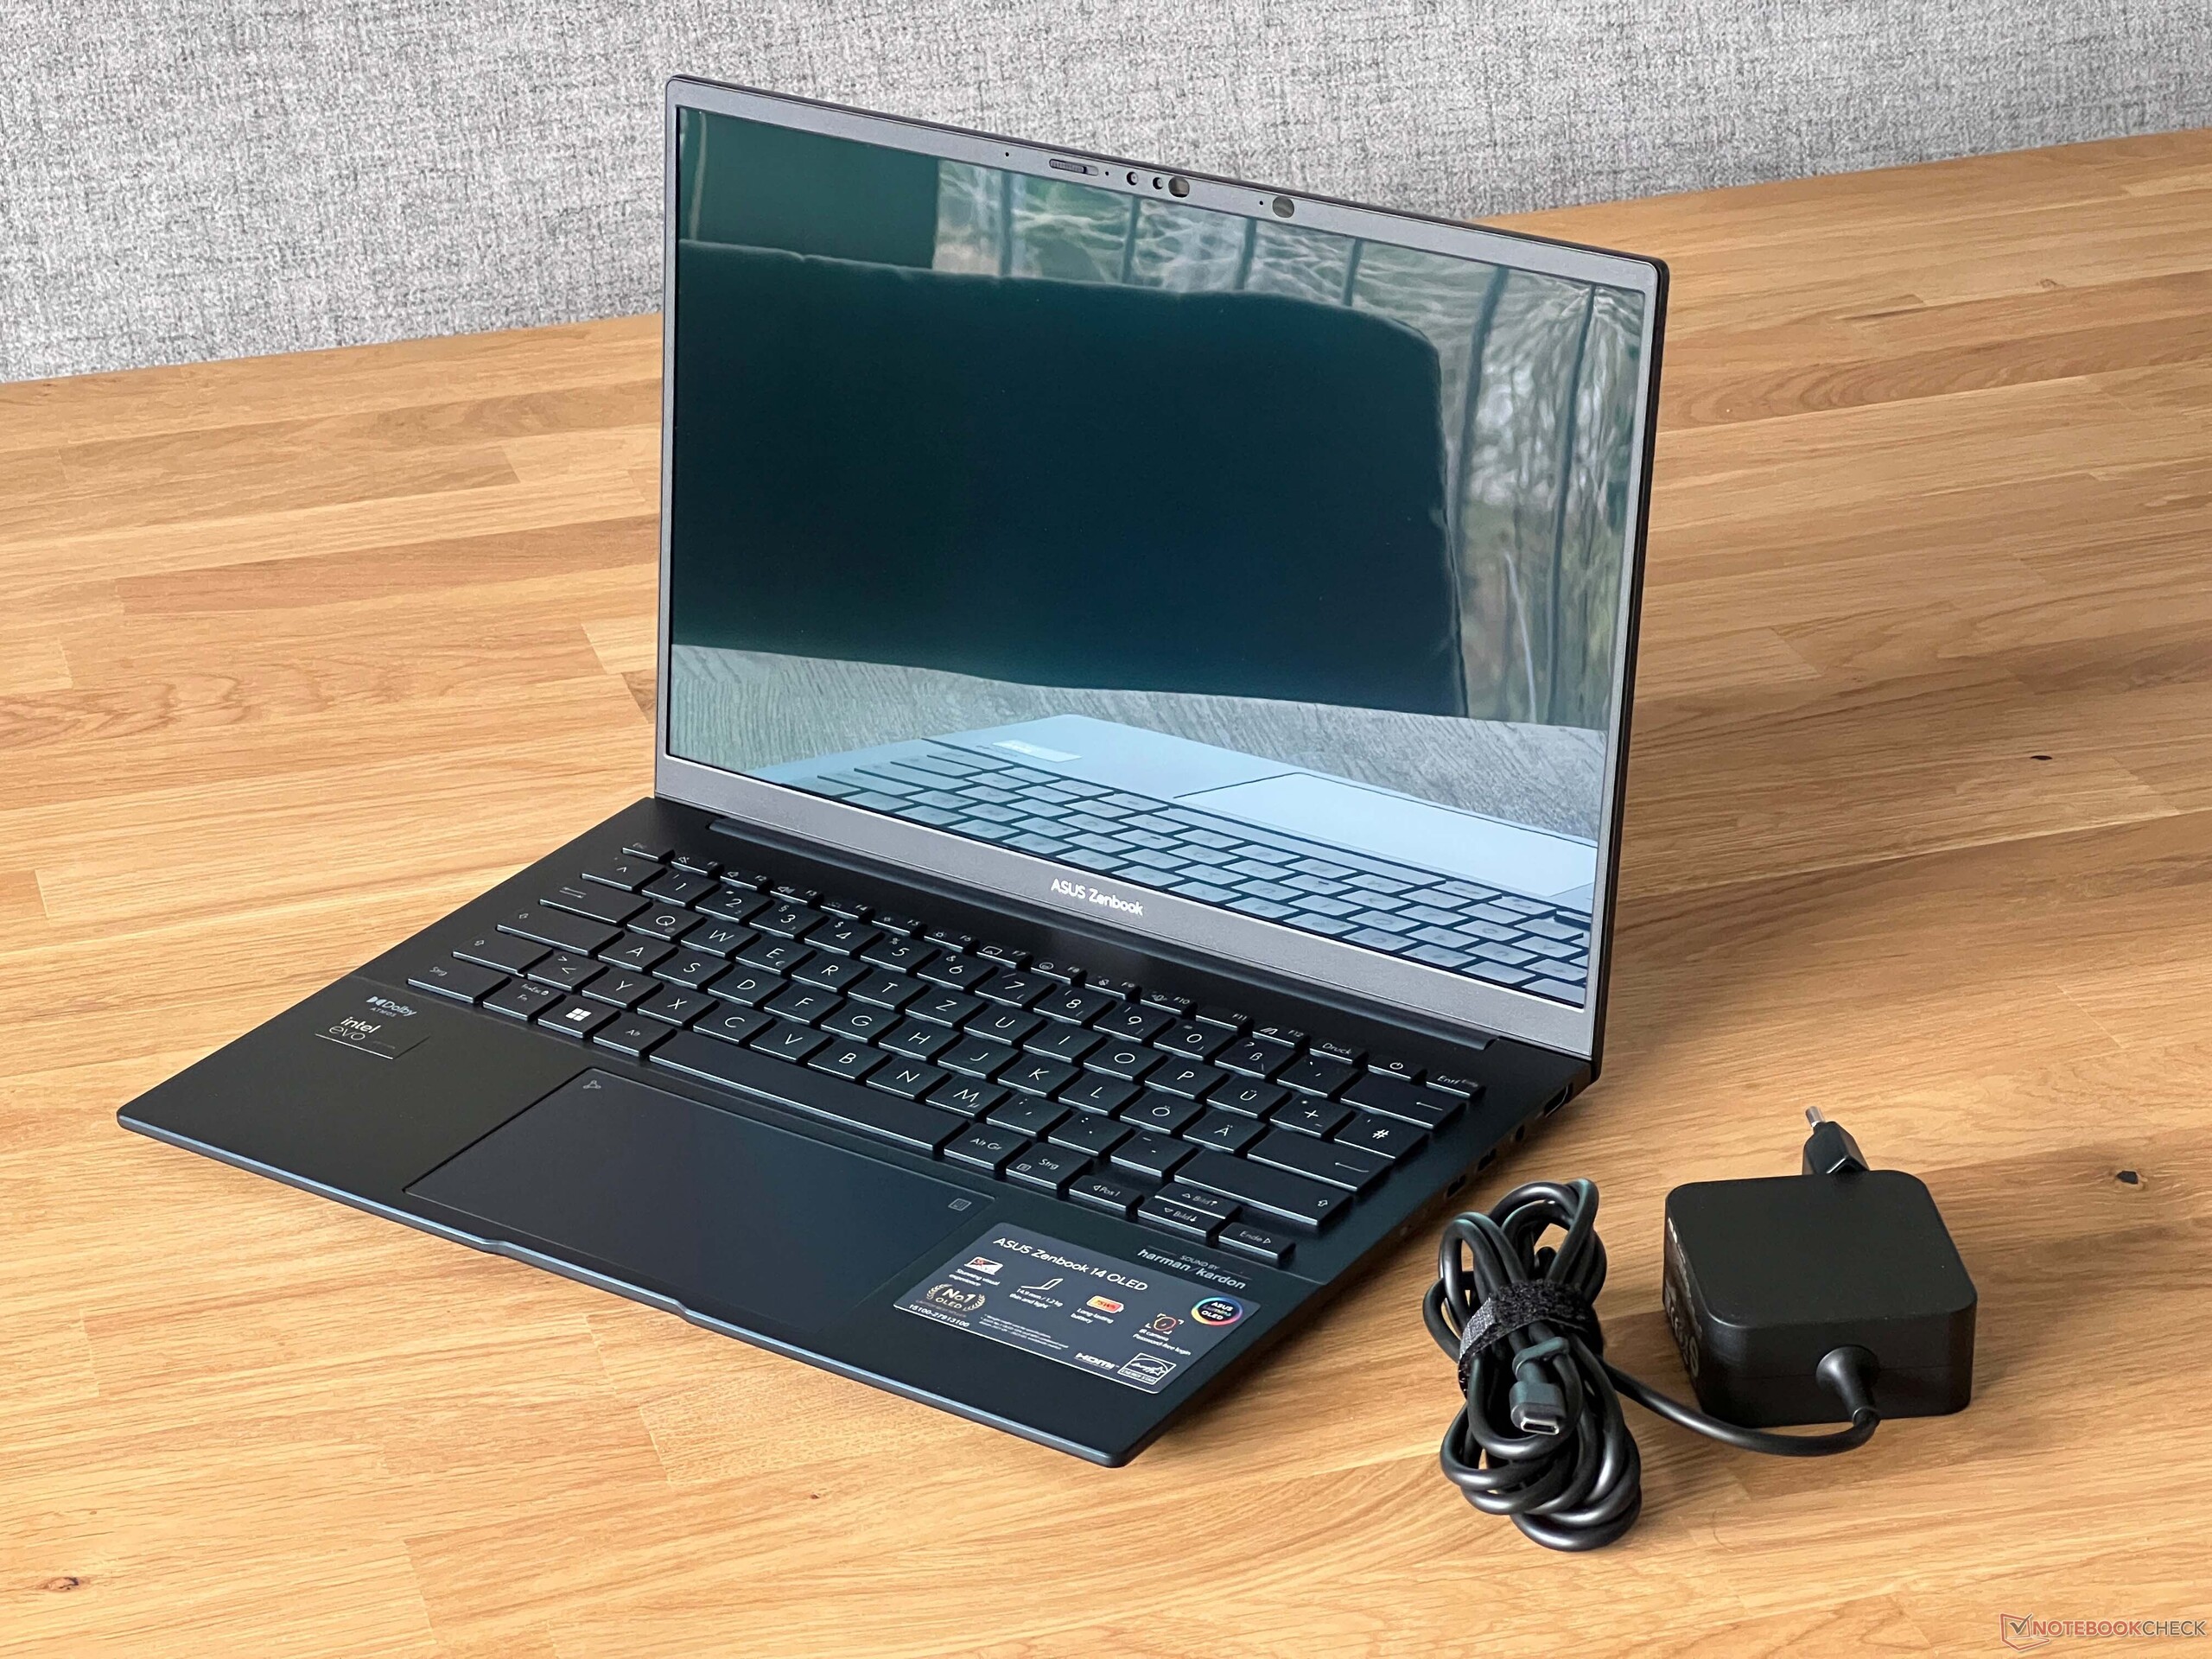
W naszej grupie porównawczej nowy Zenbook jest najlżejszym modelem, będąc jednocześnie najcieńszym laptopem z systemem Windows. Tylko pasywnie chłodzony MacBook Air M2 jest jeszcze cieńszy. Mimo to, Zenbook z łatwością zmieści się w każdym plecaku i nie powinien zajmować zbyt wiele miejsca. 65-watowy zasilacz waży 226 gramów.
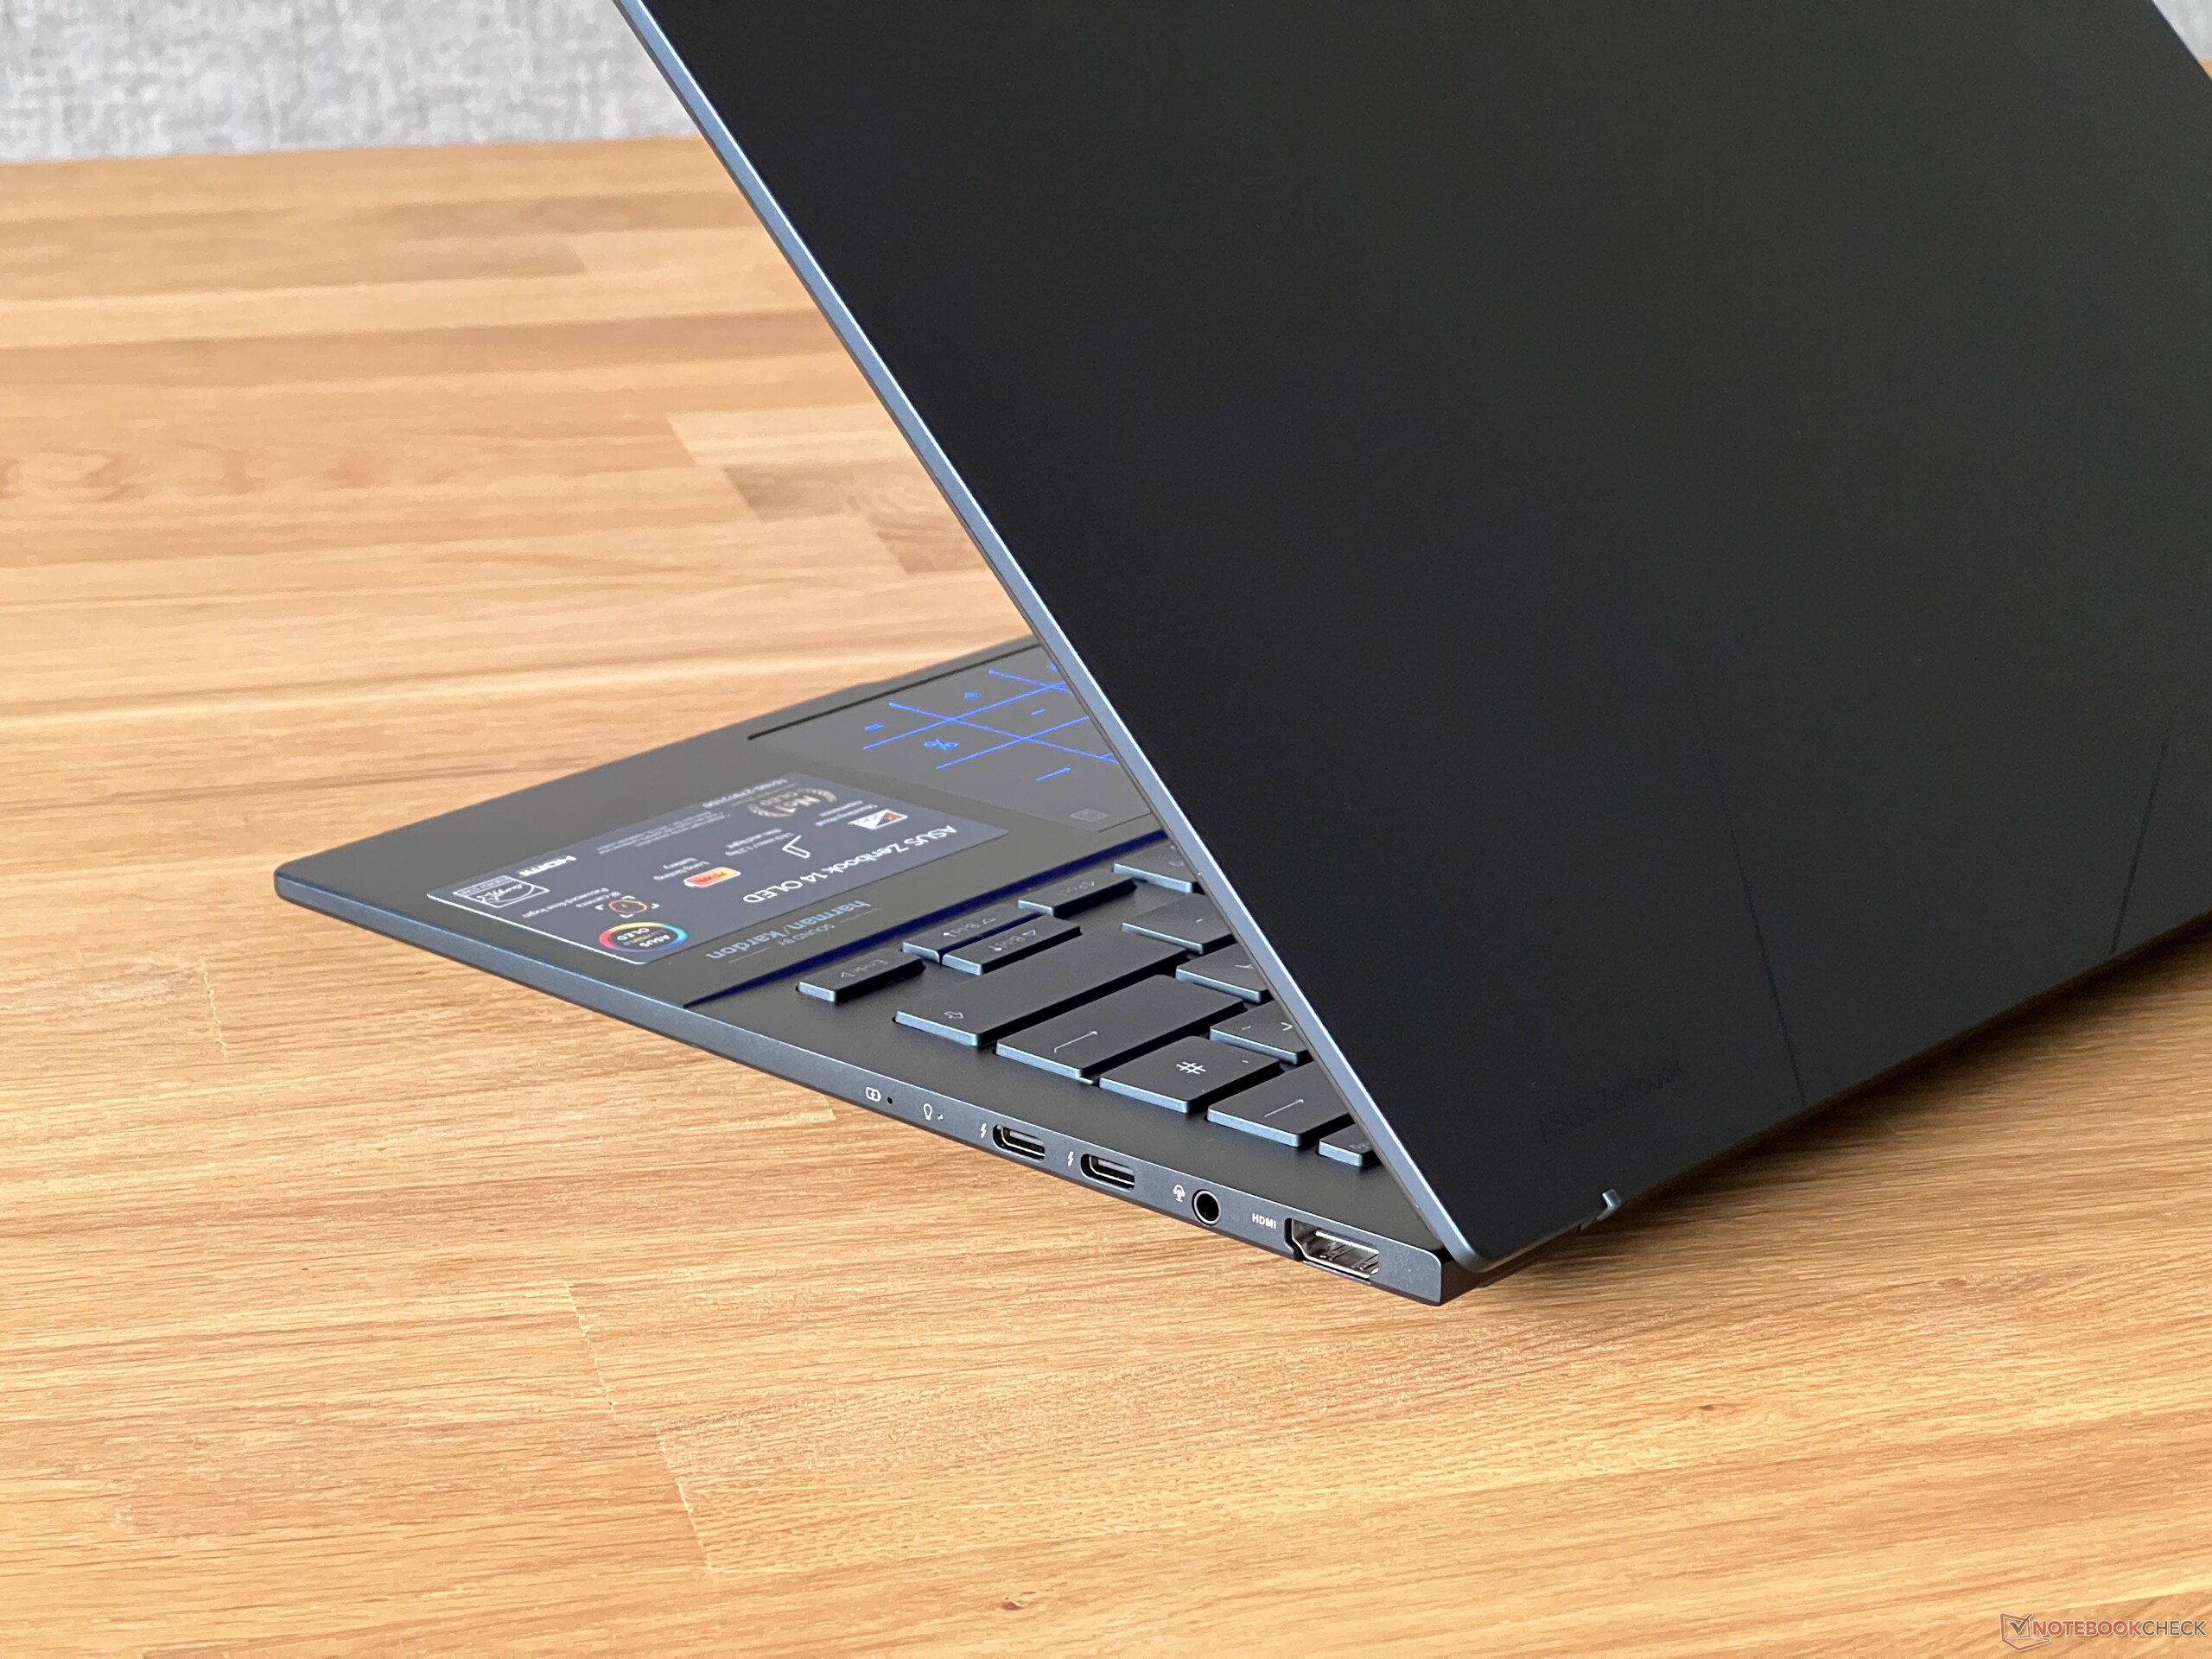
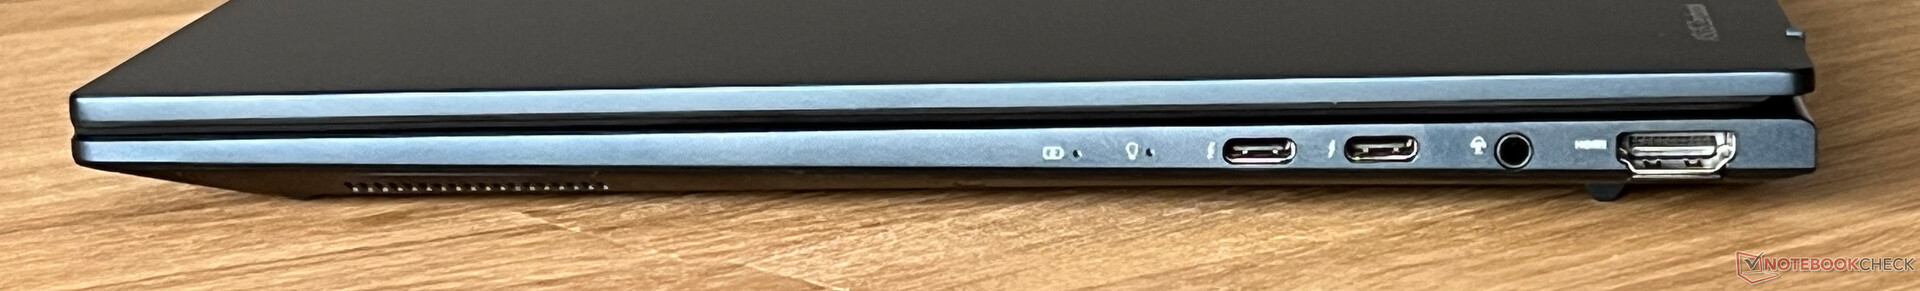
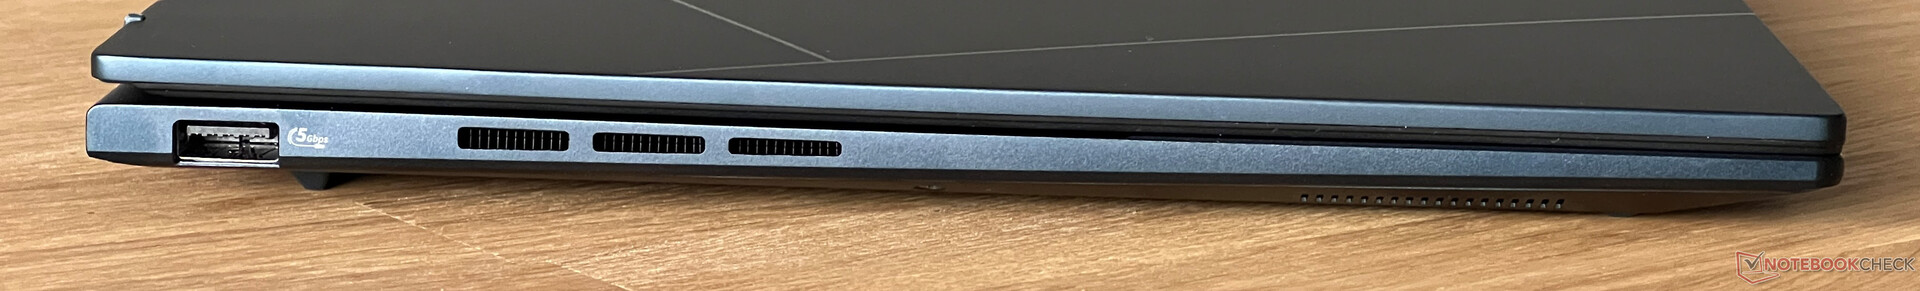
Łączność - Thunderbolt 4, ale bez czytnika kart
Zenbook 14 obejmuje wszystkie najważniejsze standardy łączności, w tym USB-A, USB-C i HDMI, a w codziennym użytkowaniu powinieneś być w stanie pracować z nimi dobrze. Port USB-C służy jednak również do ładowania urządzenia. Mówiąc o tym, nie jesteśmy do końca zadowoleni z umiejscowienia portu USB-C - wolelibyśmy, gdyby znajdował się on z tyłu jednego z boków. Co więcej, większość złączy znajduje się po prawej stronie laptopa.
Komunikacja
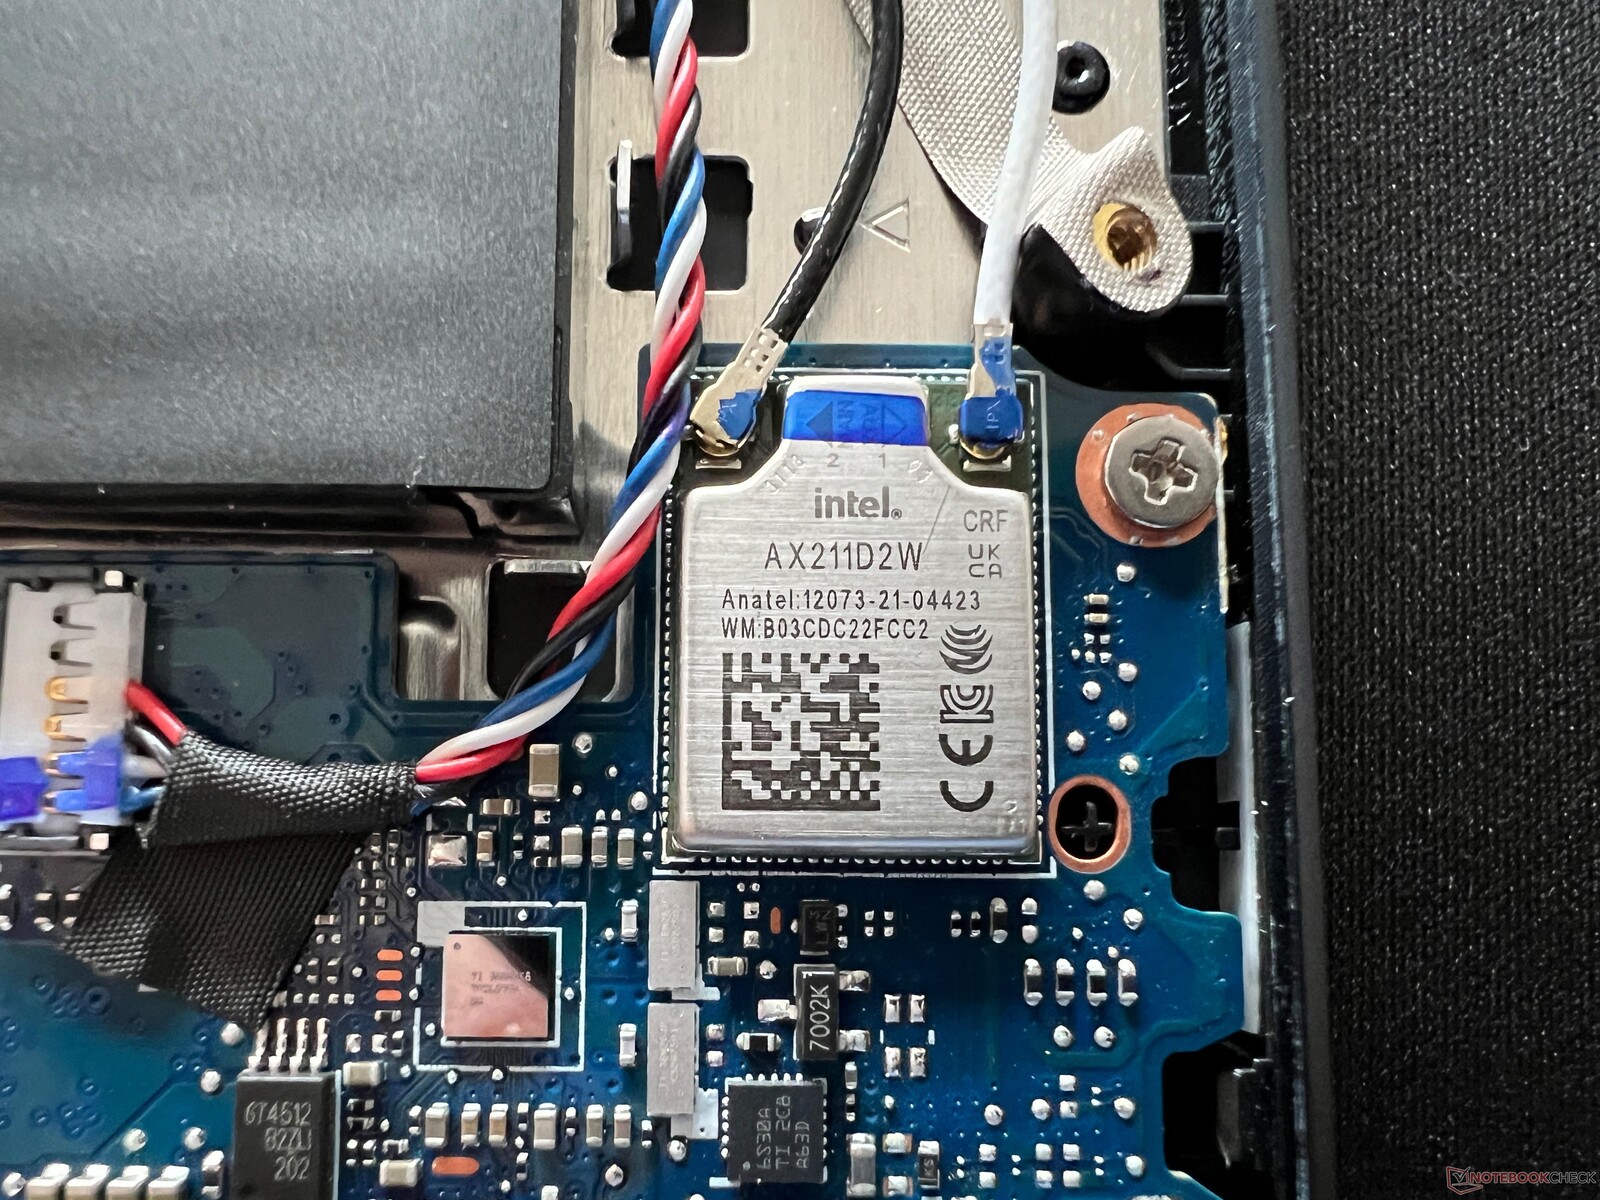
Nowy Zenbook 14 nie ma modułu Wi-Fi 7 - zamiast tego wykorzystuje dobrze znany moduł Intel AX211 z obsługą Wi-Fi 6. Szybkość transferu w połączeniu z naszym referencyjnym routerem od Asusa była bardzo dobra i stabilna, a podczas naszego okresu testowego nigdy nie mieliśmy żadnych problemów z połączeniem.
| Networking | |
| Asus ZenBook 14 UX3405MA | |
| iperf3 transmit AXE11000 | |
| iperf3 receive AXE11000 | |
| Tuxedo Pulse 14 Gen3 | |
| iperf3 transmit AXE11000 | |
| iperf3 receive AXE11000 | |
| Acer Swift Go 14 SFG14-72 | |
| iperf3 transmit AXE11000 | |
| iperf3 receive AXE11000 | |
| iperf3 transmit AXE11000 6GHz | |
| iperf3 receive AXE11000 6GHz | |
| Schenker Vision 14 2023 | |
| iperf3 transmit AXE11000 | |
| iperf3 receive AXE11000 | |
| Dell XPS 13 Plus 9320 Core i7-1360P | |
| iperf3 transmit AXE11000 | |
| iperf3 receive AXE11000 | |
| iperf3 transmit AXE11000 6GHz | |
| iperf3 receive AXE11000 6GHz | |
| Apple MacBook Air M2 Entry | |
| iperf3 transmit AXE11000 | |
| iperf3 receive AXE11000 | |
Kamera internetowa
Asus zainstalował kamerę internetową 1080p w górnej ramce wyświetlacza i zapewnia ona przyzwoitą jakość obrazu. Co więcej, użytkownicy mają dostęp do niektórych efektów studyjnych (miękka ostrość, kontakt wzrokowy, śledzenie). Jest też mechaniczna osłona, a także kamera na podczerwień do rozpoznawania twarzy za pomocą Windows Hello.


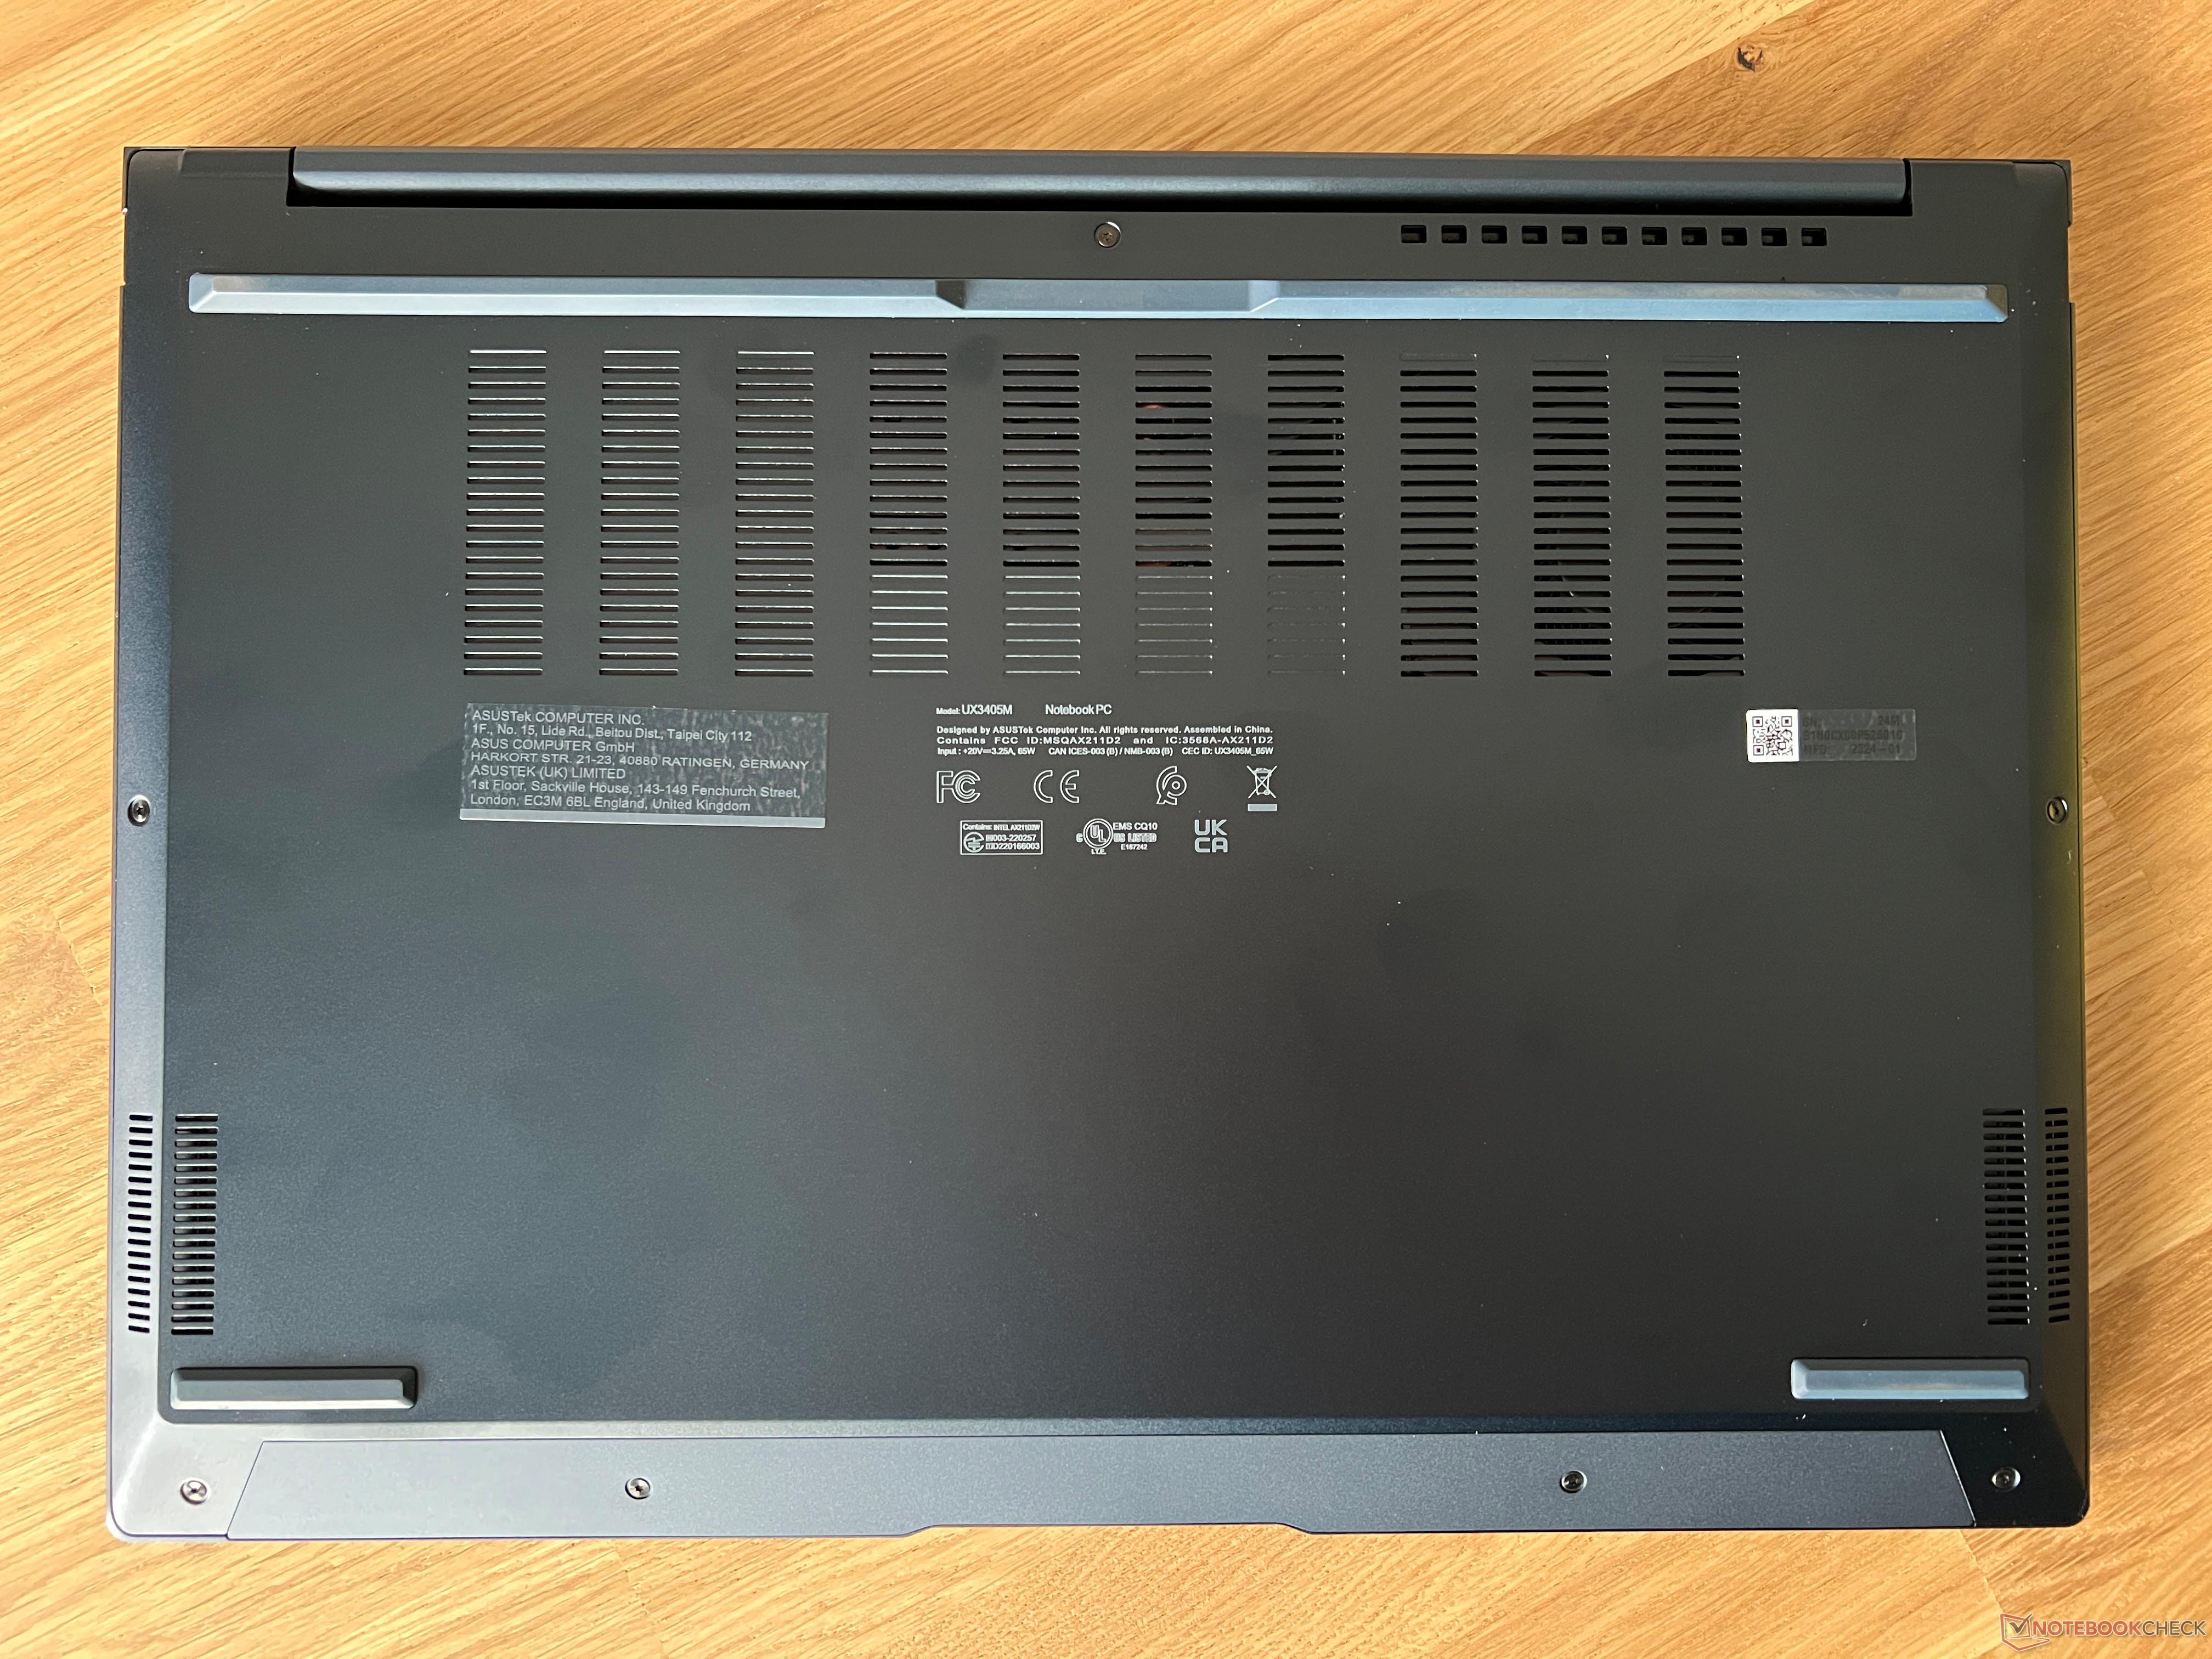
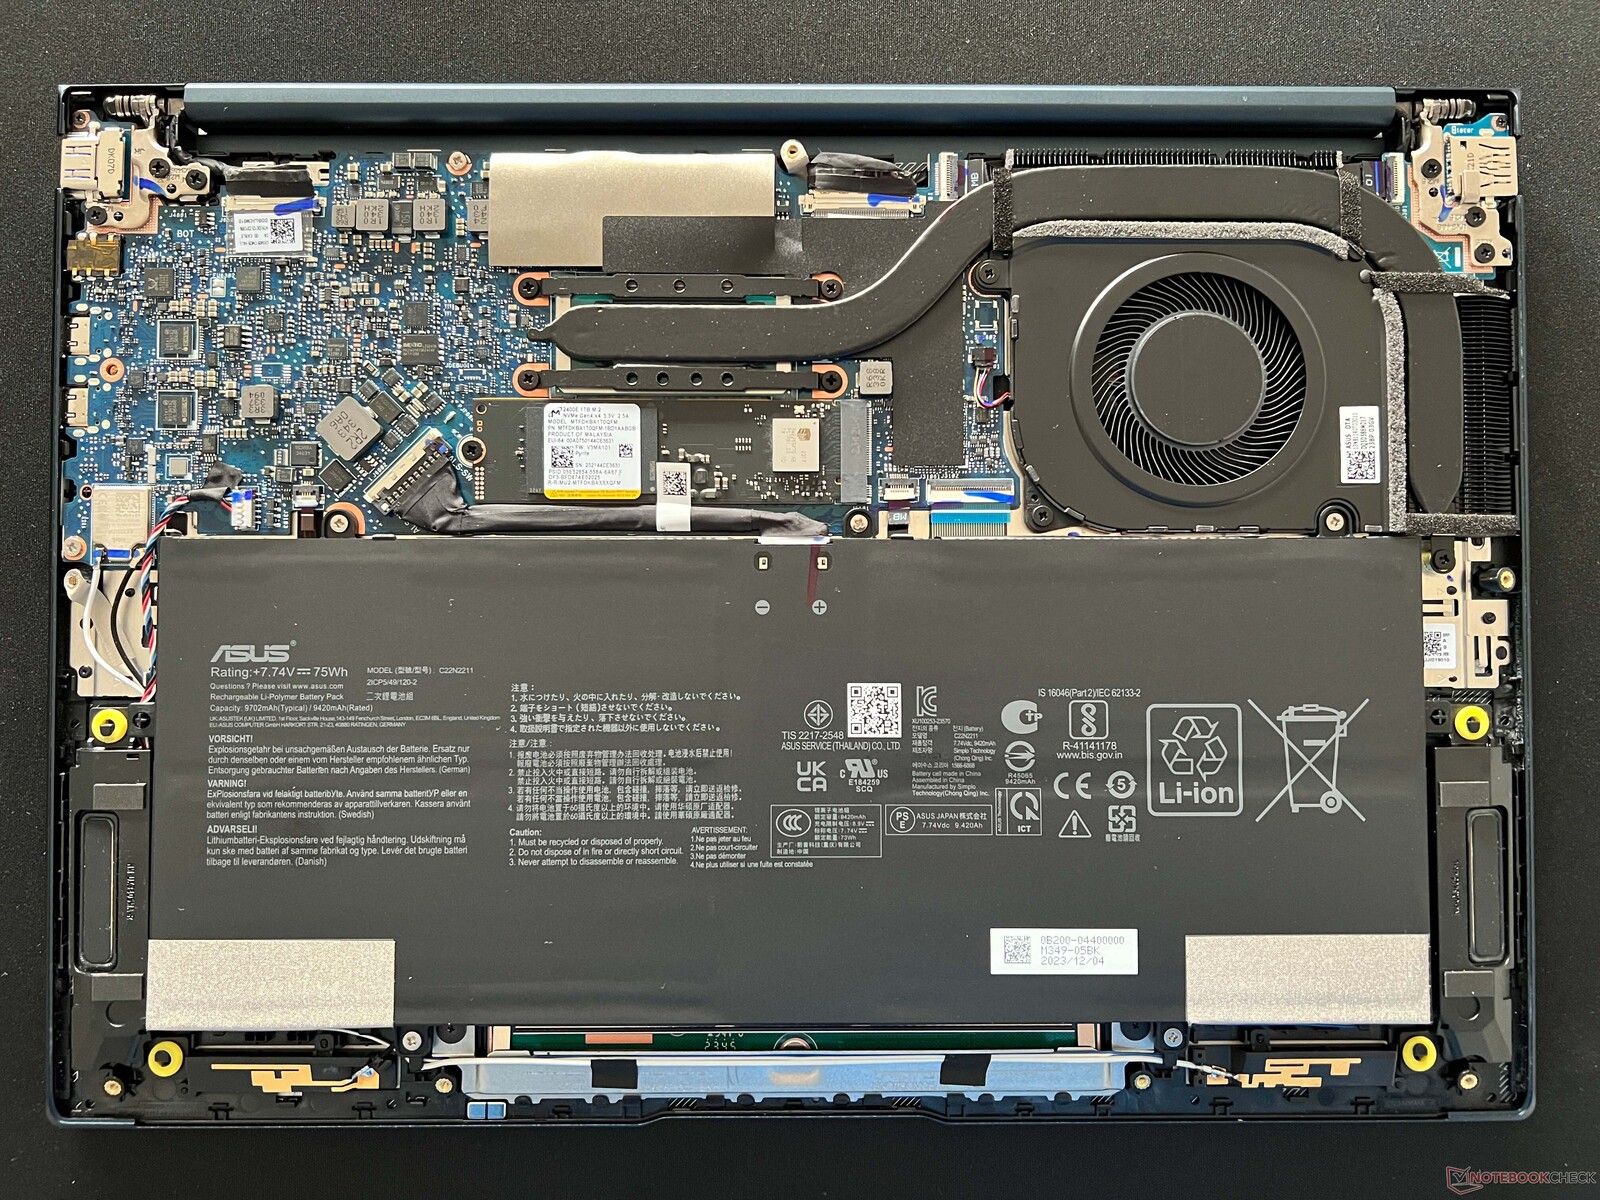
Konserwacja
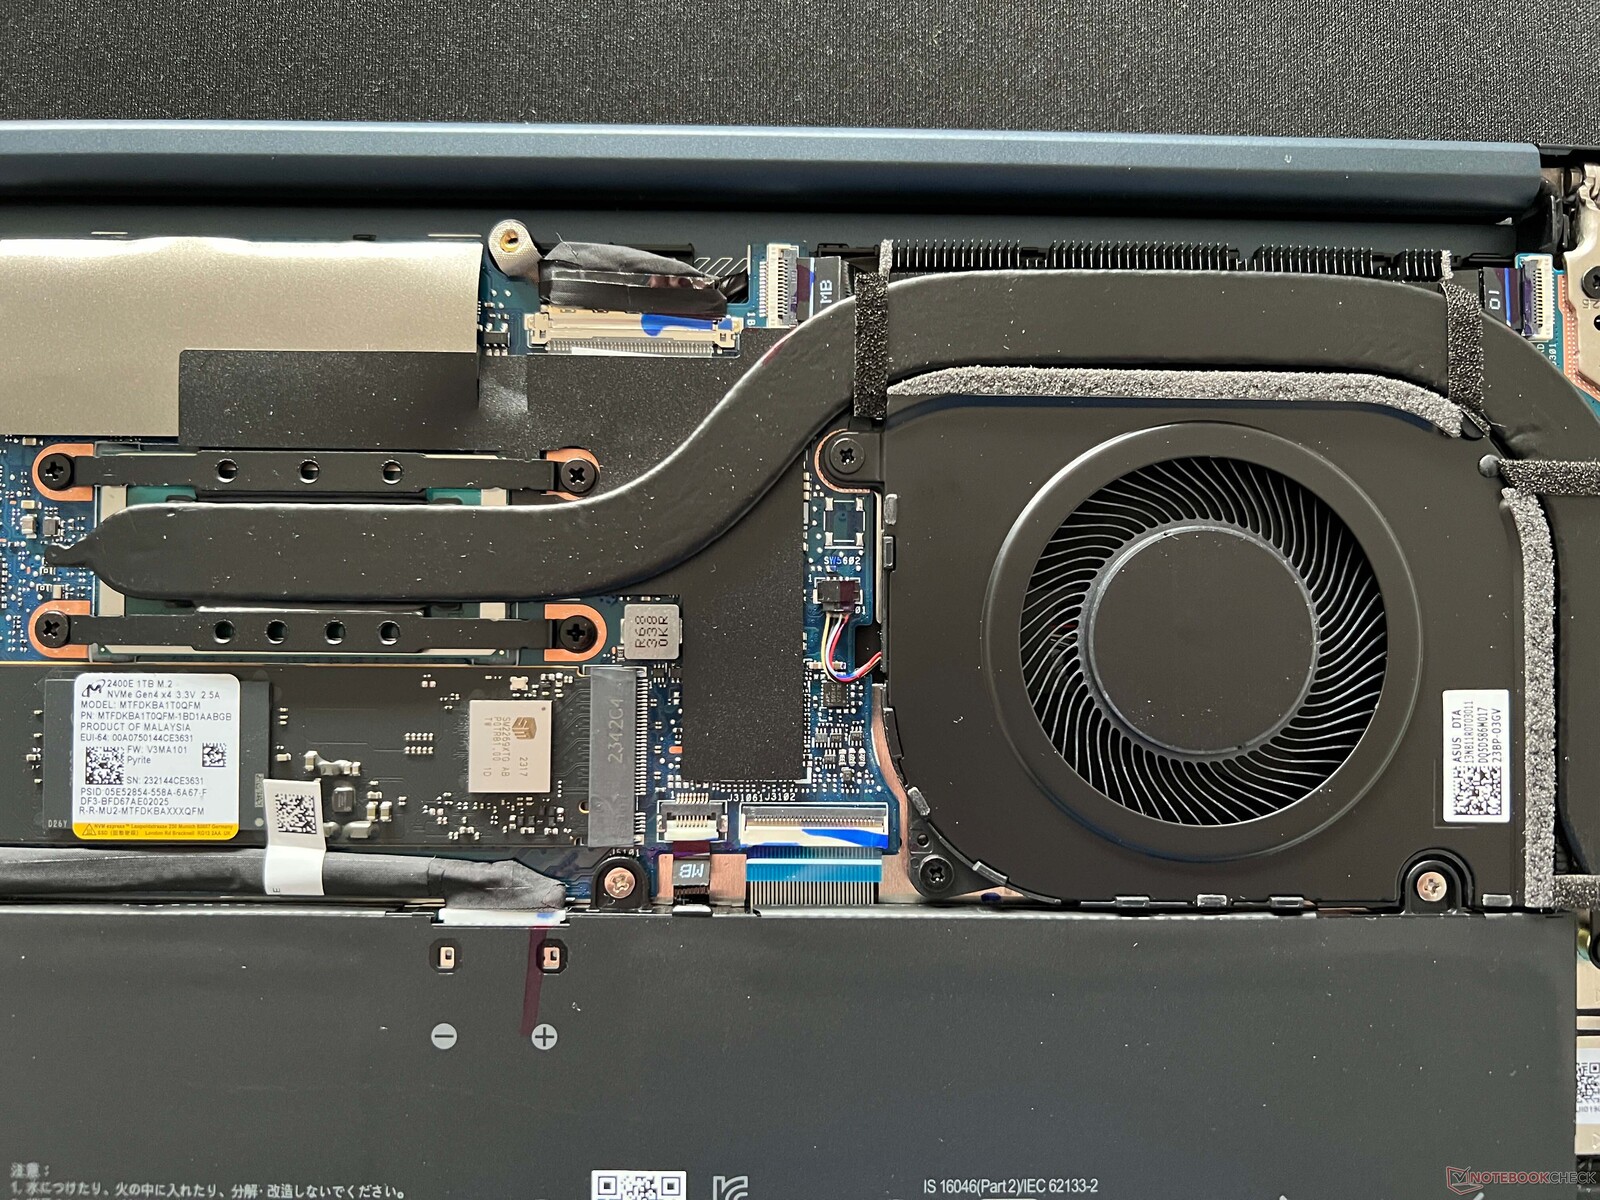
Dolna pokrywa jest utrzymywana na miejscu przez kilka śrub Torx, które można łatwo usunąć (brak ukrytych śrub). Wewnątrz można uzyskać dostęp do wentylatora w celu wyczyszczenia, a także wymienić dysk SSD M.2-2280 i baterię. Pamięć RAM i moduły WLAN są przylutowane.
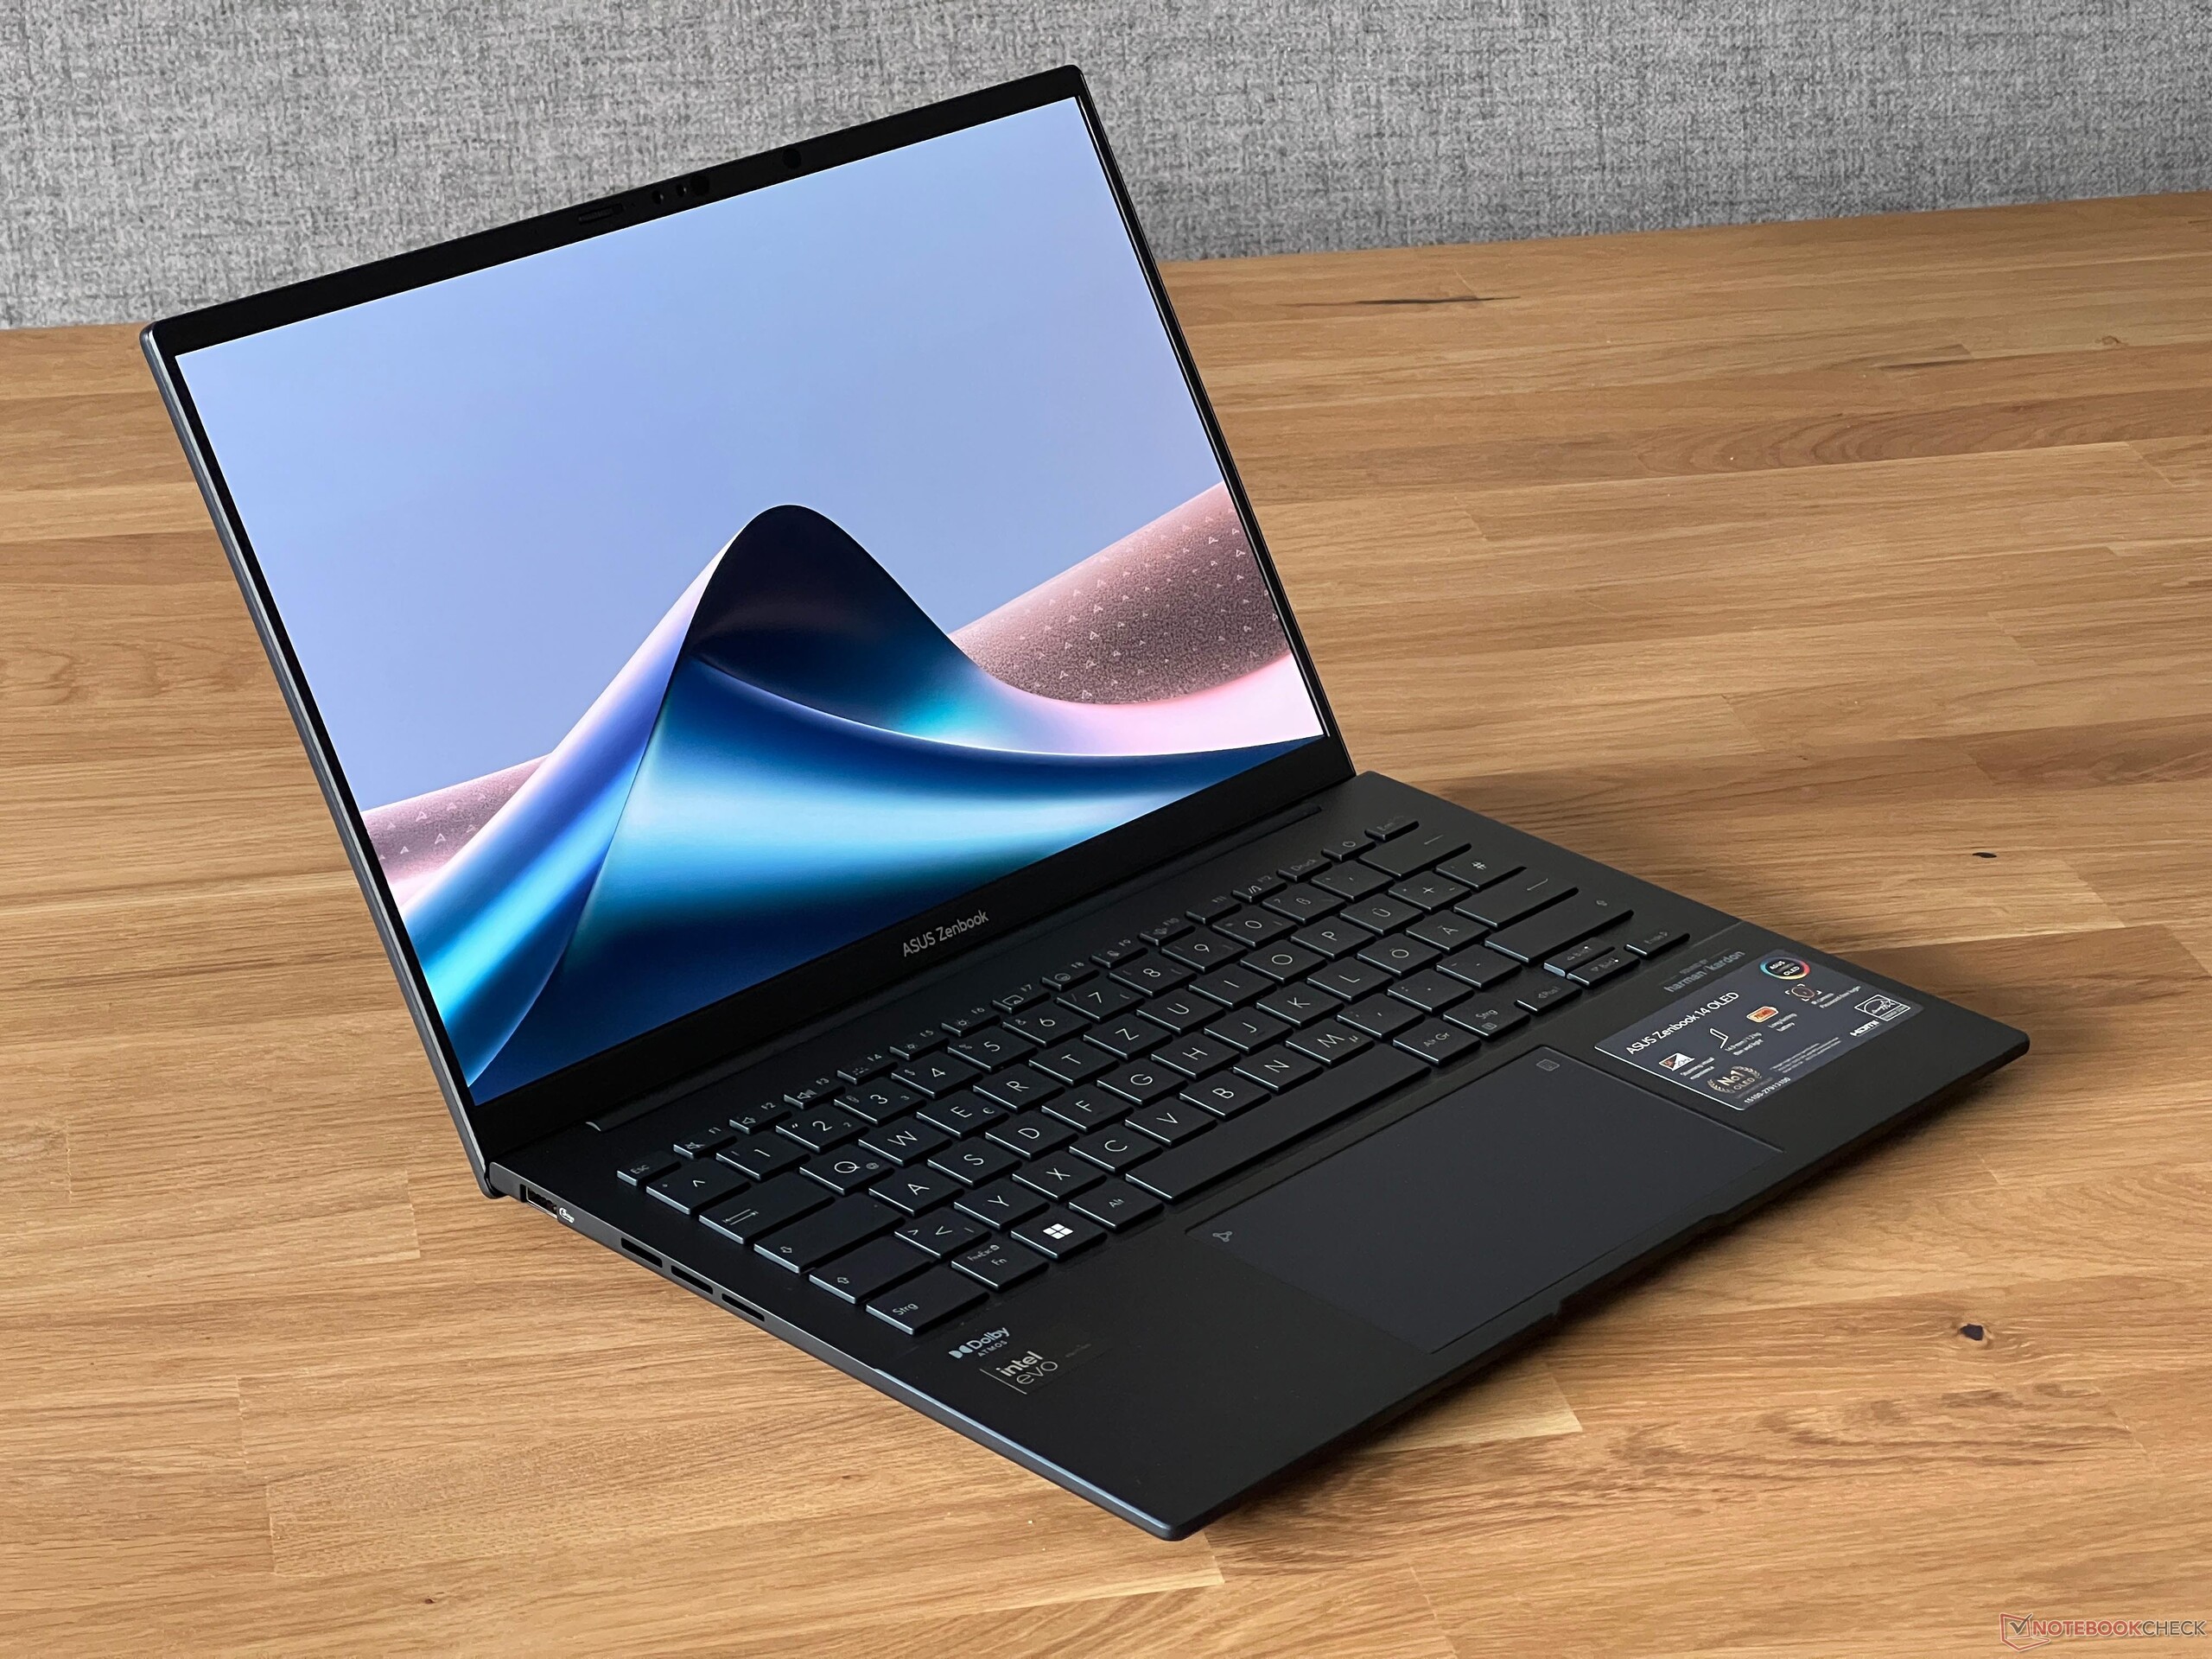
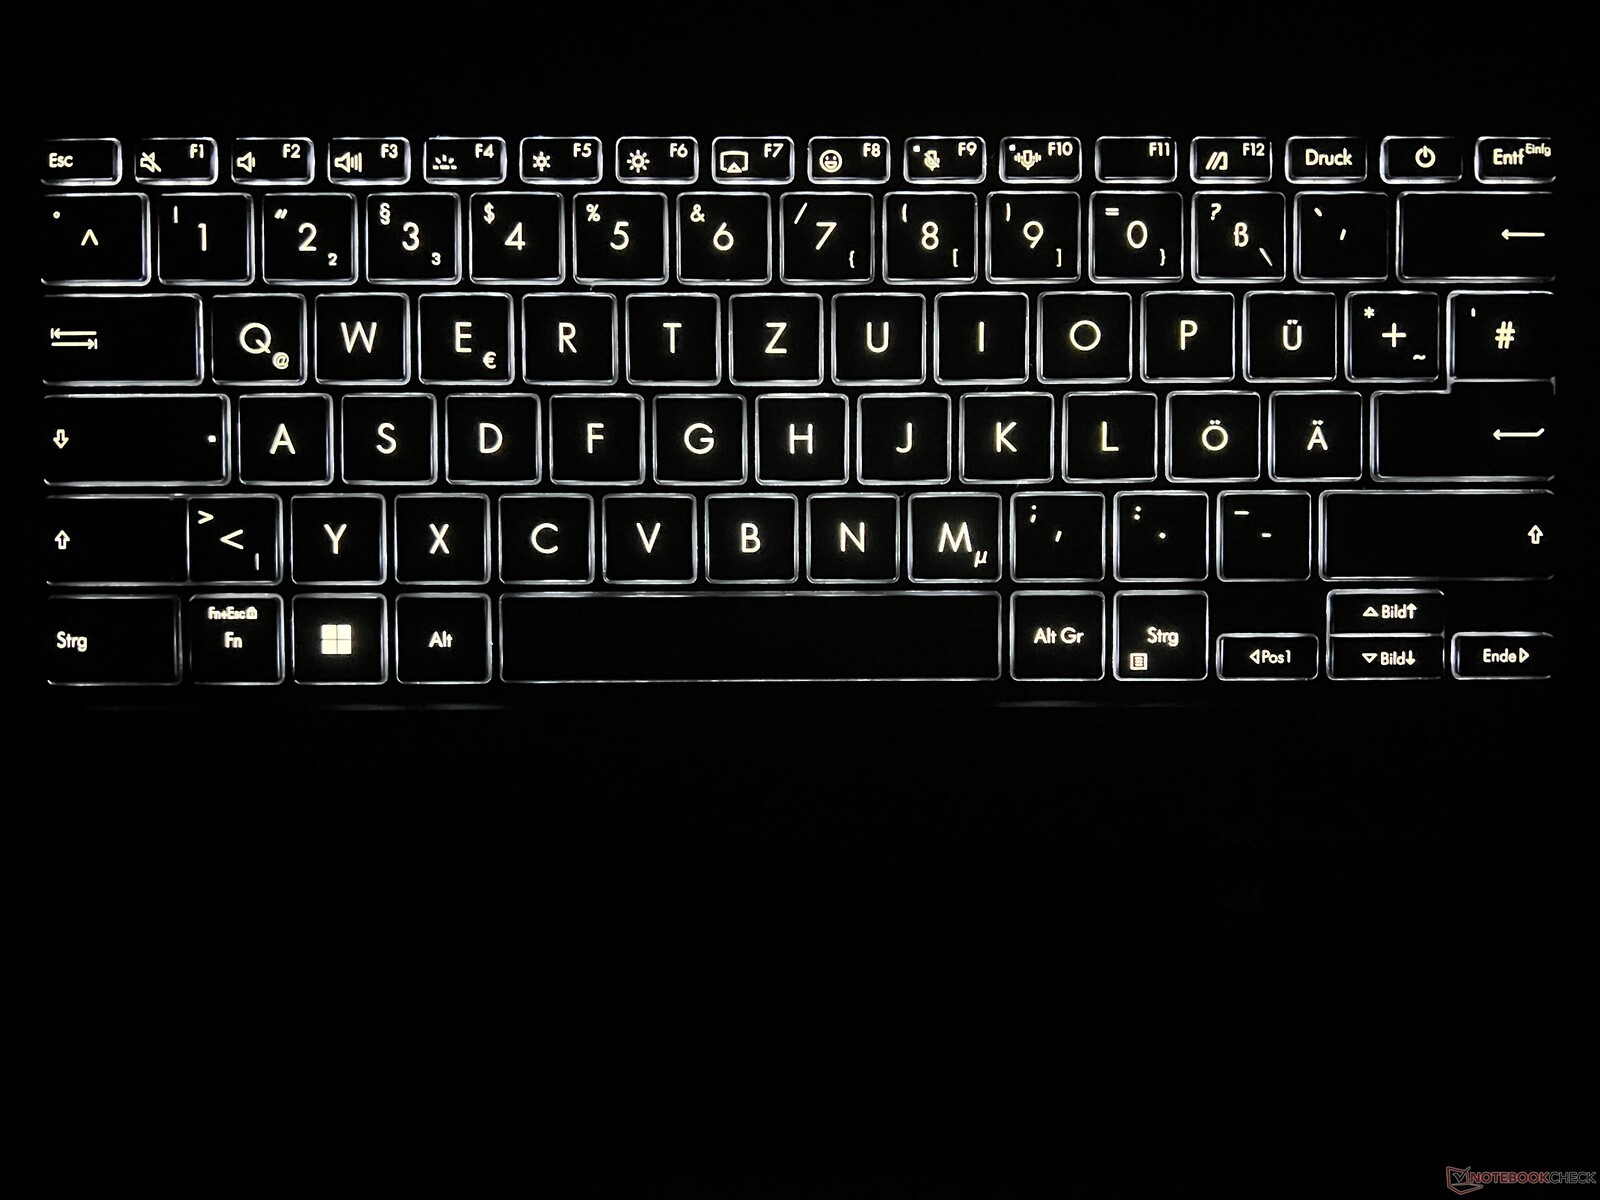
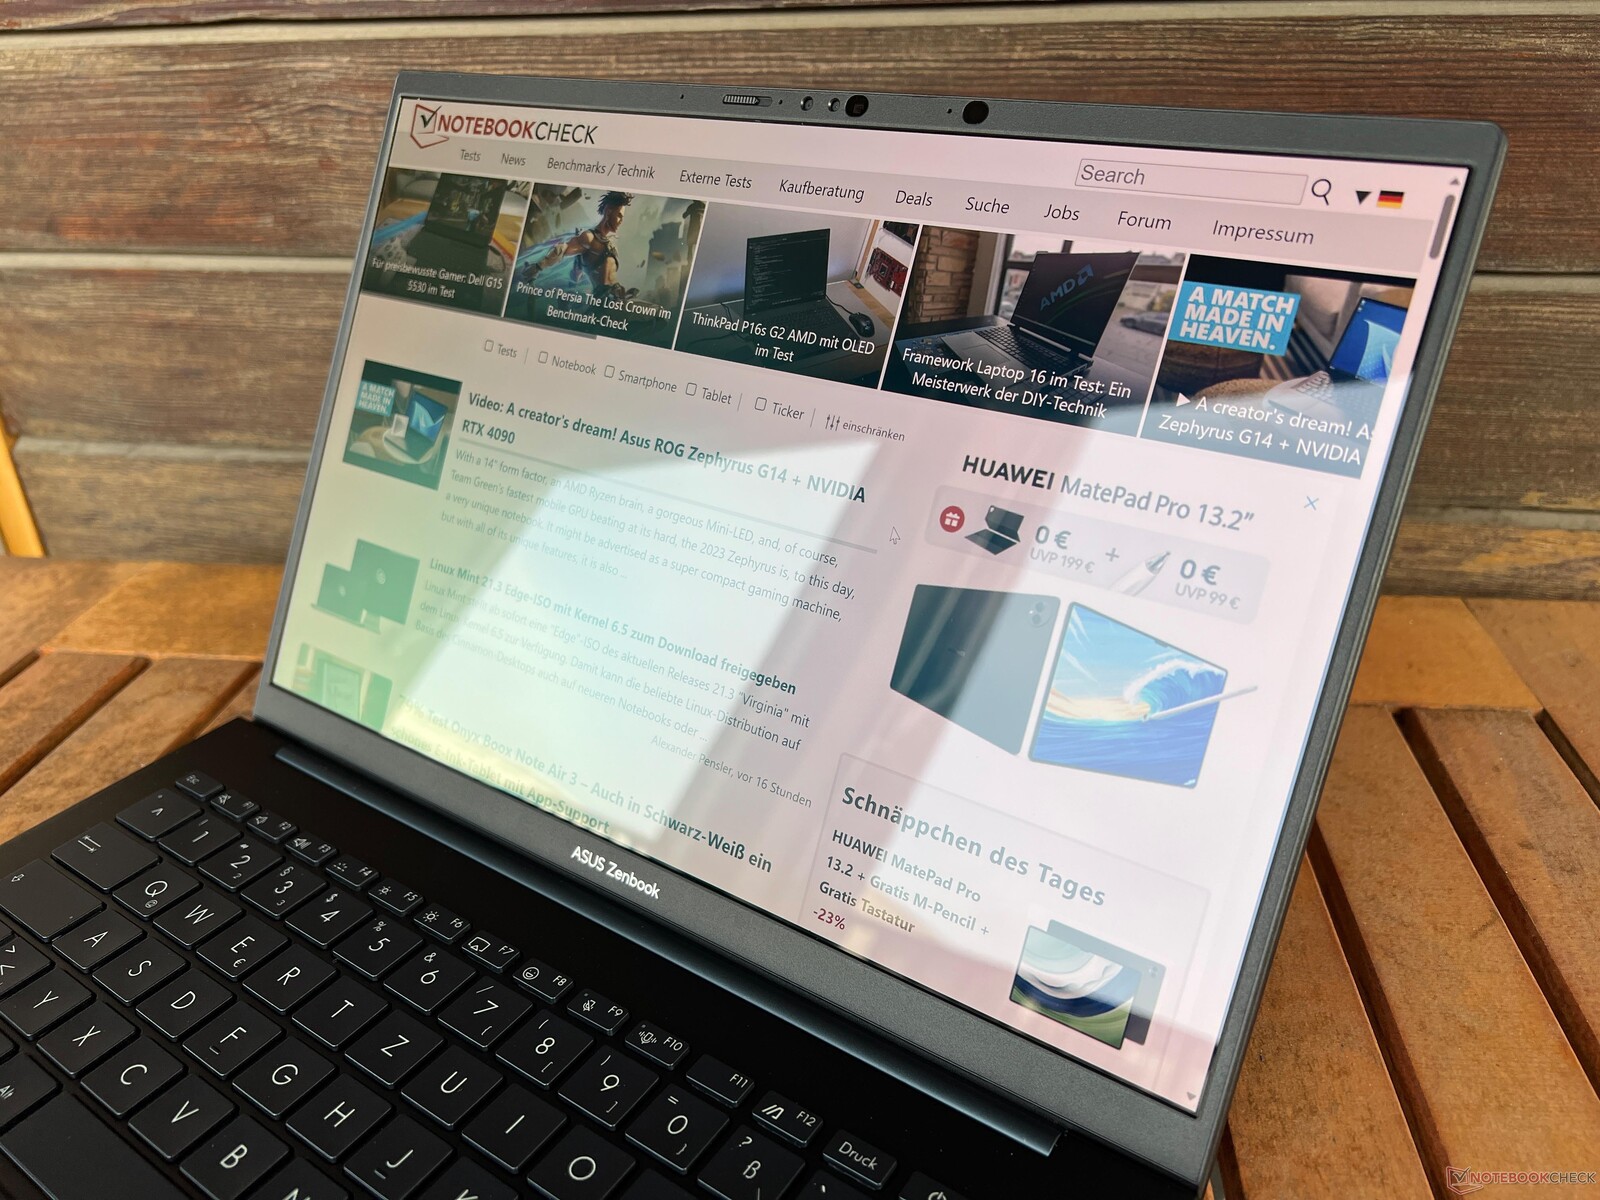
Urządzenia wejściowe - klawiatura ze skokiem 1,4 mm
Klawiatura laptopa o skoku klawiszy wynoszącym 1,4 mm nie kryje w sobie żadnych niespodzianek. Pisze się na niej wygodnie i precyzyjnie, a jedynie większe klawisze są nieco głośniejsze. Ogólnie rzecz biorąc, jest to dobra klawiatura. Z drugiej strony, jej układ nie jest całkowicie idealny, ponieważ klawisze strzałek są małe i jest tylko jeden klawisz Enter. Białe podświetlenie ma trzy poziomy intensywności i może być automatycznie aktywowane lub dezaktywowane za pomocą czujnika jasności.
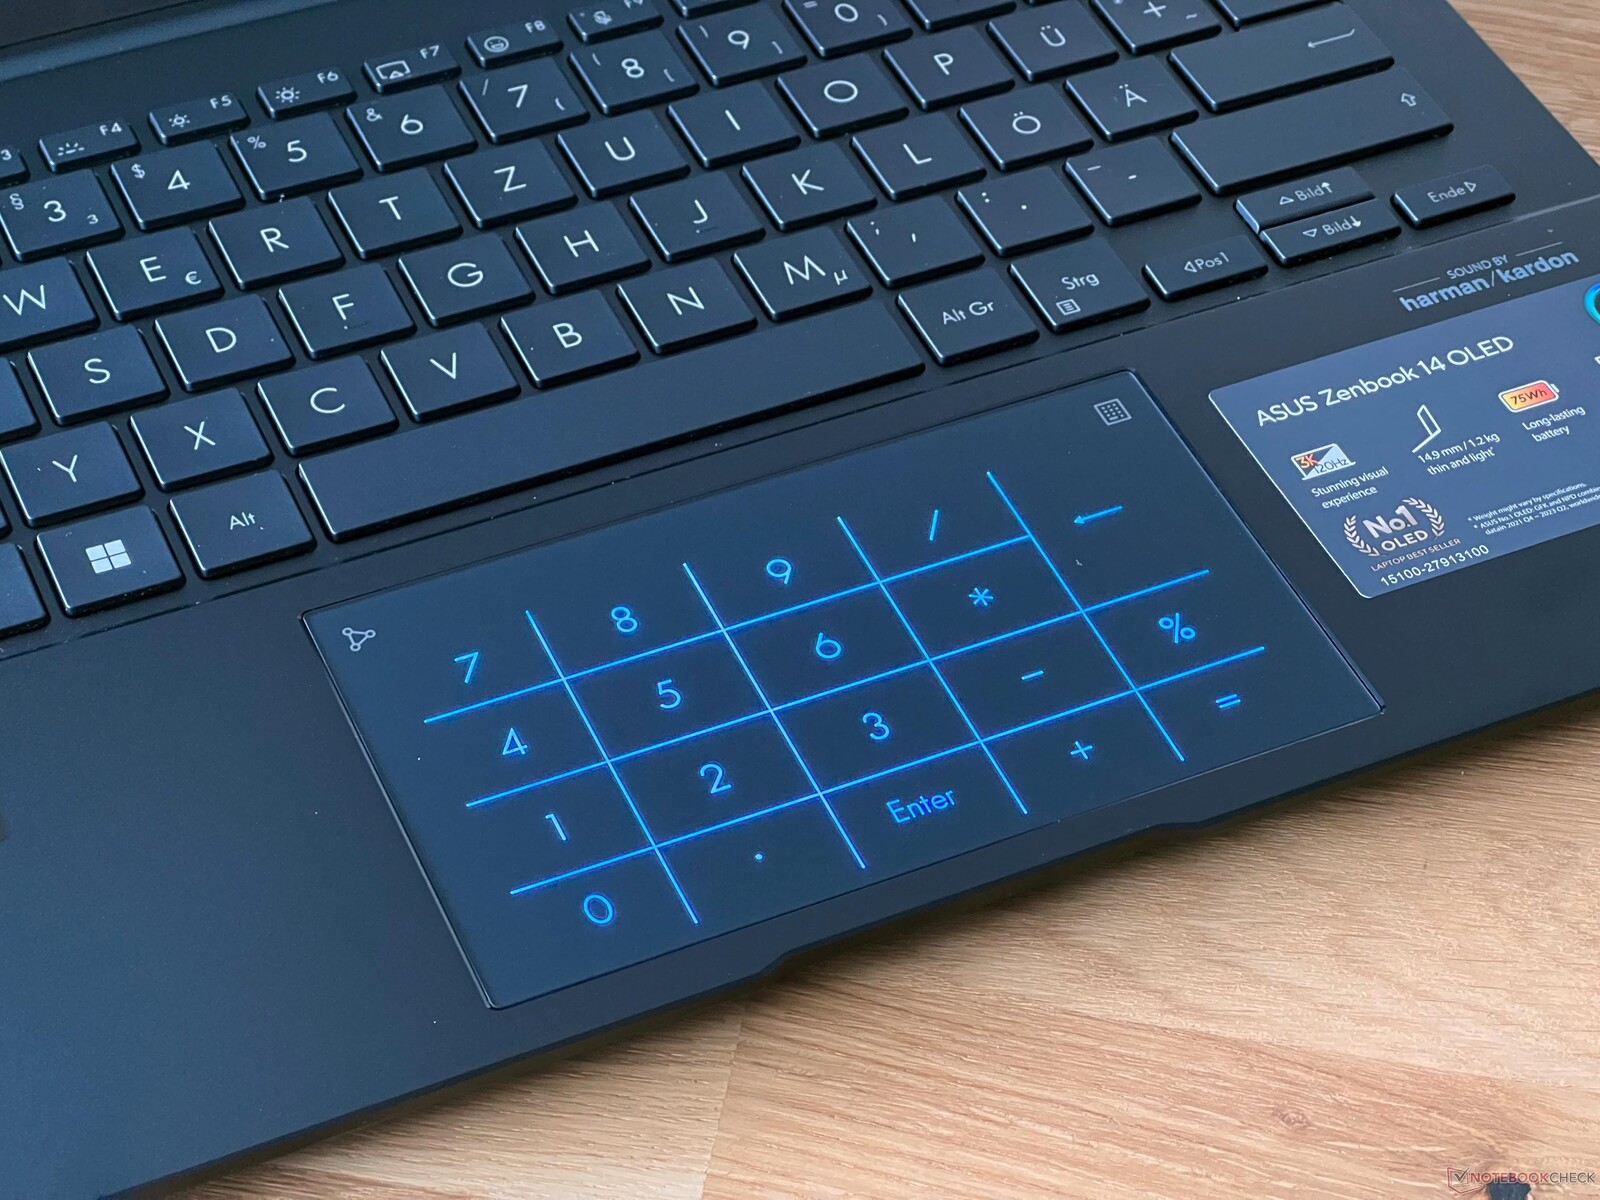
Klawiatura (13 x 7,5 cm) jest przyjemna i gładka i można ją obsługiwać bez żadnych problemów. Dolną połowę można nacisnąć, ale spotyka się to z głośnym kliknięciem. Wirtualną klawiaturę numeryczną można wyświetlić, klikając w prawym górnym rogu klawiatury. Wskaźnik myszy można wtedy nadal przesuwać, tylko kliknięcia stają się nieco skomplikowane. Ogólnie jednak klawiatura numeryczna działa dobrze.
Wyświetlacz - OLED 120 Hz
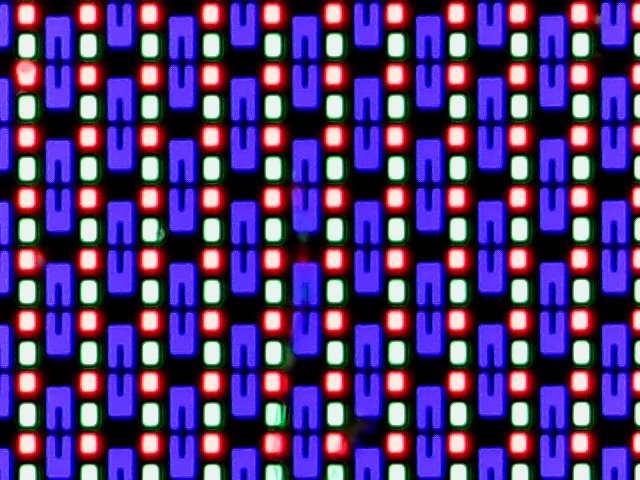
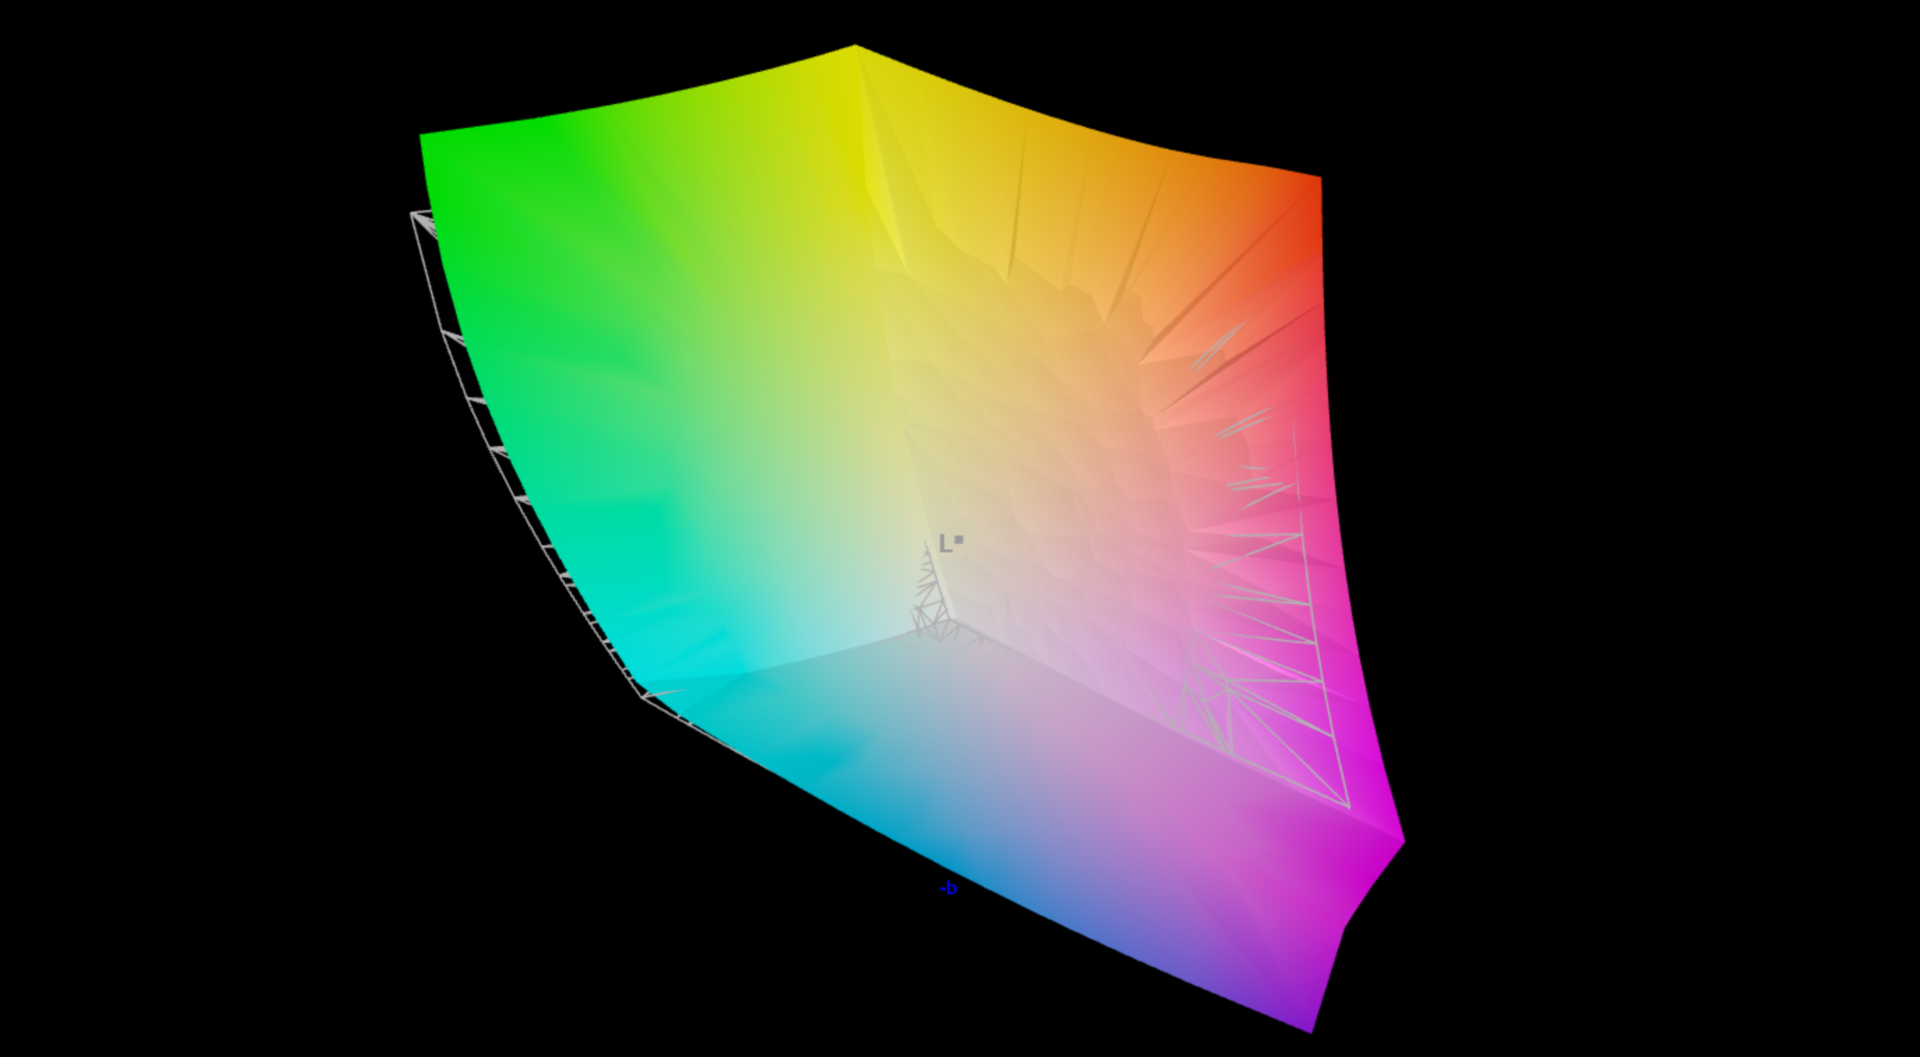
Asus oferuje swojego nowego Zenbooka 14 wyłącznie z panelami OLED - nasze urządzenie testowe posiada opcjonalny wariant 3K (2880 x 1800 pikseli, 16:10) z częstotliwością odświeżania 120 Hz, ale wejścia dotykowe nie są obsługiwane. Subiektywnie, jakość obrazu jest niesamowita i oprócz absolutnej czerni, wyświetlacz przedstawia również bardzo żywe kolory. Co więcej, jego czas reakcji jest niezwykle szybki, a ruchy wydają się bardzo płynne dzięki częstotliwości odświeżania 120 Hz. Jasność i temperatura kolorów mogą być regulowane automatycznie.
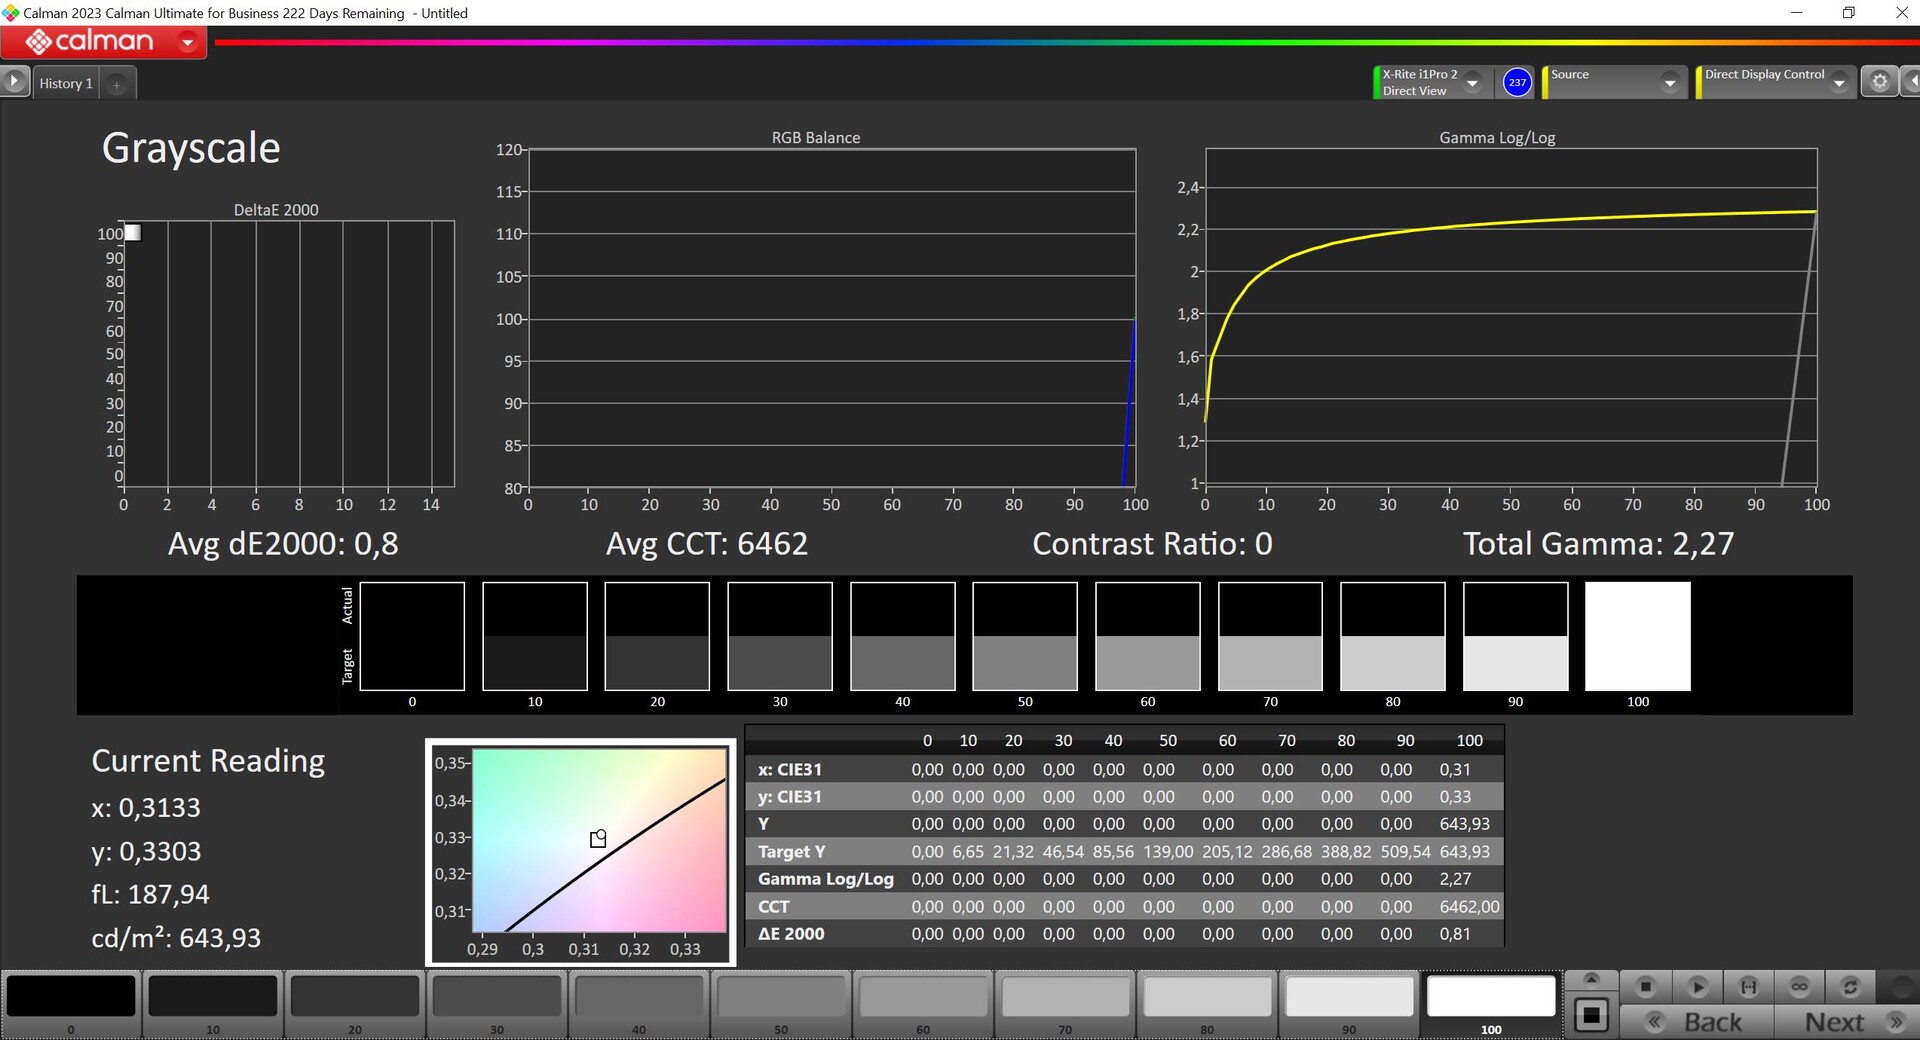
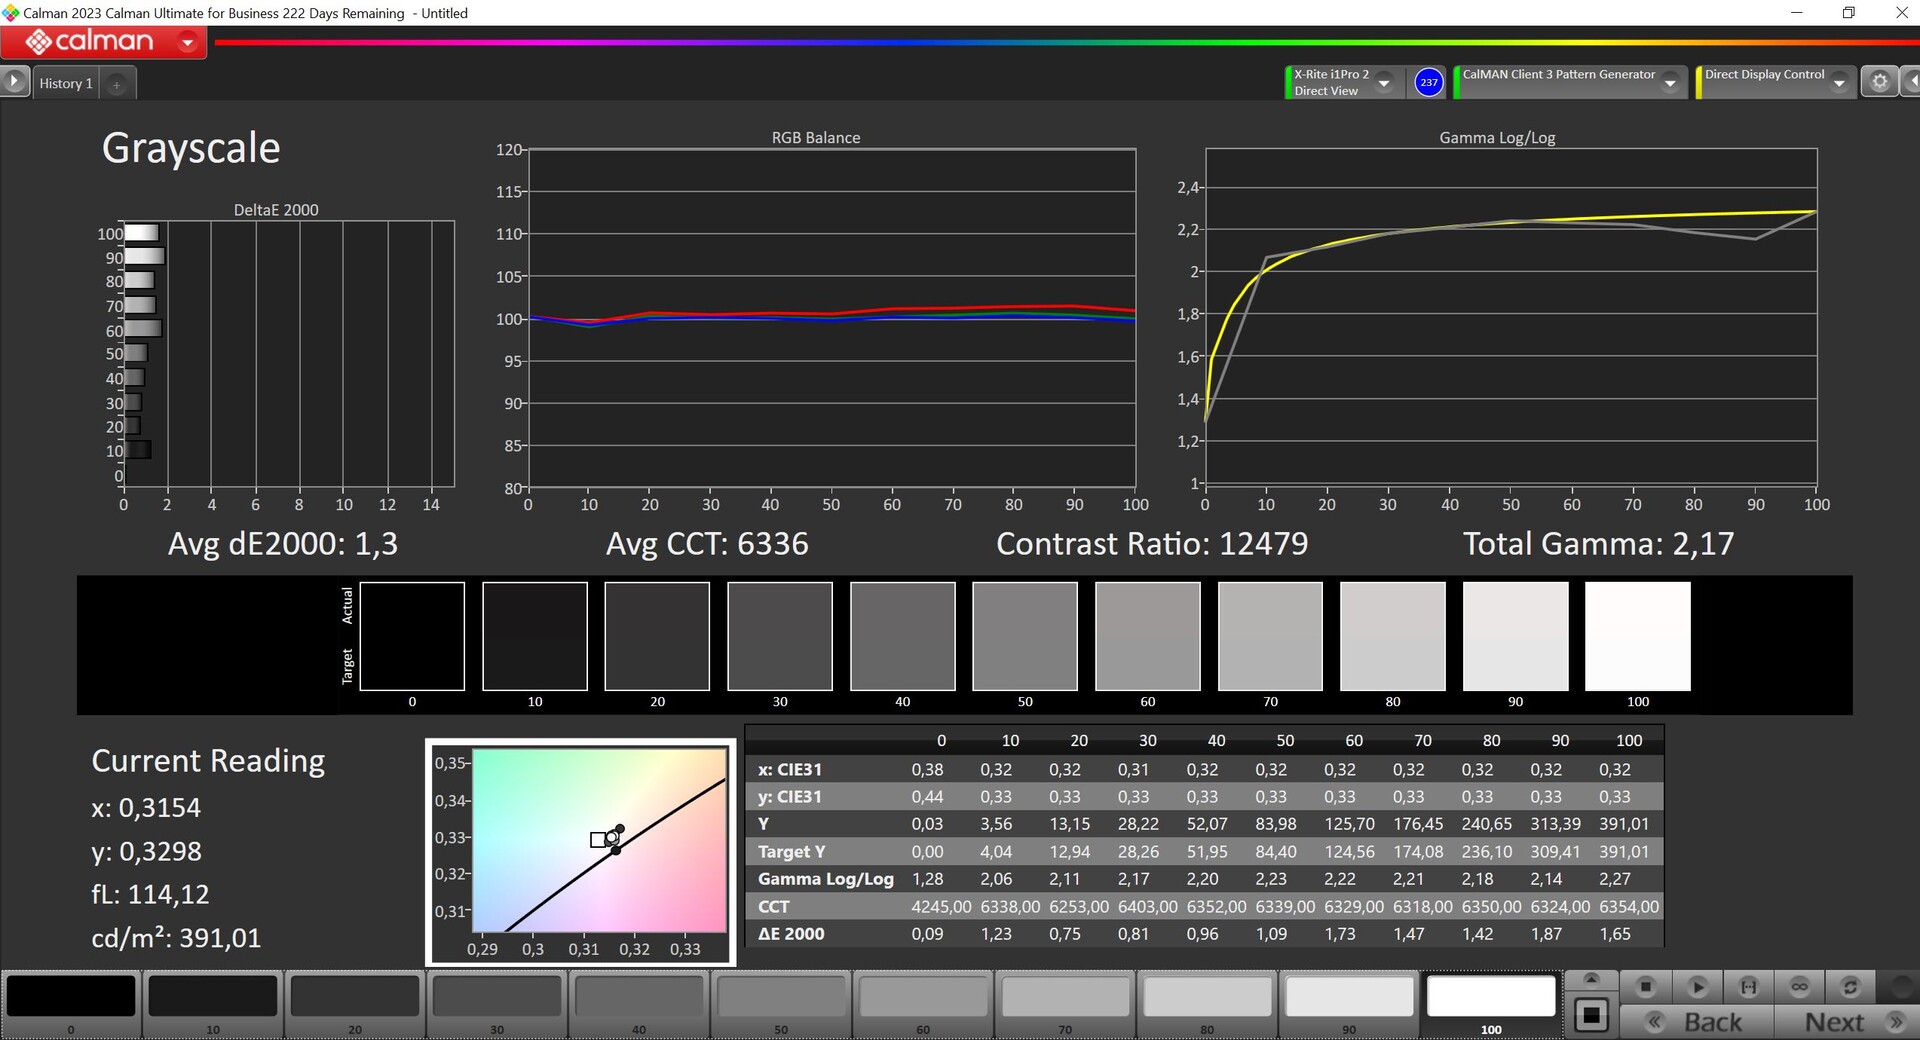
Maksymalna jasność w trybie SDR wynosi średnio 392 cd/m², a dzięki wyjątkowo niskiej wartości czerni, maksymalny współczynnik kontrastu jest bardzo wysoki. W przeciwieństwie do innych obecnych modeli OLED, Zenbook 14 radzi sobie również bardzo dobrze w trybie HDR - tutaj osiągnął wartości do 644 cd/m² przy wyświetlaniu maksymalnej jasności na małych obszarach i 620 cd/m² przy wyświetlaniu w pełni jasnego ekranu. W grę wchodzą tu jednak te same ograniczenia systemu Windows, gdyż tryb HDR trzeba aktywować ręcznie, a wtedy zarządzanie kolorami przestaje działać.
| |||||||||||||||||||||||||
rozświetlenie: 98 %
na akumulatorze: 389 cd/m²
kontrast: 19550:1 (czerń: 0.02 cd/m²)
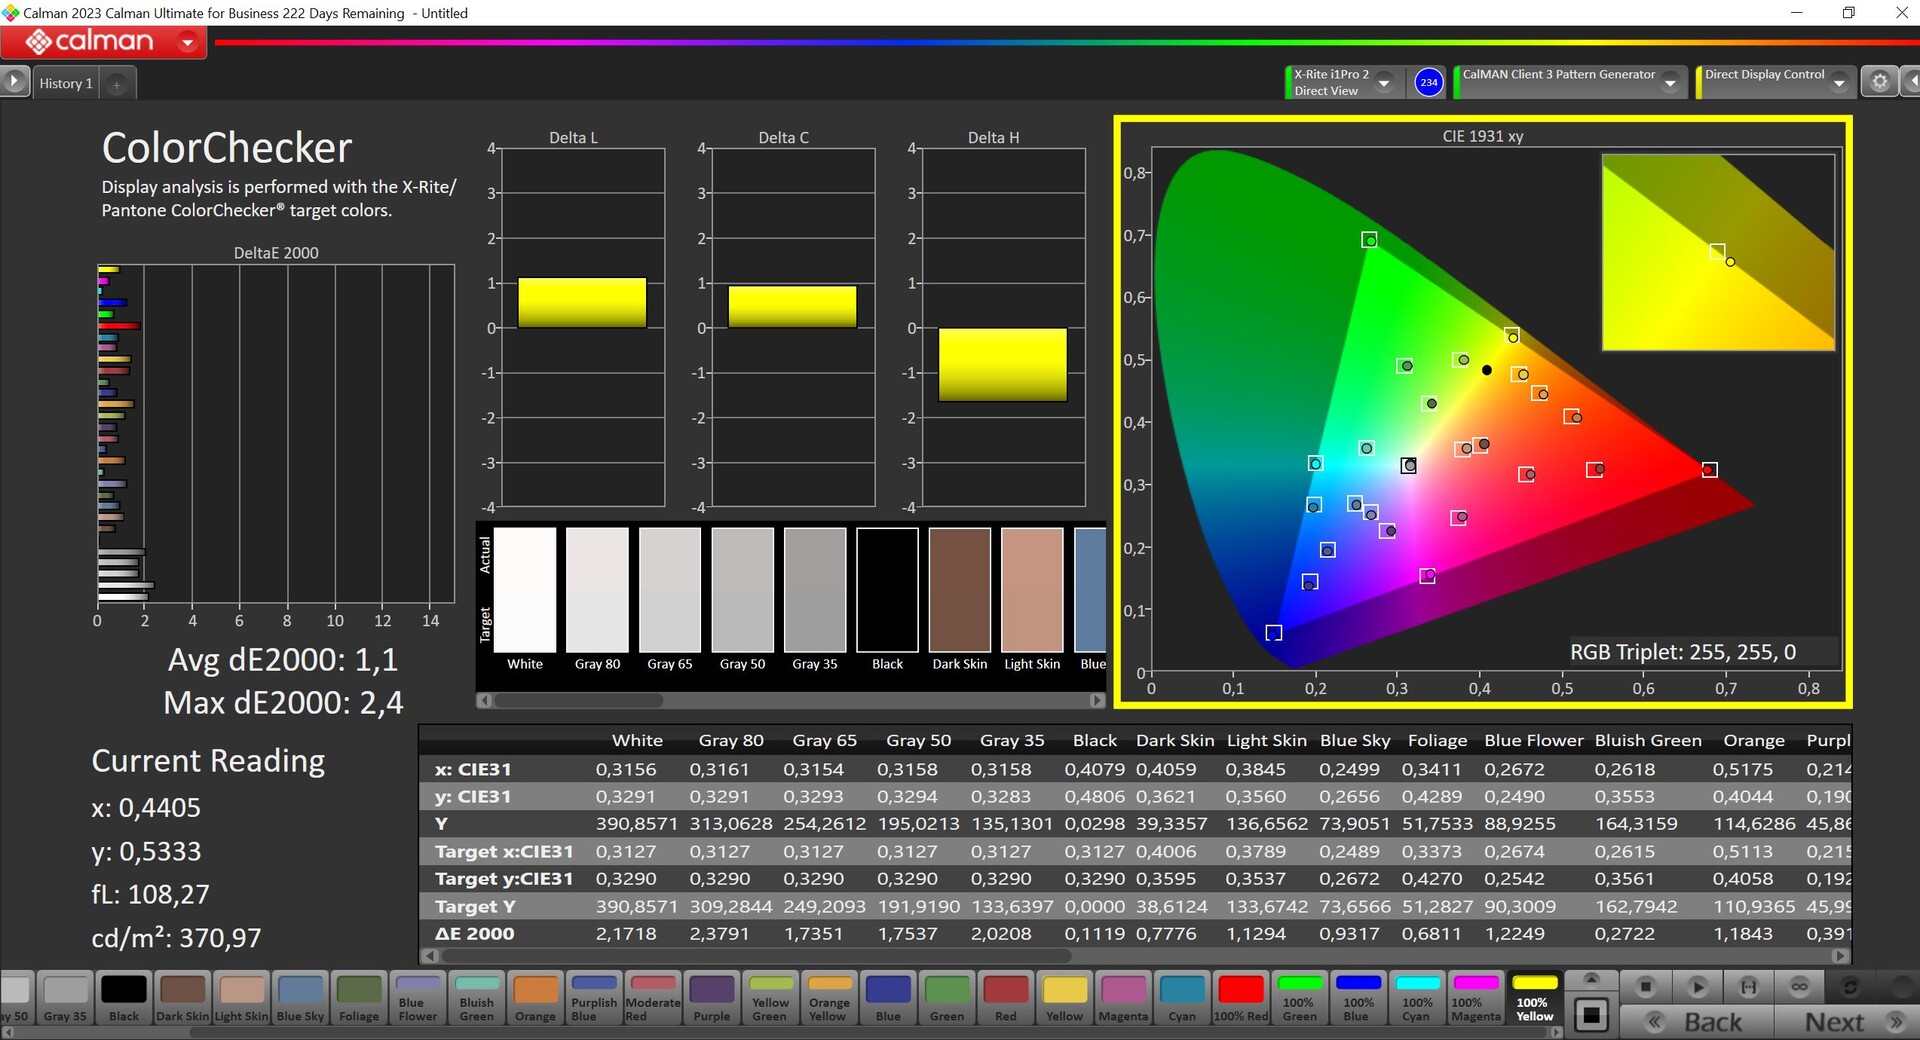
ΔE ColorChecker Calman: 1.1 | ∀{0.5-29.43 Ø4.71}
ΔE Greyscale Calman: 1.3 | ∀{0.09-98 Ø4.96}
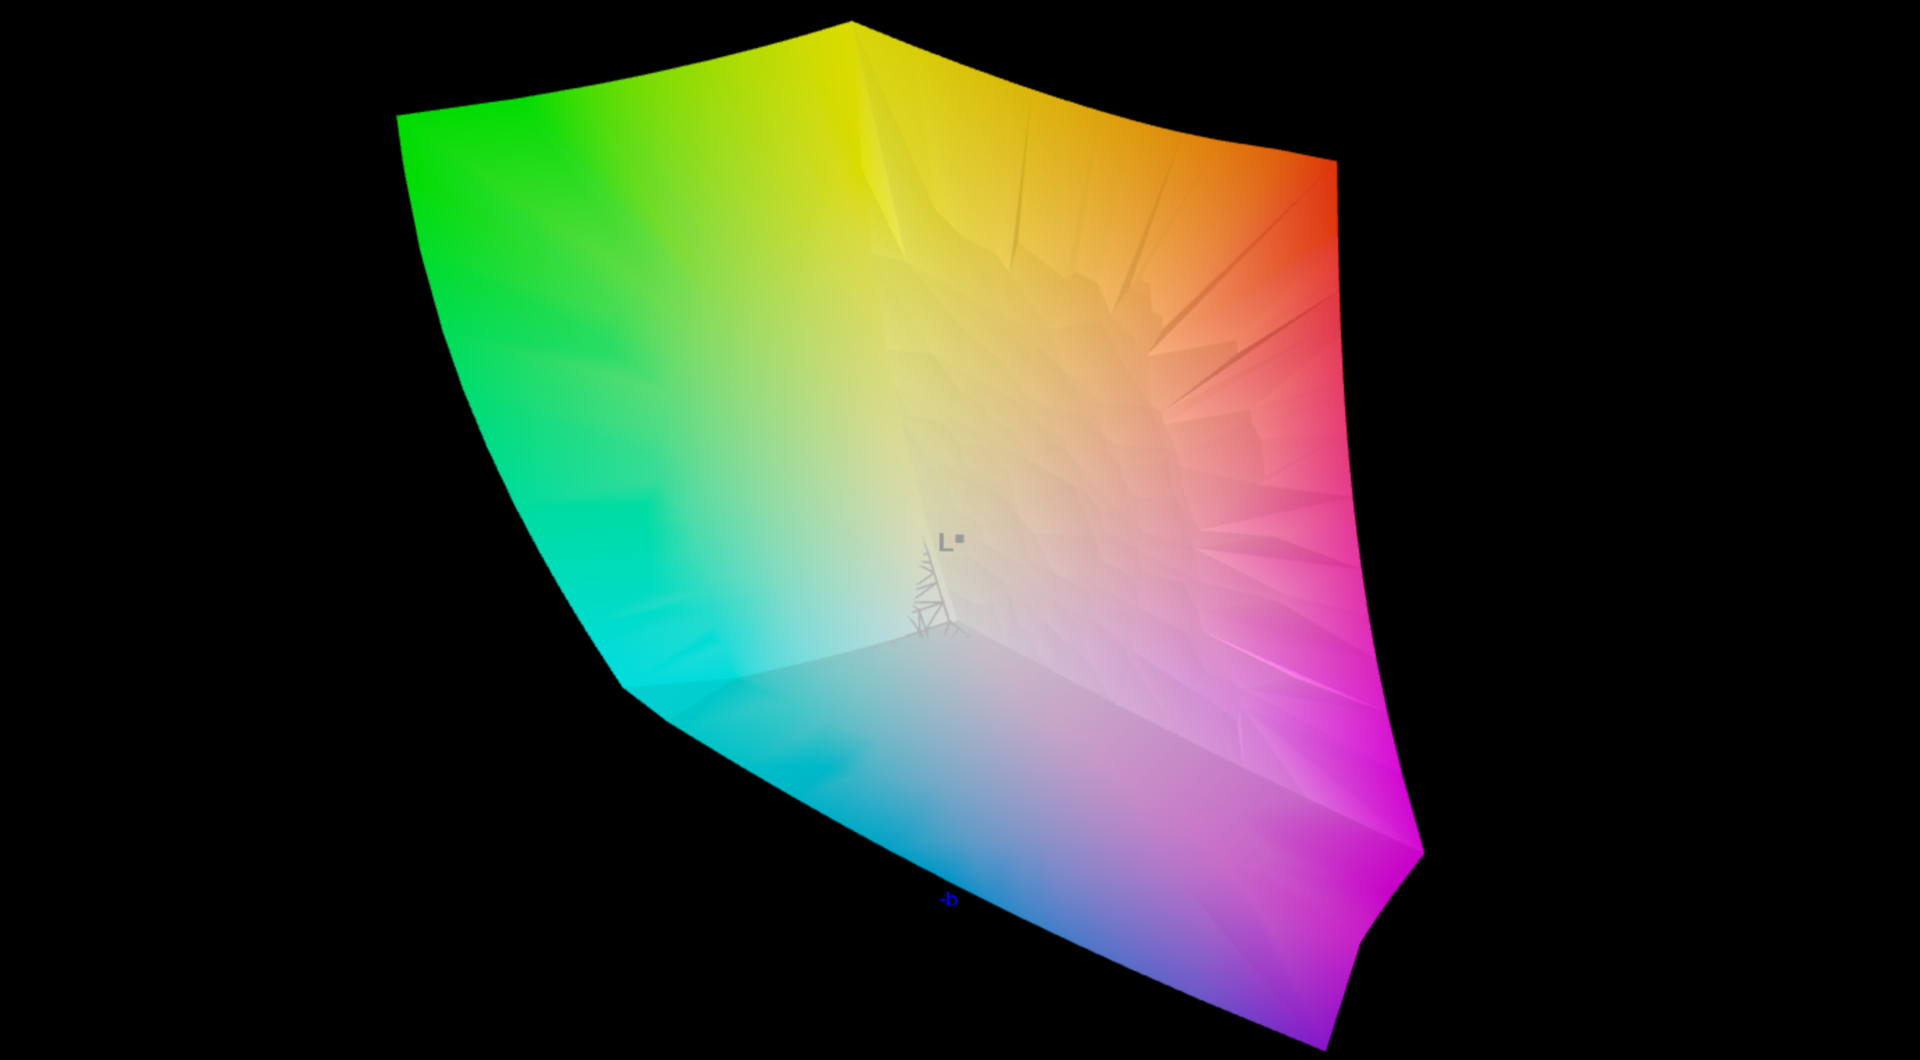
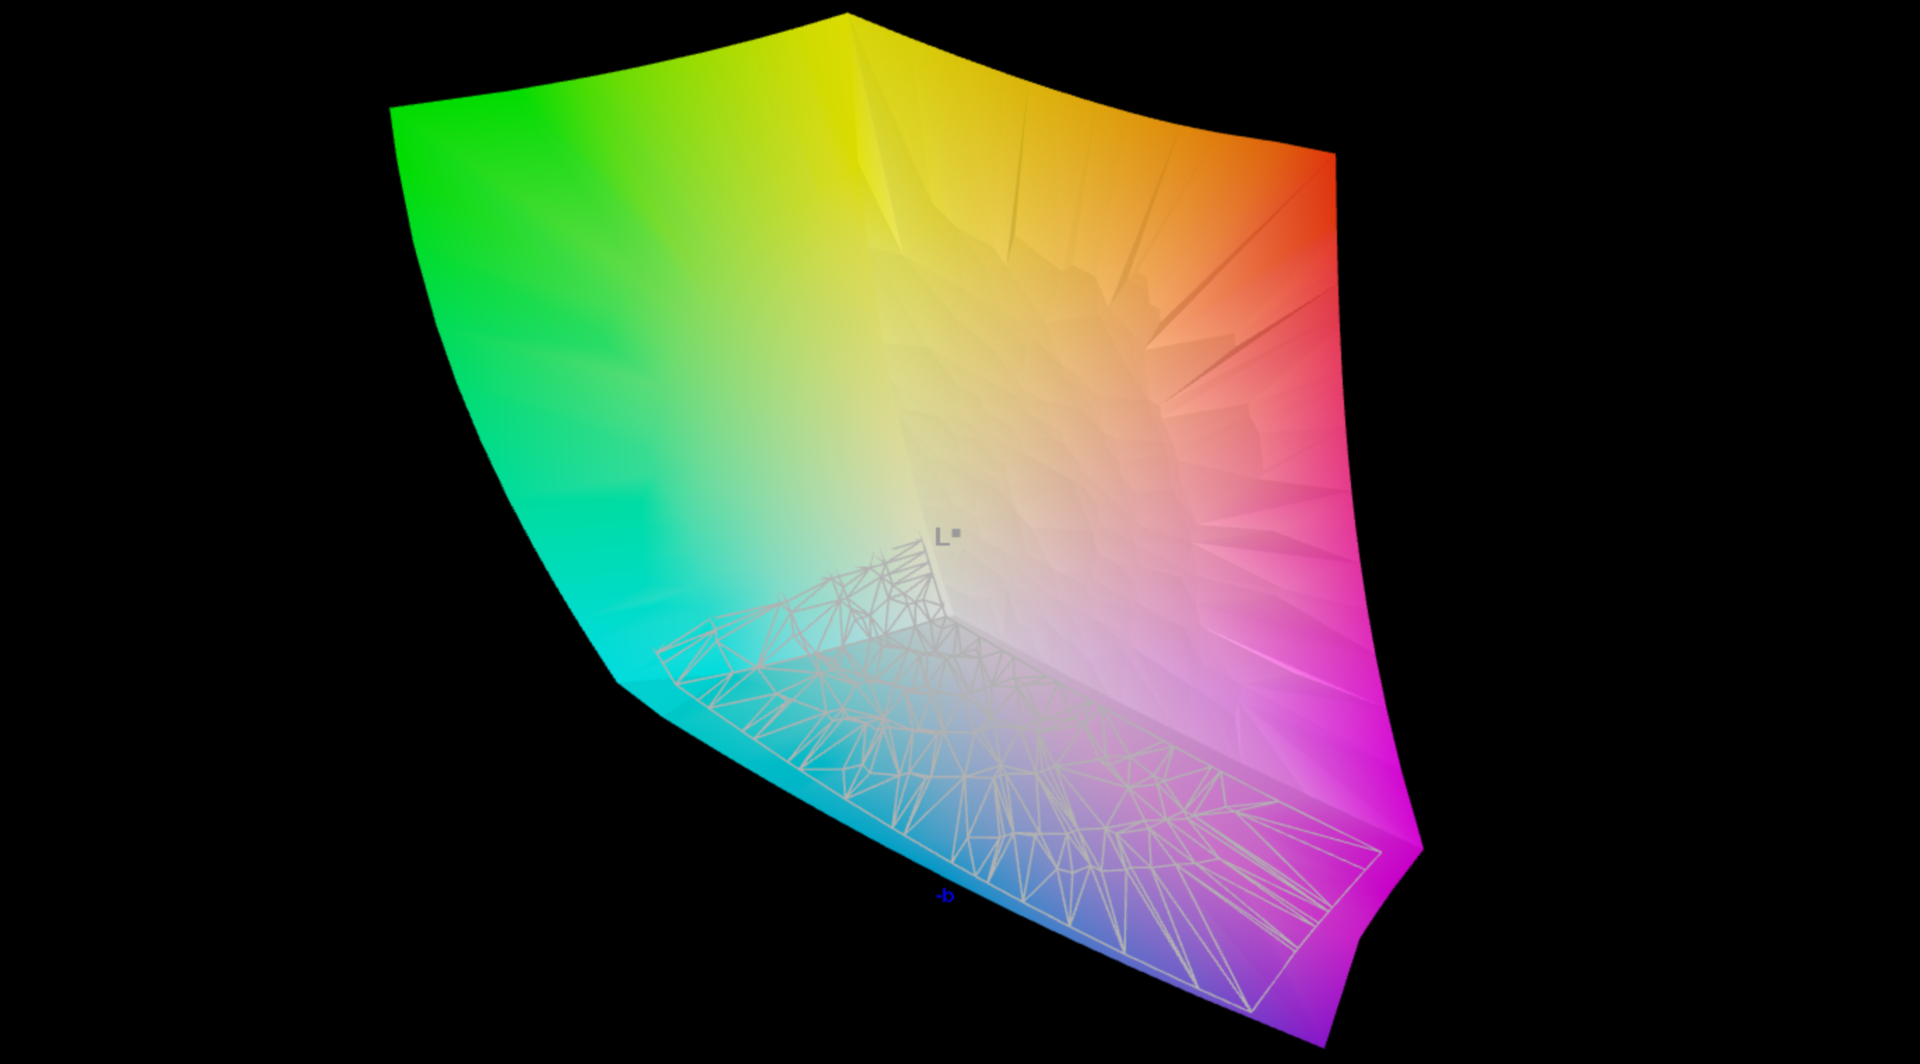
97.6% AdobeRGB 1998 (Argyll 3D)
100% sRGB (Argyll 3D)
99.8% Display P3 (Argyll 3D)
Gamma: 2.17
CCT: 6336 K
| Asus ZenBook 14 UX3405MA ATNA40CU06-0, OLED, 2880x1800, 14" | Tuxedo Pulse 14 Gen3 TL140ADXP24-0, IPS, 2880x1800, 14" | Acer Swift Go 14 SFG14-72 ATNA40YK11-0, OLED, 2880x1800, 14" | Schenker Vision 14 2023 CSOT T3 MNE007ZA1-3, IPS, 2880x1800, 14" | Dell XPS 13 Plus 9320 Core i7-1360P Samsung 134XK04, OLED, 3456x2160, 13.4" | Apple MacBook Air M2 Entry IPS, 2560x1664, 13.6" | |
|---|---|---|---|---|---|---|
| Display | -18% | 0% | -16% | -0% | -4% | |
| Display P3 Coverage (%) | 99.8 | 71.1 -29% | 99.75 0% | 74.7 -25% | 99.7 0% | 98.4 -1% |
| sRGB Coverage (%) | 100 | 98.7 -1% | 99.99 0% | 99.6 0% | 100 0% | 99.9 0% |
| AdobeRGB 1998 Coverage (%) | 97.6 | 73.2 -25% | 98.56 1% | 75.8 -22% | 96.8 -1% | 87.6 -10% |
| Response Times | -4274% | -961% | -3318% | -205% | -4038% | |
| Response Time Grey 50% / Grey 80% * (ms) | 0.69 ? | 37.9 ? -5393% | 2.2 ? -219% | 32.2 ? -4567% | 2.18 ? -216% | 32.9 ? -4668% |
| Response Time Black / White * (ms) | 0.71 ? | 23.1 ? -3154% | 12.8 ? -1703% | 15.4 ? -2069% | 2.08 ? -193% | 24.9 ? -3407% |
| PWM Frequency (Hz) | 480 ? | 300 | 238.6 ? | |||
| Screen | -129% | -125% | -189% | -114% | -241% | |
| Brightness middle (cd/m²) | 391 | 340 -13% | 388 -1% | 402 3% | 361.7 -7% | 526 35% |
| Brightness (cd/m²) | 392 | 338 -14% | 391 0% | 371 -5% | 367 -6% | 486 24% |
| Brightness Distribution (%) | 98 | 84 -14% | 98 0% | 86 -12% | 96 -2% | 87 -11% |
| Black Level * (cd/m²) | 0.02 | 0.16 -700% | 0.0411 -105% | 0.27 -1250% | 0.38 -1800% | |
| Contrast (:1) | 19550 | 2125 -89% | 9440 -52% | 1489 -92% | 1384 -93% | |
| Colorchecker dE 2000 * | 1.1 | 1.7 -55% | 6.32 -475% | 1.8 -64% | 4.83 -339% | 1.3 -18% |
| Colorchecker dE 2000 max. * | 2.4 | 3 -25% | 8.82 -268% | 3.6 -50% | 9.34 -289% | 2.7 -13% |
| Greyscale dE 2000 * | 1.3 | 2.9 -123% | 2.61 -101% | 1.8 -38% | 1.8 -38% | 2 -54% |
| Gamma | 2.17 101% | 2.22 99% | 1.772 124% | 2.27 97% | 2.33 94% | 2.25 98% |
| CCT | 6336 103% | 6729 97% | 6202 105% | 6695 97% | 6438 101% | 6858 95% |
| Colorchecker dE 2000 calibrated * | 1.3 | 4.79 | 1.5 | 3.97 | 0.7 | |
| Całkowita średnia (program / ustawienia) | -1474% /
-741% | -362% /
-225% | -1174% /
-630% | -106% /
-99% | -1428% /
-770% |
* ... im mniej tym lepiej
Przeanalizowaliśmy panel za pomocą profesjonalnego oprogramowania CalMAN (X-Rite i1 Pro 2) i standardowy profil natywny zapewnia dobrą reprodukcję od razu po wyjęciu z pudełka, choć kolory są nieco przesycone. Z drugiej strony, użycie profilu P3 prowadzi do niezwykle dokładnego odwzorowania kolorów, a wszystkie odchylenia pozostają poniżej ważnej wartości odchylenia 3. Następnie nie odnotowaliśmy żadnych odchyleń kolorów w skali szarości.
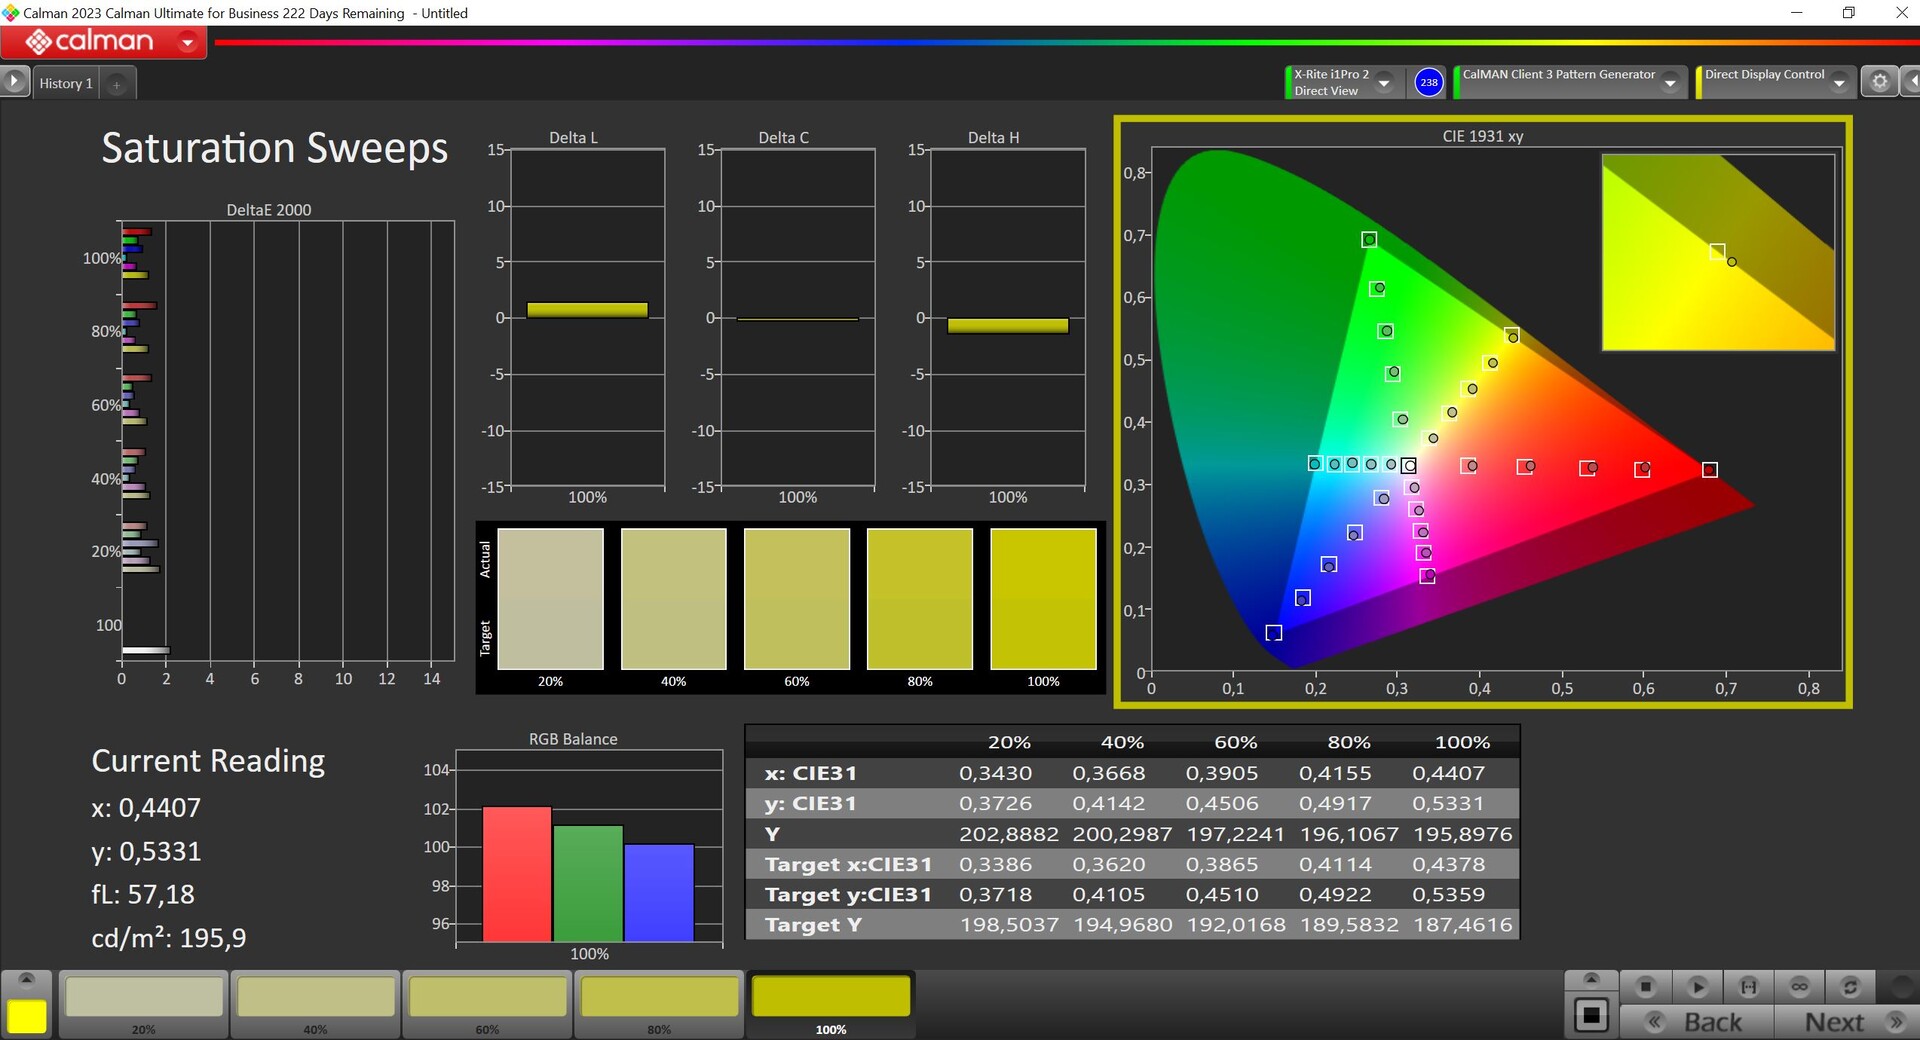

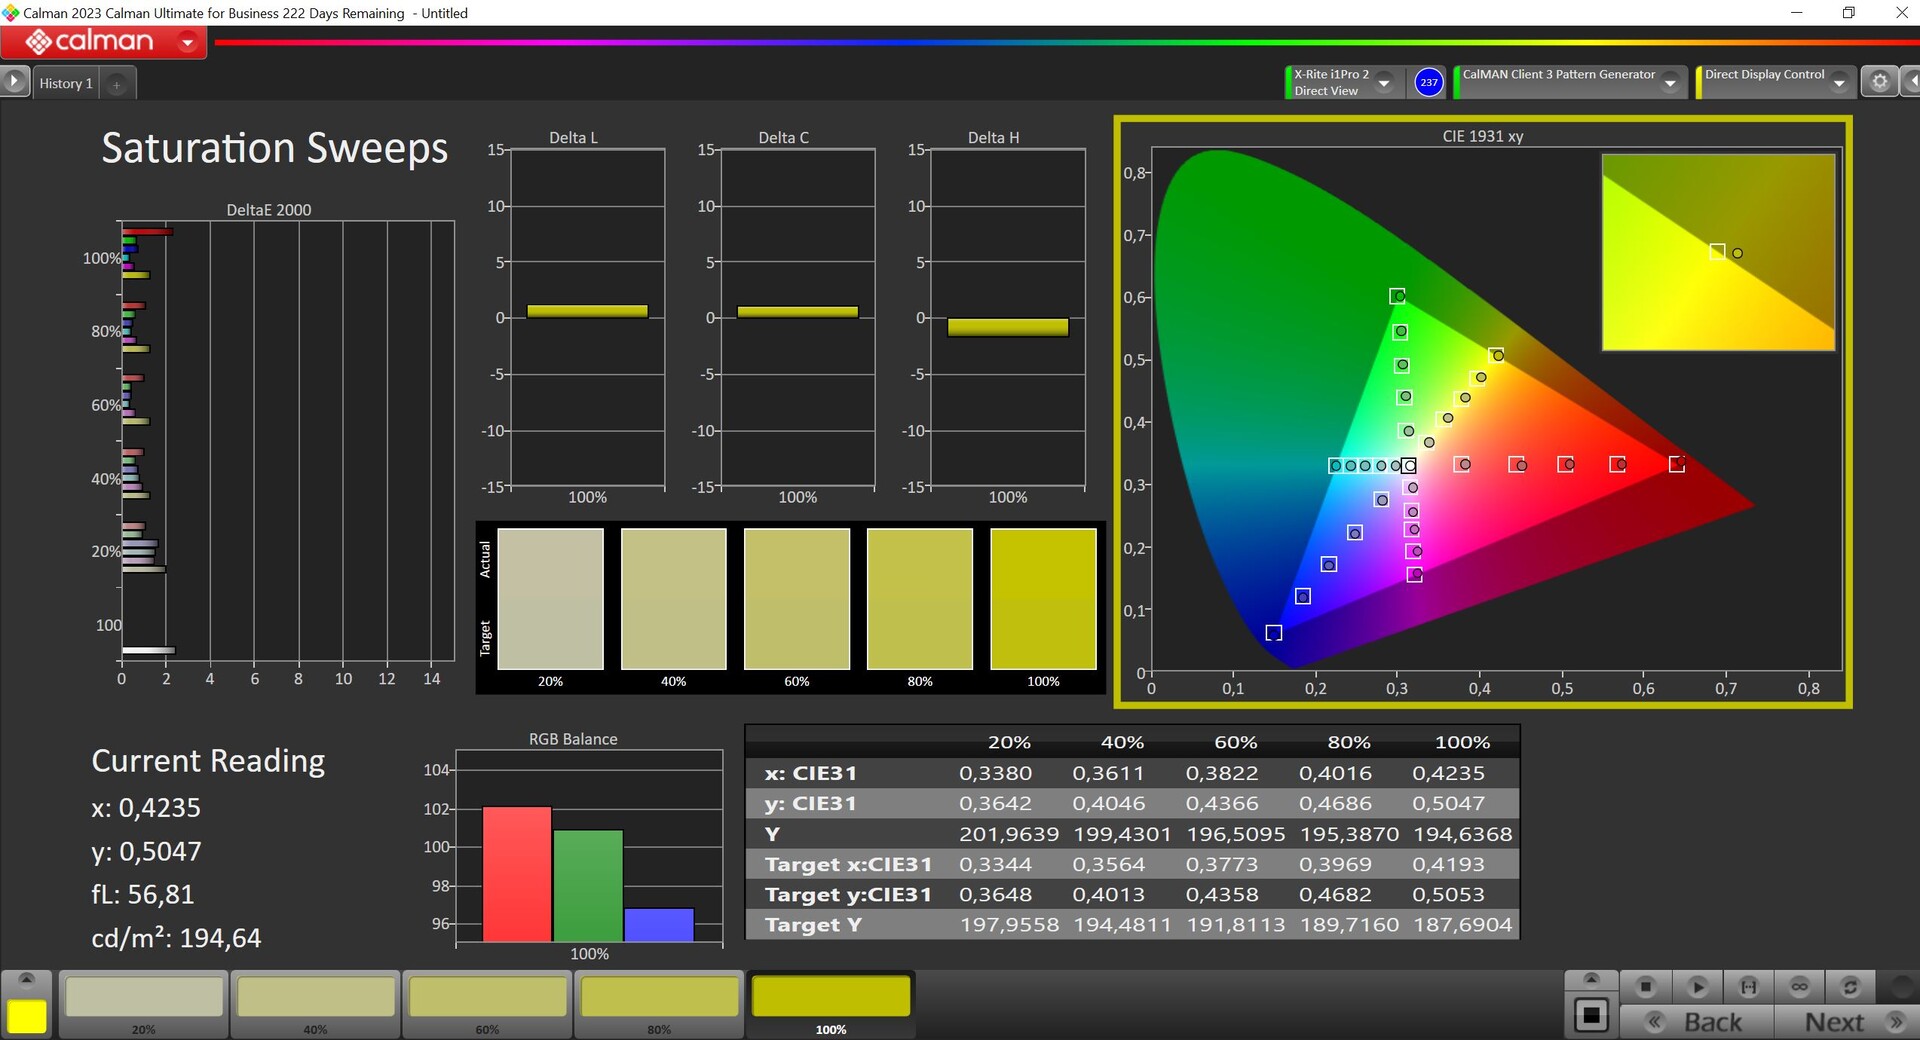
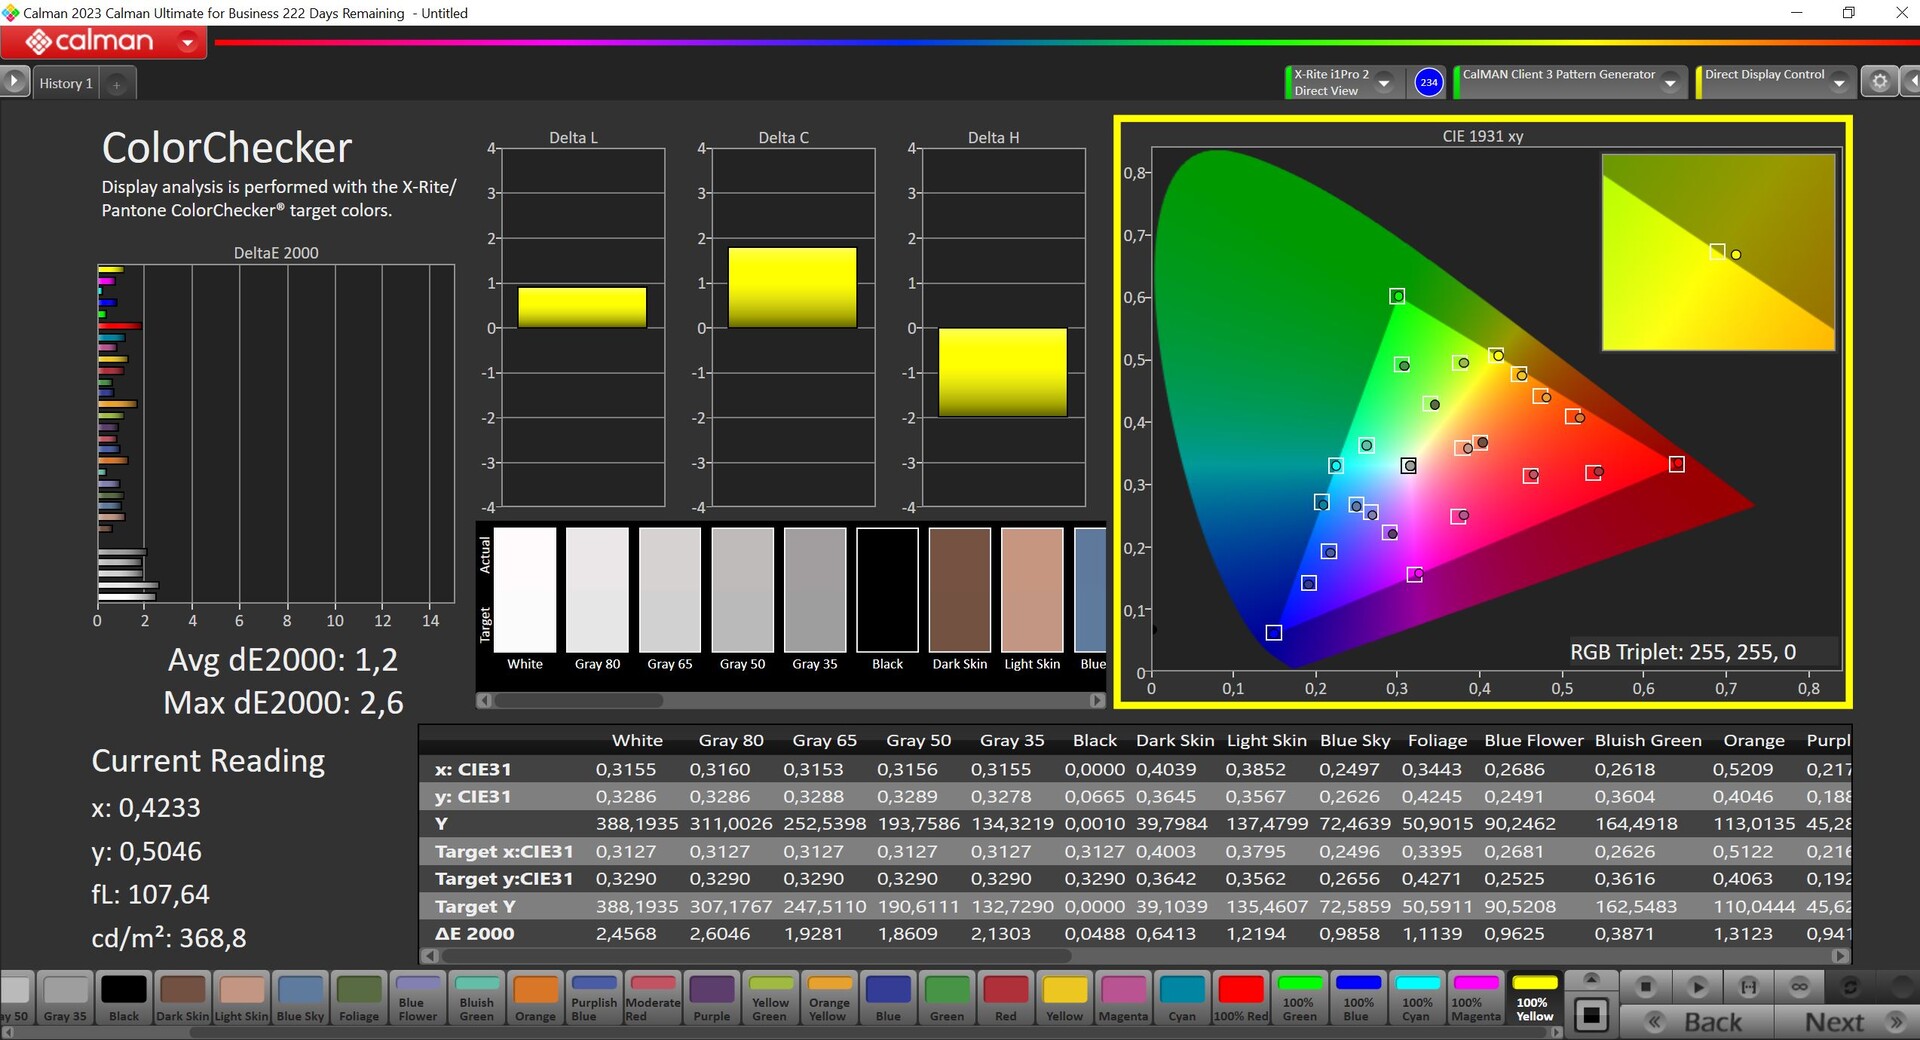
Korzystając z naszej własnej kalibracji, nie byliśmy w stanie jeszcze bardziej poprawić wyświetlanego obrazu. Ponadto można wybrać bardzo dokładny profil sRGB, jeśli chcą Państwo edytować zdjęcia w małej przestrzeni kolorów. Ekran pokrywa w całości przestrzenie kolorów sRGB i P3.
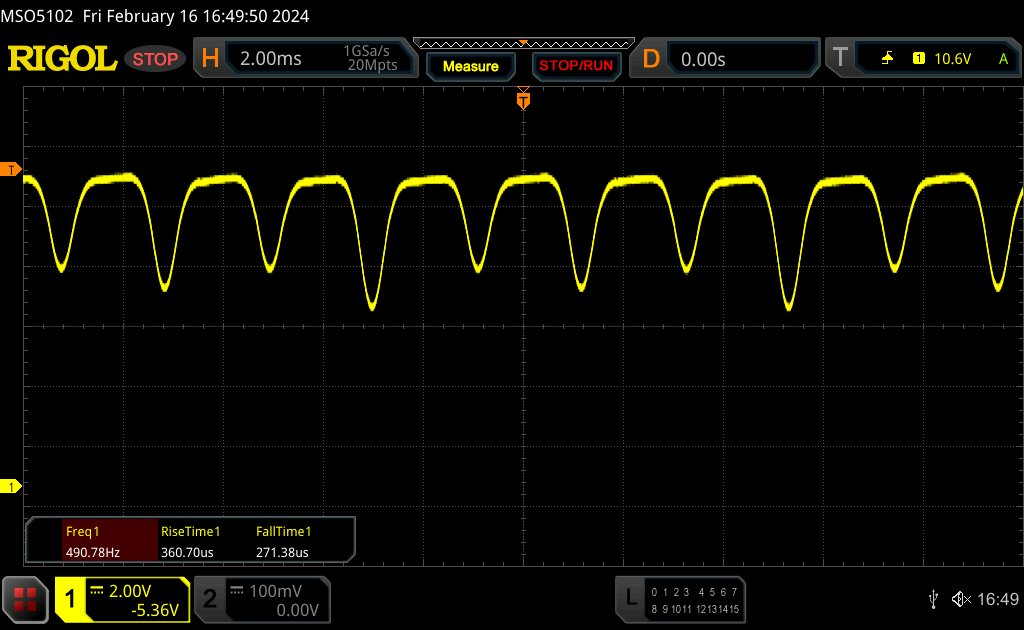
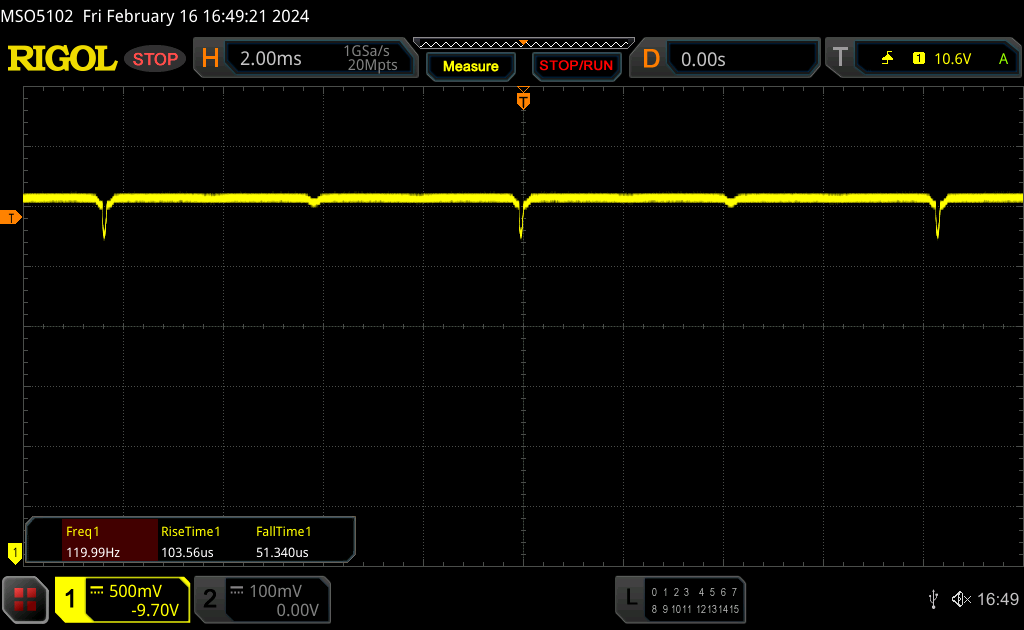
Wyświetl czasy reakcji
| ↔ Czas reakcji od czerni do bieli | ||
|---|---|---|
| 0.71 ms ... wzrost ↗ i spadek ↘ łącznie | ↗ 0.38 ms wzrost | 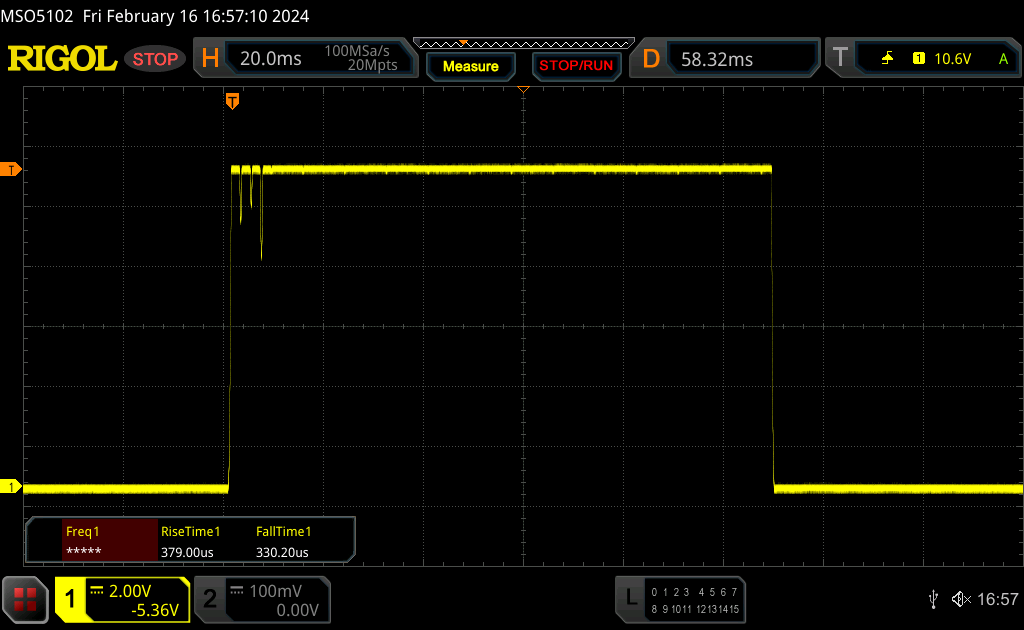 |
| ↘ 0.33 ms upadek | ||
| W naszych testach ekran wykazuje bardzo szybką reakcję i powinien bardzo dobrze nadawać się do szybkich gier. Dla porównania, wszystkie testowane urządzenia wahają się od 0.1 (minimum) do 240 (maksimum) ms. » 2 % wszystkich urządzeń jest lepszych. Oznacza to, że zmierzony czas reakcji jest lepszy od średniej wszystkich testowanych urządzeń (19.8 ms). | ||
| ↔ Czas reakcji 50% szarości do 80% szarości | ||
| 0.69 ms ... wzrost ↗ i spadek ↘ łącznie | ↗ 0.37 ms wzrost | 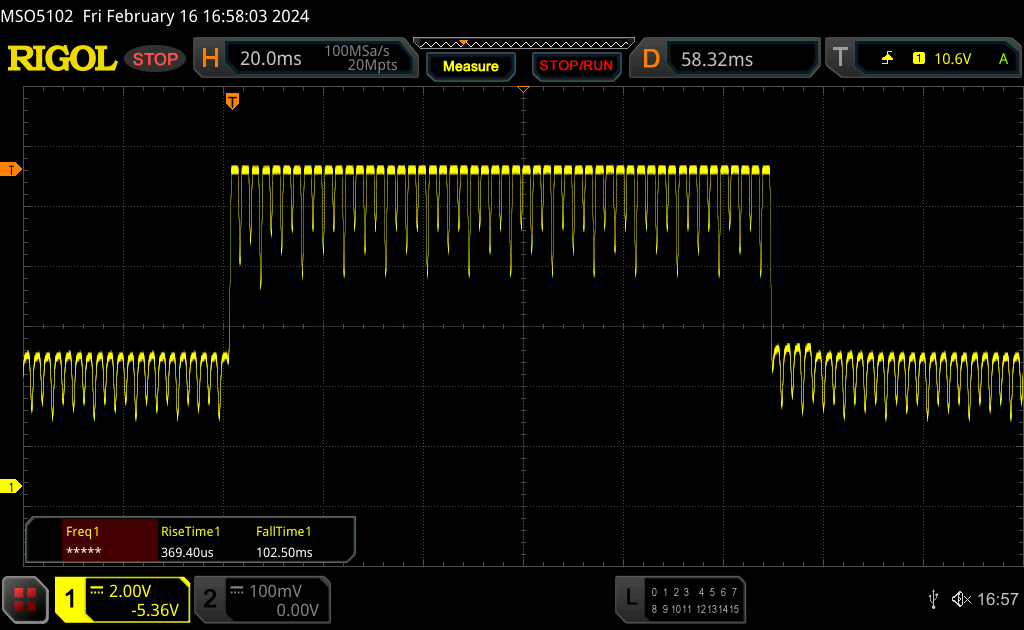 |
| ↘ 0.32 ms upadek | ||
| W naszych testach ekran wykazuje bardzo szybką reakcję i powinien bardzo dobrze nadawać się do szybkich gier. Dla porównania, wszystkie testowane urządzenia wahają się od 0.165 (minimum) do 636 (maksimum) ms. » 2 % wszystkich urządzeń jest lepszych. Oznacza to, że zmierzony czas reakcji jest lepszy od średniej wszystkich testowanych urządzeń (30.9 ms). | ||
Migotanie ekranu / PWM (modulacja szerokości impulsu)
| Wykryto migotanie ekranu/wykryto PWM | 480 Hz | ≤ 80 % ustawienia jasności | 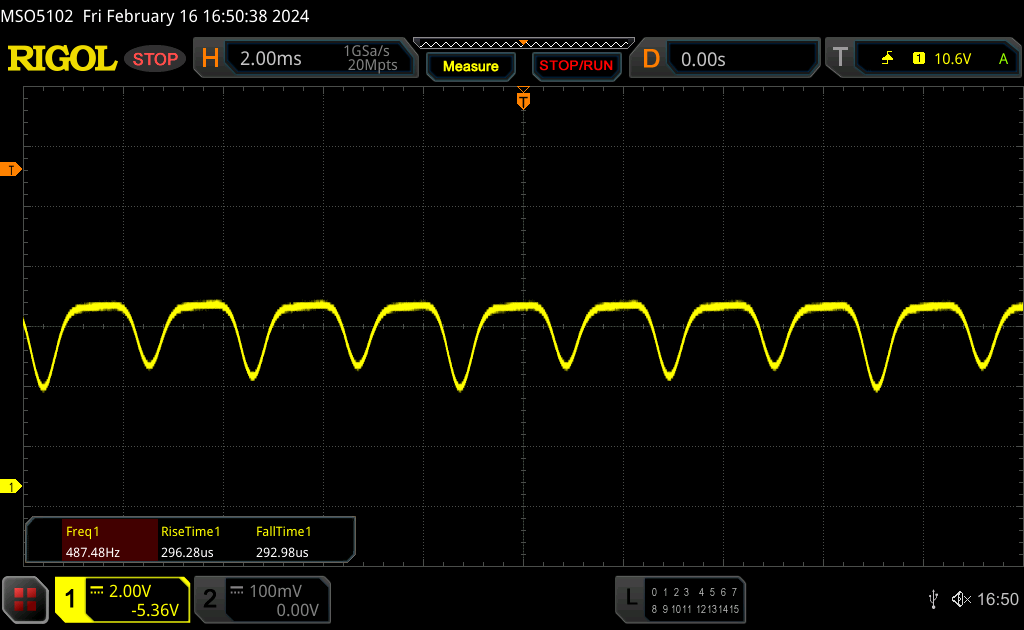 |
Podświetlenie wyświetlacza miga z częstotliwością 480 Hz (najgorszy przypadek, np. przy użyciu PWM) Wykryto migotanie przy ustawieniu jasności 80 % i poniżej. Powyżej tego ustawienia jasności nie powinno być żadnego migotania ani PWM. Częstotliwość 480 Hz jest stosunkowo wysoka, więc większość użytkowników wrażliwych na PWM nie powinna zauważyć żadnego migotania. Istnieją jednak doniesienia, że niektórzy użytkownicy są nadal wrażliwi na PWM przy częstotliwości 500 Hz i wyższej, więc należy zachować ostrożność. Dla porównania: 52 % wszystkich testowanych urządzeń nie używa PWM do przyciemniania wyświetlacza. Jeśli wykryto PWM, zmierzono średnio 7748 (minimum: 5 - maksimum: 343500) Hz. | |||
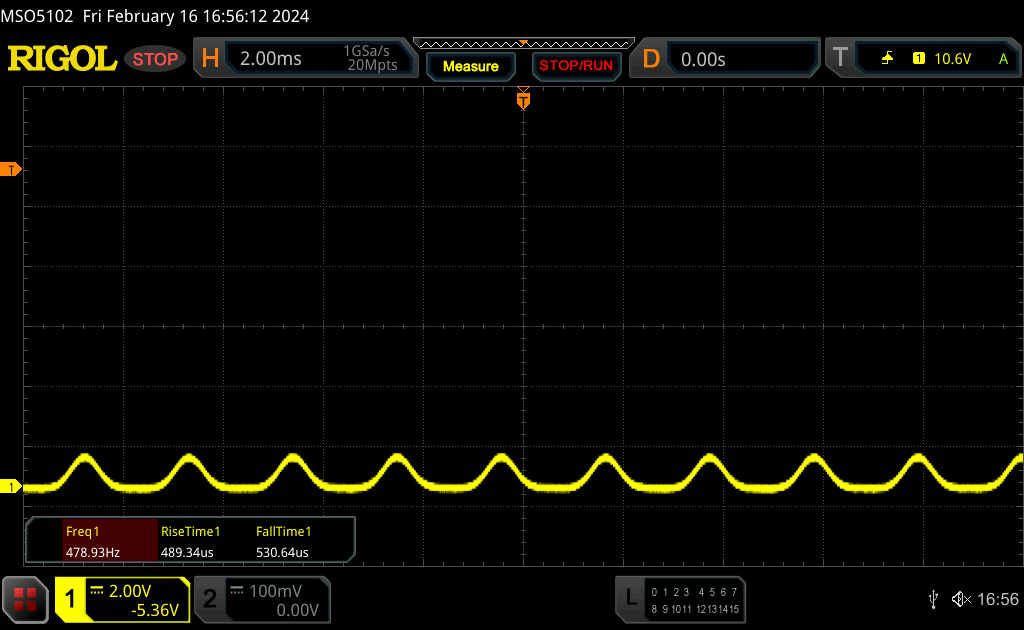
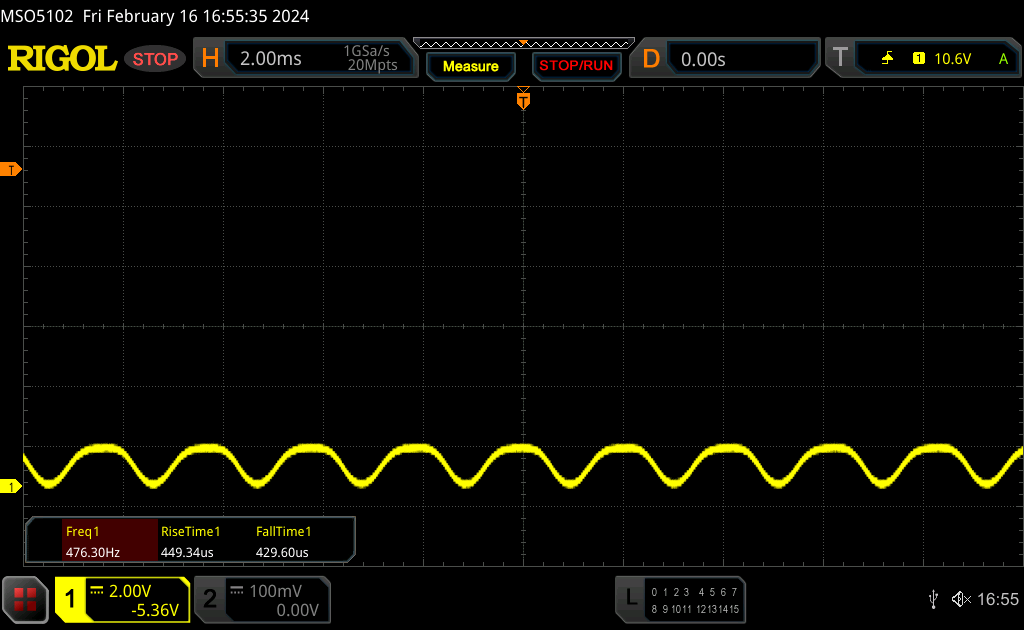
Panel OLED wykorzystuje PWM z częstotliwością 480 Hz, jeśli jasność wynosi 80% lub mniej. Asus oferuje jednak tak zwane przyciemnianie OLED bez migotania w oprogramowaniu MyAsus.
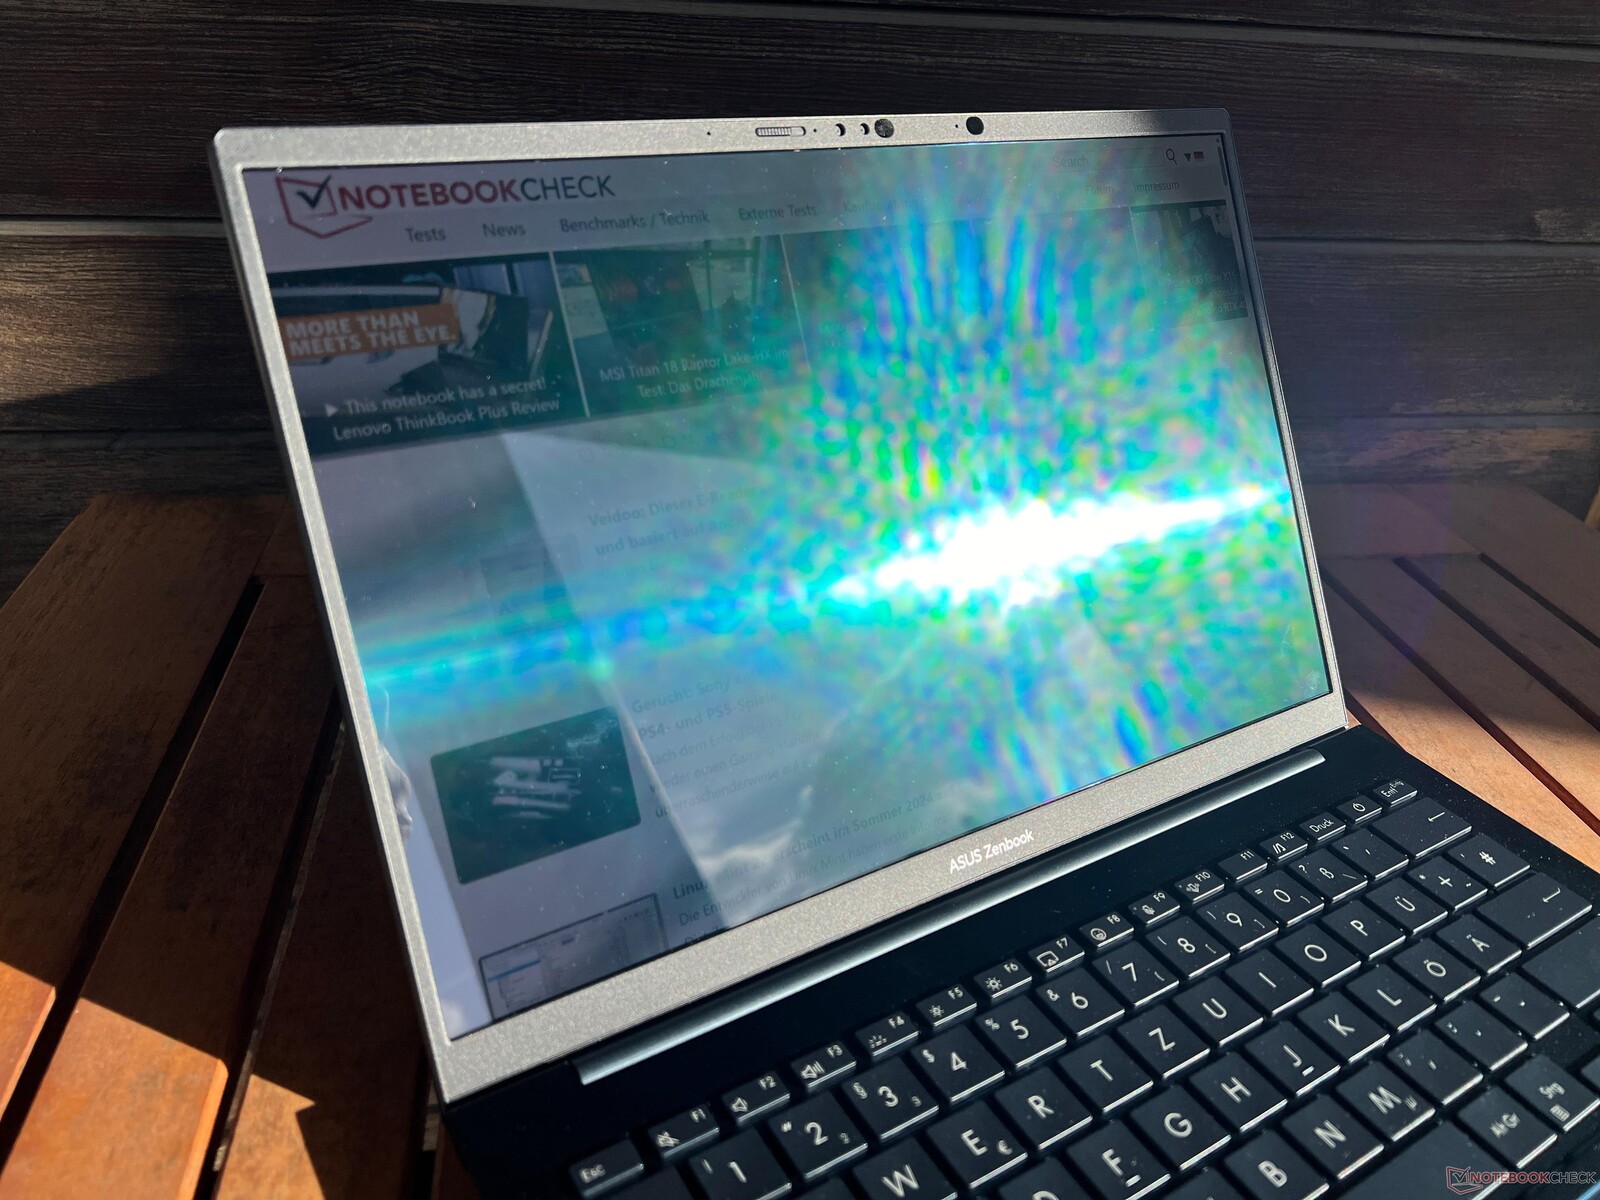
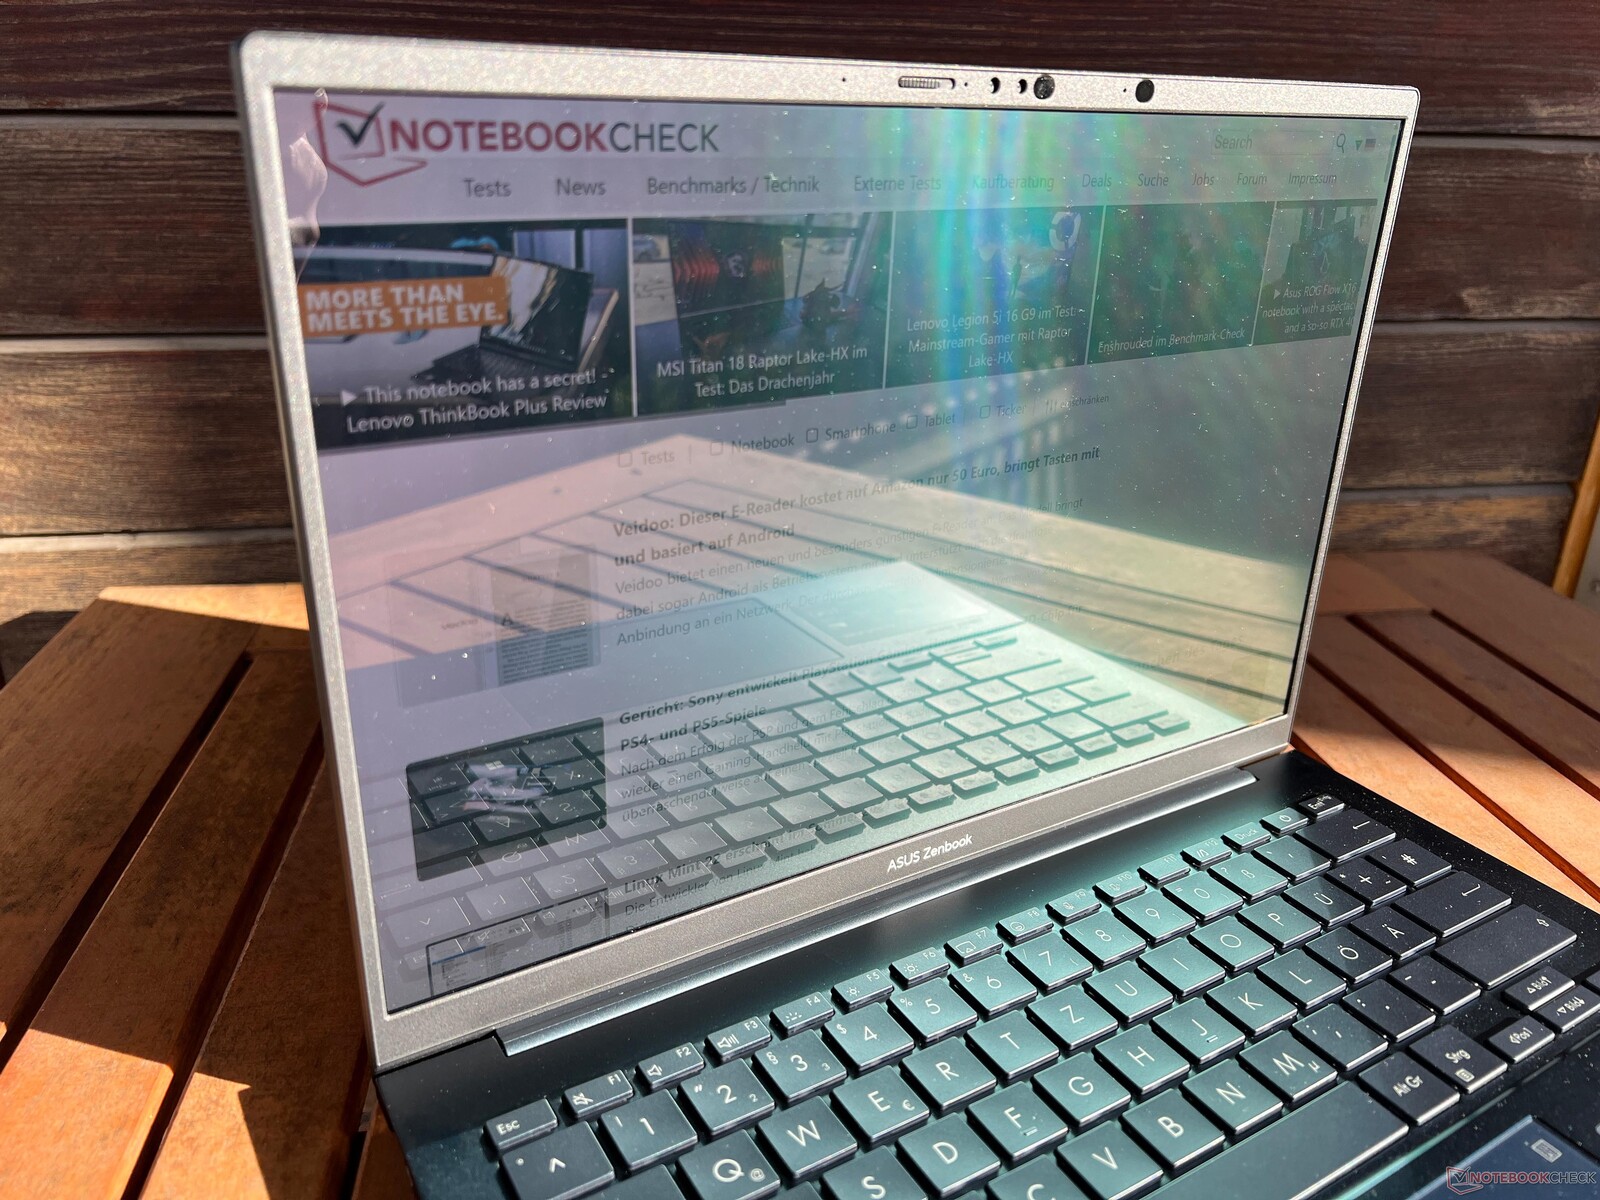
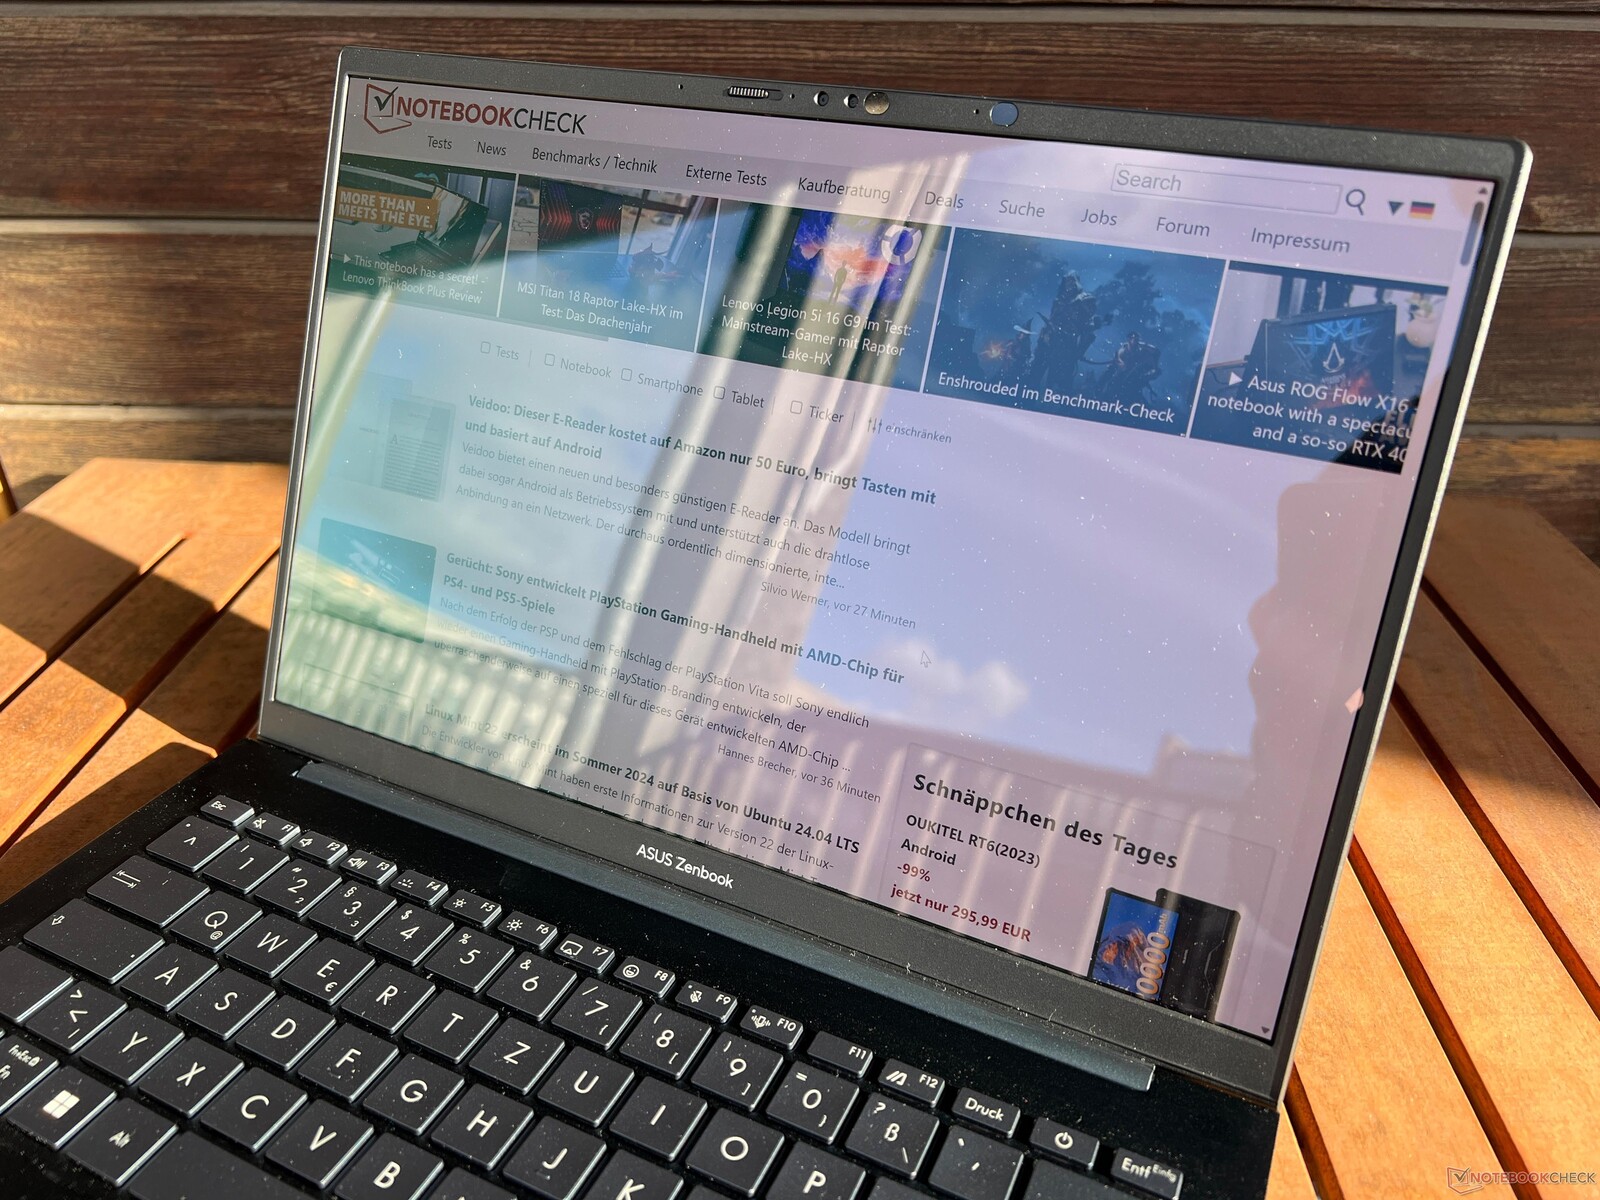
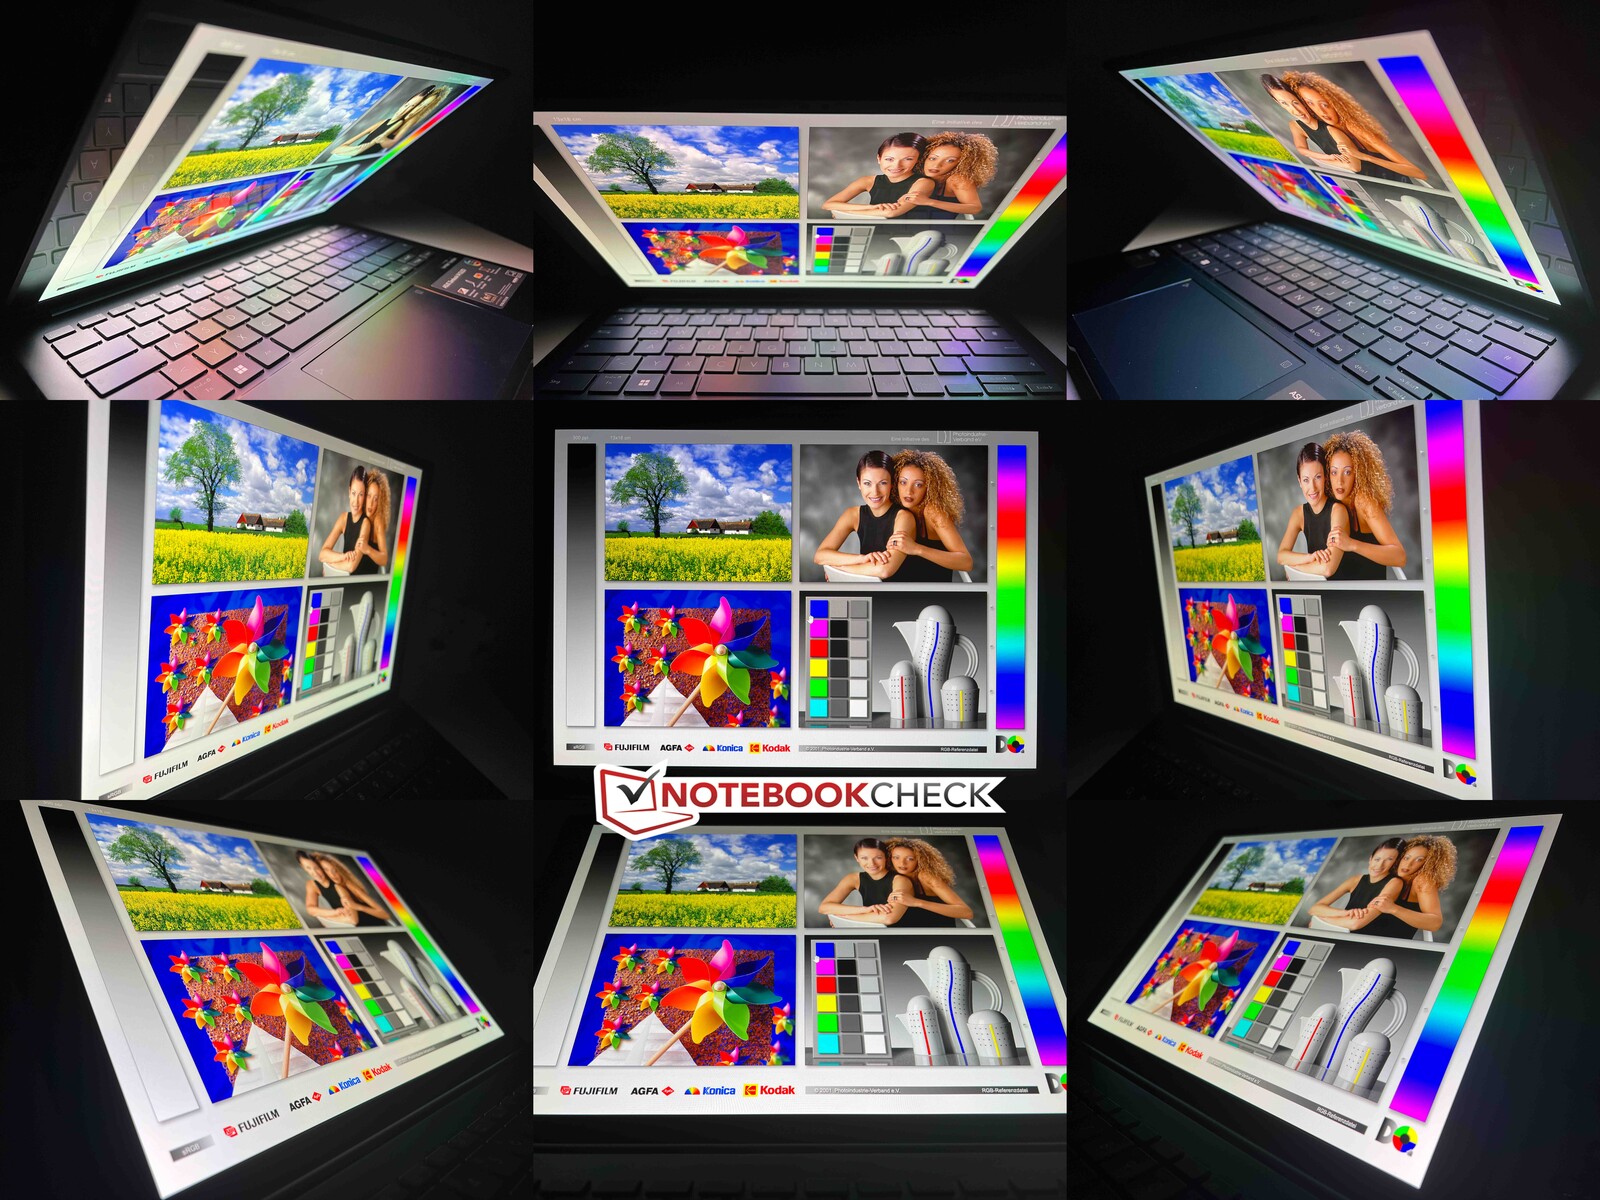
Panel OLED jest bardzo odblaskowy i choć jego jasność i wysoki kontrast pomagają to złagodzić, odbicia pozostają problemem nawet w pochmurne dni. Poza niebieskim połyskiem, który jest typowy dla paneli OLED, nie ma żadnych problemów z kątami widzenia.
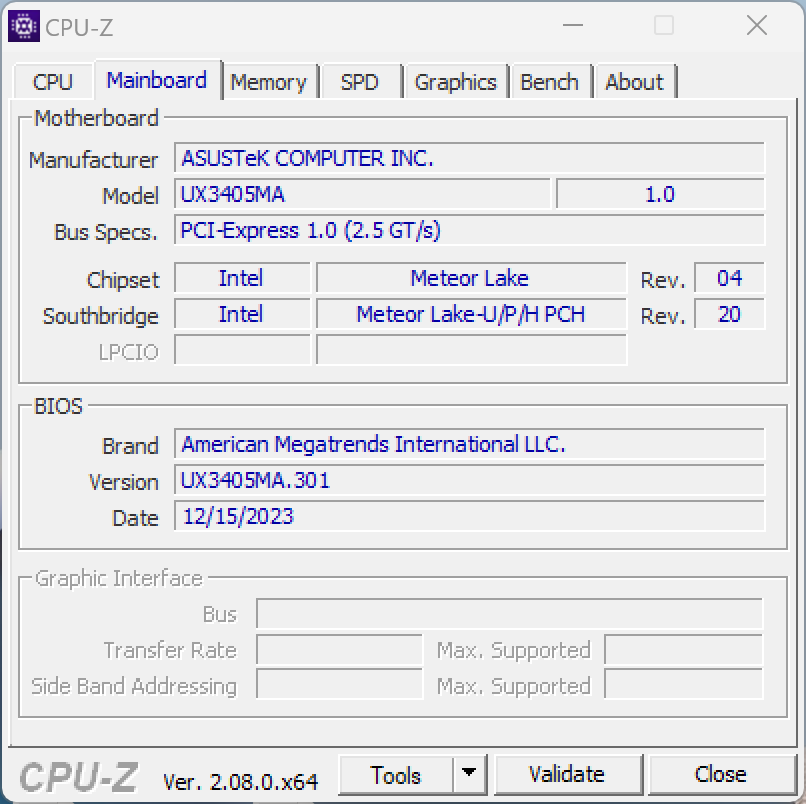
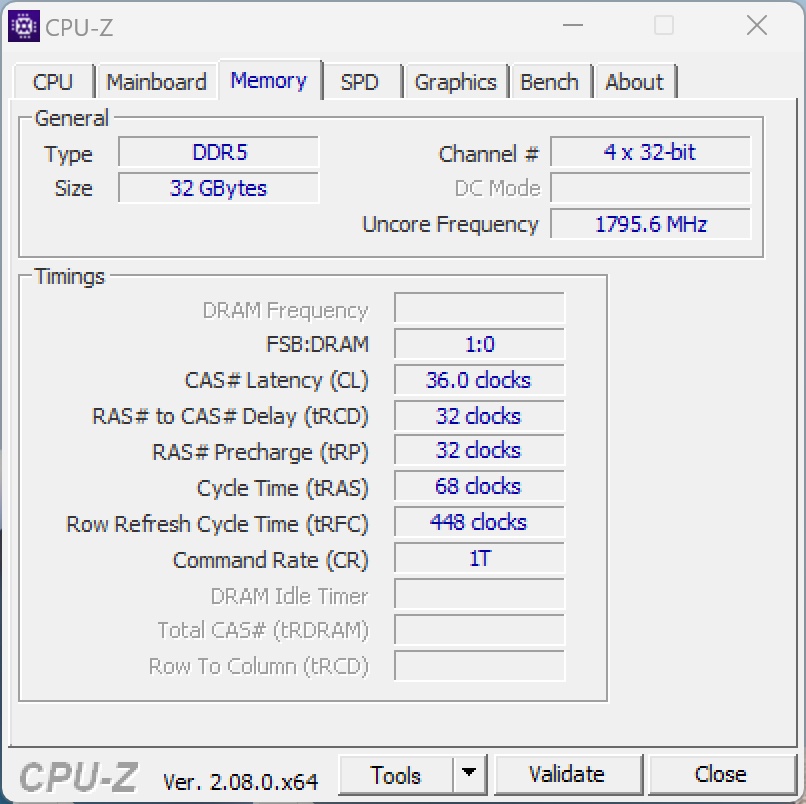
Wydajność - Intel Meteor Lake i iGPU Arc
Nowy Zenbook 14 OLED dostępny jest wyłącznie z mobilnymi procesorami Intel Meteor-Lake wraz ze zintegrowanymi układami graficznymi Arc (Core Ultra 5, 7 i 9). Jego pamięć RAM jest wlutowana i można wybrać pomiędzy 16 i 32 GB LPDDR5x-7467 RAM.
Warunki testowania
W oprogramowaniu MyAsus producent oferuje trzy różne tryby wydajności, które można również wybrać za pomocą kombinacji klawiszy FN + F. Poniższe testy przeprowadziliśmy przy użyciu wstępnie wybranego trybu standardowego (64/20 watów). Jeśli potrzebują Państwo więcej mocy, to można również wybrać tryb wydajności (64/28 W) po podłączeniu do sieci, ale naszym zdaniem ta dodatkowa wydajność nie usprawiedliwia głośności wentylatorów (około 50 dB(A)). Jeśli lubią Państwo szczególnie cichą pracę, można wybrać tryb szeptu (45/15 W).
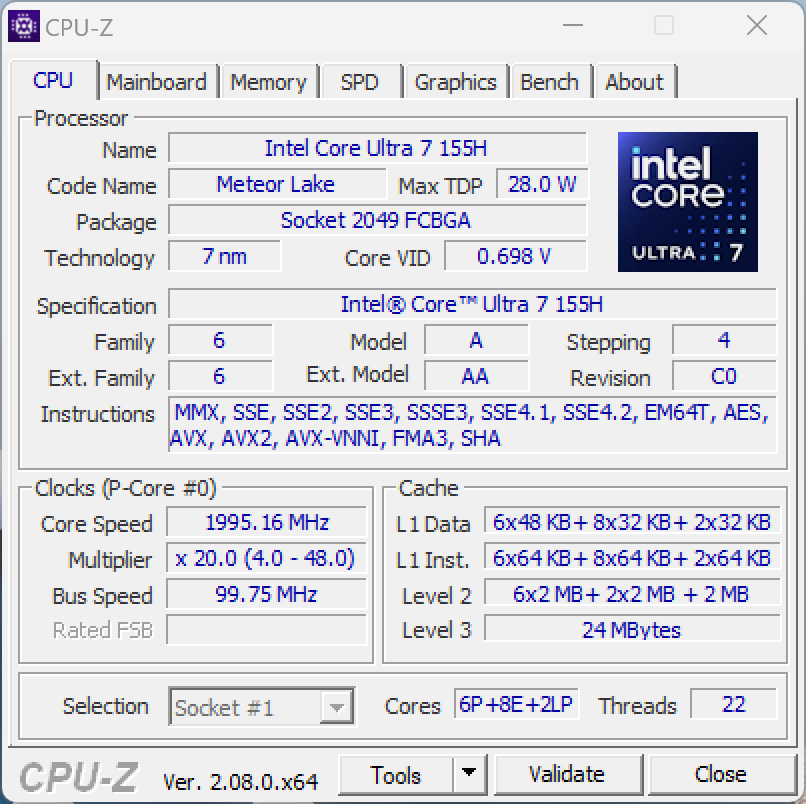
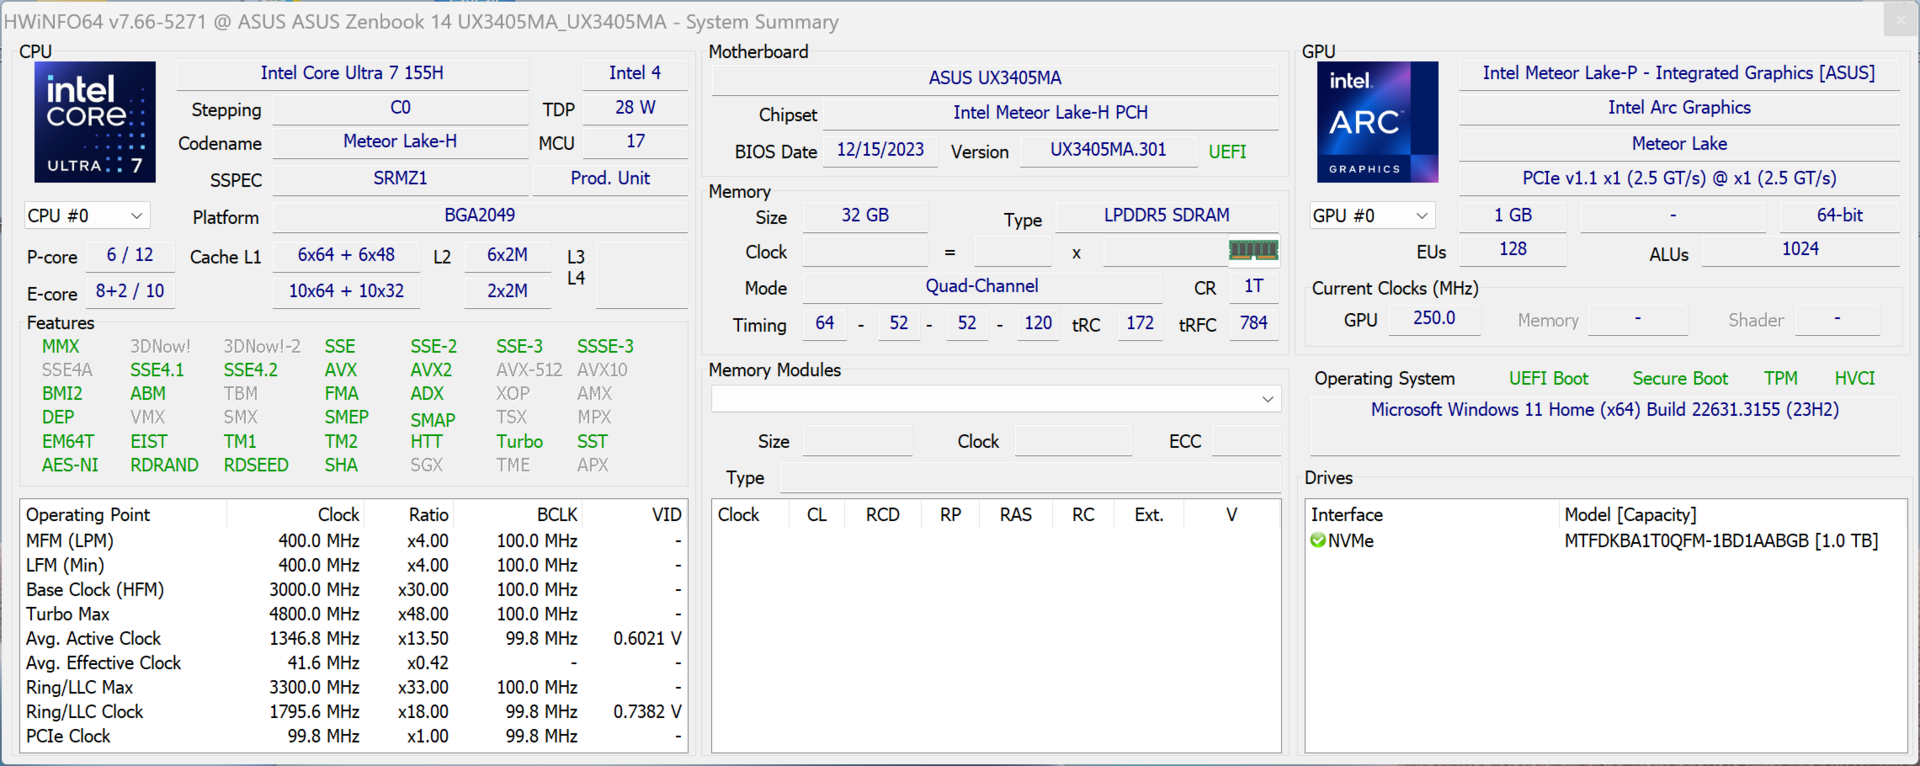
Procesor - Core Ultra 7 155H
Przetestowaliśmy nowy procesor Intel Core Ultra 7 155H (Meteor Lake) już kilka razy. Ponieważ Intel wycofał swoje stare układy z serii P, nowe układy z serii H mają teraz szerszy zakres TDP od 28 do 115 watów, jednak producent stosuje również układy o niższych limitach mocy. Zenbook 14 może utrzymać wysoki limit mocy wynoszący ponad 60 watów przez około 20 sekund, jeśli urządzenie jest chłodne. Później wartość ta spada coraz bardziej, aż balansuje na poziomie zaledwie 20 watów. W rezultacie jego wyniki są bardzo dobre podczas krótkich testów porównawczych i w codziennym użytkowaniu, ale przy dłuższych okresach obciążenia laptop cierpi na ogromny spadek wydajności (prawie 50% w naszej pętli CB). Jego wydajność jednordzeniowa jest ogólnie dobra, ale nieco słabsza niż w przypadku starych układów Raptor Lake i mniej więcej na równi z procesorami AMD Zen4. W trybie bateryjnym procesor może zużywać maksymalnie 50 watów, a następnie szybko osiada na poziomie 25 watów, dlatego też jego wydajność wielordzeniowa jest o około 14% niższa. Dalsze testy porównawcze procesora są dostępne tutaj.
Cinebench R15 Multi continuous test
Cinebench R20: CPU (Multi Core) | CPU (Single Core)
Cinebench R15: CPU Multi 64Bit | CPU Single 64Bit
Blender: v2.79 BMW27 CPU
7-Zip 18.03: 7z b 4 | 7z b 4 -mmt1
Geekbench 6.7: Multi-Core | Single-Core
Geekbench 5.5: Multi-Core | Single-Core
HWBOT x265 Benchmark v2.2: 4k Preset
LibreOffice : 20 Documents To PDF
R Benchmark 2.5: Overall mean
| Cinebench R23 / Multi Core | |
| Tuxedo Pulse 14 Gen3 | |
| Acer Swift Go 14 SFG14-72 | |
| Przeciętny Intel Core Ultra 7 155H (9769 - 19007, n=52) | |
| Asus ZenBook 14 UX3405MA | |
| Średnia w klasie Subnotebook (1555 - 21812, n=60, ostatnie 2 lata) | |
| Schenker Vision 14 2023 | |
| Dell XPS 13 Plus 9320 Core i7-1360P | |
| Apple MacBook Air M2 10C GPU | |
| Cinebench R23 / Single Core | |
| Schenker Vision 14 2023 | |
| Dell XPS 13 Plus 9320 Core i7-1360P | |
| Acer Swift Go 14 SFG14-72 | |
| Tuxedo Pulse 14 Gen3 | |
| Asus ZenBook 14 UX3405MA | |
| Średnia w klasie Subnotebook (358 - 2213, n=61, ostatnie 2 lata) | |
| Przeciętny Intel Core Ultra 7 155H (1496 - 1815, n=52) | |
| Apple MacBook Air M2 10C GPU | |
| Cinebench R20 / CPU (Multi Core) | |
| Tuxedo Pulse 14 Gen3 | |
| Przeciętny Intel Core Ultra 7 155H (3798 - 7409, n=50) | |
| Acer Swift Go 14 SFG14-72 | |
| Asus ZenBook 14 UX3405MA | |
| Schenker Vision 14 2023 | |
| Średnia w klasie Subnotebook (579 - 8541, n=57, ostatnie 2 lata) | |
| Dell XPS 13 Plus 9320 Core i7-1360P | |
| Apple MacBook Air M2 10C GPU | |
| Cinebench R20 / CPU (Single Core) | |
| Schenker Vision 14 2023 | |
| Dell XPS 13 Plus 9320 Core i7-1360P | |
| Tuxedo Pulse 14 Gen3 | |
| Acer Swift Go 14 SFG14-72 | |
| Asus ZenBook 14 UX3405MA | |
| Średnia w klasie Subnotebook (128 - 832, n=57, ostatnie 2 lata) | |
| Przeciętny Intel Core Ultra 7 155H (601 - 696, n=50) | |
| Apple MacBook Air M2 10C GPU | |
| Cinebench R15 / CPU Multi 64Bit | |
| Tuxedo Pulse 14 Gen3 | |
| Acer Swift Go 14 SFG14-72 | |
| Przeciętny Intel Core Ultra 7 155H (1932 - 2880, n=56) | |
| Asus ZenBook 14 UX3405MA | |
| Średnia w klasie Subnotebook (327 - 3345, n=57, ostatnie 2 lata) | |
| Schenker Vision 14 2023 | |
| Dell XPS 13 Plus 9320 Core i7-1360P | |
| Apple MacBook Air M2 10C GPU | |
| Cinebench R15 / CPU Single 64Bit | |
| Tuxedo Pulse 14 Gen3 | |
| Schenker Vision 14 2023 | |
| Średnia w klasie Subnotebook (72.4 - 322, n=57, ostatnie 2 lata) | |
| Dell XPS 13 Plus 9320 Core i7-1360P | |
| Acer Swift Go 14 SFG14-72 | |
| Asus ZenBook 14 UX3405MA | |
| Przeciętny Intel Core Ultra 7 155H (99.6 - 268, n=52) | |
| Apple MacBook Air M2 10C GPU | |
| Blender / v2.79 BMW27 CPU | |
| Apple MacBook Air M2 10C GPU | |
| Średnia w klasie Subnotebook (159 - 2271, n=58, ostatnie 2 lata) | |
| Dell XPS 13 Plus 9320 Core i7-1360P | |
| Asus ZenBook 14 UX3405MA | |
| Schenker Vision 14 2023 | |
| Przeciętny Intel Core Ultra 7 155H (175 - 381, n=47) | |
| Acer Swift Go 14 SFG14-72 | |
| Tuxedo Pulse 14 Gen3 | |
| 7-Zip 18.03 / 7z b 4 | |
| Tuxedo Pulse 14 Gen3 | |
| Acer Swift Go 14 SFG14-72 | |
| Przeciętny Intel Core Ultra 7 155H (41739 - 70254, n=50) | |
| Schenker Vision 14 2023 | |
| Asus ZenBook 14 UX3405MA | |
| Dell XPS 13 Plus 9320 Core i7-1360P | |
| Średnia w klasie Subnotebook (11668 - 77867, n=57, ostatnie 2 lata) | |
| 7-Zip 18.03 / 7z b 4 -mmt1 | |
| Tuxedo Pulse 14 Gen3 | |
| Schenker Vision 14 2023 | |
| Średnia w klasie Subnotebook (2643 - 6699, n=59, ostatnie 2 lata) | |
| Dell XPS 13 Plus 9320 Core i7-1360P | |
| Asus ZenBook 14 UX3405MA | |
| Przeciętny Intel Core Ultra 7 155H (4594 - 5621, n=50) | |
| Acer Swift Go 14 SFG14-72 | |
| Geekbench 6.7 / Multi-Core | |
| Asus ZenBook 14 UX3405MA | |
| Tuxedo Pulse 14 Gen3 | |
| Średnia w klasie Subnotebook (2244 - 20325, n=63, ostatnie 2 lata) | |
| Przeciętny Intel Core Ultra 7 155H (7732 - 13656, n=55) | |
| Acer Swift Go 14 SFG14-72 | |
| Schenker Vision 14 2023 | |
| Geekbench 6.7 / Single-Core | |
| Średnia w klasie Subnotebook (960 - 4195, n=62, ostatnie 2 lata) | |
| Schenker Vision 14 2023 | |
| Tuxedo Pulse 14 Gen3 | |
| Asus ZenBook 14 UX3405MA | |
| Przeciętny Intel Core Ultra 7 155H (1901 - 2473, n=52) | |
| Acer Swift Go 14 SFG14-72 | |
| Geekbench 5.5 / Multi-Core | |
| Asus ZenBook 14 UX3405MA | |
| Przeciętny Intel Core Ultra 7 155H (10017 - 13556, n=52) | |
| Acer Swift Go 14 SFG14-72 | |
| Tuxedo Pulse 14 Gen3 | |
| Dell XPS 13 Plus 9320 Core i7-1360P | |
| Średnia w klasie Subnotebook (2557 - 17218, n=49, ostatnie 2 lata) | |
| Schenker Vision 14 2023 | |
| Apple MacBook Air M2 10C GPU | |
| Geekbench 5.5 / Single-Core | |
| Tuxedo Pulse 14 Gen3 | |
| Apple MacBook Air M2 10C GPU | |
| Średnia w klasie Subnotebook (726 - 2224, n=49, ostatnie 2 lata) | |
| Schenker Vision 14 2023 | |
| Dell XPS 13 Plus 9320 Core i7-1360P | |
| Asus ZenBook 14 UX3405MA | |
| Przeciętny Intel Core Ultra 7 155H (1462 - 1824, n=52) | |
| Acer Swift Go 14 SFG14-72 | |
| HWBOT x265 Benchmark v2.2 / 4k Preset | |
| Tuxedo Pulse 14 Gen3 | |
| Przeciętny Intel Core Ultra 7 155H (9.93 - 21.2, n=50) | |
| Acer Swift Go 14 SFG14-72 | |
| Schenker Vision 14 2023 | |
| Asus ZenBook 14 UX3405MA | |
| Średnia w klasie Subnotebook (0.97 - 25.1, n=57, ostatnie 2 lata) | |
| Dell XPS 13 Plus 9320 Core i7-1360P | |
| LibreOffice / 20 Documents To PDF | |
| Średnia w klasie Subnotebook (39.9 - 220, n=56, ostatnie 2 lata) | |
| Acer Swift Go 14 SFG14-72 | |
| Schenker Vision 14 2023 | |
| Tuxedo Pulse 14 Gen3 | |
| Przeciętny Intel Core Ultra 7 155H (37.5 - 79.2, n=49) | |
| Dell XPS 13 Plus 9320 Core i7-1360P | |
| Asus ZenBook 14 UX3405MA | |
| R Benchmark 2.5 / Overall mean | |
| Średnia w klasie Subnotebook (0.4024 - 1.456, n=58, ostatnie 2 lata) | |
| Asus ZenBook 14 UX3405MA | |
| Acer Swift Go 14 SFG14-72 | |
| Przeciętny Intel Core Ultra 7 155H (0.4457 - 0.53, n=49) | |
| Dell XPS 13 Plus 9320 Core i7-1360P | |
| Tuxedo Pulse 14 Gen3 | |
| Schenker Vision 14 2023 | |
* ... im mniej tym lepiej
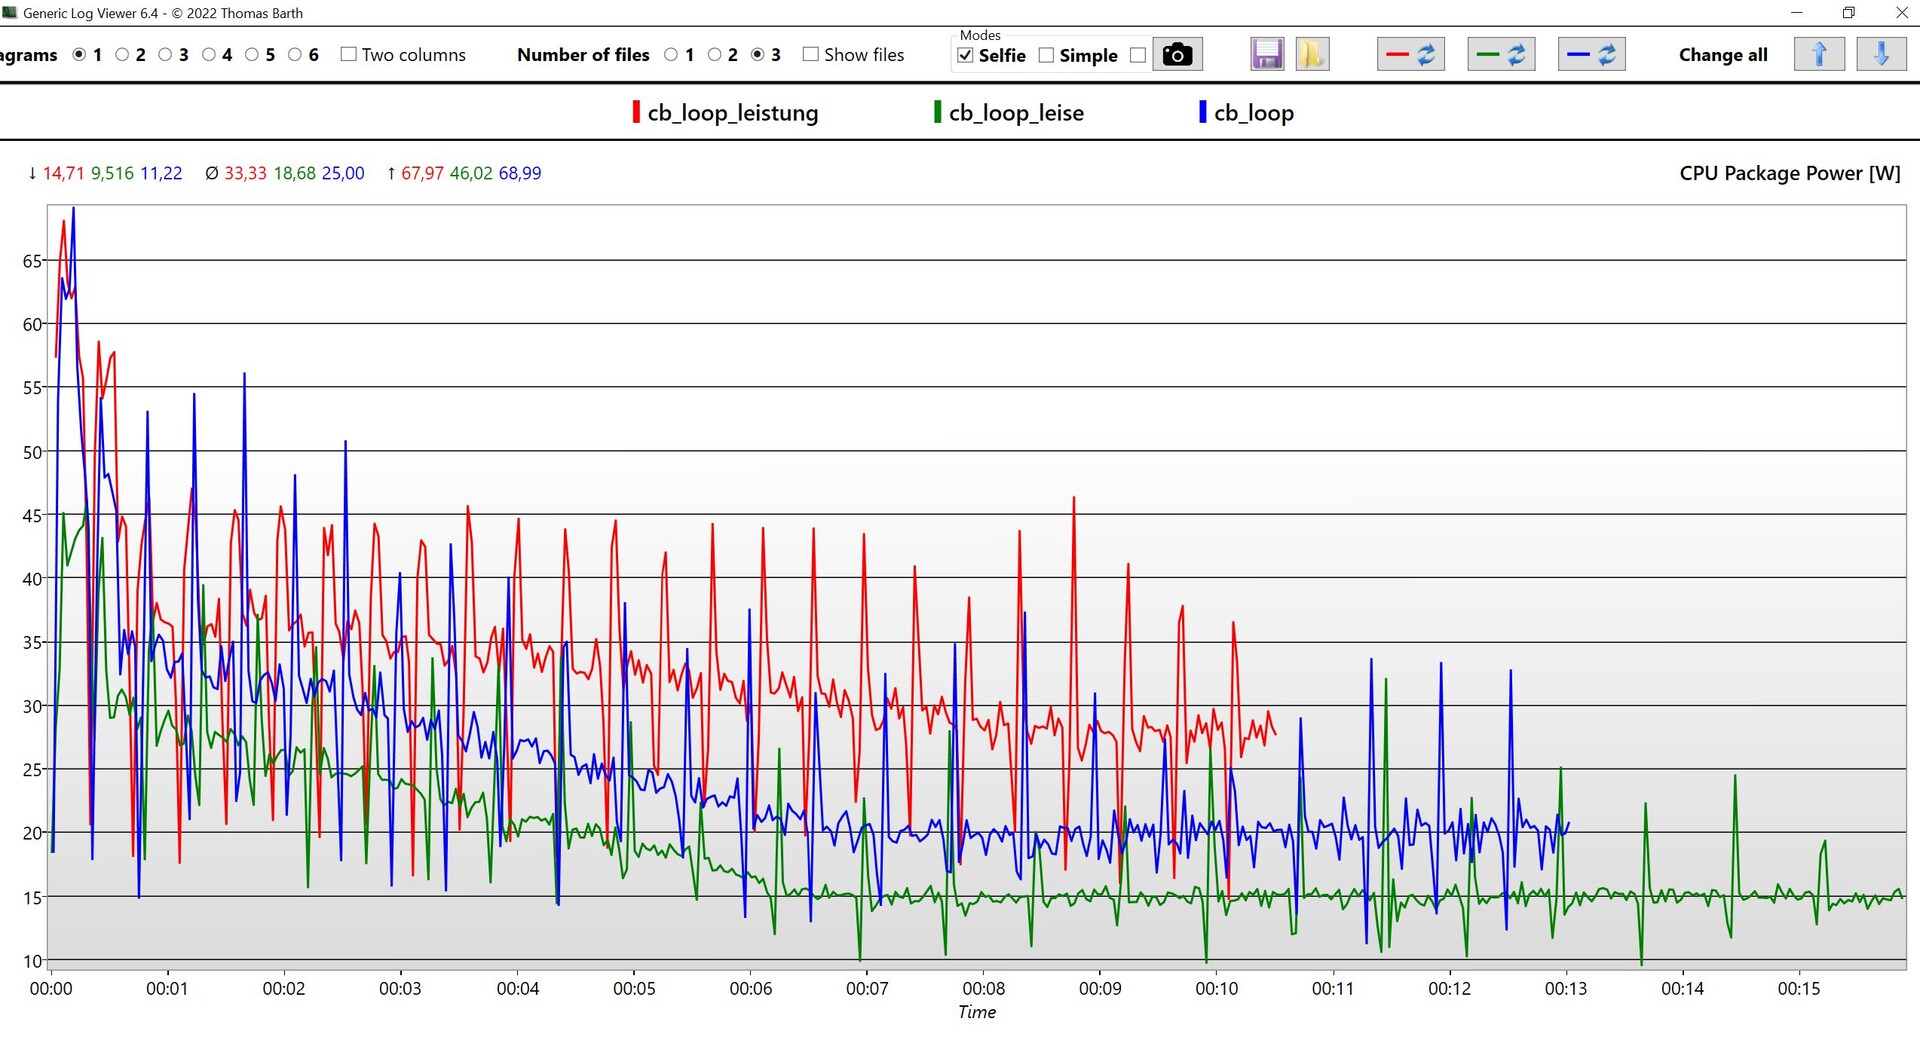
Ponadto przyjrzeliśmy się wydajności procesora przy użyciu innych trybów wydajności i oceniliśmy moc pakietu podczas naszej wielopętlowej pętli Cinebench R15. Jego wydajność spadła przy użyciu wszystkich trzech profili, ale przez krótką chwilę tryb szeptany doprowadził do dobrej wydajności, która powinna wystarczyć do pokrycia krótkich skoków obciążenia podczas codziennego użytkowania.
Cinebench R15 Multi continuous test 2
AIDA64: FP32 Ray-Trace | FPU Julia | CPU SHA3 | CPU Queen | FPU SinJulia | FPU Mandel | CPU AES | CPU ZLib | FP64 Ray-Trace | CPU PhotoWorxx
| Performance rating | |
| Tuxedo Pulse 14 Gen3 | |
| Acer Swift Go 14 SFG14-72 | |
| Przeciętny Intel Core Ultra 7 155H | |
| Średnia w klasie Subnotebook | |
| Schenker Vision 14 2023 | |
| Dell XPS 13 Plus 9320 Core i7-1360P | |
| Asus ZenBook 14 UX3405MA | |
| AIDA64 / FP32 Ray-Trace | |
| Tuxedo Pulse 14 Gen3 | |
| Średnia w klasie Subnotebook (1135 - 32888, n=58, ostatnie 2 lata) | |
| Acer Swift Go 14 SFG14-72 | |
| Przeciętny Intel Core Ultra 7 155H (6670 - 18470, n=50) | |
| Schenker Vision 14 2023 | |
| Dell XPS 13 Plus 9320 Core i7-1360P | |
| Asus ZenBook 14 UX3405MA | |
| AIDA64 / FPU Julia | |
| Tuxedo Pulse 14 Gen3 | |
| Acer Swift Go 14 SFG14-72 | |
| Przeciętny Intel Core Ultra 7 155H (40905 - 93181, n=50) | |
| Średnia w klasie Subnotebook (5218 - 123315, n=58, ostatnie 2 lata) | |
| Schenker Vision 14 2023 | |
| Dell XPS 13 Plus 9320 Core i7-1360P | |
| Asus ZenBook 14 UX3405MA | |
| AIDA64 / CPU SHA3 | |
| Tuxedo Pulse 14 Gen3 | |
| Acer Swift Go 14 SFG14-72 | |
| Przeciętny Intel Core Ultra 7 155H (1940 - 4436, n=50) | |
| Średnia w klasie Subnotebook (444 - 5287, n=58, ostatnie 2 lata) | |
| Schenker Vision 14 2023 | |
| Dell XPS 13 Plus 9320 Core i7-1360P | |
| Asus ZenBook 14 UX3405MA | |
| AIDA64 / CPU Queen | |
| Tuxedo Pulse 14 Gen3 | |
| Asus ZenBook 14 UX3405MA | |
| Acer Swift Go 14 SFG14-72 | |
| Dell XPS 13 Plus 9320 Core i7-1360P | |
| Przeciętny Intel Core Ultra 7 155H (64698 - 94181, n=50) | |
| Schenker Vision 14 2023 | |
| Średnia w klasie Subnotebook (10579 - 95002, n=48, ostatnie 2 lata) | |
| AIDA64 / FPU SinJulia | |
| Tuxedo Pulse 14 Gen3 | |
| Acer Swift Go 14 SFG14-72 | |
| Przeciętny Intel Core Ultra 7 155H (5639 - 10647, n=50) | |
| Asus ZenBook 14 UX3405MA | |
| Schenker Vision 14 2023 | |
| Średnia w klasie Subnotebook (744 - 18418, n=58, ostatnie 2 lata) | |
| Dell XPS 13 Plus 9320 Core i7-1360P | |
| AIDA64 / FPU Mandel | |
| Tuxedo Pulse 14 Gen3 | |
| Acer Swift Go 14 SFG14-72 | |
| Przeciętny Intel Core Ultra 7 155H (18236 - 47685, n=50) | |
| Średnia w klasie Subnotebook (3341 - 65433, n=58, ostatnie 2 lata) | |
| Schenker Vision 14 2023 | |
| Dell XPS 13 Plus 9320 Core i7-1360P | |
| Asus ZenBook 14 UX3405MA | |
| AIDA64 / CPU AES | |
| Tuxedo Pulse 14 Gen3 | |
| Przeciętny Intel Core Ultra 7 155H (45713 - 152179, n=50) | |
| Acer Swift Go 14 SFG14-72 | |
| Schenker Vision 14 2023 | |
| Średnia w klasie Subnotebook (638 - 96917, n=58, ostatnie 2 lata) | |
| Asus ZenBook 14 UX3405MA | |
| Dell XPS 13 Plus 9320 Core i7-1360P | |
| AIDA64 / CPU ZLib | |
| Tuxedo Pulse 14 Gen3 | |
| Przeciętny Intel Core Ultra 7 155H (557 - 1250, n=50) | |
| Acer Swift Go 14 SFG14-72 | |
| Schenker Vision 14 2023 | |
| Średnia w klasie Subnotebook (164.9 - 1379, n=58, ostatnie 2 lata) | |
| Dell XPS 13 Plus 9320 Core i7-1360P | |
| Asus ZenBook 14 UX3405MA | |
| AIDA64 / FP64 Ray-Trace | |
| Tuxedo Pulse 14 Gen3 | |
| Średnia w klasie Subnotebook (610 - 17495, n=58, ostatnie 2 lata) | |
| Acer Swift Go 14 SFG14-72 | |
| Schenker Vision 14 2023 | |
| Przeciętny Intel Core Ultra 7 155H (3569 - 9802, n=50) | |
| Dell XPS 13 Plus 9320 Core i7-1360P | |
| Asus ZenBook 14 UX3405MA | |
| AIDA64 / CPU PhotoWorxx | |
| Dell XPS 13 Plus 9320 Core i7-1360P | |
| Średnia w klasie Subnotebook (6569 - 85600, n=58, ostatnie 2 lata) | |
| Asus ZenBook 14 UX3405MA | |
| Przeciętny Intel Core Ultra 7 155H (32719 - 54223, n=50) | |
| Acer Swift Go 14 SFG14-72 | |
| Schenker Vision 14 2023 | |
| Tuxedo Pulse 14 Gen3 | |
Wydajność systemu
Pod względem wydajności systemu, Zenbook 14 nie wykazuje żadnych problemów i ogólnie rzecz biorąc, jest to bardzo szybko reagujący laptop. Jego wyniki w syntetycznych benchmarkach również były dobre i nie mieliśmy żadnych problemów z urządzeniem w trakcie naszego testu.
CrossMark: Overall | Productivity | Creativity | Responsiveness
WebXPRT 3: Overall
WebXPRT 4: Overall
Mozilla Kraken 1.1: Total
| PCMark 10 / Score | |
| Tuxedo Pulse 14 Gen3 | |
| Średnia w klasie Subnotebook (4920 - 9939, n=46, ostatnie 2 lata) | |
| Przeciętny Intel Core Ultra 7 155H, Intel Arc 8-Core iGPU (4809 - 7529, n=34) | |
| Acer Swift Go 14 SFG14-72 | |
| Asus ZenBook 14 UX3405MA | |
| Dell XPS 13 Plus 9320 Core i7-1360P | |
| Schenker Vision 14 2023 | |
| PCMark 10 / Essentials | |
| Tuxedo Pulse 14 Gen3 | |
| Dell XPS 13 Plus 9320 Core i7-1360P | |
| Asus ZenBook 14 UX3405MA | |
| Przeciętny Intel Core Ultra 7 155H, Intel Arc 8-Core iGPU (7605 - 11289, n=34) | |
| Średnia w klasie Subnotebook (8552 - 11646, n=46, ostatnie 2 lata) | |
| Schenker Vision 14 2023 | |
| Acer Swift Go 14 SFG14-72 | |
| PCMark 10 / Productivity | |
| Tuxedo Pulse 14 Gen3 | |
| Średnia w klasie Subnotebook (5435 - 16606, n=46, ostatnie 2 lata) | |
| Asus ZenBook 14 UX3405MA | |
| Przeciętny Intel Core Ultra 7 155H, Intel Arc 8-Core iGPU (6042 - 10591, n=34) | |
| Acer Swift Go 14 SFG14-72 | |
| Dell XPS 13 Plus 9320 Core i7-1360P | |
| Schenker Vision 14 2023 | |
| PCMark 10 / Digital Content Creation | |
| Tuxedo Pulse 14 Gen3 | |
| Średnia w klasie Subnotebook (5722 - 13779, n=46, ostatnie 2 lata) | |
| Acer Swift Go 14 SFG14-72 | |
| Przeciętny Intel Core Ultra 7 155H, Intel Arc 8-Core iGPU (4985 - 10709, n=34) | |
| Asus ZenBook 14 UX3405MA | |
| Dell XPS 13 Plus 9320 Core i7-1360P | |
| Schenker Vision 14 2023 | |
| CrossMark / Overall | |
| Tuxedo Pulse 14 Gen3 | |
| Dell XPS 13 Plus 9320 Core i7-1360P | |
| Średnia w klasie Subnotebook (365 - 2356, n=60, ostatnie 2 lata) | |
| Przeciętny Intel Core Ultra 7 155H, Intel Arc 8-Core iGPU (1366 - 1903, n=34) | |
| Asus ZenBook 14 UX3405MA | |
| Acer Swift Go 14 SFG14-72 | |
| Schenker Vision 14 2023 | |
| Apple MacBook Air M2 10C GPU | |
| CrossMark / Productivity | |
| Tuxedo Pulse 14 Gen3 | |
| Dell XPS 13 Plus 9320 Core i7-1360P | |
| Średnia w klasie Subnotebook (364 - 2277, n=60, ostatnie 2 lata) | |
| Przeciętny Intel Core Ultra 7 155H, Intel Arc 8-Core iGPU (1291 - 1798, n=33) | |
| Asus ZenBook 14 UX3405MA | |
| Acer Swift Go 14 SFG14-72 | |
| Schenker Vision 14 2023 | |
| Apple MacBook Air M2 10C GPU | |
| CrossMark / Creativity | |
| Dell XPS 13 Plus 9320 Core i7-1360P | |
| Tuxedo Pulse 14 Gen3 | |
| Średnia w klasie Subnotebook (372 - 2743, n=60, ostatnie 2 lata) | |
| Asus ZenBook 14 UX3405MA | |
| Apple MacBook Air M2 10C GPU | |
| Przeciętny Intel Core Ultra 7 155H, Intel Arc 8-Core iGPU (1519 - 1929, n=33) | |
| Acer Swift Go 14 SFG14-72 | |
| Schenker Vision 14 2023 | |
| CrossMark / Responsiveness | |
| Tuxedo Pulse 14 Gen3 | |
| Dell XPS 13 Plus 9320 Core i7-1360P | |
| Schenker Vision 14 2023 | |
| Przeciętny Intel Core Ultra 7 155H, Intel Arc 8-Core iGPU (939 - 1802, n=33) | |
| Acer Swift Go 14 SFG14-72 | |
| Średnia w klasie Subnotebook (312 - 1854, n=60, ostatnie 2 lata) | |
| Asus ZenBook 14 UX3405MA | |
| Apple MacBook Air M2 10C GPU | |
| WebXPRT 3 / Overall | |
| Apple MacBook Air M2 10C GPU | |
| Średnia w klasie Subnotebook (156 - 530, n=56, ostatnie 2 lata) | |
| Tuxedo Pulse 14 Gen3 | |
| Dell XPS 13 Plus 9320 Core i7-1360P | |
| Schenker Vision 14 2023 | |
| Acer Swift Go 14 SFG14-72 | |
| Przeciętny Intel Core Ultra 7 155H, Intel Arc 8-Core iGPU (252 - 299, n=34) | |
| Asus ZenBook 14 UX3405MA | |
| WebXPRT 4 / Overall | |
| Tuxedo Pulse 14 Gen3 | |
| Średnia w klasie Subnotebook (132 - 378, n=61, ostatnie 2 lata) | |
| Schenker Vision 14 2023 | |
| Dell XPS 13 Plus 9320 Core i7-1360P | |
| Przeciętny Intel Core Ultra 7 155H, Intel Arc 8-Core iGPU (166.4 - 309, n=29) | |
| Asus ZenBook 14 UX3405MA | |
| Apple MacBook Air M2 10C GPU | |
| Mozilla Kraken 1.1 / Total | |
| Przeciętny Intel Core Ultra 7 155H, Intel Arc 8-Core iGPU (517 - 614, n=35) | |
| Acer Swift Go 14 SFG14-72 | |
| Asus ZenBook 14 UX3405MA | |
| Tuxedo Pulse 14 Gen3 | |
| Schenker Vision 14 2023 | |
| Dell XPS 13 Plus 9320 Core i7-1360P | |
| Średnia w klasie Subnotebook (234 - 1104, n=61, ostatnie 2 lata) | |
| Apple MacBook Air M2 10C GPU | |
* ... im mniej tym lepiej
| PCMark 10 Score | 6527 pkt. | |
Pomoc | ||
| AIDA64 / Memory Copy | |
| Asus ZenBook 14 UX3405MA | |
| Średnia w klasie Subnotebook (14554 - 131023, n=58, ostatnie 2 lata) | |
| Przeciętny Intel Core Ultra 7 155H (62397 - 96791, n=50) | |
| Acer Swift Go 14 SFG14-72 | |
| Dell XPS 13 Plus 9320 Core i7-1360P | |
| Tuxedo Pulse 14 Gen3 | |
| Schenker Vision 14 2023 | |
| AIDA64 / Memory Read | |
| Asus ZenBook 14 UX3405MA | |
| Średnia w klasie Subnotebook (15948 - 127174, n=58, ostatnie 2 lata) | |
| Przeciętny Intel Core Ultra 7 155H (60544 - 90647, n=50) | |
| Acer Swift Go 14 SFG14-72 | |
| Schenker Vision 14 2023 | |
| Dell XPS 13 Plus 9320 Core i7-1360P | |
| Tuxedo Pulse 14 Gen3 | |
| AIDA64 / Memory Write | |
| Tuxedo Pulse 14 Gen3 | |
| Średnia w klasie Subnotebook (15709 - 135141, n=58, ostatnie 2 lata) | |
| Dell XPS 13 Plus 9320 Core i7-1360P | |
| Acer Swift Go 14 SFG14-72 | |
| Asus ZenBook 14 UX3405MA | |
| Przeciętny Intel Core Ultra 7 155H (58692 - 93451, n=50) | |
| Schenker Vision 14 2023 | |
| AIDA64 / Memory Latency | |
| Asus ZenBook 14 UX3405MA | |
| Acer Swift Go 14 SFG14-72 | |
| Przeciętny Intel Core Ultra 7 155H (116.2 - 233, n=50) | |
| Tuxedo Pulse 14 Gen3 | |
| Dell XPS 13 Plus 9320 Core i7-1360P | |
| Średnia w klasie Subnotebook (6.1 - 159.9, n=56, ostatnie 2 lata) | |
| Schenker Vision 14 2023 | |
* ... im mniej tym lepiej
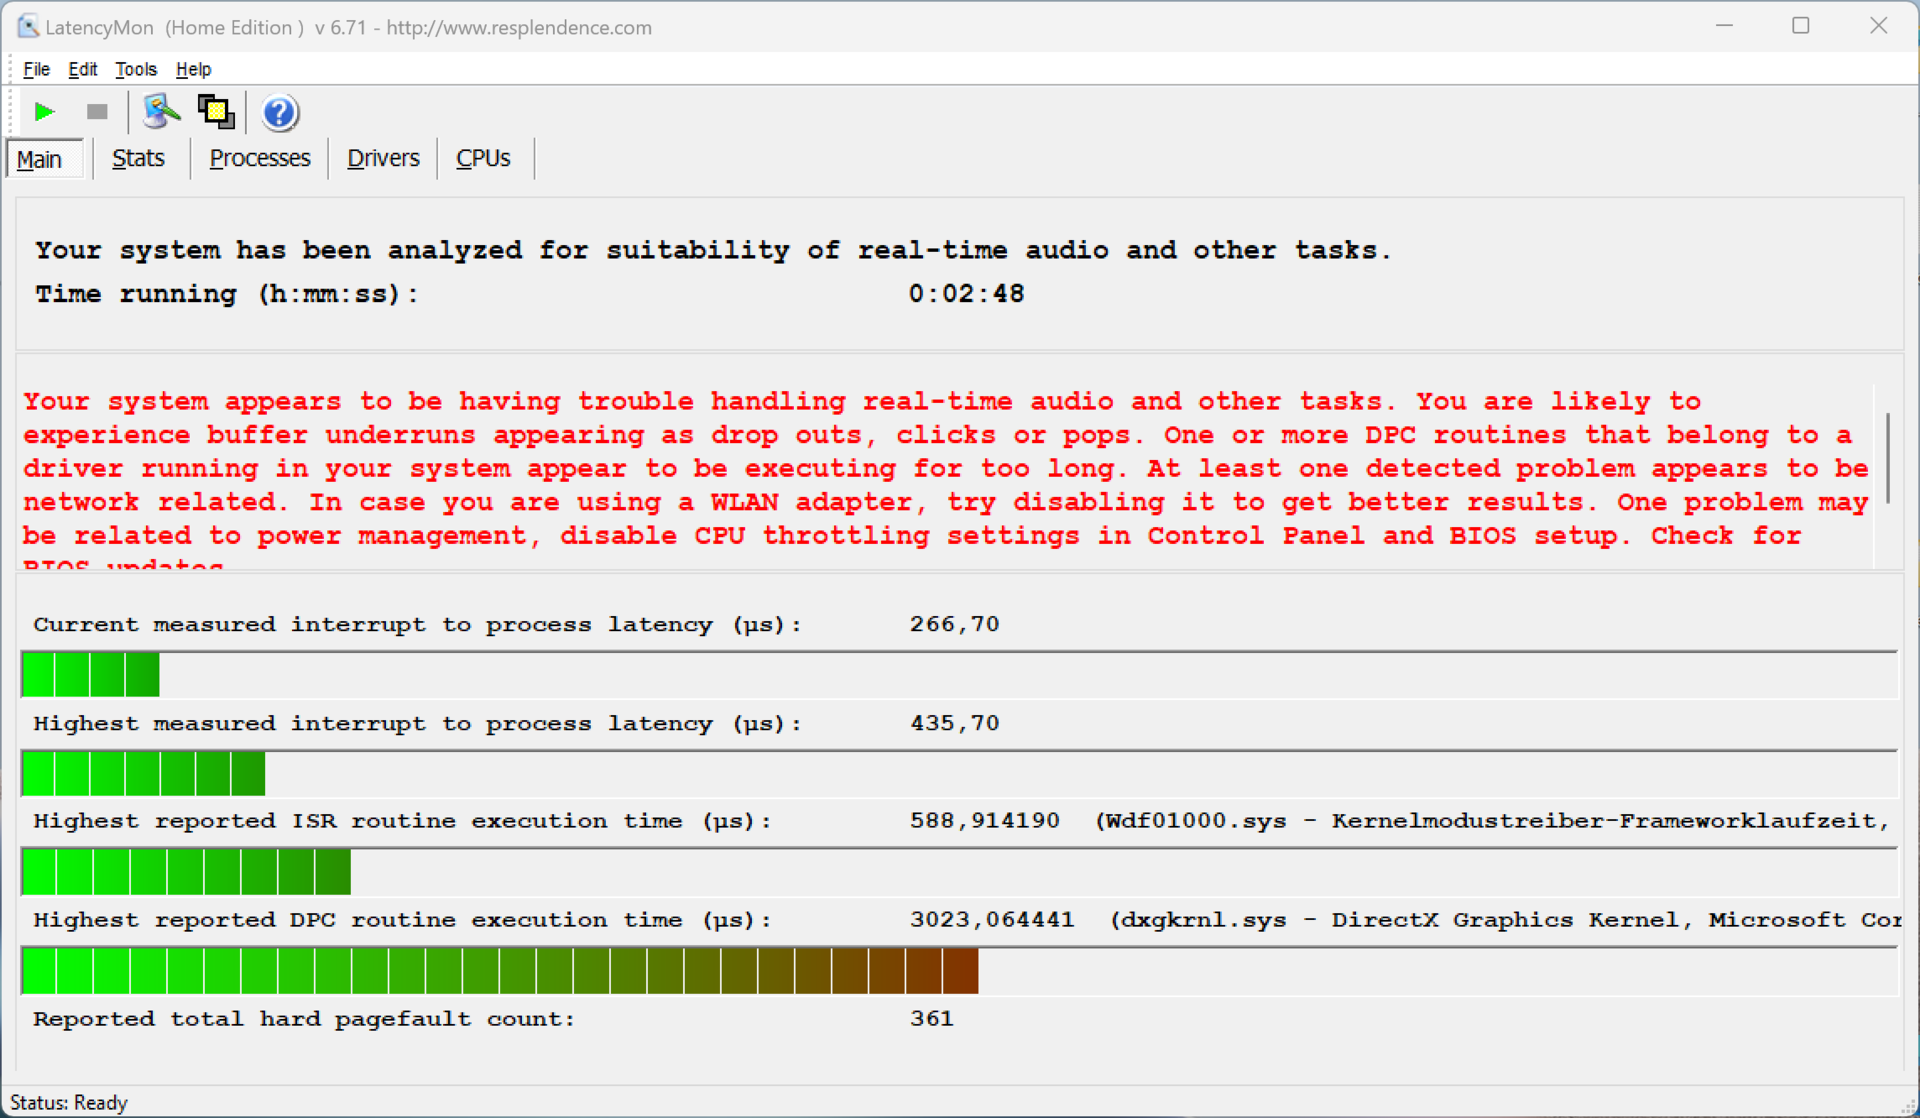
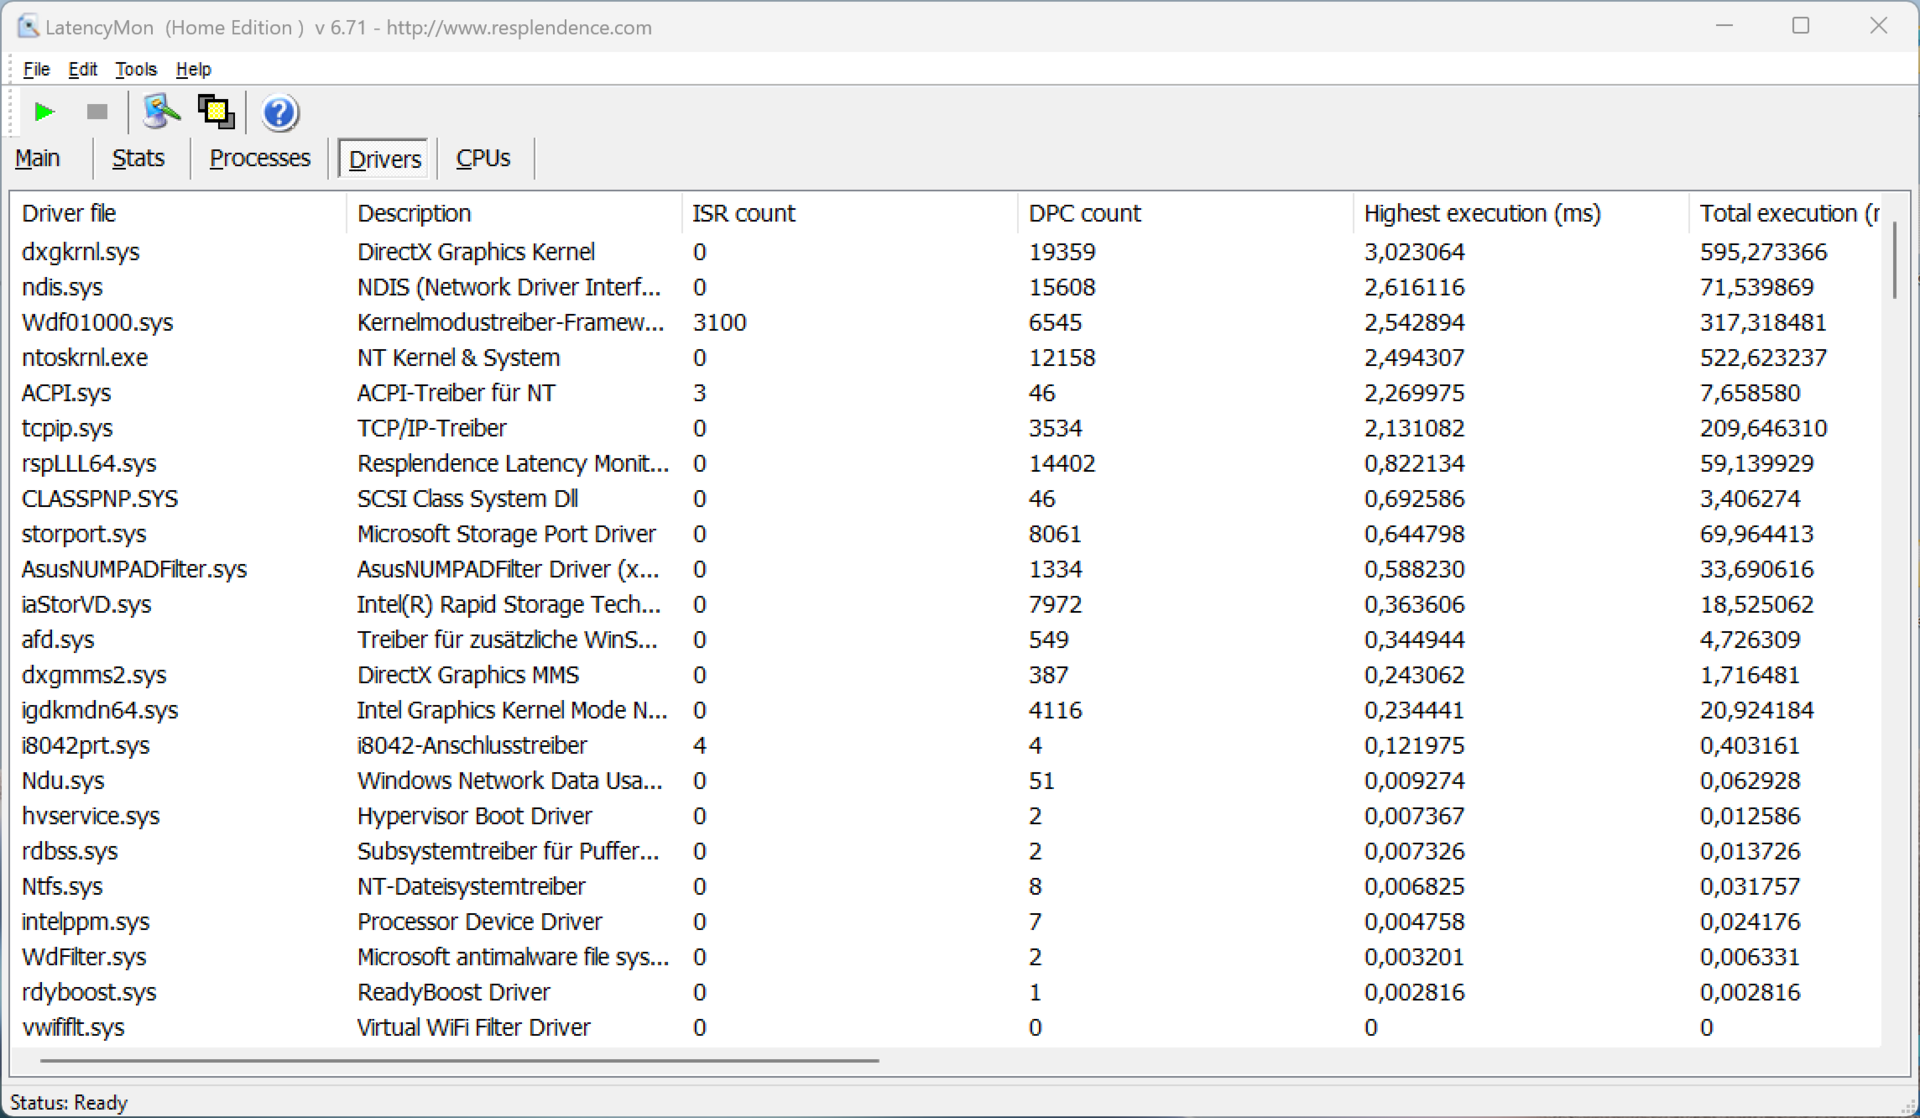
Opóźnienie DPC
W naszym standardowym teście opóźnień (surfowanie po Internecie, odtwarzanie YouTube w 4K, obciążenie procesora), Zenbook 14 z aktualną wersją BIOS-u wykazał ograniczenia z jednym sterownikiem, ale ważna wartość "opóźnienie między przerwaniem a procesem" była bardzo niska.
| DPC Latencies / LatencyMon - interrupt to process latency (max), Web, Youtube, Prime95 | |
| Dell XPS 13 Plus 9320 Core i7-1360P | |
| Schenker Vision 14 2023 | |
| Tuxedo Pulse 14 Gen3 | |
| Asus ZenBook 14 UX3405MA | |
* ... im mniej tym lepiej
Urządzenia pamięci masowej
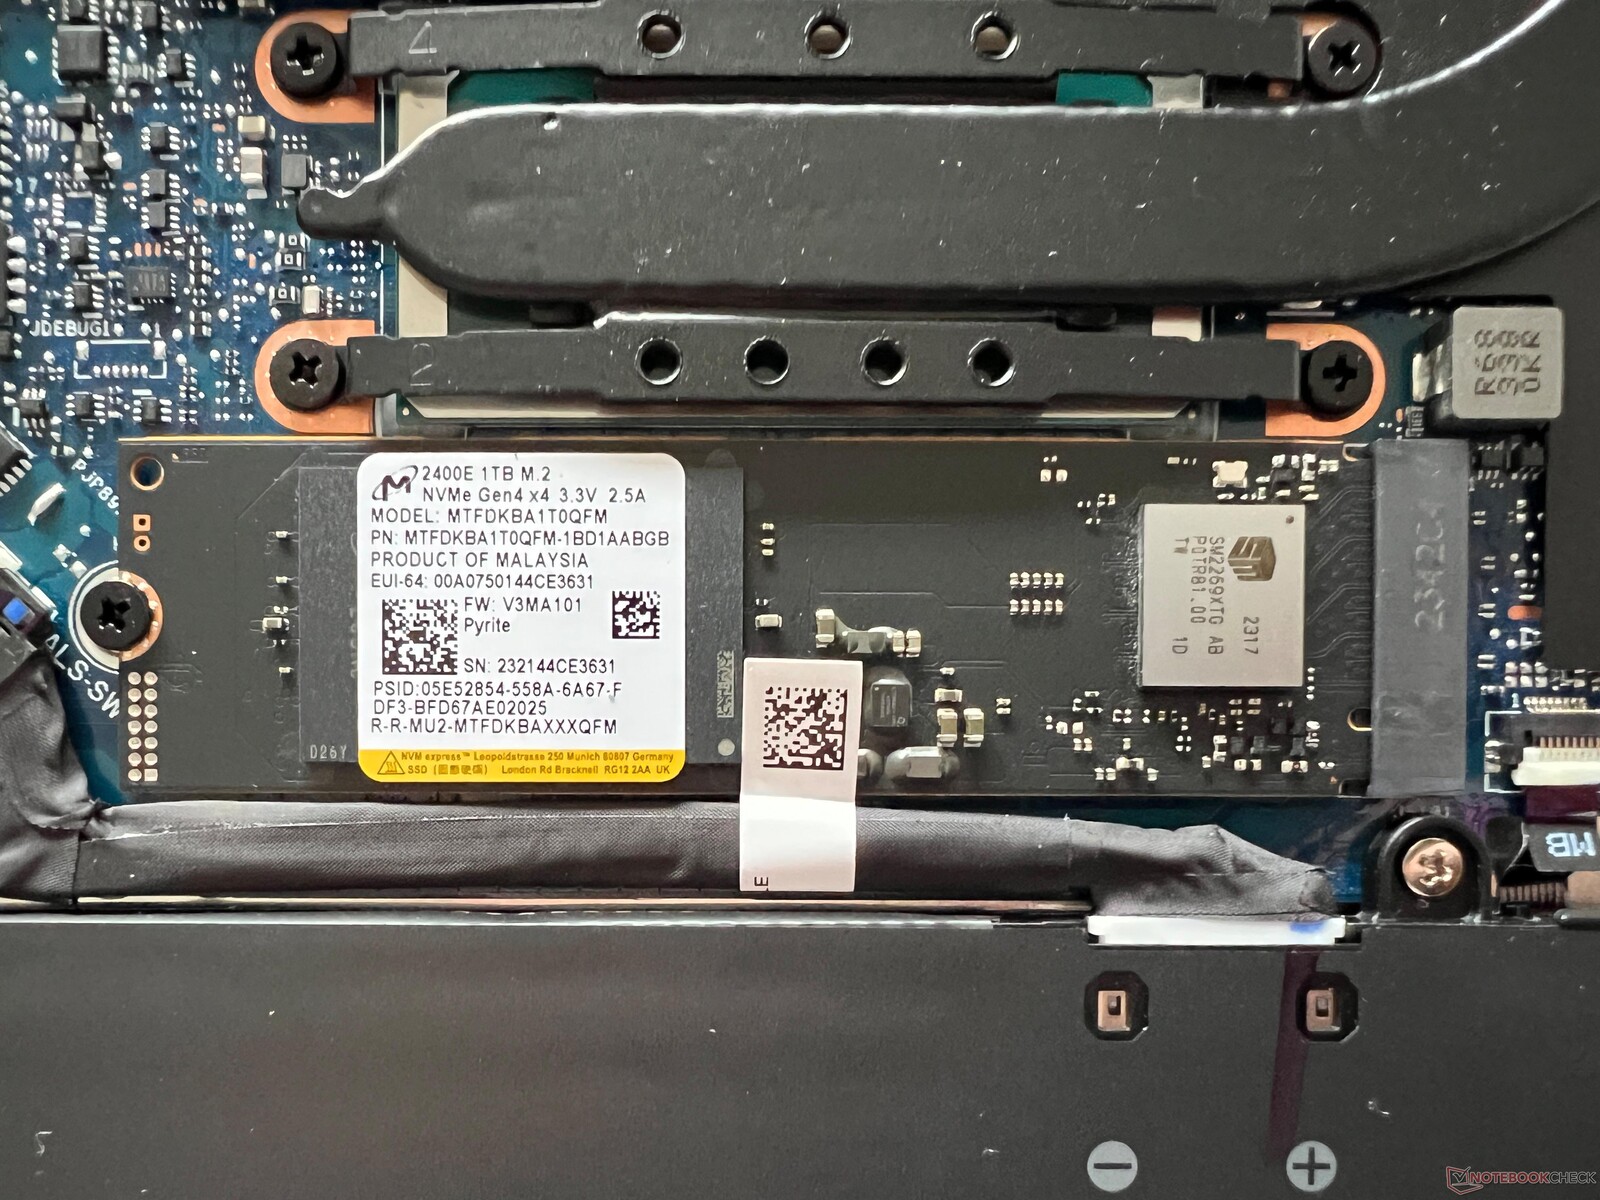
Laptop został wyposażony w dysk SSD Micron2400, PCIe-4.0 o pojemności 1 TB, dzięki czemu użytkownicy mają swobodny dostęp do 896 GB po pierwszym uruchomieniu urządzenia. Chociaż wydajność SSD jest odpowiednia do codziennych zadań i pozostaje stabilna nawet przy dłuższych okresach obciążenia, dysk nie wykazuje najlepszych wyników w porównaniu do konkurencji. Sami byliśmy nieco zaskoczeni i powtarzaliśmy testy wielokrotnie, ale nic nie zmieniło się w wynikach. Więcej testów porównawczych dysków SSD znajdą Państwo tutaj.

* ... im mniej tym lepiej
Reading continuous performance: DiskSpd Read Loop, Queue Depth 8
Karta graficzna
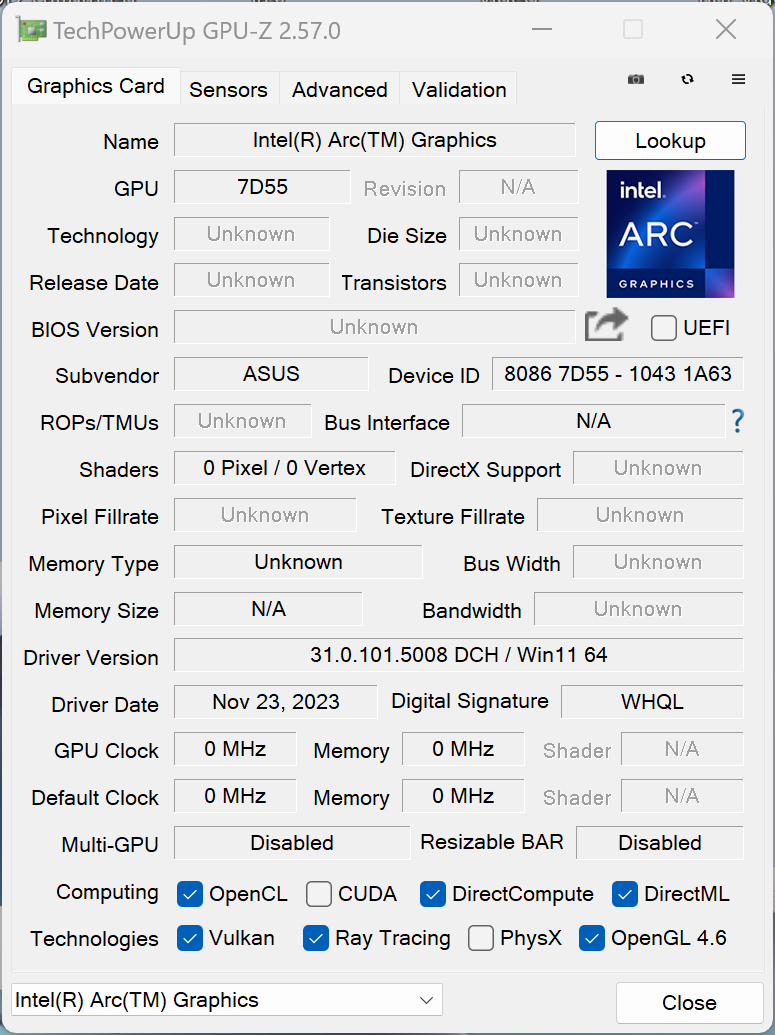
Procesory Meteor-Lake są wyposażone w nowe iGPU Arc, przy czym szybki wariant z 8 rdzeniami jest używany w połączeniu z Core Ultra 7 155H. Po tym, jak Intel prawie nie wykazał żadnego postępu w zakresie iGPU w ostatnim czasie, nowy Arc iGPU może konkurować z AMD Radeon 780M-przynajmniej w obecnych testach syntetycznych.
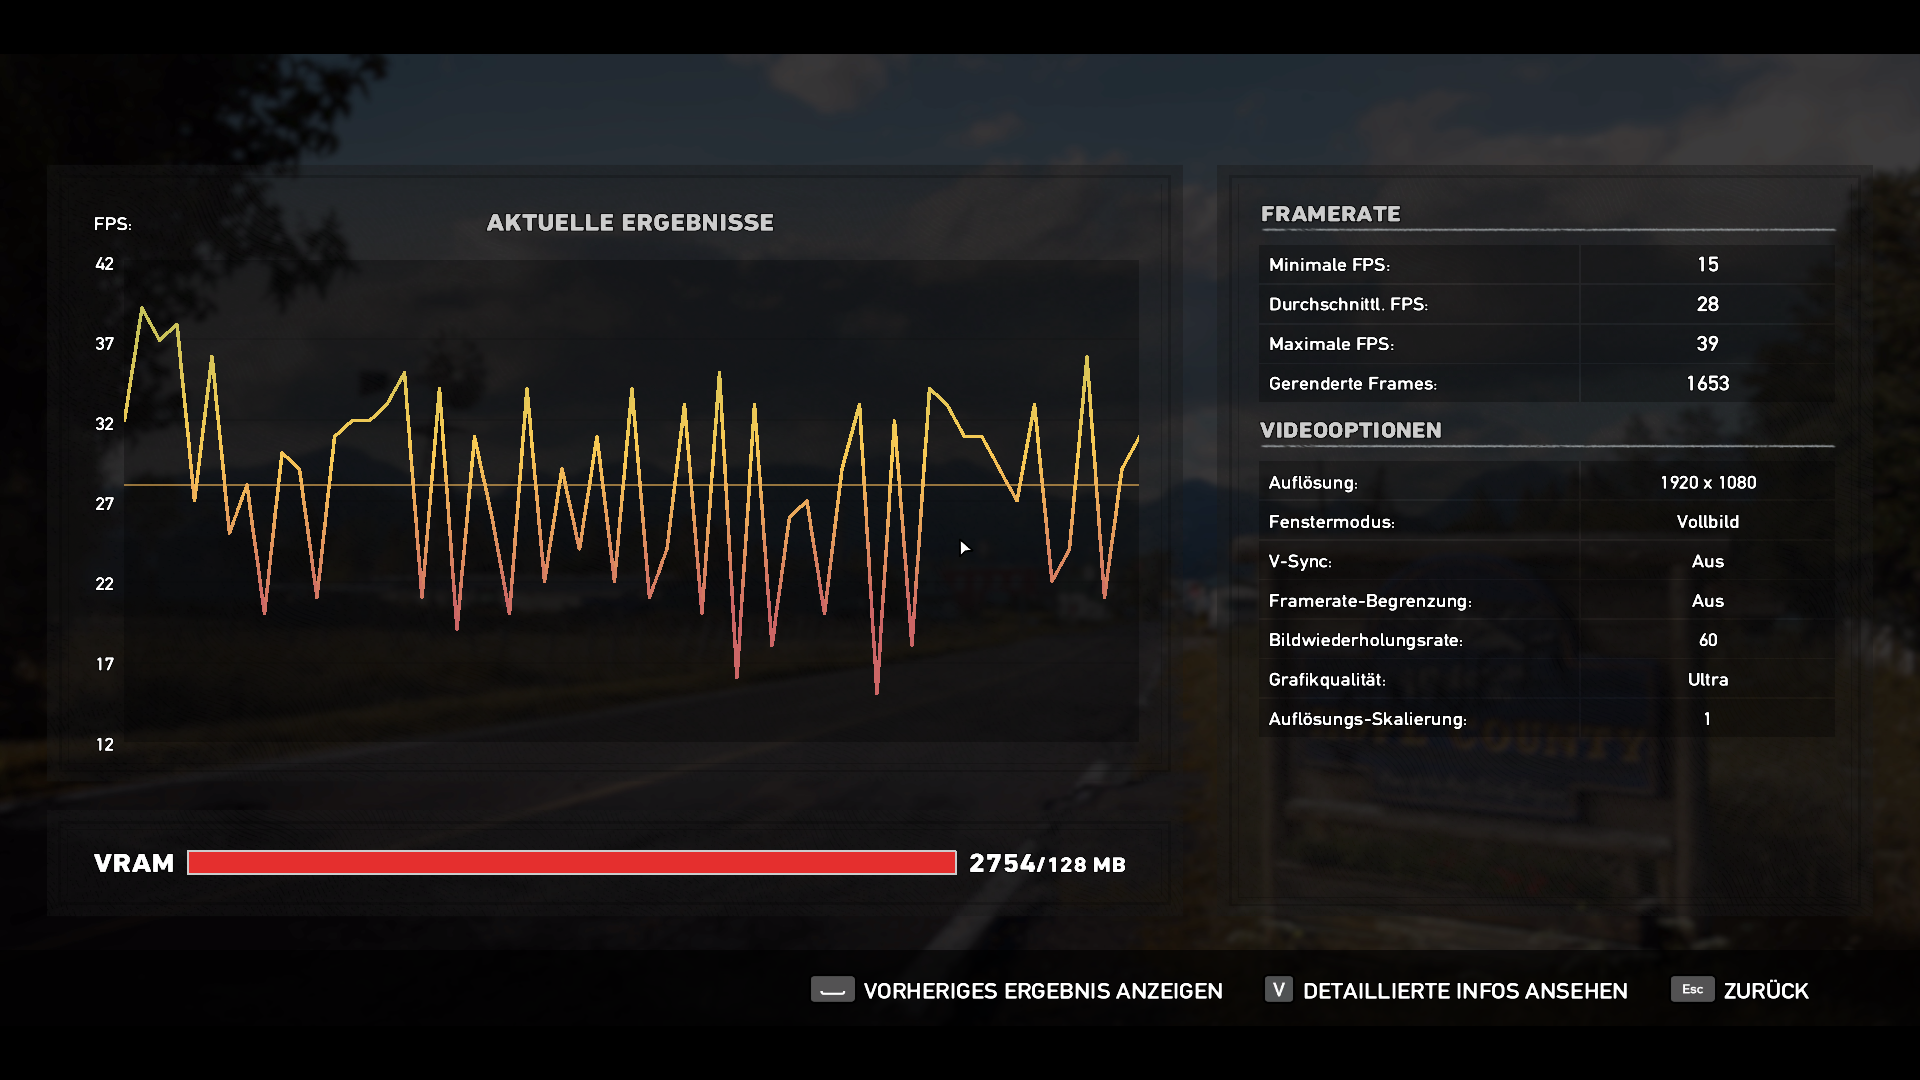
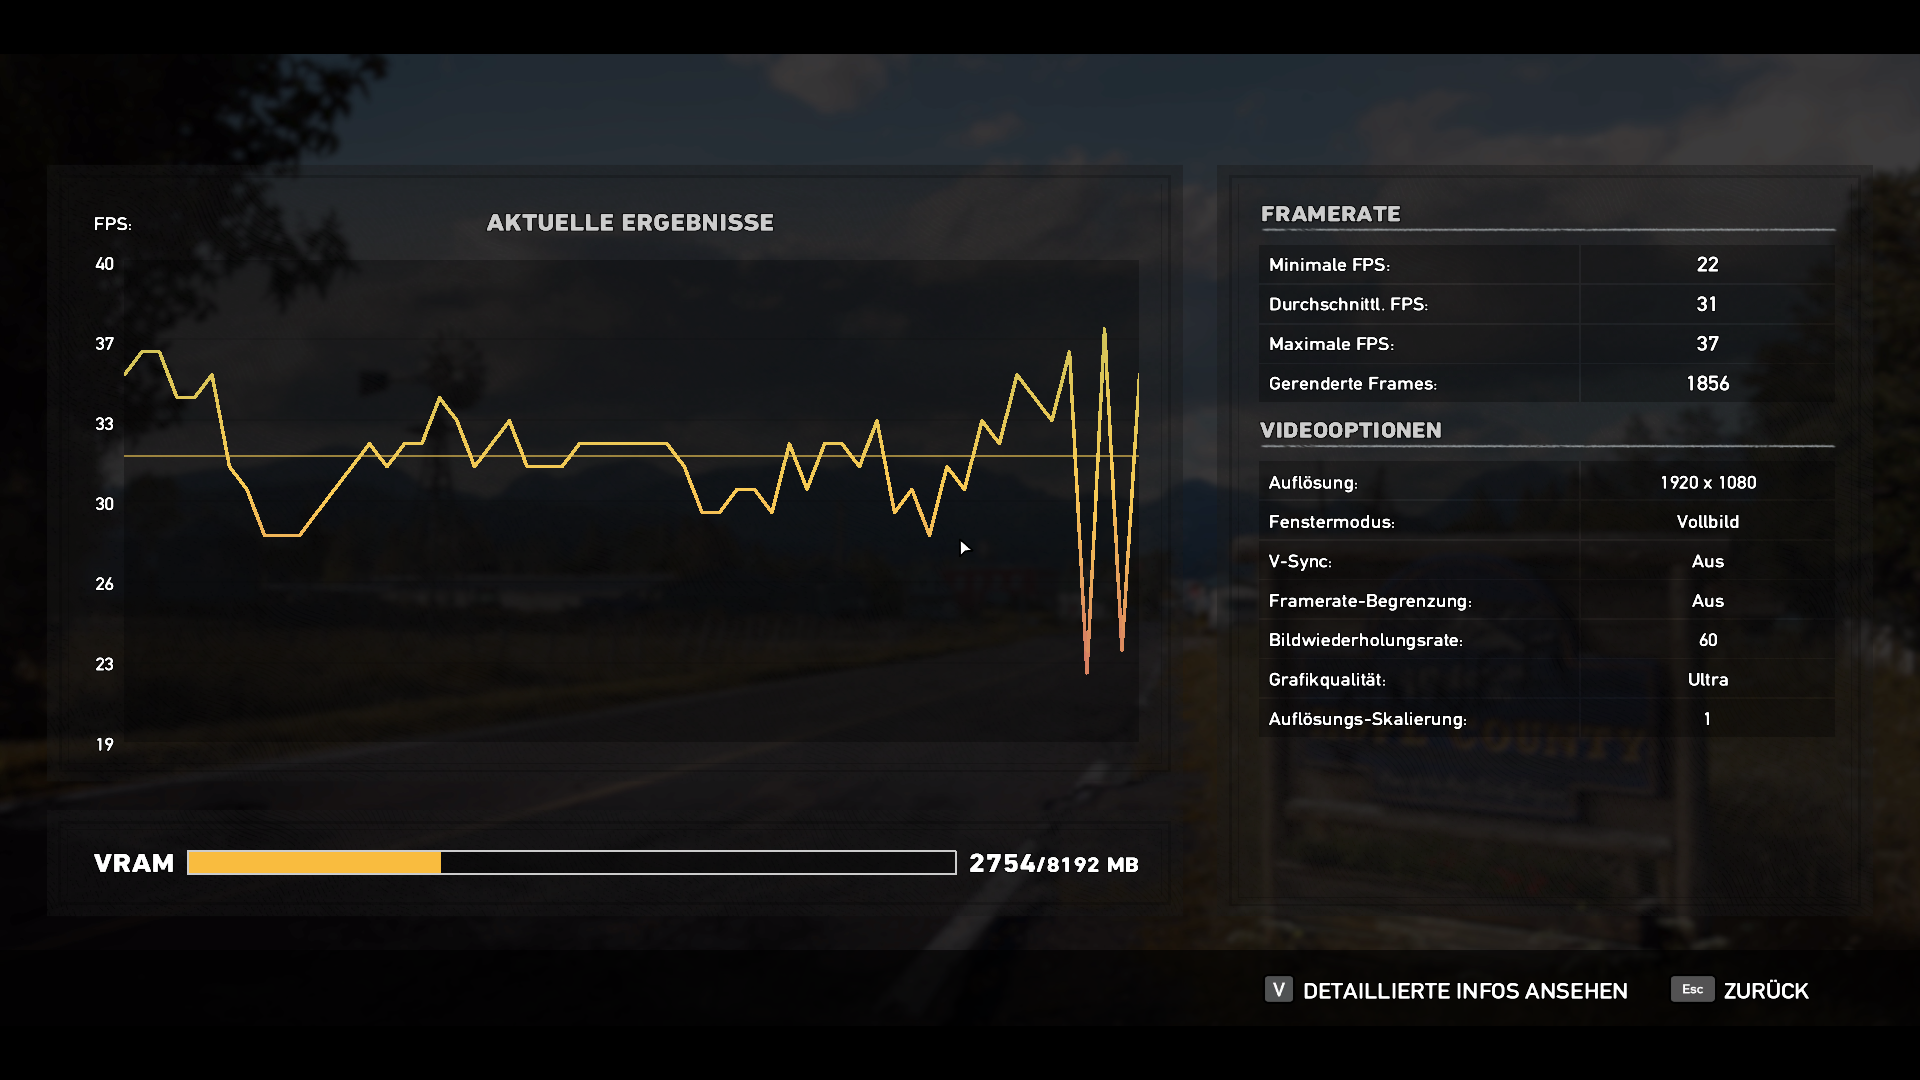
Niestety, obecnie nadal występują pewne problemy ze sterownikami GPU, ponieważ zauważyliśmy ogromne spadki klatek na wielu urządzeniach testowych w większości gier z wybranymi wysokimi detalami, takimi jak na niedawno recenzowanym HP Spectre x360 14 i oczywiście Zenbook 14 OLED. W przypadku Asusa można dostosować przydzieloną pamięć GPU za pomocą oprogramowania MyAsus, które następnie wymaga ponownego uruchomienia. Zasadniczo wartość jest przypisywana automatycznie, ale można wybrać do 8 GB. Pomaga to jednak tylko na krótki czas, ponieważ nawet przy większej ilości pamięci GPU, wciąż występują znaczne wahania wydajności, przez co granie jest obecnie praktycznie niemożliwe (szczególnie przy wysokich detalach). Nie wiemy jeszcze dokładnie, dlaczego tylko niektóre urządzenia testowe wykazują takie zachowanie.
W benchmarkach gamingowych, nowy Arc iGPU nie był w stanie potwierdzić swoich dobrych wyników z testów syntetycznych i konsekwentnie pozostawał w tyle za Radeonem 780M od AMD. Zakładamy jednak, że problem ten zostanie naprawiony w przyszłych sterownikach, co doprowadzi do dalszej poprawy wydajności w grach. Jego wydajność graficzna pozostaje stabilna zarówno przy długotrwałym obciążeniu, jak i w trybie bateryjnym. Dalsze testy porównawcze GPU są dostępne w naszej sekcji technicznej.
| 3DMark 11 Performance | 9340 pkt. | |
| 3DMark Fire Strike Score | 6445 pkt. | |
| 3DMark Time Spy Score | 3427 pkt. | |
Pomoc | ||
| Blender / v3.3 Classroom CPU | |
| Apple MacBook Air M2 10C GPU | |
| Asus ZenBook 14 UX3405MA | |
| Dell XPS 13 Plus 9320 Core i7-1360P | |
| Średnia w klasie Subnotebook (241 - 861, n=60, ostatnie 2 lata) | |
| Przeciętny Intel Arc 8-Core iGPU (294 - 692, n=43) | |
| Schenker Vision 14 2023 | |
| Acer Swift Go 14 SFG14-72 | |
| Tuxedo Pulse 14 Gen3 | |
* ... im mniej tym lepiej
| Performance rating - Percent | |
| Tuxedo Pulse 14 Gen3 | |
| Średnia w klasie Subnotebook | |
| Acer Swift Go 14 SFG14-72 | |
| Asus ZenBook 14 UX3405MA | |
| Dell XPS 13 Plus 9320 Core i7-1360P | |
| Schenker Vision 14 2023 | |
| The Witcher 3 - 1920x1080 Ultra Graphics & Postprocessing (HBAO+) | |
| Tuxedo Pulse 14 Gen3 | |
| Średnia w klasie Subnotebook (13.9 - 34.6, n=12, ostatnie 2 lata) | |
| Acer Swift Go 14 SFG14-72 | |
| Asus ZenBook 14 UX3405MA | |
| Dell XPS 13 Plus 9320 Core i7-1360P | |
| Schenker Vision 14 2023 | |
| GTA V - 1920x1080 Highest AA:4xMSAA + FX AF:16x | |
| Tuxedo Pulse 14 Gen3 | |
| Średnia w klasie Subnotebook (10.7 - 43.7, n=56, ostatnie 2 lata) | |
| Asus ZenBook 14 UX3405MA | |
| Acer Swift Go 14 SFG14-72 | |
| Dell XPS 13 Plus 9320 Core i7-1360P | |
| Schenker Vision 14 2023 | |
| Final Fantasy XV Benchmark - 1920x1080 High Quality | |
| Tuxedo Pulse 14 Gen3 | |
| Średnia w klasie Subnotebook (11.6 - 54.5, n=54, ostatnie 2 lata) | |
| Asus ZenBook 14 UX3405MA | |
| Schenker Vision 14 2023 | |
| Acer Swift Go 14 SFG14-72 | |
| Dell XPS 13 Plus 9320 Core i7-1360P | |
| Strange Brigade - 1920x1080 ultra AA:ultra AF:16 | |
| Średnia w klasie Subnotebook (19 - 101.3, n=50, ostatnie 2 lata) | |
| Tuxedo Pulse 14 Gen3 | |
| Acer Swift Go 14 SFG14-72 | |
| Asus ZenBook 14 UX3405MA | |
| Schenker Vision 14 2023 | |
| Dell XPS 13 Plus 9320 Core i7-1360P | |
| Dota 2 Reborn - 1920x1080 ultra (3/3) best looking | |
| Tuxedo Pulse 14 Gen3 | |
| Acer Swift Go 14 SFG14-72 | |
| Średnia w klasie Subnotebook (13 - 97, n=61, ostatnie 2 lata) | |
| Asus ZenBook 14 UX3405MA | |
| Dell XPS 13 Plus 9320 Core i7-1360P | |
| Schenker Vision 14 2023 | |
Witcher 3 FPS diagram
| low | med. | high | ultra | |
|---|---|---|---|---|
| GTA V (2015) | 110.5 | 107.7 | 33.9 | 14.1 |
| The Witcher 3 (2015) | 126 | 80 | 40 | 19.2 |
| Dota 2 Reborn (2015) | 98.4 | 69.4 | 66.8 | 63.9 |
| Final Fantasy XV Benchmark (2018) | 47.6 | 29.7 | 21.2 | |
| X-Plane 11.11 (2018) | 47.1 | 36 | 30.2 | |
| Far Cry 5 (2018) | 54 | 37 | 34 | 31 |
| Strange Brigade (2018) | 154.8 | 67.6 | 52.4 | 38.8 |
| F1 2021 (2021) | 143.5 | 73.9 | 56.4 | 26.9 |
| F1 22 (2022) | 73.1 | 62.2 | 46.7 | 11.9 |
| F1 23 (2023) | 73.1 | 59.5 | 37.6 | 10 |
Emisje - Zenbook cierpi z powodu wysokiej aktywności wentylatora
Emisja hałasu
Wysokie limity mocy procesora stanowią duże wyzwanie dla układu chłodzenia, a użytkownicy płacą za dobrą wydajność laptopa w postaci dużej aktywności wentylatora przy krótkich seriach obciążenia. Wentylator zaczyna się obracać nawet w trybie bezczynności, choć jego szum nie powinien być irytujący. Jednak podczas prostych zadań obraca się już szybciej, co prowadzi do szybkiego osiągnięcia słyszalnego poziomu 33-40 dB(A). Co więcej, wentylator zaczyna również pulsować pod obciążeniem, co jest nieco irytujące. W trybie wydajności odnotowaliśmy wyjątkowo głośne 49,3 dB(A), a w trybie szeptu zmierzyliśmy maksymalnie 31,6 dB(A). Ponadto nasze urządzenie testowe wydawało elektroniczne dźwięki podczas prawie każdego zadania, które pochodziły w szczególności z dysku SSD, co oznacza, że nigdy nie masz naprawdę spokoju, nawet gdy wentylatory są wyłączone.
Hałas
| luz |
| 23.4 / 23.4 / 24.5 dB |
| obciążenie |
| 39.3 / 39.3 dB |
 | ||
30 dB cichy 40 dB(A) słyszalny 50 dB(A) irytujący |
||
min: | ||
| Asus ZenBook 14 UX3405MA Arc 8-Core, Ultra 7 155H, Micron 2400 MTFDKBA1T0QFM | Tuxedo Pulse 14 Gen3 Radeon 780M, R7 7840HS, Samsung SSD 980 Pro 2TB MZ-V8P2T0 | Acer Swift Go 14 SFG14-72 Arc 8-Core, Ultra 7 155H, SK hynix HFS001TEJ9X110NA | Schenker Vision 14 2023 Iris Xe G7 96EUs, i7-13700H, Samsung 990 Pro 1 TB | Dell XPS 13 Plus 9320 Core i7-1360P Iris Xe G7 96EUs, i7-1360P, Samsung PM9A1 MZVL2512HCJQ | |
|---|---|---|---|---|---|
| Noise | 3% | -6% | -10% | -4% | |
| wyłączone / środowisko * (dB) | 23.4 | 23.5 -0% | 25 -7% | 24.5 -5% | 23.7 -1% |
| Idle Minimum * (dB) | 23.4 | 23.5 -0% | 25 -7% | 24.5 -5% | 24 -3% |
| Idle Average * (dB) | 23.4 | 23.5 -0% | 25 -7% | 24.5 -5% | 24 -3% |
| Idle Maximum * (dB) | 24.5 | 25.1 -2% | 26.2 -7% | 30.4 -24% | 24.4 -0% |
| Load Average * (dB) | 39.3 | 32.4 18% | 35.7 9% | 39.5 -1% | 37 6% |
| Witcher 3 ultra * (dB) | 35.9 | 34.9 3% | 41.7 -16% | 42.1 -17% | |
| Load Maximum * (dB) | 39.3 | 37.3 5% | 45.5 -16% | 44.9 -14% | 42 -7% |
* ... im mniej tym lepiej
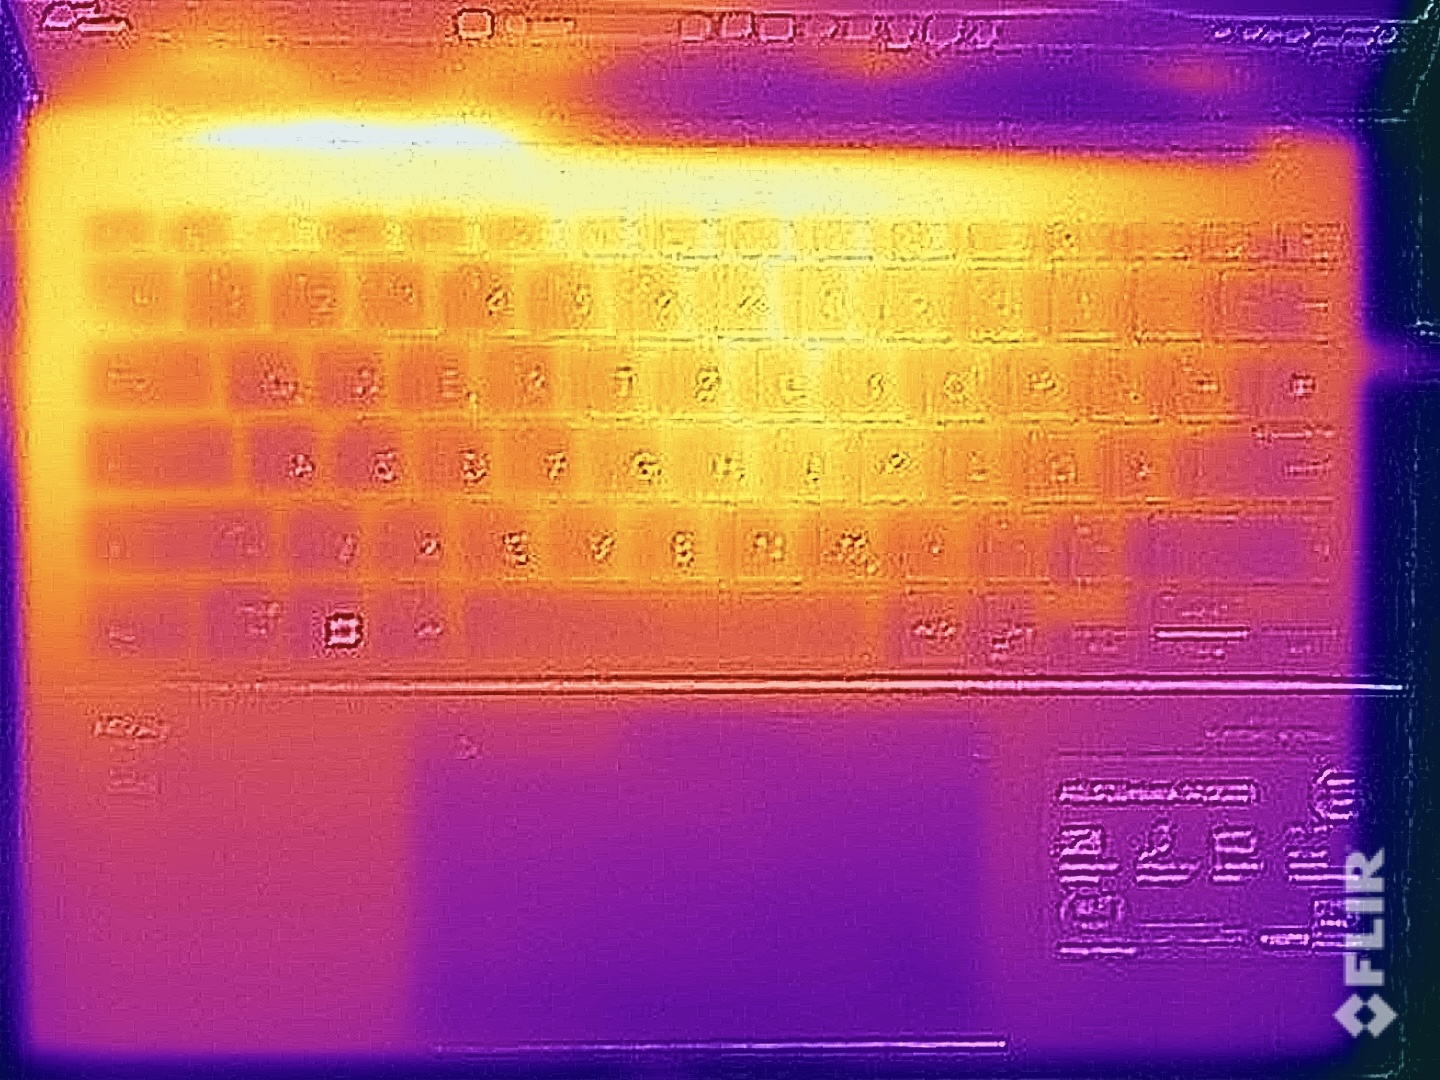
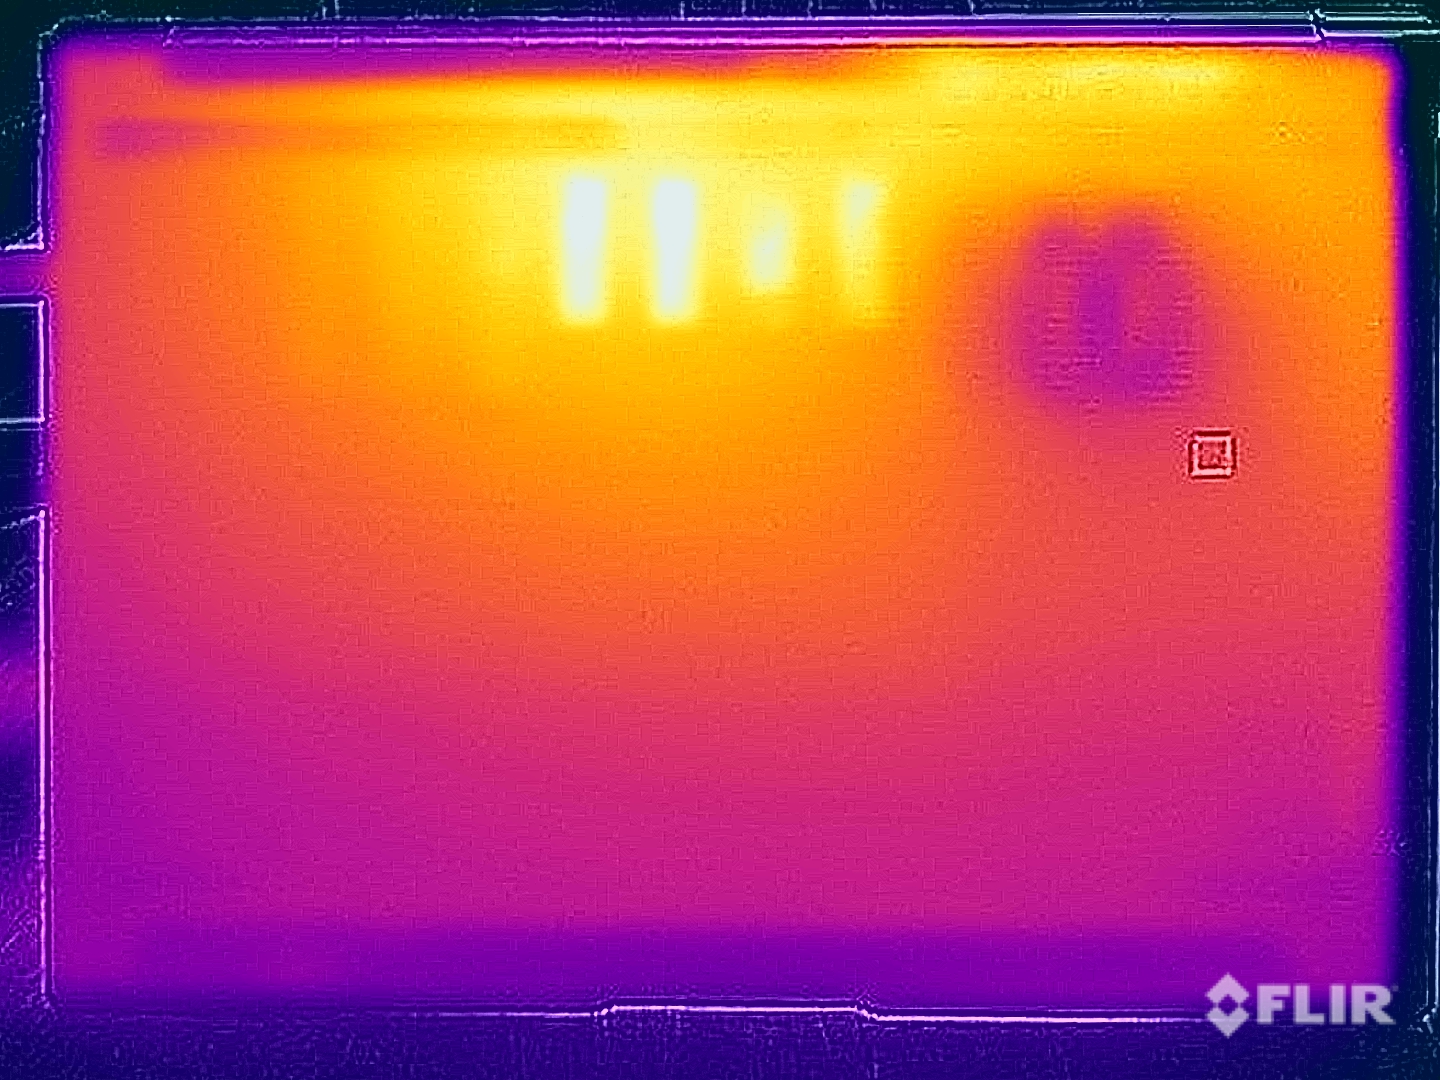
Temperatura
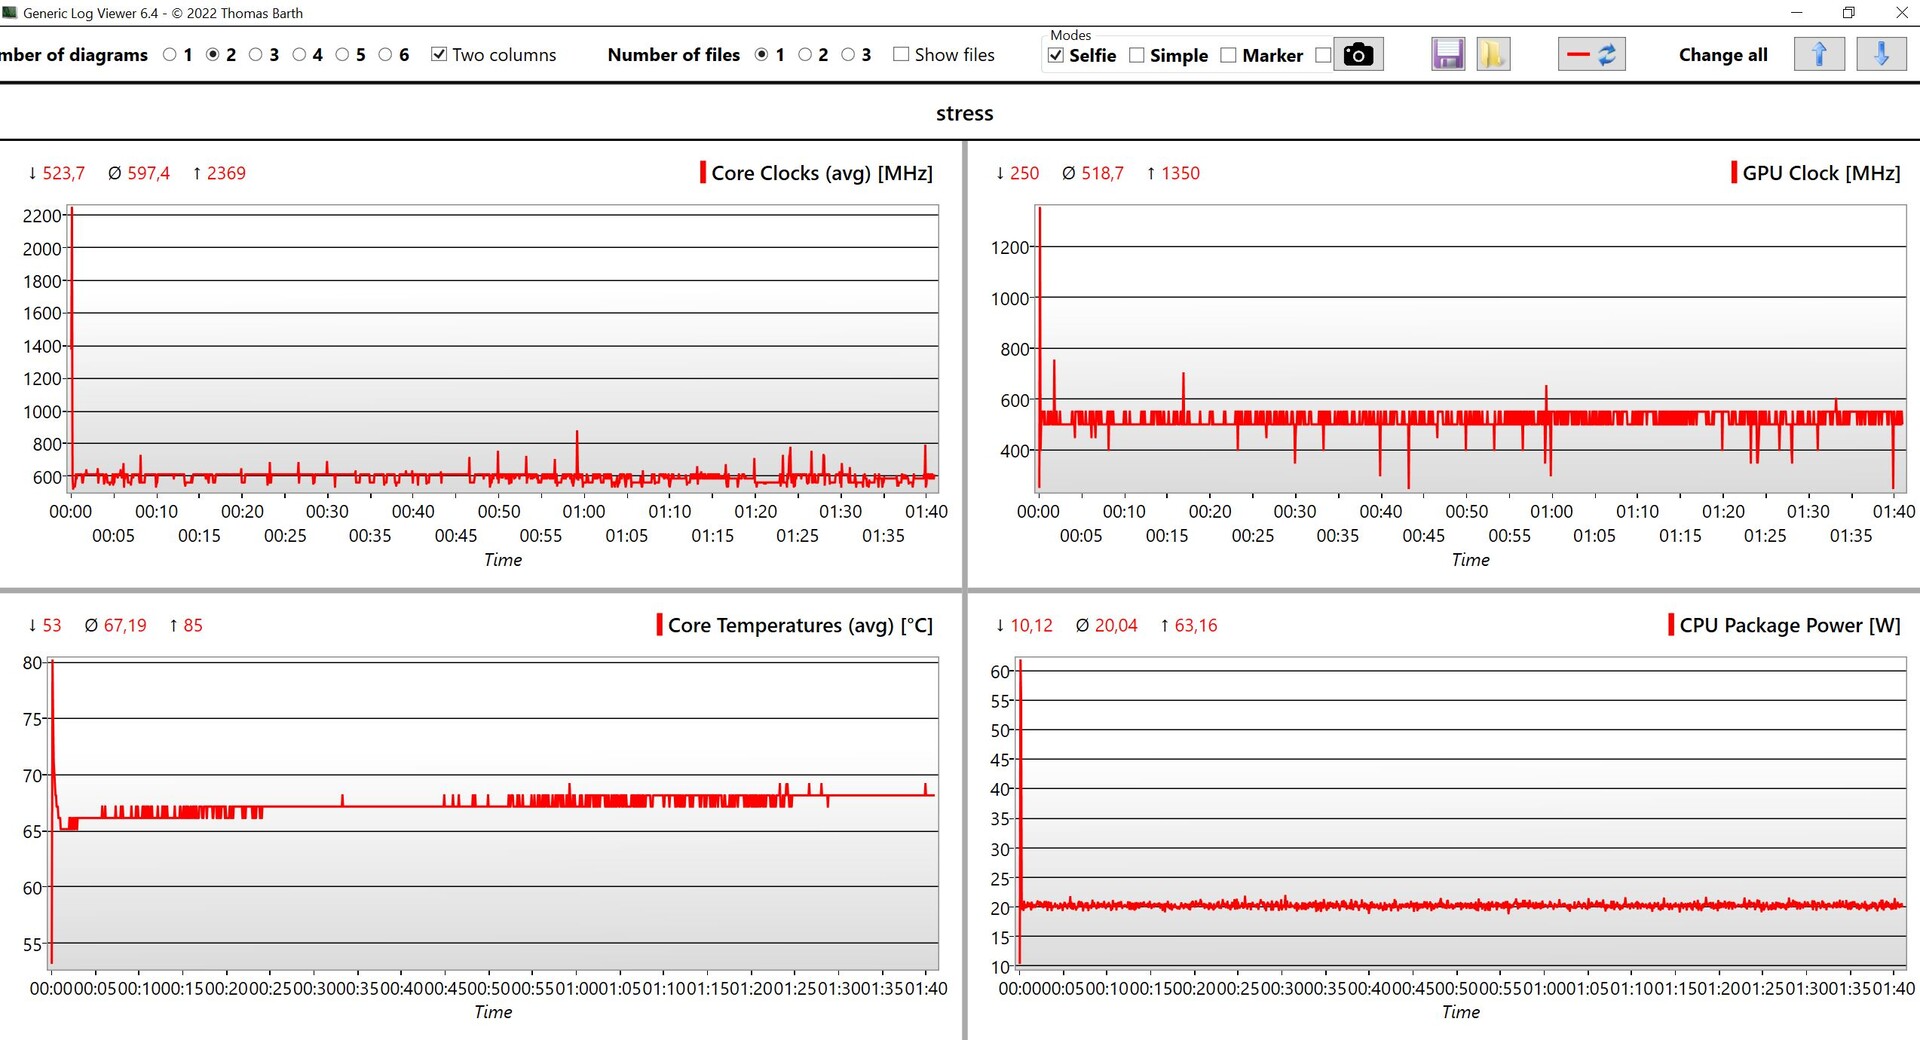
Obudowa Zenbooka 14 pozostawała bardzo chłodna w trybie bezczynności, ale zmierzyliśmy temperatury przekraczające 40 °C przy większym obciążeniu, zwłaszcza na spodzie. Hotspot znajduje się w środkowej tylnej części, co oznacza, że nadal można oprzeć laptopa na udach. Klawiatura również wyraźnie się nagrzewa, ale nie powinno to powodować żadnych ograniczeń podczas użytkowania. Biorąc jednak pod uwagę niski limit mocy wynoszący 20 W i wysoką aktywność wentylatora, te temperatury powierzchni są zbyt wysokie. Podczas testu obciążeniowego procesor osiadł na poziomie 20 watów znacznie szybciej niż miało to miejsce w przypadku czystego obciążenia CPU. Wartość ta została następnie utrzymana przez pozostały okres.
(±) Maksymalna temperatura w górnej części wynosi 40.9 °C / 106 F, w porównaniu do średniej 35.9 °C / 97 F , począwszy od 21.4 do 59 °C dla klasy Subnotebook.
(-) Dno nagrzewa się maksymalnie do 46.8 °C / 116 F, w porównaniu do średniej 39.2 °C / 103 F
(+) W stanie bezczynności średnia temperatura górnej części wynosi 23.7 °C / 75 F, w porównaniu ze średnią temperaturą urządzenia wynoszącą 30.8 °C / ### class_avg_f### F.
(±) Podczas gry w Wiedźmina 3 średnia temperatura górnej części wynosi 34.5 °C / 94 F, w porównaniu do średniej temperatury urządzenia wynoszącej 30.8 °C / ## #class_avg_f### F.
(+) Podpórki pod nadgarstki i touchpad są chłodniejsze niż temperatura skóry i maksymalnie 31.3 °C / 88.3 F i dlatego są chłodne w dotyku.
(-) Średnia temperatura obszaru podparcia dłoni w podobnych urządzeniach wynosiła 28.2 °C / 82.8 F (-3.1 °C / -5.5 F).
| Asus ZenBook 14 UX3405MA Intel Core Ultra 7 155H, Intel Arc 8-Core iGPU | Tuxedo Pulse 14 Gen3 AMD Ryzen 7 7840HS, AMD Radeon 780M | Acer Swift Go 14 SFG14-72 Intel Core Ultra 7 155H, Intel Arc 8-Core iGPU | Schenker Vision 14 2023 Intel Core i7-13700H, Intel Iris Xe Graphics G7 96EUs | Dell XPS 13 Plus 9320 Core i7-1360P Intel Core i7-1360P, Intel Iris Xe Graphics G7 96EUs | Apple MacBook Air M2 10C GPU Apple M2, Apple M2 10-Core GPU | |
|---|---|---|---|---|---|---|
| Heat | -1% | -11% | -7% | -1% | -3% | |
| Maximum Upper Side * (°C) | 40.9 | 41.5 -1% | 36.5 11% | 45.8 -12% | 43.8 -7% | 44.7 -9% |
| Maximum Bottom * (°C) | 46.8 | 45.7 2% | 49.5 -6% | 42 10% | 44.4 5% | 44.6 5% |
| Idle Upper Side * (°C) | 24.1 | 24.7 -2% | 25.5 -6% | 27.5 -14% | 24 -0% | 25.1 -4% |
| Idle Bottom * (°C) | 24.6 | 24.9 -1% | 35 -42% | 27.1 -10% | 25.2 -2% | 25.3 -3% |
* ... im mniej tym lepiej
Głośniki
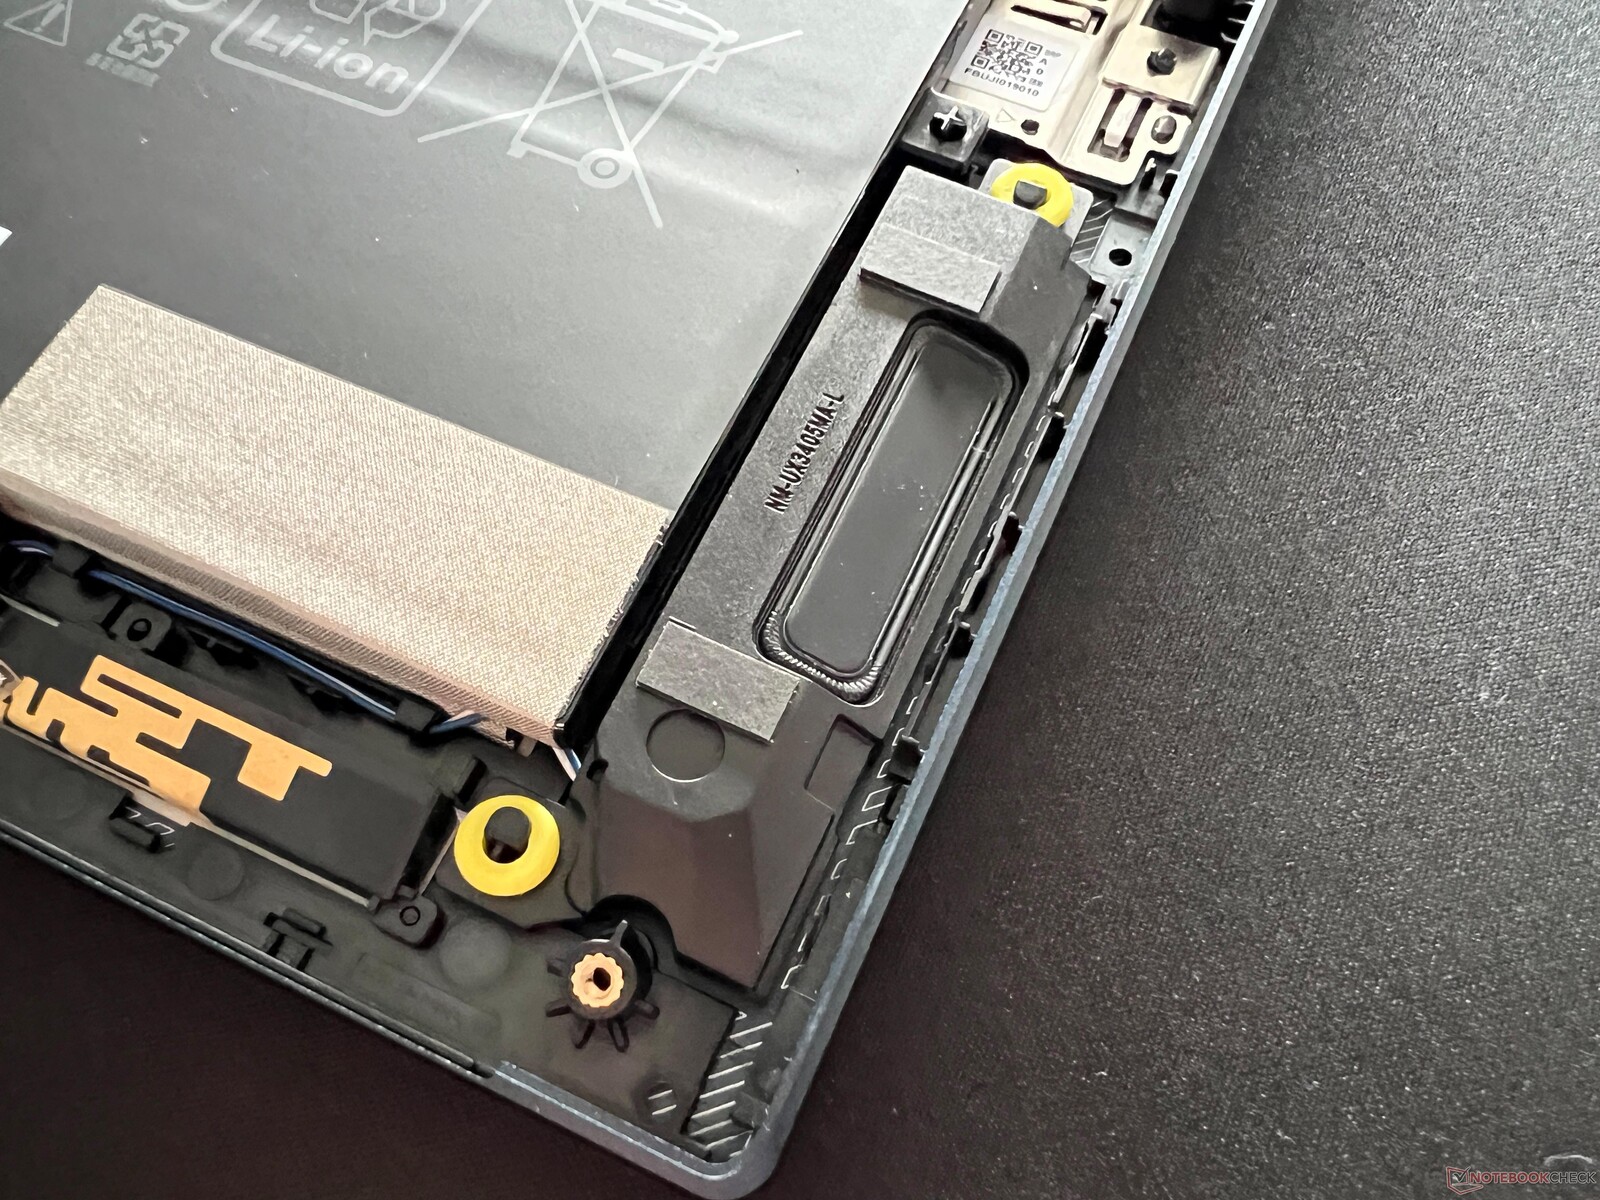
System dźwiękowy Zenbooka 14 pozytywnie nas zaskoczył, oferując bardzo dobry dźwięk, który może konkurować z najlepszymi subnotebookami. Rezultat jest potężny i przestrzenny - jedynie bas jest ograniczony, co nie jest zaskakujące, biorąc pod uwagę jego budowę.
Asus ZenBook 14 UX3405MA analiza dźwięku
(±) | głośność głośnika jest średnia, ale dobra (81.2 dB)
Bas 100 - 315 Hz
(±) | zredukowany bas - średnio 8.6% niższy od mediany
(±) | liniowość basu jest średnia (7% delta do poprzedniej częstotliwości)
Średnie 400 - 2000 Hz
(+) | zbalansowane środki średnie - tylko 1.4% od mediany
(+) | średnie są liniowe (3.1% delta do poprzedniej częstotliwości)
Wysokie 2–16 kHz
(+) | zrównoważone maksima - tylko 1.9% od mediany
(+) | wzloty są liniowe (3.5% delta do poprzedniej częstotliwości)
Ogólnie 100 - 16.000 Hz
(+) | ogólny dźwięk jest liniowy (7.3% różnicy w stosunku do mediany)
W porównaniu do tej samej klasy
» 1% wszystkich testowanych urządzeń w tej klasie było lepszych, 1% podobnych, 98% gorszych
» Najlepszy miał deltę 5%, średnia wynosiła ###średnia###%, najgorsza wynosiła 53%
W porównaniu do wszystkich testowanych urządzeń
» 1% wszystkich testowanych urządzeń było lepszych, 0% podobnych, 99% gorszych
» Najlepszy miał deltę 4%, średnia wynosiła ###średnia###%, najgorsza wynosiła 134%
Apple MacBook Air M2 10C GPU analiza dźwięku
(+) | głośniki mogą odtwarzać stosunkowo głośno (82.7 dB)
Bas 100 - 315 Hz
(±) | zredukowany bas - średnio 12.2% niższy od mediany
(±) | liniowość basu jest średnia (12.6% delta do poprzedniej częstotliwości)
Średnie 400 - 2000 Hz
(+) | zbalansowane środki średnie - tylko 1.1% od mediany
(+) | średnie są liniowe (3.1% delta do poprzedniej częstotliwości)
Wysokie 2–16 kHz
(+) | zrównoważone maksima - tylko 2.4% od mediany
(+) | wzloty są liniowe (1.9% delta do poprzedniej częstotliwości)
Ogólnie 100 - 16.000 Hz
(+) | ogólny dźwięk jest liniowy (9.5% różnicy w stosunku do mediany)
W porównaniu do tej samej klasy
» 5% wszystkich testowanych urządzeń w tej klasie było lepszych, 2% podobnych, 93% gorszych
» Najlepszy miał deltę 5%, średnia wynosiła ###średnia###%, najgorsza wynosiła 53%
W porównaniu do wszystkich testowanych urządzeń
» 4% wszystkich testowanych urządzeń było lepszych, 1% podobnych, 95% gorszych
» Najlepszy miał deltę 4%, średnia wynosiła ###średnia###%, najgorsza wynosiła 134%
Zarządzanie energią - Zenbook z dużą wytrzymałością
Zużycie energii
Panel OLED w Zenbooku 14 nie należy do najwydajniejszych i przy pełnej jasności SDR pobierał około 10 watów. Pod obciążeniem napotkaliśmy dobrze znany problem, że kompaktowe laptopy są często dostarczane tylko z 65-watowymi zasilaczami. Oczywiście nie jest to wystarczające, gdy procesor może zużywać do 64 watów. Wartość ta nie utrzymuje się długo, ale w takich sytuacjach (nawet jeśli mogą one być rzadkie w codziennym użytkowaniu) bateria zawsze musi być na krótko podłączona, aby pokryć zapotrzebowanie na energię.
| wyłączony / stan wstrzymania | |
| luz | |
| obciążenie |
|
Legenda:
min: | |
| Asus ZenBook 14 UX3405MA Ultra 7 155H, Arc 8-Core, Micron 2400 MTFDKBA1T0QFM, OLED, 2880x1800, 14" | Tuxedo Pulse 14 Gen3 R7 7840HS, Radeon 780M, Samsung SSD 980 Pro 2TB MZ-V8P2T0, IPS, 2880x1800, 14" | Acer Swift Go 14 SFG14-72 Ultra 7 155H, Arc 8-Core, SK hynix HFS001TEJ9X110NA, OLED, 2880x1800, 14" | Schenker Vision 14 2023 i7-13700H, Iris Xe G7 96EUs, Samsung 990 Pro 1 TB, IPS, 2880x1800, 14" | Dell XPS 13 Plus 9320 Core i7-1360P i7-1360P, Iris Xe G7 96EUs, Samsung PM9A1 MZVL2512HCJQ, OLED, 3456x2160, 13.4" | Apple MacBook Air M2 10C GPU M2, M2 10-Core GPU, Apple SSD AP1024Z, IPS, 2560x1664, 13.6" | Przeciętny Intel Arc 8-Core iGPU | Średnia w klasie Subnotebook | |
|---|---|---|---|---|---|---|---|---|
| Power Consumption | -20% | -14% | 12% | -2% | 32% | -3% | 24% | |
| Idle Minimum * (Watt) | 6.1 | 5.6 8% | 5.5 10% | 4.2 31% | 6.9 -13% | 1.9 69% | 5.31 ? 13% | 3.71 ? 39% |
| Idle Average * (Watt) | 10 | 9.2 8% | 10.1 -1% | 7.4 26% | 7.4 26% | 9.6 4% | 8.56 ? 14% | 6.54 ? 35% |
| Idle Maximum * (Watt) | 10.3 | 9.7 6% | 11.2 -9% | 8 22% | 13.6 -32% | 9.7 6% | 11.9 ? -16% | 7.89 ? 23% |
| Load Average * (Watt) | 53.3 | 65.2 -22% | 45.9 14% | 42.8 20% | 43.5 18% | 32.4 39% | 53.6 ? -1% | 42.1 ? 21% |
| Witcher 3 ultra * (Watt) | 42 | 70 -67% | 60.9 -45% | 47.9 -14% | 48 -14% | 30.8 27% | ||
| Load Maximum * (Watt) | 67 | 101 -51% | 104.1 -55% | 76 -13% | 63.3 6% | 35.7 47% | 84.2 ? -26% | 65.1 ? 3% |
* ... im mniej tym lepiej
Power consumption Witcher 3 / stress test
Power consumption with external monitor
Czas trwania
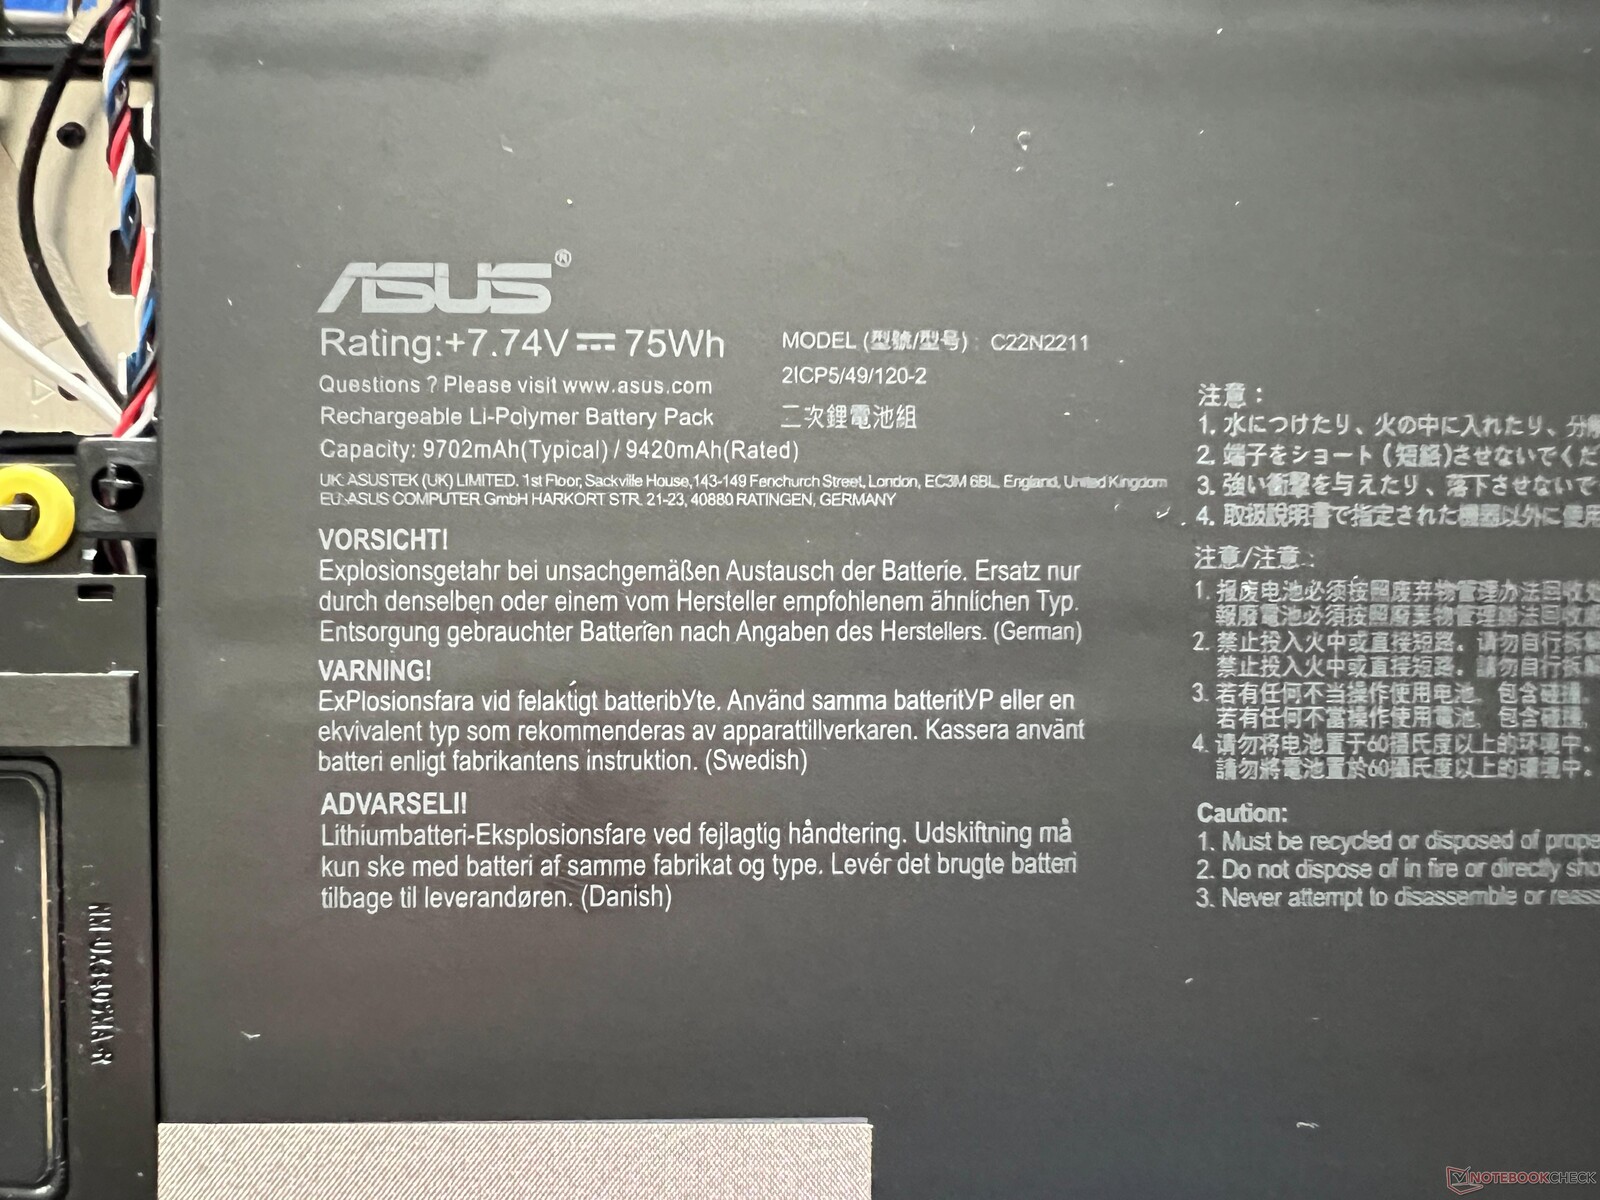
Oprogramowanie MyAsus jest wstępnie ustawione tak, aby zmniejszyć częstotliwość wyświetlania do 60 Hz w trybie bateryjnym, dlatego też wykorzystaliśmy te wyniki do naszych porównań. Bateria o pojemności 75 Wh zapewnia dobre czasy pracy, ponieważ zmierzyliśmy prawie 12 godzin (10 godzin przy 120 Hz) podczas testu WLAN przy 150 cd/m² (odpowiada 71% maksymalnej jasności SDR laptopa) i wciąż nieco poniżej 9 godzin (~7 godzin przy 120 Hz) przy pełnej jasności. Podobnie jak w innych recenzjach urządzeń Meteor Lake, czas działania wideo przy 150 cd/m² był szczególnie dobry i wyniósł nieco poniżej 17 godzin. Nawet MacBook Air M2 został tutaj pokonany (choć jego bateria jest również mniejsza).
Wideo HDR przy pełnej jasności trwało nieco ponad 5 godzin, co jest dobrym wynikiem. Całkowite naładowanie urządzenia zajmuje 130 minut, przy czym 80% jego pojemności jest ponownie dostępne po około 72 minutach.
| Asus ZenBook 14 UX3405MA Ultra 7 155H, Arc 8-Core, 75 Wh | Tuxedo Pulse 14 Gen3 R7 7840HS, Radeon 780M, 60 Wh | Acer Swift Go 14 SFG14-72 Ultra 7 155H, Arc 8-Core, 65 Wh | Schenker Vision 14 2023 i7-13700H, Iris Xe G7 96EUs, 99 Wh | Dell XPS 13 Plus 9320 Core i7-1360P i7-1360P, Iris Xe G7 96EUs, 55 Wh | Apple MacBook Air M2 10C GPU M2, M2 10-Core GPU, 52.6 Wh | Średnia w klasie Subnotebook | |
|---|---|---|---|---|---|---|---|
| Czasy pracy | -33% | -39% | 16% | -38% | 10% | 0% | |
| H.264 (h) | 16.8 | 9.9 -41% | 15.8 -6% | 15.3 ? -9% | |||
| WiFi v1.3 (h) | 11.8 | 10.3 -13% | 8 -32% | 13.7 16% | 7.3 -38% | 14.7 25% | 14.1 ? 19% |
| Load (h) | 2.2 | 1.2 -45% | 1.2 -45% | 1.998 ? -9% |
Za
Przeciw
Werdykt - Zenbook 14 z dużą ilością światła i jednym dużym cieniem
W naszym teście nowy Zenbook 14 OLED wykazał się kilkoma pozytywnymi cechami, a jedną z nich jest jego lekka, ale wciąż stabilna metalowa obudowa. Wyświetlacz OLED o częstotliwości odświeżania 120 Hz i rozdzielczości 3K oferuje również świetną jakość obrazu i dokładne profile kolorów, co oznacza, że można łatwo edytować zdjęcia i filmy (zarówno w P3, jak i sRGB). Jego urządzenia wejściowe są przyzwoite, a opcje łączności obejmują wszystkie ważne złącza, takie jak USB-C, USB-A i wyjście HMDI. Jednak jego pamięci RAM nie można rozszerzyć.
Nowy procesor Meteor-Lake w laptopie oferuje doskonałą wydajność w szczególności podczas krótkich skoków obciążenia, ale odbywa się to kosztem wysokiego zużycia energii. Przy dłuższych okresach obciążenia jego wydajność spada jednak dość znacznie, a nowa karta graficzna Arc iGPU nadal wykazuje pewne problemy ze sterownikami podczas grania. Wydajność dysku SSD jest również stosunkowo niska, ale prawdopodobnie nie zauważą tego Państwo podczas codziennego użytkowania. Mimo to, można było osiągnąć więcej. Pozytywy to przynajmniej długi czas pracy i imponujące głośniki.
Świetna obudowa, piękny ekran, doskonałe głośniki i dobre czasy pracy: Nowy Zenbook 14 OLED mógłby być bardzo dobrym laptopem, gdyby nie jego przeciążone wentylatory, a także elektroniczne hałasy.
Największym problemem Zenbooka 14 jest jego chłodzenie, ponieważ pomimo wysokich limitów mocy, Asus wykorzystuje tylko jeden wentylator - i z pewnością ma pełne ręce roboty. Nawet podczas prostych aplikacji, takich jak odtwarzanie wideo lub surfowanie po Internecie (przy użyciu jednej karty), wentylator prawie zawsze wskakuje do akcji. Ponadto zauważyliśmy częste odgłosy elektroniczne (wycie cewki) i w sumie Zenbook 14 jest po prostu zbyt głośny.
Cena i dostępność
Nowy Zenbook 14 OLED można nabyć bezpośrednio w sklepie internetowym Asusa, a jego ceny zaczynają się od 1 299,99 USD.
Asus ZenBook 14 UX3405MA
- 20/02/2024 v7 (old)
Andreas Osthoff
Przezroczystość
Wyboru urządzeń do recenzji dokonuje nasza redakcja. Próbka testowa została udostępniona autorowi jako pożyczka od producenta lub sprzedawcy detalicznego na potrzeby tej recenzji. Pożyczkodawca nie miał wpływu na tę recenzję, producent nie otrzymał też kopii tej recenzji przed publikacją. Nie było obowiązku publikowania tej recenzji. Jako niezależna firma medialna, Notebookcheck nie podlega władzy producentów, sprzedawców detalicznych ani wydawców.
Tak testuje Notebookcheck
Każdego roku Notebookcheck niezależnie sprawdza setki laptopów i smartfonów, stosując standardowe procedury, aby zapewnić porównywalność wszystkich wyników. Od około 20 lat stale rozwijamy nasze metody badawcze, ustanawiając przy tym standardy branżowe. W naszych laboratoriach testowych doświadczeni technicy i redaktorzy korzystają z wysokiej jakości sprzętu pomiarowego. Testy te obejmują wieloetapowy proces walidacji. Nasz kompleksowy system ocen opiera się na setkach uzasadnionych pomiarów i benchmarków, co pozwala zachować obiektywizm.Price comparison

