Recenzja Microsoft Surface Pro 9: Konwertowalny teraz ze znacznie większą mocą procesora

Microsoft wprowadził kilka zmian w swoich produktach z serii Surface, ponieważ poprzedni tablet Surface Pro X ARM nie jest już samodzielnym produktem i odtąd będzie kontynuowany pod nazwą Surface Pro 9. Oznacza to, że obecnie istnieją dwa warianty Surface Pro 9, a mianowicie jeden ze zwykłym procesorem Intela (od 989,00 USD) oraz drugi z układem ARM (1357,12 USD), który wspiera również łączność 5G. Nowy wariant ARM z układem Microsoft SQ3 Adreno 8CX Gen3 również zrecenzujemy już wkrótce, ale to Surface Pro 9 z procesorem Alder Lake-U jest naszym pierwszym obiektem testów na dziś.
Nasz egzemplarz recenzencki to topowy wariant procesora z Core i7 1255U, 16 GB pamięci RAM i 512 GB PCIe-SSD. W tej konfiguracji kabriolet kosztuje 1,879,99 USD, choć trzeba doliczyć kolejne ~300 USD za klawiaturę Signature Keyboard i pióro Surface Slim Pen 2. Szereg sprzedawców internetowych (w zależności od lokalizacji) może oferować takie pakiety w tańszych cenach - nasz pakiet, na przykład, jest dostępny od 2130 EUR (~2320 USD). Kolejna zmiana dotyczy biznesowej wersji Surface Pro 9, który w wariancie z Intelem również nie jest już dostępny z modułem WWAN.
Poza nowym procesorem Alder Lake, zaktualizowanym modułem WLAN i usunięciem gniazda audio, nie ma większych zmian technicznych, ani w samym Surface Pro, ani w urządzeniach wejściowych. Po więcej informacji odsyłamy do naszych recenzji poprzednich modeli Surface Pro:
Potencjalni konkurenci w porównaniu
Ocena | Data | Model | Waga | Wysokość | Rozmiar | Rezolucja | Cena |
|---|---|---|---|---|---|---|---|
| 88.4 % v7 (old) | 01/2023 | Microsoft Surface Pro 9, i7-1255U i7-1255U, Iris Xe G7 96EUs | 877 g | 9.3 mm | 13.00" | 2880x1920 | |
| 90.1 % v7 (old) | 11/2022 | Dell XPS 13 9315 2-in-1 Core i5-1230U i5-1230U, Iris Xe G7 80EUs | 764 g | 7.4 mm | 13.00" | 2880x1920 | |
| 88.5 % v7 (old) | Lenovo ThinkPad X12 20UVS03G00 i7-1160G7, Iris Xe G7 96EUs | 1.1 kg | 14.5 mm | 12.30" | 1920x1280 | ||
| 90.3 % v7 (old) | 12/2022 | HP Elite Dragonfly Folio 13.5 G3 i7-1265U, Iris Xe G7 96EUs | 1.4 kg | 17.8 mm | 13.50" | 1920x1280 | |
| 91.8 % v7 (old) | 11/2022 | Apple iPad Pro 12.9 2022 M2, M2 10-Core GPU | 682 g | 6.4 mm | 12.90" | 2732x2048 | |
| 86.8 % v7 (old) | Asus ROG Flow Z13 GZ301ZE i9-12900H, GeForce RTX 3050 Ti Laptop GPU | 1.2 kg | 12 mm | 13.40" | 1920x1200 |
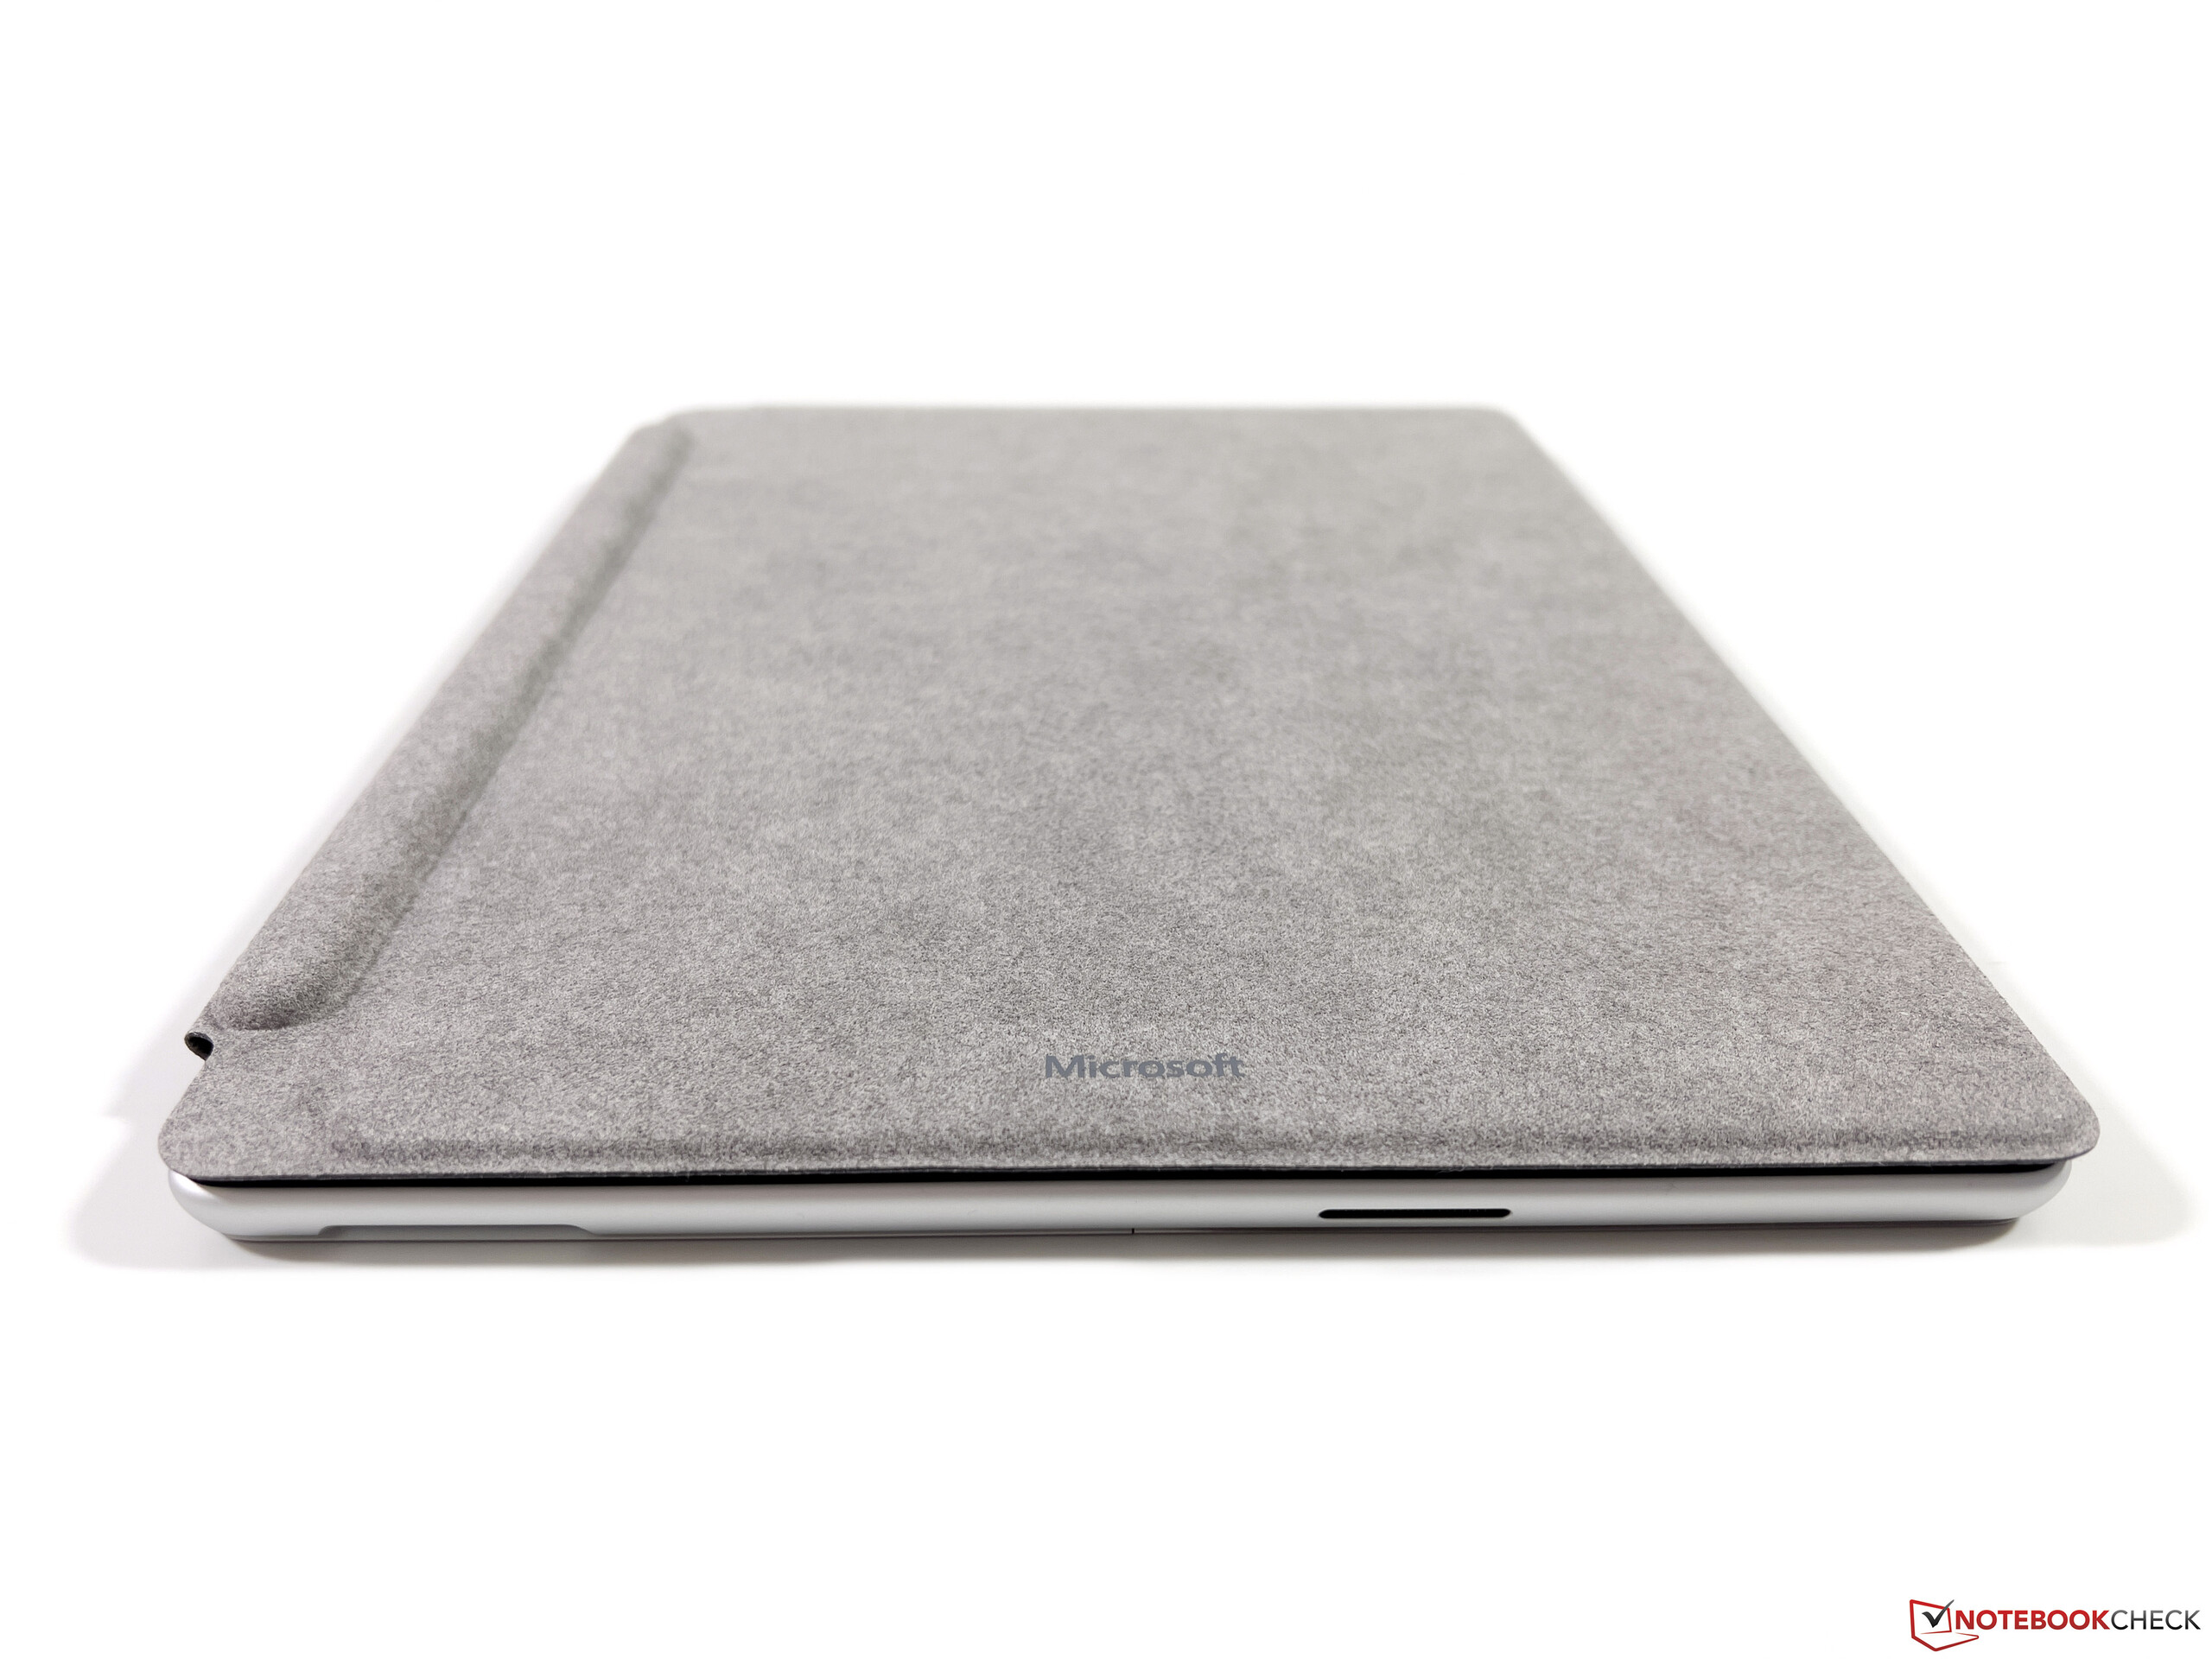
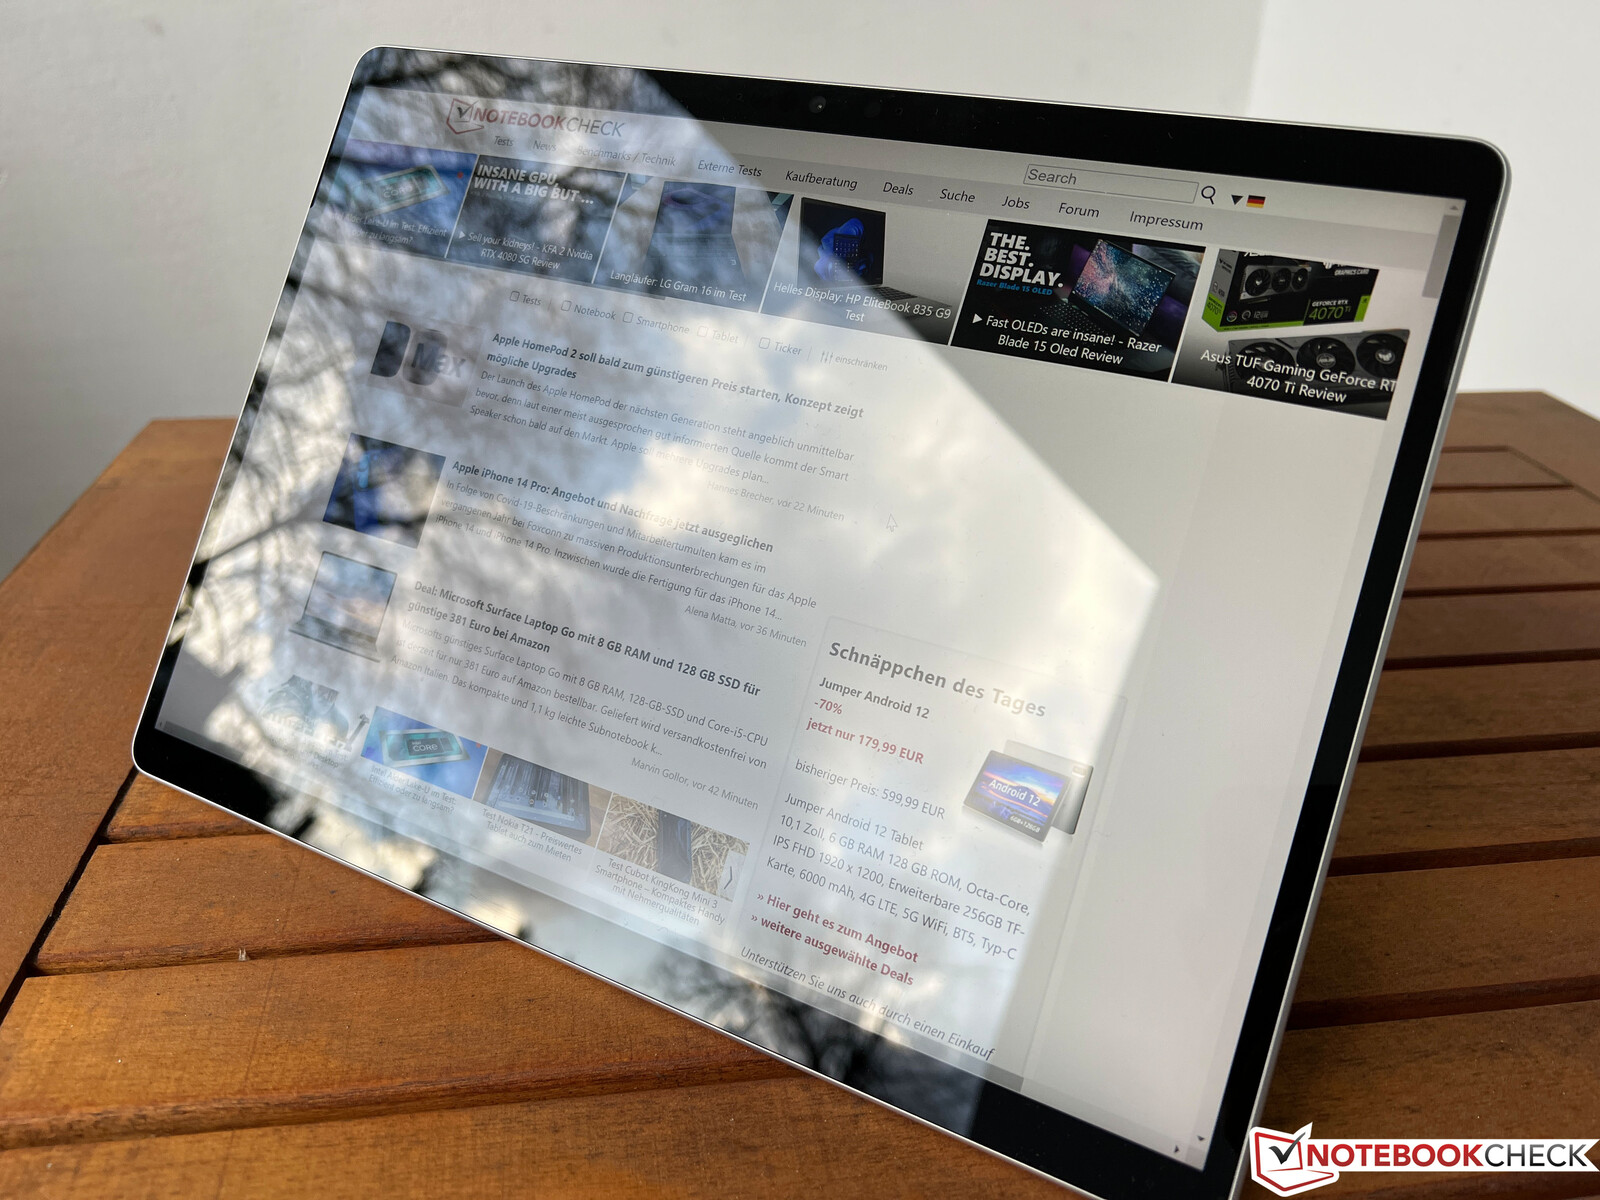
Sprawa - drobne zmiany w kabriolecie
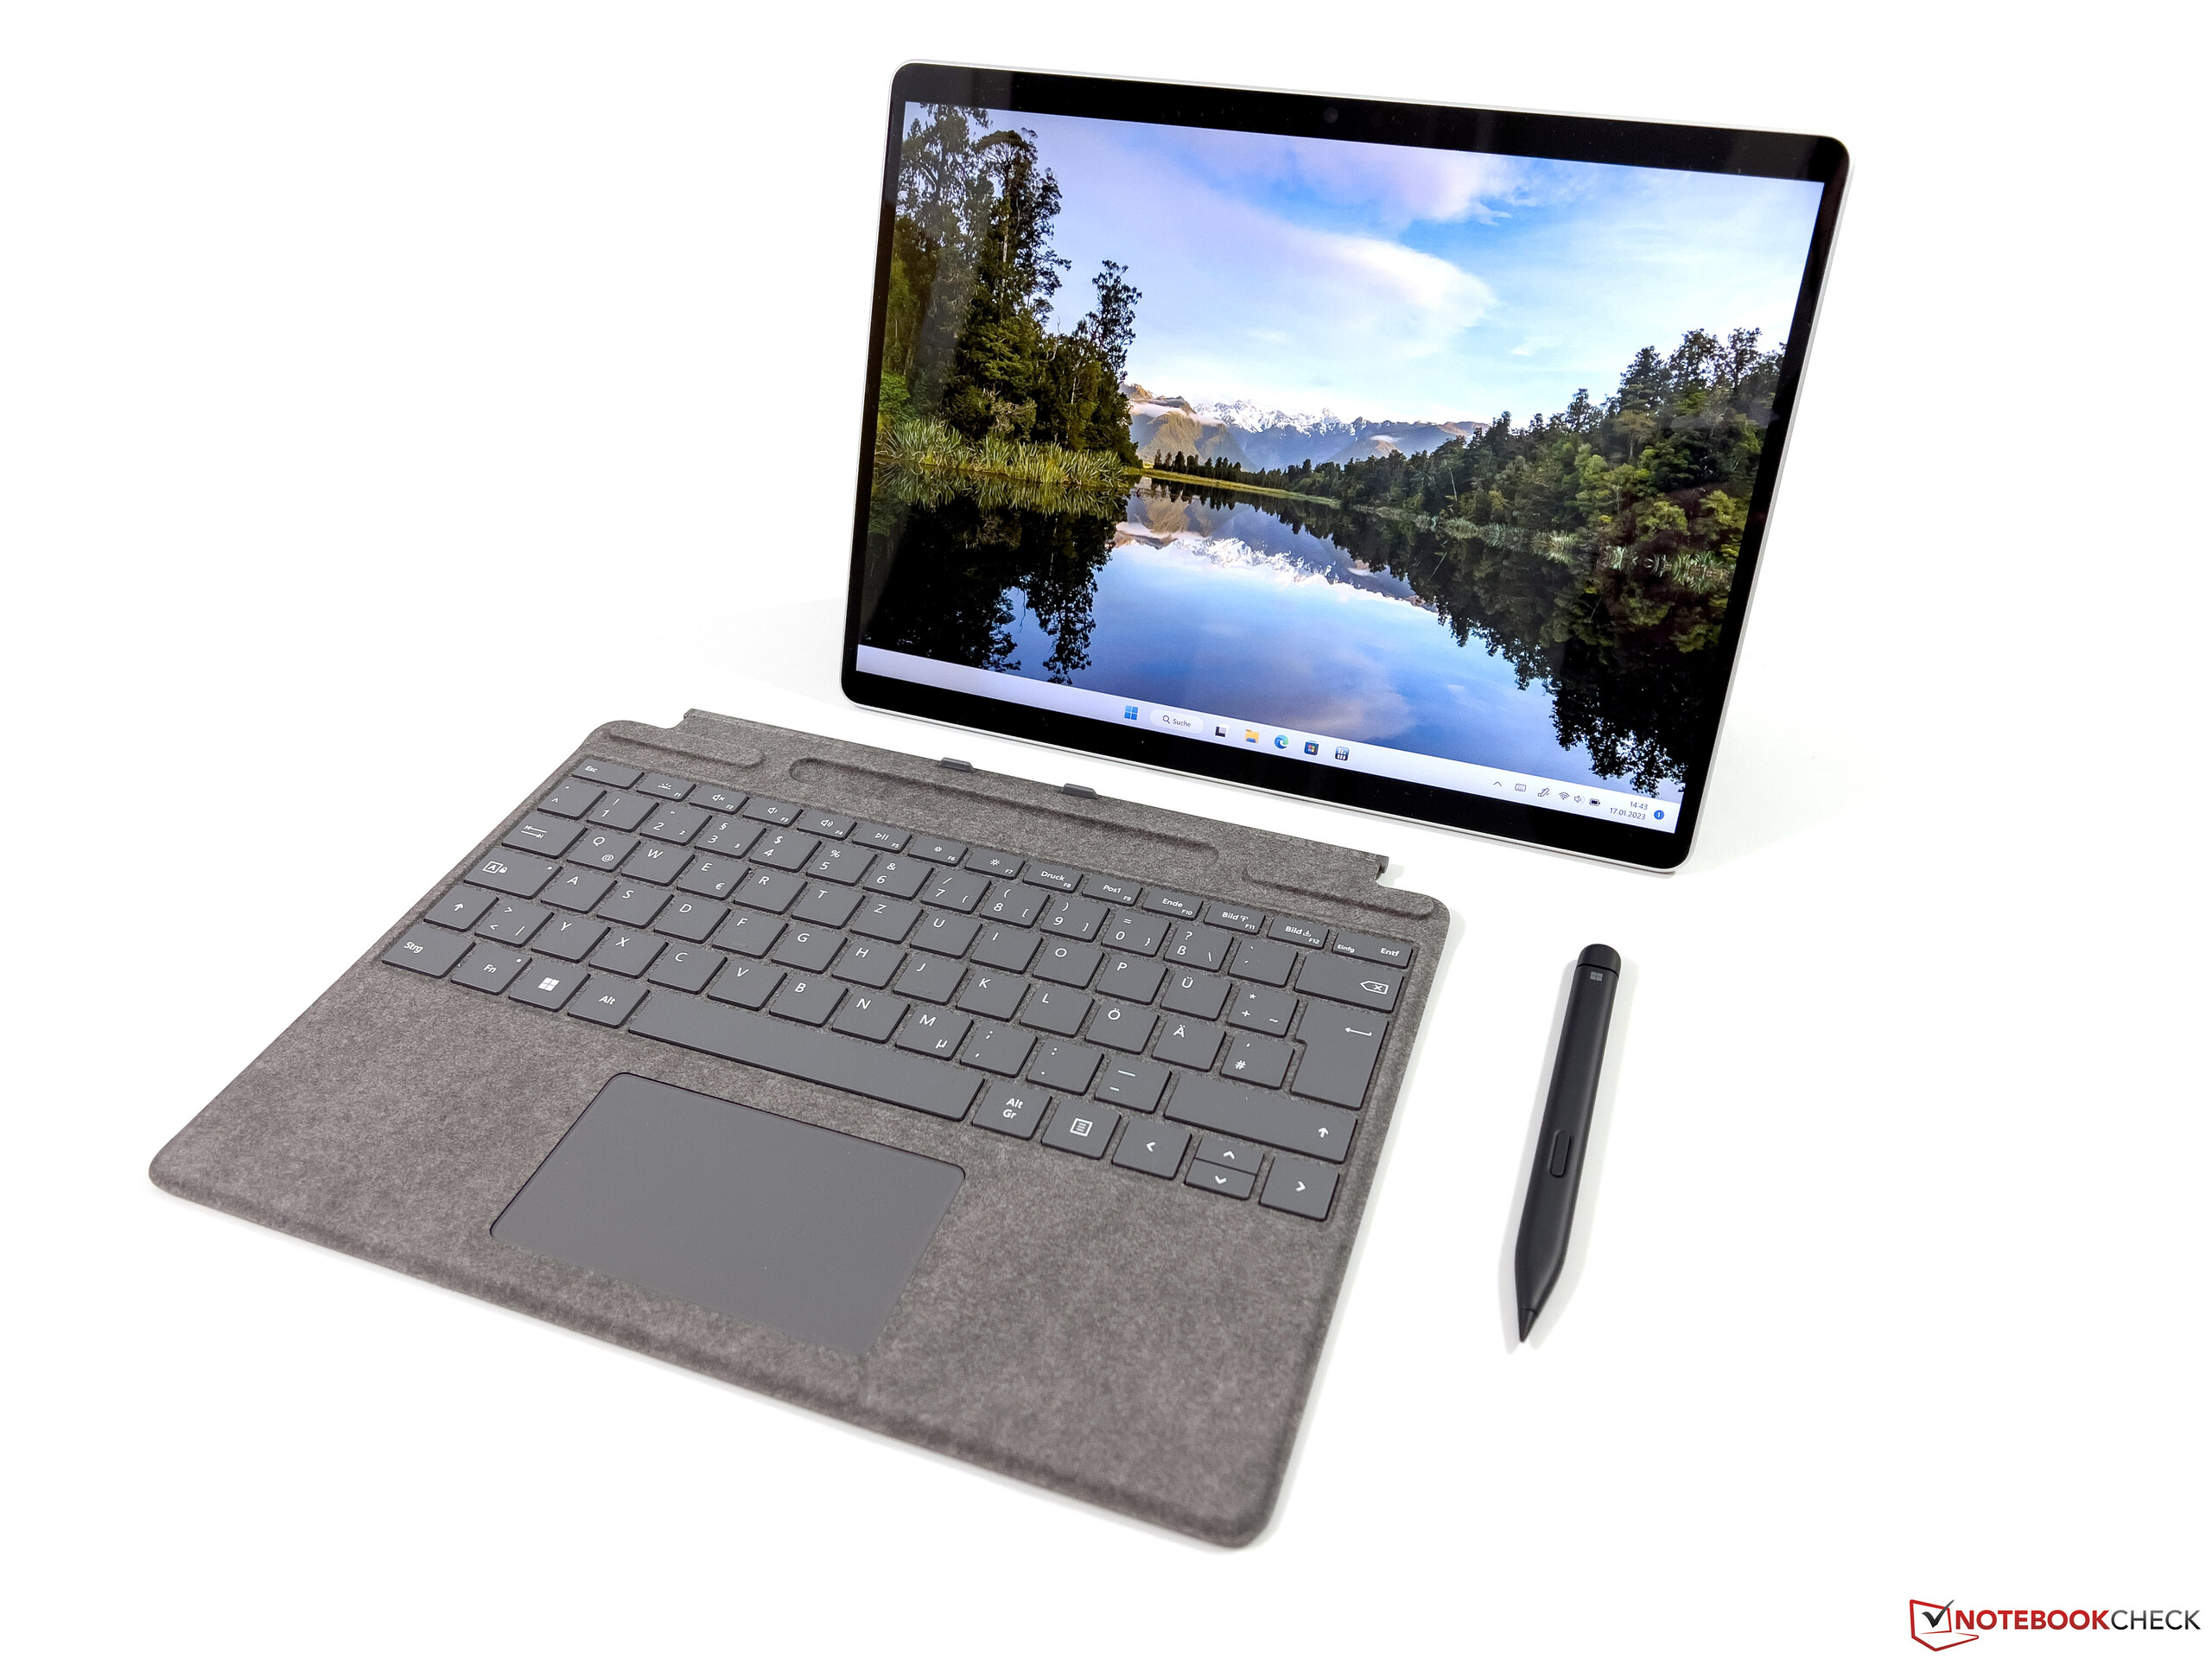
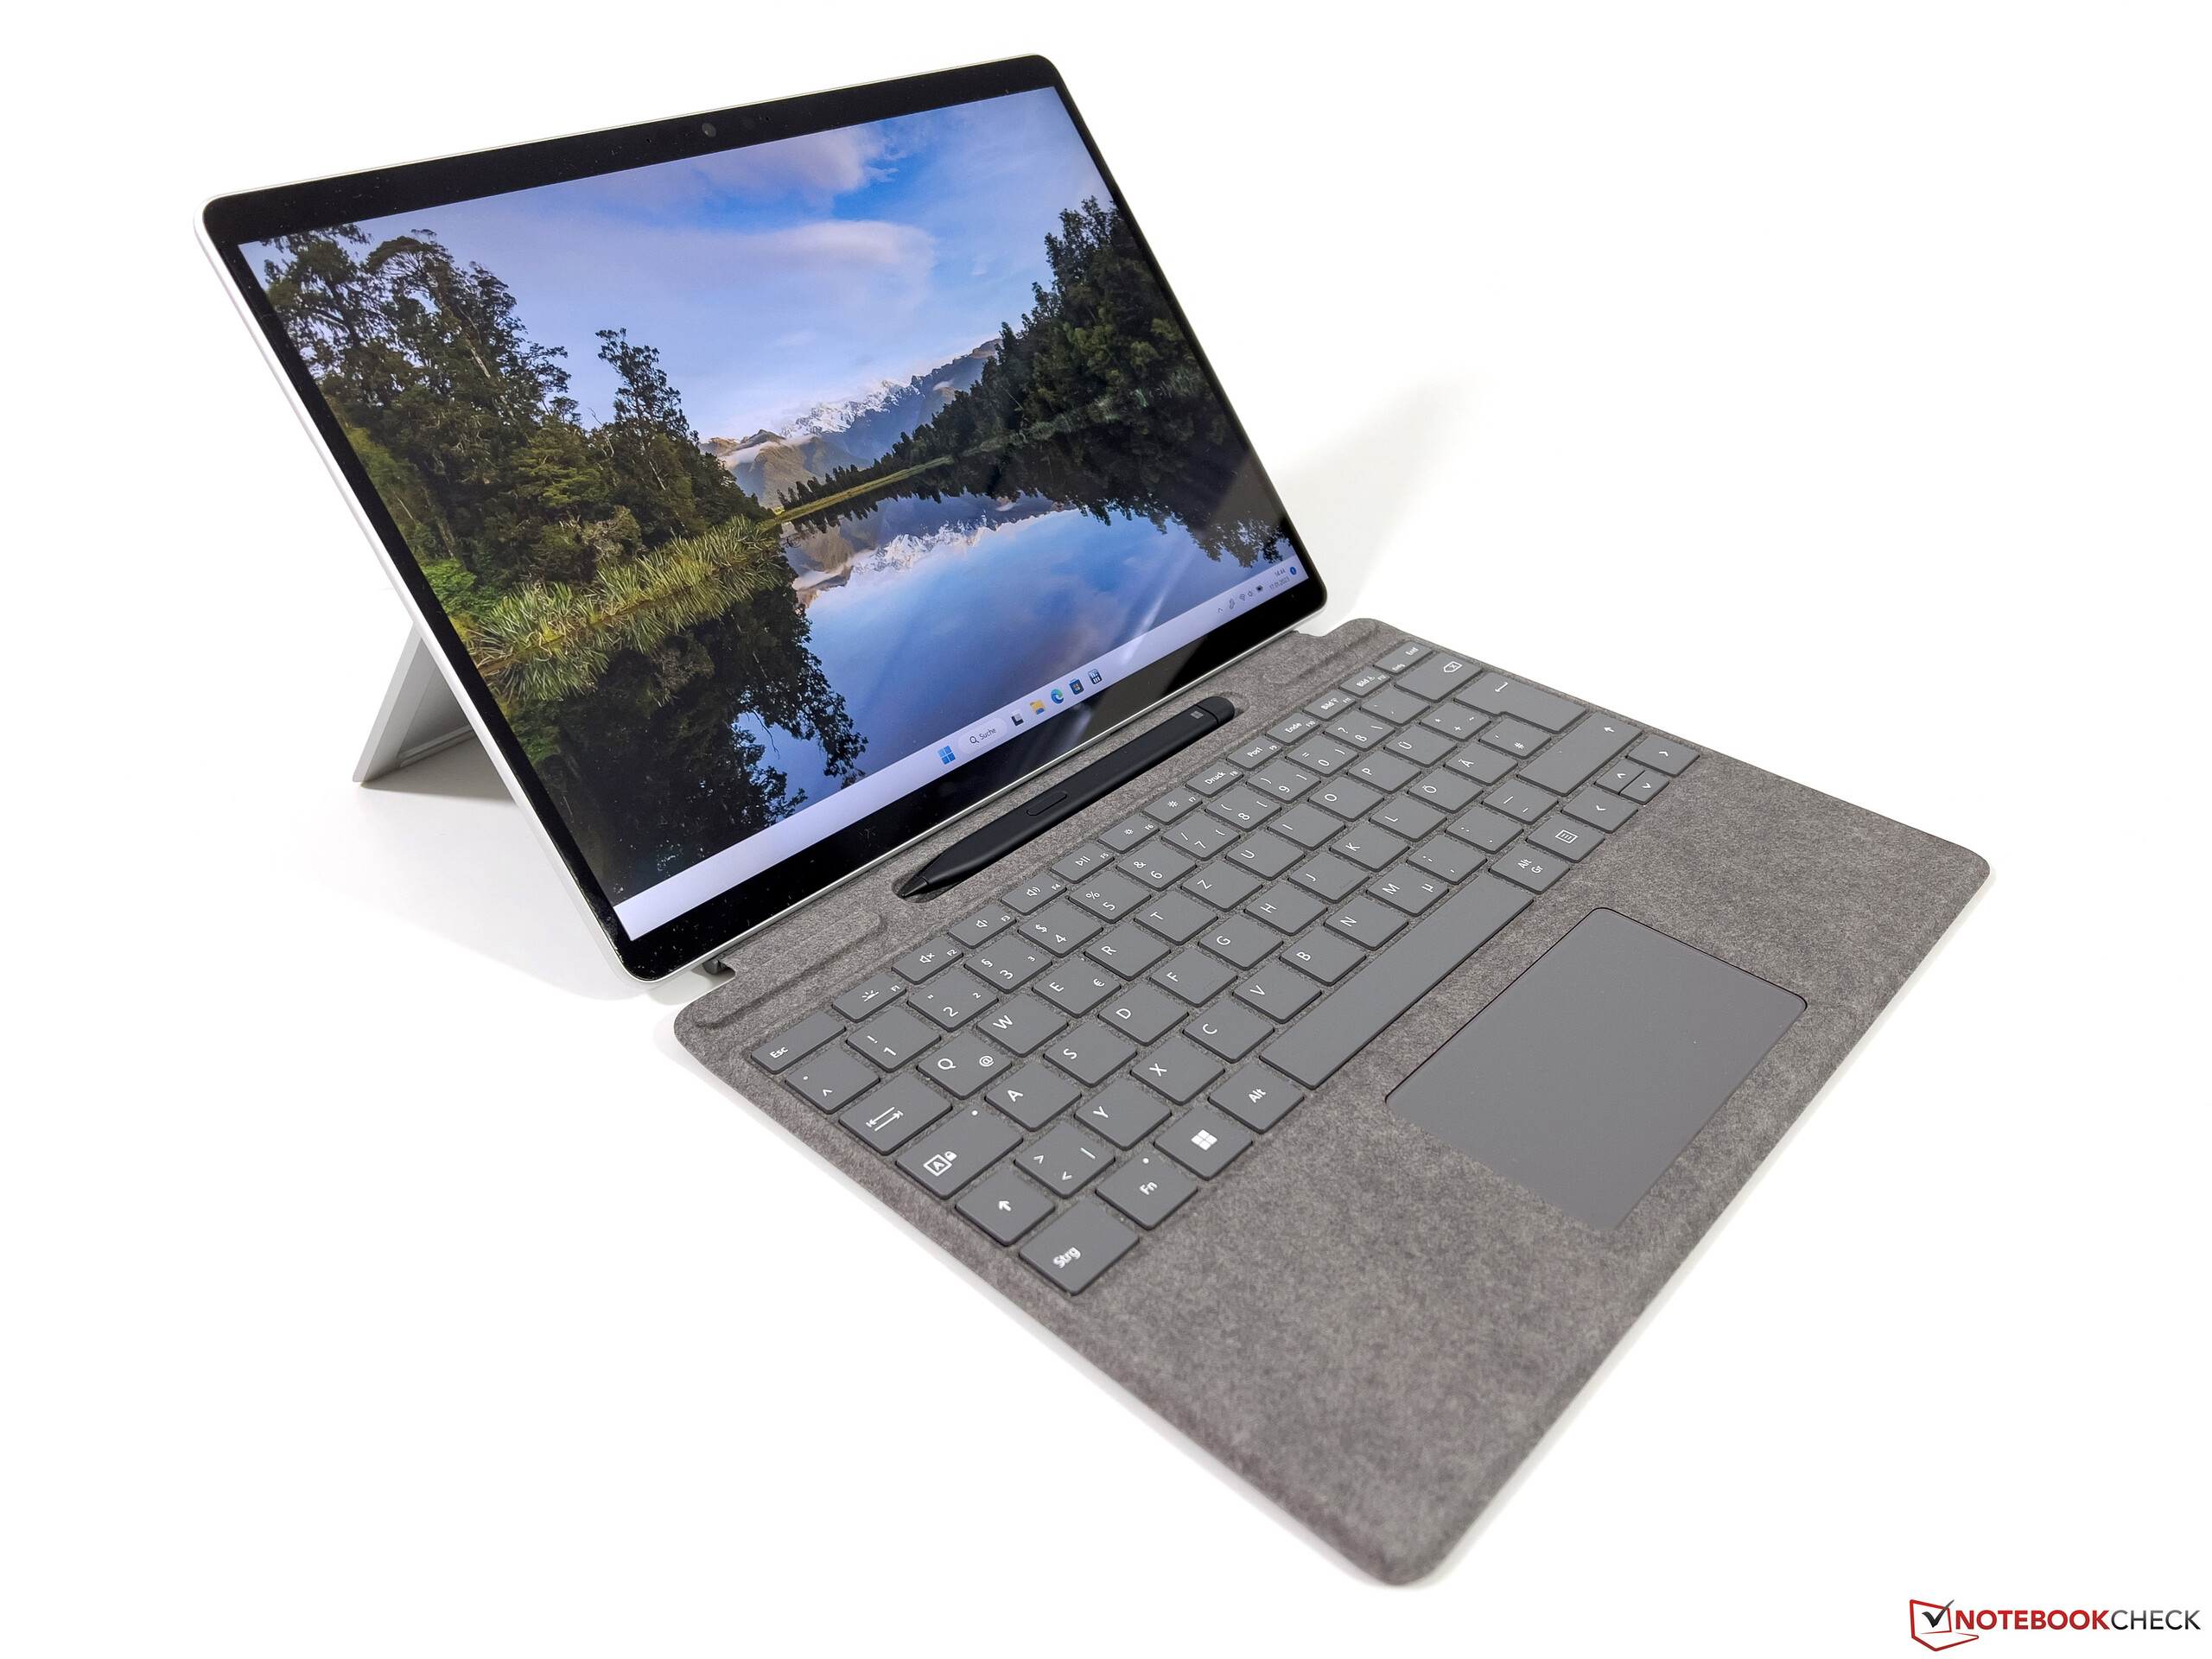
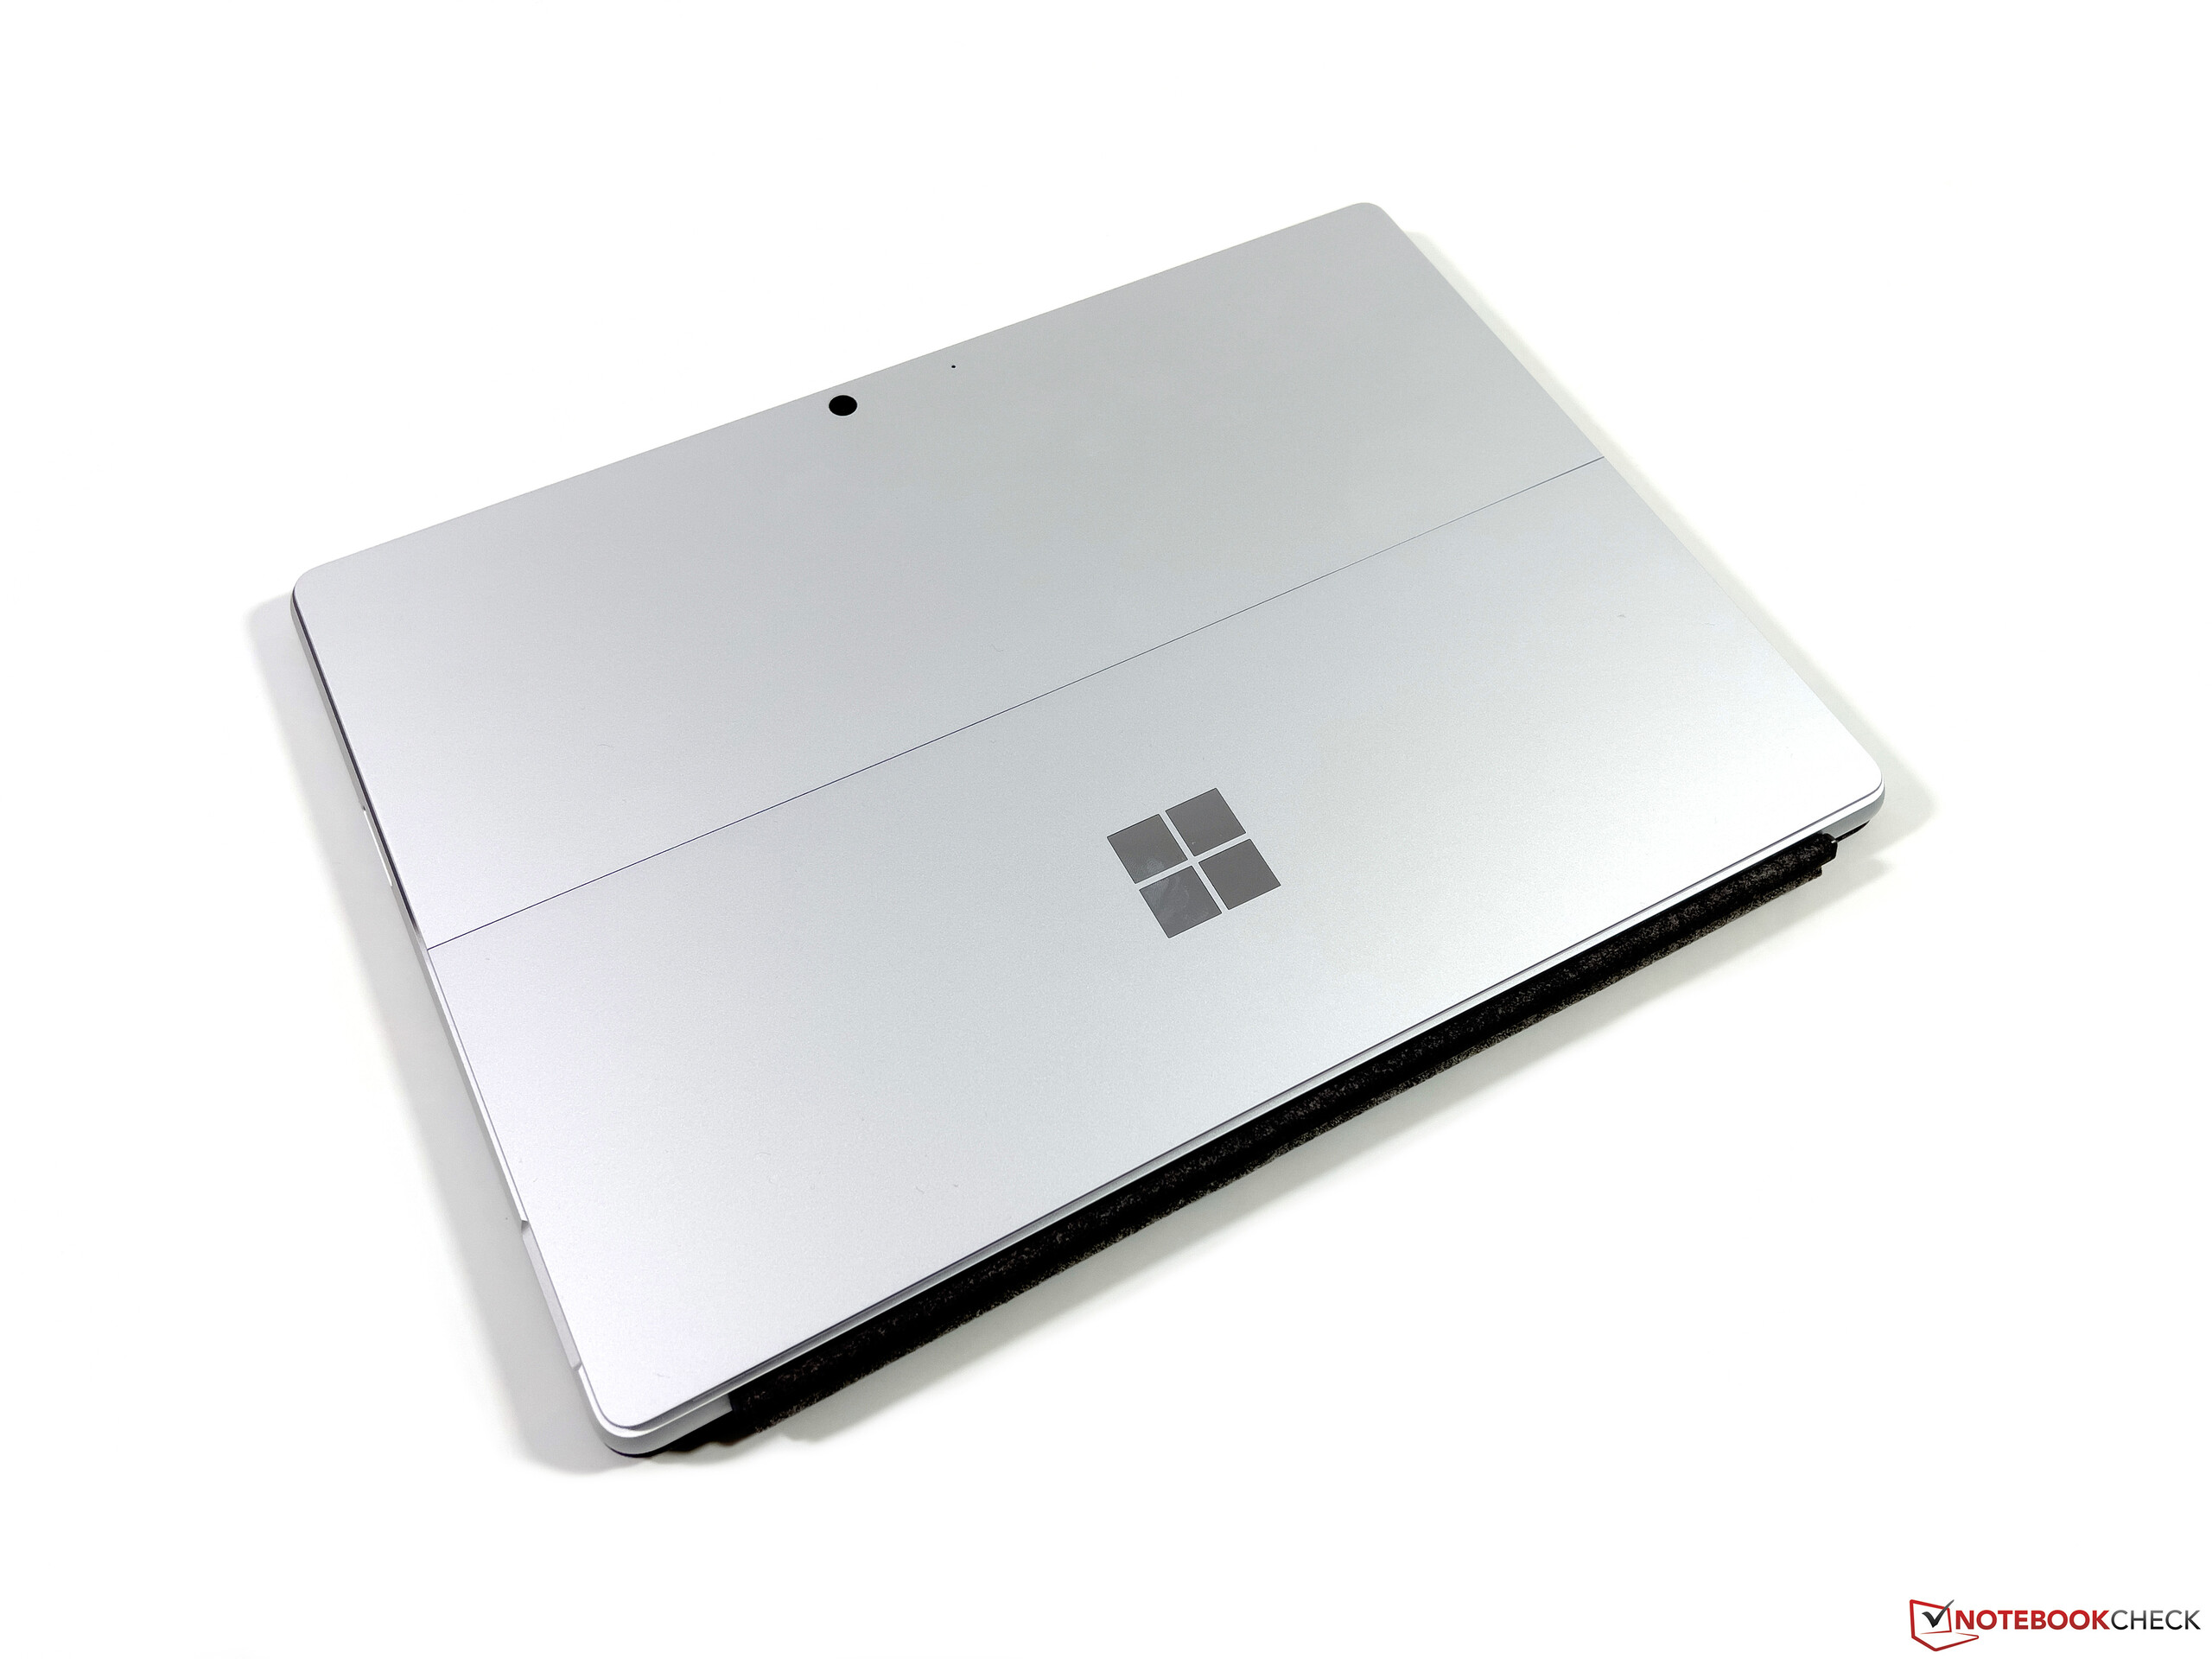
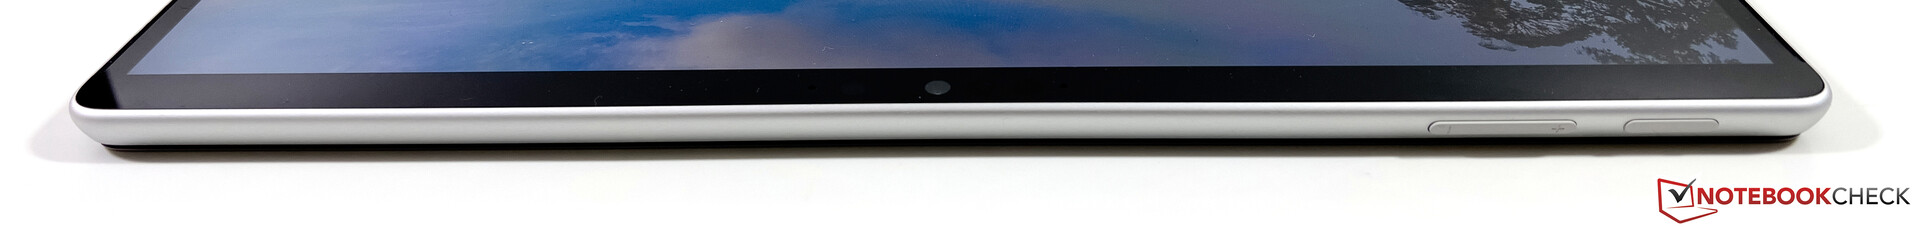
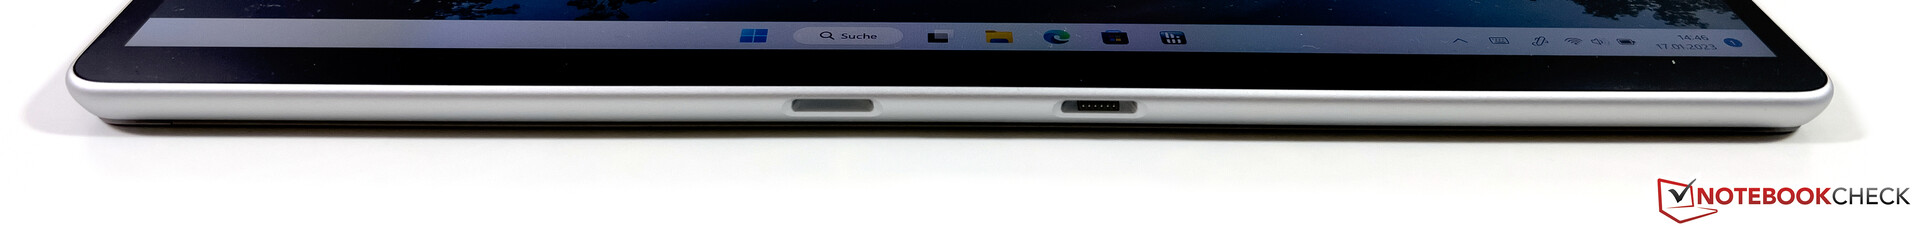
Na pierwszy rzut oka w obudowie Surface Pro 9 nic się nie zmieniło, poza nowym rozmieszczeniem portów. Waga różni się nieznacznie, więc prawdopodobnie zaszły też drobne zmiany w układzie wewnętrznym. Microsoft oferuje kabriolet w czterech różnych kolorach, począwszy od srebrnego (platynowego) urządzenia z naszej recenzji, poprzez szafirowy niebieski, leśną zieleń, aż po grafitowy (ciemnoszary). W przeciwieństwie do tego, model ARM jest dostępny tylko w kolorze platynowym.
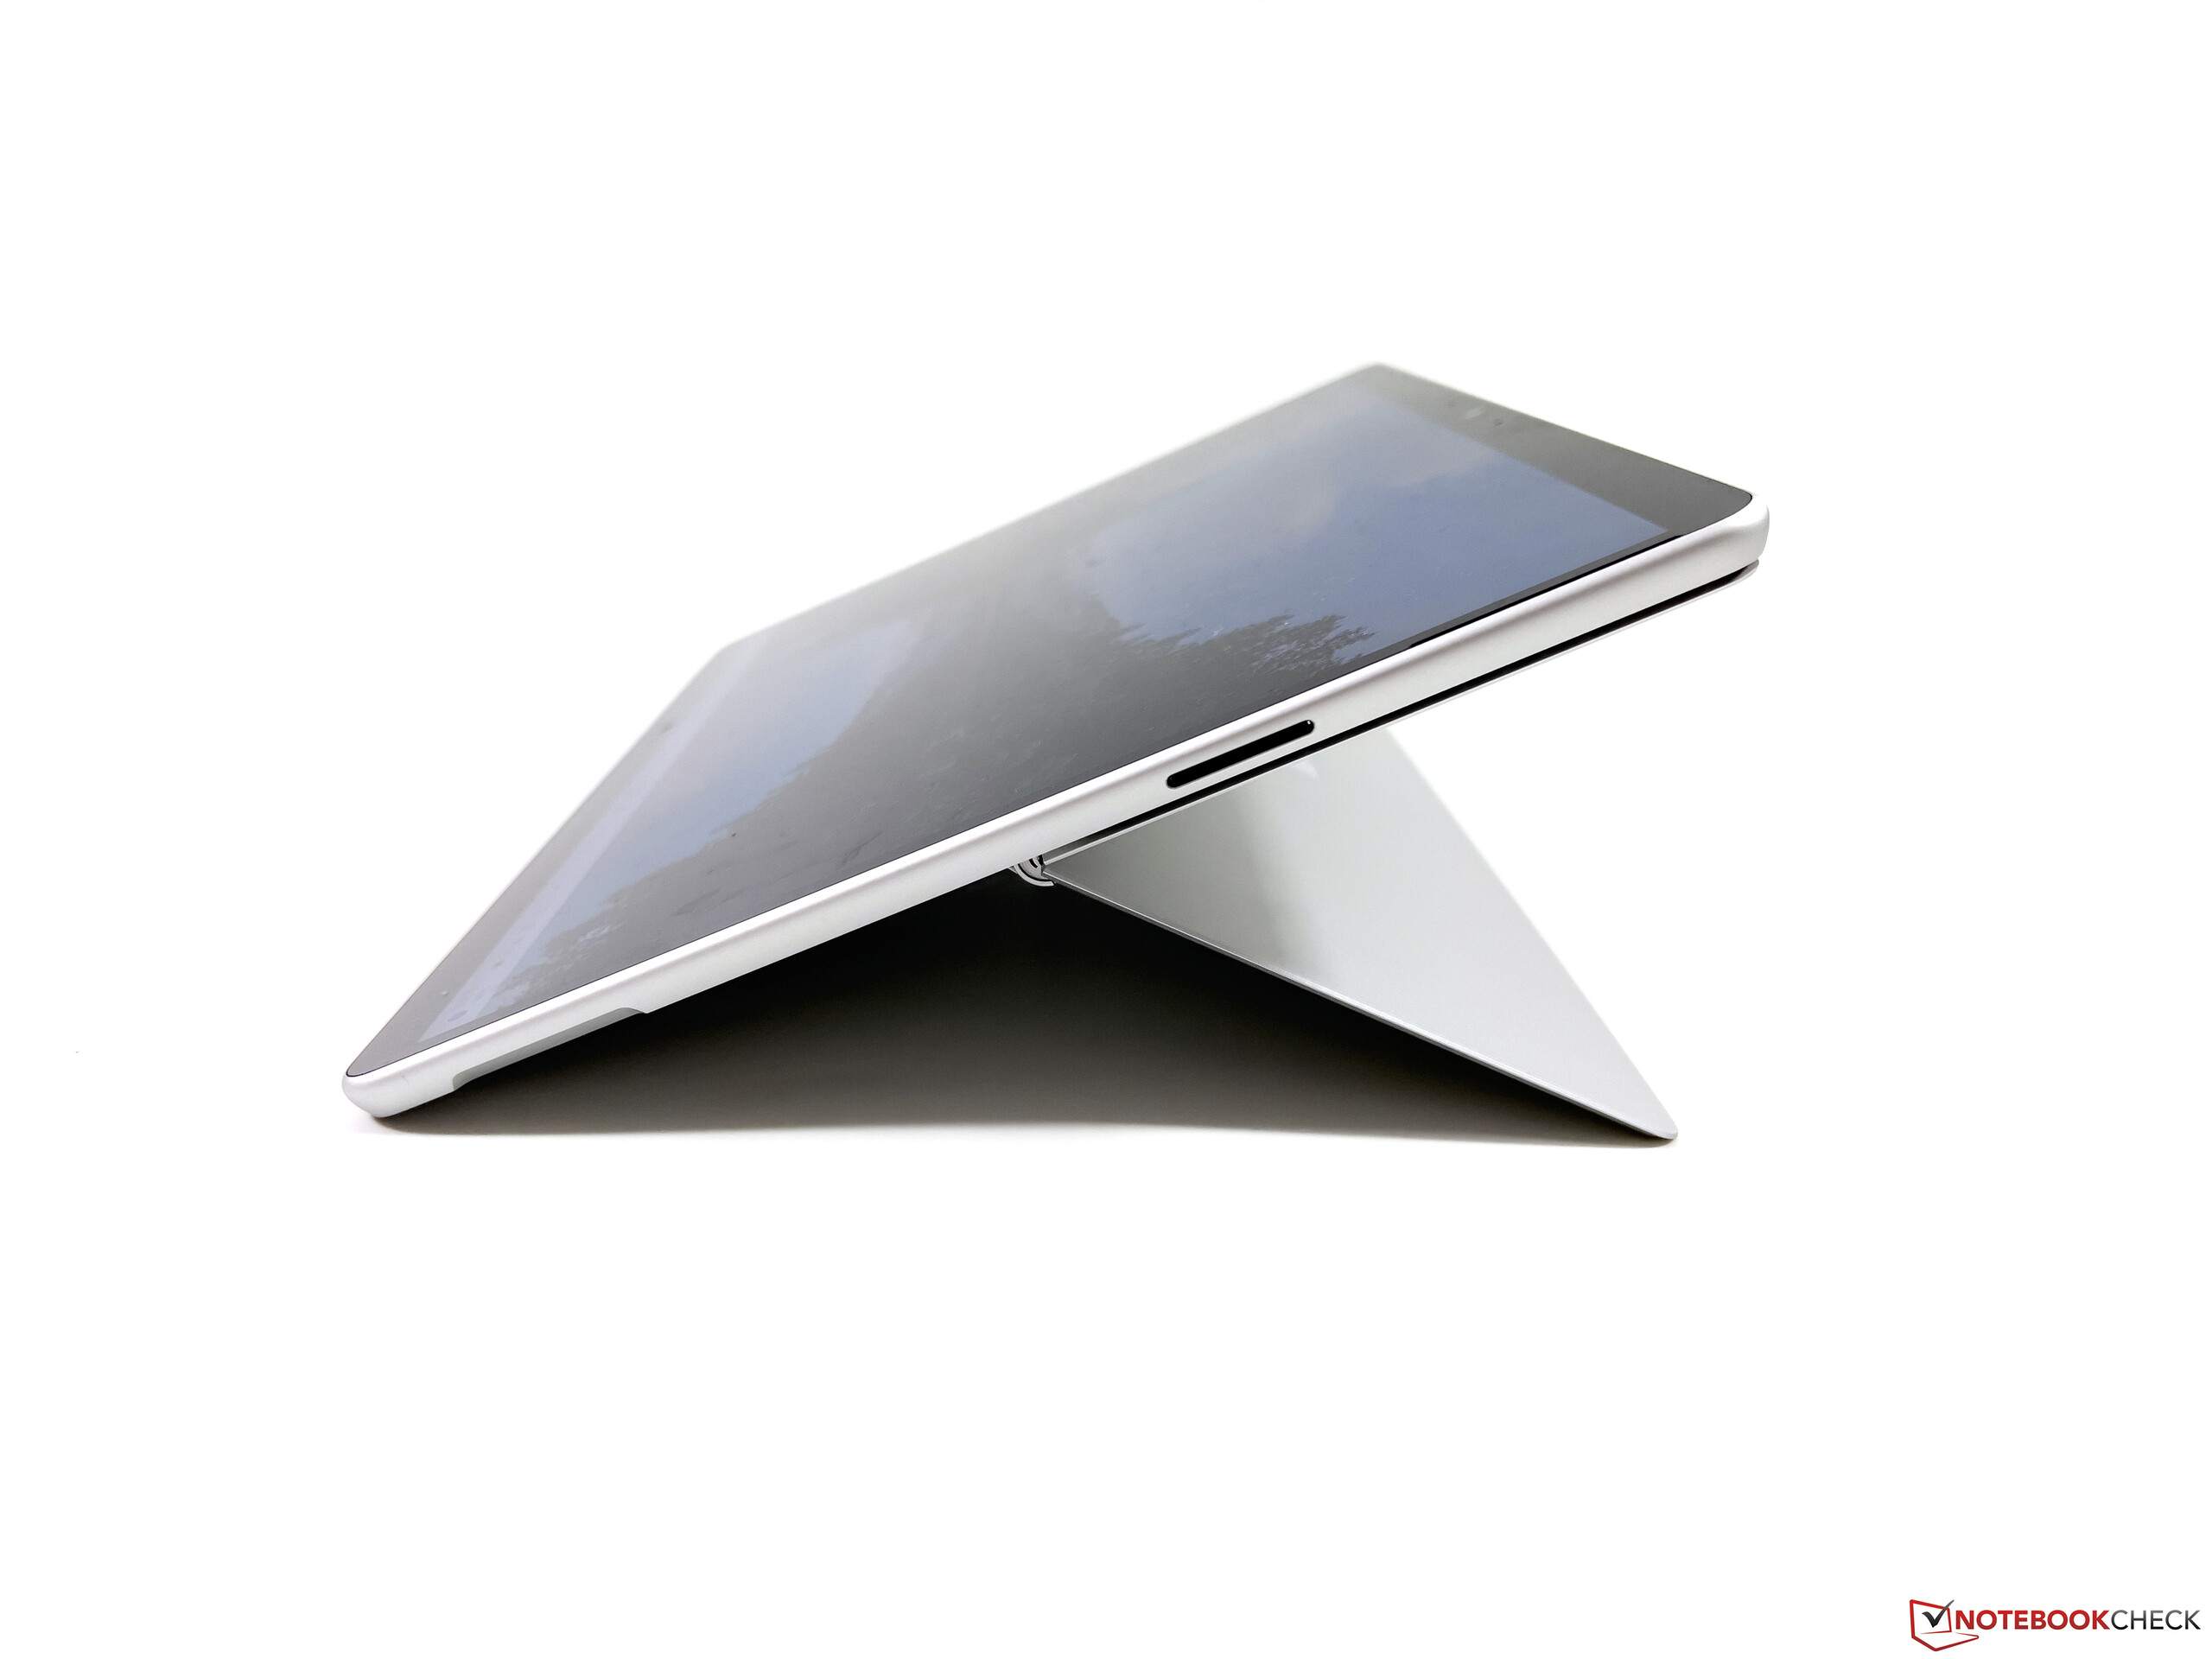
Jakość wykonania jest jak poprzednio znakomita, a aluminiowa obudowa jest niezwykle solidna. Nie ma żadnych trzeszczących odgłosów ani zniekształceń obrazu, choć zintegrowany kickstand nadal jest słabym punktem. Obudowa jest bardzo cienka, więc krawędzie szybko wciskają się w skórę, gdy stawiamy Surface Pro 9 na przykład na udach. Podstawka jest też bardzo elastyczna, a zawiasy zawsze dobrze spełniają swoje zadanie.
Sprzęt - Surface Pro z Thunderbolt 4
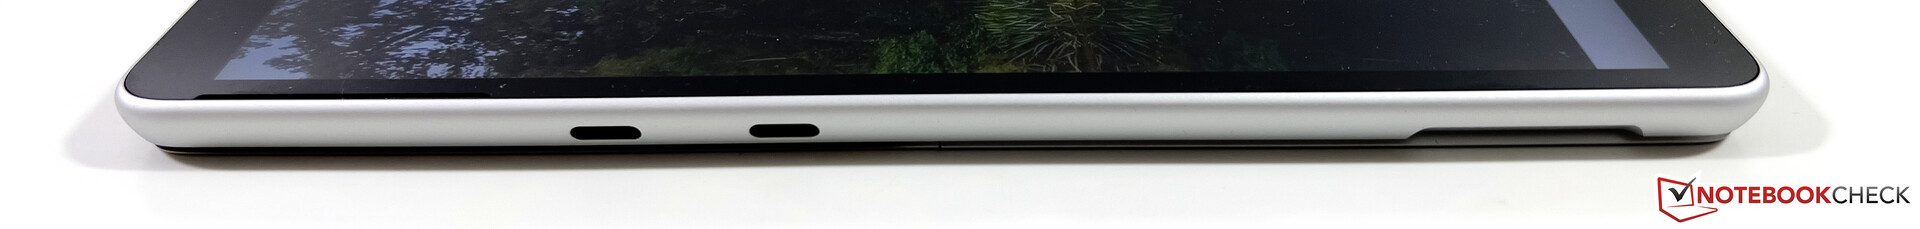
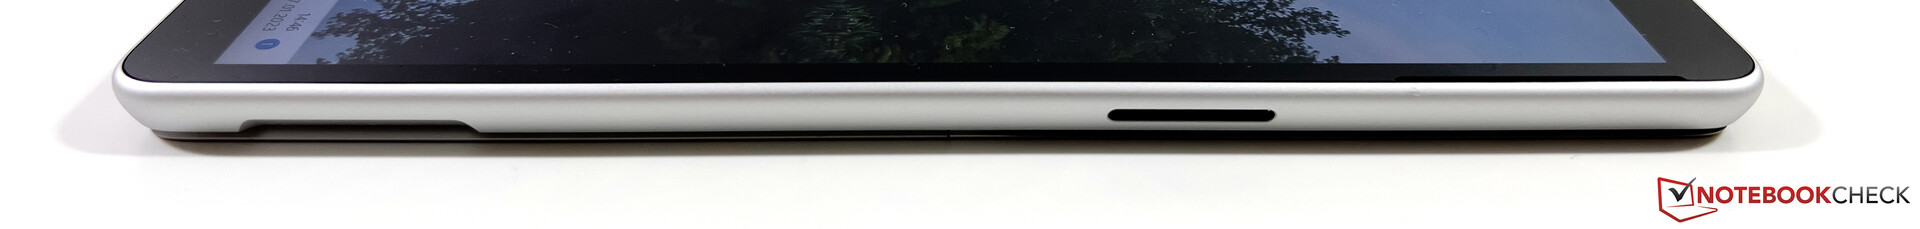
Porty zostały przesunięte i nadal pozostały 2x porty USB-C (w tym Thunderbolt 4), a także autorski port Surface Connect, ale Microsoft usunął gniazdo 3,5 mm. Dołączony do zestawu adapter zasilania wykorzystuje port Surface Connect, ale kabriolet można też ładować przez USB-C. Nieco rozczarowujący jest dalszy brak czytnika kart, który w ostatnim modelu został zastąpiony przez opcjonalny slot Nano SIM. Ponieważ model Intela nie jest już wyposażony w moduł WWAN, Microsoft mógł bez problemu po raz kolejny zainstalować czytnik kart micro SD.
Komunikacja
Jak już wcześniej wspomniano, tylko ARM-owy wariant Surface Pro 9 oferuje mobilny internet, natomiast wersja z Intelem nie. Przynajmniej moduł WLAN został zaktualizowany i nowoczesny standard WiFi 6E jest teraz obsługiwany dzięki modułowi AX211 od Intela. Bez problemu udało nam się połączyć z siecią 6 GHZ naszego referencyjnego routera Asusa, a transfer okazał się bardzo wysoki i stabilny.
| Networking | |
| Microsoft Surface Pro 9, i7-1255U | |
| iperf3 receive AXE11000 6GHz | |
| iperf3 transmit AXE11000 6GHz | |
| Dell XPS 13 9315 2-in-1 Core i5-1230U | |
| iperf3 receive AXE11000 6GHz | |
| iperf3 transmit AXE11000 6GHz | |
| Lenovo ThinkPad X12 20UVS03G00 | |
| iperf3 transmit AX12 | |
| iperf3 receive AX12 | |
| HP Elite Dragonfly Folio 13.5 G3 | |
| iperf3 receive AXE11000 6GHz | |
| iperf3 receive AXE11000 | |
| iperf3 transmit AXE11000 6GHz | |
| iperf3 transmit AXE11000 | |
| Apple iPad Pro 12.9 2022 | |
| iperf3 receive AXE11000 6GHz | |
| iperf3 receive AXE11000 | |
| iperf3 transmit AXE11000 6GHz | |
| iperf3 transmit AXE11000 | |
| Asus ROG Flow Z13 GZ301ZE | |
| iperf3 transmit AX12 | |
| iperf3 receive AX12 | |
| Microsoft Surface Pro 8, i7-1185G7 | |
| iperf3 transmit AX12 | |
| iperf3 receive AX12 | |
Kamera internetowa
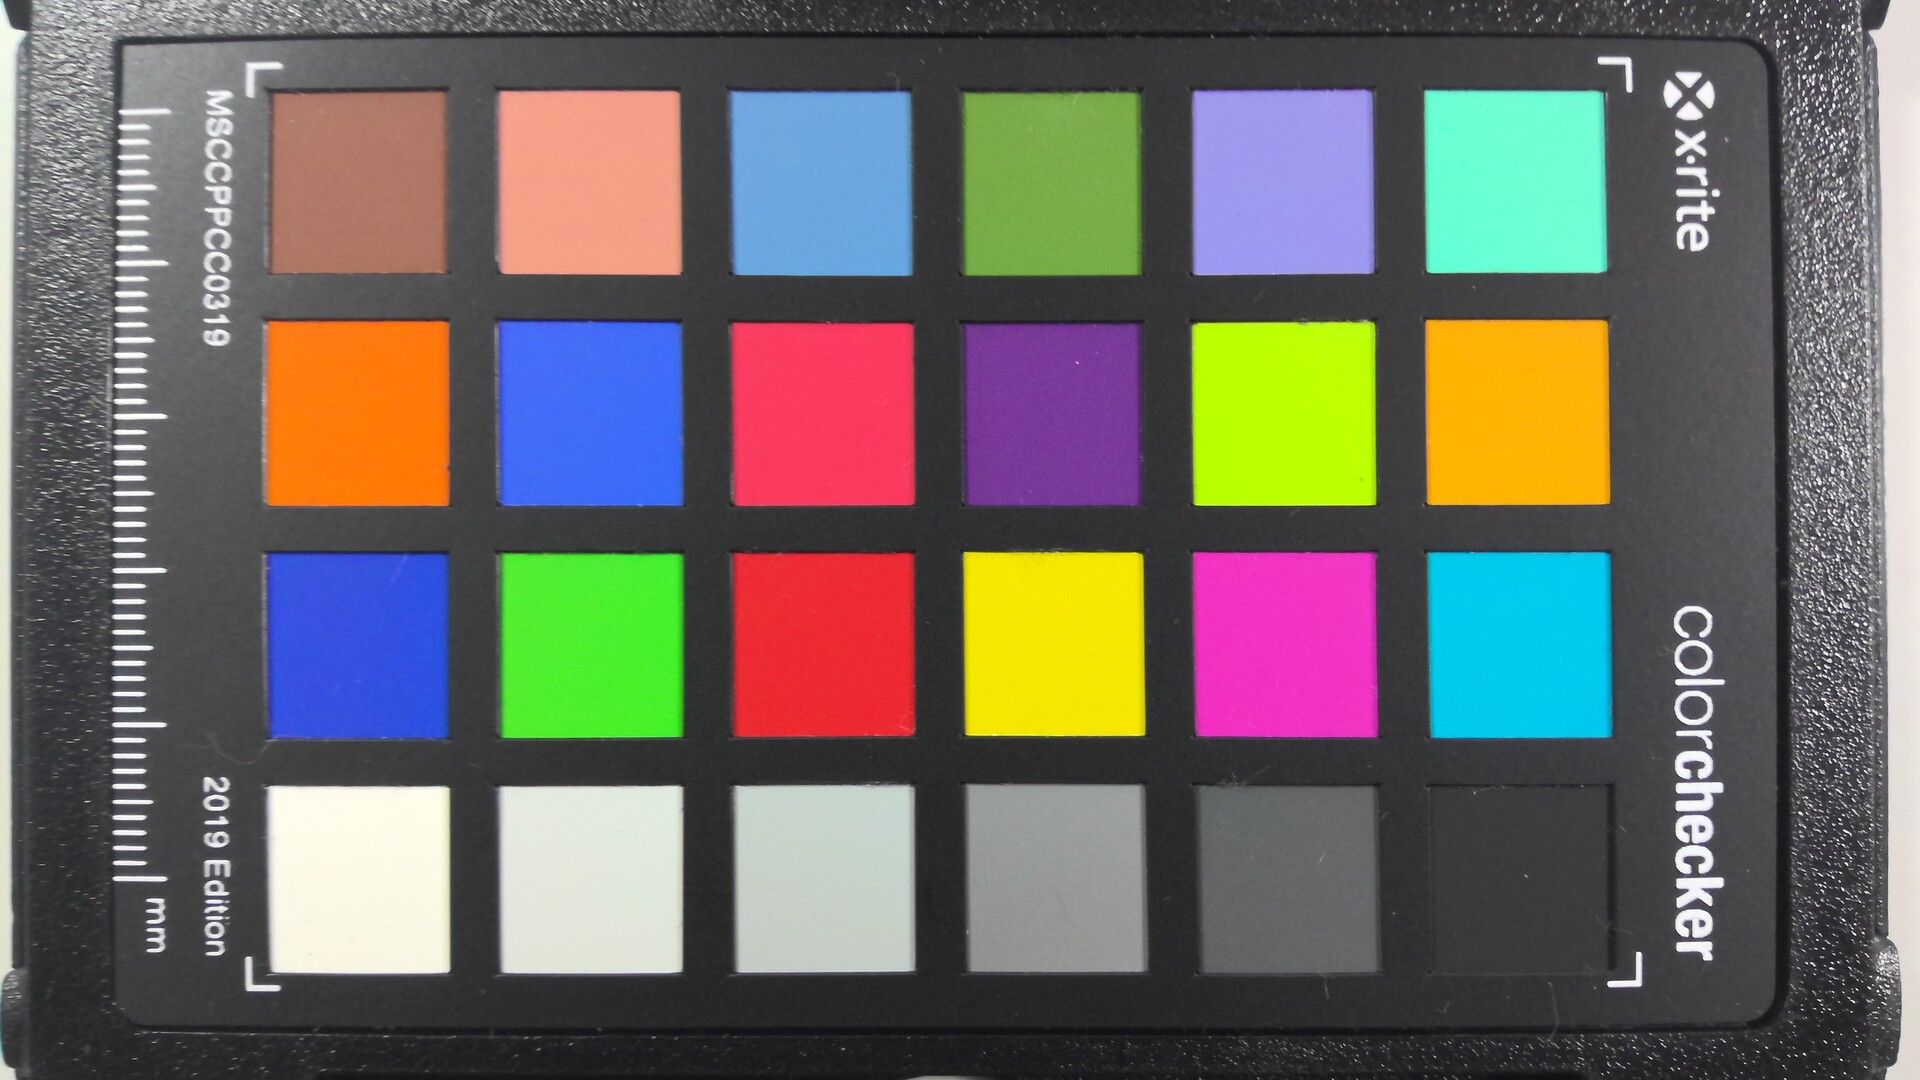
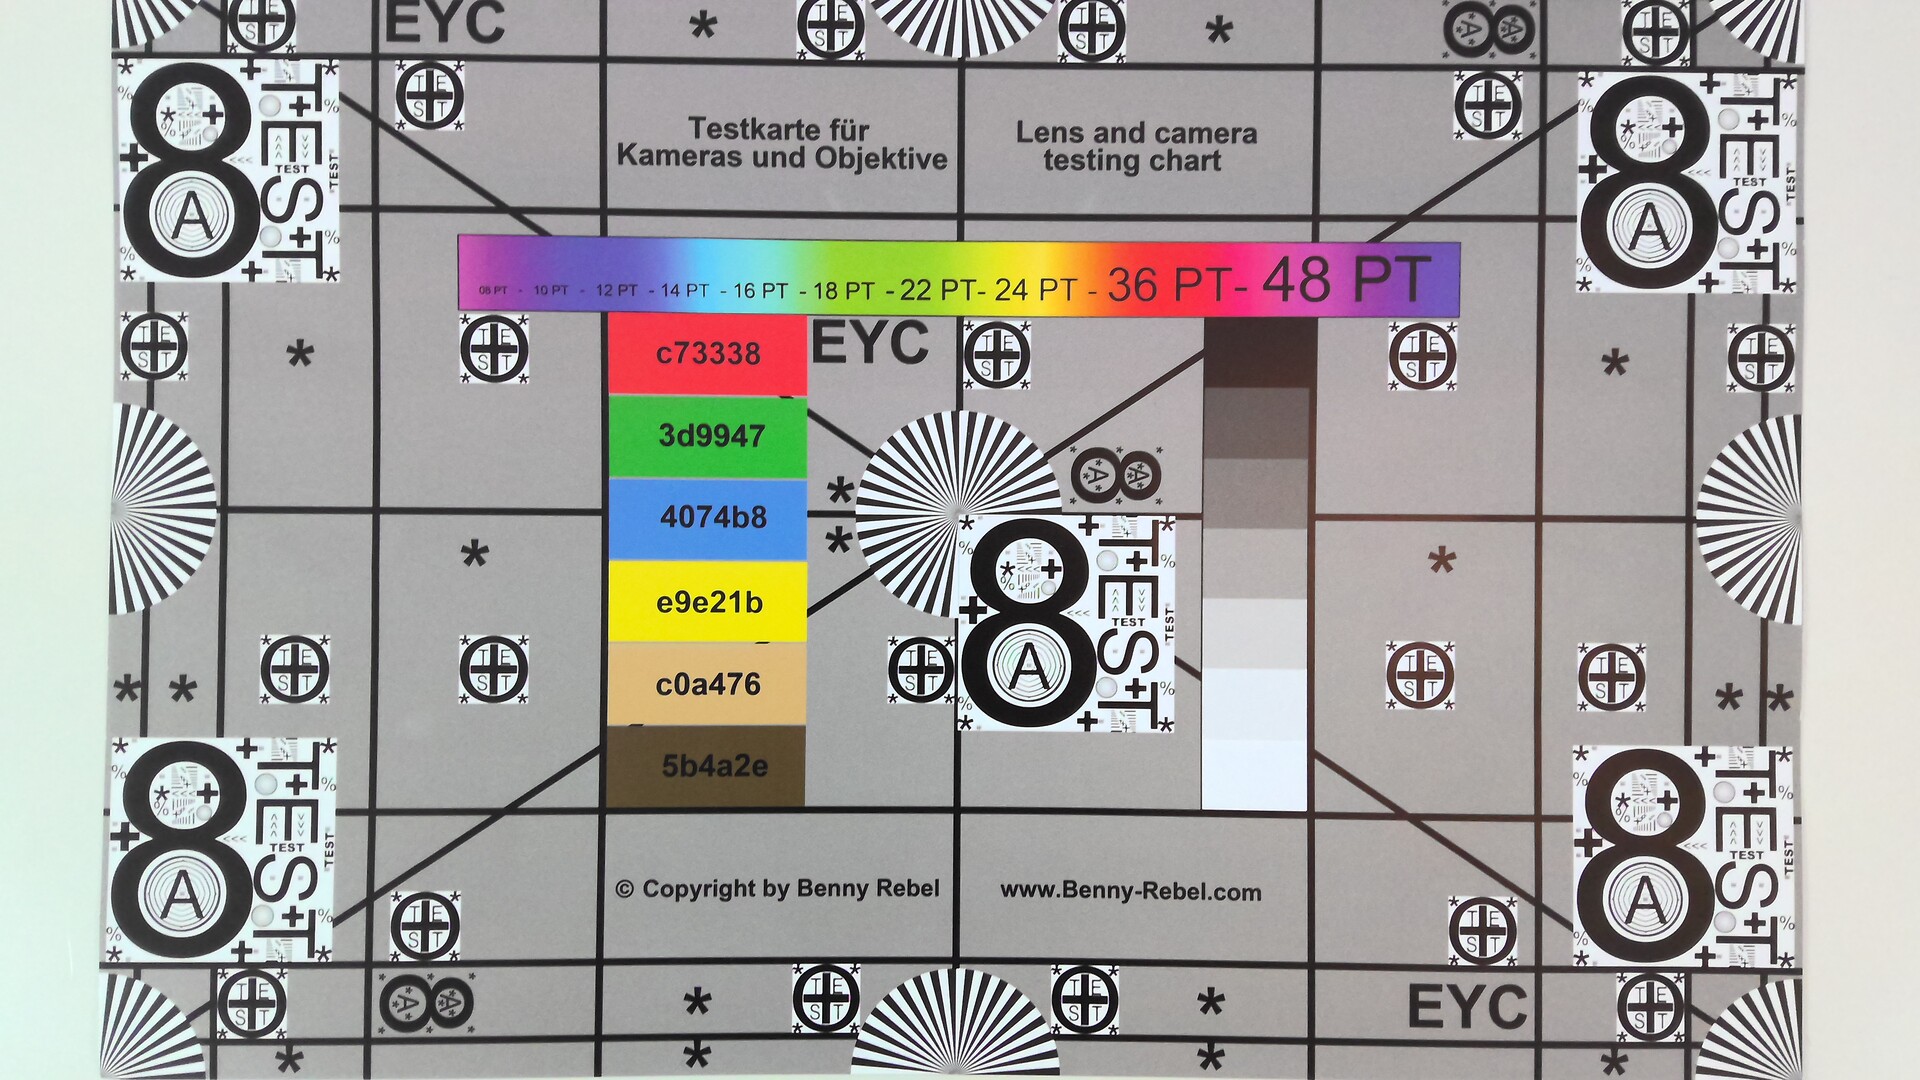
Nie wprowadzono żadnych zmian w konfiguracji kamer internetowych - z przodu znajduje się aparat 5 MP, a z tyłu 10 MP. Surface Pro 9 pozostaje więc wśród najlepszych urządzeń z systemem Windows pod względem wydajności aparatu. W wariancie ARM modelu Surface Pro 9 oferowanych jest jeszcze więcej funkcji aparatu, takich jak miękka ostrość (lub efekt bokeh) dla tła, automatyczny kontakt z oczami czy automatyczne kadrowanie obrazu.


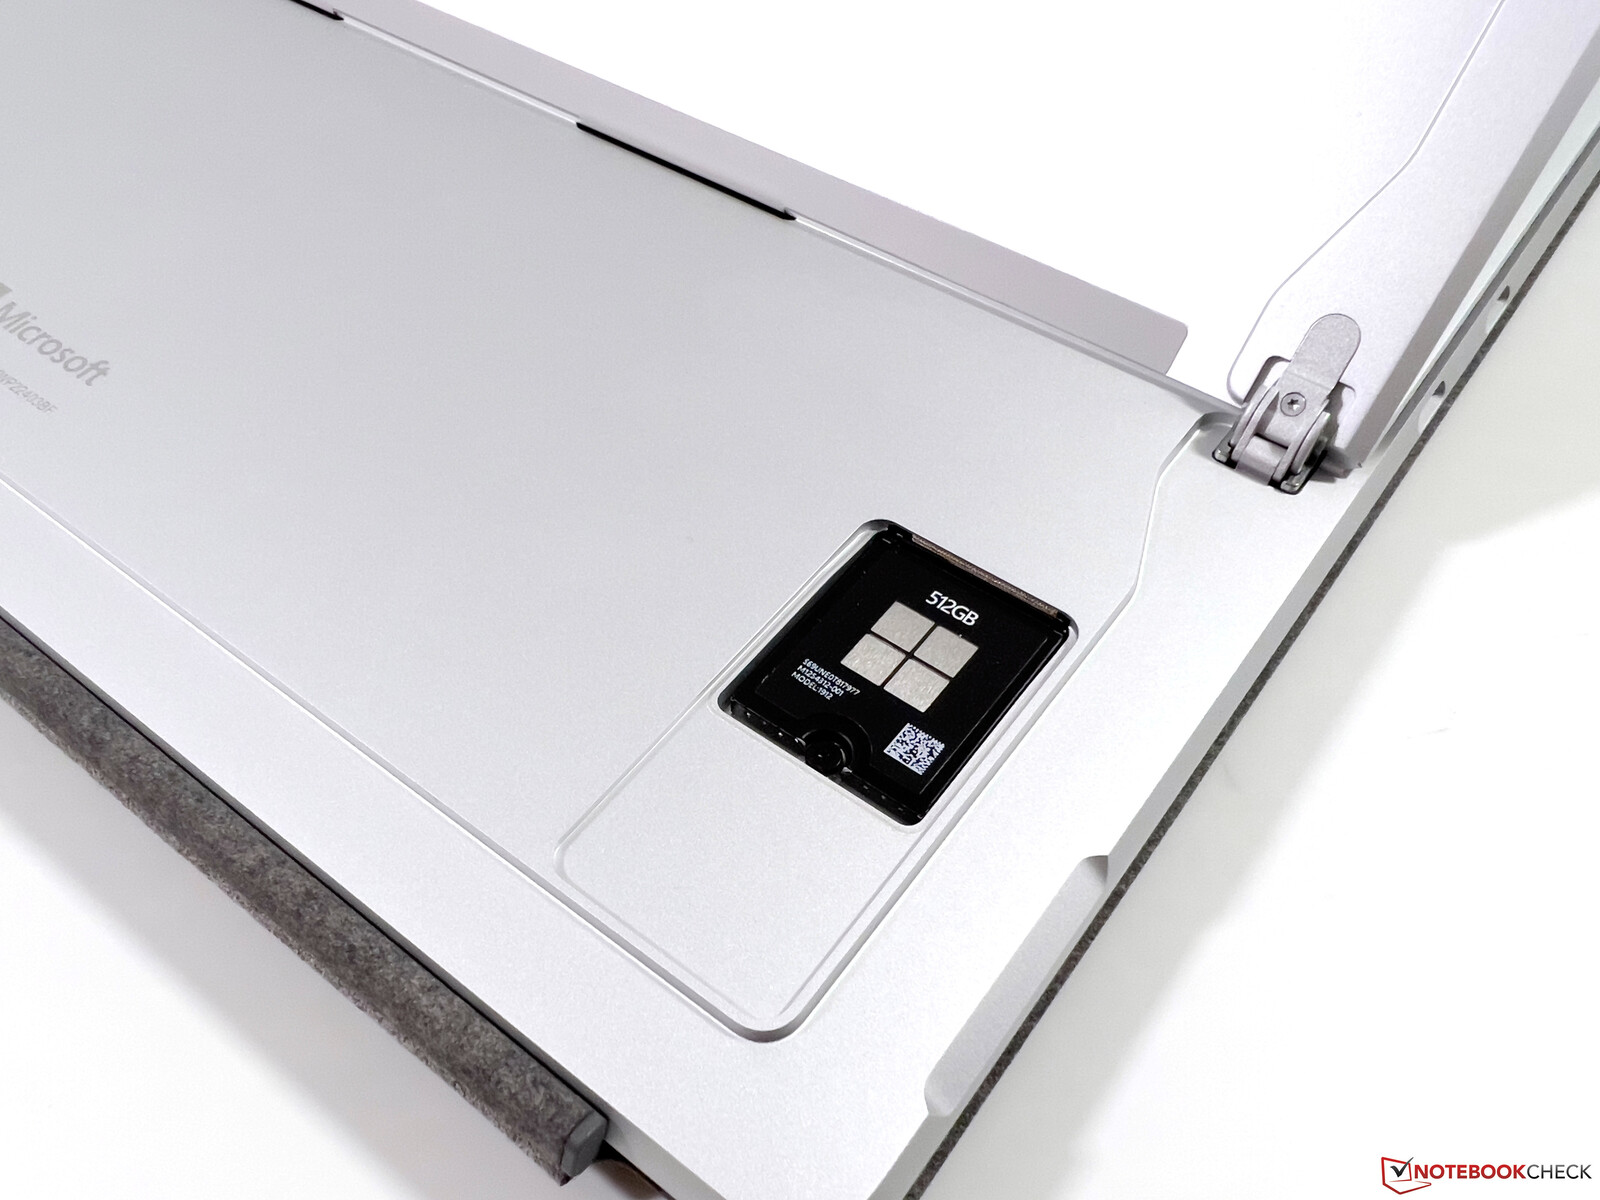
Konserwacja
Podobnie jak wcześniej, Surface Pro 9 nadal zapewnia użytkownikom możliwość wymiany kompaktowego dysku SSD M.2-2230, a Microsoft jeszcze bardziej ułatwił ten proces, ponieważ do otwarcia pokrywy nie są już potrzebne narzędzia SIM. Zamiast tego jest tu niewielkie wgłębienie, w które wciska się palec, co otwiera przeciwległą stronę (przytrzymywaną magnetycznie) i pozwala na łatwe zdjęcie pokrywy. Pozostałe elementy wewnętrzne nie są jednak dostępne.
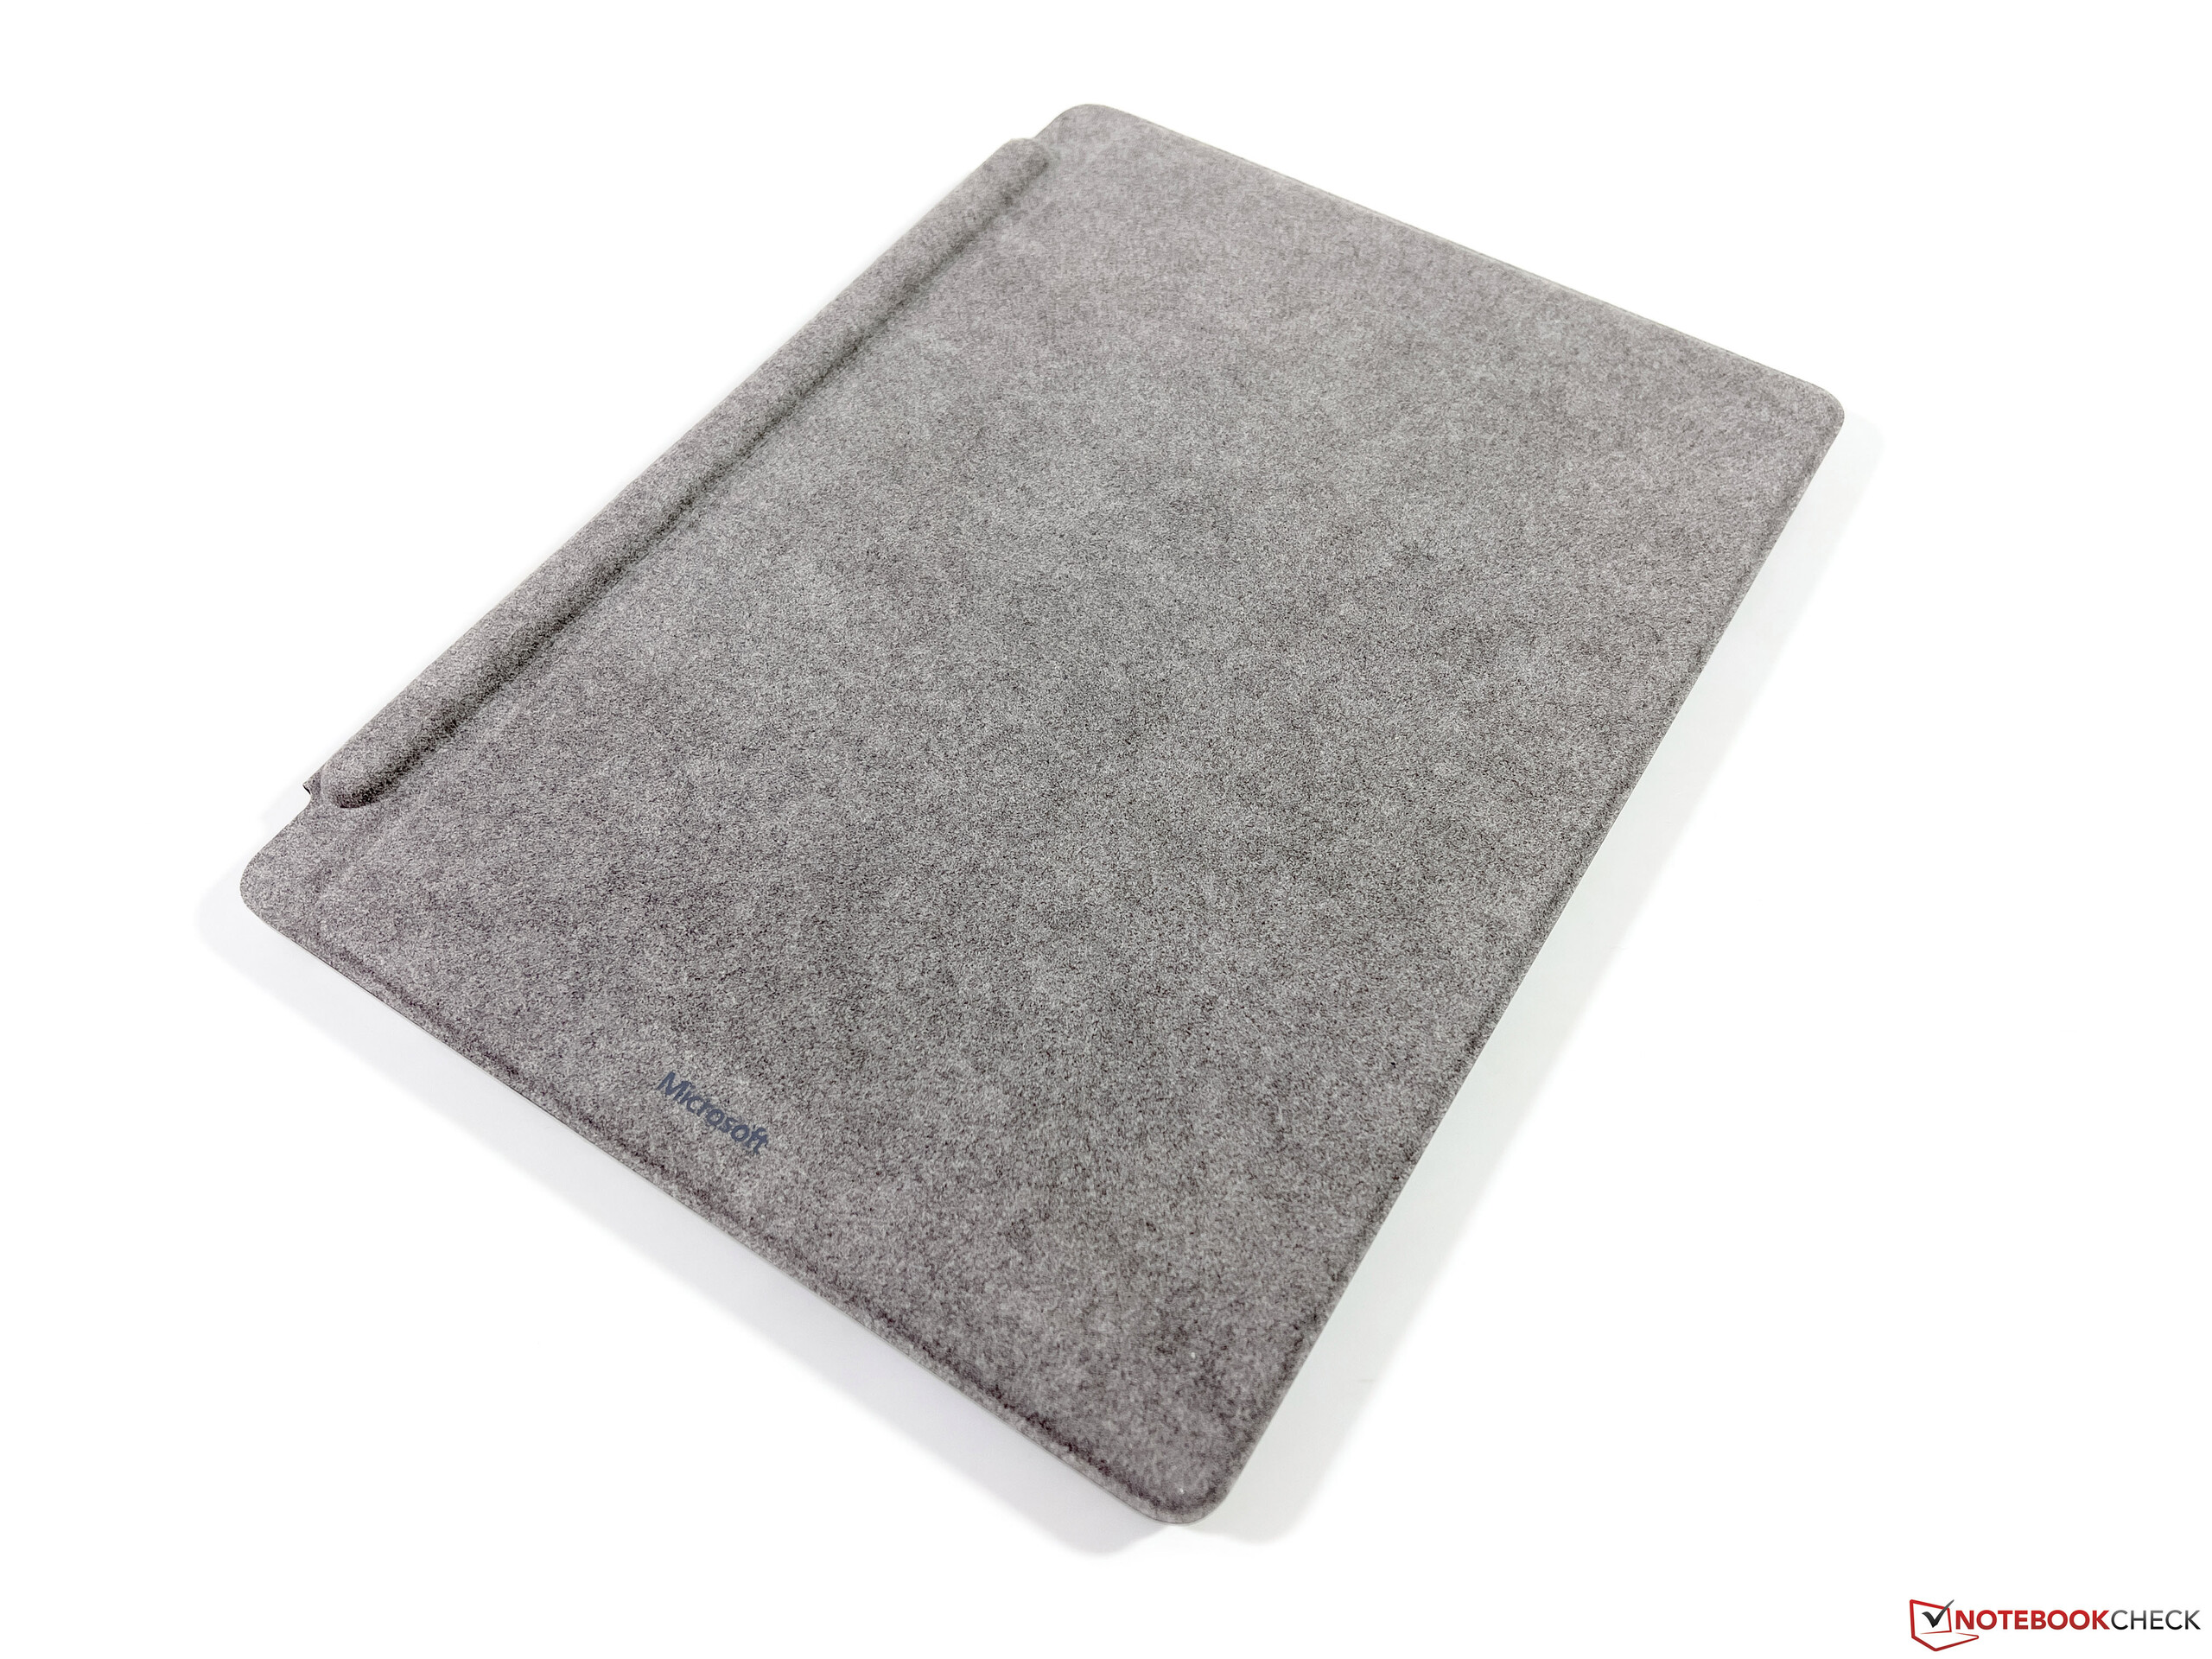
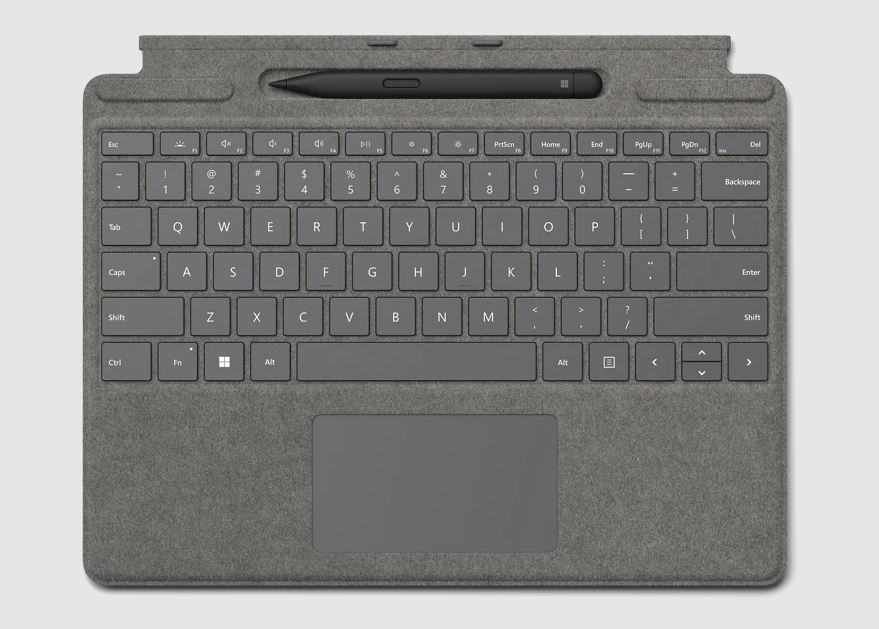
Urządzenia wejściowe - klawiatura Signature pozostaje bez zmian
Ponieważ wymiary Surface Pro nie uległy zmianie, Microsoft nadal oferuje dwie różne pokrywy klawiatury. Podobnie jak w ostatnim modelu, ponownie mamy klawiaturę Signature Keyboard oraz rysik Slim Pen 2, który można schować i naładować wewnątrz pokrywy klawiatury. Rysik nadal działa bardzo dobrze, jest też wsparcie dla haptycznego sprzężenia zwrotnego. Obsługa pióra nie jest już jednak tak ergonomiczna ze względu na jego spłaszczony kształt.
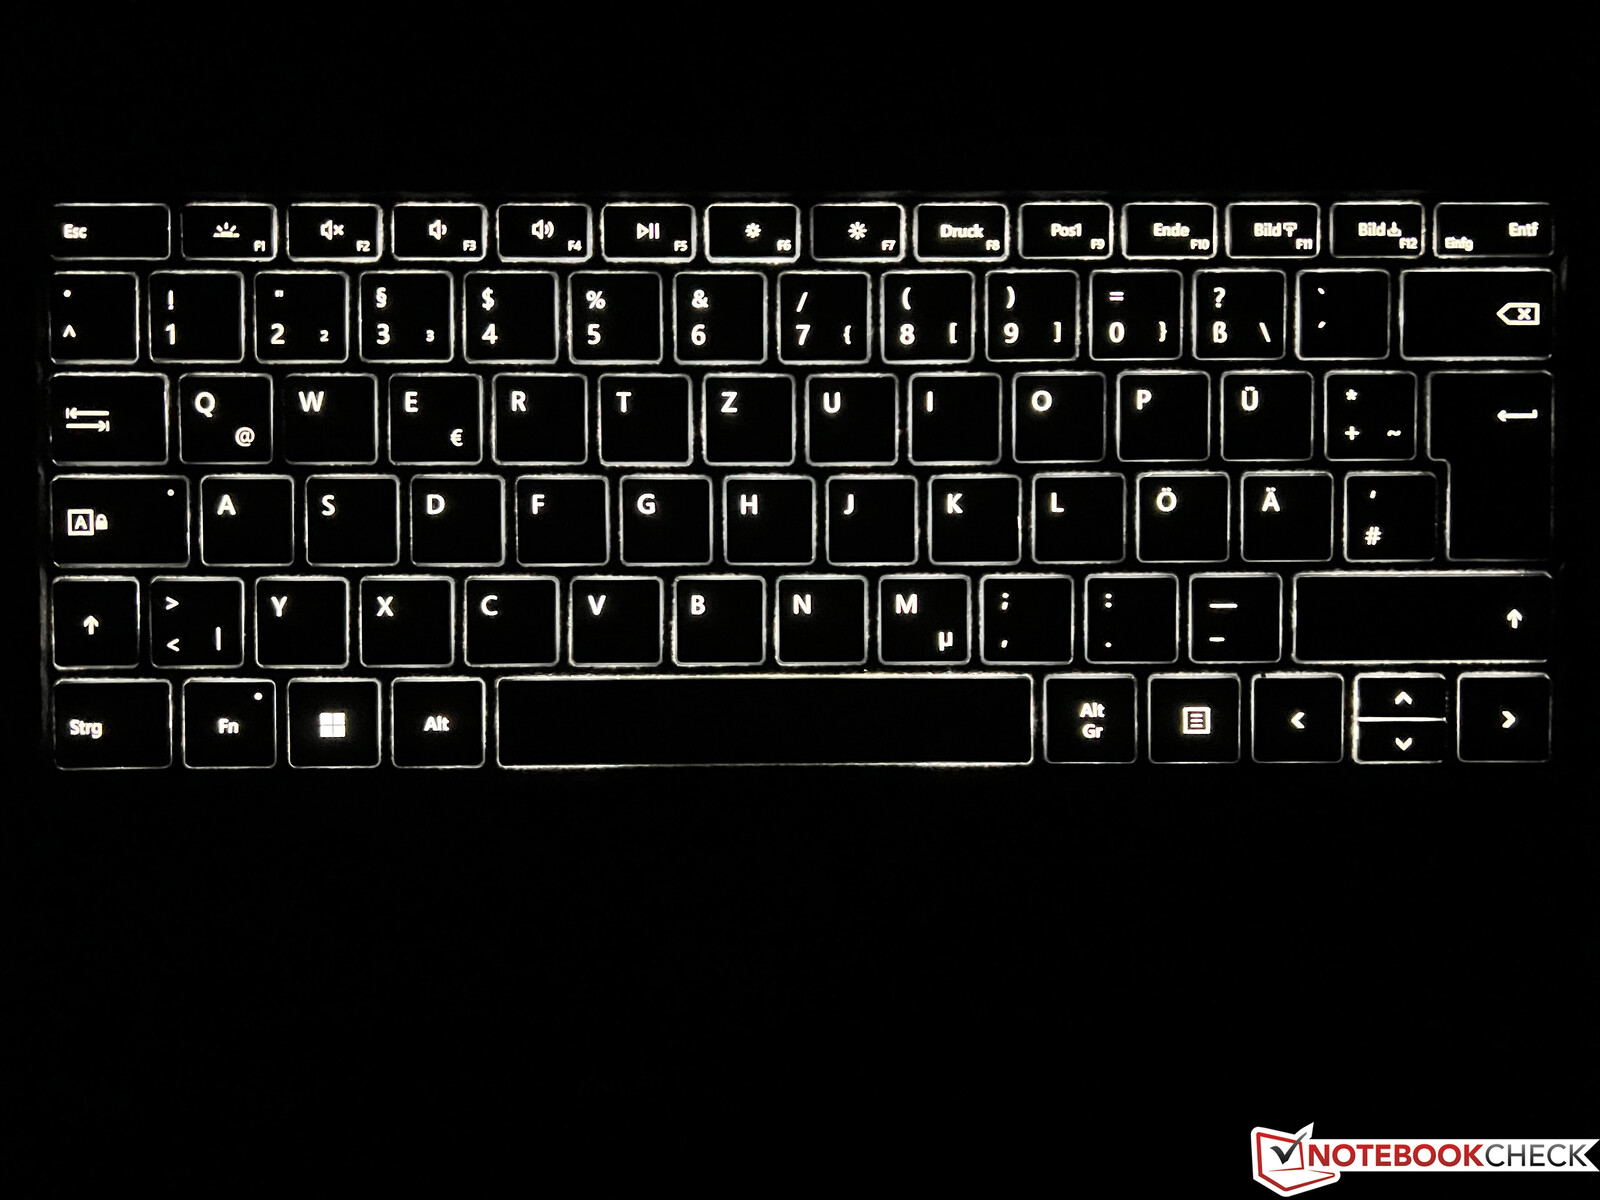
Sama klawiatura oferuje przyzwoity komfort pisania i jest również podświetlana. Ponadto klawiaturę można ustawić pod niewielkim kątem (dzięki magnesom), ale stabilność jest wtedy ograniczona. Zwłaszcza w podróży komfort pisania nie jest tak dobry, jak w normalnym laptopie, a Surface wymaga ogólnie dużej powierzchni ustawienia ze względu na wbudowane zawiasy (ale dotyczy to też większości komputerów konwertowalnych z pokrywą klawiatury).
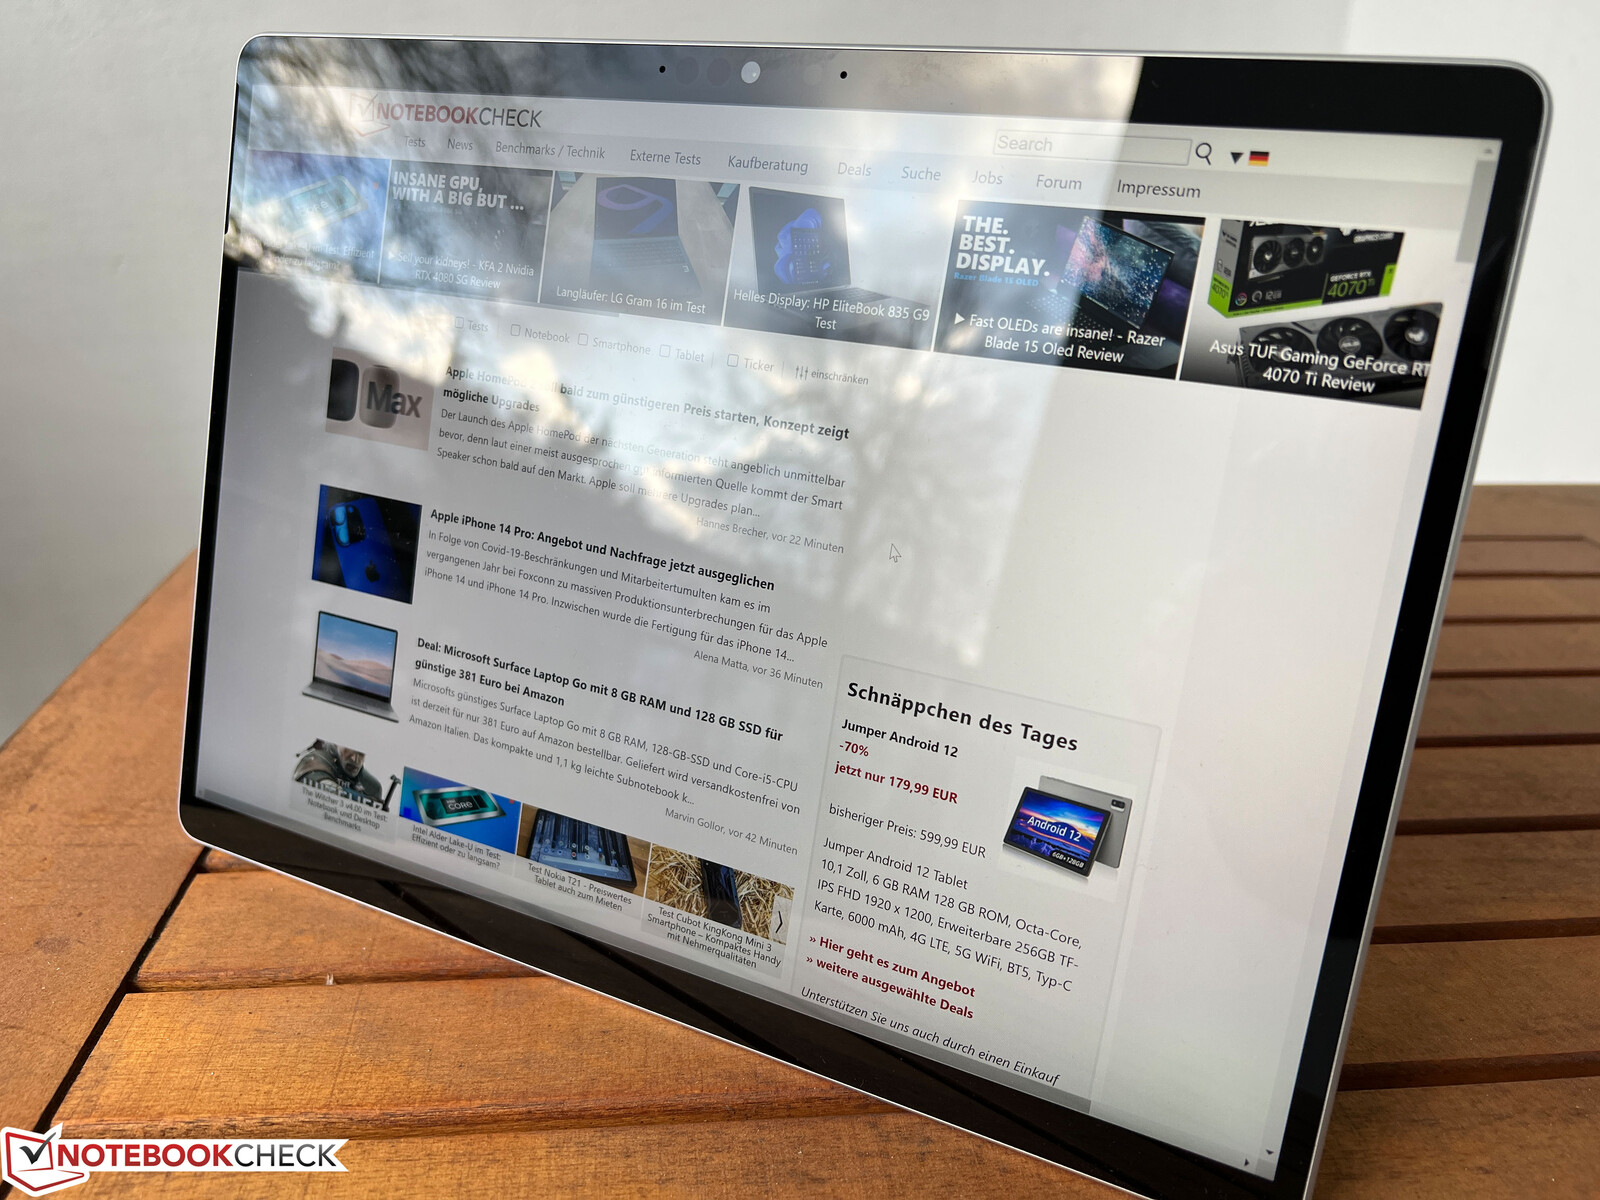
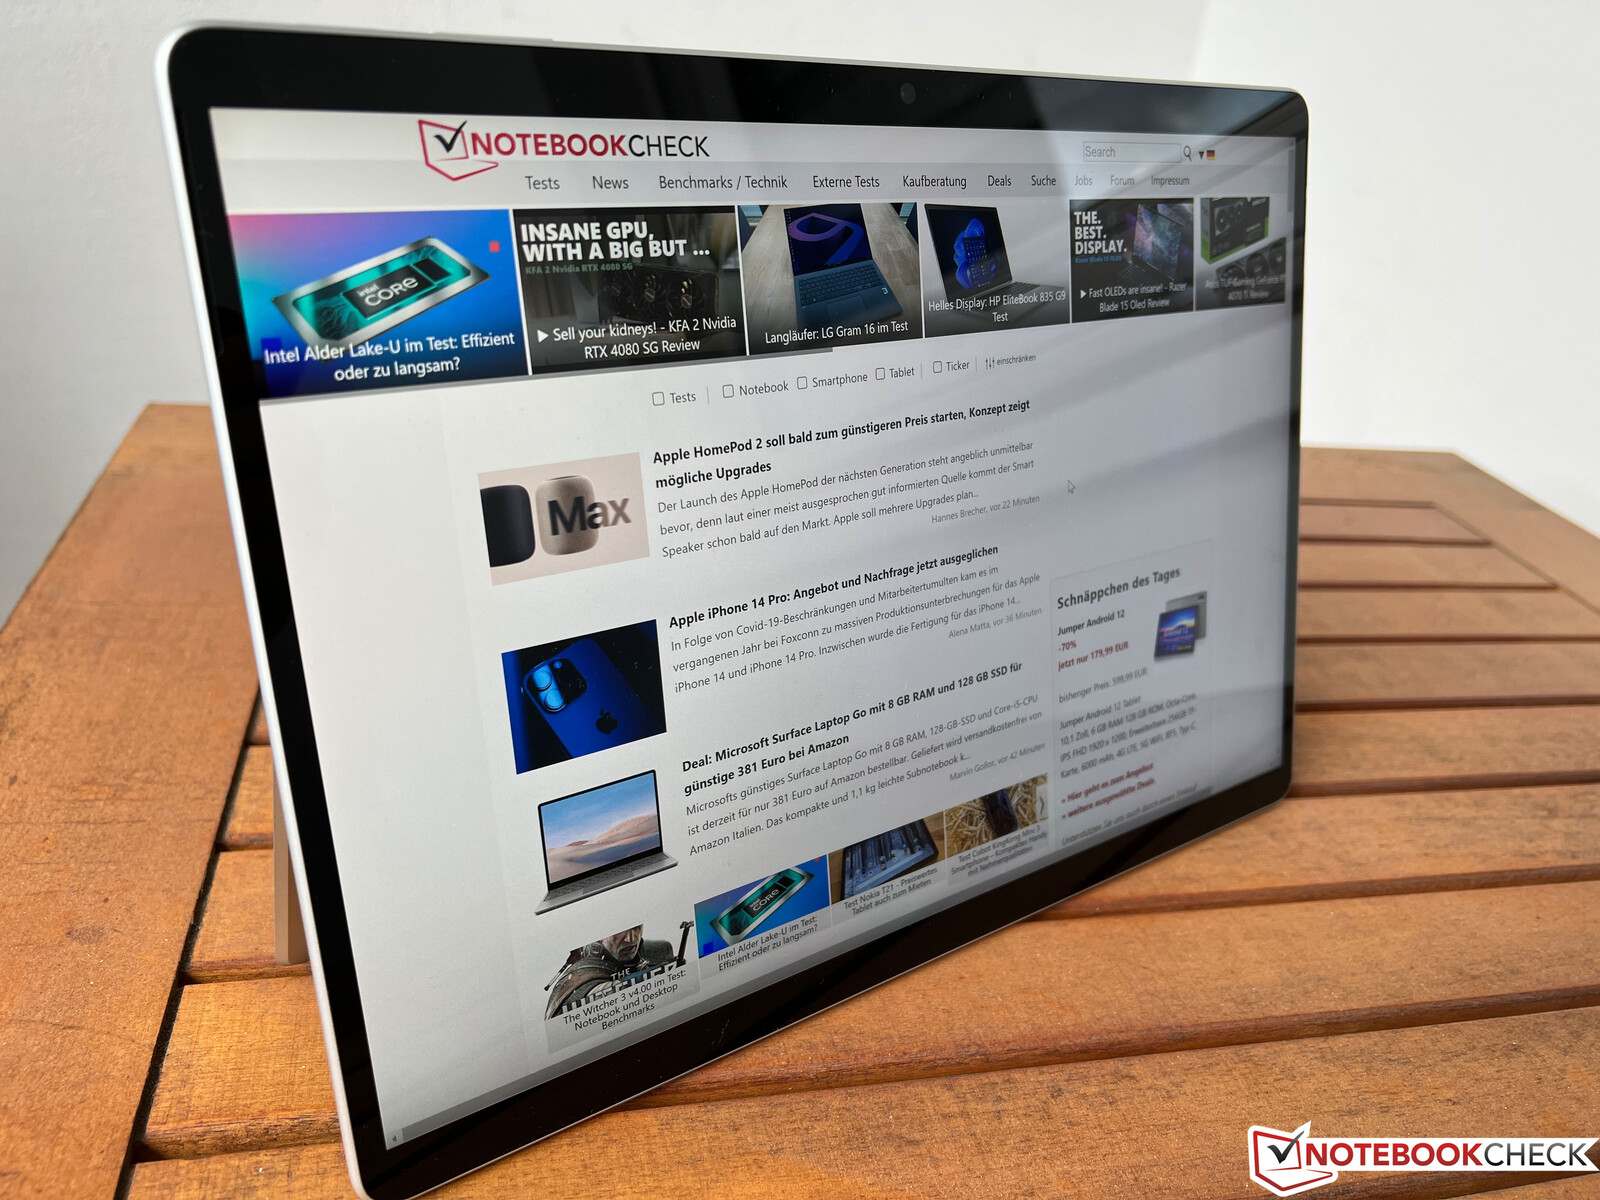
Wyświetlacz - 3:2 IPS przy 120 Hz
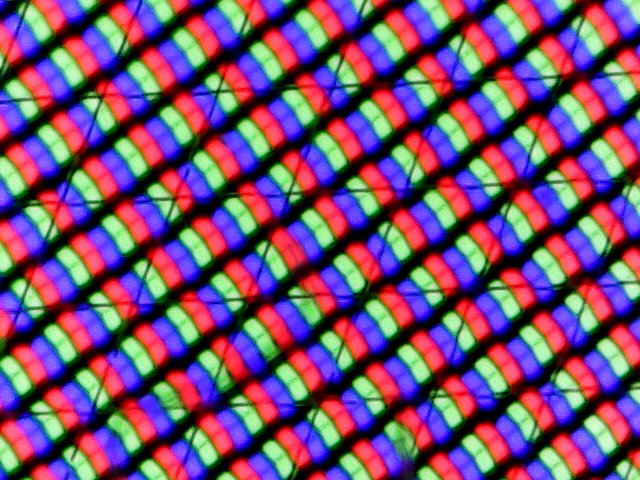
Nic nie zmieniło się w podstawowej charakterystyce wyświetlacza, który pozostaje ekranem dotykowym IPS w formacie 3:2, oferuje rozdzielczość 2880 x 1920 (267 PPI) i częstotliwość odświeżania do 120 Hz. 60 Hz jest ustawione jako domyślna częstotliwość, więc 120 Hz trzeba ręcznie wybrać w ustawieniach. Nasze subiektywne wrażenie z błyszczącego ekranu jest nadal bardzo dobre. Dzięki czujnikom jasność i temperatura barwowa są automatycznie regulowane i to również działa dobrze.
Panel ponownie pochodzi od LG Philips, ale ID panelu uległo zmianie. Zasadniczo wartości są porównywalne, gdyż maksymalna jasność ponownie oscyluje wokół 450 cd/m². Poziom czerni jest nieco lepszy, przez co również współczynnik kontrastu, na poziomie prawie 1.200:1, wydaje się nieco lepszy. Konkurencyjne urządzenia wypadają tu jednak lepiej, zwłaszcza pod względem kontrastu, jak np. Mini-LED-Display z iPada Pro.
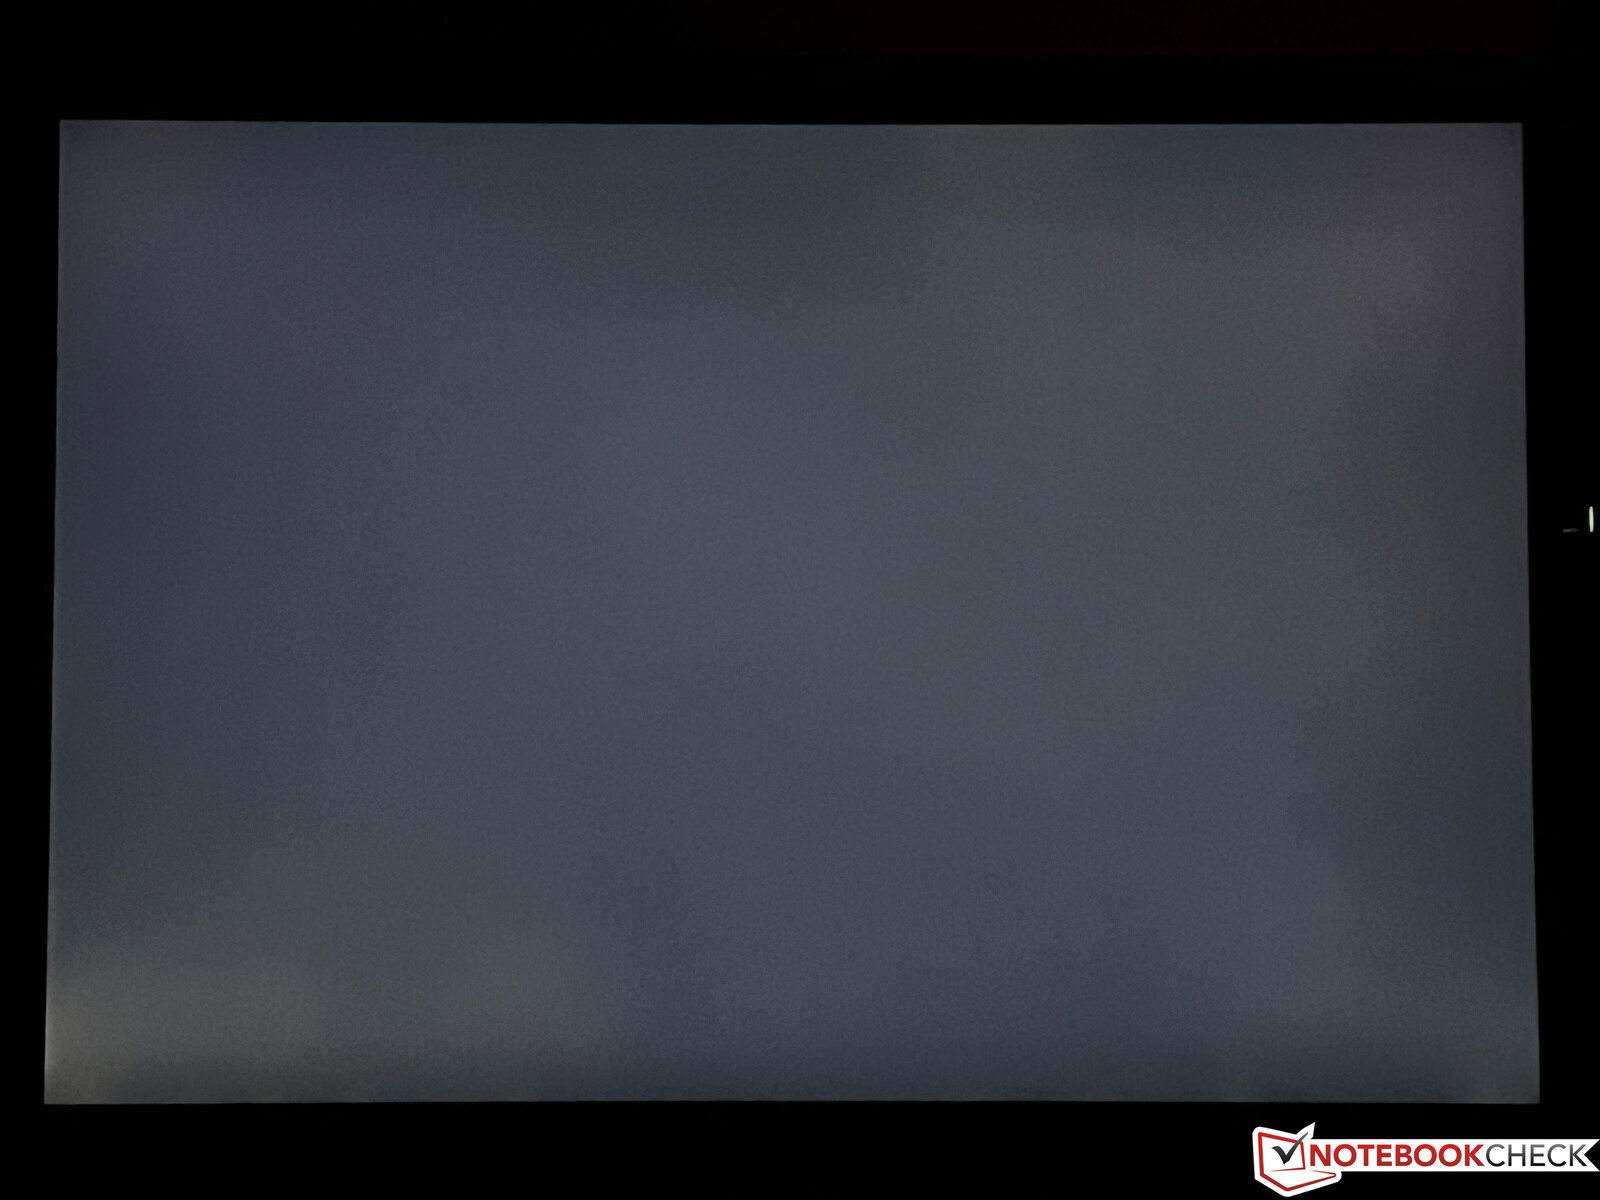
Nie występuje klasyczne migotanie PWM, ale po raz kolejny zarejestrowaliśmy migotanie przy ~30 KHz przy jasności 55% lub niższej. Nie powinno to jednak stanowić problemu ze względu na wysoką częstotliwość. Dotyczy to również aureoli, bowiem tylko przy pełnej jasności zauważamy nieco jaśniejszą plamę na dole po lewej stronie ciemnego ekranu.
| |||||||||||||||||||||||||
rozświetlenie: 94 %
na akumulatorze: 454 cd/m²
kontrast: 1197:1 (czerń: 0.38 cd/m²)
ΔE ColorChecker Calman: 1.7 | ∀{0.5-29.43 Ø4.73}
calibrated: 1.5
ΔE Greyscale Calman: 1.5 | ∀{0.09-98 Ø4.97}
67.7% AdobeRGB 1998 (Argyll 3D)
97.7% sRGB (Argyll 3D)
65.6% Display P3 (Argyll 3D)
Gamma: 2.17
CCT: 6761 K
| Microsoft Surface Pro 9, i7-1255U LP129WT2-SPA6, IPS, 2880x1920, 13" | Dell XPS 13 9315 2-in-1 Core i5-1230U BOE NE13A1M, IPS, 2880x1920, 13" | Lenovo ThinkPad X12 20UVS03G00 N123NCA-GS1, a-Si IPS LED, 1920x1280, 12.3" | HP Elite Dragonfly Folio 13.5 G3 Chi Mei CMN13C0, IPS, 1920x1280, 13.5" | Apple iPad Pro 12.9 2022 Liquid Retina XDR Display, Mini-LED, 2732x2048, 12.9" | Asus ROG Flow Z13 GZ301ZE LQ134N1JW54, IPS, 1920x1200, 13.4" | Microsoft Surface Pro 8, i7-1185G7 LP129WT212166, IPS, 2880x1920, 13" | |
|---|---|---|---|---|---|---|---|
| Display | 6% | 2% | 3% | 1% | 12% | ||
| Display P3 Coverage (%) | 65.6 | 70.7 8% | 67 2% | 68.3 4% | 67.5 3% | 78.2 19% | |
| sRGB Coverage (%) | 97.7 | 99.8 2% | 99.2 2% | 98.6 1% | 97.1 -1% | 100 2% | |
| AdobeRGB 1998 Coverage (%) | 67.7 | 72.6 7% | 68.8 2% | 70.2 4% | 69.3 2% | 77.6 15% | |
| Response Times | -133% | -236% | -272% | -133% | -115% | -139% | |
| Response Time Grey 50% / Grey 80% * (ms) | 13 ? | 44 ? -238% | 63.2 ? -386% | 66.8 ? -414% | 35.3 ? -172% | 44 ? -238% | 46.4 ? -257% |
| Response Time Black / White * (ms) | 19.4 ? | 24.8 ? -28% | 36 ? -86% | 44.4 ? -129% | 37.53 ? -93% | 17.6 ? 9% | 23.2 ? -20% |
| PWM Frequency (Hz) | 29896 ? | 6401 ? | 29760 ? | ||||
| Screen | 8% | 24% | -9% | 7% | -0% | -7% | |
| Brightness middle (cd/m²) | 455 | 507 11% | 419 -8% | 369.5 -19% | 611 34% | 515 13% | 444 -2% |
| Brightness (cd/m²) | 453 | 486 7% | 406 -10% | 350 -23% | 605 34% | 476 5% | 451 0% |
| Brightness Distribution (%) | 94 | 87 -7% | 94 0% | 87 -7% | 92 -2% | 87 -7% | 91 -3% |
| Black Level * (cd/m²) | 0.38 | 0.34 11% | 0.23 39% | 0.24 37% | 0.35 8% | 0.43 -13% | |
| Contrast (:1) | 1197 | 1491 25% | 1822 52% | 1540 29% | 1471 23% | 1033 -14% | |
| Colorchecker dE 2000 * | 1.7 | 2.04 -20% | 1.1 35% | 2.3 -35% | 1.4 18% | 1.6 6% | 2 -18% |
| Colorchecker dE 2000 max. * | 3.8 | 3.1 18% | 2.2 42% | 4.34 -14% | 3.3 13% | 4 -5% | 3.2 16% |
| Colorchecker dE 2000 calibrated * | 1.5 | 0.86 43% | 0.5 67% | 0.6 60% | 1.2 20% | 1.7 -13% | |
| Greyscale dE 2000 * | 1.5 | 1.8 -20% | 1.5 -0% | 3.1 -107% | 2.3 -53% | 2.5 -67% | 1.8 -20% |
| Gamma | 2.17 101% | 2.12 104% | 2.06 107% | 2.1 105% | 2.22 99% | 2.2 100% | 2.11 104% |
| CCT | 6761 96% | 6561 99% | 6524 100% | 6248 104% | 6930 94% | 6939 94% | 6417 101% |
| Color Space (Percent of AdobeRGB 1998) (%) | 62.8 | ||||||
| Color Space (Percent of sRGB) (%) | 99.2 | ||||||
| Całkowita średnia (program / ustawienia) | -40% /
-13% | -70% /
-18% | -93% /
-44% | -63% /
-28% | -38% /
-16% | -45% /
-22% |
* ... im mniej tym lepiej
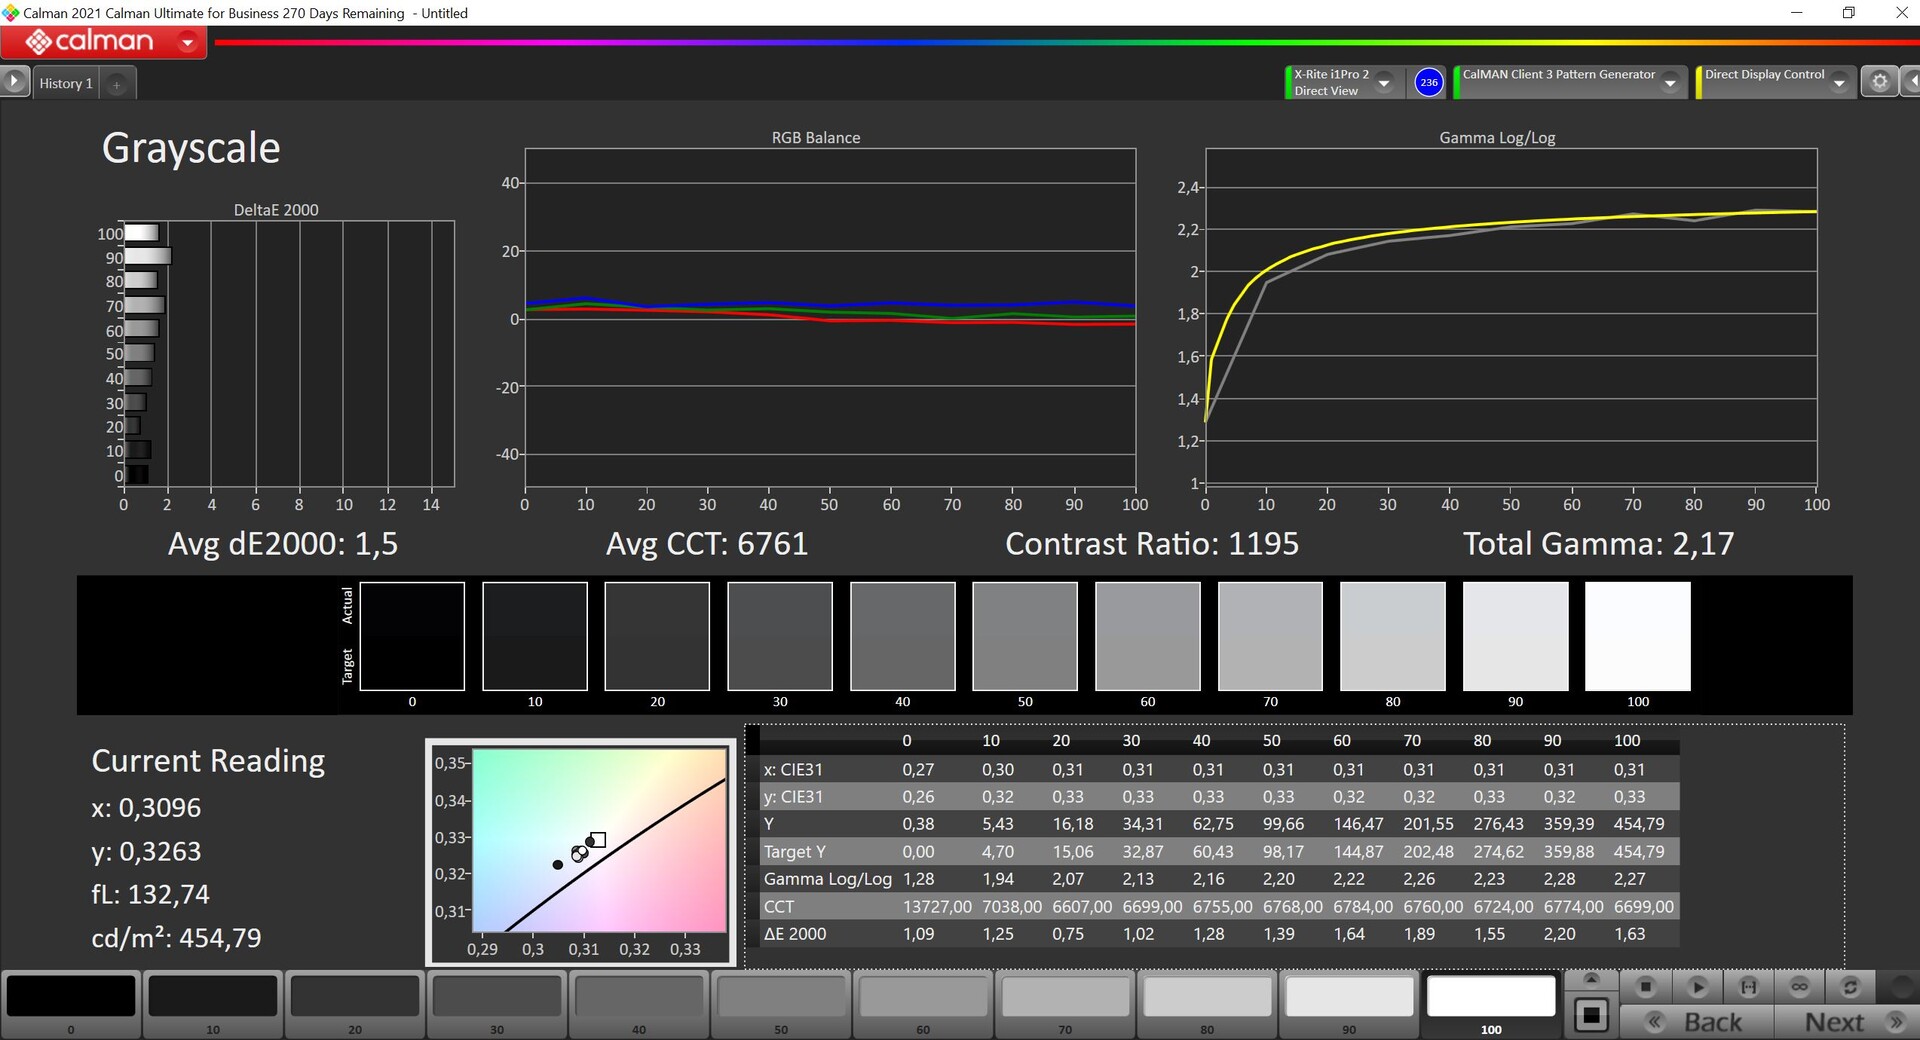
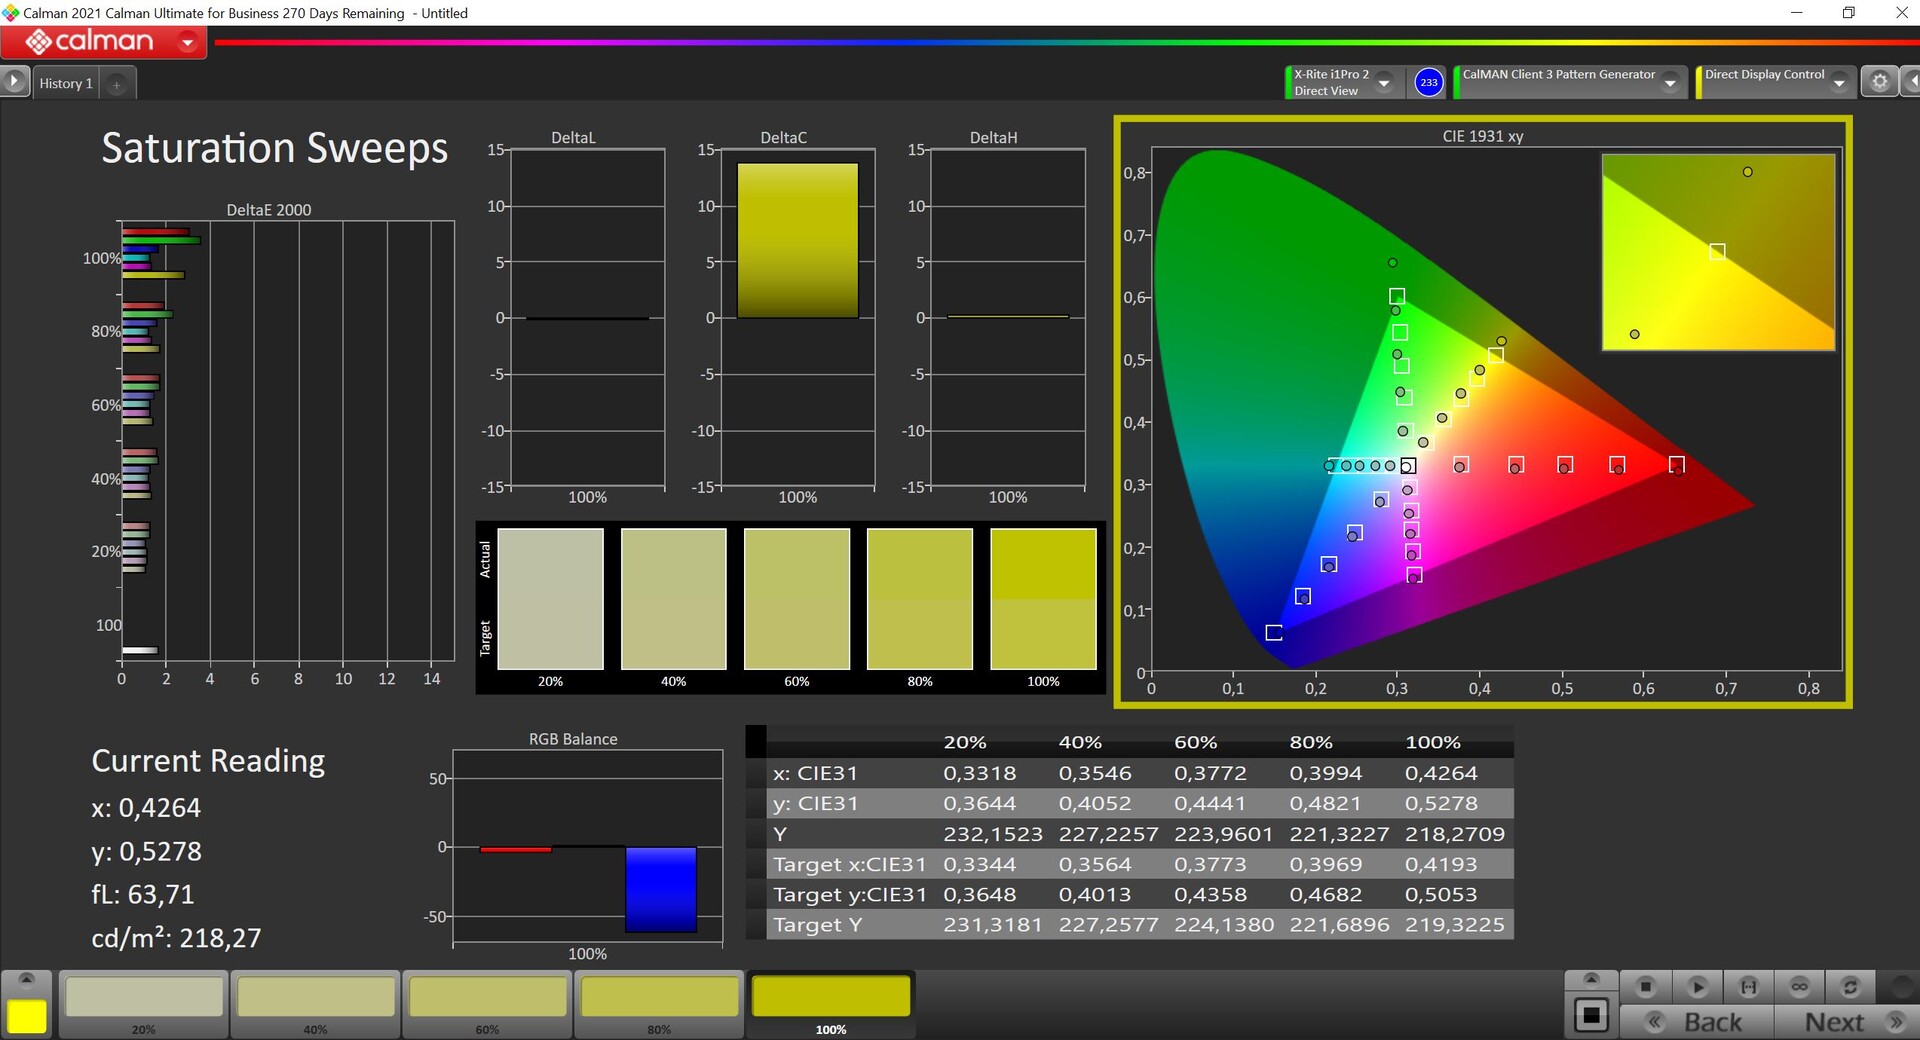
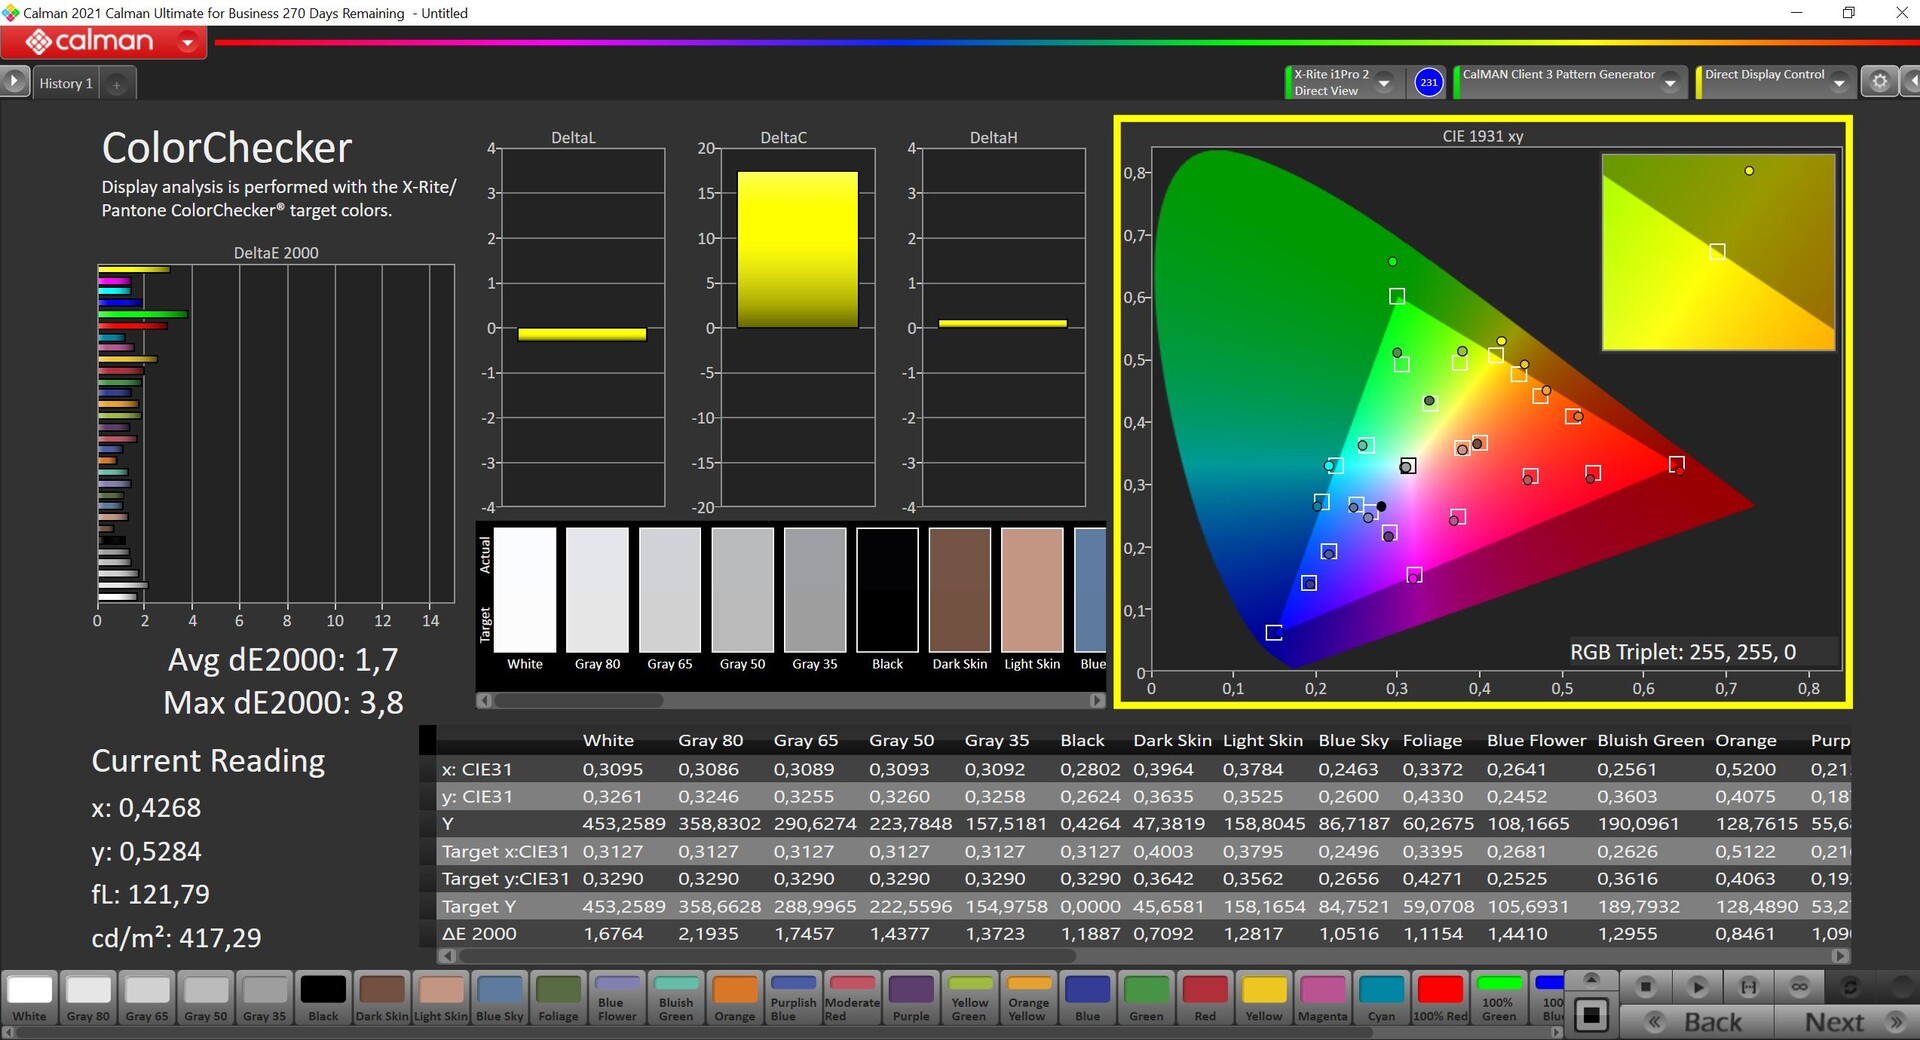
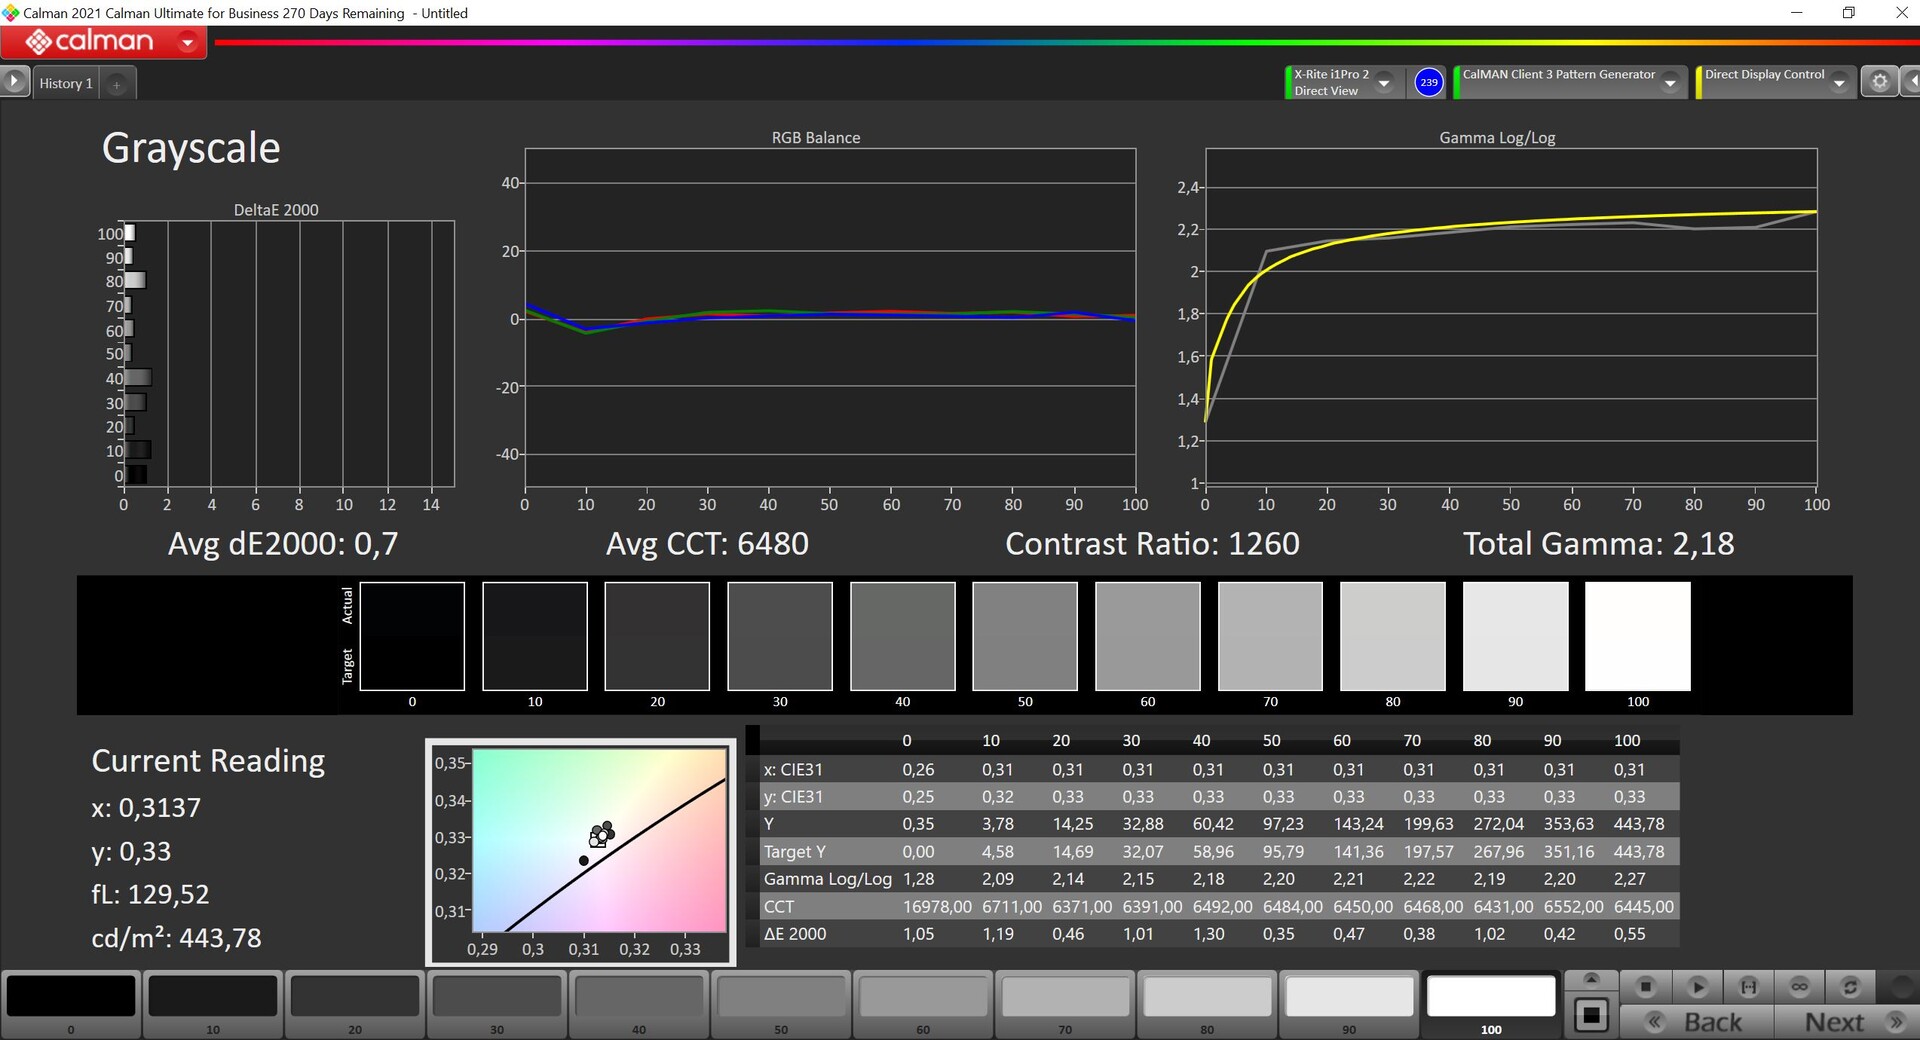
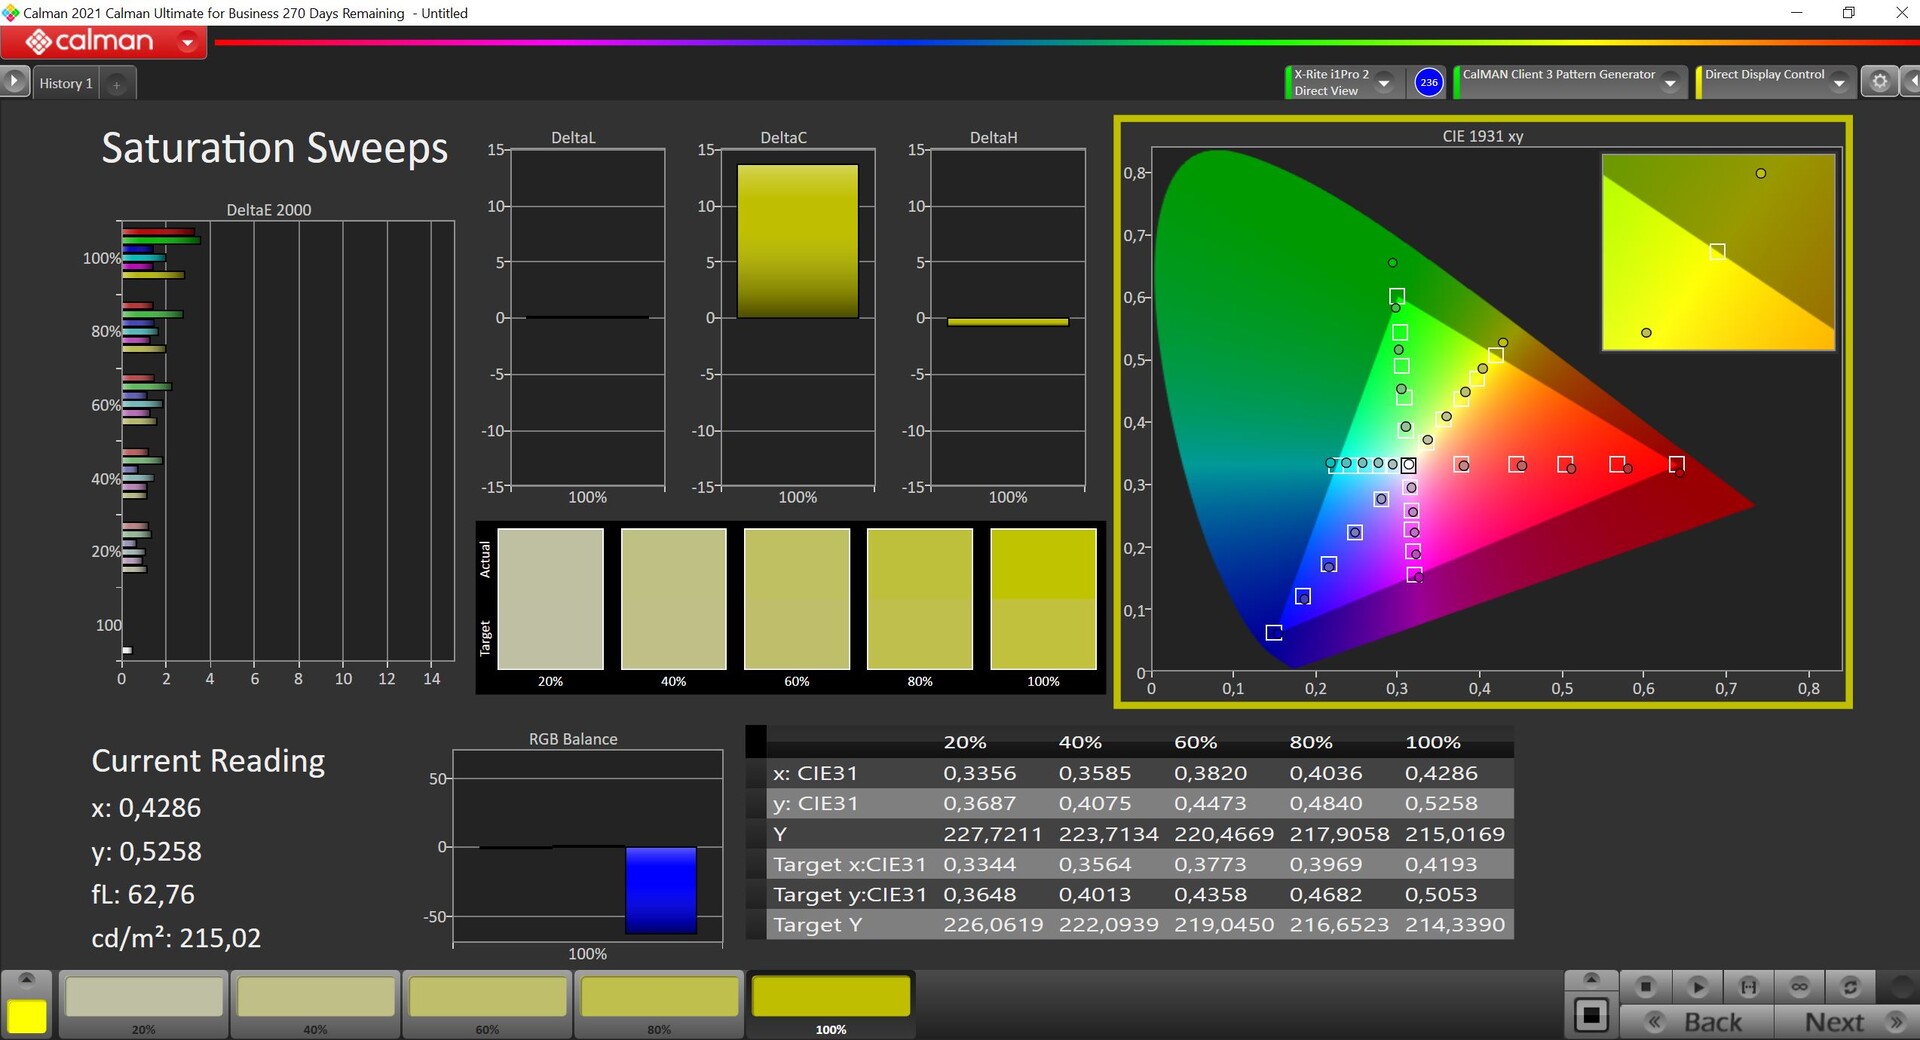

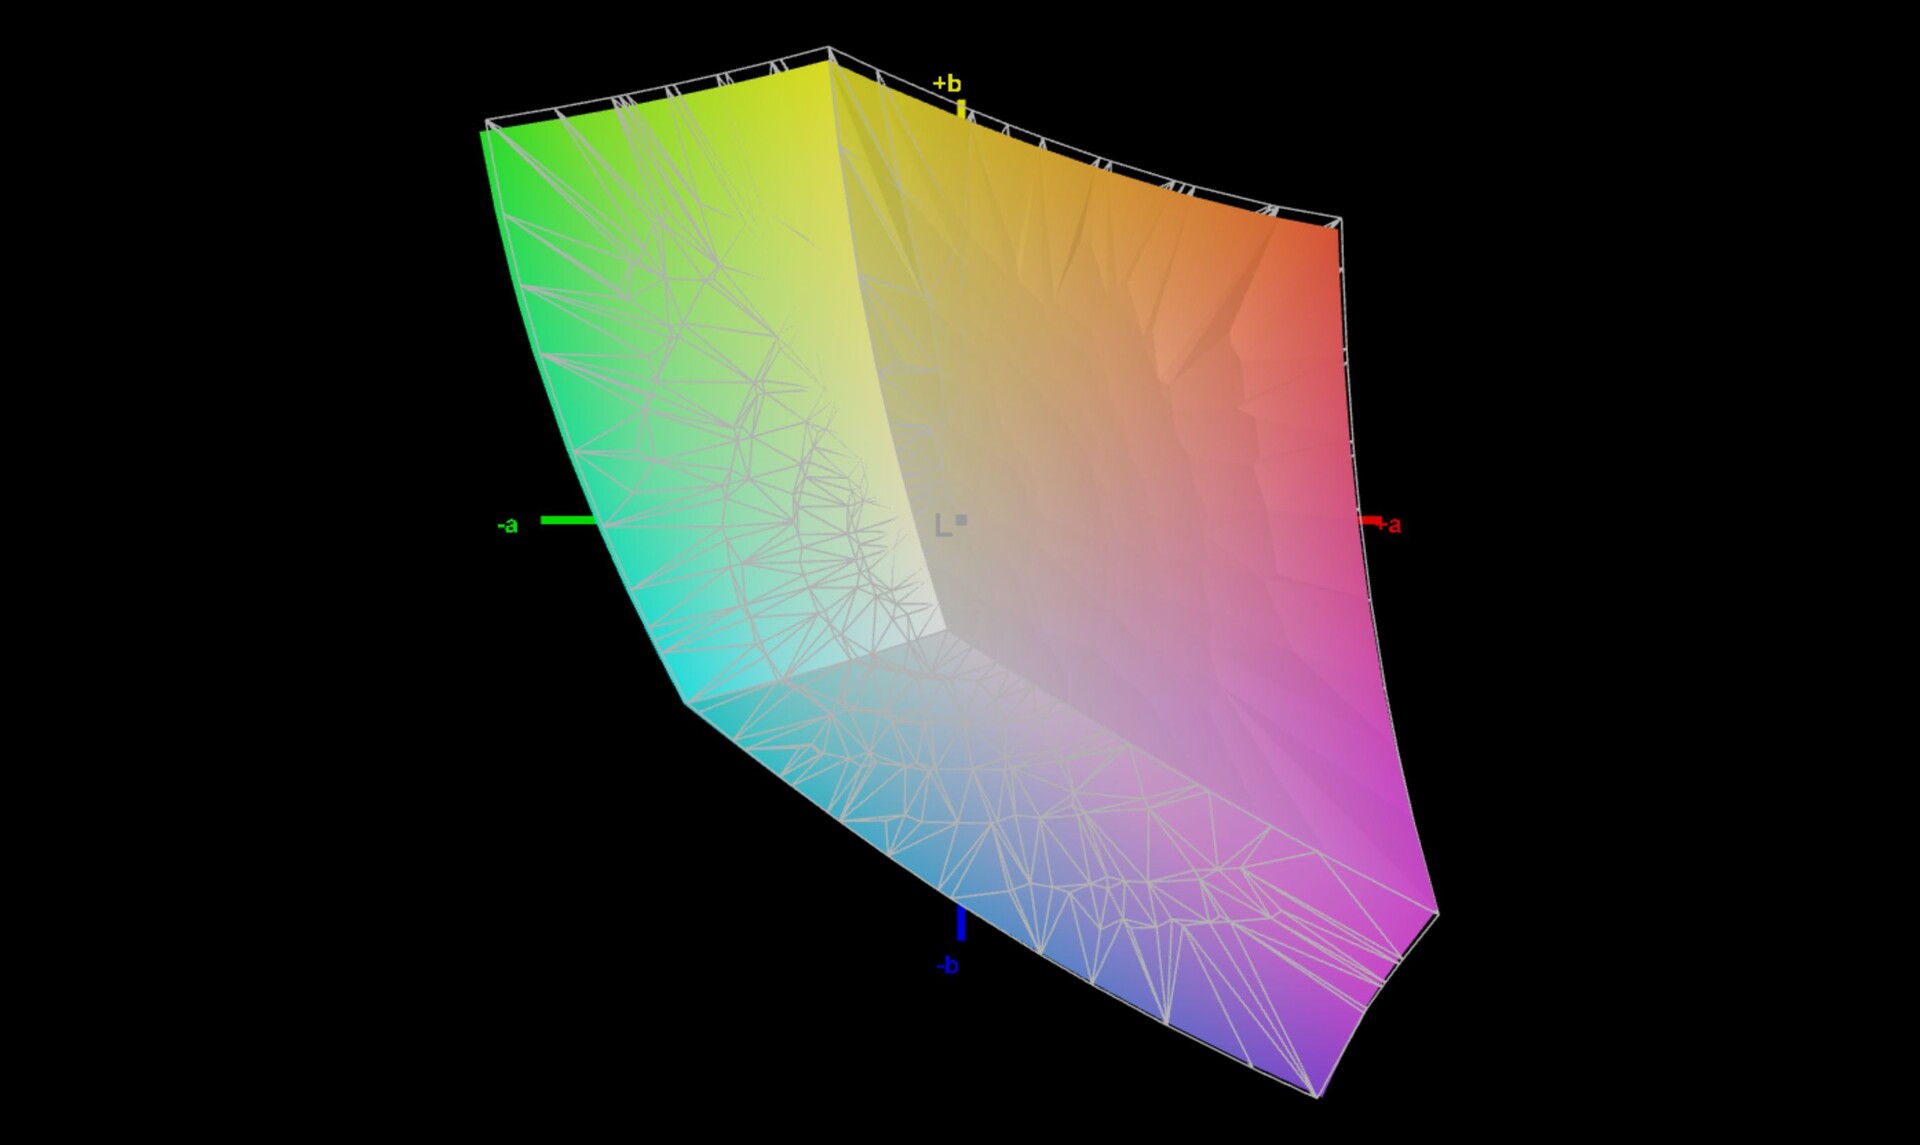
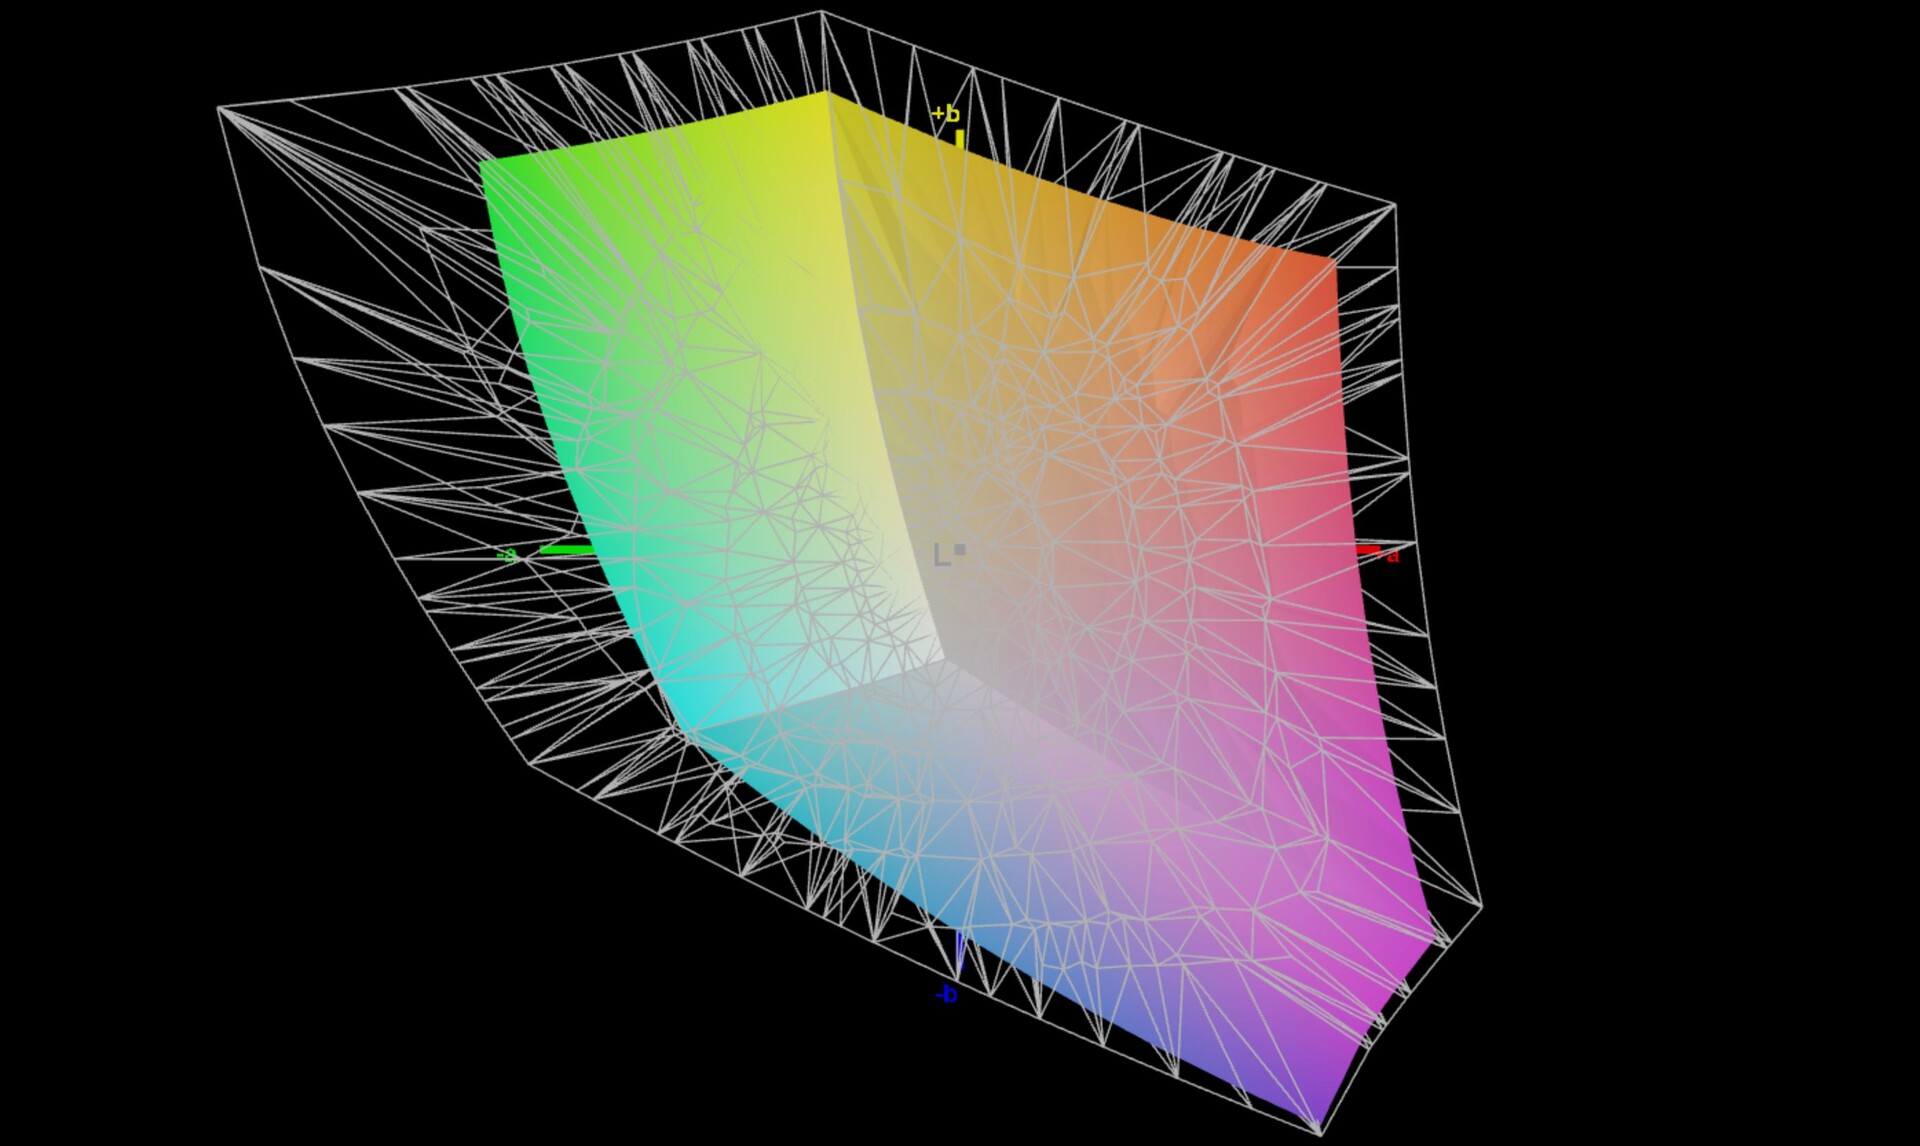
Panel przetestowaliśmy przy użyciu profesjonalnego oprogramowania CalMAN (X-Rite i1 Pro 2): jego wydajność w stanie dostawy jest już bardzo dobra, choć nie udało nam się wykryć różnic między profilami sRGB i Vivid. Skala szarości wykazuje lekkie oddanie kolorów, ale w praktyce nie jest to zauważalne. Odchylenia kolorów są zgodne z celem; jedynie kolory 100% wykazują nieco większe odchylenia (przy czym tylko kolor zielony jest powyżej wartości docelowej 3). Byliśmy w stanie poprawić te wartości jeszcze bardziej poprzez naszą własną kalibrację (profil dostępny powyżej do pobrania za darmo), ale nie było to tak naprawdę konieczne. Pod względem pokrycia przestrzeni kolorów nowy panel wypada jednak nieco gorzej, bo sRGB osiąga tylko 97,7% pokrycia (poprzednio 100%), a zarówno P3 jak i AdobeRGB są również nieco niższe niż poprzednio.

Wyświetl czasy reakcji
| ↔ Czas reakcji od czerni do bieli | ||
|---|---|---|
| 19.4 ms ... wzrost ↗ i spadek ↘ łącznie | ↗ 6.8 ms wzrost | 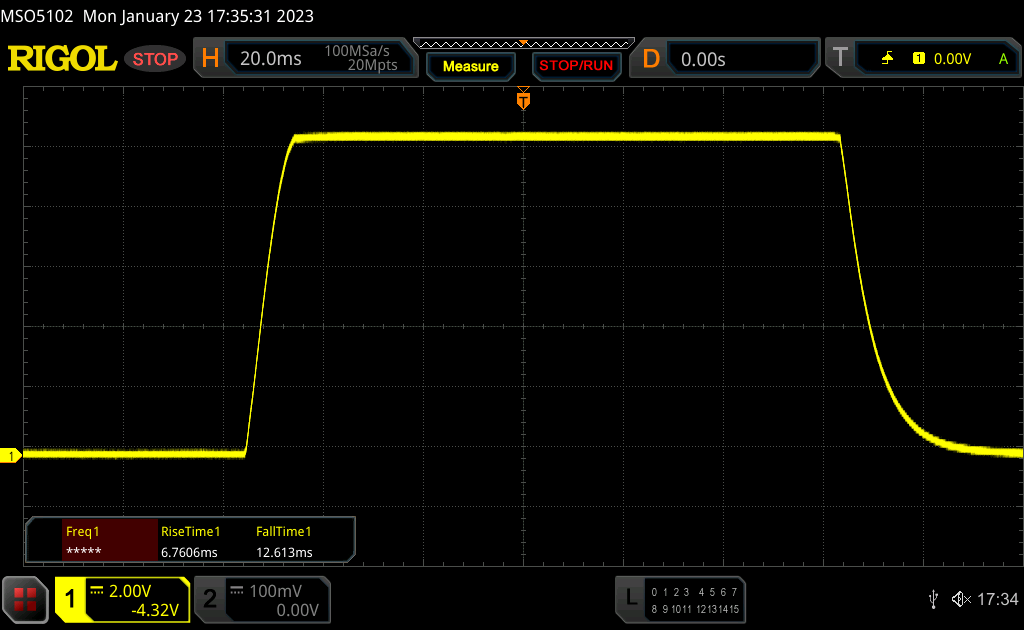 |
| ↘ 12.6 ms upadek | ||
| W naszych testach ekran wykazuje dobry współczynnik reakcji, ale może być zbyt wolny dla graczy rywalizujących ze sobą. Dla porównania, wszystkie testowane urządzenia wahają się od 0.1 (minimum) do 240 (maksimum) ms. » 43 % wszystkich urządzeń jest lepszych. Oznacza to, że zmierzony czas reakcji jest zbliżony do średniej wszystkich testowanych urządzeń (19.9 ms). | ||
| ↔ Czas reakcji 50% szarości do 80% szarości | ||
| 13 ms ... wzrost ↗ i spadek ↘ łącznie | ↗ 6 ms wzrost | 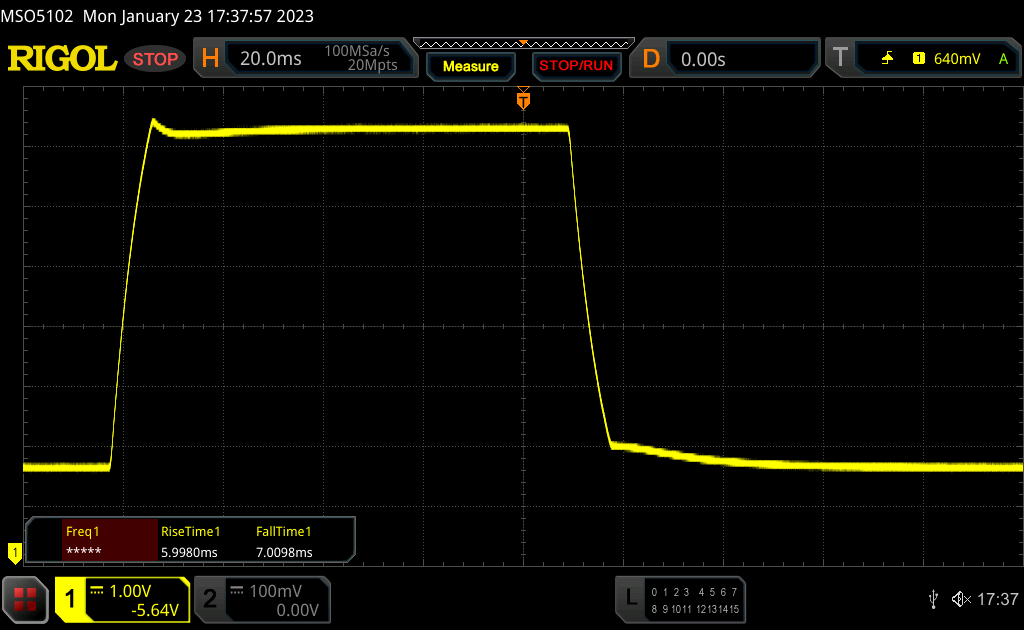 |
| ↘ 7 ms upadek | ||
| W naszych testach ekran wykazuje dobry współczynnik reakcji, ale może być zbyt wolny dla graczy rywalizujących ze sobą. Dla porównania, wszystkie testowane urządzenia wahają się od 0.165 (minimum) do 636 (maksimum) ms. » 26 % wszystkich urządzeń jest lepszych. Oznacza to, że zmierzony czas reakcji jest lepszy od średniej wszystkich testowanych urządzeń (31.1 ms). | ||
Migotanie ekranu / PWM (modulacja szerokości impulsu)
| Wykryto migotanie ekranu/wykryto PWM | 29896 Hz | ≤ 55 % ustawienia jasności |  |
Podświetlenie wyświetlacza miga z częstotliwością 29896 Hz (najgorszy przypadek, np. przy użyciu PWM) Wykryto migotanie przy ustawieniu jasności 55 % i poniżej. Powyżej tego ustawienia jasności nie powinno być żadnego migotania ani PWM. Częstotliwość 29896 Hz jest dość wysoka, więc większość użytkowników wrażliwych na PWM nie powinna zauważyć żadnego migotania. Dla porównania: 52 % wszystkich testowanych urządzeń nie używa PWM do przyciemniania wyświetlacza. Jeśli wykryto PWM, zmierzono średnio 7794 (minimum: 5 - maksimum: 343500) Hz. | |||
Błyszcząca powierzchnia ekranu nie jest idealna do użytku na zewnątrz, więc zasadniczo trzeba w miarę możliwości unikać odbić od źródeł światła. Tylko wtedy maksymalny poziom jasności jest wystarczający do komfortowego oglądania wyświetlanych treści. Stabilność kątów widzenia nie pozostawia miejsca na krytykę.

Wydajność - Alder Lake-U zapewnia znacznie większą moc
Warianty Intela nowego Surface Pro 9 dostępne są tylko z procesorami Alder Lake w klasie 15-watowej, są to Core i5 1235Ulub Core i7 1255U. Osoby wymagające 16 GB RAM lub 256 GB pamięci masowej będą musiały zdecydować się na wariant z i7. Maksymalnie możliwe jest 32 GB RAM i 1 TB SDD (2499,99 USD).
Warunki badania
Microsoft korzysta jedynie z ustawień zasilania systemu Windows, których nazwa różni się nieco od innych urządzeń z tym systemem(Recommended, Better Performance i Best Performance). Do benchmarków użyliśmy Best Performance, a do pomiarów energii wykorzystaliśmy domyślny tryb 60 Hz.
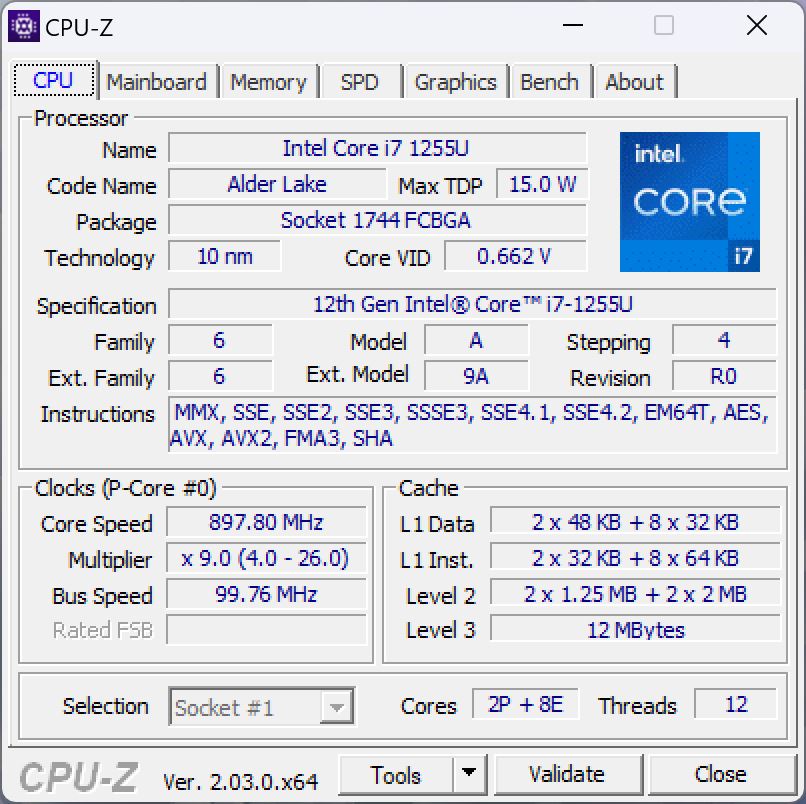
Procesor - Core i7-1255U
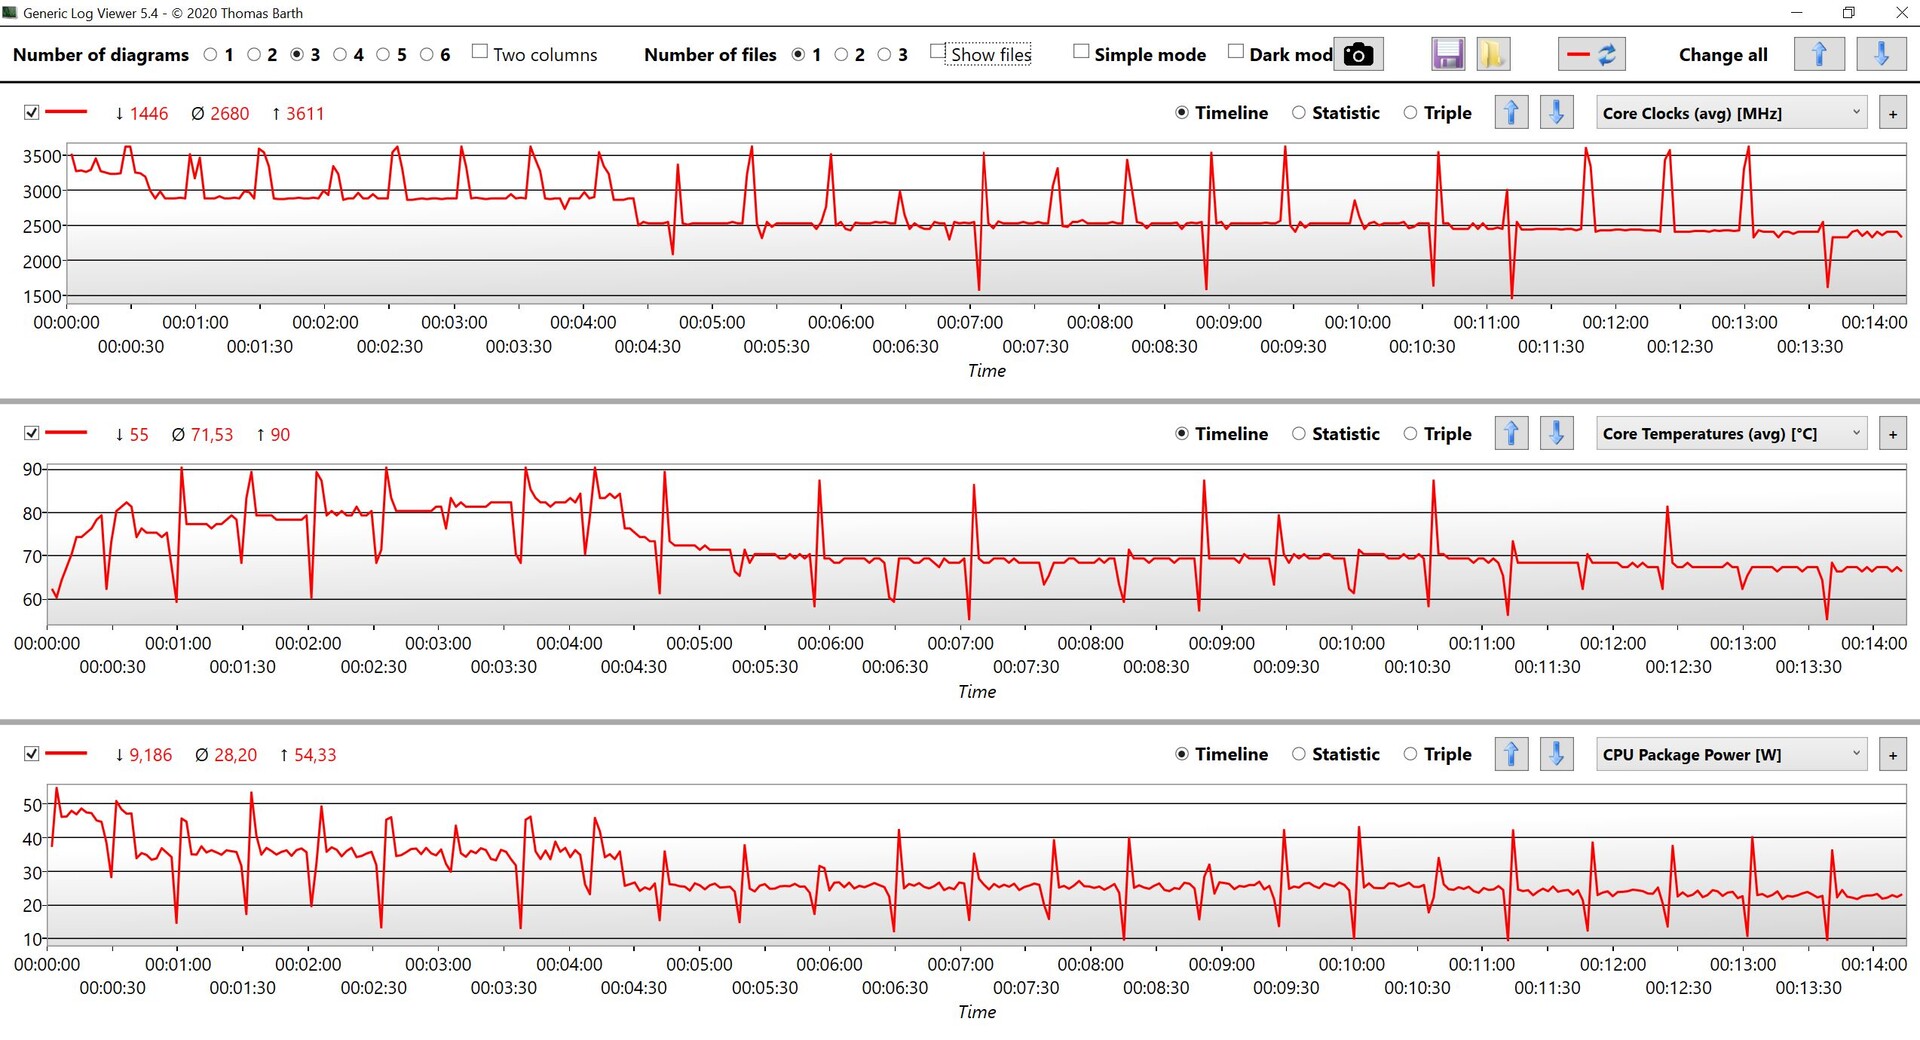
Na stronie Core i7 1255Unależy do obecnej generacji Alder Lake Intela i łączy dwa szybkie rdzenie wydajnościowe z 8 rdzeniami wydajnościowymi. Jest to w zasadzie 15-watowy procesor, ale Microsoft daje tu procesorowi wolną rękę i zaobserwowaliśmy maksymalne zużycie około 20 watów pod obciążeniem jednordzeniowym i do 54 watów pod obciążeniem wielordzeniowym, co również jest bliskie maksymalnej granicy procesorów Alder Lake-U określonej przez Intela. Oczywiście wartości te utrzymują się tylko przez bardzo krótki czas, ale Surface Pro 9 może utrzymać 35 watów pod stałym obciążeniem przez około 4,5 minuty, zanim spadnie do około 25 watów, a nawet dalej do 22 watów. Czy te wysokie wartości mają sens, to oczywiście inna kwestia, za nasza niedawna analiza procesorów Alder Lake-U wykazała, że układ Alder Lake-P (np Core i7 1260P) z dwoma dodatkowymi rdzeniami oferuje większą wydajność przy takich wartościach.
Cinebench R15 Multi Sustained Load
W testach CPU, Surface Pro 9 jest pokonany tylko przez.Asus ROG Flow Z13gamingowy kabriolet, który również wyposażony jest w Core i9 12900H.zarówno wydajność jednordzeniowa jak i wielordzeniowa jest znacznie lepsza niż w starym Surface Pro 8 z jego Core i7 1185G7. Dla porównania z Procesorem M2 w iPadzie Pro, zamieściliśmy wyniki MacBooka Air, ponieważ nie wszystkie benchmarki są obsługiwane na iPadzie. Apple M2 nie jest dość szybki, ale jest znacznie bardziej wydajny (~5 watów jednordzeniowo i ~20 watów wielordzeniowo).
W trybie akumulatorowym wydajność procesora jest nieco gorsza, gdyż limity mocy są obniżone do 45/30 W. W teście wielordzeniowym Cinebench R23 prowadzi to do spadku wydajności o niecałe 5%, ale wydajność jednordzeniowa nie jest gorsza. Więcej benchmarków CPU jest dostępnychtutaj.
Cinebench R23: Multi Core | Single Core
Cinebench R20: CPU (Multi Core) | CPU (Single Core)
Cinebench R15: CPU Multi 64Bit | CPU Single 64Bit
Blender: v2.79 BMW27 CPU
7-Zip 18.03: 7z b 4 | 7z b 4 -mmt1
Geekbench 5.5: Multi-Core | Single-Core
HWBOT x265 Benchmark v2.2: 4k Preset
LibreOffice : 20 Documents To PDF
R Benchmark 2.5: Overall mean
| CPU Performance rating | |
| Asus ROG Flow Z13 GZ301ZE | |
| Średnia w klasie Convertible | |
| Microsoft Surface Pro 9, i7-1255U | |
| Apple MacBook Air M2 10C GPU -5! | |
| HP Elite Dragonfly Folio 13.5 G3 | |
| Przeciętny Intel Core i7-1255U | |
| Dell XPS 13 9315 2-in-1 Core i5-1230U | |
| Microsoft Surface Pro 8, i7-1185G7 | |
| Lenovo ThinkPad X12 20UVS03G00 -1! | |
| Cinebench R23 / Multi Core | |
| Asus ROG Flow Z13 GZ301ZE | |
| Średnia w klasie Convertible (1317 - 30959, n=49, ostatnie 2 lata) | |
| Microsoft Surface Pro 9, i7-1255U | |
| Apple MacBook Air M2 10C GPU | |
| Przeciętny Intel Core i7-1255U (5269 - 9628, n=11) | |
| HP Elite Dragonfly Folio 13.5 G3 | |
| Dell XPS 13 9315 2-in-1 Core i5-1230U | |
| Microsoft Surface Pro 8, i7-1185G7 | |
| Lenovo ThinkPad X12 20UVS03G00 | |
| Cinebench R23 / Single Core | |
| Asus ROG Flow Z13 GZ301ZE | |
| Średnia w klasie Convertible (740 - 2188, n=49, ostatnie 2 lata) | |
| HP Elite Dragonfly Folio 13.5 G3 | |
| Microsoft Surface Pro 9, i7-1255U | |
| Przeciętny Intel Core i7-1255U (1408 - 1775, n=11) | |
| Apple MacBook Air M2 10C GPU | |
| Microsoft Surface Pro 8, i7-1185G7 | |
| Dell XPS 13 9315 2-in-1 Core i5-1230U | |
| Lenovo ThinkPad X12 20UVS03G00 | |
| Cinebench R20 / CPU (Multi Core) | |
| Asus ROG Flow Z13 GZ301ZE | |
| Średnia w klasie Convertible (595 - 12102, n=49, ostatnie 2 lata) | |
| Microsoft Surface Pro 9, i7-1255U | |
| Przeciętny Intel Core i7-1255U (2095 - 3702, n=11) | |
| HP Elite Dragonfly Folio 13.5 G3 | |
| Dell XPS 13 9315 2-in-1 Core i5-1230U | |
| Apple MacBook Air M2 10C GPU | |
| Microsoft Surface Pro 8, i7-1185G7 | |
| Lenovo ThinkPad X12 20UVS03G00 | |
| Cinebench R20 / CPU (Single Core) | |
| Asus ROG Flow Z13 GZ301ZE | |
| Średnia w klasie Convertible (273 - 834, n=49, ostatnie 2 lata) | |
| HP Elite Dragonfly Folio 13.5 G3 | |
| Microsoft Surface Pro 9, i7-1255U | |
| Przeciętny Intel Core i7-1255U (550 - 682, n=11) | |
| Dell XPS 13 9315 2-in-1 Core i5-1230U | |
| Microsoft Surface Pro 8, i7-1185G7 | |
| Lenovo ThinkPad X12 20UVS03G00 | |
| Apple MacBook Air M2 10C GPU | |
| Cinebench R15 / CPU Multi 64Bit | |
| Asus ROG Flow Z13 GZ301ZE | |
| Średnia w klasie Convertible (478 - 4940, n=48, ostatnie 2 lata) | |
| Microsoft Surface Pro 9, i7-1255U | |
| HP Elite Dragonfly Folio 13.5 G3 | |
| Przeciętny Intel Core i7-1255U (919 - 1577, n=11) | |
| Dell XPS 13 9315 2-in-1 Core i5-1230U | |
| Apple MacBook Air M2 10C GPU | |
| Microsoft Surface Pro 8, i7-1185G7 | |
| Lenovo ThinkPad X12 20UVS03G00 | |
| Cinebench R15 / CPU Single 64Bit | |
| Asus ROG Flow Z13 GZ301ZE | |
| Średnia w klasie Convertible (149.8 - 317, n=48, ostatnie 2 lata) | |
| HP Elite Dragonfly Folio 13.5 G3 | |
| Przeciętny Intel Core i7-1255U (161 - 251, n=12) | |
| Microsoft Surface Pro 8, i7-1185G7 | |
| Apple MacBook Air M2 10C GPU | |
| Microsoft Surface Pro 9, i7-1255U | |
| Dell XPS 13 9315 2-in-1 Core i5-1230U | |
| Lenovo ThinkPad X12 20UVS03G00 | |
| Blender / v2.79 BMW27 CPU | |
| Lenovo ThinkPad X12 20UVS03G00 | |
| Apple MacBook Air M2 10C GPU | |
| Microsoft Surface Pro 8, i7-1185G7 | |
| Dell XPS 13 9315 2-in-1 Core i5-1230U | |
| Przeciętny Intel Core i7-1255U (372 - 601, n=11) | |
| HP Elite Dragonfly Folio 13.5 G3 | |
| Microsoft Surface Pro 9, i7-1255U | |
| Średnia w klasie Convertible (105 - 1051, n=48, ostatnie 2 lata) | |
| Asus ROG Flow Z13 GZ301ZE | |
| 7-Zip 18.03 / 7z b 4 | |
| Asus ROG Flow Z13 GZ301ZE | |
| Średnia w klasie Convertible (12977 - 121368, n=48, ostatnie 2 lata) | |
| Microsoft Surface Pro 9, i7-1255U | |
| Dell XPS 13 9315 2-in-1 Core i5-1230U | |
| HP Elite Dragonfly Folio 13.5 G3 | |
| Przeciętny Intel Core i7-1255U (24126 - 37365, n=11) | |
| Microsoft Surface Pro 8, i7-1185G7 | |
| Lenovo ThinkPad X12 20UVS03G00 | |
| 7-Zip 18.03 / 7z b 4 -mmt1 | |
| Asus ROG Flow Z13 GZ301ZE | |
| Średnia w klasie Convertible (3672 - 6655, n=48, ostatnie 2 lata) | |
| Przeciętny Intel Core i7-1255U (5059 - 5529, n=11) | |
| HP Elite Dragonfly Folio 13.5 G3 | |
| Microsoft Surface Pro 8, i7-1185G7 | |
| Microsoft Surface Pro 9, i7-1255U | |
| Dell XPS 13 9315 2-in-1 Core i5-1230U | |
| Geekbench 5.5 / Multi-Core | |
| Asus ROG Flow Z13 GZ301ZE | |
| Średnia w klasie Convertible (1608 - 22023, n=48, ostatnie 2 lata) | |
| Apple MacBook Air M2 10C GPU | |
| Microsoft Surface Pro 9, i7-1255U | |
| HP Elite Dragonfly Folio 13.5 G3 | |
| Przeciętny Intel Core i7-1255U (4463 - 8821, n=12) | |
| Dell XPS 13 9315 2-in-1 Core i5-1230U | |
| Microsoft Surface Pro 8, i7-1185G7 | |
| Lenovo ThinkPad X12 20UVS03G00 | |
| Geekbench 5.5 / Single-Core | |
| Apple MacBook Air M2 10C GPU | |
| Asus ROG Flow Z13 GZ301ZE | |
| Średnia w klasie Convertible (806 - 2275, n=48, ostatnie 2 lata) | |
| Microsoft Surface Pro 9, i7-1255U | |
| HP Elite Dragonfly Folio 13.5 G3 | |
| Przeciętny Intel Core i7-1255U (1560 - 1712, n=12) | |
| Microsoft Surface Pro 8, i7-1185G7 | |
| Dell XPS 13 9315 2-in-1 Core i5-1230U | |
| Lenovo ThinkPad X12 20UVS03G00 | |
| HWBOT x265 Benchmark v2.2 / 4k Preset | |
| Asus ROG Flow Z13 GZ301ZE | |
| Średnia w klasie Convertible (3.43 - 36.2, n=48, ostatnie 2 lata) | |
| Microsoft Surface Pro 9, i7-1255U | |
| HP Elite Dragonfly Folio 13.5 G3 | |
| Przeciętny Intel Core i7-1255U (6.31 - 10.1, n=11) | |
| Dell XPS 13 9315 2-in-1 Core i5-1230U | |
| Microsoft Surface Pro 8, i7-1185G7 | |
| Lenovo ThinkPad X12 20UVS03G00 | |
| LibreOffice / 20 Documents To PDF | |
| Lenovo ThinkPad X12 20UVS03G00 | |
| Średnia w klasie Convertible (42.5 - 84.3, n=48, ostatnie 2 lata) | |
| Microsoft Surface Pro 9, i7-1255U | |
| Dell XPS 13 9315 2-in-1 Core i5-1230U | |
| Microsoft Surface Pro 8, i7-1185G7 | |
| HP Elite Dragonfly Folio 13.5 G3 | |
| Przeciętny Intel Core i7-1255U (35.6 - 52.5, n=11) | |
| Asus ROG Flow Z13 GZ301ZE | |
| R Benchmark 2.5 / Overall mean | |
| Lenovo ThinkPad X12 20UVS03G00 | |
| Microsoft Surface Pro 8, i7-1185G7 | |
| Dell XPS 13 9315 2-in-1 Core i5-1230U | |
| Microsoft Surface Pro 9, i7-1255U | |
| Przeciętny Intel Core i7-1255U (0.4688 - 0.558, n=11) | |
| Średnia w klasie Convertible (0.3915 - 0.84, n=48, ostatnie 2 lata) | |
| HP Elite Dragonfly Folio 13.5 G3 | |
| Asus ROG Flow Z13 GZ301ZE | |
* ... im mniej tym lepiej
AIDA64: FP32 Ray-Trace | FPU Julia | CPU SHA3 | CPU Queen | FPU SinJulia | FPU Mandel | CPU AES | CPU ZLib | FP64 Ray-Trace | CPU PhotoWorxx
| Performance rating | |
| Średnia w klasie Convertible | |
| Asus ROG Flow Z13 GZ301ZE | |
| Microsoft Surface Pro 9, i7-1255U | |
| HP Elite Dragonfly Folio 13.5 G3 | |
| Przeciętny Intel Core i7-1255U | |
| Microsoft Surface Pro 8, i7-1185G7 | |
| Dell XPS 13 9315 2-in-1 Core i5-1230U | |
| Lenovo ThinkPad X12 20UVS03G00 | |
| AIDA64 / FP32 Ray-Trace | |
| Średnia w klasie Convertible (1480 - 64158, n=48, ostatnie 2 lata) | |
| Microsoft Surface Pro 9, i7-1255U | |
| Asus ROG Flow Z13 GZ301ZE | |
| Microsoft Surface Pro 8, i7-1185G7 | |
| Przeciętny Intel Core i7-1255U (4313 - 8127, n=11) | |
| HP Elite Dragonfly Folio 13.5 G3 | |
| Dell XPS 13 9315 2-in-1 Core i5-1230U | |
| Lenovo ThinkPad X12 20UVS03G00 | |
| AIDA64 / FPU Julia | |
| Średnia w klasie Convertible (11392 - 184800, n=48, ostatnie 2 lata) | |
| Microsoft Surface Pro 9, i7-1255U | |
| Asus ROG Flow Z13 GZ301ZE | |
| HP Elite Dragonfly Folio 13.5 G3 | |
| Przeciętny Intel Core i7-1255U (19813 - 41353, n=11) | |
| Dell XPS 13 9315 2-in-1 Core i5-1230U | |
| Microsoft Surface Pro 8, i7-1185G7 | |
| Lenovo ThinkPad X12 20UVS03G00 | |
| AIDA64 / CPU SHA3 | |
| Średnia w klasie Convertible (797 - 8291, n=48, ostatnie 2 lata) | |
| Asus ROG Flow Z13 GZ301ZE | |
| Microsoft Surface Pro 9, i7-1255U | |
| Microsoft Surface Pro 8, i7-1185G7 | |
| Przeciętny Intel Core i7-1255U (1325 - 2135, n=11) | |
| HP Elite Dragonfly Folio 13.5 G3 | |
| Dell XPS 13 9315 2-in-1 Core i5-1230U | |
| Lenovo ThinkPad X12 20UVS03G00 | |
| AIDA64 / CPU Queen | |
| Asus ROG Flow Z13 GZ301ZE | |
| Microsoft Surface Pro 9, i7-1255U | |
| HP Elite Dragonfly Folio 13.5 G3 | |
| Przeciętny Intel Core i7-1255U (61375 - 65892, n=11) | |
| Średnia w klasie Convertible (14686 - 148874, n=41, ostatnie 2 lata) | |
| Dell XPS 13 9315 2-in-1 Core i5-1230U | |
| Microsoft Surface Pro 8, i7-1185G7 | |
| Lenovo ThinkPad X12 20UVS03G00 | |
| AIDA64 / FPU SinJulia | |
| Asus ROG Flow Z13 GZ301ZE | |
| Średnia w klasie Convertible (1120 - 29155, n=48, ostatnie 2 lata) | |
| Microsoft Surface Pro 9, i7-1255U | |
| Microsoft Surface Pro 8, i7-1185G7 | |
| Przeciętny Intel Core i7-1255U (3577 - 5095, n=11) | |
| HP Elite Dragonfly Folio 13.5 G3 | |
| Dell XPS 13 9315 2-in-1 Core i5-1230U | |
| Lenovo ThinkPad X12 20UVS03G00 | |
| AIDA64 / FPU Mandel | |
| Średnia w klasie Convertible (4929 - 97193, n=48, ostatnie 2 lata) | |
| Asus ROG Flow Z13 GZ301ZE | |
| Microsoft Surface Pro 9, i7-1255U | |
| Microsoft Surface Pro 8, i7-1185G7 | |
| HP Elite Dragonfly Folio 13.5 G3 | |
| Przeciętny Intel Core i7-1255U (11759 - 20187, n=11) | |
| Dell XPS 13 9315 2-in-1 Core i5-1230U | |
| Lenovo ThinkPad X12 20UVS03G00 | |
| AIDA64 / CPU AES | |
| Asus ROG Flow Z13 GZ301ZE | |
| Lenovo ThinkPad X12 20UVS03G00 | |
| Średnia w klasie Convertible (5271 - 190280, n=48, ostatnie 2 lata) | |
| Microsoft Surface Pro 9, i7-1255U | |
| Microsoft Surface Pro 8, i7-1185G7 | |
| Przeciętny Intel Core i7-1255U (27900 - 67458, n=11) | |
| HP Elite Dragonfly Folio 13.5 G3 | |
| Dell XPS 13 9315 2-in-1 Core i5-1230U | |
| AIDA64 / CPU ZLib | |
| Asus ROG Flow Z13 GZ301ZE | |
| Średnia w klasie Convertible (218 - 2017, n=48, ostatnie 2 lata) | |
| Microsoft Surface Pro 9, i7-1255U | |
| Przeciętny Intel Core i7-1255U (393 - 640, n=11) | |
| HP Elite Dragonfly Folio 13.5 G3 | |
| Dell XPS 13 9315 2-in-1 Core i5-1230U | |
| Microsoft Surface Pro 8, i7-1185G7 | |
| Lenovo ThinkPad X12 20UVS03G00 | |
| AIDA64 / FP64 Ray-Trace | |
| Średnia w klasie Convertible (1169 - 34297, n=48, ostatnie 2 lata) | |
| Asus ROG Flow Z13 GZ301ZE | |
| Microsoft Surface Pro 9, i7-1255U | |
| Microsoft Surface Pro 8, i7-1185G7 | |
| HP Elite Dragonfly Folio 13.5 G3 | |
| Przeciętny Intel Core i7-1255U (2474 - 4400, n=11) | |
| Dell XPS 13 9315 2-in-1 Core i5-1230U | |
| Lenovo ThinkPad X12 20UVS03G00 | |
| AIDA64 / CPU PhotoWorxx | |
| Średnia w klasie Convertible (14193 - 85327, n=48, ostatnie 2 lata) | |
| Microsoft Surface Pro 9, i7-1255U | |
| Asus ROG Flow Z13 GZ301ZE | |
| HP Elite Dragonfly Folio 13.5 G3 | |
| Microsoft Surface Pro 8, i7-1185G7 | |
| Lenovo ThinkPad X12 20UVS03G00 | |
| Dell XPS 13 9315 2-in-1 Core i5-1230U | |
| Przeciętny Intel Core i7-1255U (13899 - 44054, n=11) | |
Wydajność systemu
Subiektywna wydajność Surface Pro 9 jest bardzo dobra i wszystkie wejścia są realizowane bez opóźnień i zawieszeń. Niewątpliwie odpowiada za to dysk SSD PCIe. Wydajność w benchmarkach syntetycznych jest również bardzo dobra.
CrossMark: Overall | Productivity | Creativity | Responsiveness
Jetstream 2: 2.0 Total
Speedometer 2.0: Result 2.0
WebXPRT 3: Overall
WebXPRT 4: Overall
| PCMark 10 / Score | |
| Średnia w klasie Convertible (3229 - 10123, n=45, ostatnie 2 lata) | |
| Asus ROG Flow Z13 GZ301ZE | |
| HP Elite Dragonfly Folio 13.5 G3 | |
| Przeciętny Intel Core i7-1255U, Intel Iris Xe Graphics G7 96EUs (4676 - 5523, n=9) | |
| Microsoft Surface Pro 9, i7-1255U | |
| Microsoft Surface Pro 8, i7-1185G7 | |
| Dell XPS 13 9315 2-in-1 Core i5-1230U | |
| Lenovo ThinkPad X12 20UVS03G00 | |
| PCMark 10 / Essentials | |
| HP Elite Dragonfly Folio 13.5 G3 | |
| Asus ROG Flow Z13 GZ301ZE | |
| Średnia w klasie Convertible (7233 - 12222, n=45, ostatnie 2 lata) | |
| Przeciętny Intel Core i7-1255U, Intel Iris Xe Graphics G7 96EUs (9381 - 11654, n=9) | |
| Dell XPS 13 9315 2-in-1 Core i5-1230U | |
| Microsoft Surface Pro 9, i7-1255U | |
| Lenovo ThinkPad X12 20UVS03G00 | |
| Microsoft Surface Pro 8, i7-1185G7 | |
| PCMark 10 / Productivity | |
| Asus ROG Flow Z13 GZ301ZE | |
| Średnia w klasie Convertible (5062 - 17914, n=45, ostatnie 2 lata) | |
| HP Elite Dragonfly Folio 13.5 G3 | |
| Przeciętny Intel Core i7-1255U, Intel Iris Xe Graphics G7 96EUs (6530 - 7418, n=9) | |
| Dell XPS 13 9315 2-in-1 Core i5-1230U | |
| Microsoft Surface Pro 9, i7-1255U | |
| Microsoft Surface Pro 8, i7-1185G7 | |
| Lenovo ThinkPad X12 20UVS03G00 | |
| PCMark 10 / Digital Content Creation | |
| Średnia w klasie Convertible (2496 - 16551, n=45, ostatnie 2 lata) | |
| Asus ROG Flow Z13 GZ301ZE | |
| HP Elite Dragonfly Folio 13.5 G3 | |
| Microsoft Surface Pro 9, i7-1255U | |
| Przeciętny Intel Core i7-1255U, Intel Iris Xe Graphics G7 96EUs (4498 - 6203, n=9) | |
| Microsoft Surface Pro 8, i7-1185G7 | |
| Dell XPS 13 9315 2-in-1 Core i5-1230U | |
| Lenovo ThinkPad X12 20UVS03G00 | |
| CrossMark / Overall | |
| Asus ROG Flow Z13 GZ301ZE | |
| HP Elite Dragonfly Folio 13.5 G3 | |
| Apple iPad Pro 12.9 2022 | |
| Średnia w klasie Convertible (524 - 2274, n=49, ostatnie 2 lata) | |
| Microsoft Surface Pro 9, i7-1255U | |
| Przeciętny Intel Core i7-1255U, Intel Iris Xe Graphics G7 96EUs (1329 - 1573, n=9) | |
| Microsoft Surface Pro 8, i7-1185G7 | |
| Dell XPS 13 9315 2-in-1 Core i5-1230U | |
| CrossMark / Productivity | |
| Asus ROG Flow Z13 GZ301ZE | |
| HP Elite Dragonfly Folio 13.5 G3 | |
| Średnia w klasie Convertible (554 - 1942, n=49, ostatnie 2 lata) | |
| Microsoft Surface Pro 9, i7-1255U | |
| Przeciętny Intel Core i7-1255U, Intel Iris Xe Graphics G7 96EUs (1364 - 1554, n=9) | |
| Apple iPad Pro 12.9 2022 | |
| Microsoft Surface Pro 8, i7-1185G7 | |
| Dell XPS 13 9315 2-in-1 Core i5-1230U | |
| CrossMark / Creativity | |
| Asus ROG Flow Z13 GZ301ZE | |
| Apple iPad Pro 12.9 2022 | |
| Średnia w klasie Convertible (550 - 2949, n=49, ostatnie 2 lata) | |
| HP Elite Dragonfly Folio 13.5 G3 | |
| Microsoft Surface Pro 9, i7-1255U | |
| Przeciętny Intel Core i7-1255U, Intel Iris Xe Graphics G7 96EUs (1372 - 1660, n=9) | |
| Microsoft Surface Pro 8, i7-1185G7 | |
| Dell XPS 13 9315 2-in-1 Core i5-1230U | |
| CrossMark / Responsiveness | |
| Asus ROG Flow Z13 GZ301ZE | |
| HP Elite Dragonfly Folio 13.5 G3 | |
| Średnia w klasie Convertible (381 - 1719, n=49, ostatnie 2 lata) | |
| Microsoft Surface Pro 9, i7-1255U | |
| Przeciętny Intel Core i7-1255U, Intel Iris Xe Graphics G7 96EUs (1117 - 1434, n=9) | |
| Dell XPS 13 9315 2-in-1 Core i5-1230U | |
| Apple iPad Pro 12.9 2022 | |
| Microsoft Surface Pro 8, i7-1185G7 | |
| Jetstream 2 / 2.0 Total | |
| Średnia w klasie Convertible (127.2 - 454, n=16, ostatnie 2 lata) | |
| Microsoft Surface Pro 9, i7-1255U | |
| Przeciętny Intel Core i7-1255U, Intel Iris Xe Graphics G7 96EUs (206 - 249, n=7) | |
| Dell XPS 13 9315 2-in-1 Core i5-1230U | |
| Apple iPad Pro 12.9 2022 | |
| Asus ROG Flow Z13 GZ301ZE | |
| Microsoft Surface Pro 8, i7-1185G7 | |
| Lenovo ThinkPad X12 20UVS03G00 | |
| Speedometer 2.0 / Result 2.0 | |
| Średnia w klasie Convertible (168.2 - 644, n=13, ostatnie 2 lata) | |
| Apple iPad Pro 12.9 2022 | |
| Przeciętny Intel Core i7-1255U, Intel Iris Xe Graphics G7 96EUs (222 - 299, n=5) | |
| Microsoft Surface Pro 9, i7-1255U | |
| Microsoft Surface Pro 8, i7-1185G7 | |
| Asus ROG Flow Z13 GZ301ZE | |
| WebXPRT 3 / Overall | |
| Apple iPad Pro 12.9 2022 | |
| Asus ROG Flow Z13 GZ301ZE | |
| Średnia w klasie Convertible (171 - 426, n=49, ostatnie 2 lata) | |
| HP Elite Dragonfly Folio 13.5 G3 | |
| Przeciętny Intel Core i7-1255U, Intel Iris Xe Graphics G7 96EUs (200 - 366, n=9) | |
| Microsoft Surface Pro 9, i7-1255U | |
| Microsoft Surface Pro 8, i7-1185G7 | |
| Dell XPS 13 9315 2-in-1 Core i5-1230U | |
| Lenovo ThinkPad X12 20UVS03G00 | |
| WebXPRT 4 / Overall | |
| Średnia w klasie Convertible (91.2 - 317, n=48, ostatnie 2 lata) | |
| HP Elite Dragonfly Folio 13.5 G3 | |
| Przeciętny Intel Core i7-1255U, Intel Iris Xe Graphics G7 96EUs (183.4 - 249, n=9) | |
| Microsoft Surface Pro 9, i7-1255U | |
| Apple iPad Pro 12.9 2022 | |
| Dell XPS 13 9315 2-in-1 Core i5-1230U | |
| PCMark 10 Score | 5257 pkt. | |
Pomoc | ||
| AIDA64 / Memory Copy | |
| Średnia w klasie Convertible (23880 - 161475, n=48, ostatnie 2 lata) | |
| Asus ROG Flow Z13 GZ301ZE | |
| Microsoft Surface Pro 9, i7-1255U | |
| HP Elite Dragonfly Folio 13.5 G3 | |
| Dell XPS 13 9315 2-in-1 Core i5-1230U | |
| Microsoft Surface Pro 8, i7-1185G7 | |
| Lenovo ThinkPad X12 20UVS03G00 | |
| Przeciętny Intel Core i7-1255U (22846 - 67017, n=11) | |
| AIDA64 / Memory Read | |
| Średnia w klasie Convertible (19931 - 131960, n=48, ostatnie 2 lata) | |
| Asus ROG Flow Z13 GZ301ZE | |
| HP Elite Dragonfly Folio 13.5 G3 | |
| Microsoft Surface Pro 9, i7-1255U | |
| Microsoft Surface Pro 8, i7-1185G7 | |
| Lenovo ThinkPad X12 20UVS03G00 | |
| Dell XPS 13 9315 2-in-1 Core i5-1230U | |
| Przeciętny Intel Core i7-1255U (22877 - 67398, n=11) | |
| AIDA64 / Memory Write | |
| Średnia w klasie Convertible (17473 - 216896, n=48, ostatnie 2 lata) | |
| HP Elite Dragonfly Folio 13.5 G3 | |
| Dell XPS 13 9315 2-in-1 Core i5-1230U | |
| Asus ROG Flow Z13 GZ301ZE | |
| Microsoft Surface Pro 9, i7-1255U | |
| Lenovo ThinkPad X12 20UVS03G00 | |
| Microsoft Surface Pro 8, i7-1185G7 | |
| Przeciętny Intel Core i7-1255U (22883 - 65839, n=11) | |
| AIDA64 / Memory Latency | |
| Średnia w klasie Convertible (6.9 - 536, n=47, ostatnie 2 lata) | |
| HP Elite Dragonfly Folio 13.5 G3 | |
| Asus ROG Flow Z13 GZ301ZE | |
| Dell XPS 13 9315 2-in-1 Core i5-1230U | |
| Microsoft Surface Pro 9, i7-1255U | |
| Microsoft Surface Pro 8, i7-1185G7 | |
| Lenovo ThinkPad X12 20UVS03G00 | |
| Przeciętny Intel Core i7-1255U (76 - 163.2, n=11) | |
* ... im mniej tym lepiej
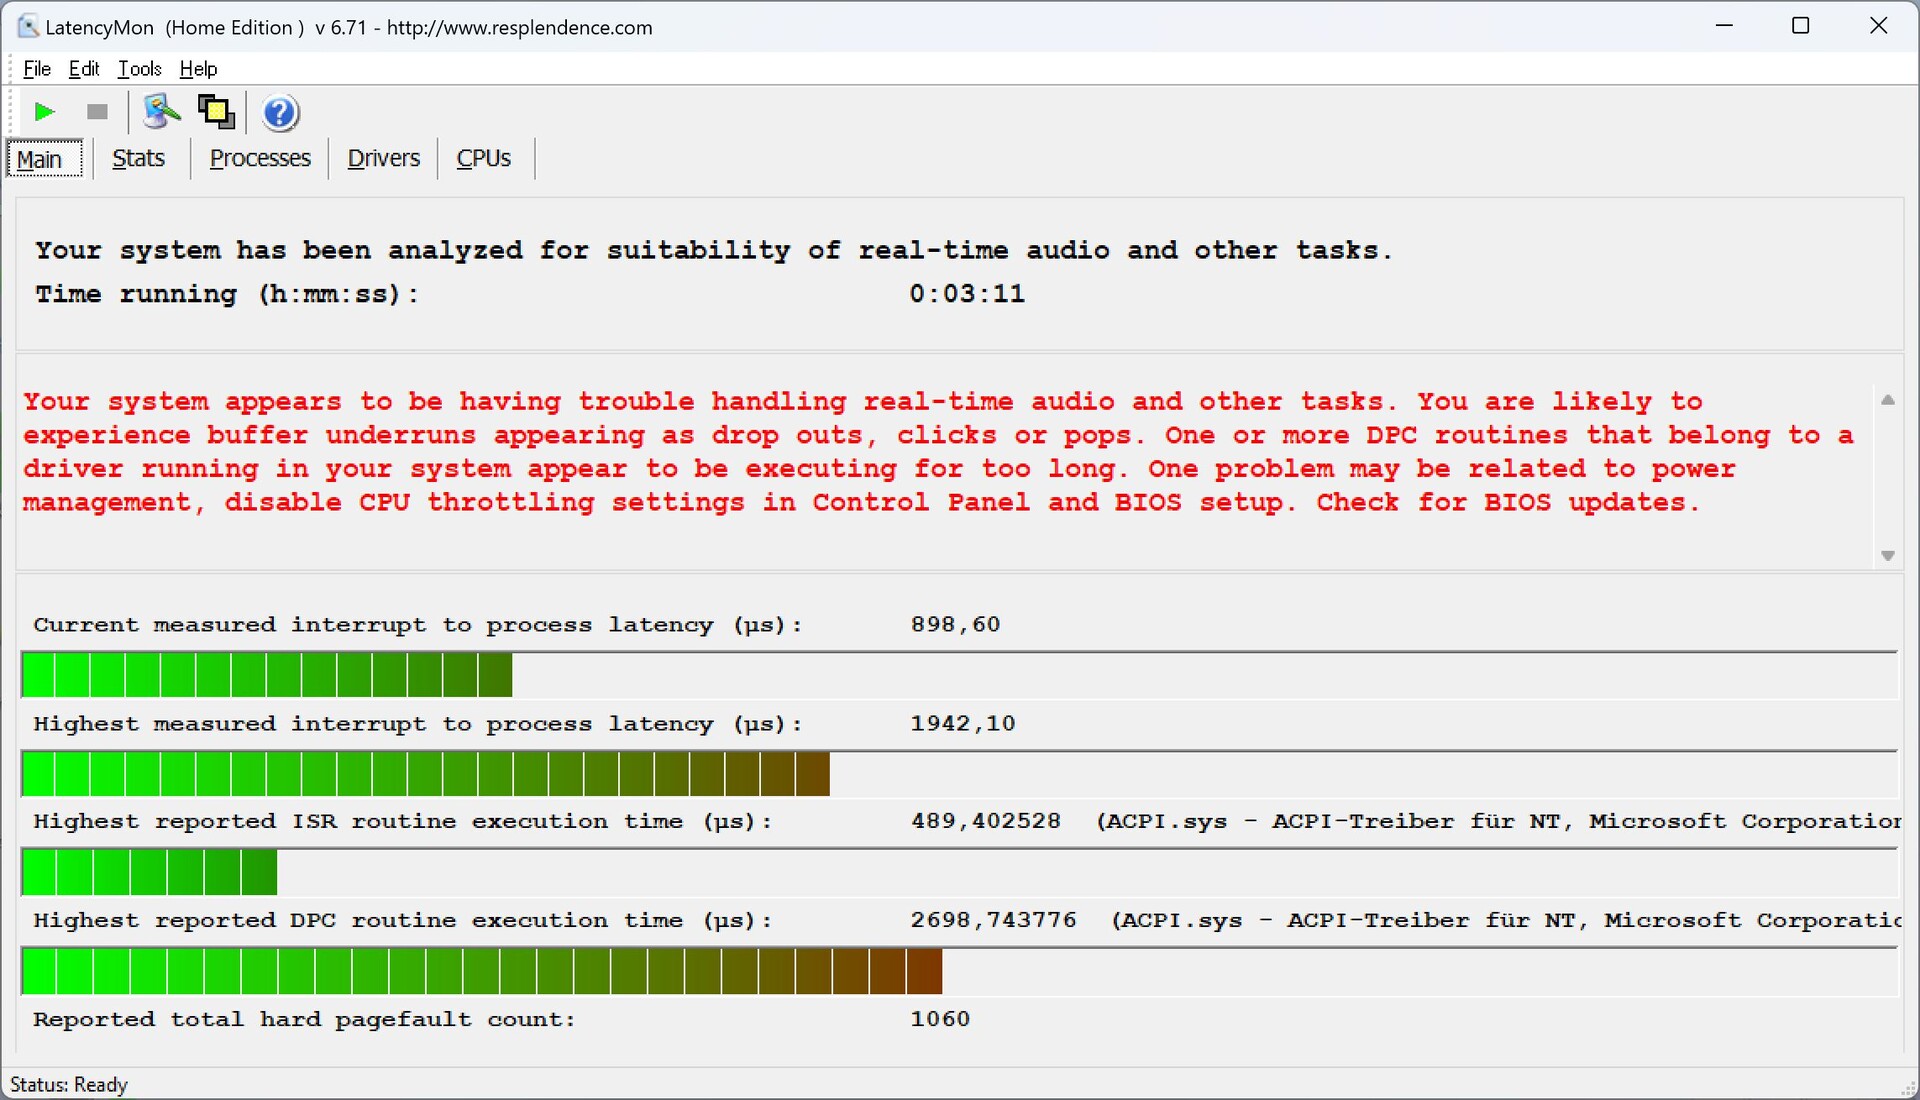
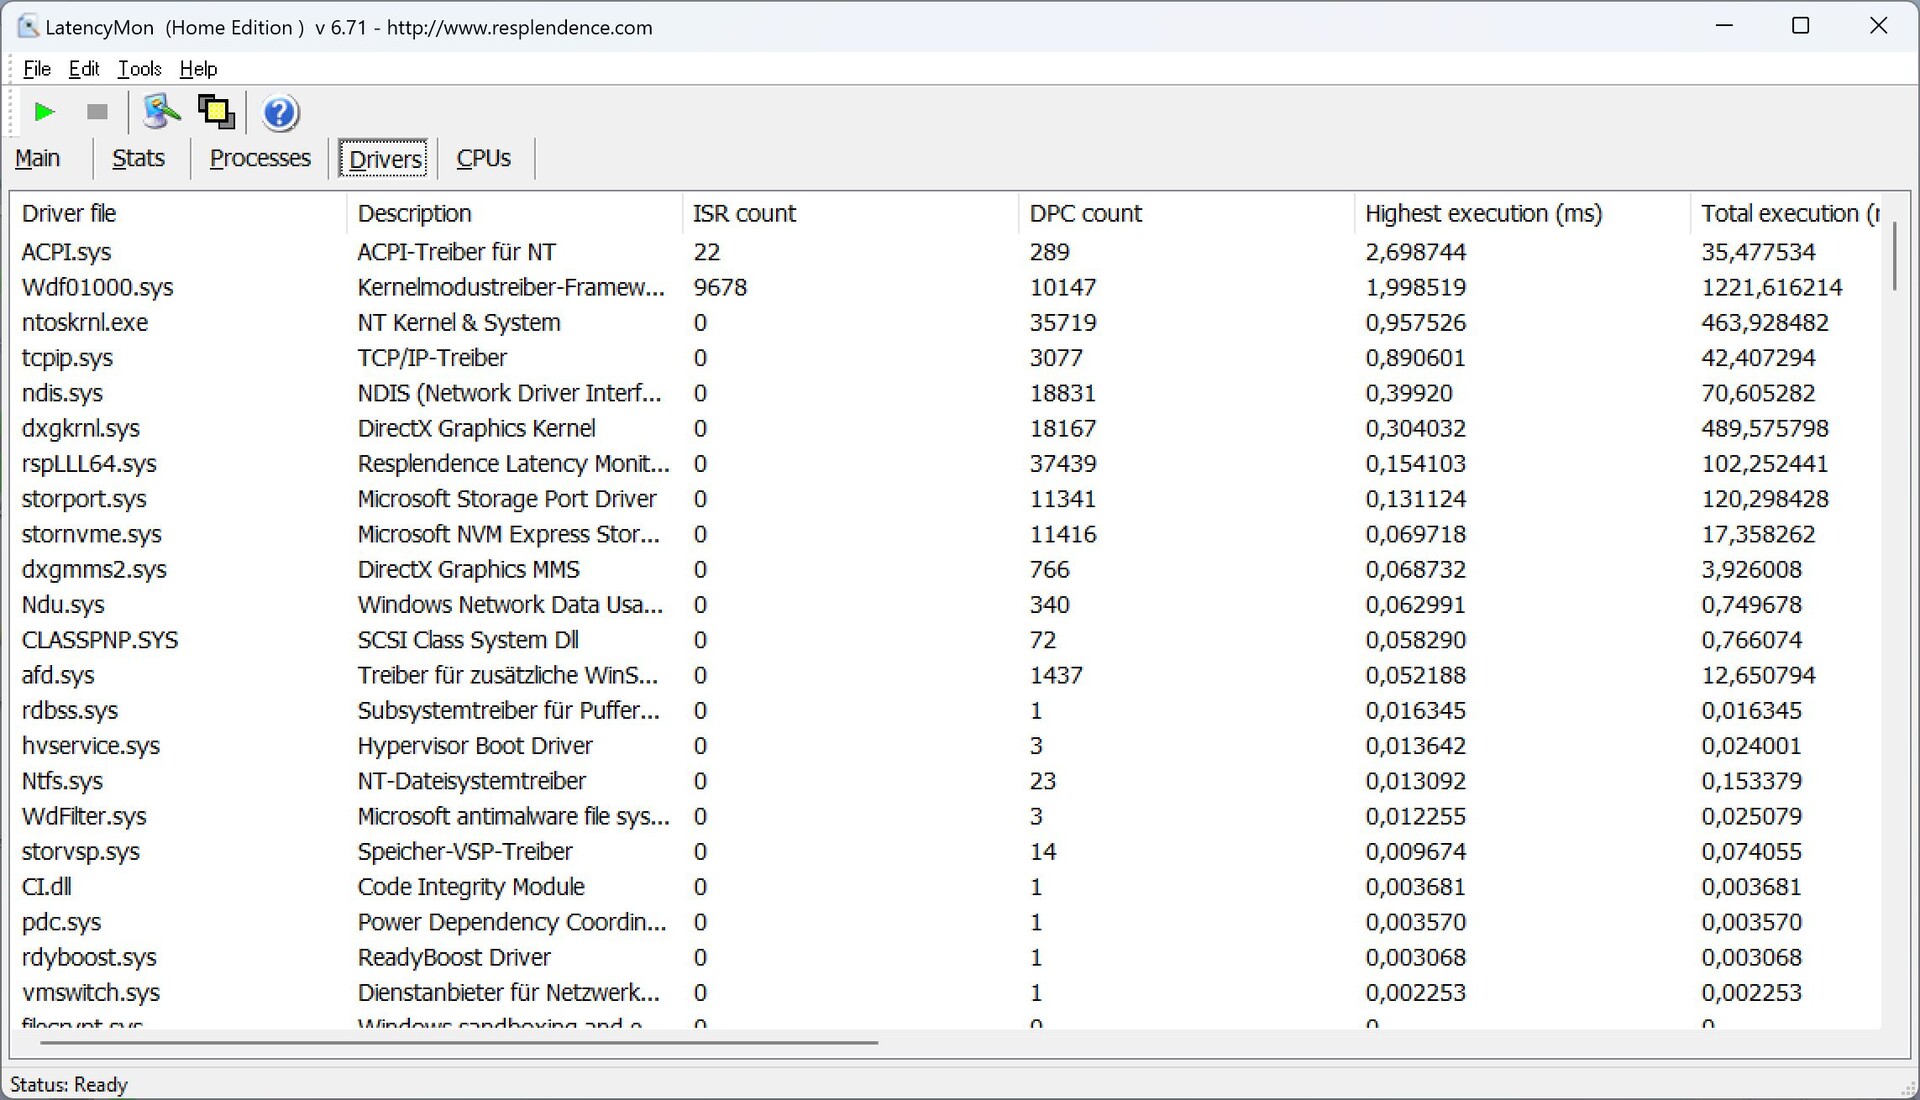
Opóźnienie DPC
W naszym standaryzowanym teście opóźnień (przeglądanie stron internetowych, odtwarzanie YouTube 4K, obciążenie procesora) nowy Surface Pro 9 z obecną wersją BIOS-u wypada gorzej niż jegopoprzednika więc tylko warunkowo nadaje się do zastosowań audio w czasie rzeczywistym.
| DPC Latencies / LatencyMon - interrupt to process latency (max), Web, Youtube, Prime95 | |
| HP Elite Dragonfly Folio 13.5 G3 | |
| Dell XPS 13 9315 2-in-1 Core i5-1230U | |
| Microsoft Surface Pro 9, i7-1255U | |
| Asus ROG Flow Z13 GZ301ZE | |
| Microsoft Surface Pro 8, i7-1185G7 | |
| Lenovo ThinkPad X12 20UVS03G00 | |
* ... im mniej tym lepiej
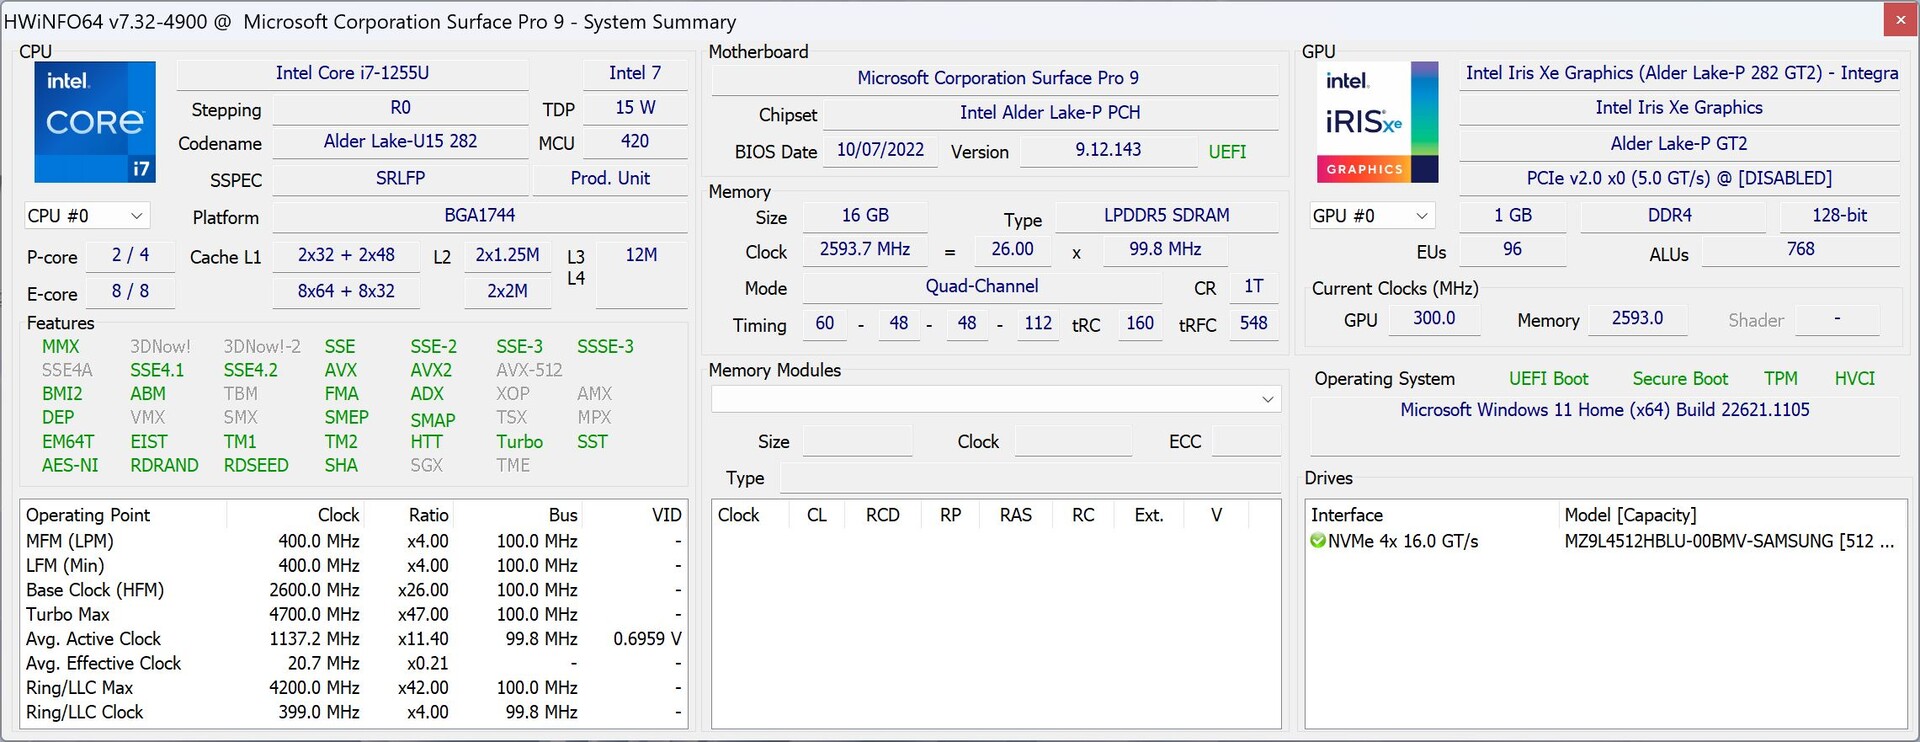
Urządzenia do przechowywania danych
Microsoft nadal stosuje kompaktowe dyski SSD M.2-2230, a urządzenia te mogą być również wymieniane przez użytkownika. W naszym egzemplarzu recenzenckim zastosowano dysk o pojemności 512 GB od Samsunga, który według Microsoft Tools wydaje się być podłączony przez PCIe 4.0. Maksymalny transfer jest jednak ograniczony do około 3,4 GB/s i nie wiemy dokładnie, czy przyczyną jest tu dysk SSD, czy Surface Pro. Potem znów nie odgrywa to większej roli w codziennym użytkowaniu i prędkość jest w zupełności wystarczająca. Z 512 GB po zainstalowaniu systemu operacyjnego pozostaje 429 GB. Więcej benchmarków SSD znajduje się wnaszym dziale "tech.

| Drive Performance rating - Percent | |
| HP Elite Dragonfly Folio 13.5 G3 -11! | |
| Asus ROG Flow Z13 GZ301ZE | |
| Średnia w klasie Convertible | |
| Przeciętny Samsung MZ9L4512HBLU-00BMV | |
| Microsoft Surface Pro 9, i7-1255U | |
| Microsoft Surface Pro 8, i7-1185G7 | |
| Dell XPS 13 9315 2-in-1 Core i5-1230U | |
| Lenovo ThinkPad X12 20UVS03G00 | |
* ... im mniej tym lepiej
Dauerleistung Lesen: DiskSpd Read Loop, Queue Depth 8
Karta graficzna
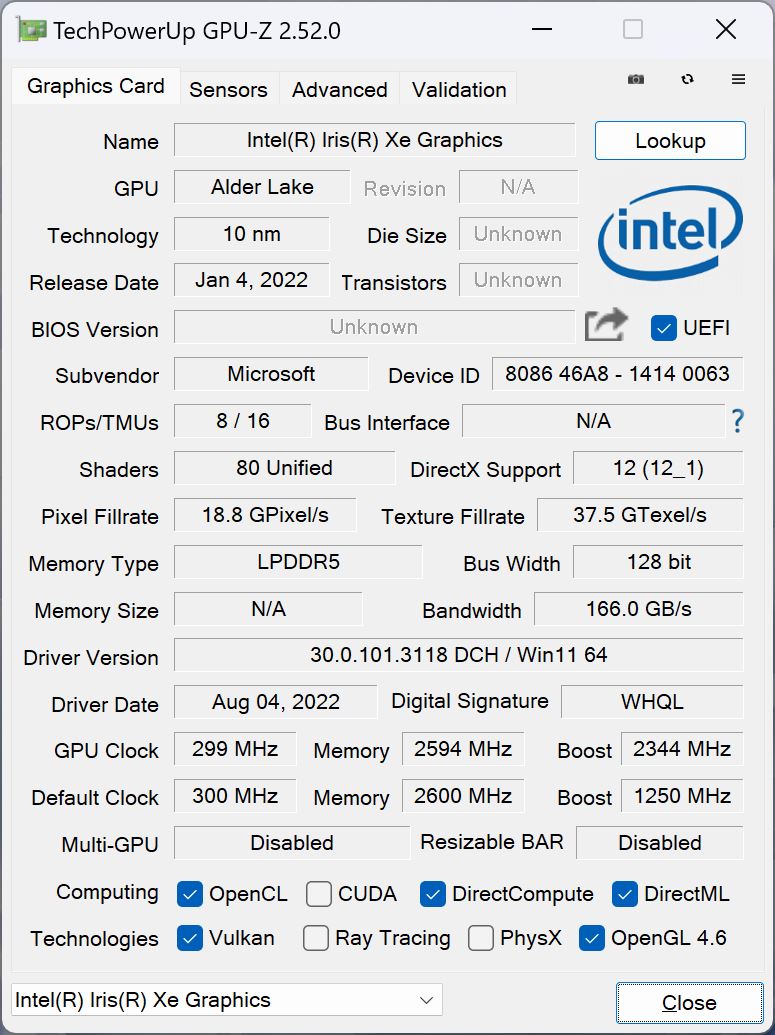
Procesory Intel Alder Lake nadal są wyposażone w dobrze znanyIris Xe Graphics G7. W połączeniu z Core i5 1235U zastosowano układ z 80 jednostkami wykonawczymi; w naszym samplu recenzenckim z Core i7 mamy szybszy układ z 96 EU. Pod względem wydajności nie ma różnic względem starego modelu, a zintegrowane GPU od AMD i Apple są wyraźnie szybsze (choć obecnie praktycznie nie ma porównywalnych konwertorów/tabletów ze sprzętem AMD).
Wydajność jest w zupełności wystarczająca do codziennych zastosowań, a filmy w wysokiej rozdzielczości również uruchamiają się bez problemu, ale gry zazwyczaj ograniczają się do minimalnych lub średnich detali i zmniejszonych rozdzielczości. Ci, którzy są zapalonymi graczami, mogą podłączyć zewnętrzny procesor graficzny lub powinni przyjrzeć się modelowiROG Flow Z13który oferuje większą wydajność w grach dzięki RTX 3050.
Przynajmniej wydajność GPU pozostaje stabilna podczas długich sesji gier. Na zasilaniu bateryjnym wydajność spada jednak o około 75%. Więcej benchmarków GPU jest dostępnychtutaj.
| 3DMark Performance rating - Percent | |
| Apple iPad Pro 12.9 2022 -3! | |
| Asus ROG Flow Z13 GZ301ZE -2! | |
| Średnia w klasie Convertible | |
| Microsoft Surface Pro 9, i7-1255U | |
| Microsoft Surface Pro 8, i7-1185G7 -2! | |
| Przeciętny Intel Iris Xe Graphics G7 96EUs | |
| HP Elite Dragonfly Folio 13.5 G3 -2! | |
| Lenovo ThinkPad X12 20UVS03G00 -2! | |
| Dell XPS 13 9315 2-in-1 Core i5-1230U -2! | |
| 3DMark 11 - 1280x720 Performance GPU | |
| Asus ROG Flow Z13 GZ301ZE | |
| Średnia w klasie Convertible (1505 - 40732, n=48, ostatnie 2 lata) | |
| Microsoft Surface Pro 8, i7-1185G7 | |
| Przeciętny Intel Iris Xe Graphics G7 96EUs (2867 - 7676, n=209) | |
| Microsoft Surface Pro 9, i7-1255U | |
| HP Elite Dragonfly Folio 13.5 G3 | |
| Lenovo ThinkPad X12 20UVS03G00 | |
| Dell XPS 13 9315 2-in-1 Core i5-1230U | |
| 3DMark 11 Performance | 6903 pkt. | |
| 3DMark Fire Strike Score | 4873 pkt. | |
| 3DMark Time Spy Score | 1821 pkt. | |
Pomoc | ||
* ... im mniej tym lepiej
| Performance rating - Percent | |
| Asus ROG Flow Z13 GZ301ZE | |
| Średnia w klasie Convertible | |
| Microsoft Surface Pro 8, i7-1185G7 | |
| HP Elite Dragonfly Folio 13.5 G3 | |
| Microsoft Surface Pro 9, i7-1255U | |
| Lenovo ThinkPad X12 20UVS03G00 -4! | |
| Dell XPS 13 9315 2-in-1 Core i5-1230U -2! | |
| The Witcher 3 - 1920x1080 Ultra Graphics & Postprocessing (HBAO+) | |
| Asus ROG Flow Z13 GZ301ZE | |
| Średnia w klasie Convertible (11 - 101, n=6, ostatnie 2 lata) | |
| Microsoft Surface Pro 8, i7-1185G7 | |
| HP Elite Dragonfly Folio 13.5 G3 | |
| Microsoft Surface Pro 9, i7-1255U | |
| Dell XPS 13 9315 2-in-1 Core i5-1230U | |
| GTA V - 1920x1080 Highest AA:4xMSAA + FX AF:16x | |
| Asus ROG Flow Z13 GZ301ZE | |
| Średnia w klasie Convertible (7.14 - 90.6, n=40, ostatnie 2 lata) | |
| Microsoft Surface Pro 8, i7-1185G7 | |
| Microsoft Surface Pro 9, i7-1255U | |
| HP Elite Dragonfly Folio 13.5 G3 | |
| Dell XPS 13 9315 2-in-1 Core i5-1230U | |
| Final Fantasy XV Benchmark - 1920x1080 High Quality | |
| Asus ROG Flow Z13 GZ301ZE | |
| Microsoft Surface Pro 8, i7-1185G7 | |
| Średnia w klasie Convertible (4.48 - 86.6, n=45, ostatnie 2 lata) | |
| Microsoft Surface Pro 9, i7-1255U | |
| HP Elite Dragonfly Folio 13.5 G3 | |
| Strange Brigade - 1920x1080 ultra AA:ultra AF:16 | |
| Asus ROG Flow Z13 GZ301ZE | |
| Średnia w klasie Convertible (10.8 - 176.8, n=44, ostatnie 2 lata) | |
| Microsoft Surface Pro 8, i7-1185G7 | |
| Microsoft Surface Pro 9, i7-1255U | |
| HP Elite Dragonfly Folio 13.5 G3 | |
| Dota 2 Reborn - 1920x1080 ultra (3/3) best looking | |
| Asus ROG Flow Z13 GZ301ZE | |
| Średnia w klasie Convertible (18.8 - 142, n=49, ostatnie 2 lata) | |
| Microsoft Surface Pro 9, i7-1255U | |
| Microsoft Surface Pro 8, i7-1185G7 | |
| HP Elite Dragonfly Folio 13.5 G3 | |
| Dell XPS 13 9315 2-in-1 Core i5-1230U | |
| Lenovo ThinkPad X12 20UVS03G00 | |
| X-Plane 11.11 - 1920x1080 high (fps_test=3) | |
| Asus ROG Flow Z13 GZ301ZE | |
| HP Elite Dragonfly Folio 13.5 G3 | |
| Średnia w klasie Convertible (12.8 - 76.7, n=47, ostatnie 2 lata) | |
| Microsoft Surface Pro 9, i7-1255U | |
| Microsoft Surface Pro 8, i7-1185G7 | |
| Dell XPS 13 9315 2-in-1 Core i5-1230U | |
| Lenovo ThinkPad X12 20UVS03G00 | |
Witcher 3 FPS Chart
| low | med. | high | ultra | |
|---|---|---|---|---|
| GTA V (2015) | 104.3 | 93.1 | 24.7 | 10.6 |
| The Witcher 3 (2015) | 91 | 59 | 33 | 12.8 |
| Dota 2 Reborn (2015) | 104.2 | 82.2 | 64.8 | 57 |
| Final Fantasy XV Benchmark (2018) | 42.9 | 24.2 | 16.8 | |
| X-Plane 11.11 (2018) | 46.3 | 36.6 | 31.6 | |
| Far Cry 5 (2018) | 28 | 24 | 20 | |
| Strange Brigade (2018) | 88.9 | 41.7 | 32.5 | 26.2 |
| F1 2021 (2021) | 107.8 | 51.6 | 40.6 | 27.8 |
| Farming Simulator 22 (2021) | 81 | 37 | 28 | 26 |
| F1 22 (2022) | 47.4 | 43.5 | 30.7 |
Emisje - Szybszy procesor prowadzi do większej aktywności wentylatora
Hałas
Wentylator w Surface Pro 9 jest porównywalny ze starym Surface Pro 8 na maksymalnych obrotach i osiąga prawie 42 dB(A) przy pełnym obciążeniu. Mały wentylator jest wyraźnie słyszalny, ale bardziej problematyczne jest to, że w codziennym użytkowaniu wentylator kopie częściej ze względu na wysokie limity mocy. Do prostych zadań należy więc wybrać słabszy tryb energetyczny, wtedy w zwykłym użytkowaniu kabriolet pozostaje dłużej cichy. Nie wykryto żadnych innych elektronicznych odgłosów. Zarówno w przypadku XPS 13 9315 oraz iPad Promają tu oczywiście wyraźną przewagę, gdyż są chłodzone pasywnie, a więc pozostają bezgłośne.
Hałas
| luz |
| 24.3 / 24.3 / 24.3 dB |
| obciążenie |
| 37.9 / 41.8 dB |
 | ||
30 dB cichy 40 dB(A) słyszalny 50 dB(A) irytujący |
||
min: | ||
| Microsoft Surface Pro 9, i7-1255U Iris Xe G7 96EUs, i7-1255U, Samsung MZ9L4512HBLU-00BMV | Dell XPS 13 9315 2-in-1 Core i5-1230U Iris Xe G7 80EUs, i5-1230U | Lenovo ThinkPad X12 20UVS03G00 Iris Xe G7 96EUs, i7-1160G7, Toshiba BG4 KBG40ZNT512G | HP Elite Dragonfly Folio 13.5 G3 Iris Xe G7 96EUs, i7-1265U, Samsung PM9A1 MZVL2512HCJQ | Apple iPad Pro 12.9 2022 M2 10-Core GPU, M2, 128 GB NVMe | Asus ROG Flow Z13 GZ301ZE GeForce RTX 3050 Ti Laptop GPU, i9-12900H, Micron 2450 1TB MTFDKBK1T0TFK | Microsoft Surface Pro 8, i7-1185G7 Iris Xe G7 96EUs, i7-1185G7, Toshiba KBG40ZNS256G NVMe | |
|---|---|---|---|---|---|---|---|
| Noise | 2% | 8% | -2% | -0% | |||
| wyłączone / środowisko * (dB) | 24.3 | 25.1 -3% | 24.6 -1% | 24.5 -1% | 24.7 -2% | ||
| Idle Minimum * (dB) | 24.3 | 25.1 -3% | 24.6 -1% | 24.5 -1% | 24.7 -2% | ||
| Idle Average * (dB) | 24.3 | 25.1 -3% | 24.6 -1% | 24.5 -1% | 24.7 -2% | ||
| Idle Maximum * (dB) | 24.3 | 26 -7% | 24.6 -1% | 24.5 -1% | 24.7 -2% | ||
| Load Average * (dB) | 37.9 | 34.6 9% | 27.8 27% | 41 -8% | 36.8 3% | ||
| Witcher 3 ultra * (dB) | 39.6 | 34.6 13% | 33.4 16% | 41 -4% | 36.8 7% | ||
| Load Maximum * (dB) | 41.8 | 37 11% | 33.4 20% | 41 2% | 43.8 -5% |
* ... im mniej tym lepiej
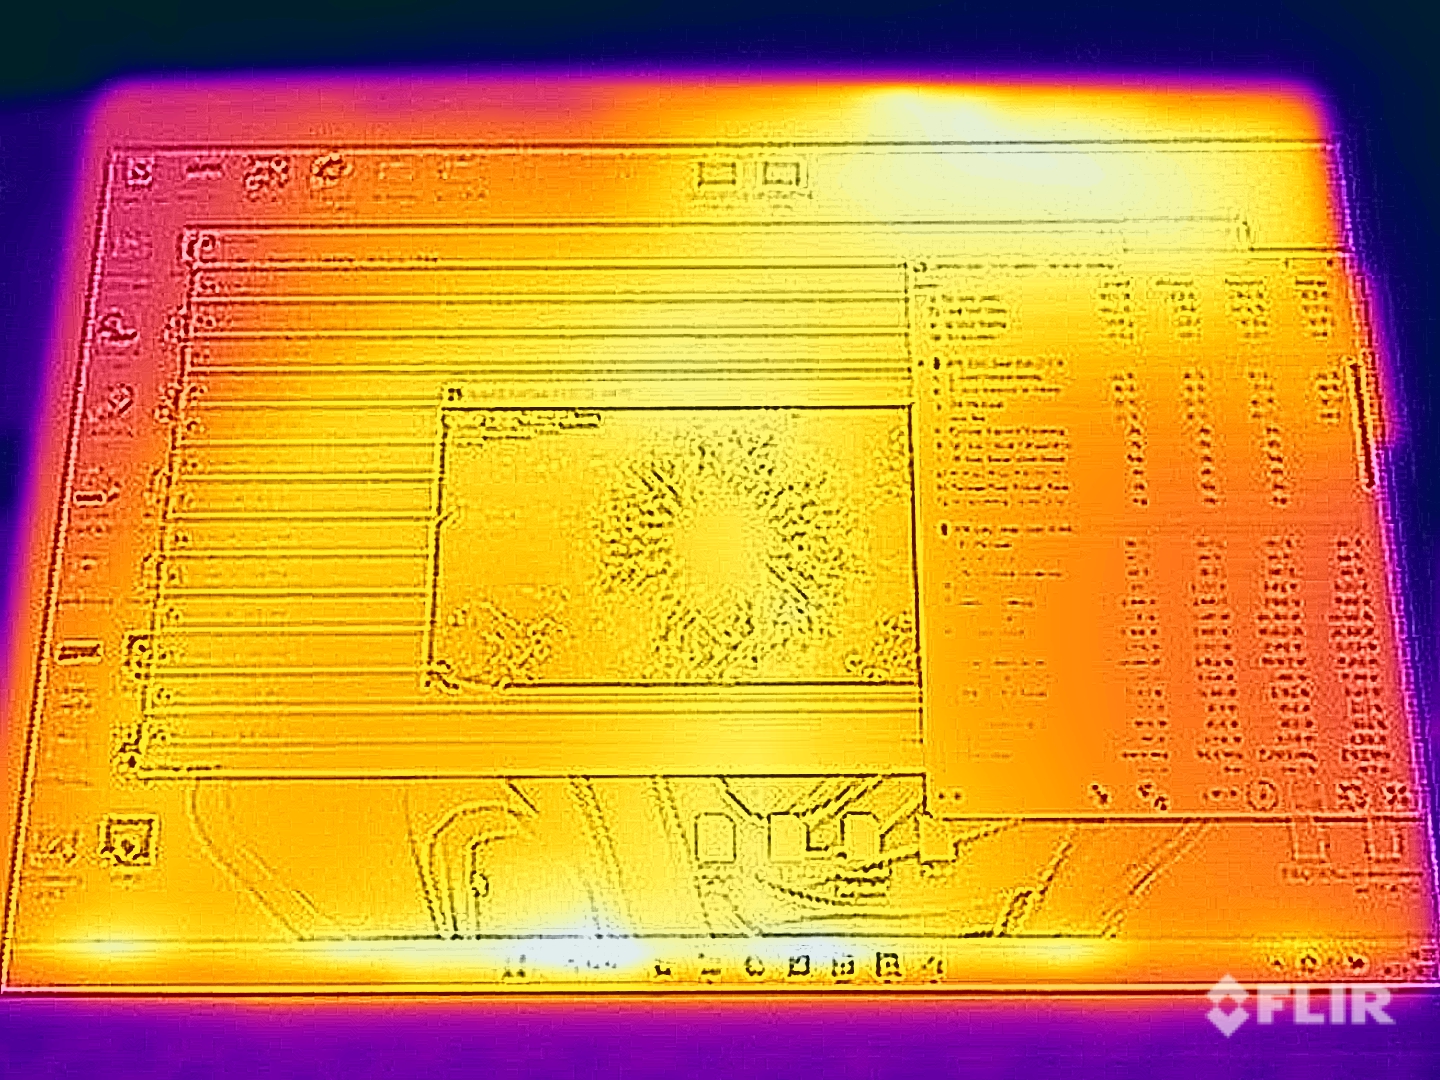
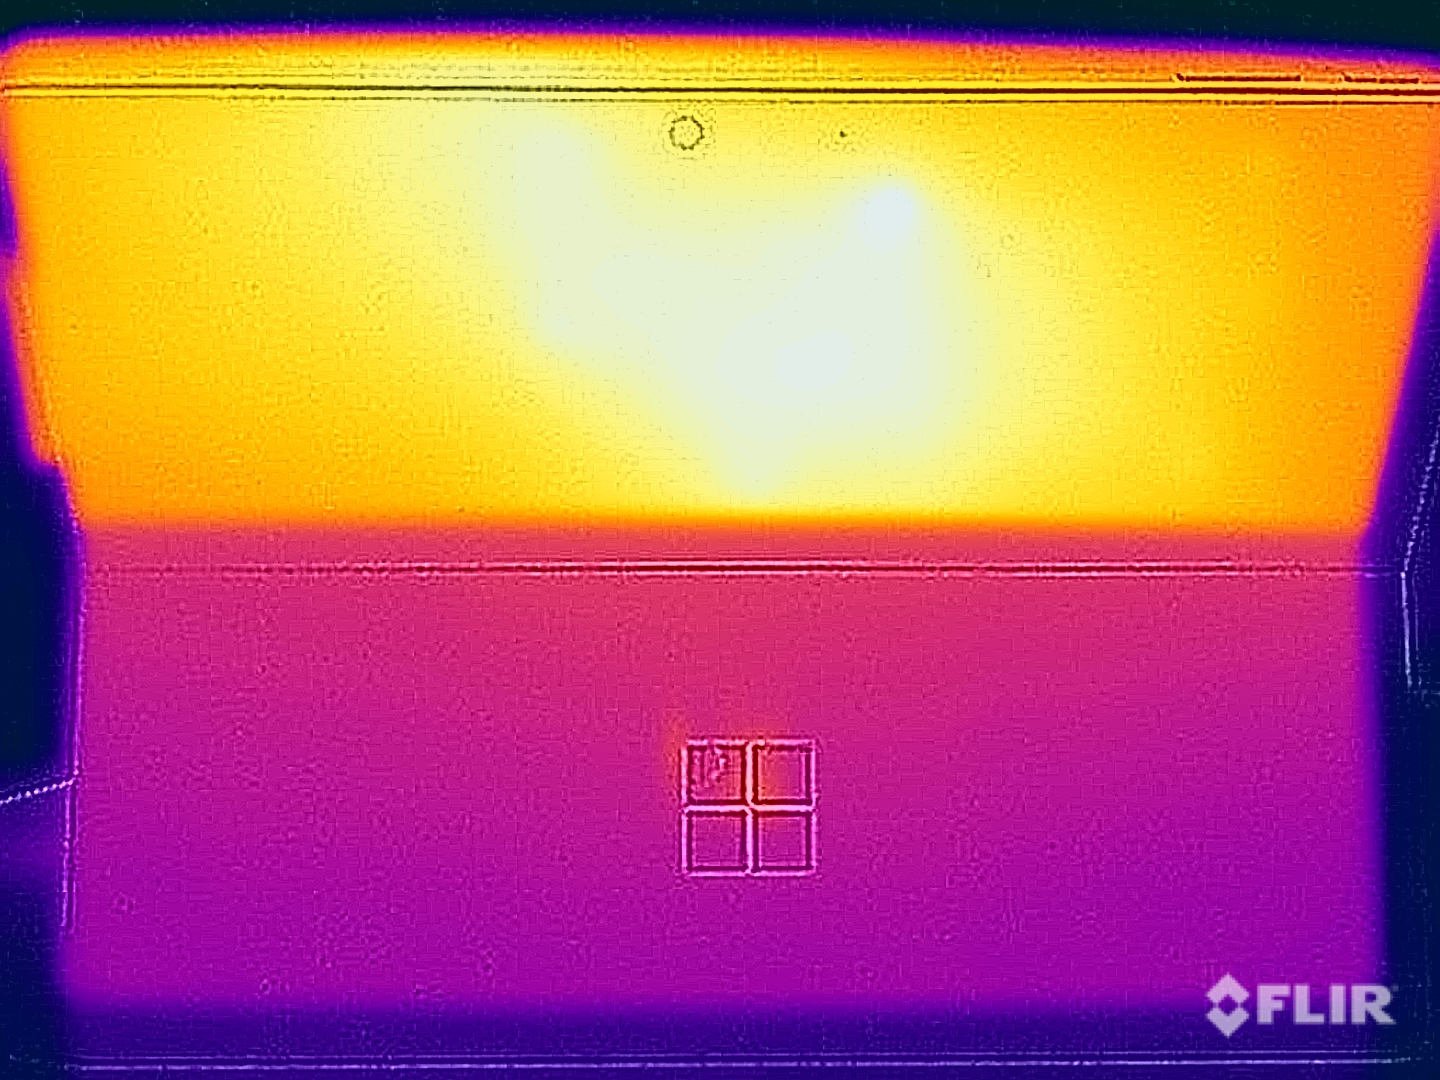
Temperatura
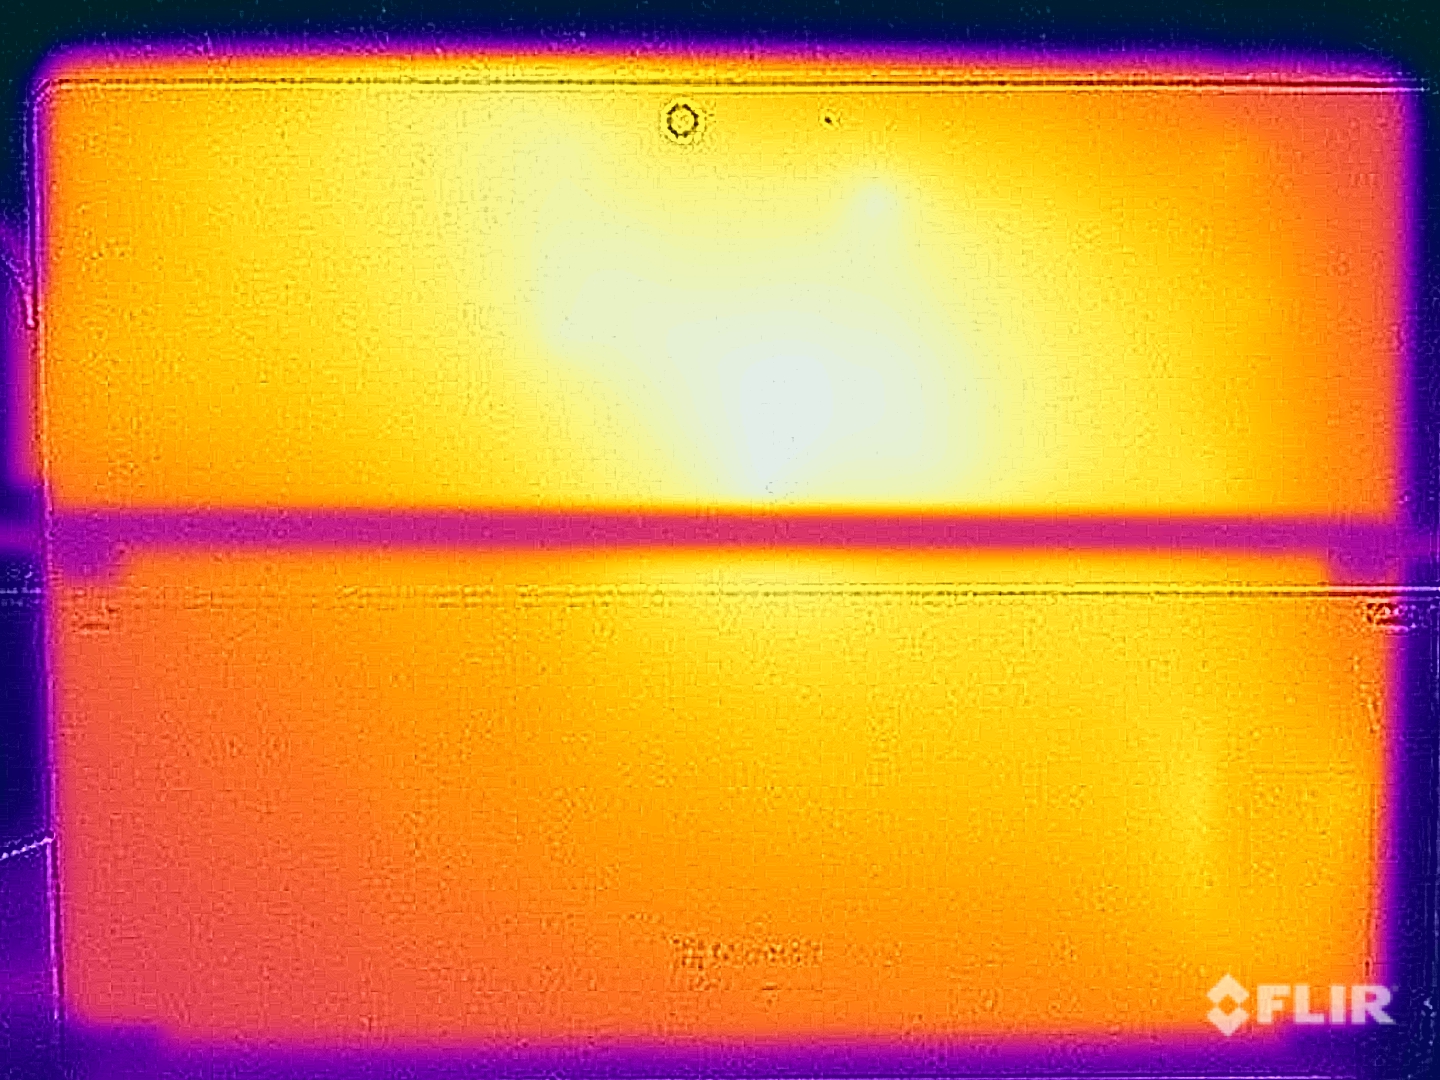
Metalowa obudowa Surface Pro 9 prawie nie nagrzewa się w codziennym użytkowaniu i podczas lekkich zadań, ale pod dużym obciążeniem (np. dużym obciążeniem procesora lub podczas grania) zmierzyliśmy na plecach ponad 45°C. Ze względu na metalową powierzchnię jest to nieprzyjemne uczucie i nie należy w takich sytuacjach trzymać urządzenia w rękach, a raczej postawić je na udach lub stole.
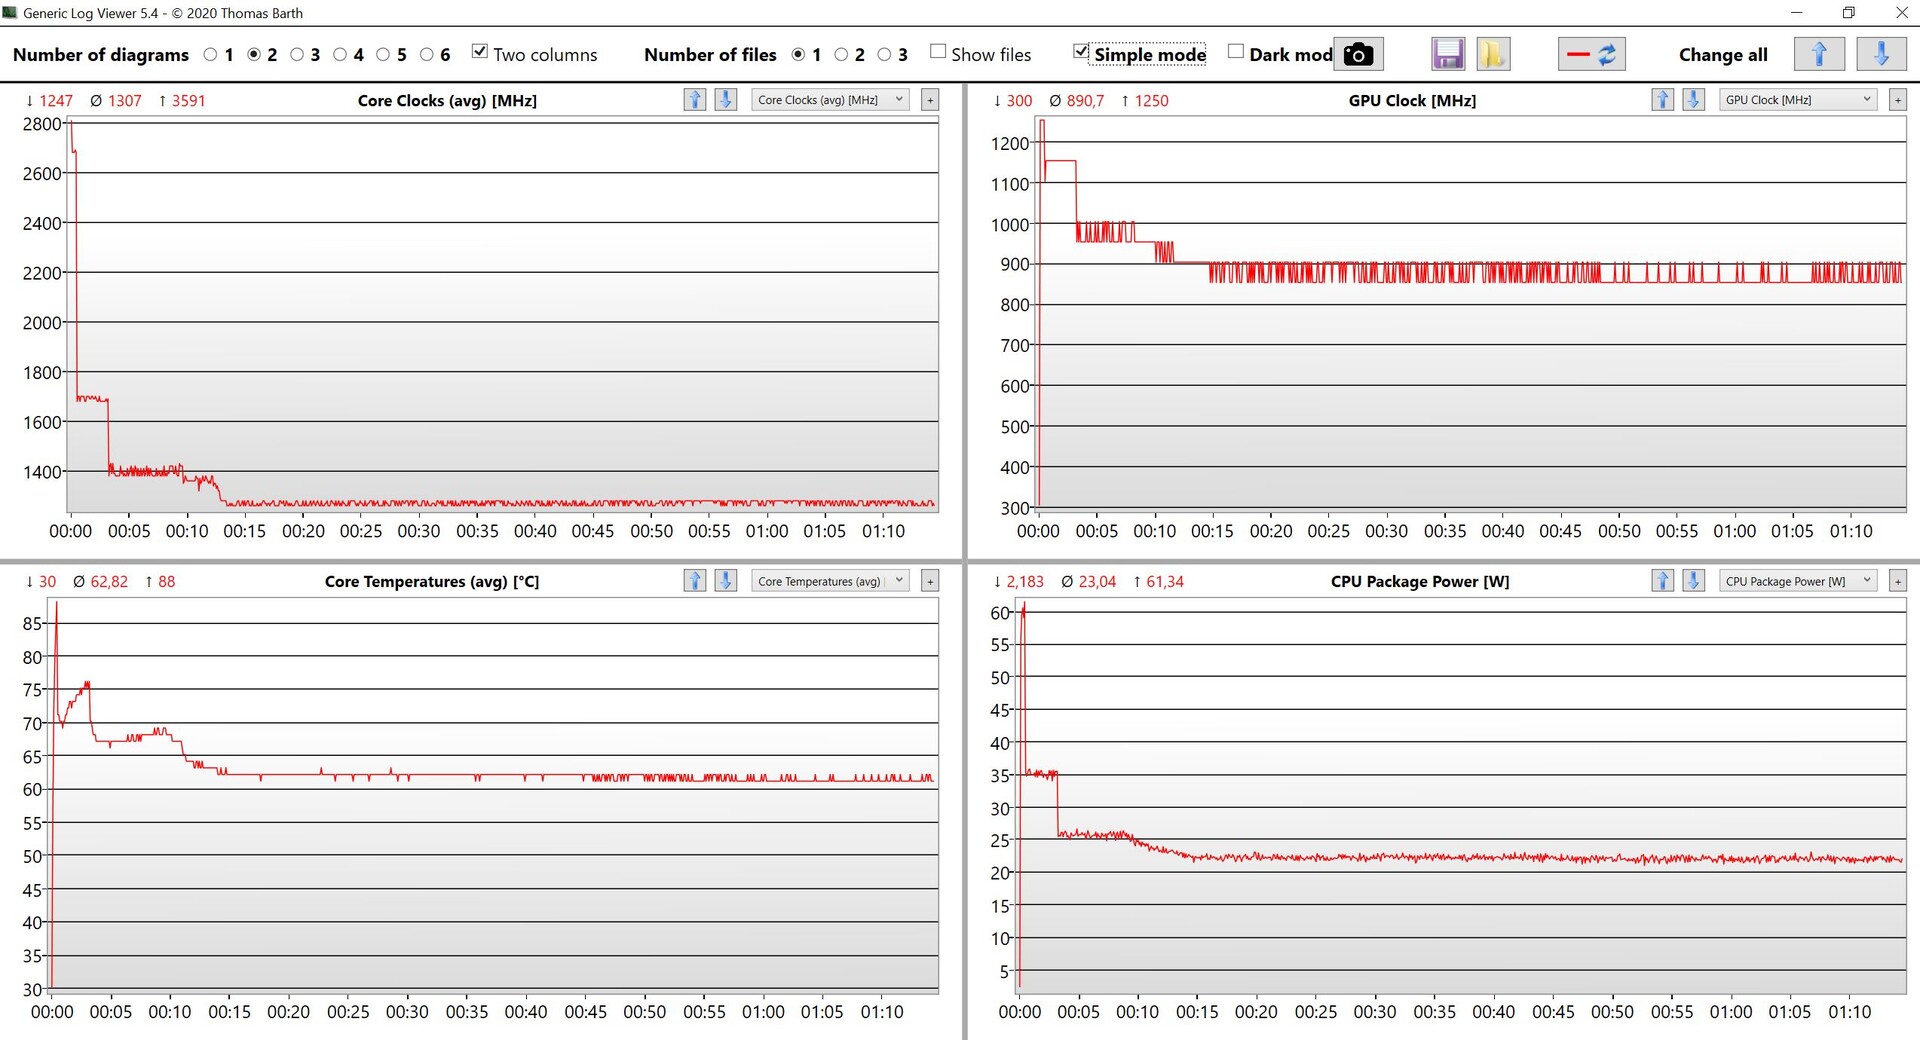
Test stresu pokazuje takie samo zachowanie jak w przypadku czystego obciążenia procesora. Po osiągnięciu szczytu na poziomie 60 watów, procesor pozostaje na poziomie 35 watów przez kilka minut, zanim osiądzie na poziomie 22 watów. Interesujące jest tutaj, że Microsoft nawet przekracza maksymalne zużycie 55 watów określone (przez Intela) dla procesora Alder Lake-U.
(±) Maksymalna temperatura w górnej części wynosi 44.6 °C / 112 F, w porównaniu do średniej 35.4 °C / 96 F , począwszy od 19.6 do 60 °C dla klasy Convertible.
(-) Dno nagrzewa się maksymalnie do 45.9 °C / 115 F, w porównaniu do średniej 36.9 °C / 98 F
(+) W stanie bezczynności średnia temperatura górnej części wynosi 24.6 °C / 76 F, w porównaniu ze średnią temperaturą urządzenia wynoszącą 30.3 °C / ### class_avg_f### F.
(-) Podczas gry w Wiedźmina 3 średnia temperatura górnej części wynosi 41.5 °C / 107 F, w porównaniu do średniej temperatury urządzenia wynoszącej 30.3 °C / ## #class_avg_f### F.
(-) Podpórki pod nadgarstki i touchpad mogą się bardzo nagrzać w dotyku, maksymalnie do 42.6 °C / 108.7 F.
(-) Średnia temperatura obszaru podparcia dłoni w podobnych urządzeniach wynosiła 28 °C / 82.4 F (-14.6 °C / -26.3 F).
| Microsoft Surface Pro 9, i7-1255U Intel Core i7-1255U, Intel Iris Xe Graphics G7 96EUs | Dell XPS 13 9315 2-in-1 Core i5-1230U Intel Core i5-1230U, Intel Iris Xe Graphics G7 80EUs | Lenovo ThinkPad X12 20UVS03G00 Intel Core i7-1160G7, Intel Iris Xe Graphics G7 96EUs | HP Elite Dragonfly Folio 13.5 G3 Intel Core i7-1265U, Intel Iris Xe Graphics G7 96EUs | Apple iPad Pro 12.9 2022 Apple M2, Apple M2 10-Core GPU | Asus ROG Flow Z13 GZ301ZE Intel Core i9-12900H, NVIDIA GeForce RTX 3050 Ti Laptop GPU | Microsoft Surface Pro 8, i7-1185G7 Intel Core i7-1185G7, Intel Iris Xe Graphics G7 96EUs | |
|---|---|---|---|---|---|---|---|
| Heat | 1% | 5% | 14% | -3% | -11% | 2% | |
| Maximum Upper Side * (°C) | 44.6 | 41.8 6% | 39 13% | 32.8 26% | 36.9 17% | 45.3 -2% | 45 -1% |
| Maximum Bottom * (°C) | 45.9 | 38.2 17% | 41.7 9% | 33.4 27% | 37.6 18% | 48.3 -5% | 47.2 -3% |
| Idle Upper Side * (°C) | 24.8 | 27.4 -10% | 25.6 -3% | 24.6 1% | 31.9 -29% | 29.2 -18% | 24.1 3% |
| Idle Bottom * (°C) | 25.3 | 27.2 -8% | 25.6 -1% | 24.6 3% | 29.4 -16% | 30 -19% | 23.4 8% |
* ... im mniej tym lepiej
Mówcy
Dwa głośniki stereo (2 W) są nadal bardzo dobre i brzmią dość obszernie. Nie należy jednak oczekiwać zbyt wiele pod względem basów, co generalnie dotyczy tej kategorii urządzeń (np. także głośników w.iPad Pro).
Microsoft Surface Pro 9, i7-1255U analiza dźwięku
(±) | głośność głośnika jest średnia, ale dobra (79.4 dB)
Bas 100 - 315 Hz
(±) | zredukowany bas - średnio 11.7% niższy od mediany
(±) | liniowość basu jest średnia (8.8% delta do poprzedniej częstotliwości)
Średnie 400 - 2000 Hz
(±) | wyższe średnie - średnio 5.1% wyższe niż mediana
(+) | średnie są liniowe (3% delta do poprzedniej częstotliwości)
Wysokie 2–16 kHz
(+) | zrównoważone maksima - tylko 4% od mediany
(+) | wzloty są liniowe (3.4% delta do poprzedniej częstotliwości)
Ogólnie 100 - 16.000 Hz
(+) | ogólny dźwięk jest liniowy (14.9% różnicy w stosunku do mediany)
W porównaniu do tej samej klasy
» 23% wszystkich testowanych urządzeń w tej klasie było lepszych, 5% podobnych, 72% gorszych
» Najlepszy miał deltę 6%, średnia wynosiła ###średnia###%, najgorsza wynosiła 57%
W porównaniu do wszystkich testowanych urządzeń
» 20% wszystkich testowanych urządzeń było lepszych, 4% podobnych, 76% gorszych
» Najlepszy miał deltę 4%, średnia wynosiła ###średnia###%, najgorsza wynosiła 134%
Apple iPad Pro 12.9 2022 analiza dźwięku
(+) | głośniki mogą odtwarzać stosunkowo głośno (84.3 dB)
Bas 100 - 315 Hz
(±) | zredukowany bas - średnio 9.6% niższy od mediany
(±) | liniowość basu jest średnia (9% delta do poprzedniej częstotliwości)
Średnie 400 - 2000 Hz
(+) | zbalansowane środki średnie - tylko 2.4% od mediany
(+) | średnie są liniowe (3.4% delta do poprzedniej częstotliwości)
Wysokie 2–16 kHz
(+) | zrównoważone maksima - tylko 1.5% od mediany
(+) | wzloty są liniowe (3.2% delta do poprzedniej częstotliwości)
Ogólnie 100 - 16.000 Hz
(+) | ogólny dźwięk jest liniowy (8.8% różnicy w stosunku do mediany)
W porównaniu do tej samej klasy
» 2% wszystkich testowanych urządzeń w tej klasie było lepszych, 2% podobnych, 96% gorszych
» Najlepszy miał deltę 7%, średnia wynosiła ###średnia###%, najgorsza wynosiła 129%
W porównaniu do wszystkich testowanych urządzeń
» 3% wszystkich testowanych urządzeń było lepszych, 1% podobnych, 97% gorszych
» Najlepszy miał deltę 4%, średnia wynosiła ###średnia###%, najgorsza wynosiła 134%
Dell XPS 13 9315 2-in-1 Core i5-1230U analiza dźwięku
(±) | głośność głośnika jest średnia, ale dobra (80.3 dB)
Bas 100 - 315 Hz
(±) | zredukowany bas - średnio 8.9% niższy od mediany
(+) | bas jest liniowy (5.7% delta do poprzedniej częstotliwości)
Średnie 400 - 2000 Hz
(+) | zbalansowane środki średnie - tylko 2.2% od mediany
(+) | średnie są liniowe (5.2% delta do poprzedniej częstotliwości)
Wysokie 2–16 kHz
(±) | wyższe maksima - średnio 5.5% wyższe od mediany
(+) | wzloty są liniowe (6.8% delta do poprzedniej częstotliwości)
Ogólnie 100 - 16.000 Hz
(+) | ogólny dźwięk jest liniowy (11.9% różnicy w stosunku do mediany)
W porównaniu do tej samej klasy
» 11% wszystkich testowanych urządzeń w tej klasie było lepszych, 3% podobnych, 85% gorszych
» Najlepszy miał deltę 6%, średnia wynosiła ###średnia###%, najgorsza wynosiła 57%
W porównaniu do wszystkich testowanych urządzeń
» 9% wszystkich testowanych urządzeń było lepszych, 2% podobnych, 89% gorszych
» Najlepszy miał deltę 4%, średnia wynosiła ###średnia###%, najgorsza wynosiła 134%
Zarządzanie energią - 120 Hz kosztuje żywotność baterii
Pobór mocy
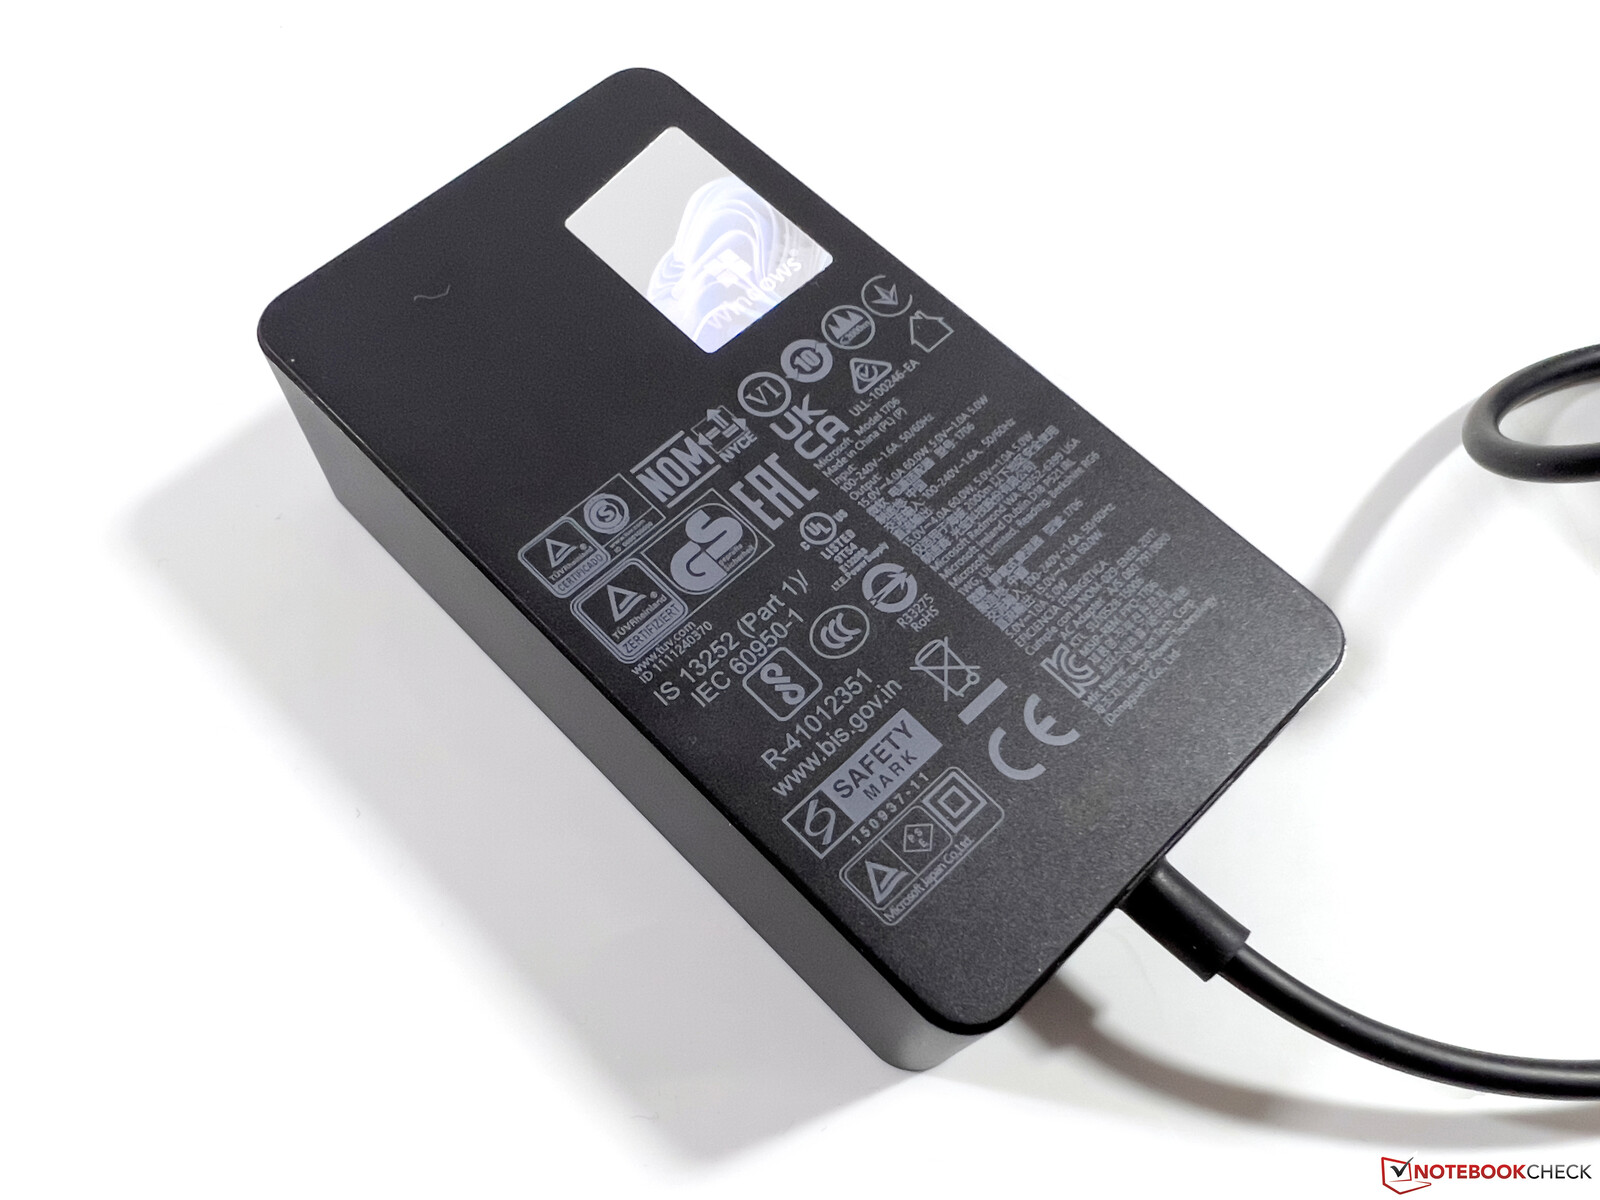
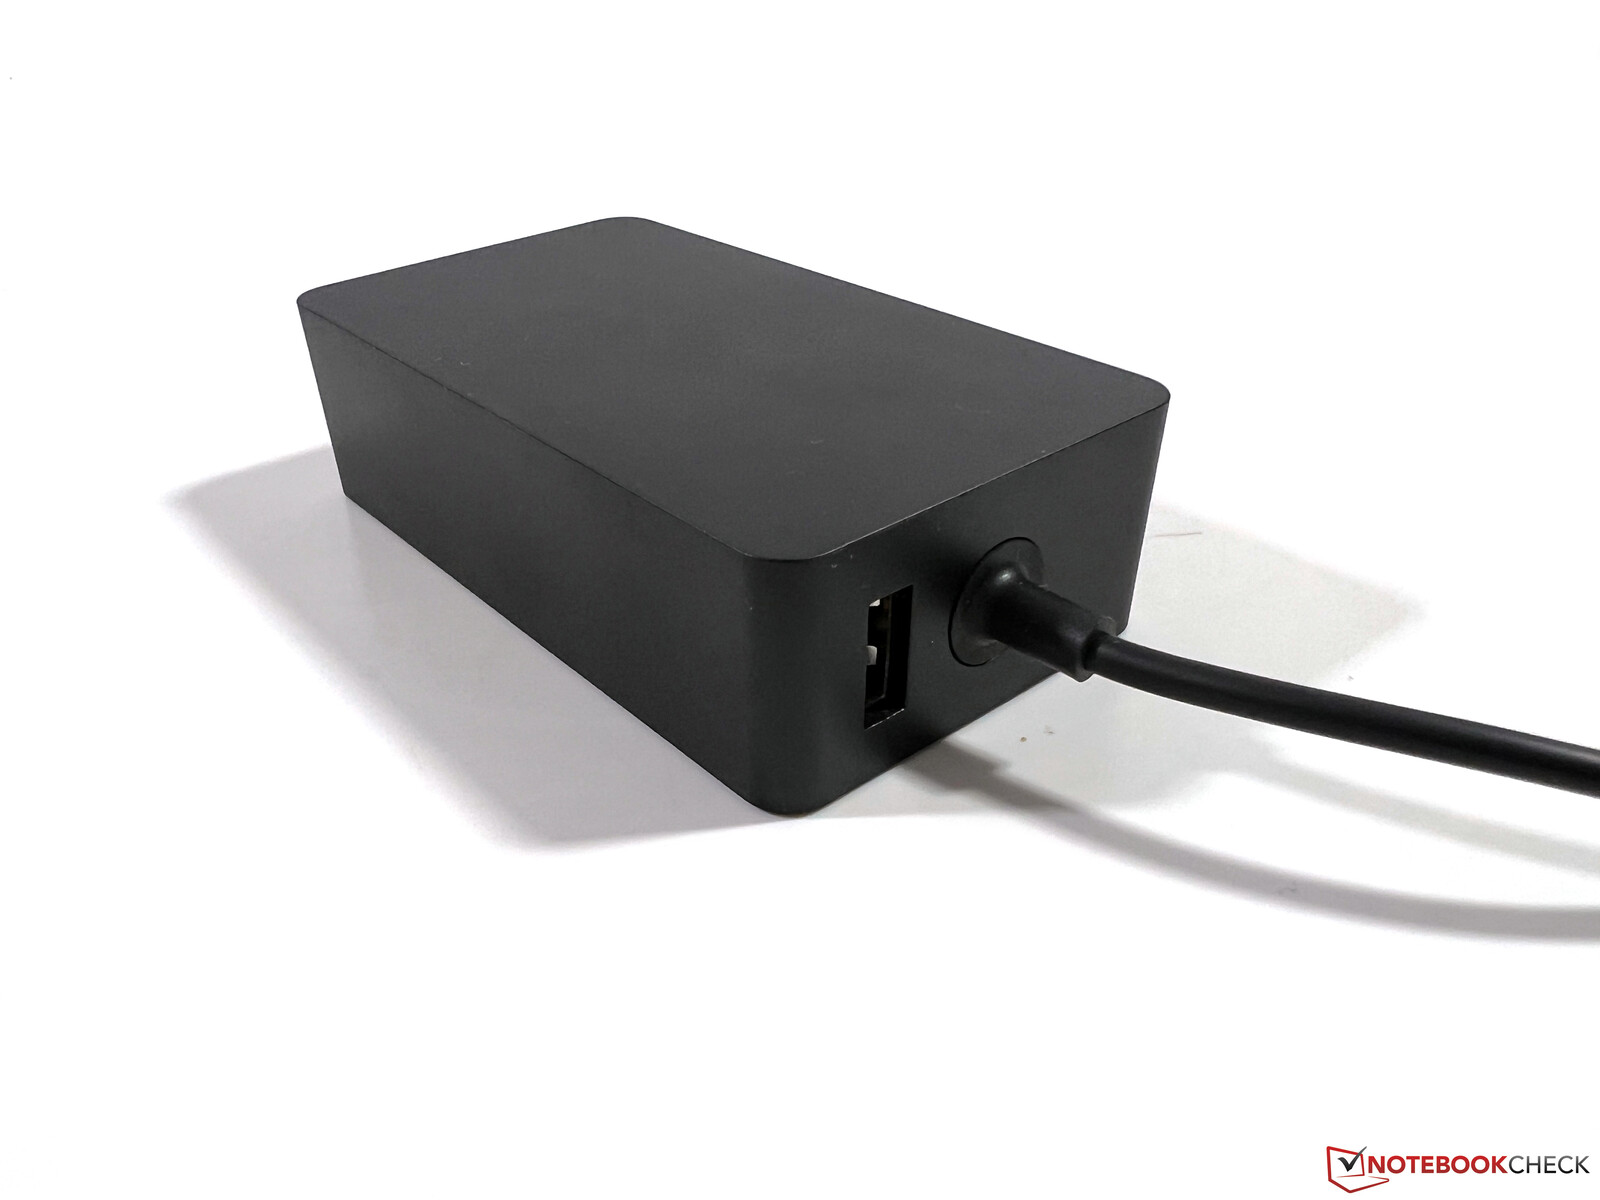
Pomiary mocy przeprowadziliśmy również w trybie 60 Hz, ale wartości w spoczynku od 5,1 do 11,3 W są nieco wyższe niż w starym modelu. Pod obciążeniem wartości są podobne, ale wysokie limity mocy procesora stają się zauważalne pod pełnym obciążeniem, ponieważ w pierwszych ~30 sekundach osiągnęliśmy limit zasilania 68 watów. W tym miejscu urządzenie musi na krótko sięgnąć do akumulatora, aby zapewnić wymaganą energię. Później zużycie wyrównuje się do niższych wartości (najpierw ~58, a potem ~46 watów), więc 60-watowy zasilacz w praktyce nadal jest wystarczający.
Microsoftowi udało się zmniejszyć pobór mocy w stanie wyłączonym i w stanie czuwania. Zasilacz oferuje także port USB-A, który można wykorzystać na przykład do ładowania smartfona (maksymalnie 5 watów).
| wyłączony / stan wstrzymania | |
| luz | |
| obciążenie |
|
Legenda:
min: | |
| Microsoft Surface Pro 9, i7-1255U i7-1255U, Iris Xe G7 96EUs, Samsung MZ9L4512HBLU-00BMV, IPS, 2880x1920, 13" | Dell XPS 13 9315 2-in-1 Core i5-1230U i5-1230U, Iris Xe G7 80EUs, , IPS, 2880x1920, 13" | Lenovo ThinkPad X12 20UVS03G00 i7-1160G7, Iris Xe G7 96EUs, Toshiba BG4 KBG40ZNT512G, a-Si IPS LED, 1920x1280, 12.3" | HP Elite Dragonfly Folio 13.5 G3 i7-1265U, Iris Xe G7 96EUs, Samsung PM9A1 MZVL2512HCJQ, IPS, 1920x1280, 13.5" | Apple iPad Pro 12.9 2022 M2, M2 10-Core GPU, 128 GB NVMe, Mini-LED, 2732x2048, 12.9" | Asus ROG Flow Z13 GZ301ZE i9-12900H, GeForce RTX 3050 Ti Laptop GPU, Micron 2450 1TB MTFDKBK1T0TFK, IPS, 1920x1200, 13.4" | Microsoft Surface Pro 8, i7-1185G7 i7-1185G7, Iris Xe G7 96EUs, Toshiba KBG40ZNS256G NVMe, IPS, 2880x1920, 13" | Przeciętny Intel Iris Xe Graphics G7 96EUs | Średnia w klasie Convertible | |
|---|---|---|---|---|---|---|---|---|---|
| Power Consumption | 22% | 26% | 19% | 36% | -54% | 7% | 3% | 15% | |
| Idle Minimum * (Watt) | 5.1 | 5.2 -2% | 4 22% | 3.4 33% | 2.54 50% | 8.8 -73% | 3.9 24% | 5.51 ? -8% | 4.29 ? 16% |
| Idle Average * (Watt) | 9.8 | 7.9 19% | 5.9 40% | 4.9 50% | 11.24 -15% | 12.1 -23% | 8.5 13% | 8.66 ? 12% | 7.08 ? 28% |
| Idle Maximum * (Watt) | 11.3 | 8 29% | 8.3 27% | 9.3 18% | 11.48 -2% | 12.7 -12% | 9.8 13% | 10.9 ? 4% | 8.68 ? 23% |
| Load Average * (Watt) | 47.5 | 31.2 34% | 30.1 37% | 41.9 12% | 12.97 73% | 72.3 -52% | 48 -1% | 45.6 ? 4% | 44 ? 7% |
| Witcher 3 ultra * (Watt) | 36 | 28.2 22% | 30.8 14% | 36.4 -1% | 77.3 -115% | 41.5 -15% | |||
| Load Maximum * (Watt) | 68.5 | 47.6 31% | 59 14% | 67.5 1% | 16.6 76% | 103.1 -51% | 63 8% | 67.8 ? 1% | 67.3 ? 2% |
* ... im mniej tym lepiej
Power Consumption Witcher 3 / Stress Test
Power Consumption with an External Monitor
Czas pracy na baterii
Microsoft zmniejszył pojemność baterii z 51,5 do 47,7 Wh, ale ogólnie czasy pracy są bardzo podobne do starych Surface Pro 8. Przy jasności 150 cd/m² (co odpowiada 62% maksymalnej jasności w urządzeniu recenzenckim). W teście wideo udało się uzyskać prawie 9,5 h, a w teście Wi-Fi - 7,5 h. Nasz test Wi-Fi przebiegł na maksymalnej jasności przez nieco ponad 5 godzin.
Zaraz po przejściu do trybu 120 Hz czas pracy ponownie zauważalnie spada. Wartości dla trzech scenariuszy zestawiliśmy w tabeli poniżej. Należy więc unikać trybu 120 Hz podczas podróży.
| Test WLAN maksymalna jasność | Test WLAN 150 cd/m² | Test wideo | |
|---|---|---|---|
| 60 Hz | 314 minut | 451 minut | 562 minuty |
| 120 Hz | 274 minuty | 369 minut | 529 minut |
W porównaniu z konkurencją, Surface Pro 9 wyprzedza jedynie m.in.Asus ROG Flow Z13 gamingowy kabriolet, ale wszyscy pozostali konkurenci oferują większą wytrzymałość. Pełne naładowanie trwa około 2 godzin przy włączonym urządzeniu, przy czym 35% jest dostępne po 21 minutach, a 80% po około 63 minutach.
Uwaga: Czas pracy na baterii podany przez Microsoft jest znacznie dłuższy i wynosi do 15,5 godziny przy typowym użytkowaniu, ale obejmuje również czas w trybie czuwania.
| Microsoft Surface Pro 9, i7-1255U i7-1255U, Iris Xe G7 96EUs, 47.7 Wh | Dell XPS 13 9315 2-in-1 Core i5-1230U i5-1230U, Iris Xe G7 80EUs, 49.5 Wh | Lenovo ThinkPad X12 20UVS03G00 i7-1160G7, Iris Xe G7 96EUs, 42 Wh | HP Elite Dragonfly Folio 13.5 G3 i7-1265U, Iris Xe G7 96EUs, 53 Wh | Apple iPad Pro 12.9 2022 M2, M2 10-Core GPU, 40.88 Wh | Asus ROG Flow Z13 GZ301ZE i9-12900H, GeForce RTX 3050 Ti Laptop GPU, 56 Wh | Microsoft Surface Pro 8, i7-1185G7 i7-1185G7, Iris Xe G7 96EUs, 51.5 Wh | Średnia w klasie Convertible | |
|---|---|---|---|---|---|---|---|---|
| Czasy pracy | 32% | 19% | 56% | 67% | -25% | -2% | 50% | |
| H.264 (h) | 9.4 | 10 6% | 13.6 45% | 6 -36% | 10.1 7% | 15.3 ? 63% | ||
| WiFi v1.3 (h) | 7.5 | 9 20% | 8.2 9% | 9.4 25% | 11.2 49% | 5.6 -25% | 7.6 1% | 11.9 ? 59% |
| Load (h) | 1.4 | 2 43% | 2 43% | 2.6 86% | 2.9 107% | 1.2 -14% | 1.2 -14% | 1.779 ? 27% |
| Witcher 3 ultra (h) | 0.8 |
Za
Przeciw
Werdykt: Surface Pro 9 ma więcej mocy, ale traci funkcje

Z zewnątrz nowy Surface Pro 9 wygląda raczej jak mała aktualizacja z nowym procesorem. W szczegółach jednak Microsoft wprowadził kilka zmian i nie wszystkie są pozytywne. Przede wszystkim należy wspomnieć, że wydajność procesora znacznie wzrosła dzięki nowemu procesorowi Alder Lake-U. Pewien potencjał wciąż jest tu jednak marnowany, ponieważ układ Alder Lake P z dwoma dodatkowymi rdzeniami wydajnościowymi generuje większą wydajność przy tych wartościach TDP, co pokazuje nasza Analiza Alder Lake-U.
Microsoft wyposażył Surface Pro 9 w aktualny moduł WLAN z obsługą sieci 6 GHz. Jednocześnie zrezygnowano z wersji LTE modelu Intela, gdyż dawny Surface Pro X jest obecnie sprzedawany także jako Surface Pro 9. Czy wersja ARM z Windowsem rzeczywiście może być jego pełnoprawnym zamiennikiem, to się dopiero okaże. Życzylibyśmy sobie opcjonalnego modelu Intela z LTE lub 5G. Pod tym względem krytycznie oceniamy też wcześniejszą decyzję Microsoftu o usunięciu czytnika microSD na rzecz opcjonalnego slotu SIM. Skoro model Intela nie posiada już slotu SIM, można było ponownie zainstalować czytnik kart. Z drugiej strony, pominięty jack 3,5 mm jest znacznie bardziej niepozorny, ale i tę decyzję uważamy za niezrozumiałą.
Nowy Microsoft Surface Pro 9 oferuje teraz większą moc procesora, ale zrezygnowano z opcjonalnego modelu WWAN i usunięto gniazdo audio. Ponadto czas pracy na baterii pozostaje słabym punktem tego kabrioletu.
W pozostałych obszarach wydajność jest solidna, ale zwłaszcza wyświetlacz wymaga rychłej aktualizacji. 120 Hz jest w praktyce bardzo przyjemne, ale konkurencyjne urządzenia zwykle oferują więcej pod względem pokrycia przestrzeni kolorów i współczynnika kontrastu. Ponadto kabriolet z Core i7 jest dość drogi, a podstawowa wersja z Core i5, 8 GB RAM i 256 GB pamięci masowej SSD z trudem spełnia wymagania urządzenia "Pro" w 2023 roku.
Wkrótce zrecenzujemy też wersję ARM Surface Pro 9 + 5G i jesteśmy ciekawi, czy Windows działa teraz lepiej z SoC ARM i czy stanowi realną alternatywę dla m.in Apple iPad Pro 12.9. Na stronie Dell XPS 13 9315 oferuje mniejszą moc procesora, ale jest ona zazwyczaj wystarczająca do codziennych zastosowań, a użytkownik korzysta też z pasywnego chłodzenia.
Cena i dostępność
Microsoft Surface Pro 9 wydaje się być szeroko dostępny we wszystkich konfiguracjach, zarówno bezpośrednio przez oficjalny sklep internetowy Microsoftu, jak i przez typowych dostawców, takich jak Amazon. Nasza konfiguracja recenzencka (Core i7, 16GB RAM, 512 GB) jest wymieniona na US$ 1,879,99 na Amazon US, oraz na £1,799.00 na Amazon UK. Zainteresowani nabywcy w Australii lub Singapurze mogą na przykład kupić bezpośrednio od Microsoftu, gdzie ceny zaczynają się od AU$1,649.00 i SG$1,608.00, odpowiednio.
Powyższe przykłady nie są wyczerpujące. Ceny są aktualne na dzień 25.01.2023 i mogą ulec zmianie.
Microsoft Surface Pro 9, i7-1255U
- 24/01/2023 v7 (old)
Andreas Osthoff
Przezroczystość
Wyboru urządzeń do recenzji dokonuje nasza redakcja. Próbka testowa została udostępniona autorowi jako pożyczka od producenta lub sprzedawcy detalicznego na potrzeby tej recenzji. Pożyczkodawca nie miał wpływu na tę recenzję, producent nie otrzymał też kopii tej recenzji przed publikacją. Nie było obowiązku publikowania tej recenzji. Jako niezależna firma medialna, Notebookcheck nie podlega władzy producentów, sprzedawców detalicznych ani wydawców.
Tak testuje Notebookcheck
Każdego roku Notebookcheck niezależnie sprawdza setki laptopów i smartfonów, stosując standardowe procedury, aby zapewnić porównywalność wszystkich wyników. Od około 20 lat stale rozwijamy nasze metody badawcze, ustanawiając przy tym standardy branżowe. W naszych laboratoriach testowych doświadczeni technicy i redaktorzy korzystają z wysokiej jakości sprzętu pomiarowego. Testy te obejmują wieloetapowy proces walidacji. Nasz kompleksowy system ocen opiera się na setkach uzasadnionych pomiarów i benchmarków, co pozwala zachować obiektywizm.Price comparison

