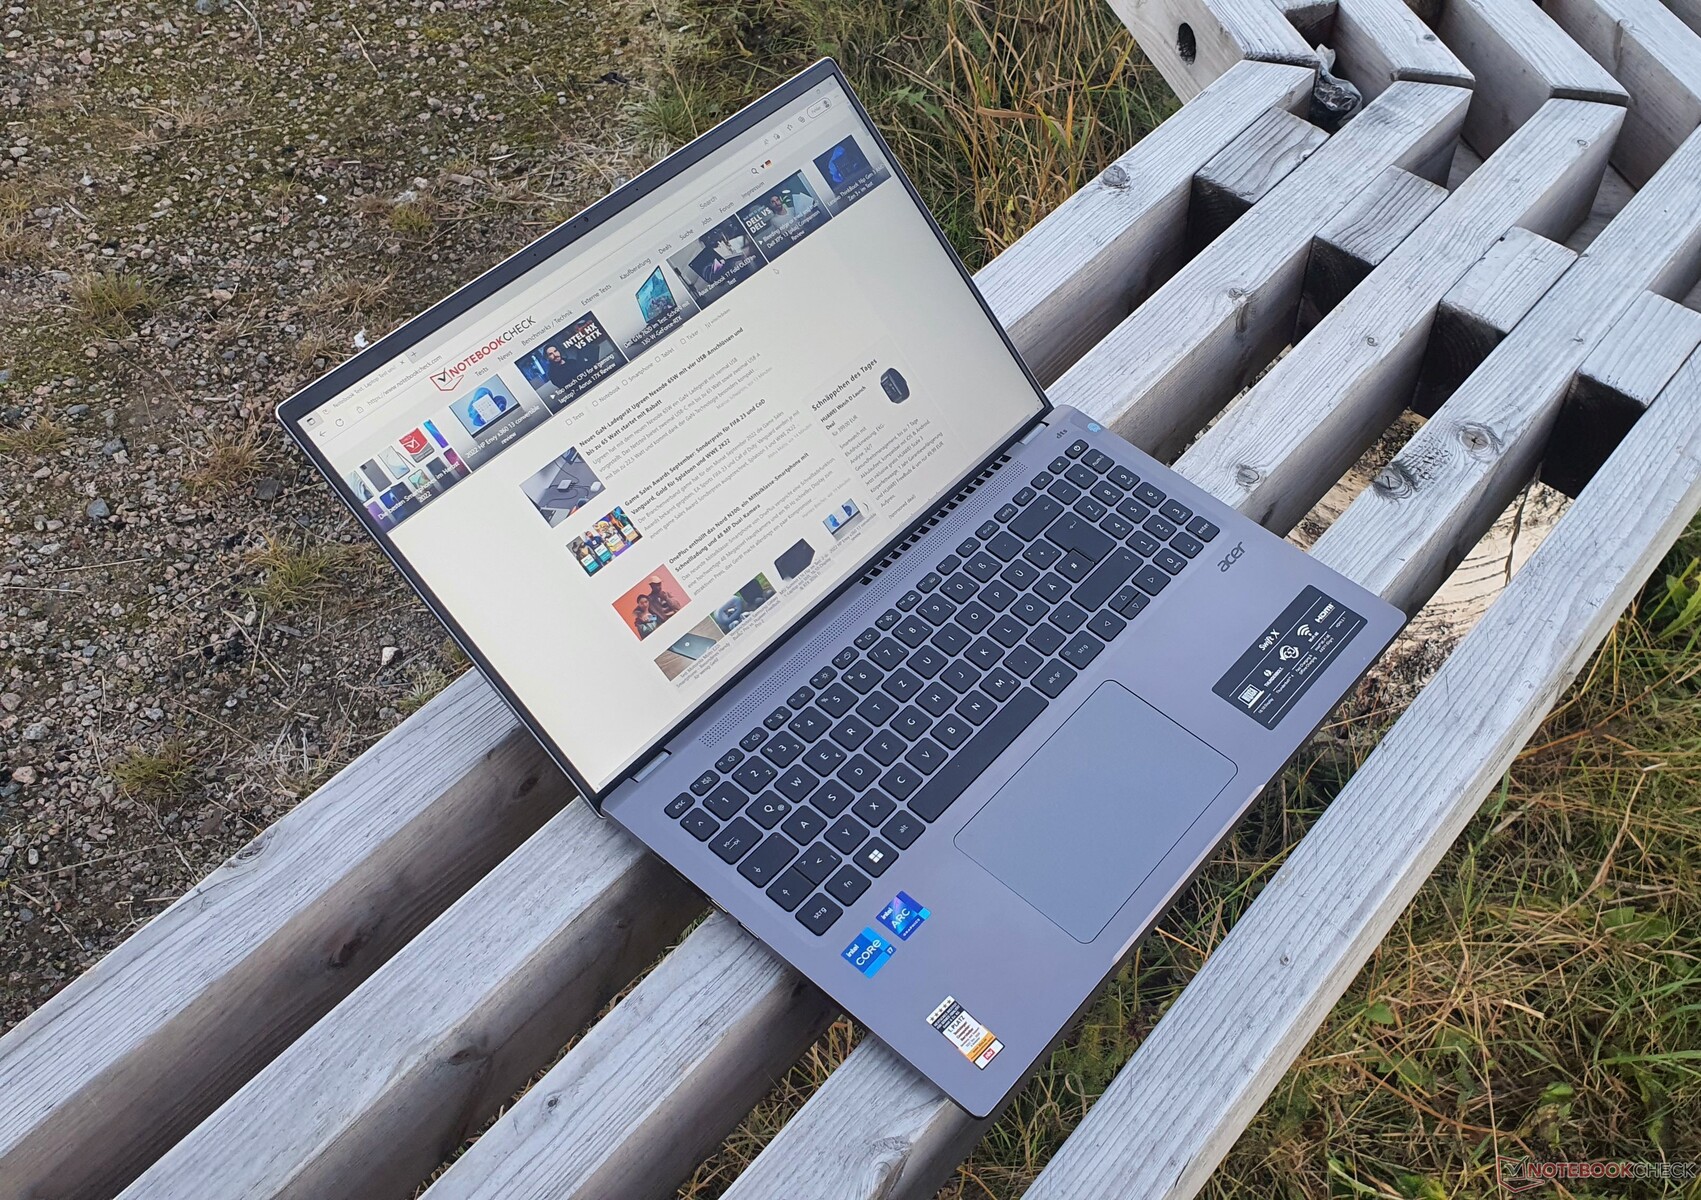
Recenzja Acer Swift X 16 (2022): 16-calowy laptop z potężnymi aktualizacjami
Acer Swift X 16 (2022) otrzymał wiele ulepszeń: Jasny 16-calowy wyświetlacz o rozdzielczości 2,5K w formacie 16:10 uruchamiany przez Intel Arc A370M,.Core i7-1260P, oraz szybki dysk SSD PCIe 4.0 o pojemności 1 TB. We wszystkich przypadkach jest 16 GB wlutowanej pamięci RAM DDR5 4800. Kilka mniejszych usprawnień, takich jak HDMI 2.1 i kamerka internetowa 1080p, również działa na korzyść multimedialnego laptopa.
W obecnej generacji Swift X 16 Acer jest w stanie naprawić wiele niedociągnięć poprzednika. Jak jednak Intel Arc A370Mwypada w porównaniu z kartą Nvidii GeForce RTX 3050 Tiw urządzeniach porównawczych, takich jak Dell Inspiron 16 Plusi Asus Vivobook Pro 16XlubRTX 2050 w Lenovo ThinkBook 16 G4+?
Ponieważ poza procesorem i dyskiem SSD model rodzeństwa, który niedawno testowaliśmy, jest identyczny, po szczegóły dotyczące obudowy, wyposażenia, urządzeń wejściowych i komunikacji odsyłamy Was do odpowiedniej recenzji Acer Swift X SFX16-52G-52VE. Nawet zastosowany wyświetlacz jest identyczny.
Dodatkowe recenzje Acerów:
Potencjalni konkurenci w porównaniu
Ocena | Data | Model | Waga | Wysokość | Rozmiar | Rezolucja | Cena |
|---|---|---|---|---|---|---|---|
| 86.4 % v7 (old) | 11/2022 | Acer Swift X SFX16-52G-77RX i7-1260P, A370M | 1.8 kg | 21.2 mm | 16.00" | 2560x1600 | |
| 88.4 % v7 (old) | 10/2022 | Lenovo ThinkBook 16 G4+ IAP i7-12700H, GeForce RTX 2050 Mobile | 1.8 kg | 16.5 mm | 16.00" | 2560x1600 | |
| 87.4 % v7 (old) | Dell Inspiron 16 Plus 7620 i7-12700H, GeForce RTX 3050 Ti Laptop GPU | 2.1 kg | 18.99 mm | 16.00" | 3072x1920 | ||
| 86.9 % v7 (old) | 09/2022 | HP Envy 16 h0112nr i7-12700H, GeForce RTX 3060 Laptop GPU | 2.3 kg | 19.8 mm | 16.00" | 3840x2400 | |
| 86.2 % v7 (old) | 11/2022 | Acer Swift X SFX16-52G-52VE i5-1240P, A370M | 1.8 kg | 21.3 mm | 16.00" | 2560x1600 | |
| 86.2 % v7 (old) | Acer Swift X SFX16-51G-5388 i5-11320H, GeForce RTX 3050 4GB Laptop GPU | 1.8 kg | 18.9 mm | 16.10" | 1920x1080 | ||
| 85.7 % v7 (old) | 10/2022 | Lenovo IdeaPad 5 Pro 16ARH7 R5 6600HS, Radeon 660M | 1.9 kg | 18.4 mm | 16.00" | 2560x1600 | |
v (old) | Asus Vivobook Pro 16X-M7600QE R9 5900HX, GeForce RTX 3050 Ti Laptop GPU | 1.9 kg | 19 mm | 16.10" | 3840x2400 |
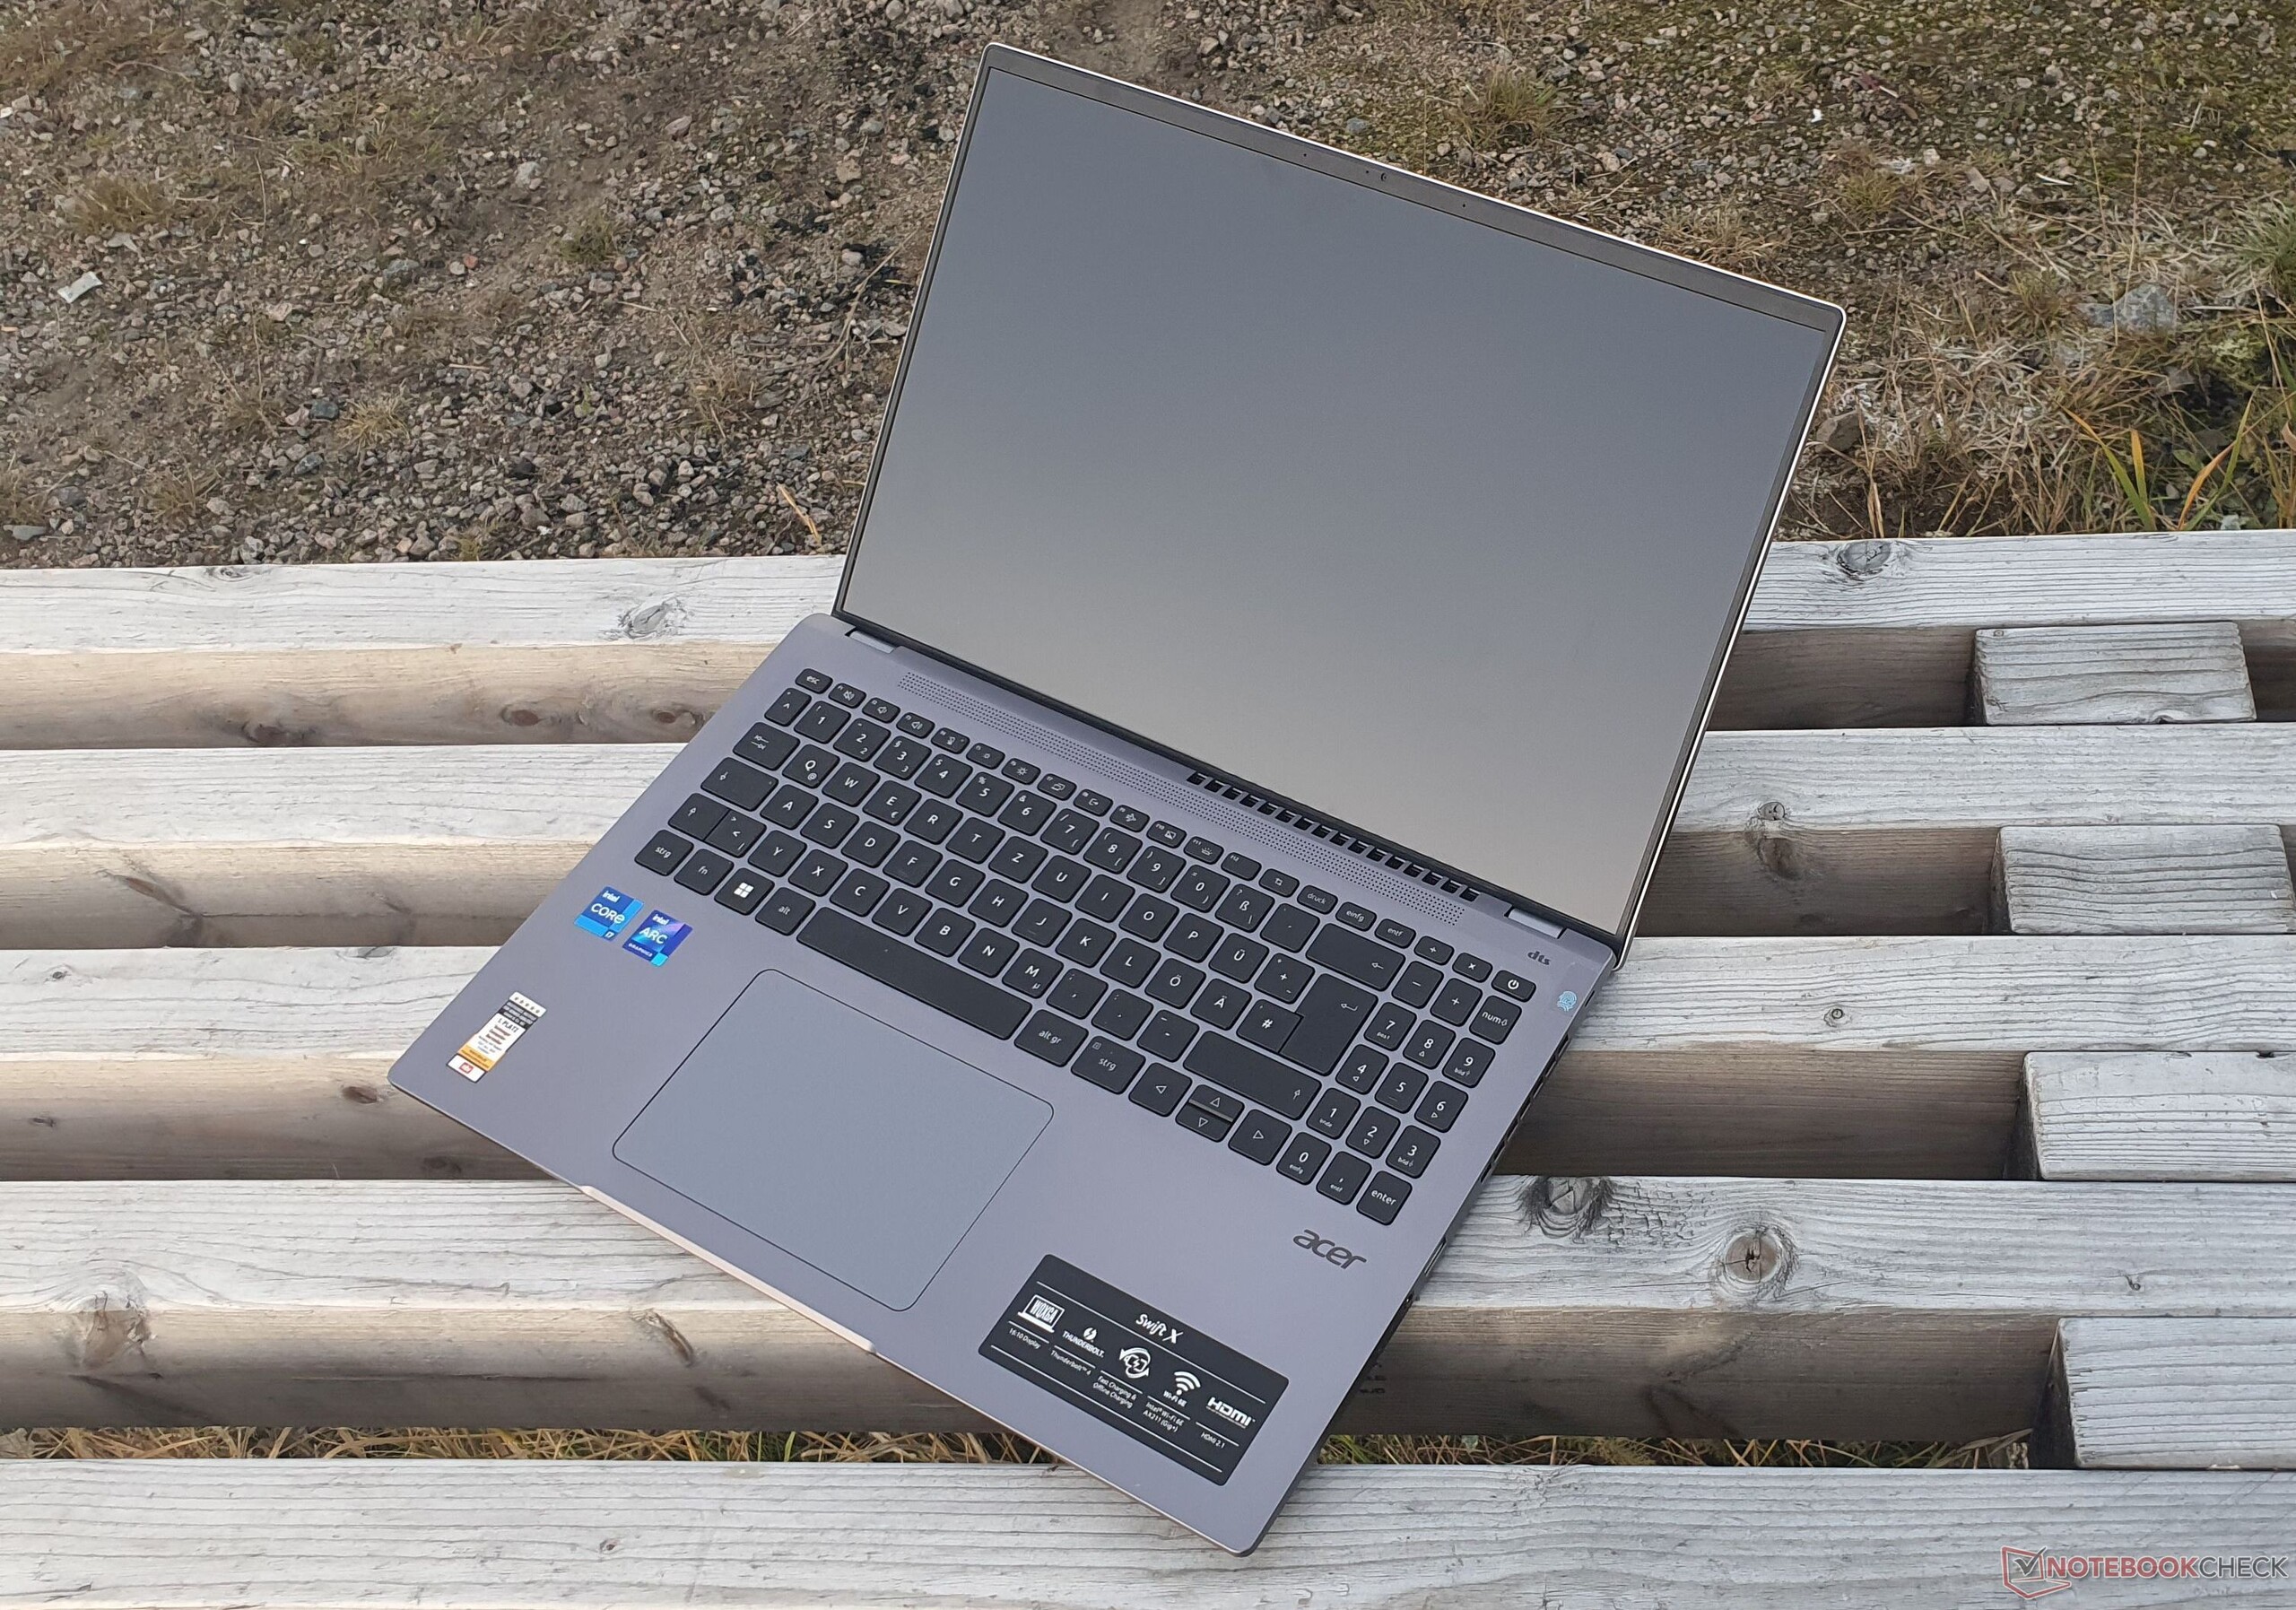


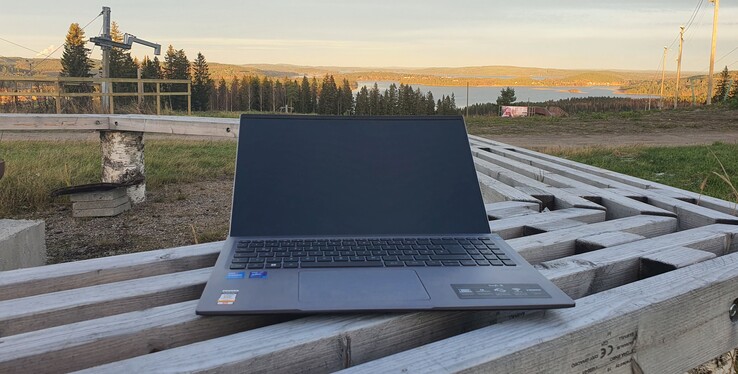
Ponieważ cały spód obudowy jest wybrzuszony, daje to maksymalną grubość obudowy wynoszącą około 21 mm (~0,83 in). Specyfikacja producenta mówiąca o 17,9 mm (~0,7 in) odnosi się do pomiaru, który nie uwzględnia tego wybrzuszenia.
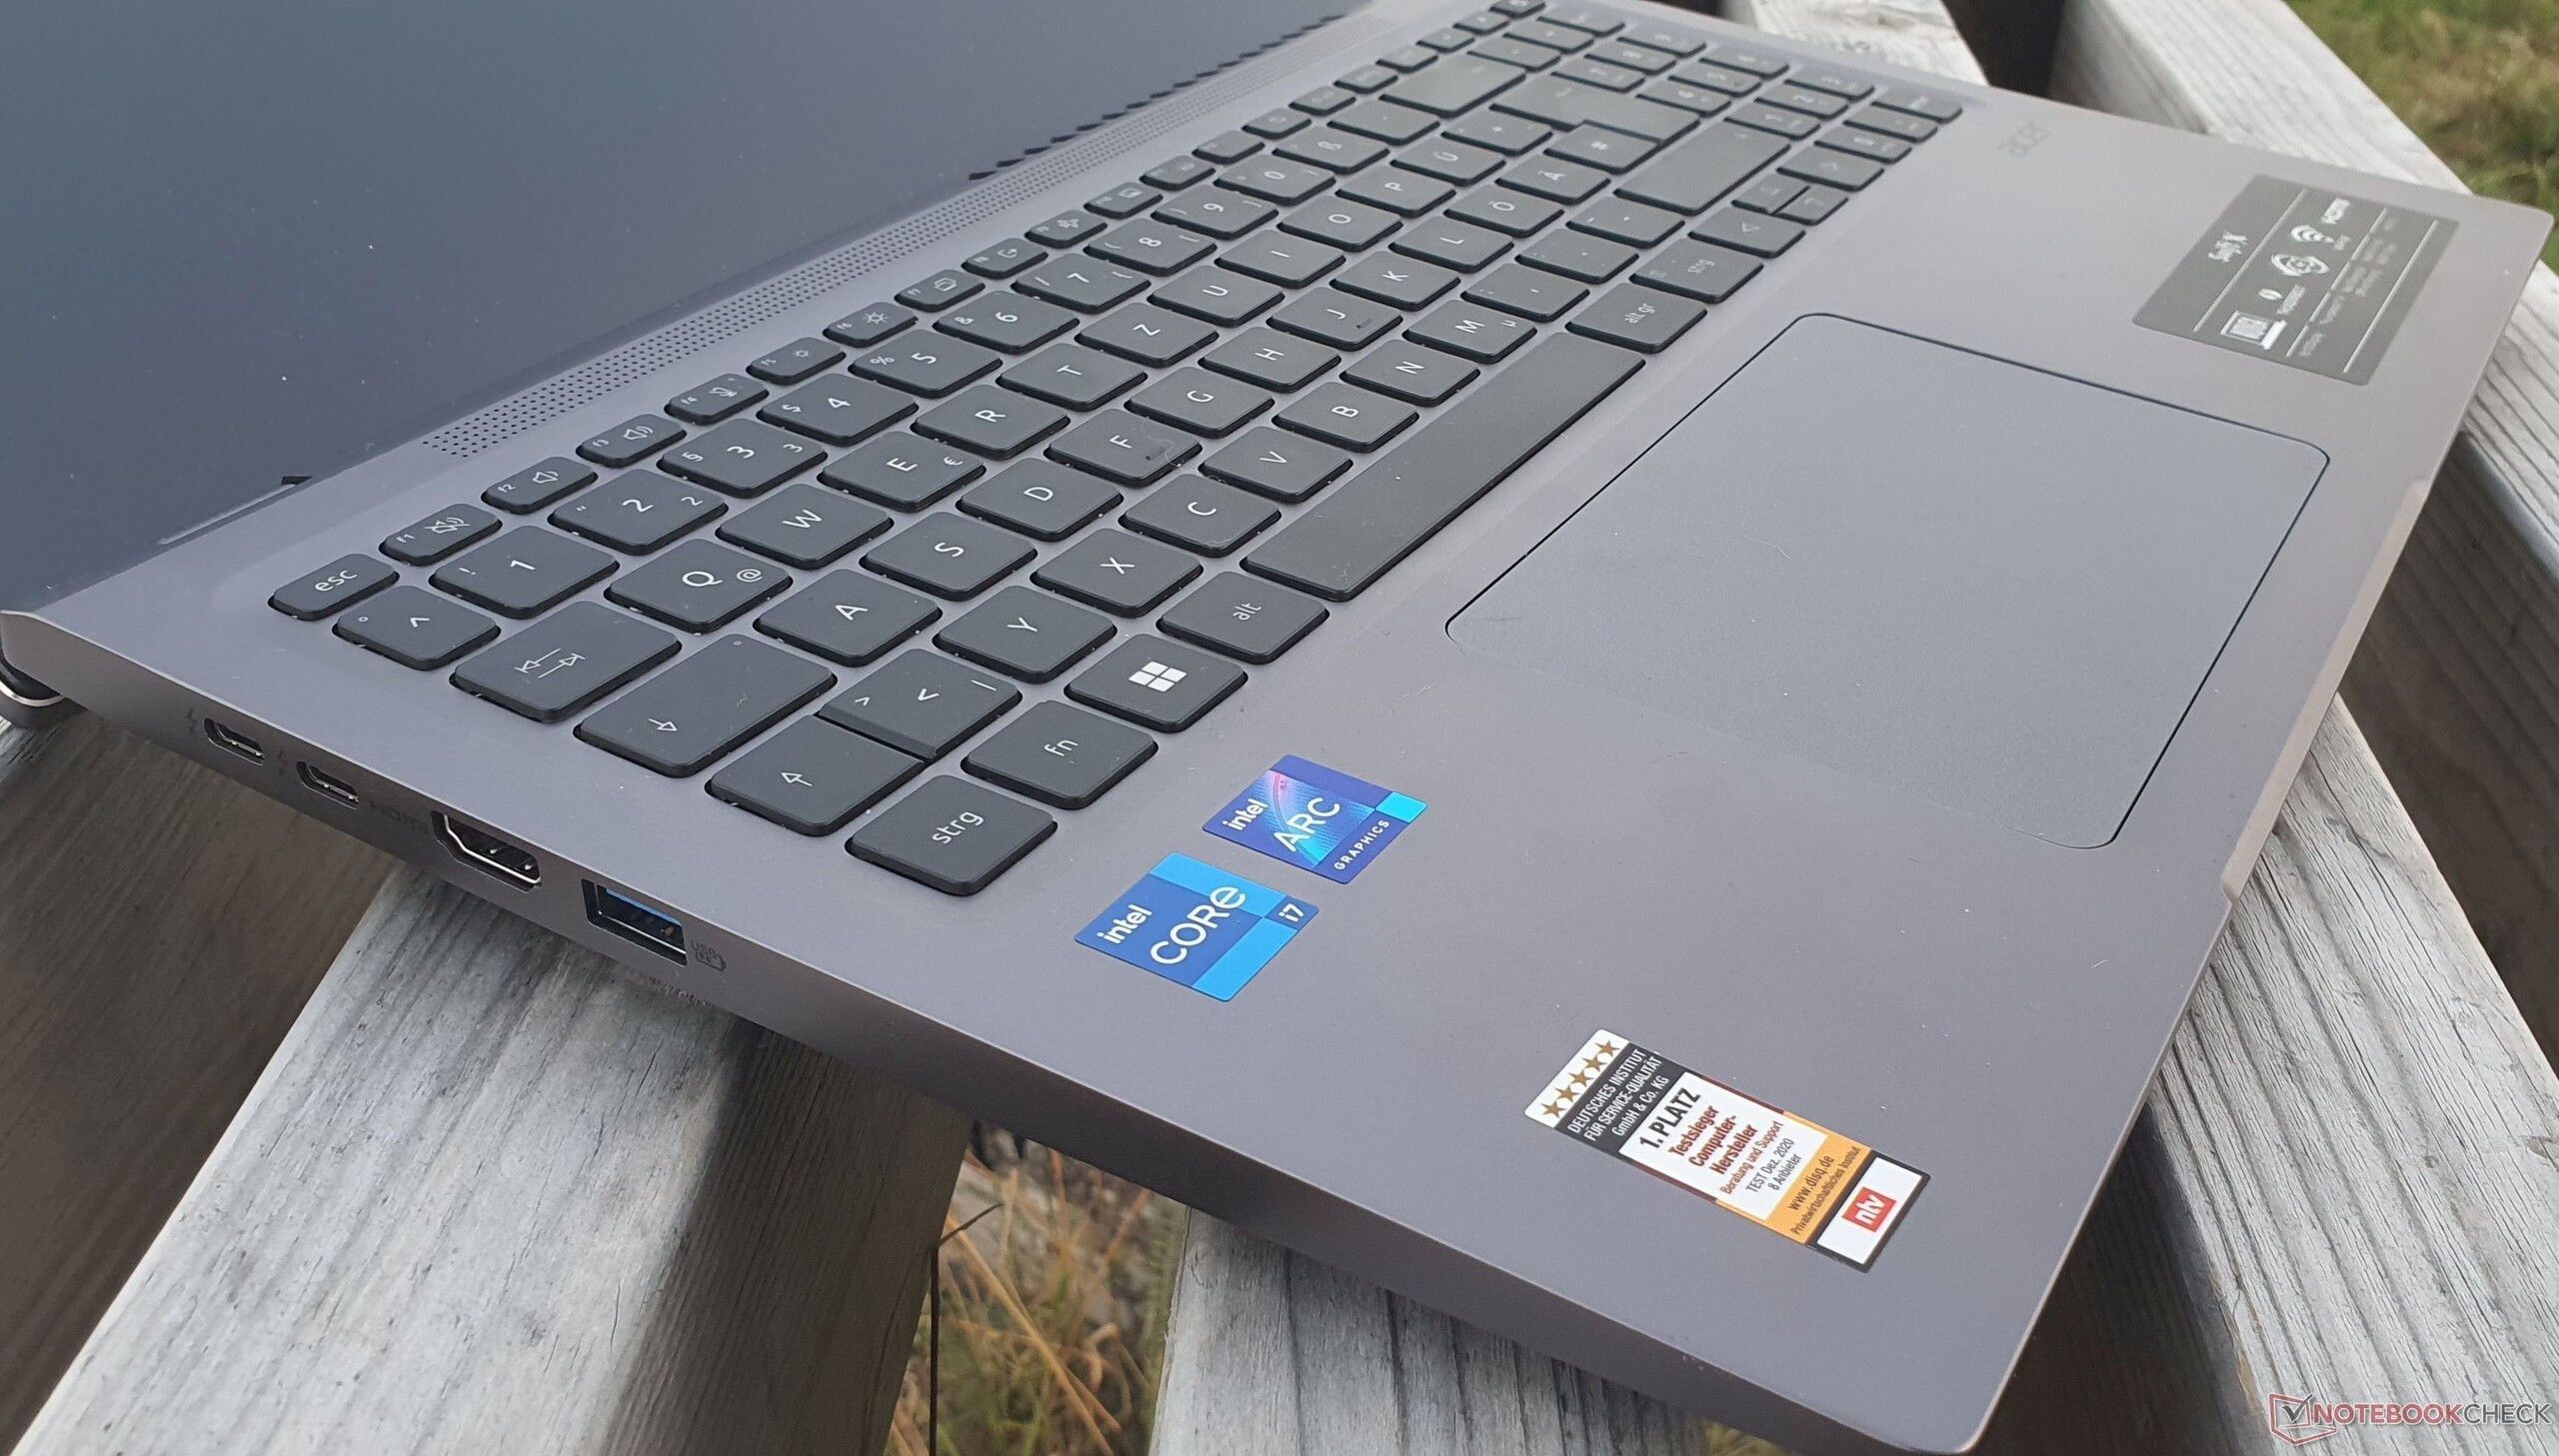
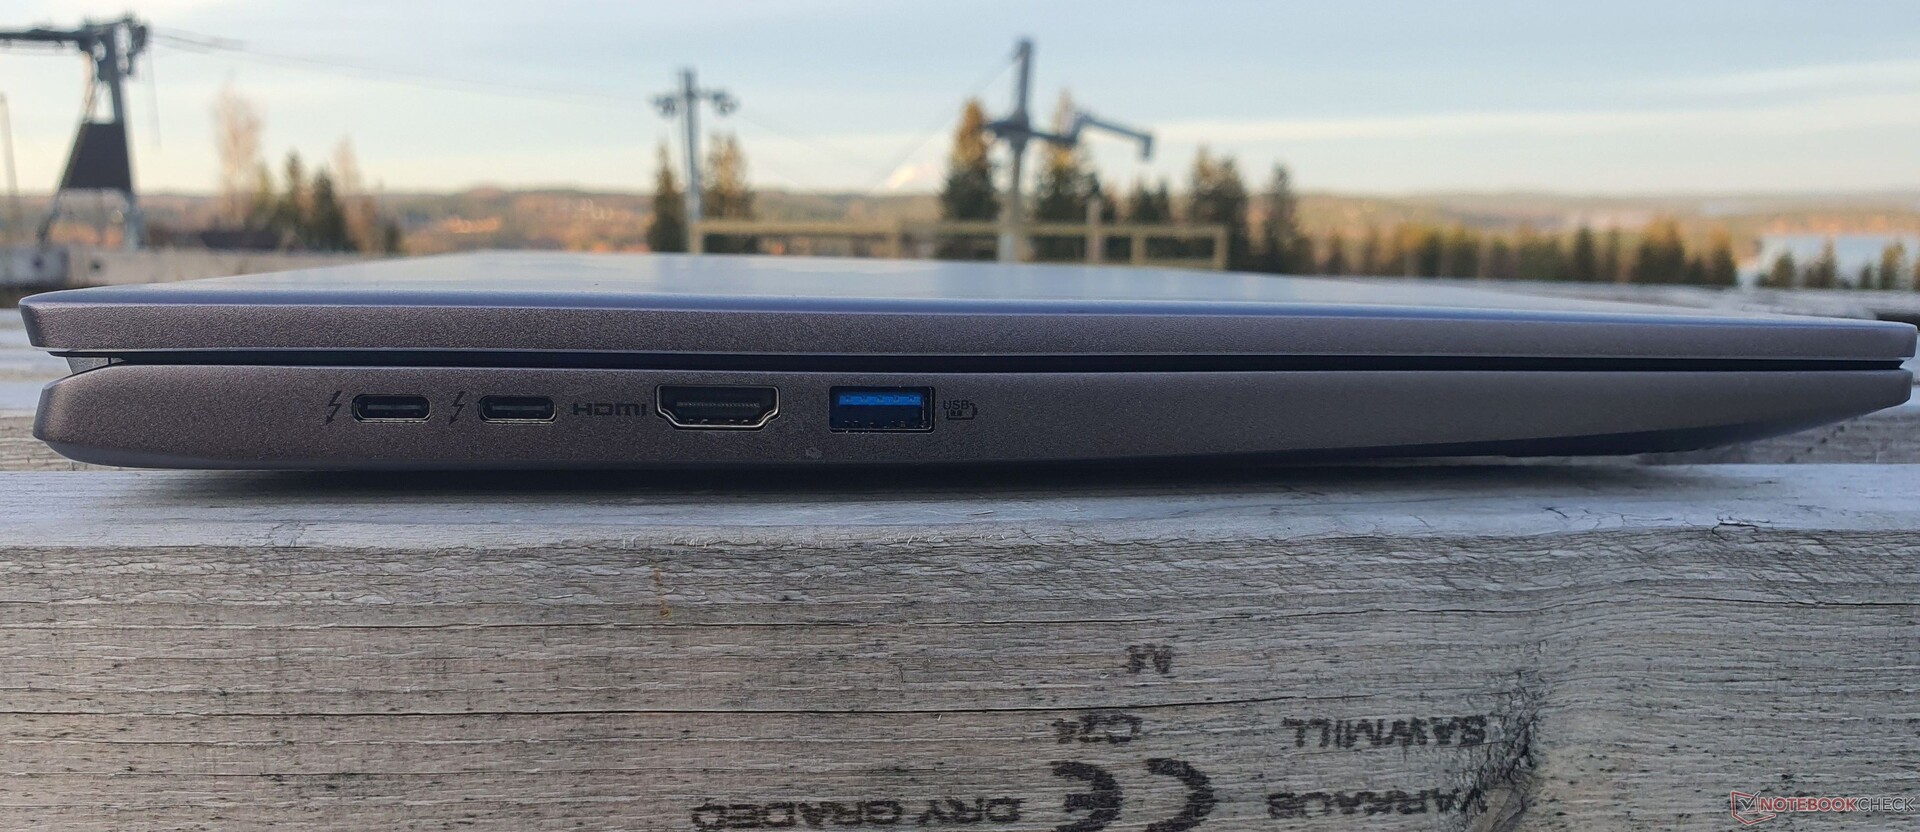
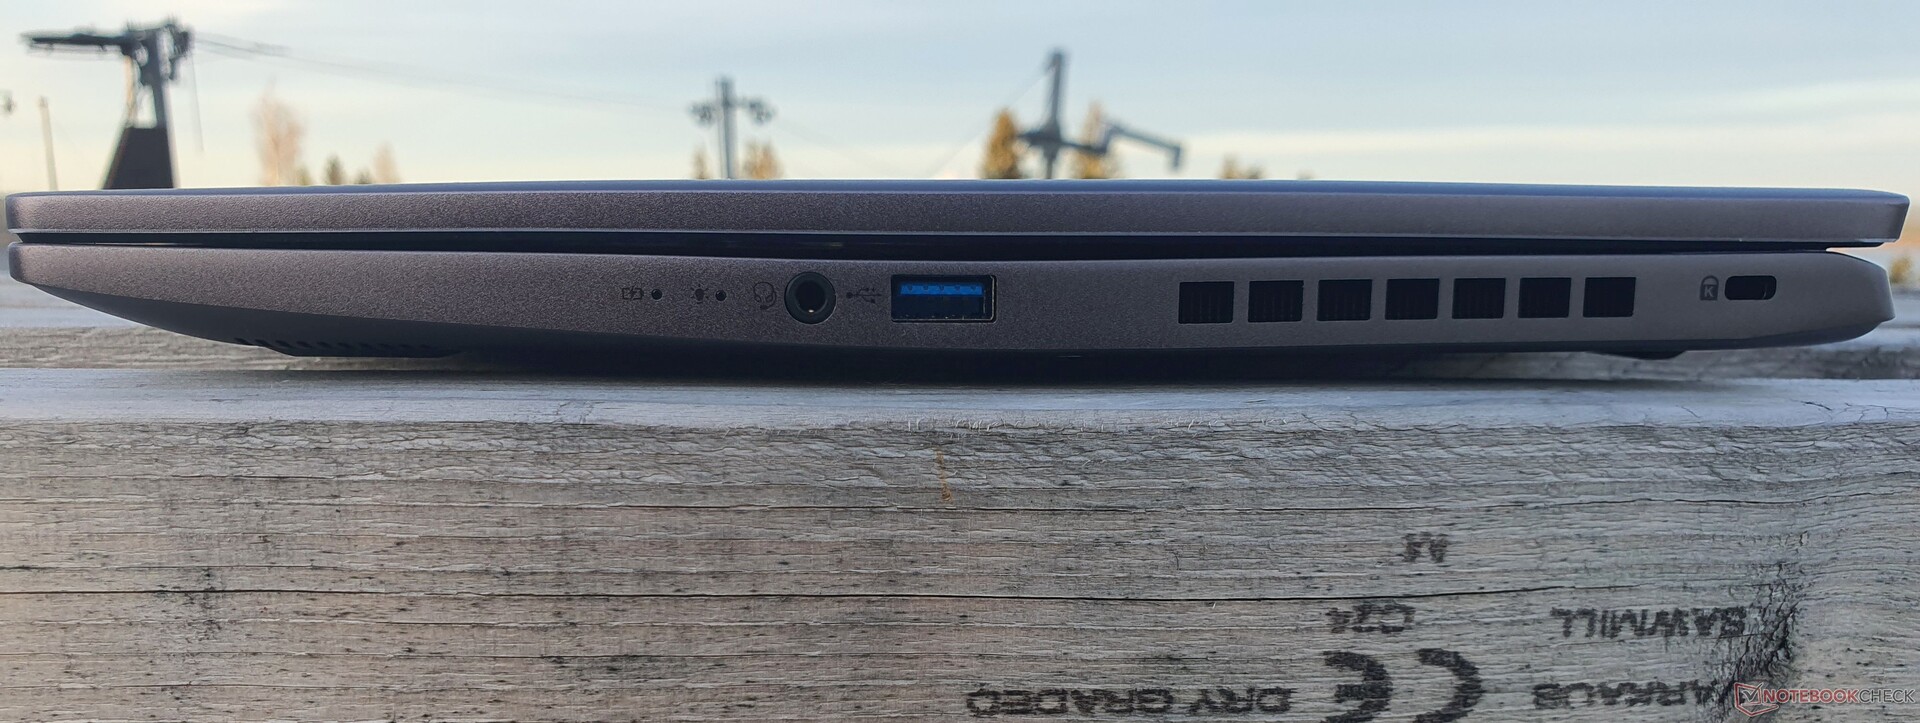
Sprzęt: Aktualizacja do HDMI 2.1 & TB4 dla Acer Swift X
| Networking | |
| Acer Swift X SFX16-52G-77RX | |
| iperf3 receive AXE11000 | |
| iperf3 transmit AXE11000 | |
| Acer Swift X SFX16-52G-52VE | |
| iperf3 receive AXE11000 | |
| iperf3 transmit AXE11000 | |
| Acer Swift X SFX16-51G-5388 | |
| iperf3 transmit AX12 | |
| iperf3 receive AX12 | |
| Lenovo ThinkBook 16 G4+ IAP | |
| iperf3 receive AXE11000 | |
| iperf3 transmit AXE11000 | |
| HP Envy 16 h0112nr | |
| iperf3 receive AXE11000 6GHz | |
| iperf3 transmit AXE11000 6GHz | |
| Dell Inspiron 16 Plus 7620 | |
| iperf3 receive AXE11000 6GHz | |
| iperf3 transmit AXE11000 6GHz | |
| Lenovo IdeaPad 5 Pro 16ARH7 | |
| iperf3 receive AXE11000 | |
| iperf3 transmit AXE11000 | |
| Asus Vivobook Pro 16X-M7600QE | |
| iperf3 transmit AX12 | |
| iperf3 receive AX12 | |
WiFi Chart
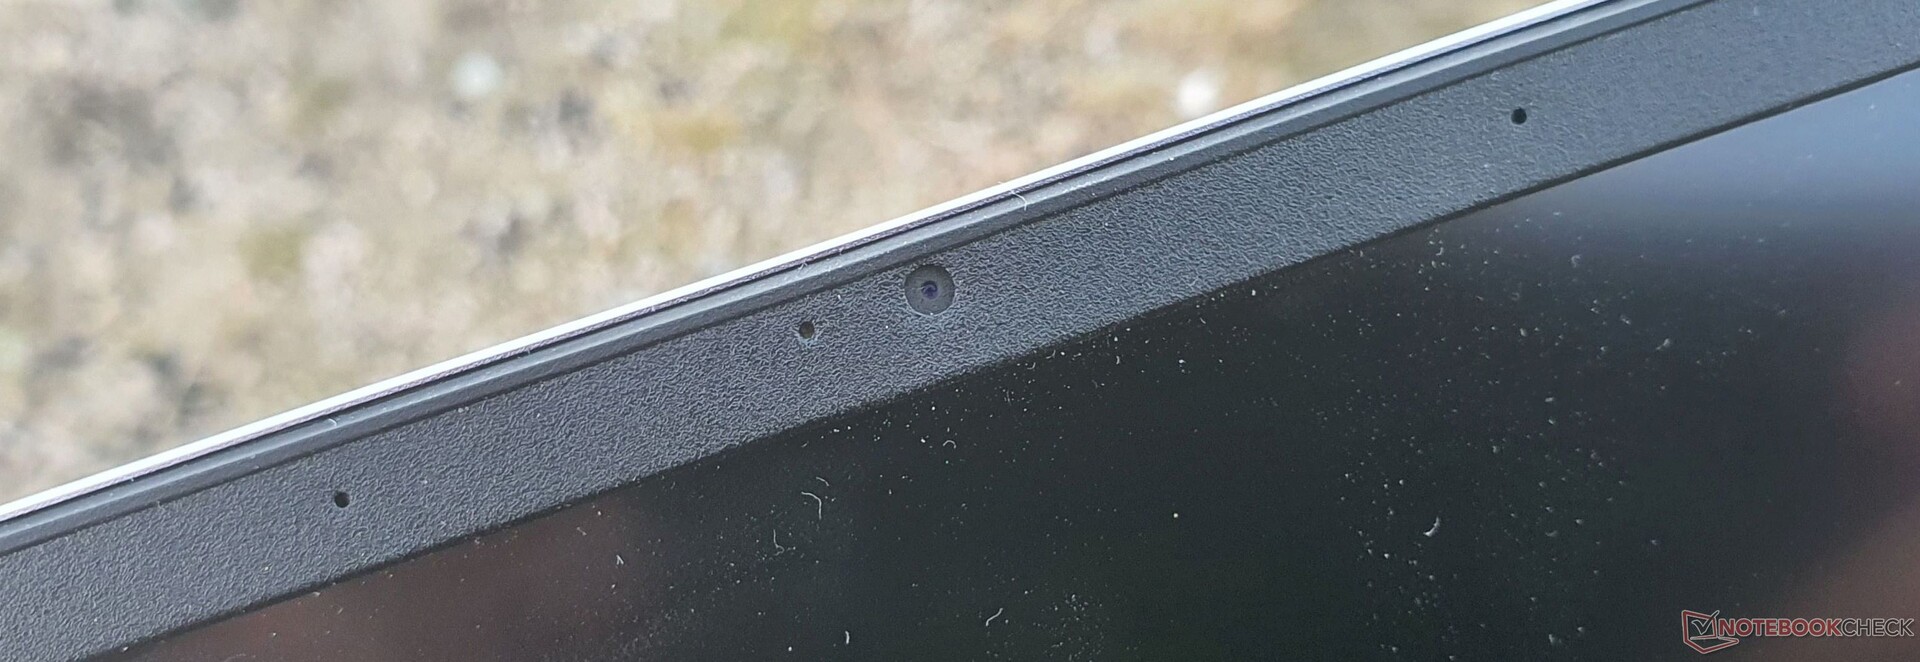
Kamera internetowa


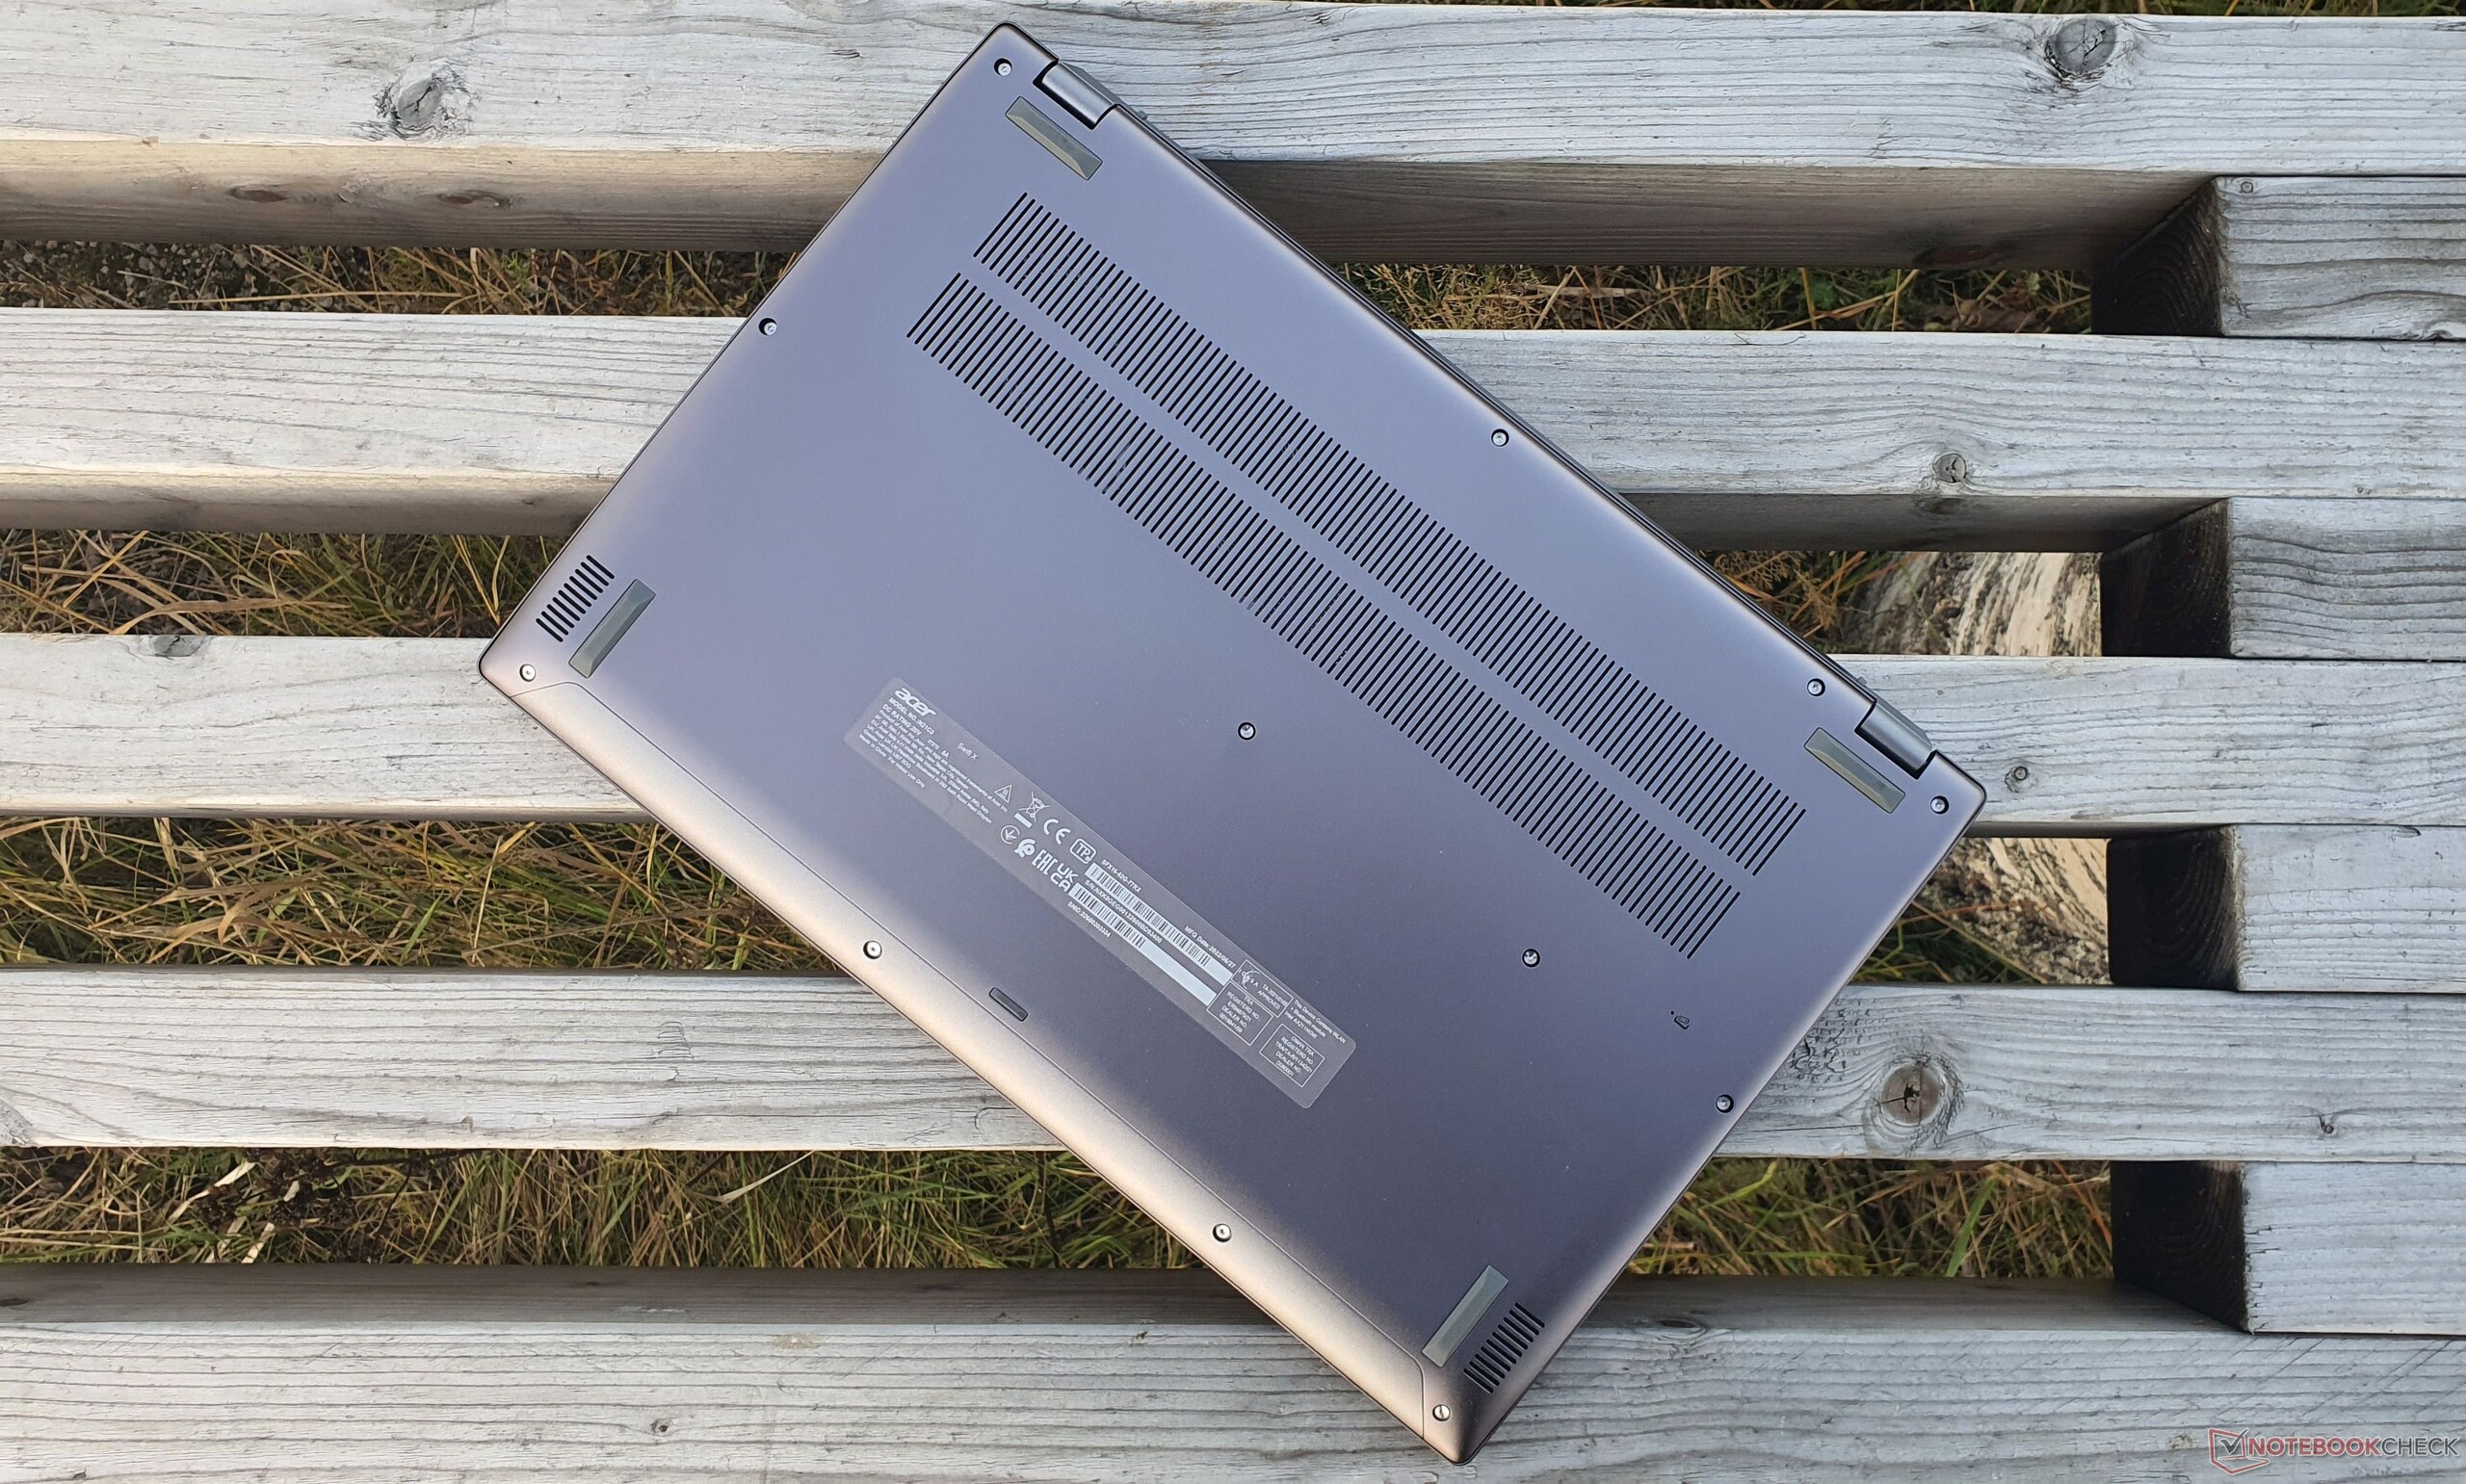
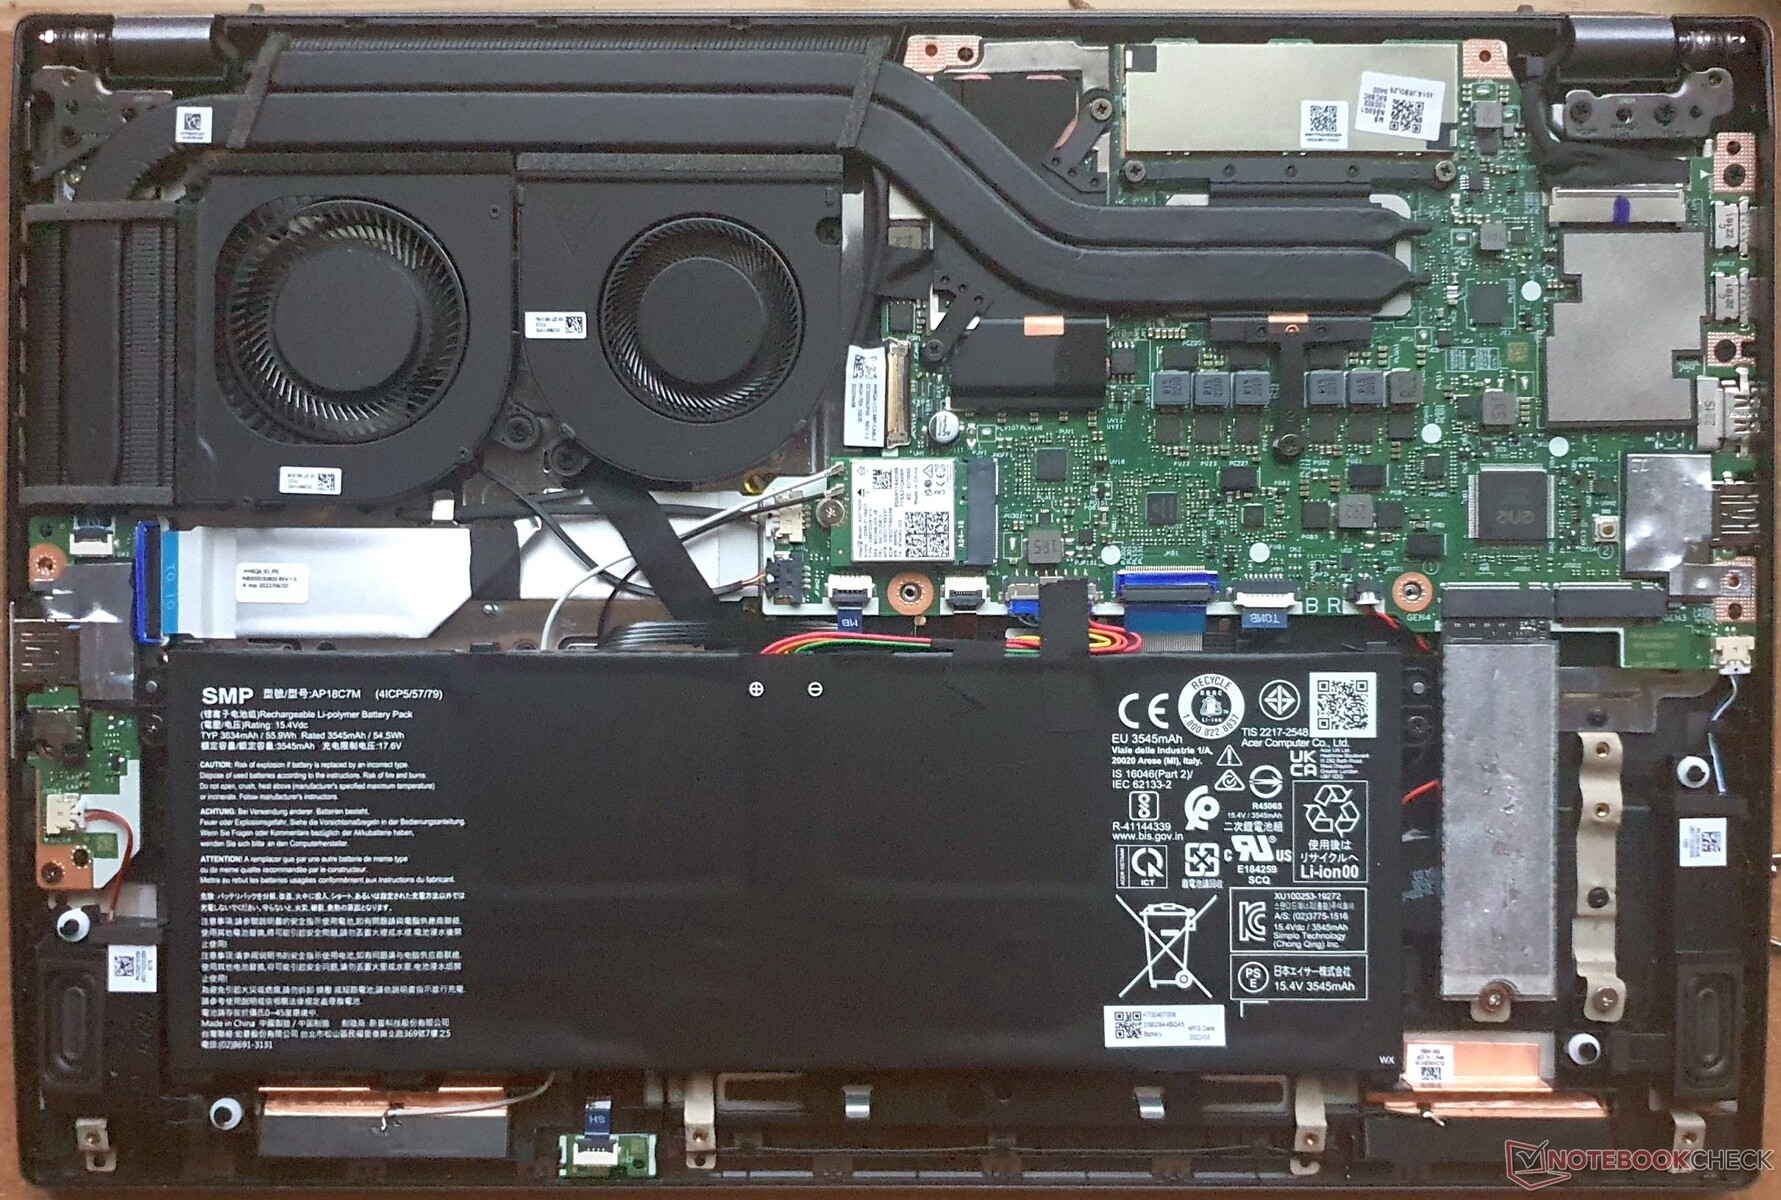
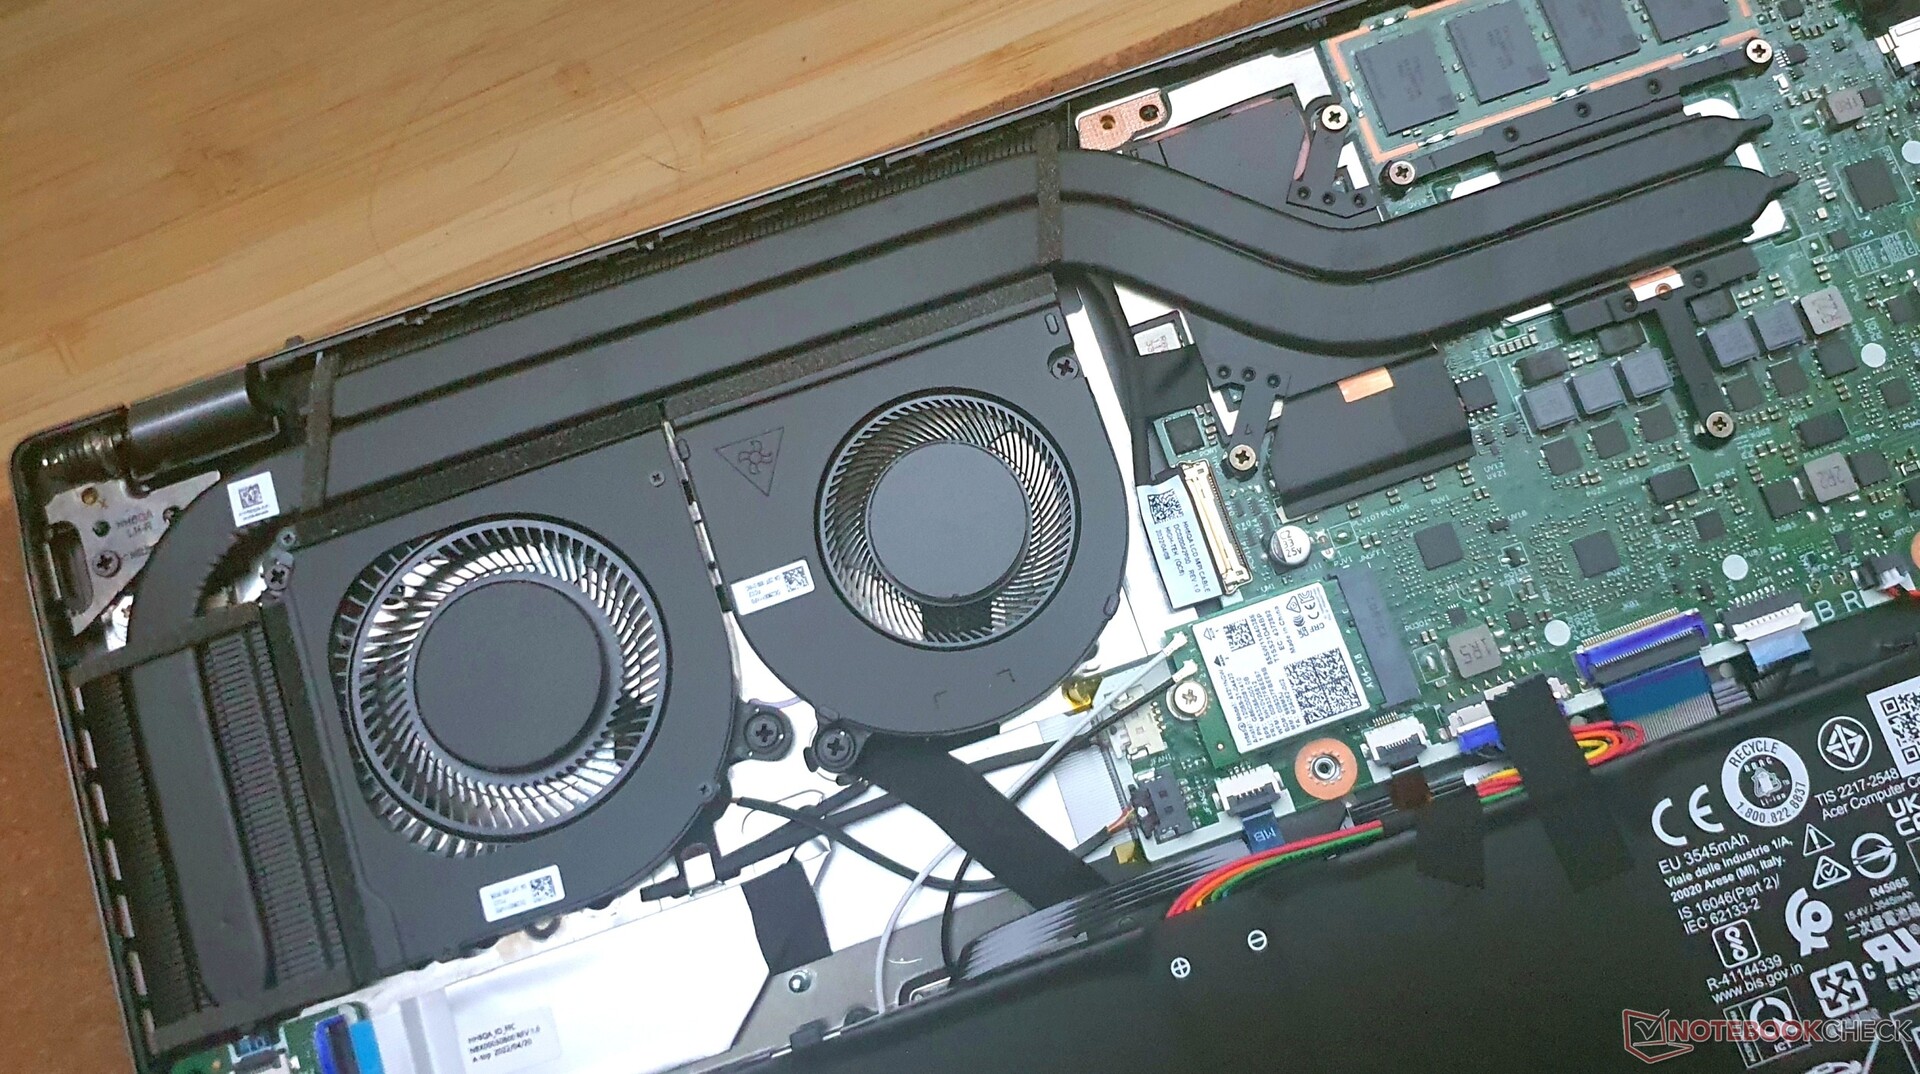
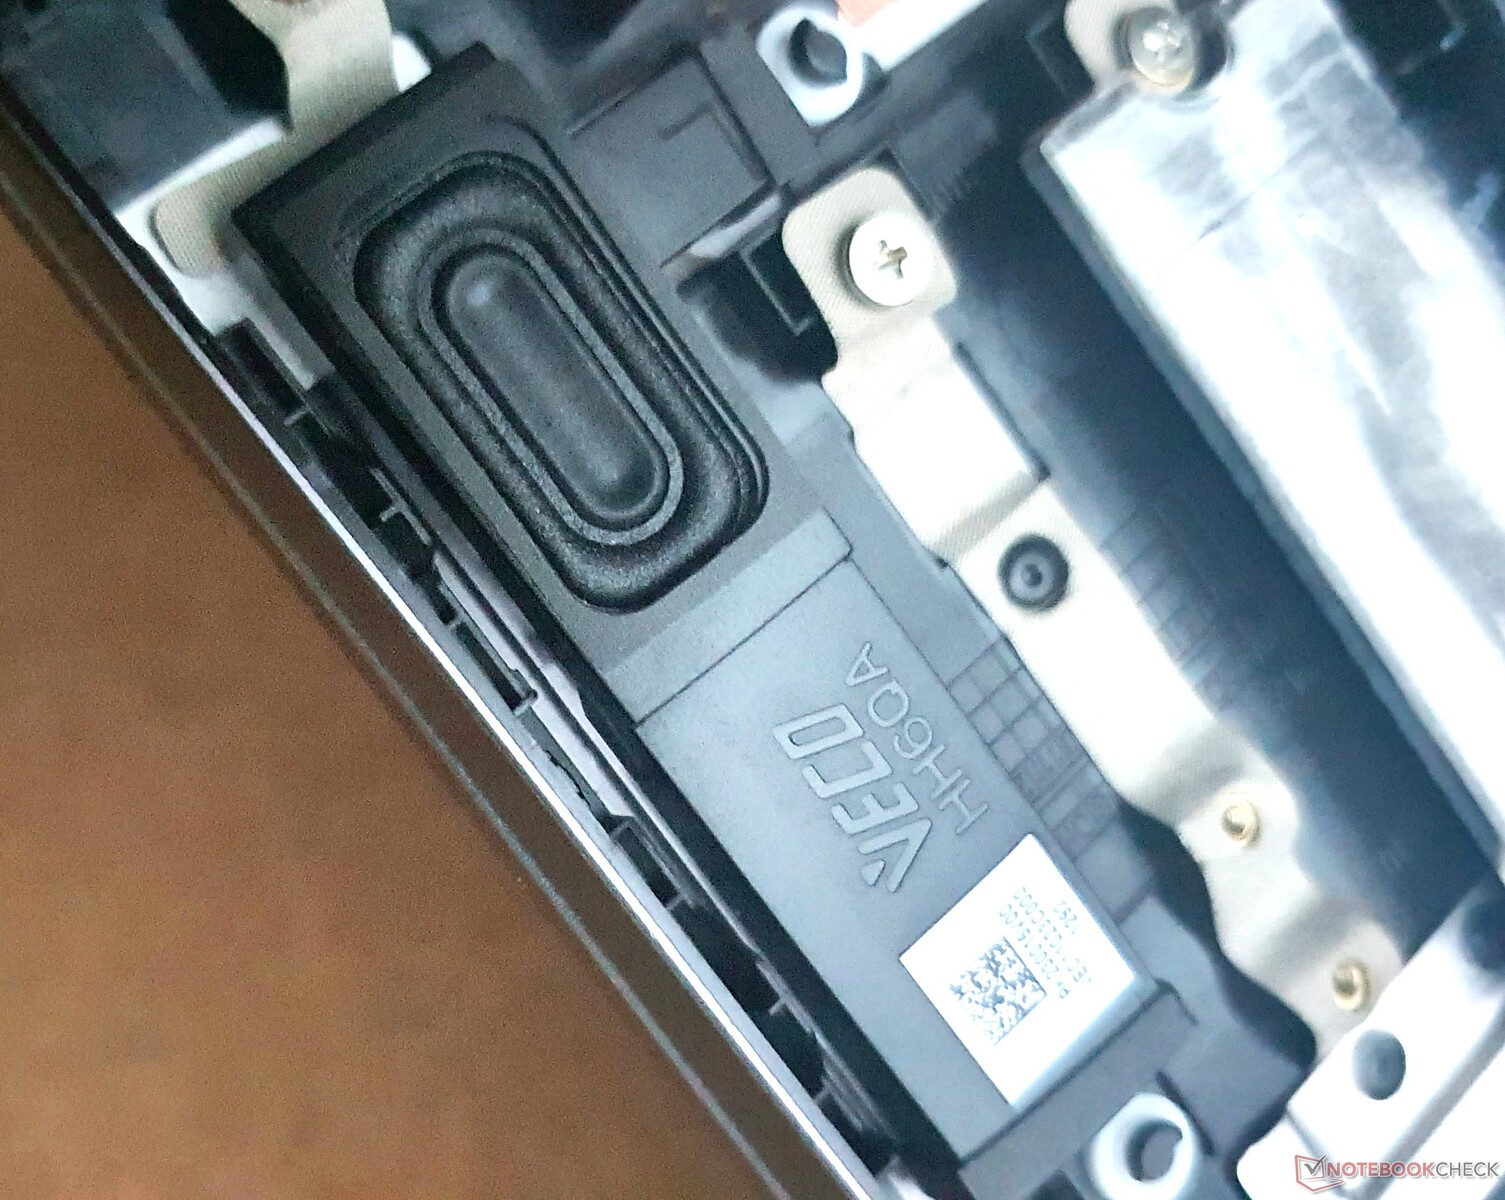
Konserwacja
Gwarancja
Acer na swoją serię Swift oferuje w Niemczech zwyczajowe 2 lata gwarancji.
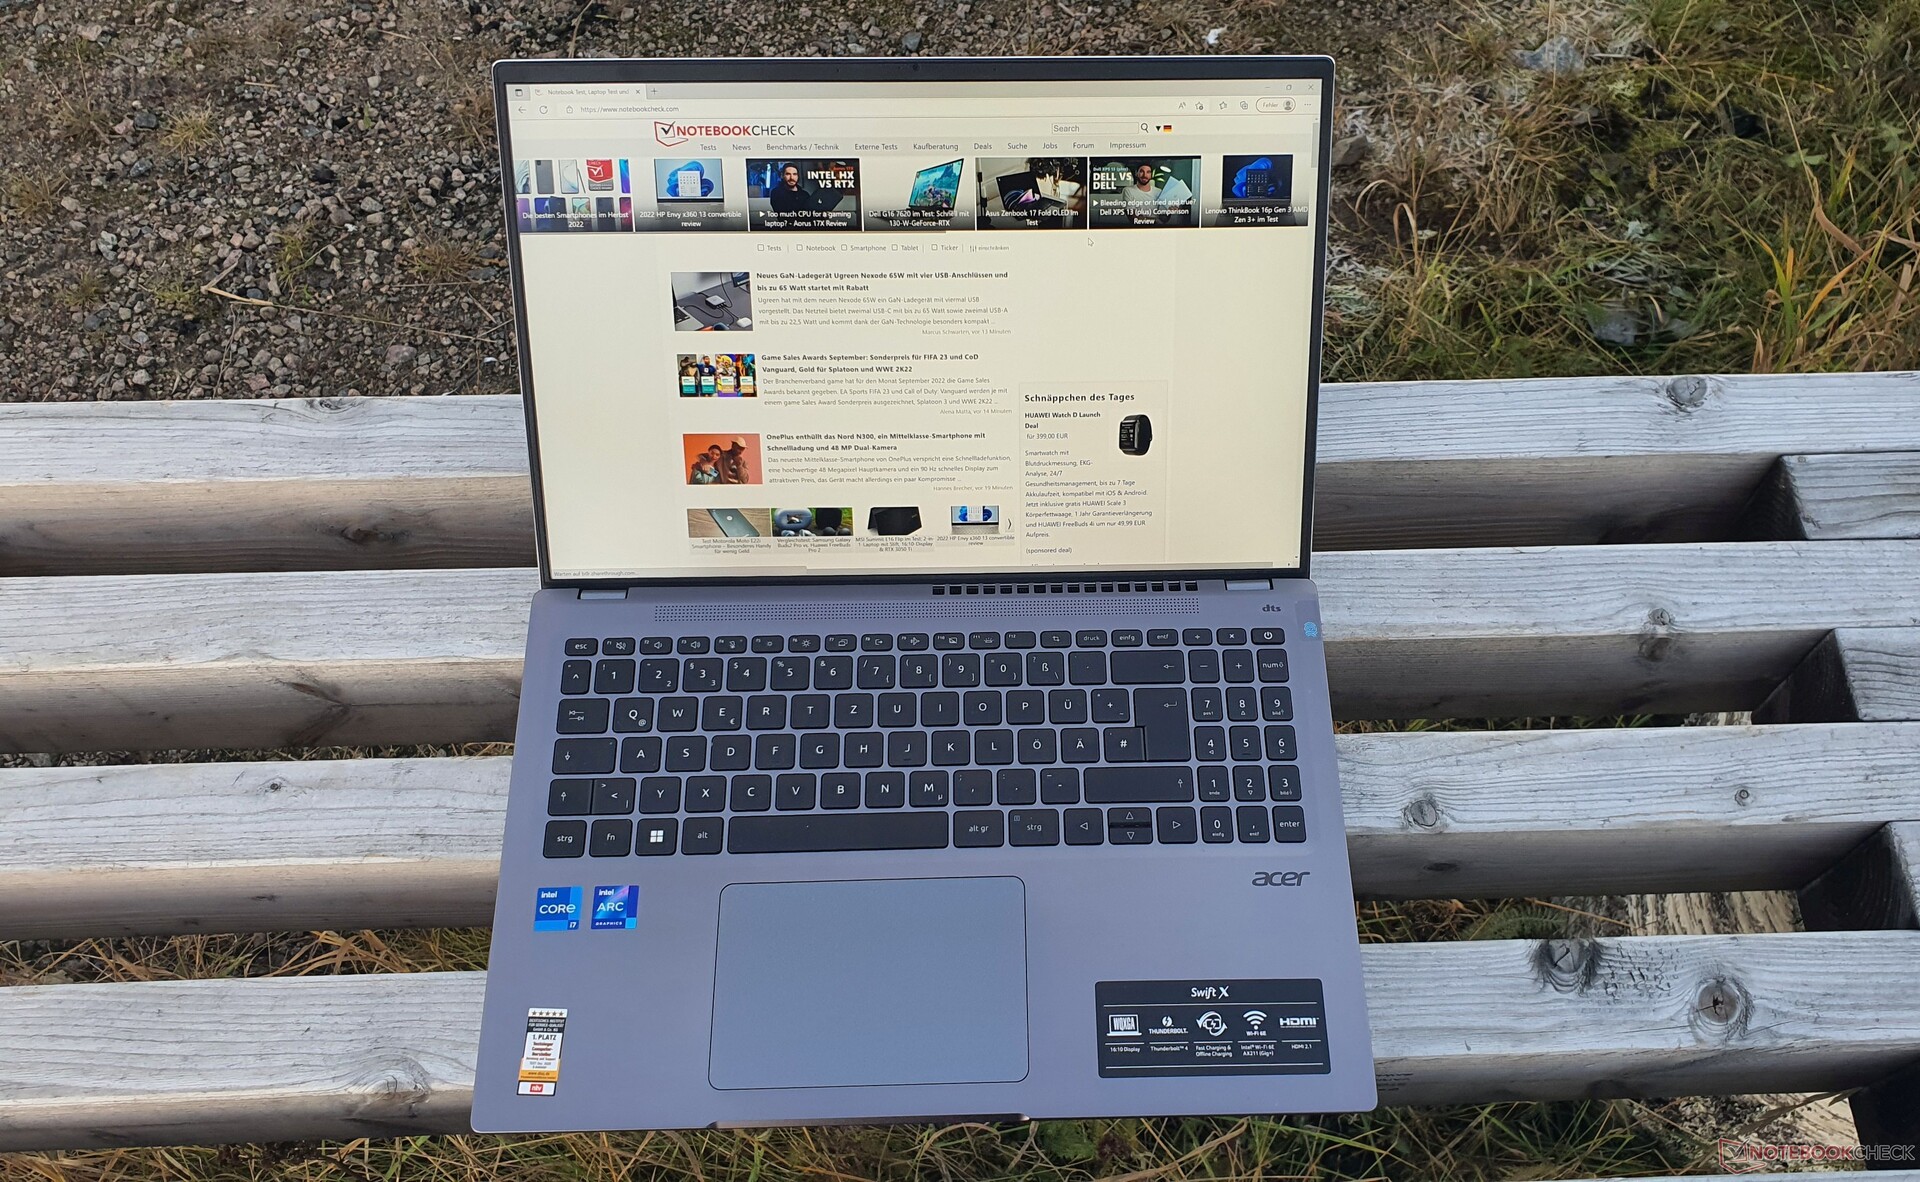
Urządzenia wejściowe: Świetna klawiatura, ale słaby touchpad w Acer Swift X
Klawiatura
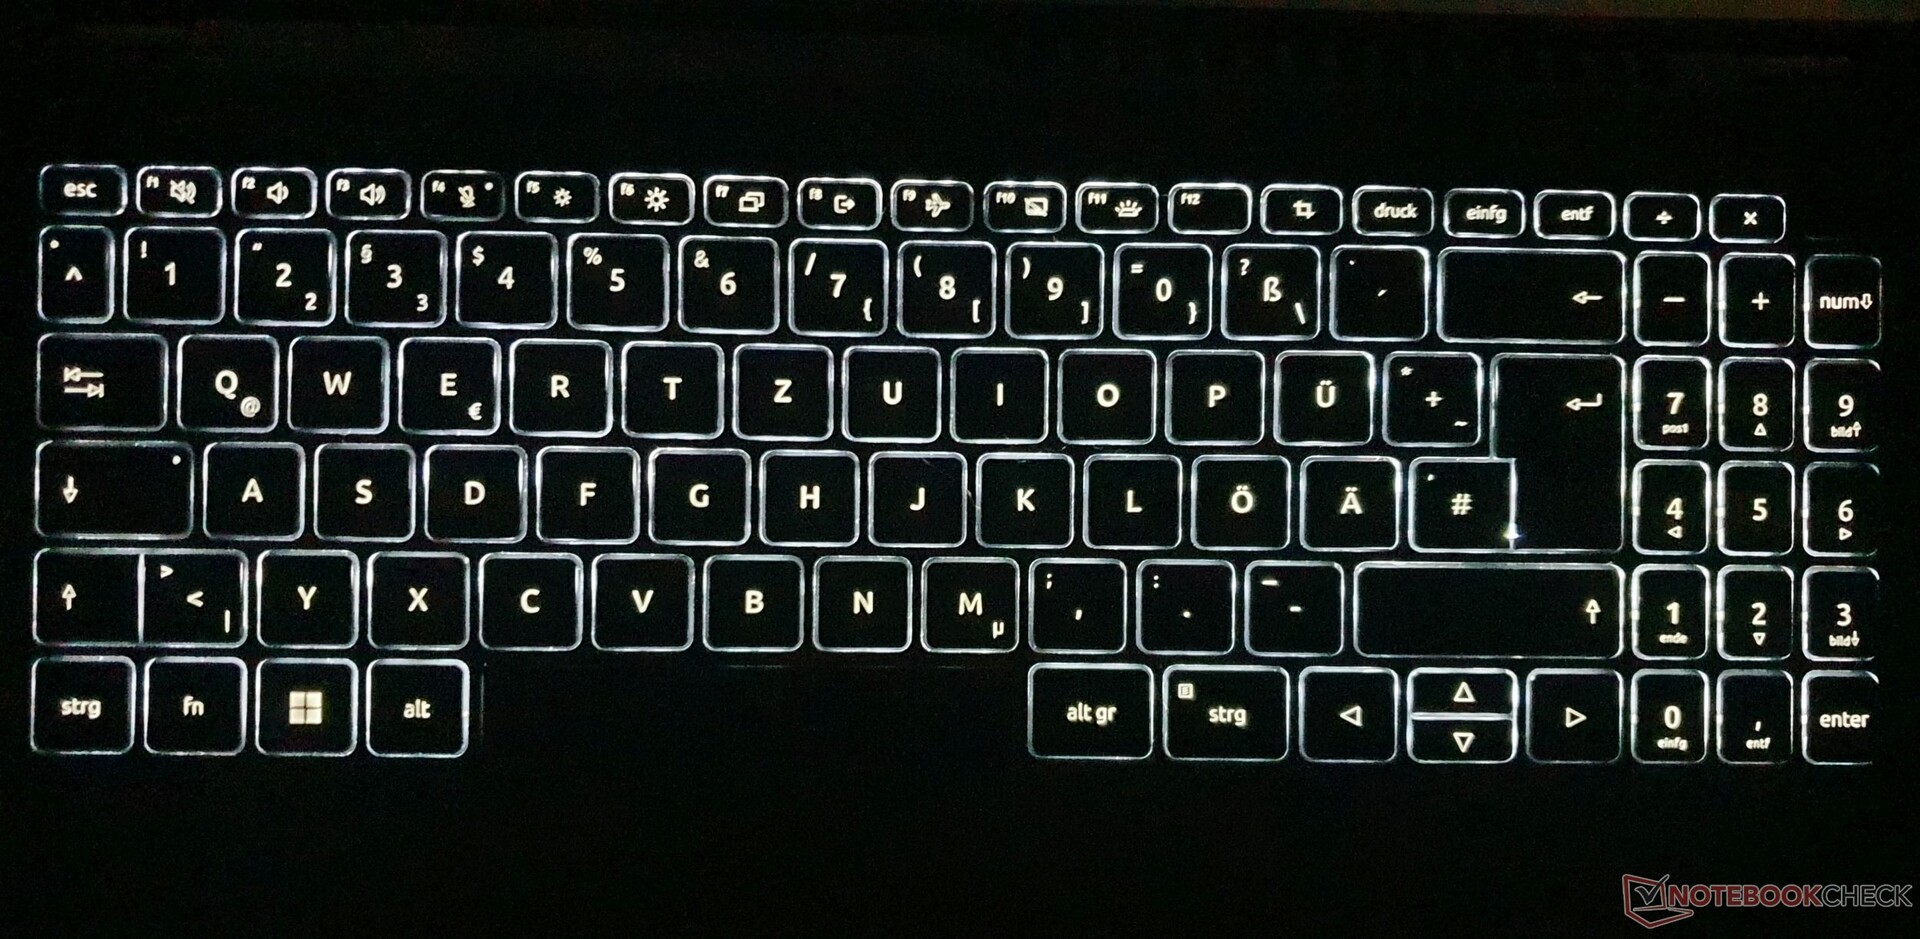
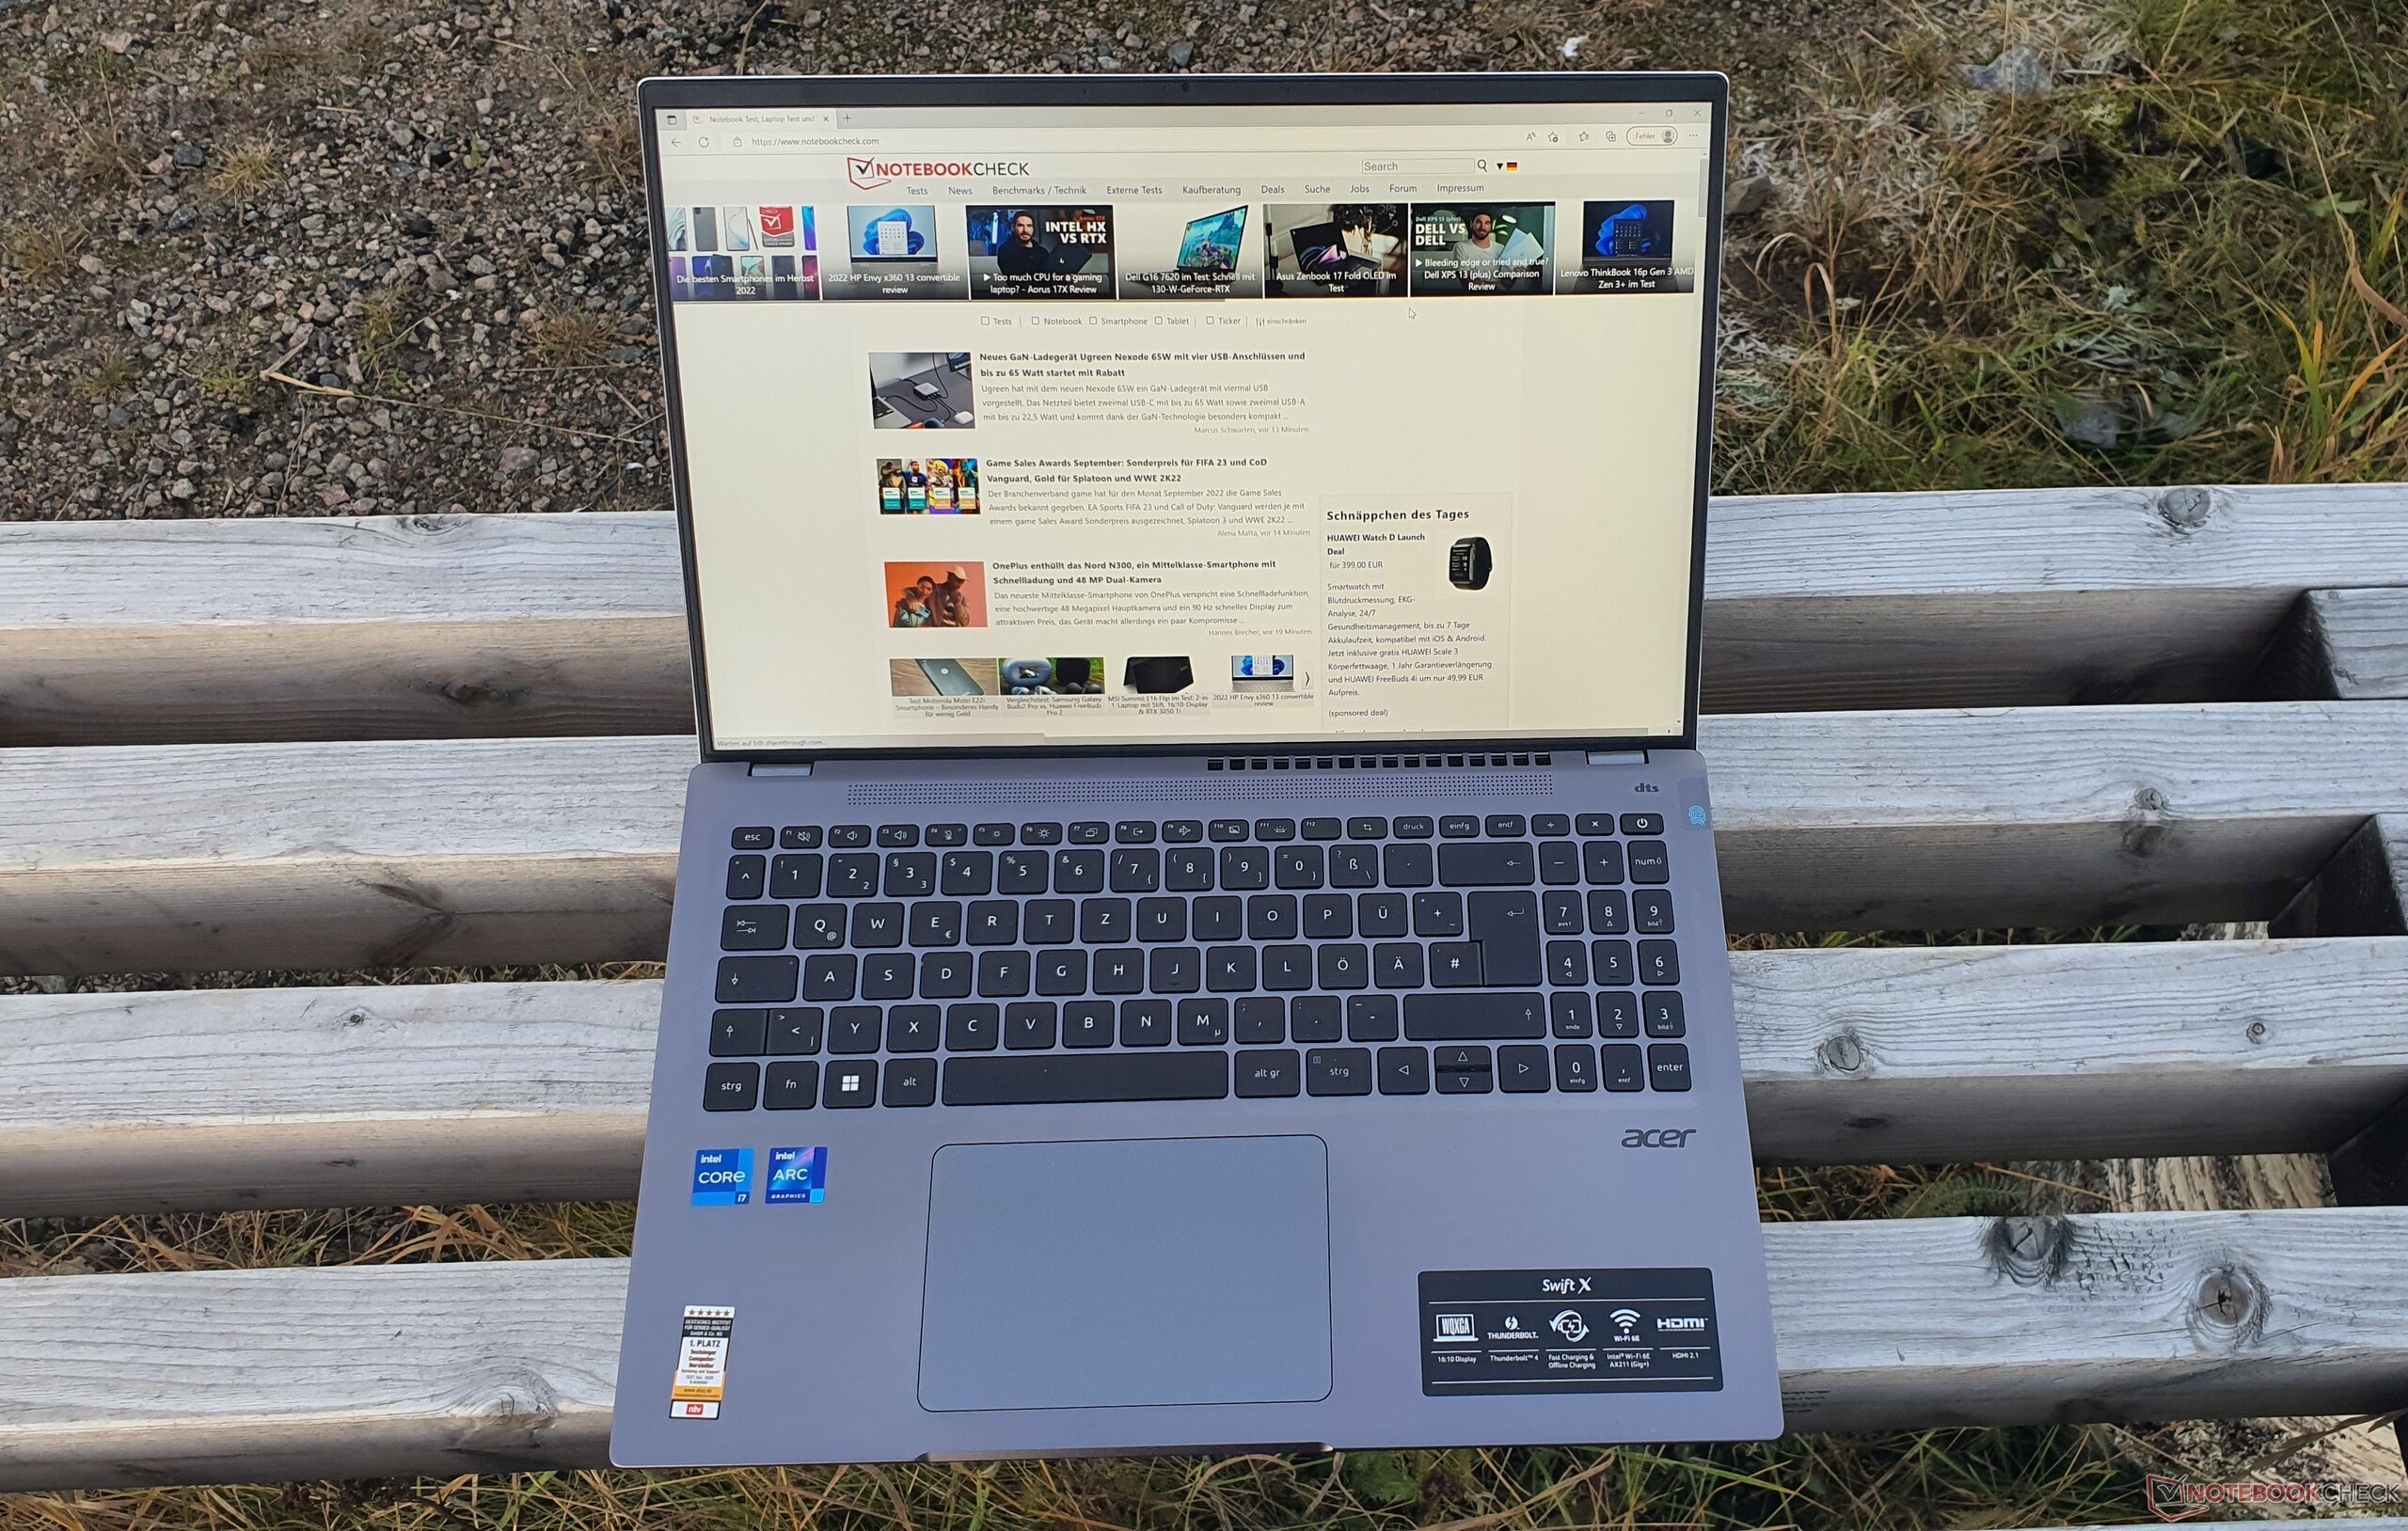
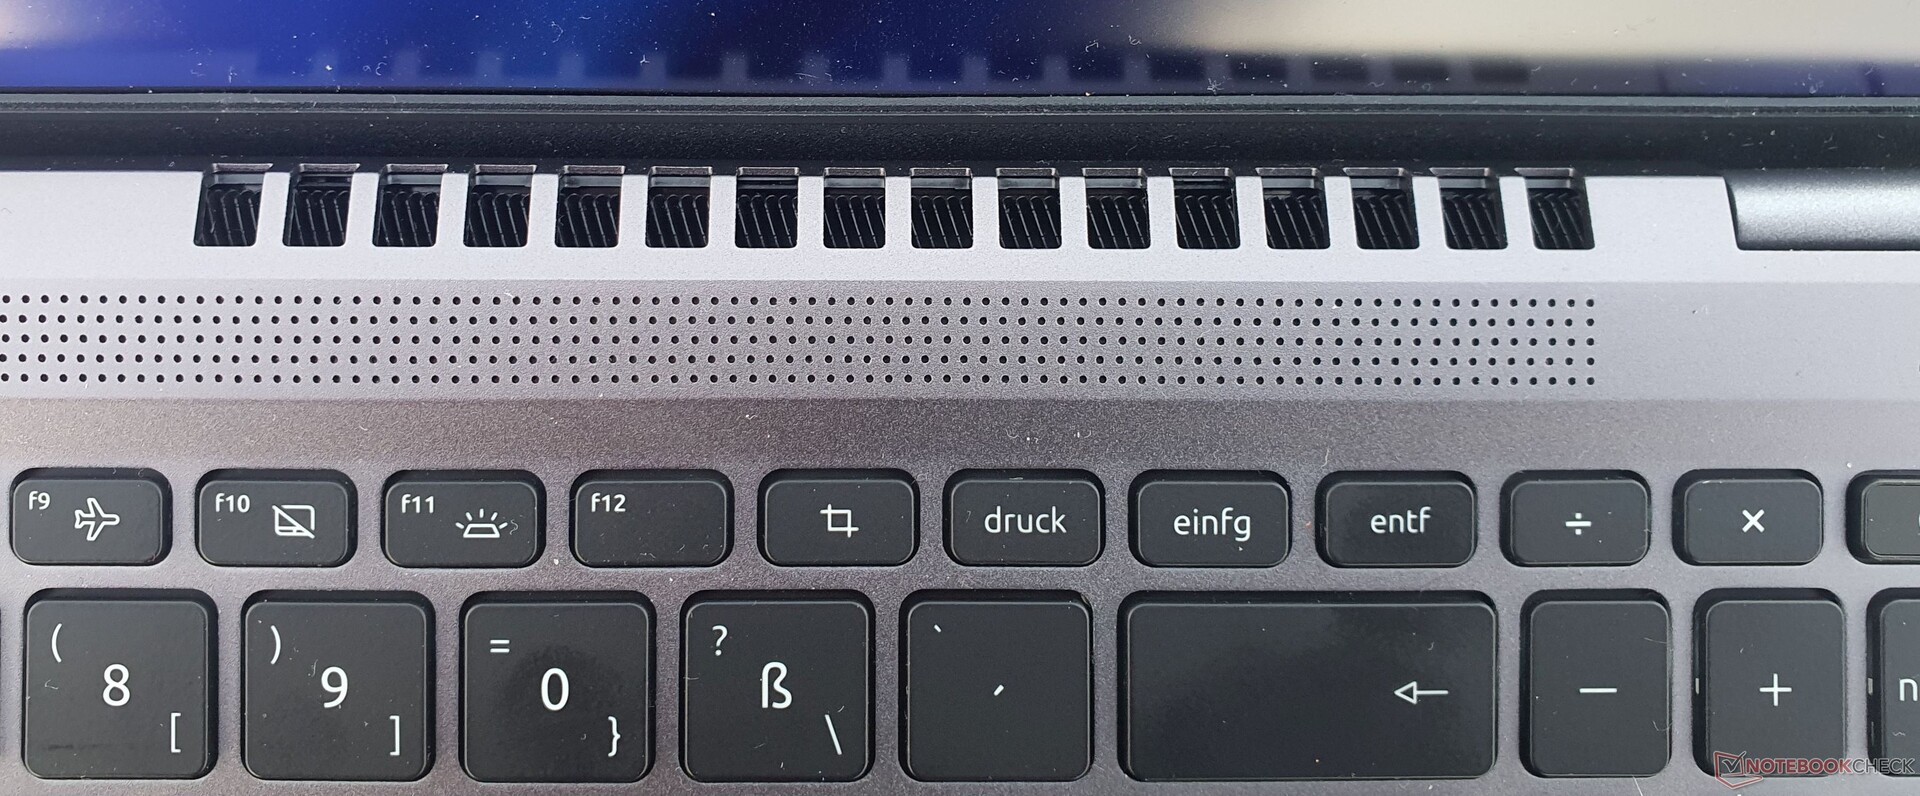
Rozmiar klawiszy 6-rzędowej klawiatury chiclet jest nieco zmniejszony i wynosi 15 x 15 mm (~0,59 x 0,59 cala). Skok klawiszy jest krótki, ale wraz z dobrze dobranym oporem punkt nacisku tworzy mocny feedback. Bez problemu można jej używać także do pisania dłuższych tekstów.
Klawiatura ma jednak pewien luz pod ukierunkowanym naciskiem. Podczas pisania daje się to zauważyć w postaci lekko klekotliwych klawiszy Enter i Hash. Układ klawiatury Acer ma typowe podwójne obłożenie, ciasny blok numeryczny oraz mniejsze klawisze strzałek góra/dół.
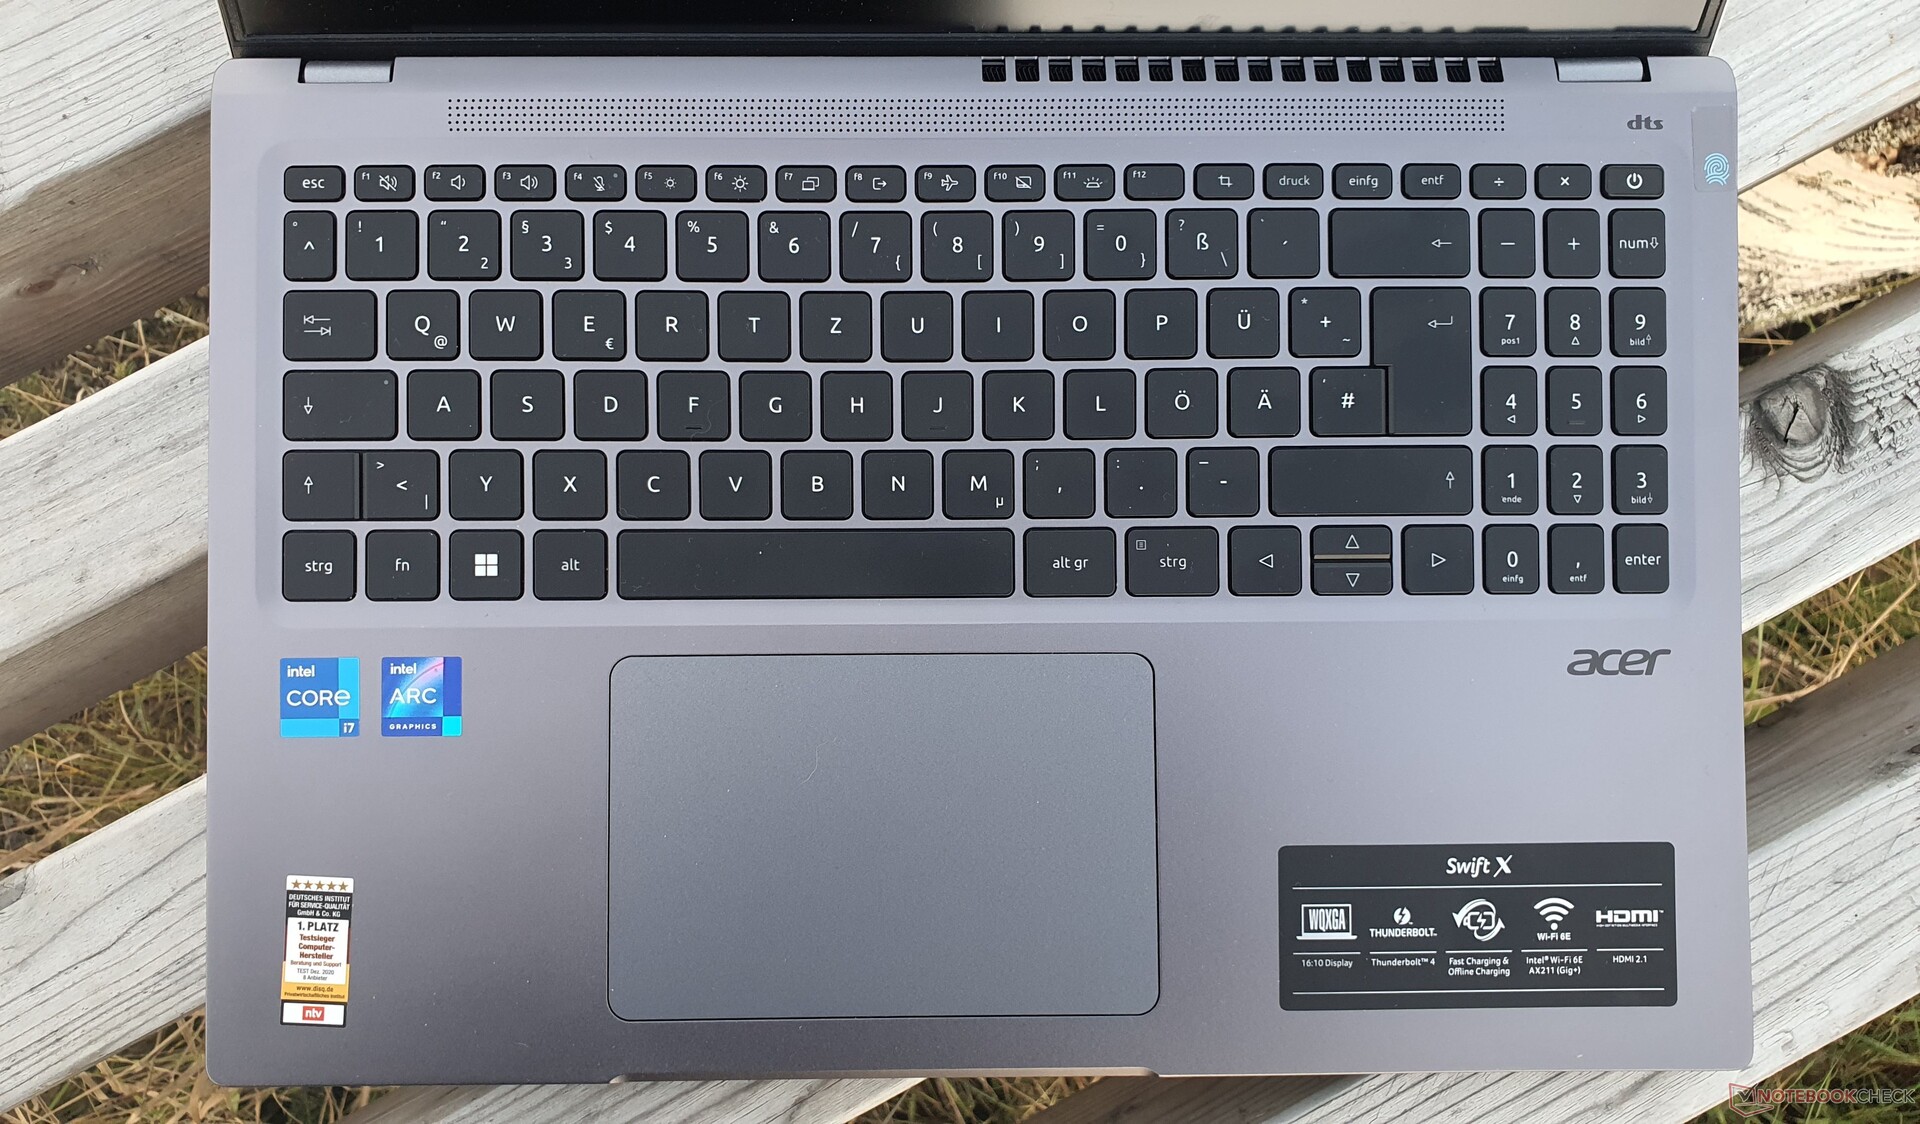
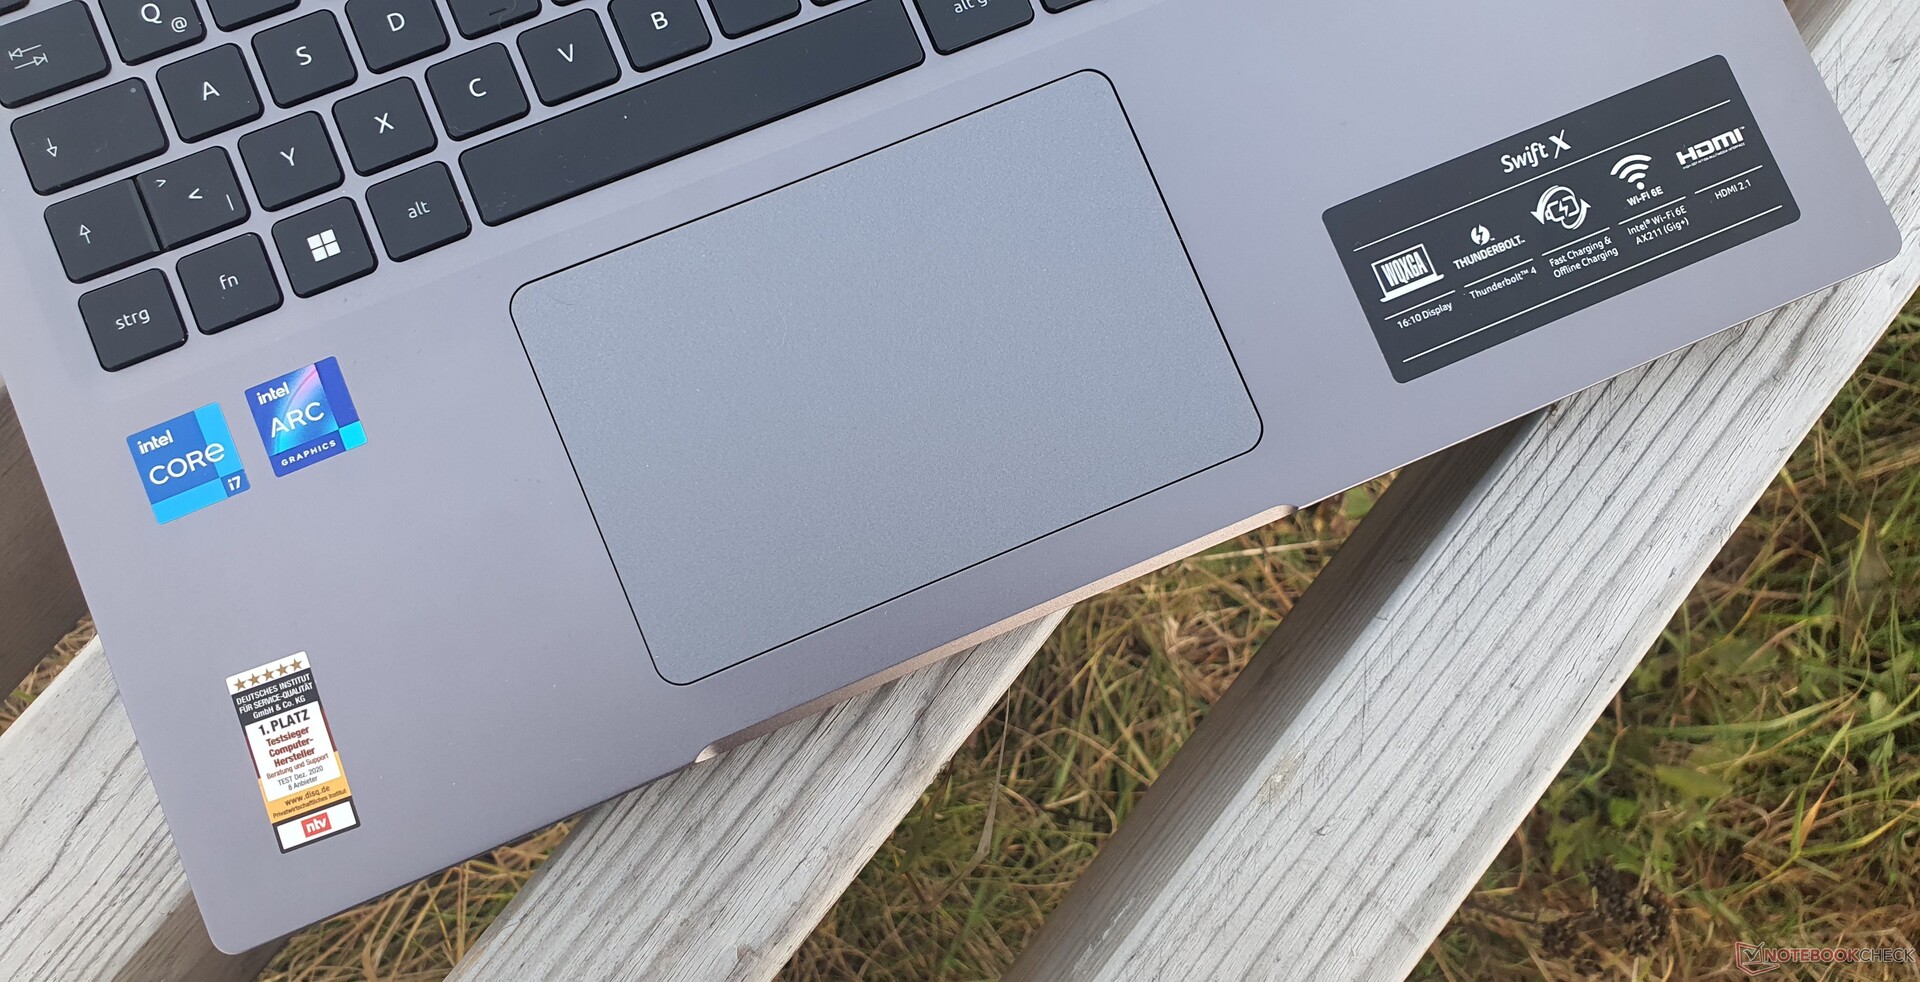
Touchpad
W tym roku Acer wyposażył Swift X 16 w swój touchpad "OceanGlass". Powierzchnia o wymiarach 12,7 x 8,3 cm jest śliska i niemal tłusta, co praktycznie uniemożliwia precyzyjne wprowadzanie danych. Ruchy przeciągania i upuszczania są również znacznie trudniejsze do wykonania. Zintegrowane klawisze o średnim skoku są matowe i klekotliwe, kiedy palce przesuwają się po touchpadzie.
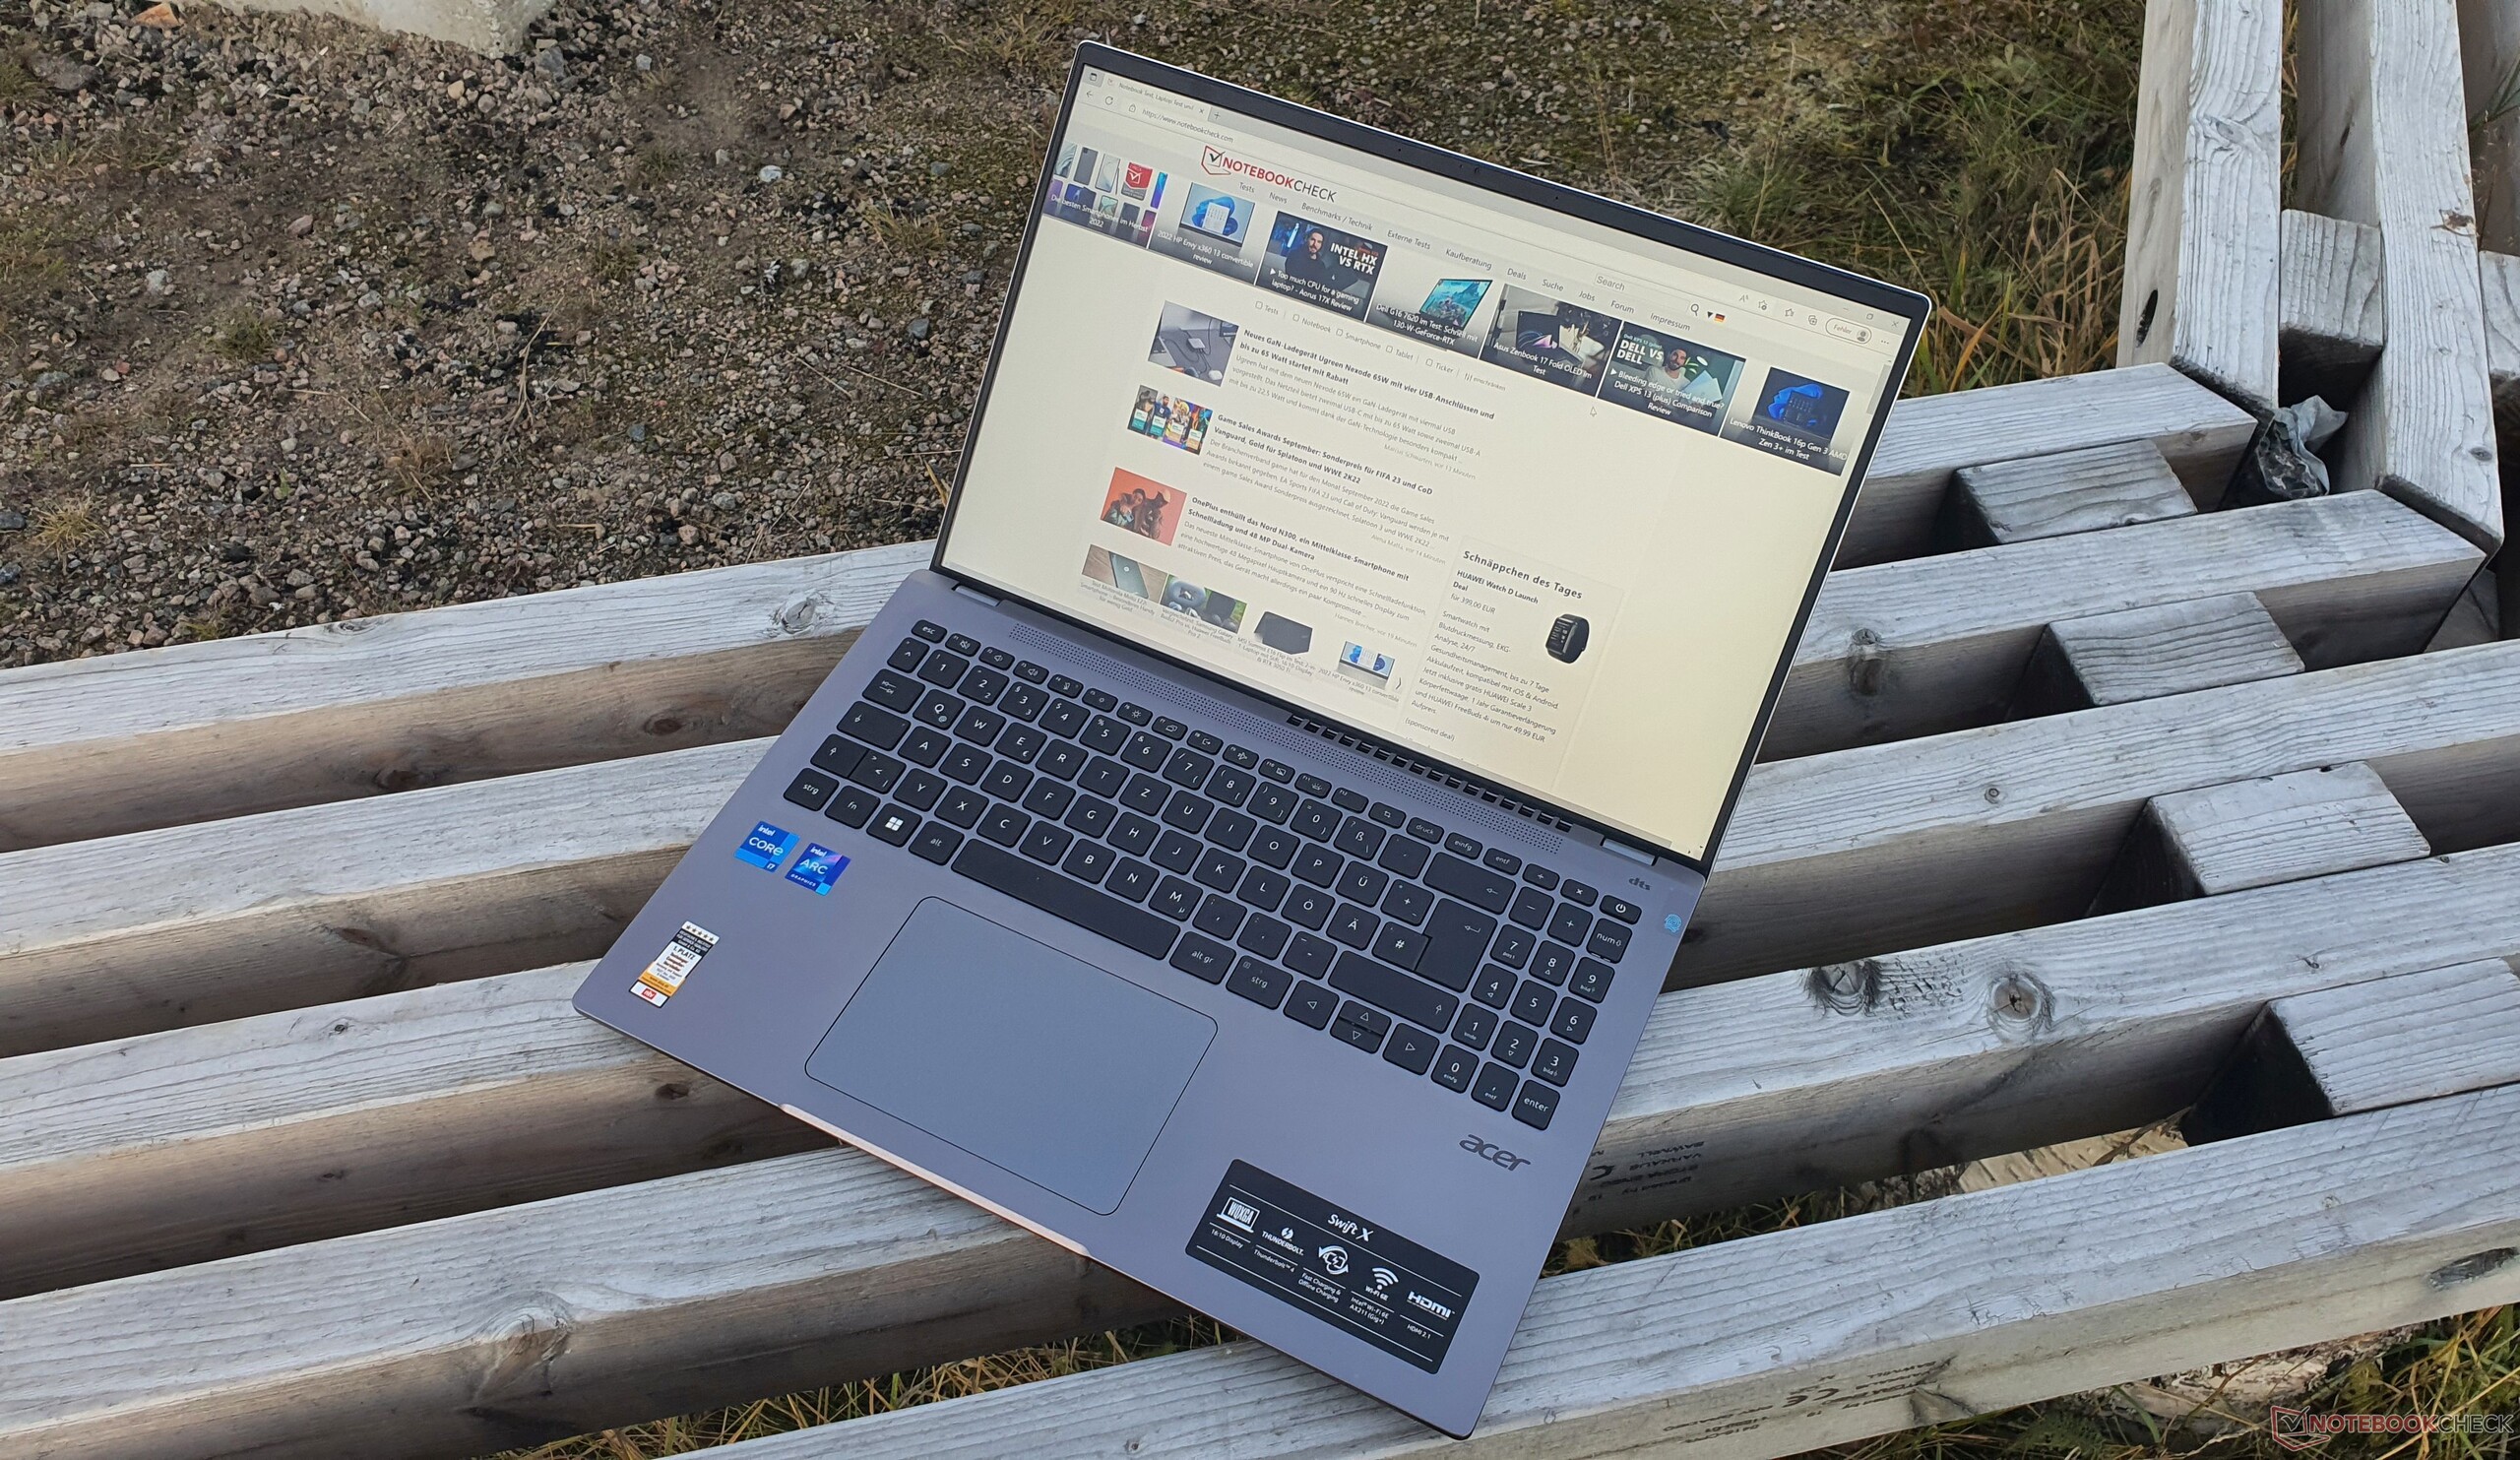
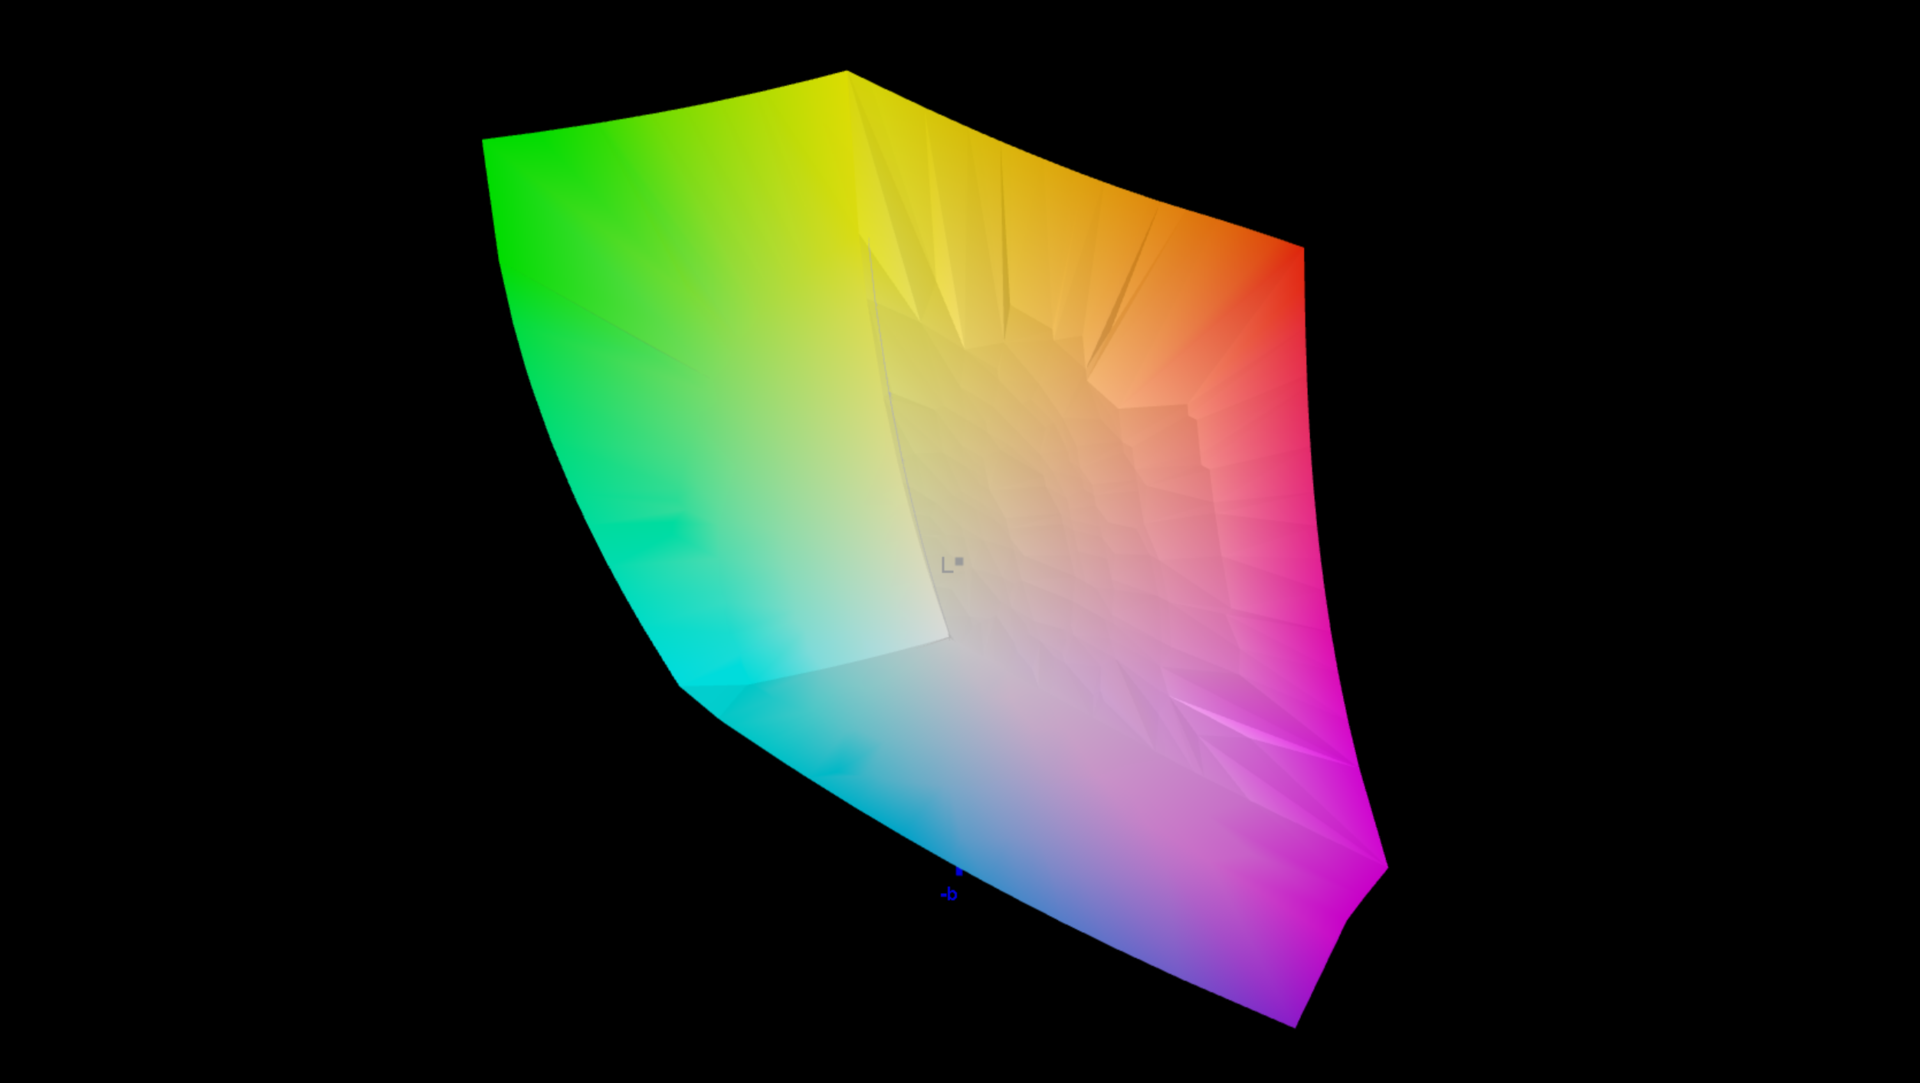
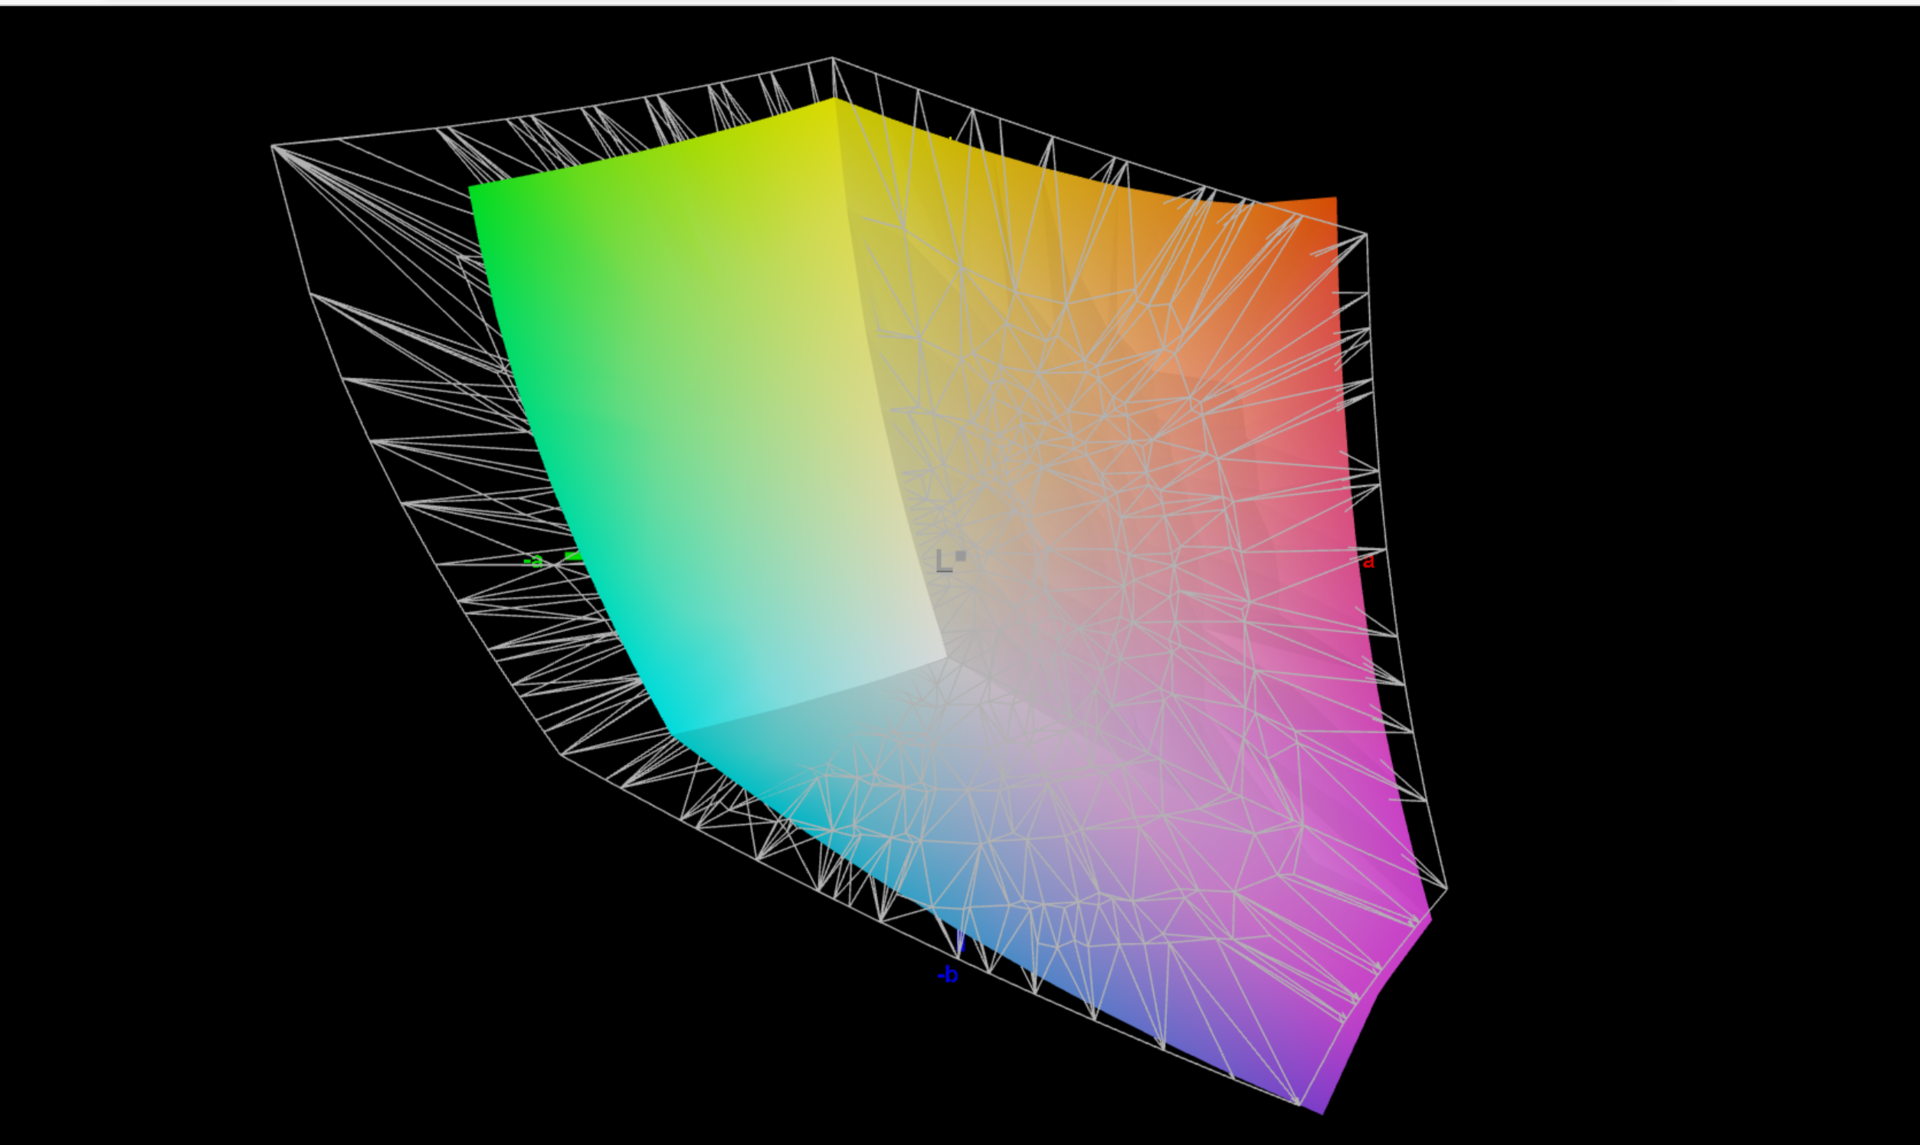
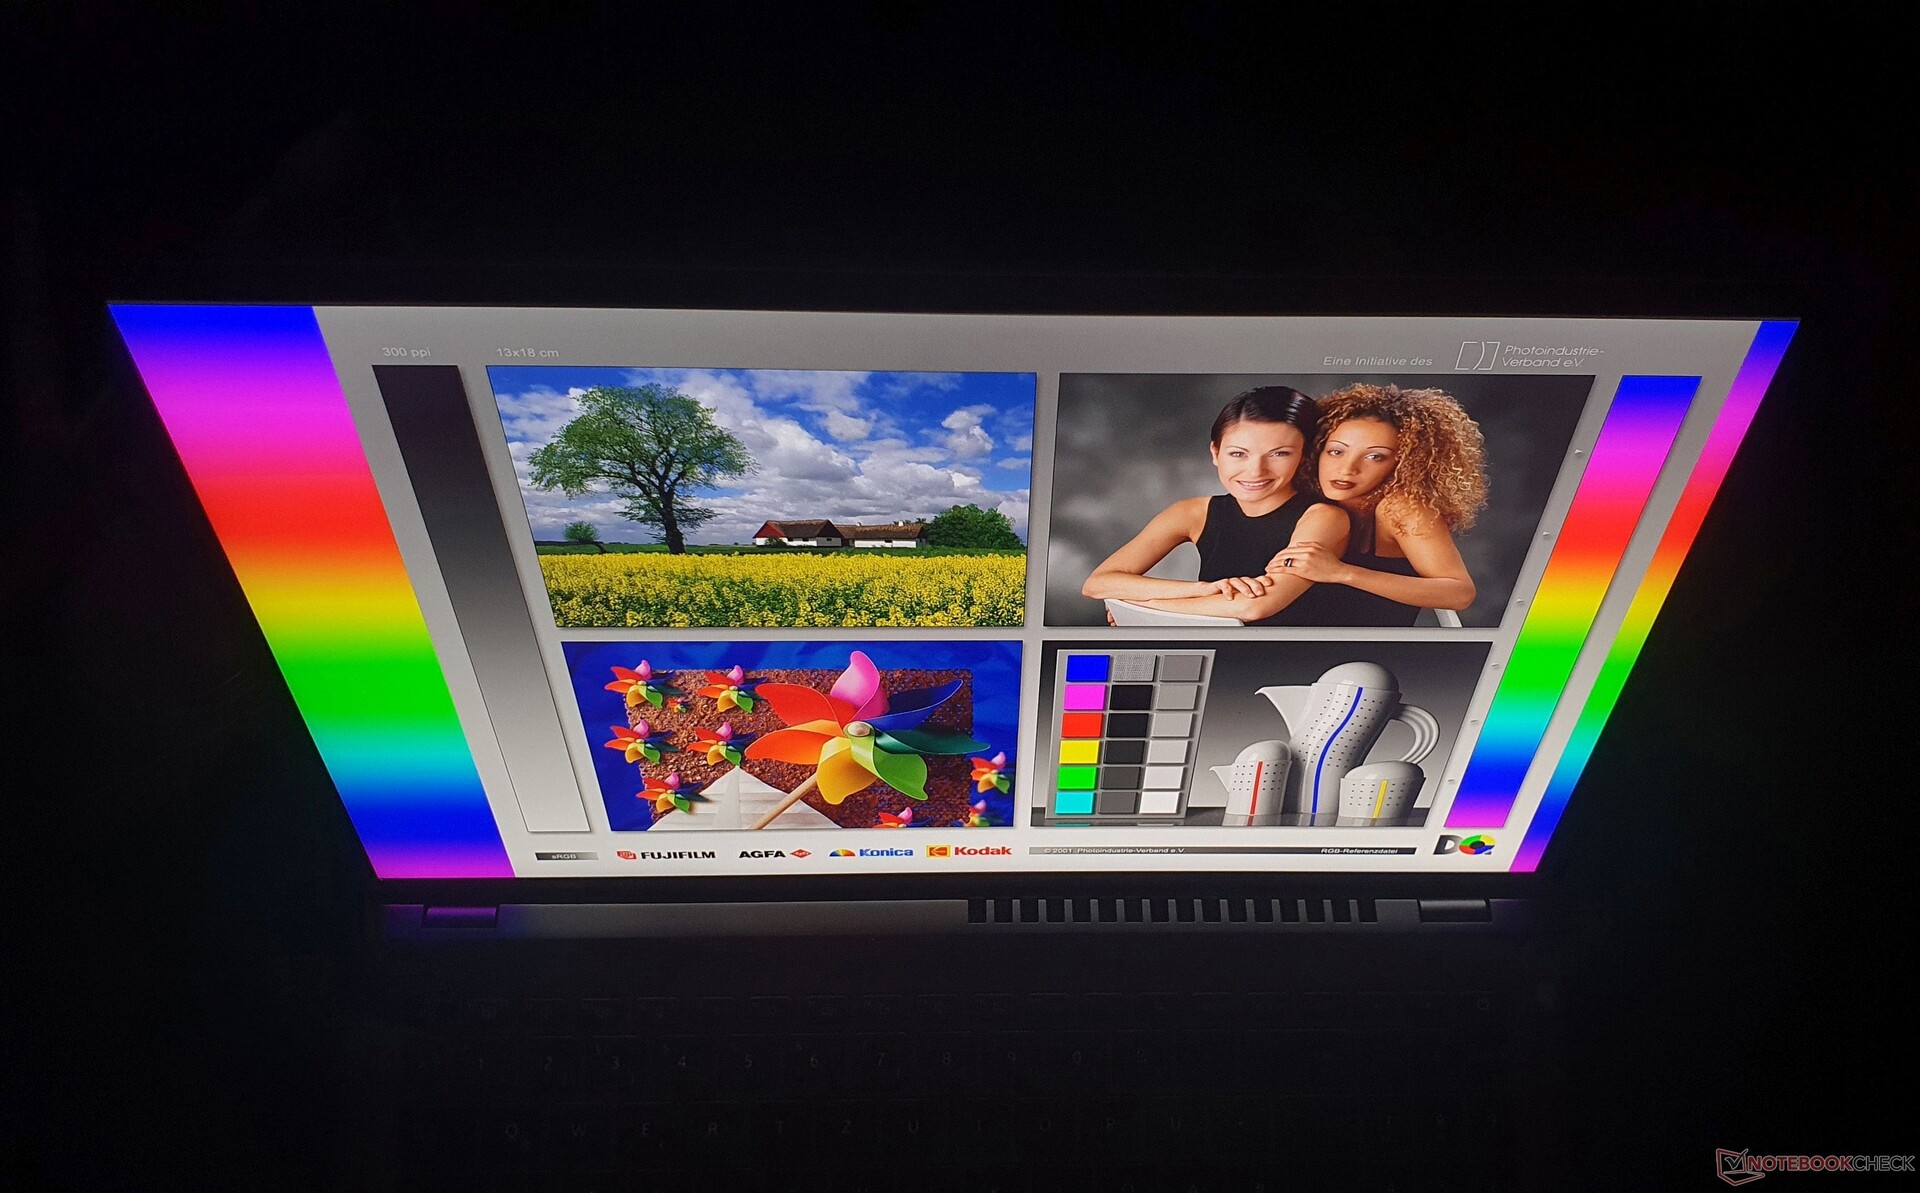
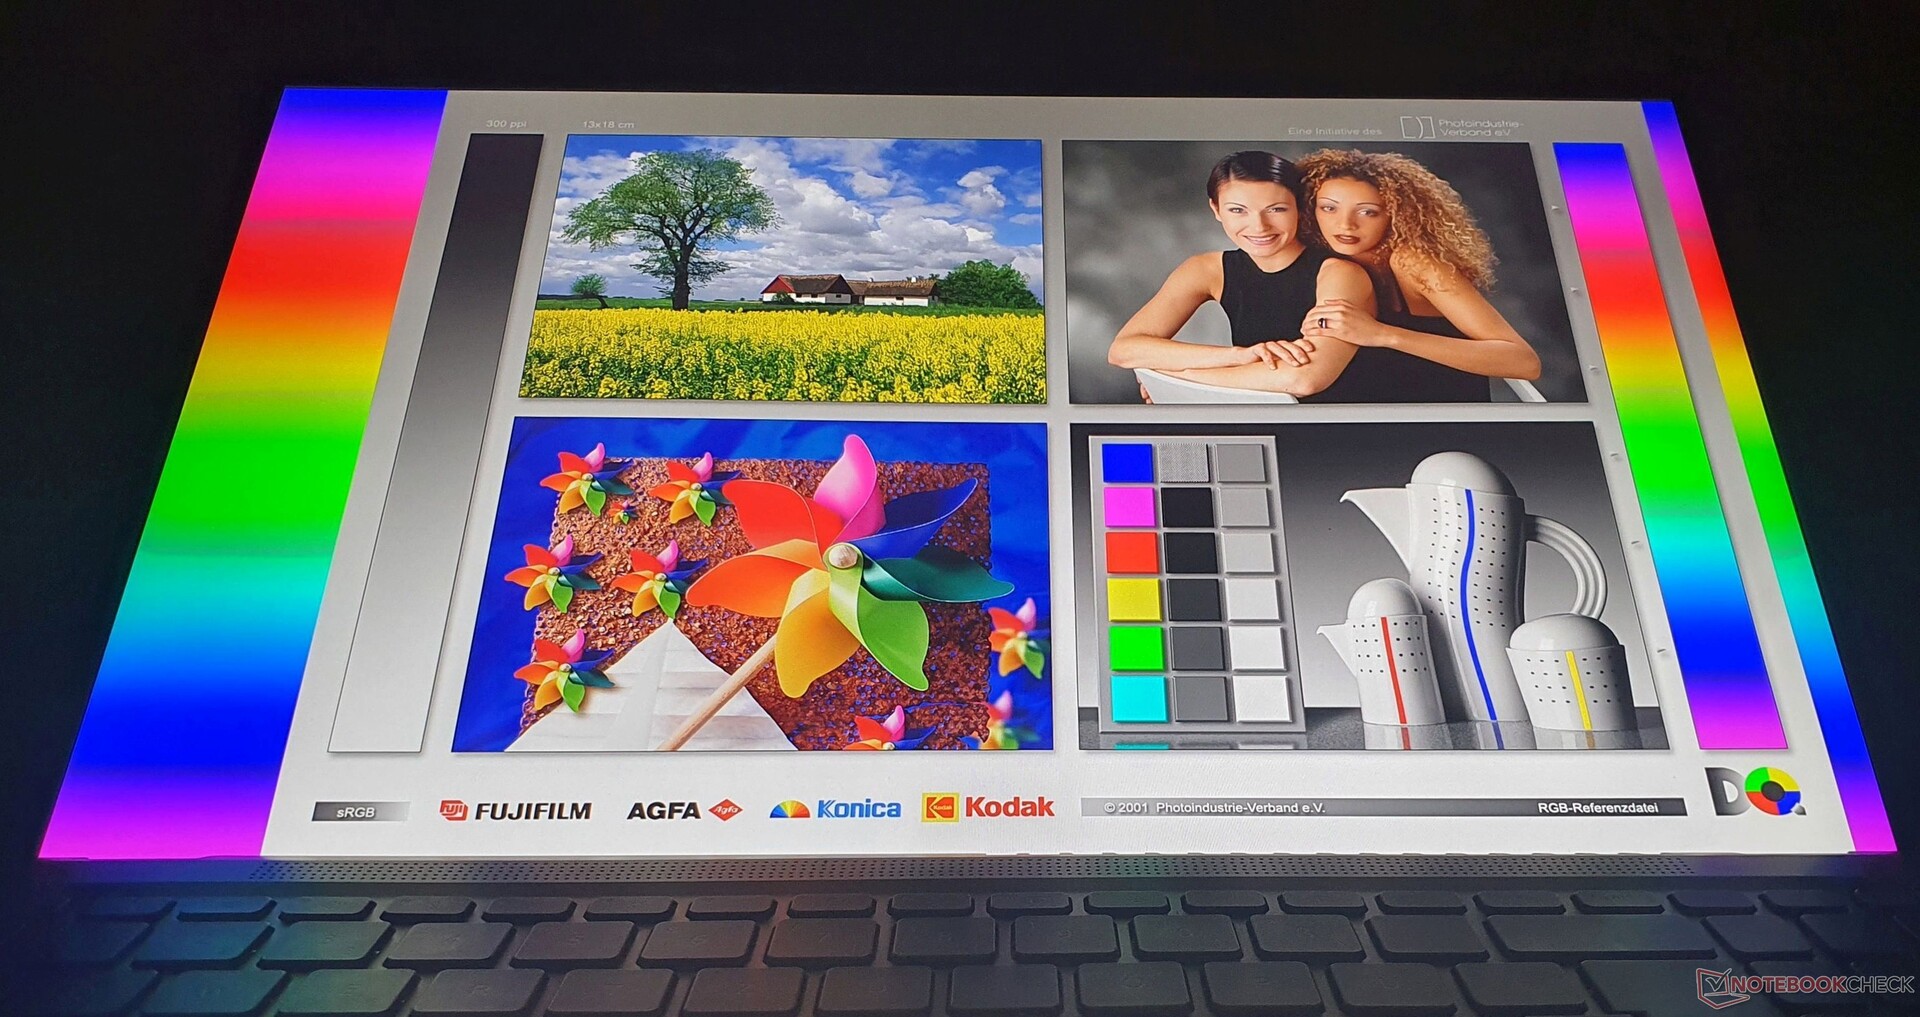
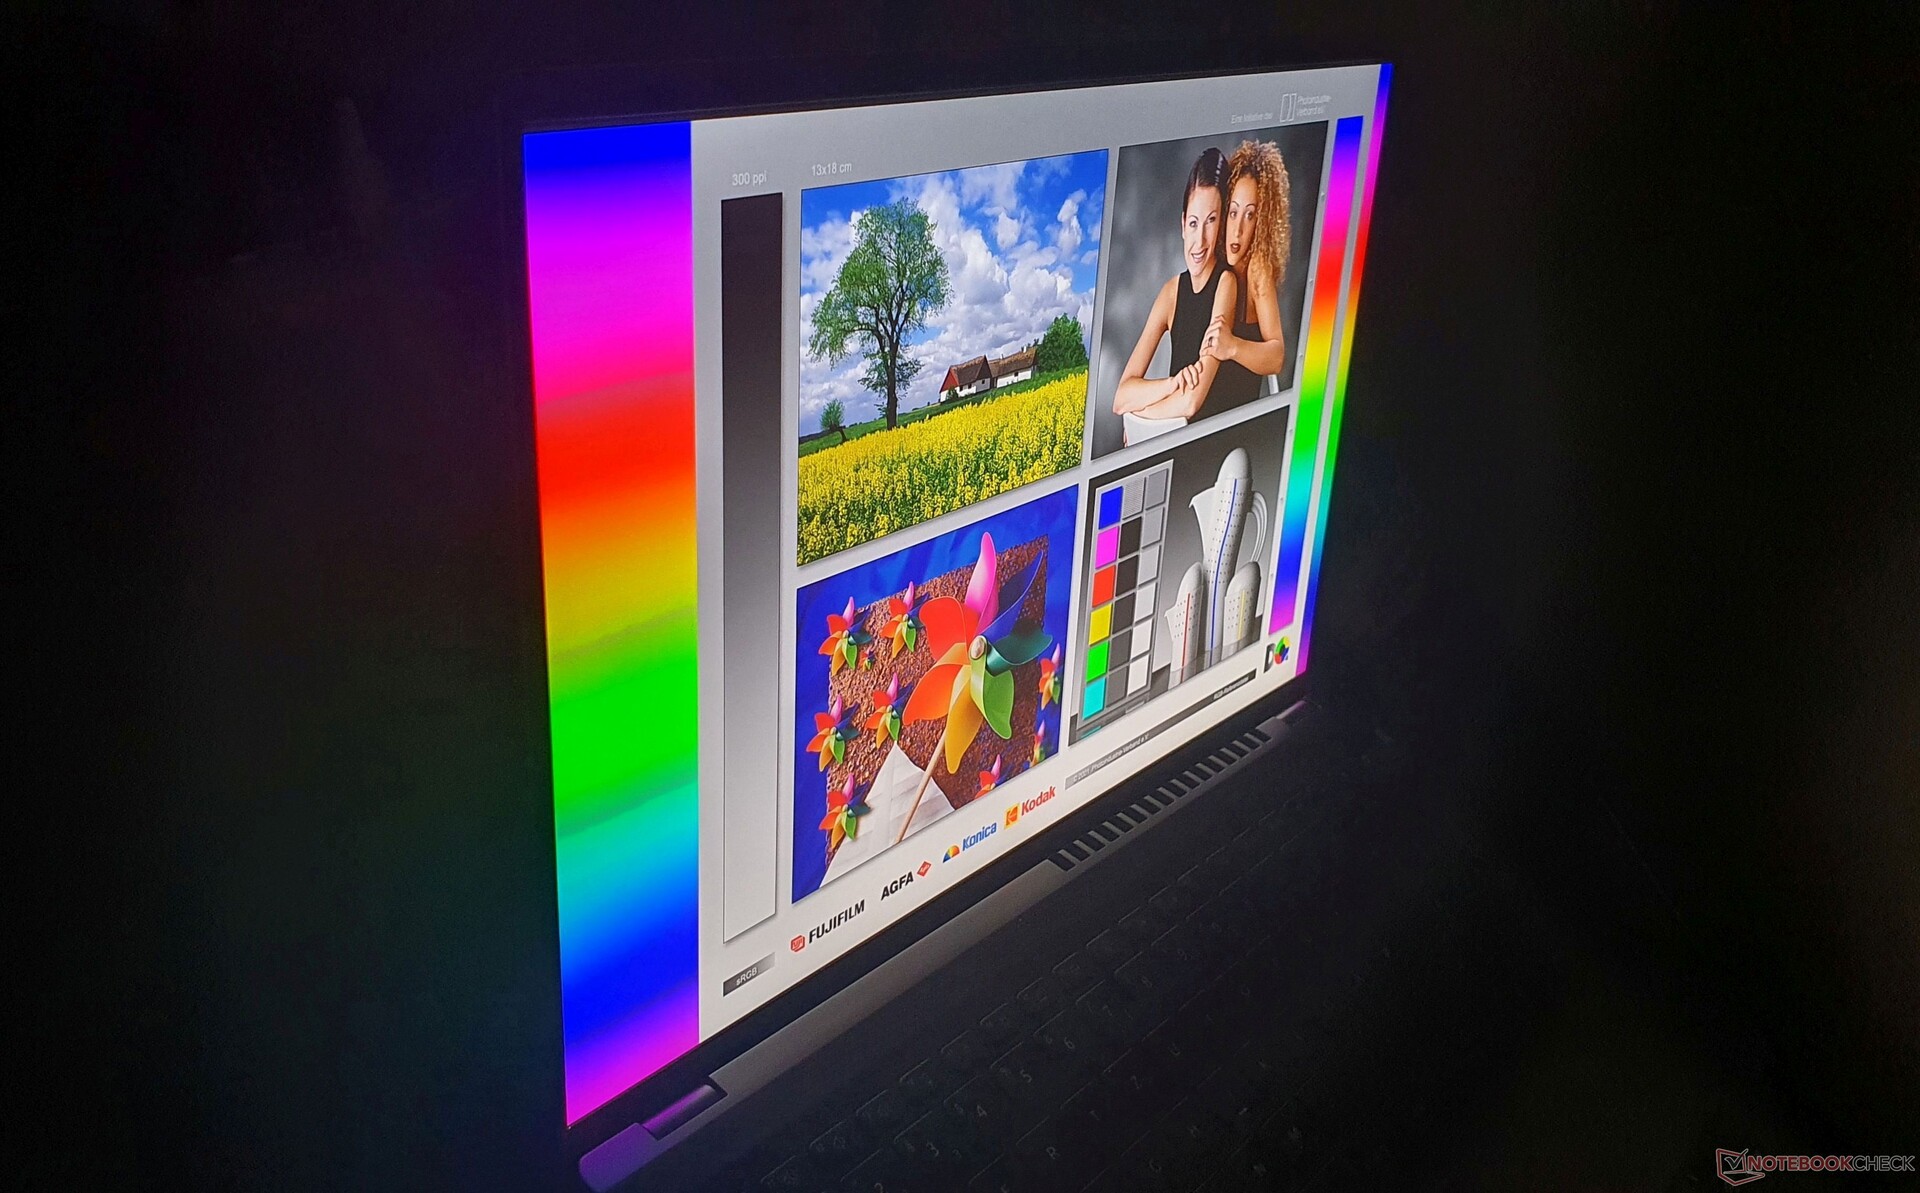
Wyświetlacz: Jasny panel 2,5K i wreszcie 16:10 w Swift X 16

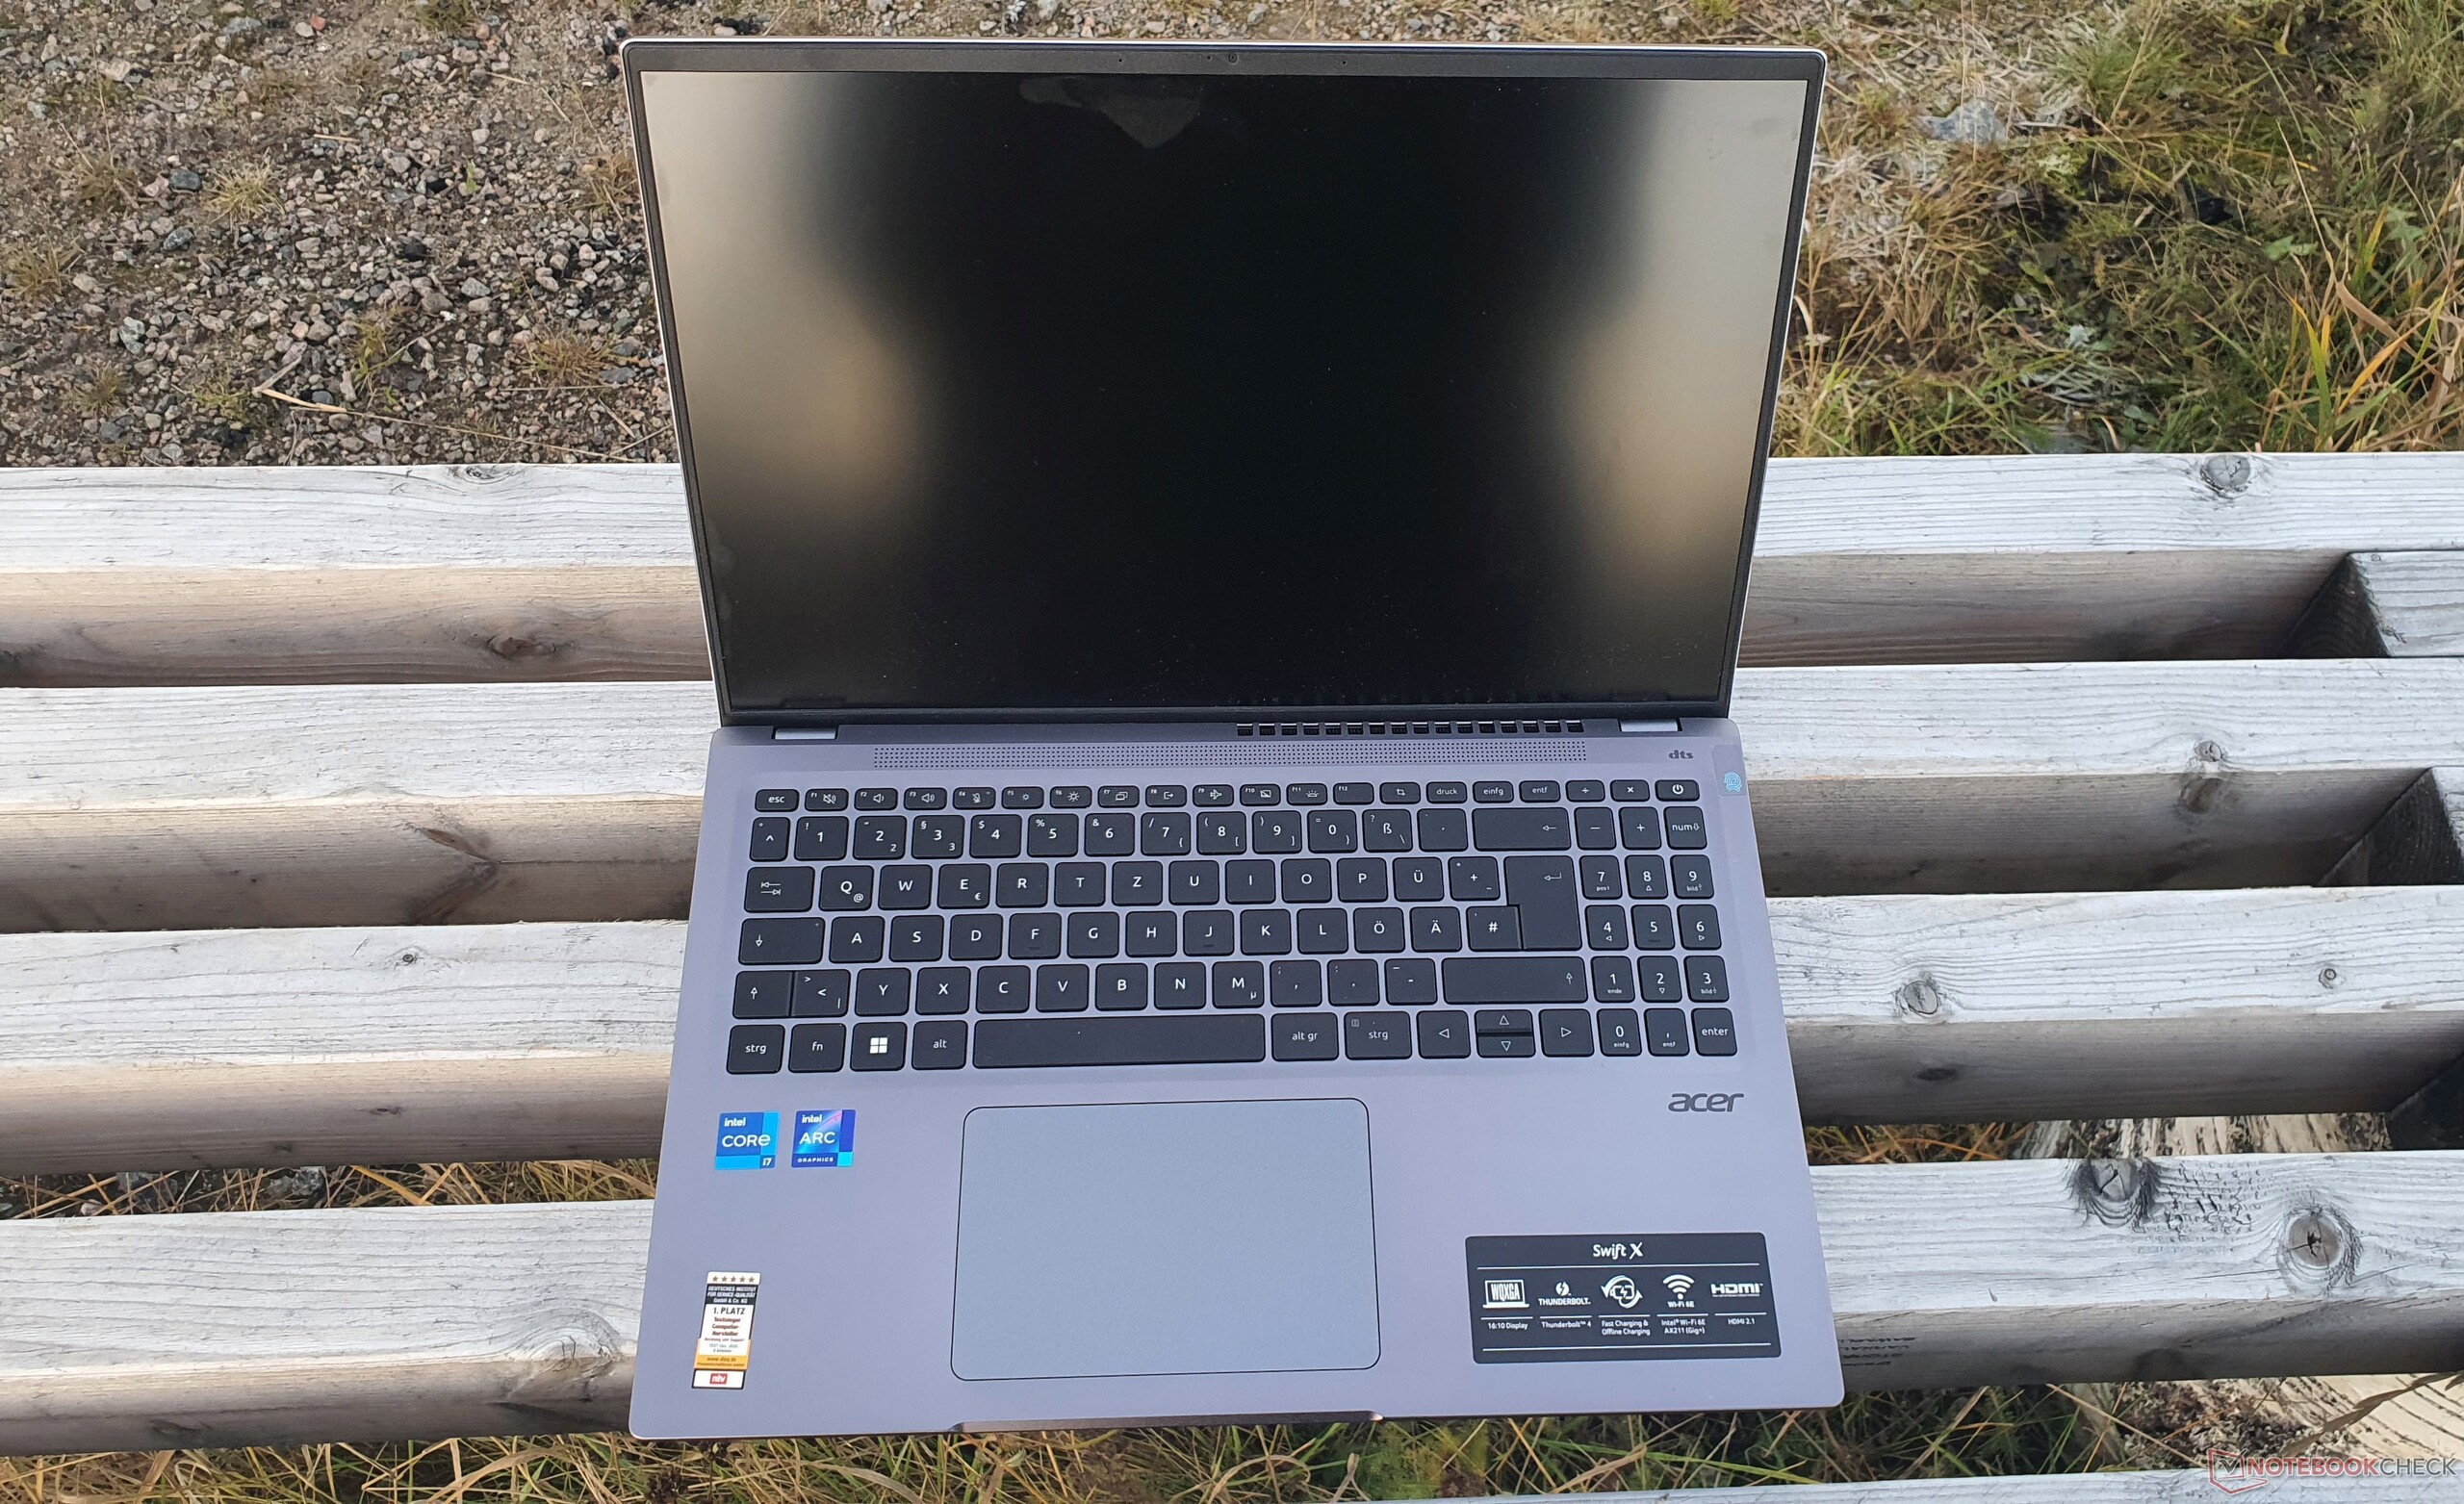
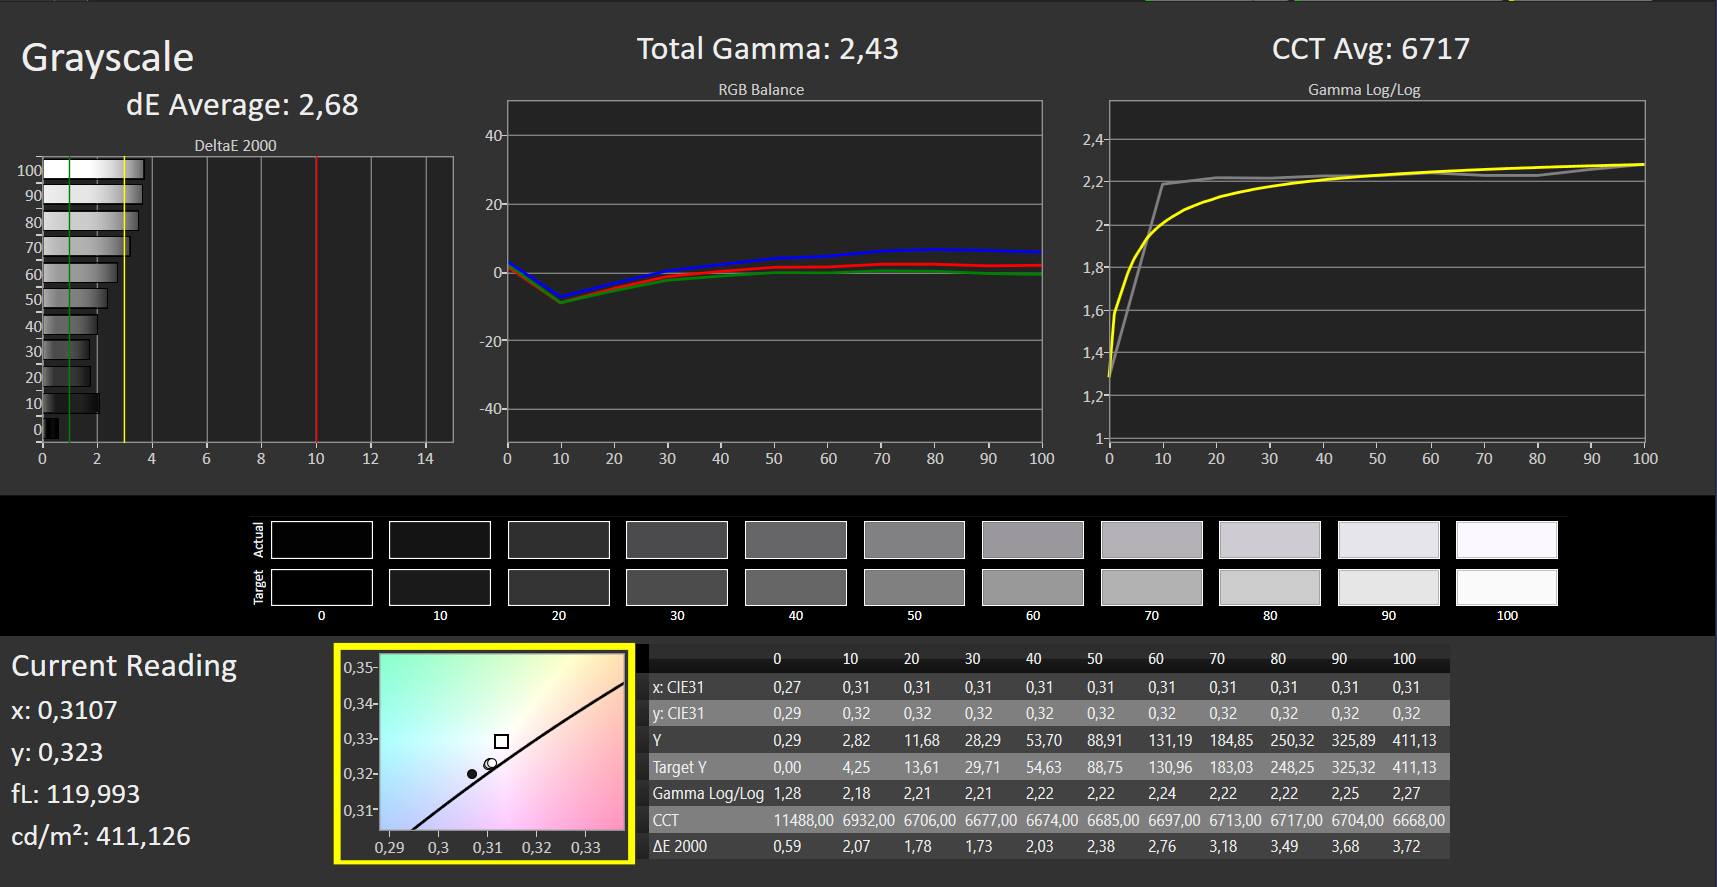
Matowy panel z oznaczeniem "B160QAN02.M" jest taki sam jak w modelu rodzeństwa. W przeciwieństwie do poprzednika zastosowano tu format 16:10, a jasność wynosi teraz dobre 378 nitów.
Rozdzielczość 2 560 x 1 600 pikseli w 16-calowym panelu skutkuje ostrym wyświetlaniem obrazu. Asus Vivobook Pro 16Xoraz Envy 16 firmy HPoferują rozdzielczość 3.840 x 2.400 pikseli i panele OLED.
Kontrast 1.417:1 i wartość czerni 0,29 nita prowadzą do nasyconej czerni. Również wartość bieli wynosząca 6.717K jest bliska ideałowi, jakim jest 6.500K
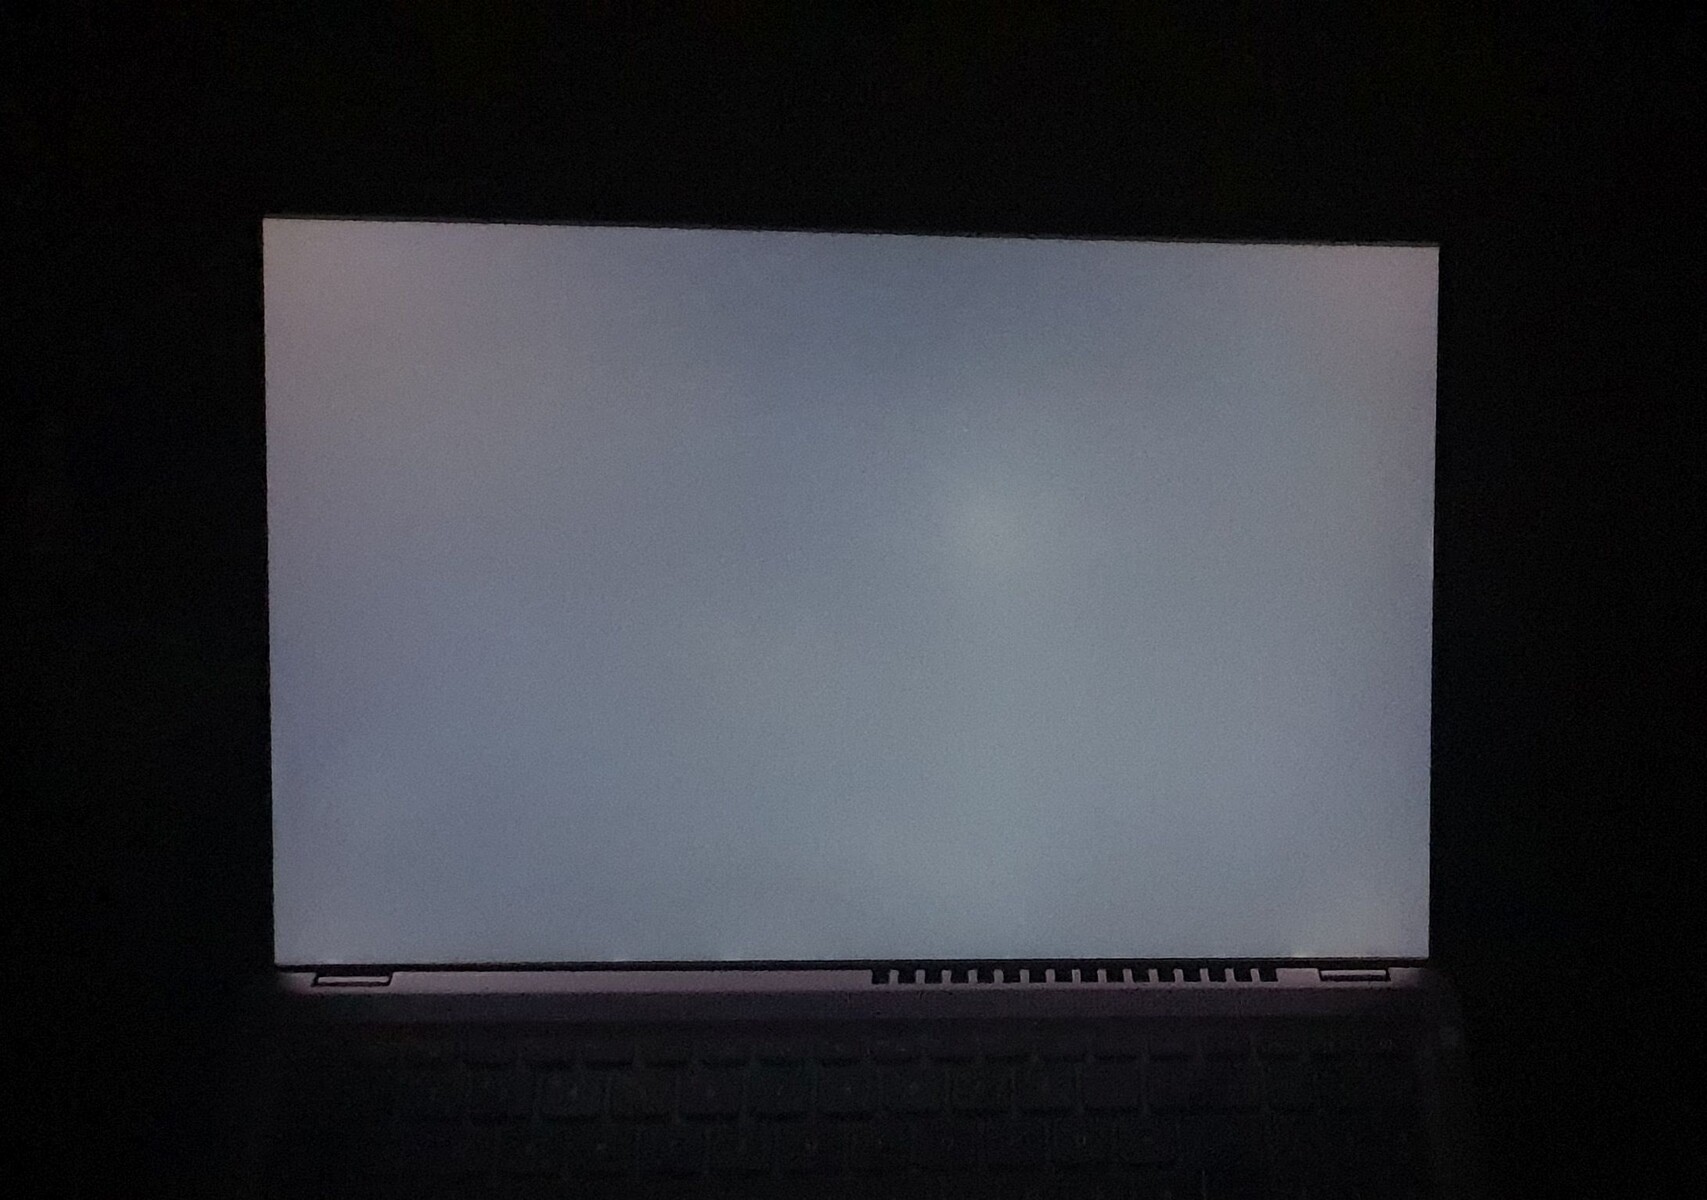
Przy 83% rozkład jasności nie jest zbyt równomierny, ale w codziennej eksploatacji nie rzuca się to w oczy. Alternatywnie dostępny jest także panel o rozdzielczości 1 920 x 1 200 pikseli. Nie występuje tu migotanie PWM.
| |||||||||||||||||||||||||
rozświetlenie: 83 %
na akumulatorze: 411 cd/m²
kontrast: 1417:1 (czerń: 0.29 cd/m²)
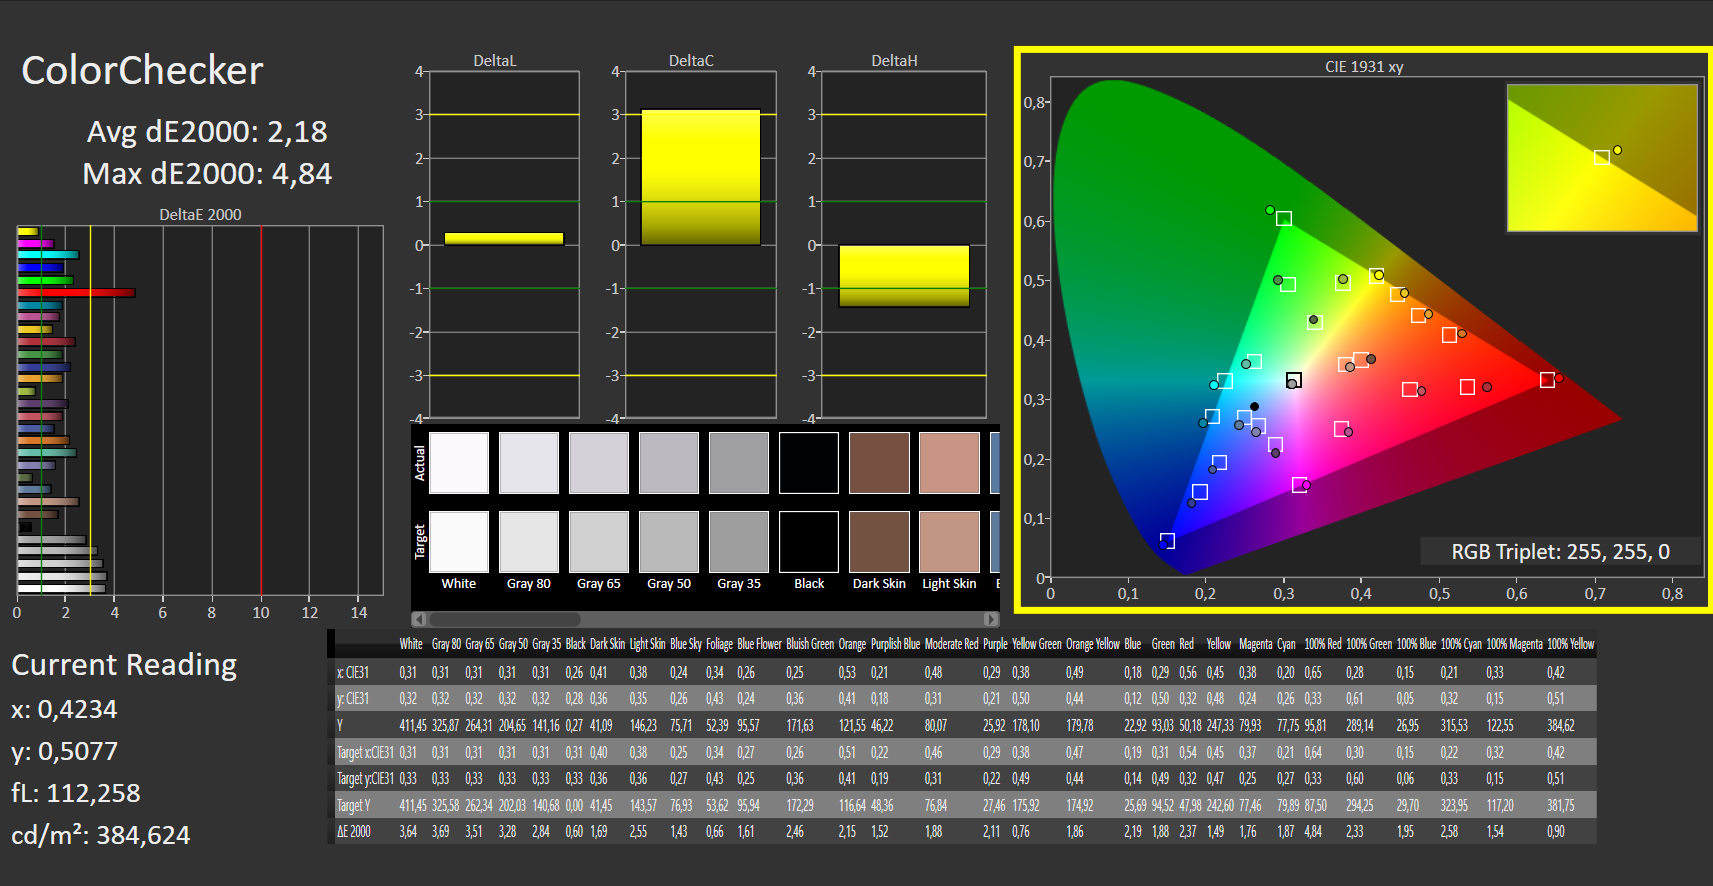
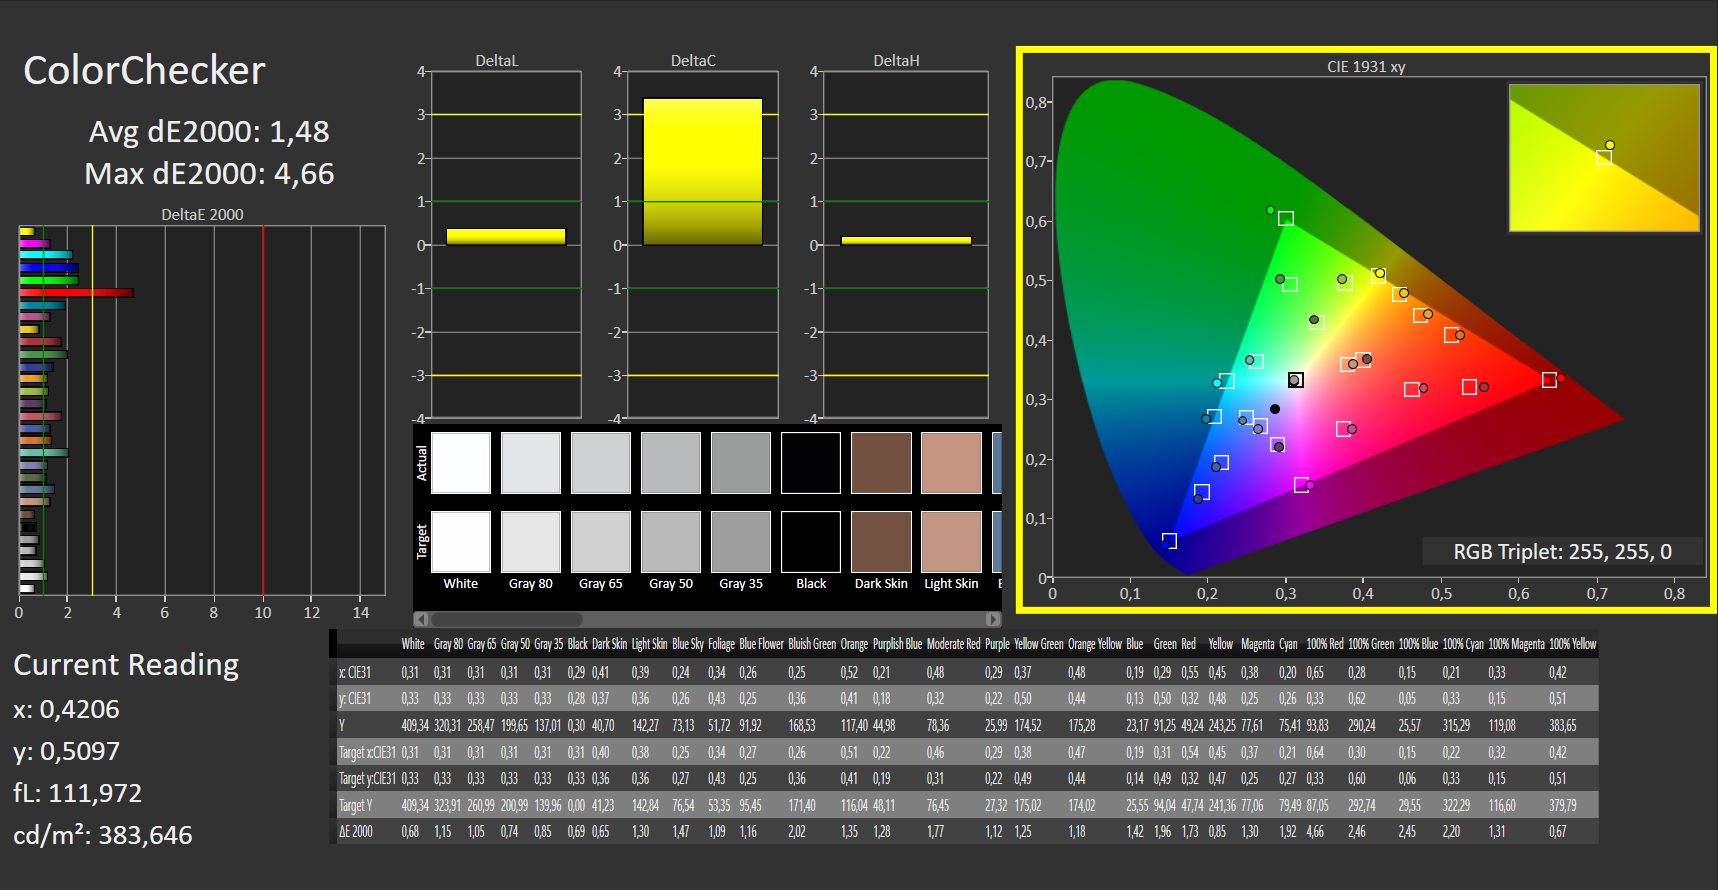
ΔE ColorChecker Calman: 2.18 | ∀{0.5-29.43 Ø4.72}
calibrated: 1.48
ΔE Greyscale Calman: 2.68 | ∀{0.09-98 Ø4.97}
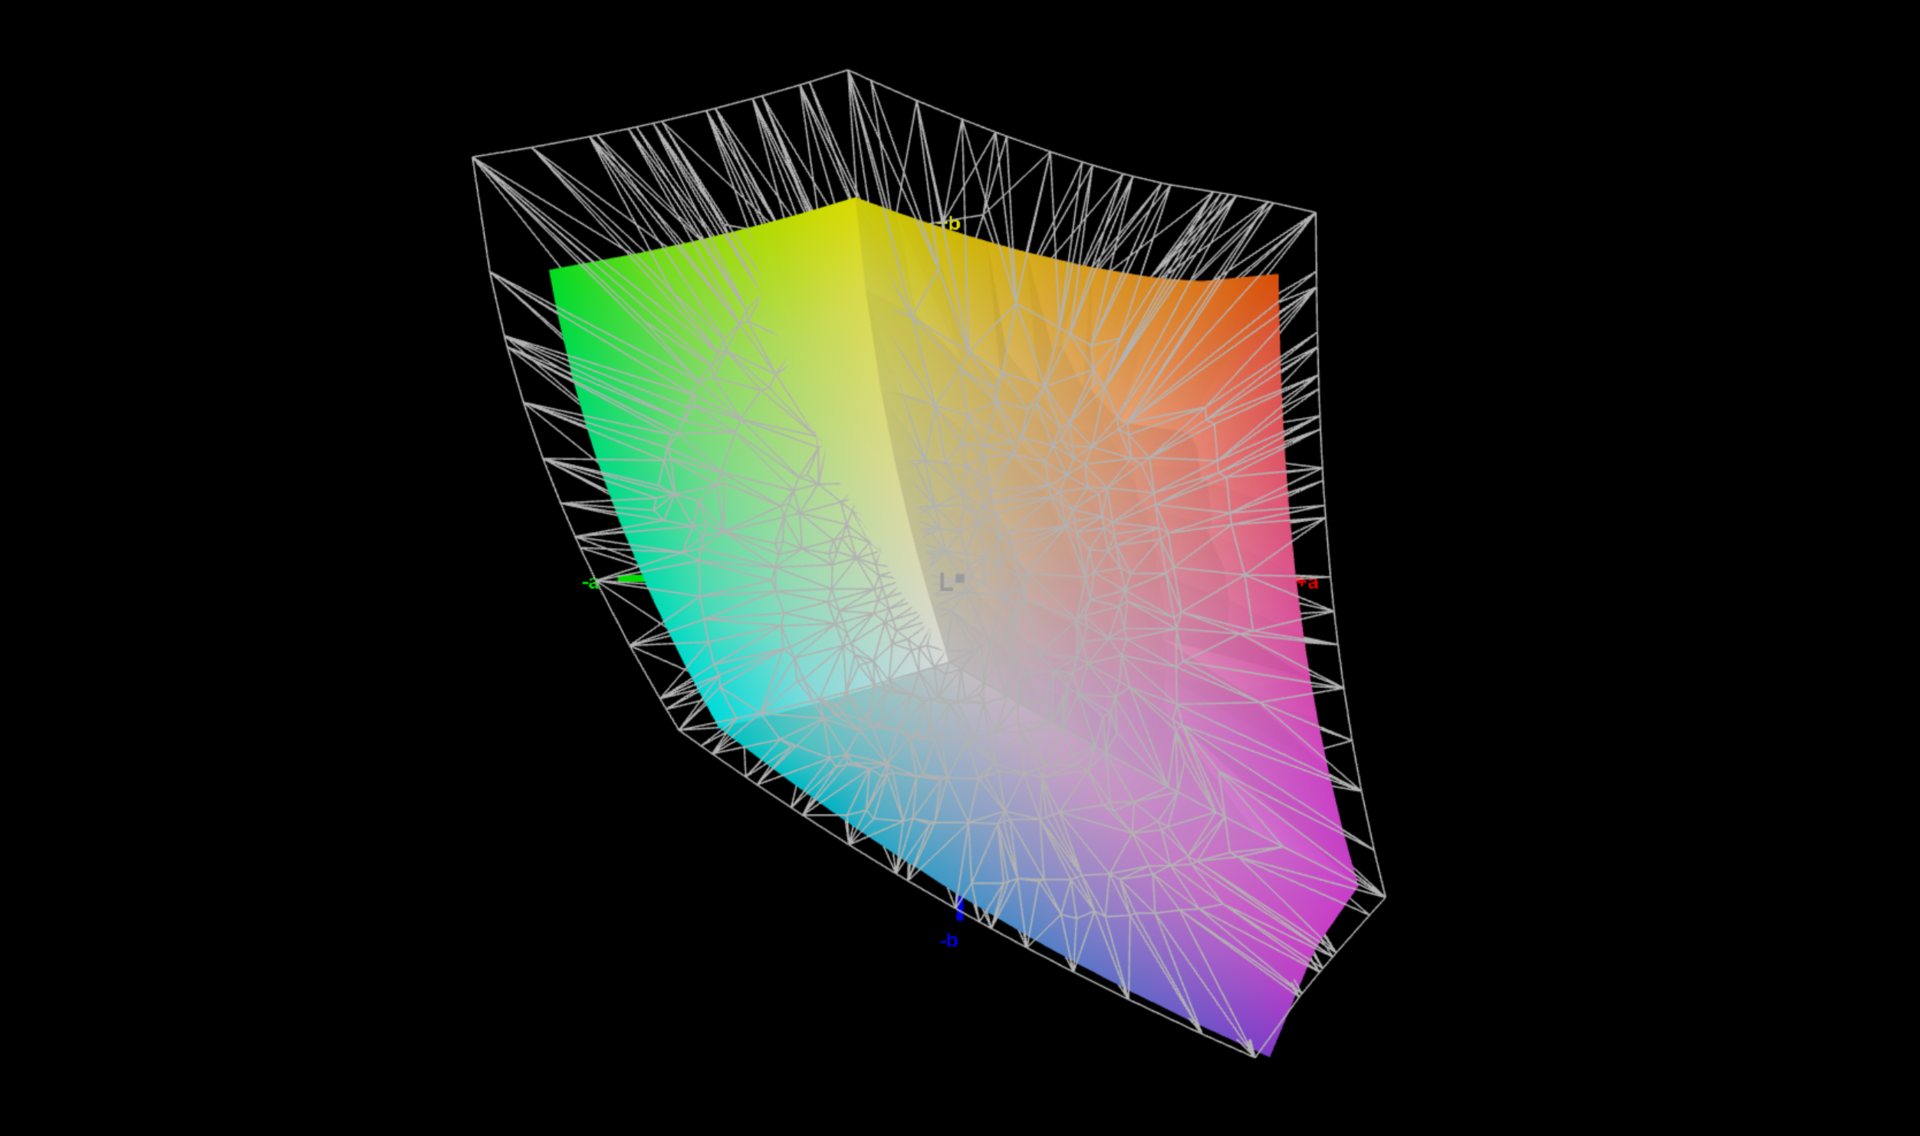
76.6% AdobeRGB 1998 (Argyll 3D)
100% sRGB (Argyll 3D)
76.4% Display P3 (Argyll 3D)
Gamma: 2.43
CCT: 6717 K
| Acer Swift X SFX16-52G-77RX B160QAN02.M, IPS-LED, 2560x1600, 16" | Acer Swift X SFX16-52G-52VE AU Optronics AUOBD9E, , 2560x1600, 16" | Acer Swift X SFX16-51G-5388 Chi Mei N161HCA-EA3, , 1920x1080, 16.1" | Lenovo ThinkBook 16 G4+ IAP LEN160WQXGA, IPS, 2560x1600, 16" | Dell Inspiron 16 Plus 7620 BOE NE16N41, IPS, 3072x1920, 16" | HP Envy 16 h0112nr Samsung SDC4174, OLED, 3840x2400, 16" | Lenovo IdeaPad 5 Pro 16ARH7 AUO B160QAN02.H, IPS, 2560x1600, 16" | Asus Vivobook Pro 16X-M7600QE Samsung ATNA60YV02-0, OLED, 3840x2400, 16.1" | |
|---|---|---|---|---|---|---|---|---|
| Display | -0% | -11% | -6% | -4% | 15% | -10% | 19% | |
| Display P3 Coverage (%) | 76.4 | 75.75 -1% | 65.1 -15% | 69.6 -9% | 70.8 -7% | 99.3 30% | 65 -15% | 99.8 31% |
| sRGB Coverage (%) | 100 | 100 0% | 95.65 -4% | 97.5 -2% | 99.5 0% | 100 0% | 98 -2% | 100 0% |
| AdobeRGB 1998 Coverage (%) | 76.6 | 76.51 0% | 66.75 -13% | 71.7 -6% | 73.2 -4% | 88 15% | 67.2 -12% | 96.9 27% |
| Response Times | -10% | -12% | -6% | -51% | 91% | 55% | 91% | |
| Response Time Grey 50% / Grey 80% * (ms) | 33 ? | 37 ? -12% | 30 ? 9% | 32.7 ? 1% | 38 ? -15% | 2 ? 94% | 14.1 ? 57% | 2 ? 94% |
| Response Time Black / White * (ms) | 15 ? | 16 ? -7% | 20 ? -33% | 16.8 ? -12% | 28 ? -87% | 1.9 ? 87% | 7.1 ? 53% | 2 ? 87% |
| PWM Frequency (Hz) | 240.4 ? | 60 ? | ||||||
| Screen | 14% | 11% | -1% | 10% | 7% | 2% | 12% | |
| Brightness middle (cd/m²) | 411 | 411 0% | 276 -33% | 371 -10% | 288.9 -30% | 328.8 -20% | 415 1% | 392 -5% |
| Brightness (cd/m²) | 378 | 364 -4% | 264 -30% | 357 -6% | 276 -27% | 332 -12% | 409 8% | 396 5% |
| Brightness Distribution (%) | 83 | 81 -2% | 85 2% | 91 10% | 92 11% | 97 17% | 91 10% | 98 18% |
| Black Level * (cd/m²) | 0.29 | 0.295 -2% | 0.16 45% | 0.23 21% | 0.26 10% | 0.32 -10% | ||
| Contrast (:1) | 1417 | 1393 -2% | 1725 22% | 1613 14% | 1111 -22% | 1297 -8% | ||
| Colorchecker dE 2000 * | 2.18 | 1.73 21% | 1.8 17% | 2.6 -19% | 1.88 14% | 1.53 30% | 1.92 12% | 1.74 20% |
| Colorchecker dE 2000 max. * | 4.84 | 2.7 44% | 3.77 22% | 4.4 9% | 4.37 10% | 6.04 -25% | 5.71 -18% | 3.18 34% |
| Colorchecker dE 2000 calibrated * | 1.48 | 1.18 20% | 0.63 57% | 1.3 12% | 0.42 72% | 0.58 61% | 1.85 -25% | |
| Greyscale dE 2000 * | 2.68 | 1.26 53% | 2.76 -3% | 3.7 -38% | 1.4 48% | 1.3 51% | 3.7 -38% | 1.77 34% |
| Gamma | 2.43 91% | 2.35 94% | 2.37 93% | 2.32 95% | 2.3 96% | 2.18 101% | 2.272 97% | 2.22 99% |
| CCT | 6717 97% | 6616 98% | 6564 99% | 7271 89% | 6634 98% | 6362 102% | 7132 91% | 6483 100% |
| Całkowita średnia (program / ustawienia) | 1% /
8% | -4% /
3% | -4% /
-3% | -15% /
-2% | 38% /
24% | 16% /
7% | 41% /
27% |
* ... im mniej tym lepiej
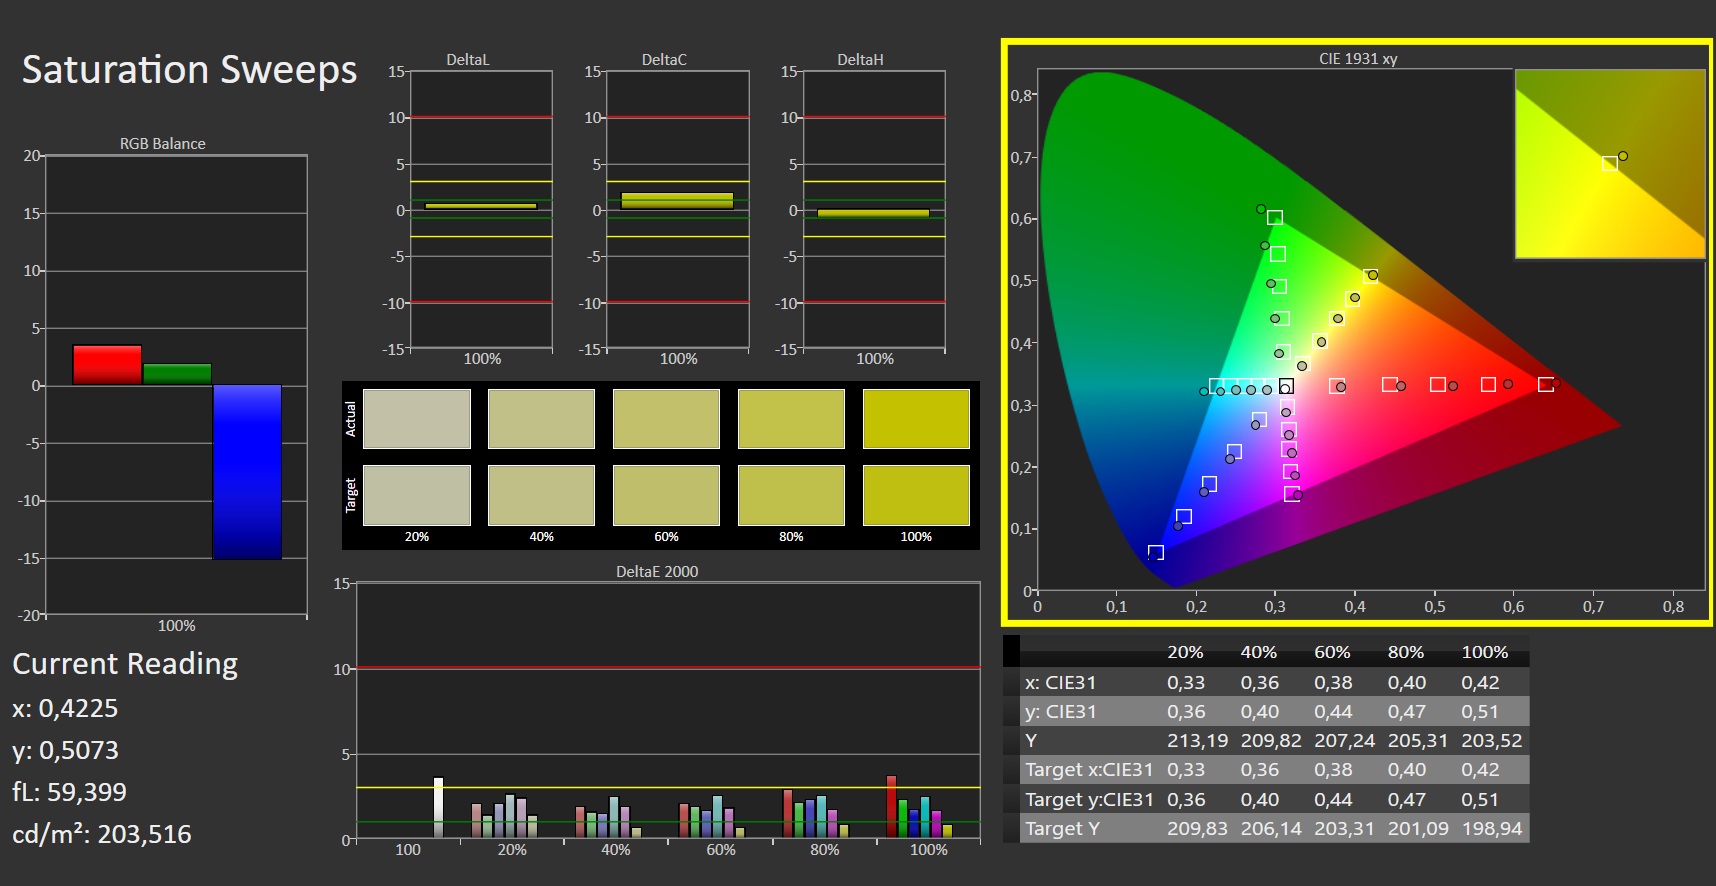
Przestrzeń kolorów sRGB jest pokryta do 100%, co pozwala na nieco mniej ambitną obróbkę zdjęć i filmów.
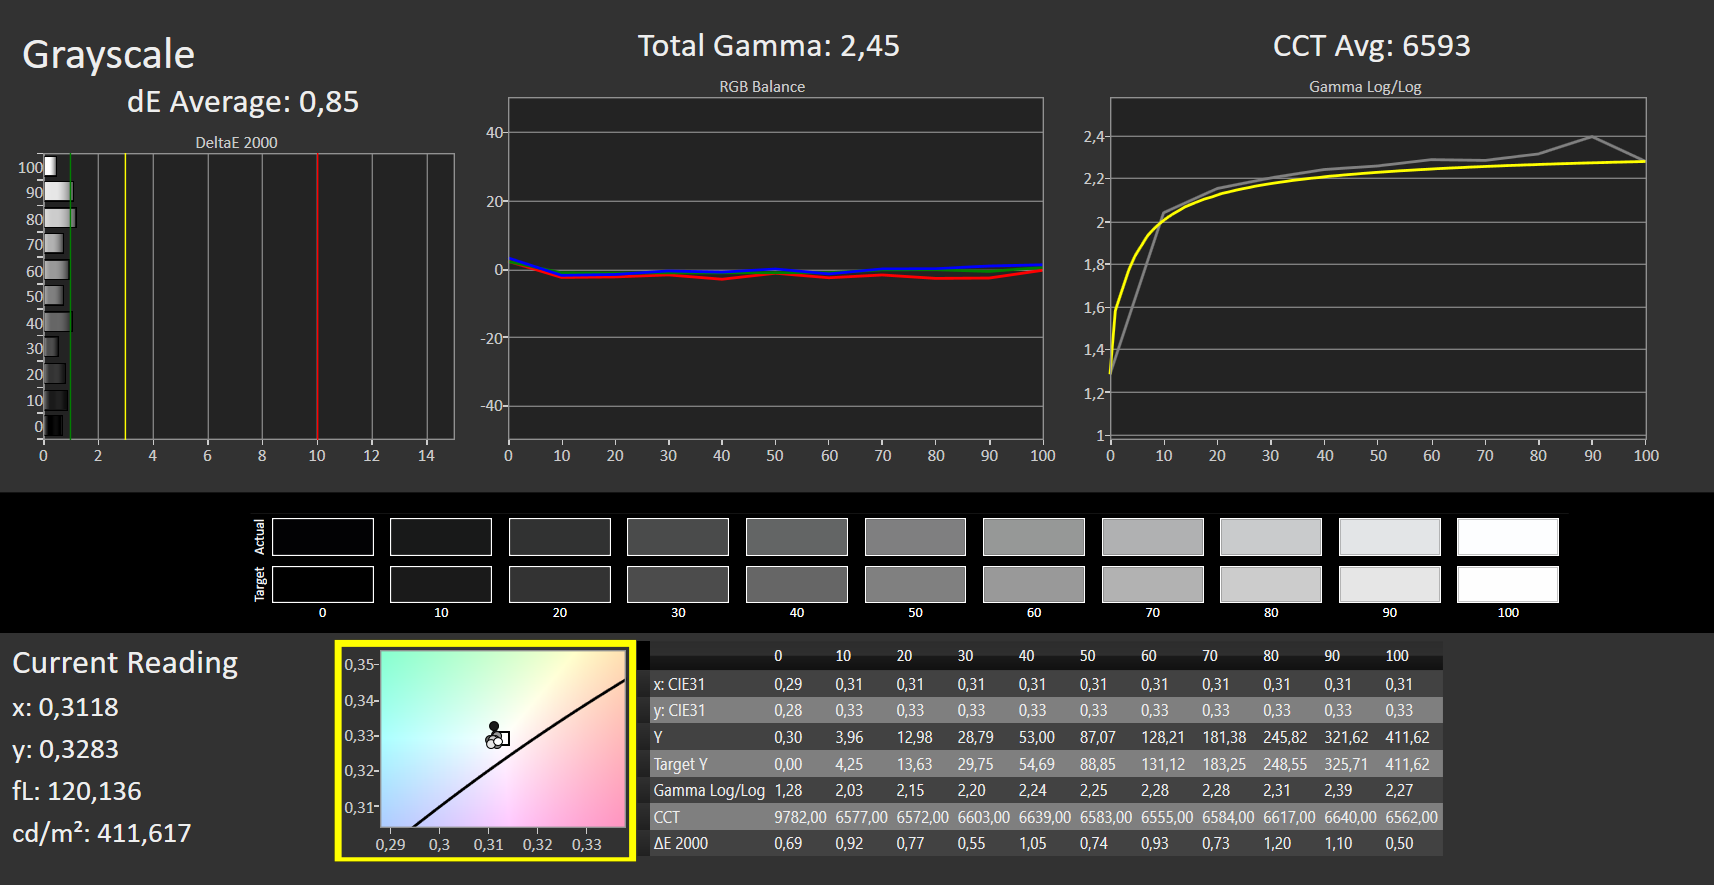
Wartość DeltaE nieco powyżej 2 może być zredukowana do jeszcze dokładniejszej wartości 1,48 po naszej kalibracji. Jedynie kolor czerwony nadal wykazuje znaczne odchylenie przy wartości nieco poniżej 5. Nasz skalibrowany profil barwny można pobrać w polu po prawej stronie obok grafiki rozkładu jasności.

Wyświetl czasy reakcji
| ↔ Czas reakcji od czerni do bieli | ||
|---|---|---|
| 15 ms ... wzrost ↗ i spadek ↘ łącznie | ↗ 5 ms wzrost |  |
| ↘ 10 ms upadek | ||
| W naszych testach ekran wykazuje dobry współczynnik reakcji, ale może być zbyt wolny dla graczy rywalizujących ze sobą. Dla porównania, wszystkie testowane urządzenia wahają się od 0.1 (minimum) do 240 (maksimum) ms. » 36 % wszystkich urządzeń jest lepszych. Oznacza to, że zmierzony czas reakcji jest lepszy od średniej wszystkich testowanych urządzeń (19.8 ms). | ||
| ↔ Czas reakcji 50% szarości do 80% szarości | ||
| 33 ms ... wzrost ↗ i spadek ↘ łącznie | ↗ 15 ms wzrost |  |
| ↘ 18 ms upadek | ||
| W naszych testach ekran wykazuje powolne tempo reakcji, co będzie niezadowalające dla graczy. Dla porównania, wszystkie testowane urządzenia wahają się od 0.165 (minimum) do 636 (maksimum) ms. » 45 % wszystkich urządzeń jest lepszych. Oznacza to, że zmierzony czas reakcji jest zbliżony do średniej wszystkich testowanych urządzeń (31 ms). | ||
Migotanie ekranu / PWM (modulacja szerokości impulsu)
| Migotanie ekranu/nie wykryto PWM |    | ||
Dla porównania: 52 % wszystkich testowanych urządzeń nie używa PWM do przyciemniania wyświetlacza. Jeśli wykryto PWM, zmierzono średnio 7747 (minimum: 5 - maksimum: 343500) Hz. | |||
Dzięki matowej powierzchni wyświetlacza jasność 378 nitów jest wystarczająca, by umożliwić korzystanie z Acer Swift X 16 także na zewnątrz. Nadal jednak należy unikać bezpośredniego światła słonecznego.
Wydajność: Szybkie Turbo, ale słaby Intel Arc A370M
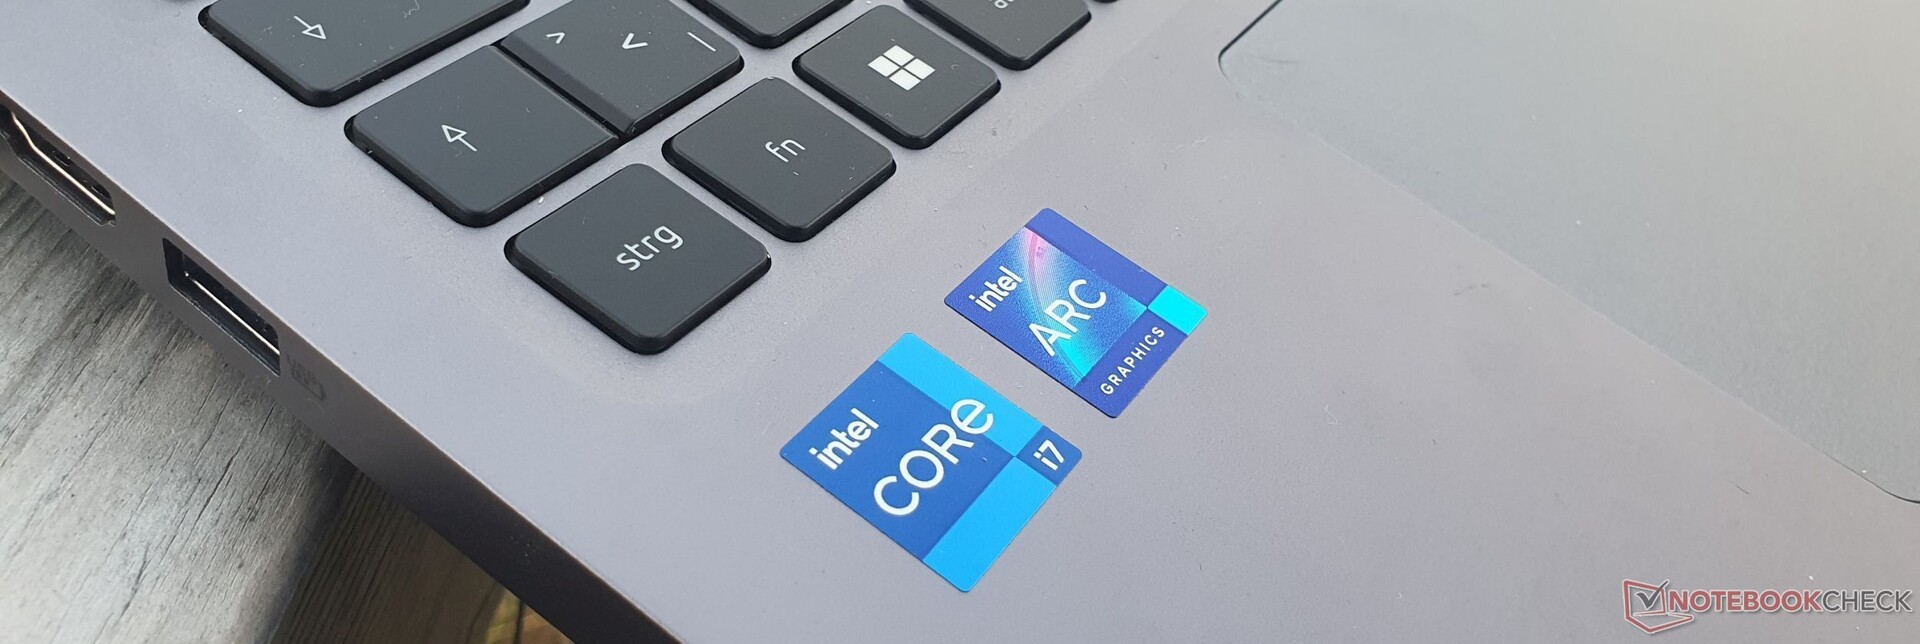
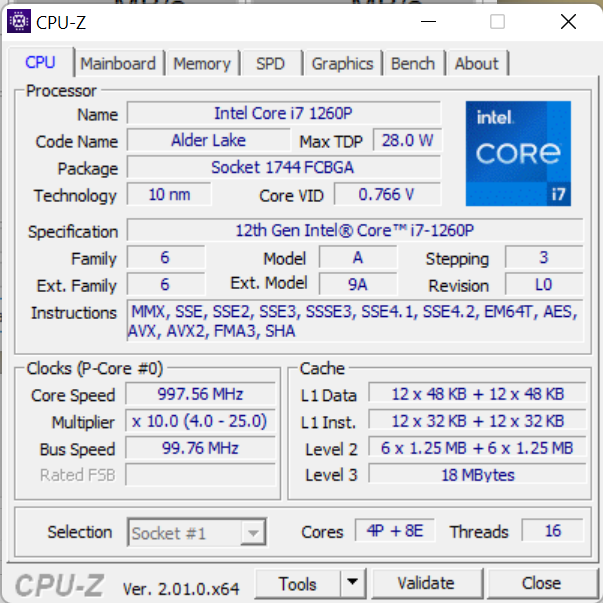
Podczas gdy model rodzeństwa wykorzystuje procesor Intel Core i5-1240Pi 512-GB PCIe 4.0 SSD, jako jedyną alternatywną opcję, nasz egzemplarz testowy jest wyposażony w Core i7-1260Pi szybszym dyskiem SSD o pojemności 1 TB. Wersje z procesorami AMD nie są dostępne. Oba modele oferują 16 GB wlutowanej pamięci RAM DDR5-4800 oraz Intelowski "Arc A370M. 16-calowy laptop jest przeznaczony np. do łatwego cięcia wideo i konsumpcji mediów, w tym gier w rozdzielczości Full-HD.
Warunki badania
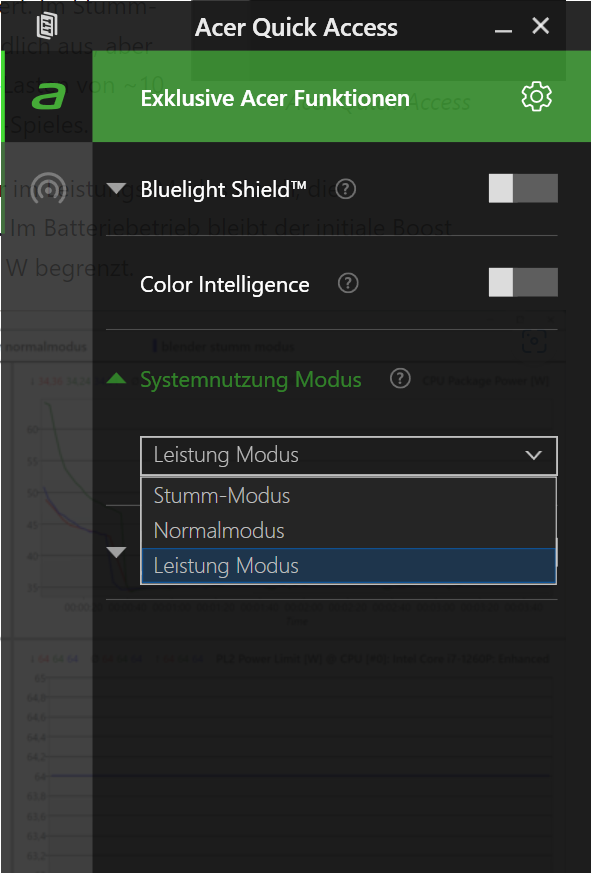
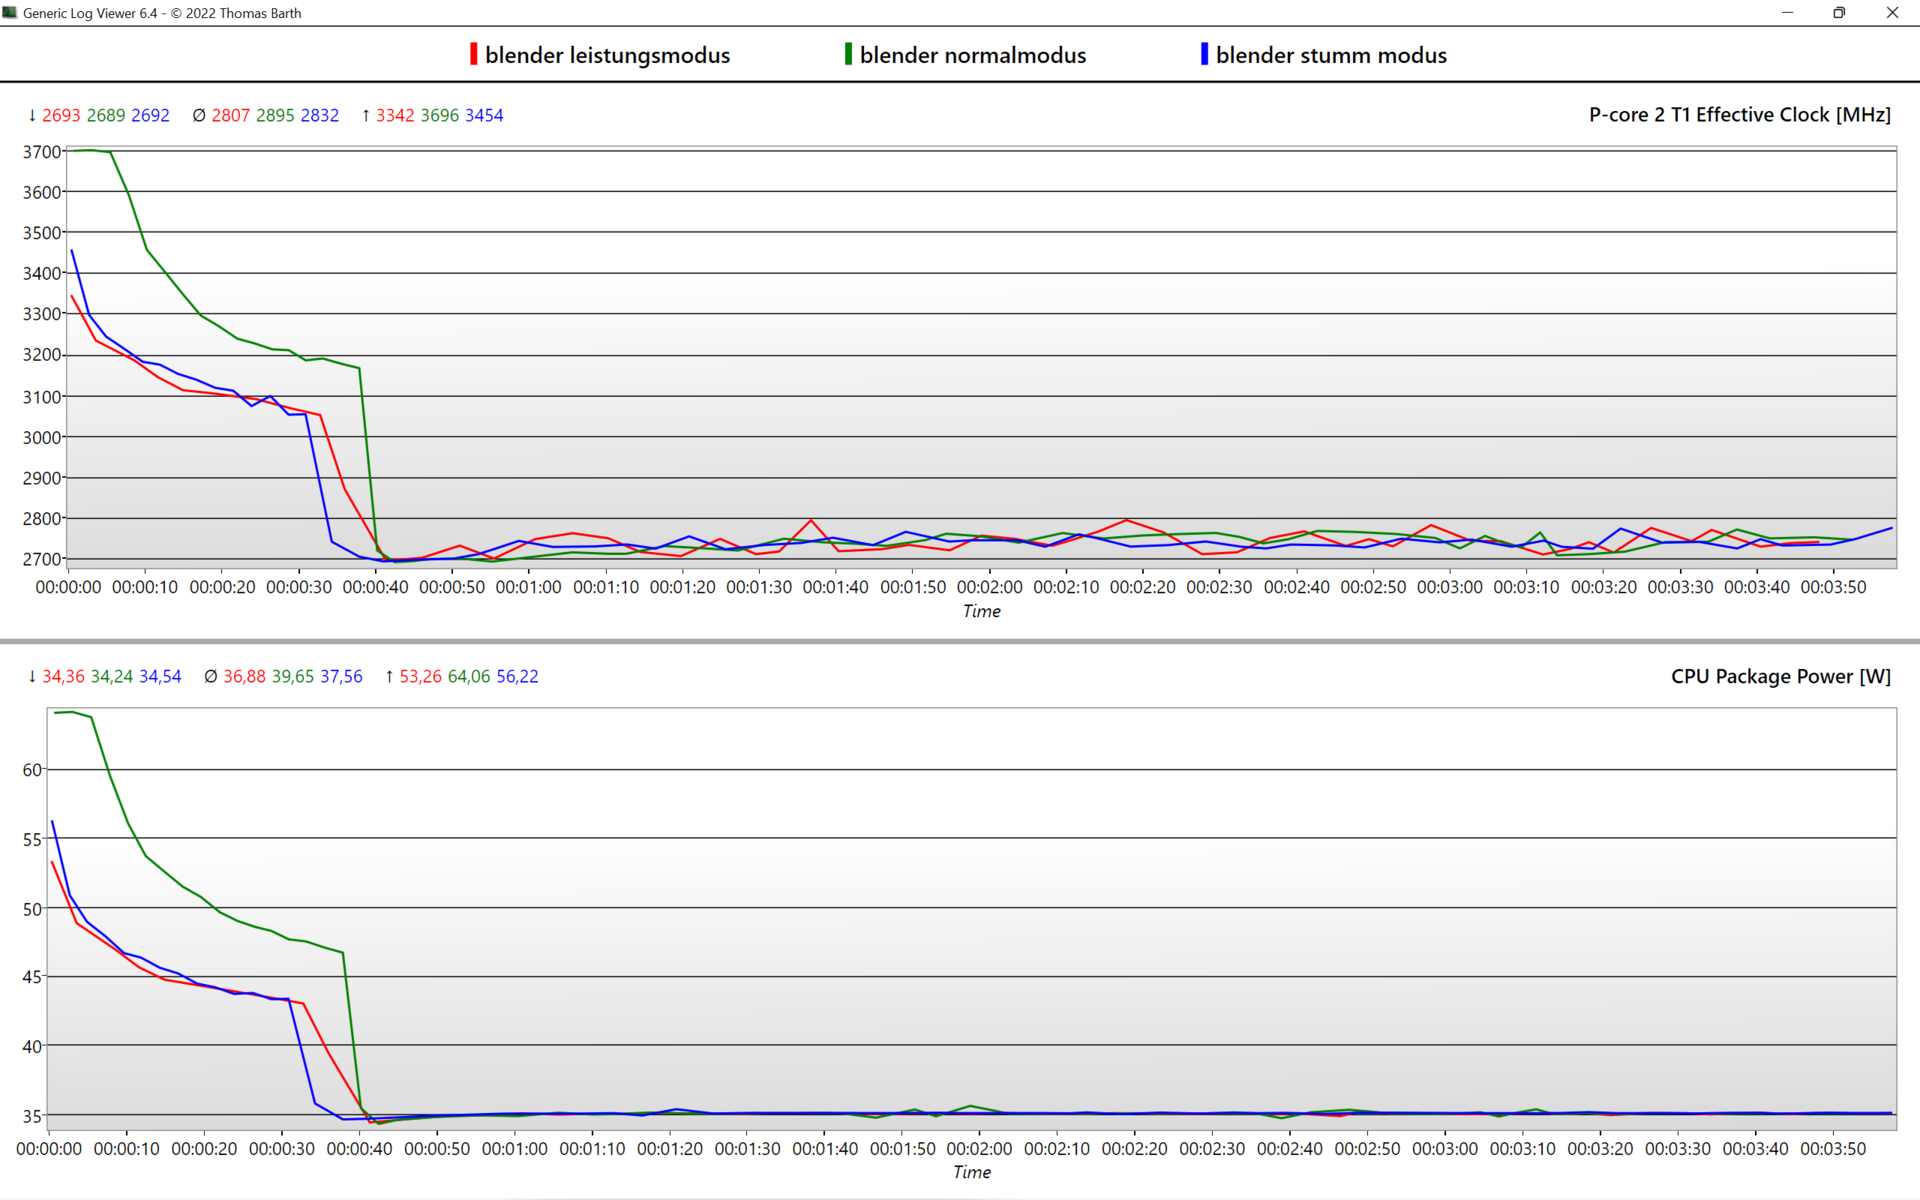
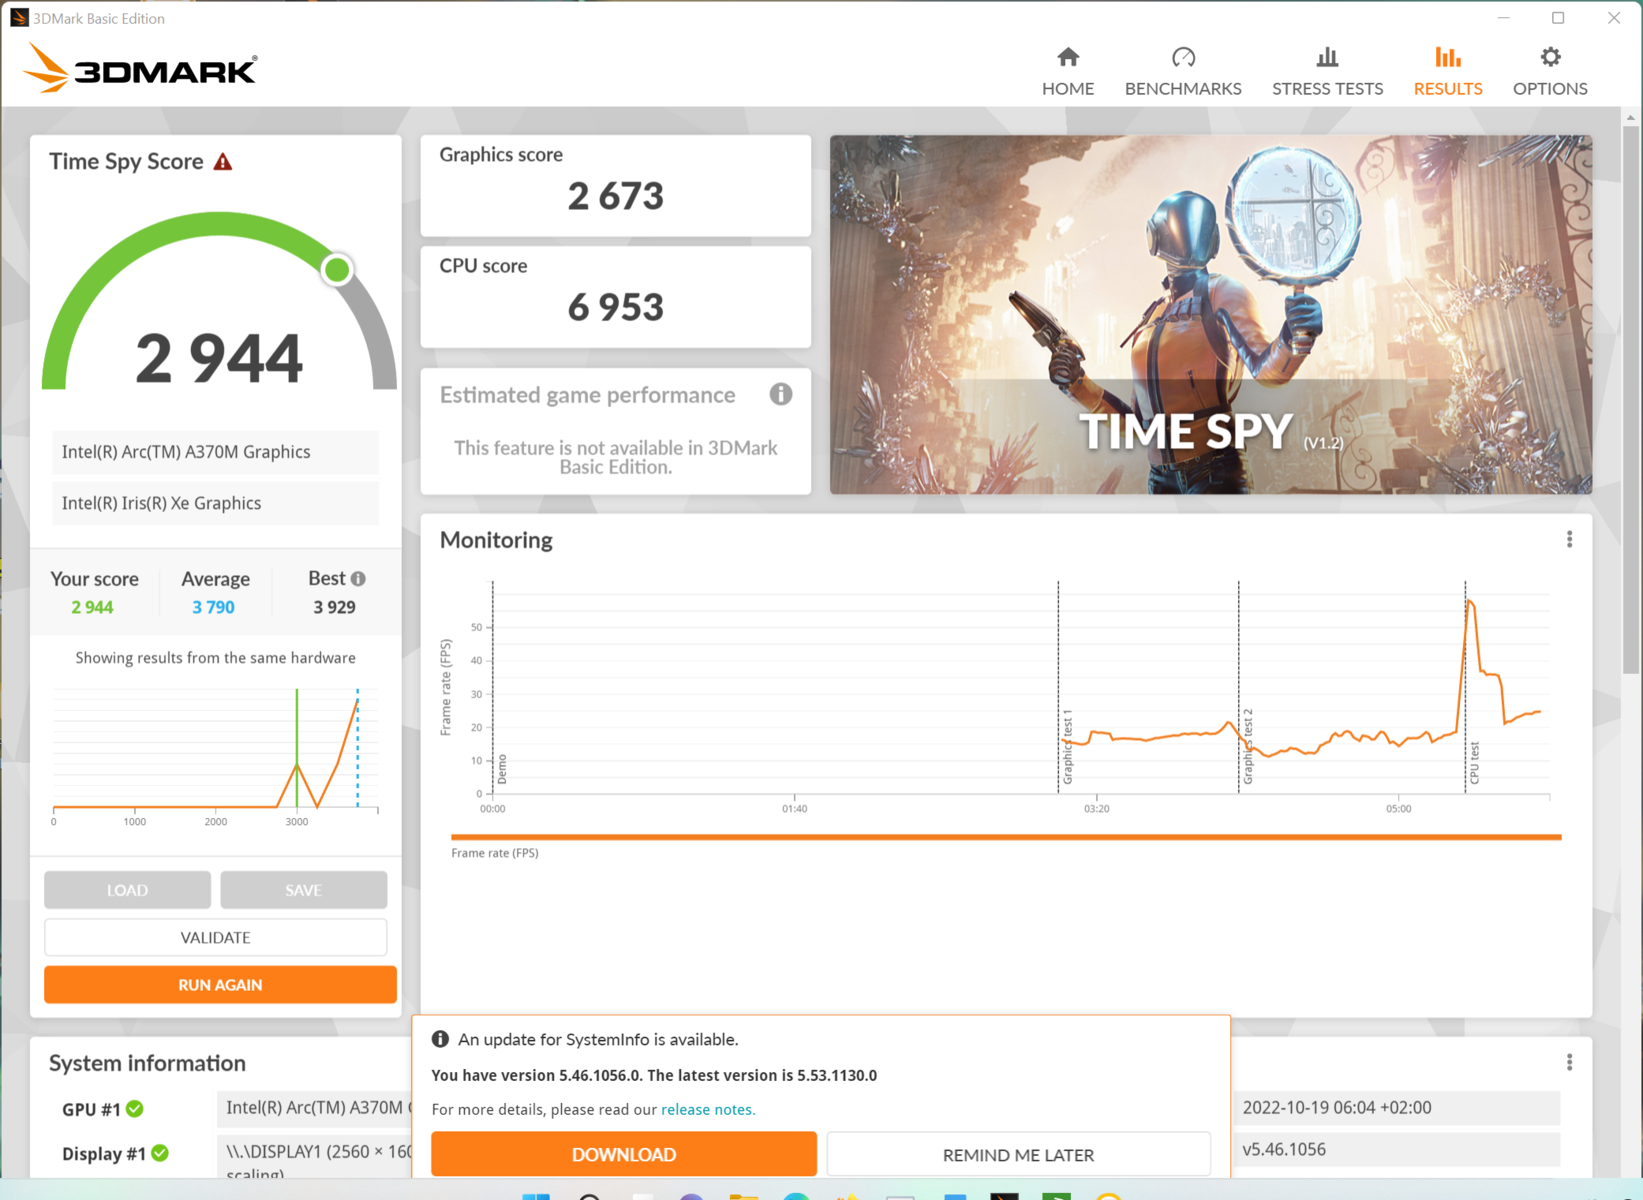
Dzięki funkcji "Acer Quick Access" można wybrać jeden z trzech profili wydajności. Mają one jednak wpływ tylko na GPU Arc firmy Intel, co pokazuje poniższy wykres. Zmienia się również zachowanie wentylatora, co wyjaśniamy w sekcji "Emisje" poniżej.
Nasze testy związane z wydajnością przeprowadzamy w trybie Performance, a czas pracy na baterii określamy w trybie Normal. W trybie bateryjnym początkowe podbicie 64 W jest całkowicie pominięte, a procesor jest ograniczony do 28 W.
| Tryb wydajności | Tryb normalny | Tryb cichy | Tryb baterii | |
|---|---|---|---|---|
| CPU | 64 W > 35 W | 56 W > 35 W | 53 W > 35 W | 28 W |
| GPU | 35 W | 25 W | 20 W | 25 W |
Procesor
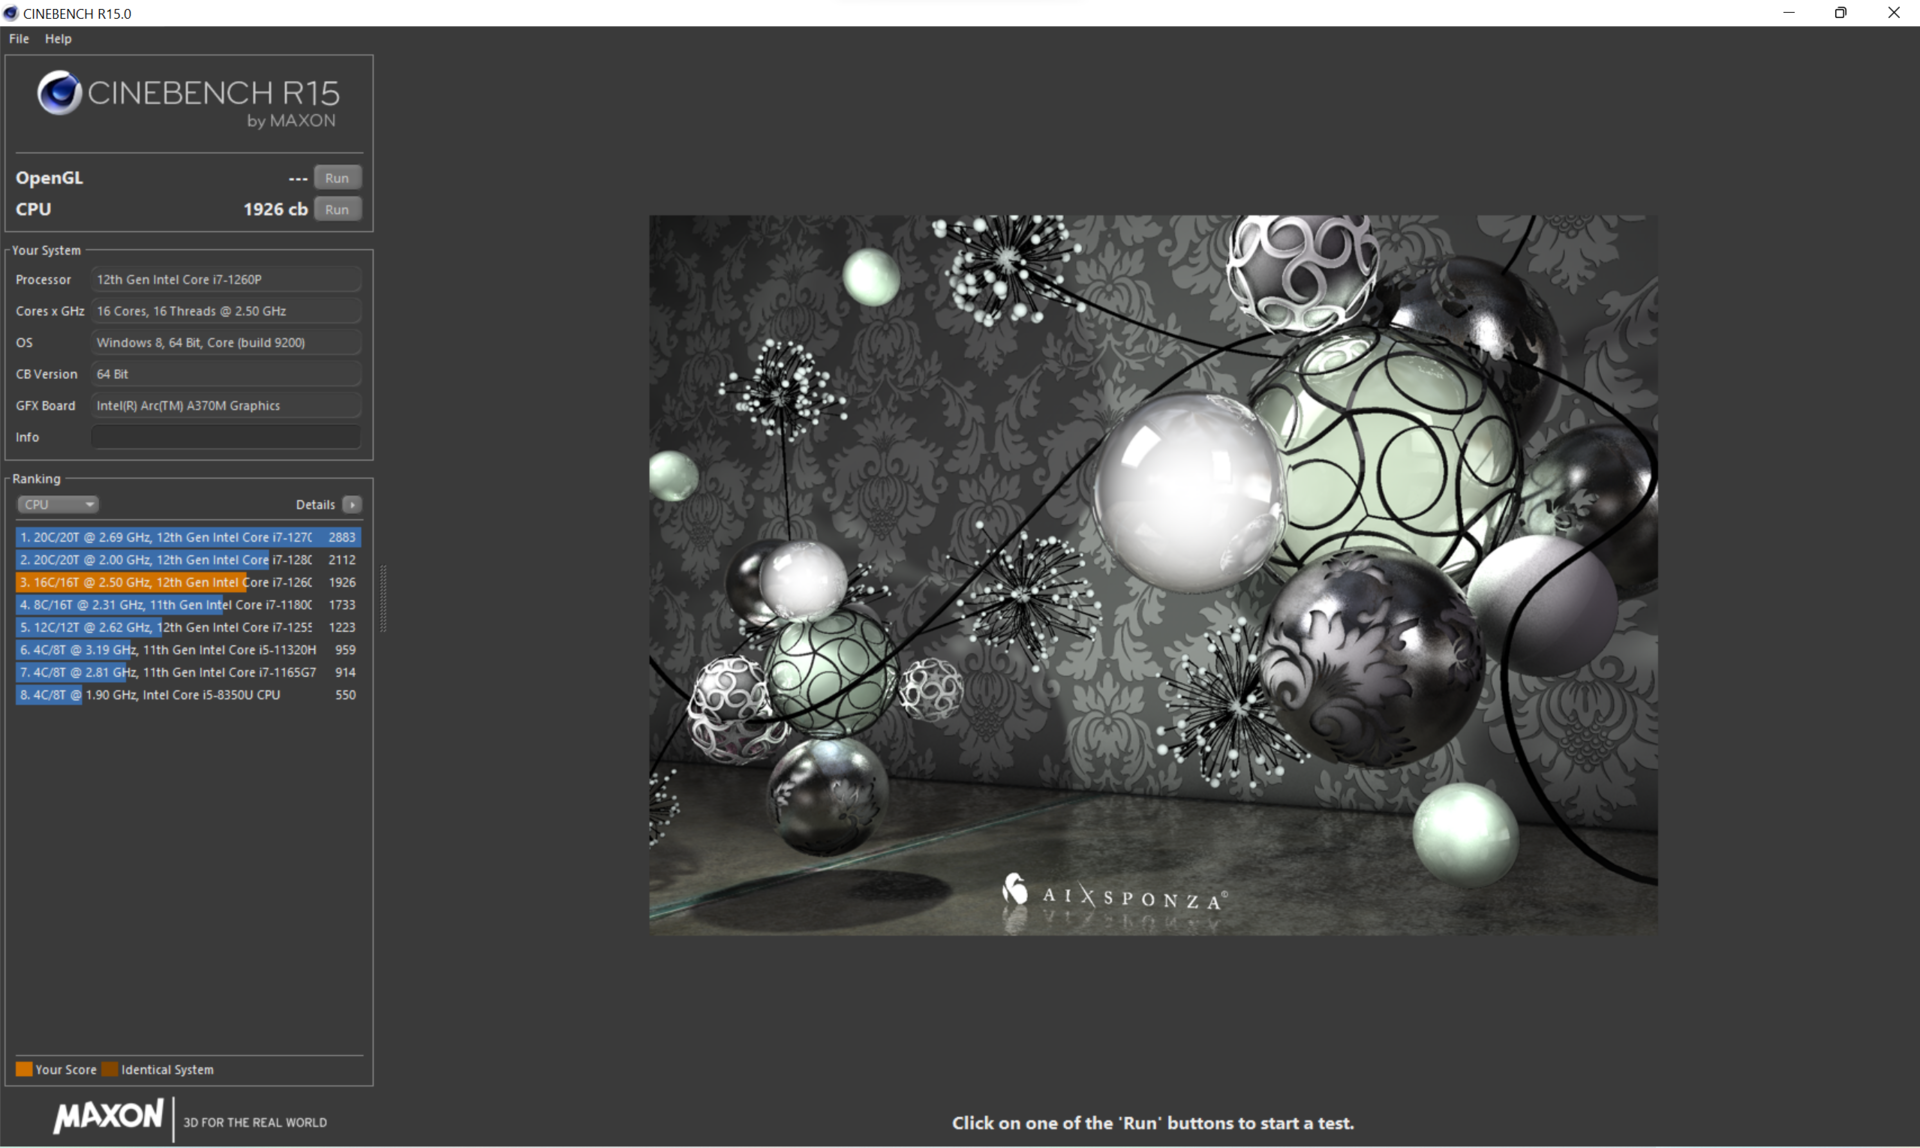
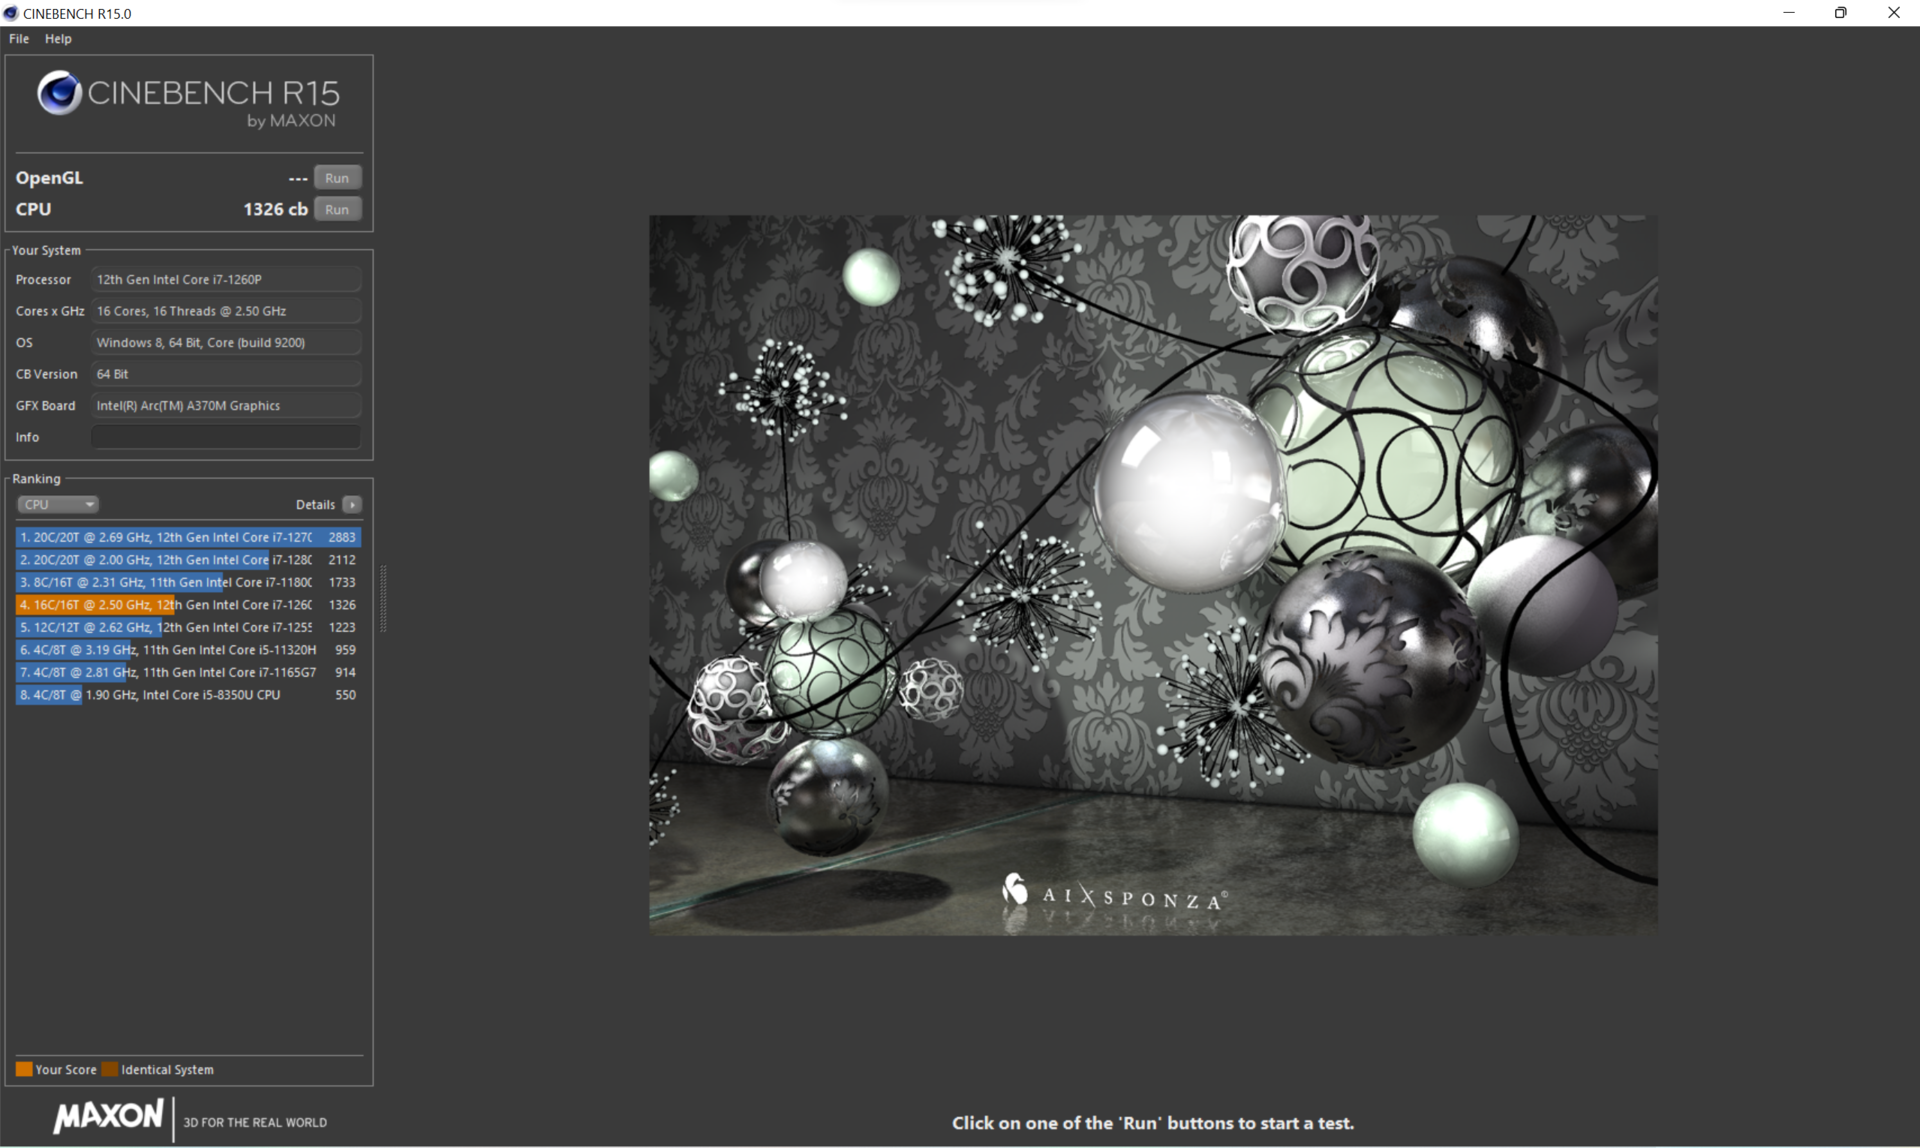
Wydajność wielordzeniowa procesora Intel Core i7-1260Pjest na tym samym poziomie co Core i5 z modelu rodzeństwa. W wydajności jednordzeniowej jest tylko 10% przewagi. Zgodnie z tym dodatkowa premia w wysokości 200 euro (~198 dolarów) nie jest uzasadniona, mimo większego dysku SSD.
Na początku rdzenie P startują z prędkością zegara 3,7 GHz, po czym w ciągu 40 sekund stopniowo spadają do 3,2 GHz, a kiedy limit mocy 35 W bierze górę, ostatecznie wyrównują się do stałego poziomu 2,8 GHz. Temperatury rdzeni utrzymują się na odpowiednim poziomie 70 °C (158 °F).
Długotrwała wydajność przewyższa wydajność poprzednika z czterordzeniowym procesoremo ~65% przy tym samym 35-watowym limicie mocy. Nawet AMD's Ryzen 9 5900X w Asusie Vivobook Pro 16Xjest tylko minimalnie szybszy w większości scenariuszy. JednakThinkBook 16 G4+i Dell's Inspiron 16 Plusprowadzą w rankingu z wyraźną przewagą dzięki swoim Core i7-12700Ho wyższych limitach mocy.
Ponieważ nie ma Turbo boost, a moc jest ograniczona do 28 W w trybie pracy na akumulatorze, wydajność spada o 20-30%, w zależności od scenariusza.
Cinebench R15 Multi Constant Load Test
Cinebench R23: Multi Core | Single Core
Cinebench R20: CPU (Multi Core) | CPU (Single Core)
Cinebench R15: CPU Multi 64Bit | CPU Single 64Bit
Blender: v2.79 BMW27 CPU
7-Zip 18.03: 7z b 4 | 7z b 4 -mmt1
Geekbench 5.5: Multi-Core | Single-Core
HWBOT x265 Benchmark v2.2: 4k Preset
LibreOffice : 20 Documents To PDF
R Benchmark 2.5: Overall mean
| CPU Performance rating | |
| Średnia w klasie Multimedia | |
| Lenovo ThinkBook 16 G4+ IAP | |
| Dell Inspiron 16 Plus 7620 | |
| HP Envy 16 h0112nr | |
| Asus Vivobook Pro 16X-M7600QE | |
| Acer Swift X SFX16-52G-77RX | |
| Acer Swift X SFX16-52G-52VE | |
| Przeciętny Intel Core i7-1260P | |
| Lenovo IdeaPad 5 Pro 16ARH7 | |
| Acer Swift X SFX16-51G-5388 | |
| Cinebench R23 / Multi Core | |
| Średnia w klasie Multimedia (4861 - 33362, n=77, ostatnie 2 lata) | |
| Lenovo ThinkBook 16 G4+ IAP | |
| Dell Inspiron 16 Plus 7620 | |
| HP Envy 16 h0112nr | |
| Asus Vivobook Pro 16X-M7600QE | |
| Asus Vivobook Pro 16X-M7600QE | |
| Acer Swift X SFX16-52G-77RX | |
| Acer Swift X SFX16-52G-52VE | |
| Przeciętny Intel Core i7-1260P (3173 - 12150, n=27) | |
| Lenovo IdeaPad 5 Pro 16ARH7 | |
| Acer Swift X SFX16-51G-5388 | |
| Cinebench R23 / Single Core | |
| Średnia w klasie Multimedia (1128 - 2459, n=69, ostatnie 2 lata) | |
| Lenovo ThinkBook 16 G4+ IAP | |
| HP Envy 16 h0112nr | |
| Dell Inspiron 16 Plus 7620 | |
| Acer Swift X SFX16-52G-77RX | |
| Przeciętny Intel Core i7-1260P (1155 - 1812, n=25) | |
| Acer Swift X SFX16-52G-52VE | |
| Asus Vivobook Pro 16X-M7600QE | |
| Asus Vivobook Pro 16X-M7600QE | |
| Lenovo IdeaPad 5 Pro 16ARH7 | |
| Acer Swift X SFX16-51G-5388 | |
| Cinebench R20 / CPU (Multi Core) | |
| Średnia w klasie Multimedia (1887 - 12912, n=60, ostatnie 2 lata) | |
| Lenovo ThinkBook 16 G4+ IAP | |
| Dell Inspiron 16 Plus 7620 | |
| HP Envy 16 h0112nr | |
| Asus Vivobook Pro 16X-M7600QE | |
| Asus Vivobook Pro 16X-M7600QE | |
| Acer Swift X SFX16-52G-77RX | |
| Acer Swift X SFX16-52G-52VE | |
| Lenovo IdeaPad 5 Pro 16ARH7 | |
| Przeciętny Intel Core i7-1260P (1234 - 4748, n=25) | |
| Acer Swift X SFX16-51G-5388 | |
| Cinebench R20 / CPU (Single Core) | |
| Średnia w klasie Multimedia (425 - 853, n=60, ostatnie 2 lata) | |
| Lenovo ThinkBook 16 G4+ IAP | |
| HP Envy 16 h0112nr | |
| Dell Inspiron 16 Plus 7620 | |
| Acer Swift X SFX16-52G-77RX | |
| Przeciętny Intel Core i7-1260P (448 - 698, n=25) | |
| Acer Swift X SFX16-52G-52VE | |
| Lenovo IdeaPad 5 Pro 16ARH7 | |
| Asus Vivobook Pro 16X-M7600QE | |
| Asus Vivobook Pro 16X-M7600QE | |
| Acer Swift X SFX16-51G-5388 | |
| Cinebench R15 / CPU Multi 64Bit | |
| Średnia w klasie Multimedia (856 - 5224, n=64, ostatnie 2 lata) | |
| HP Envy 16 h0112nr | |
| Lenovo ThinkBook 16 G4+ IAP | |
| Dell Inspiron 16 Plus 7620 | |
| Asus Vivobook Pro 16X-M7600QE | |
| Asus Vivobook Pro 16X-M7600QE | |
| Acer Swift X SFX16-52G-77RX | |
| Acer Swift X SFX16-52G-52VE | |
| Lenovo IdeaPad 5 Pro 16ARH7 | |
| Przeciętny Intel Core i7-1260P (549 - 2034, n=29) | |
| Acer Swift X SFX16-51G-5388 | |
| Cinebench R15 / CPU Single 64Bit | |
| Średnia w klasie Multimedia (184.8 - 326, n=62, ostatnie 2 lata) | |
| Lenovo ThinkBook 16 G4+ IAP | |
| HP Envy 16 h0112nr | |
| Dell Inspiron 16 Plus 7620 | |
| Acer Swift X SFX16-52G-77RX | |
| Asus Vivobook Pro 16X-M7600QE | |
| Asus Vivobook Pro 16X-M7600QE | |
| Lenovo IdeaPad 5 Pro 16ARH7 | |
| Acer Swift X SFX16-52G-52VE | |
| Przeciętny Intel Core i7-1260P (165.4 - 260, n=27) | |
| Acer Swift X SFX16-51G-5388 | |
| Blender / v2.79 BMW27 CPU | |
| Acer Swift X SFX16-51G-5388 | |
| Przeciętny Intel Core i7-1260P (264 - 906, n=26) | |
| Lenovo IdeaPad 5 Pro 16ARH7 | |
| Acer Swift X SFX16-52G-52VE | |
| Acer Swift X SFX16-52G-77RX | |
| Asus Vivobook Pro 16X-M7600QE | |
| Asus Vivobook Pro 16X-M7600QE | |
| HP Envy 16 h0112nr | |
| Średnia w klasie Multimedia (100 - 557, n=61, ostatnie 2 lata) | |
| Dell Inspiron 16 Plus 7620 | |
| Lenovo ThinkBook 16 G4+ IAP | |
| 7-Zip 18.03 / 7z b 4 | |
| Lenovo ThinkBook 16 G4+ IAP | |
| Dell Inspiron 16 Plus 7620 | |
| Asus Vivobook Pro 16X-M7600QE | |
| Asus Vivobook Pro 16X-M7600QE | |
| Średnia w klasie Multimedia (26062 - 130368, n=58, ostatnie 2 lata) | |
| HP Envy 16 h0112nr | |
| Acer Swift X SFX16-52G-52VE | |
| Lenovo IdeaPad 5 Pro 16ARH7 | |
| Acer Swift X SFX16-52G-77RX | |
| Przeciętny Intel Core i7-1260P (16146 - 47064, n=25) | |
| Acer Swift X SFX16-51G-5388 | |
| 7-Zip 18.03 / 7z b 4 -mmt1 | |
| Średnia w klasie Multimedia (3666 - 7545, n=59, ostatnie 2 lata) | |
| Asus Vivobook Pro 16X-M7600QE | |
| Asus Vivobook Pro 16X-M7600QE | |
| HP Envy 16 h0112nr | |
| Lenovo ThinkBook 16 G4+ IAP | |
| Dell Inspiron 16 Plus 7620 | |
| Lenovo IdeaPad 5 Pro 16ARH7 | |
| Przeciętny Intel Core i7-1260P (4064 - 5791, n=25) | |
| Acer Swift X SFX16-52G-77RX | |
| Acer Swift X SFX16-52G-52VE | |
| Acer Swift X SFX16-51G-5388 | |
| Geekbench 5.5 / Multi-Core | |
| Średnia w klasie Multimedia (4652 - 20422, n=59, ostatnie 2 lata) | |
| HP Envy 16 h0112nr | |
| Lenovo ThinkBook 16 G4+ IAP | |
| Dell Inspiron 16 Plus 7620 | |
| Acer Swift X SFX16-52G-77RX | |
| Acer Swift X SFX16-52G-52VE | |
| Przeciętny Intel Core i7-1260P (3866 - 10570, n=25) | |
| Asus Vivobook Pro 16X-M7600QE | |
| Asus Vivobook Pro 16X-M7600QE | |
| Lenovo IdeaPad 5 Pro 16ARH7 | |
| Acer Swift X SFX16-51G-5388 | |
| Geekbench 5.5 / Single-Core | |
| Średnia w klasie Multimedia (805 - 2974, n=59, ostatnie 2 lata) | |
| Acer Swift X SFX16-52G-77RX | |
| HP Envy 16 h0112nr | |
| Lenovo ThinkBook 16 G4+ IAP | |
| Dell Inspiron 16 Plus 7620 | |
| Przeciętny Intel Core i7-1260P (1436 - 1786, n=25) | |
| Acer Swift X SFX16-52G-52VE | |
| Asus Vivobook Pro 16X-M7600QE | |
| Asus Vivobook Pro 16X-M7600QE | |
| Lenovo IdeaPad 5 Pro 16ARH7 | |
| Acer Swift X SFX16-51G-5388 | |
| HWBOT x265 Benchmark v2.2 / 4k Preset | |
| Średnia w klasie Multimedia (5.26 - 36.1, n=59, ostatnie 2 lata) | |
| Lenovo ThinkBook 16 G4+ IAP | |
| Dell Inspiron 16 Plus 7620 | |
| Asus Vivobook Pro 16X-M7600QE | |
| Asus Vivobook Pro 16X-M7600QE | |
| HP Envy 16 h0112nr | |
| Acer Swift X SFX16-52G-77RX | |
| Acer Swift X SFX16-52G-52VE | |
| Lenovo IdeaPad 5 Pro 16ARH7 | |
| Przeciętny Intel Core i7-1260P (3.45 - 13.6, n=26) | |
| Acer Swift X SFX16-51G-5388 | |
| LibreOffice / 20 Documents To PDF | |
| Lenovo IdeaPad 5 Pro 16ARH7 | |
| Acer Swift X SFX16-52G-77RX | |
| Asus Vivobook Pro 16X-M7600QE | |
| Asus Vivobook Pro 16X-M7600QE | |
| Acer Swift X SFX16-51G-5388 | |
| Średnia w klasie Multimedia (23.9 - 146.7, n=60, ostatnie 2 lata) | |
| Przeciętny Intel Core i7-1260P (40.2 - 65.7, n=25) | |
| Acer Swift X SFX16-52G-52VE | |
| Lenovo ThinkBook 16 G4+ IAP | |
| Dell Inspiron 16 Plus 7620 | |
| HP Envy 16 h0112nr | |
| R Benchmark 2.5 / Overall mean | |
| Acer Swift X SFX16-51G-5388 | |
| Acer Swift X SFX16-52G-52VE | |
| Lenovo IdeaPad 5 Pro 16ARH7 | |
| Przeciętny Intel Core i7-1260P (0.4559 - 0.727, n=25) | |
| Asus Vivobook Pro 16X-M7600QE | |
| Asus Vivobook Pro 16X-M7600QE | |
| Dell Inspiron 16 Plus 7620 | |
| Acer Swift X SFX16-52G-77RX | |
| Średnia w klasie Multimedia (0.3604 - 0.947, n=59, ostatnie 2 lata) | |
| Lenovo ThinkBook 16 G4+ IAP | |
| HP Envy 16 h0112nr | |
* ... im mniej tym lepiej
AIDA64: FP32 Ray-Trace | FPU Julia | CPU SHA3 | CPU Queen | FPU SinJulia | FPU Mandel | CPU AES | CPU ZLib | FP64 Ray-Trace | CPU PhotoWorxx
| Performance rating | |
| Średnia w klasie Multimedia | |
| Asus Vivobook Pro 16X-M7600QE | |
| Lenovo ThinkBook 16 G4+ IAP | |
| HP Envy 16 h0112nr | |
| Dell Inspiron 16 Plus 7620 | |
| Lenovo IdeaPad 5 Pro 16ARH7 | |
| Acer Swift X SFX16-52G-77RX | |
| Acer Swift X SFX16-52G-52VE | |
| Przeciętny Intel Core i7-1260P | |
| Acer Swift X SFX16-51G-5388 | |
| AIDA64 / FP32 Ray-Trace | |
| Średnia w klasie Multimedia (2214 - 50388, n=56, ostatnie 2 lata) | |
| Lenovo ThinkBook 16 G4+ IAP | |
| Asus Vivobook Pro 16X-M7600QE | |
| Asus Vivobook Pro 16X-M7600QE | |
| Dell Inspiron 16 Plus 7620 | |
| HP Envy 16 h0112nr | |
| Lenovo IdeaPad 5 Pro 16ARH7 | |
| Acer Swift X SFX16-52G-52VE | |
| Acer Swift X SFX16-52G-77RX | |
| Przeciętny Intel Core i7-1260P (2176 - 10898, n=26) | |
| Acer Swift X SFX16-51G-5388 | |
| AIDA64 / FPU Julia | |
| Asus Vivobook Pro 16X-M7600QE | |
| Asus Vivobook Pro 16X-M7600QE | |
| Średnia w klasie Multimedia (12867 - 201874, n=57, ostatnie 2 lata) | |
| Lenovo ThinkBook 16 G4+ IAP | |
| Lenovo IdeaPad 5 Pro 16ARH7 | |
| Dell Inspiron 16 Plus 7620 | |
| HP Envy 16 h0112nr | |
| Acer Swift X SFX16-52G-77RX | |
| Acer Swift X SFX16-52G-52VE | |
| Przeciętny Intel Core i7-1260P (11015 - 56906, n=26) | |
| Acer Swift X SFX16-51G-5388 | |
| AIDA64 / CPU SHA3 | |
| Średnia w klasie Multimedia (626 - 8623, n=57, ostatnie 2 lata) | |
| Lenovo ThinkBook 16 G4+ IAP | |
| Asus Vivobook Pro 16X-M7600QE | |
| Asus Vivobook Pro 16X-M7600QE | |
| Dell Inspiron 16 Plus 7620 | |
| HP Envy 16 h0112nr | |
| Lenovo IdeaPad 5 Pro 16ARH7 | |
| Acer Swift X SFX16-52G-77RX | |
| Acer Swift X SFX16-52G-52VE | |
| Acer Swift X SFX16-51G-5388 | |
| Przeciętny Intel Core i7-1260P (669 - 2709, n=26) | |
| AIDA64 / CPU Queen | |
| Lenovo ThinkBook 16 G4+ IAP | |
| HP Envy 16 h0112nr | |
| Asus Vivobook Pro 16X-M7600QE | |
| Asus Vivobook Pro 16X-M7600QE | |
| Dell Inspiron 16 Plus 7620 | |
| Acer Swift X SFX16-52G-77RX | |
| Lenovo IdeaPad 5 Pro 16ARH7 | |
| Średnia w klasie Multimedia (13483 - 181505, n=44, ostatnie 2 lata) | |
| Przeciętny Intel Core i7-1260P (42571 - 82493, n=26) | |
| Acer Swift X SFX16-52G-52VE | |
| Acer Swift X SFX16-51G-5388 | |
| AIDA64 / FPU SinJulia | |
| Asus Vivobook Pro 16X-M7600QE | |
| Asus Vivobook Pro 16X-M7600QE | |
| Lenovo ThinkBook 16 G4+ IAP | |
| Lenovo IdeaPad 5 Pro 16ARH7 | |
| Średnia w klasie Multimedia (886 - 28794, n=57, ostatnie 2 lata) | |
| Dell Inspiron 16 Plus 7620 | |
| HP Envy 16 h0112nr | |
| Acer Swift X SFX16-52G-77RX | |
| Acer Swift X SFX16-52G-52VE | |
| Przeciętny Intel Core i7-1260P (2901 - 6975, n=26) | |
| Acer Swift X SFX16-51G-5388 | |
| AIDA64 / FPU Mandel | |
| Asus Vivobook Pro 16X-M7600QE | |
| Asus Vivobook Pro 16X-M7600QE | |
| Średnia w klasie Multimedia (6395 - 105740, n=56, ostatnie 2 lata) | |
| Lenovo IdeaPad 5 Pro 16ARH7 | |
| Lenovo ThinkBook 16 G4+ IAP | |
| Dell Inspiron 16 Plus 7620 | |
| HP Envy 16 h0112nr | |
| Acer Swift X SFX16-52G-77RX | |
| Acer Swift X SFX16-52G-52VE | |
| Acer Swift X SFX16-51G-5388 | |
| Przeciętny Intel Core i7-1260P (5950 - 26376, n=26) | |
| AIDA64 / CPU AES | |
| Asus Vivobook Pro 16X-M7600QE | |
| Asus Vivobook Pro 16X-M7600QE | |
| HP Envy 16 h0112nr | |
| Lenovo ThinkBook 16 G4+ IAP | |
| Średnia w klasie Multimedia (8171 - 126790, n=57, ostatnie 2 lata) | |
| Dell Inspiron 16 Plus 7620 | |
| Acer Swift X SFX16-51G-5388 | |
| Acer Swift X SFX16-52G-77RX | |
| Acer Swift X SFX16-52G-52VE | |
| Przeciętny Intel Core i7-1260P (16041 - 92356, n=26) | |
| Lenovo IdeaPad 5 Pro 16ARH7 | |
| AIDA64 / CPU ZLib | |
| Lenovo ThinkBook 16 G4+ IAP | |
| Średnia w klasie Multimedia (143.8 - 2022, n=57, ostatnie 2 lata) | |
| Dell Inspiron 16 Plus 7620 | |
| Acer Swift X SFX16-52G-52VE | |
| HP Envy 16 h0112nr | |
| Asus Vivobook Pro 16X-M7600QE | |
| Asus Vivobook Pro 16X-M7600QE | |
| Acer Swift X SFX16-52G-77RX | |
| Lenovo IdeaPad 5 Pro 16ARH7 | |
| Przeciętny Intel Core i7-1260P (259 - 771, n=26) | |
| Acer Swift X SFX16-51G-5388 | |
| AIDA64 / FP64 Ray-Trace | |
| Średnia w klasie Multimedia (1014 - 26875, n=57, ostatnie 2 lata) | |
| Asus Vivobook Pro 16X-M7600QE | |
| Asus Vivobook Pro 16X-M7600QE | |
| Lenovo ThinkBook 16 G4+ IAP | |
| Dell Inspiron 16 Plus 7620 | |
| HP Envy 16 h0112nr | |
| Lenovo IdeaPad 5 Pro 16ARH7 | |
| Acer Swift X SFX16-52G-77RX | |
| Acer Swift X SFX16-52G-52VE | |
| Przeciętny Intel Core i7-1260P (1237 - 5858, n=26) | |
| Acer Swift X SFX16-51G-5388 | |
| AIDA64 / CPU PhotoWorxx | |
| Średnia w klasie Multimedia (8187 - 88154, n=57, ostatnie 2 lata) | |
| Acer Swift X SFX16-52G-52VE | |
| Acer Swift X SFX16-52G-77RX | |
| Lenovo ThinkBook 16 G4+ IAP | |
| HP Envy 16 h0112nr | |
| Acer Swift X SFX16-51G-5388 | |
| Dell Inspiron 16 Plus 7620 | |
| Przeciętny Intel Core i7-1260P (13261 - 43652, n=26) | |
| Lenovo IdeaPad 5 Pro 16ARH7 | |
| Asus Vivobook Pro 16X-M7600QE | |
| Asus Vivobook Pro 16X-M7600QE | |
Wydajność systemu
Podobnie jak w przypadku model "sibling, wydajność systemu stoi na wysokim poziomie, szczególnie podczas przeglądania stron internetowych, dzięki wysokiemu Turbo boost w procesorach Intela.
Ze względu na zastosowany RTX 3060,.HP Envy 16jest w stanie pójść do przodu szczególnie w dziedzinie tworzenia treści. Podczas intensywnego surfowania po sieci z wykorzystaniem procesora, dystans do Core i7-12700Hzastosowanego w tym laptopie zmniejsza się do poziomu od 10 do 15%.
CrossMark: Overall | Productivity | Creativity | Responsiveness
Youtube: 2160p60 CPU Load
Sunspider: 1.0 Total Score
Mozilla Kraken 1.1: Total
Speedometer 2.0: Result 2.0
Octane V2: Total Score
Jetstream 2: 2.0 Total
WebXPRT 3: Overall
WebXPRT 4: Overall
| PCMark 10 / Score | |
| Średnia w klasie Multimedia (4325 - 10386, n=55, ostatnie 2 lata) | |
| HP Envy 16 h0112nr | |
| Dell Inspiron 16 Plus 7620 | |
| Asus Vivobook Pro 16X-M7600QE | |
| Acer Swift X SFX16-52G-77RX | |
| Przeciętny Intel Core i7-1260P, Intel Arc A370M (n=1) | |
| Acer Swift X SFX16-52G-52VE | |
| Lenovo IdeaPad 5 Pro 16ARH7 | |
| Acer Swift X SFX16-51G-5388 | |
| PCMark 10 / Essentials | |
| HP Envy 16 h0112nr | |
| Acer Swift X SFX16-52G-77RX | |
| Przeciętny Intel Core i7-1260P, Intel Arc A370M (n=1) | |
| Średnia w klasie Multimedia (8025 - 11664, n=54, ostatnie 2 lata) | |
| Asus Vivobook Pro 16X-M7600QE | |
| Dell Inspiron 16 Plus 7620 | |
| Lenovo IdeaPad 5 Pro 16ARH7 | |
| Acer Swift X SFX16-52G-52VE | |
| Acer Swift X SFX16-51G-5388 | |
| PCMark 10 / Productivity | |
| Średnia w klasie Multimedia (7323 - 18233, n=54, ostatnie 2 lata) | |
| Asus Vivobook Pro 16X-M7600QE | |
| HP Envy 16 h0112nr | |
| Dell Inspiron 16 Plus 7620 | |
| Lenovo IdeaPad 5 Pro 16ARH7 | |
| Acer Swift X SFX16-51G-5388 | |
| Acer Swift X SFX16-52G-52VE | |
| Acer Swift X SFX16-52G-77RX | |
| Przeciętny Intel Core i7-1260P, Intel Arc A370M (n=1) | |
| PCMark 10 / Digital Content Creation | |
| HP Envy 16 h0112nr | |
| Średnia w klasie Multimedia (3651 - 16240, n=54, ostatnie 2 lata) | |
| Dell Inspiron 16 Plus 7620 | |
| Asus Vivobook Pro 16X-M7600QE | |
| Acer Swift X SFX16-52G-77RX | |
| Przeciętny Intel Core i7-1260P, Intel Arc A370M (n=1) | |
| Acer Swift X SFX16-52G-52VE | |
| Acer Swift X SFX16-51G-5388 | |
| Lenovo IdeaPad 5 Pro 16ARH7 | |
| CrossMark / Overall | |
| Średnia w klasie Multimedia (866 - 2728, n=63, ostatnie 2 lata) | |
| HP Envy 16 h0112nr | |
| Lenovo ThinkBook 16 G4+ IAP | |
| Dell Inspiron 16 Plus 7620 | |
| Acer Swift X SFX16-52G-77RX | |
| Przeciętny Intel Core i7-1260P, Intel Arc A370M (n=1) | |
| Acer Swift X SFX16-52G-52VE | |
| Acer Swift X SFX16-51G-5388 | |
| CrossMark / Productivity | |
| Średnia w klasie Multimedia (931 - 2489, n=63, ostatnie 2 lata) | |
| HP Envy 16 h0112nr | |
| Lenovo ThinkBook 16 G4+ IAP | |
| Acer Swift X SFX16-52G-77RX | |
| Przeciętny Intel Core i7-1260P, Intel Arc A370M (n=1) | |
| Dell Inspiron 16 Plus 7620 | |
| Acer Swift X SFX16-51G-5388 | |
| Acer Swift X SFX16-52G-52VE | |
| CrossMark / Creativity | |
| Średnia w klasie Multimedia (907 - 3465, n=63, ostatnie 2 lata) | |
| HP Envy 16 h0112nr | |
| Lenovo ThinkBook 16 G4+ IAP | |
| Dell Inspiron 16 Plus 7620 | |
| Acer Swift X SFX16-52G-77RX | |
| Przeciętny Intel Core i7-1260P, Intel Arc A370M (n=1) | |
| Acer Swift X SFX16-52G-52VE | |
| Acer Swift X SFX16-51G-5388 | |
| CrossMark / Responsiveness | |
| Acer Swift X SFX16-52G-77RX | |
| Przeciętny Intel Core i7-1260P, Intel Arc A370M (n=1) | |
| HP Envy 16 h0112nr | |
| Lenovo ThinkBook 16 G4+ IAP | |
| Średnia w klasie Multimedia (605 - 2024, n=63, ostatnie 2 lata) | |
| Dell Inspiron 16 Plus 7620 | |
| Acer Swift X SFX16-52G-52VE | |
| Acer Swift X SFX16-51G-5388 | |
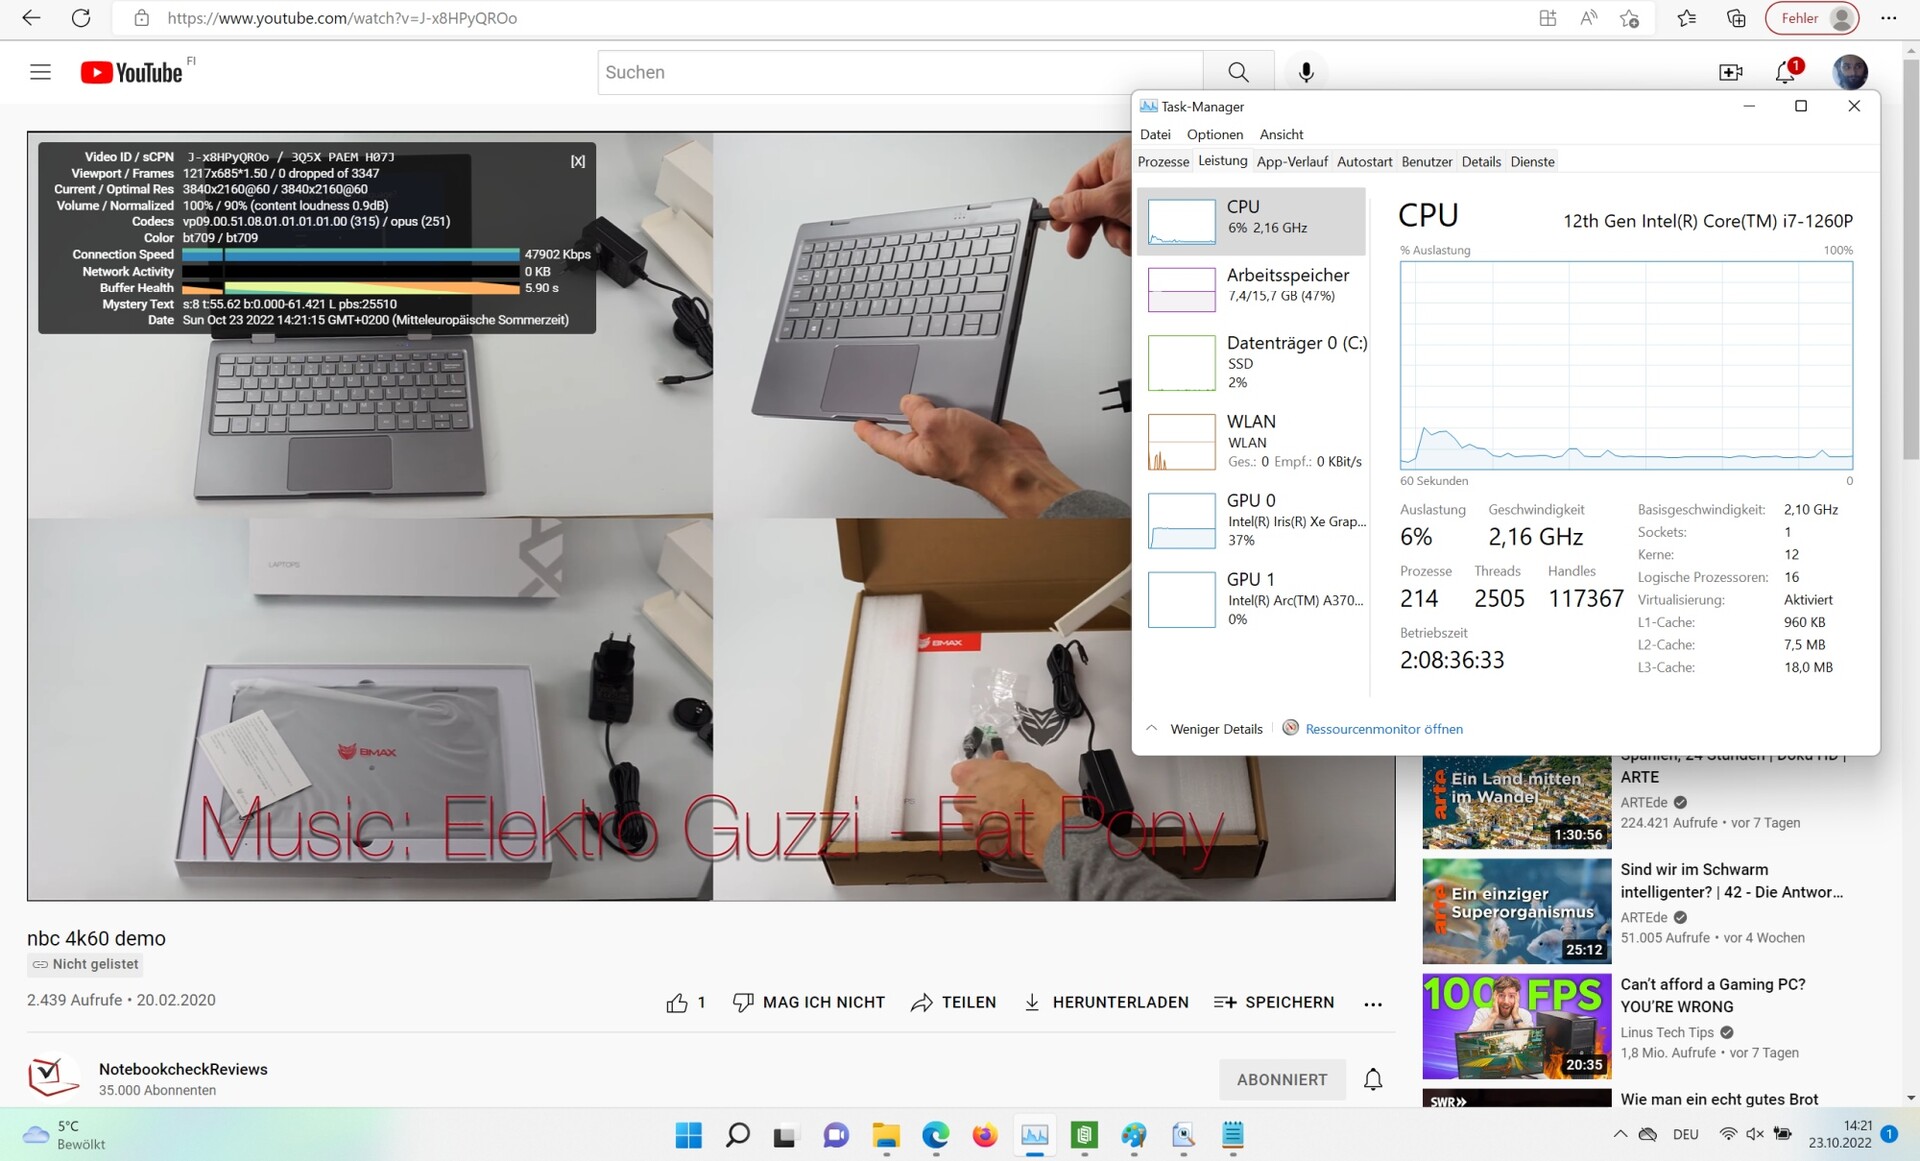
| Youtube / 2160p60 CPU Load | |
| Średnia w klasie Multimedia (3 - 46, n=55, ostatnie 2 lata) | |
| Acer Swift X SFX16-52G-52VE (42, 1) | |
| Lenovo ThinkBook 16 G4+ IAP (43, 8) | |
| Acer Swift X SFX16-52G-77RX (37) | |
| Przeciętny Intel Core i7-1260P, Intel Arc A370M (n=1) | |
| Asus Vivobook Pro 16X-M7600QE (76, 38) | |
| Dell Inspiron 16 Plus 7620 (46, 1) | |
| HP Envy 16 h0112nr (45, 3) | |
| Lenovo IdeaPad 5 Pro 16ARH7 (1) | |
| Sunspider / 1.0 Total Score | |
| Lenovo IdeaPad 5 Pro 16ARH7 | |
| Acer Swift X SFX16-52G-77RX | |
| Przeciętny Intel Core i7-1260P, Intel Arc A370M (n=1) | |
| Średnia w klasie Multimedia (n=1ostatnie 2 lata) | |
| Mozilla Kraken 1.1 / Total | |
| Acer Swift X SFX16-51G-5388 | |
| Lenovo IdeaPad 5 Pro 16ARH7 | |
| Asus Vivobook Pro 16X-M7600QE | |
| Asus Vivobook Pro 16X-M7600QE | |
| Acer Swift X SFX16-52G-77RX | |
| Przeciętny Intel Core i7-1260P, Intel Arc A370M (n=1) | |
| Acer Swift X SFX16-52G-52VE | |
| HP Envy 16 h0112nr | |
| Dell Inspiron 16 Plus 7620 | |
| Lenovo ThinkBook 16 G4+ IAP | |
| Średnia w klasie Multimedia (228 - 835, n=69, ostatnie 2 lata) | |
| Speedometer 2.0 / Result 2.0 | |
| Średnia w klasie Multimedia (337 - 946, n=32, ostatnie 2 lata) | |
| Lenovo ThinkBook 16 G4+ IAP | |
| Acer Swift X SFX16-52G-77RX | |
| Przeciętny Intel Core i7-1260P, Intel Arc A370M (n=1) | |
| Octane V2 / Total Score | |
| Średnia w klasie Multimedia (64079 - 153175, n=32, ostatnie 2 lata) | |
| Lenovo ThinkBook 16 G4+ IAP | |
| Acer Swift X SFX16-52G-77RX | |
| Przeciętny Intel Core i7-1260P, Intel Arc A370M (n=1) | |
| Acer Swift X SFX16-52G-52VE | |
| Acer Swift X SFX16-51G-5388 | |
| Jetstream 2 / 2.0 Total | |
| Średnia w klasie Multimedia (287 - 481, n=33, ostatnie 2 lata) | |
| HP Envy 16 h0112nr | |
| Dell Inspiron 16 Plus 7620 | |
| Lenovo ThinkBook 16 G4+ IAP | |
| Acer Swift X SFX16-52G-77RX | |
| Przeciętny Intel Core i7-1260P, Intel Arc A370M (n=1) | |
| Acer Swift X SFX16-52G-52VE | |
| Acer Swift X SFX16-51G-5388 | |
| WebXPRT 3 / Overall | |
| Średnia w klasie Multimedia (136.4 - 596, n=66, ostatnie 2 lata) | |
| HP Envy 16 h0112nr | |
| Dell Inspiron 16 Plus 7620 | |
| Lenovo ThinkBook 16 G4+ IAP | |
| Asus Vivobook Pro 16X-M7600QE | |
| Acer Swift X SFX16-52G-77RX | |
| Przeciętny Intel Core i7-1260P, Intel Arc A370M (n=1) | |
| Acer Swift X SFX16-52G-52VE | |
| Acer Swift X SFX16-51G-5388 | |
| Lenovo IdeaPad 5 Pro 16ARH7 | |
| WebXPRT 4 / Overall | |
| Średnia w klasie Multimedia (167.3 - 402, n=68, ostatnie 2 lata) | |
| HP Envy 16 h0112nr | |
| Lenovo ThinkBook 16 G4+ IAP | |
| Dell Inspiron 16 Plus 7620 | |
| Acer Swift X SFX16-52G-77RX | |
| Przeciętny Intel Core i7-1260P, Intel Arc A370M (n=1) | |
| Acer Swift X SFX16-52G-52VE | |
| Acer Swift X SFX16-51G-5388 | |
* ... im mniej tym lepiej
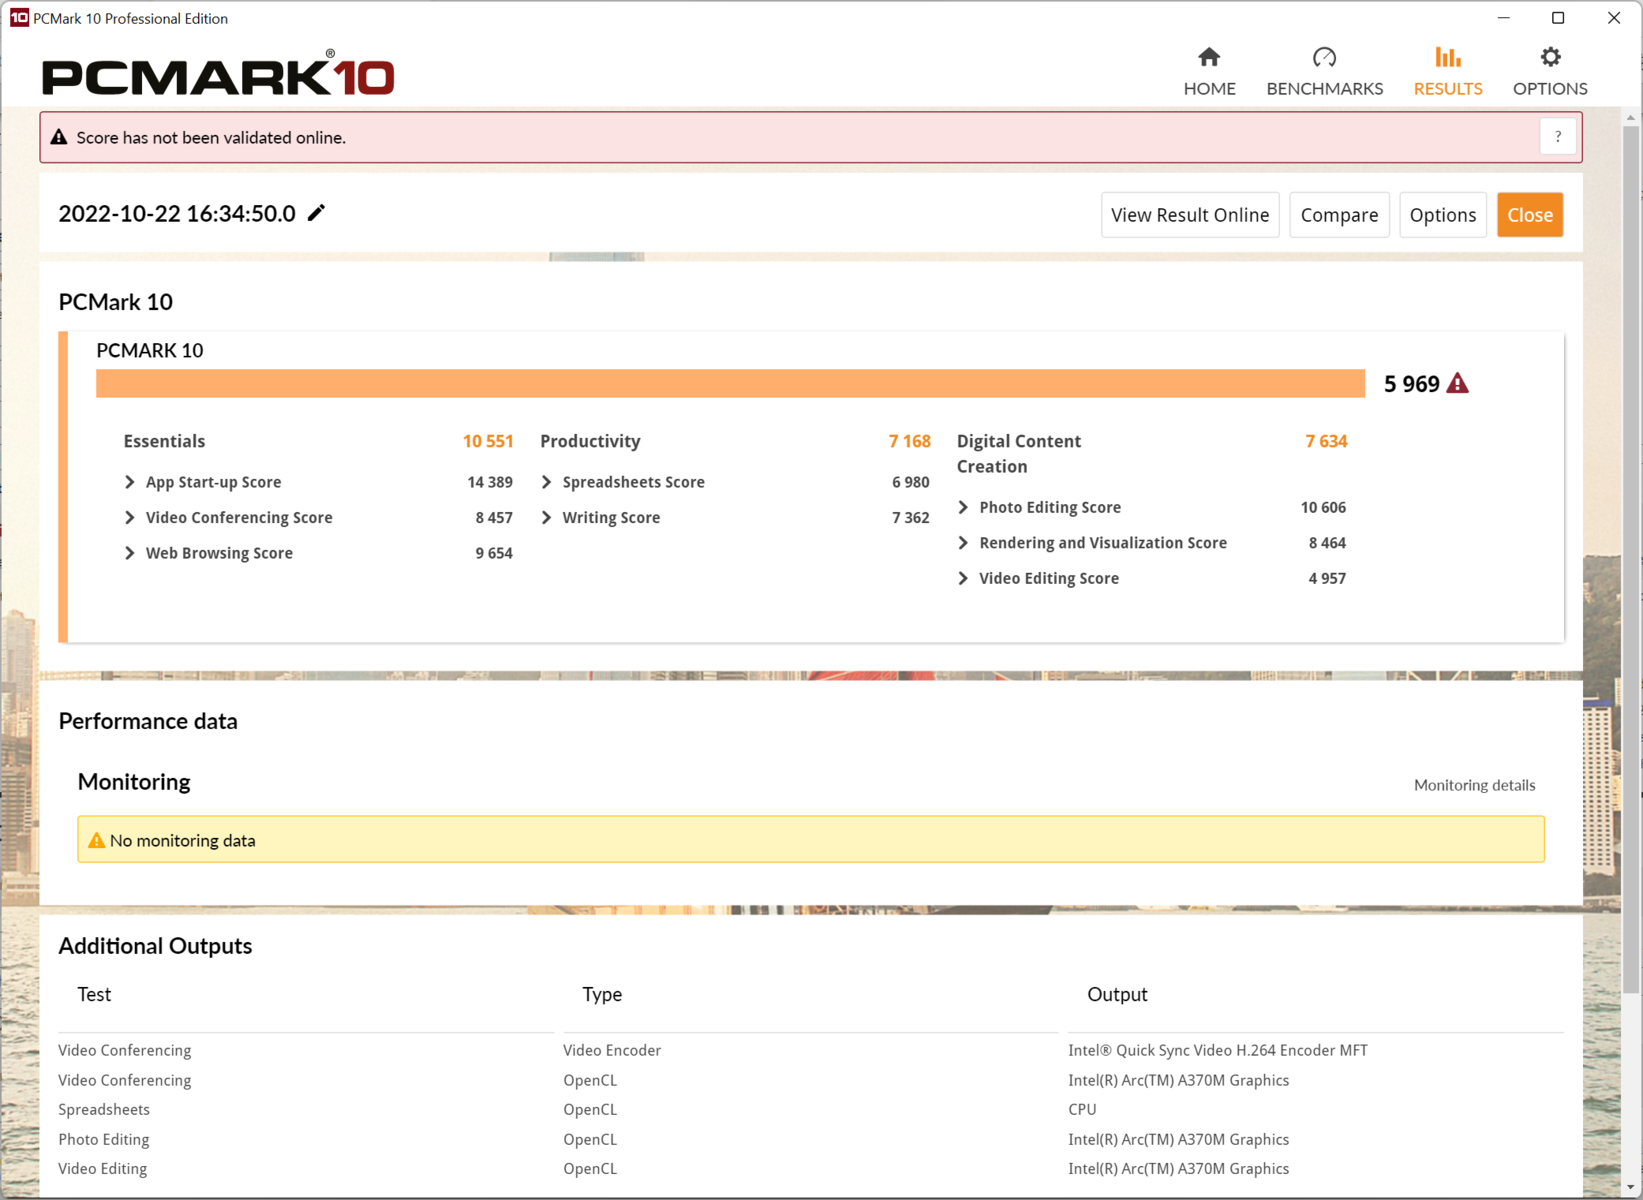
| PCMark 10 Score | 5969 pkt. | |
Pomoc | ||
| AIDA64 / Memory Copy | |
| Średnia w klasie Multimedia (11299 - 132135, n=57, ostatnie 2 lata) | |
| Acer Swift X SFX16-52G-77RX | |
| Acer Swift X SFX16-52G-52VE | |
| Lenovo ThinkBook 16 G4+ IAP | |
| HP Envy 16 h0112nr | |
| Acer Swift X SFX16-51G-5388 | |
| Dell Inspiron 16 Plus 7620 | |
| Przeciętny Intel Core i7-1260P (25125 - 71544, n=25) | |
| Lenovo IdeaPad 5 Pro 16ARH7 | |
| Asus Vivobook Pro 16X-M7600QE | |
| Asus Vivobook Pro 16X-M7600QE | |
| AIDA64 / Memory Read | |
| Średnia w klasie Multimedia (11624 - 174586, n=57, ostatnie 2 lata) | |
| Lenovo ThinkBook 16 G4+ IAP | |
| Acer Swift X SFX16-52G-77RX | |
| HP Envy 16 h0112nr | |
| Acer Swift X SFX16-52G-52VE | |
| Dell Inspiron 16 Plus 7620 | |
| Przeciętny Intel Core i7-1260P (24983 - 72065, n=25) | |
| Acer Swift X SFX16-51G-5388 | |
| Asus Vivobook Pro 16X-M7600QE | |
| Asus Vivobook Pro 16X-M7600QE | |
| Lenovo IdeaPad 5 Pro 16ARH7 | |
| AIDA64 / Memory Write | |
| Lenovo IdeaPad 5 Pro 16ARH7 | |
| Średnia w klasie Multimedia (11755 - 134998, n=57, ostatnie 2 lata) | |
| Acer Swift X SFX16-51G-5388 | |
| Acer Swift X SFX16-52G-77RX | |
| HP Envy 16 h0112nr | |
| Acer Swift X SFX16-52G-52VE | |
| Lenovo ThinkBook 16 G4+ IAP | |
| Dell Inspiron 16 Plus 7620 | |
| Przeciętny Intel Core i7-1260P (23512 - 66799, n=25) | |
| Asus Vivobook Pro 16X-M7600QE | |
| Asus Vivobook Pro 16X-M7600QE | |
| AIDA64 / Memory Latency | |
| Średnia w klasie Multimedia (7 - 535, n=56, ostatnie 2 lata) | |
| Lenovo IdeaPad 5 Pro 16ARH7 | |
| Acer Swift X SFX16-51G-5388 | |
| Acer Swift X SFX16-52G-77RX | |
| Lenovo ThinkBook 16 G4+ IAP | |
| Acer Swift X SFX16-52G-52VE | |
| Dell Inspiron 16 Plus 7620 | |
| HP Envy 16 h0112nr | |
| Przeciętny Intel Core i7-1260P (77.9 - 118.4, n=21) | |
| Asus Vivobook Pro 16X-M7600QE | |
| Asus Vivobook Pro 16X-M7600QE | |
* ... im mniej tym lepiej
Opóźnienia DPC
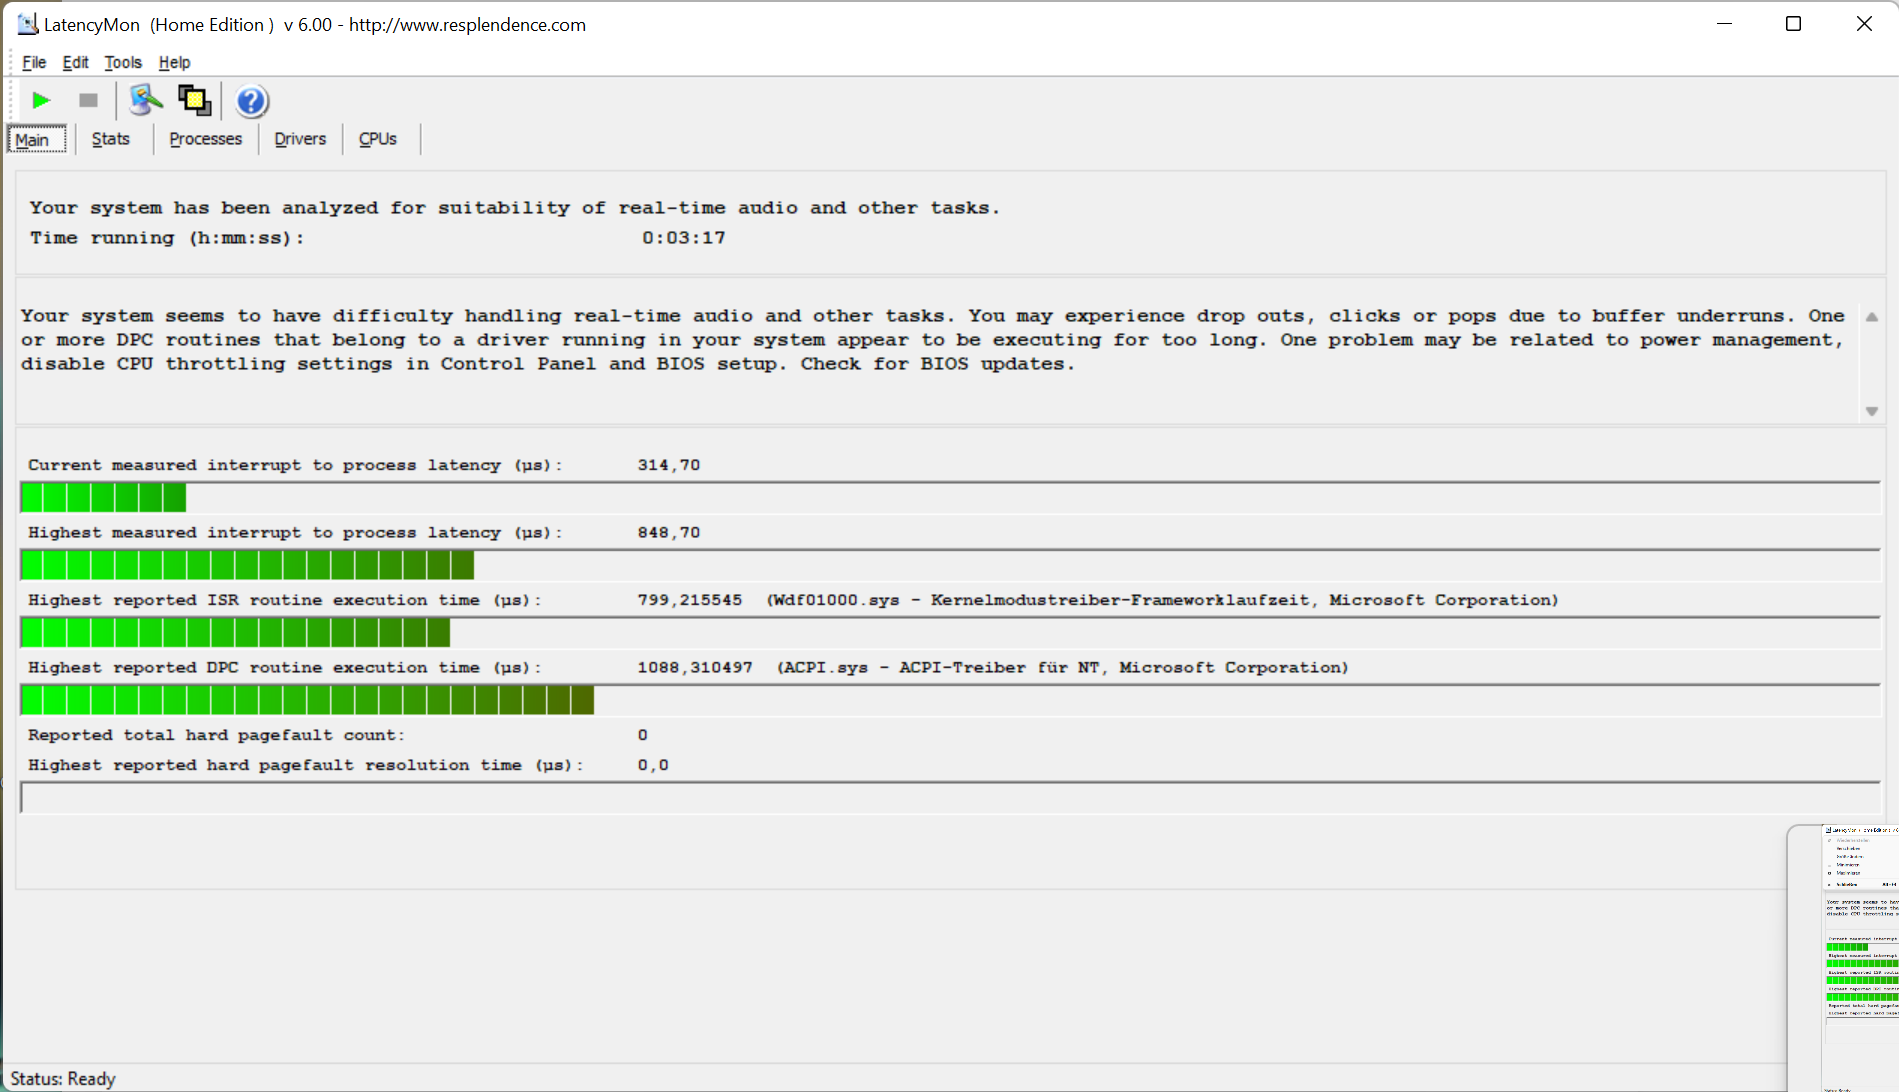
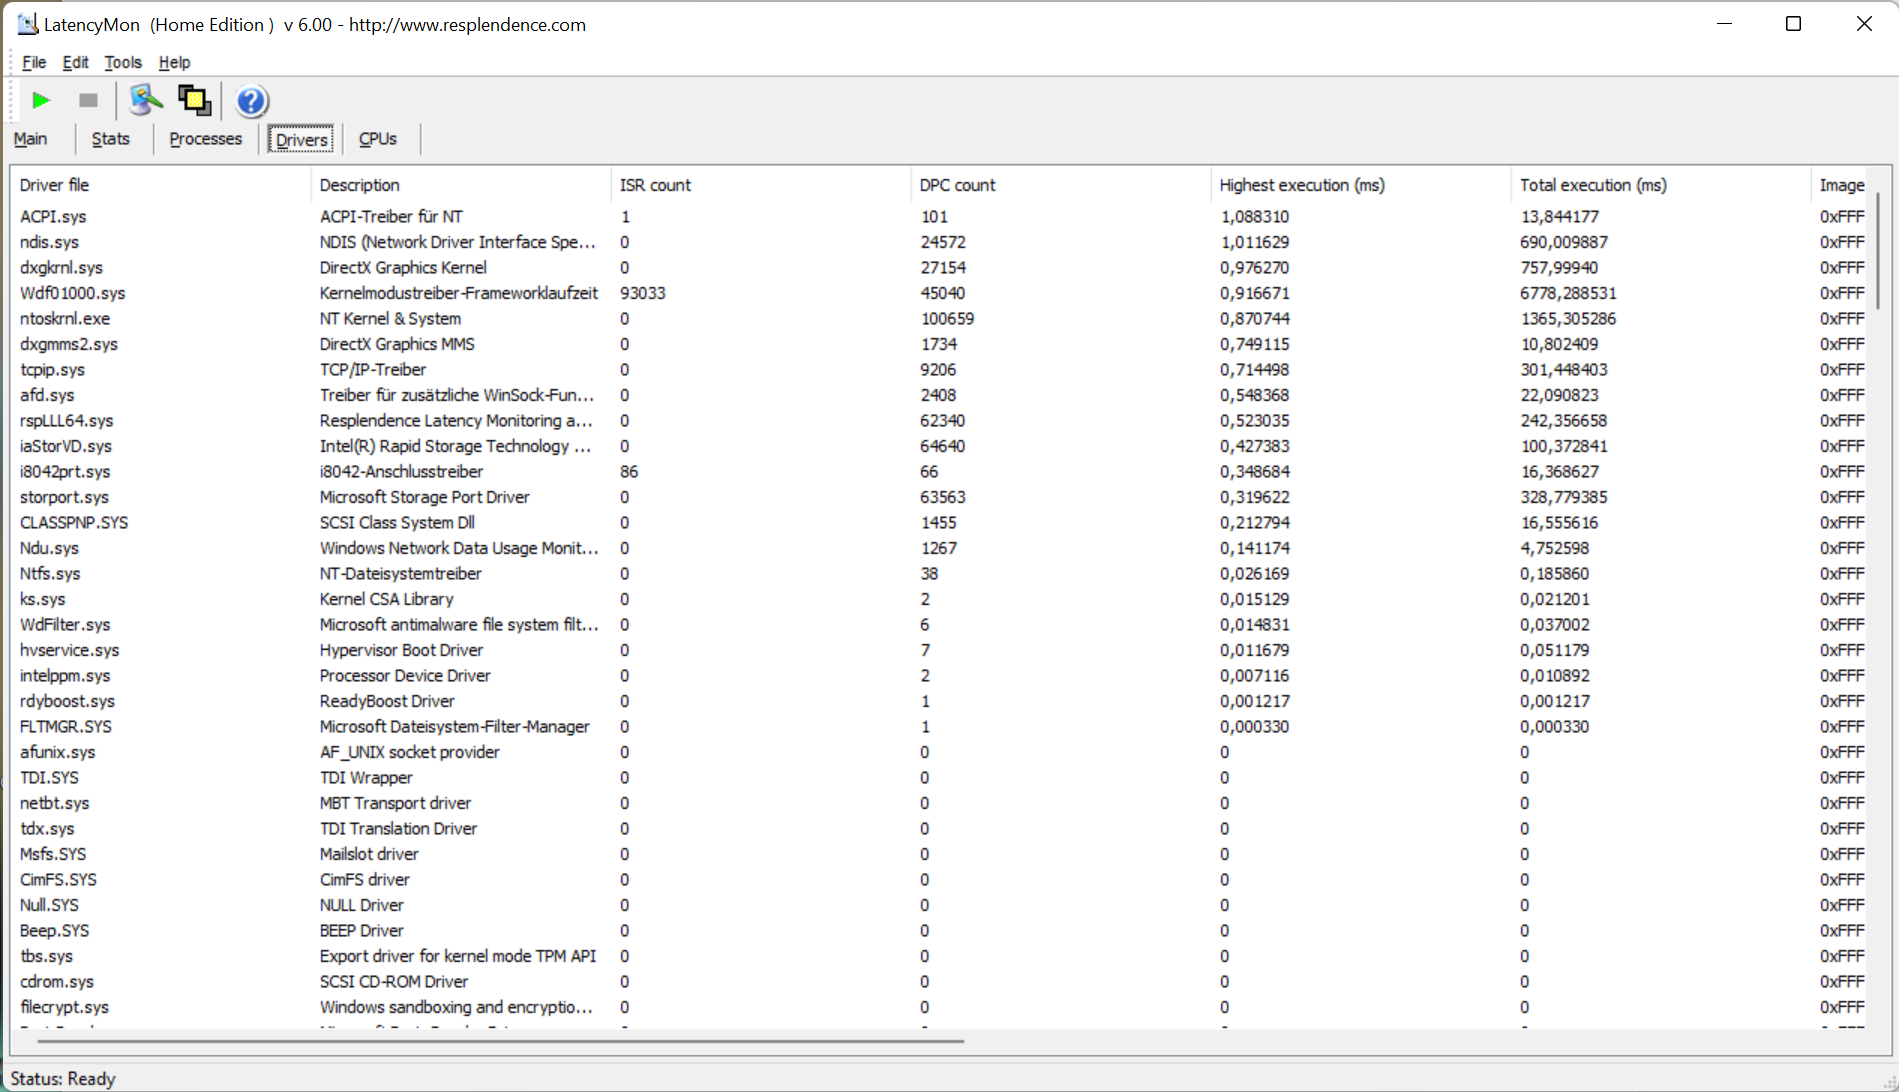
| DPC Latencies / LatencyMon - interrupt to process latency (max), Web, Youtube, Prime95 | |
| Acer Swift X SFX16-51G-5388 | |
| Lenovo ThinkBook 16 G4+ IAP | |
| Asus Vivobook Pro 16X-M7600QE | |
| Acer Swift X SFX16-52G-52VE | |
| Dell Inspiron 16 Plus 7620 | |
| HP Envy 16 h0112nr | |
| Acer Swift X SFX16-52G-77RX | |
| Lenovo IdeaPad 5 Pro 16ARH7 | |
* ... im mniej tym lepiej
Rozwiązanie w zakresie przechowywania
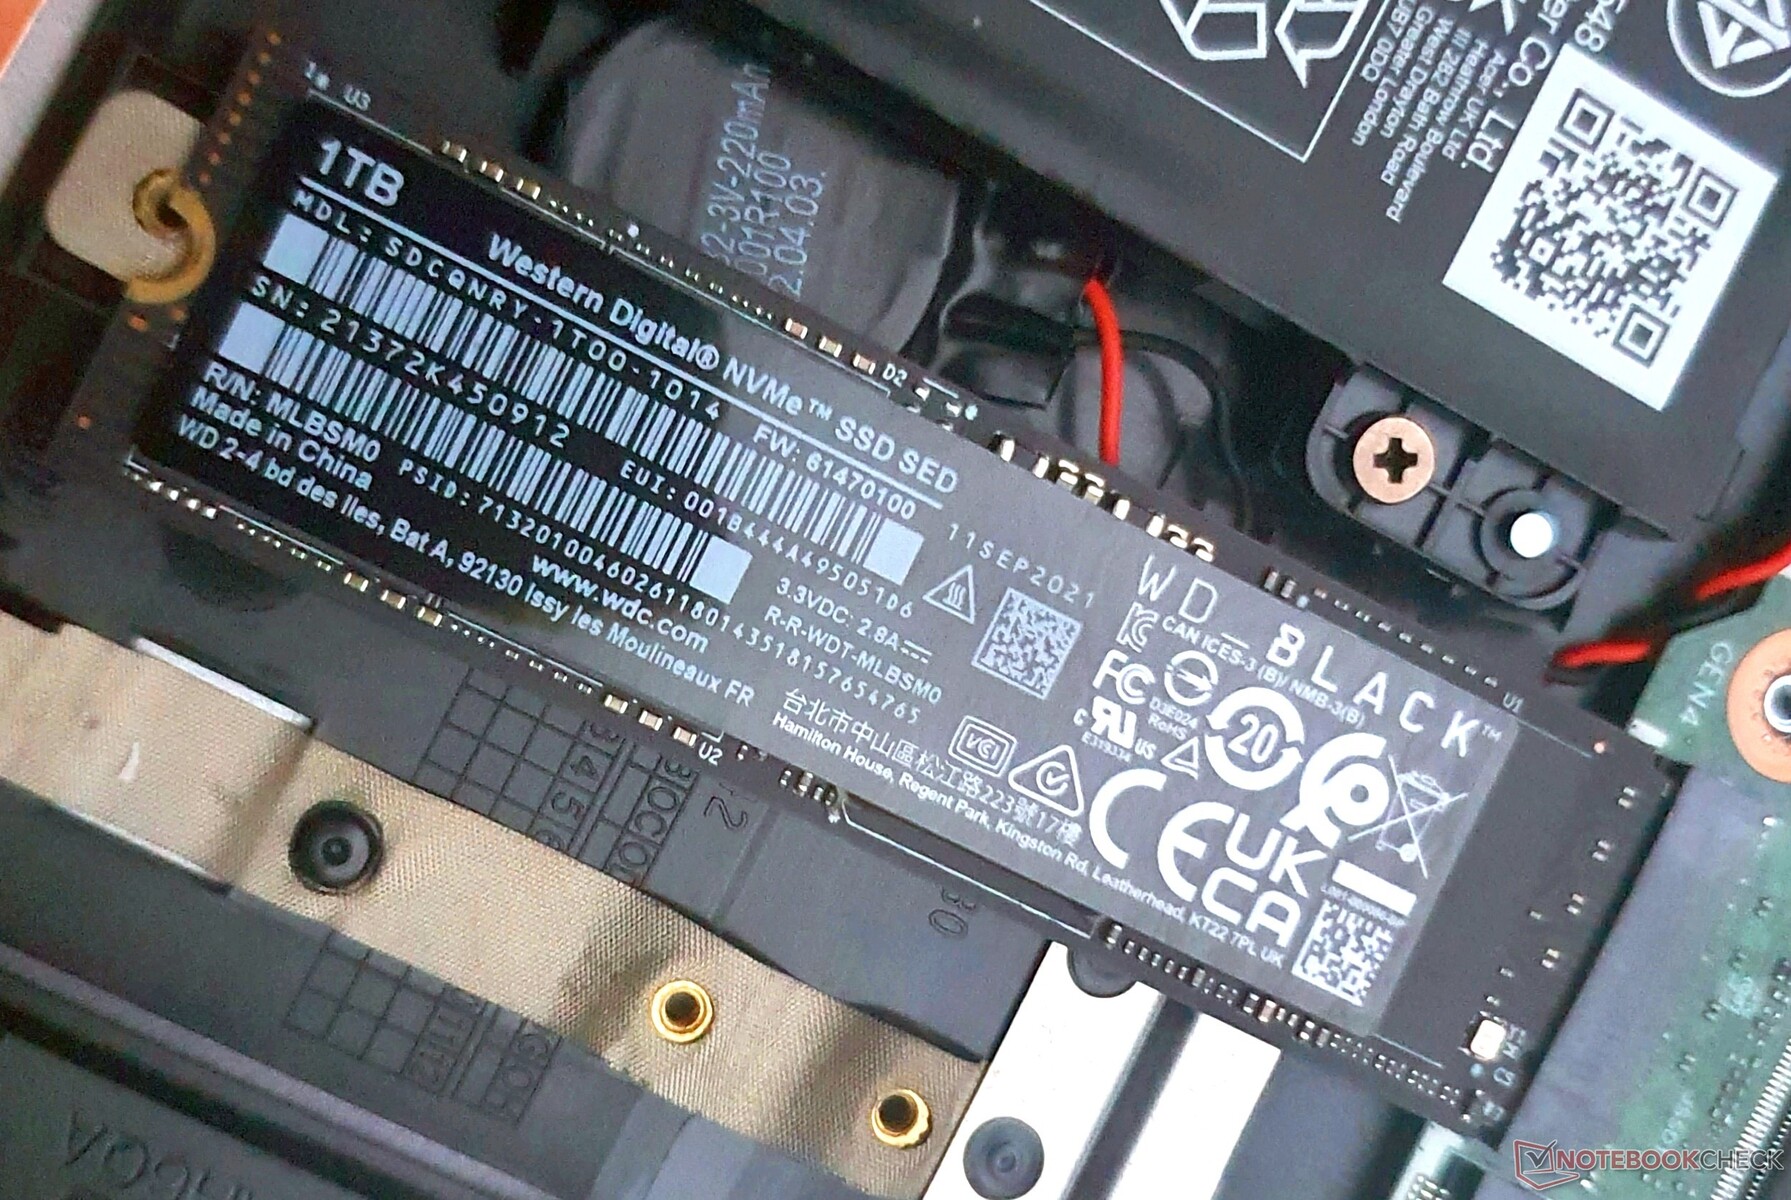
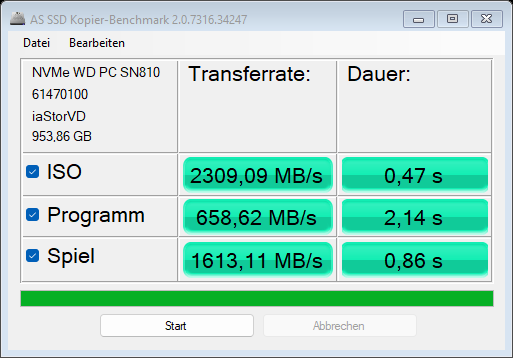
Dzięki bardzo wysokim prędkościom transferu, 1-TB SSD od Western Digital oddaje sprawiedliwość standardowi PCIe 4.0.
Podczas gdy bezpośredni poprzednik Acer Swift X plasuje się na dole naszych rankingów wydajności dysków SSD, tegoroczny model jest w stanie uplasować się na samym szczycie, pozostawiając pewien dystans do kolejnych modeli.
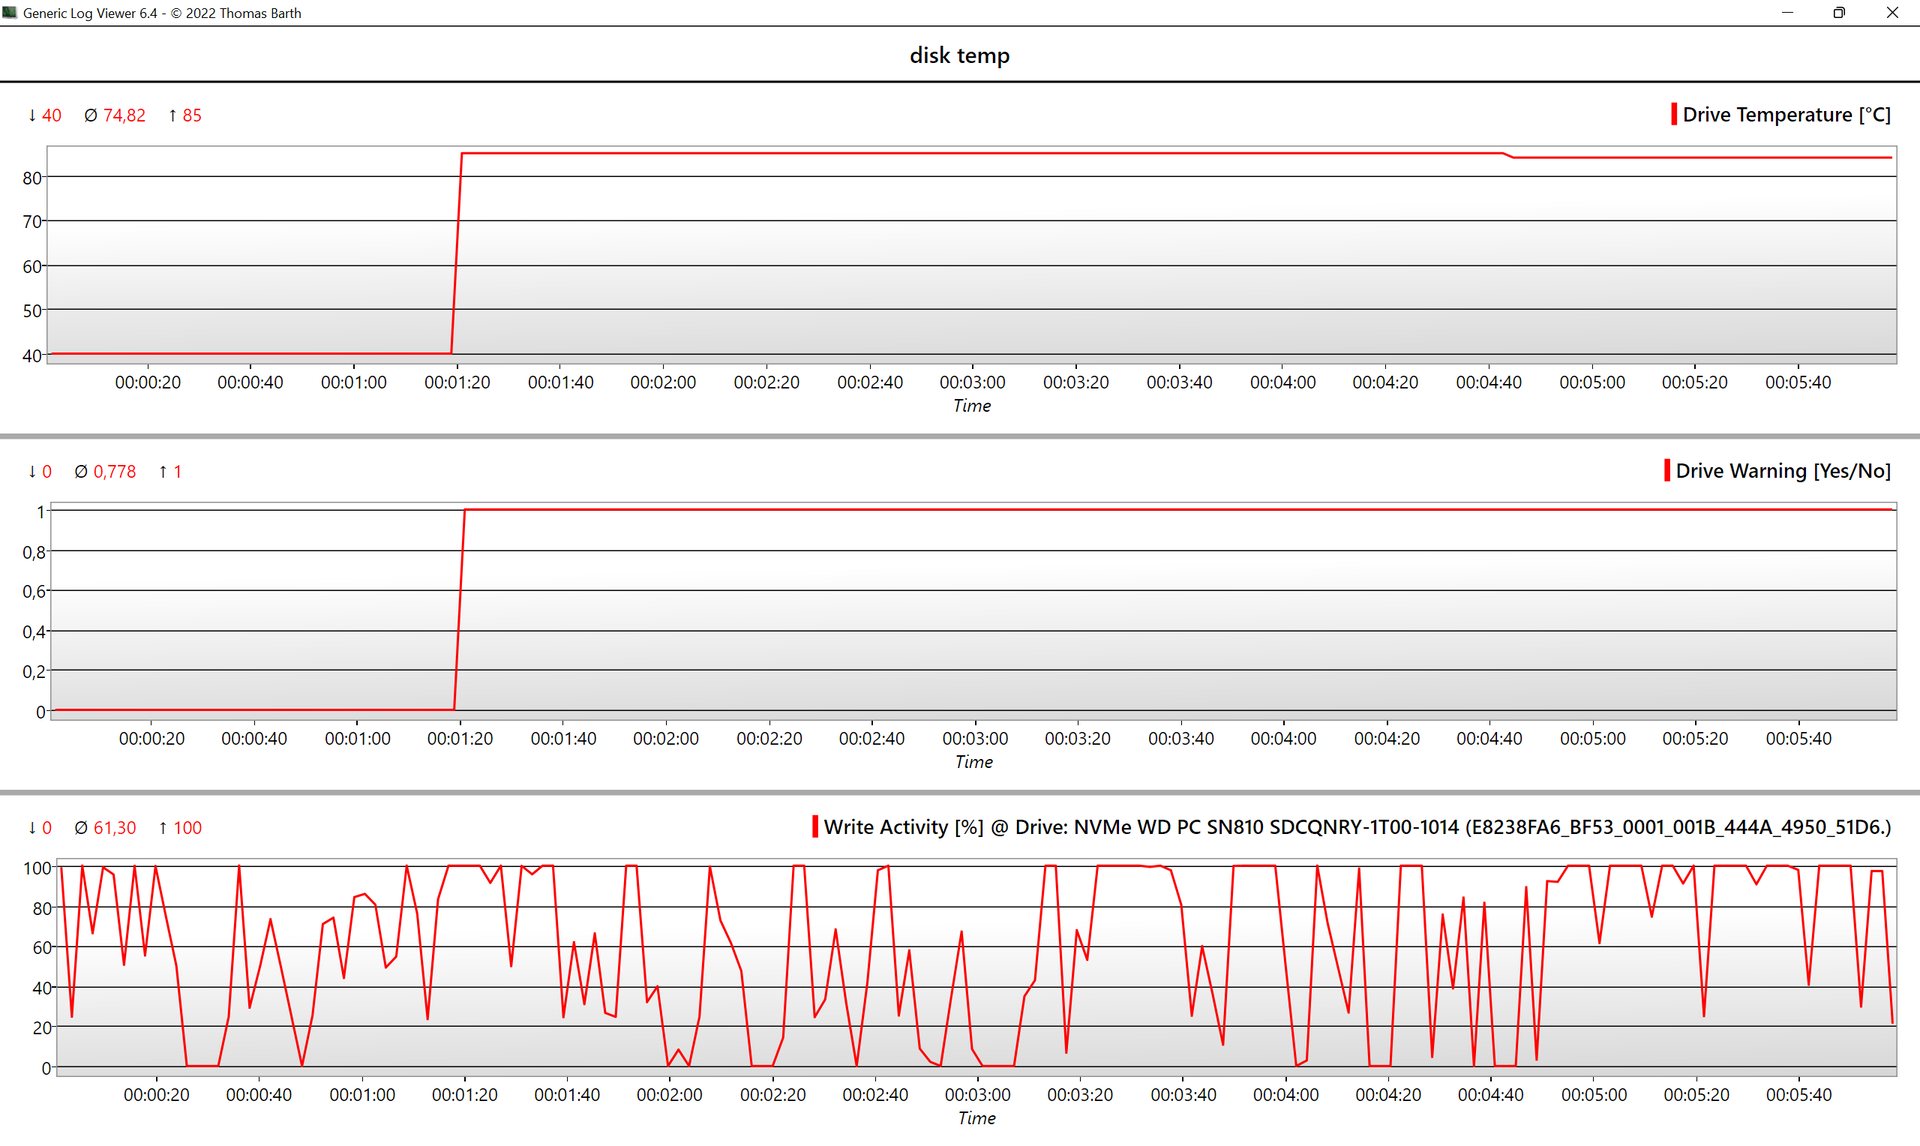
Model rodzeństwa z 512-GB dyskiem SSD również zostaje znacznie prześcignięty. Dyski SSD w obu modelach są jednak mocno dławione z powodu przegrzewania się.
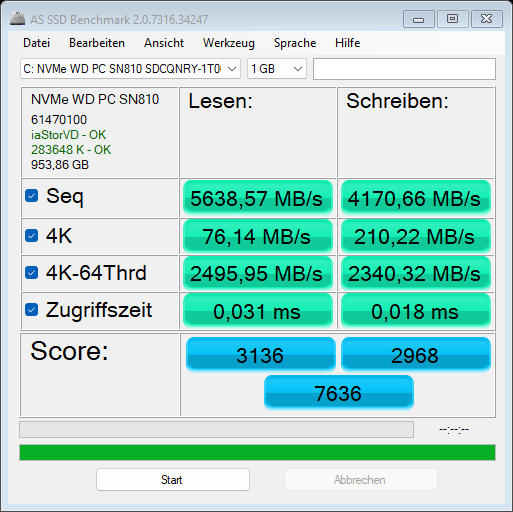
| Acer Swift X SFX16-52G-77RX WDC PC SN810 1TB | Acer Swift X SFX16-52G-52VE Micron 3400 MTFDKBA512TFH 512GB | Acer Swift X SFX16-51G-5388 Samsung PM991 MZVLQ512HBLU | Lenovo ThinkBook 16 G4+ IAP Micron 2450 1TB MTFDKCD1T0TFK | Dell Inspiron 16 Plus 7620 Kioxia BG5 KBG50ZNS512G | Lenovo IdeaPad 5 Pro 16ARH7 Samsung PM9A1 MZVL2512HCJQ | |
|---|---|---|---|---|---|---|
| AS SSD | -39% | -55% | -70% | -69% | -53% | |
| Seq Read (MB/s) | 5639 | 3200 -43% | 2744.12 -51% | 2825 -50% | 2693.29 -52% | 4687.88 -17% |
| Seq Write (MB/s) | 4171 | 3430 -18% | 1559.79 -63% | 1852 -56% | 1683.46 -60% | 2697.07 -35% |
| 4K Read (MB/s) | 76.1 | 63.1 -17% | 51.41 -32% | 58.44 -23% | 65.01 -15% | 61.12 -20% |
| 4K Write (MB/s) | 210.2 | 141.6 -33% | 156.13 -26% | 227.47 8% | 197.81 -6% | 125.7 -40% |
| 4K-64 Read (MB/s) | 2496 | 1354 -46% | 1014.34 -59% | 954.65 -62% | 855.48 -66% | 827.56 -67% |
| 4K-64 Write (MB/s) | 2340 | 1802 -23% | 940.2 -60% | 2413.44 3% | 395.8 -83% | 1884.06 -19% |
| Access Time Read * (ms) | 0.031 | 0.064 -106% | 0.073 -135% | 0.026 16% | 0.078 -152% | 0.073 -135% |
| Access Time Write * (ms) | 0.018 | 0.026 -44% | 0.028 -56% | 0.131 -628% | 0.06 -233% | 0.04 -122% |
| Score Read (Points) | 3136 | 1737 -45% | 1340 -57% | 1296 -59% | 1190 -62% | 1357 -57% |
| Score Write (Points) | 2968 | 2287 -23% | 1252 -58% | 2826 -5% | 762 -74% | 2279 -23% |
| Score Total (Points) | 7636 | 4936 -35% | 3229 -58% | 4750 -38% | 2529 -67% | 4247 -44% |
| Copy ISO MB/s (MB/s) | 2309 | 1363.82 -41% | 2155.05 -7% | 1634.1 -29% | ||
| Copy Program MB/s (MB/s) | 658.6 | 433.2 -34% | 414.57 -37% | 379.46 -42% | ||
| Copy Game MB/s (MB/s) | 1613 | 1055.69 -35% | 1055.89 -35% | 1174.45 -27% | ||
| DiskSpd | -25% | -71% | -50% | -56% | -40% | |
| seq read (MB/s) | 4206 | 2619 -38% | 1248 -70% | 2124 -50% | 2355 -44% | 3304 -21% |
| seq write (MB/s) | 5015 | 3900 -22% | 790 -84% | 2677 -47% | 2020 -60% | 2744 -45% |
| seq q8 t1 read (MB/s) | 6940 | 6439 -7% | 1655 -76% | 3377 -51% | 2569 -63% | 6708 -3% |
| seq q8 t1 write (MB/s) | 5031 | 3911 -22% | 871 -83% | 3241 -36% | 2752 -45% | 4857 -3% |
| 4k q32 t16 read (MB/s) | 2605 | 1522 -42% | 778 -70% | 923 -65% | 652 -75% | 824 -68% |
| 4k q32 t16 write (MB/s) | 2780 | 2390 -14% | 640 -77% | 501 -82% | 408 -85% | 299 -89% |
| 4k q1 t1 read (MB/s) | 88 | 65.3 -26% | 43.2 -51% | 61.2 -30% | 62.7 -29% | 63.4 -28% |
| 4k q1 t1 write (MB/s) | 305 | 208 -32% | 123.5 -60% | 187.8 -38% | 162.6 -47% | 125.7 -59% |
| Całkowita średnia (program / ustawienia) | -32% /
-33% | -63% /
-61% | -60% /
-62% | -63% /
-64% | -47% /
-47% |
* ... im mniej tym lepiej
| Drive Performance rating - Percent | |
| Acer Swift X SFX16-52G-77RX | |
| Przeciętny WDC PC SN810 1TB | |
| Acer Swift X SFX16-52G-52VE | |
| HP Envy 16 h0112nr | |
| Średnia w klasie Multimedia | |
| Lenovo IdeaPad 5 Pro 16ARH7 | |
| Lenovo ThinkBook 16 G4+ IAP | |
| Dell Inspiron 16 Plus 7620 | |
| Acer Swift X SFX16-51G-5388 | |
* ... im mniej tym lepiej
Constant Performance Reading: DiskSpd Read Loop, Queue Depth 8
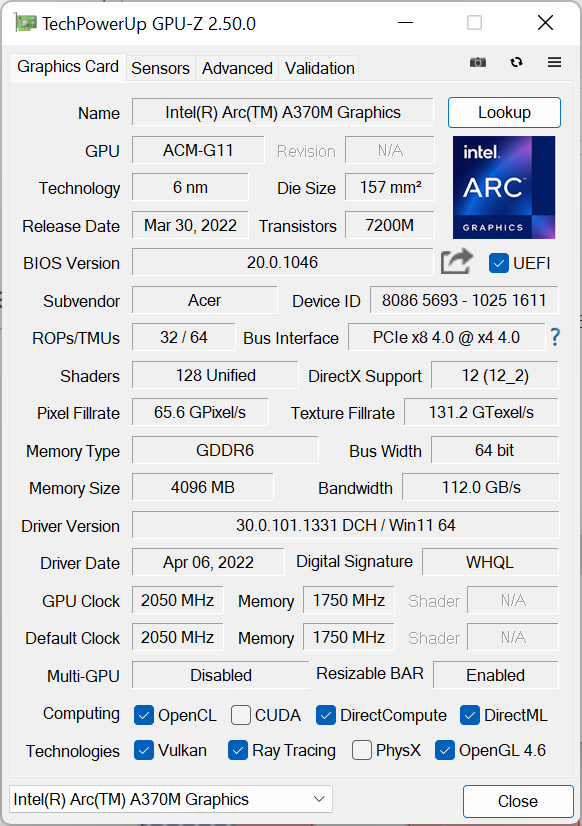
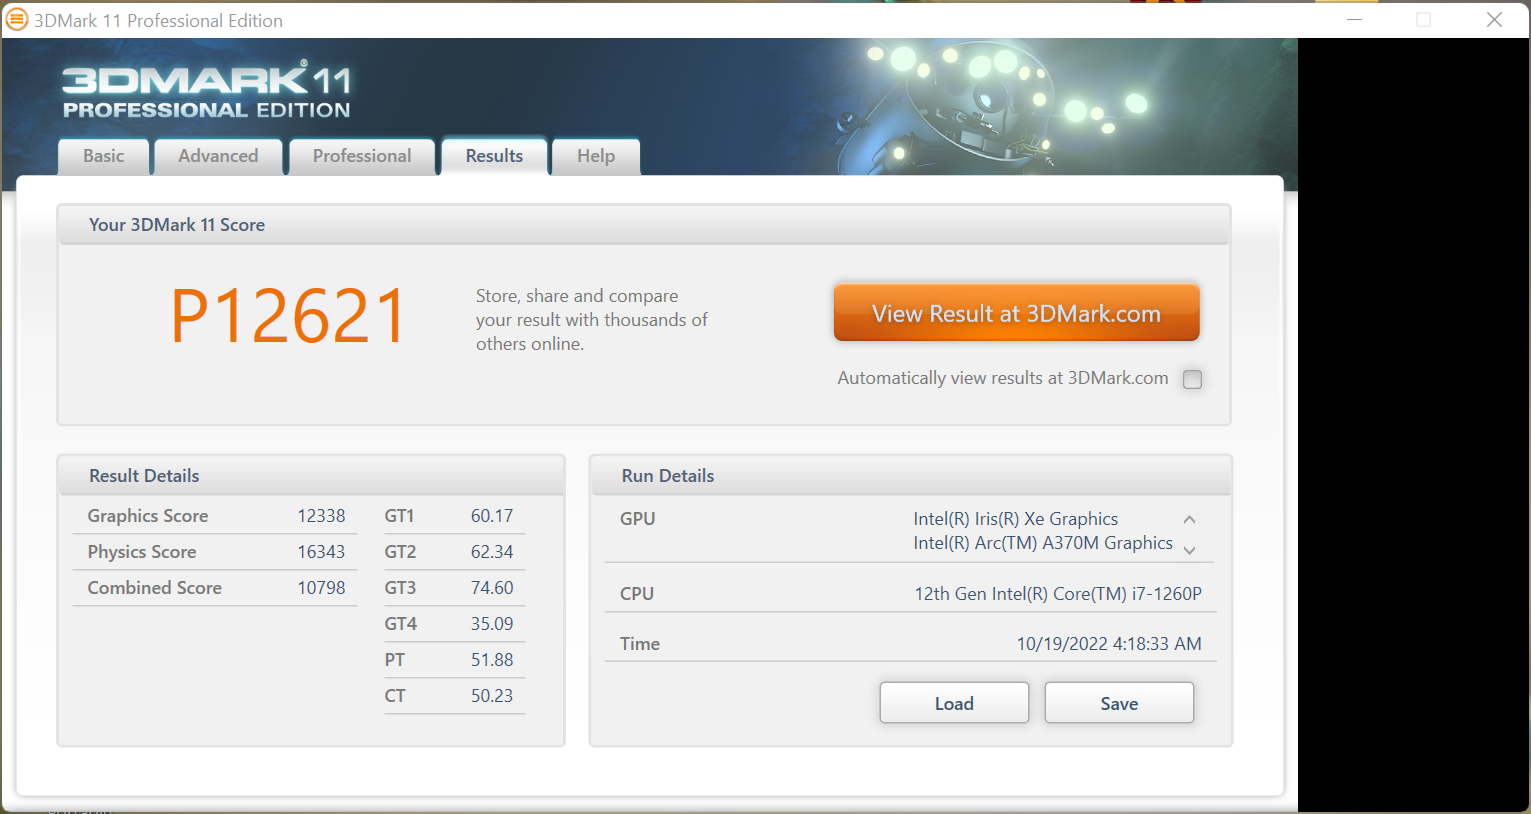
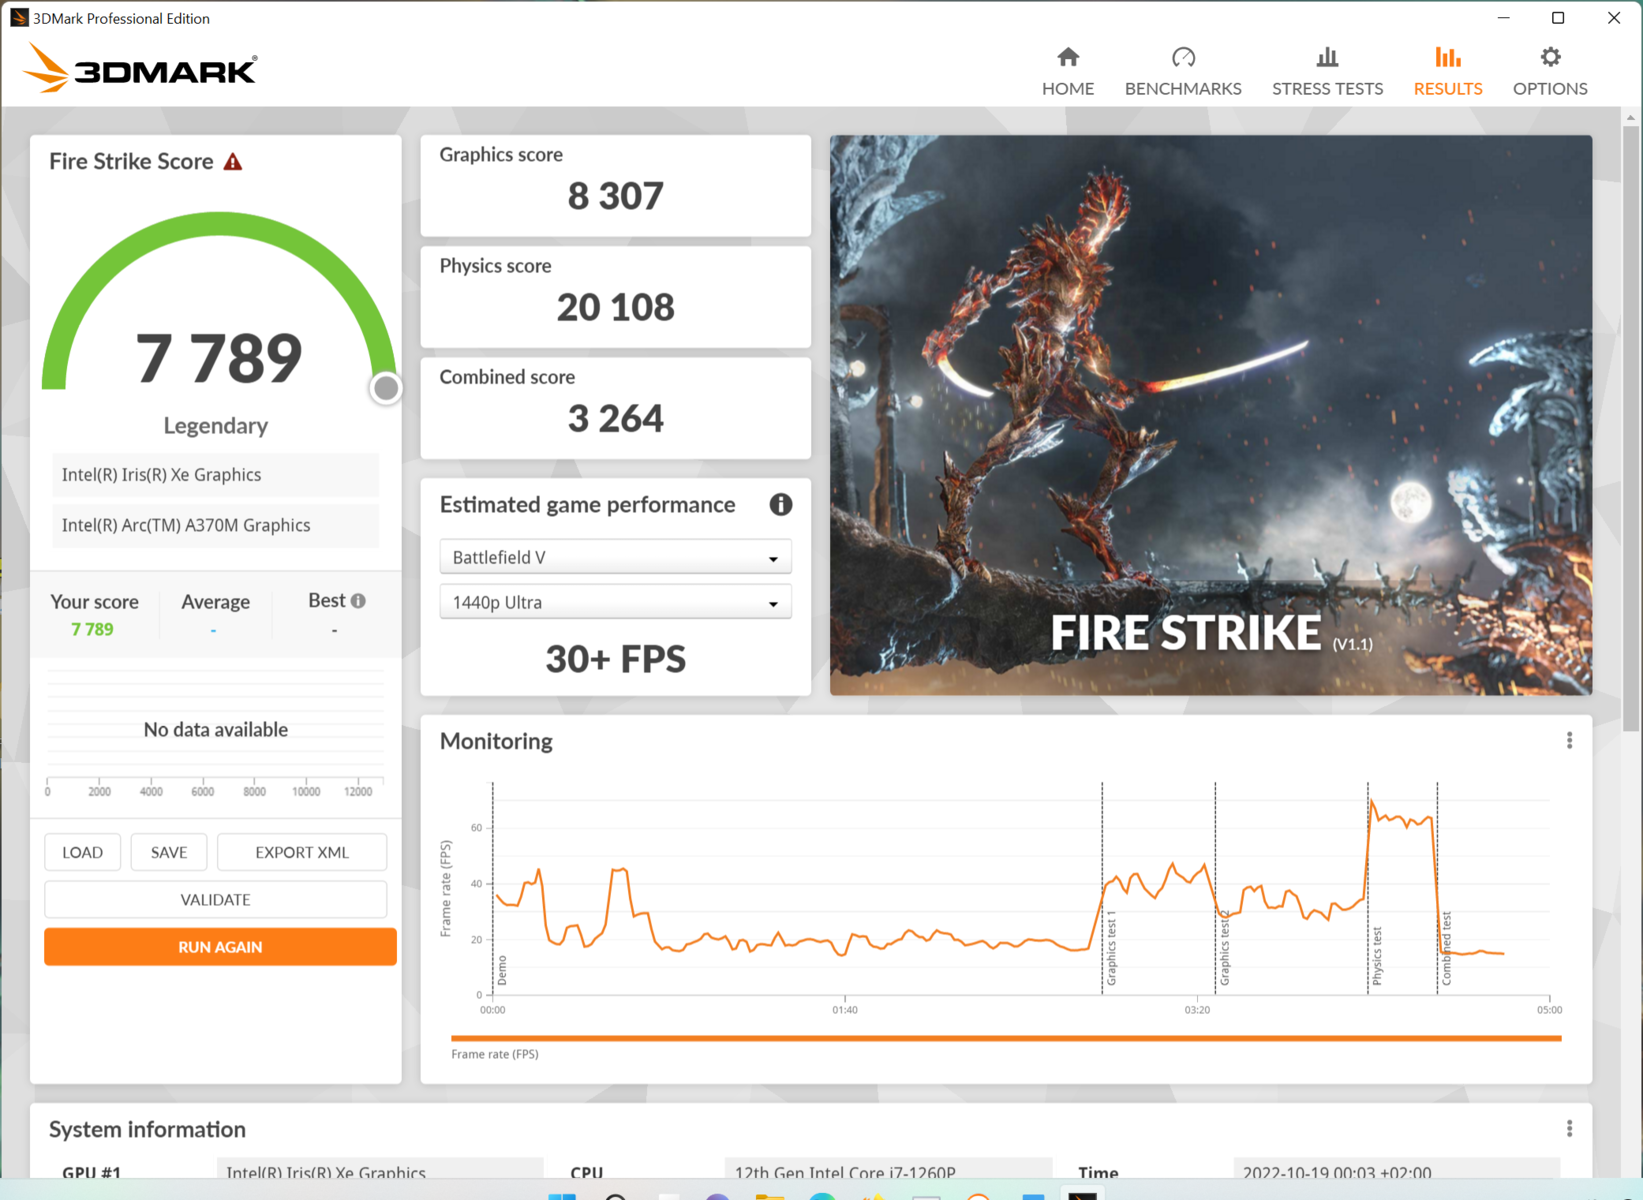
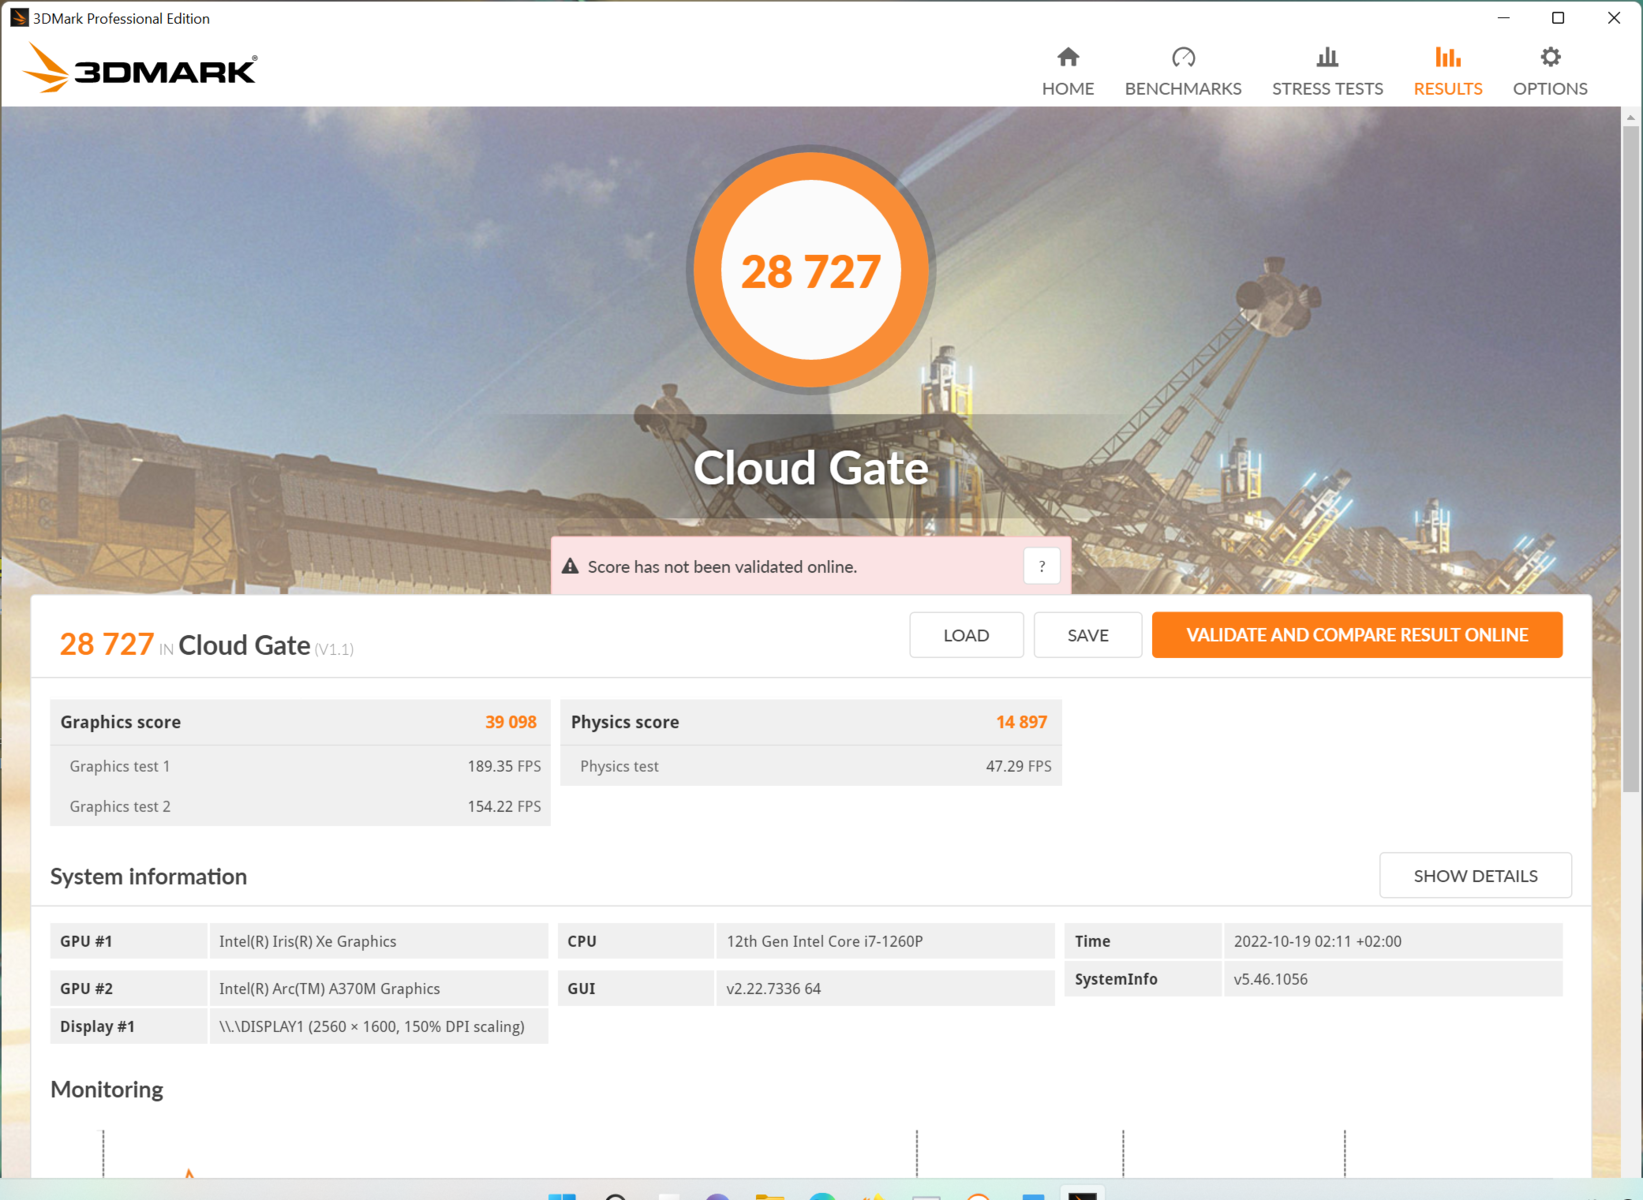
Karta graficzna
Na stronieIntel Arc A370Mużyty tutaj jest wariantem o najniższym TGP wynoszącym 35 W. Przeciętnie, tj RTX 3050w poprzednim modelu oraz Asus Vivobook Pro 16Xjest o około 50% szybszy w benchmarkach syntetycznych. W benchmarkach 3D związanych ze stacjami roboczymi może to szybko wzrosnąć do 150 lub 200%. Wydajność syntetyczna zintegrowanego AMD Radeon 680Mleży mniej więcej na poziomie Arc A370M.
Podczas pracy na akumulatorze wydajność grafiki spada o dodatkowe 30%.
| 3DMark Performance rating - Percent | |
| HP Envy 16 h0112nr | |
| Średnia w klasie Multimedia | |
| Dell Inspiron 16 Plus 7620 | |
| Lenovo ThinkBook 16 G4+ IAP | |
| Asus Vivobook Pro 16X-M7600QE | |
| Acer Swift X SFX16-51G-5388 | |
| Acer Swift X SFX16-52G-77RX | |
| Asus ZenBook Flip 15 Q539ZD | |
| Przeciętny Intel Arc A370M | |
| Acer Swift X SFX16-52G-52VE | |
| Lenovo ThinkPad T14 G3-21CF004NGE | |
| 3DMark 11 - 1280x720 Performance GPU | |
| HP Envy 16 h0112nr | |
| Średnia w klasie Multimedia (3749 - 60002, n=59, ostatnie 2 lata) | |
| Dell Inspiron 16 Plus 7620 | |
| Asus Vivobook Pro 16X-M7600QE | |
| Lenovo ThinkBook 16 G4+ IAP | |
| Acer Swift X SFX16-52G-77RX | |
| Asus ZenBook Flip 15 Q539ZD | |
| Przeciętny Intel Arc A370M (11748 - 12338, n=4) | |
| Acer Swift X SFX16-51G-5388 | |
| Acer Swift X SFX16-52G-52VE | |
| Lenovo ThinkPad T14 G3-21CF004NGE | |
| 3DMark 11 Performance | 12621 pkt. | |
| 3DMark Cloud Gate Standard Score | 28727 pkt. | |
| 3DMark Fire Strike Score | 7789 pkt. | |
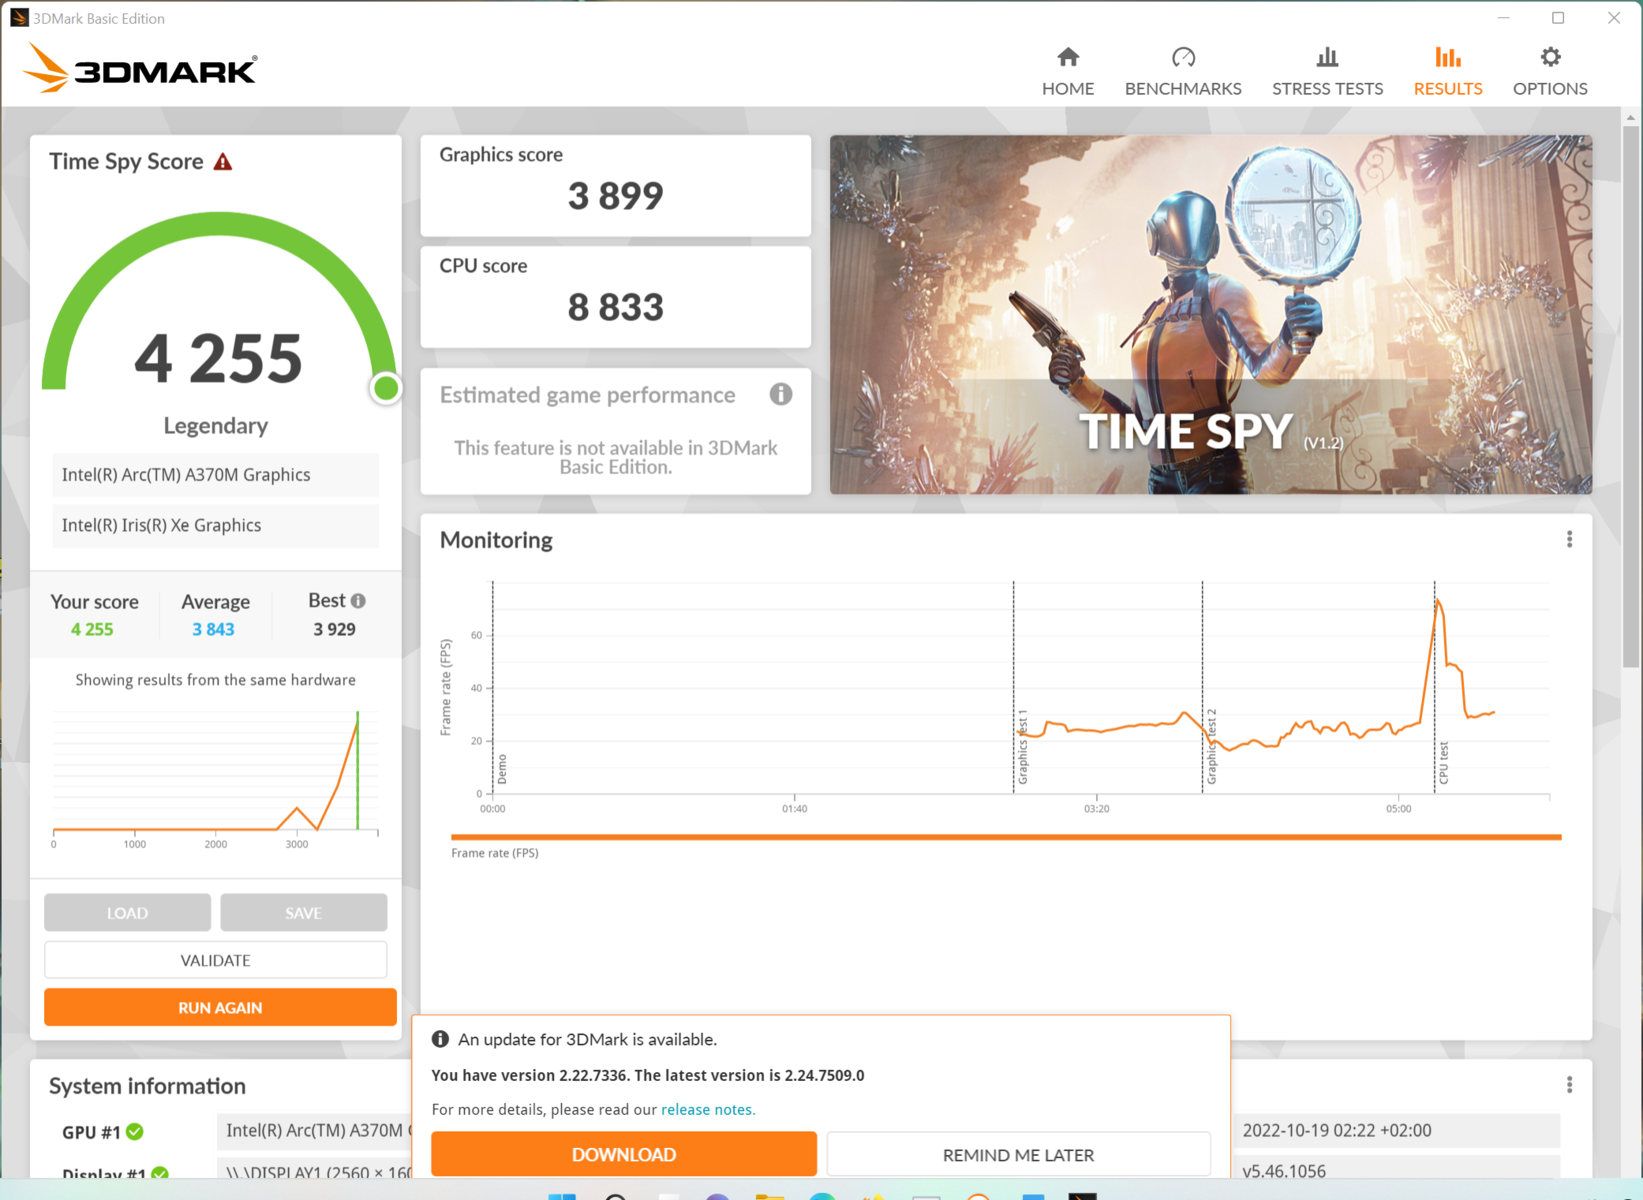
| 3DMark Time Spy Score | 4255 pkt. | |
Pomoc | ||
| Blender | |
| v3.3 Classroom oneAPI/Intel | |
| Acer Swift X SFX16-52G-77RX | |
| v3.3 Classroom HIP/AMD | |
| Lenovo ThinkPad T14 G3-21CF004NGE | |
| v3.3 Classroom CUDA | |
| HP ZBook Firefly 14 G9-6B8A2EA | |
| Acer Swift X SFX16-51G-5388 | |
| HP Envy 16 h0112nr | |
| Dell Inspiron 16 Plus 7620 | |
| v3.3 Classroom CPU | |
| HP ZBook Firefly 14 G9-6B8A2EA | |
| Acer Swift X SFX16-51G-5388 | |
| Acer Swift X SFX16-52G-77RX | |
| Acer Swift X SFX16-52G-52VE | |
| Lenovo ThinkPad T14 G3-21CF004NGE | |
| HP Envy 16 h0112nr | |
| Dell Inspiron 16 Plus 7620 | |
| Geekbench 5.5 - OpenCL Score | |
| Dell Inspiron 16 Plus 7620 | |
| HP Envy 16 h0112nr | |
| Acer Swift X SFX16-51G-5388 | |
| Lenovo ThinkPad P15v G2 21A9000XGE | |
| Apple MacBook Pro 16 2021 M1 Pro | |
| HP ZBook Power 15 G8 313S5EA | |
| Lenovo ThinkPad T14 G3-21CF004NGE | |
| HP ZBook Firefly 14 G9-6B8A2EA | |
| Asus ZenBook Flip 15 Q539ZD | |
| Acer Swift X SFX16-52G-77RX | |
| Acer Swift X SFX16-52G-52VE | |
| V-Ray Benchmark Next 4.10 - GPU | |
| Acer Swift X SFX16-51G-5388 | |
| HP ZBook Power 15 G8 313S5EA | |
| Lenovo ThinkPad P15v G2 21A9000XGE | |
| Acer Swift X SFX16-52G-77RX | |
| Lenovo ThinkPad T14 G3-21CF004NGE | |
| Acer Swift X SFX16-52G-52VE | |
| HP ZBook Firefly 14 G9-6B8A2EA | |
| SPECviewperf 2020 | |
| 1920x1080 3ds Max (3dsmax-07) | |
| Lenovo ThinkPad P15v G2 21A9000XGE | |
| HP ZBook Power 15 G8 313S5EA | |
| Lenovo ThinkPad T14 G3-21CF004NGE | |
| HP ZBook Firefly 14 G9-6B8A2EA | |
| Acer Swift X SFX16-52G-77RX | |
| 1920x1080 CATIA (catia-06) | |
| Lenovo ThinkPad P15v G2 21A9000XGE | |
| HP ZBook Power 15 G8 313S5EA | |
| HP ZBook Firefly 14 G9-6B8A2EA | |
| Lenovo ThinkPad T14 G3-21CF004NGE | |
| Acer Swift X SFX16-52G-77RX | |
| 1920x1080 Creo (creo-03) | |
| Lenovo ThinkPad P15v G2 21A9000XGE | |
| HP ZBook Power 15 G8 313S5EA | |
| HP ZBook Firefly 14 G9-6B8A2EA | |
| Lenovo ThinkPad T14 G3-21CF004NGE | |
| 1920x1080 Energy (energy-03) | |
| Lenovo ThinkPad P15v G2 21A9000XGE | |
| HP ZBook Power 15 G8 313S5EA | |
| HP ZBook Firefly 14 G9-6B8A2EA | |
| Acer Swift X SFX16-52G-77RX | |
| Lenovo ThinkPad T14 G3-21CF004NGE | |
| 1920x1080 Maya (maya-06) | |
| Lenovo ThinkPad P15v G2 21A9000XGE | |
| HP ZBook Power 15 G8 313S5EA | |
| Lenovo ThinkPad T14 G3-21CF004NGE | |
| HP ZBook Firefly 14 G9-6B8A2EA | |
| 1920x1080 Medical (medical-03) | |
| Lenovo ThinkPad P15v G2 21A9000XGE | |
| HP ZBook Power 15 G8 313S5EA | |
| Lenovo ThinkPad T14 G3-21CF004NGE | |
| HP ZBook Firefly 14 G9-6B8A2EA | |
| Acer Swift X SFX16-52G-77RX | |
| 1920x1080 Siemens NX (snx-04) | |
| Lenovo ThinkPad P15v G2 21A9000XGE | |
| HP ZBook Power 15 G8 313S5EA | |
| HP ZBook Firefly 14 G9-6B8A2EA | |
| Lenovo ThinkPad T14 G3-21CF004NGE | |
| Acer Swift X SFX16-52G-77RX | |
| 1920x1080 Solidworks (solidworks-05) | |
| Lenovo ThinkPad P15v G2 21A9000XGE | |
| HP ZBook Power 15 G8 313S5EA | |
| HP ZBook Firefly 14 G9-6B8A2EA | |
| Lenovo ThinkPad T14 G3-21CF004NGE | |
| Acer Swift X SFX16-52G-77RX | |
* ... im mniej tym lepiej
Wydajność w grach
W grach, w których Intel Arc A370M zostaje prześcignięty o 60% przez RTX 3050 Ti w Vivobook Pro 16X, a o około 100% przez Dell Inspiron 16. W niektórych grach przewaga ta staje się ekstremalna na poziomie 200 - 300%, co jest spowodowane pewnymi niedostatecznymi optymalizacjami sterowników tej wciąż dość młodej jednostki graficznej
Na stronie GeForce.RTX 3060 w HP Envy 16 jest około 3 razy szybszy w prawie każdym przypadku, a zintegrowany Radeon 680Mustępuje tylko o 10 do 20%.
Jeśli wybierzemy niższą rozdzielczość (Full HD) niż natywna QHD+ i pozostawimy detale na poziomie średnim lub wysokim, większość gier da się wyświetlić płynnie. Jednak w nowoczesnych grach wysoki poziom detali jest wtedy możliwy tylko rzadko.
| Performance rating - Percent | |
| HP Envy 16 h0112nr | |
| Dell Inspiron 16 Plus 7620 | |
| Lenovo ThinkBook 16 G4+ IAP | |
| Średnia w klasie Multimedia | |
| Acer Swift X SFX16-51G-5388 | |
| Lenovo IdeaCentre AIO 3 24IAP7 | |
| Acer Swift X SFX16-52G-77RX | |
| Acer Swift X SFX16-52G-52VE | |
| Lenovo IdeaPad 5 Pro 16ARH7 | |
| The Witcher 3 - 1920x1080 High Graphics & Postprocessing (Nvidia HairWorks Off) | |
| HP Envy 16 h0112nr | |
| Dell Inspiron 16 Plus 7620 | |
| Średnia w klasie Multimedia (22 - 224, n=11, ostatnie 2 lata) | |
| Lenovo ThinkBook 16 G4+ IAP | |
| Acer Swift X SFX16-51G-5388 | |
| Acer Swift X SFX16-52G-77RX | |
| Lenovo IdeaCentre AIO 3 24IAP7 | |
| Acer Swift X SFX16-52G-52VE | |
| Lenovo IdeaPad 5 Pro 16ARH7 | |
| GTA V - 1366x768 Normal/Off AF:4x | |
| HP Envy 16 h0112nr | |
| Dell Inspiron 16 Plus 7620 | |
| Lenovo ThinkBook 16 G4+ IAP | |
| Acer Swift X SFX16-51G-5388 | |
| Lenovo IdeaCentre AIO 3 24IAP7 | |
| Średnia w klasie Multimedia (60.1 - 185.6, n=43, ostatnie 2 lata) | |
| Acer Swift X SFX16-52G-77RX | |
| Acer Swift X SFX16-52G-52VE | |
| Lenovo IdeaPad 5 Pro 16ARH7 | |
| Final Fantasy XV Benchmark - 1920x1080 Standard Quality | |
| HP Envy 16 h0112nr | |
| Dell Inspiron 16 Plus 7620 | |
| Średnia w klasie Multimedia (11.4 - 181.1, n=61, ostatnie 2 lata) | |
| Lenovo ThinkBook 16 G4+ IAP | |
| Acer Swift X SFX16-51G-5388 | |
| Lenovo IdeaCentre AIO 3 24IAP7 | |
| Acer Swift X SFX16-52G-77RX | |
| Acer Swift X SFX16-52G-52VE | |
| Lenovo IdeaPad 5 Pro 16ARH7 | |
| Strange Brigade - 1920x1080 high AA:high AF:8 | |
| HP Envy 16 h0112nr | |
| Dell Inspiron 16 Plus 7620 | |
| Średnia w klasie Multimedia (15.7 - 321, n=61, ostatnie 2 lata) | |
| Acer Swift X SFX16-51G-5388 | |
| Lenovo ThinkBook 16 G4+ IAP | |
| Acer Swift X SFX16-52G-52VE | |
| Acer Swift X SFX16-52G-77RX | |
| Lenovo IdeaCentre AIO 3 24IAP7 | |
| Lenovo IdeaPad 5 Pro 16ARH7 | |
| Dota 2 Reborn - 1920x1080 ultra (3/3) best looking | |
| Dell Inspiron 16 Plus 7620 | |
| HP Envy 16 h0112nr | |
| Lenovo ThinkBook 16 G4+ IAP | |
| Acer Swift X SFX16-51G-5388 | |
| Lenovo IdeaCentre AIO 3 24IAP7 | |
| Średnia w klasie Multimedia (29 - 179.9, n=63, ostatnie 2 lata) | |
| Acer Swift X SFX16-52G-77RX | |
| Acer Swift X SFX16-52G-52VE | |
| Lenovo IdeaPad 5 Pro 16ARH7 | |
| X-Plane 11.11 - 1920x1080 med (fps_test=2) | |
| HP Envy 16 h0112nr | |
| Dell Inspiron 16 Plus 7620 | |
| Lenovo ThinkBook 16 G4+ IAP | |
| Acer Swift X SFX16-51G-5388 | |
| Lenovo IdeaCentre AIO 3 24IAP7 | |
| Średnia w klasie Multimedia (18.7 - 177.4, n=59, ostatnie 2 lata) | |
| Lenovo IdeaPad 5 Pro 16ARH7 | |
| Acer Swift X SFX16-52G-77RX | |
| Acer Swift X SFX16-52G-52VE | |
| The Witcher 3 | |
| 1920x1080 High Graphics & Postprocessing (Nvidia HairWorks Off) | |
| HP Envy 16 h0112nr | |
| Dell Inspiron 16 Plus 7620 | |
| Średnia w klasie Multimedia (22 - 224, n=11, ostatnie 2 lata) | |
| Lenovo ThinkBook 16 G4+ IAP | |
| Asus Vivobook Pro 16X-M7600QE | |
| Acer Swift X SFX16-51G-5388 | |
| Acer Swift X SFX16-52G-77RX | |
| Przeciętny Intel Arc A370M (45 - 55.9, n=3) | |
| Acer Swift X SFX16-52G-52VE | |
| Lenovo IdeaPad 5 Pro 16ARH7 | |
| 1920x1080 Ultra Graphics & Postprocessing (HBAO+) | |
| HP Envy 16 h0112nr | |
| Dell Inspiron 16 Plus 7620 | |
| Średnia w klasie Multimedia (11 - 121, n=11, ostatnie 2 lata) | |
| Asus Vivobook Pro 16X-M7600QE | |
| Lenovo ThinkBook 16 G4+ IAP | |
| Acer Swift X SFX16-51G-5388 | |
| Acer Swift X SFX16-52G-77RX | |
| Przeciętny Intel Arc A370M (25 - 26.3, n=3) | |
| Acer Swift X SFX16-52G-52VE | |
| Lenovo IdeaPad 5 Pro 16ARH7 | |
| GTA V | |
| 1366x768 Normal/Off AF:4x | |
| HP Envy 16 h0112nr | |
| Dell Inspiron 16 Plus 7620 | |
| Lenovo ThinkBook 16 G4+ IAP | |
| Acer Swift X SFX16-51G-5388 | |
| Średnia w klasie Multimedia (60.1 - 185.6, n=43, ostatnie 2 lata) | |
| Przeciętny Intel Arc A370M (135.1 - 148.3, n=3) | |
| Acer Swift X SFX16-52G-77RX | |
| Acer Swift X SFX16-52G-52VE | |
| Lenovo IdeaPad 5 Pro 16ARH7 | |
| 1920x1080 High/On (Advanced Graphics Off) AA:2xMSAA + FX AF:8x | |
| HP Envy 16 h0112nr | |
| Dell Inspiron 16 Plus 7620 | |
| Lenovo ThinkBook 16 G4+ IAP | |
| Acer Swift X SFX16-51G-5388 | |
| Średnia w klasie Multimedia (19.5 - 186.1, n=51, ostatnie 2 lata) | |
| Acer Swift X SFX16-52G-77RX | |
| Przeciętny Intel Arc A370M (40.5 - 41.4, n=3) | |
| Acer Swift X SFX16-52G-52VE | |
| Lenovo IdeaPad 5 Pro 16ARH7 | |
| Final Fantasy XV Benchmark | |
| 1920x1080 Standard Quality | |
| HP Envy 16 h0112nr | |
| Dell Inspiron 16 Plus 7620 | |
| Średnia w klasie Multimedia (11.4 - 181.1, n=61, ostatnie 2 lata) | |
| Lenovo ThinkBook 16 G4+ IAP | |
| Asus Vivobook Pro 16X-M7600QE | |
| Acer Swift X SFX16-51G-5388 | |
| Acer Swift X SFX16-52G-77RX | |
| Przeciętny Intel Arc A370M (34.4 - 38.4, n=3) | |
| Acer Swift X SFX16-52G-52VE | |
| Lenovo IdeaPad 5 Pro 16ARH7 | |
| 1920x1080 High Quality | |
| HP Envy 16 h0112nr | |
| Średnia w klasie Multimedia (7.61 - 144.4, n=61, ostatnie 2 lata) | |
| Dell Inspiron 16 Plus 7620 | |
| Asus Vivobook Pro 16X-M7600QE | |
| Lenovo ThinkBook 16 G4+ IAP | |
| Acer Swift X SFX16-51G-5388 | |
| Acer Swift X SFX16-52G-77RX | |
| Przeciętny Intel Arc A370M (19.6 - 26.7, n=3) | |
| Acer Swift X SFX16-52G-52VE | |
| Lenovo IdeaPad 5 Pro 16ARH7 | |
| Far Cry 5 | |
| 1920x1080 Ultra Preset AA:T | |
| Asus Vivobook Pro 16X-M7600QE | |
| Średnia w klasie Multimedia (17 - 145, n=20, ostatnie 2 lata) | |
| Lenovo ThinkBook 16 G4+ IAP | |
| Acer Swift X SFX16-51G-5388 | |
| Acer Swift X SFX16-52G-77RX | |
| Przeciętny Intel Arc A370M (42 - 43, n=2) | |
| Acer Swift X SFX16-52G-52VE | |
| 2560x1440 Ultra Preset AA:T | |
| Średnia w klasie Multimedia (45 - 106, n=4, ostatnie 2 lata) | |
| Asus Vivobook Pro 16X-M7600QE | |
| Lenovo ThinkBook 16 G4+ IAP | |
| Acer Swift X SFX16-52G-77RX | |
| Przeciętny Intel Arc A370M (28 - 29, n=2) | |
| Acer Swift X SFX16-52G-52VE | |
| Shadow of the Tomb Raider | |
| 1920x1080 High Preset AA:SM | |
| Średnia w klasie Multimedia (26 - 143, n=8, ostatnie 2 lata) | |
| Przeciętny Intel Arc A370M (39 - 42, n=2) | |
| Acer Swift X SFX16-52G-77RX | |
| 1920x1080 Highest Preset AA:T | |
| Średnia w klasie Multimedia (23 - 129, n=8, ostatnie 2 lata) | |
| Acer Swift X SFX16-52G-77RX | |
| Przeciętny Intel Arc A370M (n=1) | |
| God of War | |
| 1920x1080 Original Preset | |
| Acer Swift X SFX16-52G-77RX | |
| Przeciętny Intel Arc A370M (30 - 31.8, n=3) | |
| Acer Swift X SFX16-52G-52VE | |
| Lenovo IdeaPad 5 Pro 16ARH7 | |
| 1920x1080 High Preset | |
| Acer Swift X SFX16-52G-77RX | |
| Przeciętny Intel Arc A370M (24 - 25.6, n=3) | |
| Acer Swift X SFX16-52G-52VE | |
| Lenovo IdeaPad 5 Pro 16ARH7 | |
| GRID Legends | |
| 1920x1080 Ultra Preset | |
| Acer Swift X SFX16-52G-77RX | |
| Przeciętny Intel Arc A370M (41.7 - 41.9, n=2) | |
| Acer Swift X SFX16-52G-52VE | |
| 2560x1440 Ultra Preset | |
| Acer Swift X SFX16-52G-77RX | |
| Przeciętny Intel Arc A370M (31.3 - 34.4, n=2) | |
| Acer Swift X SFX16-52G-52VE | |
| Strange Brigade | |
| 1920x1080 high AA:high AF:8 | |
| HP Envy 16 h0112nr | |
| Dell Inspiron 16 Plus 7620 | |
| Średnia w klasie Multimedia (15.7 - 321, n=61, ostatnie 2 lata) | |
| Asus Vivobook Pro 16X-M7600QE | |
| Acer Swift X SFX16-51G-5388 | |
| Lenovo ThinkBook 16 G4+ IAP | |
| Acer Swift X SFX16-52G-52VE | |
| Przeciętny Intel Arc A370M (61.4 - 64.2, n=3) | |
| Acer Swift X SFX16-52G-77RX | |
| Lenovo IdeaPad 5 Pro 16ARH7 | |
| 1920x1080 ultra AA:ultra AF:16 | |
| HP Envy 16 h0112nr | |
| Średnia w klasie Multimedia (13.3 - 303, n=61, ostatnie 2 lata) | |
| Dell Inspiron 16 Plus 7620 | |
| Asus Vivobook Pro 16X-M7600QE | |
| Lenovo ThinkBook 16 G4+ IAP | |
| Acer Swift X SFX16-51G-5388 | |
| Acer Swift X SFX16-52G-52VE | |
| Przeciętny Intel Arc A370M (52.1 - 54.3, n=3) | |
| Acer Swift X SFX16-52G-77RX | |
| Lenovo IdeaPad 5 Pro 16ARH7 | |
| Dota 2 Reborn | |
| 1920x1080 ultra (3/3) best looking | |
| Dell Inspiron 16 Plus 7620 | |
| HP Envy 16 h0112nr | |
| Lenovo ThinkBook 16 G4+ IAP | |
| Asus Vivobook Pro 16X-M7600QE | |
| Asus Vivobook Pro 16X-M7600QE | |
| Acer Swift X SFX16-51G-5388 | |
| Średnia w klasie Multimedia (29 - 179.9, n=63, ostatnie 2 lata) | |
| Acer Swift X SFX16-52G-77RX | |
| Przeciętny Intel Arc A370M (57.7 - 68.3, n=3) | |
| Acer Swift X SFX16-52G-52VE | |
| Lenovo IdeaPad 5 Pro 16ARH7 | |
| 3840x2160 ultra (3/3) best looking | |
| Średnia w klasie Multimedia (106.4 - 139.3, n=4, ostatnie 2 lata) | |
| Asus Vivobook Pro 16X-M7600QE | |
| Asus Vivobook Pro 16X-M7600QE | |
| HP Envy 16 h0112nr | |
| Acer Swift X SFX16-52G-77RX | |
| Przeciętny Intel Arc A370M (n=1) | |
| X-Plane 11.11 | |
| 1920x1080 med (fps_test=2) | |
| HP Envy 16 h0112nr | |
| Dell Inspiron 16 Plus 7620 | |
| Lenovo ThinkBook 16 G4+ IAP | |
| Asus Vivobook Pro 16X-M7600QE | |
| Asus Vivobook Pro 16X-M7600QE | |
| Acer Swift X SFX16-51G-5388 | |
| Średnia w klasie Multimedia (18.7 - 177.4, n=59, ostatnie 2 lata) | |
| Lenovo IdeaPad 5 Pro 16ARH7 | |
| Przeciętny Intel Arc A370M (27.4 - 34.2, n=3) | |
| Acer Swift X SFX16-52G-77RX | |
| Acer Swift X SFX16-52G-52VE | |
| 1920x1080 high (fps_test=3) | |
| HP Envy 16 h0112nr | |
| Dell Inspiron 16 Plus 7620 | |
| Lenovo ThinkBook 16 G4+ IAP | |
| Asus Vivobook Pro 16X-M7600QE | |
| Asus Vivobook Pro 16X-M7600QE | |
| Acer Swift X SFX16-51G-5388 | |
| Średnia w klasie Multimedia (16.9 - 141.1, n=58, ostatnie 2 lata) | |
| Lenovo IdeaPad 5 Pro 16ARH7 | |
| Przeciętny Intel Arc A370M (23.9 - 29.9, n=3) | |
| Acer Swift X SFX16-52G-77RX | |
| Acer Swift X SFX16-52G-52VE | |
The Witcher 3 FPS Chart
| low | med. | high | ultra | QHD | 4K | |
|---|---|---|---|---|---|---|
| GTA V (2015) | 148.6 | 136.9 | 41.4 | 16.4 | 11 | |
| The Witcher 3 (2015) | 168.8 | 100 | 53 | 26.3 | ||
| Dota 2 Reborn (2015) | 99.1 | 83.5 | 68.4 | 66.3 | 39.5 | |
| Final Fantasy XV Benchmark (2018) | 70.4 | 37.9 | 26.3 | 19.3 | ||
| X-Plane 11.11 (2018) | 34.7 | 27.8 | 24 | 22.2 | ||
| Far Cry 5 (2018) | 90 | 49 | 46 | 43 | 29 | |
| Strange Brigade (2018) | 175.8 | 73.2 | 61.4 | 52.1 | ||
| Shadow of the Tomb Raider (2018) | 67 | 49 | 39 | 32 | 20 | |
| God of War (2022) | 35.8 | 31.8 | 25.6 | 20.4 | 12.4 | |
| GRID Legends (2022) | 95.6 | 69.4 | 55 | 41.9 | 34.4 |
Emisje: Acer Swift X 16 lubi wydmuchiwać dużo powietrza
Emisja hałasu
Wentylatory są najgłośniejsze w trybie Performance, a także pracują przez większość czasu pod bardzo małym obciążeniem.
W trybie Normal pracują ciszej i pod małym obciążeniem są przynajmniej ledwo zauważalne. Jednak i to zmienia się ponownie pod nieco większym obciążeniem.
W trybie Silent wentylatory pozostają znacznie częściej wyłączone, ale zaczynają pracować już przy obciążeniu procesora wynoszącym tylko około 10%, na przykład podczas pobierania gry Steam.
Przy średniej wartości 44,7 dB(A) wentylatory nie są też specjalnie ciche pod większym obciążeniem. 36,5 dB(A) w przypadku.Modelu Core-i5są znacznie cichsze.
Wszystkie pozostałe urządzenia w naszym polu testowym są jednak podobnie głośne pod obciążeniem. Podczas ładowania słyszymy od czasu do czasu jakieś elektroniczne odgłosy w pobliżu portu USB-C.
Hałas
| luz |
| 25 / 25 / 25 dB |
| obciążenie |
| 44.7 / 45.6 dB |
 | ||
30 dB cichy 40 dB(A) słyszalny 50 dB(A) irytujący |
||
min: | ||
| Acer Swift X SFX16-52G-77RX A370M, i7-1260P, WDC PC SN810 1TB | Acer Swift X SFX16-52G-52VE A370M, i5-1240P, Micron 3400 MTFDKBA512TFH 512GB | Lenovo ThinkBook 16 G4+ IAP GeForce RTX 2050 Mobile, i7-12700H, Micron 2450 1TB MTFDKCD1T0TFK | Dell Inspiron 16 Plus 7620 GeForce RTX 3050 Ti Laptop GPU, i7-12700H, Kioxia BG5 KBG50ZNS512G | HP Envy 16 h0112nr GeForce RTX 3060 Laptop GPU, i7-12700H, Micron 3400 1TB MTFDKBA1T0TFH | Asus Vivobook Pro 16X-M7600QE GeForce RTX 3050 Ti Laptop GPU, R9 5900HX, SK Hynix HFM001TD3JX013N | |
|---|---|---|---|---|---|---|
| Noise | 3% | 1% | -6% | -1% | -4% | |
| wyłączone / środowisko * (dB) | 25 | 25 -0% | 24.2 3% | 23.3 7% | 22.8 9% | 26 -4% |
| Idle Minimum * (dB) | 25 | 25 -0% | 24.2 3% | 25.7 -3% | 22.9 8% | 27 -8% |
| Idle Average * (dB) | 25 | 25 -0% | 24.2 3% | 26.1 -4% | 22.9 8% | 27 -8% |
| Idle Maximum * (dB) | 25 | 26.4 -6% | 24.2 3% | 30.6 -22% | 30.5 -22% | 27.5 -10% |
| Load Average * (dB) | 44.7 | 36.5 18% | 47 -5% | 46.2 -3% | 41.4 7% | 41.7 7% |
| Load Maximum * (dB) | 45.6 | 43 6% | 47 -3% | 49.4 -8% | 51.4 -13% | 45.3 1% |
| Witcher 3 ultra * (dB) | 47 | 49.2 | 51.1 |
* ... im mniej tym lepiej
Temperatury
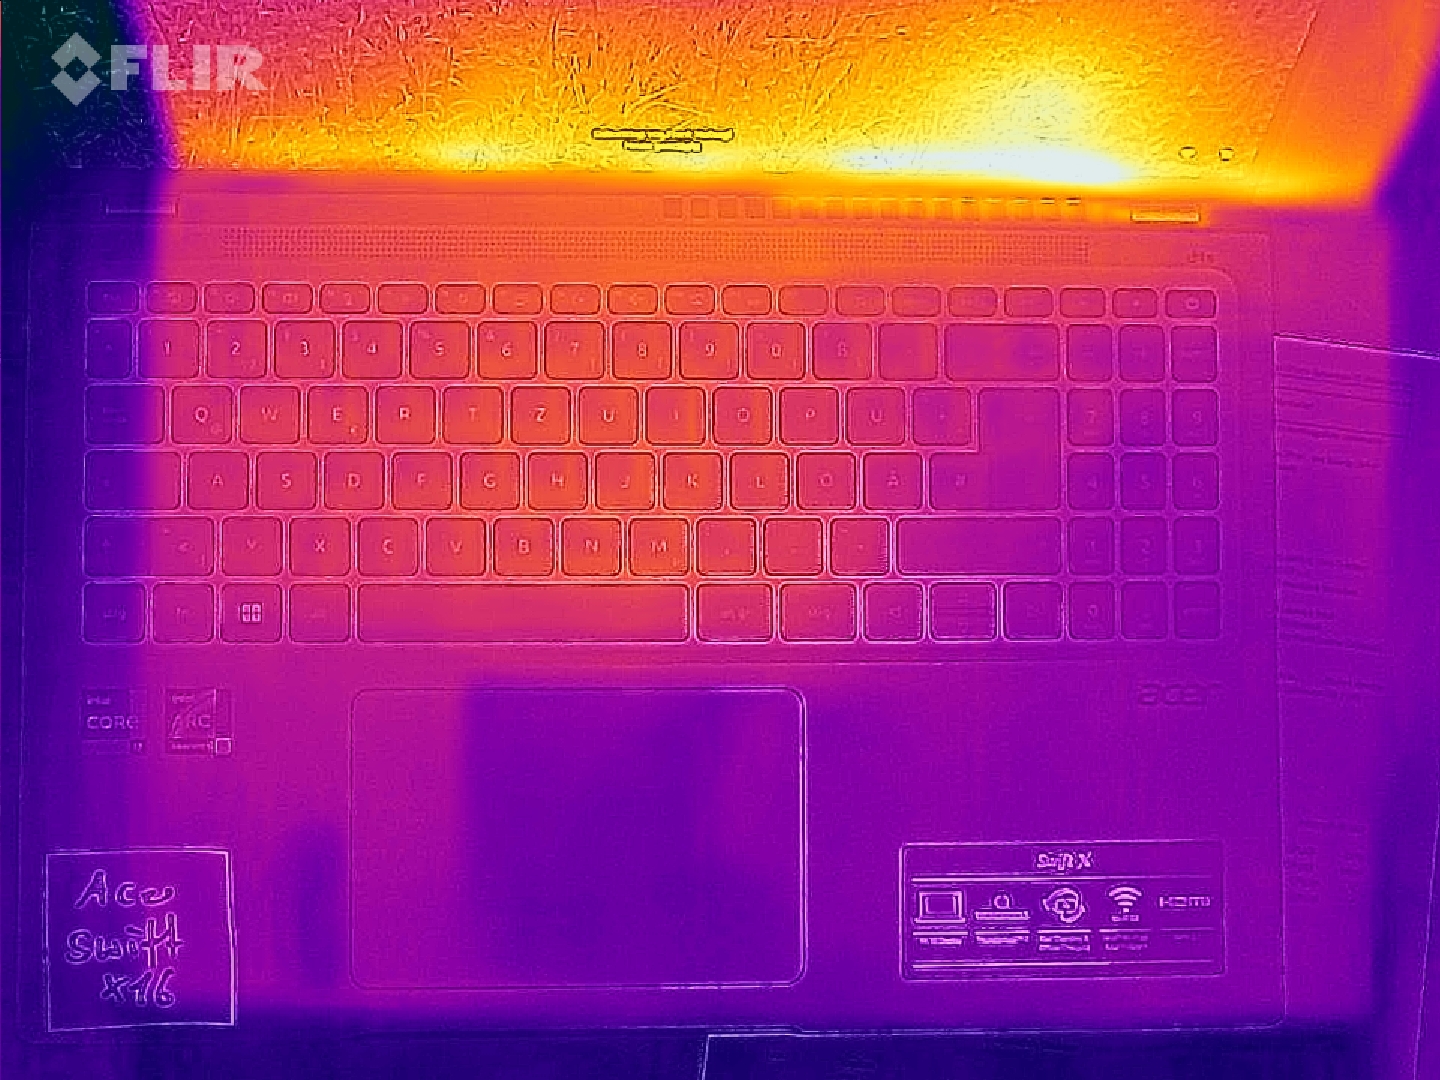
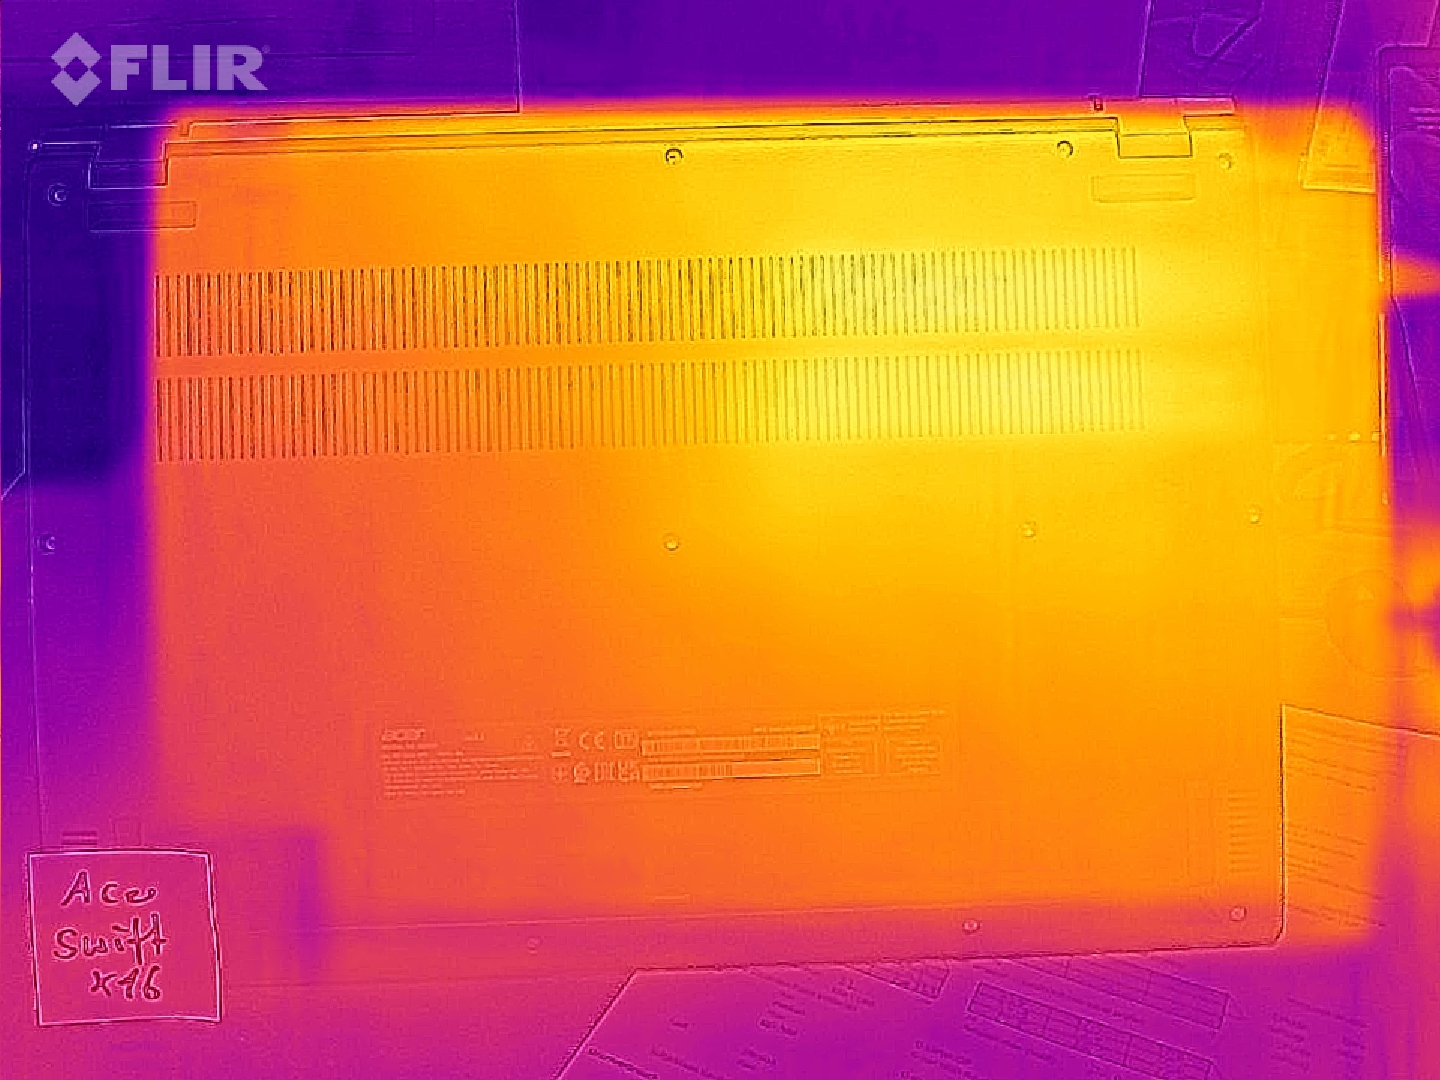
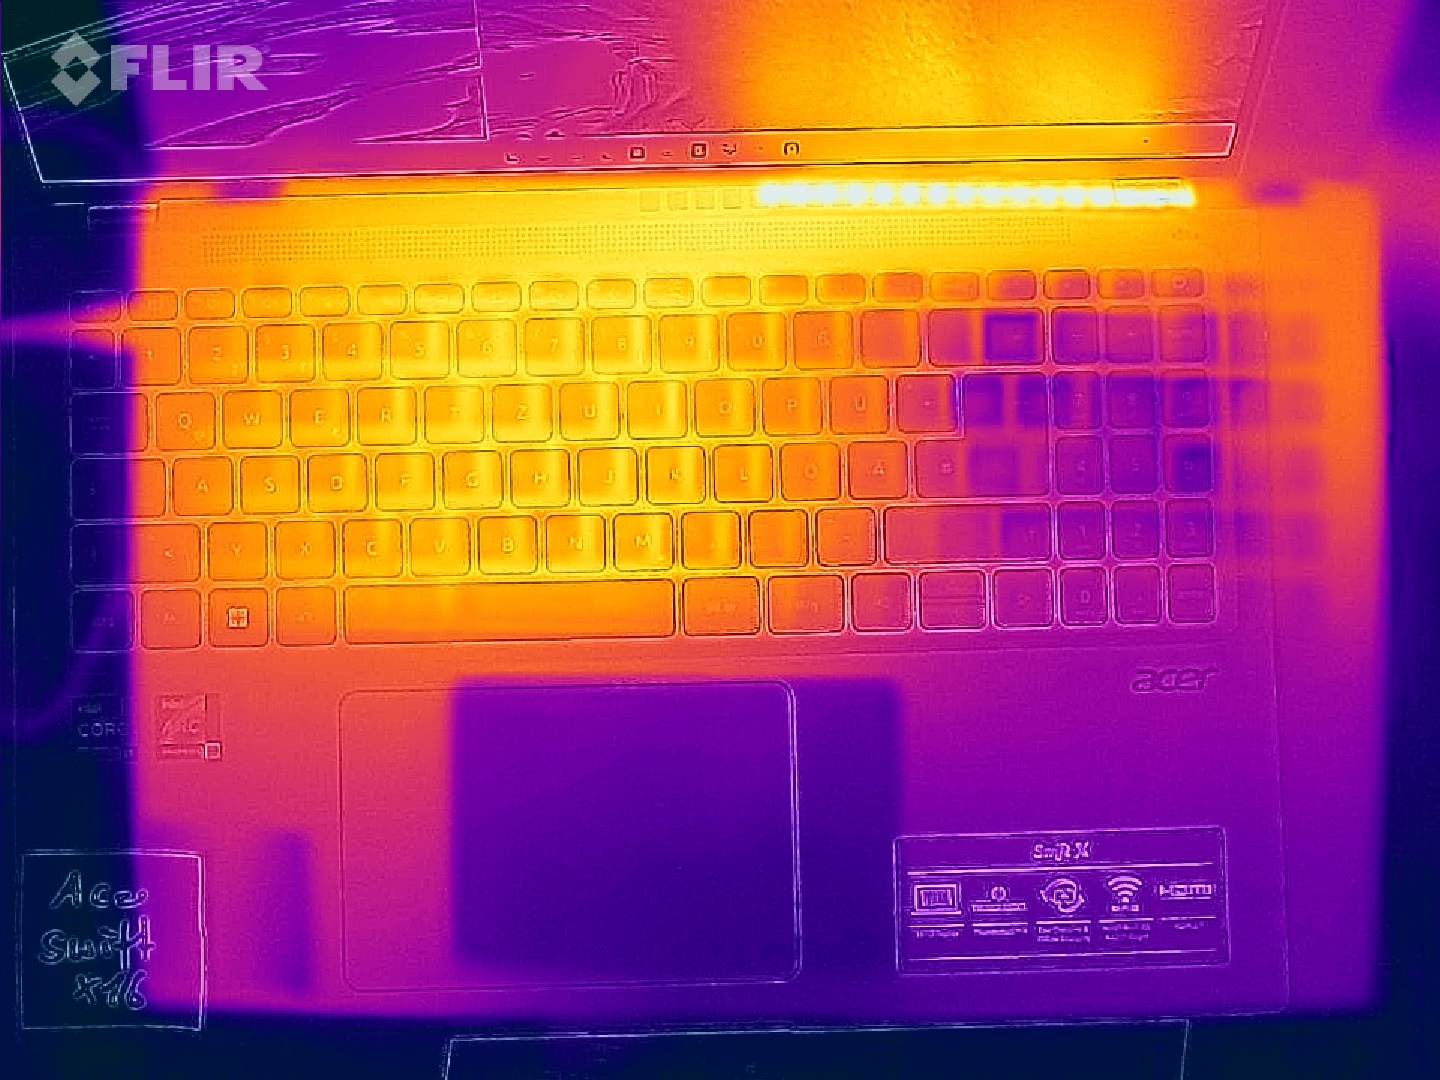
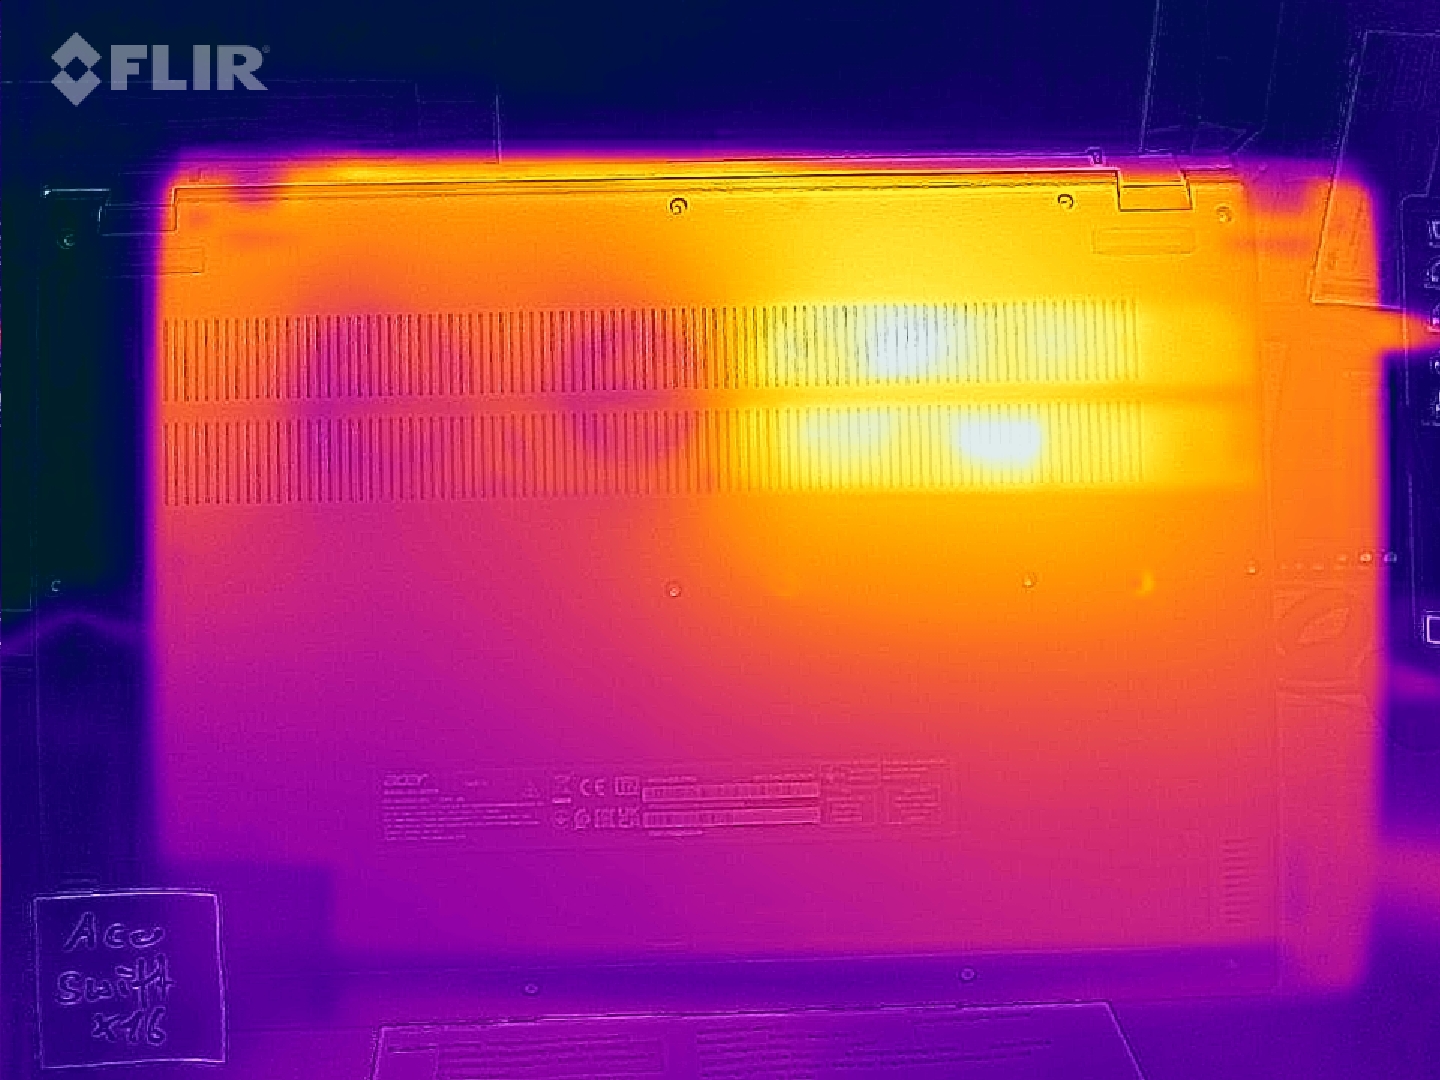
Układ chłodzenia jest nie tylko głośny, ale i słaby. Szczególnie obszar nad klawiaturą w pobliżu otworów wentylacyjnych potrafi się niekomfortowo nagrzać pod pełnym obciążeniem, a spód urządzenia też się wtedy nagrzewa z temperaturą do 55,5°C (131°F). Nawet przy mocniejszych podzespołach konkurenci wiedzą, że jest chłodniej.
(-) Maksymalna temperatura w górnej części wynosi 49.4 °C / 121 F, w porównaniu do średniej 36.8 °C / 98 F , począwszy od 21 do 71 °C dla klasy Multimedia.
(-) Dno nagrzewa się maksymalnie do 55.5 °C / 132 F, w porównaniu do średniej 39.1 °C / 102 F
(+) W stanie bezczynności średnia temperatura górnej części wynosi 25.9 °C / 79 F, w porównaniu ze średnią temperaturą urządzenia wynoszącą 31.3 °C / ### class_avg_f### F.
(-) Podpórki pod nadgarstki i touchpad mogą się bardzo nagrzać w dotyku, maksymalnie do 49.4 °C / 120.9 F.
(-) Średnia temperatura obszaru podparcia dłoni w podobnych urządzeniach wynosiła 28.7 °C / 83.7 F (-20.7 °C / -37.2 F).
| Acer Swift X SFX16-52G-77RX Intel Core i7-1260P, Intel Arc A370M | Acer Swift X SFX16-52G-52VE Intel Core i5-1240P, Intel Arc A370M | Lenovo ThinkBook 16 G4+ IAP Intel Core i7-12700H, NVIDIA GeForce RTX 2050 Mobile | Dell Inspiron 16 Plus 7620 Intel Core i7-12700H, NVIDIA GeForce RTX 3050 Ti Laptop GPU | HP Envy 16 h0112nr Intel Core i7-12700H, NVIDIA GeForce RTX 3060 Laptop GPU | Lenovo IdeaPad 5 Pro 16ARH7 AMD Ryzen 5 6600HS, AMD Radeon 660M | Asus Vivobook Pro 16X-M7600QE AMD Ryzen 9 5900HX, NVIDIA GeForce RTX 3050 Ti Laptop GPU | |
|---|---|---|---|---|---|---|---|
| Heat | -0% | 12% | 7% | 3% | 10% | 15% | |
| Maximum Upper Side * (°C) | 49.4 | 52 -5% | 42.9 13% | 46 7% | 45.2 9% | 46 7% | 39.4 20% |
| Maximum Bottom * (°C) | 55.5 | 50.4 9% | 50.6 9% | 45.8 17% | 44 21% | 48 14% | 43.6 21% |
| Idle Upper Side * (°C) | 28.4 | 30 -6% | 26 8% | 29.2 -3% | 33.6 -18% | 28 1% | 27.6 3% |
| Idle Bottom * (°C) | 32.6 | 32.4 1% | 26.5 19% | 31 5% | 32.6 -0% | 27 17% | 27.5 16% |
* ... im mniej tym lepiej
Stress Test
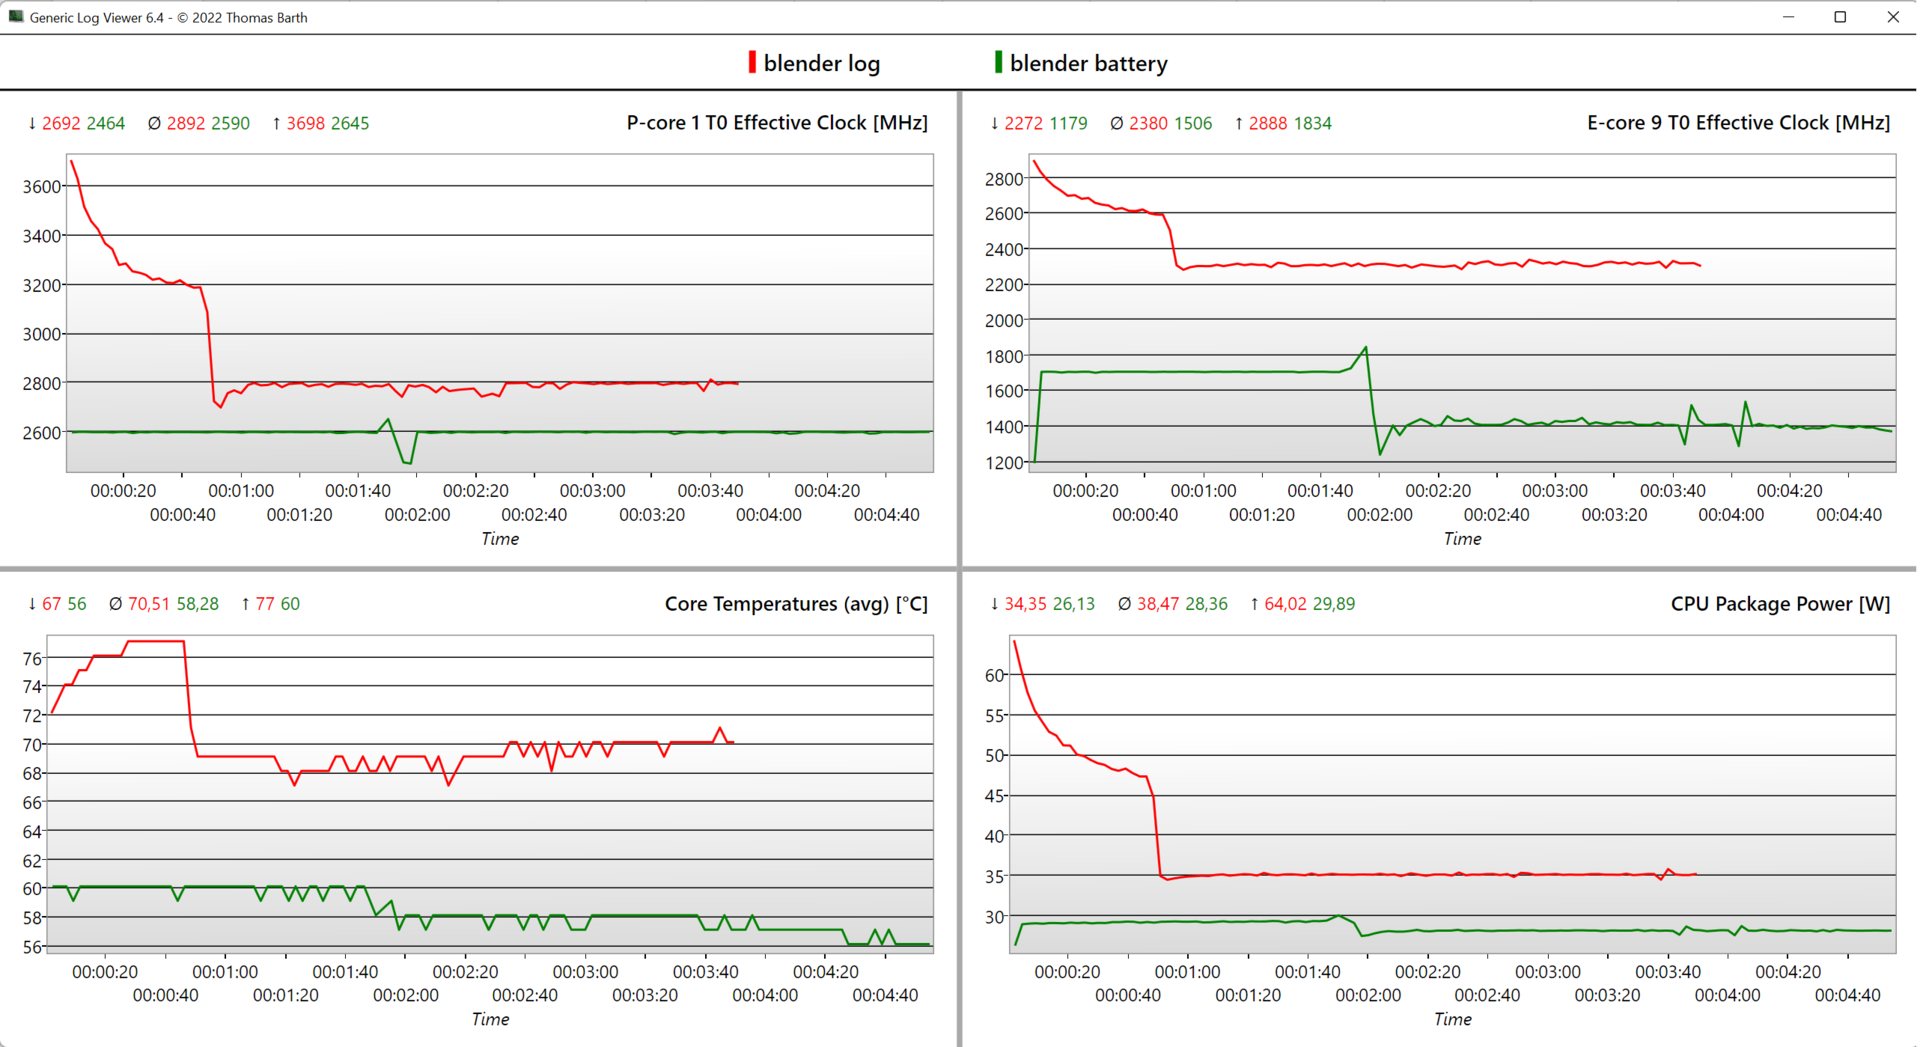
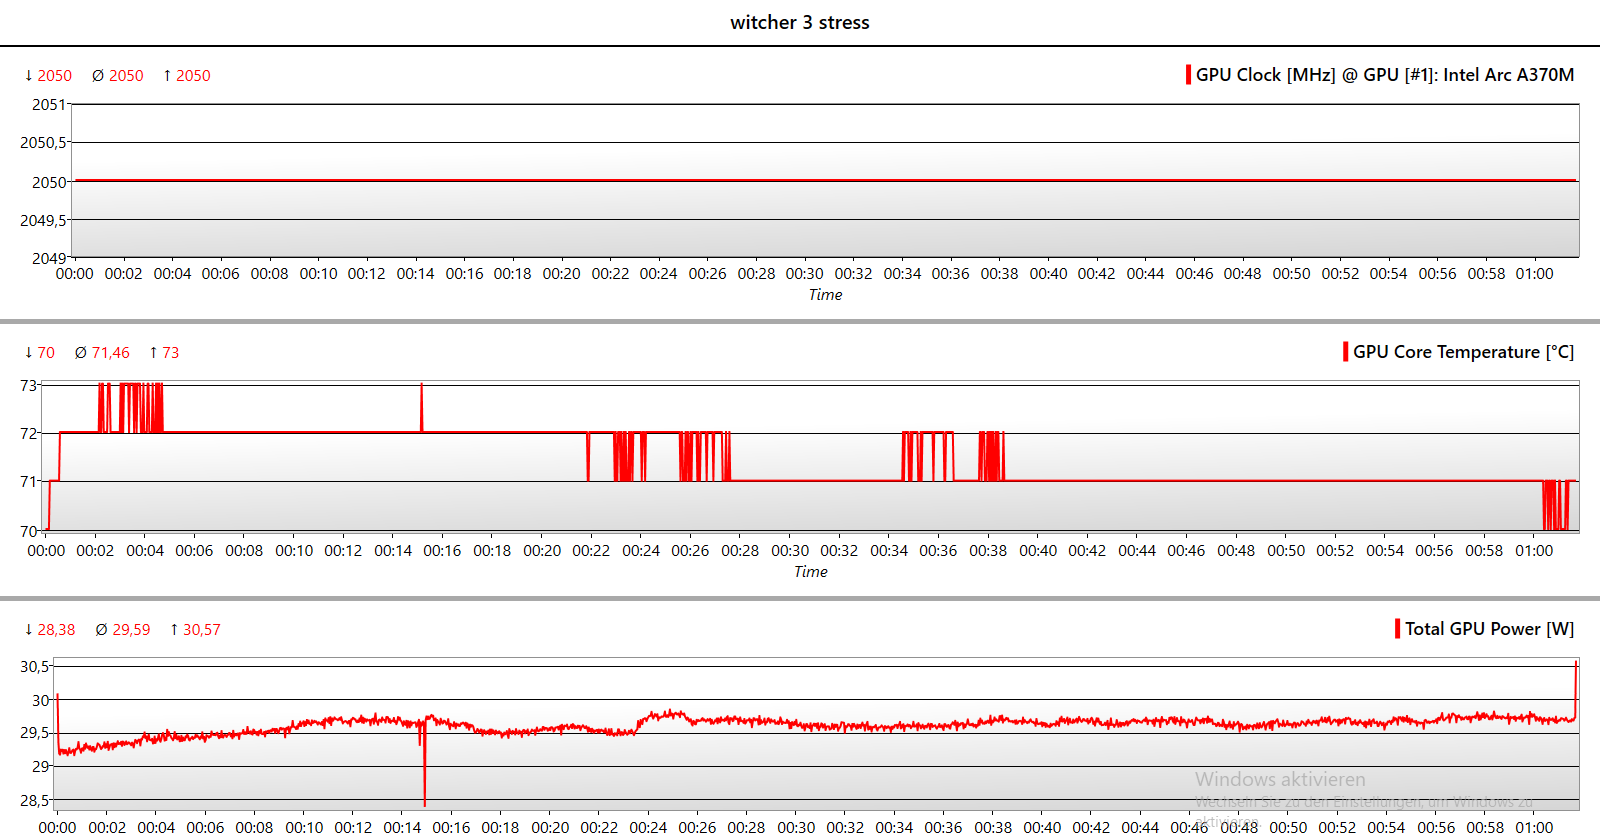
Nawet w godzinnym, połączonym teście obciążeniowym Prime95 i FurMark, taktowanie GPU pozostaje tylko o 5% niższe od maksymalnego. Procesor jest następnie dławiony z 35 do 25 W, osiągając temperaturę 88 °C (190 °F), podczas gdy GPU osiąga 86 °C (187 °F). Rdzenie P będą miały wtedy taktowanie tylko około 1,75 GHz, czyli poniżej podstawowego taktowania 2,1 GHz. Podczas czystego stresu CPU prędkość nie schodzi poniżej tej granicy.
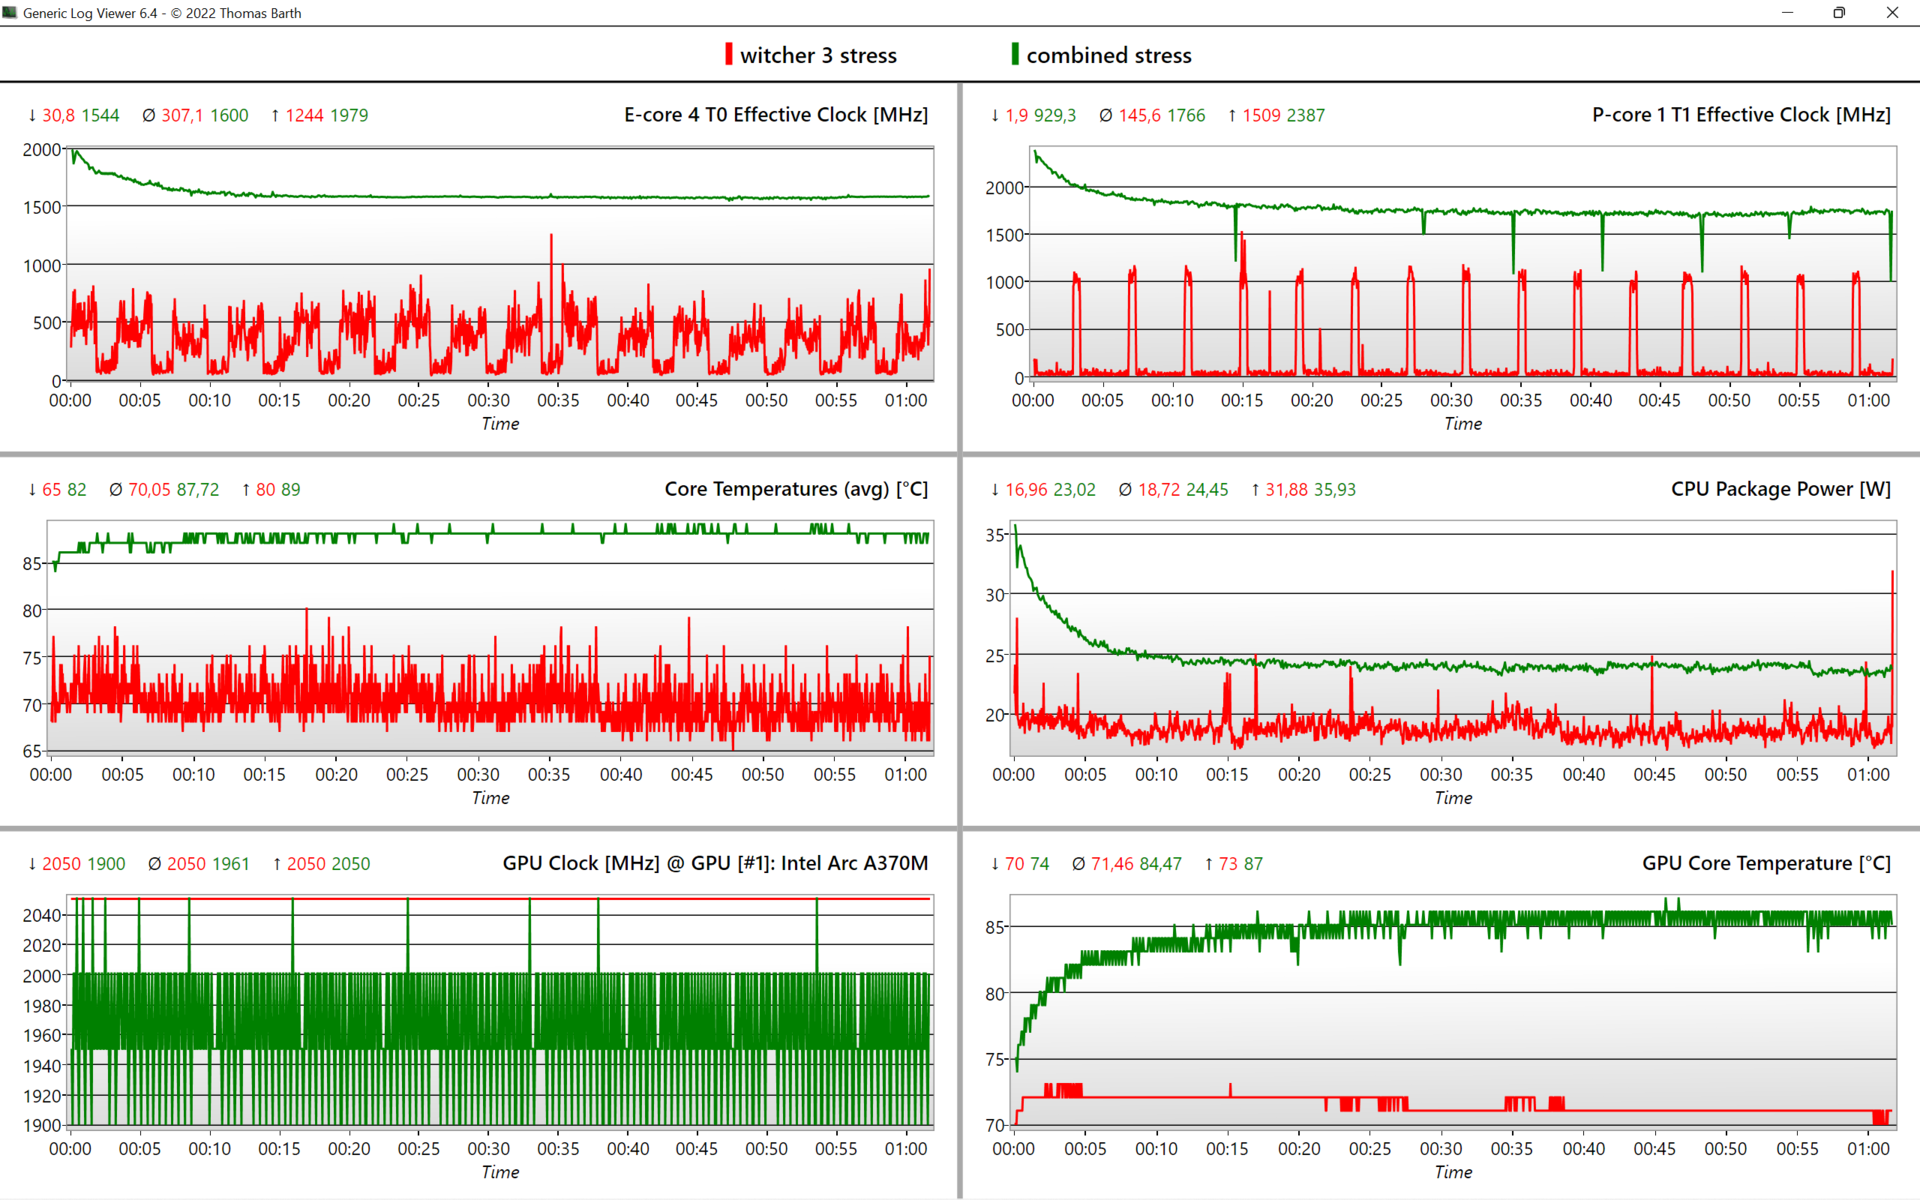
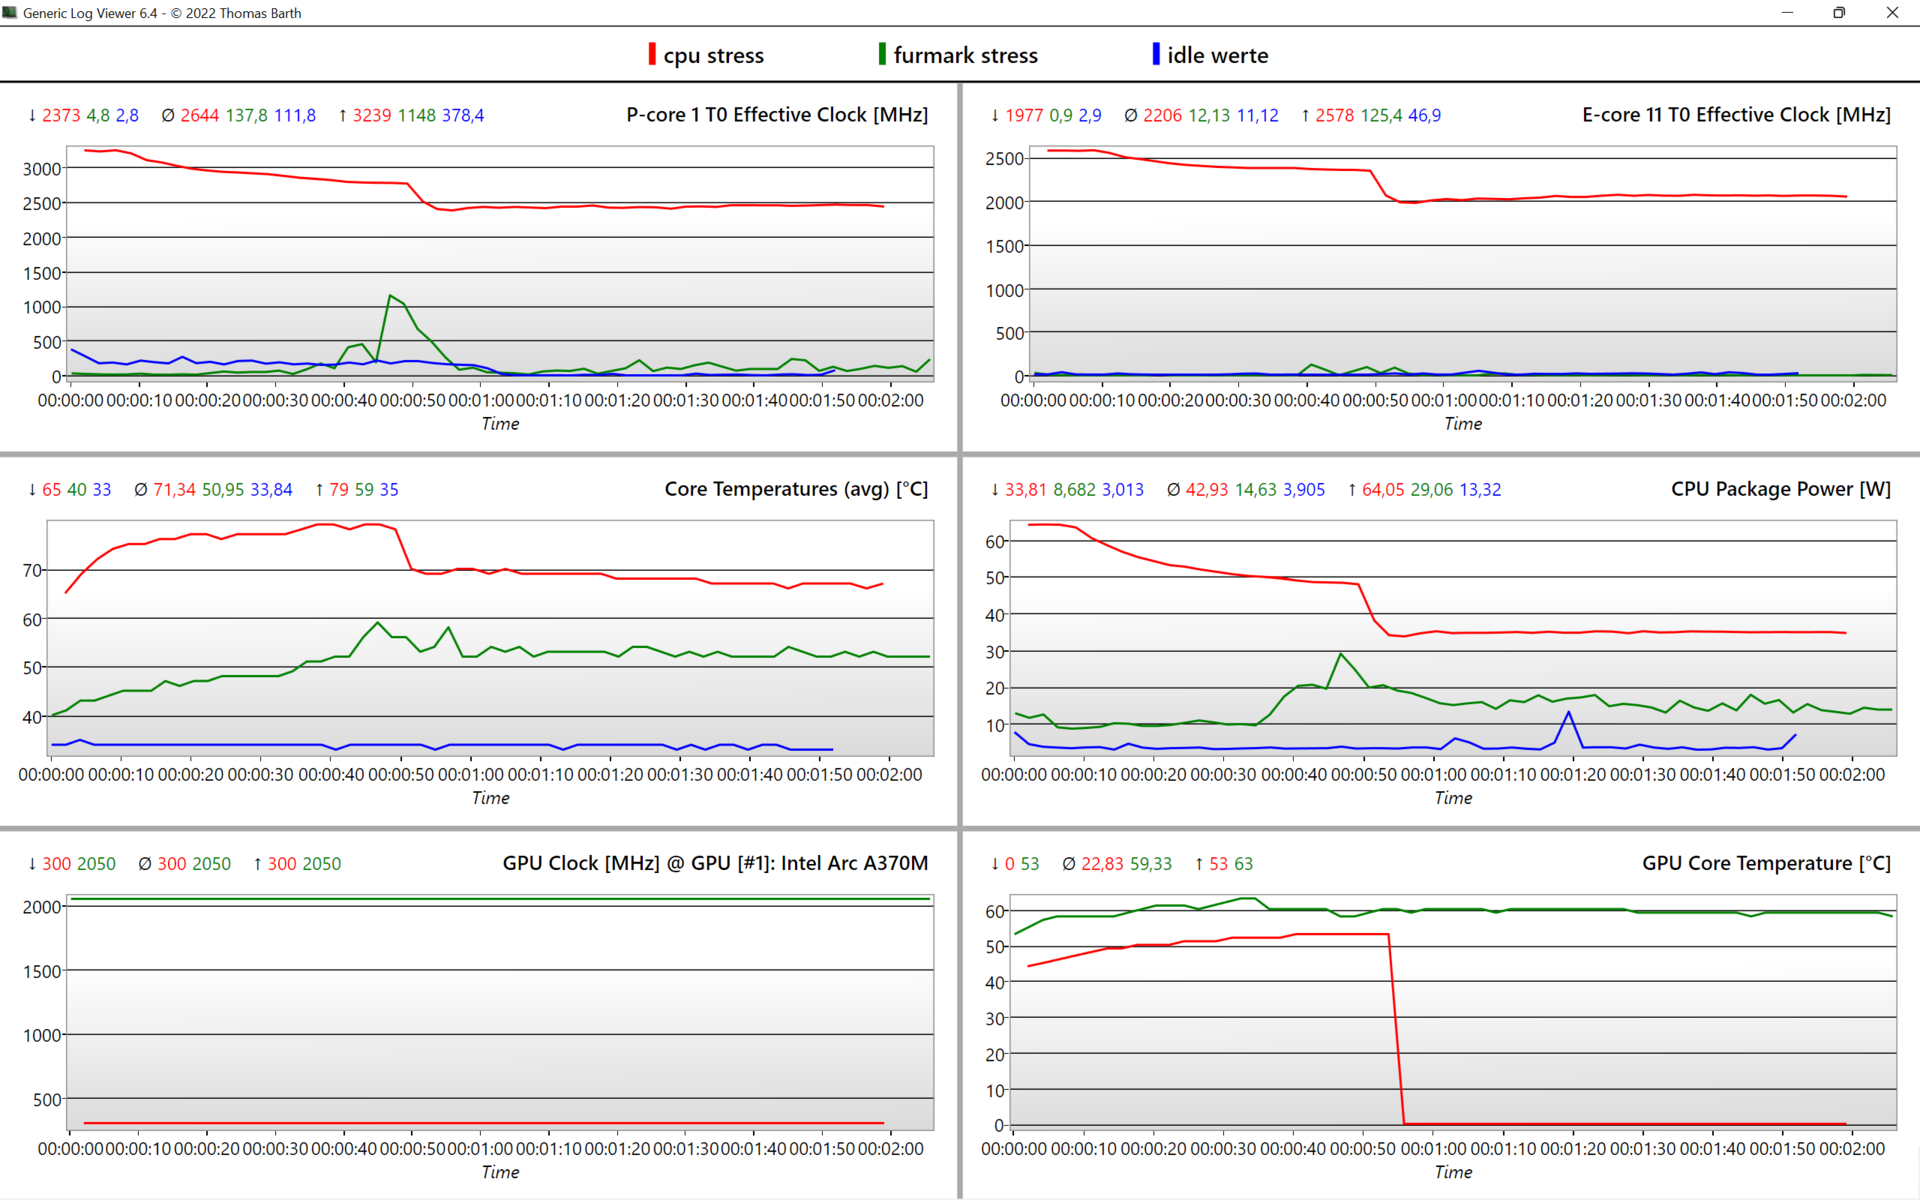
| Zegar CPU E-/P-Cores (GHz) | Zegar GPU (MHz) | Średnia temperatura CPU (°C) | Średnia temperatura GPU (°C) | |
| System w stanie bezczynności | - | 300 | 34 | 29 |
| Prime95 Stress | 2.1 / 2.5 | 300 | 67 | 53 |
| Prime95 + FurMark Stress | 1,6 / 1,75 | 1,960 | 88 | 86 |
| FurMark Stress | - | 2.050 | 52 | 60 |
| Witcher 3 Stres | 0,3 / 0,15 | 2,050 | 70 | 71 |
Mówcy
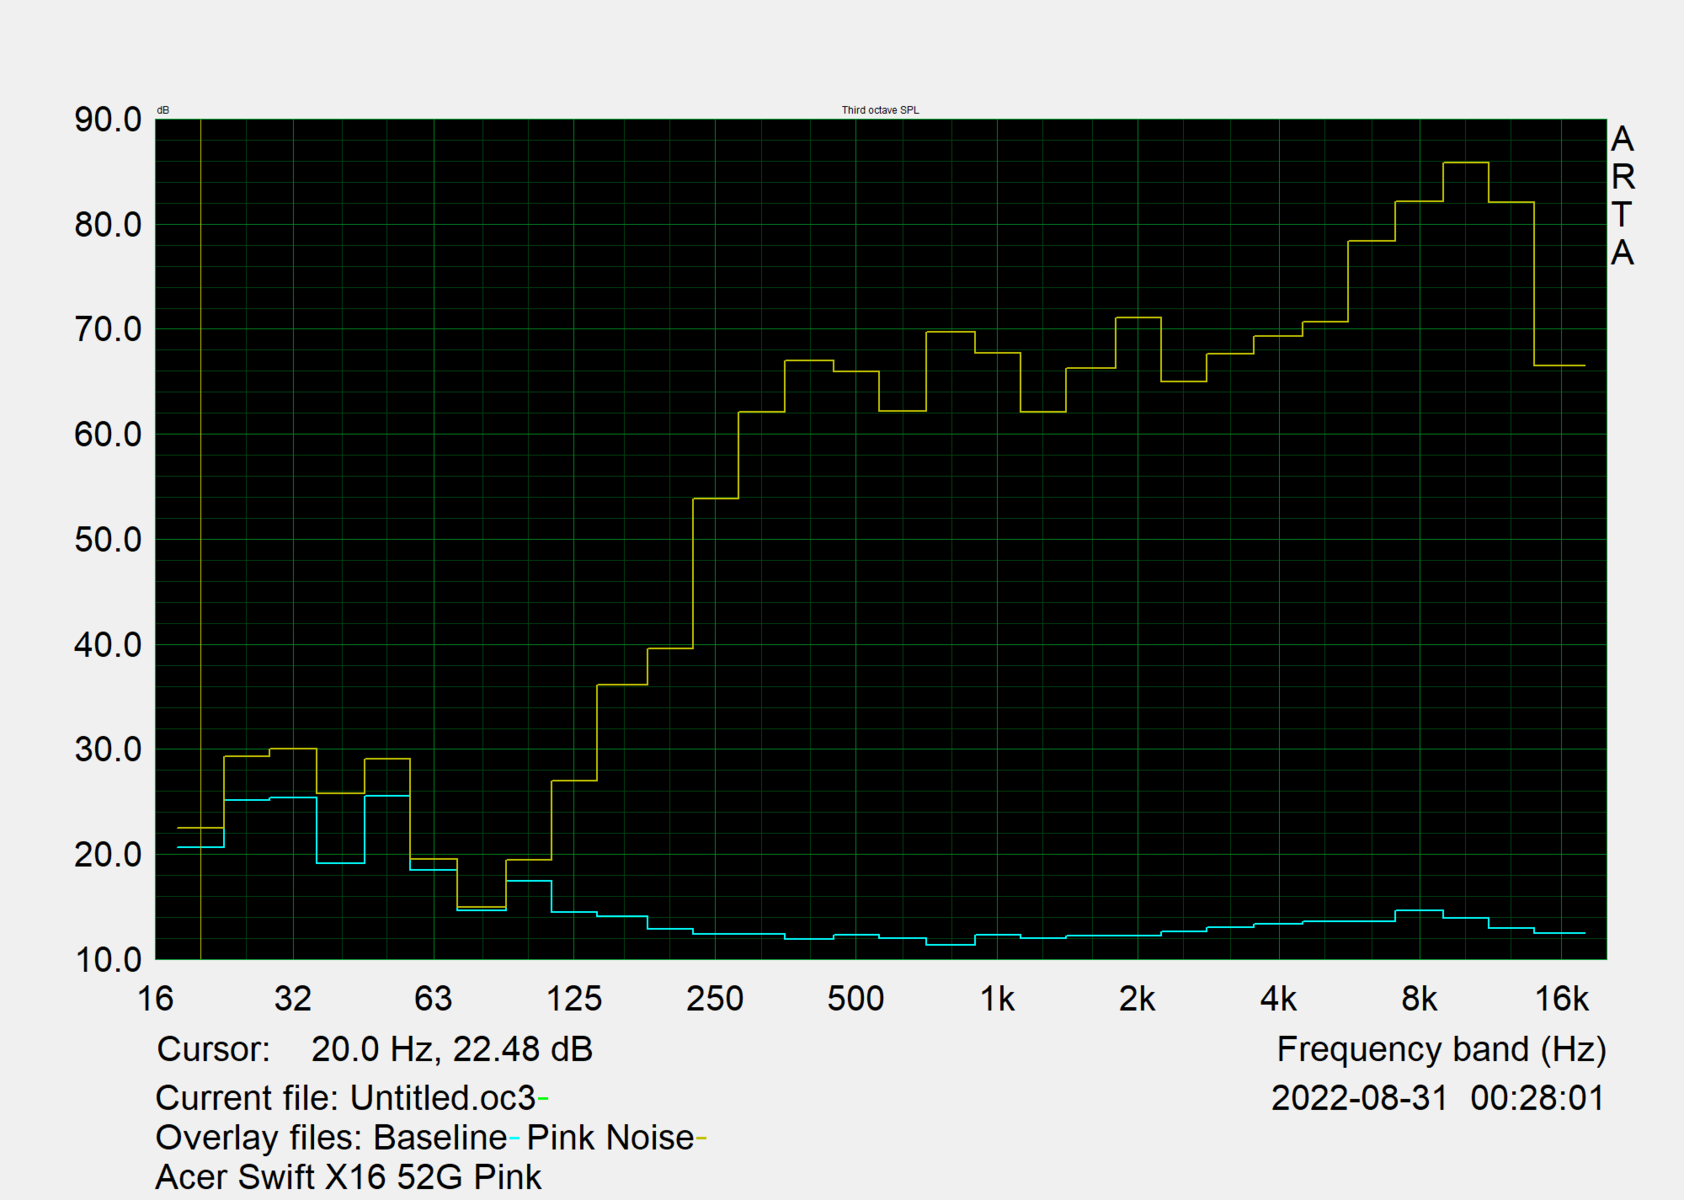
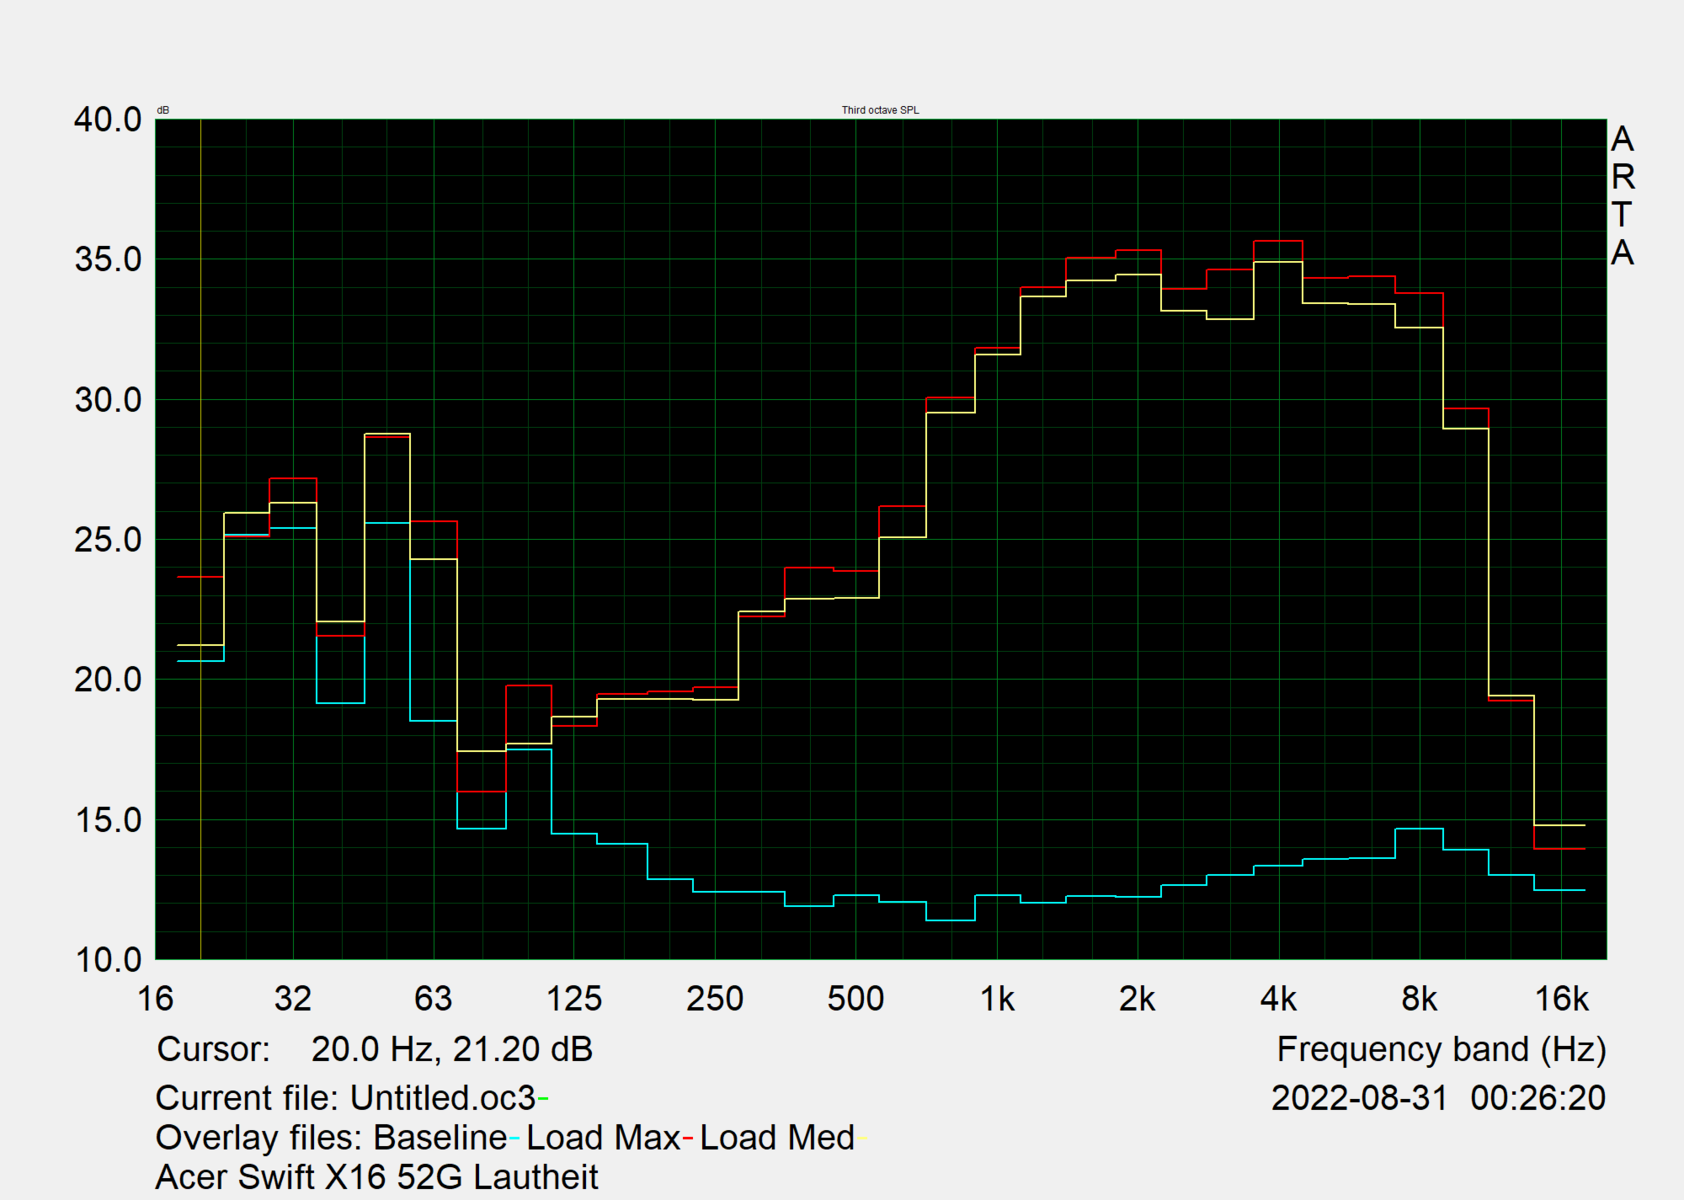
Dźwięk z głośników, skierowanych ku górze, jest ubogi w basy i ma jakość poniżej przeciętnej. Przy poziomie prawie 88 dB(A) udaje im się jednak wypełnić nawet duże pomieszczenie. Jeśli potrzebujemy tylko odtworzyć głosy, są wystarczające, ale jeśli chcemy cieszyć się muzyką, powinniśmy skorzystać z zewnętrznych urządzeń audio za pośrednictwem portu audio lub Bluetooth.
Acer Swift X SFX16-52G-77RX analiza dźwięku
(+) | głośniki mogą odtwarzać stosunkowo głośno (87.8 dB)
Bas 100 - 315 Hz
(-) | prawie brak basu - średnio 26.8% niższa od mediany
(±) | liniowość basu jest średnia (14.6% delta do poprzedniej częstotliwości)
Średnie 400 - 2000 Hz
(+) | zbalansowane środki średnie - tylko 2.4% od mediany
(±) | liniowość środka jest średnia (7.9% delta do poprzedniej częstotliwości)
Wysokie 2–16 kHz
(±) | wyższe maksima - średnio 8.1% wyższe od mediany
(±) | liniowość wysokich wartości jest średnia (7.1% delta do poprzedniej częstotliwości)
Ogólnie 100 - 16.000 Hz
(±) | liniowość ogólnego dźwięku jest średnia (20.6% różnicy w stosunku do mediany)
W porównaniu do tej samej klasy
» 70% wszystkich testowanych urządzeń w tej klasie było lepszych, 8% podobnych, 22% gorszych
» Najlepszy miał deltę 5%, średnia wynosiła ###średnia###%, najgorsza wynosiła 45%
W porównaniu do wszystkich testowanych urządzeń
» 55% wszystkich testowanych urządzeń było lepszych, 8% podobnych, 37% gorszych
» Najlepszy miał deltę 4%, średnia wynosiła ###średnia###%, najgorsza wynosiła 134%
Lenovo ThinkBook 16 G4+ IAP analiza dźwięku
(±) | głośność głośnika jest średnia, ale dobra (77.6 dB)
Bas 100 - 315 Hz
(-) | prawie brak basu - średnio 17.3% niższa od mediany
(±) | liniowość basu jest średnia (10.3% delta do poprzedniej częstotliwości)
Średnie 400 - 2000 Hz
(+) | zbalansowane środki średnie - tylko 4.6% od mediany
(+) | średnie są liniowe (4.6% delta do poprzedniej częstotliwości)
Wysokie 2–16 kHz
(+) | zrównoważone maksima - tylko 1.6% od mediany
(+) | wzloty są liniowe (6.2% delta do poprzedniej częstotliwości)
Ogólnie 100 - 16.000 Hz
(±) | liniowość ogólnego dźwięku jest średnia (15.7% różnicy w stosunku do mediany)
W porównaniu do tej samej klasy
» 39% wszystkich testowanych urządzeń w tej klasie było lepszych, 5% podobnych, 56% gorszych
» Najlepszy miał deltę 5%, średnia wynosiła ###średnia###%, najgorsza wynosiła 45%
W porównaniu do wszystkich testowanych urządzeń
» 24% wszystkich testowanych urządzeń było lepszych, 5% podobnych, 71% gorszych
» Najlepszy miał deltę 4%, średnia wynosiła ###średnia###%, najgorsza wynosiła 134%
Zarządzanie energią: Duża żywotność baterii i niskie zużycie energii Swift X
Pobór mocy
Podczas codziennych zadań mierzymy około 7,6 W, co może pobić tylko nieliczne urządzenia w klasie multimedialnej, jak np IdeaPad 5 Pro 16.
Około 70 watów podczas gier i w innych scenariuszach obciążenia to tyle samo, co poprzednik z m.in Nvidia RTX 3050 również korzystał. Według naszej bazy danych urządzenia ze zintegrowanym GPU RDNA 2 od AMD są nawet znacznie wydajniejsze przy około 45 watach. Z drugiej strony.HP Envy 16 zRTX 3060zużywa około dwa razy więcej energii podczas grania (133 waty).
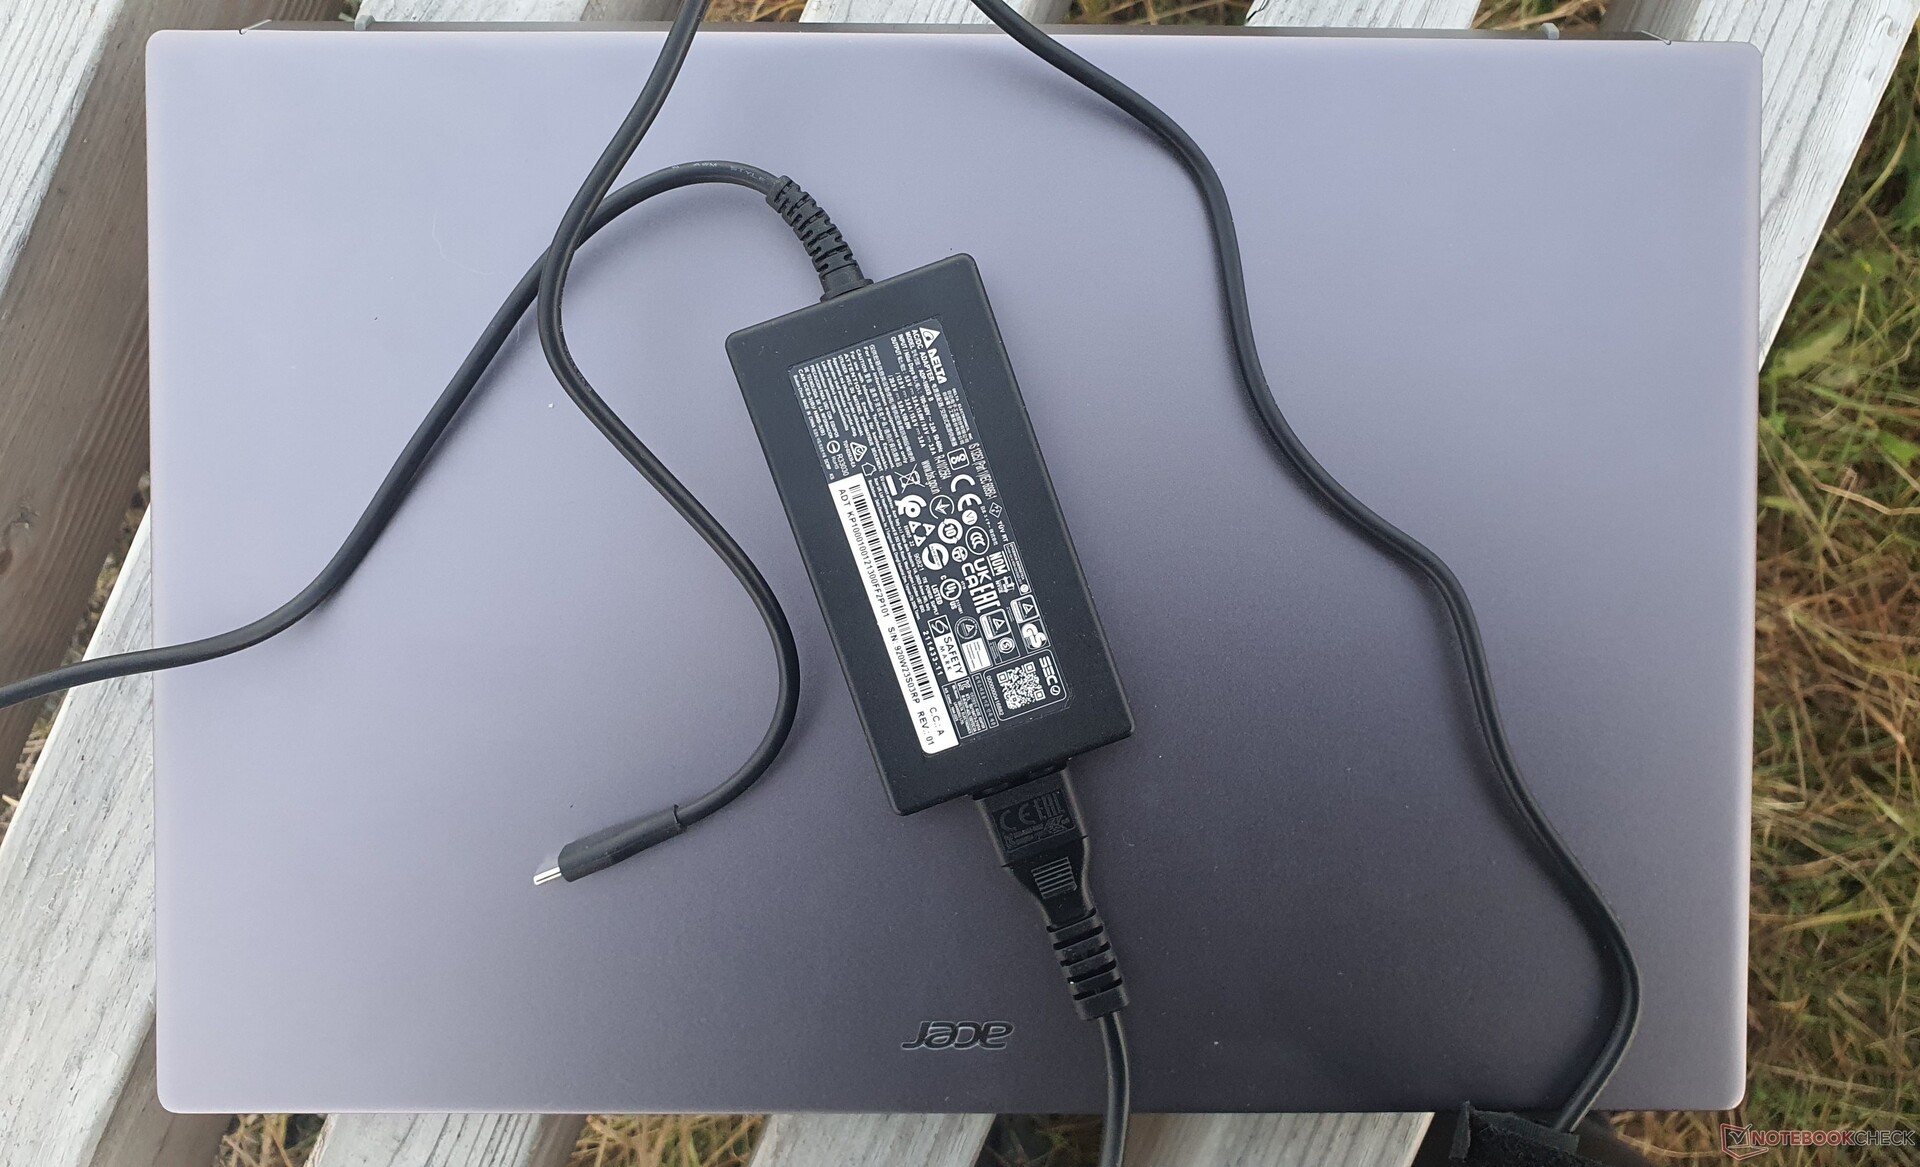
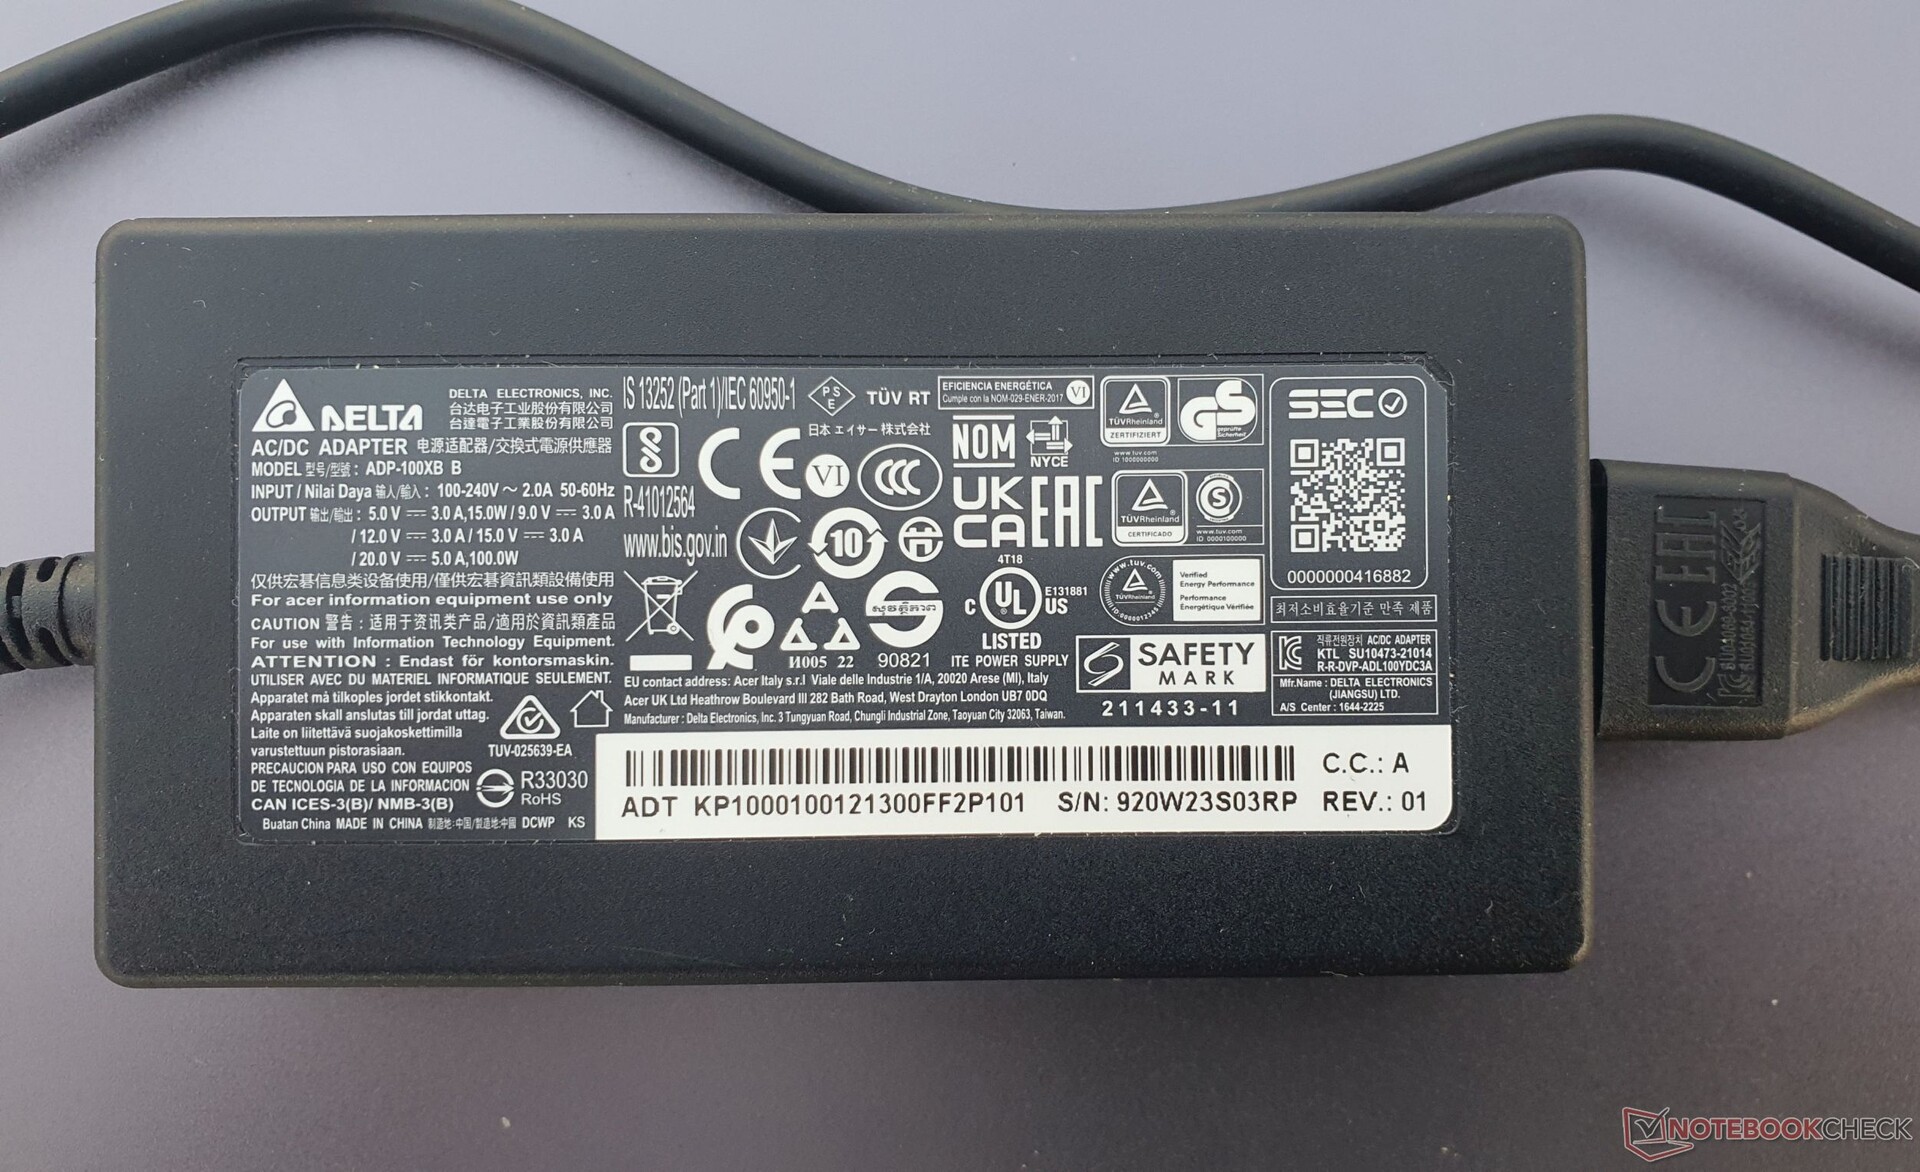
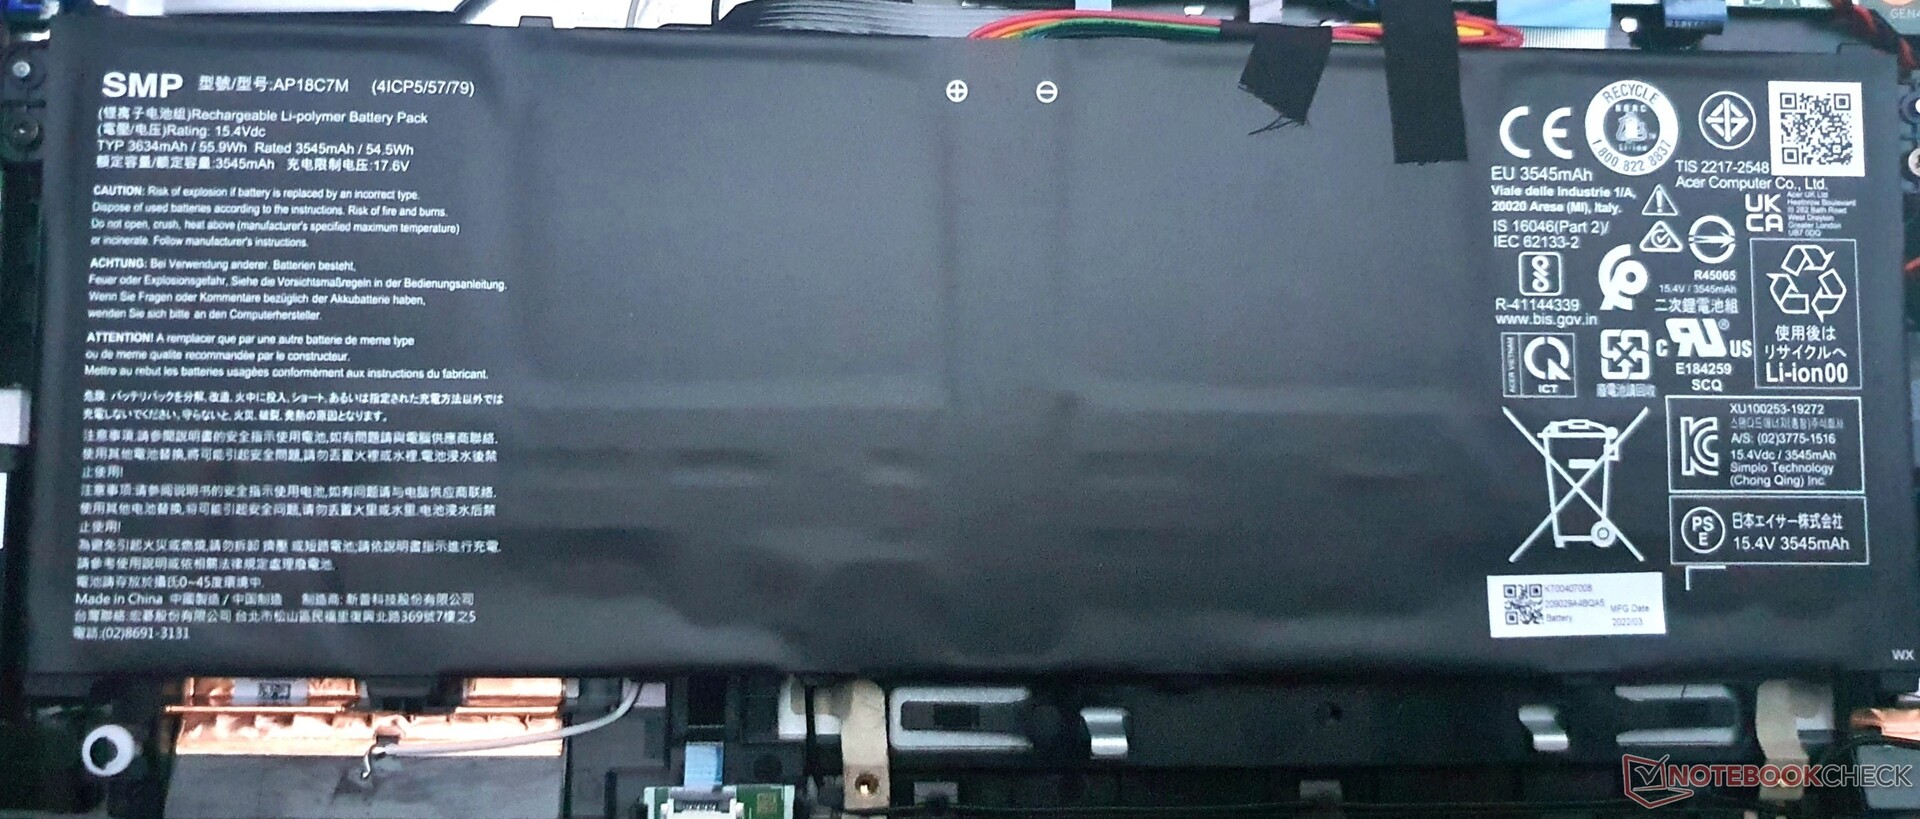
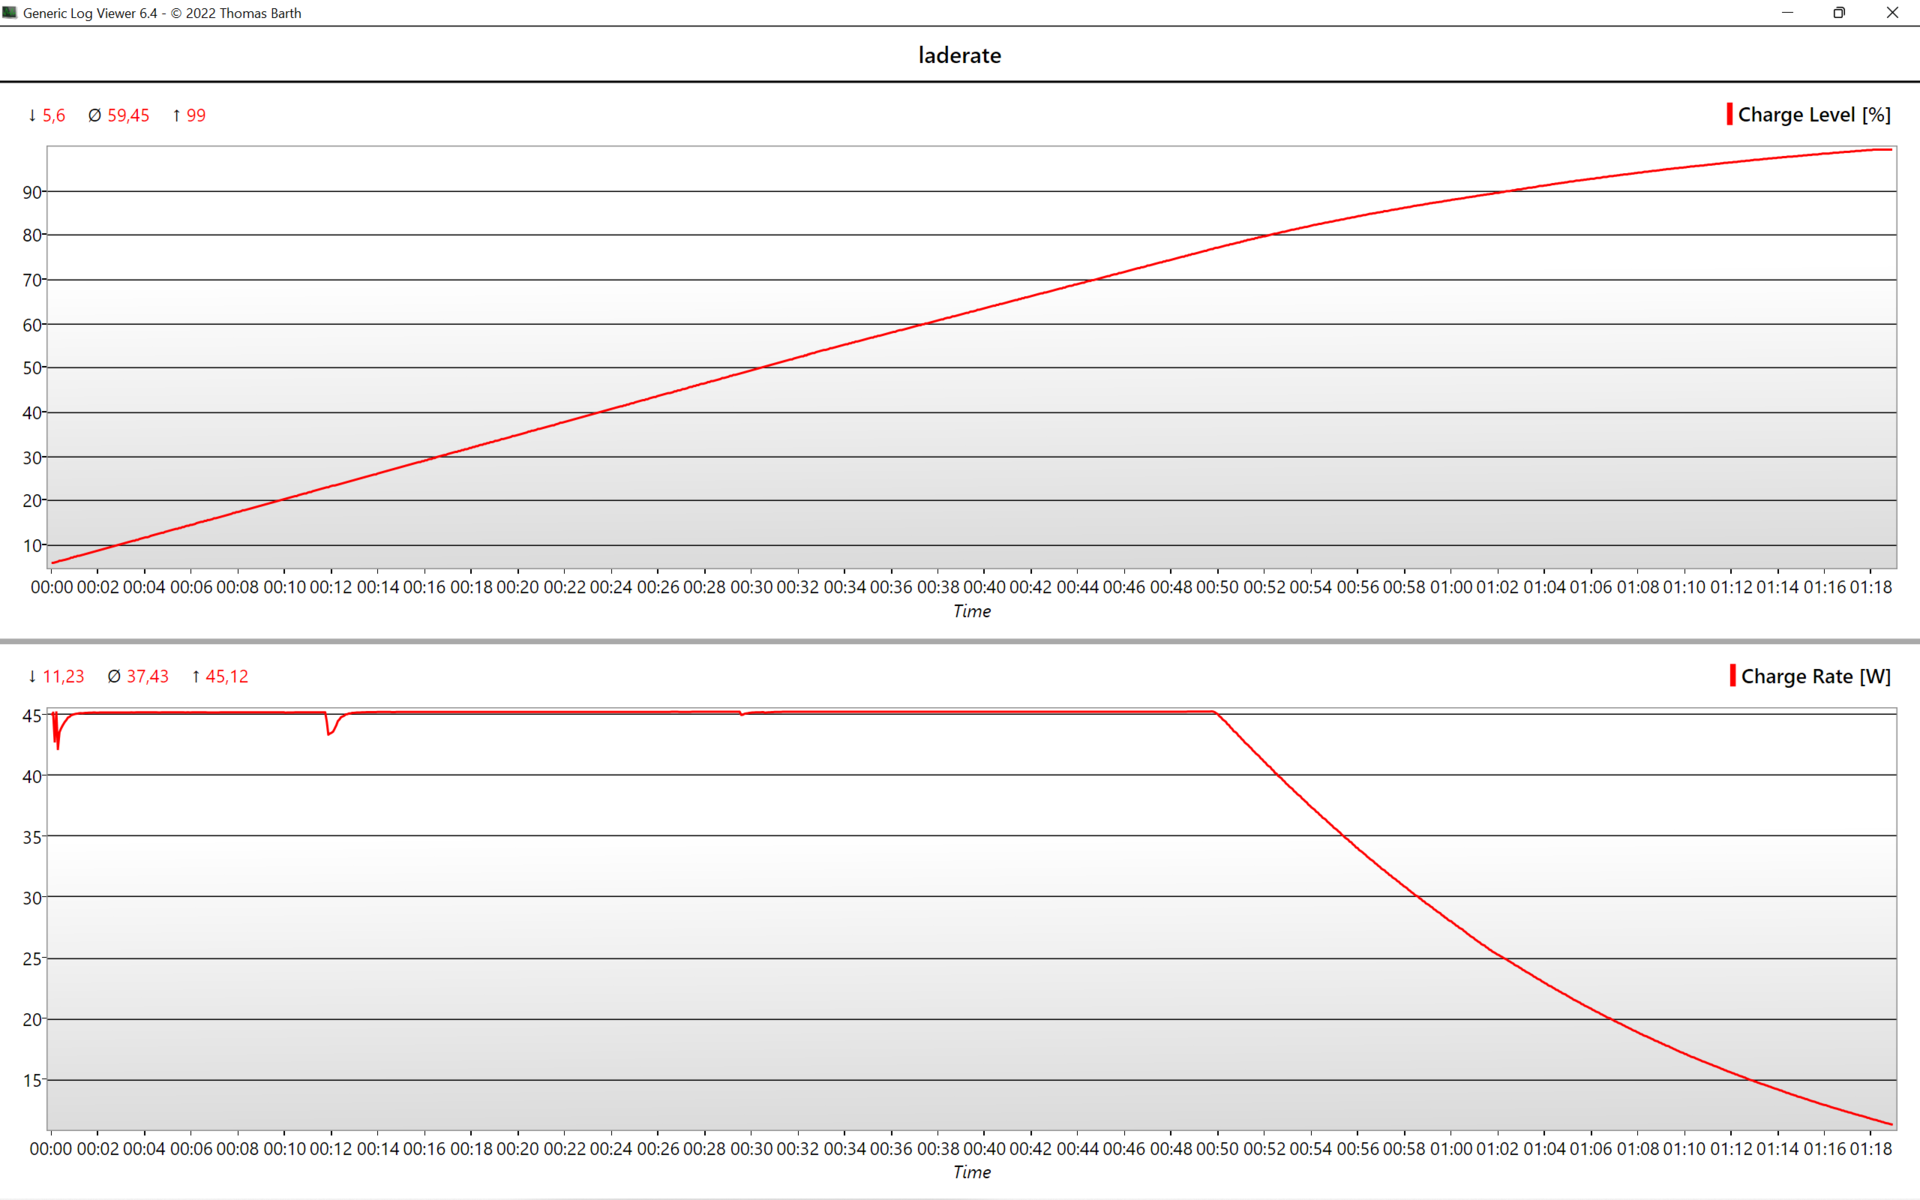
Ładowarka USB-C o mocy 100 W jest wystarczająca, ponieważ szczytowe obciążenia nieco powyżej 100 W występują tylko podczas nierealistycznego scenariusza naszego połączonego testu obciążeniowego, który w rzeczywistości nie miałby miejsca w codziennej pracy. Mogłyby ewentualnie wystąpić tylko w pierwszej sekundzie, na przykład pod pełnym czystym obciążeniem procesora lub podczas gry.
| wyłączony / stan wstrzymania | |
| luz | |
| obciążenie |
|
Legenda:
min: | |
| Acer Swift X SFX16-52G-77RX i7-1260P, A370M, WDC PC SN810 1TB, IPS-LED, 2560x1600, 16" | Acer Swift X SFX16-52G-52VE i5-1240P, A370M, Micron 3400 MTFDKBA512TFH 512GB, , 2560x1600, 16" | Lenovo ThinkBook 16 G4+ IAP i7-12700H, GeForce RTX 2050 Mobile, Micron 2450 1TB MTFDKCD1T0TFK, IPS, 2560x1600, 16" | Dell Inspiron 16 Plus 7620 i7-12700H, GeForce RTX 3050 Ti Laptop GPU, Kioxia BG5 KBG50ZNS512G, IPS, 3072x1920, 16" | HP Envy 16 h0112nr i7-12700H, GeForce RTX 3060 Laptop GPU, Micron 3400 1TB MTFDKBA1T0TFH, OLED, 3840x2400, 16" | Asus Vivobook Pro 16X-M7600QE R9 5900HX, GeForce RTX 3050 Ti Laptop GPU, SK Hynix HFM001TD3JX013N, OLED, 3840x2400, 16.1" | Średnia w klasie Multimedia | |
|---|---|---|---|---|---|---|---|
| Power Consumption | -9% | -22% | -54% | -103% | -50% | -20% | |
| Idle Minimum * (Watt) | 3.7 | 5.7 -54% | 5 -35% | 6.8 -84% | 10 -170% | 8.2 -122% | 5.68 ? -54% |
| Idle Average * (Watt) | 7.6 | 8 -5% | 11.2 -47% | 9.6 -26% | 10.9 -43% | 16.2 -113% | 10.2 ? -34% |
| Idle Maximum * (Watt) | 11.1 | 10.4 6% | 11.6 -5% | 17 -53% | 27.8 -150% | 19.7 -77% | 12.4 ? -12% |
| Load Average * (Watt) | 70 | 74 -6% | 89.3 -28% | 117.5 -68% | 116.4 -66% | 65.8 6% | 65.4 ? 7% |
| Witcher 3 ultra * (Watt) | 68.8 | 65 6% | 83 -21% | 113.1 -64% | 133.7 -94% | 65.6 5% | |
| Load Maximum * (Watt) | 108 | 108.5 -0% | 102 6% | 137.4 -27% | 209.8 -94% | 104 4% | 113.3 ? -5% |
* ... im mniej tym lepiej
Power Consumption The Witcher 3 / Stress Test
Power Consumption With External Monitor
Czas pracy na baterii
W naszym teście WLAN z jasnością ustawioną na 150 nitów i w trybie normalnym Acer wytrzymał 9 godzin Swift X 16. To o godzinę dłużej od poprzednika i o 40 minut krócej od modelu rodzeństwa, choć tamten był testowany w trybie oszczędzania energii
Ogólnie rzecz biorąc, wartości te mieszczą się w średniej tej klasy. Asus Vivobook Pro 16Xwytrzymuje ponad 11 godzin, podczas gdy Dell Inspiron 16 Plusi Lenovo IdeaPad 5 Pro 16osiągają podobne wartości jak Swift X.
| Acer Swift X SFX16-52G-77RX i7-1260P, A370M, 56 Wh | Acer Swift X SFX16-52G-52VE i5-1240P, A370M, 56 Wh | Acer Swift X SFX16-51G-5388 i5-11320H, GeForce RTX 3050 4GB Laptop GPU, 58.7 Wh | Lenovo ThinkBook 16 G4+ IAP i7-12700H, GeForce RTX 2050 Mobile, 71 Wh | Dell Inspiron 16 Plus 7620 i7-12700H, GeForce RTX 3050 Ti Laptop GPU, 86 Wh | HP Envy 16 h0112nr i7-12700H, GeForce RTX 3060 Laptop GPU, 83 Wh | Lenovo IdeaPad 5 Pro 16ARH7 R5 6600HS, Radeon 660M, 75 Wh | Asus Vivobook Pro 16X-M7600QE R9 5900HX, GeForce RTX 3050 Ti Laptop GPU, 96 Wh | Średnia w klasie Multimedia | |
|---|---|---|---|---|---|---|---|---|---|
| Czasy pracy | -6% | 2% | 16% | 7% | 16% | 8% | 12% | 48% | |
| H.264 (h) | 10.4 | 9.8 -6% | 8.4 -19% | 12.6 21% | 16.4 ? 58% | ||||
| WiFi v1.3 (h) | 9.1 | 9.7 7% | 8.1 -11% | 8.2 -10% | 9.6 5% | 7.9 -13% | 9.8 8% | 11.3 24% | 12.2 ? 34% |
| Load (h) | 1.1 | 0.9 -18% | 1.5 36% | 1.5 36% | 1.2 9% | 1.6 45% | 1.1 0% | 1.662 ? 51% |
Za
Przeciw
Werdykt: Mimo znacznych ulepszeń, Acer Swift X 16 wciąż nie spełnia oczekiwań
Acer Swift X 16 (2022) to kompaktowy 16-calowy laptop, który waży zaledwie 1,75 kg (~3,96 lb). Wiele obszarów problemowych poprzednika zostało na szczęście naprawionych. Wyświetlacz jest teraz znacznie jaśniejszy - 380 nitów, oferuje wysoką rozdzielczość 2 560 x 1 600 pikseli, podoba nam się też format 16:10.
Niestety, GPU Intel's Arc nie jest stworzony do pracy w 3D i również kuleje za GeForce RTX 3050 Tiw DelluInspiron 16 Plusi AsusVivoBook Pro 16Xpodczas rozgrywki. Z drugiej strony system oferuje wysoką wydajność dzięki procesorowi Intel Alder Lake P. Ponadto wbudowany dysk SSD PCIe 4.0 jest jednym z najszybszych, choć cierpi na silny throttling termiczny. Ale przynajmniej można zainstalować drugi pełnowymiarowy dysk SSD M.2.
Inne pozytywne punkty to aktualizacja do HDMI 2.1 i kamera internetowa 1080p, podczas gdy obudowa nadal jest wykonana z solidnego metalu, a klawiatura nadaje się również dla częstych maszynistów. Znacznie gorszy jest jednak śliski touchpad.
Pomimo kilku znaczących ulepszeń w zakresie wyświetlacza i wydajności systemu, biorąc pod uwagę obniżoną wydajność grafiki z powodu Intel Arc i wysoką emisję, cena 1500 euro (~1482 dolarów) jest po prostu zbyt wysoka
Zachowanie wentylatora i wydajność chłodzenia nie są zbyt imponujące, głośniki nadal są złe, a wersja AMD z wydajnym iGPU nie jest dostępna. Ogólnie więc nie widzimy uzasadnienia dla wysokiej ceny 1500 euro (~1482$). Ale przynajmniej przy mniej więcej takiej samej wydajności, wersja z Core i5 i 512-GB dyskiem SSD kosztuje 200 euro (~$198) mniej.
Z drugiej strony, przy jeszcze niższych kosztach, konkurenci dostarczają więcej w wielu aspektach, np. Lenovo ThinkBook 16 G4+ za 1200 euro (~$1186) lub IdeaPad 5 Pro 16 za 1000 euro (~$988) Envy 16 firmy HPoferuje połączenie multimediów, biznesu i gier oraz zapewnia znacznie większą wydajność za 1700 euro (~$1680)
Cena i dostępność
Amerykański model Acer Swift X, SFX16-52G-73U6 z dyskiem SSD o pojemności 512 GB, 16 GB pamięci RAM, wyświetlaczem o rozdzielczości 1920 x 1200 pikseli oraz procesorem Intel Core i7-1260P, można zamówić za 1250 dolarów bezpośrednio w sklepie internetowym firmy Acer, a Amazon wymienia obecnie ten model w cenie 1049 USD.
Acer Swift X SFX16-52G-77RX
- 25/10/2022 v7 (old)
Marvin Gollor
Price comparison

